Comparative Evaluation of Public-Private Partnerships in Roadway Preservation
18
Anastasopoulos, Volovski, Islam, Powell, Labi COMPARATIVE EVALUATIO OF PUBLIC-PRIVATE PARTERSHIPS I ROADWAY PRESERVATIO by Panagiotis Ch. Anastasopoulos (Corresponding Author) Visiting Assistant Professor - School of Civil Engineering Research Program Manager - Center for Road Safety 550 Stadium Mall Drive, Purdue University West Lafayette, IN 47907-2051 (512) 810-3226, [email protected] Mouyid Bin Islam Graduate Research Assistant - School of Civil Engineering 550 Stadium Mall Drive, Purdue University West Lafayette, IN 47907-2051 (765) 337-8450, [email protected] Matthew Volovski Graduate Research Assistant - School of Civil Engineering 550 Stadium Mall Drive, Purdue University West Lafayette, IN 47907-2051 (765) 494-2205, [email protected] Jarrett Powell Undergraduate Research Assistant - School of Civil Engineering 550 Stadium Mall Drive, Purdue University West Lafayette, IN 47907-2051 (765) 494-5926, [email protected] and Samuel Labi Assistant Professor - School of Civil Engineering 550 Stadium Mall Drive, Purdue University West Lafayette, IN 47907-2051 (765) 494-5926, [email protected] Number of Words in Text: 6,093, Number of Tables: 5, Number of Figures: 1 Total Equivalent Number of Words: 7,593 Prepared for presentation at the 90th Annual Meeting of the Transportation Research Board and publication in the Transportation Research Record. 1 TRB 2011 Annual Meeting Paper revised from original submittal.
Transcript of Comparative Evaluation of Public-Private Partnerships in Roadway Preservation

Anastasopoulos, Volovski, Islam, Powell, Labi
COMPARATIVE EVALUATIO� OF PUBLIC-PRIVATE PART�ERSHIPS
I� ROADWAY PRESERVATIO� by Panagiotis Ch. Anastasopoulos (Corresponding Author) Visiting Assistant Professor - School of Civil Engineering Research Program Manager - Center for Road Safety 550 Stadium Mall Drive, Purdue University West Lafayette, IN 47907-2051 (512) 810-3226, [email protected]
Mouyid Bin Islam
Graduate Research Assistant - School of Civil Engineering 550 Stadium Mall Drive, Purdue University West Lafayette, IN 47907-2051 (765) 337-8450, [email protected] Matthew Volovski
Graduate Research Assistant - School of Civil Engineering 550 Stadium Mall Drive, Purdue University West Lafayette, IN 47907-2051 (765) 494-2205, [email protected] Jarrett Powell
Undergraduate Research Assistant - School of Civil Engineering 550 Stadium Mall Drive, Purdue University West Lafayette, IN 47907-2051 (765) 494-5926, [email protected] and
Samuel Labi
Assistant Professor - School of Civil Engineering 550 Stadium Mall Drive, Purdue University West Lafayette, IN 47907-2051 (765) 494-5926, [email protected] Number of Words in Text: 6,093, Number of Tables: 5, Number of Figures: 1 Total Equivalent Number of Words: 7,593 Prepared for presentation at the 90th Annual Meeting of the Transportation Research Board and publication in the Transportation Research Record.
1
TRB 2011 Annual Meeting Paper revised from original submittal.

Anastasopoulos, Islam, Volovski, Powell, Labi 2
ABSTRACT 1
In a bid to reduce overall costs, manage risks, and attract private capital, highway agencies worldwide 2
strive to increase private sector participation in road infrastructure development, particularly at the 3
developmental phases of construction and preservation. A common mechanism for private sector 4
participation is the concept of a public-private partnership (PPP). As agencies grapple with the decision 5
on whether to adopt a specific PPP or the traditional contracting approach for a specific project, they lack 6
a rational decision-support structure. In addressing this major gap in PPP-related literature, this paper 7
presents a framework by which an agency may assess the performance (relative benefits) of different PPP 8
contracting approaches for highway preservation. For purposes of this paper, performance is expressed in 9
terms of the likelihood and intensity of cost savings that were calculated using data from both domestic 10
(United States) and international projects. In addition, the influence of project and contract attributes 11
(such as the expected project duration, work type, and project size) on PPP project performance is 12
investigated. The framework can be used or duplicated by highway-related agencies and international 13
organizations for identifying the superior contracting option for a given road preservation project on the 14
basis of the project characteristics, and for quantifying the consequences of such choices in terms of the 15
cost savings or other performance criteria. 16
17
I�TRODUCTIO� 18
Public-private partnerships (PPPs) in transportation refer to contractual agreements formed between 19
public agencies and private sector entities to allow for greater private sector participation in the delivery 20
of transportation projects. Therefore any work not completed in-house is considered to be a PPP. 21
Expanding the private sector role allows public agencies to tap private sector technical, management and 22
financial resources in new ways to achieve certain public agency objectives such as greater cost and 23
schedule certainty, supplementing in-house staff, innovative technology applications, specialized 24
expertise, or access to private capital. Public agencies, through PPPs, can accelerate the implementation 25
of high-priority projects by utilizing private sector strengths in packaging and procuring services in 26
innovative ways. The private sector, through PPPs, provides specialized management capacity for large 27
and complex programs, expertise in accessing and organizing a wide range of private sector financial 28
resources, and enables the delivery of new technology developed by private entities. PPPs help to 29
improve product quality and reduce costs, but also potentially reduce project duration, improve 30
construction/maintenance technology and techniques, encourage contractor innovation, and reduce project 31
impacts on the highway user and the surrounding community (1-4). By encouraging private 32
entrepreneurship and participation in the construction, operation, rehabilitation, and maintenance of 33
highway infrastructure, PPPs can allow public agencies to reduce their size or to function effectively with 34
a dwindling workforce particularly in the current era that is characterized by incipient retirement of the 35
baby boomer generation. 36
At the current time, most agencies do not have a set of rational guidelines for deciding on whether 37
to adopt PPP for a given project, and if so, the type of PPP to adopt. As such, agencies need to develop 38
and implement a PPP evaluation and decision-support framework that will incorporate the costs and 39
benefits of each PPP contracting approach for projects at the different phases of highway infrastructure 40
development such as construction, preservation, and operation. 41
In sum, there is a need to identify the performance of alternative project delivery options such as 42
work done by an agency in-house, traditional contracting, and PPP-related contracting. Performance 43
could be expressed using any of several criteria including cost savings likelihood and intensity. Research 44
is also needed to identify and quantify the influence of project attributes (such as the expected project 45
duration, work type, and project size) on PPP project performance. These questions need to be answered 46
for the benefit of highway-related agencies and international organizations who seek to identify the 47
superior contracting option (PPP or otherwise) for a given road preservation project on the basis of the 48
project characteristics, and to quantify the consequences of such choices in terms of the cost savings or 49
other agency specified performance criteria. If this is done, agencies’ public accountability could be 50
TRB 2011 Annual Meeting Paper revised from original submittal.
Anastasopoulos, Islam, Volovski, Powell, Labi 3
enhanced as the costs and benefits of alternative contracting options could be more clearly articulated to 1
the taxpayers or to project sponsor institutions. 2
3
PROJECT DELIVERY APPROACHES A�D PERFORMA�CE ASSESSME�T 4
5
Project Delivery Approaches 6
Highway projects, at the phases of construction, maintenance, and/or operation have been delivered via a 7
variety of contracting approaches as described below. 8
9
In-house Project Delivery 10
In this approach, the highway project is not given out on contract but is delivered by the agency’s in-11
house personnel and equipment. Several decades ago, projects at almost all phases of highway 12
infrastructure development were delivered in-house. However, in recent years, only the phases of 13
planning, operations, and routine maintenance are largely dominated by in-house project delivery while 14
the phases of design, construction, and preservation (the rehabilitation type) are dominated by contracting 15
approaches. 16
17
Traditional Contracting 18
In this approach, the facility design phase is carried out independently of the construction phase. The 19
contract for delivering the project is awarded to the qualified bidder with the lowest total bid price. 20
21
Design-Bid-Build 22
Variants of this contracting approach include design-build-operate-maintain, and design-build-operate-23
maintain-warrant. A major disadvantage of this approach is that the public entity (the government 24
highway agency) is solely responsible for any project deficiencies. Other disadvantages are that they do 25
not encourage innovation, are unfavorable to life-cycle costing (5), and require that the agency maintains 26
a large staff to conduct necessary functions of highway construction, maintenance, and operations. 27
28
Warranty Contracting 29
In warranty contracts, the owner is provided an assurance that the product will serve its useful life without 30
undue defects or failure; otherwise the contractor duly repairs or replaces the product. The premise is that 31
warranties motivate the contractor to produce a higher quality product than would be produced without 32
such assurance of quality, and that in the long run the agency saves costs through higher product 33
longevity. Recent research suggests that pavement resurfacing warranties generally offer a superior 34
product from the perspectives of effectiveness (longevity) and cost-effectiveness in the long term (6). 35
36
Cost-Plus-Time (A+B Bidding) and Incentives/Disincentives (I/D) 37
This is a contracting method that not only considers the initial construction, maintenance, and 38
rehabilitation cost in the bidding process, but also takes into account the time needed to complete the 39
project (4, 7). Incentives/Disincentives (I/D) are project delivery approaches that are structured to 40
incentivize the contractor to finish the project earlier than the time indicated in the contractor’s original 41
bid document. 42
43
Lane Rental 44
This contracting approach imposes on the contractor a fee for occupying lanes or shoulders during the 45
rehabilitation or reconstruction project, and thus incentivizes the contractor to compete the project in as 46
little time as possible (7). 47
48
49
TRB 2011 Annual Meeting Paper revised from original submittal.

Anastasopoulos, Islam, Volovski, Powell, Labi 4
Performance-based Contracting (PBCs) 1
In PBCs, the contract specifies the minimum physical performance of the highway facility that needs to 2
be satisfied by the contractor over a specified period of time subsequent to the project completion. 3
Payment amounts are based on how well the contractor complies with the specified performance 4
standards, not on the amount of work and services provided (8). 5
6
Criteria for Evaluating Alternative Contracting Approaches 7
For assessing the benefits of different contracting approaches, cost-related performance measures, 8
particularly cost savings, have been widely used (9-13). An important distinction needs to be made 9
regarding the definition of cost savings used in this study and that used in past studies. In past studies, 10
cost savings was defined as the difference between the final price and the bid price, or the difference 11
between the bid price and the engineers’ estimate. However, these definitions of cost savings, which are 12
consistent with “lowest price” contractor selection, do not necessarily provide the most economical end 13
results or the desired best value (14, 15). Past researchers have argued that such cost savings is illusory as 14
contractors may seek other means to compensate for unrealistically low bids. In this paper, the definition 15
of cost savings is established to avoid such pitfalls: we define cost savings as the percent cost difference 16
between the PPP contracting approach and its in-house counterpart. Other performance measures besides 17
cost savings include expenditure certainty, improved road conditions, cost-effectiveness (6) and greater 18
road user satisfaction. Zhang identified 21 factors that influence the “best value”, or performance, of PPP 19
contracts (14). Recent studies (16-26) show that road agencies that have adopted PPP approaches have 20
achieved considerable benefits on the basis of at least one of these performance measures. The following 21
section describes these performance measures in detail. 22
23
Risk Minimization 24
For traditional contracts, the risk to the agency (the public entity) is high and the risk to the contractor (the 25
private entity) is relatively low because the contractor hands over the facility after the work completion. 26
For contracting approaches that involve increased private participation, such as warranties and lane-27
rentals, the risk to the agency is lowered as the contractor is responsible for the operation of the facility 28
for a relatively longer time following project completion. This means that any deficiencies and errors in 29
the contract are the government agency’s responsibility. One reason why certain contractors are 30
unwilling to use warranties is the higher liability and risk they perceive to be associated with this 31
contracting approach. 32
33
Opportunities for Contractor Innovation 34
Other major limitations to traditional contracts include impedance to innovation (5). It is well understood 35
that the free market stimulates innovation, and transportation has severely lacked innovation in the fields 36
of traffic control and maintenance. A few states, such as Virginia, have privatized maintenance 37
operations on segments of their interstates. Over a span of five and a half years (from 1997 to 2002) 38
Virginia saved an estimated 22 million dollars (14%) on maintenance costs for 250 miles of interstate due 39
mostly to private sector innovation (27). 40
41
Consistency with Life-cycle Costing 42
As pointed out by past studies, the integration of finance, design, construction and operation in a single 43
source, i.e., the concessionaire, helps to facilitate the achievement of low cost and overall best value over 44
the life cycle of the project (5 & 14). The structure of certain contracting approaches inherently favor the 45
application of life-cycle costing in their evaluation to a greater extent compared to others. 46
47
Staff Strength Requirement 48
This can be a key performance criterion that can vary significantly across the alternative contracting 49
approaches. The in-house delivery approach and the traditional contracting approaches require that the 50
TRB 2011 Annual Meeting Paper revised from original submittal.
Anastasopoulos, Islam, Volovski, Powell, Labi 5
agency maintains a large staff to conduct necessary functions of highway design, construction, 1
maintenance, and operation. 2
3
Product Quality 4
For project delivery approaches that involve greater private participation through extended stewardship of 5
the facility by that sector, an important advantage is that the contractor is more likely to deliver a high 6
quality product initially in order to reduce subsequent defects and consequently, subsequent maintenance 7
and repair costs for which they are responsible (28, 29). 8
9
Resource Requirements for Additional Specification Development 10
The additional resources, costs and expertise needed to develop the warranty performance specifications 11
could be considered a disadvantage. Other contracting approaches have fewer resource requirements for 12
any additional specification development. 13
14
Project Delivery Duration 15
An advantage of the design-build-operate-maintain approach is the reduction in the duration of project 16
delivery from the facility development phases of design to the construction completion phase (24). The 17
reason for reduction in delivery time is two-fold: first, unlike traditional contracting, design-build-18
operate-maintain allows the contractor to proceed with the construction or rehabilitation work even when 19
the design is partially complete, thus saving valuable time for the agency, contractor, and road user. 20
Second, it allows for enhanced coordination between design and construction teams compared with the 21
design-build approach. Therefore, the contractor is able to provide input during the design phase, so there 22
are fewer change orders during the construction and/or rehabilitation phase. 23
24
Other Performance Measures 25
Other advantages include a single point of responsibility for the project and the increased opportunity to 26
use innovative designs, materials, and construction/rehabilitation methods and techniques. A notable 27
concern, however, is that the reduced schedule and the increased control of the contractor may lead to 28
lower overall project quality and decline in construction worker safety (30). 29
30
Performance Comparison across Different Contracting Approaches 31
Anderson and Russell (31) state that the major advantages of the A+B bidding and I/D over the traditional 32
approaches include the lower project completion time and the encouragement of the contractor’s use of 33
innovative construction techniques to enhance product quality and to reduce the project delivery period. 34
However, limitations include an increased burden on the resources of the government agencies (5) as 35
these approaches require additional inspection and testing personnel on site. Also, these approaches 36
generally weaken the competition because smaller contractors may not have the resources to complete the 37
project schedule on the basis of the combined cost of work items and time. 38
Past studies identify as a major advantage of the lane rental method, the reduction in construction, 39
maintenance and/or rehabilitation time, and the consequent reduction in public impact. As is the case for 40
other innovative contracting methods, lane rentals contracts are often hindered by the lack of contractor 41
experience. This is a limitation encountered at many countries that have implemented this contracting 42
approach (5). 43
For performance-based contracts (PBCs), which are a type of PPP whose administration is based 44
on the product quality, an advantage is the potential for reducing costs and improving product quality. 45
Another important advantage of this relatively new contracting approach is that the users have an inherent 46
knowledge of the expected quality of the product. Furthermore, PBCs encourage innovation, allow small 47
businesses to be involved through economic development initiatives, improve asset quality, and transfer 48
risks to the contractor. Unfortunately, improper implementation of this contracting approach could have 49
TRB 2011 Annual Meeting Paper revised from original submittal.
Anastasopoulos, Islam, Volovski, Powell, Labi 6
adverse effects. PBCs are a recently-developed contracting approach, thus the lack of contractor 1
experience is often a major disadvantage. 2
3
FRAMEWORK FOR PPP EVALUATIO� 4
To help agencies decide, for a specific project, on whether to adopt traditional contracting, use a PPP 5
approach, or complete the project in-house, this paper presents a decision-support structure. Using the 6
proposed framework, an agency can assess the performance (relative benefits) of different contracting 7
approaches for highway preservation projects. Product performance may be defined by an agency as it 8
deems fit. However, for demonstration purposes in this paper, performance is expressed in terms of the 9
likelihood and intensity of cost savings. The framework can be used or duplicated by highway-related 10
agencies and international donor organizations for identifying the superior contracting option (PPPs or 11
otherwise) for a given project on the basis of the project characteristics, and for quantifying the 12
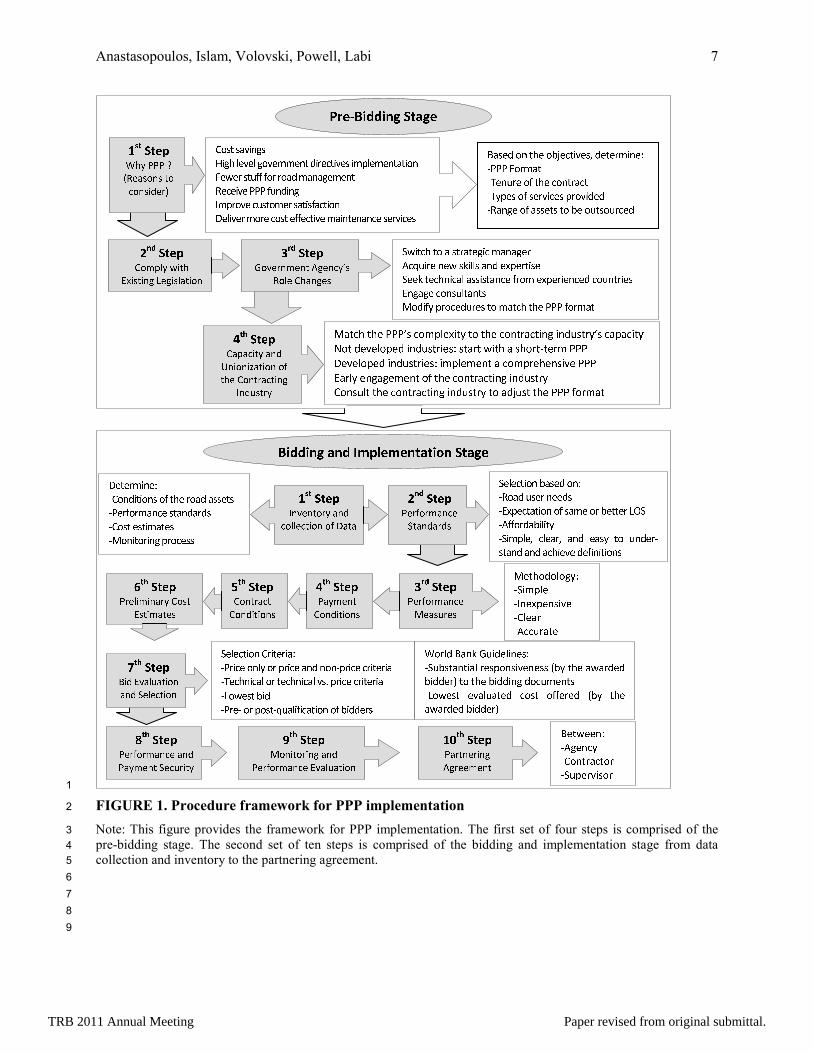
consequences of such choices in terms of the cost savings or otherwise. This framework (Figure 1) can 13
be applied to evaluate any PPP contracting approach. However, it should be noted that the output from 14
the framework is only for the purposes of decision support; for any given project, the final 15
recommendation should be made after weighing carefully other considerations, including local site 16
conditions and the administrative and political environment and culture of the area. 17
18
TRB 2011 Annual Meeting Paper revised from original submittal.
Anastasopoulos, Islam, Volovski, Powell, Labi 7
1
FIGURE 1. Procedure framework for PPP implementation 2
Note: This figure provides the framework for PPP implementation. The first set of four steps is comprised of the 3
pre-bidding stage. The second set of ten steps is comprised of the bidding and implementation stage from data 4
collection and inventory to the partnering agreement. 5
6
7
8
9
������� ��� ����������� ������������������������ �� ��� ���� ������������������ �������������� ���������� ��������! "������ #�$������ %��������&���'��� ������()"�������� �� ������ %����� *+#�,������%�$��-�#��"$�. �$���. ��� ���- �� '���������� ��� �����/� �����������012 3456789:;9<=>?8@A=>B=9BCDEF 3456G>H8>A;9I =>B?;JJ8?A K;> ;: L=A= ������$�!-��#��"$��M��)"����/���$����,��'����NO2 3456789:;9<=>?8P8=CQ98CRFS 34567=I<8>AT;>BKA K;>CUFS 3456T;>A9=?AT;>BKA K;>CVFS 3456798JK<K>=9I T;CAWCA K<=A8C #�$������ ��������������� ��$- �� "���� �������"���� ���������X�������$ �� ��������$ /�Y "���� ��������Z*�[��� %������� �� "����\'�$��������� �� %������ ]��$� ^��_ `'���$������#'%�������$ ���"����/����� a%- ��� �[�����%�����b �� ��� %�����! ���'������*�[��� �/�$'���� ���� ������� a%- ����[����� %�����bcFS 3456dKB WH=JQ=A K;>=>B @8J8?A K;>eFS 3456789:;9<=>?8 =>B7=I<8>A @8?Q9KAI fFS 3456P;>KA;9K>g =>B789:;9<=>?8 WH=JQ=A K;> DhFS 34567=9A>89K>gig988<8>A ^��[�����,!���-������������#'"��/����
jkl������� ��� ^���� �� ��� �%m����/��. �������������� n������X��'�� �� ��� ���������X-"�� �� ���/���� "��/�����&��!� �� ������ �� %� �'���'�������� ��/��!�o�!� $�/�$!�/��������������/�� ��"$����������n�[�� ��'�� ��� ��������!�����&����/���� �'����!M�"��/��'������ ��������������$�/���������� �������/������������ ���/����DEF 3456pqI 777 rst8=C;>CA;?;>CKB89uRFS 3456T=v=?KAI =>Bw>K;>Kx=A K;> ;:Aq8 T;>A9=?A K>gG>BQCA 9I
#[���� �� � ������!������!��,�\'��� ��[ �_�$$� ��� �)"������#��_ ��������$ ���������� ���� �)"�������� ��'������(�!�!� ����'$����� ����- "�����'��� ������� ��� ��� ������NO2 3456y;H89><8>A ig8>?Iz Ct;J8 Tq=>g8C {|}~� }�� ����� ~�������}� }� }�� ~��}�|~}��� �����}���� ~|�|~�}���} ��������� �����}����� �}|�} ��}� | ����}Z}��� ������������ �����}����� ��������} | ~������������ ����|��� ���|�����} �� }�� ~��}�|~}��� �����}��������} }�� ~��}�|~}��� �����}�� }� |����} }�� ��� ����|}012 3456T;<vJI �KAqW� KCA K>g �8gKCJ=A K;>
TRB 2011 Annual Meeting Paper revised from original submittal.

Anastasopoulos, Islam, Volovski, Powell, Labi 8
The rest of this section discusses the various aspects of the study framework. First, the criterion 1
for the evaluation is defined. Then the factors that influence the possibility of cost savings for each 2
contract type are analyzed using binary probit models. Finally, linear regression is applied to investigate 3
the amount of costs saved or lost. In each case, the best model is selected on the basis of the intuitiveness 4
of the model results, the number of observations, as well as goodness-of-fit. 5
6
Defining the Criterion for Evaluation 7
The criterion for evaluation in this paper, cost savings, is herein defined as follows:
8
% 100B A
S
B
C CC
C
−= × (1)
where; %CS is the percent cost savings of the PPP contracting approach under consideration, relative to 9
the corresponding in-house approach, CA is the cost of project carried out using a PPP contracting 10
approach, and CB is the cost of a similar project carried out in-house. 11
12
Estimation of Cost Savings Likelihood 13
In Equation (1), the cost savings, %CS, is positive when the PPP yields a cost savings relative to in-house 14
project delivery approach, and negative when the PPP approach yields a cost loss relative to the in-house 15
approach. The binary probit model, which estimates the probability of any one of two discrete outcomes 16
such as that in this problem setting, can be defined as: 17
−Φ=
σββ nn
n
XXP 2211)1( (2)
where, Pn(1) is the probability of observation n having discrete outcome 1, Φ(.) is the standardized 18
cumulative normal distribution, X1n and X2n are vectors of factors affecting the probabilities for outcomes 19
1 and 2, respectively, and σ is a scaling parameter that determines the discrete outcomes and is typically 20
set to 1.00. For estimating the parameter vector β, standard maximum likelihood methods can be used 21
(32). 22
23
Estimation of Cost Savings Intensity 24
The intensity of cost savings, calculated as a percentage using Equation (1), is a continuous variable that 25
takes positive or negative values depending on whether the PPP yielded cost savings or otherwise 26
(relative to the corresponding in-house project). Linear regression can be used to model the relationship 27
between a continuous dependent variable and one or more independent variables. The linear regression 28
model is of the form: 29
iiiY εββ +Χ×+= 110 (3)
where, Yi the dependent variable which is a function of a constant term, β0, and a constant, β1, times the 30
value X1 of independent variable X for observation i (i = 1, 2,…, n), plus a disturbance term, ε. 31
32
APPLICATIO� OF THE FRAMEWORK 33
34
Data Description 35
This study used data from 570 contracts that were let or completed in the United States and abroad 36
(Africa, Asia, Europe, North and South America, and the Pacific) between 1996 and 2007 inclusive. The 37
data were collected from internet resources and a number of transportation agencies in the United States 38
and abroad (8, 17, 22, 33-37). Table 1 presents summary statistics of selected variables by type of 39
contracting approach. Further details on this data are provided in Anastasopoulos (38). 40
41
42
43
TRB 2011 Annual Meeting Paper revised from original submittal.
Anastasopoulos, Islam, Volovski, Powell, Labi 9
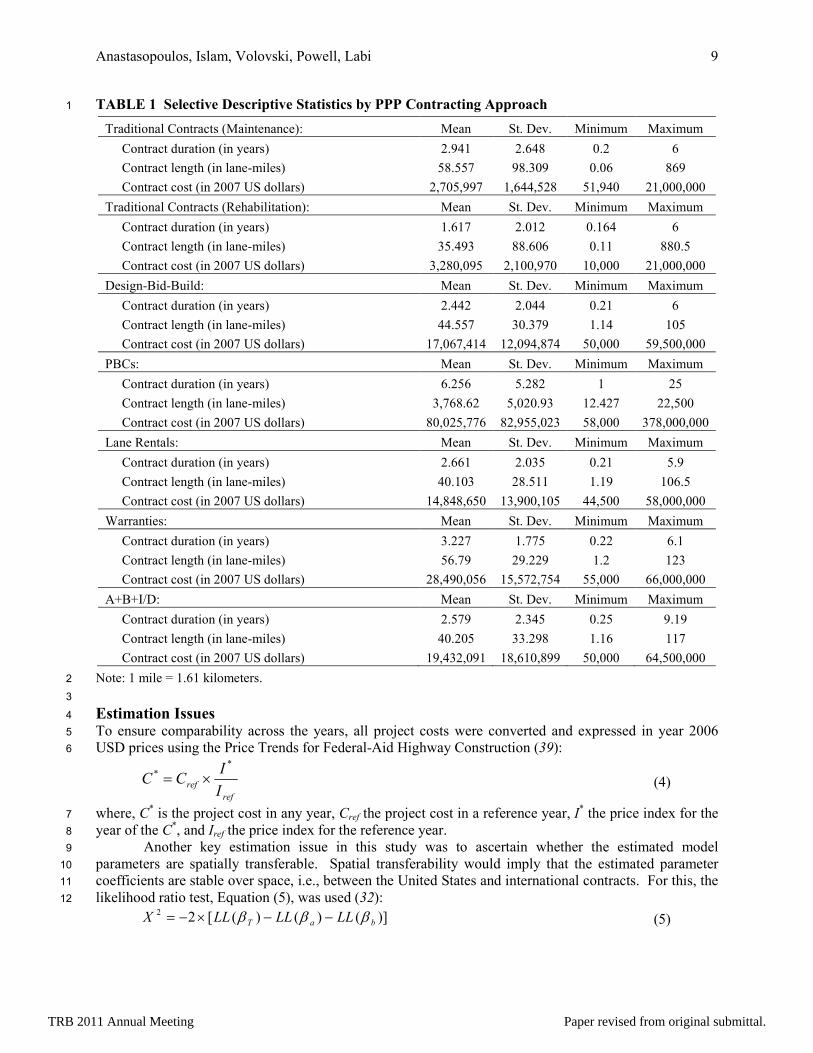
TABLE 1 Selective Descriptive Statistics by PPP Contracting Approach 1
Traditional Contracts (Maintenance): Mean St. Dev. Minimum Maximum
Contract duration (in years) 2.941 2.648 0.2 6
Contract length (in lane-miles) 58.557 98.309 0.06 869
Contract cost (in 2007 US dollars) 2,705,997 1,644,528 51,940 21,000,000
Traditional Contracts (Rehabilitation): Mean St. Dev. Minimum Maximum
Contract duration (in years) 1.617 2.012 0.164 6
Contract length (in lane-miles) 35.493 88.606 0.11 880.5
Contract cost (in 2007 US dollars) 3,280,095 2,100,970 10,000 21,000,000
Design-Bid-Build: Mean St. Dev. Minimum Maximum
Contract duration (in years) 2.442 2.044 0.21 6
Contract length (in lane-miles) 44.557 30.379 1.14 105
Contract cost (in 2007 US dollars) 17,067,414 12,094,874 50,000 59,500,000
PBCs: Mean St. Dev. Minimum Maximum
Contract duration (in years) 6.256 5.282 1 25
Contract length (in lane-miles) 3,768.62 5,020.93 12.427 22,500
Contract cost (in 2007 US dollars) 80,025,776 82,955,023 58,000 378,000,000
Lane Rentals: Mean St. Dev. Minimum Maximum
Contract duration (in years) 2.661 2.035 0.21 5.9
Contract length (in lane-miles) 40.103 28.511 1.19 106.5
Contract cost (in 2007 US dollars) 14,848,650 13,900,105 44,500 58,000,000
Warranties: Mean St. Dev. Minimum Maximum
Contract duration (in years) 3.227 1.775 0.22 6.1
Contract length (in lane-miles) 56.79 29.229 1.2 123
Contract cost (in 2007 US dollars) 28,490,056 15,572,754 55,000 66,000,000
A+B+I/D: Mean St. Dev. Minimum Maximum
Contract duration (in years) 2.579 2.345 0.25 9.19
Contract length (in lane-miles) 40.205 33.298 1.16 117
Contract cost (in 2007 US dollars) 19,432,091 18,610,899 50,000 64,500,000
Note: 1 mile = 1.61 kilometers. 2
3
Estimation Issues 4
To ensure comparability across the years, all project costs were converted and expressed in year 2006 5
USD prices using the Price Trends for Federal-Aid Highway Construction (39): 6
ref
refI
ICC
** ×= (4)
where, C* is the project cost in any year, Cref the project cost in a reference year, I*
the price index for the 7
year of the C*, and Iref the price index for the reference year. 8
Another key estimation issue in this study was to ascertain whether the estimated model 9
parameters are spatially transferable. Spatial transferability would imply that the estimated parameter 10
coefficients are stable over space, i.e., between the United States and international contracts. For this, the 11
likelihood ratio test, Equation (5), was used (32): 12
)]()()([22
baT LLLLLLX βββ −−×−= (5)
TRB 2011 Annual Meeting Paper revised from original submittal.
Anastasopoulos, Islam, Volovski, Powell, Labi 10
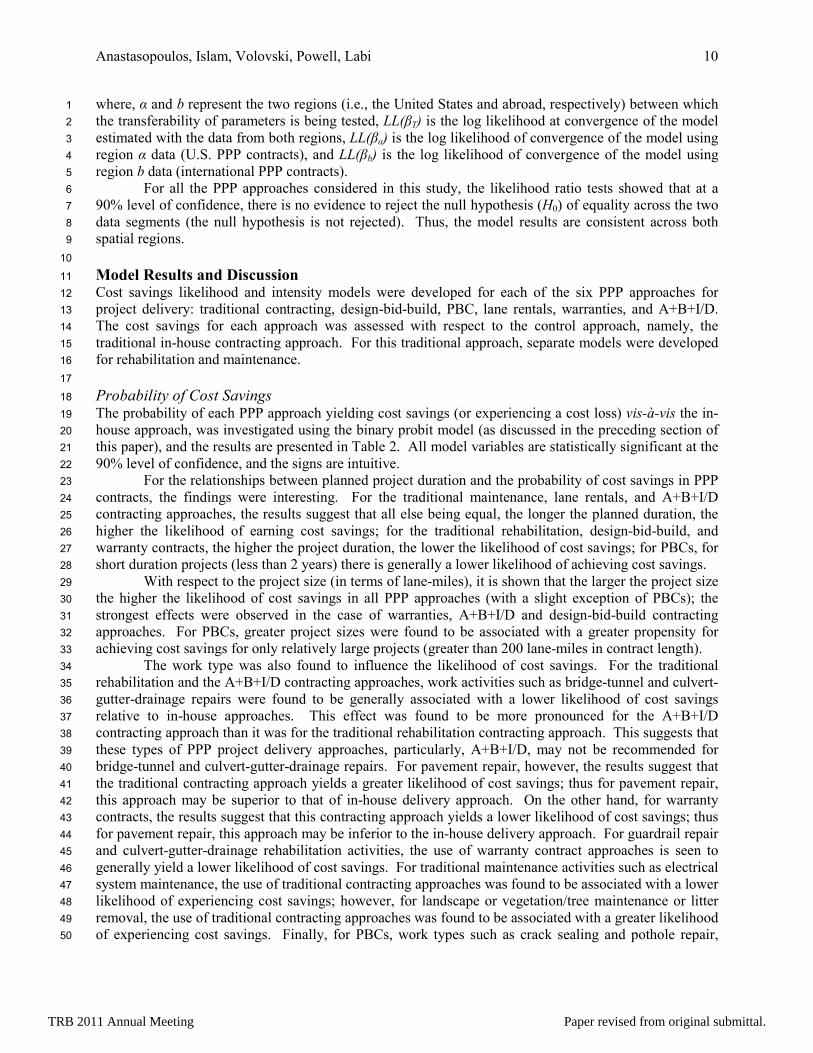
where, α and b represent the two regions (i.e., the United States and abroad, respectively) between which 1
the transferability of parameters is being tested, LL(βT) is the log likelihood at convergence of the model 2
estimated with the data from both regions, LL(βα) is the log likelihood of convergence of the model using 3
region α data (U.S. PPP contracts), and LL(βb) is the log likelihood of convergence of the model using 4
region b data (international PPP contracts). 5
For all the PPP approaches considered in this study, the likelihood ratio tests showed that at a 6
90% level of confidence, there is no evidence to reject the null hypothesis (H0) of equality across the two 7
data segments (the null hypothesis is not rejected). Thus, the model results are consistent across both 8
spatial regions. 9
10
Model Results and Discussion 11
Cost savings likelihood and intensity models were developed for each of the six PPP approaches for 12
project delivery: traditional contracting, design-bid-build, PBC, lane rentals, warranties, and A+B+I/D. 13
The cost savings for each approach was assessed with respect to the control approach, namely, the 14
traditional in-house contracting approach. For this traditional approach, separate models were developed 15
for rehabilitation and maintenance. 16
17
Probability of Cost Savings 18
The probability of each PPP approach yielding cost savings (or experiencing a cost loss) vis-à-vis the in-19
house approach, was investigated using the binary probit model (as discussed in the preceding section of 20
this paper), and the results are presented in Table 2. All model variables are statistically significant at the 21
90% level of confidence, and the signs are intuitive. 22
For the relationships between planned project duration and the probability of cost savings in PPP 23
contracts, the findings were interesting. For the traditional maintenance, lane rentals, and A+B+I/D 24
contracting approaches, the results suggest that all else being equal, the longer the planned duration, the 25
higher the likelihood of earning cost savings; for the traditional rehabilitation, design-bid-build, and 26
warranty contracts, the higher the project duration, the lower the likelihood of cost savings; for PBCs, for 27
short duration projects (less than 2 years) there is generally a lower likelihood of achieving cost savings. 28
With respect to the project size (in terms of lane-miles), it is shown that the larger the project size 29
the higher the likelihood of cost savings in all PPP approaches (with a slight exception of PBCs); the 30
strongest effects were observed in the case of warranties, A+B+I/D and design-bid-build contracting 31
approaches. For PBCs, greater project sizes were found to be associated with a greater propensity for 32
achieving cost savings for only relatively large projects (greater than 200 lane-miles in contract length). 33
The work type was also found to influence the likelihood of cost savings. For the traditional 34
rehabilitation and the A+B+I/D contracting approaches, work activities such as bridge-tunnel and culvert-35
gutter-drainage repairs were found to be generally associated with a lower likelihood of cost savings 36
relative to in-house approaches. This effect was found to be more pronounced for the A+B+I/D 37
contracting approach than it was for the traditional rehabilitation contracting approach. This suggests that 38
these types of PPP project delivery approaches, particularly, A+B+I/D, may not be recommended for 39
bridge-tunnel and culvert-gutter-drainage repairs. For pavement repair, however, the results suggest that 40
the traditional contracting approach yields a greater likelihood of cost savings; thus for pavement repair, 41
this approach may be superior to that of in-house delivery approach. On the other hand, for warranty 42
contracts, the results suggest that this contracting approach yields a lower likelihood of cost savings; thus 43
for pavement repair, this approach may be inferior to the in-house delivery approach. For guardrail repair 44
and culvert-gutter-drainage rehabilitation activities, the use of warranty contract approaches is seen to 45
generally yield a lower likelihood of cost savings. For traditional maintenance activities such as electrical 46
system maintenance, the use of traditional contracting approaches was found to be associated with a lower 47
likelihood of experiencing cost savings; however, for landscape or vegetation/tree maintenance or litter 48
removal, the use of traditional contracting approaches was found to be associated with a greater likelihood 49
of experiencing cost savings. Finally, for PBCs, work types such as crack sealing and pothole repair, 50
TRB 2011 Annual Meeting Paper revised from original submittal.

Anastasopoulos, Islam, Volovski, Powell, Labi 11
were generally found to yield greater likelihood of cost savings; on the other hand, emergency facilities 1
maintenance/response work types were generally found to have a lower propensity of cost savings. 2
3
Intensity of Cost Savings 4
Table 3 presents the relevant variables in the cost savings intensity model. It is seen that the model 5
variables are statistically significant at the 90% level of confidence, and the signs are intuitive, with 6
positive constant terms for all the models. 7
With regard to the planned project duration, the results suggest that for traditional maintenance, 8
PBC, lane rentals and A+B+I/D contract approaches, greater values of the duration are associated with a 9
greater percentage of cost savings; for traditional rehabilitation, Design-Bid-Build, and warranty contract 10
approaches, the opposite effect is observed. As indicated by the regression model coefficients, a unit 11
increase in the planned project duration (i.e., one year), would generally result in the following increases 12
in cost savings: 1% for A+B+I/D, 2.5% for traditional maintenance, 0.4% for PBCs, and 0.2% for lane 13
rental contract; and would result in the following increases in cost loss: 2.4% for warranties, 1.0% for 14
Design-Bid-Build, and 0.1% for traditional rehabilitation contracting approaches. 15
The project size (contract length) is found to be positively related to cost savings. A unit increase 16
of contract length (i.e., one lane-mile), is found to be generally associated with the following increases in 17
cost savings: 0.6% for traditional maintenance, 0.3% for traditional rehabilitation, 0.1% for warranties, 18
and 0.04% for A+B+I/D contract approaches. However, for the Lane Rentals contracting approach, the 19
results suggest that increasing project size is generally associated with reduced cost savings: a one lane-20
mile increase of contract length results in 0.2% increase in cost loss. It is also observed that for PBCs 21
which project size exceeds 600 lane-miles of contract length, a further increase in project size is 22
associated with a 3.3% increase in cost loss. For very costly projects, specifically, Design-Bid-Build and 23
lane rentals were generally found to yield the highest cost savings compared to the cost savings of other 24
contracting approaches. For projects with in-house cost exceeding $25 million, PBC approaches 25
generally yield a 5.5% increase in cost savings, on average. 26
With regard to the work type, bridge-tunnel maintenance or culvert-gutters drainage repair using 27
traditional rehabilitation or A+B+I/D contracting approaches, were found to have a propensity to generate 28
a cost loss of 2.3% and 10.2%, respectively, all other factors remaining the same. The use of warranty 29
contracting approaches for pavement or shoulder repair activities was generally found to yield a 3% cost 30
loss; whereas, the use of A+B+I/D for that work type generally results in a 27% increase in cost savings. 31
Also, the use of warranty approaches for guardrail repair or culvert-gutters drainage work activities was 32
generally found to yield a 13% cost loss; similarly, the use of traditional maintenance or PBCs for 33
landscape or vegetation/tree maintenance or litter removal activities were found to result in 4% or 9.5% 34
cost loss, respectively. Furthermore, the use of the traditional maintenance contracting approach for rest-35
area maintenance was observed to be associated with a 5% cost saving; similarly, the use of PBCs in 36
illumination repair/maintenance or mowing was found to generally yield a 6% cost saving. 37
TRB 2011 Annual Meeting Paper revised from original submittal.
Anastasopoulos, Islam, Volovski, Powell, Labi 12
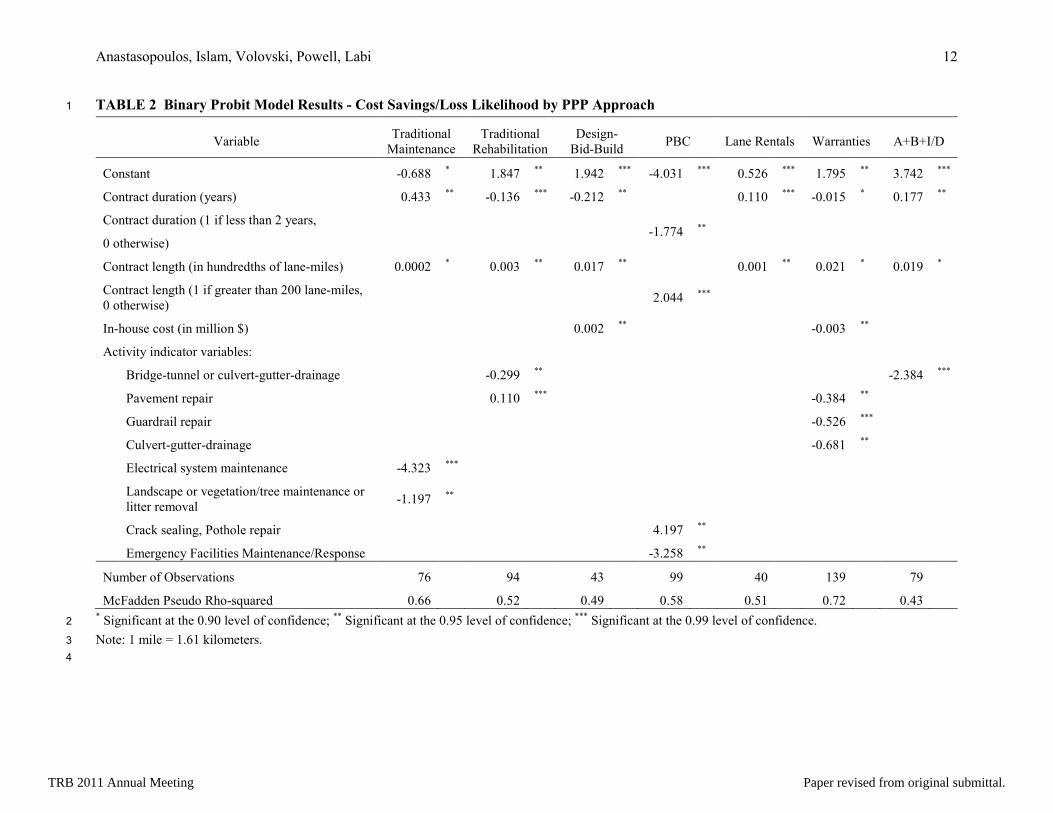
TABLE 2 Binary Probit Model Results - Cost Savings/Loss Likelihood by PPP Approach 1
Variable Traditional
Maintenance Traditional
Rehabilitation Design-
Bid-Build PBC Lane Rentals Warranties A+B+I/D
Constant -0.688 * 1.847 ** 1.942 *** -4.031 *** 0.526 *** 1.795 ** 3.742 ***
Contract duration (years) 0.433 ** -0.136 *** -0.212 ** 0.110 *** -0.015 * 0.177 **
Contract duration (1 if less than 2 years,
0 otherwise) -1.774 **
Contract length (in hundredths of lane-miles) 0.0002 * 0.003 ** 0.017 ** 0.001 ** 0.021 * 0.019 *
Contract length (1 if greater than 200 lane-miles, 0 otherwise)
2.044 ***
In-house cost (in million $) 0.002 ** -0.003 **
Activity indicator variables:
Bridge-tunnel or culvert-gutter-drainage -0.299 ** -2.384 ***
Pavement repair 0.110 *** -0.384 **
Guardrail repair -0.526 ***
Culvert-gutter-drainage -0.681 **
Electrical system maintenance -4.323 ***
Landscape or vegetation/tree maintenance or litter removal
-1.197 **
Crack sealing, Pothole repair 4.197 **
Emergency Facilities Maintenance/Response -3.258 **
Number of Observations 76 94 43 99 40 139 79
McFadden Pseudo Rho-squared 0.66 0.52 0.49 0.58 0.51 0.72 0.43 * Significant at the 0.90 level of confidence; ** Significant at the 0.95 level of confidence; *** Significant at the 0.99 level of confidence. 2
Note: 1 mile = 1.61 kilometers. 3
4
TRB 2011 Annual Meeting Paper revised from original submittal.

Anastasopoulos, Islam, Volovski, Powell, Labi 13
TABLE 3 Linear Regression Model Results for Cost Savings/Loss Amounts by PPP Approach. 1
Variable Traditional
Maintenance Traditional
Rehabilitation Design-
Bid-Build PBC
Lane Rentals
Warranties A+B+I/D
Constant 0.067 ** 0.042 * 0.092 *** 0.047 *** 0.031 *** 0.172 *** 0.211 ***
Contract duration (years) 0.011 *** -0.001 * -0.009 ** 0.004 ** 0.002 ** -0.024 *** 0.025 **
Contract length (in hundredths of lane-miles) 0.006 * 0.003 * -0.002 * 0.001 * 0.0004 *
Contract length (1 if greater than 600 lane-miles,
0 otherwise) -0.033 **
In-house cost (in million $) 0.001 * 0.002 *** 0.001 ** 0.001 ***
In-House cost (1 if greater than $25,000,000,
0 otherwise) 0.055 ***
Activity indicator variables:
Bridge-tunnel or culvert-gutter-drainage -0.023 ** -0.102 **
Pavement or shoulder repair -0.029 ** 0.266 **
Guardrail repair or culvert-gutters-drainage -0.131 *
Landscape or vegetation/tree maintenance or litter removal
-0.038 ** -0.094 **
Rest areas maintenance 0.051 **
Illumination Repair/Maintenance or Mowing 0.062 ***
Number of Observations 76 94 43 99 40 139 79
Adjusted R-square 0.71 0.57 0.51 0.58 0.47 0.61 0.55 * Significant at the 0.90 level of confidence; ** Significant at the 0.95 level of confidence; *** Significant at the 0.99 level of confidence 2
Note: 1 mile = 1.61 kilometers. 3
4
5
TRB 2011 Annual Meeting Paper revised from original submittal.
Anastasopoulos, Islam, Volovski, Powell, Labi 14
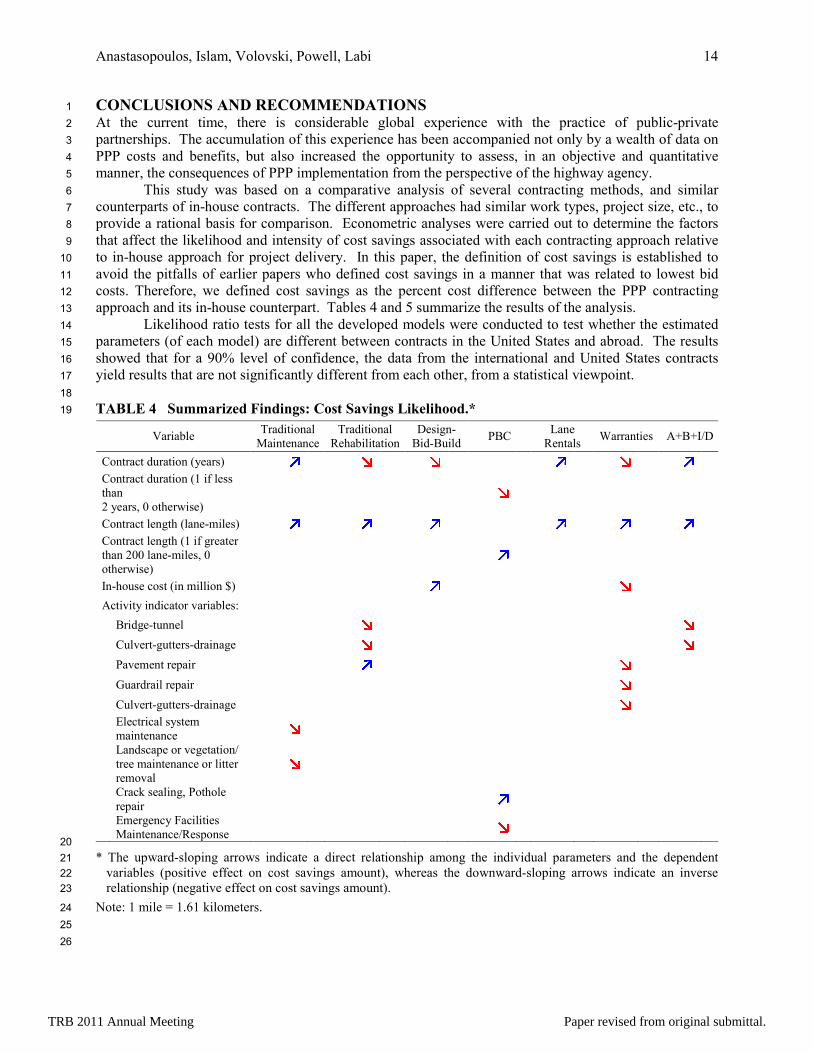
CO�CLUSIO�S A�D RECOMME�DATIO�S 1
At the current time, there is considerable global experience with the practice of public-private 2
partnerships. The accumulation of this experience has been accompanied not only by a wealth of data on 3
PPP costs and benefits, but also increased the opportunity to assess, in an objective and quantitative 4
manner, the consequences of PPP implementation from the perspective of the highway agency. 5
This study was based on a comparative analysis of several contracting methods, and similar 6
counterparts of in-house contracts. The different approaches had similar work types, project size, etc., to 7
provide a rational basis for comparison. Econometric analyses were carried out to determine the factors 8
that affect the likelihood and intensity of cost savings associated with each contracting approach relative 9
to in-house approach for project delivery. In this paper, the definition of cost savings is established to 10
avoid the pitfalls of earlier papers who defined cost savings in a manner that was related to lowest bid 11
costs. Therefore, we defined cost savings as the percent cost difference between the PPP contracting 12
approach and its in-house counterpart. Tables 4 and 5 summarize the results of the analysis. 13
Likelihood ratio tests for all the developed models were conducted to test whether the estimated 14
parameters (of each model) are different between contracts in the United States and abroad. The results 15
showed that for a 90% level of confidence, the data from the international and United States contracts 16
yield results that are not significantly different from each other, from a statistical viewpoint. 17
18
TABLE 4 Summarized Findings: Cost Savings Likelihood.* 19
20
* The upward-sloping arrows indicate a direct relationship among the individual parameters and the dependent 21
variables (positive effect on cost savings amount), whereas the downward-sloping arrows indicate an inverse 22
relationship (negative effect on cost savings amount). 23
Note: 1 mile = 1.61 kilometers. 24
25
26
Variable Traditional
Maintenance Traditional
Rehabilitation Design-
Bid-Build PBC
Lane Rentals
Warranties A+B+I/D
Contract duration (years) � � � � � � Contract duration (1 if less than 2 years, 0 otherwise)
�
Contract length (lane-miles) � � � � � � Contract length (1 if greater than 200 lane-miles, 0 otherwise)
�
In-house cost (in million $) � � Activity indicator variables: Bridge-tunnel � � Culvert-gutters-drainage � � Pavement repair � � Guardrail repair � Culvert-gutters-drainage �
Electrical system maintenance �
Landscape or vegetation/ tree maintenance or litter removal
�
Crack sealing, Pothole repair
�
Emergency Facilities Maintenance/Response
�
TRB 2011 Annual Meeting Paper revised from original submittal.

Anastasopoulos, Islam, Volovski, Powell, Labi 15
TABLE 5 Summarized Findings: Cost Savings Amount.* 1
2
* The upward-sloping arrows indicate a direct relationship among the individual parameters and the dependent 3
variables (positive effect on cost savings amount), whereas the downward-sloping arrows indicate an inverse 4
relationship (negative effect on cost savings amount). 5
Note: 1 mile = 1.61 kilometers. 6
7
Apart from a quantitative assessment of PPP use, a number of issues related to PPP are worthy of 8
discussion. First, agencies tend to be concerned that if they continue to adopt PPP for their project 9
delivery, they may lose valuable in-house expertise. Another issue is the establishment of the appropriate 10
levels of service for the highway facilities that are constructed, maintained and operated through PPP 11
approaches. In such cases, the contractor has stewardship of the facility for a relatively long period of 12
time following construction, and needs to juggle post-construction spending to maintain a reasonable 13
balance between facility level of service and operating/maintenance costs. Inability to attain this balance 14
may result in dissatisfied users and, ultimately, public relations problems for the contractor as well as the 15
agency. Finally, highway agencies and sponsoring organizations need a decision-support framework to 16
evaluate whether, and under what conditions, different PPP approaches will lead to overall quality and 17
longevity of the product, and if these approaches are cost-effective in the long-term. 18
Although the nature of this study is primarily exploratory, the research findings can help highway 19
agencies and related organizations facilitate decision-making processes regarding the adoption (or 20
otherwise) of the PPPs for different maintenance and rehabilitation work types. However, final 21
recommendations for a given project should only be made after weighing carefully other considerations 22
such as local site conditions and the social and political culture. In general, the developed models can be 23
useful in the overall management functions of maintenance planning and management, facility 24
preservation planning, and contract administration. 25
26
27
Variable Traditional
Maintenance Traditional
Rehabilitation Design-
Bid-Build PBC
Lane Rentals
Warranties A+B+I/D
Contract duration (years) � � � � � � �
Contract length (lane-miles) � � � � �
Contract length (1 if greater than 600 lane-miles, 0 otherwise)
�
In-house cost (in million $) � � � �
In-House cost (1 if greater than $25,000,000, 0 otherwise) �
Activity indicator variables:
Bridge-tunnel � �
Culvert-gutters-drainage � �
Pavement repair � �
Shoulder repair � �
Guardrail repair �
Culvert-gutters-drainage �
Landscape or vegetation/ tree maintenance or litter removal
� �
Rest areas maintenance �
Mowing �
Illumination Repair/Maintenance �
TRB 2011 Annual Meeting Paper revised from original submittal.
Anastasopoulos, Islam, Volovski, Powell, Labi 16
ACK�OWLEDGEME�TS 1
This work was supported by the Joint Transportation Research Program administered by the Indiana 2
Department of Transportation (DOT) and Purdue University, and the Nextrans Center. The authors thank 3
the following executives for providing contract data and for useful information: Mike Bowman, Scott 4
Trammel, John Burkhardt, Todd Shields, Scott Newbolds, Joe Lewien, Mark Miller, John Morton, Bill 5
Tompkins and Dennis Belter of INDOT, Frank T. Richards of Alaska DOT, Susan J. Berndt, Hope 6
Jensen, Nancy Worline and Steven Lund of Minnesota DOT, Lance Davis, Audry Reeves and Steve 7
Foskey of Polk County, Florida, Larry Buttler, Tammy Booker Sims, Bob Blackwell and Kerry Hardy of 8
Texas DOT, Diane L. Mitchell, Dick Kiefer, Roy A. Thacker and Robert Prezioso of Virginia DOT, Gary 9
Stebbins from E+B Paving Inc., Ted Lucas from Milestone, Stove Koble from Brooks Construction Co., 10
and Keith Rose from Rieth-Riley. The authors also thank Kumares C. Sinha, Fred L. Mannering, Srinivas 11
Peeta, Bob G. McCullouch, Gunter Zietlow, and Pekka Pakkala for their helpful suggestions and 12
comments. The contents of this paper reflect the views of the authors, who are responsible for the facts 13
and the accuracy of the data presented herein, and do not necessarily constitute a standard, specification, 14
or regulation. 15
16
REFERE�CES 17
(1) Florida Department of Transportation. Highway Construction and Engineering and 18
Transportation System Maintenance Programs. Office of Program Policy Analysis and 19
Government Accountability, Report 99-29, 2000. 20
(2) Anastasopoulos, P. Ch., S. Labi, and B. G. McCullouch. Analyzing Duration and Prolongation 21
of Performance-Based Contracts Using Hazard-Based Duration and Zero-Inflated Random 22
Parameters Poisson Models. In Transportation Research Record: Journal of the 23
Transportation Research Board, No. 2136, Transportation Research Board of the National 24
Academies, Washington, D.C., 2009, pp. 11–19. 25
(3) Anastasopoulos, P. Ch., S. Labi, B. G. McCullouch, M. G. Karlaftis, and F. Moavenzadeh. 26
(2010). Influence of highway project characteristics on contract type selection: An empirical 27
assessment. Forthcoming in ASCE Journal of Infrastructure Systems, 28
http://dx.doi.org/10.1061/(ASCE)IS.1943-555X.0000035. 29
(4) Carpenter, B., E. Fekpe, and D. Gopalakrishna. Performance-Based Contracting for the 30
Highway Construction Industry. Washington DC: Koch Industries Inc., Final Report, 2003. 31
(5) Hancher, D. E. (1999) Contracting Methods for Highway Construction. TR Fews, 32
Transportation Research Board, Vol. 205, pp. 10-14. 33
(6) Singh, P., J. E. Oh, S. Labi, and K. C. Sinha. Cost-Effectiveness Evaluation of Warranty 34
Pavement Projects. ASCE Journal of Construction Engineering and Management, Vol. 133, 35
N0. 3, 2007, pp. 217–224. 36
(7) Herbsman, Z. J., and C. R. Glagola. Lane Rental: Innovative Way to Reduce Road 37
Construction Time. ASCE Journal of Construction and Engineering Managements, Vol. 124, 38
No. 5, 1998, pp. 411–417. 39
(8) Zietlow, G. (2005) Cutting Costs and Improving Quality through Performance-Based Road 40
Management and Maintenance Contracts - The Latin American and OECD Experiences. 41
Regional Seminar on Performance-Based Road Management and Maintenance Contracts, 42
Arusha, February 2008. 43
(9) Anastasopoulos, P. Ch., R. J. G. M. Florax, S. Labi, and M. G. Karlaftis. Contracting in 44
highway maintenance and rehabilitation: Are spatial effects important? Transportation 45
Research Part A: Policy and Practice, Vol. 44, 2010, pp. 136–146. 46
(10) Fulkerson, D. R. A Network Flow Computation for Project Cost Curves. Management Science, 47
Vol. 7, No. 2, 1961, pp. 167–178. 48
(11) Foldes, S., and F. Soumis. Pert and Crashing Revisited: Mathematical Generalizations. 49
European Journal of Operational Research, Vol. 64, No. 2, 1993, pp. 286–294. 50
TRB 2011 Annual Meeting Paper revised from original submittal.

Anastasopoulos, Islam, Volovski, Powell, Labi 17
(12) Skutella, M. Approximation Algorithms for the Discrete Time-Cost Trade-Off Problem. 1
Mathematics of Operations Research, Vol., 23, No. 4, 1998, pp. 909–929. 2
(13) Zheng, D. X. M., S. T. Ng, and M. M. Kumaraswamy. Applying a Genetic Algorithm-Based 3
Multiobjective Approach for Time-Cost Optimization. ASCE Journal of Construction 4
Engineering and Management, Vol. 130, No. 2, 2004, pp. 168–176. 5
(14) Zhang, X. Public Clients’ Best Value Perspectives of Public Private Partnerships in 6
Infrastructure Development. ASCE Journal of Construction Engineering and Management 7
Vol. 132, No. 2, 2006, pp. 107–114. 8
(15) Gransberg, D. D., and M. A. Ellicott. Best value contracting: Breaking the low-bid paradigm. 9
Transactions of AACE International, ABI/INFORM Global, VEC51, 5.1–5.4, 1996. 10
(16) Anastasopoulos, P. Ch., B. G. McCullouch, K. Gkritza, F. L. Mannering, and K. C. Sinha. 11
(2009b). A Cost Savings Analysis of Performance-Based Contracts for Highway Maintenance 12
Operations. ASCE Journal of Infrastructure Systems, HTTP://DX.DOI.ORG/10.1061/(ASCE) 13
IS.1943-555X.0000012 (In Press). 14
(17) Stankevich, N., N. Qureshi, and C. Queiroz. Contrats basés sur les résultats pour la 15
préservation et l’amélioration des actifs routiers. Transport Fote TF-27, Washington, D.C.: 16
The World Bank, USA, 2005. 17
(18) Federal Highway Administration, FHWA. Highway Maintenance Contracting 2004. World 18
State of Practices. Report of the Fational Highway Maintenance Contract Seminar, Orlando, 19
Florida, 2005. 20
(19) Liautaud, G. Maintaining Roads: Experience with Output-based Contracts in Argentina. 21
Washington DC: World Bank, USA, 2004. 22
(20) Estonian National Road Administration, ENRA. Annual Report 2003. Tallinn, Finland, 2004. 23
http://www.mnt.ee/atp/failid/mnt_2003aastakogumik_eng_.pdf. Accessed October 2006. 24
(21) Zietsman, J. Performance measures for performance based maintenance contracts. In 83rd 25
Annual Meeting of the Transportation Research Board, Washington, DC, USA, 2004. 26
(22) Pakkala, P. Performance-based Contracts – International Experiences. Finnish Road 27
Administration. Presentation at the TRB Workshop on “Performance-based Contracting”, 28
Washington, D.C. USA, April, 2005. 29
(23) Anastasopoulos, P. Ch., K. Gkritza, B. G. McCullouch, F. L. Mannering, and K. C. Sinha. 30
Performance-based contracting for roadway maintenance: An exploratory empirical analysis. 31
Proceedings of the 10th International Conference on Applications of Advanced Technologies 32
in Transportation, Athens, Greece, May 2008. 33
(24) Anastasopoulos, P. Ch., S. Labi, and B. G. McCullouch. Identifying Appropriate Contract 34
Type on the Basis of Highway Maintenance and Rehabilitation Project Characteristics. 35
Proceedings of the 88th Transportation Research Board Annual Meeting, Washington D.C., 36
January 2009. 37
(25) McCullouch, B. G., and P. Ch. Anastasopoulos. Performance Based Contracting, Yes or No, 38
an In-Depth Analysis. Proceedings of the 12th AASHTO/TRB Maintenance Management 39
Conference, Annapolis, Maryland, May 2009. 40
(26) Anastasopoulos, P. Ch., and S. Labi. Public-Private Partnerships (PPPs) in Highway 41
Reconstruction, Rehabilitation, and Operations. InStep, InLine, OnTime: Regional Strategies 42
for Trade, Security and Mobility Challenges at the U.S.-Canada Border, A Fextrans 43
Conference, Purdue University Discovery Park, November 2009. 44
(27) Ybarra, S. J. VMS Asset Management Contract for Virginia's Interstate Highways. Secretary 45
of Transportation for the Commonwealth of Virginia, 1998. http://shirleyybarra.com/V-46
DOTcasestudy.pdf. Accessed January 2010. 47
(28) Hastak, M., I. A. Minkarah, Q. Cui, and M. Bayraktar. The evaluation of warranty provisions 48
on ODOT construction projects. Ohio Dept. of Transportation, Report #14780, 2003. 49
http://www.dot.state.oh.us/Divisions/TransSysDev/Research/reportsandplans/Reports/2003/Co50
nstruction/14780-FR.pdf. Accessed June 2010. 51
TRB 2011 Annual Meeting Paper revised from original submittal.

Anastasopoulos, Islam, Volovski, Powell, Labi 18
(29) Wisconsin Department of Transportation (DOT). Wisconsin Works (W–2) and Related 1
Programs Contract. Report for the Wisconsin Works (W–2) Program Resource, 1998. 2
http://www.dwd.state.wi.us/w2/rfp/pdf/ appendixb.pdf. Accessed April 2007. 3
(30) Ernzen, J., and T. Feeny. Contractor Led Quality Control and Quality Assurance Plus Design-4
Build: Who is Watching the Quality? In Transportation Research Record: Journal of the 5
Transportation Research Board, No. 1813, Transportation Research Board of the National 6
Academies, Washington, D.C., 2002, pp. 253–259. 7
(31) Anderson, S. D., and J. S. Russell. FCHRP Report 451: Guidelines for Warranty, Multi-8
Parameter, and Best Value Contracting, Transportation Research Board, National Research 9
Council, Washington, D.C., 2001. 10
(32) Washington, S. P., M. G. Karlaftis, and F. L. Mannering. Statistical and Econometric methods 11
for transportation data analysis. Chapman & Hall/CRC, 2010. 12
(33) Zietlow, G., 2004. Implementing performance-based road management and maintenance 13
contracts in developing countries – an instrument of German technical cooperation. Report 14
11/2004 – German Development Cooperation, Eschborn, Germany, 2004. 15
(34) Segal, G. F., A. T. Moore, and S. McCarthy. Contracting for Road and Highway Maintenance. 16
Los Angeles: Reason Public Policy Institute, Final Report, 2003. 17
(35) Porter, T. International Trends in Procurement Models for Highway Maintenance. Opus 18
International Consultants, Ltd., Final Report, 2002. http://www.opus.co.nz. Accessed 19
September 2006. 20
(36) Robinson, D. M., E. Raynault, W. Frazer, M. Lakew, S. Rennie, and E. A. Sheldahl. DC 21
Streets Performance-Based Asset Preservation Experiment: Current Quantitative Results and 22
Suggestions for Future Contracts. Presented at the 85th Transportation Research Board 23
Annual Meeting, Washington D.C., January 2006. 24
(37) Federal Highway Administration, FHWA. Price Trends for Federal-Aid Highway 25
Construction. Federal Highway Administration, 2007. http://www.fhwa.dot.gov/program 26
admin/pt2006q4.cfm. Accessed April 2007. 27
(38) Anastasopoulos, P. Ch. Performance-based contracting for roadway maintenance operations. 28
M.Sc. Thesis, Purdue University, West Lafayette, Indiana, 2007. 29
(39) Sinha, K. C., and S. Labi. Transportation Decision-Making: Principles of Project Evaluation 30
and Programming, John Wiley & Sons Inc., 2007. 31
TRB 2011 Annual Meeting Paper revised from original submittal.