quality specifications for roadway bridges, standardization at a ...
418
Funded by the Horizon 2020 Framework Programme of the European Union QUALITY SPECIFICATIONS FOR ROADWAY BRIDGES, STANDARDIZATION AT A EUROPEAN LEVEL eBook for the 8 th Workshop Meeting Barcelona, 27 th September 2018 Editors: Joan R. Casas, José Matos, Rade Hajdin, Amir Kedar, Vikram Pakrashi, Jan Bień Publisher: Technical University of Catalunya. UPC-BarcelonaTech ISBN: 978-84-9880-756-1
-
Upload
khangminh22 -
Category
Documents
-
view
0 -
download
0
Transcript of quality specifications for roadway bridges, standardization at a ...
Funded by the Horizon 2020 Framework
Programme of the European Union
QUALITY SPECIFICATIONS FOR ROADWAY BRIDGES,
STANDARDIZATION AT A EUROPEAN LEVEL
eBook for the 8th Workshop Meeting
Barcelona, 27th September 2018
Editors: Joan R. Casas, José Matos, Rade Hajdin, Amir Kedar, Vikram Pakrashi, Jan Bień
Publisher: Technical University of Catalunya. UPC-BarcelonaTech
ISBN: 978-84-9880-756-1

COST Action TU1406 aims to address the European economic and societal needs by standardizing
the condition assessment and maintenance level of roadway bridges. Currently, bridge quality
control plans vary from country to country and, in some cases, within the same country. This
therefore urges the establishment of a European guideline to surpass the lack of a standard
methodology to assess bridge condition and to define quality control plans for roadway bridges.
COST ACTION TU1406 SLIDE 2
Opening note from the Chair
Such guideline will comprise specific recommendations for assessing performance indicators as well as for the
definition of performance goals, bringing together different stakeholders (e.g. universities, institutes, operators,
consultants and owners) from various scientific disciplines (e.g. on-site testing, visual inspection, structural engineering,
sustainability, etc.) in order to establish a common trans-national language.
COST Action TU1406 Workshops aim to facilitate the exchange of ideas and experiences between active researchers
and practitioners as well as to stimulate discussions on new and emerging issues In line with the conferences topics.
This is accomplished through the organization of conferences and workshops as the one organized at UPC-Barcelona-
Tech in Barcelona.
José C. Matos
Chair COST Action TU1406

This e-book contains the contributions presented by the participants and shows the last works carried out within the
Action.
Joan R. Casas
Vice Chair COST Action TU1406
COST Action TU1406 Workshops aim to facilitate the exchange of ideas and experiences between
active researchers and practitioners as well as to stimulate discussions on new and emerging
issues in line with the project topics. This eighth Workshop, organized by UPC-BarcelonaTech in
the North Campus of the University addresses the following topics:
• Methods and experiences of bridge Life-cycle Assessment;
• Establishment of Quality control plans;
• Quality control measurements, techniques and methods;
• Applications to Case Studies;
• Guidelines for implementation of Quality Control Plans;
• Quality control and standardization;
• Bridge management systems.
COST ACTION TU1406 SLIDE 3
Note from the Vice Chair

COST ACTION TU1406 SLIDE 4
Table of Contents
• Welcome and opening session
by José Matos, Chair of COST Action TU1406,
Joan R. Casas, Vice-Chair of COST Action TU1406 and Local Organizer.
• A study on data driven strategy of management and maintenance of large-scale bridges
by Prof. Airong Chen, Tongji University, Shangai, China [Keynote Lecturer]
• Economy and societal performance indicators for bridge maintenance prioritization
by Sandra Škarić Palić, Infra Plan konzalting, Croatia
• On the development of key performance indicators for a rapid seismic assessment of roadway bridges
by Andrej Anžlin, Slovenian National Building and Civil Engineering Institute, Slovenia
• Tecnalia´s vision on bridge life cycle management through innovation: A practical
example through GENIA tool for inspection and assessment
by Jesus Isoird, TECNALIA, Derio, Spain [Keynote Lecturer]
• Life-cycle assessment of a masonry arch bridge
by Naida Ademovic, University of Sarajevo, Bosnia and Herzegovina

COST ACTION TU1406 SLIDE 5
Table of Contents
• Automatically identify damage of a bridge deck using low-cost UAV-based images
by Linh Truong-Hong, University College Dublin, Ireland
• Human errors and corresponding risks for reinforced concrete bridges
by Neryvaldo Galvão, University of Minho, Portugal
• Quality control,infrastructure managements systems and their implementation in medium-size highway networks
by Flora Faleschini, University of Padova, Padova, Italy [Keynote Lecturer]
• Quality control of roadway bridges – reliability assessment
by Nikola Tanasić, University of Belgrade, Serbia
• East bridge over the Channel of the Prague Port in Warsaw – Poland
by Paulina Bielecka, Warsaw University of Technology, Poland
• Implementation of quality control plan into two case studies
by Marija Docevska, University Cyril and Methodius-Skopje, Republic of Macedonia

Funded by the Horizon 2020 Framework
Programme of the European Union
WORKGROUPS & SUBGROUPS
WORKSHOP
Technical University of Catalonia
Barcelona, 27th September 2018
José C. Matos – Chairman
SLIDE 7
WORKGROUP & SUBGROUPS WORKSHOP | José C. Matos
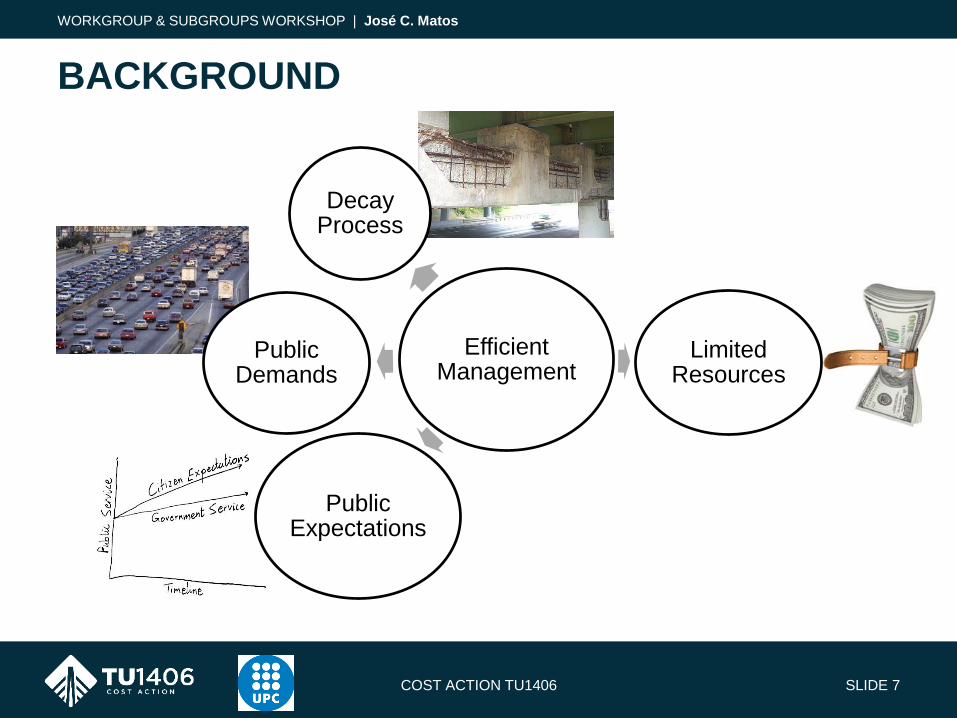
Efficient Management
Decay Process
Limited Resources
Public Expectations
Public Demands
BACKGROUND
COST ACTION TU1406
SLIDE 8
WORKGROUP & SUBGROUPS WORKSHOP | José C. Matos
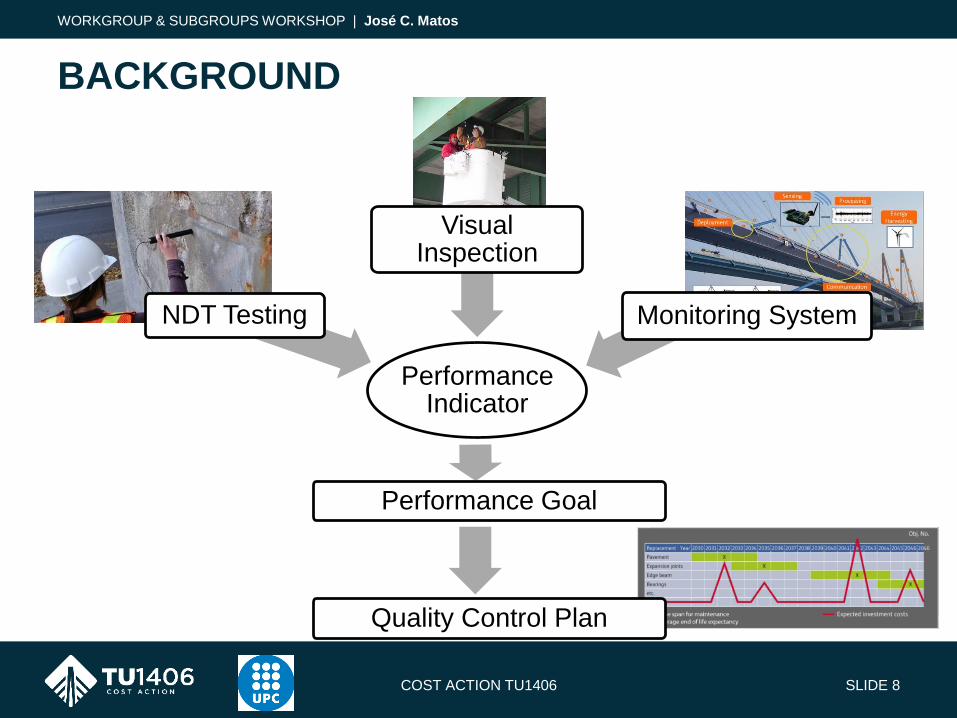
Performance Indicator
NDT Testing
Visual Inspection
Monitoring System
Performance Goal
Quality Control Plan
BACKGROUND
COST ACTION TU1406

SLIDE 9
WORKGROUP & SUBGROUPS WORKSHOP | José C. Matos
REASONS FOR THE ACTION
COST ACTION TU1406
There is a REAL NEED to standardize the quality
assessment of roadway bridges at an European Level

COST ACTION TU1406 SLIDE 10
CSO Approval: 13-11-2014
Start of the Action: 16-04-2015
End of Action: 15-04-2019 (extension to end 2019)
Total Number of COST countries accepting MoU: 37
Total Number of COST countries intending to accept MoU: 0
REASONS FOR THE ACTION
WORKGROUP & SUBGROUPS WORKSHOP | José C. Matos
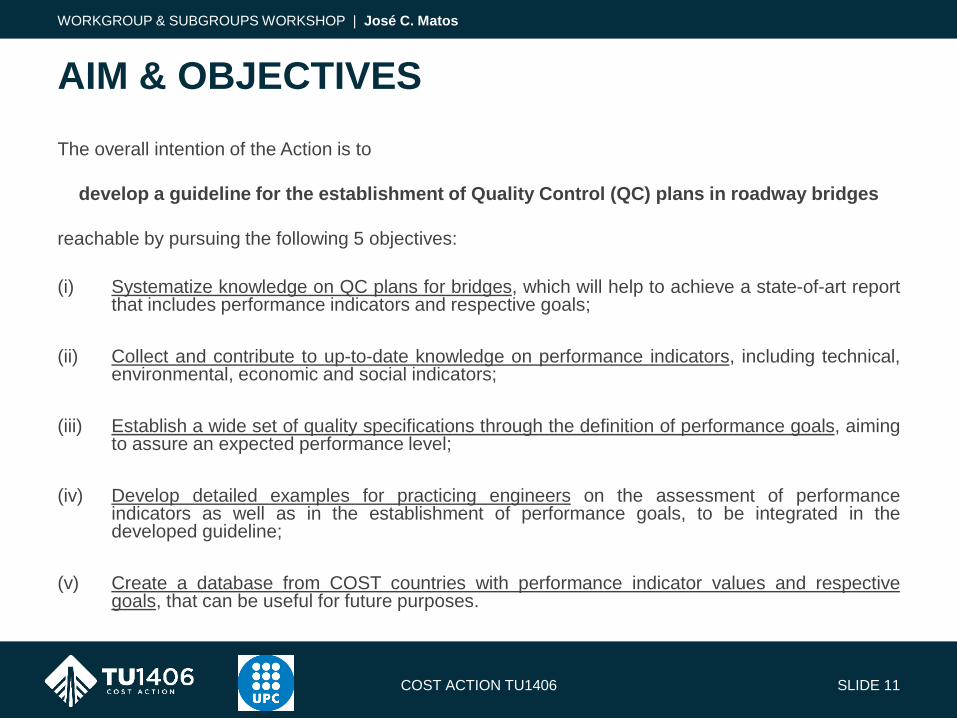
The overall intention of the Action is to
develop a guideline for the establishment of Quality Control (QC) plans in roadway bridges
reachable by pursuing the following 5 objectives:
(i) Systematize knowledge on QC plans for bridges, which will help to achieve a state-of-art reportthat includes performance indicators and respective goals;
(ii) Collect and contribute to up-to-date knowledge on performance indicators, including technical,environmental, economic and social indicators;
(iii) Establish a wide set of quality specifications through the definition of performance goals, aimingto assure an expected performance level;
(iv) Develop detailed examples for practicing engineers on the assessment of performanceindicators as well as in the establishment of performance goals, to be integrated in thedeveloped guideline;
(v) Create a database from COST countries with performance indicator values and respectivegoals, that can be useful for future purposes.
COST ACTION TU1406 SLIDE 11
AIM & OBJECTIVES
WORKGROUP & SUBGROUPS WORKSHOP | José C. Matos

COST ACTION TU1406 SLIDE 12
WORKGROUP & SUBGROUPS WORKSHOP | José C. Matos
Core Group
• MC Chair
• MC Vice-Chair
• WG’s Leaders
• General Secretariat
• STSM Leader
• M&E Leader *
• Innovation Leader *
• R&D Leader *
Advisory Board
• Industry/Owners/Operators
• External Advisors (MC Observers)
Management Committee
Including:
• MC Chair
• MC Vice-Chair
• WG’s Leaders and Vice-Leaders
• General Secretariat
• STSM Leader and Vice-Leader
• M&E Leader and Vice-Leader
• Innovation Leaderand Vice-Leader
• R&D Leader and Vice-Leader
MC Observers
• Australia
• Chile
• Japan
• South Africa
• United States of America
An MC Observer per Continent
* under an “ad-hoc” basis
ORGANIZATION
COST ACTION TU1406 SLIDE 13
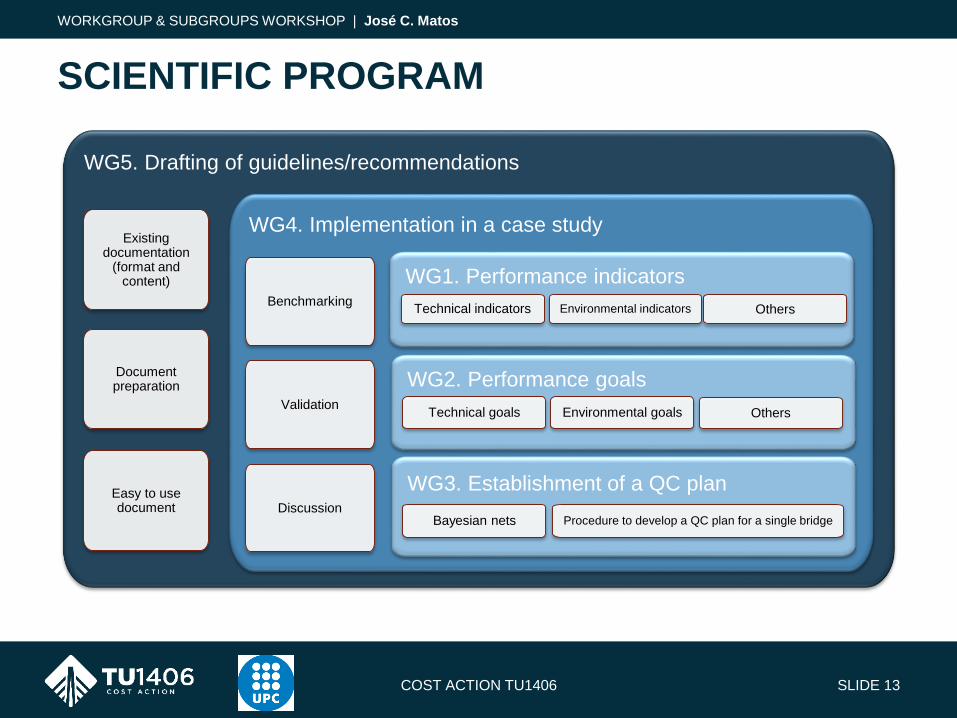
SCIENTIFIC PROGRAM
WORKGROUP & SUBGROUPS WORKSHOP | José C. Matos
WG5. Drafting of guidelines/recommendations
Existingdocumentation
(format andcontent)
Documentpreparation
Easy to use document
WG4. Implementation in a case study
Benchmarking
Validation
Discussion
WG3. Establishment of a QC plan
Bayesian nets Procedure to develop a QC plan for a single bridge
WG2. Performance goals
Technical goals Environmental goals Others
WG1. Performance indicators
Technical indicators Environmental indicators Others

M1: WG1 – Performance indicators
Elaborate a report of performance indicators
M2: WG2 – Performance goals
Elaborate a report of performance goals
M3: WG3 – Establishment of a QC plan
Prepare recommendations for the establishment of Quality Control plan
M4: WG4 – Implementation in a Case Study
Prepare database from benchmarking
M5: WG5 – Drafting of guideline/recommendations
Prepare guideline/recommendations for the establishment of QC plan
COST ACTION TU1406 SLIDE 14
SCIENTIFIC PROGRAM
WORKGROUP & SUBGROUPS WORKSHOP | José C. Matos
Activity/Months 3 6 9 12 15 18 21 24 27 30 33 36 39 42 45 48
Milestone M1 M2 M3 M4 M5
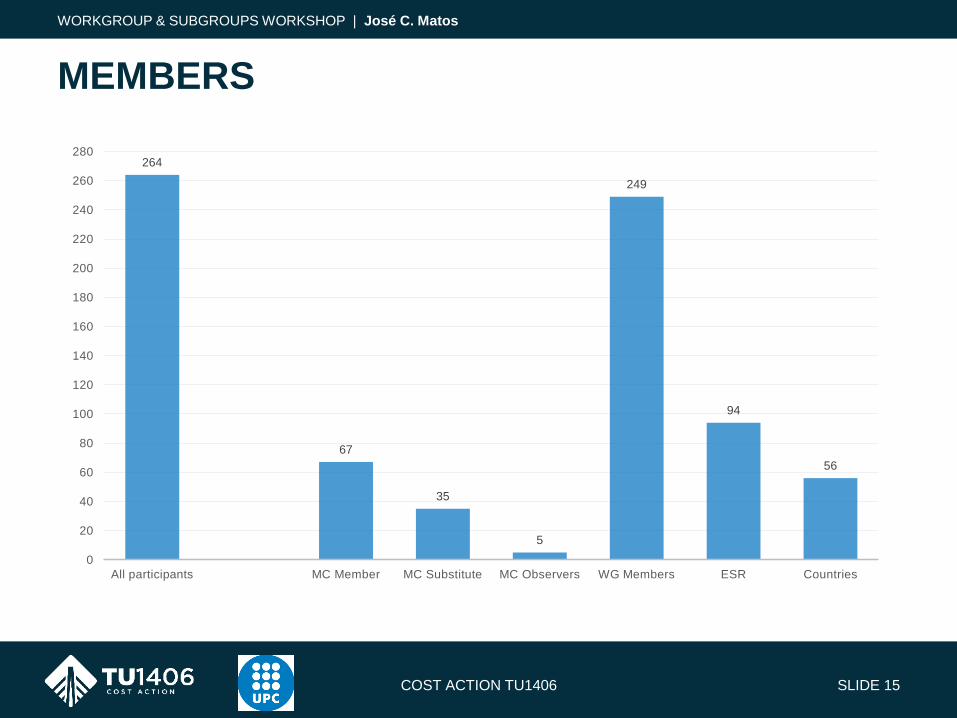
264
67
35
5
249
94
56
0
20
40
60
80
100
120
140
160
180
200
220
240
260
280
All participants MC Member MC Substitute MC Observers WG Members ESR Countries
COST ACTION TU1406 SLIDE 15
WORKGROUP & SUBGROUPS WORKSHOP | José C. Matos
MEMBERS

COST ACTION TU1406 SLIDE 16
WG1. Milestone
available on website: www.tu1406.eu
GeneralPerformance Indicators
terms after surveying
OperatorsOperators list of documents
and database per countryResearch
Research list of documents
and database per country
GlossaryGlossary and specific term
sheet per country
WORKGROUP & SUBGROUPS WORKSHOP | José C. Matos
COST ACTION TU1406 SLIDE 17
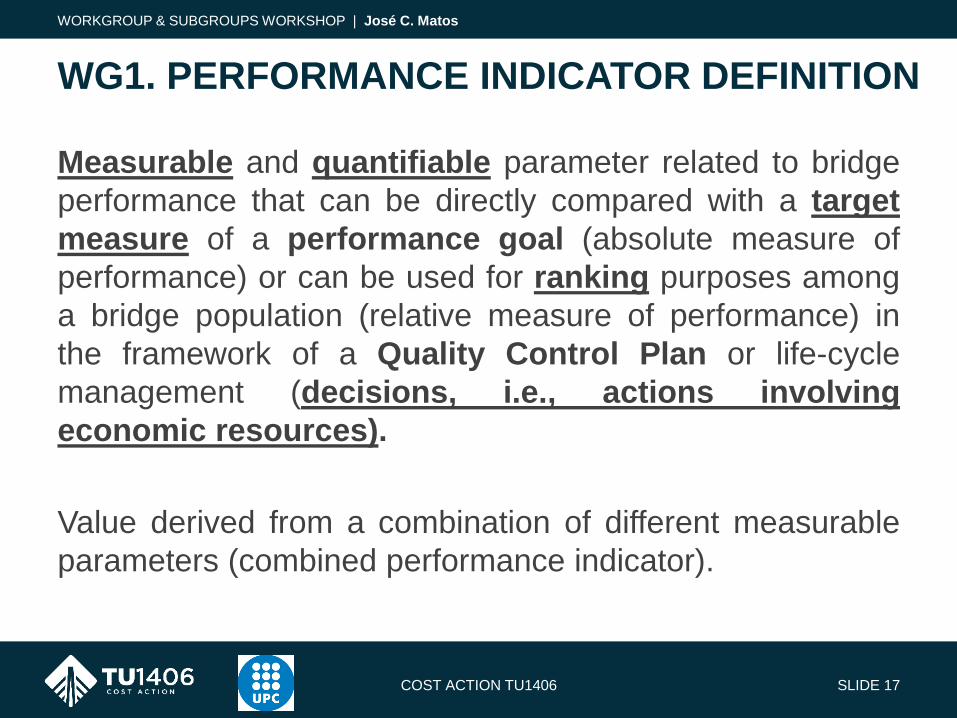
WG1. PERFORMANCE INDICATOR DEFINITION
Measurable and quantifiable parameter related to bridge
performance that can be directly compared with a target
measure of a performance goal (absolute measure of
performance) or can be used for ranking purposes among
a bridge population (relative measure of performance) in
the framework of a Quality Control Plan or life-cycle
management (decisions, i.e., actions involving
economic resources).
Value derived from a combination of different measurable
parameters (combined performance indicator).
WORKGROUP & SUBGROUPS WORKSHOP | José C. Matos
COST ACTION TU1406 SLIDE 18
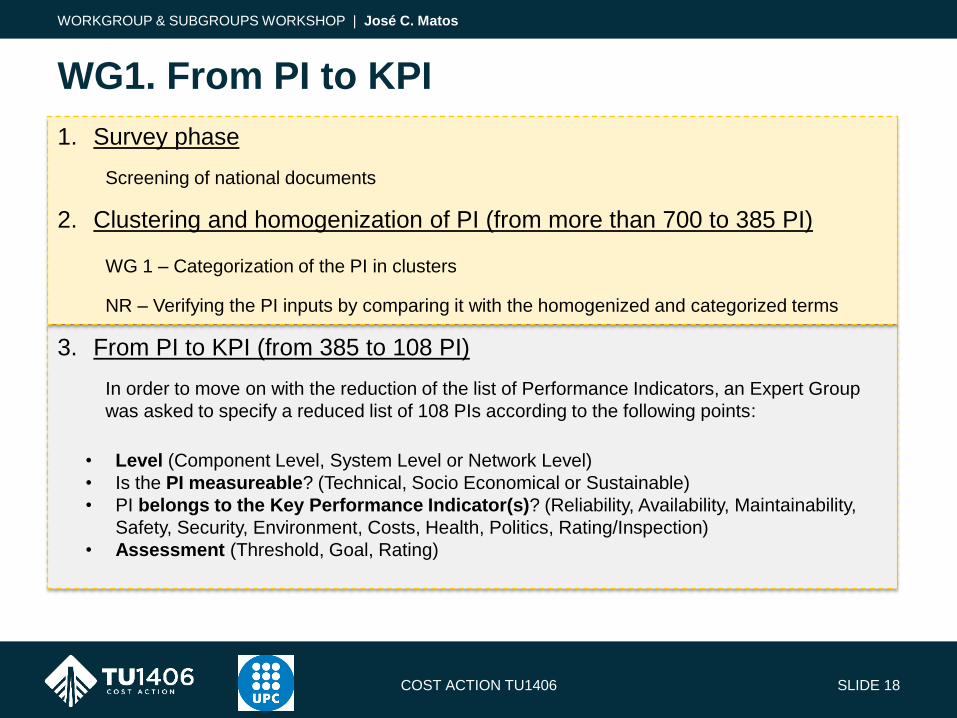
WG1. From PI to KPI
1. Survey phase
Screening of national documents
2. Clustering and homogenization of PI (from more than 700 to 385 PI)
WG 1 – Categorization of the PI in clusters
NR – Verifying the PI inputs by comparing it with the homogenized and categorized terms
3. From PI to KPI (from 385 to 108 PI)
In order to move on with the reduction of the list of Performance Indicators, an Expert Group
was asked to specify a reduced list of 108 PIs according to the following points:
• Level (Component Level, System Level or Network Level)
• Is the PI measureable? (Technical, Socio Economical or Sustainable)
• PI belongs to the Key Performance Indicator(s)? (Reliability, Availability, Maintainability,
Safety, Security, Environment, Costs, Health, Politics, Rating/Inspection)
• Assessment (Threshold, Goal, Rating)
WORKGROUP & SUBGROUPS WORKSHOP | José C. Matos

COST ACTION TU1406 SLIDE 19
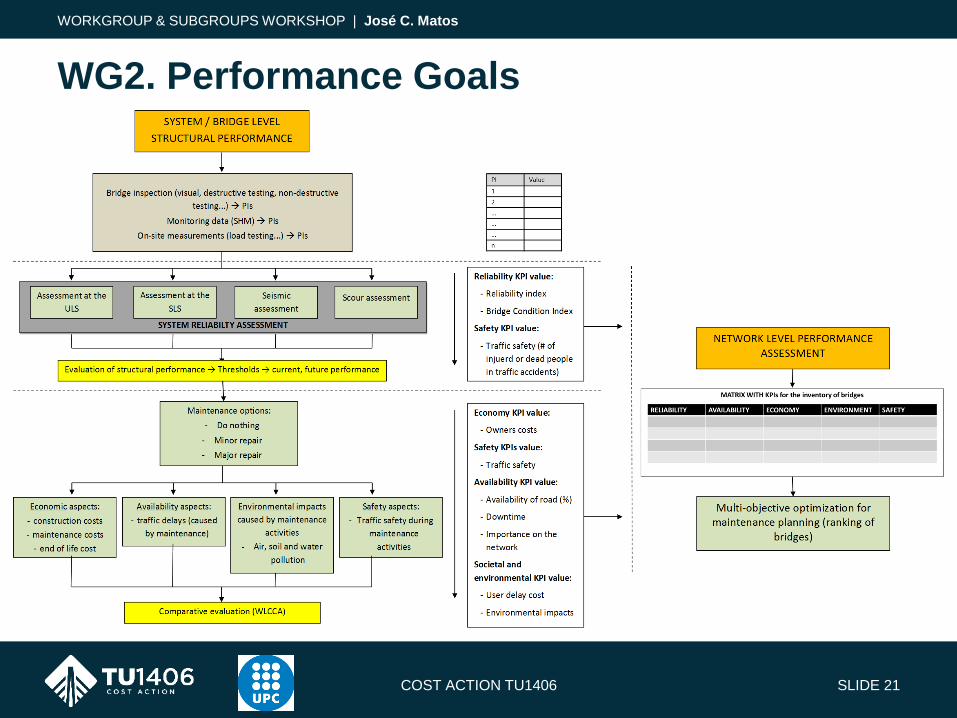
WG2. Milestone
available on website: www.tu1406.eu
Performance
Goals
Reliability
Performance
Assessment
Economy, Societal
and Environmental
Assessment
Glossary
Multi-Objective
Optimization Models
WORKGROUP & SUBGROUPS WORKSHOP | José C. Matos

COST ACTION TU1406 SLIDE 20
WG2. Interaction of PI with PG
PI – Performance Indicators
G(T) – Goals (Tasks)
WP – Weighting Parameters
WORKGROUP & SUBGROUPS WORKSHOP | José C. Matos
COST ACTION TU1406 SLIDE 21
WG2. Performance Goals
WORKGROUP & SUBGROUPS WORKSHOP | José C. Matos
COST ACTION TU1406 SLIDE 22
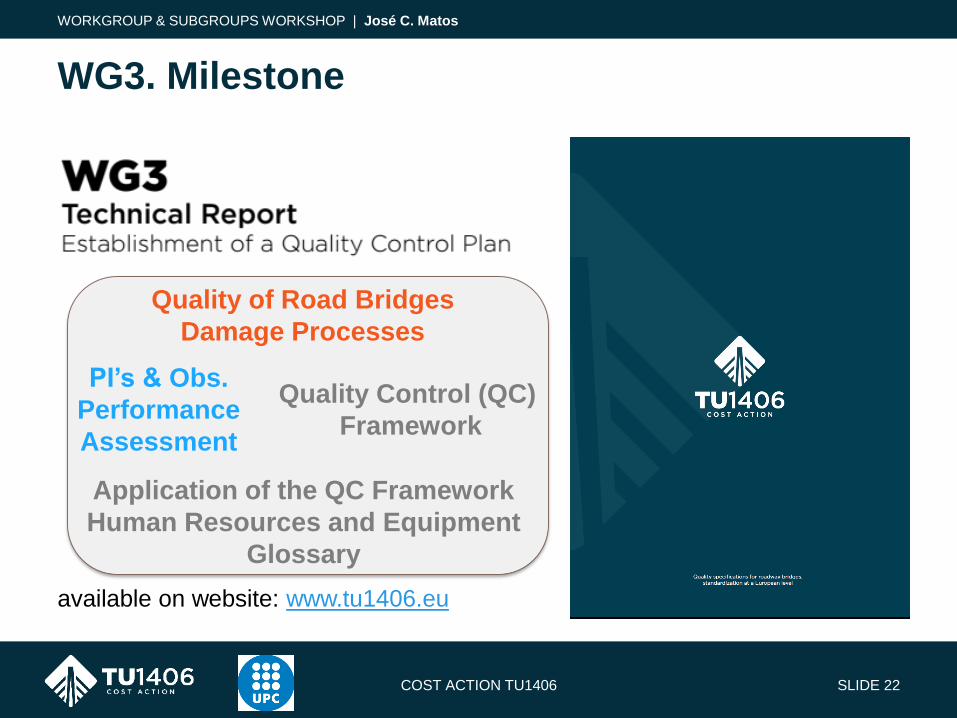
WG3. Milestone
available on website: www.tu1406.eu
Quality of Road Bridges
Damage Processes
PI’s & Obs.
Performance
Assessment
Quality Control (QC)
Framework
Application of the QC Framework
Human Resources and Equipment
Glossary
WORKGROUP & SUBGROUPS WORKSHOP | José C. Matos

COST ACTION TU1406 SLIDE 23
WG3. General Approach
WORKGROUP & SUBGROUPS WORKSHOP | José C. Matos

COST ACTION TU1406 SLIDE 24
WG3. Key Performance Indicators
WORKGROUP & SUBGROUPS WORKSHOP | José C. Matos

COST ACTION TU1406 SLIDE 25
WG3. Damage Processes
WORKGROUP & SUBGROUPS WORKSHOP | José C. Matos

COST ACTION TU1406 SLIDE 26
WG3. Common Drivers for PIs
WORKGROUP & SUBGROUPS WORKSHOP | José C. Matos
COST ACTION TU1406 SLIDE 27
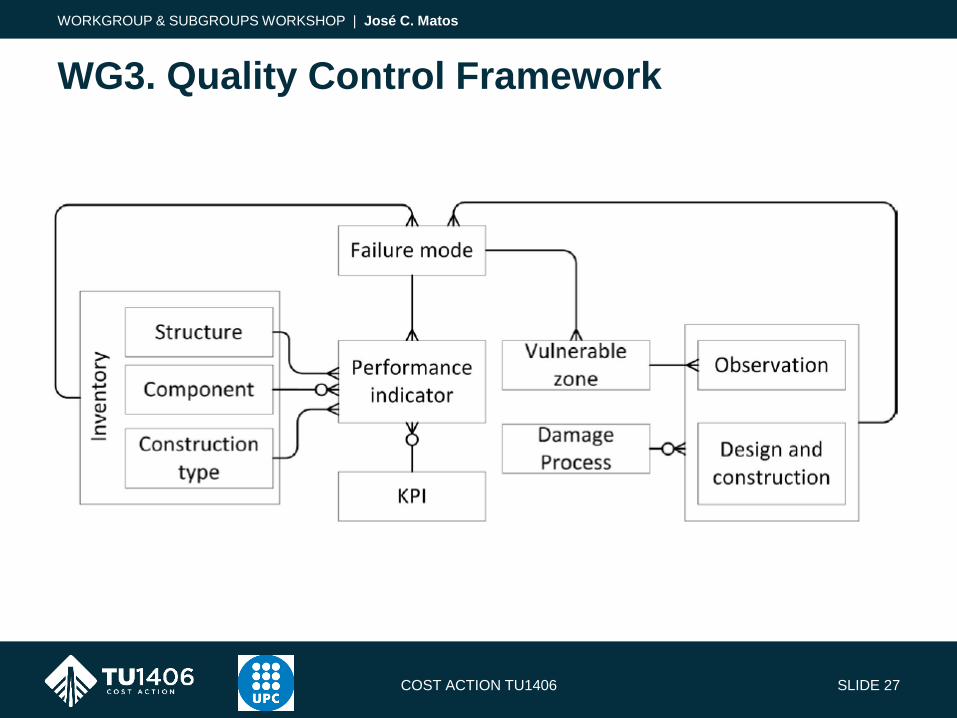
WG3. Quality Control Framework
WORKGROUP & SUBGROUPS WORKSHOP | José C. Matos
COST ACTION TU1406 SLIDE 28
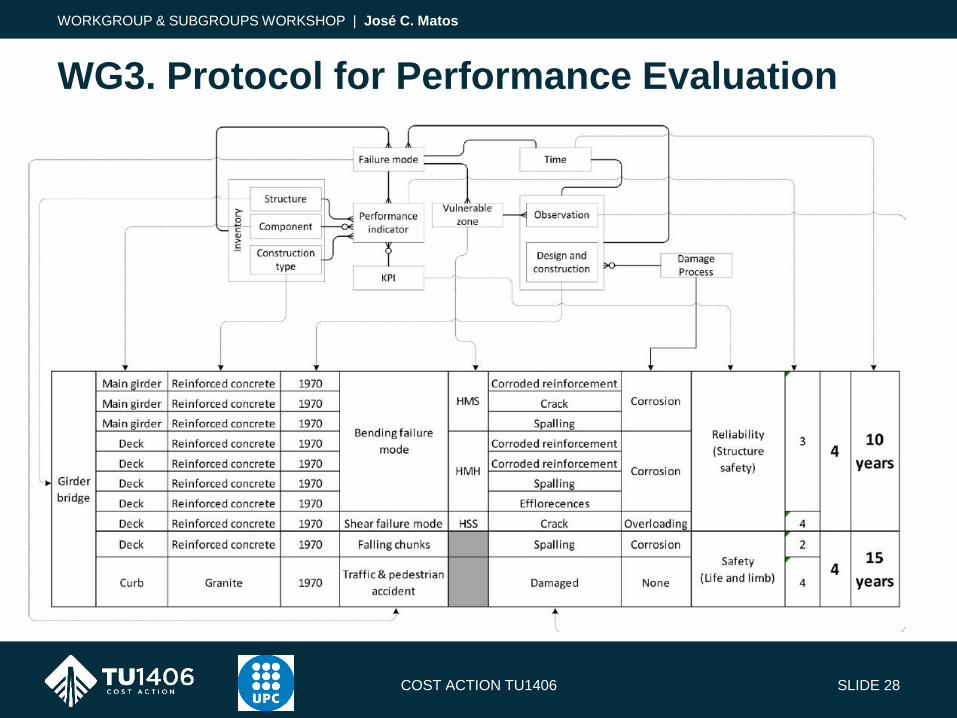
WG3. Protocol for Performance Evaluation
WORKGROUP & SUBGROUPS WORKSHOP | José C. Matos
COST ACTION TU1406 SLIDE 29
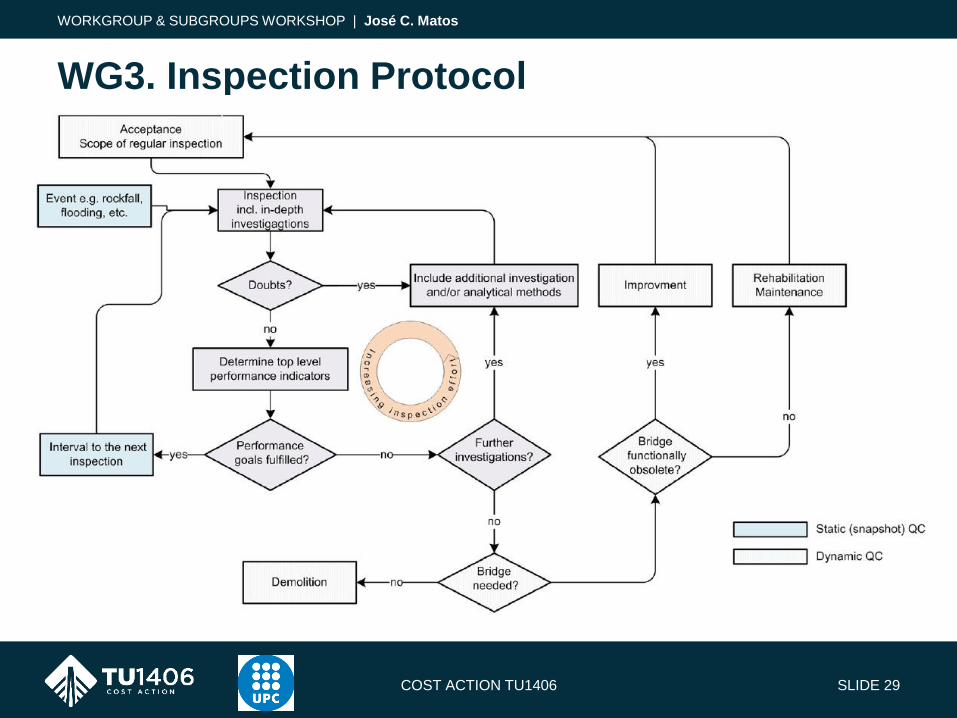
WG3. Inspection Protocol
WORKGROUP & SUBGROUPS WORKSHOP | José C. Matos
COST ACTION TU1406 SLIDE 30
NEXT EVENTS
WORKGROUP & SUBGROUPS WORKSHOP | José C. Matos
Activity Location Date LOS
Training School
Thessaloniki,
Greece
(GR)
1-4 Oct. 2018
(4D)
Yiannis Xenidis
Panagiotis Panetsos

COST ACTION TU1406 SLIDE 31
NEXT EVENTS
WORKGROUP & SUBGROUPS WORKSHOP | José C. Matos
Activity Location Date LOS
WG & MC meeting + Workshop
FINAL CONFERENCE
Guimarães,
Portugal
(PT)
25-26 Mar. 2018
(2D)
José Matos
???
Call for Papers deadline: ##th aaaaaaaa 2018
Towards a Resilient
Built EnvironmentRisk and Asset Management
27-29 March 2019
Guimarães, Portugal
You are invited
Hope to see you soon
COST ACTION TU1406 SLIDE 33
CLOSING
WORKGROUP & SUBGROUPS WORKSHOP | José C. Matos
JOSÉ C. MATOS
Civil Engineering Department
Minho University
4800-058 Guimarães, Portugal
P: +351 253 510 200
F: +351 253 510 217
www.tu1406.euBarcelona, 27.9.2018

EUROPEAN ASSOCIATION ON
QUALITY CONTROL OF BRIDGES AND
STRUCTURES
José C. Matos
Chairman of the Executive Committee
Supported by:

• Portugal, June 7, 2017
• Founding members
– José C. Matos, University of Minho, Guimarães, Portugal
– Joan R. Casas, BarcelonaTech, Barcelona, Spain
– Alfred Strauss, BOKU, Vienna, Austria
• Supported by COST Association
• Formed following the work carried out in the framework of COST
Action TU1406 – Quality specifications for roadway bridges,
standardization at a European level (BridgeSpec)
• International non-profit association under Portuguese law
SLIDE 35
Established
EUROSTRUCT – EUROPEAN ASSOCIATION ON QUALITY CONTROL OF BRIDGES AND STRUCTURES
José C. MatosChairman of the Executive Committee

Promote, at a European level, the understanding
and advancement of practice on quality control of
bridges and structures
SLIDE 36
Aim
EUROSTRUCT – EUROPEAN ASSOCIATION ON QUALITY CONTROL OF BRIDGES AND STRUCTURES
José C. MatosChairman of the Executive Committee

• Improvement of quality of bridges and structures in Europe;
• To promote worldwide cooperation and understanding through
the exchange of knowledge and experience in quality control;
• To encourage awareness and responsibility of structural
engineers towards the needs of society;
• To encourage actions necessary for progress of quality control
in bridges and structures;
• To improve and foster cooperation and understanding
between organisations with similar objectives.
SLIDE 37
Objectives
EUROSTRUCT – EUROPEAN ASSOCIATION ON QUALITY CONTROL OF BRIDGES AND STRUCTURES
José C. MatosChairman of the Executive Committee

• Organise meetings, seminars, conferences and related
activities independently or in collaboration with other
organisations;
• Collaborate with other organizations and institutions having
objectives consistent with those of the Association;
• Identify research and development needs;
• Initiate and support research activities;
• Publish reports, communications, periodicals, books, amongst
others.
SLIDE 38
Initiatives
EUROSTRUCT – EUROPEAN ASSOCIATION ON QUALITY CONTROL OF BRIDGES AND STRUCTURES
José C. MatosChairman of the Executive Committee

• Conferences on odd years (1st Conference will be held in
2019, and will coincide with the Final Conference of COST
TU1406) [open to proposal for 2021];
• Training Schools (open to proposals for 2020);
• E-Newsletter and E-Books of the Conferences;
• Publish reports, communications, periodicals, books, amongst
others;
• Facebook, LinkedIn, YouTube channels.
SLIDE 39
Activities
EUROSTRUCT – EUROPEAN ASSOCIATION ON QUALITY CONTROL OF BRIDGES AND STRUCTURES
José C. MatosChairman of the Executive Committee

• General Assembly;
• Executive Committee;
• Advisory Committee;
• Audit Committee;
• National Groups (to be constituted in an independente way).
Elections for three year periods (limited to two consecutive terms)
SLIDE 40
Organization
EUROSTRUCT – EUROPEAN ASSOCIATION ON QUALITY CONTROL OF BRIDGES AND STRUCTURES
José C. MatosChairman of the Executive Committee
• Executive Committee
– President
• José Matos
– Vice-President
• Joan Casas
– Secretary
• Eleni Chatzi
– Treasurer
• Alfred Strauss
– 4 Members
• Irina Stipanović
• Rade Hajdin
• Amir Kedar
• Vikram Pakrashi
• Gudmundur Gudmundsson
• Audit Committee
– President
• Jan Bień
– Secretary
• Sérgio Fernandes
– Rapporteur
• Yiannis Xenidis
José C. MatosChairman of the Executive Committee
SLIDE 41
Organization
EUROSTRUCT – EUROPEAN ASSOCIATION ON QUALITY CONTROL OF BRIDGES AND STRUCTURES

• Individual members;
• Institutional members which shall appoint three
representatives who may attend meetings and participate in
the Association's scientific meetings programme with the
same privileges as individual members;
• Young members, with 25 years or less;
• Honorary members;
• Observer members.
SLIDE 42
Membership
EUROSTRUCT – EUROPEAN ASSOCIATION ON QUALITY CONTROL OF BRIDGES AND STRUCTURES
José C. MatosChairman of the Executive Committee

• Individual members: 75,00 €
• Institutional members: 300,00 €
• Young members: 25,00 €
• Honorary & Observer members: no fee
registration can be made online, where payment method is described
SLIDE 43
Membership Fees
EUROSTRUCT – EUROPEAN ASSOCIATION ON QUALITY CONTROL OF BRIDGES AND STRUCTURES
José C. MatosChairman of the Executive Committee

SLIDE 44
Website: eurostruct.org
EUROSTRUCT – EUROPEAN ASSOCIATION ON QUALITY CONTROL OF BRIDGES AND STRUCTURES
José C. MatosChairman of the Executive Committee

SLIDE 45
Website: eurostruct.org
EUROSTRUCT – EUROPEAN ASSOCIATION ON QUALITY CONTROL OF BRIDGES AND STRUCTURES
José C. MatosChairman of the Executive Committee

• EUROSTRUCT – EUROPEAN ASSOCIATION ON QUALITY
CONTROL OF BRIDGES AND STRUCTURES
SLIDE 46
Website: eurostruct.org
EUROSTRUCT – EUROPEAN ASSOCIATION ON QUALITY CONTROL OF BRIDGES AND STRUCTURES
José C. MatosChairman of the Executive Committee

SLIDE 47
Website: eurostruct.org
EUROSTRUCT – EUROPEAN ASSOCIATION ON QUALITY CONTROL OF BRIDGES AND STRUCTURES
José C. MatosChairman of the Executive Committee

• First conference on March 25 & 26, 2019 in Guimarães, Portugal
• Joint conference with “COST Action TU1406 – Quality specifications
for roadway bridges, standardization at a European level
(BridgeSpec)”
SLIDE 48
Events
EUROSTRUCT – EUROPEAN ASSOCIATION ON QUALITY CONTROL OF BRIDGES AND STRUCTURES
José C. MatosChairman of the Executive Committee

THANK YOUR FOR YOUT ATTENTION!
WWW.TU1406.EU
EUROSTRUCT.ORG

WG4 and WG5 WORKSHOP
Sustainable Bridge Management
27th – 28th September 2018
Barcelona, Spain
A STUDY ON DATA DRIVEN STRATEGY OF
MANAGEMENT AND MAINTENANCE
FOR LARGE-SCALE BRIDGES
Airong CHEN – Tongji University, China
同济大学桥梁工程系桥梁设计方法与过程研究室Dept. of Bridge Eng., Tongji Univ.
Bridge Design Methods and Processes
QUALITY SPECIFICATIONS FOR ROADWAY BRIDGES,
STANDARDIZATION AT A EUROPEAN LEVEL
Barcelona,
27th – 28th September, 2018
1
DATA DRIVEN STRATEGY OF MANAGEMENT AND MAINTENANCE
OF LARGE-SCALE BRIDGES Airong Chen
Department of Bridge Engineering, Tongji University,1239, Siping Rd. Shanghai, 200092, China
E-mails: [email protected]
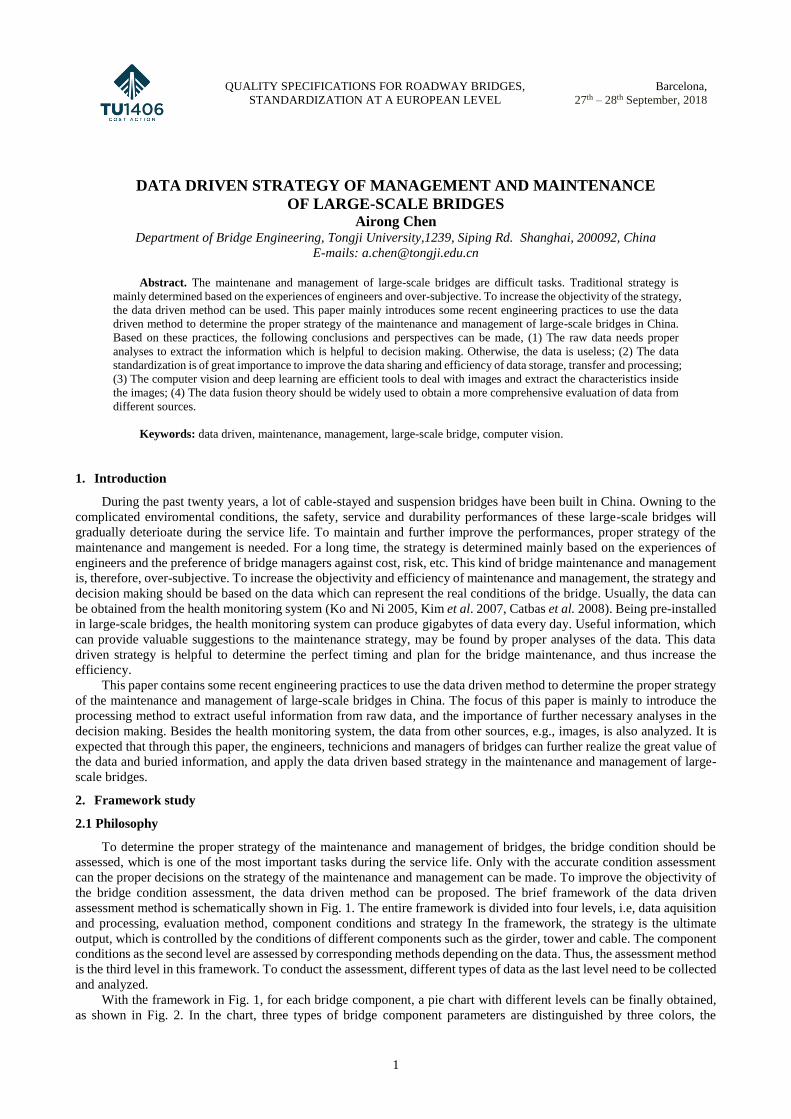
Abstract. The maintenane and management of large-scale bridges are difficult tasks. Traditional strategy is
mainly determined based on the experiences of engineers and over-subjective. To increase the objectivity of the strategy,
the data driven method can be used. This paper mainly introduces some recent engineering practices to use the data
driven method to determine the proper strategy of the maintenance and management of large-scale bridges in China.
Based on these practices, the following conclusions and perspectives can be made, (1) The raw data needs proper
analyses to extract the information which is helpful to decision making. Otherwise, the data is useless; (2) The data
standardization is of great importance to improve the data sharing and efficiency of data storage, transfer and processing;
(3) The computer vision and deep learning are efficient tools to deal with images and extract the characteristics inside
the images; (4) The data fusion theory should be widely used to obtain a more comprehensive evaluation of data from
different sources.
Keywords: data driven, maintenance, management, large-scale bridge, computer vision.
1. Introduction
During the past twenty years, a lot of cable-stayed and suspension bridges have been built in China. Owning to the
complicated enviromental conditions, the safety, service and durability performances of these large-scale bridges will
gradually deterioate during the service life. To maintain and further improve the performances, proper strategy of the
maintenance and mangement is needed. For a long time, the strategy is determined mainly based on the experiences of
engineers and the preference of bridge managers against cost, risk, etc. This kind of bridge maintenance and management
is, therefore, over-subjective. To increase the objectivity and efficiency of maintenance and management, the strategy and
decision making should be based on the data which can represent the real conditions of the bridge. Usually, the data can
be obtained from the health monitoring system (Ko and Ni 2005, Kim et al. 2007, Catbas et al. 2008). Being pre-installed
in large-scale bridges, the health monitoring system can produce gigabytes of data every day. Useful information, which
can provide valuable suggestions to the maintenance strategy, may be found by proper analyses of the data. This data
driven strategy is helpful to determine the perfect timing and plan for the bridge maintenance, and thus increase the
efficiency.
This paper contains some recent engineering practices to use the data driven method to determine the proper strategy
of the maintenance and management of large-scale bridges in China. The focus of this paper is mainly to introduce the
processing method to extract useful information from raw data, and the importance of further necessary analyses in the
decision making. Besides the health monitoring system, the data from other sources, e.g., images, is also analyzed. It is
expected that through this paper, the engineers, technicions and managers of bridges can further realize the great value of
the data and buried information, and apply the data driven based strategy in the maintenance and management of large-
scale bridges.
2. Framework study
2.1 Philosophy
To determine the proper strategy of the maintenance and management of bridges, the bridge condition should be
assessed, which is one of the most important tasks during the service life. Only with the accurate condition assessment
can the proper decisions on the strategy of the maintenance and management can be made. To improve the objectivity of
the bridge condition assessment, the data driven method can be proposed. The brief framework of the data driven
assessment method is schematically shown in Fig. 1. The entire framework is divided into four levels, i.e, data aquisition
and processing, evaluation method, component conditions and strategy In the framework, the strategy is the ultimate
output, which is controlled by the conditions of different components such as the girder, tower and cable. The component
conditions as the second level are assessed by corresponding methods depending on the data. Thus, the assessment method
is the third level in this framework. To conduct the assessment, different types of data as the last level need to be collected
and analyzed.
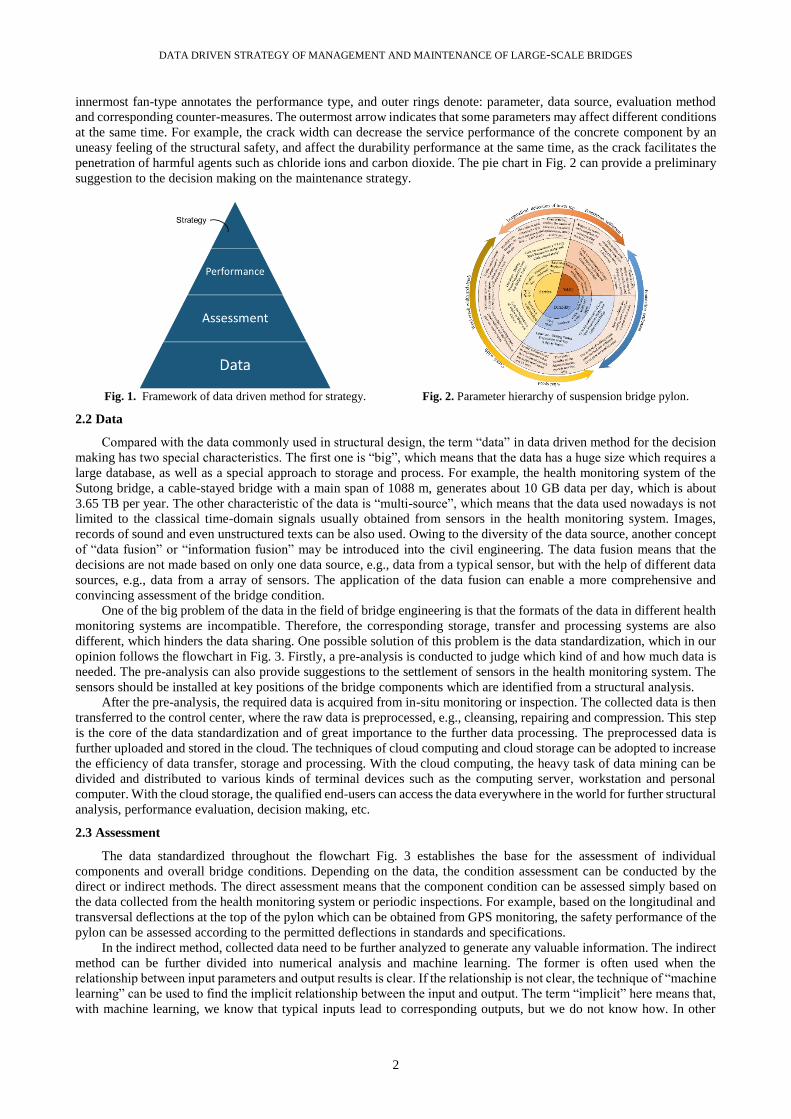
With the framework in Fig. 1, for each bridge component, a pie chart with different levels can be finally obtained,
as shown in Fig. 2. In the chart, three types of bridge component parameters are distinguished by three colors, the
DATA DRIVEN STRATEGY OF MANAGEMENT AND MAINTENANCE OF LARGE-SCALE BRIDGES
2
innermost fan-type annotates the performance type, and outer rings denote: parameter, data source, evaluation method
and corresponding counter-measures. The outermost arrow indicates that some parameters may affect different conditions
at the same time. For example, the crack width can decrease the service performance of the concrete component by an
uneasy feeling of the structural safety, and affect the durability performance at the same time, as the crack facilitates the
penetration of harmful agents such as chloride ions and carbon dioxide. The pie chart in Fig. 2 can provide a preliminary
suggestion to the decision making on the maintenance strategy.
Fig. 1. Framework of data driven method for strategy.
Fig. 2. Parameter hierarchy of suspension bridge pylon.
2.2 Data
Compared with the data commonly used in structural design, the term “data” in data driven method for the decision
making has two special characteristics. The first one is “big”, which means that the data has a huge size which requires a
large database, as well as a special approach to storage and process. For example, the health monitoring system of the
Sutong bridge, a cable-stayed bridge with a main span of 1088 m, generates about 10 GB data per day, which is about
3.65 TB per year. The other characteristic of the data is “multi-source”, which means that the data used nowadays is not
limited to the classical time-domain signals usually obtained from sensors in the health monitoring system. Images,
records of sound and even unstructured texts can be also used. Owing to the diversity of the data source, another concept
of “data fusion” or “information fusion” may be introduced into the civil engineering. The data fusion means that the
decisions are not made based on only one data source, e.g., data from a typical sensor, but with the help of different data
sources, e.g., data from a array of sensors. The application of the data fusion can enable a more comprehensive and
convincing assessment of the bridge condition.
One of the big problem of the data in the field of bridge engineering is that the formats of the data in different health
monitoring systems are incompatible. Therefore, the corresponding storage, transfer and processing systems are also
different, which hinders the data sharing. One possible solution of this problem is the data standardization, which in our
opinion follows the flowchart in Fig. 3. Firstly, a pre-analysis is conducted to judge which kind of and how much data is
needed. The pre-analysis can also provide suggestions to the settlement of sensors in the health monitoring system. The
sensors should be installed at key positions of the bridge components which are identified from a structural analysis.
After the pre-analysis, the required data is acquired from in-situ monitoring or inspection. The collected data is then
transferred to the control center, where the raw data is preprocessed, e.g., cleansing, repairing and compression. This step
is the core of the data standardization and of great importance to the further data processing. The preprocessed data is
further uploaded and stored in the cloud. The techniques of cloud computing and cloud storage can be adopted to increase
the efficiency of data transfer, storage and processing. With the cloud computing, the heavy task of data mining can be
divided and distributed to various kinds of terminal devices such as the computing server, workstation and personal
computer. With the cloud storage, the qualified end-users can access the data everywhere in the world for further structural
analysis, performance evaluation, decision making, etc.
2.3 Assessment
The data standardized throughout the flowchart Fig. 3 establishes the base for the assessment of individual
components and overall bridge conditions. Depending on the data, the condition assessment can be conducted by the
direct or indirect methods. The direct assessment means that the component condition can be assessed simply based on
the data collected from the health monitoring system or periodic inspections. For example, based on the longitudinal and
transversal deflections at the top of the pylon which can be obtained from GPS monitoring, the safety performance of the
pylon can be assessed according to the permitted deflections in standards and specifications.
In the indirect method, collected data need to be further analyzed to generate any valuable information. The indirect
method can be further divided into numerical analysis and machine learning. The former is often used when the
relationship between input parameters and output results is clear. If the relationship is not clear, the technique of “machine
learning” can be used to find the implicit relationship between the input and output. The term “implicit” here means that,
with machine learning, we know that typical inputs lead to corresponding outputs, but we do not know how. In other

QUALITY SPECIFICATIONS FOR ROADWAY BRIDGES,
STANDARDIZATION AT A EUROPEAN LEVEL
Barcelona,
27th – 28th September, 2018
3
words, we do not know the exact mechanism hidden behind the data. In most cases, however, this implicit relationship is
already enough for the decision making on the strategy of the maintenance and management.
Sound TextImageSensor
Pre-analysis
Dataacquisition
In-situ
Datapreprocessing
Control center
Datastorage and processing
Cloud
Enduser
EvaluationNumerical Analysis
Decision making
Fig. 3. Data standardization analysis process.
Data
Numerical analysis Machine learning
Direct evaluation Indirect evaluation
Component performance
Bridge condition
Ro
ute
A
Ro
ute
B
Ro
ute
C
Fig. 4. Flowchart of assessment method.
2.4 Condition
The conditions of different bridge components can be categorized into three types: safety condition, service condition
and durability condition. These conditions may have different proportions for different components. For example, the
condition of the deck pavement is dominated by its service conditions as it is closely related to the driving comfort. But
for the suspender cable, the safety is absolutely the first concern of its condition assessment. As a common approach, the
bridge condition is usually assessed based on the condition of each component. Thus, to facilitate the condition assessment,
the bridge components need to be classified. In the current engineering practice, the components of large-scale bridges
are usually classified into structural components and auxiliary facilities based on their importance levels. This
classification, however, is over-simplified and does not fully consider the above different proportions of conditions for
different components. Thus, a proper and refined classification of bridge components is needed in the framework of the
data driven method for the strategy of the manitenance and management of large-scale bridges.
In the following parts of this paper, several recent engineering practices by us to use the data driven method to
determine the proper strategy of the maintenance and management of large-scale bridges in China are presented.
3. Prediction of vortex-induced vibration
3.1 Background
The Xihoumen bridge is a suspension bridge in the East China Sea. It has a main span of 1650m which is the second
largest span all over the world. The girder of the bridge is a separated steel box girder with a height of 3.51m and a width
of 36m. The pylon of the bridge is 211m high. As a sea crossing bridge, the wind environment is very complicated. To
ensure the safety of the bridge in extreme weather conditions, e.g., typhoon in the summer, monsoon in the winter, a high
level of safety performance agains the wind disaster is required in the structural design of the bridge. However,
corresponding maintenance is still necessary during the operation stage.
3.2 Data aquisition
To provide reliable data to assess the safety of the bridge under wind effect, two propeller anemometers and six
three-directional ultrasonic anemometers were installed to collect the wind field data of the bridge site. As is shown in
Fig. 5, propeller anemometers and three-directional ultrasonic anemometers were installed on the top of the pylon and the
deck, respectively. Two propeller anemometers (AN1, AN2) were installed in the north and south pylon of the bridge.
The three-directional ultrasonic anemometers (UA1-UA6) were installed on the upper and lower sides of the stiffened
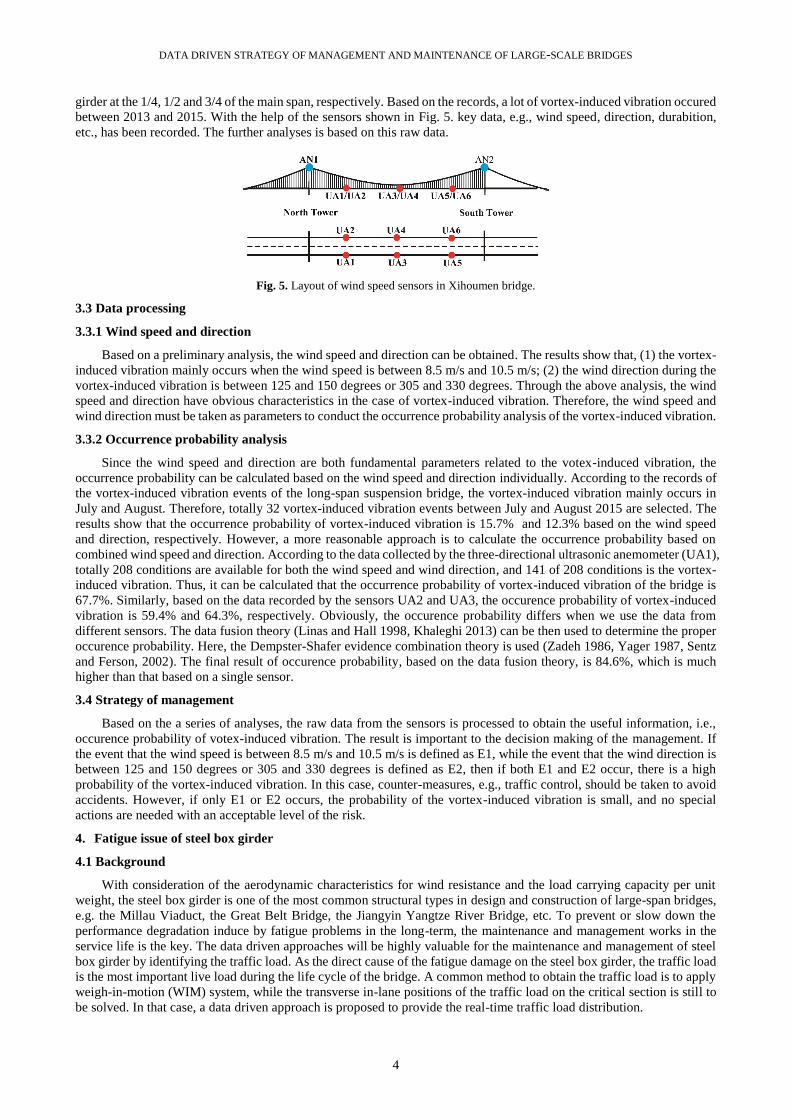
DATA DRIVEN STRATEGY OF MANAGEMENT AND MAINTENANCE OF LARGE-SCALE BRIDGES
4
girder at the 1/4, 1/2 and 3/4 of the main span, respectively. Based on the records, a lot of vortex-induced vibration occured
between 2013 and 2015. With the help of the sensors shown in Fig. 5. key data, e.g., wind speed, direction, durabition,
etc., has been recorded. The further analyses is based on this raw data.
Fig. 5. Layout of wind speed sensors in Xihoumen bridge.
3.3 Data processing
3.3.1 Wind speed and direction
Based on a preliminary analysis, the wind speed and direction can be obtained. The results show that, (1) the vortex-
induced vibration mainly occurs when the wind speed is between 8.5 m/s and 10.5 m/s; (2) the wind direction during the
vortex-induced vibration is between 125 and 150 degrees or 305 and 330 degrees. Through the above analysis, the wind
speed and direction have obvious characteristics in the case of vortex-induced vibration. Therefore, the wind speed and
wind direction must be taken as parameters to conduct the occurrence probability analysis of the vortex-induced vibration.
3.3.2 Occurrence probability analysis
Since the wind speed and direction are both fundamental parameters related to the votex-induced vibration, the
occurrence probability can be calculated based on the wind speed and direction individually. According to the records of
the vortex-induced vibration events of the long-span suspension bridge, the vortex-induced vibration mainly occurs in
July and August. Therefore, totally 32 vortex-induced vibration events between July and August 2015 are selected. The
results show that the occurrence probability of vortex-induced vibration is 15.7% and 12.3% based on the wind speed
and direction, respectively. However, a more reasonable approach is to calculate the occurrence probability based on
combined wind speed and direction. According to the data collected by the three-directional ultrasonic anemometer (UA1),
totally 208 conditions are available for both the wind speed and wind direction, and 141 of 208 conditions is the vortex-
induced vibration. Thus, it can be calculated that the occurrence probability of vortex-induced vibration of the bridge is
67.7%. Similarly, based on the data recorded by the sensors UA2 and UA3, the occurence probability of vortex-induced
vibration is 59.4% and 64.3%, respectively. Obviously, the occurence probability differs when we use the data from
different sensors. The data fusion theory (Linas and Hall 1998, Khaleghi 2013) can be then used to determine the proper
occurence probability. Here, the Dempster-Shafer evidence combination theory is used (Zadeh 1986, Yager 1987, Sentz
and Ferson, 2002). The final result of occurence probability, based on the data fusion theory, is 84.6%, which is much
higher than that based on a single sensor.
3.4 Strategy of management
Based on the a series of analyses, the raw data from the sensors is processed to obtain the useful information, i.e.,
occurence probability of votex-induced vibration. The result is important to the decision making of the management. If
the event that the wind speed is between 8.5 m/s and 10.5 m/s is defined as E1, while the event that the wind direction is
between 125 and 150 degrees or 305 and 330 degrees is defined as E2, then if both E1 and E2 occur, there is a high
probability of the vortex-induced vibration. In this case, counter-measures, e.g., traffic control, should be taken to avoid
accidents. However, if only E1 or E2 occurs, the probability of the vortex-induced vibration is small, and no special
actions are needed with an acceptable level of the risk.
4. Fatigue issue of steel box girder
4.1 Background
With consideration of the aerodynamic characteristics for wind resistance and the load carrying capacity per unit
weight, the steel box girder is one of the most common structural types in design and construction of large-span bridges,
e.g. the Millau Viaduct, the Great Belt Bridge, the Jiangyin Yangtze River Bridge, etc. To prevent or slow down the
performance degradation induce by fatigue problems in the long-term, the maintenance and management works in the
service life is the key. The data driven approaches will be highly valuable for the maintenance and management of steel
box girder by identifying the traffic load. As the direct cause of the fatigue damage on the steel box girder, the traffic load
is the most important live load during the life cycle of the bridge. A common method to obtain the traffic load is to apply
weigh-in-motion (WIM) system, while the transverse in-lane positions of the traffic load on the critical section is still to
be solved. In that case, a data driven approach is proposed to provide the real-time traffic load distribution.
QUALITY SPECIFICATIONS FOR ROADWAY BRIDGES,
STANDARDIZATION AT A EUROPEAN LEVEL
Barcelona,
27th – 28th September, 2018
5
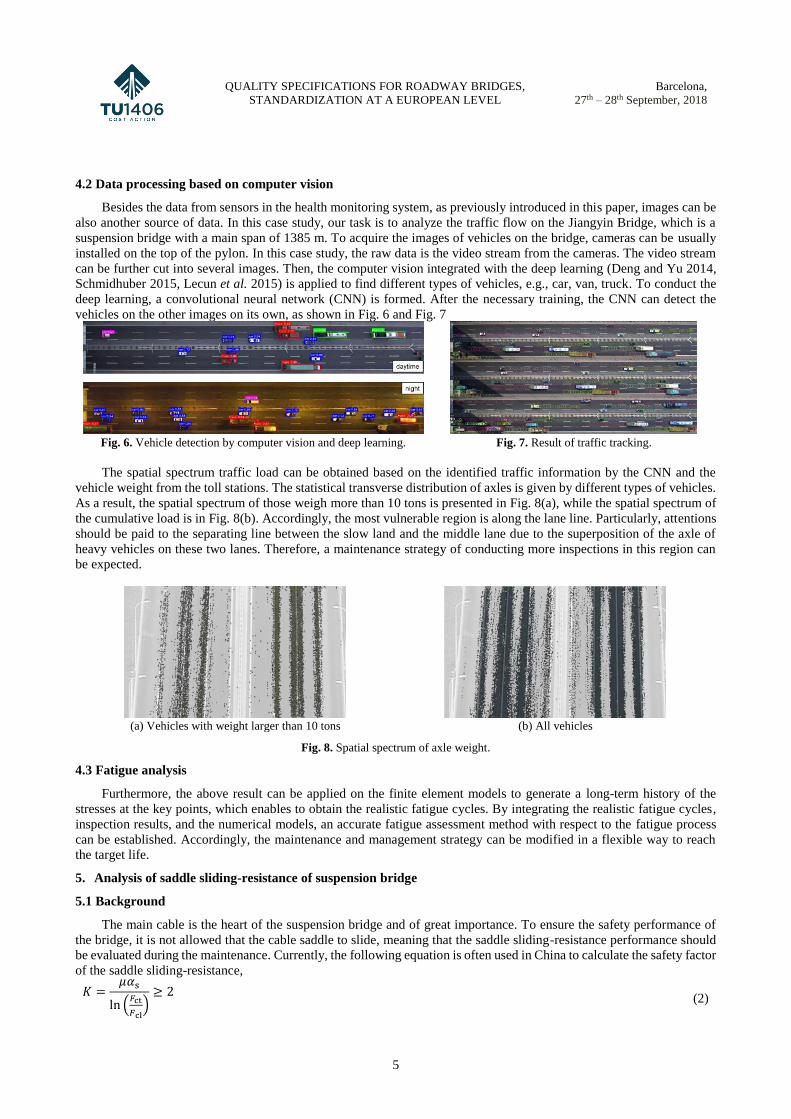
4.2 Data processing based on computer vision
Besides the data from sensors in the health monitoring system, as previously introduced in this paper, images can be
also another source of data. In this case study, our task is to analyze the traffic flow on the Jiangyin Bridge, which is a
suspension bridge with a main span of 1385 m. To acquire the images of vehicles on the bridge, cameras can be usually
installed on the top of the pylon. In this case study, the raw data is the video stream from the cameras. The video stream
can be further cut into several images. Then, the computer vision integrated with the deep learning (Deng and Yu 2014,
Schmidhuber 2015, Lecun et al. 2015) is applied to find different types of vehicles, e.g., car, van, truck. To conduct the
deep learning, a convolutional neural network (CNN) is formed. After the necessary training, the CNN can detect the
vehicles on the other images on its own, as shown in Fig. 6 and Fig. 7
Fig. 6. Vehicle detection by computer vision and deep learning.
Fig. 7. Result of traffic tracking.
The spatial spectrum traffic load can be obtained based on the identified traffic information by the CNN and the
vehicle weight from the toll stations. The statistical transverse distribution of axles is given by different types of vehicles.
As a result, the spatial spectrum of those weigh more than 10 tons is presented in Fig. 8(a), while the spatial spectrum of
the cumulative load is in Fig. 8(b). Accordingly, the most vulnerable region is along the lane line. Particularly, attentions
should be paid to the separating line between the slow land and the middle lane due to the superposition of the axle of
heavy vehicles on these two lanes. Therefore, a maintenance strategy of conducting more inspections in this region can
be expected.
(a) Vehicles with weight larger than 10 tons
(b) All vehicles
Fig. 8. Spatial spectrum of axle weight.
4.3 Fatigue analysis
Furthermore, the above result can be applied on the finite element models to generate a long-term history of the
stresses at the key points, which enables to obtain the realistic fatigue cycles. By integrating the realistic fatigue cycles,
inspection results, and the numerical models, an accurate fatigue assessment method with respect to the fatigue process
can be established. Accordingly, the maintenance and management strategy can be modified in a flexible way to reach
the target life.
5. Analysis of saddle sliding-resistance of suspension bridge
5.1 Background
The main cable is the heart of the suspension bridge and of great importance. To ensure the safety performance of
the bridge, it is not allowed that the cable saddle to slide, meaning that the saddle sliding-resistance performance should
be evaluated during the maintenance. Currently, the following equation is often used in China to calculate the safety factor
of the saddle sliding-resistance,
𝐾 =𝜇𝛼s
ln (𝐹ct
𝐹cl)≥ 2
(2)

DATA DRIVEN STRATEGY OF MANAGEMENT AND MAINTENANCE OF LARGE-SCALE BRIDGES
6
where 𝜇 is the friction coefficient which is specified in design standards, 𝐹ct and 𝐹cl are cable forces on the left and righe
of the cable, which can be either directly measured or calculated. The wrapping angle 𝛼s, however, is difficult to measured.
Thus, in this case study, the computer vision is used to obtain 𝛼s.
5.2 Image acquisition and processing
The image acquisition in this case study is simple. Only two images are taken to partially cover the left and right
sides of the saddle, respectively. Then, a panorama is obtained by image stitching (Lowe 2004, Brown and Lowe 2007),
as shown in Fig. 9. Then, the methods of the Canny edge detection (Canny 1986) and Hough line transform (Hough 1962)
are used to detect all edges in the panorama image. Irrelevant edges are removed from the output of the detection manually.
Only the edges along the orientations of the cables are left. Based on these edges, it is easy to calculate the wrapping
angle, which is 47.7° in this case to be specific. When the wrapping angle is determined, the safety factor can be calculated
by Eq. (2). Thus, the saddle sliding-resistance performance of the suspension bridge can be evaluated by checking whether
the safety factor is larger than 2.0, which is specified in standards.
(a) Image for left side
of saddle
(b) Image for right
side of saddle
(c) Panorama by image stitching
(d) Edge detection
Fig. 9. Calibration of wrapping angle based on computer vision.
6. Conclusions
This paper mainly introduces some recent engineering practices to use the data driven method to determine the proper
strategy of the maintenance and management of large-scale bridges in China. Based on these practices, the following
conclusions and perspectives can be made, (1) A framework with four levels from data to strategy is proposed to develop
the data driven method to determine the proper strategy of the manitenance and management of large-scale bridges; (2)
The data standardization is of great importance to improve the data sharing; (3) Currently, the health monitoring system
is still the main source of data. The other sources such as images, however, are also available; (4) The computer vision
and deep learning are efficient tools to deal with images and extract the characteristics inside the images; (5) The data
fusion theory should be widely used to obtain a more comprehensive evaluation of data from different sources.
References
Brown, M. and Lowe, D.G. 2007. Automatic Panoramic Image Stitching using Invariant Features, International Journal
of Computer Vision 74(1): 59-73.
Canny, J. 1986. A Computational Approach to Edge Detection, IEEE Transactions on Pattern Analysis and Machine
Intelligence PAMI-8(6): 679-698.
Catbas, F.N., Susoy, M. and Dan. M.F. 2008. Structural health monitoring and reliability estimation: Long span truss
bridge application with environmental monitoring data, Engineering Structures 30(9): 2347-2359.
Deng, L. and Yu, D. 2014. Deep Learning: Methods and Applications, Foundations & Trends in Signal Processing 7(3):
197-387.
Hough, P.V.C 1962. Method and means for recognizing complex patterns, U.S. Patent 3,069,654.
Khaleghi, B., Khamis, A., Karray, F.O., Razavi, S.N. 2013. Multisensor data fusion: A review of the state-of-the-art,
Information Fusion 14(1): 28-44.
Kim, S., Pakzad, S. and Culler, D. et al. 2007 Health Monitoring of Civil Infrastructures Using Wireless Sensor Networks,
in Proc. of 6th International Symposium on Information Processing in Sensor Networks, Cambridge, MA, 254-263.
Ko, J.M. and Ni, Y.Q. Technology development in structural health monitoring of large-scale bridge, Engineering
Structures 27(12): 1715-1725.
Lecun, Y., Bengio, Y. and Hinton, G. 2015. Deep learning, Nature 521(7553): 436.
Llinas, J. and Hall D.L. 1998. An introduction to multi-sensor data fusion, IEEE International Symposium on Circuits &
Systems 85(1): 537-540.
Lowe, D.G., 2004. Distinctive Image Features from Scale-Invariant Keypoints, International Journal of Computer Vision
60(2): 91-110.
Schmidhuber, J. 2015. Deep learning in neural networks: an overview, Neural Netw 61: 85-117.
Sentz, K. and Ferson, S. 2002. Combination of Evidence in Dempster-Shafer Theory, Contemporary Pacific 11(2):416-
426.
Yager, R.R. 1987. On the Dempster-Shafer framework and new combination rules, information Sciences 41(2): 93-137.
Zadeh, L.A. 1986. A Simple View of the Dempster-Shafer Theory of Evidence and its Implication for the Rule of
Combination, Ai Magazine 7(2): 85-90.

WG4 and WG5 WORKSHOP
Sustainable Bridge Management
27th – 28th September 2018
Barcelona, Spain
A STUDY ON DATA DRIVEN STRATEGY OF
MANAGEMENT AND MAINTENANCE
FOR LARGE-SCALE BRIDGES
Airong CHEN – Tongji University, China
同济大学桥梁工程系桥梁设计方法与过程研究室Dept. of Bridge Eng., Tongji Univ.
Bridge Design Methods and Processes

WG4 and WG5 WORKSHOP
27th – 28th September 2018
Barcelona, Spain
SLIDE 52
Xihoumen Bridge (2008)
Runyang Bridge (2005)
Jiangyin Bridge (1999)
Sutong Bridge (2007)
Edong Bridge (2007)
Yangluo Bridge (2007)
Minpu Bridge (2007)
Stonecutters Bridge (2009)Aizhai Bridge (2012)
Hong Kong-Zhuhai-Macao Bridges (2018)
During the past 20 years, a lot of large-scale cable-stayed and suspension bridges have been built in China.
WG4 and WG5 WORKSHOP
27th – 28th September 2018
Barcelona, Spain
SLIDE 53
A STUDY ON DATA DRIVEN STRATEGY OF MANAGEMENT AND MAINTENANCE FOR LARGE-SCALE BRIDGES | AIRONG CHEN
Framework
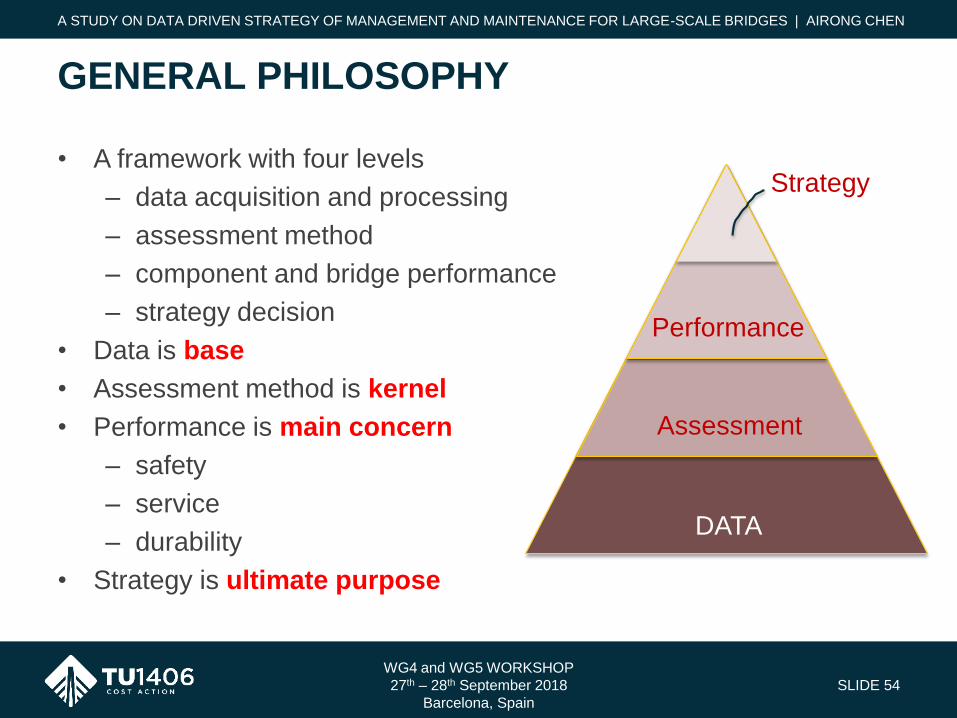
• A framework with four levels
– data acquisition and processing
– assessment method
– component and bridge performance
– strategy decision
• Data is base
• Assessment method is kernel
• Performance is main concern
– safety
– service
– durability
• Strategy is ultimate purpose
WG4 and WG5 WORKSHOP
27th – 28th September 2018
Barcelona, Spain
SLIDE 54
GENERAL PHILOSOPHY
A STUDY ON DATA DRIVEN STRATEGY OF MANAGEMENT AND MAINTENANCE FOR LARGE-SCALE BRIDGES | AIRONG CHEN
DATA
Assessment
Performance
Strategy
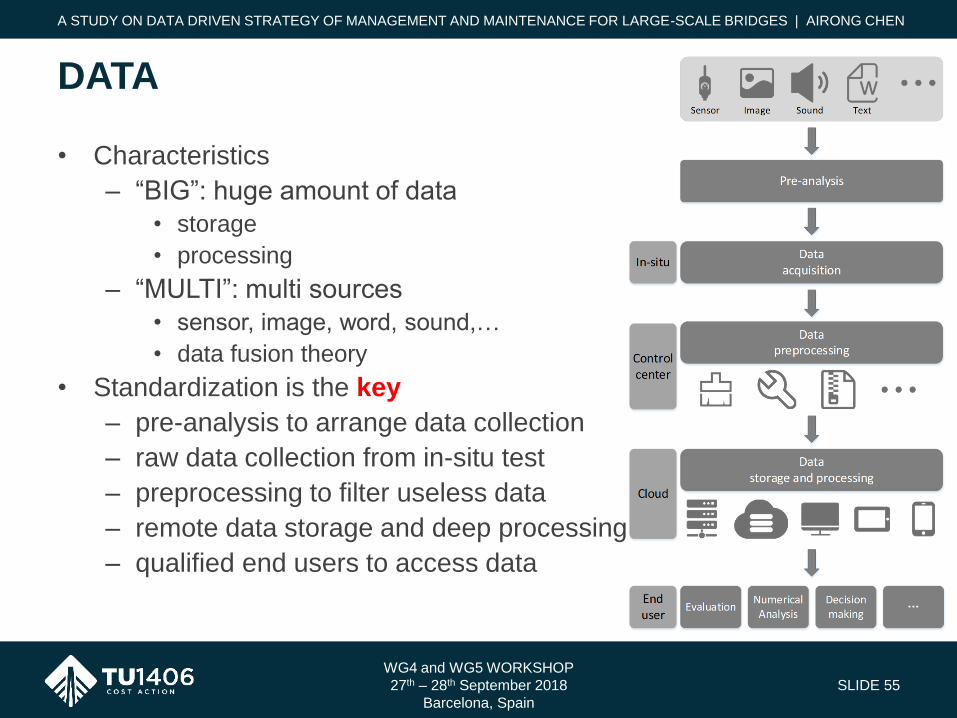
• Characteristics
– “BIG”: huge amount of data
• storage
• processing
– “MULTI”: multi sources
• sensor, image, word, sound,…
• data fusion theory
• Standardization is the key
– pre-analysis to arrange data collection
– raw data collection from in-situ test
– preprocessing to filter useless data
– remote data storage and deep processing
– qualified end users to access data
WG4 and WG5 WORKSHOP
27th – 28th September 2018
Barcelona, Spain
SLIDE 55
DATA
A STUDY ON DATA DRIVEN STRATEGY OF MANAGEMENT AND MAINTENANCE FOR LARGE-SCALE BRIDGES | AIRONG CHEN

• “DIRECT”: simple condition index
– Index is decided by a single type of data
• “INDIRECT”: complex condition index
– index is decided by multi-types of data
– numerical analysis
• numerical model is available
• the relationship of “raw data ~ condition index” is clear
– Machine learning
• no model is available
• the relationship of of “raw data ~ condition index” is unkown
WG4 and WG5 WORKSHOP
27th – 28th September 2018
Barcelona, Spain
SLIDE 56
ASSESSMENT
A STUDY ON DATA DRIVEN STRATEGY OF MANAGEMENT AND MAINTENANCE FOR LARGE-SCALE BRIDGES | AIRONG CHEN

• Safety
• Service
• Durability
WG4 and WG5 WORKSHOP
27th – 28th September 2018
Barcelona, Spain
SLIDE 57
CONDITION
A STUDY ON DATA DRIVEN STRATEGY OF MANAGEMENT AND MAINTENANCE FOR LARGE-SCALE BRIDGES | AIRONG CHEN
WG4 and WG5 WORKSHOP
27th – 28th September 2018
Barcelona, Spain
SLIDE 58
A STUDY ON DATA DRIVEN STRATEGY OF MANAGEMENT AND MAINTENANCE FOR LARGE-SCALE BRIDGES | AIRONG CHEN
Pattern Analysis
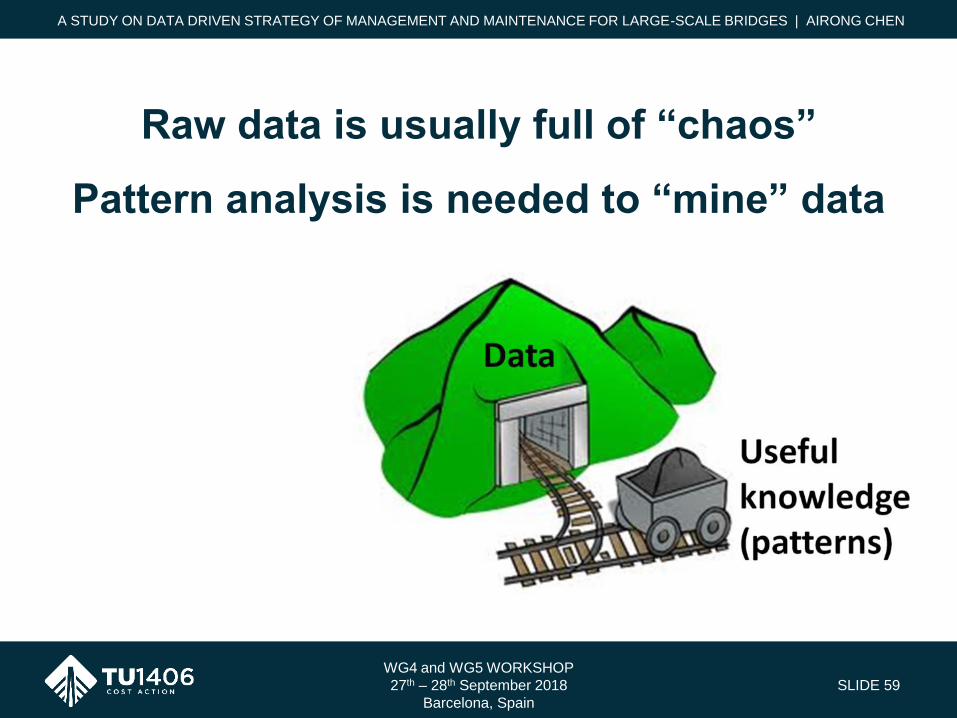
Raw data is usually full of “chaos”
Pattern analysis is needed to “mine” data
WG4 and WG5 WORKSHOP
27th – 28th September 2018
Barcelona, Spain
SLIDE 59
A STUDY ON DATA DRIVEN STRATEGY OF MANAGEMENT AND MAINTENANCE FOR LARGE-SCALE BRIDGES | AIRONG CHEN

• Damper is an ancillary facility, but plays an important role in maintaining health condition of large-scale bridges
• However, various kinds of diseases exist during service life of bridges
• Damper has its own design service life, which is determined based on the laboratory test.
• In complex environment, however, the real service life of dampers may be far from the expect owing to the predictable and unpredictable diseases.
• So, how to evaluate the current condition and predict the remaining service life of dampers in large-scale bridges?
WG4 and WG5 WORKSHOP
27th – 28th September 2018
Barcelona, Spain
SLIDE 60
Damper condition assessment
A STUDY ON DATA DRIVEN STRATEGY OF MANAGEMENT AND MAINTENANCE FOR LARGE-SCALE BRIDGES | AIRONG CHEN
oil leakage
components broken
painting damage

• Raw data can be collected from sensors.
• How to mine useful pattern from raw data?
– First, a proper assessment index is chosen: system damping ratio
– Second, a mathematic model (method) is needed.
• Our purpose of the pattern analysis
– deterioration of assessment index
– judgement of current condition and decision making
• periodic inspection?
• repair?
• replacement?
WG4 and WG5 WORKSHOP
27th – 28th September 2018
Barcelona, Spain
SLIDE 61
Damper condition assessment
A STUDY ON DATA DRIVEN STRATEGY OF MANAGEMENT AND MAINTENANCE FOR LARGE-SCALE BRIDGES | AIRONG CHEN
WG4 and WG5 WORKSHOP
27th – 28th September 2018
Barcelona, Spain
SLIDE 62
Damper condition assessment
A STUDY ON DATA DRIVEN STRATEGY OF MANAGEMENT AND MAINTENANCE FOR LARGE-SCALE BRIDGES | AIRONG CHEN
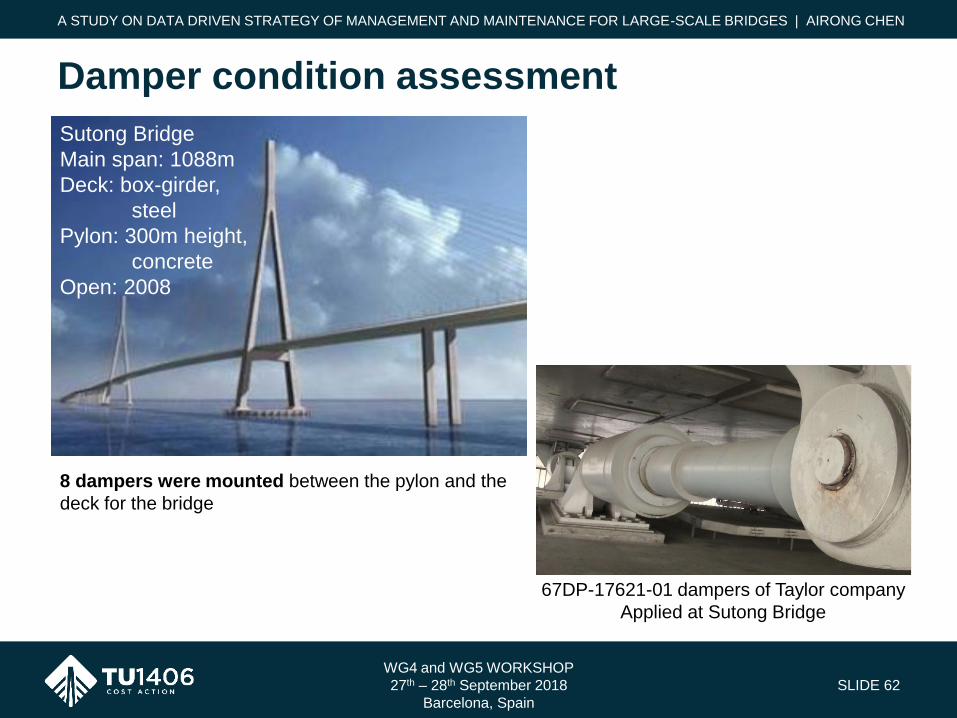
Sutong Bridge
Main span: 1088m
Deck: box-girder,
steel
Pylon: 300m height,
concrete
Open: 2008
8 dampers were mounted between the pylon and the
deck for the bridge
67DP-17621-01 dampers of Taylor company
Applied at Sutong Bridge

• Workflow
– raw data: from sensors
– pre-processing: remove noise
– data processing: wavelet transform
filtering
– pattern analysis: parameter
identification
• frequency
• damping ratio
– final result
• current condition
• future tendency
WG4 and WG5 WORKSHOP
27th – 28th September 2018
Barcelona, Spain
SLIDE 63
Damper condition assessment
A STUDY ON DATA DRIVEN STRATEGY OF MANAGEMENT AND MAINTENANCE FOR LARGE-SCALE BRIDGES | AIRONG CHEN
On-site acquisition of
longitudinal vibration data
Data processing
to remove noise
Power spectrum extraction
in lower frequency range by
wavelet transform filtering
Parameter identification of
frequency and damping ratio
damping ratio tendency
over years
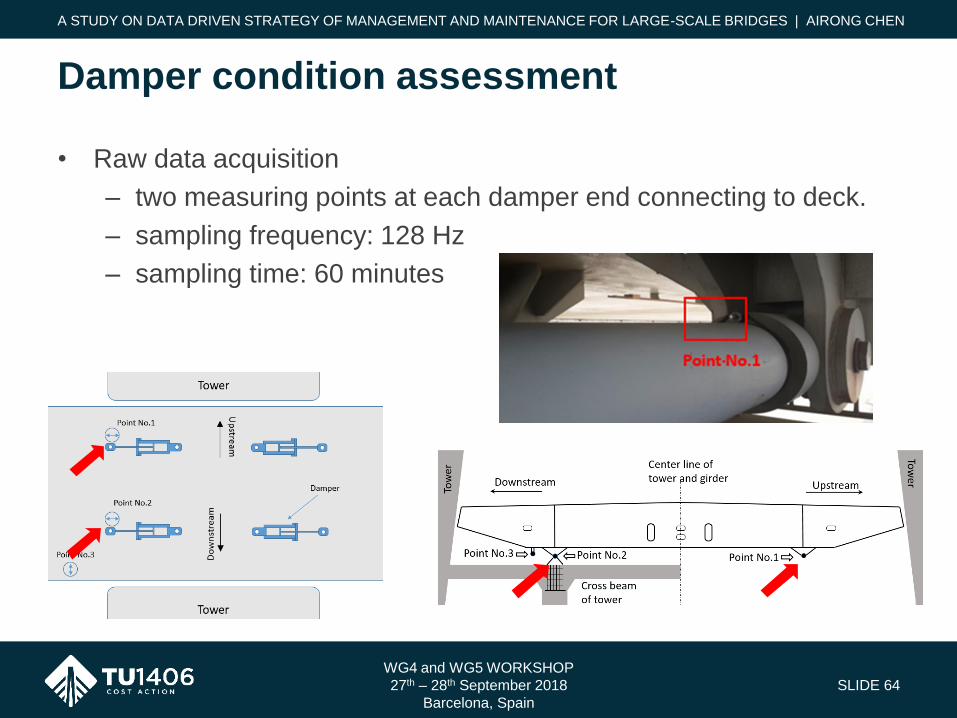
• Raw data acquisition
– two measuring points at each damper end connecting to deck.
– sampling frequency: 128 Hz
– sampling time: 60 minutes
WG4 and WG5 WORKSHOP
27th – 28th September 2018
Barcelona, Spain
SLIDE 64
Damper condition assessment
A STUDY ON DATA DRIVEN STRATEGY OF MANAGEMENT AND MAINTENANCE FOR LARGE-SCALE BRIDGES | AIRONG CHEN
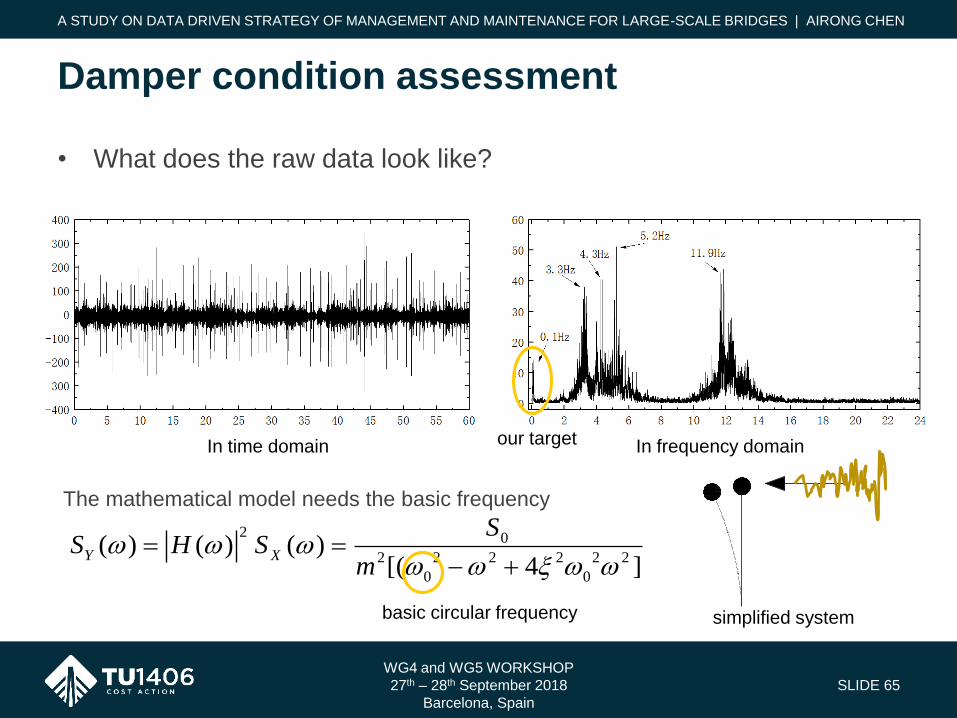
• What does the raw data look like?
The mathematical model needs the basic frequency
WG4 and WG5 WORKSHOP
27th – 28th September 2018
Barcelona, Spain
SLIDE 65
Damper condition assessment
A STUDY ON DATA DRIVEN STRATEGY OF MANAGEMENT AND MAINTENANCE FOR LARGE-SCALE BRIDGES | AIRONG CHEN
In time domain In frequency domain
2 0
2 2 2 2 2 2
0 0
( ) ( ) ( )[( 4 ]
Y X
SS H S
m
our target
basic circular frequency simplified system
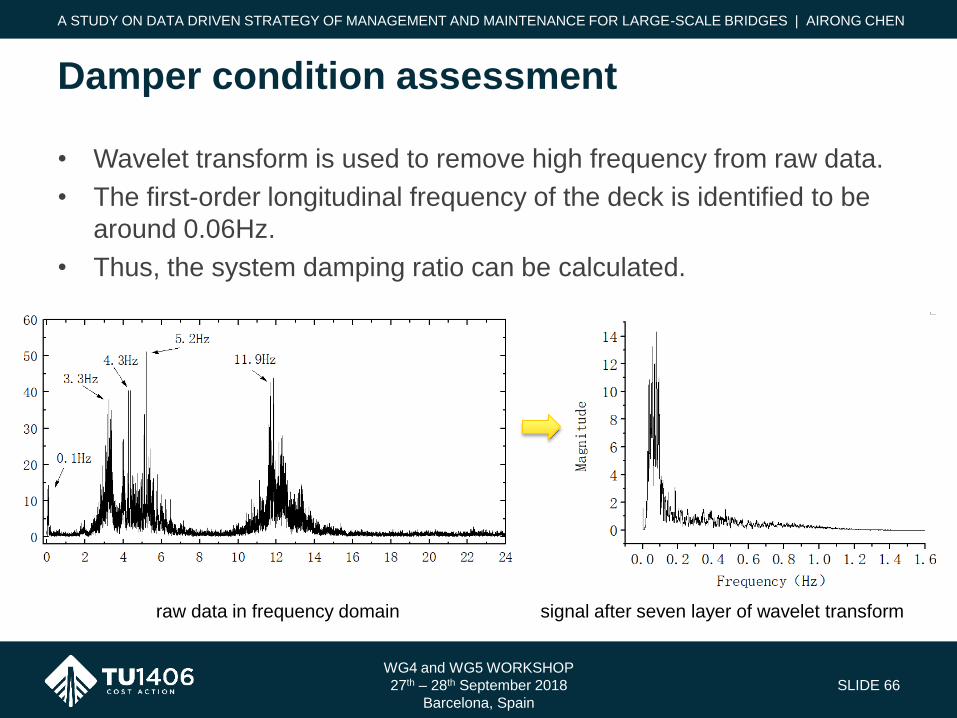
• Wavelet transform is used to remove high frequency from raw data.
• The first-order longitudinal frequency of the deck is identified to be
around 0.06Hz.
• Thus, the system damping ratio can be calculated.
WG4 and WG5 WORKSHOP
27th – 28th September 2018
Barcelona, Spain
SLIDE 66
Damper condition assessment
A STUDY ON DATA DRIVEN STRATEGY OF MANAGEMENT AND MAINTENANCE FOR LARGE-SCALE BRIDGES | AIRONG CHEN
raw data in frequency domain signal after seven layer of wavelet transform

• Using raw data collected during different time periodic, different system
damping ratios can be obtained.
– 2014-04-17
– 2015-04-27
– 2016-11-09
WG4 and WG5 WORKSHOP
27th – 28th September 2018
Barcelona, Spain
SLIDE 67
Damper condition assessment
A STUDY ON DATA DRIVEN STRATEGY OF MANAGEMENT AND MAINTENANCE FOR LARGE-SCALE BRIDGES | AIRONG CHEN
2014 2015 2016 2017 2018 2019 20200.0
0.1
0.2
0.3
0.4
0.5
0.6
0.7
Sy
sten
dam
pin
g r
atio
Year
Rational extrapolation
plot of system damping ratio as a function of time
• System damping ratio gradually
decreases with time, which reflects
the slow degradation of the damper
condition.
• To better predict the deterioration of
damper condition, it is necessary to
repeat the experiment for more data
and further analysis.
• It is possible to predict the remaining service life of dampers and help the
decision making on repair or replacement
WG4 and WG5 WORKSHOP
27th – 28th September 2018
Barcelona, Spain
SLIDE 68
A STUDY ON DATA DRIVEN STRATEGY OF MANAGEMENT AND MAINTENANCE FOR LARGE-SCALE BRIDGES | AIRONG CHEN
Data fusion
WG4 and WG5 WORKSHOP
27th – 28th September 2018
Barcelona, Spain
SLIDE 69
A STUDY ON DATA DRIVEN STRATEGY OF MANAGEMENT AND MAINTENANCE FOR LARGE-SCALE BRIDGES | AIRONG CHEN
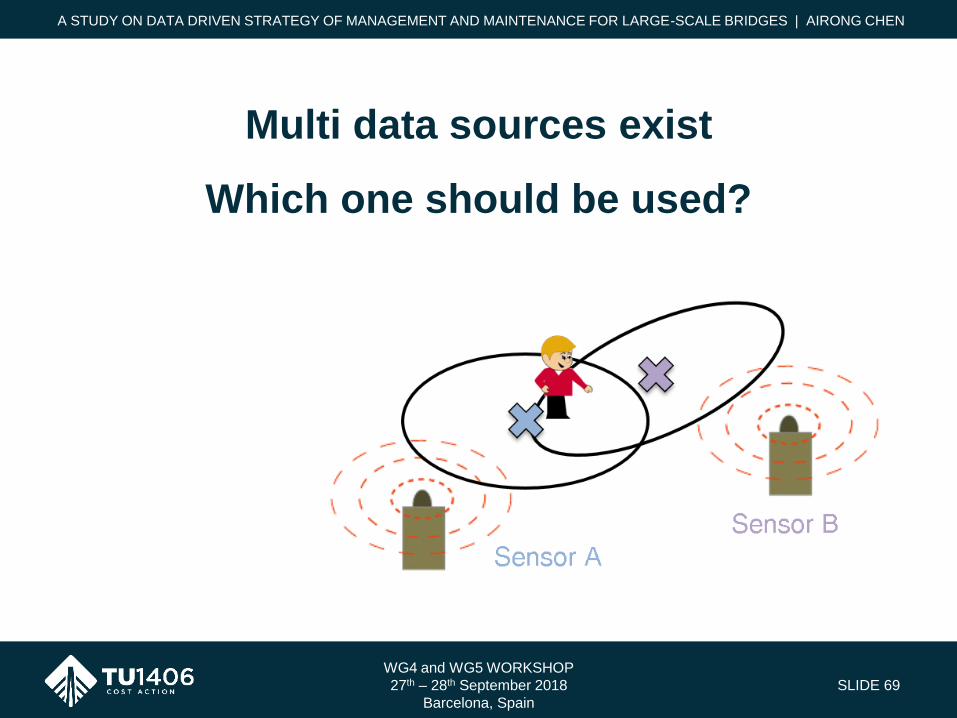
Multi data sources exist
Which one should be used?

• The Xihoumen bridge, a suspension bridge in East China Sea, is
one of the largest sea-crossing bridge between Zhoushan mainland
and islands link project.
• The span of the bridge is 578 m + 1650 m + 485 m which is the
second largest span suspension bridges.
WG4 and WG5 WORKSHOP
27th – 28th September 2018
Barcelona, Spain
SLIDE 70
VORTEX-INDUCED VIBRATION
A STUDY ON DATA DRIVEN STRATEGY OF MANAGEMENT AND MAINTENANCE FOR LARGE-SCALE BRIDGES | AIRONG CHEN
Shanghai
Ningbo Zhoushan

• Owing to the severe sea environment, vortex-induced vibration is a
common event on this bridge
• Through the records of the bridge manager, the bridge has occurred
97 times vortex-induced vibration from 2013 to 2015, including 26
times in 2013, 35 times in 2014, 36 times in 2015.
WG4 and WG5 WORKSHOP
27th – 28th September 2018
Barcelona, Spain
SLIDE 71
VORTEX-INDUCED VIBRATION
A STUDY ON DATA DRIVEN STRATEGY OF MANAGEMENT AND MAINTENANCE FOR LARGE-SCALE BRIDGES | AIRONG CHEN
Events
number
Vibration
frequency
Wind
speed
Wind
direction
Duration
time
Hz m/s degree minute
1 0.3284 10.45 311 30
2 0.3287 9.85 310 160
3 0.3269 8.97 134 40
4 0.3271 8.68 155 70
5 0.3257 7.59 132 30
6 0.4357 9.47 313 100
7 0.3264 8.25 132 50
8 0.4357 7.91 317 170
9 0.3261 10.09 128 30
10 0.3264 9.75 331 110

• To monitor the vortex-induced vibration, sensors are installed on the
bridge.
– propeller anemometers (AN1, AN2)
– three-directional ultrasonic anemometers (UA1 ~ UA2)
• These sensors transfer back huge amount of data everyday.
• What can we get from the data?
WG4 and WG5 WORKSHOP
27th – 28th September 2018
Barcelona, Spain
SLIDE 72
VORTEX-INDUCED VIBRATION
A STUDY ON DATA DRIVEN STRATEGY OF MANAGEMENT AND MAINTENANCE FOR LARGE-SCALE BRIDGES | AIRONG CHEN

0
3
6
9
12
15
0
45
90
135
180
225
270
315
0
3
6
9
12
15
Vortex-induced vibration
Normal condition
Bridge axis
Win
d s
pee
d (
m/s
)
• Two indices are chosen,
– wind speed
– wind direction
• Critical range
– vortex-induced vibration occurs when
• wind speed: 8.5 m/s ~ 13.5 m/s
• wind direction: 125° ~150° or 305° ~ 330°
• What is the occurrence probability?
WG4 and WG5 WORKSHOP
27th – 28th September 2018
Barcelona, Spain
SLIDE 73
VORTEX-INDUCED VIBRATION
A STUDY ON DATA DRIVEN STRATEGY OF MANAGEMENT AND MAINTENANCE FOR LARGE-SCALE BRIDGES | AIRONG CHEN
wind direction angle Φ
wind speed in the plane U
125°
150°
305°
330°
0 20 40 60 80 100 120 140
9
10
11
12
13
14
Win
d s
pee
d (
m/s
)
Vortex-induced vibration
Normal condition
Calculation condition number
8.5 m/s
13.5 m/s
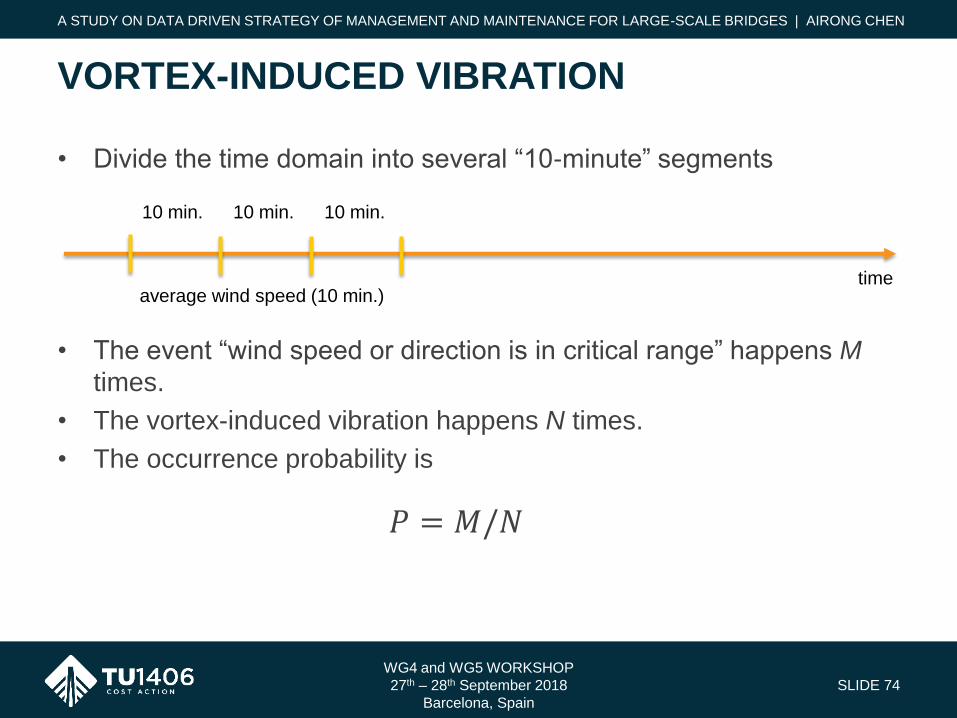
• Divide the time domain into several “10-minute” segments
• The event “wind speed or direction is in critical range” happens M
times.
• The vortex-induced vibration happens N times.
• The occurrence probability is
WG4 and WG5 WORKSHOP
27th – 28th September 2018
Barcelona, Spain
SLIDE 74
VORTEX-INDUCED VIBRATION
A STUDY ON DATA DRIVEN STRATEGY OF MANAGEMENT AND MAINTENANCE FOR LARGE-SCALE BRIDGES | AIRONG CHEN
average wind speed (10 min.)time
10 min. 10 min. 10 min.
𝑃 = 𝑀/𝑁

• Occurrence probability
– only based on wind speed (speed is in critical range)
• sensor U1: 15.7%
• sensor U2: 14.6%
• sensor U3: 14.3%
– only based on wind direction (direction is in critical range)
• sensor U1: 12.3%
• sensor U2: 11.8%
• sensor U3: 12.1%
– based on both wind speed and direction (both speed and direction are in critical ranges)
• sensor U1: 67.7%
• sensor U2: 59.4%
• sensor U3: 64.3%
WG4 and WG5 WORKSHOP
27th – 28th September 2018
Barcelona, Spain
SLIDE 75
VORTEX-INDUCED VIBRATION
A STUDY ON DATA DRIVEN STRATEGY OF MANAGEMENT AND MAINTENANCE FOR LARGE-SCALE BRIDGES | AIRONG CHEN
different sensors have
different results!
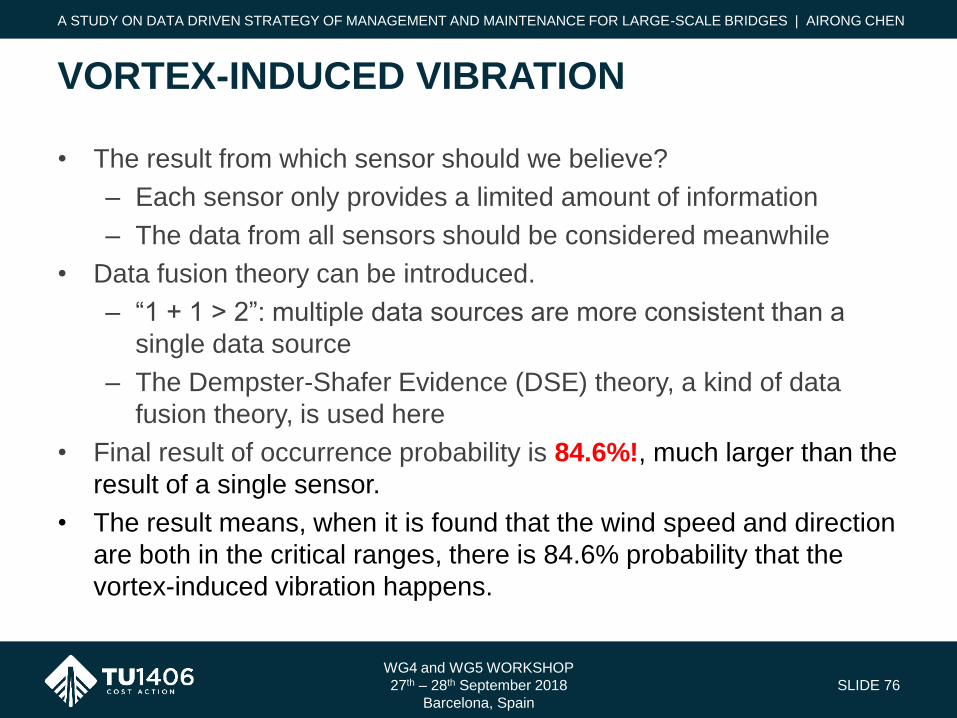
• The result from which sensor should we believe?
– Each sensor only provides a limited amount of information
– The data from all sensors should be considered meanwhile
• Data fusion theory can be introduced.
– “1 + 1 > 2”: multiple data sources are more consistent than a
single data source
– The Dempster-Shafer Evidence (DSE) theory, a kind of data
fusion theory, is used here
• Final result of occurrence probability is 84.6%!, much larger than the
result of a single sensor.
• The result means, when it is found that the wind speed and direction
are both in the critical ranges, there is 84.6% probability that the
vortex-induced vibration happens.
WG4 and WG5 WORKSHOP
27th – 28th September 2018
Barcelona, Spain
SLIDE 76
VORTEX-INDUCED VIBRATION
A STUDY ON DATA DRIVEN STRATEGY OF MANAGEMENT AND MAINTENANCE FOR LARGE-SCALE BRIDGES | AIRONG CHEN
WG4 and WG5 WORKSHOP
27th – 28th September 2018
Barcelona, Spain
SLIDE 77
A STUDY ON DATA DRIVEN STRATEGY OF MANAGEMENT AND MAINTENANCE FOR LARGE-SCALE BRIDGES | AIRONG CHEN
Computer vision
WG4 and WG5 WORKSHOP
27th – 28th September 2018
Barcelona, Spain
SLIDE 78
A STUDY ON DATA DRIVEN STRATEGY OF MANAGEMENT AND MAINTENANCE FOR LARGE-SCALE BRIDGES | AIRONG CHEN
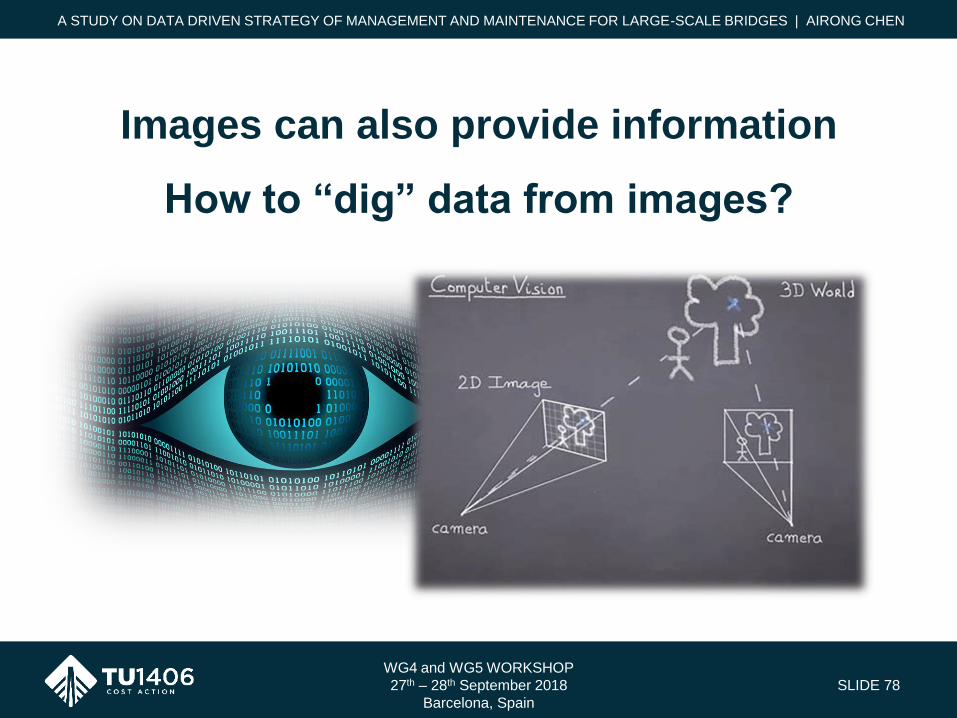
Images can also provide information
How to “dig” data from images?
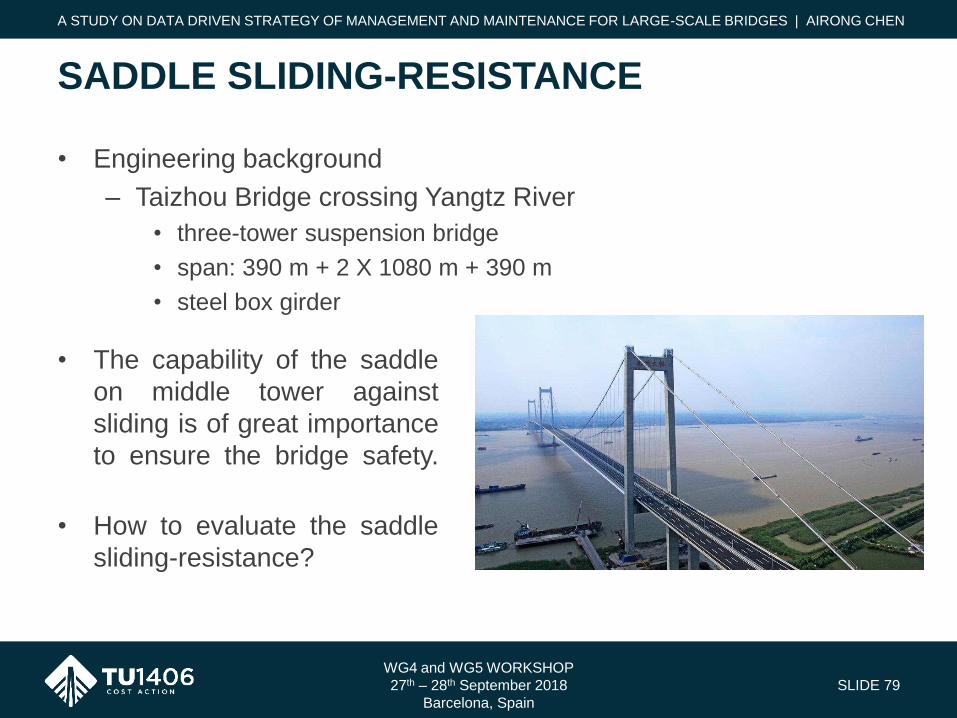
• Engineering background
– Taizhou Bridge crossing Yangtz River
• three-tower suspension bridge
• span: 390 m + 2 X 1080 m + 390 m
• steel box girder
WG4 and WG5 WORKSHOP
27th – 28th September 2018
Barcelona, Spain
SLIDE 79
SADDLE SLIDING-RESISTANCE
A STUDY ON DATA DRIVEN STRATEGY OF MANAGEMENT AND MAINTENANCE FOR LARGE-SCALE BRIDGES | AIRONG CHEN
• The capability of the saddle
on middle tower against
sliding is of great importance
to ensure the bridge safety.
• How to evaluate the saddle
sliding-resistance?

• Sliding-resistance of saddle could be evaluated through safety
factor,
• But, the wrapping angle cannot be directly measured.
• Only images are available. The data of the wrapping angle is hidden
inside the images.
• Thus, a computer vision based technique is applied to dig the data.
WG4 and WG5 WORKSHOP
27th – 28th September 2018
Barcelona, Spain
SLIDE 80
SADDLE SLIDING-RESISTANCE
A STUDY ON DATA DRIVEN STRATEGY OF MANAGEMENT AND MAINTENANCE FOR LARGE-SCALE BRIDGES | AIRONG CHEN
s
ct
cl
2
ln
KF
F
safety factor
cable force
wrapping angle

• First, a panorama is obtained by image stitching.
WG4 and WG5 WORKSHOP
27th – 28th September 2018
Barcelona, Spain
SLIDE 81
SADDLE SLIDING-RESISTANCE
A STUDY ON DATA DRIVEN STRATEGY OF MANAGEMENT AND MAINTENANCE FOR LARGE-SCALE BRIDGES | AIRONG CHEN
+
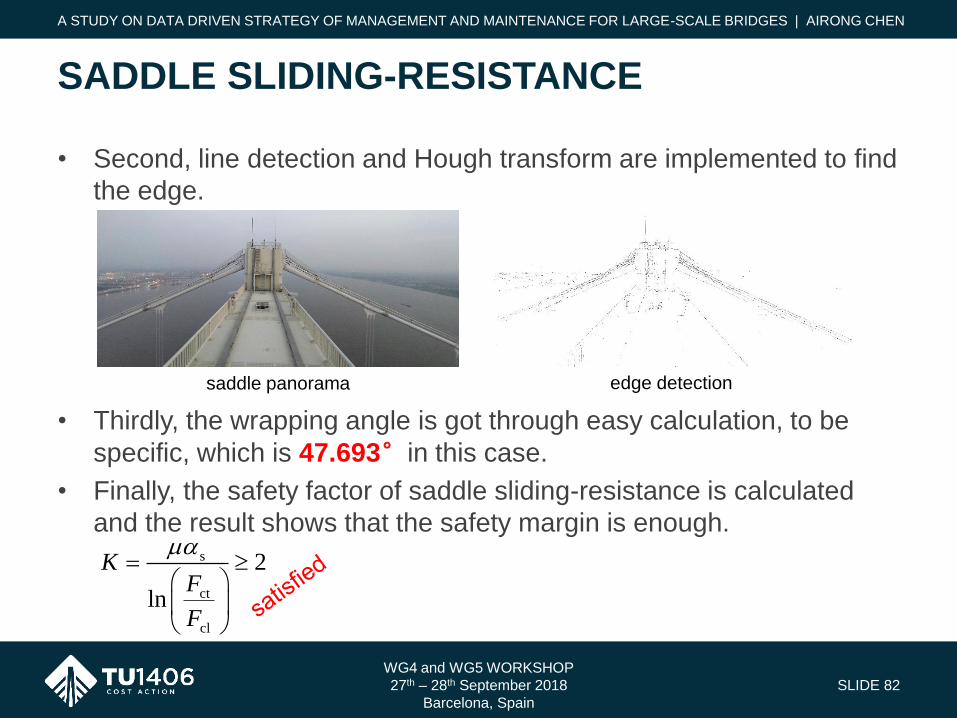
• Second, line detection and Hough transform are implemented to find
the edge.
• Thirdly, the wrapping angle is got through easy calculation, to be
specific, which is 47.693°in this case.
• Finally, the safety factor of saddle sliding-resistance is calculated
and the result shows that the safety margin is enough.
WG4 and WG5 WORKSHOP
27th – 28th September 2018
Barcelona, Spain
SLIDE 82
SADDLE SLIDING-RESISTANCE
A STUDY ON DATA DRIVEN STRATEGY OF MANAGEMENT AND MAINTENANCE FOR LARGE-SCALE BRIDGES | AIRONG CHEN
saddle panorama edge detection
s
ct
cl
2
ln
KF
F

WG4 and WG5 WORKSHOP
27th – 28th September 2018
Barcelona, Spain
SLIDE 83
A STUDY ON DATA DRIVEN STRATEGY OF MANAGEMENT AND MAINTENANCE FOR LARGE-SCALE BRIDGES | AIRONG CHEN
Machine learning

WG4 and WG5 WORKSHOP
27th – 28th September 2018
Barcelona, Spain
SLIDE 84
A STUDY ON DATA DRIVEN STRATEGY OF MANAGEMENT AND MAINTENANCE FOR LARGE-SCALE BRIDGES | AIRONG CHEN
Deal with “Big Data”
more “intelligent”

• The traffic load information is of great importance for a loading test.
• At present, Weigh In Motion (WIM) systems are usually used to
provide traffic load information.
• But, …
– WIM systems may be unavailable in some bridges
– WIM system could only provide information of a certain section
– WIM system could not reflect vehicle driving characteristics on bridge
WG4 and WG5 WORKSHOP
27th – 28th September 2018
Barcelona, Spain
SLIDE 85
TRAFFIC LOAD
A STUDY ON DATA DRIVEN STRATEGY OF MANAGEMENT AND MAINTENANCE FOR LARGE-SCALE BRIDGES | AIRONG CHEN
Is there any other
method to acquire the
traffic information on
bridges?
WIM system on bridge
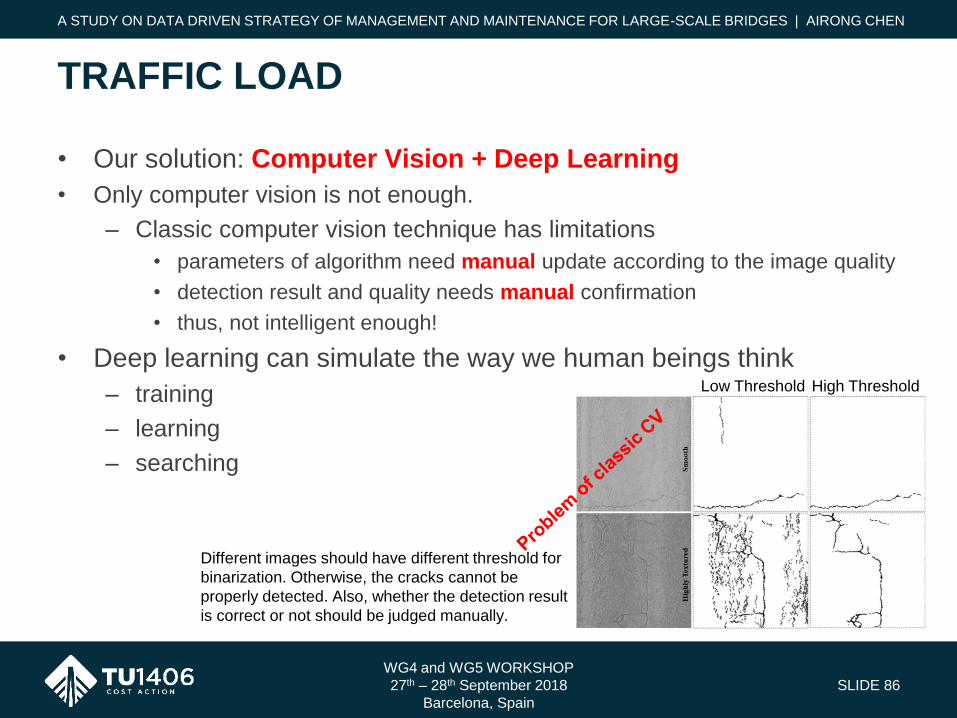
• Our solution: Computer Vision + Deep Learning
• Only computer vision is not enough.
– Classic computer vision technique has limitations
• parameters of algorithm need manual update according to the image quality
• detection result and quality needs manual confirmation
• thus, not intelligent enough!
• Deep learning can simulate the way we human beings think
– training
– learning
– searching
WG4 and WG5 WORKSHOP
27th – 28th September 2018
Barcelona, Spain
SLIDE 86
TRAFFIC LOAD
A STUDY ON DATA DRIVEN STRATEGY OF MANAGEMENT AND MAINTENANCE FOR LARGE-SCALE BRIDGES | AIRONG CHEN
Different images should have different threshold for
binarization. Otherwise, the cracks cannot be
properly detected. Also, whether the detection result
is correct or not should be judged manually.
Low Threshold High Threshold

• What can Computer Vision + Deep Learning do?
– Classification: it is a cat.
– Localization: the cat is there.
– Detection: there are a cat, a dog and a duck in this image.
– Segmentation: the outlines of the cat, dog and duck can be cut from the
image
WG4 and WG5 WORKSHOP
27th – 28th September 2018
Barcelona, Spain
SLIDE 87
TRAFFIC LOAD
A STUDY ON DATA DRIVEN STRATEGY OF MANAGEMENT AND MAINTENANCE FOR LARGE-SCALE BRIDGES | AIRONG CHEN

• Traffic tracking is essentially a problem of object detection.
• How to track the traffic?
– We feed the computer several images containing different types of
vehicles.
– We manually tell the computer where the vehicle is and what type it is.
– After training, the computer can automatically learn the essential
characteristics of a vehicle with a typical type (car, van, bus, etc.).
– Then, the computer can find the vehicles in the other images.
– The process is just the same as we teach a child to identify different
objects in the environment.
• Our ultimate objectives: real-time vehicle loading distribution
(time vs space)
– Real-time testing, real-time evaluation, accident reporting, traffic jam
alarming….
WG4 and WG5 WORKSHOP
27th – 28th September 2018
Barcelona, Spain
SLIDE 88
TRAFFIC LOAD
A STUDY ON DATA DRIVEN STRATEGY OF MANAGEMENT AND MAINTENANCE FOR LARGE-SCALE BRIDGES | AIRONG CHEN

Vehicle labelling
• To acquire images, cameras are installed at the top of pylons.
• From the video stream, totally 4,375 images (295×1920 px) are
selected and labeled to form the Jiangyin vehicle detection dataset.
• The vehicles are classified into four types, i.e., car, bus, truck and
van.
WG4 and WG5 WORKSHOP
27th – 28th September 2018
Barcelona, Spain
SLIDE 89
TRAFFIC LOAD
A STUDY ON DATA DRIVEN STRATEGY OF MANAGEMENT AND MAINTENANCE FOR LARGE-SCALE BRIDGES | AIRONG CHEN
car
bus
truck
van
Cameras installed at top of pylon
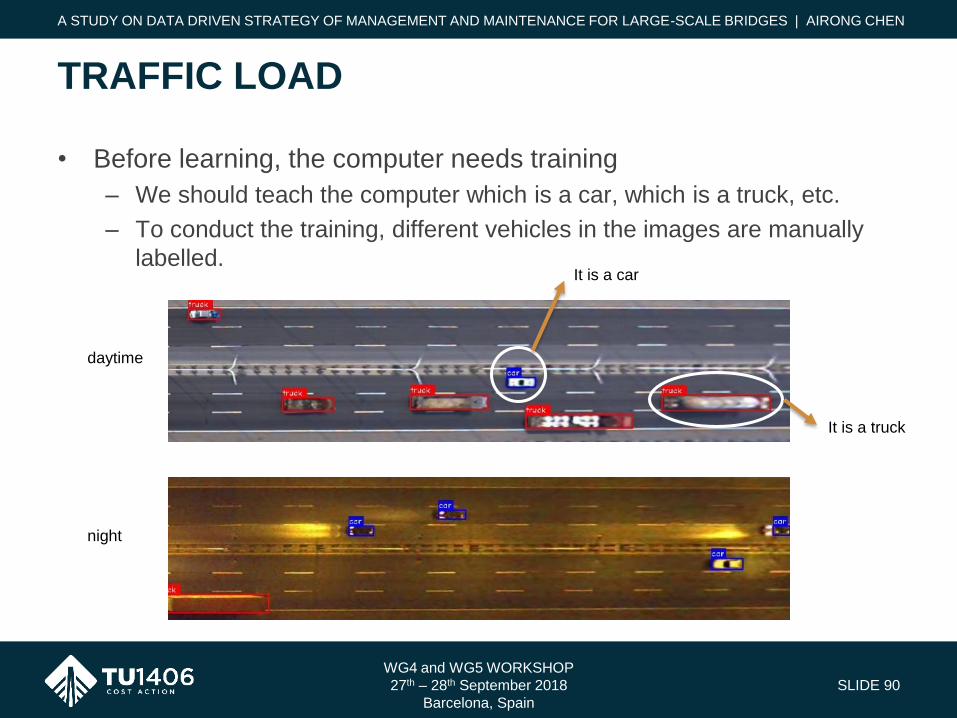
• Before learning, the computer needs training
– We should teach the computer which is a car, which is a truck, etc.
– To conduct the training, different vehicles in the images are manually
labelled.
WG4 and WG5 WORKSHOP
27th – 28th September 2018
Barcelona, Spain
SLIDE 90
TRAFFIC LOAD
A STUDY ON DATA DRIVEN STRATEGY OF MANAGEMENT AND MAINTENANCE FOR LARGE-SCALE BRIDGES | AIRONG CHEN
daytime
night
It is a car
It is a truck
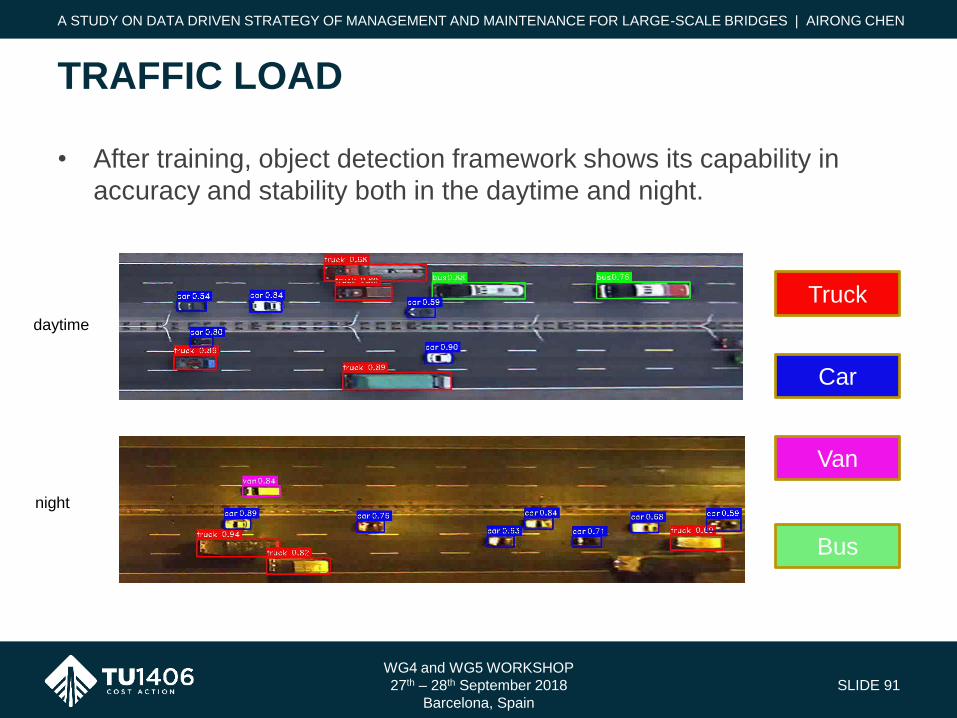
• After training, object detection framework shows its capability in
accuracy and stability both in the daytime and night.
WG4 and WG5 WORKSHOP
27th – 28th September 2018
Barcelona, Spain
SLIDE 91
TRAFFIC LOAD
A STUDY ON DATA DRIVEN STRATEGY OF MANAGEMENT AND MAINTENANCE FOR LARGE-SCALE BRIDGES | AIRONG CHEN
daytime
night
Truck
Car
Van
Bus
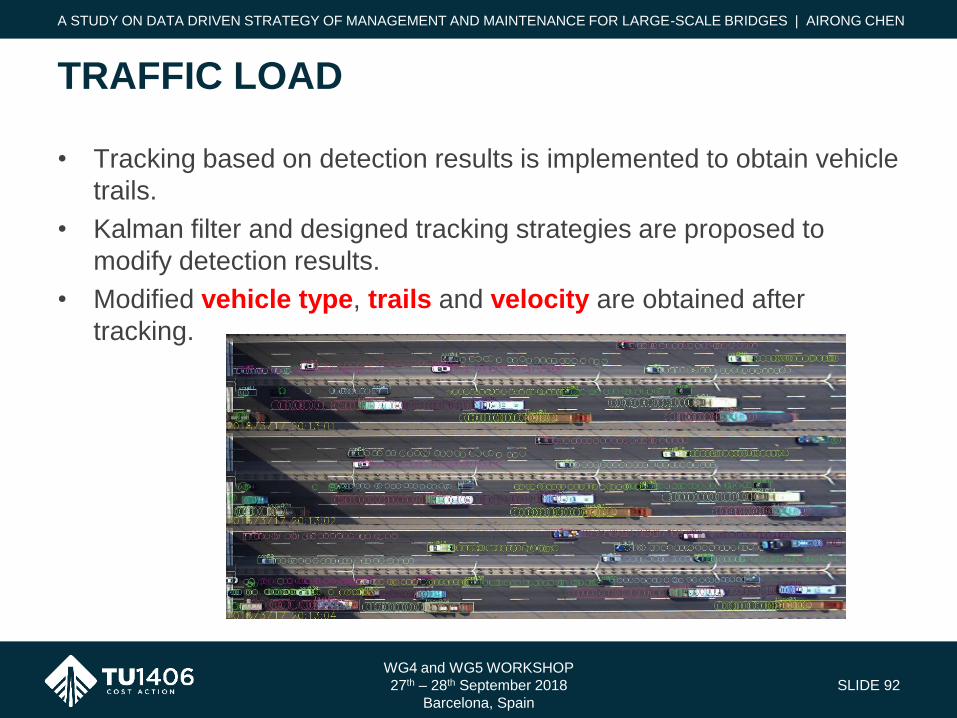
• Tracking based on detection results is implemented to obtain vehicle
trails.
• Kalman filter and designed tracking strategies are proposed to
modify detection results.
• Modified vehicle type, trails and velocity are obtained after
tracking.
WG4 and WG5 WORKSHOP
27th – 28th September 2018
Barcelona, Spain
SLIDE 92
TRAFFIC LOAD
A STUDY ON DATA DRIVEN STRATEGY OF MANAGEMENT AND MAINTENANCE FOR LARGE-SCALE BRIDGES | AIRONG CHEN

• Vehicle information can be obtained based on tracking results.
• Vehicle flow, hourly distribution, traverse distribution, speed
distribution, tyres distribution surface…
• All the needed information related to the vehicle load can be
obtained.
WG4 and WG5 WORKSHOP
27th – 28th September 2018
Barcelona, Spain
SLIDE 93
TRAFFIC LOAD
A STUDY ON DATA DRIVEN STRATEGY OF MANAGEMENT AND MAINTENANCE FOR LARGE-SCALE BRIDGES | AIRONG CHEN
Traverse distribution of different types of vehicles
Vehicle tyres trails

• Apparent diseases can be initiated and propagated under severe
environment
• Periodic inspection is important to identify these diseases.
• For the girder, inspection vehicle is usually installed.
• But, …
WG4 and WG5 WORKSHOP
27th – 28th September 2018
Barcelona, Spain
SLIDE 94
STEEL COATING DISEASE
A STUDY ON DATA DRIVEN STRATEGY OF MANAGEMENT AND MAINTENANCE FOR LARGE-SCALE BRIDGES | AIRONG CHEN
The inspection vehicle and track have
their own diseases, and may be
detached from the bridge!
Thus, it is unsafety to send workers
by the inspection vehicle for manual
inspection

• For the pylon, the drone inspection is often used.
• But, …
• The drone is not stable, and greatly affected by the wind
environment and signal interruption.
• The battery of the drone is currently quite limited.
WG4 and WG5 WORKSHOP
27th – 28th September 2018
Barcelona, Spain
SLIDE 95
STEEL COATING DISEASE
A STUDY ON DATA DRIVEN STRATEGY OF MANAGEMENT AND MAINTENANCE FOR LARGE-SCALE BRIDGES | AIRONG CHEN

• Computer Vision + Deep Learning: a more efficient approach to
detect bridge apparent diseases?
WG4 and WG5 WORKSHOP
27th – 28th September 2018
Barcelona, Spain
SLIDE 96
STEEL COATING DISEASE
A STUDY ON DATA DRIVEN STRATEGY OF MANAGEMENT AND MAINTENANCE FOR LARGE-SCALE BRIDGES | AIRONG CHEN
Computer Vision based Disease Identification
System
Reasonable hardware
Image capture Image stitchingDisease semantic
segmentation
Network architecture
Network trainingNetwork inference
Disease identification
Image acquisition
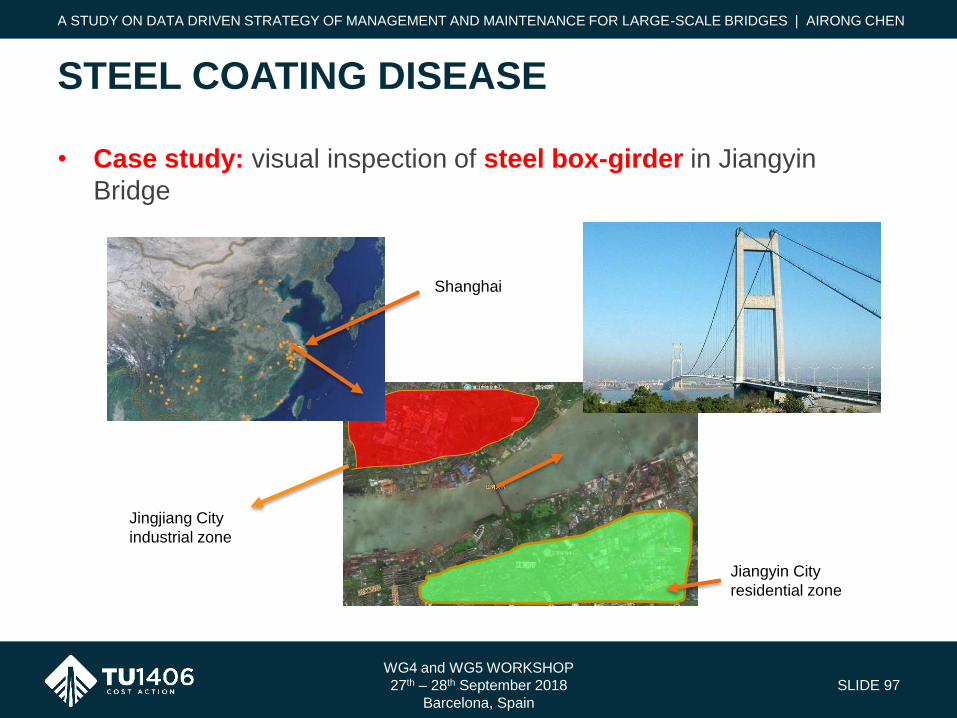
Jingjiang City
industrial zone
Jiangyin City
residential zone
• Case study: visual inspection of steel box-girder in Jiangyin
Bridge
WG4 and WG5 WORKSHOP
27th – 28th September 2018
Barcelona, Spain
SLIDE 97
STEEL COATING DISEASE
A STUDY ON DATA DRIVEN STRATEGY OF MANAGEMENT AND MAINTENANCE FOR LARGE-SCALE BRIDGES | AIRONG CHEN
Shanghai

• Hardware:
– Industrial camera: 2058 pixel ×1536 pixel, up to 120 fps with full
resolution.
– Camera support: 400 mm length slide.
– Only cameras are installed in the inspection vehicle.
WG4 and WG5 WORKSHOP
27th – 28th September 2018
Barcelona, Spain
SLIDE 98
STEEL COATING DISEASE
A STUDY ON DATA DRIVEN STRATEGY OF MANAGEMENT AND MAINTENANCE FOR LARGE-SCALE BRIDGES | AIRONG CHEN
Bottom of steel box-girder
Top of inspection vehicleCamera support
Industrial camera
H
W
Camera view
Camera array

• Image acquisition by inspection vehicle
– Sampling rate: 0.5 fps
– Vehicle speed: 0.35 km/h
WG4 and WG5 WORKSHOP
27th – 28th September 2018
Barcelona, Spain
SLIDE 99
STEEL COATING DISEASE
A STUDY ON DATA DRIVEN STRATEGY OF MANAGEMENT AND MAINTENANCE FOR LARGE-SCALE BRIDGES | AIRONG CHEN
Inspection vehicle Steel Box-girder
Uniform motion
0.35 km/h
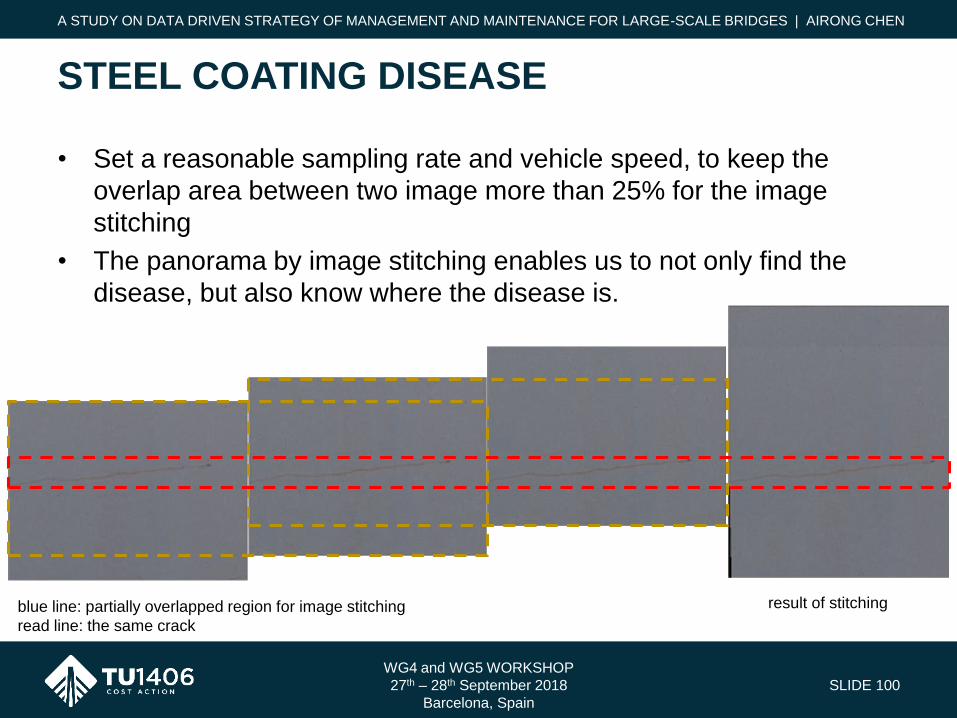
• Set a reasonable sampling rate and vehicle speed, to keep the
overlap area between two image more than 25% for the image
stitching
• The panorama by image stitching enables us to not only find the
disease, but also know where the disease is.
WG4 and WG5 WORKSHOP
27th – 28th September 2018
Barcelona, Spain
SLIDE 100
STEEL COATING DISEASE
A STUDY ON DATA DRIVEN STRATEGY OF MANAGEMENT AND MAINTENANCE FOR LARGE-SCALE BRIDGES | AIRONG CHEN
blue line: partially overlapped region for image stitching
read line: the same crack
result of stitching
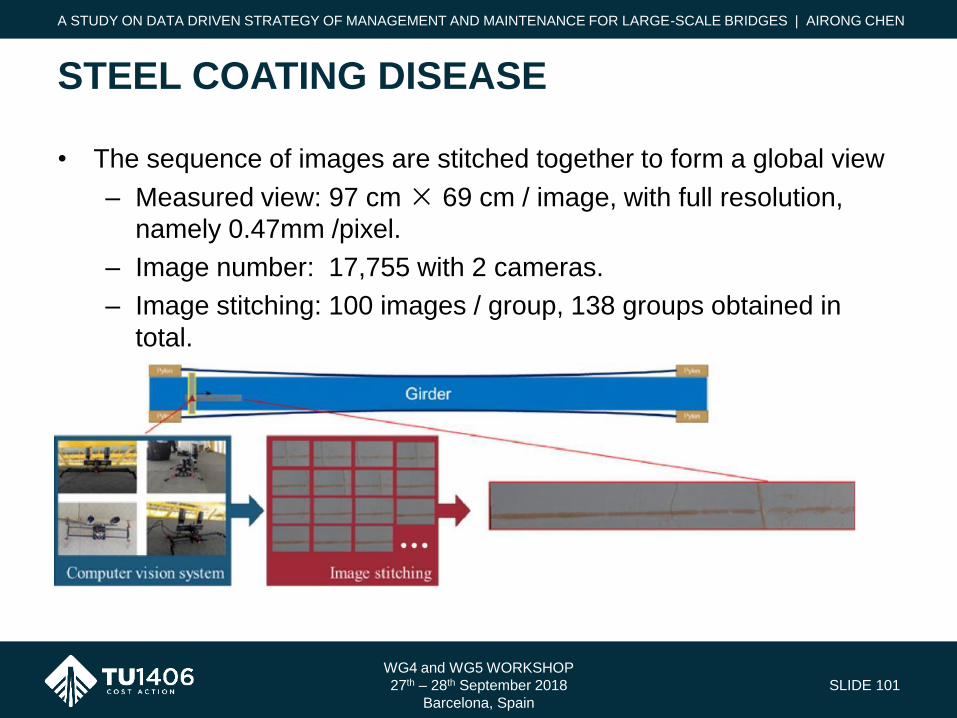
• The sequence of images are stitched together to form a global view
– Measured view: 97 cm × 69 cm / image, with full resolution,
namely 0.47mm /pixel.
– Image number: 17,755 with 2 cameras.
– Image stitching: 100 images / group, 138 groups obtained in
total.
WG4 and WG5 WORKSHOP
27th – 28th September 2018
Barcelona, Spain
SLIDE 101
STEEL COATING DISEASE
A STUDY ON DATA DRIVEN STRATEGY OF MANAGEMENT AND MAINTENANCE FOR LARGE-SCALE BRIDGES | AIRONG CHEN
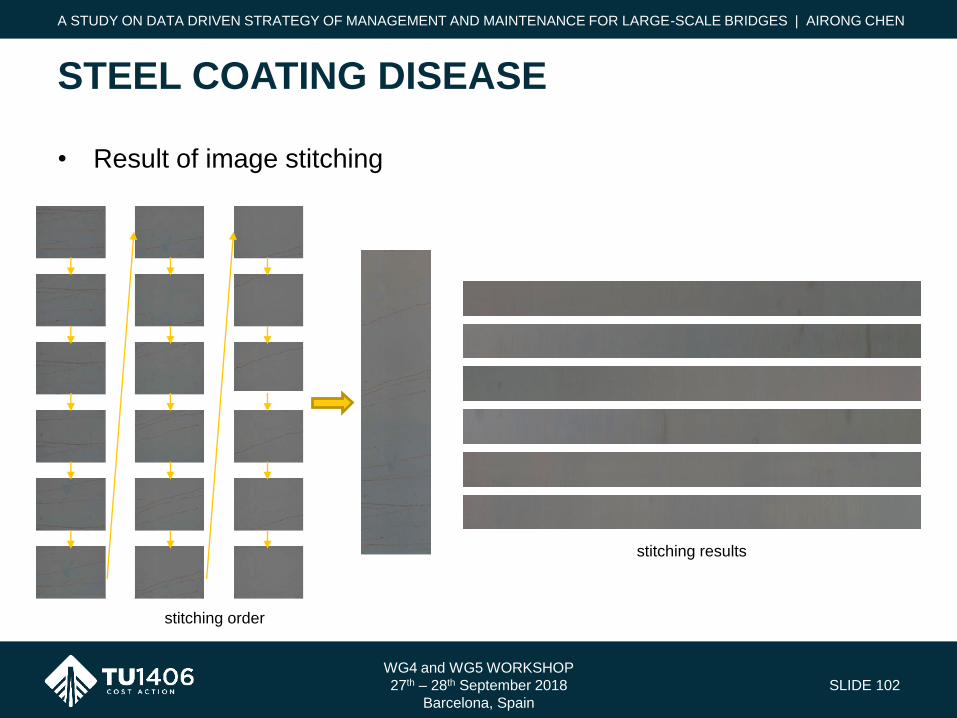
• Result of image stitching
WG4 and WG5 WORKSHOP
27th – 28th September 2018
Barcelona, Spain
SLIDE 102
STEEL COATING DISEASE
A STUDY ON DATA DRIVEN STRATEGY OF MANAGEMENT AND MAINTENANCE FOR LARGE-SCALE BRIDGES | AIRONG CHEN
stitching order
stitching results
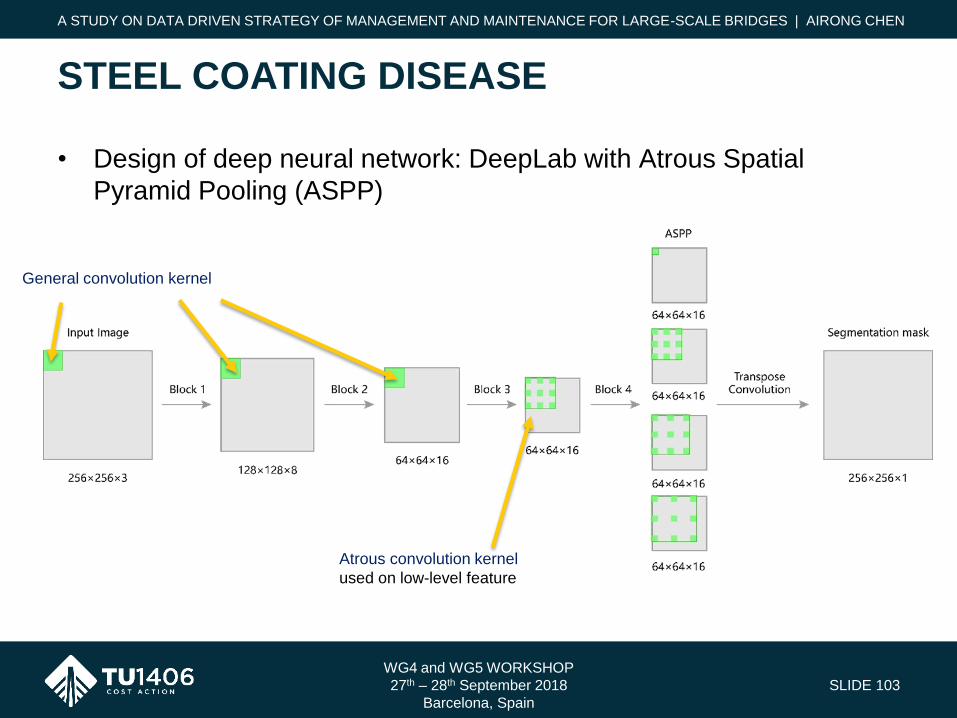
• Design of deep neural network: DeepLab with Atrous Spatial
Pyramid Pooling (ASPP)
WG4 and WG5 WORKSHOP
27th – 28th September 2018
Barcelona, Spain
SLIDE 103
STEEL COATING DISEASE
A STUDY ON DATA DRIVEN STRATEGY OF MANAGEMENT AND MAINTENANCE FOR LARGE-SCALE BRIDGES | AIRONG CHEN
General convolution kernel
Atrous convolution kernel
used on low-level feature
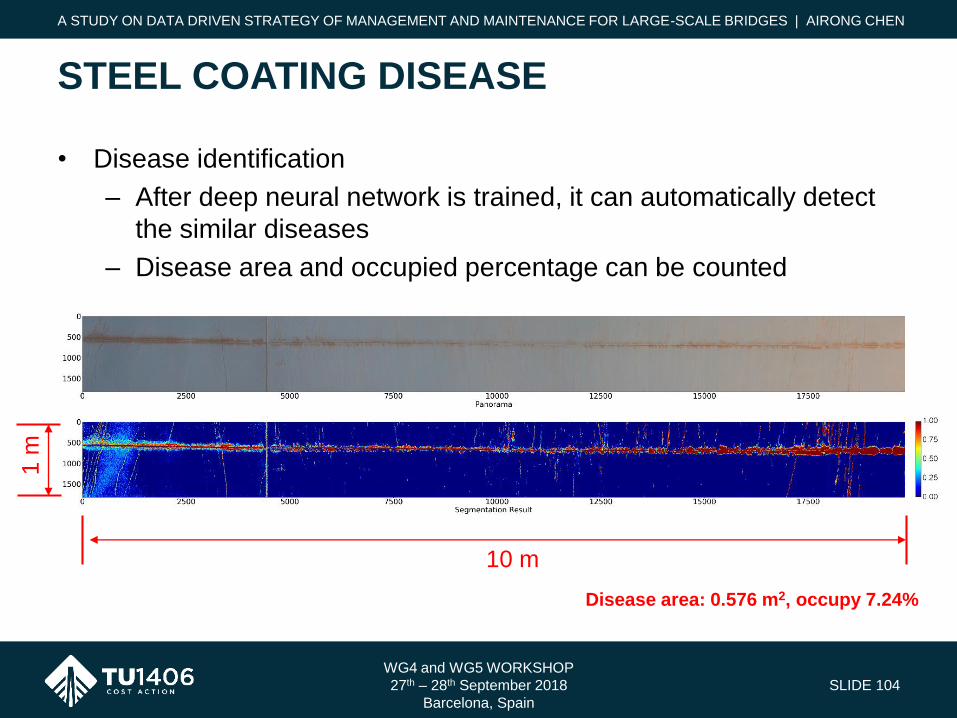
• Disease identification
– After deep neural network is trained, it can automatically detect
the similar diseases
– Disease area and occupied percentage can be counted
WG4 and WG5 WORKSHOP
27th – 28th September 2018
Barcelona, Spain
SLIDE 104
STEEL COATING DISEASE
A STUDY ON DATA DRIVEN STRATEGY OF MANAGEMENT AND MAINTENANCE FOR LARGE-SCALE BRIDGES | AIRONG CHEN1 m
Disease area: 0.576 m2, occupy 7.24%
10 m
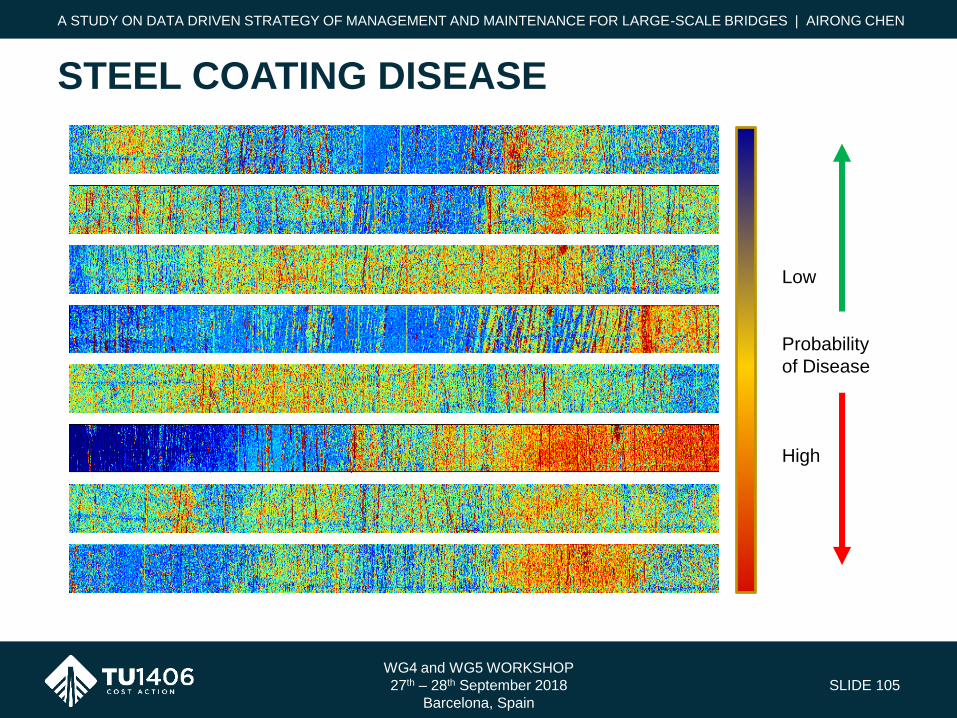
WG4 and WG5 WORKSHOP
27th – 28th September 2018
Barcelona, Spain
SLIDE 105
STEEL COATING DISEASE
A STUDY ON DATA DRIVEN STRATEGY OF MANAGEMENT AND MAINTENANCE FOR LARGE-SCALE BRIDGES | AIRONG CHEN
Low
Probability
of Disease
High
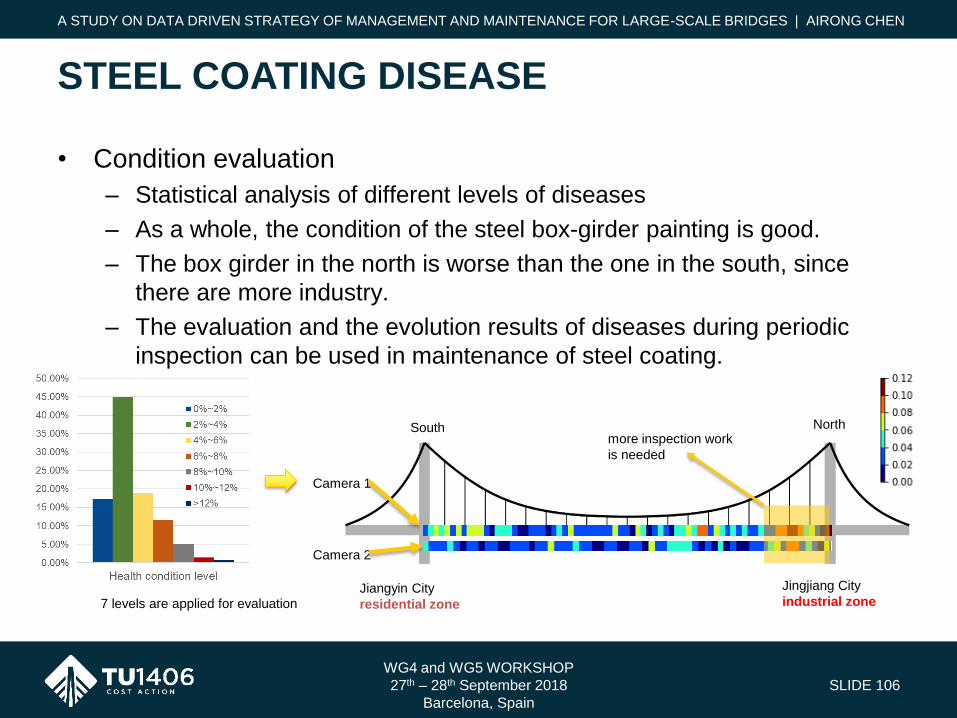
• Condition evaluation
– Statistical analysis of different levels of diseases
– As a whole, the condition of the steel box-girder painting is good.
– The box girder in the north is worse than the one in the south, since
there are more industry.
– The evaluation and the evolution results of diseases during periodic
inspection can be used in maintenance of steel coating.
WG4 and WG5 WORKSHOP
27th – 28th September 2018
Barcelona, Spain
SLIDE 106
STEEL COATING DISEASE
A STUDY ON DATA DRIVEN STRATEGY OF MANAGEMENT AND MAINTENANCE FOR LARGE-SCALE BRIDGES | AIRONG CHEN
Jingjiang City
industrial zoneJiangyin City
residential zone
NorthSouth
Camera 2
Camera 1
7 levels are applied for evaluation
more inspection work
is needed
WG4 and WG5 WORKSHOP
27th – 28th September 2018
Barcelona, Spain
SLIDE 107
A STUDY ON DATA DRIVEN STRATEGY OF MANAGEMENT AND MAINTENANCE FOR LARGE-SCALE BRIDGES | AIRONG CHEN
Conclusion and Prospect

• Data is the elementary (One can't make bricks without straw)
– Which kind of Data? How to get? In more efficient way?
– New generation of structural monitoring system?
– How to connect with structural performance?
– More performance indicators for long span bridges?
– Standardisation?
– …….
WG4 and WG5 WORKSHOP
27th – 28th September 2018
Barcelona, Spain
SLIDE 108
Conclusion and Prospect
A STUDY ON DATA DRIVEN STRATEGY OF MANAGEMENT AND MAINTENANCE FOR LARGE-SCALE BRIDGES | AIRONG CHEN

THANK YOU FOR YOUR ATTENTION!
WWW.TU1406.EU
WG4 and WG5 WORKSHOP
Sustainable Bridge Management
27th – 28th September 2018
Barcelona, Spain
ECONOMY AND SOCIETAL
PERFORMANCE INDICATORS FOR
BRIDGE MAINTENANCE
PRIORATIZATION
Sandra Škarić Palić - Infra Plan konzalting, Croatia
Zaharah Allah Bukhsh - University of Twente, The Netherlands
Irina Stipanović - University of Twente, The Netherlands
QUALITY SPECIFICATIONS FOR ROADWAY BRIDGES,
STANDARDIZATION AT A EUROPEAN LEVEL
Barcelona,
27th – 28th September, 2018
1
ECONOMY AND SOCIETAL PERFORMANCE INDICATORS FOR BRIDGE
MAINTENANCE PRIORATIZATION
Sandra Škarić Palić1, Zaharah Allah Bukhsh2, Irina Stipanović 1,2 1Infra Plan konzalting, Nova cesta 109, 10000 Zagreb, Croatia,
2University of Twente, Faculty of Engineering Technology, P.O.Box 217, 7500AE Enschede, The Netherlands,
E-mails: 1 [email protected]; 2 [email protected]; 3 [email protected].
.
Abstract: Strategic decisions regarding preservation activities encompassing both reactive and preventive
maintenance as well as capital investments should be based on solid facts and reliable data, especially in the context of
considerable impacts on economy, society and environment. The circumstances for infrastructure networks have
changed during the last decades due to the increasing performance requirements, less public acceptance of risk, higher
legal requirements and a limited budget. Sustainability in most business practices, as well as decision making process
in bridge management is still often assessed only from economical point of view while environmental and especially
societal dimension is underrated or even completely excluded from the analysis. Several issues add up to this complex
problem among which are lack of indicators, metrics to assess environmental and societal pillars, and existence of
trade-offs between the pillars and the stakeholder groups. This is even more valid and present in bridge management
decision making process because of uncertainties regarding a number of different life cycle stages, a number of parties
included and long service period of structures involved. In this paper a model for the development of maintenance plan
for bridges which integrates multiple performance objectives has been proposed. Key performance indicators (KPIs)
for reliability, economy, availability and societal impacts have been proposed, in order to support performance based
decision making which needs to satisfy multiple performance goals. The proposed matrix with KPIs has been applied
on the case study in Croatia, where different regions and number of bridges have been analysed.
Keywords: economy performance indicators, societal performance indicators, bridges, maintenance planning
1. Introduction
The road network facilitates the movement of people and goods, allowing for social interaction and economic growth.
The road infrastructure needs to satisfy number of performance objectives related to operation, safety, economy,
environment and other. Optimization of maintenance activities regarding technical and economic requirements is essential
for road owners to fulfil societal expectations. Due to the long life time of the road infrastructure, especially bridge
structures (often longer than 50 years), assessment of technical and economic performance is necessary in order to
optimize budget expenditure. It is estimated that the ratio of expenses per route km of bridges is 10 times the average
expense per route km of roads. The length of bridges compared to the whole length of road networks is only approximately
2% but at the same time they present 30% value of the whole network (PIARC,1999). During the last decade a new
network management philosophy, Asset Management has emerged, which puts the customer - the traffic user - into the
centre, and, at the same time, methods to allocate the socio-economic optimal amount of money to each specific asset
(roads, bridges, tunnels, lighting, signs, guard rails, etc.).
The circumstances for infrastructure networks have changed during the last decades due to the increasing performance
requirements, less public acceptance of risk, higher legal requirements and a limited budget. (Wijnia & Herder, 2009)
Within asset management, physical assets are to be considered in relation with all other activities of the organization to
deliver the required performance. For physical assets such as bridges, this means bridge management is to be part of the
management of the network, and the bridge performance has to fulfil the network performance goals (Velde et al. 2010). Therefore the asset management has transformed into a performance management process that supports performance-
based decision-making at both the network and object levels.
There is a large disparity in Europe regarding the way performance indicators are quantified and how performance goals
are specified. Therefore, COST TU 1406 Action aims to develop an overview or a database of existing performance
indicators. (COST TU 1406 WG2, 2017, Strauss et al. 2016). In this paper the model for development of maintenance
plan for bridges which integrates multiple performance objectives has been proposed. Key performance indicators (KPIs)

ECONOMY AND SOCIETAL PERFORMANCE INDICATORS FOR BRIDGE MAINTENANCE PRIORATIZATION
2
for reliability, economy, availability and societals impacts have been proposed, in order to support performance based
decision making which needs to satisfy multiple performance goals.
2. KPIs for Multiple performance objectives
Bridge performance goals should serve as the basis for bridge remediation priority ranking, based on the chosen
maintenance strategy and assessment of the bridge condition and analysis of possible remediation alternatives. Some of
the aspects of performance goals can be also seen as the client constraints, e.g. changes in governance strategies or
minimal work implication.
Road agencies around the world have defined their own strategic goals. For example, UK Government has defined
Strategic Road Network Specifications, in which following resquirements on the network level have been defined
(Department for Transportation, 2013):
• A strategic road network which supports and facilitates economic growth;
• A strategic road network which is maintained to a safe and serviceable condition;
• An efficiently and effectively operated strategic road network;
• A strategic road network which minimizes its negative impacts on users, local communities and the environment;
• A strategic road network which balances the needs of individuals and businesses that use and rely on it.
In the paper Stipanovic Oslakovic et al. (2016) the overview of strategic, tactical and operational level performance goals
wiht the suggested performance indicators has been presented. Some of thise indicators have been chosen for the
development of MAUT model (Allah Bukhsh et al. 2018).
In the Table 1 the summary of suggested KPIs for different performance aspects are presented.
Table 1. Overview of performance goals and suggested KPIs
Performance aspect Performance goals (examples) Key Performance indicators
RELIABILITY
- To provide safe and reliable road
network , responsive and
sustainable network;
Technical indicators:
- Condition Index (BCI)
- reliability index
- risk levels
AVAILABILITY
- To minimize its negative impacts
on the road users,
- To balance the needs of
individuals and businesses that use
and rely on it.
- Availability of the road (% of time)
- Traffic delays caused by road works
- Availability of the road during rush hour
- User Delay Costs (UDC)
ECONOMY - To provide an efficiently and
effectively operated strategic road
network;
- Life cycle costs
- Maintenance Costs (MC)
- operational costs
ENVIRONMENT - To minimize its negative impacts
on the environment;
Environmental indicators:
- air pollution
- noise
- soil and water pollution
- Environmental Costs*
SOCIETY AS A WHOLE
- To support and facilitate economic
growth;
- Traffic intensity
- (Un)Employment rate
- Personal income
- Property values
- GDP * see paper Allah Bukhsh et al. 2018
3. Case study Croatia
Transport infrastructure in the Republic of Croatia consists of app. 30.000 km of roads and motorways, 3000 km of
railways, 6 seaports, 800 km of inland waterways and 9 airports. Construction of highways in Croatia began in 1970s
with approximately 240 km (two routes, Zagreb-Karlovac and Zagreb- Slavonski Brod) of full profile highways in use
when Croatia declared independence in 1991. In the year 2000, the process of accelerated highway construction began
resulting in a network of almost 1300 km of highways across the country (http://www.huka.hr/mreza-autocesta ). Large
part of this network is connecting continental parts of Croatia with the touristic areas along the Adriatica coast.
The significance of road infrastructure network has been additionally articulated by the fact that transport connection is a
pre-codnition of regional and tourist developmet of a country, as well as of a better geo-strategic positioning in the
European integration processes. When speaking of international traffic flows in Croatia, the importance of the tourist
traffic should be especially evaluated, therefore we have proposed a new indicator related to the average summer daily
traffic.
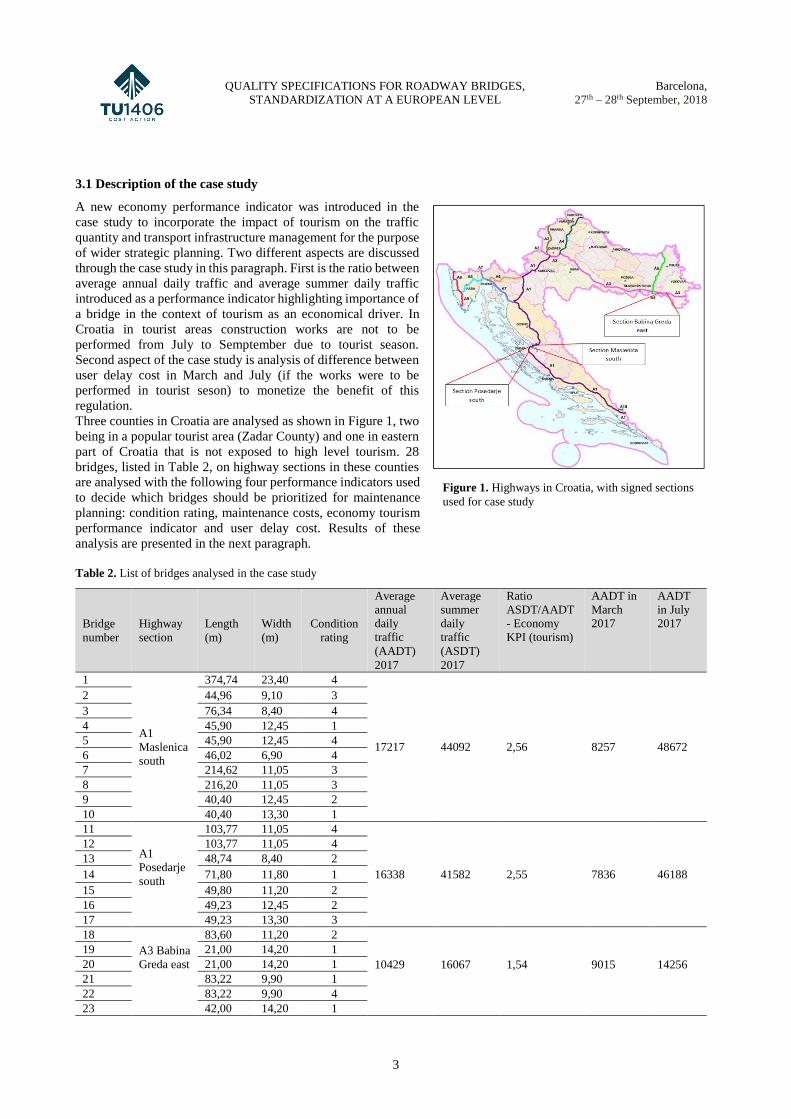
QUALITY SPECIFICATIONS FOR ROADWAY BRIDGES,
STANDARDIZATION AT A EUROPEAN LEVEL
Barcelona,
27th – 28th September, 2018
3
3.1 Description of the case study
A new economy performance indicator was introduced in the
case study to incorporate the impact of tourism on the traffic
quantity and transport infrastructure management for the purpose
of wider strategic planning. Two different aspects are discussed
through the case study in this paragraph. First is the ratio between
average annual daily traffic and average summer daily traffic
introduced as a performance indicator highlighting importance of
a bridge in the context of tourism as an economical driver. In
Croatia in tourist areas construction works are not to be
performed from July to Semptember due to tourist season.
Second aspect of the case study is analysis of difference between
user delay cost in March and July (if the works were to be
performed in tourist seson) to monetize the benefit of this
regulation.
Three counties in Croatia are analysed as shown in Figure 1, two
being in a popular tourist area (Zadar County) and one in eastern
part of Croatia that is not exposed to high level tourism. 28
bridges, listed in Table 2, on highway sections in these counties
are analysed with the following four performance indicators used
to decide which bridges should be prioritized for maintenance
planning: condition rating, maintenance costs, economy tourism
performance indicator and user delay cost. Results of these
analysis are presented in the next paragraph.
Table 2. List of bridges analysed in the case study
Bridge
number
Highway
section
Length
(m)
Width
(m)
Condition
rating
Average
annual
daily
traffic
(AADT)
2017
Average
summer
daily
traffic
(ASDT)
2017
Ratio
ASDT/AADT
- Economy
KPI (tourism)
AADT in
March
2017
AADT
in July
2017
1
A1
Maslenica
south
374,74 23,40 4
17217 44092 2,56 8257 48672
2 44,96 9,10 3
3 76,34 8,40 4
4 45,90 12,45 1
5 45,90 12,45 4
6 46,02 6,90 4
7 214,62 11,05 3
8 216,20 11,05 3
9 40,40 12,45 2
10 40,40 13,30 1
11
A1
Posedarje
south
103,77 11,05 4
16338 41582 2,55 7836 46188
12 103,77 11,05 4
13 48,74 8,40 2
14 71,80 11,80 1
15 49,80 11,20 2
16 49,23 12,45 2
17 49,23 13,30 3
18
A3 Babina
Greda east
83,60 11,20 2
10429
16067
1,54
9015
14256
19 21,00 14,20 1
20 21,00 14,20 1
21 83,22 9,90 1
22 83,22 9,90 4
23 42,00 14,20 1
Figure 1. Highways in Croatia, with signed sections
used for case study

ECONOMY AND SOCIETAL PERFORMANCE INDICATORS FOR BRIDGE MAINTENANCE PRIORATIZATION
4
Bridge
number
Highway
section
Length
(m)
Width
(m)
Condition
rating
Average
annual
daily
traffic
(AADT)
2017
Average
summer
daily
traffic
(ASDT)
2017
Ratio
ASDT/AADT
- Economy
KPI (tourism)
AADT in
March
2017
AADT
in July
2017
24 A3 Babina
Greda east
42,00 14,45 3
10429
16067
1,54
9015
14256 25 84,50 14,20 2
26 84,50 14,20 2
27 69,60 14,20 3
28 69,60 14,20 4
3.2 Results
The multiple performance criteria can be combined into a so-called utility function, in which all the criteria are brought
into a single scale. In order to transform the various out into a single (mostly monetary) scale it is necessary to establish
weight factor for the individual types of criteria. Some of the weight factors are available in some countries (for example
weight factor for traffic delays, noise, injuries etc.), depending on the selec-tion of criteria, some weight factor may still
need to be developed.
In the development of the weight factors the starting point can be taken in the qualitative approach mentioned above, from
which the apparent relative weight can be deducted. Once the possible outcomes have been brought to a single scale, the
best decision can be found as a formal optimised decision process, in which option with the maximum “utility” shall be
selected as the recommended decision.
Multi attribute utility theory (MAUT) provides a systematic approach to reduce the qualitative values of various attributes
(i.e. performance indicators) into utility functions (Ishizaka & Nemery, 2013). The resulting scores are then aggregated
based on the relative importance of attributes. The final score assign a ranking to each alternative based on either
minimization or maximization function. This method assigns the relative importance of performance indicators (e.g.
condition, cost, economy etc.), while comparing number of bridges.
A decision maker choose among the set of possible outcomes while exposed with uncertainty and risk (Keeney and Raiffa,
1993). The uncertainty is usually originated because of unavailable and dynamic nature of data, and involvement of
number of stakeholders. For instance, in the bridge planning the exact estimation on number of users affected due to
maintenance activity is difficult to define. MAUT integrates a body of mathematical utility models and a range of decision
assessment methods in order to assist in decision ranking problem (Thevenot et. al., 2006). The single attribute utility
function is calculated for each performance indicator, which reflects the risk attitude of the decision maker.
The mathematical formulation of MAUT is represented as follows:
U(x) = k1 U(x1) + k2 U(x2)+ …… kn U(xn) (1)
Where
U(x) is overall utility value of each alternative
k is a scaling constant that provides the relative importance of each performance indicator
Ui(xi) is a utility value of each performance indicator i for the alternative x
Ui(xi) = A – Be (RT/x) (2)
Where
A and B are scaling constants
RT is risk tolerance
The details of MAUT application on maintenance planning decision-making problem can be found at Allah Bukhsh et
al. (2018).
The single utility scores of each performance indicator is computed. A decision maker is provided with a lottery questions
representing the minimum and maximum value of a certain performance indicator. The median values between the
maximum and minimum is called Expected Value (EV), where the selection of values greater or smaller than EV define
the Certainty Equivalent (CE). The CE also represents the risk attitude of a decision-maker. In such case, a CE > EV
represents risk taking attitude, CE= EV shows risk neutral, whereas CE < EV represents ris avoiding attitude. Throughout
this case study, we have considered risk-avoiding attitude as a decision maker wants to improve the economy and focuses
on direct user costs.
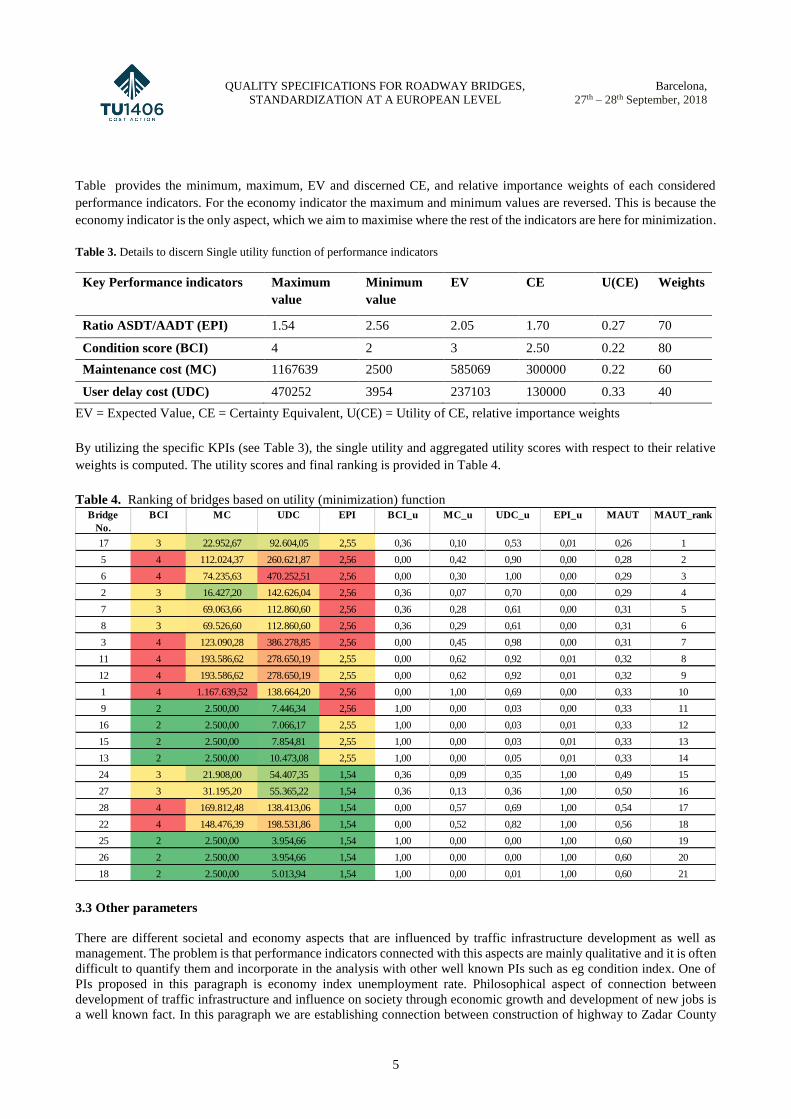
QUALITY SPECIFICATIONS FOR ROADWAY BRIDGES,
STANDARDIZATION AT A EUROPEAN LEVEL
Barcelona,
27th – 28th September, 2018
5
Table provides the minimum, maximum, EV and discerned CE, and relative importance weights of each considered
performance indicators. For the economy indicator the maximum and minimum values are reversed. This is because the
economy indicator is the only aspect, which we aim to maximise where the rest of the indicators are here for minimization.
Table 3. Details to discern Single utility function of performance indicators
Key Performance indicators Maximum
value
Minimum
value
EV CE U(CE) Weights
Ratio ASDT/AADT (EPI) 1.54 2.56 2.05 1.70 0.27 70
Condition score (BCI) 4 2 3 2.50 0.22 80
Maintenance cost (MC) 1167639 2500 585069 300000 0.22 60
User delay cost (UDC) 470252 3954 237103 130000 0.33 40
EV = Expected Value, CE = Certainty Equivalent, U(CE) = Utility of CE, relative importance weights
By utilizing the specific KPIs (see Table 3), the single utility and aggregated utility scores with respect to their relative
weights is computed. The utility scores and final ranking is provided in Table 4.
Table 4. Ranking of bridges based on utility (minimization) function
3.3 Other parameters
There are different societal and economy aspects that are influenced by traffic infrastructure development as well as
management. The problem is that performance indicators connected with this aspects are mainly qualitative and it is often
difficult to quantify them and incorporate in the analysis with other well known PIs such as eg condition index. One of
PIs proposed in this paragraph is economy index unemployment rate. Philosophical aspect of connection between
development of traffic infrastructure and influence on society through economic growth and development of new jobs is
a well known fact. In this paragraph we are establishing connection between construction of highway to Zadar County
Bridge
No.
BCI MC UDC EPI BCI_u MC_u UDC_u EPI_u MAUT MAUT_rank
17 3 22.952,67 92.604,05 2,55 0,36 0,10 0,53 0,01 0,26 1
5 4 112.024,37 260.621,87 2,56 0,00 0,42 0,90 0,00 0,28 2
6 4 74.235,63 470.252,51 2,56 0,00 0,30 1,00 0,00 0,29 3
2 3 16.427,20 142.626,04 2,56 0,36 0,07 0,70 0,00 0,29 4
7 3 69.063,66 112.860,60 2,56 0,36 0,28 0,61 0,00 0,31 5
8 3 69.526,60 112.860,60 2,56 0,36 0,29 0,61 0,00 0,31 6
3 4 123.090,28 386.278,85 2,56 0,00 0,45 0,98 0,00 0,31 7
11 4 193.586,62 278.650,19 2,55 0,00 0,62 0,92 0,01 0,32 8
12 4 193.586,62 278.650,19 2,55 0,00 0,62 0,92 0,01 0,32 9
1 4 1.167.639,52 138.664,20 2,56 0,00 1,00 0,69 0,00 0,33 10
9 2 2.500,00 7.446,34 2,56 1,00 0,00 0,03 0,00 0,33 11
16 2 2.500,00 7.066,17 2,55 1,00 0,00 0,03 0,01 0,33 12
15 2 2.500,00 7.854,81 2,55 1,00 0,00 0,03 0,01 0,33 13
13 2 2.500,00 10.473,08 2,55 1,00 0,00 0,05 0,01 0,33 14
24 3 21.908,00 54.407,35 1,54 0,36 0,09 0,35 1,00 0,49 15
27 3 31.195,20 55.365,22 1,54 0,36 0,13 0,36 1,00 0,50 16
28 4 169.812,48 138.413,06 1,54 0,00 0,57 0,69 1,00 0,54 17
22 4 148.476,39 198.531,86 1,54 0,00 0,52 0,82 1,00 0,56 18
25 2 2.500,00 3.954,66 1,54 1,00 0,00 0,00 1,00 0,60 19
26 2 2.500,00 3.954,66 1,54 1,00 0,00 0,00 1,00 0,60 20
18 2 2.500,00 5.013,94 1,54 1,00 0,00 0,01 1,00 0,60 21
ECONOMY AND SOCIETAL PERFORMANCE INDICATORS FOR BRIDGE MAINTENANCE PRIORATIZATION
6
which finished in 2003 and decrease of unemployment rate to show the actual numbers proving interaction between the
two. Table 5 is presenting the data about average annual and summer daily traffic on highway section Zadar 1 and
unemployment rate in Zadar County through the years. The correlation between the increase of traffic intensity, especially
in the summer period, and decrease of unemployment rates is clearly visible and can be referred to the tourism.
Table 5. Traffic quantity data and unemployment rate trough the years in Zadar County
Highway section Year Average annual daily
traffic (AADT)
Average summer
daily traffic (ASDT)
Unemployment rate in Zadar
county (%)
Zadar 1
1998 - - 29,8
2003 5019 9872 28,8
2005 6803 18537 22,4
2010 9775 25897 21,1
2016 11757 31153 16,0
4. Conclusion
Traffic itself and transport infrastructure including bridges influence society and economy in many different ways. Most
of these interconnections are well known but mainly on a qualitative basis and without quantitative performance indicators
which would enable detailed measurements of certain impacts. Strategic decisions regarding transport networks and
bridges should be directed towards societal and economical development based on solid facts, reliable data and
quantifiable measures.
In this paper establishment of connections between tourism as an important economic branch, traffic intensity,
unemployment rate and infrastructure management is presented through a case study in Croatia. Novel performance
indicators regarding society and economy presented in this paper suggest an approach towards sustainable strategic
decision making and should be further developed in a multidisciplinary manner. For this kind of analysis professionals
from different areas of expertise such as economists, sociologists and demographs should be included in the research to
achieve reliable and concrete results.
References
Allah Bukhsh, Z., Stipanovic, I., Klanker, G., O’Connor, A., Dorée, A. Network level bridges maintenance planning using Multi-Attribute Utility Theory, January 2018, Structure and Infrastructure Engineering, DOI: 10.1080/15732479.2017.1414858
COST Action TU 1406, Working Group 2 Report: Performance Goals for Roadway Bridges of Cost Action TU1406, 2017 ISBN: 978-3-900932-41-1, 2017
Croatian Association of toll motorways concessionaires, Key figures, Report 2017, ISSN: 1848-0993 http://www.huka.hr/mreza-autocesta
Department for Transportation (DfT), 2013. Strategic road network performance specification 2013-15, London, UK, www.gov.uk/dft
Ishizaka, A., & Nemery, P. (2013). Multi-attribute utility theory. In Multicriteria decision analysis:Methods and software (pp. 81–113). JohnWiley & Sons Ltd. DOI: 10.1002/9781118644898.ch4
Keeney, R., & Raiffa, H. (1993). Decisions with multiple objectives: Preferences and value tradeoffs. Cambridge: Cambridge University Press.
Stipanovic Oslakovic, I., Hoj, N.P., Klanker, G. 2016. Multi-objective bridge performance goals, IALCCE 2016, Life-Cycle of Engineering Systems: Emphasis on SustainableCivil Infrastructure – Bakker, Frangopol & van Breugel (Eds)© 2017 Taylor & Francis Group, London, ISBN 978-1-138-02847-0r, pp. 540 – 1547.
Strauss, A., Vidovic, A., Zambon, I., Dengg, F., Tanasic, N., Matos, J.C. 2016, Performance indicators for roadway bridges, IABMAS 2016.
Thevenot, H. J., Steva, E. D., Okudan, G. E., & Simpson, T. W. (2006). A multi-attribute utility theory-based approach to product line consolidation and selection. In ASME 2006 International Design Engineering Technical Conferences and Computers and Information in Engineering Conference (pp. 441–450). doi:10.1115/DETC2006-99506
Velde, J. van der, Klatter, L., Bakker, J. 2010, A holistic ap-proach to asset management in the Netherlands. Pro-ceedings of the 5th international conference on Bridge Maintenance, Safety and Management, Philadelphia, USA.
Wijnia, I., & Herder, P. 2009, The state of asset management in the Netherlands. Proceedings of the 4th World Con-gress on Engineering Asset Management (WCEAM 2009) (pp. 164-172). Athens: Springer London.

WG4 and WG5 WORKSHOP
Sustainable Bridge Management
27th – 28th September 2018
Barcelona, Spain
ECONOMY AND SOCIETAL
PERFORMANCE INDICATORS FOR
BRIDGE MAINTENANCE
PRIORATIZATION
Sandra Škarić Palić - Infra Plan konzalting, Croatia
Zaharah Allah Bukhsh - University of Twente, The Netherlands
Irina Stipanović - University of Twente, The Netherlands
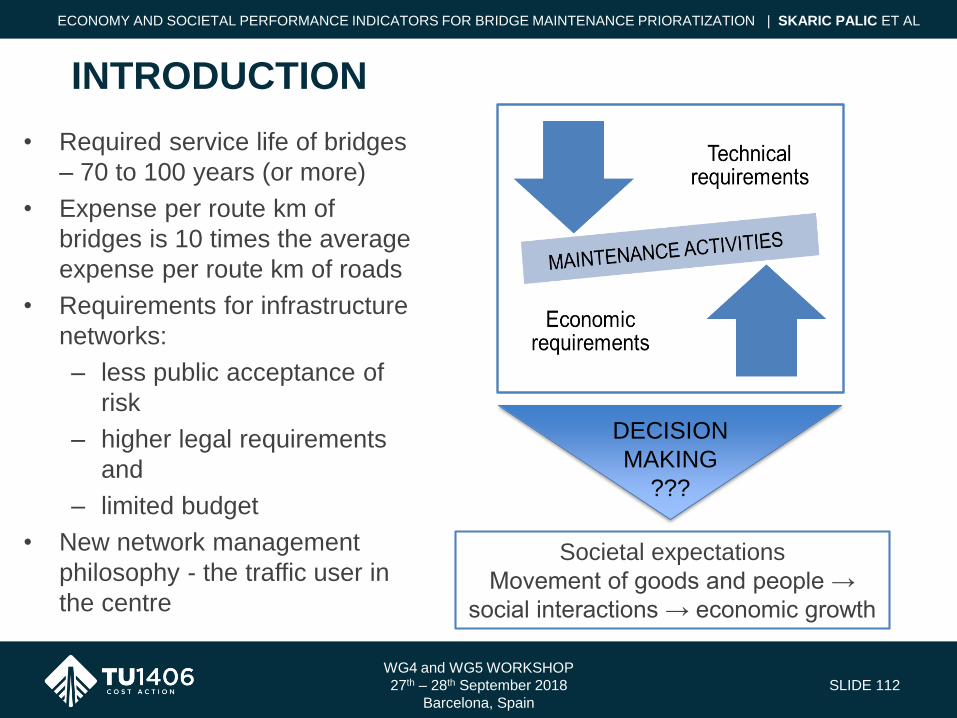
• Required service life of bridges
– 70 to 100 years (or more)
• Expense per route km of
bridges is 10 times the average
expense per route km of roads
• Requirements for infrastructure
networks:
– less public acceptance of
risk
– higher legal requirements
and
– limited budget
• New network management
philosophy - the traffic user in
the centre
WG4 and WG5 WORKSHOP
27th – 28th September 2018
Barcelona, Spain
SLIDE 112
INTRODUCTION
ECONOMY AND SOCIETAL PERFORMANCE INDICATORS FOR BRIDGE MAINTENANCE PRIORATIZATION | SKARIC PALIC ET AL
Societal expectations
Movement of goods and people →
social interactions → economic growth
DECISION
MAKING
???
• Key performance indicators (KPIs) for reliability, economy,
availability and societal impacts - multiple performance goals
• Road agencies define their own strategic goals. For example:
– Supporting economic growth
– Road network which is maintained to a safe and serviceable
condition
– Efficiently and effectively operated strategic road network
– Minimize negative impacts on users, local communities and the
environment
– Balance the needs of individuals and businesses that use and
rely on the road network
WG4 and WG5 WORKSHOP
27th – 28th September 2018
Barcelona, Spain
SLIDE 114
KPIs FOR MULTIPLE PERFORMANCE
OBJECTIVES
ECONOMY AND SOCIETAL PERFORMANCE INDICATORS FOR BRIDGE MAINTENANCE PRIORATIZATION | SKARIC PALIC ET AL
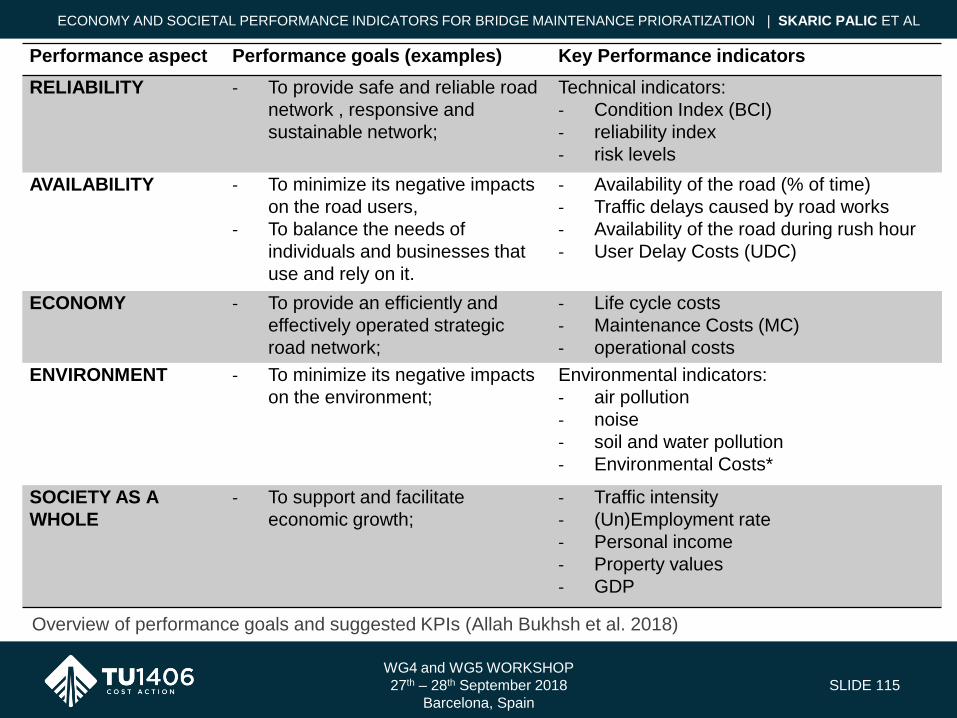
Performance aspect Performance goals (examples) Key Performance indicators
RELIABILITY - To provide safe and reliable road
network , responsive and
sustainable network;
Technical indicators:
- Condition Index (BCI)
- reliability index
- risk levels
AVAILABILITY - To minimize its negative impacts
on the road users,
- To balance the needs of
individuals and businesses that
use and rely on it.
- Availability of the road (% of time)
- Traffic delays caused by road works
- Availability of the road during rush hour
- User Delay Costs (UDC)
ECONOMY - To provide an efficiently and
effectively operated strategic
road network;
- Life cycle costs
- Maintenance Costs (MC)
- operational costs
ENVIRONMENT - To minimize its negative impacts
on the environment;
Environmental indicators:
- air pollution
- noise
- soil and water pollution
- Environmental Costs*
SOCIETY AS A
WHOLE
- To support and facilitate
economic growth;
- Traffic intensity
- (Un)Employment rate
- Personal income
- Property values
- GDP
WG4 and WG5 WORKSHOP
27th – 28th September 2018
Barcelona, Spain
SLIDE 115
ECONOMY AND SOCIETAL PERFORMANCE INDICATORS FOR BRIDGE MAINTENANCE PRIORATIZATION | SKARIC PALIC ET AL
Overview of performance goals and suggested KPIs (Allah Bukhsh et al. 2018)

• Transport infrastructure in the
Republic of Croatia: 30.000 km
of roads and motorways, 3000
km of railways, 6 seaports, 800
km of inland waterways and 9
airports
• 1970s – first highways in Croatia
constructed
• Until 1991 – 240 km
• 2000 - process of accelerated
highway construction began -
resulting in more than 1300 km
of highways
WG4 and WG5 WORKSHOP
27th – 28th September 2018
Barcelona, Spain
SLIDE 116
CASE STUDY CROATIA
ECONOMY AND SOCIETAL PERFORMANCE INDICATORS FOR BRIDGE MAINTENANCE PRIORATIZATION | SKARIC PALIC ET AL

• Transport connection:
– pre-condition of regional and tourist development of a country
– better geo-strategic positioning in the European integration
processes
WG4 and WG5 WORKSHOP
27th – 28th September 2018
Barcelona, Spain
SLIDE 117
ECONOMY AND SOCIETAL PERFORMANCE INDICATORS FOR BRIDGE MAINTENANCE PRIORATIZATION | SKARIC PALIC ET AL
• International traffic flows in Croatia –
importance of tourist traffic - certain
sections of highway have up to 6.5
times more traffic during summer
months
• e.g. data for toll station Zadar 1 for
year 2016 are: 19.802 vehicles in
January and 132.443 vehicles in
August
CASE STUDY CROATIA

• A new economy performance indicator - impact of tourism on the
traffic quantity
• Importance for wider strategic planning in transport infrastructure
management
• Analysis of two different aspects:
– Ratio between average annual daily traffic and average summer
daily traffic - PI highlighting importance of a bridge in the context
of tourism as an economical driver
– Difference between user delay cost in March and July -
monetizing the benefit of performing maintenance in off tourist
season months
WG4 and WG5 WORKSHOP
27th – 28th September 2018
Barcelona, Spain
SLIDE 118
CASE STUDY CROATIA
ECONOMY AND SOCIETAL PERFORMANCE INDICATORS FOR BRIDGE MAINTENANCE PRIORATIZATION | SKARIC PALIC ET AL
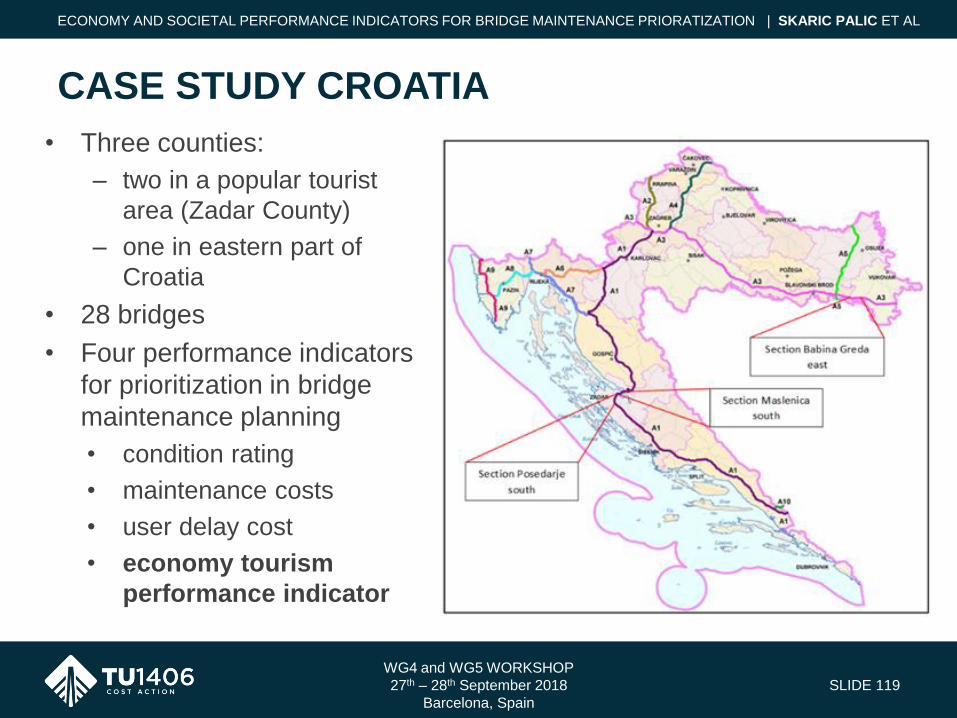
• Three counties:
– two in a popular tourist
area (Zadar County)
– one in eastern part of
Croatia
• 28 bridges
• Four performance indicators
for prioritization in bridge
maintenance planning
• condition rating
• maintenance costs
• user delay cost
• economy tourism
performance indicator
WG4 and WG5 WORKSHOP
27th – 28th September 2018
Barcelona, Spain
SLIDE 119
CASE STUDY CROATIA
ECONOMY AND SOCIETAL PERFORMANCE INDICATORS FOR BRIDGE MAINTENANCE PRIORATIZATION | SKARIC PALIC ET AL
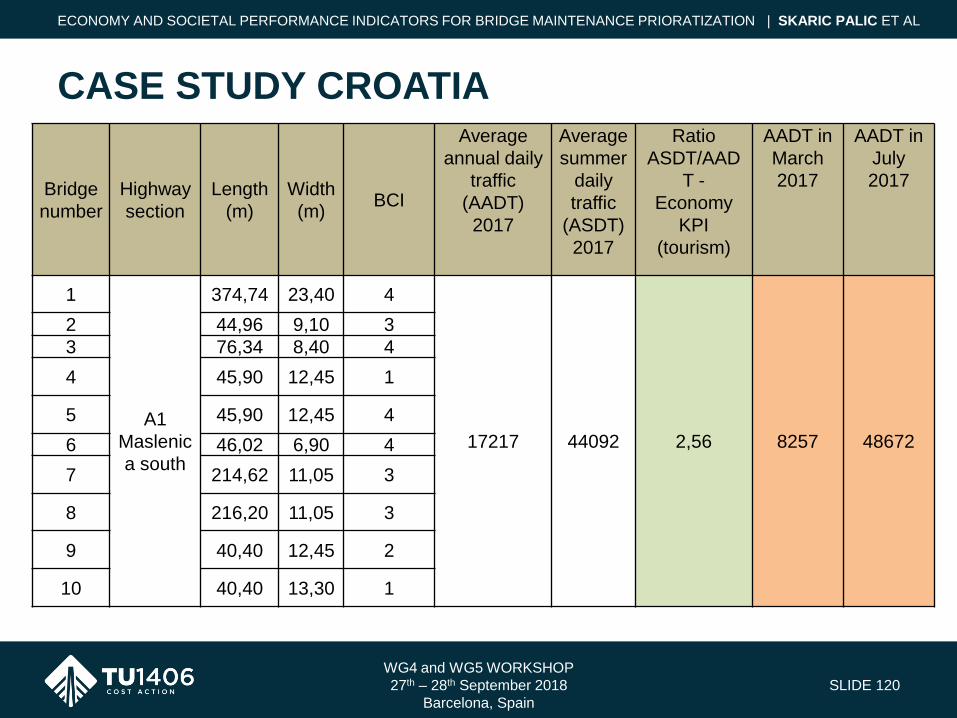
Bridge
number
Highway
section
Length
(m)
Width
(m)BCI
Average
annual daily
traffic
(AADT)
2017
Average
summer
daily
traffic
(ASDT)
2017
Ratio
ASDT/AAD
T -
Economy
KPI
(tourism)
AADT in
March
2017
AADT in
July
2017
1
A1
Maslenic
a south
374,74 23,40 4
17217 44092 2,56 8257 48672
2 44,96 9,10 3
3 76,34 8,40 4
4 45,90 12,45 1
5 45,90 12,45 4
6 46,02 6,90 4
7 214,62 11,05 3
8 216,20 11,05 3
9 40,40 12,45 2
10 40,40 13,30 1
WG4 and WG5 WORKSHOP
27th – 28th September 2018
Barcelona, Spain
SLIDE 120
CASE STUDY CROATIA
ECONOMY AND SOCIETAL PERFORMANCE INDICATORS FOR BRIDGE MAINTENANCE PRIORATIZATION | SKARIC PALIC ET AL
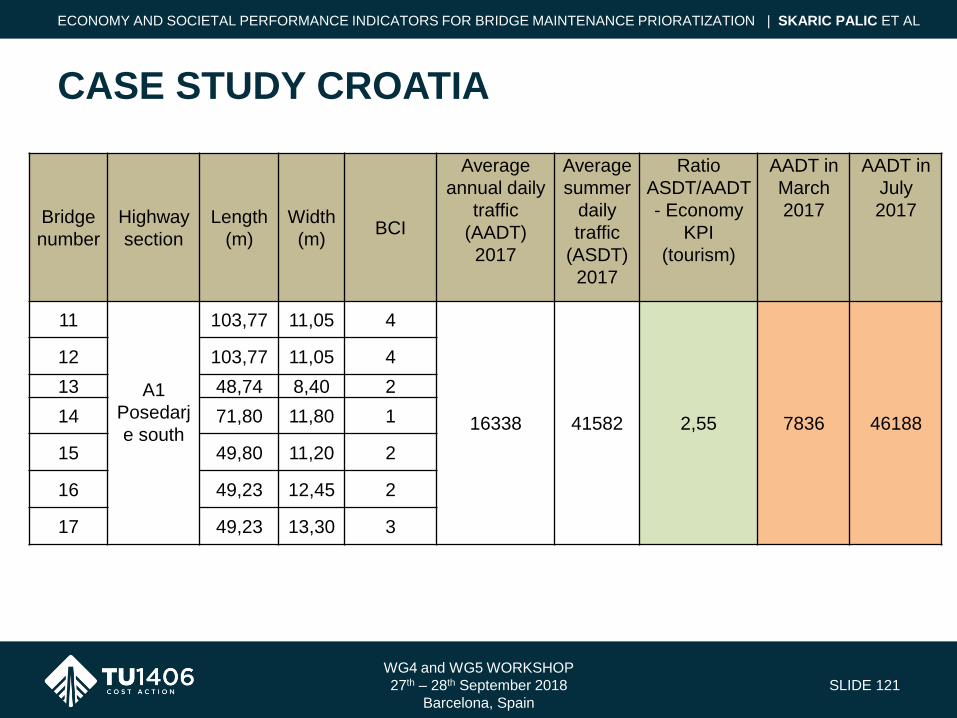
Bridge
number
Highway
section
Length
(m)
Width
(m)BCI
Average
annual daily
traffic
(AADT)
2017
Average
summer
daily
traffic
(ASDT)
2017
Ratio
ASDT/AADT
- Economy
KPI
(tourism)
AADT in
March
2017
AADT in
July
2017
11
A1
Posedarj
e south
103,77 11,05 4
16338 41582 2,55 7836 46188
12 103,77 11,05 4
13 48,74 8,40 2
14 71,80 11,80 1
15 49,80 11,20 2
16 49,23 12,45 2
17 49,23 13,30 3
WG4 and WG5 WORKSHOP
27th – 28th September 2018
Barcelona, Spain
SLIDE 121
CASE STUDY CROATIA
ECONOMY AND SOCIETAL PERFORMANCE INDICATORS FOR BRIDGE MAINTENANCE PRIORATIZATION | SKARIC PALIC ET AL

WG4 and WG5 WORKSHOP
27th – 28th September 2018
Barcelona, Spain
SLIDE 122
CASE STUDY CROATIA
ECONOMY AND SOCIETAL PERFORMANCE INDICATORS FOR BRIDGE MAINTENANCE PRIORATIZATION | SKARIC PALIC ET AL
Bridge
number
Highway
section
Length
(m)
Width
(m)BCI
Average
annual daily
traffic
(AADT)
2017
Average
summer
daily
traffic
(ASDT)
2017
Ratio
ASDT/AADT
- Economy
KPI
(tourism)
AADT in
March
2017
AADT in
July 2017
18
A3
Babina
Greda
east
83,60 11,20 2
10429 16067 1,54 9015 14256
19 21,00 14,20 1
20 21,00 14,20 1
21 83,22 9,90 1
22 83,22 9,90 4
23 42,00 14,20 1
24 42,00 14,45 3
25 84,50 14,20 2
26 84,50 14,20 2
27 69,60 14,20 3
28 69,60 14,20 4

WG4 and WG5 WORKSHOP
27th – 28th September 2018
Barcelona, Spain
SLIDE 123
MAUT – Multi Attribute Utility Theory
ECONOMY AND SOCIETAL PERFORMANCE INDICATORS FOR BRIDGE MAINTENANCE PRIORATIZATION | SKARIC PALIC ET AL
• Systematic approach to reduce the qualitative values of various
attributes (i.e. performance indicators) into utility functions
• The multiple performance criteria - bring all criteria into a single
scale - utility values
• Establish relative importance of performance indicators (e.g.
condition, cost, economy etc.) - weight factors
• Formal optimised decision process - Option with the maximum or
minimum “utility” shall be selected
• The resulting scores are then aggregated based on the relative
importance of attributes

WG4 and WG5 WORKSHOP
27th – 28th September 2018
Barcelona, Spain
SLIDE 124
ECONOMY AND SOCIETAL PERFORMANCE INDICATORS FOR BRIDGE MAINTENANCE PRIORATIZATION | SKARIC PALIC ET AL
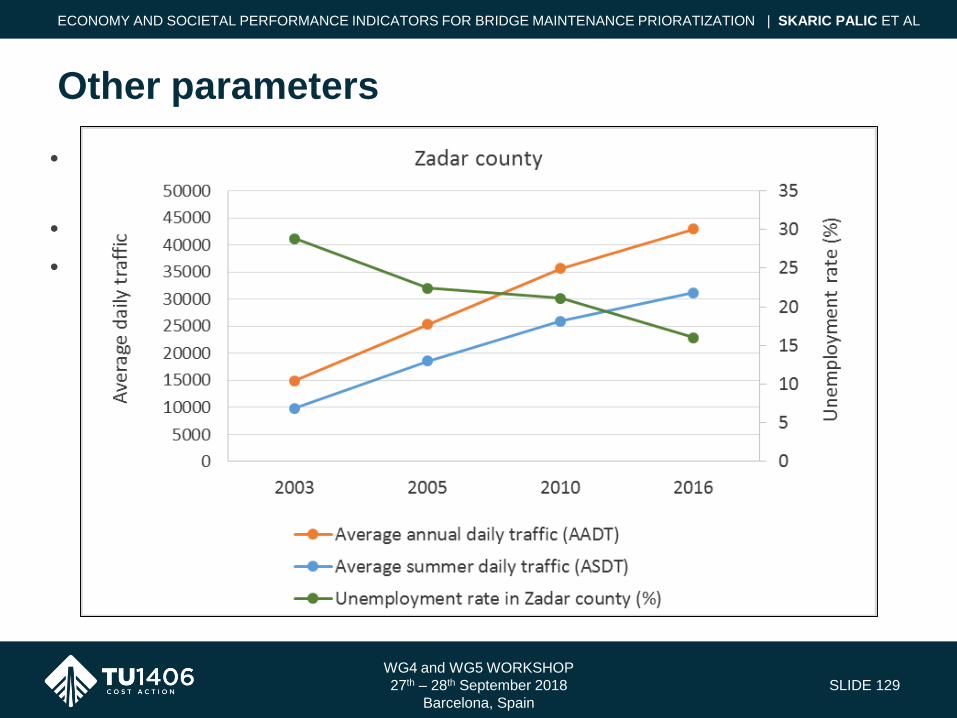
WG4 and WG5 WORKSHOP
27th – 28th September 2018
Barcelona, Spain
SLIDE 129
Other parameters
ECONOMY AND SOCIETAL PERFORMANCE INDICATORS FOR BRIDGE MAINTENANCE PRIORATIZATION | SKARIC PALIC ET AL
• Different societal and economy aspects are influenced by traffic
infrastructure development
• Economy PI - unemployment rate
• Correlation between construction of highway finished in 2003 which
connected Zadar County with the rest of Croatia and Europe and
decrease of unemployment rate

WG4 and WG5 WORKSHOP
27th – 28th September 2018
Barcelona, Spain
SLIDE 130
CONCLUSION
ECONOMY AND SOCIETAL PERFORMANCE INDICATORS FOR BRIDGE MAINTENANCE PRIORATIZATION | SKARIC PALIC ET AL
• Traffic and transport infrastructure influence society and economy
• Interconnections are well known but mainly on a qualitative basis
• Strategic decisions - solid facts, reliable data and quantifiable
measures.
• Case study in Croatia -
novel performance
indicators regarding society
and economy →
sustainable strategic
decision making → further
development in a
multidisciplinary manner

THANK YOU FOR YOUR ATTENTION!
WWW.TU1406.EU

WG4 and WG5 WORKSHOP
Sustainable Bridge Management
27th – 28th September 2018
Barcelona, Spain
ON THE DEVELOPLEMNT OF KEY PERFORMANCE
INDICATORS FOR A RAPID SEISMIC ASSESSMENT OF
ROADWAY BRIDGESAndrej Anžlin – Slovenian National Building and Civil Engineering Institute, Slovenia
Juan Murcia-Delso – The University of Texas at Austin, United States of America
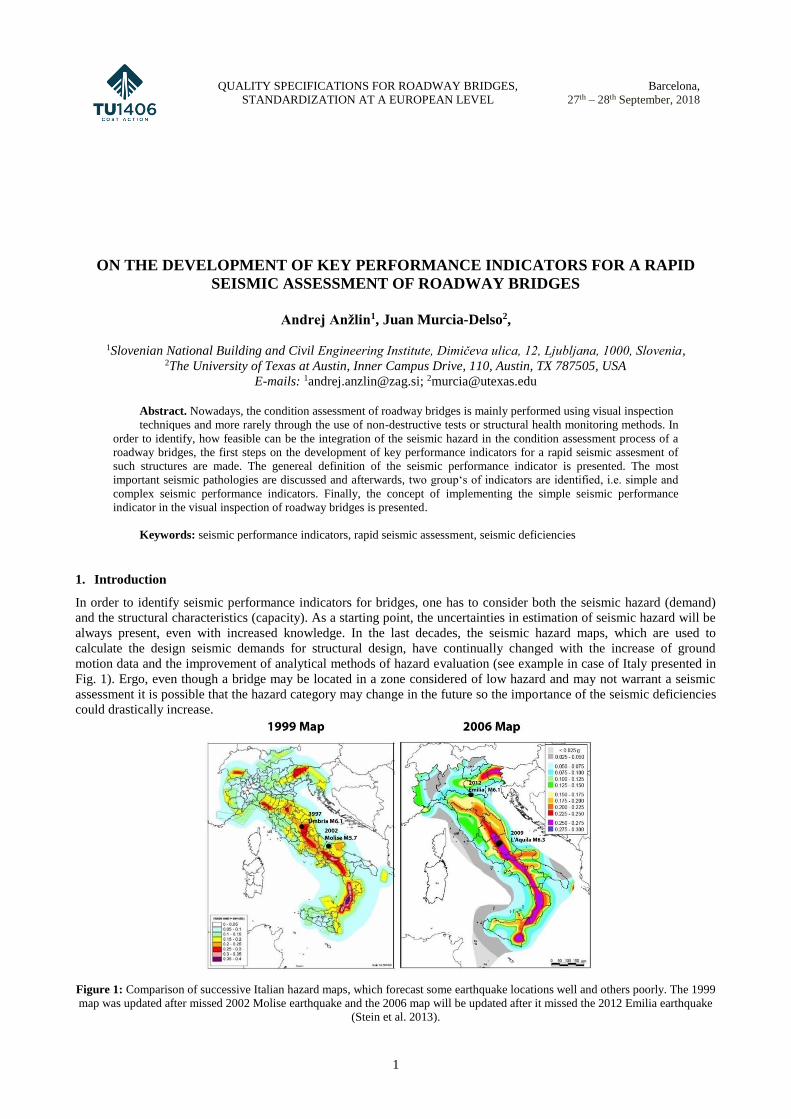
QUALITY SPECIFICATIONS FOR ROADWAY BRIDGES,
STANDARDIZATION AT A EUROPEAN LEVEL
Barcelona,
27th – 28th September, 2018
1
ON THE DEVELOPMENT OF KEY PERFORMANCE INDICATORS FOR A RAPID
SEISMIC ASSESSMENT OF ROADWAY BRIDGES
Andrej Anžlin1, Juan Murcia-Delso2,
1Slovenian National Building and Civil Engineering Institute, Dimičeva ulica, 12, Ljubljana, 1000, Slovenia,
2The University of Texas at Austin, Inner Campus Drive, 110, Austin, TX 787505, USA
E-mails: [email protected]; [email protected]
Abstract. Nowadays, the condition assessment of roadway bridges is mainly performed using visual inspection
techniques and more rarely through the use of non-destructive tests or structural health monitoring methods. In
order to identify, how feasible can be the integration of the seismic hazard in the condition assessment process of a
roadway bridges, the first steps on the development of key performance indicators for a rapid seismic assesment of
such structures are made. The genereal definition of the seismic performance indicator is presented. The most
important seismic pathologies are discussed and afterwards, two group‘s of indicators are identified, i.e. simple and
complex seismic performance indicators. Finally, the concept of implementing the simple seismic performance
indicator in the visual inspection of roadway bridges is presented.
Keywords: seismic performance indicators, rapid seismic assessment, seismic deficiencies
1. Introduction
In order to identify seismic performance indicators for bridges, one has to consider both the seismic hazard (demand)
and the structural characteristics (capacity). As a starting point, the uncertainties in estimation of seismic hazard will be
always present, even with increased knowledge. In the last decades, the seismic hazard maps, which are used to
calculate the design seismic demands for structural design, have continually changed with the increase of ground
motion data and the improvement of analytical methods of hazard evaluation (see example in case of Italy presented in
Fig. 1). Ergo, even though a bridge may be located in a zone considered of low hazard and may not warrant a seismic
assessment it is possible that the hazard category may change in the future so the importance of the seismic deficiencies
could drastically increase.
Figure 1: Comparison of successive Italian hazard maps, which forecast some earthquake locations well and others poorly. The 1999
map was updated after missed 2002 Molise earthquake and the 2006 map will be updated after it missed the 2012 Emilia earthquake
(Stein et al. 2013).
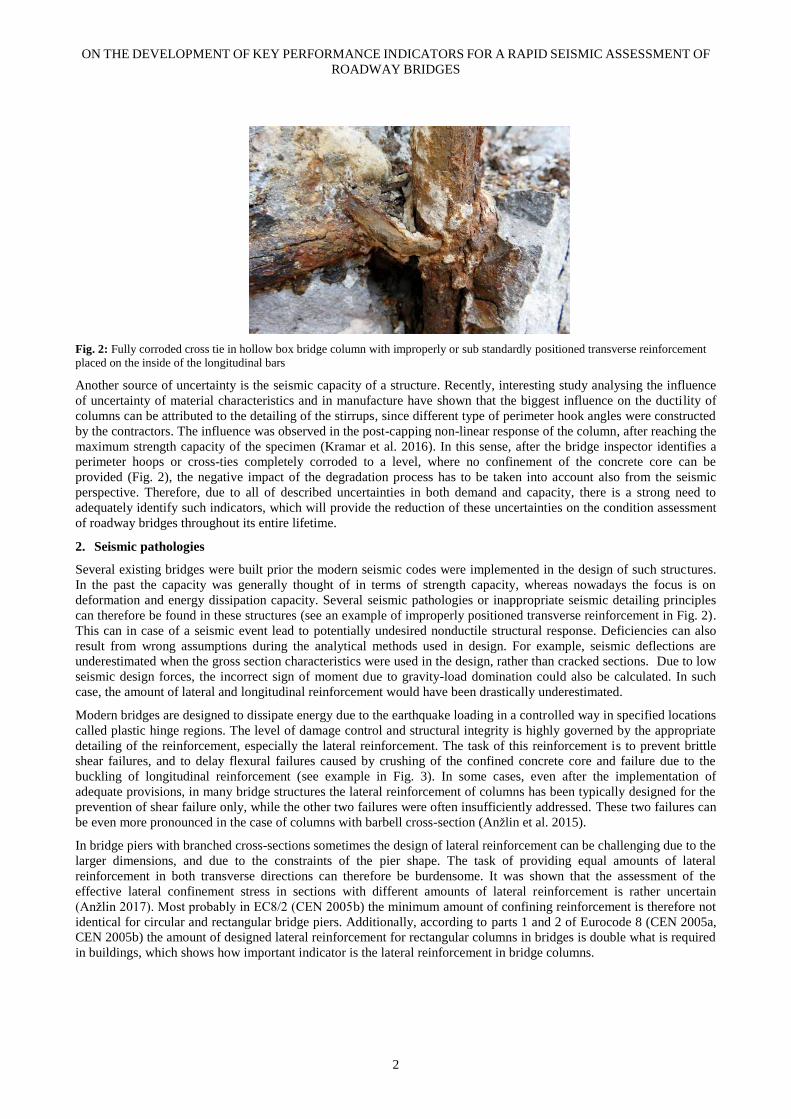
ON THE DEVELOPMENT OF KEY PERFORMANCE INDICATORS FOR A RAPID SEISMIC ASSESSMENT OF
ROADWAY BRIDGES
2
Fig. 2: Fully corroded cross tie in hollow box bridge column with improperly or sub standardly positioned transverse reinforcement
placed on the inside of the longitudinal bars
Another source of uncertainty is the seismic capacity of a structure. Recently, interesting study analysing the influence
of uncertainty of material characteristics and in manufacture have shown that the biggest influence on the ductility of
columns can be attributed to the detailing of the stirrups, since different type of perimeter hook angles were constructed
by the contractors. The influence was observed in the post-capping non-linear response of the column, after reaching the
maximum strength capacity of the specimen (Kramar et al. 2016). In this sense, after the bridge inspector identifies a
perimeter hoops or cross-ties completely corroded to a level, where no confinement of the concrete core can be
provided (Fig. 2), the negative impact of the degradation process has to be taken into account also from the seismic
perspective. Therefore, due to all of described uncertainties in both demand and capacity, there is a strong need to
adequately identify such indicators, which will provide the reduction of these uncertainties on the condition assessment
of roadway bridges throughout its entire lifetime.
2. Seismic pathologies
Several existing bridges were built prior the modern seismic codes were implemented in the design of such structures.
In the past the capacity was generally thought of in terms of strength capacity, whereas nowadays the focus is on
deformation and energy dissipation capacity. Several seismic pathologies or inappropriate seismic detailing principles
can therefore be found in these structures (see an example of improperly positioned transverse reinforcement in Fig. 2).
This can in case of a seismic event lead to potentially undesired nonductile structural response. Deficiencies can also
result from wrong assumptions during the analytical methods used in design. For example, seismic deflections are
underestimated when the gross section characteristics were used in the design, rather than cracked sections. Due to low
seismic design forces, the incorrect sign of moment due to gravity-load domination could also be calculated. In such
case, the amount of lateral and longitudinal reinforcement would have been drastically underestimated.
Modern bridges are designed to dissipate energy due to the earthquake loading in a controlled way in specified locations
called plastic hinge regions. The level of damage control and structural integrity is highly governed by the appropriate
detailing of the reinforcement, especially the lateral reinforcement. The task of this reinforcement is to prevent brittle
shear failures, and to delay flexural failures caused by crushing of the confined concrete core and failure due to the
buckling of longitudinal reinforcement (see example in Fig. 3). In some cases, even after the implementation of
adequate provisions, in many bridge structures the lateral reinforcement of columns has been typically designed for the
prevention of shear failure only, while the other two failures were often insufficiently addressed. These two failures can
be even more pronounced in the case of columns with barbell cross-section (Anžlin et al. 2015).
In bridge piers with branched cross-sections sometimes the design of lateral reinforcement can be challenging due to the
larger dimensions, and due to the constraints of the pier shape. The task of providing equal amounts of lateral
reinforcement in both transverse directions can therefore be burdensome. It was shown that the assessment of the
effective lateral confinement stress in sections with different amounts of lateral reinforcement is rather uncertain
(Anžlin 2017). Most probably in EC8/2 (CEN 2005b) the minimum amount of confining reinforcement is therefore not
identical for circular and rectangular bridge piers. Additionally, according to parts 1 and 2 of Eurocode 8 (CEN 2005a,
CEN 2005b) the amount of designed lateral reinforcement for rectangular columns in bridges is double what is required
in buildings, which shows how important indicator is the lateral reinforcement in bridge columns.
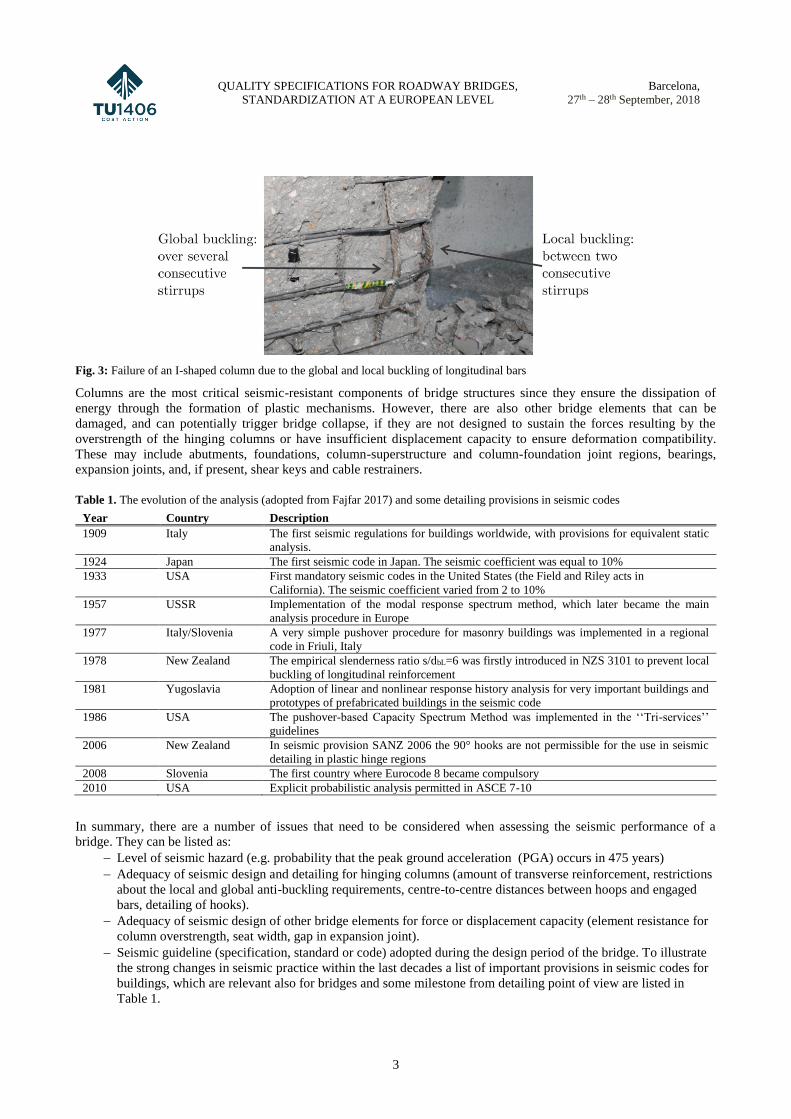
QUALITY SPECIFICATIONS FOR ROADWAY BRIDGES,
STANDARDIZATION AT A EUROPEAN LEVEL
Barcelona,
27th – 28th September, 2018
3
Fig. 3: Failure of an I-shaped column due to the global and local buckling of longitudinal bars
Columns are the most critical seismic-resistant components of bridge structures since they ensure the dissipation of
energy through the formation of plastic mechanisms. However, there are also other bridge elements that can be
damaged, and can potentially trigger bridge collapse, if they are not designed to sustain the forces resulting by the
overstrength of the hinging columns or have insufficient displacement capacity to ensure deformation compatibility.
These may include abutments, foundations, column-superstructure and column-foundation joint regions, bearings,
expansion joints, and, if present, shear keys and cable restrainers.
Table 1. The evolution of the analysis (adopted from Fajfar 2017) and some detailing provisions in seismic codes
Year Country Description
1909 Italy The first seismic regulations for buildings worldwide, with provisions for equivalent static
analysis.
1924 Japan The first seismic code in Japan. The seismic coefficient was equal to 10%
1933 USA First mandatory seismic codes in the United States (the Field and Riley acts in
California). The seismic coefficient varied from 2 to 10%
1957 USSR Implementation of the modal response spectrum method, which later became the main
analysis procedure in Europe
1977 Italy/Slovenia A very simple pushover procedure for masonry buildings was implemented in a regional
code in Friuli, Italy
1978 New Zealand The empirical slenderness ratio s/dbL=6 was firstly introduced in NZS 3101 to prevent local
buckling of longitudinal reinforcement
1981 Yugoslavia Adoption of linear and nonlinear response history analysis for very important buildings and
prototypes of prefabricated buildings in the seismic code
1986 USA The pushover-based Capacity Spectrum Method was implemented in the ‘‘Tri-services’’
guidelines
2006 New Zealand In seismic provision SANZ 2006 the 90° hooks are not permissible for the use in seismic
detailing in plastic hinge regions
2008 Slovenia The first country where Eurocode 8 became compulsory
2010 USA Explicit probabilistic analysis permitted in ASCE 7-10
In summary, there are a number of issues that need to be considered when assessing the seismic performance of a
bridge. They can be listed as:
Level of seismic hazard (e.g. probability that the peak ground acceleration (PGA) occurs in 475 years)
Adequacy of seismic design and detailing for hinging columns (amount of transverse reinforcement, restrictions
about the local and global anti-buckling requirements, centre-to-centre distances between hoops and engaged
bars, detailing of hooks).
Adequacy of seismic design of other bridge elements for force or displacement capacity (element resistance for
column overstrength, seat width, gap in expansion joint).
Seismic guideline (specification, standard or code) adopted during the design period of the bridge. To illustrate
the strong changes in seismic practice within the last decades a list of important provisions in seismic codes for
buildings, which are relevant also for bridges and some milestone from detailing point of view are listed in
Table 1.

ON THE DEVELOPMENT OF KEY PERFORMANCE INDICATORS FOR A RAPID SEISMIC ASSESSMENT OF
ROADWAY BRIDGES
4
The list above represents issues related to earthquake shaking which should be addressed in the quality control of the
roadway bridges located in the seismically active areas. Additional issues could be included if seismic hazards other
than shaking, e.g. soil liquefaction and fault rupture, are considered.
3. Evolution of the seismic assessment of bridges in the USA
Important advances in the seismic design, assessment and retrofit of bridges have been made in the last decades based
on the lessons learned after a number of strong earthquakes in California. The 1971 San Fernando earthquake caused
major damage and collapses in bridge infrastructure in Southern California. As a result, significant changes were
introduced in the seismic design practice to ensure the ductility of structures. A retrofit program was also put in place.
This program initially focused on reducing vulnerabilities related to joint separation and superstructure unseating by
providing cable restrainers. The 1987 Whittier Narrows and 1989 Loma Prieta earthquakes revealed again the
vulnerability of existing bridge columns to brittle shear failures, which increased funding for the retrofit program to
install steel jackets in vulnerable columns. Modern bridges and retrofitted structures performed generally well during
the 1994 Northridge earthquake, but bridges with complex configurations, such as large skews, presented significant
damage.
To evaluate the bridges at risk and prioritize retrofit actions, The California Department of Transportation (Caltrans) has
developed and refined over time a screening algorithm that provides a score that takes into account the structural
vulnerability, the seismic hazard, and the bridge importance. The latest developments on this method have be included
new types of hazards, such as bridges on liquefiable soils and bridges located over active faults, as well as new bridge
vulnerabilities, such as bridges with early retrofits that have not been fully effective and bridges with short seats and
stiff restrainers (Ostrom 2016).
Fragility curves, which define the probability of exceeding a specific damage state for a given earthquake intensity,
have also been developed to assess the probable seismic performance of bridges (e.g., Ramanathan 2012). These are
useful tools for pre-event planning and post-earthquake emergency response. However, they are specific for a given
bridge structure or prototype configuration as well as the seismic region for which they were developed. To develop
fragility curves, different demand parameters associated to a bridge component and/or damage mode are defined
(column deformation, abutment seat displacement, shear key displacement, etc.). Fragility functions are commonly
developed by running multiple nonlinear time-history dynamic analyses of increasing intensity and then performing a
statistical analysis of the exceedance of damage thresholds for each of the demand parameters. The demand parameters
and thresholds values can be regarded as performance objectives and goals.
Simple indicators have also been proposed for post-earthquake damage evaluation based on visual inspection. For
example, Veletzos et al. (2008) developed a visual catalog that documents damage from laboratory experiments and
from historic earthquake. This catalog defines five levels of damage for different bridge components (e.g., columns,
foundations, abutments) and bridge sub-assemblies. Each level of damage has associated a performance level (from
fully operational to collapse) and description of intervention needs (from no repair to replacement). Quantitative
indicators based on simple field measurements have also been used by Caltrans to characterize the bridge response after
an earthquake, such as markers at expansion joints to track bridge movements or tension indicators on cable restrainers
to indicate yielding of the cables.
4. Seismic performance indicators
The seismic performance indicator (SPI) is a parameter, which is obtained from (a) visual inspection, (b) non-
destructive or destructive measurements, (c) analytical methods or (d) project documentation and can be further used to
estimate seismic performance of a bridge before an event occurs or to evaluate the actual performance after the event.
The impact of a SPI is related to the seismic performance of a structure in relation to its strategic goals and objectives.
For example, the permissible/threshold value of the residual displacement of bridge piers after an earthquake is in the
case of the high-speed railway line somewhat more rigorous than in the case of the structure located in the remotely
accessed areas due to the need to operate the system even after the seismic event. Such indicator can be measured in the
case after the seismic event has occurred or in the design or assessment process by means of non-linear time-history
dynamic analysis, from which the anticipated drift value is calculated. The level of attained residual displacement is
highly correlated with the seismic detailing (standard vs. substandard detailing) or the presence of seismic pathologies.
These are again manifested after the seismic event, which will expose some (not all, because the response depends on
the characteristics of the ground motion) shortcomings of the structure.
Different types of seismic performance indicators with different levels of complexity can be developed for pre-event
quality control of bridges. They can be related to design and detailing practices, nonlinear response predictions, and also
the level of seismic hazard. However, the author suggest, that only two groups, simple and complex SPI’s, should be
defined. The former SPI is simply obtained from visual inspection or as-build drawings, in some cases even non-

QUALITY SPECIFICATIONS FOR ROADWAY BRIDGES,
STANDARDIZATION AT A EUROPEAN LEVEL
Barcelona,
27th – 28th September, 2018
5
destructive or destructive techniques may be needed to complement such data. The latter, more complex SPI is based
for example on a moment-curvature analysis and plastic hinge model: curvature or displacement ductility capacity of
columns. Nonlinear time-history analyses may be needed to characterize the response of complex bridge structures and
predict the force and displacement response of the different elements of a bridge. Comprehensive discussion about the
complex SPI’s is not primary focus of this paper, since these indicators cannot be evalutated by the bridge inspector.
However, the evaluation and identification of simple SPI’s can be easly implemented into the process a bridge
inspection, by periodically collecting simple SPI’s using standardized “seismic data sheets”, which would encapsulate
all seismic issues presented in this paper (level of lateral reinforcement, detailing, period of seismic design, level of
seismic hazard, etc. ). In this way the complex SPI’s will be more accurately and efficiently defined by a structural or
seismic engineer. To some extent, this is already done by bridge inspectors, but clearly not from the seismic perspective
presented in this paper. For example, when the detailing in bridge columns does not meet current seismic standard, the
near collapse rotation of bridge columns is according to Eurocode 8/3 (CEN, 2005c) reduced for nearly 20%. When the
bar slenderness ratio, which is defined as the ratio between the stirrups distance and diameter of longitudinal
reinforcement, is below the threshold value of 6 or 8, the local buckling of bars is prevented when severe or moderate
curvature ductility demands for DCH or DCM ductility class are designed, respectively. Furthermore, no limits of RC
needs to be placed on the allowable strain ranges, if the limit value 6 is considered, since a stress greater than yield can
be sustained over the entire compression range.
5. Conclusions
The condition assessment of roadway bridges from the perspective of the seismic performance is analysed in this paper.
The seismic pathologies relevant for roadway RC bridges are therefore presented. Afterwards, general definition of the
seismic performance indicator is introduced. It was concluded, that these indicators must be put in two groups, simple
and complex seismic performance indicators (1st conclusion). They are defined in a way that the evaluation of former
one can be performed by a bridge inspector, while the latter are post festum analysed by the structural engineer (2st
conclusion). By performing the inspection of bridges taking into account presented indicators, the uncertainties in both
seismic demand and capacity can be decreased and consequently the probability of damage caused to the infrastructure
in case of a seismic event (3rd conclusion). A detailed overview of complex SPI’s should be given in future studies. A
single seismic index for a rapid seismic assessment of roadway bridges, like that used in the screening program of
Caltrans, but more generic, could be afterwards developed by weighting indicators related to the bridge configuration,
design and detailing, and the seismic hazard.
References
Anžlin A. 2017. Influence of buckling of longitudinal reinforcement in columns on seismic response of existing
reinforced concrete bridges. Ph.D. Thesis. Faculty of Civil and Geodetic Engineering, University of Ljubljana,
Slovenia.
Anžlin, A.; Fishinger, M.; Isaković, T. 2015. Cyclic response of I-shaped bridge columns with substandard transverse
reinforcement. Engineering Structures 99: 642-652. http://dx.doi.org/10.1016/j.engstruct.2015.05.032 ASCE 7-10
CEN (2005a). Eurocode 8: Design of structures for earthquake resistance – Part 1
CEN (2005b). Eurocode 8: Design of structures for earthquake resistance – Part 2: Bridges. CEN, Brussels.
CEN (2005c). Eurocode 8: Design of structures for earthquake resistance – Part 3: Assessment and retrofit of buildings.
CEN, Brussels.
Fajfar, P. 2017. Analysis in seismic provisions for buildings: past, present and future. Bulletin of Earthquake
Engineering 16(7):2567-2608. https://doi.org/10.1007/s10518-017-0290-8
Kramar, M.; Gams, M.; Anžlin, A.; Dolšek, M. 2016. Ciklični preiskusi armiranobetonskih stebrov (in Slovene).
Gradbeni vestnik 65(12): 277-288. https://www.dlib.si/stream/URN:NBN:SI:DOC-DJ7R67GJ/94dd85aa-c014-
4b56-b754-f5a903772bc1/PDF
Ostrom, T.A. (2016), Caltrans Bridge Seismic Screening Program, Proceedings of the 11th US-Taiwan Bridge
Engineering Workshop, Taipei, Taiwan. NZS 3101 Ramanathan, K.N. (2012), Next generation seismic fragility curves for California bridges incorporating the evolution in
seismic design, PhD Dissertation, Georgia Institute of Technology.

ON THE DEVELOPMENT OF KEY PERFORMANCE INDICATORS FOR A RAPID SEISMIC ASSESSMENT OF
ROADWAY BRIDGES
6
SANZ. 2016. Concrete Structures Standard, Part 1 - The Design of Concrete Structures, Standards New Zealand,
Wellington, New Zeland.
Stein, S.; Geller, R., J.; Liu, M. 2013. Reply to comment by Arthur Frankel on „Why Earthquake Hazard Maps Often
Fail and What to do About It“. Tectonophysics 592: 207-209. https://doi.org/10.1016/j.tecto.2013.01.024
Veletzos, M. Panagiutou, M., Restrepo, J., Sahs, S. (2008), Visual Inspection & Capacity Assessment of Earthquake
Damaged Reinforced Concrete Bridge Elements, Report No. CA08-0284, Department of Structural Engineering,
University of California, San Diego.

WG4 and WG5 WORKSHOP
Sustainable Bridge Management
27th – 28th September 2018
Barcelona, Spain
ON THE DEVELOPLEMNT OF KEY PERFORMANCE
INDICATORS FOR A RAPID SEISMIC ASSESSMENT OF
ROADWAY BRIDGESAndrej Anžlin – Slovenian National Building and Civil Engineering Institute, Slovenia
Juan Murcia-Delso – The University of Texas at Austin, United States of America
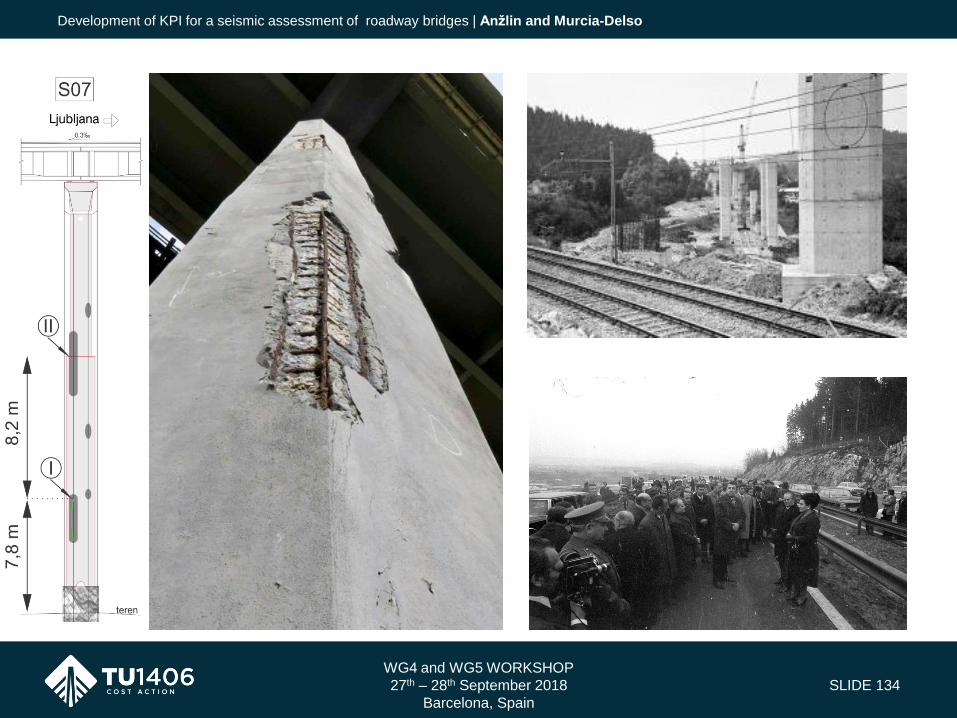
WG4 and WG5 WORKSHOP
27th – 28th September 2018
Barcelona, Spain
SLIDE 134
Development of KPI for a seismic assessment of roadway bridges | Anžlin and Murcia-Delso

WG4 and WG5 WORKSHOP
27th – 28th September 2018
Barcelona, Spain
SLIDE 135
Poor seismic design / seismic pathologies
Development of KPI for a seismic assessment of roadway bridges | Anžlin and Murcia-Delso
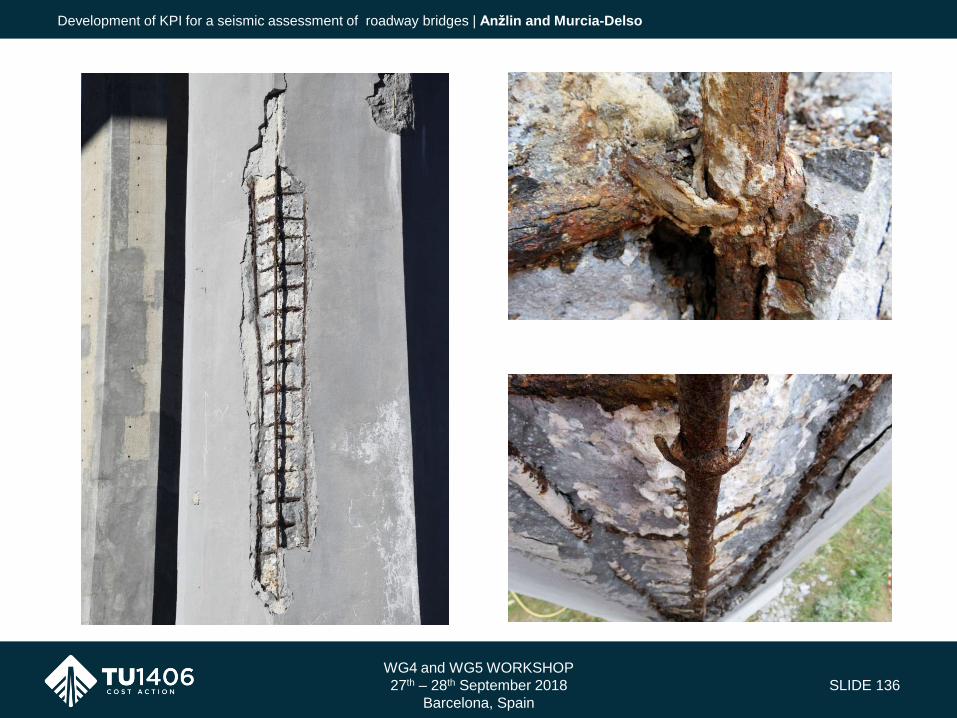
WG4 and WG5 WORKSHOP
27th – 28th September 2018
Barcelona, Spain
SLIDE 136
Development of KPI for a seismic assessment of roadway bridges | Anžlin and Murcia-Delso
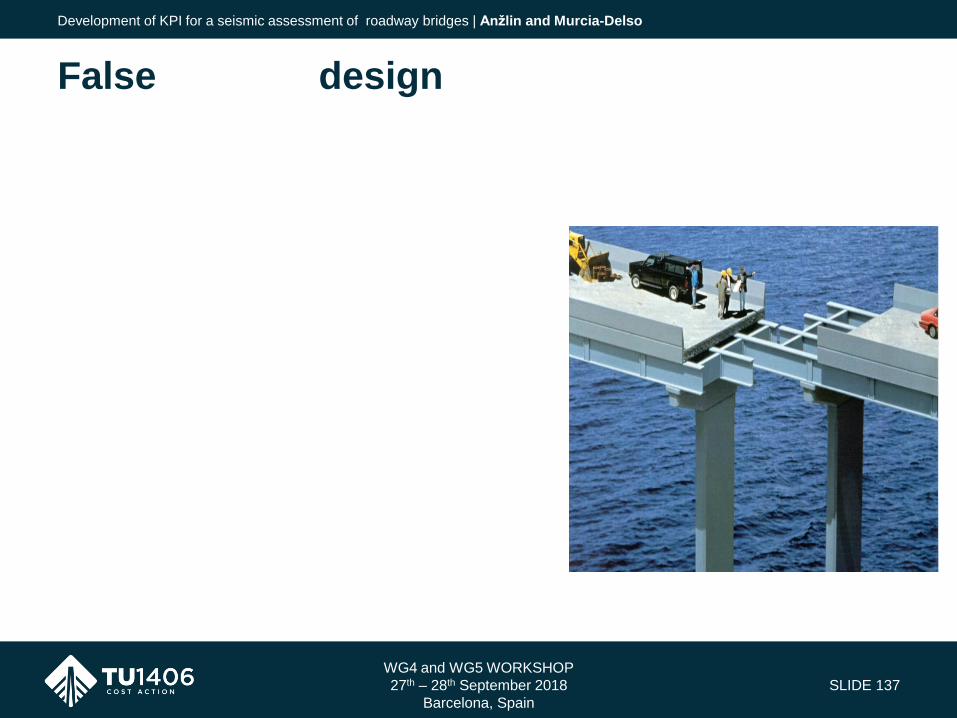
WG4 and WG5 WORKSHOP
27th – 28th September 2018
Barcelona, Spain
SLIDE 137
False seismic design
Development of KPI for a seismic assessment of roadway bridges | Anžlin and Murcia-Delso
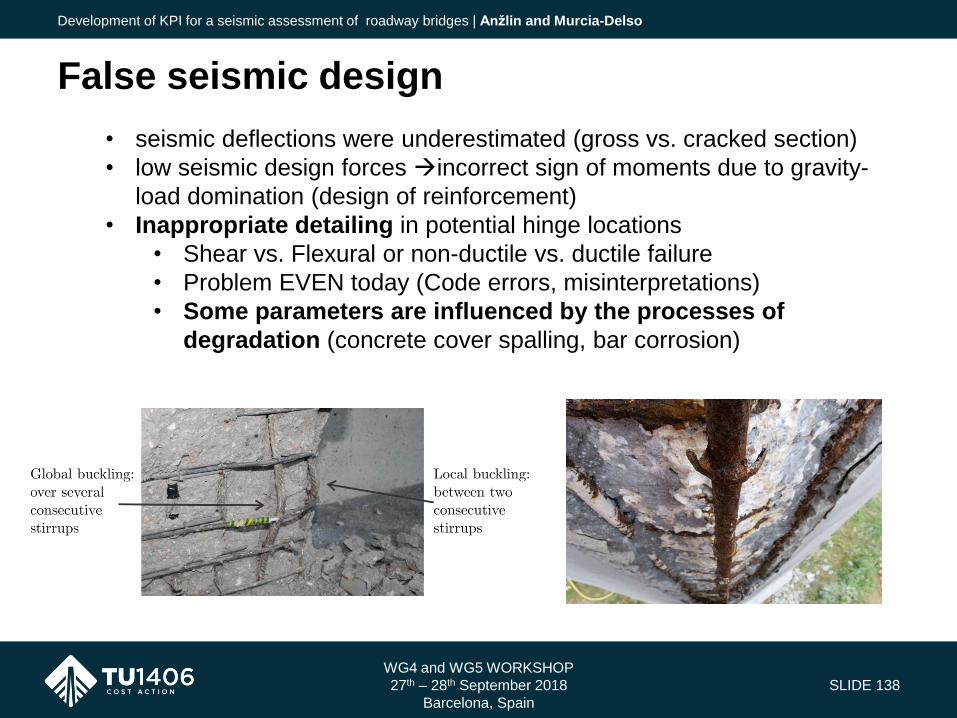
WG4 and WG5 WORKSHOP
27th – 28th September 2018
Barcelona, Spain
SLIDE 138
False seismic design
Development of KPI for a seismic assessment of roadway bridges | Anžlin and Murcia-Delso
• seismic deflections were underestimated (gross vs. cracked section)
• low seismic design forces incorrect sign of moments due to gravity-
load domination (design of reinforcement)
• Inappropriate detailing in potential hinge locations
• Shear vs. Flexural or non-ductile vs. ductile failure
• Problem EVEN today (Code errors, misinterpretations)
• Some parameters are influenced by the processes of
degradation (concrete cover spalling, bar corrosion)
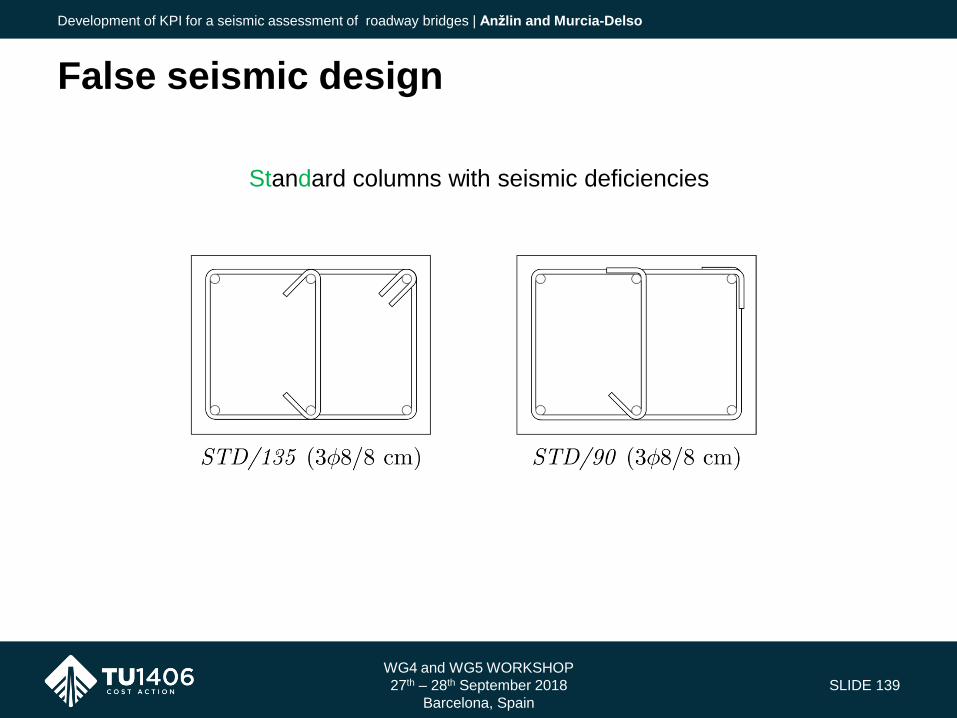
WG4 and WG5 WORKSHOP
27th – 28th September 2018
Barcelona, Spain
SLIDE 139
False seismic design
Development of KPI for a seismic assessment of roadway bridges | Anžlin and Murcia-Delso
Standard columns with seismic deficiencies
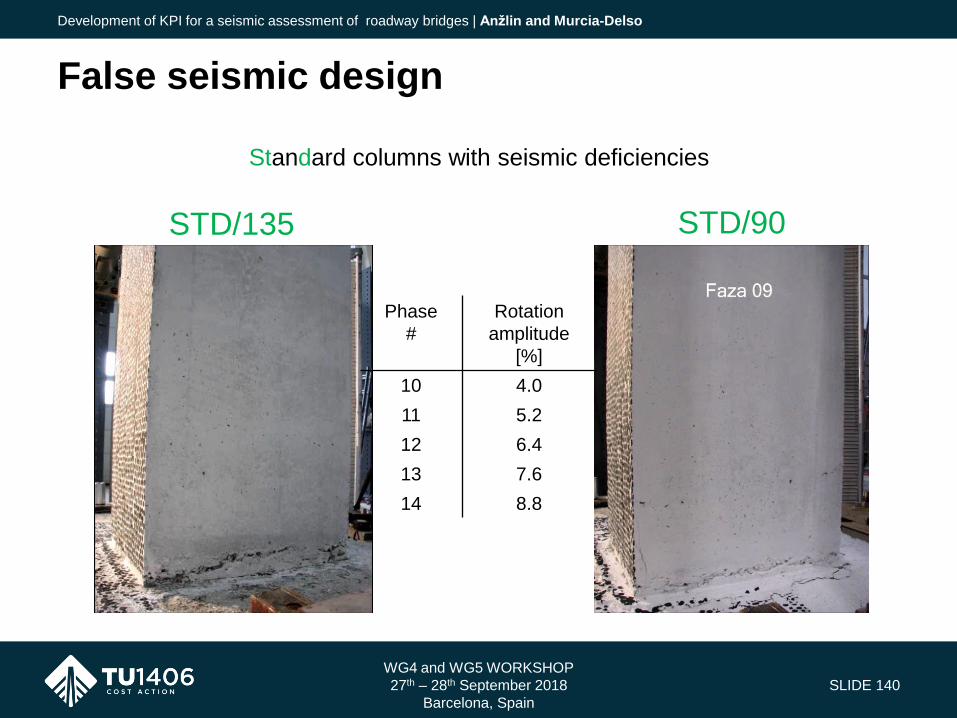
WG4 and WG5 WORKSHOP
27th – 28th September 2018
Barcelona, Spain
SLIDE 140
False seismic design
Development of KPI for a seismic assessment of roadway bridges | Anžlin and Murcia-Delso
Standard columns with seismic deficiencies
STD/135 STD/90
Phase
#
Rotation
amplitude
[%]
10 4.0
11 5.2
12 6.4
13 7.6
14 8.8
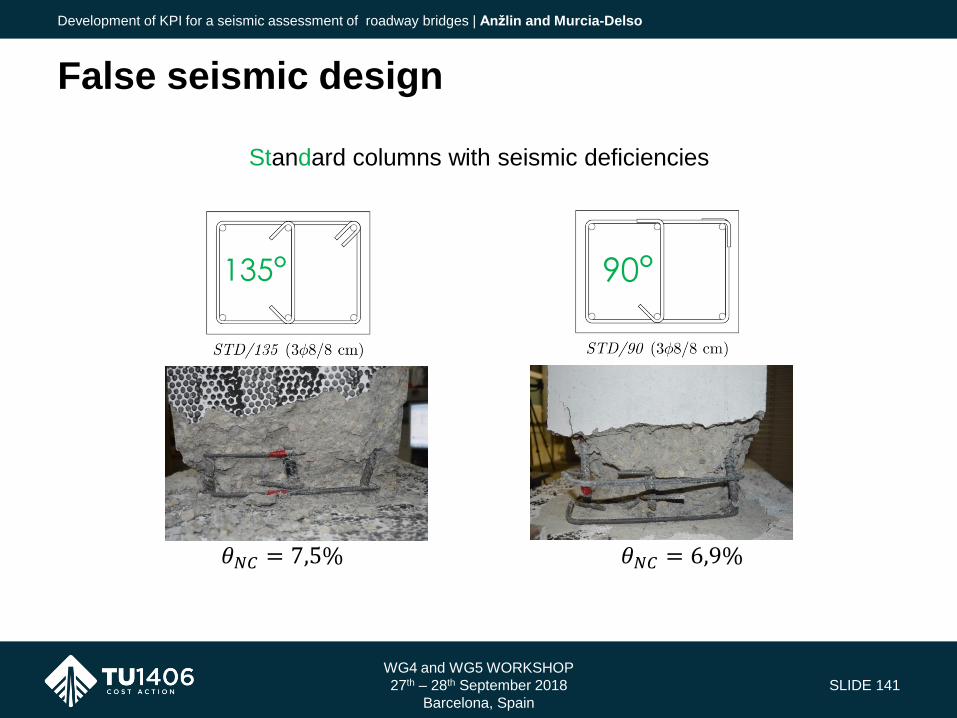
WG4 and WG5 WORKSHOP
27th – 28th September 2018
Barcelona, Spain
SLIDE 141
False seismic design
Development of KPI for a seismic assessment of roadway bridges | Anžlin and Murcia-Delso
Standard columns with seismic deficiencies
135° 90°
𝜃𝑁𝐶 = 7,5% 𝜃𝑁𝐶 = 6,9%

– A parameter obtained before/after a seismic event, which can be used to estimate the seismic performance of a bridge before/after the seismic event
– A parameter obtained from
• Visual inspection (degradation process)
- Bar slenderness ratio change
- Spalling of the concrete cover
• Non-destructive/destructive measurements
• Project documentation
- Birth certificate, history of interventions
– Which seismic design principles were assumed?
• Analytical methods
- Sectional full moment-curvature analysis
- Near collapse rotation of the column
- Effective buckling ratio of lateral reinf.
- Non-linear dynamic analysis
WG4 and WG5 WORKSHOP
27th – 28th September 2018
Barcelona, Spain
SLIDE 142
Seismic Performance Indicators
Development of KPI for a seismic assessment of roadway bridges | Anžlin and Murcia-Delso
the relevance of a SPI

– A parameter obtained before/after a seismic event, which can be used to estimate the seismic performance of a bridge before/after the seismic event
– A parameter obtained from
• Visual inspection (degradation process)
- Bar slenderness ratio change
- Spalling of the concrete cover
• Non-destructive/destructive measurements
• Project documentation
- Birth certificate, history of interventions
– Which seismic design principles were assumed?
• Analytical methods
- Sectional full moment-curvature analysis
- Near collapse rotation of the column
- Effective buckling ratio of lateral reinf.
- Non-linear dynamic analysis
WG4 and WG5 WORKSHOP
27th – 28th September 2018
Barcelona, Spain
SLIDE 143
Seismic Performance Indicators
Development of KPI for a seismic assessment of roadway bridges | Anžlin and Murcia-Delso
Simple SPI
(bridge inspector)
Complex SPI
(structural engineer)
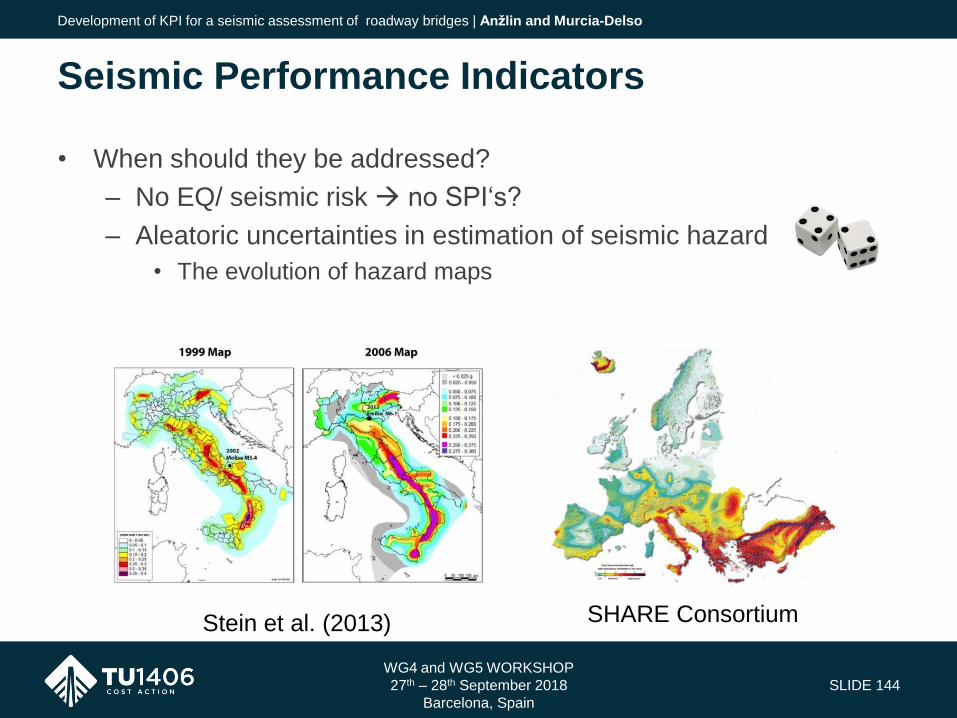
• When should they be addressed?
– No EQ/ seismic risk no SPI‘s?
– Aleatoric uncertainties in estimation of seismic hazard
• The evolution of hazard maps
WG4 and WG5 WORKSHOP
27th – 28th September 2018
Barcelona, Spain
SLIDE 144
Seismic Performance Indicators
Development of KPI for a seismic assessment of roadway bridges | Anžlin and Murcia-Delso
Stein et al. (2013) SHARE Consortium

– What about uncertainties in the
estimation of the seismic capacity?
– How „accurate“ must be the estimation?
WG4 and WG5 WORKSHOP
27th – 28th September 2018
Barcelona, Spain
SLIDE 145
Seismic Performance Indicators
Development of KPI for a seismic assessment of roadway bridges | Anžlin and Murcia-Delso
degradation processes
Uncertainty in manufacture and
material characteristics

• The definition of a seismic performance indicator was presented
– Simple SPI (bridge inspector)
– Complex SPI (structural engineer)
• The introduction of SPI in a quality control of bridges can reduce the
uncertainties in the estimation of the seismic capacity of such
structures
• Future studies:
– A detailed overview of SPI‘s should be given
– Single seismic index for a rapid seismic assesment of roadway
bridges (e.g. Caltrans), but more generic, can be afterwords
developed
WG4 and WG5 WORKSHOP
27th – 28th September 2018
Barcelona, Spain
SLIDE 146
Main conclusions
Development of KPI for a seismic assessment of roadway bridges | Anžlin and Murcia-Delso

THANK YOU FOR YOUR ATTENTION!
WWW.TU1406.EU
WG4 and WG5 WORKSHOP
Sustainable Bridge Management
27th – 28th September 2018
Barcelona, Spain
Bridge life cycle management through
innovation: A practical example with GENIA
tool for inspection and assessment
Jesus Isoird - Tecnalia, Spain. Director of Infrastructures business area
Iñaki Piñero – Tecnalia, Senior Researcher

QUALITY SPECIFICATIONS FOR ROADWAY BRIDGES, STANDARDIZATION AT A EUROPEAN LEVEL
Barcelona, 27th – 28th September, 2018
1
BRIDGES INSPECTION AND ASSESSMENT. TECNALIA´S VISIÓN THROUGH INNOVATION AND EXPERIENCE
Ignacio Piñero1, Jesús Isoird2 1, 2 Fundación TECNALIA Research & Innovation - Sustainable Construction – Infrastructures
(C/ Geldo – Parque Tecnológico de Bizkaia, Edf. 700, Derio, 48160, España)
Abstract. Roads, and infrastructures of a country have a direct influence on its economic and social development,
which is why their proper maintenance is fundamental. Regular inspections are essential to detect incidents or pathologies in time. The inspections, as part of maintenance process, are really useful, since they allow us to know the functional and resistant status of the different elements that are integrated within a road, confirming if this state is adequate to offer the service in a safe way and there are no risks that could endanger the users. Such is the case of bridges, one of the most common structures in all road infraestructures. In the specific case of road bridge inspections, in Spain, they are carried out every five years (on the roads that depend on the Ministry of Public Works). This period is shortened if unforeseen situations occur that could damage the structure (floods, earthquakes, vehicle impact, etc.). The first inspection is performed before putting the bridge into operation, allowing other subsequent revisions to observe the evolution of damage or deterioration.
These inspections involve technical teams that have sufficient knowledge to perform these tasks, in addition to being supervised by a structural engineer. These professionals must have sufficient knowledge to know the structural behavior of the bridges, degradation and deterioration of the structures and also have information to prepare the inspection properly.
The Sustainable Construction Division of TECNALIA, through its Infrastructures Business Area, has developed a methodology based on the experience in the field of main inspections of bridges and technical assistance and rehabilitation in a wide range of bridges. It has been implemented in a Bridge Management System, which has implied an innovation in the procedures of the main inspections bridge as well as the digitalization and management.
Keywords: bridge management, condition index, main inspection of bridges, MIVES
1. Introduction
Every bridge management system requires inspections to assess, at different scope levels, the possible damages and their evolution. In Spain, the "Guide for carrying out main inspections of road works in the State Roads Network", of the General Directorate of Roads [1], distinguishes three levels of inspection: basic, main and special. In this document, "inspection" is understood as the set of technical actions carried out according to a previous plan, which provide the necessary data to know, at a particular point in time, the state of conservation of a bridge. The consequence of these inspections is the determination of the maintenance or conservation operations when they are desirable, the assignation of a condition index of the structure, the adoption of rehabilitation measures or other extraordinary actions.
In order to know the existing real condition and evaluate each of the elements of the bridge, an inspection program is needed, which must be carried out in an organized way. Furthermore, against a backdrop of rapid technological progress, in terms of digitalization these operations are taking a turn and are being optimized with the creation of software tools for this practice as well as scanning, robotics or BIM technologies. TECNALIA has developed its own tool based on the experience and knowledge of this field. Likewise, the use of drones for the execution of inspections and even a particular tests, the implementation of structural health monitoring throguh different sensorics and the development of digital twins based on BIM methodology are a great advance in this area.
2. The perspective of the life cycle of bridges
Sustainability in the field of construction is an important line of work at this time [2] [3] [4]. The bridges are designed to be functional for decades, so all aspects related to their life cycle must be considered: project, construction, operation and dismantling. That is why the investment must contemplate the deterioration of the bridge and its maintenance to maintain the structure in good condition for as long as possible. A recent review of the application of multicriteria decision methods to bridges can be found in the work of Penadés-Plà et al [5] and Piñero et al [6].
Sarma and Adeli [7] reviewed the studies carried out on the optimization of concrete structures and detected certain gap in terms of research in the field of optimization of structures that considers the cost of the entire life cycle, and not only the initial cost of its construction. Frangopol and Kim [8] also claimed the importance of extending the useful life of the structures, as many of them begin to show significant signs of deterioration sooner than expected. In order to prolong the life of deteriorated structures, maintenance measures can be applied that delay the spread of damage, or reduce the degree of damage [9]. Frangopol and Soliman (2016) [10] described the actions necessary for efficient maintenance
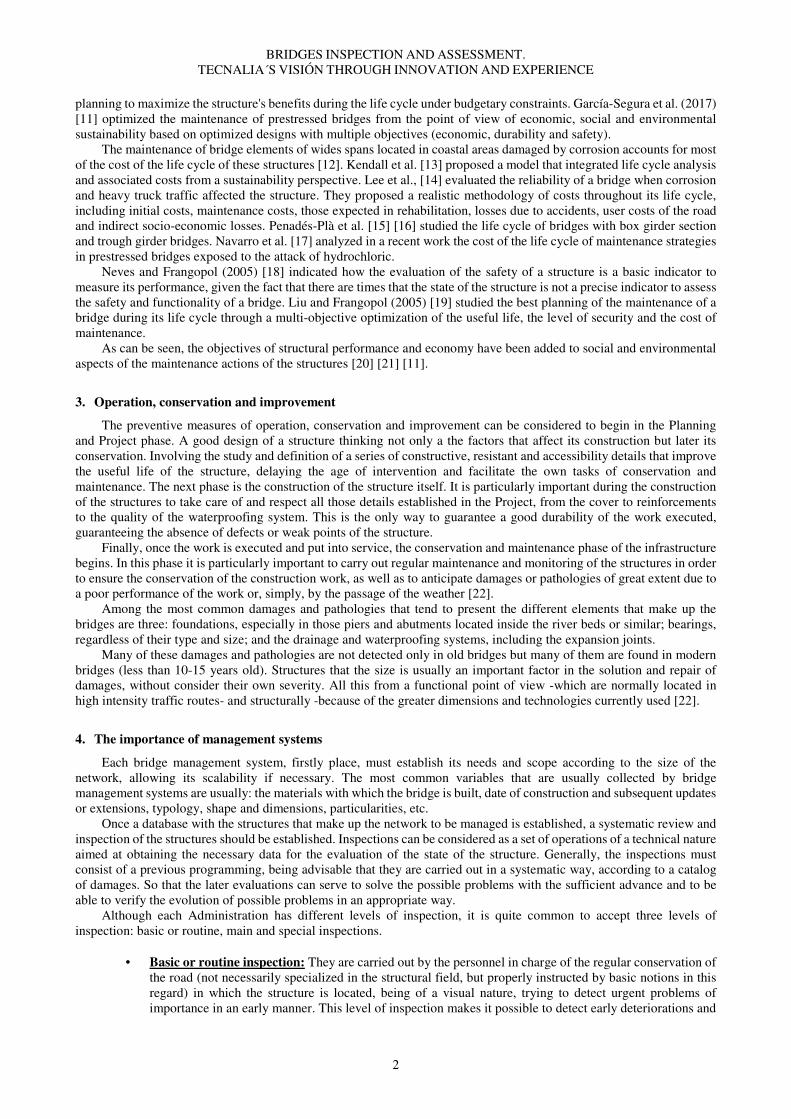
BRIDGES INSPECTION AND ASSESSMENT. TECNALIA´S VISIÓN THROUGH INNOVATION AND EXPERIENCE
2
planning to maximize the structure's benefits during the life cycle under budgetary constraints. García-Segura et al. (2017) [11] optimized the maintenance of prestressed bridges from the point of view of economic, social and environmental sustainability based on optimized designs with multiple objectives (economic, durability and safety).
The maintenance of bridge elements of wides spans located in coastal areas damaged by corrosion accounts for most of the cost of the life cycle of these structures [12]. Kendall et al. [13] proposed a model that integrated life cycle analysis and associated costs from a sustainability perspective. Lee et al., [14] evaluated the reliability of a bridge when corrosion and heavy truck traffic affected the structure. They proposed a realistic methodology of costs throughout its life cycle, including initial costs, maintenance costs, those expected in rehabilitation, losses due to accidents, user costs of the road and indirect socio-economic losses. Penadés-Plà et al. [15] [16] studied the life cycle of bridges with box girder section and trough girder bridges. Navarro et al. [17] analyzed in a recent work the cost of the life cycle of maintenance strategies in prestressed bridges exposed to the attack of hydrochloric.
Neves and Frangopol (2005) [18] indicated how the evaluation of the safety of a structure is a basic indicator to measure its performance, given the fact that there are times that the state of the structure is not a precise indicator to assess the safety and functionality of a bridge. Liu and Frangopol (2005) [19] studied the best planning of the maintenance of a bridge during its life cycle through a multi-objective optimization of the useful life, the level of security and the cost of maintenance.
As can be seen, the objectives of structural performance and economy have been added to social and environmental aspects of the maintenance actions of the structures [20] [21] [11].
3. Operation, conservation and improvement
The preventive measures of operation, conservation and improvement can be considered to begin in the Planning and Project phase. A good design of a structure thinking not only a the factors that affect its construction but later its conservation. Involving the study and definition of a series of constructive, resistant and accessibility details that improve the useful life of the structure, delaying the age of intervention and facilitate the own tasks of conservation and maintenance. The next phase is the construction of the structure itself. It is particularly important during the construction of the structures to take care of and respect all those details established in the Project, from the cover to reinforcements to the quality of the waterproofing system. This is the only way to guarantee a good durability of the work executed, guaranteeing the absence of defects or weak points of the structure.
Finally, once the work is executed and put into service, the conservation and maintenance phase of the infrastructure begins. In this phase it is particularly important to carry out regular maintenance and monitoring of the structures in order to ensure the conservation of the construction work, as well as to anticipate damages or pathologies of great extent due to a poor performance of the work or, simply, by the passage of the weather [22].
Among the most common damages and pathologies that tend to present the different elements that make up the bridges are three: foundations, especially in those piers and abutments located inside the river beds or similar; bearings, regardless of their type and size; and the drainage and waterproofing systems, including the expansion joints.
Many of these damages and pathologies are not detected only in old bridges but many of them are found in modern bridges (less than 10-15 years old). Structures that the size is usually an important factor in the solution and repair of damages, without consider their own severity. All this from a functional point of view -which are normally located in high intensity traffic routes- and structurally -because of the greater dimensions and technologies currently used [22].
4. The importance of management systems
Each bridge management system, firstly place, must establish its needs and scope according to the size of the network, allowing its scalability if necessary. The most common variables that are usually collected by bridge management systems are usually: the materials with which the bridge is built, date of construction and subsequent updates or extensions, typology, shape and dimensions, particularities, etc.
Once a database with the structures that make up the network to be managed is established, a systematic review and inspection of the structures should be established. Inspections can be considered as a set of operations of a technical nature aimed at obtaining the necessary data for the evaluation of the state of the structure. Generally, the inspections must consist of a previous programming, being advisable that they are carried out in a systematic way, according to a catalog of damages. So that the later evaluations can serve to solve the possible problems with the sufficient advance and to be able to verify the evolution of possible problems in an appropriate way.
Although each Administration has different levels of inspection, it is quite common to accept three levels of inspection: basic or routine, main and special inspections.
• Basic or routine inspection: They are carried out by the personnel in charge of the regular conservation of
the road (not necessarily specialized in the structural field, but properly instructed by basic notions in this regard) in which the structure is located, being of a visual nature, trying to detect urgent problems of importance in an early manner. This level of inspection makes it possible to detect early deteriorations and

QUALITY SPECIFICATIONS FOR ROADWAY BRIDGES, STANDARDIZATION AT A EUROPEAN LEVEL
Barcelona, 27th – 28th September, 2018
3
thus prevent them from becoming serious, as well as to locate damages that need urgent repair. The periodicity of this type of inspections is usually established in the environment of 1 year.
• Main inspection: This is a detailed visual inspection of the state of all elements of the structure to be
inspected. It is recommended a first main inspection, called "Zero Inspection" that is performed before the bridge is put into service and that serves as a reference to determine the evolution of the deterioration. They are made by specialized technical personnel. It is usual to use “damage libraries“ for avoiding the subjectivity of the inspection, in order to unify the criteria of the different inspectors and to know with sufficient accuracy the level of deterioration of the structure. In this case, the periodicity of the inspections varies greatly between the different Administrations, from the minimum of 5 years of the General Directorate of Roads of the Ministry of Public Works [1], to the maximum 15 years established in ITPF-05 [23]. Likewise, this type of inspections is usually recommended after exceptional events such as the impact of a vehicle, earthquakes or floods.
• Special inspection: Special inspections are not systematic, but are the result of significant deterioration
detected in a Main Inspection or by any special situation. Usually they are the previous step to works of rehabilitation, repair or reinforcement of the structure. They require a multidisciplinary technical team, qualified and highly specialized in structural, geotechnical and material deterioration analysis. Here it is no longer a matter of performing a visual inspection, but rather complete quantitative data is required for the evaluation of the bridge. Trials and destructive or semi-destructive tests are common, through the realization of trial pits, specimen extraction and other tests related to durability. With the results obtained, a characterization and damage assessment report or a repair project is written.
Once defined what is a management system and established the usual levels of inspection that are usually available,
it is necessary to follow up and to control the structures. Every management system must be easily manageable and offer objective data on the status of the bridges. From the conservation status of the structures, depending on their severity, investment cost, the importance of the road, the possibility of alternative itineraries, etc., it should help to establish investment priorities. Likewise, a complete management system must have the capacity to perform the control and follow-up of the repairs undertaken, which will serve to evaluate the effectiveness of the adapted measures, as well as to calibrate and correct future actions.
5. The role of innovation in bridge inspection
The knowledge economy is transforming the global economic landscape. The speed and intensity with which economic activities absorb new technologies and the ease with which information is obtained and shared is drawing a new economic reality. This situation highlights the enormous importance of innovation and human capital as a source of competitiveness and growth of a country. In response to this challenge, TECNALIA is creating and incorporating new methodologies and technologies in the field of infrastructures and their management, among which include:
• Use of Drones in inspection and maintenance tasks.
The field of inspection and maintenance of infrastructures, especially in height, is about to change radically due to
the irruption of drones. Traditionally to perform inspection and maintenance tasks, in infrastructures, there was only the possibility of choosing between lifting platforms or special inspection vehicles, ladders, scaffolding structures or directly performing work at height. Regardless of the method used to carry out the task, the associated times, costs and hazards remain a challenge and present a great opportunity for improvement. Most of them also require the closure of lanes with the economic losses that implies. Therefore, the use of drones presents a great opportunity that is expected to revolutionize inspection and maintenance work in the coming years.
Although drones have already been used in recent years for certain inspection tasks, they have mainly focused on
taking visual and infrared images that need to be analyzed by a qualified operator to determine the state of the infrastructure and actions of associated maintenance. However, this type of drone operation does not solve the entire inspection problem since the visual inspection only covers one of the phases of the necessary procedure. For this reason the use of drones for the inspection of infrastructures has not yet become popular, since if they are only able to solve a phase of a complete process, and it is necessary to make use of traditional methods (cranes, scaffolding, work at height)

BRIDGES INSPECTION AND ASSESSMENT. TECNALIA´S VISIÓN THROUGH INNOVATION AND EXPERIENCE
4
for the other phases (detail and contact inspection), then the added value of general visual inspection through the use of drones is drastically reduced.
• Structural Health Monitoring, SHM.
Structural Health Monitoring (SHM) is the process of assessing the health status of a structure based on data from
the instrumentation. It supposes four phases or subprocesses:
Instrumentation: is the set of sensors and data acquisition systems that collect the physical structural parameters object of control and analysis.
Monitoring: it is the service, transmission, web publication and distribution in real time. Analysis: is the set of techniques that allow converting data into knowledge and understanding structural
behavior. Implementation of systems for assessing the state of the structure for the detection of damage and its location.
Management: helps decision making on the performance and maintenance. The purpose of SHM is the detection of damage before it evolves until reaching a limit value thus achieving the
following impacts:
Prolongation of the useful life and economic savings in its life cycle by detecting damage before reaching the critical state.
Reduction of the time spent outside the structure, minimizing the socio-economic impact. Technification / objectification of inspection work. Focus of inspections on areas susceptible to damage. Improvement of work efficiency.
The detection of damage through SHM systems can also allow to determine the current condition of the structure.
The SHM combines a variety of technologies to measure, record and analyze data (temperature, humidity, stress, deformations, displacements, accelerations ...) in real time, allowing to know the behavior and detect the state of the structure early and thus decrease maintenance costs and repairs. The absence of monitoring in some cases can lead to serious problems that are not evident until the situation is critical or irreversible, having to adopt costly solutions.
• Digital Twin based on BIM technology.
Digital Twin is one of the concepts that is changing the dynamics of the infraestructure maintenance sector. These
are virtual replicas of objects or processes that simulate the behavior of their real counterparts. The purpose is to analyze its effectiveness or behavior in certain cases to improve its effectiveness.
Digital Twins will transform the processes of construction and the maintenance of infrastructures. They will offer new ways to reduce costs, monitor assets, optimize maintenance, reduce downtime and allow the creation of new connected products. This concept is already part of the strategy of companies dedicated to innovation and product design of Industry 4.0.
Innovation in this area must develop knowledge and technology that allows to digitalize and treat automatically the information obtained in the inspection tasks. In this way it is possible to geo-reference all the images acquired for later use in maintenance tasks, being possible to detect and locate anomalies, such as effects of corrosion on surfaces or deformations in bridges compared with a digital twin based on BIM technology.
Through the development tasks of strategic planning methodologies of the drone inspection processes (previously mentioned) and the implementation of digital twins based on BIM technology for the advanced capture of information, Reliability and Maintenance Indicators can be visualized in platforms that enhance performance and meet the objectives of bridge management in two directions:
Inward, facilitating the processes of data management, process improvement and information exploitation. Outward, improving design and user experience (client).
6. TECNALIA Bridge Management System
Having a useful management tool can help in different aspects:
Technically: It helps to identify the characteristics and constructive typologies and to know the actual updated status of the assets.
Services for the most needy asset: You can control at all times the assets of an infrastructure, bridges, tunnels, etc. and thus be able to offer a better service to those which need more emergency actions. You can optimze life cycle cost ann the service to users. It will help, in short, to better understand the needs of action.

QUALITY SPECIFICATIONS FOR ROADWAY BRIDGES, STANDARDIZATION AT A EUROPEAN LEVEL
Barcelona, 27th – 28th September, 2018
5
Elements and materials: It allows to know the most deteriorated elements and the materials and products that must be available to conserve, repair, rehabilitate or replace them.
Historical: The programmed inspections will give rise to a history of the asset that will allow the rapid detection of the evolution of existing pathologies or the appearance of new damages, as well as the repairs or actions carried out in them.
The bridge management system developed by Tecnalia is an effective system that implements a methodology for the
assignment of the bridge condition index derived from the main inspections. The MIVES methodology (created by TECNALIA together with the University of the Basque Country, the
Polytechnic University of Catalonia and the University of La Coruña) has been developed and implemented in the tool for obtaining the bridge evaluation index and helps in decision-making. MIVES is a multicriteria decision-making methodology that evaluates each of the alternatives that can solve a defined generic problem, through a value index [24] [25] [26] [27]. This methodology is included in the multi-attribute utility theory, since to obtain the value index of each alternative, a weighted sum is made of the valuations of the different criteria considered, admitting that there is certainty. That is, the preferences of the decision maker, with respect to the proposed indicators, are known [6] [28].
For the definition of the elements of a bridge, a gradation criterion has been adopted in levels, according to the detail with which it is intended to decompose the whole of the bridge in its different elements, thus defining 4 levels. Thus, for example, LEVEL 1 is constituted by a single element, the Bridge. While in LEVEL 2 it is broken down into 5 components: Foundation, Substructure, Superstructure, Connection elements and Equipment. Levels 3 and 4 deepen this decomposition into elements and sub-elements [29].
Throughout this process it is essential that the inspectors are experienced technicians with training in the field of structures, the durability of materials and the equipment of bridges.
The tool comes up with libraries of damages depending on the materials. It allows to distinguish between damage associated with poor performance and associated with poor durability. Different types of damage to elements and equipment have also been taken into account.
This methodology allows implement an objective and transparent proceder for obtaining of the condition index of the bridge, once the main inspection has been carried out, and based on the allocation of weights to the different indicators and the assignment of value functions to the different alternatives [29].
The bridge management system of Tecnalia solves the following objectives:
It has operational, congruent and easily accessible information about the characteristics, status and possible deterioration of each of the bridges that it manages.
Evaluates the safety and the state of conservation of the bridges in an agile manner and with a clearly objective method, independent of the technician who carries out the inspection.
Optimizes and prioritizes the use of limited budgets to undertake the actions that are required depending on the state of the bridges (in process).
The aforementioned objectives are achieved through the execution of a series of activities, which are listed below:
1. Inventory of all bridges and general data of them. 2. Systematization of Inspection tasks. 3. Evaluation of the condition index of the bridge. 4. Strategic prioritization for intervention. 5. Estimation of the cost of repair work (in process). 6. Optimization of the use of available budgets (in process).
The bridge management tool of Tecnalia is designed to integrate advanced modules among which stand out, for example, instrumentation and monitoring, BIM methodologies or the implementation of drone inspection.
Acknowledgements
The authors appreciate the participation of the Research Group Formed by the UPV / EHU and TECNALIA under the agreement IT781-13 with the Basque Government. Last, we would like to extend our appreciation particularly to Jesús Díez, Laura Pérez for their dedication and participation by providing experience and good judgment.
BRIDGES INSPECTION AND ASSESSMENT. TECNALIA´S VISIÓN THROUGH INNOVATION AND EXPERIENCE
6
References
[1] Ministerio de Fomento. “Guía para la realización de inspecciones principales de obras de paso en la Red de Carreteras del Estado” ISBN: 978-84-498-0907-1. 2012.
[2] Yepes, V.; Torres-Machí, C.; Chamorro, A.; Pellicer, E. (2016). Optimal pavement maintenance programs based on a hybrid greedy randomized adaptive search procedure algorithm. Journal of Civil Engineering and Management, 22(4):540-550.
[3] Torres-Machí, C.; Pellicer, E.; Yepes, V.; Chamorro, A. (2017). Towards a sustainable optimization of pavement maintenance programs under budgetary restrictions. Journal of Cleaner Production, 148:90-102.
[4] Zastrow, P.; Molina-Moreno, F.; García-Segura, T.; Martí, J.V.; Yepes, V. (2017). Life cycle assessment of cost-optimized buttress earth-retaining walls: a parametric study. Journal of Cleaner Production, 140:1037-1048.
[5] Penadés-Plà, V.; García-Segura, T.; Martí, J.V.; Yepes, V. (2016). A review of multi-criteria decision making methods applied to the sustainable bridge design. Sustainability, 8(12):1295.
[6] Piñero, I.; San-José J. T., Garmendia L.; Zalbide M. (2017). Metodología para la priorización de estructuras degradadas. VII Congreso Internacional de Estructuras. Congreso de la Asociación Científico-Técnica del Hormigón Estructural (ACHE). A Coruña, 20-22 de junio de 2017 - ISSN: 0439-5689 (pp200-211).
[7] Sarma, K.C.; Adeli, H. (1998). Cost optimization of concrete structures. J. of Structural Eng., 124(5), 570–578. [8] Frangopol, D.M.; Kim, S. (2011). Service life, reliability and maintenance of civil structures. In L. S. Lee; V. Karbari
(Eds.), Service Life Estimation and Extension of Civil Engineering Structures (pp. 145–178). Elsevier. [9] Kim, S.; Frangopol, D.M.; Soliman, M. (2013). Generalized probabilistic framework for optimum inspection and
maintenance planning. Journal of Structural Engineering, 139(3), 435–447. [10] Frangopol, D.M.; Soliman, M. (2016). Life-cycle of structural systems: recent achievements and future directions.
Structure and Infrastructure Engineering, 12(1), 1–20. [11] García-Segura, T.; Yepes, V.; Frangopol, D.M.; Yang, D.Y. (2017). Lifetime Reliability-Based Optimization of Post-
Tensioned Box-Girder Bridges. Engineering Structures, 145:381-391. [12] Cheung, M. M.; Zhao, J.; Chan, Y. B. (2009). Service life prediction of RC bridge structures exposed to chloride
environments. Journal of Bridge Engineering, 14(3), 164–178. [13] Kendall, A.; Keoleian, G.A.; Helfand, G. E. (2008). Integrated life-cycle assessment and life-cycle cost analysis
model for concrete bridge deck applications. Journal of Infrastructure Systems, 14(3), 214–222. [14] Lee, K.M.; Cho, H.N.; Cha, C.J. (2006). Life-cycle cost-effective optimum design of steel bridges considering
environmental stressors. Engineering Structures, 28(9), 1252–1265. [15] Penadés-Plà, V.; Martí, J.V.; García-Segura, T.; Yepes, V. (2017). Life-cycle assessment: A comparison between
two optimal post-tensioned concrete box-girder road bridges. Sustainability, 9(10):1864. [16] Penadés-Plà, V.; García-Segura, T.; Martí, J.V.; Yepes, V. (2018). An optimization-LCA of a prestressed concrete
precast bridge. Sustainability, 10(3):685. [17] Navarro, I.J.; Yepes, V.; Martí, J.V. (2018). Life cycle cost assessment of preventive strategies applied to prestressed
concrete bridges exposed to chlorides. Sustainability, 10(3), 845. [18] Neves, L.C.; Frangopol, D.M. (2005). Condition, safety and cost profiles for deteriorating structures with emphasis
on bridges. Reliability Engineering & System Safety, 89(2), 185–198. [19] Liu, M.; Frangopol, D. M. (2005). Multiobjective maintenance planning optimization for deteriorating bridges
considering condition, safety, and life-cycle cost. Journal of Structural Engineering, 131(5), 833–842. [20] Dong, Y.; Frangopol, D.M.; Saydam, D. (2013). Time-variant sustainability assessment of seismically vulnerable
bridges subjected to multiple hazards. Earthquake Engineering & Structural Dynamics, 42(10), 1451–1467. [21] Sierra, L.A.; Pellicer, E.; Yepes, V. (2016). Social sustainability in the life cycle of Chilean public infrastructure.
Journal of Construction Engineering and Management ASCE, 142(5): 05015020. [22] Matute, L.; Pulido, I. (2012). Medidas eficientes en la conservación de puentes. VI Congreso Nacional de la
Ingeniería Civil Valencia, 23 y 24 de febrero de 2012. [23] ITPF-05 Orden FOM/1951/2005 de 10 de Junio, por la que se aprueba la Instrucción sobre las inspecciones técnicas
en los puentes de ferrocarril (BOE 24/06/2005). [24] MIVES I Project. “Integrated Model for a Sustainable Constructive Design. Aplication to Industrial and Service
Buildings”; Ministerio de Ciencia y Educacion: Madrid, Spain. 2002. [25] MIVES II Project. “Sustainability through Value Analysis Applied to Several Fields”; Ministerio de Ciencia y
Educacion: Madrid, Spain. 2005. [26] MIVES III Project. “Towards Sustainability in Construction through Value Analysis with and without Uncertainty”;
Ministerio de Ciencia y Educacion: Madrid, Spain. 2009. [27] MIVES IV Project. “Quantification of Sustainability in Construction Engineering with and without Uncertainty”;
Ministerio de Ciencia y Educacion: Madrid, Spain. 2010. [28] Piñero, I. (2013). “ Methodology to prioritize and plan, in a sustainable way, the rehabilitation of degraded
structures”. Doctoral thesis. University of the Basque Country. [29] Piñero, I., Murcia-Delso, J., Aurtenetxe, J. (2016). Value-based method for condition assessment and management
of bridges. Delft .ISBN: 978-90-365-4325-5

WG4 and WG5 WORKSHOP
Sustainable Bridge Management
27th – 28th September 2018
Barcelona, Spain
Bridge life cycle management through
innovation: A practical example with GENIA
tool for inspection and assessment
Jesus Isoird - Tecnalia, Spain. Director of Infrastructures business area
Iñaki Piñero – Tecnalia, Senior Researcher

1. Introduction
2. The perspective of the life cycle in bridges
3. The role of innovation in bridge inspection and assessment
4. The importance of bridge management systems
5. Genia: Tecnalia’s bridge management system
6. Conclusions
SLIDE 150
Table of Contents
Bridge life cycle management through innovation: A practical example with GENIA tool for inspection and assessment | Jesus Isoird ET AL
WG4 and WG5 WORKSHOP
27th – 28th September 2018
Barcelona, Spain
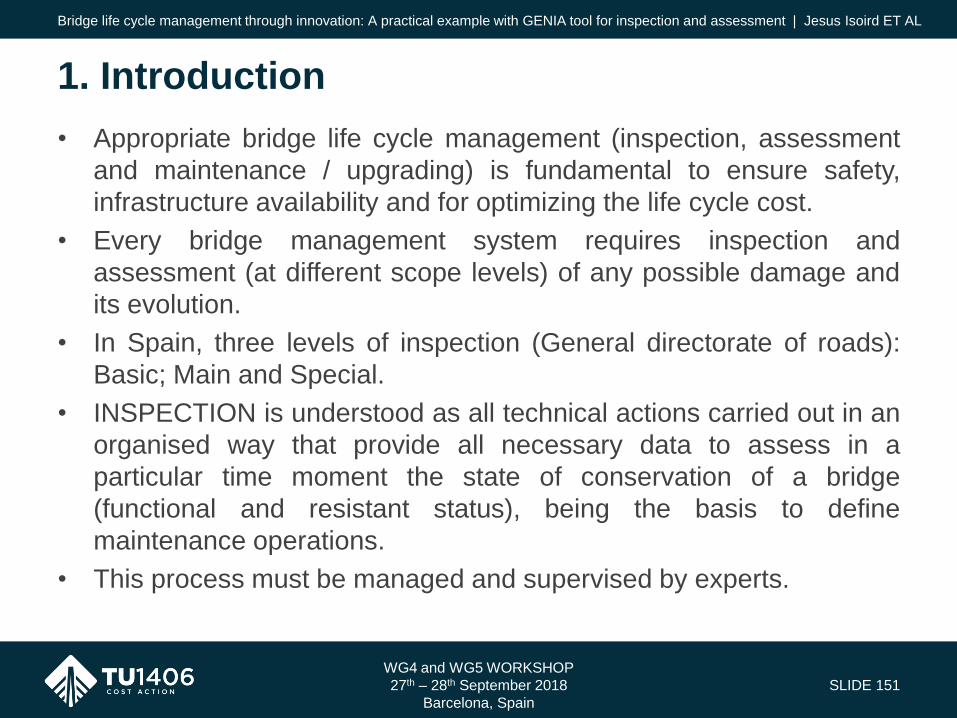
• Appropriate bridge life cycle management (inspection, assessment
and maintenance / upgrading) is fundamental to ensure safety,
infrastructure availability and for optimizing the life cycle cost.
• Every bridge management system requires inspection and
assessment (at different scope levels) of any possible damage and
its evolution.
• In Spain, three levels of inspection (General directorate of roads):
Basic; Main and Special.
• INSPECTION is understood as all technical actions carried out in an
organised way that provide all necessary data to assess in a
particular time moment the state of conservation of a bridge
(functional and resistant status), being the basis to define
maintenance operations.
• This process must be managed and supervised by experts.
SLIDE 151
1. Introduction
Bridge life cycle management through innovation: A practical example with GENIA tool for inspection and assessment | Jesus Isoird ET AL
WG4 and WG5 WORKSHOP
27th – 28th September 2018
Barcelona, Spain
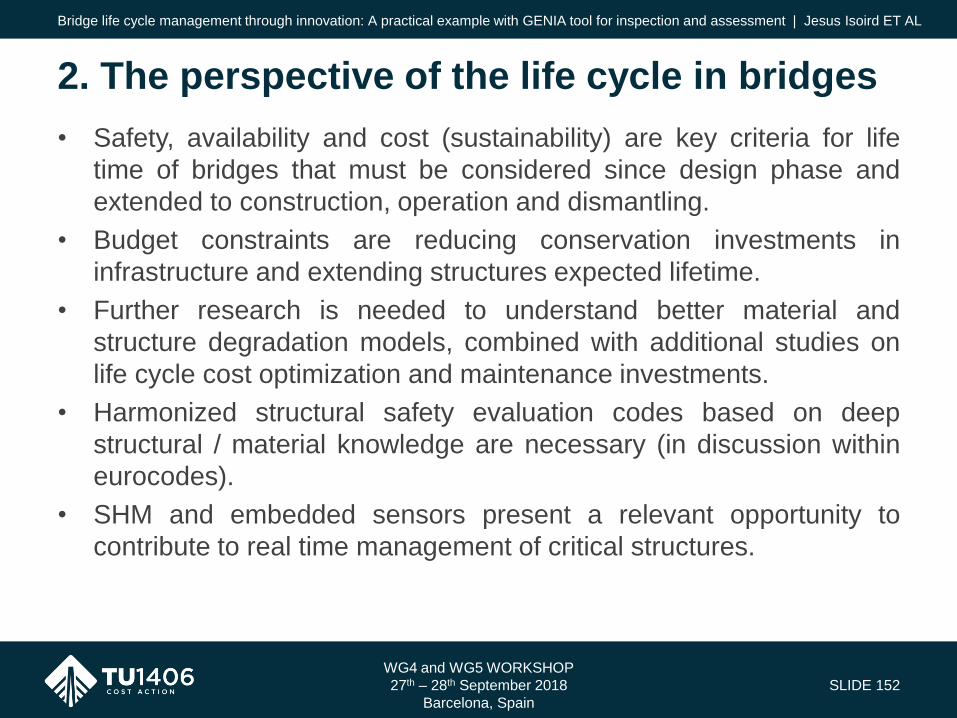
• Safety, availability and cost (sustainability) are key criteria for life
time of bridges that must be considered since design phase and
extended to construction, operation and dismantling.
• Budget constraints are reducing conservation investments in
infrastructure and extending structures expected lifetime.
• Further research is needed to understand better material and
structure degradation models, combined with additional studies on
life cycle cost optimization and maintenance investments.
• Harmonized structural safety evaluation codes based on deep
structural / material knowledge are necessary (in discussion within
eurocodes).
• SHM and embedded sensors present a relevant opportunity to
contribute to real time management of critical structures.
SLIDE 152
2. The perspective of the life cycle in bridges
Bridge life cycle management through innovation: A practical example with GENIA tool for inspection and assessment | Jesus Isoird ET AL
WG4 and WG5 WORKSHOP
27th – 28th September 2018
Barcelona, Spain
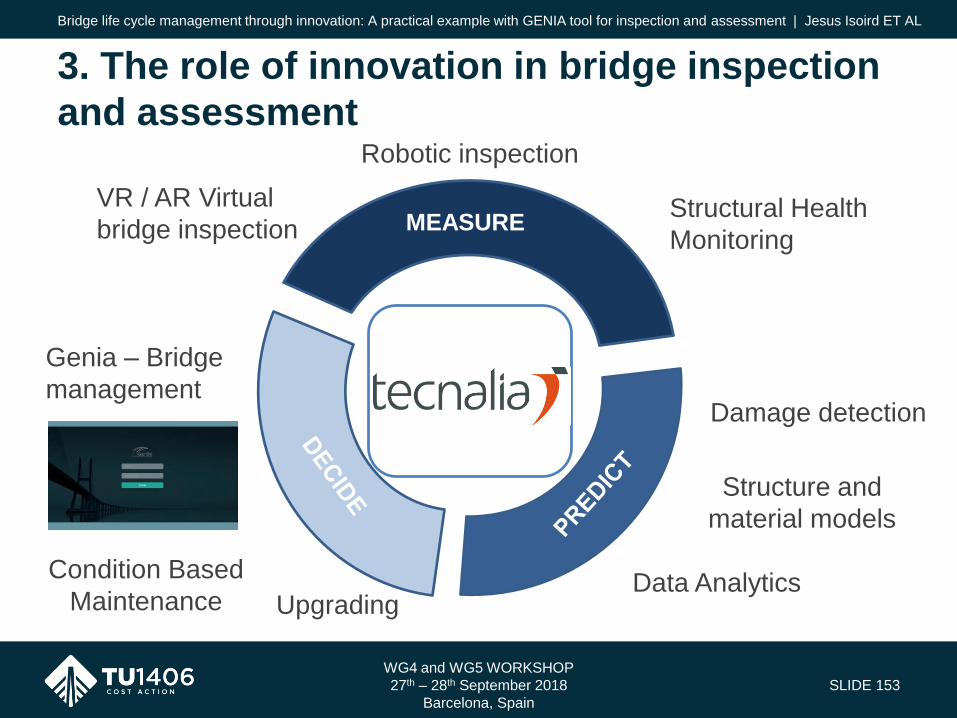
SLIDE 153
3. The role of innovation in bridge inspection
and assessment
Bridge life cycle management through innovation: A practical example with GENIA tool for inspection and assessment | Jesus Isoird ET AL
Genia – Bridge
management
VR / AR Virtual
bridge inspection MEASURE
Robotic inspection
Structural Health
Monitoring
Condition Based
Maintenance
Structure and
material models
Data AnalyticsUpgrading
Damage detection
WG4 and WG5 WORKSHOP
27th – 28th September 2018
Barcelona, Spain
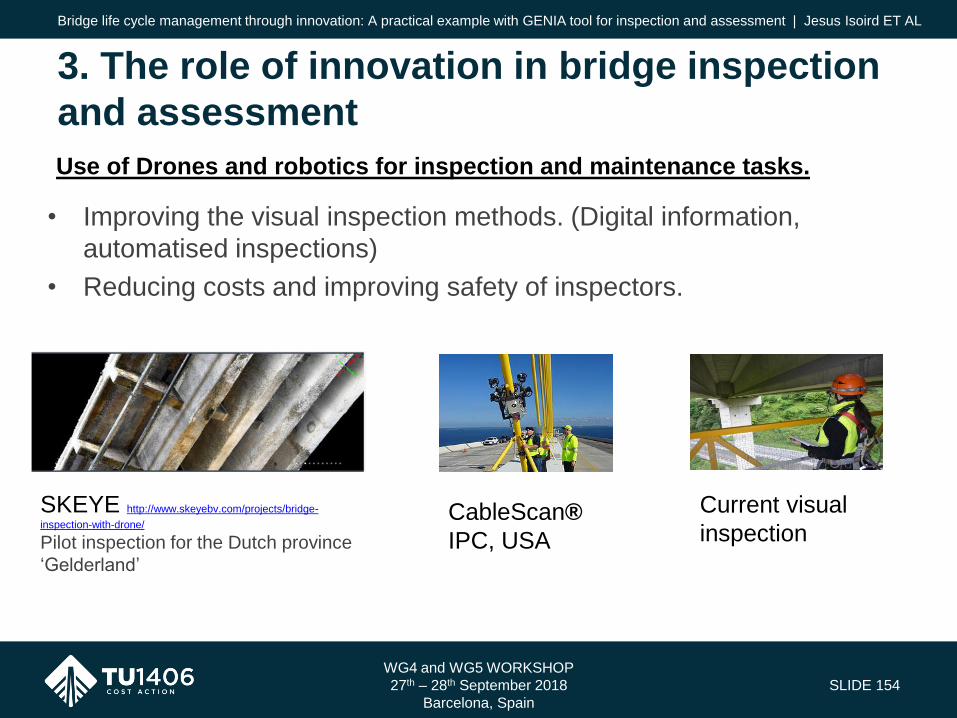
• Improving the visual inspection methods. (Digital information,
automatised inspections)
• Reducing costs and improving safety of inspectors.
SLIDE 154
3. The role of innovation in bridge inspection
and assessment
Bridge life cycle management through innovation: A practical example with GENIA tool for inspection and assessment | Jesus Isoird ET AL
Use of Drones and robotics for inspection and maintenance tasks.
SKEYE http://www.skeyebv.com/projects/bridge-
inspection-with-drone/
Pilot inspection for the Dutch province
‘Gelderland’
CableScan®
IPC, USA
Current visual
inspection
WG4 and WG5 WORKSHOP
27th – 28th September 2018
Barcelona, Spain

Structural Health Monitoring, SHM.
• Reduction of monitoring costs increases the interest for the use of
sensing technologies.
• Research is needed to improve structural models.
• Hybrid models with data analytics can make a step forward in the
use of data.
• SHM can be design for critical structures or focused on specific
elements to be controlled.
• The detection of damage through SHM systems can also allow to
determine the current condition of the structure.
SLIDE 155
3. The role of innovation in bridge inspection
and assessment
Bridge life cycle management through innovation: A practical example with GENIA tool for inspection and assessment | Jesus Isoird ET AL
WG4 and WG5 WORKSHOP
27th – 28th September 2018
Barcelona, Spain
Digital Twin based on BIM technology.
• Virtual replicas of objects or processes that simulate the behavior of
their real counterparts. The purpose is to analyze its effectiveness or
behavior in certain cases to improve its effectiveness.
• Digital Twins will transform the processes of construction and the
maintenance of infrastructures.
• They will offer new ways to reduce costs, monitor assets, optimize
maintenance, reduce downtime and allow the creation of new
connected products. This concept is already part of the strategy of
companies dedicated to innovation and product design of Industry
4.0.
SLIDE 156
3. The role of innovation in bridge inspection
and assessment
Bridge life cycle management through innovation: A practical example with GENIA tool for inspection and assessment | Jesus Isoird ET AL
WG4 and WG5 WORKSHOP
27th – 28th September 2018
Barcelona, Spain

SLIDE 157
3. The role of innovation in bridge inspection
and assessment
Bridge life cycle management through innovation: A practical example with GENIA tool for inspection and assessment | Jesus Isoird ET AL
Relevant EU coordinated research projects in development.
• Ragtime (H2020) on innovative asset
management. http://ragtime-asset.eu/
• Fasstbridge (infravation) on fast and
effective solutions for Steel bridges live
extension https://fasstbridge.eu/
• FORESEE (H2020) on resilient
infrastructure with specific focus on real
time data managment and structural
diagnosis.
WG4 and WG5 WORKSHOP
27th – 28th September 2018
Barcelona, Spain
Every management system must be easily manageable and offerobjective data on the status of the bridges along their life. They shouldinclude:
1. Inventory of all structures and general data of Project
2. Inspections based on systematic tasks
3. Evaluation of structure condition index
4. Estimated cost of repair work
5. Strategic prioritization for intervention
A complete management system must have the capacity to perform thecontrol and follow-up of the repairs undertaken, which will serve toevaluate the effectiveness of the adapted measures, as well as tocalibrate and correct future actions.
SLIDE 158
4. The importance of bridge management
systems
Bridge life cycle management through innovation: A practical example with GENIA tool for inspection and assessment | Jesus Isoird ET AL
WG4 and WG5 WORKSHOP
27th – 28th September 2018
Barcelona, Spain
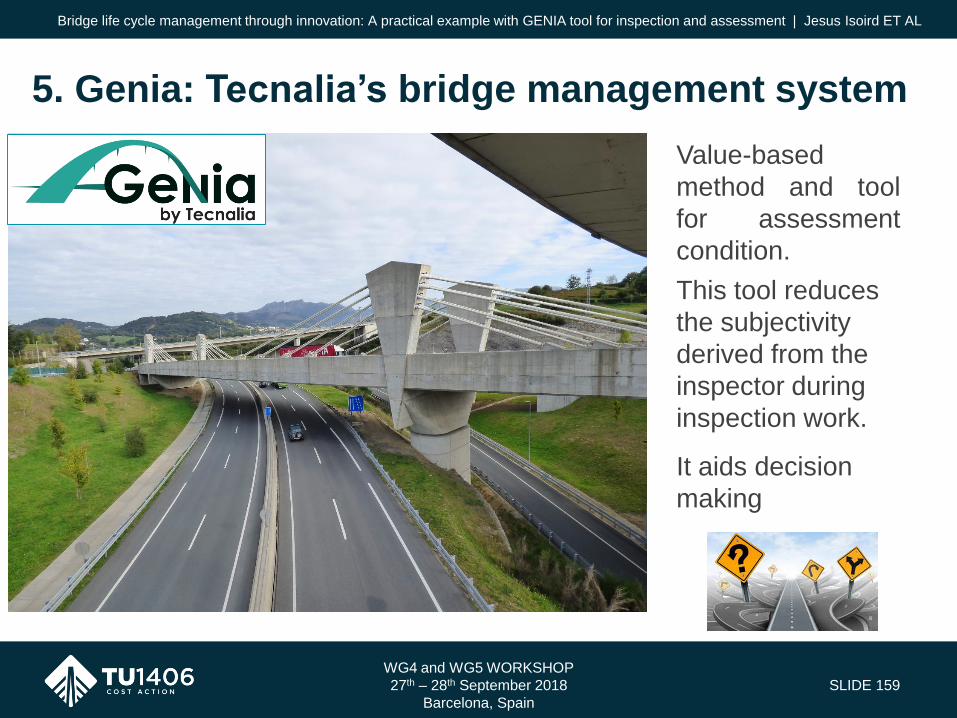
Value-based
method and tool
for assessment
condition.
This tool reduces
the subjectivity
derived from the
inspector during
inspection work.
It aids decision
making
SLIDE 159
5. Genia: Tecnalia’s bridge management system
Bridge life cycle management through innovation: A practical example with GENIA tool for inspection and assessment | Jesus Isoird ET AL
WG4 and WG5 WORKSHOP
27th – 28th September 2018
Barcelona, Spain

• GENIA integrates all Project data valid
for serveral operation needs from
inventory, inspection, assessment and
reporting, and investment decision
support module.
• It is developed with the concept of
Software as a Service (SaaS) through
a web tool giving access to the users
from the desktop or on the field during
inspection works.
SLIDE 160
Bridge life cycle management through innovation: A practical example with GENIA tool for inspection and assessment | Jesus Isoird ET AL
5. Genia: Tecnalia’s bridge management system
WG4 and WG5 WORKSHOP
27th – 28th September 2018
Barcelona, Spain

SLIDE 161
Bridge life cycle management through innovation: A practical example with GENIA tool for inspection and assessment | Jesus Isoird ET AL
Introducing Bridges:
Databases
Catalogues
Inventory
Historic information
Detailed information and elements:
Structuring information and component
naming(by levels)
Typology and definition of elements
Extension to similar elements with different
naming.
5. Genia: Tecnalia’s bridge management system
SLIDE 161
WG4 and WG5 WORKSHOP
27th – 28th September 2018
Barcelona, Spain

Bridge life cycle management through innovation: A practical example with GENIA tool for inspection and assessment | Jesus Isoird ET AL
Activate and asigne bridges:
Activate inspection
Asigne inspection: dates and inspectors
Inspection:
Identify damages
Attache images and relevant information
5. Genia: Tecnalia’s bridge management system
SLIDE 162
WG4 and WG5 WORKSHOP
27th – 28th September 2018
Barcelona, Spain
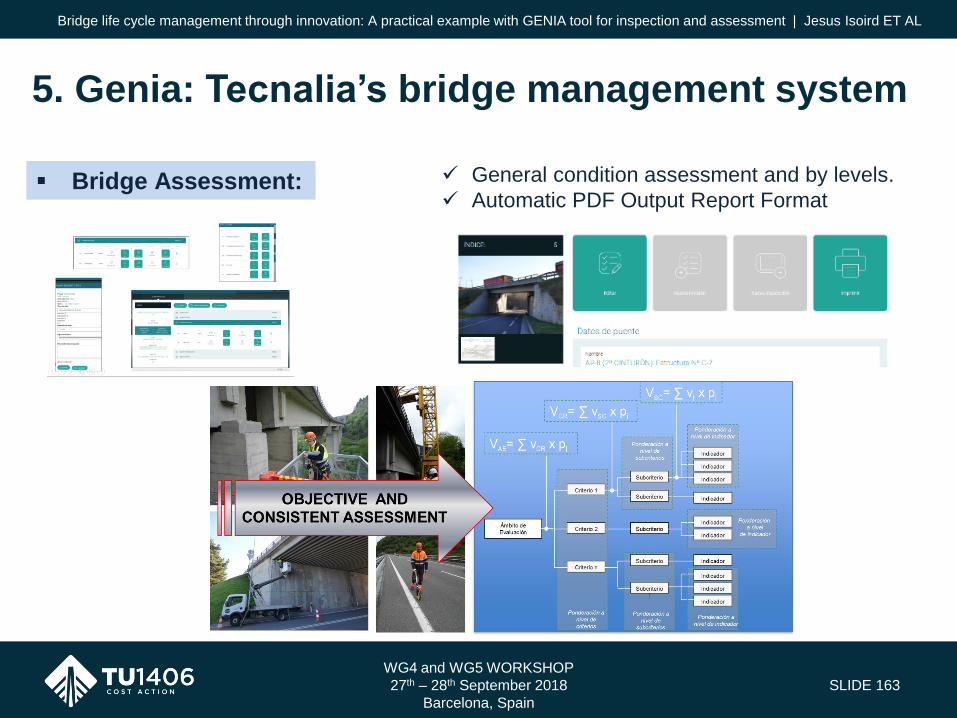
Bridge life cycle management through innovation: A practical example with GENIA tool for inspection and assessment | Jesus Isoird ET AL
Bridge Assessment: General condition assessment and by levels.
Automatic PDF Output Report Format
5. Genia: Tecnalia’s bridge management system
SLIDE 163
WG4 and WG5 WORKSHOP
27th – 28th September 2018
Barcelona, Spain
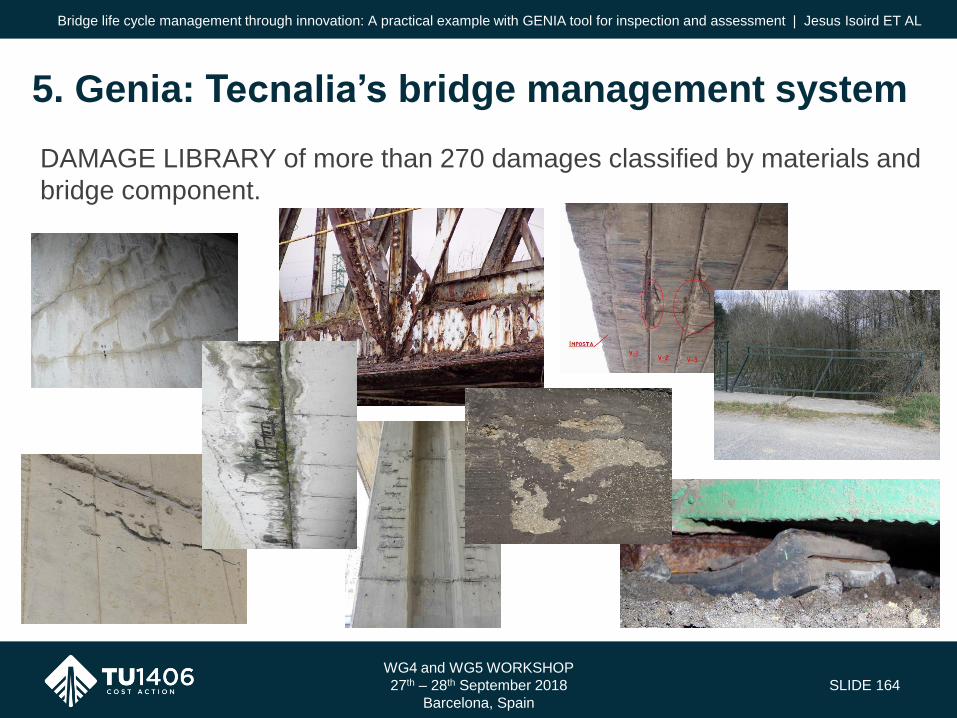
DAMAGE LIBRARY of more than 270 damages classified by materials and
bridge component.
SLIDE 164
Bridge life cycle management through innovation: A practical example with GENIA tool for inspection and assessment | Jesus Isoird ET AL
5. Genia: Tecnalia’s bridge management system
WG4 and WG5 WORKSHOP
27th – 28th September 2018
Barcelona, Spain
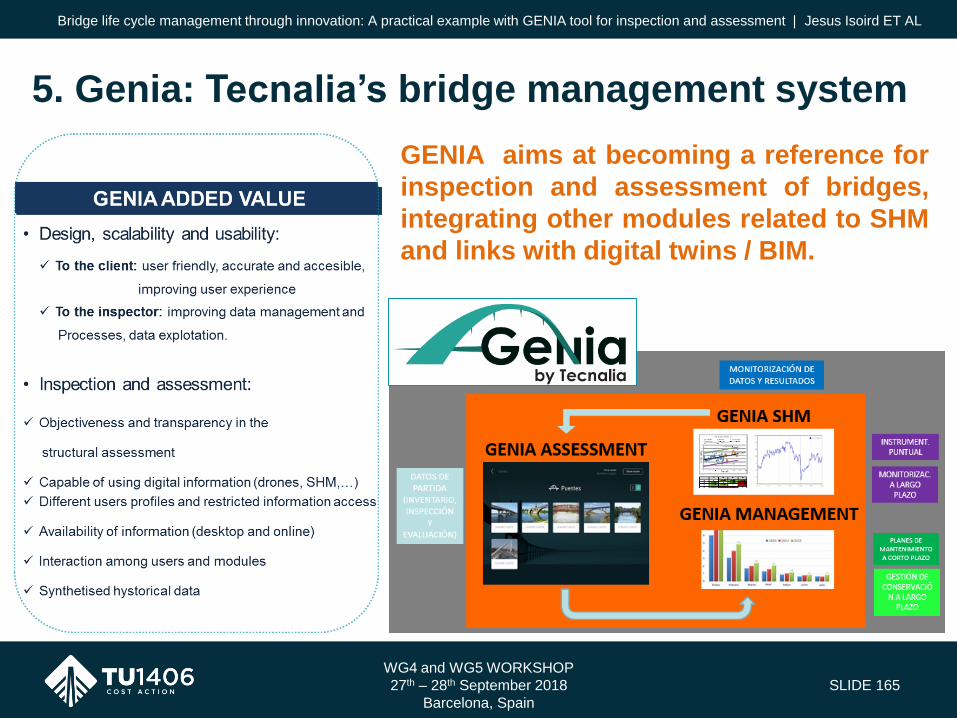
Bridge life cycle management through innovation: A practical example with GENIA tool for inspection and assessment | Jesus Isoird ET AL
5. Genia: Tecnalia’s bridge management system
GENIA aims at becoming a reference for
inspection and assessment of bridges,
integrating other modules related to SHM
and links with digital twins / BIM.
SLIDE 165
WG4 and WG5 WORKSHOP
27th – 28th September 2018
Barcelona, Spain

• Bridge inspection and assessment based on strong knowledge and expertise.
• New knowledge and technologies will impact infrastructure management.
• New management tools like GENIA should contribute to:
– Improve the processes for inspection and assessment (quality and safety)
– Possess operational, consistent and easily accessible information on the characteristics and status of deterioration of all structures.
– Assess the safety and condition of structures with an objective method.
– Provide decision support for maintenance actions and optimizing the use of limited budget.
– The integration of data from the digital inspection technologies, SHM, and new digital environments.
WG4 and WG5 WORKSHOP
27th – 28th September 2018
Barcelona, Spain
SLIDE 166
6. Conclusions
Bridge life cycle management through innovation: A practical example with GENIA tool for inspection and assessment | Jesus Isoird ET AL

THANK YOU FOR YOUR ATTENTION!
WWW.TU1406.EU

WG4 and WG5 WORKSHOP
Sustainable Bridge Management
27th – 28th September 2018
Barcelona, Spain
LIFE-CYCLE ASSESSMENT OF A
MASONRY ARCH BRIDGENaida Ademović - University of Sarajevo, Faculty of Civil Engineering, Bosnia
and Herzegovina

QUALITY SPECIFICATIONS FOR ROADWAY BRIDGES,
STANDARDIZATION AT A EUROPEAN LEVEL
Barcelona,
27th – 28th September, 2018
1
LIFE-CYCLE ASSESSMENT OF A MASONRY ARCH BRIDGE
Naida Ademovic1,
1 Associate Professor, Faculty of Civil Engineering, University of Sarajevo, Patriotske lige 30, 71 000 Sarajevo,
Bosnia and Herzegovina
E-mails: [email protected] 1
Abstract. Design of the new bridges takes care of the economic, technical, and safety issues. Still the issue of
their environmental performance and influence is not tacked in the right way. It is the global methodology of Life Cycle
Assessment which takes into account not only economical but also environmental and lately some attempts are done to
take into account socio-cultural impacts. The paper elaborated the environmental impact of the bridge reconstruction
and indicates the impact data for stonework maintenance. Bridges are designed for life of 120 years, while masonry
arch bridges have proven to be sustainable long-lasting structures requiring low maintenance. Special attention has to
be given to bridges of cultural heritage.
Keywords: life cycle assessment, environmental impact, masonry arch bridges, deterioration, maintenance,
strengthening
1. Introduction
Bridges are an integral part of the transportation vain in one country and a vital part of the modern society. Apart
from that, masonry arch bridges are a cultural bench mark of a certain historical period and special procedures have to be
respected during its rehabilitation and strengthening procedures. Numerous examples in literature are available regarding
Life Cycle Assessment of concrete, pre-stressed and steel bridges (Gervasio, deSilva 2008), (Rantala 2010), (Dequidt
2012), (Mousavi 2013), (Widman 2000), (Mara et al. 2013), (Du, Karoumi 2013), (Du, Karoumi 2013a), (Hammervold
2013), (Ademović 2018). However, there is very limited data regarding masonry arch bridges. On the basis of the
European research project “SeRoN – Security of Road Transport Networks”, which was concentrated on the investigation
on bridges and tunnels on major highways of the Trans European Road Network (TEN-T roads), on the length of 26.400
km, a number of various bow bridge/arch bridge in respect to their type and material exist: reinforced concrete bow having
reinforced or prestressed concrete deck and composite deck; steel bow of composite deck and steel deck, and brick bow
made of masonry/stone (Kaundinya, Heimbecher 2011). In Europe 25% of all road bridges are masonry (Bień, 2007),
whereas for the railway bridges 60% are made of masonry, 23% concrete, 22% metallic (Sustainable bridge project,
2004).
In the process of life assessment of bridges several elements have to be considered; the ones of age which is directly
connected to maintenance and different procedures of rehabilitation, repair or strengthening, and the others relating the
increase in the weight of trucks and the transport facilities going over the bridge. It is amazing that taking all these
considerations into account, masonry bridges aged over 200 years are still standing and taking over the passing traffic. It
was concluded (Transportation Research Board of the National Academy of Sciences 2013) that this can be connected
with bridges which have been feasible to maintain, adaptable to changes in traffic demands and originally overdesigned.
One has to pose a question, why are masonry bridges not constructed anymore? They have proved to have a much
longer life than concrete or steel bridges (life expectancy less than 120 years) on one hand, and on the other require low
maintenance needs in comparison with bridges made of concrete or steel.
In order to complete the Life Cycle Assessment, it is vital to start taking into account environmental impact and
sustainability into account.
2. Sustainability
How do we define if something is sustainable or not? There are various definitions regarding this issue, one given
by the World Commission on Environment and Developments, says: “Sustainable development is development that meets
the needs of the present, without compromising the ability of future generations to meet their own needs”.

LIFE-CYCLE ASSESSMENT OF MASONRY ARCH BRIDGES
2
There are three primary objectives of sustainable development. One of economic growth, environmental protection
and social inclusion. Each of these elements is equally important and in order to achieve sustainable development no
hierarchy among them should exist. This indicates that all of these objectives are cross linked and sustainable development
is in the center of this interaction as denoted in Fig. 1.
Fig. 1. Sustainable development (https://www.quora.com/What-are-the-advantages-of-sustainable-development)
3. Brick Arch Bridge in Bosnia and Herzegovina-Mehmed Paša Sokolović Bridge
Bridge Mehmed-paša Sokolović over the Drina river in Višegrad was built at the end of the 16th century (1571-
1577). The construction of the bridge was entrusted to the famous builder of the Ottoman Empire Mimar Koça Sinan ibn
Abd al-Mannan. This bridge represents one of the pearls of monumental architecture throughout the Ottoman Empire
(Ademović, Kurtović 2017). The 179.5 m length bridge consists of 11 stone arches ranging from 11 m to 15 m and an
access ramp at a right angle to 4 ports on the left bank of the Drina River (Fig. 2).
Fig. 2. Bridge Mehmed-paša Sokolović over the Drina river in Višegrad (http://www.avlija.me/kulturna-
bastina/mehmed-pase-sokolovica)
During its long history the bridge experienced various damages due to floods (1664, 1875, 1896, 1911, 1939 and
1940), war actions (1914-1915 and 1939-1940) and underwent several rehabilitation and reconstruction scenarios. During
one of its reconstruction a temporary steel arch structure was constructed over the bridge in 1915 and stayed there until
1939 (Fig. 3). Additionally, due to the natural and manmade disasters, the bridge was exposed to heavy traffic for which
it has not been designed. However, it was only in 1977, given the traffic load, which was then 10,000 kg per 24 hours,
concluded that the bridge was endangered (Ademović, Kurtović 2017). As a result, a design for rehabilitation of the bridge
was conducted including strengthening of the foundations, rehabilitation of piers and replacement of the deck structure.
Further, the construction of two power plants, one downstream of the bridge in 1968, and the other upstream of the
bridge in 1989, had a significant impact on the bridge. It was already in 1977 that damages were observed on the bridge
not only due to bad maintenance and heavy traffic but also due to the operation of the power plant. The bridge is now
located between two accumulation basins which significantly changes the atmospheric actions on the bridge elements.
One of the elements to be considered is the micro climate that is very specific to this region. The maximum relative
humidity of the air in Višegrad ranges from 77% in August to 88% during the winter months (Ademović, Kurtović 2017).
Long lasting bridges are the ones that have had a good form, material, construction, abutments, and maintenance and no

QUALITY SPECIFICATIONS FOR ROADWAY BRIDGES,
STANDARDIZATION AT A EUROPEAN LEVEL
Barcelona,
27th – 28th September, 2018
3
military damage (Marland and Weinberg 1998). Regardless of all this, the construction of the bridge has remained
remarkably firm and steady (Hadzimuharemović 2007).
Fig. 3. Bridge Mehmed-paša Sokolović after destruction of the spans during I World War and with the steel arch
structure (http://www.avlija.me/kulturna-bastina/mehmed-pase-sokolovica)
It can be concluded that traffic and environmental effects, were the two main causes for deterioration of bridges,
which was the case here as well, leading to critical conditions followed by required repair/strengthening and replacement
of some elements of the bridge (Tomor 2013). In that respect a new road bridge 2 km downstream of the Bridge Mehmed-
paša Sokolović was built in the 1980’s (Gojković 1989).
In March 2003, the Commission for the Preservation of National Monuments of Bosnia and Herzegovina made the
decision to declare the historic monument Mehmed-paša Sokolović Bridge in Višegrad as a national monument of Bosnia
and Herzegovina (Odluka 2003) and on the 31st session the bridge was placed on the list of UNESCO monuments. The
restauration of the bridge took place from 2013 and was finalized in 2015. Foreseen works were the remediation of bridge
foundation damaged by erosion in the river bed; laying stone blocks in the river basin 30 meters upstream and downstream
of the bridge to prevent further erosion of the foundation; self-cleaning vegetation; removal of cement mortar from joints
connecting the stone blocks, and repointing with appropriate lime mortar; remediation of access ramps on the left bank
of the Drina river; removal of a carriage way structure and laying of stone slabs; and removal of lighting on the bridge
and installation. Additionally, it was decided, after many years, to close the bridge for traffic and its use now is for
pedestrians only.
4. Life Cycle Assessment
Life Cycle Assessment (LCA) determines the environmental impacts of products, processes or services, through
production, usage, and disposal. It is a method being independent of the construction or material (Ademović 2018). Life
cycle of a bridge is a rather unique feature, which depends on numerous influencing factors, even for bridges that have a
similar or common service. In this respect each structure has to be elaborated separately and no general conclusions can
be made ad hoc.
Frequency of the maintenance activities were taken from the proposal given by (Steele et. al 2003) and presented in
Table 1.
Table 1. Frequency of maintenance activities
Maintenance activity Activity frequency: years
Vegetation removal 5
Coping stone replacement/realignment 10
Brickwork maintenance: repoint/renew 15
Parapet repairs/replacement 15
Invert clearance 20
Cutwaters replaced 40
First refurbishment scheme 120
Second refurbishment scheme 200
Due to the lack of maintenance the bridge was at risk from self-sown vegetation (Fig 4.).
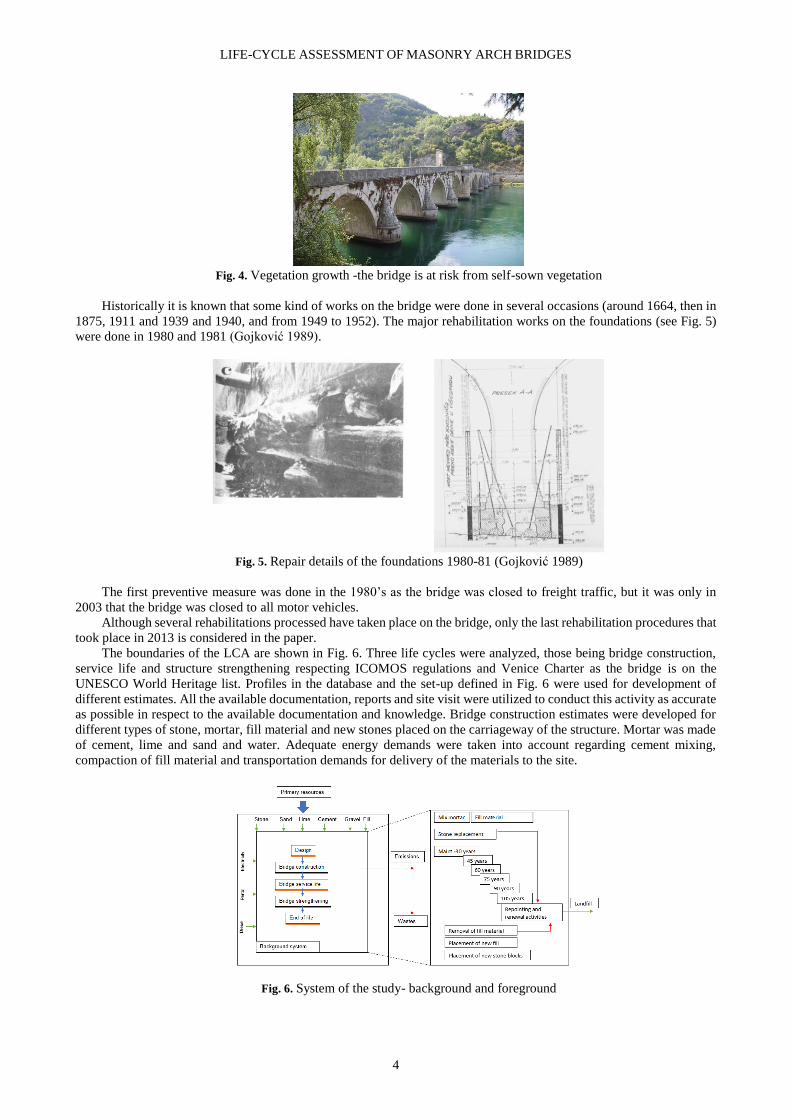
LIFE-CYCLE ASSESSMENT OF MASONRY ARCH BRIDGES
4
Fig. 4. Vegetation growth -the bridge is at risk from self-sown vegetation
Historically it is known that some kind of works on the bridge were done in several occasions (around 1664, then in
1875, 1911 and 1939 and 1940, and from 1949 to 1952). The major rehabilitation works on the foundations (see Fig. 5)
were done in 1980 and 1981 (Gojković 1989).
Fig. 5. Repair details of the foundations 1980-81 (Gojković 1989)
The first preventive measure was done in the 1980’s as the bridge was closed to freight traffic, but it was only in
2003 that the bridge was closed to all motor vehicles.
Although several rehabilitations processed have taken place on the bridge, only the last rehabilitation procedures that
took place in 2013 is considered in the paper.
The boundaries of the LCA are shown in Fig. 6. Three life cycles were analyzed, those being bridge construction,
service life and structure strengthening respecting ICOMOS regulations and Venice Charter as the bridge is on the
UNESCO World Heritage list. Profiles in the database and the set-up defined in Fig. 6 were used for development of
different estimates. All the available documentation, reports and site visit were utilized to conduct this activity as accurate
as possible in respect to the available documentation and knowledge. Bridge construction estimates were developed for
different types of stone, mortar, fill material and new stones placed on the carriageway of the structure. Mortar was made
of cement, lime and sand and water. Adequate energy demands were taken into account regarding cement mixing,
compaction of fill material and transportation demands for delivery of the materials to the site.
Fig. 6. System of the study- background and foreground

QUALITY SPECIFICATIONS FOR ROADWAY BRIDGES,
STANDARDIZATION AT A EUROPEAN LEVEL
Barcelona,
27th – 28th September, 2018
5
Repointing of the stonework and replacement of the stonework represent material replacement activities. The entire
surface of the bridge was investigated and depending on the state of the surface different levels of maintenance were
defined (good, average and poor), which would take place at a standard 15-year frequency. Taking into account the
amount of the stone and mortar replacement as well as repointing, material quantities were calculated. Replacement of
the fill in material was taken as the disposal material and transport of this material to the disposal site was taken into
account at a distance of 20 km.
5. Impact assessment
The starting point for determination of the environmental impact various impact categories were utilized. Within the
impact categories, substances are grouped into classes in respect to their contribution to environmental impact. The
quantity of each emission is weighted by damage factors in order to present the contribution of a certain emission to the
impact category (Stelle et al. 2003). Three damage categories were considered: Human Health (HH), Ecosystem Quality
(EQ) and Resources (R). Within in HH three impact categories were taken into account HH – Carcinogen: cancers due to
toxic chemicals in air, drinking water and food; HH - Respiratory organic: respiratory diseases due to toxic chemicals in
air, drinking water and food and HH - Respiratory inorganic: respiratory diseases due to toxic chemicals in air, drinking
water and food. Two Ecosystem Qualities: EQ - Eco-toxicity: the potentially affected fraction of species in relation to the
concentration of toxic substances and EQ - Acidification and eutrophication: a measure of reduction in plant and animal
diversity. Resources were taken into account as Fossil fuels: qualitative structure of resources and continued decreasing
concentration.
5.1. Results and discussion
Results obtained form the environmental analysis of the selected bridge structure are presented in Fig 7. It is
straightforward that the demand for the stone replacement represents the biggest issue of all the investigated categories.
This is quite understandable due to a large amount of material and reopening of the quarry and explanation of the stone,
as well as all required processes required for stone preparation. The next larges impact is one of the mortar production
used in the repointing process of the large area of the bridge.
Fig. 7. Environmental impact of the bridge reconstruction Fig. 8 Impact data for stonework maintenance
Repointing in respect to renewal of stonework has a much smaller impact. As it can be seen from the Fig. 8 stone removal
represents always an amount greater than 73%. On the other hand, repointing is less than 22%, having minimal impact
on the environments and represents a valuable investment. The increase from poor to good maintenance is 15%, which is
much smaller in respect to the removal of the bridge structure, which is in this situation not acceptable as it is a UNESCO
monument. It is well known that good maintenance prevents and prolongs the structure deterioration and as a consequence
extends the life of the structure. In that respect stonework maintenance can be seen as an environmental saving.
6. Conclusion
Environmental impact of a stone bridge was investigated utilizing a proposed methodology. Several key impact
categories were selected in order to analyze environmental impact with the utilization of the life cycle assessment.
This was an attempt to use the methodology provided by Steele (Stelle et al. 2003). It is evident that larger works
encompassing of renewal of the stone works represents the biggest contribution to the environmental impact during the
0%
10%
20%
30%
40%
50%
60%
70%
80%
90%
100%
HH – Carcinogen HH - Respiratoryorganic
HH - Respiratoryinorganic
EQ - Eco-toxicity EQ - Acidificationand
eutrophication
Resources Fossilfuels
Rel
ati
ve i
mp
act
Impact category
Stone transport Fil transport Displacement of stone Fill material Mortar mix Stone
0102030405060708090
100
Rel
ati
ve i
mp
act
%
Impact category
Average stone renewal rate Average stone repointing rate Disposal of waste

LIFE-CYCLE ASSESSMENT OF MASONRY ARCH BRIDGES
6
life time of a bridge. Maintenance on the other hand has been identified to have a rather small impact on the environment
and prolongs the life of the bridge.
In the process of application of the life cycle assessment it is necessary to expand our views and besides
environmental impacts take into account socio-cultural aspect, even though they are difficult to assess. Sometimes these
aspects can lead to different scenarios in respect to the ones obtained from economic and environmental assessment
(Ademović 2018). This is not taken into account in this paper but should be something to be considered and evaluated.
References
Ademović N. 2018. Life-cycle Assessment of Composite Bridges-Some Experiences. Quality Specifications for
Roadway Bridges, Standardization at a European Level. COST TU 1406, WG3, WG4 and WG5 WORKSHOP.
Sustainable Bridge Management. Wroclaw, Poland. 1-2 May, 2018, 1-6
Ademović N., Kurtović A. 2017. Bridges from the Ottoman Period in Bosnia snd Herzegovina. eZbornik, No. 14,
14 December: 31-46, ISSN 2232-9080. http://gf.sum.ba/e-zbornik/e_zbornik_14_03.pdf
Bień J., Kamiński T. 2007. Damage to Masonry Arch Bridges-Proposal for Terminology Unification, Proceedings
of the 5th International Conference on Arch Bridges, ARCH’07.: 1-8, Editors: Paulo B. Lourenço, Daniel V. Oliveira,
Artur Portela, Madeira, Portugal
Dequidt, T.C.E. 2012. Life Cycle Assessment of a Norwegian Bridge, Master Thesis. Norwegian University of
Science and Technology, Department of Civil and Transport Engineering.
Du, G., Karoumi, R. 2013. Environmental Life Cycle Assessment Comparison Between Two Bridge Types:
Reinforced Concrete Bridge and Steel Composite Bridge.: 1-10. SCMT3, Third international Conference on Sustainable
Materials and Technologies.
Du, G., Karoumi R., 2013. Life Cycle Assessment of a Railway Bridge: Comparison of Two Superstructure Designs,
Structure and Infrastructure Engineering: Maintenance, Management, Life-Cycle Design and Performance, 9(11).: 1149-
1160
Gervasio, H., and deSilva L.S. 2008. Comparative Life-Cycle Analysis of Steel-Concrete Composite Bridges.
Structure and Infrastructure Engineering, Vol.4, No.4, August 2008.: 251-269. DOI:https://doi.org/10.17226/1093
Gojković, M. 1989: Stari kameni mostovi. Beograd: Naučna knjiga
Hadzimuharemović, A. 2007. The Bridge Among People and Distant Lands, Baština
Hammervold J., Reenaas, M., Brattebø H., 2013. Environmental Life Cycle Assessment of Bridges, J. Bridge Eng.
18:153-161.
Kaundinya I., Heimbecher F. 2011. Identification and Classification of European Bridge and Tunnel Types. :1-8.
IABSE-IASS. http://www.seron-project.eu/download/Full-paper_IABSE_IASS_2011_Kaundinya.pdf
Mara, V., Haghani, R., Sagemo, A., Storck, L., Nilsson D. 2013. Comparative Study of Different Bridge Concepts
Based on Lifecycle Cost Analyses and Life-Cycle Assessment.: 1-8.
http://publications.lib.chalmers.se/records/fulltext/193796/local_193796.pdf
Marland, G., and Weinberg, A. M. 1988. Longevity of Infrastructure. Cities and Their Vital Systems, J. H. Ausubel
and R. Herman, eds., National Academy Press, Washington, D.C..: 312-332.
Mousavi, M. 2013. Life Cycle Assessment of Portland Cement and Concrete Bridge, Concrete Bridge vs. Wooden
Bridge, Royal Institute of Technology, Master of Science Thesis. Stockholm
Odluka o Proglašenju Istorijskog Spomenika Mosta Mehmed-paše Sokolovića u Višegradu Nacionalnim
Spomenikom Bosne i Hercegovine, Komisija za Očuvanje Nacionalnih Spomenika BiH
(http://old.kons.gov.ba/main.php?id_struct=6&lang=1&action=view&id=769). 2003
Rantala, T. 2010. Life Cycle Analysis of three Finnish Standard Bridges, Liikennevirasto, Helsinki
https://julkaisut.liikennevirasto.fi/pdf3/life_cycle_analysis_of_three_finnish_standard_bridges_web.pdf
Steele, K., Cole, G., Parke, G., Clarke, B., and Harding, J. 2003. Environmental Impact of Brick Arch Bridge
Management, Proceedings of the Institution of Civil Engineers, Structures and Buildings 156, August 2003, Issue SB3.
:273-281
Sustainable bridge project. 2004. Assessment for Future Traffic Demands and Longer Lives, D.1.2. European
Railway Bridge Demography. Availabe from: http://suistanablebridges.net (accessed 16 June 2013)
Tomor A. 2013. Life-Cycle Assessment and Deterioration Models for Masonry Arch Bridges, The Sustainable City
VIII. Vol. 1.: 535-546
Widman J. 2000. Experiences from Life-Cycle Assessments on Steel and Concrete Composite Bridges.
http://www.irbnet.de/daten/iconda/CIB8517.pdf. :1-8

WG4 and WG5 WORKSHOP
Sustainable Bridge Management
27th – 28th September 2018
Barcelona, Spain
LIFE-CYCLE ASSESSMENT OF A
MASONRY ARCH BRIDGENaida Ademović - University of Sarajevo, Faculty of Civil Engineering, Bosnia
and Herzegovina

• Introduction
• Life Cycle Assessment
• Mehmed-Paša Sokolović Bridge
• Conclusion
WG4 and WG5 WORKSHOP
27th – 28th September 2018
Barcelona, Spain
SLIDE 170
LIFE-CYCLE ASSESSMENT OF A MASONRY
ARCH BRIDGE
LIFE-CYCLE ASSESSMENT OF A MASONRY ARCH BRIDGE | NAIDA ADEMOVIĆ
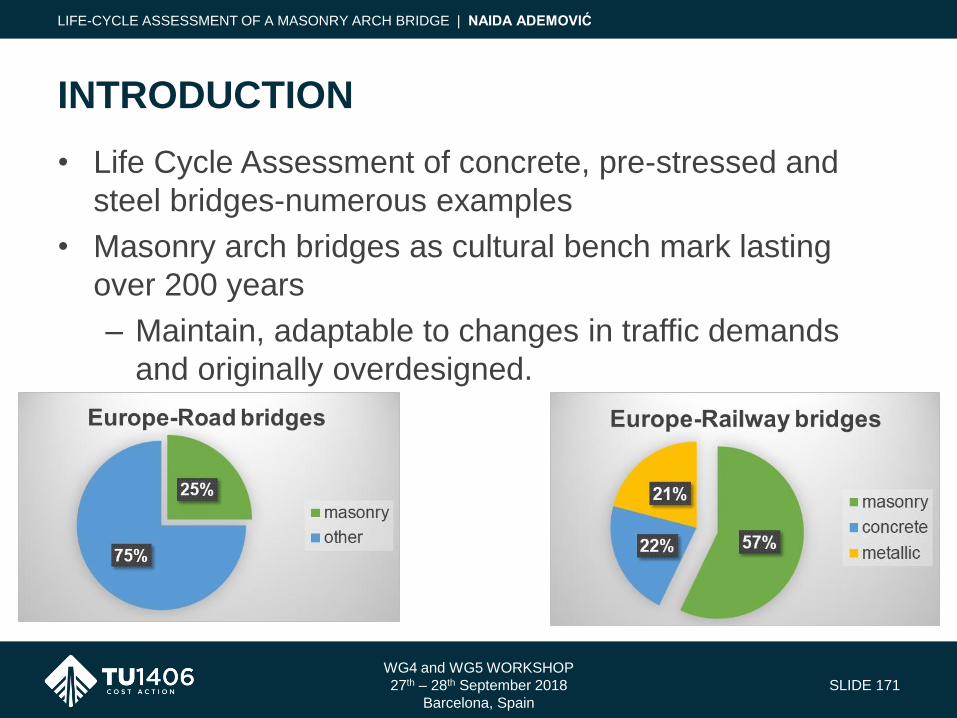
• Life Cycle Assessment of concrete, pre-stressed and
steel bridges-numerous examples
• Masonry arch bridges as cultural bench mark lasting
over 200 years
– Maintain, adaptable to changes in traffic demands
and originally overdesigned.
WG4 and WG5 WORKSHOP
27th – 28th September 2018
Barcelona, Spain
SLIDE 171
INTRODUCTION
LIFE-CYCLE ASSESSMENT OF A MASONRY ARCH BRIDGE | NAIDA ADEMOVIĆ
• Bridge Assessment:
– Age-maintenance and rehabilitation, repair,
strengthening
– Increase of weight-trucks and transport facilities
• Masonry bridges – over 200 years
• Why are masonry bridges not constructed anymore?
– Longer life;
– Low maintenance
WG4 and WG5 WORKSHOP
27th – 28th September 2018
Barcelona, Spain
SLIDE 172
INTRODUCTION
LIFE-CYCLE ASSESSMENT OF A MASONRY ARCH BRIDGE | NAIDA ADEMOVIĆ
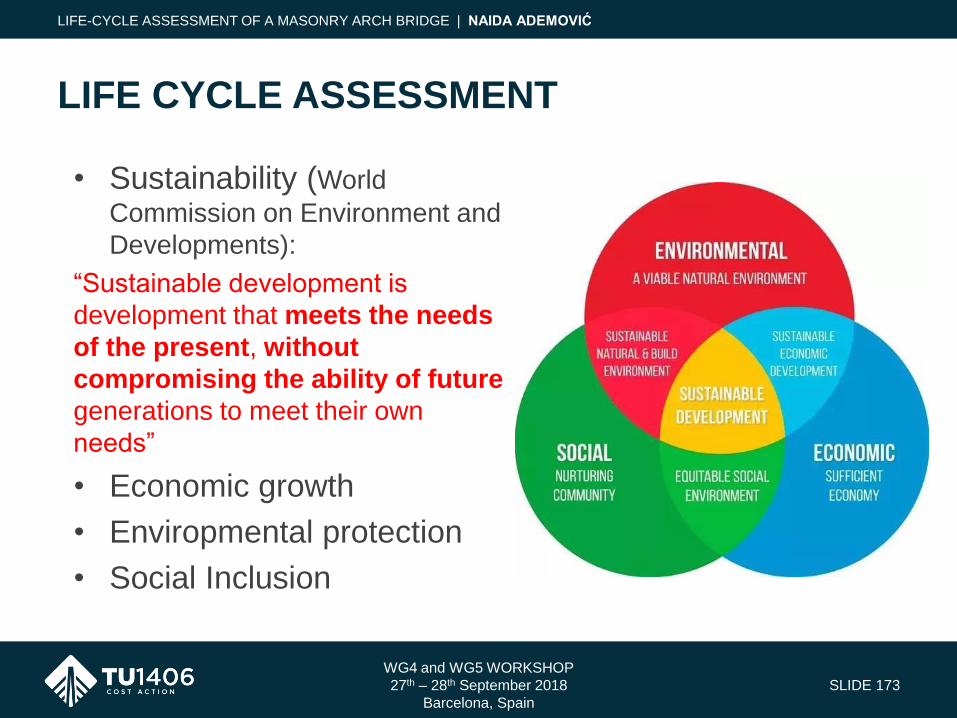
WG4 and WG5 WORKSHOP
27th – 28th September 2018
Barcelona, Spain
SLIDE 173
LIFE CYCLE ASSESSMENT
LIFE-CYCLE ASSESSMENT OF A MASONRY ARCH BRIDGE | NAIDA ADEMOVIĆ
• Sustainability (World
Commission on Environment and
Developments):
“Sustainable development is
development that meets the needs
of the present, without
compromising the ability of future
generations to meet their own
needs”
• Economic growth
• Enviropmental protection
• Social Inclusion
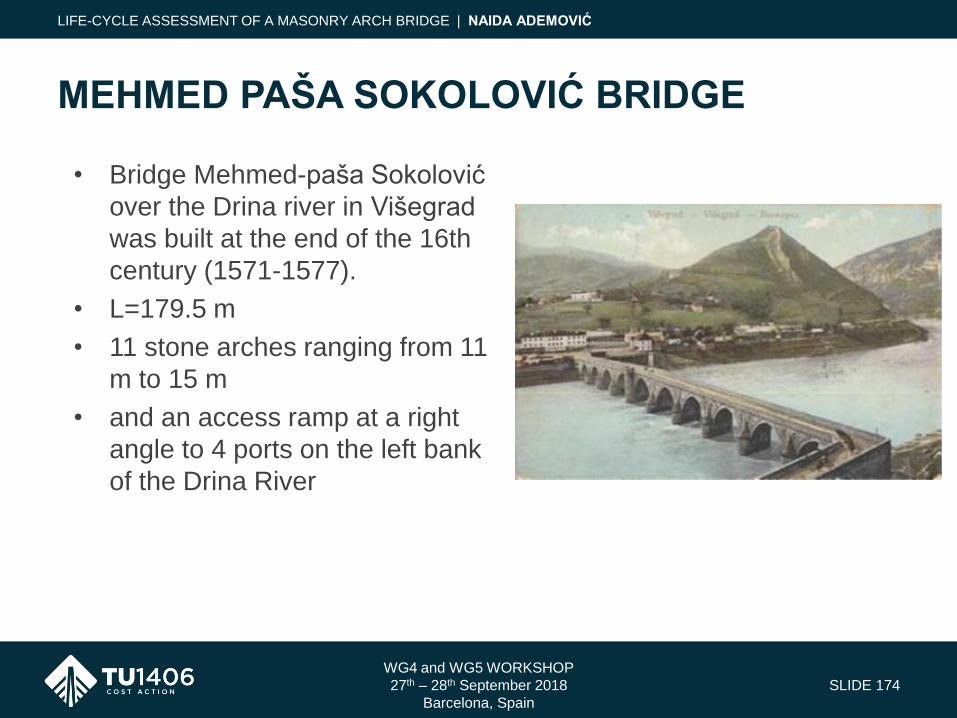
WG4 and WG5 WORKSHOP
27th – 28th September 2018
Barcelona, Spain
SLIDE 174
MEHMED PAŠA SOKOLOVIĆ BRIDGE
LIFE-CYCLE ASSESSMENT OF A MASONRY ARCH BRIDGE | NAIDA ADEMOVIĆ
• Bridge Mehmed-paša Sokolović
over the Drina river in Višegrad
was built at the end of the 16th
century (1571-1577).
• L=179.5 m
• 11 stone arches ranging from 11
m to 15 m
• and an access ramp at a right
angle to 4 ports on the left bank
of the Drina River
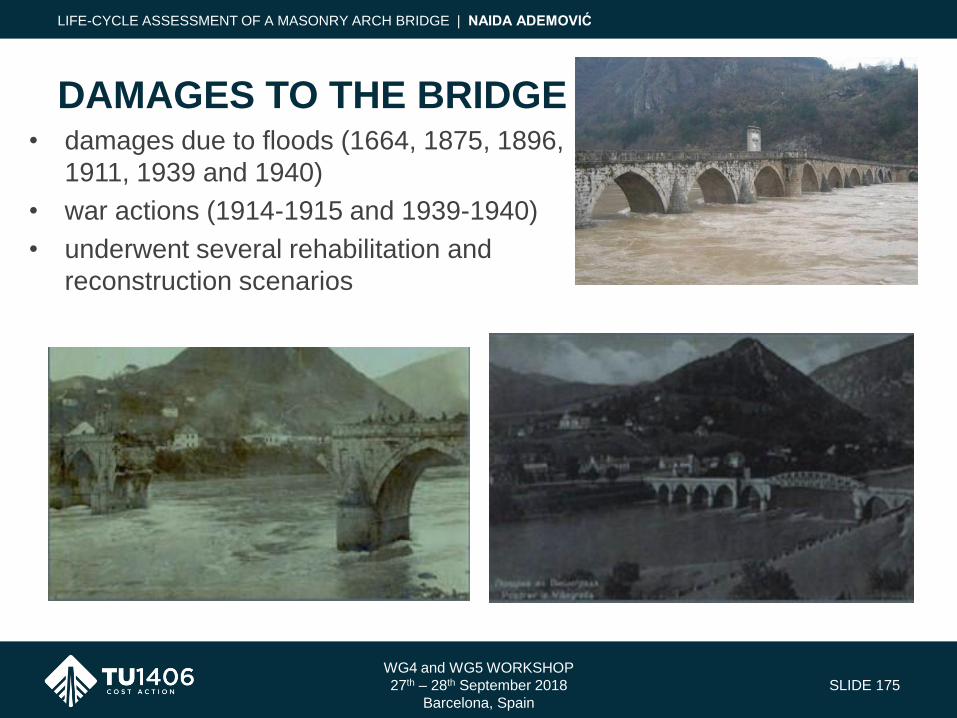
WG4 and WG5 WORKSHOP
27th – 28th September 2018
Barcelona, Spain
SLIDE 175
DAMAGES TO THE BRIDGE
LIFE-CYCLE ASSESSMENT OF A MASONRY ARCH BRIDGE | NAIDA ADEMOVIĆ
• damages due to floods (1664, 1875, 1896,
1911, 1939 and 1940)
• war actions (1914-1915 and 1939-1940)
• underwent several rehabilitation and
reconstruction scenarios

WG4 and WG5 WORKSHOP
27th – 28th September 2018
Barcelona, Spain
SLIDE 176
DAMAGES TO THE BRIDGE
LIFE-CYCLE ASSESSMENT OF A MASONRY ARCH BRIDGE | NAIDA ADEMOVIĆ
• construction of two power plants: 1968 downstream and in
1989 upstream
• In 1977: bad maintenance + the traffic load + operation of
the power plaants - the bridge was endangered .
As a result, a design for rehabilitation of the bridge was
conducted including strengthening of the foundations,
rehabilitation of piers and replacement of the deck structure.
Regardless of all this, the construction of the bridge has
remained remarkably firm and steady
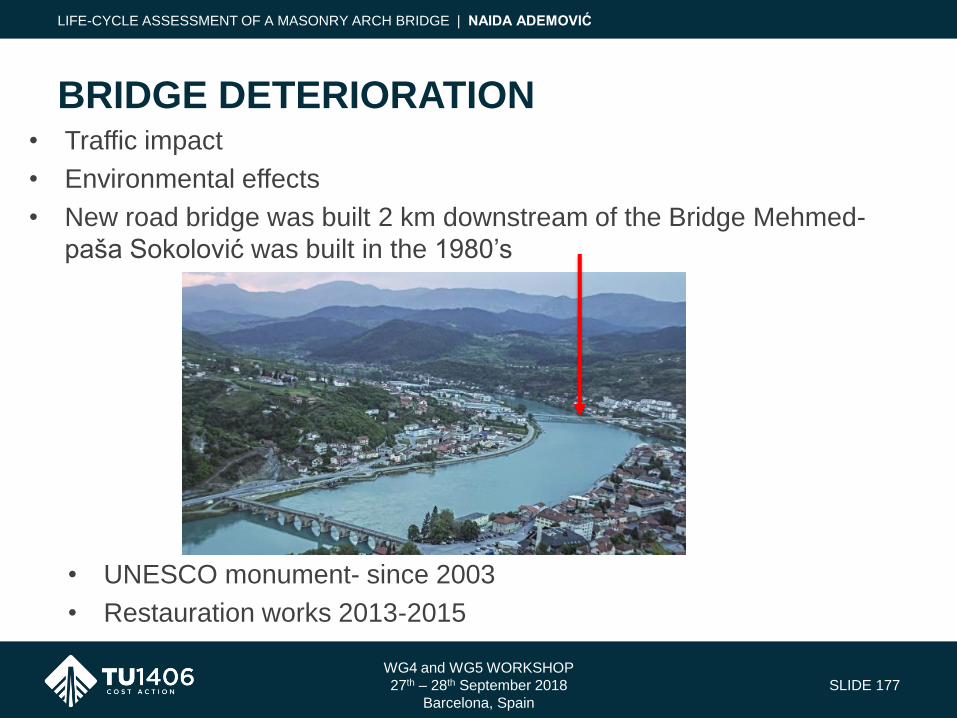
WG4 and WG5 WORKSHOP
27th – 28th September 2018
Barcelona, Spain
SLIDE 177
BRIDGE DETERIORATION
LIFE-CYCLE ASSESSMENT OF A MASONRY ARCH BRIDGE | NAIDA ADEMOVIĆ
• Traffic impact
• Environmental effects
• New road bridge was built 2 km downstream of the Bridge Mehmed-
paša Sokolović was built in the 1980’s
• UNESCO monument- since 2003
• Restauration works 2013-2015
WG4 and WG5 WORKSHOP
27th – 28th September 2018
Barcelona, Spain
SLIDE 178
BRIDGE DETERIORATION
LIFE-CYCLE ASSESSMENT OF A MASONRY ARCH BRIDGE | NAIDA ADEMOVIĆ
• Restauration works:
– remediation of bridge foundation damaged by erosion in the river bed;
– laying stone blocks in the river basin 30 meters upstream and downstream of the bridge to prevent further erosion of the foundation;
– self-cleaning vegetation;
– removal of cement mortar from joints connecting the stone blocks, and repointing with appropriate lime mortar;
– remediation of access ramps on the left bank of the Drina river;
– removal of a carriage way structure and laying of stone slabs;
– and removal of lighting on the bridge and installation.
• Closure of the bridge for traffic pedestrians use only.
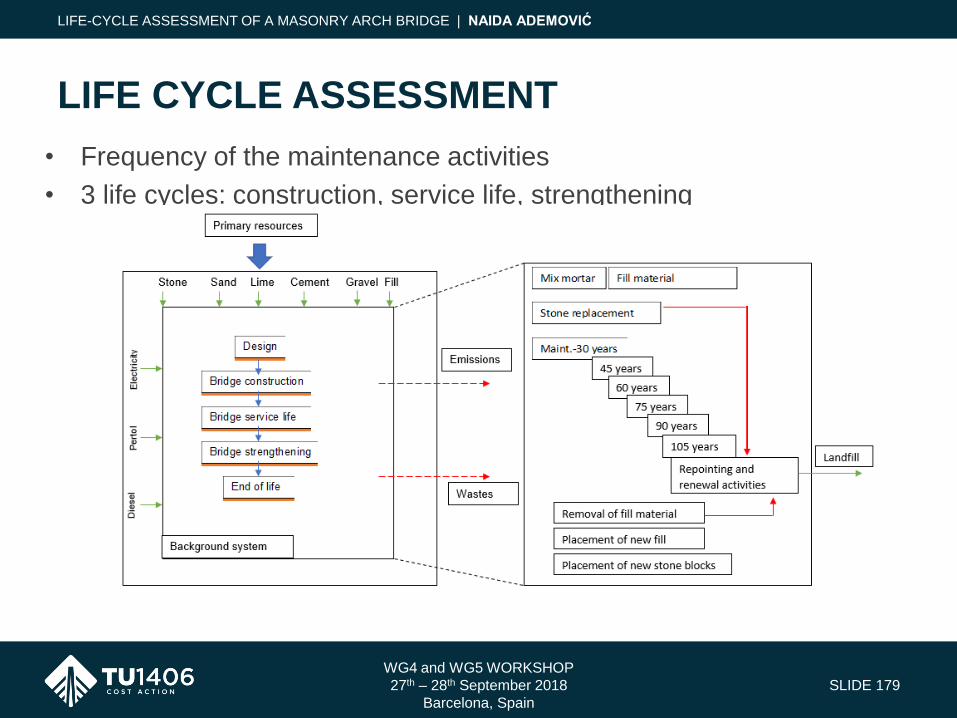
WG4 and WG5 WORKSHOP
27th – 28th September 2018
Barcelona, Spain
SLIDE 179
LIFE CYCLE ASSESSMENT
LIFE-CYCLE ASSESSMENT OF A MASONRY ARCH BRIDGE | NAIDA ADEMOVIĆ
• Frequency of the maintenance activities
• 3 life cycles: construction, service life, strengthening

WG4 and WG5 WORKSHOP
27th – 28th September 2018
Barcelona, Spain
SLIDE 180
IMPACT ASSESSMENT
LIFE-CYCLE ASSESSMENT OF A MASONRY ARCH BRIDGE | NAIDA ADEMOVIĆ

WG4 and WG5 WORKSHOP
27th – 28th September 2018
Barcelona, Spain
SLIDE 181
RESULTS AND DISCUSSION
LIFE-CYCLE ASSESSMENT OF A MASONRY ARCH BRIDGE | NAIDA ADEMOVIĆ
• demand for the stone replacement represents the biggest issue of all
the investigated categories:
– large amount of material
– reopening of the quarry
– and explanation of the stone,
– all required processes required for stone preparation
• mortar production used in the repointing process of the large area of
the bridge
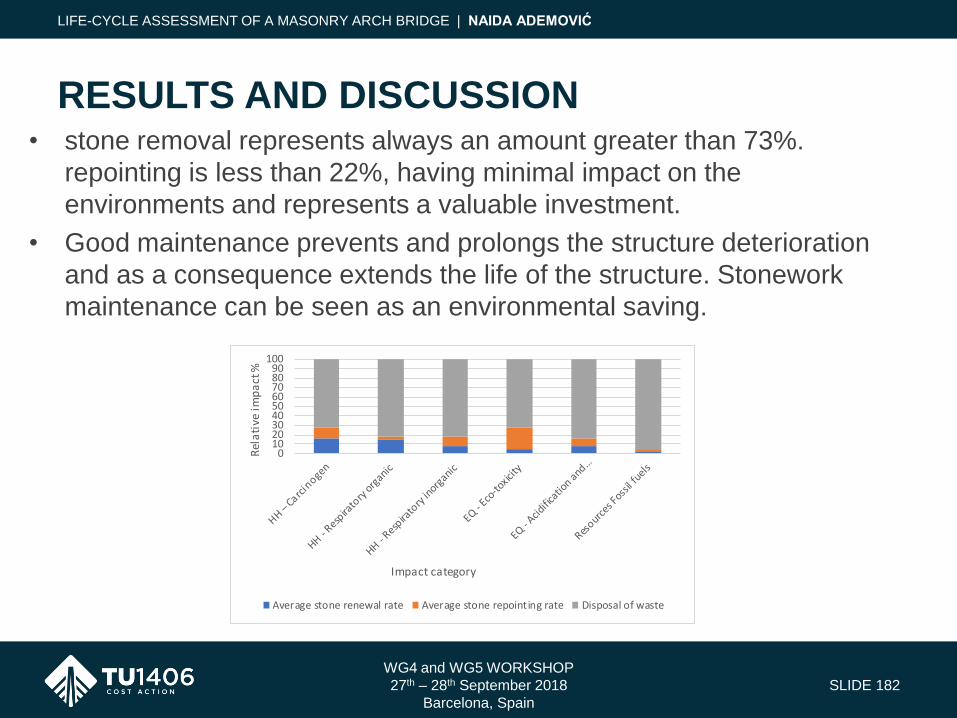
WG4 and WG5 WORKSHOP
27th – 28th September 2018
Barcelona, Spain
SLIDE 182
RESULTS AND DISCUSSION
LIFE-CYCLE ASSESSMENT OF A MASONRY ARCH BRIDGE | NAIDA ADEMOVIĆ
• stone removal represents always an amount greater than 73%.
repointing is less than 22%, having minimal impact on the
environments and represents a valuable investment.
• Good maintenance prevents and prolongs the structure deterioration
and as a consequence extends the life of the structure. Stonework
maintenance can be seen as an environmental saving.
0102030405060708090
100
Rel
ati
ve i
mp
act
%
Impact category
Average stone renewal rate Average stone repointing rate Disposal of waste
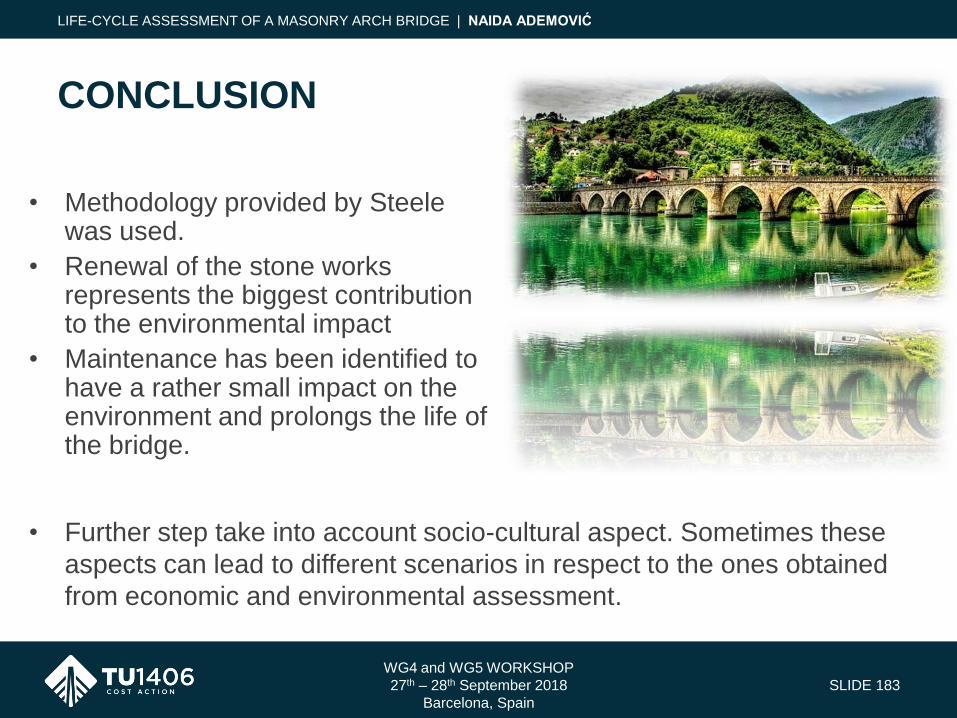
WG4 and WG5 WORKSHOP
27th – 28th September 2018
Barcelona, Spain
SLIDE 183
CONCLUSION
LIFE-CYCLE ASSESSMENT OF A MASONRY ARCH BRIDGE | NAIDA ADEMOVIĆ
• Methodology provided by Steele was used.
• Renewal of the stone works represents the biggest contribution to the environmental impact
• Maintenance has been identified to have a rather small impact on the environment and prolongs the life of the bridge.
• Further step take into account socio-cultural aspect. Sometimes these
aspects can lead to different scenarios in respect to the ones obtained
from economic and environmental assessment.

THANK YOU FOR YOUR ATTENTION!
WWW.TU1406.EU
WG4 and WG5 WORKSHOP
Sustainable Bridge Management
27th – 28th September 2018
Barcelona, Spain
AUTOMATIC BRIDGE DECK DAMAGE
EXTRACTION USING LOW-COST UAV-
BASED IMAGES
Linh Truong-Hong, Siyuan Chen, Van Loi Cao- University College Dublin, Ireland
Debra F. Laefer - New York University, United State of American
QUALITY SPECIFICATIONS FOR ROADWAY BRIDGES,
STANDARDIZATION AT A EUROPEAN LEVEL
Barcelona,
27th – 28th September, 2018
1
AUTOMATICALLY IDENTIFY DAMAGE OF A BRIDGE DECK USING LOW-COST
UAV-BASED IMAGES
Linh Truong-Hong(1), Siyuan Chen(1), Van Loi Cao(2), Debra F. Laefer(3)
(1) School of Civil Engineering, University College Dublin, Dublin, Ireland (2) NCRA Group, University College Dublin, Dublin, Ireland
(3) Center for Urban Science & Department of Civil and Urban Engineering, New York University, US
E-mails: [email protected]; [email protected]; [email protected]; [email protected]
Abstract: Bridge structures are subjected to deterioration due to excessive usage, overloading, aging, and environmental impacts. Use
of visual inspection by live, on-site inspectors predominates the requisite inspection of these structures, despite the known
disadvantages of subjective results, high costs, and traffic disruptions due lane closures needed for close-range inspection access. Over
the last two decades, significant advancements have occurred in the field of a remote sensing for bridge inspection. Prominent amongst
these are a point cloud based inspection using unmanned aerial vehicle (UAV)-based image. The approach offers quickly acquiring
surface details and can overcome many of the shortcomings of live, visual inspection. This paper proposed a robust and efficient method
to automatically extract a point cloud of a bridge deck through a cell-based region growing segmentation. Next, locations and areas of
the patch deterioration can be automatically determined by comparing elevations of the point clouds to the surface of the undamaged
bridge deck. Finally, a deep learning method, a one-class autoencoder, was proposed to classify the point cloud of the bridge deck into
cracking area and undamaged one.
Keywords: bridge inspection, bridge deck, UAV, point cloud, segmentation, patch deterioration, cracking, deep learning,
autoencoder
1. Introduction
The most recent American Society of Civil Engineers’ (ASCE) Report Card on infrastructure reported more than 50% of
614,387 nation’s bridge are over 40-year-old with about 9.1% of them subjected to structural deficiencies (ASCE 2017).
Similar quantities were also found in 6 European nations, a majority of the bridges were built in the period 1945-1965,
undergone significant (Pakrashi, et al. 2011). With a designed 50-year lifespan, the bridge’s current performance was
significantly reduced because of excessive usage, overloading, material aging, and environmental impacts. As such,
accurate assessment of a bridge’s condition is needed for maintaining a safe, functional, and reliable structure.
Additionally, inspection is needed to updating asset inventories and bridge management. In practice, visual inspection
with on-site inspectors associated with special equipment is the predominant method. This approach, albeit the most
common one, has many downsides: subjective and highly dependent upon an inspectors’ experience, slow and expensive
inspectors, and traffic closures (Metni and Hamel 2007; Phares et al. 2004).
In contrast, with development of robotics and computer vision, low-cost unmanned aerial vehicles (UAVs) have
been introduced and widely used in topographic surveying. The method can capture high resolution images of surfaces
from an air, and then high dense, accurate three-dimensional (3D) data points of the components can be generated.
Following, features and 3D models of objects can be extracted from those point cloud. That leads to using UAV for bridge
inspection to be emerging an alternative method, which can partially replace to or to provide complement information for
current methods. That is because the method does not require traffic closure, on-site experienced inspectors.
Researchers have preliminarily deployed UAV-based images for bridge inspection, but their works only focused on
specific tasks. For example, Kim et al. (Kim et al. 2015) detected cracks in bridge superstructures. Ellenberg et al.
(Ellenberg et al. 2016) analysed an error budget of an UAV with an integrated 10-megapixel camera measuring in situ
displacements of a steel girder in a laboratory. Result showed deviations of up to 31.5%. Recent efforts on reconstructing
3D point clouds from overlapping images have been developed for bridge assessment, but reported accuracies are
relatively low. Neitzel and Klonowski (Neitzel and Klonowski 2011) showed point cloud-based images having an
absolute deviation of up to 20 cm. Moreover, Escobar-Wolf et al. (Escobar-Wolf et al. 2017) have used infrared and
digital single-lens reflex (DSLR) Nikon D800 cameras mounted on UAV to image the bridge deck for identifying
delamination. The study has been tested on Merriman and Stark Road overpass bridges, located on highway I-96 in
Detroit, Michigan, and reported that infrared and DSLR images can give acceptable results of delamination. Recently,
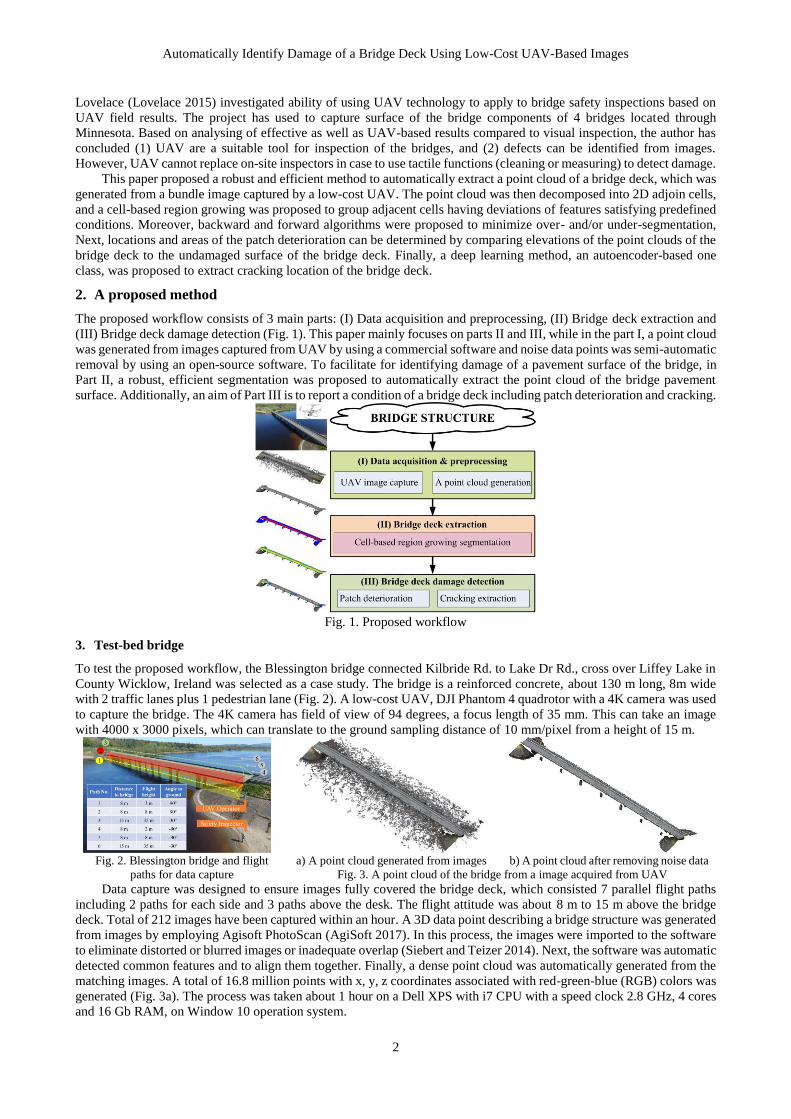
Automatically Identify Damage of a Bridge Deck Using Low-Cost UAV-Based Images
2
Lovelace (Lovelace 2015) investigated ability of using UAV technology to apply to bridge safety inspections based on
UAV field results. The project has used to capture surface of the bridge components of 4 bridges located through
Minnesota. Based on analysing of effective as well as UAV-based results compared to visual inspection, the author has
concluded (1) UAV are a suitable tool for inspection of the bridges, and (2) defects can be identified from images.
However, UAV cannot replace on-site inspectors in case to use tactile functions (cleaning or measuring) to detect damage.
This paper proposed a robust and efficient method to automatically extract a point cloud of a bridge deck, which was
generated from a bundle image captured by a low-cost UAV. The point cloud was then decomposed into 2D adjoin cells,
and a cell-based region growing was proposed to group adjacent cells having deviations of features satisfying predefined
conditions. Moreover, backward and forward algorithms were proposed to minimize over- and/or under-segmentation,
Next, locations and areas of the patch deterioration can be determined by comparing elevations of the point clouds of the
bridge deck to the undamaged surface of the bridge deck. Finally, a deep learning method, an autoencoder-based one
class, was proposed to extract cracking location of the bridge deck.
2. A proposed method
The proposed workflow consists of 3 main parts: (I) Data acquisition and preprocessing, (II) Bridge deck extraction and
(III) Bridge deck damage detection (Fig. 1). This paper mainly focuses on parts II and III, while in the part I, a point cloud
was generated from images captured from UAV by using a commercial software and noise data points was semi-automatic
removal by using an open-source software. To facilitate for identifying damage of a pavement surface of the bridge, in
Part II, a robust, efficient segmentation was proposed to automatically extract the point cloud of the bridge pavement
surface. Additionally, an aim of Part III is to report a condition of a bridge deck including patch deterioration and cracking.
Fig. 1. Proposed workflow
3. Test-bed bridge
To test the proposed workflow, the Blessington bridge connected Kilbride Rd. to Lake Dr Rd., cross over Liffey Lake in
County Wicklow, Ireland was selected as a case study. The bridge is a reinforced concrete, about 130 m long, 8m wide
with 2 traffic lanes plus 1 pedestrian lane (Fig. 2). A low-cost UAV, DJI Phantom 4 quadrotor with a 4K camera was used
to capture the bridge. The 4K camera has field of view of 94 degrees, a focus length of 35 mm. This can take an image
with 4000 x 3000 pixels, which can translate to the ground sampling distance of 10 mm/pixel from a height of 15 m.
Fig. 2. Blessington bridge and flight
paths for data capture
a) A point cloud generated from images b) A point cloud after removing noise data Fig. 3. A point cloud of the bridge from a image acquired from UAV
Data capture was designed to ensure images fully covered the bridge deck, which consisted 7 parallel flight paths
including 2 paths for each side and 3 paths above the desk. The flight attitude was about 8 m to 15 m above the bridge
deck. Total of 212 images have been captured within an hour. A 3D data point describing a bridge structure was generated
from images by employing Agisoft PhotoScan (AgiSoft 2017). In this process, the images were imported to the software
to eliminate distorted or blurred images or inadequate overlap (Siebert and Teizer 2014). Next, the software was automatic
detected common features and to align them together. Finally, a dense point cloud was automatically generated from the
matching images. A total of 16.8 million points with x, y, z coordinates associated with red-green-blue (RGB) colors was
generated (Fig. 3a). The process was taken about 1 hour on a Dell XPS with i7 CPU with a speed clock 2.8 GHz, 4 cores
and 16 Gb RAM, on Window 10 operation system.
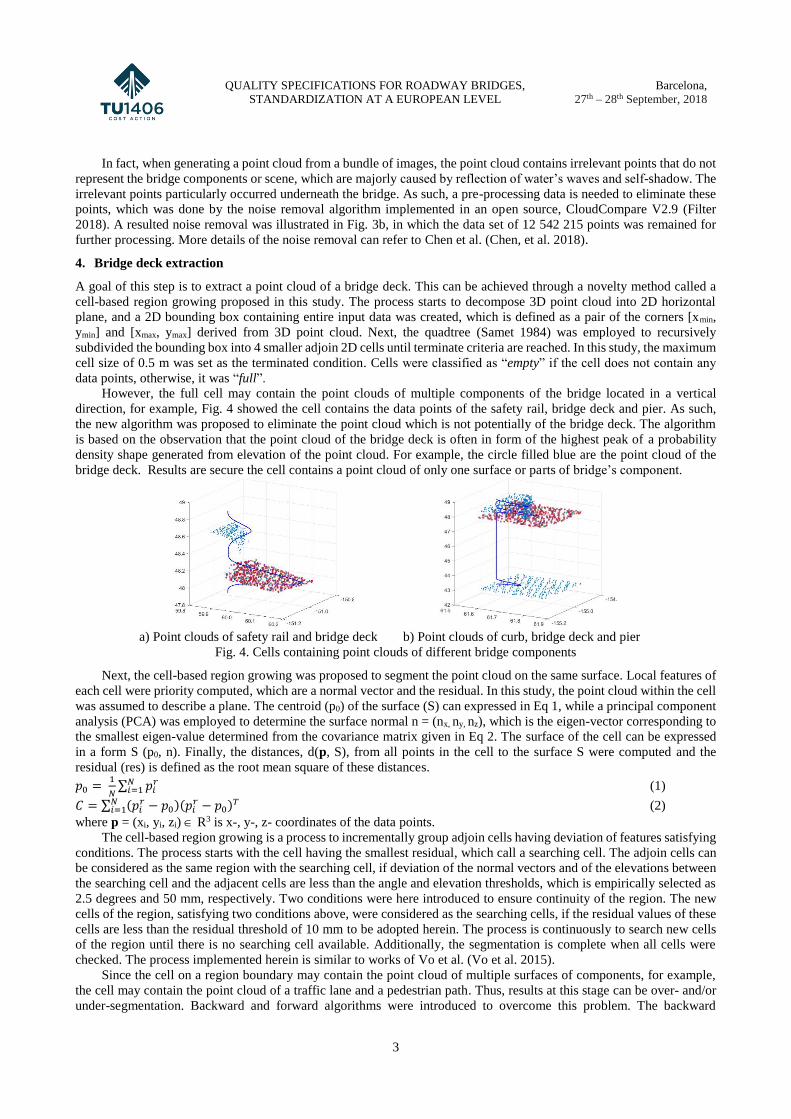
QUALITY SPECIFICATIONS FOR ROADWAY BRIDGES,
STANDARDIZATION AT A EUROPEAN LEVEL
Barcelona,
27th – 28th September, 2018
3
In fact, when generating a point cloud from a bundle of images, the point cloud contains irrelevant points that do not
represent the bridge components or scene, which are majorly caused by reflection of water’s waves and self-shadow. The
irrelevant points particularly occurred underneath the bridge. As such, a pre-processing data is needed to eliminate these
points, which was done by the noise removal algorithm implemented in an open source, CloudCompare V2.9 (Filter
2018). A resulted noise removal was illustrated in Fig. 3b, in which the data set of 12 542 215 points was remained for
further processing. More details of the noise removal can refer to Chen et al. (Chen, et al. 2018).
4. Bridge deck extraction
A goal of this step is to extract a point cloud of a bridge deck. This can be achieved through a novelty method called a
cell-based region growing proposed in this study. The process starts to decompose 3D point cloud into 2D horizontal
plane, and a 2D bounding box containing entire input data was created, which is defined as a pair of the corners [xmin,
ymin] and [xmax, ymax] derived from 3D point cloud. Next, the quadtree (Samet 1984) was employed to recursively
subdivided the bounding box into 4 smaller adjoin 2D cells until terminate criteria are reached. In this study, the maximum
cell size of 0.5 m was set as the terminated condition. Cells were classified as “empty” if the cell does not contain any
data points, otherwise, it was “full”.
However, the full cell may contain the point clouds of multiple components of the bridge located in a vertical
direction, for example, Fig. 4 showed the cell contains the data points of the safety rail, bridge deck and pier. As such,
the new algorithm was proposed to eliminate the point cloud which is not potentially of the bridge deck. The algorithm
is based on the observation that the point cloud of the bridge deck is often in form of the highest peak of a probability
density shape generated from elevation of the point cloud. For example, the circle filled blue are the point cloud of the
bridge deck. Results are secure the cell contains a point cloud of only one surface or parts of bridge’s component.
a) Point clouds of safety rail and bridge deck b) Point clouds of curb, bridge deck and pier
Fig. 4. Cells containing point clouds of different bridge components
Next, the cell-based region growing was proposed to segment the point cloud on the same surface. Local features of
each cell were priority computed, which are a normal vector and the residual. In this study, the point cloud within the cell
was assumed to describe a plane. The centroid (p0) of the surface (S) can expressed in Eq 1, while a principal component
analysis (PCA) was employed to determine the surface normal n = (nx, ny, nz), which is the eigen-vector corresponding to
the smallest eigen-value determined from the covariance matrix given in Eq 2. The surface of the cell can be expressed
in a form S (p0, n). Finally, the distances, d(p, S), from all points in the cell to the surface S were computed and the
residual (res) is defined as the root mean square of these distances.
𝑝0 = 1
𝑁∑ 𝑝𝑖
𝑟𝑁𝑖=1 (1)
𝐶 = ∑ (𝑝𝑖𝑟 − 𝑝0)(𝑝𝑖
𝑟 − 𝑝0)𝑇𝑁𝑖=1 (2)
where p = (xi, yi, zi) R3 is x-, y-, z- coordinates of the data points.
The cell-based region growing is a process to incrementally group adjoin cells having deviation of features satisfying
conditions. The process starts with the cell having the smallest residual, which call a searching cell. The adjoin cells can
be considered as the same region with the searching cell, if deviation of the normal vectors and of the elevations between
the searching cell and the adjacent cells are less than the angle and elevation thresholds, which is empirically selected as
2.5 degrees and 50 mm, respectively. Two conditions were here introduced to ensure continuity of the region. The new
cells of the region, satisfying two conditions above, were considered as the searching cells, if the residual values of these
cells are less than the residual threshold of 10 mm to be adopted herein. The process is continuously to search new cells
of the region until there is no searching cell available. Additionally, the segmentation is complete when all cells were
checked. The process implemented herein is similar to works of Vo et al. (Vo et al. 2015).
Since the cell on a region boundary may contain the point cloud of multiple surfaces of components, for example,
the cell may contain the point cloud of a traffic lane and a pedestrian path. Thus, results at this stage can be over- and/or
under-segmentation. Backward and forward algorithms were introduced to overcome this problem. The backward

Automatically Identify Damage of a Bridge Deck Using Low-Cost UAV-Based Images
4
algorithm is to remove the points of other segments out of the current segment, while the forward algorithm is to group
the points of the current segment have not included. From the cell Ci on the boundary of the region Ri, its neighbour cells,
Cj was extracted. The Cj were classified as 3 groups: (1) interior cell(s), Ck of Ri, (2) boundary cell(s), Cl of Ri, and (3),
out-region cell(s) Cm of Ri. Next, the fitting surface Sl was created the point clouds within Ck by using PCA. In the
backward algorithm, the points (pi) in Ci were removed out of Ci if the distance, d(p, Sl), is larger than the distance
threshold of 10 mm. Similarly, in the forward algorithm, the points (q) in Cm was considered to merge to Ri if the distance,
d(q, Sl), is smaller than the distance threshold of 10 mm. Figure 5a-d was illustrated processes of the backward and
forward algorithms, while Fig. 5e showed the bridge deck automatically extracted from the proposed method. Finally,
performance pf the proposed method was evaluated by comparing the point cloud of the bridge pavement extracted to a
reference data that manually extraction. That showed the proposed method can automatically extract these points high
accurately, with F1-score of 0.95. Moreover, an executing time is about 171.4 seconds when the algorithm was
implemented in Matlab script and run on HP 2570p with a processor i7-3520M CPU @ 2.9 GHz and 16GB RAM.
The data points of a pavement surface of the
bridge was rendered in a red color.
a) A point cloud of Ri and adjacent segments b) Classification of neighbour cells
c) Result of the backward algorithm d) Result of the forward algorithm e) Segmentation results
Fig. 5. Cell-based region growing segmentation for extracting a pavement surface of a bridge
5. Bridge deck condition
5.1 Patch deterioration
A goal of this step is to identify damage of the bridge deck from a point cloud. Damage including patch deterioration and
cracking are mostly interested in this study although other types of damages can be available. The patch deterioration
caused parts of the surface to be peered and additional material can be filled during road pavement maintenance. In this
case, geometry of the patch is often different from undamaged areas. Therefore, it is assumed small portions of the patch
deterioration in the bridge deck, which implied the fitting surface through a point cloud can represent the undamaged
surface. The fitting surface of the bridge deck expressed in Eq 3 can be obtained by employing a 3D curve fitting algorithm
built in Matlab software (MathWorks 2016). The fitting results showed R-square of 0.998 with RMS of 12.7 mm, which
implied the fitting surface can be accepted to represent the bridge deck in undamaged condition. Additionally, elevation
differences (ef) from the point cloud to the fitting surface was then computed according to Eq 4.
S(x, y) = 47.32 -0.03*x + -0.04*y -0.002xy -0.003*x2 -0.0007*y2 (3)
efi = zi – S(xi, yi) (4)
where x and y are x- and y- coordinates of the point cloud, while xi, yi and zI are coordinates of a point pi in the data set.
a) Distribution of ef b) Distribution of patch deterioration
Figure 6. Identifying patch deterioration of a bridge deck
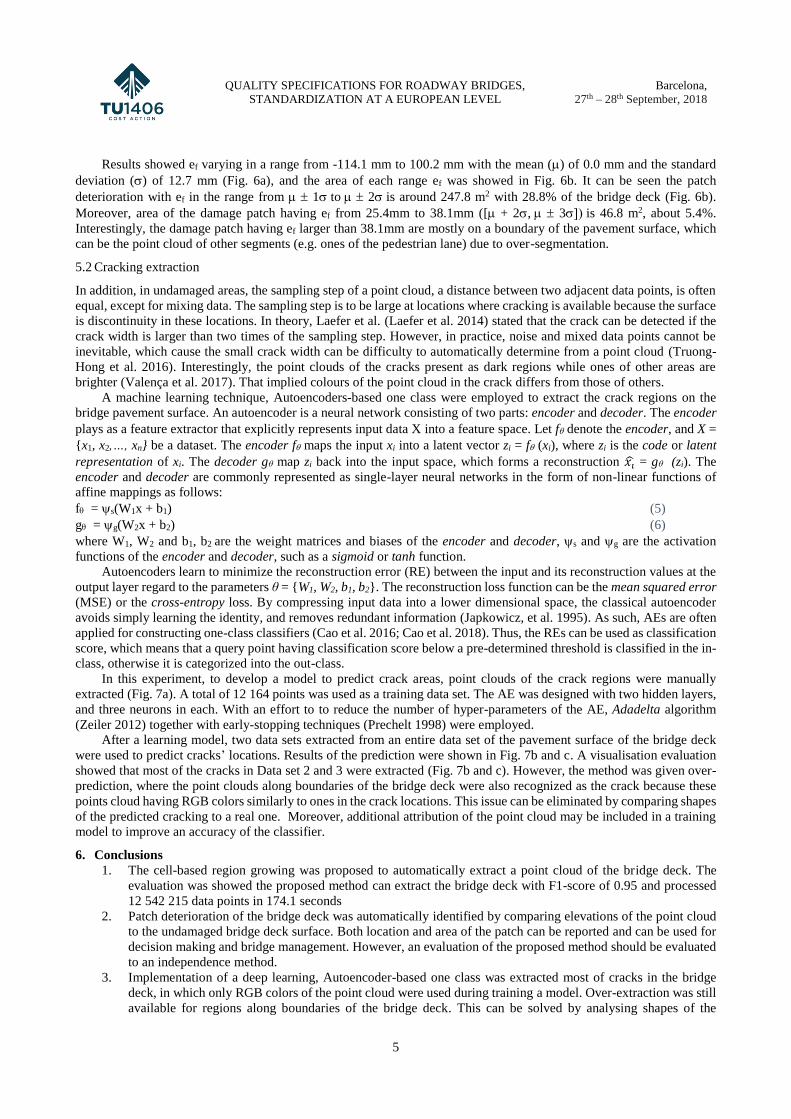
QUALITY SPECIFICATIONS FOR ROADWAY BRIDGES,
STANDARDIZATION AT A EUROPEAN LEVEL
Barcelona,
27th – 28th September, 2018
5
Results showed ef varying in a range from -114.1 mm to 100.2 mm with the mean () of 0.0 mm and the standard
deviation () of 12.7 mm (Fig. 6a), and the area of each range ef was showed in Fig. 6b. It can be seen the patch
deterioration with ef in the range from 1to 2is around 247.8 m2 with 28.8% of the bridge deck (Fig. 6b).
Moreover, area of the damage patch having ef from 25.4mm to 38.1mm ([ + 2, 3is 46.8 m2, about 5.4%.
Interestingly, the damage patch having ef larger than 38.1mm are mostly on a boundary of the pavement surface, which
can be the point cloud of other segments (e.g. ones of the pedestrian lane) due to over-segmentation.
5.2 Cracking extraction
In addition, in undamaged areas, the sampling step of a point cloud, a distance between two adjacent data points, is often
equal, except for mixing data. The sampling step is to be large at locations where cracking is available because the surface
is discontinuity in these locations. In theory, Laefer et al. (Laefer et al. 2014) stated that the crack can be detected if the
crack width is larger than two times of the sampling step. However, in practice, noise and mixed data points cannot be
inevitable, which cause the small crack width can be difficulty to automatically determine from a point cloud (Truong-
Hong et al. 2016). Interestingly, the point clouds of the cracks present as dark regions while ones of other areas are
brighter (Valença et al. 2017). That implied colours of the point cloud in the crack differs from those of others.
A machine learning technique, Autoencoders-based one class were employed to extract the crack regions on the
bridge pavement surface. An autoencoder is a neural network consisting of two parts: encoder and decoder. The encoder
plays as a feature extractor that explicitly represents input data X into a feature space. Let f denote the encoder, and X =
{x1, x2,…, xn} be a dataset. The encoder f maps the input xi into a latent vector zi = f (xi), where zi is the code or latent
representation of xi. The decoder g map zi back into the input space, which forms a reconstruction 𝑥�̂� = g (zi). The
encoder and decoder are commonly represented as single-layer neural networks in the form of non-linear functions of
affine mappings as follows:
f = s(W1x + b1) (5)
g = g(W2x + b2) (6)
where W1, W2 and b1, b2 are the weight matrices and biases of the encoder and decoder, s and g are the activation
functions of the encoder and decoder, such as a sigmoid or tanh function.
Autoencoders learn to minimize the reconstruction error (RE) between the input and its reconstruction values at the
output layer regard to the parameters θ = {W1, W2, b1, b2}. The reconstruction loss function can be the mean squared error
(MSE) or the cross-entropy loss. By compressing input data into a lower dimensional space, the classical autoencoder
avoids simply learning the identity, and removes redundant information (Japkowicz, et al. 1995). As such, AEs are often
applied for constructing one-class classifiers (Cao et al. 2016; Cao et al. 2018). Thus, the REs can be used as classification
score, which means that a query point having classification score below a pre-determined threshold is classified in the in-
class, otherwise it is categorized into the out-class.
In this experiment, to develop a model to predict crack areas, point clouds of the crack regions were manually
extracted (Fig. 7a). A total of 12 164 points was used as a training data set. The AE was designed with two hidden layers,
and three neurons in each. With an effort to to reduce the number of hyper-parameters of the AE, Adadelta algorithm
(Zeiler 2012) together with early-stopping techniques (Prechelt 1998) were employed.
After a learning model, two data sets extracted from an entire data set of the pavement surface of the bridge deck
were used to predict cracks’ locations. Results of the prediction were shown in Fig. 7b and c. A visualisation evaluation
showed that most of the cracks in Data set 2 and 3 were extracted (Fig. 7b and c). However, the method was given over-
prediction, where the point clouds along boundaries of the bridge deck were also recognized as the crack because these
points cloud having RGB colors similarly to ones in the crack locations. This issue can be eliminated by comparing shapes
of the predicted cracking to a real one. Moreover, additional attribution of the point cloud may be included in a training
model to improve an accuracy of the classifier.
6. Conclusions
1. The cell-based region growing was proposed to automatically extract a point cloud of the bridge deck. The
evaluation was showed the proposed method can extract the bridge deck with F1-score of 0.95 and processed
12 542 215 data points in 174.1 seconds
2. Patch deterioration of the bridge deck was automatically identified by comparing elevations of the point cloud
to the undamaged bridge deck surface. Both location and area of the patch can be reported and can be used for
decision making and bridge management. However, an evaluation of the proposed method should be evaluated
to an independence method.
3. Implementation of a deep learning, Autoencoder-based one class was extracted most of cracks in the bridge
deck, in which only RGB colors of the point cloud were used during training a model. Over-extraction was still
available for regions along boundaries of the bridge deck. This can be solved by analysing shapes of the

Automatically Identify Damage of a Bridge Deck Using Low-Cost UAV-Based Images
6
extracted cracks. Furthermore, additional attributes of the point cloud can be used to improve an accuracy of
the proposed method.
a) Data set 1 and the training data b) Data set 2 and resulted cracking c) Data set 3 and resulted cracking
Note: color points is either a training data or resulted cracking predicted from a machine learning model
Fig. 7. Illustrated results of cracking extraction from Autoencode-based one class
Acknowledgements
This work was funded with the generous support of the UCD Seed funding for the project Laser Scanning for Automatic Bridge Rating,
grant SF1404. The first author is grateful for this support.
References
ASCE, 2017 infrastructure report card: Bridge, Report No.: 2017.
Pakrashi, V.; O'Brien, E.;O'Connor, A. 2011, A review of road structure data in six european countries, Proceedings of the ICE-Urban
Design and Planning 164 (4), 225-232
Metni, N.; Hamel, T. 2007, A uav for bridge inspection: Visual servoing control law with orientation limits, Automation in Construction
17 (1), 3-10
Phares, B.M.; Washer, G.A.; Rolander, D.D.; Graybeal, B.A.;Moore, M. 2004, Routine highway bridge inspection condition
documentation accuracy and reliability, J Bridge Eng 9 (4), 403-413
Kim, J.-W.; Kim, S.-B.; Park, J.-C.;Nam, J.-W. 2015, Development of crack detection system with unmanned aerial vehicles and digital
image processing, Advances in structural engineering and mechanics (ASEM15),
Ellenberg, A.; Kontsos, A.; Moon, F.; Bartoli, I. 2016, Bridge related damage quantification using unmanned aerial vehicle imagery,
Structural Control and Health Monitoring 23 (9), 1168-1179
Neitzel, F.; Klonowski, J. 2011, Mobile 3d mapping with a low-cost uav system, Int. Arch. Photogramm. Remote Sens. Spat. Inf. Sci
38, 1-6
Escobar-Wolf, R.; Oommen, T.; Brooks, C.N.; Dobson, R.J.; Ahlborn, T.M. 2017, Unmanned aerial vehicle (uav)-based assessment
of concrete bridge deck delamination using thermal and visible camera sensors: A preliminary analysis, Research in
Nondestructive Evaluation, 1-16
Lovelace, B. 2015, Unmanned aerial vehicle bridge inspection demonstration project, Minnesota Department of Transportation, 1-44
Photoscan pro 2017, [Commercial], Version 1.3.2, Retrieved from: http://www.agisoft.com/downloads/installer/
Siebert, S.;Teizer, J. 2014, Mobile 3d mapping for surveying earthwork projects using an unmanned aerial vehicle (uav) system,
Automation in Construction 41, 1-14, https://doi.org/10.1016/j.autcon.2014.01.004.
Cloudcompare-noise filter 2018, [GNU GPL], Version 2.9.0, Retrieved from: http://www.cloudcompare.org/
Chen, S.; Truong-Hong, L.; O'Keeffe, E.; Laefer, D.F.; Mangina1, E. 2018, Outlier detection of point clouds generating from low cost
uavs for bridge inspection, in Proc. of The Sixth International Symposium on Life-Cycle Civil Engineering, IALCCE 2018Ghent,
Belgium, 28-31 October 2018
Samet, H. 1984, The quadtree and related hierarchical data structures, ACM Comput. Surv. 16 (2), 187-260, 10.1145/356924.356930.
Vo, A.-V.; Truong-Hong, L.; Laefer, D.F.; Bertolotto, M. 2015, Octree-based region growing for point cloud segmentation, ISPRS
Journal of Photogrammetry and Remote Sensing 104, 88-100, http://dx.doi.org/10.1016/j.isprsjprs.2015.01.011.
Mathworks: Curve fitting toolbox 2016, [Commercial], Version: 2016a, Retrieved from:
https://uk.mathworks.com/products/curvefitting.html
Laefer, D.F.; Truong-Hong, L.; Carr, H.; Singh, M. 2014, Crack detection limits in unit based masonry with terrestrial laser scanning,
NDT & E International 62, 66-76
Truong-Hong, L.; Falter, H.; Lennon, D.; Laefer, D.F. 2016, Framework for bridge inspection with laser scanning, in Proc. of EASEC-
14 Structural Engineering and ConstructionHo Chi Minh City, Vietnam, 6-8 January 2016
Valença, J.; Puente, I.; Júlio, E.; González-Jorge, H.; Arias-Sánchez, P. 2017, Assessment of cracks on concrete bridges using image
processing supported by laser scanning survey, Construction and Building Materials 146, 668-678
Japkowicz, N.; Myers, C.; Gluck, M. 1995, A novelty detection approach to classification, in Proc. of IJCAI, Vol. 1, 1995, pp. 518-
523
Cao, V.L.; Nicolau, M.; McDermott, J. 2016, A hybrid autoencoder and density estimation model for anomaly detection, in Proc. of
International Conference on Parallel Problem Solving from Nature, 2016, pp. 717-726
Cao, V.L.; Nicolau, M.; McDermott, J. 2018, Learning neural representations for network anomaly detection, IEEE Transactions on
Cybernetics, 1-14, 10.1109/TCYB.2018.2838668.
Zeiler, M.D. 2012, Adadelta: An adaptive learning rate method, arXiv preprint arXiv:1212.5701,
Prechelt, L., Early stopping-but when?, Neural networks: Tricks of the trade, Springer, 1998, pp. 55-69.

WG4 and WG5 WORKSHOP
Sustainable Bridge Management
27th – 28th September 2018
Barcelona, Spain
AUTOMATIC BRIDGE DECK DAMAGE
EXTRACTION USING LOW-COST UAV-
BASED IMAGES
Linh Truong-Hong, Siyuan Chen, Van Loi Cao- University College Dublin, Ireland
Debra F. Laefer - New York University, United State of American

WG4 and WG5 WORKSHOP
27th – 28th September 2018
Barcelona, Spain
SLIDE 187
OUTLINE
• Motivation
• A proposed method for determining surface deterioration and extracting cracks
• Test-bed bridge: Bridge configuration, data acquisition, point cloud generation
• Bridge deck extraction: cell-based region growing segmentation method, and
backward and forward propagation for refining segmentation outcome
• Bridge deck condition: Patch deterioration and crack extraction
• Conclusions
AUTOMATIC BRIDGE DECK DAMAGE EXTRACTION USING LOW-COST UAV-BASED IMAGES | Linh Truong-Hong et al.

WG4 and WG5 WORKSHOP
27th – 28th September 2018
Barcelona, Spain
SLIDE 188
MOTIVATION• In the US, with nearly 25% of the 600,000 highway bridges considered to be in a
deficient, and the majority of the bridges have average life span about 70 years
• In 6 European nations (Slovenia, Poland, Hungary, Czech Public, Norway and
Austria), most bridges were built in the period 1945-1965 and have undergone
significant deterioration
• In practice, visual inspection is the predominant method for bridge assessment,
which requires physical inspectors and special machines/devices.
AUTOMATIC BRIDGE DECK DAMAGE EXTRACTION USING LOW-COST UAV-BASED IMAGES | Linh Truong-Hong et al.
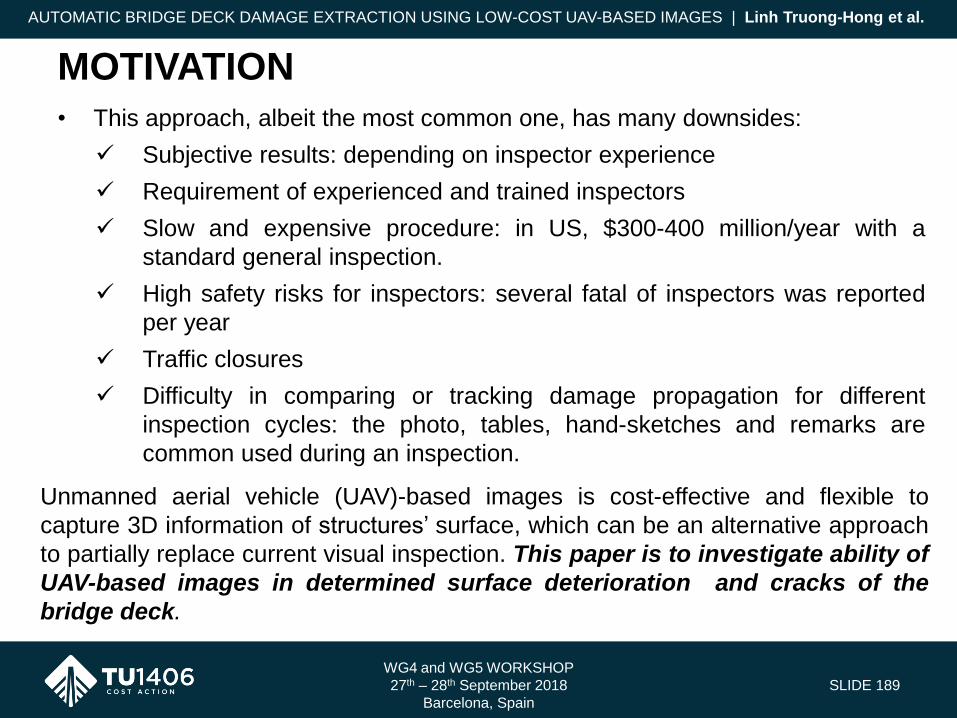
WG4 and WG5 WORKSHOP
27th – 28th September 2018
Barcelona, Spain
SLIDE 189
• This approach, albeit the most common one, has many downsides:
Subjective results: depending on inspector experience
Requirement of experienced and trained inspectors
Slow and expensive procedure: in US, $300-400 million/year with a
standard general inspection.
High safety risks for inspectors: several fatal of inspectors was reported
per year
Traffic closures
Difficulty in comparing or tracking damage propagation for different
inspection cycles: the photo, tables, hand-sketches and remarks are
common used during an inspection.
MOTIVATION
Unmanned aerial vehicle (UAV)-based images is cost-effective and flexible to
capture 3D information of structures’ surface, which can be an alternative approach
to partially replace current visual inspection. This paper is to investigate ability of
UAV-based images in determined surface deterioration and cracks of the
bridge deck.
AUTOMATIC BRIDGE DECK DAMAGE EXTRACTION USING LOW-COST UAV-BASED IMAGES | Linh Truong-Hong et al.

WG4 and WG5 WORKSHOP
27th – 28th September 2018
Barcelona, Spain
SLIDE 190
A PROPOSED METHOD
BRIDGE STRUCTURE
Point cloud generation
(I) Data acquisition & preprocessing
(II) Bridge deck extraction
UAV image capture
Patch deterioration Cracking extraction
(III) Bridge deck damage detection
Cell-based region growing segmentation
AUTOMATIC BRIDGE DECK DAMAGE EXTRACTION USING LOW-COST UAV-BASED IMAGES | Linh Truong-Hong et al.

WG4 and WG5 WORKSHOP
27th – 28th September 2018
Barcelona, Spain
SLIDE 191
TEST-BED BRIDGE
- Blessington bridge connecting Kilbride Rd. to Lake Dr Rd., crossing Liffey Lake
- Reinforced concrete: 130 m long and 8m wide
2 traffic lanes and 1 pedestrian lane
DJI Phantom 4
• Image: 4000x3000
• FoV: 94 degrees
• A focal length: 35 mm
• Resolution: 10mm/pixel
AUTOMATIC BRIDGE DECK DAMAGE EXTRACTION USING LOW-COST UAV-BASED IMAGES | Linh Truong-Hong et al.
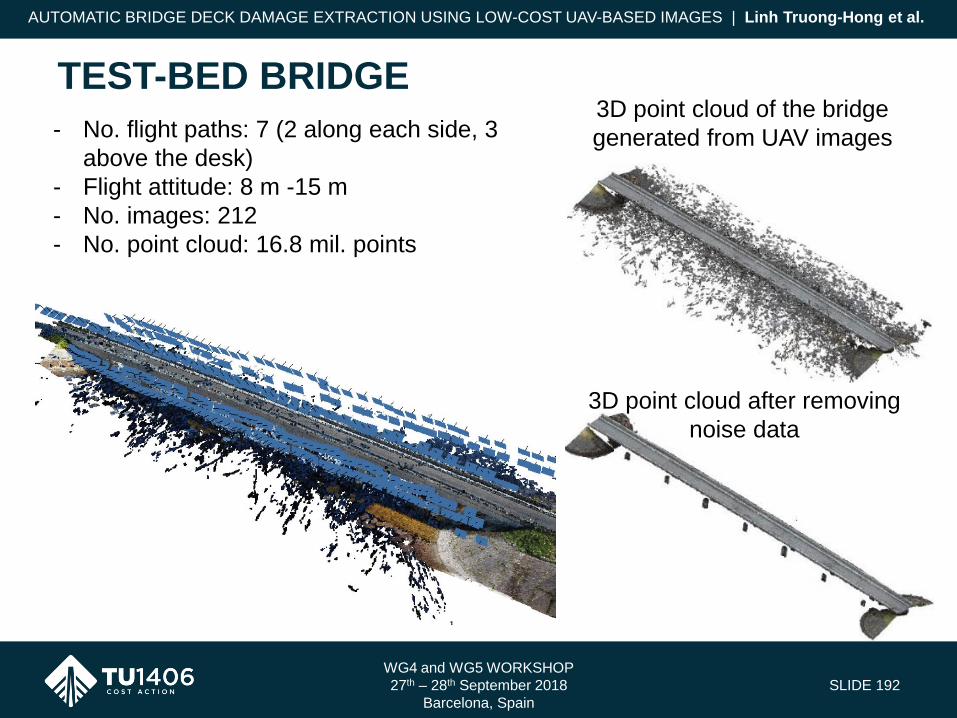
WG4 and WG5 WORKSHOP
27th – 28th September 2018
Barcelona, Spain
SLIDE 192
TEST-BED BRIDGE
- No. flight paths: 7 (2 along each side, 3
above the desk)
- Flight attitude: 8 m -15 m
- No. images: 212
- No. point cloud: 16.8 mil. points
3D point cloud of the bridge
generated from UAV images
3D point cloud after removing
noise data
AUTOMATIC BRIDGE DECK DAMAGE EXTRACTION USING LOW-COST UAV-BASED IMAGES | Linh Truong-Hong et al.
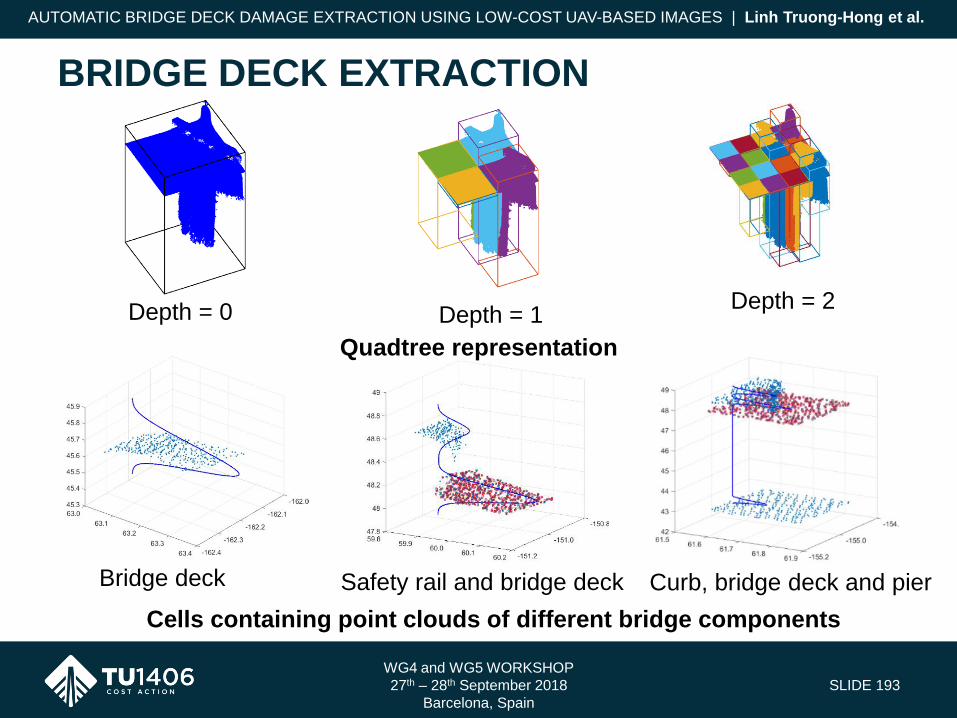
WG4 and WG5 WORKSHOP
27th – 28th September 2018
Barcelona, Spain
SLIDE 193
BRIDGE DECK EXTRACTION
Bridge deck Curb, bridge deck and pier
Cells containing point clouds of different bridge components
Depth = 0
Safety rail and bridge deck
Depth = 1Depth = 2
Quadtree representation
AUTOMATIC BRIDGE DECK DAMAGE EXTRACTION USING LOW-COST UAV-BASED IMAGES | Linh Truong-Hong et al.
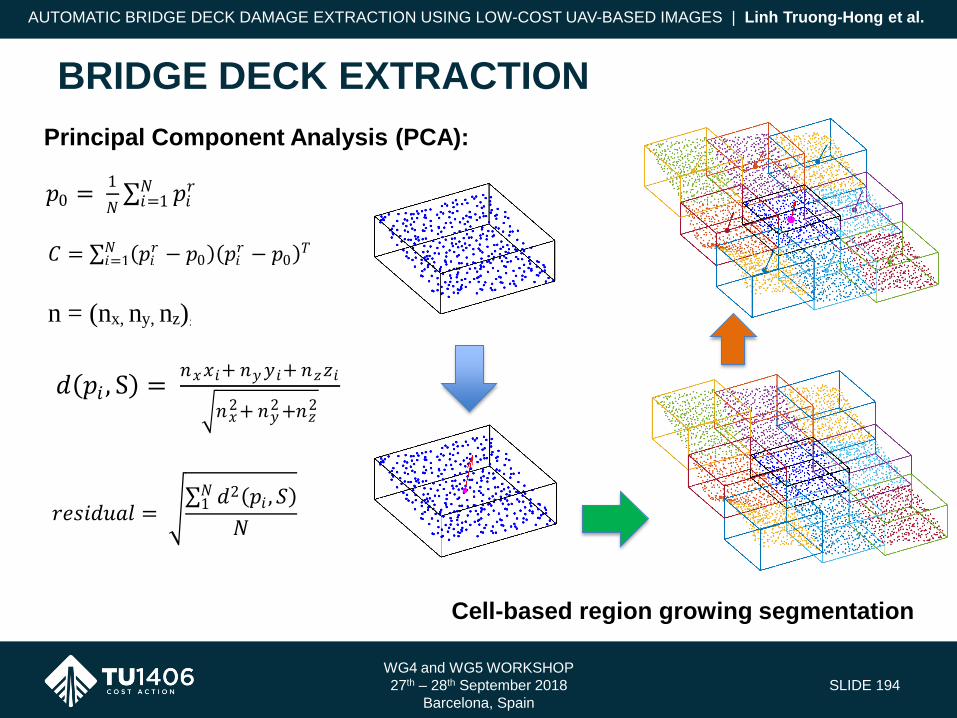
WG4 and WG5 WORKSHOP
27th – 28th September 2018
Barcelona, Spain
SLIDE 194
BRIDGE DECK EXTRACTION
𝑝0 = 1
𝑁 𝑝𝑖
𝑟𝑁𝑖=1 (1)
𝐶 = 𝑝𝑖𝑟 − 𝑝0 𝑝𝑖
𝑟 − 𝑝0 𝑇𝑁
𝑖=1 (1)
n = (nx, ny, nz),
Principal Component Analysis (PCA):
𝑑 𝑝𝑖 , S = 𝑛𝑥𝑥𝑖+ 𝑛𝑦𝑦𝑖+ 𝑛𝑧𝑧𝑖
𝑛𝑥2+ 𝑛𝑦
2 +𝑛𝑧2
(1)
𝑟𝑒𝑠𝑖𝑑𝑢𝑎𝑙 = 𝑑2 𝑝𝑖 , 𝑆 𝑁1
𝑁
Cell-based region growing segmentation
AUTOMATIC BRIDGE DECK DAMAGE EXTRACTION USING LOW-COST UAV-BASED IMAGES | Linh Truong-Hong et al.
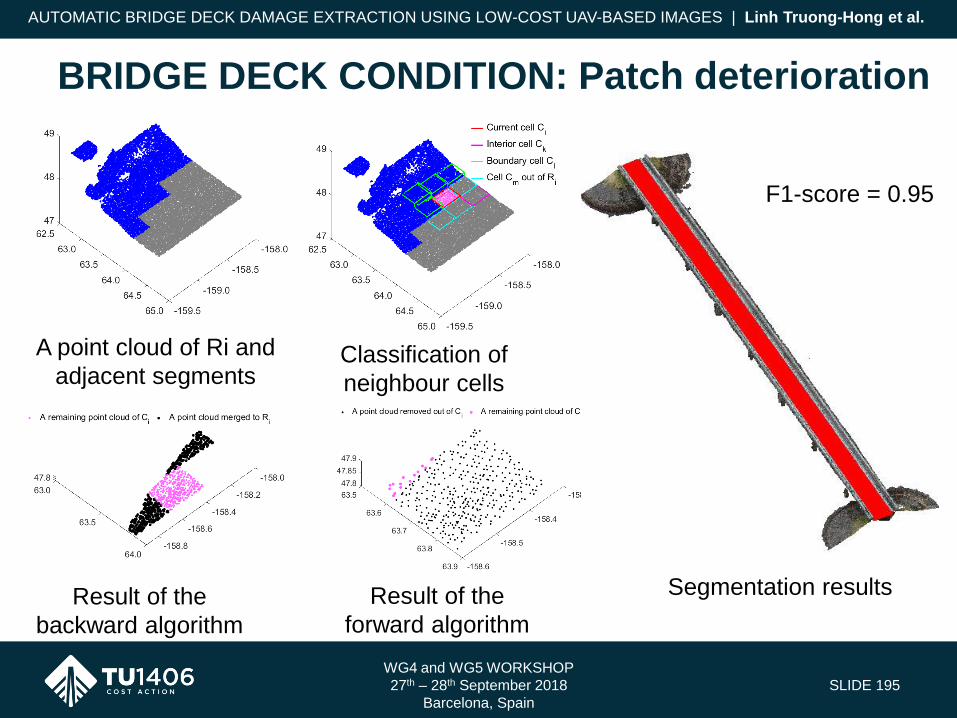
WG4 and WG5 WORKSHOP
27th – 28th September 2018
Barcelona, Spain
SLIDE 195
BRIDGE DECK CONDITION: Patch deterioration
A point cloud of Ri and
adjacent segmentsClassification of
neighbour cells
Result of the
backward algorithm
Result of the
forward algorithm
Segmentation results
F1-score = 0.95
AUTOMATIC BRIDGE DECK DAMAGE EXTRACTION USING LOW-COST UAV-BASED IMAGES | Linh Truong-Hong et al.
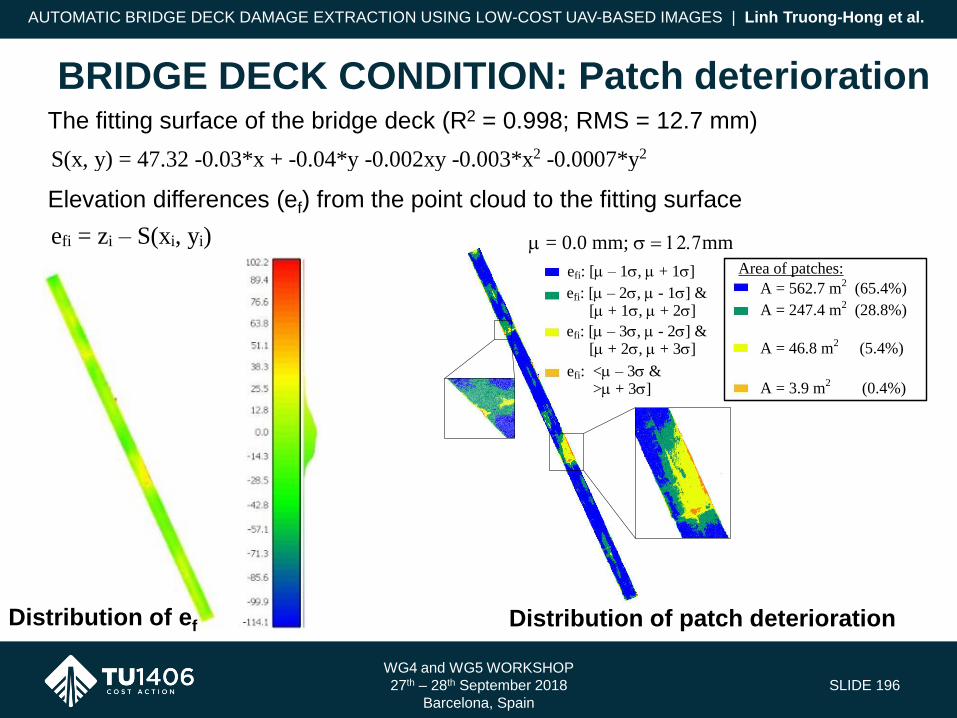
WG4 and WG5 WORKSHOP
27th – 28th September 2018
Barcelona, Spain
SLIDE 196
S(x, y) = 47.32 -0.03*x + -0.04*y -0.002xy -0.003*x2 -0.0007*y2 (1)
efi = zi – S(xi, yi) (1)
The fitting surface of the bridge deck (R2 = 0.998; RMS = 12.7 mm)
Elevation differences (ef) from the point cloud to the fitting surface
Distribution of patch deterioration
efi: [ – 1s, + 1s]
efi: [ – 2s, - 1s] & [ + 1s, + 2s]
efi: [ – 3s, - 2s] & [ + 2s, + 3s]
efi: < – 3s & > + 3s]
A = 562.7 m2 (65.4%)
A = 247.4 m2 (28.8%)
A = 46.8 m2 (5.4%)
A = 3.9 m2 (0.4%)
Area of patches:
= 0.0 mm; s 12.7mm
BRIDGE DECK CONDITION: Patch deterioration
Distribution of ef
AUTOMATIC BRIDGE DECK DAMAGE EXTRACTION USING LOW-COST UAV-BASED IMAGES | Linh Truong-Hong et al.
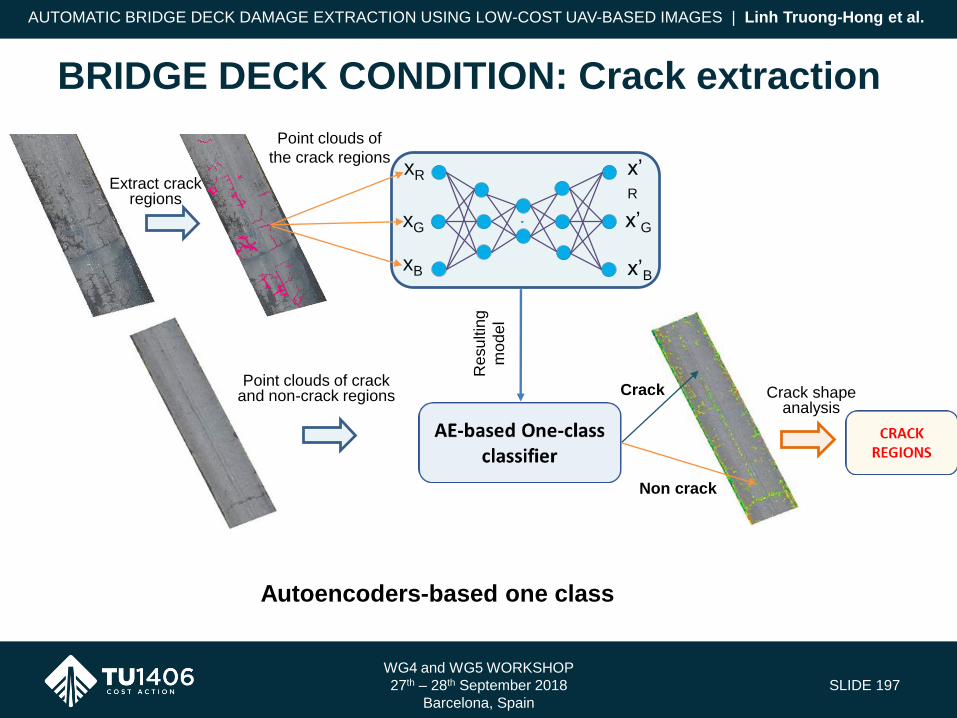
WG4 and WG5 WORKSHOP
27th – 28th September 2018
Barcelona, Spain
SLIDE 197
Autoencoders-based one class
BRIDGE DECK CONDITION: Crack extraction
xR
xG
xB
x’R
x’G
x’B
Point clouds of
the crack regions
Extract crack regions
Resu
ltin
g
mo
de
l
Point clouds of crack and non-crack regions Crack
Non crack
Crack shape analysis
AUTOMATIC BRIDGE DECK DAMAGE EXTRACTION USING LOW-COST UAV-BASED IMAGES | Linh Truong-Hong et al.

WG4 and WG5 WORKSHOP
27th – 28th September 2018
Barcelona, Spain
SLIDE 198
Data set 2 and resulted cracking Data set 3 and resulted cracking
BRIDGE DECK CONDITION: Crack extraction
AUTOMATIC BRIDGE DECK DAMAGE EXTRACTION USING LOW-COST UAV-BASED IMAGES | Linh Truong-Hong et al.
WG4 and WG5 WORKSHOP
27th – 28th September 2018
Barcelona, Spain
SLIDE 199
CONCLUSIONS- A cell-based region growing was proposed to automatically extract a point cloud
of the bridge deck robustly and efficiently, which was given F1-score of 0.95
and processed more than 12 million data points in 174.1 seconds
- Patch deterioration of the bridge deck was automatically identified by
comparing elevations of the point cloud to the undamaged bridge deck surface.
- An evaluation of the proposed method should be evaluated against an
independent method.
- Implementation of deep learning in the form of an Autoencoder-based one class
was successful in extracting most of cracks in the bridge deck, in which only
RGB colors of the point cloud were used in the training model.
- Over-extraction occurred along bridge deck boundaries, but can be solved by
analyzing shapes of the extracted cracks. Furthermore, additional attributes of
the point cloud can be used in learning the model to improve an accuracy.
AUTOMATIC BRIDGE DECK DAMAGE EXTRACTION USING LOW-COST UAV-BASED IMAGES | Linh Truong-Hong et al.

THANK YOU FOR YOUR ATTENTION!
WWW.TU1406.EU

WG4 and WG5 WORKSHOP
Sustainable Bridge Management
27th – 28th September 2018
Barcelona, Spain
HUMAN ERRORS AND CORRESPONDING RISKS IN
REINFORCED CONCRETE BRIDGES
Neryvaldo Galvão –1st PhD student at University of Minho, Portugal
José Matos – Professor at University of Minho, Portugal
Daniel Oliveira – Professor at University of Minho, Portugal
João Fernandes – 2nd PhD student at University of Minho, Portugal

QUALITY SPECIFICATIONS FOR ROADWAY BRIDGES,
STANDARDIZATION AT A EUROPEAN LEVEL
Barcelona,
27th – 28th September, 2018
1
HUMAN ERRORS AND CORRESPONDING RISKS FOR REINFORCED CONCRETE
BRIDGES
Neryvaldo Galvão1, José Campos e Matos2, Daniel Oliveira 3, João Fernandes4
1Researcher, University of Minho, Campus de Azurém, Guimarães, 4800-058 2Assistant Professor, University of Minho, Campus de Azurém, Guimarães, 4800-058 3Associate Professor, University of Minho, Campus de Azurém, Guimarães, 4800-058
4PhD Student, University of Minho, Campus de Azurém, Guimarães, 4800-058
E-mails: [email protected]; [email protected]; [email protected], [email protected]
Abstract. Concerning the bridges failures that have been arising over the years, experts have pointed out as the
principal cause of bridges failures, the human errors that usually take place in the design, construction and operation
stages. The main goal of this paper is the identification of the design and construction errors that represent a higher risk
for reinforced concrete bridges. Therefore, a human error survey was developed together with design and construction
experts on this subject, to collect and assess these errors by using risk-based indicators (probability of occurrence and
consequences). The survey results, given by design and construction experts, are analysed by using a decision-making
tool, named Analytic Hierarchy Process (AHP), which will allow the identification of the errors with higher
consequences and a higher probability of occurrence. The outcome of the performed qualitative risk-based evaluation
of the errors is also presented in this paper.
Keywords: Design Errors, Construction Errors, Reinforced Concrete Bridges, Risk Analysis, Analytic Hierarchy
Process (AHP), Bridge Failure.
1. Introduction
The collapse of bridges is very often connected to tremendous consequences for society and the local economy once it is
part of an imperative network system for the growth of an economy and the fulfilment of human happiness (Scheer, 2010)
(Imhof, 2004) (Cavaco, 2013). To improve the reliability of bridges is first required, the documentation of the main source
of the issues (uncertainties) that are leading to their failure (Campos e Matos, 2013). Relying on a bridge failure database
developed by (Syrkov, 2017) which contain several common bridge failure cases with their leading causes of failure,
since 1966 to 2017, we can state that design and construction error has a vital role to play in this matter, representing 31%
of the failures. Although, the operation errors are responsible for most of the collapses, with a percentage of 51% (Fig.
1).
Fig. 1. Leading causes of failure for reinforced concrete bridges (Syrkov, 2017)
Design and
Construction
Errors
31%
User's Errors
and Natural
Hazards
18%
Operation Errors
51%
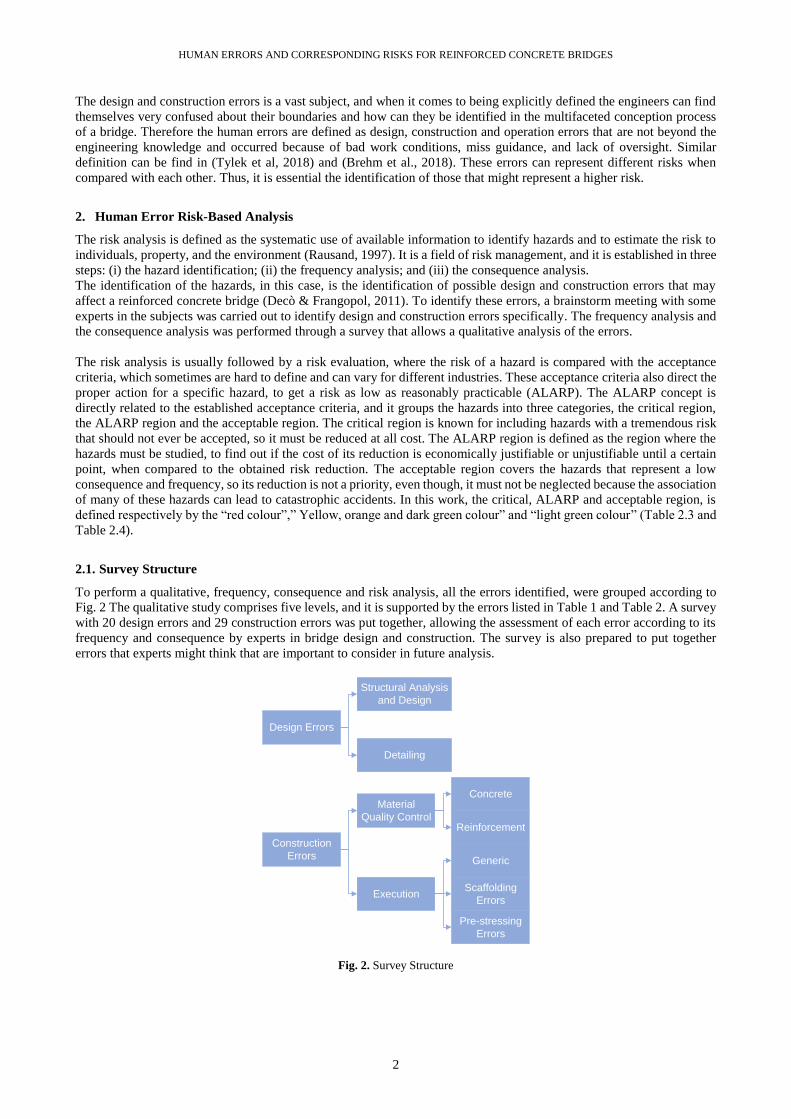
HUMAN ERRORS AND CORRESPONDING RISKS FOR REINFORCED CONCRETE BRIDGES
2
The design and construction errors is a vast subject, and when it comes to being explicitly defined the engineers can find
themselves very confused about their boundaries and how can they be identified in the multifaceted conception process
of a bridge. Therefore the human errors are defined as design, construction and operation errors that are not beyond the
engineering knowledge and occurred because of bad work conditions, miss guidance, and lack of oversight. Similar
definition can be find in (Tylek et al, 2018) and (Brehm et al., 2018). These errors can represent different risks when
compared with each other. Thus, it is essential the identification of those that might represent a higher risk.
2. Human Error Risk-Based Analysis
The risk analysis is defined as the systematic use of available information to identify hazards and to estimate the risk to
individuals, property, and the environment (Rausand, 1997). It is a field of risk management, and it is established in three
steps: (i) the hazard identification; (ii) the frequency analysis; and (iii) the consequence analysis.
The identification of the hazards, in this case, is the identification of possible design and construction errors that may
affect a reinforced concrete bridge (Decò & Frangopol, 2011). To identify these errors, a brainstorm meeting with some
experts in the subjects was carried out to identify design and construction errors specifically. The frequency analysis and
the consequence analysis was performed through a survey that allows a qualitative analysis of the errors.
The risk analysis is usually followed by a risk evaluation, where the risk of a hazard is compared with the acceptance
criteria, which sometimes are hard to define and can vary for different industries. These acceptance criteria also direct the
proper action for a specific hazard, to get a risk as low as reasonably practicable (ALARP). The ALARP concept is
directly related to the established acceptance criteria, and it groups the hazards into three categories, the critical region,
the ALARP region and the acceptable region. The critical region is known for including hazards with a tremendous risk
that should not ever be accepted, so it must be reduced at all cost. The ALARP region is defined as the region where the
hazards must be studied, to find out if the cost of its reduction is economically justifiable or unjustifiable until a certain
point, when compared to the obtained risk reduction. The acceptable region covers the hazards that represent a low
consequence and frequency, so its reduction is not a priority, even though, it must not be neglected because the association
of many of these hazards can lead to catastrophic accidents. In this work, the critical, ALARP and acceptable region, is
defined respectively by the “red colour”,” Yellow, orange and dark green colour” and “light green colour” (Table 2.3 and
Table 2.4).
2.1. Survey Structure
To perform a qualitative, frequency, consequence and risk analysis, all the errors identified, were grouped according to
Fig. 2 The qualitative study comprises five levels, and it is supported by the errors listed in Table 1 and Table 2. A survey
with 20 design errors and 29 construction errors was put together, allowing the assessment of each error according to its
frequency and consequence by experts in bridge design and construction. The survey is also prepared to put together
errors that experts might think that are important to consider in future analysis.
Design Errors
Detailing
Structural Analysis
and Design
Construction
Errors
Material
Quality Control
Execution
Generic
Concrete
Reinforcement
Scaffolding
Errors
Pre-stressing
Errors
Fig. 2. Survey Structure
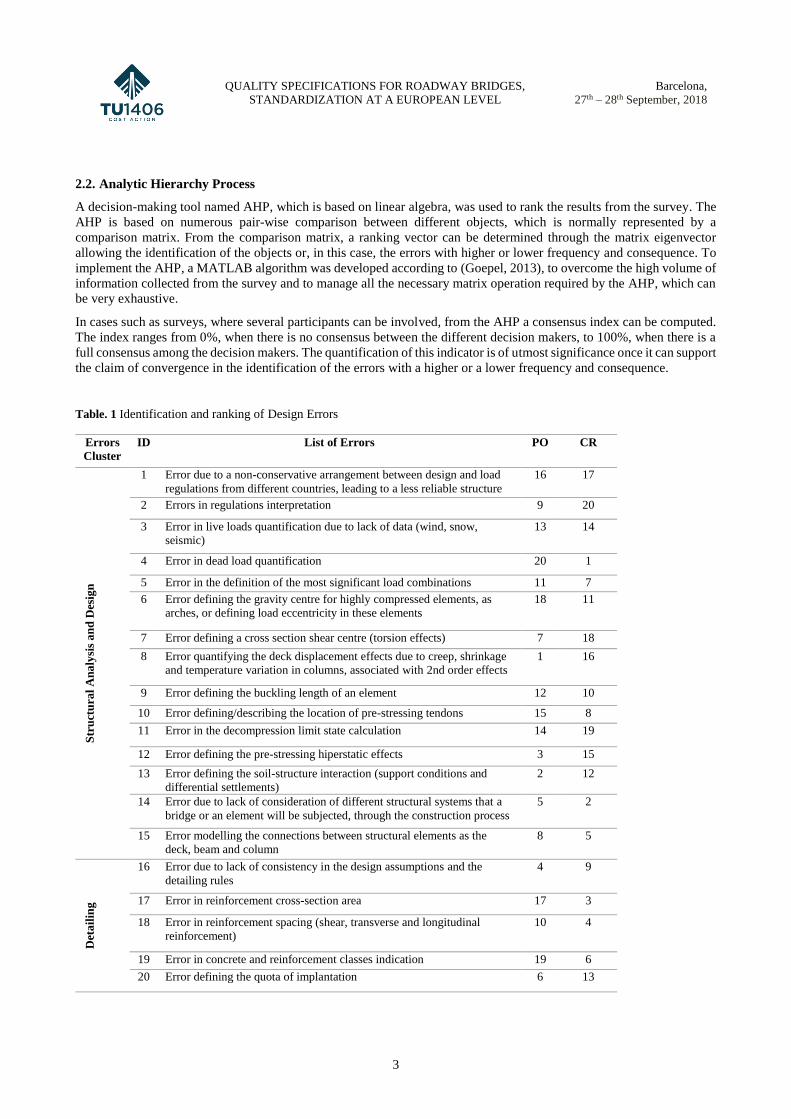
QUALITY SPECIFICATIONS FOR ROADWAY BRIDGES,
STANDARDIZATION AT A EUROPEAN LEVEL
Barcelona,
27th – 28th September, 2018
3
2.2. Analytic Hierarchy Process
A decision-making tool named AHP, which is based on linear algebra, was used to rank the results from the survey. The
AHP is based on numerous pair-wise comparison between different objects, which is normally represented by a
comparison matrix. From the comparison matrix, a ranking vector can be determined through the matrix eigenvector
allowing the identification of the objects or, in this case, the errors with higher or lower frequency and consequence. To
implement the AHP, a MATLAB algorithm was developed according to (Goepel, 2013), to overcome the high volume of
information collected from the survey and to manage all the necessary matrix operation required by the AHP, which can
be very exhaustive.
In cases such as surveys, where several participants can be involved, from the AHP a consensus index can be computed.
The index ranges from 0%, when there is no consensus between the different decision makers, to 100%, when there is a
full consensus among the decision makers. The quantification of this indicator is of utmost significance once it can support
the claim of convergence in the identification of the errors with a higher or a lower frequency and consequence.
Table. 1 Identification and ranking of Design Errors
Errors
Cluster
ID List of Errors PO CR
Str
uct
ura
l A
na
lysi
s a
nd
Des
ign
1 Error due to a non-conservative arrangement between design and load
regulations from different countries, leading to a less reliable structure
16 17
2 Errors in regulations interpretation 9 20
3 Error in live loads quantification due to lack of data (wind, snow,
seismic)
13 14
4 Error in dead load quantification 20 1
5 Error in the definition of the most significant load combinations 11 7
6 Error defining the gravity centre for highly compressed elements, as
arches, or defining load eccentricity in these elements
18 11
7 Error defining a cross section shear centre (torsion effects) 7 18
8 Error quantifying the deck displacement effects due to creep, shrinkage
and temperature variation in columns, associated with 2nd order effects
1 16
9 Error defining the buckling length of an element 12 10
10 Error defining/describing the location of pre-stressing tendons 15 8
11 Error in the decompression limit state calculation 14 19
12 Error defining the pre-stressing hiperstatic effects 3 15
13 Error defining the soil-structure interaction (support conditions and
differential settlements)
2 12
14 Error due to lack of consideration of different structural systems that a
bridge or an element will be subjected, through the construction process
5 2
15 Error modelling the connections between structural elements as the
deck, beam and column
8 5
Det
ail
ing
16 Error due to lack of consistency in the design assumptions and the
detailing rules
4 9
17 Error in reinforcement cross-section area 17 3
18 Error in reinforcement spacing (shear, transverse and longitudinal
reinforcement)
10 4
19 Error in concrete and reinforcement classes indication 19 6
20 Error defining the quota of implantation 6 13

HUMAN ERRORS AND CORRESPONDING RISKS FOR REINFORCED CONCRETE BRIDGES
4
The Table 1 and Table 2, list all the errors collected to create the survey and its respectively ranking position for frequency
and consequence, obtained from the AHP. Another valuable aspect of the AHP is the fact that it allows the use of different
weighting factors to enhance the influence of the input of different decision makers in the outcome. For instance, the
informations given by a civil engineer with more professional experience should have more influence on the outcome,
than the contribution of a civil engineer with less experience. Therefore, four weighting factors were used, according to
the years of experience of each engineer, 1.0 (1-10 years), 1.5(10-20 years), 1.75 (20-30 years) and 2.0 (30-40 years).
Table 2. Identification and ranking of Construction Errors
Errors
Cluster ID List of Errors FR CR
Ma
teri
al
Qu
ali
ty C
on
tro
l
Err
ors
Co
ncr
ete
1 Errors leading to alkali-aggregate reaction 19 15
2 Error in the quantification of cement hydration heat 18 22
3 Error in the evaluation of aggregates humidity 13 28
4 Error due to poor concrete workmanship leading to a concrete with
characteristics and properties different from the requested
22 13
Rei
nfo
rcem
ent 5 Errors leading to reinforcement corrosion 10 25
6 Error using a wrong reinforcement class especially when different
reinforcement classes are also used in construction
29 23
7 Error related to reinforcement cross-section area 26 14
Ex
ecu
tio
n E
rro
rs
Gen
eric
Err
ors
8 Error due to wrong positioning of supports 15 12
9 Error due to expansion joints deficiency and wrong positioning 3 19
10 Error due to wrong interpretation of the design project 21 8
11 Error in topographic implantation 14 16
12 Error due to wrong concrete vibration 20 27
13 Error in the reinforcement cover 2 18
14 Error in the longitudinal shape due to shrinkage and creep effects that were not
correctly computed in the design project
9 26
15 Error due to consideration of support conditions different from those defined
in the design project
23 24
16 Error due to the establishment of wrong final support conditions 25 20
17 Error due to wrong evaluation of the foundation soil properties 5 4
18 Error due to geometric imperfections (inclination and cross section
imperfection)
11 29
Sca
ffo
ldin
g E
xec
uti
on
Err
ors
19 Error due to poor evaluation of the foundation soil properties of the scaffolds,
and variation of these properties before different rainfall conditions
1 3
20 Error due to poor preparation of the scaffold foundation using gravel material
and/or poor positioning of the timber elements that support the scaffold
8 10
21 Error due to deficiency in the continuous scaffold bracing, leading to global
instability
4 1
22 Error due to a deficient maintenance plan leading to poor scaffold material
quality
12 7
23 Error in the scaffold clamping elements (connectors and couplers) 6 6
24 Error in movable scaffolds due to non-controlled hyperstaticity reduction to
perform his movement
16 2
25 Error in the assessment of the formwork and scaffold deformability properties 7 17
26 Error due to wrong positioning of formwork ties 17 21
Pre
stre
ssin
g
Err
ors
27 Error due to insufficient prestressing tension 28 5
28 Error due to over loss of prestressing tension 24 11
29 Error due to insufficient concrete curing, necessary, to bond the concrete with
the prestressed steel by static friction (pre-tensioned concrete)
27 9
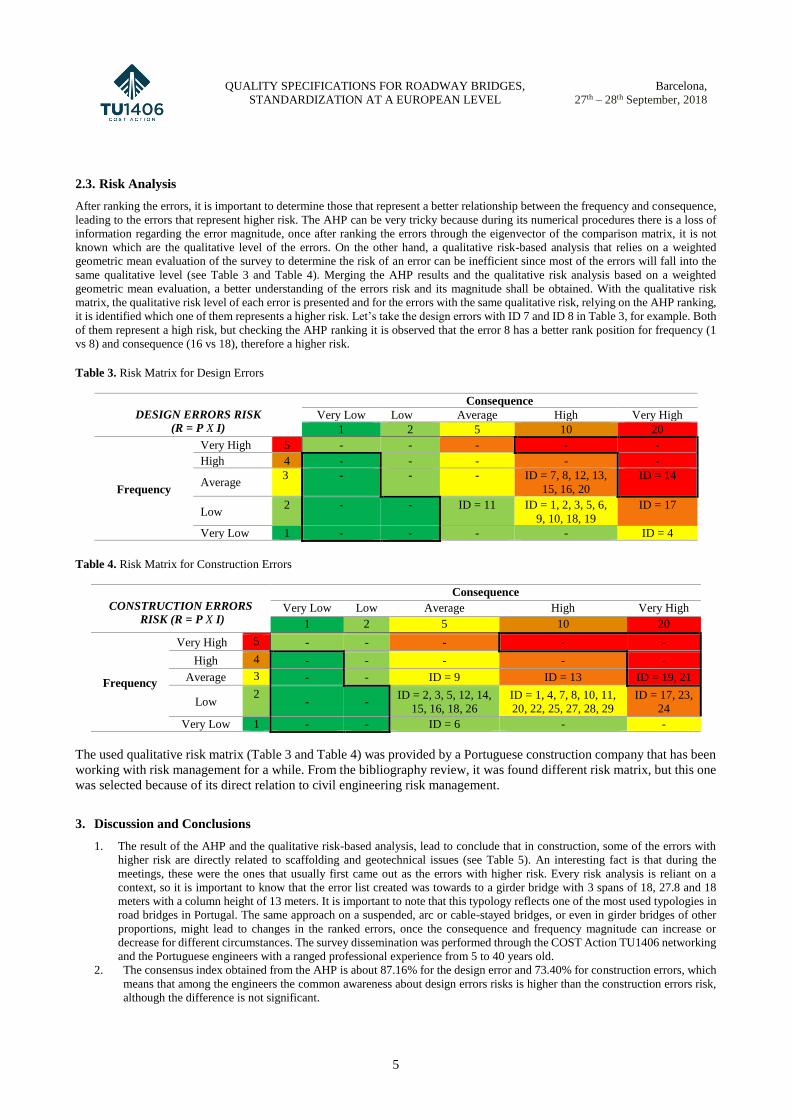
QUALITY SPECIFICATIONS FOR ROADWAY BRIDGES,
STANDARDIZATION AT A EUROPEAN LEVEL
Barcelona,
27th – 28th September, 2018
5
2.3. Risk Analysis
After ranking the errors, it is important to determine those that represent a better relationship between the frequency and consequence,
leading to the errors that represent higher risk. The AHP can be very tricky because during its numerical procedures there is a loss of
information regarding the error magnitude, once after ranking the errors through the eigenvector of the comparison matrix, it is not
known which are the qualitative level of the errors. On the other hand, a qualitative risk-based analysis that relies on a weighted
geometric mean evaluation of the survey to determine the risk of an error can be inefficient since most of the errors will fall into the
same qualitative level (see Table 3 and Table 4). Merging the AHP results and the qualitative risk analysis based on a weighted
geometric mean evaluation, a better understanding of the errors risk and its magnitude shall be obtained. With the qualitative risk
matrix, the qualitative risk level of each error is presented and for the errors with the same qualitative risk, relying on the AHP ranking,
it is identified which one of them represents a higher risk. Let’s take the design errors with ID 7 and ID 8 in Table 3, for example. Both
of them represent a high risk, but checking the AHP ranking it is observed that the error 8 has a better rank position for frequency (1
vs 8) and consequence (16 vs 18), therefore a higher risk.
Table 3. Risk Matrix for Design Errors
DESIGN ERRORS RISK (R = P X I)
Consequence
Very Low Low Average High Very High
1 2 5 10 20
Frequency
Very High 5 - - - - -
High 4 - - - - -
Average 3 - - - ID = 7, 8, 12, 13,
15, 16, 20
ID = 14
Low 2 - - ID = 11 ID = 1, 2, 3, 5, 6,
9, 10, 18, 19
ID = 17
Very Low 1 - - - - ID = 4
Table 4. Risk Matrix for Construction Errors
CONSTRUCTION ERRORS RISK (R = P X I)
Consequence
Very Low Low Average High Very High
1 2 5 10 20
Frequency
Very High 5 - - - - -
High 4 - - - - -
Average 3 - - ID = 9 ID = 13 ID = 19, 21
Low 2
- - ID = 2, 3, 5, 12, 14,
15, 16, 18, 26
ID = 1, 4, 7, 8, 10, 11,
20, 22, 25, 27, 28, 29
ID = 17, 23,
24
Very Low 1 - - ID = 6 - -
The used qualitative risk matrix (Table 3 and Table 4) was provided by a Portuguese construction company that has been
working with risk management for a while. From the bibliography review, it was found different risk matrix, but this one
was selected because of its direct relation to civil engineering risk management.
3. Discussion and Conclusions
1. The result of the AHP and the qualitative risk-based analysis, lead to conclude that in construction, some of the errors with
higher risk are directly related to scaffolding and geotechnical issues (see Table 5). An interesting fact is that during the
meetings, these were the ones that usually first came out as the errors with higher risk. Every risk analysis is reliant on a
context, so it is important to know that the error list created was towards to a girder bridge with 3 spans of 18, 27.8 and 18
meters with a column height of 13 meters. It is important to note that this typology reflects one of the most used typologies in
road bridges in Portugal. The same approach on a suspended, arc or cable-stayed bridges, or even in girder bridges of other
proportions, might lead to changes in the ranked errors, once the consequence and frequency magnitude can increase or
decrease for different circumstances. The survey dissemination was performed through the COST Action TU1406 networking
and the Portuguese engineers with a ranged professional experience from 5 to 40 years old.
2. The consensus index obtained from the AHP is about 87.16% for the design error and 73.40% for construction errors, which
means that among the engineers the common awareness about design errors risks is higher than the construction errors risk,
although the difference is not significant.

HUMAN ERRORS AND CORRESPONDING RISKS FOR REINFORCED CONCRETE BRIDGES
6
3. From the qualitative analysis, for the very low-risk category, no error was identified. It is believed that this is because of the
pre-requisite used in the identification of the errors. The errors list used in the survey already stand for those that may
represent a higher risk.
4. At this point is important to say that this work was developed aiming the identification of damages on a structure caused by
human errors with direct impact on the reliability of the structure. A hierarchy of the listed errors gives us also a clue of
where should be put the efforts to increase the safety of structures, effectively. A better understanding of the human errors
risk will allow a better-quality control plan to increase the safety of roadway bridges.
Table 5. Top five design and construction errors with higher risk
Design Errors Construction Errors
Error due to lack of consideration of different structural
systems that a bridge or an element will be subjected, through
the construction process (ID = 14)
Error due to poor evaluation of the foundation soil
properties of the scaffolds, and variation of these properties
before different rainfall conditions (ID= 19)
Error modelling the connections between structural elements
like deck, beam and column; (ID = 15)
Error due to deficiency in the continuous scaffold's bracing
leading to global instability (ID = 21)
Error due to lack of consistency in the design assumptions and
the detailing rules (ID = 16)
Error due to wrong evaluation of the foundation soil
properties (ID = 17)
Error defining the soil-structure interaction (support
conditions and differential settlements) (ID = 13)
Error in the scaffold clamping elements (connectors and
couplers) (ID = 23)
Error in reinforcement spacing (shear, transverse and
longitudinal reinforcement) (ID = 18)
Error in movable scaffolds due to non-controlled
hyperstaticity reduction needed to perform his movement
(ID = 24)
4. Bibliografy
Brehm, E., Hertle, R., Brehm, E., Dir, M., Gmbh, B. B., Hertle, R., & Ingenieure, H. (2018). Failure Identification :
Procedural Causes and Corresponding Responsibilities Failure Identi fi cation : Procedural Causes and
Corresponding Responsibilities, 8664. https://doi.org/10.2749/101686617X14881937385160
Campos e Matos, J. (2013). Uncertainty Evaluation of Reinforced Concrete and Composite Structures Behavior.
Retrieved from https://repositorium.sdum.uminho.pt/bitstream/1822/25307/1/PhD_Thesis _José António
Matos_2013.pdf
Cavaco, E. S. (2013). Robustness of corroded reinforced concrete structures. Civil engineering PhD thesis. Faculty of
science and tecnhology of University of Nova Lisboa, Lisboa.
Decò, A., & Frangopol, D. M. (2011). Risk assessment of highway bridges under multiple hazards. Journal of Risk
Research, 14(9), 1057–1089. https://doi.org/10.1080/13669877.2011.571789
Goepel, K. D. (2013). Implementing the Analytic Hierarchy Process as a Standard Method for Multi-Criteria Decision
Making In Corporate Enterprises – A New AHP Excel Template with Multiple Inputs. Proceedings of the
International Symposium on the Analytic Hierarchy Process, 1–10. Retrieved from http://bpmsg.com/wp-
content/uploads/2013/06/ISAHP_2013-13.03.13.Goepel.pdf
Imhof, D. (2004). Risk Assessment of Existing Bridge Structures. University of Cambridge. Retrieved from
http://www.nbq.ch/PhD/Thesis.pdf
Melchers, R. . (2001). On the ALARP approach to risk management. Reliability Engineering & System Safety, 71(2),
201–208. https://doi.org/10.1016/S0951-8320(00)00096-X
Rausand, M. (1997). [Risk assessment]. Der Chirurg; Zeitschrift fur alle Gebiete der operativen Medizen (Vol. 68).
Retrieved from NS -
Scheer, J. (2010). Failed Bridges - Case Studies, Causes and Consequences. Hannover: Ernst&Sohn.
https://doi.org/10.1002/9783433600634
Syrkov, A. (2017). Review of bridge collapses worldwide 1966 - 2017. In IABSE Workshop Ignorance, uncertainty and
human errors in structural engineering.
Tylek, I., Kuchta, K., & Rawska-skotniczny, A. (2018). Human Errors in the Design and Execution of Steel Structures
— A Case Study Human Errors in the Design and Execution of Steel Structures — A Case Study, 8664.
https://doi.org/10.2749/101686617X14881937385287

WG4 and WG5 WORKSHOP
Sustainable Bridge Management
27th – 28th September 2018
Barcelona, Spain
HUMAN ERRORS AND CORRESPONDING RISKS IN
REINFORCED CONCRETE BRIDGES
Neryvaldo Galvão –1st PhD student at University of Minho, Portugal
José Matos – Professor at University of Minho, Portugal
Daniel Oliveira – Professor at University of Minho, Portugal
João Fernandes – 2nd PhD student at University of Minho, Portugal
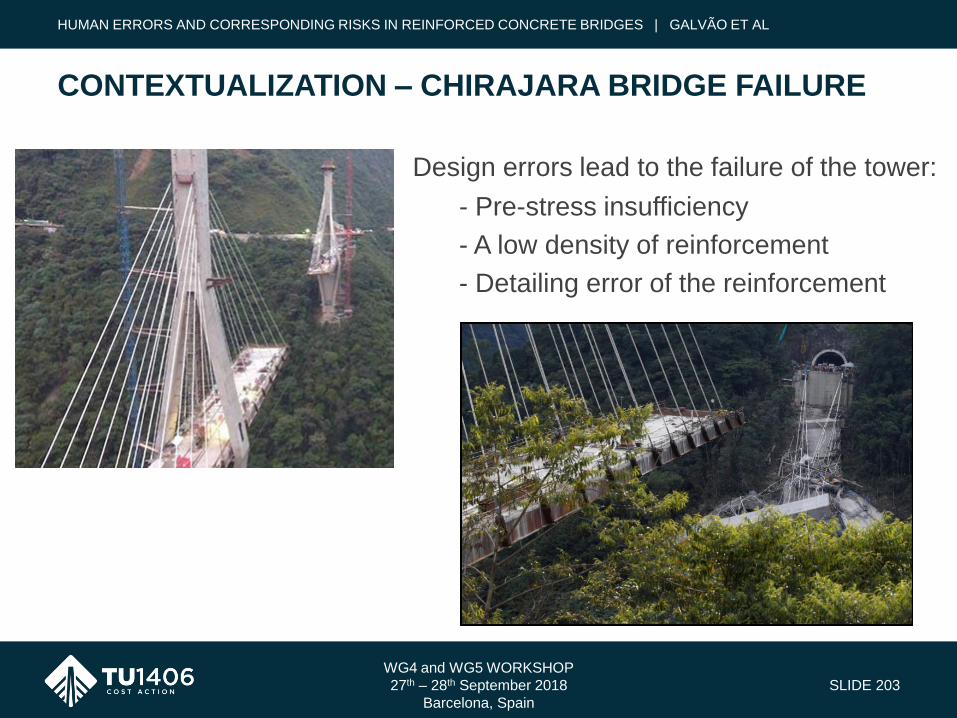
HUMAN ERRORS AND CORRESPONDING RISKS IN REINFORCED CONCRETE BRIDGES | GALVÃO ET AL
WG4 and WG5 WORKSHOP
27th – 28th September 2018
Barcelona, Spain
SLIDE 203
Design errors lead to the failure of the tower:
- Pre-stress insufficiency
- A low density of reinforcement
- Detailing error of the reinforcement
CONTEXTUALIZATION – CHIRAJARA BRIDGE FAILURE

HUMAN ERRORS AND CORRESPONDING RISKS IN REINFORCED CONCRETE BRIDGES | GALVÃO ET AL
WG4 and WG5 WORKSHOP
27th – 28th September 2018
Barcelona, Spain
SLIDE 204
CONTEXTUALIZATION – BRIDGE COLLAPSE DATA BASE
14%
0%
3%
5%
10%
4%15%
31%
3%
15%
Concrete Bridges FailureDesign & expertise error of newobjects
Design & expertise error ofrepairs, demolitions
Design, expertise, construction &supervise errors
Construction & supervision errorduring repairs, demolitions
Construction & supervision errorduring new building
Managerial & organizationalerror during operation
Inspection, testing error duringoperation
Maintenance error
Unpredictable case
Infrastructure User's Error
Human Error82%
Hazard Events and Misuse
18%
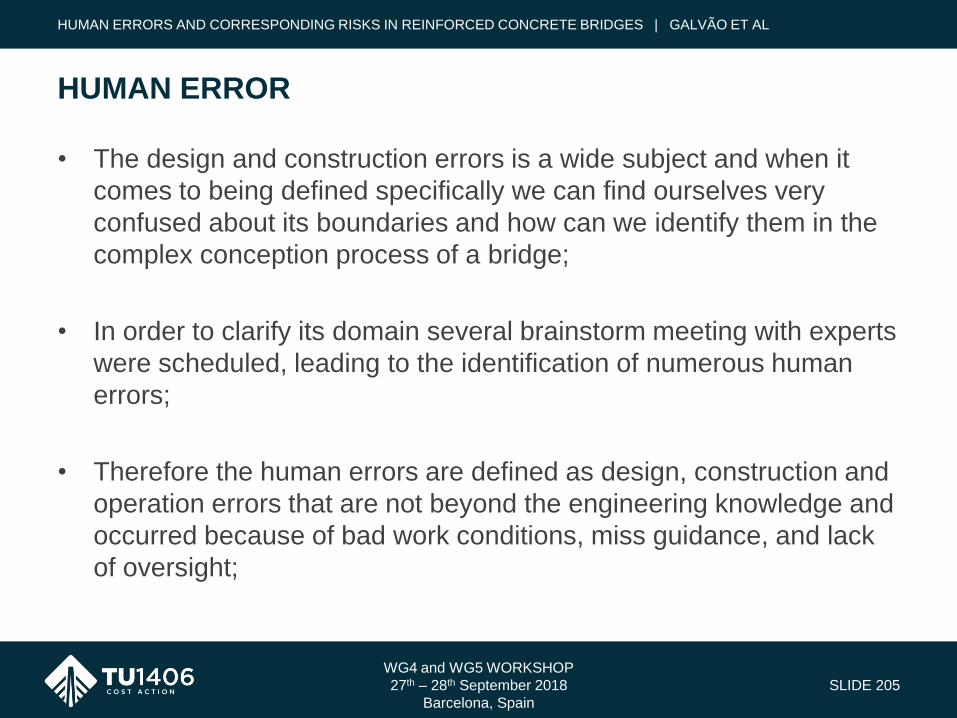
HUMAN ERRORS AND CORRESPONDING RISKS IN REINFORCED CONCRETE BRIDGES | GALVÃO ET AL
WG4 and WG5 WORKSHOP
27th – 28th September 2018
Barcelona, Spain
SLIDE 205
HUMAN ERROR
• The design and construction errors is a wide subject and when it
comes to being defined specifically we can find ourselves very
confused about its boundaries and how can we identify them in the
complex conception process of a bridge;
• In order to clarify its domain several brainstorm meeting with experts
were scheduled, leading to the identification of numerous human
errors;
• Therefore the human errors are defined as design, construction and
operation errors that are not beyond the engineering knowledge and
occurred because of bad work conditions, miss guidance, and lack
of oversight;
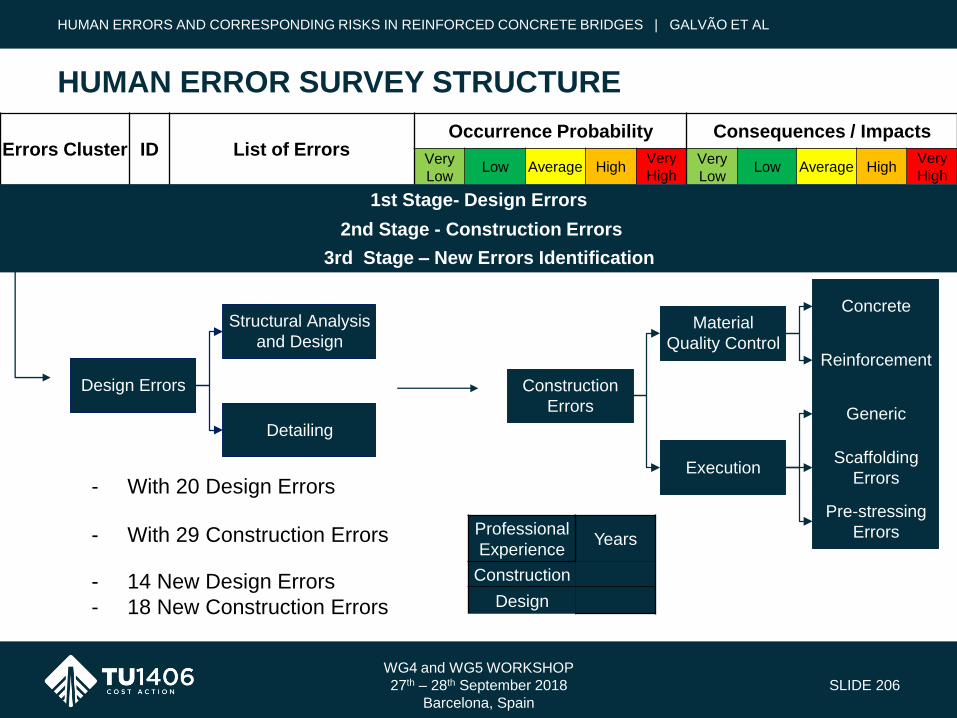
HUMAN ERRORS AND CORRESPONDING RISKS IN REINFORCED CONCRETE BRIDGES | GALVÃO ET AL
WG4 and WG5 WORKSHOP
27th – 28th September 2018
Barcelona, Spain
SLIDE 206
HUMAN ERROR SURVEY STRUCTURE
Errors Cluster ID List of ErrorsOccurrence Probability Consequences / Impacts
Very
LowLow Average High
Very
HighVery
LowLow Average High
Very
High
1st Stage- Design Errors
- With 20 Design Errors
- 14 New Design Errors
- 18 New Construction Errors
- With 29 Construction Errors Professional
Experience Years
Construction
Design
2nd Stage - Construction Errors
3rd Stage – New Errors Identification
Design Errors
Detailing
Structural Analysis
and Design
Construction
Errors
Material
Quality Control
Execution
Generic
Concrete
Reinforcement
Scaffolding
Errors
Pre-stressing
Errors

HUMAN ERRORS AND CORRESPONDING RISKS IN REINFORCED CONCRETE BRIDGES | GALVÃO ET AL
WG4 and WG5 WORKSHOP
27th – 28th September 2018
Barcelona, Spain
SLIDE 207
HUMAN ERROR RANKING
- The analytical hierarchy process (AHP) is a decision-making tool,
based on linear algebra that through numerous pair-wise
comparison between different objects allows the establishment of a
comparison matrix;
- The Eigenvector of the comparison matrix allows the ranking of the
compared objects;
- Using a Matlab script the AHP was implemented allowing to rank the
Human errors;
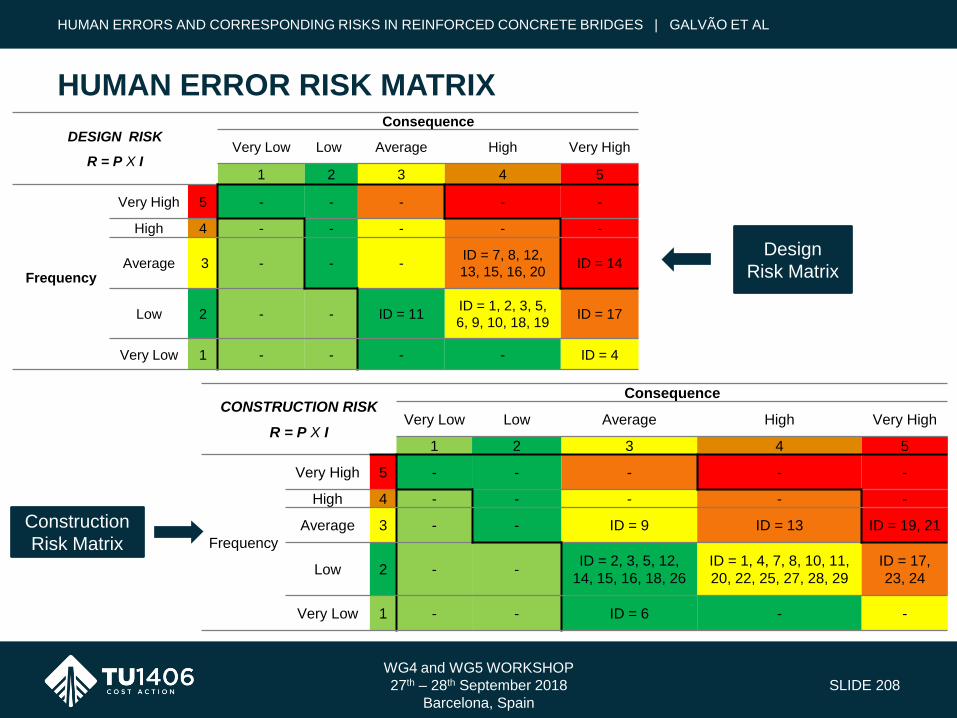
HUMAN ERRORS AND CORRESPONDING RISKS IN REINFORCED CONCRETE BRIDGES | GALVÃO ET AL
WG4 and WG5 WORKSHOP
27th – 28th September 2018
Barcelona, Spain
SLIDE 208
HUMAN ERROR RISK MATRIX
DESIGN RISK
R = P X I
Consequence
Very Low Low Average High Very High
1 2 3 4 5
Frequency
Very High 5 - - - - -
High 4 - - - - -
Average 3 - - -ID = 7, 8, 12,
13, 15, 16, 20ID = 14
Low 2 - - ID = 11 ID = 1, 2, 3, 5,
6, 9, 10, 18, 19ID = 17
Very Low 1 - - - - ID = 4
CONSTRUCTION RISK
R = P X I
Consequence
Very Low Low Average High Very High
1 2 3 4 5
Frequency
Very High 5 - - - - -
High 4 - - - - -
Average 3 - - ID = 9 ID = 13 ID = 19, 21
Low 2 - -ID = 2, 3, 5, 12,
14, 15, 16, 18, 26
ID = 1, 4, 7, 8, 10, 11,
20, 22, 25, 27, 28, 29
ID = 17,
23, 24
Very Low 1 - - ID = 6 - -
Design
Risk Matrix
Construction
Risk Matrix

HUMAN ERRORS AND CORRESPONDING RISKS IN REINFORCED CONCRETE BRIDGES | GALVÃO ET AL
WG4 and WG5 WORKSHOP
27th – 28th September 2018
Barcelona, Spain
SLIDE 209
DISCUSSION AND CONCLUSION
Design Errors Construction Errors
Error due to lack of consideration of different
structural systems that a bridge or an element
will be subjected, through the construction
process;
(Risk Level - V)
Error due to poor evaluation of the foundation
soil properties of the scaffolds, and variation of
these properties before different rainfall
conditions;
(Risk Level - V)
Error modelling the connections between
structural elements like deck, beam and column;
(Risk Level - IV)
Error due to deficiency in the continuous
scaffold's bracing leading to global instability;
(Risk Level - V)
Error due to lack of consistency in the design
assumptions and the detailing rules;
(Risk Level - IV)
Error due to wrong evaluation of the foundation
soil properties;
(Risk Level - IV)
Error defining the soil-structure interaction
(support conditions and differential settlements);
(Risk Level - IV)
Error in the scaffold clamping elements
(connectors and couplers);
(Risk Level - IV)
Error in reinforcement spacing (shear, transverse
and longitudinal reinforcement);
(Risk Level - IV)
Error in movable scaffolds due to non-
controlled hyperstaticity reduction needed to
perform his movement;
(Risk Level - IV)

HUMAN ERRORS AND CORRESPONDING RISKS IN REINFORCED CONCRETE BRIDGES | GALVÃO ET AL
WG4 and WG5 WORKSHOP
27th – 28th September 2018
Barcelona, Spain
SLIDE 210
• In construction, the errors with higher risk are directly related to
scaffolding and geotechnical issues;
• The consensus index obtained from the AHP is about 87.16% for the
design error and 73.40% for construction errors;
• For the very low-risk category, no error was identified which means
that the errors list used in the survey, already stand for those that
represent higher risks;
• Most of the errors listed fall into the ALARP region, which means
that the relation between the risk and its reduction costs should be
assessed;
DISCUSSION AND CONCLUSION

THANK YOU FOR YOUR ATTENTION!
WWW.TU1406.EU

WG4 and WG5 WORKSHOP
Sustainable Bridge Management
27th – 28th September 2018
Barcelona, Spain
QUALITY CONTROL, INFRASTRUCTURE MANAGEMENT
SYSTEMS AND THEIR IMPLEMENTATION IN MEDIUM-SIZE
HIGHWAY NETWORKS
Flora Faleschini - University of Padova, ItalyMariano Angelo Zanini - University of Padova, Italy
Carlo Pellegrino - University of Padova, Italy
QUALITY SPECIFICATIONS FOR ROADWAY BRIDGES,
STANDARDIZATION AT A EUROPEAN LEVEL
Barcelona,
26th – 27th September, 2018
1
Quality control, infrastructure management systems and their
implementation in medium-size highway networks
Flora Faleschini1, Mariano Angelo Zanini2, Carlo Pellegrino3
1,2,3University of Padova, Dept. of Civil, Environmental and Architectural Engineering, Via Marzolo 9,
35131 Padova, Italy
E-mails: [email protected]; [email protected]; [email protected].
Abstract. Bridge maintenance is a key issue in deteriorating infrastructure systems. The present work
aims to illustrate the real perception of such topic in the Italian context, and describing bridge
maintenance practices currently in use among roadway infrastructure owners in Italy. Furthermore, an
in-depth description of the activities related to the development of Bridge Management Systems for
reliable Quality Control at the University of Padova - Department of Civil, Environmental and
Architecture Engineering (UNIPD) is outlined. In the final part of the work, some results coming from
the application of the tools developed at UNIPD and applied on an existing infrastructure asset belonging
to a medium-size highway network located in the North-Eastern part of Italy are presented.
Keywords: bridge management; deterioration; performance indicators; quality control; visual inspections.
1 Introduction
Bridges are usually subject to deterioration depending on several factors e.g. environmental condition, natural
aging, quality of the material, and planned maintenance. These structures are the most highly exposed to
deterioration induced by harsh climatic conditions, aging, and increased volumes and weights of traffic axle loads.
Greater demand to improve the management protocols for bridges is becoming increasingly evident. Many road
managing authorities have made significant efforts to develop bridge management systems (BMSs) (Zonta et al.
2007, Pellegrino et al. 2011). A BMS is a systematic method through which a public authority can manage all the
activities related to maintenance of its bridge assets, to optimize their life-cycle management and avoid any kind
of damage or out-of-service situation, which could involve severe indirect losses to infrastructure users. Several
BMSs have been developed over the years: examples can be found in Thoft-Christensen (1995), Markow (1995)
and Kitada et al. (2000). During the last decade, several research projects focusing on management at network
level of existing bridges have been financed by the European Commission and corresponding guidelines have been
produced (BR.I.M.E. (2001), COST345 (2004), SA.MA.R.I.S. (2005) and Sustainable Bridges (2006)). In
currently available BMSs, decision-making mainly depends on combined quantitative/qualitative information
coming from in-situ investigations and visual inspections. Natural aging cannot be considered the unique source
of damage, since in many situations other different kinds of natural or anthropic hazards - like earthquakes, floods,
tsunamis, vehicle collisions - might severely affect the stability of existing bridges. In addition, the combined
effect of deterioration with such hazards can lead to premature failures (Zanini et al. 2013). Past experience has
shown how, during their lifetime, bridges undergo structural problems due to environmental conditions and natural
disasters: concrete cover damage exposes bars to the atmosphere, steel may become corroded by freezing/thawing
cycles, and aging of structural materials are some of the causes leading to degradation of the mechanical properties
of reinforced concrete (Biondini et al. 2014), thus amplifying the effects of earthquakes and increasing the risk of
seismic damage (Franchin et al. 2006; Morbin et al. 2015). It is therefore relevant to perform surveillance and to
promptly carrying out retrofit measures aimed at strengthening structurally deficient bridges in order to avoid
failures and related socio-economic impacts. In the present work, issues related to the development of rational
maintenance programs are addressed looking at the Italian context and current practices, and illustrating the
regulatory framework, the state-of-art of the implementation of BMSs, describing research on this field carried out
at UNIPD and finally presenting, as virtuous example, the long-term bridge surveillance program of Concessioni
Autostradali Venete S.p.A., a medium-size highway concessionaire company of northeastern Italy.

QUALITY CONTROL, INFRASTRUCTURE MANAGEMENT SYSTEMS AND THEIR IMPLEMENTATION IN MEDIUM-SIZE
HIGHWAY NETWORKS
2
2 The Italian context: legislative prescriptions and state-of-art on BMSs
In Italy there is a substantial lack of clear regulatory prescriptions on the maintenance activities to be carried out
by infrastructure owners in order to guarantee and adequate structural safety level for existing bridges. The first
indication can be found in the Ministerial Circular 6736/61A1 (1967), in which it is evidenced the issue of a proper
maintenance to be carried out in order to preserve structures over time. After more than two decades, the
Ministerial Circular 34233 (1991) provided rough suggestions on frequency and types of inspections, highlighting
how managing authorities should plan a periodic assessment of the static conditions with a frequency - arbitrarily
defined by the owner - also in relation to the specific importance of a bridge with respect to the network to which
it belongs. An interesting manual devoted to the maintenance of railway bridges (Istruzione 44C, 1994) was
approved in 1994, reporting a wide series of defects that can be detected on steel, reinforced concrete and masonry
bridges during a visual survey. Istruzione 44C (1994) gives in addition precise indications on how to rate them
and to use ratings for the subsequent calculation of a health indicator at structure level, useful for priority ranking
purposes. In recent years, new National Building Codes were approved in 2008 (NTC2008, actually replaced by
NTC2018), where issues related to maintenance actions are slightly mentioned in the chapter related to existing
structures, suggesting to take into account the quality and the state of maintenance of the materials and components
of an existing structure, but without providing clear prescriptions on frequency and types of inspections. However,
an interesting document was enacted by the Autonomous Province of Bozen (2011), inspired by German
(DIN1076) and Austrian (RVS 2011) regulations, which defines 4 types of inspections, providing clear indications
on frequency, activities to be carried out, how and to perform them and which type of technician has to be involved,
and contents of the reports.
In Italy, most of bridges were built in between 1960-1980, when the infrastructure roadway and highway networks
were characterized by an exponential growth, and the design philosophy was more focused in developing novel
construction practices and design approaches than to take into account issues related to long-term behavior of
structures, including in the design insights related to aging, sustainability and life cycle costs (LCC) analyses, as
nowadays in many parts of the world.
In addition, the actual administrative configuration is fragmentary: highways are mainly managed by different
private concessionaire companies, that should be subject to periodic audits by the Italian Ministry of Infrastructure,
whereas, as regards roadways, are mainly managed by public administrations at regional, provincial, and municipal
level.
The combination of such factors, i.e. the absence of a clear regulatory framework for maintenance activities, aging
bridges with an average service life of 40-60 years and designed with poor detailing with respect to maintenance
issues, and administrative fragmentation in the management of infrastructure systems, constitute an issue of
national relevance that can no more be postponed and need urgent measures to be implemented over the entire
territory. The awareness of this huge issue has been exponentially increased over the recent years, also due to a
series of relevant bridge failures (Figure 1).
Fig. 1. Examples of recent bridge failures in Italy (2014 – 2017).

QUALITY SPECIFICATIONS FOR ROADWAY BRIDGES,
STANDARDIZATION AT A EUROPEAN LEVEL
Barcelona,
26th – 27th September, 2018
3
In addition to aging phenomena, many bridges were designed without stringent prescriptions with respect to
seismic actions and therefore can undergo to brittle failures when infrastructure networks are hit by earthquakes,
affecting public safety and interrupting vital lifelines.
Actually, each concessionaire company handles maintenance activities without a common standardization, and
BMSs are mainly based on visual inspection data and subsequent processing with the aim to define a priority
ranking. However, ratings are assigned using qualitative performance indicators without a specific relationship
with quantitative measures (e.g. reliability), and in addition, BMSs lack the use of prediction models based on
probabilistic-models to forecast future deterioration scenarios.
3 Procedures for the deterioration and seismic vulnerability assessment of bridges developed
at UNIPD
Two specific procedures for the deterioration state evaluation and the seismic vulnerability assessment of bridge
structures have been developed at UNIPD with the aim to enclose them in a BMS environment. The procedure for
bridge qualitative deterioration assessment proposed by Zanini et al. (2017), based on a refinement of the original
one proposed by Pellegrino et al. (2011) was adopted here, with improvements taking into account the costs of
maintenance operations. A brief description of the method, improved with the part related to costs, is given below.
The inspection system used is the visual survey method, according to the standards adopted by countries
(BR.I.M.E. 2001, NTCs2008). Visual inspections can be carried out on main structural and non-structural elements
of bridges, to assess their condition without the need for special equipment or restrictions on traffic flow. The
method defines the Total Sufficiency Rating (TSR) parameter, a global qualitative indicator of the "state of health"
of each bridge. Figure 2 shows a general overview of the TSR assessment framework.
Fig. 2. General overview of the TSR assessment framework for a bridge case study.
Calculation of TSR involves a specific algorithm, based on the definition of the Condition Value (CV) of each
element composing the bridge under analysis. The CV is a qualitative variable, representing a condition related to
a precise group of defects of the element for which it is estimated. A CV value ranging from 1 to 5 can be defined
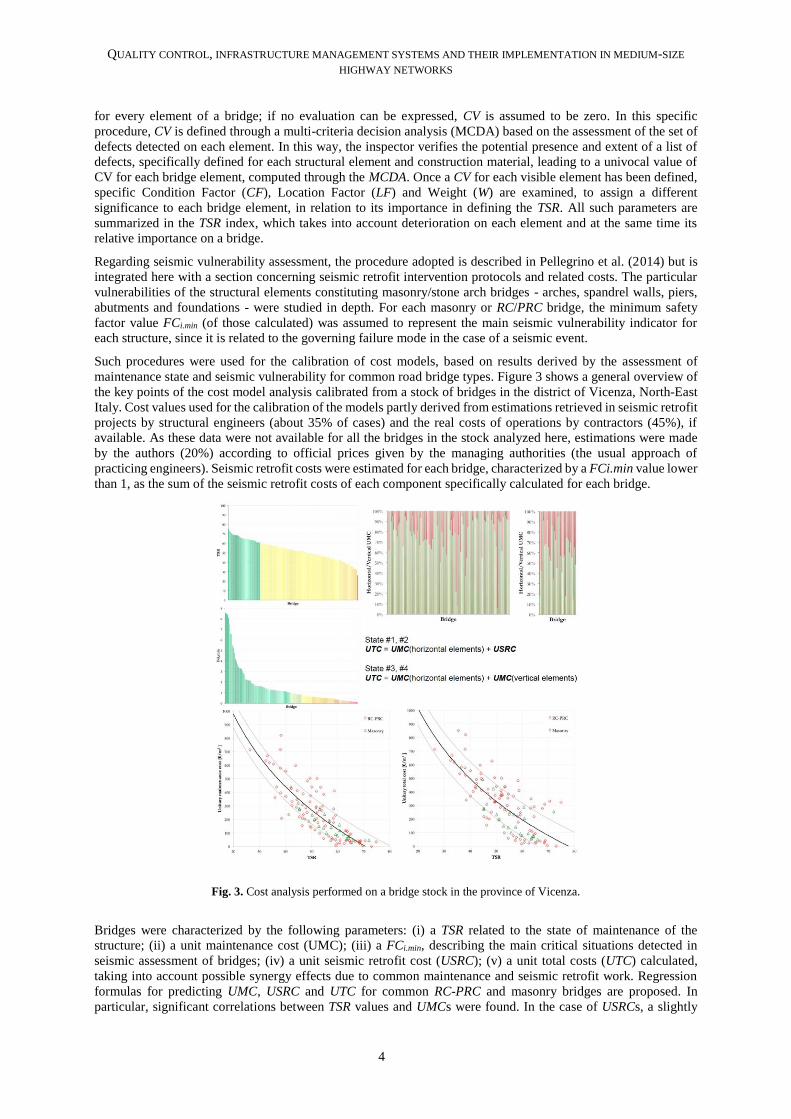
QUALITY CONTROL, INFRASTRUCTURE MANAGEMENT SYSTEMS AND THEIR IMPLEMENTATION IN MEDIUM-SIZE
HIGHWAY NETWORKS
4
for every element of a bridge; if no evaluation can be expressed, CV is assumed to be zero. In this specific
procedure, CV is defined through a multi-criteria decision analysis (MCDA) based on the assessment of the set of
defects detected on each element. In this way, the inspector verifies the potential presence and extent of a list of
defects, specifically defined for each structural element and construction material, leading to a univocal value of
CV for each bridge element, computed through the MCDA. Once a CV for each visible element has been defined,
specific Condition Factor (CF), Location Factor (LF) and Weight (W) are examined, to assign a different
significance to each bridge element, in relation to its importance in defining the TSR. All such parameters are
summarized in the TSR index, which takes into account deterioration on each element and at the same time its
relative importance on a bridge.
Regarding seismic vulnerability assessment, the procedure adopted is described in Pellegrino et al. (2014) but is
integrated here with a section concerning seismic retrofit intervention protocols and related costs. The particular
vulnerabilities of the structural elements constituting masonry/stone arch bridges - arches, spandrel walls, piers,
abutments and foundations - were studied in depth. For each masonry or RC/PRC bridge, the minimum safety
factor value FCi.min (of those calculated) was assumed to represent the main seismic vulnerability indicator for
each structure, since it is related to the governing failure mode in the case of a seismic event.
Such procedures were used for the calibration of cost models, based on results derived by the assessment of
maintenance state and seismic vulnerability for common road bridge types. Figure 3 shows a general overview of
the key points of the cost model analysis calibrated from a stock of bridges in the district of Vicenza, North-East
Italy. Cost values used for the calibration of the models partly derived from estimations retrieved in seismic retrofit
projects by structural engineers (about 35% of cases) and the real costs of operations by contractors (45%), if
available. As these data were not available for all the bridges in the stock analyzed here, estimations were made
by the authors (20%) according to official prices given by the managing authorities (the usual approach of
practicing engineers). Seismic retrofit costs were estimated for each bridge, characterized by a FCi.min value lower
than 1, as the sum of the seismic retrofit costs of each component specifically calculated for each bridge.
Fig. 3. Cost analysis performed on a bridge stock in the province of Vicenza.
Bridges were characterized by the following parameters: (i) a TSR related to the state of maintenance of the
structure; (ii) a unit maintenance cost (UMC); (iii) a FCi.min, describing the main critical situations detected in
seismic assessment of bridges; (iv) a unit seismic retrofit cost (USRC); (v) a unit total costs (UTC) calculated,
taking into account possible synergy effects due to common maintenance and seismic retrofit work. Regression
formulas for predicting UMC, USRC and UTC for common RC-PRC and masonry bridges are proposed. In
particular, significant correlations between TSR values and UMCs were found. In the case of USRCs, a slightly
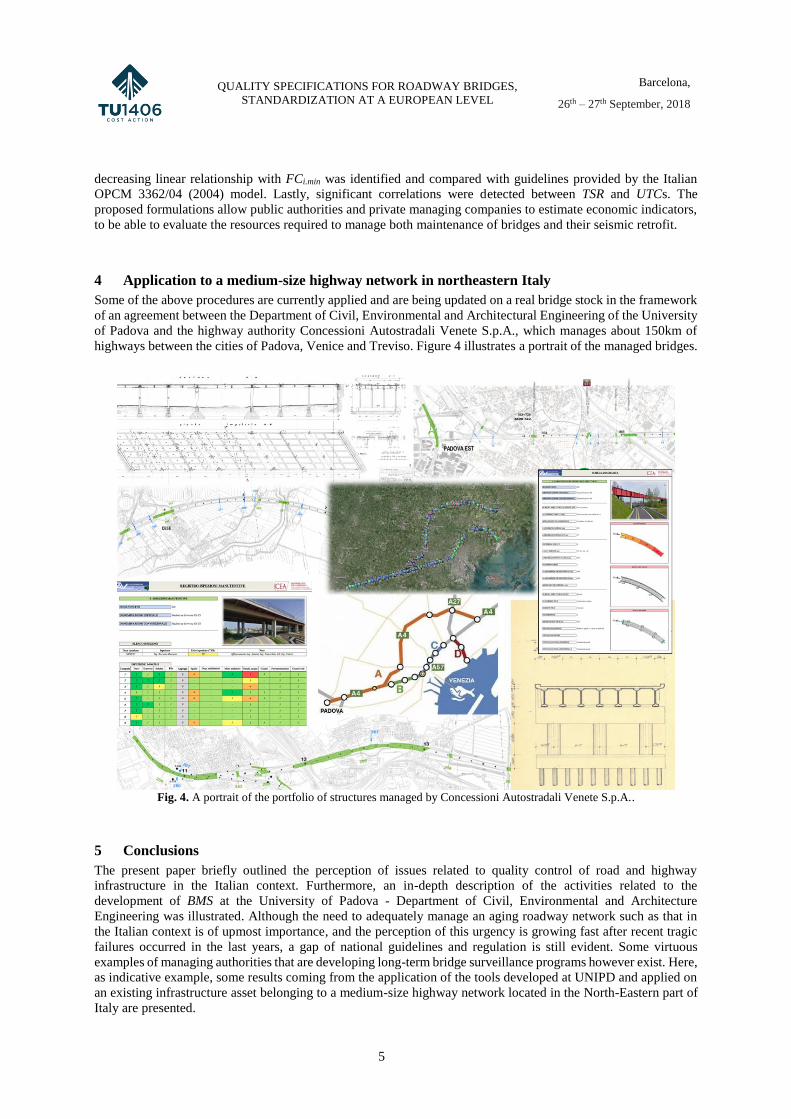
QUALITY SPECIFICATIONS FOR ROADWAY BRIDGES,
STANDARDIZATION AT A EUROPEAN LEVEL
Barcelona,
26th – 27th September, 2018
5
decreasing linear relationship with FCi.min was identified and compared with guidelines provided by the Italian
OPCM 3362/04 (2004) model. Lastly, significant correlations were detected between TSR and UTCs. The
proposed formulations allow public authorities and private managing companies to estimate economic indicators,
to be able to evaluate the resources required to manage both maintenance of bridges and their seismic retrofit.
4 Application to a medium-size highway network in northeastern Italy
Some of the above procedures are currently applied and are being updated on a real bridge stock in the framework
of an agreement between the Department of Civil, Environmental and Architectural Engineering of the University
of Padova and the highway authority Concessioni Autostradali Venete S.p.A., which manages about 150km of
highways between the cities of Padova, Venice and Treviso. Figure 4 illustrates a portrait of the managed bridges.
Fig. 4. A portrait of the portfolio of structures managed by Concessioni Autostradali Venete S.p.A..
5 Conclusions
The present paper briefly outlined the perception of issues related to quality control of road and highway
infrastructure in the Italian context. Furthermore, an in-depth description of the activities related to the
development of BMS at the University of Padova - Department of Civil, Environmental and Architecture
Engineering was illustrated. Although the need to adequately manage an aging roadway network such as that in
the Italian context is of upmost importance, and the perception of this urgency is growing fast after recent tragic
failures occurred in the last years, a gap of national guidelines and regulation is still evident. Some virtuous
examples of managing authorities that are developing long-term bridge surveillance programs however exist. Here,
as indicative example, some results coming from the application of the tools developed at UNIPD and applied on
an existing infrastructure asset belonging to a medium-size highway network located in the North-Eastern part of
Italy are presented.
QUALITY CONTROL, INFRASTRUCTURE MANAGEMENT SYSTEMS AND THEIR IMPLEMENTATION IN MEDIUM-SIZE
HIGHWAY NETWORKS
6
Acknowledgements
The authors would thank Concessioni Autostradali Venete S.p.A. who founded the development of part of the
procedures described above.
References
Autonomous Province of Bozen (2011) Disposizioni tecniche sul collaudo e sul controllo statico e periodico dei
ponti stradali (in Italian).
Biondini, F., Camnasio, E., & Palermo, A. (2014). Lifetime seismic performance of concrete bridges exposed to
corrosion. Structure and Infrastructure Engineering. 10, 880-900.
BRI.M.E. (2001). Bridge management in Europe. Final Report D14, IV Framework Programme, Brussels.
COST345 (2004). Procedures required for the assessment of highway infrastructures, European Research Project
under the framework of European Cooperation in the field of Scientific and Technical Research, EU
Commission-Directorate General Transport and Energy.
Franchin, P., Pinto, P.E. (2006). On the role of road networks in reducing human losses after earthquakes. Journal
of Earthquake Engineering, 13(5): 585-599.
Istruzione 44C (1994) Visite di controllo ai ponti, alle gallerie ed alle altre opere d’arte del corpo stradale –
Frequenza, modalità e relative verbalizzazioni (in Italian).
Kitada, T., Maekawa, Y., Nakamura, I., Horie, Y. (2000). Bridge management system for elevated steel highways.
Computer-Aided and Civil Infrastructure Engineering, 15 (2), 147–157.
Markow, M.J. (1995). Highway management systems: state of the art. Journal of Infrastructure Systems, 1 (3),
186– 191.
Ministerial Circular 34233 (1991) Istruzioni relative alla normativa tecnica dei ponti stradali (in Italian).
Ministerial Circular 6736/61A1 (1967) Controllo delle condizioni delle opera d’arte stradali (in Italian).
Morbin, R., Zanini, M.A., Pellegrino, C., Zhang, H., Modena, C. (2015). A probabilistic strategy for seismic
assessment and FRP retrofitting of existing bridges. Bulletin of Earthquake Engineering, DOI:
10.1007/s10518-015-9725-2.
NTC2008 (2008) Decreto Ministeriale 14/01/2008 - Norme Tecniche per le Costruzioni (in Italian).
Pellegrino, C., Pipinato, A., & Modena, C. (2011). A simplified management procedure for bridge network
maintenance. Structure and Infrastructure Engineering, 7(5): 341-351.
Pellegrino, C., Zanini, M.A., Zampieri, P., Modena, C. (2014). Contribution of in-situ and laboratory investigations
for assessing seismic vulnerability of existing bridges. Structure and Infrastructure Engineering,
DOI:10.1080/15732479.2014.938661.
SA.MA.R.I.S. (2005). Sustainable and advanced materials for road infrastructure. Final report, VI Framework
Programme, Brussels.
Sustainable Bridges (2006). Guidelines for load and resistance assessment of existing European railway bridges –
advice on the use of advanced methods. European research project under the EU 6th framework programme
(http://www.sustainablebridges.net/).
Thoft-Christensen, P. (1995). Advanced bridge management systems. Structural Engineering Review, 7(3), 151–
163.
Zanini, M.A., Pellegrino, C., Morbin, R., & Modena C. (2013). Seismic vulnerability of bridges in transport
networks subjected to environmental deterioration. Bulletin of Earthquake Engineering, 11(2): 561-579.
Zanini, M.A., Faleschini, F., Pellegrino, C. (2017). Bridge residual service-life prediction through Bayesian visual
inspection and data updating. Structure and Infrastructure Engineering, 13(7): 906-917.
Zonta, D., Zandonini, R., & Bortot, F. (2007). A reliability-based bridge management concept. Structure and
Infrastructure Engineering, 3(3): 215-235.
WG4 and WG5 WORKSHOP
Sustainable Bridge Management
27th – 28th September 2018
Barcelona, Spain
QUALITY CONTROL, INFRASTRUCTURE MANAGEMENT
SYSTEMS AND THEIR IMPLEMENTATION IN MEDIUM-SIZE
HIGHWAY NETWORKS
Flora Faleschini - University of Padova, ItalyMariano Angelo Zanini - University of Padova, Italy
Carlo Pellegrino - University of Padova, Italy
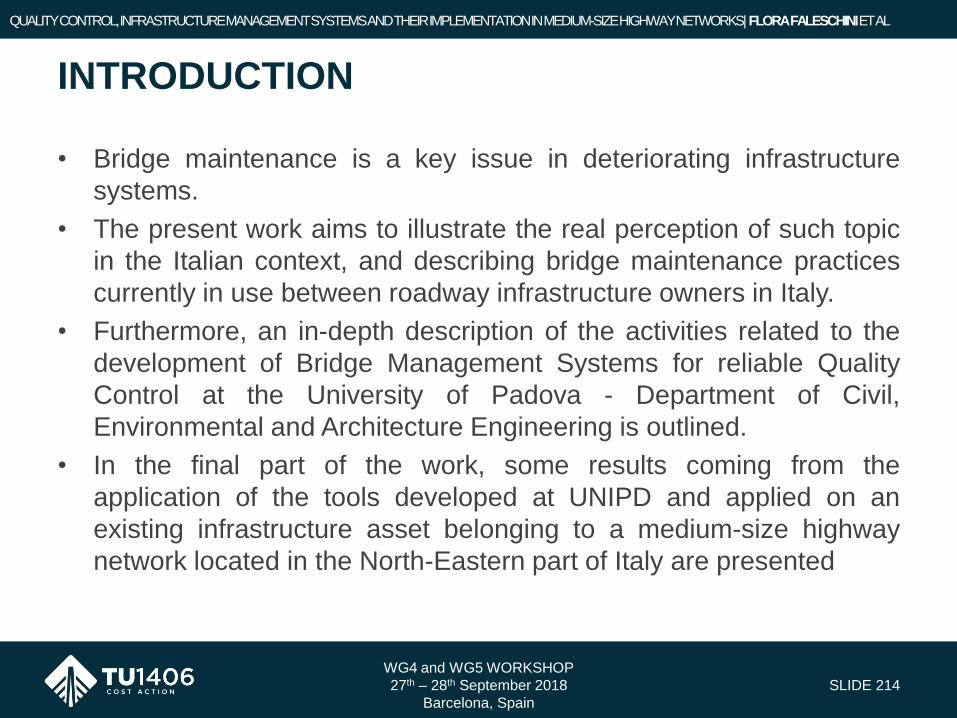
• Bridge maintenance is a key issue in deteriorating infrastructure
systems.
• The present work aims to illustrate the real perception of such topic
in the Italian context, and describing bridge maintenance practices
currently in use between roadway infrastructure owners in Italy.
• Furthermore, an in-depth description of the activities related to the
development of Bridge Management Systems for reliable Quality
Control at the University of Padova - Department of Civil,
Environmental and Architecture Engineering is outlined.
• In the final part of the work, some results coming from the
application of the tools developed at UNIPD and applied on an
existing infrastructure asset belonging to a medium-size highway
network located in the North-Eastern part of Italy are presented
WG4 and WG5 WORKSHOP
27th – 28th September 2018
Barcelona, Spain
SLIDE 214
INTRODUCTION
QUALITY CONTROL, INFRASTRUCTURE MANAGEMENT SYSTEMS AND THEIR IMPLEMENTATION IN MEDIUM-SIZE HIGHWAY NETWORKS| FLORA FALESCHINI ET AL

Which are the main aims of an infrastructure owner?
- To ensure adequate safety levels for road users
- and at the same time, To minimize infrastructure management costs
WG4 and WG5 WORKSHOP
27th – 28th September 2018
Barcelona, Spain
SLIDE 215
INTRODUCTION
QUALITY CONTROL, INFRASTRUCTURE MANAGEMENT SYSTEMS AND THEIR IMPLEMENTATION IN MEDIUM-SIZE HIGHWAY NETWORKS| FLORA FALESCHINI ET AL

WG4 and WG5 WORKSHOP
27th – 28th September 2018
Barcelona, Spain
SLIDE 216
INTRODUCTION
QUALITY CONTROL, INFRASTRUCTURE MANAGEMENT SYSTEMS AND THEIR IMPLEMENTATION IN MEDIUM-SIZE HIGHWAY NETWORKS| FLORA FALESCHINI ET AL
… and with reference to bridges?
- To ensure adequate structural reliability levels, both in case of latent
(i.e. ageing) and sudden (i.e. natural hazards) events.
- To optimize budget allocation for maintenance actions and rationally
plan them on the basis of results coming from a BMSs
- To minimize the impact of such interventions on infrastructure
functionality

… however, many Italian bridges are structurally deficient due to
advanced deterioration phenomena…
WG4 and WG5 WORKSHOP
27th – 28th September 2018
Barcelona, Spain
SLIDE 217
INTRODUCTION
QUALITY CONTROL, INFRASTRUCTURE MANAGEMENT SYSTEMS AND THEIR IMPLEMENTATION IN MEDIUM-SIZE HIGHWAY NETWORKS| FLORA FALESCHINI ET AL

WG4 and WG5 WORKSHOP
27th – 28th September 2018
Barcelona, Spain
SLIDE 218
INTRODUCTION
QUALITY CONTROL, INFRASTRUCTURE MANAGEMENT SYSTEMS AND THEIR IMPLEMENTATION IN MEDIUM-SIZE HIGHWAY NETWORKS| FLORA FALESCHINI ET AL
… however, many Italian bridges are structurally deficient due to
advanced deterioration phenomena…

WG4 and WG5 WORKSHOP
27th – 28th September 2018
Barcelona, Spain
SLIDE 219
INTRODUCTION
QUALITY CONTROL, INFRASTRUCTURE MANAGEMENT SYSTEMS AND THEIR IMPLEMENTATION IN MEDIUM-SIZE HIGHWAY NETWORKS| FLORA FALESCHINI ET AL
… however, many Italian bridges are structurally deficient due to
advanced deterioration phenomena…
…that over time may result in bridge failures!
Bridge failures can be related to lack of maintenance, design without
taking care of suitable detailing, occurrence of natural hazards like
floods, earthquakes, landslides…
Looking at the Italian history of bridge failures in the last 10 years…
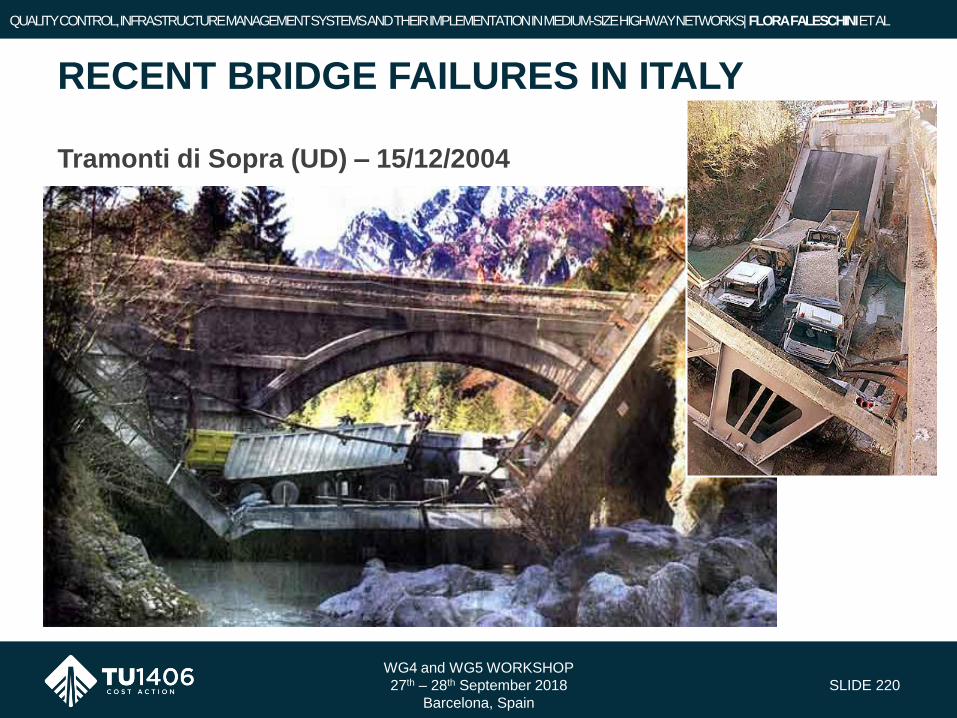
Tramonti di Sopra (UD) – 15/12/2004
WG4 and WG5 WORKSHOP
27th – 28th September 2018
Barcelona, Spain
SLIDE 220
RECENT BRIDGE FAILURES IN ITALY
QUALITY CONTROL, INFRASTRUCTURE MANAGEMENT SYSTEMS AND THEIR IMPLEMENTATION IN MEDIUM-SIZE HIGHWAY NETWORKS| FLORA FALESCHINI ET AL
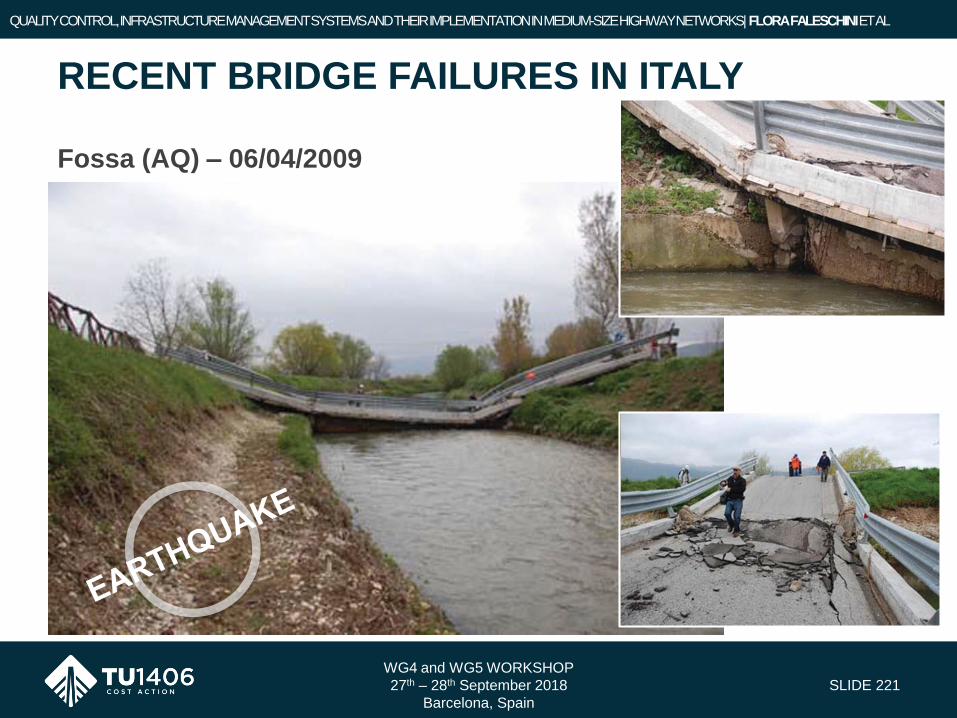
Fossa (AQ) – 06/04/2009
WG4 and WG5 WORKSHOP
27th – 28th September 2018
Barcelona, Spain
SLIDE 221
RECENT BRIDGE FAILURES IN ITALY
QUALITY CONTROL, INFRASTRUCTURE MANAGEMENT SYSTEMS AND THEIR IMPLEMENTATION IN MEDIUM-SIZE HIGHWAY NETWORKS| FLORA FALESCHINI ET AL
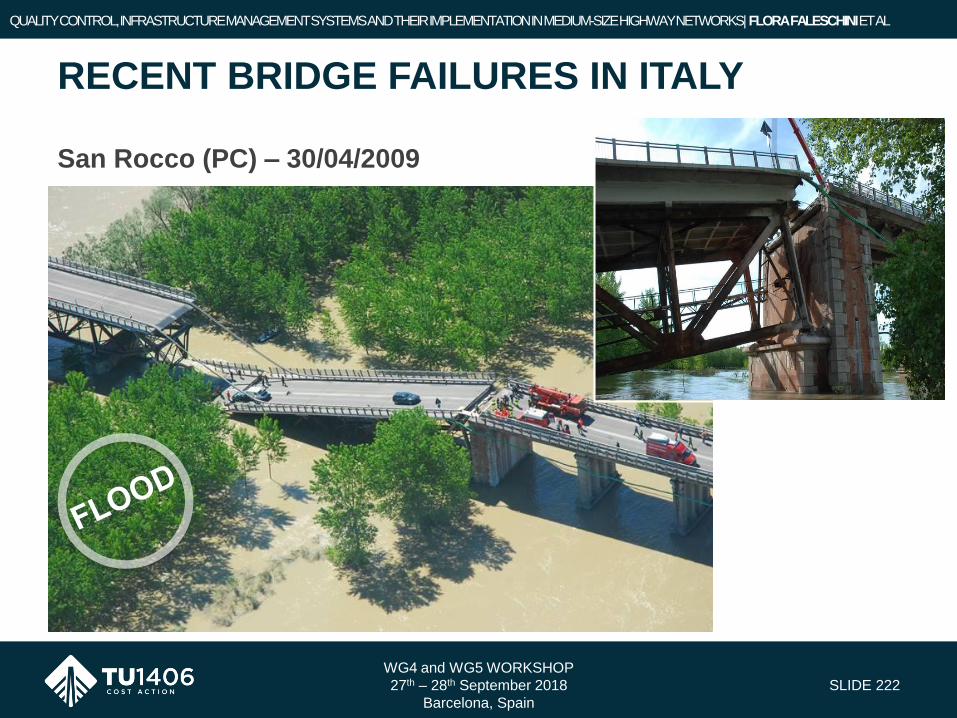
San Rocco (PC) – 30/04/2009
WG4 and WG5 WORKSHOP
27th – 28th September 2018
Barcelona, Spain
SLIDE 222
RECENT BRIDGE FAILURES IN ITALY
QUALITY CONTROL, INFRASTRUCTURE MANAGEMENT SYSTEMS AND THEIR IMPLEMENTATION IN MEDIUM-SIZE HIGHWAY NETWORKS| FLORA FALESCHINI ET AL

Bridge over Cesano river (AN) – 01/03/2011
WG4 and WG5 WORKSHOP
27th – 28th September 2018
Barcelona, Spain
SLIDE 223
RECENT BRIDGE FAILURES IN ITALY
QUALITY CONTROL, INFRASTRUCTURE MANAGEMENT SYSTEMS AND THEIR IMPLEMENTATION IN MEDIUM-SIZE HIGHWAY NETWORKS| FLORA FALESCHINI ET AL
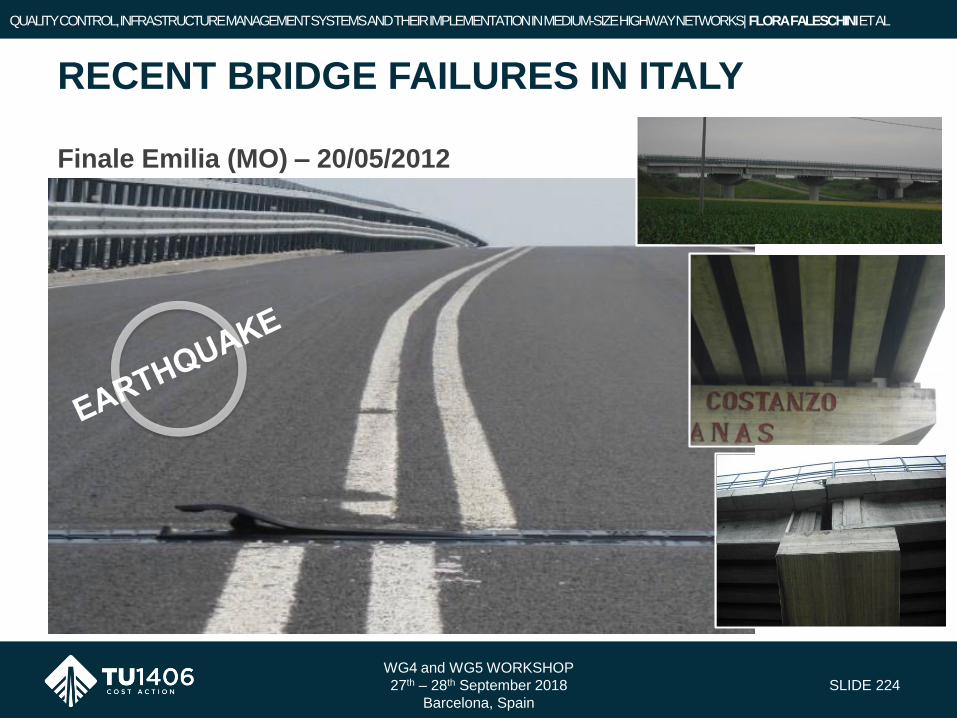
Finale Emilia (MO) – 20/05/2012
WG4 and WG5 WORKSHOP
27th – 28th September 2018
Barcelona, Spain
SLIDE 224
RECENT BRIDGE FAILURES IN ITALY
QUALITY CONTROL, INFRASTRUCTURE MANAGEMENT SYSTEMS AND THEIR IMPLEMENTATION IN MEDIUM-SIZE HIGHWAY NETWORKS| FLORA FALESCHINI ET AL
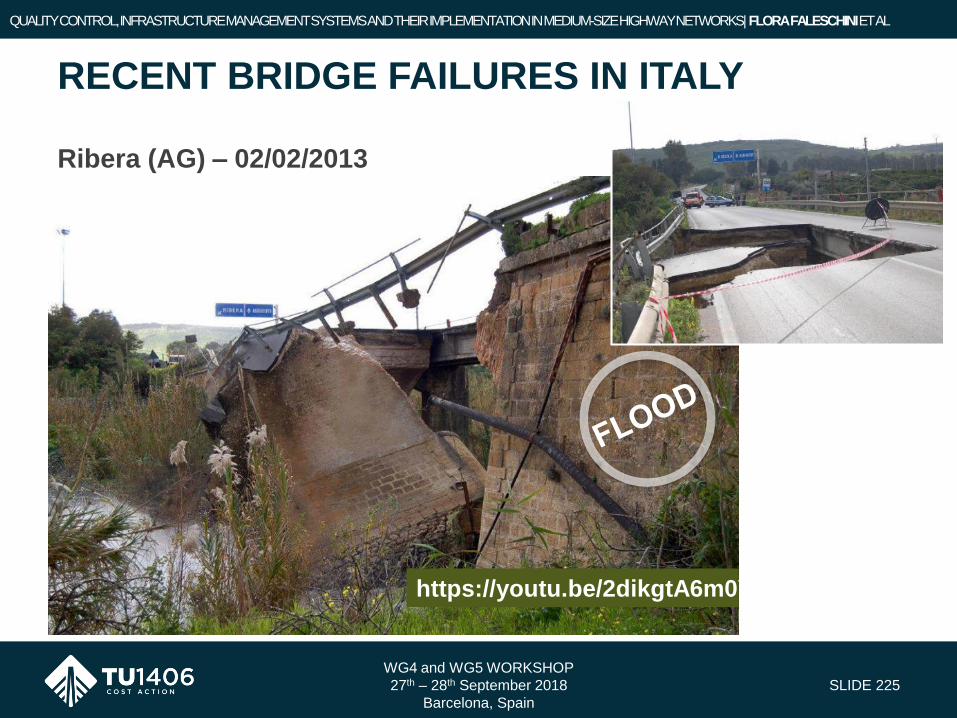
Ribera (AG) – 02/02/2013
WG4 and WG5 WORKSHOP
27th – 28th September 2018
Barcelona, Spain
SLIDE 225
RECENT BRIDGE FAILURES IN ITALY
QUALITY CONTROL, INFRASTRUCTURE MANAGEMENT SYSTEMS AND THEIR IMPLEMENTATION IN MEDIUM-SIZE HIGHWAY NETWORKS| FLORA FALESCHINI ET AL
https://youtu.be/2dikgtA6m0Y

Carasco (GE) – 22/10/2013
WG4 and WG5 WORKSHOP
27th – 28th September 2018
Barcelona, Spain
SLIDE 226
QUALITY CONTROL, INFRASTRUCTURE MANAGEMENT SYSTEMS AND THEIR IMPLEMENTATION IN MEDIUM-SIZE HIGHWAY NETWORKS| FLORA FALESCHINI ET AL
RECENT BRIDGE FAILURES IN ITALY

Oloè (NU) – 18/11/2013
WG4 and WG5 WORKSHOP
27th – 28th September 2018
Barcelona, Spain
SLIDE 227
RECENT BRIDGE FAILURES IN ITALY
QUALITY CONTROL, INFRASTRUCTURE MANAGEMENT SYSTEMS AND THEIR IMPLEMENTATION IN MEDIUM-SIZE HIGHWAY NETWORKS| FLORA FALESCHINI ET AL
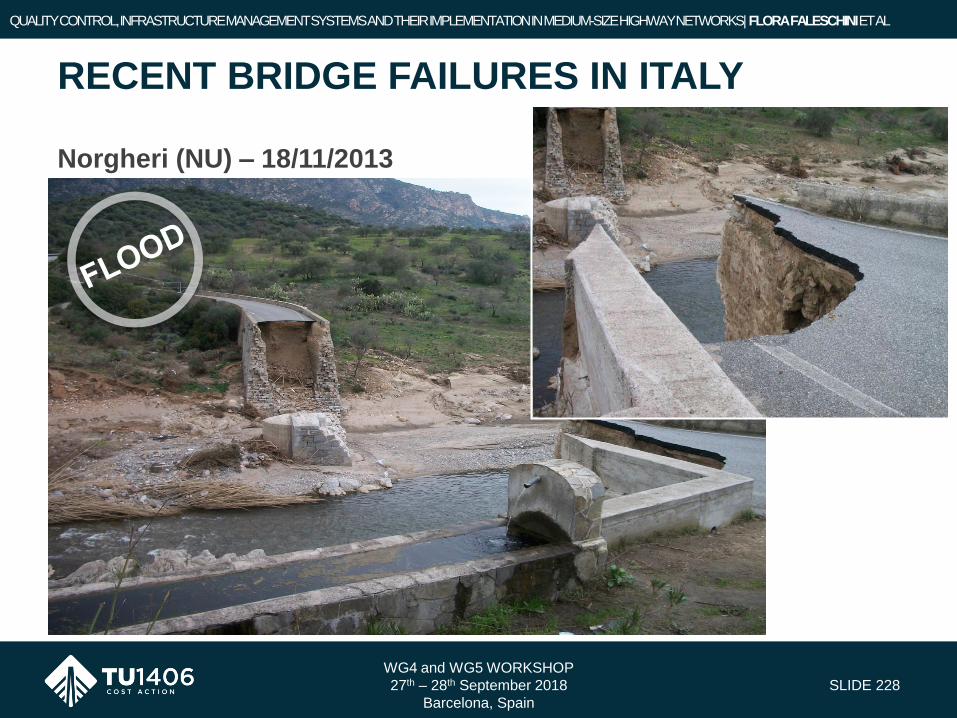
Norgheri (NU) – 18/11/2013
WG4 and WG5 WORKSHOP
27th – 28th September 2018
Barcelona, Spain
SLIDE 228
RECENT BRIDGE FAILURES IN ITALY
QUALITY CONTROL, INFRASTRUCTURE MANAGEMENT SYSTEMS AND THEIR IMPLEMENTATION IN MEDIUM-SIZE HIGHWAY NETWORKS| FLORA FALESCHINI ET AL

Rubbianello (AP) – 02/12/2013
WG4 and WG5 WORKSHOP
27th – 28th September 2018
Barcelona, Spain
SLIDE 229
RECENT BRIDGE FAILURES IN ITALY
QUALITY CONTROL, INFRASTRUCTURE MANAGEMENT SYSTEMS AND THEIR IMPLEMENTATION IN MEDIUM-SIZE HIGHWAY NETWORKS| FLORA FALESCHINI ET AL

SS Palermo-Agrigento – 07/07/2014
WG4 and WG5 WORKSHOP
27th – 28th September 2018
Barcelona, Spain
SLIDE 230
RECENT BRIDGE FAILURES IN ITALY
QUALITY CONTROL, INFRASTRUCTURE MANAGEMENT SYSTEMS AND THEIR IMPLEMENTATION IN MEDIUM-SIZE HIGHWAY NETWORKS| FLORA FALESCHINI ET AL
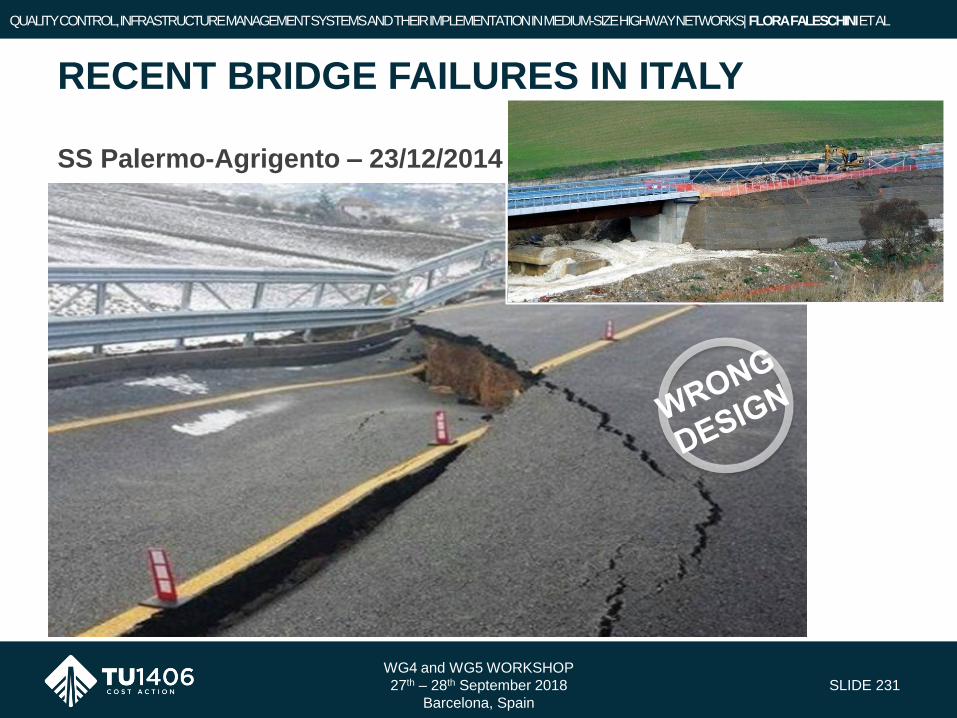
SS Palermo-Agrigento – 23/12/2014
WG4 and WG5 WORKSHOP
27th – 28th September 2018
Barcelona, Spain
SLIDE 231
RECENT BRIDGE FAILURES IN ITALY
QUALITY CONTROL, INFRASTRUCTURE MANAGEMENT SYSTEMS AND THEIR IMPLEMENTATION IN MEDIUM-SIZE HIGHWAY NETWORKS| FLORA FALESCHINI ET AL
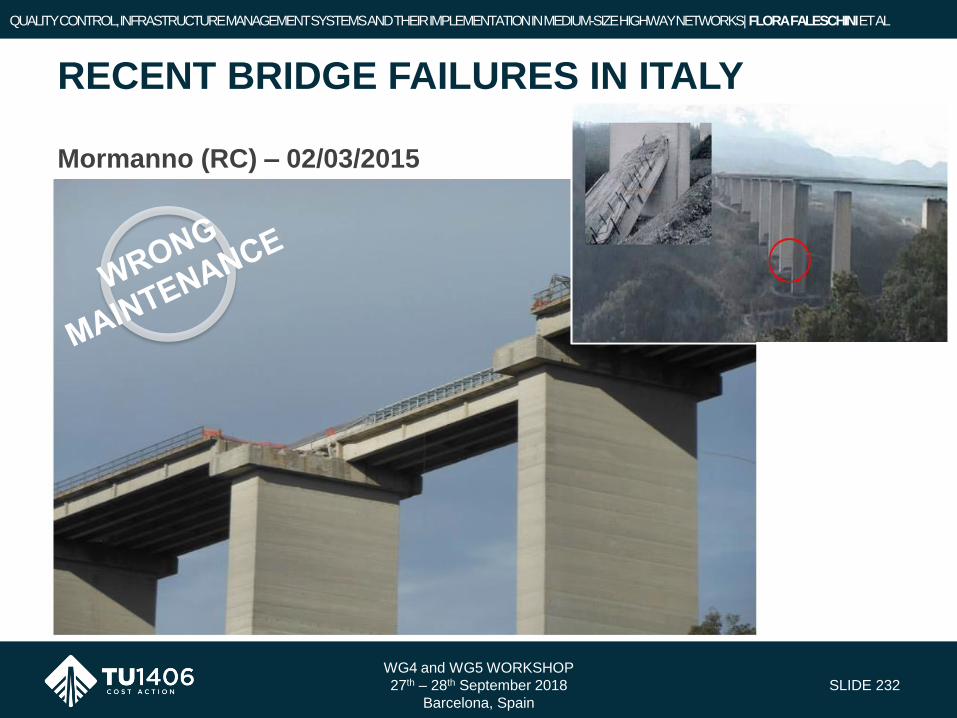
Mormanno (RC) – 02/03/2015
WG4 and WG5 WORKSHOP
27th – 28th September 2018
Barcelona, Spain
SLIDE 232
RECENT BRIDGE FAILURES IN ITALY
QUALITY CONTROL, INFRASTRUCTURE MANAGEMENT SYSTEMS AND THEIR IMPLEMENTATION IN MEDIUM-SIZE HIGHWAY NETWORKS| FLORA FALESCHINI ET AL
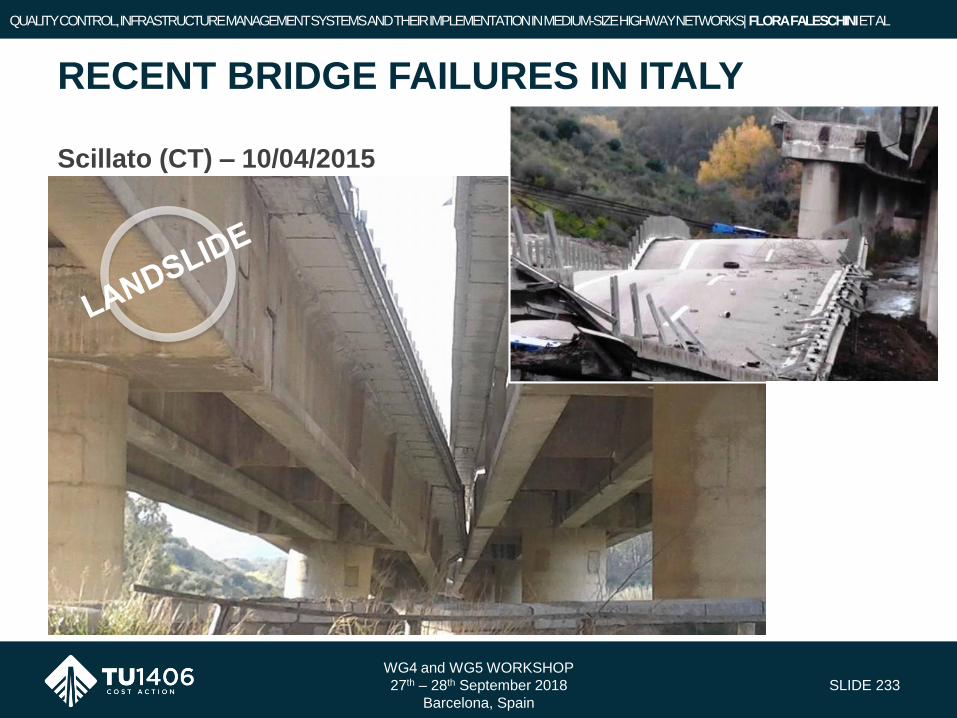
Scillato (CT) – 10/04/2015
WG4 and WG5 WORKSHOP
27th – 28th September 2018
Barcelona, Spain
SLIDE 233
RECENT BRIDGE FAILURES IN ITALY
QUALITY CONTROL, INFRASTRUCTURE MANAGEMENT SYSTEMS AND THEIR IMPLEMENTATION IN MEDIUM-SIZE HIGHWAY NETWORKS| FLORA FALESCHINI ET AL
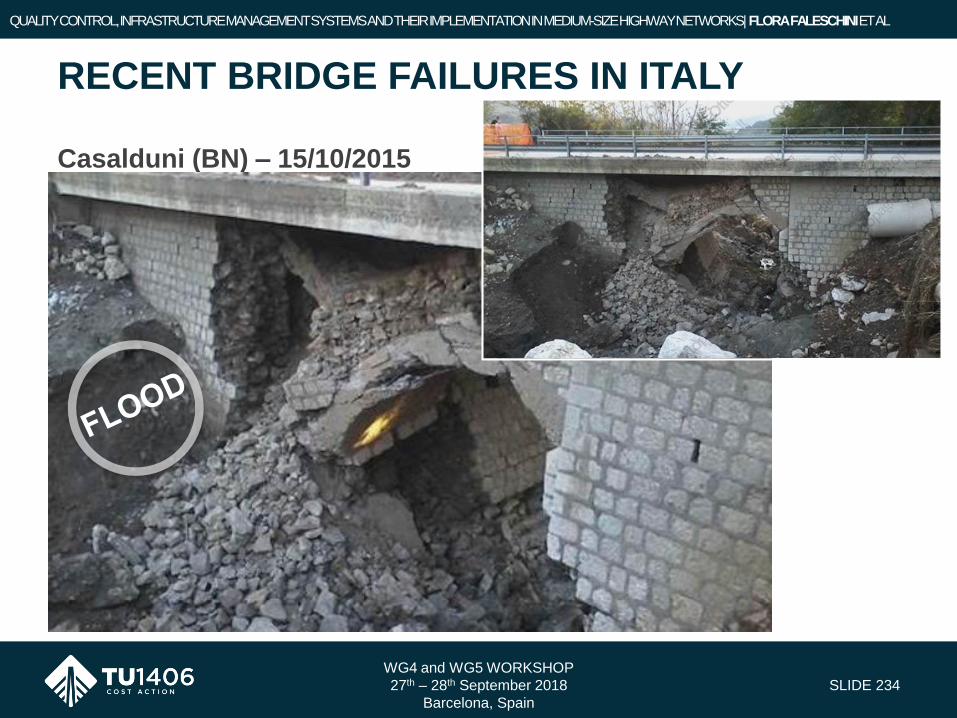
Casalduni (BN) – 15/10/2015
WG4 and WG5 WORKSHOP
27th – 28th September 2018
Barcelona, Spain
SLIDE 234
RECENT BRIDGE FAILURES IN ITALY
QUALITY CONTROL, INFRASTRUCTURE MANAGEMENT SYSTEMS AND THEIR IMPLEMENTATION IN MEDIUM-SIZE HIGHWAY NETWORKS| FLORA FALESCHINI ET AL

Bruzzano Zeffirio (RC) – 02/11/2015
WG4 and WG5 WORKSHOP
27th – 28th September 2018
Barcelona, Spain
SLIDE 235
RECENT BRIDGE FAILURES IN ITALY
QUALITY CONTROL, INFRASTRUCTURE MANAGEMENT SYSTEMS AND THEIR IMPLEMENTATION IN MEDIUM-SIZE HIGHWAY NETWORKS| FLORA FALESCHINI ET AL
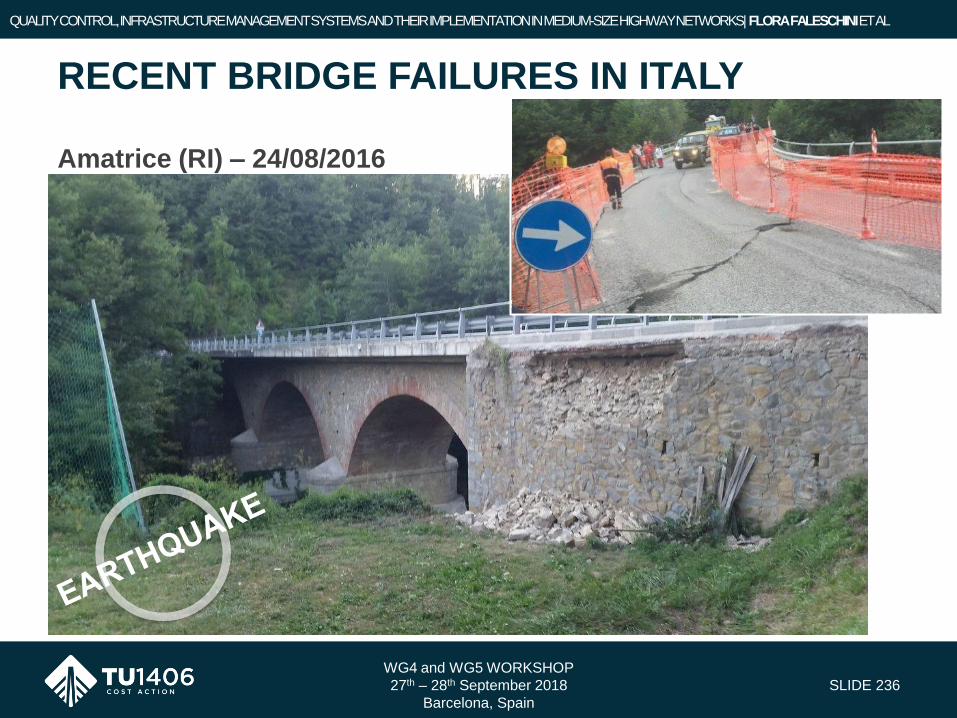
Amatrice (RI) – 24/08/2016
WG4 and WG5 WORKSHOP
27th – 28th September 2018
Barcelona, Spain
SLIDE 236
RECENT BRIDGE FAILURES IN ITALY
QUALITY CONTROL, INFRASTRUCTURE MANAGEMENT SYSTEMS AND THEIR IMPLEMENTATION IN MEDIUM-SIZE HIGHWAY NETWORKS| FLORA FALESCHINI ET AL
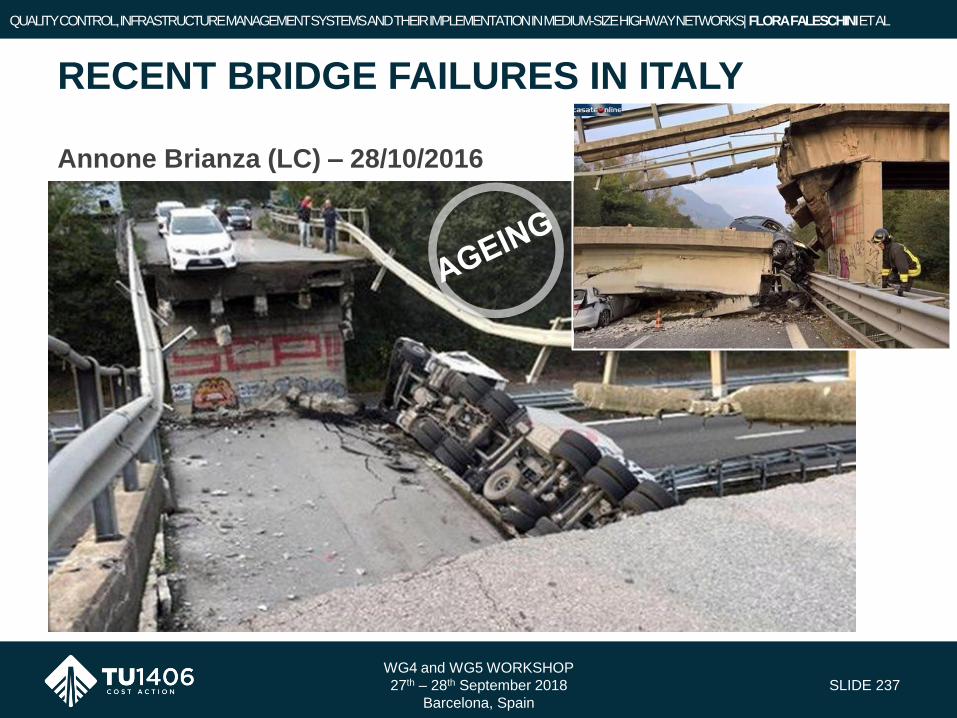
Annone Brianza (LC) – 28/10/2016
WG4 and WG5 WORKSHOP
27th – 28th September 2018
Barcelona, Spain
SLIDE 237
RECENT BRIDGE FAILURES IN ITALY
QUALITY CONTROL, INFRASTRUCTURE MANAGEMENT SYSTEMS AND THEIR IMPLEMENTATION IN MEDIUM-SIZE HIGHWAY NETWORKS| FLORA FALESCHINI ET AL
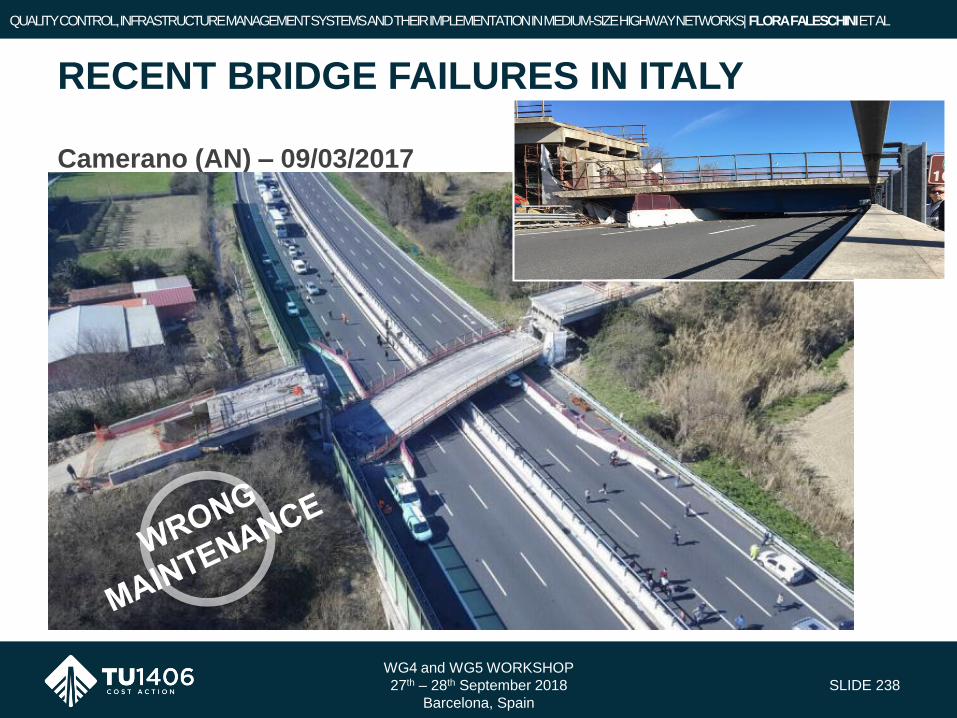
Camerano (AN) – 09/03/2017
WG4 and WG5 WORKSHOP
27th – 28th September 2018
Barcelona, Spain
SLIDE 238
RECENT BRIDGE FAILURES IN ITALY
QUALITY CONTROL, INFRASTRUCTURE MANAGEMENT SYSTEMS AND THEIR IMPLEMENTATION IN MEDIUM-SIZE HIGHWAY NETWORKS| FLORA FALESCHINI ET AL
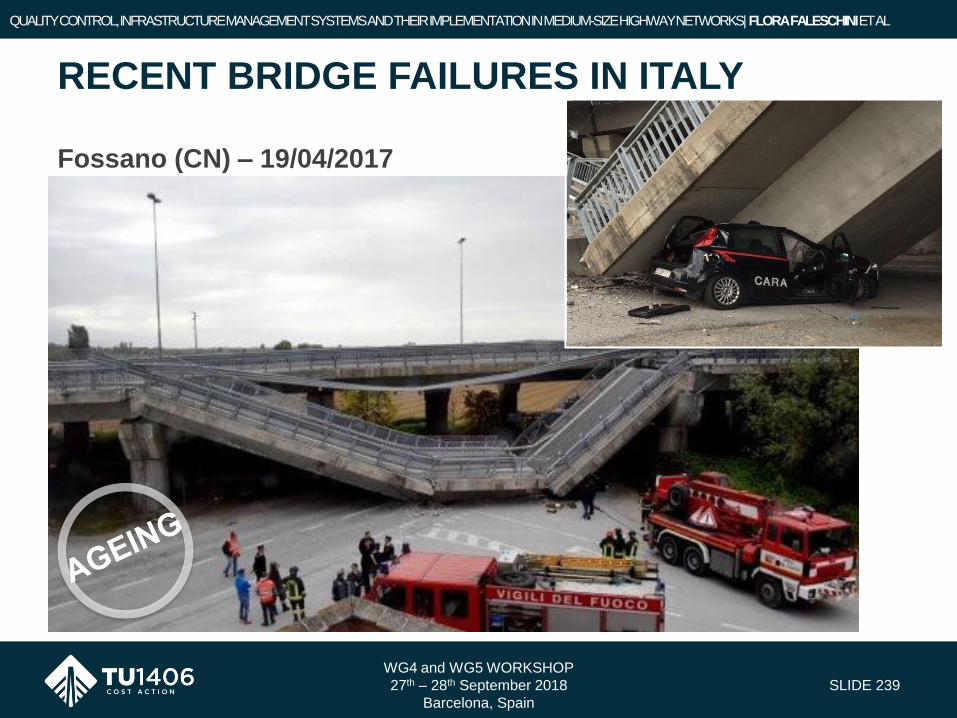
Fossano (CN) – 19/04/2017
WG4 and WG5 WORKSHOP
27th – 28th September 2018
Barcelona, Spain
SLIDE 239
RECENT BRIDGE FAILURES IN ITALY
QUALITY CONTROL, INFRASTRUCTURE MANAGEMENT SYSTEMS AND THEIR IMPLEMENTATION IN MEDIUM-SIZE HIGHWAY NETWORKS| FLORA FALESCHINI ET AL
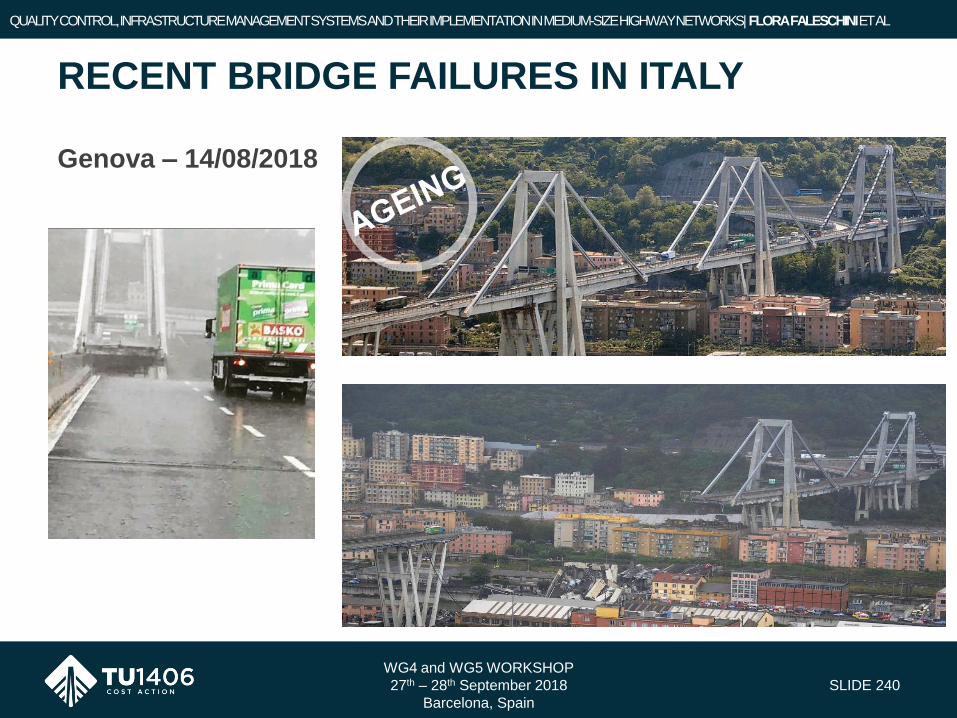
Genova – 14/08/2018
WG4 and WG5 WORKSHOP
27th – 28th September 2018
Barcelona, Spain
SLIDE 240
RECENT BRIDGE FAILURES IN ITALY
QUALITY CONTROL, INFRASTRUCTURE MANAGEMENT SYSTEMS AND THEIR IMPLEMENTATION IN MEDIUM-SIZE HIGHWAY NETWORKS| FLORA FALESCHINI ET AL

Genova – 14/08/2018
WG4 and WG5 WORKSHOP
27th – 28th September 2018
Barcelona, Spain
SLIDE 241
RECENT BRIDGE FAILURES IN ITALY
QUALITY CONTROL, INFRASTRUCTURE MANAGEMENT SYSTEMS AND THEIR IMPLEMENTATION IN MEDIUM-SIZE HIGHWAY NETWORKS| FLORA FALESCHINI ET AL
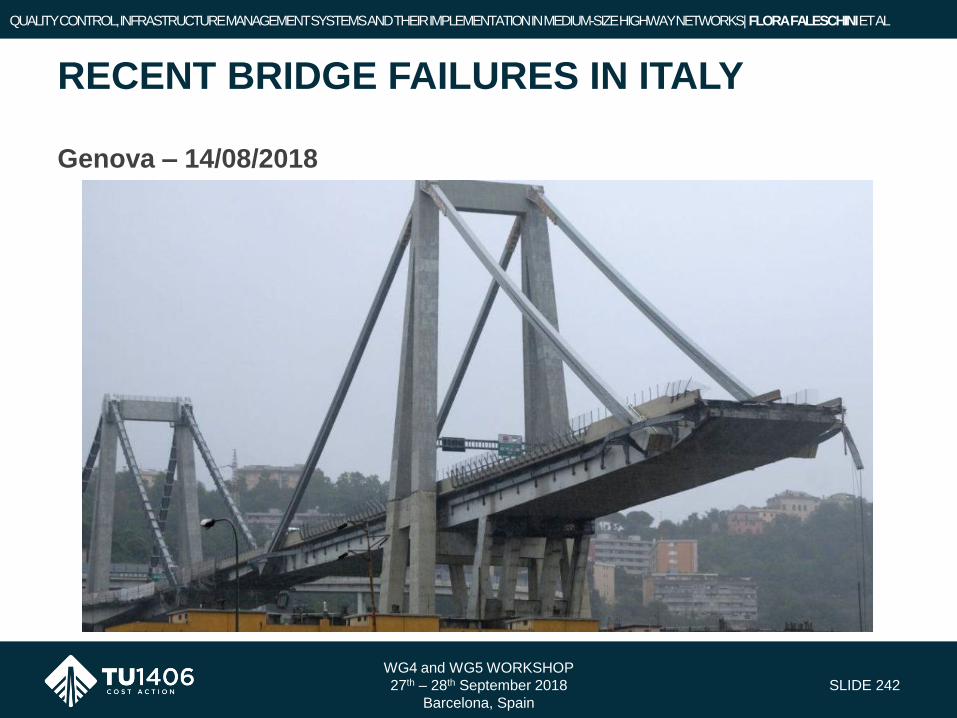
Genova – 14/08/2018
WG4 and WG5 WORKSHOP
27th – 28th September 2018
Barcelona, Spain
SLIDE 242
RECENT BRIDGE FAILURES IN ITALY
QUALITY CONTROL, INFRASTRUCTURE MANAGEMENT SYSTEMS AND THEIR IMPLEMENTATION IN MEDIUM-SIZE HIGHWAY NETWORKS| FLORA FALESCHINI ET AL

Genova – 14/08/2018
WG4 and WG5 WORKSHOP
27th – 28th September 2018
Barcelona, Spain
SLIDE 243
RECENT BRIDGE FAILURES IN ITALY
QUALITY CONTROL, INFRASTRUCTURE MANAGEMENT SYSTEMS AND THEIR IMPLEMENTATION IN MEDIUM-SIZE HIGHWAY NETWORKS| FLORA FALESCHINI ET AL

Genova – 14/08/2018
WG4 and WG5 WORKSHOP
27th – 28th September 2018
Barcelona, Spain
SLIDE 244
RECENT BRIDGE FAILURES IN ITALY
QUALITY CONTROL, INFRASTRUCTURE MANAGEMENT SYSTEMS AND THEIR IMPLEMENTATION IN MEDIUM-SIZE HIGHWAY NETWORKS| FLORA FALESCHINI ET AL

In Italy there is a substantial lack of clear regulatory prescriptions onthe maintenance activities to be carried out by infrastructure owners inorder to guarantee and adequate structural safety level for existingbridges.
• The first indication can be found in the Ministerial Circular6736/61A1 (1967) in which it is evidenced the issue of a propermaintenance to be carried out in order to preserve structures overtime.
• After more than two decades, the Ministerial Circular 34233 (1991)provided rough suggestions on frequency and types of inspections,highlighting how managing authorities should plan a periodicassessment of the static conditions with a frequency arbitrarilydefined by the owner also in relation to the specific importance of abridge with respect to the network to which it belongs.
WG4 and WG5 WORKSHOP
27th – 28th September 2018
Barcelona, Spain
SLIDE 245
THE REGULATORY FRAMEWORK IN ITALY
QUALITY CONTROL, INFRASTRUCTURE MANAGEMENT SYSTEMS AND THEIR IMPLEMENTATION IN MEDIUM-SIZE HIGHWAY NETWORKS| FLORA FALESCHINI ET AL
• An interesting manual devoted to the maintenance of railway
bridges (Istruzione 44C, 1994) was approved in 1994, reporting a
wide series of defects that can be detected on steel, reinforced
concrete and masonry bridges during a visual survey.
• Istruzione 44C (1994) gives in addition precise indications on
how to rate them and to use ratings for the subsequent
calculation of a health indicator at structure level useful for
priority ranking purposes.
WG4 and WG5 WORKSHOP
27th – 28th September 2018
Barcelona, Spain
SLIDE 246
THE REGULATORY FRAMEWORK IN ITALY
QUALITY CONTROL, INFRASTRUCTURE MANAGEMENT SYSTEMS AND THEIR IMPLEMENTATION IN MEDIUM-SIZE HIGHWAY NETWORKS| FLORA FALESCHINI ET AL
• In recent years, new National Building Codes were approved in
2008 (NTC2008, actually to be replaced by NTC2018), where
issues related to maintenance actions are slightly mentioned in
the chapter related to existing structures, suggesting to take into
account the quality and the state of maintenance of the materials
and components of an existing structure, but without providing
clear prescriptions on frequency and types of inspections.
• However, an interesting document was enacted by the
Autonomous Province of Bozen (2011), inspired by German
(DIN1076) and Austrian (RVS 2011) regulations, which defines 4
types of inspections, providing clear indications on frequency,
activities to be carried out, how and to perform them and which
type of technician has to be involved, and contents of the reports.
WG4 and WG5 WORKSHOP
27th – 28th September 2018
Barcelona, Spain
SLIDE 247
THE REGULATORY FRAMEWORK IN ITALY
QUALITY CONTROL, INFRASTRUCTURE MANAGEMENT SYSTEMS AND THEIR IMPLEMENTATION IN MEDIUM-SIZE HIGHWAY NETWORKS| FLORA FALESCHINI ET AL
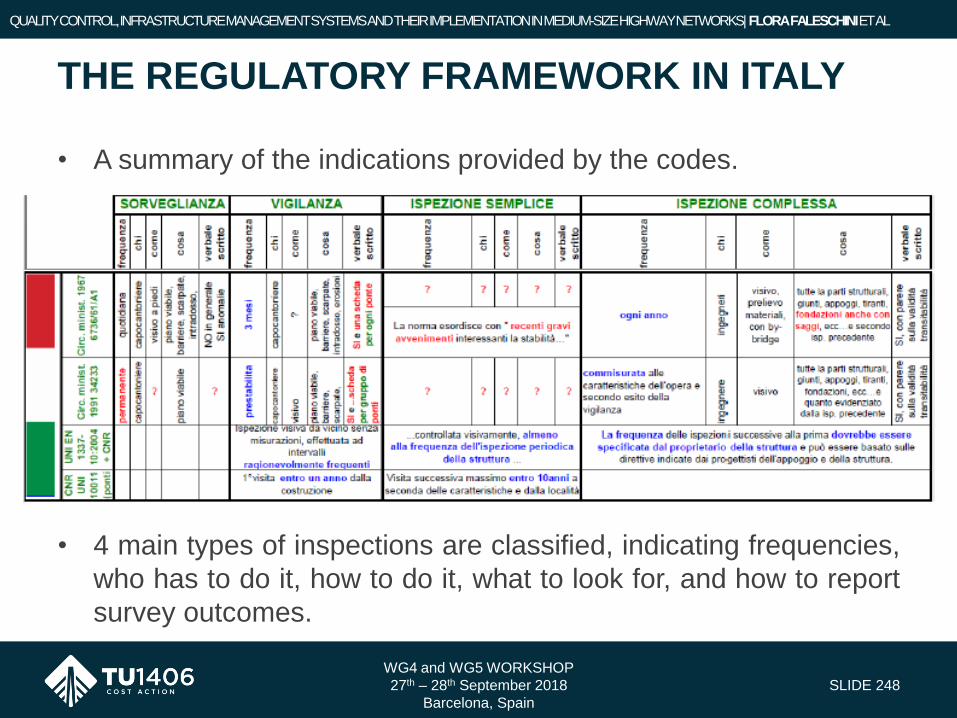
• A summary of the indications provided by the codes.
• 4 main types of inspections are classified, indicating frequencies,
who has to do it, how to do it, what to look for, and how to report
survey outcomes.
WG4 and WG5 WORKSHOP
27th – 28th September 2018
Barcelona, Spain
SLIDE 248
THE REGULATORY FRAMEWORK IN ITALY
QUALITY CONTROL, INFRASTRUCTURE MANAGEMENT SYSTEMS AND THEIR IMPLEMENTATION IN MEDIUM-SIZE HIGHWAY NETWORKS| FLORA FALESCHINI ET AL
The 4 types of inspections mentioned are:
• Fast survey: daily, without reporting, only to check if all is ok.
• Surveillance inspection: everty 3 months, with a simple reporting.
• Simple inspection: every 2/3 years, visual survey with condition assessment ratingand reporting with photos and notes.
• Complex inspection: every 6 years, visual survey with condition assessment ratingand reporting with photos and notes, in-situ survey for characterizing materials.Frequency of such types of inspections can be set by the infrastructure owner also onthe basis of structural assessment carried out by structural engineers.
• Special inspection: visual survey after the occurrence of a natural/antropichazardous event (e.g. flood, earthquake, landslide, tornado, explosion, collision, fire)
WG4 and WG5 WORKSHOP
27th – 28th September 2018
Barcelona, Spain
SLIDE 249
THE REGULATORY FRAMEWORK IN ITALY
QUALITY CONTROL, INFRASTRUCTURE MANAGEMENT SYSTEMS AND THEIR IMPLEMENTATION IN MEDIUM-SIZE HIGHWAY NETWORKS| FLORA FALESCHINI ET AL

However, failures and progression of ageing and deterioration is allowed mainlydue:
• Lack of reliable information about many bridges and viaducts;
• Lack of a rational surveillance and maintenance planning;
• Lack of financial funds to periodically perform visual surveys andsubsequent tests for improving the level of knowledge of existing bridges;
• Understimation of risks related to bridge failures or reduced functionalitylevels;
• Lack of a culture of prevention, often emergencies are the triggers.
WG4 and WG5 WORKSHOP
27th – 28th September 2018
Barcelona, Spain
SLIDE 250
THE REGULATORY FRAMEWORK IN ITALY
QUALITY CONTROL, INFRASTRUCTURE MANAGEMENT SYSTEMS AND THEIR IMPLEMENTATION IN MEDIUM-SIZE HIGHWAY NETWORKS| FLORA FALESCHINI ET AL

In addition, the actual administrative configuration is fragmentary:
highways are mainly managed by different private concessionaire
companies, that should be subject to periodic audits by the Italian
Ministry of Infrastructure.
WG4 and WG5 WORKSHOP
27th – 28th September 2018
Barcelona, Spain
SLIDE 251
ADMISTRATIVE CONFIGURATION IN ITALY
QUALITY CONTROL, INFRASTRUCTURE MANAGEMENT SYSTEMS AND THEIR IMPLEMENTATION IN MEDIUM-SIZE HIGHWAY NETWORKS| FLORA FALESCHINI ET AL
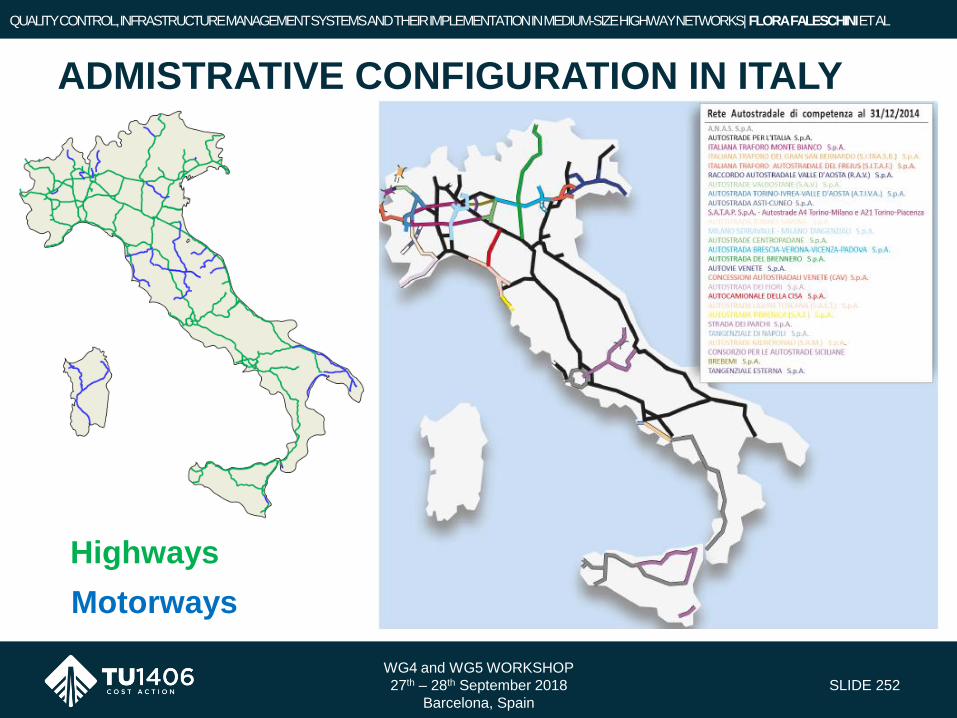
WG4 and WG5 WORKSHOP
27th – 28th September 2018
Barcelona, Spain
SLIDE 252
ADMISTRATIVE CONFIGURATION IN ITALY
QUALITY CONTROL, INFRASTRUCTURE MANAGEMENT SYSTEMS AND THEIR IMPLEMENTATION IN MEDIUM-SIZE HIGHWAY NETWORKS| FLORA FALESCHINI ET AL
Highways
Motorways
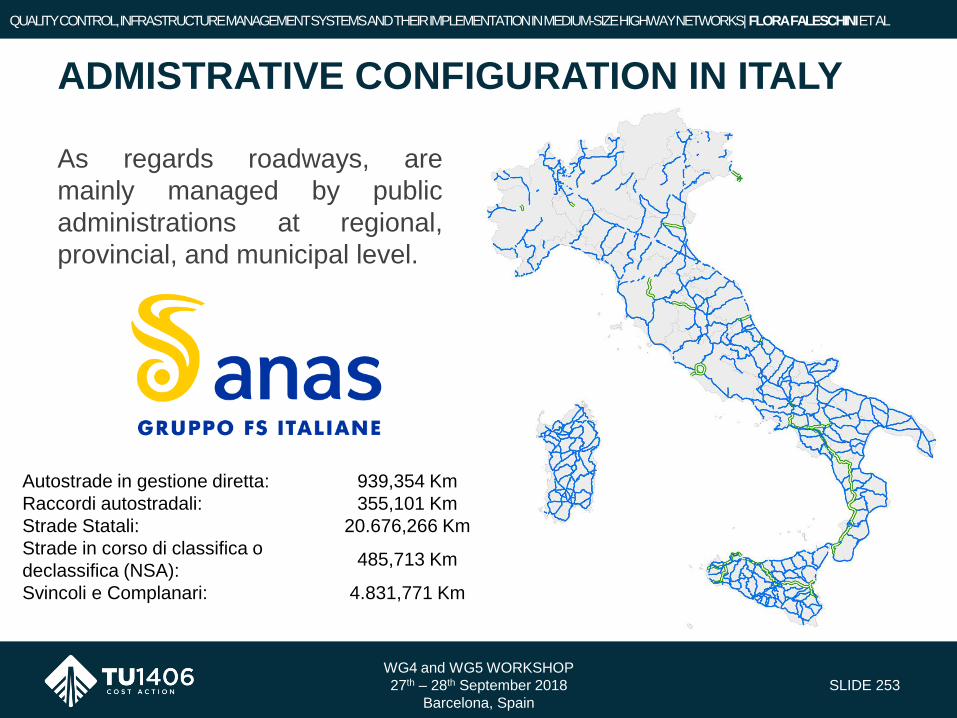
As regards roadways, are
mainly managed by public
administrations at regional,
provincial, and municipal level.
WG4 and WG5 WORKSHOP
27th – 28th September 2018
Barcelona, Spain
SLIDE 253
ADMISTRATIVE CONFIGURATION IN ITALY
QUALITY CONTROL, INFRASTRUCTURE MANAGEMENT SYSTEMS AND THEIR IMPLEMENTATION IN MEDIUM-SIZE HIGHWAY NETWORKS| FLORA FALESCHINI ET AL
Autostrade in gestione diretta: 939,354 Km
Raccordi autostradali: 355,101 Km
Strade Statali: 20.676,266 Km
Strade in corso di classifica o
declassifica (NSA):485,713 Km
Svincoli e Complanari: 4.831,771 Km
Totale: 27.288,205 Km

• The combination of such factors, i.e. absence of a clear regulatory
framework for maintenance activities, ageing bridges with an
average service life of 40-60 years and designed with poor detailing
with respect to maintenance issues, and administrative
fragmentation in the management of infrastructure systems,
constitute an issue of national relevance that can no more
postponed and need urgent measures to be implemented over the
entire territory.
• In addition to ageing phenomena, many bridges were designed
without stringent prescriptions with respect to seismic actions and
therefore can undergo to brittle failures when infrastructure networks
are hit by earthquakes, affecting public safety and interrupting vital
lifelines.
WG4 and WG5 WORKSHOP
27th – 28th September 2018
Barcelona, Spain
SLIDE 254
INFRASTRUCTURE MANAGEMENT IN ITALY:
AN ISSUE OF RELEVANT CONCERN
QUALITY CONTROL, INFRASTRUCTURE MANAGEMENT SYSTEMS AND THEIR IMPLEMENTATION IN MEDIUM-SIZE HIGHWAY NETWORKS| FLORA FALESCHINI ET AL

• Actually, each concessionaire company handles maintenance
activities without a common standardization, and BMSs are mainly
based on visual inspection data and subsequent processing with the
aim to define a priority ranking.
• However, ratings are assigned using qualitative performance
indicators without a specific relationship with quantitative measures
(e.g. reliability).
• BMSs lack the use of prediction models based on probabilistic-
models to forecast future deterioration scenarios.
• No preliminary cost estimations are automatically carried out in
order to support decision making.
• Lack of any systematic consideration of other impacts like
environmental, social, etc.
WG4 and WG5 WORKSHOP
27th – 28th September 2018
Barcelona, Spain
SLIDE 255
QUALITY CONTROL, INFRASTRUCTURE MANAGEMENT SYSTEMS AND THEIR IMPLEMENTATION IN MEDIUM-SIZE HIGHWAY NETWORKS| FLORA FALESCHINI ET AL
INFRASTRUCTURE MANAGEMENT IN ITALY:
AN ISSUE OF RELEVANT CONCERN
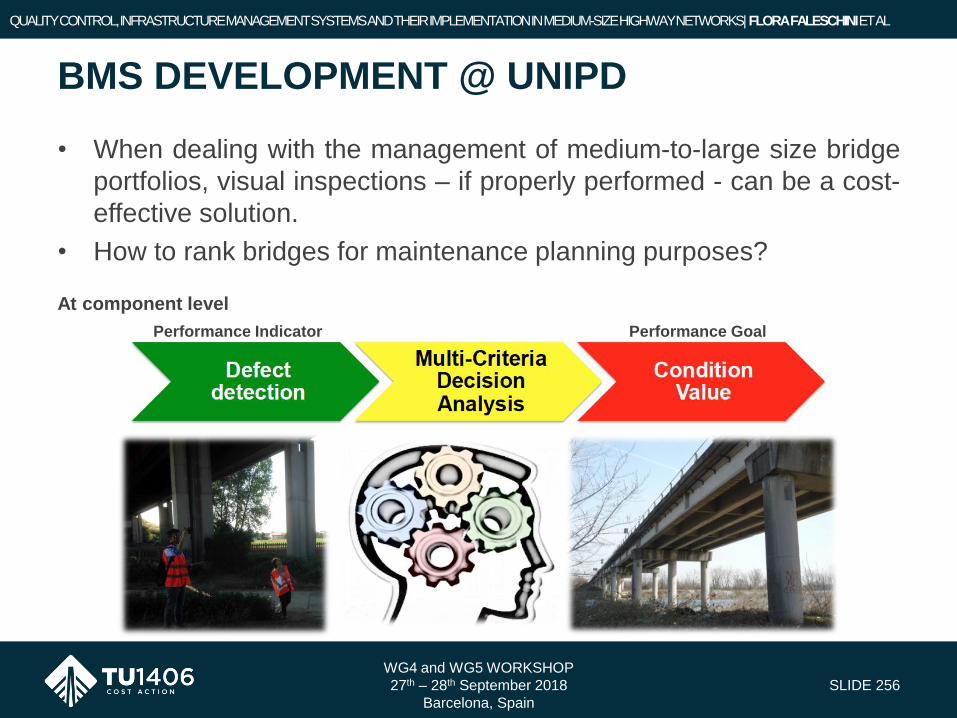
WG4 and WG5 WORKSHOP
27th – 28th September 2018
Barcelona, Spain
SLIDE 256
BMS DEVELOPMENT @ UNIPD
QUALITY CONTROL, INFRASTRUCTURE MANAGEMENT SYSTEMS AND THEIR IMPLEMENTATION IN MEDIUM-SIZE HIGHWAY NETWORKS| FLORA FALESCHINI ET AL
• When dealing with the management of medium-to-large size bridge
portfolios, visual inspections – if properly performed - can be a cost-
effective solution.
• How to rank bridges for maintenance planning purposes?
At component level
Performance Indicator Performance Goal
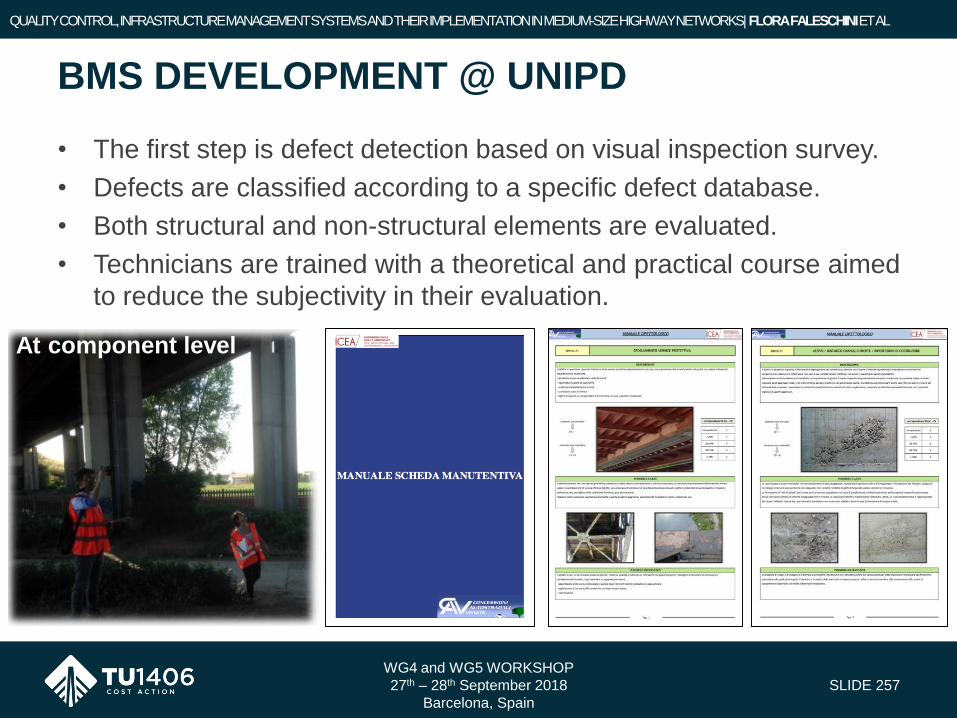
WG4 and WG5 WORKSHOP
27th – 28th September 2018
Barcelona, Spain
SLIDE 257
BMS DEVELOPMENT @ UNIPD
QUALITY CONTROL, INFRASTRUCTURE MANAGEMENT SYSTEMS AND THEIR IMPLEMENTATION IN MEDIUM-SIZE HIGHWAY NETWORKS| FLORA FALESCHINI ET AL
• The first step is defect detection based on visual inspection survey.
• Defects are classified according to a specific defect database.
• Both structural and non-structural elements are evaluated.
• Technicians are trained with a theoretical and practical course aimed
to reduce the subjectivity in their evaluation.
At component level
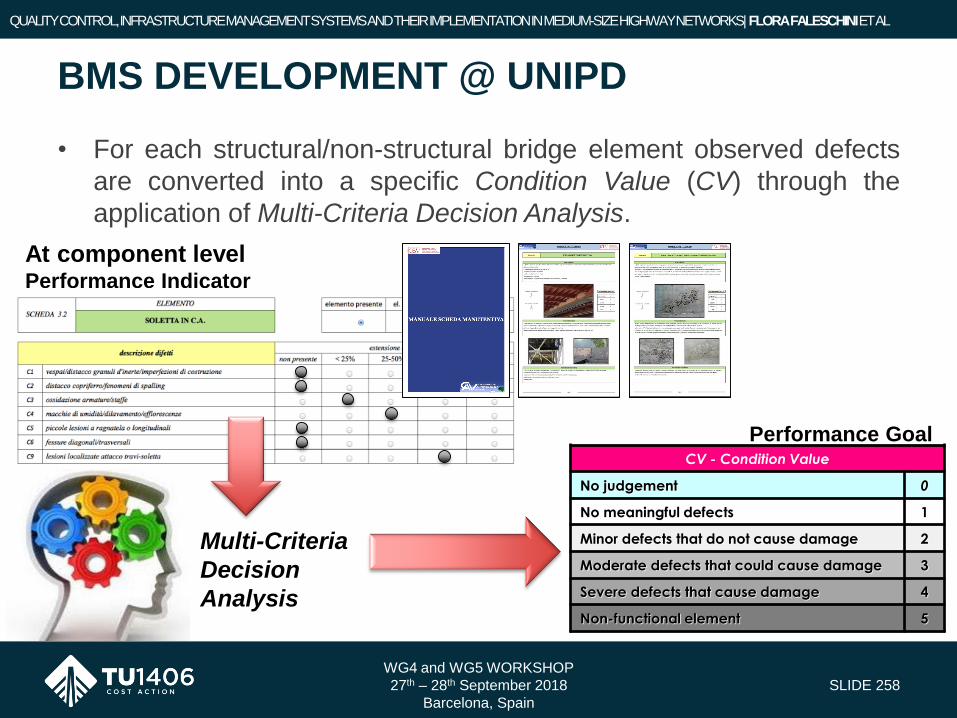
WG4 and WG5 WORKSHOP
27th – 28th September 2018
Barcelona, Spain
SLIDE 258
BMS DEVELOPMENT @ UNIPD
QUALITY CONTROL, INFRASTRUCTURE MANAGEMENT SYSTEMS AND THEIR IMPLEMENTATION IN MEDIUM-SIZE HIGHWAY NETWORKS| FLORA FALESCHINI ET AL
At component levelPerformance Indicator
Performance Goal
• For each structural/non-structural bridge element observed defects
are converted into a specific Condition Value (CV) through the
application of Multi-Criteria Decision Analysis.
CV - Condition Value
No judgement 0
No meaningful defects 1
Minor defects that do not cause damage 2
Moderate defects that could cause damage 3
Severe defects that cause damage 4
Non-functional element 5
Multi-Criteria
Decision
Analysis
,
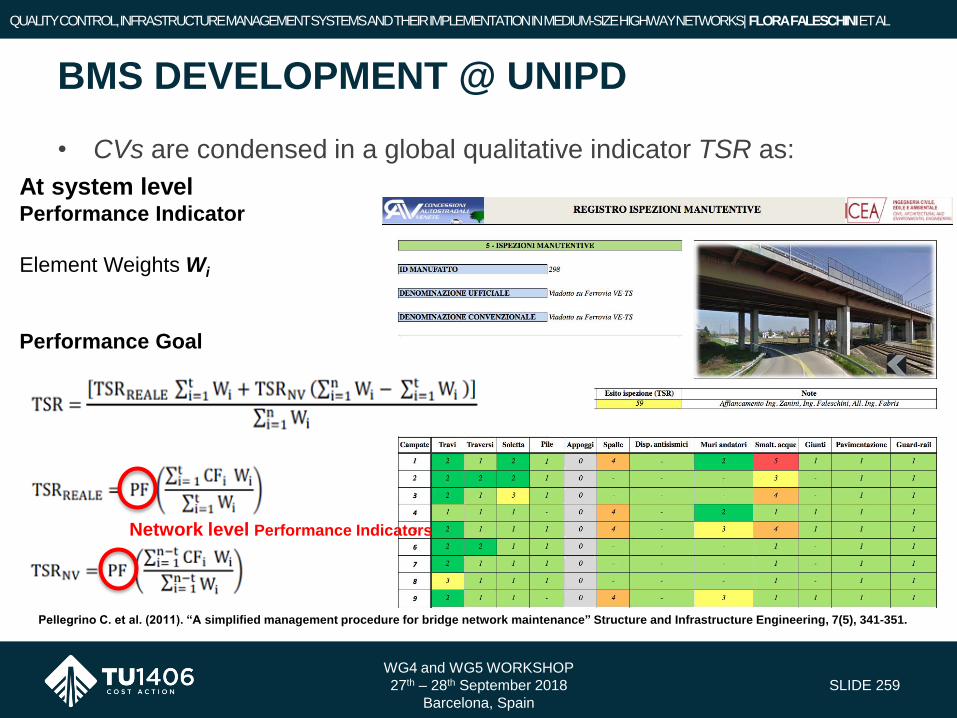
WG4 and WG5 WORKSHOP
27th – 28th September 2018
Barcelona, Spain
SLIDE 259
BMS DEVELOPMENT @ UNIPD
QUALITY CONTROL, INFRASTRUCTURE MANAGEMENT SYSTEMS AND THEIR IMPLEMENTATION IN MEDIUM-SIZE HIGHWAY NETWORKS| FLORA FALESCHINI ET AL
• CVs are condensed in a global qualitative indicator TSR as:
Pellegrino C. et al. (2011). “A simplified management procedure for bridge network maintenance” Structure and Infrastructure Engineering, 7(5), 341-351.
At system levelPerformance Indicator
Element Weights Wi
Performance Goal
Network level Performance Indicators

WG4 and WG5 WORKSHOP
27th – 28th September 2018
Barcelona, Spain
SLIDE 260
BMS DEVELOPMENT @ UNIPD
QUALITY CONTROL, INFRASTRUCTURE MANAGEMENT SYSTEMS AND THEIR IMPLEMENTATION IN MEDIUM-SIZE HIGHWAY NETWORKS| FLORA FALESCHINI ET AL
• At network level, performance goals are represented by intervention
urgency (TSR) and restoration costs.
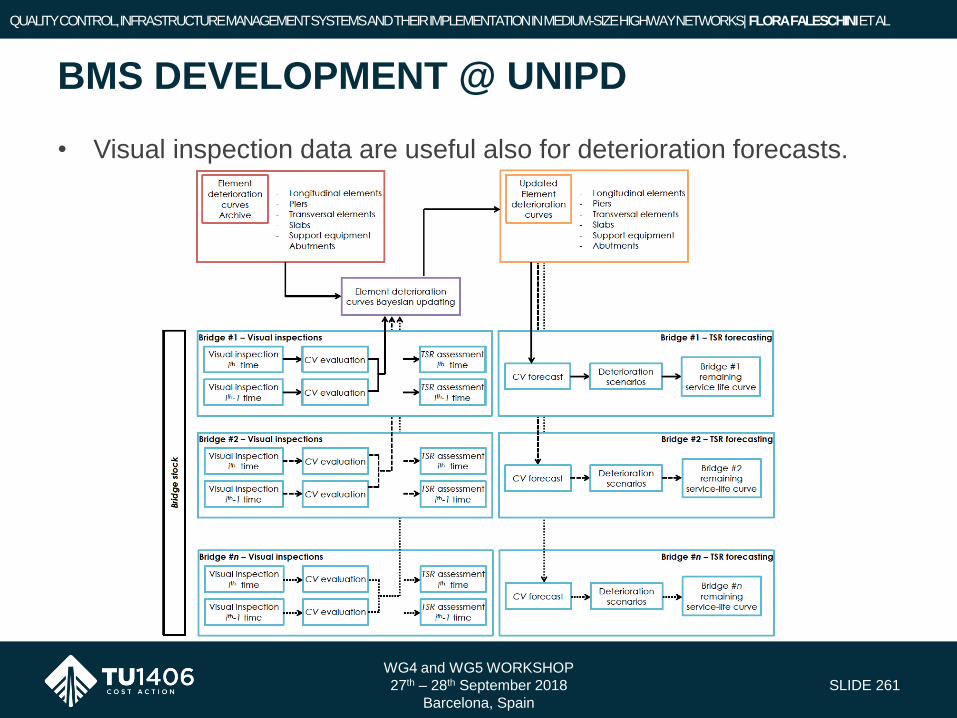
WG4 and WG5 WORKSHOP
27th – 28th September 2018
Barcelona, Spain
SLIDE 261
BMS DEVELOPMENT @ UNIPD
QUALITY CONTROL, INFRASTRUCTURE MANAGEMENT SYSTEMS AND THEIR IMPLEMENTATION IN MEDIUM-SIZE HIGHWAY NETWORKS| FLORA FALESCHINI ET AL
• Visual inspection data are useful also for deterioration forecasts.

WG4 and WG5 WORKSHOP
27th – 28th September 2018
Barcelona, Spain
SLIDE 262
BMS DEVELOPMENT @ UNIPD
QUALITY CONTROL, INFRASTRUCTURE MANAGEMENT SYSTEMS AND THEIR IMPLEMENTATION IN MEDIUM-SIZE HIGHWAY NETWORKS| FLORA FALESCHINI ET AL
• Information on time intervals between consequent inspections and
related CVs are stored in datasets.
• For each element it is possible to define deterioration curves
updated when new data are available.
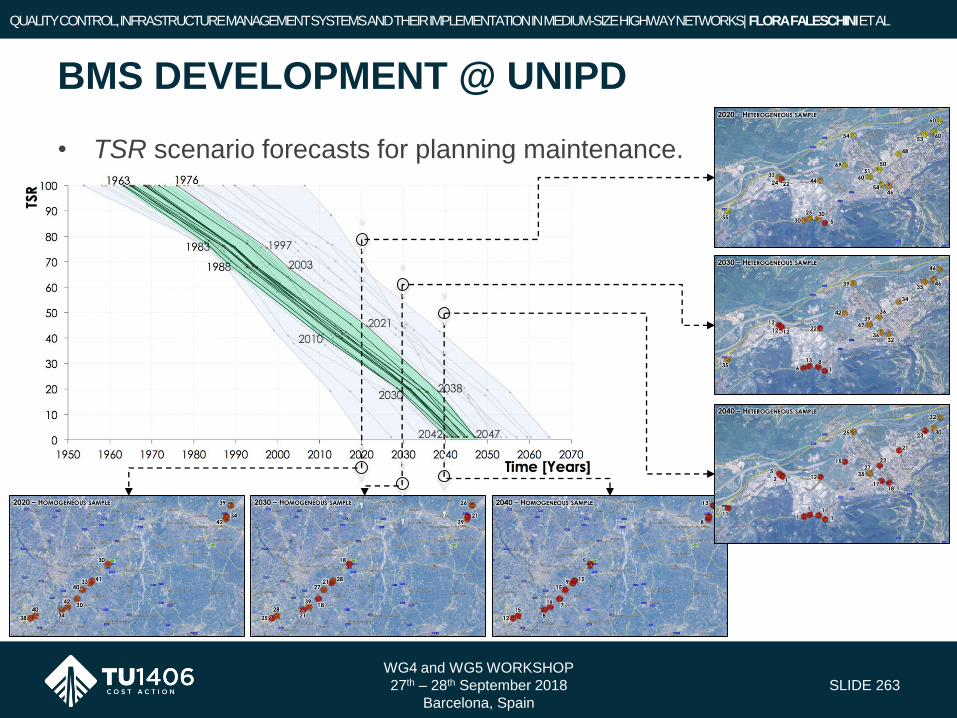
WG4 and WG5 WORKSHOP
27th – 28th September 2018
Barcelona, Spain
SLIDE 263
BMS DEVELOPMENT @ UNIPD
QUALITY CONTROL, INFRASTRUCTURE MANAGEMENT SYSTEMS AND THEIR IMPLEMENTATION IN MEDIUM-SIZE HIGHWAY NETWORKS| FLORA FALESCHINI ET AL
• TSR scenario forecasts for planning maintenance.
,
,
,
,
,
,
,
,
,
,
,
,
,
,
,
,
,
,
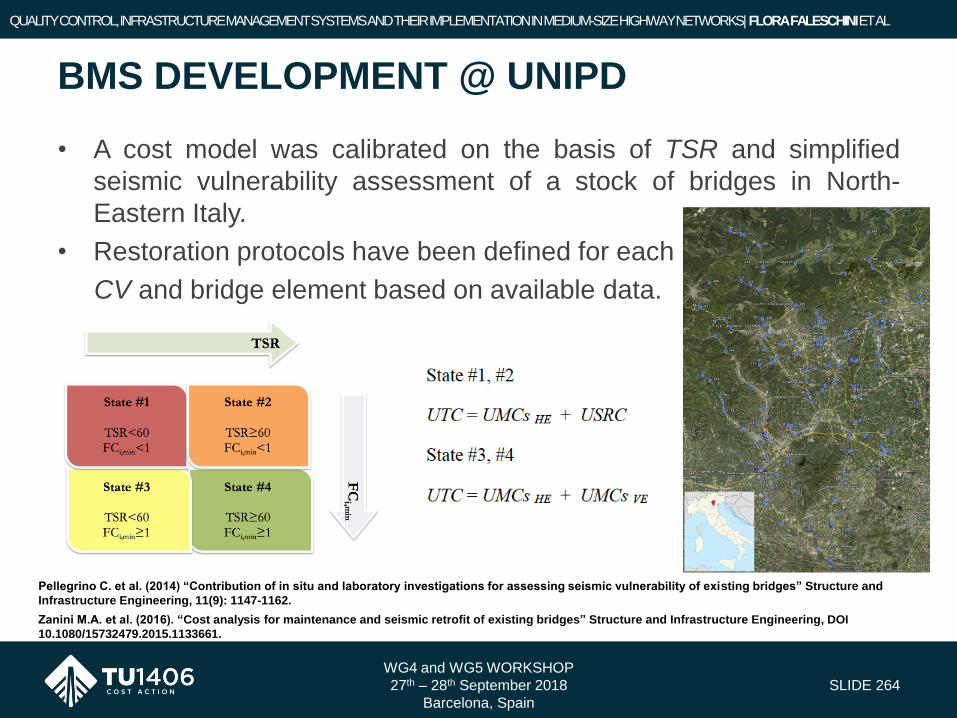
WG4 and WG5 WORKSHOP
27th – 28th September 2018
Barcelona, Spain
SLIDE 264
BMS DEVELOPMENT @ UNIPD
QUALITY CONTROL, INFRASTRUCTURE MANAGEMENT SYSTEMS AND THEIR IMPLEMENTATION IN MEDIUM-SIZE HIGHWAY NETWORKS| FLORA FALESCHINI ET AL
• A cost model was calibrated on the basis of TSR and simplified
seismic vulnerability assessment of a stock of bridges in North-
Eastern Italy.
• Restoration protocols have been defined for each
CV and bridge element based on available data.
Pellegrino C. et al. (2014) “Contribution of in situ and laboratory investigations for assessing seismic vulnerability of existing bridges” Structure and
Infrastructure Engineering, 11(9): 1147-1162.
Zanini M.A. et al. (2016). “Cost analysis for maintenance and seismic retrofit of existing bridges” Structure and Infrastructure Engineering, DOI
10.1080/15732479.2015.1133661.

WG4 and WG5 WORKSHOP
27th – 28th September 2018
Barcelona, Spain
SLIDE 265
BMS DEVELOPMENT @ UNIPD
QUALITY CONTROL, INFRASTRUCTURE MANAGEMENT SYSTEMS AND THEIR IMPLEMENTATION IN MEDIUM-SIZE HIGHWAY NETWORKS| FLORA FALESCHINI ET AL
Zanini M.A. et al. (2016). “Cost analysis for maintenance and seismic retrofit of existing bridges” Structure and Infrastructure Engineering, DOI
10.1080/15732479.2015.1133661.
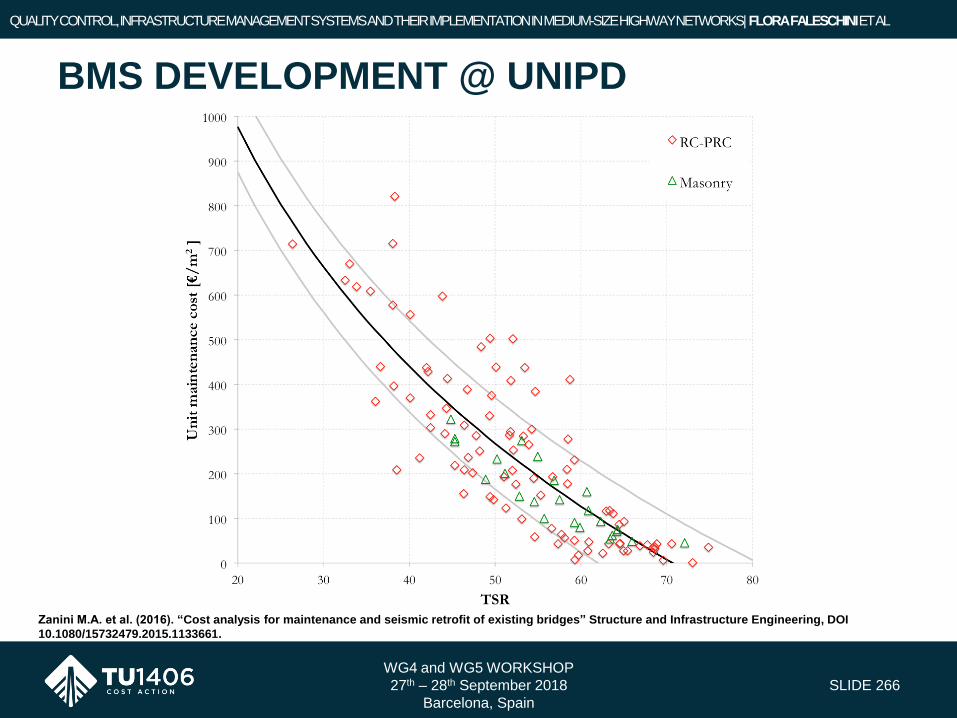
WG4 and WG5 WORKSHOP
27th – 28th September 2018
Barcelona, Spain
SLIDE 266
BMS DEVELOPMENT @ UNIPD
QUALITY CONTROL, INFRASTRUCTURE MANAGEMENT SYSTEMS AND THEIR IMPLEMENTATION IN MEDIUM-SIZE HIGHWAY NETWORKS| FLORA FALESCHINI ET AL
Zanini M.A. et al. (2016). “Cost analysis for maintenance and seismic retrofit of existing bridges” Structure and Infrastructure Engineering, DOI
10.1080/15732479.2015.1133661.

WG4 and WG5 WORKSHOP
27th – 28th September 2018
Barcelona, Spain
SLIDE 267
BMS DEVELOPMENT @ UNIPD
QUALITY CONTROL, INFRASTRUCTURE MANAGEMENT SYSTEMS AND THEIR IMPLEMENTATION IN MEDIUM-SIZE HIGHWAY NETWORKS| FLORA FALESCHINI ET AL
Zanini M.A. et al. (2016). “Cost analysis for maintenance and seismic retrofit of existing bridges” Structure and Infrastructure Engineering, DOI
10.1080/15732479.2015.1133661.

WG4 and WG5 WORKSHOP
27th – 28th September 2018
Barcelona, Spain
SLIDE 268
BMS DEVELOPMENT @ UNIPD
QUALITY CONTROL, INFRASTRUCTURE MANAGEMENT SYSTEMS AND THEIR IMPLEMENTATION IN MEDIUM-SIZE HIGHWAY NETWORKS| FLORA FALESCHINI ET AL
Zanini M.A. et al. (2016). “Cost analysis for maintenance and seismic retrofit of existing bridges” Structure and Infrastructure Engineering, DOI
10.1080/15732479.2015.1133661.

Agreement with UNIPD and Concessioni Autostradali Venete S.p.A. for
the development of an integrated Bridge Management System.
WG4 and WG5 WORKSHOP
27th – 28th September 2018
Barcelona, Spain
SLIDE 269
UNIPD & CAV
QUALITY CONTROL, INFRASTRUCTURE MANAGEMENT SYSTEMS AND THEIR IMPLEMENTATION IN MEDIUM-SIZE HIGHWAY NETWORKS| FLORA FALESCHINI ET AL

Concessioni Autostradali Venete S.p.A. manages one of the oldest
highways built in Italy (first opening in October 15, 1933).
WG4 and WG5 WORKSHOP
27th – 28th September 2018
Barcelona, Spain
SLIDE 270
UNIPD & CAV
QUALITY CONTROL, INFRASTRUCTURE MANAGEMENT SYSTEMS AND THEIR IMPLEMENTATION IN MEDIUM-SIZE HIGHWAY NETWORKS| FLORA FALESCHINI ET AL

WG4 and WG5 WORKSHOP
27th – 28th September 2018
Barcelona, Spain
SLIDE 271
UNIPD & CAV
QUALITY CONTROL, INFRASTRUCTURE MANAGEMENT SYSTEMS AND THEIR IMPLEMENTATION IN MEDIUM-SIZE HIGHWAY NETWORKS| FLORA FALESCHINI ET AL
• Web application for CAV BMS for 130 bridges.

WG4 and WG5 WORKSHOP
27th – 28th September 2018
Barcelona, Spain
SLIDE 272
UNIPD & CAV
QUALITY CONTROL, INFRASTRUCTURE MANAGEMENT SYSTEMS AND THEIR IMPLEMENTATION IN MEDIUM-SIZE HIGHWAY NETWORKS| FLORA FALESCHINI ET AL
• Web application for CAV BMS: inventory
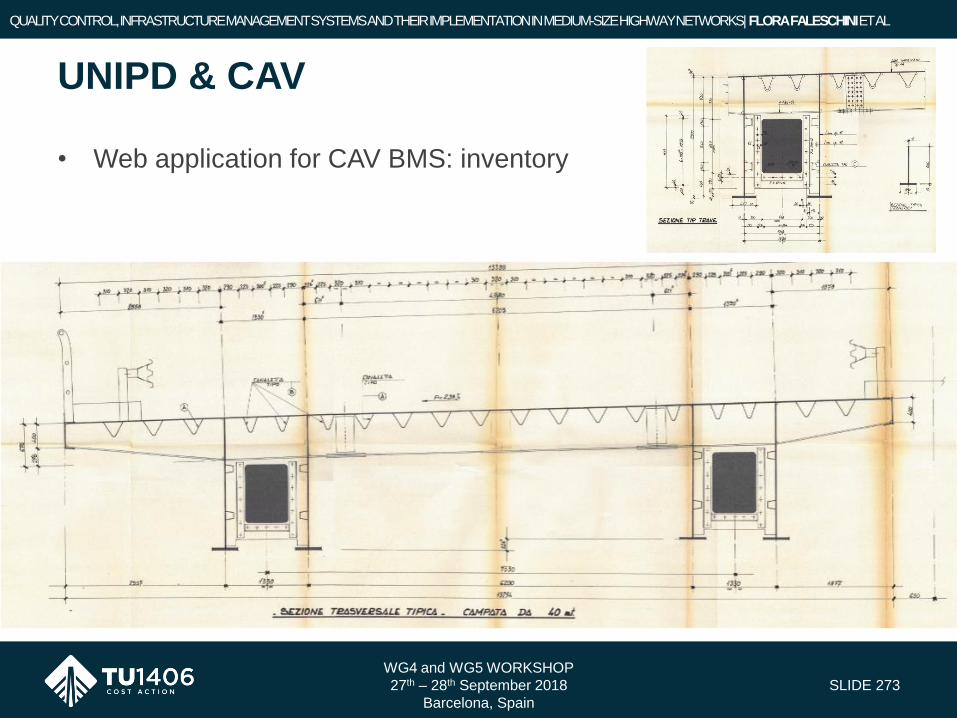
WG4 and WG5 WORKSHOP
27th – 28th September 2018
Barcelona, Spain
SLIDE 273
UNIPD & CAV
QUALITY CONTROL, INFRASTRUCTURE MANAGEMENT SYSTEMS AND THEIR IMPLEMENTATION IN MEDIUM-SIZE HIGHWAY NETWORKS| FLORA FALESCHINI ET AL
• Web application for CAV BMS: inventory

WG4 and WG5 WORKSHOP
27th – 28th September 2018
Barcelona, Spain
SLIDE 274
UNIPD & CAV
QUALITY CONTROL, INFRASTRUCTURE MANAGEMENT SYSTEMS AND THEIR IMPLEMENTATION IN MEDIUM-SIZE HIGHWAY NETWORKS| FLORA FALESCHINI ET AL
• Web application for CAV BMS: inspection schemes
Deck IDs Beam IDs

WG4 and WG5 WORKSHOP
27th – 28th September 2018
Barcelona, Spain
SLIDE 275
UNIPD & CAV
QUALITY CONTROL, INFRASTRUCTURE MANAGEMENT SYSTEMS AND THEIR IMPLEMENTATION IN MEDIUM-SIZE HIGHWAY NETWORKS| FLORA FALESCHINI ET AL
• Web application for CAV BMS: inspection schemes
Pier and abutment IDs Bearing and joint IDs

WG4 and WG5 WORKSHOP
27th – 28th September 2018
Barcelona, Spain
SLIDE 276
UNIPD & CAV
QUALITY CONTROL, INFRASTRUCTURE MANAGEMENT SYSTEMS AND THEIR IMPLEMENTATION IN MEDIUM-SIZE HIGHWAY NETWORKS| FLORA FALESCHINI ET AL
• Web application for CAV BMS: visual inspections
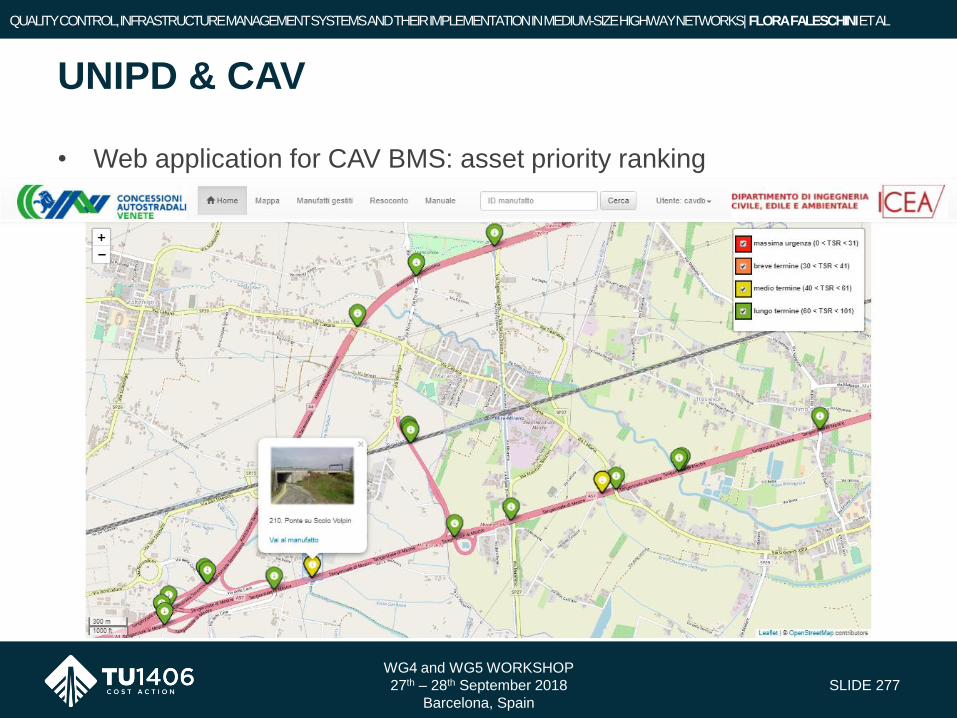
WG4 and WG5 WORKSHOP
27th – 28th September 2018
Barcelona, Spain
SLIDE 277
UNIPD & CAV
QUALITY CONTROL, INFRASTRUCTURE MANAGEMENT SYSTEMS AND THEIR IMPLEMENTATION IN MEDIUM-SIZE HIGHWAY NETWORKS| FLORA FALESCHINI ET AL
• Web application for CAV BMS: asset priority ranking
Next steps:
• Implementation of deterioration model to forecast ageing;
• Seismic and flood structural assessment;
• Structural Health Monitoring for most important bridges;
• Evaluation of environmental impacts.
WG4 and WG5 WORKSHOP
27th – 28th September 2018
Barcelona, Spain
SLIDE 278
UNIPD & CAV
QUALITY CONTROL, INFRASTRUCTURE MANAGEMENT SYSTEMS AND THEIR IMPLEMENTATION IN MEDIUM-SIZE HIGHWAY NETWORKS| FLORA FALESCHINI ET AL

WG4 and WG5 WORKSHOP
27th – 28th September 2018
Barcelona, Spain
SLIDE 279
QUALITY CONTROL, INFRASTRUCTURE MANAGEMENT SYSTEMS AND THEIR IMPLEMENTATION IN MEDIUM-SIZE HIGHWAY NETWORKS| FLORA FALESCHINI ET AL
Thank you for your attention!
Contact:

THANK YOU FOR YOUR ATTENTION!
WWW.TU1406.EU
WG4 and WG5 WORKSHOP
Sustainable Bridge Management
27th – 28th September 2018
Barcelona, Spain
Quality control of roadway bridges
– Reliability assessment –
Nikola Tanasić, Dušan Isailović & Rade Hajdin - University of Belgrade, Serbia
Jose Matos – University of Minho, Portugal

QUALITY SPECIFICATIONS FOR ROADWAY BRIDGES,
STANDARDIZATION AT A EUROPEAN LEVEL
Barcelona,
27th – 28th September, 2018
1
QUALITY CONTROL OF ROADWAY BRIDGES – RELIABILITY ASSESSMENT
Nikola Tanasić1, Dušan Isailović1, Rade Hajdin1, Jose Matos2
1Faculty of Civil Engineering, University of Belgrade, Serbia
2 University of Minho, Guimaraes, Portugal
E-Mail: [email protected], [email protected], [email protected],
Abstract. The elaboration of adequate quality control plans is one of the crucial tasks in bridge management
today. This is the topic of the ongoing COST TU1406 action, where it is proposed to control quality focus by means of
key performance indicators. To this date, the qualitative methodology for the assessment of the indicators is suggested,
with a framework that can be upgraded to a full quantitative approach in future. The methodology is envisioned to
enhance current management practices, which predominantly rely on visual inspections, and use only the essential data
from bridge inventory and inspections for decision-making. The pivotal key performance indicator is suggested to be
reliability, the assessment of which is performed for likely bridge failure modes. Here, it is required to include the
impact of physical features (e.g. damages, symptoms) observed in inspections, especially those which may considerably
affect the reliability. The two approaches suggested within COST Working Group 3 report to assess the reliability and
the possibilities for their application in practice are presented in this paper.
Keywords: Quality control, Key Performance indicators, Reliability, Bayesian net, Vulnerable zones, Failure
modes,
1. Introduction
The majority of current bridge quality control procedures are solely based on the results of visual inspections. The results
are used to evaluate a qualitative performance indicator, i.e. a condition rating/state, which is used to roughly define
necessary maintenance interventions and their urgency. However, in the face of the increasing traffic volumes and loading,
decreasing budget as well as the climate change, existing bridges are in need of more comprehensive approaches to assess
their performance over the entire service life and provide timely and affordable, i.e. optimal maintenance. Here, there is
a need to reduce subjectivity and perhaps overly conservative rules in the current practice. Recognizing the value of
inspections and condition rating, the methodology is introduced to use this information to estimate key performance
indicators (KPI) with the focus on the reliability related to structural safety and serviceability.
Within the COST Action 1406, the Working Group 1 (WG1) performed a survey for performance indicators (PI)
which are applied in European countries (Strauss & Mandić Ivanković, 2016). Further, in the Working Group 2 (WG2)
report (Stipanovic, et al., 2017), the performance goals and key performance indicators (KPIs) based on the Dutch
RAMSSHE€P approach (Rijkswaterstaat, 2012) were defined. Finally, the Working group 3 (WG3) proposed a
framework (Hajdin, et al., 2018) aimed at establishment of standardized quality control plans for European bridge
management practice. The suggested qualitative methodology is based on the application of KPIs: Reliability,
Availability, Safety, Economy and Environment, with a possibility for an upgrade to a full quantitative approach. The
widely recognized indicator is Reliability as it accounts for structural safety and serviceability. In order to evaluate it, all
relevant information from inventory and inspections must be considered and coupled with engineering judgement. The
latter is based on the knowledge on possible bridge failure modes and their vulnerable zones i.e. parts/segments of a
bridge where damages have the most significant impact on the bridge performance.
The paper discusses the two approaches suggested by WG3 to evaluate the KPI of Reliability and further include the
results of inspections to update its value. To tailor the approaches to their own needs with respect to the bridges in national
networks and currently available inventory and inspection data is left to the owners/operators.
2. Approach in the COST TU1406 Working Group 3
The ontology of the Working Group 3 (WG3) framework has been presented in Figure 1 in a form of an Entity
Relationship Diagram (ERD). Here, the “crow foot” symbolizes one-to-many relationship whereas the “crow foot with a
circle” stands for one-to-zero or one-to-many relationships. Firstly, the definitions of the main entities are given, which
is followed by the explanation of the ERD.

QUALITY CONTROL OF BRIDGES - RELIABILITY ASSESSMENT
2
The entity “Structure” includes bridge types (e.g. a girder, a frame and an arch bridge) and the entity “Element” all
element types (e.g. beams, decks, piers). In the entity group “Inventory”, there can be other entities apart from
“Construction type” such as “Geometry” and “Construction method”. The entity “Design and construction” include
several other entities related to original design such as construction year, design loads, soil characteristics, etc.
The entity “Observation” relates to a perception of human senses or data measured by instrument that is regarded as
relevant within the context of the inquiry (e.g. damages and geometry changes). Observations can be qualitative i.e. only
the absence or presence of a property is noted, or quantitative, if a numerical value is coupled to the observed phenomenon
by counting or measuring. The “Performance indicator“ (PI) is related to measuring the fitness for purpose of a bridge or
its element. Thus, the difference between observations and PIs is that the first are “just the fact“ and the latter is already
an interpretation of its impact on a bridge performance.
Figure 1. The WG3 framework ontology
Generally, there is no clear distinction between PIs and KPIs. In the WG3, the KPI of Reliability is defined as the
probability that a bridge will be fit for purpose during its service life, complementary to the probability of structural failure
(safety), operational failure (serviceability) or any other failure mode.
The “Failure modes” represent quasi-permanent or transient situations that violate code specifications or owner’s/
operator’s provisions. This includes but is not limited to overall bridge collapse. Some of these situations, e.g. Ultimate
Limit State (ULS) and Serviceability Limit State (SLS), are specified in bridge design. Due to slow (deterioration) and
sudden (e.g. natural hazard) processes, damages may occur that result in additional failure modes. Finally,
owners/operators may define situations (e.g. spalling, corrosion traces, etc.) that are regarded as failure modes since they
might comprise public perception of safety and owner’s/operator’s reputation.
The “Vulnerable zones” are those segments and/or elements of a bridge structure in which damages have the largest
impact on safety and serviceability. One vulnerable zone may be related to several failure modes. The damages outside
vulnerable zones can also trigger failures, but for them to occur the extent of damages need to be significantly larger than
in the vulnerable zones. If this seems likely, one needs to define an additional failure mode that can be triggered by the
observed damages.
The diagram in Figure 1. can be interpreted as follows: there is an observation (e.g. a crack) with a certain property
(e.g. a crack width), on an element of a certain type (e.g. a beam), with the location in a vulnerable zone that is related to
a specific failure mode of a structure. With an influence of other data (e.g. the construction year), this observation will
have an impact on a KPI expressed by a performance value. The damage process is derived based on observations and on
original design and construction data. It governs the development of the observed damages in the future and allows a
forecast of the KPIs. The decision is up to owner/operator how to combine different failure modes in the evaluation of a
KPI. For instance, a certain crack width can be chosen to be a failure criterion as it affects serviceability, but this failure
mode cannot be rationally combined with those failure modes related to structural safety (i.e. collapse), as an adequate
consequence analysis is necessary (i.e. a risk-based approach). Alternatively, an owner/operator can introduce own
performance thresholds and assessment procedures (e.g. a weighted sum) to distinguish failure mode type importance in
structuring of a quality control plan, which is again, implicitly risk-based approach.
3. The simplified evaluation of the „virgin” reliability
The partial safety factors in modern codes are calibrated to satisfy the reliability requirements (safety and serviceability).
According to (CEN EN 1990, 2002), non-landmark bridges are in RC2 class which have the target annual reliability index
for structural safety of 4.7 (occurrence probability of 1.3‧ 10-6) and for serviceability 2.9 (occurrence probability of
1.9‧ 10-3). The bridge is considered as safe and serviceable if specified reliability indexes are not below these target
values. The assessment of the reliability of existing bridges can be tedious task as there is a need to model all actions and
material properties as stochastic variables. But, based on experience and available data, a simplified assessment can be
performed.
The “virgin” reliability is obtained as the reliability of an undamaged bridge for the resistance based on the original
codes and the live load actions from the current codes. The original design load situation thus is used to assess the
characteristic value of resistance against the chosen failure mode. The mathematical distributions for the self-weight as
well as for other loading actions can be derived based on percentile assumption of their characteristic values following
the recommendations from literature, e.g. (JCSS, 2013). The traffic load is normally modelled by extreme distributions
(e.g. Gumbel max), which is supported by measurements and simulation performed within research project all over the
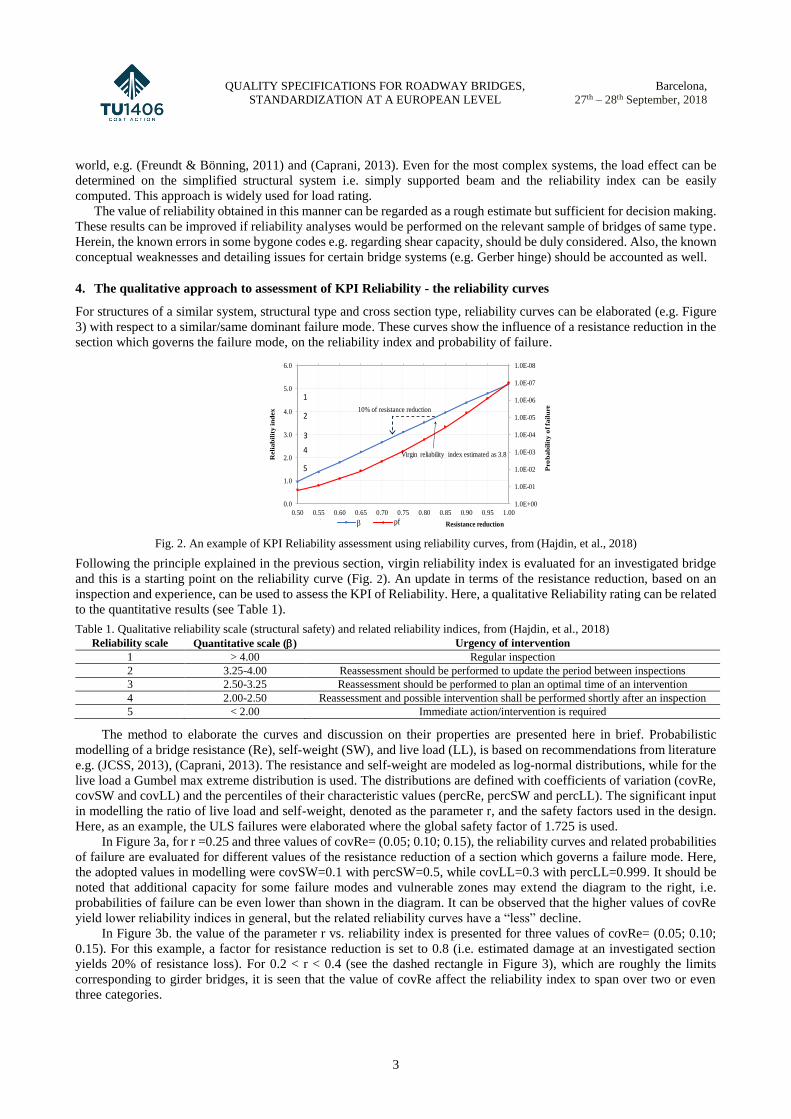
QUALITY SPECIFICATIONS FOR ROADWAY BRIDGES,
STANDARDIZATION AT A EUROPEAN LEVEL
Barcelona,
27th – 28th September, 2018
3
world, e.g. (Freundt & Bönning, 2011) and (Caprani, 2013). Even for the most complex systems, the load effect can be
determined on the simplified structural system i.e. simply supported beam and the reliability index can be easily
computed. This approach is widely used for load rating.
The value of reliability obtained in this manner can be regarded as a rough estimate but sufficient for decision making.
These results can be improved if reliability analyses would be performed on the relevant sample of bridges of same type.
Herein, the known errors in some bygone codes e.g. regarding shear capacity, should be duly considered. Also, the known
conceptual weaknesses and detailing issues for certain bridge systems (e.g. Gerber hinge) should be accounted as well.
4. The qualitative approach to assessment of KPI Reliability - the reliability curves
For structures of a similar system, structural type and cross section type, reliability curves can be elaborated (e.g. Figure
3) with respect to a similar/same dominant failure mode. These curves show the influence of a resistance reduction in the
section which governs the failure mode, on the reliability index and probability of failure.
Fig. 2. An example of KPI Reliability assessment using reliability curves, from (Hajdin, et al., 2018)
Following the principle explained in the previous section, virgin reliability index is evaluated for an investigated bridge
and this is a starting point on the reliability curve (Fig. 2). An update in terms of the resistance reduction, based on an
inspection and experience, can be used to assess the KPI of Reliability. Here, a qualitative Reliability rating can be related
to the quantitative results (see Table 1).
Table 1. Qualitative reliability scale (structural safety) and related reliability indices, from (Hajdin, et al., 2018)
Reliability scale Quantitative scale () Urgency of intervention
1 > 4.00 Regular inspection
2 3.25-4.00 Reassessment should be performed to update the period between inspections
3 2.50-3.25 Reassessment should be performed to plan an optimal time of an intervention
4 2.00-2.50 Reassessment and possible intervention shall be performed shortly after an inspection
5 < 2.00 Immediate action/intervention is required
The method to elaborate the curves and discussion on their properties are presented here in brief. Probabilistic
modelling of a bridge resistance (Re), self-weight (SW), and live load (LL), is based on recommendations from literature
e.g. (JCSS, 2013), (Caprani, 2013). The resistance and self-weight are modeled as log-normal distributions, while for the
live load a Gumbel max extreme distribution is used. The distributions are defined with coefficients of variation (covRe,
covSW and covLL) and the percentiles of their characteristic values (percRe, percSW and percLL). The significant input
in modelling the ratio of live load and self-weight, denoted as the parameter r, and the safety factors used in the design.
Here, as an example, the ULS failures were elaborated where the global safety factor of 1.725 is used.
In Figure 3a, for r =0.25 and three values of covRe= (0.05; 0.10; 0.15), the reliability curves and related probabilities
of failure are evaluated for different values of the resistance reduction of a section which governs a failure mode. Here,
the adopted values in modelling were covSW=0.1 with percSW=0.5, while covLL=0.3 with percLL=0.999. It should be
noted that additional capacity for some failure modes and vulnerable zones may extend the diagram to the right, i.e.
probabilities of failure can be even lower than shown in the diagram. It can be observed that the higher values of covRe
yield lower reliability indices in general, but the related reliability curves have a “less” decline.
In Figure 3b. the value of the parameter r vs. reliability index is presented for three values of covRe= (0.05; 0.10;
0.15). For this example, a factor for resistance reduction is set to 0.8 (i.e. estimated damage at an investigated section
yields 20% of resistance loss). For 0.2 < r < 0.4 (see the dashed rectangle in Figure 3), which are roughly the limits
corresponding to girder bridges, it is seen that the value of covRe affect the reliability index to span over two or even
three categories.
1.0E-08
1.0E-07
1.0E-06
1.0E-05
1.0E-04
1.0E-03
1.0E-02
1.0E-01
1.0E+000.0
1.0
2.0
3.0
4.0
5.0
6.0
0.50 0.55 0.60 0.65 0.70 0.75 0.80 0.85 0.90 0.95 1.00
Reli
ab
ilit
y in
dex
Pro
bab
ilit
y o
f fa
ilu
re
Resistance reductionb2 pf2
10% of resistance reduction
pf
Virgin reliability index estimated as 3.8
1
2
3
4
5

QUALITY CONTROL OF BRIDGES - RELIABILITY ASSESSMENT
4
a) b)
Fig. 3. Properties of reliability curves. a- The effect of different covRe on reliability curves & related probabilities of failure; b –
parameter r vs. reliability index for an assumed resistance reduction
5. The quantitative assessment of Reliability – application of Bayesian nets
The methodology for introducing Bayesian nets in a bridge reliability assessment was discussed in (Isailovic, Hajdin, &
Matos, 2018). In a simplified form, the net is shown in Fig. 4. The nodes “Current loads” and “Resistance” represent
random variables of traffic load and self-weight on one side and a resistance of the virgin i.e. undamaged bridge on the
other. The “Failure” node represents evaluation of the probability of failure via the limit state function. The results of an
inspection are used to assess the resistance reduction (“Inspection findings” node), which implies an increase probability
of failure i.e. a decrease of reliability due to the observed damages.
Fig. 4. Conceptual Bayesian net for a bridge reliability assessment
In general, when assessing structural safety, the reliability of bridge is evaluated taking into account several potential
bending and shear failure modes. The Bayesian net for a system consisted of n failure modes has n couples of “Current
loads” and “Resistance” nodes corresponding to each node “Failure mode”. In terms of reliability, bridge structure can
be represented as a series system of different failure modes, which can be mutually statistically dependent i.e. correlated.
Since the correlation is often difficult to estimate, a failure probability of the system PF is assessed by evaluation the lower
and upper bound limits of the of failure probability (Melchers, 1999).
n
i
iFi
n
iFMPPFMP
11
))(1(1)(max (1)
where P( iFM ) ‒ probability of a structure failure in a failure mode i.
The lower bound corresponds to the case where failure modes are fully correlated, while the upper bound relates to the
case where there are completely uncorrelated failure modes. An actual failure probability is somewhere between these
bounds.
5.1 Case study
The subject bridge is a RC plate, three-spanned overpass from 1983 with the total length of 29.4 m (
1.0E-09
1.0E-08
1.0E-07
1.0E-06
1.0E-05
1.0E-04
1.0E-03
1.0E-02
1.0E-01
1.0E+000.0
1.0
2.0
3.0
4.0
5.0
6.0
0.70 0.75 0.80 0.85 0.90 0.95 1.00
Reliabilit
y i
ndex
Pro
babilit
y of
failure
Resistance reduction Series5 Series9 Series4
1
2
4
0.25r
covRe 0.10covRe 0.15
covRe 0.05
covRe 0.15
covRe 0.05
covRe 0.10
1
2
3
4
5
fP
0.0
1.0
2.0
3.0
4.0
5.0
6.0
0.00 0.20 0.40 0.60 0.80 1.00
Re
lia
bil
ity
in
de
x
r
1
2
4
covRe 0.10covRe 0.15
covRe 0.05
1
2
3
4
5 for resistance reduction = 0.8
[% ]
[% ]
Liveload of total loadr
Dead load of total load
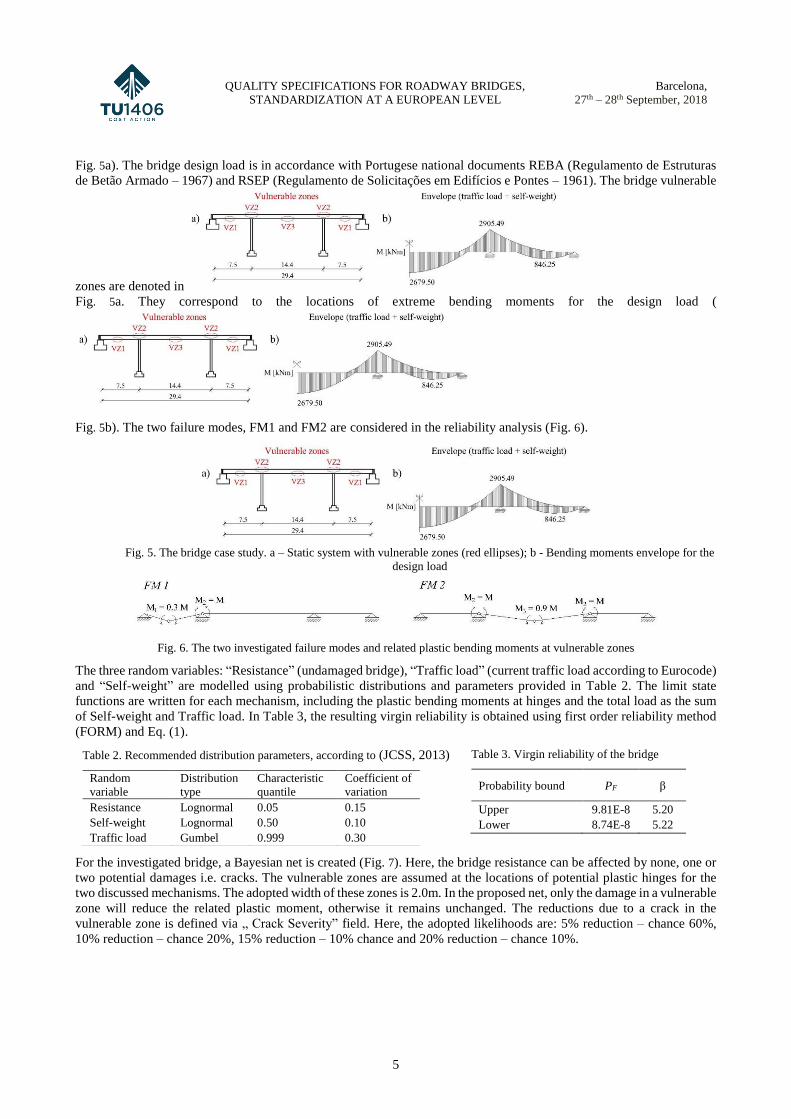
QUALITY SPECIFICATIONS FOR ROADWAY BRIDGES,
STANDARDIZATION AT A EUROPEAN LEVEL
Barcelona,
27th – 28th September, 2018
5
Fig. 5a). The bridge design load is in accordance with Portugese national documents REBA (Regulamento de Estruturas
de Betão Armado – 1967) and RSEP (Regulamento de Solicitações em Edifícios e Pontes – 1961). The bridge vulnerable
zones are denoted in
Fig. 5a. They correspond to the locations of extreme bending moments for the design load (
Fig. 5b). The two failure modes, FM1 and FM2 are considered in the reliability analysis (Fig. 6).
Fig. 5. The bridge case study. a – Static system with vulnerable zones (red ellipses); b - Bending moments envelope for the
design load
Fig. 6. The two investigated failure modes and related plastic bending moments at vulnerable zones
The three random variables: “Resistance” (undamaged bridge), “Traffic load” (current traffic load according to Eurocode)
and “Self-weight” are modelled using probabilistic distributions and parameters provided in Table 2. The limit state
functions are written for each mechanism, including the plastic bending moments at hinges and the total load as the sum
of Self-weight and Traffic load. In Table 3, the resulting virgin reliability is obtained using first order reliability method
(FORM) and Eq. (1).
Table 2. Recommended distribution parameters, according to (JCSS, 2013)
Random
variable
Distribution
type
Characteristic
quantile
Coefficient of
variation
Resistance
Self-weight
Traffic load
Lognormal
Lognormal
Gumbel
0.05
0.50
0.999
0.15
0.10
0.30
Table 3. Virgin reliability of the bridge
Probability bound PF β
Upper 9.81E-8 5.20
Lower 8.74E-8 5.22
For the investigated bridge, a Bayesian net is created (Fig. 7). Here, the bridge resistance can be affected by none, one or
two potential damages i.e. cracks. The vulnerable zones are assumed at the locations of potential plastic hinges for the
two discussed mechanisms. The adopted width of these zones is 2.0m. In the proposed net, only the damage in a vulnerable
zone will reduce the related plastic moment, otherwise it remains unchanged. The reductions due to a crack in the
vulnerable zone is defined via „ Crack Severity” field. Here, the adopted likelihoods are: 5% reduction – chance 60%,
10% reduction – chance 20%, 15% reduction – 10% chance and 20% reduction – chance 10%.

QUALITY CONTROL OF BRIDGES - RELIABILITY ASSESSMENT
6
Fig. 7. The Bayesian net for the investigated bridge, the case with two cracks detected: 1st (15% severity, at VZ2), 2nd (15%
severity, at VZ3)
The evaluation of the probability of failure using the proposed net for several cases is presented in Table 4. For the a
priori state, i.e. state before an inspection, the three cases are evaluated: the virgin state and the two states when a damage
or two damages are present on the bridge, without information on location and severity. The location of a crack was
adopted to have a uniform distribution (based on the lengths of vulnerable zones), while severity was accounted as a
percentage of the plastic moment reduction. For an a posteriori state, a few inspection scenarios are analyzed, where one
or two cracks were found at vulnerable zones in an inspection.
Table 4. Case study results
State Case Dominant FM PF lower PF upper Reliability index
a priori
Virgin (non-damaged state) FM2 1.47E-08 1.82E-08 5.51 < β < 5.54
One crack, arbitrary location & severity FM2 1.84E-08 2.58E-08 5.45 < β < 5.51
Two cracks, arbitrary location & severity FM2 2.30E-08 3.85E-08 5.37 < β < 5.47
a posteriori
(data update)
One crack, 15% severity, VZ1 FM1 2.17E-08 3.64E-08 5.38 < β < 5.48
One crack, 15% severity, VZ2 FM1 4.39E-08 8.12E-08 5.24 < β < 5.35
One crack, 15% severity, VZ3 FM2 7.99E-08 8.34E-08 5.23 < β < 5.24
Two cracks, each 15% severity, VZ1 & VZ2 FM1 2.74E-07 3.12E-07 4.98 < β < 5.01
Two cracks, each 15% severity, VZ2 & VZ3 FM2 1.99E-07 2.43E-07 5.03 < β < 5.07
Two cracks, each 15% severity, VZ1 & VZ3 FM2 7.99E-08 1.02E-07 5.20 < β < 5.24
It is seen that one damage can have a significant impact on the probability of failure which can change even 8-fold, but
the related reliability index does not change significantly. Only when two damages are present in the vulnerable zones,
there is a considerable effect i.e. the reliability index reduces by 10% in respect to the virgin state. This is the consequence
of bridge being a hyper-static system. As a further research for the investigated bridge, it would be of interest to evaluate
failure modes for shear as well as serviceability failure modes, which could possibly give more severe reductions of
reliability index than those presented herein.
6. Conclusion
The paper gives example of the two approaches to assess the key performance indicator of Reliability according to the
COST TU1406 WG 3 framework for establishing of quality control plans for roadway bridges. The both approaches are
based on possible bridge failure modes and related vulnerable zones. The idea is to use the crucial data from inventory
and inspections in the evaluation of bridges for the two states, a priori i.e. a non-damaged state (virgin) and a posteriori
i.e. state of damage location/severity update following an inspection.

QUALITY SPECIFICATIONS FOR ROADWAY BRIDGES,
STANDARDIZATION AT A EUROPEAN LEVEL
Barcelona,
27th – 28th September, 2018
7
The qualitative approach comprises application of reliability curves, which elaboration and properties are
discussed. For structures of similar type and failure modes, the resistance of a section governing the failure mode, self-
weight and live load actions are modelled using adequate probabilistic distributions defined with characteristic values and
percentiles, using existing codes, experience and available literature. By reducing the resistance of the section, the
reliability curves are obtained. Upon estimation of the virgin reliability for an investigated bridge, an update of its
reliability index can be done based on the related curve and outcome of an inspection i.e. the observed resistance reduction
assessed by an inspector.
The approach with Bayesian nets was presented in the example of a multiple span bridge. The two bending
failure modes were accounted, which are mutually exclusive for live load action, but correlated for resistance and self-
weight. The upper and lower bound of probability of failure were estimated for several cases – for arbitrary locations of
damages with specific severity. The obtained results show the importance of accounting for the bridge failure modes in
hyper-static systems and provide crucial information on the impact of damages in vulnerable zones on a bridge reliability.
References
Caprani, C. (2013). Lifetime highway bridge traffic load effect from a combination of traffic states
allowing for dynamic amplification. ASCE Journal of Bridge Engineering, 18(9), 901-909.
CEN EN 1990. (2002). Basis of structural design. Brussels: European Committee for
Standardisation.
Faber, M. H. (2009). Risk and Safety in Engineering. Swiss Federal Institute of Technology Zurich.
Freundt, U., & Bönning, S. (2011). Traffic load models for recalculation of existing
(Verkehrslastmodelle für die Nachrechnung von Straßenbrücken im Bestand). Bonn: Federal
Highway Institute.
Hajdin, R., Kušar, M., Mašović, S., Lineberg, P., Amado, J., & Tanasic, N. (2018). Establishment of
a Quality Control Plan, COST Action TU1406 (WG3 Technical report). COST TU1406.
Isailovic, D., Hajdin, R., & Matos, J. (2018). Bridge quality control using Bayesian net. IABSE.
JCSS. (2013). Probabilistic Model Code. Lyngby: Joint Committee for Structural Safety.
Melchers, R. E. (1999). Structural Reliability Analysis and Prediction. West Sussex: John Wiley &
Sons.
Stipanovic, I., Chatzi, E., Limongelli, M., Gavin, K., Allah Bukhsh, Z., Skaric Palic, S., . . .
Ademovic, N. (2017). Perofrmance Goals for roadway bridges of COST TU1406 (WG2
Tehnical Report). COST TU1406.
Strauss, A., & Mandić Ivanković, A. (2016). Performance Indicators for Roadway Bridges of COST
Action TU1406 (WG1 Technical report). COST TU1406. doi:ISBN: 978-3-900932-41-1

WG4 and WG5 WORKSHOP
Sustainable Bridge Management
27th – 28th September 2018
Barcelona, Spain
Quality control of roadway bridges
– Reliability assessment –
Nikola Tanasić, Dušan Isailović & Rade Hajdin - University of Belgrade, Serbia
Jose Matos – University of Minho, Portugal

• Introduction
• Work Group 3 Approach
• „Virgin“ Reliability – simplified assessment
• Assessment of KPI Reliability
– Qualitative approach / Reliability curves
– Quantitative approach / Bayesian nets
WG4 and WG5 WORKSHOP
27th – 28th September 2018
Barcelona, Spain
SLIDE 283
OUTLINE
QUALITY CONTROL OF ROADWAY BRIDGES – RELIABILITY ASSESSMENT | TANASIC ET AL.
• Quality control in bridge management today =
visual inspections & condition rating
• Increasing traffic volume & loadings, higher exposure to natural hazards
(effects of climate change)
– The performance of bridges in the future is questioned
– Optimal maintenance strategies are necessary
• COST TU1406 WG1, WG2, WG3 Reports
KPI-s: Reliability, Availability, Safety, Economy & Environment
– Bridge performance = KPI evaluation – tailored according to
needs of operators/owners
– Qualitative and quantitative approach possible
WG4 and WG5 WORKSHOP
27th – 28th September 2018
Barcelona, Spain
SLIDE 284
Introduction
QUALITY CONTROL OF ROADWAY BRIDGES – RELIABILITY ASSESSMENT | TANASIC ET AL.
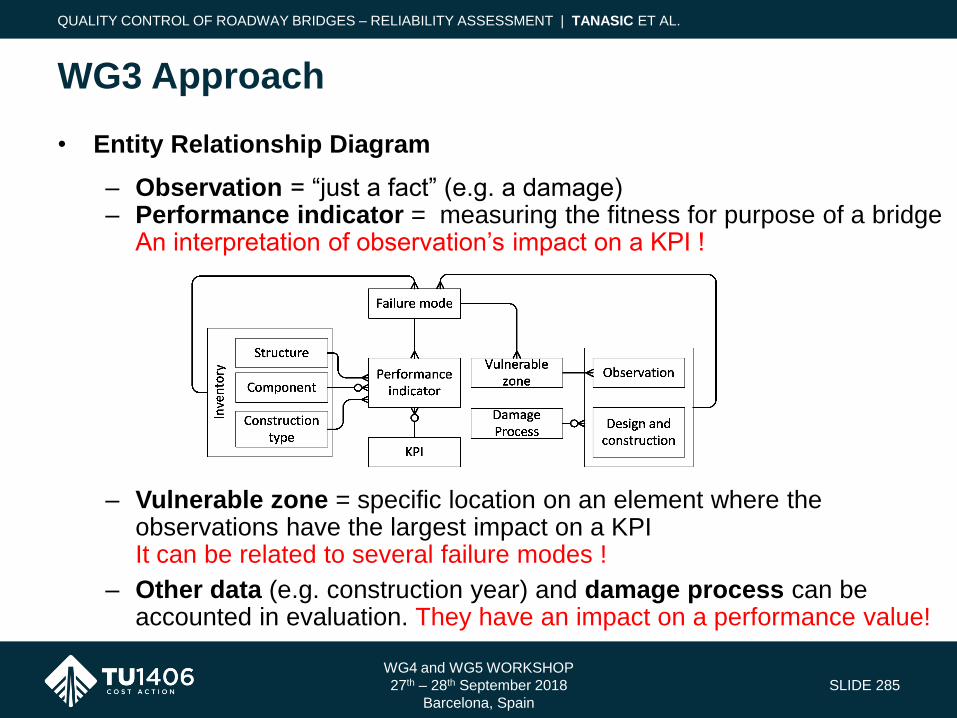
• Entity Relationship Diagram
– Observation = “just a fact” (e.g. a damage)– Performance indicator = measuring the fitness for purpose of a bridge
An interpretation of observation’s impact on a KPI !
– Vulnerable zone = specific location on an element where the observations have the largest impact on a KPIIt can be related to several failure modes !
– Other data (e.g. construction year) and damage process can be accounted in evaluation. They have an impact on a performance value!
WG4 and WG5 WORKSHOP
27th – 28th September 2018
Barcelona, Spain
SLIDE 285
WG3 Approach
QUALITY CONTROL OF ROADWAY BRIDGES – RELIABILITY ASSESSMENT | TANASIC ET AL.
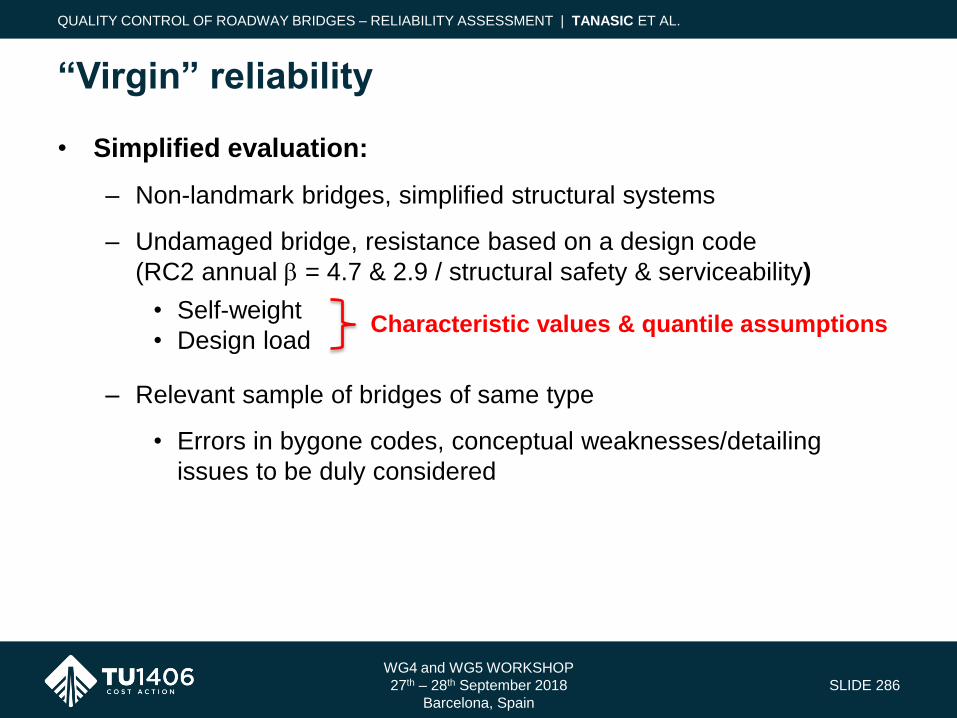
WG4 and WG5 WORKSHOP
27th – 28th September 2018
Barcelona, Spain
SLIDE 286
“Virgin” reliability
QUALITY CONTROL OF ROADWAY BRIDGES – RELIABILITY ASSESSMENT | TANASIC ET AL.
• Simplified evaluation:
– Non-landmark bridges, simplified structural systems
– Undamaged bridge, resistance based on a design code
(RC2 annual b = 4.7 & 2.9 / structural safety & serviceability)
• Self-weight
• Design load
– Relevant sample of bridges of same type
• Errors in bygone codes, conceptual weaknesses/detailing
issues to be duly considered
Characteristic values & quantile assumptions

WG4 and WG5 WORKSHOP
27th – 28th September 2018
Barcelona, Spain
SLIDE 287
KPI Reliability - Qualitative approach
QUALITY CONTROL OF ROADWAY BRIDGES – RELIABILITY ASSESSMENT | TANASIC ET AL.
• Reliability curves
– Similar bridges with similar dominant failure modes
– Influence of a resistance reduction on a reliability index
• Inspection, experience and various methods of evaluation
1.0E-08
1.0E-07
1.0E-06
1.0E-05
1.0E-04
1.0E-03
1.0E-02
1.0E-01
1.0E+000.0
1.0
2.0
3.0
4.0
5.0
6.0
0.50 0.55 0.60 0.65 0.70 0.75 0.80 0.85 0.90 0.95 1.00
Reli
ab
ilit
y in
dex
Pro
ba
bil
ity
of fa
ilu
re
Resistance reductionb2 pf2
10% of resistance reduction
b pf
Virgin reliability index estimated as 3.8
1
2
3
4
5
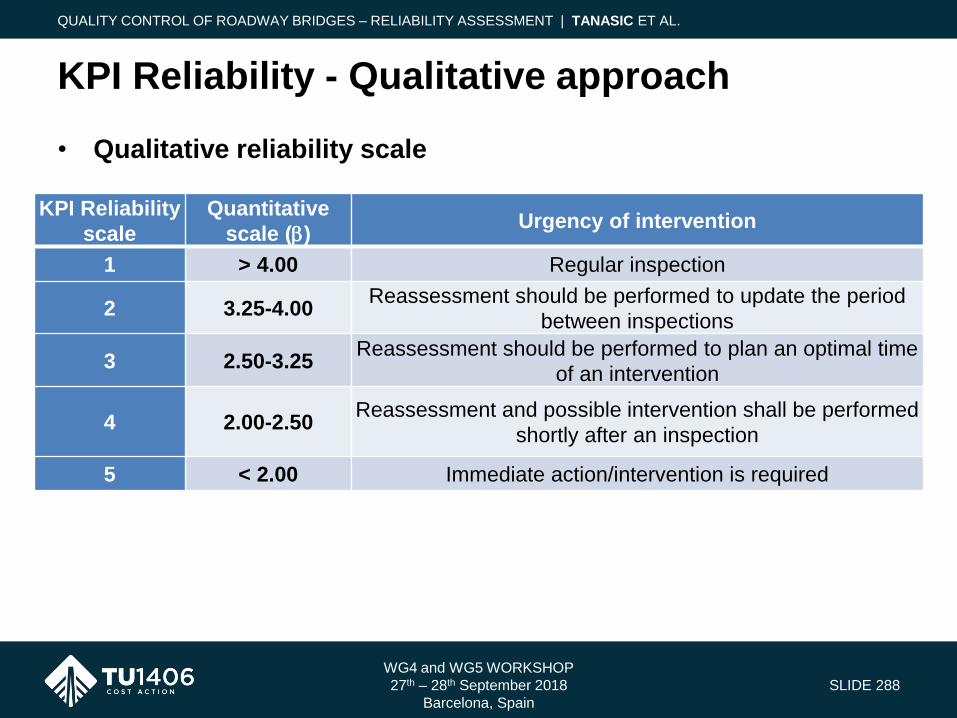
WG4 and WG5 WORKSHOP
27th – 28th September 2018
Barcelona, Spain
SLIDE 288
KPI Reliability - Qualitative approach
QUALITY CONTROL OF ROADWAY BRIDGES – RELIABILITY ASSESSMENT | TANASIC ET AL.
• Qualitative reliability scale
KPI Reliability
scale
Quantitative
scale (b)Urgency of intervention
1 > 4.00 Regular inspection
2 3.25-4.00Reassessment should be performed to update the period
between inspections
3 2.50-3.25Reassessment should be performed to plan an optimal time
of an intervention
4 2.00-2.50Reassessment and possible intervention shall be performed
shortly after an inspection
5 < 2.00 Immediate action/intervention is required

WG4 and WG5 WORKSHOP
27th – 28th September 2018
Barcelona, Spain
SLIDE 289
KPI Reliability - Qualitative approach
QUALITY CONTROL OF ROADWAY BRIDGES – RELIABILITY ASSESSMENT | TANASIC ET AL.
• Resistance (Re), Self-weight (SW) and Live load (LL):
– Re = log-normal distribution (e.g. cov = 0.15; quant=0.05)
– SW = normal or log-normal distributions (cov = 0.50; quant=0.10)
– LL = Gumbel distribution (e.g. cov = 0.30; quant=0.999)
– Ratio of live and dead load, here denoted as r = LL / SW
1.0E-09
1.0E-08
1.0E-07
1.0E-06
1.0E-05
1.0E-04
1.0E-03
1.0E-02
1.0E-01
1.0E+000.0
1.0
2.0
3.0
4.0
5.0
6.0
0.70 0.75 0.80 0.85 0.90 0.95 1.00
Reliabilit
y i
ndex
Pro
babilit
y of
failure
Resistance reduction Series5 Series9 Series4
1
2
4
0.25r
covRe 0.10covRe 0.15
covRe 0.05
covRe 0.15
covRe 0.05
covRe 0.10
1
2
3
4
5
fPb
0.0
1.0
2.0
3.0
4.0
5.0
6.0
0.00 0.20 0.40 0.60 0.80 1.00
Rel
iabi
lity
inde
x
r
1
2
4
covRe 0.10covRe 0.15
covRe 0.05
b
1
2
3
4
5 for resistance reduction = 0.8
[% ]
[% ]
Liveload of total loadr
Dead load of total load
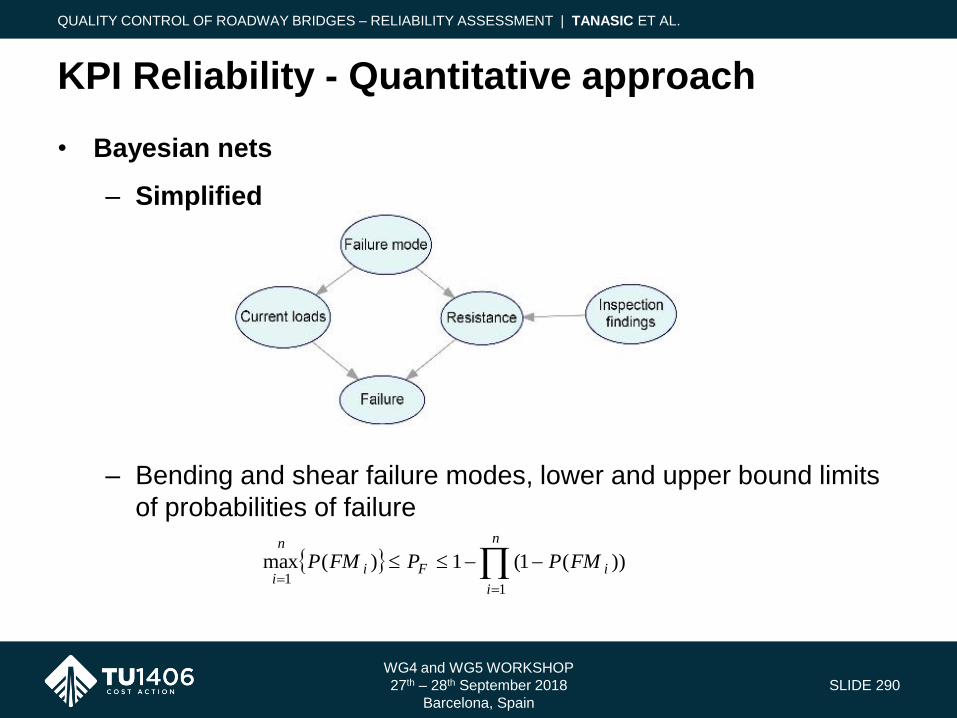
WG4 and WG5 WORKSHOP
27th – 28th September 2018
Barcelona, Spain
SLIDE 290
KPI Reliability - Quantitative approach
QUALITY CONTROL OF ROADWAY BRIDGES – RELIABILITY ASSESSMENT | TANASIC ET AL.
• Bayesian nets
– Simplified
– Bending and shear failure modes, lower and upper bound limits
of probabilities of failure
n
i
iFi
n
iFMPPFMP
11
))(1(1)(max

WG4 and WG5 WORKSHOP
27th – 28th September 2018
Barcelona, Spain
SLIDE 291
KPI Reliability - Quantitative approach
QUALITY CONTROL OF ROADWAY BRIDGES – RELIABILITY ASSESSMENT | TANASIC ET AL.
• Case study / Overpass in Portugal
– RC, three-span bridge
Probability bound pF β
upper 9.81E-8 5.20
lower 8.74E-8 5.22
FM1
FM2

WG4 and WG5 WORKSHOP
27th – 28th September 2018
Barcelona, Spain
SLIDE 292
KPI Reliability - Quantitative approach
QUALITY CONTROL OF ROADWAY BRIDGES – RELIABILITY ASSESSMENT | TANASIC ET AL.
• Bayesian net – evaluation, a priori and a posterioriResistance reduction with Cracks = f (Location, Severity)
CRACK
Location
in Vulnerable
zone or not
CRACK
Severity
likelihood for
various
resistance
reduction
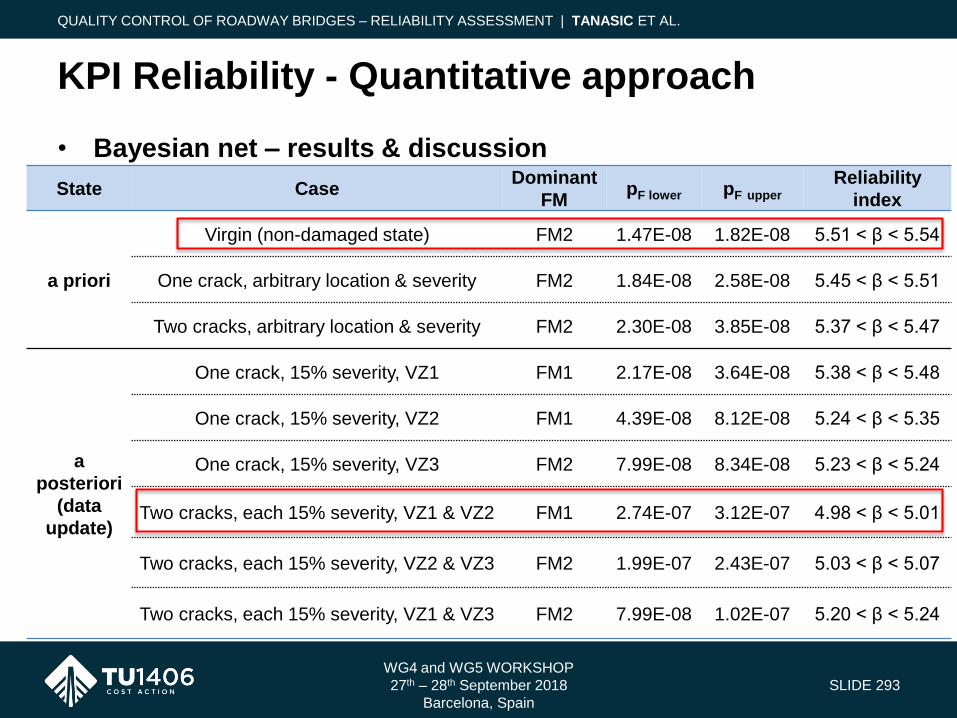
WG4 and WG5 WORKSHOP
27th – 28th September 2018
Barcelona, Spain
SLIDE 293
KPI Reliability - Quantitative approach
QUALITY CONTROL OF ROADWAY BRIDGES – RELIABILITY ASSESSMENT | TANASIC ET AL.
• Bayesian net – results & discussion
State CaseDominant
FMpF lower pF upper
Reliability
index
a priori
Virgin (non-damaged state) FM2 1.47E-08 1.82E-08 5.51 < β < 5.54
One crack, arbitrary location & severity FM2 1.84E-08 2.58E-08 5.45 < β < 5.51
Two cracks, arbitrary location & severity FM2 2.30E-08 3.85E-08 5.37 < β < 5.47
a
posteriori
(data
update)
One crack, 15% severity, VZ1 FM1 2.17E-08 3.64E-08 5.38 < β < 5.48
One crack, 15% severity, VZ2 FM1 4.39E-08 8.12E-08 5.24 < β < 5.35
One crack, 15% severity, VZ3 FM2 7.99E-08 8.34E-08 5.23 < β < 5.24
Two cracks, each 15% severity, VZ1 & VZ2 FM1 2.74E-07 3.12E-07 4.98 < β < 5.01
Two cracks, each 15% severity, VZ2 & VZ3 FM2 1.99E-07 2.43E-07 5.03 < β < 5.07
Two cracks, each 15% severity, VZ1 & VZ3 FM2 7.99E-08 1.02E-07 5.20 < β < 5.24

• Two approaches suggested to assess Reliability in COST TU1406
– Failure modes and vulnerable zones are accounted for
– A priori (“virgin”) and a posteriori (“damage update”) states
WG4 and WG5 WORKSHOP
27th – 28th September 2018
Barcelona, Spain
SLIDE 294
Conclusion
QUALITY CONTROL OF ROADWAY BRIDGES – RELIABILITY ASSESSMENT | TANASIC ET AL.
Approach Pros Cons
Qualitative
Reliability
curves
• Convenient & clear for similar
bridges and dominant failure modes
• Several curves per bridge type
for different failure modes
Quantitative
Bayesian nets
• Simultaneous effect of several
damages on resistance
• Analysis of various failure modes
• Different bridge types
• Somewhat complex
• Knowledge on observations’
impacts on the resistance

THANK YOU FOR YOUR ATTENTION!
WWW.TU1406.EU

WG4 and WG5 WORKSHOP
Sustainable Bridge Management
27th – 28th September 2018
Barcelona, Spain
East bridge over the Channel of the
Prague Port in Warsaw - PolandPaulina Bielecka - Warsaw University of Technology, Poland
Kacper Wasilewski - Warsaw University of Technology, Poland
Patryk Mazur - Warsaw University of Technology, Poland
Wojciech Karwowski - Warsaw University of Technology, Poland
QUALITY SPECIFICATIONS FOR ROADWAY
BRIDGES, STANDARDIZATION AT A EUROPEAN
LEVEL
Barcelona,
27th – 28th
September, 2018
1
CASE STUDY OF THE EAST BRIDGE OVER THE CHANNEL OF THE PRAGUE
PORT IN WARSAW
Paulina Bielecka1, Kacper Wasilewski2, Patryk Mazur3, Wojciech Karwowski4
Faculty of Civil Engineering, Warsaw University of Technology, 16 Lech Kaczyński St. 00-637, Warsaw, Poland,
E-mails: [email protected]; 2 [email protected]; 3 [email protected]; [email protected]
Abstract
The paper presents a structural diagnostic case study of the East Bridge over the Channel of the Prague Port in Warsaw in
the framework established by working groups of TU1406 COST Action. The report is based on the exploitation documents
of the bridge, such as: former technical reviews, technical book and technical card of the object, which are documents
required for each bridge object in Poland) and an authors’ evaluation of technical condition of the bridge. The analysis is
followed by analysis and comparison of two maintaining strategies – reference and preventive. The paper presents
implementation of procedure of quality control planning established by WG 3 of TU1406 COST.
Keywords
combined steel-concrete road bridge, technical report of the bridge, technical condition of the bridge, failure modes
of the bridge, maintenance of the bridge, costs of maintenance of the bridge
1. Introduction
The aim of this paper is a structural diagnostic case study of the East Bridge over the Channel of the Prague Port in
Warsaw. Based on the previous reviews [Zobel 2008, Protocol of Periodic Inspection of the East Bridge over the
Channel of the Prague Port in Warsaw], bridge’s documentation [Technical Card of the East Bridge over the
Channel of the Prague Port in Warsaw, Technical Book of the East Bridge over the Channel of the Prague Port in
Warsaw] and an evaluation of technical condition of the bridge, made by authors, the pathologies and damages of
the bridge were listed. The Polish law requires the annual general reviews of the bridge structures and detailed
review performed every 5 years [Directive 1994.89.414. Construction Law of 7 July 1994, Directive 2000.63.735.
of the Minister of Transport and Maritime Economy of 30 May 2000 on Technical Conditions of Road
Engineering Facilities and Their Location]. The instruction for preparing reports from the reviews are given by the
General Directorate for National Roads and Motorways (GDDKiA) [Janas et al. 2011] and discussed in several
works [Madaj, Wołowicki 2013, Mistewicz 1992, Jarominiak 1991, Jarominiak et al. 2011].
For each of structural elements the estimates failure time was determined as well as costs of its repair or
replacement. As the conclusion authors perform comparison of two approaches – referenced and preventive. In the
referenced approach the structural elements are replaced only after failure, and the preventive approach is based on
regular repairs of worn elements. Analysed performance factors were: cost, safety, availability and reliability. The
framework of the quality control is stated in working groups reports of TU1406 COST Action [Hajdin et al. 2018,
Stipanovic et al. 2017, Strauss et al. 2016].
2. General data of the bridge
2.1. Basic information
The investigated bridge is a 104,60 meters three-spans combined steel-concrete bridge structure built in 2001. The
bridge carries road no. 801 (Wybrzeże Szczecińskie Street) across the Channel of the Prague Port in Warsaw.
2.2. Description of the bridge structure
The bridge is based on the bored pile foundations of 1200 mm diameter. The substructure of the bridge is formed
by two abutments and two wall piers made from reinforced concrete. The angle between deck axis and support axis
is 60 degrees. The superstructure is 104,60 meters long composed of 3 spans: 30,55 + 42,00 + 30,55, designed as
combined steel-concrete structure. Main load bearing members are 4 plate girders placed in 2,52 m spacing. Two
girders on the east side of the bridge are placed 126 mm higher than the western pair. Webs of the girders are 1200
mm high in the span section and it rise to 2400 mm in the sections above supports. The steel girders are connected
with reinforced concrete slab, which is 22 cm high (increased above girders’ top flanges). The slab’s cantilevers
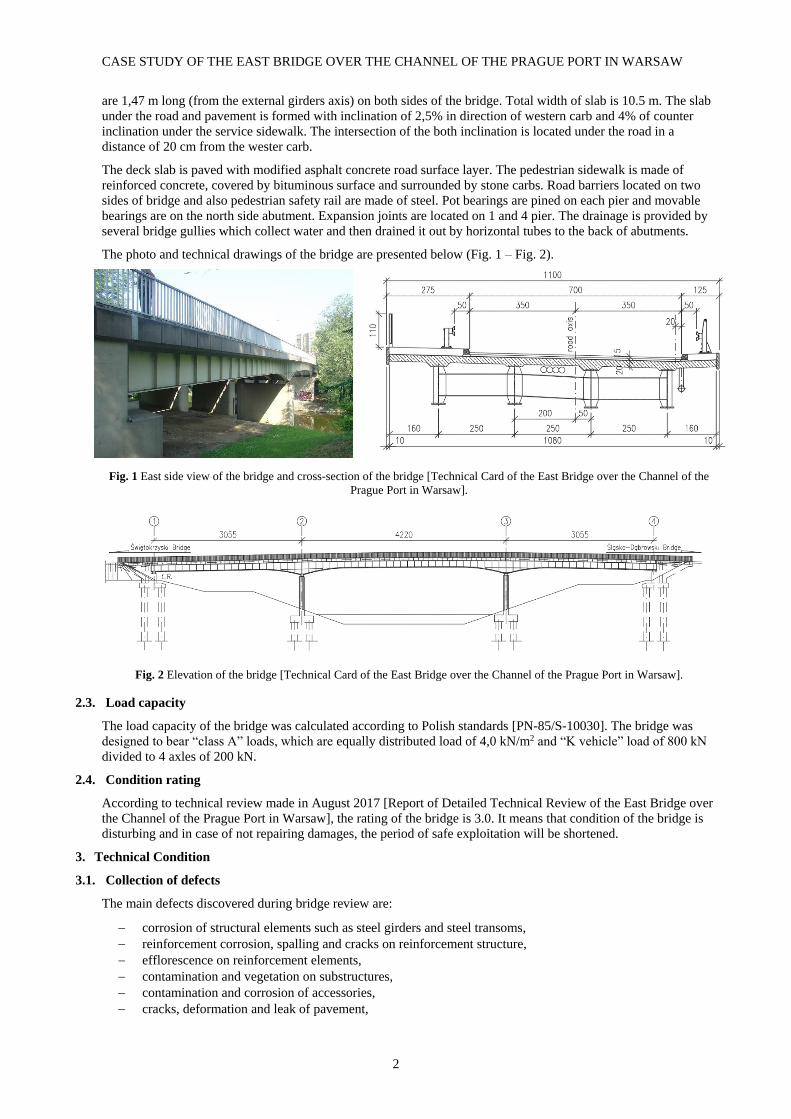
CASE STUDY OF THE EAST BRIDGE OVER THE CHANNEL OF THE PRAGUE PORT IN WARSAW
2
are 1,47 m long (from the external girders axis) on both sides of the bridge. Total width of slab is 10.5 m. The slab
under the road and pavement is formed with inclination of 2,5% in direction of western carb and 4% of counter
inclination under the service sidewalk. The intersection of the both inclination is located under the road in a
distance of 20 cm from the wester carb.
The deck slab is paved with modified asphalt concrete road surface layer. The pedestrian sidewalk is made of
reinforced concrete, covered by bituminous surface and surrounded by stone carbs. Road barriers located on two
sides of bridge and also pedestrian safety rail are made of steel. Pot bearings are pined on each pier and movable
bearings are on the north side abutment. Expansion joints are located on 1 and 4 pier. The drainage is provided by
several bridge gullies which collect water and then drained it out by horizontal tubes to the back of abutments.
The photo and technical drawings of the bridge are presented below (Fig. 1 – Fig. 2).
Fig. 1 East side view of the bridge and cross-section of the bridge [Technical Card of the East Bridge over the Channel of the
Prague Port in Warsaw].
Fig. 2 Elevation of the bridge [Technical Card of the East Bridge over the Channel of the Prague Port in Warsaw].
2.3. Load capacity
The load capacity of the bridge was calculated according to Polish standards [PN-85/S-10030]. The bridge was
designed to bear “class A” loads, which are equally distributed load of 4,0 kN/m2 and “K vehicle” load of 800 kN
divided to 4 axles of 200 kN.
2.4. Condition rating
According to technical review made in August 2017 [Report of Detailed Technical Review of the East Bridge over
the Channel of the Prague Port in Warsaw], the rating of the bridge is 3.0. It means that condition of the bridge is
disturbing and in case of not repairing damages, the period of safe exploitation will be shortened.
3. Technical Condition
3.1. Collection of defects
The main defects discovered during bridge review are:
− corrosion of structural elements such as steel girders and steel transoms,
− reinforcement corrosion, spalling and cracks on reinforcement structure,
− efflorescence on reinforcement elements,
− contamination and vegetation on substructures,
− contamination and corrosion of accessories,
− cracks, deformation and leak of pavement,
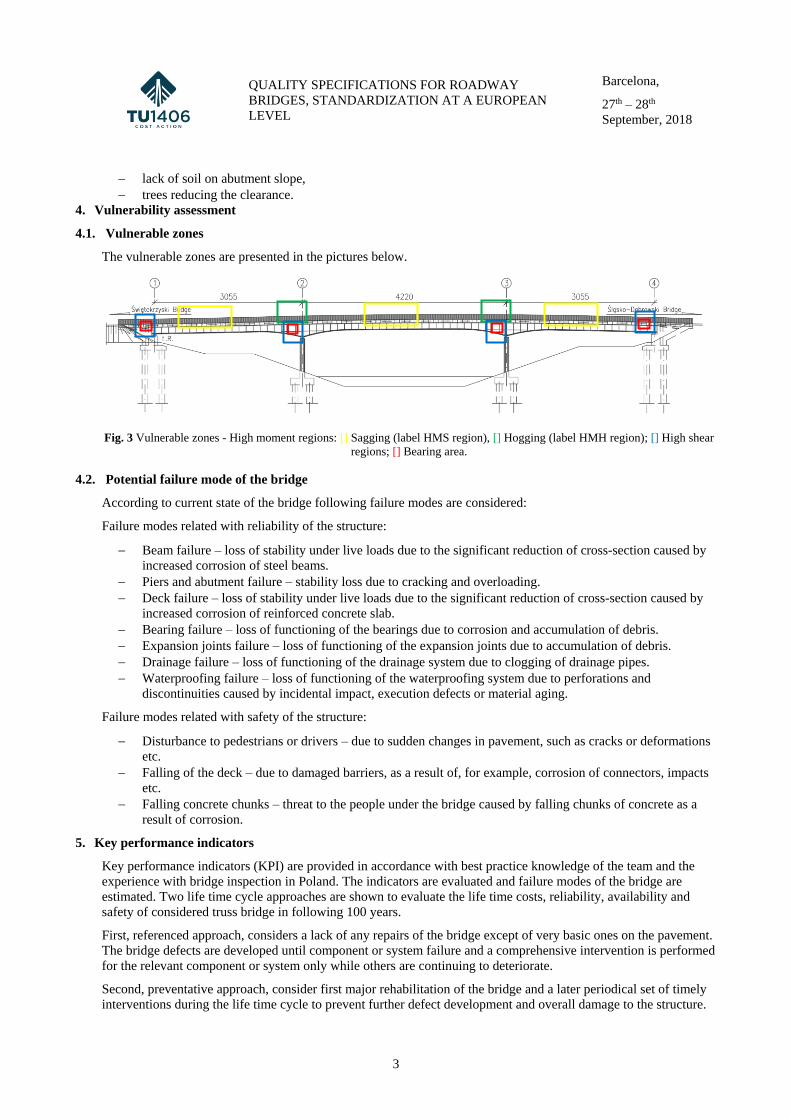
QUALITY SPECIFICATIONS FOR ROADWAY
BRIDGES, STANDARDIZATION AT A EUROPEAN
LEVEL
Barcelona,
27th – 28th
September, 2018
3
− lack of soil on abutment slope,
− trees reducing the clearance.
4. Vulnerability assessment
4.1. Vulnerable zones
The vulnerable zones are presented in the pictures below.
Fig. 3 Vulnerable zones - High moment regions: [] Sagging (label HMS region), [] Hogging (label HMH region); [] High shear
regions; [] Bearing area.
4.2. Potential failure mode of the bridge
According to current state of the bridge following failure modes are considered:
Failure modes related with reliability of the structure:
− Beam failure – loss of stability under live loads due to the significant reduction of cross-section caused by
increased corrosion of steel beams.
− Piers and abutment failure – stability loss due to cracking and overloading.
− Deck failure – loss of stability under live loads due to the significant reduction of cross-section caused by
increased corrosion of reinforced concrete slab.
− Bearing failure – loss of functioning of the bearings due to corrosion and accumulation of debris.
− Expansion joints failure – loss of functioning of the expansion joints due to accumulation of debris.
− Drainage failure – loss of functioning of the drainage system due to clogging of drainage pipes.
− Waterproofing failure – loss of functioning of the waterproofing system due to perforations and
discontinuities caused by incidental impact, execution defects or material aging.
Failure modes related with safety of the structure:
− Disturbance to pedestrians or drivers – due to sudden changes in pavement, such as cracks or deformations
etc.
− Falling of the deck – due to damaged barriers, as a result of, for example, corrosion of connectors, impacts
etc.
− Falling concrete chunks – threat to the people under the bridge caused by falling chunks of concrete as a
result of corrosion.
5. Key performance indicators
Key performance indicators (KPI) are provided in accordance with best practice knowledge of the team and the
experience with bridge inspection in Poland. The indicators are evaluated and failure modes of the bridge are
estimated. Two life time cycle approaches are shown to evaluate the life time costs, reliability, availability and
safety of considered truss bridge in following 100 years.
First, referenced approach, considers a lack of any repairs of the bridge except of very basic ones on the pavement.
The bridge defects are developed until component or system failure and a comprehensive intervention is performed
for the relevant component or system only while others are continuing to deteriorate.
Second, preventative approach, consider first major rehabilitation of the bridge and a later periodical set of timely
interventions during the life time cycle to prevent further defect development and overall damage to the structure.
A
r
e
a
p
o
s
s
i
b
l
y
e
x
p
o
s
e
d
t
o
S
c
o
u
r
A
r
e
a
p
o
s
s
i
b
l
y
e
x
p
o
s
e
d
t
o
S
c
o
u
r

CASE STUDY OF THE EAST BRIDGE OVER THE CHANNEL OF THE PRAGUE PORT IN WARSAW
4
5.1. Current state evaluation
According to current condition of the described bridge structure following KPIs are considered:
Table 1. Current state evaluation
5.2. Referenced approach
In the referenced approach to the maintenance of the bridge it is assumed that there is lack of any repairs of the
bridge structure and accessories except removing the trees disturbance to pedestrians clearance. This approach
leads to the defects escalation which ends with the bridge failure. The time history of KPI for referenced approach
are given in Fig. 4. The existing structure defects development and estimated failure times are assumed below.
In 10 years:
− expansion joints failure – due to corrosion and contamination,
− safety barriers failure – due to corrosion of connectors or accidental impact.
In 15 years:
Str
uct
ure
typ
e
Gro
up
Component Material Design &
Construction Failure mode
Location/
Position
Damage
/Observation
Damage
process KPI
Performance
Indicator
component
level
Perform-
ance
value Estimated
failure
time
[years] R S
SC3
Str
uct
ura
l el
emen
ts
Steel beams Steel 2001
Beam bending
failure mode
Bottom flanges
(HMS region)
Corroded flanges Corrosion
Reliability
3
3
4 3
40
Damage of
anticorrosion Impact 2 10
Top flanges
(HMH region)
Corroded flanges
(connection with
deck)
Corrosion 3 40
Beam shear
failure mode Beams’ webs Corroded webs Corrosion 2 40
Transoms Steel 2001 Beam shear
failure mode Bearing area Corroded webs Corrosion Reliability 2 2 40
Piers Reinforced
concrete 2001
Pier failure Pier 2 Horizontal crack Corrosion Reliability 3
3
80
Pier failure Pier 2 Reinforcement
corrosion Corrosion Reliability 2 80
Pier failure Pier 2 Efflorescence Water
penetrability (Symptom) (2) 80
Abutment Reinforced
concrete 2001
Abutment
failure
Abutment 1
(north) and
abutment 2
(south)
Reinforcement
corrosion Corrosion Reliability 2
2
80
Abutment 1
(north)
Contamination
and vegetation
Debris and
biological
growth
(Symptom) (2) 80
Expansion joints Steel 2001 Locking of
expansion joint
EJ 1 (north)
and EJ 2
(south)
Contamination of
expansion joint Debris Reliability 4 4 10
Pedestrian deck
slab
Reinforced
concrete 2001
Deck bending
failure Bottom
Reinforcement
corrosion Corrosion Reliability 3
3
30
Deck bending
failure Bottom Spalling Corrosion Reliability 3 30
Deck bending
failure Bottom Efflorescence
Water
penetrability (Symptom) (3) 30
Pedestrian deck
slab
Reinforced
concrete 2001 Falling chunks Bottom Spalling Corrosion Safety 3 3 30
Abutment slope Soil 2001 Disturbance to
pedestrians
Abutment 2
(south) Lack of soil Soil failure Safety 3 3 3 3 80
Equip
men
t
Bearings
Elastomer
and steel
cast
2001 Bearing failure Bearings Corrosion of
casts Corrosion Reliability 2 2
4 4
15
Safety barrier Steel 2001 Falling of the
deck Safety barrier
Corrosion
(connection with
deck)
Corrosion Safety 2 2 10
Road pavement Asphalt 2001 Disturbance to
driver
Expansion
joints
surroundings
Deformation of
pavements,
cracks
Locking of
expansion joints Safety 2 2 15
Pedestrian
pavement Bitumen 2001
Disturbance to
pedestrians
Expansion
joints and
safety barriers
surroundings
Cracks and
deformation
Corrosion and
locking of
expansion joints
Safety 2 2 15
Pedestrian
pavement
(approach)
Concrete
paving
blocks
2001 Disturbance to
pedestrians Approach Deformation Soil failure Safety 3 3 15
Cover of
expansion joints Steel 2001
Disturbance to
pedestrians
Expansion
joints Deformation Corrosion Safety 4 4 10
Drainage
installation PCV 2001
Failure of
drainage Connectors Corrosion Corrosion Reliability 2 2 15
Waterproofing Asphalt felt 2001 Failure of
waterproofing Deck bottom Leaks
Discontinuity,
perforations Reliability 4 4 15
Pedestrian
traffic clearance - 2001
Disturbance to
pedestrians
Pedestrian
sidewalk
Trees reducing
the clearance
Biological
growth Safety 4 4 0
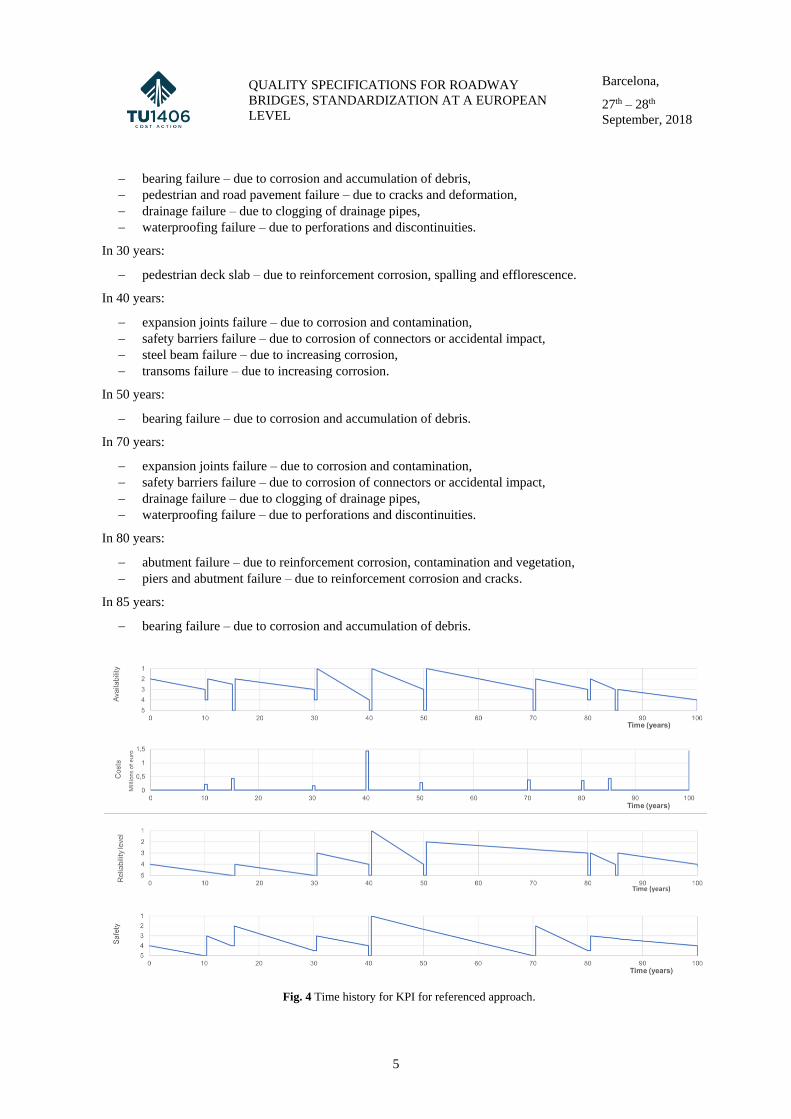
QUALITY SPECIFICATIONS FOR ROADWAY
BRIDGES, STANDARDIZATION AT A EUROPEAN
LEVEL
Barcelona,
27th – 28th
September, 2018
5
− bearing failure – due to corrosion and accumulation of debris,
− pedestrian and road pavement failure – due to cracks and deformation,
− drainage failure – due to clogging of drainage pipes,
− waterproofing failure – due to perforations and discontinuities.
In 30 years:
− pedestrian deck slab – due to reinforcement corrosion, spalling and efflorescence.
In 40 years:
− expansion joints failure – due to corrosion and contamination,
− safety barriers failure – due to corrosion of connectors or accidental impact,
− steel beam failure – due to increasing corrosion,
− transoms failure – due to increasing corrosion.
In 50 years:
− bearing failure – due to corrosion and accumulation of debris.
In 70 years:
− expansion joints failure – due to corrosion and contamination,
− safety barriers failure – due to corrosion of connectors or accidental impact,
− drainage failure – due to clogging of drainage pipes,
− waterproofing failure – due to perforations and discontinuities.
In 80 years:
− abutment failure – due to reinforcement corrosion, contamination and vegetation,
− piers and abutment failure – due to reinforcement corrosion and cracks.
In 85 years:
− bearing failure – due to corrosion and accumulation of debris.
Fig. 4 Time history for KPI for referenced approach.
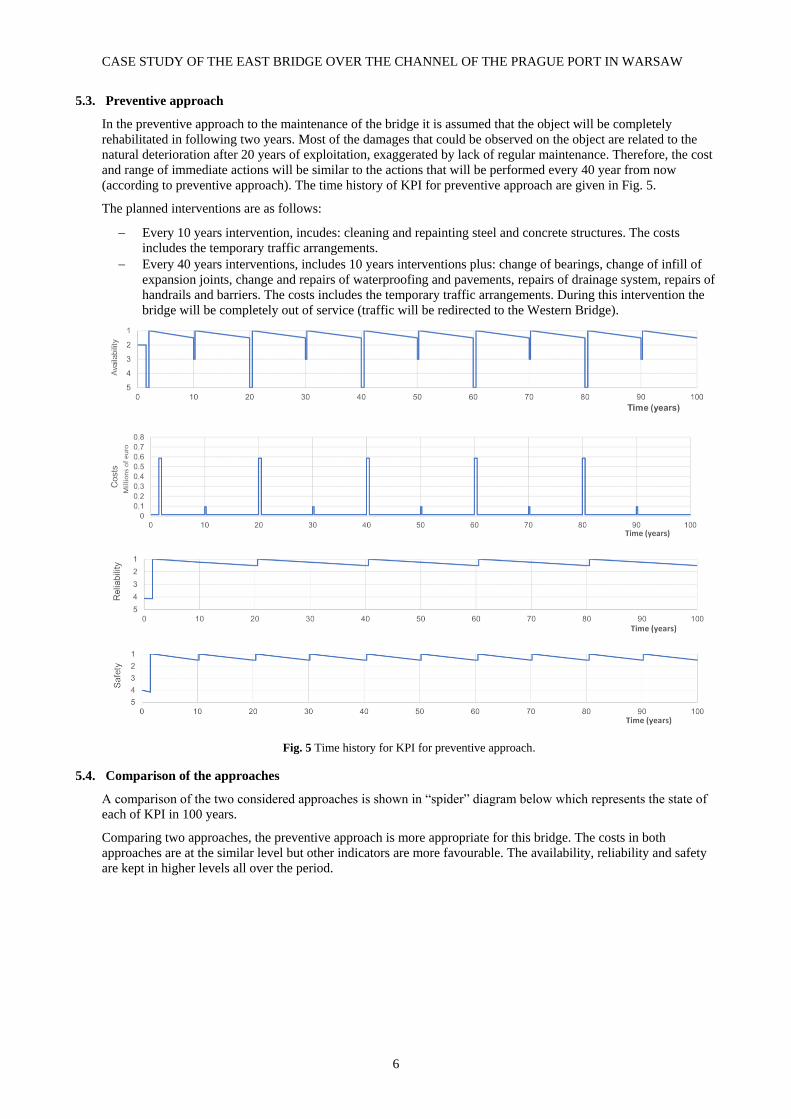
CASE STUDY OF THE EAST BRIDGE OVER THE CHANNEL OF THE PRAGUE PORT IN WARSAW
6
5.3. Preventive approach
In the preventive approach to the maintenance of the bridge it is assumed that the object will be completely
rehabilitated in following two years. Most of the damages that could be observed on the object are related to the
natural deterioration after 20 years of exploitation, exaggerated by lack of regular maintenance. Therefore, the cost
and range of immediate actions will be similar to the actions that will be performed every 40 year from now
(according to preventive approach). The time history of KPI for preventive approach are given in Fig. 5.
The planned interventions are as follows:
− Every 10 years intervention, incudes: cleaning and repainting steel and concrete structures. The costs
includes the temporary traffic arrangements.
− Every 40 years interventions, includes 10 years interventions plus: change of bearings, change of infill of
expansion joints, change and repairs of waterproofing and pavements, repairs of drainage system, repairs of
handrails and barriers. The costs includes the temporary traffic arrangements. During this intervention the
bridge will be completely out of service (traffic will be redirected to the Western Bridge).
Fig. 5 Time history for KPI for preventive approach.
5.4. Comparison of the approaches
A comparison of the two considered approaches is shown in “spider” diagram below which represents the state of
each of KPI in 100 years.
Comparing two approaches, the preventive approach is more appropriate for this bridge. The costs in both
approaches are at the similar level but other indicators are more favourable. The availability, reliability and safety
are kept in higher levels all over the period.
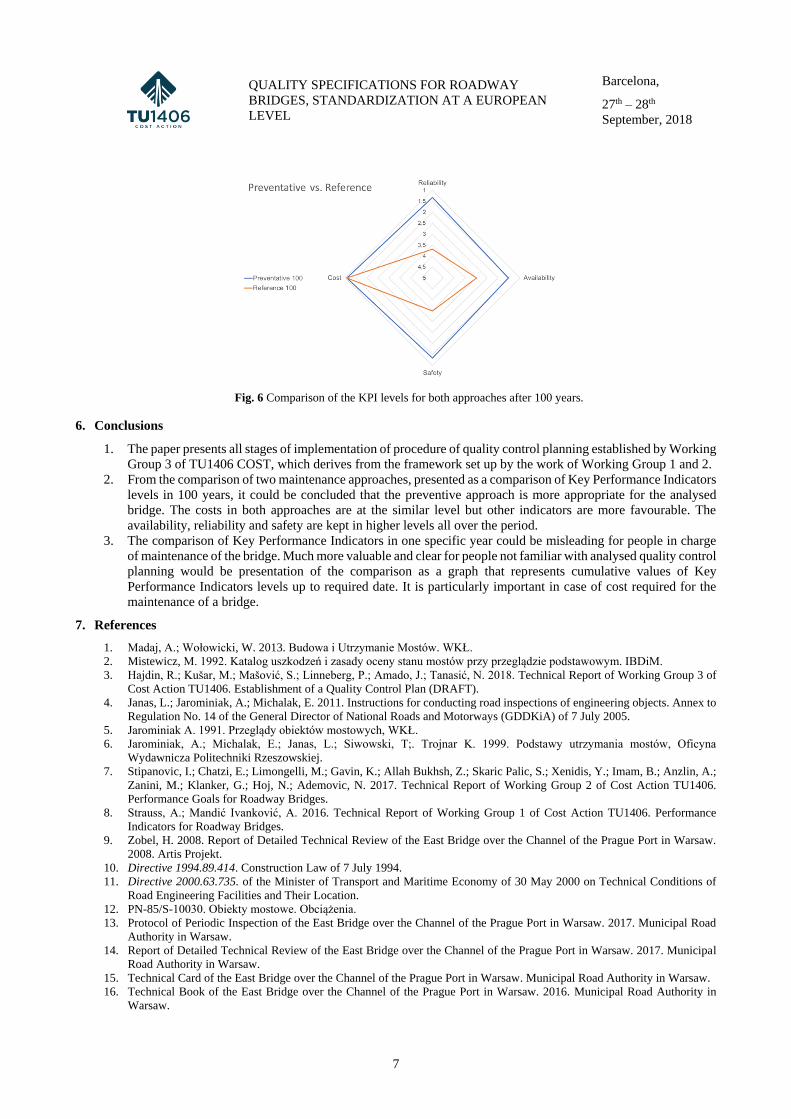
QUALITY SPECIFICATIONS FOR ROADWAY
BRIDGES, STANDARDIZATION AT A EUROPEAN
LEVEL
Barcelona,
27th – 28th
September, 2018
7
Fig. 6 Comparison of the KPI levels for both approaches after 100 years.
6. Conclusions
1. The paper presents all stages of implementation of procedure of quality control planning established by Working
Group 3 of TU1406 COST, which derives from the framework set up by the work of Working Group 1 and 2.
2. From the comparison of two maintenance approaches, presented as a comparison of Key Performance Indicators
levels in 100 years, it could be concluded that the preventive approach is more appropriate for the analysed
bridge. The costs in both approaches are at the similar level but other indicators are more favourable. The
availability, reliability and safety are kept in higher levels all over the period.
3. The comparison of Key Performance Indicators in one specific year could be misleading for people in charge
of maintenance of the bridge. Much more valuable and clear for people not familiar with analysed quality control
planning would be presentation of the comparison as a graph that represents cumulative values of Key
Performance Indicators levels up to required date. It is particularly important in case of cost required for the
maintenance of a bridge.
7. References
1. Madaj, A.; Wołowicki, W. 2013. Budowa i Utrzymanie Mostów. WKŁ.
2. Mistewicz, M. 1992. Katalog uszkodzeń i zasady oceny stanu mostów przy przeglądzie podstawowym. IBDiM.
3. Hajdin, R.; Kušar, M.; Mašović, S.; Linneberg, P.; Amado, J.; Tanasić, N. 2018. Technical Report of Working Group 3 of
Cost Action TU1406. Establishment of a Quality Control Plan (DRAFT).
4. Janas, L.; Jarominiak, A.; Michalak, E. 2011. Instructions for conducting road inspections of engineering objects. Annex to
Regulation No. 14 of the General Director of National Roads and Motorways (GDDKiA) of 7 July 2005.
5. Jarominiak A. 1991. Przeglądy obiektów mostowych, WKŁ.
6. Jarominiak, A.; Michalak, E.; Janas, L.; Siwowski, T;. Trojnar K. 1999. Podstawy utrzymania mostów, Oficyna
Wydawnicza Politechniki Rzeszowskiej.
7. Stipanovic, I.; Chatzi, E.; Limongelli, M.; Gavin, K.; Allah Bukhsh, Z.; Skaric Palic, S.; Xenidis, Y.; Imam, B.; Anzlin, A.;
Zanini, M.; Klanker, G.; Hoj, N.; Ademovic, N. 2017. Technical Report of Working Group 2 of Cost Action TU1406.
Performance Goals for Roadway Bridges.
8. Strauss, A.; Mandić Ivanković, A. 2016. Technical Report of Working Group 1 of Cost Action TU1406. Performance
Indicators for Roadway Bridges.
9. Zobel, H. 2008. Report of Detailed Technical Review of the East Bridge over the Channel of the Prague Port in Warsaw.
2008. Artis Projekt.
10. Directive 1994.89.414. Construction Law of 7 July 1994.
11. Directive 2000.63.735. of the Minister of Transport and Maritime Economy of 30 May 2000 on Technical Conditions of
Road Engineering Facilities and Their Location.
12. PN-85/S-10030. Obiekty mostowe. Obciążenia.
13. Protocol of Periodic Inspection of the East Bridge over the Channel of the Prague Port in Warsaw. 2017. Municipal Road
Authority in Warsaw.
14. Report of Detailed Technical Review of the East Bridge over the Channel of the Prague Port in Warsaw. 2017. Municipal
Road Authority in Warsaw.
15. Technical Card of the East Bridge over the Channel of the Prague Port in Warsaw. Municipal Road Authority in Warsaw.
16. Technical Book of the East Bridge over the Channel of the Prague Port in Warsaw. 2016. Municipal Road Authority in
Warsaw.

WG4 and WG5 WORKSHOP
Sustainable Bridge Management
27th – 28th September 2018
Barcelona, Spain
East bridge over the Channel of the
Prague Port in Warsaw - PolandPaulina Bielecka - Warsaw University of Technology, Poland
Kacper Wasilewski - Warsaw University of Technology, Poland
Patryk Mazur - Warsaw University of Technology, Poland
Wojciech Karwowski - Warsaw University of Technology, Poland

WG4 and WG5 WORKSHOP
27th – 28th September 2018
Barcelona, Spain
SLIDE 298
GENERAL DATA – METRIC OF THE BRIDGE
East bridge over the Channel of the Prague Port in Warsaw – Poland | Paulina Bielecka
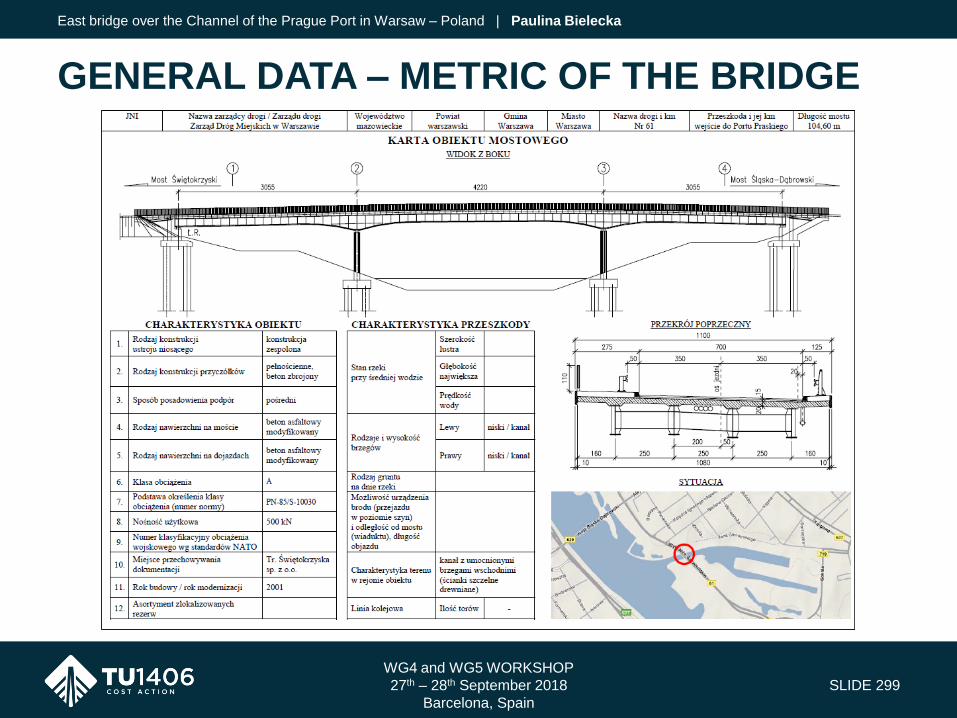
WG4 and WG5 WORKSHOP
27th – 28th September 2018
Barcelona, Spain
SLIDE 299
GENERAL DATA – METRIC OF THE BRIDGE
East bridge over the Channel of the Prague Port in Warsaw – Poland | Paulina Bielecka

• Road no. 801 (Wybrzeże Szczecińskie Street)
• Across the Channel of the Prague Port in Warsaw
• Built in 2001
WG4 and WG5 WORKSHOP
27th – 28th September 2018
Barcelona, Spain
SLIDE 300
GENERAL DATA - LOCALIZATION
East bridge over the Channel of the Prague Port in Warsaw – Poland | Paulina Bielecka

WG4 and WG5 WORKSHOP
27th – 28th September 2018
Barcelona, Spain
SLIDE 301
GENERAL DATA
East bridge over the Channel of the Prague Port in Warsaw – Poland | Paulina Bielecka
East side view of the bridge. View along the road over the bridge
from the south side.
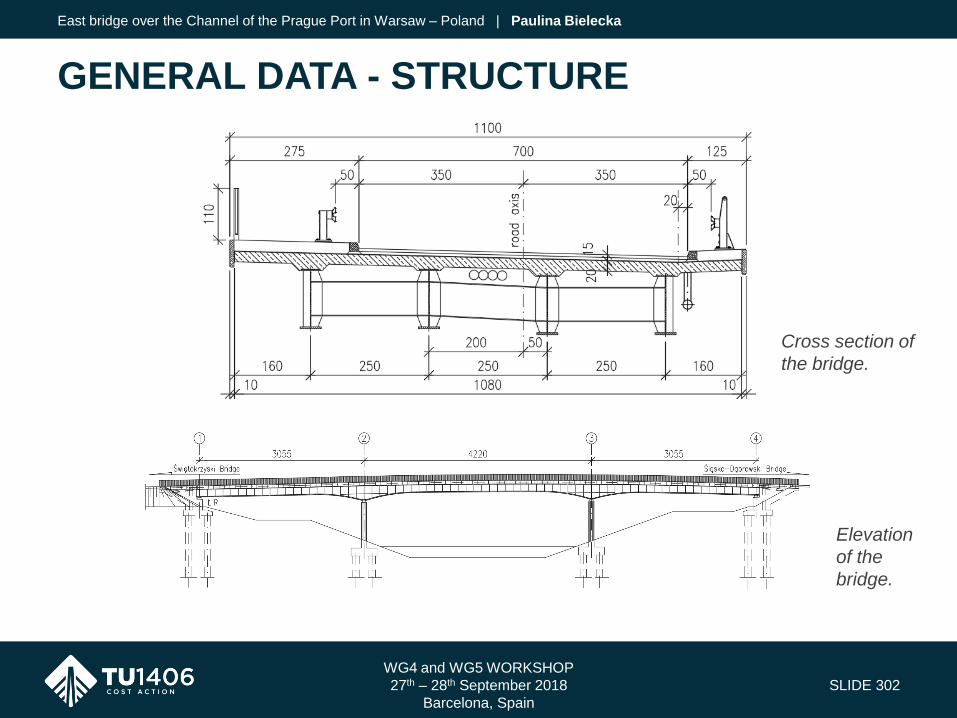
WG4 and WG5 WORKSHOP
27th – 28th September 2018
Barcelona, Spain
SLIDE 302
GENERAL DATA - STRUCTURE
East bridge over the Channel of the Prague Port in Warsaw – Poland | Paulina Bielecka
Cross section of
the bridge.
Elevation
of the
bridge.
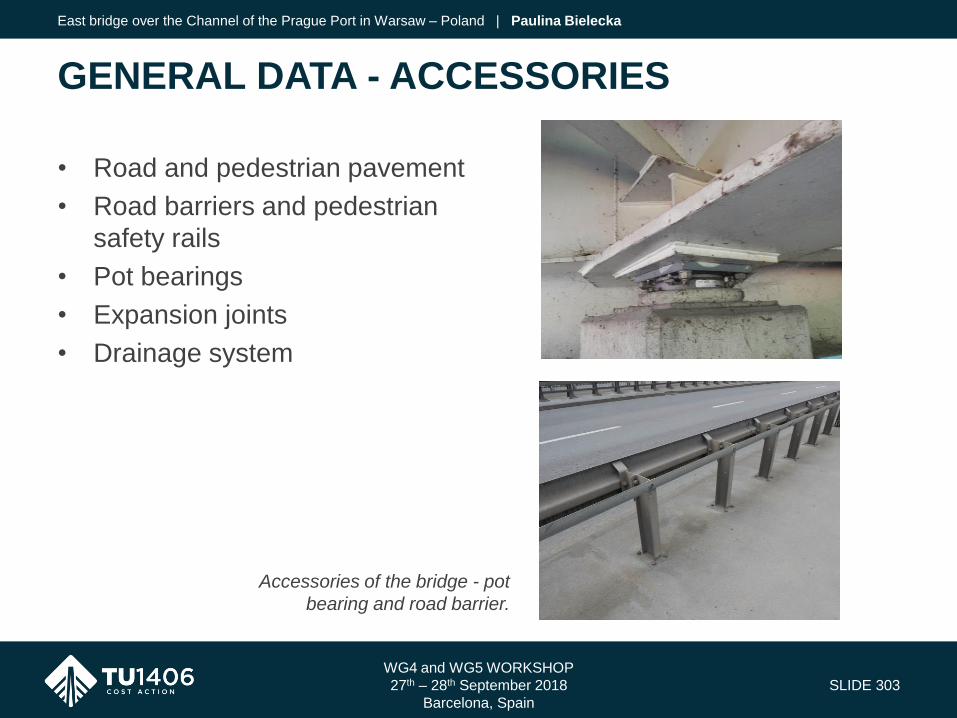
• Road and pedestrian pavement
• Road barriers and pedestrian
safety rails
• Pot bearings
• Expansion joints
• Drainage system
WG4 and WG5 WORKSHOP
27th – 28th September 2018
Barcelona, Spain
SLIDE 303
GENERAL DATA - ACCESSORIES
East bridge over the Channel of the Prague Port in Warsaw – Poland | Paulina Bielecka
Accessories of the bridge - pot
bearing and road barrier.
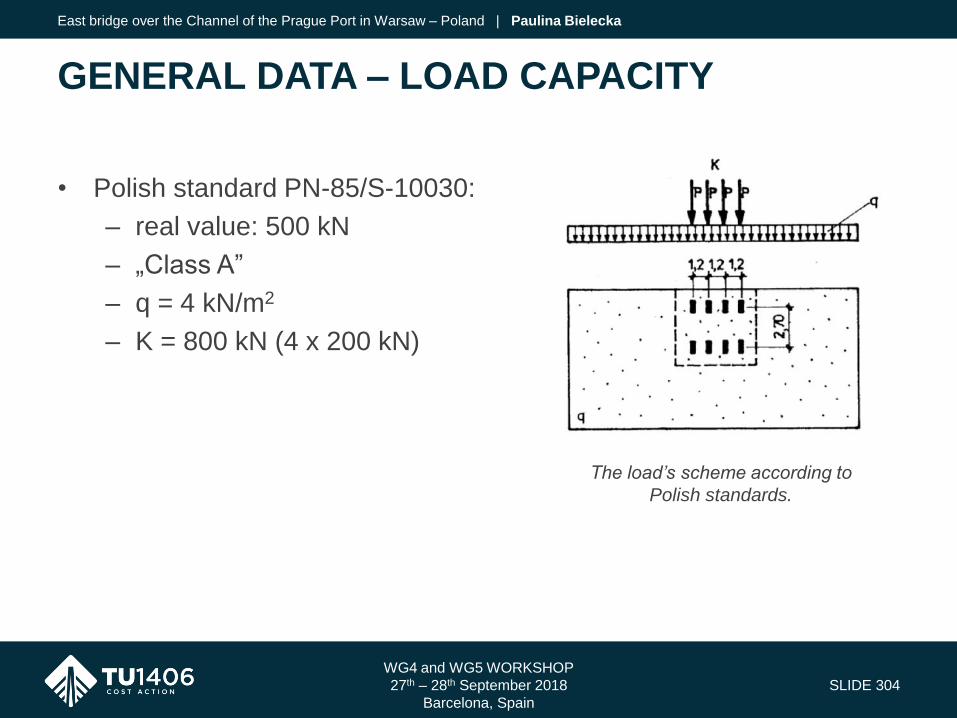
• Polish standard PN-85/S-10030:
– real value: 500 kN
– „Class A”
– q = 4 kN/m2
– K = 800 kN (4 x 200 kN)
WG4 and WG5 WORKSHOP
27th – 28th September 2018
Barcelona, Spain
SLIDE 304
GENERAL DATA – LOAD CAPACITY
East bridge over the Channel of the Prague Port in Warsaw – Poland | Paulina Bielecka
The load’s scheme according to
Polish standards.
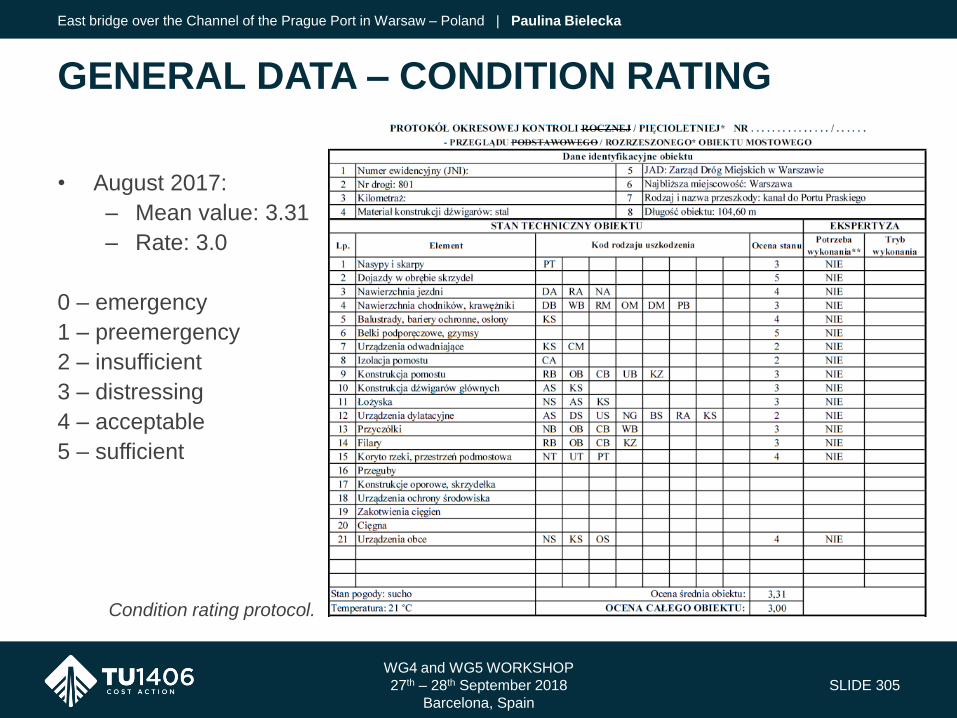
• August 2017:
– Mean value: 3.31
– Rate: 3.0
0 – emergency
1 – preemergency
2 – insufficient
3 – distressing
4 – acceptable
5 – sufficient
WG4 and WG5 WORKSHOP
27th – 28th September 2018
Barcelona, Spain
SLIDE 305
GENERAL DATA – CONDITION RATING
East bridge over the Channel of the Prague Port in Warsaw – Poland | Paulina Bielecka
Condition rating protocol.
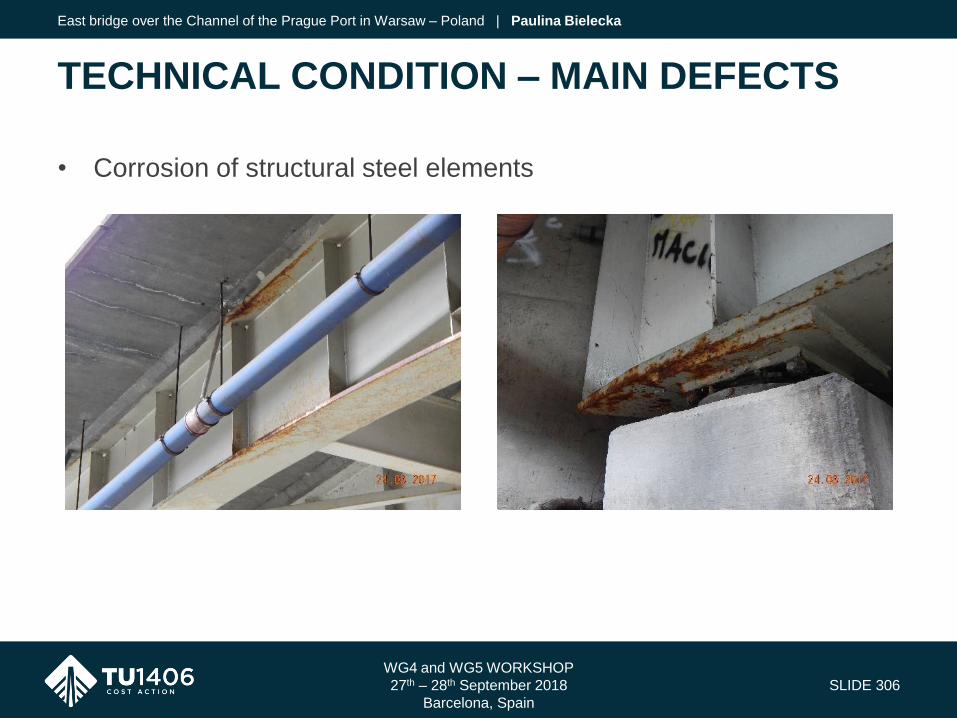
• Corrosion of structural steel elements
WG4 and WG5 WORKSHOP
27th – 28th September 2018
Barcelona, Spain
SLIDE 306
TECHNICAL CONDITION – MAIN DEFECTS
East bridge over the Channel of the Prague Port in Warsaw – Poland | Paulina Bielecka

• Corrosion of structural steel elements
WG4 and WG5 WORKSHOP
27th – 28th September 2018
Barcelona, Spain
SLIDE 307
TECHNICAL CONDITION – MAIN DEFECTS
East bridge over the Channel of the Prague Port in Warsaw – Poland | Paulina Bielecka
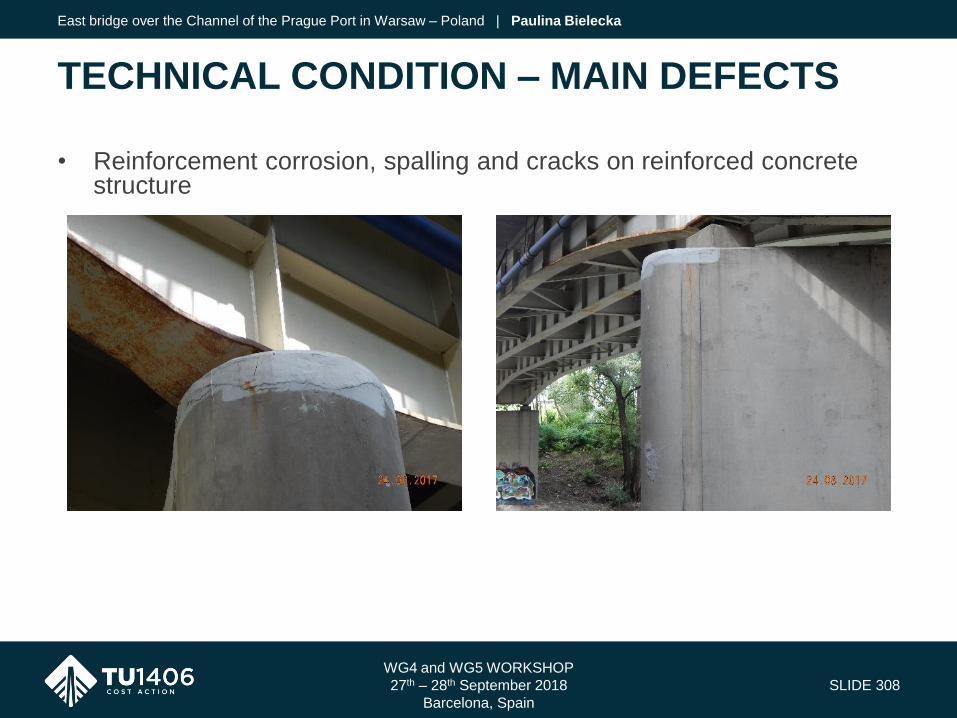
• Reinforcement corrosion, spalling and cracks on reinforced concretestructure
WG4 and WG5 WORKSHOP
27th – 28th September 2018
Barcelona, Spain
SLIDE 308
TECHNICAL CONDITION – MAIN DEFECTS
East bridge over the Channel of the Prague Port in Warsaw – Poland | Paulina Bielecka
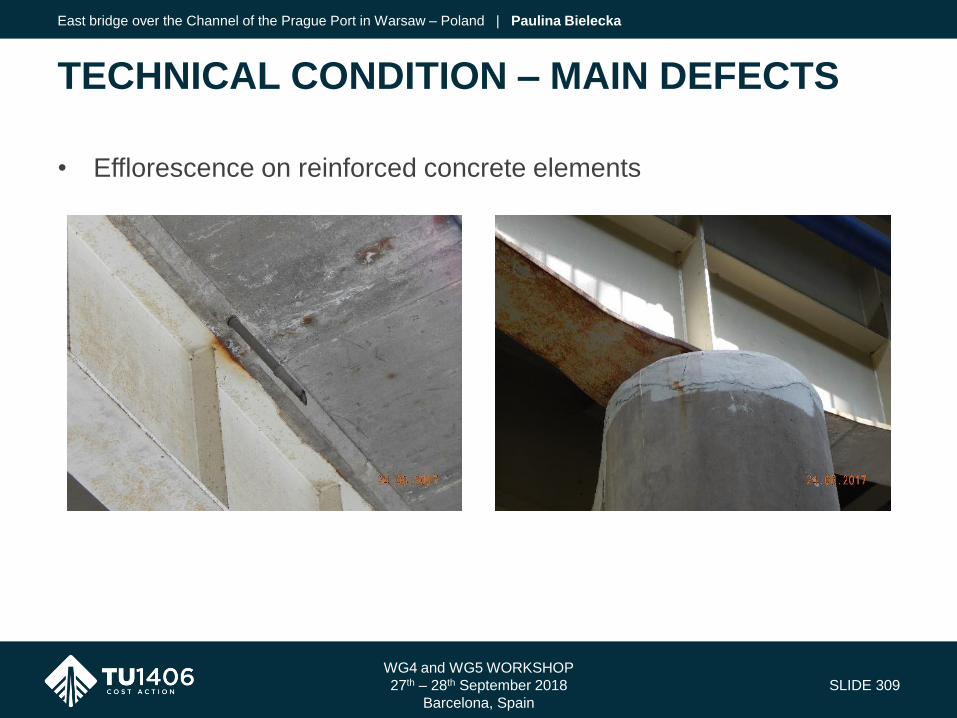
• Efflorescence on reinforced concrete elements
WG4 and WG5 WORKSHOP
27th – 28th September 2018
Barcelona, Spain
SLIDE 309
TECHNICAL CONDITION – MAIN DEFECTS
East bridge over the Channel of the Prague Port in Warsaw – Poland | Paulina Bielecka
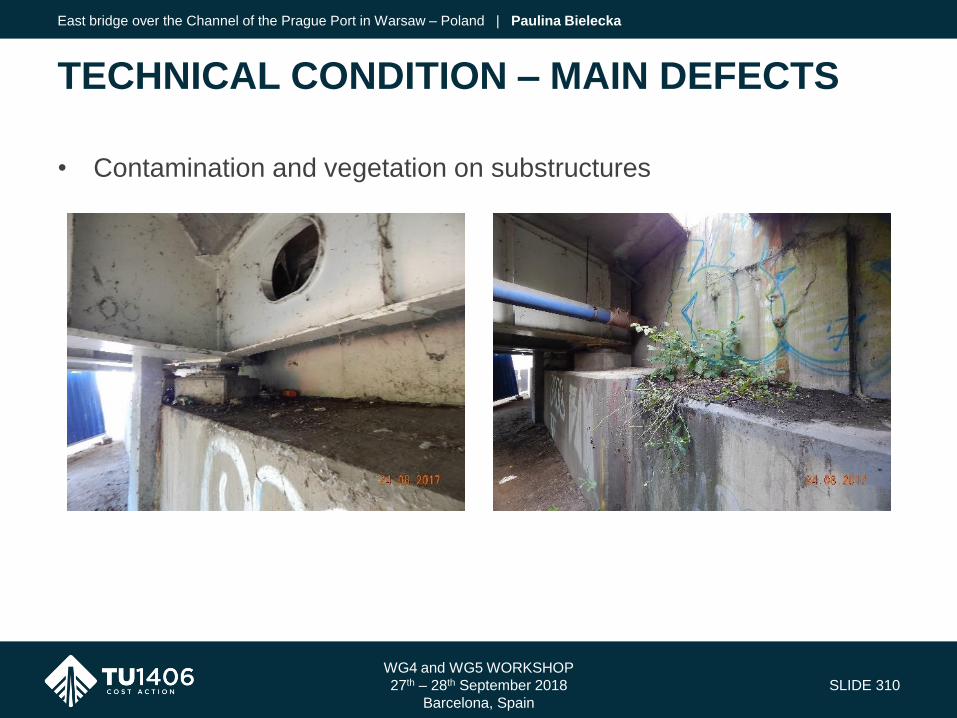
• Contamination and vegetation on substructures
WG4 and WG5 WORKSHOP
27th – 28th September 2018
Barcelona, Spain
SLIDE 310
TECHNICAL CONDITION – MAIN DEFECTS
East bridge over the Channel of the Prague Port in Warsaw – Poland | Paulina Bielecka
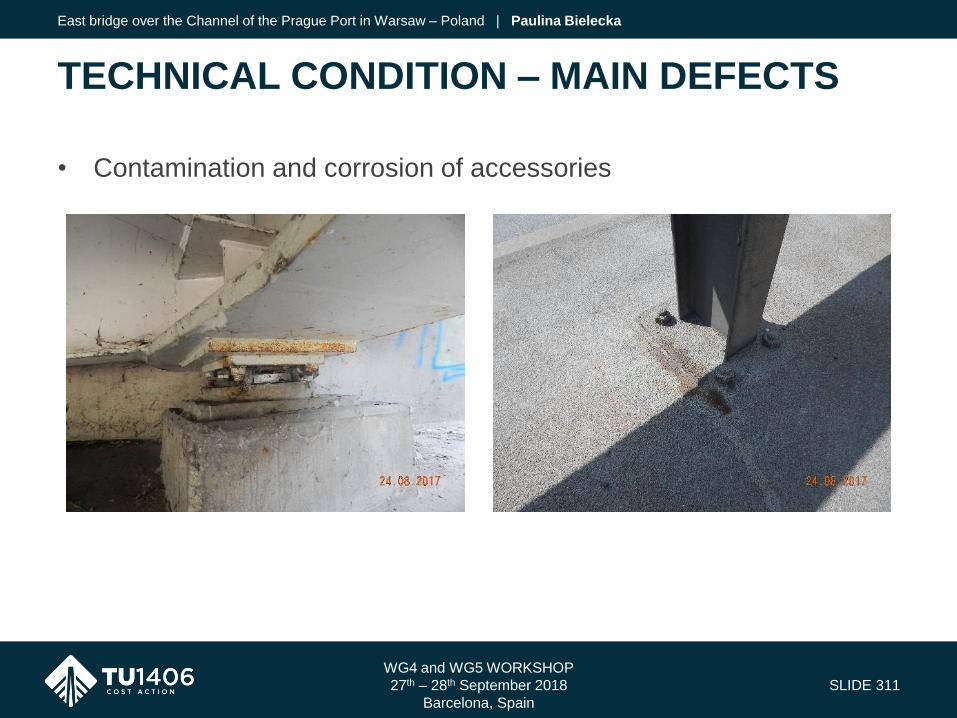
• Contamination and corrosion of accessories
WG4 and WG5 WORKSHOP
27th – 28th September 2018
Barcelona, Spain
SLIDE 311
TECHNICAL CONDITION – MAIN DEFECTS
East bridge over the Channel of the Prague Port in Warsaw – Poland | Paulina Bielecka

• Contamination and corrosion of accessories
WG4 and WG5 WORKSHOP
27th – 28th September 2018
Barcelona, Spain
SLIDE 312
TECHNICAL CONDITION – MAIN DEFECTS
East bridge over the Channel of the Prague Port in Warsaw – Poland | Paulina Bielecka
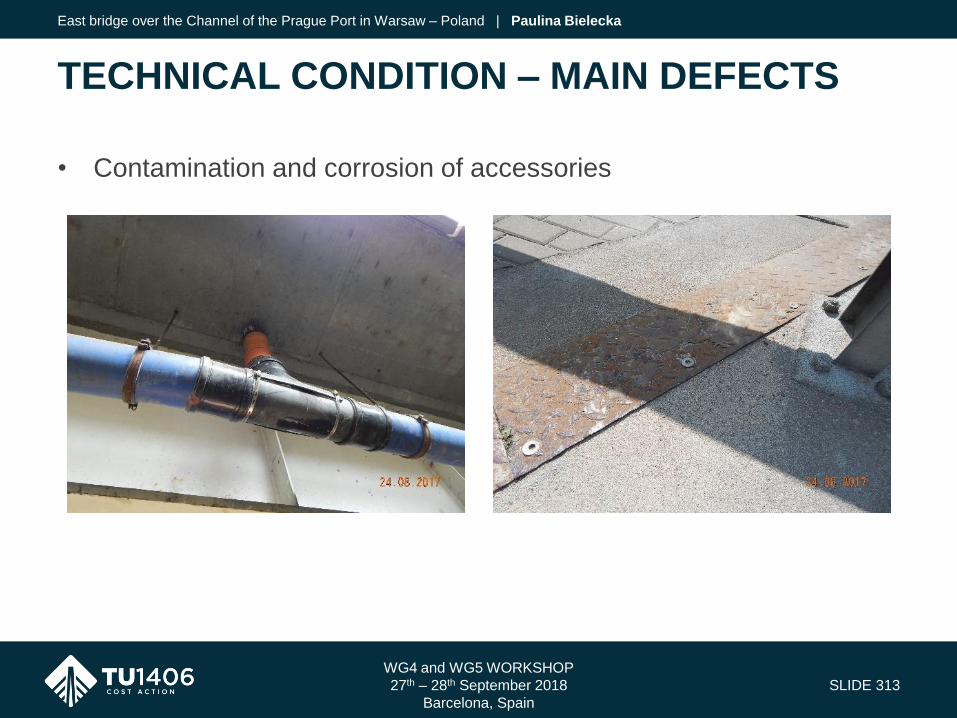
• Contamination and corrosion of accessories
WG4 and WG5 WORKSHOP
27th – 28th September 2018
Barcelona, Spain
SLIDE 313
TECHNICAL CONDITION – MAIN DEFECTS
East bridge over the Channel of the Prague Port in Warsaw – Poland | Paulina Bielecka
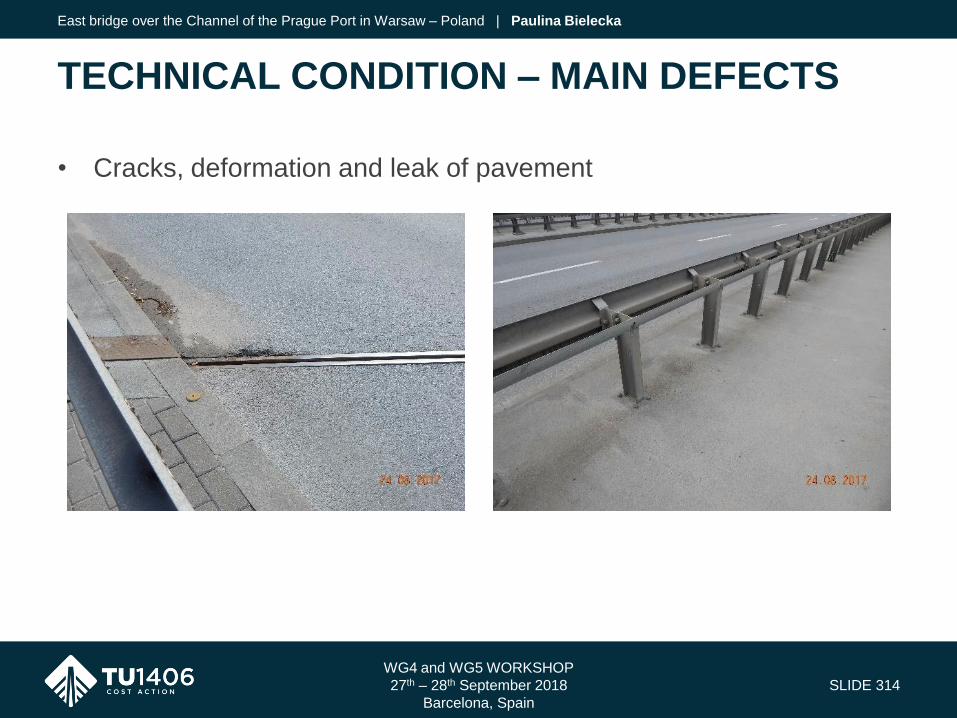
• Cracks, deformation and leak of pavement
WG4 and WG5 WORKSHOP
27th – 28th September 2018
Barcelona, Spain
SLIDE 314
TECHNICAL CONDITION – MAIN DEFECTS
East bridge over the Channel of the Prague Port in Warsaw – Poland | Paulina Bielecka
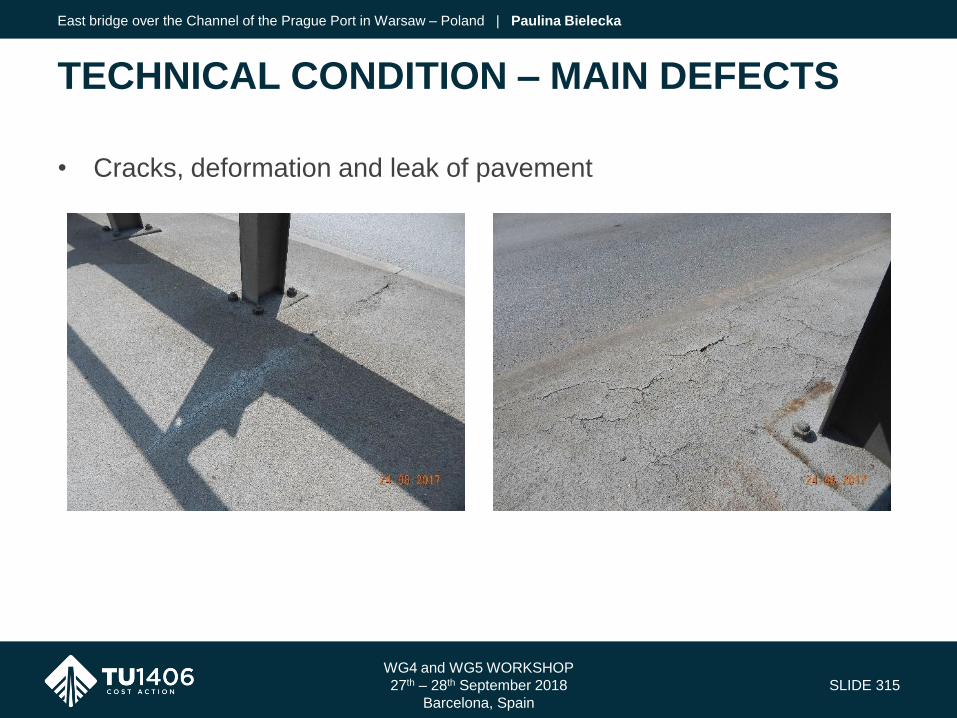
• Cracks, deformation and leak of pavement
WG4 and WG5 WORKSHOP
27th – 28th September 2018
Barcelona, Spain
SLIDE 315
TECHNICAL CONDITION – MAIN DEFECTS
East bridge over the Channel of the Prague Port in Warsaw – Poland | Paulina Bielecka
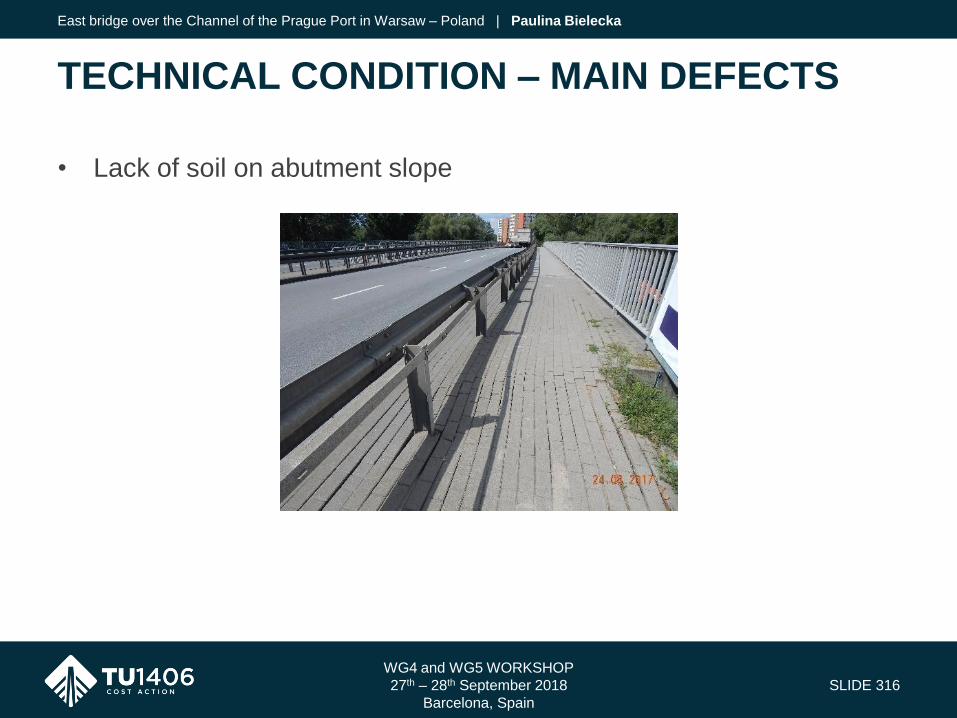
• Lack of soil on abutment slope
WG4 and WG5 WORKSHOP
27th – 28th September 2018
Barcelona, Spain
SLIDE 316
TECHNICAL CONDITION – MAIN DEFECTS
East bridge over the Channel of the Prague Port in Warsaw – Poland | Paulina Bielecka
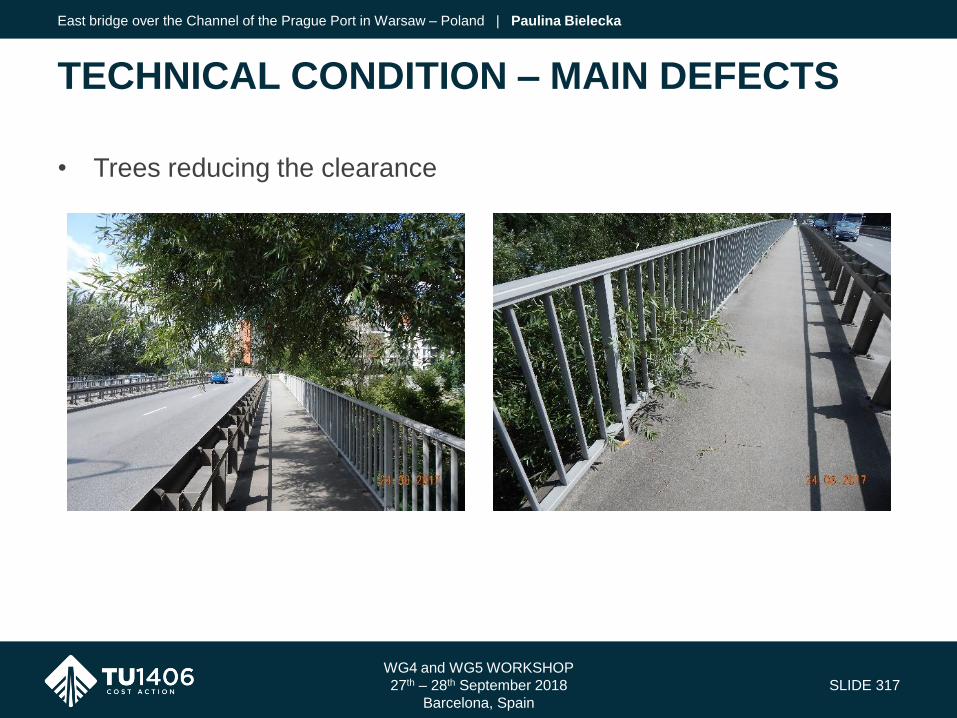
• Trees reducing the clearance
WG4 and WG5 WORKSHOP
27th – 28th September 2018
Barcelona, Spain
SLIDE 317
TECHNICAL CONDITION – MAIN DEFECTS
East bridge over the Channel of the Prague Port in Warsaw – Poland | Paulina Bielecka

• [] Sagging (label HMS region)
• [] Hogging (label HMH region)
• [] High shear regions
• [] Bearing area
WG4 and WG5 WORKSHOP
27th – 28th September 2018
Barcelona, Spain
SLIDE 318
VULNERABLE ZONES
East bridge over the Channel of the Prague Port in Warsaw – Poland | Paulina Bielecka
• Failure modes related with reliability of the structure:
– beam failure,
– piers and abutment failure,
– deck failure,
– bearing failure,
– expansion joints failure,
– drainage failure,
– waterproofing failure.
• Failure modes related with safety of the structure:
– disturbance to pedestrians or drivers,
– falling of the deck,
– falling concrete chunks.
WG4 and WG5 WORKSHOP
27th – 28th September 2018
Barcelona, Spain
SLIDE 319
POTENTIAL FAILURE MODES
East bridge over the Channel of the Prague Port in Warsaw – Poland | Paulina Bielecka

WG4 and WG5 WORKSHOP
27th – 28th September 2018
Barcelona, Spain
SLIDE 320
CURRENT STATE EVALUATION
East bridge over the Channel of the Prague Port in Warsaw – Poland | Paulina Bielecka
Str
uct
ure
typ
e
Gro
up
Component Material Design &
Construction Failure mode
Location/
Position
Damage
/Observation
Damage
process KPI
Performance
Indicator
component
level
Perform-
ance
value Estimated
failure
time
[years] R S
SC3
Str
uct
ura
l el
emen
ts
Steel beams Steel 2001
Beam bending
failure mode
Bottom flanges
(HMS region)
Corroded flanges Corrosion
Reliability
3
3
4 3
40
Damage of
anticorrosion Impact 2 10
Top flanges
(HMH region)
Corroded flanges
(connection with
deck)
Corrosion 3 40
Beam shear
failure mode Beams’ webs Corroded webs Corrosion 2 40
Transoms Steel 2001 Beam shear
failure mode Bearing area Corroded webs Corrosion Reliability 2 2 40
Piers Reinforced
concrete 2001
Pier failure Pier 2 Horizontal crack Corrosion Reliability 3
3
80
Pier failure Pier 2 Reinforcement
corrosion Corrosion Reliability 2 80
Pier failure Pier 2 Efflorescence Water
penetrability (Symptom) (2) 80
Abutment Reinforced
concrete 2001
Abutment
failure
Abutment 1
(north) and
abutment 2
(south)
Reinforcement
corrosion Corrosion Reliability 2
2
80
Abutment 1
(north)
Contamination
and vegetation
Debris and
biological
growth
(Symptom) (2) 80
Expansion joints Steel 2001 Locking of
expansion joint
EJ 1 (north)
and EJ 2
(south)
Contamination of
expansion joint Debris Reliability 4 4 10
Pedestrian deck
slab
Reinforced
concrete 2001
Deck bending
failure Bottom
Reinforcement
corrosion Corrosion Reliability 3
3
30
Deck bending
failure Bottom Spalling Corrosion Reliability 3 30
Deck bending
failure Bottom Efflorescence
Water
penetrability (Symptom) (3) 30
Pedestrian deck
slab
Reinforced
concrete 2001 Falling chunks Bottom Spalling Corrosion Safety 3 3 30
Abutment slope Soil 2001 Disturbance to
pedestrians
Abutment 2
(south) Lack of soil Soil failure Safety 3 3 3 3 80

WG4 and WG5 WORKSHOP
27th – 28th September 2018
Barcelona, Spain
SLIDE 321
CURRENT STATE EVALUATION
East bridge over the Channel of the Prague Port in Warsaw – Poland | Paulina Bielecka
Equip
men
t
Bearings
Elastomer
and steel
cast
2001 Bearing failure Bearings Corrosion of
casts Corrosion Reliability 2 2
4 4
15
Safety barrier Steel 2001 Falling of the
deck Safety barrier
Corrosion
(connection with
deck)
Corrosion Safety 2 2 10
Road pavement Asphalt 2001 Disturbance to
driver
Expansion
joints
surroundings
Deformation of
pavements,
cracks
Locking of
expansion joints Safety 2 2 15
Pedestrian
pavement Bitumen 2001
Disturbance to
pedestrians
Expansion
joints and
safety barriers
surroundings
Cracks and
deformation
Corrosion and
locking of
expansion joints
Safety 2 2 15
Pedestrian
pavement
(approach)
Concrete
paving
blocks
2001 Disturbance to
pedestrians Approach Deformation Soil failure Safety 3 3 15
Cover of
expansion joints Steel 2001
Disturbance to
pedestrians
Expansion
joints Deformation Corrosion Safety 4 4 10
Drainage
installation PCV 2001
Failure of
drainage Connectors Corrosion Corrosion Reliability 2 2 15
Waterproofing Asphalt felt 2001 Failure of
waterproofing Deck bottom Leaks
Discontinuity,
perforations Reliability 4 4 15
Pedestrian
traffic clearance - 2001
Disturbance to
pedestrians
Pedestrian
sidewalk
Trees reducing
the clearance
Biological
growth Safety 4 4 0
Str
uct
ure
typ
e
Gro
up
Component Material Design &
Construction Failure mode
Location/
Position
Damage
/Observation
Damage
process KPI
Performance
Indicator
component
level
Perform-
ance
value Estimated
failure
time
[years] R S
SC3
Str
uct
ura
l el
emen
ts
Steel beams Steel 2001
Beam bending
failure mode
Bottom flanges
(HMS region)
Corroded flanges Corrosion
Reliability
3
3
4 3
40
Damage of
anticorrosion Impact 2 10
Top flanges
(HMH region)
Corroded flanges
(connection with
deck)
Corrosion 3 40
Beam shear
failure mode Beams’ webs Corroded webs Corrosion 2 40
Transoms Steel 2001 Beam shear
failure mode Bearing area Corroded webs Corrosion Reliability 2 2 40
Piers Reinforced
concrete 2001
Pier failure Pier 2 Horizontal crack Corrosion Reliability 3
3
80
Pier failure Pier 2 Reinforcement
corrosion Corrosion Reliability 2 80
Pier failure Pier 2 Efflorescence Water
penetrability (Symptom) (2) 80
Abutment Reinforced
concrete 2001
Abutment
failure
Abutment 1
(north) and
abutment 2
(south)
Reinforcement
corrosion Corrosion Reliability 2
2
80
Abutment 1
(north)
Contamination
and vegetation
Debris and
biological
growth
(Symptom) (2) 80
Expansion joints Steel 2001 Locking of
expansion joint
EJ 1 (north)
and EJ 2
(south)
Contamination of
expansion joint Debris Reliability 4 4 10
Pedestrian deck
slab
Reinforced
concrete 2001
Deck bending
failure Bottom
Reinforcement
corrosion Corrosion Reliability 3
3
30
Deck bending
failure Bottom Spalling Corrosion Reliability 3 30
Deck bending
failure Bottom Efflorescence
Water
penetrability (Symptom) (3) 30
Pedestrian deck
slab
Reinforced
concrete 2001 Falling chunks Bottom Spalling Corrosion Safety 3 3 30
Abutment slope Soil 2001 Disturbance to
pedestrians
Abutment 2
(south) Lack of soil Soil failure Safety 3 3 3 3 80

• Referenced approach
WG4 and WG5 WORKSHOP
27th – 28th September 2018
Barcelona, Spain
SLIDE 322
MAINTENANCE APPROACHES
East bridge over the Channel of the Prague Port in Warsaw – Poland | Paulina Bielecka
In 40 years:
– expansion joints
failure,
– safety barriers
failure,
– steel beam failure,
– transoms failure.
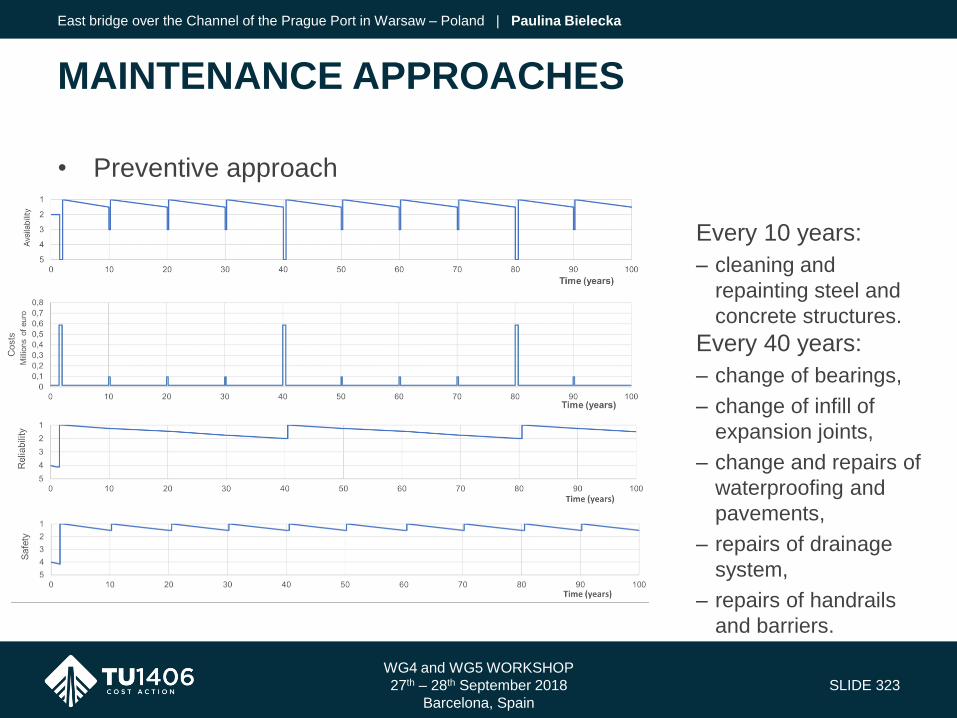
• Preventive approach
WG4 and WG5 WORKSHOP
27th – 28th September 2018
Barcelona, Spain
SLIDE 323
MAINTENANCE APPROACHES
East bridge over the Channel of the Prague Port in Warsaw – Poland | Paulina Bielecka
Every 10 years:
– cleaning and
repainting steel and
concrete structures.
Every 40 years:
– change of bearings,
– change of infill of
expansion joints,
– change and repairs of
waterproofing and
pavements,
– repairs of drainage
system,
– repairs of handrails
and barriers.
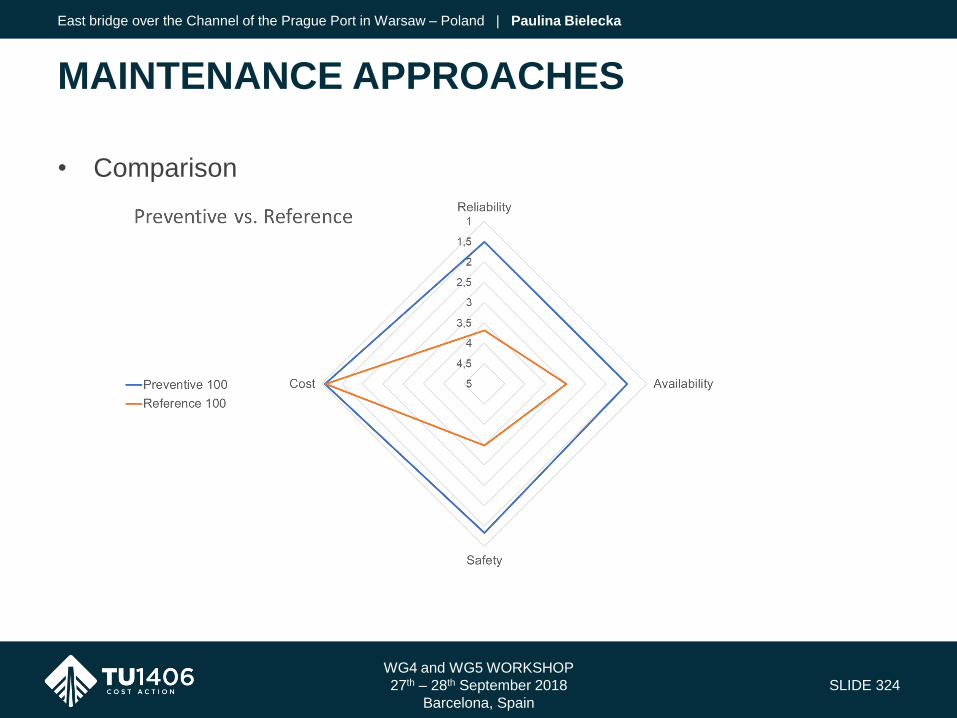
• Comparison
WG4 and WG5 WORKSHOP
27th – 28th September 2018
Barcelona, Spain
SLIDE 324
MAINTENANCE APPROACHES
East bridge over the Channel of the Prague Port in Warsaw – Poland | Paulina Bielecka

• The paper presents all stages of implementation of procedure of
quality control planning established by Working Group 3 of TU1406
COST.
• From the comparison of two maintenance approaches it could be
concluded that the preventive approach is more appropriate for the
analysed bridge.
• The main issue of the implemented approach is final presentation of
obtained results. It has to be comprehendible by people in chargé of
the object.
WG4 and WG5 WORKSHOP
27th – 28th September 2018
Barcelona, Spain
SLIDE 325
CONCLUSIONS
East bridge over the Channel of the Prague Port in Warsaw – Poland | Paulina Bielecka

THANK YOU FOR YOUR ATTENTION!
WWW.TU1406.EU

WG4 and WG5 WORKSHOP
Sustainable Bridge Management
27th – 28th September 2018
Barcelona, Spain
IMPLEMENTATION OF QUALITY
CONTROL PLAN INTO TWO CASE
STUDIESMarija Docevska – University Cyril and Methodius-Skopje, R. of Macedonia
Leart Taravari - University Cyril and Methodius-Skopje, R. of Macedonia
Jose Campos e Matos – University of Minho Guimaraes, Portugal
Goran Markovski - University Cyril and Methodius-Skopje, R. of Macedonia
QUALITY SPECIFICATIONS FOR ROADWAY BRIDGES, STANDARDIZATION AT A EUROPEAN LEVEL
Barcelona, 27th – 28th September, 2018
1
IMPLEMENTATION OF QUALITY CONTROL PLAN INTO TWO CASE STUDIES
Marija Docevska1, Leart Taravari1, Jose Campos e Matos2, Goran Markovski1,
1Faculty of Civil Engineering-Skopje UKIM, Partizanski odredi 24, 1000 Skopje, R. Macedonia 2Civil Engineering Department Minho University, Campus de Azurem, 4800-058 Guimaraes, Portugal
E-mails: [email protected]; [email protected]; [email protected]; [email protected];
Abstract. Most of the quality control plans are element-oriented, facing with the lack of holistic approach in assessment of concrete bridges. Without considering the structural system and without linking the damage type, damage position and damage process with the type of structural system, it is hardly possible to derive key performance indicators (reliability, safety, etc.). Here, quality control methodology established within WG3 of COST Action 1406 was implemented into two case studies, concrete bridge located in Portugal and in Macedonia, both arch with similar topology. The applied quality control plan considers ‘virgin‘ reliability, focuses on failure modes and related vulnerable zones. To consider all these aspects, results from visual inspections were used and numerical models of the bridges were built. In both case studies, different life time cycle approaches were applied to qualitativly evaluate different key performance indicators over time. Finally, the results are compared in order to find the most effective scenario.
Keywords: quality control plan, arch concrete bridges, vulnerable zone, virgin reliability, key performance
indicator, visual inspection
1. Introduction
Quality control (QC) of bridges is differently implemented from country to country. However, most of them have the same basic approach consisting of inspection and rating of each bridge element separately. This element-oriented procedure is facing with a lack of holistic approach to the bridge assessment (Isailovic et al. 2018) . Without considering the structural system and linking the damage type, damage position and damage process with the type of structural system, it is hardly possible to derive key performance indicators. Additionally, the inspector should bear in mind all possible failure modes. Applied QC plan considers the vulnerability of the structural system to the defects locations. It takes into consideration the ‘virgin‘ reliability, focuses on failure modes and related vulnerable zones. A general approach for QC plans was already developed in the scope of WG3 for all types of structures and is now analyzed within the scope of arch bridges. In this paper, evolution in time of performance indicators of two existing arch bridges, in terms of reliability, safety, costs and availability, was performed qualitatively under no maintenance, corrective and preventative maintenance.
2. Case studies
In this section, a protocol for a quality control plan is used to demonstrate the methodology established in WG3 of COST Action TU1406. The research presented in this paper is performed during a short-term scientific mission at University of Minho, Guimaraes, Portugal in March 2018. The quality control plan was performed in few steps: - collecting the general data of the bridge (original drawings, construction year, inspection/intervention year, location, obstacle type, climate, exposure, etc.) - comparison of current traffic load to traffic load model used for the previous calculation - estimation of an initial ‘virgin’ reliability index 𝛽 - assessment of damage extend, intensity and identification of damage processes - qualitative assessment of resistance reduction based on observed damages (rough assessment of resistance reduction on structural level (reliability)) - definition of various maintenance scenarios, evaluation of KPIs for all of them and comparison.
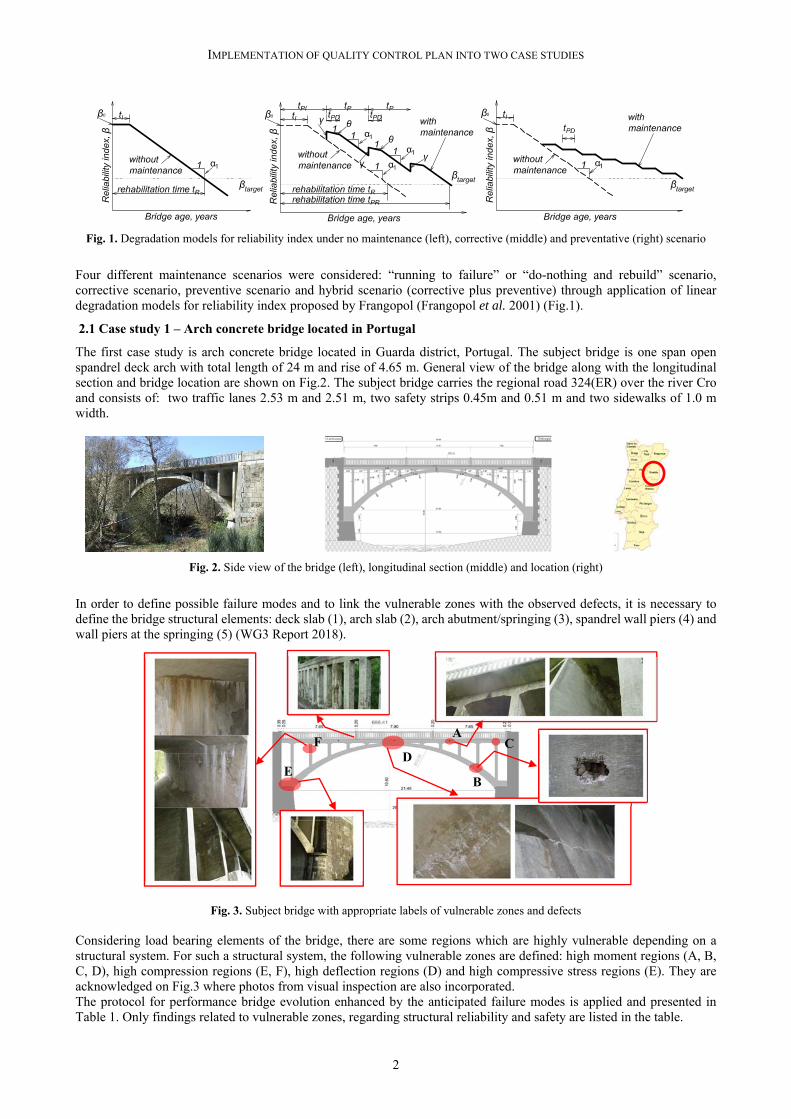
IMPLEMENTATION OF QUALITY CONTROL PLAN INTO TWO CASE STUDIES
2
Fig. 1. Degradation models for reliability index under no maintenance (left), corrective (middle) and preventative (right) scenario
Four different maintenance scenarios were considered: “running to failure” or “do-nothing and rebuild” scenario, corrective scenario, preventive scenario and hybrid scenario (corrective plus preventive) through application of linear degradation models for reliability index proposed by Frangopol (Frangopol et al. 2001) (Fig.1).
2.1 Case study 1 – Arch concrete bridge located in Portugal
The first case study is arch concrete bridge located in Guarda district, Portugal. The subject bridge is one span open spandrel deck arch with total length of 24 m and rise of 4.65 m. General view of the bridge along with the longitudinal section and bridge location are shown on Fig.2. The subject bridge carries the regional road 324(ER) over the river Cro and consists of: two traffic lanes 2.53 m and 2.51 m, two safety strips 0.45m and 0.51 m and two sidewalks of 1.0 m width.
Fig. 2. Side view of the bridge (left), longitudinal section (middle) and location (right)
In order to define possible failure modes and to link the vulnerable zones with the observed defects, it is necessary to define the bridge structural elements: deck slab (1), arch slab (2), arch abutment/springing (3), spandrel wall piers (4) and wall piers at the springing (5) (WG3 Report 2018).
Fig. 3. Subject bridge with appropriate labels of vulnerable zones and defects
Considering load bearing elements of the bridge, there are some regions which are highly vulnerable depending on a structural system. For such a structural system, the following vulnerable zones are defined: high moment regions (A, B, C, D), high compression regions (E, F), high deflection regions (D) and high compressive stress regions (E). They are acknowledged on Fig.3 where photos from visual inspection are also incorporated. The protocol for performance bridge evolution enhanced by the anticipated failure modes is applied and presented in Table 1. Only findings related to vulnerable zones, regarding structural reliability and safety are listed in the table.
A
B
D E
F C

QUALITY SPECIFICATIONS FOR ROADWAY BRIDGES, STANDARDIZATION AT A EUROPEAN LEVEL
Barcelona, 27th – 28th September, 2018
3
Failure mode Vulnerable
area Element
Damage observations
Damage process
KPI Performance
value (1-5) Overall rating
Bending failure
A Deck Efflorescence Leaching Symp. / R=4
S=2 Deck Wet spots
Water permeability
R 3
B Arch Surface cracks Corrosion R 3 Arch Spalling Corrosion R 1 Arch White spots Carbonization R 3
C Deck Efflorescence Leaching Symp. / Deck White spots Carbonization R 3
D Arch
Longitudinal crack
Structural damage
R 3
Arch Surface cracks Corrosion R 3
Compression failure
Е Arch No damage / / /
F Walls Surface cracks Corrosion R 4 Walls Brown spots Corrosion R 3
Falling from the bridge
/ Railing Spalling Corrosion S 2 / Railing Cracks Corrosion S 2
Table 1. The protocol
2.1.1 Semi-quantitative assessment of bridge reliability
For each scenario, qualitative evolution of the following KPIs was made: R-reliability, C-costs, A-availability and S-safety. The reference information needed to evaluate KPIs in time, is the evaluation performed on damage-free state of the bridge, so-called “virgin” state (WG3 Report 2018). Therefore, an initial reliability index 𝛽 was roughly calculated using Monte Carlo simulation and First Order Reliability Method (FORM) as the shortest distance from the origin in the n-dimensional space of reduced variables to the curve described by 𝑔 𝑅, 𝑆 𝑅 𝑆 0. Ultimate bending moment from the unfavourable load combination taken from the original design project is presented on the Fig.4 below. The axial force was low and therefore neglected.
Fig. 4. Ultimate bending moment from the unfavourable load combination The bending moments at the supports are very low comparing with the bending moment at the midspan, showing that the system is simple supported. Therefore, the overall reliability of the bridge was obtained as the reliability of the midspan section of the arch (Nowak, Collins 2000). The limit state function for the bending failure mode is the following:
xkbxfdfAxkFdFMR avcdydsacddsRd 1 kNmMS sd 170 (1)
MxkbxfdfASRSRg sdavcdyds ),( (2)
Herein, the depth and width of the cross-section were considered as deterministic parameters, while 𝑀 , 𝐴 , 𝑓 and 𝑓 were considered as random variables, which parameters are taken from the literature (Nowak, Collins 2000). With both methods a value of 5.05 was obtained. On the basis of the report from the last visual inspection of the bridge, approximately 5% resistance reduction was assessed, since the last inspection was taken 5 years after repairing of the bridge and the bridge is in overall good condition. Therefore, the initial reliability index for the further analysis was reduced from 5.05 to the value of 4.90 using the abacus presented in WG3 report.
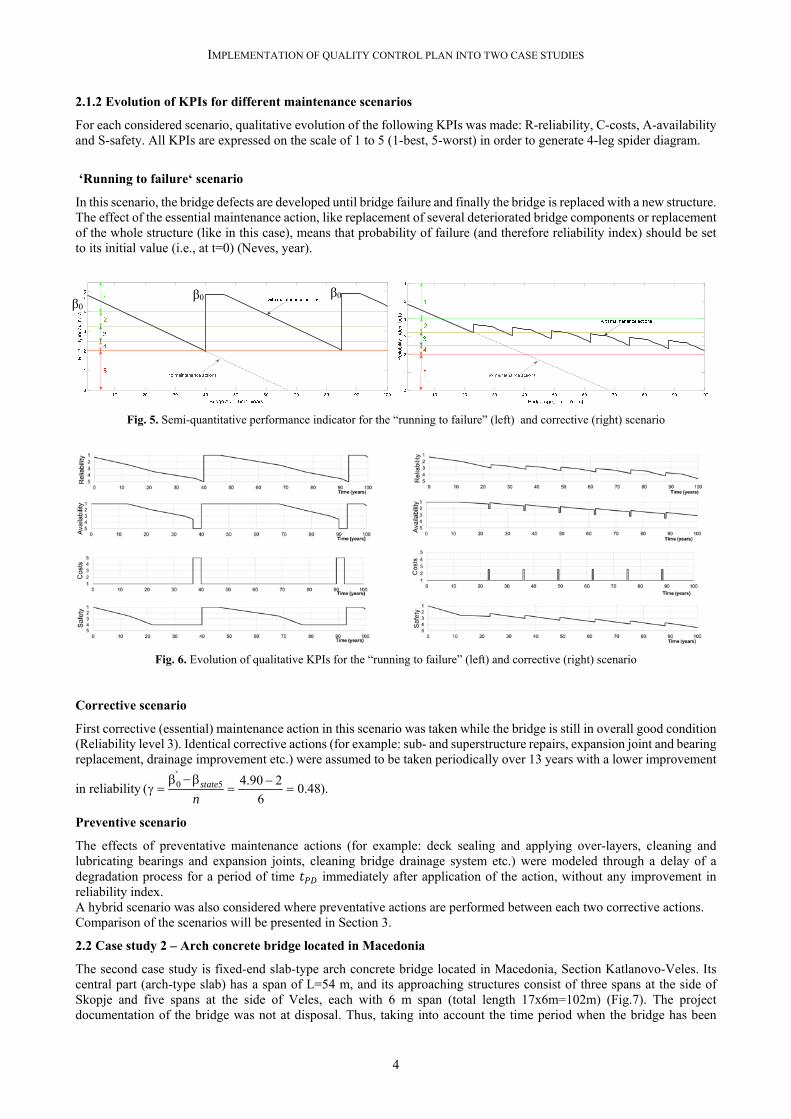
IMPLEMENTATION OF QUALITY CONTROL PLAN INTO TWO CASE STUDIES
4
2.1.2 Evolution of KPIs for different maintenance scenarios
For each considered scenario, qualitative evolution of the following KPIs was made: R-reliability, C-costs, A-availability and S-safety. All KPIs are expressed on the scale of 1 to 5 (1-best, 5-worst) in order to generate 4-leg spider diagram.
‘Running to failure‘ scenario
In this scenario, the bridge defects are developed until bridge failure and finally the bridge is replaced with a new structure. The effect of the essential maintenance action, like replacement of several deteriorated bridge components or replacement of the whole structure (like in this case), means that probability of failure (and therefore reliability index) should be set to its initial value (i.e., at t=0) (Neves, year).
Fig. 5. Semi-quantitative performance indicator for the “running to failure” (left) and corrective (right) scenario
Fig. 6. Evolution of qualitative KPIs for the “running to failure” (left) and corrective (right) scenario
Corrective scenario
First corrective (essential) maintenance action in this scenario was taken while the bridge is still in overall good condition (Reliability level 3). Identical corrective actions (for example: sub- and superstructure repairs, expansion joint and bearing replacement, drainage improvement etc.) were assumed to be taken periodically over 13 years with a lower improvement
in reliability ).48.06
290.4( 5
'0
nstate
Preventive scenario
The effects of preventative maintenance actions (for example: deck sealing and applying over-layers, cleaning and lubricating bearings and expansion joints, cleaning bridge drainage system etc.) were modeled through a delay of a degradation process for a period of time 𝑡 immediately after application of the action, without any improvement in reliability index. A hybrid scenario was also considered where preventative actions are performed between each two corrective actions. Comparison of the scenarios will be presented in Section 3.
2.2 Case study 2 – Arch concrete bridge located in Macedonia
The second case study is fixed-end slab-type arch concrete bridge located in Macedonia, Section Katlanovo-Veles. Its central part (arch-type slab) has a span of L=54 m, and its approaching structures consist of three spans at the side of Skopje and five spans at the side of Veles, each with 6 m span (total length 17x6m=102m) (Fig.7). The project documentation of the bridge was not at disposal. Thus, taking into account the time period when the bridge has been
β0 β0 β0
’
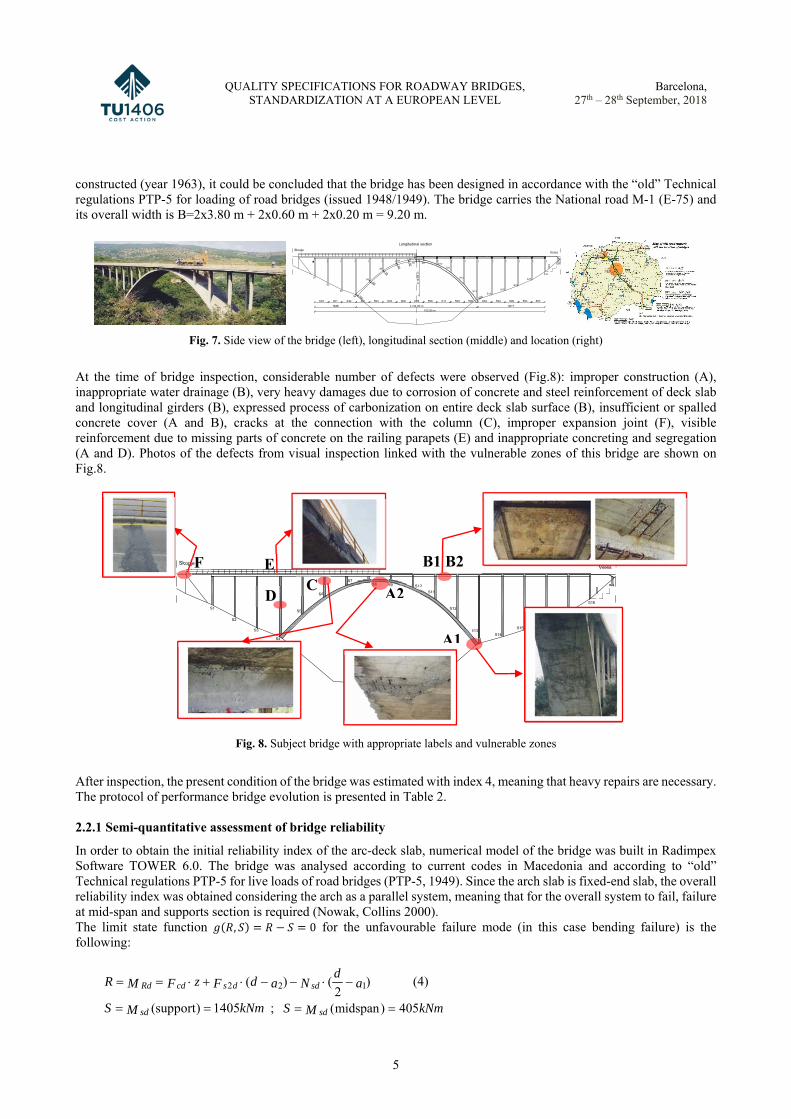
QUALITY SPECIFICATIONS FOR ROADWAY BRIDGES, STANDARDIZATION AT A EUROPEAN LEVEL
Barcelona, 27th – 28th September, 2018
5
constructed (year 1963), it could be concluded that the bridge has been designed in accordance with the “old” Technical regulations PTP-5 for loading of road bridges (issued 1948/1949). The bridge carries the National road M-1 (E-75) and its overall width is B=2x3.80 m + 2x0.60 m + 2x0.20 m = 9.20 m.
Fig. 7. Side view of the bridge (left), longitudinal section (middle) and location (right)
At the time of bridge inspection, considerable number of defects were observed (Fig.8): improper construction (A), inappropriate water drainage (B), very heavy damages due to corrosion of concrete and steel reinforcement of deck slab and longitudinal girders (B), expressed process of carbonization on entire deck slab surface (B), insufficient or spalled concrete cover (A and B), cracks at the connection with the column (C), improper expansion joint (F), visible reinforcement due to missing parts of concrete on the railing parapets (E) and inappropriate concreting and segregation (A and D). Photos of the defects from visual inspection linked with the vulnerable zones of this bridge are shown on Fig.8.
Fig.
Fig. 8. Subject bridge with appropriate labels and vulnerable zones
After inspection, the present condition of the bridge was estimated with index 4, meaning that heavy repairs are necessary. The protocol of performance bridge evolution is presented in Table 2. 2.2.1 Semi-quantitative assessment of bridge reliability
In order to obtain the initial reliability index of the arc-deck slab, numerical model of the bridge was built in Radimpex Software TOWER 6.0. The bridge was analysed according to current codes in Macedonia and according to “old” Technical regulations PTP-5 for live loads of road bridges (PTP-5, 1949). Since the arch slab is fixed-end slab, the overall reliability index was obtained considering the arch as a parallel system, meaning that for the overall system to fail, failure at mid-span and supports section is required (Nowak, Collins 2000). The limit state function 𝑔 𝑅, 𝑆 𝑅 𝑆 0 for the unfavourable failure mode (in this case bending failure) is the following:
)2
()( 122 ad
NadFzFMR sddscdRd (4)
kNmMS sd 1405)support( ; kNmMS sd 405)midspan(
A2
A1
B1 B2
C
F
D
E

IMPLEMENTATION OF QUALITY CONTROL PLAN INTO TWO CASE STUDIES
6
Failure mode Vulnerable
area Element
Damage observation
Damage process
KPI Performance
value (1-5) Overall raiting
Bending failure mode
A1 Arch-slab Segregation Poor
construction Symp. /
R=4 S=3
A2 Arch-slab Spalled concrete
Corrosion R 2
B1 Deck slab Brown spots Corrosion R 4
B1 Deck slab Wet spots Water
permeability R 4
B2 Girder Spalled concrete
Corrosion R 4
C Column Cracks Structural R 3
F Exp.Joint Longitudinal
crack Structural R 3
Compression failure mode
A1 Arch slab Segregation Poor
construction Symp. 3
D Piers Segregation Poor
construction Symp. /
Falling from the bridge
/ Parapet Spalled concrete
Poor construction
S 3
/ Railing Rust Corrosion S 2
Table 2. The protocol
Fig. 9. Ultimate bending moment from the unfavourable load combination The bridge overall reliability index using Monte Carlo and FORM, as well as, the approach with the parallel systems, was obtained 2.15 (since the bridge is originally designed according to old, less conservative codes for loads). According to the relation between qualitative and quantitative reliability scale proposed in WG3 Report, this bridge belongs to reliability level 4 (𝛽 2 2.50 where old bridges with major resistance reduction belong (WG3 report, 2018).
2.2.2 Evolution of KPIs for different maintenance scenarios
Two life time cycle approaches are shown to evaluate all key performance indicators considered for the bridge in the following 100 years. In the first scenario (Reference – “Do nothing” scenario) (Fig.10 left) the bridge will be repaired and strengthened in the next years, since the reliability and availability for heavy vehicles are already limited. When the reliability reaches level 5, the bridge will be reconstructed and thus inserts the reliability to level 1. In between, lack of any major repairs of superstructure was considered, except basic pavement repairs each 20 year. With this scenario, defects were developed up to the bridge failure. The cost of the reconstruction was assumed to be 1 Milion EUR (on the basis of the original project for the bridge reconstruction), big repairs 500 000 EUR and small (pavement) repairs 100 000 EUR.
Fig. 10. Evolution of KPIs for the reference (left) and preventative (right) scenario
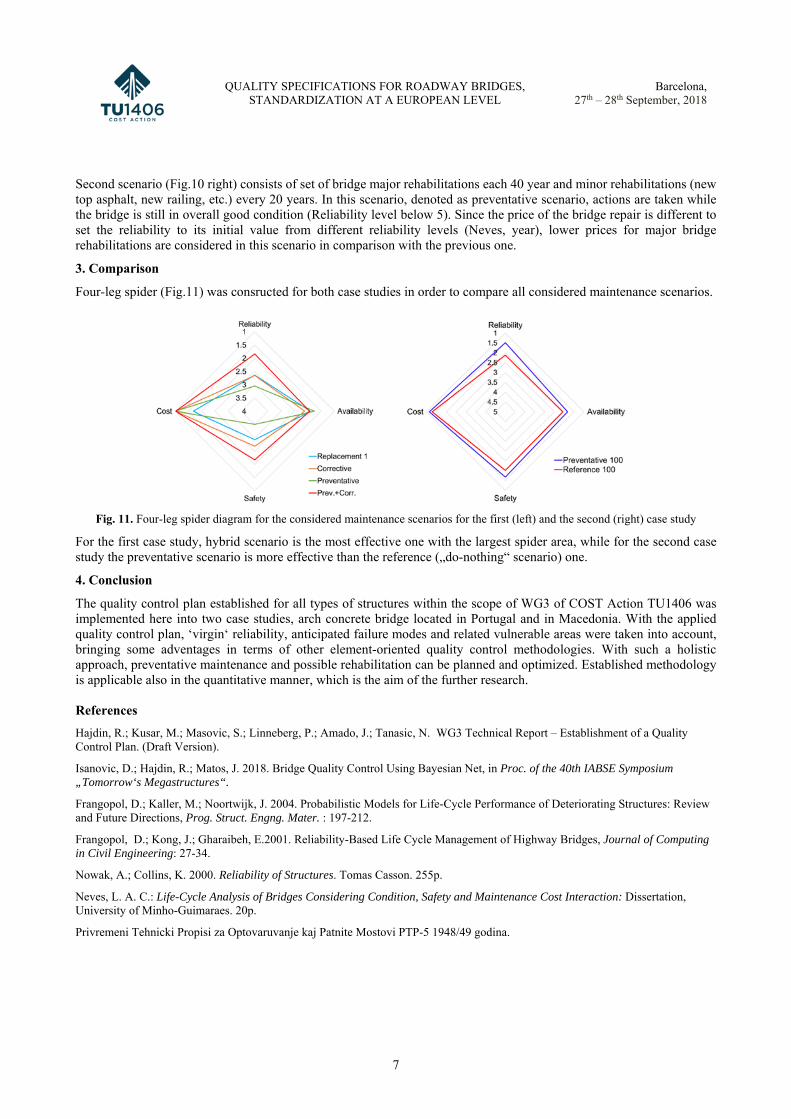
QUALITY SPECIFICATIONS FOR ROADWAY BRIDGES, STANDARDIZATION AT A EUROPEAN LEVEL
Barcelona, 27th – 28th September, 2018
7
Second scenario (Fig.10 right) consists of set of bridge major rehabilitations each 40 year and minor rehabilitations (new top asphalt, new railing, etc.) every 20 years. In this scenario, denoted as preventative scenario, actions are taken while the bridge is still in overall good condition (Reliability level below 5). Since the price of the bridge repair is different to set the reliability to its initial value from different reliability levels (Neves, year), lower prices for major bridge rehabilitations are considered in this scenario in comparison with the previous one.
3. Comparison
Four-leg spider (Fig.11) was consructed for both case studies in order to compare all considered maintenance scenarios.
Fig. 11. Four-leg spider diagram for the considered maintenance scenarios for the first (left) and the second (right) case study
For the first case study, hybrid scenario is the most effective one with the largest spider area, while for the second case study the preventative scenario is more effective than the reference („do-nothing“ scenario) one.
4. Conclusion
The quality control plan established for all types of structures within the scope of WG3 of COST Action TU1406 was implemented here into two case studies, arch concrete bridge located in Portugal and in Macedonia. With the applied quality control plan, ‘virgin‘ reliability, anticipated failure modes and related vulnerable areas were taken into account, bringing some adventages in terms of other element-oriented quality control methodologies. With such a holistic approach, preventative maintenance and possible rehabilitation can be planned and optimized. Established methodology is applicable also in the quantitative manner, which is the aim of the further research. References
Hajdin, R.; Kusar, M.; Masovic, S.; Linneberg, P.; Amado, J.; Tanasic, N. WG3 Technical Report – Establishment of a Quality Control Plan. (Draft Version).
Isanovic, D.; Hajdin, R.; Matos, J. 2018. Bridge Quality Control Using Bayesian Net, in Proc. of the 40th IABSE Symposium „Tomorrow‘s Megastructures“.
Frangopol, D.; Kaller, M.; Noortwijk, J. 2004. Probabilistic Models for Life-Cycle Performance of Deteriorating Structures: Review and Future Directions, Prog. Struct. Engng. Mater. : 197-212.
Frangopol, D.; Kong, J.; Gharaibeh, E.2001. Reliability-Based Life Cycle Management of Highway Bridges, Journal of Computing in Civil Engineering: 27-34.
Nowak, A.; Collins, K. 2000. Reliability of Structures. Tomas Casson. 255p.
Neves, L. A. C.: Life-Cycle Analysis of Bridges Considering Condition, Safety and Maintenance Cost Interaction: Dissertation, University of Minho-Guimaraes. 20p.
Privremeni Tehnicki Propisi za Optovaruvanje kaj Patnite Mostovi PTP-5 1948/49 godina.

WG4 and WG5 WORKSHOP
Sustainable Bridge Management
27th – 28th September 2018
Barcelona, Spain
IMPLEMENTATION OF QUALITY
CONTROL PLAN INTO TWO CASE
STUDIESMarija Docevska – University Cyril and Methodius-Skopje, R. of Macedonia
Leart Taravari - University Cyril and Methodius-Skopje, R. of Macedonia
Jose Campos e Matos – University of Minho Guimaraes, Portugal
Goran Markovski - University Cyril and Methodius-Skopje, R. of Macedonia
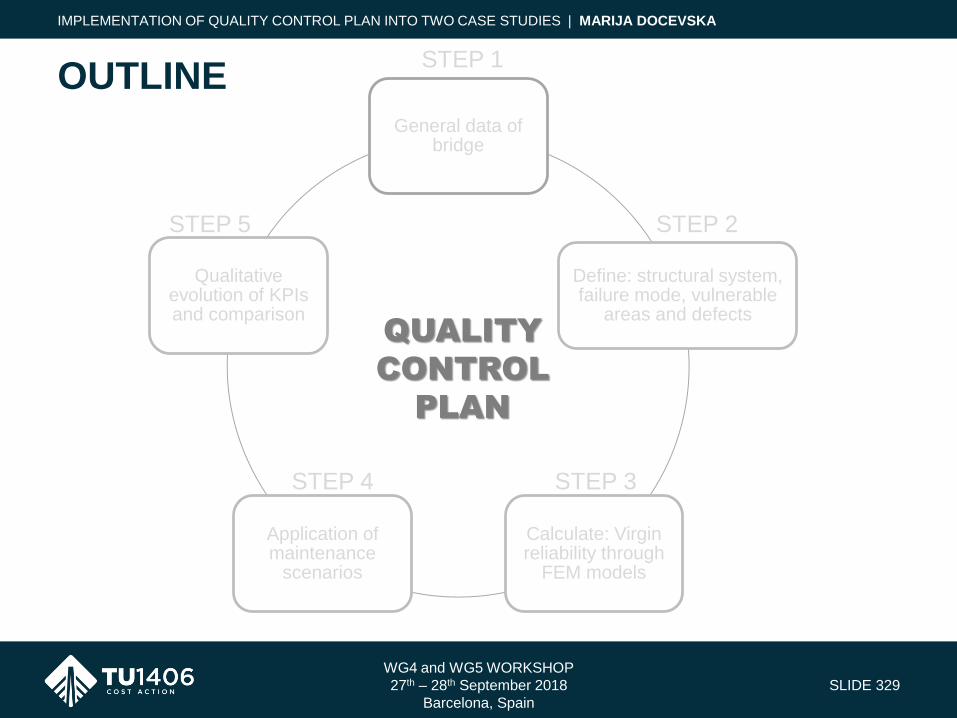
WG4 and WG5 WORKSHOP
27th – 28th September 2018
Barcelona, Spain
SLIDE 329
OUTLINE
IMPLEMENTATION OF QUALITY CONTROL PLAN INTO TWO CASE STUDIES | MARIJA DOCEVSKA
General data of bridge
Define: structural system, failure mode, vulnerable
areas and defects
Calculate: Virgin reliability through
FEM models
Application of maintenance
scenarios
Qualitative evolution of KPIs and comparison
QUALITY
CONTROL
PLAN
STEP 1
STEP 2
STEP 3STEP 4
STEP 5

WG4 and WG5 WORKSHOP
27th – 28th September 2018
Barcelona, Spain
SLIDE 330
OUTLINE
IMPLEMENTATION OF QUALITY CONTROL PLAN INTO TWO CASE STUDIES | MARIJA DOCEVSKA
General data of bridge
Define: structural system, failure mode, vulnerable
areas and defects
Calculate: Virgin reliability through
FEM models
Application of maintenance
scenarios
Qualitative evolution of KPIs and comparison
QUALITY
CONTROL
PLAN
STEP 1
STEP 2
STEP 3STEP 4
STEP 5
-Location
-Current traffic load vs. traffic
load model from design
-Visual inspections
-Results from NDT tests
-Exposure, Climate
-…
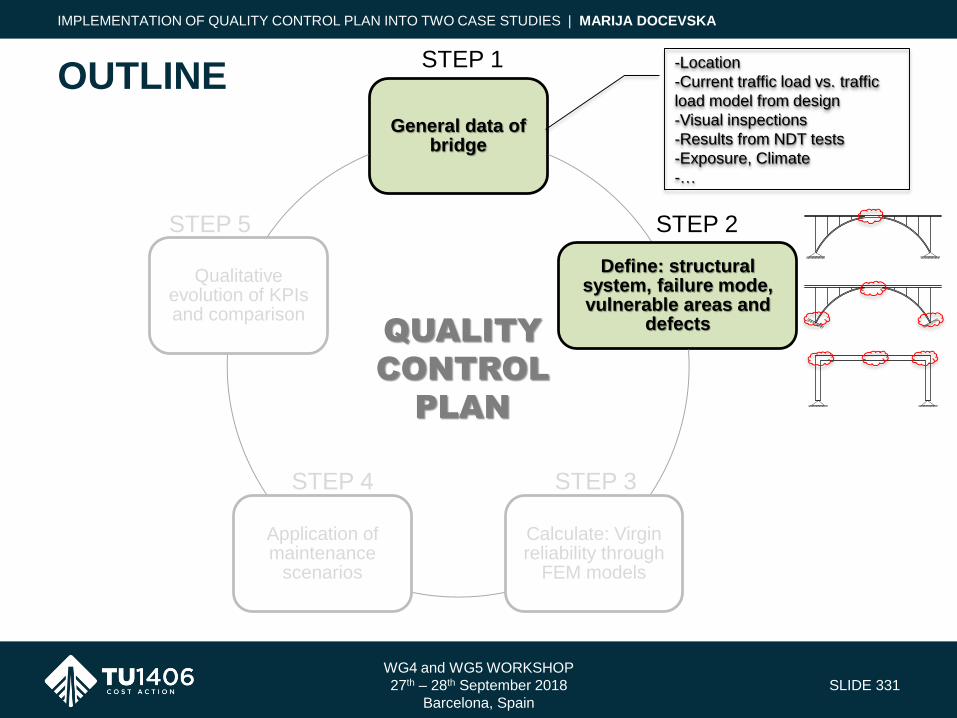
WG4 and WG5 WORKSHOP
27th – 28th September 2018
Barcelona, Spain
SLIDE 331
OUTLINE
IMPLEMENTATION OF QUALITY CONTROL PLAN INTO TWO CASE STUDIES | MARIJA DOCEVSKA
General data of bridge
Define: structural system, failure mode, vulnerable areas and
defects
Calculate: Virgin reliability through
FEM models
Application of maintenance
scenarios
Qualitative evolution of KPIs and comparison
QUALITY
CONTROL
PLAN
STEP 1
STEP 2
STEP 3STEP 4
STEP 5
-Location
-Current traffic load vs. traffic
load model from design
-Visual inspections
-Results from NDT tests
-Exposure, Climate
-…
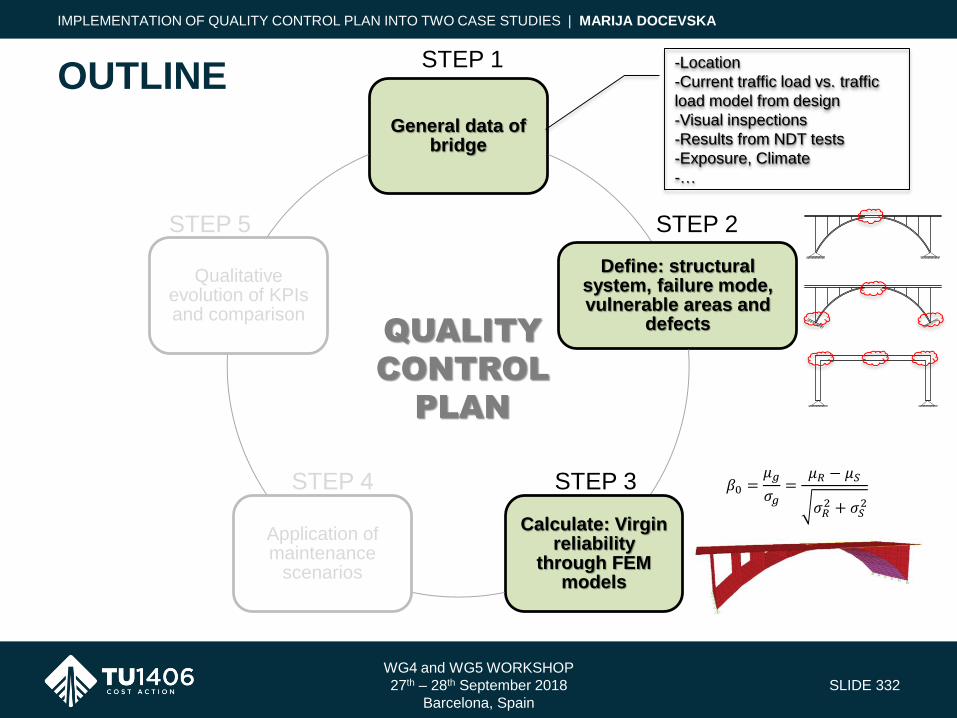
WG4 and WG5 WORKSHOP
27th – 28th September 2018
Barcelona, Spain
SLIDE 332
OUTLINE
IMPLEMENTATION OF QUALITY CONTROL PLAN INTO TWO CASE STUDIES | MARIJA DOCEVSKA
General data of bridge
Define: structural system, failure mode, vulnerable areas and
defects
Calculate: Virgin reliability
through FEM models
Application of maintenance
scenarios
Qualitative evolution of KPIs and comparison
QUALITY
CONTROL
PLAN
𝛽0 =𝜇𝑔
𝜎𝑔=
𝜇𝑅 − 𝜇𝑆
𝜎𝑅2 + 𝜎𝑆
2
STEP 1
STEP 2
STEP 3STEP 4
STEP 5
-Location
-Current traffic load vs. traffic
load model from design
-Visual inspections
-Results from NDT tests
-Exposure, Climate
-…

WG4 and WG5 WORKSHOP
27th – 28th September 2018
Barcelona, Spain
SLIDE 333
OUTLINE
IMPLEMENTATION OF QUALITY CONTROL PLAN INTO TWO CASE STUDIES | MARIJA DOCEVSKA
General data of bridge
Define: structural system, failure mode, vulnerable areas and
defects
Calculate: Virgin reliability
through FEM models
Application of maintenance
scenarios
Qualitative evolution of KPIs and comparison
QUALITY
CONTROL
PLAN
STEP 1
STEP 2
STEP 3STEP 4
STEP 5
-Location
-Current traffic load vs. traffic
load model from design
-Visual inspections
-Results from NDT tests
-Exposure, Climate
-…
𝛽0 =𝜇𝑔
𝜎𝑔=
𝜇𝑅 − 𝜇𝑆
𝜎𝑅2 + 𝜎𝑆
2
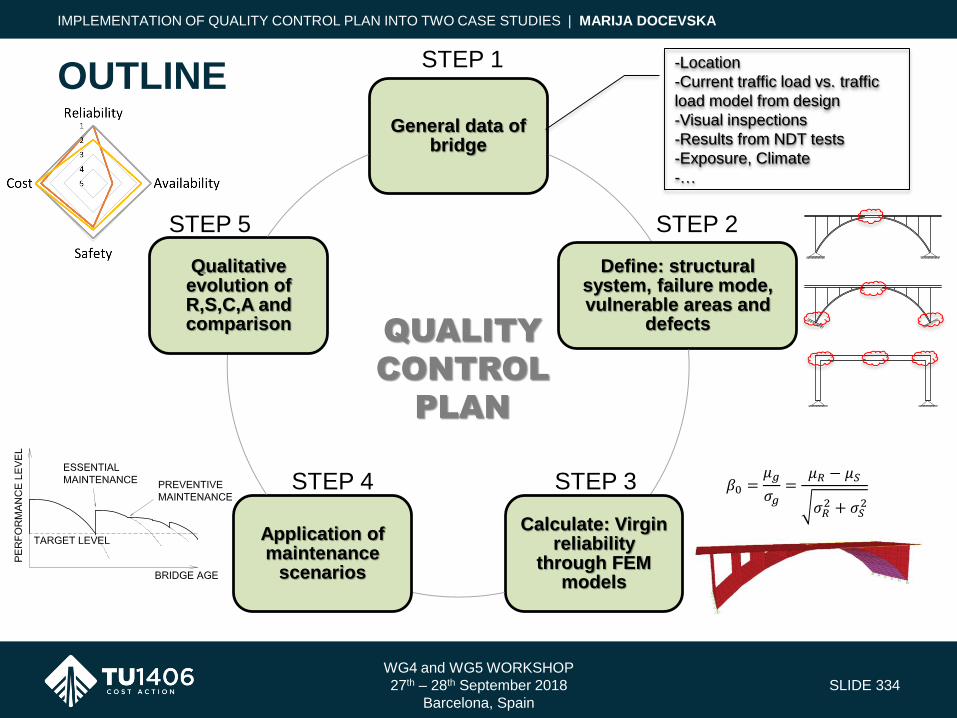
General data of bridge
Define: structural system, failure mode, vulnerable areas and
defects
Calculate: Virgin reliability
through FEM models
Application of maintenance
scenarios
Qualitative evolution of R,S,C,A and comparison
WG4 and WG5 WORKSHOP
27th – 28th September 2018
Barcelona, Spain
SLIDE 334
OUTLINE
IMPLEMENTATION OF QUALITY CONTROL PLAN INTO TWO CASE STUDIES | MARIJA DOCEVSKA
QUALITY
CONTROL
PLAN
STEP 1
STEP 2
STEP 4
STEP 5
STEP 3
-Location
-Current traffic load vs. traffic
load model from design
-Visual inspections
-Results from NDT tests
-Exposure, Climate
-…
𝛽0 =𝜇𝑔
𝜎𝑔=
𝜇𝑅 − 𝜇𝑆
𝜎𝑅2 + 𝜎𝑆
2

WG4 and WG5 WORKSHOP
27th – 28th September 2018
Barcelona, Spain
SLIDE 335
QUALITY CONTROL PLAN
IMPLEMENTATION OF QUALITY CONTROL PLAN INTO TWO CASE STUDIES | MARIJA DOCEVSKA
TWO CASE STUDIESSTEP
ARCH CONCRETE BRIDGES
GENERAL DATA/1/
-Construction year:1940
-Category of road:
Regional road 324
-Construction year: 1963
-Category of road:National
road M-1 (E-75)
-Designed acc. to a
previous Code of practice
PORTUGAL MACEDONIA

WG4 and WG5 WORKSHOP
27th – 28th September 2018
Barcelona, Spain
SLIDE 336
QUALITY CONTROL PLAN
IMPLEMENTATION OF QUALITY CONTROL PLAN INTO TWO CASE STUDIES | MARIJA DOCEVSKA
TWO CASE STUDIESSTEP
STRUCTURAL SYSTEM
VULNERABLE AREAS
/2/
/2a/
Open spandrel deck arch
(simple supported)Open spandrel deck arch with
approaching structure (fixed end)
1 2 3
HMR HCR HDR
1,2-ULS; 2,3-SLS
HMR - High Moment Region
HCR - High Compression Region
HDR - High Deflection Region

WG4 and WG5 WORKSHOP
27th – 28th September 2018
Barcelona, Spain
SLIDE 337
QUALITY CONTROL PLAN
IMPLEMENTATION OF QUALITY CONTROL PLAN INTO TWO CASE STUDIES | MARIJA DOCEVSKA
TWO CASE STUDIESSTEP
DEFFECTS IN VULNERABLE AREAS - Portuguese bridge/2b/
A
BD
E
F
C
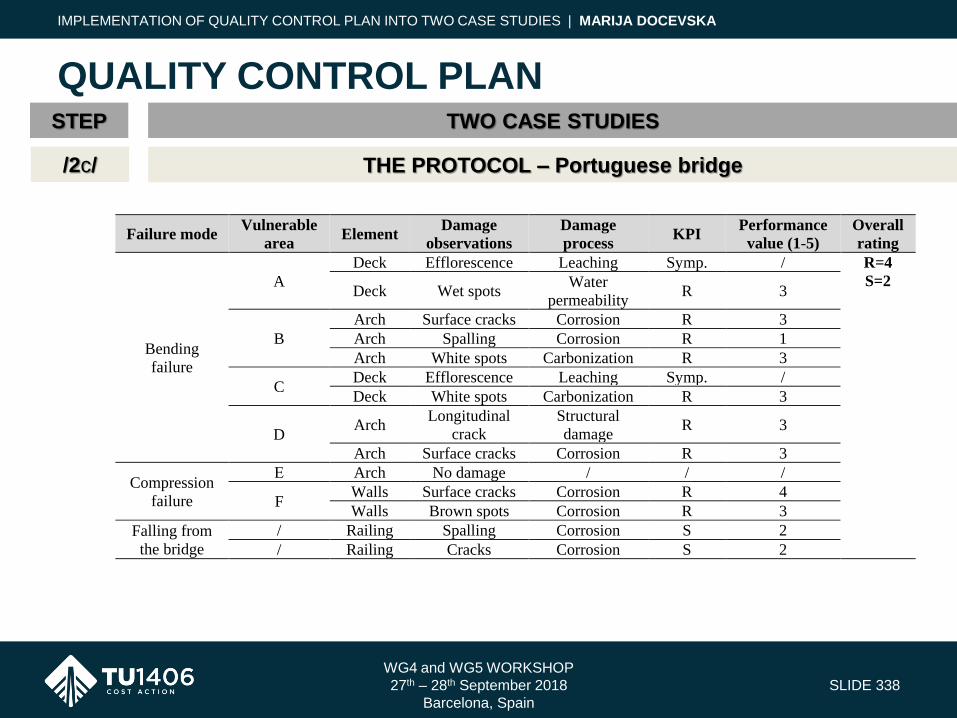
WG4 and WG5 WORKSHOP
27th – 28th September 2018
Barcelona, Spain
SLIDE 338
QUALITY CONTROL PLAN
IMPLEMENTATION OF QUALITY CONTROL PLAN INTO TWO CASE STUDIES | MARIJA DOCEVSKA
TWO CASE STUDIESSTEP
THE PROTOCOL – Portuguese bridge/2c/
Failure mode Vulnerable
area Element
Damage
observations
Damage
process KPI
Performance
value (1-5)
Overall
rating
Bending
failure
A
Deck Efflorescence Leaching Symp. / R=4
S=2 Deck Wet spots
Water
permeability R 3
B
Arch Surface cracks Corrosion R 3
Arch Spalling Corrosion R 1
Arch White spots Carbonization R 3
C Deck Efflorescence Leaching Symp. /
Deck White spots Carbonization R 3
D Arch
Longitudinal
crack
Structural
damage R 3
Arch Surface cracks Corrosion R 3
Compression
failure
Е Arch No damage / / /
F Walls Surface cracks Corrosion R 4
Walls Brown spots Corrosion R 3
Falling from
the bridge
/ Railing Spalling Corrosion S 2
/ Railing Cracks Corrosion S 2

WG4 and WG5 WORKSHOP
27th – 28th September 2018
Barcelona, Spain
SLIDE 339
QUALITY CONTROL PLAN
IMPLEMENTATION OF QUALITY CONTROL PLAN INTO TWO CASE STUDIES | MARIJA DOCEVSKA
TWO CASE STUDIESSTEP
DEFFECTS IN VULNERABLE AREAS - Macedonian bridge/2b/
A1
A2
B1/B2
C
D
E
F
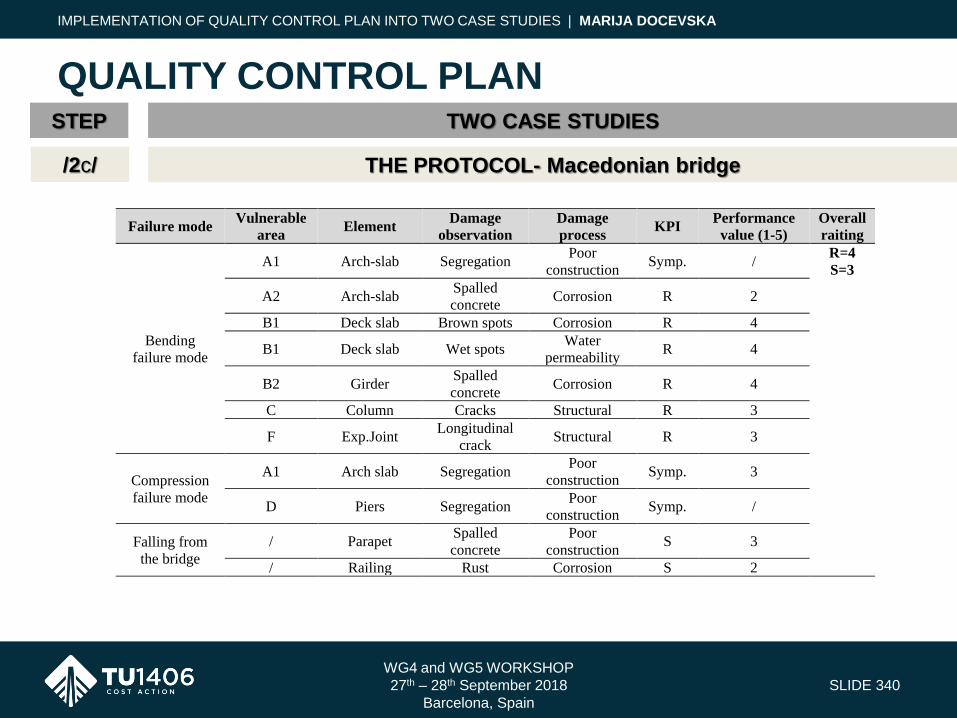
WG4 and WG5 WORKSHOP
27th – 28th September 2018
Barcelona, Spain
SLIDE 340
QUALITY CONTROL PLAN
IMPLEMENTATION OF QUALITY CONTROL PLAN INTO TWO CASE STUDIES | MARIJA DOCEVSKA
TWO CASE STUDIESSTEP
THE PROTOCOL- Macedonian bridge/2c/
Failure mode Vulnerable
area Element
Damage
observation
Damage
process KPI
Performance
value (1-5)
Overall
raiting
Bending
failure mode
A1 Arch-slab Segregation Poor
construction Symp. /
R=4
S=3
A2 Arch-slab Spalled
concrete Corrosion R 2
B1 Deck slab Brown spots Corrosion R 4
B1 Deck slab Wet spots Water
permeability R 4
B2 Girder Spalled
concrete Corrosion R 4
C Column Cracks Structural R 3
F Exp.Joint Longitudinal
crack Structural R 3
Compression
failure mode
A1 Arch slab Segregation Poor
construction Symp. 3
D Piers Segregation Poor
construction Symp. /
Falling from
the bridge
/ Parapet Spalled
concrete
Poor
construction S 3
/ Railing Rust Corrosion S 2
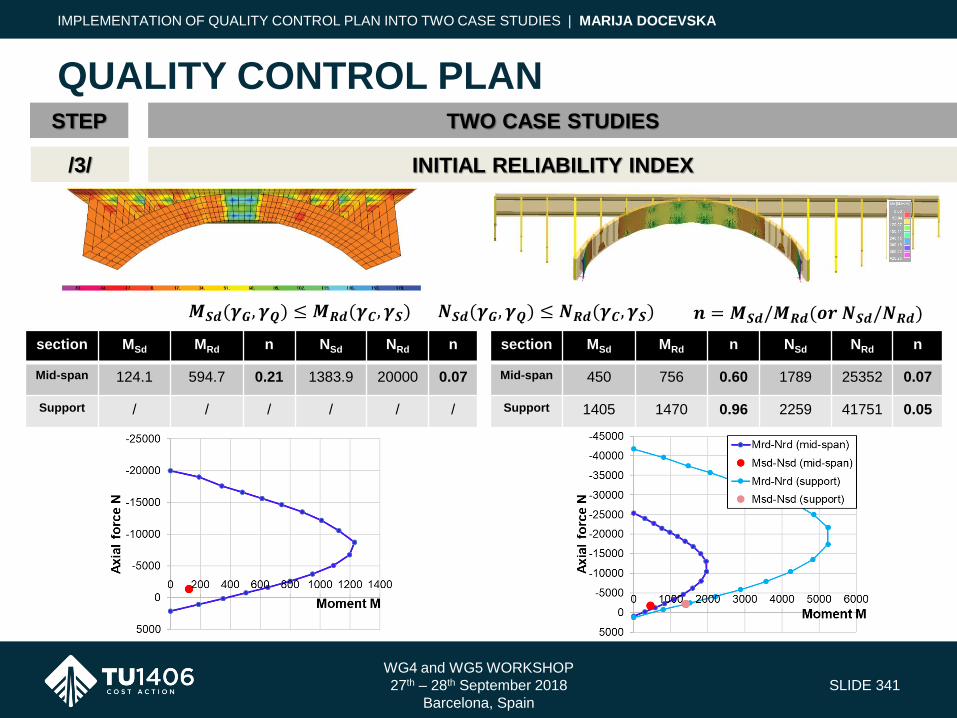
WG4 and WG5 WORKSHOP
27th – 28th September 2018
Barcelona, Spain
SLIDE 341
QUALITY CONTROL PLAN
IMPLEMENTATION OF QUALITY CONTROL PLAN INTO TWO CASE STUDIES | MARIJA DOCEVSKA
TWO CASE STUDIESSTEP
INITIAL RELIABILITY INDEX/3/
section MSd MRd n NSd NRd n
Mid-span 450 756 0.60 1789 25352 0.07
Support 1405 1470 0.96 2259 41751 0.05
section MSd MRd n NSd NRd n
Mid-span 124.1 594.7 0.21 1383.9 20000 0.07
Support / / / / / /
𝑴𝑺𝒅 𝜸𝑮, 𝜸𝑸 ≤ 𝑴𝑹𝒅 𝜸𝑪, 𝜸𝑺 𝑵𝑺𝒅 𝜸𝑮, 𝜸𝑸 ≤ 𝑵𝑹𝒅 𝜸𝑪, 𝜸𝑺 𝒏 = 𝑴𝑺𝒅/𝑴𝑹𝒅 𝒐𝒓 𝑵𝑺𝒅/𝑵𝑹𝒅

WG4 and WG5 WORKSHOP
27th – 28th September 2018
Barcelona, Spain
SLIDE 342
QUALITY CONTROL PLANTWO CASE STUDIESSTEP
INITIAL RELIABILITY INDEX/3/
𝛽0𝑏𝑟𝑖𝑑𝑔𝑒 = 𝛽0
𝑚𝑖𝑑−𝑠𝑝𝑎𝑛 = −𝛷−1 𝑃𝑓
𝜷𝟎𝒃𝒓𝒊𝒅𝒈𝒆 = 𝟓. 𝟐𝟓
𝜷𝟎𝒎𝒊𝒅. = 𝟓. 𝟐𝟓
𝑳𝒊𝒎𝒊𝒕 𝒔𝒕𝒂𝒕𝒆 𝒇𝒖𝒏𝒄𝒕𝒊𝒐𝒏: 𝒈 𝑹, 𝑺 = 𝑹− 𝑺 = 𝟎 𝑹 = 𝑴𝑹𝒅 = 𝑭𝒄𝒅 × 𝒛 + 𝑭𝒔𝒅𝟐 × 𝒅 − 𝒂𝟐 −𝑵𝒔𝒅 ×𝒉
𝟐− 𝒂𝟏
𝑺 = 𝑴𝒔𝒅 = 𝟏𝟐𝟒. 𝟎𝟔𝒌𝑵𝒎 𝑺 𝒎𝒊𝒅 = 𝑴𝒔𝒅 = 𝟒𝟓𝟎 𝒌𝑵𝒎 𝑺 𝒔𝒖𝒑𝒑. = 𝑴𝒔𝒅 = 𝟏𝟒𝟎𝟓 𝒌𝑵𝒎
𝜷𝟎𝒎𝒊𝒅. = 𝟐. 𝟒𝟎
𝜷𝟎𝒃𝒓𝒊𝒅𝒈𝒆 = −𝛷−1 𝑃𝑓
= 𝟐. 𝟖𝟕
𝜷𝟎𝒔𝒖𝒑𝒑. = 𝟎. 𝟔𝟔
IMPLEMENTATION OF QUALITY CONTROL PLAN INTO TWO CASE STUDIES | MARIJA DOCEVSKA

WG4 and WG5 WORKSHOP
27th – 28th September 2018
Barcelona, Spain
SLIDE 343
QUALITY CONTROL PLANTWO CASE STUDIESSTEP
RESISTANCE REDUCTION/3a/
7%
𝛽0 = 5.25𝛽0′ = 4.90
IMPLEMENTATION OF QUALITY CONTROL PLAN INTO TWO CASE STUDIES | MARIJA DOCEVSKA
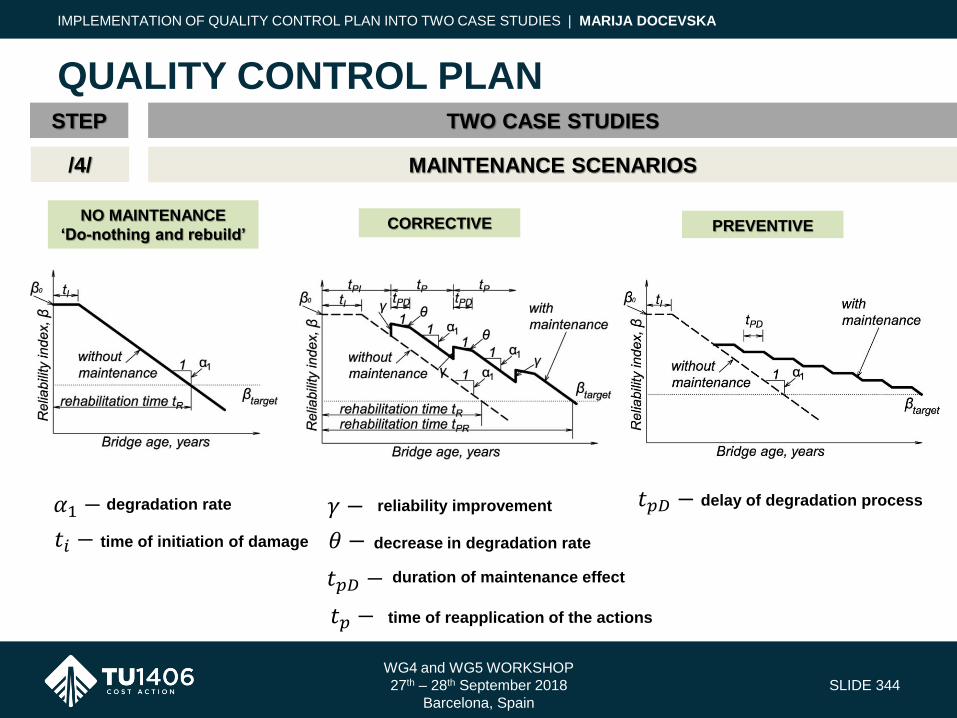
WG4 and WG5 WORKSHOP
27th – 28th September 2018
Barcelona, Spain
SLIDE 344
QUALITY CONTROL PLANTWO CASE STUDIESSTEP
MAINTENANCE SCENARIOS/4/
NO MAINTENANCE
‘Do-nothing and rebuild’CORRECTIVE PREVENTIVE
𝛼1 − degradation rate
𝑡𝑖 − time of initiation of damage
𝛾 − reliability improvement
𝜃 − decrease in degradation rate
𝑡𝑝𝐷 − duration of maintenance effect
𝑡𝑝 − time of reapplication of the actions
𝑡𝑝𝐷 − delay of degradation process
IMPLEMENTATION OF QUALITY CONTROL PLAN INTO TWO CASE STUDIES | MARIJA DOCEVSKA

WG4 and WG5 WORKSHOP
27th – 28th September 2018
Barcelona, Spain
SLIDE 345
QUALITY CONTROL PLANTWO CASE STUDIESSTEP
MAINTENANCE SCENARIOS/4/
𝛽 𝑡 = 𝛽𝑜, 0 ≤ 𝑡 ≤ 𝑡𝑖
𝛽𝑜 − 𝑡 − 𝑡𝑖 𝛼, 𝑡 ≥ 𝑡𝑖
NO MAINTENANCE
‘Do-nothing and rebuild’CORRECTIVE PREVENTIVE
IMPLEMENTATION OF QUALITY CONTROL PLAN INTO TWO CASE STUDIES | MARIJA DOCEVSKA

WG4 and WG5 WORKSHOP
27th – 28th September 2018
Barcelona, Spain
SLIDE 346
QUALITY CONTROL PLANTWO CASE STUDIESSTEP
MAINTENANCE SCENARIOS/4/
CORRECTIVE
PREVENTIVE
Action td [years] δ [years-1] γ [/]
Crack sealing [0.5 1.5 3] [0.7 0.8 0.9] [2 1 1]
Depth conc.
repair
- - [1 0 0]
Waterproofing [2 3 3] [0.75 0.8 1.0] -
Bearing
replacement - - [2 2 2]
Action td [years] δ [years-1] γ [/]
Deck
washing
[1 1.5 2] - -
Minor spall
repairs
[1.5 2 3] - -
Concrete spot
painting
[4 6 8] [0.3 0.4 0.5] -
Bearing
cleaning[0.5 1 2] - -
IMPLEMENTATION OF QUALITY CONTROL PLAN INTO TWO CASE STUDIES | MARIJA DOCEVSKA
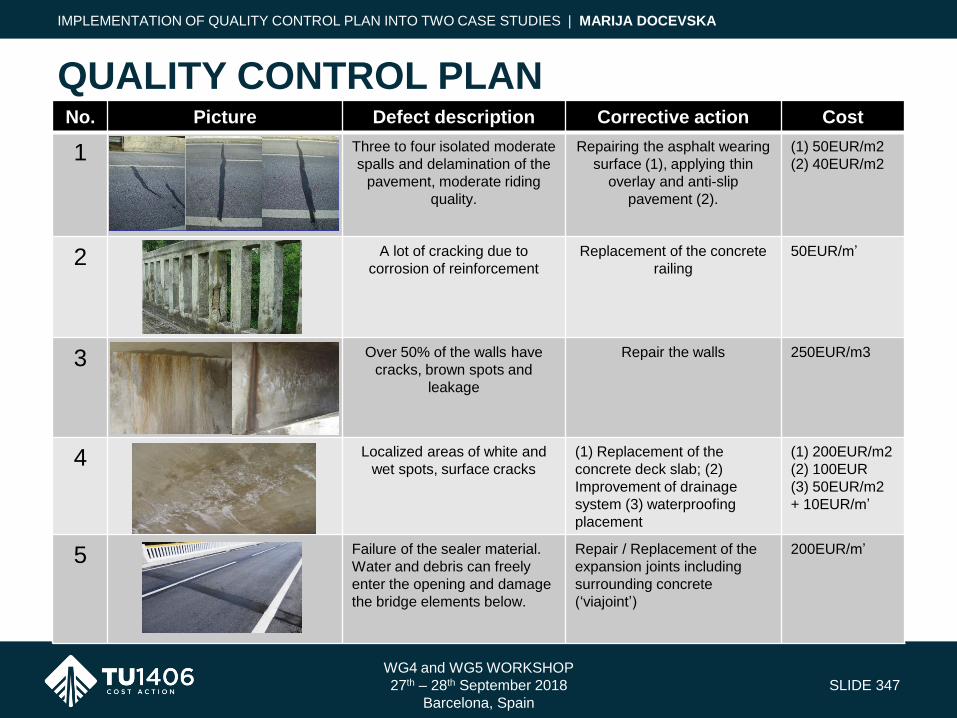
WG4 and WG5 WORKSHOP
27th – 28th September 2018
Barcelona, Spain
SLIDE 347
QUALITY CONTROL PLANNo. Picture Defect description Corrective action Cost
1 Three to four isolated moderate
spalls and delamination of the
pavement, moderate riding
quality.
Repairing the asphalt wearing
surface (1), applying thin
overlay and anti-slip
pavement (2).
(1) 50EUR/m2
(2) 40EUR/m2
2 A lot of cracking due to
corrosion of reinforcement
Replacement of the concrete
railing
50EUR/m’
3 Over 50% of the walls have
cracks, brown spots and
leakage
Repair the walls 250EUR/m3
4 Localized areas of white and
wet spots, surface cracks
(1) Replacement of the
concrete deck slab; (2)
Improvement of drainage
system (3) waterproofing
placement
(1) 200EUR/m2
(2) 100EUR
(3) 50EUR/m2
+ 10EUR/m’
5 Failure of the sealer material.
Water and debris can freely
enter the opening and damage
the bridge elements below.
Repair / Replacement of the
expansion joints including
surrounding concrete
(‘viajoint’)
200EUR/m’
IMPLEMENTATION OF QUALITY CONTROL PLAN INTO TWO CASE STUDIES | MARIJA DOCEVSKA
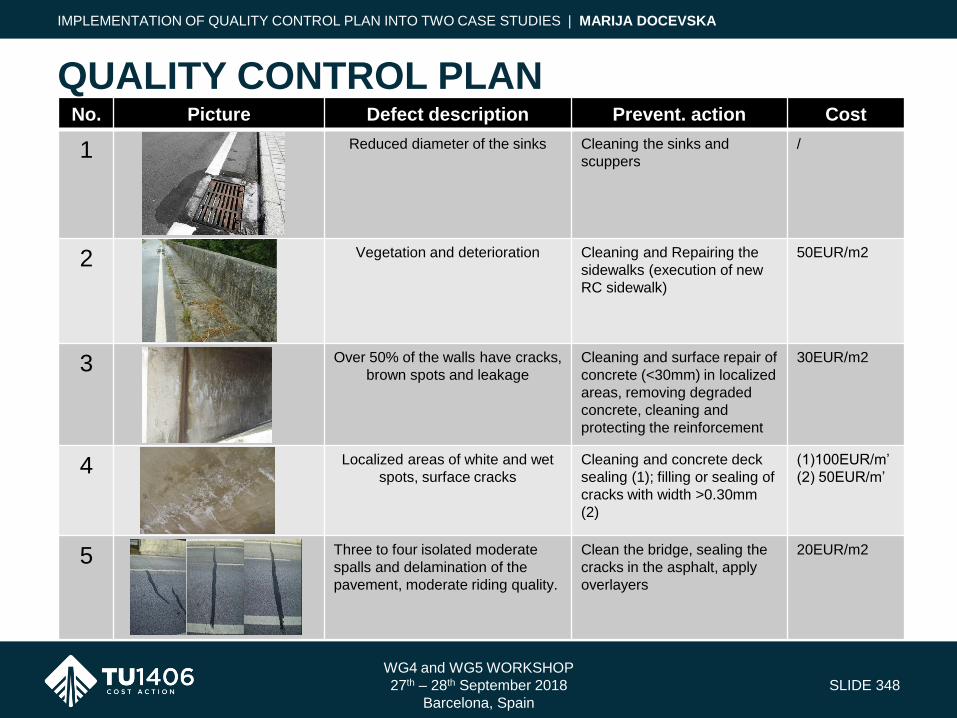
WG4 and WG5 WORKSHOP
27th – 28th September 2018
Barcelona, Spain
SLIDE 348
QUALITY CONTROL PLANNo. Picture Defect description Prevent. action Cost
1 Reduced diameter of the sinks Cleaning the sinks and
scuppers
/
2 Vegetation and deterioration Cleaning and Repairing the
sidewalks (execution of new
RC sidewalk)
50EUR/m2
3 Over 50% of the walls have cracks,
brown spots and leakage
Cleaning and surface repair of
concrete (<30mm) in localized
areas, removing degraded
concrete, cleaning and
protecting the reinforcement
30EUR/m2
4 Localized areas of white and wet
spots, surface cracks
Cleaning and concrete deck
sealing (1); filling or sealing of
cracks with width >0.30mm
(2)
(1)100EUR/m’
(2) 50EUR/m’
5 Three to four isolated moderate
spalls and delamination of the
pavement, moderate riding quality.
Clean the bridge, sealing the
cracks in the asphalt, apply
overlayers
20EUR/m2
IMPLEMENTATION OF QUALITY CONTROL PLAN INTO TWO CASE STUDIES | MARIJA DOCEVSKA
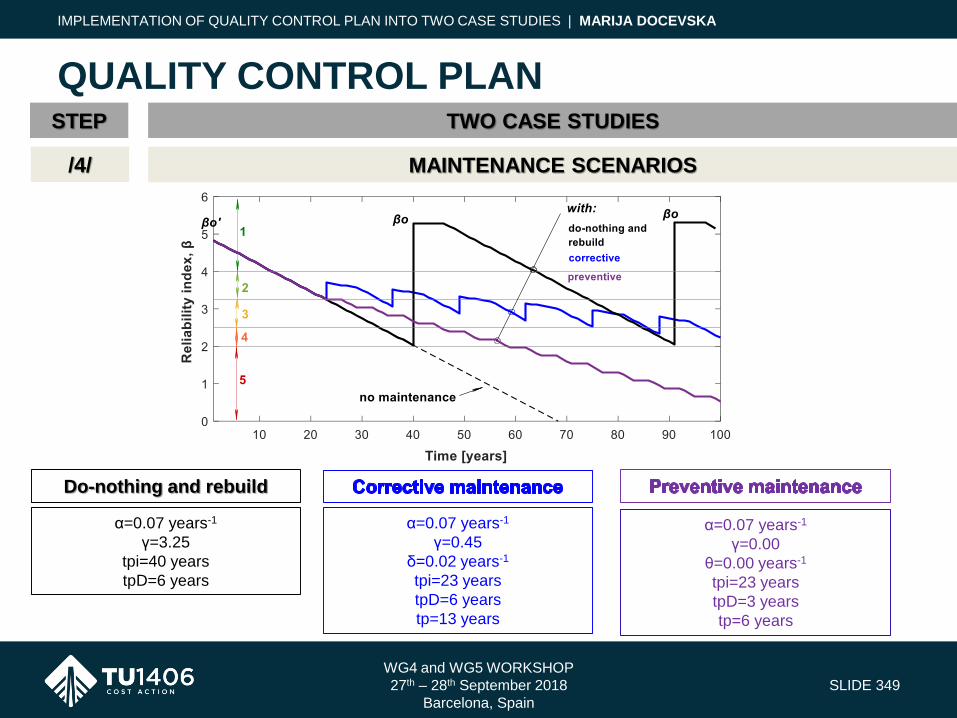
WG4 and WG5 WORKSHOP
27th – 28th September 2018
Barcelona, Spain
SLIDE 349
QUALITY CONTROL PLANTWO CASE STUDIESSTEP
MAINTENANCE SCENARIOS/4/
Do-nothing and rebuild
α=0.07 years-1
γ=3.25
tpi=40 years
tpD=6 years
α=0.07 years-1
γ=0.45
δ=0.02 years-1
tpi=23 years
tpD=6 years
tp=13 years
α=0.07 years-1
γ=0.00
θ=0.00 years-1
tpi=23 years
tpD=3 years
tp=6 years
IMPLEMENTATION OF QUALITY CONTROL PLAN INTO TWO CASE STUDIES | MARIJA DOCEVSKA

WG4 and WG5 WORKSHOP
27th – 28th September 2018
Barcelona, Spain
SLIDE 350
STEP
Qualitative evolution of
KPIs –Portuguese
bridge
/5/
IMPLEMENTATION OF QUALITY CONTROL PLAN INTO TWO CASE STUDIES | MARIJA DOCEVSKA

WG4 and WG5 WORKSHOP
27th – 28th September 2018
Barcelona, Spain
SLIDE 351
QUALITY CONTROL PLANTWO CASE STUDIESSTEP
Qualitative evolution of KPIs – Macedonian bridge/5/
IMPLEMENTATION OF QUALITY CONTROL PLAN INTO TWO CASE STUDIES | MARIJA DOCEVSKA
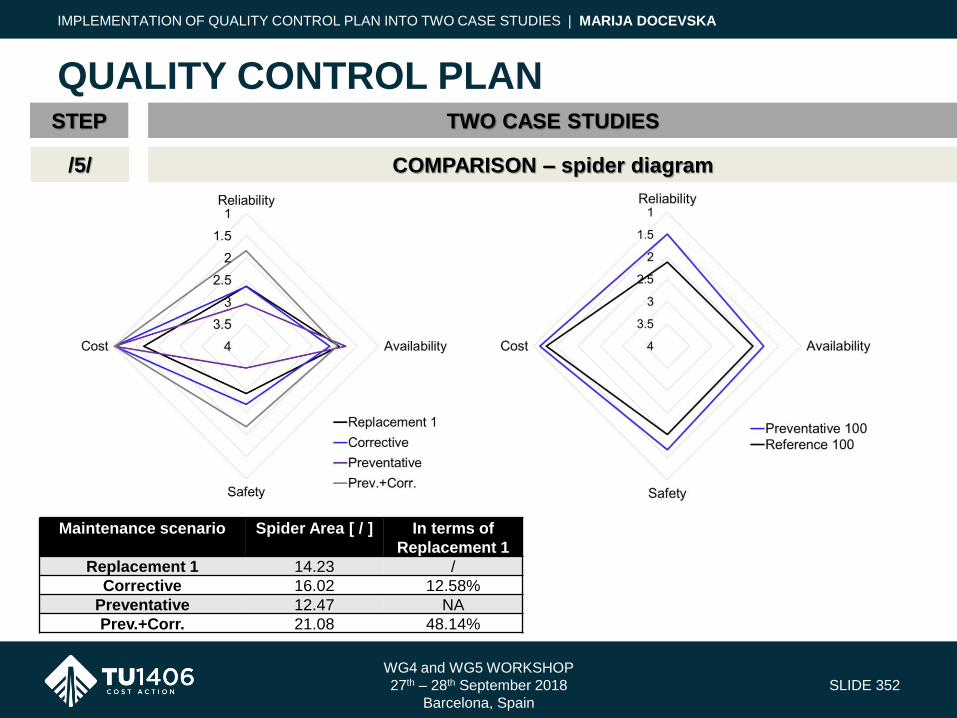
WG4 and WG5 WORKSHOP
27th – 28th September 2018
Barcelona, Spain
SLIDE 352
QUALITY CONTROL PLANTWO CASE STUDIESSTEP
COMPARISON – spider diagram/5/
Maintenance scenario Spider Area [ / ] In terms of
Replacement 1
Replacement 1 14.23 /
Corrective 16.02 12.58%
Preventative 12.47 NA
Prev.+Corr. 21.08 48.14%
IMPLEMENTATION OF QUALITY CONTROL PLAN INTO TWO CASE STUDIES | MARIJA DOCEVSKA
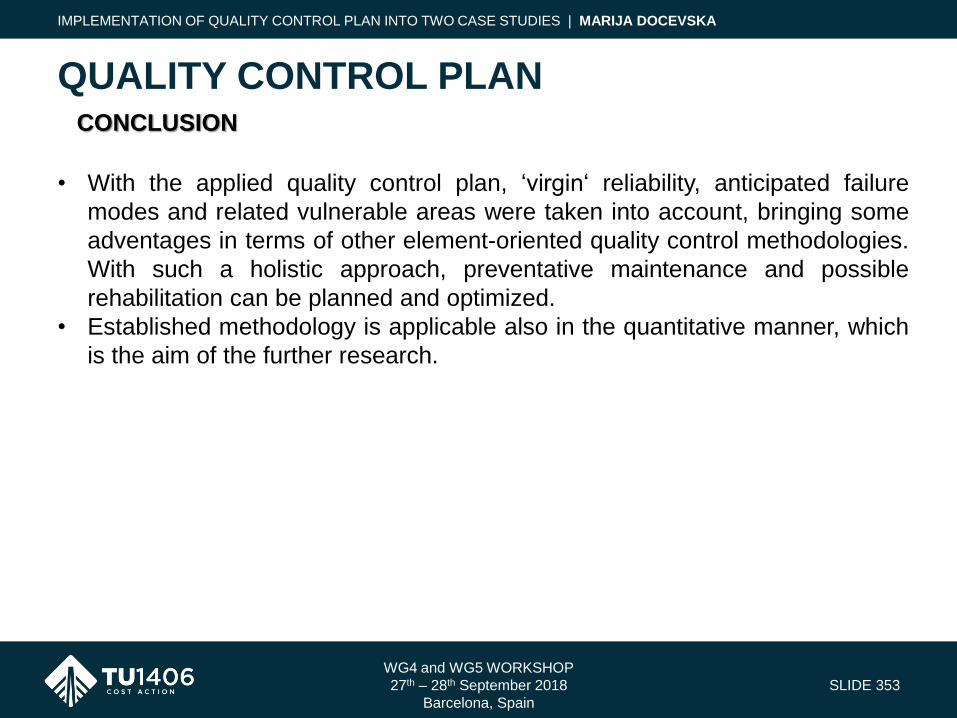
WG4 and WG5 WORKSHOP
27th – 28th September 2018
Barcelona, Spain
SLIDE 353
QUALITY CONTROL PLANCONCLUSION
IMPLEMENTATION OF QUALITY CONTROL PLAN INTO TWO CASE STUDIES | MARIJA DOCEVSKA
• With the applied quality control plan, ‘virgin‘ reliability, anticipated failure
modes and related vulnerable areas were taken into account, bringing some
adventages in terms of other element-oriented quality control methodologies.
With such a holistic approach, preventative maintenance and possible
rehabilitation can be planned and optimized.
• Established methodology is applicable also in the quantitative manner, which
is the aim of the further research.

THANK YOU FOR YOUR ATTENTION!
WWW.TU1406.EU