City of Napa Bicycle Plan
206
January 2012 Submitted by Whitlock & Weinberger Transportation, Inc. 490 Mendocino Avenue Suite 201 Santa Rosa, CA 95401 voice 707.542.9500 475 14 th Street Suite 290 Oakland, CA 94612 voice 510.444.2600 web www.w-trans.com Questa Engineering Corporation 1220 Brickyard Cove Road Suite 206 Point Richmond, CA 94801 voice 510.236.6114 web www.questaec.com City of Napa Bicycle Plan Prepared for Napa County Transportation & Planning Agency City of Napa
-
Upload
khangminh22 -
Category
Documents
-
view
0 -
download
0
Transcript of City of Napa Bicycle Plan
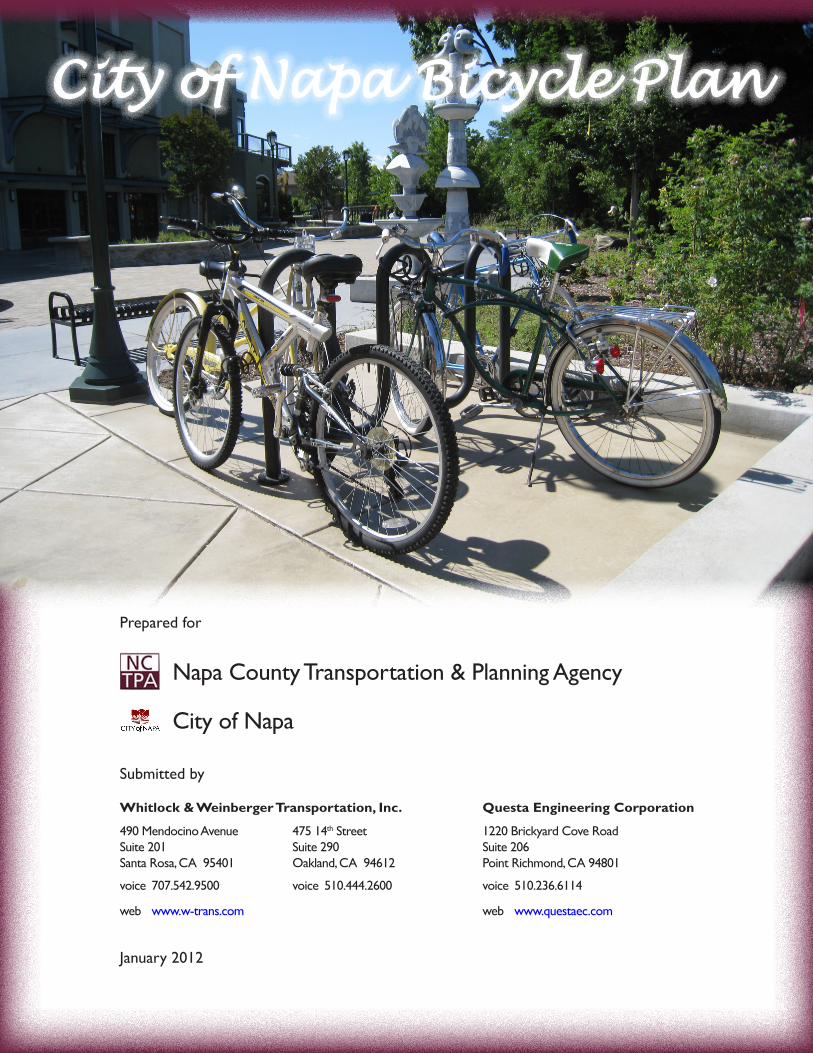
January 2012
Submitted by
Whitlock & Weinberger Transportation, Inc.
490 Mendocino AvenueSuite 201Santa Rosa, CA 95401
voice 707.542.9500
475 14th StreetSuite 290Oakland, CA 94612
voice 510.444.2600
web www.w-trans.com
Questa Engineering Corporation
1220 Brickyard Cove RoadSuite 206Point Richmond, CA 94801
voice 510.236.6114
web www.questaec.com
City of Napa Bicycle Plan
Prepared for
Napa County Transportation & Planning Agency
City of Napa

City of Napa Bicycle Plan January 2012
Acknowledgments
Project Team
Napa County Transportation & Planning Agency Eliot Hurwitz, Program Manager Paul Price, Executive Director Renée Kulick, Administrative Assistant
Consultant Team
Whitlock & Weinberger Transportation, Inc. Steve Weinberger, PE, PTOE, Principal Mary Jo Yung, PE, PTOE, Traffic Engineer Allan Tilton, PE, Traffic Engineer Josh Abrams, Transportation Planner Angela McCoy, Editing/Formatting Dalene J. Whitlock, PE, PTOE, Report Review Questa Engineering Corporation Jeffery Peters, Principal Margaret Henderson, ASLA, Principal Aaron Fulton, GIS Specialist Shaun O’Bryan, GIS Specialist
Project Steering Committee
Michael Costanzo, Executive Director Napa County Bicycle Coalition/ Napa County Bicycle Advisory Committee
Randy Davis, Director, Parks and Recreation City of American Canyon
Jean Hasser, Principal Planner (Retired) City of Napa
Greg Desmond, Acting Planning Director City of St. Helena
Rick Marshall, Deputy Director, Public Works County of Napa
City Staff
Jacques Larochelle, Public Works Director
Eric Whan, Assistant Public Works Director
Helena Allison, Traffic Engineer Jason Holley, Senior Civil Engineer Jean Hasser, Principal Planner (Retired)
City Council
Jill Techel, Mayor James Krider, Vice Mayor Peter Mott Juliana Inman Mark van Gorder
Planning Commission
Gordon Huether, Chairperson Tom Trzesniewski, Vice Chairperson Michael Murray Arthur Roosa Carol Whichard

City of Napa Bicycle Plan Page i January 2012
Table of Contents
Page Introduction ........................................................................................................................................................................ 1
Setting and Context ........................................................................................................................................................ 11
Bicyclists and Bicycle Facilities ...................................................................................................................................... 28
The Local Bicycle Transportation Network ............................................................................................................. 32
Implementation ................................................................................................................................................................ 71
Definitions, Terms, and List of Acronyms ................................................................................................................. 84
Bibliography ....................................................................................................................................................................... 89
Figures
1 City of Napa Bikeways Map ......................................................................................................................................................3 2 Planning Area – City of Napa ...................................................................................................................................................4 3 Planning Area – Mid Valley .......................................................................................................................................................5 4 Planning Area – South Valley ....................................................................................................................................................6 5 Napa County Bicycle Facilities .................................................................................................................................................7 6 City of Napa Land Use Map .................................................................................................................................................. 12 7 City of Napa Circulation Map ............................................................................................................................................... 16 8 City of Napa Bicycle Collisions ............................................................................................................................................. 35 9 City of Napa Bicycle Count Locations ................................................................................................................................ 41 10 Grant Application Development Calendar ......................................................................................................................... 83
Tables
1 Required Bicycle Master Plan Elements .................................................................................................................................9 2 General Community Statistics .............................................................................................................................................. 11 3 2000 US Census – Travel Time to Work .......................................................................................................................... 14 4 2000 US Census – Mode Split Data for the City of Napa .............................................................................................. 14 5 Bicyclist Types, Preferences and Needs .............................................................................................................................. 29 6 City of Napa Bicycle Collisions High Incidence Intersections (January 1, 1999 – December 31, 2008) .............. 37 7 City of Napa Bicycle Collisions High Incidence Mid-Block Locations (January 1, 1999 – December 31, 2008) . 38 8 Napa Proposed Bike Count Locations ................................................................................................................................ 43 9 Napa Schools ............................................................................................................................................................................ 44 10 City of Napa Parks .................................................................................................................................................................. 46 11 Napa Bicycle Shops ................................................................................................................................................................. 47 12 Existing Napa Bikeway Segments ......................................................................................................................................... 48 13 City of Napa Park and Ride Lots .......................................................................................................................................... 53 14 Proposed Bikeways and Project Priorities ......................................................................................................................... 57 15 Bicycle System Maintenance .................................................................................................................................................. 72 16 Maintenance Cost Assumptions ........................................................................................................................................... 73 17 Construction Cost Assumptions for Bikeway Improvements ....................................................................................... 75 18 Cost Assumptions for Programmatic Improvements ...................................................................................................... 77 19 Napa Historical Expenditures on Bicycle Facilities Fiscal Year 2004/05 to 2009/10 ................................................. 79

City of Napa Bicycle Plan Page ii January 2012
Appendices
A Summaries of Relevant Planning Documents and Policies B City of Napa’s Policy Guidelines: Share the Road Signs C City of Napa’s Policy Guidelines: Bicycle Boulevard D Bikeway Type Design Details E OTS Collision Rankings, Charts and Graphs F MTC and National Bicycle and Pedestrian Documentation Project Information G Napa Bicycle Parking Facilities – Existing Bike Racks Inventory (Field Survey June 2010) H Project Ranking Matrix I Funding Program Summaries

City of Napa Bicycle Plan Page 1 January 2012
Introduction
Purpose of the Plan
The Napa Bicycle Plan was developed as a component of the Napa County Transportation Authority’s Countywide Bicycle Plan Update. The Plan is intended to guide and influence the development of bikeways, bicycle policies, bicycle programs and bicycle facility design standards to make bicycling throughout the City of Napa and Napa County more safe, comfortable, convenient and enjoyable for all bicyclists. The overarching goal of the Bicycle Plan is to increase the number of persons who bicycle throughout the City and County of Napa for transportation to work, school, for utilitarian purposes, and recreation.
This Countywide Bicycle Plan presents a cooperatively-developed 25-year vision for building a complete bicycling system for our community. It also presents a carefully chosen set of specific goals, objectives, and policies to guide the ongoing evolution of that system.
Napa County, with its varied terrain, beautiful scenery, and mild weather is ideal for both practical and recreational cycling. Cities in the County are relatively flat and compact, characteristics that are optimal for intra-city commute and utilitarian trips. Currently, inter-city travel on the valley floor via bicycle can be challenging because of the distance between the cities, limited connections, and roads with high-speed traffic. Outside of the cities and valley floor, the County’s mountains, valleys, and scenery provide a “world class” experience that is a physically challenging and attractive for recreational cyclists.
This Plan has been developed at a time when there has been a strong surge of interest in bicycling in Napa County, as well as in the Bay Area Region, the nation and the world. New programs, systems and technologies have been emerging month by month, spurred on by an intention to reduce greenhouse gas emissions, to promote more active, healthy transportation options, to reduce traffic congestion, and to provide connections between our communities. The Napa Vine Trail Coalition, dedicated to creating a Class I Multi-use Path the full length of Napa Valley, has emerged as a popular community organization, made up of 27 of the county’s most influential non-profit and government groups. The Napa Bicycle Coalition, recently re-named “Napa Bike,” has energized the cycling community to become an even more active participant in the development of cycling resources in the county. The local “Safe Routes to School” program has been expanding rapidly, now serving schools throughout Napa County. The Napa County Transportation and Planning Agency (NCTPA) has adopted a long range strategic goal of having 10 percent of all trips made by bicycle in Napa County. This new Countywide Bicycle Plan is one way that NCTPA looks to accomplish this goal, in close partnership with the governments, non-profit organizations and citizens of our community.
This plan has been developed to address the needs of all types of bicyclists, including novice riders and children, the average bicyclist, and advanced riders and commuters, as well as shoppers, recreational riders, and tourists. Important reasons for increasing bicycle travel include reducing congestion and greenhouse gas emissions due to automobile traffic as well as general public health benefits of active transportation. This plan is designed to address the most common reasons why people do NOT use bicycles, including lack of convenience and perceived safety concerns. Important reasons for increasing bicycle travel include reducing congestion and greenhouse gas emissions due to automobile traffic as well as general public health benefits of active transportation.
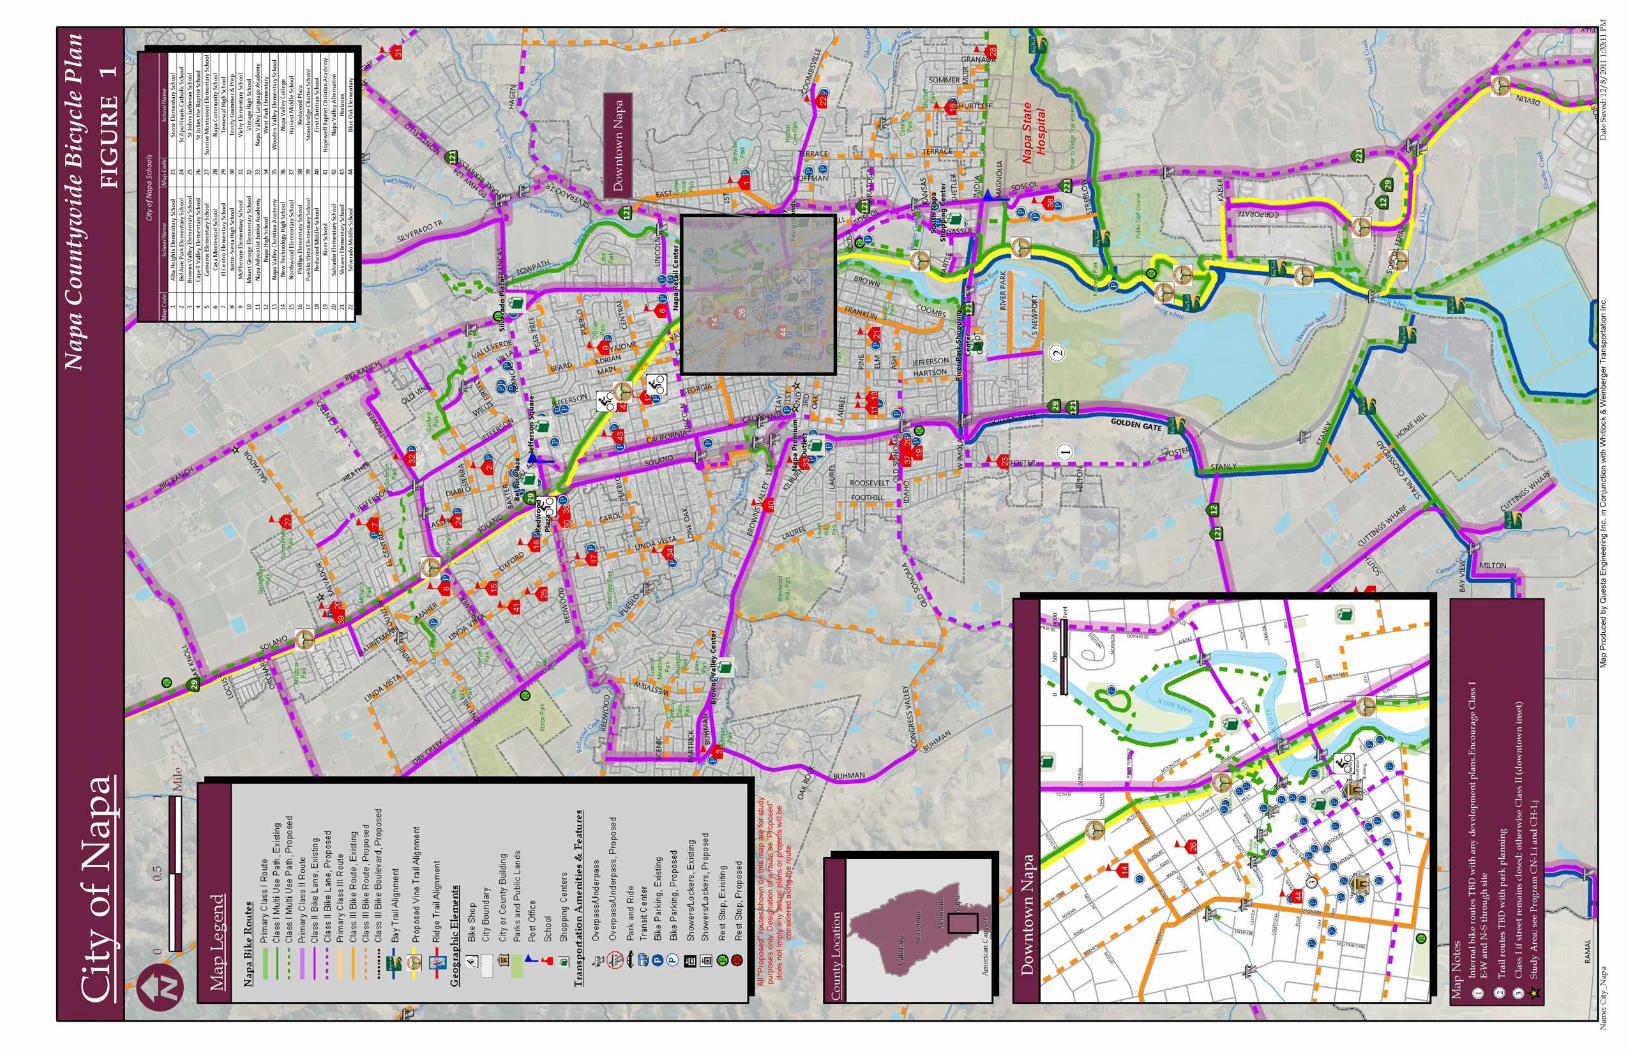
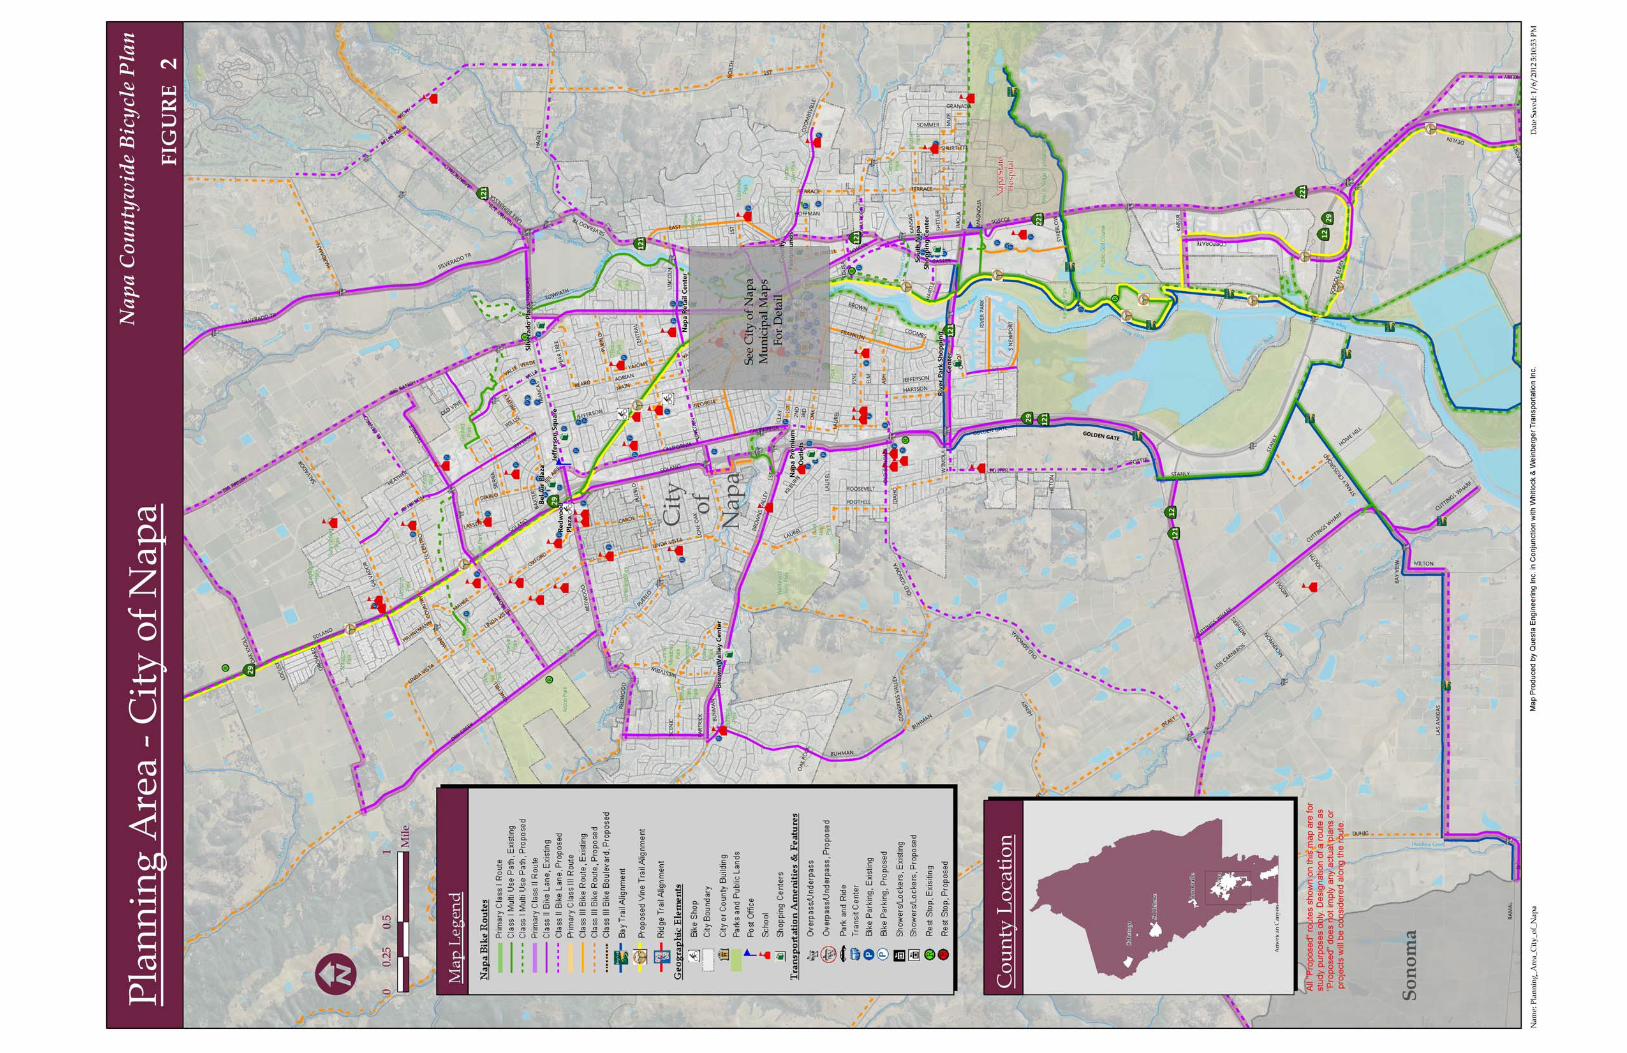
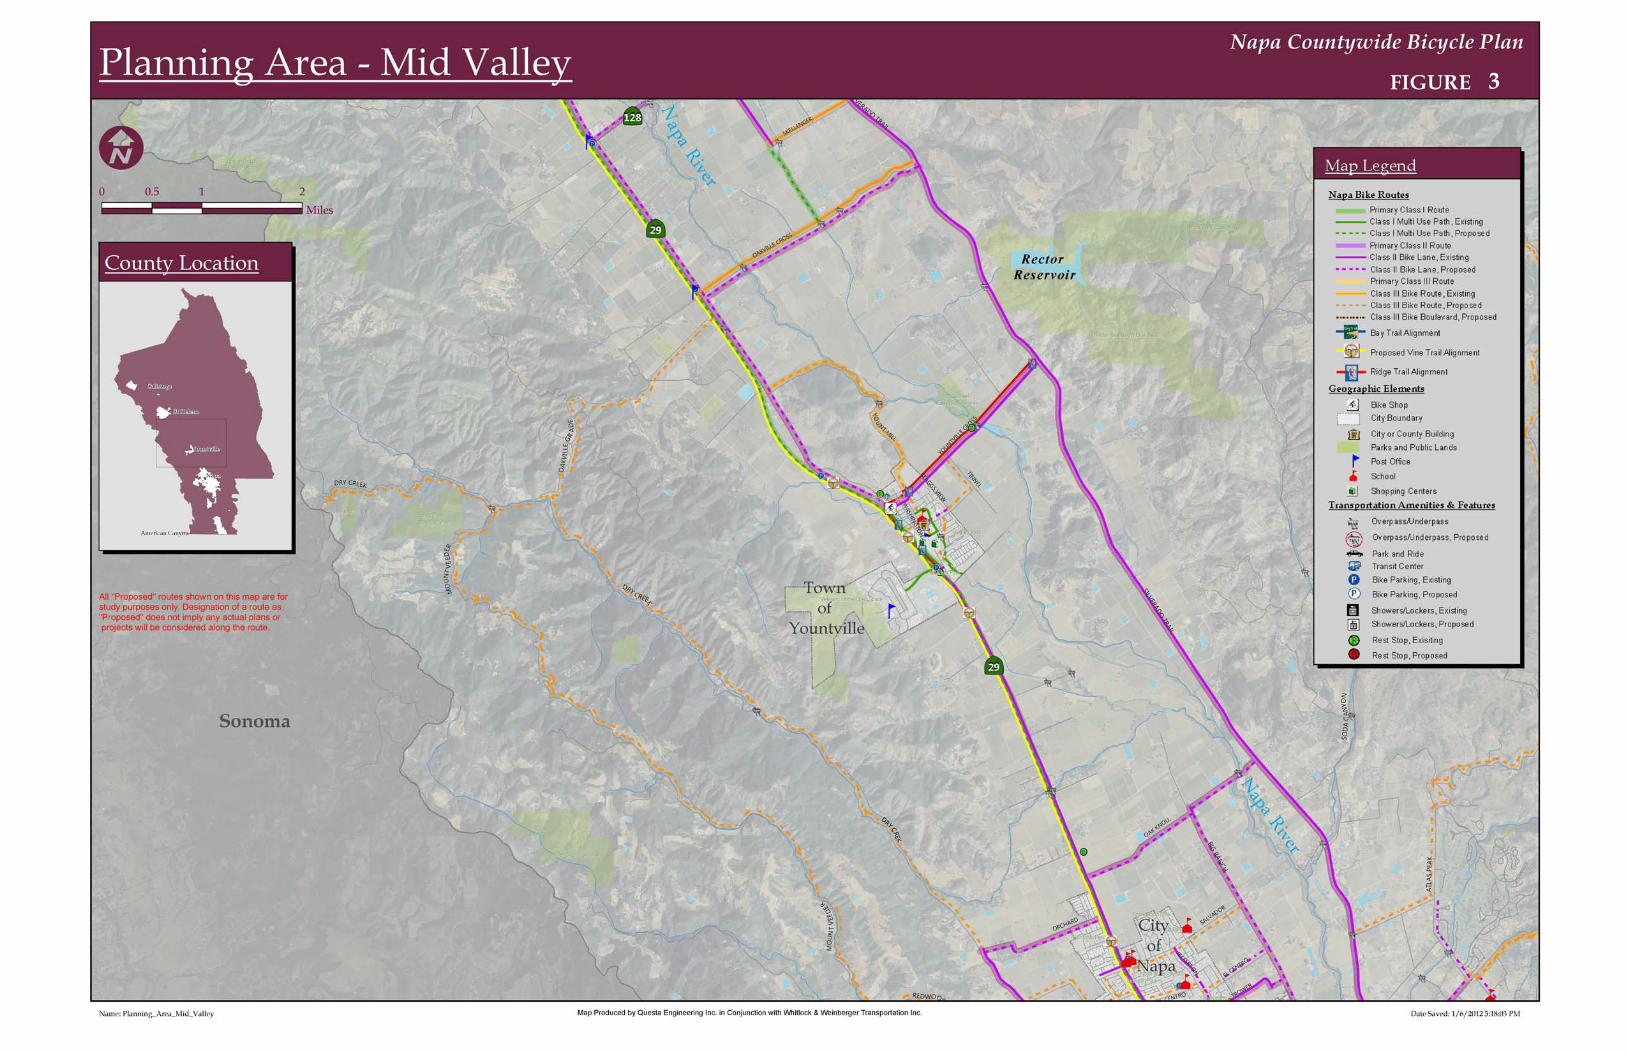
Bicycle Plan Maps including the City of Napa Bikeways Map, Planning Area – City of Napa, Planning Area – Mid Valley, Planning Area – South Valley, and Napa County Bicycle Facilities are shown in Figures 1-5 respectively. The Plan is expected to be adopted as an update of the City’s General Plan.

City of Napa Bicycle Plan Page 2 January 2012
This page intentionally left blank
1
2
3

4

5

City of Napa Bicycle Plan Page 8 January 2012
This page intentionally left blank

City of Napa Bicycle Plan Page 9 January 2012
Background
This Bicycle Master Plan is Napa’s first comprehensive bicycle plan, though Napa has a long history of planning bicycle facilities. Previous bicycle planning and implementation efforts have included adopting bicycle route maps, developing policies and guidance that were included in the General Plan, addressing bicycle facility planning in various specific plans, and forming a Bicycle Trails Advisory Commission.
Caltrans Compliance
The Napa Bicycle Plan was prepared in accordance with the California Bicycle Transportation Act. To be eligible for Bicycle Transportation Account Funds, the California Bicycle Transportation Act requires that cities and counties prepare and adopt a Bicycle Transportation Plan that addresses items a – k in Section 891.2 of the Streets and Highways Code. These items are outlined in Table 1. To maintain eligibility with the Caltrans BTA, Bicycle Transportation Plans must be updated every five years. Information on the Bicycle Transportation Act, Bicycle Transportation Plan (BTP) preparation and processing and eligible Bicycle Transportation Account projects is available on Caltrans’ BTA webpage: http://www.dot.ca.gov/hq/LocalPrograms/bta/btawebPage.htm
Table 1 Required Bicycle Master Plan Elements
California Bicycle Transportation Act (1994) Bicycle Plan Update Reference Page
a. Estimated number of existing and future bicycle commuters
Existing – Table 4 ........................................................ 14 Proposed – Objective 1 ............................................ 19
b. Map and description of land use settlement patterns
Setting and Land Use ............................................... 11
c. Map and description of existing and proposed bikeways
Figures 1-5 ................................................................. 3-7 Existing – Bikeways Inventory ...................................... 47 Existing – Table 12 ..................................................... 48-51 Proposed – Proposed Bikeway System ...................... 54 Proposed – Table 14 .................................................. 57-63
d. Map and description of bicycle parking facilities Figure 1 ......................................................................... 3 Bicycle Parking ........................................................ 52
e. Map and description of multi-modal connections Figure 1 ................................................................................ 3 Multi-Modal Connections ............................................. 52
f. Map and description of facilities for changing and storing clothes and equipment
Figure 1 ................................................................................ 3 Shower and Locker Facilities ....................................... 67
g. Description of bicycle safety and education programs
Safety, Education, and Support Programs ........... 67
h. Description of citizen and community participation
Public Participation ................................................... 10
i. Description of consistency with transportation, air quality, and energy conservation plans
Coordination and Consistency with Existing Plans and Policies .............................................. 18
j. Description of proposed projects and implementation priorities
Proposed Improvements .............................................. 53 Table 14 ....................................................................... 57-63
k. Description of past expenditures and future financial needs for bicycle facilities
Past – Table 19 ................................................................. 79 Future –Table 14 ........................................................ 57-63

City of Napa Bicycle Plan Page 10 January 2012
Public Participation
This Bicycle Plan Update was developed over an 18-month period in 2010/11. The Plan was prepared by a consulting team working closely with NCTPA staff, a Project Steering Committee, local agency staff, the Napa Bicycle and Trails Advisory Commission, other responsible groups from the County and Napa’s cities, stakeholders, the bicycle community, and interested citizens. The 2011 Napa Countywide Bicycle Plan Update builds upon the efforts of NCTPA’s 2003 Plan and integrates new projects, partnerships, concepts, and programs. Public participation was an important component of the Countywide Bicycle Plan Update. The NCTPA and plan participants solicited public input on existing conditions for bicyclists, potential improvement projects and programs, and site specific issues such as safety concerns, access, connectivity, bicycle parking, and other items needed to improve conditions for bicyclists in the Plan Area. The public participation process utilized an “advocacy” approach, where the general public and citizen representatives serving on advisory committees were instrumental in the development of a vision for bicycling in the community. The public participation process is summarized below.
• Project Steering Committee – A project steering committee comprised of local agency staff, representatives from the Napa County Bicycle Coalition, Vine Trail Coalition, Napa County Safe Routes to Schools Program, Bay Trail Project, and Napa County Parks and Open Space, bicycle advocates, and others was established to oversee the development and progress of the Plan.
• Advisory Commission Meetings – The project consultant and NCTPA staff attended bicycle or other responsible advisory commission meetings in each participating jurisdiction to kick off the project, collect input on issues and opportunities, and develop a vision and goals for the project. A second round of advisory commission meetings was conducted to review draft plans and project and program proposals.
• Public Workshop #1 – The initial public workshop for the Bicycle Plan Update was held on Saturday, October 23, 2010, from 10:30 a.m. to 12:30 p.m. at the Yountville Community Center. Approximately 65 people attended the workshop, including local agency staff, elected officials, NCTPA board members, local bicycle advocates, and members of public. The purpose of the workshop was to collect input on issues, opportunities, and constraints throughout the Plan Area. Attendees were led through a series of small and large group exercises designed to solicit their input using a slide presentation, mapping exercise, issues discussion, and a visioning exercise.
• Staff Interviews – Members of local agency staff responsible for bikeway implementation and maintenance were interviewed to solicit their input on existing conditions, issues, opportunities, and constraints regarding Napa’s bikeway system and programs.
• Public Workshop #2 – Public Workshop #2 was held on Saturday, September 24, 2011, from 1:00 to 4:00 PM at New Technology High School in the City of Napa. Approximately 50 people attended the workshop including local agency staff, elected officials, NCTPA board members, local bicycle advocates, and members of public. The purpose of the meeting was to give the public an opportunity to comment on the draft Bicycle Plan Update. The draft Plan was presented and attendees participated in group discussions and mapping exercises. Public comments were recorded and incorporated into the Bicycle Plan Update.
• City Council Hearings – In early 2012, the Plan will be presented to the City Council for review and adoption.

City of Napa Bicycle Plan Page 11 January 2012
Mode Split is a term that describes the number of trips or the percentage of travelers using a particular type of transportation, e.g., walking, bicycling, taking a bus, driving, etc.
Setting and Context
Jurisdiction Overview Setting and Land Use
The City of Napa is located in southern Napa County along SR 29. Situated along the Napa River, the City is nestled between the foothills of the Mayacamas Mountains to the west, the Howell Mountains to the east, San Pablo Bay to the south, and agricultural lands to the north. The City of Napa is the County’s largest urban center, most populous community, and the county seat. The Napa County Airport and the City of American Canyon are located to the south of Napa, and the Town of Yountville is located to the north. The City of Napa is the commercial hub for the greater Napa Valley, including regional shopping destinations, employment sites, and local and regional government offices. Downtown Napa is an international tourist destination, and a cultural and shopping hub for the greater Napa Valley.
Residential development is the predominant land use in Napa. The City’s General Plan defines twelve distinct neighborhoods or planning areas: Linda Vista, Vintage, Browns Valley, Pueblo, Beard, Alta Heights, Westwood, Central Napa, Soscol, Terrace/Shurtleff, River East, and Stanly Ranch. The City’s street network includes a large grid of arterials that facilitate intra-city and regional access and frame local neighborhoods with a variety of street network types including traditional grids, conventional loops and cul-de-sacs, and other variations in response to the topography and historical land use patterns. While SR 29, the Napa River, and high volume/high speed arterials impact bicycle access, especially for east-west travel, the City’s mostly flat topography, relatively small land area, and development density create many opportunities for residents and visitors to bicycle throughout the community as well as to the surrounding County, area vineyards, open space, and hills. General demographic and land use information is presented in Table 2. An overview of land uses in Napa is presented in Figure 6: City of Napa Land Use Map.
More information on issues, opportunities, constraints, and the benefits of bicycling, are presented in the NCTPA’s Countywide Overview.
Demographics, Commute Patterns and Visitors
Demographics and travel information for the City of Napa were analyzed to identify mode split and to evaluate travel time to work. The analysis establishes base data on the existing number of bicycle commuters, and also provides an indication of the number of potential bicycle commuters in the Plan area. This information can then be used by staff and local officials to develop improvement plans and set priorities, with the objective of increasing the percentage of people who choose to bicycle rather than drive a car or be driven. Visitors are another important existing and future user group.
Table 2 General Community Statistics
Total Population 1 78,791
Males 1, 2 49.10% 38,686
Females 1, 2 50.90% 40,105
Median Age 2 36.0
2035 ABAG Population Projections 3 88,900
Land Area 4 17.70 sq. mi
Average Population Density 1, 4 4,451.47 persons/sq. mi.
Elevation 4 17 feet
Source: 1 CADOF 2010 2 United States Census 2000 3 2035 ABAG Projections, 2009 4 City-data.com July 2008

City of Napa Bicycle Plan Page 12 January 2012
Figure 6 – City of Napa Land Use Map

City of Napa Bicycle Plan Page 13 January 2012
For several years, the Napa Valley Vine Trail organization has been working on developing a 44-mile continuous, Class 1 trail from Vallejo to Calistoga through the City of Napa and its Downtown. Parts of the trail already exist and others are or will soon be under design. The organization identified the importance of such a trail in providing transportation options, tourism opportunities, and enhanced quality of life for residents throughout the valley. The trail will offer transportation, recreation, education and healthy lifestyle benefits to residents and the 4.7 million visitors who come to the Valley each year while potentially replacing the need for 150,000 automobile trips in the process. As it provides these benefits, the Vine Trail is expected to generate $75 million per year in ongoing economic impact as well as providing jobs for 60 people per mile built during construction. The Greenway Feasibility Study projected over 3 million uses per year of a completed regional Vine Trail with about half being residents; half visitors. The Napa Valley is renowned as a grape growing region making it an international tourist destination. Aside from its scenic qualities, wineries, spas, and restaurants, the Napa Valley is known for its temperate climate, making it ideal for walking and bicycling. The area was one of the first to attract bicycle touring groups, and continues to draw residents and visitors committed to an active lifestyle. Bicycle adventure tourists are a match for the Napa Destination Council's Targeted Visitor Profile. Other studies have shown that with safe bicycle/pedestrian trails such as the Vine Trail, cycle tourists stay longer, spend more and participate in more activities than non-cycle tourists, including in the shoulder seasons. Ongoing surveys among visitors continue to indicate that bicycling is one of the top ten reasons tourists choose Napa Valley as their destination.
A review of available demographic and commute statistics was performed in order to better understand the level of bicycling in the City of Napa and Napa County as a whole. Several data sources were reviewed, including California Department of Finance Population Estimates, the Bay Area Travel Survey, and Journey-to-Work (JTW) Data from the US Census Bureau.
Every ten years, the US Census Bureau attempts to count every person throughout the nation. As part of this survey process, the agency collects information on the primary mode of transportation employed people over the age of 16 used to get to work. The collective responses to the Census Bureau’s question “How did you usually get to work last week?” form a set of data known as Journey-to-Work (JTW). JTW data is considered the most reliable source of transportation mode choice information available. However, while the JTW provides a glimpse of how Napa residents travel to and from work, the data source only provides a partial understanding of the travel characteristics of bicyclists within the community. This is particularly true since it does not reflect multi-modal or non-work trips. For example, survey respondents who typically use more than one method of transportation are instructed to mark the mode used for “most of the distance,” thus overlooking bicycling and walking trips to transit. The survey wording leaves the response, for commuters who do not use the same mode every day, up to the respondent; and the survey takes place in the month of March, which can be rainy in Napa County and a deterrent to bicycling. Further, the JTW data does not include school, shopping, and recreational trips, which constitute much of the bicycle and pedestrian travel by Napa’s student and senior populations, tourists, migrants, homeless, and others.
The 2010 Census finds that the City of Napa has a population of 76,915 persons. Based on this estimate, the City’s population has grown by approximately 4,300 persons since the 2000 U.S. Census. Population projections from the Association of Bay Area Government’s Projections 2009 anticipate that the City of Napa will add approximately 10,000 additional residents by the year 2035. According to the 2000 US Census, (the most current Census for which data is available) there were 33,743 workers in the City of Napa 16 years old or older. Of these, 32,560 worked outside the home. Thirty-nine percent, or 13,284 workers, have a travel time to work of 15 minutes or less. The City of Napa has a higher than average rate of workers with a commute time of less than 15 minutes when compared to the state and nation which are at 25 percent and 30 percent respectively. This indicates that a substantial portion of the City’s workers were employed within the community. Travel time to work in Napa is shown in Table 3.

City of Napa Bicycle Plan Page 14 January 2012
As shown in Table 4, JTW data indicates that 75 percent of workers in Napa (25,320 persons) drove to work alone. Approximately 1.1 percent of the workers (375 persons) commuted to work by bicycle, a rate that is higher than the Countywide and statewide averages of 0.8 percent, and more than twice the national average of 0.4 percent. Approximately 2 percent (696 persons) of work trips were taken on foot, the second lowest walk-to-work rate in Napa County. While approximately 15 percent of workers in the City of Napa (5,211 persons) carpooled, the majority of workers drove to work alone. Given Napa’s climate, topography, and percentage of commuters with a travel time to work of 15 minutes or less, a significant opportunity exists to achieve a greater bicycle mode split. Every motor vehicle trip or vehicle mile traveled that is eliminated results in less air pollution, reduced green house gas emissions, and lessened traffic congestion.
Table 4 2000 US Census – Mode Split Data for the City of Napa
City of Napa Napa County California
Population (2000 US Census) 72,585 124,279 33,871,648
Employed persons 16 years of age + 34,378 58,501 14,525,322
Mode Split Percent Number Percent Number Percent Number
Mode Split 100.00% 33,743 100.00% 57,393 100.00% 14,525,322
Drove Alone 75.04% 25,320 72.65% 41,698 71.82% 10,432,462
Bike 1.11% 375 0.83% 479 0.83% 120,567
Walk 2.06% 696 4.14% 2,378 2.85% 414,581
Public Transit 1.78% 600 1.40% 803 5.07% 736,037
Carpool 15.44% 5,211 14.84% 8,519 14.55% 2,113,313
Motorcycle 0.32% 108 0.22% 127 0.25% 36,262
Other 0.74% 250 0.83% 474 0.79% 115,064
Worked at Home 3.51% 1,183 5.08% 2,915 3.83% 557,036
Source: United States Census 2000 Visitors and Tourism
Visitors are another important existing and future user group. The Napa Valley is renowned as a grape growing region making it an international tourist destination. Aside from its scenic qualities, wineries, spas, and restaurants, the Napa Valley is known for its temperate climate, making it ideal for walking and bicycling. The area was one of the first to attract bicycle touring groups, and continues to draw residents and visitors committed to an active lifestyle. Bicycle adventure tourists are a match for the Napa Destination Council’s Targeted Visitor Profile. Other studies have shown that with safe bicycle/pedestrian trails such as the Vine Trail, cycle tourists stay longer, spend more and participate in more activities than non-cycle tourists, including in the shoulder seasons. Ongoing surveys among visitors continue to indicate that bicycling is one of the top 10 reasons tourists choose Napa Valley as their destination.
Table 3 2000 US Census – Travel Time to Work
Total Employed Persons 100.00% 33,743
Worked at home 3.51% 1,183
Less than 15 minutes 39.37% 13,284
15 to 29 minutes 27.46% 9,266
30 to 44 minutes 15.52% 5,236
45 or more minutes 14.15% 4,774
Did not work at home 96.49% 32,560
Source: United States Census 2000

City of Napa Bicycle Plan Page 15 January 2012
For several years, the Napa Valley Vine Trail Coalition has been working on developing a 44-mile continuous, Class 1 trail from Vallejo to Calistoga through the City of Napa and its Downtown. Parts of the trail already exist and others are or will soon be under design. The organization identified the importance of such a trail in providing transportation options, tourism opportunities and to enhance the quality of life for residents throughout the Napa Valley. The trail will offer transportation, recreation, education and healthy lifestyle benefits to residents and the 4.7 million visitors who come to the Valley each year while potentially replacing the need for 150,000 automobile trips in the process. As it provides these benefits, the Vine Trail is expected to generate $75 million per year in ongoing economic impact as well as providing jobs for 60 people per mile built during construction. The Greenway Feasibility Study projected over 3 million uses per year of a completed regional Vine Trail with about half being residents; half visitors.
Existing Circulation Network
Napa’s street network is on a slightly skewed north-south axis. SR 29, a regional highway, forms the backbone of the City’s transportation network and provides access into and from Napa County to the City of Vallejo and the Interstate 80 corridor. I-80, SR 12, SR 121, and SR 37 are primary regional routes in the vicinity of the City of Napa that connect the City with the greater San Francisco Bay Area and the greater Northern California region.
The existing circulation network within the Planning Area is composed of state highways, arterials, collectors and local streets. The City of Napa General Plan (1998) provides the definitions below for street classifications, which govern engineering design standards and the roadway level of service thresholds.
• State Highways – State Highways provide for intra- and inter-regional mobility with limited direct access to abutting parcels. Typical daily volumes and rights-of-way vary between urban and rural areas.
• Arterials (Major/Minor) – Arterials collect and distribute traffic from freeways to collector streets and vice versa. Major Arterials consist of four to six lanes and provide for a left-turn median within an 84- to 128-foot right-of-way. Minor arterials have two travel lanes. The optimum minimum distance between intersections is approximately one-half mile and driveways to major traffic generators may be permitted within the half-mile spacing. Arterial streets may carry daily volumes of up to 40,000 vehicles per day.
• Collectors – Collectors serve as connectors between local and arterial streets. They provide direct access to parcels and consist of two lanes of traffic, usually without a left-turn median on rights-of-way between 60 and 84 feet. At major intersections, driveways on collector streets should be no closer than 50 feet to the intersection. Non-residential driveways and/or intersecting streets should be no closer than 300 to 400 feet apart. Collectors typically carry up to 12,000 vehicles per day.
• Local Streets – Local streets provide access to parcels with little access restriction. They consist of two travel lanes within rights-of-way of up to 56 feet and may carry up to 5,000 vehicles per day. Local streets constitute the largest part of the City’s circulation system.
The City of Napa General Plan includes a map of the street network which is displayed in Figure 7.
State Highways
SR 29 is a four-lane, median-divided state highway that primarily runs north-south connecting Napa to nearby cities and I-80.
SR 12/121 is a two- to four-lane state highway that runs primarily north-south, extending from Sonoma County in the southwest, north through the City of Napa, then northeast beyond the Napa city limits.

City of Napa Bicycle Plan Page 16 January 2012
Figure 7 – City of Napa Circulation Map
SR 221/Napa-Vallejo Highway (SR 221) is a north-south state highway that becomes SR 121(Soscol Avenue) at its intersection with Imola Avenue. There are two lanes in each direction divided by a raised median.
North-South Arterial and Collector Streets
The following north-south and east-west streets form the primary grid of Napa’s roadway network. These streets form the base of the community’s transportation system; however, there are numerous local streets that provide access for bicyclists in Napa to residential neighborhoods and destinations throughout the community.
Dry Creek Road is a two-lane minor arterial in the City’s northwest quadrant that provides residential access and extends from Redwood Road into the unincorporated County. Dry Creek Road is popular with recreational bicyclists headed for the Napa’s western mountains and Up Valley.
Solano Avenue is a two-lane collector that extends north-south from Lincoln Avenue through central Napa all the way to Yountville. Solano Avenue is a frontage road located along the west side SR 29 adjacent to Napa Wine Train tracks, which is well used by commuter and recreational bicyclists.
Golden Gate Drive is a two-lane collector and frontage road on the west side of SR 29, extending north-south between Imola Avenue West and Carneros Highway (SR 12/SR 121) on the south side of the City of Napa. Cyclists can use the stoplight at Stanly Lane to cross SR 12/SR 121 and access the wineries and marshlands south of the City.
Jefferson Street is a two- to four-lane arterial that extends north-south through central Napa from Atrium Parkway at the southern end of the City to the northern city limit.
Soscol Avenue is a four-lane major arterial that extends north-south along the east side of the City from Imola Avenue in the south to Trancas Street.
Big Ranch Road is a two-lane collector that extends north-south from Soscol Avenue at Trancas Street. Big Ranch Road extends north into the unincorporated County to Oak Knoll Avenue.
Silverado Trail (SR 121) is a scenic two-lane major north-south collector that runs from Soscol Avenue north through the unincorporated County to Calistoga. Many wineries and vineyards are located on Silverado Trail. It is heavily traveled by visitors, residents, and employees, as well as a popular route for bicyclists.
California Boulevard is a two-lane major collector that extends north-south between Trancas Street and Laurel Street. A raised median, turning lanes, and Class II bicycle lanes on both sides of the street are present between Pueblo Avenue and 1st Street.
City of Napa Bicycle Plan Page 17 January 2012
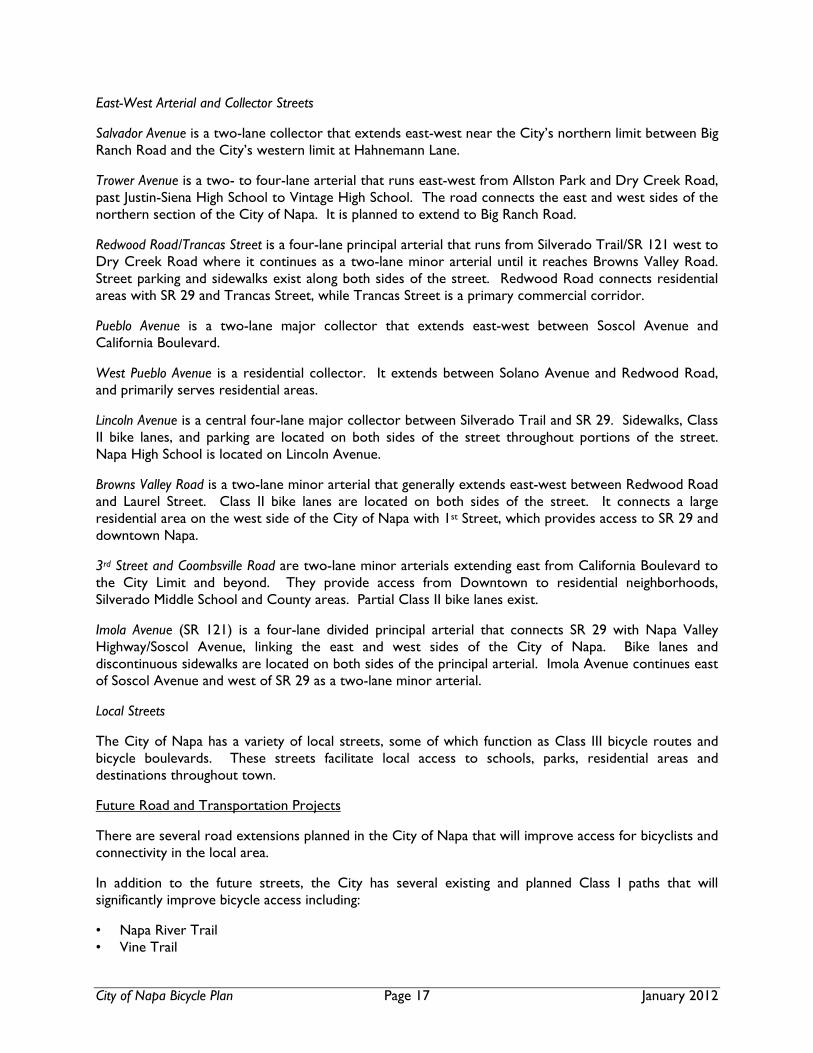
East-West Arterial and Collector Streets
Salvador Avenue is a two-lane collector that extends east-west near the City’s northern limit between Big Ranch Road and the City’s western limit at Hahnemann Lane.
Trower Avenue is a two- to four-lane arterial that runs east-west from Allston Park and Dry Creek Road, past Justin-Siena High School to Vintage High School. The road connects the east and west sides of the northern section of the City of Napa. It is planned to extend to Big Ranch Road.
Redwood Road/Trancas Street is a four-lane principal arterial that runs from Silverado Trail/SR 121 west to Dry Creek Road where it continues as a two-lane minor arterial until it reaches Browns Valley Road. Street parking and sidewalks exist along both sides of the street. Redwood Road connects residential areas with SR 29 and Trancas Street, while Trancas Street is a primary commercial corridor.
Pueblo Avenue is a two-lane major collector that extends east-west between Soscol Avenue and California Boulevard.
West Pueblo Avenue is a residential collector. It extends between Solano Avenue and Redwood Road, and primarily serves residential areas.
Lincoln Avenue is a central four-lane major collector between Silverado Trail and SR 29. Sidewalks, Class II bike lanes, and parking are located on both sides of the street throughout portions of the street. Napa High School is located on Lincoln Avenue.
Browns Valley Road is a two-lane minor arterial that generally extends east-west between Redwood Road and Laurel Street. Class II bike lanes are located on both sides of the street. It connects a large residential area on the west side of the City of Napa with 1st Street, which provides access to SR 29 and downtown Napa.
3rd Street and Coombsville Road are two-lane minor arterials extending east from California Boulevard to the City Limit and beyond. They provide access from Downtown to residential neighborhoods, Silverado Middle School and County areas. Partial Class II bike lanes exist.
Imola Avenue (SR 121) is a four-lane divided principal arterial that connects SR 29 with Napa Valley Highway/Soscol Avenue, linking the east and west sides of the City of Napa. Bike lanes and discontinuous sidewalks are located on both sides of the principal arterial. Imola Avenue continues east of Soscol Avenue and west of SR 29 as a two-lane minor arterial.
Local Streets
The City of Napa has a variety of local streets, some of which function as Class III bicycle routes and bicycle boulevards. These streets facilitate local access to schools, parks, residential areas and destinations throughout town.
Future Road and Transportation Projects
There are several road extensions planned in the City of Napa that will improve access for bicyclists and connectivity in the local area.
In addition to the future streets, the City has several existing and planned Class I paths that will significantly improve bicycle access including:
• Napa River Trail • Vine Trail

City of Napa Bicycle Plan Page 18 January 2012
• Bay Trail • Ridge Trail • Oxbow Commons • Downtown Trails • Salvador Creek
These Class I paths are described in greater detail on page 30.
Coordination and Consistency with Existing Plans and Policies
There are a number of federal, state, regional, and local plans, policies and standards that govern bikeway development in Napa. Preparation of the Bicycle Plan included an extensive review of the pertinent planning documents and policies. Brief summaries of these relevant efforts are provided in Appendix A. The Bicycle Plan update was undertaken in context with the projects, policies, and standards from the following local efforts:
• Downtown Napa Mixed Use and Residential Infill Development Strategy, City of Napa, 2004 • Downtown Riverfront Urban Design Plan, City of Napa, 2003 • Envision Napa 2020: City of Napa General Plan, City of Napa, 2007 • Kennedy Park Master Plan, City of Napa, 1998 • Napa Airport Area Bicycle Route Study, Landpeople, 2005 • Napa Municipal Code, Quality Code Publishing, 2011 (includes Zoning Code) • Napa River Parkway Master Plan, City of Napa, 2005 • Oxbow Commons (Bypass Channel) Betterments Design, SWA, 2009 • Park and Facilities Master Plan, City of Napa, 2010 • Public Review Draft Downtown Napa Specific Plan, MIG, 2011 • Residential Design Guidelines, City of Napa, 2004 • Soscol Gateway Vision Plan, City of Napa, 2004 • Stanly Ranch Subdivision and Draft EIR for St. Regis, City of Napa, 2009 • Trancas Crossing Park Plan, DCE, 2M Associates, 2008
Vision, Goals, Objectives and Policies
Introduction
The following vision, goal, objectives, and common policies are meant to function as a mutually agreed upon framework applicable to both the primary countywide bicycle system and Napa’s local bicycle Plan. The policies are designed to guide the development and maintenance of a bicycle system throughout Napa County and express the intent of the City of Napa, the NCTPA, and its member agencies to enhance bicycle mobility and to improve safety, access, traffic congestion, air quality, and the quality of life throughout Napa County for residents, workers and visitors. In addition to common policies that are mutually agreed to, local policies and implementing programs are included that address issues in the City of Napa and complement the common policies.
It is important to note that as projects advance or are developed, local and countywide bicycle policies should be referenced to ensure that both private development and public works projects are consistent with the mutually agreed upon countywide policies, and that planning and development projects in Napa implement the full measures of the Bicycle Plan elements. The common countywide policies were a focal point of the Bicycle Plan effort and appear in the Overview Section of the plan as well.
Definitions
For context, definitions of terms used in this report are provided below.

City of Napa Bicycle Plan Page 19 January 2012
Summaries of Federal, State, and Regional policies regarding the importance and consideration of non-motorized modes are provided in Appendix A.
• Bicycle “System” – the whole of all of the components, including both physical and programmatic.
• Bicycle “Network” – the physical improvements that establish bikeways (Class I, II, or III routes).
• Goal – the destination or where we want to be at the end of the planning journey. Goals are usually broad, optimistic and expressive of a long-term vision.
• Objective – mileposts along the way to achieving the goals. They are specific, measurable steps to be achieved if the overall goals are to be met.
• Policy – a principle or rule to guide decisions by the local agency with regard to a particular issue or set of issues.
• Program – a specific action to accomplish the policy or objective.
Bicycling Vision for the Region
A comprehensive, connected bicycle system is established with supportive development patterns and programmatic practices, providing people with safe, convenient and enjoyable access throughout all Napa County jurisdictions and to destinations beyond. Bicycling is common for everyday trips and recreation, contributing to the quality of life in Napa and the health, safety and welfare of its residents, workers and visitors. Napa is known as a bicycle friendly community with a “world class” bicycling system.
Principal Goal: To develop and maintain a safe and comprehensive countywide bicycle transportation and recreation system that provides access, opportunities for healthy physical activity, and reduced traffic congestion and energy use. Policies, programs and projects work together to provide safe, efficient and enjoyable opportunities for bicyclists of all types, ages, and abilities to access public transportation, school, work, recreation areas, shopping and other activity centers, and residential neighborhoods, and to connect Napa jurisdictions to each other and the region.
Countywide Objectives
Objective 1.0: The Countywide Bicycle Network
Establish a comprehensive, safe, connected countywide bicycle transportation and recreation system to support increases in bicycle trips made throughout the County to 10 percent of all trips by 2035.
Policies
1.1 Develop and maintain a local and countywide bicycle transportation and recreation network that connects Napa’s neighborhoods and communities, and provides access to public transportation, school, work, recreation areas, shopping and other activity centers, and to regional routes according to the maps and recommendations in this plan. [NCTPA, cities, towns, County]
1.2 Develop and maintain continuous north-south Class I pathways to provide inter-city connections and serve as primary bikeways in the Countywide Bikeway System. [NCTPA, cities, towns, County]

City of Napa Bicycle Plan Page 20 January 2012
1.3 Consistent with federal, state1 and regional directives for “routine accommodation and complete streets”2, ensure that all transportation projects on designated bicycle routes in the jurisdiction’s bicycle plan include, enhance or maintain bicycle transportation facilities. [NCTPA, cities, towns, County]
1.4 Seek opportunities to work cooperatively with all responsible departments and agencies (for example, transportation agencies, flood districts, utility agencies, parks and open space districts) to close existing gaps in facilities and ensure the network is funded, designed, constructed, and maintained. [NCTPA, cities, towns, County]
1.5. Consider the needs of all types of bicyclists (commuters, recreational riders, children, and families) in planning, developing, and maintaining a bikeway network that is safe and convenient. [NCTPA, cities, towns, County]
1.6 Establish and/or maintain local and countywide bicycle advisory committees to advise staff on bicycle network issues. [NCTPA, cities, towns, County]
City of Napa Programs
CN-1.a The City shall promote development of the transportation and recreation bicycle routes shown on the City’s Bicycle Route Map.
CN-1.b The City shall continue to work with the County Flood Control District and Corps of Engineers to complete the City’s multi-use Napa River Trail and connect multiuse trails through the Oxbow Commons and along Napa Creek in conjunction with completion of the Napa River Flood Protection Project.
CN-1.c The City shall pursue completion of regionally significant bicycle routes through the City including the Napa Valley Vine Trail, the Bay Trail and the Ridge Trail, many segments of which are shared local/regional routes.
CN-1.d. When improvements are made within the public right of way on designated bicycle routes, the City shall assess the potential for concurrent bicycle safety improvements and implement them where feasible, for example, through improved striping, signage, bike crossing signals, etc.
CN-1.e The City shall provide for safe bicycle facilities on new or reconstructed freeway crossings. The City shall also consider modifications to existing bridges and freeway crossings to improve bicycle safety.
CN-1.f The City will seek to provide at least three north-south and three east-west routes suitable for family use.
CN-1.g The Plan identifies several routes that require bridges or undercrossings including, but not limited to, an undercrossing under Trancas Street to connect the River Trail to Trancas Crossing Park; a mid-block undercrossing under 1st Street to the Opera House Plaza; an
1 Caltrans Deputy Directive-64-R1 (DD-64-R1), “Complete Streets-Integrating the Transportation System,” a policy directive related to “Complete Streets” non-motorized travel throughout the state, was adopted by Caltrans in October of 2008. This directive is summarized in Appendix A. 2 US DOT Policy Statement: Integrating Bicycling and Walking into Transportation Infrastructure, 2000; Assembly Concurrent Resolution 211, 2002; Caltrans Deputy Directive 64, 2001; Caltrans Director’s Policy 22 (Director’s Policy on Context Sensitive Solutions), 2001; Metropolitan Transportation Commission Resolution No. 3765, (Routine Accommodations), 2006

City of Napa Bicycle Plan Page 21 January 2012
European Design
European cities employ a variety of bikeway designs generally known as “Cycle Tracks” that protect or separate bikeways from vehicle traffic where possible. These engineering efforts combined with a comprehensive approach to safety, encouragement, and awareness have helped to establish mode split rates where up to 40 percent of all trips are made by bicycle. Where appropriate, similar practices should be tested or employed to determine if significant mode split shifts and community can be achieved within the Napa Valley.
undercrossing under SR 29 between California Boulevard and Coffield; a crossing of the rail line at Tulocay Creek; and a Linda Vista bridge.
CN-1.h The General Plan calls for Solano Avenue to be extended south across Napa Creek to 1st Street. Should Solano or Coffield Street be extended to 1st Street in conjunction with this program, the design of the roadway extension shall include Class II bicycle lanes.
CN-1.i A continuous safe Class II connection from Browns Valley to Downtown between California Boulevard and Jefferson Street is desirable goal. Pending the availability of funds, design options to use 3rd Street or a parallel street to provide a bicycle-friendly solution that is also supported by the neighborhood will be evaluated.
CN-1.j Pending the availability of funds, Salvador Avenue will be studied to determine how best to address pedestrian and bicycle needs.
CN-1.k Seek funding to evaluate the potential for upgrades to priority Class III routes.
CN-1.l The General Plan calls for Linda Vista Avenue to be extended south across Napa Creek to Robinson Lane and the design of the bridge across the Creek shall include Class II bicycle lanes.
Objective 2.0: Design
Utilize accepted design standards and “best practices” to facilitate completion of a connected bicycle system that is safe, convenient and enjoyable to use.
Policies
2.1 Utilize Chapter 1000, "Bikeways Planning and Design," of the California Highway Design Manual, the California Manual of Uniform Traffic Control Devices, and the American Association of State Highway Transportation Officials (AASHTO) Guide for the Development of Bicycle Facilities, as well as evolving “best practices” for the development of bicycle facilities. [NCTPA, cities, towns, County]
2.2 Consistent with Assembly Bill 1581 (Fuller) and Caltrans Policy Directive 09-06, assure that all approaches to signalized intersections include bicycle detection devices that are operational and properly marked. [NCTPA, cities, towns, County]
2.3 Provide consistent enhanced crossing features at uncontrolled intersections with Class I paths. [NCTPA, cities, towns, County]
2.4 Where standard Class II bike lanes are infeasible under current conditions, local jurisdictions shall consider innovative approaches to safely accommodate bicycles. (Approaches may include but are not limited to: striped edge lines, signs, shared lane markings, reduced lane widths, “road diets,” eliminating parking, etc.) [NCTPA, Caltrans, cities, towns, County]
2.5 Install way finding signage, markers, and stencils on off-street paths, on-street bikeways, local Class III routes, and State Routes to improve way finding for bicyclists, assist emergency personnel, and heighten motorists’ awareness. [NCTPA, Caltrans, cities, towns, County]
City of Napa Bicycle Plan Page 22 January 2012
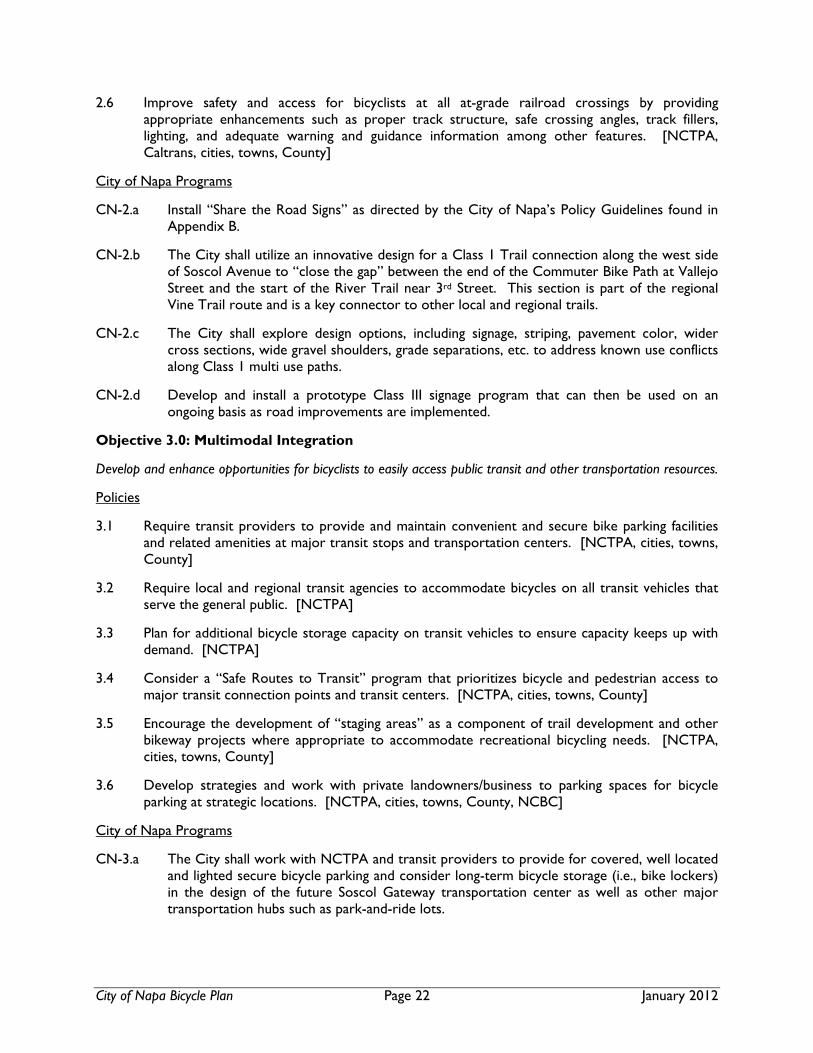
2.6 Improve safety and access for bicyclists at all at-grade railroad crossings by providing appropriate enhancements such as proper track structure, safe crossing angles, track fillers, lighting, and adequate warning and guidance information among other features. [NCTPA, Caltrans, cities, towns, County]
City of Napa Programs
CN-2.a Install “Share the Road Signs” as directed by the City of Napa’s Policy Guidelines found in Appendix B.
CN-2.b The City shall utilize an innovative design for a Class 1 Trail connection along the west side of Soscol Avenue to “close the gap” between the end of the Commuter Bike Path at Vallejo Street and the start of the River Trail near 3rd Street. This section is part of the regional Vine Trail route and is a key connector to other local and regional trails.
CN-2.c The City shall explore design options, including signage, striping, pavement color, wider cross sections, wide gravel shoulders, grade separations, etc. to address known use conflicts along Class 1 multi use paths.
CN-2.d Develop and install a prototype Class III signage program that can then be used on an ongoing basis as road improvements are implemented.
Objective 3.0: Multimodal Integration
Develop and enhance opportunities for bicyclists to easily access public transit and other transportation resources.
Policies
3.1 Require transit providers to provide and maintain convenient and secure bike parking facilities and related amenities at major transit stops and transportation centers. [NCTPA, cities, towns, County]
3.2 Require local and regional transit agencies to accommodate bicycles on all transit vehicles that serve the general public. [NCTPA]
3.3 Plan for additional bicycle storage capacity on transit vehicles to ensure capacity keeps up with demand. [NCTPA]
3.4 Consider a “Safe Routes to Transit” program that prioritizes bicycle and pedestrian access to major transit connection points and transit centers. [NCTPA, cities, towns, County]
3.5 Encourage the development of “staging areas” as a component of trail development and other bikeway projects where appropriate to accommodate recreational bicycling needs. [NCTPA, cities, towns, County]
3.6 Develop strategies and work with private landowners/business to parking spaces for bicycle parking at strategic locations. [NCTPA, cities, towns, County, NCBC]
City of Napa Programs
CN-3.a The City shall work with NCTPA and transit providers to provide for covered, well located and lighted secure bicycle parking and consider long-term bicycle storage (i.e., bike lockers) in the design of the future Soscol Gateway transportation center as well as other major transportation hubs such as park-and-ride lots.

City of Napa Bicycle Plan Page 23 January 2012
Objective 4.0: Comprehensive Support Facilities
Ensure development of comprehensive support facilities for bicycling such as short- and long-term bicycle parking, end of trip amenities, bicycle staging areas, repair stations, and other resources such as bicycle maps, guide information, and on-line tools.
Policies
4.1 Require adequate short-term (i.e. bike racks) and long-term (i.e. bike lockers) bicycle parking for non-residential uses as provided in local standards. Nonresidential uses include private commercial and industrial uses, as well as hospitals, clinics, gyms, parks and other civic facilities. [Cities, towns, County]
4.2 Provide adequate short-term bicycle parking and long-term bicycle storage for transportation centers including transit transfer centers, park-and-ride lots, train stations, transit stops, etc. [NCTPA, Caltrans, cities, towns, County]
4.3 Work with businesses and private property owners to provide bicycle parking at existing employment, retail, and commercial sites. [NCTPA, cities, towns, County]
4.4 Encourage employers to provide secure indoor and/or covered bicycle parking for their employees. [Cities, towns, County]
4.5 Encourage major employers to provide shower and locker facilities for workers. [Cities, towns, County]
4.6 Encourage local school district to provide well located, secure bicycle parking at schools. [NCTPA, cities, towns, County]
4.7 Design Class 1 paths to incorporate pedestrian scale lighting, street furniture, drinking fountains, wayfinding signage, interpretive elements, high-visibility crossing treatments, and other amenities where appropriate. [NCTPA, cities, towns, County]
City of Napa Programs
CN-4.a The City shall seek funding for installation and maintenance of bicycle parking in city facilities and as part of a unified program for Downtown.
CN-4.b The City shall continue to require bicycle parking in conjunction with new non-residential development.
CN-4.c The City shall support efforts by the school district and encourage other organizations and businesses to incorporate safe and secure bicycle parking in their facilities, particularly when substantial remodels are proposed.
CN-4.d The City shall review and provide adequate standards for bicycle racks, lockers and related amenities for new and existing nonresidential uses and multifamily residential developments. Guidelines for appropriate location of bicycle parking shall be included.
Objective 5.0: Safety and Security
Create a countywide bicycle system that is perceived to be safe for bicyclists of all types and age groups, and work to reduce collisions involving bicyclists by 50 percent by the year 2035. (Use 2008 collision data as the baseline for analysis and perform periodic progress evaluations at five-year intervals to benchmark progress.)
City of Napa Bicycle Plan Page 24 January 2012
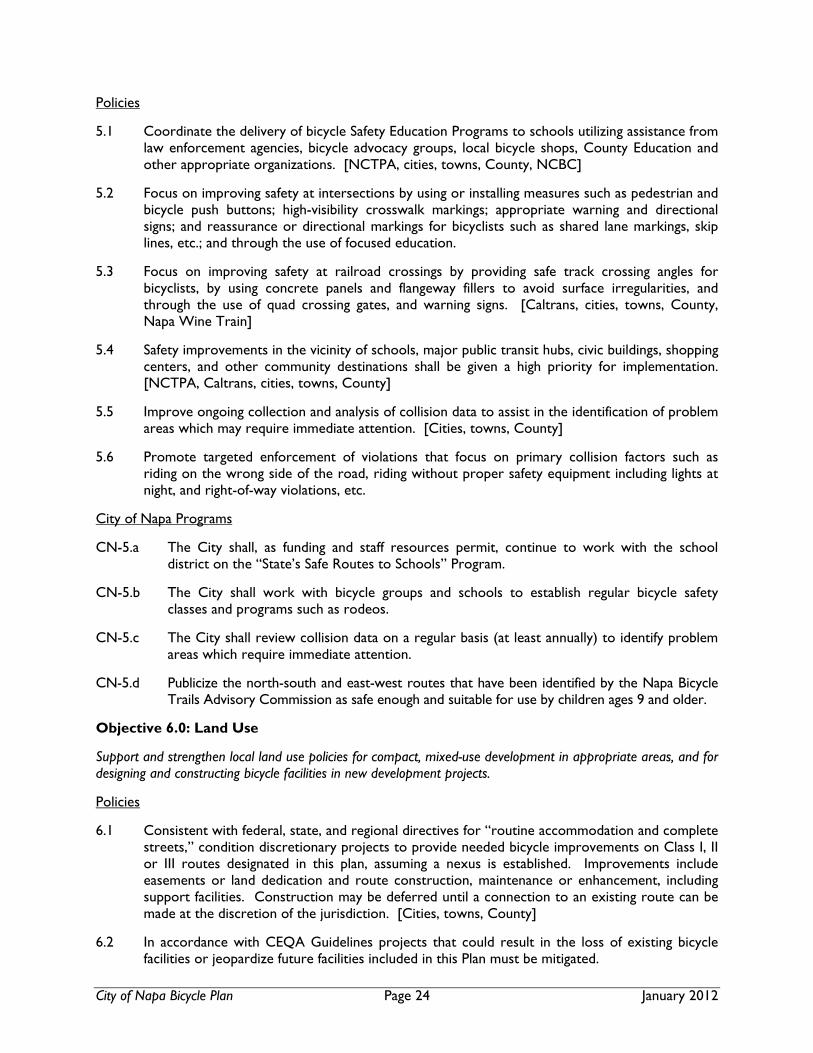
Policies
5.1 Coordinate the delivery of bicycle Safety Education Programs to schools utilizing assistance from law enforcement agencies, bicycle advocacy groups, local bicycle shops, County Education and other appropriate organizations. [NCTPA, cities, towns, County, NCBC]
5.2 Focus on improving safety at intersections by using or installing measures such as pedestrian and bicycle push buttons; high-visibility crosswalk markings; appropriate warning and directional signs; and reassurance or directional markings for bicyclists such as shared lane markings, skip lines, etc.; and through the use of focused education.
5.3 Focus on improving safety at railroad crossings by providing safe track crossing angles for bicyclists, by using concrete panels and flangeway fillers to avoid surface irregularities, and through the use of quad crossing gates, and warning signs. [Caltrans, cities, towns, County, Napa Wine Train]
5.4 Safety improvements in the vicinity of schools, major public transit hubs, civic buildings, shopping centers, and other community destinations shall be given a high priority for implementation. [NCTPA, Caltrans, cities, towns, County]
5.5 Improve ongoing collection and analysis of collision data to assist in the identification of problem areas which may require immediate attention. [Cities, towns, County]
5.6 Promote targeted enforcement of violations that focus on primary collision factors such as riding on the wrong side of the road, riding without proper safety equipment including lights at night, and right-of-way violations, etc.
City of Napa Programs
CN-5.a The City shall, as funding and staff resources permit, continue to work with the school district on the “State’s Safe Routes to Schools” Program.
CN-5.b The City shall work with bicycle groups and schools to establish regular bicycle safety classes and programs such as rodeos.
CN-5.c The City shall review collision data on a regular basis (at least annually) to identify problem areas which require immediate attention.
CN-5.d Publicize the north-south and east-west routes that have been identified by the Napa Bicycle Trails Advisory Commission as safe enough and suitable for use by children ages 9 and older.
Objective 6.0: Land Use
Support and strengthen local land use policies for compact, mixed-use development in appropriate areas, and for designing and constructing bicycle facilities in new development projects.
Policies
6.1 Consistent with federal, state, and regional directives for “routine accommodation and complete streets,” condition discretionary projects to provide needed bicycle improvements on Class I, II or III routes designated in this plan, assuming a nexus is established. Improvements include easements or land dedication and route construction, maintenance or enhancement, including support facilities. Construction may be deferred until a connection to an existing route can be made at the discretion of the jurisdiction. [Cities, towns, County]
6.2 In accordance with CEQA Guidelines projects that could result in the loss of existing bicycle facilities or jeopardize future facilities included in this Plan must be mitigated.
City of Napa Bicycle Plan Page 25 January 2012
6.3 Encourage School districts to participate in providing safe and continuous bicycle and pedestrian connections from surrounding neighborhoods when constructing new or improving existing school facilities. [NCTPA, cities, towns, County]
City of Napa Programs
CN-6.a As new private or public development is approved on or along designated bicycle routes in the City’s bicycle plan, the City shall continue to require needed bicycle improvements appropriate for the type of route, including recreational multi use trail system segments (as along the Napa River and Salvador Channel) using the BTAC as a resource to review and provide recommendations regarding such projects.
CN-6.b The City shall promote bicycle access and support facilities in the design of future development.
CN-6.c Specific plans or master plans for larger properties shall incorporate bicycle routes that integrate with the overall city bicycle network. (Such routes may be specific to the property and go beyond routes currently planned.)
CN-6.d The City shall continue to promote compact, mixed use development that facilitates bicycle use in Downtown and other mixed use areas shown on the land use map.
Objective 7.0: Education and Promotion
Develop programs and public outreach materials to promote safety and the positive benefits of bicycling.
Policies
7.1 Develop and implement a multimedia countywide bicycle and pedestrian safety and education campaign to increase knowledge of riding rules, improve etiquette between motorized and non-motorized modes, to promote bicycle tourism, and increase the awareness of the benefits of bicycling and walking as transportation modes. [NCTPA, cities, towns, County – potentially jointly]
7.2 Expand the delivery of Safe Routes to Schools curriculum to all elementary and middle schools annually. [NCTPA, cities, towns, County, School Districts, NCBC]
7.3 Educate law enforcement personnel, agency staff, elected officials, and school officials about the benefits of non-motorized transportation, and the safety needs of bicyclists and pedestrians. [NCTPA, cities, towns, County, School Districts, NCBC]
7.4 Develop and maintain a public bikeway map and user guide that provides bike route, education, safety, and promotional information. [NCTPA, cities, towns, County- potentially jointly]
7.5 Distribute bicycle and pedestrian safety, educational, and promotional materials at drivers training and citation diversion programs, school orientations and community and civic events. [NCTPA, cities, towns, County, law enforcement agencies, schools, advocacy organizations]
7.6 Encourage events that introduce the public to bicycling and walking such as bike-to-work, commuter challenges, bike/walk-to-school days, elected official bike rides, etc. [NCTPA, cities, towns, County, schools, advocacy organizations]
7.7 Encourage major employment centers and employers to facilitate commuting by bicycle, including the use of flex-time work schedules to support non-rush hour bicycle commuting. [NCTPA, cities, towns, County, advocacy organizations]
City of Napa Bicycle Plan Page 26 January 2012
City of Napa Programs
CN-7.a The City shall participate with countywide and regional agencies, and other interested partners in the preparation and distribution of up-to-date City bicycle maps for public use, and other safety, education, and promotional materials.
Objective 8.0: Planning
Continue to update and integrate bicycle-related transportation, land use and recreation plans and improvement projects.
Policies
8.1 The countywide and/or local Bicycle Advisory Committee (BAC) shall be responsible for advising staff and decision makers on the planning and policy development for, and coordination and implementation of the countywide bicycle transportation system. [County, city and town BACs]
8.2 Update and adopt the Bicycle Plan in accordance with the California Bicycle Transportation Act, and to coordinate with Regional Transportation Plan updates. [NCTPA, County, participating cities and towns]
8.3 Participating jurisdictions shall update their general plans to incorporate the key contents of this Bicycle Plan. [County, participating cities and towns]
8.4 Use local commissions and/or the Countywide BAC as a resource to review roadway improvement projects, on designated bicycle routes in the jurisdiction’s bicycle plan, for bicycle safety and compatibility and consistency with the plan, except when proposed improvements meet all standards “Roadway improvements” include widening, resurfacing, rehabilitation, capacity improvements, traffic calming improvements, rumble strips, etc. Advisory commission recommendations are part of the Metropolitan Transportation Commission review guidelines. [NCTPA, cities, towns, County]
8.5 Proactively seek new opportunities for acquisition of abandoned rights-of-way, natural waterways, flood control rights-of-way, utility rights-of-way, and lands for the development of new Class I multi-use pathways that integrate with the planned system. [NCTPA, cities, towns, County]
8.6 Recognize the varied needs of bicyclists by striving to maintain on-street bikeways where off street pathways or alternative routes are proposed. Existing bikeways should not be altered or eliminated without the consultation of local bicycle advisory committees. [NCTPA, cities, towns, County]
8.7 NCTPA and local jurisdictions are encouraged to assign staff to assume bicycle coordination duties to oversee implementation of the Countywide Bicycle Plan and coordinate activities between affected departments and jurisdictions. [NCTPA, cities, towns, County]
City of Napa Programs
CN-8.a The City shall update its bicycle plan to incorporate the policies and maps contained herein and continue to participate in local and regional bicycle planning efforts.
CN-8.b The City shall consider the potential for new bicycle connections/routes along existing natural and man-made corridors (railroads, utility easements, creeks, under crossings, etc.) when opportunities arise. Specific connections not currently in the plan but that may be considered in the future include under crossings of 1st Street and 3rd Street at Soscol Avenue.

City of Napa Bicycle Plan Page 27 January 2012
Objective 9.0: Maintenance
Maintain and/or improve the quality, operation, and integrity of bicycle infrastructure.
Policies
9.1 Maintain Class 1 paths, and maintain geometry, pavement surface condition, debris removal, markings, and signage on Class II and Class III bikeways to the same standards and condition as the adjacent motor vehicle lanes. [Cities, towns, County]
9.2 Develop or retain a maintenance reporting system with a central point of contact to report, track, and respond to routine bicycle maintenance issues in a timely manner. [NCTPA, NCBC, cities, towns, County]
9.3 Require that road construction projects minimize their impacts on bicyclists by avoiding placement of construction signs and equipment in bicycle lanes, and by providing adequate detours. [Caltrans, cities, towns, County]
9.4 Consider bicycle safety in the routine maintenance of local roads and seek to, at a minimum, include the following activities [Caltrans, cities, towns, County]:
• Trim vegetation to provide a minimum horizontal clearance of two feet from the edge of pavement and a minimum vertical clearance of eight feet.
• Clear debris from road shoulder areas to provide a clean surface for bicycling.
City of Napa Programs
CN-9.a The City shall update as necessary and utilize its existing web-based traffic hazard reporting system to log and respond to bicycle maintenance issues.
CN-9.b Encourage public-private partnerships to expand maintenance activities, for example through the city’s adopt a park/trail program or an annual trail cleanup.
Objective 10.0: Funding
Work to maximize the amount of funding to implement bicycle projects and programs throughout the county.
Policies
10.1 Seek varied sources of funding, including but not limited to federal, state, and regional programs, partnerships with local non-profits and other local agencies, and local sources such as assessments to improve the bicycle system. [NCTPA, cities, towns, County]
10.2 Encourage multi-jurisdictional funding applications to implement the primary network and countywide bicycle system. [NCTPA, cities, towns, County]
10.3 Promote the availability of adequate regional, state and federal funding sources for bicycle transportation projects. [NCTPA, NCBC, cities, towns, County]
City of Napa Programs
CN-10.a The City shall continue to seek funding for bicycle improvement projects within the city.
CN-10.b The BTAC develops a prioritized a list of needed bicycle improvements. The City recognizes that some funding sources are specific to particular types of bicycle facilities, or even a specific route or operation program; however, the BTAC list will be consulted when funding opportunities arise.
City of Napa Bicycle Plan Page 28 January 2012
Bicyclists and Bicycle Facilities
Operation of Bicycles/Rules of the Road
In California, the California Vehicle Code (VC) is the set of traffic laws that govern the behaviors of vehicle drivers. VC 231 defines a bicycle as “a device upon which any person may ride, propelled exclusively by human power through a belt, chain, or gears and having one or more wheels.” The VC does not define bicycles as vehicles, but states that persons riding bicycles have all the rights and responsibilities of the drivers of vehicles (Division 11, “Rules of the Road”). Additionally, the VC includes several sections specific to bicyclists. In general, bicyclists are required to ride according to the basic traffic laws that all drivers follow including but not limited to the following:
• Drive on the right-hand side of the roadway • Obey traffic control devices (signs, signals) • Yield to cross traffic • Yield when changing lanes
Duty of Bicycle Operator: Operation On Roadway (VC 21202)
a) Any person operating a bicycle upon a roadway at a speed less than the normal speed of traffic moving in the same direction at such time shall ride as close as practicable to the right-hand curb or edge of the roadway except under any of the following situations:
• When overtaking and passing another bicycle or motor vehicle proceeding in the same direction.
• When preparing for a left turn at an intersection or into a private road or driveway. • When reasonably necessary to avoid conditions (including, but not limited to, fixed or moving
objects, vehicles, bicycles, pedestrians, animals, surface hazards, or substandard width lanes) that make it unsafe to continue along the right-hand curb or edge. For purposes of this section, a "substandard width lane" is a lane that is too narrow for a bicycle and a vehicle to travel safely side by side within the lane.
b) Any person operating a bicycle on a one-way street or highway with two or more marked traffic lanes, may ride as near the left-hand curb or edge of such roadway as practicable.
Permitted Movements from Bicycle Lanes (VC 21208)
a) Whenever a bicycle lane has been established on a roadway, any person operating a bicycle upon the roadway at a speed less than the normal speed of traffic moving in the same direction shall ride in the bicycle lane, except under the following situations.
• When overtaking or passing another bicycle, vehicle, or pedestrian within the lane or about to enter the lane if such overtaking and passing cannot be done safely within the lane.
• When preparing for a left turn at an intersection or into a private road or driveway. • When necessary to leave the lane to avoid debris or other hazardous conditions.
b) No operator of a bicycle shall leave a bicycle lane until it can be done safely and then only after giving an appropriate hand signal in the event that any vehicle might be affected by the movement.
Intersection Positioning
At intersections, bicycles should travel in the right-most lane that leads to their destination. This means that if a bicycle is preparing for a left-hand turn, they may leave the right side of the road even if a bike lane is provided.
City of Napa Bicycle Plan Page 29 January 2012
Types of Bicyclists
Understanding the needs and preferences of the various types of bicyclists in the Plan Area is an important part of the process of evaluating existing usage, projecting future demand, and planning for improvement projects. While bicyclists’ skills, confidence, and preferences can vary significantly amongst the various bicyclist types, concerns about the safety of bicycling remain paramount for all bicyclists. According to the Portland Office of Transportation, “riding a bicycle should not require bravery, yet all too often, that is the perception among bicyclists and non-bicyclists alike.” The common denominator for cities around the world that have achieved a high share of bicyclists in their mode splits is that they have essentially removed the element of fear associated with bicycling in an urban environment. In regard to travel choices, it is unfortunate that fear currently exists in our society. In many cities, bicycling is often the most logical, enjoyable and cost effective choice for short trips for a substantial portion of the community, if not the majority of their populace.
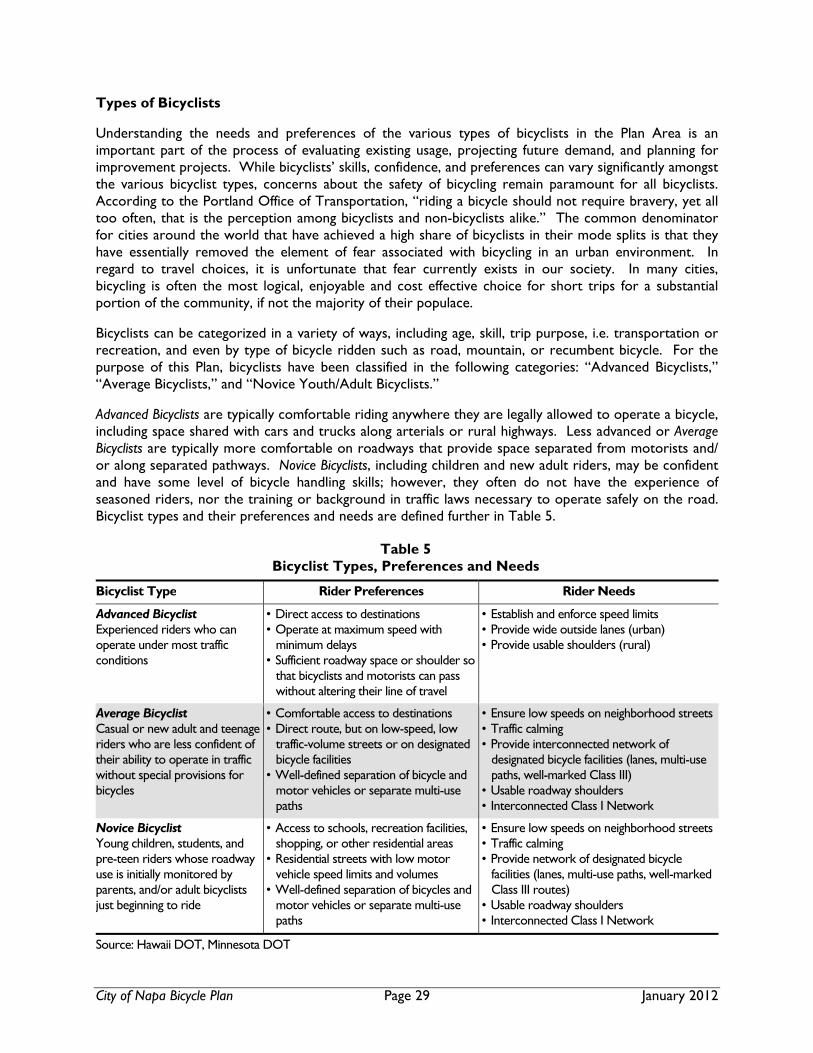
Bicyclists can be categorized in a variety of ways, including age, skill, trip purpose, i.e. transportation or recreation, and even by type of bicycle ridden such as road, mountain, or recumbent bicycle. For the purpose of this Plan, bicyclists have been classified in the following categories: “Advanced Bicyclists,” “Average Bicyclists,” and “Novice Youth/Adult Bicyclists.”
Advanced Bicyclists are typically comfortable riding anywhere they are legally allowed to operate a bicycle, including space shared with cars and trucks along arterials or rural highways. Less advanced or Average Bicyclists are typically more comfortable on roadways that provide space separated from motorists and/ or along separated pathways. Novice Bicyclists, including children and new adult riders, may be confident and have some level of bicycle handling skills; however, they often do not have the experience of seasoned riders, nor the training or background in traffic laws necessary to operate safely on the road. Bicyclist types and their preferences and needs are defined further in Table 5.
Table 5 Bicyclist Types, Preferences and Needs
Bicyclist Type Rider Preferences Rider Needs
Advanced Bicyclist Experienced riders who can operate under most traffic conditions
• Direct access to destinations • Operate at maximum speed with
minimum delays • Sufficient roadway space or shoulder so
that bicyclists and motorists can pass without altering their line of travel
• Establish and enforce speed limits • Provide wide outside lanes (urban) • Provide usable shoulders (rural)
Average Bicyclist Casual or new adult and teenage riders who are less confident of their ability to operate in traffic without special provisions for bicycles
• Comfortable access to destinations • Direct route, but on low-speed, low
traffic-volume streets or on designated bicycle facilities
• Well-defined separation of bicycle and motor vehicles or separate multi-use paths
• Ensure low speeds on neighborhood streets • Traffic calming • Provide interconnected network of
designated bicycle facilities (lanes, multi-use paths, well-marked Class III)
• Usable roadway shoulders • Interconnected Class I Network
Novice Bicyclist Young children, students, and pre-teen riders whose roadway use is initially monitored by parents, and/or adult bicyclists just beginning to ride
• Access to schools, recreation facilities, shopping, or other residential areas
• Residential streets with low motor vehicle speed limits and volumes
• Well-defined separation of bicycles and motor vehicles or separate multi-use paths
• Ensure low speeds on neighborhood streets • Traffic calming • Provide network of designated bicycle
facilities (lanes, multi-use paths, well-marked Class III routes)
• Usable roadway shoulders • Interconnected Class I Network
Source: Hawaii DOT, Minnesota DOT
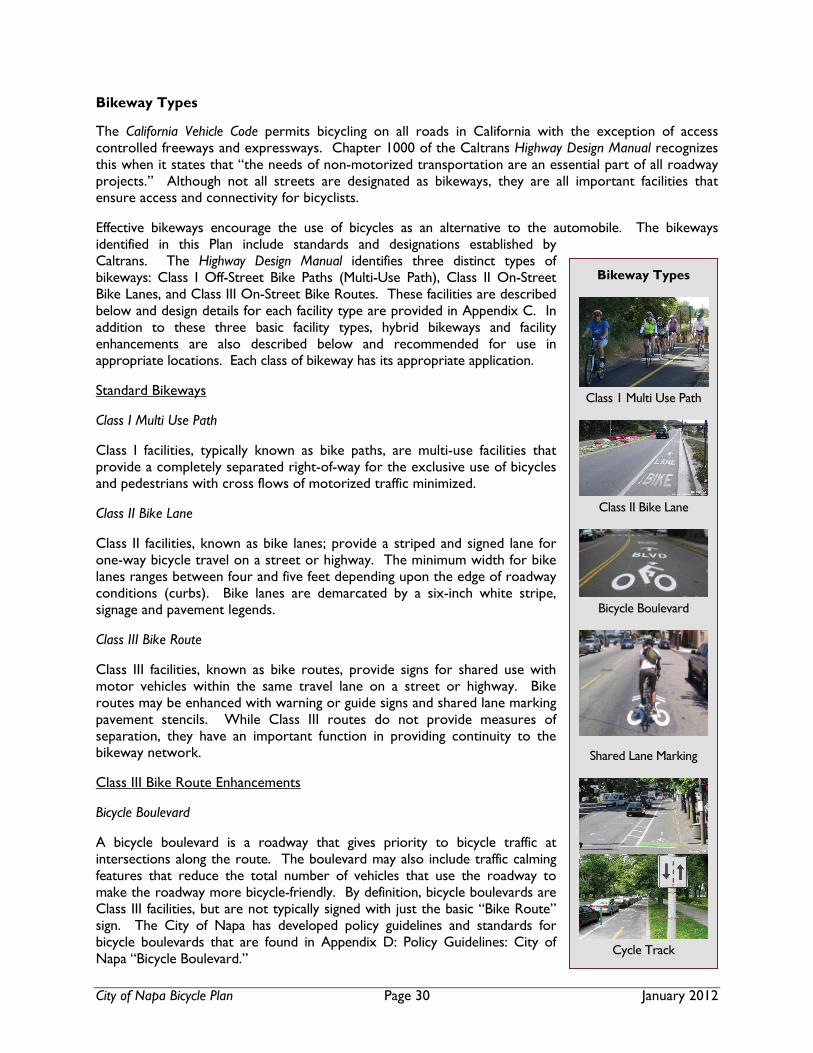
City of Napa Bicycle Plan Page 30 January 2012
Bikeway Types
Class 1 Multi Use Path
Class II Bike Lane
Bicycle Boulevard
Shared Lane Marking
Cycle Track
Bikeway Types
The California Vehicle Code permits bicycling on all roads in California with the exception of access controlled freeways and expressways. Chapter 1000 of the Caltrans Highway Design Manual recognizes this when it states that “the needs of non-motorized transportation are an essential part of all roadway projects.” Although not all streets are designated as bikeways, they are all important facilities that ensure access and connectivity for bicyclists.
Effective bikeways encourage the use of bicycles as an alternative to the automobile. The bikeways identified in this Plan include standards and designations established by Caltrans. The Highway Design Manual identifies three distinct types of bikeways: Class I Off-Street Bike Paths (Multi-Use Path), Class II On-Street Bike Lanes, and Class III On-Street Bike Routes. These facilities are described below and design details for each facility type are provided in Appendix C. In addition to these three basic facility types, hybrid bikeways and facility enhancements are also described below and recommended for use in appropriate locations. Each class of bikeway has its appropriate application.
Standard Bikeways
Class I Multi Use Path
Class I facilities, typically known as bike paths, are multi-use facilities that provide a completely separated right-of-way for the exclusive use of bicycles and pedestrians with cross flows of motorized traffic minimized.
Class II Bike Lane
Class II facilities, known as bike lanes; provide a striped and signed lane for one-way bicycle travel on a street or highway. The minimum width for bike lanes ranges between four and five feet depending upon the edge of roadway conditions (curbs). Bike lanes are demarcated by a six-inch white stripe, signage and pavement legends.
Class III Bike Route
Class III facilities, known as bike routes, provide signs for shared use with motor vehicles within the same travel lane on a street or highway. Bike routes may be enhanced with warning or guide signs and shared lane marking pavement stencils. While Class III routes do not provide measures of separation, they have an important function in providing continuity to the bikeway network.
Class III Bike Route Enhancements
Bicycle Boulevard
A bicycle boulevard is a roadway that gives priority to bicycle traffic at intersections along the route. The boulevard may also include traffic calming features that reduce the total number of vehicles that use the roadway to make the roadway more bicycle-friendly. By definition, bicycle boulevards are Class III facilities, but are not typically signed with just the basic “Bike Route” sign. The City of Napa has developed policy guidelines and standards for bicycle boulevards that are found in Appendix D: Policy Guidelines: City of Napa “Bicycle Boulevard.”

City of Napa Bicycle Plan Page 31 January 2012
Shared Lane Marking
Shared Lane Markings (SLM), known “Sharrows,” are pavement legends which may be placed in the travel lane adjacent to on-street parking. The purpose of the marking is to provide positional guidance to bicyclists on roadways that are too narrow to be striped with bike lanes. SLM do not designate a particular part of the street for the exclusive use of bicyclists. They simply guide bicyclists to the best place to ride on the road to avoid the “door swing” of parked cars, and to warn motorists that they should expect to see and share the lane with bicyclists.
Non-Standard Bikeways
Cycle Track
A cycle track is a bikeway that is separated from adjacent traffic flows through the use of a visible grade change or other physical buffer between the bikeway and the roadway. Cycle tracks may provide for one- or two-way travel. Additionally, cycle tracks may be placed outside the parking lane, but in front of the sidewalk. There are no federal or State standards for cycle tracks, and they are not currently approved for use in California.
City of Napa Bicycle Plan Page 32 January 2012
The Local Bicycle Transportation Network
Existing Conditions
This section describes existing conditions for bicyclists in the City of Napa, including opportunities and constraints, a safety analysis, existing programs, bicycle counts, origins and destinations, schools and safe routes, bicycle parking, and a map and inventory of existing bikeways.
Opportunities and Constraints
A variety of issues and opportunities related to bicycling have been identified through the review of existing documents, maps, aerial images, and public input. These items are summarized below.
• SR 29 is a barrier to east-west travel. • There is a need for improved east-west connectivity for bicyclists in central and northern Napa –
both Class I and Class II routes are desired. • There is a need for secure and convenient bicycle parking at parks and commercial destinations
throughout the community. • Various traffic signals throughout the community do not detect bicyclists. • There is a need to improve safety for bicyclists at railroad crossings. • Degrading pavement and/or a lack of maintenance along bicycle routes is a safety concern. • Bicycle parking is needed at the City’s park-and-ride lot. • Additional wayfinding signage and safety education is needed for the large number of visitors looking
for routes out of town and to the vineyards.
Safety Analysis
The following section addresses safety conditions for bicyclists in the City of Napa and includes a review of the California Office of Traffic Safety’s (OTS) collision rankings, the Statewide Integrated Traffic Records System, Seasonal Trends in Napa County, an understanding of the limitations of bicycle collision reporting, an analysis of bicycle collisions in the City of Napa for a ten-year period for which collision data was available, a summary of collision findings, a location map of bicycle collisions, and a review of urban and rural bicycle crash types.
Collision Rankings
The California Office of Traffic Safety (OTS) conducts ongoing research of traffic safety statewide. OTS prepares an annual traffic safety ranking of all California cities and counties. Cities are broken into groups based on population, while all 58 counties are grouped together; however, the grouping does not take into account other local demographics or characteristics. Accordingly, any small increase or decrease in annual collisions can result in a dramatic shift in OTS rankings. Therefore, these rankings were used for a generalized look at collision performance, not as an exact metric.
Seasonal Trends
Seasonally, Napa County experiences the most bicycle collisions during the summer and early fall months, which corresponds to periods with more tourism. Additionally, most crashes occur on Friday through Monday with generally fewer collisions midweek. This also corresponds to increased tourism activity on weekends. The vast majority of collisions reported occurred during daylight and with clear weather conditions.
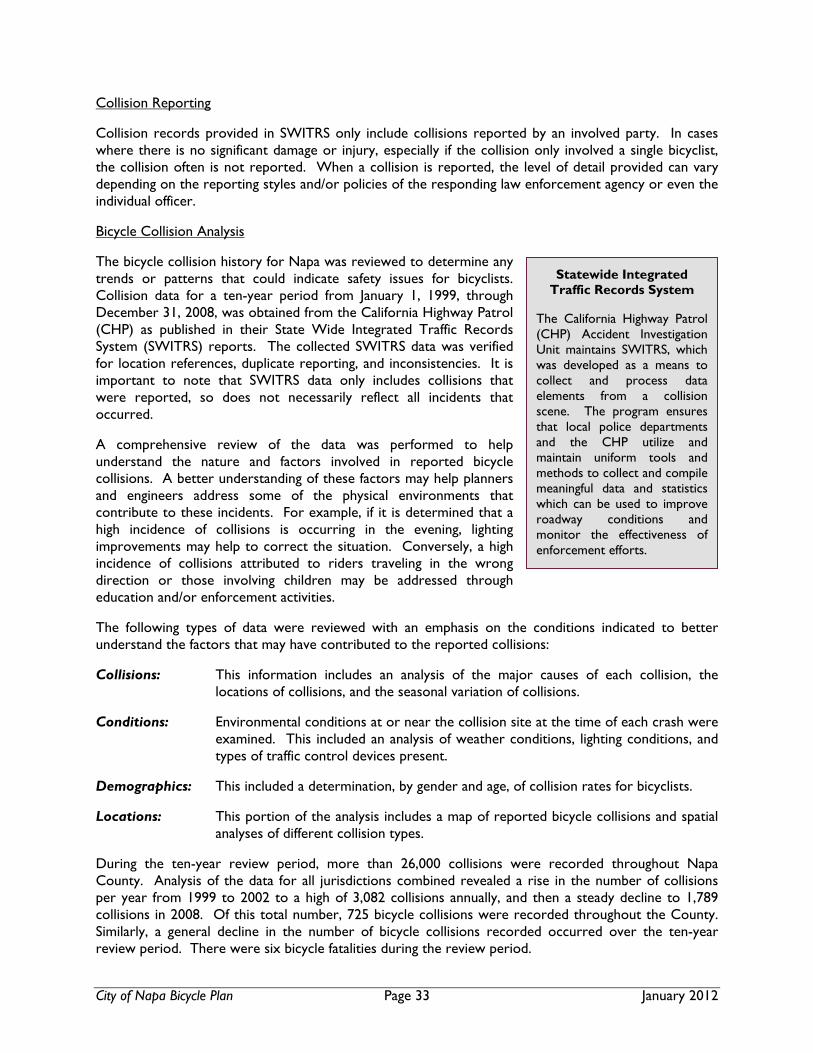
City of Napa Bicycle Plan Page 33 January 2012
Collision Reporting
Collision records provided in SWITRS only include collisions reported by an involved party. In cases where there is no significant damage or injury, especially if the collision only involved a single bicyclist, the collision often is not reported. When a collision is reported, the level of detail provided can vary depending on the reporting styles and/or policies of the responding law enforcement agency or even the individual officer.
Bicycle Collision Analysis
The bicycle collision history for Napa was reviewed to determine any trends or patterns that could indicate safety issues for bicyclists. Collision data for a ten-year period from January 1, 1999, through December 31, 2008, was obtained from the California Highway Patrol (CHP) as published in their State Wide Integrated Traffic Records System (SWITRS) reports. The collected SWITRS data was verified for location references, duplicate reporting, and inconsistencies. It is important to note that SWITRS data only includes collisions that were reported, so does not necessarily reflect all incidents that occurred.
A comprehensive review of the data was performed to help understand the nature and factors involved in reported bicycle collisions. A better understanding of these factors may help planners and engineers address some of the physical environments that contribute to these incidents. For example, if it is determined that a high incidence of collisions is occurring in the evening, lighting improvements may help to correct the situation. Conversely, a high incidence of collisions attributed to riders traveling in the wrong direction or those involving children may be addressed through education and/or enforcement activities.
The following types of data were reviewed with an emphasis on the conditions indicated to better understand the factors that may have contributed to the reported collisions:
Collisions: This information includes an analysis of the major causes of each collision, the locations of collisions, and the seasonal variation of collisions.
Conditions: Environmental conditions at or near the collision site at the time of each crash were examined. This included an analysis of weather conditions, lighting conditions, and types of traffic control devices present.
Demographics: This included a determination, by gender and age, of collision rates for bicyclists.
Locations: This portion of the analysis includes a map of reported bicycle collisions and spatial analyses of different collision types.
During the ten-year review period, more than 26,000 collisions were recorded throughout Napa County. Analysis of the data for all jurisdictions combined revealed a rise in the number of collisions per year from 1999 to 2002 to a high of 3,082 collisions annually, and then a steady decline to 1,789 collisions in 2008. Of this total number, 725 bicycle collisions were recorded throughout the County. Similarly, a general decline in the number of bicycle collisions recorded occurred over the ten-year review period. There were six bicycle fatalities during the review period.
Statewide Integrated Traffic Records System
The California Highway Patrol (CHP) Accident Investigation Unit maintains SWITRS, which was developed as a means to collect and process data elements from a collision scene. The program ensures that local police departments and the CHP utilize and maintain uniform tools and methods to collect and compile meaningful data and statistics which can be used to improve roadway conditions and monitor the effectiveness of enforcement efforts.
City of Napa Bicycle Plan Page 34 January 2012
The City of Napa had a total of 13,769 collisions reported during the ten-year study period, including 479 bicycle collisions total, with 38 to 57 collisions involving bicyclists per year. Of all cities in Napa County, the City of Napa experienced the largest number of bicycle-involved collisions, but the City also has the largest population of all cities in the county.
The two most common bicycle collision causes were riding on the wrong side of the road and auto right of way violation (where the bicyclist violates the right of way of the motorist); these accounted for about half of all reported collisions and are both collision types where the cyclist is likely at fault. The vast majority of collisions occurred during daylight hours and clear or cloudy weather conditions.
The City of Napa is in a category with 103 other California cities with populations that range from 50,001 to 100,000 persons. For 2008, the City’s OTS bicycle collision ranking was in the bottom third, resulting in a higher than average number of collisions per year. However, for bicyclists under the age of 15, the City of Napa ranked mid-range, possibly indicating a successful youth safety education program, but with room for continued improvement. Bicycle collisions in Napa are mapped in Figure 8. Table 6 identifies high incident collision locations in the City of Napa by intersection; the mid-block locations are summarized in Table 7. An explanation of OTS collision rankings and collision charts and graphs is provided in Appendix E.
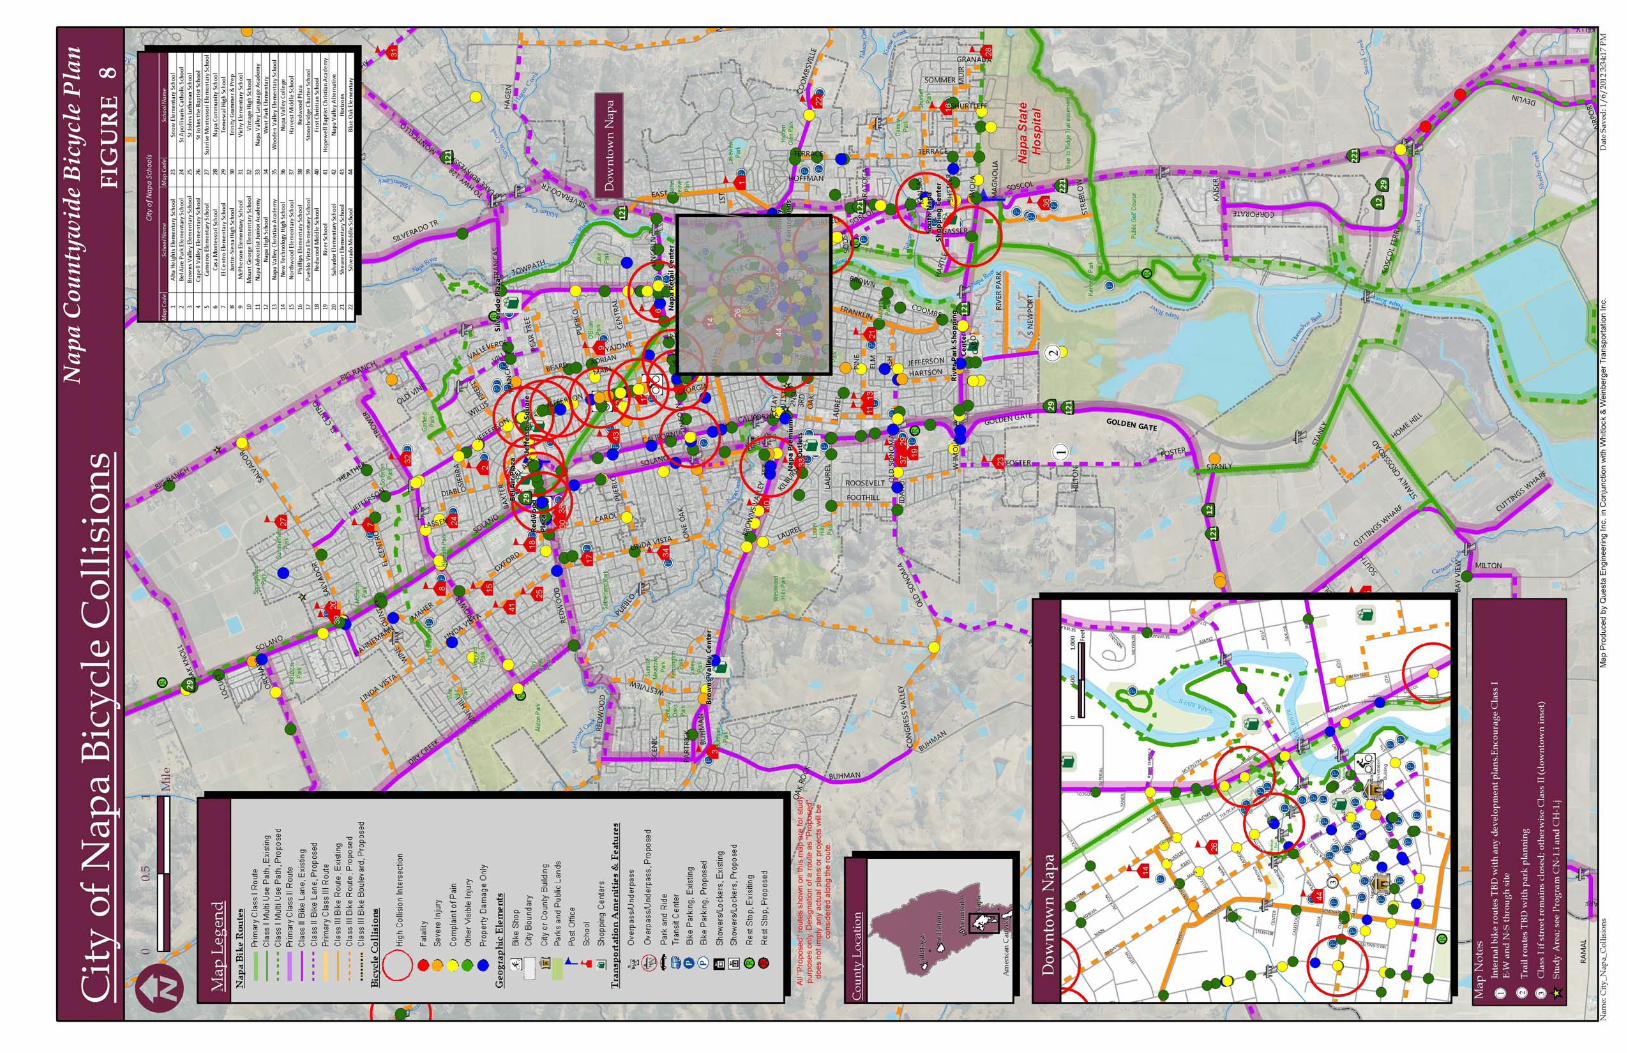
8

City of Napa Bicycle Plan Page 36 January 2012
This page intentionally left blank

City of Napa Bicycle Plan Page 37 January 2012
Table 6 City of Napa Bicycle Collisions
High Incidence Intersections (January 1, 1999 – December 31, 2008)
Rank Intersection Total Collisions
Jurisdiction Description of Location
Bicycle Facilities
Intersection Type
Predominant Collision
Type
1 California Blvd/ Trancas St
13 City of Napa
Central Napa east of &
adjacent to SR 29
Class II bike lanes on
Trancas W of int
Signalized Broadside
2 Jefferson St/ Pueblo Ave
9 City of Napa
Central Napa N of railroad
None Signalized Broadside
T3 1st St/ Freeway Dr
7 City of Napa
W of SR 29/1st St
interchange
Class II bike lanes on 1st St, on Freeway Dr
S of int
Signalized Broadside
T3 California Blvd/ Lincoln Ave (W)
7 City of Napa
Adjacent to Lincoln/SR 29 interchange
Class II bike lanes N/S on
California
Signalized Other
T3 Soscol Ave/ Lincoln Ave
7 City of Napa
Central Napa ~0.5 mi W of Silverado Trail ~0.9 mi N of downtown
Class II bike lanes on Lincoln &
Soscol – all directions
Signalized Broadside
T3 Jefferson St/ Lincoln Ave
7 City of Napa
Adjacent to Napa High
School
None Signalized Broadside; Other
T7 Trancas St/ Jefferson St
5 City of Napa
0.4 miles E of Trancas/SR 29
int., central Napa
None Signalized Broadside
T7 Lincoln Ave/ Main St
5 City of Napa
Central Napa, W of
downtown
None Side Street stop-
controlled
Other
T7 Trancas St/ NB SR 29 Offramp
5 Caltrans/ City of Napa
NW of Central Napa
Class II bike lanes on Trancas
Signalized Broadside
T7 Pearl St/ Main St
5 City of Napa
Downtown Napa
None Signalized Other
T7 Soscol Ave/ Pearl St (W)
5 City of Napa
E of Central Napa
Class II bike lanes on Soscol
Signalized Other
T7 Solano Ave/ Redwood Rd
5 City of Napa
Adjacent to Trancas/SR 29 interchange
Class II bike lanes N/S of int on Solano, E of
int on Redwood
Signalized Other
T7 W Imola Ave/ Gasser Dr
5 Caltrans/ City of Napa
S Napa, E end SR 121 Napa
River Br
Class II bike lanes on W
Imola
Signalized Broadside
Note: T = tie
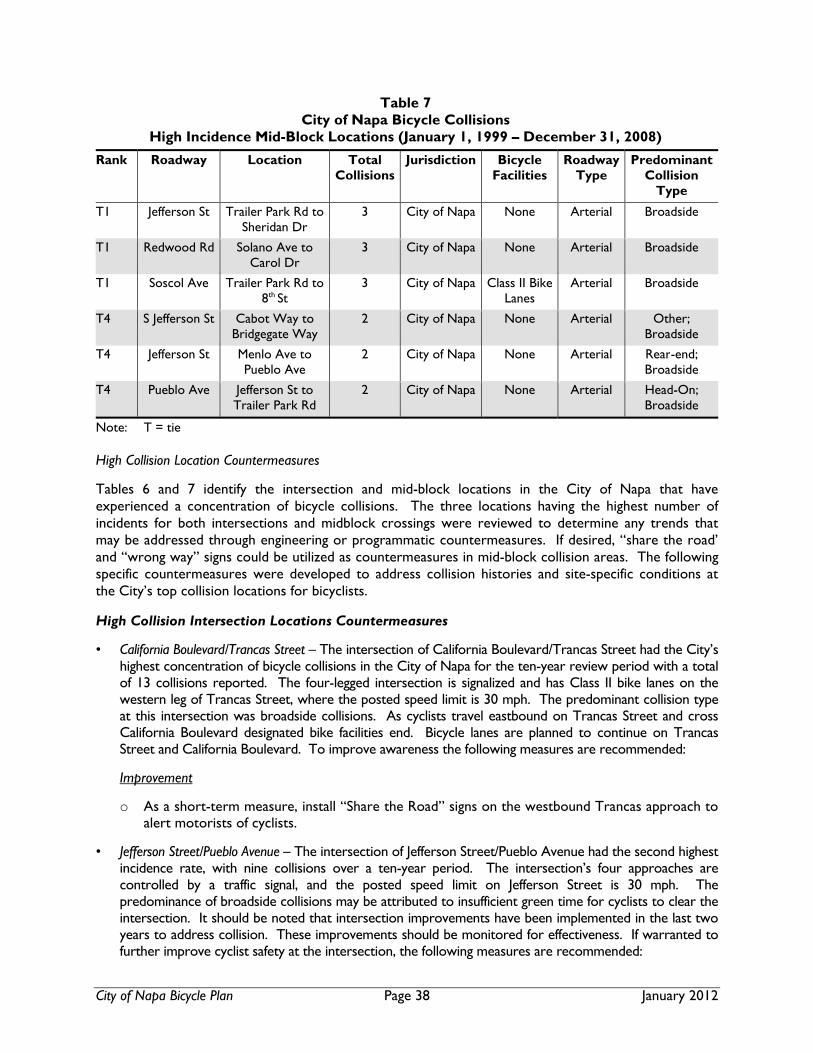
City of Napa Bicycle Plan Page 38 January 2012
Table 7 City of Napa Bicycle Collisions
High Incidence Mid-Block Locations (January 1, 1999 – December 31, 2008)
Rank Roadway Location Total Collisions
Jurisdiction Bicycle Facilities
Roadway Type
Predominant Collision
Type
T1 Jefferson St Trailer Park Rd to Sheridan Dr
3 City of Napa None Arterial Broadside
T1 Redwood Rd Solano Ave to Carol Dr
3 City of Napa None Arterial Broadside
T1 Soscol Ave Trailer Park Rd to 8th St
3 City of Napa Class II Bike Lanes
Arterial Broadside
T4 S Jefferson St Cabot Way to Bridgegate Way
2 City of Napa None Arterial Other; Broadside
T4 Jefferson St Menlo Ave to Pueblo Ave
2 City of Napa None Arterial Rear-end; Broadside
T4 Pueblo Ave Jefferson St to Trailer Park Rd
2 City of Napa None Arterial Head-On; Broadside
Note: T = tie High Collision Location Countermeasures
Tables 6 and 7 identify the intersection and mid-block locations in the City of Napa that have experienced a concentration of bicycle collisions. The three locations having the highest number of incidents for both intersections and midblock crossings were reviewed to determine any trends that may be addressed through engineering or programmatic countermeasures. If desired, “share the road’ and “wrong way” signs could be utilized as countermeasures in mid-block collision areas. The following specific countermeasures were developed to address collision histories and site-specific conditions at the City’s top collision locations for bicyclists.
High Collision Intersection Locations Countermeasures
• California Boulevard/Trancas Street – The intersection of California Boulevard/Trancas Street had the City’s highest concentration of bicycle collisions in the City of Napa for the ten-year review period with a total of 13 collisions reported. The four-legged intersection is signalized and has Class II bike lanes on the western leg of Trancas Street, where the posted speed limit is 30 mph. The predominant collision type at this intersection was broadside collisions. As cyclists travel eastbound on Trancas Street and cross California Boulevard designated bike facilities end. Bicycle lanes are planned to continue on Trancas Street and California Boulevard. To improve awareness the following measures are recommended:
Improvement
o As a short-term measure, install “Share the Road” signs on the westbound Trancas approach to alert motorists of cyclists.
• Jefferson Street/Pueblo Avenue – The intersection of Jefferson Street/Pueblo Avenue had the second highest incidence rate, with nine collisions over a ten-year period. The intersection’s four approaches are controlled by a traffic signal, and the posted speed limit on Jefferson Street is 30 mph. The predominance of broadside collisions may be attributed to insufficient green time for cyclists to clear the intersection. It should be noted that intersection improvements have been implemented in the last two years to address collision. These improvements should be monitored for effectiveness. If warranted to further improve cyclist safety at the intersection, the following measures are recommended:
City of Napa Bicycle Plan Page 39 January 2012
Improvements
o Modify signal timing to include adequate green time for cyclists to clear the intersection safely. o Provide additional signing to inform motorists of the presence of cyclists.
• 1st Street/Freeway Drive – 1st Street/Freeway Drive experienced seven collisions over the ten-year study period. This intersection has four approaches and is signalized, with striped bike lanes on 1st Street. The intersection widens to include right-turn pockets on the northbound and eastbound approaches. The primary collision factor at this location was broadside collisions. To improve cyclist safety at the intersection the following counter measures are recommended:
Improvements
o Install signing to inform motorists of cyclist activity. o Install bicycle signing recommended in the CA-MUTCD for bike lanes adjacent to right turn
lanes on the eastbound approach to reinforce the expectation of bicyclists and promote orderly movements through the intersection for motorists.
High Collision Locations General Countermeasures
Improvements
o On both streets with bicycle facilities and those without bicycle facilities, a high percentage of bicycle collisions within the City of Napa are related to riding the wrong way or against traffic. Therefore, “wrong way” warning signs should be installed behind the “bike lane” signs to alert cyclists that they are riding in the wrong direction. Education programs would also inform users of the appropriate way to use the different bicycle facilities.
o Implement a bicycle safety education program.
Comparison of Rural and Urban Bicycle Crashes
FHWA Summary Report of Factors Contributing to Pedestrian and Bicycle Crashes on Rural Highways
A 2010 report by the FHWA’s Highway Safety Information System, Factors Contributing to Pedestrian and Bicycle Crashes on Rural Highways, was prepared to examine the difference between pedestrian and bicycle crashes in urban and rural settings in order to identify crash types and crash locations specific to rural highways that could be addressed through the use of existing safety treatments and/or through the development of new treatments.
According to the study, “approximately 25 percent of nationwide pedestrian and bicycle fatal and injury accidents occur on rural highways. In contrast to urban highways, rural highways have certain characteristics that can be more hazardous to pedestrians and bicyclists, such as higher average vehicle speeds and a lack of sidewalk and/or shoulder provisions.” Further, limited research has been conducted on rural highways in regards to the potential to link crash data with roadway characteristics and traffic counts.
The first objective of the study was to compare general descriptive statistics of rural versus urban crashes. This general comparison is useful for indicating which factors are common to both localities as well as which factors are over-represented in a rural environment.
The most common crash types for bicyclists differed in rural and urban areas. The most common rural crashes included bicyclists turning/merging into the path of the driver and drivers overtaking the bicyclist. The most common urban crashes included drivers failing to yield, bicyclists failing to yield midblock, and bicyclists failing to yield at the intersection. One noticeable difference is that common rural crash types generally occurred on midblock segments, while urban crash types generally occurred at intersections.
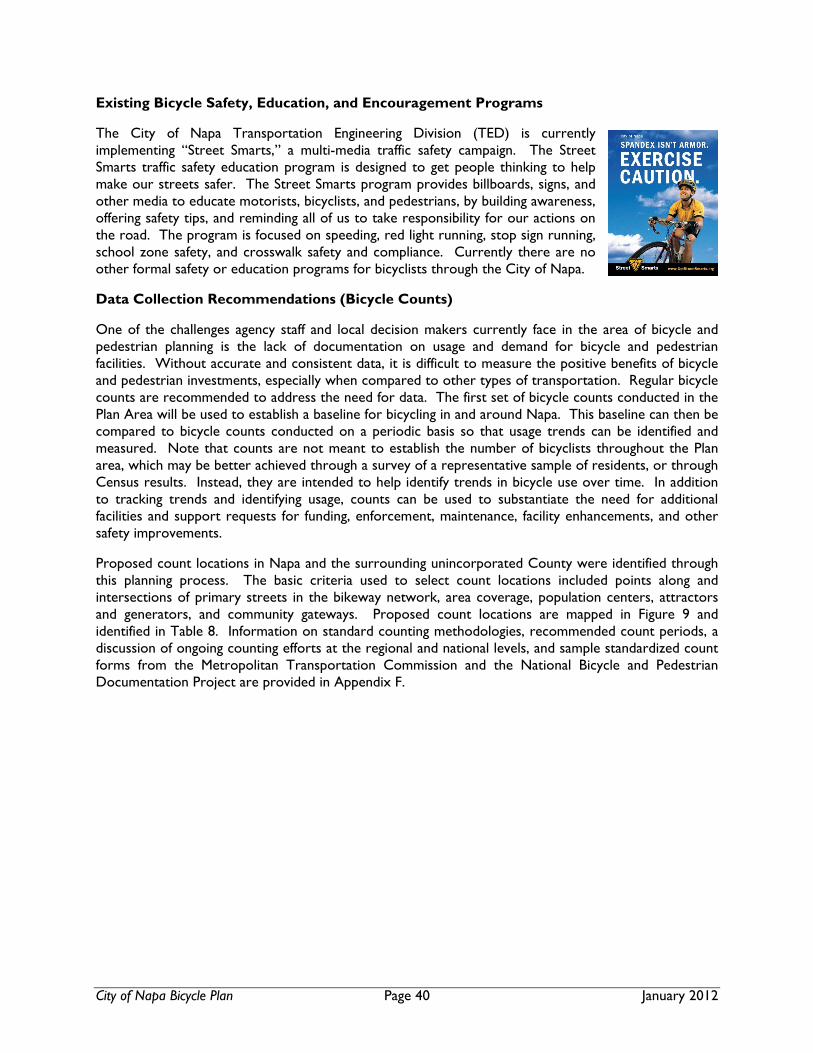
City of Napa Bicycle Plan Page 40 January 2012
Existing Bicycle Safety, Education, and Encouragement Programs
The City of Napa Transportation Engineering Division (TED) is currently implementing “Street Smarts,” a multi-media traffic safety campaign. The Street Smarts traffic safety education program is designed to get people thinking to help make our streets safer. The Street Smarts program provides billboards, signs, and other media to educate motorists, bicyclists, and pedestrians, by building awareness, offering safety tips, and reminding all of us to take responsibility for our actions on the road. The program is focused on speeding, red light running, stop sign running, school zone safety, and crosswalk safety and compliance. Currently there are no other formal safety or education programs for bicyclists through the City of Napa.
Data Collection Recommendations (Bicycle Counts)
One of the challenges agency staff and local decision makers currently face in the area of bicycle and pedestrian planning is the lack of documentation on usage and demand for bicycle and pedestrian facilities. Without accurate and consistent data, it is difficult to measure the positive benefits of bicycle and pedestrian investments, especially when compared to other types of transportation. Regular bicycle counts are recommended to address the need for data. The first set of bicycle counts conducted in the Plan Area will be used to establish a baseline for bicycling in and around Napa. This baseline can then be compared to bicycle counts conducted on a periodic basis so that usage trends can be identified and measured. Note that counts are not meant to establish the number of bicyclists throughout the Plan area, which may be better achieved through a survey of a representative sample of residents, or through Census results. Instead, they are intended to help identify trends in bicycle use over time. In addition to tracking trends and identifying usage, counts can be used to substantiate the need for additional facilities and support requests for funding, enforcement, maintenance, facility enhancements, and other safety improvements.
Proposed count locations in Napa and the surrounding unincorporated County were identified through this planning process. The basic criteria used to select count locations included points along and intersections of primary streets in the bikeway network, area coverage, population centers, attractors and generators, and community gateways. Proposed count locations are mapped in Figure 9 and identified in Table 8. Information on standard counting methodologies, recommended count periods, a discussion of ongoing counting efforts at the regional and national levels, and sample standardized count forms from the Metropolitan Transportation Commission and the National Bicycle and Pedestrian Documentation Project are provided in Appendix F.
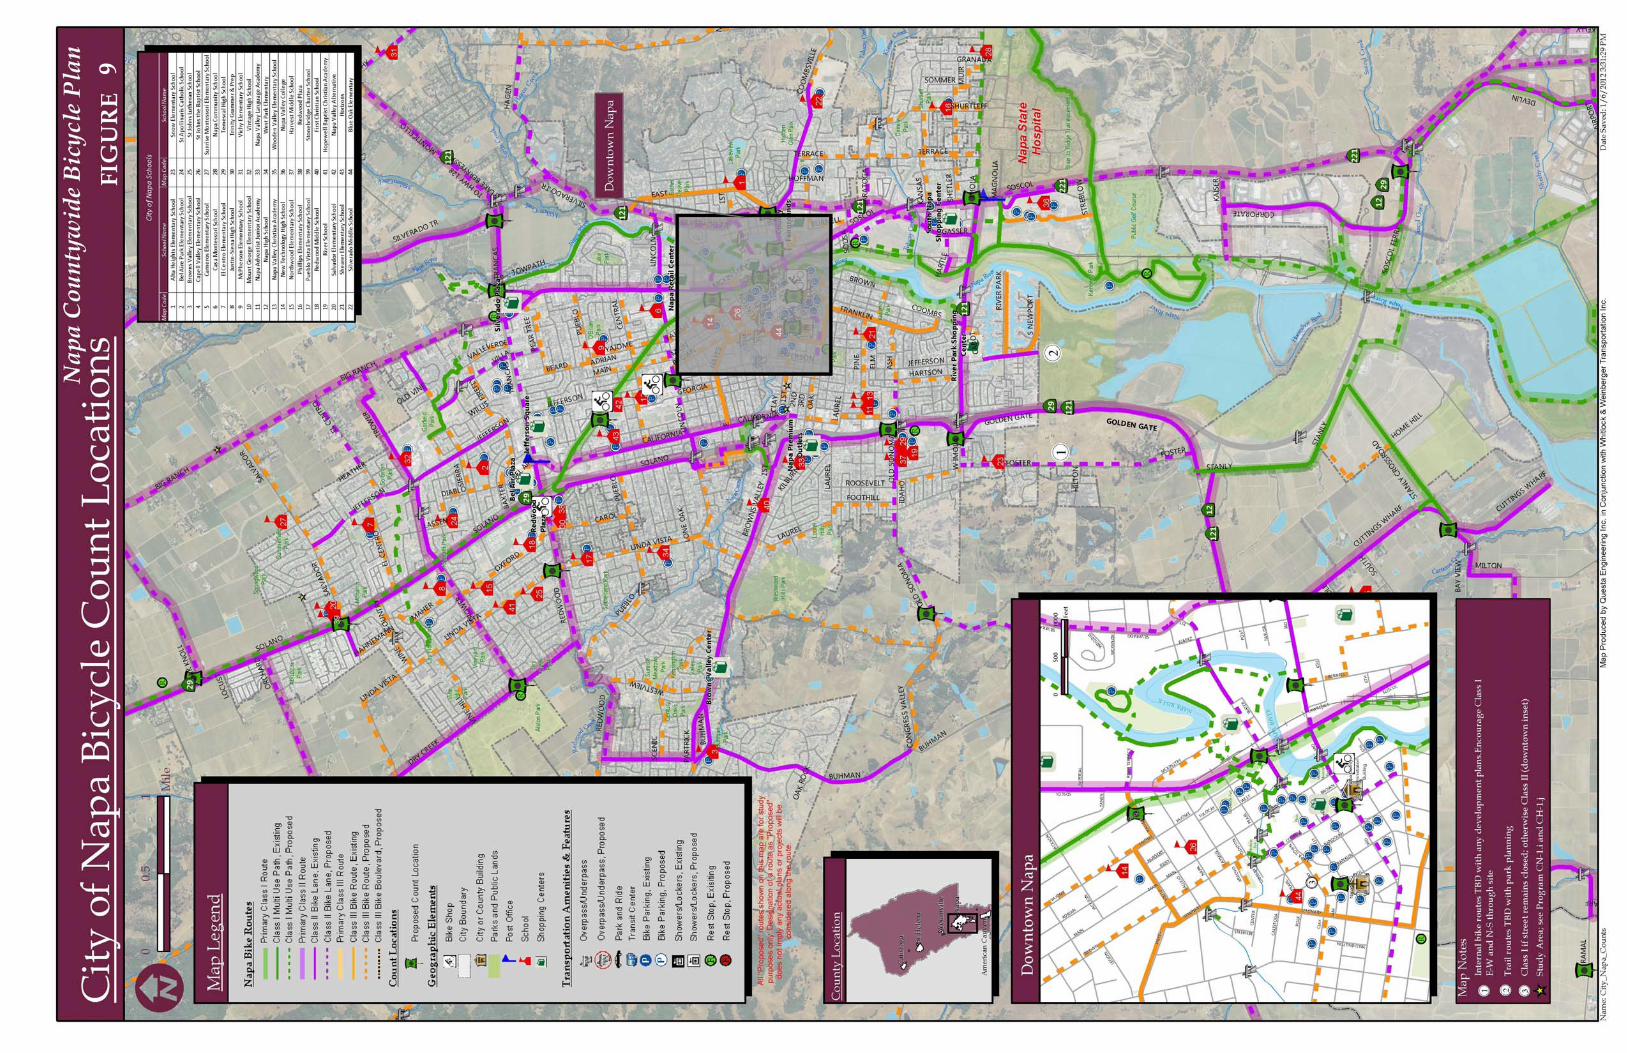
9

City of Napa Bicycle Plan Page 42 January 2012
This page intentionally left blank
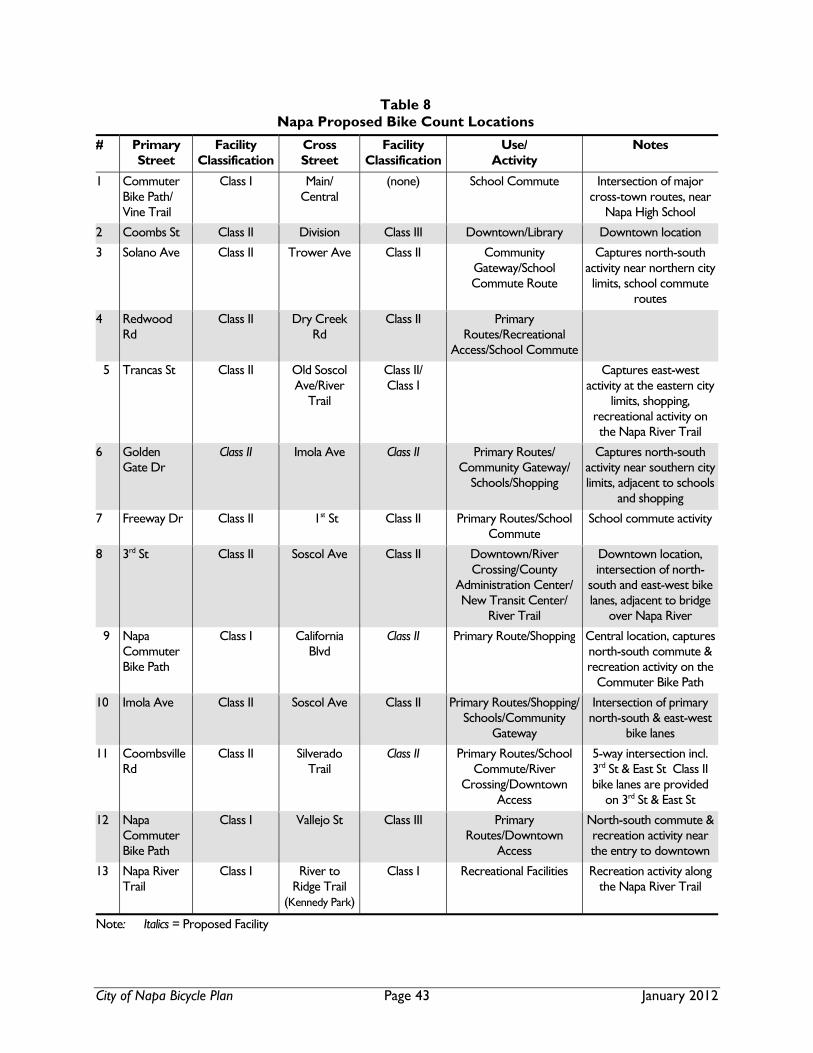
City of Napa Bicycle Plan Page 43 January 2012
Table 8 Napa Proposed Bike Count Locations
# Primary Street
Facility Classification
Cross Street
Facility Classification
Use/ Activity
Notes
1 Commuter Bike Path/ Vine Trail
Class I Main/ Central
(none) School Commute Intersection of major cross-town routes, near
Napa High School
2 Coombs St Class II Division Class III Downtown/Library Downtown location
3 Solano Ave Class II Trower Ave Class II Community Gateway/School Commute Route
Captures north-south activity near northern city limits, school commute
routes
4 Redwood Rd
Class II Dry Creek Rd
Class II Primary Routes/Recreational
Access/School Commute
5 Trancas St Class II Old Soscol Ave/River
Trail
Class II/ Class I
Captures east-west activity at the eastern city
limits, shopping, recreational activity on the Napa River Trail
6 Golden Gate Dr
Class II Imola Ave Class II Primary Routes/ Community Gateway/
Schools/Shopping
Captures north-south activity near southern city limits, adjacent to schools
and shopping
7 Freeway Dr Class II 1st St Class II Primary Routes/School Commute
School commute activity
8 3rd St Class II Soscol Ave Class II Downtown/River Crossing/County
Administration Center/ New Transit Center/
River Trail
Downtown location, intersection of north-
south and east-west bike lanes, adjacent to bridge
over Napa River
9 Napa Commuter Bike Path
Class I California Blvd
Class II Primary Route/Shopping Central location, captures north-south commute & recreation activity on the
Commuter Bike Path
10 Imola Ave Class II Soscol Ave Class II Primary Routes/Shopping/ Schools/Community
Gateway
Intersection of primary north-south & east-west
bike lanes
11 Coombsville Rd
Class II Silverado Trail
Class II Primary Routes/School Commute/River
Crossing/Downtown Access
5-way intersection incl. 3rd St & East St Class II bike lanes are provided
on 3rd St & East St
12 Napa Commuter Bike Path
Class I Vallejo St Class III Primary Routes/Downtown
Access
North-south commute & recreation activity near the entry to downtown
13 Napa River Trail
Class I River to Ridge Trail
(Kennedy Park)
Class I Recreational Facilities Recreation activity along the Napa River Trail
Note: Italics = Proposed Facility
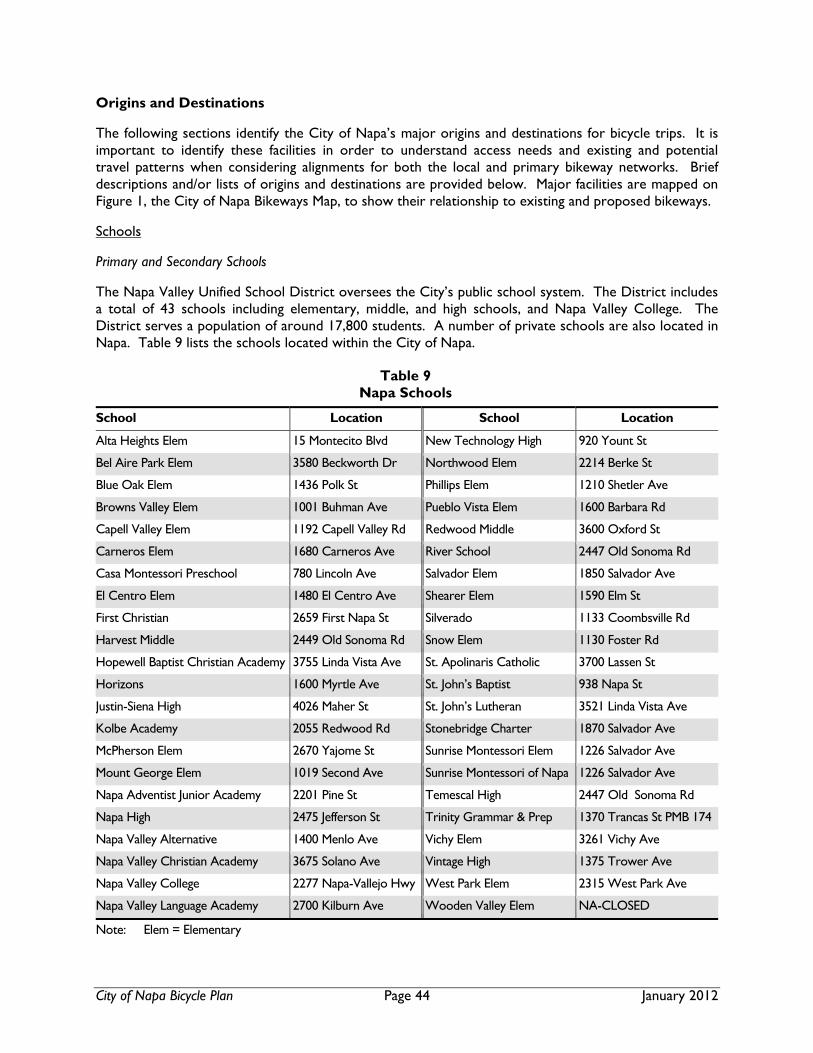
City of Napa Bicycle Plan Page 44 January 2012
Origins and Destinations
The following sections identify the City of Napa’s major origins and destinations for bicycle trips. It is important to identify these facilities in order to understand access needs and existing and potential travel patterns when considering alignments for both the local and primary bikeway networks. Brief descriptions and/or lists of origins and destinations are provided below. Major facilities are mapped on Figure 1, the City of Napa Bikeways Map, to show their relationship to existing and proposed bikeways.
Schools
Primary and Secondary Schools
The Napa Valley Unified School District oversees the City’s public school system. The District includes a total of 43 schools including elementary, middle, and high schools, and Napa Valley College. The District serves a population of around 17,800 students. A number of private schools are also located in Napa. Table 9 lists the schools located within the City of Napa.
Table 9 Napa Schools
School Location School Location
Alta Heights Elem 15 Montecito Blvd New Technology High 920 Yount St
Bel Aire Park Elem 3580 Beckworth Dr Northwood Elem 2214 Berke St
Blue Oak Elem 1436 Polk St Phillips Elem 1210 Shetler Ave
Browns Valley Elem 1001 Buhman Ave Pueblo Vista Elem 1600 Barbara Rd
Capell Valley Elem 1192 Capell Valley Rd Redwood Middle 3600 Oxford St
Carneros Elem 1680 Carneros Ave River School 2447 Old Sonoma Rd
Casa Montessori Preschool 780 Lincoln Ave Salvador Elem 1850 Salvador Ave
El Centro Elem 1480 El Centro Ave Shearer Elem 1590 Elm St
First Christian 2659 First Napa St Silverado 1133 Coombsville Rd
Harvest Middle 2449 Old Sonoma Rd Snow Elem 1130 Foster Rd
Hopewell Baptist Christian Academy 3755 Linda Vista Ave St. Apolinaris Catholic 3700 Lassen St
Horizons 1600 Myrtle Ave St. John’s Baptist 938 Napa St
Justin-Siena High 4026 Maher St St. John’s Lutheran 3521 Linda Vista Ave
Kolbe Academy 2055 Redwood Rd Stonebridge Charter 1870 Salvador Ave
McPherson Elem 2670 Yajome St Sunrise Montessori Elem 1226 Salvador Ave
Mount George Elem 1019 Second Ave Sunrise Montessori of Napa 1226 Salvador Ave
Napa Adventist Junior Academy 2201 Pine St Temescal High 2447 Old Sonoma Rd
Napa High 2475 Jefferson St Trinity Grammar & Prep 1370 Trancas St PMB 174
Napa Valley Alternative 1400 Menlo Ave Vichy Elem 3261 Vichy Ave
Napa Valley Christian Academy 3675 Solano Ave Vintage High 1375 Trower Ave
Napa Valley College 2277 Napa-Vallejo Hwy West Park Elem 2315 West Park Ave
Napa Valley Language Academy 2700 Kilburn Ave Wooden Valley Elem NA-CLOSED
Note: Elem = Elementary

City of Napa Bicycle Plan Page 45 January 2012
Community Facilities
There are a variety of civic destinations and community facilities located in the City of Napa that can be reached by bicycle or on foot. Major community facilities in Napa include:
• Napa Post Office – 1351 2nd Street, 1625 Trancas Street • Napa Public Library – 580 Coombs Street • Napa City Hall – 955 School Street • Napa County Fairgrounds – 575 3rd Street • Napa County Administration Complex – 1195 3rd Street • Queen of the Valley Hospital – 1000 Trancas Street • Kaiser Clinic – Permanente Way
Commercial / Shopping Centers
• Farmer’s Markets • Oxbow Market • Redwood Plaza • South Napa Marketplace • Silverado Plaza • River Park Plaza • Bel Aire Plaza • Napa Premium Factory Outlets • Downtown/Riverfront
Major Employment Centers
• Napa Corporate Park • Napa State Hospital • Napa County Administration Complex • Kaiser • Queen of the Valley Hospital • City of Napa • Napa Valley Wine Train
Parks
The City of Napa maintains more than 48 public parks with a total of over 800 acres of parkland. These parks include a variety of recreation attractions. A list of existing parks in the City of Napa is provided in Table 10.
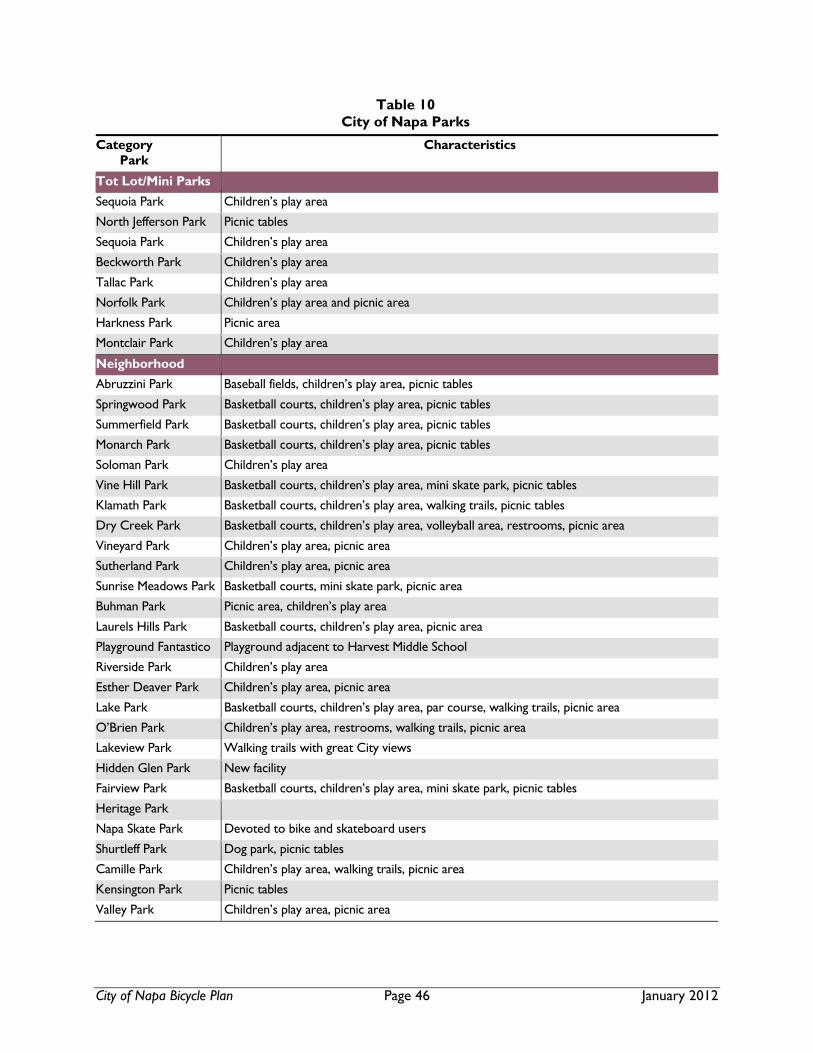
City of Napa Bicycle Plan Page 46 January 2012
Table 10 City of Napa Parks
Category Park
Characteristics
Tot Lot/Mini Parks
Sequoia Park Children’s play area
North Jefferson Park Picnic tables
Sequoia Park Children’s play area
Beckworth Park Children’s play area
Tallac Park Children’s play area
Norfolk Park Children’s play area and picnic area
Harkness Park Picnic area
Montclair Park Children’s play area
Neighborhood
Abruzzini Park Baseball fields, children’s play area, picnic tables
Springwood Park Basketball courts, children’s play area, picnic tables
Summerfield Park Basketball courts, children’s play area, picnic tables
Monarch Park Basketball courts, children’s play area, picnic tables
Soloman Park Children’s play area
Vine Hill Park Basketball courts, children’s play area, mini skate park, picnic tables
Klamath Park Basketball courts, children’s play area, walking trails, picnic tables
Dry Creek Park Basketball courts, children’s play area, volleyball area, restrooms, picnic area
Vineyard Park Children’s play area, picnic area
Sutherland Park Children’s play area, picnic area
Sunrise Meadows Park Basketball courts, mini skate park, picnic area
Buhman Park Picnic area, children’s play area
Laurels Hills Park Basketball courts, children’s play area, picnic area
Playground Fantastico Playground adjacent to Harvest Middle School
Riverside Park Children’s play area
Esther Deaver Park Children’s play area, picnic area
Lake Park Basketball courts, children’s play area, par course, walking trails, picnic area
O’Brien Park Children’s play area, restrooms, walking trails, picnic area
Lakeview Park Walking trails with great City views
Hidden Glen Park New facility
Fairview Park Basketball courts, children’s play area, mini skate park, picnic tables
Heritage Park
Napa Skate Park Devoted to bike and skateboard users
Shurtleff Park Dog park, picnic tables
Camille Park Children’s play area, walking trails, picnic area
Kensington Park Picnic tables
Valley Park Children’s play area, picnic area
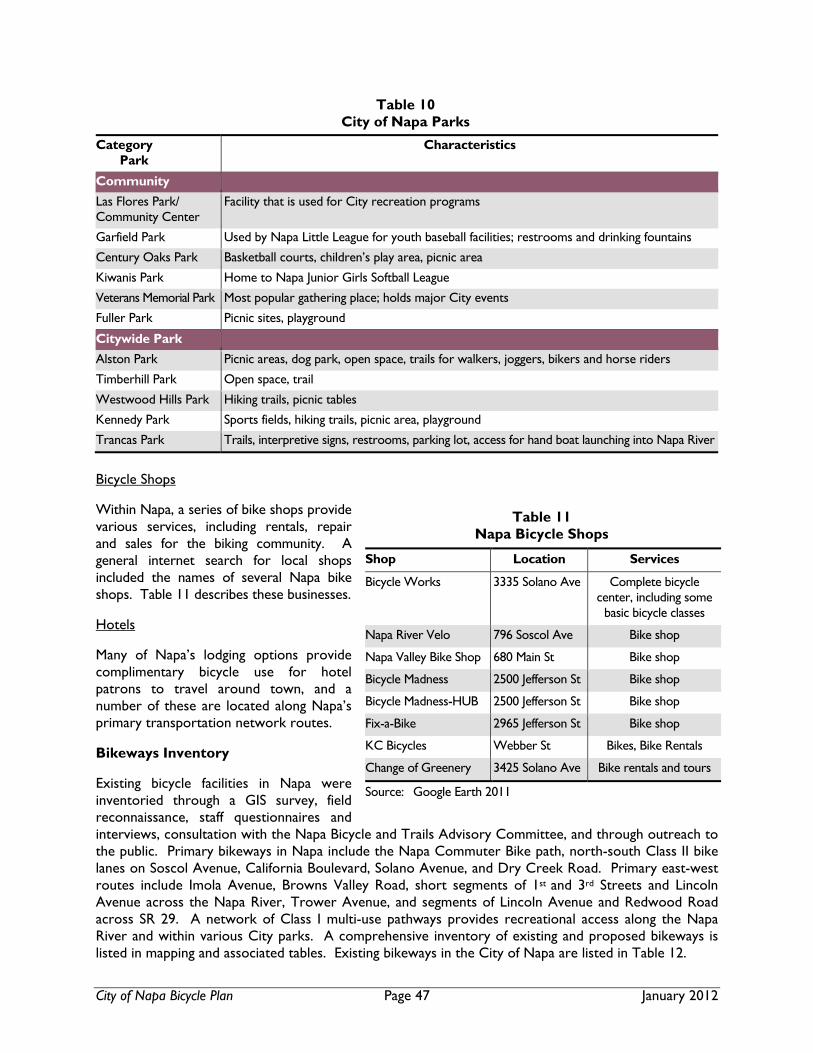
City of Napa Bicycle Plan Page 47 January 2012
Table 10 City of Napa Parks
Category Park
Characteristics
Community
Las Flores Park/ Community Center
Facility that is used for City recreation programs
Garfield Park Used by Napa Little League for youth baseball facilities; restrooms and drinking fountains
Century Oaks Park Basketball courts, children’s play area, picnic area
Kiwanis Park Home to Napa Junior Girls Softball League
Veterans Memorial Park Most popular gathering place; holds major City events
Fuller Park Picnic sites, playground
Citywide Park
Alston Park Picnic areas, dog park, open space, trails for walkers, joggers, bikers and horse riders
Timberhill Park Open space, trail
Westwood Hills Park Hiking trails, picnic tables
Kennedy Park Sports fields, hiking trails, picnic area, playground
Trancas Park Trails, interpretive signs, restrooms, parking lot, access for hand boat launching into Napa River
Bicycle Shops
Within Napa, a series of bike shops provide various services, including rentals, repair and sales for the biking community. A general internet search for local shops included the names of several Napa bike shops. Table 11 describes these businesses.
Hotels
Many of Napa’s lodging options provide complimentary bicycle use for hotel patrons to travel around town, and a number of these are located along Napa’s primary transportation network routes.
Bikeways Inventory
Existing bicycle facilities in Napa were inventoried through a GIS survey, field reconnaissance, staff questionnaires and interviews, consultation with the Napa Bicycle and Trails Advisory Committee, and through outreach to the public. Primary bikeways in Napa include the Napa Commuter Bike path, north-south Class II bike lanes on Soscol Avenue, California Boulevard, Solano Avenue, and Dry Creek Road. Primary east-west routes include Imola Avenue, Browns Valley Road, short segments of 1st and 3rd Streets and Lincoln Avenue across the Napa River, Trower Avenue, and segments of Lincoln Avenue and Redwood Road across SR 29. A network of Class I multi-use pathways provides recreational access along the Napa River and within various City parks. A comprehensive inventory of existing and proposed bikeways is listed in mapping and associated tables. Existing bikeways in the City of Napa are listed in Table 12.
Table 11 Napa Bicycle Shops
Shop Location Services
Bicycle Works 3335 Solano Ave Complete bicycle center, including some
basic bicycle classes
Napa River Velo 796 Soscol Ave Bike shop
Napa Valley Bike Shop 680 Main St Bike shop
Bicycle Madness 2500 Jefferson St Bike shop
Bicycle Madness-HUB 2500 Jefferson St Bike shop
Fix-a-Bike 2965 Jefferson St Bike shop
KC Bicycles Webber St Bikes, Bike Rentals
Change of Greenery 3425 Solano Ave Bike rentals and tours
Source: Google Earth 2011
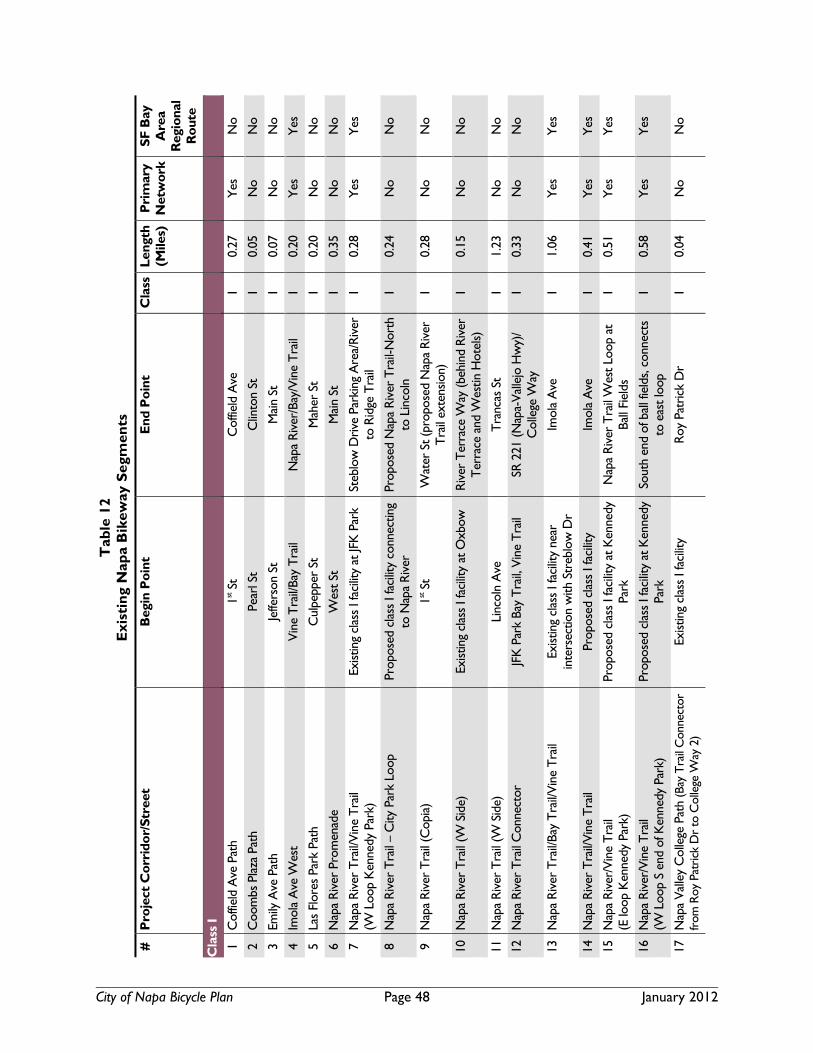
City of Napa Bicycle Plan Page 48 January 2012
Tab
le 1
2 E
xist
ing
Nap
a B
ikew
ay S
egm
ents
# P
roje
ct C
orri
dor/
Str
eet
Beg
in P
oint
E
nd P
oint
C
lass
L
engt
h (M
iles)
P
rim
ary
Net
wor
k S
F B
ay
Are
a R
egio
nal
Rou
te
Cla
ss I
1 C
offie
ld A
ve P
ath
1st S
t C
offie
ld A
ve
I 0.
27
Yes
N
o
2 C
oom
bs P
laza
Pat
h
Pear
l St
Clin
ton
St
I 0.
05
No
No
3 Em
ily A
ve P
ath
Jeffe
rson
St
Mai
n St
I
0.07
N
o N
o
4 Im
ola
Ave
Wes
t V
ine
Tra
il/Ba
y T
rail
Nap
a R
iver
/Bay
/Vin
e T
rail
I 0.
20
Yes
Y
es
5 La
s Fl
ores
Par
k Pa
th
Cul
pepp
er S
t M
aher
St
I 0.
20
No
No
6 N
apa
Riv
er P
rom
enad
e W
est S
t M
ain
St
I 0.
35
No
No
7 N
apa
Riv
er T
rail/
Vin
e T
rail
(W L
oop
Ken
nedy
Par
k)
Exist
ing
clas
s I f
acili
ty a
t JFK
Par
k St
eblo
w D
rive
Park
ing
Are
a/R
iver
to
Rid
ge T
rail
I 0.
28
Yes
Y
es
8 N
apa
Riv
er T
rail
– C
ity P
ark
Loop
Pr
opos
ed c
lass
I fa
cilit
y co
nnec
ting
to N
apa
Riv
er
Prop
osed
Nap
a R
iver
Tra
il-N
orth
to
Lin
coln
I
0.24
N
o N
o
9 N
apa
Riv
er T
rail
(Cop
ia)
1st S
t W
ater
St (
prop
osed
Nap
a R
iver
T
rail
exte
nsio
n)
I 0.
28
No
No
10
Nap
a R
iver
Tra
il (W
Sid
e)
Exist
ing
clas
s I f
acili
ty a
t Oxb
ow
Riv
er T
erra
ce W
ay (b
ehin
d R
iver
T
erra
ce a
nd W
estin
Hot
els)
I
0.15
N
o N
o
11
Nap
a R
iver
Tra
il (W
Sid
e)
Linc
oln
Ave
T
ranc
as S
t I
1.23
N
o N
o
12
Nap
a R
iver
Tra
il C
onne
ctor
JF
K P
ark
Bay
Tra
il, V
ine
Tra
il SR
221
(Nap
a-V
alle
jo H
wy)
/ C
olle
ge W
ay
I 0.
33
No
No
13
Nap
a R
iver
Tra
il/Ba
y T
rail/
Vin
e T
rail
Exist
ing
clas
s I f
acili
ty n
ear
inte
rsec
tion
with
Str
eblo
w D
r Im
ola
Ave
I
1.06
Y
es
Yes
14
Nap
a R
iver
Tra
il/V
ine
Tra
il Pr
opos
ed c
lass
I fa
cilit
y Im
ola
Ave
I
0.41
Y
es
Yes
15
Nap
a R
iver
/Vin
e T
rail
(E lo
op K
enne
dy P
ark)
Pr
opos
ed c
lass
I fa
cilit
y at
Ken
nedy
Pa
rk
Nap
a R
iver
Tra
il W
est L
oop
at
Ball
Fiel
ds
I 0.
51
Yes
Y
es
16
Nap
a R
iver
/Vin
e T
rail
(W L
oop
S en
d of
Ken
nedy
Par
k)
Prop
osed
cla
ss I
faci
lity
at K
enne
dy
Park
So
uth
end
of b
all f
ield
s, co
nnec
ts
to e
ast l
oop
I 0.
58
Yes
Y
es
17
Nap
a V
alle
y C
olle
ge P
ath
(Bay
Tra
il C
onne
ctor
fr
om R
oy P
atri
ck D
r to
Col
lege
Way
2)
Exist
ing
clas
s I f
acili
ty
Roy
Pat
rick
Dr
I 0.
04
No
No

City of Napa Bicycle Plan Page 49 January 2012
Tab
le 1
2 E
xist
ing
Nap
a B
ikew
ay S
egm
ents
# P
roje
ct C
orri
dor/
Str
eet
Beg
in P
oint
E
nd P
oint
C
lass
L
engt
h (M
iles)
P
rim
ary
Net
wor
k S
F B
ay
Are
a R
egio
nal
Rou
te
18
Nap
a V
alle
y C
olle
ge P
ath
(Bay
Tra
il C
onne
ctor
fr
om R
oy P
atri
ck D
r to
Col
lege
Way
1)
clas
s I f
acili
ty s
outh
of J
FK P
ark
park
ing
lot
Col
lege
Wy/
Bay
Tra
il C
onne
ctor
(a
long
Col
lege
Way
/Mag
nolia
Dr)
I
0.04
N
o N
o
19
Ope
ra H
ouse
Brid
ge o
ver
Nap
a C
reek
M
ain
St
Wes
t St
I 0.
06
No
No
20
Riv
er to
Rid
ge T
rail/
Bay
Tra
il C
onne
ctor
(a
long
Str
eblo
w D
r)
Skyl
ine
Park
SR
221
(Nap
a-V
alle
jo H
wy)
I
0.62
Y
es
Yes
21
Salv
ador
Cre
ek T
rail
Gar
field
Ln
Ran
ch L
n I
0.45
N
o N
o
22
Salv
ador
Cre
ek T
rail
End
of G
arfie
ld L
n W
illis
Dr
I 0.
31
No
No
23
Stan
ly C
ross
road
Pat
hway
C
uttin
gs W
harf
Rd
Stan
ly L
n I
1.17
Y
es
Yes
24
Stan
ly L
n Pa
thw
ay
Stan
ly C
ross
road
SR
12
I 1.
32
Yes
Y
es
25
Vin
e T
rail/
Com
mut
er B
ike
Path
V
alle
jo S
t C
entr
al A
ve/M
ain
St
I 0.
71
Yes
Y
es
26
Vin
e T
rail/
Com
mut
er B
ike
Path
C
entr
al A
ve
Cal
iforn
ia B
lvd
I 0.
80
Yes
Y
es
27
Vin
e T
rail/
Com
mut
er B
ike
Path
Brid
ge
over
SR
29
Cal
iforn
ia B
lvd
Sola
no A
ve
I 0.
20
Yes
Y
es
Cla
ss II
28
1st S
t V
erno
n St
Ju
arez
St
II 0.
19
No
No
29
1st S
t Brid
ge
NE
of M
ain
St in
ters
ectio
n So
scol
Ave
II
0.09
N
o N
o
30
3rd S
t M
ain
St
Sosc
ol A
ve
II 0.
13
No
No
31
3rd S
t R
R tr
acks
, Law
renc
e St
Si
lver
ado
Tra
il II
0.31
N
o N
o
32
Big
Ran
ch R
d La
Hom
a D
r T
ranc
as S
t II
0.33
Y
es
No
33
Brow
ns V
alle
y R
d Pa
tric
k R
d Bu
hman
Rd
II 0.
14
No
No
34
Brow
ns V
alle
y R
d Bu
hman
Rd
Patr
ick
Rd
II 0.
30
No
No
35
Brow
ns V
alle
y R
d Pa
tric
k R
d R
edw
ood
Rd
II 0.
59
Yes
N
o
36
Buhm
an A
ve
Con
gres
s V
alle
y R
d Br
owns
Val
ley
Rd
II 1.
43
No
No
37
Cal
iforn
ia B
lvd
1st S
t Pu
eblo
Ave
II
1.20
Y
es
No
38
Coo
mbs
St (
Inte
rsec
tion
impr
ovem
ents
N
Coo
mbs
leg)
Im
ola
Ave
Pr
opos
ed N
apa
Riv
er T
rail
II 0.
06
Yes
N
o

City of Napa Bicycle Plan Page 50 January 2012
Tab
le 1
2 E
xist
ing
Nap
a B
ikew
ay S
egm
ents
# P
roje
ct C
orri
dor/
Str
eet
Beg
in P
oint
E
nd P
oint
C
lass
L
engt
h (M
iles)
P
rim
ary
Net
wor
k S
F B
ay
Are
a R
egio
nal
Rou
te
39
Coo
mbs
ville
Rd
Silv
erad
o T
rail
Silv
erad
o M
iddl
e Sc
hool
II
0.90
N
o N
o
40
Dry
Cre
ek R
d R
edw
ood
Rd
NW
city
lim
it II
1.04
Y
es
No
41
Free
way
Dr
Imol
a A
ve
1st S
t II
1.40
Y
es
No
42
Gar
field
Ln
Old
Vin
e W
y Bi
g R
anch
Rd
II 0.
27
No
No
43
Gas
ser
Dr
Imol
a A
ve
Kan
sas
Ave
II
0.31
Y
es
No
44
Gol
den
Gat
e D
r N
apa
city
lim
it Im
ola
Ave
II
0.56
Y
es
Yes
45
Har
tle C
t V
ine
Tra
il G
asse
r D
r II
0.14
Y
es
Yes
46
Imol
a A
ve W
SR
29
SR 2
21
II 1.
55
Yes
Y
es
47
Jam
es D
iem
er D
r N
apa
Val
ley
Col
lege
R
oy P
atric
k D
r II
0.46
N
o N
o
48
Jeffe
rson
St
Rub
icon
St
El C
entr
o II
0.92
N
o N
o
49
Jeffe
rson
St
Dar
ling
St
Salv
ador
St
II 0.
27
No
No
50
Kan
sas
Ave
G
asse
r D
r So
scol
Ave
II
0.17
N
o N
o
51
Linc
oln
Ave
So
lano
Ave
C
alifo
rnia
Blv
d II
0.22
Y
es
No
52
Linc
oln
Ave
V
ine
Tra
il, R
R tr
acks
Si
lver
ado
Tra
il II
0.72
N
o N
o
53
Nap
a V
alle
y C
orpo
rate
Dr,
Vist
a Po
int D
r So
uth
Nap
a ci
ty li
mit
Kai
ser
Rd
II 0.
92
Yes
Y
es
54
Old
Son
oma
Rd
Fost
er R
d O
ld S
onom
a R
d tu
rn o
ff II
0.26
N
o N
o
55
Old
Sos
col W
ay
Big
Ran
ch R
d T
ranc
as S
t II
0.23
Y
es
No
56
Patr
ick
Rd-
Brow
ns V
alle
y R
d Br
owns
Val
ley
Rd
Free
way
Dr/
SR 2
9 R
amps
II
1.98
Y
es
No
57
Salv
ador
Ave
(W)
Hah
nem
ann
Ln
Sola
no A
ve
II 0.
24
No
No
58
Sola
no A
ve
Linc
oln
Ave
Lo
cust
St
II 3.
43
Yes
N
o
59
Sosc
ol A
ve
Imol
a A
ve
6th S
t II
1.17
Y
es
No
60
Sosc
ol A
ve
6th S
t La
Hom
a D
r II
1.76
Y
es
No
61
Sout
h Je
ffers
on S
t N
apa
city
lim
it C
abot
Wy
II 0.
36
No
No
62
SR 2
21 (N
apa
Val
lejo
Hw
y)
Mag
nolia
Dr
Imol
a A
ve
II 0.
15
Yes
Y
es
63
Tra
ncas
St
Sosc
ol A
ve
Nap
a R
iver
II
0.07
Y
es
No

City of Napa Bicycle Plan Page 51 January 2012
Tab
le 1
2 E
xist
ing
Nap
a B
ikew
ay S
egm
ents
# P
roje
ct C
orri
dor/
Str
eet
Beg
in P
oint
E
nd P
oint
C
lass
L
engt
h (M
iles)
P
rim
ary
Net
wor
k S
F B
ay
Are
a R
egio
nal
Rou
te
64
Tra
ncas
St
Sola
no A
ve
Cal
iforn
ia B
lvd
II 0.
24
Yes
N
o
65
Tro
wer
Ave
So
lano
Ave
E
end
of T
row
er a
t Vin
tage
Hig
h II
1.25
Y
es
No
66
Vill
a Ln
Fi
refly
Ln
Salv
ador
Cre
ek P
ath
II 0.
34
No
No
Cla
ss II
I
67
E St
, Hay
es S
t, Se
min
ary
St, F
rank
lin S
t C
ombs
St
Cal
iforn
ia B
lvd
III
2.23
N
o N
o
68
East
Ave
3rd
St
Silv
erad
o T
rail
III
0.98
N
o N
o
69
Riv
er P
ark
Blvd
Je
ffers
on S
t N
orth
New
port
Driv
e/R
iver
Par
k O
verlo
ok
III
0.55
N
o N
o
70
Roy
Pat
rick
Dr
Stre
blow
Dr
Col
lege
Wy
III
0.62
N
o N
o
71
S N
ewpo
rt D
r Je
ffers
on S
t Li
ghth
ouse
Ct/R
iver
Par
k O
verlo
ok
III
0.44
N
o N
o
72
Wes
t F S
t, C
offie
ld A
ve
Prop
osed
cla
ss I
faci
lity,
Cof
field
A
ve
Sola
no A
ve
III
0.42
Y
es
No
73
You
nt S
t-V
alle
jo S
t (Bi
ke B
lvd)
Se
min
ary
St
Sosc
ol A
ve
III
0.41
N
o N
o
C
lass
I 11
.93
C
lass
II
26.0
8
C
lass
III
5.64
City of Napa Bicycle Plan Page 52 January 2012
Bicycle Parking
The City’s Zoning Ordinance includes the following bicycle parking requirements:
17.54.060 Bicycle parking.
All nonresidential uses required to provide 10 or more vehicular parking spaces shall also provide bicycle-parking facilities according to the following standards:
A. Spaces. One bicycle space for each 10 vehicular spaces is required.
B. Modifications. The parking requirement for any specific use listed may be modified with a use permit in order to provide adequate parking, which is fair, equitable, logical and consistent with the intent of this chapter. Such modification shall be subject to review and approval by the Planning Commission.
C. Lockers. Bicycle lockers may be installed but are not required.
D. Waiver. The decision-making body may waive or reduce this requirement only if it can be demonstrated that the bicycle parking facilities are provided nearby to satisfy the proposed requirements or there is pre-existing development such that there is no feasible location for such facilities. (O2003 12; O2004 9 18).
Bicycle parking (racks, lockers, and corrals) is provided at destinations throughout the City including within downtown, at schools, civic destinations, parks, employment sites, and retail and commercial locations. An inventory of existing bicycle parking facilities was conducted by City staff in June 2010. The results of the inventory are provided in Appendix G.
Every public school has bicycle racks. To date, a few parks have bicycle racks. Many public buildings and all major shopping centers have bicycle racks and staff surveyed more than 135 bicycle racks in the Downtown Area in 2010. While there are many bicycle racks located throughout the city, they may not be located in convenient or highly visible places.
In 2011, City staff reviewed Downtown bicycle parking locations and has mapped potential added locations. The City recently installed 10 new single hoop racks and will install a new bike locker. Further, some existing larger bike racks will be moved to higher use locations.
For further information on bicycle parking programs and placement guidelines, see page 56-58 of the countywide plan.
Multi-Modal Connections
Bicycles are often used in combination with other modes of transit (such as bus, carpool, ferry, or train) as part of a multimodal trip. Convenient multi-modal connections that are well-integrated into the transportation system are a vital component of a balanced transportation network. Transit has the potential to extend trip ranges for bicyclists to both nearby communities, and destinations outside of Napa County. Multi-modal connections are especially important in Napa County, considering existing barriers to bicycle travel such as distances between communities, existing gaps in the bicycle network between urban areas, heat during summer months, and rain during winter months. While these obstacles likely serve as deterrents to existing and potential trips by bike, convenient multi-modal access can help to address these issues and extend trip ranges. Front loading bicycle racks, which typically accommodate two bicycles, are provided on all fixed route transit buses that operate in Napa County. Bicycle rack spaces are available on a first come, first served basis. When the front loading racks are
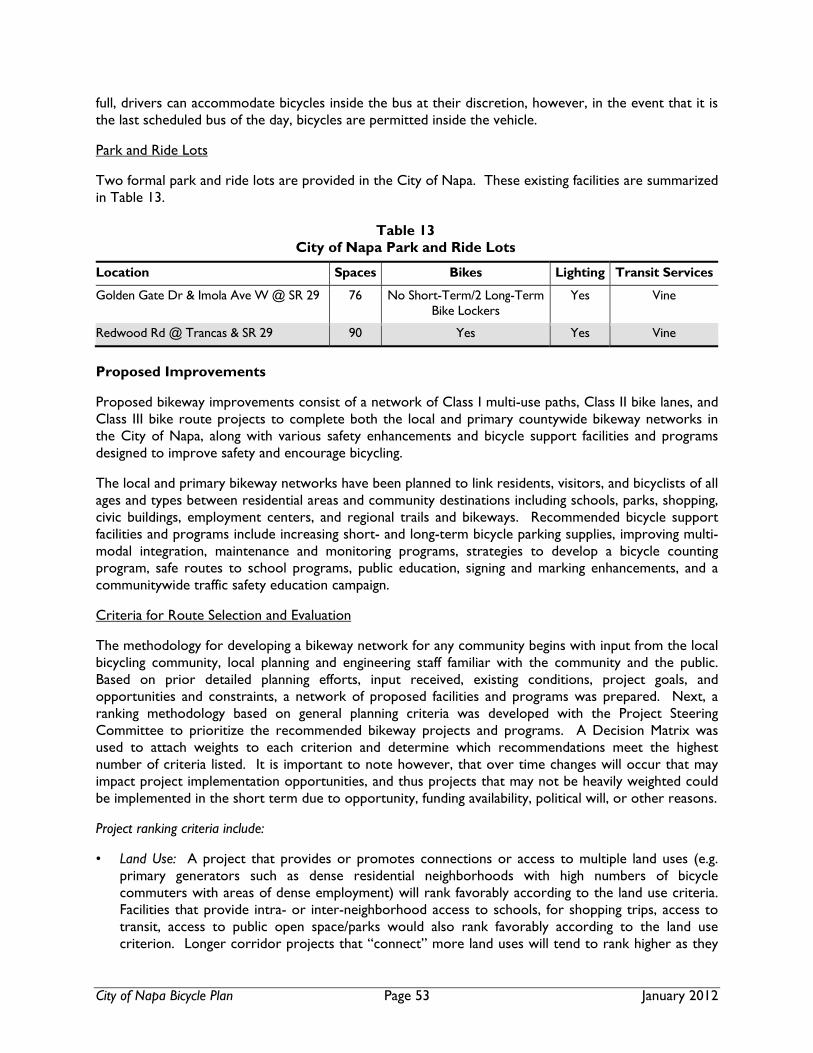
City of Napa Bicycle Plan Page 53 January 2012
full, drivers can accommodate bicycles inside the bus at their discretion, however, in the event that it is the last scheduled bus of the day, bicycles are permitted inside the vehicle.
Park and Ride Lots
Two formal park and ride lots are provided in the City of Napa. These existing facilities are summarized in Table 13.
Table 13 City of Napa Park and Ride Lots
Location Spaces Bikes Lighting Transit Services
Golden Gate Dr & Imola Ave W @ SR 29 76 No Short-Term/2 Long-Term Bike Lockers
Yes Vine
Redwood Rd @ Trancas & SR 29 90 Yes Yes Vine
Proposed Improvements
Proposed bikeway improvements consist of a network of Class I multi-use paths, Class II bike lanes, and Class III bike route projects to complete both the local and primary countywide bikeway networks in the City of Napa, along with various safety enhancements and bicycle support facilities and programs designed to improve safety and encourage bicycling.
The local and primary bikeway networks have been planned to link residents, visitors, and bicyclists of all ages and types between residential areas and community destinations including schools, parks, shopping, civic buildings, employment centers, and regional trails and bikeways. Recommended bicycle support facilities and programs include increasing short- and long-term bicycle parking supplies, improving multi-modal integration, maintenance and monitoring programs, strategies to develop a bicycle counting program, safe routes to school programs, public education, signing and marking enhancements, and a communitywide traffic safety education campaign.
Criteria for Route Selection and Evaluation
The methodology for developing a bikeway network for any community begins with input from the local bicycling community, local planning and engineering staff familiar with the community and the public. Based on prior detailed planning efforts, input received, existing conditions, project goals, and opportunities and constraints, a network of proposed facilities and programs was prepared. Next, a ranking methodology based on general planning criteria was developed with the Project Steering Committee to prioritize the recommended bikeway projects and programs. A Decision Matrix was used to attach weights to each criterion and determine which recommendations meet the highest number of criteria listed. It is important to note however, that over time changes will occur that may impact project implementation opportunities, and thus projects that may not be heavily weighted could be implemented in the short term due to opportunity, funding availability, political will, or other reasons.
Project ranking criteria include:
• Land Use: A project that provides or promotes connections or access to multiple land uses (e.g. primary generators such as dense residential neighborhoods with high numbers of bicycle commuters with areas of dense employment) will rank favorably according to the land use criteria. Facilities that provide intra- or inter-neighborhood access to schools, for shopping trips, access to transit, access to public open space/parks would also rank favorably according to the land use criterion. Longer corridor projects that “connect” more land uses will tend to rank higher as they
City of Napa Bicycle Plan Page 54 January 2012
are assigned greater points over shorter projects that do not connect generators with destinations, or vice versa.
• Current and Latent Bicyclist Demand: Higher points are awarded to those projects that currently have significant usage or latent demand, that is they are likely to generate significant usage based on land uses, population, corridor aesthetics, etc. Justification for this criterion is that corridors or spot locations currently receiving high demand may or may not be optimally designed for safety and functionality and additional improvement would benefit a large number of existing bicyclists. Under latent demand, existing corridors or spot locations may be viewed by a high percentage of potential users as undesirable from a safety or operational perspective, and if safety or functionality is improved, even high use facilities may experience an increase in use levels.
• Technical Ease of Implementation: Technical ease of implementation focuses on the actual engineering challenges of a project, emphasizing the point that typical physical requirements of bicycle projects such as parking removal, traffic lane removal, or lane re-striping are not technically challenging from an engineering perspective. Physical solutions are often readily apparent but may require development of political support, addressed under "Non-Technical Ease of Implementation," or that specific operational issues be addressed to demonstrate that no negative impacts will occur to other modes. These criteria specifically address the technical and physical aspects of an engineering solution.
• Non-Technical Ease of Implementation: Maximum points are assigned for an easy, popular project. If significant neighborhood opposition is a known factor, if support of elected officials is not anticipated, or if other political opposition to a particular aspect of the assumed engineering solution (such as parking removal or agricultural issues) is anticipated, then the project would receive fewer points under this criterion.
Note: Projects that are supported by current or adopted planning efforts by regional or local agencies receive points under this criterion, for example, projects that are identified in Bay, Ridge, or Vine Trail Studies that have the potential to serve both pedestrians and bicyclists. In addition, projects that are supported by existing or anticipated funding would receive points under this criterion.
• Overcomes Barrier/Connectivity (Safety): Maximum points should be assigned to projects that address a major safety concern for bicyclists using bridges, interchanges, and/or negotiating other environments difficult for bicyclists to navigate. Higher points should be assigned to roadways with high speed, high traffic volume, wide road width, difficult intersections or other obstacles to bicycle travel. Maximum points should be assigned for filling a gap in the existing network.
• Public Input: This criterion is based directly on public input received during workshops, results from the surveys, indirect public input through agency staff, and an informal survey of local elected officials. Points are assigned in correlation to the number of comments and perceived interest of workshop attendees.
The ranking matrix is located in Appendix H.
Proposed Bikeway System
This section describes proposed bicycle improvements in the City of Napa including both physical and programmatic improvements. A range of users must be considered in building a bicycle system. Whereas an experienced rider or bicycle commuter might prefer the shortest and fastest on-road route, a young or inexperienced rider will likely prefer a Class 1, separated bicycle facility. Bicycle riders of all ages and abilities, and those who are riding for both recreation and transportation to destinations like work and school, must be considered in system improvement and implementation. The proposed
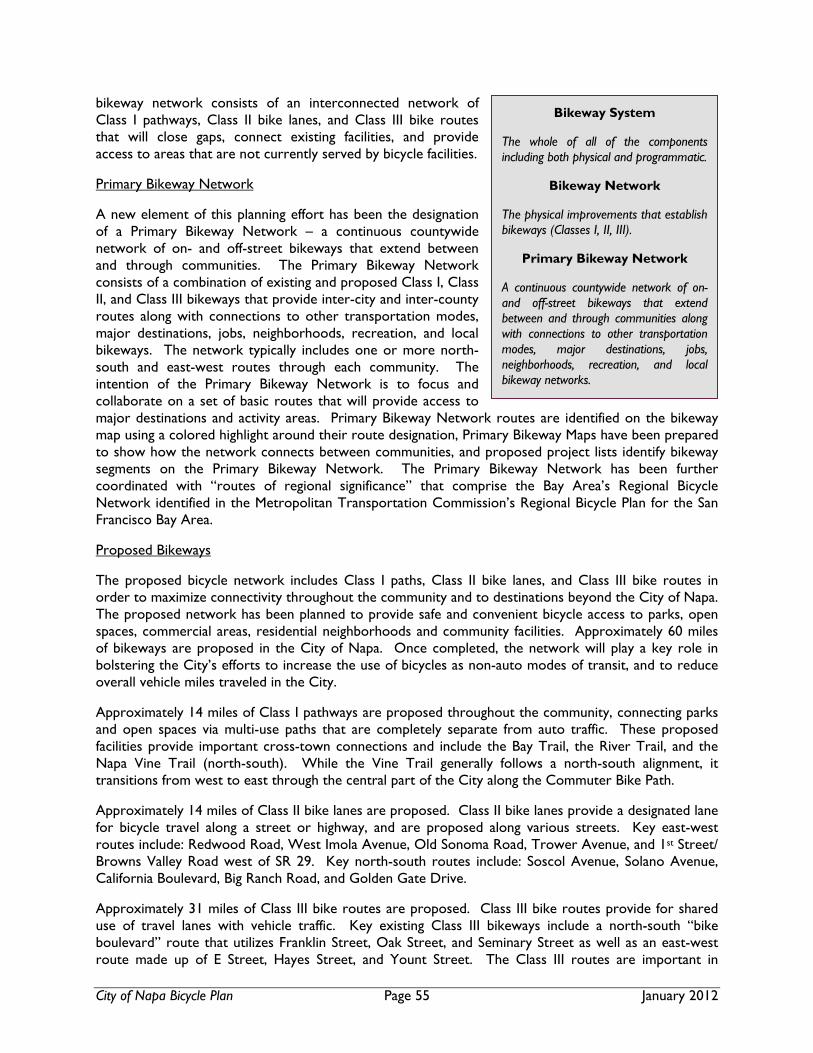
City of Napa Bicycle Plan Page 55 January 2012
bikeway network consists of an interconnected network of Class I pathways, Class II bike lanes, and Class III bike routes that will close gaps, connect existing facilities, and provide access to areas that are not currently served by bicycle facilities.
Primary Bikeway Network
A new element of this planning effort has been the designation of a Primary Bikeway Network – a continuous countywide network of on- and off-street bikeways that extend between and through communities. The Primary Bikeway Network consists of a combination of existing and proposed Class I, Class II, and Class III bikeways that provide inter-city and inter-county routes along with connections to other transportation modes, major destinations, jobs, neighborhoods, recreation, and local bikeways. The network typically includes one or more north-south and east-west routes through each community. The intention of the Primary Bikeway Network is to focus and collaborate on a set of basic routes that will provide access to major destinations and activity areas. Primary Bikeway Network routes are identified on the bikeway map using a colored highlight around their route designation, Primary Bikeway Maps have been prepared to show how the network connects between communities, and proposed project lists identify bikeway segments on the Primary Bikeway Network. The Primary Bikeway Network has been further coordinated with “routes of regional significance” that comprise the Bay Area’s Regional Bicycle Network identified in the Metropolitan Transportation Commission’s Regional Bicycle Plan for the San Francisco Bay Area.
Proposed Bikeways
The proposed bicycle network includes Class I paths, Class II bike lanes, and Class III bike routes in order to maximize connectivity throughout the community and to destinations beyond the City of Napa. The proposed network has been planned to provide safe and convenient bicycle access to parks, open spaces, commercial areas, residential neighborhoods and community facilities. Approximately 60 miles of bikeways are proposed in the City of Napa. Once completed, the network will play a key role in bolstering the City’s efforts to increase the use of bicycles as non-auto modes of transit, and to reduce overall vehicle miles traveled in the City.
Approximately 14 miles of Class I pathways are proposed throughout the community, connecting parks and open spaces via multi-use paths that are completely separate from auto traffic. These proposed facilities provide important cross-town connections and include the Bay Trail, the River Trail, and the Napa Vine Trail (north-south). While the Vine Trail generally follows a north-south alignment, it transitions from west to east through the central part of the City along the Commuter Bike Path.
Approximately 14 miles of Class II bike lanes are proposed. Class II bike lanes provide a designated lane for bicycle travel along a street or highway, and are proposed along various streets. Key east-west routes include: Redwood Road, West Imola Avenue, Old Sonoma Road, Trower Avenue, and 1st Street/ Browns Valley Road west of SR 29. Key north-south routes include: Soscol Avenue, Solano Avenue, California Boulevard, Big Ranch Road, and Golden Gate Drive.
Approximately 31 miles of Class III bike routes are proposed. Class III bike routes provide for shared use of travel lanes with vehicle traffic. Key existing Class III bikeways include a north-south “bike boulevard” route that utilizes Franklin Street, Oak Street, and Seminary Street as well as an east-west route made up of E Street, Hayes Street, and Yount Street. The Class III routes are important in
Bikeway System
The whole of all of the components including both physical and programmatic.
Bikeway Network
The physical improvements that establish bikeways (Classes I, II, III).
Primary Bikeway Network
A continuous countywide network of on- and off-street bikeways that extend between and through communities along with connections to other transportation modes, major destinations, jobs, neighborhoods, recreation, and local bikeway networks.

City of Napa Bicycle Plan Page 56 January 2012
providing an interconnected system of preferred routes. As indicated in Policy CN-2.c, it is recommended that Class III bike routes receive a full package of signing improvements combined with the use of pavement stencils to create “prominent” bike routes that help guide bicyclists and increase motorists awareness of the need to watch for bicyclists and share the road.
Following is a description of select proposed projects, including route alignments, the ultimate vision or concept for the route, improvement needs and destinations served. A detailed segment-by-segment breakdown of the proposed bikeway facilities, including facility type, length, estimated cost of improvements, project priority, and other criteria, is provided in Table 14. The proposed bikeway network is shown in Figure 1. The proposed bikeways network has been developed to provide bicycle access to destinations throughout the City of Napa, and to provide access to neighboring jurisdictions. Primary bikeways that extend beyond the City Limits are shown in Figures 2-5. A list of short-term actions follows. While the projects in this Plan have received a preliminary program level feasibility evaluation, engineering and environmental studies will be required prior to project implementation to determine project specific issues such as right-of-way impacts, traffic operations, parking impacts, and/or specific environmental issues.
Short-Term Actions
There are a variety of recommended projects, improvements, and actions distributed throughout this plan. The following list consolidates a series of low-cost actions, programmatic, and infrastructure improvements that can be achieved in the short-term, a period of one to five years, to improve conditions for bicyclists in the City of Napa. Recommendations are not listed any particular order.
• Update Journey to Work Commute Statistics – Analyze and update Journey to work commute statistics with 2010 US Census Data upon its release, which is anticipated in 2012-13.
• Conduct Bicycle Counts – Work with NCTPA to implement bicycle counts at locations identified in this Plan to create baseline data.
• Bicycle Advisory Committee (BAC) – Establish a Bicycle Advisory Committee to review bicycle issues and help oversee implementation of this plan. Invite law enforcement personnel, school district representatives, and elected officials to participate. Continue to participate in the Countywide BAC.
• Maintenance Monitoring and Reporting System – Continue to use the City’s on-line maintenance monitoring and reporting system to respond to bicycle facility and street maintenance issues. Advise the Countywide BAC on the City’s reporting system to assist in the development of a countywide program, and work to integrate efforts.
• Bicycle Guide Map – Work with/support the NCTPA’s effort to update a public bikeway map and user guide that provides bike route, education, safety, and promotional information for locals and visitors.
• Install Bicycle Signs and Shared Lane Marking Stencils – Install wayfinding, warning, guide, and regulatory signs, and Shared Lane Marking stencils on existing bicycle facilities to improve way finding for bicyclists, assist emergency personnel, and heighten motorists’ awareness of bicycle activity.
• Napa Bike Program – Support the development and implementation of a countywide multimedia bicycle and pedestrian safety and education campaign to increase knowledge of riding rules, improve etiquette between motorized and non-motorized modes, to promote bicycle tourism, and increase the awareness of the benefits of bicycling and walking as transportation modes.

American Canyon Bicycle Plan Page 57 January 2012
Tab
le 1
4 P
rop
ose
d B
ikew
ays
and
Pro
ject
Pri
ori
ties
# P
roje
ct C
orri
dor/
Stre
et
Beg
in P
oint
E
nd P
oint
C
lass
Len
gth
(Mile
s)
Pri
mar
y N
etw
ork
SF B
ay
Are
a R
egio
nal
Rou
te
Us e
C
ost
Pri
orit
y
Cla
ss I
1 Ba
y Tr
ail C
onne
ctor
– S
tanl
y Ln
to
Nap
a Ri
ver
Stan
ly C
ross
road
N
apa
Rive
r I
0.72
Ye
s Ye
s R
$398
,711
M
ediu
m
2 Be
hren
s St
Pat
hway
Con
nect
or
Begi
nnin
g of
Beh
rens
St
Sem
inar
y St
at V
alle
jo S
t I
0.05
N
o N
o C
$2
8,22
9 Lo
w
3 D
ownt
own
Path
alo
ng N
apa
Cre
ek/H
erita
ge P
ark
Coo
mbs
St
Mai
n St
I
0.12
N
o N
o C
$6
6,65
5 M
ediu
m
4 Fa
irvie
w D
r Pa
thw
ay C
onne
ctor
Agu
ire W
y Te
rrac
e D
r I
0.15
N
o N
o R
$84,
244
Low
5 N
apa
Cre
ek P
ath/
SR 2
9 U
nder
pass
C
offie
ld A
ve/1
st S
tree
t C
alifo
rnia
Blv
d I
0.20
Ye
s N
o C
$1
12,6
05
Hig
h
6 N
apa
Cre
ek, P
earl
St
SR 2
21 (S
osco
l Ave
), O
xbow
C
omm
ons
Exist
ing
Cla
ss I
Faci
lity
250'
N
W o
f 1st S
t I
0.07
N
o N
o C
$3
6,45
8 M
ediu
m
7 N
apa
Rive
r Pr
omen
ade
(1st S
t C
onne
ctor
) Ve
tera
ns P
ark
Ope
ra H
ouse
I
0.05
N
o N
o R/
C
$27,
658
Med
ium
8 N
apa
Rive
r Tr
ail
SR 2
9 N
apa
Valle
y C
orpo
rate
Dr
I 0.
51
Yes
No
R/C
$2
78,9
26
Med
ium
9 N
apa
Rive
r Tr
ail
Exist
ing
clas
s I f
acilit
y at
Riv
er
Terr
ace
Exist
ing
clas
s I f
acilit
y at
O
xbow
I
0.10
N
o N
o C
$5
3,47
1 M
ediu
m
10
Nap
a Ri
ver
Trai
l Ex
istin
g cl
ass
I fac
ility
at
Clin
ton
Road
Ext
ensio
n Ex
istin
g cl
ass
I fac
ility
at
Oxb
ow
I 0.
13
No
No
R/C
$7
2,46
1 M
ediu
m
11
Nap
a Ri
ver
Trai
l N
apa
city
lim
it (A
djac
ent t
o K
aise
r Ro
ad)
Exist
ing
Bay
Trail
at s
outh
en
d of
Ken
nedy
Par
k I
0.16
Ye
s Ye
s R/
C
$86,
837
Med
ium
12
Nap
a Ri
ver
Trai
l (cr
ossin
g)
3rd S
t adj
acen
t to
Burn
ell S
t Pr
opos
ed c
lass
I br
idge
ove
r N
apa
Rive
r I
0.08
N
o N
o C
$4
1,46
9 H
igh
13
Nap
a Ri
ver
Trai
l (E
side
of U
P Tr
acks
) Pr
opos
ed T
uluc
ay C
reek
Tr
ail
Oil
Com
pany
Rd
I 0.
41
No
No
C/R
$2
25,0
73
Med
ium
14
Nap
a Ri
ver
Trai
l (Lo
op a
roun
d Tr
anca
s C
ross
ing
Park
) Tr
anca
s St
Tr
anca
s St
I
0.85
N
o N
o R
$467
,781
M
ediu
m

American Canyon Bicycle Plan Page 58 January 2012
Tab
le 1
4 P
rop
ose
d B
ikew
ays
and
Pro
ject
Pri
ori
ties
# P
roje
ct C
orri
dor/
Stre
et
Beg
in P
oint
E
nd P
oint
C
lass
Len
gth
(Mile
s)
Pri
mar
y N
etw
ork
SF B
ay
Are
a R
egio
nal
Rou
te
Us e
C
ost
Pri
orit
y
15
Nap
a Ri
ver
Trai
l (W
Sid
e of
Ri
ver)
W
ater
St (
Aro
und
bend
co
nnec
ting
to C
opia
) 1st
St
I 0.
28
No
No
C/R
$1
51,7
34
Med
ium
16
Nap
a Ri
ver
Trai
l (W
Sid
e of
Ri
ver)
C
oom
bs S
t at I
mol
a A
ve
Coo
mbs
St a
t Im
ola
Ave
I
1.10
Ye
s N
o C
$6
03,0
80
Hig
h
17
Nap
a Ri
ver
Trai
l (W
Sid
e of
Ri
ver)
Ju
st n
orth
of R
iver
Ter
race
W
y at
pro
pose
d cl
ass
I fac
ility
Linc
oln
Ave
I
0.42
N
o N
o C
$2
29,4
65
Hig
h
18
Nap
a Ri
ver
Trai
l/Bay
Tr
ail/A
nsel
mo
Ct L
oop
Nap
a Ri
ver
Bay
Trai
l N
apa
Rive
r Ba
y Tr
ail
I 0.
34
Yes
Yes
C
$185
,694
M
ediu
m
19
Nap
a Ri
ver
Trial
(E S
ide
of
Rive
r)
Exist
ing
clas
s I f
acilit
y at
Par
k Lo
op
1st S
t I
0.23
N
o N
o C
$1
24,8
21
Med
ium
20
Nap
a Va
lley
Col
lege
Pat
h al
ong
Roy
Patr
ick
Dr
Col
lege
Wy,
Mag
nolia
Dr
Imol
a A
ve
I 0.
16
No
No
C
$87,
369
Med
ium
21
Oxb
ow C
omm
ons
Bypa
ss
Cha
nnel
N
apa
Rive
r So
scol
Ave
I
0.17
N
o N
o C
$9
4,81
8 M
ediu
m
22
Oxb
ow C
omm
ons
Bypa
ss
Cha
nnel
Ba
y Tr
ail,
Nea
r N
apa
Rive
r O
xbow
Com
mon
s I
0.02
N
o N
o R/
C
$9,3
59
Med
ium
23
Oxb
ow C
omm
ons
Bypa
ss T
rail
Wes
t St
Sosc
ol A
ve
I 0.
09
No
No
R/C
$4
9,45
7 M
ediu
m
24
Oxb
ow C
omm
ons
Bypa
ss T
rail
Div
ision
St
Mai
n St
I
0.04
N
o N
o R/
C
$23,
437
Med
ium
25
Oxb
ow C
omm
ons
Path
W
est S
t Pr
opos
ed V
ine
Trai
l alo
ng
Sosc
ol A
ve
I 0.
09
No
No
R/C
$5
0,15
9 M
ediu
m
26
Oxb
ow C
omm
ons,
Nap
a C
reek
Pr
opos
ed V
ine
Trai
l Ex
istin
g C
lass
I Fa
cilit
y 25
0'
NW
of 1
st S
t I
0.15
N
o N
o R/
C
$82,
852
Med
ium
27
Salv
ador
Cre
ek T
rail
SR 2
9 Je
ffers
on S
t I
0.68
N
o N
o C
/R
$372
,599
H
igh
28
Salv
ador
Cre
ek T
rail
Mah
er S
t So
lano
Ave
I
0.23
N
o N
o C
/R
$129
,178
H
igh
29
Salv
ador
Cre
ek T
rail
Ranc
h Ln
/ Vall
e Ve
rde
Dr
Big
Ranc
h Rd
I
0.23
N
o N
o C
$1
27,2
96
Med
ium
30
SR 2
9 Vi
ne T
rail/
Com
mut
er B
ike
Path
/SR
29 O
verp
ass
Redw
ood
Rd
I 0.
11
Yes
Yes
C
$61,
019

American Canyon Bicycle Plan Page 59 January 2012
Tab
le 1
4 P
rop
ose
d B
ikew
ays
and
Pro
ject
Pri
ori
ties
# P
roje
ct C
orri
dor/
Stre
et
Beg
in P
oint
E
nd P
oint
C
lass
Len
gth
(Mile
s)
Pri
mar
y N
etw
ork
SF B
ay
Are
a R
egio
nal
Rou
te
Us e
C
ost
Pri
orit
y
31
Tulu
cay
Cre
ek T
rail
Vine
Tra
il So
scol
Ave
I
0.36
N
o N
o C
/R
$198
,872
M
ediu
m
32
Vine
Tra
il (a
djac
ent t
o So
scol
A
ve)
Prop
osed
Dow
ntow
n/N
apa
Cre
ek T
rail
Valle
jo S
t I
0.26
Ye
s Ye
s C
$1
44,1
02
Hig
h
33
Vine
Tra
il ad
jace
nt to
Sol
ano
Ave
/SR
29
Nor
ther
n Te
rmin
us o
f C
omm
uter
Bik
e Pa
th
adja
cent
to R
edw
ood
Rd
Hac
iend
a D
r / N
orth
ern
City
Lim
it I
1.75
Ye
s Ye
s C
/R
$962
,772
H
igh
34
Vine
Tra
il al
ong
Kai
ser
Rd
SR 2
9 RR
trac
k no
rth-
wes
twar
d de
viat
ion
I 0.
28
Yes
Yes
C/R
$1
54,9
62
Med
ium
35
Vine
Tra
il/N
apa
Rive
r Tr
ail (
E sid
e of
Riv
er a
djac
ent t
o Ri
ver
St)
Tulu
cay
Cre
ek P
ath
/Nap
a Ri
ver
Trai
l/Vin
e Tr
ail
Prop
osed
Oxb
ow
Com
mon
s Pa
th (a
ppro
x 10
0'
SE o
f Pea
rl St
)
I 1.
11
Yes
Yes
C
$608
,968
H
igh
Cla
ss II
36
1st S
t So
scol
Ave
Ve
rnon
St
II 0.
15
No
No
C
$13,
655
Hig
h
37
1st S
t Ju
arez
St
Silv
erad
o Tr
ail
II 0.
07
No
No
C
$5,9
10
Hig
h
38
1st S
t (SR
29
Ove
rpas
s)
Free
way
Dr
Cal
iforn
ia B
lvd
II 0.
36
Yes
No
C
$31,
955
Hig
h
39
3rd S
t Je
ffers
on S
t M
ain
St
II 0.
56
No
No
C
$50,
248
Hig
h
40
3rd S
t So
scol
Ave
RR
trac
ks, L
awre
nce
St
II 0.
05
No
No
C
$4,0
50
Hig
h
41
Cal
iforn
ia B
lvd
Cal
iforn
ia B
lvd
near
Pue
blo
Ave
Tr
anca
s St
II
0.49
Ye
s N
o C
$4
4,21
8 M
ediu
m
42
Cal
iforn
ia B
lvd,
Lau
rel S
t, W
alnu
t St
1st S
t 3rd
St
II 0.
12
No
No
C
$10,
970
Hig
h
43
Cof
field
, F S
t, So
lano
Ave
(SR
29
fron
tage
on
W s
ide
betw
een
Linc
oln
& 1
st)
Prop
osed
cla
ss I
faci
lity,
C
offie
ld A
ve
Linc
oln
Ave
II
0.41
Ye
s N
o C
$3
6,89
4 H
igh
44
Coo
mbs
St
Div
ision
St
Com
bs S
t nea
r G
rigsb
y C
t II
0.41
N
o N
o C
$3
6,66
3 M
ediu
m
45
Fost
er R
d H
ilton
Ave
Im
ola
Ave
II
0.78
N
o N
o C
$6
9,71
6 M
ediu
m
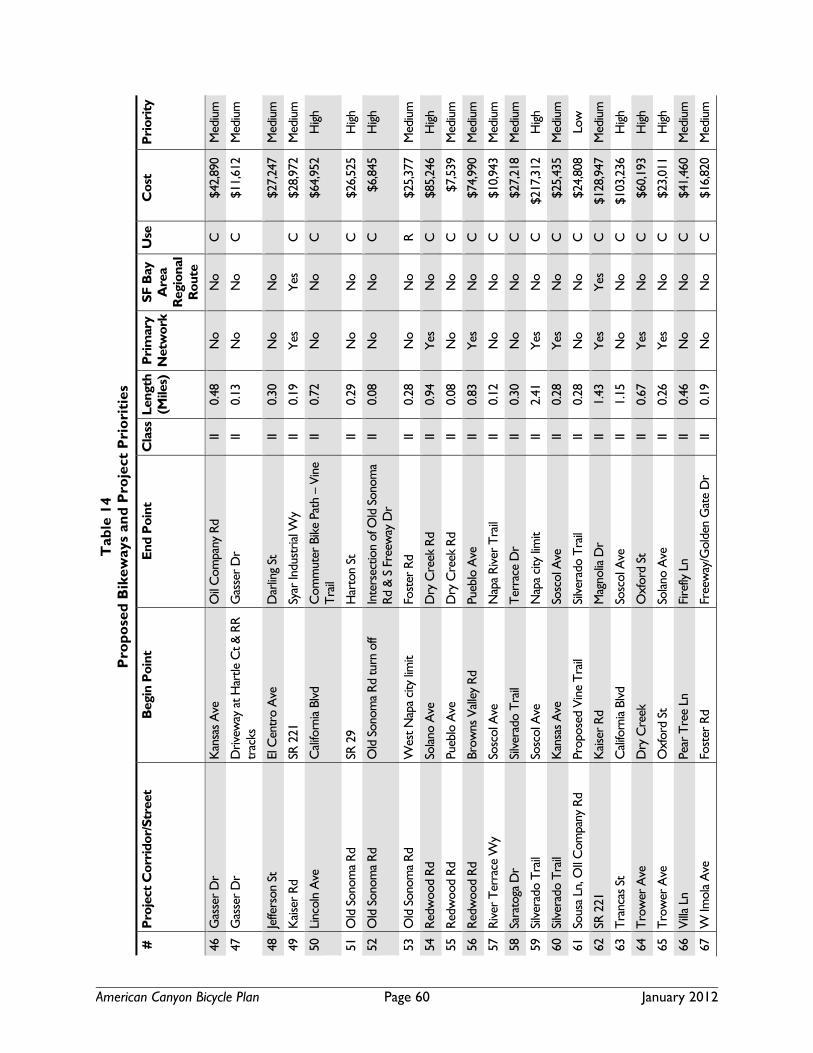
American Canyon Bicycle Plan Page 60 January 2012
Tab
le 1
4 P
rop
ose
d B
ikew
ays
and
Pro
ject
Pri
ori
ties
# P
roje
ct C
orri
dor/
Stre
et
Beg
in P
oint
E
nd P
oint
C
lass
Len
gth
(Mile
s)
Pri
mar
y N
etw
ork
SF B
ay
Are
a R
egio
nal
Rou
te
Us e
C
ost
Pri
orit
y
46
Gas
ser
Dr
Kan
sas
Ave
O
il C
ompa
ny R
d II
0.48
N
o N
o C
$4
2,89
0 M
ediu
m
47
Gas
ser
Dr
Driv
eway
at H
artle
Ct &
RR
trac
ks
Gas
ser
Dr
II 0.
13
No
No
C
$11,
612
Med
ium
48
Jeffe
rson
St
El C
entr
o A
ve
Dar
ling
St
II 0.
30
No
No
$2
7,24
7 M
ediu
m
49
Kai
ser
Rd
SR 2
21
Syar
Indu
stria
l Wy
II 0.
19
Yes
Yes
C
$28,
972
Med
ium
50
Linc
oln
Ave
C
alifo
rnia
Blv
d C
omm
uter
Bik
e Pa
th –
Vin
e Tr
ail
II 0.
72
No
No
C
$64,
952
Hig
h
51
Old
Son
oma
Rd
SR 2
9 H
arto
n St
II
0.29
N
o N
o C
$2
6,52
5 H
igh
52
Old
Son
oma
Rd
Old
Son
oma
Rd tu
rn o
ff In
ters
ectio
n of
Old
Son
oma
Rd &
S F
reew
ay D
r II
0.08
N
o N
o C
$6
,845
H
igh
53
Old
Son
oma
Rd
Wes
t Nap
a ci
ty li
mit
Fost
er R
d II
0.28
N
o N
o R
$25,
377
Med
ium
54
Redw
ood
Rd
Sola
no A
ve
Dry
Cre
ek R
d II
0.94
Ye
s N
o C
$8
5,24
6 H
igh
55
Redw
ood
Rd
Pueb
lo A
ve
Dry
Cre
ek R
d II
0.08
N
o N
o C
$7
,539
M
ediu
m
56
Redw
ood
Rd
Brow
ns V
alle
y Rd
Pu
eblo
Ave
II
0.83
Ye
s N
o C
$7
4,99
0 M
ediu
m
57
Rive
r Te
rrac
e W
y So
scol
Ave
N
apa
Rive
r Tr
ail
II 0.
12
No
No
C
$10,
943
Med
ium
58
Sara
toga
Dr
Silv
erad
o Tr
ail
Terr
ace
Dr
II 0.
30
No
No
C
$27,
218
Med
ium
59
Silv
erad
o Tr
ail
Sosc
ol A
ve
Nap
a ci
ty li
mit
II 2.
41
Yes
No
C
$217
,312
H
igh
60
Silv
erad
o Tr
ail
Kan
sas
Ave
So
scol
Ave
II
0.28
Ye
s N
o C
$2
5,43
5 M
ediu
m
61
Sous
a Ln
, OIl
Com
pany
Rd
Prop
osed
Vin
e Tr
ail
Silv
erad
o Tr
ail
II 0.
28
No
No
C
$24,
808
Low
62
SR 2
21
Kai
ser
Rd
Mag
nolia
Dr
II 1.
43
Yes
Yes
C
$128
,947
M
ediu
m
63
Tran
cas
St
Cal
iforn
ia B
lvd
Sosc
ol A
ve
II 1.
15
No
No
C
$103
,236
H
igh
64
Trow
er A
ve
Dry
Cre
ek
Oxf
ord
St
II 0.
67
Yes
No
C
$60,
193
Hig
h
65
Trow
er A
ve
Oxf
ord
St
Sola
no A
ve
II 0.
26
Yes
No
C
$23,
011
Hig
h
66
Villa
Ln
Pear
Tre
e Ln
Fi
refly
Ln
II 0.
46
No
No
C
$41,
460
Med
ium
67
W Im
ola
Ave
Fo
ster
Rd
Free
way
/Gol
den
Gat
e D
r II
0.19
N
o N
o C
$1
6,82
0 M
ediu
m
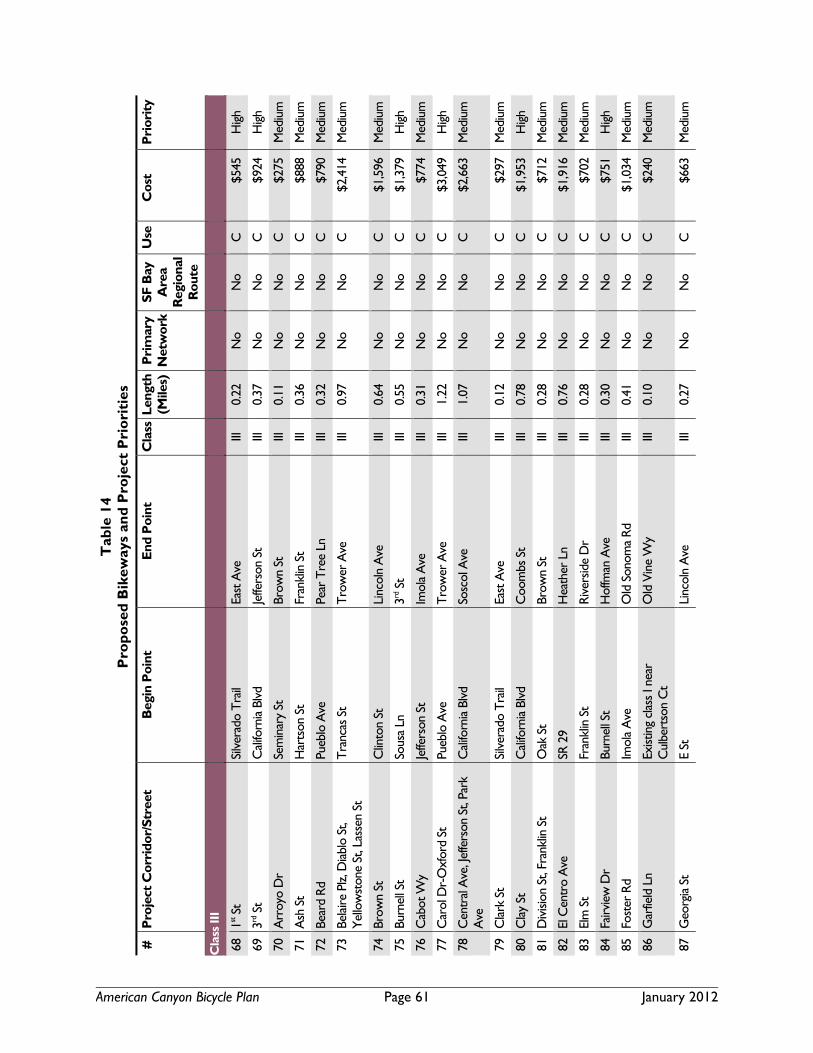
American Canyon Bicycle Plan Page 61 January 2012
Tab
le 1
4 P
rop
ose
d B
ikew
ays
and
Pro
ject
Pri
ori
ties
# P
roje
ct C
orri
dor/
Stre
et
Beg
in P
oint
E
nd P
oint
C
lass
Len
gth
(Mile
s)
Pri
mar
y N
etw
ork
SF B
ay
Are
a R
egio
nal
Rou
te
Us e
C
ost
Pri
orit
y
Cla
ss II
I
68
1st S
t Si
lver
ado
Trai
l Ea
st A
ve
III
0.22
N
o N
o C
$5
45
Hig
h
69
3rd S
t C
alifo
rnia
Blv
d Je
ffers
on S
t III
0.
37
No
No
C
$924
H
igh
70
Arr
oyo
Dr
Sem
inar
y St
Br
own
St
III
0.11
N
o N
o C
$2
75
Med
ium
71
Ash
St
Har
tson
St
Fran
klin
St
III
0.36
N
o N
o C
$8
88
Med
ium
72
Bear
d Rd
Pu
eblo
Ave
Pe
ar T
ree
Ln
III
0.32
N
o N
o C
$7
90
Med
ium
73
Bela
ire P
lz, D
iabl
o St
, Ye
llow
ston
e St
, Las
sen
St
Tran
cas
St
Trow
er A
ve
III
0.97
N
o N
o C
$2
,414
M
ediu
m
74
Brow
n St
C
linto
n St
Li
ncol
n A
ve
III
0.64
N
o N
o C
$1
,596
M
ediu
m
75
Burn
ell S
t So
usa
Ln
3rd S
t III
0.
55
No
No
C
$1,3
79
Hig
h
76
Cab
ot W
y Je
ffers
on S
t Im
ola
Ave
III
0.
31
No
No
C
$774
M
ediu
m
77
Car
ol D
r-O
xfor
d St
Pu
eblo
Ave
Tr
ower
Ave
III
1.
22
No
No
C
$3,0
49
Hig
h
78
Cen
tral
Ave
, Jef
fers
on S
t, Pa
rk
Ave
C
alifo
rnia
Blv
d So
scol
Ave
III
1.
07
No
No
C
$2,6
63
Med
ium
79
Cla
rk S
t Si
lver
ado
Trai
l Ea
st A
ve
III
0.12
N
o N
o C
$2
97
Med
ium
80
Cla
y St
C
alifo
rnia
Blv
d C
oom
bs S
t III
0.
78
No
No
C
$1,9
53
Hig
h
81
Div
ision
St,
Fran
klin
St
Oak
St
Brow
n St
III
0.
28
No
No
C
$712
M
ediu
m
82
El C
entr
o A
ve
SR 2
9 H
eath
er L
n III
0.
76
No
No
C
$1,9
16
Med
ium
83
Elm
St
Fran
klin
St
Rive
rsid
e D
r III
0.
28
No
No
C
$702
M
ediu
m
84
Fairv
iew
Dr
Burn
ell S
t H
offm
an A
ve
III
0.30
N
o N
o C
$7
51
Hig
h
85
Fost
er R
d Im
ola
Ave
O
ld S
onom
a Rd
III
0.
41
No
No
C
$1,0
34
Med
ium
86
Gar
field
Ln
Exist
ing
clas
s I n
ear
Cul
bert
son
Ct
Old
Vin
e W
y III
0.
10
No
No
C
$240
M
ediu
m
87
Geo
rgia
St
E St
Li
ncol
n A
ve
III
0.27
N
o N
o C
$6
63
Med
ium

American Canyon Bicycle Plan Page 62 January 2012
Tab
le 1
4 P
rop
ose
d B
ikew
ays
and
Pro
ject
Pri
ori
ties
# P
roje
ct C
orri
dor/
Stre
et
Beg
in P
oint
E
nd P
oint
C
lass
Len
gth
(Mile
s)
Pri
mar
y N
etw
ork
SF B
ay
Are
a R
egio
nal
Rou
te
Us e
C
ost
Pri
orit
y
88
Gra
nada
St,
Mui
r St
, Som
mer
St,
Shel
ter
Ave
SR
221
Im
ola
Ave
III
1.
08
No
No
C
$2,6
89
Hig
h
89
Hah
nem
ann
Ln
Win
e C
ount
ry A
ve
Salv
ador
Ave
III
0.
27
No
No
C
$684
M
ediu
m
90
Har
tson
St
Imol
a A
ve
Old
Son
oma
Rd
III
0.42
N
o N
o C
$1
,058
M
ediu
m
91
Kan
sas
Ave
So
scol
Ave
Sh
urtle
ff A
ve
III
0.60
N
o N
o C
$1
,502
M
ediu
m
92
Lark
in W
y, S
ceni
c D
r Br
owns
Val
ley
Rd
Brow
ns V
alle
y Rd
III
1.
08
No
No
C
$2,7
00
Med
ium
93
Laur
el S
t, Fo
othi
ll Bl
vd
Old
Son
oma
Rd
Brow
ns V
alle
y Rd
III
1.
11
No
No
C
$2,7
65
Med
ium
94
Linc
oln
Ave
Li
nda
Vist
a A
ve
Sola
no A
ve
III
0.52
N
o N
o C
$1
,292
M
ediu
m
95
Lind
a Vi
sta
Ave
Br
owns
Val
ley
Rd
Redw
ood
Rd
III
1.23
N
o N
o C
$3
,082
H
igh
96
Lind
a Vi
sta
Ave
Re
dwoo
d Rd
D
ry C
reek
Rd
III
2.03
N
o N
o C
$5
,072
M
ediu
m
97
Mah
er S
t Tr
ower
Ave
W
ine
Cou
ntry
Ave
III
0.
54
No
No
C
$1,3
39
Med
ium
98
Mai
n St
Li
ncol
n A
ve
Cen
tral
Ave
III
0.
25
No
No
C
$631
M
ediu
m
99
Mai
n St
, Pue
blo
Ave
C
entr
al A
ve
Bear
d Rd
III
0.
34
No
No
C
$848
M
ediu
m
100
McK
inst
ry S
t So
scol
Ave
W
ater
St
III
0.33
N
o N
o C
$8
30
Med
ium
101
Old
Son
oma
Rd, W
alnu
t St,
Laur
el S
t, C
alifo
rnia
Blv
d O
ld S
onom
a Rd
3rd
St
III
0.73
N
o N
o C
$1
,814
M
ediu
m
102
Patr
ick
Rd
Borr
ette
Ln
Brow
ns V
alle
y Rd
III
0.
78
No
No
C
$1,9
54
Med
ium
103
Pear
Tre
e Ln
Be
ard
Rd
Big
Ranc
h Rd
III
0.
54
No
No
C
$1,3
46
Med
ium
104
Pine
St
Wal
nut S
t Fr
ankl
in S
t III
0.
64
No
No
C
$1,6
06
Hig
h
105
Pueb
lo A
ve
Bear
d Rd
So
scol
Ave
III
0.
49
No
No
C
$1,2
14
Med
ium
106
Salv
ador
Ave
SR
29
East
city
lim
it III
0.
81
No
No
C
$2,0
22
Med
ium
107
Shur
tleff
Ave
Im
ola
Ave
Te
rrac
e D
r III
0.
94
No
No
C
$2,3
56
Hig
h
108
Sier
ra A
ve
Dia
blo
St
Willi
s D
r III
0.
46
No
No
C
$1,1
54
Med
ium
109
St. R
egis
Stan
ly C
ross
road
St
anly
Ln
III
0.65
N
o N
o R
$1,6
25
Med
ium
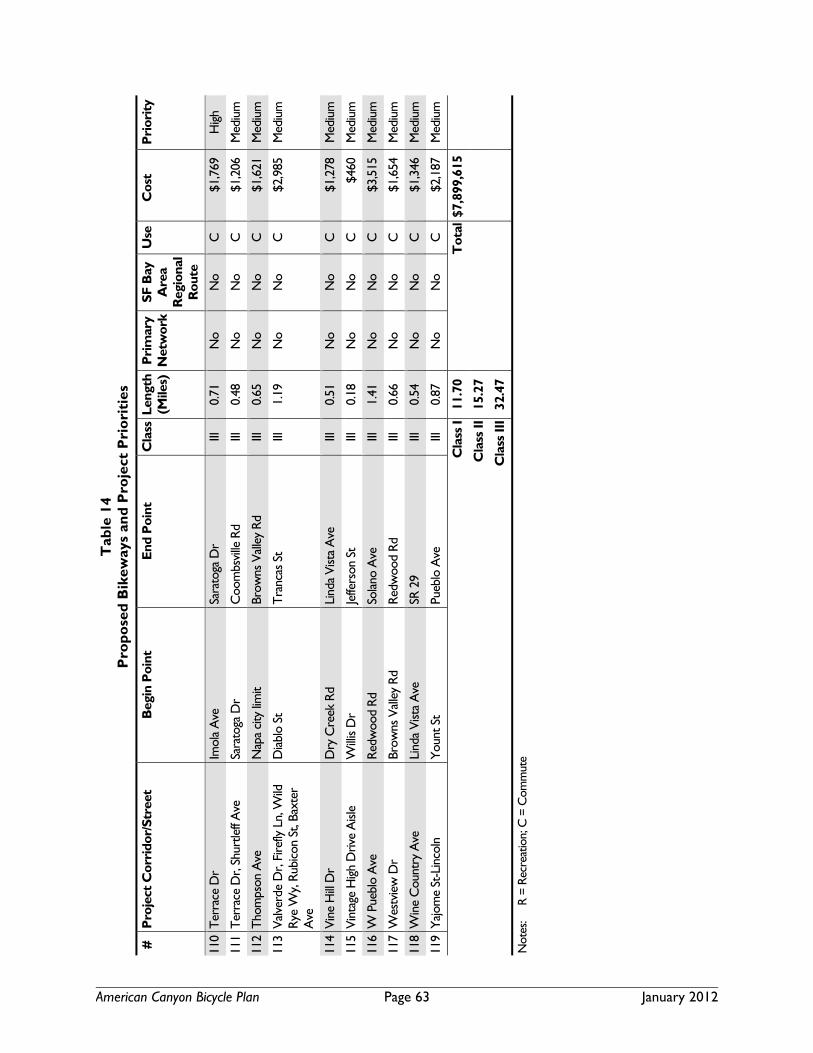
American Canyon Bicycle Plan Page 63 January 2012
Tab
le 1
4 P
rop
ose
d B
ikew
ays
and
Pro
ject
Pri
ori
ties
# P
roje
ct C
orri
dor/
Stre
et
Beg
in P
oint
E
nd P
oint
C
lass
Len
gth
(Mile
s)
Pri
mar
y N
etw
ork
SF B
ay
Are
a R
egio
nal
Rou
te
Us e
C
ost
Pri
orit
y
110
Terr
ace
Dr
Imol
a A
ve
Sara
toga
Dr
III
0.71
N
o N
o C
$1
,769
H
igh
111
Terr
ace
Dr,
Shur
tleff
Ave
Sa
rato
ga D
r C
oom
bsvi
lle R
d III
0.
48
No
No
C
$1,2
06
Med
ium
112
Thom
pson
Ave
N
apa
city
lim
it Br
owns
Val
ley
Rd
III
0.65
N
o N
o C
$1
,621
M
ediu
m
113
Valv
erde
Dr,
Fire
fly L
n, W
ild
Rye
Wy,
Rub
icon
St,
Baxt
er
Ave
Dia
blo
St
Tran
cas
St
III
1.19
N
o N
o C
$2
,985
M
ediu
m
114
Vine
Hill
Dr
Dry
Cre
ek R
d Li
nda
Vist
a A
ve
III
0.51
N
o N
o C
$1
,278
M
ediu
m
115
Vint
age
Hig
h D
rive
Aisl
e W
illis
Dr
Jeffe
rson
St
III
0.18
N
o N
o C
$4
60
Med
ium
116
W P
uebl
o A
ve
Redw
ood
Rd
Sola
no A
ve
III
1.41
N
o N
o C
$3
,515
M
ediu
m
117
Wes
tvie
w D
r Br
owns
Val
ley
Rd
Redw
ood
Rd
III
0.66
N
o N
o C
$1
,654
M
ediu
m
118
Win
e C
ount
ry A
ve
Lind
a Vi
sta
Ave
SR
29
III
0.54
N
o N
o C
$1
,346
M
ediu
m
119
Yajo
me
St-L
inco
ln
Youn
t St
Pueb
lo A
ve
III
0.87
N
o N
o C
$2
,187
M
ediu
m
Cla
ss I
11.7
0
Tot
al $
7,89
9,61
5
Cla
ss II
15
.27
Cla
ss II
I 32
.47
Not
es:
R =
Recr
eatio
n; C
= C
omm
ute

City of Napa Bicycle Plan Page 64 January 2012
Key Class I Bicycle Facilities
This section provides a description of the key Class I bicycle paths that make up the primary network. Class I bicycle facilities that are not part of the primary network are not described.
San Francisco Bay Trail: Vine Trail and River Trail
Existing Conditions • Class I path on east side of the Napa River. Extends through Kennedy Park up to Tulucay Creek. • Class II bike lanes on Imola/Maxwell Bridge • Class II bike lanes on Golden Gate Drive
Vision for Route • Extend the trail south to connect the City of Napa with the remainder of the 500-mile San
Francisco Bay Trail.
Major Destinations Along the Route • Kennedy Park • Napa Valley Community College
Vine Trail
Existing Conditions • Class I path extending northwest from McKinstry Street to the intersection of Redwood Road
and Solano Avenue.
Vision for Route • Extend the Vine Trail south to Tulucay Creek to connect with the Bay Trail. • Extend the Vine Trail north along SR 29 to form continuous Vine Trail, providing cyclists with a
trail following the train tracks to reach communities and destinations outside of the City of Napa.
Major Destinations Along the Route • Napa Hilton Garden Inn • Grace Academy of Napa Valley • Justin-Siena High School
Key Class II Bicycle Facilities
This section provides a description of the key Class II bicycle paths that make up the primary network. Class II bicycle facilities that are not part of the primary network are not described.
Old Sonoma Road
Existing Conditions • Class II bicycle lanes extend east-west from Almond Avenue to Old Sonoma Road.
Vision for Route • Extend Class II bicycle lanes west to the City Limits and beyond, connecting the City of Napa with
the unincorporated county, and west to connect with the Bay Trail via SR 12 and Ramal Road.
Major Destinations Along the Route • Harvest Middle School • Temescal High School • River School
City of Napa Bicycle Plan Page 65 January 2012
Silverado Trail
Existing Conditions • Class II bicycle lanes extend north from Trancas Street to the City Limits and beyond.
Vision for Route • Extend Class II bicycle lanes south on SR 129 from Trancas Street to Soscol Avenue, connecting
with the bicycle lanes on Soscol Avenue.
Major Destinations Along the Route • Milliken Creek Inn • Oxbow School • Napa County Fairgrounds • Hotel Napa Discovery Inn
1st Street
Existing Conditions • Class II bicycle facilities exist between Soscol Avenue and Main Street. • Class II bicycle facilities exist between McKinstry Street and Juarez Street.
Vision for Route • Extend Class II bicycle lanes to connect existing facilities between Soscol Avenue and McKinstry
Street. • Extend Class II bicycle lanes west of Juarez Street to connect with the Silverado Trail.
Major Destinations Along the Route • None from main list (a few wine tasting places)
California Boulevard
Existing Conditions • Class II bicycle lanes extend from Pueblo Avenue to 1st Street.
Vision for Route • Extend Class II bicycle lanes north to connect with Class II bicycle lanes on Trancas Street.
Major Destinations Along the Route • Winton School • Davis School • Embassy Suites Hotel Napa Valley
Big Ranch Road
Existing Conditions • No existing bicycle facilities.
Vision for Route • Construct Class II bicycle facilities between Trancas Street and Salvador Avenue, forming a
section of the Vine Trail.
Major Destinations Along the Route • None from main list (a vineyard and banks)
City of Napa Bicycle Plan Page 66 January 2012
Orchard Avenue
Existing Conditions • No bicycle facilities.
Vision for Route • Construct Class II bicycle lanes between Solano Avenue and Dry Creek Road, connecting the
northern residential areas of the City and the unincorporated areas with a major north-south bicycle facility.
Major Destinations Along the Route • O’Brien Estate Winery • Muir-Hannah Vineyards
SR 221
Existing Conditions • Class II bicycle lanes exist between Imola Avenue and Magnolia Drive.
Vision for Route • Extend Class II bicycle lanes south to Kaiser Road, forming another section of the Bay Trail and
connecting to the Napa Valley Corporate Loop.
Major Destinations Along the Route • Napa Valley Community College
West Imola Avenue
Existing Conditions • Class II bicycle lanes currently exist between Highway 221 and Hunt Street.
Vision for Route • Extend Class II bicycle lanes west to Foster Road, connecting with the Bay Trail at Golden Gate
Drive.
Major Destinations Along the Route • None from main list (a few hotels off side-streets but none on route)
Golden Gate Drive
Existing Conditions • No bicycle facilities currently exist on Golden Gate Drive.
Vision for Route • Construct Class II bicycle lanes from West Imola Avenue south to the City Limits, forming
another section of the Bay Trail and connecting the west side of the City of Napa with the rest of the 500-mile Bay Trail.
• Bike lanes are planned for construction on the entirety of Golden Gate Drive in 2011-2012.
Major Destinations Along the Route • None

City of Napa Bicycle Plan Page 67 January 2012
Redwood Road
Existing Conditions • No bicycle facilities currently exist on Redwood Road.
Vision for Route • Construct Class II bicycle lanes west from Trancas Street to Browns Valley Road.
Major Destinations Along the Route • Kolbe Academy and Trinity Prep
Bicycle Parking and Support Facilities
Every bicycle trip has two main components: the route selected by the bicyclist and the “end-of-trip” facilities at the destinations. The availability of safe bicycle routes and secure and convenient facilities is critical to promoting greater bike usage in the City of Napa. Bicycle facilities can include short- and long-term bicycle parking, showers, lockers and lighting of bicycle parking areas.
Providing short- and long-term bicycle parking at key destinations, such as parks, schools, community facilities, transit stops, and shopping areas, is essential to the development of a complete bicycle system. Parking should be highly visible, accessible and easy to use. In addition, facilities should be located in well-lit areas and covered where possible.
Support facilities for bicyclists should also be provided. Showers are an important amenity for those bicycle commuters with a rigorous commute and/or formal office attire. Lockers provide a secure place for bicyclists to store their helmets and other gear.
Shower and Locker Facilities
Currently, the City does not require employers to install shower and locker facilities for employees. Large employers and/or business parks often provide these facilities. Public input indicated that additional shower and locker facilities are desired by commuter bicyclists, however, none are proposed at this time.
Safety, Education, and Support Programs
The bikeway network has been planned to provide safe, convenient access for all types of bicyclists to destinations throughout the Plan Area. Like all other modes of transportation, the system and its network of facilities must be used appropriately to maximize the safety of all users, bicyclists, pedestrians, and motorists alike. To help minimize safety risks, it is imperative that bicyclists and motorists follow basic traffic laws. For bicyclists, this includes activities such as riding in the correct direction, stopping at stop signs and traffic signals when the light is red, riding predictably, and taking proper measures to be visible day and night; and for motorists yielding to turning bicyclists, passing with care, and not driving or parking in designated bicycle lanes, to name a few behaviors for both.
Efforts must be made to encourage a culture of respect and shared usage, among motorists and bicyclists alike. The safety, education, encouragement, and enforcement programs recommended in this section are intended to help grow the number of bicyclists in the Plan Area, while also increasing safe and appropriate behavior by bicyclists and all other roadway users.
Bicycle Safety Education for Students
Action: Provide bicycling/walking safety education to all students in the City of Napa from second grade through high school on an annual basis.

City of Napa Bicycle Plan Page 68 January 2012
The Napa County Office of Education Safe Routes to School Program currently provides bicycling/walking safety education to approximately eight (8) schools throughout the County annually. The City and Napa Valley Unified School District should work together to ensure Safe Routes to Schools programs are delivered to the City of Napa’s schools.
• Expected Result: Decrease the number of bicycle crashes among school age children and increase the number of students bicycling/walking to school through increased Safe Routes to School safety education delivery efforts.
• Measure: Collision analysis and bicycle and walking counts performed regularly by agency staff.
Action: Develop a sustainable Walking School Bus/Bicycle Train Program for interested schools.
Safety is a primary concern when parents decide whether to allow their children to bicycle/walk to school. Walking school busses and bicycle trains are organized groups of students who walk or bicycle to school under the supervision of one or more adults. The Program’s formal organization and adult supervision can provide peace of mind for parents wanting to let their child walk or bicycle to school. The City, Napa Valley Unified School District, and individual schools should work with the Napa County Office of Education to develop a formal program identifying school commute routes and establishing a roster of volunteer parent or staff “bus drivers” from each participating school.
• Expected Result: More students will bicycle and walk to school on a regular basis.
• Measure: The Napa County Office of Education Safe Routes to School Coordinator will track the number of children walking and biking to school and survey participating schools to track the success of walking and bicycling school busses.
Bicycle Safety Education for Adults
Action: Develop and deliver bicycle safety education to adult bicyclists throughout the community using a variety of media (print, radio, web, and hands-on instruction) targeted toward specific user groups: migrant workers, college students, commuter bicyclists, recreational bicyclists, families, senior citizens, and large employers.
Adult bicyclists account for the majority of bicyclists in the Plan Area. A variety of rider types comprise the “adult bicyclist” category, as such appropriate safety education information should be developed to target focused issues for each user group. Safety information is widely available from FHWA, AAA, the League of American Bicyclists, and a variety of local and regional transportation agencies. Existing resources should be used and adapted to meet the needs of the local community. Safety education should stress the importance of following the rules of the road and how doing so plays a role in the prevention of collisions. Educational messages should be targeted at addressing common violations, issues, and/or collision types such as: wrong-way riding, no lights or other required night-riding equipment, running stop signs or red lights, bicyclists that are careless or disobey traffic laws, proper helmet use, riding with children, sharing trails and roads, riding two abreast or in groups, yielding to pedestrians, etc. Specific destinations that generate frequent bicycle travel should also be targeted. For example, the Napa State Hospital is a destination for many patients on day release and should therefore provide a bicycle safety education program to its patients.
• Expected Result: Bicyclists will employ safe bicycling techniques and etiquette on streets and pathways, parents will serve as role models for safe bicycling techniques for their children,
City of Napa Bicycle Plan Page 69 January 2012
bicycle conflicts along streets and pathways will decrease, and annual bicycle collisions will be reduced.
• Measure: Traffic citations, bicycle crash data, and bicycle/traffic complaints will be analyzed on an annual basis to determine trends. Surveys may be conducted on trails and/or as a component of regular bicycle counts to determine the effectiveness of the outreach and if bicycle/vehicle/ pedestrian interactions have improved.
Bicycle Safety Education and Encouragement Campaign for Tourists
Action: Develop and deliver bicycle safety education information to tourists throughout the Plan Area to make bicycling more attractive and available to short-term tourists.
Findings from the 2005 Napa Valley Visitor Profile Study document the profound significance that tourism has on the Napa Valley’s economy and transportation system. In order to help alleviate traffic congestion, improve traffic safety, reduce vehicle miles traveled, and make bicycling more attractive and available to tourists, a focused tourist information, safety, and education campaign should be developed. The campaign would require collaboration from multiple entities including NCTPA and local agencies, and tourism, winery hospitality, agricultural, and visitor serving interests. Marketing will be critical to inspire tourists of all levels, abilities, and desires to tour the Valley’s many attractions by bicycle. Materials should be developed in multiple languages, and focus on issues such as bicycling safety and etiquette, tips to improve comfort and convenience, route planning and wayfinding, bike rental services, and information on both guided tours and unguided routes.
• Expected Result: The number bicycle trips by made by short-term tourists visiting the Napa Valley will increase substantially. Both bicycle and traffic safety will improve as a greater understanding of the bicycle system is developed and vehicle miles traveled are reduced. Targeted reductions in Greenhouse Gas Emissions will be achieved as fewer “short” tourism trips are made. Touring the Napa Valley’s vineyards, wineries, and attractions by bicycle, and experiencing Napa’s “healthy lifestyle” will be central to the Valley’s tourism industry and an active destination choice for tourists worldwide.
• Measure: Traffic citations, bicycle crash data, and bicycle/traffic complaints will be analyzed on an annual basis to determine trends. Visitor serving businesses including bicycle tours and rental establishments, wineries, and lodging will be surveyed to determine trends and the effectiveness of the campaign.
Law Enforcement Activities
Police officers are responsible for enforcing traffic laws and improving safety for bicyclists and motorists on Napa’s highways, streets and pathways. Traffic officers interact with bicyclists and motorists on a daily basis, which puts them in a unique position to add credibility to efforts to encourage bicycling and to improve bicycle safety. Coordination with law enforcement agencies and an improved understanding of bicycling issues by officers can lead to better enforcement, heightened awareness of safety issues, and recognition of “teachable moments” for both bicyclists and motorists.
Action: Provide bicycle specific training for law enforcement personnel and establish a community policing agreement.
Training of law enforcement personnel, including on-bike enforcement techniques, is critical to keeping officers up to date on current bicycle laws and issues, and will help officers to understand the behaviors, rights, and traffic safety concerns associated with bicycling. A
City of Napa Bicycle Plan Page 70 January 2012
community policing agreement engages members of the community, including agency engineering and planning staff, local elected officials, non-profit community advocates, schools, and others, to ensure the coordination of enforcement goals and strategies, and to develop a balanced approach to address traffic safety issues that includes education, engineering, and enforcement. A community policing agreement amongst local law enforcement agencies in the Plan Area will help to ensure specific and consistent consideration of enforcement efforts as well as consistent investigation techniques of collisions for on-going monitoring purposes.
• Expected Result: Bicycle specific training for police officers will familiarize enforcement personnel with bicycle issues and the bicyclist’s perspective. A community policing agreement will ensure a collaborative approach to traffic safety that includes enforcement, engineering, and education efforts to improve traffic safety.
• Measure: Trained enforcement officers may be required to complete post training evaluation forms. Community policing agreements would result in regular committee meetings and a reduction in bicycle-related citations and collisions.
Action: Establish a bicycle diversion program for bicycle traffic offenders.
Bicycle diversion programs are provided in a variety of jurisdictions throughout the nation. Diversion programs allow persons cited for eligible bicycle-related traffic violations to attend a bicycle safety course sponsored by law enforcement and the Court in lieu of paying a fine. Courses are typically free of charge, and successful completion results in the dismissal of the fine and all charges. Eligibility is determined by the Court. Diversion courses range from one to four hours in duration and include the delivery of instructional videos, bicycle safety materials, a review of state and local laws, and hands on safety skill training.
• Expected Result: Court administered bicycle diversion program for bicycle traffic offenders which would provide bicycle safety training in lieu of a fine.
• Measure: Bicycle safety training delivered to (number) of residents through the program.
Action: Provide focused law enforcement operations at high collision locations.
The Bicycle Plan Update has identified the top collision locations for bicyclists throughout the community. Increased law enforcement efforts at these specific locations may help to decrease collisions between motorists and bicyclists. The City’s planning and engineering staff should work with law enforcement (community policing) to develop a strategy to address safety concerns at these locations. Strategies may include increased patrols during peak periods, crosswalk(s), signal compliance, etc.
• Expected Result: Increased law enforcement patrols at top collision locations throughout the County.
• Measure: Reduction in bicycle collisions at high collision locations.
City of Napa Bicycle Plan Page 71 January 2012
Implementation
Introduction
This section identifies the activities and actions that are necessary to implement the physical improvements, facilities, and programs contained in this Plan, along with the estimated costs for the proposed improvements, maintenance requirements, and funding and financing strategies.
Implementation
Successful implementation of the projects and programs contained in the Bicycle Plan will require ongoing cooperation within and among City departments, other public agencies, and bicycle stakeholders. The planning horizon for the projects identified in this plan is the year 2035. Implementation of the projects in this plan will occur incrementally in a variety of ways. Many projects will be incorporated into the City’s Capital Improvement Program (CIP) process and will be implemented as the CIP projects get funded. Others can happen as part of regular maintenance and operations practices and road resurfacing projects. Development and/or redevelopment in some areas of the City will present a significant opportunity to implement some of the recommendations of this Plan. While improvements associated with development and/or redevelopment often occur “piecemeal’, this is the way development happens and it is important to include bicycle improvements as a component of project improvements. Finally, outside funding can be obtained to finance the design and construction of other projects, improvements and programs. The most likely funding sources are addressed in the last section of this chapter.
Project Implementation Process
The actions necessary to complete infrastructure projects identified in this Plan will vary from project to project, but generally include:
1. Adoption of the Plan by resolution.
a. Approval of the Plan by the Metropolitan Transportation Commission.
b. Certification of the Plan by the Caltrans Bicycle Facilities Unit.
c. Programmatic level review and environmental clearance of the Plan.
2. Feasibility analysis, environmental analysis, and cost estimates for individual projects as needed.
3. Public review as necessary.
4. Project approvals; Advisory Committee, Planning Commission, City Council.
5. Secure local and outside funding commitments.
6. Completion of final plans, specifications and estimates, advertising for bids, receipt of bids and award of contract(s).
7. Project construction.
Maintenance and Monitoring
Bicycle system maintenance needs include cleaning/sweeping, asphalt resurfacing, striping maintenance, sign replacement, pavement repairs, signal maintenance, drainage work, refuse removal, graffiti removal, and landscape maintenance. Maintenance of on-street facilities such as Class II bike lanes, Class III bike

City of Napa Bicycle Plan Page 72 January 2012
routes, and bicycle boulevards, is generally treated as a component of typical roadway maintenance activities which are funded through gas taxes and programmed annually. While some maintenance needs such as re-striping or re-surfacing can be placed on a periodic schedule, other needs such as fixing potholes, addressing signal detection sensitivity, and trimming overgrown vegetation require immediate attention. Table 15 provides a recommended timetable for regular maintenance activities associated with the City of Napa bicycle network.
Table 15 Bicycle System Maintenance
Maintenance Item Schedule/Frequency
Pavement/pathway sweeping Monthly – annually as needed
Signal detection sensitivity Bi-annually – or as needed on a request basis
Trash disposal Weekly – as needed
Graffiti removal Weekly – monthly as needed
Potholes As needed – on a request basis
Sign replacement/repair 1 to 3 years – as needed
Pavement marking replacement 1 to 3 years – as needed
Pavement sealing Every 5 years – as needed
Lighting (replacement/repair) Annually – or as needed on a request basis
Clean drainage system Annually – or as needed on a request basis
Maintain furniture, bus stops, railings Annually – or as needed on a request basis
Fountain/restroom cleaning/repair Weekly - monthly as needed
Bridge/Underpass inspection Annually
Maintain emergency telephones, Closed circuit TV 1 year
Replenish shoulder material Annually
Landscape Maintenance
Tree, Shrub, & grass trimming/fertilization 5 months – 1 year
Maintain irrigation lines/replace sprinklers 1 year
Irrigate/water plants Weekly – monthly as needed
Shoulder and grass mowing Seasonally as needed
Vegetation maintenance Annually – or as needed on a request basis
Weed control Monthly – as needed
Maintenance Recommendations
Recommendation: Ensure that all bikeways and roadway shoulders are included in the City’s street sweeping program and swept as part of routine street sweeping operations. Street sweeper operators should be properly trained to understand the needs of bicyclists and the importance of clearing debris from bikeways.
Recommendation: Ensure that all construction projects (roadway and/or road adjacent projects) maintain both a clean swept shoulder and a through right-of-way for bicycles.
Recommendation
Implement a Maintenance Reporting System
Policy 9.2: Develop or retain a maintenance reporting system with a central point of contact to report, track, and respond to routine bicycle maintenance issues in a timely manner. [NCTPA, NCBC, cities, towns, County]

City of Napa Bicycle Plan Page 73 January 2012
Recommendation: Continue to maintain the City’s maintenance reporting system as a means to report, track, and respond to routine bicycle maintenance issues in a timely manner. Ensure that the City’s maintenance reporting system is integrated with any countywide efforts to develop a similar program.
Maintenance Costs
Maintenance costs for the bikeway system are generally lumped into two categories. As previously noted, maintenance activities associated with on-street bikeways are typically accommodated as a component of routine street maintenance activities that are programmed annually, while maintenance of off-street bikeways (Class I multi-use paths) and support facilities such as bike lockers and racks is generally funded through local revenues. Given the limited number of existing and proposed Class I bikeway miles, maintenance costs for the City of Napa bikeway network should be relatively low. Cost assumptions for typical bikeway maintenance activities are presented in Table 16.
Table 16 Maintenance Cost Assumptions
Facility Classification
Estimated Annual Cost Per Mile
Notes
Class I $8,500 Assumes maintenance associated with Class I trails, trail amenities, and landscaping
Class II $2,000 Assumes regular/periodic lane sweeping, sign and stripe/stencil maintenance, signal detection, and minor surface repairs
Class III
$1,000 Assumes sweeping and minor surface repairs
Sidewalks
$2,500 Assumes landscape/vegetation maintenance and surface repairs
Monitoring
The projects and programs recommended in this Plan are dynamic and subject to change as bicycling conditions and demands throughout the plan area evolve. Periodically monitoring certain indicators and conditions along the bikeway network will allow the City to assess needs and issues that require attention and/or to adjust plans and project recommendations accordingly. The primary components to monitor include: bicycle collisions, bicycle usage, and safety/security and enforcement. The following monitoring actions are recommended to evaluate the success the City’s efforts and to ensure implementation of the Bicycle Plan goals over time.
• Collect and analyze collision data on an ongoing basis to assist in the identification of problem locations.
• Conduct and log bicycle counts on an annual or semi-annual basis so that usage trends can be identified and measured.
• Conduct regular meetings with bicycle stakeholders (annually or bi-annually) to solicit feedback on bicycle facilities, network maintenance, promotional and educational activities, and safety/security and enforcement issues.
• Consider the use of periodic public surveys to receive input on bicycle issues from the larger community.

City of Napa Bicycle Plan Page 74 January 2012
Project Costs
Construction costs for bicycle infrastructure are presented in Table 17. Costs estimates were developed by researching the latest unit costs experienced by the local jurisdictions in Napa County and the North Bay, and were cross-referenced by reviewing the National Cooperative Highway Research Program’s Guidelines for Analysis of Investments in Bicycle Facilities3. In recent years, actual costs have fluctuated significantly, with sharp rises in the costs of construction materials in the late 1990’s and early 2000’s, followed by steep declines in labor costs and a leveling of construction material costs in last few years. Overall, these changes have been dramatic and have resulted in instabilities that are difficult to predict, especially over a long-term. The costs below are for planning level estimates. They are unit costs for construction and do not include contingencies, design, environmental analysis, administrative costs, right-of-way acquisition, or inflation factors. Furthermore, unit costs may vary considerably depending on the size of the job and the location. For example, the unit cost of striping only 1,000 linear feet can easily be two to three times that of a 15,000-foot project. The same ‘economy of scale’ can be applied to sign installation and signal modification projects. Pavement widening costs also vary considerably depending on the terrain and other variables, such as presence of utility poles, monuments, and drainage issues.
3 Transportation Research Board, National Cooperative Highway Research Program’s Guidelines for Analysis of Investments in Bicycle Facilities, 2006

City of Napa Bicycle Plan Page 75 January 2012
Table 17 Construction Cost Assumptions for Bikeway Improvements
Capital Project Unit Cost
Class I: Multi Use Trail
Construct Multi-Use Pathway Mile $550,000
Rehabilitation Mile $125,000
Trail Entry Improvements (may include bollards, signs, minor paving, & concrete driveway apron)
Each $2,000-$6,000
At Grade Roadway Crossing (varies by improvement type) Each $10,000-$90,000
Grade Separated Crossing (under/over crossing) Each **
Trail Bridge (Prefabricated steel bridge 10-12 ft wide by 100 ft long) Each $200,000
Class II: Bike Lanes
Road widening to accommodate bike lanes Mile $300,000
Install Signs, Striping, & Stencils Mile $30,000
Reconfigure Roadway Striping, add Bike Lanes Mile $75,000-$90,000
Install Loop Detectors Each Intersection $2,500-$5,000
Intersection Striping (bike lane pockets, combined turn lanes, advanced stop bar/pocket)
Each Intersection $2,000-$6,000
Class III: Bike Route
Install Signing (Up to 10 signs per mile) Mile $2,500
Bicycle Boulevard
(Signing and Stencils Only) Mile $4,500
(Traffic Calming Treatments) Each $2,000-$60,000
Shoulder/Roadway Widening (One side, 6 foot) Mile $325,000
Shared Lane Markings / Pavement Legends Each $175-$300
Bicycle Parking
Inverted “U” Rack (I rack parks 2 bikes) Each $250
Post and Ring Rack (1 rack parks 2 bikes) Each $200
Bicycle Locker (1 to 2 bikes per unit depending upon locker type) Each $1,500
Bus Bicycle Racks – Front Loading Each $600-$800
Notes: The above unit costs are for construction. These planning level estimates do not include contingencies, design, administrative, right-of-way acquisition costs, or inflation factors. ** Costs are highly variable depending upon conditions
A variety of bicycle rack and bicycle locker products and styles are available through local and national manufactures and retailers. The sample “styles” identified in Table 17 are intended for reference. Local agencies and developers are encouraged to utilize racks and lockers that are effective and appropriate for the context of the respective installation site.
City of Napa Bicycle Plan Page 76 January 2012
Program Costs
This plan includes a variety of collaborative programmatic improvements and actions that will help achieve the vision of increased bicycling throughout Napa County and bicycle safety improvements for each community. The programs and actions are important to help realize Plan vision and safety enhancements and should be implemented as soon as time and funding resources are available. Costs for individual programs and actions are highly variable and dependent upon the scope and scale of actions. For example, bicycle counts are often collected using volunteer labor which results in a significant savings. Other programs and actions can be carried out using existing staff resources and/or by utilizing existing media available free of charge from other transportation agencies such as safety education materials and/or public service announcements. Table 18 identifies the primary programmatic improvements, which are defined in greater detail in earlier sections, includes a range of estimated costs, a potential lead agency, likely partner agencies, and potential funding sources.

American Canyon Bicycle Plan Page 77 January 2012
Tab
le 1
8 C
ost
Ass
um
pti
on
s fo
r P
rogr
amm
atic
Im
pro
vem
ents
Pro
gram
/Pro
ject
Nam
e L
ead
Age
ncy
P
artn
er A
gen
cies
E
stim
ated
Co
st
Est
imat
ed A
nn
ual
M
ain
ten
ance
Co
st
Po
ten
tial
Fu
nd
ing
So
urc
e
Nap
a B
ike
Pro
gram
– E
du
cati
on
an
d E
nco
ura
gem
ent
Act
ivit
ies
Cen
tral
ized
Bic
ycle
Pro
gram
W
ebpa
ge
NC
TPA
C
ities
, Cou
nty,
Tow
n $2
0,00
0 st
art
up
0.25
tim
e st
aff p
ositi
on
Fede
ral,
Stat
e, R
egio
nal
Fund
s
Mai
nten
ance
, Mon
itori
ng, a
nd
Rep
ortin
g Sy
stem
N
CT
PA
Citi
es, C
ount
y, T
own
$0
Com
pone
nt o
f Bic
ycle
Pro
gram
W
ebpa
ge
$0
Part
of r
egul
ar s
taff
dutie
s
Cou
ntyw
ide
Tra
ffic
Safe
ty C
ampa
ign
NC
TPA
C
ities
, Cou
nty,
Tow
n $2
50,0
00 s
tart
up
and
oper
atio
n fo
r tw
o ye
ar p
erio
d $1
0,00
0+ p
rint
ing,
m
aint
enan
ce, a
nd
outr
each
cos
ts
CA
Offi
ce o
f Tra
ffic
Safe
ty, F
eder
al, S
tate
Bicy
cle
Gui
de M
ap
NC
TPA
C
ities
, Cou
nty,
Tow
n $4
0,00
0 $1
0,00
0 pr
intin
g an
d up
date
cos
ts e
very
3 t
o 5
year
s
Reg
iona
l and
Sta
te
Gra
nts
Safe
ty a
nd E
duca
tion
Publ
icat
ions
(In
clud
es p
rint
med
ia, b
illbo
ards
, tr
ansi
t bi
llboa
rds)
NC
TPA
C
ities
, Cou
nty,
Tow
n $1
5,00
0 as
sum
es u
tiliz
atio
n of
ex
istin
g m
ater
ials
. In
clud
es in
itial
pr
int
runs
.
$5,0
00 t
o $7
,000
Fe
dera
l and
sta
te g
rant
s
Stre
et S
kills
Bic
ycle
Saf
ety
Cou
rses
N
CT
PA
Citi
es, C
ount
y, T
own
$5,0
00 a
dmin
istr
atio
n an
d co
ntra
ct in
stru
ctor
s $2
,000
to
$4,0
00
Non
-pro
fit, G
rant
s
Enco
urag
emen
t A
ctiv
ities
(b
ike
to w
ork
day,
city
str
eets
, fai
rs,
race
s, s
tude
nt, a
nd c
omm
unity
ev
ents
)
NC
TPA
, Citi
es,
Cou
nty,
Tow
n,
Non
-pro
fits
Citi
es, C
ount
y, T
own,
no
n-pr
ofits
, loc
al
busi
ness
es
$5,0
00 t
o $2
0,00
0 pe
r ev
ent
Var
ies
per
even
t N
on-p
rofit
s, lo
cal
busi
ness
es, T
ouri
sm
and
Hos
pita
lity
Indu
stri
es
Rad
io, T
V, P
ublic
Ser
vice
A
nnou
ncem
ents
N
CT
PA, C
ities
, C
ount
y, T
own
Non
-pro
fits,
loca
l law
en
forc
emen
t ag
enci
es,
priv
ate
busi
ness
$15,
000
star
t up
ass
umes
ad
min
istr
atio
n an
d m
ater
ials
ac
quis
ition
$3,0
00 t
o $5
,000
D
onat
ions
, non
-pro
fit
gran
ts, l
ocal
bus
ines
ses,
Fe
dera
l, st
ate,
reg
iona
l gr
ants
, CA
Offi
ce o
f T
raffi
c Sa
fety
Tou
rism
/Tou
rist
Saf
ety
and
Way
findi
ng M
ater
ials
Lo
cal B
usin
esse
s,
Tou
rism
/Hos
pita
lity
Indu
stry
NC
TPA
, Citi
es,
Cou
nty,
Tow
n $7
5,00
0 st
artu
p $1
0,00
0 pr
intin
g an
d m
aint
enan
ce c
osts
N
on-p
rofit
s, lo
cal
busi
ness
es, T
ouri
sm
and
Hos
pita
lity
Indu
stri
es

American Canyon Bicycle Plan Page 78 January 2012
Tab
le 1
8 C
ost
Ass
um
pti
on
s fo
r P
rogr
amm
atic
Im
pro
vem
ents
Pro
gram
/Pro
ject
Nam
e L
ead
Age
ncy
P
artn
er A
gen
cies
E
stim
ated
Co
st
Est
imat
ed A
nn
ual
M
ain
ten
ance
Co
st
Po
ten
tial
Fu
nd
ing
So
urc
e
Bicy
cle
Park
ing
Prog
ram
N
CT
PA, C
ities
, C
ount
y, T
own,
loca
l bu
sine
sses
Non
-pro
fits
$20,
000
star
t-up
A
ssum
es d
esig
n, a
dmin
istr
atio
n,
site
sel
ectio
n
$5,0
00
Ann
ual i
nsta
llatio
n ex
pens
es
Bicy
cle
Tra
nspo
rtat
ion
Acc
ount
, sta
te a
nd
regi
onal
gra
nts
Way
findi
ng S
igni
ng C
ampa
ign
NC
TPA
C
ities
, Cou
nty,
Tow
n $7
5,00
0 A
ccou
nts
for
desi
gn a
nd
adm
inis
trat
ion
alon
g w
ith
inst
alla
tion
of a
ppro
xim
atel
y 25
0 si
gns
Cou
ntyw
ide
$5,0
00
Bicy
cle
Tra
nspo
rtat
ion
Acc
ount
, sta
te a
nd
regi
onal
gra
nts
Shar
e th
e R
oad
Cam
paig
n N
CT
PA
Citi
es, C
ount
y, T
own
$35,
000
Acc
ount
s fo
r de
sign
and
ad
min
istr
atio
n al
ong
with
in
stal
latio
n of
app
roxi
mat
ely
75
sign
s C
ount
ywid
e
$2,5
00
Bicy
cle
Tra
nspo
rtat
ion
Acc
ount
, sta
te a
nd
regi
onal
gra
nts,
gen
eral
fu
nd
Bicy
cle
Am
bass
ador
Pro
gram
2
to 4
par
t-tim
e pe
rson
s Po
tent
ial i
nter
nshi
p or
vol
unte
er
oppo
rtun
ities
NC
TPA
C
ities
, Cou
nty,
Tow
n $5
,000
Adm
inis
trat
ion
cost
s $2
,000
to
$5,0
00
Priv
ate
fund
ing,
non
-pr
ofits
, loc
al b
usin
esse
s
Bicy
cle
Shar
e Pr
ogra
m
NC
TPA
C
ities
, Cou
nty,
Tow
n,
loca
l bus
ines
ses
$5,0
00 p
er in
stal
latio
n si
te.
Doe
s no
t in
clud
e la
nd c
osts
. A
nnua
l ope
ratin
g co
sts
can
rang
e fr
om $
1,00
0 to
$2,
000
per
bike
Priv
ate
Fund
ing,
loca
l bu
sine
sses
, Tou
rism
an
d H
ospi
talit
y In
dust
ries
Loca
l Age
ncy
Bicy
cle
Flee
ts
Loca
l Age
ncie
s an
d N
CT
PA
Citi
es, C
ount
y, T
own
$3,0
00 t
o $6
,000
per
age
ncy
$250
to
$500
Bicy
cle
Div
ersi
on P
rogr
am
Nap
a C
ount
y C
ourt
s
Loca
l Pol
ice
Age
ncie
s $5
,000
Pr
ogra
m s
tart
-up
$0
Part
of a
nnua
l op
erat
ing
cost
s
Focu
sed/
Tar
gete
d En
forc
emen
t Lo
cal L
aw
Enfo
rcem
ent
Age
ncie
s
Citi
es, C
ount
y, T
own
$0
G
ener
al F
und,
CA
O
ffice
of T
raffi
c Sa
fety
G
rant
s
Bicy
cle
Cou
nts
Citi
es, C
ount
y,
Tow
n N
CT
PA, N
on-p
rofit
s,
volu
ntee
rs
$6,0
00
Prog
ram
sta
rt-u
p an
d ad
min
istr
atio
n
$3,5
00
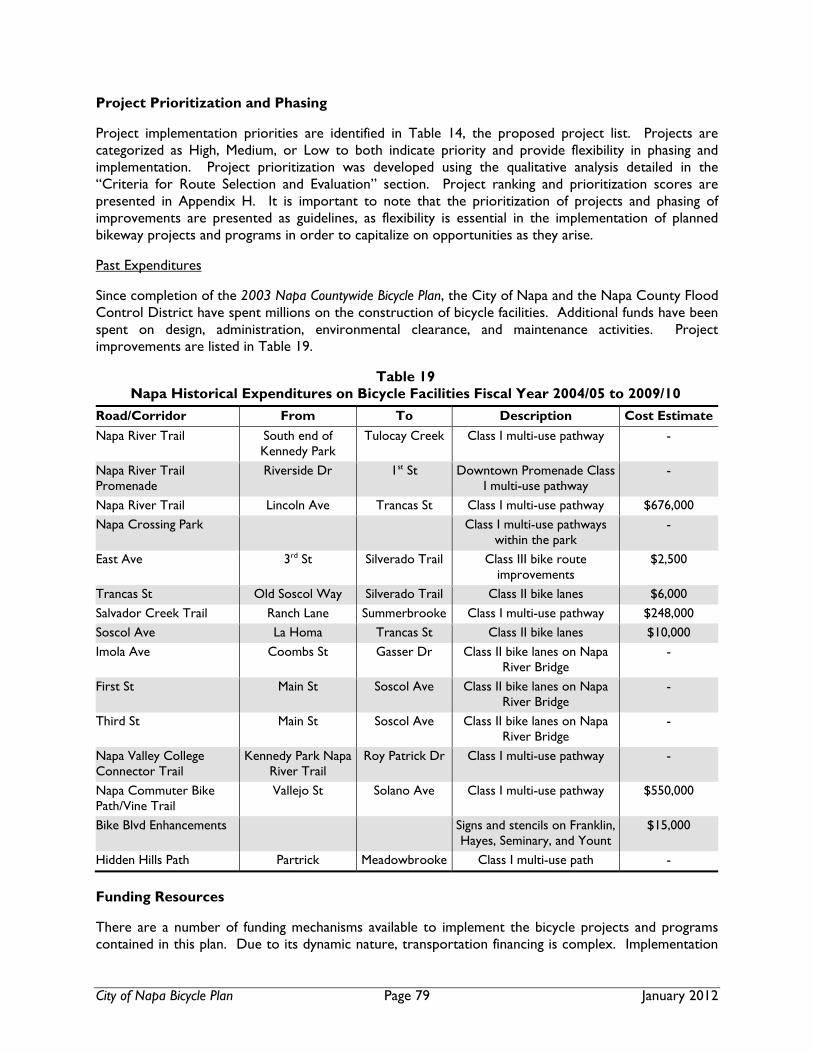
City of Napa Bicycle Plan Page 79 January 2012
Project Prioritization and Phasing
Project implementation priorities are identified in Table 14, the proposed project list. Projects are categorized as High, Medium, or Low to both indicate priority and provide flexibility in phasing and implementation. Project prioritization was developed using the qualitative analysis detailed in the “Criteria for Route Selection and Evaluation” section. Project ranking and prioritization scores are presented in Appendix H. It is important to note that the prioritization of projects and phasing of improvements are presented as guidelines, as flexibility is essential in the implementation of planned bikeway projects and programs in order to capitalize on opportunities as they arise.
Past Expenditures
Since completion of the 2003 Napa Countywide Bicycle Plan, the City of Napa and the Napa County Flood Control District have spent millions on the construction of bicycle facilities. Additional funds have been spent on design, administration, environmental clearance, and maintenance activities. Project improvements are listed in Table 19.
Table 19 Napa Historical Expenditures on Bicycle Facilities Fiscal Year 2004/05 to 2009/10
Road/Corridor From To Description Cost Estimate
Napa River Trail South end of Kennedy Park
Tulocay Creek Class I multi-use pathway -
Napa River Trail Promenade
Riverside Dr 1st St Downtown Promenade Class I multi-use pathway
-
Napa River Trail Lincoln Ave Trancas St Class I multi-use pathway $676,000 Napa Crossing Park Class I multi-use pathways
within the park -
East Ave 3rd St Silverado Trail Class III bike route improvements
$2,500
Trancas St Old Soscol Way Silverado Trail Class II bike lanes $6,000
Salvador Creek Trail Ranch Lane Summerbrooke Class I multi-use pathway $248,000 Soscol Ave La Homa Trancas St Class II bike lanes $10,000
Imola Ave Coombs St Gasser Dr Class II bike lanes on Napa River Bridge
-
First St Main St Soscol Ave Class II bike lanes on Napa River Bridge
-
Third St Main St Soscol Ave Class II bike lanes on Napa River Bridge
-
Napa Valley College Connector Trail
Kennedy Park Napa River Trail
Roy Patrick Dr Class I multi-use pathway -
Napa Commuter Bike Path/Vine Trail
Vallejo St Solano Ave Class I multi-use pathway $550,000
Bike Blvd Enhancements Signs and stencils on Franklin, Hayes, Seminary, and Yount
$15,000
Hidden Hills Path Partrick Meadowbrooke Class I multi-use path -
Funding Resources
There are a number of funding mechanisms available to implement the bicycle projects and programs contained in this plan. Due to its dynamic nature, transportation financing is complex. Implementation

City of Napa Bicycle Plan Page 80 January 2012
of bicycle facilities, improvements, and programs is made possible by a wide variety of funding sources including:
• Federal, State, Regional, and Local Governmental Sources • Private Sector Development and Investment • Community, Special Interest and Philanthropic Organizations
Federal, State, Regional, and Local Governmental Sources
The dollars used to fund transportation projects originate from a wide variety of government sources including federal and state fuel taxes, sales taxes, property taxes, transit fares, truck weight fees, vehicle registration fees, tolls, development fees, bonds, traffic fines, local general funds, and assessment districts, among others. Many transportation fund sources are closely tied to larger local, state, and national economic trends, and as a result, the availability of these funds can fluctuate with economic upturns and downturns.
In the San Francisco Bay Area, the flow of revenues for bicycle and pedestrian projects from source to implementing entity most often involves the California Department of Transportation (Caltrans), the regional Metropolitan Transportation Commission (MTC), to a limited extent, the Bay Area Air Quality Management District (BAAQMD), the Bay Trail, and at the local level, the Napa County Transportation Planning Agency (NCTPA). Funding for bicycle projects is possible from various sources that NCTPA facilitates. While the NCTPA does not own or operate bicycle facilities or services, the agency supports the implementation of projects and programs identified by its member agencies.
At the federal, state, regional and local levels, transportation funds are divided into myriad funding programs. Each program is handled differently, depending on its size, eligible uses, and the agency responsible for making spending decisions. While some programs remain relatively consistent, the majority are dynamic, changing regularly with passage of legislation or as a result of administrative or programmatic adjustments. Moreover, many programs, especially at the regional level, are not funded from a single source; rather they are derived from a combination of federal and/or state funds. Government funds can be used for both non-infrastructure and infrastructure projects. Examples of the non-infrastructure or “programmatic” improvements include safe routes to school education and community traffic safety campaigns; examples of infrastructure projects include roadway rehabilitation, roadway construction, construction of Class I multi-use pathways and Class II bike lanes, and traffic signal infrastructure.
In general, federal funds are used for capital projects, such as new roadway, highway, and rail construction, as well as for specific projects earmarked by Congress. State funds are used for new capital projects too, but also cover maintenance costs, like street and highway resurfacing. Certain State funds may also be used as matching funds for larger federal projects, and/or to cover operational costs. Regional and local funds are often the most flexible, and may be used for capital project, maintenance, and operational costs, and programmatic improvements.
The primary implementers of infrastructure projects are city and county public works departments. Project selection is typically based on planning processes involving public participation. Additionally, schools and school districts can be the implementers of on-site bicycle and pedestrian infrastructure and amenities, such as sidewalks and bicycle racks; and/or for bicycle and pedestrian education programs and incentives. Other governmental partners are law enforcement agencies and parks and recreation departments. Such entities can sponsor enforcement and/or safety programs that are aimed at improving motorist, bicyclist and pedestrian behaviors to bring about greater community safety and security.
City of Napa Bicycle Plan Page 81 January 2012
Redevelopment agencies are another source of governmental funding. Many redeveloped districts have incorporated bicycle and pedestrian facilities in their planning. Likewise, fees exacted from developers for project mitigation can potentially be used to accommodate pedestrians and bicyclists.
Private Sector Development and Investment
Private sector development and investment play an important role in funding non-motorized infrastructure. Many newer housing and retail developments throughout Napa County have been planned, or required, to include sidewalks, pathways, and bicycle facilities. Private development is expanding its focus on “smart growth” and balanced transportation options. This inherently builds in orientation to the bicycle and pedestrian modes. Sometimes developers also fund such amenities as bicycle racks, bicycle storage, benches, lockers and shower facilities. Additionally, in many locations improvements such as closure of gaps in sidewalks or road widenings are made only after a private land use change is approved. Improvements or right-of-way dedication can be made conditions of approval, allowing upgrades for bicyclists and pedestrians. Finally, both the government and the private sector can play important roles in providing employee programs that encourage walking and bicycling, as well as use of transit.
Community, Special Interest and Philanthropic Organizations
Other non-governmental sources of funding include the contributions of community-based organizations, such as the Napa County Bicycle Coalition, in carrying out programs that support bicycle usage. Examples include Bike to Work Day efforts, bicycle valet parking at events, education programs, and community bike rides. Special-interest groups have made contributions toward non-motorized improvements and programs if such are in alignment with group objectives. Sometimes the contribution is monetary, at other times in the form of volunteer efforts, such as path or trail upkeep programs.
Philanthropic entities including non-profit, foundation, and corporate organizations and individuals can fund programs, and at times facilities. Donations and grants have paid for community amenities such as pathways and trails; landscaping, fountains and other aesthetic improvements; and street furniture such as bicycle racks, lighting and seating benches. The latter “beautification” efforts create bicycle and pedestrian friendly environments.
Construction Projects
Because this Plan’s planning process has generated a ranked list of construction projects for each entity, additional information about the sources of infrastructure financing will be useful. Bicycle projects are eligible for funding through a variety of program sources. However, while a portion of the funds available for such improvements are programmed or ‘guaranteed’ to the local agencies based on various formulas, the majority of the funds are available through a competitive process at the state, regional, or local level. Thus while improvements to major roadways are likely to be financed through programmed transportation funds, the majority of the projects contained in this Plan are likely to be funded through competitive grant programs or some combination of the two sources.
To ensure timely implementation of the projects contained in this plan, it will be incumbent upon the local agencies to pursue competitive source funds, which are expected to account for the majority of funds available to implement the projects in this Plan. Competition for these limited funds can be intense, especially at the state and regional levels where often hundreds of applicants compete for monies from impacted programs. Therefore, competitive programs typically require the development of extensive applications with clear documentation of the project need, costs, and benefits, along with maps, schedules, letters of support, and proposed work scopes. A local match of between 10 and 15 percent is typically required; however, some programs require a dollar for dollar match. While the

City of Napa Bicycle Plan Page 82 January 2012
development of applications combined with securing local matching funds can be challenging, competitive source funding programs represent an outstanding opportunity to secure funds for local improvements.
Costs and Implementation
This section provides an overview of the costs, implementation strategies, and actions that are necessary to implement the projects and programs that have been identified in this Plan.
Project Costs
Planning level cost estimates were developed for this effort. Bicycle project cost estimates were developed by utilizing available information on each proposed project including segment length, corridor condition, and other available information. Each segment was evaluated according to an estimated cost-per-mile based on the recommended facility type. Unit costs were developed by researching the latest unit costs experienced by local agencies in Napa County and the North Bay; and were reviewed by agency staff for verification.
Proposed projects and programs in this Plan have been analyzed to determine financing requirements, and to allow the entities to budget their resources and target available funding sources. It is important to note that the majority of funding for the projects contained in this Plan is expected to be derived from competitive funding sources that require a combination of sound applications, local support, and lobbying on the regional and state level. Figure 10 displays a calendar overview of primary competitive source programs to provide an understanding of funding program timelines. Since the programs are dynamic, often changing annually, the calendar is formatted on a quarterly basis. It provides a twelve-week time to provide guidance on when calls for projects are typically released and application deadlines occur. Summaries of funding programs including weblinks are provided in Appendix I.

American Canyon Bicycle Plan Page 83 January 2012
Gra
nt A
pplic
atio
n D
evel
opm
ent C
alen
dar
Ag
ency
Pro
gra
mE
stim
ated
Du
e D
ate
Cal
tran
sH
ighw
ay S
afet
y Im
prov
emen
t Pro
gram
4th
Qua
rter
Cal
tran
sT
rans
port
atio
n E
nhan
cem
ents
(S
tate
wid
e)4t
h Q
uart
erS
tate
Par
ksR
ecre
atio
nal T
rails
Pro
gram
4th
Qua
rter
Cal
tran
sB
icyc
le T
rans
port
atio
n A
ccou
nt1s
t Qua
rter
Cal
tran
sS
afe
Rou
te to
Sch
ool
3rd
Qua
rter
OT
SO
TS
Gra
nts
1st Q
uart
erC
altr
ans
Env
ironm
enta
l Enh
ance
men
t & M
itiga
tion
Pro
gram
4th
Qua
rter
CA
Coa
stal
CoO
n-go
ing
Coa
stal
Con
serv
ancy
Gra
nts
On-
goin
gS
tate
Par
ksH
abita
t Con
serv
atio
n F
und
Pro
gram
4th
Qua
rter
Sta
te P
arks
Land
and
Wat
er C
onse
rvat
ion
Fun
d P
rogr
am4t
h Q
uart
erC
altr
ans
Cal
tran
s T
rans
port
atio
n P
lann
ing
Gra
nts
1st Q
uart
erM
TC
Tra
nspo
rtat
ion
for
Liva
ble
Com
mun
ities
*B
AA
QM
DB
AA
QM
D -
Bic
ycle
Fac
ility
Pro
gram
3rd
Qua
rter
BA
AQ
MD
Tra
nspo
rtat
ion
for
Cle
an A
ir P
rogr
am2n
d Q
uart
erM
TC
Reg
iona
l Bic
ycle
and
Ped
estr
ian
Pro
gram
*A
BA
GB
ay T
rail
Fun
dsO
n-go
ing
CM
AT
DA
-Art
icle
31s
t Qua
rter
* V
arie
s ba
sed
on fe
dera
l fun
ding
Pro
ject
Sel
ectio
n an
d D
evel
opm
ent
Pro
ject
App
licat
ion
Pre
para
tion
Nov
Dec
Sep
Oct
Aug
Jan
Feb
Mar
Apr
Jul
May
Jun
Fig
ure
10
– G
rant
App
licat
ion
Dev
elop
men
t C
alen
dar
City of Napa Bicycle Plan Page 84 January 2012
Definitions, Terms, and List of Acronyms
AASHTO – American Association of State Highway and Transportation Officials
Accessible – Characteristic of a location allowing approach and use; absence of barriers
Accessible Pathway – Unobstructed path connecting all accessible elements and spaces of a building or a facility that meets the requirements of ADAAG
Accessible Pedestrian Signal (APS) – A device that communicates information about pedestrian signal timing in non-visual format, through the use of audible tones (or verbal messages) and vibrating surfaces
ADAAG – ADA Accessibility Guidelines for Buildings and Facilities
Americans with Disabilities Act (ADA) – A Federal law prohibiting discrimination against people with disabilities. Requires public entities and public accommodations to provide accessible accommodations for people with disabilities
AQMD – Air Quality Management District
Arterial – Through route/street carrying traffic to and from major points of interest, often inter-city
BAC – Bicycle Advisory Committee
Bicycle Boulevard – A low volume or residential street that has been modified for bicyclist safety and access.
Bicycle Connection – Paths or roadways created to link bicycle users with major streets/corridors
Bicycle Facilities – A general term denoting improvements and provisions to accommodate or encourage bicycling, including parking facilities, all bikeways and shared roadways, bicycle activated signal infrastructure, bicycle storage and changing facilities, etc.
Bicycle Lane (Class II Bike Lane or Class II Bikeway) – A portion of a roadway that has been designated by striping, signing, and pavement markings for the preferential or exclusive use of bicyclists. Bike lanes are ideal for minor thoroughfares or collectors. Under certain conditions, bike lanes may be beneficial on streets with significant traffic volumes and/or speeds. The Highway Design Manual (HDM) specifies the minimum width for bike lanes under various curb and on-street parking conditions. The HDM also states that “for greater safety,” widths wider than the minimums should be provided “wherever possible.”
Bicycle Path (Class I Multi-Use Path or Class I Bike Path) – A bikeway physically separated from motorized vehicular traffic and either within the highway right-of-way or within an independent right-of-way. Bike paths have a minimum paved width of 8 feet, with an additional graded area maintained on each side of the path. Typically, these facilities are usually shared with other non-motorized modes of travel.
Bicycle “Network” – the physical improvements that establish bikeways (Class I, II, or III routes)
Bicycle Route (Class III Bike Route or Class III Bikeway) – a designated route that provides for shared use of paved surfaces with pedestrian or motor vehicle traffic, also termed “shared roadway” designated by appropriate directional and/or informational signs. In this plan, a Class 3 signed bike route may be a local or residential street, bicycle boulevard, an arterial with wide outside lanes, or a roadway with a paved shoulder.
City of Napa Bicycle Plan Page 85 January 2012
Bicycle “System” – the whole of all of the components, including both physical bikeways and programmatic improvements
Bicyclist Demand – Number determined by count of recreational and non-recreational bike trips during a specific duration of time (i.e. peak commute, weekly, monthly, etc.) on a given street/corridor
Bikeway – Any path or roadway with a provision for transportation or recreational use by bicyclists
Bikeway Network – The combined system of all bikeway types and amenities; connects destinations and attractions via bicycle accessible routes
Bollards – A rigid post placed in a through fare so as to limit access or traffic of certain widths or types
BPAC – Bicycle & Pedestrian Advisory Committee
BTA – Bicycle Transportation Account
Caltrans – California Department of Transportation
CARB – California Air Resources Board
CEQA – California Environmental Quality Act
Circulation Enhancements – Elements placed to modify and improve circulation for one or more modes of transportation
CMAQ – Congestion Mitigation and Air Quality Program
Connectivity – The relative relationship of transportation routes and access corridors to necessary resources and points of interest
Controlled Intersection – Area with a traffic light or other traffic control device where traffic flow from two or more paths or roadways meet
Corridor – An area that follows the shape and path of a major environmental feature; also a term used for transportation routes with designated district activities such as a mixed use-retail corridor
Crosswalk – Portion of a roadway where pedestrians are permitted to cross the street; can be marked or unmarked
CTC – California Transportation Commission
Curb Ramp – A combined ramp and landing that accomplishes a change in level at a curb. This element provides street and sidewalk access to pedestrians using wheelchairs
Design Guidelines – Specifications set to govern the physical or visual elements of development
Detectable Warning – A standardized surface feature built in or applied to walking surfaces or other elements to warn people who are blind or visually impaired of specified hazards
Existing Conditions – Current context of a site, including physical, demographic and political data
FAS – Federal Aid System

City of Napa Bicycle Plan Page 86 January 2012
FHWA – Federal Highway Administration
FTA – Federal Transit Administration
FTIP – Federal Transportation Improvement Program
Gateway – A designated or marked entrance to a pathway or area
Goal – a "goal" describes the destination, or where we want to be at the end of the planning journey. Goals are usually broad, optimistic and expressive of a long-term vision.
Greenway – A pathway for various modes of transportation, including bicycles, that contains elements of a linear park
Infill Development – Development of new building adjacent to or on the same lots as existing buildings, utilizes pockets of un- or underdeveloped real estate contiguous with existing development
Infrastructure – Physical structures that support basic uses and services
Intersection – Where traffic flow from two or more paths or roadways meet
ISTEA – Intermodal Surface Transportation Efficiency Act of 1991 (reauth’d 1998 as TEA-21, and 2006 at SAFTEA-LU)
JARC – Job Access and Reverse Commute Program
Landscaping – Alteration of the ground through grading, planting and contouring
LTF – Local Transportation Fund
Median – A barrier (paved, landscaped, or planted) separating two traffic through fares
Median Refuge – An area within an island or median that is intended for pedestrians to wait safely away from travel lanes for an opportunity to continue crossing the roadway
Midblock Crosswalk – A legally established crosswalk that is not at an intersection
Mode Split – the number of people using a particular mode of transportation (bicycle, public transit, vehicle, walking, etc.)
MPO – Metropolitan Planning Organization
MTC – Metropolitan Transportation Commission – The Metropolitan Transportation Commission is the transportation planning, coordinating and financing agency for the nine-county San Francisco Bay Area
MUTCD – Manual on Uniform Traffic Control Devices
NCTPA – Napa County Transportation Planning Agency
NEPA – National Environmental Quality Act
Objective – objectives describe mileposts along the way to achieving the goals. They are specific, measurable steps to be achieved if the overall goals are to be met.
City of Napa Bicycle Plan Page 87 January 2012
Paved Shoulder – The part of the highway/street that is adjacent to the regularly traveled portion of the highway, is on the same level as the highway, and when paved can serve as a bikeway. Paved shoulders should be at least four feet wide and additional width is desirable in areas where speeds are high and/or a large percentage of trucks use the roadway.
Paving Treatments – a variety of materials, utilitarian and /or decorative used to level and condition pathway and roadway surfaces
Pedestrian Accessibility – the relative ease with which a location can be approached and utilized by pedestrian traffic
Policy – a principle or rule to guide decisions by the local agency with regard to a particular issue or set of issues.
Primary Bikeway Network – a continuous countywide network of on- and off-street bikeways that extend between and through communities developed specifically through this planning effort. The Primary Bikeway Network consists of a selection of existing and proposed Class I, Class II, and Class III bikeways that provide inter-city and inter-county routes along with connections to other transportation modes, major destinations, jobs, neighborhoods, recreation, and local bicycle networks.
Program – a specific action to accomplish the policy or objective
PSR – Project Study Report
Public Improvements – additions to public space intended to increase value and functionality
Public Transit – a system of multi-user transportation incorporating light rail, busses, ferries, streetcars, aerial trams, commuter trains
PUC – Public Utilities Commission / Public Utilities Code
Regional Trail System – a trail system that cross jurisdictional lines
Right of Way – the right of a vehicle or pedestrian to proceed in a lawful manner in preference to another vehicle or pedestrian. (2) A general term denoting land, property, or interest therein, usually in a strip. (3) Land designated for transportation purposes, usually in the public sphere
RPA – Rural Planning Assistance
RSTP – Regional Surface Transportation Program
RTIP – Regional Transportation Improvement Program
RTP – Regional Transportation Plan
RTPA – Regional Transportation Planning Agency
Safe Routes to Schools – a nationwide program focusing efforts on improving the paths and routes used by children to commute to and from school
SHA – State Highway Account
SHOPP – State Highway Operation and Protection Program

City of Napa Bicycle Plan Page 88 January 2012
Shared Lane Markings (Sharrows) – pavement legends which may be placed in the travel lane to provide positional guidance to bicyclists on roadways that are too narrow to be striped with bike lanes
Shoulder – Any portion of a roadway to the right of the right-most travel lane, but not including curbs, planting buffers and sidewalks. Shoulders can have a variety of surface treatments including pavement, gravel or grass. Depending on their width and surface, they serve a variety of purposes, including providing space for vehicles to slow and turn right, accommodation of stopped or broken-down vehicles, to allow emergency vehicles to pass, for structural support of the roadbed, or for bicycle and pedestrian travel.
Sidepath – An informal term referring to a portion of a street or highway right-of-way, separated from motor vehicle traffic, and designed for non-motorized modes of travel, including bicycles
STA – State Transit Assistance
STIP – State Transportation Improvement Program
STP – Surface Transportation Program
Streetscape – the overall appearance and functionality of the roadway, incorporating the rights-of-way, landscaping, built features and adjacent land uses
Subdivision – an area that has been divided into smaller lots for individual development
TAC – Technical Advisory Committee, a committee made up of citizens and technical professionals, convened to create recommendations for the development of a plan
TDA – Transportation Development Act of 1971
TE – Transportation Enhancement Program (formerly TEA)
TEA-21 – Transportation Equity Act for the 21st Century (1998 – formerly ISTEA)
Title 24 Standards – administrative, building, mechanical, and safety codes set forth in the California Code of Regulations
Traffic Congestion – roadway condition characterized by reduced travel speeds or even complete stoppage of flow of vehicles
Transportation Routes – all widely used paths and roadways
USDOT – United States Department of Transportation
Utilitarian Trips – all trips made to secure basic needs and services; e.g. grocery, pharmacy, local commerce
VMT – vehicle miles traveled
Wide Outside Lane – an outside (curb) lane on a roadway that does not have a striped bike lane, but may be of sufficient width for a bicyclist and motorist to share the lane with a degree of separation
Wrong-Way Riding – riding against the flow of traffic
Zoning – regulation by a governing agency to specify permitted land uses for a given area
City of Napa Bicycle Plan Page 89 January 2012
Bibliography
California Manual on Uniform Traffic Control Devices for Streets and Highways, California Department of
Transportation, 2010 California Vehicle Code, California Department of Motor Vehicles, 2011 Caltrans Bicycle Transportation Account, http://www.dot.ca.gov/hq/LocalPrograms/bta/btawebPage.htm Downtown Napa Mixed Use and Residential Infill Development Strategy, City of Napa, 2004 Downtown Riverfront Urban Design Plan, City of Napa, 2003 Envision Napa 2020: City of Napa General Plan, City of Napa, 2007 Factors Contributing to Pedestrian and Bicycle Crashes on Rural Highways, Federal Highway Administration,
2010 Google Earth, http://earth.google.com/ Guide for the Development of Bicycle Facilities, American Association of State Highway and Transportation
Officials, 1999 Guidelines for Analysis of Investments in Bicycle Facilities, Transportation Research Board, 2006 Kennedy Park Master Plan, City of Napa, 1998 Napa Airport Area Bicycle Route Study, Landpeople, 2005 Napa Municipal Code, Quality Code Publishing, 2011 Napa River Parkway Master Plan, City of Napa, 2005 Napa Valley Visitor Profile Study, Purdue University Tourism and Hospitality Research Center, 2005 Oxbow Commons (Bypass Channel) Betterments Design, SWA, 2009 Park and Facilities Master Plan, City of Napa, 2010 Public Review Draft Downtown Napa Specific Plan, MIG, 2011 Residential Design Guidelines, City of Napa, 2004 SCTA Countywide Bicycle & Pedestrian Master Plan, Sonoma County Transportation Authority, 2008 Soscol Gateway Vision Plan, City of Napa, 2004 Stanly Ranch Subdivision and Draft EIR for St. Regis, City of Napa, 2009 Statewide-Integrated Traffic Records System (SWITRS), California Highway Patrol, 1999-2008 Trancas Crossing Park Plan, DCE, 2M Associates, 2008 United States Census 2000, United States Census Bureau, 2000 VINE, http://www.nctpa.net/vine.cfm


City of Napa Bicycle Plan January 2012
Appendix A
Summaries of Relevant Planning Documents and Policies


Existing Plan and Policy Review A-1 January 2012
Appendix A – Existing Plan and Policy Review
Federal
Safe, Accountable, Flexible, Efficient, Transportation Equity Act: A Legacy for Users (SAFETEA-LU)
Federal Transportation Legislation sets policy, addresses challenges, and provides funding for federal and a variety of state and regional transportation programs throughout the nation. In August 2005, the Safe, Accountable, Flexible, Efficient Transportation Equity Act: A Legacy for Users (SAFETEA-LU) was signed into law. SAFETEA-LU, which will run through December 31, 2010, replaces TEA-21, the Transportation Equity Act for the 21st Century.
The new bill provides $286.5 billion nationwide for surface transportation projects, including highways, mass transit, road safety programs, and bicycle and pedestrian improvements. SAFETEA-LU builds on the initiatives established in TEA-21 and its predecessor, ISTEA. It combines the continuation and improvement of current programs with new initiatives to meet the challenges of improving safety, increasing multi-modal transportation options, reducing traffic congestion, and protecting and enhancing communities and the natural environment through efficient and flexible transportation improvements.
SAFETEA-LU promotes more efficient and effective Federal surface transportation programs by focusing on transportation issues of national significance, while giving State and local transportation decision makers more flexibility for solving transportation problems in their communities.
Policy:
Federal transportation policy is to increase non-motorized transportation to at least 15 percent of all trips and to simultaneously reduce the number of non-motorized travelers killed or injured in traffic collisions by at least 10 percent (TEA-21, 1998). This policy, which was adopted in 1994 as part of the National Bicycling and Walking Study, remains a high priority for the U.S. Department of Transportation (USDOT). Federal Transportation Legislation provides the funding opportunities, planning processes, and policy language by which states and metropolitan areas can achieve these ambitious national goals.
http://www.fhwa.dot.gov/safetealu/index.htm
US DOT Accommodating Bicycle and Pedestrian Travel
“Accommodating Bicycle and Pedestrian Travel: A Recommended Approach” is a policy statement that was adopted by the U.S. Department of Transportation (USDOT) in response to TEA-21. USDOT encourages public agencies, professional organizations, advocacy groups, and any other groups involved in transportation issues to adopt this policy to further promote bicycling and walking as viable components of the transportation system. The policy statement address measures to improve bicycle and pedestrian access, convenience, and safety in transportation projects. It incorporates three key principles:
a. policy statement that bicycling and walking facilities will be incorporated into all transportation projects unless exceptional circumstances exist;
b. an approach to achieving this policy that has already worked in State and local agencies; and c. a series of action items that a public agency, professional association, or advocacy group can
take to achieve the overriding goal of improving conditions for bicycling and walking.
Finally, the policy statement notes that:
The challenge for transportation planners, highway engineers and bicycle and pedestrian user groups, therefore, is to balance their competing interest in a limited amount of right-of-way, and to develop a
Existing Plan and Policy Review A-2 January 2012
transportation infrastructure that provides access for all, a real choice of modes, and safety in equal measure for each mode of travel.
http://www.fhwa.dot.gov/environment/bikeped/design.htm
Federal Americans with Disabilities Act (ADA)
In 1990, Congress passed the Americans with Disabilities Act (ADA), which provides comprehensive rights and protections to people with disabilities in the areas of employment, public accommodations, state and local government services, and telecommunications. Title II of the ADA requires that new and altered facilities constructed by, on behalf of, or for the use of state and local government entities be designed to be readily accessible to and usable by people with disabilities (28 CFR 35.151).
Title II also requires that public entities prepare and submit “transition plans,” which identify alterations that are needed to make their facilities (including transportation networks) and programs accessible; and specify how those alterations will be accomplished. ADA transition plans must include a schedule for providing curb ramps where pedestrian walkways cross curbs, giving priority to walkways serving government offices, public transportation and other public places.
http://www.usdoj.gov/crt/ada/adahom1.htm
Revised Draft Guidelines for Accessible Public Rights-of-Way, US Access Board
The goal of the ADA is to assure equality of opportunity, full participation, independent living, and economic self-sufficiency. Under the ADA, the US Access Board has developed and continues to maintain design guidelines for accessible buildings and facilities known as the ADA Accessibility Guidelines (ADAAG). ADAAG covers a wide variety of facilities including roadway design practices, slope and terrain issues, and pedestrian access to streets, sidewalks, curb ramps, street furnishings, pedestrian signals, parking, and other components of public rights-of-way. The ADAAG establishes minimum requirements for new construction and alterations.
The Board’s aim is to ensure that access for persons with disabilities is provided wherever a pedestrian way is newly built or altered, and that the same degree of convenience, connection, and safety afforded the public generally is available to pedestrians with disabilities. The guidelines do not require alterations to existing public rights-of-way, but apply where a pedestrian route or facility is altered as part of a planned project to improve existing public rights-of-way.
http://www.access-board.gov/prowac/draft.htm
Federal Statutes – State
Title 23, CFR Sec §450.214 (b) (3) The State shall develop a statewide transportation plan for all areas of the State and contain, as an element, a plan for bicycle transportation, pedestrian walkways and trails which is appropriately interconnected with other modes.
Title 23, CFR Sec §450.214 (b) (4) The State shall develop a statewide transportation plan that is coordinated with the metropolitan transportation plans required under 23 U.S.C. 134.
Title 23, U.S.C. Sec. 135 (a) (3). The plans and programs for each State shall provide for the development and integrated management and operation of transportation systems and facilities (including pedestrian walkways and bicycle transportation facilities) that will function as an intermodal transportation system for the State and an integral part of an intermodal transportation system for the United States.
Title 23 U.S.C. 217(g) Planning and Design. Bicyclists and pedestrians shall be given due consideration in the comprehensive transportation plans developed by each metropolitan planning organization and state in accordance with sections 134 and 135, respectively. Bicycle transportation facilities and pedestrian

Existing Plan and Policy Review A-3 January 2012
walkways shall be considered, where appropriate, in conjunction with all new construction and reconstruction of transportation facilities, except where bicycle and pedestrian use are not permitted.
Federal Statues – Metropolitan Planning Organizations
Title 23, CFR §450.322 The Metropolitan Transportation Plan shall contain adopted congestion management strategies including, as appropriate, traffic operations, ridesharing, pedestrian and bicycle facilities, alternative work schedules, freight movement options, high occupancy vehicle treatments, telecommuting, and public transportation improvements (including regulatory, pricing, management, and operational options), that demonstrate a systematic approach in addressing current and future transportation demand and identify pedestrian walkway and bicycle transportation facilities in accordance with 23 U.S.C. 217(g).
Title 23, U.S.C. Sec. 134 (a) (3) The plans and programs for each metropolitan area shall provide for the development and integrated management and operation of transportation systems and facilities (including pedestrian walkways and bicycle transportation facilities) that will function as an intermodal transportation system for the metropolitan area and as an integral part of an intermodal transportation system for the State and the United States.
State
State bicycle and pedestrian related policies and laws are found in a variety of documents, legislative actions, and codes. State policies are generally more focused than Federal policies and statutes, and are applicable to Federal and state transportation facilities, as well as local bicycle and pedestrian projects.
California Streets and Highways Code, Division 1: State Highways, Chapter 8 Non-Motorized Transportation – California Bicycle Transportation Act, 890-894 (1994)
The California Bicycle Transportation Act, Streets and Highways Code 890-894 is legislation that seeks "to establish a bicycle transportation system designed and developed to achieve the functional commuting needs of the employee, student, business person, and shopper as the foremost consideration in route selection, to have the physical safety of the bicyclist and bicyclist's property as a major planning component, and to have the capacity to accommodate bicyclists of all ages and skills."
A city or county may complete a bicycle transportation plan pursuant to Section 891.2 in order for their project to be considered by the Department for funding. Section 890.6 states the Department, in cooperation with county and city governments, shall establish minimum safety design criteria for the planning and construction of bikeways and roadways where bicycle travel is permitted. Section 890.8 states the Department shall establish uniform specifications and symbols for signs, markers, and traffic control devices to designate bikeways, regulate traffic, improve safety and convenience for bicyclists, and alert pedestrians and motorists of the presence of bicyclists on bikeways and on roadways where bicycle travel is permitted. As Section 891 states, “All city, county, regional, and other local agencies responsible for the development or operation of bikeways or roadways where bicycle travel is permitted shall utilize all minimum safety design criteria and uniform specifications and symbols for signs, markers, and traffic control devices established pursuant to Sections 890.6 and 890.8.”
http://www.leginfo.ca.gov/.html/shc_table_of_contents.html
California Vehicle Code
The California Vehicle Code is an extensive body of laws which regulate all facets of driving in California. The Vehicle Code is nearly 700 pages long and covers everything to do with roads and driving, including pedestrians and bicyclists.

Existing Plan and Policy Review A-4 January 2012
Sections 2149-21971 describe the responsibilities of pedestrians when crossing the street or walking along a street on a sidewalk, and the roles and responsibilities of motorists in relationship to pedestrians and wheelchair users. According to the Vehicle Code, "it is the policy of the State of California that safe and convenient pedestrian travel and access, whether by foot, wheelchair, walker, or stroller, be provided to the residents of the state." The code also states that it is the intent of the Legislature that all government levels, especially Caltrans and other DOTs, will work to provide safe, convenient passage for pedestrians on or across all streets and highways, increase levels of walking, and reduce pedestrian fatalities and injuries.
Sections 21200-21212 pertain to the operation of bicycles including laws applicable to bicycle use, operating bicycles on a roadway, bicycle parking, and bicycle regulations. Sections 39000-39011 pertain to the licensing and registration of bicycles. Section 21200 states that “every person riding a bicycle upon a street or highway has all the rights and is subject to all the duties applicable to the driver of a vehicle,” and the CVC permits the use of bicycles on all streets and highways, except where restricted on Freeways by discretion of the State DOT or local authorities as identified in Section 21960.
http://www.dmv.ca.gov/pubs/vctop/vc/vc.htm
Chapter 1000, California Highway Design Manual
Highway Design Manual, Chapter 1000, “Bikeway Planning and Design. The Highway Design Manual, Chapter 1000, “Bikeway Planning and Design,” provides design standards and guidelines for on- and off-street bikeways. State and local transportation agencies are required to comply with Chapter 1000 mandatory standards as a minimum when implementing new bikeways. Chapter 1000 differs from the rest of the Highway Design Manual in that it also applies to facilities off the State Highway System (California Streets and Highways Code, Sections 890.8 and 891).
www.dot.ca.gov/hq/oppd/hdm/hdmtoc.htm
California Manual on Uniform Traffic Control Devices (CA MUTCD), 2006
The MUTCD provides general standards and guidance for traffic control devices, nationally. The California MUTCD clarifies which policies, practices or standards are different in California, by identifying and including them. It also enhances the federal standards by providing additional details.
The California Manual on Uniform Traffic Control Devices (California MUTCD) is published by the State of California, Department of Transportation and is issued to adopt uniform standards and specifications for all official traffic control devices, in accordance with Section 21400 of the California Vehicle Code.
http://www.dot.ca.gov/hq/traffops/signtech/mutcdsupp/ca_mutcd.htm
California Blueprint for Bicycling and Walking
The Supplemental Report of the 2001 Budget Act required the California Department of Transportation (Caltrans) to submit a report addressing “measurable goals for increasing bicycling and walking within the state, funding of facilities, and a reduction in pedestrian and bicycling injuries and fatalities.” The California Blueprint for Bicycling and Walking responds to the Budget Act requirements with three main statewide goals:
• A 50 percent increase in bicycling and walking trips by 2010. • A 50 percent decrease in bicycle and pedestrian fatality rates by 2010. • Increased funding for bicycle and pedestrian programs.
Achieving the first two goals lies largely on local agencies. Policies and programs in this Plan will allow Napa County and its cities to actively work towards fulfilling these goals.
http://www.dot.ca.gov/hq/tpp/offices/bike/CABlueprintRpt.pdf

Existing Plan and Policy Review A-5 January 2012
Caltrans Project Development Procedures Manual, CHAPTER 31 – Non-motorized Transportation Facilities
The Office of State Project Development Procedures and Quality Improvement in the Division of Design is responsible for the development and consistent application of Caltrans' policies for the project development process. The office maintains the Project Development Procedures Manual (PDPM), to provide guidance for project development on State Highway System projects. While the emphasis of the PDPM is directed toward State highway projects, projects on local transportation systems and other modes are also discussed. Chapter 31: Non-motorized Transportation Facilities outlines pertinent statutory requirements, planning policies, and implementing procedures regarding non-motorized transportation facilities.
http://www.dot.ca.gov/hq/oppd/pdpm/chap_htm/chapt31/chapt31.htm
Caltrans Deputy Directive-64-R1 (DD-64-R1), Deputy Directive on “Complete Streets-Integrating the Transportation System”
Deputy Directive 64-R1, a policy directive related to “Complete Streets” non-motorized travel throughout the state, was adopted by Caltrans in October of 2008. DD 64-R1 supersedes DD 64, which was developed to consider the needs of non-motorized travelers. DD 64-R1 reads:
The California Department of Transportation (Department) provides for the needs of travelers of all ages and abilities in all planning, programming, design, construction,' operations, and maintenance activities and products on the State highway system. The Department views all transportation improvements as opportunities to improve safety, access, and mobility for all travelers in California and recognizes bicycle, pedestrian, and transit modes as integral elements of the transportation system.
The Department develops integrated multimodal projects in balance with community goals, plans, and values. Addressing the safety and mobility needs of bicyclists, pedestrians, and transit users in all projects, regardless of funding, is implicit in these objectives. Bicycle, pedestrian, and transit travel is facilitated by creating "complete streets" beginning early in system planning and continuing through project delivery and maintenance and operations. Developing a network of "complete streets" requires collaboration among all Department functional units and stakeholders to establish effective partnerships.
http://www.dot.ca.gov/hq/tpp/offices/bike/guidelines_files/DD64.pdf
Director’s Policy 22 (DP-22), “Director’s Policy on Context Sensitive Solutions”
Directors Policy 22, a policy regarding the use of “Context Sensitive Solutions” on all state highways, was adopted by Caltrans in November of 2001. The policy reads:
The Department uses “Context Sensitive Solutions” as an approach to plan, design, construct, maintain, and operate its transportation system. These solutions use innovative and inclusive approaches that integrate and balance community, aesthetic, historic, and environmental values with transportation safety, maintenance, and performance goals. Context sensitive solutions are reached through a collaborative, interdisciplinary approach involving all stakeholders.
The context of all projects and activities is a key factor in reaching decisions. It is considered for all State transportation and support facilities when defining, developing, and evaluating options. When considering the context, issues such as funding feasibility, maintenance feasibility, traffic demand, impact on alternate routes, impact on safety, and relevant laws, rules, and regulations must be addressed.
The policy recognizes that “in towns and cities across California, the State highway may be the only through street or may function as a local street,” that “these communities desire that their main street be an economic, social, and cultural asset as well as provide for the safe and efficient movement of people and goods”, and that “communities want transportation projects to provide opportunities for
Existing Plan and Policy Review A-6 January 2012
enhanced non-motorized travel and visual quality.” The policy acknowledges that addressing these needs will assure that transportation solutions meet more than just traffic and operational objectives.
http://www.dot.ca.gov/hq/transprog/stip/2004%20ITIP/references/DP-22.pdf
Assembly Concurrent Resolution No. 211 (ACR 211)
California’s cities and counties have even more reason to pay attention to the aforementioned policies. ACR 211 (Nation) “Integrating walking and biking into transportation infrastructure” became effective in August 2002. ACR 211 encourages all cities and counties to implement the policies of DD-64 and the USDOT design guidance document when building local transportation infrastructure. Specifically, ACR 211 asks local governments to "fully consider the needs of non-motorized travelers (including pedestrians, bicyclists and person with disabilities) in all programming, planning, maintenance, construction, operations, and project development activities and projects.” The resolution also states that bicycling and walking contribute to cleaner air, encourage physical activity, provide for alternative transportation, help to safeguard California's coast from offshore oil drilling, and enhance California's energy independence and national security by reducing our reliance upon imported oil.
http://www.leginfo.ca.gov/pub/01-02/bill/asm/ab_0201-0250/acr_211_bill_20020820_chaptered.html
California Department of Motor Vehicles
The California Department of Motor Vehicles maintains a webpage dedicated to bicycle rules and safety. The page contains information for drivers and bicyclists and includes links to the Bicycle Section of the DMV Driver’s Handbook, bicycle safety information on the California Department of Transportation’s website, information on the National Highway Transportation Safety Agency and the California Vehicle Code as well as other links.
http://www.dmv.ca.gov/about/bicycle.htm
Caltrans Bicycle Transportation Account
The California Bicycle Transportation Account (BTA) provides state funds for city and county projects that improve safety and convenience for bicycle commuters, which are included in an adopted local Bicycle Transportation Plan that complies with Section 891.2 of the Streets and Highways Code, and are designed and constructed in accordance with the Chapter 1000 of the Highway Design Manual. The program is consistent with the Legislature’s intent when it adopted the California Bicycle Transportation Act:
“...to establish a bicycle transportation system...designed and developed to achieve the functional commuting needs of the employee, student, business person, and shopper as the foremost consideration in route selection, to have the physical safety of the bicyclist and bicyclist’s property as a major planning component, and to have the capacity to accommodate bicyclists of all ages and skills”.
http://www.dot.ca.gov/hq/LocalPrograms/bta/btaweb%20page.htm
Assembly Bill 32: Global Warming Solutions Act
In 2006, the California Legislature passed the Global Warming Solutions Act, which set the 2020 greenhouse gas emissions reduction goal into law. It directed the California Air Resources Board to begin developing actions to reduce greenhouse gases while also preparing a scoping plan to identify how best to reach the 2020 limit. The reduction measures to meet the 2020 target are to be adopted by the start of 2011.
Assembly Bill 32 Includes a Number of Specific Requirements:
• ARB shall prepare and approve a scoping plan for achieving the maximum technologically feasible and cost-effective reductions in greenhouse gas emissions from sources or categories of sources

Existing Plan and Policy Review A-7 January 2012
of greenhouse gases by 2020 (Health and Safety Code (HSC) §38561). • Identify the statewide level of greenhouse gas emissions in 1990 to serve as the emissions limit
to be achieved by 2020 (HSC §38550). • Adopt a regulation requiring the mandatory reporting of greenhouse gas emissions (HSC
§38530). • Identify and adopt regulations for discrete early actions that could be enforceable on or before
January 1, 2010 (HSC §38560.5). • Ensure early voluntary reductions receive appropriate credit in the implementation of AB 32
(HSC §38562(b) (3)). • Convene an Environmental Justice Advisory Committee (EJAC) to advise the Board in
developing the Scoping Plan and any other pertinent matter in implementing AB 32 (HSC §38591).
• Appoint an Economic and Technology Advancement Advisory Committee (ETAAC) to provide recommendations for technologies, research and greenhouse gas emission reduction measures (HSC §38591).
http://www.arb.ca.gov/cc/ab32/ab32.htm
Senate Bill 375: Linking Regional Transportation Plans to State Greenhouse Gas Reduction Goals
Senate Bill 375 enhances California's ability to reach its AB 32 goals by promoting good planning with the goal of more sustainable communities. SB 375 establishes a process for the California Air Resources Board (ARB) to implement the state’s global warming legislation (AB 32) for the transportation sector. It requires ARB to adopt regional greenhouse gas (GHG) targets for emissions associated with the automobile and light truck sector. ARB will also work with California's 18 metropolitan planning organizations to align their regional transportation, housing and land-use plans and prepare a "sustainable communities strategy" to reduce the amount of vehicle miles traveled in their respective regions and demonstrate the region's ability to attain its greenhouse gas reduction targets. The Bill acknowledges that spending less time on the road is the single-most powerful way for California to reduce its carbon footprint. Additionally, SB 375 provides incentives for creating attractive, walkable and sustainable communities and revitalizing existing communities.
http://www.arb.ca.gov/cc/sb375/sb375.htm
Regional
Federal and state policy are often used to inform regional policy, which is then crafted to be more focused with specific requirements, actions and design implications.
Metropolitan Transportation Commission
The Metropolitan Transportation Commission (MTC) is the transportation planning authority for the nine county San Francisco Bay Area. The MTC serves as the state designated Regional Transportation Planning Agency (RTPA) and the federally designated Metropolitan Planning Organization (MPO). MTC provides oversight on all transportation projects in the region and is responsible for preparing the Regional Transportation Plan (RTP). MTC is largely responsible for transportation financing in the Bay Area, and helps to set priorities for the hundreds of millions of dollars flowing each year to the Bay Area from flexible federal funding programs. Using flexible federal dollars, MTC has established several funding programs that were developed to enhance Bay Area communities including the Transportation for Livable Communities (TLC) Program, Housing Incentive Program (HIP), Low Income Flexible Transportation (LIFT) Program, and the Regional Bicycle and Pedestrian Program (RBPP).
http://www.mtc.ca.gov/
Existing Plan and Policy Review A-8 January 2012
Regional Transportation Plan (RTP)
The current RTP, Transportation 2035, was finalized in February 2009 and updates the previous 2005 RTP. The 2035 Plan sets forth regional transportation policy and provides capital program planning for all regional, state and federally funded projects. In addition, the 2035 Plan provides strategic investment recommendations to improve regional transportation system performance over the next 25 years. Investments in regional highway, transit, local roadway, bicycle, and pedestrian projects are set forth in the 2035 Plan. These projects have been identified through regional and local transportation planning processes. Project recommendations are premised upon factors related to existing infrastructure maintenance, increased transportation system efficiencies, improved traffic and transit operations, and strategic expansions of the regional transportation system.
The 2035 Plan includes programs and projects which provide or contribute to a safe and well maintained transportation system, a reliable commute, access to mobility, livable communities, clean air, and efficient freight travel. A key element of the Transportation 2035 Plan is the coordination of land use and transportation planning, both at a regional and local level. Further, this plan element calls for an emphasis on “the Three E’s of sustainability-Economy, environment, and equity.” The Plan also recommends that existing transportation infrastructure be utilized efficiently while new investment is coordinated regionally. This includes new public transit service supporting existing transit centers and densification of development around existing transit infrastructure.
http://www.mtc.ca.gov/planning/2035_plan/FINAL/T2035_Plan-Final.pdf
Regional Bicycle Plan for the San Francisco Bay Area
The 2001 Regional Bicycle Plan for the San Francisco Bay Area was developed by the MTC and has been incorporated into the Regional Transportation Plan (RTP), which establishes a 25-year investment plan for regional transportation projects in the nine-county Bay Area. The overall goal of the plan is to ensure that bicycling is a convenient, safe, and practical means of transportation throughout the Bay Area. To achieve this goal, the plan established a regional bicycle network, programs to enhance bicycling, and a financial strategy to implement the improvements. To ensure implementation of the Plan, MTC developed the Regional Bicycle and Pedestrian Program Fund, which uses regional discretionary funds allocated through the federal Surface Transportation Program/Congestion Mitigation and Air Quality improvement program (STP-CMAQ) for bicycle and pedestrian projects that support the Regional Network.
Programs identified to enhance bicycling include safe routes to transit, a comprehensive network leading to major transit hubs; annual bicycle counts; more detailed collision data collection; and increased outreach and marketing efforts such as training programs, emphasis on Bike to Work Week, and a web-based trip planner, www.511.org.
http://www.mtc.ca.gov/planning/bicyclespedestrians/
Metropolitan Transportation Commission Complete Streets (Routine Accommodations)
The San Francisco Bay Area’s Regional Transportation Plan – Transportation 2030 – calls for “full consideration of the needs of pedestrians and bicyclists during transportation project development design, construction, and rehabilitation.” To help accomplish this “Call for Action,” in 2006 the MTC adopted Resolution No. 3765, which sets forth “MTC’s regional policies for accommodating bicycle and pedestrian facilities during transportation project planning, design, funding and construction.” The policy was written in recognition that developing such facilities in conjunction with the development of parallel facilities for motor vehicles offers cost savings and can create safer and more convenient bicycle and pedestrian travel.
To implement the Resolution’s requirements, MTC maintains a “Complete Streets” checklist, which sponsors of projects seeking regional transportation funds are now required to submit with their
Existing Plan and Policy Review A-9 January 2012
funding applications. The checklist requires project sponsors to document how the needs of bicyclists and pedestrians were considered in the process of planning and designing the project for which funds are being requested. It is meant to prompt consideration of bicyclists and pedestrians during project planning and design and alert bicycle and pedestrian advisory committees of upcoming projects that may deserve their attention.
MTC Resolution 3765, “Routine Accommodations” Policy requires that:
Projects funded all or in part with regional funds (e.g. federal, STIP, bridge tolls) shall consider the accommodation of bicycle and pedestrian facilities, as described in Caltrans Deputy Directive 64. These recommendations shall not replace locally adopted policies regarding transportation planning, design, and construction. These recommendations are intended to facilitate the accommodation of pedestrians, which include wheelchair users, and bicyclist needs into all projects where bicycle and pedestrian travel is consistent with current, adopted regional and local plans. In the absence of such plans, federal, state, and local standards and guidelines should be used to determine appropriate accommodations.
http://www.mtc.ca.gov/planning/bicyclespedestrians/routine_accommodations.htm
The Bay Trail
The Bay Trail Project is a nonprofit organization administered by the Association of Bay Area Governments (ABAG) that plans, promotes and advocates for the implementation of a continuous 500-mile bicycling and hiking path around San Francisco and San Pablo Bays. The Bay Trail Plan was prepared by ABAG pursuant to Senate Bill 100, which was passed into law in 1987. In 1990, the San Francisco Bay Trail Project was created as a nonprofit organization dedicated to planning, promoting and advocating implementation of the Bay Trail. To carry out its mission, the Bay Trail Project makes available grant funds for trail construction and maintenance; participates in planning efforts and encourages consistency with the adopted Bay Trail Plan; educates the public and decision-makers about the merits and benefits of the Bay Trail; produces maps and other materials to publicize the existence of the Bay Trail; and disseminates information about progress on its development. The Bay Trail Project does not own land, construct trail segments, or maintain them; segments are built, owned, managed and maintained by cities, counties, park districts and other agencies with land-management responsibilities.
In Napa, the original alignment in the 1989 Bay Trail Plan was along Highway 29 – not a particularly pleasant experience, and also not along the shoreline. For many years, the North Bay counties of Sonoma, Napa and Solano saw little or no progress on their sections of Bay Trail. However, in the last 6-8 years, significant strides have been made. The City of American Canyon has constructed and opened 3 miles of Bay Trail with another 3 miles in the planning phase. Local jurisdictions in coordination with the Bay Trail Steering Committee have reassessed and realigned 6 miles of trail from busy roadways to the edges of the Napa River and bay wetlands. The Bay Trail is collaborating with the Napa Vine Trail to capture synergies, and continues its long partnership with the Ridge Trail to connect the two systems.
Pending environmental review and Bay Trail Steering Committee approval, segments of trail through the Napa Pipe property, across Napa Sanitation District levees, and along the edge of the Napa airport will connect existing trail at Kennedy Park to existing trail at the California Department of Fish and Game’s Napa Plant Site restoration project off of Green Island Road, and south into American Canyon.
Ultimately, the Bay Trail will be a 500-mile bicycle and hiking trail encircling the San Francisco and San Pablo Bays. Currently over 300 miles of the trail are in operation, including several segments located within Napa County. The segments in Napa County are comprised of various on- and off-street routes including:
Built Trail Sections
• Las Amigas from Milton to Cuttings Wharf (Class II) • Cuttings Wharf from Las Amigas to Cuttings Wharf Boat Ramp (Class II)
Existing Plan and Policy Review A-10 January 2012
• Stanly Lane from Stanly Crossroad to Hwy 12/121 (Class I) • Maxwell Bridge on Imola (Class II) • Napa River Trail from Hartle Ct to Southern end of Kennedy Park (Class I) • CA Department of Fish and Game Napa Plant Site Trail – end of Green Island Rd to existing
Bay/River trail near Eucalyptus/treatment ponds (levee-top gravel trail) • American Canyon--Eucalyptus to River Trail (gravel/levee top) • American Canyon Wetlands Edge Trail--Eucalyptus to American Canyon Road (Class I) • Golden Gate Drive (Class II)
Un-Built Trail Sections
The following sections of the un-built trail have been identified by the Bay Trail Project. As of November 2010, additional route planning is underway by the Bay Trail in conjunction with local agency staff. Route updates will be documented when official plans are in place.
• Duhig from Ramal onto Las Amigas to Milton (proposed Class II) • Stanly Crossroad (proposed Class I) • Imola from Golden Gate to Maxwell Bridge (proposed Class II) • Napa Pipe (proposed Class I) • Napa Sanitation District Levees (Proposed levee top trail) • CDFG Lands: Fagan Marsh (proposed boardwalk) • Kimberly Park to Vallejo/Solano border (Class I and natural surface trails)
http://baytrail.abag.ca.gov/
The Bay Area Ridge Trail
The Bay Area Ridge Trail Council formed in 1987 with the vision of a trail that would ring the San Francisco Bay Area high on the ridges of the hills and mountains that encircle San Francisco and San Pablo Bays. Current plans call for over 550 miles of trail along these ridge tops, open to hikers, equestrians, mountain bicyclists, and outdoor enthusiasts of all types. To date, the Council has worked with state, regional, local, and non-profit agencies to dedicate over 325 miles of trail.
Many of the existing Ridge Trails in Napa County run through regional and state parks along existing trails. Most of these trail sections are isolated, with either on-street connections or large gaps between them. The built and un-built sections of the Bay Area Ridge Trail within Napa County include the following:
Built Trail Sections
• Sugarloaf Ridge State Park: From Visitor Center to Bald Mountain Summit (2.7 mi) • Yountville Cross Road: From Locust Ave. and Highway 29 to Yountville Cross Road and
Silverado Trail (7.5 mi) • Skyline Wilderness Park and Napa Solano Ridge Trail: From Skyline Wilderness Park Entrance
to south boundary (5.7 mi)
Un-Built Trail Sections
• Bald Mountain Summit to Locust Ave and Highway 29 • Yountville Cross Road and Silverado Trail to Skyline Wilderness Park Entrance
The Ridge Trail Council is working to close existing facility gaps in order to connect the routes for hikers, equestrians, and bicyclists. More details about the ridge trail are located at the Bay Area Ridge Trail website.
www.ridgetrail.org

Existing Plan and Policy Review A-11 January 2012
Bay Area Air Quality Management District
Bay Area Air Quality Management District (BAAQMD) is the regional agency with the authority to develop and enforce regulations for the control of air pollution throughout the Bay Area including Napa County. The clean Air Plan is the BAAQMD’s plan for reducing the emission of air pollutants that lead to ozone. BAAQMD has also published CEQA Guidelines for the purpose of evaluating the air quality impact of projects and plans. One of the criteria that the Guidelines describe is that plans must demonstrate reasonable efforts to implement transportation control measures included in the Clean Air Plan, and identify local governments as the implementing agencies. The BAAQMD cites on-road motor vehicles as the largest source of air pollution in the Bay Area. To address the impact of vehicles, the California Clean Air Act requires air districts to adopt, implement, and enforce transportation control measures.
The BAAQMD has implemented the Bicycle Facility Program, an annual grant program developed from the Transportation Fund for Clean Air that provides funding to reduce motor vehicle emissions through the implementation of new bikeways and bicycle parking facilities in the San Francisco Bay Area.
http://www.baaqmd.gov/
Bay Area Ozone Strategy
The 2005 Bay Area Ozone Strategy was prepared by the BAAQMD in cooperation with the Metropolitan Transportation Committee and the Association of Bay Area Governments (ABAG). The Plan was developed to show how the Bay Area will achieve compliance with State air quality standards. According to the report, “the Bay Area has made considerable progress towards improving ozone conditions over the years; however, the region fails to meet the State one-hour ozone standard.”
The 2005 Ozone Strategy is a comprehensive document that describes the Bay Area’s strategy for compliance with State one-hour ozone standard planning requirements, and represents the region’s commitment to achieving clean air to protect the public's health and the environment. The control strategy includes: stationary source control measures to be implemented through Air District regulations; mobile source control measures to be implemented through incentive programs and other activities; and transportation control measures to be implemented through transportation programs in cooperation with the MTC, local governments, transit agencies and others. Transportation control measures (TCM) were developed to mitigate the impact of mobile pollution sources. The TCMs proposed in the 2005 Strategy that relate to bicycling and walking include:
TCM #1: Support Voluntary Employer-Based Trip Reduction Programs – provide incentives and assistance to help employers develop programs to reduce single-occupancy vehicle use to work.
TCM #5: Improve Access to Rail & Ferries – Safe Routes to Transit program sponsored by the MTC; develop a master plan for innovative secure bicycle storage strategies at key transit hubs.
TCM #9: Improve Bicycle Access and Facilities – fund the Regional Bicycle Plan and Safe Routes to Transit improvements; continue Transportation Development Act (TDA) Article 3, Tobacco Litigation Settlement (TLS), and Transportation fund for Clean Air (TFCA) funding for bike improvements; develop an on-line bicycle mapping tool as part of the regional 511 traveler information number; promote Bike-to-Work Week/Day; encourage local jurisdictions to develop safe and convenient bicycle lane and route networks, provide secure bike racks and storage, and require bicycle access and amenities as conditions of approval of development projects; explore innovative bicycle programs, such as “station bike” or bike sharing programs at transit stations, downtowns, and activity centers; encourage public education about bicycle safety for both bicyclists and motorists.
TCM #10: Youth Transportation – encourage Safe Routes to School program.

Existing Plan and Policy Review A-12 January 2012
TCM #15: Local Land Use Planning and Development Strategies – MTC to continue Transportation for Livable Communities (TLC) planning, capital grant, and HIP programs; MTC will examine opportunities for transit oriented development along major transit corridors; BAAQMD will continue the TFCA program; ABAG will provide incentives for smart growth.
TCM #19: Improve Pedestrian Access and Facilities – review and comment on general/specific plan policies to promote development patterns that encourage walking; encourage amending zoning ordinances to include pedestrian-friendly design standards; MTC will continue to fund TLC, support SR2S, and support the Regional Pedestrian Committee and associated pedestrian safety programs; identify and fund projects that enhance pedestrian movement in neighborhoods, downtowns, and near transit stops.
TCM #20: Promote Traffic Calming Measures – implement projects such as pedestrian-only streets, residential and neighborhood traffic calming measures, and arterial and major route traffic calming measures.
http://www.baaqmd.gov/pln/plans/ozone/2005_strategy/index.htm
Lake County Regional Bikeway Plan
The 2006 Lake County Regional Bikeway Plan was prepared by the Lake County/City Area Planning Council through the transportation planning agency's planning work program. This document is an update to the 2002 Regional Bikeway Plan. The Plan is consistent with projects, goals, policies and objects identified in the 2005 Regional Transportation Plan. This Regional Bikeway Plan is a capital improvement program of commuter bikeways. It incorporates proposals for bikeway improvements for all jurisdictions within Lake County into one document. It is directed toward meeting the provisions of the California Bicycle Transportation Act. Napa County shares a common border with Lake County along the northern Napa County border. The two counties are connected by SR 29 and Butts Canyon Road. The Lake County Regional Bikeway Plan does not include planned bikeways to Napa County.
http://lakeapc.org/acc.asp?Webpage=Documents
Solano Countywide Bicycle Plan
The 2004 Solano Countywide Bicycle Plan was prepared by the Solano Transportation Authority. The Plan aims to encourage the development of a bicycle network that will provide connections within Solano County as well as connections to surrounding counties. The Plan covers the entire County and contains policies designed to encourage and support biking, implementation standards, and promotional strategies. The Plan includes proposed bikeway connections to Napa County along the SR 12, SR 29, Suisun Valley Road, and McGary Road corridors.
http://www.sta.dst.ca.us/plans2.html#bikeplan
County of Yolo Bicycle Implementation Plan
The County of Yolo Bicycle Implementation Plan was prepared by the Yolo County Transportation Advisory Committee and published in 2006. This plan is an update of the 2002 County of Yolo Bicycle Implementation Plan and formulates a long-range, comprehensive, and consistent policy guide for achieving a countywide bikeway network. The plan includes goals and policies for bicycle facilities in the unincorporated County to encourage bicycle ridership. The Plan includes a proposed bikeway connection to Napa County along the SR 128 corridor between northeastern Napa County and southwestern Yolo County.
http://www.yolocounty.org/Index.aspx?page=834
Existing Plan and Policy Review A-13 January 2012
Sonoma County – SCTA Countywide Bicycle and Pedestrian Master Plan
The 2008 SCTA Countywide Bicycle and Pedestrian Master Plan was developed under the guidance of the Sonoma County Transportation Authority. The Plan is designed to prioritize bicycle and pedestrian improvements, develop implementation strategies, and foster countywide collaboration and coordination. Consisting of eight stand alone documents specific to local agencies and a countywide overview section, the SCTA Countywide Bicycle and Pedestrian Master Plan is designed to facilitate transportation improvements for bicyclists and pedestrians. The recommendations of the plan include physical improvements, expanding existing facilities, and connecting gaps in the network, addressing constraints, and providing greater local and regional connectivity. Several bicycle facilities are planned that would connect Sonoma County to Napa County including Class II bike lanes on SR 128, Petrified Forest Road, and SR 12/121. A Class I pathway connection is proposed via the Bay Trail, and Class III bike route connections are proposed on St. Helena Road, Trinity Road, and Duhig/Ramal Road.
http://www.sctainfo.org/Bike_Main_files/index.htm
Local
Napa Wine Train
The Napa Valley Wine Train (NVWT) runs between the Cities of Napa and St. Helena. The Napa Valley Railroad (NVRR) owns the right-of-way used by the NVWT. The NVRR has indicated its willingness to consider hosting passenger rail along the existing NVWT route as detailed in the Napa/Solano Passenger/Freight Rail Study provided that sufficient infrastructure improvements are made to prevent any conflict with existing NVWT and freight rail service.
Napa/Solano Passenger/Freight Rail Study
The Napa/Solano Passenger/Freight Rail Study is a comprehensive new-start public rail transportation plan completed in 2003. The main objectives of the study were to determine economic feasibility of possible passenger rail service and enhanced rail freight activity, compare of potential rail versus existing and potential bus service, and examine the long run potential of connecting passenger rail services. The plan addresses both new passenger rail and increased freight service between Vallejo, Fairfield/Suisun, Napa, Calistoga and intervening areas. The Fairfield/Suisun Amtrak station, Vallejo Ferry Terminal and Downtown Napa were identified as locations for major intermodal stations.
http://www.nctpa.net/docs/Napa%20Solano%20Freight%20Rail%20Study.pdf
Napa’s Transportation Future
The 2009 Napa’s Transportation Future document was developed by the Napa County Transportation and Planning Agency (NCTPA). The NCTPA is a “Joint Powers Agency” (JPA) made up of the City of Calistoga, the City of St. Helena, the Town of Yountville, the City of Napa, the City of American Canyon and Napa County and acts as the transportation program and funding administrator for all member jurisdictions. The vision of Napa’s Transportation Future is to create an attractive, flexible, fully integrated transportation system with a diverse set of transportation mode options which will enable people and good to flow throughout the County in a more efficient manner. This plan coordinates the transportation planning efforts throughout the County in order to prioritize transportation needs for the horizon of the year 2035. The Plan establishes a series of visionary goals to address traffic congestion and air quality issues including:
• Goal: Reduce/restrain growth of automobile vehicle miles traveled (VMT) Objective: 0 percent net growth in aggregate VMT
• Goal: Shift travel from Single-Occupancy Vehicles to other modes Objective: Increase the percent of county trips made by transit to 5 percent

Existing Plan and Policy Review A-14 January 2012
Objective: Increase the percent of county trips made by bicycle to 10 percent Objective: increase the percent of county trips made by walking to 10 percent
http://sites.google.com/site/napastransportationfuture/
Napa County General Plan
In 2008 the Napa County Department of Conservation, Development & Planning updated the 1983 Napa County General Plan. The General Plan acts as the blueprint for growth and development on County unincorporated land through the year 2025. The General Plan will determine how much growth will occur and where it will occur. Development of the document included extensive public outreach, input and oversight from a General Plan Update Steering Committee, and community meetings. Currently adopted key General Plan policies regarding transportation and circulation that are applicable to bicycle and pedestrian planning include:
• Circulation CIR-2 – CIR-4; CIR-31 – CIR-37 • Conservation CON-65 d, CON-69 • Recreation and Open Space ROS-10 – ROS-12.5, ROS-15
http://www.countyofnapa.org/GeneralPlan/
Napa County Regional Parks and Open Space District Master Plan
The Napa County Regional Park and Open Space District Master Plan was completed in 2009 and covers the time period of 2008-2013. This plan provides a comprehensive framework for guiding the future work of the District through the identification of long-term goals and guiding principles, as well as identifying a 2008 through 2013 work program. The Master Plan is consistent with the Napa County General Plan and strives to meet the goal of providing opportunities for outdoor recreation through the development of a system of parks, trails, water resource activities, open space and related facilities. The Master Plan identifies 61 separate projects in its work program of which 17 are trail projects. These trail projects consist of the following:
A.1 Oat Hill Mine Trail Improvements A.2 Milliken Creek Trails and Picnic Area Development A.4 Rector Ridge/Stag’s Leap Trail Development A.5/A.6 Napa River and Bay Trail Development from American Canyon to Napa A.7 Lake Hennessey North Shore Trail Expansion A.9 Newell Preserve Access Improvement A.10 Lake Berryessa Trail Development A.11 Berryessa Peak and Blue Ridge Public Access Development A.12. Berryessa Vista Wilderness Park Development A.13 Pope and Putah Creeks Trail Development A.15 Camp Berryessa to Knoxville Wildlife Area Trail Development A.19 Bay Area Ridge Trail Completion A.22 Moore Creek Trail, Picnic Area and Camping Facilities Development A.24 Napa Valley Greenway / Vine Trail Development A.25 Henry Road/Milliken Peak Area Trail Development A.26 Countywide Trail Network Development
http://napaoutdoors.org/documents
Napa County Flood Control and Water Conservation District
The Napa County Flood Control and Water Conservation District administers water supply contracts, watershed management and stormwater management programs throughout Napa County. The District's
Existing Plan and Policy Review A-15 January 2012
mission is the conservation and management of flood and storm waters to protect life and property; the maintenance of the County watershed using the highest level of environmentally sound practices; and to provide coordinated planning for water supply needs for the community. The Napa County Flood Control and Water Conservation District maintains the 13 miles of channels within its jurisdiction.
http://www.countyofnapa.org/FloodDistrict/
Napa Countywide Community Climate Action Plan
The 2009 a preliminary draft of the Napa Countywide Community Climate Action Plan was completed by the private consultant MIG. The Action Plan includes viable measures to help the County reduce Green House Gas emissions resulting from County operations. The report establishes a baseline during the year of 2005, and emissions contributors are categorized by three distinct categories: jurisdiction, sector, and source. The report notes that 55% of the County’s green house gas emissions result from transportation and mobility related activities. The Plan contains reduction targets of 30 percent below the baseline year, and provides a series of actions that can be utilized to reduce Napa County’s green house gas emissions including shifting the current commute habits of County employees to alternative modes such as public transit, ridesharing, bicycling, and walking as much as possible.
Napa County Bicycle Coalition
The Napa County Bicycle Coalition is a non-profit member based organization that was created to encourage bicycling in Napa County. The NCBC works with local government from an advocacy stand point to ensure that bicycles are an integral part of the part of the County’s transportation system. The Coalition serves the four main functions of bicycle education, bicycle advocacy, promotion of events and programs, and fundraising to support the coalition.
http://www.napabike.org/
Napa Greenway Feasibility Study
The Napa Greenway Feasibility Study was completed in 2009 by Alta Planning for the Napa County Transportation and Planning Agency. The proposed 48 mile Greenway is planned to provide a continuous pedestrian and bicycle path from the BayLink Ferry terminal in Vallejo north through the Napa Valley and ending in the City of Calistoga. The Greenway study consisted of background data gathering, development of route options and alternatives, alternative alignment analysis, and design and implementation strategies. The Greenway is designed in a manner which allows for each individual segment can function as a stand-along facility until connections are built. Key implementation steps for the future include funding, identifying an agency responsible for the Greenway as a whole, and finding implementation sponsorship for the project.
http://sites.google.com/site/napastransportationfuture/napagreenwayfeasibilitystudy
Napa Valley Vine Trail
The nonprofit Napa Valley Vine Trail Coalition was created in 2008 after the completion of the Greenway Feasibility Study to design, fund and implement its conclusions. The trail is planned to follow Highway 29 and the existing Wine Train tracks north of Napa. South of Napa it will follow the Wine Train Tracks and the Napa River. The design will ultimately link the existing unconnected segments including the Napa Valley Vine Trail, the San Francisco Bay Trail, the Bay Area Ridge Trail and the wider Bay Area and when completed make-up a combined 149 miles of trails. When completed, the Napa Valley Vine Trail is anticipated to be one of the premier active transportation systems in the country.
http://www.railstotrails.org/resources/documents/ourWork/Napa%20Valley%20Vine%20Trail%20Case%20Statement.pdf
Existing Plan and Policy Review A-16 January 2012
2007 Calistoga Bicycle Transportation Plan
The 2007 Calistoga Bicycle Transportation Plan was prepared by Calistoga staff and the Calistoga Bicycle Advisory Committee. The Plan was developed to meet the requirements of the California Bicycle Transportation Act, and the needs of the community. The Plan was developed over the course of approximately two years and included a number of opportunities for public involvement. The Plan includes goals, objectives, policies, and actions to improve conditions for bicyclists within the community of Calistoga, and to provide bikeway connections to the outlying County and neighboring communities. It identifies an extensive network of Class I pathways, Class II bike lanes, and Class III bike routes within Calistoga, and recommends Class II bike lanes on SR 128, Tubbs Lane, Bennett Lane, and Dunaweal Lane.
http://www.ci.calistoga.ca.us/Index.aspx?page=101
Existing Plan and Policy Review – City of Napa
Policies
City of Napa General Plan
LU-6.6 – The City shall enhance public access to the downtown, including a stronger link to downtown residential neighborhoods, through improvements to directional signs, roads, transit and pedestrian and bike trails along streets and the river. (Page 1-19) LU-6.10 – The City shall continue to support development of public amenities along the Napa Riverfront such as parking, plazas, trails, docks and landscaping. (Page 1-19)
T1.1d – Bikeways For streets which are designated bikeways, minimum street widths shall be increased accordingly to accommodate bicycle facilities. The Public Works Director shall determine which local street cross section is appropriate in each case, and may approve minor modifications to local street standards, provided safe and adequate public access and circulation are preserved. The City will also review and revise and necessary, existing policies which regulate which street designs are public and which are private. Criteria will be established to restrict the use of public streets in specific situations. (Page 3-9)
Goal T-6 – To develop and maintain a safe, integrated bicycle route network for residents and visitors, connecting key destinations to neighborhoods, neighborhoods to each other, and the city of Napa to the County. (Page 3-25)
T-6.1 – The City shall promote the development of a comprehensive and safe system of recreational and commuter bicycle routes. To this end, the City shall continue to implement the bicycle network shown in Figure 3-5. (Page 3-25)
T-6.2 – The City shall apply for funding to undertake bicycle network route improvements that include the following components: (a) Completion of through north/south and east/west routes, (b) Completion of elements of the existing network, (c) Connections to employment centers and shopping areas: downtown, corporate park, Trancas, State Hospital, (d) Connections to larger schools (high schools, middle schools, Napa Valley College), (e) Connections to Napa to destinations outside Napa (e.g. “Up-valley,” Vallejo, Sonoma Valley). (f) Easily and affordably implemented, building on the existing network, (g) Off-road routes such as the River Trail; Wine-Train trail (“Rail Trail”). (Page 3-25)
T6.3 – The city shall evaluate the feasibility of establishing two “bicycle boulevards” to provide priority travel for bicycles, establishing a north/south and east/west route through the city. (Page 3-25)
T6.4 – The City shall provide for safe bicycle lanes or new or reconstructed freeway crossings and bridges. The City shall also consider modifications to existing bridges and freeway crossings to improve bicycle safety. (Page 3-25)
Existing Plan and Policy Review A-17 January 2012
T6.5 – The City shall consider the feasibility of constructing a bicycle/pedestrian bridge of Highway 29 at Pueblo Avenue. (Page 3-25)
T6.6 – The City shall consider innovative ways of encouraging bicycle use on a few key through streets that are normally too narrow (in part or in whole) to safely accommodate bicycles. (Page 3-25)
T-6.7 – The City shall incorporate designs to support bicycle operating characteristics in intersections and traffic controls systems. (Page 3-25)
T-6.8 – The City shall provide for bicycle storage and access in future development. (Page 3-25)
T-6.9 – The City shall promote bicycle access in the site planning and design of all residential subdivisions over 20 units, and of all commercial or industrial projects over 20,000 square feet. (Page 3-25)
T-6.10 – The City shall encourage bicycling by providing information to the public and participating in regional bicycle planning efforts. To this end, the City shall support efforts by the County to prepare a regional bicycle plan and a regional bicycle route map. (Page 3-25)
T-6.11 – The City shall maintain existing bicycle facilities and regularly review the status of the City’s progress in improving bicycle facilities. (Page 3-25)
T-6.12 – The City shall incorporate regional bicycle routes (such as the Bay Trail) into the City bicycle route system. (Page 3-25)
T-6.A – The city shall investigate the feasibility and location of two “bicycle boulevards” in the City of Napa, to include a north/south and an east/west route. (Page 3-25)
T-6.B – The City shall investigate innovate ways of encouraging bicycle use on a few key through streets which are normally too narrow (in part or in whole) to safely accommodate bicycles. Such innovations may include prohibiting parking during peak travel times and/or prohibiting parking on one side of a particularly important street and restriping the street for bicycle lanes. Candidate streets for this type of treatment include Lincoln Avenue and narrower portions of Jefferson Street and others deemed appropriate by the Public Works Director. (Page 3-26)
T-6.C – The City shall investigate the feasibility of constructing a bicycle/pedestrian bridge over Highway 29 at Pueblo Avenue. (Page 3-25)
T-6.D – The City shall, as funding permits, implement a demonstration project for intersection controls. Based on the results of the demonstration project, the City may prepare a recommendation for new intersection design and control standards which are “bicycle friendly.” (Page 3-26)
T-6.E – The City shall seek funding from USTEA and other funding programs to retrofit intersections along designated bicycle routes to make them bicycle friendly. (Page 3-26)
T-6.F – The City shall, as funding is available, prepare a bicycle route map to be made available to the public. (Page 3-26)
T-6.G – The City shall continue to seek funding for development of a recreation trail system along the Napa River, Salvador Channel and other trail segments included in the Napa River and Citywide Trails Plans. (Page 3-26)
Goal T-7 – To develop and maintain bicycle support facilities in appropriate locations to encourage the use of bicycle travel in Napa. (Page 3-28)
T-7.1 – The City shall continue to require that commercial and industrial projects requiring more than 10 parking spaces provide bicycle parking at the rate of 1 space per 10 parking spaces. (Page 3-28)

Existing Plan and Policy Review A-18 January 2012
T-7.2 – The City shall provide for bicycle support facilities, as appropriate, in existing and new development. (Page 3-28)
T-7.A – The City shall review and update its standards for bicycle racks so that bicycle racks and/or lockers are provided for all new retail commercial, industrial uses and existing commercial and industrial uses and theaters. (Page 3-28)
T-7.B – The City shall investigate requiring the provision of bicycle racks or lockers in all older commercial and industrial buildings, theaters, shopping centers or other similar uses over 5,000 square feet upon an application for any use permit where automobile parking is provided on-site. (Page 3-28)
T-7.C – The city shall consider the feasibility of establishing the position of Bicycle Coordinator with primary responsibility for implementing the bicycle policies of this General Plan. (Page 3-28)
Goal T-8 – To improve bicycle safety in promoting the use of bicycle travel in the City. (Page 3-28)
T-8.1 – The City shall encourage and assist bicycle educations programs for youth and adults. (Page 3-28)
T-8.2 – The City shall, as funding and staff resources permit, work with the school district to encourage students to identify safe routes to school, such as a “Safe Way to School” program. (Page 3-28)
T-8.3 – The City shall consider seeking changes in bicycle law enforcement procedures to allow bicycle enforcement to focus on improving bicycle safety. For example, bicycle violators could be required to take bicycle safety classes, and income from bicycle enforcement could be used to support bicycle safety programs. (Page 3-28)
T-8.A – The City shall work with bicycle clubs and schools to establish regular bicycle safety classes and programs such as bike rodeos. (Page 3-29)
T-8.B – The City shall review existing bicycle accident records and develop a focused enforcement program with a goal of reducing accidents by 10 percent. (Page 3-29)
T-9.3 – The City shall develop a major public multi-use trial and amenities along the Napa River from Stanly Ranch to Trancas Street, and along Salvador Channel, while protecting the natural resources along the trail corridor. If feasible, establish a multi-use trail along the Wine Train Railroad right-of-way. (Page 3-29)
T-9.4 – The City shall connect the City’s major planned trails to the proposed regional Ridge and Bay Trails, connecting all of these major pedestrian and bicycle routes to downtown. (Page 3-29)
T-9.8 – The City shall, where deficiencies in school route are identified, coordinate with NVUSD and property owners to develop cost-effective pedestrian and bicycle access to school sites. (Page 3-30)
T-10.4 – The City shall consider possible future transportation uses of existing rail rights-of-way when reviewing or developing short-term recreational use plans that include portions of such rights-of-way. (Page 3-32)
Goal PR-5 – To develop a comprehensive system of trails for bicycle and pedestrian traffic both within the existing urbanized area and connecting to surrounding County areas. (Page 5-14)
PR-5.1 – The City shall provide for a trial system that provides connections with open space areas in and outside the City. In the City, trials should connect Kennedy Park, Westwood Hills Park, Timberhill Park and Alston Park with the Napa River Trail. Outside the City, trail destinations should include the Napa Marshes, Skyline Park, watershed areas, and views of vineyards and other agricultural lands. (Page 5-14)
Existing Plan and Policy Review A-19 January 2012
PR-5.2 – Trails shall be located off road, following creeks wherever possible. As trial opportunities are limited, on-road connections should also be included to link the off-road sections of the system. These connections should be included in the Bicycle Facilities System. The trail system should consist of the following components. Alignment possibilities are included in Appendix D. (a) Napa River Trail South: east bank, (b) River Trail South: west bank, (c) River Trail north of Salvador Channel to Alston Park with connection to Las Flores Community Center, (d) Napa River Trail east to Skyline Park, (e) Napa River Trail to Westwood Hills and Timberhill city parks, (f) Other creek connections to the Napa River Trail, (g) Connections to surrounding county areas. (Page 5-14)
PR-5.3 – The City shall connect City trails with regional trails: the Bay Area Ridge Trail and the Bay Trail. (Page 5-14)
PR-5.4 – The City shall provide trails to serve the needs of residents, tourists and workers and visitors to the commercial and industrial areas of the City. (Page 5-14)
PR-5.5 – The City shall develop trails that are safe for people of all age groups, especially children and those persons with special needs. (Page 5-14)
PR-5.6 – The City shall provide trails accessible to people of all abilities and conform to the requirements of the American with Disabilities Act wherever feasible. (Page 5-15)
PR-5.7 – In creekside areas, the City shall develop trails outside any riparian setback requirements wherever possible. (Page 5-15)
PR-5.8 – The City shall design trails to be consistent with the City’s Trail Design Standards to accessibility, width, surfaces, signage, safety elements and access appropriate to the proposed use. (Page 5-15)
PR-5.9 – The city shall seek community support for public trails. (Page 5-15)
PR-5.10 – The City shall establish a liaison with trails organizations and groups. (Page 5-15)
PR-5.11 – The City shall support development of a regional trail network for bicycle and pedestrian use. (Page 5-15)
PR-5.12 – The City shall identify potential linkages along easements and rights-of-way to publicly accessible open space lands in the Napa vicinity, such as the Napa Marsh. (Page 5-15)
PR-5.13 – The City shall assist, when appropriate, in the identification and acquisition of elements of the regional trail network within the City of Napa. (Page 5-15)
PR-5.14 – The City shall coordinate trails planning in Napa to ensure integration with the plans of other public and nonprofit agencies. (Page 5-15)
PR-5.15 – The City shall identify and utilize equitable and realistic methods of financing and/or implementing acquisition, improvement and maintenance of trails. (Page 5-15)
PR-5.16 – The City shall require new development to dedicate trail alignments and associated improvements as a condition of development approval. (Page 5-15)
PR-5.17 – The City shall seek federal, state and private funding for development of trails as part of mitigation efforts associated with roadway improvements. (Page 5-15)
PR-5.18 – Where trails are joint-use, such as for utility access and along flood control channels, the City may share capital improvement and maintenance costs. (Page 5-15)

Existing Plan and Policy Review A-20 January 2012
PR-5.19 – The City shall continue to support a Citizen Trail Advisory Subcommittee to the Parks and Recreation Commission. (Page 5-15)
PR-5.A – The City shall prepare and adopt trail design guidelines. (Page 5-15)
Goal PR-6 – To develop a major public multi-use trail and amenities along the Napa River, while protecting and enhancing the natural resources along the trail corridor. (Page 5-15)
PR-6.1 – The City shall develop a major public multi-use trail and amenities along the Napa River from Stanly Ranch to Trancas Street and along the Salvador Channel, while protecting and enhancing the natural resources along the trail corridor. (Page 5-15)
PR-6.2 – The Napa River Trail shall be developed according to design guidelines adopted by the City. (Page 5-16)
PR-6.3 – Trail development shall be consistent with protection and enhancement of wildlife habitats along the River. The City shall identify potential areas for habitat preservation and enhancement along the river during the preparation of trail design and development plans. The City shall design and locate the multi-use trail to minimize impacts to sensitive habitats and resources wherever possible. (Page 5-16)
PR-6.4 – The City shall link that Napa River Trail to other trails, parklands and community resources including downtown and river-oriented businesses. (Page 5-16)
PR-6.5 – The City shall provide trail access points, staging and rest areas, and other amenities, such as boat launches and enhanced fishing areas. Facilities should be designed to meet accessibility standards whenever possible. Facilities should accommodate boat traffic, including some oriented toward commercial/tourist river boating, as well as recreational boating. (Page 5-16)
PR-6.6 – The city shall establish a continuous trail corridor and sites for trail-related amenities. The city shall pursue various methods for acquiring a trail corridor, including coordination with other public agencies and utility companies and negotiation with property owners for an easement or fee title for a trail corridor. (Page 5-16)
PR-6.7 – The city shall work with the Army Corps of Engineers to ensure that the Napa River Trail is incorporated into any flood control project. (Page 5-16)
PR-6.8 – The city shall conduct appropriate site investigations to identify any contaminated soils and/or groundwater which could affect public health along the proposed trail and staging areas near the River and shall identify mitigation to ensure adequate remediation. (Page 5-16)
PR-6.10 – The City shall establish financial strategies for acquiring and developing the Napa River Trail and facilities. These financial strategies may include the following: (a) Allocate funds for Napa River Trail when appropriate and necessary to use as leverage for additional funding, (b) Pursue various grand and funding programs from public and private sources, (c) Establish donation program through the Foundation for Napa Recreation, (d) Organize special fund raising events. (Page 5-16)
PR-6.11 – The City shall prioritize and phase trail development, taking into account funding and acquisition opportunities. (Page 5-16)
PR-6.13 – The City shall provide for long-term maintenance, safety and security of the trail. (Page 5-16)
PR-6.14 – The City shall prepare and adopt a trail sign program to address tail safety and etiquette. (Page 5-16)
PR-6.15 – The City shall provide adequate access for emergency and maintenance vehicles along the trail. (Page 5-16)

Existing Plan and Policy Review A-21 January 2012
PR-6.17 – The City shall solicit participation of the business community in trail planning and development. (Page 5-16)
PR-6.18 – The City shall involve neighborhoods in the process of designing trail segments and amenities. (Page 5-16)
PR-6.A – The City shall establish an ongoing trail inspection and maintenance program. (Page 5-17)
From the City of Napa’s Bicycle Boulevard Implementation Policies (Pages 3 through 5)
“BICYCLE BOULEVARD” IMPLEMENTATION
A. Definition of and Selection of Streets for Bicycle Boulevards
The “Bicycle Boulevard” concept is an innovative approach to developing efficient bikeways for all types of cyclists in an urban environment with limited street space. The City of Napa “Bicycle Boulevard” guidelines include the following criteria, which should be used to select roadways where “Bicycle Boulevards” could be implemented:
1. The City of Napa “Bicycle Boulevard” is an enhanced Class 3 bike route with more pavement legends and road signs (see attached Figure 2 for locally developed standards). The definition of a “Bicycle Boulevard” as a Class 3 bike facility is consistent with the definitions by other cities such as Berkeley, Davis, and Palo Alto. These cities also have an existing and extensive traffic calming program integrated into their “Bicycle Boulevards.”
2. There shall be no striped bike lanes on the “Bicycle Boulevard.”
3. There should be no loss of existing on-street parking in the implementation of a “Bicycle Boulevard” unless safety enhancements are required.
4. Potential candidate streets include local streets or low-volume collector streets with less than 5,000-average daily traffic (ADT).
5. Potential candidate streets should have low-accident history and should not include any “high accident locations” with an average of five or more accidents/year over the last three years.
6. The proposed route should provide direct connection to at least one school.
7. Typical 12-foot travel lanes are preferred on the proposed route; but narrower lanes are possible for lower-volume streets (approximately 2,500 ADT or less) that are not on the Fire Department’s Primary Emergency Response Routes.
8. The proposed route must be consistent with Goal T-6 and the associated policies of the General Plan, which provide the conceptual framework for citywide bike planning.
9. The proposed route could be an interim bikeway facility implementation for a designated Class 2 future bike lane in Figure 3-5 of the General Plan.
10. The proposed route should provide access to major destinations and could provide basic directional signs to the Downtown, schools, and parks—assuming funding for installation and maintenance of these directional signs is available.
11. The proposed route should provide connections to other bicycle facilities and fill in gaps in missing links between bicycle facilities.
12. City staff will consider the need for appropriate traffic control devices that would allow bicyclists on “Bicycle Boulevards” to safely cross major streets and arterials. The traffic control devices on a

Existing Plan and Policy Review A-22 January 2012
“Bicycle Boulevard” shall meet current professional engineering standards and practices as required by the California Vehicle Code.
In addition to the above guidelines and criteria, the Napa County Transportation Planning Agency (NCTPA) 2005 Countywide Bicycle Plan Amendment has the following guidelines for bicycle boulevards in urban areas that shall aid in the planning of the City of Napa’s “Bicycle Boulevards”:
13. “In developed areas, there exists the potential to designate a street or streets that have design features that help make it a more attractive route to bicyclists, particularly the casual and child cyclists. These features provide significantly more benefit to bicyclists than simply signing existing streets as bike routes (as is done for Class III routes).” Based on available funding, these design features could be integrated in a major capital improvement project (CIP) for the redesign of a street as long as right-of-way needs are minimized and on-street parking is not lost, unless safety enhancements are required.
14. “Where possible, priority is given to the street at intersections by, for example, giving right-of-way to traffic on the Bicycle Priority Street.” Priority for streets must be assigned to achieve the citywide transportation goals from the General Plan—where the mobility and access needs of motorists, pedestrians, bicyclists, transit providers, truck services, emergency service providers, and other road users are balanced to preserve the quality of life of neighborhoods and to promote the economic development of the City. Removal or alteration of existing traffic control devices (e.g. stop signs) or the addition of new traffic control devices shall be subject to the requirements of the California Vehicle Code as documented in the Caltrans’ standards for traffic control devices and supplemented by the Public Works Department policy guidelines for traffic control devices.
15. “Other measures are to include design features used for traffic calming such motor vehicle traffic is discouraged and/or motor vehicle speeds are reduced. Such streets are sometimes referred to as Bicycle Boulevards… They are appropriate within cities or other areas where the street network is laid out in a grid pattern or otherwise have low volume streets and many alternatives for auto traffic.” ‘Bicycle Boulevards’ are appropriate candidates for traffic calming to transform an ordinary local residential street into a “bikeway expressway” that accommodates local motor traffic while deterring through motor traffic. The planning, design, implementation, and maintenance of traffic calming features on the City of Napa “Bicycle Boulevards” shall be guided by the Public Works Department’s new “Citywide Guidelines for Traffic Calming and Neighborhood Traffic Management.” The pursuit of traffic calming on “Bicycle Boulevards” shall be subject to the availability of dedicated funding sources and the commitment of staff resources by the City Administration.

City of Napa Bicycle Plan January 2012
Appendix B
City of Napa’s Policy Guidelines: Share the Road Signs

Public Works Department Transportation Engineering Division
G:\PubWrks\Traffic\Policy Guidelines\Share the Road Sign Policy.doc
Policy Guidelines for “Share the Road” Signs Placement
Adopted by the Traffic Advisory Committee
Last Update on June 12, 2003 INTRODUCTION:
The City of Napa Public Works Department (PWD) receives numerous requests from
local citizens and residents who wish to have roadway signs for traffic control installed or changed on their neighborhood streets.
PWD’s policies and procedures on roadway signing for traffic control are based on
the exact language from California Vehicle Code (CVC) 1, the Manual of Uniform Traffic Control Devices (MUTCD) 2, and the California Department of Transportation (Caltrans) Traffic Manual 3. PWD follows standard professional engineering practices as prescribed in the Caltrans Traffic Manual and the MUTCD.
I. GENERAL POLICY ON TRAFFIC CONTROL SIGNING The California Vehicle Code (CVC) provides that “only those official traffic control
devices that conform to the uniform standards and specifications promulgated by the Department of Transportation shall be placed upon a street or highway…” Hence, PWD follows standard professional engineering practices as prescribed in the Caltrans Traffic Manual and the MUTCD, as it becomes the new Caltrans standard reference manual for traffic control devices.
In situations where the Traffic Manual and/or the MUTCD do not provide detailed
guidance on a roadway signing relevant to a citizen request or defer the engineering decision to the professional judgment of a traffic engineer, PWD will follow these policy guidelines. PWD prepared these policy guidelines to help the Traffic Advisory Committee in making its recommendation on the appropriate modifications to existing roadway signing used for traffic control in response to citizen requests while considering larger and citywide interests.
PWD reserves complete and total discretion on the appropriate traffic signage on all
public streets maintained by the City of Napa. These policy guidelines do not, in any shape, manner or form, pre-empt the professional engineering judgment of the Public Works Department as they relate to locally-maintained public streets.
1 State of California 2001 Vehicle Code Through the 2000 Legislative Session 2 Manual on Uniform Traffic Control Devices, Millennium Edition, Part 2 - Signs, U.S. Department of Transportation Federal Highway Administration, 2001. 3 California Department of Transportation Traffic Manual, Chapter 4 - Signs, January, 1996

Policy Guidelines for “Share the Road” Signs Placement Page 2 of 2
G:\PubWrks\Traffic\Policy Guidelines\Share the Road Sign Policy.doc
II. SPECIFIC GUIDELINES FOR “SHARE THE ROAD” SIGNS
These guidelines are intended to help inform the Traffic Advisory Committee in forming its recommendation regarding “Share the Road” signs.
The Bicycle Warning sign (W79 or W11-1) with the supplemental Share the Road
sign (W79A or W16-1) are warning signs intended to increase awareness for both vehicle operators and bicyclists. All sign layout, construction and placement should be in accordance with the latest edition of the California Traffic Manual or the Federal Highway Administration’s Manual on Uniform Traffic Control Devices with the California Supplement; whichever is the state adopted manual.
“Share the Road” signs are not expected to be installed on Class I or II facilities
except under unusual circumstances; however, Class III facilities may be signed. Excessive use of these signs should be avoided as over proliferation of signs tends to diminish their effectiveness. Consideration should be given to the visual impacts of each installation particularly in rural areas and on designated scenic roadways.
For these signs to be installed, the following criterion must be met prior to
installation: A. Safety Concerns
1. Locations with high bicycle/auto accident history (> 5/year for 3 years) as recorded in official Police Department records (i.e. Crossroads data)
In addition to the above necessary condition, a minimum of two (2) criteria from any
of the following categories should be met prior to installation: B. Safety Concerns
1. Areas with high bicycle (> 100 riders/day) and auto traffic (> 10,000 ADT) volume
2. Locations that have a high number of reported bike/vehicle conflicts C. Facility Constraints
1. Roads with inadequate shoulders (greater than 2,000 ADT, < 4’ shoulders, and > 50 riders/day)
2. Locations where there are significant changes in roadway character such as shoulder narrowing, non-continuous bike lanes and obstructions that necessitate the co-use of the traveled way
3. Locations where bike paths enter roadways
City of Napa Bicycle Plan January 2012
Appendix C
City of Napa’s Policy Guidelines: Bicycle Boulevard


Public Works Department Transportation Engineering Division
G:\PubWrks\Traffic\Policy Guidelines\Bike Boulevard Guidelines.doc
Policy Guidelines: City of Napa “Bicycle Boulevard”
Adopted by the Traffic Advisory Committee on May 12, 2005
Approved by the Bicycles & Trails Subcommittee INTRODUCTION
Implementation of bicycle facilities is included as part of the City of Napa General Plan.
The goal is to develop and maintain a safe integrated bicycle route network for residents and visitors, connecting key destinations to neighborhoods, neighborhoods to each other, and the City of Napa to the county.
Because Napa’s road system is within a largely built-out urban environment, new bicycle
lanes or paths within the City require retrofitting existing streets and intersections. Retrofitting streets comes with the challenge of requiring new right-of way and/or elimination of on-street parking. In addition, the number of through east-west and north-south routes within the City is limited. As a result, the through routes that would be most convenient for bicycles are usually City arterials, which have the highest volumes of motor vehicle traffic in the City.
When looking to implement bike lanes or similar facilities on Napa’s streets, the standard
design manuals offer limited solutions for Napa’s built-out conditions. The “Bike Boulevard” concept offers a creative and innovative solution that has been used in other California communities, such as Berkeley and Palo Alto, and can be tailored to fit Napa’s local needs and constraints.
These policy guidelines supplement the Caltrans Highway Design Manual, AASHTO guidebooks, and the Manual for Uniform Traffic Control Devices (MUTCD)/California Traffic Manual Supplement engineering design standards that guide roadway and street design. I. GENERAL PLAN – STREET AND ROADWAY SYSTEM 1
The City of Napa General Plan, Envision Napa 2020, identifies the following major transportation objectives in the Plan’s Transportation/Circulation Element that relate to bicycle facilities:
• Create a citywide transportation system that allows users to choose from a variety of safe transportation options including an adequate system of streets, transit, pedestrian and bicycle facilities
• Minimize the negative effects of additional automobile traffic and other transportation
1 Envision Napa 2020, City of Napa General Plan Policy Document, Adopted Dec. 1, 1998, Reprinted with Amendments to Jan. 1, 2002
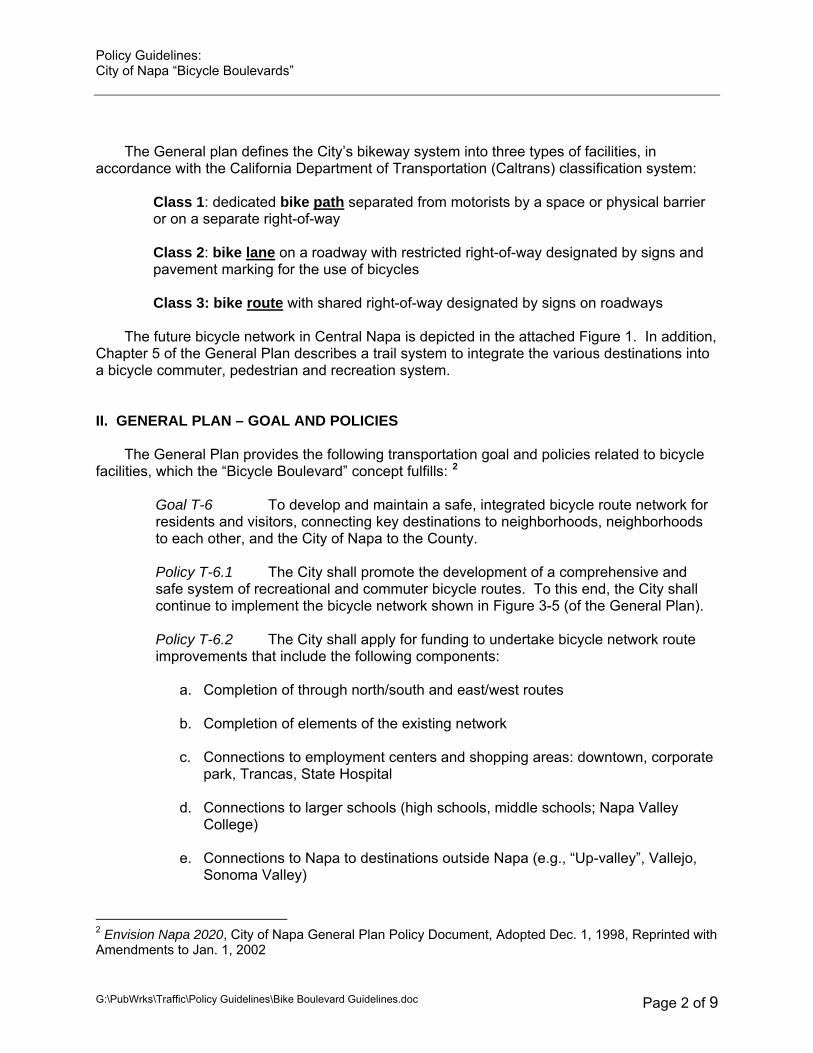
Policy Guidelines: City of Napa “Bicycle Boulevards”
G:\PubWrks\Traffic\Policy Guidelines\Bike Boulevard Guidelines.doc Page 2 of 9
The General plan defines the City’s bikeway system into three types of facilities, in
accordance with the California Department of Transportation (Caltrans) classification system:
Class 1: dedicated bike path separated from motorists by a space or physical barrier or on a separate right-of-way
Class 2: bike lane on a roadway with restricted right-of-way designated by signs and pavement marking for the use of bicycles
Class 3: bike route with shared right-of-way designated by signs on roadways
The future bicycle network in Central Napa is depicted in the attached Figure 1. In addition, Chapter 5 of the General Plan describes a trail system to integrate the various destinations into a bicycle commuter, pedestrian and recreation system. II. GENERAL PLAN – GOAL AND POLICIES
The General Plan provides the following transportation goal and policies related to bicycle
facilities, which the “Bicycle Boulevard” concept fulfills: 2
Goal T-6 To develop and maintain a safe, integrated bicycle route network for residents and visitors, connecting key destinations to neighborhoods, neighborhoods to each other, and the City of Napa to the County. Policy T-6.1 The City shall promote the development of a comprehensive and safe system of recreational and commuter bicycle routes. To this end, the City shall continue to implement the bicycle network shown in Figure 3-5 (of the General Plan). Policy T-6.2 The City shall apply for funding to undertake bicycle network route improvements that include the following components:
a. Completion of through north/south and east/west routes
b. Completion of elements of the existing network
c. Connections to employment centers and shopping areas: downtown, corporate
park, Trancas, State Hospital
d. Connections to larger schools (high schools, middle schools; Napa Valley College)
e. Connections to Napa to destinations outside Napa (e.g., “Up-valley”, Vallejo,
Sonoma Valley)
2 Envision Napa 2020, City of Napa General Plan Policy Document, Adopted Dec. 1, 1998, Reprinted with Amendments to Jan. 1, 2002

Policy Guidelines: City of Napa “Bicycle Boulevards”
G:\PubWrks\Traffic\Policy Guidelines\Bike Boulevard Guidelines.doc Page 3 of 9
f. Easily and affordably implemented, building on the existing network
g. Off-road routes such as the River Trail; Wine-Train trail (“Rail Trail”)
Policy T-6.3 The City shall evaluate the feasibility of establishing two "bicycle boulevards" to provide priority travel for bicycles, establishing a north/south and east/west route through the city. Policy T-6.6 The City shall consider innovative ways of encouraging bicycle use on a few key through streets that are normally too narrow (in part or in whole) to safely accommodate bicycles. Policy T-6.7 The City shall incorporate designs to support bicycle operating characteristics in intersections and traffic control systems. Implementation Program T-6.A The City shall investigate the feasibility and location of two "bicycle boulevards" in the City of Napa, to include a north/south and an east/west route. Implementation Program T-6.B: The City shall investigate innovative ways of encouraging bicycle use on a few key through streets which are normally too narrow (in part or in whole) to safely accommodate bicycles. Such innovations may include prohibiting parking during peak travel times and/or prohibiting parking on one side of a particularly important street and restriping the street for bicycle lanes. Candidate streets for this type of treatment include Lincoln Avenue and narrower portions of Jefferson Street and others deemed appropriate by the Public Works Director.
III. “BICYCLE BOULEVARD” IMPLEMENTATION
A. Definition of and Selection of Streets for Bicycle Boulevards
The “Bicycle Boulevard” concept is an innovative approach to developing efficient bikeways for all types of cyclists in an urban environment with limited street space. The City of Napa “Bicycle Boulevard” guidelines include the following criteria, which should be used to select roadways where “Bicycle Boulevards” could be implemented:
1. The City of Napa “Bicycle Boulevard” is an enhanced Class 3 bike route with more pavement legends and road signs (see attached Figure 2 for locally developed standards). The definition of a “Bicycle Boulevard” as a Class 3 bike facility is consistent with the definitions by other cities such as Berkeley, Davis, and Palo Alto. These cities also have an existing and extensive traffic calming program integrated into their “Bicycle Boulevards.”
2. There shall be no striped bike lanes on the “Bicycle Boulevard.”
3. There should be no loss of existing on-street parking in the implementation of a “Bicycle Boulevard” unless safety enhancements are required.
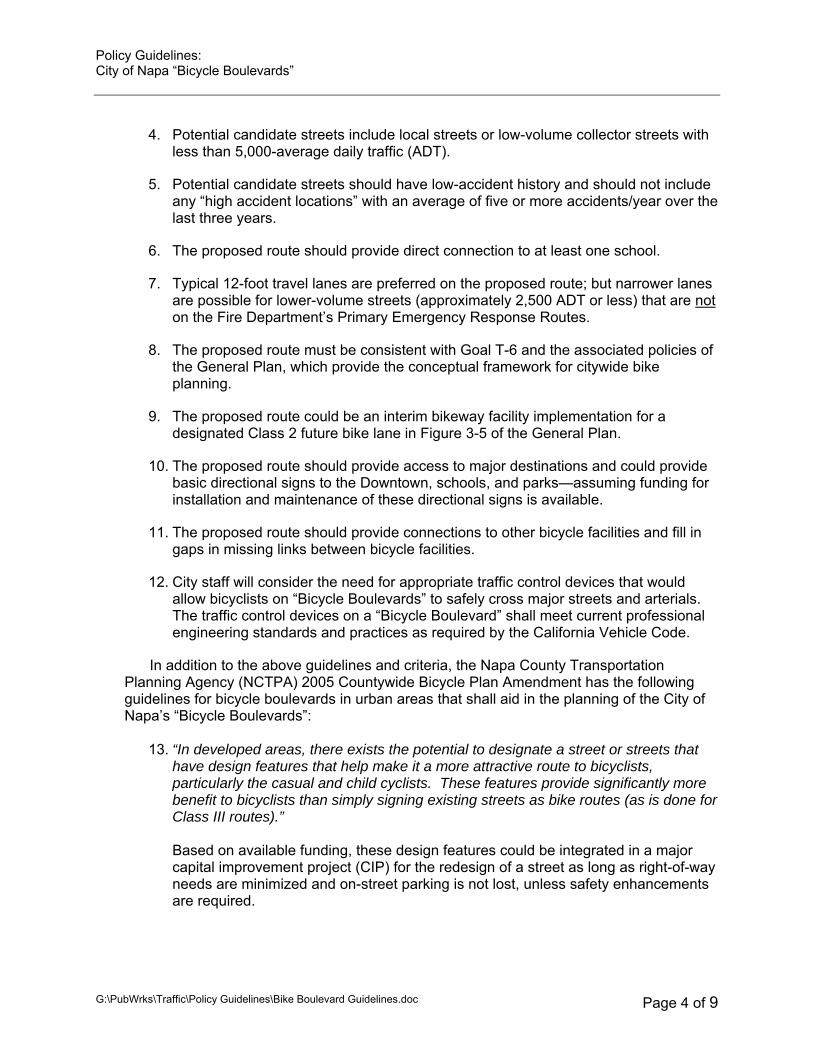
Policy Guidelines: City of Napa “Bicycle Boulevards”
G:\PubWrks\Traffic\Policy Guidelines\Bike Boulevard Guidelines.doc Page 4 of 9
4. Potential candidate streets include local streets or low-volume collector streets with less than 5,000-average daily traffic (ADT).
5. Potential candidate streets should have low-accident history and should not include any “high accident locations” with an average of five or more accidents/year over the last three years.
6. The proposed route should provide direct connection to at least one school.
7. Typical 12-foot travel lanes are preferred on the proposed route; but narrower lanes are possible for lower-volume streets (approximately 2,500 ADT or less) that are not on the Fire Department’s Primary Emergency Response Routes.
8. The proposed route must be consistent with Goal T-6 and the associated policies of the General Plan, which provide the conceptual framework for citywide bike planning.
9. The proposed route could be an interim bikeway facility implementation for a designated Class 2 future bike lane in Figure 3-5 of the General Plan.
10. The proposed route should provide access to major destinations and could provide basic directional signs to the Downtown, schools, and parks—assuming funding for installation and maintenance of these directional signs is available.
11. The proposed route should provide connections to other bicycle facilities and fill in gaps in missing links between bicycle facilities.
12. City staff will consider the need for appropriate traffic control devices that would allow bicyclists on “Bicycle Boulevards” to safely cross major streets and arterials. The traffic control devices on a “Bicycle Boulevard” shall meet current professional engineering standards and practices as required by the California Vehicle Code.
In addition to the above guidelines and criteria, the Napa County Transportation Planning Agency (NCTPA) 2005 Countywide Bicycle Plan Amendment has the following guidelines for bicycle boulevards in urban areas that shall aid in the planning of the City of Napa’s “Bicycle Boulevards”:
13. “In developed areas, there exists the potential to designate a street or streets that
have design features that help make it a more attractive route to bicyclists, particularly the casual and child cyclists. These features provide significantly more benefit to bicyclists than simply signing existing streets as bike routes (as is done for Class III routes).” Based on available funding, these design features could be integrated in a major capital improvement project (CIP) for the redesign of a street as long as right-of-way needs are minimized and on-street parking is not lost, unless safety enhancements are required.

Policy Guidelines: City of Napa “Bicycle Boulevards”
G:\PubWrks\Traffic\Policy Guidelines\Bike Boulevard Guidelines.doc Page 5 of 9
14. “Where possible, priority is given to the street at intersections by, for example, giving right-of-way to traffic on the Bicycle Priority Street.” Priority for streets must be assigned to achieve the citywide transportation goals from the General Plan—where the mobility and access needs of motorists, pedestrians, bicyclists, transit providers, truck services, emergency service providers, and other road users are balanced to preserve the quality of life of neighborhoods and to promote the economic development of the City. Removal or alteration of existing traffic control devices (e.g. stop signs) or the addition of new traffic control devices shall be subject to the requirements of the California Vehicle Code as documented in the Caltrans’ standards for traffic control devices and supplemented by the Public Works Department policy guidelines for traffic control devices.
15. “Other measures are to include design features used for traffic calming such motor vehicle traffic is discouraged and/or motor vehicle speeds are reduced. Such streets are sometimes referred to as Bicycle Boulevards… They are appropriate within cities or other areas where the street network is laid out in a grid pattern or otherwise have low volume streets and many alternatives for auto traffic.” ”Bicycle Boulevards” are appropriate candidates for traffic calming to transform an ordinary local residential street into a “bikeway expressway” that accommodates local motor traffic while deterring through motor traffic. The planning, design, implementation, and maintenance of traffic calming features on the City of Napa “Bicycle Boulevards” shall be guided by the Public Works Department’s new “Citywide Guidelines for Traffic Calming and Neighborhood Traffic Management.” The pursuit of traffic calming on “Bicycle Boulevards” shall be subject to the availability of dedicated funding sources and the commitment of staff resources by the City Administration.
B. Completed Implementation The City Council authorized the implementation of an enhanced bike route or “Bicycle Boulevard” on an east-west route (Vallejo Street – Yajome Street – Yount Street – Hayes Street – E Street) using these policy guidelines. This Council action follows the policies in the General Plan Implementation Program T-6.A for the east-west route. See Figure 3 for the implemented east-west “Bicycle Boulevard.” The pursuit of additional “Bicycle Boulevards” shall be subject to the availability of dedicated funding sources and the commitment of staff resources by the City Administration. C. “Bicycle Boulevard” Planning Process
1. The Community Resources Department (CRD) will work with the Bicycle & Trails Subcommittee (BTS) to identify and prioritize potential routes for “Bicycle Boulevards” in the City of Napa.
2. CRD/BTS will identify and secure funding for the implementation of the proposed “Bicycle Boulevard.”
Policy Guidelines: City of Napa “Bicycle Boulevards”
G:\PubWrks\Traffic\Policy Guidelines\Bike Boulevard Guidelines.doc Page 6 of 9
3. CRD and the Public Works Department (PWD) will recommend a potentially feasible route for the BTS-desired “Bicycle Boulevard” based on field conditions, both existing and proposed.
4. CRD will present the recommended potentially feasible route to the BTS for approval or concurrence.
5. PWD will present preferred alternative for the BTS-desired “Bicycle Boulevard” to the Traffic Advisory Committee for approval or concurrence.
6. PWD will send courtesy letters to property owners along proposed “Bicycle Boulevard” route that is approved by the TAC prior to implementation.
7. PWD will implement the “Bicycle Boulevard” concept on the TAC-approved route using the funding secured by CRD/BTS.

Policy Guidelines: City of Napa “Bicycle Boulevards”
G:\PubWrks\Traffic\Policy Guidelines\Bike Boulevard Guidelines.doc Page 7 of 9
FIGURE 1: FUTURE BIKEWAY SYSTEM
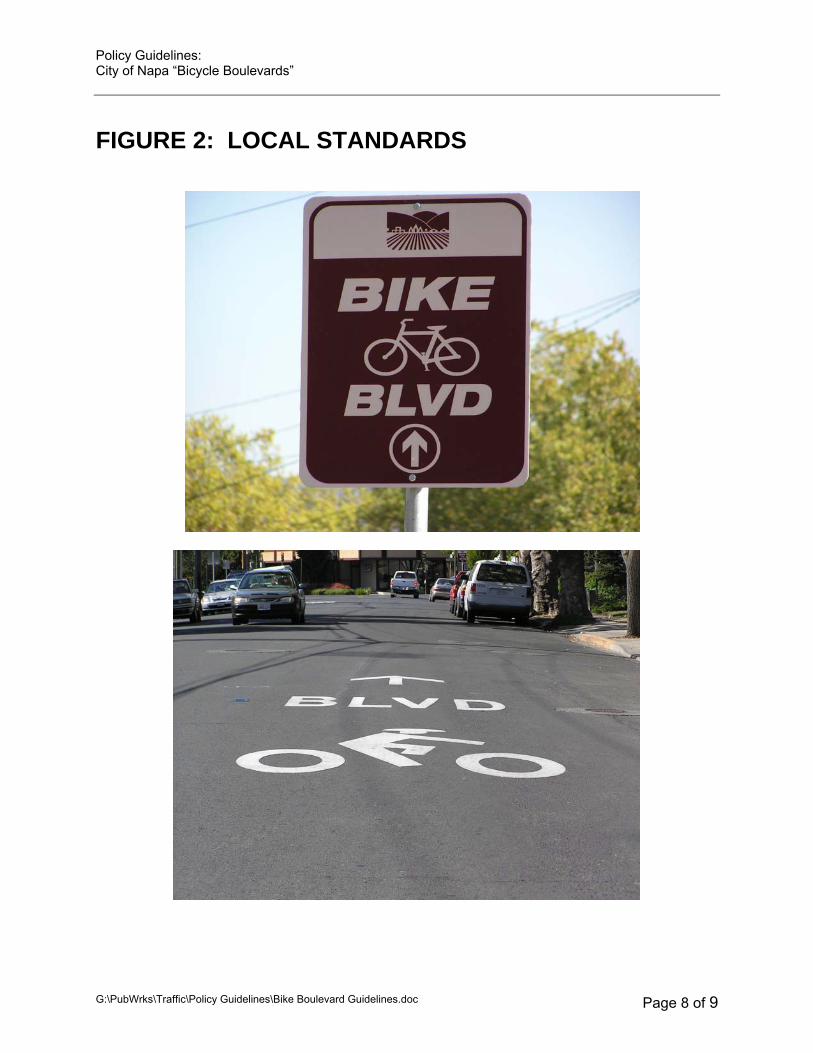
Policy Guidelines: City of Napa “Bicycle Boulevards”
G:\PubWrks\Traffic\Policy Guidelines\Bike Boulevard Guidelines.doc Page 8 of 9
FIGURE 2: LOCAL STANDARDS
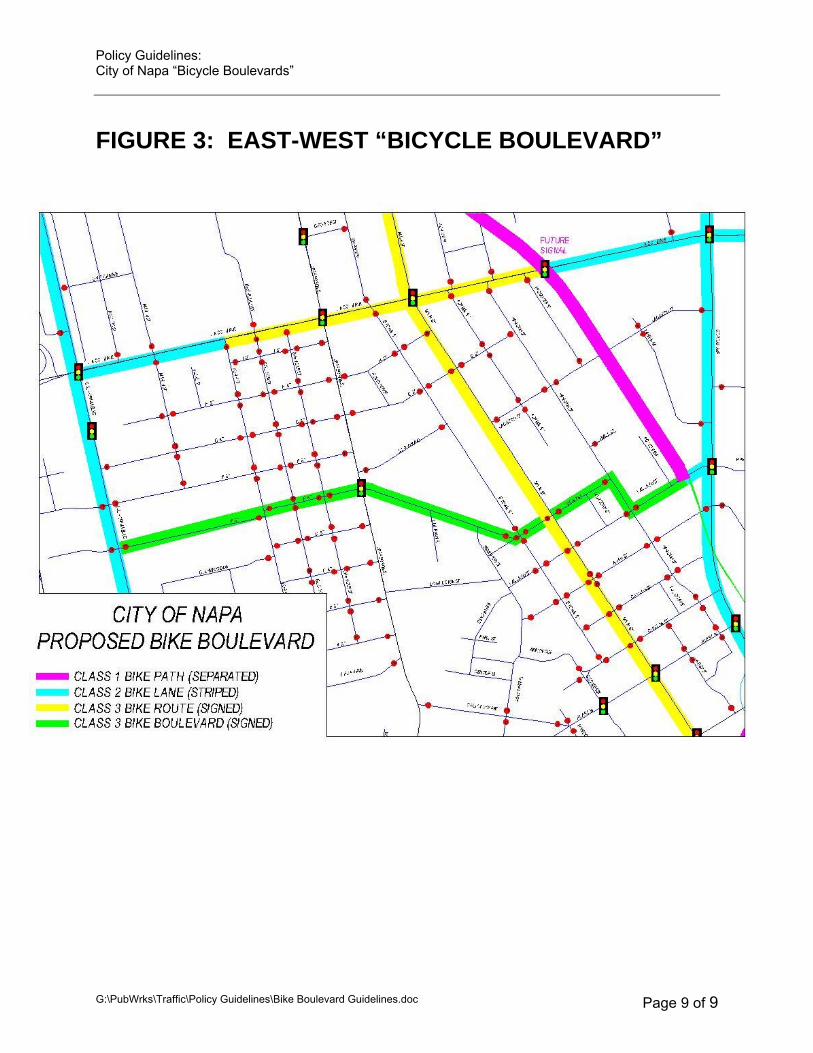
Policy Guidelines: City of Napa “Bicycle Boulevards”
G:\PubWrks\Traffic\Policy Guidelines\Bike Boulevard Guidelines.doc Page 9 of 9
FIGURE 3: EAST-WEST “BICYCLE BOULEVARD”

City of Napa Bicycle Plan January 2012
Appendix D
Bikeway Type Design Details


Bicycle Design Standards D-1 January 2012
Appendix D – Design Standards for Class I, II, and III Bikeways
Introduction
The bicycle design guidelines presented in this section are intended to provide guidance to staff, policy makers, developers, and the public for the development, retrofit, and maintenance of bicycle facilities in Napa County. The guidelines are a combination of the minimum bicycle facility standards defined in Chapter 1000 of the Caltrans Highway Design Manual (HDM) and the California Manual on Uniform Traffic Control Devices (CA MUTCD), along with recommended standards contained in the American Association of State Highway and Transportation Officials’ (AASHTO) Guide for the Development of Bicycle Facilities. Standards and guidelines from these resources have been assembled to improve the quality of consistency of Napa’s countywide bikeway system. In addition to the standardized treatments, there are several creative solutions drawn from ‘best practices’ used in other locations throughout the state and nation that provide promising results, but remain experimental at this time. While ‘best practice’ or non-standard features have been identified at the request of the BAC, it should be noted that implementation of non-standard treatments should be done under the guidance and permission of State and Federal authorities.
The following resources, which provide detailed design guidance for the development of bikeways and bicycle parking facilities, are recommended to supplement the design information presented below.
• NACTO Urban Bikeway Design Guide, National Association of City Transportation Officials, 2011 http://nacto.org/cities-for-cycling/design-guide/
• APBP Bicycle Parking Guidelines, 2nd Edition, Association of Pedestrian and Bicycle Professionals, 2010 http://www.apbp.org/?page=Publications
Bicycle Characteristics
To understand the needs of bicyclists, and help encourage and accommodate safe bicycling within the plan area, it is important to have an understanding of the dimensions of typical bicycles as well as the operational characteristics of bicyclists. These design factors are critical in planning and designing both on-road and off-road bicycle facilities.
Horizontal Clearance
The images below show the dimensions and operating space of a typical bicyclist. The width of a stationary bicyclist is approximately 2.0 feet, and a moving bicyclist generally requires a 3.0-foot operating envelope in order to maintain their balance. To ride comfortably and avoid fixed objects (curbs, potholes, debris, automobiles, etc.) as well as other facility users including bicyclists, pedestrians, strollers, or in-line skaters, a bicyclist requires an operating envelope of five feet. If space is restricted, such as in a tunnel or on a bridge,
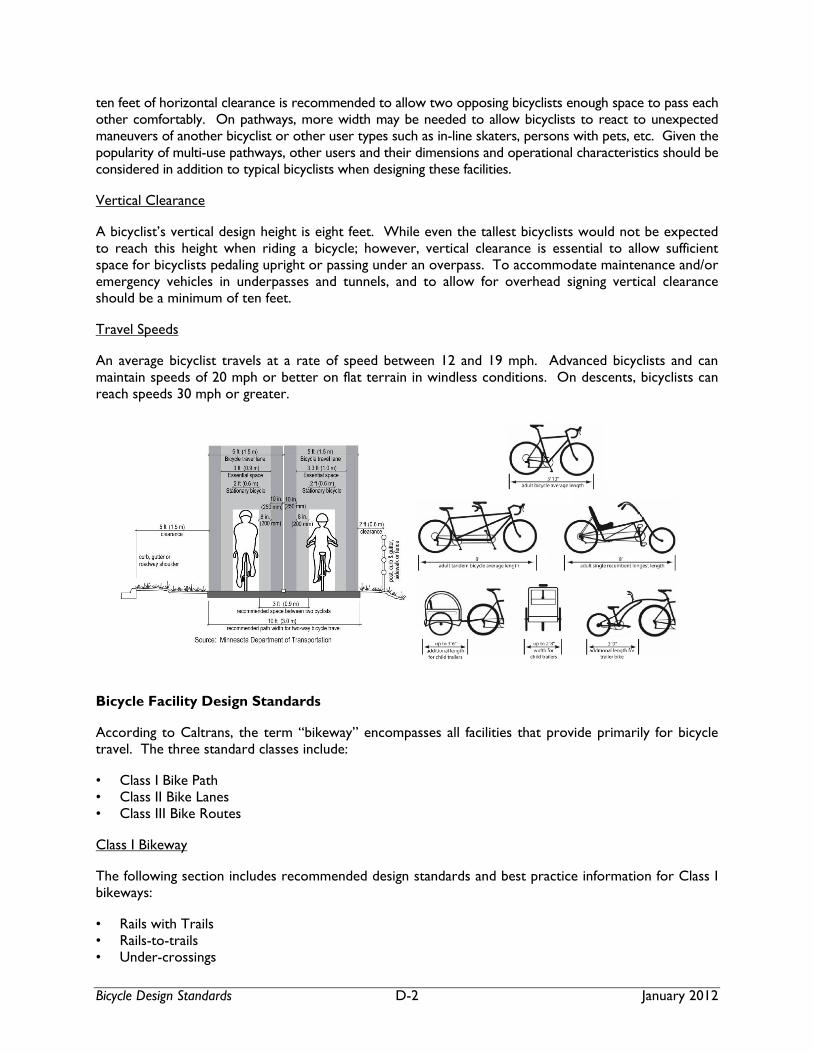
Bicycle Design Standards D-2 January 2012
ten feet of horizontal clearance is recommended to allow two opposing bicyclists enough space to pass each other comfortably. On pathways, more width may be needed to allow bicyclists to react to unexpected maneuvers of another bicyclist or other user types such as in-line skaters, persons with pets, etc. Given the popularity of multi-use pathways, other users and their dimensions and operational characteristics should be considered in addition to typical bicyclists when designing these facilities.
Vertical Clearance
A bicyclist’s vertical design height is eight feet. While even the tallest bicyclists would not be expected to reach this height when riding a bicycle; however, vertical clearance is essential to allow sufficient space for bicyclists pedaling upright or passing under an overpass. To accommodate maintenance and/or emergency vehicles in underpasses and tunnels, and to allow for overhead signing vertical clearance should be a minimum of ten feet.
Travel Speeds
An average bicyclist travels at a rate of speed between 12 and 19 mph. Advanced bicyclists and can maintain speeds of 20 mph or better on flat terrain in windless conditions. On descents, bicyclists can reach speeds 30 mph or greater.
Bicycle Facility Design Standards
According to Caltrans, the term “bikeway” encompasses all facilities that provide primarily for bicycle travel. The three standard classes include:
• Class I Bike Path • Class II Bike Lanes • Class III Bike Routes
Class I Bikeway
The following section includes recommended design standards and best practice information for Class I bikeways:
• Rails with Trails • Rails-to-trails • Under-crossings

Bicycle Design Standards D-3 January 2012
• Rivers with Trails • Mid-block Crossing
Typically called a “bike path” or “multi-use path,” a Class I bikeway provides for bicycle travel on a paved right-of-way completely separated from any street or highway. The recommended design width of a Class I path is dependent upon anticipated usage:
• 8 feet (2.4 m) is the minimum width for Class I facilities; • 10 feet (3.0 m) is the recommended minimum width for a typical two-way Class I path; and • 12 feet (3.6 m) is the preferred minimum width, if heavy mixed bicycle and pedestrian use is
anticipated
Typically, 25 feet of right-of-way is preferred to accommodate a Class I bikeway, including the pathway surface, required shoulders, signage, amenities, landscaping, and offsets. However, pathway implementation can be achieved in constrained corridors of 15 feet or less where necessary.
Guidelines:
1. Paths should be constructed with adequate sub grade compaction to minimize cracking and sinking (stabilization fabric is recommended), and should be designed to accommodate appropriate loadings, including maintenance trucks and emergency vehicles.
2. A minimum 2-foot wide graded area must be provided adjacent to the path to provide clearance from trees, poles, walls, guardrails, etc. Wider shoulders on one or both sides of the path are recommended where feasible to accommodate pedestrians and help reduce pathway conflicts.
3. A 2% cross slope shall be provided to ensure proper drainage.
4. A yellow centerline stripe is recommended to separate travel in opposite directions.
5. Pathway lighting should be provided where commuters will be expected during dark or nighttime hours.
6. Pathway/roadway intersections require engineering review to ensure appropriate safety features are incorporated. Pathways that cross roadways with average traffic volumes of 20,000 vehicles per day or greater generally require signalization or grade separation.
7. Landscaping should generally be low water consuming native vegetation. Vegetation that produces minimal debris is recommended to reduce maintenance needs.
8. Barriers at pathway entrances (bollards, gates, etc.) should be clearly marked with reflectors and be ADA accessible (minimum five feet clearance).
9. Bridges and/or other structures should be designed to accommodate appropriate vehicle loadings. The width of structures should be the same as the approaching trail width, plus minimum two-foot wide clear areas.
10. To minimize potential conflicts, pedestrian traffic should be directed to the right side of pathway with signing and/or stenciling.
11. Staging areas and/or trailhead parking including restrooms, drinking fountains, and secure bicycle parking should be provided at appropriate locations.

Bicycle Design Standards D-4 January 2012
Class 1 Bike Path: Rail-with-Trail
Rail with trail (RWT) describes any shared use path or trail located on or directly adjacent to an active railroad corridor. No national standards or guidelines dictate RWT facility design. Therefore design guidance is pieced together from existing standards for Class I bikeways, railroad requirements, and pedestrian, road and highway design resources. In order to achieve safe and attractive designs, it is important for trail designers to work closely with railroad planning, operations, and maintenance staff.
General Design Guidelines:
1. RWT designers should maximize the setback between any RWT and active railroad track. The setback distance between a track centerline and the closest edge of the RWT should correlate to the type, speed, and frequency of train operations, as well as the topographic conditions and separation techniques.
2. Subject to railroad and State and Federal guidelines and the advice of engineering and safety experts, exceptions to the recommended setbacks may include:
a. Constrained areas (bridges, cut and fill areas) b. Low speed and low frequency train operations
In these cases and in areas with a history of extensive trespassing, fencing or other separation technique is recommended.
3. When on railroad property, RWT planners should adhere to the request or requirements for fencing by the railroad company. Fencing and/or other separation techniques should be a part of all RWT projects.
4. Trail planners should minimize the number of at-grade crossings, examine all reasonable alternatives to new at-grade track crossings, and seek to close existing at grade crossings as part of the project.
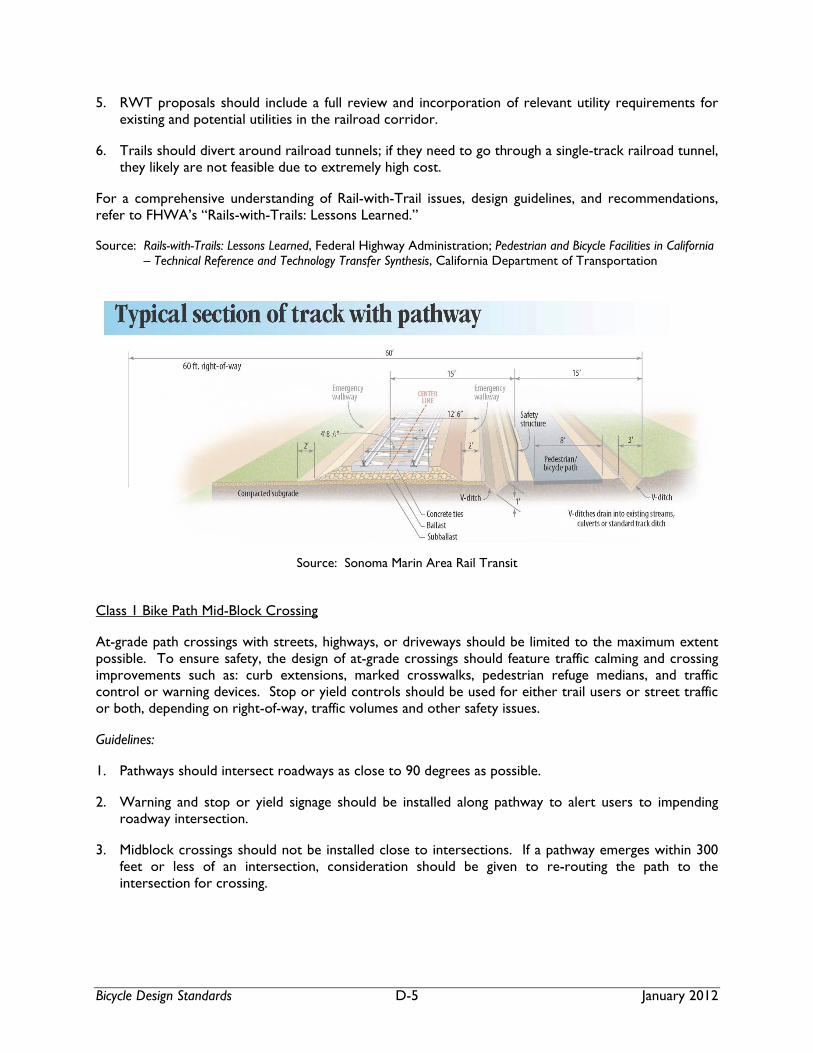
Bicycle Design Standards D-5 January 2012
5. RWT proposals should include a full review and incorporation of relevant utility requirements for existing and potential utilities in the railroad corridor.
6. Trails should divert around railroad tunnels; if they need to go through a single-track railroad tunnel, they likely are not feasible due to extremely high cost.
For a comprehensive understanding of Rail-with-Trail issues, design guidelines, and recommendations, refer to FHWA’s “Rails-with-Trails: Lessons Learned.”
Source: Rails-with-Trails: Lessons Learned, Federal Highway Administration; Pedestrian and Bicycle Facilities in California – Technical Reference and Technology Transfer Synthesis, California Department of Transportation
Source: Sonoma Marin Area Rail Transit
Class 1 Bike Path Mid-Block Crossing
At-grade path crossings with streets, highways, or driveways should be limited to the maximum extent possible. To ensure safety, the design of at-grade crossings should feature traffic calming and crossing improvements such as: curb extensions, marked crosswalks, pedestrian refuge medians, and traffic control or warning devices. Stop or yield controls should be used for either trail users or street traffic or both, depending on right-of-way, traffic volumes and other safety issues.
Guidelines:
1. Pathways should intersect roadways as close to 90 degrees as possible.
2. Warning and stop or yield signage should be installed along pathway to alert users to impending roadway intersection.
3. Midblock crossings should not be installed close to intersections. If a pathway emerges within 300 feet or less of an intersection, consideration should be given to re-routing the path to the intersection for crossing.

Bicycle Design Standards D-6 January 2012
Sample crossing treatment on a two-lane collector street
Class II Bikeway – Bike Lanes
The following section includes recommended design standards and best practice information for Class II bikeways:
• On-Street Parking • Right turn lanes • Left turn lanes • Railroad tracks
A Bike Lane is defined as a portion of the roadway or highway that has been designated by striping, signage, and pavement markings for the preferential or exclusive use of bicyclists. Bike lanes enable bicyclists to ride along a roadway or highway without interference from prevailing traffic conditions. Bike lanes increase safety by facilitating predictable behavior and movements between bicyclists and motorists. Bike lanes typically run in the same direction of traffic, although they may be configured in a contra-flow direction along one-way streets for system connectivity where necessary.
Guidelines:
Class II bike lanes shall be one-way facilities, running with the direction of traffic. (Contra-flow bike lanes may be installed on one-way streets where necessary.)
Where on-street parking is allowed, Class II bike lanes must be striped between the parking area and the travel lanes.
The width of the bike lanes vary according to parking and street conditions:
• 4’ minimum if no gutter exists, measured from edge of pavement; • 5’minimum with normal gutter, measured from curb face; or 3' measured from the gutter pan seam; • 5’ minimum when parking stalls are marked; and

Bicycle Design Standards D-7 January 2012
• 11’ minimum for a shared bike/parking lane where parking is permitted but not marked on streets without curbs or 12’ for a shared lane adjacent to a curb face.
Bike Lane striping standards:
• Bicycle lanes shall be comprised of a 6 inch solid white stripe on the outside of the lane, and a 4 inch solid white stripe on the inside of the lane.
• The inside 4 inch stripe of the bicycle lane should be dropped 90-180 feet prior to any intersection where right turns are permitted, and the outside 6 inch stripe should be dashed in this location.
• Bicycle lanes shall never be striped to the right of a right-hand turn lane
Bicycle lane signage standards:
• The R81 bicycle lane sign shall be placed at the beginning of all bicycle lanes, on the far side of arterial street intersections, at all changes in direction and at a maximum of 0.6 mile intervals, however, reassurance signs may be placed at 200 to 500 foot intervals.
• Standard signage is shown in Chapter 9 of the 2010 edition of the CA MUTCD.
Class II Bike Lanes with On-Street Parking
Parked vehicles can pose a serious hazard to bicyclists. Conflicts can occur during parking maneuvers and bicyclists are especially vulnerable to being hit by an opening door. On streets with parked vehicles, experienced bicyclists will generally ride three or four feet away from parked vehicles even if it means riding in a travel lane. To help maximize separation between bicyclists and parked vehicles, the following techniques may be employed:
• Minimize the parking lane width. This technique may be used in conjunction with widening the bike lane. Research suggests that the narrower the parking lane, the closer vehicles park to the curb. The traditional eight-feet wide parking lane can be reduced to seven feet or narrower where acceptable to help achieve this result.
• Parking stall markings. Marked parking spaces with cross hatches indicating the parking lane limits may help guide drivers closer to the curb.
• Angled parking should be avoided in areas of high bike traffic. If angled parking is used a four-foot buffer is recommended to provide maneuvering space for bicyclists, and/or reverse angle parking should be considered so that drivers back into spaces, which provides drivers greater visibility of bicyclists when entering and leaving the space.
Class II Bike Lanes Approaching Intersections
Right Turn Lanes
Bike lanes approaching intersections should dash the solid bike lane line for the last 100 to 200 feet in advance of the intersection. Dashing is preferable to dropping the bike lane stripe because it alerts bicyclists and right-turning motorist of the weave. Further, the treatment encourages bicyclists to wait in the proper location to be detected when signal detection is provided.

Bicycle Design Standards D-8 January 2012
Left Turn Lanes
Left turns at intersections present difficulty to bicyclists in two ways: conicts with left-turning motorists and the difficulty experienced by a bicyclist in executing a left turn. Improper left turns by motorist are often one of the chief causes of collisions at intersections. Often motorists are concentrating on finding a gap in vehicular traffic that they fail to notice oncoming bicycle traffic. Potential counter measures include:
• Provide left-turn pockets • Provide protected left-turn signal phasing
Bike Lanes approaching Right-Turn Only Lanes Source: Guide for the Development of Bicycle Facilities, AASHTO

Bicycle Design Standards D-9 January 2012
Class II Bike Lanes: Railroad Tracks
All railroad crossings should be made as bicycle-safe as possible. Optimizing bicycle safety at railroad crossings involves three issues:
1. The Angle of the Crossing
Where the angle of the tracks is not 90 degrees, additional pavement shall be provided so that bicyclists can approach the crossing at 90 degrees as depicted in Figure 1003.6A of the Highway Design Manual. Warning signs should be installed at skewed railroad crossings.
2. The Smoothness of the Crossing
The surface of the crossing should be designed such that the rails are as flush as possible with the surrounding pavement with minimal gaps between the roadway and the flangeway. Rubber or concrete crossing materials last longer than wood or asphalt and accordingly require less maintenance.
Bikeway Crossing Skewed Railroad Tracks
Bike Lane Striping at a Left-Turn Only Lane Source: VTA Bicycle Technical Guidelines
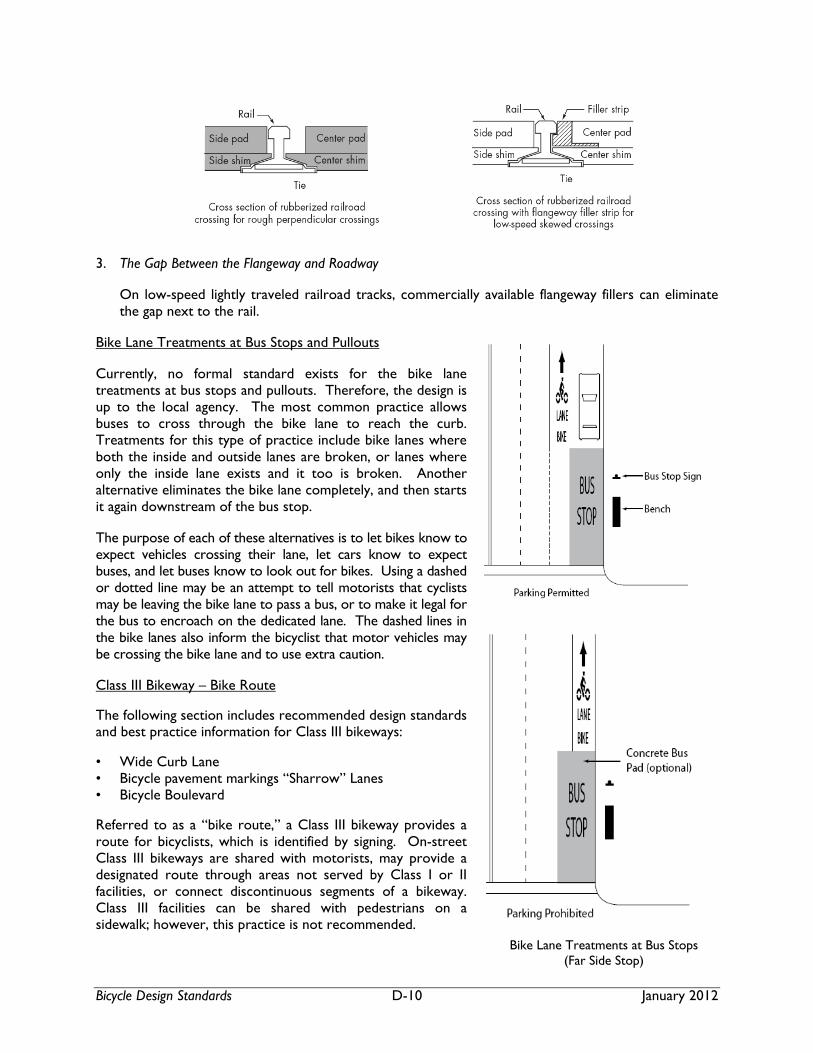
Bicycle Design Standards D-10 January 2012
3. The Gap Between the Flangeway and Roadway
On low-speed lightly traveled railroad tracks, commercially available flangeway fillers can eliminate the gap next to the rail.
Bike Lane Treatments at Bus Stops and Pullouts
Currently, no formal standard exists for the bike lane treatments at bus stops and pullouts. Therefore, the design is up to the local agency. The most common practice allows buses to cross through the bike lane to reach the curb. Treatments for this type of practice include bike lanes where both the inside and outside lanes are broken, or lanes where only the inside lane exists and it too is broken. Another alternative eliminates the bike lane completely, and then starts it again downstream of the bus stop.
The purpose of each of these alternatives is to let bikes know to expect vehicles crossing their lane, let cars know to expect buses, and let buses know to look out for bikes. Using a dashed or dotted line may be an attempt to tell motorists that cyclists may be leaving the bike lane to pass a bus, or to make it legal for the bus to encroach on the dedicated lane. The dashed lines in the bike lanes also inform the bicyclist that motor vehicles may be crossing the bike lane and to use extra caution.
Class III Bikeway – Bike Route
The following section includes recommended design standards and best practice information for Class III bikeways:
• Wide Curb Lane • Bicycle pavement markings “Sharrow” Lanes • Bicycle Boulevard
Referred to as a “bike route,” a Class III bikeway provides a route for bicyclists, which is identified by signing. On-street Class III bikeways are shared with motorists, may provide a designated route through areas not served by Class I or II facilities, or connect discontinuous segments of a bikeway. Class III facilities can be shared with pedestrians on a sidewalk; however, this practice is not recommended.
Bike Lane Treatments at Bus Stops (Far Side Stop)
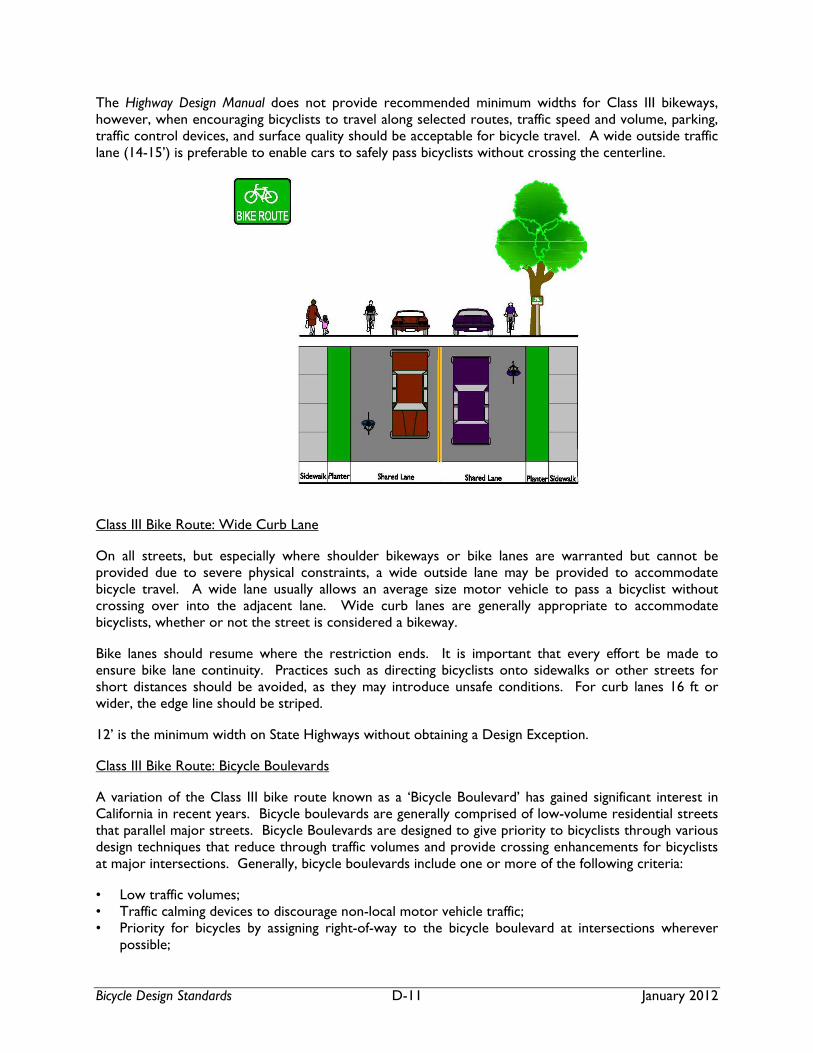
Bicycle Design Standards D-11 January 2012
The Highway Design Manual does not provide recommended minimum widths for Class III bikeways, however, when encouraging bicyclists to travel along selected routes, traffic speed and volume, parking, traffic control devices, and surface quality should be acceptable for bicycle travel. A wide outside traffic lane (14-15’) is preferable to enable cars to safely pass bicyclists without crossing the centerline.
Class III Bike Route: Wide Curb Lane
On all streets, but especially where shoulder bikeways or bike lanes are warranted but cannot be provided due to severe physical constraints, a wide outside lane may be provided to accommodate bicycle travel. A wide lane usually allows an average size motor vehicle to pass a bicyclist without crossing over into the adjacent lane. Wide curb lanes are generally appropriate to accommodate bicyclists, whether or not the street is considered a bikeway.
Bike lanes should resume where the restriction ends. It is important that every effort be made to ensure bike lane continuity. Practices such as directing bicyclists onto sidewalks or other streets for short distances should be avoided, as they may introduce unsafe conditions. For curb lanes 16 ft or wider, the edge line should be striped.
12’ is the minimum width on State Highways without obtaining a Design Exception.
Class III Bike Route: Bicycle Boulevards
A variation of the Class III bike route known as a ‘Bicycle Boulevard’ has gained significant interest in California in recent years. Bicycle boulevards are generally comprised of low-volume residential streets that parallel major streets. Bicycle Boulevards are designed to give priority to bicyclists through various design techniques that reduce through traffic volumes and provide crossing enhancements for bicyclists at major intersections. Generally, bicycle boulevards include one or more of the following criteria:
• Low traffic volumes; • Traffic calming devices to discourage non-local motor vehicle traffic; • Priority for bicycles by assigning right-of-way to the bicycle boulevard at intersections wherever
possible;

Bicycle Design Standards D-12 January 2012
Shared Lane Marking
The SLM consists of a standard bicycle symbol combined with chevron
arrows.
• Traffic control to help bicycles cross major streets (i.e. bicycle sensitive detectors at signals); • Distinct “look” to alert bicyclists and motorists that the route is a priority for bicyclists (special
signs, pavement markings, etc.); and • By emphasizing bicycle use over automobiles, the walking environment for pedestrians along bicycle
boulevards is also improved.
Class III Bike Route: Shared Lane Markings “Sharrows”
The shared lane marking (SLM), known as “shared roadway bicycle marking” in the MUTCD, and as “sharrows” by the bicycling public, is a pavement legend which may be placed in the travel lane adjacent to on-street parking. The purpose of the marking is to provide positional guidance to bicyclists on roadways that are too narrow to be striped with bike lanes. Unlike bike lanes, a SLM does not designate a particular part of the street for the exclusive use of bicyclists. It is simply an informational marking to guide bicyclists to the best place to ride on the road to avoid the “door swing” of parked cars, and to help motorists expect to see and share the lane with bicyclists. The marking gives bicyclists freedom to move further to the left within a travel lane rather than brave the door zone, squeezed between moving and parked cars. The marking is usually repeated every several hundred feet. Without such markings, bicyclists might seek refuge on the sidewalk, ride in a serpentine pattern between parked vehicles, or travel in the wrong direction. Perhaps the most important benefit of SLM is that they send a message to cyclists and drivers alike that bikes belong on the road.
Sample Bicycle Boulevard treatments from Berkeley, CA

Bicycle Design Standards D-13 January 2012
Positional Layout of Shared Lane Markings
Source: San Francisco Bicycle Design Guidelines
Shared Lane Markings were approved for use in California in 2007 after device testing was performed by the City of San Francisco. While the version of the 2010 MUTCD adopted by California specifies that the device is to be used only where there is existing on-street parallel parking (Section 9C.103), the national MUTCD provides for use of the device on streets without on-street parking. Further, jurisdictions around the nation are recognizing the benefit of utilizing the device in locations where it may not be obvious where cyclists should be riding, such as at intersections with multiple turn lanes, as a guide marking through intersections (similar to skip lines), and as a guide-marking between bikeways.
Marking Placement
Laterally – According to the California MUTCD guidelines, SLM shall be placed so that the centers of the markings are a minimum of 11 feet from the curb face or edge of paved shoulders, and the distance may be increased beyond 11 feet. According to the National MUTCD, if SLM are used on a street without parking, the markings should be placed far enough from the curb to direct cyclists away from gutters, seams, and other obstacles, or near the center of the lane if the lane is less than 14 feet wide.
Longitudinally – SLM should be placed immediately after intersections and spaced at intervals of 250 feet. The longitudinal spacing of the markings may be increased or decreased as needed for roadway and traffic conditions (Source: 2010 CA MUTCD).
Signalized Intersections
Signal Detection
Actuated traffic signals pose a significant barrier to bicyclists when the detectors do not sense the presence of a bicycle. Bicyclists are then forced to wait for a vehicle to actuate the signal, dismount and use the intersection as a pedestrian, or proceed against the red light. A variety of signal detection technologies are currently available including inductive loop detectors which utilize an electromagnetic field to sense the presence of vehicles, video detection which senses the presence of vehicles optically, and a new technology – magnetometers – which uses magnetic anomaly detection.
Each of these technologies is suitable for the detection of bicycles, and bicycle detection should be provided at all traffic signal installations. Efforts need to be made to ensure that signal detection devices are capable of detecting a bicycle and detectors need to be located in the bicyclist’s expected path, including left-turn lanes and shoulders. Marking the road surface to indicate the optimum location for bicycle detection is helpful to the bicyclist so that they may position themselves properly to trigger the traffic signal.
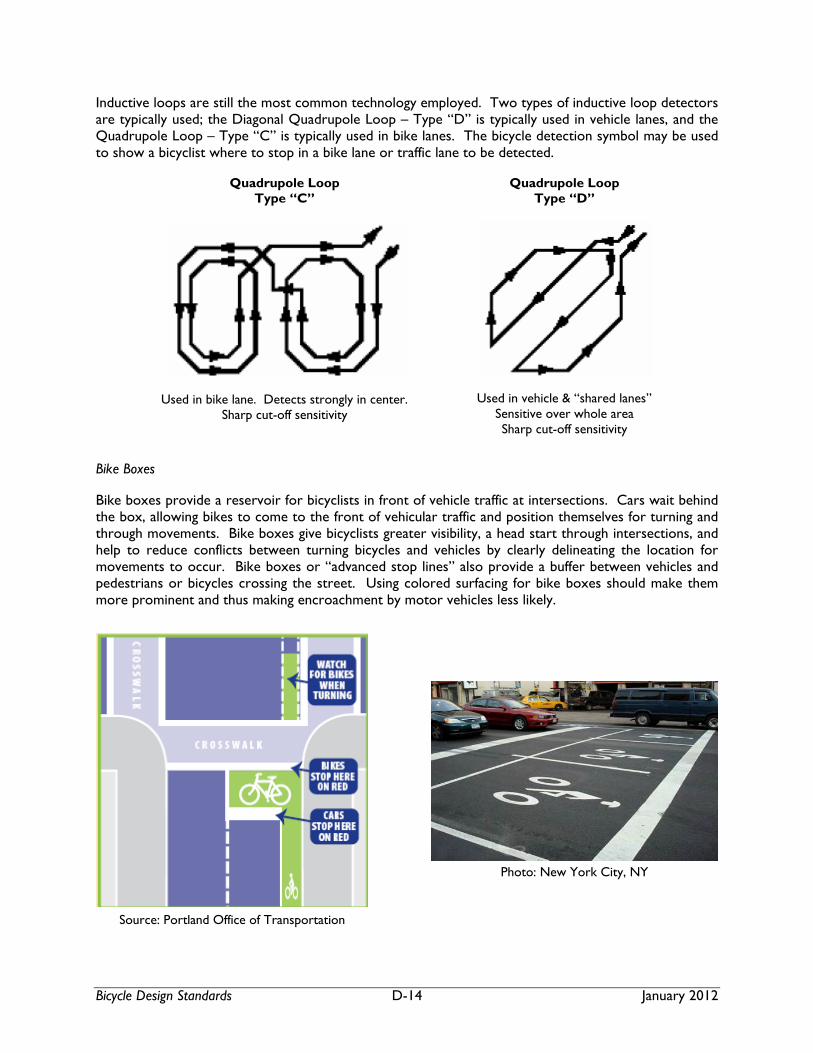
Bicycle Design Standards D-14 January 2012
Inductive loops are still the most common technology employed. Two types of inductive loop detectors are typically used; the Diagonal Quadrupole Loop – Type “D” is typically used in vehicle lanes, and the Quadrupole Loop – Type “C” is typically used in bike lanes. The bicycle detection symbol may be used to show a bicyclist where to stop in a bike lane or traffic lane to be detected.
Bike Boxes
Bike boxes provide a reservoir for bicyclists in front of vehicle traffic at intersections. Cars wait behind the box, allowing bikes to come to the front of vehicular traffic and position themselves for turning and through movements. Bike boxes give bicyclists greater visibility, a head start through intersections, and help to reduce conflicts between turning bicycles and vehicles by clearly delineating the location for movements to occur. Bike boxes or “advanced stop lines” also provide a buffer between vehicles and pedestrians or bicycles crossing the street. Using colored surfacing for bike boxes should make them more prominent and thus making encroachment by motor vehicles less likely.
Quadrupole Loop Type “C”
Used in bike lane. Detects strongly in center. Sharp cut-off sensitivity
Quadrupole Loop Type “D”
Used in vehicle & “shared lanes” Sensitive over whole area Sharp cut-off sensitivity
Photo: New York City, NY
Source: Portland Office of Transportation

Bicycle Design Standards D-15 January 2012
Design Elements
Drainage Grates
The function of drainage grates is to drain storm water quickly from the roadway and to provide access to the storm water system. Gutters are sloped to direct water flow into the inlet. This keeps water from ponding at the longitudinal joint and undermining the pavement. Improperly designed drainage grates can catch bicycle tires and cause bicyclists to lose control of their bicycle. Because of this, cyclists may veer into traffic lanes to avoid grates and utility covers. Properly designed grates and utility covers allow cyclists to maintain their direction of travel without catching tires or being forced into travel lanes.
Optimally the roadway should be designed so that the bicyclist does not have to traverse the grate per HDM Section 837.2. On roadways with curb and gutter, the grate should not be wider than the gutter pan. If the gutter pan needs to be widened to accommodate a large drainage grate, the taper should be on the outside edge.
On roads with bike lanes, the roadway shall be designed such that the minimum asphalt concrete pavement width of 48 inches is maintained between the bike lane stripe and the edge of the gutter lip. If 48 inches of asphalt cannot be maintained, then a curb face inlet design for the drainage grate should be considered (see Section 3.2.1).
On roadways with shoulders, the grate should be placed outside the travel path of the bicyclist, i.e. 48 inches of clear pavement should be maintained between the shoulder stripe and the left edge of the drainage grate. If 48 inches cannot be provided within the existing shoulder width, the shoulder can be widened to accommodate the grate, with the taper on the outside edge, or a narrower grate should be selected. See also Section 7.4.2 and Figure 7-13.
Only drainage grates depicted in Caltrans Standard Plans D77B-Bicycle- Proof Grate Details or otherwise known to be bicycle-safe may be used on all roadways per HDM 837.2. Regardless of type of roadway or placement on the roadway, all grates on the roadway should be bicycle-proof.
Pavement Marking Materials
Paint is the least recommended marking material due to its low reflectivity and low skid resistance, plus it needs to be reapplied every 12 to 24 months, increasing maintenance costs. Durable pavement markings are preferred. They should be reflectorized and be capable of maintaining an appropriate skid resistance under rainy or wet conditions to maximize safety for bicyclists. The minimum coefficient of friction should be 0.30 as measured with California Test 342 to test surface skid resistance. Pavement marking tape or thermoplastic is recommended.
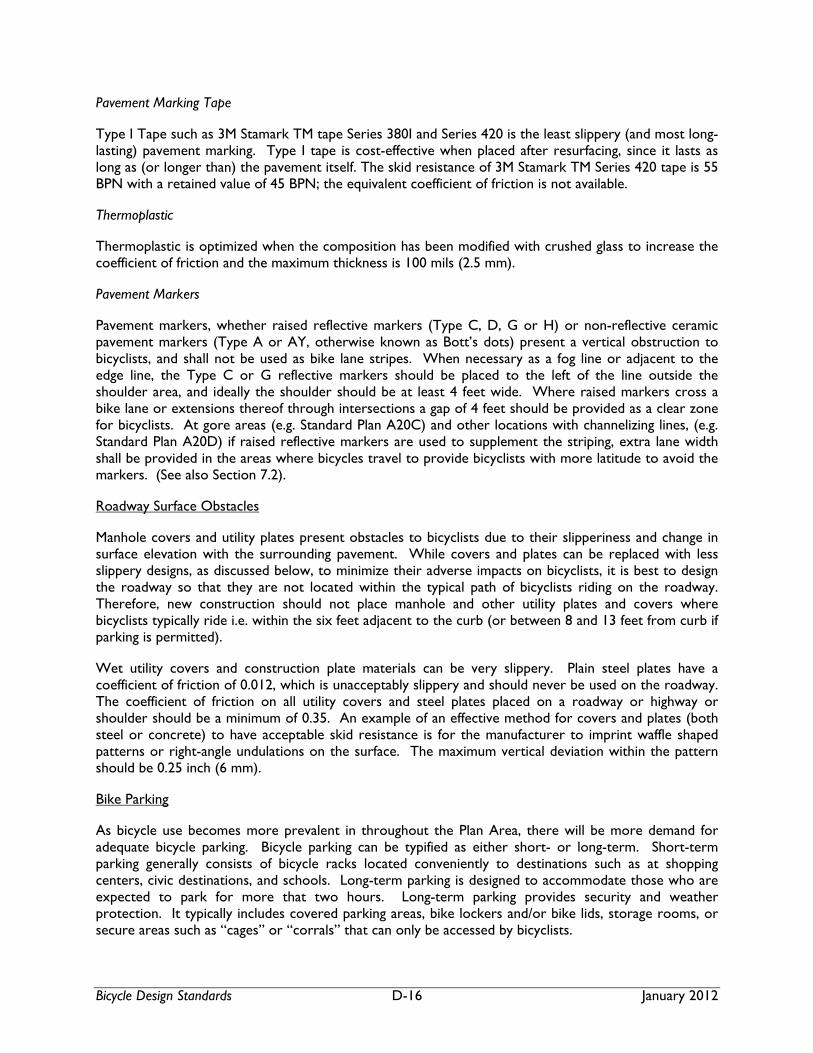
Bicycle Design Standards D-16 January 2012
Pavement Marking Tape
Type I Tape such as 3M Stamark TM tape Series 380I and Series 420 is the least slippery (and most long-lasting) pavement marking. Type I tape is cost-effective when placed after resurfacing, since it lasts as long as (or longer than) the pavement itself. The skid resistance of 3M Stamark TM Series 420 tape is 55 BPN with a retained value of 45 BPN; the equivalent coefficient of friction is not available.
Thermoplastic
Thermoplastic is optimized when the composition has been modified with crushed glass to increase the coefficient of friction and the maximum thickness is 100 mils (2.5 mm).
Pavement Markers
Pavement markers, whether raised reflective markers (Type C, D, G or H) or non-reflective ceramic pavement markers (Type A or AY, otherwise known as Bott’s dots) present a vertical obstruction to bicyclists, and shall not be used as bike lane stripes. When necessary as a fog line or adjacent to the edge line, the Type C or G reflective markers should be placed to the left of the line outside the shoulder area, and ideally the shoulder should be at least 4 feet wide. Where raised markers cross a bike lane or extensions thereof through intersections a gap of 4 feet should be provided as a clear zone for bicyclists. At gore areas (e.g. Standard Plan A20C) and other locations with channelizing lines, (e.g. Standard Plan A20D) if raised reflective markers are used to supplement the striping, extra lane width shall be provided in the areas where bicycles travel to provide bicyclists with more latitude to avoid the markers. (See also Section 7.2).
Roadway Surface Obstacles
Manhole covers and utility plates present obstacles to bicyclists due to their slipperiness and change in surface elevation with the surrounding pavement. While covers and plates can be replaced with less slippery designs, as discussed below, to minimize their adverse impacts on bicyclists, it is best to design the roadway so that they are not located within the typical path of bicyclists riding on the roadway. Therefore, new construction should not place manhole and other utility plates and covers where bicyclists typically ride i.e. within the six feet adjacent to the curb (or between 8 and 13 feet from curb if parking is permitted).
Wet utility covers and construction plate materials can be very slippery. Plain steel plates have a coefficient of friction of 0.012, which is unacceptably slippery and should never be used on the roadway. The coefficient of friction on all utility covers and steel plates placed on a roadway or highway or shoulder should be a minimum of 0.35. An example of an effective method for covers and plates (both steel or concrete) to have acceptable skid resistance is for the manufacturer to imprint waffle shaped patterns or right-angle undulations on the surface. The maximum vertical deviation within the pattern should be 0.25 inch (6 mm).
Bike Parking
As bicycle use becomes more prevalent in throughout the Plan Area, there will be more demand for adequate bicycle parking. Bicycle parking can be typified as either short- or long-term. Short-term parking generally consists of bicycle racks located conveniently to destinations such as at shopping centers, civic destinations, and schools. Long-term parking is designed to accommodate those who are expected to park for more that two hours. Long-term parking provides security and weather protection. It typically includes covered parking areas, bike lockers and/or bike lids, storage rooms, or secure areas such as “cages” or “corrals” that can only be accessed by bicyclists.
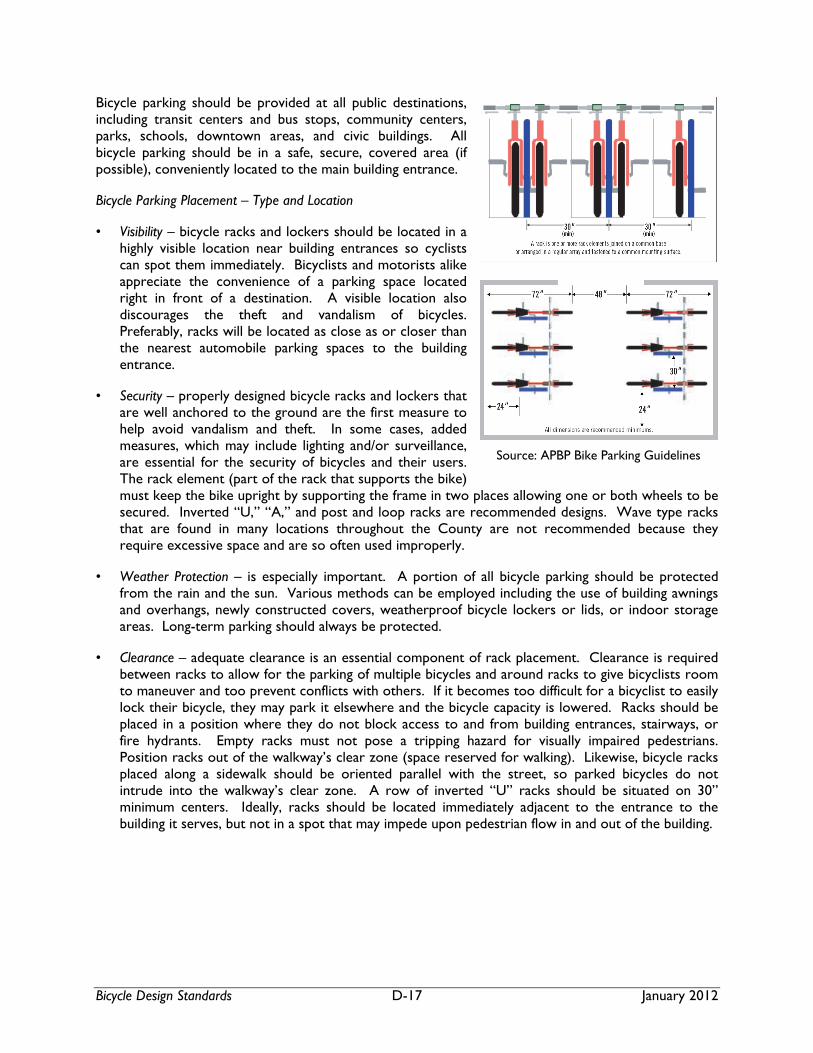
Bicycle Design Standards D-17 January 2012
Bicycle parking should be provided at all public destinations, including transit centers and bus stops, community centers, parks, schools, downtown areas, and civic buildings. All bicycle parking should be in a safe, secure, covered area (if possible), conveniently located to the main building entrance.
Bicycle Parking Placement – Type and Location
• Visibility – bicycle racks and lockers should be located in a highly visible location near building entrances so cyclists can spot them immediately. Bicyclists and motorists alike appreciate the convenience of a parking space located right in front of a destination. A visible location also discourages the theft and vandalism of bicycles. Preferably, racks will be located as close as or closer than the nearest automobile parking spaces to the building entrance.
• Security – properly designed bicycle racks and lockers that are well anchored to the ground are the first measure to help avoid vandalism and theft. In some cases, added measures, which may include lighting and/or surveillance, are essential for the security of bicycles and their users. The rack element (part of the rack that supports the bike) must keep the bike upright by supporting the frame in two places allowing one or both wheels to be secured. Inverted “U,” “A,” and post and loop racks are recommended designs. Wave type racks that are found in many locations throughout the County are not recommended because they require excessive space and are so often used improperly.
• Weather Protection – is especially important. A portion of all bicycle parking should be protected from the rain and the sun. Various methods can be employed including the use of building awnings and overhangs, newly constructed covers, weatherproof bicycle lockers or lids, or indoor storage areas. Long-term parking should always be protected.
• Clearance – adequate clearance is an essential component of rack placement. Clearance is required between racks to allow for the parking of multiple bicycles and around racks to give bicyclists room to maneuver and too prevent conflicts with others. If it becomes too difficult for a bicyclist to easily lock their bicycle, they may park it elsewhere and the bicycle capacity is lowered. Racks should be placed in a position where they do not block access to and from building entrances, stairways, or fire hydrants. Empty racks must not pose a tripping hazard for visually impaired pedestrians. Position racks out of the walkway’s clear zone (space reserved for walking). Likewise, bicycle racks placed along a sidewalk should be oriented parallel with the street, so parked bicycles do not intrude into the walkway’s clear zone. A row of inverted “U” racks should be situated on 30” minimum centers. Ideally, racks should be located immediately adjacent to the entrance to the building it serves, but not in a spot that may impede upon pedestrian flow in and out of the building.
Source: APBP Bike Parking Guidelines


City of Napa Bicycle Plan January 2012
Appendix E
OTS Collision Rankings, Charts and Graphs


READING AND UNDERSTANDING THE OTS RANKINGS
What are the OTS Rankings?
How are the OTS Rankings determined?
How to Read and Understand the OTS RankingsTop Horizontal Bar
Center Table
Bottom Table
The OTS Rankings were developed so that individual cities could compare their city’s traffic safety statistics to those of other cities withsimilar-sized populations. Cities could use these comparisons to see what areas they may have problems in and which they were doingwell in. The results helped both cities and OTS identify emerging or on-going traffic safety problem areas in order to help plan how tocombat the problems and help with the possibility of facilitating grants. In recent years, media, researchers and the public have taken aninterest in the OTS Rankings. It should be noted that OTS rankings are only indicators of potential problems; there are many factors thatmay either understate or overstate a city/county ranking that must be evaluated based on local circumstances.
NOTE: City rankings are for incorporated cities only. County Rankings include all roads – state, county and local – and all jurisdictions –CHP, Sheriff, Police and special.
Return to top
Victim and collision data for the rankings is taken from the latest available California Highway Patrol (CHP) Statewide Integrated TrafficRecords System (SWITRS) data.
Victim and collision rankings are based on rates of victims killed and injured or fatal and injury collisions per “1,000 daily-vehicle-miles-of-travel" (Caltrans data) and per “1,000 average population" (Department of Finance data) figures. This more accurately ensures properweighting and comparisons when populations and daily vehicle miles traveled vary.
DUI arrest totals and rankings are calculated for cities only and are based on rates of non-CHP DUI arrests (Department of Justicedata). This is so that local jurisdictions can see how their own efforts are working.
Counties are assigned statewide rankings, while cities are assigned population group rankings.
Return to top
Top Horizontal Bar:
Agency – local jurisdiction that the data applies to.
Year – the year the data represents. The rankings are updated once per year when all component statistics and data have beenreported.
County – county in which the city is located.
Group – Cities are grouped by population:
Group A – 13 cities, populations over 250,000
Group B – 55 cities, population 100,001-250,000
Group C – 103 cities, population 50,001-100,000
Group D – 97 cities, population 25,001-50,000
Rankings for smaller cities are not included on-line, but are available through the OTS Public Affairs Office.
Population – estimates matched to “Year”
DVMT – Daily Vehicle Miles Traveled. Caltrans estimate of the total number of miles all vehicles traveled on that city’s streets on anaverage day during that year.
What are the OTS Rankings?
How are the OTS Rankings determined?
How to Read and Understand the OTS Rankings
11/17/2010 California Office of Traffic Safety (OTS) - Grants
ots.ca.gov/Media_and_Research/…/default.asp 2/4
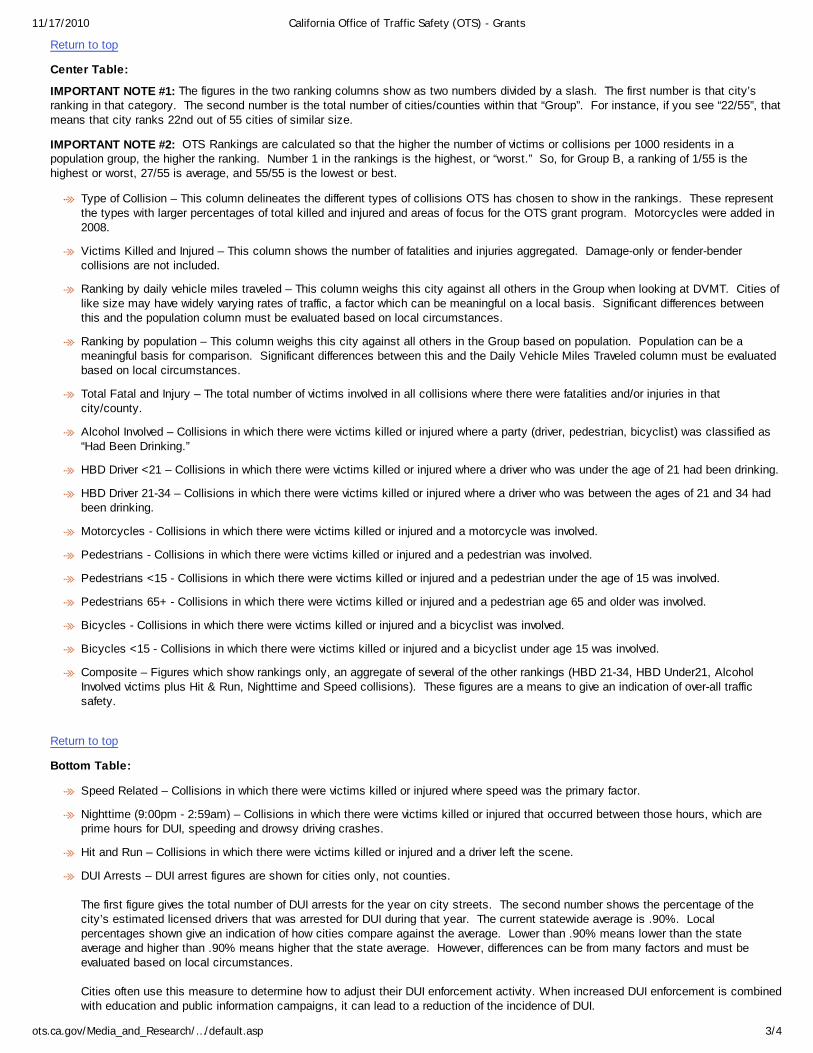
Return to top
Center Table:
IMPORTANT NOTE #1: The figures in the two ranking columns show as two numbers divided by a slash. The first number is that city’sranking in that category. The second number is the total number of cities/counties within that “Group”. For instance, if you see “22/55”, thatmeans that city ranks 22nd out of 55 cities of similar size.
IMPORTANT NOTE #2: OTS Rankings are calculated so that the higher the number of victims or collisions per 1000 residents in apopulation group, the higher the ranking. Number 1 in the rankings is the highest, or “worst.” So, for Group B, a ranking of 1/55 is thehighest or worst, 27/55 is average, and 55/55 is the lowest or best.
Type of Collision – This column delineates the different types of collisions OTS has chosen to show in the rankings. These representthe types with larger percentages of total killed and injured and areas of focus for the OTS grant program. Motorcycles were added in2008.
Victims Killed and Injured – This column shows the number of fatalities and injuries aggregated. Damage-only or fender-bendercollisions are not included.
Ranking by daily vehicle miles traveled – This column weighs this city against all others in the Group when looking at DVMT. Cities oflike size may have widely varying rates of traffic, a factor which can be meaningful on a local basis. Significant differences betweenthis and the population column must be evaluated based on local circumstances.
Ranking by population – This column weighs this city against all others in the Group based on population. Population can be ameaningful basis for comparison. Significant differences between this and the Daily Vehicle Miles Traveled column must be evaluatedbased on local circumstances.
Total Fatal and Injury – The total number of victims involved in all collisions where there were fatalities and/or injuries in thatcity/county.
Alcohol Involved – Collisions in which there were victims killed or injured where a party (driver, pedestrian, bicyclist) was classified as“Had Been Drinking.”
HBD Driver <21 – Collisions in which there were victims killed or injured where a driver who was under the age of 21 had been drinking.
HBD Driver 21-34 – Collisions in which there were victims killed or injured where a driver who was between the ages of 21 and 34 hadbeen drinking.
Motorcycles - Collisions in which there were victims killed or injured and a motorcycle was involved.
Pedestrians - Collisions in which there were victims killed or injured and a pedestrian was involved.
Pedestrians <15 - Collisions in which there were victims killed or injured and a pedestrian under the age of 15 was involved.
Pedestrians 65+ - Collisions in which there were victims killed or injured and a pedestrian age 65 and older was involved.
Bicycles - Collisions in which there were victims killed or injured and a bicyclist was involved.
Bicycles <15 - Collisions in which there were victims killed or injured and a bicyclist under age 15 was involved.
Composite – Figures which show rankings only, an aggregate of several of the other rankings (HBD 21-34, HBD Under21, AlcoholInvolved victims plus Hit & Run, Nighttime and Speed collisions). These figures are a means to give an indication of over-all trafficsafety.
Return to top
Bottom Table:
Speed Related – Collisions in which there were victims killed or injured where speed was the primary factor.
Nighttime (9:00pm - 2:59am) – Collisions in which there were victims killed or injured that occurred between those hours, which areprime hours for DUI, speeding and drowsy driving crashes.
Hit and Run – Collisions in which there were victims killed or injured and a driver left the scene.
DUI Arrests – DUI arrest figures are shown for cities only, not counties.
The first figure gives the total number of DUI arrests for the year on city streets. The second number shows the percentage of thecity’s estimated licensed drivers that was arrested for DUI during that year. The current statewide average is .90%. Localpercentages shown give an indication of how cities compare against the average. Lower than .90% means lower than the stateaverage and higher than .90% means higher that the state average. However, differences can be from many factors and must beevaluated based on local circumstances.
Cities often use this measure to determine how to adjust their DUI enforcement activity. When increased DUI enforcement is combinedwith education and public information campaigns, it can lead to a reduction of the incidence of DUI.
11/17/2010 California Office of Traffic Safety (OTS) - Grants
ots.ca.gov/Media_and_Research/…/default.asp 3/4

“0” Note: Cities reporting 0 victims and/or collisions for a category or 0 DUI arrests are ranked using the variable upon which the ranking isbased. For example, if 10 of 97 cities in population group D reported 0 hit-and-run fatal and injury collisions when ranking by per “1,000average population,” the city with the highest population of these 10 cities would be ranked 97/97, and the city with the lowest population ofthese 10 cities would be ranked 88/97. The same methodology has been applied when ranking per “1,000 daily-vehicle-miles-of-travel” andper “estimated average number of licensed drivers.”
Return to top
Conditions of Use | Privacy PolicyCopyright © 2007 State of California
11/17/2010 California Office of Traffic Safety (OTS) - Grants
ots.ca.gov/Media_and_Research/…/default.asp 4/4

OFFICE OF TRAFFIC SAFETY - 2006 RANKINGS
AGENCY
2802 NAPA COUNTY 76,818C
562
40
NCIC COUNTY POPULATION (AVG) DVMTGROUP
7
14
40
35
136
22
6
0
35
7
37/103
13/103
22/103
25/103
16/103
18/103
5/103
561,016
57/103
41/103
102/103
12/103
21/103
5/103
10/103
11/103
8/103
12/103
1/103
22/103
36/103
33/103
94/103
8/103
11/103
TYPE OF COLLISION
Total Fatal and Injury.......................
Speed Related..................................
Alcohol Involved..............................
Nighttime...........................................
Hit and Run........................................
HBD Driver <21..................................
HBD Driver 21-34...............................
Pedestrians........................................
Pedestrians 65+.................................
Pedestrians <15.................................
Bicyclists...........................................
Bicyclists <15.....................................
DUI ARRESTS 268
3/103 7/103Composite ...........................................................................
0.58 64/101%
VICTIMS
KILLED AND
INJURED
NAPA
RANKING BY
DAILY VEHICLE
MILES TRAVELED
RANKING BY
AVERAGE
POPULATION
COLLISIONS
10/20/2010Printed: Page 1 of 1
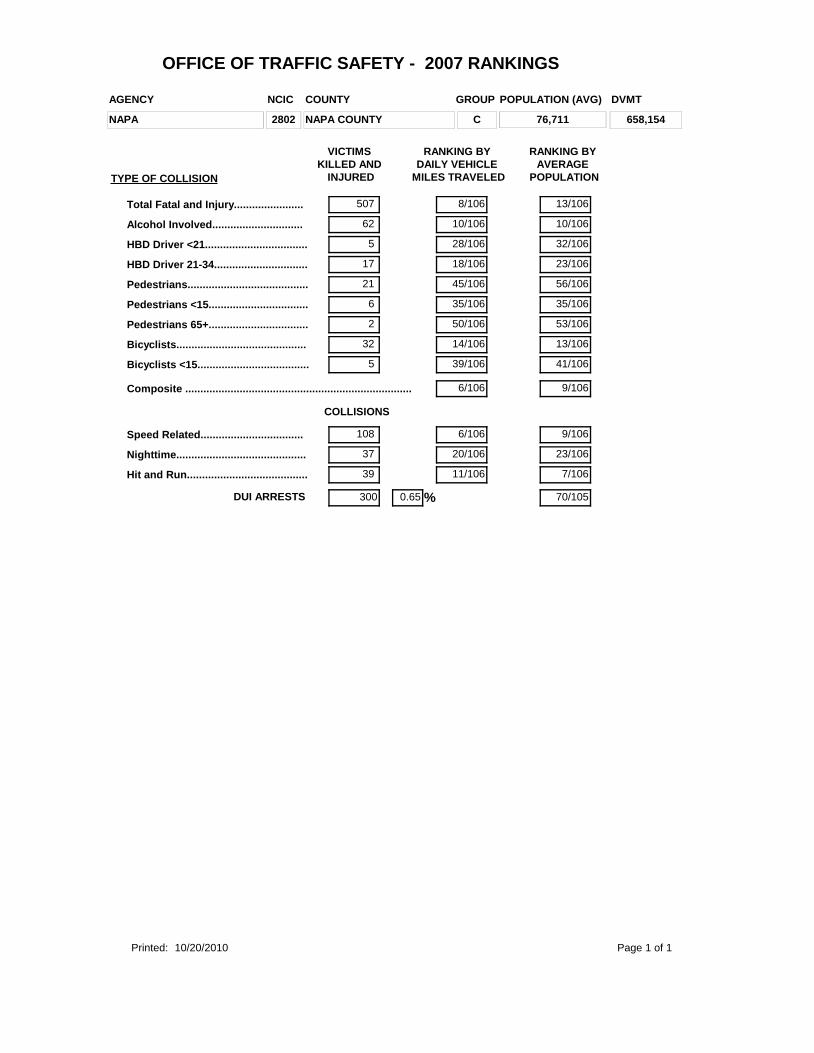
OFFICE OF TRAFFIC SAFETY - 2007 RANKINGS
AGENCY
2802 NAPA COUNTY 76,711C
507
62
NCIC COUNTY POPULATION (AVG) DVMTGROUP
5
17
37
39
108
21
6
2
32
5
10/106
13/106
32/106
23/106
23/106
7/106
9/106
658,154
56/106
35/106
53/106
13/106
41/106
8/106
28/106
18/106
20/106
11/106
6/106
10/106
45/106
35/106
50/106
14/106
39/106
TYPE OF COLLISION
Total Fatal and Injury.......................
Speed Related..................................
Alcohol Involved..............................
Nighttime...........................................
Hit and Run........................................
HBD Driver <21..................................
HBD Driver 21-34...............................
Pedestrians........................................
Pedestrians 65+.................................
Pedestrians <15.................................
Bicyclists...........................................
Bicyclists <15.....................................
DUI ARRESTS 300
6/106 9/106Composite ...........................................................................
0.65 70/105%
VICTIMS
KILLED AND
INJURED
NAPA
RANKING BY
DAILY VEHICLE
MILES TRAVELED
RANKING BY
AVERAGE
POPULATION
COLLISIONS
10/20/2010Printed: Page 1 of 1

City: -- SELECT ONE --
SHOW CITY
County: -- SELECT ONE --
SHOW COUNTY
Home Media and Research Rankings
OTS RANKINGS
Select a City or County from one of the dropdown lists and click on the Show City or Show County button.
Agency Year County Group Population (Avg) DVMT
Napa 2008 NAPA COUNTY C 77,285 640,657
TYPE OF COLLISIONVICTIMSKILLED &INJURED
RANKING BYDAILY VEHICLE
MILES TRAVELED
RANKING BYAVERAGE
POPULATION
Total Fatal and Injury 497 2/103 12/103
Alcohol Involved 51 8/103 16/103
HBD Driver < 21 2 54/103 62/103
HBD Driver 21 - 34 20 3/103 5/103
Motorcycles 16 14/103 27/103
Pedestrians 25 30/103 39/103
Pedestrians < 15 2 82/103 88/103
Pedestrians 65+ 2 50/103 55/103
Bicyclists 37 13/103 13/103
Bicyclists < 15 4 50/103 62/103
Composite 4/103 9/103
TYPE OF COLLISIONFATAL &INJURY
COLLISIONS
RANKING BYDAILY VEHICLE
MILES TRAVELED
RANKING BYAVERAGE
POPULATION
Speed Related 95 7/103 12/103
Nighttime (9:00pm - 2:59am) 39 8/103 16/103
Hit and Run 36 14/103 10/103
DUI ARRESTS 305 0.65% 64/102
11/17/2010 California Office of Traffic Safety (OTS) - Grants
ots.ca.gov/Media_and_Research/…/default.asp 1/4

10
20
30
40
50
60
70
80
90
100
1999
49
2000
55
2001
38
2002
51
2003
46
2004
57
2005
57
2006
46
2007
41
2008
39
NAPA COUNTY BICYCLE STUDYCITY OF NAPA
Collisions by Year 1/1/1999 to 12/31/2008 Total Collisions: 479

10
20
30
40
50
60
70
80
90
100
January
31
February
29
March
34
April
46
May
51
June
44
July
36
August
41
September
39
October
52
November
30
December
46
NAPA COUNTY BICYCLE STUDYCITY OF NAPA
Collisions by Month 1/1/1999 to 12/31/2008 Total Collisions: 479
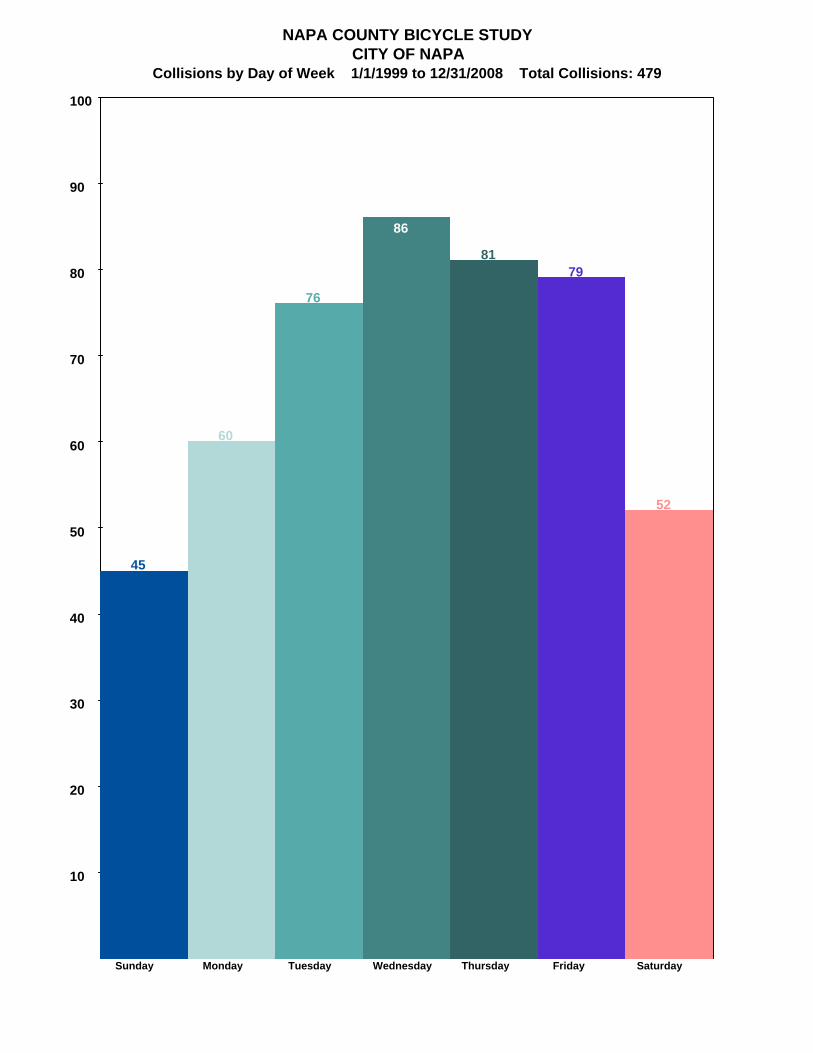
10
20
30
40
50
60
70
80
90
100
Sunday
45
Monday
60
Tuesday
76
Wednesday
86
Thursday
81
Friday
79
Saturday
52
NAPA COUNTY BICYCLE STUDYCITY OF NAPA
Collisions by Day of Week 1/1/1999 to 12/31/2008 Total Collisions: 479

10
20
30
40
50
60
70
80
90
100
0100
2
0300
1 0500
1 0600
4
0700
29
0800
28
0900
13
1000
18
1100
31
1200
32
1300
30
1400
37
1500
50
1600
44
1700
51
1800
42
1900
22
2000
15
2100
13
2200
8
2300
7
NAPA COUNTY BICYCLE STUDYCITY OF NAPA
Collisions by Hour 1/1/1999 to 12/31/2008 Total Collisions: 479 (Unkown Time: 1)
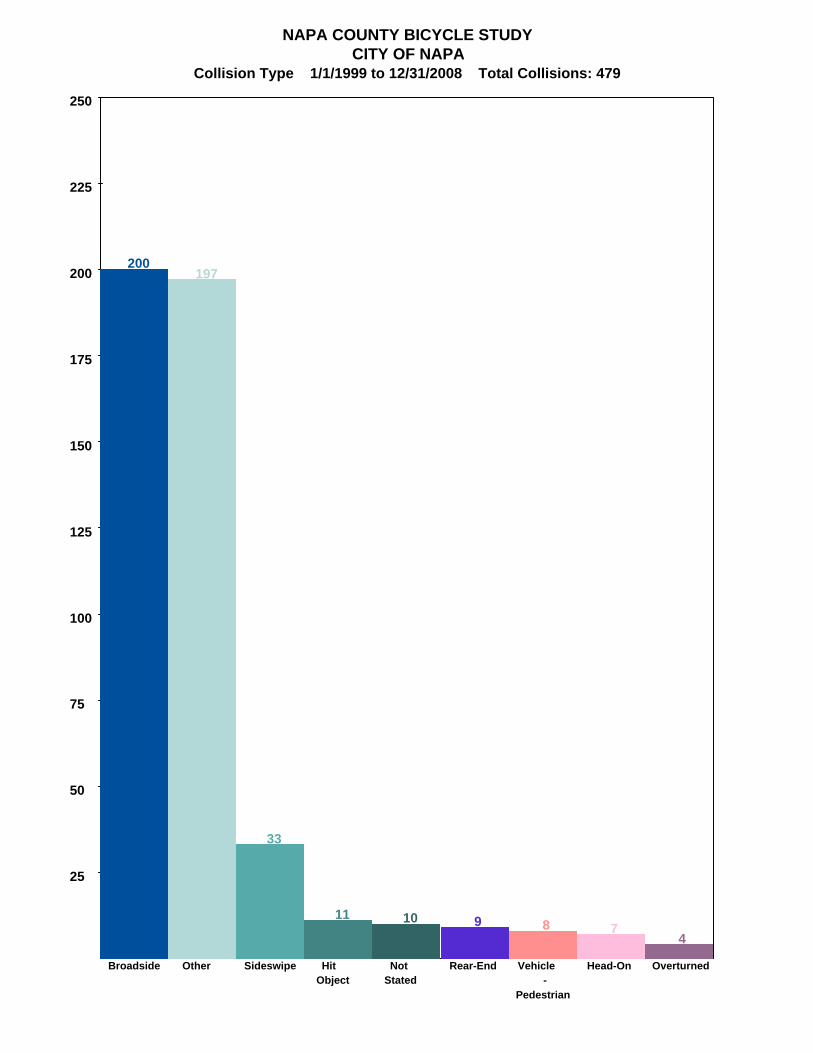
25
50
75
100
125
150
175
200
225
250
Broadside
200
Other
197
Sideswipe
33
HitObject
11
NotStated
10
Rear-End
9
Vehicle-
Pedestrian
8
Head-On
7
Overturned
4
NAPA COUNTY BICYCLE STUDYCITY OF NAPA
Collision Type 1/1/1999 to 12/31/2008 Total Collisions: 479

25
50
75
100
125
150
175
200
225
250
WrongSide
ofRoad
158
AutoR/W
Violation
88
Unknown
46
ImproperTurning
43
TrafficSignals
andSigns
38
OtherHazardousMovement
36
AllOthers
14
Other
13
UnsafeSpeed
11
DrivingUnder
Influence
10
ImproperPassing
7
OtherThan
DriverorPed
5
UnsafeStarting
orBacking
5
PedR/W
Violation
5
NAPA COUNTY BICYCLE STUDYCITY OF NAPA
Primary Collision Factors 1/1/1999 to 12/31/2008 Total Collisions: 479

25
50
75
100
125
150
175
200
225
250
PropertyDamage
Only
92
Complaintof
Pain
147
OtherVisibleInjury
214
SevereInjury
25
Fatal 1
NAPA COUNTY BICYCLE STUDYCITY OF NAPA
Extent of Injury 1/1/1999 to 12/31/2008 Total Collisions: 479
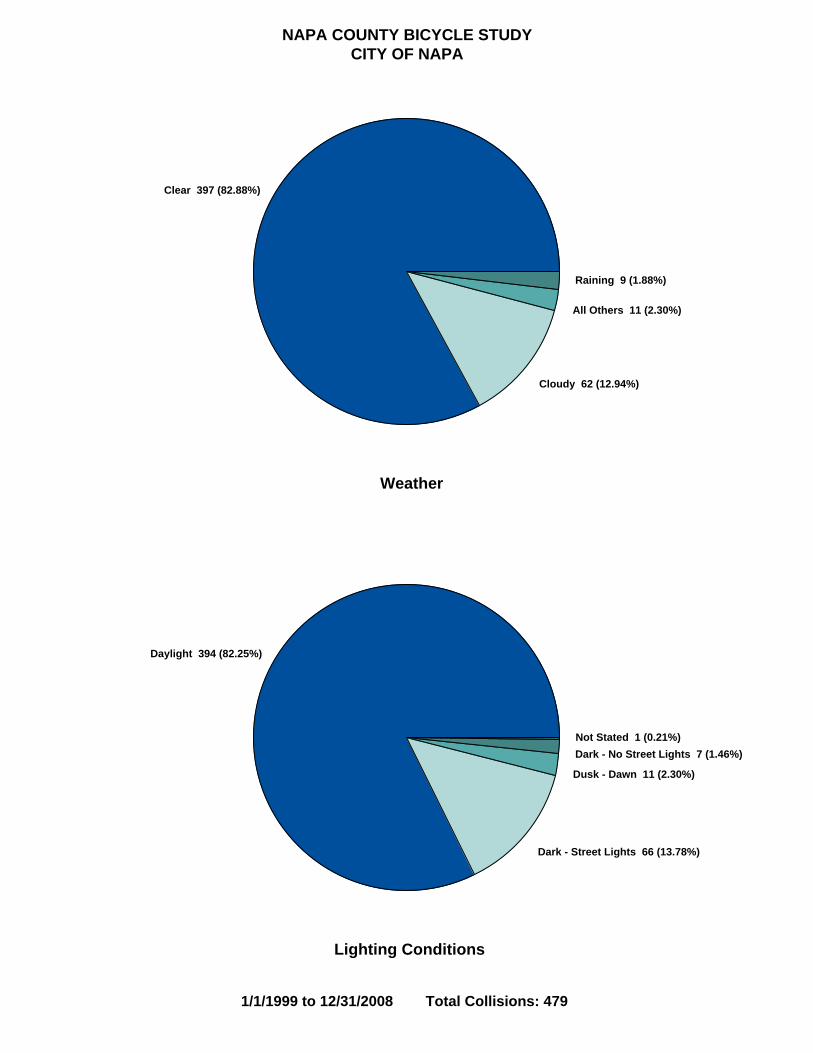
Clear 397 (82.88%)
Cloudy 62 (12.94%)
All Others 11 (2.30%)
Raining 9 (1.88%)
Weather
Daylight 394 (82.25%)
Dark - Street Lights 66 (13.78%)
Dusk - Dawn 11 (2.30%)
Dark - No Street Lights 7 (1.46%)Not Stated 1 (0.21%)
Lighting Conditions
NAPA COUNTY BICYCLE STUDYCITY OF NAPA
1/1/1999 to 12/31/2008 Total Collisions: 479

City of Napa Bicycle Plan January 2012
Appendix F
MTC and National Bicycle and Pedestrian Documentation Project Information


Bicycle Count Guidelines F-1 January 2012
Appendix F – Bicycle Count Guidelines
Count Methodologies
Metropolitan Transportation Commission
In 2003, the Metropolitan Transportation Commission (MTC) funded the Bicyclist and Pedestrian Data Collection and Analysis Project. The project resulted in the Handbook for Bicyclists and Pedestrian Counts, for use by local agencies throughout the Bay Area. The Handbook presents guidelines and standard methodologies for conducting counts of bicyclist and pedestrian activity. MTC’s bicycle count methodology was developed to attain a consistent regional bicycle count and analysis procedures so that trends in usage can be documented throughout the Bay Area. The counting strategy outlined in the Handbook provides an easy and inexpensive method of conducting bicycle and pedestrian counts on a regular basis. The level of detail to be extracted during routine counts is kept to a minimum to reduce ambiguity while still providing useful data. The methodology is not unlike a typical traffic count which reveals little more than the time of day, and direction of travel. Collection of data regarding the motorist’s age, trip purpose, length of trip, etc. is relatively rare. Using the procedures outlined in MTC’s Handbook and any subsequent updates will ensure consistent results among local agencies for the development of a count database, as well as with larger efforts conducted by MTC throughout the region. Count procedures and instructions provided by MTC can be found on MTC’s website via the following web link: http://www.mtc.ca.gov/planning/bicyclespedestrians/counts.htm
National Bicycle and Pedestrian Documentation Project
The National Bicycle and Pedestrian Documentation Project (NBPDP) is an annual bicycle and pedestrian count and survey effort sponsored by the Institute of Transportation Engineers Pedestrian and Bicycle Council. The goals of the NBPD are to: (1) Establish a consistent national bicycle and pedestrian count and survey methodology; (2) Establish a national database of bicycle and pedestrian count information generated by these consistent methods and practices; and (3) Use the count and survey information to begin analysis on the correlations between local demographic, climate and land-use factors and bicycle and pedestrian activity. More information about the project can be found at: http://bikepeddocumentation.org/
Recommendations
In order to supplement US Census Journey to Work (JTW) data, to attain a better understanding of existing usage and travel patterns, and to be able to project demand, regular bicycle counts (on an annual or bi-annual basis as needed), are recommended as a programmatic improvement. Periodic counts should be coordinated through a central clearing house such as the NCTPA or the Napa County Bicycle Coalition and conducted in each jurisdiction within the plan area. Counts may be conducted by volunteers, interns, and others as appropriate.
Recommended Count Locations
Count locations were selected using the following criteria:
1. To ensure a balanced geographical representation of the count locations.
2. To capture inter-jurisdiction activity at community gateways.
3. The intersection of primary bicycle routes.

Bicycle Count Guidelines F-2 January 2012
4. Proximity to major destinations such as downtowns, civic destinations, employment centers, transit facilities, schools, etc.
5. Location on the regional or local bicycle network (existing or proposed)
Recommended count locations are catalogued in a database by jurisdiction in Attachment A, and shown graphically on maps in Attachment B. Count locations generally consist of street intersections and/or pathway/street intersections. Each count location is identified by its primary street and cross street, and includes notations about the existing and/or proposed bikeway facilities at the site. Additional details are provided about the general type of bicycle use or activity expected in the area along with notes specific to the site or future uses in the vicinity of the count location where appropriate. Over time, additional data fields may be built into the database such as Average Daily Traffic Volumes, traffic speeds, street widths, pavement conditions, etc.
Count Periods
Bicyclist and pedestrian counts can be conducted during each season of the year: fall, spring, summer and winter. However, counts during the winter months are often avoided due to poor weather conditions and extended holiday-related vacations. The second week in September is the official annual National Bicycle and Pedestrian Count and survey week. Counts are also conducted optionally for the National Bicycle and Pedestrian Count program during the second week of January, the second week of May, and the first week of July.
Prior to conducting counts, school districts and/or institutions within each jurisdiction should be contacted to verify when schools will be in session to avoid spring and winter breaks and special school events. Counts at locations that are not near schools can be accurately conducted during the summer months. In Napa, summertime conditions typically represent peak travel volumes. It should be noted that counting periods should be as condensed as much as possible to ensure the most consistent conditions.
Counts should be conducted during non-holiday weeks on Tuesdays, Wednesdays or Thursdays and the Saturdays preceding or following the count week. If counts must be conducted during holiday weeks, the actual holiday day should be avoided, and the Tuesday after Monday holidays and the Thursday before Friday holidays should also be avoided.
Counts should be conducted during standard peak commute hours. Typically, the weekday morning peak occurs between 7:00 and 9:00 AM, the weekday evening peak occurs between 4:00 and 6:00 PM, and the weekend midday peak occurs on Saturdays between 12:00 noon and 2:00 PM. Time periods may be adjusted to account for local considerations, and supplementary counts may be conducted to capture specific activities, such as school commutes.
Recommendation: It is recommended that bicycle counts conducted throughout the Plan area be consistent with MTC’s guidelines and conducted in accordance with the National Bicycle and Pedestrian Documentation Project so that they may be coordinated with regional and national databases.
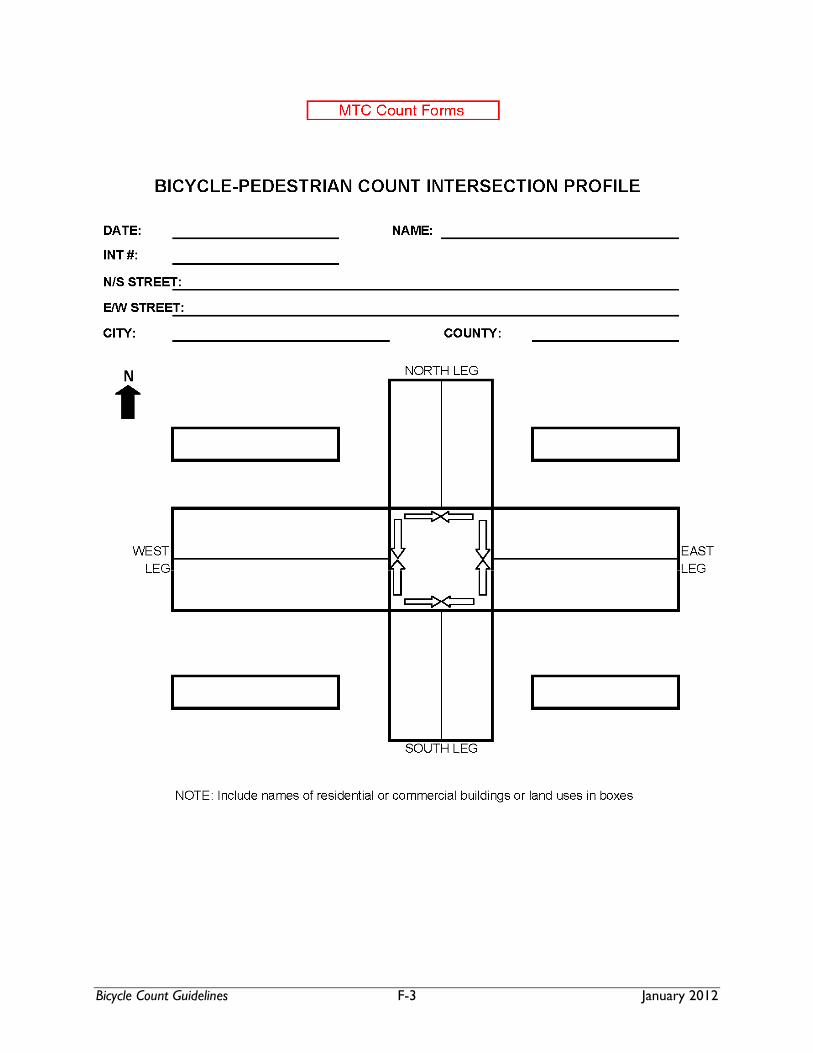
Bicycle Count Guidelines F-3 January 2012

Bicycle Count Guidelines F-4 January 2012
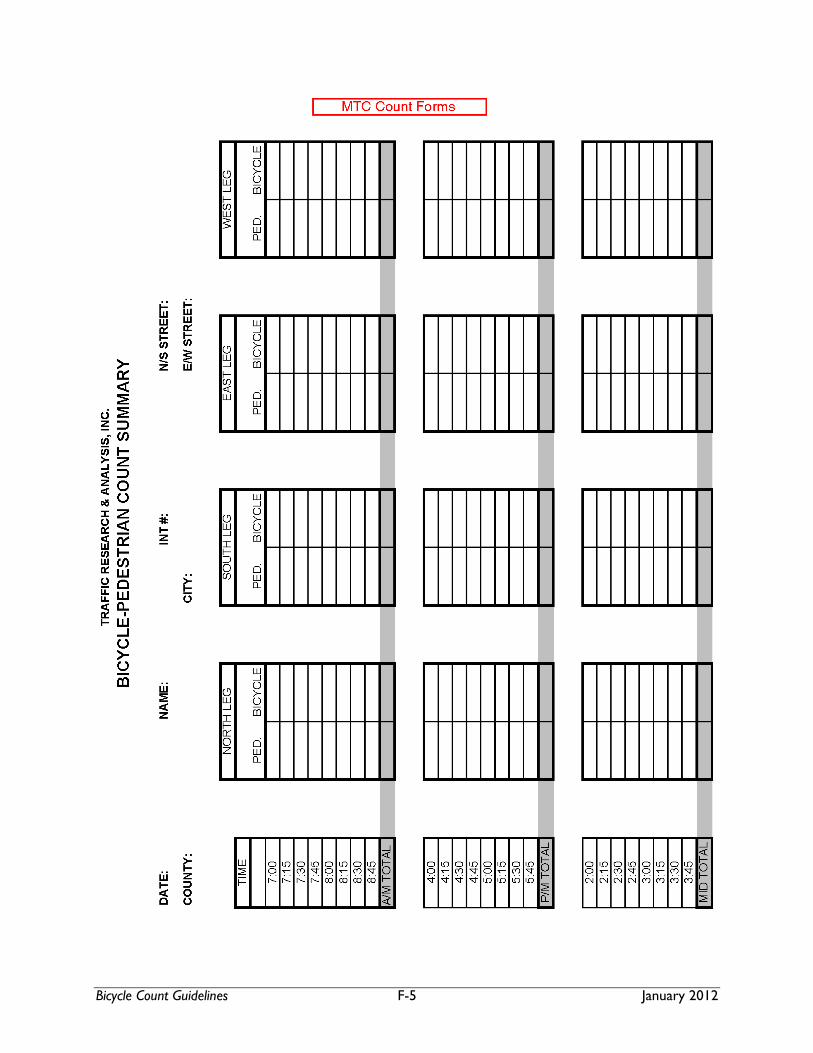
Bicycle Count Guidelines F-5 January 2012

Bicycle Count Guidelines F-6 January 2012

Bicycle Count Guidelines F-7 January 2012

Bicycle Count Guidelines F-8 January 2012
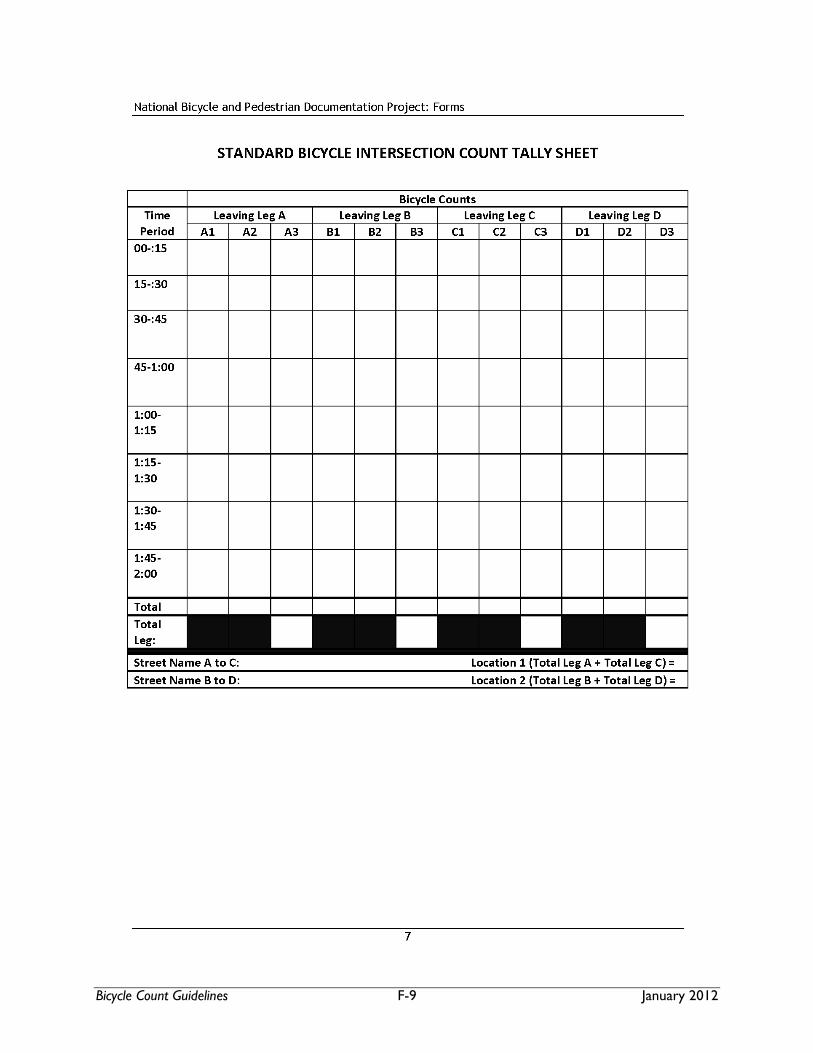
Bicycle Count Guidelines F-9 January 2012


City of Napa Bicycle Plan January 2012
Appendix G
Napa Bicycle Parking Facilities – Existing Bike Racks Inventory (Field Survey June 2010)


Napa Bicycle Parking Facilities – Existing Bike Racks Inventory (Field Survey June 2010) G-1 January 2012
Napa Bicycle Parking Facilities – Existing Bike Racks Inventory (Field Survey June 2010)
Land Use Type Name Address Location of Bike Racks Type of Rack Size Notes
Schools
Public Elementary School Alta Heights Elementary 15 Montecito Blvd at East Ave 17
Public Elementary School Bel Aire Elementary 3580 Beckworth near El Capitan behind library and in main entrance/picnic courtyard Traditional 20
Public Elementary School Browns Valley Elementary 1001 Buhman Rd at Browns Valley E/front of school facing street & parking lot, screened Traditional 27+
Public Elementary School El Centro Elementary 1480 El Centro at Moss Court in paved area southeast corner of school facing st. traditional 33
Public Elementary School McPherson Elementary 2670 Yajome at Pueblo interior court by picnic tables & room 3 loops and trad 5 (X2) + 18
Public Elementary School Napa Valley Language Academy 2700 Kilburn St at Cornwall behind main entry to left and right trad and low 27 + 6
Public Elementary School Northwood Elementary 2214 Berks ay Oxford NONE apparent 18
Public Elementary School Phillips Charter Elementary 1210 Shetler at Shurtleff not surveyed; info from school 25
Public Elementary School Pueblo Vista Elementary 1600 Barbara Rd at Linda Vista south corner next to parking low & playground traditional 30
Public Elementary School Salvador Elementary 1850 Salvador at SR 29 not surveyed; info from school 18
Public Elementary School Shearer Charter Elementary 1590 Elm at Franklin by room 20, NE corner playground; not visible from street traditional 24
Public Elementary School Snow Elementary 1130 Foster Rd NONE apparent
Public Elementary School West Park Elementary 2315 West Park at Linda Vista behind Linda Vista portables low racks 18
Private Elementary School Blue Oak Elementary 1436 Polk at Seminary east side of building facing Pearl St; rear entrance loops 3 (6 bikes)
Private Elementary School St. Johns Catholic Elementary 960 Caymus NONE apparent
Private Elementary School St. Johns Lutheran 3521 Linda Vista NONE apparent
Private Elementary School St. Appolinarias Catholic 3700 Lassen north side of office in central entrance plaza Traditional 18
Private Elementary School St. Appolinarias Catholic 3700 Lassen southern end of campus by basketball courts traditional 18
Middle School Redwood Middle School 3600 Oxford at Redwood enclosure at front entrance, new 5-4 loops X 4 80 both sides avail
Middle School Silverado Middle School 1133 Coombsville Rd at Jacks Ln not surveyed; info from school 35
Private K-12 school Napa Christian south side Pine at Seymour front facing to west of entrance trad 6
High School Napa High 2475 Jefferson at Lincoln adult school entrance & inside main entrance courtyard trad + trad 9 + 78 None by admin
High School New Technology High 920 Yount at Yajome under construction summer 2010
High School Vintage High 1375 Trower at Jefferson new main entrance plaza loops 16 (32 bikes)
Private High School Justin Siena 4026 Maher at Trower north side of main entrance inside fence low racks 8
Private High School Valley Oak Cont. High Marin at Myrtle at entrance facing street traditional 18
Adult School, Middle, & High Napa Adult, River & Temescal 2447 Old Sonoma Rd at Freeway Dr in chain link enclosure at SW end of lrg campus trad, low and other 74 4 "Bike rack/
Community College Napa Valley College west side 2277 Napa Valley Hwy so/of Imola east side of building by new library entrance freestanding loops 10 Bike locker"
Community College Napa Valley College west side 2277 Napa Valley Hwy so/of Imola south side by entrance of old library loops 3 (6 bikes) locations
Community College Napa Valley College west side 2277 Napa Valley Hwy so/of Imola east side building 1400 loops 2 (4 bikes) planned &
Community College Napa Valley College west side 2277 Napa Valley Hwy so/of Imola north side of building 900 traditional 4 on campus map
Community College Napa Valley College west side 2277 Napa Valley Hwy so/of Imola south and south east corner of tennis courts loops 1 + 6 (14 bikes)
Community College Napa Valley College west side 2277 Napa Valley Hwy so/of Imola west side new gym (#400) loops 5 (10 bikes)
Community College Napa Valley College west side 2277 Napa Valley Hwy so/of Imola west side performing arts building loops 5 (10 bikes)
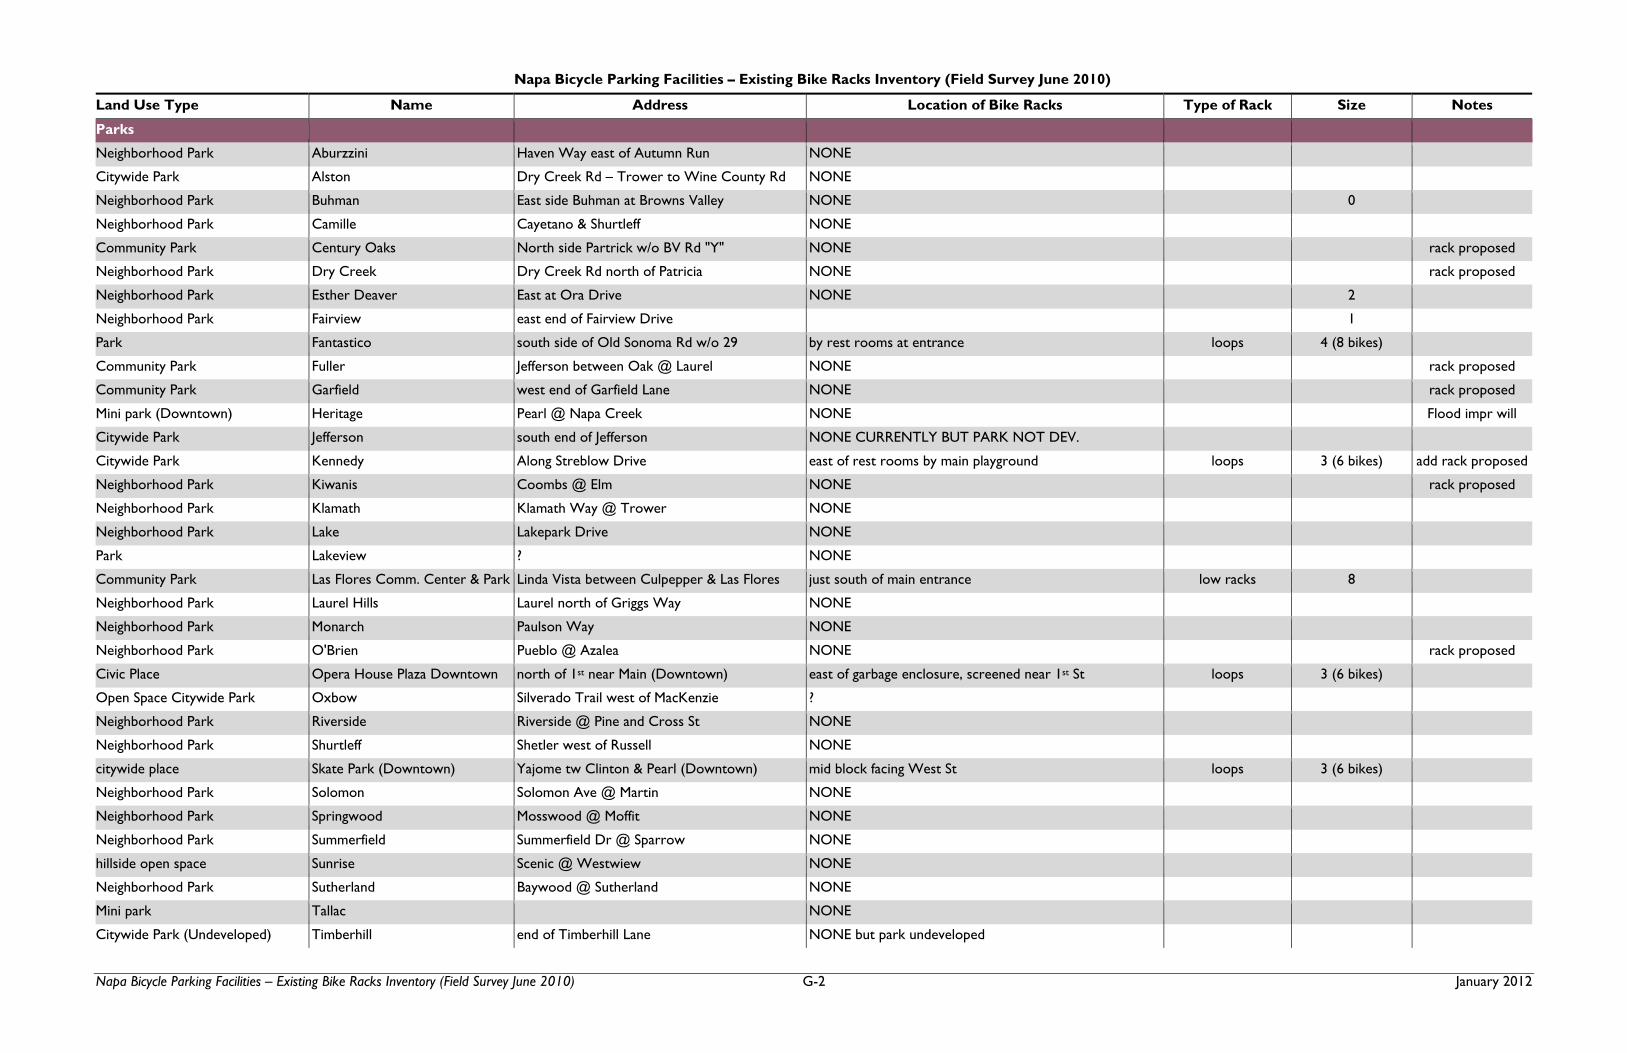
Napa Bicycle Parking Facilities – Existing Bike Racks Inventory (Field Survey June 2010) G-2 January 2012
Napa Bicycle Parking Facilities – Existing Bike Racks Inventory (Field Survey June 2010)
Land Use Type Name Address Location of Bike Racks Type of Rack Size Notes
Parks
Neighborhood Park Aburzzini Haven Way east of Autumn Run NONE
Citywide Park Alston Dry Creek Rd – Trower to Wine County Rd NONE
Neighborhood Park Buhman East side Buhman at Browns Valley NONE 0
Neighborhood Park Camille Cayetano & Shurtleff NONE
Community Park Century Oaks North side Partrick w/o BV Rd "Y" NONE rack proposed
Neighborhood Park Dry Creek Dry Creek Rd north of Patricia NONE rack proposed
Neighborhood Park Esther Deaver East at Ora Drive NONE 2
Neighborhood Park Fairview east end of Fairview Drive 1
Park Fantastico south side of Old Sonoma Rd w/o 29 by rest rooms at entrance loops 4 (8 bikes)
Community Park Fuller Jefferson between Oak @ Laurel NONE rack proposed
Community Park Garfield west end of Garfield Lane NONE rack proposed
Mini park (Downtown) Heritage Pearl @ Napa Creek NONE Flood impr will
Citywide Park Jefferson south end of Jefferson NONE CURRENTLY BUT PARK NOT DEV.
Citywide Park Kennedy Along Streblow Drive east of rest rooms by main playground loops 3 (6 bikes) add rack proposed
Neighborhood Park Kiwanis Coombs @ Elm NONE rack proposed
Neighborhood Park Klamath Klamath Way @ Trower NONE
Neighborhood Park Lake Lakepark Drive NONE
Park Lakeview ? NONE
Community Park Las Flores Comm. Center & Park Linda Vista between Culpepper & Las Flores just south of main entrance low racks 8
Neighborhood Park Laurel Hills Laurel north of Griggs Way NONE
Neighborhood Park Monarch Paulson Way NONE
Neighborhood Park O'Brien Pueblo @ Azalea NONE rack proposed
Civic Place Opera House Plaza Downtown north of 1st near Main (Downtown) east of garbage enclosure, screened near 1st St loops 3 (6 bikes)
Open Space Citywide Park Oxbow Silverado Trail west of MacKenzie ?
Neighborhood Park Riverside Riverside @ Pine and Cross St NONE
Neighborhood Park Shurtleff Shetler west of Russell NONE
citywide place Skate Park (Downtown) Yajome tw Clinton & Pearl (Downtown) mid block facing West St loops 3 (6 bikes)
Neighborhood Park Solomon Solomon Ave @ Martin NONE
Neighborhood Park Springwood Mosswood @ Moffit NONE
Neighborhood Park Summerfield Summerfield Dr @ Sparrow NONE
hillside open space Sunrise Scenic @ Westwiew NONE
Neighborhood Park Sutherland Baywood @ Sutherland NONE
Mini park Tallac NONE
Citywide Park (Undeveloped) Timberhill end of Timberhill Lane NONE but park undeveloped

Napa Bicycle Parking Facilities – Existing Bike Racks Inventory (Field Survey June 2010) G-3 January 2012
Napa Bicycle Parking Facilities – Existing Bike Racks Inventory (Field Survey June 2010)
Land Use Type Name Address Location of Bike Racks Type of Rack Size Notes
"Citywide Civic area" Veterans Park (Downtown) Main St at 3rd St Near 3rd St & Main St by stairs up from River Trail Loops 2 (4 bikes)
"Citywide Civic area" Veterans Park (Downtown) Main St at 2nd St On Main near 2nd St loops 2 (4 bikes)
Neighborhood Park Vinehill Vine Hill Drive at Chablis NONE
Neighborhood Park Vineyard end of Young St NONE
Citywide Park Westwood Hills Browns Valley Rd west of Robinson NONE 0
Other Land Uses
Club Boys & Girls Club 1501 Pueblo in back parking lot Traditional 23 not a used area
Shopping Center Browns Valley Market 3623 Browns Valley Rd 4 front of market and 1 in sidewalk to restaurant concrete bases only 0
Shopping Center Downtown Safeway 1620 Clay at Jefferson front of building facing Jefferson, S of entry Loops 3 (6 bikes)
Shopping Center Factory Outlet Freeway Drive south of 1st St front of building facing parking, NW area (T Hilf) Traditional 3
Shopping Center Factory Outlet (Factory Stores Drive) front of building facing parking, central W area (Cole Hahn) Traditional 4
Shopping Center Factory Outlet (Factory Stores Drive) front of building facing parking, central E area (Liz C) Traditional 4
Shopping Center Factory Outlet (Factory Stores Drive) front of building, north east area (C Klein) Traditional 4
Shopping Center Redwood Plaza 3385 Solano at Redwood facing Solano, side of Round Table, S end of center loops 4 (8 bikes)
Shopping Center Redwood Plaza 3385 Solano at Redwood so/of Vallergas in plaza facing parking lot loops 4 (8 bikes)
Shopping Center Bel Aire Plaza north side Trancas at 29 (east of 29) south side of Target west of entrance circle on pole 1 (2 bikes)
Shopping Center Bel Aire Plaza (Bel Aire Plaza addresses) east side of Target, north and south of entrance circle on pole 2 (4 bikes)
Shopping Center Bel Aire Plaza (Bel Aire Plaza addresses) south side Cost Plus west of door (hidden) circle on pole 1 (2 bikes)
Shopping Center Bel Aire Plaza (Bel Aire Plaza addresses) east of Petsmart by main drive circle on pole 1 (2 bikes)
Shopping Center Bel Aire Plaza (Bel Aire Plaza addresses) in front of barber shop between W.Food & TJ's circle on pole 2 (4 bikes)
Shopping Center Bel Aire Plaza (Bel Aire Plaza addresses) in north (Closed) entrance to Whole Foods loops 3 (6 bikes) all in use eve
Shopping Center CVS Lucky's 1312 Trancas at Jefferson NONE
Shopping Center Trancas Safeway (Ross, Staples) 3375 Jefferson at Trancas south side W side of Safeway so/of pillar, part hidden facing st. loops 4 (8 bikes)
Shopping Center-small Pueblo Plaza southwest corner, Pueblo at Lincoln NONE
Shopping Center-small Jefferson? -McDonalds, Curves 3220 Jefferson in front of Curves concrete bases only 4
Medical Facility Kaiser 3285 Claremont at Permanente Way at east entrance of older building circle on pole 1 (2 bikes) 0 bikes using
Medical Facility Kaiser 3285 Claremont at Permanente Way by west entrance to older building low rack 6 0 by new bldg
Public building Post Office South side Trancas at end of Baxter Way NONE
Hospital Queen of the Valley 1000 Trancas west of main hospital entrance trad + low racks 5 trad+ 4 signed!
Hospital Queen of the Valley 1000 Trancas rear of new outpatient surgery loops 5 (10 bikes) 0 @ other entr
Hospital Queen of the Valley 1000 Trancas in interior shaded courtyard near cafeteria Traditional 9 3 bikes using
Fitness Center QVH Fitness Center Trancas at Villa, northwest northeast corner of building near entrance loops 3 (6 bikes)
Shopping Center (small) Photo Pro, Thai Rest… 1258 Trancas near Jefferson, north side NONE
Large Office Center Five Financial Plaza Trancas at Soscol, southwest corner NONE
Shopping Center Silverado Plaza 611 Trancas at Soscol, southeast covern interior corner by food/plaza low racks 8

Napa Bicycle Parking Facilities – Existing Bike Racks Inventory (Field Survey June 2010) G-4 January 2012
Napa Bicycle Parking Facilities – Existing Bike Racks Inventory (Field Survey June 2010)
Land Use Type Name Address Location of Bike Racks Type of Rack Size Notes
Shopping Center Silverado Plaza 611 Trancas at Soscol, southeast covern west end of Nob Hill away from entrances Traditional 3
Shopping Center Hollywood Video 705 Lincoln at Soscol (southwest) front of round table pizza, southeast end of center Traditional 3
Shopping Center Wal Mart 681 Lincoln at Soscol (southeast) far W & E of entrance behind cart enclosures Traditional 28
Shopping Center Oxbow Public Market 644 1st St & McKinstry (no/east side) facing McKinstry near Model Bakery Traditional 9
Shopping Center Oxbow Public Market 644 1st St & McKinstry (no/east side) east side of Oxbow Market Traditional 5
Shopping Center Oxbow Public Market 644 1st St & McKinstry (no/east side) northeast corner by eating patio loops 4 (8 bikes)
Shopping Center Lucky's, etc 2355 California at Lincoln south side building around corner fr entrance loops 6 (12 bikes) 1 bike near entr
Shopping Center Lucky's, etc 2355 California at Lincoln north side building around corner fr entrance loops 8 (16 bikes no bikes using;
Shopping Center River Park 1433 Imola at Jefferson NONE
Shopping Center South Napa Marketplace 225 Soscol at Imola north side of Togo's by entrance loops 1 (2 bikes)
Shopping Center South Napa Marketplace 225 Soscol at Imola east side of KFC entrance loops 3 (6 bikes)
Shopping Center South Napa Marketplace 225 Soscol at Imola near Home Depot entrance loops 5 (10 bikes)
Shopping Center South Napa Marketplace 225 Soscol at Imola Near Raley's entrance loops 5 (10 bikes) 3 used
Shopping Center South Napa Marketplace 225 Soscol at Imola Near Office Depot entrance loops 6 (12 bikes)
Shopping Center South Napa Marketplace 225 Soscol at Imola Near Target entrance loops 5 (10 bikes)
Fast food Taco Bell 3177 Jefferson south of Claremont north side of building by entrance loops 3 (6 bikes)
County buildings County Health Complex 2261 Elm (Old Sonoma Rd west of Gesford) behind and between buildings A & B loops 3 (6 bikes)
County buildings County Health Complex 2261 Elm (Old Sonoma Rd west of Gesford) north west and east sides of building F Loops 4 (8 bikes)
County buildings County Health Complex 2261 Elm (Old Sonoma Rd west of Gesford) between buildings C and E facing O.S. Rd loops 6 (12 bikes)
County building New Juvenile Hall 212 Walnut north of Old Sonoma Rd 3 separate racks facing O.S. Rd by front entrances loops 9 (18 bikes)
Church & school First Christian Church 1st St e/o Bancroft Ct. NONE (randomly surveyed)
Retail 7 - 11 convenience store 1st St at Matt NONE (randomly surveyed)
Downtown Area Except Parks
Teen Center Wolfe Center 2310 1st St at Monroe Mid block facing Monroe loops 6 (for 12 bikes)
City building Community Services Building 1600 1st St Downtown Lockers in rear; loops at front entrance Lockers and Loops 8 and 3 (for 6)
Health Club Exertec 1500 1st St Downtown front of Exertec facing Clay St Traditional 6 all in use
Hotel Avia Hotel 1450 1st St at Franklin Downtown facing Franklin near 1st loops 2 (4 bikes)
City Hall City Hall 955 School St Downtown corner 1st St & School St Loops 2 (4 bikes)
City Building Personnel Department 1541 2nd near Church St. Downtown west of front entrance Circles on pole 2 (4 bikes)
Church First Presbyterian Church 1333 3rd at Randolph Downtown side of building, mid block between Randolph/Franklin Traditional 8
Commercial building CP Thrift Shop 715 Franklin at 4th St Downtown mid block facing Franklin Loops 4 (8 bikes)
Public Building NCTPA 707 Randolph at 4th St Downtown facing 4th St Loop 1 (2 bikes)
Church Methodist Church 625 Randolph at 4th St facing 4th St loops 3 (6 bikes)
Public Building City County Library 580 Coombs south of 5th St Downtown facing Coombs north of entrance stairs loops 4 (8 bikes)
Commercial complex Napa Mill 500 Main south of 5th St Downtown east end of Main (by restaurant and in river plaza loops 5 + 2 (10 bikes)

Napa Bicycle Parking Facilities – Existing Bike Racks Inventory (Field Survey June 2010) G-5 January 2012
Napa Bicycle Parking Facilities – Existing Bike Racks Inventory (Field Survey June 2010)
Land Use Type Name Address Location of Bike Racks Type of Rack Size Notes
Commercial complex Riverfront 400 Main Downtown south east corner facing river & front of bike shop loops & trad. 2 (4 bikes) + 10
County building Administration superblock 1195 3rd at Coombs Downtown 6 loops facing Main St (northeast corner new garage; loops 6 (12 bikes)
County building Administration superblock 1195 3rd at Coombs Downtown 16 lockers & 4 lockers & 2 Loops in courtyard Lockers and Loops 20 + 2 (4 bikes)
County building Administration superblock 1195 3rd at Coombs Downtown traditional rack by west side jail entrance traditional 8
County building Courthouse block 825 Brown north of 3rd Downtown Brown St mid block behind landscaping 2 low racks 2 (4 bikes)
Parking Lot Entrance to River Trail Main tw 1st & 2nd Downtown Facing parking lot, Main St at River Trail entrance loops 2 (4 bikes)
Sidewalk First and Main 1st and Main Downtown southeast corner 1st/Main facing 1st loops 1 (2 bikes)
Creekside end of West St, north side creek Main tw 1st & Pearl Downtown just south & east of Cole's Rest. Patio by creek loops 2 (4 bikes)
City building Parks Department 1100 West St south of Pearl Downtown by entrance to building loops 2 (4 bikes)
near Cinema Cine Dome 825 Pearl tw West & Yajome Downtown end of Yajome St, west side Downtown loops 2 (4 bikes)
retail/office building Main St West Clinton St tw Main & West Downtown sidewalk mid block-West tw Clinton & Pearl loops 2 (4 bikes)
temporary transit center transit center -temporary Pearl west of Napa Creek Downtown east of temp. transit center building broken, low profile 3 (useless, broken)
Sidewalk near Miyamo's store 1128 1st St betweem Coombs & Randolph north side mid block
Sidewalk 2nd St between Coombs & Randolph north side mid block
Sidewalk Coombs St North of city parking garage loop 1 (2 bikes)
Sidewalk 1st St @ Randolph, southwest corner by entrance to Fine Art shop loop 1 (2 bikes)
Sidewalk 1st St @ Franklin near & east of Town Center entrance loop 1 (2 bikes)
sidewalk Clay St at Randolph south side (back of Gilwoods) Bicycle style 1 (2 bikes)
Shopping Center Napa Town Center Downtown No side 1st St between Franklin & Main Brown St. ROW east of Zins Valley Rest loops 2 (4 bikes)
Shopping Center Napa Town Center Downtown No side 1st St between Franklin & Main Coombs St. ROW no. of Kohl's Store loops 3 (6 bikes)
Shopping Center Napa Town Center Downtown No side 1st St between Franklin & Main Coombs St. ROW no. of 1st St loops 3 (6 bikes)
Shopping Center Downtown Safeway 1620 Clay at Jefferson front of building facing Jefferson, so. of entry triangle shapes 4
Notes: "loop" = upside down "U" or horizontal "S" (assumed 2 bikes could use each loop, as noted); traditional = rectangle with vertical slots; bicycle style = bike appearance


City of Napa Bicycle Plan January 2012
Appendix H
Project Ranking Matrix

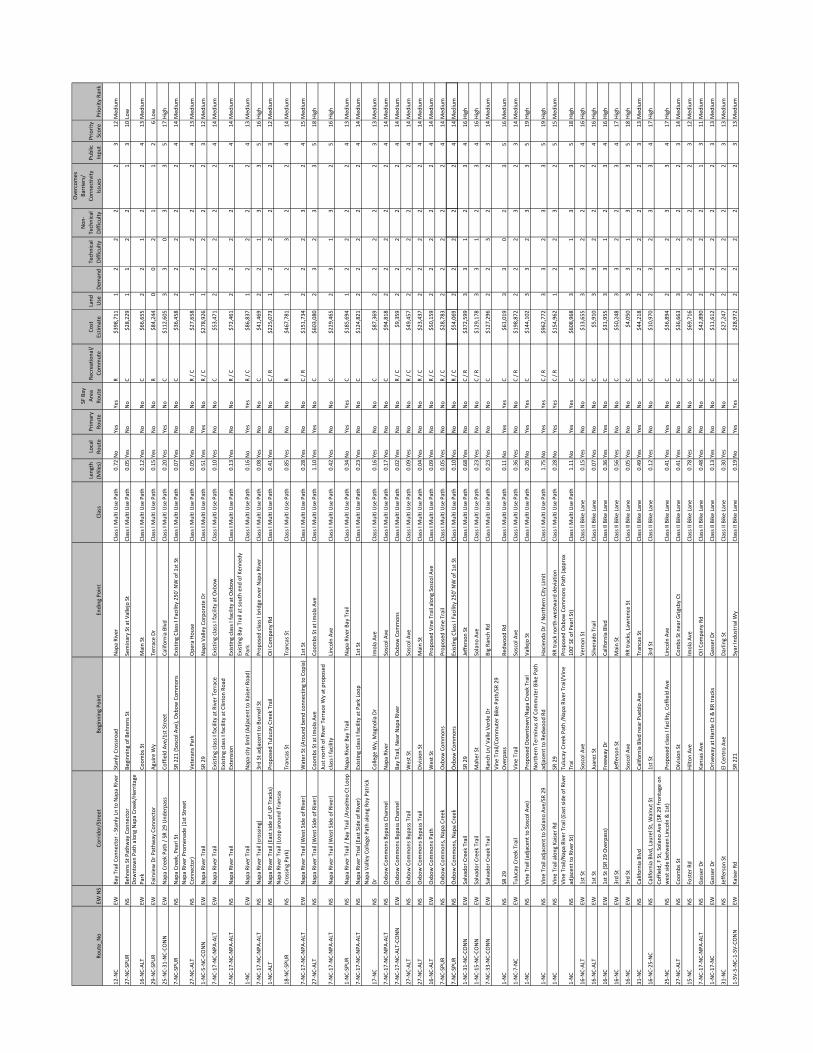
Route_No
EW NS
Corridor/Street
Beginn
ing Po
int
Ending
Point
Class
Length
(Miles)
Local
Route
Prim
ary
Route
SF Bay
Area
Route
Recreatio
nal/
Commute
Cost
Estim
ate
Land
Use
Dem
and
Technical
Difficulty
Non
‐
Technical
Difficulty
Overcom
es
Barriers/
Conn
ectiv
ity
Issues
Public
Inpu
tPriority
Score
Priority Rank
12‐NC
EWBa
y Trail Con
nector ‐ Stanly Ln to
Napa River
Stanly Crossroad
Napa River
Class I M
ulti Use Path
0.72
No
Yes
Yes
R$3
98,711
12
22
23
12Med
ium
27‐NC‐SPUR
NS
Behren
s St Pathw
ay Con
nector
Beginn
ing of Beh
rens St
Seminary St at V
allejo St
Class I M
ulti Use Path
0.05
Yes
No
No
C$2
8,22
91
12
21
310
Low
16‐NC‐ALT
EWDow
ntow
n Path along
Napa Creek/Herritage
Park
Coom
bs St
Main St
Class I M
ulti Use Path
0.12
Yes
No
No
C$6
6,65
52
21
22
413
Med
ium
29‐NC‐SPUR
EWFairview
Dr Pathway Con
nector
Aguire Wy
Terrace Dr
Class I M
ulti Use Path
0.15
Yes
No
No
R$8
4,24
40
02
11
26Low
25‐NC‐31
‐NC‐CO
NN
EWNapa Creek Path / SR 29
Und
erpass
Coffield Ave/1st Street
California Blvd
Class I M
ulti Use Path
0.20
Yes
Yes
No
C$1
12,605
33
03
35
17High
7‐NC‐SPUR
NS
Napa Creek, Pearl St
SR 221
(Soscol A
ve), Oxbow
Com
mon
sExistin
g Class I Facility 250
' NW of 1
st St
Class I M
ulti Use Path
0.07
Yes
No
No
C$3
6,45
82
22
22
414
Med
ium
27‐NC‐ALT
NS
Napa River Prom
enade (1st Street
Conn
ector)
Veterans Park
Ope
ra Hou
seClass I M
ulti Use Path
0.05
Yes
No
No
R / C
$27,65
81
22
22
413
Med
ium
1‐NC‐5‐NC‐CO
NN
EWNapa River Trail
SR 29
Napa Va
lley Co
rporate Dr
Class I M
ulti Use Path
0.51
Yes
Yes
No
R / C
$278
,926
12
22
23
12Med
ium
7‐NC‐17
‐NC‐NPA
‐ALT
EWNapa River Trail
Existin
g class I facility at R
iver Terrace
Existin
g class I facility at O
xbow
Class I M
ulti Use Path
0.10
Yes
No
No
C$5
3,47
12
22
22
414
Med
ium
7‐NC‐17
‐NC‐NPA
‐ALT
NS
Napa River Trail
Existin
g class I facility at C
linton Ro
ad
Extension
Existin
g class I facility at O
xbow
Class I M
ulti Use Path
0.13
Yes
No
No
R / C
$72,46
12
22
22
414
Med
ium
1‐NC
EWNapa River Trail
Napa city limit (Adjacen
t to Kaiser Road)
Existin
g Ba
y Trail at sou
th end
of K
enne
dy
Park
Class I M
ulti Use Path
0.16
No
Yes
Yes
R / C
$86,83
71
22
22
413
Med
ium
7‐NC‐17
‐NC‐NPA
‐ALT
NS
Napa River Trail (crossing)
3rd St adjacen
t to Bu
rnell St
Prop
osed
class I bridge over Napa River
Class I M
ulti Use Path
0.08
Yes
No
No
C$4
1,46
92
21
33
516
High
1‐NC‐ALT
NS
Napa River Trail (East side of UP Tracks)
Prop
osed
Tulucay Creek Trail
Oil Co
mpany
Rd
Class I M
ulti Use Path
0.41
Yes
No
No
C / R
$225
,073
12
22
23
12Med
ium
18‐NC‐SPUR
NS
Napa River Trail (Loop
aroun
d Trancas
Crossing
Park)
Trancas St
Trancas St
Class I M
ulti Use Path
0.85
Yes
No
No
R$4
67,781
12
32
24
14Med
ium
7‐NC‐17
‐NC‐NPA
‐ALT
EWNapa River Trail (West S
ide of River)
Water St (Aroun
d be
nd con
necting to Cop
ia)
1st S
tClass I M
ulti Use Path
0.28
Yes
No
No
C / R
$151
,734
22
23
24
15Med
ium
27‐NC‐ALT
NS
Napa River Trail (West S
ide of River)
Coom
bs St a
t Imola Ave
Coom
bs St a
t Imola Ave
Class I M
ulti Use Path
1.10
Yes
Yes
No
C$6
03,080
23
23
35
18High
7‐NC‐17
‐NC‐NPA
‐ALT
NS
Napa River Trail (West S
ide of River)
Just north of R
iver Terrace W
y at propo
sed
class I facility
Lincoln Ave
Class I M
ulti Use Path
0.42
Yes
No
No
C$2
29,465
23
13
25
16High
1‐NC‐SPUR
NS
Napa River Trail / Bay Trail /Anselmo Ct Loo
pNapa River Ba
y Trail
Napa River Ba
y Trail
Class I M
ulti Use Path
0.34
No
Yes
Yes
C$1
85,694
12
22
24
13Med
ium
7‐NC‐17
‐NC‐NPA
‐ALT
NS
Napa River Trial (East Side of River)
Existin
g class I facility at P
ark Loop
1st S
tClass I M
ulti Use Path
0.23
Yes
No
No
C$1
24,821
22
22
24
14Med
ium
17‐NC
NS
Napa Va
lley Co
llege Path alon
g Ro
y Patrick
Dr
College W
y, M
agno
lia Dr
Imola Ave
Class I M
ulti Use Path
0.16
Yes
No
No
C$8
7,36
92
22
22
313
Med
ium
7‐NC‐17
‐NC‐NPA
‐ALT
NS
Oxbow
Com
mon
s Bypass Chann
elNapa River
Soscol Ave
Class I M
ulti Use Path
0.17
Yes
No
No
C$9
4,81
82
22
22
414
Med
ium
7‐NC‐17
‐NC‐ALT‐CONN
EWOxbow
Com
mon
s Bypass Chann
elBa
y Trail, Near Napa River
Oxbow
Com
mon
sClass I M
ulti Use Path
0.02
Yes
No
No
R / C
$9,359
22
22
24
14Med
ium
27‐NC‐ALT
NS
Oxbow
Com
mon
s Bypass Trail
West S
tSoscol Ave
Class I M
ulti Use Path
0.09
Yes
No
No
R / C
$49,45
72
22
22
414
Med
ium
27‐NC‐ALT
NS
Oxbow
Com
mon
s Bypass Trail
Division St
Main St
Class I M
ulti Use Path
0.04
Yes
No
No
R / C
$23,43
72
22
22
414
Med
ium
16‐NC‐ALT
EWOxbow
Com
mon
s Path
West S
tProp
osed
Vine Trail along
Soscol A
veClass I M
ulti Use Path
0.09
Yes
No
No
R / C
$50,15
92
22
22
414
Med
ium
7‐NC‐SPUR
NS
Oxbow
Com
mon
s, Napa Creek
Oxbow
Com
mon
sProp
osed
Vine Trail
Class I M
ulti Use Path
0.05
Yes
No
No
R / C
$28,78
32
22
22
414
Med
ium
7NCSPUR
NS
Ob
CN
Ck
Ob
CEiti
ClIF
ilit
250'NW
f1tS
tCl
IMlti
UPth
010
YN
NR/C
$5406
92
22
22
414
Mdi
7‐NC‐SPUR
NS
Oxbow
Com
mon
s, Napa Creek
Oxbow
Com
mon
sExistin
g Class I Facility 250
' NW of 1
st St
Class I M
ulti Use Path
0.10
Yes
No
No
R / C
$54,069
22
22
24
14Med
ium
1‐NC‐31
‐NC‐CO
NN
EWSalvador Creek Trail
SR 29
Jefferson St
Class I M
ulti Use Path
0.68
Yes
No
No
C / R
$372
,599
33
12
34
16High
1‐NC‐15
‐NC‐CO
NN
EWSalvador Creek Trail
Maher St
Solano
Ave
Class I M
ulti Use Path
0.23
Yes
No
No
C / R
$129
,178
33
12
34
16High
7‐NC‐33
‐NC‐CO
NN
EWSalvador Creek Trail
Ranch Ln/ Va
lle Verde
Dr
Big Ra
nch Rd
Class I M
ulti Use Path
0.23
Yes
No
No
C$1
27,296
22
32
23
14Med
ium
1‐NC
NS
SR 29
Vine
Trail/Co
mmuter Bike Path/SR 29
Overpass
Redw
ood Rd
Class I M
ulti Use Path
0.11
No
Yes
Yes
C$6
1,01
93
30
23
516
Med
ium
1‐NC‐7‐NC
EWTulucay Creek Trail
Vine
Trail
Soscol Ave
Class I M
ulti Use Path
0.36
Yes
No
No
C / R
$198
,872
22
23
23
14Med
ium
1‐NC
NS
Vine
Trail (adjacen
t to Soscol Ave)
Prop
osed
Dow
ntow
n/Napa Creek Trail
Vallejo St
Class I M
ulti Use Path
0.26
No
Yes
Yes
C$1
44,102
33
23
35
19High
1‐NC
NS
Vine
Trail adjacent to
Solano Ave/SR 29
Northern Term
inus of C
ommuter Bike Path
adjacent to
Red
woo
d Rd
Haciend
a Dr / Northern City Lim
itClass I M
ulti Use Path
1.75
No
Yes
Yes
C / R
$962
,772
33
23
35
19High
1‐NC
NS
Vine
Trail alon
g Kaiser Rd
SR 29
RR track no
rth‐westw
ard de
viation
Class I M
ulti Use Path
0.28
No
Yes
Yes
C / R
$154
,962
12
23
25
15Med
ium
1‐NC
NS
Vine
Trail/Napa River Trail (East side of River
adjacent to
River St)
Tulucay Creek Path /Napa River Trail/Vine
Trai
Prop
osed
Oxbow
Com
mon
s Path (app
rox
100' SE of Pearl St)
Class I M
ulti Use Path
1.11
No
Yes
Yes
C$6
08,968
33
13
35
18High
16‐NC‐ALT
EW1st S
tSoscol Ave
Vernon
St
Class II Bike Lane
0.15
Yes
No
No
C$1
3,65
53
32
22
416
High
16‐NC‐ALT
EW1st S
tJuarez St
Silverado Trail
Class II Bike Lane
0.07
Yes
No
No
C$5
,910
33
22
24
16High
16‐NC
EW1st S
t (SR
29 Overpass)
Freeway Dr
California Blvd
Class II Bike Lane
0.36
Yes
Yes
No
C$3
1,95
53
31
23
416
High
16‐NC
EW3rd St
Jefferson St
Main St
Class II Bike Lane
0.56
Yes
No
No
C$5
0,24
83
32
23
417
High
16‐NC
EW3rd St
Soscol Ave
RR tracks, Law
rence St
Class II Bike Lane
0.05
Yes
No
No
C$4
,050
33
13
35
18High
31‐NC
NS
California Blvd
California Blvd
near Pu
eblo Ave
Trancas St
Class II Bike Lane
0.49
Yes
Yes
No
C$4
4,21
82
22
22
313
Med
ium
16‐NC‐25
‐NC
NS
California Blvd, Laurel St, W
alnu
t St
1st S
t3rd St
Class II Bike Lane
0.12
Yes
No
No
C$1
0,97
02
32
33
417
High
25‐NC
NS
Coffield, F St, Solano Ave (SR 29
fron
tage on
west side be
tween Lincoln & 1st)
Prop
osed
class I facility, Coffie
ld Ave
Lincoln Ave
Class II Bike Lane
0.41
Yes
Yes
No
C$3
6,89
42
32
33
417
High
27‐NC ‐ALT
NS
Coom
bs St
Division St
Combs St n
ear Grigsby
Ct
Class II Bike Lane
0.41
Yes
No
No
C$3
6,66
33
22
22
314
Med
ium
15‐NC
NS
Foster Rd
Hilton
Ave
Imola Ave
Class II Bike Lane
0.78
Yes
No
No
C$6
9,71
62
12
22
312
Med
ium
7‐NC‐17
‐NC‐NPA
‐ALT
NS
Gasser Dr
Kansas Ave
Oil Co
mpany
Rd
Class II Bike Lane
0.48
Yes
No
No
C$4
2,89
02
12
21
311
Med
ium
1‐NC‐17
‐NC
EWGasser Dr
Driveway at H
artle
Ct &
RR tracks
Gasser Dr
Class II Bike Lane
0.13
Yes
No
No
C$1
1,61
22
22
22
313
Med
ium
31‐NC
NS
Jefferson St
El Cen
tro Ave
Darling St
Class II Bike Lane
0.30
Yes
No
No
$2
7,24
72
22
22
313
Med
ium
1‐SV
‐5‐NC‐1‐SV
‐CONN
EWKaiser Rd
SR 221
Syar Indu
strial W
yClass II Bike Lane
0.19
No
Yes
Yes
C$2
8,97
22
22
22
313
Med
ium

20‐NC
EWLincoln Ave
California Blvd
Commuter Bike Path ‐ Vine Trail
Class II Bike Lane
0.72
Yes
No
No
C$6
4,95
23
32
33
519
High
13‐NPA
‐25‐NC‐27
‐NC‐CO
NN
EWOld Son
oma Rd
SR 29
Harton St
Class II Bike Lane
0.29
Yes
No
No
C$2
6,52
53
32
23
417
High
13‐NPA
‐25‐NC‐27
‐NC‐CO
NN
EWOld Son
oma Rd
Old Son
oma Rd
turn off
Intersectio
n of Old Son
oma Rd
& S Freew
ay
Dr
Class II Bike Lane
0.08
Yes
No
No
C$6
,845
33
22
34
17High
13‐NPA
‐25 ‐NC‐27
‐NC‐CO
NN
EWOld Son
oma Rd
West N
apa city limit
Foster Rd
Class II Bike Lane
0.28
Yes
No
No
R$2
5,37
72
22
22
414
Med
ium
15‐NC‐18
‐NC‐JNCT
EWRe
dwoo
d Rd
Lind
a Vista Ave
Dry Creek Rd
Class II Bike Lane
0.49
Yes
Yes
No
C$4
4,40
02
32
23
416
High
18‐NC
EWRe
dwoo
d Rd
Lind
a Vista Ave
Solano
Ave
Class II Bike Lane
0.45
Yes
Yes
No
C$4
0,84
63
32
33
519
High
18‐NC
EWRe
dwoo
d Rd
Pueb
lo Ave
Dry Creek Rd
Class II Bike Lane
0.08
Yes
No
No
C$7
,539
22
22
23
13Med
ium
18‐NC
EWRe
dwoo
d Rd
Brow
ns Valley Rd
Pueb
lo Ave
Class II Bike Lane
0.83
Yes
Yes
No
C$7
4,99
02
23
22
314
Med
ium
7‐NC‐SPUR
EWRiver Terrace Wy
Soscol Ave
Napa River Trail
Class II Bike Lane
0.12
Yes
No
No
C$1
0,94
31
13
21
311
Med
ium
17‐NC‐29
‐NC‐CO
NN
EWSaratoga Dr
Silverado Trail
Terrace Dr
Class II Bike Lane
0.30
Yes
No
No
C$2
7,21
82
22
11
311
Med
ium
17‐NC
NS
Silverado Trail
Soscol Ave
3rd St
Class II Bike Lane
0.75
Yes
Yes
No
C$6
7,93
12
32
23
416
High
17‐NC
NS
Silverado Trail
3rd St
Napa city limit
Class II Bike Lane
1.66
Yes
Yes
No
C$1
49,381
23
22
34
16High
17‐NC
NS
Silverado Trail
Kansas Ave
Soscol Ave
Class II Bike Lane
0.28
Yes
Yes
No
C$2
5,43
52
22
22
414
Med
ium
7‐NC‐17
‐NC‐CO
NN
EWSousa Ln, O
Il Co
mpany
Rd
Prop
osed
Vine Trail
Silverado Trail
Class II Bike Lane
0.28
Yes
No
No
C$2
4,80
82
12
11
310
Low
7‐NC
NS
SR 221
Kaiser Rd
Magno
lia Dr
Class II Bike Lane
1.43
No
Yes
Yes
C$1
28,947
22
32
24
15Med
ium
18‐NC
EWTrancas St
California Blvd
Soscol Ave
Class II Bike Lane
1.15
Yes
No
No
C$1
03,236
33
13
35
18High
24‐NC
EWTrow
er Ave
Dry Creek
Oxford St
Class II Bike Lane
0.67
Yes
Yes
No
C$6
0,19
33
32
23
417
High
24‐NC
EWTrow
er Ave
Oxford St
Solano
Ave
Class II Bike Lane
0.26
Yes
Yes
No
C$2
3,01
13
32
33
519
High
33‐NC
NS
Villa Ln
Pear Tree Ln
Firefly
Ln
Class II Bike Lane
0.46
Yes
No
No
C$4
1,46
02
22
11
311
Med
ium
14‐NC‐15
‐NC‐CO
NN
EWW Im
ola Ave
Foster Rd
Freeway/G
olde
n Gate DR
Class II Bike Lane
0.19
Yes
No
No
C$1
6,82
02
23
22
314
Med
ium
16‐NC‐ALT
EW1st S
tSilverado Trail
East Ave
Class III Bike Ro
ute
0.22
Yes
No
No
C$5
453
23
32
417
High
16‐NC
EW3rd St
California Blvd
Jefferson St
Class III Bike Ro
ute
0.37
Yes
No
No
C$9
242
23
32
416
High
27‐NC‐SPUR
EWArroyo Dr
Seminary St
Brow
n St
Class III Bike Ro
ute
0.11
Yes
No
No
C$2
752
23
31
314
Med
ium
13‐NPA
‐25‐NC‐27
‐NC‐CO
NN
EWAsh St
Hartson
St
Franklin St
Class III Bike Ro
ute
0.36
Yes
No
No
C$8
881
13
31
312
Med
ium
33‐NC
NS
Beard Rd
Pueb
lo Ave
Pear Tree Ln
Class III Bike Ro
ute
0.32
Yes
No
No
C$7
901
13
31
312
Med
ium
31‐NC
NS
Belaire Plz, Diablo St, Yellowston
e St, Lassen
StTrancas St
Trow
er Ave
Class III Bike Ro
ute
0.97
Yes
No
No
C$2
,414
22
33
23
15Med
ium
27‐NC‐ALT
NS
Brow
n St
Clinton St
Lincoln Ave
Class III Bike Ro
ute
0.64
Yes
No
No
C$1
,596
22
33
13
14Med
ium
7‐NC‐17
‐NC‐NPA
‐ALT
NS
Burnell St
Sousa Ln
3rd St
Class III Bike Ro
ute
0.55
Yes
No
No
C$1
,379
22
33
24
16High
27‐NC
EWCabo
t Wy
Jefferson St
Imola Ave
Class III Bike Ro
ute
0.31
Yes
No
No
C$7
742
23
31
314
Med
ium
15‐NC‐ALT
NS
Carol D
r ‐Oxford St
Pueb
lo Ave
Trow
er Ave
Class III Bike Ro
ute
1.22
Yes
No
No
C$3
,049
32
33
23
16High
7‐NC‐31
‐NC‐CO
NN
EWCe
ntral A
ve, Jefferson
St, Park Ave
California Blvd
Soscol Ave
Class III Bike Ro
ute
1.07
Yes
No
No
C$2
,663
22
33
23
15Med
ium
20‐NC
EWClark St
Silverado Trail
East Ave
Class III Bike Ro
ute
0.12
Yes
No
No
C$2
971
23
32
314
Med
ium
16NCALT
EWClay
StCaliforniaBlvd
Coom
bsSt
ClassIIIBike
Route
078
Yes
No
No
C$1
953
22
33
24
16High
16‐NC‐ALT
EWClay St
California Blvd
Coom
bs St
Class III Bike Ro
ute
0.78
Yes
No
No
C$1
,953
22
33
24
16High
27‐NC‐CO
NN‐ALT
EWDivision St, Franklin
St
Oak St
Brow
n St
Class III Bike Ro
ute
0.28
Yes
No
No
C$7
122
23
32
315
Med
ium
7‐NC‐31
‐NC‐CO
NN
EWEl Cen
tro Ave
Jefferson St
Heather Ln
Class III Bike Ro
ute
0.21
Yes
No
No
C$5
291
23
31
212
Med
ium
1‐NC‐31
‐NC‐CO
NN
EWEl Cen
tro Ave
SR 29
Jefferson St
Class III Bike Ro
ute
0.55
Yes
No
No
C$1
,387
22
33
12
13Med
ium
27‐NC‐CO
NN‐ALT
EWElm St
Franklin St
Riversdie Dr
Class III Bike Ro
ute
0.28
Yes
No
No
C$7
021
13
32
313
Med
ium
17‐NC‐SPUR
EWFairview
Dr
Burnell St
Hoffm
an Ave
Class III Bike Ro
ute
0.30
Yes
No
No
C$7
512
23
32
416
High
15‐NC
NS
Foster Rd
Imola Ave
Old Son
oma Rd
Class III Bike Ro
ute
0.41
Yes
No
No
C$1
,034
22
33
12
13Med
ium
7‐NC‐33
‐NC‐CO
NN
EWGarfie
ld Ln
Existin
g class I near Cu
lbertson
Ct
Old Vine Wy
Class III Bike Ro
ute
0.10
Yes
No
No
C$2
402
23
31
314
Med
ium
20‐NC‐27
‐NC‐CO
NN
NS
Geo
rgia St
E St
Lincoln Ave
Class III Bike Ro
ute
0.27
Yes
No
No
C$6
632
13
32
314
Med
ium
14‐NC‐ALT
EWGranada
St, M
uir St, Som
mer St, She
lter Ave
SR 221
Im
ola Ave
Class III Bike Ro
ute
1.08
Yes
No
No
C$2
,689
32
33
24
17High
15‐NC‐ALT
NS
Hahne
mann Ln
Wine Co
untry Ave
Salvador Ave
Class III Bike Ro
ute
0.27
Yes
No
No
C$6
841
03
31
311
Med
ium
31‐NC
NS
Hartson
St
Imola Ave
Old Son
oma Rd
Class III Bike Ro
ute
0.42
Yes
No
No
C$1
,058
11
33
12
11Med
ium
7‐NC‐14
‐NC‐CO
NN
EWKansas Ave
Soscol Ave
Shurtle
ff Ave
Class III Bike Ro
ute
0.60
Yes
No
No
C$1
,502
32
33
13
15Med
ium
13‐NC‐16
‐NC‐CO
NN
EWLarkin W
y, Scenic Dr
Brow
ns Valley Rd
Brow
ns Valley Rd
Class III Bike Ro
ute
1.08
Yes
No
No
C$2
,700
11
33
12
11Med
ium
15‐NC
NS
Laurel St, Foo
thill Blvd
Old Son
oma Rd
Brow
ns Valley Rd
Class III Bike Ro
ute
1.11
Yes
No
No
C$2
,765
12
33
12
12Med
ium
20‐NC
EWLincoln Ave
Lind
a Vista Ave
Solano
Ave
Class III Bike Ro
ute
0.52
Yes
No
No
C$1
,292
12
33
13
13Med
ium
15‐NC
NS
Lind
a Vista
Brow
ns Valley Rd
Redw
ood Rd
Class III Bike Ro
ute
1.23
Yes
No
No
C$3
,082
32
33
23
16High
15‐NC‐NPA
‐ALT
EWLind
a Vista Ave
Redw
ood Rd
Dry Creek Rd
Class III Bike Ro
ute
2.03
Yes
No
No
C$5
,072
22
33
13
14Med
ium
15‐NC‐ALT
NS
Maher St
Trow
er Ave
Wine Co
untry Ave
Class III Bike Ro
ute
0.54
Yes
No
No
C$1
,339
22
33
23
15Med
ium
20‐NC‐33
‐NC‐CO
NN
NS
Main St
Lincoln Ave
Central A
veClass III Bike Ro
ute
0.25
Yes
No
No
C$6
312
13
32
314
Med
ium
20‐NC‐33
‐NC‐CO
NN
NS
Main St, Pue
blo Ave
Central A
veBe
ard Rd
Class III Bike Ro
ute
0.34
Yes
No
No
C$8
482
23
32
315
Med
ium
7‐NC‐17
‐NC‐NPA
‐ALT
NS
McKinstry St
Soscol Ave
Water St
Class III Bike Ro
ute
0.33
Yes
No
No
C$8
303
23
31
315
Med
ium
31‐NC
NS
Old Son
oma Rd
, Walnu
t St, Laurel St,
California Blvd
Old Son
oma Rd
3rd St
Class III Bike Ro
ute
0.73
Yes
No
No
C$1
,814
22
33
23
15Med
ium
16‐NC
EWPatrick Rd
Borrette Ln
Brow
ns Valley Rd
Class III Bike Ro
ute
0.78
Yes
No
No
C$1
,954
11
33
12
11Med
ium
33‐NC
EWPe
ar Tree Ln
Beard Rd
Villa Ln
Class III Bike Ro
ute
0.15
Yes
No
No
C$3
821
13
31
312
Med
ium

7‐NC‐33
‐NC‐CO
NN
EWPe
ar Tree Ln
Villa Ln
Big Ra
nch Rd
Class III Bike Ro
ute
0.39
Yes
No
No
C$9
641
13
32
313
Med
ium
27‐NC‐31
‐NC‐CO
NN
EWPine
St
Walnu
t St
Franklin St
Class III Bike Ro
ute
0.64
Yes
No
No
C$1
,606
32
33
23
16High
7‐NC‐SPUR
EWPu
eblo Ave
Beard Rd
Soscol Ave
Class III Bike Ro
ute
0.49
Yes
No
No
C$1
,214
22
33
23
15Med
ium
1‐NC‐7‐NC‐CO
NN
EWSalvador Ave
SR 29
East city
limit
Class III Bike Ro
ute
0.81
Yes
No
No
C$2
,022
22
33
23
15Med
ium
29‐EC‐ALT
NS
Shurtle
ff Ave
Imola AVe
Terrace Dr
Class III Bike Ro
ute
0.94
Yes
No
No
C$2
,356
32
33
24
17High
31‐NC‐33
‐NC‐CO
NN
EWSierra Ave
Diablo St
Willis Dr
Class III Bike Ro
ute
0.46
Yes
No
No
C$1
,154
22
32
12
12Med
ium
12‐NC‐15
‐NC‐CO
NN
NS
St. R
egis
Stanly Crossroad
Stanly Ln
Class III Bike Ro
ute
0.65
Yes
No
No
R$1
,625
11
33
13
12Med
ium
29‐NC
NS
Terrace Dr
Imola Ave
Saratoga Dr
Class III Bike Ro
ute
0.71
Yes
No
No
C$1
,769
22
33
24
16High
29‐NC
NS
Terrace Dr, Shu
rtleff Ave
Saratoga Dr
Coom
bsville Rd
Class III Bike Ro
ute
0.48
Yes
No
No
C$1
,206
22
33
12
13Med
ium
13‐NPA
‐16‐NC‐CO
NN
NS
Thom
pson
Ave
Napa city limit
Brow
ns Valley Rd
Class III Bike Ro
ute
0.65
Yes
No
No
C$1
,621
21
33
13
13Med
ium
18‐NC‐31
‐NC‐CO
NN
EWVa
lverde
Dr, Firefly Ln, W
ild Rye W
y, Rub
icon
St, B
axter Ave
Diablo St
Trancas St
Class III Bike Ro
ute
1.19
Yes
No
No
C$2
,985
22
33
23
15Med
ium
15‐NC‐SPUR
EWVine
Hill Dr
Dry Creek Rd
Lind
a Vista Ave
Class III Bike Ro
ute
0.51
Yes
No
No
C$1
,278
22
33
12
13Med
ium
33‐NC
EWVintage High Drive Aisle
Willis Dr
Jefferson St
Class III Bike Ro
ute
0.18
Yes
No
No
C$4
602
12
22
211
Med
ium
18‐NC‐SPUR
EWW Pue
blo Ave
Redw
ood Rd
Solano
Ave
Class III Bike Ro
ute
1.41
Yes
No
No
C$3
,515
12
33
13
13Med
ium
16‐NC‐18
‐NC‐CO
NN
NS
Westview Dr
Brow
ns Valley Rd
Redw
ood Rd
Class III Bike Ro
ute
0.66
Yes
No
No
C$1
,654
21
33
12
12Med
ium
1‐NC‐15
‐NC‐CO
NN
EWWine Co
untry Ave
Lind
a Vista Ave
SR 29
Class III Bike Ro
ute
0.54
Yes
No
No
C$1
,346
11
33
12
11Med
ium
33‐NC
NS
Yajome St, Lincoln
Youn
t St
Pueb
lo Ave
Class III Bike Ro
ute
0.87
Yes
No
No
C$2
,187
22
33
23
15Med
ium


City of Napa Bicycle Plan January 2012
Appendix I
Funding Program Summaries


Summary of Funding Programs I-1 January 2012
Appendix I – Summary of Funding Programs
The following section presents a general description of funding programs that can be used to implement the projects contained in this plan.
Federal Funding Programs
Approximately every six years, the U.S. Congress adopts a surface transportation act — Congress’s authorization to spend tax dollars on highways, streets, roads, transit and other transportation related projects. The most recent surface transportation act is titled the Safe, Accountable, Flexible, Efficient Transportation Equity Act: A Legacy for Users (SAFETEA-LU). SAFETEA-LU ended on September 30, 2009. To date the U.S. Congress has yet to enact a new authorization act. Instead, it has passed several extensions to SAFETEA which run through September 30, 2011 to continue the flow of funding to transportation programs. It is now anticipated that the passage of the new act will be completed by this date.
Federal funding through SAFETEA-LU and its future successors will provide much of the funding available for transportation projects in this Plan. SAFETEA-LU contains several major programs, which are highlighted below, that may be used to fund transportation and/or recreation improvements in this Plan. SAFETEA-LU funding is administered through the state (Caltrans or Resources Agency) and regional governments such as the Metropolitan Transportation Commission (MTC). Most, but not all, of the funding programs are transportation versus recreation oriented, with an emphasis on (a) reducing auto trips and (b) providing an intermodal connection. Funding criteria often includes project listing in a Regional Transportation Improvement Plan, completion and adoption of a bicycle master plan, quantification of the costs and benefits of the system (such as saved vehicle trips and reduced air pollution), proof of public involvement and support, National Environmental Policy Act (NEPA) compliance, and commitment of some local resources. In most cases, SAFETEA-LU provides matching grants of 80 to 90 percent, but prefers to leverage other moneys at a lower rate.
Web Link: http://www.fhwa.dot.gov/safetealu/index.htm
Congestion Mitigation and Air Quality Improvement Program / Surface Transportation Program
The majority of federal transportation funds flow to the states in the form of Congestion Mitigation & Air Quality Improvement Program (CMAQ) Funds and Surface Transportation Program (STP) Funds. In California these funds are administered by Caltrans, however, Caltrans assigns a significant portion of two of the programs to MTC and other regional planning agencies to be used at their own discretion subject to federal regulations. Using these sources, MTC develops and administers its own funding programs, including the Transportation for Livable Communities Program and the Regional Bicycle and Pedestrian Program to target Bay Area transportation needs.
Web Link: http://www.mtc.ca.gov/funding/STPCMAQ/
Highway Safety Improvement Program
Section 1401 of the Safe, Accountable, Flexible Efficient Transportation Equity Act - Legacy for Users (SAFETEA-LU) amended Section 148 of Title 23 to create a new, core Highway Safety Improvement Program. This new Highway Safety Improvement Program (HSIP) replaces the Hazard Elimination Safety Program, (23 U.S.C §152). This new stand-alone program reflects increased importance and emphasis on highway safety initiatives in SAFETEA-LU. It replaces the current statutory requirement that States set aside 10 percent of their Surface Transportation Program (STP) funds for carrying out the rail-highway crossings and hazard elimination programs. Funds can be used for safety improvement projects
Summary of Funding Programs I-2 January 2012
on any public road or publicly owned bicycle or pedestrian pathway or trail. A safety improvement project corrects or improves a hazardous roadway condition, or proactively addresses highway safety problems that may include: intersection improvements; installation of rumble strips and other warning devices; elimination of roadside obstacles; railway-highway grade crossing safety; pedestrian or bicycle safety; traffic calming; improving highway signage and pavement marking; installing traffic control devices at high crash locations or priority control systems for emergency vehicles at signalized intersections, safety conscious planning and improving crash data collection and analysis, etc. The States that adopt and implement a strategic highway safety plan are provided additional flexibility to use Highway Safety Improvement Program (HSIP) funds for public awareness, education, and enforcement activities otherwise not eligible if they are consistent with a strategic State highway safety plan and comprehensive safety planning process.
Web Link: http://www.dot.ca.gov/hq/LocalPrograms/hsip.htm
Transportation Enhancements
Transportation Enhancements (TE) are transportation-related activities that strengthen the cultural, aesthetic, and environmental aspects of the Nation's transportation system. Similar to CMAQ and STP funds, MTC develops and administers its own funding programs using TE funds to target Bay Area transportation needs. TE funds help to make up regional funding programs such as the Transportation for Livable Communities Program and the Regional Bicycle and Pedestrian Program.
Web Link: http://www2.dot.ca.gov/hq/TransEnhAct/TransEnact.htm
National Recreational Trails Program
The Recreational Trails Program (RTP) provides funds to states to develop and maintain recreational trails and trail-related facilities for both non-motorized and motorized recreational trail uses. Examples of trail uses include hiking, bicycling, in-line skating, equestrian use, and other non-motorized as well as motorized uses.
Recreational Trails Program funds may be used for:
Maintenance and restoration of existing trails;
Development and rehabilitation of trailside and trailhead facilities and trail linkages;
Purchase and lease of trail construction and maintenance equipment;
Construction of new trails (with restrictions for new trails on federal lands);
Acquisition of easements or property for trails;
State administrative costs related to this program (limited to seven percent of a State's funds); and
Operation of educational programs to promote safety and environmental protection related to trails (limited to five percent of a State's funds).
Web Links: http://www.parks.ca.gov/?Page_id=24324
http://www.fhwa.dot.gov/environment/rectrails/index.htm
Summary of Funding Programs I-3 January 2012
State Funding Programs
State Highway Operations Protection Program
The State Highway Operations Protection Program (SHOPP) is a multi-year program of capital projects whose purpose is to preserve and protect the State Highway System. Funding is comprised of state and federal gas taxes. SHOPP funds capital improvements relative to maintenance, safety, and rehabilitation of state highways and bridges that do not add a new traffic lane to the system. Just over $1 billion is allocated to SHOPP annually. Funding is based on need, so there are no set distributions by county or Caltrans district. There are no matching requirements for this program. Projects include rehabilitation, landscaping, traffic management systems, rest areas, auxiliary lanes, and safety. Caltrans Projects are “applied” for by each Caltrans District. Each project must have a completed Project Study Report (PSR) to be considered for funding. Projects are developed in fall every odd numbered year.
Web Link: http://www.dot.ca.gov/hq/transprog/shopp.htm
State Transportation Improvement Program
The State Transportation Improvement Program (STIP) is a multi-year capital improvement program of transportation projects on and off the State Highway System. The STIP is funded with revenues from the state Transportation Investment Fund and other federal funding sources. STIP programming generally occurs every two years. The programming cycle begins with the release of a proposed fund estimate in July of odd-numbered years, followed by California Transportation
Commission (CTC) adoption of the fund estimate in August (odd years). The STIP program represents the lion’s share of California’s state and federal transportation dollars. The amount of funds available for the STIP is dependent on the state budget, and therefore, funding levels fluctuate from year to year. The majority of the program’s funds are earmarked for improvements determined by locally adopted priorities contained in Regional Transportation Improvement Programs (RTIP). RTIPS are submitted by regional transportation planning agencies from around the state. STIP funds can be used for a wide variety of projects, including road rehabilitation, road capacity, intersections, bicycle and pedestrian facilities, public transit, passenger rail and other projects that enhance the region’s transportation infrastructure.
Regional Transportation Planning Agencies (RTPAs), such as MTC, are allocated 75 percent of STIP funding for regional transportation projects in their Regional Improvement Program (RIP). Caltrans is allocated 25 percent of STIP funding for interregional transportation projects in the Interregional Improvement Program (IIP).
Web Link: http://www.mtc.ca.gov/funding/STIP/
Bicycle Transportation Account
The state Bicycle Transportation Account (BTA) is an annual statewide discretionary program that is available through the Caltrans Bicycle Facilities Unit for funding bicycle projects. The BTA provides state funds for city and county projects that improve safety and convenience for bicycle commuters including: New bikeways serving major transportation corridors; New bikeways removing travel barriers to potential bicycle commuters; Secure bicycle parking at employment centers, park-and-ride lots, rail and transit terminals, and ferry docks and landings; Bicycle-carrying facilities on public transit vehicles;
Installation of traffic control devices to improve the safety and efficiency of bicycle travel; Elimination of

Summary of Funding Programs I-4 January 2012
hazardous conditions on existing bikeways; Planning; Improvement and maintenance of bikeways; Project planning; Preliminary engineering; Final design; Right of way acquisition; Construction engineering; and Construction and/or rehabilitation among other items. To be eligible for Bicycle Transportation Account (BTA) funds, a city or county must prepare and adopt a Bicycle Transportation Plan (BTP) that addresses items a – k in Streets and Highways Code Section 891.2. BTP adoption establishes eligibility for five consecutive BTA funding cycles. Funding is available on a statewide basis. $7.2 million was available for FY 2010/11.
Web Link: http://www.dot.ca.gov/hq/LocalPrograms/bta/btawebPage.htm
Safe Routes to School
There are currently two Safe Routes to School funding programs in California. In 1999 the State legislature enacted a State Safe Routes to School (SR2S) program through a set-aside of federal transportation funds. The program has since been re-authorized three times and will run through 2013. In the meantime, the federal government created a Safe Routes to School (SRTS) with the passage of SAFETEA-LU. Both programs are meant to improve school commute routes through construction of bicycle and pedestrian safety and traffic calming projects. The State program provides funding for projects that address school commutes for students in grades K-12, the
federal program provides funding for projects that address school commutes for students in grades K-8. Both programs require a local match. While both programs fund construction improvements, the federal program also includes a programmatic element that will fund activities related to education, enforcement, or encouragement.
Web Link: http://www.dot.ca.gov/hq/LocalPrograms/saferoutes/saferoutes.htm
Office of Traffic Safety
The California Office of Traffic Safety (OTS) has the mission to obtain and effectively administer traffic safety grant funds to reduce deaths, injuries and economic losses resulting from traffic related collisions in California. OTS distributes federal funding apportioned to California under the National Highway Safety Act and SAFETEA-LU.
Grants are used to mitigate traffic safety program deficiencies, expand ongoing activity, or develop a new program. Grant funding cannot replace existing program expenditures, nor can traffic safety funds be used for program maintenance, research, rehabilitation, or construction.
OTS grants address several traffic safety priority areas including Pedestrian and Bicycle Safety. Eligible activities include programs to increase safety awareness and skills among pedestrians and bicyclists. Concepts may encompass activities such as safety programs, education, enforcement, traffic safety and bicycle rodeos, safety helmet distribution, and court diversion programs for safety helmet violators.
Web Link: http://www.ots.ca.gov/
Environmental Enhancement and Mitigation Program
Environmental Enhancement and Mitigation Program (EEMP) funds are allocated to projects that offset environmental impacts of modified or new public transportation facilities including streets, mass transit guideways,
park-n-ride facilities, transit stations, tree planting to equalize the effects of vehicular emissions, and the acquisition or development of roadside recreational facilities, such as trails. State gasoline tax monies
Summary of Funding Programs I-5 January 2012
fund the EEMP. The EEMP program represents an opportunity to fund improvements as mitigation to highway work in the SR 12, 29, and 128 corridors, as well as other highway facilities in Napa County.
Web Links: http://resources.ca.gov/grant_programs.html
http://www2.dot.ca.gov/hq/LocalPrograms/EEM/homepage.htm
California State Coastal Conservancy
The California State Coastal Conservancy manages several programs that provide grant funds for coastal trails, access, and habitat restoration projects. The funding cycle for these programs is open and on-going throughout the year. Funds are available to local government as well as non-profits. The Conservancy may be a funding source for bicycle facilities that improve access to Napa’s rivers and creeks.
Web Link: http://www.scc.ca.gov/Programs/guide.htm
Habitat Conservation Fund
The Habitat Conservation Fund (HCF) provides $2 million dollars annually in grants for the conservation of habitat including wildlife corridors and urban trails statewide. Eligible activities include property acquisition, design, and construction. The HCF is 50% dollar for dollar matching program. California Environmental Quality Act (CEQA) compliance is required. Urban projects should demonstrate how the project would increase the public’s awareness and use of park, recreation, or wildlife areas.
Web Link: http://www.parks.ca.gov/?page_id=21361
Land and Water Conservation Fund
Administered by CA State Parks, the Land and Water Conservation Fund is offered annually to cities, counties and districts. Funds can be used to acquire or develop outdoor recreation areas and facilities. Communities can use these funds to build trails, picnic areas, and preserve natural and cultural areas.
Web Link: http://www.parks.ca.gov/?page_id=21360
Caltrans Transportation Planning Grants
Caltrans Transportation Planning Grants are intended to promote strong and healthy communities, economic growth, and protection of our environment. These planning grants (Environmental Justice: Context-Sensitive Planning, Community-Based Transportation Planning, Partnership Planning, and Transit Planning) support closer
placement of jobs and housing, efficient movement of goods, community involvement in planning, safe and convenient pedestrian and bicycle mobility and access, smart or strategic land use, and commute alternatives.
Web Link: http://www.dot.ca.gov/hq/tpp/grants.html

Summary of Funding Programs I-6 January 2012
Regional Funding Programs
Regional Transportation Improvement Program
The Regional Transportation Improvement Program (RTIP) funds are a portion of the State Transportation Improvement Program. The Metropolitan Transportation Commission, acting as the Regional Transportation Planning Agency in the nine-county Bay Area, is responsible for allocating Napa County’s share of the funding.
Web Link: http://www.mtc.ca.gov/funding/STIP/
Transportation for Livable Communities
MTC’s Transportation for Livable Communities (TLC) Program was created to support community-based transportation projects that revitalize downtown areas, commercial cores, neighborhoods and transit corridors by enhancing their amenities and ambiance and making them places where people want to live, work and visit. The TLC Program supports the region’s FOCUS Program by investing in Priority Development Areas, designated areas in which there is local commitment to developing housing, along with amenities and services, to meet the day-to-day needs of residents in a pedestrian-friendly environment served by transit. TLC provides funding for planning and capital improvement projects that provide for a range of transportation choices, support connectivity between transportation investments and land uses, and are developed through an inclusive community planning effort.
Web Link: http://www.mtc.ca.gov/planning/smart_growth/tlc_grants.htm
Regional Bicycle and Pedestrian Program
The Regional Bicycle and Pedestrian Program (RBPP) was created by the MTC in 2003 through a set-aside of federal funds to fund construction of the Regional Bicycle Network, regionally-significant pedestrian projects, and bicycle and pedestrian projects that serve schools and transit. MTC has committed $200 million in the Transportation 2030 Plan to support the regional program over a 25-year period ($8 million each year). The program is administered through County Congestion Management Agencies (CMAs; NCTPA in Napa County).
Web Link: http://www.mtc.ca.gov/planning/bicyclespedestrians/regional.htm#bikepedprog
TDA Article 3
Transportation Development Act (TDA) Article 3 funds are generated from State gasoline sales taxes and are returned to the source counties from which they originate to fund transportation projects. Article 3 funds provide a 2 percent set aside of the County TDA funds for bicycle and pedestrian projects. Eligible projects include right-of-way acquisition; planning, design and engineering; support programs; and construction of bicycle and pedestrian infrastructure, including retrofitting to meet ADA requirements, and related facilities. Each year NCTPA approves a Program of Projects for Napa County, which is submitted to MTC for approval.
Web Link: http://www.mtc.ca.gov/funding/STA-TDA/
Lifeline Transportation Program
The Lifeline Transportation Program (LTP) was established to fund projects that result in improved mobility for low-income residents of the nine San Francisco Bay Area counties. Lifeline funds may be used for either capital or operating purposes. Eligible capital projects include (but are not necessarily
Summary of Funding Programs I-7 January 2012
limited to) purchase of vehicles, provision of bus shelters, benches, lighting, sidewalk improvements or other enhancements to improve transportation access for residents of low-income communities. A local match of a minimum of 20% of the total program cost is required.
Web Link: http://www.mtc.ca.gov/planning/lifeline/
Safe Routes to Transit
Funded through Regional Measure 2, this competitive program is designed to promote bicycling and walking to transit stations by funding projects and plans that make important feeder trips easier, faster, and safer. The program is administered by the Transportation and Land Use Coalition (TALC). TALC is a Bay Area partnership of over 90 groups that develops and forwards a range of projects, programs, and campaigns supporting sustainability and equity in the land use, housing, and transportation arenas.
Web Link: http://www.transcoalition.org/c/bikeped/bikeped_saferoutes.html#application
Bay Trail
The Association of Bay Area Governments (ABAG) sponsors the San Francisco Bay Trail project. As funds become available, the Bay Trail Project administers grant programs to fund planning and construction of the Bay Trail. Grant monies are available for planning studies, trail design work, feasibility studies, and construction of new Bay Trail segments and associated amenities including bike lane striping, sidewalk construction and improvements to roadway bicycle routes. The deadline for the program is on-going until program funds are programmed. While a local match is not required, it is encouraged. Grant awards generally range from $150,000-$500,000.
Web Link: http://baytrail.abag.ca.gov/grants.html
Transportation Fund for Clean Air
The Transportation Fund for Clean Air (TFCA) is a grant program funded by a $4 surcharge on motor vehicles registered in the Bay Area. The program generates
approximately $22 million per year in revenue and consists of two parts: Program Manager Funds (60 percent of revenues), which guarantees a calculated percentage to each county, and Regional Funds (40 percent of revenues), which are allocated on the basis of regional competition. The program's goal is to implement cost-effective projects that will decrease motor vehicle emissions. The fund covers a wide range of project types, including purchase or lease of clean fuel buses, purchase of clean air vehicles, ridesharing programs to encourage carpool and transit use, bicycle facility improvements such as bike lanes, bicycle racks, and projects to enhance the availability of transit information. Applications for the Regional Funds are made directly to BAAQMD. The Program Manager Funds are administered by NCTPA.
Web Link: http://www.baaqmd.gov/Work.aspx
BAAQMD Bicycle Facility Program
The Bay Area Air Quality Management District's (Air District’s) Bicycle Facility Program (BFP) provides grant funding to reduce motor vehicle emissions through the implementation of new bikeways and bicycle parking facilities in the Bay Area. The BFP is funded through the Transportation Fund for Clean Air (TFCA) program. Proposed projects must comply with Board-adopted policies and be located within the Air District’s boundaries. Eligible project types include: Class I – Bicycle Paths; Class II –

Summary of Funding Programs I-8 January 2012
Bicycle Lanes; Class III – Bicycle Routes; Bicycle Lockers and Racks; Secure Bicycle Parking; and Bicycle Racks on Public Transportation Vehicles.
Web Link: http://www.baaqmd.gov/Divisions/Strategic-Incentives/Bicycle-Facility-Program.aspx
Local Funding Programs
Direct Local Jurisdiction Funding
Local jurisdictions can fund bicycle and pedestrian projects using a variety of sources. A city’s general funds are often earmarked for non-motorized transportation projects, especially sidewalk and ADA improvements.
Future road widening and construction projects are one means of providing bike lanes and sidewalks. To ensure that roadway construction projects provide these facilities where needed, appropriate, and feasible, it is important that an effective review process is in place so that new roads meet the standards and guidelines presented in this Plan.
Impact fees
Another potential local source of funding is developer impact fees, typically tied to trip generation rates and traffic impacts produced by a proposed project. A developer may reduce the number of trips (and hence impacts and cost) by paying for on- and off-site pedestrian and bikeway improvements, which will encourage residents to walk and bicycle rather than drive. In-lieu parking fees may be used to help construct new or improved bicycle parking. A clear connection between the impact fee and the mitigation project must be established.
Special Taxing Districts
Special taxing districts, such as redevelopment districts, can be good instruments to finance new infrastructure – including shared use trails and sidewalks – within specified areas. New facilities are funded by assessments placed on those that are directly benefited by the improvements rather than the general public. In a “tax increment financing (TIF) district, taxes are collected on property value increases above the base year assessed property value. This money can then be utilized for capital improvements within the district. TIFS are especially beneficial in downtown redevelopment districts. These districts are established by a petition from landowners to a local government. The districts can operate independently from the local government and some are established for single purposes, such as roadway construction.
Other
Local sales taxes, fees, and permits may be implemented, requiring a local election. Parking meter revenues may be used according to local ordinance. Volunteer programs may substantially reduce the cost of implementing some of the proposed pathways. Use of groups such as the California Conservation Corp which offer low-cost assistance will be effective at reducing project costs. Local schools or community groups may use the bikeway or pedestrian project as a project for the year, possibly working with a local designer or engineer. Work parties may be formed to help clear the right of way where needed. A local construction company may donate or discount services. A challenge grant program with local businesses may be a good source of local funding, where corporations “adopt” a bikeway and help construct and maintain the facility.