Pedestrian and Bicycle Facilities - Transportation Research ...
83
TRANSPORTATION RESEARCH RECORD 95 9 Pedestrian and Bicycle Facilities TRANSPORTATION RESEARCH BOARD NATIONAL RESEARCH COUNCIL WASHINGTON, D. C. 1984
-
Upload
khangminh22 -
Category
Documents
-
view
1 -
download
0
Transcript of Pedestrian and Bicycle Facilities - Transportation Research ...

TRANSPORTATION RESEARCH RECORD 9 5 9
Pedestrian and Bicycle Facilities
TRANSPORTATION RESEARCH BOARD NATIONAL RESEARCH COUNCIL WASHINGTON, D.C. 1984

Transportation Research Record 959 Price $11.40 Editor: Naomi Kassabian Comrositor: Joan G. Zubal Layout: Theresa L. Johnson
mode 1 highway transportation
subject areas 51 transportation safety 5 2 h urnan factors 54 operations and traffic control
Transportation Research Board publications are available by ordering directly from TRB. They may also be obtained on a regular basis through organizational or individual affiliation with TRB; affiliates or library subscribers are eligible for substantial discounts. For further information, write to the Transportation Research Board, National Research Council, 2101 Constitution Avenue, N.W., Washington, D.C. 20418.
Printed iil the United States of America
Library of Congress Cataloging in Publication Data National Research Council. Transportation Research Board.
Pedestrian and bicycle facilities
(Tramportation research record; 959) Reports prepared for the 63rd annual meeting of the Transpor
tation Research Board. 1. Pedestrian facilities design-Addresses, essays, lectures.
2. Cycling paths-Addresses, essays, lectures, 3. Traffic signs and signals-Addresses, essays, lectures. I. National Resl!arch Council (U.S.). Transportation Research Board. II. Series. TE7.H5 no. 959 380.5 s 84-22649 [TE279.5] [388.4'1) ISBN 0-309-03705-0 ISSN 0361-1981
Sponsorship of Transportation Research Record 959
GROUP 3-0PERATION AND MAINTENANCE OF TRANSPORTATION FACILITIES D.E. Orne, Michigan Deportment of Transportation, chairman
Committee on Pedestrians Ozorles V. Zegeer, Goodell-Grivas, Inc., chairman Ke1111et/1 S. Opiela, Goodell-Grivas, inc., secrermy ferry L. Borrett,.David A. Baskett. Gregory l'. Benz, Eugene D. 8rC11ni11g, Kay Colpitts. Richard L. Duek(!J·, Patricio Hause Ehrlich Joh11 C. Fegan. Dm11a G. Fielder, Timothy P.. Harpst, Jolin D. ' He11drickso11, Michael R. Hill, Margaret /lubbard Jones. S111!/1omoy KJ;asnabis, C. _Joti11 K.l1isty, Richard J, . Knoblauch, Marvi11 M. Levy Richard A. Richter, Robert D. Sleight, Steven A. Smith, Robert C. Vonstrum
Committee on Bicycling and Bicycle Facilities Curtis~- Yates, North Carolina Deportment of Transportation,
chairma11 Jesse Blatt, Bruce Burgess. Ste1•e11 J·: Faust, Joh11 C. Fegan, William N. Feldman, William f-1. Prey, Ralph 8. Hirsch. Joshua D. Lehman Richard R. Lemieux, Ste11e11 R. Mclfe11ry, Catherine G. Moran.' Tltomas S. Pe11dleto11. Laurence Reilly, Michael A. Replogle, Dia11e Rowe, Ja11er Schaeffer, Alex Sorto11, Sharon K. Jllagner. IVilliam C. lllilkinso11 ff!, Earl C. Williams. Jr.
Jam es K. Williams, Transportation Research Board staff
Sponsorship is indicated by a footnote at the end of each report The organizational units, officers, and members are as of December 31, 1983.

Contents
THE SAFETY, OPERATIONAL, AND COST IMPACTS OF PEDESTRIAN INDICATIONS AT SIGNALIZED INTERSECTIONS
H. Douglas Robertson and Everett C. Carter . . . . . . . . . . . . . . . . . . . . . . . . . . . . . . . . . . . . . . . . 1
EVALUATION OF INNOVATIVE PEDESTRIAN SIGNALIZATION ALTERNATIVES Charles V. Zegeer, Michael J. Cynecki,'and Kenneth S. Opiela........................... 7
PEDESTRIAN TIME-SPACE CONCEPT FOR ANALYZING CORNERS AND CROSSWALKS John J. Fruin and Gregory P. Benz ................................................ 18
PEDESTRIAN EXPOSURE TO RISK IN HOUSING AREAS D. H. Crompton . . . . . . . . . . . . . . . . . . . . . . . . . . . . . . . . . . . . . . . . . . . . . . . . . . . . . . . . . . . . . . 25
PEDESTRIAN CHARACTERISTICS AND EXPOSURE MEASURES Richard L. Knoblauch, Henry N. Tobey, and Evelyn M. Shunaman . ... .......... ...... ... 35
MID BLOCK CROSSWALKS: A USER COMPLIANCE AND PREFERENCE STUDY Nagui M. Rouphail ........................................................ .... 41
PEDESTRIAN CROSSING-TIME REQUIREMENTS AT INTERSECTIONS Mark R. Virkler and David L. Guell . . . . . . . . . . . . . . . . . . . . . . . . . . . . . . . . . . . . . . . . . . . . . . . 4 7
WALKING STRAIGHT HOME FROM SCHOOL: PEDESTRIAN ROUTE CHOICE BY YOUNG CHILDREN
Michael R. Hill . . . . . . . . . . . . . . . . . . . . . . . . . . . . . . . . . . . . . . . . . . . . . . . . . . . . . . . . . . . . . . . 51
ROLE OF BICYCLES IN PUBLIC TRANSPORTATION ACCESS Michael A. Replogle . . . . . . . . . . . . . . . . . . . . . . . . . . . . . . . . . . . . . . . . . . . . . . . . . . . . . . . . . . . 5 5
BICYCLE-MOTOR VEHICLE ACCIDENTS IN THE BOSTON METROPOLITAN REGION Wendy Plotkin and Anthony Komornick, Jr. ............................... .' ........ 62
PROMOTION AND PLANNING FOR BICYCLE TRANSPORTATION: AN INTERNATIONAL OVERVIEW
Werner Brog, Erhard Erl, Konrad Otto, and Gerd Sammer .............................. 73
iii

Addresses of Authors
Benz, Gregory P.; Parsons, Brinckerhoff, Quade and Douglas, Inc., One Penn Plaza, 250 West 34th Street, New York, N.Y. 10091
Brog, Werner, Socialdata GmbH, Hans-Grassel-Weg 1, 8000 Munchen 70, Federal Republic of Germany Carter, Everett C., Department of Civil Engineering, University of Maryland, College Park, Md. 20742 Crompton, D. H., Department of Civil Engineering, Imperial College of Science and Technology, South Kensington, S.W.
7, London, England Cynecki, Michael J., Goodell-Grivas, Inc., 17320 West Eight Mile Road, Southfield, Mich. 48075 Erl, Erhard, Socialdata GmbH, Hans-Grassel-Weg 1, 8000 Munchen 70, Federal Republic of Germany Fruin, John J., Port Authority of New York and New Jersey, One Path Plaza, Jersey City, N.J. 07306 Guell, David L., Department of Civil Engineering, College of Engineering, University of Missouri-Columbia, Columbia, Mo.
65211 Hill, Michael R., Department of Sociology, University of Nebraska-Lincoln, Lincoln, Nebr. 68588 Knoblauch, Richard L., Center for Applied Research, Inc., 9617 Beach Mill, Great Falls, Va. 22006 Komornick, Anthony, Jr., Merrimack Valley Planning Commission, 5 Washington Street, Haverhill, Mass. 01830 Opiela, Kenneth S., Goodell-Grivas, Inc., 17320 West Eight Mile Road, Southfield, Mich. 48075 Otto, Konrad, Umweltbundesamt, Bismarckplatz l, 1000 Berlin 33, Federal Republic of Germany Plotkin, Wendy, 36 Queensberry Street, Apt. 14, Boston, Mass. 02215 Replogle, Michael A., Maryland National Capital Park and Planning Commission, 8787 Georgia Avenue, Silver Spring, Md.
20907 Robertson, H. Douglas, Department of Civil Engineering, University of Nor.th Carolina, Charlotte, N .C. 28223 Rouphail, Nagui M., Department of Civil Engineering, University of Illinois at Chicago, P.O. Box 4348, Chicago, Ill. 60680 Sammer, Gerd, Technical University, Rechbauerstrasse 12, 8010 Graz, Austria Shunaman, Evelyn M., Urbitran Associates, Inc., 15 Park Row, New York, N.Y. 10038 Tobey, Henry N., Center for Applied Research, Inc., 9617 Beach Mill, Great Falls, Va. 22006 Virkler, Mark R., Department of Civil Engineering, College of Engineering, University of Missouri-Columbia, Columbia,
Mo. 65211 Zegeer, Charles V., Goodell-Grivas, Inc., 17320 West Eight Mile Road, Southfield, Mich. 48075
iv

1
The Safety, Operational, and Cost Impacts of Pedestrian Indications at Signalized Intersections
H. DOUGLAS ROBERTSON and EVERETT C. CARTER
ABSTRACT
Pedestrian signals have been used in the United States since the 1920s. Although these signals are viewed by many as a safety improvement, studies to date have not entirely sustained this premise. Other studies have centered on improving operational efficiency of pedestrian signals through timing, phasing, and uniformity of displays. In addition to these safety and operational considerations, energy conservation and reduced operation and maintenance revenues are added justification for optimal and judicious use of pedestrian signals. The effects that pedestrian signal indications have on safety, operations, and cost are examined. Information is drawn from the literature and analyses of accidents, delay, and benefits versus cost. The study concludes that there is evidence indicating that pedestrian signals are overused and thus contribute to unnecessary costs and delays and possibly reduced safety. A need exists for the more judicious use of pedestrian indications at signalized intersections.
Approximately 130,000 motor vehicle accidents involving pedestrians occurred in 1981, which resulted in 9,000 pedestrian fatalities and 100,000 injuries. A majority of these accidents (84 percent) occurred in urban areas. Approximately 25 percent of the pedestrians killed or injured ( 26, 700) were crossing or entering intersections (1, pp. 45-47, 55, 61).
The competition for space between pedestrians and vehicles is increasing, particularly in densely populated regions. Provisions for pedestrian movements and pedestrian-vehicle conflicts reduce intersection capacity and increase delay. The traffic engineer is thus confronted with two sometimes conflicting considerations: safety and operational efficiencv.
Pedestrian signals have been used in the United States since the 1920s. Although they are viewed by many engineers as a safety improvement, studies to date have not entirely sustained this premise. In some instances the correlation between pedestrian signal installations and public pressure is far greater than the correlation between pedestrian signals and accident reduction or improved operations.
In addition to the safety and operational considerations just mentioned, energy conservation and reduced operation and maintenance funds are added justification for optimal and judicious use of pedestrian signals. At this time traffic engineers have insufficient information and data to determine where pedestrian signals are needed most and in what manner they should be operated to best meet all requirements.
The safety, operational, and cost impacts of using pedestrian signal indications at signalized in-
tersections are examined in this paper. Four sources of information are used: existing literature, a pedestrian accident analysis, a delay analysis, and a benefit/cost analysis.
LITERATURE REVIEW
The information that appears to be most useful to pedestrians is a clear indication of when to walk without interference from traffic. In evaluating the effect of pedestrian signals versus no pedestrian signals at intersections, Mortimer (_~) found that the pedestrian signal aided pedestrians in estimating the safe crossing time remaining. As a result, a significantly greater number of pedestrians crossed during the WALK interval compared with the green interval of the traffic signal. At the traffic signal without pedestrian indications, the highest pedestrian flow occurred during the amber interval, a potentially hazardous situation.
Forsythe and Berger ( 3) presented the results of interviews with pedestrians crossing unsafely (without a WALK or a green indication). The overriding factor was clearly time related. A need to hurry or a desire to keep moving was the prime motivation behind disobeying peaestrian (or traffic) signals. The implication for intersection safety appeared to be that, as with vehicles, the pedestrian stream must be kept flowing.
A study by Orne (_!) developed some interesting findings. Data were collected on pedestrian violations, pedestrian volume, and vehicle volume at intersections with and without pedestrian signals in two cities. The data analysis showed that pedestrian violations were positively correlated with both pedestrian and vehicle volumes even though a regional difference in pedestrian characteristics was shown to exist between the two cities. The correlation was higher at the intersections with pedestrian signals than at those without.
A particular aspect of the pedestrian signal has been of concern. As Sleight (~, pp. 224-253) noted, the meaning of pedestrian signals is not always clear. In certain installations, WALK means that the pedestrian has exclusive use of the crosswalk and no traffic will interfere: however, in the majority of situations traffic is permitted to turn through a crosswalk during the WALK indication. A pedestrian really has no way of knowing which type of control is in effect at a particular intersection. Obviously the pedestrian who frequents semiexclusive, controlled crosswalks builds a different set of expectancies than the pedestrian who has to watch for turning traffic regardless of signal message.
One way of providing more information is to use a flashing signal. However, a similar problem exists in that the WALK or DONT WALK indication may flash with the intent of conveying two different messages. The flashing WALK is intended to warn pedestrians of turning vehicles. The flashing DONT WALK indicates the clearance interval: that is, the signal is about to change. Again pedestrians build expectancies that may be incorrect for other intersections, or if they face different uses of the flashing signal and can-

2
not build an expectancy, they will tend to ignore that signal.
In a study of pedestrians' understanding of the meaning of signal indications, Robertson (~) found that of 400 pedestrians surveyed in two cities, only 2.5 percent understood the intended meanings of flashing WALK and steady WALK. Less than half of the pedestrians in both cities said that they would expect vehicles to be turning into the crosswalk during the WALK interval even though turning vehicles in both cities made up one-fourth of the total traffic passing through the intersections and all turns were permitted.
Overall the pedestrian signal appears to have 1 imited effectiveness. The major limitation is the uncertainty of information provided. However, it may not be practical to expect all of the desirable information features to be included in every pedestrian signal system. As Welke (7) pointed out, the practical aspects of complicated signal systems (i.e., cost and maintenance) limit their use to heavily t raveled intersections. Even if a complete information set cannot be provided in ever y signal application, considerable gain can result by standardizing the meaning of the information presented. If different amounts of information need to be given at various sites, provisions must be made for the pedestrian to identify or be aware of the difference.
It is apparent from the literature that researchers have some degree of understanding of the needs and expectations of pedestrians crossing at signalized intersections; however, there is much evidence to indicate that these needs and expectations are not being fully accommodated. Low compliance with the signal; lack of understanding of the meaning of pedestrian indications; and inadequate accommodations for special pedestrians, such as the elderly and th e hand i c appe d, are e xamples of needs and expectations not being met.
ACCIDENT DATA ANALYSIS
Accidents and accident rates have traditionally been accepted as the ultimate measures of safety because they represent the ultimate failure of safety provisions. Although numerous from an overall viewpoint, pedestrian accidents are rare events that often occur under various circumstances. I t is therefore quite difficult to use pedestrian accident statistics to determine accident causation factors or to ascertain which countermeasures are effective or show a potential benefit. The difficulty could be reduced if there were a way to measure, or express, pedestrian exposure and thus indicate some measure of risk. Because vehicle traffic is somewhat homogeneous, exposure may be calculated in terms of measures such as vehicle miles of travel. Pedestrian traffic is for the most part heterogeneous and meaningful exposure relationships have not yet been fully developed.
Three existing data bases containing more than 5,100 accidents and representing 20 different urban areas were obtained and examined. These included the following:
1. District of Columbia pedestrian intersection accidents from 1971 throuqh 1973 (2,685),
2. Pedestrian intersection accidents f rom 13 cities collected during the Snyder and Knoblauch (~)
study of pedestrian behavior (973), and 3. Pedestrian intersection accidents
cities collected during the Knoblauch (~)
urban pedestrians (1,443).
from 7 study of
Transportation Research Record 959
For convenience, these data bases will hereafter be referred to as the D.C., PED, and URPED data bases, respectively. The D.C. data base contained only information from police accident reports. The other data bases contained behavioral data from indepth investigations in addition to police report information.
Table 1 gives the frequency and percentaqe of pedestrian accidents by type of control for each of the three data bases analyzed. The percentaqes of control type from the PED and URPED data bases reflect the average for several cities and are in close agreement with one another. The D.C. data base, which represents a sinqle city, has different percentages but shows the same trend between control types as reflected in the average data from 20 cities. Overall, at intersections with pedestrian accident histories, 44 percent of the accidents occurred at signalized intersections.
TABLE 1 Pedestrian Intersection Accidents by Data Base and Type of Control
Type of Control
Signal Nonea Stop or Yield
Data Base Frequency Percent Frequency Percent Frequency Percent
D.C. 1,043 39 1,378 51 264 10 PED 477 49 359 37 137 14 URPED 700 48 506 35 237 17 Total 2,220 44 2,243 44 638 12
a Th.is category includes accidents that occurred on the major street of a nonsignalized intersection.
Total
2,685 973
1,443
5,101
An analysis was conducted of 47 intersections (23 with pedestrian signals, 19 with traffic siqnals only, and 5 with no signals) in washinqton, D.C., where pedestr ian and vehicle volumes as well as pedestrian acc i dent data were a va i lable. Pedestrian accident rates were calculated for each intersection by dividing the number of pedestrian accidents in 3 years during a 10-hr period by a sample of the pedestrian volume during the same 10-hr period. Mean pedestrian accident rates were then calculated for each type of control. Tests of significanc e (Student's t) revealed that the intersections with vehicular or pedestrian signals o r both had a significantly lower accident rate than nonsignalized intersections. There was no significant difference in mean accident rates between intersections with pedestrian signals and intersections with traffic signals only. These results imply that signalized intersections are safer than nonsignalized intersections and that pedestrian siqnals are no safer than traffic signals alone. Caution should be exercised when these findings are used because the small samples may not be representative.
More substantial evidence may be found in a recent study by Zegeer et al. (10) in which it was concluded that there was no significant difference in pedestrian accidents between signalized intersections with standard timed pedestrian signals and those with no pedestrian signal indications. The study was based on data from 1,100 intersections in 15 U.S. cities, and the analysis controlled for both pedestrian and vehicle volumes as well as one-way and two-way operation. The study did not examine nonsignalized intersections but does offer strong evidence that, in general, pedestrian signal indications are no safer than traffic signals alone.
Approximately one of every five accidents in the data base involved a turning vehicle hitting a pe-

Robertson and Carter
destrian. Left turns accounted for about 62 percent of the turning accidents [60 percent in the data by Zegeer et al. (.!Q) J • Before these statistics could be used as indicators of a safety problem, however, it was necessary to examine them in light of some measure of exposure. The first step was to determine whether accidents between turning vehicles and pedestrians occurred at a greater rate than the rate of turning vehicles. Sixty-two intersections were sampled from the o.c. accident data base. The only sampling criterion was that pedestrian volumes, vehicle counts by movement, and accident histories be available for each intersection. The pedestrian and vehicle volumes were based on 10-hr counts. The 3-year accident histories ranged from zero to seven accidents per intersection. Of the 62 intersections in the sample, 8 had no signals, 29 had traffic signals only, and 25 had both traffic and pedestrian signals.
This sample data base revealed the following:
1. Of the 202 pedestrian accidents that occurred, 29 percent involved turning vehicles,
2. The average ratio of turning vehicles to total vehicles entering the intersection was 17 percenti
3. Left-turning accidents accounted for 59 percent of the total turning accidentsr and
4. Left turns represented 44 percent of the total turns.
On the basis of these data, turning vehicles, and in particular left-turning vehicles, were overrepresented in these pedestrian intersection accidents. This analysis assumed that the vehicle counts were representative of the vehicle volumes over the period in which the accident data were collected.
Some interesting trends were reflected by the pedestrian accident rates in Table 2. Left turns had a higher rate than right turns at signalized intersections. The through-movement rate was higher than
TABLE 2 Pedestrian Accident Rates by Type of Control
Type of Control
Type of Rate•,b No Signal Signal Only Pedestrian Signal All
Left turn _ c 5.99 3.69 4.33 Right turn 2.24 1.85 2.59 2.34 Total turn 1.22 3.78 3.06 3.22 Through 5.95 1.54 1.17 1.51 Total vehicle 5.52 1.95 1.60 1.90 Pedestrian volume 3.16 1.41 0.81 1.10
3Accident rates based on vehicles= number of pedestrian accidents divided by total 10-hr vehicle volume times 10,000. bAccident rates based on pedestrfans =number of pedestrian accidents divided by total 10-hr pedestdan volume times 1,000. CNo left-tum accidents occurred at unsignalized intersections. Left turns made up 45 percent of the total turns.
the turning-movement rate at nonsignalized intersect ions but lower at signalized intersections. Overall, left turns were almost three times more hazardous to pedestrians than through movements. This corresponded to research by Habib (11), who found the left-turning maneuver to be abou~our times as hazardous as the through movement with regard to pedestrian accidents when turning volumes were considered.
On the basis of the data reflected in Table 2, signalized intersections had lower pedestrian accident rates than nonsignalized intersections when either vehicle or pedestrian volumes were considered. Standard tests of differences in mean accidents, pedestrian volume, vehicle volume, and number
3
of turns per intersection between each type of control showed no significant difference in mean accidents per intersection and significant differences (O.l level) in all of the other means. As one might expect, the mean volumes (pedestrians, vehicles, and turns) were higher at the signal-only intersections and highest at the pedestrian signal intersections. Caution should be exercised when interpreting the findings in Table 2, because the sample of 62 intersections from which the data were drawn may not be representative of each of the types of control.
In conclusion there was evidence to support the contention that turning movements, and in particular left-turning movements, present a safety problem for pedestrians crossing at intersections and that it appears that the problem may be more acute at signalized intersections.
In addition, Zegeer et al. ( 10) concluded that the presence of pedestrian indications may tend to create a false sense of security in that pedestrians may think that they are fully protected and do not need to be cautious. The absence of pedestrian indications makes pedestrians feel that they must rely on their own senses and judgment and thus exercise more caution, particularly with regard to turning vehicles.
Age appears to have a significant effect on pedestrian behavior. The data were analyzed to determine what age groups of pedestrians crossing at intersections were overinvolved or at risk when exposure was taken into account. Age data were available on 2,397 pedestrians in the total data base. Almost 40 percent of the pedestrians involved were under the age of 15.
Risk for each age group was calculated by dividing the percentage of pedestrians involved in accidents by the corresponding percentage of the population. Risk was then plotted by age and is shown in Figure 1. Risk values greater than 1 represented age ranges that were overinvolved in pedestrian intersection accidents given the proportion of those age ranges found in the general population. These data tended to confirm the results of other studies that the young (between 5 and 15 years) and the elderly (more than 64 years) are overrepresented in pedestrian intersection accidents.
The accident factors discussed thus far have all related to the incidence of the accident. In other words these factors related to the occurrence of the accident and to whether that occurrence could be expected given the situation with regard to exposure. The following factors characterized those accidents that occurred (and were reported). The sa-1 ient factors included pedestrian injury severity, pedestrian actions, driver actions, and blocked vision.
The data on 2,371 pedestrians indicated that injuries occurred most frequently at signalized intersections and least frequently on approaches with stop or yield control. Fatalities were particularly high at signalized intersections when compared with nonsignalized intersections. The number of pedestrians with no injuries was lowi that is, 4 percent of those struck were not injured. This indicates that when struck by a vehicle, the pedestrian seldom escapes injury. It is also possible that many no-inj ury accidents go unreported. Except for the trends already noted, the other injury categories reflected few differences.
With respect to causal factors, inattention was cited for pedestrians over drivers by almost three to one. Blocked vision was also frequently cited as a causal factor by both pedestrians and drivers. The blocking objects were almost identically reported: parked cars, 39 percenti standing traffic, 23 per-

4 Transportation Research Record 959
RISK•
2.0
"PEDESTRIANS IN ACCIDENTS
% POPULATION
1.5
1.0
0.5
AGE
FIGURE 1 Pedestrian intersection accident risk by age based on exposure.
cent: moving traffic, 22 percent: and other, 16 percent.
To drivers, pedestrians appeared suddenly in their path in one-third of the accidents coded. The pedestrians did not recognize the need for evasive action in two-thirds of the accidents coded.
The major violations coded were failure by dr ivers to yield the right-of-way to pedestrians, crossing against the signal by pedestrians, speeding, and hit and run. The pedestrian was charged in approximately one-half of the accidents, the driver in approximately one-third.
By comparison, the study by Zegeer et al. (10) concluded that approximately one-half of the intersection pedestrian accidents were caused by pedestrians violating the traffic or pedestrian signal or both. In the other half of the pedestrian accidents, the pedestrians were following the instructions of traffic or pedestrian signals, but were struck by motorists who failed to observe or yield to pedestrians in time.
DELAY ANALYSIS
The purpose of the delay analysis was to assess the impact of pedestrians on intersection performance as reflected by vehicle and pedestrian delay. The analysis included signalized intersections with and without pedestrian signals.
Pedestrian delay at signalized intersections has been shown to be a function of signal timing, pedestrian and vehicle volume, and roadway width. It is also a function of one other major factor, which is often overlooked or assumed away. Pedestrian compliance with the signal can have a significant impact on pedestrian delay, particularly at intersections with moderate to low vehicle volumes. Pedestrians who are willing to trust their own judgment of gaps in traffic incur less delay than those who comply with the signal. A number of factors appear to influence a pedestrian's willingness to obey the signal. The strongest motivation for high pedestrian compliance with pedestrian signals is the pedes-
tr ian' s perceived need for assistance in crossing the street. This motivation is reflected by the relationship between the percentage of violators (those crossing when vehicles have the right-of-way) and vehicle volume, which has been established in several studies and confirmed in this study. As vehicle volume increases, pedestrian violations decrease.
Signal timing was found to influence compliance. When too much green time was given to vehicle traffic with respect to its volume, pedestrian violations increased. Increasing pedestrian clearance time was also accompanied by an increase in pedestrian violations. Other factors such as age, sex, width of street, sight distance, and weather affect compliance in varying degrees. Because of the number of factors that influence pedestrian compliance, there is a large variance from site to site and city to city.
With respect to type of control, an examination of the proportion of the cycle where the pedestrian must wait (assuming he complies) shows that one would anticipate the least pedestrian delay under pedestrian-actuated control and the most delay under fixed-time, exclusive-pedestrian-phase (scramble) control, all else being equal.
Traditionally vehicle delay has often been the controlling factor when trade-offs were made with pedestrian delay and to a large extent safety. This is not unexpected given the magnitude or difference between pedestrian and vehicle volumes.
In general, vehicles are delayed by pedestrians in one of the following ways:
1. Direct conflict with left- and right-turning vehicles when pedestrians are given the right-of-way concurrently with vehicles on the street parallel to the crosswalks,
2. control of vehicle green time by the minimum walk time requirement,
3. The use of an exclusive pedestrian phase (scramble) or prohibition of turns, or
4. Pedestrian-actuated control at intersections

Robertson and Carter
of high-volume major streets and low-volume minor streets.
In assessing the impact of various pedestrian signal phasing and timinq alternatives on vehicle delay, Abrams and Smith (12) dealt exclusively with delay to right-turning vehicles. They assumed that the delay incurred when right-turning vehicles must yield to pedestrians in the crosswalk was the only significant delay to vehicles beyond that normally introduced by the signal. They found that street width (length of crosswalk) had a significant effect on right-turn delay. With crosswalks less than 60 ft (18.3 m) long, right-turning vehicles had to wait until pedestrians crossing from both curbs had cleared the street. With longer crosswalks, one or more vehicles could turn right between the time that the near-side curb pedestrians had cleared and the time that the far-side curb pedestrians reached the lane into which the vehicles were turning.
Pedestrian-induced left-turn delay is generally less severe than right-turn delay. This is primarily because heavy left-turn movements are usually accommodated by a separate left-turn phase during which pedestrians are not permitted to enter the crosswalk where conflicts may occur. When left turns are permitted without a separate left-turn phase, the turning vehicles must first yield to opposing through traffic before they turn. This usually gives pedestrians an opportunity to clear the crosswalk before the left-turning vehicle reaches it. As indicated in the accident analysis portion of this paper, the conflict between left turn and the pedestrian is one of the most hazardous. A left-turning driver who is seeking a gap in opposing traffic may be sufficiently distracted not to see the pedestrian in the crosswalk through which he is turning.
During the early 1950s the exclusive pedestrian phase, or scramble, was introduced in several u.s. cities. It met with mixed success. Installed as a safety measure (pedestrians and vehicles were separated from conflict), it was found to siqnificantly increase both pedestrian and vehicle delay (13). The application of. scramble is somewhat limitedtoday. It is found in some of the larger cities in downtown sections and has also enjoyed a wider application at intersections where safety is paramount, such as at school crossings.
BENEFIT/COST ANALYSIS
Pedestrian indications could conceivably benefit users in two ways: reduced delay and improved safety. As discussed previously, delay to pedestrians and vehicles at signalized intersections is primarily a function of signal timing and, to a lesser extent, compliance with the signal indications. Siqnal timing is a function of vehicle and pedestrian demand (usually expressed in terms of volumes). Vehicular signals are generally timed to accommodate vehicles and pedestrians regardless of whether pedestrian indications are present. Therefore, pedestrian indications have no significant effect on that portion of delay that is affected by signal timing.
The remaining question is whether pedestrian indications have an impact on pedestrian compliance. The evidence is somewhat mixed on this issue. Some studies have reported increases in compliance after pedestrian indications were installed, whereas others have found no change. Even where increases in compliance have occurred, the overall noncompliance rate has remained relatively high except at intersections with high vehicular volumes.
From another point of view, the delay to motorists caused by pedestrians who do not comply with
5
the signal is generally offset by the reduction in pedestrian delay resulting from the noncompliance. Thus the conclusion is that, in general, pedestrian indications do not significantly affect either pedestrian or vehicle delay.
with respect to safety, data from a sample of 47 intersections in this study revealed no siqni ficant difference in mean pedestrian accident rates between signalized intersections with and without pedestrian indications. More conclusively, the study by Zegeer et al. (10) found concurrently timed pedestrian siqnals to have no significant effect on pedestrian accident distributions or frequencies for a sample of more than 1,100 locations representing these two groups. This finding was also true for the five largest cities in the sample, both individually and collectively.
On the basis of this evidence, one could conclude that pedestrian signal indications, as predominantly applied (i.e., concurrent timing) , offer no safety benefit over that provided by vehicular signals alone. However, it is clear from the literature that safety did improve at some locations. The safety benefit then had to be a function of proper application. In other words, the pedestrian indications had to meet specific pedestrian needs that could not be met by the vehicular signals alone. For example, the indications may serve to reduce the hazards posed by poor sight distance; to clarify confusing traffic signal phasing; or to aid young, old, and handicapped pedestrians.
The following analysis included the costs to equip and operate pedestrian indications at a typical four-leg intersection with crosswalks on all approaches. It was assumed that traffic signals were in place and that the existing fixed-time controller would accommodate the operation of the pedestrian indications. A signal life of 10 years and a discount rate of 8 percent were assumed; signal equipment costs were based on prices in various sources (14115, p. 6). The annual costs, expressed in 1981 dollars, are summarized in Table 3. The most expensive (incandescent) and least expensive (fiber optics) signal types were chosen to establish the cost ranges shown. Power consumption was the largest single item and represented between 30 and 68 percent of the total annual cost.
TABLE 3 Annualized Cost of Pedestrian Indications (Incandescent and Fiber OpticB)
Annual Cost ($1981)
Item
Equipment cost ($225-353) Power consumptionc (based on
$0.06/kW ·hr) Installation (I hr at $20/hr) Maintenance per signal per
year (includes parts and labor)
Total
Per Signal"
33.53- 52.61
70.96- 23 .65 2.98
16.88- 29.81
124.35-109.05
a Assume 10-year signal lire with a discount rate of 8 percent . bJncludes eight signals. CW11tts per signal x 24 hr x 365 x $0.05.
Per Intersection b
268.24-420.88
567 .65-189.22 23 .84
135.08-238.45
994.81-872.39
The total annual cost of pedestrian indications was not easily compared with the total annual costs of the intersection traffic signals because of the wide variance in different types of controllers and signal equipment. A comparison was made, however, between the power consumption costs of traffic signals versus pedestrian indications. The power consumed by the controller was not included. It was

6
assumed that the same typical four-leg intersection had two 3-section, 12-in. traffic signals on each approach for a total of 24 signal heads rated at 150 W per head. It must be remembered that only eight heads are lit at any given time. The annual power consumption for each head (at $0.06/kW•hr) would cost $78.84 and for the intersection $630. 72. If incandescent pedestrian indications were used in conjunction with the traffic signals, they would consume 47 percent of the power needed to operate this intersection. Fiber-optic indications would consume 23 percent of the total power to operate the intersection.
With the methodology suggested by AASHTO (16, pp. 11-34 and 63-65) , the estimated benefits and costs were compared for alternative improvements at a typical signalized intersection. Two cases were examined. Case 1 was the installation of pedestrian signal indications, and case 2 was the removal of the pedestrian indications. The criterion for economic feasibility was that the equivalent uniform annual benefits exceed the equivalent uniform annual costs.
For case 1 it was assumed that the pedestrian indications were being installed to meet specific pedestrian needs: thus the benefit was in terms of the prevention of pedestrian accidents. For this hypothetical example it was assumed that the pedestrian indications would prevent an average of one pedestrian accident every 2 years (or 0.5 accident per year). The cost of a pedestrian accident was calculated by multiplyinq the proportions of fatalities and injuries by the representative costs for fatal and injury accidents (Hi), respectively, and summing the products. Performing this calculation resulted in a cost of $22,953 per pedestrian accident (in 1981 dollars). The annual benefit (cost savings) of installing pedestrian indications was found by multiplying the number of accidents prevented annually (0.5) by the cost per accident ($22,953). Thus, the equivalent uniform annual benefit for case 1 was $11,477.
The equivalent uniform annual costs to purchase, install, operate, and maintain incandescent pedestrian signals at the intersection were taken from Table 3 and amounted to $995. The equivalent uniform annual benefits exceeded the equivalent uniform annual costs by $10,482, which indicated that the installation of pedestrian indications at this intersection was economically desirable.
In case 2 the alternative improvement was the removal of pedestrian indications at a signalized intersection where there were no specific pedestrian needs being met beyond those provided by the vehicular signal. Based on the findings of both this and the study by Zegeer et al. (10), there would be no difference in safety with or -;ithout the pedestrian indications: therefore, the equivalent uniform annual benefit was zero. The equivalent uniform annual costs were the same as those in case 1 ($995), but because the pedestrian indications had been removed, these costs were in reality negative costs or savings. Therefore the costs actually represented an economic benefit of $995 ro - (-$995) l, thus indicating that the removal of pedestrian indications was economically desirable.
These hypothetical examples demonstrate that both the installation and the removal of pedestrian indications may be economically feasible if they are installed where they are needed and removed from where they are not needed.
CONCLUSIONS
There is no doubt that pedestrian intersection accidents pose a safe ty problem. In 1981 alone, 26 , 700
Transportation Research Record 959
pedestrians were killed or injured at intersections (1). Evidence indicates that traffic signals offer a-;;- improvement to pedestrian safety. Pedestrian indications, when properly applied to meet specific pedestrian needs, are thought to provide an additional safety improvement. The magnitude or extent of that added improvement has not been established. In short, pedestrian indications appear to contribute to the reduction of accidents or accident potential at some intersections, have little or no effect at others, and even increase accidents at still others. There is clearly a need to determine the conditions under which the safety afforded by pedestrian indications is realized, or in other words, when pedestrian indications are effective in enhancing safety.
The presence of pedestrian signal indications does not appear to significantly affect the performance of the intersection as measured by pedestrian and vehicle delay. The operation of those indications in conjunction with the vehicular signals (in terms of phasing and timing), however, has a profound effect on delay. When traffic signals are employed, care must be taken to ensure that they are properly timed.
Until recent years, the cost of providing and operating traffic and pedestrian signals has not been a major problem to most jurisdictions. During the 1950s, 1960s, and early 1970s, intersection signalization experienced tremendous growth. In the absence of more definitive information and armed with generally worded warrants and guidelines in the Manual on Uniform Traffic Control Devices (MUTCD) , many jurisdictions undertook use of pedestrian indications. For example, Los Angeles had pedestrian indications at 89 percent of its signalized intersections in 1974.
Since 1974 the economic situation has changed significantly. Inflation has reduced buying power and in turn the ability of government budgets to sustain the growth of signal control. Operating budgets have, in effect, been reduced by the rising cost of energy. The luxury of signal control that does not produce a reasonable and necessary benefit can no longer be afforded. As the analysis demonstrated, the cost of pedestrian signals is substantial.
With no relief to the economic and energy problems in sight, ways must be found to reduce costs. Pedestrian indications offer a cost-reduction target; therefore, it is critical that the conditions for the effective use of these indications be determined so that the safety benefits afforded by these devices will not be lost in an arbitrary move to cut costs.
REFERENCES
1. Accident Facts. National Safety Council, Chicago, Ill., 1982.
2. R.G. Mortimer. Behavioral Evaluation of Pedestrian Signals. Traffic Engineering, Nov. 1973, pp. 22-26.
3. M.J. Forsythe and w.G. Berger. Urban Pedestrian Accident Countermeasures Experimental Evaluation, Vol. 1, Appendix C: Behavioral Evaluation Summary Data. BioTechnoloqy, Inc., Falls Church, Va.: U.S. Department of Transportation, 1973.
4. D.E. Orne. A Preliminary Evaluation of Special Pedestrian Signals. Ph.D. thesis. Bureau of Highway Traffic, Yale University, New Haven, Conn., May 1959.
5 . R.B. Sleight. The Pedestrian. In Human Factors in Highway Traffic Safety Research (T.W.

Forbes, ed.), Wiley-Interscience, New York, 1972.
6 . H.D. Robertson. Urban Intersection Improvements for Pedestrian Safety, Vol. 4: Pedestrian Siqnal Displays and Operation. Report FHWA-RD-77-145. FHWA, U.S. Department of Transportation, Dec. 1977.
7. R.C. Welke. Improved Pedestrian Indications Aid D.C. Drivers. Traffic Engineering, Jan. 1968, pp. 26-33.
8. M.B. Snyder and R.L. Knoblauch. Pedestrian Safety: The Identification of Precipitating Factors and Possible Countermeasures, Vols. 1 and 2. Report FH-11-7312. National Highway Safety Bureau, Washington, D.C., Jan. 1971.
9. R.L. Knoblauch. Urban Pedestrian Accident Countermeasures Experimental Evaluation, Vol. 2: Accident Studies. Report DOT-HS-801 347. U .s. Department of Transportation, Feb. 1975.
10 . C.V. Zegeer, K.S. Opiela, and M.J. Cynecki. The Effect of Pedestrian Signals and Signal Timing on Pedestrian Accidents. In Transportation Research Record 847, TRB, National Research Council, Washington, D.C., 1982, pp. 62-72.
7
11. P.A. Habib. Pedestrian Safety: The Hazards of Left-Turning Vehicles. ITE Journal, April 1980, pp. 33-37.
12. C.M. Abrams and S.A. Smith. Urban Intersection Improvements for Pedestrian Safety, Vol. ~=
Signal Timing for the Pedestrian. Report FHWARD-77-144. FHWA, U.S. Department of Transportation, Dec. 1977.
13. R.T. Shoaf. A Discussion of Warrants for Scramble Signals. Traffic Engineering, April 1955, pp. 261-263.
14. A Guide to Choosing Pedestrian Traffic Signals. valtec Corp., West Boyleton, Mass., 1977.
15. Crouse-Hinds Traffic Control Price List TSPL-1. catalog 228. Crouse-Hinds co., Syracuse, N. Y., Dec. 1974.
16. A Manual on User Benefit Analysis of Highway and Bus-Transit Improvements. AASHTO, Washington, D.C., 1978.
Publication of this paper sponsored by Committee on Pedestrians.
Evaluation of Innovative Pedestrian Signalization
Alternatives
CHARLES V. ZEGEER, MICHAEL J. CYNECKI, and KENNETH S. OPIELA
ABSTRACT
The purpose of this study was to develop and evaluate innovative pedestrian sign and signal alternatives, particularly those that indicate the clearance interval (in place of the flashing DONT WALK message) and those that warn pedestrians of possible turning vehicles (instead of the flashing WALK message). A total of 41 alternatives were developed, and the 8 judged most promising were evaluated at several sites within 5 U.S. cities. The alternatives were evaluated using before-and-after studies of pedestrian violations and various types of pedestrianvehicle conflicts. Based on the results of the z-test analyses of observations at the study sites, several alternatives were recommended for inclusion in the Manual on Uniform Traffic Control Devices for application at intersections with pedestrian safety problems. These included the WALK WITH CARE signal indication, a sign for motorists stating YIELD TO PEDESTRIANS WHEN TURNING (regulatory sign), a pedestrian warning siqn stating PEDESTRIANS WATCH FOR TURNING VEHICLES, and a pedestrian signal explanation sign (word and symbolic). A three-sec-
tion pedestrian signal using DONT START to indicate the clearance interval was recommended for additional testing, but little or no benefit was found for the use of the steady DONT WALK indication for the clearance interval or the flashing WALK indication (to warn pedestrians of turning vehicles) •
One of the major pedestrian safety problems in the United States today is the ineffectiveness and confusion associated with pedestrian signal indications. Pedestrians in many cities often do not comply with pedestrian signal indications because of a lack of understanding or respect for the devices. In fact, violations of the DONT WALK message have been found to be higher than 50 percent in many cities (l_).
There could be several reasons for the lack of effectiveness of pedestrian signal indications in commanding respect, improving compliance, or reducing pedestrian accidents. This study addressed the misunderstanding and confusion on the part of pedestrians regarding the meaning of the steady or flashing DONT WALK indication and the steady and flashing WALK indication.
A steady, illuminated DONT WALK messaqe means that a pedestrian shall not enter the intersection

B
"in the direction of the indication," according to the 1978 edition of the Manual on Uniform Traffic Control Devices (MUTCD) (_3). The flashing DONT WALK sign indicates a clearance interval and is intended to inform pedestrians not to start crossing the stree t bu t to complete t heir crossing if t hey have already beg un. Ma ny p edestr i ans do not distinguish between l:he flashing and t he steady DONT WALK indi cations. Other pedestrians tend to treat the DONT WALK message as only advisory and cross at their own discretion. An accident analysis conducted in an earlier study by Zegeer e t al. (3) ind i cated t ha t in the majority of pede strian accidents a t signali zed intersections , the pedestr iafl had violated t he s ignal message.
A . second problem with pedestrian signal indicat ions involves the flashing WALK display. The steady WALK i nd i cation is widely used to designat e the pedestrian crossing interval, but the flashing WALK indication is used in some jurisdictions to inform pedestrians tha t vehicles may be tu rn i ng acros s the i r path. When t he fl ashing WALK signal i s us ed, the steady WALK s i gnal is g.enerally used to desiqnate a protected pedestrian crossing inte r val during which vehicles are not permitted to turn across the crosswalk. However, many jurisdictions do not use the flashing WALK signal for the following reasons : (a) ma ny pedestrians do not understand its meaning, (b) t hei r signal display har dwa re is not easily
Transportation Research Record 959
adapted to providing it, or (c) its use at one location would necessitate its use at all other appropriate locations, which could require major monetary outlays by the agency.
Confusion is common because many pedestrians either do not know the meaning of the flashing WALK signal or believe that any WALK indication (whether flashing or steady) means that they need not look around for cars or use caution. The danger is that a motor vehicle may run through the red light or turn across the cro s s wa lk without _yielding to pedestrians. Although pedestr i ans may be within their rights, they should also exercise caution whenever crossing the street because they are most. susceptible to injury or death in the event of an accident with a motor vehicle.
It is believed that these basic problems related to pedestrian signals can be addressed in part by innovative sign and signal al te r na ti ves . These alternatives i nclude new s ign a nd signal dev i ce s, modifications o f existing dev ices , s upplemental dev i c es t o enhanc e the fu nc Uon of the signal, and promotio n o f i mproved understand ing a nd respec t o f t he signals .
Figure l shows how signal alternatives might address specific pedestrian problems at signalized intersections. For e xample , p edestrians who understand and comply with pedestrian siqnals still need to be alerted to turning vehicles. Pedestrians who
I Population of Pedestrians
Crossing the Street
l l i
I Pedestrians I Pedestrians I Who Violate Who Comply with
The Signal The Signal
I ~
r
i • ~ Pedestrians Who Pedestrians Pedestrians Who do not see the Who do not Understand
Pedestrian Signal Understand the P~destrlan Signals, Pedestrian But do not Comply
Signal Messages With Them
I ~ I I I • •
Install New Types Upgrade Police of Signals or Signs Enforcell\ent For the Pedestrians ~ of Pedestrian
which are more Laws Understandable or
Visible
• , Modify Pedes- Install Devices trian Signals To Alert Pedes-To be More trians of Turn-
Deserving of ing Vehicles Respect
f I
·~ I ~
Provide/UP<Jrade I Install Devices I Education Proq- L - - - - - - - - Aimed at Alerting
ra-,ns I Radio, TV, Motor is ts of Handouts, Etc.) Pedestrians
Possible Pedestrian Signal Alternatives
+- - - These a l t e r na t ives can be used i n conjunc tion with alterna tives a i med at t he pedestr i an.
FIGURE 1 Breakdown of pedestrian signal alternativP.8 11~ they relate to the pedestrian problem.

Zegeer et al.
violate signals do not understand their meaninq, do not notice them, or simply choose to disreqard them. For pedestrians who intentionally violate the signals, police enforcement or improved pedestrian signs or signals (more demanding of respect) may be appropriate.
This study focused on two situations in which signal alternatives were considered most likely to be effective:
1. Pedestrian clearance: to replace or supplement .the flashing DONT WALK indication, and
2. Indication of potential conflicts: to replace or supplement the flashing WALK indication.
It was recognized, however, that other methods must also be considered in efforts to enhance pedestrian safety at signalized intersections. These methods include the following:
1. Enforcement of pedestrian compliance with the signal messages;
2. Enforcement of vehicle compliance with the pedestrian's r i ght- of-way in crosswalks;
3. Public educa t i on (i.e., in schools, on radio and TV, and so on) or awareness programs addressing the meaning of pedestrian signals, pedestrian and vehicle laws, and pedestrian behavior; and
4. Changes in the roadway environment through traffic engineering or geometric improvements.
DEVELOPMENT OF PEDESTRIAN SIGNAL ALTERNATIVES
As a part of this study a comprehensive review of the literature and current practices was completed to identify alternatives for indicating the clearance interval and warning of potential conflicts. Subsequently a range of candidate signal alternatives was developed and priority ranked, and the alternatives judged most promising were selected for field testing. The alternatives selected were fabricated and field tested at certain intersections in five cities. Before-and-after analyses of pedestrian compliance and pedestrian-vehicle conflicts were used to evaluate each alternative. The results of these tests are presented in this paper and recommendations are provided for application of the most promising pedestrian signalization alternatives. The alternatives evaluated in this study are described in the following sections.
Selection of Pedestrian Clearance Alternatives
A careful review was conducted of past research and current practices relative to pedestrian clearance indications. Approximately 22 different alternatives for depicting the clearance interval were proposed by various members of the project team for further consideration. These alternatives were refined with inputs from various city, state, and federal officials and other pedestrian signal and safety experts. Detailed descriptions of these alternatives were compiled, which included design features (movement, color, message, size, and location), a sketch or drawing, past use, justification for use, potential advantages and disadvantages, estimated cost of installation, and estimated cost of maintenance and operation. The detailed descriptions were used to rate alternatives in terms of their practicality and expected level of effectiveness. The results were then summarized and recommendations were made concerning the alternatives that should be considered for field testing.
9
Examples of the 22 experimental devices not selected for testing include education programs (driver education, school education, and so forth), signal displays (various messages on three-section signal heads, color-only lenses, yellow ball for clearance with DONT WALK and WALK messages, and so forth), audible devices (beeping messages, spoken word messages, and so forth), and other alternatives (digital and symbolic countdown devices, variable message displays, pavement messages, and so forth). Such messages were generally rejected for field testing because of their high cost, electronic sophistication, or expected ineffectiveness. Details of these devices are giv.en in the full report on this study by Goodell-Grivas, Inc. (_!). The three clearance alternatives selected for field testing and the justification for their selection are described in the following.
Alternative 1: Pedestrian Signal Explanation Sign
An informational sign may be placed on the pedestrian signal pole or other pole near the crosswalk to explain the meaning of the flashing DONT WALK, the steady DONT WALK, and the steady WALK signals (and also the flashing WALK signal, if used). This sign was developed for both word messages and symbolic messages, depending on the type of pedestrian signal at a given site, as shown in Figure 2.
As justification for its use, this alternative will provide continual education and remind pedestrians of the meaning of these indications. Also, a sign placed at the intersection should have the greatest impact on those who need it most. This alternative has a low cost (approximately $10 per sign) and would not require modifications to signal hardware. Although this type of alternative had been used to a limited degree in the past, it was never formally evaluated.
Alternative 2: DONT START Signal Indication
A three-section signal head with an orange DONT WALK indication, a yellow DONT START indication, and a white WALK indication may be used. This pedestrian signal device is shown in Figure 2 (right).
To justify its use, this alternative displays three distinct indications for the different crossing situations, which could eliminate the confusion caused by the flashing DONT WALK signal display. Robertson tested the DONT START indication to replace both the flashing DONT WALK signal (clearance interval) and the steady DONT WALK signal (prohibitive crossing interval), so pedestrians were not shown a separate clearance indication C2l • The use of the DONT START signal as a separate clearance display was believed to be more easily understood by pedestrians, because this display for pedestrians would then be comparable with the amber indication of a traffic signal.
Alternative 3: Steady DONT WALK Signal Indication
A steady orange DONT WALK (or a symbolic hand) may be displayed for the clearance interval as well as for the prohibitive crossing period. It is justified on the basis that the flashing mode causes confusion. This option would be to use only the steady WALK and DONT WALK indications. This alternative was estimated to be low in cost and adaptable to existing signal hardware.
10 Transportation Research Record 959
,.
II O.K.TO CROSS WATCH FOR
TURNING CARS ITEADY
II DON'T START FINISH CROSSING
IF STARTED FLASHING
II PEDESTRIANS SHOULD NOT BE IN CROSSWALK
.... 9TlADY ,.I
FIGURE 2 Devices tested to indicate the clearance interval: symbolic pedestrian signal explanation sign (left) and DONT START signal display (right).
Selection of Alternatives to Indicate Potential Conflicts witb ~urning Vehicles
Alternatives to indicate potential pedestrian-vehicle conflicts were developed by project team members after a comprehensive review of the MUTCD guidelines, current practices, and available literature. After the available information had been reviewed, 19 alternatives were developed. These alternatives were developed by using the same procedure as that for indicating the clearance interval. Each alternative was evaluated by the project team as discussed earlier for the clearance alternatives, and recommendations were made for alternatives to be field tested.
Of the 19 candidate devices, examples of those not selected for field testing include motorist signs (motorist warning or turn prohibition signs with or without flashing lights), pedestrian signs (symbolic pedestrian warning signs with or without flashers or loop detectors to detect approaching vehicles), pedestrian signals (pedestrian symbolic or word and signal messages such as CAUTION: TURNING VEHICLES), and other alternatives (reduction of sight obstructions, variable-message pedestrian signal, audible message, and so forth). As discussed previously, each of these devices was considered to be undesirable in terms of cost, practicality, effectiveness, complexity, or other reasons. The alternatives selected are described in the following paragraphs.
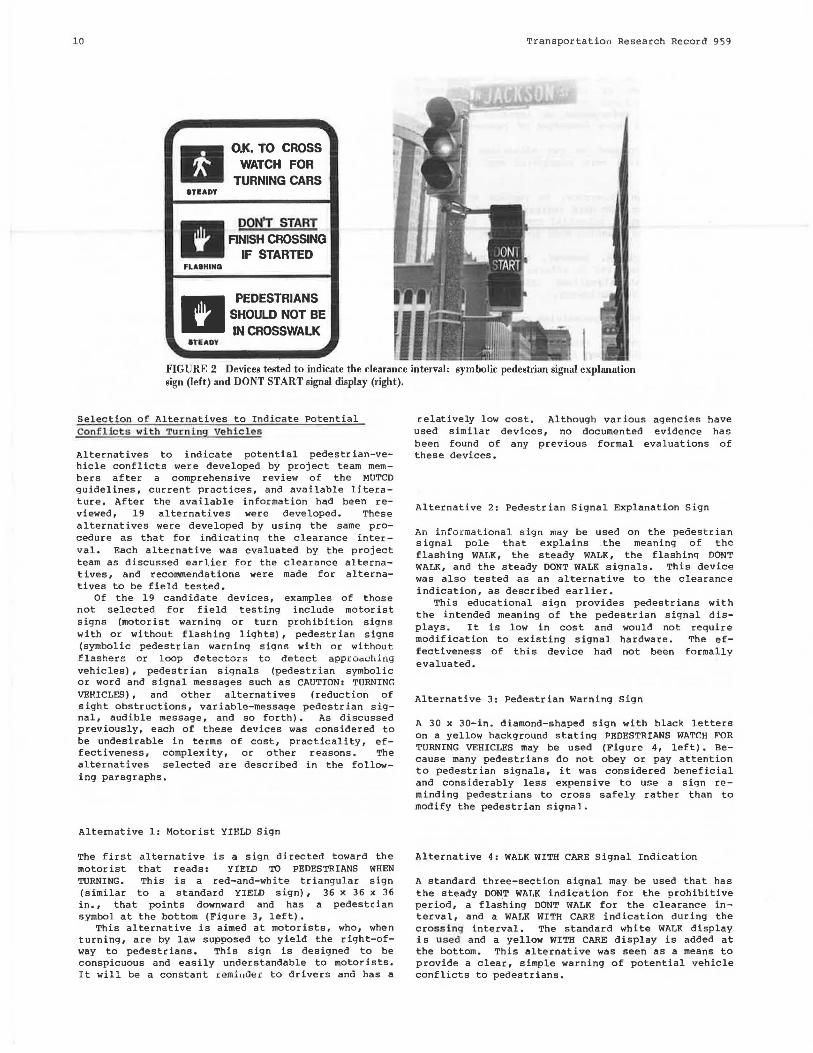
Alternative 1: Motorist YIELD Sign
The first alternative is a sign directed toward the motorist that reads: YIELD TO PEDESTRIANS WHEN TURNING. This is a red-and-white triangular sign (similar to a standard YIELD sign), 36 x 36 x 36 in., that points downward and has a pedestrian symbol at the bottom (Figure 3, left).
This alternative is aimed at motorists, who, when turning, are by law supposed to yield the right-ofway to pedestrians. This sign is designed to be conspicuous and easily understandable to motorists. It will be a constant reminder to drivers and has a
relatively low cost. Although various agencies have used similar devices, no documented evidence has been found of any previous formal evaluations of these devices.
Alternative 2: Pedestrian Signal Explanation Sign
An informa t ional sign may be used on the pedestrian signal pole that explains .the meaning of the flashing WALK, the steady WALK, the flashing DONT WALK, and the steady DONT WALK signals. This device was also tested as an alternative to the clearance indication, as described earlier.
This educational sign provides pedestrians with the intended meaning of the pedestrian signal displays. It is low in cost and would not require modification to existing signal hardware. The effectiveness of this device had not been formally evaluated.
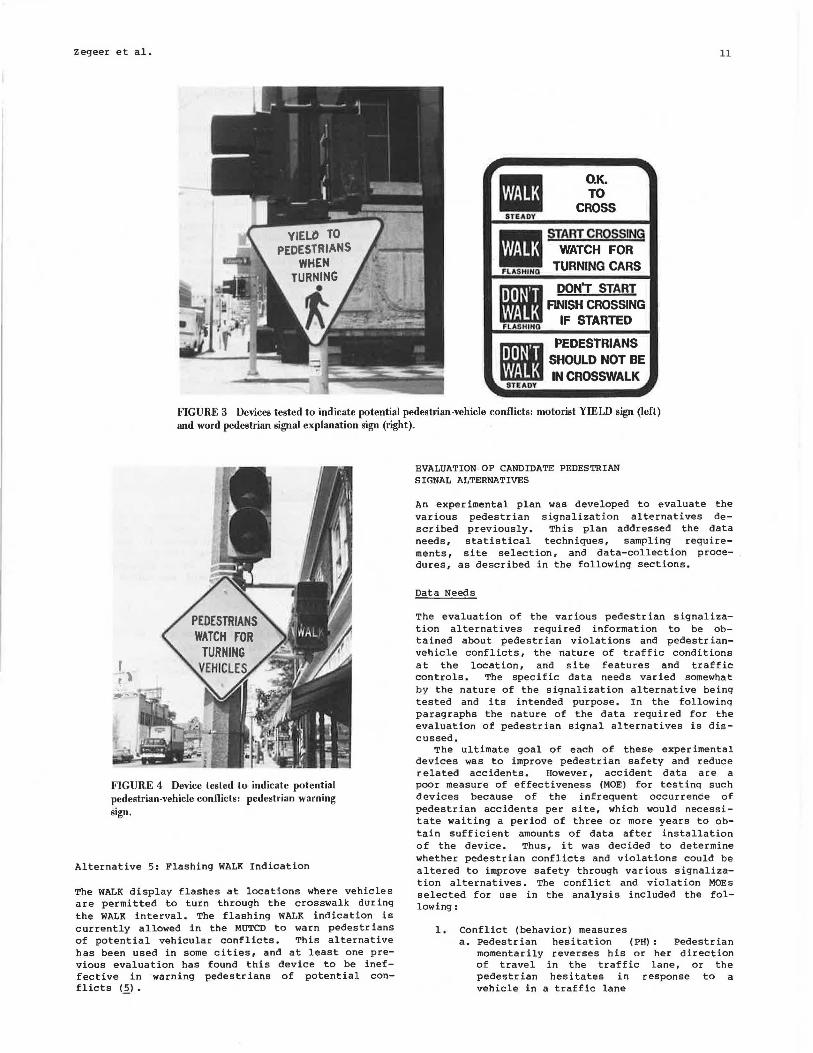
Alternative 3: Pedestrian Warning Sign
A 30 x 30-in. diamond-shaped sign with black letters on a yellow background stating PEDESTRIANS WATCH FOR TURNING VEHICLES may be used (Figure 4, left). Because many pedestrians do not obey or pay attention to pedestrian signals, it was considered beneficial and considerably less expensive to use a sign reminding pedestrians to cross safely rather than to modify the pedestrian signal.
Alternative 4: WALK WITH CARE Signal Indication
A standard three-section signal may be used that has the steady DON_T WALK indication for the prohibitive period, a flashing DONT WALK for the clearance interval, and a WALK WITH CARE indication during the cross i ng interval. The standard white WALK display is used and a yellow WITH CARE display is added at the bottom. This alternative was seen as a means to provide a clear, simple warning of potential vehicle conflicts to pedestrians.
Zegeer et al. 11
,.. ....
• 0.K. TO
CROSS STEADY
• STARTCRQSSJNg WATCH FOR
FLASHING TURNING CARS
• DON'T START RNISH CROSSING
FLASHING IF STARTED
• PEDESTRIANS SHOULD NOT BE IN CROSSWALK
Ito. STEADY ....
FIGURE 3 Devices tested to indicate potential pedestrian-vehicle conflicts: motorist YIELD sign (left) and word pedestrian signal explanation sign (right).
FIGURE 4 Device tested to indicate potential pedestrian-vehicle conflicts: pedestrian warning sign.
Alternative 5: Flashing WALK Indication
The WALK display flashes at locations where vehicles are permitted to turn through the crosswalk during the WALK interval. The flashing WALK indication is currently allowed in the MUTCD to warn pedestrians of potential vehicular conflicts. This alternative has been used in some cities, and at least one previous evaluation has found this device to be ineffective in warning pedestrians of potential conflicts (2).
EVALUATION OF CANDIDATE PEDESTRIAN SIGNAL ALTERNATIVES
An experimental plan was developed to evaluate the various pedestrian signalization alternatives described previously. This plan addressed the data needs, statistical techniques, sampling requirements, site selection, and data-collection procedures, as described in the following sections.
Data Needs
The evaluation of the various pedestrian signalization alternatives required information to be obtained about pedestrian violations and pedestrianvehicle conflicts, the nature of traffic conditions at the location, and site features and traffic controls. The specific data needs varied somewhat by the nature of the signalization alternative being tested and its intended purpose. In the followinq paragraphs the nature of the data required for the evaluation of pedestrian signal alternatives is discussed.
The ultimate goal of each of these experimental devices was to improve pedestrian safety and reduce related accidents. However, accident data are a poor measure of effectiveness (MOE) for testinq such devices because of the infrequent occurrence of pedestrian accidents per site, which would necessitate waiting a period of three or more years to obtain sufficient amounts of data after installation of the device. Thus, it was decided to determine whether pedestrian conflicts and violations could be altered to improve safety through various signalization alternatives. The conflict and violation MOEs selected for use in the analysis included the following:
1. Conflict (behavior) measures a. Pedestrian hesitation (PH): Pedestrian
momentarily reverses his or her direction of travel in the traffic lane, or the pedestrian hesitates in response to a vehicle in a traffic lane

12
2.
b. Aborted crossing (AC): Pedestrian steps off curb but later reverses direction back to the curb
c. Moving vehicle (MV): Through traffic is moving through the crosswalk within 20 ft of a pedestrian in a traffic lane
d. Right-turning-vehicle (RT) interaction: Pedestrian is in the path and within 20 ft of a right-turning vehicle
e. Left-turning-vehicle (LT) interaction: Pedestrian is in the path and within 20 ft of a left-turning vehicle
f. Running pedestrian conflict (or run-vehicle) (RV): Pedestrian runs in a traffic lane in an effort to avoid a possible col-1 ision with a vehicle
g. Run on clearance (RC): Pedestrian runs at onset of clearance interval in response to the change in the signal message
h. Run from turning vehicle (RTV): Pedestrian runs in a traffic lane in response to a turning vehicle or potential turning vehicle
Violation (compliance) measures a. Pedestrian starting on the clearance in
terval (SC) b. Pedestrian starting on the prohibited in
terval (SP) c. Pedestrian anticipating the
(starting just before the end hibited crossing) (AW)
WALK signal of the pro-
Because various pedestrian signali~ation alternatives with differing functions and objectives were tested, it was necessary to determine the most appropriate operational MOEs for each alternative. For example, the three clearance alternatives are primarily intended to improve pedestrian compliance with pedestrian signals, but they should also have the secondary effect of reducing pedestrian-vehicle conflicts. Some of the devices aimed at the motorist only (such as the motorist YIELD sign) should not affect pedestrian compliance but could affect pedestrian-vehicle conflicts because of changes in driver behavior. A summary of the pedestrian signal alternatives along with the corresponding appropriate MOEs is given in Table 1.
There is a possibility that some types of MOEs will be reduced at the expense of an increase in some seemingly unrelated MOEs. Thus, each sign and
Transportation Research Record 959
signal device was also evaluated by usinq the following MOEs:
1. Total conflicts with through vehicles: PH, AC, MV, RV, RC:
2. Total turning conflicts: RT and LT interactions, RTV:
3. Total conflicts (conflicts with through and turning vehicles) : and
4. Total pedestrian violations: SC, SP, AW.
It was also considered necessary to obtain data related to the vehicular and pedestrian traffic volume at each study site. This information involved counts of vehicles and pedestrians and included vehicle turning movements. This information was required to compute the proportions of pedestrian conflicts and violations and to account for the effects of varying traffic volumes.
In addition to volume and operational data collected before and after installation of each experimental device, site information was also obtained. The information on physical features was used primarily to help select the most appropriate type of experimental device at each site and to assure proper timing, placement, and installation of the device. Site information was also useful in interpreting the results of the analysis, partic ularly in cases in which a specific device was effective at one site but ineffective at another.
Sta tistical Analysi s Technique
The z-test for proportions was selected as the statistical test. This test is used to determine whether the proportion of occurrences in one group is significantly different from the proportion of occurrences in a second group. It is applicable to continuous data (proper tions) and has three underlying assumptions (!?,) :
1. The distribution is binomial, so that an event either does or does not occur,
2. The observations are independent, and 3. The sample of events is greater than 30 in
each sampling period.
TABLE l MOEs Selected for Analyzing Each Sign and Signal Alternative
Alternative
WALK WITH CARE signal indication
YIELD TO PEDESTRIANS WHEN TURNING sign
PEDESTRIANS WATCH FOR TURNING VEHICLES sign
Steady or flashing WALK signal indication
DONT START signal indication
Steady or flashing DONT WALK signal indication
Pedestrian signal explanation sign
Purpose
Turning-vehicle warning
Turning-vehicle warning
Turning-vehicle warning
Turning-vehicle warning
Clearance indication
Clearance indication
Oearance indication and turning-vehicle warning
No. of Sites
4
4
4
5
4
s
MOE Selected
SC, SP, AW, PH, AC, MY, RT interaction, LT interaction, RV, RC,RTV
PH, AC, RT interaction, LT interaction, RTV
PH, AC, RT interaction, LT interaction, RTV
SC, SP, AW, PH, AC, MY, RT interaction, LT interaction, RV,RC,RTV
SC, SP, AW, PH, AC, MY, RT interaction, LT interaction, RV, RC,RTV
SC, SP, AW, PH, AC, MY, RT interaction, LT interaction, RV,RC,RTV
SC, SP, AW, PH , AC, MY , RT interaction, LT interaction, RV,RC,RTV
Note: Violation measures: SC = start on clearance interval, SP= start on pi-ohibited interval, AW= anticipate WALK signal. Connict measures: PH= pedestrian hesitation, AC= abor1ed crnssing, MY= moving vehicle, RT interaction== right-turning-vehicle internc:tinn, f Tinteraction= left-turning-vehic1e interaction, RV= running pedestrian conflict, RC= run on cle:m:rnce, RTV = run from turning vehicle.

zegeer et al.
In this analysis the events are pedestrian conflicts or violations and an opportunity for an event is a pedestrian crossing.
Sampling Requirements
To allow for proper use of the z-test for proportions it was necessary to collect a minimum of 30 conflicts and violations at each site. To fulfill this data requirement, it was estimated that 2 to 6 hr of data were required for each test site in each before-and-after period, depending on pedestrian volume levels.
Site Selection
Sites for the collection of data were selected with moderate to high pedestrian volumes (a minimum of approximately 1,000 per day) to ensure adequate samples of events in a reasonable period of time. The sites represented typical situations and were not highly unusual in geometry or traffic control strategy. Attempts were made to select sites that had a pedestrian safety problem, because these sites are prime candidates for improvement.
Acceptable vantage points were needed at the sites to allow discrete observation by using manual data-collection methods or video cameras (i.e., a pole or buildings or other structures near the intersection). In addition, sites were selected to reflect typical applications for the type of device to be tested. For example, the clearance alternatives are most appropriate at sites with moderate to high levels of pedestrian violations and long crossing distances. Alternatives for turning-vehicle conflicts were tested at sites with high turning volumes and high pedestrian volumes.
Some variation was desired in region of the country and in type of city, because the effectiveness of a device may differ considerably depending on local laws and attitudes. Ci ties also had to be found that were willing to install and maintain the devices until the experimental data could be collected. The cities selected for testing of experimental devices included Detroit, Ann Arbor, and Saginaw, Michigan: Washington, D.C.: and Milwaukee, Wisconsin.
Data-Collection Procedures
A data-collection scheme was developed to allow for the collection of pedestrian behavior and compliance data, traffic and pedestrian volumes, pedestrian-vehicle conflicts, and site characteristics. Two different data-collection plans were used for operational and volume data: video-recording techniques and manual data collection. Video recording was considered particularly desirable in the early stages of data collection at high-volume sites to allow for close quality control of all data, because the film could be viewed repeatedly for checking and verification to guarantee data accuracy. The manual data collection was found to be adequate in the later stages of the project after close control of data collection had been ensured.
Most of the data were collected by using two video cameras, which allowed one camera to film the crosswalk of concern and the other camera to simultaneously film the pedestrian signal message. With a signal mixer, the real-time image of the pedestrian signal message was super imposed into one corner of the video screen, so the pedestrian violations and
13
conflicts could be easily recorded as a function of the pedestrian signal indication. This allowed the analyst, for example, to record the number of pedestrians crossing on the flashing DONT WALK interval, steady DONT WALK interval, and WALK interval. Counts were also made of pedestrians anticipating the WALK interval or those waiting at the signal and stepping off the curb before the WALK signal. A time-image generator was used to super impose the elapsed time directly onto the screen for use in recording data in 10-min or other intervals.
To collect data, trained technicians viewed the film and recorded the volume, behavior, and conflict data in 10-min intervals. The film was viewed twice, with pedestrian and traffic volumes and turning movements recorded on the first pass and the conflicts and pedestrian violations recorded on the second pass. The data were then entered into a computer file and thoroughly checked for completeness and accuracy.
ANALYSIS OF RESULTS
Before-and-after data were collected for each experimental sign and signal device, and a comprehensive statistical analysis was conducted to determine the effect of each device on pedestrian violations and conflicts.
Statistical Analysis
The statistical analysis consisted of a series of Z-tests for proportions to compare several MOEs, such as the percentage of pedestrian violations and conflicts. For example, the percentage of pedestrian conflicts or compliance violations in the before, or base, condition was computed. This percentage was matched with that for the corresponding after, or experimental, period by using the Z-test, and one at the following results was found and illustrated with the corresponding symbol:
- A: significant difference was found in favor of the experimental condition,
- B: significant difference was found in favor of the base condition,
- NC: no significant difference was found between the base and experimental conditions, and
- NA: the MOE was not applicable (for example, on a one-way street approach, conflicts involving right- and left-turning vehicles from other approaches are not applicable: also, some MOEs are not applicable for some types of experimental devices) •
The levels of significance used were o.os and 0.01. Because of the small sample sizes of some MOEs,
the analysis included MOEs individually and also in the following groups:
1. Total conflicts with through vehicles, 2. Total conflicts with turning vehicles, 3. Total conflicts (through and turning ve
hicles) , and 4. Total pedestrian violations.
These four groups of combined conflicts and violations represent useful information, because they provide a better perspective of the overall effect of a sign or signal. In order to account for changes in traffic volume between the base and experimental periods, data at each site were stratified into low, medium, and high levels of through-traffic volume. A

14
separate analysis was then conducted within each of the three volume levels. Then data at each site were stratified again based on turning volumes for low, medium, and high levels and analyzed for each of these groups. When the results of the z-tests within each traffic-volume category did not support the overall analysis, differences in traffic volume were assumed to be responsible for at least part of the changes in the MOE.
Pedestrian-Clearance Alternatives
The three pedestrian-clearance alternatives that were field tested in this study included
1. A pedestrian signal explanation sign that defined the intent of the pedestrian signal indications,
2. A three-section pedestrian signal with a steady DONT START indication during the clearance interval, and
3. The steady DONT WALK indication used during the clearance (and prohibitive cro s s ing) inte rval instead of the flashing DONT WALK indication.
The first two alternatives correspond to the experimental period. Tt1e steady DONT WALK indication was used in the base period and the flashing DONT WALK signal in the experimental period. It should be mentioned that these clearance alternatives are intended to improve pedestrian understanding and to reduce violations and associated conflicts . 'T'hus, all types of MOEs listed previously were analyzed before and after the installation of each clearance device. The flashing DONT WALK signal was used as during the base period unless it is stated otherwise. The results of the three alternatives are discussed in the following.
Alternative 1: Pedestrian Signal Explanation Sign
The pedestrian signal explanation signs were tested at two isolated sites in Saginaw, Michigan, where the pedestrian signals used were the symbols for a walking man and a hand (Figure 2, left), and at two sites in Washington, n.c., where the pedestrian word indications WP.~LK er DONT Wl\LK (in addition to the flashing WALK and DONT WALK) were used (Figure 3, right). The signal explanation signs were located at or near the approaches to each crosswalk at the sites and at several nearby signalized crossing locations. The effects of this informational sign on pedestrian violations and conflicts are summari zed in Table 2.
At one site in Saginaw, total clearance-related conflicts decreased significantly (0.01 level), and anticipation of WALK signal decreased significantly at the two sites combined (0.05 level). However, no significant changes occurred in total conflicts, pedestrian violations, or any other type of pedestrian behavior at either of the sites tested in Saginaw.
At the two sites in Washington, n.c., the sign describing the four word messages was used that explained the flashing WALK as used in that city as well as the flashing DON'T' WALK. Several significant changes occurred after the signs had been installed. For the two sites combined, a significant improvement resulted in overall pedestrian violations (0.01 level) from 44. 4 percent in the base period to 34. 7 percent in the experimental period. The total turning-related conflicts dropped from 687 (7.8 percent) to 535 (6.7 percent), which was significant at the 0.01 level based on a z-value of 2.65.
Transportation Research Record 959
TABLE 2 Results of Installation of Pedestrian Signal Explanation Sign
Saginaw Washington
Site Site Sites I Site Site Sites 3 MOE I 2 and 2 3 4 and 4
Conflict PH Aa B" NC AC MY NC Bb Bb RT interaction NC NC NC Ab NA NA LT interaction NC NC NC NA Ab NA RV Bb NC RC A" NC NC RTV Total clearance related NC Ab Ab Ab Bb NC Total turning related NC NC NC Ab Ab Ab Total conflicts NC NC NC Ab NC NC
Violation SC NC NC NC Ab Bb Bb SP NC A' Ab Ab AW A' Ab Bb Ab Total violations J'JC NC NC Ab Ab Ab
Note: A;:; significant difference jn favor of experimental condition, a= significant djf. ference in favor of base condition, NC= no significant difference between base and ex-perhnont11I condt 1lons, NA = not applicable, A dash indicates insuffident sample size. MOE:! 11.to as do(J111:d in Table 1. aSignificant at the 0.05 level. bSignificant at the 0.01 level.
In summary, the pedestrian signal explanation signs did not result in significant reductions in violations or conflicts at the two sites in Saginaw but resulted in a siqnificant decrease in violations and some conflict types at the two sites in Washinqton. The reason for its increased effectiveness at the Washington sites compared with that at the Saginaw sites is not fully known. It was noted, however, that the violation rate was much higher in the base period at the Washington site (44.4 percent) than at the Saginaw sites (16.2 percent), so there was more room for improvement.
Alternative 2: DONT START Signal Indication
This device was tested at one site in Ann Arbor, Michigan; one site in Washington, o.c.; and at two sites in Milwaukee, Wisconsin. A summary of results for the four sites where t he three-section DONT START signal indication was tested is given in Table 3.
At the site in Ann Arbor, no significant changes were observed in clearance-related conflicts, in turning-related conflicts, or in total conflicts. However, pedestrian hesitation increased and movingvehicle conflicts decreased significantly (0. 05 level). Also, the percentage of violations increased significantly (0. 05 level) during the experimental period at the Ann Arbor site. City personnel increased the DONT WALK interval by 4 sec during the experimental period, and it is likely that this change was partly responsible for this increased violation rate. Also, on reviewinq z-tests for various traffic volume groups, no significant change in pedestrian violations was found for any group. This implies that the increase in violations in the experimental period was likely because of factors other than the DONT START signal (such as shifts in traffic volume) •
At the site tested in Washington, n.c., overall conflicts dropped from 19.3 percent in the base period to 13.0 percent in the experimental period, which is a significant reduction at the 0.01 level. Total violations dropped from 22.8 percent to 18.7 percent, which is also a significant reduction (0.01 level). The reductions occurred in spite of in-

Zegeer et al.
TABLE 3 Results of Use of DONT START Signal Indication
Milwaukee
Ann Wash- Sites Arbor ington 7 and
MOE Site 5 Site 6 Site 7 Site 8 8
Conflict PH B' Bb Ab AC MV A' RT interaction NC Ab B' NA NA LT interaction NC NA NC NA NA RV RC NC RTV NA NA Total clearance related NC Bb Ab Ab Ab Total turning related NC Ab NC NA NA Total conflicts NC Ab Ab Ab Ab
Violation Ab SC A' Ab Ab Ab
SP Bb Bb Ab Ab Ab AW Ab Ab Ab NC Ab Total violations B' Ab Ab Ab Ab
Note: A= significant difference jn favor of experiment a] condHion, B = signfficant difference in favor of base condition, NC= no significant difference between base and experimental conditions, NA= not applicable. A dash indicates insufficient sampJe size. MOEs are as defined in Table 1. aSignfficant at the 0.05 level. bSignificant at the 0.01 level.
creases in a few individual MOEs. A review of ztests by volume group indicates significant reductions in total violations, total conflicts, and turn conflicts in virtually all volume groups (0.01 level).
At the two sites in Milwaukee where the DONT' START signal indication was tested, significant reductions were found in total violations, total conflicts, and clearance-related conflicts (0. 01 level in all cases). In fact, total conflicts dropped from 20. 9 percent ( 391 of 1, 870 pedestrians) in the base period to 13.8 percent (331 of 2,392) in the experimental period. Overall pedestrian violations dropped from 41.6 percent to 22.8 percent, and clearance-related conflicts were reduced from 8.9 percent to 3.7 percent. The Z-tests by volume groups agreed with the overall results from the Milwaukee sites.
In summary, there is strong evidence that the three-section DONT START signal resulted in a significant improvement over the standard flashing DONT WALK display. At three of the four sites, the DONT START display resulted in significantly fewer conflicts and pedestrian violations. At the fourth site (in Ann Arbor, Michigan) no significant changes were experienced. This may have been because of the different signal timing in the experimental period (4 sec of additional DONT WALK signal) and the high percentage of college students (University of Michigan) who crossed. In fact, more than 54 percent of the pedestrians at this site violated the pedestrian signal in the base period, which was a higher violation rate than at any other site where testinq was conducted. No type of pedestrian signal would have any effect on a pedestrian ·population that largely ignores pedestrian signals.
Alternative 3: Steady DONT WALK Versus Flashing DONT WALK Indication
None of the cities selected to test devices agreed to convert their signals to a steady DONT WALK display during the clearance interval for testing purposes (because of legal risks). However, in Washington, D.C., two sites were found where the pedestrian signal did not flash during the clearance interval or during the WALK interval. Thus, in the base
15
period the steady WALK (permissive interval) and the steady DONT WALK (clearance and prohibitive interval) signals were displayed, and in the experimental period the flashing WALK and DONT WALK signals were displayed as well as the steady DONT WALK signal during the prohibitive crossing interval.
The results of the comparison between steady and flashing DONT WALK signals showed no significant reductions in pedestrian violations, pedestrian hesitations, left-·turn conflicts, movinq-vehicle conflicts, or total conflicts at the two sites. Left-turning-related conflicts dropped signif icantly, whereas total clearance-related conflicts increased significantly (0.01 level in each case).
It appears from the analysis at these sites that there is no significant difference in overall conflicts or violations due to flashing signal indications or steady indications for the combined WALK and DONT WALK intervals. This finding basically agrees with Robertson's results, which found that the steady DONT WALK signal had the same effectiveness as the flashing DONT WALK signal, and that the flashing WALK is not an effective means of warning pedestrians about turning vehicles C2l· The testing in the Robertson study involved a comparison of the flashing versus the steady WALK signals separately from the flashing versus the steady DONT WALK siqnals. The results of this study are based on flashing both the WALK and the DONT WALK signals in the experimental period.
Turn ins-Vehicle Alternatives
The second category of alternatives that were field tested included sign and signal messages to warn pedestrians or motorists or both of possible turning conflicts. The devices tested included
1. Motorist YIELD sign, 2. Pedestrian signal explanation sign, 3. Pedestrian warning sign, 4. WALK WITH CARE signal indication, and 5. Steady versus flashing WALK indication.
The results of the field testing are discussed in the following.
Alternative 1: Motorist YIELD Sign
The YIELD TO PEDESTRIANS WHEN TURNING sign was tested at two sites in Detroit, Michigan, and two sites in Milwaukee, Wisconsin. Because this sign is directed toward motor is ts approaching an intersection who turn left or right, the only MOEs selected for evaluation purposes are those involving turning vehicles as well as total conflicts. At the Detroit sites, signs were aimed at both left- and rightturning vehicles at one site, but signs were aimed only at right-turners at another site (because left turns were prohibited). For the two sites combined, right-turn conflicts decreased from 20.l percent (415 of 2,063 pedestrians) to 14.1 percent (414 of 2,926 pedestrians), which is significant at the 0.01 level. Left turns were prohibi tea at one of the sites, so left-turn conflicts are not applicable. For the two Detroit sites combined, total turn-related conflicts dropped significantly (21.6 to 15. 7 percent), even though these conflicts at one of the sites experienced no significant change. Total conflicts (including all types of behavioral MOEs) also dropped from 25. 6 to 19. 2 percent, which was significant at the 0.01 level.

16
At the two Milwaukee sites, a siqn was installed for both left- and right-turning vehicles at both sites. Based on the analysis, a significant reduction was found in right-turn conflicts for both sites combined (8. 8 to S. 8 percent), even though there was no significant change at either site individually. However, there was no significant change in left-turn conflicts. Total turning conflicts were significantly reduced at each of the sites in Milwaukee (0. 05 level at one site and 0. 01 level at another site), and total conflicts dropped significantly (0.01 level) from 17.9 percent to 11.3 percent at the two sites combined.
An analysis of the data by individual volume groups revealed no conflicting results. The effectiveness of the sign was not influenced by the level of through or turning volume. Thus, the sign may be considered applicable to a wide range of traffic volumes.
In conclusion, the YIELD TO PEDESTRIANS WHEN TURNING sign was found to be effective in reducing tur n ing c onflicts a nd in p artic ular r i ght-turning conflicts. Left-turning conflicts were not significantly affected, possibly because of smaller sample sizes and other effects such as the preoccupation of left-turning motorists with through traffic, other visual information, and poor sign location. Also, pedestrians are inherently more aware of right-turning vehicles than of left-turning vehicles, as noted in the literature. The signs were equally effective for low, medium, and high traffic volume levels.
Alternative 2: Pedestrian Signal Explanation Sign
This device was tested at two sites in Washington, D.C., and Saginaw, Michigan, as discussed previously . At the sites in Washinqton, D.C •• the flashing WALK indication was used and the pedestrian signal explanation sign had separate messages : for the steady WALK and the flashing WALK, signals, as shown in Figure 3 (right). At the two sites in Saqinaw symbolic pedestrian signals were used with the steady WALK signal (Figure 2, left). The results of this test (Table 2) showed no significant difference in turn-related conflicts at the Saginaw sites but a significant reduction in turn-related conflicts at the two Washington, D.C., sites.
Alternative 3: Pedestrian Warning Sign
The PEDESTRIANS WATCH FOR TURNING VEHICLES sign was tested at two sites in De t roi t and t wo sites in Mi lwaukee. This sign was intended to reduce turning-vehicle conflicts by alerting pedestrians to the possibility of turning vehicles. Thus, the MOEs used in analyzing this device were turning conflicts and total conflicts.
Right-turn conflicts at the two Detroit sites dropped significantly (0.01 level) overall, from 17.S percent to 8.1 percent. Left-turn conflicts were not applicable at one site (left turns were prohibited) and did not change significantly at the other Detroit site. There were significant reduct ions in total turning conflicts ( 18. 8 percent to 8.4 percent) and in total conflicts (23.9 percent to 12.9 percent), which are both significant at the 0.01 level.
At the two sites in Milwaukee, there was a significant reduction in right-turn vehicle conflicts ( 5. 8 to 3. 4 percent), although the sample of leftturn conflicts was inadequate to evaluate this type of conflict. Total turning conflicts dropped significantly (0.01 level) as a result. and total conflicts dropped from 12.0 to 6.7 percent. The results
Transportation Research Record 959
from the Z-tests for various traffic volume groups revealed no conflicting information.
In summary, the sign PEDESTRIANS WATCH FOR TURNING VEHICLES was found to be effective at each of the four test sites, particularly relative to riqhtturning-vehicle conflicts. The signs, however, have no proven effect relative to left-turn-related conflicts.
Alternative 4: WALK WITH CARE Signal Indication
The WALK WITH CARE display was tested at one site in Ann Arbor, Michigan; one site in Washington, o.c. ; and two sites in Milwaukee, Wisconsin (Table 4). Because the WALK WITH CARE message provided a general warning message to pedestrians, all of the selected MOES were expected to be related in some way to this device, al though the message was expected to have the greatest impact on conflicts related to turning vehicles.
TABLE 4 Results of Use of WALK WITH CARE Signal
Milwaukee Ann Wash-Arbor ington Sites 21
MOE Site 19 Site 20 Site 21 Site 22 and 22
Conflict PH B" Aa AC MV RT interaction Ab Ab Ab Aa Ab LT interaction Ab Ab RV RC RTV Total clearance related Ab NC Ab Ab Total turning related Ab Ah • h • h Ati 1' " Total conrncts Ab Ab Ab Ab Ab
Violation SC NC NC NC Ab Ab SP Ab NC Ab Ab Ab AW Ab Total violations Ab Ab Ab Ab Ab
Note: A= significant difference in Favor of experimental condition, B =significant difference in favor of base condWon, NC= no significant difference between base and experimental conditions, NA= not applicable. A dash indicates insufficient sample size. MOEs are as defined in Table 1. 8SJgnificant at the 0.05 leveJ. bS,ignificant at tile O.Oi ievei.
At the site in Ann Arbor, right-turn conflicts dropped from 8.1 pe rcent (46 of 571 pedestrians) to 3.9 percent (95 of 2,427 pedestrians), which is significant at the 0.01 level. Significant reductions (0.01 level) were also found in total clearance-related conflicts (7 percent to 2.1 percent) and total conflicts (17.7 to 7.B percent). Also, total pedestrian violations were reduced from 45. 9 percent to 17.7 percent, which is also significant at the 0.01 level (Z-value of 14.37 compared with the critical z-value of 2.58).
At the site in Washington, D.C., there were significant reductions (0.01 level) in right-turn conflicts (18. 7 to 15.4 percent), left-turn conflicts (2.8 to 1.7 percent), total turning-related conflicts (23.0 to 18.2 percent), and total conflicts (28.2 to 24.4 percent). Pedestrian hes itations increased from 1.9 percent to 3.0 percent, which was a significant increase at the 0.05 level. A significant reduction was also observed in pedestrian violations i 23. 5 percent of the 1, 844 pedestrians were involved in violations during the base period compared with 19.8 perc~nt. of the 3,269 pedestrians in the experimental period.

Zegeer et al.
The two sites in Milwaukee with the WALK WITH CARE indication also experienced significant reduct ions in conflicts and violations. For the two sites combined, there were significant reductions in pedestrian hesitations (2.6 to 1.6 percent), rightturn conflicts ( 8. 3 to 5. 8 percent) , left-turn conflicts (4.7 to 2.2 percent), and total clearance-related conflicts (7.0 to 3.3 percent). Total conflicts also dropped significantly (0.01 level), from 20. 6 percent to 11. 6 percent, and pedestrian violations dropped by nearly two-thirds, from 35. 9 percent (of 3,127 pedestrians) to 12.7 percent (of 1,866 pedestrians), which is significant at the 0.01 level (and a z-value of 17.8). Of the Z-tests conducted for each traffic volume category, results were basically similar to those discussed previously for the total data base. The significant reductions in conflicts and violations were more prevalent for medium and high levels of turning volume than for low-volume periods.
The results of field testing at four sites in three cities indicate that the WALK WITH CARE indication is effective in reducing turn-related conflicts as well as pedestrian violations.
Alternative 5: Steady Versus Flashing WALK Indication
The steady WALK display was compared with the flashing WALK display at a total of four sites--two in Washington, D.C., and two in Milwaukee. At the two sites in Washington, D.C., the steady WALK signal (permissive phase) was originally used in conjunction with a steady DONT WALK signal (clearance and prohibitive interval). After conversion to flashing WALK and flashing DONT WALK (clearance interval only), the analysis showed no significant difference in violations or total conflicts, as discussed earlier.
The Milwaukee sites were converted from the steady WALK signal (base period) to the flashing WALK mode (experimental period). There was no significant change in pedestrian violations at the two sites combined, although a significant reduction occurred in total conflicts, turning conflicts, and conflicts with through vehicles. However, after the results of the z-tests had been checked by volume group, these findings were not fully supported. For example, within the individual volume groups, total conflicts were reduced significantly only for one volume group at one of the two sites. A large inc tease in hourly pedestrian volume (134 to 290) combined with shifts in right- and left-turning volume and lower through volume in the experimental period could also be largely responsible for the res~lts.
In summary, the results of the analysis of sites in Milwaukee and in Washington, D.C., provide evidence that little or no difference exists relative to the flashing or steady WALK display in terms of pedestrian compliance or conflicts.
CONCLUSIONS AND RECOMMENDATIONS
The following conclusions and recommendations were developed based on the results of the analysis. The first three conclusions involve clearance alternatives and the next four relate to alternatives to turning conflicts.
1. The pedestrian signal explanation sign was found to have no effect at two sites and was effective at two other sites in reducing pedestrian violations and turning conflicts. Its ineffectiveness at the two sites in Saginaw, Michigan, was thought
17
to be the result of little or no pedestrian safety problems (i.e., more than 80 percent pedestrian compliance in the base period) compared with the Washington, D.C., sites (at which there was only 56 percent compliance in the base period).
2. The steady DONT START clearance indication using a three-lens pedestrian signal was found to result in a significant improvement over the flashing DONT WALK display in terms of pedestrian violations and associated clearance-related conflicts at three of the four sites.
3. The steady DONT WALK display for the clearance interval provides no improvement over the flashing DONT WALK signal.
4. The WALK WITH CARE display was tested in conjunction with the WALK interval to warn pedestrians of turning vehicles. The results of the field tests at four sites in three cities indicate that the WALK WITH CARE message is effective in reducing turn-related conflicts as well as pedestrian violations. Further analysis showed that these displays were effective for moderate to high right-turn volumes. It is recommended that the WALK WITH CARE display be used at only those intersections with (a) a high incidence of pedestrian accidents involving right- or left-turning vehicles, (b) moderate to high turning volumes and numerous turning-pedestrian conflicts, and (c) a high incidence of pedestrian violations. A specific warrant should be developed for use of this three-lens signal to prevent its overuse, which could reduce its effectiveness.
5. The motorist YIELD sign stating YIELD TO PEDESTRIANS WHEN TURNING was found to be effective in reducing turning conflicts, particularly rightturn conflicts. The sign would be most appropriate for use on the right side of intersection approaches, particularly in cases where right-turning motorists commonly fail to yield the right-of-way to pedestrians.
6. The pedestrian warning sign stating PEDESTRIANS WATCH FOR TURNING VEHICLES was also found to be effective in reducing right-turn conflicts. This sign would be appropriate in place of or in conjunct ion with the YIELD TO PEDESTRIANS WHEN TURNING sign discussed previously. The PEDESTRIANS WATCH FOR TURNING VEHICLES sign could also be applicable to sites with a high incidence or potential for riqhtturn pedestrian accidents.
7. The flashing WALK signal has no proven benefit over the steady WALK display in terms of warning pedestrians of turning vehicles. Based on studies by Robertson and others, the distinction between the flashing and the steady WALK signals is understood by only about 3 percent of pedestrians (~). The flashing WALK display is not recommended.
Based on the findings of this study, several recommendations are relevant regarding the inclusion of these devices in the MUTCD, as follows:
1. The option for a flashing WALK display should be taken out of the MUTCD, because the flashing display offers no advantage over the steady WALK display and only serves to confuse pedestrians, according to other major studies.
2. The signs WATCH FOR TURNING VEHICLES (warning sign) and YIELD TO PEDESTRIA~S WHEN TURNING (regulatory sign) should be added to the MUTCD as optional signs to be installed at sites where a particular problem exists with accidents or conflicts relative to turning vehicles, particularly right-turning vehicles interacting with pedestrians.
3. The pedestrian signal explanation sign (both word and symbolic options) should be added to the

18
MUTCD as information signs to inform pedestrians of the meaning of existing signal messages.
4. The WALK WITH CARE signal display should be addej to the MUTCD as a special device that can be used as an option at locations with a high pedestrian accident rate or at locations with an unusual problem of heavy vehicular turning maneuvers and moderate to high pedestrian volumes.
5. Because of its beneficial effect at three of four test sites, further testing of the three-section DONT START pedestrian signal indication is justified to determine under what conditions it is effective. However, even if it is more understandable than the flashing DONT WALK signal, its adoption on a national basis may not be practical, because all pedestrian signals would require the addition of a third signal head and additional electronic work.
ACKNOWLEDGMENT
This paper was based on a study conducted by GoodellGrivas, Inc. for FHWA (_i).
REFERENCES
1. H.D. Robertson. Signalized Intersection Controls for Pedestrians. Ph.D. dissertation. University of Maryland, College Park, 1982.
2. Manual on Uniform Traffic Control Devices for
Streets and Highways. FHWA, U.S. Department of Transportation, 1978.
3. c.v. Zegeer, K.S. Opiela, and M.J. Cynecki. The Effect of Pedestrian Signals and Signal Timing on Pedestrian Accidents. In Transportation Research Record 847, TRB, National Research Council, Washington, D.C., 1982, pp. 62-72.
4. C.V. Zegeer, K.S. Opiela, and M.J. Cynecki. Pedestrian Signalization Alternatives. Draft final report. Goodell-Grivas, Southfield, Mich.; FHWA, U.S. Department of Transportation, Nov. 1983.
5. Urban Intersection Improvements for Pedestrian Safety, Vols. 1-5. Report FHWA-RD-77-152 to 146. BioTechnology, Inc., Falls Church, Va.; FHWA, U.S. Department of Transportation, 1977.
6. F .M. Council et al. Accident Research Manual. Report FHWA/RD-80/016. FHWA, u.s. Department of Transportation, Feb. 1980.
The opinions and viewpoints expressed in this paper are those of the authors and do not necessarily reflect the viewpoints, programs, or policies of the U.S. Department of Transportation or any state or local agency.
Publication of this paper sponsored by Committee on Pedestrians.
Pedestrian Time-Space Concept for Analyzing Corners and Crosswalks
JOHN J. FRUIN and GREGORY P. BENZ
ABSTRACT
The preliminary version of the new Highway Capacity Manual, Interim Materials on Highway Capacity (Transportation Research Board Circular 212), contains procedures for determining pedestrian levels of service at street corners and in crosswalks. Problems encountered during several applications of the Circular 212 procedures ace discussed and a new conceptual approach for analyzing crosswalks and corners is introduced. Based on a time-space concept, this analysis method has several advantages over the Circular 212 procedure. Simply stated, the method is based on developing an estimate of total pedestrian occupancy time for a corner or crosswalk and relating this occupancy value to the available time and space. Average pedestrian occupancies derived from these values are compared with
level-of-service criteria to determine re la ti ve degrees of convenience. The times pace analysis method and an illustrative problem are presented and compared with the Circular 212 procedure. Additional research to further increase the utility of the time-space technique is discussed.
Increasingly planners and engineers must address the problem of pedestrians at intersections. In the past the primary concern was to provide adequate walk time for safe crossing of the street, and little attention was paid to the volume of pedestrian activity and relative convenience. Vehicular traffic was accommodated first. Sidewalk widths were often reduced to create turning or parking lanes. However, the concentration of workers, shoppers, and visitors in many urban centers is becoming so intense that sidewalks and crosswalks are proving inadequate. Be-

Fruin and Benz
yond safety concerns, attractive pedestrian environments and enhancement of pedestrian activity are being recognized as important determinants of the usefulness of urban centers. Until recently few analytical tools existed to evaluate pedestrian-related issues.
Building on previous work (1,2), TRB Circular 212, Interim Materials on Highway Capacity (3), introduced an analytical procedure for evaluating crosswalks and corner spaces. However, several conceptual a nd application problems make it difficult to use. A new approach based on a time-space (TS) concept of the functioning of street corners and crosswalks is described that presents several advantages over the TRB Circular 212 procedure.
CORNER AND CROSSWALK ANALYSIS
The concentration of pedestrian activity at street corners and in crosswalks makes them the er i tic al links for both sidewalk and highway networks in the urban core. Overloaded corners and crosswalks affect not only pedestrian convenience and safety but also roadway capacity by delaying vehicle turning movements and thereby reducing the through capacity of an intersection.
The corner is a difficult analysis problem because of the many events that occur there. Pedestrians entering a corner space from the sidewalk or crosswalk can turn left or right or continue ahead (Figure 1). Pedestrians that accumulate at corners
BA,CA,OA OUT
® IN
SIDEWALK
MINOR
STREET
BLOG. " LINE2_
IN @
Vao
v.,,
AC,BC,OC Vco
OUT @
OUT l
Vc1
IN
AB CB.OB
Ke.y
MAJOR STREET
A,B = sidewalks C,D = crosswalks
V c pedestrian volume i = inbound flow o • outbound flow
FIGURE 1 Intersection corner: pedestrian movements.
during the red signal phase require standing space, which reduces the space for circulation. Pedestrians accumulating during the red phase also create denser platoons when they cross. Conflicts with turning vehicles during the crossing cycle reduce crosswalk capacity and can cause pedestrians to drift outside the marked crosswalk area, which potentially endangers them.
The basis for determining the adequacy of pedestrian facilities used in both the Circular 212 procedure and the TS method are the level-of-service (LOS) criteria for walkways and queuing spaces. These criteria provide a measure of relative degrees of convenience based on the average amount of space available per person. For walkways the criteria relate average space per person to the flow rate per unit of walkway width, conflict probability, ease of
19
pedestrian movement, and average walking speed. LOS criteria for standing or queuing spaces relate average pedestrian space to degrees of personal comfort and individual mobility within the queuing space. LOS criteria presented in Circular 212 are summarized in Tables 1 (3, p. 124) and 2 (3).
Both the Circular 212 procedure a-nd the TS method focus on pedestrian space demands at the corner and in the crosswalk. For corners there are two distinctly different types of pedestrian space requirements:
- Circulation space: Space needed to accommodate the movement of pedestrians crossing during the green signal phase, those joining the red phase queue, and those moving between the adjoining sidewalks but not crossing the street.
- Hold space: Space needed to accommodate standing pedestrians waiting during the red signal phase.
CIRCULAR 212 PROCEDURE
In 1980 TRB published Circular 212: Interim Materials on Highway Capacity (3), which contained a sect ion on analy sis techniques for pedestrian facilities. A new technique for analyzing corners was presented that included procedures for both intersection reservoirs (corner space) and crosswalks. The adequacy of the reservoir space for an assumed pedestrian LOS s tandard is compared with that of the space available. For crosswalks the procedure estimates the width required to accommodate the surge of pedestrians during the walk phases.
The reservoir space analysis technique estimates the space required for circulation--pedestrians passing through the corner. It includes pedestrians approaching the corner by way of the intersecting sidewalks and from the crosswalk with the walk phase. Pe des tr ian flow volumes expanded by peaking factors for platooning are converted into equivalent flow rates and the required circulation space is determined by using an assumed level of service, for example, level of service C. Requirements for holding space are determined by the maximum number of waiting pedestrians who would accumulate just before the walk signal phase. A space requirement per person, again using an assumed level of service, is applied to the build-up and the required holding space is determined. The combined circulation and holding-space requirements plus dead space (region not available for circulation or queuing) are then compared with the space available at the corner.
As the procedure is set up, the evaluatio n determines whether the pedestrian demands satisfy the assumed levels of service. Some analysts ha ve developed a use measure by comparing the space required with the space available. A use under 1.0 would indicate that excess capacity exists.
In crosswalks crossing-pedestrian volumes are factored to account for signal phasing and converted into equivalent flow rates. By using LOS curves supplied in Circular 212, the required width of the crosswalk is determined for the flow rates. The required width is then compared with the actual or proposed width of the crosswalk.
The Circular 212 procedure was applied in several studies in midtown Manhattan where intensive pedestrian activity is both common and an increasingly sensitive planning and design issue. In the course of these applications, some problems were encoun tered with the procedure :
1. The data-collection requirements are expensive in terms of manpoweri in addition to crosswalk

20 Transportation Research Record 959
TABLE 1 Pedestrian LOS Standards for Walkways: Average Flow Conditions (3)
Avg Unit Width Avg Speedb Space Flow Rate• Volume/Capacity
Level of Service (ft 2 /pedestrian) [pedestrians/(min ·ft)] (ft/min) Ratioc
A >40 <6 B 24-40 10-6 c 16-24 14-10 D 11-16 18-14 E 6-11 25-18 F <6 0-25
8 Flow rates are relnUve to effective walkway width. bSpeeds are computed from speed ==flow x space. CAssumed capacity =- 2 S pedestrians/( min ·ft).
>250 < 0.24 240-250 0.24-0.40 224-240 0.40-0.5 6 198-224 0.56-0.72 150-198 0 .72-1 .00 0-1 so Variable
TABLE 2 Pedestrian LOS Standards for Queuing Spaces (3)
Level of Service
Avg Pedestrian Space Occupancy (ft2 )
Avg Interpersonal Spacing (ft) Description
A B
c
D
E
F
13+ I 0-13
7-10
3-7
2-3
<2
4+ 3.5-4.0
3.0-3.5
2-3
<2
Close contact
volumes, directional volumes on sidewalks ar e required 1
2. The series of trial assumptions required makes the procedure cumbersome, particularly because the majority of corners are not in the problem ranqei
3 = The roethodology and the output are conceptually difficult for laymen to understandi
4. Many professionals, especially those accustomed to vehicular traffic analysis, have difficulty with the cut-and-try assumptions requiredi
5. The procedure is sensitive to certain of its parameters, particularly the space assumed per queuing pedestriani
6. The analysis is not responsive to changes in approach volumes and at higher volumes requires interpolation on a logarithmic curvei
7. The corner analysis measures the maximum build-up of pedestrians on the corner just before the siqnal change and does not adequately respond to crowding conditions existing over longer periods of time.
The Circular 212 procedure advanced the state of the art in pedestrian analysis. However, in the spirit of the issuance of the interim materials for review, testing, comment, and revision, an alternative concept is proposed.
TS CONCEPT
The theoretical capacity of any traffic system is definable in terms of time and space. Transportation engineers are familiar with time-and-space graphs and diagrams for signal phasing, train scheduling, and terminal operations studies, but TS principles can be applied to other problems where different types of traffic elements occupy a system (space) for varying times related to their speeds or other operational characteristics. (The TS concept as used here is different from the time-and-space diagram used in vehicular and railroad traffic analyses in which the relative location of vehicles is plotted
Standing and free circulation Standing and partly restricted circulation without
disturbance to others Standing and limited circulation with disturbance to others
Standing without touching others, circulation severely restricted
Unavoidable physical contact, circulation not possible
Close physical contact, discomfort, no movement, potential danger
over time.; TS analysis is useful for corner and crosswalk evaluations because it is a relatively simple technique that is sensitive to changes in corner and crosswalk geometry, pedestrian volumes, and signal phasing. The method also provides a potential means o f evaluat i nq the effects of vehicle turning movements on crosswalk adequacy.
Conceptually the method assumes that corners and crosswalks are TS zones in which moving and standinq pedestrians require different amounts of space and occupy the zones for different periods of time. The total amount of time and space available for these activities is simply the net usable area of the zone in square feet multiplied by the time of the analysis period, usually the peak 15 min. The time and space used by queuing pedestrians at corners becomes the product of the average number waiting to cross during the red phases and an assumed standing area. The analysis presented assumes that pedestrians waiting for a signal change form a competitive queue with an average space occupancy of 5 ft 2 per person (level of service D). This is the typical average occupancy observed at most crowded corners, and the assumption simplifies the calculations. In the corner analysis this queuing or holdinq TS is deducted from the total TS to determine the net available for circulation.
In order to determine the average circulation space for movinq pedestrians ann r.orner level of service, the total volume of pedestrians using the corner during the analysis period is multiplied by an estimated corner occupancy time (typically in the range of 3 to 5 sec) needed to walk through ~he corner space. In the problem presented, this time is estimated at 4 sec, based on the longest travel path. An assumption of travel on the longest path is conservative, because many pedestrians cut across the corner edges. The resulting product in pedestrian minutes is divided into the available circulation TS in area minutes to determine averaqe circulation area per pedestrian. This area is then compared with the LOS er i ter ia for walkways and translated into relative degrees of pedestrian convenience.

Fruin and Benz
The crosswalk can also be analyzed as a TS zone. The TS for pedestrian movement is the product of the green-phase crossing time less 3 sec platoon startup time and the area of the crosswalk in square feet. The product of pedestrian crossing volume and the average pedestrian crossing time gives the demand for this TS in pedestrian minutes. Division of demand into the available TS produces the area per moving pedestrian available during crossing. This area can also be compared with LOS criteria for walkways.
A brief maximum flow or surge condition occurs in crosswalks during the green phase when the two lead platoons from opposite corners, accumulated during the red waiting phase, are simultaneously moving in the crosswalk. Excessive pedestrian flows during this surge could cause pedestrians to drift out of the marked crosswalk area, which potentially endangers them. The time element used in the analysis of this surge is the time it takes for the lead pedestrian in each platoon to walk across the street.
Neither the average nor the maximum surge estimate of the crosswalk level of service accounts for the effects of turning vehicles during the pedestrian crossing phase. A rough estimate of pedestrian
SIDEWALK@
SIDEWALK@
Wb
... . . . . . . -.. . ...
21
LOS degradation by turning vehicles has been made in the problem presented by assuming a vehicle-swept path and the time that the vehicle occupies the crosswalk. The method can be used to make approximate evaluations of the effects of different signalphasing and vehicle-turning strategies on pedestrian movement, but it is emphasized that this approach has not been validated by field observations and will require further research.
ANALYSIS PROCEDURES
In order to simplify the understanding and application of the TS method, the development of its equations is presented in parallel with the solution of a sample corner and crosswalk problem. The problem is based on actual data from a street corner in midtown Manhattan previously analyzed by the Circular 212 procedure. The results of the two analysis methods are then compared. (Users of these procedures should review assumed values presented in this paper for appropriateness for their locality and adjust the assumed values accordingly.)
Figures 2 and 3 show the two signal phase condi-
HOLD AREA (Minor red)
CROSSWALK ~1 _J ---------
MINOR STREET
CROSSWALK
©
1 Key Condition l
I Va,b = sidewalk flow
peds . joining queue
outbound crossing peds.
inbound crossing platoon
wa,b = width sidewalks
FIGURE 2 Intersection corner: condition I-minor-street crossing.
<::SIDEWALK A J Sl~EWALK@ / a,b 7- -----1 -
vco
MAJOR STREET
vdi CROSSING
--1---Vdo PLATOON
CROSSWALK@ _ _. ______ __J_,,__:•:..,•~·_..,_•.e:· - - _J - - - - - - - - - -
MINOR STREET
1 (Maier Redl I Key Condition 2
CROSSWALK
©
I
I Va b I '
I VCO I
I Vdo
sidewalk flow
peds. joining queue
outbound crossing peds.
Vdi inbound crossing platoon
wa,b = width sidewalks
FIGURE 3 Intersection corner: condition 2-major-street crossing.

22
tions that are analyzed in both corner and crosswalk computations. Condition 1 is the crossing of the minor street occurring during the major-street qreen phase; a maximum queue is built up on the majorstreet side. Condition 2 is the major-street crossing occurring during the minor-street green: a maximum queue is built up on the minor-street side.
The sidewalks at the intersection of a major and a minor street are 20 ft and 15 ft wide, respectively, with a corner radius of 10 ft. The roadway width for the major street is 50 ft and for the minor street, 30 ft. The cycle length of the signal is 90 sec, with a two-phase split of 50 sec of green plus amber for the major street (56 percent) and 40 sec of green plus amber for the minor street (44 percent). The 15-min peak-period pedestrian crossing and sidewalk volumes (Figures 2 and 3) are as follows:
Peak Flow Rate 15-min (pedes-
Flow count trians£'.'.min) Vci ~ 24
Vco 276 18
Vdi 505 34
vdo 797 53
Va b 227 15 Total 2,159 m
The problem is to find
1. The average level of service for pedestrian circulation at the street corner,
2. The average level of service for pedestrians crossing in minor- and major-street crosswalks for the green phase and maximum surge conditions, and
3. The decrement in average crosswalk pedestrian level of service due to five turning vehicles per cycle on the major-street crossing.
Corner Analysis
1. Total available TS in the intersection corner in area minutes for both queuinq and circulation for an analysis period of tp min is the product of this time and the net corner area (Ac). 1'1.c is found by multiplying the intersectinq sidewalk widths (Wa, Wb) and deducting the area lost because of the corner radius and any obstructions:
1'1.c (area corner radius seqment = 0.215R 2 )
15 * 20 - 0.215 * 10 * 10 = 279 ft'.
TS Ac * tp, or
TS 279 * 15 min = 4,185 ft 2 • min.
2. Assuming uniform arrivals at the crossing queues, the average pedestrian holding times (Qtdo and Qtc
0) of persons waiting to use crosswalks C
and D, respectively, are one-half the product of the 15-min outbound flows (Vdo• Vcol , the proportion of the analysis period that these flows are held up, and their holding time based on the red signal length, determined as follows:
Condition 1 (minor-street crossing on major green):
Qtdo = (Vdo * ratio minor red * minor red t)/ (2*60),or
Qto0 = (797 * 0.56 * 50)/(2 * 60) min.
186 pedestrian
Transportation Research Record 959
The ratio of minor red is the proportion of time that the major-street crossing flow is held back and as used determines the total number of pedestrians waiting in the major-street queue (Vdo * ratio minor red). Minor red t is the time that these pedestrians wait to cross, in seconds, converted to minutes (sec/60). The divisor 2 converts the total waiting time distribution based on the assumption of uniform arrivals to an average waiting time in pedestrian minutes.
Condition 2 (major-street crossing on minor green):
Qtco = (Vco * ratio major red* major red t)/ ( 2 * 60) , or
Q~0 = (276 * 0. 44 * 40)/(2 * 60) min.
40 pedestrian
The variables are similar to those described previously.
3. Holding-area TS requirement (Tsh) is the product of the average waiting times (Qtdo• Qtcol and the average area used by a wait:ing pedestrian, assumed to be 5 ft 2 /pedestrian (level of service D), determined as follows:
Tsh (Qtdo + Qtc0 l * 5, or
Tsh (186 + 40) * 5 = 1,130 ft 2 • min.
4. Net circulation area TS (Tsp) is the total TS available minus that used for holding (Tsh), as follows:
Tsp TS - Tsh, or
Tsp 4,185 - 1,130 = 3,055 ft 2 • min.
5. Total circulation volume (P), which must use the available circulation TS (Tse), is the sum of all pedestrian flows for the 15-min analysis period, as follows:
p
p 354 + 276 + 505 + 797 + 227 2,159 pedestrians.
!i~ll values are in pedestrians per 15 min and all volumes are defined in Figures 2 and 3 and stated in the data given.
6. Total circulation time (Ct) that pedestrians consume while circulating through the corner area is taken as the product of P and an assumed average circulation time of 4 sec:
Ct P * (4/60), or
Ct = 2,159 * (4/60) = 144 pedestrian min,
where 60 is a conversion from seconds to minutes.
7. Circulation area per pedestrian (M) (called the pedestrian space module) is computed as Tsp divided by Ct:
M Tsp/Ct, or
M 3,055/144 = 21.2 ft 2 /pedestrian.
8. For the corner level of service M is compared with the LOS standards of Table 1 to obtain an approximate measure of pedestrian circulation convenience for the street corner. Values equal to or below level of service C indicate a potential problem and should be the subject of further field study

Fruin and Benz
and possibly remedia l actions , which coul d include changes i n signal-cycle tim ing , prohibition of vehicle tur ning movements , sidewalk widening , a nd removal of sidewalk obstructions.
From Table 1 a value for M of 21. 2 ft• /pedestrian falls within the range of level of service C (16 to 24 ft•/pedestrian), which is indicative of a busy corner potentially requiring more detailed study .
Crosswalk Analysis
1. The total available TS in each crosswalk (Tse, Tsd) is the product of their areas and the effective green times. The corner radius area segment of 1.5 ft• subtracted from the corner area is added to the crosswalk area (there are two corner area seqments for each crosswalk). Therefore,
Area crosswalk c (15 * 30) + (2 * 21.5) 493 ft•.
Area crosswalk D 1,043 ft•.
(20 * 50) + (2 * 21.5)
2. The TS available for each condition is follows:
Condition 1 (minor-street crossing, crosswalk C):
Tse Ac * (major green t - 3)/60, or
Tse 493 * (50 - 3)/60 386 ft• • min,
Condition 2 (major street crossing, crosswalk D):
Tsd Ad * (minor green t 3)/60, or
Tsd 1,043 * (40 - 3) / 60 643 ft• • min.
as
3. Crosswalk time (tc, td) is the average time a pedestrian occ upies each crosswalk, obtained by dividing the street width by the assumed pedestrian walking speed. Street widths are in feet, and walking speed is assumed to be 4.5 ft/sec. Then
Condition 1 (crosswalk C, L = 30 ft):
tc = 30/4.5 = 6. 6 sec.
condition 2 (crosswalk D, L 50 ft):
td = 50/4.5 = 11.l sec.
4. Total crosswalk occupancy time (Tc, Td) is the product of the pedestr i an volumes using each crosswalk during the green phase and the street crossing times (tc, td). The average pedestrian volume or number crossing during a given green phase is the product of the crosswalk flow rates and the total cycle length (St). This includes pedestrians held in the red phase and new arr i vals during the green phase.
Condition 1 (crosswalk C):
Tc (vci + Vco> * (St/60) * (tc/60), or
Tc (24 + 18) * (90/60) * (6.6/60) = 6.9 pedestrian min.
condition 2 (crosswalk D):
Td = (Vdi + Vd0 ) * (St/60) * (td/60), or
Td = (34 + 53) * (90/60) * (ll.l/60) trian min.
24.1 pedes -
23
5. Average circulation space (Mc, Md) per pedestrian is determined by dividing the TS available during each crossing phase (Tse, Tsd) by the respective occupancy times (Tc, Td). This yields the average space module ava ilable for each crosswalk, a value that can be compared directly with LOS criteria in Table 1.
Condition 1 (minor street) :
Mc = Tse/Tc 386/6.9 = 56 ft 2 /pedestrian.
From Table 1, this is equivalent to level of service A.
Condition 2 (major street):
Md = Tsd/Td 643/24.1 = 27 ft 2 /pedestrian.
From Table 1, this is equivalent to level of service B.
In the foregoing procedure only average conditions in the crosswalk during the green phase are considered. The maximum surge condition, the condition with the maximum number of pedestrians in the crosswalk, should also be examined. This occurs when the lead pedestrians in each crossing platoon accumulated during the red phase reach the opposite corner. The space module (Mc, Md) for the surge is the area of the crosswalk divided by the maximum number of pedestrians in the crosswalk (Pcmax• Pdmax> • The majo r and minor red times plus 3 sec and the outbound volumes determine the size of the crossing platoon. The addition of the crossing times (tc, td) determi nes the new arrivals as these platoons cross the street.
Condition 1 (minor street):
(Vci + V00) * (major red t + 3 + tc)/60, or
PCmax • (24 + 18) * (40 + 3 + 6.6)/60 = 35 pedestrians.
Mc= Ac/ Pcmax = 493/35 = 14 . 1 ft 2 / pedestrian.
Condition 2 (major street):
(Vdi + Vd0 ) * (minor red t + 3 + td)/60, or
Pdmax • (34 + 53) * (50 + 3 + 11.1)/60 trians.
93 pedes-
Md = Ad/Pdmax = 1,043/93 = 11.2 ft 2 /pedestrian.
From Table 1 pedestrian area modules of 14.l and 11. 2 ft 2 /pedestrian fall within the range of level of service D (11 to 16 ft 2 / pedestrian), indicative that these crosswalks are both quite congested but still below capacity limits .
Estimating the Decrement to Crosswalk Level of Service due to Turning Vehicles
The TS method allows a rough estimate to be made of the effect of turning vehicles on the average level of service for pedestrians crossing in a given green phase. This is done by assuming an average area occupancy of a vehicle in the crosswalk based on the p roduct of the vehicle-swept path and crosswalk

24
widths and an estimate of the time that the vehicle preempts this space.
For this example, the vehicle-swept path has been assumed to be 8 ft wide, and the time the vehicle preempts the crosswalk space is taken as 5 sec to allow for some avoidance behavior on the part of either the driver or the crossing pedestrians. The vehicle TS decrement in square feet minutes would then be as follows:
Veh.Dec. = swept path * crosswalk width * preempt time/60, or
veh.Dec. = 8 * 15 * 5/60 = 10.0 ft 2 •· min/vehicle.
The impact for the average level of service on the major-street crossing (not the maximum surge) of five turning vehicles is as follows:
5 vehicles x 10.0 = 50 ft 2 • min/phase.
For the major crossing, the total available Tsd was found to be 643 ft 2
• min in each phase. Deducting 50 ft 2 min for the five turning vehicles reduces Tsd to 593 ft 2 min. The average crosswalk area per pedestrian may now be recomputed as follows:
Md = 593 ft 2 • min/24.l pedestrian min pedestrian.
24.6 ft 2 /
This is in the range of level of service c, one level of service worse than originally indicated in the major-street crossing analysis. This method could be adapted to evaluate various signal-phasing and vehicle-turning strategies on pedestrian convenience. However, further research is necessary to validate its use for these applications.
Comparison with Circular 212
This same corner was analyzed by using the Circular 212 procedure. Using level of service c for the analysis, the corner area required under condition 1 was 537 ft 2 , whereas for condition 2, the area required was 368 ft 2 • In this procedure, dead areas (including the buffer spaces) are included in the area required. The corner space available is 480 ft 2 • (This procedure extends the corner space back up the adjacent sidewalks by multiplying the product to the two sidewalk widths by a factor of 1.67.) For condition 1, the corner is functioning below level of service C in the peak period, whereas for condition 2, it is functioning within level of service c.
The TS analysis for the corner, which encompasses both conditions, indicated that the corner is functioning at level of service C, showing general consistency with the more involved Circular 212 procedure.
Transportation Research Record 959
The Circular 212 crosswalk analysis procedure is comparable to the average condition during the walk phase. The Circular 212 procedure does not directly determine a level of service, but one can be found by converting the flow into an equivalent flow rate of pedestrians per foot per minute rather than using the space module. For condition 1, the crosswa lk is functioning at level of service A and for condition 2 at level of service c, as compared to the level of service A and B using the TS method. The difference may result from the use by the TS concept of crosswalk area, whereas the Circular 212 procedure uses crosswalk width. Circular 212 does not examine maximum surge conditions in the crosswalk.
CONCLUSIONS AND CONSIDERATIONS FOR FURTHER RESEARCH
The TS technique represents a different way of examining pedestrian conditions at sidewalk corners and crosswalks. TS is the product of the space (area) available or occupied and the time it is available or occupied. The output is an area per person that can then be compared with the commonly used pedestrian level of service criteria. The method can be used to test means of improving problem pedestrian corners, such as changes in sidewalk and crosswalk geometry, changes in signal timing, and vehicle turning strategies. It yields results comparable with those of the more cumbersome Circular 212 procedure but with less involved computations.
A subject for further research would be the development of general values to use in the analysis (default values) if the user does not have local data. Extensions of this analysis procedure to such issues as the influence of turning vehicles on crosswalk capacity or, conversely, heavy pedestrian volumes on the vehicle throughput of intersections require further examination. The TS technique also has potential application in the analysis of other pedestrian facilities involving circulation and queuing spaces, such as transit platforms. The relatively simple computational steps also make it adaptable to programming on a microcomputer.
REFERENCES
1. J.J. Fruin. Pedestrian Planning and Design. Metropolitan Association of Urban Designers and Environmental Planners, New York, 1971.
2. B.S. Pushkarev and J.M. Zupan. Urban Space for Pedestrians. MIT Press, Cambridge, Mass., 1975.
3. Interim Materials on Highway Capacity. Transportation Research Circular 212. TRB, National Research Council, Washington, D.C., 1978.
Publication of this paper sponsored by Committee on Pedestrians.

25
Pedestrian Exposure to Risk 1n Housing Areas
D.H. CROMPTON
ABSTRACT
A large-scale study has been carried out for the U. K. Transport and Road Research Laboratory to determine levels of pedestrian activity in representative housing areas and to examine their influence, along with other factors, on annual pedestrian casualty rates. Data were collected on land use and layout, population and socioeconomic character is tics, number of pedestrians (by age and sex), traffic, and casualties to pedestrians in 4 7 4 squares of 1 km each, distributed in the reg ions of England and Wales. Analysis of these data has resulted in a group of models in which annual casualty rates per square kilometer of housing area are explained in terms of pedestrian and traffic data, population and census data, and land use and layout data. The best of the models (which were tested against an independent data set) explain up to 77 percent of the variation about the mean casualty rate (R = 0.88). But standard errors of the estimate are disappointingly high. Factors influencing the size of these errors are examined, and possible practical applications of the models are discussed.
Annual records of accidents or casualties involving pedestrians in housing areas can be expressed as rates per 100,000 residents and used to compare conditions in different localities. These casualty rates vary considerably from region to region. Among the many factors influencing these variations, levels of pedestrian exposure appear likely to be important. The level of pedestrian exposure in a housing area might be defined in terms of some function of the number of pedestrians and their age and sex distributions together with the amount and character of the traffic and certain geometric characteristics of the layout of the roads and adjacent buildings; the supposition is that these are the factors that appear likely to influence risk of accidents to pedestrians.
But at this time little is known about these relationships or their actual influence on pedestrian casualty rates. Apart from the inherent complexity of the subject, problems arise in the very collection of suitable data on levels of pedestrian exposure to risk. Because of the great lengths of roads in housing areas and because of the generally small numbers of both pedestrians and annual casualties per unit area, the collection of enough data requires large resources of manpower in the field. In 1970 some experiments were carried out at Imperial College to test the feasibility of carrying out surveys of housing areas on a large scale by using photographic or video apparatus from a moving car.
OBJECTIVES
On completion of these preliminary trials, sample housing areas throughout England and Wales were surveyed with the aim of determining levels of pedes-
trian activity and risk and to provide enough data on the various relevant factors to determine the importance of each in relation to pedestrian casualty
rates <ll. The task was seen first as one of collecting and
tabulating information on pedestrian activity, traffic flows, and land use and layout characteristics; population and other socioeconomic characteristics; and pedestrian casualty statistics. These data should enable typical and atypical conditions encountered in housing areas to be described and should make up a comprehensive data base for use in further studies. But beyond this, an important aim of the study was to try to develop models that explain the relationships between pedestrian exposure levels and casualty rates in different housing areas.
WORKING ASSUMPTIONS
The whole study was based on the working assumption that casualty rates can be explained mainly in terms of three sets of data: (a) those relating to population and socioeconomic characteristics as derived from census material; (b) those on land use and layout characteristics as derived from maps and observation; and (c) those on activity characteristics as derived from relatively short-period surveys of pedestrians and traffic in sample housing areas.
The data available for use in the study appeared likely to have certain shortcomings in that the time periods for the casualty, census, and pedestrian sets of data were not strictly compatible with each other. It was also realized that for any particular survey area, the absolute number of casualties per year was likely to be low. A further working assumption was adopted that given both a consistent basis for the collection of each separate set of data and examination of a large number of sample housing areas, it should be possible to produce useful models that help to explain the factors that influence the known variations in casualty rates.
SCOPE OF REPORT
The general procedure adopted in the surveys is outlined in the next section. Next the data for each of the regions of England and Wales are used to determine which of the main factors were significant in relation to the casualty rates. Then all the data are treated as a single data set to allow various stratification tests to be carried out and multivariate casualty models are described that use the census data only, the pedestrian and traffic data (the activity variables) only, and the layout data only. A final model is developed by using all these types of explanatory variables. The procedure adopted to test the validity of the models is described: The entire data set was subdivided into two equal parts, models were developed by using only one of the two subsets, and then these models were used to compare predicted casualty rates with the actual rates for the second of the two subsets. In the last section the factors influencing the size of the predictive errors are examined and possible practical applications of the models are discussed.

26
METHODS AND DATA BASES
General Approach
The basic unit for the selection of sample survey areas was 1-km squares of the national grid. For any given developed square, the resident population can be obtained from the 1971 census, and the yearly number of pedestrian casualties can be obtained from police reports on road traffic accidents.
The 9 standard regions of England and Wales were adopted for the study, but the South East region was subdivided into 3 parts, making 11 regions in all (Figure 1). For each of these regions a sample of 40 to 50 squares of 1 km was selected, making a total sample of 474 squares {Figure 2). Data on land use, layout, population, socioeconomic characteristics, and casualties to pedestrians were collected; the sample areas were then surveyed to collect data on traffic and pedestrian numbers and age and sex distributions.
Selection of Sample Survey Areas
For each region, the universe from which sample survey squares were chosen was the set of 1-km squares containing parts of the built-up areas of all towns
0 50m
Transportation Research Record 959
whose 1971 populations exceeded 1,500. But all squares with less than 20 percent of the area developed and all predominantly nonresidential squares (i.e., central areas and major industrial areas) were omitted.
The two criteria used for the selection of survey squares were the 1971 census population and the mean { 1970-1971) annual number of pedestrian casualties in each square. The mean annual casualty rate per 100, 000 population for each square was calculated and an ordered listing of these rates prepared. Every fourth square was then selected to obtain the sample. This sampling approach had the practical merit of being relatively simple and applicable to all the 11 regions. It resulted in the selection of a set of sample squares having representative casualty rates per 100,000 population.
Layout and Land use Data
A 1:2,500 scale map of each sample square was used in the field for navigational purposes and for recording various field observations relating to land use. The maps were also used to measure the extent of the developed area within the 1-km grid square. The color coding on 1:50,000 scale OS maps was used to classify the roads into class A and B roads and
Police Authorities for which casualty data were not available
South East (9) - Greater London
( 10) - Outer Metropoliuin Area ( 11) - Outer South East
FIGURE 1 Regional boundaries for selection of survey squares and analysis of data.

Crompton
·.
.. .. ~ ...... . ··.· . .:.· .. \..,• ~ ..... ........ · . . . .
. \ .. ., ... , . ·, . : .
.... ... ... . ....... . .. ..
" ... .. ...
. · .. -; .
FIGURE 2 Distribution of the 474 grid squares.
minor roads (coded C and D) , whereas cul-de-sacs were classified separately as group E.
On the assumption that certain layout factors may play a role in determining accident rates or relative risk ratios or both, an attempt was made to develop quantified measures that could be used consistently to describe the salient physical character is tics of all types of development. However, it was accepted that it would not be possible to describe the layout characteristics in great detail (e.q., to record slight or irregular changes in street width from one end of a street block to the other). Accordingly, the following basic measures of layout were adopted:
1. (E);
2. 3.
Road lengths of types A, B, C, D, and others
Numbers of junctions of various types; Carriageway widths for each road type; and
4. Numbers of traffic sianals, pedestrian crossing facilities, and bus stops.
Although most of the sample squares consisted of land in residential use, many had at least a small number of nonresidential uses such as shops or nursery schools, but some included shoppinq centers, large schools, or industrial areas. When such nonresidential uses are extensive, they may generate larger numbers (and different types) of pedestrians. It therefore is desirable to quantify these other uses so that the pedestrian exposure levels and casualty rates associated with the residential population and age and sex structure of each square can be determined. Data were therefore collected in the field on numbers or frontages of shops, and the presence of schools and other nonresidential uses were noted. A simple point systems was employed to
27
define the amount of nonresidential land use in each square.
Census and Casualty Data
The data for each sample grid square were obtained from the 100 percent population and the 100 percent household census returns. These data were particularly useful in that they enabled resident populations and observed pedestrians to be compared in terms of their aqe and sex distributions •
Casualty data included details of age and sex of pedestrian casualties and other details such as class of road and pedestrian's activity at the time of the accident for the years 1969-1975. Because of the generally small and variable numbers of casualties per square per year, the 7 years of data for each square were converted into a mean annual rate for use in the subsequent analyses •
The Apparatus
For the field surveys, it was necessary to traverse all roads in each sample square, collect data on traffic and pedestrian numbers, and record details of land use and layout that could not readily be obtained by other means. A visual and audio recording was made with a portable 0.5-in. National Panasonic video tape recorder and video camera with zoom lens coupled to a convex mirror projecting throuqh the roof of the survey car. Each videotape ran for only 35 to 40 min but that proved adequate for recording the survey runs on the roads of a 1-km square, even though the actual surveys qenerally took 1.5 to 2 hr to complete. The sound track was used to mak.e verbal identification of road sections, locations of bus stops, and certain land uses such as shops, schools, and industry. Three such recording units were available for the surveys, and these were used in Renault 4Ls with opening roofs.
Traffic Surveys
The field surveys were conducted by making videotape recordings as the survey vehicle passed along all the roads in each 1-km square. If generally only one survey per street was made, the total time spent in any one section of the road network was comparatively short. But the reliability of traffic counts derived from the recordings would then be low, particularly in the common case of roads with low traffic volumes. Resources of time and manpower did not permit a large number of survey runs to be made down each street. It was therefore decided that the best approach was to make four runs on each of the A and B (major) roads but only one run on the C and D (minor) roads. Traffic on the E roads (cul-de-sacs) was not recorded, although number of parked vehicles was.
Th is approach reflected the view that for the c and D roads with generally lower amounts of traffic, pedestrian accidents are essentially random occurrences that are unlikely to be explained in terms of observed traffic flows. But class A and B roads generally have traffic volumes or densities that are likely to be more highly correlated with the data on casualties. Adoption of the moving-observer technique, when based on videotape recordings of the repeated runs on the A and B roads, enabled the number of moving vehicles to be counted and likely errors of the estimate to be calculated. Initially,

28
the traffic data were expressed in terms of vehicle densities per kilometer of road.
Pedestrian Surveys
Number, age, and sex of pedestrians on both sides of each length of road were recorded in every 1-km square. Pedestrians were classified into six age groups: 0 to 4, 5 to 9, 10 to 15, 16 to 24, 25 to 59, and 60 and over. These divisions follow those used in the casualty data but differ sliqhtly from the age grouping used in the 1971 population census. The surveys were carried out between 9: 30 a.m. and 12:30 p.m. and 2:00 and 3:30 p.m. on weekdays and in the main during the school term. All surveys were carried out in dry weather. Pedestrian crossing facilities (such as zebras) were few, and the observable flows of pedestrians crossing at random locations were generally low. It did not prove possible to collect data on number of pedestrians crossing the roads.
PRELIMINARY ANALYSES
Data Base
The total (1971) population resident within the 474 squares was 1,669,000. Road length as measured off 1:2,500 scale maps was 3670 km. Pedestrian casualties (1969-1975) average 2, 223 per year. The total
Transportation Research Record 959
urban area from which the sample squares were selected was made up of 8,006 squares of 1 km, with a total population of 27,973,000. Thus the sample set embraced 5. 92 percent of the area and 5. 97 percent of the population of the sampling universe.
Regions Compared
In Tables 1 and 2 the data from the regional samples and their relation to the regional sampling universes are compared in terms of their numbers of 1-km squares, populations, total casualties, population densities, and cas ualty rates. Individual regions had total sample areas ranging from 3.5 to 8.0 percent of the regional sampling universes. But for East Anglia, a 25 percent sample was taken.
Population samples ranged between 3.1 percent and 10.5 percent (East Ang l ia, 26.2 percent). Mean population density per square kilometer was 3,494 for the whole universe of grid squares and 3,521 for the 474 sample squares. In the individual regions densities ranged between 2,505 (South West) and 5,815 (Greater London) persons/km2 • Annual pedestrian casualty rates per 100,000 population were 154.5 for the universe of grid squares, and averaged 140.8 for the sample squaresi regional figures ranged between 87 (East Anglia) and 213 (Greater London).
Table 3 shows that for a range of key variables (including popul.ation, pedestrians, and vehicle counts) the mean values per square differ between regions by a factor of up to 2. But for pedestrian
TABLE 1 Number of 1-Km Squares and Total Resident Population in Each of the 11 Regional Sample Sets
Population per Square Number of I-Km Squares Population (OOOs) Kilometer
Region Whole Region Sample Percent Whole Region Sample Percent Whole Region Sample
East Anglia 228 57 2.5 661 173 26 .2 2,897 3,037 North 531 42 9.9 1,568 138 8.8 2,953 3,295 Yorkshire and
Humberside 1,031 43 4.1 3,326 154 4 .6 3,226 3,553 North West 540 41 7.6 2,148 175 8.1 3,977 4,271 East Midlands 527 42 8.0 l,675 164 9.8 3,179 3,902 West Midlands 949 41 4.3 3,518 180 5.1 3,707 4,380 Wales 524 44 8.4 1,396 147 10.5 2,665 3,344 South West 512 36 7.0 1,283 88 6.9 2,505 2,436 Greater London l ,205 42 3.5 7,007 218 3.1 5.815 5)82 Outer metropolitan
area 1,176 42 3.6 3,172 Ill 3.5 2,697 2,645 Outer South East _I§ ...i! 5.6 ..lll.2 _ill 5.45 2,834 2,754
Total area 8,006 474 5.9 27,973 1,669 6.0 3,494 3 ,521
TABLE 2 Mean Casualty Rates for Each of the 11 Regional Sample Sets
Pedestrian Casualties" per Total Pedestrian Casualties, Year per 100 ,000 Pedestrian Casualties• per Year 1970 and 1971 Population per Square Kilometer
Region Whole Region Sample Percent Whole Region Sample Whole Region Sample
East Anglia I ,145 302 26.3 87 87 2.5 2.7 North 4,544 422 9.3 147 153 4.3 5.0 Yorkshire and
Humberside 9,427 427 4.5 142 139 4.5 4.9 North West 7,154 529 7.4 167 151 6.1 6.5 East Midlands 4,585 474 10.3 137 145 4.3 5.3 West Midlands 10,048 513 5.1 143 143 5.3 6.3 Wales 4,093 421 10.3 147 143 3.6 4.8 South West 2,079 186 8.9 81 106 2.0 2.6 Greater London 31,540 882 2.8 225 213 13.0 10.5 Outer metropolitan area 6,81 l 254 3.7 107 114 2.9 3.0
Outer South East --5...Q!.§ ___].§_§ 5.7 113 119 3.2 3.4
Total area 86,442 4,698 5.4 155 141 5.4 5.0
ac:i.s uaJt ies co ns ist of 19 71 and 19 72 data o n ly.

Crompton 29
TABLE 3 Comparison of Regions: Mean Values per Sample. Square of Selected Key Variables
Annual Pedes- Moving Parked Road Percentage of Region Population Pedestrians trian Casualties Vehicles Vehicles Length (km) Area Developed
East Anglia 3,037 92 2,5 North 3,295 147 4 ,9 Yorkshire and
Humberside 3,553 95 4.2 North West 4,271 149 6.1 East Midlands 3,902 119 6.1 West Midlands 4,380 102 5,6 Wales 3,344 96 4.8 South West 2,435 85 2.6 Greater London 5,182 138 9.9 Outer metropolitan
area 2,561 77 2.6 Outer South East 2,7 54 78 2.8
Total area 3,511 107 4 .7
casualties the discrepancy widens: Greater London sample squares have almost four times as many pedestrian casualties as squares in East Anglia or the South West. Road length and size of the developed area, on the other hand, are relatively constant.
Definitions of various pedestrian casualty rates used in Tables 4 and 5 are given as follows:
- Cas: annual pedestrian casualty total per sample square,
- Cas/pop: annual pedestrian casualty 100,000 residents,
- Cas/ped: annual pedestrian casualty 100 pedestrians observed,
- Cas/veh: annual pedestrian casualty 100 moving vehicles observed,
- Cas/dev: annual pedestrian casualty square kilometer of developed area,
- Cas/km: annual pedestrian casualty kilometer of road length,
rate per
rate per
rate per
rate per
rate per
32 149 26 137
31 156 31 217 26 195 40 187 30 238 25 169 55 519
23 132 26 177
31 206
- Cas/(PV) 1 / 2
per square pedestrian square.
7.3 64 8.2 51
8.3 54 9.3 66 7.4 56 8.1 69 7.4 49 6.9 50 9.0 70
6.6 54 6.9 53
7.7 58
annual pedestrian casualty rate root of the product of observed
and vehicle numbers on a sample
In Table 4 the regions are compared in terms of various alternative pedestrian casualty rates that were considered. By ranking the regions in terms of these different casualty rates, Table 5 shows that whatever the particular rate adopted, the order in the ranking is more or less the same: Greater London has the highest, and East Anglia the lowest, casualty rates.
Table 6 shows, for the 474 squares, the distribution of the pedestrian casualties in terms of severity, age, sex, time of day and year, and pedestrian's location and action at the time of accident. For the 474 grid squares as a whole, the number of pedestrians observed was about 3.0 percent of the
TABLE 4 Mean Pedestrian Casualty Rates for Samples Squares of Diffe rent Regions
Region Cas/Pop Cas/Ped Cas/Veh Cas/(PV)'1' Cas/Dev Cas/Km
East Anglia 83 2.7 7.9 5.0 3.5 0.35 North 153 3.4 19.0 8.5 8.8 0.61 Yorkshire and
Humberside 119 4.4 14.8 8.3 7.1 0.51 North West 142 4.1 19.5 9.3 8.9 0.65 East Midlands 156 5.1 23.6 11.6 9.3 0.82 West Midlands 130 5.6 14.0 9.2 7.4 0.69 Wales 142 5.0 16.0 9.3 8.9 0.64 South West 106 3.4 10.3 5.8 4.5 0.37 Greater London 191 7.2 18 .0 12.2 12.4 l.l 0 Outer metropolitan
area 102 3.4 11.2 7.1 4.5 0.39 Outer South East 102 3.6 10.9 6.6 4 ,6 0.40
Total area 134 4 .4 15.0 8.7 7.2 0.61
Note: PedeslrJan casualty rates are defined in the text.
TABLE 5 Rankings of Regions in Terms of Alternative Casualty Rates
Cas/Pop Cas/Ped Cas/Veh Cas Cas/Km Cas/Dev Cas/(PV/'
High casualty rate 9 9 5 9 9 9 9
l 5 6 4 4 5 5 5 2 5 2 5 6 4 4 4 1 9 6 4 7 7 7 3 7 2 7 2 6 6 4 3 7 2 6 2 3 11 6 3 3 3 3 8 2 10 11 11 11 10
10 8 ll 8 10 8 11 11 10 8 10 8 10 8
Low casualty rate l l I l l I I
Note: Region 1, East AngUa; 2, North; 3, Yorkshire and HuJJlberside; 4, North West; 5, East Midlands; 6, West Midlands; 7, Wales; 8, South West; 9, Greater London; 10, outer metropolitan area; and 11, outer South East.

30
TABLE 6 Key Characteristics of the Casualty Distribution for the 474 Sample Squares
Percentage of All Casualties (All Squares)
Children Adults Total Variable (N = 7 ,809) (N = 6,942) (N=14,751)
Severity Fatal 1.3 4.9 3.0 Serious 28.0 3 l .3 29.6 Slight 70.7 63.8 67.4
Age (years) 04 20.0 10.6 5-9 49.8 26.4 10-15 30.2 16.0 16-24 20.5 9.6 25-59 41.9 19.7 60+ 37.6 17 .7
Sex Male 59.6 49.3 54.7 Female 40.4 50.7 45.3
Time of day (hr) 0-7 0.8 6.4 3 .4 8-9 10.9 9.7 10.3 10-11 7.1 11.5 9.2 12-13 15.4 11.6 13.6 14-15 16.1 11.6 14.0 16-17 30.3 16.5 23.8 18-19 14.3 10.0 23.8 20-23 5.1 22.7 13.4
Month January 6.9 10.1 8.4 February 6.9 7.9 7.4 March 8.6 8.0 8.3 April 9.0 7 .5 8.3 May 9.9 7.2 8.6 June 9.3 6 .9 R,, July 9.1 6.9 8.1 August 8.3 6.9 7.7 September 8.5 7.7 8.1 October 9.6 8.2 8.9 November 7.5 11.3 9.3 December 6.4 11.4 8.7
Pedestrian action Crossing at a pedestrian
crossing 5.7 13.3 9.3 Crossing within SO yd of pedestrian crossing 3.0 6.2 4.5
Pedestrian location In the road, not crossing 4.6 8.2 6.3 Masked by stationary vehicle 31.2 11.5 21.9
Daylight conditions 88.7 62.0 76.1
Junction type Tor Y 36.0 39.3 37.6 X or multiple 13.0 16.5 14 ,6
Automatic signal control 4.3 8.2 6.1 Parked vehicle contributing
to accident 17.9 7.0 12.8
resident population, the figure varying between 2. 3 percent and 4.6 percent in the individual regions. The ratio of the child (0 to 15 years) casualty rate per 100,000 population of the same age group to the rate for the rest of the population varied in the regions between 1.8 and 5.3.
Transportation Research Record 959
In Table 7 the data from the 474 squares are stratified into six age groups and the distributions of their resid.ent population, observed pedestrians, and casualties are shown. Comparison of columns 2 and 3 with columns 3 and 4 shows that the 0-4 and the 10-15 age groups were less in evidence as pedestrians than in the resident populations. The highest casualty rate in column 8 was 428 annual casualties per 100,000 residents for the 5-9 age qroup, and the lowest was 62 for the 25-59 age group. If the casualty figures are expressed as rates per 100 pedestrians (column 9), the 10-15 age group had the highest rate. This is explained at least partly by the fact that the surveys were carried out mainly during school hours and consequently pedestrians 10 to 15 years old were underrepresented.
Key Variables and Si mple Linear Regressions
In the preliminary regional analysis, mean values of key va riab l es and simple linear correlations between selected variables and annual casualty rates per 1-km square were calculated (Table 8). Resident population per grid square kilometer gave correlation coefficients ranging from O. 66 to O. 92 for the 11 regions and 0.81 for all 474 squares. A number of other variables were found to have fairly high values of R. These included number of pedestrians (P) (0.60 and 0.89 for regions 10 and 9, respectively), moving ve hic les (V) (0.65 and 0.85 for regions 6 and 8, respecti ve ly), (PV)l/2 (0.76 and 0.92 for regions 2 and 11, respectively), and number of parked vehicles (0. 58 and 0. 95 for regions 10 and 11, respectively).
For the 474 squares as a whole, equations of the regression lines for the foregoing variables in relation to annual casualty rates per grid square kilometer were derived (Table 9). The standard errors of the estimate for the seven variables listed ranged from 3.8 to 5.3 casualties per grid square per year, and these may be compared with the overall annual mean of 4.67 casualties per square.
When resident population is used as the explanatory variable, all 11 regions have regression line slopes fairly similar to the slope for all 474 (national) squares, except for East Anglia and the outer metropolitan region. When number of observed pedestr i ans was used as the variable, the regional slopes lay close to the national slope, except for the previous two regions and also the northern and South West regions. In those four cases, there is a smaller rate of increase in number of casualties per grid square as number of pedestrians increases.
But the use of these rates per qr id square may not provide the best basis, either for purposes of analysis or for practical application, of the derived casualty models. The data and the simple correlations were therefore examined in terms of the rates per square kilometer of developed area. On
TABLE 7 Distribution of Mean Resident Populations, Observed Pedestrians, and Casualty Rates by Age Group
Resident Observed Pedestrian Age Population Pedestrians Casualties Casualties per Casualties per Group 10 5 Popula- 100 Pedes-(years) No. Percent No. Percent No. Percent ti on trians
04 276 7.9 4.9 4.7 0.50 10.7 181 10.2 5-9 292 8,3 9.6 9.3 1.25 26.8 428 13 .0
10-15 316 9.0 4.7 4.5 0.75 16.0 238 16.0 16-24 472 13.4 15.9 J 5 .4 0.45 9.6 95 2.8 25-29 1,479 42.l 46.3 44.9 0.91 19 .4 62 2.0 60+ ....21.!l 19.3 ..11..2 21.2 0.82 J 7.5 121 3.7
All 3,511 103.3 4.68 133 4.5

Crompton 31
TABLES Correlations of Key V ariahles with Annual Pedestrian Casualties
Moving Road Pedestrians Vehicles Length Parked
Region Population (P) (V) (PV)y, PV (km) Vehicles
l 0.66 0.72 0 .79 0.85 0.73 0.62 0.82 2 0.82 0.62 0.76 0.76 0.66 0.59 0.73 3 0.76 0.80 0.71 0.86 0.89 0.74 0.89 4 0.78 0.70 0.80 0.84 0.91 0.67 0.74 5 0.92 0.88 0.83 0.91 0.91 0.70 0.94 6 0.80 0.77 0.65 0.80 0.77 0.52 0.84 7 0.82 0.80 0.77 0.85 0.86 0.72 0.84 8 0.85 0.83 0.85 0.90 0.84 0.66 0.92 9 0.83 0.89 0.72 0.91 0.87 0.60 0.83
10 0.38 0.60 0.68 0 .80 0.73 0.43 0.58 II 0.78 0.83 0.83 0.92 0.94 0.68 0.95 All 0.81 0.74 0.71 0.82 0.79 0.61 0.80
TABLE 9 Annual Pedestrian Casualties Related to Key Explanatory Variables
Rates per I-Km Square Rates per Square Kilometer Developed Rates per Kilometer of Road
Correlation Equation of Correlation Equation of Correlation Equation of Explanatory Variables Coefficient SEE Regression Line Coefficient SEE Regression Line Coefficient SEE Regression Line
Population 0.81 3.9 -3 .46 + 0 .0023X 0.69 Road length (km) 0.61 5.3 -6.08 + 0.0014X 0.26 Observed pedestrians (P) 0.74 4.5 0.08 + 0.0432X 0.59 Observed moving vehicle (V) 0.71 4.6 -l.37 + 0.1934X 0.54 Observed parked vehicles 0 .8 4.0 0.032 + 0.0226X 0.7 PV 0.79 4.1 2.12 + 0.0005X 0.64 (PV)y' 0.82 3.8 -1.80 + 0.l 2X 0.73
Note: SEE= standard error of regression equations.
this basis (for t he 11 s epa rate regions), parked vehicles per deve l ope d squa re kilometer and (PV) 1/2
generally had the highest simple linear correlation coefficients, whereas the values of r based on resident population, number of pedestrians, or number of moving vehicles were generally relatively lower. Simple regression equations are set out along with the associated standard errors of the estimate for all the main variables in Table 9. For the 474 squares as a whole, values of R when numbers of observed pedestrians (P) 1 moving vehicles (V), parked vehicles, and {PV)l/:l are used as explanatory variables ranged between 0.54 and 0.73.
Surprisingly, these correlation coefficients were lower than was the case when casualty rates were expressed using the 1-km grid square as the areal unit of measurement. Possible explanations for this were that the extent to which a grid square is actually developed might be determined by other factors that have a bearing on casualty rate, such as distance of the square from town center or size of town. The preliminary analyses led to the conclusion that the correlations between annual casualty rates and a number of key explanatory variables were sufficiently high to make a more elaborate analysis worthwhile.
FURTHER ANALYSES
Cas ua lty .Models Ba sed on Stratific ation of Data
Next, casualty rates were modeled by using only casualty data that matched the survey data (in terms of period of the day). Data from all 474 squares were stratified in terms of 24-hr and off-peak daytime (OPDT) casualties. Simple regression analyses produced three models of annual casualty rates per grid square using only OPDT casualties. These models had lower values of R and higher standard errors of the estimate (SEEs) than were obtained by using the full 24-hr casualty data, and it was concluded that stratification of the data by time of day did not improve the understanding of the relationships.
6.0 -5 .45 + 0 .0022X 0 .57 0 ,5 --0.22 + O,OOl 71X 7.9 -I .I I + 0.0006X 0 .44 0.5 --0.13 + 0.000084X 6.7 2.20 + 0.0284X 0.54 0.5 0.23 + 0.0222X 6.9 --0.14 + 0.0139X 0 .53 0.5 0.062 + O.l 144X 5.9 0.371 + 0.208X 0 .7 0.4 0.046 + O.Ol 974X 6.4 4.19 + 0.000267X 0 .51 0.5 0.4 + 0.00l 76X 5.7 -2.01 + 0.1038X 0.69 0.4 --0.049 + 0.0855X
It was thought likely that different age and sex groups might have different casualty rates and that these rates might be differently distributed by time of day. Twenty-four-hour and OPDT models were derived with pedestrian numbers weighted to reflect the relative vulnerability of the six age and sex groups. But the correlation coefficients of both these weighted models were lower than the values obtained for either the 24-hr or OPDT data by using unweighted pedestrian numbers as the explanatory variable.
Further casualty models were derived by using both observed pedestrian numbers and resident populations as explanatory variables, stratified again by age groups: children, adults, and the elderly. For children (0-15 years), casualty rates correlated well (R = 0.83) with numbers of resident child populations: similarly for the 60+ age group (R = 0.73). But for the adult group (16-59), the correlation with resident adult population was only 0.70.
When the number of pedestrians (stratified into the same three groups) was used as the explanatory variable, the simple regression model was best for the adult pedestrian numbers (R = 0.79) but the correlations for the children and the elderly were much weaker (R = o. 43 and o. 60, respectively). rt was concluded that prediction of annual casualties to children and the elderly is likely to be best when census population data are used, whereas for the adult population, use of observed pedestrian numbers gives the best results.
The casualty data were next stratified by road type (i.e., major and minor roads). Simple regression models were derived in terms of numbers of pedestrians, parked vehicles, and road lenqth for each of the two road types. For both types the simple correlation coefficients were much lower and the SEEs higher than was the case for similar models based on all road types.
The data were then examined in greater depth by stratifying the set of 474 squares according to the values taken by some key variables and then compar-

32
ing the characteristics of the subsets of squares thus formed. Squares with low casualty totals also tended to have low population and activity levels and relatively small amounts of urban development. Squares with high casualty totals tended to score high on all other counts. Where squares were less than 1 km from a town center, casualty rates per resident were some 50 percent higher than elsewhere, whereas the rates per pedestrian were some 25 percent lower than elsewhere.
Casualty rate patterns vary considerably according to the particular denominator chosen. It was concluded that by using crude casualty totals, the arbitrary position of the national grid lines has an undue and confusing influence on the figures. On the other hand, if the casualty figures are expressed as rates per unit of developed area, the effect of that arbitrariness can be eliminated. This approach was therefore adopted in the last stages of the analysis.
Multivariate Models of Casualty Rates
Multiple-regression analyses were carried out with casualty rates per square kilometer of development as the dependent variable and with three different sets of independent variables: the activity set (including numbers of pedestrians, vehicles, and parked vehicles) , the census set (including population, number of households, etc.), and the land use set (including road length, number of shops, etc.). The best of these equations are discussed in the following.
Activity Set
The best activity set models were as follows:
C=-3.09+0.013PRK+0.017P+0.063V R=0.80 SEE=5.4 (I)
C = -3.13 + 0.012PRK + 0.o75 (PV)i> R = 0.81 SEE = 5.3 (2)
where
C annual pedestrian casualties per developed square kilometer of housing area,
PRK number of parked vehicles per developed square kilometer,
p number of pedestrians per developed square kilometer, and
V number of moving vehicles per developed square kilometer.
Model 1 has a multiple correlation coefficient of 0. BO (SEE = 5. 4 casualties per year per developed square kilometer). PRK, P, and V per developed square kilometer provided significant contributions to the equation. In model 2, PRK and (PV)l/2
proved significant and the value of R rose to o. 81 (SEE= 5.3).
Census Set
The best census set models were the following:
C = 2.02 + 0.0029Pop + 0.034SH - 0.009 IC0 - 0.0078CT
R = 0.85 SEE= 4.8
C = 2.91 + 0.023H -0.0087C0 -0.0lSDW -0.0061CT
R = 0.84 SEE= 4.9
(3)
(4)
Transportation Research Record 959
where
Pop resident population per developed square kilometer,
H number of households per developed square kilometer,
SH • number of households in shared dwellings per 1,000 households,
C0 number of cars owned per developed square kilometer,
CT = number of council tenants per 1,000 households, and
DW = number of dwellings per developed square kilometer.
Significant explanatory variables included resident population and number of dwellings, households, cars owned, and council tenants per 1,000 households (all expressed as rates per developed square kilometer). These two models could be used in appropriate cases to predict the annual pedestrian casualty rate per developed square kilometer , provided that the census data could be matched in temporal and areal terms to the housing area.
Land use Set
The best model using only the land use set was the following:
C = -15 .5 + 0.0077FR + 7.3 x 10⁻⁶ T + 1.7EC
+ 0.93SC + 0.05J + 10.6DEV + 0.58RL R = 0.73 SEE= 6.7 (5)
where
FR shop frontage in meters per developed square kilometer,
T resident population of nearest town, EC = employment code (0-3, index of nonresi
dential land use) , SC school code (0-3, index of number and type
of schools) , J total number of junctions per developed
square kilometer, DEV = proportion of developed area in grid square
kilometer, and RL total road length.
Significant variables were shop frontage, town size, extent of industrial and office uses, number of schools, number of road junctions, road length, and proportion of the grid square that was developed. Although the multiple correlation coefficient of the model is lower than those for models 1-4, it is apparent that the land use variables influence the pedestrian casualty rate to a considerable extent.
Full Data Set
Finally, a model using all three types of data sets was derived:
C = -2.37 + 0.0029Pop + 0.091V -0.0085C0 -0.0072CT
R = 0.88 SEE= 4.4 (6)
Significant variables were resident population, number of moving vehicles, car ownership, and number of council tenants per 1,000 households (all expressed as rates per square kilometer of developed housing area). It should be noted that the number of pedestrians does not appear as a variable in the

Crompton
model because its introduction along with two other variables (numbers of major road junctions and households in shared dwellings) only marginally increased the value of R from o. BB to o. B9 and slightly decreased the value of the SEE.
Tests of Models Using Data Subsets
To test the robustness or validity of the models, the data set of 4 74 squares was divided into two subsets. An examination of the means and standard deviations of the key variables showed that each subset had values similar to those for the full data set. New models were constructed that were similar in form and used the same variables as the original models. Their multiple correlation coefficients and SEEs were slightly lower than those resulting from the use of the full data set, as would be expected.
These new models were then used to predict casualty rates for the other independent data subset of 237 grid squares, and the results were compared with the actual casualty rates. The means of the residuals were close to zero, and the standard deviations of the residuals were similar to the SEEs of the models.
The sample grid squares of the 11 survey regions had mean casualty rates that varied considerably from region to region as did mean population, number of pedestrians, and so on, per grid square. It may be asked how far the models really explain these differences in casualty rates. Comparison of the recorded mean annual casualty rates for each of the 11 regions with the mean rates as predicted by models 2 and 6 showed that for each model more than half the res !duals were less than 1. 0 casualty per year.
The two regions with the greatest differences in mean annual casualty rate were East Anglia (region 1) and Greater London (region 9). The differences between the actual casualty rate and that predicted by models 2 and 6 were +l, 4 and +l. 0 for the East Anglia sample and +0.6 and -1.B for the Greater London sample.
CONCLUSIONS
The Models
Casualty rate models 1 and 2, based on the activity data set, and the census data set models 3 and 4 all explain between about 66 and 72 percent of the variation about the mean. Model 6, which uses all types of variables, explains nearly BO percent of the variation. It was concluded that the census models 3 and 4 gave better results in the prediction of annual numbers of casualties among children or the elderly, whereas the activity models 1 and 2 were more effective for the 16-59 age groups. Tests of the model by using half the data as an independent data set as described previously appeared to confirm that models 1-6 are robust. But the SEEs are disappointingly high.
Factors Influencing SEEs
The SEEs of models 1-4 and 6 ranged from 5.4 to 4.4 pedestrian casualties per year per developed square kilometer. These figures may be compared with the mean recorded value of 7. 2 (with a standard deviation of 8.3). To some unknown extent, random variations in the annual number of casualties may be responsible for the size of the SEEs. For example, the sample grid squares had about 30 pedestrian casualties per square over the 7-year period. A typical
33
square that because of its inherent characteristics should have had 30 casualties over the same period might simply because of chance have actually had anywhere between 20 and 40 casualties (95 percent confidence interval) •
But a number of other contributory factors need to be considered. First, the method of selecting sample 1-km grid squares was based on examination of the universe of urbanized squares and their ranking by casualty rates per 100, 000 resident population. The casualty data used for this (1971 and 1972) closely matched the population used (1971 census) , but the selection of every fourth of the ranked squares of course could not ensure that the chosen housing area samples were representative as regards size of urban settlement, age or sex or socioeconomic structure of the resident population, population density, or type of layout arrangement of the squares. Moreover, the numbers of pedestrians coming into or passing though the survey squares or both could not be determined. Nor was it possible to count the numbers of pedestrians crossing the roads surveyed. Such crossing activity may be an important factor influencing casualty rates.
Tests of the representativeness of the samples for the East Anglia and West Midlands regions indicated that no special bias had been introduced in the selection of the sample squares. But no further tests were carried out of the representativeness of the squares in terms of their layout or other character is tics by which a housing area may be said to be representative. Admittedly, the sampling procedure adopted had the advantage not only that it was simple and straightforward but also that it made it possible to bypass the difficult problem of precisely defining the term nrepresentative housing areas.n
As to the amount of data collected for each region, it is considered that the scale was about right; had the number of squares surveyed been doubled it is unlikely that the regional models would have shown any significant improvements. The number of samples for each region was, however, too small to allow the various stratification analyses to be undertaken on a regional basis. But the amount of data available (for instance, for the age and sex stratifications) , when based on all 474 squares, was adequate and there is nothing to suggest a need for a more extended data set.
Another problem that may have influenced the size of the standard errors arose because of the unavoidably differing dates of the 1971 census data, the 7-year casualty data, and the field surveys. The underlying relationships between number of pedestrians observed (in 1976 and 1977) and resident (1971) population may have been obscured in those squares in which fairly large population changes or new development had taken place since 1971.
An examination was made of the effect of excluding casualty data from outside of the field survey times, and it was concluded that the models could not be improved by such a stratification. In general, it must be accepted that, viewed on a global scale, the data collected were rather remote from the detailed and local factors leading to accidents, especially because the actual factors contributing to casualties (e.g., pedestrian activity and time of day) were not analyzed in the main modeling process.
One shortcoming of this study has been the uncertainty about the extent to which the surveys of number of pedestrians and vehicles were representative of long-term average local conditions. In particular, seasonal factors and school holidays may have had some influence on the effectiveness of the models. Short-term variations in the number of pedestrians (especially because total numbers per survey square were generally low) certainly take place;

34
thus the number of pedestrians observed for any particular square is not necessarily representative. But to the extent that these short-term variations occur randomly, the effects of the short survey times on the complete data set of 474 squares and on the resultant casualty models may not have been considerable. In fact, the SEEs of the activity-based models (1 and 2) were only marginally greater than the errors of models 3, 4, and 6, none of which used number of pedestrians as an explanatory variable. But it seems possible that had three or four more full surveys been carried out at each location, the fuller activity data might have resulted in marginally improved equations.
Finally, the standard errors of the models might have been lower had more time been spent on deriving and testing the best possible composite variables, and the mathematical form of the models themselves could perhaps have been improved. But it is considered that further work on the current data set along such lines would not be likely to produce dramatic reductions of the SEEs.
Practical Application of Models
It has been concluded that the data collected and the variables used in the resulting models provide a good basis · for explaining the variation in annual casualty rates in housing areas. It remains to be considered whether the models are both suitable and sufficiently accurate to allow than to be put to practical use.
On the question of their suitability, models 1 and 2 require data inputs on number of pedestrian and other activity variables. Collection of such data in existing housing areas is of course possible, although tedious, but where alternative large-scale housing developments not yet built are being examined, no activity observations are possible. To use predicted number of pedestrians, for example, by invoking the simple linear regression models would be hazardous. No attempt has been made in this study to develop multiple-regression models of numbers of pedestrians but further analysis of the data from the 474 squares would almost certainly enable a useful pedestrian-number model to be derived.
Models 3 and 4, based on census data, would eliminate the need for collecting activity data but would require (a) reasonably up-to-date census data and (b) census data properly matched with the geographical boundaries of the housing area being examined. This certainly can raise problems. Where models 3 and 4 are to be applied to proposed alternative developments, much of the necessary data on the population, number of households, and so on, can be predetermined by the design for the area, but for some of the variables, such as number of cars per square kilometer of development, presumably some predictive model would have to be invoked.
The relatively poor performance of the land use variable models suggests that as a basis for practical application, the activity or census variable models are definitely to be preferred. Model 6, which incoporates all three types of variables, has the best performance of the group of models, but its practical and easy use may be limited because both census and activity data are required as inputs.
Model 6 has an SEE of 4.4 casualties per year per square kilome ter of development. This SEE may be compared with the overall mean of 7.2 casualties per year per square kilometer. If the equation is used to predict the number of casualties likely to occur within a square kilometer of housing area, there would be a 95 percent confidence interval of ± 8. 6
Transportation Research Record 959
casualties per year. If the predictive errors on different squares are statistically independent, a housing area of 18 km2 would enable a prediction accurate to ±2 casualties per year per developed kilometer of housing area. To reduce the predictive error to ±1 casualty per year, an area of 75 km2
would be required. The models could be usefully adopted as a basis
for comparison, for example, where a local authority (or indeed a residents' group) may be concerned about the number of pedestrian casualties in a particular housing area. The equations would show whether the area's casualty record is better or worse than what might be expected on the basis of the national sample. In this way, the models would help in identifying problem areas. This kind of use of the models is possible whatever the size of the area to be considered, although of course the statistical significance of any differences between the two casualty rates increases with the size of the housing area being examined.
Pedestrian Exposure to Risk
A brief discussion of the concept of pedestrian exposure to risk and of the extent to which the data and models measure the levels of exposure and risk follows. In the main study it has been assumed that the so-called activity variables, number of pedestrians and moving vehicles, represent the main factors relating to levels of exposure. The assumption has plausibility, because in the absence of pedestrians or moving vehicles or both, there could be no pedestrian casualties. The composite variables PV or ( PV) 112 can be fairly regarded as measures of exposure because they explain much of the variation about the mean casualty rate (Table 8). Equations 1 and 2 use (PV)1 / 2 as an explanatory variable, but the number of parked vehicles per developed square kilometer also appears as a significant variable. As Table 6 shows, parked vehicles contributed to 12. 8 percent of all pedestrian casualties and to 17. 9 percent of casualties to children. But it may be that this variable also acts as a proxy for levels of activity not measured by the short-period surveys of pedestrians or traffic or both.
The census models 3 and 4 result in somewhat better equations without including number of pedestrians or vehicles as explanatory variables. From this it can be inferred either that the census variables function as proxies for the activity or exposure variables (and that owing to the short survey periods for the pedestrian and vehicle counts, the proxy variables are therefore to be preferred) or that over and above the activity or exposure variables used in models 1 and 2, other compounding factors relating to certain of the land use and census variables also influence the casualty rates. This view appears to be supported by the superiority of model 6, which includes both activity and census variables. It seems likely that in the absence of number of pedestrians from the model, resident popuation serves as a proxy variable.
ACKNOWLEDGMENT
The work described in this paper was carried out under contract to the Road user Characteristics Division of the Safety Department of the u.K. Transport and Road Research Laboratory. The Accident Investigation Division of the Laboratory provided the necessary pedestrian casualty data in computerized
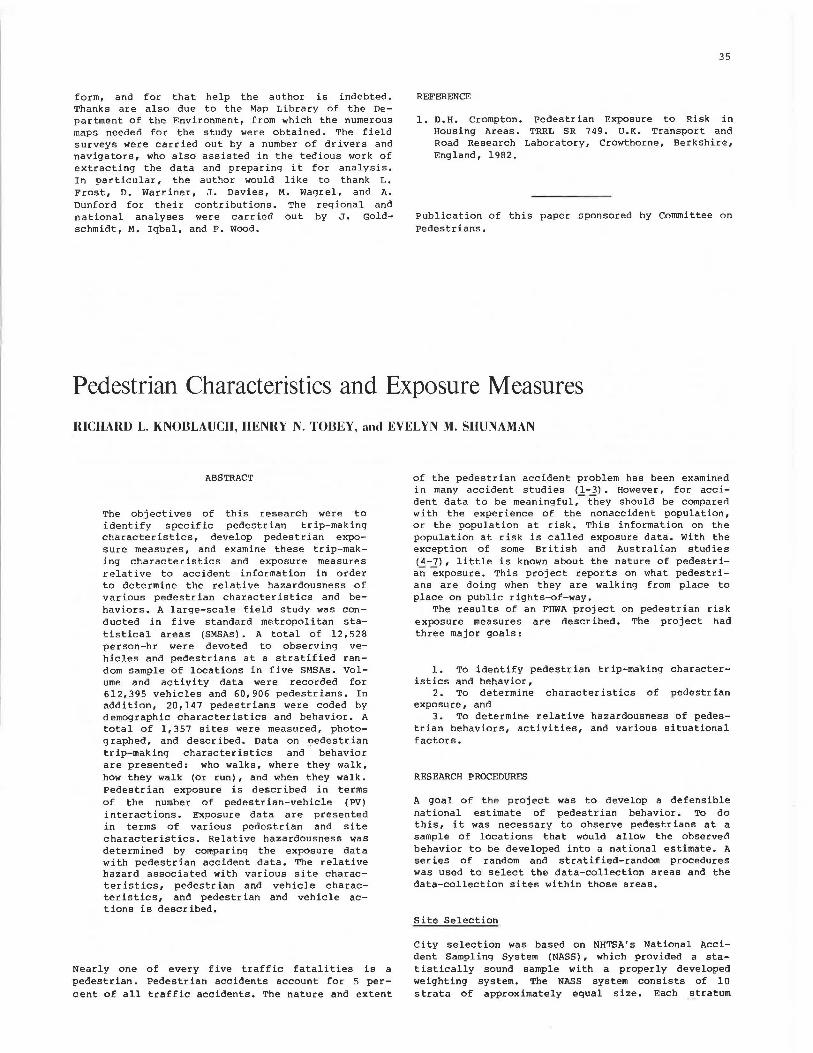
form, and for that help the author is indebted. Thanks are also due to the Map Library of the Department of the Environment, from which the numerous maps needed for the study were obtained. The field surveys were carried out by a number of drivers and navigators, who also assisted in the tedious work of extracting the data and preparing it for analysis. In particular, the author would like to thank L. Frost, D. Warriner, J. Davies, M. Wagrel, and A. Dunford for their contributions. The regional and national analyses were carried out by J. Goldschmidt, M. Iqbal, and P. Wood.
REFERENCE
1. D.H. Crompton. Housing Areas. Road Research England, 1982.
35
Pedestrian Exposure to Risk in TRRL SR 749. U.K. Transport and
Laboratory, Crowthorne, Berkshire,
Publication of this paper sponsored by Committee on Pedestrians.
Pedestrian Characteristics and Exposure Measures
RICHARD L. KNOBLAUCH, HENRY N. TOBEY, and EVELYN M. SHUNAMAN
ABSTRACT
The objectives of this research were to identify specific pedestrian trip-making characteristics, develop pedestrian exposure measures, and examine these trip-making characteristics and exposure measures relative to accident information in order to determine the relative hazardousness of various pedestrian characteristics and behaviors. A large-scale field study was conducted in five standard metropolitan statistical areas (SMSAs). A total of 12,528 person-hr were devoted to observing vehicles and pedestrians at a stratified random sample of locations in five SMSAs. Volume and activity data were recorded for 612,395 vehicles and 60,906 pedestrians. In addition, 20,147 pedestrians were coded by demographic characteristics and behavior. A total of 1, 357 sites were measured, photographed, and described. Data on pedestrian trip-making characteristics and behavior are presented: who walks, where they walk, how they walk (or run), and when they walk. Pedestrian exposure is described in terms of the number of pedestrian-vehicle (PV) interactions. Exposure data are presented in terms of various pedestrian and site characteristics. Relative hazardousness was determined by comparing the exposure data with pedestrian accident data. The relative hazard associated with various site characteristics, pedestrian and vehicle characteristics, and pedestrian and vehicle actions is described.
Nearly one of every five traffic fatalities is a pedestrian. Pedestrian accidents account for 5 percent of all traffic accidents. The nature and extent
of the pedestrian accident problem has been examined in many accident studies ( 1-3) • However, for accident data to be meaningful,- they should be compared with the experience of the nonaccident population, or the population at risk. This information on the population at risk is called exposure data. With the exception of some British and Australian studies (4-7), little is known about the nature of pedestrian exposure. This project reports on what pedestrians are doing when they are walking from place to place on public rights-of-way.
The results of an FHWA project on pedestrian risk exposure measures are described. The project had three major goals:
1. To identify pedestrian trip-making characteristics and behavior,
2. To determine characteristics of pedestrian exposure, and
3. To determine relative hazardousness of pedestrian behaviors, activities, and various situational factors.
RESEARCH PROCEDURES
A goal of the project was to develop a defensible national estimate of pedestrian behavior. To do this, it was necessary to observe pedestrians at a sample of locations that would allow the observed behavior to be developed into a national estimate. A series of random and stratified-random procedures was used to select the data-collection areas and the data-collection sites within those areas.
Site Selection
City selection was based on NHTSA' s National Accident Sampling System (NASS), which provided a statistically sound sample with a properly developed weighting system. The NASS system consists of 10 strata of approximately equal size. Each stratum

36
contains about 10 percent of the nation's population. They range in size from stratum 1, which contains large cities, to stratum 10, which contains small villages and towns. To concentrate efforts on the more densely populated areas of the country, data-collection areas were selected from the first four strata. The five areas selected included New York City: St. Louis, Missouri: Seattle, Washington: St. Petersburg, Florida: and Prince Georges and Charles counties in Maryland. These areas represent 40 percent of the nation's population and include urban as well as relatively densely populated suburban and rural areas.
The site selection procedure had to have the capability to allow the projection of activity within the entire city and allow comparability among the data collected in each of the various cities. Because of the lack of comparability in zoning maps, land use maps, and street inventories, a site inventory procedure was developed.
A randomly selected 5 percent sample of the area of each city was inventoried to catalog all the intersection and midblock sections. Each intersection and each midblock section in the sample was visited and defined in terms of land use (commercial, residential, etc.), number of traffic lanes, signalization, and total length (midblock sections only). The sites inventoried were divided into categories based on these descriptors. A stratified random sample of 99 locations was selected from the sites inventoried in each of the study areas. Thus, a stratified random sample of 495 sites in five randomly selected cities was selected.
Data Collection
Three types of data were collected and analyzed: pedestrian and vehicle exposure data, site-characteristics data, and accident data. The exposure data were collected to determine the number and type of people and vehicles that pass through the site and to specifically identify what they are doing. Four different types of exposure data were collected: pedestrian volume and action data, vehicle volume and action data, pedestrian activity sample, and counts of special types.
The pedestrian volume and action data included the number of pedestrians crossing within a crosswalk, crossing within 50 ft of a crosswalk, crossing midblock, and crossing the intersection diagonally. This information was recorded for more than 60, 000 pedestrians observed at the sites.
The vehicle volume and action data included the total number of vehicles i the number of vehicles turning right, turning left, and making a right turn on a red signal: the number of vehicles encountering pedestrians i the type of vehicle i and the number of specific vehicle actions. This information was recorded for more than 612,000 vehicles passing through the sites.
The pedestrian activity sampling data involved specific information on a randomly selected subset of all the pedestrians observed. Each pedestrian selected was tracked as he or she passed through the site. The following information was recorded: age, sex, accompaniment (alone or with others), location, distance walked, signal compliance, mode (walking or running), and interactions with vehicles either passing straight through or turning at the intersection. This information was coded for more than 20,000 pedestrians.
Additional tallies were kept of certain types passing through the site. These special counts kept track of the number of bicyclists, joggers, skaters,
Transportation Research Record 959
blind pedestrians, and transportation-handicapped pedestrians.
The exposure data describe what pedestrians and vehicles are doing. The site characteristics describe where they are doing it. The following site factors were recorded: land use, roadway functional classification, parking characteristics, roadway surface, shoulder surface, pavement markings, crosswalks, street lighting, signalization, channelization, signing, type of intersection, and pedestrian accommodations. This information was recorded at all 495 exposure sites from 7:00 a.m. to 11:00 p.m. on a weekday. In addition, one-third of the sites (some from each site type) were covered from 7:00 a.m. to 11:00 p.m. on a Saturday and a Sunday.
The exposure data and the site-characteristic data give a picture of when, where, and how people are exposed to traffic. To determine which of these activities or characteristics are dangerous, comparable information was needed from pedestrians involved in accidents. A sample of approximately 200 pedestrian accident reports was obtained from each of the five study jurisdictions. The accidents were selected to correspond to the same time of the day and same general time of the year as the exposure data. The following information was coded from each police report: time of day, pedestrian age and sex, 1 ight condition, vehicle type, pedestrian location (crosswalk or midblock), signal compliance, pedestrian accompaniment, vehicle type and action, and accident type. In addition, more detailed information on the character is tics of the accident sites was needed. Each of the 762 accident sites was visited and the previously described site factors were recorded.
Sample Weighting
A series of random and stratified-random selection techniques was used to select the data-collection sites and to collect the data. In order to develop national estimates of pedestrian behavior from the data that were collected, a series of sample weighting procedures was applied. Weighting procedures were developed to project the data-collection sessions to produce hourly vehicle and pedestrian volumes, project hourly volumes to produce a full week of pedestrian and vehicle activity, project the stratified sample to locations to represent an entire city, correct for the deliberate oversampling of central business districts (CBDs), project the city totals to represent their NASS strata, and project the NASS strata totals to represent the study nation. In this project, the nation is the more densely populated 40 percent of the country. A total of 12, 528 hr of pedestrian and vehicle activity was observed and recorded. The weighting procedures were used to project the pedestrians and vehicles observed to represent the nation.
RESULTS
Pedestrian Characteristics
A great deal of descriptive information on pedestrian characteristics was collected. By conducting tracking studies, information was collected on pedestrian sex, pedestrian age, estimated age, mode (walking or running), crossing location, accompani
ment, signal observance, and other factors that provide a useful basis for describing activity and behavior of the American pedestrian. The pedestrian

Knoblauch et al.
characteristics were analyzed under four major headings:
1. Who walks (age and sex of the observed pedestrian population) ;
2. Where pedestrians walk (pedestrian activity in terms of adjoining land use and crossinq behavior);
3. When pedestrians walk (pedestrian activity in terms of time of day, day of week, and crossinq location; age and sex differences also);
4. What pedestrians do [pedestrian activity in terms of crossing behavior, time spent in the roadway, mode (walkinq or running), accompaniment (alone or with others), signal compliance, and qap acceptance] •
Two examples of the pedestrian characteristics are presented. Figure 1 shows the age and sex distribution of the national walking population. Children under 14 account for 16.5 percent of the pedestrians observed, yet they constitute 21.1 percent of the population of the study locations. Nearly 60 percent of the pedestrians observed were male, a finding that was consistent across all age groups except for those 60 and over. In contrast, slightly less than half of the population of the study locations was male.
c 4 5
~ 40 u.. a: 35
~~ 30 1.70 25
~~ 20 Z< w-IE~ 15 w 10 IL
w 6 IL
~Male 0Female
D-4 6-9 10-14 16-111 20-211 30-69 6(}+
AGE BRACKET
FIGURE I Pedestrian characteristics by age and sex.
Figure 2 shows pedestrian activity by hour of day for males and females. The relatively high level of pedestrian activity across the entire data-collection day (7:00 a.m. to 11:00 p.m.) was somewhat surprising. It was expected that the curves would be trimodal with a.m., noon, and p.m. pedestrian activity peaks. The curves for female and male pedestrians show distinctive noon peaks; in addition, the curves indicate that more males walk in the evening hours.
.. .. . ,.
7 AM
12 NOON
TIME OF DAY
5 PM
• · • MALE
/ "··· ... FEMA LE
FIGURE 2 Pedestrian activity by sex by hour of the day.
10
37
Pedestr ian Exposure Measures
Pedestrian exposure measures were developed by combining the pedestrian and vehicle activity information. The exposure measure used was a refinement of Cameron's (~) concept of pedestrian-vehicle (PV) interaction. In addition to Cameron's constraint that the pedestrians and vehicles need to be counted within a relatively similar time frame and that the periods of observation be short, it was required that the paths of particular vehicles and pedestrians cross each other in order for those vehicles and pedestrians to enter the exposure count. The pedestrian and vehicle actions and locations had to be organized to resemble potential accident encounters. A total of six different types of exposure measures was collected and analyzed:
1. Pedestrian crossing midblock, vehicle proceeding straight ahead;
2. Pedestrian crossing at intersection, vehicle proceeding straight through the intersection;
3. Pedestrian crossing at intersection, vehicle concluding either a right or left turn (two types) ;
4. Pedestrian crossing at intersection, vehicle initiating either a right or left turn (two types).
Each of these exposure measures was considered relative to adjoining land use, day of the week, NASS strata, time of day, number of traffic lanes, roadway functional classification, block lenqth, intersection configuration, and special activity magnets (schools, parks, etc.).
Two examples of the pedestrian exposure data are presented. Figure 3 shows the total of all six pedestrian exposure types categorized by land use. The
70
~1 : W.L
~ )( E ~ •o CJ z 30 a: 0
~~ 20 z
10
71 .8%
21-6%
6-6%
100% Commercial Mixed Residential
FIGURE 3 Pedestrian exposure by type of land use.
majority of the PV exposure occurs in commercial (71.B percent) and mixed residential (21.6 percent) areas. Only 6. 6 percent of the exposure occu:rs in areas classified as 100 percent residential. Of particular interest is the discovery that more than 55 percent of the total sites were classified as 100 percent residential and only 17 percent were classified as commercial. More than 70 percent of the pedestrian exposure occurs at 17 percent of the sites. Figure 4 shows the distribution of pedestrian exposure by roadway classification. More than 60 percent of the total pedestrian exposure occurs on collector-distributor roadways; 24 percent is on local streets. Not shown is the finding that the percentaqe of midblock crossing contributing to the total exposure decreases across roadway type; there is more midblock crossing on local streets than on collector-distributors and even less on major arte-

38
70
w 60 a: 11.;:) OU> 50 w~ l!lx <w 40 I- .J
in< 30 uz a::o ~~ 20
z 10 B.0%
Major Arterial
61 .3%
Collector · Distributor
24.0%
Local Streets
FIGURE 4 Pedestrian exposure by roadway classification.
rials. Thirty percent of the local street pedestrian exposure occurs midblock, whereas 23 percent of exposure on major arterials is at midblock locations.
Relative Hazard
In previous sections pedestrian exposure measures and pedestrian trip-making characteristics have been discussed. The relationship between these pedestrian exposure and pedestrian trip-making characteristics and pedestrian accidents is addressed here. If a factor--for example, runninq--is found to be associated with the accident population more than with t he e xposure population , i t s ho ulU be consider~<l
relatively hazardous. If another factor--for example, walking--is found more often in the exposure population than it is in the accident population, it should be considered to be relatively less hazardo us , o r safe.
Hazard scores were developed to analyze the relationship between the occurrence of certain factors in the accident population and their occurrence in the general population at risk. These hazard scores are the ratio created by dividing the percentage of occurrence of a characteristic in either the accident population or the exposure population by the percentage of occurrence in the other population. In order to maintain an interval scale, the larger percentage is always divided by the smaller percentage. Thus, hazard scores always have an absolute value greater than or equal to 1.0. If the accident population had the larger percentage--an indication that more hazard is associated with the characteristic-the hazard score is presented as a positive number. If the exposure population had the larger percentage, the hazard score is presented as a negative number--an indication that less hazard is associated with the characteristic.
Three types of hazard scores were examined: site, pedestrian volume, and PV. The site hazard scores are based on how frequently sites with various characteristics occur in the accident population relative to the general population of sites at risk. The pedestrian volume hazard scores are based on the percentage of the total national projection of pedestrians crossing found at each type of site. The PV hazard scores are based on the exposure measure PV--the number of pedestrians (P) times the number of vehicles (V). Like the pedestrian volume hazard score, it is based on the percentage of the PV exposure occurring at sites with certain characteristics.
In order to simplify the discussion associated with relative hazard, only the PV scores are presented at this time. In the remainder of this paper the relative hazardousness, in terms of PV exposure,
Transportation Research Record 959
associated with roadway and intersection characteristics, pedestrian and vehicle characteristics, and accident characteristics will be addressed.
Roadway and Intersection Characteristics
Hazard scores for many descriptive factors associated with the roadway and the intersection were computed. Figure 5 shows the relative hazard associated with some selected roadway and intersection characteristics.
Percent of National Px V Proiection of: Hazard Score
Roadway PxV Less More Characteristics Accidents Exposure Hazard Hazard
-5 -3 · 1 +1 +3 +5
Roadway Functional Classification
Major Arterial 17 0 8 1 tJ + 2.1
Collector Distributor 30.8 61 .2 • 2,0 [ Local Street 39.4 24.0 b + 1 6
Other 12.9 6 .7
.
+ 1 9
Pedestrian Accommodations
No Sidewalks or Pathways 23,2 10.7 D + 2 1
Sidewalk (one or both sides} 76 7 89.3 • 1.2
Street Lighting
None 14.5 1,2 t=:7D2:i; I -~-Present 85 5 988 1.2
Land Use
100% Residential 21 .7 65 D +33
Commercial 47.7 71 8 - 1.5 [ ivlhu:U 30,6 21 (j D I l .~
Lane Configuration
2x2 48.7 29 0 I + 1 7
2x4 34,2 19 3 + 1 8
4x4 17,0 51 ,7 - 3 ,0 c Signalization
No Signalization 63.3 31.8 ? +20
Red, Green, Amber CRGAI 12,1 10.1 + 1 2
RGA + Pedestrian, Signal 24,7 58.2 - 2.4 c Crosswalks
Not Marked 612 24 ,8 QJ + 2 5
Marked 38,8 75.2 - 1,9 [
FIGURE 5 Relative hazard: selected roadway and intersection characteristics.
The PV score for the roadway functional classification variable indicates that both major arterials and local streets are relatively hazardous. Major arterials, for example, have 17.l percent of the accidents yet account for only 8.1 percent of the PV exposure. The hazard score of +2.l is produced by dividing 17.l by 8.1. Because the sites have more accidents than exposure, the hazard score is positive, indicating that more hazard is associated with the major arterials. Collector-distributors, on the other hand, represent less hazard to pedestrians.
The relative hazardousness of sites with and without sidewalks is shown under the pedestrian accommodations variable. Sites with no sidewalks represent about one-tenth of the PV exposure: they account for only about one-fourth of the accidents. The PV hazard score shows that they are 2.1 times overrepresented when pedestrian and vehicle volumes are considered.
The data on street lighting show an even larger effect. Sites with no street lighting account for 14.5 percent of the accidents and qet only 1.2 percent of the PV exposure. The PV hazard score of +12.l indicates that locations with no street lighting represent a great hazard to pedestrians.

Knoblauch et al.
The land use variable shows the effect of adjoining land use on relative hazardousness. Although 100 percent residential areas are relatively common, the proportion of the pedestrian volumes found in these locations is almost exactly the same as the proportion of accidents. However, because vehicle volumes are low, the PV hazard score (+3.3) indicates that 100 percent residential areas are hazardous. Commercial and industrial areas are relatively safe (PV = -1.5), whereas mixed residential areas are only somewhat hazardous (PV = +1.4).
Also shown is relative hazardousness associated with signalization. Sites with no signal are more hazardous (PV = +2.0) than sites with a red, green, and amber (RGA) signal (PV = +1.2). Sites with an RGA siqnal and a pedestrian head are relatively less hazardous (PV = -2.4).
The PV hazard scores for sites with crosswalks indicate that far less hazard (PV = -1.9) is associated with marked crosswalks than with locations with no marked crosswalks (PV = +2.5).
Pedestrian and Vehicle Characteristics
Unlike the previously described site characteristics, because the factors are not site specific, it is not possible to generate three separate hazard scores for site, pedestrian volume, and PV exposure. In the remaining discussio~ a single hazard score is presented. This scor e is based on the percentage of the accident-invol ved pedestrians or ve hicles and the percentage of the pedestrians or vehicles observed. Figure 6 shows the relative hazardousness associated with various pedestrian and vehicle characteristics. The data on pedestrian age are particularly interesting. It has long been known that pedestrian accidents are a particular problem for
Percenta_Qe or Hazard Score Pedestrian edestnans
and 0,
Vehicle Pedestrian Vehicles Less More Characteristics Accidents Observed Hazard Hazard
Pedestrian Age
1- 4 years old a 3 ~9 216
10-14 122 15-19 10,9 20-29 18 4 30-59 15 B
60+ 12,B
Pedestrian Mode Walking 47 , l Running 52.9
Pedestrian Crossing Location Crosswalk 24.0 Within 50' of Intersection 24,1 Diagonally Across Intersection 0 9 M idblock 51 .0
Pedestrian Signal Response With Signal: Green 51 ,3 Against Signal: Red 48,7
Vehicle Action
Going Straight 90 0 Turning Right 3 8 Turning Left 4 6 Right Turn on Red 1.6
Vehicle Type Cars Vans, Pickups Trucks, Other Buses Taxis Motorcycles
79 3 12.4 2.3 20 07 J.J
.5 -J +1 +3
1,0 5 .4
10.1 11 ,5 • 1.1 22 .6 - 1.2 41 7 - 2.6
7.7
88 8 - 1.9 11 2
54,J - 2.3 9.4 1.7 - 1.9
34.6
90,4 - 1.8 9,6
84 ,6 7,7 - 2.0 7.2 - 1-6 0 .5
83 ,5 ·· 1. 1 11 .6 2,4 - 1.0 0,7 0 .8 - 11 1,0
FIGURE 6 Relative hazard: selected pedestrian and vehicle characteristics.
+5
39
the very young and the elderly. The data shown reveal that the very young and the elderly are overinvolved in pedestrian accidents relative to their exposure as pedestrians. Surprisingly, the data on pedestrian sex and accompaniment (being alone or with others) did not reveal a similar effect. The proportion of pedestrians exposed was almost exactly the same as the proportion of pedestrian accidents.
Running has long been recognized as a frequently occurring precipitating factor in pedestrian accidents. Over half of the pedestrians struck by vehicles were running, yet only one-tenth of pedestrians observed were running. Thus, a hazard score of +4. 7 is associated with running.
The data on crossing location indicate that it is more hazardous to cross within 50 ft of an intersection (hazard score = +2.6) than it is to cross midblock (hazard score = +1. 5). It is by far safer to cross in a crosswalk (hazard score = -2. 3) than at any other location. Somewhat surprisingly, it was found that crossing diagonally across an intersect ion resulted in reduced hazard (hazard score = -1.9°). However, this score is based on a small percentage (0.9 percent) of the accidents and should be carefully considered.
The response of pedestrians crossing at signalized intersections was examined. It was found that about half (48.7 percent) of the pedestriar.s struck had crossed against the signal, whereas only 9.6 percent of the pedestrians observed crossed against the light. The hazard score (+5.1) indicates that crossing against the signal is indeed a hazardous activity. Clearly, efforts to improve signal compliance would result in an improvement in pedestrian safety.
Figure 6 also highlights the relative hazard associated with various vehicle characteristics. Vehicles were observed to turn, either right or left, about twice as often as they were found to be turning in pedestrian ace id en ts. The hazard scores for turning right (-2.0) and turning left (-1.6) indicate that these vehicle turning maneuvers do not result in increased risk to pedestrians. The data on right turn on red (RTOR) indicate the opposite effect. RTOR vehicles are over involved in accidents relative to their involvement in the exposure population. The hazard score (+3.2) indicates that RTOR presents a hazard to pedestrians •
The hazard scores associated with various types of vehicles indicate that buses (+2.9) and motorcycles ( +3. 3) present a hazard to pedestrians. The other vehicle types--cars, vans, trucks, and taxis-are involved in accidents in almost exactly the same proportion as they were observed in the exposure population.
Accident Characteristics
Two characteristics of pedestrian accidents will be described in this section: the time of day of occurrence and the accident type. Each of these characteristics will be described relative to the exposure data that were collected.
In Figure 7 the occurrence of the national projection of pedestrian accidents is plotted by time of day. Also shown are the percentage of the pedestrian volumes and the percentage of the PV exposure measures observed during each hour of the day. The accident curve shows a slight early a.m. peak, a major early afternoon peak, and a minor early evening peak. Although the curves for the pedestrian and the PV exposure measures tend to follow one another, they do deviate from the accident profile in several places. The relatively low rate of accident occur-

40
10.0
5.0
1.0
12
Pede1tri9ns x Vehicles
5
TIME OF DAY
10 PM
FIGURE 7 Pedestrian activity and pedestrianvehicle exposure by time of day.
rences in the late morning indicates that hazard to pedestrians is lowest at that time. The traditional afternoon peak in pedestrian accidents is shown to closely follow a similar peak in the PV exposure measure plot. Accidents are occurring only sliqhtly more often than would be expected on the basis of PV exposure. In the early evening, however, a large relative separation occurs between the curves. Both the pedestrian and the PV exposure measures show a continual decline, whereas the accident rate remains relatively stable and even shows a modest increase at 9:00 p.m. This indicates that periods of darkness, after 8:00 p.m., represent the greatest relative hazard for pedestrians.
F igu~e B shows a plot of the PV hazard scores by time of day. The relative safety associated with early and midday pedestrian exposure is shown in contrast to the increase in hazard after 7:00 p.m.
+3 MORE HAZARD +2
±1
-2 LESS HAZARD .3
·11
3 5 7 9 AM PM
TIME OF DAY
FIGURE 8 PV hazard score by time of day.
Each accident report in the sample was reviewed and assigned to an accident type. Each pedestrian observed during the pedestrian activity sampling portion of the field data collection was also assigned to an accident type. The field researchers simply coded the appropriate accident type in response to the question, "If the pedestrian had been struck during the time that he or she was being observed, into what type would the accident have been classified?" The accident types were based on the behavioral activities of the pedestrians when they were struck. The relative frequency of the accident types in the accident population and in the exposure population was used to generate a hazard score.
Figure 9 shows the data on the relative hazard associated with the various accident types. Four accident types were found to have neqative scores, an indication that there is less hazard associated with these pedestrian activities. Not surprisingly, a pedestrian on the sidewalk--not crossing--was the
Transportation Research Record 959
Percenta e of Hazard Score estnan Pedestrians
Accident Type Accidents Observed Less More 3 +1 +3 +5
Pedestrian on Sidewalk-Not Crossing 3.3 16 5
Intersection Crossing-Walking 12,1 52.5
Trapped: Changing Light 06 2.2
Exiting Entering Parked Vehicles 32 6.a
Midblock Dart-out 33.0 1.2
Bus Stop Related 1 9 0 .1
Vehicle Turn Merge 4.9 0.4
Vendor, Ice Cream Truck-Related 1.7 0 ,2
Right Turn On Red 1.4 0.2
Disabled Vehicle Related 1.7 03
Crossing Expressway 04 0. 1
Multiple Threat 23 0 .8
Intersection Dash 11 . 1 54
Playing in Roadway 3 7 1.8
Walking Along Roadway 69 4.6
Midblock Crossing Walking 94 6 ,3
Hitchhiking 0 1 0.1 1.0
School Bus Related 02 o.o 1.0
Mailbox Related o.o 0.5 1 0
FIGURE 9 Relative hazard: accident types.
safest accident scenario; walkinq across the roadway at an intersection was the second safest. A surprising 2. 2 percent of the pedestrians observed were trapped by a changing light. Because only o. 6 percent of the accidents involved that situation, the hazard score of -3.7 indicates that the situation is not a hazardous one.
The midblock dart-out is by far the most common accident type, accounting for one-third of all pedestrian accidents. However, darting out was rarely done by the pedestrians observed, only 1. 2 percent. The +27.5 hazard score shows this behavior to be by far the most hazardous. Other less frequently occur ring accident types were also found to have high positive hazard scores: bus-stop related, +19.0; vehicle turn-merge, +12.3; and vendor, ice cream truck related, +8.5. The RTOR accident type also had a high positive hazard score, +7.0. This is supportive of the high hazard (+3.2) previously reported to be associated with RTOR as a vehicle action. The hazard scores for RTOR as an accident type and as a vehicle action are different because they are based on the proportions associated with two different distributions.
Three other accident types accounted for relatively frequently occurring scenarios: intersection dash (11.l percent), walking along the roadway (6.9 percent), and midblock crossing (9.4 percent). These accident types had positive hazard scores of +2.1, +1.9, and +1.5, respectively. Playinq in the roadway accounted for 3. 7 percent of the accidents. Interestingly, a total of 1. 8 percent of the pedestrians observed were also playing in the roadway. Although a hazard score of +2.1 results, this activity is not as hazardous as might have been expected.
CONCLUSIONS
In the project described in this paper a great deal
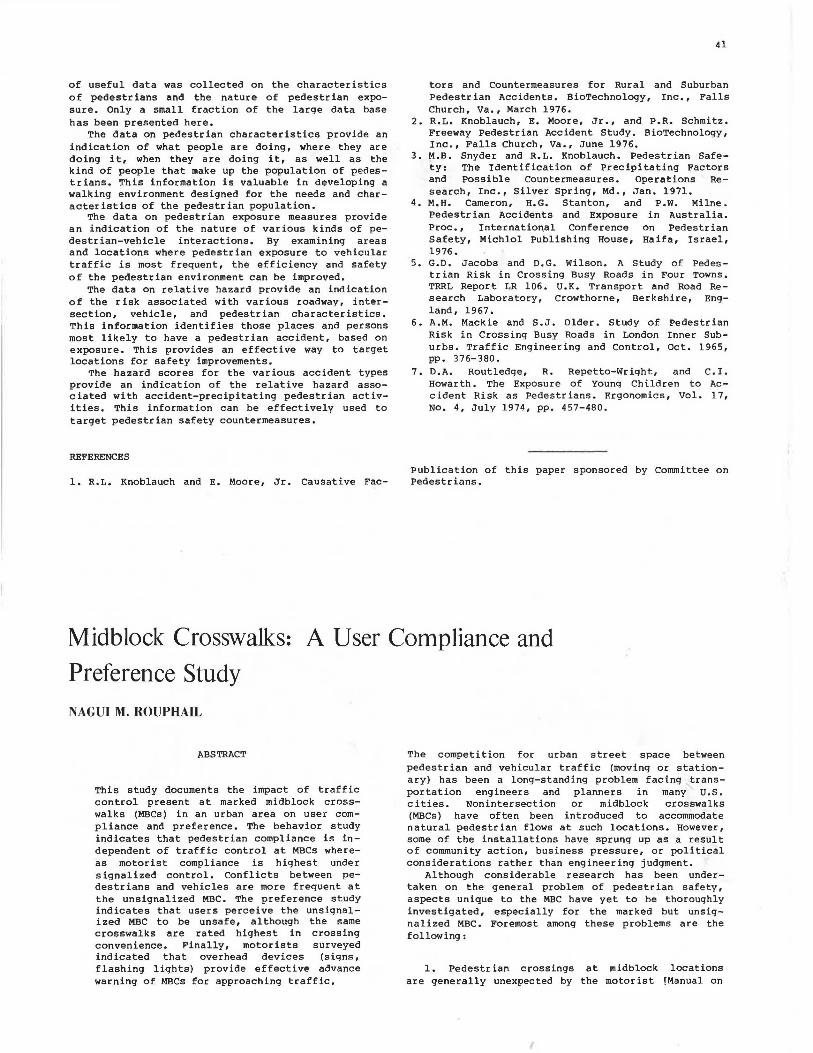
of useful data was collected on the characteristics of pedestrians and the nature of pedestrian exposure. Only a small fraction of the large data base has been presented here.
The data on pedestrian characteristics provide an indication of what people are doing, where they are doing it, when they are doing it, as well as the kind of people that make up the population of pedestrians. This information is valuable in developing a walking environment designed for the needs and characteristics of the pedestrian population.
The data on pedestrian exposure measures provide an indication of the nature of various kinds of pedestrian-vehicle interactions. By examining areas and locations where pedestrian exposure to vehicular traffic is most frequent, the efficiency and safety of the pedestrian environment can be improved.
The data on relative hazard provide an indication of the risk associated with various roadway, intersection, vehicle, and pedestrian characteristics. This information identifies those places and persons most likely to have a pedestrian accident, based on exposure. This provides an effective way to target locations for safety improvements.
The hazard scores for the various accident types provide an indication of the relative hazard associated with accident-precipitating pedestrian activities. This information can be effectively used to target pedestrian safety countermeasures.
REFERENCES
1. R.L. Knoblauch and E. Moore, Jr. Causative Fae-
41
tors and Countermeasures for Rural and Suburban Pedestrian Accidents. BioTechnology, Inc., Falls Church, Va., March 1976.
2. R.L. Knoblauch, E. Moore, Jr., and P.R. Schmitz. Freeway Pedestrian Accident Study. BioTechnology, Inc., Falls Church, va., June 1976.
3. M.B. Snyder and R.L. Knoblauch. Pedestrian Safety: The Identification of Precipitating Factors and Possible Countermeasures. Operations Research, Inc., Silver Spring, Md., Jan. 1971.
4. M.H. Cameron, H.G. Stanton, and P.W. Milne. Pedestrian Accid.ents and Exposure in Australia. Proc., International Conference on Pedestrian Safety, Michlol Publishing House, Haifa, Israel, 1976.
5. G.D. Jacobs and D.G. Wilson. A Study of Pedestrian Risk in Crossing Busy Roads in Four Towns. TRRL Report LR 106. U.K. Transport and Road Research Laboratory, crowthorne, Berkshire, England, 1967.
6. A .M. Mackie and s. J. Older. Study of Pedestrian Risk in Crossing Busy Roads in London Inner Suburbs. Traffic Engineering and Control, Oct. 1965, pp. 376-380.
7. D.A. Routledge, R. Repetto-Wriqht, and c. I. Howarth. The Exposure of Young Children to Accident Risk as Pedestrians. Ergonomics, Vol. 17, No. 4, July 1974, pp. 457-480.
Publication of this paper sponsored by Committee on Pedestrians.
Midblock Crosswalks: A User Compliance and
Preference Study
NAGUI M. ROUPHAIL
ABSTRACT
This study documents the impact of traffic control present at marked midblock crosswalks (MBCs) in an urban area on user compliance and preference. The behavior study indicates that pedestrian compliance is independent of traffic control at MBCs whereas motorist compliance is highest under signalized control. Conflicts between pedestrians and vehicles are more frequent at the unsignalized MBC. The preference study indicates that users perceive the unsiqnalized MBC to be unsafe, although the same crosswalks are rated highest in crossing convenience. Finally, motorists surveyed indicated that overhead devices (signs, flashing lights) provide effective advance warning of MBCs for approaching traffic.
The competition for urban street space between pedestrian and vehicular traffic (moving or stationary) has been a long-standing problem facing transportation engineers and planners in many U.S. cities. Nonintersection or midblock crosswalks (MBCs) have often been introduced to accommodate natural pedestrian flows at such locations. However, some of the installations have sprung up as a result of community action, business pressure, or political considerations rather than engineering judgment.
Although considerable research has been undertaken on the general problem of pedestrian safety, aspects unique to the MBC have yet to be thoroughly investigated, especially for the marked but unsiqnalized MBC. Foremost among these problems are the following:
1. Pedestrian crossings at midblock locations are generally unexpected by the motorist [Manual on

42
Uniform Traffic Control Devices (MUTCD) , Sec. 3B-5 (1) I. This problem is further compounded by the occurrence of hiqher midblock travel speeds and sight distance restrictions due to curb parking.
2. Conflicting interpretations exist between pedestrians and motorists as to who has the right-ofway at any given time, provided that there is no specific guidance from traffic control (e.g., signals, stop signs). Existing legislation often adds to the ambiguity by giving pedestrians the right-ofway at unsignalized crosswalks while prohibiting them from leaving the curb when there is a danger of collision with oncoming vehicles. For example, the Ohio Revised Code, Sec. 4511-46 (1978), which applied to the sites included in this study, defines pedestrian rights at the MBC as follows:
a. Pedestrian on crosswalk has right-of-way (Ohio Rev. Code Ann., Sec. 4511-46, 1978):
(A) When traffic control signals are not in place or not in operation the driver of a vehicle ••• shall yield the right-ofway, slowing down or stopping if need be to so yield, to a pedestrian crossing the roadway within a crosswalk when the pedestrian is upon the half of the roadway upon which the vehicle is traveling or when the pedestrian is approaching so closely from the opposite half of the roadway as to be in danger. (B) No pedestrian shall suddenly leave a curb or other place of safety and walk or run into the path of a vehicle ••• which is so close as to constitute an immediate hazard. (D) Whenever any vehicle ••• is stopped at a marked crosswalk ••• to permit a pedestrian to cross the roadway, the driver of any other vehicle ••• shall not overtake and pass the stopped vehicle.
b. Right-of-way yielded by pedestrian (Ohio Rev. Code Ann., Sec. 4511-48, 1978):
(A) Every pedestrian crossing a roadway at any point other than within a marked crosswalk or within an unmarked crosswalk at an intersection shall yield the rightof-way to all vehicles. (C) Between adjacent intersections at which traffic control signals are in operation, pedestrians shall not cross at any place except in a marked crosswalk. (E) [This section does not relieve the operator of a vehicle] ••• from exercising due care to avoid colliding with any pedestrian upon any roadway.
As shown, the pedestrian and driver responsibilities in midblock crossings are not specifically delineated. Pedestrians are not supposed to leave a curb and walk or run into the path of a vehicle that is so close as to constitute an immediate hazard. Drivers are supposed to yield to pedestrians crossinq within a crosswalk when the pedestrian is on the half of the roadway on which the vehicle is approaching. Thus, no specific sugqestions are afforded regarding a minimum pedestrian-vehicle separation before right-of-way preferences are reversed. This is not altogether surprising given the wide variations in gap (or risk) acceptance characteristics among pedestrians.
Although some of these concerns may be addressed
Transportation Research Record 959
by installing a midblock signal, it is unlikely under current MUTCD warrants that many sites would qualify for such action. In a recent survey of 422 signalized intersections in Chicago and Washington conducted by Zegeer (2), only 8 percent met the minimum pedestrian warra;t (warrant 3), whereas 84 percent met the minimum vehicular volume warrant (warrant 1). In addition, the high capital costs incurred for signal installation (especially within interconnected siqnal systems) , the uncertainty on the part of the traffic engineer of improved safety performance, and the inevitable increase in delays to both motorists and pedestrians tend to diminish the perceived benefits of the alternative.
Some of these issues are addressed by focusing on the safety aspects of the MBC relative to the level of traffic control adopted at the crossing facility. The following tasks are addressed:
1. A review of safety literature pertaining to the MBC and nonintersection crossings in general,
2. Documentation of a limited field compliance study of pedestrians and motorists to MBC traffic control in an urban area, and
3. Documentation of motorist and pedestrian attitudes and preferences regarding the operation of the MBC.
REVIEW OF SAFETY STUDIES
Nonintersection accidents involving a pedestrian and a vehicle traveling straight ahead account for the largest percentage of vehicle-related fatalities in u.s. urban areas (3). ~hP. neqree of nonintersection pedestrian accident involvement is related significantly to age groupi pedestrians under the aqe of 14 are more likely to be involved in accidents at these locations.
A comprehensive accident study of 6,000 pedestrian ace idents conducted by Knoblauch (~) identified pedestrian actions that are concomitant with accident occurrence for the purpose of developing multidisciplinary countermeasures for each type of behavior (5). Midblock actions including pedestrian dart-outs and dashes were involved in almost 40 percent of the pedestrian accident samples in the study.
The impact of traffic control on accident frequency and severity at the MBC was studied by Inwood and Grayson (6) at zebra (unsignalized) and pelican (pedestrian-actuated signal) crossings in England. Pedestrian accident rates were found to be not statistically significant amonq crosswalk types although vehicle accident rates were lower at the pelicans. A similar study by Crompton Ql analyzed 31 streets in Greater London from 1972 through 1977. Pedestrian accidents per 1, 000 crossings per hour were derived for zebra, pelican, and signalized intersection cro~sings, among other types. Zebras performed best at a rate of 1.2, whereas pelicans and intersection crossings exhibited accident rates of 1.8 and 3.0, respectively. Similar to Inwood's findings, however, no significant difference was found between accident rates at zebras and those at pelicans.
Data compiled by Rayner !_!!) provided a unique opportunity for monitoring the safety performance of zebra crossings that were later converted to pelicans, with some being relocated for signal hardware requirements. It was found that at pelicans relocated within 50 ft of the original zebras (30 sites), pedestrian accidents dropped by 28 percent at the crossing but increased by 133 percent within 150 ft from the crossing. It was postulated that as the crosswalks became safer for crossing, they also became less convenient from a delay standpoint. Thus

Rouphail
more pedestrians chose to cross between gaps in the traffic, which increased the potential (and indeed actual) conflict with oncoming traffic. Similar to Inwood' s findings, vehicle accidents dropped by 20 percent at the new pelican crossings. Because only eight sites were relocated 50 ft or more, no attempt was made to draw statistical inferences from their accident records.
Supplemental traffic control devices such as special reflectorized signs, floodlights, and special illumination techniques were also found to be generally effective in reducing nighttime accidents at pedestrian crosswalks (9-11). However, when sound engineering design is coupled with effective legislative, educational, and enforcement programs, drastic reductions in pedestrian accidents can be achieved, such as those observed in the Toronto Pedestrian Crossover Program (12) •
Many studies have resorted to proxy safety indicators in assessing traffic control effectiveness at pedestrian crossings. This is in part because of an increasing need for quick-response techniques that do not rely on long-term accident experience. Cynecki (13), for example, has developed a conflictanalysis ~echnique for pedestrian crossings, and other studies have selected user compliance as the barometer for crosswalk safety <2,14-.!.!) . Although the use of proxy variables has been challenged on the grounds that no firm correlation between compliance and accident has yet been established (19), it appears that in the short term, proxy variables can provide a quick, albeit imperfect, tool for the identification of problem crossings in urban areas and the subsequent implementation of needed countermeasures to alleviate some of these problems.
USER COMPLIANCE STUDY
This study was conducted in Columbus, Ohio, and included a total of 10 MBCs, located in the downtown area. Existing traffic ~ontrol at the MBC consisted of
1. Three signalized MB Cs (all on one-way streets);
2. Seven unsignalized MBCs (all on one-way streets) , four of which had side-mounted crosswalk signs: and
3. The unprotected approach width (i.e., street width minus width of parking lane or lanes), which ranged from 38 to 62 ft.
Parameter Identification and Data Collection
The basic premise of the study was that effective traffic control at the MBC promotes higher user compliance and lower conflict opportunities between pedestrians and vehicles. The following variables were measured at each site:
1. The number of pedestrian violations at signalized crosswalks was recorded for crossings outside the MBC (halfway between the MBC and adjacent crosswalks on either side) or against the pedestrian signal indication. At the unsignalized MBC, pedestrian ;.'iolations included crossings outside the crosswalk area and crossings initiated when no adequate vehicular gaps (in the observer's judgment) existed.
2. Number of motorist violations included vehi-cles illegally parked in the vicinity of the crosswalks or those stopped on the marked crosswalk. Moving violations included motorists crossing against signal indication at signalized MBCs or those fail-
43
ing to stop or slow for pedestrians already crossing at an unsignalized MBC.
3. For number of pedestrian-vehicle conflicts, because no turning conflicts occur at the MBC, only sudden braking or swerving to avoid collision with a pedestrian was considered in this study.
4. The number of vehicle-vehicle conflicts was similar to the previous category: these included rear-end conflicts when the lead vehicle is stopped for a pedestrian on the MBC or sudden swerves when the following vehicle passes a stopped vehicle on the crosswalk (multiple threat).
In addition, control variables such as pedestrian and vehicle volumes were recorded at each site. A total data-collection effort of 20 hr yielded more than 3, 000 pedestrian and 17, 000 vehicle observations in the course of the study. Manual counting techniques with three observers were used to gather the data at all sites.
Results
Table 1 gives a summary of site characteristics for the user compliance study. Pedestrian volumes ranged from 153 to 261 pedestrians per hour per site and vehicle volumes from 880 to 1,325 vehicles per hour per site. Following is a summary of the results obtained.
TABLE 1 Relevant Site Characteristics for User Compliance Study
Signalized Parameter MBC
No. of sites• 3 Avg approach width (ft) 45 Total pcdestrianb flow observed 1,306 Total v~hlcleb flow observed 6,623 Avg pedestrian volume per hour per site 261
Avg vehicle volume per hour per site 1,325
8 0nly ona-way streets are included in this analysis. bu.iscd on ten 10-min observations at each site.
Pedestrian Violations
Unsignalized MBC
Signs Present No Signs
4 3 51 43
I ,I 53 761 5,941 4,401
173 153
1,188 880
A chi-square test for independence at the 5 percent significance level indicated that for the given sample of MBCs, there were no significant differences in pedestrian violation percentages among the three categories of MBCs shown in Table 2. The results did not change when unsignalized MBCs were grouped into one category.
TABLE 2 Pedestrian Violations Versus MBC Control
No , of No.of Total Pedestrian Pedestrian Pedestrian
MBC Control Violations Compliances Flow
Signalized 191 (l 90)a 1,115 (1,116) 1,306 Un signalized ws 157 (167) 996 (985) 1,153 wos !lQ.(111) ....§.±.! (650) ...1.§1
All sites 468b 2,752 3,220
Note: WS =with signs present; WOS =without signs. llValues in parentheses are the expected frequencies (rounded) under the null hypothesis. bareakdown of total violatfons (468): crossing against signal, J29;cross· ing in inadequate gap, 26i crossing outside MBC, 313.

44
Motorist Violations
Table 3 summarizes the results for this variable. Two observations were made. First , the magnitude of motorist violations appears to be minimal when compared with those of pedestrians (0.52 percent versus 15 percent overall). The chi-square analysis at 5 percent also revealed that motorist violations were indeed reflective of type of MBC crosswalk. Signalized crosswalks exhibited the lowest percentage of violations, 0.4 percent.
TABLE 3 Motorist Violations Versus MBC Control
No.of No. of Total Motorist Motorist Vehicle
MBC Control Violations Compliances Flow
Signalized 27 (35)0 6,596 (6,588) 6,623 Unsignalized ws 45 (31) 5,896 (5,910) 5,941 wos .!2. (23) 4 341 (4,378) 4 401
All sites 89b 16,876 16,965
Note: WS = with signs present; WOS =without signs. avaJues in parentheses are the expected frequencies (rounded) under the null hypothesJs. bBreakdown of total violations (89): moving against signal, 1 S; b1ocking part or aU of MBC, 17; illegally parked in vicinity of MBC, 20; did not slow or stop for pedestrians, 37.
Pedestrian-Vehicle Conflicts
The results summarized in Table 4 indicate that the magnitude of pedestrian-vehicle conflicts is reflective of crosswalk control. Significant differences were found between signalized and unsignalized (pooled in one category) MBCs. Again, signalized locations exhibited lower conflict rates than other types of control.
TABLE 4 Pedestrian-Vehicle Conflicts Versus MBC Control
No. of No. of Pedestrians Pedestrians Total Involved in Not Involved Pedestrian
MBC Control Conflicts in Conflicts Flow
Signalized 10 (18)8 1,296 (I ,288) 1,306 Unsignalized ws 20 (16) 1,122 (! ,13 7) 1,153 wos l_i (10) 747 (751) -1.fil.
All sites 44 3,176 3,220
Note: WS = wjth signs present; WOS =without signs. 3 Values In parentheses are the expected frequencies (rounded) under the null hypothesis.
Vehicle-Vehicle Conflicts
Only 14 vehicles out of the 17,000 observed were involved in vehicle-vehicle conflicts. Hence no rigorous statistical test was conducted on this sample. Simple conflict ratios were estimated at 0. 075 and 0.087 for signalized and unsignalized MBCs, respectively.
Summary
The preceding results have indicated that pedestrian behavior is virtually unaffected by the type of control prevalent at the MBCs at the study sites. However, because of the continuous exposure of pedestrians to moving traffic at the unsignalized locations, the potential for accidents (conflicts in this study) is greater there. There were no observed
Transportation Research Record 959
differences between sites equipped with side-mounted signs and those with pavement marking alone. Midblock signals, albeit imperfect in affecting pedestrian behavior, could be valuable in providing an improved target value for the crossing facility and consequently adequate response time for approaching motorists. This was demonstrated in this study by observing lower motorist violations and pedestrianvehicle conflicts at the signalized locations.
USER PREFERENCE SURVEY
Eliciting user understanding of and preference for traffic control devices can be a useful tool in planning safer pedestrian facilities. Reiss (1.Q), for example, has used such data to correlate knowledge of traffic control with accident involvement rates. Robertson ( 14) conducted a pedestrian understanding study of ~rious pedestrian signal indications in an effort to assess the effectiveness of such devices, whereas Crompton (7) aimed at identifying threshold delays that were noticed by pedestrians in a survey.
Survey De s ign
The scope of the survey was limited to downtown Columbus. Two types of interviews were conducted: a pedestrian survey that was administered at the same sites as the user compliance study and a driver survey that was conducted at major parking generators in the downtown area. A total of approximately 600 complete interviews (more than 90 percent response rate) from both surveys were analyzed in the course of this study.
Pedestrian SurvPv
There were three objectives in this survey, to identify
1. Users' opinions regarding safety problems associated with the MBC,
2. Users' interpretations of their legal r iqhts and duties at the unsignalized MBC, and
3. Users' preference regarding the level of traffic control to be adopted at the MBC.
Responses from the pedestrian survey were first categorized as those from drivers and those from nondrivers, as shown in Table 5, in order to test whether each group perceived the role of traffic control differently. Statistical tests conducted at the 5 percent level indicated that nondrivers were more likely to respond that the unsignalized MBC is unsafe (77 percent versus 49. 8 percent). Responses regarding legal responsibility and crossing preference did not differ significantly between the two groups. Yet one in five respondents indicated that drivers have the right-of-way at the unsiqnalized MBC. It should be noted, however, that because of the small sample size of nondrivers in the survey (26) these findings should not be extrapolated beyond the population represented in the survey.
A classification of responses by survey location was also undertaken to test whether the crossing problems at the unsignalized MBC perceived by some users reflect on the selection of crossing location. This was not found to be the case, as shown in Table 6. A chi-square test on the data showed that crossing location and pedestrian opinion regarding the safety of the unsignalized MBC were independent. Preference of crossing type, however, was found to

Rouphail 45
TABLE 5 Pedestrian Survey: Drivers Versus Nondrivers
Percentage of Response
All Drivers Nondrivers Question Response (N = 298) (N= 271) (N= 26)
Safe when crossing Very safe 9.9 10.8 0 unsignalized MBC? Fairly safe 38.3 39.4 23.0 (objective I) Not so safe 31.7 31.0 38.5
Unsafe 20.1 18.8 38.5 Who has the right-of- Pedestrian 78.9 82.2 76,0
way at unsignalized Driver 21.1 17.8 24.0 MBC? (objective 2)
Which crossing is Corner traffic signal 37.4 37.3 38.5 more convenient? Signalized MBC 17.2 16.3 26.9 (objective 3) Unsignalized MBC 45.4 46.4 34.6
TABLE 6 Pedestrian Survey: Signalized Versus Unsignalized Location
Question Response
Safe when crossing Very safe unsignalized MBC? Fairly safe (objective I) Not so safe
Unsafe Who has the right-of- Pedestrian
way at unsignalized Driver MBC? (objective 2)
Which crossing is more Corner traffic signal convenient? (ob- Signalized MBC jective 3) Unsignalized MBC
be significantly related to crossing location; users of the unsignalized MBC were more likely to favor this type of crossing.
Driver Survey
The objectives of the driver survey were threefold:
1. To detect whether conflicting interpretations exist between pedestrians and motorists regarding the right-of-way at the unsignalized MBC,
2. To assess the degree of inconvenience perceived by the motorists for stopping at the MBC, and
3. To elicit motorists' preference of traffic control devices to be adopted at the MBC.
A summary of the survey results is given in Table 7. The problem of conflicting interpretations is not
overwhelmingly evident from the survey data. In fact, the proportions of pedestrians and drivers who
TABLE 7 Driver Survey Results
Question Response
Who has the right-of- Pedestrian way at unsignalized Driver MBC? (objective I)
Are unsignalized MBCs Very convenient inconvenient? Somewhat incon-(objective 2) venient
Not inconvenient Preference for advance Traffic signal
warning? (objective Warning light 3) Overhead sign or
flashing light Crosswalk markings only
Percentage of Response
All Signalized Unsignalized (N = 298) (N = 88) (N = 210)
9.9 14.1 18.1 38.3 37.1 38.9 31.7 33.7 30.8 20.l 15.1 22.2 78.9 81.2 78.6 21.1 18.8 21.4
37.4 37.0 37.6 17.2 21.7 15.3 45.4 41.3 47.l
indicated that pedestrians have the right-of-way are within 5 percent of one another (79 versus 84 percent for pedestrians and drivers, respectively). It should be pointed out, however, that the potential consequences of some pedestrian violations (for example, relinquishing their right-of-way to motorists) are often less hazardous than motorist violations (not stopping or slowing for a pedestrian legally crossing at MBC). Thus because about 20 percent of the drivers surveyed indicated that drivers have the right-of-way at unsignalized MBCs, this must be a source of concern for the traffic engineer and ought to be addressed through some engineering as well as nonengineerinq means (enforcement, education, etc.).
Approximately one in three drivers surveyed believed that stopping at the MBC was inconvenient. This is quite close to the percentage of pedestrians (who also drove) who preferred to cross at corner traffic signals (37 percent).
When given a choice of warning devices at the
Percentage of Response
All Group I a Group 2 (N=291) (N= 100) (N= 191)
84.l 81.6 85.5 15.9 18.4 14.5
11.0 100
24.5 64.5 100 18.1 23.8 15.0 26.4 31.1 23.8
42.4 43.2 42.0
13,1 1.9 19.2
8Group 1 =respondents finding unsignalized MBC very or somewhat inconvenient.

46
MBC, overhead signs or flashing lights were more likely to be stated as the preferred type by the survey respondents (42 percent). The least-liked options were traffic signals (18 percent) and crosswalk markings (13 percent).
Finally, responses were classified into two groups. The first group consisted of respondents who indicated that they were inconvenienced by the presence of an MBC. The remaining responses were allocated to the second group. The objective was to depict whether inconvenience on the part of some respondents was associated with any of the factors included in the survey. A chi-square test on the two groups showed that drivers who did perceive a problem in stopping for pedestrians at the MBC overwhelmingly favored traffic signals over crosswalk markings as a means for advance warning (23.8 versus 1.9 percent). On the other hand, other motorists ranked both alternatives almost equally (15 versus 19 percent) • Both groups, however, indicated their first preference to be some type of overhead device.
Summary
The results of the user preference survey provided some insight into the perceived safety of the MBC in Columbus. It was found that neither motor is ts nor pedestrians appeared to favor the signalized MBC, presumably because of the added travel delays to both types of users. Drivers rated the signalized MBC at the lower end of the preference scale, whereas pedestrians favored the unsignalized MBC by a ratio of 2.6 to 1.0 over the signalized MBC.
However, the survey respondents expressed a genuine concern about the safety of the unsignalized MBC. One in two pedestrians surveyed believed that they were unsafe. Nondrivers were even more skeptical (77 percent), perhaps because of their inability to predict driver actions. Drivers were qenerallv tolerant of the MBC but indicated a strong need for effective warning ahead of the crossings. Overhead signs and flashing lights were preferred because side-mounted devices tend to lose their target value in the visual clutter of high-density areas. Finally, a clear majority of the surveyed pedestrians (79 percent) and drivers (84 percent) agree that pedestrians have the right-of-way at the unsiqnalized MBC. However, because of the general nature of the response, little can be inferred regarding motorist and pedestrian actions in situations where right-ofway priority is not clear-<:ut. Additional findings of the user compliance and preference studies can be found in the original study report (21).
CONCLUSIONS AND RECOMMENDATIONS
This study has focused on pedestrian and motorist behavior at MBCs in an urban area. Although the scope of the findings is limited to the population under study, many issues were raised pertaining to the safety, operational, and legal aspects of MBCs.
The behavior study indicated that pedestrians are less influenced by type of control than motor is ts. On the other hand, both groups indicated a preference for the unsignalized MBC, because delays are minimized to all users. Yet concern was expressed over the safety of unsignalh:ed crossings, partly because of inadequate advance warning and uncertainty over right-of-way priority.
Further research is needed to secure a comprehensive view on the operation of marked MBCs. This includes research as follows:
l. To compile nationwide data on existing engi-
Transportation Research Record 959
neering and nonengineering guidelines for establishing marked MBCs (excluding school crossings) in urban areas. This information is needed to assess the feasibility of a uniform warrant for such installations.
2. To generate a comprehensive MBC accident data base and test for correlations between accident frequency and level of traffic control, including supplemental devices.
3. To link short-term behavioral observations (e.g., compliance, conflicts, attitudes) with longterm accident experience at MBCs. The hypothesis assumed in the study presented in this paper and other referenced work can be tested as a result of this effort.
4. To review existing legislation regarding right-of-way at unsignalized MBCs and to explore means of clarifying and delineating users' responsibilities.
ACKNOWLEDGMENT
This study was sponsored by the Ohio Department of Transportation with funding from NHTSA. The research effort was directed by zoltan A. Nemeth, Professor of Civil Engineering at the Ohio State University.
REFERENCES
1. Manual on Uniform Traffic Control Devices for Streets and Highways. U.S. Department of Transportation, 1978.
2. C.V. Zegeer, S. Khasnabis, and J.C. Fegan. Development of Improved Pedestrian Warrant for Traffic Signals. In Transportation Research Record 904, TRB, "N"ational Research Council, Washington, D.C., 1983, pp. 58-65.
3. Accident Facts. National Safety Council, Washington, D.C., 1982.
4. R. Knoblauch. Accident Data Base for urban Pedestrians. In Transportation Research Record 629, TRB, National Research Council, Washington, D.C., 1977, pp. 26-30.
5. Model Pedestrian Safety Program. FHWA Report IP-78-6. FHWA, U.S. Department of Transportation, June 1978.
6. J. Inwood and G.B. Grayson. The comparative Safety of Pedestrian Crossings. TRRL Report 895. U.K. Transport and Road Research Laboratory, Crowthorne, Berkshire, England, 1979.
7. D.H. Crompton. Pedestrian Delay, Annoyance, and Risk: Preliminary Results from a Two-Year Study. Proc., Seminar in Traffic and Envirc::mmental Management, PTRC Education and Research Services, Ltd., Warwick, England, 1979.
8. D.S. Rayner. Some Safety Considerations in the Conversion of Zebra Crossings to Pelican Crossings. Traffic Engineering and Control, Vol. 16, No. 3, March 1975.
9. Accident Prevention Effects of Road Safety Devices. Annual Report. Japan Road Association, Tokyo, 1969.
10. B.V. Pegrum. The Application of Certain Traffic Management Techniques and Their Effect on Road Safety. Presented at National Road Safety Symposium, March 1972.
11. A. Polus and A. Katz. Analysis of Nighttime Pedestrian Accidents at Specially Illuminated Crosswalks. Accident Analysis and Prevention, Vol. 10, No. 3, 1978.
12. M. Rotman. The Toronto Pedestrian Crossover Program. Traffic Engineering, Feb. 1961.
13. M.J. Cynecki. Development of a Conflict Analysis Technique for Pedestrian Crossings. .!!!.

Transportation Research Record 743, TRB, National Research Council, Washington, D.C., 1980, pp. 12-20.
14. H.D. Robertson. Pedestrian Signal Displays: An Evaluation of Word Message and Operation. .!..!2 Transportation Research Record 629, TRB, National Research Council, Washington, D.C., 1977, pp. 19-22.
15. R.R. Miller, F.A. Street, and J.C. Holmstrom. Evaluating Pedestrian Safety Facilities using Videotape Observation. Presented at the 62nd Annual Meeting of the Transportation Research Board, Washington, D.C., 1983.
16. J. Hauck and B. Leland. Well-Marked Crosswalks Are a Pedestrian's Best Friend. Rural and urban Roads, Vol. 17, No. 3, March 1979.
17. A.S. McLean and D.J. Howie. Survey of the Performance of Pedestrian Crossing Facilities. Australian Road Research, Vol. 10, No. 3, Sept. 1980.
18. w.c. Berger and H.D. Robertson. Measures of Pedestrian Behavior at Intersections. In Transportation Research Record 615, TRB, National Research Council, Washington, D.C., 1976, pp. 54-59.
47
19. s. Khasnabis, c.v. Zegeer, and M.J. Cynecki. Effects of Pedestrian Signals on Safety, Operations, and Pedestrian Behavior--Li terature Review. In Transportation Research Record 847, TRB, National Research Council, Washington, D.C., 1982, pp. 78-86.
20. M.L. Reiss. Knowledge and Perceptions of Young Pedestrians. In Transportation Research Record 629, TRB, National Research council, Washington, D.C., 1977, pp. 13-19.
21. Safety Aspects of Mid-Block Crosswalks, Vol. 2. Final Report EES 572X. Engineering Experiment Station, Ohio State University, Columbus, Oct. 1978.
The opinions expressed in this paper do not necessarily reflect those of the U.S. Department of Transportation or the Ohio Department of Transportation.
Publication of this paper sponsored by Committee on Pedestrians.
Pedestrian Crossing-Time Requirements at Intersections
MARK R. VIRKLER and DAVID L. GUELL
ABSTRACT
Existing procedures for determining pedestrian crosswalk-time requirements are inadequate because they ignore the number of people crossing. A study of six crossing locations showed that those in large crossing groups walk at fairly uniform headways and uniform speeds. Pedestrian headways are close to 6. 7 sec per pedestrian per foot width of walkway and speeds are close to 4.5 ft/sec. A model of crossing time is developed. The inputs are the number crossing, crosswalk length, and crosswalk width.
The time required by pedestrians to cross streets at signalized intersections must be determined to ensure safe and efficient operation of the intersection. Most procedures used today (1-3) treat crossing time as a function of crosswalk-length divided by a walking speed. However, crossing time is also a function of the number crossing (4).
Figure 1 shows the times required by groups (herds) of four or more to cross a street in downtown Richmond, Virginia. The ordinate is the time between when the first person in the herd leaves the curb and when the last person reaches the opposite curb. The horizontal lines are the crossing times predicted by dividing the crosswalk length (32 ft)
by walking speeds of 3.5 and 4.0 ft/sec (the values usually recommended). The diagonal line is the regression line of best fit. The slope of this line was significantly different from zero at the 1 percent level.
'!'he purpose of this study was to develop an improved design procedure for considering pedestrians in traffic signal timing. Data on crossing times are examined in the next section. A basis for modeling pedestrian crossing times is then developed. This is followed by a recommended design procedure.
METHODOLOGY AND DATA ANALYSIS
Data were collected for 85 herd crossings at 6 crossing locations. Four crossings were in downtown Richmond, Virginia. These crossings were controlled by pedestrian signals, and crosswalk lines were marked on the pavement. A majority of pedestrians were shoppers. The other crossings were near the University of Missouri-Columbia football stadium. These had no crosswalk lines and traffic was controlled by a police officer. The pedestrians were football patrons going to the stadium.
Data Collected
For all the crossings, curb-to-curb distance (L) was measured. For the downtown shoppers, crosswalk width
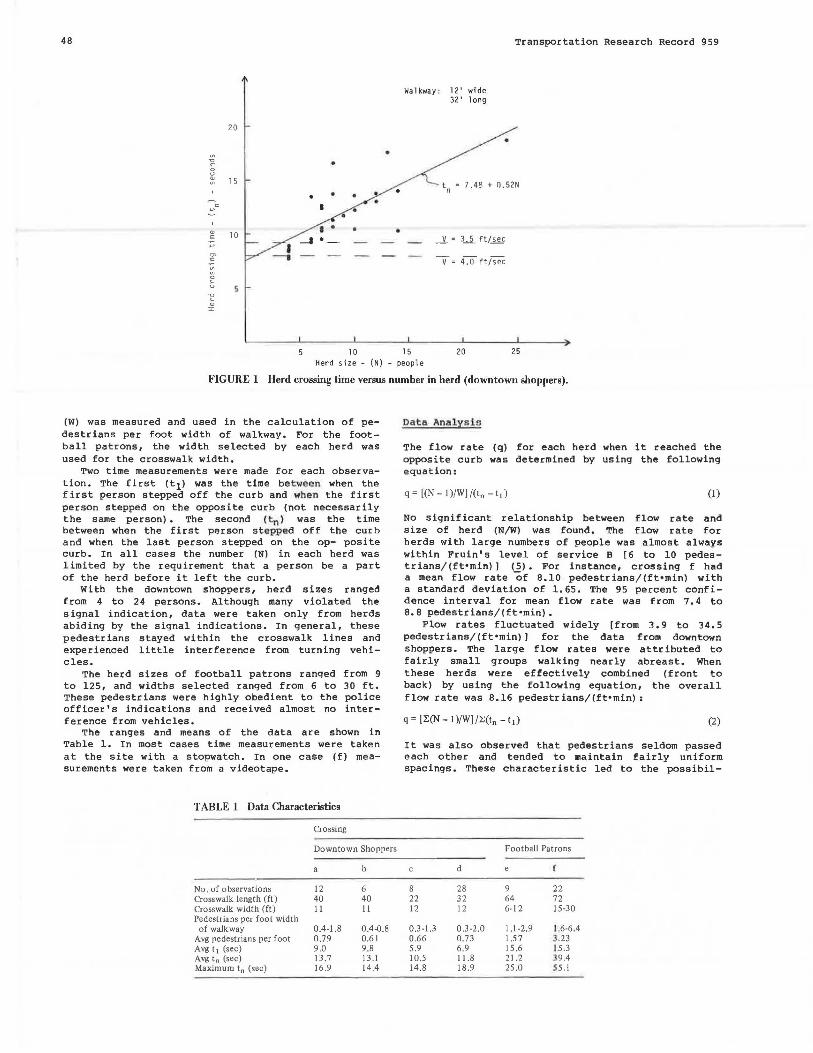
48 Transportation Research Record 959
20
~
"C c 0 u (U 15 ~
c ~
(U l 0 E
~
g' ~ ~
0
b "C '-(U
"'
•
10
Walkway: 12' wide 32' long
7 ,48 + 0.52N
_J_ = 3_.j_ ftlsec
V = 4-:0 ft/sec
15 20 25 Herd size - (N) - people
FIGURE 1 Herd crossing time versus number in herd (downtown shoppers).
(W) was measured and used in the calculation of pedestrians per foot width of walkway. For the football patrons, the width selected by each herd was used for the crosswalk width.
Two time measurements were made for each observation. The flrst (t1) was the time be t ween when the first person stepped off the curb and when the first person stepped on the opposite curb (not necessarily the same person). The second ( t n> was the time between when the first person stepped off the curb and when the last person stepped on the op- posite curb. In all cases the number (N) in each herd was limited by the requirement that a person be a part of the herd before it left the curb.
With the downtown shoppers, herd sizes ranged from 4 to 24 persons. Although many violated the signal indication, data were taken only from herds abiding by the signal indications. In general, these pedestrians stayed within the crosswalk lines and experienced little interference from turning vehicles.
The herd sizes of football patrons ranged from 9 to 125, and widths selected ranged from 6 to 30 ft. These pedestrians were highly obedient to the police officer's indications and received almost no interference from vehicles.
The ranges and means of the data are shown in Table 1. In most cases time measurements were taken at the site with a stopwatch. In one case (f) measurements were taken from a videotape.
TABLE 1 Data Characteristics
Crossing
Downtown Shoppers
b
No . of observations 12 6 Crosswalk length (ft} 40 40 Crosswalk width (ft) 11 11 Pedestrians per foot width of walkway 0.4-1.8 0.4--0.8
Avg pedestrians per foot 0.79 0.61 Avg t 1 (sec) 9.0 9.8 Avg tn (sec) 13.7 13.l Maximum tn (sec} 16.9 14.4
Da ta Analysis
The flow rate (q) for each herd when it reached the opposite curb was determined by using the following equation:
q = [(N-1)/W]/(tn -ti) (1)
No significant relationship between flow rate and size of herd (N/W) was found. The flow rate for herds with large numbers of people was almost always within Fruin' s level of service B [6 to 10 pedestrians/(ft•min) J (5). For instance, crossing f had a mean flow rate of B.10 pedestrians/(ft•min) with a standard deviation of 1.65. The 95 percent confidence interval for mean flow rate was from 7. 4 to 8.8 pedestrians/(ft•min).
Flow rates fluctuated widely [from 3.9 to 34.5 pedestrians/(ft•min) I for the data from downtown shoppers. The large flow rates were attributed to fairly small groups walking nearly abreast. When these herds were effectively combined (front to back) by using the following equation, the overall flow rate was 8.16 pedestrians/(ft•min):
q = [~(N - I )/W] / ~(tn - ti) (2)
It was also observed that pedestrians seldom passed each other and tended to maintain fairly uniform spacings. These characteristic led to the possibil-
Football Patrons
d
8 28 9 22 22 32 64 72 12 12 6-12 15·30
0.3-1.3 0.3-2.0 l.l -2.9 l .6-6.4 0.66 0.73 l.57 3.23 5.9 6.9 15 .6 15.3 10.5 l l.8 21.2 9.4 14.8 18.9 25.0 55.l

Virkler and Guell
ity that a linear relationship between crossing time (t ) and pedestrians pe r ft,,vt of crosswalk width (N?W) could provide an a ppropriate model. The linear regression equations found for the crossings are given in Table 2. All of the slopes were found to be different from zero at a 1 percent significance level.
TABLE 2 Regression: Crossing Time Versus Pedestrians per Foot of Crosswalk Width
Crossing
Football Downtown Shoppers Patrons
a and b8 d
Crosswalk length (ft) 40 22 32 64 Avg N/W (pedestrians/ft) 0.73 0.66 0.73 1.57 No. of observations 18 8 28 10 Ao (sec) 10.55 5.97 7.48 10.75 A1 [sec/(pcdestrian ·ft)] 4.08 6.83 6.02 6.47 Correlation coefficient 0.66 0.90 0.75 0.90 Sample standard deviation
from regression 1.64 J.18 1.92 1.75
Note: tn =Ao+ A1 (N/W); tn is in seconds. 3 Crossings a and b were combined because of their identical lengths and widths.
72 3.23 22 22.90 5.11 0.80
5.17
49
Two shortcomings of these particular models were apparent. First, a given equation would .apply only for a particular crosswalk length. Second, the variance of the data from the fitted lines did not appear to be constant. Rather, the variance increased with N/W. To deal with these problems a more general model was developed:
10 = (L/V) + H (N/W)
where L =crosswalk length (ft), V speed of front of herd (ft/sec), and H time headway (reciprocal of flow rate)
[sec/(pedestrian•ft)].
(3)
To find H, tq tn - tJ. was calculated for each observation and plotted as a function of N/W (t1 was the average t 1 for the given crossing). H was then calculated as the slope of the line of best fit. In determining the slopes it was assumed that the variance of the error from the fitted line was proportional to N/W and that all lines would pass through the origin.
The slopes and implied flow rates for each crossing are given in Table 3. The data and line of best fit are shown in Figure 2. Combining all of the data
TABLE 3 Best Fit: Flow Time Versus Pedestrians per Foot of Crosswalk Width
40
30 ~
-g 0 u
:l:
~.,,. 20
.µ
"' E -;; .. 10 0
~
0
Avg Speed of Weighted
No.of Front of Standard Standard Observa- Herd (V 1 ) Slope (H) Error from Error of
Crossing tions (ft/sec) [sec/(pedestrian • ft)] Fitted Line• Slope
a,b 18 4.33 5.80 1.87 0.52 8 4.42 6.94 1.40 0.61
d 28 4.61 6.76 2.24 0.50 9 4.10 3.59 1.98 0.53
22 4.74 7.4 7 3.09 0.37 a,b,c,d 54 4.42 6.46 2.04 0.33 e,f 31 4.54 6.82 3.69 0.40 All 85 4.47 6.71 2.74 0.25
Note: tq = H(N{W). lt is assumed that lines pass through origin and that the variance of residuals is proportional to N(W. 3The square root of the weighted mean square of the resMuaJs from the fitted line.
•
• • •
• .. .
Pedestrians per foot of walkway width - (N/W) - pedestrians/foot
FIGURE 2 Flow time versus pedestrians per foot of crosswalk width.

50
led to a slope (H) of 6.7 sec/(pedestrian•ft) [a flow rate of 8.94 pedestrians/(ft•min)]. The weighted mean square of the residuals was 7.53, implying a standard error of the estima te of (7. 53 x (N/W) 1112 . The 95 percent confide nce interval for the slope was from 6.23 to 7.19 sec/(pedestrian•ft) [flow rates from 9. 6 to 8. 3 pedestrians/ (ft•min) , well within the limits for level of service BJ. Except for crossing e, the slopes for each crossing fell within a relatively narrow ranqe.
DESIGN PROCEDURE
The following equation is recommended for determining crossinq time for a herd (this time is a reasonable lower limit for green plus amber time):
T = t + (L/V) + H (N/W)
where
T crossing time (sec), t 2 pedestrian starting time = 3 sec, L =length of crosswalk (ft), v walking speed= 4.5 ft/sec, and Hz time headway between persons= 6.7
sec/(pedestrian•ft).
(4)
The pedestrian starting time is the value recommended in the TRB Interim Materials on Highway Capacity (6). The walking speed was the average (for the fron"t of the herd) found in this study. The value of H was the slope of best fit for all of the data collected.
If the number crossing was small and W and L were large, the crossing time given by this equation would be less than that given by most earlier techniques and therefore inadequate for slower pedestrians. However, a herd of modest size (e.g., four to eight people) would yield higher crossing times through this technique than through the earlier techniques.
using the Equation
Some judgement is required in determining an appropriate N/W. For N the largest herd expected during the pedestrian peak hour appears reasonable. At times this number would be exceeded or a herd of a slightly smaller size could have a higher crossing time than expected. However, the crossing time allowed would be exceeded only during a small percentage of the signal phases within the peak hour. When the time expired, the end of the herd would be close to the opposite curb.
In this study, the crosswalk width was either that selected by the herd or that painted on the pavement. In both cases this width was almost always available to the herd. At many locations the behavior of motorists could constrain the available width. Similarly, large herds might select a width qreater than that provided by pavement markings.
The largest N/W value in the data was 6.4 pedestrians/ft. For values larger than this (e.g., 80 people using a width of 10 ft) the model of crossing time may not be reliable.
Additional Considerations
The pedestrian space for level of service B ranges
Transportation Research Record 959
from 24 to 40 ft 2 /pedestrian. Ceding <2> described this as being in the upper range of "tolerable." Pushkarev and Zupan (_!!.) described this range as •constrained" (between "crowded" and "impeded"). Fruin stated that in this range pedestrians can select a normal speed and when in primarily one-directional flows can pass other pedestrians. Minor conflicts would occur if reverse-direction or crossing flows existed, thereby lowering average speeds ( 5) • These considerations would imply that if two large herds of roughly equal size met while traveling in opposite directions, the equation for crossing time would underestimate the time needed for crossing.
Crossing time could also be affected by constraints before or after the crossing. For instance, sidewalk furniture, parked vehicles, or the presence of other pedestrians miqht reduce the rate at which people could leave the curb. The same factors could cause a bottleneck when the herd reaches the opposite curb. In the interest of consistency, one might seek to ensure that a pedestrian level of service near B was provided at those two locations. A minimum requirement might be that the available walkway capacity would not be exceeded by the herd plus any other pedestrians near the crosswalk.
Finally, it should be recognized that turning vehicles could have a large effect on the time required for crossing. Equation 5 is based on little interference with pedestrians by vehicles.
SUMMARY
Earlier techniques for determining pedestrian crossing-time requirements are adequate for small numbers of pedestrians but do not provide enough time for larger numbers. Those who are first tc cross in large herds travel at about 4.5 ft/sec. Those behind the first ones maintain fairly constant spacings and require about 6. 7 sec/(pedestrian•ft) to reach the opposite curb.
If an appropriate starting time (to perceive and react to a signal indication) is included, adequate time can be provided for the herd to cross. Particular care is needed for determining the effective crosswalk width and to ensure that flows will not be limited by conditions at the curb that the pedestrians leave or the curb that they reach.
REFERENCES
1. s. Cass. Traffic Signals. In Transportation and Traffic Engineering Handbook (J.E. Baerwald, ed.), Prentice-Hall, Englewood Cliffs, N. J., 1976, Chap. 17, p. 810.
2. L.J. Pignataro. Traffic Engineering: Theory and Practice. Prentice-Hall, Inc., Englewood Cliffs, N.J., 1973, p. 253.
3. Manual on Uniform Traffic Control Devices. FHWA, u.s. Department of Transportation, Wash- inqton, D.C., 1978, Section 4D-5.
4. M.R. Virkler. Pedestrian Flows at Signalized Intersections. In Transportation Research Record 847, TRB, National Research Council, Washington, D.C., 1982, pp. 72-77.
5. J .J. Fruin. Pedestrian Planning and Design. New York Metropolitan Association of Urban Designers and Environmental Planners, New York, 1971.
6. Interim Materials on Highway Capacity. Transportation Research Circular 212. TRB, National

Research Council, washin~son, D,C., Jan. 19BO, pp. 115-147.
7. D. Ceding. Verkehrsbelastung und Dimensionierung von Gehwegen und anderen Anlagen des Fussgaengerverkehrs. Strassenbau und Strassenverkehrstechnik, No. 22, 1963.
B. B. Pushkarev and J. M. Zupan. Capacity of walkways. In Transportation Research Record 53B, TRB,
51
National Research Council, Washington, D.C., 1975, pp. 1-15.
Publication of this paper sponsored by Committee on Pedestrians.
Walking Straight Home from School: Pedestrian Route Choice by Young Children MICHAEL R. HILL
ABSTRACT
Unobtrusive observations of 50 randomly selected pedestrian youngsters were made after the children had been dismissed from elementary schools in Lincoln, Nebraska. The results demonstrate that (a) BB percent of the students walked directly to a residential dwelling; (b) 98 percent chose a least-distance path from their school to their residence or other destination; (c) the majority of students (62 percent), by choosing to minimize distance, found their route choices reduced to a single route option; and (d) when faced with the choice between two or more distance-minimizing routes, the children in this study selected structurally more complex routes than did adults. All the children in this study were among the first students to leave school after class and walked home unaccompanied. The children appear to follow the admonition to come straight home from school, but in so doing they are generally limited to a single shortest-distance option. Such children thus have a much constrained opportunity for environmental exploration. When faced with the chance to choose a more interesting and spatially complex route while still adhering to the norm to come straight home, the complex route was generally selected. Because of the small sample size in this study, these findings are best considered suggestive rather than definitive.
Young children in the United States are frequently directed by their parents to come straight home from school. Whether this admonition is generally heeded as well as questions about trip length, walking velocity, and route complexity form the central focus of this study. An empirical investigation of the pedestrian routes selected by youngsters after they
are dismissed from elementary school is reported here. A random sample of grade-school students from public schools was unobtrusively tracked and their routes were mapped in order to gather the data required for this study. The sections below provide a description of the methodology employed and a discussion of the results obtained. First, however, it is noted that choosing a route involves somewhat more than just the ability to place one foot in front of the other.
PEDF.STRIAN SKILLS IN CHILDREN
Selecting a route that leads from school to home represents a high degree of pedestrian skill. This skill builds on the ability to walk per se as well as on development of sufficient risk-assessment capability to cross streets without being struck by motor vehicles. In addition, each youngster learns a subtle set of social norms (for example, which side to step to in order to avoid collision with another pedestrian, how to look at other pedestrians without appearing to stare at them, what minimum distance to maintain when following another pedestrian, and so on) that facilitate walking in its social context. Finally, the pedestrian navigator also requires knowledge of his or her spatial environment and the ability to utilize this information to choose and follow a route (1).
'!'he age at which these interrelated skills are adequately developed and integrated is not known at this time with certainty. It is likely that development is influenced by culture, social class, and the texture of the physical environment. Routledge et al. (2) found that school children can provide reliable ~stimates of their exposure to risk during the journey to and from school. Reiss (3) suggests that school children can be quite verbal ~bout their reasons for following a particular route, for example, that it is the shortest or safest way. He concludes his paper with the following observation (]., p.43): "The pattern of responses shows a progression of pedestrian capability from kindergarteners to the eigth graders.•

52
A decade ago, Wolff (_~) found that adult pedestrians often treat children under 7 years old as baggage. He suggested that we might profitably ask (~, p.45)'
At what age or stage of development have children learned to negotiate right-ofway, territorial possession, and so forth, in public places? At what age or under what conditions is their attempted use of such knowledge "respected"?
Routledge, Reiss, Wolff, and others provide starting points for further investigation related not only to pedestrian safety and transportation research but also to our increasing understanding of human perception and cognition, environmental utilization, and spatial experience. In any event, it appears that the required pedestrian skills are developed early in most youngsters to the extent that many parents permit their children to walk home from school unaccompanied.
The young, capable pedestrian now stands in front of his or her school building, choosing a route homeward that fulf.ills his or her parents' mandate to come straight home from school. In some instances, if the chosen route is the shortest possible one, there will be only one possible route to follow. There will be, statistically speaking, no degrees of freedom given the geometry of the street network and the constraint to minimize distance. In many other cases, however, depending on the geometry of the street network, there may be several routes, which all minimize distance. This latter situation occurs frequently when one must move diagonally across a rectangular or Manhattan street grid. In graph theoretic terms, the route selection problem involves choosing a set of connected edges from those available in a given graph to form a path from an origin to a destination. Further discussion and illustration of this terminology and descriptive framework is found in the work of Garbrecht (5,6) and Hill C~-~) . The character of the• route networks faced by school children in particular is discussed more fully below. First, however, the following section describes the sampling and observational methodology employed to empirically study the paths selected by school-age children on their way home after classes.
METHODOLOGY
Lincoln, Nebraska, was selected for the study. This city provides a diverse urban environment of moderate size (approximately 180, 000 population). There are 27 public elementary schools within the study region and 10 were randomly selected as observation sites. All schools selected conducted afternoon classes in kindergarten through sixth grade. Enrollments ranged from a high of 700 students to a low of 168 students. The mean number of students was 418 per school.
Fifty observations (five at each school) were made of the routes selected by grade-school children as they walked home from school during the spring months (March-May) • Observation began at afternoon class dismissal time when the first student crossed through the street intersection nearest the main entrance to the school. This student was unobtrusively tracked on foot and his or her path was recorded on a prepared data-collection form. Route data were recorded only for children who walked home unaccom-
Transportation Research Record 959
panied. Research on the paths selected by groups of children remains to be done in the future as does research on children other than the first ones to leave the school building each day.
When a student entered a building and remained there for a period of 10 min, the observation was terminated and the child was recorded as having reached a destination. No student was included more than once in the sample. Following data collection, each observation was mapped on a standardized record sheet at the scale of l: 8, 000. All data were then summarized for each case and entered for machine storage and processing. After each ob11ervation, the school for the next day's observation was determined by random choice.
Only one observation could be completed per day. Thus, this technique required more than 50 trips to the selected schools and approximately 3 months to complete. The data are therefore time-consuming to collect, so methodologically speaking, they are fairly expensive.
Reactivity of the method was judged to be minimal. Two observations were discontinued (and the data thrown out) when the researcher felt that he may have been spotted by the children under observation. With practice, it is possible to make observations from as much as two blocks away and from the side of the street opposite that on which the subject is walking. It is recommended that the observer wear comfortable shoes and be in relatively good physical condition so that he or she can catch up quickly when the subject rounds a street corner and thereby escapes the observer's direct line of vision. To further reduce reactivity, an observation should, as a rule, be discarded if the subject turns and looks in the direction of the observer more than one time during the course of the observation. Although used in other studies <2.l, this rule never received an opportunity for application in this study. Finally, a surprisingly large number of adults (many in automobiles) waited near the schools each day to pick up their children. As a result, the presence of the researcher at class dismissal time was not particularly conspicuous or unusual.
RESULTS
The basic characteristics of the sample are straightforward. Nineteen subjects (38 percent) were boys and 31 (62 percent) were girls. The shortest trip observed was 0 .10 km and the longest was 1. 3 4 km. Mean length of observed trips was 0.58 km. Mean trip length was essentially identical for both sexes. This result should occur in a random sample, especially if it is- assumed that all students, regardless of sex, generally go straight home and it is further assumed that the homes of both male and female students are randomly located around the elementary school. Insofar as the majority of trips (88 percent) terminated at residential dwellings, it seems reasonable to assume that most unaccompanied youngsters, at least those who are among the first to leave the school building each day, go directly home after school.
Boys were observed traveling at slightly higher velocities, on average, than girls, but the difference is not statistically significant. As a group, the observed school children traveled faster (102 m/min) than a random sample of 21 subjects from the general population aged 5 to 21 years observed in a companion study (9) , who on average logged only 87 m/min. This difference is statistically significant at the O. 01 level. It appears that some children in fact run rather than walk home from school.
Hill
Distance Minimization in Route Choice
With only one exception, every trip observed followed a shortest-distance path from start to finish. This finding demonstrates the overwhelming importance of distance minimization in path selection. This finding is expected given the frequently observed human tendency to minimize effort (10,11). Hill (~) has shown that the same behavior occurs in adults as well. Because no students became lost, a condition that would be indicated by longer-thannecessary routes, this finding further suggests that the subjects knew their routes and destinations well. Because subjects were not interviewed, however, it is not known if the observed route choices were prescribed by parents or teachers or were learned through experience or by watchinq other children or siblinqs. Nonetheless, in the sense that the observed students almost universally took the shortest paths to their destinations, it is clear that these students did come straiqht home when, in fact, home (as indicated by a residential dwellinq) was their intended destination.
When distance minimization is employed as a pr imary route-selection strategy, however, the number of available routes is often reduced dramatically. In other words, if one is not willinq to walk further than necessary, one cannot then select from many other, but more roundabout, routes. In the case of the school children observed in this study, 31 students (62 percent) had no choice but to take the route they did if they wished to minimize distance. The remaining 19 students ( 38 percent) had the opt ion of choosing from two or more different routes that minimized the distance to their destinations.
It should be noted further that students who tend to live closer to school (0.5 km on average) have no option in route choice except for a single, distance-minimizinq route, whereas those who live farther away (0. 8 km on average) get to choose from more than one distance-minimizing option. This result stems in part from the interacting dimensions of trip length and street geometry. Generally, the greater the distance a student lives from an elementary school, the higher the probability that more route options will be available (9). The important point is that the street qeomet-;y faced by the majority of students who actually do walk home from school is exceedingly simple, if not boring: There is frequently only one least-distance route from which to choose. Day after day, if students follow the maxim to minimize distance (and 98 percent of the students observed did so) , they are often constrained by street geometry to repeat the same route choice again and again without variation.
Choosing Between Paths of Equal Lenqth
Not all students, however, are constrained by rigid geometry and they have some degree of real choice in selecting from a variety of distance-minimizing routes. Based on the observations in this study, it is estimated that approximately 38 percent of the students have the opportunity for more varied route selection. The next stage of inquiry, therefore, is to ask how children behave when they experience the problem of choosing between two or more distanceminimizing routes of equal length. Such routes can be compared on the dimension of structural complexity.
An important aspect of route structure is the complexity of the route. Conceptually, environmental complexity is best approached with the subtlety and keen theoretical edge demonstrated by Rapoport and Hawkes (12) and Rapoport (13,14). In this study,
53
however, a simple but readily quantifiable measure of structural complexity is employed as a rouqh substitute. Here the complexity of a route depends on the number of turns (or changes of direction) that a subject i s free to incorporate into his or her path from one point to another. The spatial structure index (SS!) is a measure that allows objective comparison of route compl~xi ty for paths followed in street networks of radically different size and configuration. Further, the parametric properties of the SSI ultimately permit the analysis Of route complexity as a function of other variables. In brief, the index is a standardized measure of the number of turns incorporated in a given distanceminimizing trip relative to the maximum and minimum number of turns that could have been taken by the pedestrian. The index is based on an adaptation of the formula for computing standardized scores (Z-scores) • The computation and limitations of the index, together with examples, have been illustrated by Hill (9).
Comput"itional limitations are such that the SSI could be computed meaninqfully for only 12 children in the sample. Given this small sample size, the SSI results reported here must be seen as indicative rather than definitive. Although larqer samples are undoubtedly desirable, they are time-consuming and difficult to obtain. Hill (1 ) has demonstrated that route selection by adults can be studied adequately through survey questionnaire techniques, but it is not known whether grade school children can be depended on to adequately and reliably describe their exact walking routes on a questionnaire. If such techniques (or alternatives such as video simulations) could be perfected, much larger samples would be obtained with considerably greater ease.
The SSI has a maximum value of 0.7071, a mean of 0. 0, and a min i mum value of -0. 7071 reqardless of the size or shape of the street network involved. A value of -0.7071 results when a trip with the least number of turns possible has been chosen. Conversely, a positive value of O. 7071 is found when a trip wi th the maximum number of turns has been selected. Following the lead of Rapoport and Hawkes (.!1) , a route with the most possible turns is operationally defined as the structurally most complex route. It is in this sense that the SSI is said to reflect the structural complexity of a given trip.
Using the SSI, it was found that children walking home from school tend to exhibit more complex path structures than do adults generally. Recalling that a positive SSI value reflects relatively complex route choice, it is noted that the mean SSI for 12 school children (-0.059) is more positive than the SS! for a random sample of 24 distance-minimizing adults (-0.275) who were unobtrusively tracked within the same study area in a companion investigation (~).This difference is statistically siqnificant at the o. 01 level.
This result is expected, based on Perin's discussion (~) of White's thesis of effectance, in which it is maintained that increased exploration of the environment is integral to human maturation. In capsule form, thi s thesis asserts that environmental manipulation (in this case choosing more complex route structures) is important during an individual's development if that person is goinq to develop an adequate sense of personal competence. The developed adult, therefore, would no longer need to engage in environmental manipulation to the extent required for developing youngsters. In addition to the development of a sense of personal competence, Piaget and Inhelder (16) maintain that environmental exploration is required in order for youngsters to develop a sense of space. Finally, Merleau-Ponty C.!1> observes that physical movement and use of the

54
environment are required for children to establish a stable orientation in the physical world. Thus, it is expected that young school children will, given the opportunity for more complex choices, be exploratory in their route selection because they are still learning how to navigate and master the built environment in which they live.
Although the data collected in this study are the result of relatively expensive methodological techniques, it is hoped that additional work will pursue the questions that this project only began to address. Such studies, if taken in small steps, are fully within the capahili ties and thesis expectations of graduate students in planning, engineering, and the social sciences. Like the many small-scale studies on the spatial aspects of human crowding ( 18) , such investigations not only provide insights for more robust theoretical explanations of environmentally situated behavior ( 19) of which pedestrian behavior is a paradigm example, they also add to our growing stock of research and insiqht on the nature of the pedestrian experience <.!,1Q.-24).
SUMMARY
The results and methodology in this study are more fully reported elsewhere !2lr but the basic findings are straightforward. In regions similar to the study site, it is expected that unaccompanied school children (at least those who are among the first to leave their school building each day) are almost universally likely to take the shortest route home from school and, when confronted with the opportunity to choose between two or more shortest-distance routes, to frequently select a structurally more complex route. By and large, however, the majority of children are presented with only a single shortest-distance option as the route to their home. on the way home from school, at least, these children have a much constrained opportunity for environmental exploration in a spatial structural sense.
ACKNOWLEDGMENT
Portions of the research reported in this paper were made possible by a grant from the U.S. Department of Housing and Urban Development. Travel funds that made it possible to present this research at the 1984 Annual Meeting of the Transportation Research Board were generously provided by a Rappold Travel Grant from the University of Nebraska-Lincoln. The author expresses his thanks to the anonymous reviewers of this paper, who made several helpful suggestions toward its improvement. The author also thanks Robert H. Stoddard and Mary Jo Deegan for their support and encouragement during the completion of this project.
REFERENCES
1. M.R. Hill. Walking, Crossing Streets, and Choosing Pedestrian Routes: A Survey of Recent Insights from the Social/Behavioral Sciences. Nebraska Studies Monograph Series. University of Nebraska, Lincoln, in press.
2. D.A. Routledge, R. Repetto-Wright, and C.I. Howarth. The Exposure of Young Children to Accident Risk as Pedestrians. Ergonomics, Vol. 17, 1974, pp. 457-480.
Transportation Research Record 959
3. M. L. Reiss. Young Pedestrian Behavior. Transportation Engineering, Vol. 47, No. 10, 1977, pp. 40-44.
4. M. Wolff. Notes on the Behavior of Pedestrians. In People in Places: The Sociology of the Familiar (A. Birenbaum and E. Sagar in, eds.) , New York, Praeger, 1973, pp. 35- 48.
5. D. Garbrecht. The Binomial Model of Pedestrian Flows. Traffic Quarterly, vol. 23, 1969, pp. 587-595.
6. D. Garbrecht. Pedestrian Paths Through a Uniform Environment. Town Planning Review, Vol. 41, 1971, pp. 71-84.
7. M.R. Hill. Pedestrian Behavior in an Urban Environment. Department of Geography, University of Nebraska-Lincoln, 1975.
8. M.R. Hill. Pedestrians, Priorities, and Spatial Garnes. In Priorities for Environmental Design Research ( s. we idernann and J. R. Ander son, eds.), Environmental Design Research Association, Washington, D.C., 1978, pp. 126-136.
9. M. R. Hill. Spatial Structure and Decision-Making Aspects of Pedestrian Route Selection Through an Urban Environment. Ph.D dissertation. University of Nebraska-Lincoln, 1982.
10. M.R. Hill. Spatial Propinquity as an Applied Concept in Environmental Research and Design. In The Behavioral Basis of Design (P. Suedfeld and J.A. Russell, eds.), Hutchinson Ross, Stroudsburg, Pa., 1976, Vol. 1, pp. 63-68.
11. G.K. Zipf. Human Behavior and the Principle of Least Effort. Addison-Wesley, Reading, Pa., 1949.
12. A. Rapoport and R. Hawkes. The Perception of Urban Complexity. Journal of the American Institute of Planners, Vol. 36, No. 2, 1970, pp. 106-111.
13. A. Rapoport. Human Aspects of Urban Form: Towards a Man-Environment Approach to Urban Form and Desian. Peraarnon Press. Oxford. England, 1977.
14. A. Rapoport. On the Perceptual Separation of Pedestrians and Motorists. In Road Safety: Research and Practice (H.C. Foot, A.J. Chapman, and F.M. Wade, eds.), Praeger, London, 1981, pp. 161-167.
15. C. Perin. With Man in Mind: An Interdisciplinary Prospectus for Environmental Design. MIT Press, Cambridge, Mass., 1970.
16. J. Piaget and B. Inhelder. The Child's Conception of Space. Routledge and Kegan Paul, London, 1956.
1 7. M. Merleau-Ponty. The Phenomenology of Perception. Humanities Press, New York, 1963.
18. M.R. Hill. Space and the Experimental Study of Human Crowding. Great Plains--Rocky Mountain Geographical Journal, Vol. 6, No. 2, 1977, pp. 246-254.
19. M.R. Hill. Misunderstanding the Goals of Science: Myths, Reconciliation, and an Example. .!.!:! Environmental Design Research, Theory and Application (A.D. Seidel and s. Danford, eds.), Environmental Design Research Association, Washington, D.C., 1979, pp. 248-255.
2 0. D. Garbrecht. Pedestrian Movement: A Bibliography. Exchange Bibliography 225. Council of Planning Librarians, Chicago, Ill., 1971.
21. M.R. Hill. Pedestrian Behavior and Facilities Design: Selected Bibliography 1970-1975. Exchange Bibliography 1112. Council of Planning Librarians, Chicago, Ill., 1976.
22 . D. Garbrecht. Gehen: Pladoyer fur das Leven in der Stadt. Beltz Verlag, Weinheirn, West Germany, 1981.

23. M.R. Hill. Man-Environment Studies, Vol. 11, Nos. 1 and 2, 1981.
24. M.R. Hill. Recent Social/Behavioral Science Contributions to Our Understanding of the Pedestrian Experience: A Brief Review. In Feet Accompli: Linking People with Places, Proc.,
55
Third Annual Pedestrian Conference, Boulder, Colo., 1982.
Publication of this paper sponsored by Committee on Pedestrians.
Role of Bicycles in Public Transportation Access MICHAEL A. REPLOGLE
ABSTRACT
Bicycles play a vital role in access and egress for rail and express bus services in Japan and northwestern Europe as well as in a growing number of communities in the united States. suburbanization has been a driving force for the growth of bicycletransit linkage. In many suburban towns in Japan, West Germany, Denmark, and the Netherlands, 25 to 50 percent of rail station access trips and up to 20 percent of station egress trips are made by bicycle. The number of trips involving a combination of bicycles and public transportation has quadrupled in Japan and doubled in Denmark since the early 1970s. In the United States, high bicycle theft rates have restrained similar growth except for transit systems that have made special provisions for bicycle access. Significant use of bicycles for transit access is found only where bicycle theft rates are relatively low or where secure bicycle parking has been provided at transit stops. The evolution of transit access systems is discussed and park-and-ride versus bike-and-ride transit access are compared with regard to capital and operating costs, air pollution and energy use, impacts on transit ridership, implications for transit stop siting, and other factors. It is concluded that American transit agencies could substantially increase suburban transit use without increased operating costs by improving bicycle-transit integration. Bike-and-ride development is far more cost-effective than park-and-ride development.
This study arose out of research begun at Public Technology, Inc., the technical arm of the National League of Cities. A search for information about bicycle-transit linkage revealed that little information has been available on the experiences of American transit agencies. Even less information has been available in English regarding the role of bicycles as an access and egress mode to public transporta-
tion in other mature industrialized societies. Although the number of U.S. transit operators initiating bicycle-transit linkage programs has been growing, no body of information has existed to guide these efforts.
The collection of both descriptive and analytical data on bicycle-transit linkage was carried out through the course of 8 months of research, site visits, and meetings with transit agency and government officials, businessmen, and citizen activist leaders in Japan, the Netherlands, West Germany, and Denmark. Additional research was conducted over a 2-year period in the United States.
A more extensive presentation of findings is contained in a recently Bicycles and Public Transportation: Suburban Transit Markets, published Federation, Washington, D.C. (!_).
BACKGROUND
the research released book,
New Links to by the Bicycle
The traditional market base for public transportation has been eroded by the shift of population and employment growth from dense urban centers to suburbs and small cities. Although transit agencies have expanded their routes and services into these new areas of growth, it has become ever more difficult to provide cost-effective public transportation within walking distance of the places to which people want to go. Suburban growth has far outpaced the development of suburban transit services.
Suburbanization and deurbanization have not been confined to the united States but are common trends in Japan and Europe as well. By 1980 one-third of all western European cities with more than 200,000 residents were losing population ( 2) • Between 1960 and 1971, all major Dutch metropolitan areas showed significantly faster rates of employment growth in suburban areas than in their urban cores, with a dee rease in absolute employment in two out of seven metropolitan regions (_~). Similarly, the fastest rates of population and employment growth in Japan are in the areas at the fringe of metropolitan reg ions, whereas the population of major urban cores has been declining since the mid-1960s (3).
With more people living at greater distances from transit routes than at any time in the past century, the mainstay of transit access and egress, walking, is being replaced increasingly by other access and
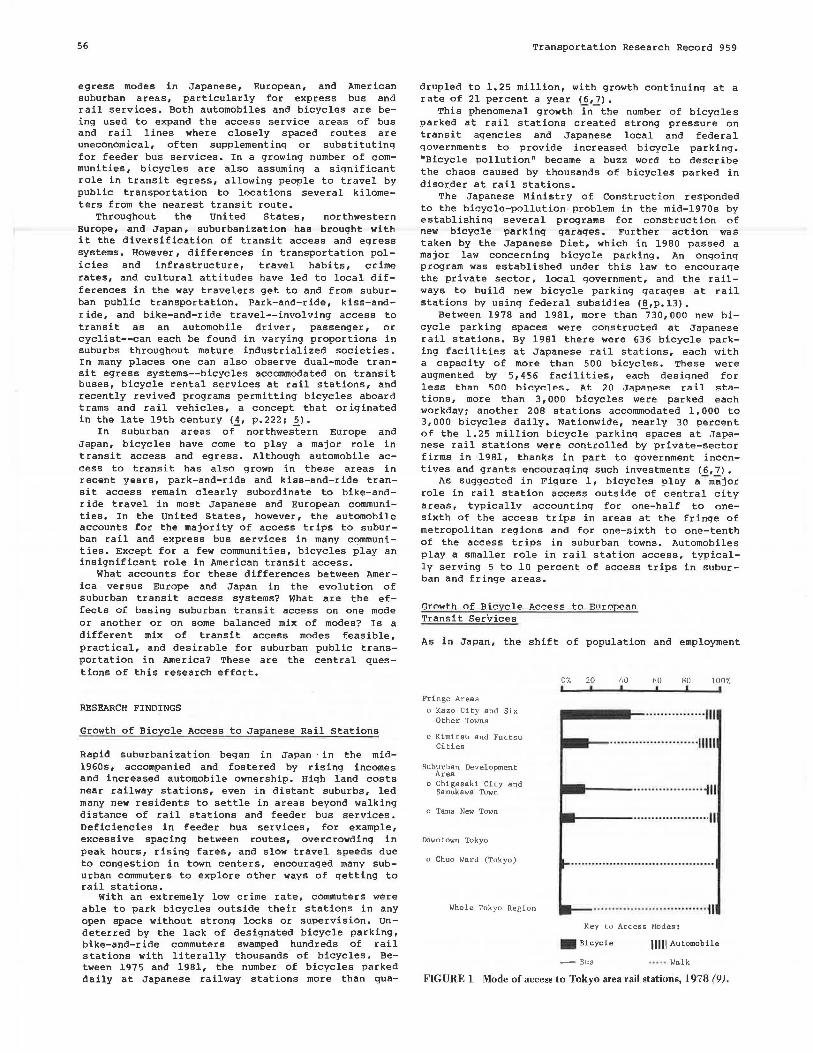
56
egress modes in Japanese, European, and American suburban areas, particularly for express bus and rail services. Both automobiles and bicycles are being used to expand the access service areas of bus and rail lines where closely spaced routes are uneconomical, often supplementing or substituting for feeder bus services. In a growing number of communities, bicycles are also assuminq a siqnificant role in transit egress, allowing people to travel by public transportation to locations several kilometers from the nearest transit route.
Throughout the United States, northwestern Europe, and Japan, suburbanization hal'l brought with it the diversification of transit access and egress systems. However, differences in transportation policies and infrastructure, travel habits, er ime rates, and cultural attitudes have led to local differences in the way travelers get to and from suburban public transportation. Park-and-ride, kiss-andr ide, and bike-and-ride travel--invol ving access to transit as an automobile driver, passenger, or cyclist--can each be found in varying proportions in suburbs throughout mature industrialized societies. In many places one can also observe dual-mode transit egress systems--bicycles accommodated on transit buses, bicycle rental services at rail stations, and recently revived programs permitting bicycles aboard trams and rail vehicles, a concept that originated in the late 19th century (_!, p.222: ~).
In suburban areas of northwestern Europe and Japan, bicycles have come to play a major role in transit access and egress. Although automobile access to transit has also grown in these areas in recent years, park-and-ride and kiss-and-ride transit access remain clearly subordinate to bike-andr ide travel in most Japanese and European communities. In the United States, however, the automobile accounts for the majority of access trips to suburban rail and express bus services in many cqmmunities. ~xcept for a few communities, bicycles play an insignificant role in American transit access.
What accounts for these differences between America versus Europe and Japan in the evolution of suburban transit access systems? What are the effects of basing suburban transit access on one mode or another or on some balanced mix of modes? Is a different mix of transit access modes feasible, practical, and desirable for suburban public transportation in America? These are the central questions of this research effort.
RESEARCH FINDINGS
Growth of Bicycle Access to Japanese Rail Stations
Rapid suburbanization began in Japan ·in the mid-1960s, accompanied and fostered by rising incomes and increased automobile ownership. High land costs near railway stations, even in distant suburbs, led many new residents to settle in areas beyond walking distance of rail stations and feeder bus services. Deficiencies in feeder bus services, for example, excessive spacing between routes, overcrowdinq in peak hours, rising fares, and slow travel speeds due to congestion in town centers, encouraged many suburban commuters to explore other ways of qetting to rail stations.
With an extremely low crime rate, commuters were able to park bicycles outside their stations in any open space without strong locks or supervision. Undeterred by the lack of designated bicycle parking, bike-and-ride commuters swamped hundreds of rail stations with literally thousands of bicycles. Between 1975 and 1981, the number of bicycles parked daily at Japanese railway stations more than qua-
Transportation Research Record 959
drupled to 1.25 million, with growth continuinq at a rate of 21 percent a year (6,7).
This phenomenal growth in- the number of bicycles parked at rail stations created strong pressure on transit agencies and Japanese local and federal governments to provide increased bicycle parking. "Bicycle pollution" became a buzz word to describe the chaos caused by thousands of bicycles parked in disorder at rail stations.
The Japanese Ministry of Construction responded to the bicycle-pollution problem in the mid-1970s by establishing several programs for construction of new bicycle parking garages. Further action was taken by the Japanese Diet, which in 1980 passed a major law concerning bicycle parking. An onqoing program was established under this law to encouraqe the private sector, local government, and the railways to build new bicycle parkinq garages at rail stations by using federal subsidies (_!!.,p.13).
Between 1978 and 1981, more than 730,000 new bicycle parking spaces were constructed at Japanese rail stations. By 1981 there were 636 bicycle parking facilities at Japanese rail stations, each with a capacity of more than 500 bicycles. These were augmented by 5,456 facilities, each designed for less th;rn "inn hi r.yr.l Ps. At: 70 .Japnnf>SP rn i l st:ntions, more than 3, 000 bicycles were parked each workday: another 208 stations accommodated 1, 000 to 3, 000 bicycles daily. Nationwide, nearly 30 percent of the 1.25 million bicycle parking spaces at Japanese rail stations were controlled by private-sector firms in 1981, thanks in part to government incentives and grants encouraging such investments (6,7).
l\s suggested in Figure 1, bicycles play a - major role in rail station access outside of central city areas, typically accounting for one-half to onesixth of the access trips in areas at the frinqe of metropolitan reg ions and for one-sixth to one-tenth of the access trips in suburban towns. Automobiles play a smaller role in rail station access, typically serving 5 to 10 percent of access trips in suburban and fringe areas.
Growth of Bicycle Access to European Transit Services
As in Japan, the shift of population and employment
Fringe Areas
o Kazo City end Six Other Towns
o Kimitsu and Futtsu Cities
Suburban Development Area
o Chigasaki City and Samukawa Town
o Tama New Town
!Xlwn town Tokyo
o Chuo Ward (Tokyo)
Whole Tokyo Region
0% 20 RO 100%
---~···· · ·· ·· .... ···Ill
Key to Access Modes:
• Bicycle 11111 Automobile
-Bus ·· · ·· Walk
FIGURE 1 Mode of access to Tokyo area rail stations, 1978 (9) .

Replogle 57
Population of City or Town .
07. 20 40 60 80 l 007.
Over 200,000 ---------···········1111
80 ,000 - 200 ,000
30,000 - 80 , 000 ------················ ····· ··1111
Under 30, 000 ------····················1111
Rural Areas . ---~---· ······· ·· ··· · ··flllllll
• Bicycle fllll Automobile - B¥~a~
FIGURE 2 Mode of access to Dutch rail stations, 1968.
··•• Walk - Other
growth to suburban areas and small cities and towns has brought about major chanqes in the modal composition of transit access trips in Europe, particularly for rail services. As sugqested in Figure 2 (data from Dutch national railway, Nederlandse Spoorwegen (NS)] bicycle access to transit has been most important in suburban areas, satellite cities, and large towns in the Netherlands. Although only 11 percent of access trips to Dutch rail stations in cities with more than 200, 000 population were made by bicycle in 1968, more than one-third of station access trips in cities and towns with less than 200,000 population were by bicycle in this same year.
As more people have moved from dense urban centers to lower-density areas where feeder bus and tram services are less widely available and offer lower quality of service, the share of rail station access of bus, tram, and walking has declined. Bicycle and automobile access have increased in importance. As shown in Figure 3, the share of rail station access trips made by bicycle in the Netherlands has doubled since 1960 (9,10); 36 percent of Dutch railway passengers, as wcllas 10 to 20 percent of regional bus passengers, bicycled to their transit boardinq point in 1981. In contrast, automobiles provided rail station access for only 1 out of 10 Dutch rail passenqers in this same year C2r!Q.l •
Similar changes in the composition of rail station access trips have been noted in Denmark and West Germany since the early 1970s (11, p.90; _!1, p. 48). The share of all travel involving a combination of bicycles and transit more than doubled in Denmark in the 1970s (12, p. 48). By 1981, one out of seven rail passenger;;-in the Copenhagen region arrived at
0% 20 40 60 80 100%
1960
·--1-----::::::::::_-__ -~::::1 ·------···· ·· ·······111111J
1968
1978
-Bicycle 1111 Automobile
- Bus & Tram Walk - Other
FIGURE 3 Change in distribution of rail station access modes in the Netherlands, 1960-1978 (9, 10).
the station by bicycle. In some West German and Dutch suburban towns bicycles account for roughly half of all railway access trips (9,13), as shown in Table 1. The increased use of bicycles for suburban transit access has led transit agencies, railroads, and local and federal governments to develop extensive bicycle parking at transit stations in northwestern Europe.
In the Netherlands more than 160,000 bicycle parking spaces are available at rail stations nationwide, including 90, 000 covered and guarded spaces at 80 of the principal railway stations (_~).
The Dutch national railway, NS, recently installed 10,000 secure bicycle lockers at low-volume stations to stem the growinq problem of bicycle theft from unguarded bicycle racks. At least 10 bicycle parking racks are provided at each of more than 200 bus stops served by companies affiliated with the Exploitatieve Samenwerking Openbaar (ESO), the coordinating body for interurban and nonmetropolitan bus operators in Holland. According to ESO planners, 10 to 20 percent of ESO bus patrons use bicycles to reach the bus stop.
In both west Germany and Denmark, more than so, 000 bicycle parking spaces are available at rail and bus stops nationwide. The city of Odense, Denmark, has provided extensive bicycle parking at most suburban bus stops in the reqion. A number of guarded bicycle parking qarages at rail stations, accommodating from several dozen to more than 1,000 bicycles each, can be found throuqhout Denmark and west Germany.
Bicycle use for transit eqress has also expanded considerably. The growth of employment in suburban areas poorly served by transit has led an increasing number of commuters to store a second bicycle overnight at a transit stop near their workplace in locations where secure parkinq is available. The use of rental bicycles at rail stations in Japan and Europe by both recreational cyclists and commuters has grown substantially. In dozens of cities it is now possible for cyclists to carry bicycles on board buses, trams, or railways, making it possible to travel almost anywhere throughout certain metropolitan and rural areas without the need for an automobile. In the Nethe r l ands, 1 out of 10 railway trips is completed by using a bicycle for station egress at the nonhome trip end (10). Clearly the bicycle has become an important element in the continued vitality of suburban public transportation in Japan and northwestern Europe.

58 Transportation Research Record 959
TABLE 1 Percentage of Transit Access and Egress by Bicycle and Automobile
Percentage of all Access and Egress Trips by Mode
Access Trips Egress Trips
Location Year Bicycle Automobile Bicycle Automobile
Netherlands National sample of Dutch rail stations (9} Home-based trips (all) 1982 36 11 10 5 Work trips 1982 43 17 11 3 School trips 1982 56 4 22 1 Recreational travel 1982 34 10 6 7
Rail stations, six midsized Dutch towns (JO) 1980 47 14 20 3 Denmark S-Bane, Copenhagen, Denmark 1979 15 7 7 I Heavy rail line , Heisinger-Copenhagen, Denmark 1979 21 6 8 3
West Germany West German railway stations (I 1)
Hassloch (Rhein-Neckar region) 1979 43 N.A. N.A. N.A. Bohl-lggelheim (Rhein-Neckar region) 1979 31 N.A. N.A. N.A. Eichenau (Munich region) 1976 25 N.A. N.A. N.A. Olching (Munich region) 1976 23 N.A. N.A. N.A.
Note: Source for Danish data: DSB (Danish State Railways), Copenhagen, Denmark.
Bicycle-Transit Integration in America
Althouqh the linkaqe of bicycles with public transportation in the United States has grown substantially since the early 1970s, it remains quite underdeveloped in relation to Europe and Japan. Only a handful of American transit aqencies and local governments have installed secure bicycle parking at rail and bus stops. However, in a qrowinq number of communities scattered from Connecticut and New Jersey to Illinois and California, secure bicycle parking is enabling 5 to 10 percent of suburban railway and express bus passengers to rely on bicycles for t ~am!i t access (l..1-1 7) •
Thanks to the provision of 2,000 secure bicycle racks and lockers at its San Francisco area stations and a bike-on-rail proqram that permits bicycles inside passenger coaches except for peak-direction peak-period travel, the Bay Area Rapid Transit (BART) carries thousands of passengers daily who regularly use bicycles for station access. At some suburban BART stations, 5 percent of the passengers arrive by bicycle, according to planners at BART. Surveys conducted by the California Department of Transportation (Caltrans) have shown that 40 percent of the cyclists renting bicycle lockers at Southern Pacific Railway stations between San Francisco and San Jose are storing bicycles overnight in their lockers, enabling them to cycle from the station to remote employment centers each workday. In Santa Barbara, California, the introduction of buses towing bicycle trailers attracted more than 42,000 passengers with bicycles in 1981, boosting ridership substantially and diverting thousands of passenger trips from automobiles to transit (18).
Despite the great promise shown~y these efforts to promote bicycle-transit linkage in America, transportation planners and managers have qiven little attention to the potential role of bicycles in expanding suburban transit markets and reducing the financial, energy, and environmental costs of transit access systems. In sharp contrast to the multimodal approaches pursued in Japan and Europe, the development of suburban transit access systems in America has focused almost entirely on the construction of park-and-ride lots. Indeed, in countless American suburbs, the majority of passengers on express buses and railways rely on automobile access and are offered no other workable transit access alternatives. Yet roughly half of all Americans using
park-and-ride lots travel access distancca of lccc than 2 miles (19).
Bicyc le The f t a nd Bicyc l e Pa rk i ng
Although many factors influence the demand for bicycle access to suburban express bus and rail services, it appears that one of the most significant factors is the availability of secure bicycle parking conditions. Such conditions are found either where bicycle theft rates are low or where secure parking facilities have been provided. The availability of sec1_1re b i cyc l lO' parking conditions does not guarantee any particular level of bike-and-ride demand. However, secure parking conditions are necessary if latent bike-and-ride demand is to be realized.
Bicycle theft, like most crimes, occurs at a siqn ificantly higher rate in the United States than in most other mature industrialized societies. A comparative analysis of the frequency of bicycle theft, shown in Table 2, reveals that the per-capita bicycle theft rate in the United States is roughly an order of magnitude greater than the rate observed in Jifpan in 1970, five times greater than the current
TABLE 2 Bicycle Theft: An International Comparison
Estimated Bicycles Stolen per
No. of Reported Total Estimated 100,000 Country Bicycle Thefts Year Bicycle Thefts• Population
Japan 115,000 1970 115,ooob 100 246,000 1980 246,000b 212
Denmark 21,000 1981 75,000C 494 West Germany 323 ,204 1979 323,204d 527 United States 674,654 1979 2,595,000° 1,153
8AJJ data on bicycle thert are somewhat unreliable because of underreporting or minor thefts without personal contact. Because of differences in social values and altitudes. the rate of underreporting varies widely between different nations. These data have been adjusted to account for underreporting where this is significant. bEstimate given by officials of the I apanese Transport Ministry end the Sei:retariat of the Prime Minister. According to several Japanese officials, most crime, including bicycle theft, is reported to police in Japan. CReported bicycle thefts are from insurance company reports. Estimated bicycle theft data are from estimates of the Danish Transport Ministry and officials of DSB. d From report by Schafer (20, p. 2 54), who reports that the overwhelming maiority of {West German) bicycle thefts are reported to police. eReported bicycle theft data from Uniform Crime Reports (21). According to U.S. Justice Department surveys, 74 percent of personal larceny crimes without contact were unre· ported to police. This estimate has been used to derive total estimated thefts.

Replogle
rate in Japan, and more than double the current theft rate in Denmark and West Germany.
Because people will park their bicycles at a transit stop only if they are reasonably assured that it will not be vandalized or stolen, the absence of secure bicycle parkinq facilities deters bike-and-ride travel only in regions with a hiqh incidence of bicycle theft. In circumstances where bicycle theft and the adequacy of the bicycle parkinq supply do not constrain the growth of bike-and-ride travel, the true potential of bicycle access to transit is revealed. Such conditions have prevailed in Japan, where theft rates have been low and where bicycle parking has been installed primarily to restore order to rail station squares (22).
The qrowth of bicycle access to t~sit in northwestern Europe similarly occurred in an environment with a low bicycle theft rate relative to_ the United States. Although in the past several years, bicycle theft has become a greater problem, particularly in urban areas of the Netherlands, transit agencies and governments have responded by constructing secure bicycle parking garages and bicycle lockers at numerous rail stations.
The absence of secure l::!icycle parking at most transit stops in America has exposed potential bikeand-ride travelers to generally unacceptable risks of bicycle theft. As noted in a recent U.S. Department of Transportation study (23), "Fear of theft is a significant disincentive tO- bicycle transportation •••• A recent Baltimore Maryland, survey of cyclists [ (l!J ] discovered that 25 percent of those polled had had their bicycle stolen. Twenty percent of those who had been theft victims reported that they gave up bicycling as a result of the experience." In a survey conducted by Barton-Aschman Associates in Pennsylvania, it was found that half of all bicycle commuters were afraid that their bicycles would be stolen at work (25). Bicycle thefts are at least three times more common than automobile thefts in the United States, and although threefourths or more of all stolen cars are recovered, less than one-fifth of stolen bicycles are restored to their owners (11) •
Thanks to relatively low crime rates, the consumer demand for bicycle parking at transit stops in Europe and Japan was manifested physically for all to see. In the United States, however, widespread bicycle theft and vandalism prevents cyclists from parking at most transit stops unless they are equipped with secure bicycle storage. Only a supplypush strategy--installing and marketing secure bicycle parking at transit stops--can release the latent demand for bike-and-ride services in America.
Many types of bicycle parking facilities have been successfully employed to provide secure parking conditions. Different types of facilities are needed to meet different local conditions.
Transit stop bicycle lockers, which fully enclose the bicycle, have been successfully demonstrated by many U.S. transit agencies and state and local governments to meet the needs of regular bike-andride commuters. Coin-operated bicycle lockers and lockers secured by user-supplied locks, which would be most useful for occasional bike-and-ride commuters, have proved troublesome in the United States because of abuse <.!.!> , althouqh these have operated successfully in Europe.
Secure bicycle racks, which offer theft protection to the bicycle frame and to one or both bicycle wheels, have been provided at a number of u.s. transit stops. In many locations, these have provided adequate security. However, in higher-crime locations many bicycles have been vandalized while secured in such racks. Whenever possible, bicycle
59
racks at transit stops should be sited in locations with high visibility, preferably where a station attendant or pedestrians will provide informal deterrence to vandals and thieves.
Guarded bicycle parking facilities are common in Europe and Japan but have not yet been employed in the United States. Such facilities can be more economical than bicycle lockers if a current employee, such as a station attendant, can be assiqned the added role of parking guard or if the number of parked bicycles is sufficient to generate adequate daily revenues. Ninety thousand guarded bicycle parking spaces are provided at Dutch railway stations for a monthly operating cost of $5.25 per space. The smallest of these bicycle parking garages holds 134 bicycles. The Dutch bicycle parking attendants earn an average of more than $17, 000 per year. The demonstration and evaluation of guarded bicycle parking at rail stations with substantial bike-and-ride demand should be undertaken in the United States, because such facilities can serve regular, occasional, and first-time bike-and-ride commuters equally well, unlike leased lockers and racks (_!) •
Implications of Bicycle-Transit Linkage for U.S. Transit Agencies
Several surveys have indicated that many more American rail commuters would use bicycles for station access if secure parking were installed. More than 40 percent of the passengers polled by the New Jersey Department of Transportation at five commuter rail stations would consider cycling to the station if such facilities were available (15). In a survey by the Connecticut Department of Transportation, it was indicated that 23 percent of the passengers on the New Haven commuter rail line would use protected bicycle parking if it were installed at their station (14). Moreover, roughly half of the passengers who expressed an interest in bicycle parking in both of these surveys currently park their automobiles in the filled-to-capacity station park-and-ride lots. Provision of bicycle parkinq could thus make additional park-and-ride capacity available.
Improved bicycle-transit linkage can also expand the market penetration for express bus and rail services. In a survey by Cal trans of those who use bicycle lockers at park-and-ride lots in the San Francisco region, it was found that 68 percent of the bike-and-ride travelers at lots served by buses and 30 percent of the bike-and-ride travelers at lots served by railways formerly drove automobiles to make their trip.
In Santa Barbara, California, a comprehensive bicycle-transit integration system combininq the provision of bicycle parking at bus stops and a bikeon-bus service dramatically boosted transit market penetration in areas beyond walking distance of bus routes. Ridership on the demonstration project bus routes rose by 46 percent in 1980, whereas the level of bus service increased only 19 percent and systemwide ridership grew by 15 percent. The share of access trips made by bicycle to these routes jumped f ram 1. 5 to 2 3 percent over 2 years. In the Santa Barbara region as a whole, 7 percent of employees, 14 percent of households, and 23 percent of the student population used a bicycle to reach a bus stop during the 2 year demonstration project (18).
The potential market for bicycle-transit integration in the United States is quite large. Approximately 100 million Americans own bicycles. Although precise data are unavailable, data from the 1977 National Personal Transportation Study suggest that

60
approximately 16 to more than O. 25 mile (3200 m) from the route (W.
24 million U.S. workers live ( 400 m) and less than 2 miles nearest public transportation
Few of these workers now use transit to qet to work, in part because of the lack of an inexpensive, convenient, and fast transit access system suited to trips of this distance. Although 13 percent of U.S. workers living within 0.50 mile (BOO m) of a transit route commute by public transportation, this figure falls to 4 percent for those living 0.5 to 2 miles away from a rail or bus stop. Indeed, only onefourth of all transit commuters in the United States live beyond a 0.25-mile walking distance from transit (26, Tables A-16, A-17, and pp. 19-20).
If public transportation is to serve a larqer market in suburban areas without a prohibitively expensive expansion of collection and distribution routes, opportunities for transit access and egress by private modes of transportation must be expanded.
Park-and-Ride versus Bike-and-Ride
Park-and-ride services have underqone a dramatic expansion in the United States over the past two de'-'"ll;,s " "ll "<" now a vilal elemenl in suburban transit services. Although park-and-ride transit access trip lenqths can range up to 5 miles (B km) or more, average access trip lengths range from less than 2 miles (3.2 km) to about 3.5 miles (5.6 km) for remote park-and-ride lots (19,2.1). By expanding the access service area of express transit services, park-and-ride lots have boosted suburban transit use in many communities, attracting choice riders. However, further development of park-and-ride services to increase suburban transit market penetration will only be achieved at a substantial cost, with likely diminishinq returns.
De s p i te the intense promot i on of park-and-ride systems for enerqy conservation and pollution reduct ion, bike-and-ride systems have been found to be a far more cost-effective strategy to pursue these objectives. A major American enqineering consulting firm involved in park-and-ride lot planning and construction estimates the typical construction cost of park-and-ride lots at $3, 640 per automobile space, excluding land costs. Where drainage structures or cut-and-fill work are required, the cost may be as much as twice this amount (1). In contrast, secure bicycle parking typically costs $50 to $500 per space for capital construction, excluding land costs (which are lower because of reduced space requirements).
Operating expenses show similar differentials between automobile and bicycle parking, ranqing from 2:1 to 10:1. Although a typical unattended park-andride lot costs $150 or more per year for operations and maintenance, this figure ranqes from a few dollars to about $70 per year for bicycle parking (1). In contrast, covered, enclosed, and guarded bicycle parking in the Netherlands requires $64 a year in operating and maintenance costs, including a modest profit for the contract operators. The vast difference in costs between automobile and bicycle parking has major implications for suburban transit access policy and transit cost containment.
From the perspective of transit route planning, bike-and-ride systems offer far greater flexibility in siting transit stops that do park-and-ride systems. Automobile parking typically requires as much as 330 ft 2 (30 m2 ) of land per space, compared with 6 to 12 ft 2 (0.5 to 1.0 m2 ) needed for ground-level bicycle storage spaces (24,27). As a result, parkand-ride lots are often ccmstrained in size or location. Typically either they offer inadequate capac-
Transportation Research Record 959
ity relative to the potential demand for private vehicular access at a transit station or they must be sited in remote locations unsuited for pedestrian access. In contrast, bicycle parkinq may be readily sited in congested areas around rail stations and in traffic-sensitive residential areas.
As a strategy to reduc e both air pollution and energy use, bicycle-transit linkage is far more cost-effective than further park-and-ride lot development. In a recent study by the Chicago Area Transportation Study it was found that the installation of secure bicycle parkinq at rail stations would reduce hydrocarbon emissions at a public cost of $311/ton ($0.34/kg) compared with $96,415/ton ($106/kg) for an express park-and-ride service, $214,959/ton ($237/ kg) for a feeder bus service, and $3,937/ton ($4.34/ kg) for a commuter rail carpool matching service. Similar differentials were found for carbon monoxide reduction costs (_~.~) •
Although automobile access trips to transit involve cold-start vehicle operation and the associated fuel use rates are several times higher than the average for all automobile travel, bicycle access trips require no petroleum at all. A preliminary analysis, shown in Table 3, reveals that for each American park-and-ride commuter diverted to bike-and-ride travel, gasoline use may be reduced by an average of roughly 75 gal (285 L) per year. A similar analysis reveals that by divertinq automobile commuters to bike-and-ride travel, averaqe savings may amount to roughly 400 qal (1500 L) of gaso-1 ine each year for every new bike-and-ride commuter. Although these diversions to bike-and-ride travel would likely result in some additional home-based use of automobiles by other household members, reducing fuel savings, the net enerqy savings remain substantial. If only 0.5 percent of the U.S. workers who now live 0. 25 to 2 miles from a transit route and commute by automobile could be attracted to b ike-and-ride travel, nationwid~ qaecline savings cf roughly 20 to 40 million gal (75 to 150 million L) per year would likely be achieved. The diversion of 10 percent of existing automobile park-and-ride commuters to bike and ride could similarly result i n
TABLE 3 Estimated Energy Effects of Bike-and-Ride Service Development in the United States
Estimation Explanation
Diverting Automobile Commuters to Bike and Ride
22 miles
x 0.074 gal/mile
1.63 gal/day
x 250 workdays/year
407 gal/year
Average two-way daily commuting distance for noncentral area SMSA automobile commuting trips (27)
Fuel use rate based on fleet fuel economy of 17 miles/gal with assumed reduction to 0.8 efficiency due to cold-start factor ( 1}
Fuel savings per day for each automobile commuter diverted to bike and ride
Fuel savings per year for each automobile commuter diverted to bike and ride
Diverting Existing Park-and-Ride Co mmuters to Bike and Ride
4.0 miles
x 0.147 gal/ mile
0.59 gal/day
x 250 workdays/year
14 7 gal/year
Average two-way daily automobile access distance for this group (assumed)
Fuel use rate based on fleet fuel economy of 17 miles/gal with assumed reduction to 0.4 efficiency due to cold-start factor (1)
Fuel savings per day for each park-and-ride commuter diverted to bike and ride
Fuel savings per year for each automobile commuter diverted to bike and ride
No te: 1 mile= 1.6 km; 1 gal = 3.8 L.

Replogle
gasoline use reductions of more than 1 million gal (3 million L) per year nationwide.
Despite the importance of the automobile in American transportation, one-third of all citizens do not possess a driver's license. Even in suburbia, some 12 percent of all households lack an automobile, and many households with two waqe earners must make do with one family automobile. Although not suitable for everyone in these market segments, bike-and-ride travel may offer a strong appeal to many such people.
In the evaluation of a federally sponsored demonstration project testing bicycle-transit linkaqe strategies in Santa Barbara, California, for example, it was found that only one-fourth to one-third of the passengers who parked bicycles at bus stops had an automobile available for their trip without imposing inconvenience on other household members. However, three-fourths of the bike-and-ride travelers came from households owning one or more automobiles compared with BO percent of general transit users and 90 percent of all households in the Santa Barbara region C,!!D •
In other words, although bike-and-ride services do attract those who use them by choice, they also attract many people from households where mobility is restricted by limited automobile availability combined with poor pedestrian access to suburban transit.
CONCLUSIONS
The experience in Japan, northwestern Europe, and a handful of American communities clearly suggests that bicycles can play a vital role in providing access to suburban express transit routes, both bus and rail. Bike-and-ride services can appeal to many travelers who have automobiles available for their journey and can also attract passengers who are not well served by the existing pedestrian and automobile transit access systems, thereby increasing suburban transit market penetration. Moreover, bicycle access to transit can be encouraged at a far lower cost than automobile access.
Although both automobiles and bicycles have a role in expanding the service areas of transit in lower-density areas, each provides complementary functions. An overreliance on automobile access to transit substantially increases the cost of the public transportation access system, reduces the mobility of those without automobiles, and neglects opportunities for greater fuel conservation and air pollution reduction.
The investments required to develop more multimodal transit access systems in America are modest and affordable. With the passage of the 1982 Surface Transportation Assistance Act, 100 percent funding for bicycle programs and facilities is now available from federal gasoline tax revenues. Programs designed to increase bicycle access to transit, including parking construction and marketing, qualify under this new law. If transit agencies or local governments apply to their state governments for such funds, they will be able to establish more balanced transit access systems without straining overextended operating budgets or requiring scarce local matching funds. A number of other federal funding programs, including transit capital grants, are also available to finance transit access system improvements.
Bicycle-transit linkage will likely contribute only modestly to the growth or stabilization of U.S. suburban public transportation. However, as suggested in this paper, the greater integration of bicycles with transit opens up new opportunities for
61
transit agencies at low cost in markets that have until now been neglected or penetrated only by relying on the more expensive strategy of park-and-ride services.
The fiscal austerity of the 1980s demands new approaches to transit development and the application of numerous small-scale, locally appropriate, lowcost strategies to promote better coordination between different transportation modes. Bicycle-trans! t integration has an important role to play in this larger context by helping to adapt transit to its modern nemesis, the suburb.
ACKNOWLEDGMENT
The material presented in this paper is drawn from the results of the author's recently released book, Bicycles and Public Transportation: New Links to Suburban Transit Markets (1), published in English by the Bicycle Federation, -Washington, D.C., and in German by the Umweltbundesamt (West German Off ice of Environmental Protection) in Berlin. This work was sponsored by the Bicycle Federaton with support from the Huffy Foundation, Rodale Press, the council for International Urban Liaison, and a German Federal Environmental contract.
The author wishes to thank all of the many individuals who assisted in providing information and ideas for this study, with special thanks to Katie Moran of the Bicycle Federation, Bill Wilkinson of the Bicycle Manufacturers' Association, Erhard Er 1 of Socialdata, and the staff of the Japan Bicycle Promotion Institute in Tokyo.
REFERENCES
1. M.A. Replogle. Bicycles and Public Transportation: New Links to Suburban Transit Markets. Bicycle Federation, Washington, D.C., 1984.
2. L.H. Klassen, J.A. Bovdrez, and J. Volmuller. Transport and Reurbanization. Gower Publishing Co., Ltd., Aldershot, Hants, England, 1981.
3. Japan's Metropolitan Policy. Japanese National Land Agency, Tokyo, 1977.
4. R.A. Smith. A Social History of the Bicycle: Its Early Life and Times in America. American Heritage Press, New York, 1972.
5. New Bicycle Holder. Street Railway Journal, Vol. 14, No. 1, Jan. 1898, p. 54.
6. Present Situation of Bicycle Ordinance by Local Governments, Number 3. Office of Traffic Safety Measurement, Prime Minister's Office, Tokyo, Japan, March 1982 (in Japanese).
7. Safe Utilization of Bicycles and Arrangements of Bicycle Parking Spaces. Office of Traffic Safety Management, Prime Minister's Office, Tokyo, Japan, 1980 (in Japanese).
B. Movement in Metro-Tokyo. Tokyo Metropolitan Region Transport Planning Commission, Tokyo, Japan, March 1980.
9. Fites en Trein. Nederlandse Spoorwegen, Tilburg, Holland, 1980 (in Dutch).
10. G. Teisman. Op De Fiets Naar Het station. Nederlandse Spoorwegen, Tilburq, Holland, June 1980 (in Dutch) •
11. P + R als Zubringer Zur Schnellbahn in Munchen. In Stadt Schnellbahnen und Stadtbahnen, Munich, Federal Republic of Germany, 1980.
12. Cykel- og Knallerttrafik. Projektgruppe N, Copenhagen, Denmark, Feb. 1981 (in Danish).
13. W. Patschke. Development Potential of the Plan to Link Systematically the Use of Bicycles and Rail Transport. Proc., Velo/City conference,

62
April 10-12, 1980, Bremen, Federal Republic of Germany.
14. Report of the Bicycle Locker Demonstration Program on the New Haven Rail Commuter Line. Off ice of Project Planning, Connecticut Department of Transportation, Wethersfield, March 1981.
15. w. Feldman. Bicycle as a Collector Mode for Commuter Rail Trips. In Transportation Research Record 808, TRB, National Research council, Washington, D.C., 1981, pp. 61-67.
16. S. Pinsoff. Transportation Control Measure Analysis: Bicycle Facilities. In Transportation Research Record 847, TRB, National Research council, Washington, D.C., 1982, pp. 86-93.
17. W. Wheeler. Mass Transit Companies Offer Bicycle Parking. Traffic Safety, Vol. 77, No. 6, June 1977, pp. 20-34.
18. D.A. Newman and M. Bebendorf. Integrating Bicycles and Transit in Santa Barbara, California. Office of Service and Methods Demonstration, U.S. Department of Transportation, March 1983.
19. J.M. Lutin, M. Liotine, and T.M. Ash. Empirical Models of Transit Service Areas. Transportation Engineering Journal of ASCE, Vol. 107, No. TE 4, July 1981, pp. 427-444.
2 O. H. Schafer. Comments on Bicycle Theft. Proc., Velo/City Conference, April 10-12, 1980, Bremen, Federal Republic of Germany.
21. Uniform Crime Reports. U.S. Department of Justice, 1979.
2 2. The Problems of Success: Japan's "Bicycle Menace". ITE Journal, Vol. 48, No. 8, Aug. 1978, p. 50.
23. K. Moran. Bicycle Transportation for Energy Conservation: Technical Report. U.S. Department of Transportation, 1980.
24. Bicycle Parking: A Design Manual. Baltimore county Bikeways Task Force, Baltimore, Md., n.d.
25. Bicycling in Pennsylvania. Barton-Aschrnan Associates, Evanston, Ill. i Commonwealth of Pennsylvania, Harrisburg, 1976.
26. A.B. Sosslau. Horne-to-work Trips and Travel. 1977 Nationwide Personal Transportation Study. Report 4. FHWA, U.S. Department of Transportation, 1980.
27. R. Ellis et al. Fringe Parking and Interrnodal Passenger Transportation: Operational Experience in Five Cities. FHWA, u.s. Department of Transportation, 1971.
28, Air Quality Evaluations of Selected Transportation Improvements. Chicago Area Transportation Study, Chicago, Ill., 1980.
The opinions and conclusions expressed or implied in thia paper arc those of the author, who assumes sole responsibility for any errors of content or omission.
Publication of this paper sponsored by Committee on Bicycling and Bicycle Facilities.
Bicycle-Motor Vehicle Accidents in the
Boston Metropolitan Region WENDY PLOTKIN and ANTHONY KOMORNICK, JR.
ABSTRACT
The Metropolitan Area Planning Council, the regional planning agency for the Boston metropolitan area, studied bicycle-motor vehicle accidents occurring within Route 128, a major beltway encircling 35 communities. A sample of one of every four accidents reported to the Massachusetts Registry of Motor Vehicles in 1979 and 1980 was chosen for review. Data were collected by a paid intern and by six volunteers who reviewed bicycle accidents occurring within their individual communities. This sampling technique resulted in a distribution of accidents by month and location statistically almost identical with the distribution for all accidents in the study area. The accidents were classified by using a modified version of the classification system developed by Kenneth Cross. The accident class with the highest frequency involved a motorist turning right or left at an intersection and hitting a bicyclist corn-
ing f rorn behind or from the opposite leg of the intersection. Virtually as frequent was the accident in which a motorist entered an intersection and struck a cyclist emerging from the orthogonal leg. These accidents occurred primarily among cyclists more than 18 years of age. Accidents in which the cyclist entered the road at a rnidblock location (bicycle ride-out) also occurred with some frequency, particularly among children younger than 11. Frequencies of key variables such as time of accident were also obtained. Recommendations include publicity of the study results, education of bicyclists and motor is ts, increased enforcement of traffic laws, and improved record keeping for ongoing classification of bicycle-motor vehicle accidents.
In 1982, in response to the request of the Environmental Protection Agency (EPA) for the development of reasonably available control measures (RACMs) to reduce air pollution in the Boston metropolitan

Plotkin and Komornick
area, the Metropolitan Area Planning Council (MAPC), which is the regional planning agency for the Boston metropolitan area, with 101 member communities, developed two projects to increase the use of bicycles for commuting in its area. One of these projects was a study of accidents between bicycles and motor vehicles in the Boston area patterned after the CrossFisher study completed in 1977 and the Missoula, Montana, study of 1981 (1,2). The purpose of the study was to identify the most common types of accidents occurring in the MAPC region and to develop a set of countermeasures to reduce the frequency of these accidents. The other project, which is ongoing, is an employer-based incentive program for bicycle commuting.
Several studies and articles had previously suggested the importance of fear for safety as a major deterrent against bicycle commuting (], p.18). rt was expected that the study would result in the implementation of recommendations for education and increased enforcement and directly reduce the number of accidents in the region. In addition, publicity about the study's findings could be used to increase motor is ts• and bicyclists' awareness about the most frequent accident classes and thereby motivate them to take actions to prevent their occurrence. Ultimately, it was hoped that these measures would result in the increased use of bicycles for commuting with a concomitant decrease in automobile""9enerated pollution.
In choosing to carry out this study, MAPC was aware of the limitations of the method used--review of police and operator accident reports. As has been pointed out in other studies of this type, only a fraction of the bicycle-motor vehicle accidents that occur are formally reported. Cross estimated that between 1972 and 1977, about 1,000 fatal and 40,000 nonfatal bicycle-motor vehicle accidents across the country were reported to police, whereas another 40,000 injury-producing accidents went unreported (_!, p.l).
Still, without an extraordinary effort, accident reports provide the best consistent source of · information about bicycle-motor vehicle accidents. Another suggested source of data is hospital records. The forms used would not be standardized and would include only the most serious accidents. They would also lose the advantage of involving the police in the study. It is beneficial for pol ice to be in -volved, because any recommendations for improved enforcement will rely largely on the police for implementation. Another possible benefit is that use of these forms for research purposes will encourage police, motor is ts, and bicyclists to complete them with greater attention to the quality of description. Currently, the quality of data is mediocre.
METHODOLOGY
The study was carried out between November 1982 and June 1983. Data from police and operator reports of bicycle-motor vehicle accidents occurring in 1979 and 1980 were obtained by the following methods:
1. A paid intern reviewed microfilm of accident reports at the state's Registry of Motor Vehicles and
2. Volunteers reviewed actual reports of accidents at six local police departments.
The area within Route 128, a major beltway in the region encompassing 35 cities and towns, including Boston and Cambridge, was chosen for the study (Figure 1). Because almost 2, 000 accidents had been reported for 1979 and 1980, it was decided to study a sample of the reported accidents.
.r : ..... , __ ,.· ', / • I 1~•- •)
-··-- I ,-, ~ \I ! _ _ _ :~· /... --
.... __ .... --,/~-·-..... ,
,, ,.., """"' ,-·
' ,l' ~ ; ... :_, ..
I
' ,,_...i: -°' '
.... 1""~ .. ',.
- ·Study Area Boundary
Data col lected at local police departments.
Data for all other citiPS & towns was obtained from the Massachusetts Registry of Motor Vehicles.
FIGURE 1 Study area.
63
The selection of accidents was made by using a computer printout provided by the Massachusetts Department of Public Works of all bicycle-motor vehicle accidents occurring in the study area during 1979 and 1980. One in four accidents was selected for review. When accident reports were missing from the reg is try of Motor Vehicles or the local police department, alternate reports were selected from this printout. This procedure resulted in a sample of 516 reports. [The similarity of the accidents in the sample to all reported accidents in the study area was examined on the variables of month and city or town of accident. A high correlation was found (Pearson's chi-square: p < 0.05, 34 df, city or town: p < 0.02, 34 df, month).) Of these, 87 provided insufficient information for accident classification purposes and were included in the results only for purposes of examining other variables such as month of year, time of day, and weather conditions. In total, 429 accidents were classified by using a modification of the Cross scheme (~) • (This sample size allows generalization of the distribution of accident classes to the study area as a whole at a confidence level of approximately 90 percent. Any other breakdown of the data, such as into accident types or age groups, will differ in the extent to which they can be generalized.)
CLASSIFICATION SCHEME AND MAPC REVISIONS
The Manual Accident Typing (MAT) scheme prepared by NHTSA in 1982 was used to classify the accidents (_!,p.6). This scheme is based on the classification system created by Kenneth Cross in his 1977 study, which classifies accidents according to four variables:

64
1. Precollision direction of travel of each op-erator,
2. Relative precrash m.otion of the two vehicles, 3. Operator errors, and 4. Characteristics of accident location.
In his study, Cross created 36 types (types 1-36) , which he grouped into seven classes (classes A-Gl. The MAT scheme added eight types to the Cross classification system and fitted these into classes A-G.
MAPC revised the MAT scheme slightly. Accident type 27 (Cyclist Overtaking) was removed from class G, and types 35 (Drive--Out1 On-Street Parking) and 41 (Cyclist Strikes Parked Vehicle) from the two MAT miscellaneous classes were used to create a new class, G [(Revised): Slowed or Parked Car]. It was believed that the accident types in this cl.ass represented a distinct set that may be addressed by specific countermeasures. "Other• or •weird" accident types, which were separate in the MAT system, were combined into class H [(Revised) : Other]. In a 11 other respects, the MPAC classification scheme is similar to the MAT system. [Readers are encouraged to contact Wendy Plotkin to request a detailed written description of the methodology. This will include a discussion of the problems involved in obtaining a record of bicycle-motor vehicle accidents, retrieving the data, using the data, and classifying the accidents. The MAT administrator's guide (4) contains a good discussion of potential problems as well.]
Below is a list of the eight classes used in the MAPC system:
1. Class A, Bicycle Ride-Out ley, or Other Midblock Location: emerging from a driveway, alley, location (such as over a shoulder liding with a motor vehicleo
from Driveway, AlInvolves a bicycle or other midblock or curb) and col-
2. Class B, Bicycle Ride-Out at Intersection: Involves a bicycle emerging at an intersection and proceeding straight across the intersection (accidents involving bicycles making right or left turns are included in class E).
3. Class C, Motorist Drive-Out: Involves a motor vehicle emerging from a midblock location (driveway, alley) or an intersection, thus paralleling classes A and B. Only motor vehicles proceeding straight across the intersection or turning right on red are included in this class (accidents involving motorists making right or left turns are included in class F) •
4. Class D, Motorist Overtaking and overtaking Threat: Involves a motor vehicle approaching from behind and colliding or almost colliding with a bicycle.
5. Class E, Bicyclist Unexpected Turn or Swerve: Involves a bicycle making a left or right turn at an intersection or swerving midblock into the path of an overtaking or approaching motor vehicle. Excluded are accidents where the bicyclist swings too sharply or too widely and collides with a motor vehicle on the perpendicular leg of the intersection, which are included in class H).
6. Class F, Motorist Turn: Involves a motorist turning right or left at an intersection and colliding with a motor vehicle approaching from behind or from the opposite leg of the intersection. Excluded are accidents where the motorist turns right on red (included in class C) or where the motorist makes a left-hand turn (included in class H).
7. Class G (Revised), Slowed or Parked cars: Involves a bicyclist overtaking and colliding with a motor vehicle that is slowed in traffic, parked, or entering or exiting parking. As mentioned previous-
Transportation Research Record 959
ly, this class was created by MAPC and was not included separately in the Cross or Missoula studies or NHTSA's MAT system.
8. Class H (Revised), Other: Involves unrelated accidents that do not tall under any of the foregoing classes. This class therefore cannot be analyzed as a class in terms of specific countermeasures; each of the types must be assessed individually. This class differs from the Cross or Missoula studies and from NHTSA's MAT system.
RESULTS OF STUDY
Description of Sample
Year of Accident (N = 516)
Of the 516 accidents, 45 percent occurred in 1979 and 55 percent in 1980. In calculating the percentages for the frequencies, only the cases in which information was available on the variable being studied were included. Significance tests for all comparisons are being computed and will be available in February 1984.
Month of Year (N = 513)
The majority of accidents occurred during the summer months, from June through August (54 percent). This is consistent with statistics provided by the Massachusetts Department of Public Works for the MAPC reg ion as a whole (Figure 2). Although no information on comparative ridership exists for the study area, a report by Buckley covering primarily Boston and its immediate neighbors shows a less steeply peaked distribution (5,pp.11-12). The difference may be due to a higher pr0portion of children in the study area relative to the area in which i:he Buckley bicycle counts were undertaken. In this case, it is assumed that children are more likely to ride in summer and to have accidents. Additional work is necessary to determine the relationship between accident counts and ridership. The accidents in the MAPC study showed a greater tendency to cluster during the summer months than those in the Cross study !lrP•ll7), which included two cities with year-long moderate weather in the sample.
Day of Week (N = 512)
Accidents were more likely to occur on weekdays; Friday was the day with the highest frequency (17 percent) and Sunday had the lowest frequency (10 percent). Results, shown in Figure 3, are consistent with those of both the MAPC and the Cross studies (l,p.112). This variable was not studied in the Buckley report (j) •
Time of Day (N = 479)
Accidents occurred during different time periods on weekdays and weekends. weekday accidents were concentrated during the afternoon peak hours, between 3:00 and 7:00 p.m. (42 percent). Weekend accidents were more likely to occur during the midday period, 10:00 a.m. to 3:00 p.m. (46 percent). These and the percentages for the other periods are shown in Figure 4.
Light Conditions (N = 488)
More than 82 percent of accidents occurred during

65
0 "2 (n•llll)
0.21 0.2
0.111 0.18 0.17
-' 0.18 c • 0.111 "a o.a Cl 0.13 ~ 0 .12 ... 0.11 0
= 0.1
• 0.011 0
" • 0.08 II. 0.07
0.08 0.05 o.o• 0.03 0.02 0.01
1a.n Feb liar Apr May Jun Jul Aue Sep Oct Nov Dec
a Sample + . Rqion
FIGURE 2 Accident frequency by month.
0.18
0.17
0 . 18
j 0.111
! 0.1"
'O 0.13
1 0.12
• 0.11 II.
0.1
0.09
O.OI llua lion Tu•
a Sample + Recion o Crou Non-rat.a.I
FIGURE 3 Accident frequency by day.
(n=-4.711) 100
110
80
• 70 .., c • "a 80 •• ~ .. 50 0
= •O • 0
" • 30 II.
20
10
0 Weekday W'eekead
3am ISSI 11-lOam ~ 10un-3pm ~ 3-7pm ~ 7pm-1
FIGURE4 Time of day.

66
daylight (Figure 5) • In the Cross study a similar percentage of daylight accidents (85 percent) was found and it was noted that this was consistent with several other studies of bicycle-motor vehicle accidents <.!•P·ll6).
Dark/Road Unlichted (l.6111) Dusk (6.6111) ~......-.---
Dark/Road Lighted (0.2111)
FIGURE 5 Light conditions.
weather Conditions (N = 481)
Most accidents occurred on clear days (88 percent) • Cloudy weather ( 5 percent) and rainy weather ( 5 percent) were the next most likely conditions under which accidents occurred. Snow was reported in less than 2 percent of the cases. These findings are consistent with those of the Cross study !.!,p.118).
Road Surface (N = 472)
Not surprisingly, given the above weather conditions, most of the accidents occurred on dry ~urfaces (91 percent). Wet surfaces accounted for 8 percent of the accidents and snowy surfaces for less than 1 percent. Cross does not report on this variable separately from weather.
Road Condition (N = 454)
Almost all of the accidents (97 percent) occurred on roads with no defects. Another 3 percent occurred on roads with holes, ruts, foreign matter, or other nonideal conditions. For more than 12 percent of the accidents there was no report on this variable. These findings are different from those in the Cross study (l,p.135). They also reflect the judgment of primarily operators and police, who filed most of the reports studied. Because so few bicyclists completed reports, it is not possible to determine whether their greater sensitivity to the condition of the road would result in a more critical judgment.
Age of Cyclist (N = 382)
Table 1 shows the distribution of the ages of bicyclists involved in accidents using the same categories as those chosen for the Cross study. Unfortunately, on 26 percent of the accident reports the cyclist's age was not given. Percentages both including and excluding these unreported ages are shown.
As can be seen from Table 1, cyclists between the ages of 6 and 19 accounted for more than 65 percent of the accidents in the MPAC study. Although this is high, it is still less than that accounted for in the cross study (_!,p. 83). More than 30 percent of
Transportation Research Record 959
TABLE 1 Age of Bicyclist
Percentage of Accidents
Including Excluding No.of Those Not Those Not Cross Study
Age Accidents Reported Reported (Nonfatal) (years) (N= 516) (N = 516)8 (N = 382) (N = 753 )"
<6 10 2 3 2 6-1 l 81 16 21 28 12-15 89 17 23 37 16-19 80 16 21 14 20-29 66 13 17 12 30-44 37 7 IO 4 45-59 15 3 4 2 60 4 I I 2 NA 134 26
Note: NA= data from reports on which age was not given . aActual total exceeds 100 percent because of rounding.
the accidents for which age was given on the report occurred to cyclists more than 20 years old.
Age was not recorded in the Bucklev report (5). However, the large number of universities in the area suggests a somewhat higher number of riders in the 17-25 age group (many of these colleges have graduate schools) than in other areas with fewer universities.
Cyclist Wearing Helmet (N = 516)
In more than 97 percent of the cases, the report did not indicate whether the bicyclist was wearing a helmet. In 3 percent of the cases, such compliance was indicated. However, the form of the question (a box with the instruction "Check if wearing helmet") and its obscure placement raise the possibility that many did not see the question.
Cyclist Injurv (N = 516)
In almost three-quarters of the accidents, the cyclist was reported as beino injured or killed (73 percent). There was one fatality in our sample. However, eight fatalities occurred in the study area during the study period, and all were included in our sample, resulting in an overrepresentation of fatalities.
Seriousness of Cyclist Injury (N = 382)
The injury categories of the accident report form and the proportions in each category are shown as follows i only accidents involving an injury or fatality are included in calculating percentages:
Ca t egory Killed Visible signs of injury (bleeding
wound, distorted member, or need
Percentage 2
to be carried from scene) 31 Other visible injury (bruises,
abrasions, swelling, limpinq, etc.) 45
No visible injury but complaints of pain or momentary unconscious-ness ?2
No injury reported ?7
Other Persons Injured (N = 12)
In only 12 cases (2 percent) was a person other than

Plotkin and Komornick
the cyclist injured. In 10 c:' these cases, it was another cyclist. In one case, it was a cyclist passenqer and in another a driver passenqer. In three other cases, the identity of the person injured was not shown. These results were similar to the findinqs in the Cross study.
Severity of Other Person's Injuries (N = 17.)
The severity of the other person's injuries was reported as follows:
Ca teqory Killed Visible siqns of injury (bleeding
wound, distorted member, or need
Percentaqe 0
to be carried from scene) 33 Other visible injury (bruises,
abrasions, swelling, limpinq, etc.) 42
No visible injury but complaints of pain or momentary unconscious-ness 25
Accident's Roadway Location (N = 491)
The majority of the accidents occurred at intersections (52 percent). After intersections, midblock locations accounted for the largest portion (30 percent), followed by driveways (16 percent). Alleys, rotaries, off ramps, parkinq lots, and other locations accounted for only a negliqible proportion of accidents (2 percent).
The Cross study (],,p.128) reported a lower proportion of accidents at intersections ( 44 percent) and a sliqhtly hiqher proportion of accidents at midblock locations (34 percent). '!'his is probably due to the qreater number of rural roads included in the study.
Traffic Controls Present (N = 241)
For the most part, presence of traffic controls was only indicated on reports for accidents that occurred at intersections. Traffic control information on the operators' reports proved to be unreliable
0.4
~ ... i:: I)
'ti 0.3 ·c; ~ .. 0 ... i:: 0.2 I) 0 .. m p..
0.1
FIGURE 6 Situation for motorist.
67
when checked aqainst the reviewer's knowledqe of the intersection. This was qenerally true where the operator reported that there were no traffic controls present. For this reason, for all reports that indicated no controls the intersections were verified with the local police department. The following fiqures are based on the verified information:
Type of Control Stop siqn Siqnal liqht None Other
Percentaqe 27 35 36 2
Percentaqe from Cross
59 30 ll
Traffic control information was not available for 6 percent of the intersections.
The Cross study thus showed a much higher percentage of intersections with stop siqns and a much lower percentage with no controls. The proportion with signal lights was approximately the same. It is likely that the differences are due in part to a higher proportion of uncontrolled intersections in the MAPC region. However, in the absence of additional information on this subject, the extent to which other factors account for the difference (e.g., failure of cyclists or motorists to yield at these intersections) is unknown.
Situation for Motorist (Before Accident) (N = 476)
Motorists proceeding straight ahead accounted for the highest proportion of accidents ( 48 percent) • Right turns (16 percent) and left turns (15 percent) were the next most likely maneuvers before the accident. Parked cars (6 percent) accounted for a significant number of accidents. These results are shown in Figure 6.
Situation for Cyclist (Before Accident) (N = 205)
Cyclists proceedinq straight ahead accounted for 63 percent of the accidents for which this information was available; making left turns accounted for 13
(n=476)
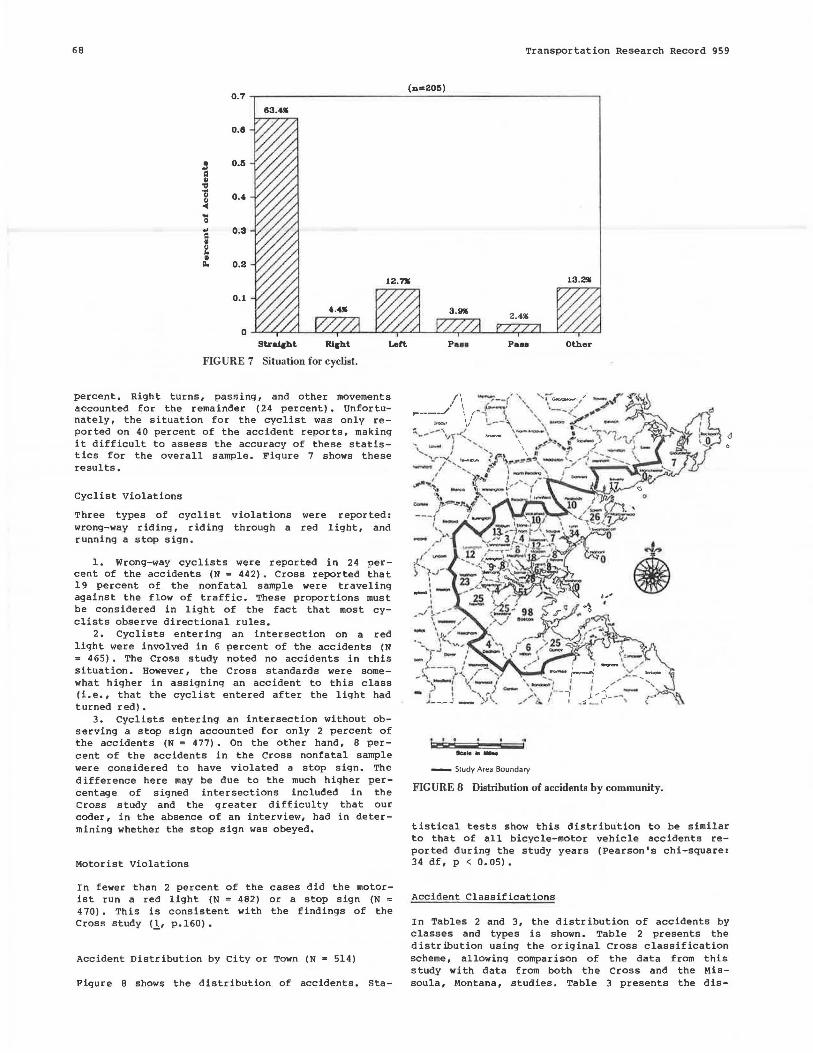
68
0.7
63.••
0.6
~ 0.5
= Cl ,, 1l 0.4 <I ~ .. 0 .. 0.3 = ti e II 0. 0.2
0.1
StraJcbt Ri1bt Lett
FIGURE 7 Situation for cyclist.
percent. Right turns, passing, and other movements accounted for the remainder ( 24 percent). Unfortunately, the situation for the cyclist was only reported on 40 percent of the accident reports, making it difficult to assess the accuracy of these statistics for the overall sample. Figure 7 shows these results.
Cyclist Violations
Three types of cyclist wrong-way riding, riding running a stop sign.
violations through a
were reported: red light, and
1. Wrong-way cyclists were reported in 24 percent of the accidents (N = 442). Cross reported that 19 percent of the nonfatal sample were traveling against the flow of traffic. These proportions must be considered in light of the fact that most cyclists observe directional rules.
2. Cyclists entering an intersection on a red light were involved in 6 percent of the accidents (N = 465) • The Cross study noted no accidents in this situation. However, the Cross standards were somewhat higher in assigning an accident to this class (i.e., that the cyclist entered after the light had turned red).
3. Cyclists entering an intersection without observing a stop sign accounted for only 2 percent of the accidents (N = 477). On the other hand, 8 percent of the accidents in the Cross nonfatal sample were considered to have violated a stop sign. The difference here may be due to the much higher percentage of signed intersections included in the Cross study and the greater difficulty that our coder, in the absence of an interview, had in determining whether the stop sign was obeyed.
Motorist Violations
In fewer than 2 percent of the cases did the motorist run a red light (N 482) or a stop sign (N = 470). This is consistent with the findings of the Cross study (,!, p.160).
Accident Distribution by City or Town (N = 514)
Figure 8 shows the distribution of accidents. Sta-
Transportation Research Record 959
(n=205)
Pu •
,, :;.v_,-\/r~, ... , ~' '• I _'..,..7 ...... --, ' , ,... ... ~
• I •
ac. ..........
Pa••
- Study Area Bounda ry
Other
FIGURE 8 Distribution of accidents by community.
t istical tests show th is dis tr ibu.tion to be similar to that of all bicycle-motor vehicle accidents reported during the study years (Pearson's chi-square: 34 df, p < 0.05).
Accident Classifications
In Tables 2 and 3, the distribution of accidents by classes and types is shown. Table 2 presents the distribution using the original Cross classification scheme, allowing comparison of the data from this study with data from both the Cross and the Missoula, Montana, studies. Table 3 presents the dis-

Plotkin and Komornick
TABLE 2 Comparison of MAPC Data with Data from Missoula and Cross-Fisher Studies
Percentage of Accidents
No. of Cross-Fisher Data Accidents3 MAPC Missoula
Accident Class (N = 432) Data Data Injuries Fatalities
A: Bicycle Ride-Out from Driveway, Al-ley, and Other
8.9b Midblock Locations 71 16.4 13 .9 15 .1 B: Bicycle Ride-Out
at Controlled Inter-section 41 9.5 10.0 17.0 12 .0°
C: Motorist Turn or Merge or Drive Through or Drive-Out 68 15.7 23.3b l 8.7 2.4
D: Motorist Over-taking and Over-taking Threat 36 8.3 13 ,3 10.5 37 .8°
E: Bicyclist Unex-pected Turn or Swerve 38 8.8 8.9 14.2 16.2d
Class F: Motorist Unexpected Turn 76 17.6 20 .0 14 .5 2.4d
Class G: Other 102 23 .6 15 .6b 11.2 13.8°
Note: Accident classes are from the 0riginaJ Cross scheme . aMAPC data. bp < 0.10 . Cp < 0.01. dp < 0.05.
tribution using the modified Cross scheme, based on NHTSA' s MAT system, which added seven new types to the Cross scheme.
In using the MAT system for this study, one prominent accident type, that involving opening doors of parked cars, was removed from the original Cross type 17 and included with two other types in a new class G, Slowed or Parked Cars. "Other" types were grouped toqether in class H. It is believed that these revisions improve the classification system. This revised classification is used in the crosstabulations with other variables in the study.
In the following, the classes are reviewed in the order of their frequency of occurrence in this study. After the name of each class there are four percentages: the MAPC revised MAT classification frequency (MAPC Rev), the MAPC original Cross system frequency (MAPC) , the Cross nonfatal sample f requency (Cross NF), and the Missoula, Montana, frequency. In addition to the frequency of occurrence, the relationship of each class to four other variables in the study is observed: wrong-way r idinq, age of cyclist, time of occurrence, and the severity of injury. Finally, those accident types with hiqh frequencies within the class are noted.
Class F: Motorist Turn (MAPC Rev, 17.2 percenti MAPC, 17.6 percenti Cross NF, 14.5 percenti Missoula, 20.0 percent)
Class F involved accidents in which a motorist who is turning right or left at an intersection (excluding right turns on red) collides with a bicyclist approaching from the motorist's front or rear. Only 14 percent of these accidents involved a wrong-way cyclist compared with the 24 percent of all accidents involving wrong-way cyclists (however, five of the six accidents included in type 22, Motorist Left Turni Parallel Pathsi Same Direction, involved wrong-way cyclists) •
Cyclists 15 years of age and more accounted for more than 87 percent of these accidents. Those more than 18 years of age accounted for more than 55 per-
69
cent of the cases. As with the other classes of accidents, approximately three-quarters of class F accidents occurred on weekdays. Most often, these occurred during the afternoon peak between 3:00 and 7: 00 p. m. ( 40 percent) • On weekends, these accidents were more likely to occur between 10: 00 a .m. and 3:00 p.m. (50 percent).
Class F accidents showed a similar distribution in the incidence and type of injury as did the sample as a whole.
The most frequent type of accident within this class is that in which the motorist turns left in front of a cyclist coming from the opposite direction (type 23). This was the most frequent accident type in the study. The next most frequent type within class F is the one in which the motorist turns right in front of a cyclist coming from the same or the opposite direction (type 24, 6 percent). Least frequent in this class was the accident type involving a motorist turning left in front of a cyclist coming from the same direction (type 22, l percent). As pointed out previously, however, wrong-way riders accounted for 83 percent of type 22 accidents.
Class C: Motorist Drive-Out (MAPC Rev, 16.8 percenti MAPC, 15.7 percenti Cross NF, 18.7 percenti Missoula, 23.3 percent)
Class C involves a motorist emerginq from an intersection, driveway, or alley onto a roadway and colliding with a bicyclist on that roadway. Right turns on red are included as type 10. Although Cross limited intersection accidents in this class to those in which the motorist's approach was controlled by a sign or signal, MAT added type 48, which are accidents that involve a collision at an uncontrolled intersection where it is established that the motorist failed to yield to the cyclist.
Wrong-way cyclists were overrepresented in this class relative to the sample as a wholei they were involved in 49 percent of class C accidents compared with 24 percent of all accidents. Class C accidents occurred among a slightly older population than the other classes. More than 76 percent occurred among cyclists over 15 years old, and 31 percent involved cyclists older than 25.
Class C accidents occurred on weekdays in the same proportion as did all accidents. Midday weekday accidents are overrepresented in this classi 36 percent occurred during the hours of 10:00 a.m. to 3:00 p.m. compared with 24 percent of all accidents. The afternoon peak period was the next most likely time period to experience these accidents (38 percent compared with 41 percent of all accidents). Weekend class C accidents were most likely to occur during the period 10:00 a.m. to 3:00 p.m. (58 percent for class C versus 47 percent of all weekend accidents).
Class C accidents were somewhat less likely than other classes to result in fatalities or the most serious injuries and somewhat more likely to result in no injury at all. The most common type of accident within class C was type 9, motorist failure to yield at stop or yield sign, which accounted for 9 percent of all accidents. This was the second most common type of accident in the study. Wrong-way cyclists were involved in 53 percent of type 9 accidents.
Class A: Bicycle Ride-Out at Driveway, Alley, or Midblock (MAPC Rev, 16.6 percenti MAPC, 16.4 percenti Cross NF, 13.9 percenti Missoula, 8.9 percent)
Class A involves a cyclist emerging from a residen-

70
"' 00 ~II "Z o~
..... N
8 ooo --
N
oci "'
"": 0
""· 00
-N ..... .,, .....
0 0 "
0 0 N
°'
oq~ 00 .....
e ,;
0 0 ;.;
] 0
\'?
Transportation Research Record 959
tial or commercial driveway, alley, or sidewalk and colliding with a motor vehicle approaching on the roadway . Only 10 percent of these accidents involved a wrong-way cyclist (compared with the 24 percent of wrong-way cyclists in the sample). More than 90 percent of class A accidents involved cyclists 14 years and less. This class was by far the most likely to include accidents with younger cyclists.
Class A accidents most frequently occurred on weekdays (75 percent). Fifty-six percent of class A weekday accidents took place between 3:00 p.m. and 7:00 p.m., the highest proportion of any class to occur within the afternoon peak. On the weekends these accidents were more likely to occur between 10:00 a.m. and 3:00 p.m. (44 percent, similar to the 47 percent share of all weekend accidents occurring during this period) .
Class A accidents were among the most likely to result in the most serious category of nonfatal injury (visible signs of injury).
Class H (Revised): Other (MAPC Rev, 13.8 percent; MAPC class G, 23.6 percent; Cross NF, 11.2 percent; Missoula, 15.6 percent)
Class H involves accident types that do not fit into the other classes. It thus differs from classes A through G by a lack of commonality among the types. As noted in the introduction to this section, class H has been revised from the original class G by removing two types, which have been placed in the new class G, Slowed or Parked Cars (type 27, Bicyclist Overtaking, and type 35, Motorist Drive-Out from OnStreet Parking) •
Within class H, dents are type 25, section, and type Wrong-Way Cyclist.
the most frequent types of acciAccident at Uncontrolled Inter-26, Vehicles Collide Head On,
Type 25 accidents include those that occur at uncontrolled intersections and where failure to yield is not apparent from the accident report. In the Cross study, all accidents occurring at uncontrolled intersections were included in this type (even where fault was assignable), and the MAPC share (7 percent) of accidents of this type using this def inition was much greater than that in the Cross or Missoula studies. Undoubtedly this resulted from the larger proportion of accidents at uncontrolled intersections in the MAPC study (36 percent of all intersection accidents versus 10 percent in the Cross study).
Class B: Bicycle Ri de-Out at Intersection (MAPC Rev, 11.9 percent; MAPC, 9.4 percent; Cross NF, 17. percent; Missoula, 10 percent)
Class B accidents involve bicyclists emerging from one leg of an intersection and colliding with a motorist emerging from the orthogonal leg of the intersection. Wrong-way cyclists were involved in 18 percent of class B accidents compared with their 24 percent share of all accidents.
Unlike class A accidents, which involve bicycle ride-out from midblock locations, class B accidents occur among a slightly older population. Over 21 percent of these accidents occurred among bicyclists more than 25 years of age (approximately the same proportion in which this age group is represented in the study sample). None of these accidents occurred to cyclists between 19 and 25, whereas more than 40

Plotkin and Komornick
percent occurred among those between 15 and 18. In fact, those 19 to 25 years old seemed remarkably exempt from accidents. Twenty-one percent of class B accidents occurred among cyclists between 12 and 14 and 16 percent among those less than 11.
Class B weekday accidents occurred with a greater frequency during both the morning peak hours (24 versus 15 percent) and the afternoon peak hours (51 versus 41 percent) than did other accident classes. This was also true on weekends (20 percent, morning peaki 50 percent, afternoon peak). They were less likely than other accident classes to occur during midday, particularly on weekdays ( 8 versus 29 percent). Class B accidents were slightly overrepresented among the accidents involving serious injuries.
The most frequent type among class B accidents was an unnumbered type, Bicyclist Entering Intersection on a Red Light. The 6.5 percent of this type of accident was higher than that in both the Cross and Missoula studies, which showed 1. 2 percent and 0 percent, respectively, of this type of accident. This discrepancy may in part be due to codingi Cross indicates in his narrative that he was only likely to include an accident in this type if the cyclist entered the intersection well after the light turned red. The MAPC coder generally placed an accident in this type whenever the cyclist entered on the red.
Class G: Slowed or Parked Cars (MAPC Rev, 11.3 percenti MAPC, not applicable: Cross NF, 2.07 percenti Missoula, 3.3 percent)
Class G, which was created for the MAPC study, includes accidents in which a bicycle collides with a motor vehicle that is slowed or stopped in traffic, entering or exiting on-street parking, or has a door opening to let the driver out. Comparison with the percentages for the Cross and Missoula studies of the aggregates of these three types of accidents shows that the MAPC region is much higher in the relative frequency with which these accidents occur. This may be due to the greater congestion and narrower widths of the major urban thoroughfares in the MAPC study area. Only 10 percent of class G accidents involved wrong-way cyclists compared with 24 percent of all accidents in the study.
Class G accidents are more common among older bicyclists: 87 percent occurred among bicyclists 15 and older. More than 64 percent of these accidents occur among bicyclists more than 18 years old. Class G accidents are unusual in that, unlike all other classes except class B, they occur with a greater relative frequency during the morning peak hours (between 6:00 and 10:00 a.m.), both on weekdays and weekends.
Class G accidents are somewhat less likely to occur during the afternoon peak hours ( 29 versus 41 percent of all accidents occurring during the afternoon peak). Although these accidents involve a slowed or stopped motor vehicle, they are as likely to result in serious injury as the other accidents studied.
The most frequent type represented in this class is type 41, Cyclist Strikes Open Door on Driver's Side of Parked Car, which includes 5.3 percent of all accidents. This type accounted for only 0.8 percent of all accidents in the Cross study, and they were negligible enough in the Missoula study to be classified as type 36, Weird. Again, further investigation is needed to explain this higher relative frequency, but it is reasonable to guess that the Boston area's narrow streets and traffic congestion are significant factors.
Class E: Bicyclist Unexpected Turn or Swerve (MAPC Rev, 8.9 percent: MAPC, 8.8 percent: Cross
NF, 14.2 percenti Missoula, 8.9 percent)
71
Class E accidents involve a bicyclist turning into the path of a motorist approaching from behind or ahead. Wrong-way cyclists were involved in 21 percent of these accidents, which is close to the 24 percent of all accidents involving wrong-way cyclists.
Like class A accidents, class E accidents occurred among a younger population: 42 percent among bicyclists age 11 and less. Cyclists between 15 and 18 years were also overrepresented in this age groupi they represented 35 percent of the class E accidents.
Class E accidents occurred more frequently during the weekday evening hours (7:00 p.m. to 1:00 a.m.) than did the sample as a whole (29 versus 19 percent). They were most likely to occur during the afternoon peak (39 percent). On weekends they were twice as likely as the average accident to occur during the afternoon peak (14 compared with 7 percent).
Class E accidents were distributed among the various injury levels in approximately the same proportion as were the overall sample. Type 18 accidents, Bicyclist Unexpected Left Turn with Auto Approaching from Same Direction, accounted for the greatest proportion of class E accidents.
Class D: Motorist Overtaking or Overtaking Threat (MAPC Rev, 3.4 percent: MAPC, 8.3 percent: Cross NF, 10.5 percent: Missoula, 13.3 percent)
Class D accidents involved a motorist striking a bicycle from behind or beside the bicyclist. As with the Cross study, this was the class with the lowest frequency in the study. The difference between the revised MAPC percentage and the MAPC cross classification scheme percentage is the removal of accidents with parked car doors from this class and their placement in class G. Wrong-way riding contributed to only 7 percent of these accidents.
Class D accidents were most likely to occur among cyclists 15 years and more (67 percent). These accidents were overrepresented among evening and midday accidents (both 27 percent compared with 19 and 24 percent for the sample). They occurred with greatest frequency during the afternoon peak (36 percent). All of the weekend class D accidents occurred between 7:00 p.m. and 6:00 a.m.
Class D accidents were the least likely among all accident classes to result in no reported injuries, but unlike the Cross study, they were more likely to cause minor injuries rather than the severe or fatal injuries. Given the smaller number of cases in this class, the one fatality that occurred involved a higher proportion of class D accidents (6.7 percent) than were involved in any other accident class.
RECOMMENDATIONS
The following recommendations are general in nature and are based on an initial review of the data. Their purpose is to help reduce the number of accidents and to prevent the most frequent occurrences.
Publicity
These findings should be made available to the Registry of Motor Vehicles, local traffic safety of-

72
f ice rs, bicycle advocacy qroups, and local schools for inclusion in their own proqrams. The results of the study should also be developed into a series of public service announcements to be aired on radio and television. These announcements will emphasize the highest-frequency accident classes (e.q., motor vehicles turning into a bicyclist's path, motor vehicles colliding with a bicyclist at an intersection) and types (e.q., opening of door of a parked car). The purpose of the publicity is to encourage further analysis of the findings · and identification of countermeasures and to increase awareness of the most frequent accidents.
Additional Exposure Information
The foregoing discussion lacks an essential element--the measurement of risk as well as frequency. Other than the Buckley report (5), little information exists on bicycle ridership and ridership habits in the greater Boston area. Additional information should be obtained to allow an assessment of the likelihood that a specific accident type will happen to an individual as well as the overall frequency.
Education
The study's findings indicate that high-frequency accidents can be reduced or prevented in part by education. Education has the dual goal of increasing awareness of an undesirable situation and providing the necessary skills to avoid the situation. The presence of a high proportion of accidents involving intersection collisions indicates the opportunity that additional training may offer, particularly among adults, who had the greatest incidence of these accidents. Although this type of accident may be no riskier, or even less risky, than other accidents, the volume of bicyclists entering intersect ions on busy downtown streets could itself be responsible for the high ranking. Eliminating or reducing this type of accident would affect a large portion of accidents in the study area.
Bicyclists in the Boston area agree with Kenneth Cross' assessment that wrong-way riding occurs among bicyclists in a lower proportion than it shows up in accidents. Awareness of the role of wrong-way ridinq in contributing to accidents may also result in a decrease in that riding behavior and a reduction in accidents.
The Registry of Motor vehicles can also provide motorists with information on improvinq their search skills in spotting bicyclists at intersections and emphasize this in its driver education materials.
Enforcement
Education and awareness are likely to improve the skills and behavior of only some bicyclists and motorists, whereas others may not be exposed to the education and publicity or may choose to ignore it. Law enforcement officials must impress on bicyclists in particular that wrong-way riding is illegal as well as dangerous. Currently, bicyclists are rarely cited or stopped for wronq-way ridinq in the Boston area.
Improved Record Keeping
Local police departments for the most part have no separate file of bicycle-motor vehicle accidents and
Transportation Research Record 959
thus are not able to carry on an elementary classification of bicycle accidents in their own communities. Police departments should create such files and review them periodically. Similarly, the Registry of Motor Vehicles should establish a separate file of bicycle-motor vehicle accidents to allow easy reference and analysis and develop a campaign to obtain the cooperation of local police departments in doing the same.
Improved Repo·rtinq
The quality of data on cyclists was markedly poorer than that on motor vehicle operators. Age of the cyc1ist was not reported on 26 percent of the sample accident reports (compared with less than l peccent for motor vehicle operators): the situation for the cyclist was not reported on 60 percent of the sample reports (compared with 8 percent for the situation of the motorist). In many cases, information on the bicyclist was only reported in the section of the accident report that deals with persons injured rather than in the section on vehicles, indicating that police and operators do not consistently identify the bicycle as a vehicle. In addition, information on traffic controls at the bicyclist's approach to an intersection was inaccurate in many reports (for both police and operator) • Anecdotal evidence also has suggested that road surface and road condition. may not be reported accurately in many reports. Finally, the question on helmet use is phrased in such a way as not to allow a distinction between no use and no response.
In the narrative and diagram sections of the report, little information was provided on whether the bicyclist observed a stop sign. Because this has been identified in the Cross report as a key variable in accident causation, it would be useful to increase reporting of this information in these sect ions.
Reporting could be improved in three ways. The Registry should actively encourage police and operators to solicit from and record complete information on both the motor vehicle operator and bicyclist and to treat the bicycle as a vehicle. The Registry, MAPC, and the Boston Area Bicycle Coalition should encourage bicyclists to complete reports on all motor vehicle collisions in which they are involved (less than 1 percent of the sample reports were filed by bicyclists). Finally, the Registry should consider revising the accident report form to address the problems identified earlier (e.g., rephrasing the helmet question and addinq the phrase "including bicycles, motorcycles, mopeds" after the word "vehicle").
ACKNOWLEDGMENT
This study has been accomplished with the cooperation of many individuals in many agencies. It was funded through EPA' s Section 1 75 air quality program, which is administered by UMTA. The Massachusetts Reqistry of Motor vehicles made the study possible by making available its microfilm of accident reports. Robert Carroll, William wood, and Paul Guerino were especially helpful in explaininq the system and providing material.
The Massachusetts Department of Public works provided printouts of all accidents from which the sample was selected. John Hickey consistently displayed patience and cooperation in supplying listings that met the special needs of the study.
The volunteers who collected data in the six communities provided this insight into the bicycle ac-

c ident report-keeping systems of local police departments. They devoted many hours, sometimes on evenings or weekends, reviewing and recording the data. Charles Hyde-Wright, Betsy Edge, Enid Paul, David Brahmer, Louise Segal, Karen McLaughlin, J. Lynn Wolk, and David Cain all made a contribution to the bicycling community in providing .this service.
Sarah Heartt, John Allen, Charles Hyde-Wright, and Webb Sussman of the Boston Area Bicycle Coalition (BABC) , David Brahmer of the Charles River Wheelmen, Richard Norcross of the American Youth Hostels, and Cathy Buckley of the Central Transportation Planning Staff (CTPS) provided valuable input into the study, including recruiting volunteers, reviewing the methodology and findings, and suggesting countermeasures. The authors will ask their assistance in publicizing the results as well. BABC is also planning to plot the locations of all accidents occurring within the MAPC region during the study years to identify high-frequency locations. Of special mention is Dan Geer of the BABC, who provided many hours of volunteer assistance to carry out most of the computer analysis in the study.
Yong Chang and Dan Beagan of CTPS provided ongoing technical support in selecting an appropriate sample size and advising on statistical tests. John Bliss and Dave Sarota were most helpful in transferring the data to the CTPS system.
Early in the study, Richard Dueker of Applied Science Associates, Inc., which prepared the MAT system, provided telephone advice on a sampling procedure.
73
The authors are appreciative to the National Highway Traffic Safety Administration, to Kenneth Cross, and to the city of Missoula, Montana, for their pioneer work, upon which the authors drew in performing their own study.
REFERENCES
1. K. Cross. A Study of Bicycle/Motor-Vehicle Accidents: Identification of Problem Types and Countermeasure Approaches. U.S. Department of Transportation, Sept. 1977.
2. J. Williams. "Crossing" Your Accident Statistics. Bicycle Forum, Vol. 8 (Winter) , 1981- 1982, pp. 22-23.
3. Bicycling and Air Quality Information Document. Office of Transportation and Land use Policy, Environmental Protection Agency, Sept. 1979.
4. Computer and Manual Accident Typing for Bicyclist Accidents: Administrator's Guide. NHTSA, u.s. Department of Transportation, Jan. 1983.
5. C.A. Buckley. Bicycle Traffic Volumes in Metropolitan Boston. Central Transportation Planning Staff, Boston, Mass., Dec. 1982.
Publication of this paper sponsored by Committee on Bicycling and Bicycle Facilities.
Promotion and Planning for Bicycle Transportation:
An International Overview
WERNER BROG, ERHARD ERL, KONRAD OTTO, and GERD SAMMER
ABSTRACT
International bicycle use, promotion, and planning were studied within the framework of a model project, a "bicycle-friendly town," sponsored by the German Federal Environmental Agency. The results of these international reports were presented and discussed during an international planning seminar in the associated model city of Graz. The results of the reports and the seminar are summarized and an overview of bicycle promotion and planning in western and eastern Europe as well as that in Japan and Australia are given. It has been found that cycling is becoming in.creasingly popular in many countries, and a large number of measures to encourage cycling are described. The international comparison shows that the types of measures to promote cycling are not limited to simply improving
the bicycle infrastructure. Finally, an attempt is made to summarize those solutions and facilities that have been characteristic of bicycle-friendly cities to determine the ideal conditions for such an environment.
In 1981 a model project (a "bicycle-friendly town") commissioned by the Federal Environmental Agency was begun in the Federal Republic of Germany. The goal of this project was (l_) "to create a model infrastructure for cyclists and a climate of opinion which is generally favourable toward cyclists, during a five year developmental period."
This model project centered in two main model cities, Detmold and Rosenheim. Eight subsidiary cities were directly involved in exchanging information and experiences. Foreign cities were also associated with the project.

74
A special planning seminar was held in Graz, Austria (one of the associated model cities) on international experiences with bicycle promotion and planning, A total of 180 participated in this seminar. Twenty-three lectures were held in which 16 different countries were represented, including 5 eastern European countries and 3 countries from overseas. A three-volume proceedings of the seminar was prepared; it is available from the Federal Environmental Agency Ill .
Because this was the first time that bicycle promotion had been discussed by a committee of experts from so many different countries, it appeared to be important to summarize a few of the most important points of the seminar in this paper.
PROMOTION AND PLANNING OF CYCLING
Western Europe
Austria
In Austria, as in many other European countries, not only was cycling not promoted until the mid-1970s, but the little cycling infrastructure that existed had been systematically eliminated. The growing ecological consciousness and the energy crisis caused cycling to be viewed as a potential way of dealing with problems caused by commuter peaks and was incorporated in the transport planning goals and measures by several cities (Graz, Klagenfurt, Salsburg). In Graz in particular, which is a university town with a population of 250,000, special emphasis was placed on cycling. Based on politically determined transport goals, a program to promote cycling was developed. This program, currently in its third year, is not limited to measures to improve the hicycle infrastructure but also includes a broad spectrum of other measures.
Political Transport Goals
Within the framework of the transport concept as a whole (3,4), the share of cyclists (1959, 10 percent; 1973, 7 percent; 1982, 8 percent) in relation to the 1973 statistics will double and the public transit share will increase marginally. These changes will result primarily from a reduction in car use, Besides intensive and coordinated programs to promote walking, cycling, and the use of public transit, car traffic will be greatly restricted. (The first steps in this direction have already been completed.) Thus, parking will be restricted throughout the built-up areas of Graz. In the future, public streets will only be used for shortterm parking and as loading zones and permanent parking zones for residents, for all of which fees will be charged (5) • Traffic tranquilization, a planning concept found especially in the Netherlands (for example, the "woonerf" concept), Germany, and Scandinavia to restrict and reduce car travel to improve urban environment and road safety, will further limit car travel in the city of Graz. Different aspects of the bicycle promotion program in Graz are discussed in the following.
Bicycle Infrastructure
The bicycle hierarchy consists of feeder routes as well as access
main, link, and to residential
Transportation Research Record 959
areas, Especially in the old city, unconventional solutions to problems of bicycle access have been used; for example, allowing bicycles to use one-way streets in the contraflow direction, allowing cycling in pedestrian areas and on streetcar lanes, and painting bicycle paths red at strategic points. Parking facilities for bicycles are available at designated sections of the bicycle network. Bicycles may be borrowed at all of the branch offices of one bank in Graz. Some businesses have been so encouraged by the cyclist-friendly climate that they have acquired business bicycles.
Traffic Safety Education
In order to encourage the most important target group, school children, to ride bicycles safely, the police and schools offer courses that also test the children after they have completed the instruction. Furthermore, information leaflets on new bicycle routes and safe traffic behavior are distributed,
Bicycle Promotion
Public relations is strongly emphasized as a marketing strategy to encourage cycling. Citizens are kept informed on what is being done, pamphlets are distributed, bicycle maps for the city and surrounding area are available, and the press covers the activities aimed at promoting cycling. Politicians use the bicycle as a means of communication during community information rides (excursions to study local problems and to talk with the citizens). The Idea Market for the Bicycle-Friendly Town was a meeting of experts and other citizens to discuss bicycle promotion. A comprehensive report lists all measures and the institutions that were involved (§.l.
Planning and Feasibility Study
The effectiveness of the promotional program has been investigated in a feasibility study, which includes surveys of travel behavior and traffic safety and conflict studies of possible problems that might result from the new solutions to bicycle access; the impact of certain measures on the environment has also been studied. Within the framework of the planning and implementation of measures to promote cycling, a method of identifying the priority level of different bicycle networks and quickly carrying out the plans was developed (1.rPP·l83-190;_!!).
Switzerland
In Zurich, Switzerland, "new elbow room for the old travel mode" (the bicycle) was developed. As in other Swiss cities, the bicycle (velo) routes are designed to supply cyclists with comfortable and safe travel connections, These bicycle routes are constructed away from the main streets so that the cyclists are not exposed to the exhaust from automobiles. The goal of bicycle planning in Zurich is the construction of an interrelated cycling network 200 km long consisting of bicycle paths, bicycle lanes, residential streets, automobile-restricted zones, and combined facilities for pedestrians and cyclists. Within the network, cycling without detours is to be made possible. Short-term feasibility has been given priority over perfect long-term solutions (~) in the construction of this network.

Br(;q et al.
France
The city of Chambery in France is impressive because of its conununity policies toward pedestrians and bicycle traffic. By European standards, Chambery can be viewed as a model city for cyclists. Traffic tranquilization to reduce car travel in specific areas and the reduction of speed limits within the city limits have led to a one-third decrease in the number of accidents over a 3-year period. Alonq the main arteries, two-way bicycle paths were constructed by limiting the amount of space available to motor vehicles. Many further improvements for cyclists have been made in Chambery, for example, permitting bicycle travel on a street in the old city that had been restricted to bus travel, enlarqinq bicycle lanes at intersections to allow cyclists to line up in front of the cars, and instituting special traffic lights for cyclists. Transport plans in Chambery are based on the theory that those who travel with the weaker transport mode should have the right of way. If pedestrian traffic is heavy enough, bicycle traffic will be slowed down by constructing bumpy surfaces or creating artificial bottlenecks for bicycles. The manner in which the planning goals are to be achieved is also noteworthy. From the start, the city administration and office of street construction worked closely with environmentalist groups and cyclist organizations. A Dutch planner worked in the city for a week as a consultant on questions related to cycling, so chambery could profit by the Dutch experience and avoid planning errors ( 10) •
Nether lands
In the Netherlands, the bicycle is a traditional, frequently used mode of transport for daily use. However, here too, bicycle use decreased in the late 1960s. Thus, in 1975 the government published the first multiyear plan for passenger transport. This plan put special emphasis on the bicycle in order to counteract the negative effects (especially pollution and accidents) of heavy use of automobiles. Within the framework of this plan, two test models were instituted that found worldwide recognition. These were the bicycle paths in The Hague and Tilburg (demonstratie fietsroute) • In The Hague (the capital of the Netherlands with a population of 450, 000) , a bicycle path 4. 9 km long crosses the city from west to east. This was built in 1977 and has since been extended B km. These bicycle paths are constructed away from the streets, and two-way bicycle travel is usually possible. Planning and construction included various special details to make these bicycle paths comfortable and attractive (11). ~In the Netherlands, integrating bicycle and train
travel is emphasized. The railway authority in the Netherlands views the combination of train and bicycle as ideal: They complement each other perfectly. In oraer to increase ridership, subsidized bicycle parking and rentals are offered, and getting to and from the train by bicycle is encouraged. The routes and quality of bicycle paths leading to train stations are being improved; riders are encouraged to leave their bicycles at the new, attractive, and safe parking facilities (which include bicycle parking lots with attendants and bicycle stands that have locks); and rental facilities at the train stations make it possible for passengers to continue their trips by bicycle when they arrive at their destination (12). However, even if the Netherlands is always cited as being the most cyclist-oriented
75
country or even the country with the most humantransport planning, one should not forget that even in the Netherlands, planning of this sort first has to overcome considerable resistance before it can be implemented (13) •
A new passenger transport plan includes, among other things, the Delft demonstration project. This project favors the concept of a hierarchically structured network rather than a bicycle path. This network consists of high-quality bicycle routes for through traffic, bicycle lanes for specific sections of the city, and a neighborhood bicycle network (.!_!) • A feasibility study is investigating the impact of the construction of the bicycle network on bicycle use with respect to
1. Number of cyclists in relation to the bicycle network,
2. Willingness to use the bicycle as a means of transport, and
3. Use of the infrastructure (route choice in relation to place of origin and destination) (15).
Great Britain
Until the early 1970s, the use of bicycles had drastically decreased in Great Britain. Since then, however, a new interest in cycling has been observed and the use of bicycles has steadily increased. There are a number of reasons for this: the energy crisis in 1973, the difficulty in finding parking spaces in built-up areas, the increasing concern with physical fitness, the desire to return to nature, and the slowing down in the growth of car ownership.
The government's main responsibilities concern the legal status of cyclists, the legislation under which local authorities provide and maintain facilities and general advice on the design and implementation of such facilities, vehicle performance, national road safety aspects, and supportive research.
In England the three new towns of Stevenage, Milton Keynes, and Peterborough are known as the model towns for cycling; when these towns were planned, separate bicycle networks were included. The Ministry of Transport supports experimental planning concerned with the solution of problems related to bicycle paths and junctions and with possible conflicts between pedestrians and cyclists (~).
Scandinavia
In Scandinavia also, the bicycle is a frequently used mode of transportation. vasteras and Oxelosund in Sweden are known to be especially bicycle friendly. vasteras has four bicycle paths leading throuqh the inner city. These paths, additional pedestrian malls, and separate bus lanes are the basic elements of the accessibility of the inner city. oxelosund (with a population of 14,000) has a network of segregated bicycle paths covering the entire town. Swedish cities are frequently characterized by plans to reduce the amount of car travel, and this naturally encourages cycling. A particularly good example of this is the city of Uppsala. Bicycle travel planning in Scandinavia emphasizes the separation of car and bicycle traffic (segregated bicycle paths are given preference over bicycle paths built along the sides of streets) as well as policies to limit car traffic by keeping through traffic out of certain streets and the widespread introduction of low speed limits (17).

76
Italy
In Italy Parma and Lucca are noteworthy as planning models. In Parma most private cars are excluded from the old city and the central business district. The bicycle and public buses serve most of the transportation needs of the city. On each cf the fou r routes leading through the inner city, 10,000 bicycle trips versus 4,000 car trips are made per day. In Lucca in the center of the densely built-up old city, there is a large pedestrian mall that can be used by cyclists as well. In spite of this mixed traffic, no major conflicts have resulted (18).
Eastern Europe
First-hand accounts of bicycle travel in eastern European countries provided some of the highlights of the seminar in Graz .
Hungary
In Hungary cycling has recently once again become important. The primary tasks in Hungary are considered to be increasing thP. Rafety of cycling and promoting bicycle use in general. In 1980 empirical studies showed that there were some 370 bicycles per 1,000 inhabitants. According to representative studies, the share of cyclists is greatest in small cities (with populations ranging from 20,000 to 40,000) and the smallest bicycle share is in large cities. In small cities 50 percent of all commuter trips are made by bicycle versus 5 to 8 percent in large cities. The annual sales figures for bicycles doubled within the last 15 years. The renewed importance of cycling will be reflected in planning guidelines and in national bicycle promotion programs (~.
Yugoslavia
The importance of cycling is especially emphasized in Slovenia. The city of Ljubljana has not only the longest cycling tradition, but also the most advanced bicycle transport planning. It is the Yugoslavian model city for cyclists. In 1976 bicycle lanes were begun to be marked on the city streets. In 1980 a study dealing with bicycle travel was concluded. The goal of bicycle planning in Ljubljana is the development and extension of bicycle lanes and bicycle paths to make it possible to travel throughout the entire city by bicycle without being forced to make detours. However, parking facilities for bicycles, bicycle rentals, and bike-and-ride facilities are also being emphasized (1Q_).
Czechoslovakia
The previously heavy use of bicycles in Czechoslovakia greatly decreased when the public bus network was extended and the use of cars increased, during the 1950s and 1960s. However, there are signs that the use of bicycles is currently on the rise again. It is estimated that in 1979 there were 364 bicy cles per 1,000 inhabitants. Hardly any data on cycling are available, however. A special traffic count in Prague showed a bicycle share of less than 1 percent in 1982, but the bicycle share in the east Bohemian city of Hradec Kr a love (with a population of 100,000) is considerably higher. In this city the street circling the city and the main streets of the city have separate bicycle paths and bicycle lanes
Transportation Research Record 959
with traffic lights that have a special sign for cyclists cm.
Poland
In Poland the ratio of travel by car versus that by bicycle is again beginning to shift in favor of the bicycle. It has been estimated that there are approximately 194 bicycles per 1,000 inhabitants. Although bicycle production has more than doubled in the last 20 years, the demand for bicycles is still greater than the supply. For commuter trips in large cities, the bicycle is the least frequently used travel mode, accounting for only 1.6 percent of all of these trips. In the country, however, it is used much more frequently, especially for shopping trips. Three research centers in Poland have been doinq studies on cycling over the past 5 years. Among other things, these studies resulted in a planning concept for a bicycle system for the city of Poznan (560,000 inhabitants). The plan calls for a stepby-step completion of the existing bicycle network until a total length of 200 km has been reached by the year 1990. The goal of this plan is to increase the share of trips made by bicycle to 15 percent of the entire traffic volume (~) •
USSR
In the cities of Lithuania, several steps are being taken to inc rease b icycle use (11). Increasing gasoline costs, health consciousness, and the desire to save time have resulted in an increase in the proportion of trips made by bicycle in recent years. Transport policies support this trend and are aimed at promoting cycling. Siauliai, the fourth largest city in Lithuania with a population of 130,000, is the model city in the USSR. In 1979 the administration of the city started a comprehensive program to enco urage cycling as a competitive transportation mode , the first program of this sort in t he OSSR. The program includes a bicycle network covering the entire city and a recreational area not far from the city, parking facilities for bicycles, areas to practice riding bicycles, service facilities and recreational facilities along the bicycle paths, as well as public relations work. A b i c ycle factory located in the city organizes annual b i cycl e festivals. The first bicycle museum is s oon to be opened in Siauliai. In r ecent years , the annual increase in bicycle use has ranged from 15 to 20 percent (~) •
Overseas
Japan
Japanese urbanization was accompanied by an improved urba n tra nspor tation infrast ru cture , most notably subways a nd c onunuter r ailroads . The majori ty of daily cof1Jllluter trips are made wl th t hes e two tr a nsit modes. However, incre asing subur bani zation made public tra nsit incre as ing l y inaccessible . Therefore, the use of the bicycle as an access mode to the commuter railroads quickly increased, as did the number of b i cycl e s left at the train stations. The phrase "bicycle pollution" was coined and soon turned into a kind of slogan. Comprehensive improvements were made in the space available for parking bicycles. Solutions using new technology have been used.
Until 1978 the majority of the parking facilities for bicycles were owned by private companies. When the parking facilities were expanded, more of the bicycle parking areas were publicly owned but pri-

Brog et al.
vately operated. With the new facilities, user fees have become more common. The scarcity of land in Japanese cities has led to the development of highdensity parking facilities for bicycles. Two revolutionary technological developments are described as follows.
I n the satellite city of Kasukabe near To kyo, the f irst fully automated and computerized bicycle p~k i ng f acility .in the world was opened in 1980 . riere t han 1, 500 bicyc les can be stored in 12 stor ies ; cranes are used to park the bicycles. :'Ji,
In Miratsuka, another satellite city of Tokyo, a new bicycle rental system was introduced in 1980. A 10-story bicycle parking lot offers 500 rental bicycles that can be borrowed by commuters for their daily trips from their homes to the train station and by others for their trips from the train station to suburban workplaces (25).
A systematic city cycle scheme is currently being tested in Sendai (670,000 inhabitants). Bicycles are offered free of charge for an unlimited period of time. These can be borrowed at designated areas and can be returned at a number of different locations (Figure 1).
FIGURE 1 City cycle system in Sendai, Japan.
The Japanese experience in combining bicycle and public transit use shows that
1. The bicycle can be used as a popular and effective access and egress mode to the commuter ~ail
system; 2. Bicycle use increases the accessibility ra
dius of the commuter rail system by at least 2 km; this can be a countermeasure to the decrease in the use of public transit caused by suburbanization and the reduction in the population density; and
3. The lack of bicycle paths leading to train stat ions probably has little negative impact on bicycle use. Cyclists find it more important that their bicycles be protected against theft when they are left at the station.
Australia
With a regionally varying share of 1 to 3 percent, the bicycle plays a subordinate role as a transport mode in Australia. Low gasoline prices and low population densities favor the use of cars. Nonetheless, as a result of increasing ecological awareness, the bicycle has experienced a renaissance in recent years. This has led to an institutionalization of bicycle planning as well as an increased emphasis on bicycle plans in Australia.
77
Australian bicycle plans are primarily a reaction to the increase in the use of bicycles rather than part of a total transport plan (e.g., to reduce travel with motor vehicles or save energy). This partly explains the shortcomings of these plans, which usually aim at increasing the safety of cycling,. analyzing accident statistics, identifying the .n£st commonly used bicycle routes, recommending const uction measures, and preparing bicycle maps.
'PJit Gee long bicycle plan, Australia's model bicycle' plan, was published in 1977; in 1978 the 5-year tmp~ementat ion period began, which is to cost a total of 4 million German marks. The concept introduced was a four-point bicycle plan:
1. Engineering (technical planning), 2. Education (traffic education), 3. Enforcement (implementation of legislation),
and 4. Encouragement (bicycle promotion).
The technical aspects (in which economical solutions were emphasized) began with the design of a bicycle network including bicycle paths, bicycle lanes, speed limits in some residential areas, and much pro-bicycle traffic legislation. In order to educate people to use bicycles safely, a model bicycle education course was developed and introduced in 70 schools. Bicycle promotion is done by using posters, information pamphlets, and contests in order to familiarize people with the improved facilities, traffic education, and special programs
<27>· The Gee long bicycle plan has two character is tics
in common with a number of other bicycle plans:
1. It is mainly concerned with and designed for existing cyclists; potential cyclists are not emphasized; and
2. No precise data on modal split are being collected or evaluated either before or after the implementation of the bicycle plan. Thus, increase of cycling cannot be precisely measured.
The concept of a bicycle plan as a planning method poses certain problems, which sometimes cause planning failures. Often there is no active and future-oriented planning but only a reaction to a changed situation, that in which there are more cy-~, clists on the road. So the bicycle plan sometimes turns into an end in itself; its implementation comes to be of secondary concern. The emphasis is also frequently on construction without preceding analysis. Thus, some useless bicycle paths are constructed and this naturally results in public criticism of the plan. Furthermore, the four-point principle (engineering, education, enforcement, and encouragement) limits bicycle planning to four factors, which in themselves are not sufficient to create bicycle-friendly cities. The bicycle is not seen as an integral part of the transportation system: the integration of the bicycle and public transport and its interdependence with car traffic are neglected. Bicycle planning is not part of an integrated strategy to reduce the environmental impacts of car traffic. The emphasis is too much on existing cyclists rather than on the population as a whole. Little is done to encourage potential cyclists or to emphasize the social value of cycling.

78
IMPORTANT INSIGHTS FOR BICYCLE PROMOTION
Current bicycle planning is characterized by three interrelated developments:
1. An increase in the bicycle share during recent yea rs ( 28) ;
2. A substantial reserve of potential cyclists, which makes it possible that bicycle use will continue to increase while some use of individual motor vehicles will be diverted (29); and
3. An increasing interest in-cycling by transport specialists as well as by ordinary citizens (j_Q).
The planning seminar showed that developments in the field of bicycle planning are international. This supports the thesis that revived interest in the bicycle as a transport mode is not a passing fad but rather part of an international reevaluation of mode choice.
This trend toward increased bicycle use should be supported by transport planners and politicians, Local efforts to promote cycling and unconventional measures seem to have a great impact on increasing the bicycle share. Thus, there is a broad spectrum of effective and economic means of encouraging the use of bicycles. A comparison of international bicycle promotion efforts shows that combining different types of measures is more effective than simply improving the infrastructure for cyclists.
THE BICYCLE-FRIENDLY TOWN
The bicycle-friendly towns show that it should be the main goal of planners to create cities in· which the bicycle is accepted as an integral part of the transportation system. To this end, it is also necessary that the transportation infrastructure of the cities be so designed that cycling is safe and pleasant. The following aspects of bicycle promotion are possible and necessary.
Bicycles should be made available to as many as possible. Only if enough people have access to bicycles can the bicycle become a standard transportation mode for all travel purposes. Bicycle availability can be increased by offering rental bicycles and repair facilities for bicycles and by encouraging city offices and businesses to buy business bicycles.
A citywide network of bicycle facilities is needed in order to ensure safe, comfortable, and direct access to all destinations in the city. Intersections should be designed to be safe for cyclists. It should be possible to use the bicycle paths at any hour of the day an.a night throughout the entire year. On the main bicycle routes, directional signs should be posted just as they are on other streets. The city bicycle network should be connected to bicycle paths leading into outlying areas. Whenever possible, the bicycle paths should be designed so that two people can ride abreast. Adequate parking facilities for bicycles should also be provided to protect the bicycles against theft; lockers for baggage should also be made available.
The bicycle can help support and integrate the use of public transit. Public transportation and the bicycle supplement each other perfectly (31).
In bicycle-friendly cities, the community climate is generally favorable for cyclists. Local conditions, citizens, community politics, and city planning encourage cycling. In these cities, cyclists feel that they are respected and that their needs are taken seriously. In order to achieve a state
Transportation Research Record 959
that is bicycle-friendly, special efforts should be made to motivate the public, for example,
1. Leading figures in the community should be encouraged to ride bicycles,
2. Private-sector cycle ventures should be supported,
3. Courses should be offered on traffic safety and bicycle skills, and
4. A central office should be set up to distribute information on cycling and act as a consultant in questions concerning cycling.
Local governments can effectively promote cycling if there is the political will and the organizational framework. Local-government transportation programs should include
1. A bicycle promotion program that analyzes the current cycling situation and outlines short-, medium-, and long-term plans;
2. Separate funding for bicycle-related programs; 3. An administrative work group on the bicycle: 4. Citizen involvement in bicycle planning and
input from representatives of bicycle groups when bicycle plans are being made; and
5. A central offlce for bicycle promotion responsible for bicycle ventures and bicycle coordination.
Bicycle planning should also take the general planning needs into consideration: it should be community and citizen oriented and flexible. Economical solutions should be given priority. Such planning should be ecologically sensitive.
A bicycle-friendly city is not a utopian vision; it can actually be realized. However, administrative and financial backing is needed if this goal is to be attained,
REFERENCES
1. K.Otto. Model Project: Towns for Cyclists--An Initiative to Promote the Bicycle as the Most Ecologically and Economically Sensible Means of Local Transport. Garten und Landschaft, Vol. 12, 1980, pp. 1027-1030,
2. Federal Environmental Agency. Werkstattberichte SA-C zum Modellvorhaben "Fahrradfreundliche Stadt.• Reihe Texte, Berlin, 1983.
3. Stadtentwicklungskonzept. Gemeinderatsbeschluss Al7-29/24. Magistrat Graz, Austria, Nov. 14, 1980.
4. Stadtentwicklungskonzept: Fuss und Radwegenetz. Gemeinderatsbeschluss, Magistrat Graz, Austria~ July 19, 1980.
5. G. Sammer. Erfahrungen mit dem Probebetrieb der Dauerparkzonen ("Grune zone") fur die Wohnbev~lkerung. ~sterreichische Gemeindezeitung, Vol. 12, 1983.
6. G. Sammer. Ergebnisbericht Ideenmarkt "Fahrradfreundliche Stadt." Buro fur Burgerinitiativen, Stadtplanungsamt, Strassen- und BrUckenbauamt, Graz, Austria, 1981.
7. G. Sammer. Strategien zur umsetzung von Sofortmassnahmen in der kommunalen Verwaltung. .!.Q. Sofortmassnahmen zur F~rderung des Fahrradverkehrs: werkstattbericht 3 zum Modellvorhaben "Fahrradfreundliche Stadt" (Federal Environmental Agency, eds.), Reihe Texte, Berlin, 1982.
8. H. Lackner, G. Sammer, and G. Zekoll. Fuss und Radwegenetz, Dringlichkeitsreihung. Sachprog ramm verkehr des Stadtplanungsamtes Graz, Graz, Austria, 1981.
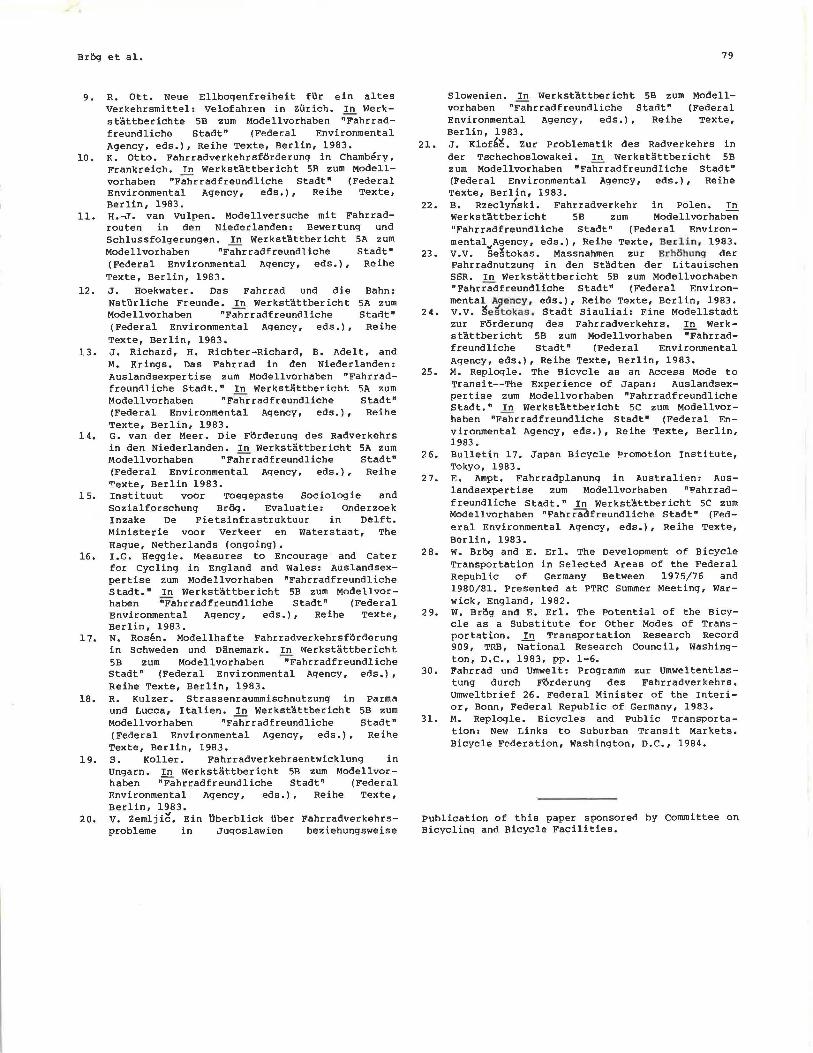
Br0g et al.
9. R. Ott. Neue Ellbogenfreiheit fur ein altes Verkehrsmittel: Velofahren in Ziirich. !!!.. Werkstattberichte SB zum Modellvorhaben "Fahrradfreundliche Stadt n (Federal Environmental
10.
11.
12.
13.
14.
lS.
16.
17.
18.
19.
Agency, eds.), Reihe Texte, Berlin, 1983. K. Otto. Fahrradverkehrsforderung in Chambery, Frankreich. In Werkstattbericht SB zum Modell-vorhaben "Fahrradfreundliche Stadt" Environmental Agency, eds.) , Reihe Berlin, 1983.
(Federal Texte,
H.""'1. van vulpen. Modellversuche mit Fahrradrouten in den Niederlanden: Bewertung und Schlussfolgerungen. In Werkstattbericht SA zum Modellvorhaben "Fahrradfreundliche Stadt n
(Federal Environmental Agency, eds.), Reihe Texte, Berlin, 1983. J. Hoekwater. Das Fahrrad und die Bahn: Naturliche Freunde. In Werkst'Attbericht SA zum Modellvorhaben "Fahrradfreundliche Stadt" (Federal Environmental Agency, eds.), Reihe Texte, Berlin, 1983. J. Richard, H. Richter-Richard, B. Adelt, and M. Krings. Das Fahrrad in den Niederlanden: Auslandsexpertise zum Modellvorhaben "Fahrradfreundliche Stadt." In Werkstattbericht SA zum Modellvorhaben "F~radfreundliche Stadt" (Federal Environmental Agency, eds.), Reihe Texte, Berlin, 1983. G. van der Meer. Die Forderung des Radverkehrs in den Niederlanden. In Werkstattbericht SA zum Modellvorhaben "Fahrradfreundliche Stadt" (Federal Environmental Agency, eds.), Reihe Texte, Berlin 1983. Instituut voor Toegepaste Sociologie and Sozialforschung BrCiq. Evaluatie: Onderzoek Inzake De Fietsinfrastruktuur in Delft. Ministerie voor Verkeer en Waterstaat, The Hague, Netherlands (ongoing). I.G. Heggie. Measures to Encourage and Cater for Cycling in England and Wales: Auslandsex-pertise zum Modellvorhaben "Fahrradfreundliche Stadt." In Werkstattbericht SB zum Modellvorhaben "Fahrradfreundliche Stadt" (Federal Environmental Agency, eds.), Reihe Texte, Berlin, 1983. N. Rosen. Modellhafte Fahrradverkehrsforderung in Schweden und Danemark. In werkstattbericht SB zum Modellvorhaben • Fahrradfreundliche Stadt" (Federal Environmental Agency, eds.), Reihe Texte, Berlin, 1983. R. Kulzer. Strassenraummischnutzung in und Lucca, Italien. In werkstattbericht Modellvorhaben "Fahrradfreundliche
Parma SB zum Stadt"
(Federal Environmental Agency, eds.), Reihe Texte, Berlin, 1983. s. Koller. Fahrradverkehrsentwicklung in Ungarn. In werkstattbericht SB zum Modellvor-haben "Fahrradfreundliche Stadt" (Federal Environmental Agency, eds.), Reihe Texte, Berlin, 1983.
20. v. Zemljic. Ein ttberblick Uber Fahrradverkehrs-probleme in Jugoslawien beziehungsweise
21.
22.
23.
24.
2S.
26.
27.
28.
29.
30.
31.
79
Slowenien. In Werkstattbericht SB zum Modellvorhaben "Fahrradfreundliche Stadt" (Federal Environmental Agency, eds.), Reihe Texte, Berlin, 1983. J. Klof,~. Zur Problematik des Radverkehrs in der Tschechoslowakei. !!!.. Werkstattbericht SB zum Modellvorhaben "Fahrradfreundliche Stadt" (Federal Environmental Agency, eds.), Reihe Texte, Berlin, 1983. B. Rzeclyriski. Fahrradverkehr in Polen. In Werkstattbericht SB zum Modellvorhaben "Fahrradfreundliche Stadt" (Federal Environmental~A~ency, eds.), Reihe Texte, Berlin , 1983. v.v. Sestokas. Massnahmen zur Erhohung der Fahrradnutzung in den Stadten der Li tauischen SSR. In Werkstattbericht SB zum Modellvorhaben "Fahrradfreundliche Stadt" (Federal Environmental AJ!ency, eds.), Reihe Texte, Berlin, 1983. v.v. ~estokas. Stadt Siauliai: Eine Modellstadt zur Forderung des Fahrradverkehrs. 1!!. Werkstattbericht SB zum Modellvorhaben "Fahrradfreundliche Stadt n (Federal Environmental Agency, eds.), Reihe Texte, Berlin, 1983. M. Replogle. The Bicycle as an Access Mode to Transi t--The Experience of Japan: Auslandsexpertise zum Modellvorhaben "Fahrradfreundliche Stadt." In Werkstattbericht SC zum Modellvorhaben "Fahrradfreundliche Stadt" (Federal Environmental Agency, eds.), Reihe Texte, Berlin, 1983. Bulletin 17. Japan Bicycle Promotion Institute, Tokyo, 1993. E. Ampt. Fahrradplanung in Australien: Auslandsexpertise zum Modellvorhaben "Fahrradfreundliche Stadt. n In Werkstattbericht SC zum Modellvorhaben "Fahrradfreundliche Stadt" (Federal Environmental Agency, eds.), Reihe Texte, Berlin, 1983. w. Br0g and E. Erl. The Development of Bicycle Transportation in Selected Areas of the Federal Republic of Germany Between 197S/76 and 1980/81. Presented at PTRC Summer Meeting, Warwick, England, 1982. W. Brog and E. Erl. The Potential of the Bicycle as a Substitute for Other Modes of Transportation. In Transportation Research Record 909, TRB, National Research Council, Washington, D.c., 1983, pp. 1-6. Fahrrad und Umwelt: Programm zur Umweltentlastung durch Forderung des Fahrradverkehrs. Umweltbrief 26. Federal Minister of the Interior, Bonn, Federal Republic of Germany, 1983. M. Replogle. Bicycles and Public Transportation: New Links to Suburban Transit Markets. Bicycle Federation, Washington, D.C., 1984.
Publication of this paper sponsored by Committee on Bicycling and Bicycle Facilities.