Study of cyclic hot corrosion of nanostructured Cr/Co���Al coatings on superalloy
Upload
independentCategory
view
0download
0
Applied Surface Science 256 (2010) 2876–2883
Effect of applied bias voltage on corrosion-resistance for TiC1�xNx andTi1�xNbxC1�yNy coatings
J.C. Caicedo a,c,*, C. Amaya a,b, L. Yate c, W. Aperador a, G. Zambrano a, M.E. Gomez a,J. Alvarado-Rivera d, J. Munoz-Saldana d, P. Prieto a,e
a Department of Physics, Universidad del Valle, Ciudad Universitaria Melendez, A.A. 25360 Cali, Colombiab Laboratorio de Recubrimientos Duros DT-ASTIN SENA, Cali, Colombiac Department de Fısica Aplicada i Optica, Universitat de Barcelona, Catalunya, Spaind Centro de Investigacion y de Estudios Avanzados del IPN, Unidad Queretaro, Mexicoe Centro de Excelencia en Nuevos Materiales, Calle 13 #100-00 Edificio 320, espacio 1026, Cali, Colombia
A R T I C L E I N F O
Article history:
Received 15 September 2009
Received in revised form 13 November 2009
Accepted 14 November 2009
Available online 20 November 2009
PACS:
61.05.cf
68.30j
68.35.Ja
68.43.Pq
67.80.de
65.40.gk
Keywords:
X-ray scattering
Raman spectra
Electrochemical properties
A B S T R A C T
Corrosion-resistance behavior of titanium carbon nitride (Ti–C–N) and titanium niobium carbon nitride
(Ti–Nb–C–N) coatings deposited onto Si(1 0 0) and AISI 4140 steel substrates via r.f. magnetron
sputtering process was analyzed. The coatings in contact with a solution of sodium chloride at 3.5% were
studied by Tafel polarization curves and impedance spectroscopy methods (EIS). Variations of the bias
voltage were carried out for each series of deposition to observe the influence of this parameter upon the
electrochemical properties of the coatings. The introduction of Nb in the ternary Ti–C–N film was
evaluated via X-ray diffraction (XRD) analysis. The structure was characterized by using Raman
spectroscopy to identify ternary and quaternary compounds. Surface corrosion processes were
characterized using optical microscopy and scanning electron microscopy (SEM). XRD results show
conformation of the quaternary phase, change in the strain of the film, and lattice parameter as the effect
of the Nb inclusion. The main Raman bands were assigned to interstitial phases and ‘‘impurities’’ of the
coatings. Changes in Raman intensities were attributed to the incorporation of niobium in the Ti–C–N
structure and possibly to resonance enhancement. Finally, the corrosion data obtained for Ti–C–N were
compared with the results of corrosion tests of Ti–Nb–C–N coating. The results obtained showed that the
incorporation of niobium to Ti–C–N coatings led to an increase in the corrosion-resistance. On another
hand, an increase in the bias voltage led to a decrease in the corrosion-resistance for both Ti–C–N and Ti–
Nb–C–N coatings.
� 2009 Elsevier B.V. All rights reserved.
Contents lists available at ScienceDirect
Applied Surface Science
journal homepage: www.e lsev ier .com/ locate /apsusc
1. Introduction
There is general agreement in the literature in which theperformance of tools and components in a tribological, corrosive,or mechanically loaded environment is mainly determined by theproperties of near-surface layers [1–3]. In order to maintain andincrease the lifetime of tools in any tribological or corrosivesystem, a broad variety of different hard coatings have been testedand used in industry, along with several different substratematerials. Recently, other new coatings like TiAIN, TiCN or (Ti)(Nb–C–N) were developed to fulfill such enhancement requirementseven better, mainly when the substrate is a metallic or a carbide
* Corresponding author at: Department of Physics, Universidad del Valle, Ciudad
Universitaria Melendez, A.A. 25360 Cali, Colombia. Tel.: +57 2 339 46 10;
fax: +57 2 339 32 37.
E-mail address: [email protected] (J.C. Caicedo).
0169-4332/$ – see front matter � 2009 Elsevier B.V. All rights reserved.
doi:10.1016/j.apsusc.2009.11.042
tool [4–6]. Their industrial use, then, often starts in advance ofsufficient knowledge in the field of coating properties and thecharacteristic of the system coating-substrate. Chemical composi-tion, mechanical and tribological properties, and electrochemicaltests are always related to each other, and it is important to achievea broad range of coating compositions which exhibit a balancebetween these properties. This relationship depends on theparameters and deposition processes [7]. The corrosion ratedepends upon the transport of corrosive species through thepassive film, in addition to the reaction occurring at the metalsurface. The passive film is formed spontaneously on the surface ofthe coating in air and in aqueous solutions. Passivation anddissolution of titanium nitride and other coatings in sodiumchloride solution are widely covered [8,9], but publications on thecorrosion behavior of composite titanium carbon nitride (Ti–C–N)and titanium niobium carbon nitride (Ti–Nb–CN) coatings wherethe Nb inclusion could increase the corrosion protection areinsufficient. It is known [11] that the properties of composite

Fig. 1. Schematic for device used in corrosion test. Auxiliary electrode or counter-
electrode (AE), working electrode (WE), reference electrode (RE).
J.C. Caicedo et al. / Applied Surface Science 256 (2010) 2876–2883 2877
coatings may be controlled by both the nature and size of dispersedgrain or by the substitution of any elements within the crystalstructure. In this paper, TiC1�xNx and Ti1�xNbxC1�yNy coatingsdeposited on Si(1 0 0) and AISI 4140 steel substrates grown viamagnetron sputtering technique at different r.f. negative biasvoltages were studied. The r.f. negative bias voltage is an importantparameter for the enhancing of the mechanical properties, but itaffects the corrosion properties since it can increase the porosity ofthe coatings produced by a high ion bombardment. It wasinvestigated the influence of the r.f. negative bias voltage, onthe electrochemical properties of the coatings exposed to anaggressive environment by using electrochemical impedancespectroscopy (EIS) and polarization methods.
2. Experimental details
TiC1�xNx and Ti1�yNbyC1�xNx coatings have been grown onSi(1 0 0) and AISI 4140 steel substrates by using a multitargetmagnetron reactive sputtering technique, with an r.f. source(13.56 MHz) and two stoichiometric TiC and Nb targets with purityat 99.9% for both targets. The deposition parameters for obtaininghigh-quality coatings were sputtering power of 400 W for TiC and350 W for the Nb target; substrate temperature of 300 8C; undercircular rotation substrate with 60 RPM to facilitate the formationof the stoichiometric film; the sputtering gas was a mixture of Ar76% and N2 24% with a total working pressure of 6 � 10�3 mbar,under argon and nitrogen gas flow of 50 and 16 sccm, respectively.It was applied an unbalanced r.f. bias voltage, which generates anegative signal of 0, 20, 50 and 100 V to systematically study iteffect upon coating electrochemical properties. The total thicknessof all the coatings was keep constant around 3 mm. The sampleswere characterized via X-ray diffraction and Raman spectroscopy.The chemical composition of the coatings was determined byenergy dispersive X-ray (EDX) analysis using a Philips XL 30 FEG.The crystal structure of the coatings was determined by using aPANALYTICAL X’Pert PRO X-ray diffractometer with Cu Karadiation. Raman spectroscopy was conducted using a 632.8 nmline of a 5.9 mW helium-neon laser through an Olympus BX40 50�objective, at 0.9 objective numerical aperture, focal length at80 mm, with a 2-mm laser spot diameter on the film surface andcorresponding to a power of 0.5 mW, low enough to preventspectral changes or coating destruction due to light absorption andlocal temperature increase. Spectra were taken at room tempera-ture. Dispersed light was analyzed by a holographic grating with1800 grooves/mm, and collected by a 1024 � 256 open-electrodecharge-coupled device (CCD) camera. The spectral resolutionranged between 0.8 and 2.1 cm�1, experimentally determined bymeasuring the Rayleigh line of the laser excitation. Spectra were
Fig. 2. XRD patterns for: (a) TiC1�xNx and (b) Ti1�xNbxC1�yNy coatings grown with differe
peaks obtained from JCPDF files.
generally recorded non-polarized in the spectral range between170 and 1470 cm�1 for all the samples. Relative film surface andincident beam orientation dependency was checked at parallel andrectangular polarization of the laser and the scattered Raman lightby rotating the coating 1808 in 308 steps without changing themeasuring point.
The electrochemical study was carried out with a Gamry unit,model PCI 4, utilized for DC and AC measurements. Electrochemi-cal impedance spectroscopy (EIS), and Tafel polarization curveswere obtained at room temperature, using a cell with a workingelectrode within an exposed area of 1 cm2, a reference electrode(Ag/AgCl) and a platinum wire counter-electrode under a 3.5% NaClsolution with distilled water for an exposure time of 30 min(Fig. 1). For Nyquist diagrams, the frequency sweep was performedin the range from 100 kHz to 0.001 Hz using sinusoidal voltageamplitude of 10 mV applied to the working electrode (sample) andreference electrode. To obtain Tafel polarization curve diagrams itwas carried out a voltage sweep at a speed of 0.5 mV/s in the rangeof �0.25 to 0.25 V. The surface corrosion process was achieved,analyzing the surface morphology by using a 50�-objective-optical Olympus PME-3 microscope and a scanning electronmicroscope (SEM) (Phenom FEI) equipped with a light opticalmagnification range: 525.00–24.00� and a height sensitivity back-scattered electron detector (multi-mode).
3. Results and discussion
3.1. X-ray diffraction analysis
Fig. 2(a) shows the XRD patterns of the TiC1�xNx coatingsdeposited on Si(1 0 0) for different r.f. negative bias voltages from 0to 100 V. Fig. 2(a) indicate that the coatings have a cubic structure
nt r.f. negative bias voltages from 0 to 100 V. Dash lines indicate the position of the
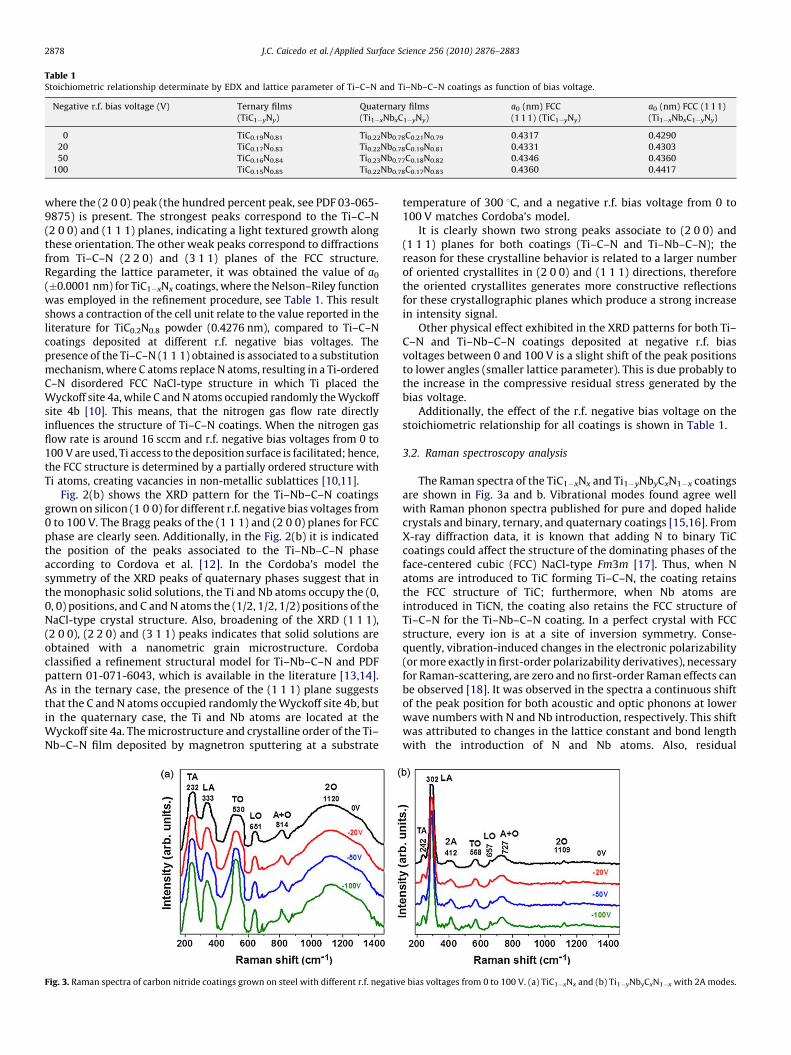
Table 1Stoichiometric relationship determinate by EDX and lattice parameter of Ti–C–N and Ti–Nb–C–N coatings as function of bias voltage.
Negative r.f. bias voltage (V) Ternary films
(TiC1�yNy)
Quaternary films
(Ti1�xNbxC1�yNy)
a0 (nm) FCC
(1 1 1) (TiC1�yNy)
a0 (nm) FCC (1 1 1)
(Ti1�xNbxC1�yNy)
0 TiC0.19N0.81 Ti0.22Nb0.78C0.21N0.79 0.4317 0.4290
20 TiC0.17N0.83 Ti0.22Nb0.78C0.19N0.81 0.4331 0.4303
50 TiC0.16N0.84 Ti0.23Nb0.77C0.18N0.82 0.4346 0.4360
100 TiC0.15N0.85 Ti0.22Nb0.78C0.17N0.83 0.4360 0.4417
J.C. Caicedo et al. / Applied Surface Science 256 (2010) 2876–28832878
where the (2 0 0) peak (the hundred percent peak, see PDF 03-065-9875) is present. The strongest peaks correspond to the Ti–C–N(2 0 0) and (1 1 1) planes, indicating a light textured growth alongthese orientation. The other weak peaks correspond to diffractionsfrom Ti–C–N (2 2 0) and (3 1 1) planes of the FCC structure.Regarding the lattice parameter, it was obtained the value of a0
(�0.0001 nm) for TiC1�xNx coatings, where the Nelson–Riley functionwas employed in the refinement procedure, see Table 1. This resultshows a contraction of the cell unit relate to the value reported in theliterature for TiC0.2N0.8 powder (0.4276 nm), compared to Ti–C–Ncoatings deposited at different r.f. negative bias voltages. Thepresence of the Ti–C–N (1 1 1) obtained is associated to a substitutionmechanism, where C atoms replace N atoms, resulting in a Ti-orderedC–N disordered FCC NaCl-type structure in which Ti placed theWyckoff site 4a, while C and N atoms occupied randomly the Wyckoffsite 4b [10]. This means, that the nitrogen gas flow rate directlyinfluences the structure of Ti–C–N coatings. When the nitrogen gasflow rate is around 16 sccm and r.f. negative bias voltages from 0 to100 V are used, Ti access to the deposition surface is facilitated; hence,the FCC structure is determined by a partially ordered structure withTi atoms, creating vacancies in non-metallic sublattices [10,11].
Fig. 2(b) shows the XRD pattern for the Ti–Nb–C–N coatingsgrown on silicon (1 0 0) for different r.f. negative bias voltages from0 to 100 V. The Bragg peaks of the (1 1 1) and (2 0 0) planes for FCCphase are clearly seen. Additionally, in the Fig. 2(b) it is indicatedthe position of the peaks associated to the Ti–Nb–C–N phaseaccording to Cordova et al. [12]. In the Cordoba’s model thesymmetry of the XRD peaks of quaternary phases suggest that inthe monophasic solid solutions, the Ti and Nb atoms occupy the (0,0, 0) positions, and C and N atoms the (1/2, 1/2, 1/2) positions of theNaCl-type crystal structure. Also, broadening of the XRD (1 1 1),(2 0 0), (2 2 0) and (3 1 1) peaks indicates that solid solutions areobtained with a nanometric grain microstructure. Cordobaclassified a refinement structural model for Ti–Nb–C–N and PDFpattern 01-071-6043, which is available in the literature [13,14].As in the ternary case, the presence of the (1 1 1) plane suggeststhat the C and N atoms occupied randomly the Wyckoff site 4b, butin the quaternary case, the Ti and Nb atoms are located at theWyckoff site 4a. The microstructure and crystalline order of the Ti–Nb–C–N film deposited by magnetron sputtering at a substrate
Fig. 3. Raman spectra of carbon nitride coatings grown on steel with different r.f. negativ
temperature of 300 8C, and a negative r.f. bias voltage from 0 to100 V matches Cordoba’s model.
It is clearly shown two strong peaks associate to (2 0 0) and(1 1 1) planes for both coatings (Ti–C–N and Ti–Nb–C–N); thereason for these crystalline behavior is related to a larger numberof oriented crystallites in (2 0 0) and (1 1 1) directions, thereforethe oriented crystallites generates more constructive reflectionsfor these crystallographic planes which produce a strong increasein intensity signal.
Other physical effect exhibited in the XRD patterns for both Ti–C–N and Ti–Nb–C–N coatings deposited at negative r.f. biasvoltages between 0 and 100 V is a slight shift of the peak positionsto lower angles (smaller lattice parameter). This is due probably tothe increase in the compressive residual stress generated by thebias voltage.
Additionally, the effect of the r.f. negative bias voltage on thestoichiometric relationship for all coatings is shown in Table 1.
3.2. Raman spectroscopy analysis
The Raman spectra of the TiC1�xNx and Ti1�yNbyCxN1�x coatingsare shown in Fig. 3a and b. Vibrational modes found agree wellwith Raman phonon spectra published for pure and doped halidecrystals and binary, ternary, and quaternary coatings [15,16]. FromX-ray diffraction data, it is known that adding N to binary TiCcoatings could affect the structure of the dominating phases of theface-centered cubic (FCC) NaCl-type Fm3m [17]. Thus, when Natoms are introduced to TiC forming Ti–C–N, the coating retainsthe FCC structure of TiC; furthermore, when Nb atoms areintroduced in TiCN, the coating also retains the FCC structure ofTi–C–N for the Ti–Nb–C–N coating. In a perfect crystal with FCCstructure, every ion is at a site of inversion symmetry. Conse-quently, vibration-induced changes in the electronic polarizability(or more exactly in first-order polarizability derivatives), necessaryfor Raman-scattering, are zero and no first-order Raman effects canbe observed [18]. It was observed in the spectra a continuous shiftof the peak position for both acoustic and optic phonons at lowerwave numbers with N and Nb introduction, respectively. This shiftwas attributed to changes in the lattice constant and bond lengthwith the introduction of N and Nb atoms. Also, residual
e bias voltages from 0 to 100 V. (a) TiC1�xNx and (b) Ti1�yNbyCxN1�x with 2A modes.

Fig. 4. Impedance diagrams of (a) TiC1�xNx and (b) Ti1�yNbyCxN1�x coatings grown on 4140 steel with bias voltages from 0 to �100 V.
Fig. 5. Equivalent circuits used for simulation of the experimental data. Reference electrode (RE), electrolyte resistance (RS), polarization resistance (Rp) (coatings), film
capacitance (Cdl), working electrode (WE), (a) TiC1�xNx and (b) Ti1�yNbyCxN1�x [24].
Table 2Polarization resistance for steel, TiC1�xNx and Ti1�yNbyCxN1�x.
0 V �20 V �50 V �100 V Steel 4140
Rp TiCN (kV) 3.01 2.59 1.41 1.34 0.58
Rp TiNbCN (kV) 9.175 2.838 1.326 0.838 0.58
J.C. Caicedo et al. / Applied Surface Science 256 (2010) 2876–2883 2879
compressive stress of ternary and quaternary coatings wassuggested as a reason for band shifting [19]. It was observed anincrease in total spectral density in the region between 232 and1120 cm�1 for TiC1�xNx coatings with increasing of r.f. negativebias voltage. This phenomenon was attributed to stoichiometrydefects and to a greater population of both first- and second-orderdensity of states. With increasing symmetry breaking due tosubstitution of N at C lattice sites in the Ti–C structure, morevibrations become Raman active and hence intensities of all bands
Fig. 6. Tafel curves of TiC1�xNx, (a) and Ti1�yNbyCxN1�x, (b), coati
are expected to increase [18,20]. This band represents probably alocal vibrational mode sensitive to the substitution of carbon bynitrogen atoms. Local vibrational modes due to transition non-metal atoms replacing each other at substitutional sites in thelattice without changing the crystal structure were observed [19].This effect may be further enhanced by local N-enriched coatingareas due to fluctuation of the N ion flux during deposition [21,22].For titanium carbon nitride coating, Fig. 3a, the Raman shifts for theLA, TO, LO, A + O and 2O modes are present with bands situated in232, 333, 530, 651, 814, and 1120 cm�1, respectively.
It was observed in Fig. 3b for Ti1�yNbyCxN1�x coatings thatbands represent probably a local vibrational mode sensitive to thesubstitution of niobium for titanium atoms. Local vibrationalmodes due to transition metal atoms replacing each other atsubstitutional sites in the lattice without changing the crystalstructure were observed [19]. This effect may be further enhanced
ngs grown on steel for bias voltages between 0 and �100 V.

Fig. 7. Corrosion rate vs. negative bias voltage for TiC1�xNx and Ti1�yNbyCxN1�x
coatings.
J.C. Caicedo et al. / Applied Surface Science 256 (2010) 2876–28832880
by local Nb-enriched coating areas due to fluctuation of the Nb ionflux during deposition. [21,22]. For titanium niobium carbonnitride coatings, the Raman shifts of the TA, LA, 2A, TO, LO, A + O,and 2O modes are present with bands situated in 242, 302, 412,568, 657, 727, and 1109 cm�1, respectively. The LA mode around302 cm�1 is more intense as compared with the spectrum for theTiC1�xNx coating. This is attributed to the introduction of Nb atomsfavoring the formation of niobium carbide into the structure [22].
3.3. Electrochemical impedance spectroscopy (EIS) and Tafel
polarization curves of TiC1�xNx and Ti1�yNbyCxN1�x coatings
Fig. 4 displays the Nyquist diagram, imaginary part of theimpedance versus its real part, for the TiC1�xNx (Fig. 4a) andTi1�yNbyCxN1�x (Fig. 4b) coatings grown at different bias voltage:0 V (filled squared symbol), �20 V (full circles), �50 V (opencircles),�100 V (filled inverted triangle) and for the uncoated 4140steel substrate (filled stars). It was observed a strong dependencyof the Nyquist diagrams in relationship with r.f. negative biasvoltage. From Z0(Z00 = 0) to Z0(Z00max) for intercept of curve with x-axis, therefore for fit the experimental data the system provides aRandles cell equivalent circuit [23] simulating the substrate-coating and coating-electrolyte interfaces, as a double layercapacitance in parallel with the coating resistance and theelectrolyte resistance due to the reaction ion transfer [6,10] fromthe electrolyte to the metallic substrate.
From the Nyquist diagrams and the equivalent circuit (Fig. 5), itwas extracted the values for the polarization resistance (Rp).Results in Table 2, indicate that polarization resistance decreaseswhen bias voltage increases, for both ternary and quaternarycoatings. The polarization resistance for the quaternary coating isbigger than that for the ternary one.
Fig. 8. Optical microscopy images showing degradation of the surface coatings after ident
of 100 V; (b) TiC1�xNx coating grown with 0 V bias voltage; (c) Ti1�yNbyCxN1�x coating gr
bias voltage.
Fig. 6 shows the Tafel polarization curves and the corrosionpotential as a function of the corrosion current density for theTiC1�xNx ternary coating (Fig. 6a) and for the Ti1�yNbyCxN1�x
quaternary coating (Fig. 6b) at different bias voltages. Tafelpolarization curves have been used to calculate the surfacecorrosion rate. Tafel polarization curves are also strongly depen-dent on the bias voltage, indicating the influence of the growthparameters, in this case the bias voltage, on the corrosionproperties of the samples. The curves for both coatings are inthe negative region of the corrosion potential, indicating that inany case there is ion transfer from electrolyte to metallic substrate,but in the quaternary Ti1�yNbyCxN1�x coating at zero bias voltage itis less negative than the corresponding ternary coating. The slopes
ical electrochemical processes. (a) TiC1�xNx coating grown with negative bias voltage
own with negative bias voltage of 100 V; (d) Ti1�yNbyCxN1�x coating grown with 0 V

J.C. Caicedo et al. / Applied Surface Science 256 (2010) 2876–2883 2881
of the anodic and cathodic zone, and also the plateau region of theTafel curves give information about the corrosion rate. The plateauvalue increases strongly for the coating at zero bias voltage incomparison to that value from the uncoated substrate, for bothternary and quaternary coatings, indicating that the coatingprovides greater corrosion protection compared to uncoated steelsurfaces. However, when the bias voltage is increased duringcoating deposition, this protection decreases nearing the nature ofthe substrate [10,25]. It was also noted that steel deposited withTi1�yNbyCxN1�x and grown under bias of �100 V presents highersusceptibility to corrosion in the solution compared to the samecoatings where the bias is lower; but if it is compared with the4140 steel deposited with TiC1�xNx under bias voltage of �100 V,the corrosion rate is higher than that for the Ti1�yNbyCxN1�x
coating deposited at the same bias voltage. This fact is probablydue to the porosity of the coating produced by ion bombardment athigher bias voltages. However, passivated coatings generate aprotective layer that responds better to corrosive events than theuncoated 4140 steel substrate.
In Fig. 7 it is observed the corrosion rate in function of the biasvoltage where the Ti1�yNbyCxN1�x coatings present a curve shifttoward low values for the corrosion rate as compared with theTiC1�xNx coatings. This effect occurs because the niobium exerts asubstitutional displacement on some titanium ions to form a stableNaCl-type FCC structure; thus, providing a variation in theelectronegativity of the Ti1�yNbyCxN1�x molecule and showing adifferent molecular energy, because titanium has an electronega-tivity of 1.54 different to niobium electronegativity of 1.60. The Nbinclusion improve the corrosion potential exhibiting higher
Fig. 9. SEM surface morphology of coatings before electrochemical processes (a) TiC1�xNx,
(d) Ti1�yNbyCxN1�x, coatings grown with �100 V r.f. negative bias voltage.
corrosion-resistance when ions polarize the surface ofTi1�yNbyCxN1�x coatings as compared with TiC1�xNx coatings.
3.4. Surface corrosion analysis
It was conducted optical microscopy analysis of the coatingsurfaces immediately after finishing the electrochemical measure-ments via optical and scanning electron microscopy. Fig. 8(a)–(d)show optical micrographs of the coating surfaces after followingidentical electrochemical processes. The images clearly display thedegradation of the surface due to the NaCl solution chemical attackfor the TiC1�xNx coating grown with (a) �100 V and (b) zero biasvoltage, and for the Ti1�yNbyCxN1�x coating grown under (c)�100 V and (d) zero bias voltage. Images were taken underidentical conditions of amplification and illumination. Thedegradation levels depended evidently on the type of coating,ternary TiC1�xNx or quaternary Ti1�yNbyCxN1�x and on the appliedbias voltage, indicating that the quaternary coating grown undernon-bias voltage is the most appropriate coating to reducecorrosion processes in steel. The Nb in the quaternary coatinghas an important contribution to the chemical attack, maybe dueto its lower electronegativity allowing an electrochemical poten-tial that promotes resistance to corrosion because the addition ofNb is even more significant in all electrochemical systems withlower corrosion rates than the TiCN coatings deposited only withTitanium as transition metal [26]. The optical images also indicatethat for anticorrosion applications, coatings must be grown at zerobias voltage. It may happen that high negative bias voltage favorsbetter adhesion of the coating allowing it to have better
(b) Ti1�yNbyCxN1�x, coatings grown at 0 V r.f. negative bias voltage, (c) TiC1�xNx, and
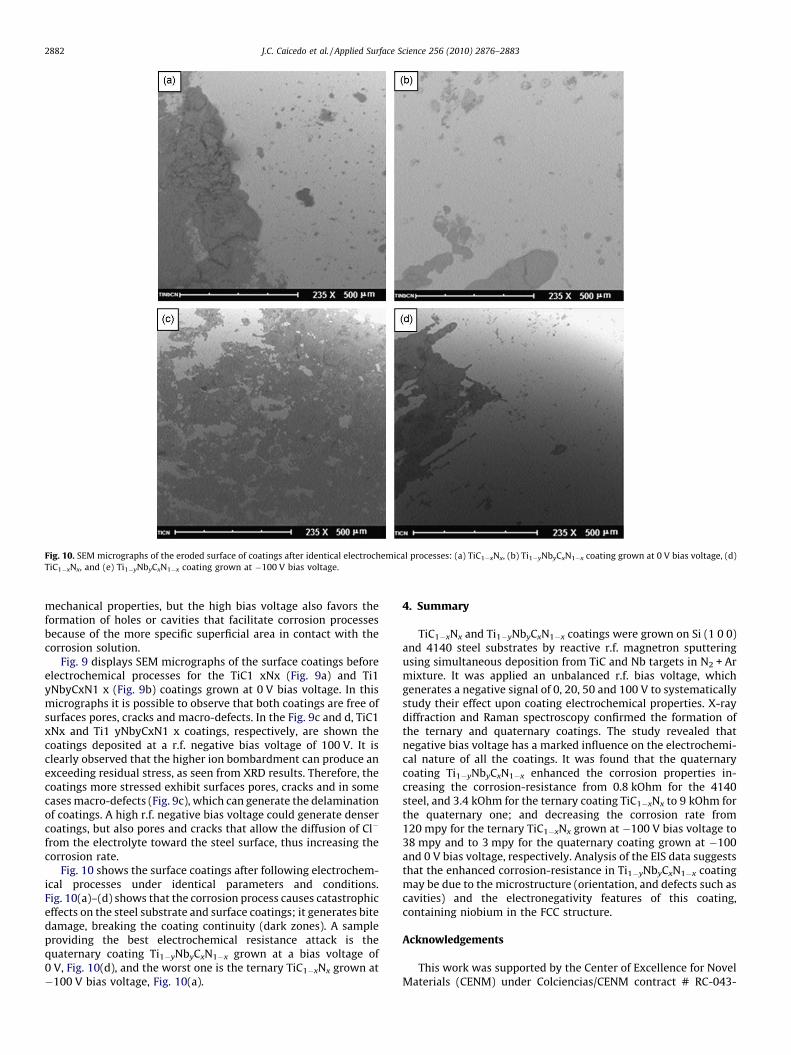
Fig. 10. SEM micrographs of the eroded surface of coatings after identical electrochemical processes: (a) TiC1�xNx, (b) Ti1�yNbyCxN1�x coating grown at 0 V bias voltage, (d)
TiC1�xNx, and (e) Ti1�yNbyCxN1�x coating grown at �100 V bias voltage.
J.C. Caicedo et al. / Applied Surface Science 256 (2010) 2876–28832882
mechanical properties, but the high bias voltage also favors theformation of holes or cavities that facilitate corrosion processesbecause of the more specific superficial area in contact with thecorrosion solution.
Fig. 9 displays SEM micrographs of the surface coatings beforeelectrochemical processes for the TiC1 xNx (Fig. 9a) and Ti1yNbyCxN1 x (Fig. 9b) coatings grown at 0 V bias voltage. In thismicrographs it is possible to observe that both coatings are free ofsurfaces pores, cracks and macro-defects. In the Fig. 9c and d, TiC1xNx and Ti1 yNbyCxN1 x coatings, respectively, are shown thecoatings deposited at a r.f. negative bias voltage of 100 V. It isclearly observed that the higher ion bombardment can produce anexceeding residual stress, as seen from XRD results. Therefore, thecoatings more stressed exhibit surfaces pores, cracks and in somecases macro-defects (Fig. 9c), which can generate the delaminationof coatings. A high r.f. negative bias voltage could generate densercoatings, but also pores and cracks that allow the diffusion of Cl�
from the electrolyte toward the steel surface, thus increasing thecorrosion rate.
Fig. 10 shows the surface coatings after following electrochem-ical processes under identical parameters and conditions.Fig. 10(a)–(d) shows that the corrosion process causes catastrophiceffects on the steel substrate and surface coatings; it generates bitedamage, breaking the coating continuity (dark zones). A sampleproviding the best electrochemical resistance attack is thequaternary coating Ti1�yNbyCxN1�x grown at a bias voltage of0 V, Fig. 10(d), and the worst one is the ternary TiC1�xNx grown at�100 V bias voltage, Fig. 10(a).
4. Summary
TiC1�xNx and Ti1�yNbyCxN1�x coatings were grown on Si (1 0 0)and 4140 steel substrates by reactive r.f. magnetron sputteringusing simultaneous deposition from TiC and Nb targets in N2 + Armixture. It was applied an unbalanced r.f. bias voltage, whichgenerates a negative signal of 0, 20, 50 and 100 V to systematicallystudy their effect upon coating electrochemical properties. X-raydiffraction and Raman spectroscopy confirmed the formation ofthe ternary and quaternary coatings. The study revealed thatnegative bias voltage has a marked influence on the electrochemi-cal nature of all the coatings. It was found that the quaternarycoating Ti1�yNbyCxN1�x enhanced the corrosion properties in-creasing the corrosion-resistance from 0.8 kOhm for the 4140steel, and 3.4 kOhm for the ternary coating TiC1�xNx to 9 kOhm forthe quaternary one; and decreasing the corrosion rate from120 mpy for the ternary TiC1�xNx grown at �100 V bias voltage to38 mpy and to 3 mpy for the quaternary coating grown at �100and 0 V bias voltage, respectively. Analysis of the EIS data suggeststhat the enhanced corrosion-resistance in Ti1�yNbyCxN1�x coatingmay be due to the microstructure (orientation, and defects such ascavities) and the electronegativity features of this coating,containing niobium in the FCC structure.
Acknowledgements
This work was supported by the Center of Excellence for NovelMaterials (CENM) under Colciencias/CENM contract # RC-043-

J.C. Caicedo et al. / Applied Surface Science 256 (2010) 2876–2883 2883
2005. Colciencias-Univalle and J. C. Caicedo thank Colciencias forthe doctoral fellowship.
References
[1] T. Hirsch, P. Mayr, Surf. Coat. Technol. 36 (1988) 729–741.[2] D.S. Rickerby, P.J. Burnett, Thin Solid Films 157 (1988) 195–199.[3] E. Bergmann, H. Kaufmann, I. Vogel, R. Schmid, Surf. Coat. Technol. 42 (1990) 237–
241.[4] M. Tobioka, in: Proceedings of the 12th International Plansee Seminar, Austria,
(1989), pp. 221–225.[5] K.T. Rie, A. Gebauer, J. Wiihle, H.K. Ttinshoff, C. Blawit, Surf. Coat. Technol. 75
(1995) 375–379.[6] D.V. Shtansky, Testing and application, in: NATO Series (Ed.), Nanostructured Thin
flims and Nanodispersion Strengthened Coatings, A.A. Acad. Publ., 2004, pp. 155–166.
[7] L.F. Senna, C.A. Achete, F.L. Freire, T. Hirsch, Surf. Coat. Technol. 95 (1997) 390–397.
[8] N.A. de Sanchez, H.E. Jaramillo, Z. Vivas, W. Aperador, C. Amaya, J.C. Caicedo, Adv.Mater. Res. 38 (2008) 63–75.
[9] F. Correa, J.C. Caicedo, W. Aperador, C. Rincon, G. Bejarano, Rev. Fac. Ing. Univ.Antioq. 46 (2008) 7–14.
[10] S. Surviliene, S. Bellozor, M. Kurtinaitiene, V.A. Safonov, Surf. Coat. Technol. 176(2004) 193–201.
[11] Y. Choquette, L. Brossard, A. Laeia, H. Menard, J. Electrochem. Soc. 137 (6) (1990)1723–1727.
[12] J.M. Cordova, M.J. Sayagues, M.D. Alcala, F.J. Gotor, J. Mater. Chem 17 (2007) 650–657.
[13] J.M. Schneider, A. Voevodin, C. Reblmlz, A. Matthews, J.H.C. Hogg, D.B. Lewis, M.Ives, Surf. Coat. Technol. 75 (1995) 312–319.
[14] G. Levi, W.D. Kaplan, M. Bamberger, Mater. Lett. 35 (1998) 344–350.[15] W. Spengler, R. Kaiser, A.N. Christensen, G. Muller-Vogt, Phys. Rev. B: Condens.
Mat. Mater. Phys. 17 (1978) 1095–1100.[16] R.T. Harley, J.B. Page, C.T. Walker, Phys. Rev. B: Condens. Mat. Mater. Phys. 3
(1971) 1365.[17] M. Kawate, A. Kimura, T. Suzuki, J. Vac. Sci. Technol. A: Vac. Surf. Coat. 20 (2002)
569–575.[18] G.P. Montgomery Jr., M.V. Klein, B.N. Ganguly, R.F. Wood, Condens. Mat. Mater.
Phys. 6 (1972) 4047–4052.[19] D. Gall, M. Stoehr, J.E. Greene, Phys. Rev. B: Condens. Mat. Mater. Phys. 64 (2001)
174302.[20] C.P. Constable, J. Yarwood, W.-D. Munz, Surf. Coat. Technol. 119 (1999) 155–
159.[21] E. Lugscheider, K. Bobzin, K. Lackner, Surf. Coat. Technol. 175 (2003) 681–684.[22] A. Talyzin, H. Hogberg, U. Jansson, Thin Solid Films 405 (2002) 42–49.[23] J.E.B. Randles, Discuss. Faraday Soc. 1 (1947) 11–18.[24] S.H. Ahn, J.H. Yoo, Y.S. Choi, J.G. Kim, J.G. Han, Surf. Coat. Technol. 162 (2003) 212–
221.[25] H.-P. Feng, C.-H. Hsu, J.-K. Lu, Y.-H. Shy, Mater. Sci. Eng. A 347 (2003) 123–129.[26] N. Alonso-Falleiros, S. Wolynec, Mater. Res. 1 (1998) 39–458.
Copyright © 2022 FDOKUMEN