
Economic Energy Savings Potential in Federal Buildings
65
PNNL-13332 1 Economic Energy Savings Potential in Federal Buildings D.R Brown LA. Dirks D.M. Hunt September 2000 Prepared for the U.S. Department of Ener~ Federal Energy Management Program Under Contract DE-AC-06-RLO-1830 Pacific Northwest National Laboratory Richland, Washington
-
Upload
independent -
Category
Documents
-
view
0 -
download
0
Transcript of Economic Energy Savings Potential in Federal Buildings
PNNL-13332 1
Economic Energy SavingsPotential in Federal Buildings
D.R BrownLA. DirksD.M. Hunt
September 2000
Prepared for the U.S. Department of Ener~Federal Energy Management ProgramUnder Contract DE-AC-06-RLO-1830
Pacific Northwest National LaboratoryRichland, Washington

DISCLAIMER*
This repo~ was prepared as an account of work sponsoredby an agency of the United States Government. Neitherthe United States Government nor any agency thereof, norany of their employees, make any warranty, express orimplied, or assumes any legal liability or responsibility forthe accuracy, completeness, or usefulness of anyinformation, apparatus, product, or process disclosed, orrepresents that its use wouid not infringe privateiy ownedrights. Reference herein to any specific commercialproduct, process, or service by trade name, trademark,manufacturer, or otherwise does not necessarily constituteor impiy its endorsement, recommendation, or favoring bythe United States Government or any agency thereof. Theviews and opinions of authors expressed herein do notnecessarily state or refiect those of the United StatesGovernment or any agency thereof.
DISCLAIMER
Portions of this document may be illegiblein electronic image products. Images areproduced from the best availabledocument.
original
Preface
The mission of the U.S. Department of Energy’s (DOE) Federal Energy Management Program(FEMP) is to reduce the cost of government by advancing energy.efficiency, water conservation, andthe use of renewable technologies. This is accomplished by creating partnerships, leveragingresources, transferring technology, and providing training, technical guidance, and assistance toagencies. Each of these activities is directly related to achieving the requirements set forth in theEnergy Policy Act of 1992 and the goals that have been established in Executive Order 13123 (June1999), as well as supporting activities that promote sound management of Federal financial andpersonnel resources. The Pacific Northwest National Laboratory (PNNL) supports the mission ofFEMP in all activity areas.
This document provides findings and recommendations from an analysis by PNNL to estimate theavailable economic energy savings potential in Federal facilities. Understanding this savingspotential will help FEMP develop programmatic strategies aimed at meeting the Federal energyefficiency goals. This analysis relied on data from previously completed DOE SAVEnergy audits,as well as modeling of facilities with the Facility Energy Decision System (FEDS).
...111

Acknowledgements
The authors would like to &knowledge the following individuals for their assistance indeveloping this repofi. Paul King (DOE Boston Regional Office] Gene Lesinski, BillKlebous, Claudia Marchione, and Ryan Paddick (DOE Philadelphia Regional Office); DaveWaldrop and Rich Combes (DOE Atlanta Regional Office); Sharon Gill (DOE ChicagoRegional Office); Randy Jones (DOE Denver Regional Office); Cheri Sayer, Arun Jhaveri,and Alison Bemis (DOE Seattle Regional Office); Teresa Nealon, (National RenewableEnergy Laboratory); Don Bollinger (Bonneville Power Administratio& Seattle Office);Mark Hopkins (Alliance to Save Energy); and Tatiana Strainic Muessel (DOE FEMP). Thiswork was fi.mded by the U.S. Department of Energy’s Federal Energy ManagementProgram. Pacific Northwest National Laboratory is operated for the U.S. Department ofEnergy by Battelle Memorial Institute under Contract DE-AC06-76RLO-1 830.
I
v

Summary
The Federal Energy Management Program (FEMP) and Federal agencies have been working foryears towards achieving mandated and legislated energy efficiency goals for Federal buildings.Recently, Executive Order 13123 extended prior requirements to a 35% reduction in energy use persquare foot by2010 relative to 1985. Since 1985, energy use at Federal buildings has dropped from139.8 M&u/kWyr (million Btu per thousand square feet) to 113.7 MBtuiksf&r in 19981. Thus,significant additional energy savings will be required to meet the fhture goal of 90.9 MBtu/ksf.
The primary objective of this study was to estimate the current life-cycle cost-effective (i.e.,economic) energy savings potential in Federal buildings and the corresponding capital investmentrequired to achieve these savings, with Federal financing. Estimates were developed for majorcategories of energy efficiency measures such as building envelope, heating system, cooling syst~and lighting. The analysis was based on conditions (building stock and characteristics, retrofittechnologies, interest rates, energy prices, etc.) existing in the late 1990s. The potential impact ofchanges to any of these factors in the fiture was not considered.
The analysis relied on results from a sampling of SAVEnergy audits and modeling with the FacilityEnergy Decision System (FEDS). Although both auditing approaches consider a broad range oftechnologies, neither of these two approaches, or any other practical approach is 100’%ocomprehensive. Thus, the estimated energy savings potential is most likely on the low side. Inaddition, the analysis was limited to consideration of savings captured via investment in capitalimprovements. Potential savings from changes in the building stock (e.g.,.demolition, newconstruction) or operation and maintenance practices, or replacement of equipment upon failurewere not evaluated.
EO 13123 applies to owned buildings and leased buildings where energy costs are paid directly bythe government. This includes foreign as well as domestic property. Certain types of energyintensive operations are excluded from the energy savings goals described above. The remainingbuildings are commonly referred to as the “goal inventory.” This studyfocused on the energysavings potential in domestic, owned, goal inventory buildings, which represent about 86% of thetotal goal inventoiy square footage.
Overall, the potential annual energy savings were estimated to be 25 MBtu/kst7yr or 0.066 Quads/yr.This is 19% of the actual Federal goal inventory building energy consumption in FY98 or 22’XOofthe per square foot consumption. The estimated investment required to achieve these savings is$5.2 billion, while annual dollar savings are estimated to be $0.95 billion. The resulting net presentvalue of the investment is $9.3 billion. The energy savings potential, if captured, would result in theFederal government nearly meeting its goal of reducing energy consumption per square foot by 35’%0relative to 1985 figures, even without including the energy savings potential in foreign and leasedproperty.
Lighting was the energy efficiency measure (EEM) category with the greatest energy savingspotential, accounting for about one-fourth of the total. The most commonly recommended lightingmeasure was the conversion of T-12 fluorescent lights to T-8s with electronic ballasts. Other
1Excludingfacilitiesthathouse energy intensiveoperations.2The energysavingsexpressedas a percentof total energyconsumption(19Yo)is less than the energysavingsexpressedas a percentof the per square foot energyconsumption(22’%o)becausethe savingspotential wasonly estimatedfor the domestic,owne~ goal inventorysquarefootage,which is 86’%of the total goalinventorysquarefootage.
vii
common lighting measures were compact fluorescence lamps (CFLS), occupancy sensors or othercontrols, and light emitting diode (LED) exit signs. Other important categories indicated by theanalysis are cooling systems, ventilation and controls, building envelope, service hot water, andheating systems. The frequencies of recommended energy efficiency measures horn the sample ofSAVEnergy audits evaluated and the FEDS modeling results are presented in Appendix D.
The clear evidence of substantial cost-effective lighting retrofit potential in both civilian and militaryagencies suggests that FEMP should continue to emphasize its lighting support programs. However,with 75°/0of the energy savings opportunity within other energy efficiency categories, acomprehensive energy efficiency program is clearly needed as well.
Although the total estinyded energy savings per square foot were approximately the same for civilianand military agencies, the mix of energy efficiency measures was estimated to be significantlydifferent. This result is mostly attributed to differences in analytical approack which relied on astatistical extrapolation of SAVEnergy audit results for civilian agencies and simulation of selected&my installations with FEDS. Resolution of these differences is recommended to improve theaccuracy of the estimates and better understand significant differences, if any, between civilian andmilitary agencies.
Additional analysis of potential savings associated with central energy plants and thermaldistribution systems is also recommended for the military. Energy savings estimates for thesefacilities were derived from SAVEnergy audit results for civilian agencies with similarly sized sites,but the savings could be several times greater based on the condition of a handfid of military sitesknown by the authors.
The cost-effective energy savings potential noted above is based on Federal financing and declines ifhigher, private financing costs are assumed. A recent investigation conducted by the authors yieldedan estimate of 0.040 to 0.048 Quads/yr of cost-effective energy savings potential via alternativefinancing [energy saving performance contracting (ESPC) or utility energy service contracts] orabout two-thirds of the estimate in this study via Federal financing.3 This range of alternativefinancing energy savings potential corresponds to required investments of $2.0 to $3.0 billion4.Even if all of the cost-effwtive alternative financing projects are implemented, the savings will leavethe Federal government about 7 MBtu/ksf short of achieving the 35% reduction goal. Therefore,direct Federal fimding of energy efficiency projects will also be required if the goal is to be met5.
3Dirks,J.A., D.R.Brow and J.W. Currie. 1999. Sensitivity of ESPC Projects to Changes in Interest Ratesand Energy Pn”ces. An informalletterreporthorn PNNL.to DOE.4Energysavingsand investmentfigureshorn Dirks, Brow and Currie(see footnote 3) were adjustedtocorrespondto the domestic,ownedportionof the goal-inventorypropertyonly.5Agah all conclusionsare subjectto the key limitationsof this study described on the previouspage, e.g., theestimatedsavingsarebasedon currentlyavailabletechnologiesbeing retrofit to the currentbuilding stock.
...Vlll
CFLDoDDOEEEMESPCEOEPAFCCFEDSFEMAFEMPFORSCOMGSAHHsksfLEDMBtuNARANASANSFNPvPNNLPTACQuadSfUSIAVA
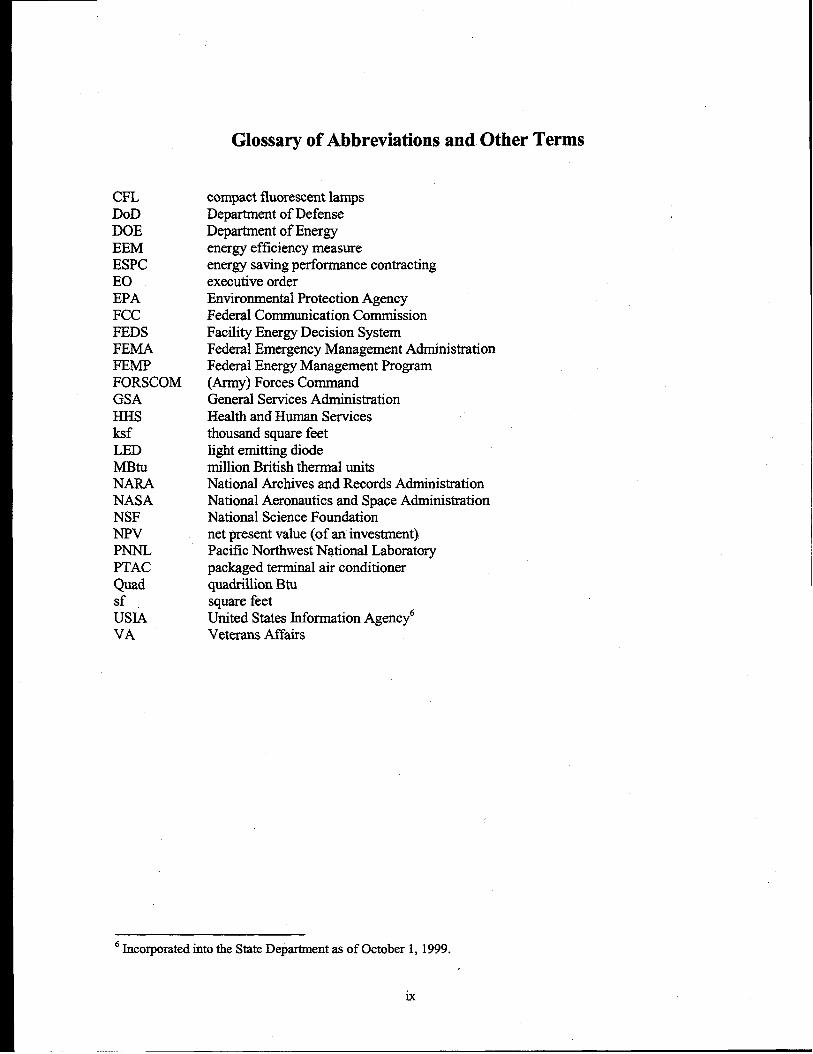
Glossary of Abbreviations and Other Terms
compact fluorescent lampsDepartment of DefenseDepartment of Energyenergy efficiency measureenergy saving performance contractingexecutive orderEnvironmental Protection AgencyFederal Communication CommissionFacility Energy Decision SystemFederal Emergency Management AdministrationFederal Energy Management Program(Army) Forces CommandGeneral Services AdministrationHealth and Human Servicesthousand square feetlight emitting diodemillion British thermal unitsNational Archives and Records AdministrationNational Aeronautics and Space AdministrationNatioml Science Foundationnet present value (of an investment)Pacific Northwest National Laboratorypackaged terminal air conditionerquadrillion 13tusquare feetUnited States Jnforrnation AgencyGVeterans Affairs
cIncorporatedinto the StateDepa.rtrnentas of October 1, 1999.
ix

Contents
P~FACE .............................................................................................................................
AC~O~EDGEME~S ..................................................................................................
suMMARY ..........................................................................................................................
GLOSSARY OF ABBREVIATIONS AND OTHER TERMS ............................................
1.0
2.0
3.0
4.0
5.0
6.0
INTRODUCTION .........................................................................................................
PREVIOUS SAVINGS ESTIMATES ...........................................................................
APPROACH ..................................................................................................................
C~~AGENCIES .................................................................................................
MILITARY AGENCIES ...............................................................................................
RESULTS ......................................................................................................................
CONCLUSIONS ............................................................................................................
RECOMMENDATIONS ...............................................................................................
REFERENCES .....................................................................................................................
APPENDIX A – SAVENERGY AUDITS REVIEWED AND SORTED BY
...111
v
vii
ix
1
3
7
9
10
13
23
25
27
DOE REGION ......................................................................................................................A.l
APPENDIX B – AUDIT DATA COLLECTED ..................................................................B.l
APPENDIX C – SAVENERGY AUDIT DATA STATISTICAL ANALYSIS ...................C.1
APPENDIX D – FREQUENCIES OF RECOMMENDED ENERGYEFFICIENCY MEASURES .................................................................................................D.1
xi

1
2
3.
4
5
6
7
8
9
10
11
12
13
14
TABLES
Federal Building Floor Space Governed byEO13123 ........................................... 7
Domestic and Foreign, Ovvnedand Leased Property ............................................... 8
Distribution of Civilian Agency Floor Space in Population and Audits .................. 9
Results by Agency for SAVEnergy Audit Sample Data .......................................... 13
Results by EEM Category for SAVEnergy Audit Sample Data .............................. 14
Regression Analysis Results by Agency for Civilian Population – Results perThousand Square Feed (k@ for Domestic, Owned, Goal-Inventory Buildings ...... 15
Regression Analysis Results by Agency for Civilian Population – Total Resultsfor Domestic, Owned, Goal-Inventory Buildtigs .................................................... 16
Regression Analysis Results by EEM Category for Civilian Population – Resultsper Thousand Square Feet (k@ for Domestic, Owned, Goal-InventoryBuildings .................................................................................................................. 17
Regression Analysis Results by Agency for Civilian Population – Total Resultsfor Domestic, Owned, Goal-Inventory Buildings .................................................... 17
Results by EEM Category for DoD FEDS Analysis – Results per ThousandSquare Feet (k@ for Domestic, Owned, Goal-Inventory Buildings ....................... 19
Results by EEM for DoD FEDS Analysis – Total Results for Domestic,Owned, Goal.kvento~ Buil&ngs ........................................................................... 19
Results by EEM for Federal Government FEDS Analysis – Results perThousand Square Feet (led) for Domestic, Owned Goal-Jnventory Buildings ........ 20
Results by EEM for Federal Government FEDS Analysis – Total Results forDomestic, Owned, Goal-Inventory Buildings .........................................................2O
Historical and Prospective Energy Intensities ......................................................... 21
xii
1.0 Introduction
FEMP and Federal agencies have been working for years towards achieving mandated and legislatedenergy efficiency goals for Federal buildings. Prior goals required energy consumption per squarefoot of building floor space to be reduced by 10%, 20%, and 30% relative to a 1985 baseline by theyears 1995,2000, and 2005, respectively. Recently, Executive Order 13123 extended therequirement to a 35% reduction by 2010 relative to 1985.
Since 1985, energy use at Federal buildings has dropped from 139.8 MBtu/ksf/yr to 113.7MBtu/ksf7yr in 1998. This 18.7% drop in 13 years puts the Federal government on pace to meet theenergy consumption goals for both 2005 (97.9 MBt&si7yr) and 2010 (90.9 MBtu/ksi7yr). Still,significant additional energy savings will be required to meet the fiture goals.
The primary objective of this study was to estimate the life-cycle cost-effective (i.e., economic)energy savings potential in Federal buildings and the corresponding capital investment required toachieve these savings. Total estimates were aggregated flom estimates prepared for major categoriesof energy efficiency measures such as building envelope, heating syst~ cooling system andlighting. The results indicate (among other things) whether the economic energy savings potential isadequate to meet future goals, the magnitude of investment required to achieve the savings and meetthe goals, and target energy efficiency measures that represent the greatest opportunity.
Over the years several estimates of the potential cost-effective energy savings and the correspondingrequired capital investment have been made. In general, these estimates must be updatedperiodically as changes occur in:
● the demand for energy services● building stock and energy equipment characteristics’● replacement or retrofit technology characteristics● energy prices● interest rates.
While prior estimates of the cost-effective energy savings potential have become dated, datacollected from a few hundred SAVEnergy audits over the last few years has created a new source ofinformation. This information can be used for characterizing the types of energy efficiencymeasures and estimating the cost-effective energy savings available for a significant portion of theFederal building inventory. The combination of these events suggested that new estimates of thepotential cost-effective energy savings should be developed.
7Includingprevious retrofits,if any.

2.0 Previous Savings Estimates
The origins of the current Federal energy efficiency mandate of Executive Order 13123 stretches allthe way back to the passage of the Federal Energy Management Improvement Act of 1988 (FEMIA).This law established for Federal agencies a 10% facility energy reduction goal by 1995 relative to1985 facility energy use. The Federal agencies were successfid in achieving this goal; through FY95DOE reported a 14.2% reduction in energy use relative to the 1985 baseline. Since the FEMIA goal,additional energy efficiency goals have been established for Federal agencies:
- Executive Order 12759 of April 17, 1991, “Federal Energy Management” – mandated anenergy reduction of 20’XOby 2000 relative to 1985
- Energy Policy Act of 1992 – legislated an energy reduction of 20% by 2000 relative to 1985
- Executive Order 12902 of March 6, 1994, “Energy Efficiency and Water Conservation atFederal Facilities” – mandated an energy reduction of 30% by 2005 relative to 1985
- Executive Order 13123 of June 8, 1999, “Greening the Government Through EfficientEnergy Management” – mandated an energy reduction of 35% by2010 relative to 1985.
Along the way there have been a number of estimates developed and made available regarding thepotential level of cost-effective savings ruder investments to either meet or exceed the legislatedand mandated goals. There are several reasons why these estimates may have been developed. Onereason is to develop policy and influence legislation and executive guidance. From the perspectiveof FEMP, estimates of savings potential are valuable for a number of reasons. First, it is desirable toveri& whether or not the energy goals are actually attainable. Note that the assessment described inthis document takes the approach that efficiency improvements will be realized primarily throughinvestments in building retrofits. Second, if the efficiency goal is attainable, the next question iswhat level of investment is necessary to attain the goal. l%ir~ and most important, FEMP is able tomake informed programmatic decisions and develop strategies based on these estimated tidingrequirements, ultimately assisting Federal agencies in meeting all the energy efficiency goals.
Below is a summary of several estimates of cost-effective potential energy savings and orinvestments. These estimates are presented in chronological order.
Alliance to Save Energy, 1991 (Hopkins 1991): “The Alliance estimates that 25 percent savings arearealistic potential . . . To reduce energy use by 25 percent, we estimate that $4.2 billion in Federalbuilding efficiency improvements should be made by the year 2000.” It appears the estimate of a25 percent savings potential was based on a number of diffkrent studies on general building energysavings potential available at that time. The Alliance also assumed that an average energ efficiencymeasure would carry a simple payback period of 5 years (or, put another way, 1 dollar in energysavings per year for 5 dollars in capital investment). The total investment potential was thenestimated by determining the total annual savings amount (25’?40of the annual facilities energy bill)and dividing that by 0.2 (the quotient of the simple payback period above).
O@ce of Technology Assessment (OTA), May 1991 (OTA 1991): “The best information available(which is only very approximate) indicates that a reduction in energy use of at least 25 percent istechnically feasible and economically attractive for both federally owned and federally assistedbuildings. This represents an annual savings of nearly $900 million in federally owned buildings,
3
although achieving those savings could require initial investments on the order of $2 to $3 billion.”The basis for the investment and savings estimates are not provided in the assessment.
Tmtimony by J. William Currie (PNNL) before the Senate Subcommittee on Governmental Ajtairs,February 1992 (Currie 1992): “... we estimate that over $2 billion in annual net savings wouldaccrue to the taxpayera flom installing all life-cycle cost effective technologies in Federal buildingsand facilities.” Also, “We estimate that an immediate investment of $5 to $10 billion for energy-efficient technologies in Federal buildings and facilities can be justified . . .“ This investment rangewas based on a rule-of-thumb, developed at PNNL through field experiences at Federal sites, that agovernment facility could invest one to two times its annual energy bill in energy efficienttechnologies.
O@ce of Technology Assessment, May 1994 (OTA 1994): There is widespread agreement thatcommercially available technologies could profitably reduce the Federal government’s $4 billionannual building costs by at least 25 percent.” As in 1991, the OTA did not provide a basis for theirestimate.
Pac@c Northwest Laboratory, August 1994 (Currie et al. 1994): “The lower-bound estimates showthat we would save . . . approximately 210/0of the energy now used in buildings, facilities, andprocesses. . . . Our analysis indicates that at least 33% of the annual bill, $1.5 billion, could besaved.” The report went onto estimate a cost effective investment potential of $5.9 billion [1991dollars] of which $1.0 billion would be in process energy improvement. This estimate, whichappears to be the first estimate developed analytically, was developed by applying thorough analysisof new technologies to the Federal building inventory data. Assumptions regarding actualequipment and systems in the Federal building inventory was enhanced by the application of fieldobservations by Pacific Northwest Laboratory staff.
FEMP, undated (FEMP): “Based on an evaluation of the life-cycle cost-effective energy and waterconservation projects required to meet the National Energy Conservation Policy Act] and ExecutiveOrder [12902] goals, the best estimate of the total investment required between 1996 and 2005 is$5.7 billion. This value could vary from a low of $4.4 billion to a high of $7.1 billion given thevariability in both energy and water investment requirements.” These estimates of investment werebased upon two sources: data flom the 1993 U.S. Army Corps of Engineers Renewable and EnergyEfficiency Planning Model and the 1994 PNL assessment noted above.
Alliance to Save Energy, 1998 (Loper, Miller and Hopkins 1998): “In order to meet the President’s30-percent energy reduction goal by 2005, we estimate that Federal agencies will need to invest $4.7billion over the next eight yeirs [fiscal years 1998 through 2005] in energy saving projects.”Calculations demonstrating how this estimate was developed were not included in the report.
Note that in addition to achieving the 1995 reduction goal of 10Yo, the 2000 reduction goal of 20%also appears to have been met in 1999 (FEMP 2000a). Also, from 1985 to 1999, an estimated $3.4billion was invested in energy efficiency retrofits in Federal facilities?
8Total estimated investment is the sum of the following:$2.502 billion in investments via agencyappropriations (FEMP 2000b),$484 million from energysavingsperformancecontracts(Reicher2000–Briefing by Assistant Secretary for Energy Efficiency and Renewable Energy on March 30,2000 to DOEsuper-ESPC energy services companies), and $378 million in utility energy services investments (Reicher2000 - Bnefmg by Assistant Secretary for Energy EE1ciency and Renewable Energy on March 30,2000 toDOE super-ESPC energy services companies).

It would be desirable to be able to identifi emerging trends from and/or similarities between all theseestirnates/analyses; however, any such trends are likely the result of coincidence more than anythingelse because most of these estimates appear to be developed by using independent simplified,assumption-driven calculations. In general, many of the estimates call for total capital investmentsin energy efficient retrofits in the neighborhood of $5 billion, as well as potential efilciencyimprovements in the neighborhood of 25°/0.
It is not really surprising that riearly 10 years after the initial savings potential estimate, an estimatedinvestment opportunity on the order of $5.2 billion remains. Even though significant investmentshave been made since 1985, new and improved technologies continue to find their way onto themarket resulting in increased savings potential. It is these new and improved technologies that boostthe Federal agencies in their efforts to clear an increasingly higher bar.

3.0 Approach
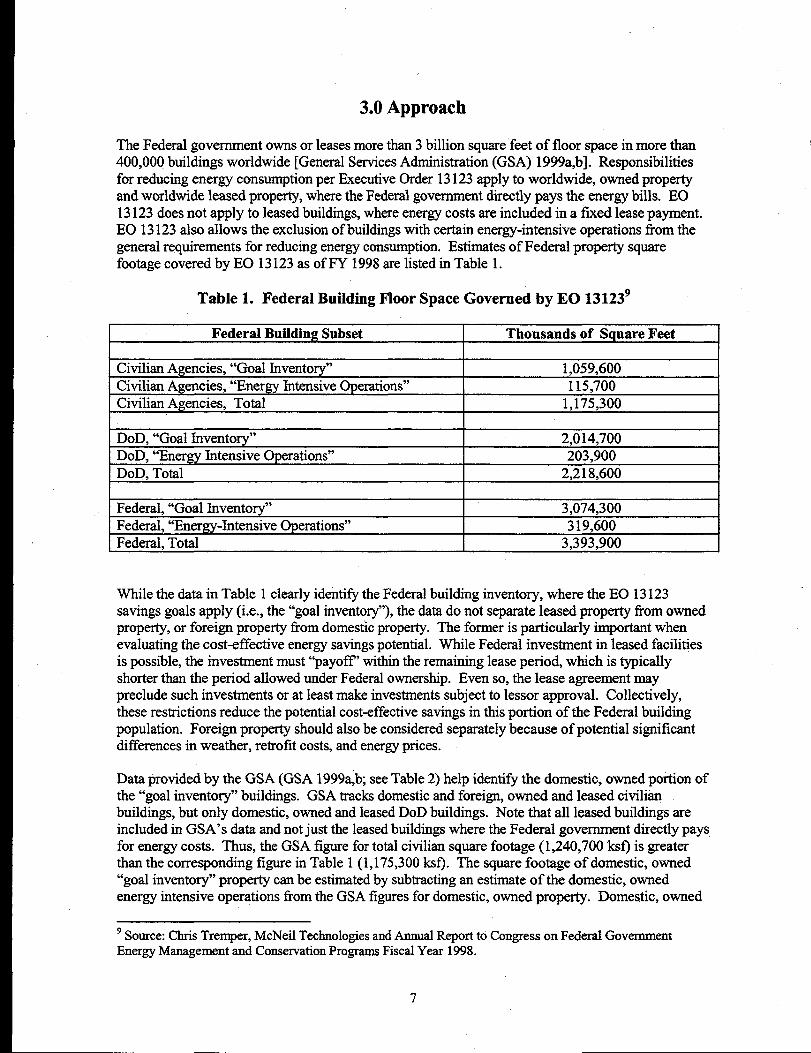
The Federal government owns or leases more than 3 billion square feet of floor space in more than400,000 buildings worldwide [General Services Administration (GSA) 1999a,b]. Responsibilitiesfor reducing energy consumption per Executive Order 13123 apply to worldwide, owned propertyand worldwide leased property, where the Federal government directly pays the energy bills. EO13123 does not apply to leased buildings, where energy costs are included in a fixed lease payment.EO 13123 also allows the exclusion of buildings with certain energy-intensive operations iiom thegeneral requirements for reducing energy consumption. Estimates of Federal property squarefootage covered by EO 13123 as of FY 1998 are listed in Table 1.
Table 1. Federal Building Floor Space Governed by EO 131239
Federal Building Subset Thousands of Square FeetI
Civilian Agencies, “Goal Inventory” 1,059,600Civilian Agencies, “Energy Intensive Operations” 115,700Civilian Assncies. Total 1.175.300
DoD, “Goal Inventory” 2,014,700DoD, “Energy Jntensive Operations” 203,900DoD. Total 2.218.600
~ 3,074,300Federal, “Energy-Intensive Operations” 319,600Federal, Total 3,393,900
While the data in Table 1 clearly identify the Federal building inventory, where the EO 13123savings goals apply (i.e., the “goal inventory”), the data do not separate leased property from ownedproperty, or foreign property from domestic property. The former is particularly important whenevaluating the cost-eff~tive energy savings potential. While Federal investment in leased facilitiesis possible, the investment must “payoff” within the remaining lease period, which is typicallyshorter than the period allowed under Federal ownership. Even so, the lease agreement maypreclude such investments or at least make investments subject to lessor approval. Collectively,these restrictions reduce the potential cost-effective savings in this portion of the Federal buildingpopulation. Foreign property should also be considered separately because of potential significantdifferences in weather, retrofit costs, and energy prices.
Data provided by the GSA (GSA 1999a,~ see Table 2) help identify the domestic, owned poition ofthe “goal inventory” buildings. GSA tracks domestic and foreign, owned and leased civilianbuildings, but only domestic, owned and leased DoD buildings. Note that all leased buildings areincluded in GSA’s data and not just the leased buildings where the Federal government directly paysfor energy costs. Thus, the GSA figure for total civilian square footage (1,240,700 I@ is greaterthan the corresponding figure in Table 1 (1,175,300 ksf). The square footage of domestic, owned“goal inventory” property can be estimated by subtracting an estimate of the domestic, ownedenergy intensive operations from the GSA figures for domestic, owned property. Domestic, owned
9Source:ChrisTremper,McNeilTechnologiesand Annual Report to Congress on Federal GovernmentEnergy Management and Conservation Programs Fiscal Year 1998.
7
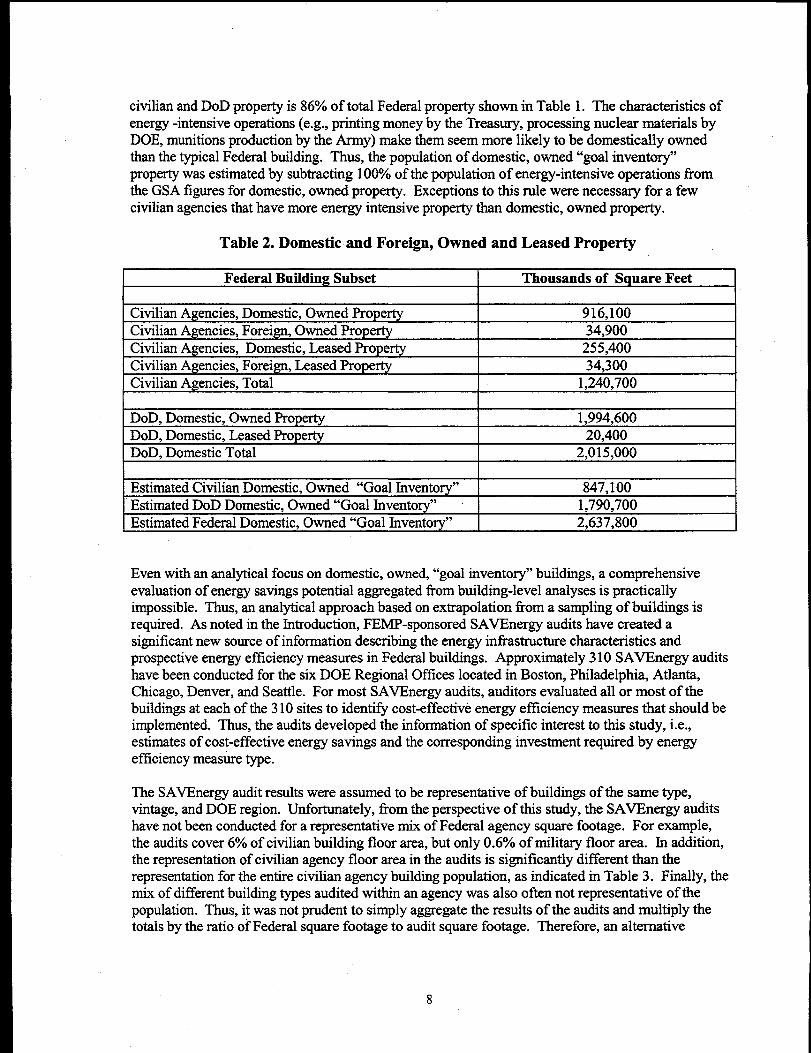
civilian and DoD property is 86°/0of total Federal property shown in Table 1. The characteristics ofenergy -intensive operations (e.g., printing money by the Treasury, processing nuclear materials byDOE, munitions production by the Army) make them seem more likely to be domestically ownedthan the ~ical Federal building. Thus, the population of domestic, owned “goal inventory”property was estimated by subtracting 100% of the population of energy-intensive operations fromthe GSA figures for domestic, owned property. Exceptions to this rule were necessary for a fewcivilian agencies that have more energy intensive property than domestic, owned property.
Table 2. Domestic and Foreign, Owned and Leased Property
Federal Building Subset I Thousands of Square Feet
Civilian Agencies, Domestic, Owned Property 916,100Civilian Agencies, Foreign, OwmedProperty 34,900Civilian Agencies, Domestic, Leased Property 255,400Civilian Agencies, Foreign, Leased Property 34,300Civilian Agencies. Total 1.240.700
DoD, Domestic, Owned Property 1,994,600DoD, Domestic, Leased Property 20,400DoD, Domestic Total 2,015,000
Estimated Civilian Domestic, Owned “Goal Inventory” 847,100Estimated DoD Domestic, Owned “Goal Inventory” - 1,790,700Estimated Federal Domestic, Owned “Goal Inventory” 2,637,800
Even with an analytical focus on domestic, owned, “goal inventory” buildings, a comprehensiveevaluation of energy savings potential aggregated from building-level analyses is practicallyimpossible. Thus, an amlytical approach based on extrapolation from a sampling of buildings isrequired. As noted in the Introduction, FEMP-sponsored SAVEnergy audits have created asignificant new source of information describing the energy infrastructure characteristics andprospective energy efficiency measures in Federal buildings. Approximately310 SAVEnergy auditshave been conducted for the six DOE Regional Offices located in Boston, Philadelphia, Atlanta,Chicago, Denver, and Seattle. For most SAVEnergy audits, auditors evaluated all or most of thebuildings at each of the 310 sites to identi& cost-effective energy efficiency measures that should beimplemented. Thus, the audits developed the information of specific interest to this study, i.e.,estimates of cost-effective energy savings and the corresponding investment required by energyefficiency measure type.
The SAVEnergy audit results were assumed to be representative of buildings of the same &pe,vintage, and DOE region. Unfortunately, from the perspective of this study, the SAVEnergy auditshave not been conducted for a representative mix of Federal agency square footage. For example,the audits cover 6% of civilian building floor area, but only 0.6% of military floor area. In addition,the representation of civilian agency floor area in the audits is significantly diffment than therepresentation for the entire civilian agency building population, as indicated in Table 3. Finally, themix of different building types audited within an agency was also ofien not representative of thepopulation. Thus, it was not prudent to simply aggregate the results of the audits and multiply thetotals by the ratio of Federal square footage to audit square fbotage. Therefore, an alternative
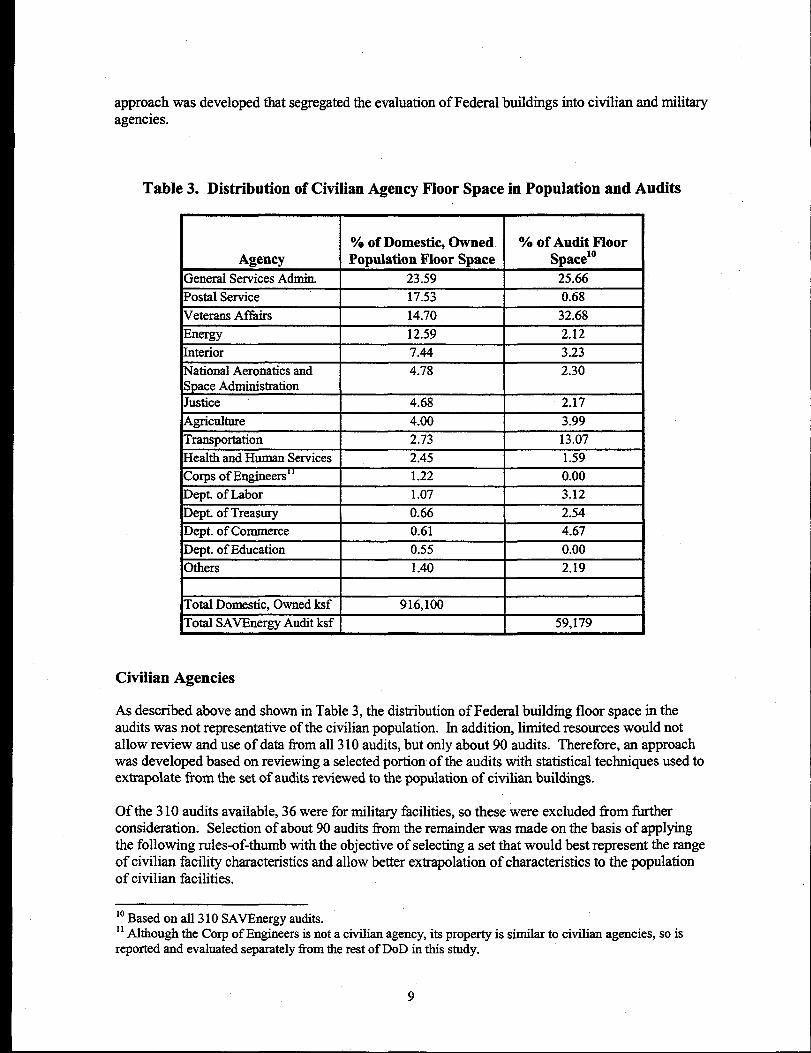
approach was developed that segregated the evaluation of Federal buildings into civilian and militaryagencies.
Table 3. Distribution of Civilian Agency Floor Space in Population and Audits
kVeterans Affhirs
Energy
Interior
National Aerobatics andSpace AdministrationJustice
Agriculture
Transportation
Health and Human Services
Corps of Engineers’1
0/0of Domestic, Owned I 0/0 of Audit FloorPomdation Floor S~ace SPace10
I
17.53 I 0.68
==F=4.68 I 2.17
4.00 3.99
2.73 13.07
2.45 1.59
1.22 I 0.00
Dept. of Labor 1.07 3.12Dept. of Treasury 0.66 2.54Dept. of Commerce 0.61 4.67Dept. of Education 0.55 0.00others 1.40 2.19
Total Domestic, Owned ksf 916,100
Total SAVEnergy Audit ksf 59,179
Civilian Agencies
As described above and shown in Table 3, the distribution of Federal building floor space in theaudits was not representative of the civilian population. In addition, limited resources would notallow review and use of data horn all310 audits, but only about 90 audits. Therefore, an approachwas developed based on reviewing a selected portion of the audits with statistical techniques used toextrapolate from the set of audits reviewed to the population of civilian buildings.
Of the310 audits available, 36 were for military facilities, so these were excluded from fbrtherconsideration. Selection of about 90 audits tiom the remainder was made on the basis of applyingthe following rules-of-thumb with the objective of selecting a set that would best represent the rangeof civilian facility characteristics and allow better extrapolation of characteristics to the populationof civilian facilities.
‘0Based on all 310 SAVEnergy audits.‘1Although the Corp of Engineers is not a civilian agency, its property is similar to civilian agencies, so isreported and evaluated separately from the rest of DoD in this study.
9
● Select audit square footage proportional to civilian square footage by agency● Select audit regional square footage proportional to total regional civilian square footage. Select at least one audit for each agency audited. Avoid lower cost audits presumed to be less detailed or technology limited. Select audits to cover a wide range of building sizes. Select audits to cover many diffkrent types of buildings● Select larger facilities (not necessarily larger buildings) to cover more total square fmtage.
As one might expect, it was not possible to exactly follow all of these rules-of-thumb. Whereconflicts existed, preference was generally given to the rule-of-thumb closer to the top of the abovelist. Several requested audits, for various reasons, were typically unavailable from each of the sixregional DOE offices, so substitutes were selected from available audits with fhrther consideration ofthe rules-of-thumb. The resulting collection of audits reviewed is listed in Appendix A.
Each of the audits was reviewed and data were extracted and recorded in a database for subsequentstatistical analysis. Data were collected at the building level, where available, but were onlyavailable at the site or facility level (i.e., for all buildings or all audited buildings at a single location)for about one-half of the audits. Data collection categories included site identification, energyprices, building type, size, and vintage (i.e., year built), and types of en6rgy efficiency measures(EEMs) considered. For each EEM recommended in the Audits, the annual energy savings (MBtuand $), annual non-energy savings ($), implementation (inveshnent) cost, and investment net presentvalue were recorded. A complete listing of the data collected (if available) from each audit ispresented in Appendix B.
The GSA’s Owned Property Database identifies the square footage, number of buildings, vintage,and location for each of the 12 Federal building types for every Federal site in the nation. Thus, theobjective of the statistical analysis was to develop valid correlations for predicting EEM energysavings, energy dollar savings, investment, and net present value based on the site characteristicsavailable in the GSA database. The correlations were then applied to the GSA Owned PropertyDatabase (adjusted to exclude foreign and energy-intensive operation property) to estimate the cost-effective energy savings potential for civilian domestic, owned, “goal-inventory” buildings.
No adjustments were made to the audit data results, except to exclude recommended EEMs that weredescribed in the audits as having a negative net present value (but were recommended anyway).Savings estimated for the civilian population were not adjusted to reflect any audit recommendationsthat have since been implemented. Additional details regarding the statistical analysis of theSAVEnergy audit data is presented in Appendix C.
Military Agencies
As noted above, only 36 or 12% of the audits were conducted for military facilities, and theserepresented only 0.6% of total military square footage or a factor of 10 less than the fkaction of totalcivilian square footage covered by the SAVEnergy audits. Therefore, an alternative approach wasdeveloped for the military sector.
Over the past decade, PNNL has conducted an ongoing energy management program for the Army’sForces Command (FORSCOM). This work has allowed PNNL to develop detailed buildingcharacterizations for each of the 11 major FORSCOM sites. Together, these sites account for 180
10

million square feet of building floor space or about 9V0of the military total. Typical of many Forts,Ports, and Bases, FORSCOM sites area collection of housing, commercial, and light-industrial typebuildings serving tens of thousands of military and civilian personnel. PNNL characterizations ofthese sites were assumed to already exclude energy intensive operations. Jn addition to directlyrepresenting a substantial fraction of military floor space, the characteristics of FORSCOM sitesshould be a reasonable proxy for the balance of the military’s non-energy intensive building squarefootage, Thus, estimates of cost-effective EEMs developed for FORSCOM were assumed to be thesame for the entire military on a per square foot basis.
The Facility Energy Decision System (FEDS) Model was used to simulate building energy use anddetermine cost-effective energy efficiency measures for each FORSCOM site (PNNL 1998). FEDSis a user-friendly, Windows-based, menu-driven soilware program for assessing the energyefficiency resource potential of facilities ranging horn single buildings to large Federal installations,such as those within FORSCOM. FEDS determines the optimum set of cost-effective retrofits froma current database of hundreds of proven technologies. These include retrofits for heating, cooling,lighting, motors, building shell, and hot water. Replacement or modification of the equipment for aretrofit operation varies Ilom complete replacement to functional enhancements to fiel switching.
11

4.0 Results
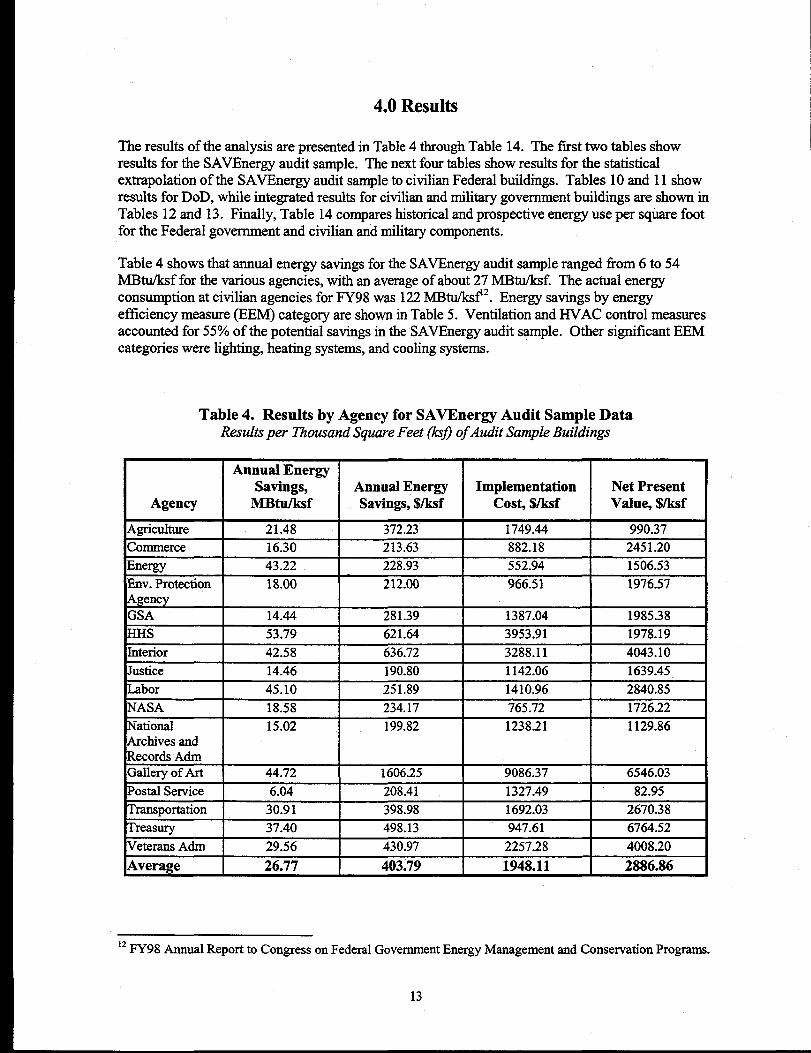
The results of the analysis are presented in Table 4 through Table 14. The first two tables showresults for the SAVEnergy audit sample. The next four tables show results for the statisticalextrapolation of the SAVEnergy audit sample to civilian Federal buildings. Tables 10 and 11 showresults for DoD, while integrated results for civilian and tilitary government buildings are shown inTables 12 and 13. Finally, Table 14 compares historical and prospective energy use per sqimre footfor the Federal government and civilian and military components.
Table 4 shows that annual energy savings for the SAVEnergy audit sample ranged from 6 to 54MBtu/ksf for the various agencies, with an average of about 27 MBtu/ksf. The actual energyconsumption at civilian agencies for FY98 was 122 MBtu/lcs?2. Energy savings by energyefficiency measure (EEM) category are shown in Table 5. Ventilation and HVAC control measuresaccounted for 55% of the potential savings in the SAVEnergy audit sample. Other significant EEMcategories were lighting, heating systems, and cooling systems.
Table 4. Results by Agency for SAVEnergy Audit Sample DataResults per 17aousand Square Feet (ksjI of Audit Sample Buildings
AnnuaI EnergySavings, Annual Energy Implementation Net Present
Agency MBtu/ksf Savings, $/ksf cost $/ksf Value, $/ksf
Agriculture 21.48 372.23 1749.44 990.37Commerce 16.30 213.63 882.18 2451.20
Energy 43.22 228.93 552.94 1506.53
Env. Protection 18.00 212.00 966.51 1976.57Agency I I I IGSA 14.44 281.39 1387.04 1985.38
HHs 53.79 621.64 3953.91 1978.19
Interior 42.58 636.72 3288.11 4043.10
Justice 14.46 190.80 1142.06 1639.45
h-abor, 1 I II 45.10 251.89 I 1410.96 2840.85
NASA 18.58 234.17 765.72 1726.22
National 15.02 199.82 1238.21 1129.86Archives and
I I I I44.72 1606.25 9086.37 6546.03, I 1 ,
I 6.04 208.41 I 1327.49 I 82.95
Transportation 30.91 398.98 1692.03 2670.38Treasury 37.40 498.13 947.61 6764.52
Veterans Adm 29.56 430.97 2257.28 4008.20
lAverage 26.77 I 403.79 I 1948.11 I 2886.86
I*FY98 Annual Report to Congress on Federal Govemrnent Energy Management and Conservation PrograI
13
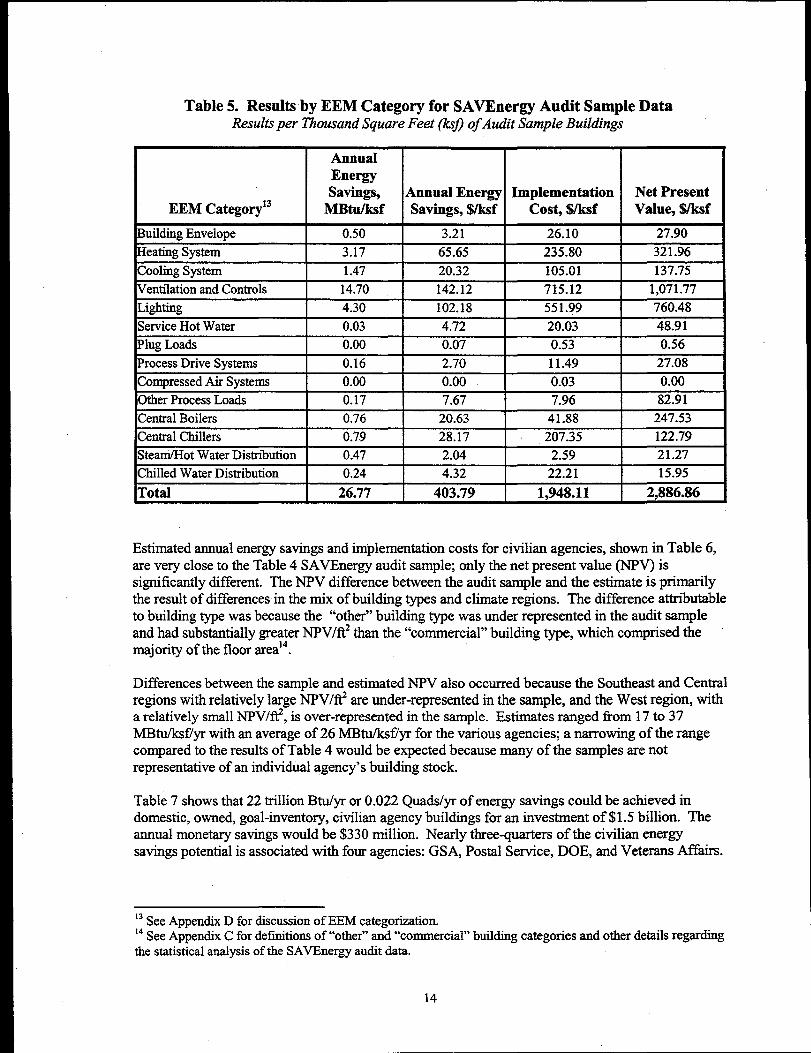
Table 5. Results by EEM Category for SAVEnergy Audit Sample DataResults per Thousand Square Feet (k@) of Audit Sample Buildings
AnnualEnergySavings, Annual Energy Implementation Net Present
EEM Category13 MBtu/ksf Savings, $/ksf cos~ wksf value wksf
Building Envelope 0.50 3.21 26.10 27.90
Heating System 3.17 65.65 235.80 321.96
Cooling System 1.47 20.32 105.01 137.75
Ventilation and Controls 14.70 142.12 715.12 1,071.77
Lighting 4.30 102.18 551.99 760.48
Service Hot Water 0.03 4.72 20.03 48.91
Plug Loads 0.00 0.07 0.53 0.56
Process Drive Systems 0.16 2.70 11.49 27.08
Compressed Air Systems 0.00 0.00 0.03 0.00
OtherProcessLoads 0.17 7.67 7.96 82.91CentralBoilers 0.76 20.63 41.88 247.53CentralChillers 0.79 28.17 207.35 122.79Steam/HotWaterDistribution 0.47 2.04 2.59 21.27ChilledWaterDistribution 0.24 4.32 22.21 15.95
Total 26.77 403.79 1,948.11 2,886.86
Estimated annual energy savings arid implementation costs for civilian agencies, shown in Table 6,are very close to the Table 4 SAVEnergy audit sample; only the net present value (NPV) issignificantly different. The NPV difference between the audit sample and the estimate is primarilythe result of differences in the mix of building types and climate regions. The difference attributableto building type was because the “other” building type was under represented in the audit sampleand had substantially greater NPV/& than the “commercial” building type, which comprised themajority of the floor area14.
Differences between the sample and estimated NW also occurred because the Southeast and Centralregions with relatively large NPV/ft? are under-represented in the sample, and the West region, witha relatively small NPV/fi?, is over-represented in the sample. Estimates ranged from 17 to 37MBtu/ksf7yr with an average of 26 MBtu/ksf7yr for the various agencies; a narrowing of the rangecompared to the results of Table 4 would be expected because many of the samples are notrepresentative of an individual agency’s building stock.
Table 7 shows that 22 trillion Btu/yr or 0.022 Quads/yr of energy savings could be achieved indomestic, owned, goal-inventory, civilian agency buildings for an investment of $1.5 billion. Theannual monetary savings would be $330 million. Nearly threequarters of the civilian energysavings potential is associated with four agencies: GSA, Postal Service, DOE, and Veterans Affairs.
*3See Appendix D for discussion of EEM categorization.14See Appendix C for deftitions of “other” and “commercial” building categories and other details regardingthe statistical analysis of the SAVEnergy audit data.
14
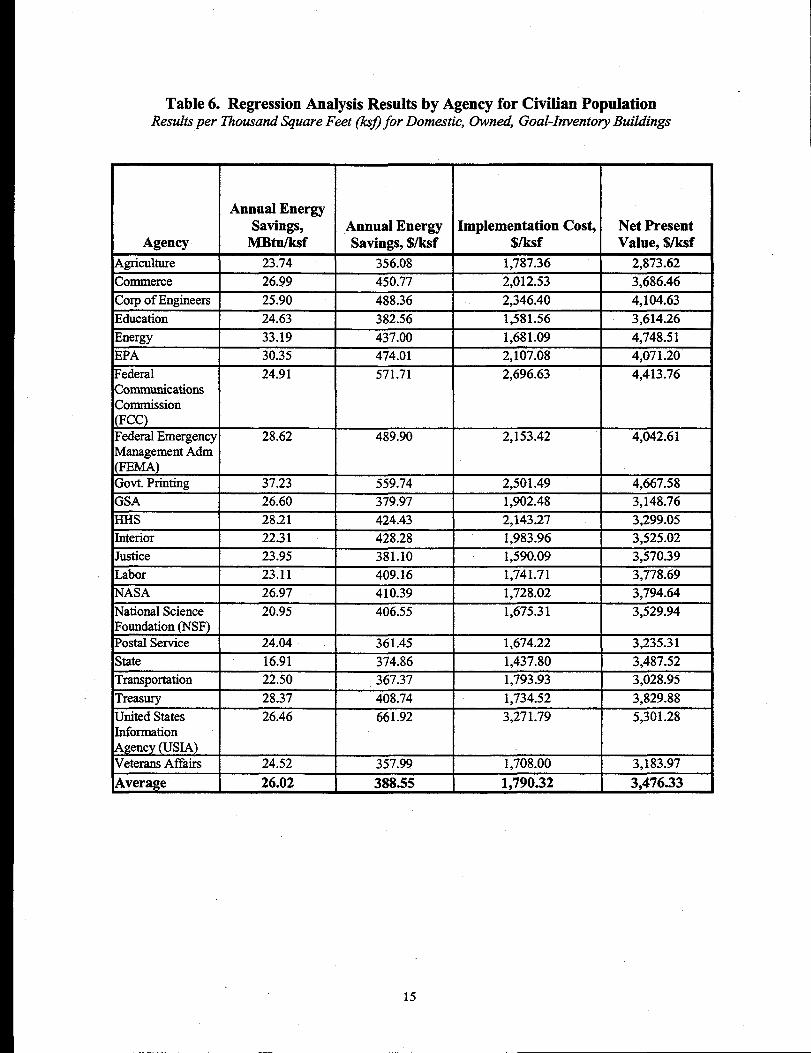
Table 6. Regression Analysis Results by Agency for Civilian PopulationResults per i%ousand Square Feet (ks# for Domestic, Owned Goal-Inventory Buildings
I Annual EnergySavings, Annual Energy Implementation Cos~ Net Present
Agency MBtu/ksf Saving% $/ksf $ncsf Value, $/ksf
Agriculture 23.74 356.08 1,787.36 2,873.62
Commerce 26.99 450.77 2,012.53 3,686.46
Corp of Engineers 25.90 488.36 2,346.40 4,104.63
Education 24.63 382.56 1.581.56 3.614.26I
Energy 33.19 437.00 1;681.09 4;748.51
EPA 30.35 I 474.01 2,107.08 4,071.20
Federal 24.91 571.71 2,696.63 4,413.76CommunicationsCommission(FCC)Federal Emergency 28.62 489.90 2,153.42 4,042.61Management Adm(FEMA)Govt. Printing 37.23 559.74 2,501.49 4,667.58
GSA 26.60 379.97 1,902.48 3,148.76
HHs 28.21 424.43 2,143.27 3,299.05Interior 22.31 428.28 1.983.96 3,525.02# *Justice 23.95 381.10 1;590.09 3;570.39
Labor 23.11 409.16 1,741.71 3,778.69
NASA 26.97 410.39 1,728.02 3,794.64
National Science 20.95 406.55 1,675.31 3,529.94Foun&tion (NSF)Postal Service 24.04 361.45 1,674.22 3,235.31
State 16.91 374.86 1,437.80 3,487.52Transportation 22.50 367.37 1,793.93 3,028.95
Treasury 28.37 408.74 1,734.52 3,829.88
United States 26.46 661.92 3,271.79 5,301.28MormationAgency (USIA)Veterans Affairs 24.52 357.99 1,708.00 3,183.97
Average 26.02 388.55 1,790.32 3,476.33
15
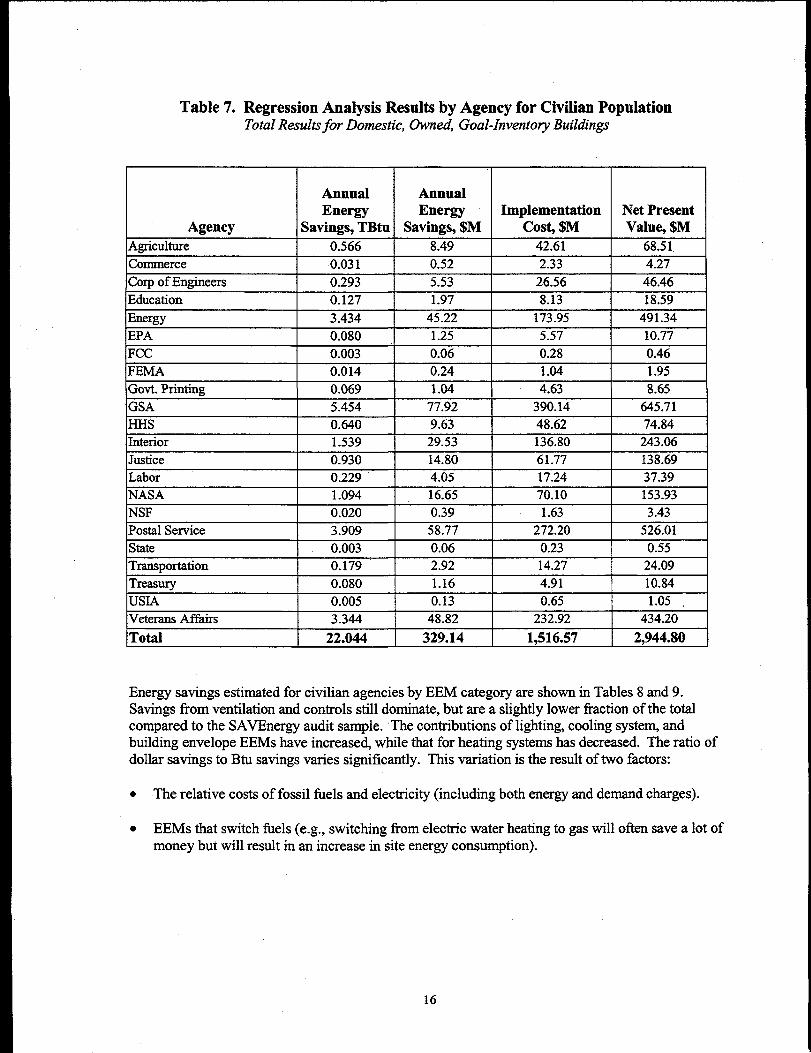
Table7. Regression Analysis Results by Agency for Civilian PopulationTotal Results for Domestic, Owned, Goal-Inventory Buildings
Annual AnnualEnergy Energy Implementation Net Present
Agency Savings, TBtu Savings, $M COSL$M Value $M
Agriculture 0.566 8.49 42.61 68.51Commerce 0.031 0.52 2.33 4.27
Corp of Engineers 0.293 5.53 26.56 46.46Education 0.127 1.97 8.13 18.59
Energy 3.434 45.22 173.95 491.34
EPA 0.080 , 1.25 5.57 10.77
FCC 0.003 0.06 0.28 0.46FEMA 0.014 0.24 1.04 1.95
Govt. Printing 0.069 1.04 4.63 8.65
GSA 5.454 77.92 390.14 645.71HHs 0.640 9.63 48.62 74.84Interior 1.539 29.53 I 136.80 243.06
Justice 0.930 14.80 61.77 138.69Labor 0.229 4.05 17.24 37.39NASA 1.094 16.65 70.10 153.93NSF 0.020 0.39 1.63 3.43Postal Service 3.909 58.77 272.20 526.01
State 0.003 0.06 0.23 0.55Transportation 0.179 2.92 14.27 24.09
Treasury 0.080 1.16 4.91 10.84
USIA 0.005 0.13 0.65 1.05Veterans Affairs 3.344 48.82 232.92 434.20
Total 22.044 329.14 1.516.57 2.944.80
Energy savings estimated for civilian agencies by EEM category are shown in Tables 8 and 9.Savings fkom ventilation and controls still dominate, but area slightly lower fraction of the totalcompared to the SAVEnergy audit sample. The contributions of lighting, cooling systen andbuilding envelope EEMs have increased, while that for heating systems has decreased. The ratio ofdollar savings to Btu savings varies significantly. This variation is the result of two factors:
. The relative costs of fossil fuels and electricity (including both energy and demand charges).
. EEMs that switch fiels (e.g., switching from electric water heating to gas will often save a lot ofmoney but will result in an increase in site energy consumption).
16
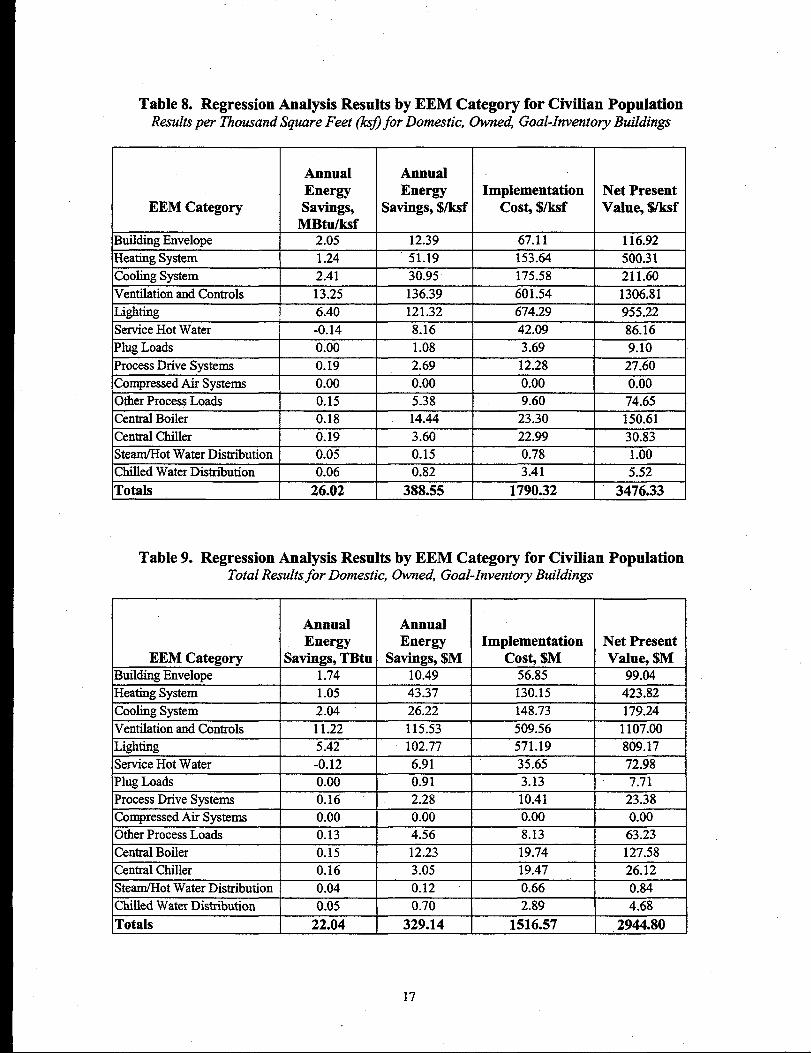
Table 8. Regression Analysis Results by EEM Category for Civilian PopulationResults per fiousand Square Feet (k@ for-Donwstic, Ow;edl Goal-Inventoiy B;ildings
I EEM Category
Buildimz Envelo~eA
Heating System
Cooling SystemVentilation and Controls
Lighting
Service Hot Water
Plug Loads
Process Drive Systems
Compressed Air Systems
Other Process LoadsCentral Boiler
Central Chiller
Steam/Hot Water DistributionChilled Water Distribution
lTotals
AnnualEnergySavings,
MBtu/ksf2.05
1.24
2.41
13.25
6.40
-0.14
0.00
0.19
0.00
0.150.18
0.190.050.06
26.02
AnnualEnergy Implementation
Savings, $/ksf Costy $lksf
12.39 67.11
51.19 153.64
30.95 175.58
136.39 601.54
121.32 674.29
8.16 42.09
1.08 3.69
2.69 12.28
0.00 0.00
5.38 9.60
14.44 23.30
3.60 22.99
0.15 0.78
0.82 3.41
388.55 1790.32
Net PresentValue, $/ksf
116.92500.31211.60
1306.81955.22
86.16
9.1027.60
0.0074.65150.61
30.831.005.52
3476.33
Table 9. Regression Analysis Results by EEM Category for Civilian PopulationTotal Results for Domestic, Owned, Goal-Inventory Buildings
AnnualEnergy
EEM Category Savings, -TBtuBuilding Envelope 1.74
lLighting 5.42
S~ice Hot Water -0.12Phuz Loads 0.00
I
Process Drive Systems 0.16Compressed Air Systems 0.00Other Process Loads 0.13Central Boiler 0.15Central Chiller 0.16SteadHot Water Distribution 0.04Chilled Water Distribution 0.05
Totals 22.04
AnnualEnergy Implementation Net Present
Savings, $M COSG$M Value, $M10.49 56.85 99.0443.37 130.15 423.8226.22 148.73 179.24115,53 509.56 1107.00102.77 571.19 809.17
6.91 35.65 72.980.91 3.13 7.712.28 10.41 23.380.00 0.00 0.004.56 8.13 63.2312.23 19.74 127.583.05 19.47 26.12
0.12 0.66 0.840.70 2.89 4.68
329.14 1516.57 2944.80 I
17
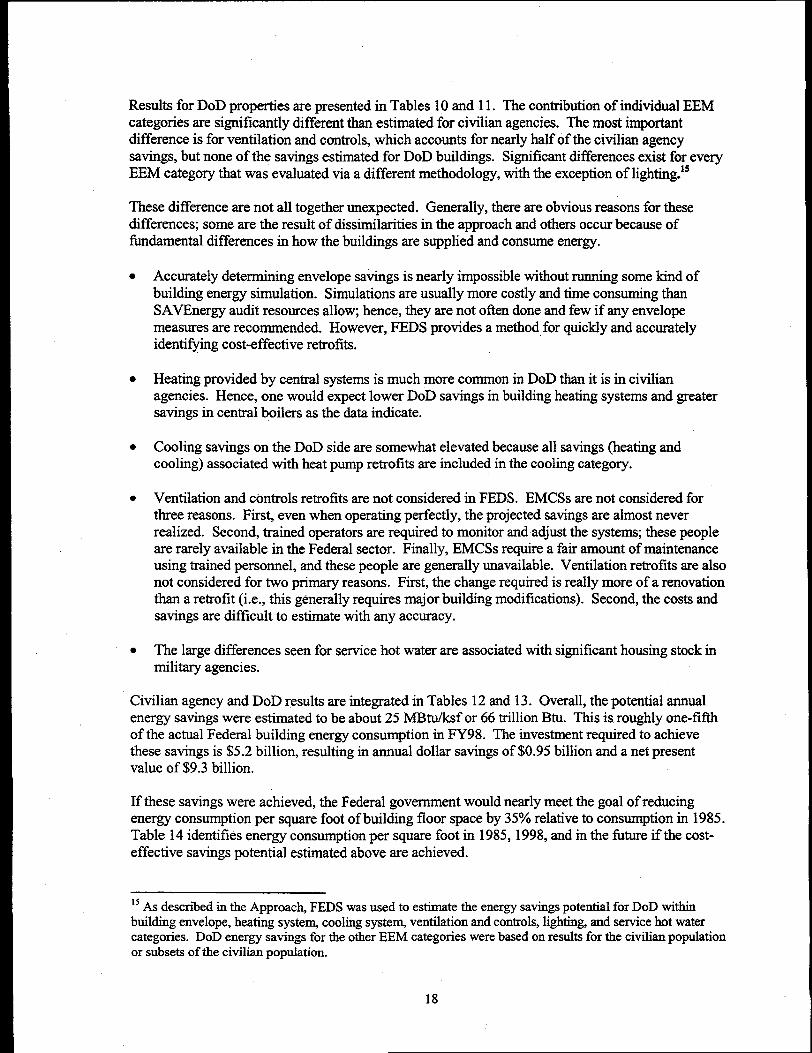
Results for DoD properties are presented in Tables 10 and 11. The contribution of individual EEMcategories are significantly different than estimated for civilian agencies. The most importantdifference is for ventilation and controls, which accounts for nearly half of the civilian agencysavings, but none of the savings estimated for DoD buildings. Significant differences exist for everyEEM category that was evaluated via a different methodology, with the exception of lighting~5
These difference are not all together unexpected. Generally, there are obvious reasons for thesediffkrence~ some are the result of dissimilarities in the approach and others occur because offundamental differences in how the buildings are supplied and consume energy.
●
●
●
●
●
Accurately determining envelope satings is nearly impossible without running some kind ofbuilding energy simulation. Simulations are usually more costly and time consuming thanSAVEnergy audit resources allow, hence, they are not ollen done and few if any envelopemeasures are recommended. However, FEDS provides a method for quickly and accuratelyidenti@ing cost-effective retrofits.
Heating provided by central systems is much more common in DoD than it is in civilianagencies. Hence, one would expect lower DoD savings in building heating systems and greatersavings in central @ilers as the data indicate.
Cooling savings on the DoD side are somewhat elevated because all savings (heating andcooling) associated with heat pump retrofits are included in the cooling category.
Ventilation and controls retrofits are not considered in FEDS. EMCSS are not considered forthree reasons. First, even when operating ptiectly, the projected savings are almost neverrealized. Second, trained operators are required to monitor and adjust the systems; these peopleare rarely available in the Federal sector. Finally, EMCSS require a fair amount of maintenanceusing trained personnel, and these people are generally unavailable. Ventilation retrofits are alsonot considered for two primary reasons. First, the change required is really more of a renovationthan a retrofit (i.e., this g~erally requires major building modifications). Second, the costs andsavings are difficult to estimate with any accuracy.
The large differences seen for service hot water are associated with significant housing stock inmilitary agencies.
Civilian agency and DoD results are integrated in Tables 12 and 13. Overall, the potential annualenergy savings were estimated to be about 25 MBtu/ksf or 66 trillion Btu. This is roughly one-fifthof the actual Federal building energy consumption in FY98. The investment required to achievethese savings is $5.2 billion, resulting in annual dollar savings of $0.95 billion and a net presentvalue of $9.3 billion-
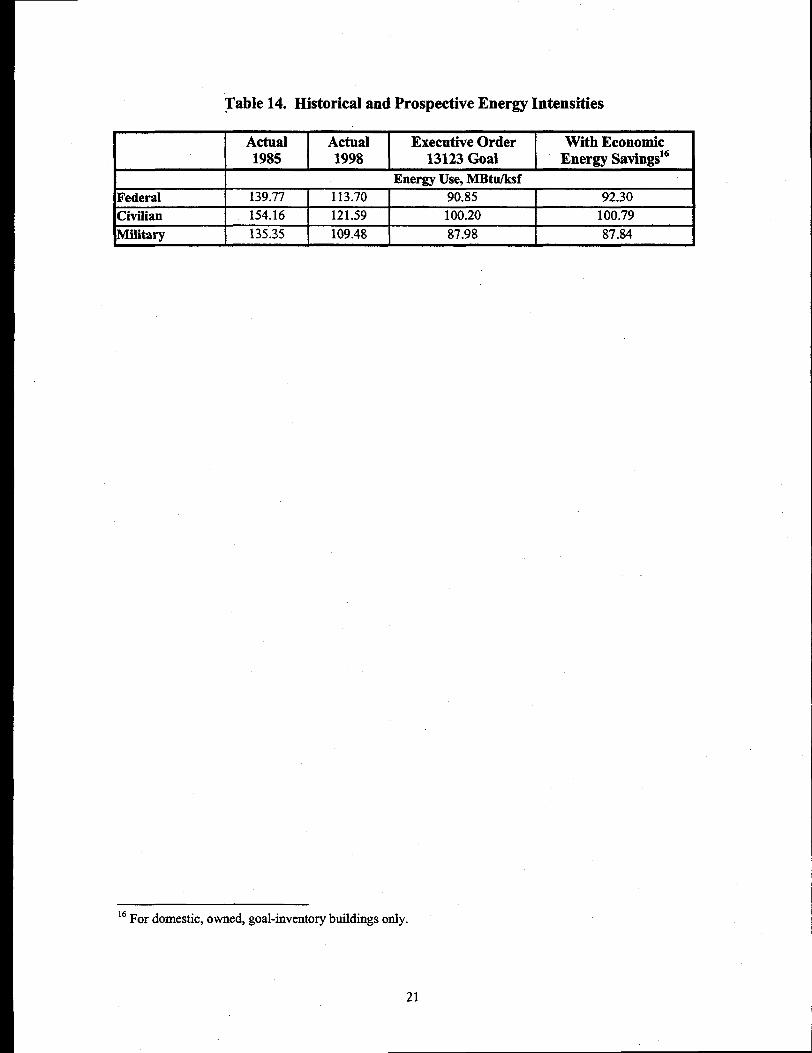
If these savings were achieved, the Federal government would nearly meet the goal of reducingenergy consumption per square foot of building floor space by 35’XOrelative to consumption in 1985.Table 14 identifies energy consumption per square foot in 1985, 1998, and in the fbture if the cost-effective savings potential estimated above are achieved.
15As described in the Approach FEDS was used to estimate the energy savings potential for DoD withinbuilding envelope, heating system cooling syste~ ventilation and controls, lighting, and service hot watercategories. DoD energy savings for the other EEM categories were based on results for the civilian populationor subsets of the civilian population.
18

Table 10. Results by EEM Category for DoD FEDS AnalysisResults per Zhousand Square Feet (k@ for Domestic, Owned, Goal-Inventory Buildings
AnnualEnergy AnnualSavings, Energy Implementation
EEM Category MBtuncsf Savings, $/ksf Cosq $/ksfBuilding Envelope 4.70 46.89 331.55
Heating System 0.80 28.66 115.04
Cooling System 6.06 41.75 488.19
Ventilation and Controls 0.00 0.00 0.00
Lighting 6.62 104.03 884.98
Service Hot Water 5.01 73.67 96.61Plug Loads 0.00 1.08 3.69Process Drive Systems 0.19 2.69 12.28
Compressed Air Systems 0.00 0.00 0.00
Other Process Loads 0.15 5.38 9.60
Central Boilers 0.34 35.50 54.81
Central Chillers 0.32 5.83 38.96Steam/Hot Water Distribution 0.02 0.11 0.59
Chilled Water Distribution 0.12 1.78 7.61
Totals 24.34 347.39 2043.91
Net PresentValue, $/ksf
365.22199.98225.77
0.001623.75
561.359.10
27.60
0.0074.65
374.29
50.030.57
12.94
3525.26
Table 11. Results by EEM Category for DoD FEDS AnalysisTotal Results for Domestic, Owned, GoaLInvento~ Buildings
Annual AnnualEnergy Energy
EEM Category Savings, TBtu Savings, $MBuilding Envelope 8.42 83.97Heating System 1.44 51.33
Cooling System 10.85 74.77
Ventilation and Controls 0.00 0.00
Lighting 11.86 186.29Service Hot Water 8.98 131.93Plug Loads 0.01 1.93
Process Drive Systems 0.33 4.82
Compressed Air Systems 0.00 0.00Other Process Loads 0.27 9.64
Central Boilers 0.61 63.58
Central Chillers 0.58 10.45
SteadHot Water Distribution 0.03 0.20
Chilled Water Distribution 0.22 3.18
Totals 43.59 622.08
Cost $M ] Value, $/M593.72 654.01206.01 358.11
874.22 404.300.00 0.00
1,584.77 2,907.72173.00 1,005.236.61 16.30
22.00 49.430.00 0.0017.19 133.68
98.15 670.2569.77 89.601.06 1.03
13.62 23.18I
3660.12 6312.83
19
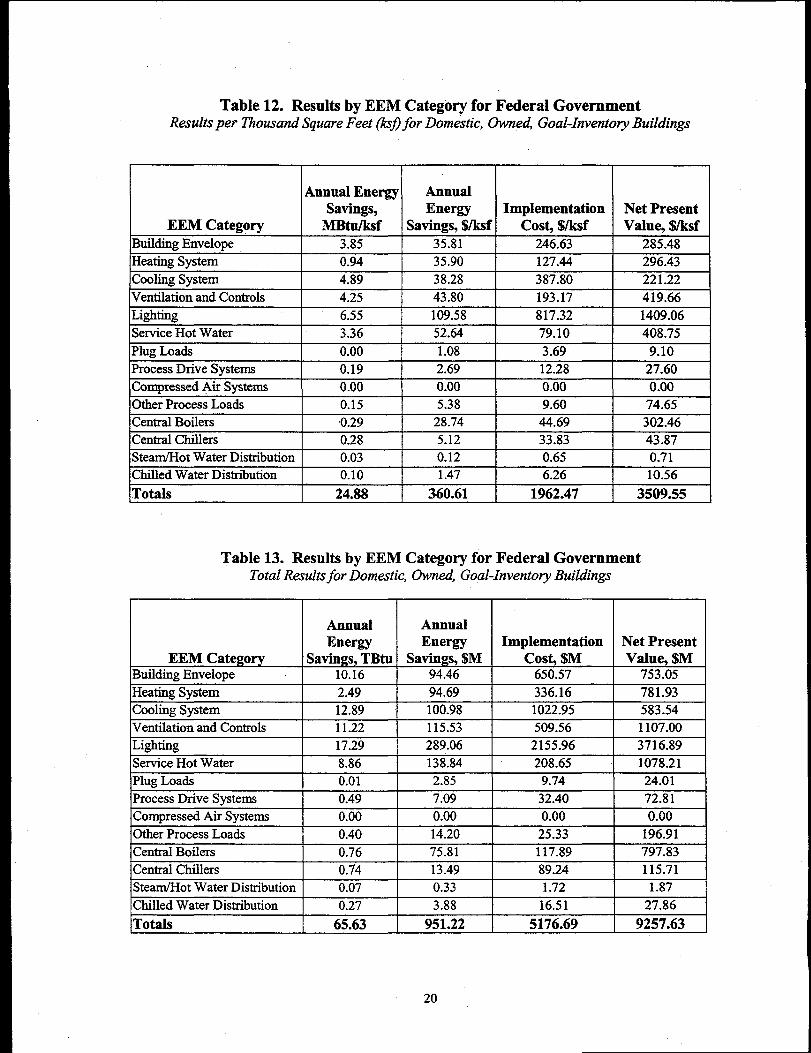
Table 12. Results by EEM Category for Federal GovernmentResults per Thousand Square Feet (kj) for Domestic, Owned, Goal-Inventory Buildings
Annual EnergySavings,
EEM Category MBtu/ksfBuilding Envelope 3.85Heating System 0.94Cooling System 4.89Ventilation and Controls 4.25Lighting 6.55Service Hot Water 3.36Plug Loads 0.00Process Drive Systems 0.19Compressed Air Systems 0.00Other Process Loads 0.15Central Boilers 0.29Central Chillers 0.28Stead-1ot Water Distribution 0.03
I
Chilled Water Distribution 0.101
Totals 24.88
AnnualEnergy Implementation Net Present
Savings, $/ksf cost $/ksf Value $/ksf35.81 246.63 285.4835.90 127.44 296.43
38.28 387.80 221.2243.80 193.17 419.66
109.58 817.32 1409.0652.64 79.10 408.75
1.08 3.69 9.102.69 12.28 27.600.00 0.00 0.005.38 9.60 74.65
28.74 44.69 302.46
Table 13. Results by EEM Category for Federal GovernmentTotal Results for Domestic, Owned, Goal-Inventory Buildings
Annual AnnualEnergy Energy Implementation Net Present
EEM Category Savings, TBtu Savings, $M Cost, $M Value, $MBuilding Envelope 10.16 94.46 650.57 753.05
Heating System 2.49 94.69 336.16 781.93Cooling System 12.89 100.98 1022.95 583.54Ventilation and Controls 11.22 115.53 509.56 1107.00Lighting 17.29 289.06 2155.96 3716.89
Service Hot Water 8.86 138,84 208.65 1078.21
Plug Loads 0.01 2.85 9.74 24.01Process Drive Systems 0.49 7.09 32.40 72.81Compressed Air Systems 0.00 0.00 0.00 0.00
Other Process Loads 0.40 14.20 25.33 196.91
Central Boilers 0.76 75.81 117.89 797.83
Central Chillers 0.74 13.49 89.24 115.71SteandHot Water Distribution 0.07 0.33 1.72 1.87
Chilled Water Distribution 0.27 3.88 16.51 27.86
Totals 65.63 951.22 5176.69 9257.63
20
TabIe 14. Historical and Prospective Energy Intensities
Actual Actual Executive Order With Economic1985 1998 13123 Goal Energy Savingslb
Energy Use, MBtu/ksf
Federal 139.77 113.70 90.85 92.30
Civilian 154.16 121.59 100.20 100.79
Military 135.35 109.48 87.98 87.84
16For domestic, owned, goal-inventory buildings only.
21

5.0 Conclusions
Based on the analytical approach and assumptions used for this study, the total cost-effective energysavings potential in domestic, owned, goal-inventory Federal buildings is about 25 MBtu/ksi7yr or66 trillion Btu/yr (0.066 Quads/yr). The energy savings potential per square foot is approximatelythe same for civilian and military sectors. The investment required to capture this potential is about$1.96/sf or $5.2 billion for the Federal government. Again, civilian and military requirements persquare foot are about the same. The resulting net present value of the investment is $9.3 billion,
The energy savings potential, if captured, would result in the Federal government nearly meeting thegoal of reducing energy consumption per square foot by 35’?4.relative to 1985 figures, as required byEO 13123. The goals would be met without including the potential energy savings in foreign andleased buildings. However, these estimates of cost-effective energy savings are based on Federalfinancing. Recent investigations of alternative financing by the authors yielded an estimate of 0.040to 0.048 Quads/yr of cost-effective energy savings potential, or about two-thirds of the estimate inthis study via Federal financing (Dirks, Brown, and Currie, footnote 3)]7. Fewer cost-effectiveenergy savings projects exist with alternative financing because ESCOS and utilities have higherborrowing costs than the Federal government. Even if all of the cost-effective alternative financingprojects are implemented, the savings would not be enough to achieve the 35% reduction goal.Therefore, direct Federal fimding of energy efficiency projects will also be required.
For the entire Federal population, lighting was found to be the EEM category with the greatestenergy savings potential, accounting for about one-fourth of the total. The most commonlyrecommended lighting measure was the conversion of T-12 fluorescent lights to T-8s with electronicballasts. Other common lighting measures were CFLS, occupancy sensors or other controls, andLED exit signs. Other important categories indicated by the analysis are cooling systems, ventilationand controls, building envelope, service hot water, and heating systems.
The significant differences in the distribution of cost-effective EEMs found for civilian and militarysectors are largely attributable to differences in analytical methodology rather than differences in thebuilding stock. Most notable,is the ventilation and controls category, which accounts for half of thecivilian savings and none of the military savings (the FEDS model does not consider ventilation andcontrol retrofits). The SAVEnergy audits are believed to overestimate ventilation and controlopportunities because of excessive reliance on simplified rules-of-thumb, but the potential forventilation and control retrofits is certainly greater than zero. On the other hand, the SAVEnergyaudits are believed to underestimate building envelope opportunities. Audit results for the civilianagencies translated into less than half of the envelope savings per square foot found withinFORSCOM with FEDS. Accurate evaluation of building envelope opportunities requires using abuilding energy simulation model like FEDS, which typically requires more effort than SAVEnergyaudit resources allow.
One expected difference in the distribution of energy efficiency measures is the significantly greaterservice hot water savings opportunity found in the military. This difference can be attributed to thesubstantial housing floorspace it maintains for personnel and their families. Lower heating systemretrofits in the milita~ agencies would also be expected, give the higher fraction of militaryfloorspace heated with central systems.
‘7Energy savings and investment figures from Dirks, Brow and Currie (footnote 3) were adjusted tocorrespond to the domestic, owned portion of the goal-inventory property only.
23
Savings opportunities associated with central energy plants and thermal distribution systems arealmost cdy greater than estimated for the military. Although the military estimates for thesesystems were based on SAVEnergy audit results for civilian agencies with similar average site sizes,selected results from specific military sites suggests enormous potential with these systems. Forexample, a PNNL evaluation of energy use at Fort Stewart in Georgia estimated that 60°Aof theenergy entering the hot water distribution system was lost to the environment. These lossesrepresent about 15’XOof total energy consumption at Fort Stewart or about 17 MBtu/ksf7yr! Whilethe conditions at Fort Stewart mayor may not be representative of the military, the potentialopportunity would appear to warrant further investigation. Conversion from central to distributedheating systems could result in significant energy savings, but was rarely considered in theSAVEnergy audits.
24
6.0 Recommendations
Resolution of the differences between SAVEnergy audit and FEDS results is needed to improve theaccuracy of the estimates from this study, and to better identifi significant differences in civilian andmilitary building stock. Clearly the potential impact of ventilation and control measures should bereviewed to determine the magnitude of underestimation by FEDS and probable overestimation bythe SAVEnergy audits. Prior studies comparing actual measured savings with predicted savingsshould be reviewed to resolve this issue. FEDS should also be used to evaluate several of thefacilities where SAVEnergy audits were conducted to help segregate analytical differences frombuilding stock differences.
The potential energy savings opportunities within central energy plants and thermal distributionsystems should be more rigorously evaluated. Consideration should be given to switching todistributed energy systems as well as improving the efficiency of existing central systems.
Alternative financing alone will not likely allow the Federal government to reach its energyefficiency goals, even if all cost-effective alternative financing opportunities are implemented.Although the overall Federal budget situation has improved tremendously from a decade or even afew years ago, prospective budgets for energy retrofits have plummeted. This trend must bereversed so that plans can be made for an integration of private and public fmcing to achieveFederal energy savings goals.
This study focused on estimating the energy satings potential for domestic, owned, “goal-inventory”property. This subset of Federal property accounts for about 78’%0of the Federal property where EO13123 applies or about 86’XOof the total “goal inventory” property. The other 14% of the goalinventory property is domestic, leased; forei~ owne~ or foreign, leased property. Analysis of theenergy savings potential for these property categories is recommended, especially for domestic,leased property, which represents the majority of the other 14%.
Family housing, which represents a substantial fraction of military floor space and energyconsumption, is currently being considered for privatization (selling federally-owned housing toprivate companies who, in turn, lease the houses back to the govemrnent) by DoD on a site-by-sitebasis. Depending on how privatization is implemented, some or all of family housing may falloutside of EO 13123 or the lease arrangement may reduce the cost-effective energy savingspotential. This issue should be investigated to determine the potential impact on meeting EO 13123goals.
About 9% of Federal buildings covered by EO 13123 are currently classified as energy intensiveoperations and are excluded from the “goal inventory.” EO 13123 requires reconsideration of theexcluded status and may significantly alter the “goal inventory.” When this occurs, the potentialenergy savings estimate should be updated to capture this change.
The clear evidence of substantial cost-effective lighting retrofit potential in both civilian and militaryagencies suggests that FEMP should re-emphasize its lighting support programs.
25

References
Currie, J.IV. 1992. Testimony b~ore The Senate Committee on Governmental AJYairs, WashingtonD. C., 18 February 1992. PNNL-SA-20228, Pacific Northwest National Laboratory, Richland,Washington.
Currie, J.W., J.A. Dirks, S.A. Shanlde, D.J. Stucky, and D.B. Elliott. 1994. Lower-Bound EstimatesofEnergy E@ciency in the Federal Sector. PNL-8362, Pacific Northwest National Laboratory,Richland, Washington.
FEMP. Undated. Federal Energy E@ciency and Water Conservation Study. U.S. Department ofEnergy – Federal Energy Management progr~ Washington, D.C.
FEMP. 2000a. FEMP Focus. “Letter from the Editor.” March/April 2000. Washington, D.C.
FEMP. 2000b. Annual Report to Congress on Federal Government Energy Management andConservation Programs, Fiscal Year 1998. DOE/EE-0221, U.S. Department of Energy – FederalEnergy Management Prograq Washington, D.C,
GSA. 1999a. Summary Report of Real Property Owned by the United States Throughout the Worldas of September 30, 1998. General Services Administration, Washington, D.C.
GSA. 1999b. Summary Report of Real Property Leased by the United States Throughout the Worldas of September 30, 1998. General Services Administration, Washington, D.C.
Hopkins, M. 1991. Energy Use in Federal Facilities: Squandering Taxpayer Dollars andNeedlessly Polluting Our Environment. The Alliance to Save Energy, Washington, D.C.
Loper, J.W,, K.L. Miller, and M. Hopkins. 1998. Leading by Example: Improving EnergyProductive@ in Federal Government Facilities. The Alliance to Save Energy, Washington, D.C.
OTA. 1991. Energy E#ciency in the Federal Government: Government by Good Example? Officeof Technology Assessment; Washington, D.C.
OTA. 1994 Energy Eflciency in Federal Facilities: Update on Funding and Potential Savings.Office of Technology Assessment, Washington, D.C.
Pacific Northwest National Laborato~. 1998. Facility Energy Decision System User’s Guide,Release 4.0. PNNL-10542 Rev 2, Richland, Washington,
27
Appendix A
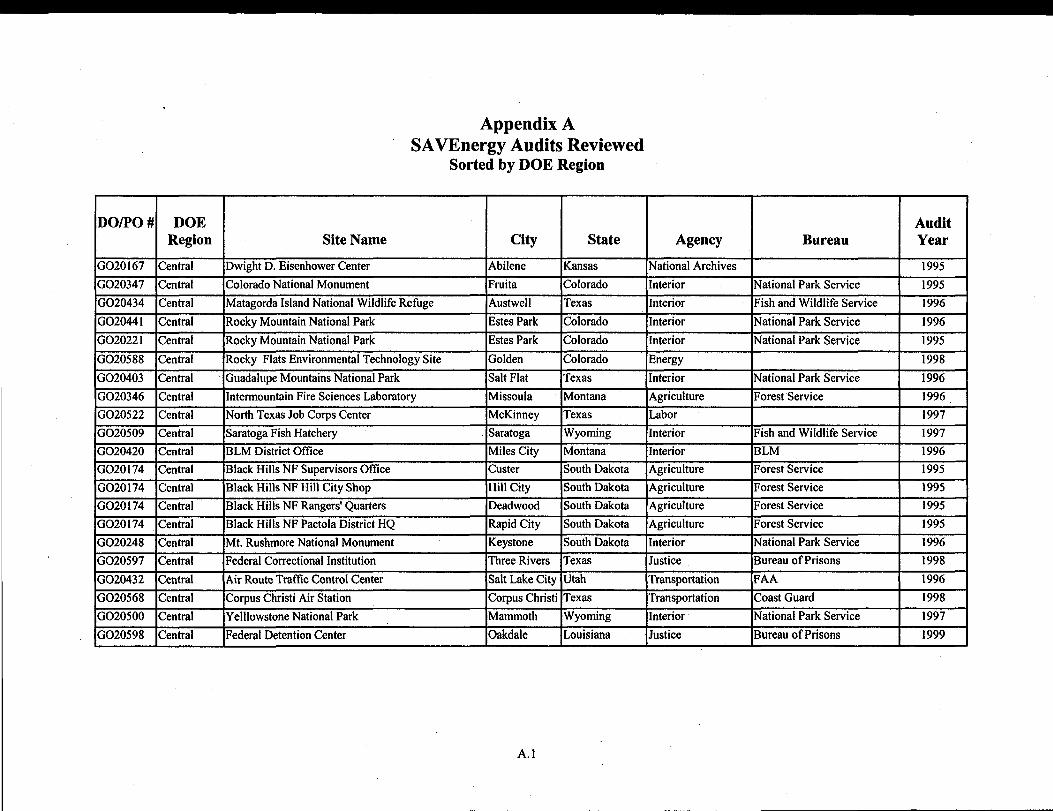
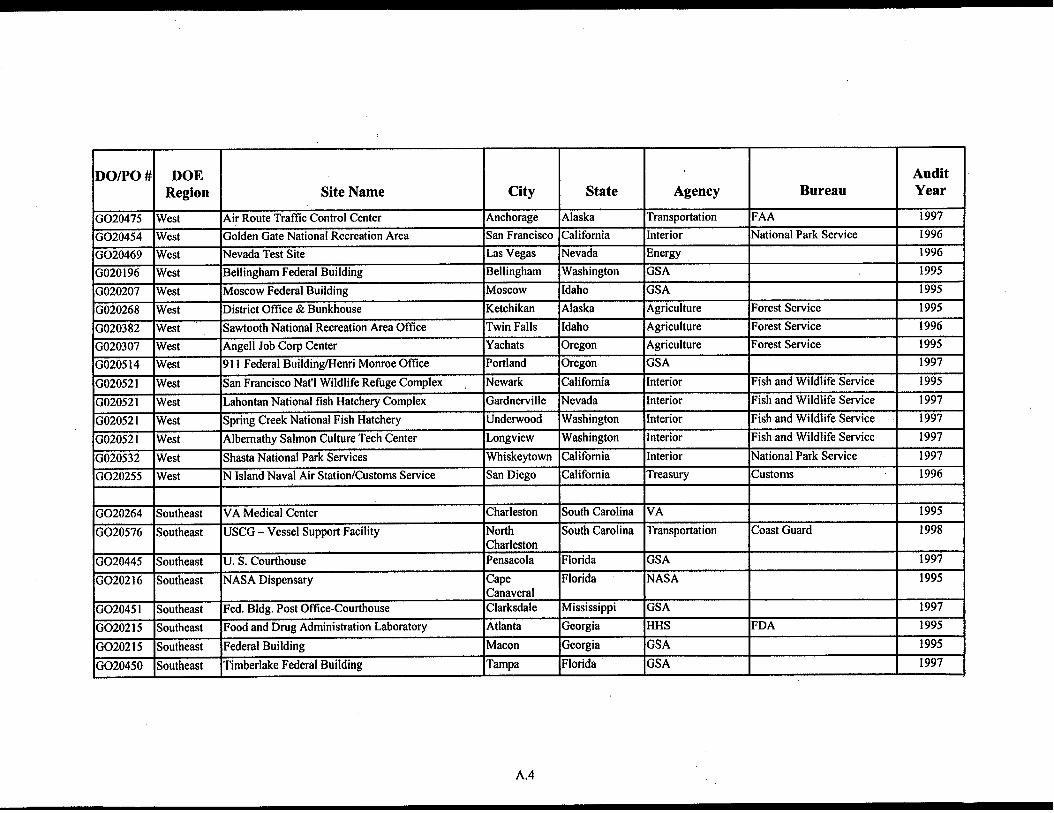
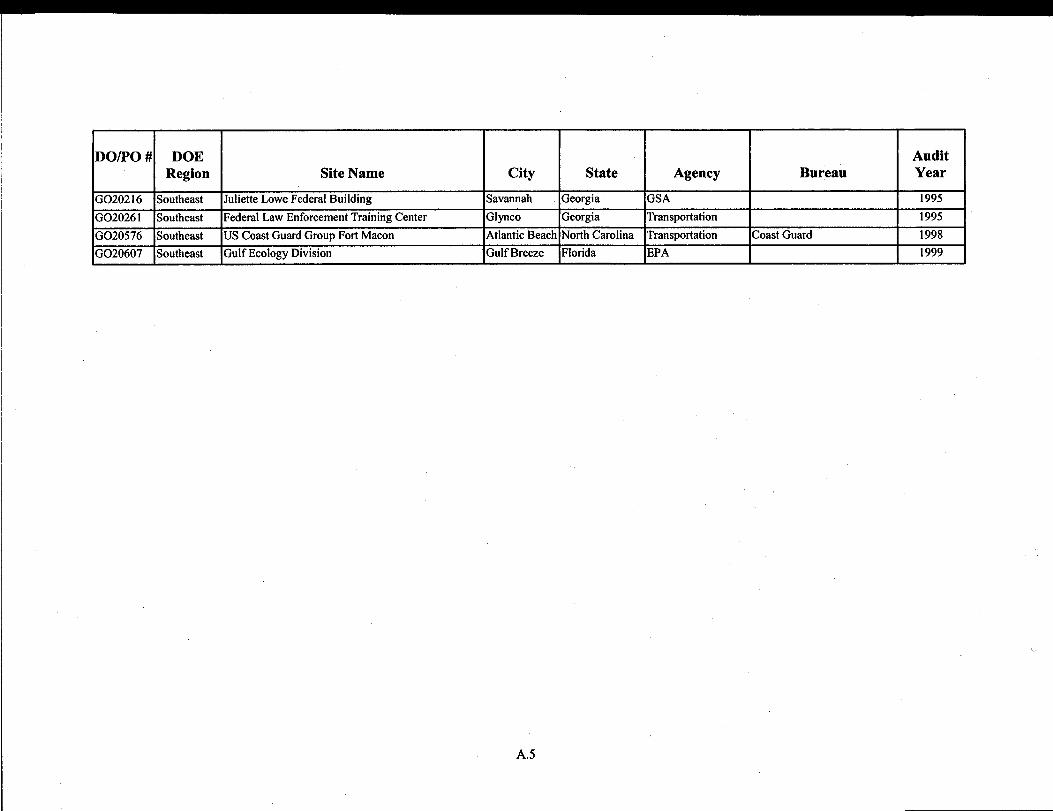
SAVEnergy Audits Reviewed and Sorted by DOE Region
I IDO/PO # DOE
Region
G020167 Central
G020347 Central
G020434 Central
G020441 Central
G020221 Central
Appendix ASAVEnergy Audits Reviewed
Sorted by DOE Region
Site Name I City I State I AgencyI I 1
DwightD. EisenhowerCenter lAbilene lKansas lNationalArchives, , tColorado National Monument lFruita lColorado lInterior# 1 I
Matagorda Island National Wildlife Refuge lAustwell [Texas lInterior& I I
RockyMountainNationalPark lEstesPark lColorado lInterior,
Rocky Mountain National Park lEstes Park lColorado I[nterior1 I 1 I I
G020588 lCentral lRocky Flats Environmental Technology Site lGolden ]Colorado lEnergy-.G020403 Central
--
Guadalupe Mountains National Park Salt Flat Texas Interior
G020346 Central Intermountain Fire Sciences Laboratory Missoula Montana Agriculture
G020522 Central North Texas Job Corps Center McKinney Texas Labor
G020509 Central Saratoga Fish Hatchery Saratoga Wyoming Interior
G020420 Central BLM District Oftlce Miles City Montana Interior
G020 174 Central Black Hills NF Supervisors Otllce Custer South Dakota Agriculture
G020174 Central Black Hills NF Hill City Shop Hill City South Dakota Agriculture
G020 174 Central Black Hills NF Rangers’ Quarters Deadwood South Dakota Agriculture
(3020174 Central BlackHills NF Pactola District HQ Rapid City South Dakota Agriculture
G020248 Central Mt. Rushmore National Monument Keystone South Dakota Interior
G020597 Central Federal Correctional Institution Three Rivers Texas Justice
G020432 Central Air Route Traftic Control Center Salt Lake City Utah Transportation
G020568 Central Corpus Christi Air Station Corpus Christi Texas Transportation
G020500 Central Yelllowstone National Park Mammoth Wyoming Interior
G020598 Central Federal Detention Center Oakdale Louisiana Justice
Bureau
Jational Park Service
~ishand Wildlife Service
{ational Park Service
Jational Park Service
?ational Park Service
rorest Service
;ish and Wildlife Service
tLM
~orestService
ForestService
‘orest Service
~orestService
Jational Park Service
)ureau of Prisons
‘AA
;oast Guard
iational Park Service
hrreau of Prisons
AuditYear
1995
1995
1996
1996
1995
1998
1996
1996
1997
1997
1996
1995
1995
1995
1995
1996
1998
1996
1998
I997
1999
A. 1
lDO/PO #l DOE I I I I I I Audit IRegion Site Name City State Agency Bureau Year
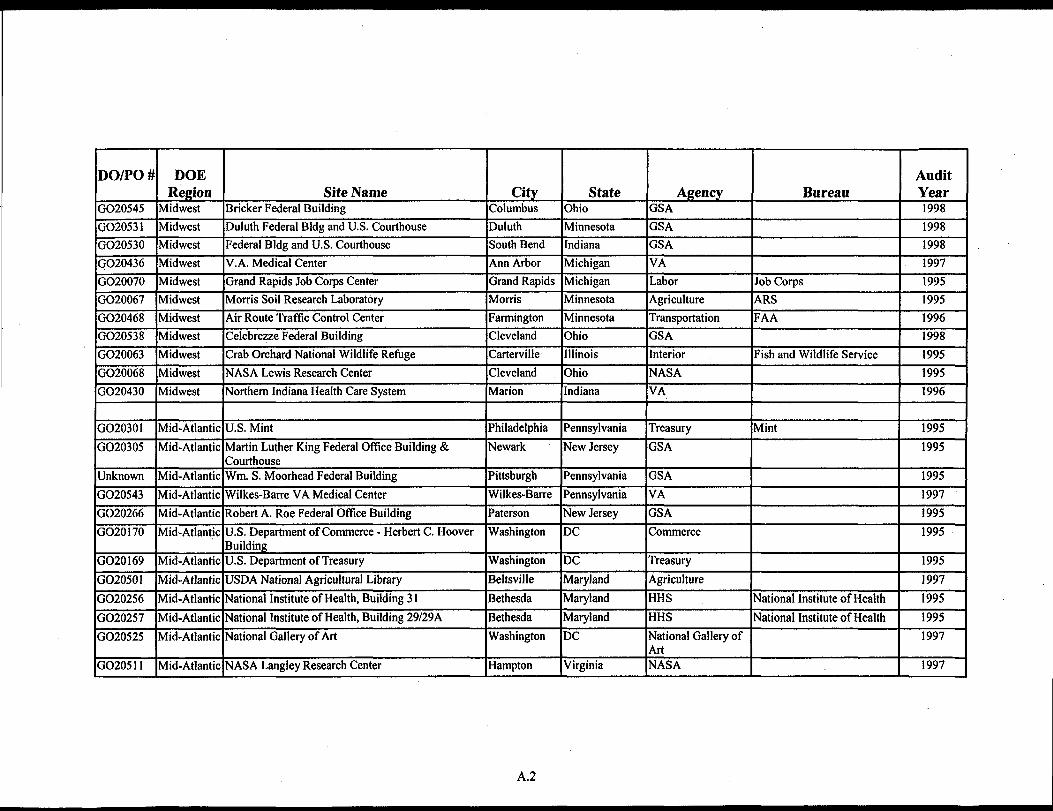
G020545 Midwest Wicker Federal Building Columbus Ohio GSA 1998
G020531 Midwest Duluth Federal Bldg and U.S. Courthouse Duluth Minnesota GSA 1998
G020530 Midwest FederalBldg and U.S. Courthouse South Bend Indiana GSA 1998
G020436 Midwest V.A. Medical Center Ann Arbor Michigan VA 1997
G020070 Midwest Grand Rapids Job Corps Center Grand Rapids Michigan Labor Job corps 1995
G020067 Midwest Morris Soil Research Laboratory Morris Minnesota Agriculture ARS 1995
G020468 Midwest Air Route Traffic Control Center Farmington Minnesota Transportation FAA 1996
G020538 Midwest Celebrezze Federal Building Cleveland Ohio GSA 1998
G020063 Midwest Crab Orchard National Wildlife Refuge Carterville Illinois Interior Fish and Wildlife Service 1995
G020068 Midwest NASA Lewis Research Center Cleveland Ohio NASA 1995
G020430 Midwest Northern Indiana Health Care System Marion Indiana VA 1996
G020301 Mid-AtlanticU.S. Mint Philadelphia Pennsylvania Treasury Mint 1995
G020305 Mid-AtlanticMartinLutherKing Federal Office Building & Newark New Jersey GSA 1995
I lCourthouse I I I I IUnknown !Mid-AtlanticlWm. S. Moorhead Federal Building lPittsburgh lPennsylvania IGSA 1995 It 1 I I I # 1 #
G020543 Mid-Atlantic Wilkes-Barre VA Medical Center Wilkes-Bame Pennsylvania VA 1997
G020266 Mid-Atlantic Robert A. Roe Federal Office Building Paterson New Jersey GSA 1995
G“020170 Mid-Atlantic U.S. Department of Commerce - Herbert C. Hoover Washington DC Commerce 1995Building
G020 169 Mid-Atlantic U.S. Department of Treasury Washington DC Treasury 1995
G020501 Mid-Atlantic USDA National Agricultural Library Behsville Maryland Agriculture 1997
G020256 Mid-Atlantic National Institute of Health, Building31 Bethesda Maryland HHS National Institute of Health 1995
G020257 Mid-Atlantic National Institute of Health, Building 29129A Bethesda Maryland HHS National Institute of Health 1995
G020525 Mid-Atlantic National Gallery of Art Washington DC National Gallery of 1997Art
G020511 Mid-Atlantic NASA Langley Research Center Hampton Virginia NASA 1997
A.2
lDO/PO #l DOE I I IRegion Site Name City State
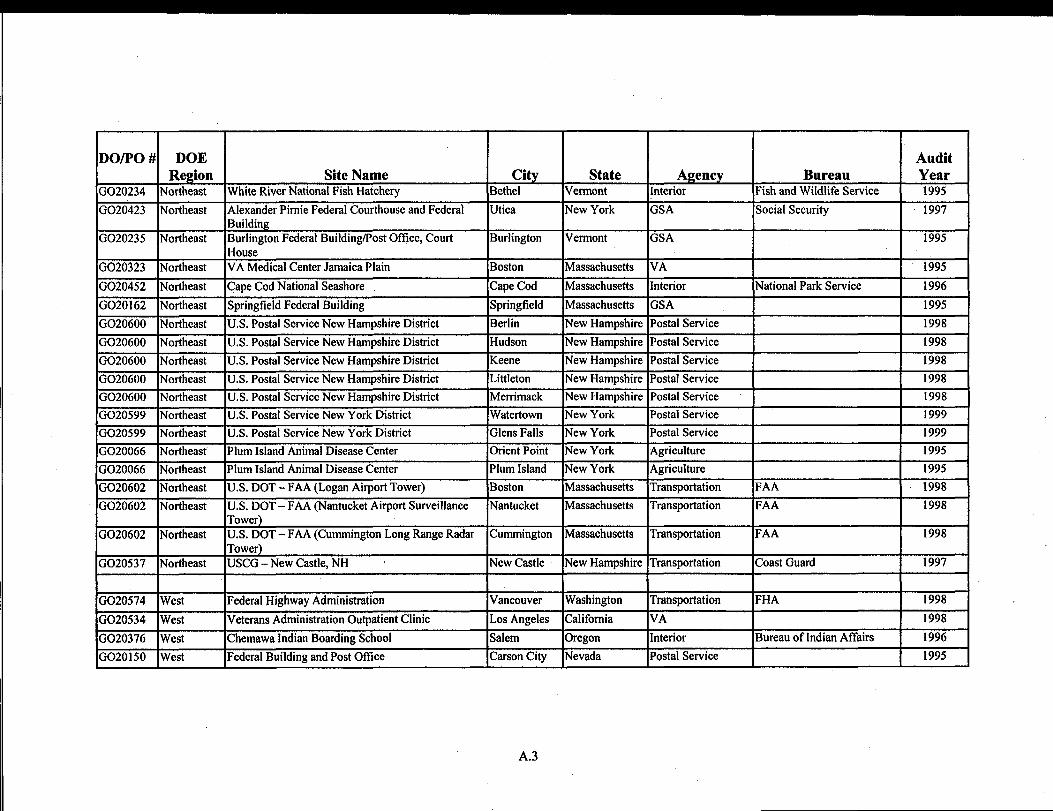
G020234 Northeast White River National Fish Hatchery Bethel Vermont,
G020423 lNortheast lAlexander Pimie Federal Courthouse and Federal lUtica lNew York
I IBuilding I IG020235 lNortheast lBurlington Federal Building/Post Office, Court [Burlington lVermont
I lHouse- 1 IG020323 lNortheast IVA Medical Center Jamaica Plain lBoston lMassachusetts
1 I I I
G020452 [Northeast lCape Cod National Seashore lCape Cod [Massachusetts
G020162 Northeast Springfield Federal Building Springfield Massachusetts
G020600 Northeast U.S. Postal Service New Hampshire District Berlin New Hampshire1 1 I 1
G020600 lNortheast ILLS.Postal Sewice New Hampshire District IHudson lNew Hampshire, ,
G020600 lNortheast IU.S. Postal Service New Hampshire District lKeene lNew Hampshire
G020600 Northeast U.S. Postal Service New Hampshire District Littleton New Hampshire
G020600 Northeast U.S. Postal Service New Hampshire District Merrimack New Hampshire
G020599 Northeast U.S. Postal Service New York District Watertown New York
G020599 Northeast U.S. Postal Service New York District Glens Falls New YorkI I 1 1
G020066 lNortheast lPlum Island Animal Disease Center 10rient Point lNew York1 I 1 1
G020066 lNortheast lPIum Island Animal Disease Center ]Plum island lNew York
G020602 Northeast U.S. DOT - FAA (Logan Airport Tower) Boston Massachusetts
G020602 Northeast U.S. DOT - FAA (Nantucket Airport Surveillance Nantucket Massachusetts
I lTower) I IG020602 lNortheast IU.S. DOT- FAA (Cumrnington Long Range Radar [Curnmington IMassachusetts
Tower)G020537 Northeast USCG - New Castle, NH New Castle New Hampshire
I I I 1G020574 lWest ]Federal Highway Administration lVancouver lWrrshington
1 1 ,
G020534 !West lVeterans Administration Outpatient Clinic IL-osAngeles ]CalifomiaI I 1 I
G020376 lWest lChemawa Indian Boarding School I!Salem Ioregonn
G020150 lWest lFederal Building and Post Office ICarson City lNevada
I I Audit IAgency I Bureau I Year
,Interior [Fish and Wildlife Service 1995 I
GSA1 tSocial Security 1997
GSA 1995
VA 1995
‘Interior National Park Service 1996
GSA 1995
Postal Service 1998
Postal Service 1998
Postal Service 1998
Postal Service 1998
Postal Service 1998
Postal Service 1999
Postal Service 1999
Agriculture 1995
Agriculture 1995
iTransportation FAA 1998
Transportation FAA 1998
I I
Transportation FAA 1998II
Transportation Coast Guard 1997
Transportation FHA 1998
VA 1998
Interior Bureau of Indian Affairs 1996
Postal Service 1995
A.3
DO/PO # DOERegion
G020475 West
G020454 West
G020469 West
G020196 West
G020207 West
G020268 West
G020382 West
G020307 WestG020514 West
G020521 West
G020521 West
G020521 West
G020521 West
G020532 West
G020255 West
l=+=G020451 Southeast
G020215 Southeast
G020215 Southeast
G020450 Southeast
Site Name
Air Route Traftlc Control Center
Golden Gate National Recreation Area
Nevada Test Site
Bellingham Federal Building
Moscow Federal Building
District Office & Bunkhouse
Sawtooth National Recreation Area Office
Angell Job Corp Center
911 Federal Building/Henri Monroe Oftlce
San Francisco Nat’1Wildlife Refuge Complex
Lahontan National fish Hatchery Complex
Spring Creek National Fish Hatchery
Abernathy Salmon Culture Tech Center
Shasta National Park Services
N Island Naval Air Station/Customs Service
VA Medical Center
USCG - Vessel Support Facility
U. S. Courthouse
NASA Dispensary
Fed. Bldg. Post Oftice-Courthouse
Food and Drur?Administration Laboratory
,Federal Building
Timberlake Federal Building
AuditCity State Agency Bureau Year
Anchorage Alaska Transportation FAA 1997
San Francisco California Interior National Park Service 1996
Las Vegas Nevada Energy 1996
Bellingham Washington GSA 1995
Moscow Idaho GSA 1995
Ketchikan Alaska Agriculture Forest Service 1995
Twin Falls Idaho Agriculture Forest Service 1996
Yachats Oregon Agriculture Forest Service 1995
Portland Oregon GSA 1997
Newark California Interior Fish and Wildlife Service 1995
Gardnerville Nevada Interior Fish and Wildlife Service 1997
Underwood Washington Interior Fish and Wildlife Service 1997
Longview Washington Interior Fish and Wildlife Service 1997
Whiskeytown California Interior National Park Service 1997
San Diego California Treasury Customs 1996
Charleston South Carolina VA 1995
North South Carolina Transportation Coast Guard 1998CharlestonPensacola Florida GSA 1997
Cape Florida NASA 1995CanaveralClarksdale Mississippi GSA 1997
Atlanta Georgia HHS FDA 1995
Macon Georgia GSA 1995
Tampa Florida GSA 1997
A.4
DO/PO # DOE AuditRegion Site Name City State Agency Bureau Year
G020216 Southeast Juliette Lowe Federal Building Savannah Georgia GSA 1995
G020261 Southeast Federal Law Enforcement Training Center Glynco Georgia Transportation 1995
G020576 Southeast US Coast Guard Group Fort Macon Atlantic Beach North Carolina Transportation Coast Guard 1998
G020607 Southeast Gulf Ecology Division Gulf Breeze Florida EPA 1999
I
A,5
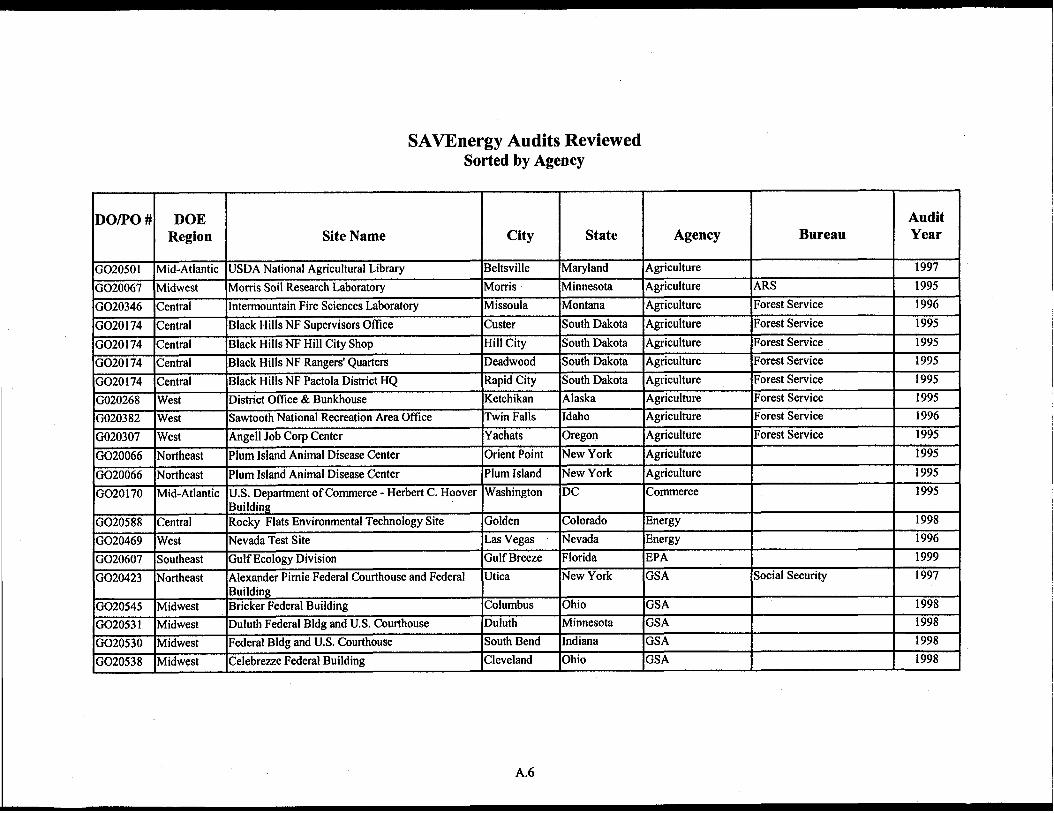
SAVEnergy Audits ReviewedSortedby Agency
Demo # DOERegion Site Name I Audit
City State Agency Bureau Year
G020501 Mid-Atlantic USDA National Agricultural Library Beltsville Maryland Agriculture 1997
G020067 Midwest Morris Soil Research Laboratory Morris Minnesota Agriculture AIM 1995I I 1 t 1 ,
G020346 lCentral Ilntermountain Fire Sciences Laboratory IMissoula ]Montana lAgriculture lForest Service I 1996 IJ
G0201 ’74 Central Black Hills NF Supervisors Ofllce Custer South Dakota Agriculture Forest Service 1995
G020174 Central Black Hills NF Hill City Shop Hill City South Dakota Agriculture Forest Service 1995. .G020 174 Central Black Hills NF Rangers’ Quarters Deadwood South Dakota Agriculture Forest Service 1995
G020 174 Central Black Hills NF Pactola District HQ Rapid City South Dakota Agriculture Forest Service 1995
G020268 West District Office & Bunkhouse Ketchikan Alaska Agriculture Forest Service 1995
G020382 West Sawtooth National Recreation Area Oftlce Twin Falls Idaho Agriculture Forest Service 1996
G020307 West Angell Job Corp Center Yachats Oregon Agriculture Forest Service 1995
G020066 Northeast Phrm Island Animal Disease Center Orient Point New York Agriculture 1995
G020066 Northeast Plum Island Animal Disease Center Plum Island New York Agriculture 1995
G020170 Mid-Atlantic U.S. Department of Commerce- Herbert C. Hoover Washington DC Commerce 1995Building
G020588 Central Rocky Flats Environmental Technology Site Golden Colorado Energy 1998
G020469 West Nevada Test Site Las Vegas Nevada Energy 1996
G020607 Southeast Gulf Ecology Division Gulf Breeze Florida EPA 1999
G020423 Northeast Alexander Pimie Federal Courthouse and Federal Utica New York GSA Social Security 1997Building
G020545 Midwest Bricker Federal Building Columbus Ohio GSA 1998
G020531 Midwest Duluth Federal Bldg and U.S. Courthouse Duluth Minnesota GSA 1998
G020530 Midwest Federal Bldg and U.S. Courthouse South Bend Indiana GSA 1998
G020538 Midwest Celebrezze Federal Building Cleveland Ohio GSA 1998
A.6
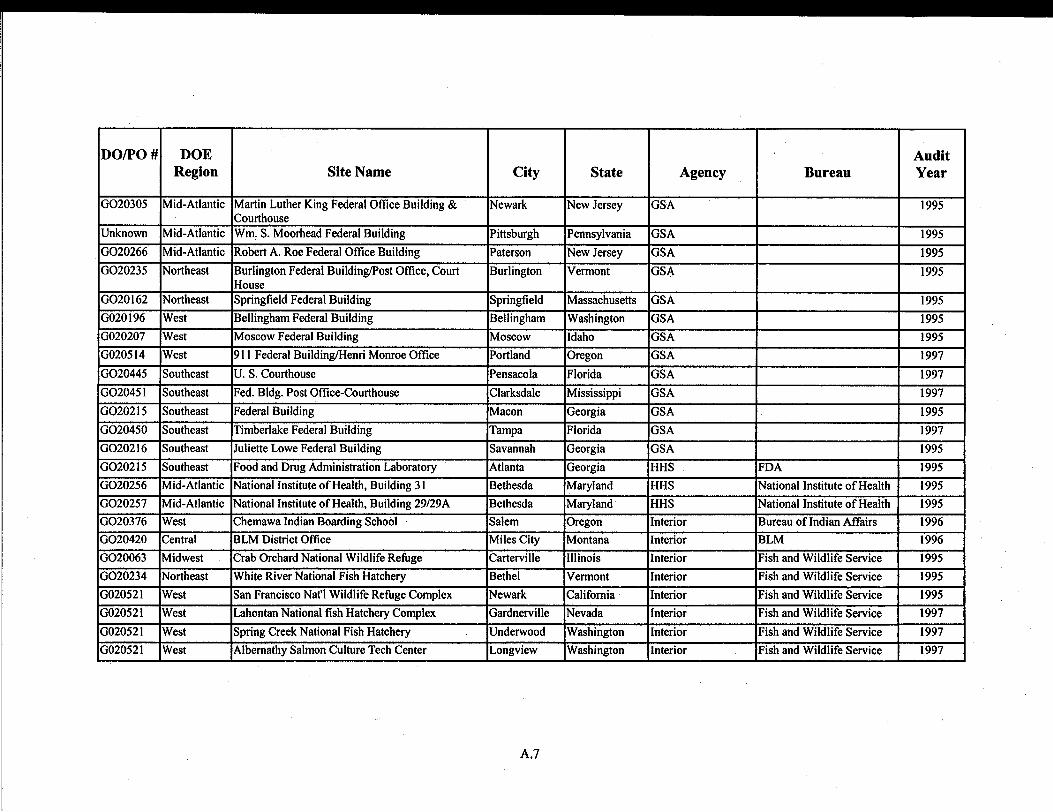
I
i
II
DO/PO# DOE AuditRegion Site Name City State Agency Bureau Year
G020305 Mid-Atlantic Martin Luther King Federal Otlice Building& Newark New Jersey GSA 1995Courthouse
Unknown Mid-Atlantic Wm. S. Moorhead Federal Building Pittsburgh Pennsylvania GSA 1995
G020266 Mid-Atlantic Robert A. Roe Federal OffliceBuilding Paterson New Jersey GSA 1995
G020235 Northeast Burlington Federal Building/Post Oftice, Court Burlington Vermont GSA 1995House
G020 162 Northeast Springfield Federal Building Springfield Massachusetts GSA 1995
G020196 West Bellingham Federal Building Bellingham Washington GSA 1995
G020207 West Moscow Federal Building Moscow Idaho GSA 1995
G020514 West 911 Federal Building/Henri Monroe OffIce Portland Oregon GSA 1997
G020445 Southeast U. S. Courthouse Pensacola Florida GSA 1997
G020451 Southeast Fed. Bldg. Post Office-Courthouse Clarksdale Mississippi GSA 1997
5020215 Southeast FederalBuilding Macon Georgia GSA 1995
3020450 Southeast TimbedakeFederalBuilding Tampa Florida GSA 1997
S020216 Southeast Juliette Lowe Federal Building Savannah Georgia GSA 1995
3020215 Southeast Food and Drug Administration Laboratory Atlanta Georgia HHS FDA 1995
2020256 Mid-Atlantic National Institute of Health, Building 31 Bethesda Maryland HHS National Institute of Health 1995
3020257 Mid-Atlantic National Institute of Health, Building 29129A Bethesda Maryland HHS National Institute of Health 1995
3020376 West Chemawa Indian Boarding School Salem Oregon Interior Bureau of Indian Affairs 1996
3020420 Central BLM District Oftice Miles City Montana Intetior BLM 1996
3020063 Midwest Crab Orchard National Wildlife Refuge Carterville Illinois Interior Fish and Wildlife Service 1995
3020234 Northeast White River National Fish Hatchery Bethel Vermont Interior Fish and Wildlife Service 1995
3020521 West San Francisco Nat’1Wildlife Refuge Complex Newark California Interior Fish and Wildlife Service 1995
3020521 West Lahontan National fish Hatchery Complex Gardnerville Nevada Interior Fish and Wildlife Service 1997
302052 I West Spring Creek National Fish Hatchery Underwood Washington Interior Fish and Wildlife Service 1997
3020521 West Albemathy Salmon Culture Tech Center Longview Washington Interior Fish and Wildlife Service 1997
A,7
I
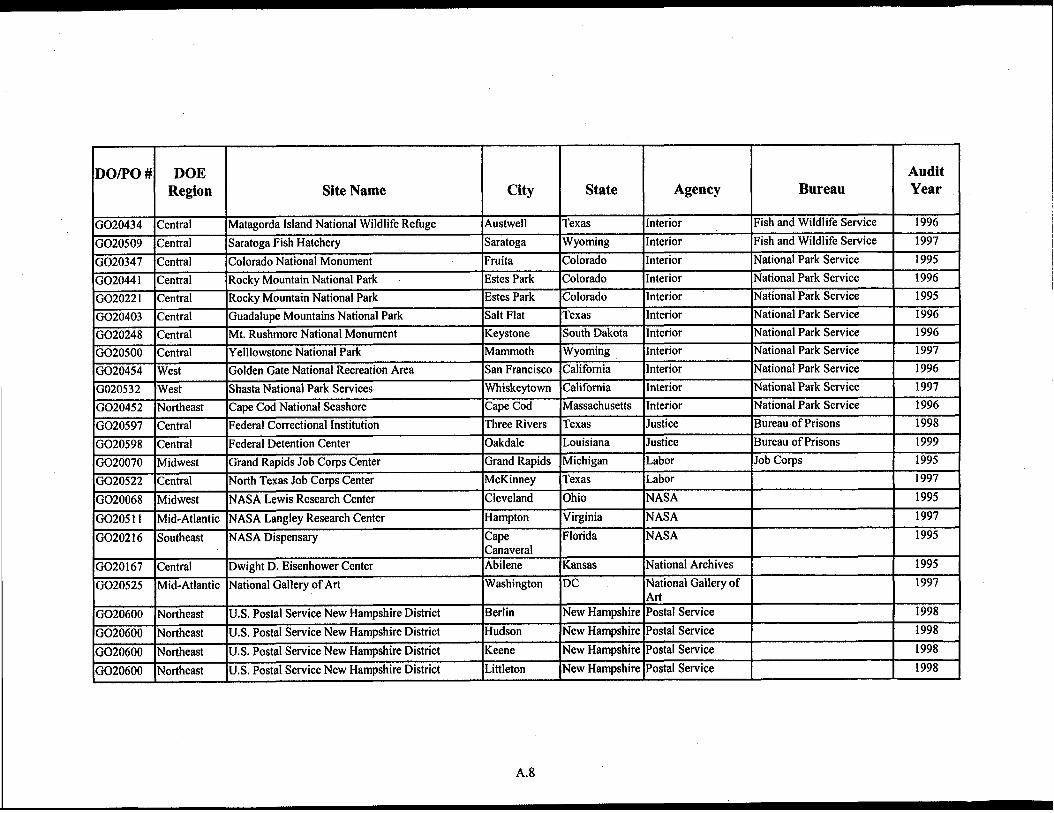
IlDO/PO # DOE
Region Site NameI I I II City
IState
IAgency
IBureau IIAudit
Year
G020434 Central Matagorda Island National Wildlife Refuge Austwell Texas Interior Fish and Wildlife Service 1996
G020509 Central Saratoga Fish Hatchery Saratoga Wyoming Interior Fish and Wildlife Service 1997I 1 , , I
G020347 lCentral lColorado National Monument lFruita lColorado [Interior lNational Park Service 1995 II 1 1 I , I
G020441 lCentral lRockv Mountain National Park lEstes Park lColorado lInterior lNational Park Service 1996 I.G020221 Central Rocky Mountain National Park Estes Park Colorado Interior National Park Service 1995
G020403 Central Guadalupe Mountains National Park Salt Flat Texas Interior National Park Service 1996
G020248 Central Mt. Rushmore National Monument Keystone South Dakota Interior National Park Service 1996
G020500 Central Yelllowstone National Park Mammoth Wyoming Interior National Park Service 1997
G020454 West Golden Gate National Recreation Area San Francisco California Interior National Park Service 1996
G020532 West Shasta National Park Services Whiskeytown California Interior National Park Service 1997
G020452 Northeast Caue Cod National Seashore Cape Cod Massachusetts lInterior lNational Park Service 1996I I I 1 , I
G020597 lCentral lFederal Correctional Institution I’fhree Rivers ]Texas lJustice ~Bureau of Prisons 1998 I
A.8
G020598 Central Federal Detention Center Oakdale Louisiana Justice Bureau of Prisons 1999
G020070 Midwest Grand Rapids Job Corps Center Grand Rapids Michigan Labor Job corps 1995
G020522 Central North Texas Job Corps Center McKinney Texas Labor 1997
G020068 Midwest NASA Lewis Research Center Cleveland Ohio NASA 1995I I I I I 1 I
G020511 lMid-Atlantic INASA Langley Research Center lHampton lVirginia INA5A I 1997 Ii I I
G020216 lSoutheast INASA Dispensary ]Cape ]Florida [NASA I 1995. .Canaveral
G020167 Central Dwight D. Eisenhower Center Abilene Kansas National Archives 1995
G020525 Mid-Atlantic National Galleryof Art Washington DC National Gallery of 1997
I I I I lArt I IG020600 lNortheast IU.S. Postal Service New Hampshire District lBerlin lNew Hampshire lPostal Service 1998
G020600 Northeast U.S. Postal Service New Hampshire District Hudson New Hampshire Postal Service 1998
G020600 Northeast U.S. Postal Service New Hampshire District Keene New Hampshire Postal Service 1998
G020600 Northeast U.S. Postal Service New Hampshire District Littleton New Hampshire Postal Service 1998
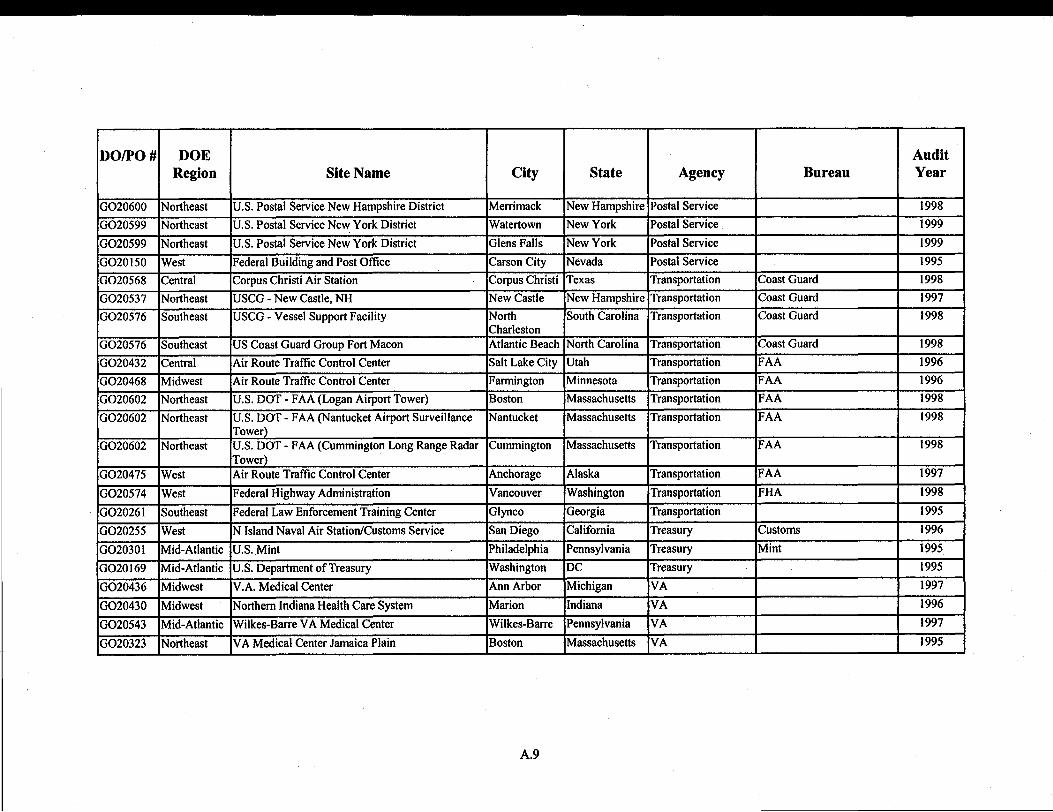
DO/PO # DOE I cityI ‘tateI ‘gencyI AuditRegion Site Name Bureau Year
I I I I I I IG020600 lNortheast IU.S. Postal Service New Hamtxhire District lMerrimack lNew Hampshire lPostal Service 1998
I 1 I 1 I 8 I
G020599 lNortheast IU.S. Postal Service New York District lWatertown lNew York lPostal Service I 1999
G020599 Northeast U.S. Postal Service New York District Glens Falls New York Postal Service 1999
G020 150 West Federal Building and Post OffIce Carson City Nevada Postal Service 1995
G020568 Central Corpus Christi Air Station Corpus Christi Texas Transportation Coast Guard 1998I I 1 1 I I I
G020537 lNortheast IUSCG - New Castle. NH lNew Castle lNew Hampshire lTransportation lCoast Guard I 1997I 1 1 I 1 1 I
G020576 lSoutheast hJSCG - Vessel Sutmort Facilitv lNorth lSouth Carolina lTransportation lCoast Guard I 1998
I I..
Charleston I I I IG020576 lSoutheast hJS Coast Guard Groutr Fort Macon [Atlantic Beach lNorth Carolina lTransportation ]Coast Guard 1998
I
G020432 Central Air Route Traftic Control Center Salt Lake City Utah Transportation FAA 1996
G020468 Midwest Air Route Traffic Control Center Farmington Minnesota Transportation FAA 1996
I G020602 Northeast U.S. DOT - FAA (Logan Airport Tower) Boston Massachusetts Transportation FAA 19981 1 I 1 ,
G020602 lNortheast IU.S. DOT- FAA (Nantucket Airport Surveillance [Nantucket lMassachusetts lTransportation IFAA I 1998
~I lTower) I I I I I
G020602 lNortheast [U.S. DOT - FAA (Cummington Long Range Radar lCummington lMassachusetts lTransportation ~FAA 1998Tower)
G020475 West Air Route Traftlc Control Center Anchorage Alaska Transportation FAA 1997
G020574 West Federal Highway Administration Vancouver Washington Transportation FHA 1998
G020261 Southeast Federal Law Enforcement Training Center Glynco Georgia Transportation I I 1995
G020255 West N Island Naval Air Station/Customs Service San Diego California Treasury lCustoms 1996
G020301 Mid-Atlantic U.S. Mint Philadelphia Pennsylvania Treasury Mint 1995
G020 169 Mid-Atlantic US. Department of Treasury Washington DC Treasury 1995
G020436 Midwest V.A, Medical Center Ann Arbor Michigan VA 1997
G020430 Midwest Northern Indiana Health Care System Manon Indiana VA 1996
G020543 Mid-Atlantic Wilkes-Barre VA Medical Center Wilkes-Barre Pennsylvania VA 1997
G020323 Northeast VA Medical Center Jamaica Plain Boston Massachusetts VA 1995
I I I I I I I I 1
A.9

I 1 I I I I I I 1
DO/PO # DOE AuditRegion Site Name City State Agency Bureau Year
G020534 West Veterans Administration Outpatient Clinic Los Angeles California VA 1998
G020264 Southeast VA Medical Center Charleston South Carolina VA 1995
A.1O
Appendix B
Audit Data Collected
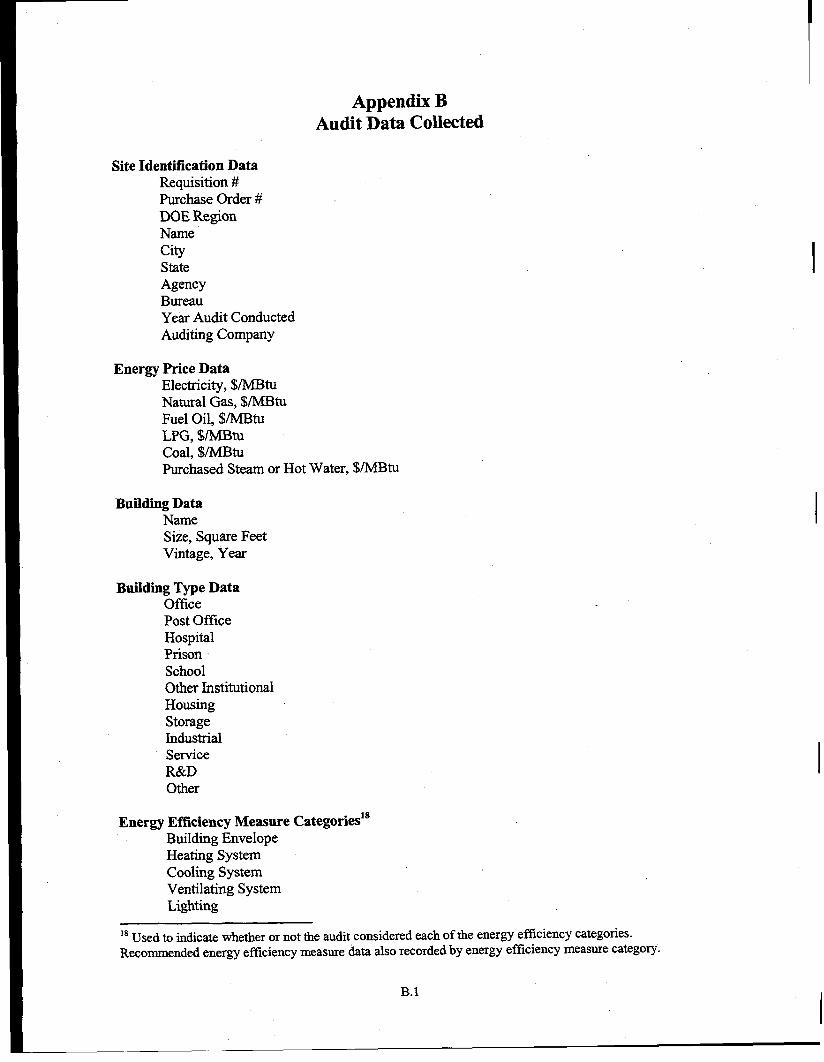
Site Identilcation DataRequisition #Purchase Order #DOE RegionNameCityStateAgencyBureau
Appendix BAudit Data Collected
Year Audit ConductedAuditing Company
Energy Price DataElectricity, $/MBtuNatural Gas, $/MBtuFuel Oil, $/MBtuLPG, $INIBtuCoal, $/h4BtuPurchased Steam or Hot Water, $/MBtu
Building DataNameSize, Square FeetVintage, Year
Building Type DataOfficePost OffIceHospitalPrisonSchoolOther InstitutionalHousingStorageIndustrialServiceR&DOther
Energy Efficiency Measure CategorieslsBuilding EnvelopeHeating SystemCooling SystemVentilating SystemLighting
1sUsed to indicate whether or not the audit considered each of the energy efficiency categories.Recommended energy efficiency measure data also recorded by energy efficiency measure category.
Ill
I
Service Hot WaterPlug LoadsProcess Drive SystemsCompressed Air SystemsOther Process LoadsCentral BoilerCentral ChillerSteam or Hot Water DistributionChilled Water Distribution
Recommended Energy Efficiency Measure DataAnnual Energy Savings, MBtuAnnual Energy Savings, $Annual Non-energy Savings, $Implementation Cost, $Net Present Value, $
B.2
Appendix C
SAVEnergy Audit Data Statistical Analysis
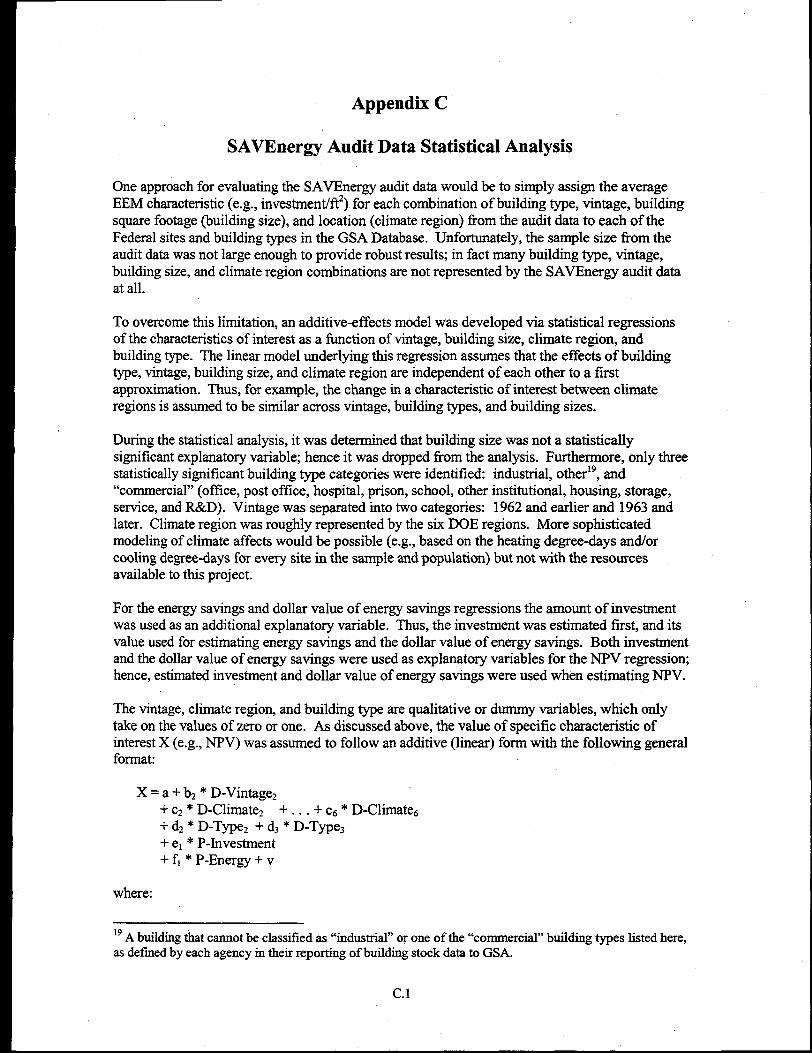
Appendix C
SAVEnergy Audit Data Statistical Analysis
One approach for evaluating the SAVEnergy audit data would be to simply assign the averageEEM characteristic (e.g., investment/@ for each combination of building type, vintage, buildingsquare footage (building size), and location (climate region) born the audit data to each of theFederal sites and building types in the GSA Database. Unfortunately, the sample size from theaudit data was not large enough to provide robust results; in fact many building type, vintage,building size, and climate region combinations are not represented by the SAVEnergy audit dataat all.
To overcome this limitatio~ an additive-effects model was developed via statistical regressionsof the characteristics of interest as a fiction of vintage, building size, climate region, andbuilding type. The linear model underlying this regression assumes that the effects of buildingtype, vintage, building size, and climate region are independent of each other to a firstapproximation. Thus, for example, the change in a characteristic of interest between climateregions is assumed to be similar across vintage, building types, and building sizes.
During the statistical analysis, it was determined that building size was not a statisticallysignificant explanatory variable; hence it was dropped from the analysis. Furthermore, only threestatistically significant building type categories were identified: industrial, other19,and“commercial” (oflice, post office, hospital, prison, school, other institutional, housing, storage,service, and R&D). Vintage was separated into two categories: 1962 and earlier and 1963 andlater. Climate region was roughly represented by the six DOE regions. More sophisticatedmodeling of climate affects would be possible (e.g., based on the heating degree-days and/orcooling degreedays for every site in the sample and population) but not with the resourcesavailable to this project.
For the energy savings and dollar value of energy savings regressions the amount of investmentwas used as an additional explanatory variable. Thus, the investment was estimated first, and itsvalue used for estimating energy savings and the dollar value of energy savings. Both investmentand the dollar value of energy savings were used as explanatory variables for the NPV regression;hence, estimated investment and dollar value of energy savings were used when estimating NPV.
The vintage, climate region, and building type are qualitative or dummy variables, which onlytake on the values of zero or one. As discussed above, the value of specific characteristic ofinterest X (e.g., NPV) was assumed to follow an additive (linear) form with the following generalformat:
X = a + b2 * D-VintageIi- c2* D-Climatez +. . . + c.5* D-Clirnate6+ d2* D-Type2 + d3* D-Type3+ el * P-Investment+ fl * P-Energy+ v
where:
19Abuilding that cannot be classified as “industrial” or one of the “commercial” building types listed here,as defined by each agency in their reporting of building stock data to GSA.
C.1
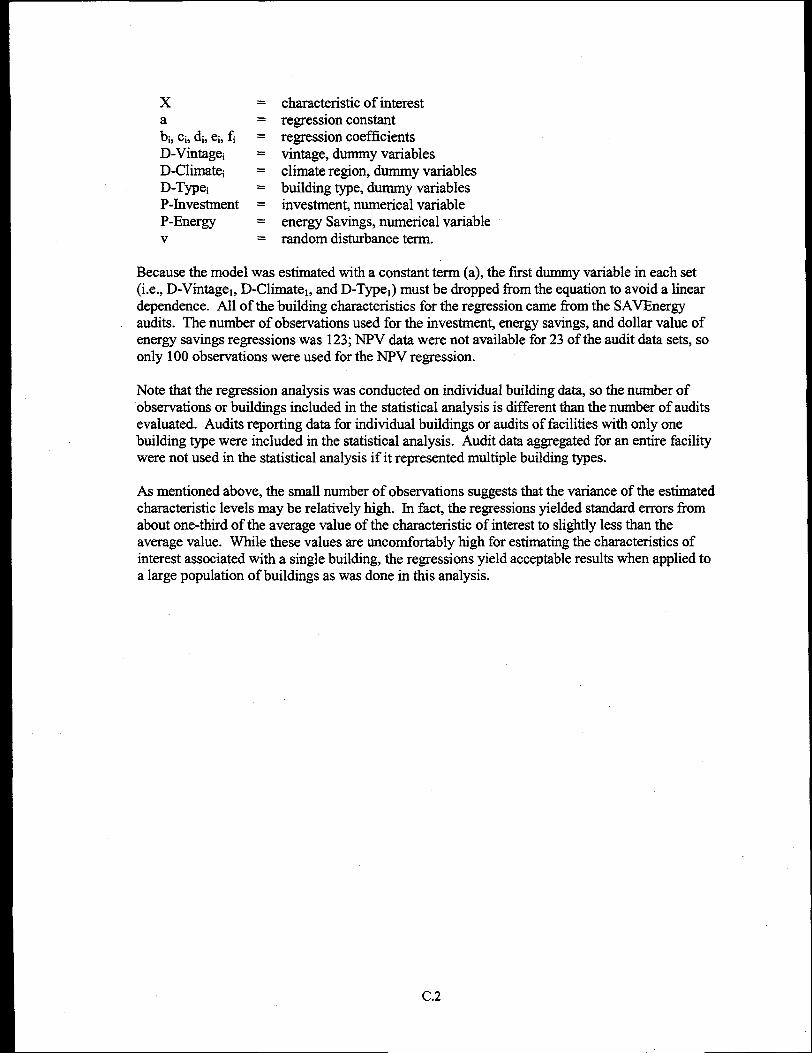
x
;i,Ci,di,ei,fD-VintigeiD-ClimatqD-TypeiP-InvestmentP-Energyv
characteristic of interestregression constantregression coefficientsvintage, dummy variablesclimate region, dummy variablesbuilding type, dummy variablesinvestment, numerical variableenergy Savings, numerical variablerandom disturbance term.
Because the model was estimated with a constant term (a), the first dummy variable in each set(i.e., D-Vintagel, D-Climatel, and D-Typel) must be dropped from the equation to avoid a lineardependence. All of the building characteristics for the regression came from the SAVEnergyaudits. The number of observations used for the investment, energy savings, and dollar value ofenergy savings regressions was 123; NPV data were not available for 23 of the audit data sets, soonly 100 observations were used for the NW regression.
Note that the regression analysis was conducted on individual building data, so the number ofobservations or buildings included in the statistical analysis is different than the number of auditsevaluated. Audits reporting data for individual buildings or audits of facilities with only onebuilding type were included in the statistical analysis. Audit data aggregated for an entire facilitywere not used in the statistical analysis if it represented multiple building types.
As mentioned above, the small number of observations suggests that the variance of the estimatedcharacteristic levels may be relatively high. In fact the regressions yielded standard errors fromabout one-third of the average value of the characteristic of interest to slightly less than theaverage value. While these values are uncomfortably high for estimating the characteristics ofinterest associated with a single building, the regressions yield acceptable results when applied toa large population of buildings as was done in this analysis.
C.2
Appendix D
Frequencies of Recommended Energy Efficiency Measures
Appendix D
Frequencies of Recommended Energy Efficiency Measures
The frequencies of recommended EEMs for the SAVEnergy audit sample and FEDS analyses ofFORSCOM sites are presented in Tables D. 1 and D.2, respectively. Table D. 1 identifies thenumber of audits (out of 94 audits in the sample) where the specific EEMs listed wererecommended. Recommendations for the same EEM within multiple buildings at the same sitewere counted as a single recommendation. Thus, the maximum frequency possible in Table D. 1is 94.
Similarly, Table D.2 identifies the number of FORSCOM sites (out of 11 FORSCOM sitesevaluated with FEDS) where the specific EEMs listed were recommended. Again, multiplerecommendations for an EEM at a single site counted as a single recommen&tion. Thus, themaximum frequency possible in Table D.2 is 11.
The frequencies of recommended EEMs were generally higher (relative to the maximumfi-equencypossible) for the FEDS analyses of FORSCOM sites than for the SAVEnergy auditsample. This can be attributed to the use of a common analysis tool (FEDS) for evaluating theFORSCOM sites in contrast to using many diffment auditors to conduct the SAVEnergy audits.This result can also be explained by the greater commonality of building intitructurecharacteristics across the FORSCOM sites than exists across the civilian agencies included in theSAVEnergy audits.
The frequencies of recommended EEMs correlate well with the estimated energy savings byEEM category for the SAVEnergy audit sample, i.e., EEMs within the Ventilation and Controlsand Lighting categories are recommended most frequently and result in the greatest energysavings potential. The same degree of correlation is not found for the FEDS analyses ofFORSCOM sites, but this should not be alarming because the frequency data shown do notcapture the variable frequency across buildings at a single site, or the relative energy savingspotential of different EEMs.
The EEM categories were developed to provide common groupings of specific EEMs. This wasnecessary to facilitate extrapolation of the SAVEnergy audit sample characteristics to thepopulation of civilian agency square footage and for reporting of results. While it was usuallyobvious if an EEM fits into the Building Envelope or Lighting EEM categories, assignment toHeating System Cooling System, or Ventilation and Control EEM categories was often moresubjective. The general rules-of-thumb were to assign EEMs that affected only space heating tothe Heating System category, those that affected only space cooling to the Cooling Systemcategory, but those that affected both space heating and cooling to the Ventilation and Controlscategory. Heating or cooling EEMs affecting a single building were assigned to the HeatingSystem or Cooling System categories. Heating or cooling EEMs affecting multiple buildingswere assigned to the Central Boiler, Central Chiller, or the appropriate thermal distributioncategory.
D.1
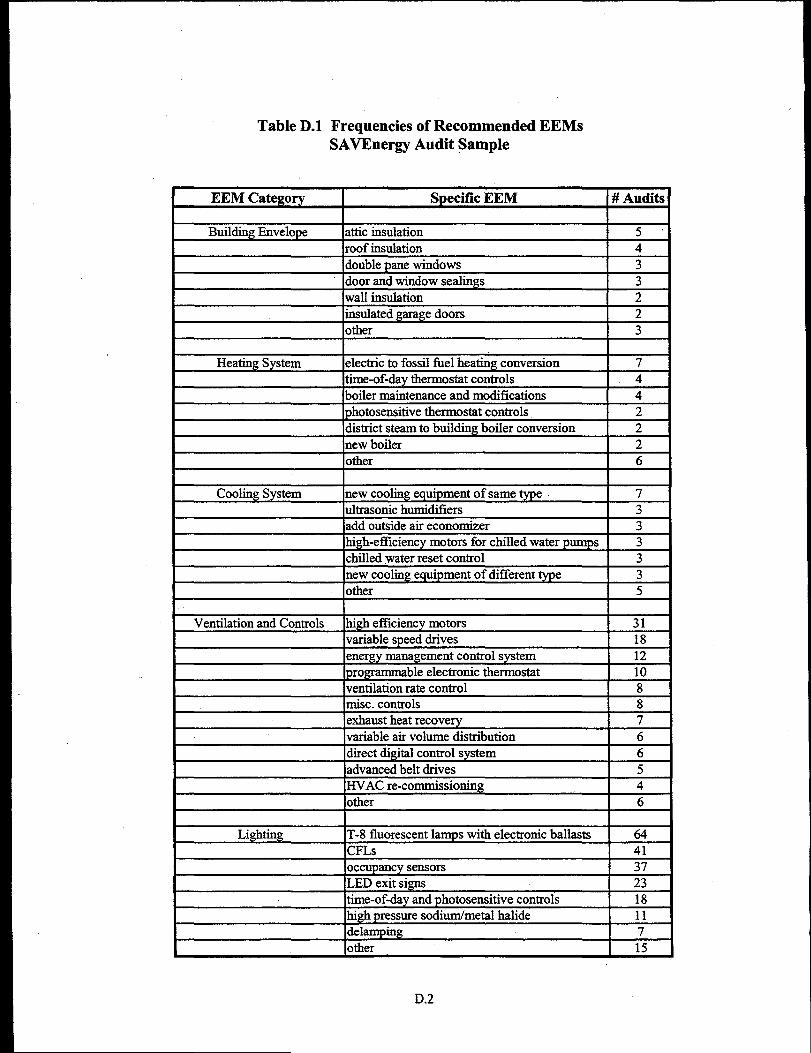
Table D.1 Frequencies of Recommended EEMsSAVEnergy Audit Sample
EEM Category SpecMc EEM # Audits
Building Envelope attic insulation 5“roof insulation 4double pane windows 3door and window scalings 3wall ixmdation 2insulatedgarage doors 2other 3
Heating System electric to fossil fuel heating conversion 7time-of-day thermostatcontrols 4boiler maintenanceand modifications 4photosensitive thermostatcontrols 2district steamto building boiler conversion 2new boiler 2
1 Iother 16[
It m. -i:-- 0. .-.-—. 1----- ‘--”rig equipment of same type 7
humidit3ers 3‘- -:- ----mnizer 3
bwwng aysusrn nc w Cuulu
ultrasonicadd outsid= u CQUUQhigh-efficiency motors for chilled water pumps I 3chilled water reset control I 3new cooling equipment of different type 3other 5
1
Ventilation and Controls high efficiency motors 31variable speed drives 18
energy management control system 12
programmable electronic thermostat 10ventilation rate control 8misc. controls 8exhaust heat recovery 7
variable air volume distribution 6
direct digital control system 6
advanced belt drives 5
HVAC re-commissioning 4
other 6
Lighting T-8 fluorescent lamp s with electronic ballasts 64CFLS 41
2
occupancy sensors 37LED exit signs 23time-of-day and photosensitive controls 18high pressure sodiurdmetal halide 11delamping 7other 15
D.2
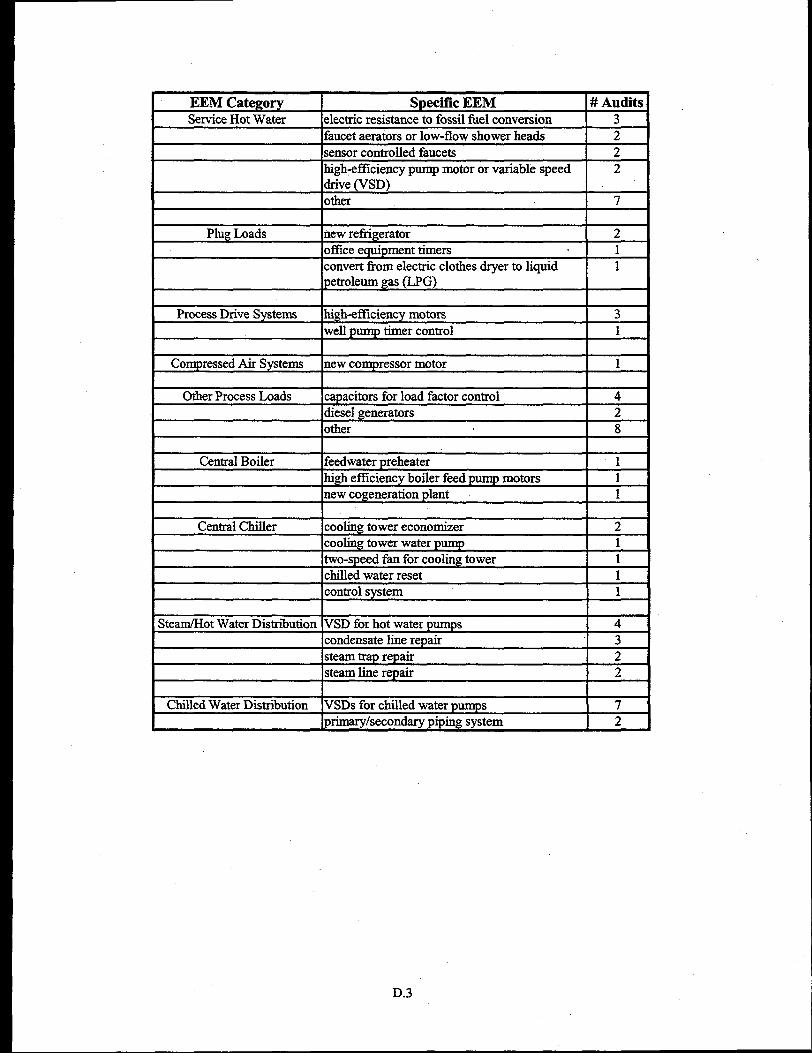
EEM Category Specific EEM # AuditsService Hot Water electric resistance to fossil fuel conversion 3
faucetaerators or low-flow shower heads 2sensor controlled faucets 2high@lciency pump motor or variable speed 2drive (VSD).-
Plug Loads new refrigerator 2office equipment timers 1convert from electric clothes dryer to liquid 1petroleum gas (LPG)
I 1I Process Drive Svstems ]hi~h-efflciencv motors 3
I Iwell pump timer control I 1I
I Compressed Air Systems new corepressor motor I 1I1 I
I Other Process Loads Icapacitors for load factor control 4
I Idiesel generators ! 2
Central Boiler feedwater preheater 1
high el%ciency boiler feed pump motors 1
new cogeneration plant 1t 1
Central Chiller cooling tower economizer 2cooling tower water pump 1two-sneed fan for coolixw tower 1chilled water reset 1control system 1
Steafiot Water Distribution VSD for hot water pumps 4
condensate line repair 3steam trm remir 2
I steam line repair I 2II I
I Chilled Water Distribution IVSDSfor chilled water pumps 7
I Iprim=y/secondary piping system I 2
D.3
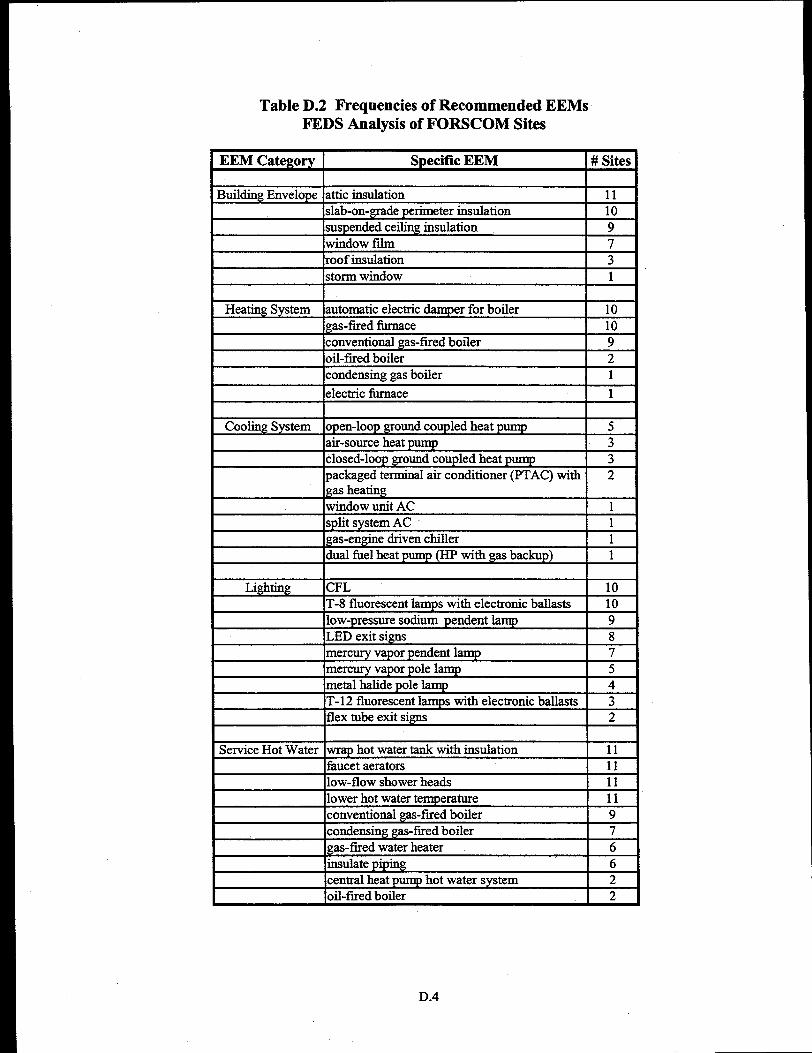
Table D.2 Frequencies of Recommended EEMsFEDS Analysis of FORSCOM Sites
Building Envelope attic insulation 11
slab-on- grade perimeter insulation 10suspended ceiling insulation 9
window film 7roof insulation 3storm window 1
Heating System automatic electric dampe r for boiler 10gas-fired iinnace 10conventional gas-fired boiler 9
I Ioil-fued boiler I 2lcondensin~ gas boiler 1 I
I Ielectric ikrnace Ill
I
Cooling System open-loop ground coupled heat pump 5air-source heat pump 3closed-loop ground coupled heat pump 3packaged terminal air conditioner (PTAC) with 2gas heatingwindow unit AC 1split system AC 1gas-en gine driven chiller 1dual fiel heat pump (HP with gas backup) 1
Lighting CFL 10T-8 fluorescent lamps with electronic ballasts 10low-pressure sodium pendent lamp 9LED exit signs 8mercury vapor pendent lamp 7mercury vapor pole lamp 5metal halide pole lamp 4T-12 fluorescent lamps with electronic ballasts 3flex tube exit signs 2
Service Hot Water wrap hot water tank with insulation 11faucet aerators 11low-flow shower heads 11lower hot water temperature 11conventional ms-fwed boiler 9condensing gas-fired boiler 7gas-fued water heater 6insulate piping 6central heat pump hot water system 2oil-fired boiler 2
D.4
PNNL-13332
DMribution
No. of
Qlx!29
OFFSITE
2 Alliance to Save Energy1200 18* St. NWSuite 900Washington DC 20036Attm Mark HO#iIIS
Lawrence Berkeley National LaboratoryBuilding Technologies Department1 Cyclotron Road B-90 MS: 1023Berkeley, CA 94720Attm Bill Carroll
National Renewable Energy Laboratory1617 Cole Blvd.Golde% CO 80401-3393AttII: Mary Coh’in
Oak Ridge National LaboratoryPO BOX 2008Building 3147Oak Ridge, TN 37831-6070Attrx Patrick Hughes
U.S. Department of Energy1000 Independence Avenue, SWWashington DC 20585Attn: J. Glicb EE-90, Room 6C-016
U.S. Department of Energy1000 Independence Avenue, SWWashingto~ DC 20585Attru B. Gustafso% EE-92, Room 6B-052
U.S. Department of Energy1000 Independence Avenue, SWWashingto~ DC 20585Attw E. Krevitz, EE-90, Room 6B-033
U.S. Department of Energy1000 Independence Avenue, SWWashingto~ DC 20585Atlm K. McGervey, EE-90 Room 6B-033
No. of
QE@
U.S. Department of Energy1000 Independence Avenue, SWWashingtorL DC 20585Attm T. Muessel, EE-92, Room 6B-052
U.S. Department of Energy1000 Independence Avenue, SWWashington DC 20585Attn: W. Prue, EE-92, Room 6B-052
U.S. Department of Energy1000 Independence Avenue, SWWashingto% DC 20585Am. T. Sadler, EE-90, Room 6B-088
U.S. Department of Energy1000 Independence Avenue, SWWashington DC 20585Attxx B. Shearer, EE-90, Room 6B-052
U.S. Department of EnergyAtlanta Regional Support Office730 Peachtree Street NE, Suite 876Atlanta, GA 30308Attsx Doug Culbreth
U.S. Department of EnergyBoston Regional OffIceJFK Federal Building, Rm 675Boston, MA 02203Amx Paul King
U.S. Department of EnergyChicago Regional Support Office1 South Wacker Drive, Suite 2380Chicago, IL 60606Attu Sharon Gill
U.S. Department of EnergyDenver Regional Office1617 Cole Blvd.Golde~ CO 80401Athx Randy Jones
U.S. Department of EnergyPhiladelphia Regional Support Office1880 JFK Blvd., Suite 501Philadelphia, PA 19102Attn: Bill Klebous
Distr. 1
PNNL-13332
No. of No. of- QE@
U.S. Department of Energy ONSITESeattle Regional Support Office800 Fifth Avenue, Suite 3950 K. Branch BSRCSeattle, WA 98104 D.R Brown (5) K8-07Attm Cheri Sayer J. Dirks (5) K8-17
D. Hunt (20) BWOA. Nicholls BWOW. Sandusky (2) K5-08~ormation Release (7) K1-06
Distr.2