Non-Voluntary Return? The Politics of Return to Afghanistan: The Politics of Return to Afghansitan
Upload
khangminh22Category
view
2download
0

1 | P a g e
Lon
g-Te
rm a
nd
Pen
sio
n S
avin
gs |
Th
e R
eal R
etu
rn |
20
21
Edit
ion
Pension Savings:
The Real Return 2021 Edition
A Research Report by BETTER FINANCE
COORDINATORS
Aleksandra Mączyńska Ján Šebo Ştefan Dragoş Voicu
CONTRIBUTORS
Torben M. Andersen Gregoire Naacke Edoardo Carlucci Dayana Nacheva Laetitia Gabaut Yordanka Popova Johannes Hagen Guillaume Prache Arnaud Houdmont Joanna Rutecka-Góra Matis Joab Dr. Thomas Url Michal Mešťan
REVIEWERS
Ján Šebo Michal Mešťan Ştefan Dragoş Voicu
2 | P a g e
Lon
g-Term an
d P
ensio
n Savin
gs | The R
eal Retu
rn | 2
02
1 Editio
n
DISCLAIMER
This report is an independent research publication, elaborated through the efforts of its independent coordinators, contributors, and reviewers.
The data published in this report stems from publicly available sources (national statistics institutes, regulatory bodies, international organisations etc) which are disclosed throughout the report.
The authors and contributors produce and/or update the contents of this report in good faith, undertaking all efforts to ensure that there are no inaccuracies, mistakes, or factual misrepresentations of the topic covered.
Since the first edition in 2013, and on an ongoing basis, BETTER FINANCE invites all interested parties to submit proposals and/or data wherever they believe that the gathered publicly available data is incomplete or incorrect to the email address [email protected].
3 | P a g e
Lon
g-Te
rm a
nd
Pen
sio
n S
avin
gs |
Th
e R
eal R
etu
rn |
20
21
Edit
ion
Table of Contents
Executive Summary ................................................................................................................. 19
EU Policy Updates .................................................................................................................... 24
General Report ........................................................................................................................ 30
Country Case: Austria .............................................................................................................. 71
Country Case: Belgium ............................................................................................................. 90
Country Case: Bulgaria ............................................................................................................122
Country Case: Croatia .............................................................................................................148
Country Case: Denmark ..........................................................................................................166
Country Case: Estonia .............................................................................................................192
Country Case: France ..............................................................................................................221
Country Case: Germany ..........................................................................................................250
Country Case: Italy ..................................................................................................................275
Country Case: Latvia ...............................................................................................................293
Country Case: Lithuania ..........................................................................................................322
Country Case: Poland ..............................................................................................................344
Country Case: Romania ...........................................................................................................372
Country Case: Slovakia ............................................................................................................394
Country Case: Spain ................................................................................................................417
Country Case: Sweden ............................................................................................................452
Country Case: The Netherlands ...............................................................................................478
4 | P a g e
Lon
g-Term an
d P
ensio
n Savin
gs | The R
eal Retu
rn | 2
02
1 Editio
n
Acronyms
AIF Alternative Investment Fund
AMC Annual Management Charges
AuM Assets under Management
BE Belgium
BG Bulgaria
Bln Billion
BPETR ‘Barclay’s Pan-European High Yield Total Return’ Index
CAC 40 ‘Cotation Assistée en Continu 40’ Index
CMU Capital Markets Union
DAX 30 ‘Deutsche Aktieindex 30’ Index
DB Defined Benefit plan
DC Defined Contribution plan
DE Germany
DG Directorate General of the Commission of the European Union
DK Denmark
DWP United Kingdom’s Governmental Agency Department for Work and Pensions
EBA European Banking Authority
EE Estonia
EEE Exempt-Exempt-Exempt Regime
EET Exempt-Exempt-Tax Regime
ETF Exchange-Traded Fund
EIOPA European Insurance and Occupational Pensions Authority
ES Spain
ESAs European Supervisory Authorities
ESMA European Securities and Markets Authority
EU European Union
EURIBOR Euro InterBank Offered Rate
EX Executive Summary
FR France
FSMA Financial Services and Market Authority (Belgium)
FSUG Financial Services Users Group - European Commission’s Expert Group
FTSE 100 The Financial Times Stock Exchange 100 Index
FW Foreword
GDP Gross Domestic Product
HICP Harmonised Indices of Consumer Prices
5 | P a g e
Lon
g-Te
rm a
nd
Pen
sio
n S
avin
gs |
Th
e R
eal R
etu
rn |
20
21
Edit
ion
IBEX 35 Índice Bursátil Español 35 Index
IKZE ‘Indywidualne konto zabezpieczenia emerytalnego’ – Polish specific Individual pension
savings account
IRA United States specific Individual Retirement Account
IT Italy
JPM J&P Morgan Indices
KIID Key Investor Information Document
LV Latvia
NAV Net Asset Value
Mln Million
MSCI Morgan Stanley Capital International Indices
NL Netherlands
OECD The Organisation for Economic Co-Operation and Development
OFT United Kingdom’s Office for Fair Trading
PAYG Pay-As-You-Go Principle
PIP Italian specific ‘Individual Investment Plan’
PL Poland
PRIIP(s) Packaged Retail and Insurance-Based Investment Products
RO Romania
S&P Standard & Poor Indexes
SE Sweden
SK Slovakia
SME Small and Medium-sized Enterprise
SPIVA
Scorecard
Standard & Poor Dow Jones’ Indices Research Report on Active Management performances
TEE Tax-Exempt-Exempt Regime
TCR/TER Total Cost Ratio/ Total Expense Ratio
UCITS Undertakings for the Collective Investment of Transferable Securities
UK United Kingdom
6 | P a g e
Lon
g-Term an
d P
ensio
n Savin
gs | The R
eal Retu
rn | 2
02
1 Editio
n
Glossary of terms
Accrued benefits* – is the amount of accumulated pension benefits of a pension plan member on
the basis of years of service.
Accumulated assets* – is the total value of assets accumulated in a pension fund.
Active member* – is a pension plan member who is making contributions (and/or on behalf of
whom contributions are being made) and is accumulating assets.
AIF(s) – or Alternative Investment Funds are a form of collective investment funds under E.U. law
that do not require authorization as a UCITS fund.1
Annuity* – is a form of financial contract mostly sold by life insurance companies that guarantees
a fixed or variable payment of income benefit (monthly, quarterly, half-yearly, or yearly) for the life
of a person(s) (the annuitant) or for a specified period of time. It is different than a life insurance
contract which provides income to the beneficiary after the death of the insured. An annuity may
be bought through instalments or as a single lump sum. Benefits may start immediately or at a pre-
defined time in the future or at a specific age.
Annuity rate* – is the present value of a series of payments of unit value per period payable to an
individual that is calculated based on factors such as the mortality of the annuitant and the possible
investment returns.
Asset allocation* – is the act of investing the pension fund’s assets following its investment strategy.
Asset management* – is the act of investing the pension fund’s assets following its investment
strategy.
Asset manager* – is(are) the individual(s) or entity(ies) endowed with the responsibility to
physically invest the pension fund assets. Asset managers may also set out the investment strategy
for a pension fund.
Average earnings scheme* – is a scheme where the pension benefits earned for a year depend on
how much the member’s earnings were for the given year.
Basic state pension* – is a non-earning related pension paid by the State to individuals with a
minimum number of service years.
Basis points (bps) – represent the 100th division of 1%.
Benchmark (financial) – is a referential index for a type of security. Its aim is to show, customized
for a level and geographic or sectorial focus, the general price or performance of the market for a
financial instrument.
1 See Article 4(1) of Directive 2011/61/EU of the European Parliament and of the Council of 8 June 2011 on Alternative Investment Fund Managers and amending Directives 2003/41/EC and 2009/65/EC and Regulations (EC) No 1060/2009 and (EU) No 1095/2010, OJ L 174, 1.7.2011, p. 1–73.
7 | P a g e
Lon
g-Te
rm a
nd
Pen
sio
n S
avin
gs |
Th
e R
eal R
etu
rn |
20
21
Edit
ion
Beneficiary* – is an individual who is entitled to a benefit (including the plan member and
dependants).
Benefit* – is a payment made to a pension fund member (or dependants) after retirement.
Bonds – are instruments that recognize a debt. Although they deliver the same utility as bank loans,
i.e., enabling the temporary transfer of capital from one person to another, with or without a price
(interest) attached, bonds can also be issued by non-financial institutions (States, companies) and
by financial non-banking institutions (asset management companies). In essence, bonds are
considered more stable (the risk of default is lower) and in theory deliver a lower, but fixed, rate of
profit. Nevertheless, Table EX2 of the Executive Summary shows that the aggregated European
Bond Index highly overperformed the equity one.
Closed pension funds* – are the funds that support only pension plans that are limited to certain
employees. (e.g., those of an employer or group of employers).
Collective investment schemes – are financial products characterised by the pooling of funds
(money or asset contributions) of investors and investing the total into different assets (securities)
and managed by a common asset manager. Under E.U. law collective investment schemes are
regulated under 6 different legal forms: UCITS (see below), the most common for individual
investors; AIFs (see above), European Venture Capital funds (EuVECA), European Long-Term
Investment Funds (ELTIFs), European Social Entrepreneurship Funds (ESEF) or Money Market
Funds.2
Contribution* – is a payment made to a pension plan by a plan sponsor or a plan member.
Contribution base* – is the reference salary used to calculate the contribution.
Contribution rate* – is the amount (typically expressed as a percentage of the contribution base)
that is needed to be paid into the pension fund.
Contributory pension scheme* – is a pension scheme where both the employer and the members
have to pay into the scheme.
Custodian* – is the entity responsible, as a minimum, for holding the pension fund assets and for
ensuring their safekeeping.
Deferred member* – is a pension plan member that no longer contributes to or accrues benefits
from the plan but has not yet begun to receive retirement benefits from that plan.
Deferred pension* – is a pension arrangement in which a portion of an employee’s income is paid
out at a date after which that income is actually earned.
Defined benefit (DB) occupational pension plans* – are occupational plans other than defined
contributions plans. DB plans generally can be classified into one of three main types, “traditional”,
“mixed” and “hybrid” plans. These are schemes where “the pension payment is defined as a
percentage of income and employment career. The employee receives a thus pre-defined pension
2 See European Commission, ‘Investment Funds’ (28 August 2019) https://ec.europa.eu/info/business-economy-euro/growth-and-investment/investment-funds_en.
8 | P a g e
Lon
g-Term an
d P
ensio
n Savin
gs | The R
eal Retu
rn | 2
02
1 Editio
n
and does not bear the risk of longevity and the risk of investment. Defined Benefits schemes may
be part of an individual employment contract or collective agreement. Pension contributions are
usually paid by the employee and the employer”.3
“Traditional” DB plan* – is a DB plan where benefits are linked through a formula to the members'
wages or salaries, length of employment, or other factors.
“Hybrid” DB plan* – is a DB plan where benefits depend on a rate of return credited to
contributions, where this rate of return is either specified in the plan rules, independently of the
actual return on any supporting assets (e.g. fixed, indexed to a market benchmark, tied to salary or
profit growth, etc.), or is calculated with reference to the actual return of any supporting assets and
a minimum return guarantee specified in the plan rules.
“Mixed” DB plan* – is a DB plans that has two separate DB and DC components, but which are
treated as part of the same plan.
Defined contribution (DC) occupational pension plans* – are occupational pension plans under
which the plan sponsor pays fixed contributions and has no legal or constructive obligation to pay
further contributions to an ongoing plan in the event of unfavourable plan experience. These are
schemes where “the pension payment depends on the level of defined pension contributions, the
career and the returns on investments. The employee has to bear the risk of longevity and the risk
of investment. Pension contributions can be paid by the employee and/or the employer and/or the
state”.4
Dependency ratio* – are occupational pension plans under which the plan sponsor pays fixed
contributions and has no legal or constructive obligation to pay further contributions to an ongoing
plan in the event of unfavourable plan experience.
Early retirement* – is a situation when an individual decides to retire earlier later and draw the
pension benefits earlier than their normal retirement age.
Economic dependency ratio* – is the division between the number of inactive (dependent)
population and the number of active (independent or contributing) population. It ranges from 0%
to 100% and it indicates how much of the inactive population’s (dependent) consumption is
financed from the active population’s (independent) contributions.5 In general, the inactive
(dependent) population is represented by children, retired persons and persons living on social
benefits.
3 Werner Eichhorst, Maarten Gerard, Michael J. Kendzia, Christine Mayrhruber, Connie Nielsen, Gerhard Runstler, Thomas Url, ‘Pension Systems in the EU: Contingent Liabilities and Assets in the Public and Private Sector’ EP Directorate General for Internal Policies IP/A/ECON/ST/2010-26. 4 Ibid. 5 For more detail on the concept, see Elke Loichinger, Bernhard Hammer, Alexia Prskawetz, Michael Freiberger, Joze Sambt, ‘Economic Dependency Ratios: Present Situation and Future Scenarios’ MS13 Policy Paper on Implications of Population Ageing for Transfer Systems, Working Paper no. 74, 18th December 2014, 3.

9 | P a g e
Lon
g-Te
rm a
nd
Pen
sio
n S
avin
gs |
Th
e R
eal R
etu
rn |
20
21
Edit
ion
EET system* – is a form of taxation of pension plans, whereby contributions are exempt, investment
income and capital gains of the pension fund are also exempt, and benefits are taxed from personal
income taxation.
Equity (or stocks/shares) – are titles of participation to a publicly listed company’s economic
activity. With regards to other categorizations, an equity is also a security, a financial asset or, under
E.U. law, a transferable security.6
ETE system* – is a form of taxation whereby contributions are exempt, investment income and
capital gains of the pension fund are taxed, and benefits are also exempt from personal income
taxation.
ETF(s) – or Exchange-Traded Funds are investment funds that are sold and bought on the market
as an individual security (such as shares, bonds). ETFs are structured financial products, containing
a basket of underlying assets, and are increasingly more used due to the very low management fees
that they entail.
Fund member* – is an individual who is either an active (working or contributing, and hence actively
accumulating assets) or passive (retired, and hence receiving benefits), or deferred (holding
deferred benefits) participant in a pension plan.
Funded pension plans* – are occupational or personal pension plans that accumulate dedicated
assets to cover the plan's liabilities.
Funding ratio (funding level) * – is the relative value of a scheme’s assets and liabilities, usually
expressed as a percentage figure.
Gross rate of return* – is the rate of return of an asset or portfolio over a specified time period,
prior to discounting any fees of commissions.
Gross/net replacement rate – is the ratio between the pre-retirement gross or net income and the
amount of pension received by a person after retirement. The calculation methodology may differ
from source to source as the average working life monthly gross or net income can used to calculate
it (divided by the amount of pension) or the past 5 year’s average gross income etc. (see below
OECD net replacement rate).
Group pension funds* – are multi-employer pension funds that pool the assets of pension plans
established for related employers.
Hedging and hedge funds – while hedging is a complex financial technique (most often using
derivatives) to protect or reduce exposure to risky financial positions or to financial risks (for
instance, currency hedging means reducing exposure to the volatility of a certain currency), a hedge
fund is an investment pool that uses complex and varying investment techniques to generate profit.
Indexation* – is the method with which pension benefits are adjusted to take into account changes
in the cost of living (e.g., prices and/or earnings).
6 Article 4(44) of Directive 2014/65/EU of the European Parliament and of the Council of 15 May 2014 on markets in financial instruments and amending Directive 2002/92/EC and Directive 2011/61/EU, OJ L 173, p. 349–496 (MiFID II).

10 | P a g e
Lon
g-Term an
d P
ensio
n Savin
gs | The R
eal Retu
rn | 2
02
1 Editio
n
Individual pension plans* – is a pension fund that comprises the assets of a single member and
his/her beneficiaries, usually in the form of an individual account.
Industry pension funds* – are funds that pool the assets of pension plans established for unrelated
employers who are involved in the same trade or businesses.
Mandatory contribution* – is the level of contribution the member (or an entity on behalf of the
member) is required to pay according to scheme rules.
Mandatory occupational plans* – Participation in these plans is mandatory for employers.
Employers are obliged by law to participate in a pension plan. Employers must set up (and make
contributions to) occupational pension plans which employees will normally be required to join.
Where employers are obliged to offer an occupational pension plan, but the employees'
membership is on a voluntary basis, these plans are also considered mandatory.
Mandatory personal pension plans* - are personal plans that individuals must join, or which are
eligible to receive mandatory pension contributions. Individuals may be required to make pension
contributions to a pension plan of their choice normally within a certain range of choices or to a
specific pension plan.
Mathematical provisions (insurances) – or mathematical reserves or reserves, are the value of liquid
assets set aside by an insurance company that would be needed to cover all current liabilities
(payment obligations), determined using actuarial principles.
Minimum pension* – is the minimum level of pension benefits the plan pays out in all
circumstances.
Mixed indexation* – is the method with which pension benefits are adjusted taking into account
changes in both wages and prices.
Money market instruments – are short-term financial products or positions (contracts) that are
characterized by the very high liquidity rate, such as deposits, short-term loans, repo-agreements
and so on.
MTF – multilateral trading facility, is the term used by the revised Markets in Financial Instruments
Directive (MiFID II) to designate securities exchanges that are not a regulated market (such as the
London Stock Exchange, for example).
Multi-employer pension funds* – are funds that pool the assets of pension plans established by
various plan sponsors. There are three types of multi-employer pension funds:
a) for related employers i.e., companies that are financially connected or owned by a
single holding group (group pension funds);
b) for unrelated employers who are involved in the same trade or business (industry
pension funds);
c) for unrelated employers that may be in different trades or businesses (collective
pension funds).
11 | P a g e
Lon
g-Te
rm a
nd
Pen
sio
n S
avin
gs |
Th
e R
eal R
etu
rn |
20
21
Edit
ion
Money-Weighted Returns (MWR) - also referred to as the internal rate of return, is a measurement
of performance that takes into account cash flows (contributions) when calculating returns.
NAV – Net Asset Value, or the amount to which the market capitalisation of a financial product (for
this report, pension funds’ or insurance funds’ holdings) or a share/unit of it arises at a given point.
In general, the Net Asset Value is calculated per unit or share of a collective investment scheme
using the daily closing market prices for each type of security in the portfolio.
Net rate of return* – is the rate of return of an asset or portfolio over a specified time period, after
discounting any fees of commissions.
Normal retirement age* – is the age from which the individual is eligible for pension benefits.
Non-contributory pension scheme* – is a pension scheme where the members do not have to pay
into scheme.
Occupational pension plans* – access to such plans is linked to an employment or professional
relationship between the plan member and the entity that establishes the plan (the plan sponsor).
Occupational plans may be established by employers or groups of thereof (e.g., industry
associations) and labour or professional associations, jointly or separately. The plan may be
administrated directly by the plan sponsor or by an independent entity (a pension fund or a financial
institution acting as pension provider). In the latter case, the plan sponsor may still have oversight
responsibilities over the operation of the plan.
Eurostat aggregate replacement rate for pensions refers to median individual pension income of
population aged 65-74 relative to median individual earnings from work of population aged 50-59,
excluding other social benefits.
Old-age dependency ratio - defined as the ratio between the total number of elderly persons when
they are generally economically inactive (aged 65 and above) and the number of persons of working
age.7 It is a sub-indicator of the economic dependency ratio and focuses on a country’s public (state)
pension system’s reliance on the economically active population’s pensions (or social security)
contributions. It is a useful indicator to show whether a public (Pillar I) pension scheme is under
pressure (when the ratio is high, or the number of retirees and the number of workers tend to be
proportionate) or relaxed (when the ratio is low, or the number of retirees and the number of
workers tend to be disproportionate). For example, a low old-age dependency ratio is 20%, meaning
that 5 working people contribute for one retiree’s pension.
Open pension funds* – are funds that support at least one plan with no restriction on membership.
Pension assets* – are all forms of investment with a value associated to a pension plan.
Pension fund administrator* – is(are) the individual(s) ultimately responsible for the operation and
oversight of the pension fud.
Pension fund governance* – is the operation and oversight of a pension fund. The governing body
is responsible for administration, but may employ other specialists, such as actuaries, custodians,
7 See Eurostat definition: http://ec.europa.eu/eurostat/web/products-datasets/product?code=tsdde511.

12 | P a g e
Lon
g-Term an
d P
ensio
n Savin
gs | The R
eal Retu
rn | 2
02
1 Editio
n
consultants, asset managers and advisers to carry out specific operational tasks or to advise the
plan administration or governing body.
Pension fund managing company* – is a type of administrator in the form of a company whose
exclusive activity is the administration of pension funds.
Pension funds* – the pool of assets forming an independent legal entity that are bought with the
contributions to a pension plan for the exclusive purpose of financing pension plan benefits. The
plan/fund members have a legal or beneficial right or some other contractual claim against the
assets of the pension fund. Pension funds take the form of either a special purpose entity with legal
personality (such as a trust, foundation, or corporate entity) or a legally separated fund without
legal personality managed by a dedicated provider (pension fund management company) or other
financial institution on behalf of the plan/fund members.
Pension insurance contracts* – are insurance contracts that specify pension plans contributions to
an insurance undertaking in exchange for which the pension plan benefits will be paid when the
members reach a specified retirement age or on earlier exit of members from the plan. Most
countries limit the integration of pension plans only into pension funds, as the financial vehicle of
the pension plan. Other countries also consider the pension insurance contract as the financial
vehicle for pension plans.
Pension plan* – is a legally binding contract having an explicit retirement objective (or – in order to
satisfy tax-related conditions or contract provisions – the benefits cannot be paid at all or without
a significant penalty unless the beneficiary is older than a legally defined retirement age). This
contract may be part of a broader employment contract, it may be set forth in the plan rules or
documents, or it may be required by law. In addition to having an explicit retirement objective,
pension plans may offer additional benefits, such as disability, sickness, and survivors’ benefits.
Pension plan sponsor* – is an institution (e.g., company, industry/employment association) that
designs, negotiates, and normally helps to administer an occupational pension plan for its
employees or members.
Pension regulator* – is a governmental authority with competence over the regulation of pension
systems.
Pension supervisor* – is a governmental authority with competence over the supervision of pension
systems.
Personal pension plans* - Access to these plans does not have to be linked to an employment
relationship. The plans are established and administered directly by a pension fund or a financial
institution acting as pension provider without any intervention of employers. Individuals
independently purchase and select material aspects of the arrangements. The employer may
nonetheless make contributions to personal pension plans. Some personal plans may have
restricted membership.
Private pension funds* – is a pension fund that is regulated under private sector law.
13 | P a g e
Lon
g-Te
rm a
nd
Pen
sio
n S
avin
gs |
Th
e R
eal R
etu
rn |
20
21
Edit
ion
Private pension plans* – is a pension plan administered by an institution other than general
government. Private pension plans may be administered directly by a private sector employer
acting as the plan sponsor, a private pension fund or a private sector provider. Private pension plans
may complement or substitute for public pension plans. In some countries, these may include plans
for public sector workers.
Public pension plans* – are pensions funds that are regulated under public sector law.
Public pension plans* – are the social security and similar statutory programmes administered by
the general government (that is central, state, and local governments, as well as other public sector
bodies such as social security institutions). Public pension plans have been traditionally PAYG
financed, but some OECD countries have partial funding of public pension liabilities or have
replaced these plans by private pension plans.
Rate of return* – is the income earned by holding an asset over a specified period.
REIT(s) or Real Estate Investment Trust(s) is the most common acronym and terminology used to
designate special purpose investment vehicles (in short, companies) set up to invest and
commercialise immovable goods (real estate) or derived assets. Although the term comes from the
U.S. legislation, in the E.U. there are many forms of REITs, depending on the country since the REIT
regime is not harmonised at E.U. level.
Replacement ratio* – is the ratio of an individual’s (or a given population’s) (average) pension in a
given time period and the (average) income in a given time period.
Service period* – is the length of time an individual has earned rights to a pension benefit.
Single employer pension funds* – are funds that pool the assets of pension plans established by a
single sponsor.
Summary Risk Reward Indicator - a measurement developed by the European Securities and
Markets Authority (former CESR) to be included in the Key Investor Information Document (KIID)
for UCITS (undertakings for collective investment in transferable securities) to reflect the risk profile
of a certain fund.
Supervisory board* – is(are) the individual(s) responsible for monitoring the governing body of a
pension entity.
System dependency ratio* – typically defined as the ratio of those receiving pension benefits to
those accruing pension rights.
TEE system* – is a form of taxation of pension plans whereby contributions are taxed, investment
income and capital gains of the pension fund are exempt, and benefits are also exempt from
personal income taxation.
Time-Weighted Returns (TWR) - is the standard method of calculating returns (and performance)
of an investment and simply represents the growth/decrease in value without incorporating the
distorting effects of cash inflows and outflows (for pensions, that means contributions and
Trust* – is a legal scheme, whereby named people (termed trustees) hold property on behalf of
other people (termed beneficiaries).
14 | P a g e
Lon
g-Term an
d P
ensio
n Savin
gs | The R
eal Retu
rn | 2
02
1 Editio
n
Trustee* – is a legal scheme, whereby named people (termed trustees) hold property on behalf of
other people (termed beneficiaries).
UCITS – or Undertakings for Collective Investment in Transferable Securities, is the legal form under
E.U. law for mutual investment funds that are open to pool and invest funds from any individual or
institutional investor, and are subject to specific authorisation criteria, investment limits and rules.
The advantage of UCITS is the general principle of home-state authorisation and mutual recognition
that applies to this kind of financial products, meaning that a UCITS fund established and authorised
in one E.U. Member State can be freely distributed in any other Member State without any further
formalities (also called E.U. fund passporting).
Unfunded pension plans* – are plans that are financed directly from contributions from the plan
sponsor or provider and/or the plan participant. Unfunded pension plans are said to be paid on a
current disbursement method (also known as the pay as you go, PAYG, method). Unfunded plans
may still have associated reserves to cover immediate expenses or smooth contributions within
given time periods. Most OECD countries do not allow unfunded private pension plans.
Unprotected pension plan* – is a plan (personal pension plan or occupational defined contribution
pension plan) where the pension plan/fund itself or the pension provider does not offer any
investment return or benefit guarantees or promises covering the whole plan/fund.
Voluntary contribution – is an extra contribution paid in addition to the mandatory contribution a
member can pay to the pension fund in order to increase the future pension benefits.
Voluntary occupational pension plans - The establishment of these plans is voluntary for employers
(including those in which there is automatic enrolment as part of an employment contract or where
the law requires employees to join plans set up on a voluntary basis by their employers). In some
countries, employers can on a voluntary basis establish occupational plans that provide benefits
that replace at least partly those of the social security system. These plans are classified as
voluntary, even though employers must continue sponsoring these plans in order to be exempted
(at least partly) from social security contributions.
Voluntary personal pension plans* – Participation in these plans is voluntary for individuals. By law
individuals are not obliged to participate in a pension plan. They are not required to make pension
contributions to a pension plan. Voluntary personal plans include those plans that individuals must
join if they choose to replace part of their social security benefits with those from personal pension
plans.
Wage indexation* – is the method with which pension benefits are adjusted taking into account
changes in wages.
Waiting period* – is the length of time an individual must be employed by a particular employer
before joining the employer’s pension scheme.
Winding-up* – is the termination of a pension scheme by either providing (deferred) annuities for
all members or by moving all its assets and liabilities into another scheme.
15 | P a g e
Lon
g-Te
rm a
nd
Pen
sio
n S
avin
gs |
Th
e R
eal R
etu
rn |
20
21
Edit
ion
World Bank multi-pillar model – is the recommended design, developed by the World Bank in 1994,
for States that had pension systems inadequately equipped to (currently and forthcoming) sustain
a post-retirement income stream for future pensioners and alleviate the old-age poverty risk.
Simpler, it is a set of guidelines for States to either enact, reform or gather legislation regulating the
state pension and other forms of retirement provisions in a form that would allow an increased
workers’ participation, enhance efficiency for pension savings products and a better allocation of
resources under the principle of solidarity between generations.
The standard design of a robust pension system would rely on five pillars:
a) the non-contributory scheme (pillar 0), through which persons who do not have an income
or do not earn enough would have insured a minimum pension when reaching the
standard retirement age;
b) the public mandatory, Pay-As-You-Go (PAYG) scheme (Pillar I), gathering and redistributing
pension contributions from the working population to the retirees, while accumulating
pension rights (entitlements) for the future retirees;
c) the mandatory funded and (recommended) privately managed scheme (Pillar II), where
workers’ contributions are directed to their own accumulation accounts in privately
managed investment products;
d) the voluntary privately managed retirement products (Pillar III), composed of pension
savings products to which subscription is universal, contributions and investments are
deregulated and tax-incentivised;
e) the non-financial alternative aid scheme (pillar IV), through which the state can offer
different forms of retirement support – such as housing or family support. Albeit the
abovementioned, the report focuses on the “main pillars”, i.e., Pillar I, II and III, since they
are the most significant (and present everywhere) in the countries that have adopted the
multi-pillar model.
Definitions with “*” are taken from OECD’s Pensions Glossary -
http://www.oecd.org/daf/fin/private-pensions/38356329.pdf.
16 | P a g e
Lon
g-Term an
d P
ensio
n Savin
gs | The R
eal Retu
rn | 2
02
1 Editio
n
Contributors Edoardo Carlucci is Research and Policy Officer at Better Finance. He obtained a bachelor’s degree
in Economics, Finance and Management with Law at Sapienza University of Rome. In 2014, he
graduated from the ULB University with a master’s degree in European Studies with Economic
Specialization. He previously worked in the European Institutions and Civil Society Organizations
dealing with various aspects of economic issues and policies such as EU Internal Market, EU
Competition Policies, Public Procurement and SMEs.
Laetitia Gabaut is an economist who graduated from the Toulouse School of Economics. She joined
the European Savings Institute in 2010, where she is in charge of the “Overview of Savings”
publication. She has been involved in European projects related to savers’ behaviour and to
retirement savings.
Yordanka Popova, CFC, is a lifestyle financial advisor who helps people articulate and achieve their
goals. She is member of the Institute of Financial Consultants and is registered as Investment
Advisor by FSC in Bulgaria. Additionally, Yordanka is a junior lecturer in Finance at Sofia University.
Dayana Nacheva is an independent financial planner and a member of the Institute of Certified
Financial Consultants (ICFC) in Bulgaria. She also works as a freelance researcher and author of
articles on personal finance.
Dr. Torben M. Andersen Torben M. Andersen, Professor Aarhus University and associate research
fellow at CEPR, CESifo, IZA and PeRCent. Main research interests: Economics of the welfare state,
labour economics, public economics and pension economics. Has published on these topics in well-
known international journals and books. Has been extensively involved in policy advice in Denmark,
the Nordic countries, OECD, EU Commission and various other contexts. Is member of various
boards, and chairman of the Board of Directors, the Danish Pension Fund ATP.
Johannes Hagen is an Assistant Professor in Economics at Jönköping International Business School
in Sweden. He graduated from Uppsala University in 2016 and conducts research primarily within
the field of public finance with a special interest in retirement behaviour and pensions.
Arnaud Houdmont is Chief Communications Officer at BETTER FINANCE. Prior to his career in
communications and research in the heart of Europe, he earned a master’s degree in Global
Communication from Goldsmith’s College and a bachelor’s degree in international relations from
Sussex University.
Matis Joab, is the Finance Officer at Better Finance. He has a bachelor’s degree in Applied
Economics and a master’s degree in Management from Tallinn University of Technology. After
working 6 years in the private sector in Estonia, mostly in Real Estate, he moved to Brussels to
become Financial Director of the European Students’ Forum (AEGEE), before joining Better Finance
at the beginning of 2020.
17 | P a g e
Lon
g-Te
rm a
nd
Pen
sio
n S
avin
gs |
Th
e R
eal R
etu
rn |
20
21
Edit
ion
Aleksandra Mączyńska is the Executive Director of BETTER FINANCE. She is a member of the EC
Financial Services User Group (FSUG), the Consumer Policy Advisory Group (CPAG), member or the
EU Ecolabelling Board and vice-chair of the EIOPA’s Occupational Pensions Stakeholder Group
(OPSG). Previously she worked for the Polish consumer and competition watchdog and was an
expert on various EU Council Working Parties such as the WP on Financial Services and the WP on
Competition.
Michal Mešťan is a Vice-Dean for Development and an Assistant Professor at the Faculty of
Economics Matej Bel University in Banská Bystrica. He is also a founder of Talent and Research
Centre at the same university. He is a member of the CFA Society Slovakia as a director of University
Relations. He holds a doctoral degree (PhD.) In Finance and focuses on financial engineering,
pension and individual asset-liability management models. Professionally, he builds robo-advice
models oriented on long-term investing.
Grégoire Naacke is Managing Partner at IEM Finance and was appointed in June 2018 as Executive
Director of the Observatoire de l’Epargne Européenne (OEE) by the Chairman Jacques de
LAROSIÈRE and the members. Before his appointment as Executive Director, Grégoire has already
worked for the OEE as Economist for eight years (2002-2010). Grégoire also worked for the World
Federation of Exchanges (WFE) as Economist (2011-2015) and Head of Operations (2015-2018). In
2008, Grégoire was a Scientific Advisor for the Centre d’Analyse Stratégique, now France Stratégie
(the French Prime Minister’s research department). Grégoire graduated with honours from the
Postgraduate Research Master “Money Banking and Finance” at the Panthéon-Sorbonne Paris
University (Paris I) and completed his thesis (“The Households’ Financial Wealth”) under the
supervision of Professor Christian de BOISSIEU.
Guillaume Prache is the Managing Director of BETTER FINANCE. He is a member of the EIOPA
(European Insurance and Occupational Pensions Authority) Insurance and Reinsurance Stakeholder
Group (IRSG), and member and former chair of the ESMA (European Securities & Markets
Authority) Securities and Markets Stakeholder Group.
Joanna Rutecka-Góra is associate professor at the Warsaw School of Economics where she conducts
research on old-age pension systems, insurance markets and consumer protection on financial
markets. She cooperated with the Polish Financial Ombudsman and was an advisor to the President
of the Polish Chamber of Pension Funds. She is an active member of the Polish Association of Social
Policy, the Polish Pension Group SGH and the European Network for Research on Supplementary
Pensions.
Ján Šebo is Vice-Dean at Matej Bel University in Slovakia and Consultant at the Institute of Savings
and Investment. He is a member of the Financial Services User Group of the European Commission
and of the European Insurance and Occupational Pensions Authority’s Occupational Pensions
Stakeholder Group. He focuses on pension systems’ research and professionally consults on the
design and implementation of private pension schemes.
18 | P a g e
Lon
g-Term an
d P
ensio
n Savin
gs | The R
eal Retu
rn | 2
02
1 Editio
n
Dr. Thomas Url is an economist at the Austrian Institute of Economic Research (WIFO) and lecturer
at the University of Vienna. He graduated at the University of Graz and attended the post graduate
course in economics at the Institute for Advanced Studies (Vienna). His main research areas are
risk management and funded pension systems, European monetary and economic union as well as
various topics in applied econometrics.
Ştefan Dragoş Voicu is Senior Research & Policy Officer at BETTER FINANCE, having a thorough
background in Romanian and EU law. He specialises in Financial Services Regulation and Capital
Markets Research, with a focus on packaged investment products (mutual funds and insurances),
retirement provision and market infrastructure. He coordinates four BETTER FINANCE Working
Groups on Pensions, Insurances, Packaged Investments and Audit & Reporting.
.
19 | P a g e
Lon
g-Te
rm a
nd
Pen
sio
n S
avin
gs |
Th
e R
eal R
etu
rn |
20
21
Edit
ion
Pension Savings: The Real Return 2021 Edition
Executive Summary
With the two of three worst financial meltdowns of the past hundred years occurring in
the past 12 years, can our societies rely on financial markets to deliver decent
retirement outcomes for millions around the world?”8
Despite improvements, real returns of pension savings still struggle to
deliver value for money
How much did pension savers earn on average?
The main question this report seeks to answer is: How much was the pension saver left with, on
average, after charges and inflation were deducted from his benefits at the end of different periods,
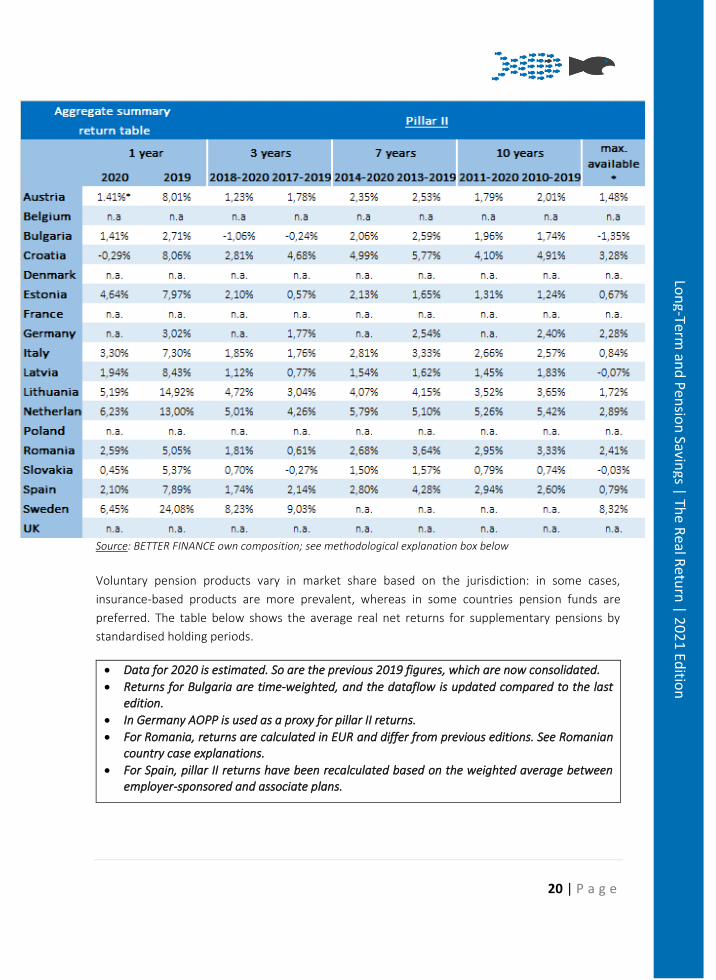
compared to the amounts he saved? The aggregate summary return tables show – for
occupational/collective (“Pillar II”) and voluntary/individual (“Pillar III”) pension products - the
annual average rate of return on investments in each country based on 5 periods: 1, 3, 7, 10 years
and since the start of the available reporting period (differs case by case). These standardised
periods eliminate inception and market timing biases, allowing to “purely” compare performances
between different pension schemes.
8 Amin Rajan (Crate Research), ‘Coronavirus Crisis Inflicts a Double Blow to Pensions’ (FT.com, 15 April 2020) available at: https://www.ft.com/content/bd878891-4f20-46c3-ab23-939162a85d9c.
20 | P a g e
Lon
g-Term an
d P
ensio
n Savin
gs | The R
eal Retu
rn | 2
02
1 Editio
n
Source: BETTER FINANCE own composition; see methodological explanation box below
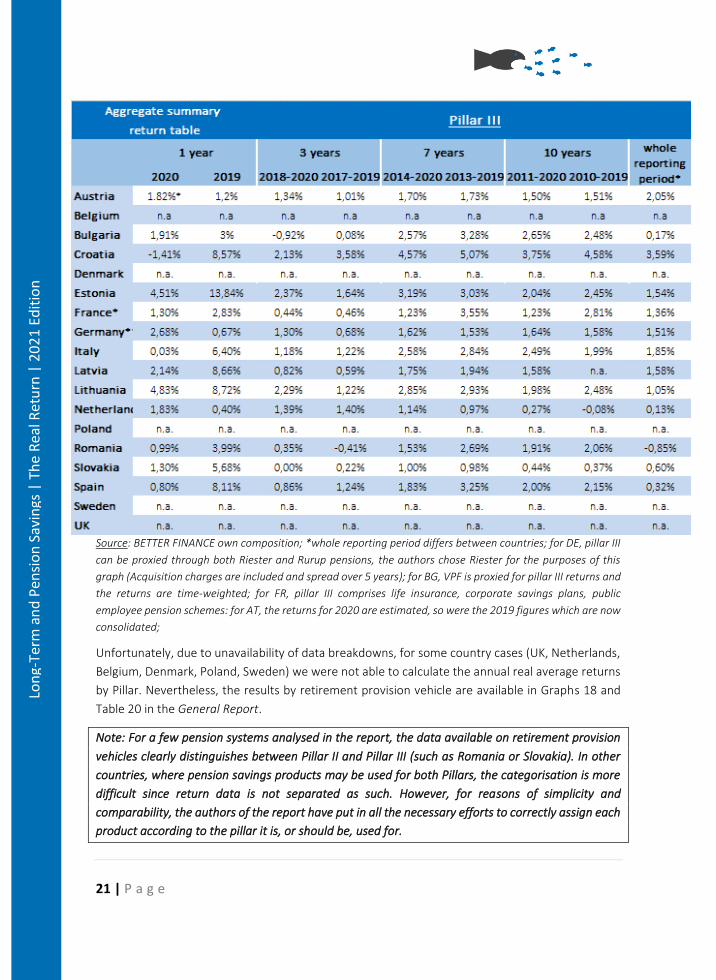
Voluntary pension products vary in market share based on the jurisdiction: in some cases,
insurance-based products are more prevalent, whereas in some countries pension funds are
preferred. The table below shows the average real net returns for supplementary pensions by
standardised holding periods.
• Data for 2020 is estimated. So are the previous 2019 figures, which are now consolidated.
• Returns for Bulgaria are time-weighted, and the dataflow is updated compared to the last edition.
• In Germany AOPP is used as a proxy for pillar II returns.
• For Romania, returns are calculated in EUR and differ from previous editions. See Romanian country case explanations.
• For Spain, pillar II returns have been recalculated based on the weighted average between employer-sponsored and associate plans.
21 | P a g e
Lon
g-Te
rm a
nd
Pen
sio
n S
avin
gs |
Th
e R
eal R
etu
rn |
20
21
Edit
ion
Source: BETTER FINANCE own composition; *whole reporting period differs between countries; for DE, pillar III
can be proxied through both Riester and Rurup pensions, the authors chose Riester for the purposes of this
graph (Acquisition charges are included and spread over 5 years); for BG, VPF is proxied for pillar III returns and
the returns are time-weighted; for FR, pillar III comprises life insurance, corporate savings plans, public
employee pension schemes: for AT, the returns for 2020 are estimated, so were the 2019 figures which are now
consolidated;
Unfortunately, due to unavailability of data breakdowns, for some country cases (UK, Netherlands,
Belgium, Denmark, Poland, Sweden) we were not able to calculate the annual real average returns
by Pillar. Nevertheless, the results by retirement provision vehicle are available in Graphs 18 and
Table 20 in the General Report.
Note: For a few pension systems analysed in the report, the data available on retirement provision
vehicles clearly distinguishes between Pillar II and Pillar III (such as Romania or Slovakia). In other
countries, where pension savings products may be used for both Pillars, the categorisation is more
difficult since return data is not separated as such. However, for reasons of simplicity and
comparability, the authors of the report have put in all the necessary efforts to correctly assign each
product according to the pillar it is, or should be, used for.
22 | P a g e
Lon
g-Term an
d P
ensio
n Savin
gs | The R
eal Retu
rn | 2
02
1 Editio
n
Taxation
What happens to investment returns after charges and inflation are deducted?
Charges, investment strategies and inflation influence earnings, but the actual sum the pension
saver will be able to withdraw and spend at retirement will depend on the taxation regime. In other
words, when and how much do savers lose of their pensions due to taxes?
The actual taxation rates (in %) are highlighted in Table GR10 and in the Taxes sub-section of each
individual country case. However, the purpose of the “pillar”-system is to stimulate pension savings
by giving tax incentives (exemptions, lower taxes, deductibility, subsidises etc).
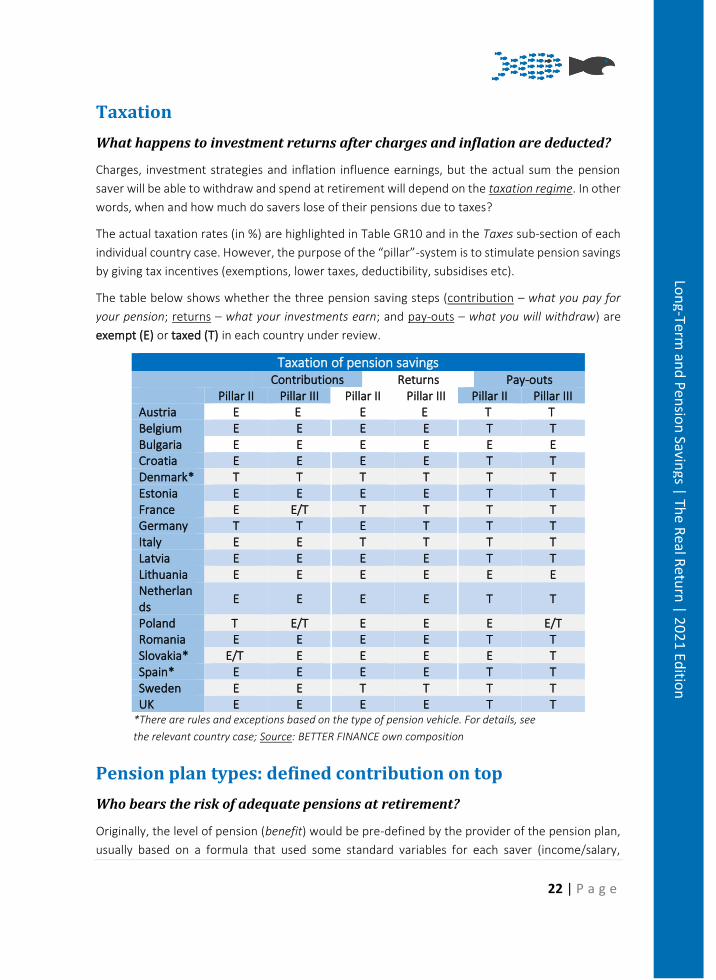
The table below shows whether the three pension saving steps (contribution – what you pay for
your pension; returns – what your investments earn; and pay-outs – what you will withdraw) are
exempt (E) or taxed (T) in each country under review.
Taxation of pension savings Contributions Returns Pay-outs Pillar II Pillar III Pillar II Pillar III Pillar II Pillar III Austria E E E E T T Belgium E E E E T T Bulgaria E E E E E E Croatia E E E E T T Denmark* T T T T T T Estonia E E E E T T France E E/T T T T T Germany T T E T T T Italy E E T T T T Latvia E E E E T T Lithuania E E E E E E Netherlands
E E E E T T
Poland T E/T E E E E/T Romania E E E E T T Slovakia* E/T E E E E T Spain* E E E E T T Sweden E E T T T T UK E E E E T T
*There are rules and exceptions based on the type of pension vehicle. For details, see
the relevant country case; Source: BETTER FINANCE own composition
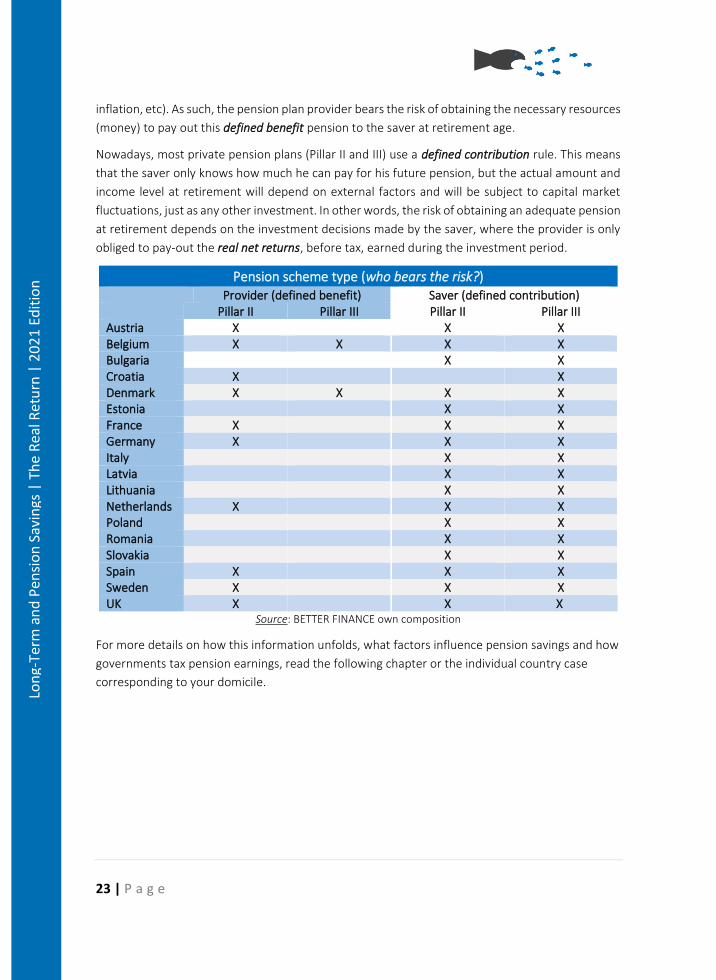
Pension plan types: defined contribution on top
Who bears the risk of adequate pensions at retirement?
Originally, the level of pension (benefit) would be pre-defined by the provider of the pension plan,
usually based on a formula that used some standard variables for each saver (income/salary,
23 | P a g e
Lon
g-Te
rm a
nd
Pen
sio
n S
avin
gs |
Th
e R
eal R
etu
rn |
20
21
Edit
ion
inflation, etc). As such, the pension plan provider bears the risk of obtaining the necessary resources
(money) to pay out this defined benefit pension to the saver at retirement age.
Nowadays, most private pension plans (Pillar II and III) use a defined contribution rule. This means
that the saver only knows how much he can pay for his future pension, but the actual amount and
income level at retirement will depend on external factors and will be subject to capital market
fluctuations, just as any other investment. In other words, the risk of obtaining an adequate pension
at retirement depends on the investment decisions made by the saver, where the provider is only
obliged to pay-out the real net returns, before tax, earned during the investment period.
Pension scheme type (who bears the risk?) Provider (defined benefit) Saver (defined contribution) Pillar II Pillar III Pillar II Pillar III Austria X X X Belgium X X X X Bulgaria X X Croatia X X Denmark X X X X Estonia X X France X X X Germany X X X Italy X X Latvia X X Lithuania X X Netherlands X X X Poland X X Romania X X Slovakia X X Spain X X X Sweden X X X UK X X X
Source: BETTER FINANCE own composition
For more details on how this information unfolds, what factors influence pension savings and how
governments tax pension earnings, read the following chapter or the individual country case
corresponding to your domicile.
24 | P a g e
Lon
g-Te
rm a
nd
Pen
sio
n S
avin
gs |
Th
e R
eal R
etu
rn |
20
21
Edit
ion
Pension Savings: The Real Return 2021 Edition
EU Policy Updates
The High-Level Forum on the Future of the Capital Markets Union9 made three important
recommendations10 for the European Commission to pursue in the area of pensions, to which
BETTER FINANCE contributed and fully supported:
• establishing national pension dashboards, which are systems of indicators for EU Member States
“to monitor the state of play in Member States and, where applicable, the progress achieved by
Member States with regard to pension sustainability and pension adequacy”;
• establishing individual pension tracking systems, which would be platforms where EU citizens
can see all their pensions data (State pension and private pension vehicles) with the purpose of
providing “an overview and an estimate of the future retirement income from different sources”;
• supporting EU Member States in establishing auto-enrolment in occupational pension schemes,
which would mean that workers would by default contribute to a pension plan, with the
possibility to opt-out (stop contributions) at no cost.
The European Commission (EC) and European Insurance and Occupational Pensions Authority
(EIOPA) followed-up on these proposals and have started work towards their implementation. The
EC formally initiated the process by mandating EIOPA to gather evidence, data, and technical
recommendations on the first two actions while also commissioning a study from a consortium of
consultants on best practices in auto-enrolment systems. Consequently, EIOPA published two
public consultations requesting:
• technical advice on the development of pension dashboards and the collection of pensions data, which is meant to gather input from stakeholders on where and how to aggregate the necessary information – and what indicators to use – to set up and update the pension dashboards;
• technical advice on pension tracking services, which is meant to collect views from stakeholders on what types of investment products will be aggregated in the tracking service, what and how the estimations of the retirement pot will be made, etc.
BETTER FINANCE, together with the experts that collaborate with the writing of this report, will leverage the long-term experience accumulated through the efforts of publishing this report since 2013 and will provide EIOPA with technical advice on both topics.
9 A group of experts from EU public authorities, industry, and consumer associations established by the European Commission between November 2019 and May 2020 to brainstorm and make recommendations to improve the regulation and supervision of EU capital markets and create better conditions to invest for EU citizens; see https://ec.europa.eu/info/publications/cmu-high-level-forum_en. 10 See the Final Report here: https://ec.europa.eu/info/sites/default/files/business_economy_euro/growth_and_investment/documents/200610-cmu-high-level-forum-final-report_en.pdf, Recommendation 11, page 85.
25 | P a g e
Lon
g-Te
rm a
nd
Pen
sio
n S
avin
gs |
Th
e R
eal R
etu
rn |
20
21
Edit
ion
Pension Savings: The Real Return 2021 Edition
Value for Money for Long-term and Pension Savings
For too many editions in a row (since 2013), BETTER FINANCE’s annual report on the real returns of
long-term and pension savings finds, in many EU jurisdictions, poorly performing retirement saving
vehicles (whether pension funds, products, or life-insurances used for pension provision) once fees
and inflation are deducted. With a few notable exceptions, such as occupational pension funds in
the Netherlands or the AP7 Safa fund in Sweden, the majority of products barely cover for inflation
and only a handful come close to a simple, broad capital markets benchmark (50% equity and 50%
bonds). Unfortunately, there is also a share – quite high – of products that deliver negative returns,
which means that, in hindsight, keeping savings “under the mattress” would have been a more
profitable solution.
Considering the impact on economic output generated by the global health pandemic, the strains
on public pension systems, the current low interest rate environment, and the shift from defined-
benefit to defined-contribution pensions, addressing the pensions time-bomb is long overdue.11
While there is no silver bullet to rectify poor pension returns, BETTER FINANCE formulates a set of
proposals to define value for money for retirement provision investments.
BETTER FINANCE already initiated the debate on value for money for retail investment products in
November 2019, when it released the joint BETTER FINANCE-CFA Institute report on Sustainable
Value for Money.12 The report, gathering the views of investment professionals and retail investors,
found, among others, that the duty of care (to act in the best interests of clients) should be
mandatory for finance professionals and that consumers should be presented with simple and
standardised information on cost and past performance.
Moreover, an earlier (2016) report by the CFA Institute found that retail investors have high
expectations for finance professionals to generate similar or better returns than those of the
benchmark, and that the charges and fees paid must reflect the value of the relationship, but with
a level of satisfaction much lower in both regards.13
In 2021, the European Insurance and Occupational Pensions Authority (EIOPA) launched a public
consultation aimed at gathering stakeholders’ views on the proposed framework to assess value for
11 See BETTER FINANCE’s Press Release of 29 November 2017 “BETTER FINANCE Applauds EU Proposal for a Pan-European Personal Pension (PEPP) to Defuse the Ticking Pensions Time Bomb”, available at: https://betterfinance.eu/wp-content/uploads/publications/PR-_PEPP_INITIATIVE_19072017_01.pdf. 12 BETTER FINANCE-CFA Institute Report, Sustainable Value for Money (2019), p. 6, available at: https://betterfinance.eu/wp-content/uploads/BETTER-FINANCE-CFA-Institute-Report-on-SUSTAINABLE-VALUE-FOR-MONEY-201119_correct.pdf. 13 CFA Institute, From Trust to Loyalty: A Global Survey of What Investors Want, (2016), p. 14. , available at: https://www.cfainstitute.org/-/media/documents/survey/from-trust-to-loyalty.ashx.
26 | P a g e
Lon
g-Te
rm a
nd
Pen
sio
n S
avin
gs |
Th
e R
eal R
etu
rn |
20
21
Edit
ion
money for unit-linked insurance-based investment products.14 According to EIOPA, value for money
would mean that “the costs and charges are proportionate to the benefits (i.e., investment
performance, guarantees, coverage and services) to the identified target market and reasonable
taking into account the expenses born by providers and in comparison to other comparable retail
solutions on the market”.15 EIOPA’s definition sets a very important milestone as it builds the
concept of value for money (VfM) around cost and performance but, very important, not in a
vacuum: what retail investors pay for their investments must be comparably better compensated
through returns and other product features than other options on the market. On this occasion,
BETTER FINANCE put forward several proposals to improve on EIOPA’s definition, namely:
• while comparability with “other solutions on the market” is a step in the right direction, in
many cases the entire peer-group of a product may be poorly performing – as is already
the case – which may still leave investors with undesirable outcomes; thus, BETTER
FINANCE proposed to replace “other solutions on the market” with the market index
benchmark, i.e., the underlying investments;
• a product’s purpose (objective and investment policy) must be aligned with the concept
of value for money;
• the products’ costs must be reviewed regularly.
At the same time, inspiration can also be drawn from the practice of the UK Financial Conduct
Authority (FCA), which spearheaded (and continues to) retail investor protection in Europe. To
begin with, the UK was the first country in Europe to ban commissions, kickbacks, retrocessions
(collectively, “inducements”) for retail investment services and products. Besides creating a conflict
of interests, inducements also increase the cost of investing, which further erodes net returns.16
Second, the UK FCA issued a handbook (guidance) for fund managers on how to evaluate and report
to clients the value their investment services deliver for the money they are paid. The guidance
highlights that fund managers should assess the value of services in light of costs (in general and
comparing classes of units), comparable market rates, the quality of the service (also in comparison
14 The framework takes the form of a supervisory convergence mechanism under the tools of EIOPA and it would be ultimately addressed to national insurance supervisors when evaluation the provision of insurance-based investment products to retail investors. 15 See the EIOPA Consultation Paper on Addresing Value for Money risk in the European unit-linked market, available at: https://www.eiopa.europa.eu/document-library/consultation/consultation-framework-address-value-money-risk-european-unit-linked_en. 16 See the BETTER FINANCE Report on the Correlation between Cost and Performance in eu Equity Retail Funds, where we analysed active funds' ability to outperform the market and the impact of fees on mutual fund performance, finding that “the more you pay, the less you get” - https://betterfinance.eu/wp-content/uploads/BETTER1.pdf. See also the ESMA Annual Statistical Report Cost and Performance (latest the 2021 edition), highlighting that passive equity funds and UCITS ETFs (which are much cheaper) overperform the more expensive actively managed ones – https://www.esma.europa.eu/sites/default/files/library/esma_50-165-1710_asr_performance_and_costs_of_eu_retail_investment_products.pdf; see also the ESMA Annual Statistical Report on Cost and Performance of 2020, highlighting that more expensive, actively managed funds impact returns and underperform not only their passive and index-tracking peers, but also the benchmark - to passive and ETFs UCITS, ultimately impacting performance" - https://www.esma.europa.eu/sites/default/files/library/esma50-165-1106-asr-performance_and_costs.pdf.
27 | P a g e
Lon
g-Te
rm a
nd
Pen
sio
n S
avin
gs |
Th
e R
eal R
etu
rn |
20
21
Edit
ion
with other services), and performance. The performance must be “considered over an appropriate
timescale having regard to the scheme’s investment objectives, policy and strategy”.17
Recently, the FCA furthered their efforts in driving value for money in retail investment products by
issuing a policy statement on assessing value for money in workplace pension schemes and pathway
investments.18 The FCA highlights that managers19 of occupational pension funds must take into
account three key elements in assessing whether they deliver value for money or not:
• costs and charges,
• investment performance, and
• the quality of services,
in comparison “with other similar propositions on the market”.
At the same time, one must also factor in pension adequacy when analysing the returns of
retirement provision vehicles. Although there is no unified understanding of pension adequacy, a
few sources can give an adequate starting point.
The European Commission builds the concept of pension adequacy (from public pensions) on three
pillars: eliminating the risk of poverty in old age, smooth transition from work income to retirement
income and the length of retirement.20 By smooth transition, the European Commission refers to a
pensions’ ability to replace the working-life income in such a way as to limit the financial impact
brought about by this transition. In simpler words, an adequate pension must ensure, at the very
least, that pensioners are not in a far worse position than when they were earning work income.
The European Commission also correctly noted that adequacy is achieved if individuals “can spend
a reasonable share of their lives in retirement”.21
Other authors define pension adequacy as allowing individuals “to maintain, to a reasonable
degree, their standard of living after retirement”.22 A World Bank report on adequate pension
systems focused, besides the smooth transition between work-life and retirement and poverty in
old age, also on smoothing consumption. In short, smoothing consumption over the lifetime of
17 See the Collective Investment Schemes sourcebook (COLL) rules that require fund managers to carry out a Value Assessment (AoV) at least annually, to report publicly on the conclusions of the AoV, and to appoint independent directors on AFM Boards - https://www.handbook.fca.org.uk/handbook/COLL.pdf. 18 UK Financial Conduct Authority, Assessing Value for Money in Workplace Pension Schemes and Pathway Investments: Requirements for IGCs and GAAs (October 2021) Policy Statement PS21/12, available at: https://www.fca.org.uk/publication/policy/ps21-12.pdf. 19 Independent Governance Committee (IGC) or Governance Advisory Arrangement (GAA). 20 European Commission Pension Adequacy Report 2021 (Vol. I), p. 22. 21 Ibid. 22 Margherita Borella, Elsa Fornero, Adequacy of Pension Systems in Europe: An Analysis Based on Comprehensive Replacement Rates (April 2009), ENEPRI Research Report no. 68, AMI WP 9, available at: https://www.ceps.eu/download/publication/?id=6260&pdf=1837.pdf.
28 | P a g e
Lon
g-Te
rm a
nd
Pen
sio
n S
avin
gs |
Th
e R
eal R
etu
rn |
20
21
Edit
ion
workers means that achieving an adequate level of pensions should not necessitate exaggerated
savings during working life.23
Therefore, it can be argued that pension adequacy:
• should not be achieved by “saving more and more”;
• should not be achieved by extending the work life (starting work earlier and retiring later);
• is achieved if the working income is replaced by a pension that is sufficient to ensure a
smooth transition, or maintain the same lifestyle, from work-life to retirement.
Although pension adequacy is mostly aimed at statutory (public) pension systems, we believe that
the growing importance of private pension savings in pension provision requires the application of
the same “adequacy” standards.
Drawing inspiration from the above practices, but also from the knowledge and empirical findings
of 9 editions of this report, BETTER FINANCE formulates the following definition for Value for Money
in long-term and pension saving products.
Value for Money through design, objective, and governance
A long-term and pension savings product delivers value for money for individual, non-professional
savers when:
• The investment objective is clearly defined by the provider in the key disclosures;
• Simple and clear full cost and performance disclosure is made publicly available and is
comparable to those of other investment products with similar goals;
• the costs borne by savers are commensurate with the investment objective (e.g., if
“active” level fees are charged, then the product must overperform the relevant
investment universe over the recommended holding period) and commensurate with
other comparable retail solutions on the market (e.g., sometimes index products on offer
are ten times more expensive than the equivalent ETF solution);
• there are at least two independent members in the governing body of the product
representing investors (can be the fund itself if it has legal personality or the product
manufacturer) like in the UK (asset manager level) and in the US (fund level);
• the product’s cost and performance must be evaluated, periodically, against the
investment objectives of the provider (for example for an active fund charging active level
fees, it will be its benchmark or the performance of its investment universe);
23 Robert Holzman, Richard Hinz, Old Age Income in the 21st Century (2005) World Bank, available at: https://openknowledge.worldbank.org/bitstream/handle/10986/7336/32672.pdf?sequence=1&isAllowed=y.

29 | P a g e
Lon
g-Te
rm a
nd
Pen
sio
n S
avin
gs |
Th
e R
eal R
etu
rn |
20
21
Edit
ion
The services provided in relation to the distribution and management of a product that delivers
Value for Money should encompass the following:
• the management or governing body should report annually and in a simple and concise
manner on how the product delivered Value for Money for its beneficiaries;
SUPERVISION
• supervisory authorities should conduct annual assessments of Value for Money reporting;
• EU supervisory authorities (EIOPA) should use their product intervention powers which
should also cover value for money issues.
30 | P a g e
Lon
g-Te
rm a
nd
Pen
sio
n S
avin
gs |
Th
e R
eal R
etu
rn |
20
21
Edit
ion
Pension Savings: The Real Return 2021 Edition
General Report
I. INTRODUCTION
In June 2013, BETTER FINANCE published a research report entitled “Private Pensions: The Real
Return”24 which evaluated the return of private pension products after charges, after inflation
(“real” returns) and – where possible – after taxation, in Denmark, France and Spain.
In September 2014, BETTER FINANCE published the second edition of the "Pension Savings: The
Real Return"25 report, which included data updates for the three initial countries covered and new
in-depth evaluations of pension savings for five new countries: Belgium, Germany, Italy, Poland and
the United Kingdom.
The following editions added 10 more countries to the report and updated the figures for those
already included. This year’s edition (the ninth in a row) expands the geographic scope once again
to include Croatia.
The actual performance of this market is unknown to clients and to public
supervisors
This report was built to respond to one of the big problems for the pensions market in the EU: lack
of data on real net performances. Since a comprehensive approach to provide this indispensable
information to savers is not yet provided by public authorities or other independent bodies, this
report aims to improve transparency and comparability on the real returns of long-term and
pension savings in Europe. This is in line with the European Commission’s current “Action” to
improve the transparency of performance and fees in this area (as part of its Capital Markets Union
- CMU - Action Plan) and it corresponds with the current tasks the ESAs are undertaking in the area
of personal pension products with respect to past performance and cost comparison.
Indeed, apart from the OECD’s (the Organisation for Economic Co-operation and Development)
report on pensions and EIOPA’s (European Insurance and Occupational Pension´s Authority) reports
on cost and performance, which covers a part of the private pensions market, the contributors to
this research report could not find any other more complete or more recent published
24 Link for the print version available here: http://www.betterfinance.eu/fileadmin/user_upload/documents/Research_Reports/en/Pension_Study_EN_website.pdf. 25 Link for the print version available here: http://www.oee.fr/files/betterfinance_pensions_report_2014.pdf.
31 | P a g e
Lon
g-Te
rm a
nd
Pen
sio
n S
avin
gs |
Th
e R
eal R
etu
rn |
20
21
Edit
ion
comprehensive series of net real pension savings returns for such a wide coverage of EU countries
and the UK.
The data reported by the OECD26 are unfortunately quite incomplete:
• At the time of writing, the most recent OECD publication on pension funds’ returns, “Pension
Funds in Figures 2021”, provides only 1-year preliminary data (for 2020) on the real returns of
pension funds in selected OECD and non-OECD countries;27
• The OECD “Pension Markets in Focus 2020” covers 15-year returns maximum (until 2019) only
for pension funds;28
• Although the OECD reports 5-year returns for 23 EU countries, it drops to 16 for 10-year
horizons and to 11 for 15-year horizons, ending in 2019;
• A part of occupational pension products, and most - if not all - individual pension products are
missing as well, as OECD performance data include only “pension funds” stricto sensu, and
exclude all “pension insurance contracts and funds managed as part of financial institutions
(often banks or investment companies), such as the Individual Retirement Accounts (IRAs) in the
United States”;
• It is questionable that the OECD was able to capture all expenses borne by pension savers - entry
fees for example - because the OECD relies mostly on reporting by national authorities and,
typically, this is not something covered by them;
• Finally, OECD figures are all before taxes, except for Italy.
EIOPA’s Annual Report on Cost and Performance of 2021 covers only 57% of the unit-linked
insurances market and 62% of the profit-participation one, and the personal pensions (insurance-
based) part covers only a few (210) products from 14 jurisdictions in the EU. Moreover, and
unfortunately, the cost data in EIOPA’s report is the Reduction-in-Yield from the PRIIPs KID and only
covers the previous 5 years.
In comparison, the present report documents a principal component of, and reason for, the
generalised level of distrust of EU citizens in capital markets, namely the frequent poor
performance of private pension products, once inflation, charges and (when possible) taxes are
deducted from nominal returns, when compared to the relevant capital market benchmarks.
Totalling 17 EU Member States under review (Austria, Belgium, Bulgaria, Croatia, Denmark, Estonia,
France, Germany, Italy, Latvia, Lithuania, Poland, Romania, Slovakia, Spain Sweden and The
Netherlands), the BETTER FINANCE research now covers 87% of the EU27 population.29 It also
26 Namely the OECD “Pension Markets in Focus 2017” (1, 5 and 10 year data), and the subsequent editions (2018, 2019, 2020), available at: https://www.oecd.org/pensions/private-pensions/pensionmarketsinfocus.htm. 27 https://www.oecd.org/daf/fin/private-pensions/Pension-Funds-in-Figures-2021.pdf. 28 https://www.oecd.org/daf/fin/private-pensions/Pension-Markets-in-Focus-2020.pdf. 29 As of January 1st, 2020 – Eurostat, [demo_gind]’ http://appsso.eurostat.ec.europa.eu/nui/show.do.
32 | P a g e
Lon
g-Te
rm a
nd
Pen
sio
n S
avin
gs |
Th
e R
eal R
etu
rn |
20
21
Edit
ion
extends the period of time covered in order to now measure performance over the 21-year period
ranging from 2000 to 2020, in as far as data was available.
It is the ambition and challenge of this research initiated by BETTER FINANCE and its partners to
collect, analyse and report on the actual past performance of all long-term and pension savings
products.
The net real return30 of pension saving products should be:
• the long-term return (at least covering two full economic and stock market cycles,
since even long-term returns are very sensitive to entry and exit dates);
• net of all fees, commissions and charges borne directly or indirectly by the customer;
• net of inflation (since for long-term products only the real return matters; that is the
right approach taken by OECD as mentioned above);
• when possible, net of taxes borne by the customer (in the USA it has been mandatory
for decades to disclose the past performance of mutual funds after tax in the summary
of the prospectus).
We have chosen a period starting from 31 December 1999 because pension savings returns should
be measured over a long-term horizon, and because it includes two market upturns (2003-2006
and 2009-2019) and two downturns (post dot com bubble of 2001-2003 and the 2008 financial
crisis).
Information on the returns of long term and pension savings is deteriorating
This report shows that it is not an impossible, albeit a very challenging, task for an independent
expert centre such as BETTER FINANCE to collect the data necessary for this report since quite a lot
of data are simply not available at an aggregate and country level, especially for earlier years. The
complexity of the taxation of pension savings in EU countries makes it also extremely difficult to
compute after tax returns.
Once more, for 2020 (2021 edition), we find that the availability and quality of information on long-
term and pension savings returns is actually not improving but on the contrary deteriorating:
- Insufficient information: for example the Belgian insurance trade organisation Assuralia no
longer reports on the returns of insurance-regulated « Branch 21 » occupational and
personal pension products since 2014, and the national supervisor FSMA does not do it
either; in Bulgaria, the necessary data for Professional Pension Funds (pillar II and III) is no
30 A limitation of the present report is that it does not take into account real estate as an asset for retirement. The proportion of households owning their residences varies greatly from one country to another. For example, it is especially low in Germany, where a majority of households rent their residences and where home loan and savings contracts have consequently been introduced as the most recent state-subsidised pension savings scheme. For the time being, returns on pension savings are all the more important since a majority of retirees cannot rely on their residential property to ensure a decent minimum standard of life. However, residential property is not necessarily the best asset for retirement: indeed, it is an illiquid asset, and it often does not fit the needs of the elderly in the absence of a broad use of reverse mortgages. The house might become too large or unsuitable in case of dependency. In that case, financial assets might be preferable, on the condition that they provide a good performance.
33 | P a g e
Lon
g-Te
rm a
nd
Pen
sio
n S
avin
gs |
Th
e R
eal R
etu
rn |
20
21
Edit
ion
longer available since 2018; in the UK, the survey conducted by the Department for
Statistics has been discontinued and information on the British pension funds stopped at
2017;
- Late information: at the time of printing, still a lot of 2020 return data have not been
released by the national trade organisations or other providers. OECD has published
preliminary data for December 2020, but on a limited number of jurisdictions and only for
pension funds; however, considering that, in many countries, pension funds are not the
most popular vehicle, this constitutes a large information gap.
- Unchecked information: the principal source remains the national trade organisations,
their methodology is most often not disclosed, return data do not seem to be checked or
audited by any independent party, and sometimes they are only based on sample surveys
covering just a portion of the products.
The European Supervisory Authorities (ESAs) have a legal duty to collect, analyse and report data
on “consumer trends” in their respective fields (Article 9(1) of the European Regulations
establishing the three ESAs).
Moreover, savvy retail savers and EU public authorities must rely on private databases (and
divergent methodologies) to learn about some of the costs and performances of “retail” saving
products. This is because the PRIIPs Key Information Document (KID) eliminated pre-contractual
disclosure of past performance and actual costs for UCITS and requires return and cost estimations
instead for all “retail” investment products, including pension products. This severe setback in
transparency and comparability is completely inconsistent with the CMU initiative. Four high-level
initiatives have struggled to repair this situation, without success: the NextCMU Report, the High-
Level Forum Final Report, the ECON CMU Report and the ESAs’ draft RTS on PRIIPs Level 2. BETTER
FINANCE continues to deplore the content of the PRIIPs KID.
How to achieve pension adequacy?
Public pension authorities typically stress two requisites for pension savings to achieve “pension
adequacy”:
a) the need to start saving as early as possible;
b) the need to save a significant portion of one’s income before retirement activity income:
“to support a reasonable level of income in retirement, 10% - 15% of an average annual
salary needs to be saved“.31
BETTER FINANCE continues to disagree: saving earlier and more is not enough. A third and even
more important factor is the need to deliver positive and decent long-term real net return (i.e., net
of inflation and fees).
31 World Economic Forum White Paper: ‘We’ll live to 100 – How can we afford it?’ May 2017
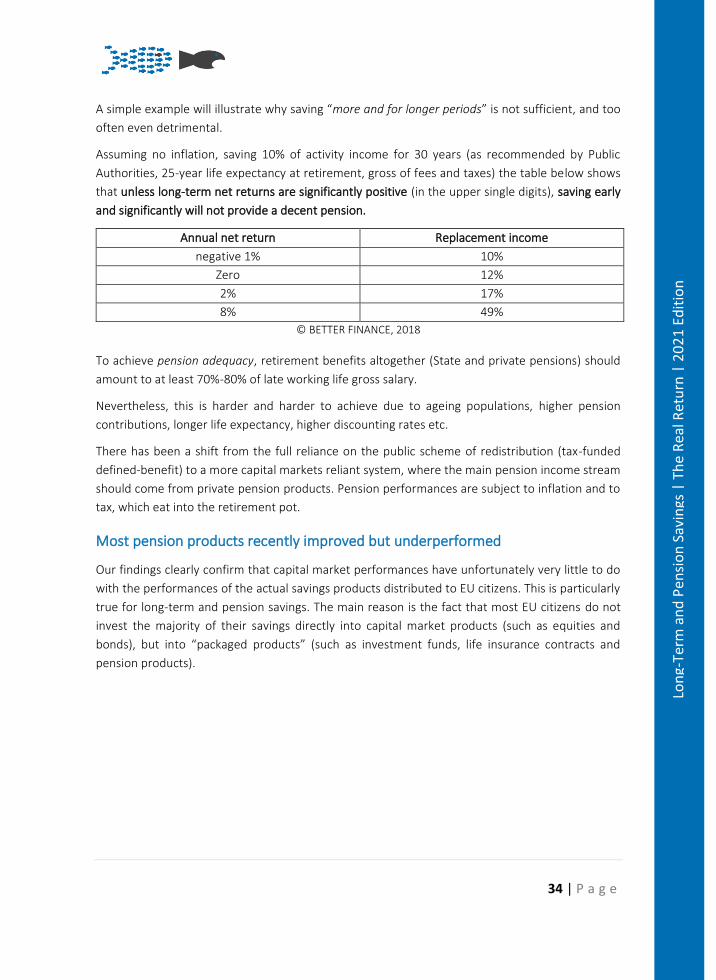
34 | P a g e
Lon
g-Te
rm a
nd
Pen
sio
n S
avin
gs |
Th
e R
eal R
etu
rn |
20
21
Edit
ion
A simple example will illustrate why saving “more and for longer periods” is not sufficient, and too
often even detrimental.
Assuming no inflation, saving 10% of activity income for 30 years (as recommended by Public
Authorities, 25-year life expectancy at retirement, gross of fees and taxes) the table below shows
that unless long-term net returns are significantly positive (in the upper single digits), saving early
and significantly will not provide a decent pension.
Annual net return Replacement income
negative 1% 10%
Zero 12%
2% 17%
8% 49%
© BETTER FINANCE, 2018
To achieve pension adequacy, retirement benefits altogether (State and private pensions) should
amount to at least 70%-80% of late working life gross salary.
Nevertheless, this is harder and harder to achieve due to ageing populations, higher pension
contributions, longer life expectancy, higher discounting rates etc.
There has been a shift from the full reliance on the public scheme of redistribution (tax-funded
defined-benefit) to a more capital markets reliant system, where the main pension income stream
should come from private pension products. Pension performances are subject to inflation and to
tax, which eat into the retirement pot.
Most pension products recently improved but underperformed
Our findings clearly confirm that capital market performances have unfortunately very little to do
with the performances of the actual savings products distributed to EU citizens. This is particularly
true for long-term and pension savings. The main reason is the fact that most EU citizens do not
invest the majority of their savings directly into capital market products (such as equities and
bonds), but into “packaged products” (such as investment funds, life insurance contracts and
pension products).
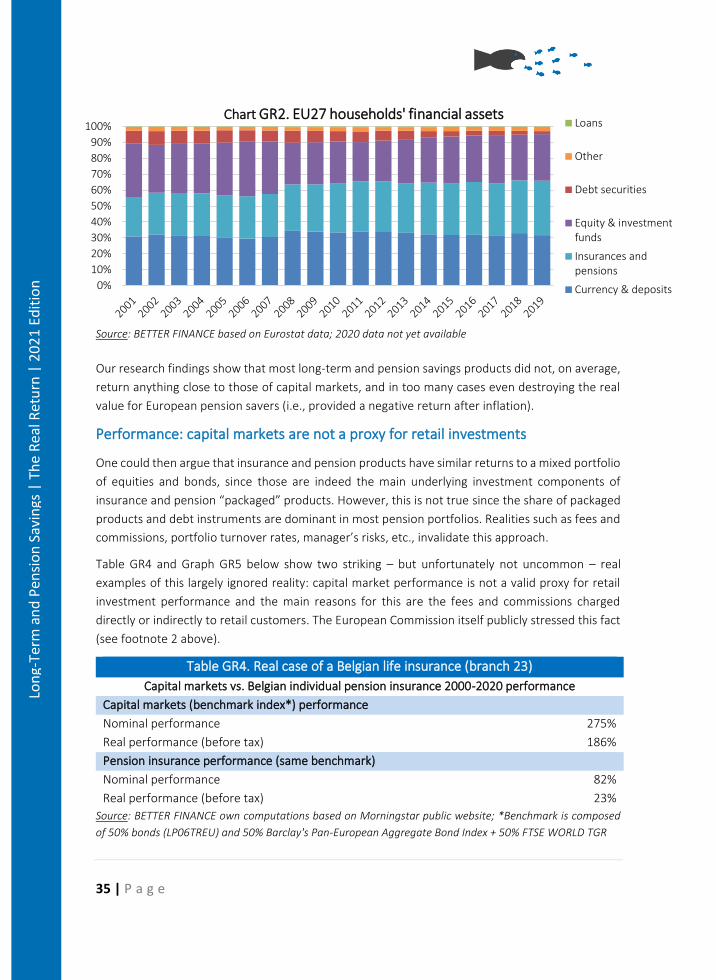
35 | P a g e
Lon
g-Te
rm a
nd
Pen
sio
n S
avin
gs |
Th
e R
eal R
etu
rn |
20
21
Edit
ion
Source: BETTER FINANCE based on Eurostat data; 2020 data not yet available
Our research findings show that most long-term and pension savings products did not, on average,
return anything close to those of capital markets, and in too many cases even destroying the real
value for European pension savers (i.e., provided a negative return after inflation).
Performance: capital markets are not a proxy for retail investments
One could then argue that insurance and pension products have similar returns to a mixed portfolio
of equities and bonds, since those are indeed the main underlying investment components of
insurance and pension “packaged” products. However, this is not true since the share of packaged
products and debt instruments are dominant in most pension portfolios. Realities such as fees and
commissions, portfolio turnover rates, manager’s risks, etc., invalidate this approach.
Table GR4 and Graph GR5 below show two striking – but unfortunately not uncommon – real
examples of this largely ignored reality: capital market performance is not a valid proxy for retail
investment performance and the main reasons for this are the fees and commissions charged
directly or indirectly to retail customers. The European Commission itself publicly stressed this fact
(see footnote 2 above).
Table GR4. Real case of a Belgian life insurance (branch 23)
Capital markets vs. Belgian individual pension insurance 2000-2020 performance
Capital markets (benchmark index*) performance
Nominal performance 275%
Real performance (before tax) 186%
Pension insurance performance (same benchmark)
Nominal performance 82%
Real performance (before tax) 23%
Source: BETTER FINANCE own computations based on Morningstar public website; *Benchmark is composed
of 50% bonds (LP06TREU) and 50% Barclay's Pan-European Aggregate Bond Index + 50% FTSE WORLD TGR
0%
10%
20%
30%
40%
50%
60%
70%
80%
90%
100%Chart GR2. EU27 households' financial assets
Loans
Other
Debt securities
Equity & investmentfunds
Insurances andpensions
Currency & deposits
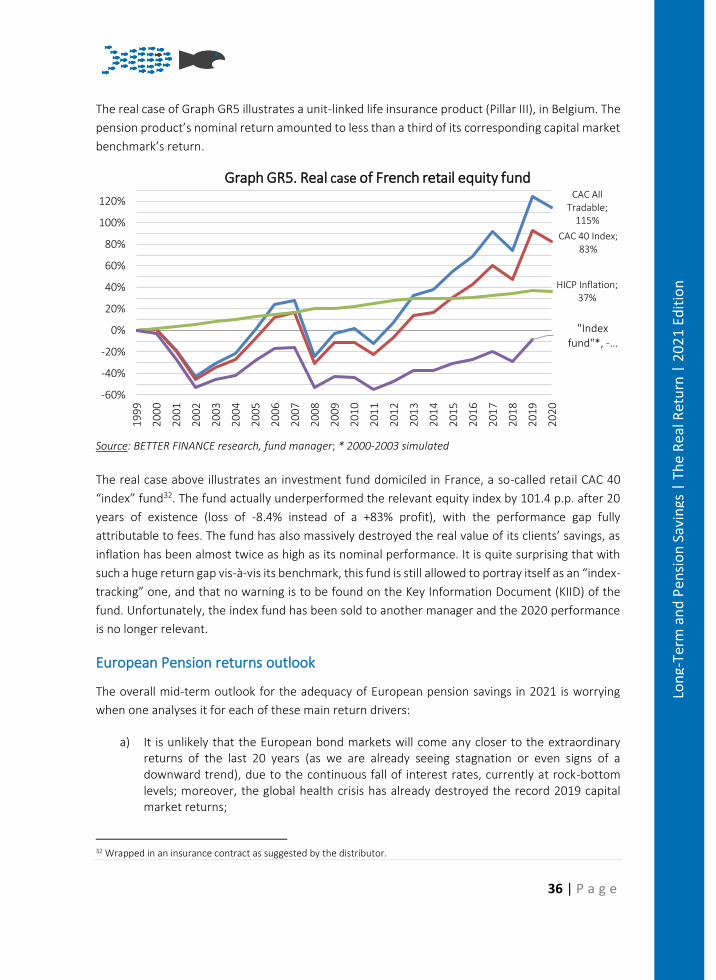
36 | P a g e
Lon
g-Te
rm a
nd
Pen
sio
n S
avin
gs |
Th
e R
eal R
etu
rn |
20
21
Edit
ion
The real case of Graph GR5 illustrates a unit-linked life insurance product (Pillar III), in Belgium. The
pension product’s nominal return amounted to less than a third of its corresponding capital market
benchmark’s return.
Source: BETTER FINANCE research, fund manager; * 2000-2003 simulated
The real case above illustrates an investment fund domiciled in France, a so-called retail CAC 40
“index” fund32. The fund actually underperformed the relevant equity index by 101.4 p.p. after 20
years of existence (loss of -8.4% instead of a +83% profit), with the performance gap fully
attributable to fees. The fund has also massively destroyed the real value of its clients’ savings, as
inflation has been almost twice as high as its nominal performance. It is quite surprising that with
such a huge return gap vis-à-vis its benchmark, this fund is still allowed to portray itself as an “index-
tracking” one, and that no warning is to be found on the Key Information Document (KIID) of the
fund. Unfortunately, the index fund has been sold to another manager and the 2020 performance
is no longer relevant.
European Pension returns outlook
The overall mid-term outlook for the adequacy of European pension savings in 2021 is worrying
when one analyses it for each of these main return drivers:
a) It is unlikely that the European bond markets will come any closer to the extraordinary returns of the last 20 years (as we are already seeing stagnation or even signs of a downward trend), due to the continuous fall of interest rates, currently at rock-bottom levels; moreover, the global health crisis has already destroyed the record 2019 capital market returns;
32 Wrapped in an insurance contract as suggested by the distributor.
CAC All Tradable;
115%
CAC 40 Index; 83%
HICP Inflation; 37%
"Index fund"*, -…
-60%
-40%
-20%
0%
20%
40%
60%
80%
100%
120%
19
99
20
00
20
01
20
02
20
03
20
04
20
05
20
06
20
07
20
08
20
09
20
10
20
11
20
12
20
13
20
14
20
15
20
16
20
17
20
18
20
19
20
20
Graph GR5. Real case of French retail equity fund
37 | P a g e
Lon
g-Te
rm a
nd
Pen
sio
n S
avin
gs |
Th
e R
eal R
etu
rn |
20
21
Edit
ion
b) The negative impact of this foreseeable trend in bond returns on pensions’ returns will be reinforced by a higher proportion of bonds being taken up in pension products’ portfolios in recent years; this is all the more relevant in light of the monetary policy response to the health-generated recession.
c) The transparency of cost disclosures is not improving. d) While it seemed unlikely that inflation – just like interest rates – would turn into deflation,
and the consequences of the “non-conventional” monetary policies of central banks on possible market “bubbles” are still unchartered, currently inflation (with its known devastating impact on the purchasing power of pension income) is surging, hitting record high after record high.
e) Taxes on long-term and pension savings do not show any significant downward trend either.
The pan-European Personal Pension (PEPP) product
In an attempt to revitalise voluntary pension savings, the EU engaged in a project to create an EU
quality label for personal retirement products, mainly to enable cross-border workers to save simply
and efficiently for retirement. Named the pan-European Personal Pension product (PEPP), it is
designed as a voluntary/personal pension product (pillar III), and should be:
• portable, allowing the PEPP saver to move across Europe and either continue contributing
to his PEPP or switch to a new national sub-account without fees;
• simple, transparent and cost-efficient, embedding proper long-term risk-mitigation
techniques; and
• benefiting of tax-incentives in a harmonised manner.
The last two objectives have not been attained – yet. First, taxation is still the sovereign competence
of EU Member States and found strong opposition from national Governments, although the
Commission and European Parliament have asked or recommended it.33
Second, EIOPA allowed insurance-based investment products (IBIPs) manufacturers to charge the
cost of guarantees separately from the “all inclusive” 1% cap for the basic PEPP.34 What is more, is
that the capital protection is a “scam” enshrined by EU law. The fact that EU savers would be
informed that their capital (meaning accumulated contributions) would be protected, but only after
the deduction of fees and without taking into account inflation, is highly misleading.35
33 Most recently, the European Parliament’s Economic and Monetary Affairs’ (ECON) own initiative report on the Further Development of the Capital Markets Union (CMU) does contain a resolution to incentivise and harmonise PEPP tax treatments across the EU; however, at the time of writing, the resolution was not yet final. 34 See EIOPA Final Regulatory Technical Standards (RTS) supplementing Regulation (EU) 2019/1238 on the PEPP: https://www.eiopa.europa.eu/sites/default/files/publications/eiopa-20-500_pepp_draft_rtss.pdf. 35 See BETTER FINANCE YouTube Video on the “PEPP Capital Protection SCAM”.
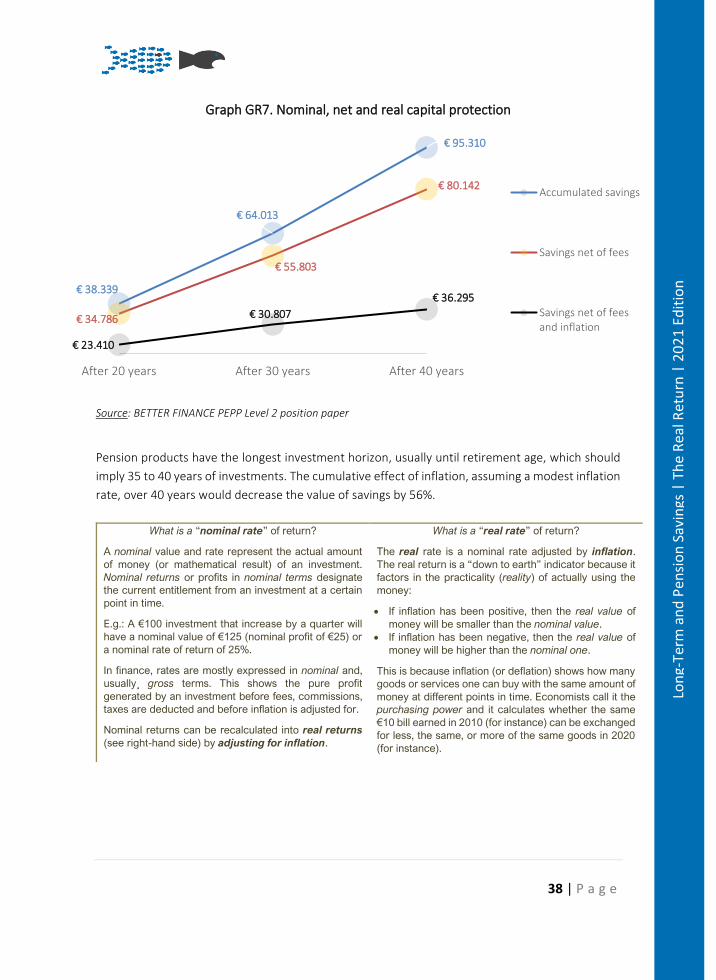
38 | P a g e
Lon
g-Te
rm a
nd
Pen
sio
n S
avin
gs |
Th
e R
eal R
etu
rn |
20
21
Edit
ion
Graph GR7. Nominal, net and real capital protection
Source: BETTER FINANCE PEPP Level 2 position paper
Pension products have the longest investment horizon, usually until retirement age, which should
imply 35 to 40 years of investments. The cumulative effect of inflation, assuming a modest inflation
rate, over 40 years would decrease the value of savings by 56%.
What is a “nominal rate” of return?
A nominal value and rate represent the actual amount
of money (or mathematical result) of an investment.
Nominal returns or profits in nominal terms designate
the current entitlement from an investment at a certain
point in time.
E.g.: A €100 investment that increase by a quarter will
have a nominal value of €125 (nominal profit of €25) or
a nominal rate of return of 25%.
In finance, rates are mostly expressed in nominal and,
usually¸ gross terms. This shows the pure profit
generated by an investment before fees, commissions,
taxes are deducted and before inflation is adjusted for.
Nominal returns can be recalculated into real returns
(see right-hand side) by adjusting for inflation.
What is a “real rate” of return?
The real rate is a nominal rate adjusted by inflation.
The real return is a “down to earth” indicator because it
factors in the practicality (reality) of actually using the
money:
• If inflation has been positive, then the real value of
money will be smaller than the nominal value.
• If inflation has been negative, then the real value of
money will be higher than the nominal one.
This is because inflation (or deflation) shows how many
goods or services one can buy with the same amount of
money at different points in time. Economists call it the
purchasing power and it calculates whether the same
€10 bill earned in 2010 (for instance) can be exchanged
for less, the same, or more of the same goods in 2020
(for instance).
€ 38.339
€ 64.013
€ 95.310
€ 34.786
€ 55.803
€ 80.142
€ 23.410
€ 30.807
€ 36.295
After 20 years After 30 years After 40 years
Accumulated savings
Savings net of fees
Savings net of feesand inflation
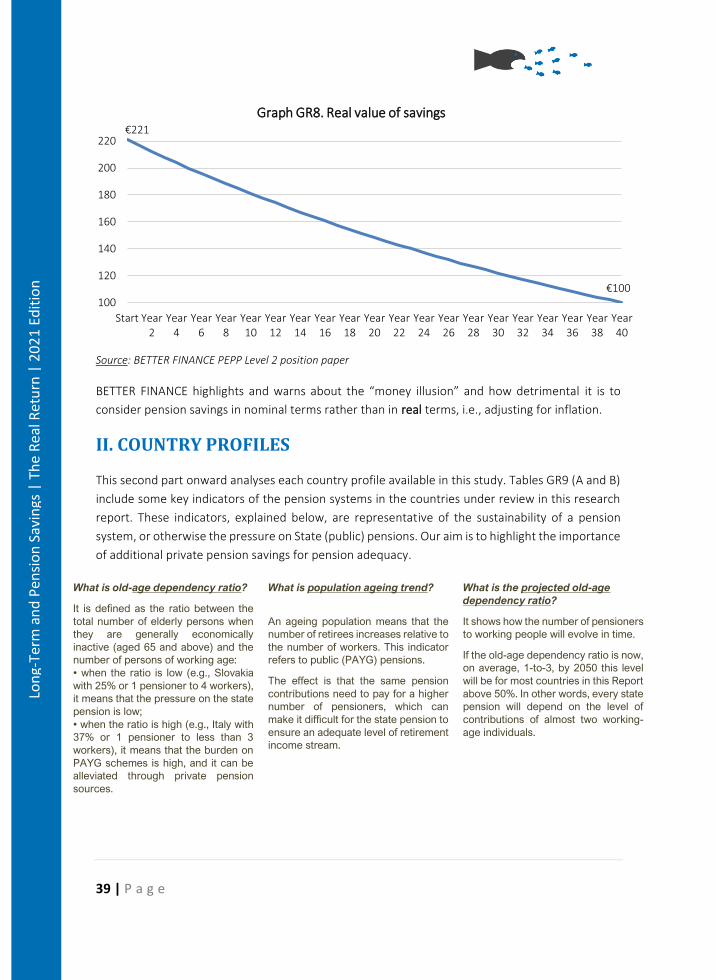
39 | P a g e
Lon
g-Te
rm a
nd
Pen
sio
n S
avin
gs |
Th
e R
eal R
etu
rn |
20
21
Edit
ion
Source: BETTER FINANCE PEPP Level 2 position paper
BETTER FINANCE highlights and warns about the “money illusion” and how detrimental it is to
consider pension savings in nominal terms rather than in real terms, i.e., adjusting for inflation.
II. COUNTRY PROFILES
This second part onward analyses each country profile available in this study. Tables GR9 (A and B)
include some key indicators of the pension systems in the countries under review in this research
report. These indicators, explained below, are representative of the sustainability of a pension
system, or otherwise the pressure on State (public) pensions. Our aim is to highlight the importance
of additional private pension savings for pension adequacy.
What is old-age dependency ratio?
It is defined as the ratio between the
total number of elderly persons when
they are generally economically
inactive (aged 65 and above) and the
number of persons of working age:
• when the ratio is low (e.g., Slovakia
with 25% or 1 pensioner to 4 workers),
it means that the pressure on the state
pension is low;
• when the ratio is high (e.g., Italy with
37% or 1 pensioner to less than 3
workers), it means that the burden on
PAYG schemes is high, and it can be
alleviated through private pension
sources.
What is population ageing trend?
An ageing population means that the
number of retirees increases relative to
the number of workers. This indicator
refers to public (PAYG) pensions.
The effect is that the same pension
contributions need to pay for a higher
number of pensioners, which can
make it difficult for the state pension to
ensure an adequate level of retirement
income stream.
What is the projected old-age
dependency ratio?
It shows how the number of pensioners
to working people will evolve in time.
If the old-age dependency ratio is now,
on average, 1-to-3, by 2050 this level
will be for most countries in this Report
above 50%. In other words, every state
pension will depend on the level of
contributions of almost two working-
age individuals.
€221
€100100
120
140
160
180
200
220
Start Year2
Year4
Year6
Year8
Year10
Year12
Year14
Year16
Year18
Year20
Year22
Year24
Year26
Year28
Year30
Year32
Year34
Year36
Year38
Year40
Graph GR8. Real value of savings
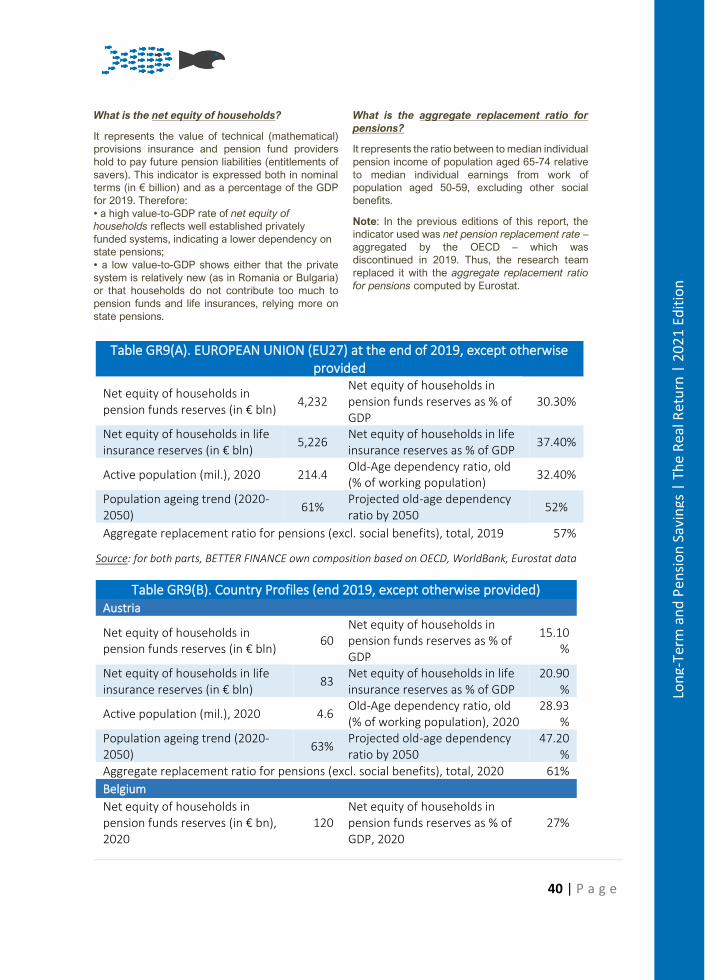
40 | P a g e
Lon
g-Te
rm a
nd
Pen
sio
n S
avin
gs |
Th
e R
eal R
etu
rn |
20
21
Edit
ion
What is the net equity of households?
It represents the value of technical (mathematical)
provisions insurance and pension fund providers
hold to pay future pension liabilities (entitlements of
savers). This indicator is expressed both in nominal
terms (in € billion) and as a percentage of the GDP
for 2019. Therefore:
• a high value-to-GDP rate of net equity of
households reflects well established privately
funded systems, indicating a lower dependency on
state pensions;
• a low value-to-GDP shows either that the private
system is relatively new (as in Romania or Bulgaria)
or that households do not contribute too much to
pension funds and life insurances, relying more on
state pensions.
What is the aggregate replacement ratio for
pensions?
It represents the ratio between to median individual
pension income of population aged 65-74 relative
to median individual earnings from work of
population aged 50-59, excluding other social
benefits.
Note: In the previous editions of this report, the
indicator used was net pension replacement rate –
aggregated by the OECD – which was
discontinued in 2019. Thus, the research team
replaced it with the aggregate replacement ratio
for pensions computed by Eurostat.
Table GR9(A). EUROPEAN UNION (EU27) at the end of 2019, except otherwise provided
Net equity of households in pension funds reserves (in € bln)
4,232 Net equity of households in pension funds reserves as % of GDP
30.30%
Net equity of households in life insurance reserves (in € bln)
5,226 Net equity of households in life insurance reserves as % of GDP
37.40%
Active population (mil.), 2020 214.4 Old-Age dependency ratio, old (% of working population)
32.40%
Population ageing trend (2020-2050)
61% Projected old-age dependency ratio by 2050
52%
Aggregate replacement ratio for pensions (excl. social benefits), total, 2019 57%
Source: for both parts, BETTER FINANCE own composition based on OECD, WorldBank, Eurostat data
Table GR9(B). Country Profiles (end 2019, except otherwise provided) Austria
Net equity of households in pension funds reserves (in € bln)
60 Net equity of households in pension funds reserves as % of GDP
15.10%
Net equity of households in life insurance reserves (in € bln)
83 Net equity of households in life insurance reserves as % of GDP
20.90%
Active population (mil.), 2020 4.6 Old-Age dependency ratio, old (% of working population), 2020
28.93%
Population ageing trend (2020-2050)
63% Projected old-age dependency ratio by 2050
47.20%
Aggregate replacement ratio for pensions (excl. social benefits), total, 2020 61%
Belgium
Net equity of households in pension funds reserves (in € bn), 2020
120 Net equity of households in pension funds reserves as % of GDP, 2020
27%
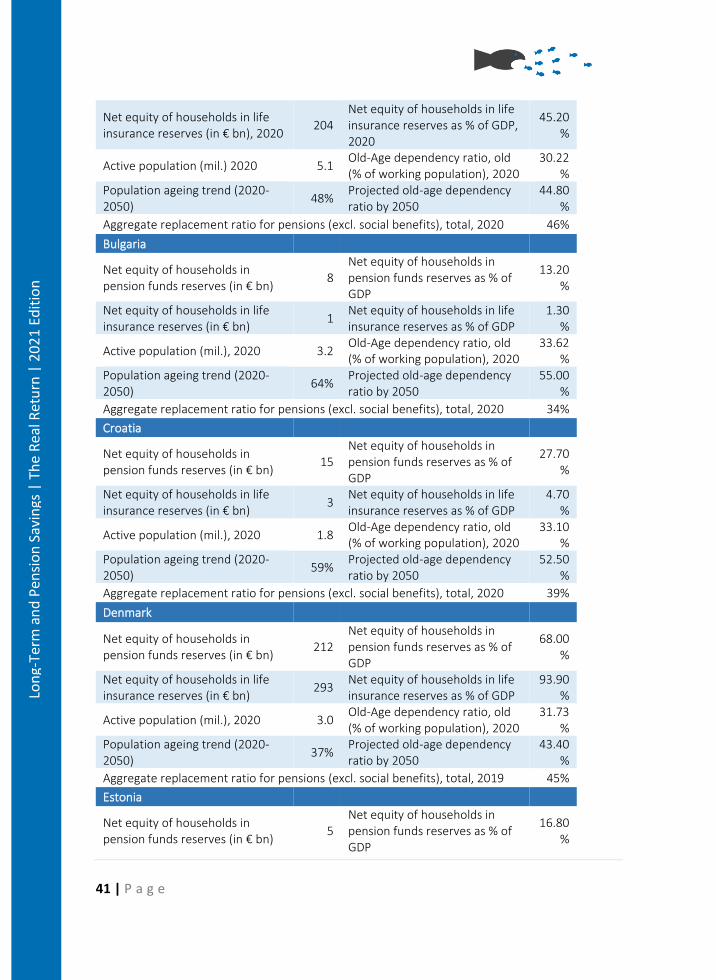
41 | P a g e
Lon
g-Te
rm a
nd
Pen
sio
n S
avin
gs |
Th
e R
eal R
etu
rn |
20
21
Edit
ion
Net equity of households in life insurance reserves (in € bn), 2020
204 Net equity of households in life insurance reserves as % of GDP, 2020
45.20%
Active population (mil.) 2020 5.1 Old-Age dependency ratio, old (% of working population), 2020
30.22%
Population ageing trend (2020-2050)
48% Projected old-age dependency ratio by 2050
44.80%
Aggregate replacement ratio for pensions (excl. social benefits), total, 2020 46%
Bulgaria
Net equity of households in pension funds reserves (in € bn)
8 Net equity of households in pension funds reserves as % of GDP
13.20%
Net equity of households in life insurance reserves (in € bn)
1 Net equity of households in life insurance reserves as % of GDP
1.30%
Active population (mil.), 2020 3.2 Old-Age dependency ratio, old (% of working population), 2020
33.62%
Population ageing trend (2020-2050)
64% Projected old-age dependency ratio by 2050
55.00%
Aggregate replacement ratio for pensions (excl. social benefits), total, 2020 34%
Croatia
Net equity of households in pension funds reserves (in € bn)
15 Net equity of households in pension funds reserves as % of GDP
27.70%
Net equity of households in life insurance reserves (in € bn)
3 Net equity of households in life insurance reserves as % of GDP
4.70%
Active population (mil.), 2020 1.8 Old-Age dependency ratio, old (% of working population), 2020
33.10%
Population ageing trend (2020-2050)
59% Projected old-age dependency ratio by 2050
52.50%
Aggregate replacement ratio for pensions (excl. social benefits), total, 2020 39%
Denmark
Net equity of households in pension funds reserves (in € bn)
212 Net equity of households in pension funds reserves as % of GDP
68.00%
Net equity of households in life insurance reserves (in € bn)
293 Net equity of households in life insurance reserves as % of GDP
93.90%
Active population (mil.), 2020 3.0 Old-Age dependency ratio, old (% of working population), 2020
31.73%
Population ageing trend (2020-2050)
37% Projected old-age dependency ratio by 2050
43.40%
Aggregate replacement ratio for pensions (excl. social benefits), total, 2019 45%
Estonia
Net equity of households in pension funds reserves (in € bn)
5 Net equity of households in pension funds reserves as % of GDP
16.80%
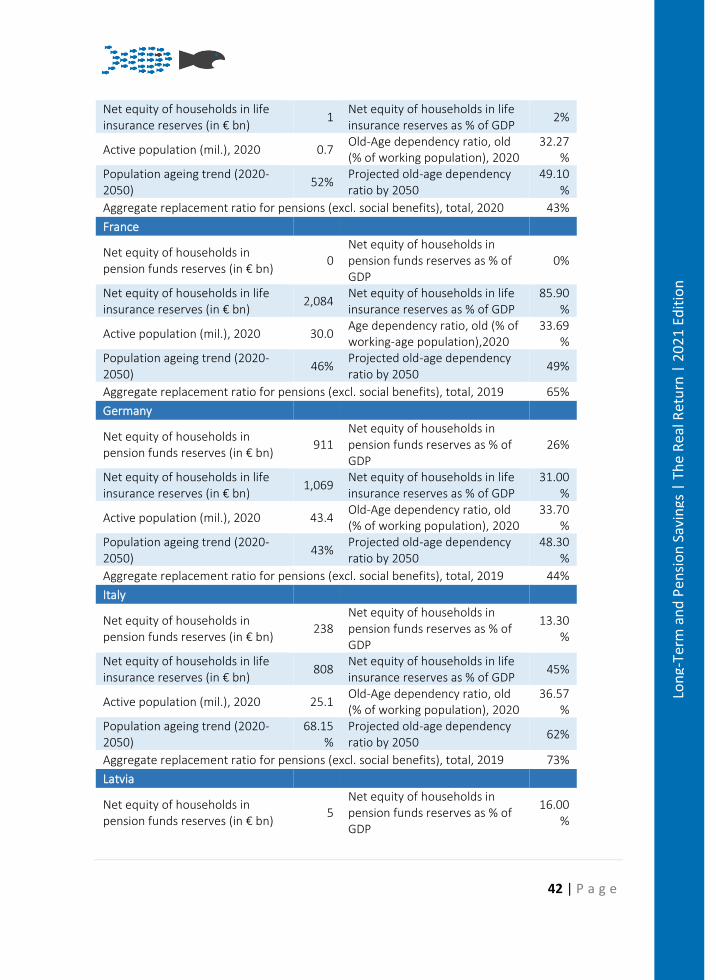
42 | P a g e
Lon
g-Te
rm a
nd
Pen
sio
n S
avin
gs |
Th
e R
eal R
etu
rn |
20
21
Edit
ion
Net equity of households in life insurance reserves (in € bn)
1 Net equity of households in life insurance reserves as % of GDP
2%
Active population (mil.), 2020 0.7 Old-Age dependency ratio, old (% of working population), 2020
32.27%
Population ageing trend (2020-2050)
52% Projected old-age dependency ratio by 2050
49.10%
Aggregate replacement ratio for pensions (excl. social benefits), total, 2020 43%
France
Net equity of households in pension funds reserves (in € bn)
0 Net equity of households in pension funds reserves as % of GDP
0%
Net equity of households in life insurance reserves (in € bn)
2,084 Net equity of households in life insurance reserves as % of GDP
85.90%
Active population (mil.), 2020 30.0 Age dependency ratio, old (% of working-age population),2020
33.69%
Population ageing trend (2020-2050)
46% Projected old-age dependency ratio by 2050
49%
Aggregate replacement ratio for pensions (excl. social benefits), total, 2019 65%
Germany
Net equity of households in pension funds reserves (in € bn)
911 Net equity of households in pension funds reserves as % of GDP
26%
Net equity of households in life insurance reserves (in € bn)
1,069 Net equity of households in life insurance reserves as % of GDP
31.00%
Active population (mil.), 2020 43.4 Old-Age dependency ratio, old (% of working population), 2020
33.70%
Population ageing trend (2020-2050)
43% Projected old-age dependency ratio by 2050
48.30%
Aggregate replacement ratio for pensions (excl. social benefits), total, 2019 44% Italy
Net equity of households in pension funds reserves (in € bn)
238 Net equity of households in pension funds reserves as % of GDP
13.30%
Net equity of households in life insurance reserves (in € bn)
808 Net equity of households in life insurance reserves as % of GDP
45%
Active population (mil.), 2020 25.1 Old-Age dependency ratio, old (% of working population), 2020
36.57%
Population ageing trend (2020-2050)
68.15%
Projected old-age dependency ratio by 2050
62%
Aggregate replacement ratio for pensions (excl. social benefits), total, 2019 73%
Latvia
Net equity of households in pension funds reserves (in € bn)
5 Net equity of households in pension funds reserves as % of GDP
16.00%
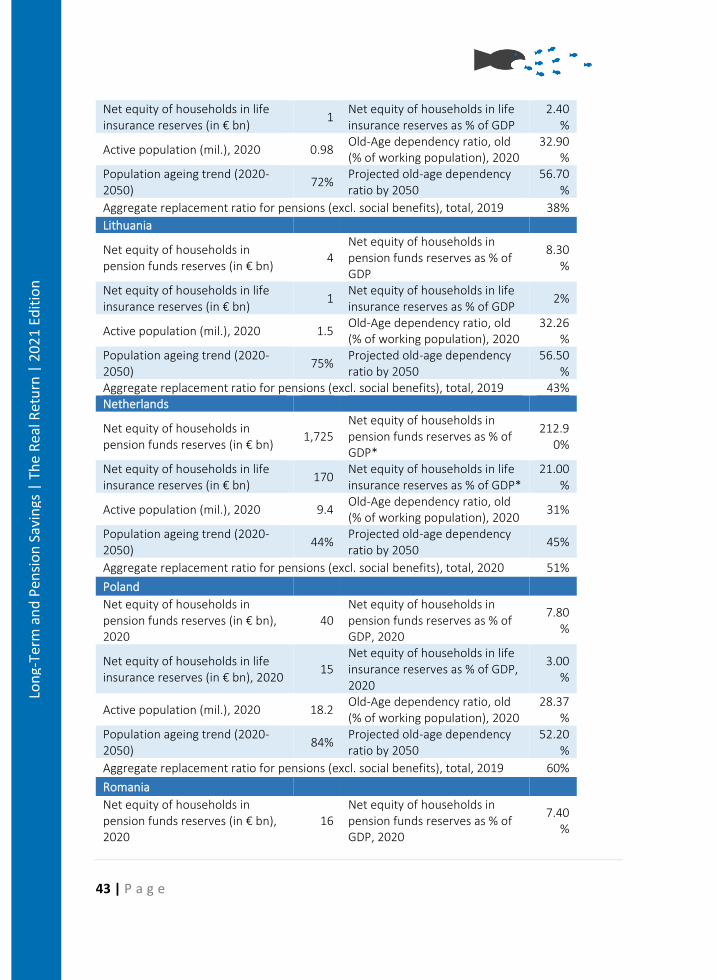
43 | P a g e
Lon
g-Te
rm a
nd
Pen
sio
n S
avin
gs |
Th
e R
eal R
etu
rn |
20
21
Edit
ion
Net equity of households in life insurance reserves (in € bn)
1 Net equity of households in life insurance reserves as % of GDP
2.40%
Active population (mil.), 2020 0.98 Old-Age dependency ratio, old (% of working population), 2020
32.90%
Population ageing trend (2020-2050)
72% Projected old-age dependency ratio by 2050
56.70%
Aggregate replacement ratio for pensions (excl. social benefits), total, 2019 38%
Lithuania
Net equity of households in pension funds reserves (in € bn)
4 Net equity of households in pension funds reserves as % of GDP
8.30%
Net equity of households in life insurance reserves (in € bn)
1 Net equity of households in life insurance reserves as % of GDP
2%
Active population (mil.), 2020 1.5 Old-Age dependency ratio, old (% of working population), 2020
32.26%
Population ageing trend (2020-2050)
75% Projected old-age dependency ratio by 2050
56.50%
Aggregate replacement ratio for pensions (excl. social benefits), total, 2019 43% Netherlands
Net equity of households in pension funds reserves (in € bn)
1,725 Net equity of households in pension funds reserves as % of GDP*
212.90%
Net equity of households in life insurance reserves (in € bn)
170 Net equity of households in life insurance reserves as % of GDP*
21.00%
Active population (mil.), 2020 9.4 Old-Age dependency ratio, old (% of working population), 2020
31%
Population ageing trend (2020-2050)
44% Projected old-age dependency ratio by 2050
45%
Aggregate replacement ratio for pensions (excl. social benefits), total, 2020 51%
Poland
Net equity of households in pension funds reserves (in € bn), 2020
40 Net equity of households in pension funds reserves as % of GDP, 2020
7.80%
Net equity of households in life insurance reserves (in € bn), 2020
15 Net equity of households in life insurance reserves as % of GDP, 2020
3.00%
Active population (mil.), 2020 18.2 Old-Age dependency ratio, old (% of working population), 2020
28.37%
Population ageing trend (2020-2050)
84% Projected old-age dependency ratio by 2050
52.20%
Aggregate replacement ratio for pensions (excl. social benefits), total, 2019 60%
Romania
Net equity of households in pension funds reserves (in € bn), 2020
16 Net equity of households in pension funds reserves as % of GDP, 2020
7.40%
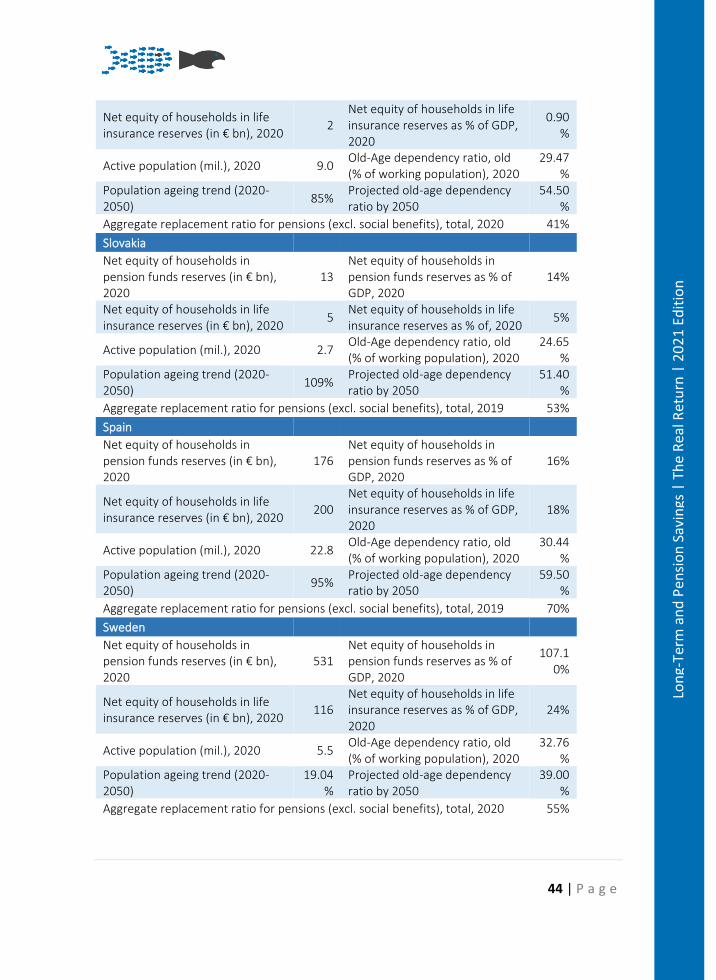
44 | P a g e
Lon
g-Te
rm a
nd
Pen
sio
n S
avin
gs |
Th
e R
eal R
etu
rn |
20
21
Edit
ion
Net equity of households in life insurance reserves (in € bn), 2020
2 Net equity of households in life insurance reserves as % of GDP, 2020
0.90%
Active population (mil.), 2020 9.0 Old-Age dependency ratio, old (% of working population), 2020
29.47%
Population ageing trend (2020-2050)
85% Projected old-age dependency ratio by 2050
54.50%
Aggregate replacement ratio for pensions (excl. social benefits), total, 2020 41%
Slovakia
Net equity of households in pension funds reserves (in € bn), 2020
13 Net equity of households in pension funds reserves as % of GDP, 2020
14%
Net equity of households in life insurance reserves (in € bn), 2020
5 Net equity of households in life insurance reserves as % of, 2020
5%
Active population (mil.), 2020 2.7 Old-Age dependency ratio, old (% of working population), 2020
24.65%
Population ageing trend (2020-2050)
109% Projected old-age dependency ratio by 2050
51.40%
Aggregate replacement ratio for pensions (excl. social benefits), total, 2019 53%
Spain
Net equity of households in pension funds reserves (in € bn), 2020
176 Net equity of households in pension funds reserves as % of GDP, 2020
16%
Net equity of households in life insurance reserves (in € bn), 2020
200 Net equity of households in life insurance reserves as % of GDP, 2020
18%
Active population (mil.), 2020 22.8 Old-Age dependency ratio, old (% of working population), 2020
30.44%
Population ageing trend (2020-2050)
95% Projected old-age dependency ratio by 2050
59.50%
Aggregate replacement ratio for pensions (excl. social benefits), total, 2019 70%
Sweden
Net equity of households in pension funds reserves (in € bn), 2020
531 Net equity of households in pension funds reserves as % of GDP, 2020
107.10%
Net equity of households in life insurance reserves (in € bn), 2020
116 Net equity of households in life insurance reserves as % of GDP, 2020
24%
Active population (mil.), 2020 5.5 Old-Age dependency ratio, old (% of working population), 2020
32.76%
Population ageing trend (2020-2050)
19.04%
Projected old-age dependency ratio by 2050
39.00%
Aggregate replacement ratio for pensions (excl. social benefits), total, 2020 55%
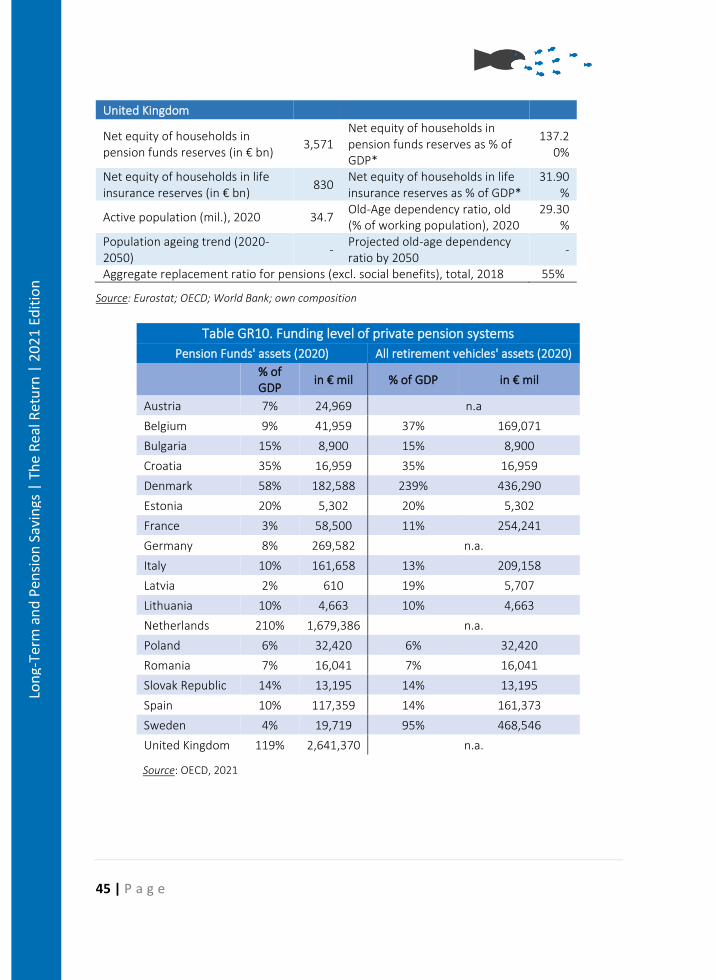
45 | P a g e
Lon
g-Te
rm a
nd
Pen
sio
n S
avin
gs |
Th
e R
eal R
etu
rn |
20
21
Edit
ion
United Kingdom
Net equity of households in pension funds reserves (in € bn)
3,571 Net equity of households in pension funds reserves as % of GDP*
137.20%
Net equity of households in life insurance reserves (in € bn)
830 Net equity of households in life insurance reserves as % of GDP*
31.90%
Active population (mil.), 2020 34.7 Old-Age dependency ratio, old (% of working population), 2020
29.30%
Population ageing trend (2020-2050)
- Projected old-age dependency ratio by 2050
-
Aggregate replacement ratio for pensions (excl. social benefits), total, 2018 55%
Source: Eurostat; OECD; World Bank; own composition
Table GR10. Funding level of private pension systems
Pension Funds' assets (2020) All retirement vehicles' assets (2020)
% of GDP
in € mil % of GDP in € mil
Austria 7% 24,969 n.a
Belgium 9% 41,959 37% 169,071
Bulgaria 15% 8,900 15% 8,900
Croatia 35% 16,959 35% 16,959
Denmark 58% 182,588 239% 436,290
Estonia 20% 5,302 20% 5,302
France 3% 58,500 11% 254,241
Germany 8% 269,582 n.a.
Italy 10% 161,658 13% 209,158
Latvia 2% 610 19% 5,707
Lithuania 10% 4,663 10% 4,663
Netherlands 210% 1,679,386 n.a.
Poland 6% 32,420 6% 32,420
Romania 7% 16,041 7% 16,041
Slovak Republic 14% 13,195 14% 13,195
Spain 10% 117,359 14% 161,373
Sweden 4% 19,719 95% 468,546
United Kingdom 119% 2,641,370 n.a.
Source: OECD, 2021
46 | P a g e
Lon
g-Te
rm a
nd
Pen
sio
n S
avin
gs |
Th
e R
eal R
etu
rn |
20
21
Edit
ion
In some countries the level of accumulated assets in pension funds is almost the same as that of
the total value of pension vehicles (such as in Italy, Bulgaria or Romania), in others we see that the
total amount of funded retirement products is up to four times higher than the amount for pension
funds (Denmark – 219% of GDP).
III. RETURN ATTRIBUTION
Pension returns drivers
This report seeks to explain the (often poor) performance of pension vehicles, especially when
compared to capital market returns. The underperformance (compared to a benchmark) of most
pension vehicles can be explained by several return drivers:
• inflation, which over a full contribution period (40 years) at a modest rate can erode
even more than 50% of nominal returns,
• pension portfolios’ asset allocation and performance,
• the asset managers’ skills in terms of picking securities and market timing,
• the investment charges deducted by asset managers and other financial
intermediaries, to a great extent from net real returns of private pensions,
• ultimately by the tax burden.
These return drivers are analysed separately in the following sections.
Inflation
As explained in the previous section, inflation is a measurement for the purchasing power of money
over time: positive inflation rate means that the real value of our money decreases over time;
negative inflation rate means that the real value of our money increases.
For several of the countries analysed in this research report, inflation rates were significant and
consequently had a severe impact on returns in real terms over the periods in review. One has to
keep in mind that even for those countries with moderate inflation, the compound effect over long
periods, as applicable to the case of retirement savings, can lead to considerable losses in
purchasing power.
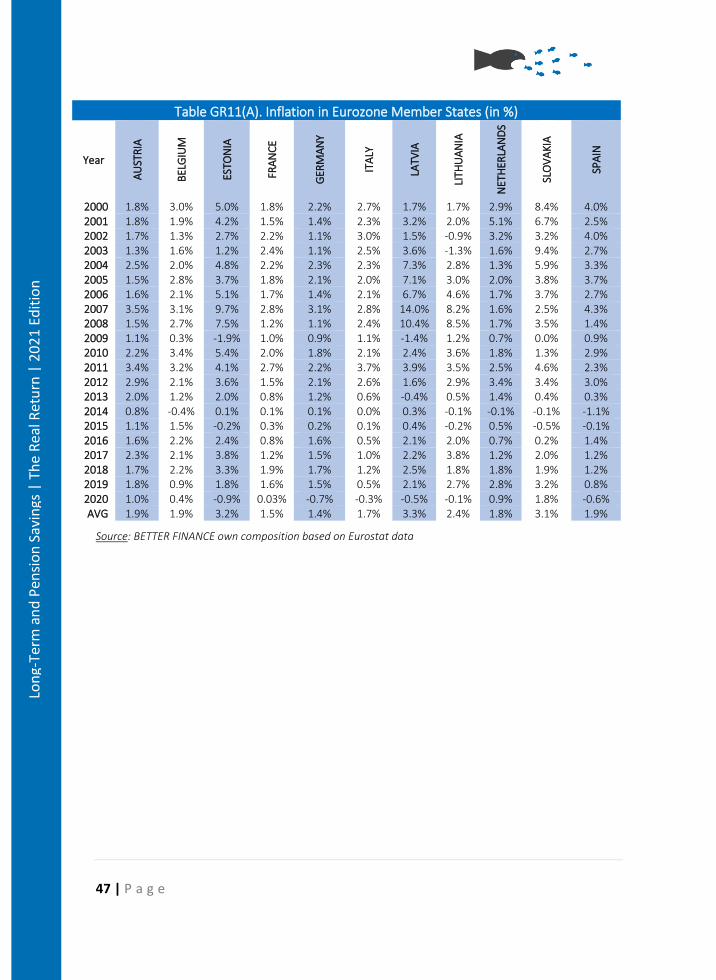
47 | P a g e
Lon
g-Te
rm a
nd
Pen
sio
n S
avin
gs |
Th
e R
eal R
etu
rn |
20
21
Edit
ion
Table GR11(A). Inflation in Eurozone Member States (in %)
Year
AU
STR
IA
BEL
GIU
M
ESTO
NIA
FRA
NC
E
GER
MA
NY
ITA
LY
LATV
IA
LITH
UA
NIA
NET
HER
LAN
DS
SLO
VA
KIA
SPA
IN
2000 1.8% 3.0% 5.0% 1.8% 2.2% 2.7% 1.7% 1.7% 2.9% 8.4% 4.0% 2001 1.8% 1.9% 4.2% 1.5% 1.4% 2.3% 3.2% 2.0% 5.1% 6.7% 2.5% 2002 1.7% 1.3% 2.7% 2.2% 1.1% 3.0% 1.5% -0.9% 3.2% 3.2% 4.0% 2003 1.3% 1.6% 1.2% 2.4% 1.1% 2.5% 3.6% -1.3% 1.6% 9.4% 2.7% 2004 2.5% 2.0% 4.8% 2.2% 2.3% 2.3% 7.3% 2.8% 1.3% 5.9% 3.3% 2005 1.5% 2.8% 3.7% 1.8% 2.1% 2.0% 7.1% 3.0% 2.0% 3.8% 3.7% 2006 1.6% 2.1% 5.1% 1.7% 1.4% 2.1% 6.7% 4.6% 1.7% 3.7% 2.7% 2007 3.5% 3.1% 9.7% 2.8% 3.1% 2.8% 14.0% 8.2% 1.6% 2.5% 4.3% 2008 1.5% 2.7% 7.5% 1.2% 1.1% 2.4% 10.4% 8.5% 1.7% 3.5% 1.4% 2009 1.1% 0.3% -1.9% 1.0% 0.9% 1.1% -1.4% 1.2% 0.7% 0.0% 0.9% 2010 2.2% 3.4% 5.4% 2.0% 1.8% 2.1% 2.4% 3.6% 1.8% 1.3% 2.9% 2011 3.4% 3.2% 4.1% 2.7% 2.2% 3.7% 3.9% 3.5% 2.5% 4.6% 2.3% 2012 2.9% 2.1% 3.6% 1.5% 2.1% 2.6% 1.6% 2.9% 3.4% 3.4% 3.0% 2013 2.0% 1.2% 2.0% 0.8% 1.2% 0.6% -0.4% 0.5% 1.4% 0.4% 0.3% 2014 0.8% -0.4% 0.1% 0.1% 0.1% 0.0% 0.3% -0.1% -0.1% -0.1% -1.1% 2015 1.1% 1.5% -0.2% 0.3% 0.2% 0.1% 0.4% -0.2% 0.5% -0.5% -0.1% 2016 1.6% 2.2% 2.4% 0.8% 1.6% 0.5% 2.1% 2.0% 0.7% 0.2% 1.4% 2017 2.3% 2.1% 3.8% 1.2% 1.5% 1.0% 2.2% 3.8% 1.2% 2.0% 1.2% 2018 1.7% 2.2% 3.3% 1.9% 1.7% 1.2% 2.5% 1.8% 1.8% 1.9% 1.2% 2019 1.8% 0.9% 1.8% 1.6% 1.5% 0.5% 2.1% 2.7% 2.8% 3.2% 0.8% 2020 1.0% 0.4% -0.9% 0.03% -0.7% -0.3% -0.5% -0.1% 0.9% 1.8% -0.6% AVG 1.9% 1.9% 3.2% 1.5% 1.4% 1.7% 3.3% 2.4% 1.8% 3.1% 1.9%
Source: BETTER FINANCE own composition based on Eurostat data
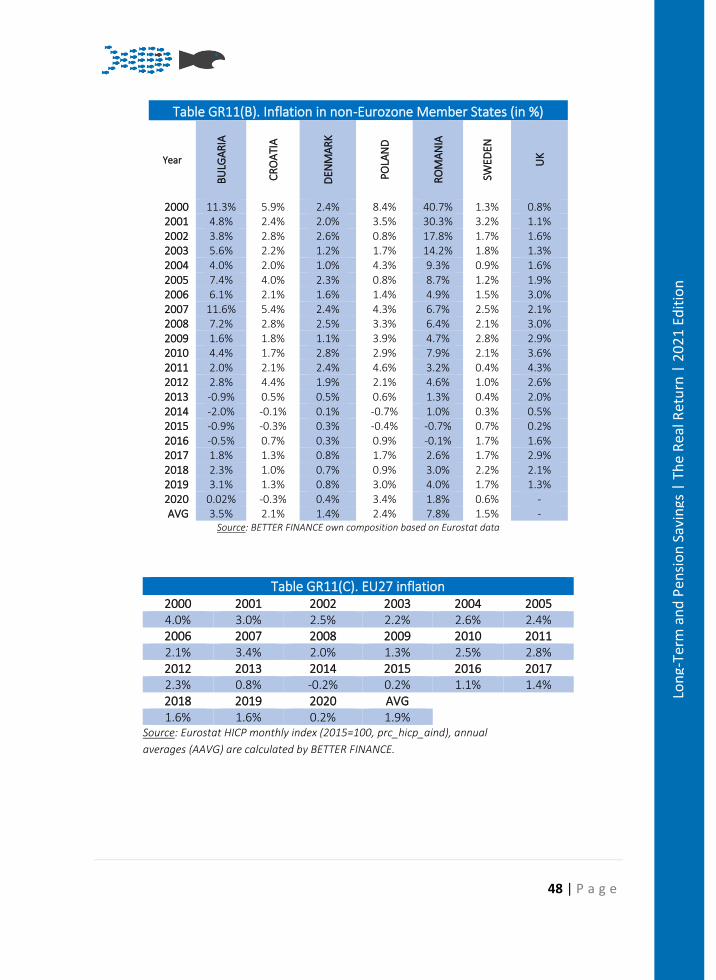
48 | P a g e
Lon
g-Te
rm a
nd
Pen
sio
n S
avin
gs |
Th
e R
eal R
etu
rn |
20
21
Edit
ion
Table GR11(B). Inflation in non-Eurozone Member States (in %)
Year
BU
LGA
RIA
CR
OA
TIA
DEN
MA
RK
POLA
ND
RO
MA
NIA
SWED
EN
UK
2000 11.3% 5.9% 2.4% 8.4% 40.7% 1.3% 0.8% 2001 4.8% 2.4% 2.0% 3.5% 30.3% 3.2% 1.1% 2002 3.8% 2.8% 2.6% 0.8% 17.8% 1.7% 1.6% 2003 5.6% 2.2% 1.2% 1.7% 14.2% 1.8% 1.3% 2004 4.0% 2.0% 1.0% 4.3% 9.3% 0.9% 1.6% 2005 7.4% 4.0% 2.3% 0.8% 8.7% 1.2% 1.9% 2006 6.1% 2.1% 1.6% 1.4% 4.9% 1.5% 3.0% 2007 11.6% 5.4% 2.4% 4.3% 6.7% 2.5% 2.1% 2008 7.2% 2.8% 2.5% 3.3% 6.4% 2.1% 3.0% 2009 1.6% 1.8% 1.1% 3.9% 4.7% 2.8% 2.9% 2010 4.4% 1.7% 2.8% 2.9% 7.9% 2.1% 3.6% 2011 2.0% 2.1% 2.4% 4.6% 3.2% 0.4% 4.3% 2012 2.8% 4.4% 1.9% 2.1% 4.6% 1.0% 2.6% 2013 -0.9% 0.5% 0.5% 0.6% 1.3% 0.4% 2.0% 2014 -2.0% -0.1% 0.1% -0.7% 1.0% 0.3% 0.5% 2015 -0.9% -0.3% 0.3% -0.4% -0.7% 0.7% 0.2% 2016 -0.5% 0.7% 0.3% 0.9% -0.1% 1.7% 1.6% 2017 1.8% 1.3% 0.8% 1.7% 2.6% 1.7% 2.9% 2018 2.3% 1.0% 0.7% 0.9% 3.0% 2.2% 2.1% 2019 3.1% 1.3% 0.8% 3.0% 4.0% 1.7% 1.3% 2020 0.02% -0.3% 0.4% 3.4% 1.8% 0.6% - AVG 3.5% 2.1% 1.4% 2.4% 7.8% 1.5% -
Source: BETTER FINANCE own composition based on Eurostat data
Table GR11(C). EU27 inflation 2000 2001 2002 2003 2004 2005 4.0% 3.0% 2.5% 2.2% 2.6% 2.4% 2006 2007 2008 2009 2010 2011 2.1% 3.4% 2.0% 1.3% 2.5% 2.8% 2012 2013 2014 2015 2016 2017 2.3% 0.8% -0.2% 0.2% 1.1% 1.4% 2018 2019 2020 AVG 1.6% 1.6% 0.2% 1.9%
Source: Eurostat HICP monthly index (2015=100, prc_hicp_aind), annual
averages (AAVG) are calculated by BETTER FINANCE.
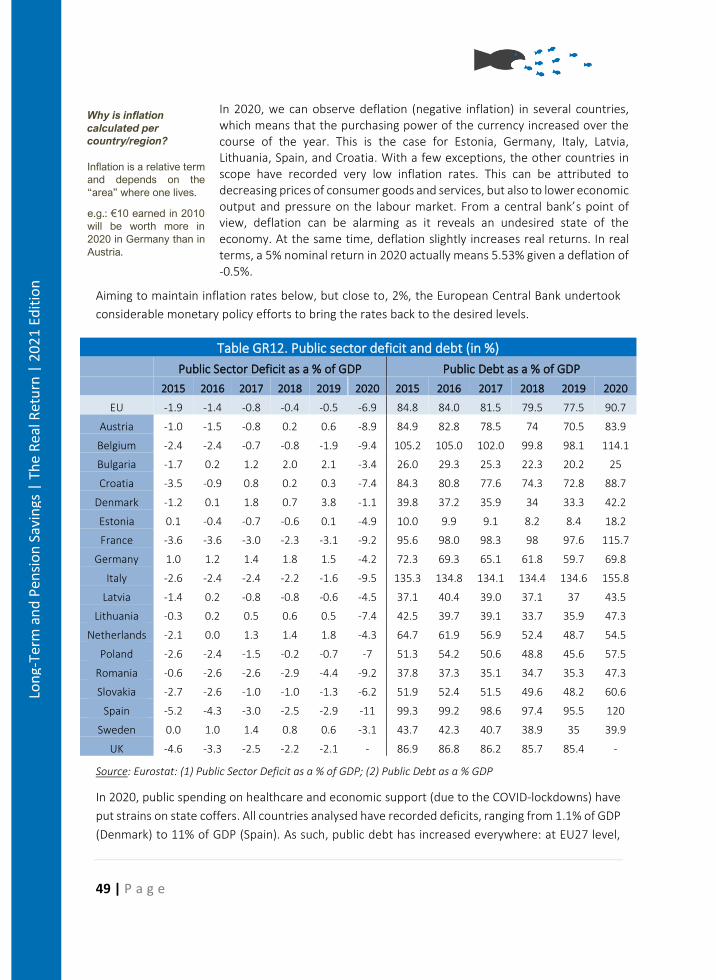
49 | P a g e
Lon
g-Te
rm a
nd
Pen
sio
n S
avin
gs |
Th
e R
eal R
etu
rn |
20
21
Edit
ion
Why is inflation
calculated per
country/region?
Inflation is a relative term
and depends on the
“area” where one lives.
e.g.: €10 earned in 2010
will be worth more in
2020 in Germany than in
Austria.
In 2020, we can observe deflation (negative inflation) in several countries, which means that the purchasing power of the currency increased over the course of the year. This is the case for Estonia, Germany, Italy, Latvia, Lithuania, Spain, and Croatia. With a few exceptions, the other countries in scope have recorded very low inflation rates. This can be attributed to decreasing prices of consumer goods and services, but also to lower economic output and pressure on the labour market. From a central bank’s point of view, deflation can be alarming as it reveals an undesired state of the economy. At the same time, deflation slightly increases real returns. In real terms, a 5% nominal return in 2020 actually means 5.53% given a deflation of -0.5%.
Aiming to maintain inflation rates below, but close to, 2%, the European Central Bank undertook
considerable monetary policy efforts to bring the rates back to the desired levels.
Table GR12. Public sector deficit and debt (in %)
Public Sector Deficit as a % of GDP Public Debt as a % of GDP
2015 2016 2017 2018 2019 2020 2015 2016 2017 2018 2019 2020
EU -1.9 -1.4 -0.8 -0.4 -0.5 -6.9 84.8 84.0 81.5 79.5 77.5 90.7
Austria -1.0 -1.5 -0.8 0.2 0.6 -8.9 84.9 82.8 78.5 74 70.5 83.9
Belgium -2.4 -2.4 -0.7 -0.8 -1.9 -9.4 105.2 105.0 102.0 99.8 98.1 114.1
Bulgaria -1.7 0.2 1.2 2.0 2.1 -3.4 26.0 29.3 25.3 22.3 20.2 25
Croatia -3.5 -0.9 0.8 0.2 0.3 -7.4 84.3 80.8 77.6 74.3 72.8 88.7
Denmark -1.2 0.1 1.8 0.7 3.8 -1.1 39.8 37.2 35.9 34 33.3 42.2
Estonia 0.1 -0.4 -0.7 -0.6 0.1 -4.9 10.0 9.9 9.1 8.2 8.4 18.2
France -3.6 -3.6 -3.0 -2.3 -3.1 -9.2 95.6 98.0 98.3 98 97.6 115.7
Germany 1.0 1.2 1.4 1.8 1.5 -4.2 72.3 69.3 65.1 61.8 59.7 69.8
Italy -2.6 -2.4 -2.4 -2.2 -1.6 -9.5 135.3 134.8 134.1 134.4 134.6 155.8
Latvia -1.4 0.2 -0.8 -0.8 -0.6 -4.5 37.1 40.4 39.0 37.1 37 43.5
Lithuania -0.3 0.2 0.5 0.6 0.5 -7.4 42.5 39.7 39.1 33.7 35.9 47.3
Netherlands -2.1 0.0 1.3 1.4 1.8 -4.3 64.7 61.9 56.9 52.4 48.7 54.5
Poland -2.6 -2.4 -1.5 -0.2 -0.7 -7 51.3 54.2 50.6 48.8 45.6 57.5
Romania -0.6 -2.6 -2.6 -2.9 -4.4 -9.2 37.8 37.3 35.1 34.7 35.3 47.3
Slovakia -2.7 -2.6 -1.0 -1.0 -1.3 -6.2 51.9 52.4 51.5 49.6 48.2 60.6
Spain -5.2 -4.3 -3.0 -2.5 -2.9 -11 99.3 99.2 98.6 97.4 95.5 120
Sweden 0.0 1.0 1.4 0.8 0.6 -3.1 43.7 42.3 40.7 38.9 35 39.9
UK -4.6 -3.3 -2.5 -2.2 -2.1 - 86.9 86.8 86.2 85.7 85.4 -
Source: Eurostat: (1) Public Sector Deficit as a % of GDP; (2) Public Debt as a % GDP
In 2020, public spending on healthcare and economic support (due to the COVID-lockdowns) have
put strains on state coffers. All countries analysed have recorded deficits, ranging from 1.1% of GDP
(Denmark) to 11% of GDP (Spain). As such, public debt has increased everywhere: at EU27 level,
50 | P a g e
Lon
g-Te
rm a
nd
Pen
sio
n S
avin
gs |
Th
e R
eal R
etu
rn |
20
21
Edit
ion
public debt increased by 13.2 p.p., and in the countries analysed the public debt increase ranges
between 4.8 p.p. (Bulgaria) to 24.5 p.p. (Spain).
We recall the two criteria concerning public deficit and debt deriving from the Maastricht Treaty,
i.e., EU countries should not exceed:
• ”-3% ratio of the planned or actual government deficit to gross domestic product at market
prices”;36
• “60% for the ratio of government debt to gross domestic product at market prices”.37
In this light, more than half of the countries analysed are still under the 60% threshold and 16 out
of the 17 have exceeded the 3% deficit threshold. Data for the UK is no longer available from
Eurostat, so it was excluded from the analysis.
Asset Allocation
There are striking differences between the asset allocation of pension funds across countries and
products.
Equities dominate only in Poland and Lithuania, being the only two jurisdictions where pension
funds are more than 50% invested in shares. Bonds are the main portfolio component in 8 out of
10 countries, and at least 40% in another 6 countries. In the UK, Germany, Spain and Slovakia at
least a third of the capital is invested in collective investment scheme units or other instruments;
cash and deposits are marginally used, mostly for short-term liquidity purposes.
The average portfolio composition remained almost constant, with a slight shift from liquidity and
bonds to collective investment schemes (11% in 2015 to 15% in 2020) across the jurisdictions
analysed in this report.
The decrease in government bond interest rates since 1999 have had a positive impact on
outstanding assets, especially in countries where this asset class dominates, but it reduces the
capacity to provide a good remuneration on new investment flows. The downside, starting in 2019,
is that yields for sovereign bonds have started to turn negative.
In this edition we also continue to observe striking differences between pension funds’ asset allocations across European countries as shown by the following table:38
36 Article 1 of the Protocol No. 12 on the excessive deficit procedure of the Treaty on European Union, OJ C 115, 9.5.2008, p. 279–280. 37 Ibid. 38 We could not find any available data for France.
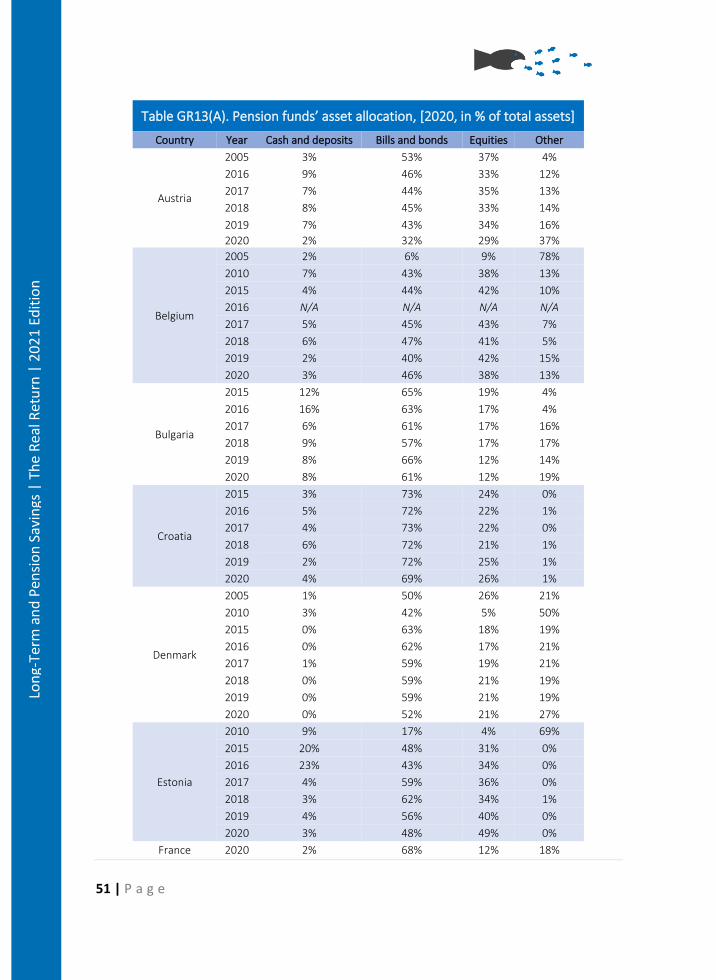
51 | P a g e
Lon
g-Te
rm a
nd
Pen
sio
n S
avin
gs |
Th
e R
eal R
etu
rn |
20
21
Edit
ion
Table GR13(A). Pension funds’ asset allocation, [2020, in % of total assets]
Country Year Cash and deposits Bills and bonds Equities Other
Austria
2005 3% 53% 37% 4%
2016 9% 46% 33% 12%
2017 7% 44% 35% 13%
2018 8% 45% 33% 14%
2019 7% 43% 34% 16%
2020 2% 32% 29% 37%
Belgium
2005 2% 6% 9% 78%
2010 7% 43% 38% 13%
2015 4% 44% 42% 10%
2016 N/A N/A N/A N/A
2017 5% 45% 43% 7%
2018 6% 47% 41% 5%
2019 2% 40% 42% 15%
2020 3% 46% 38% 13%
Bulgaria
2015 12% 65% 19% 4%
2016 16% 63% 17% 4%
2017 6% 61% 17% 16%
2018 9% 57% 17% 17%
2019 8% 66% 12% 14%
2020 8% 61% 12% 19%
Croatia
2015 3% 73% 24% 0%
2016 5% 72% 22% 1%
2017 4% 73% 22% 0%
2018 6% 72% 21% 1%
2019 2% 72% 25% 1%
2020 4% 69% 26% 1%
Denmark
2005 1% 50% 26% 21%
2010 3% 42% 5% 50%
2015 0% 63% 18% 19%
2016 0% 62% 17% 21%
2017 1% 59% 19% 21%
2018 0% 59% 21% 19%
2019 0% 59% 21% 19%
2020 0% 52% 21% 27%
Estonia
2010 9% 17% 4% 69%
2015 20% 48% 31% 0%
2016 23% 43% 34% 0%
2017 4% 59% 36% 0%
2018 3% 62% 34% 1%
2019 4% 56% 40% 0%
2020 3% 48% 49% 0%
France 2020 2% 68% 12% 18%
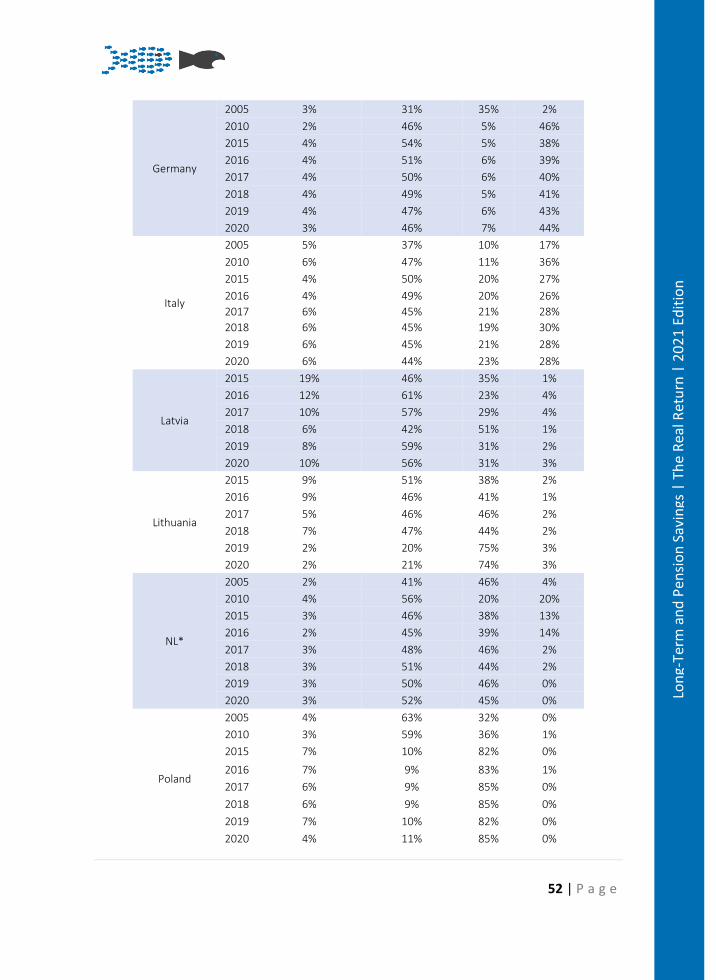
52 | P a g e
Lon
g-Te
rm a
nd
Pen
sio
n S
avin
gs |
Th
e R
eal R
etu
rn |
20
21
Edit
ion
Germany
2005 3% 31% 35% 2%
2010 2% 46% 5% 46%
2015 4% 54% 5% 38%
2016 4% 51% 6% 39%
2017 4% 50% 6% 40%
2018 4% 49% 5% 41%
2019 4% 47% 6% 43%
2020 3% 46% 7% 44%
Italy
2005 5% 37% 10% 17%
2010 6% 47% 11% 36%
2015 4% 50% 20% 27%
2016 4% 49% 20% 26%
2017 6% 45% 21% 28%
2018 6% 45% 19% 30%
2019 6% 45% 21% 28%
2020 6% 44% 23% 28%
Latvia
2015 19% 46% 35% 1%
2016 12% 61% 23% 4%
2017 10% 57% 29% 4%
2018 6% 42% 51% 1%
2019 8% 59% 31% 2%
2020 10% 56% 31% 3%
Lithuania
2015 9% 51% 38% 2%
2016 9% 46% 41% 1%
2017 5% 46% 46% 2%
2018 7% 47% 44% 2%
2019 2% 20% 75% 3%
2020 2% 21% 74% 3%
NL*
2005 2% 41% 46% 4%
2010 4% 56% 20% 20%
2015 3% 46% 38% 13%
2016 2% 45% 39% 14%
2017 3% 48% 46% 2%
2018 3% 51% 44% 2%
2019 3% 50% 46% 0%
2020 3% 52% 45% 0%
Poland
2005 4% 63% 32% 0%
2010 3% 59% 36% 1%
2015 7% 10% 82% 0%
2016 7% 9% 83% 1%
2017 6% 9% 85% 0%
2018 6% 9% 85% 0%
2019 7% 10% 82% 0%
2020 4% 11% 85% 0%
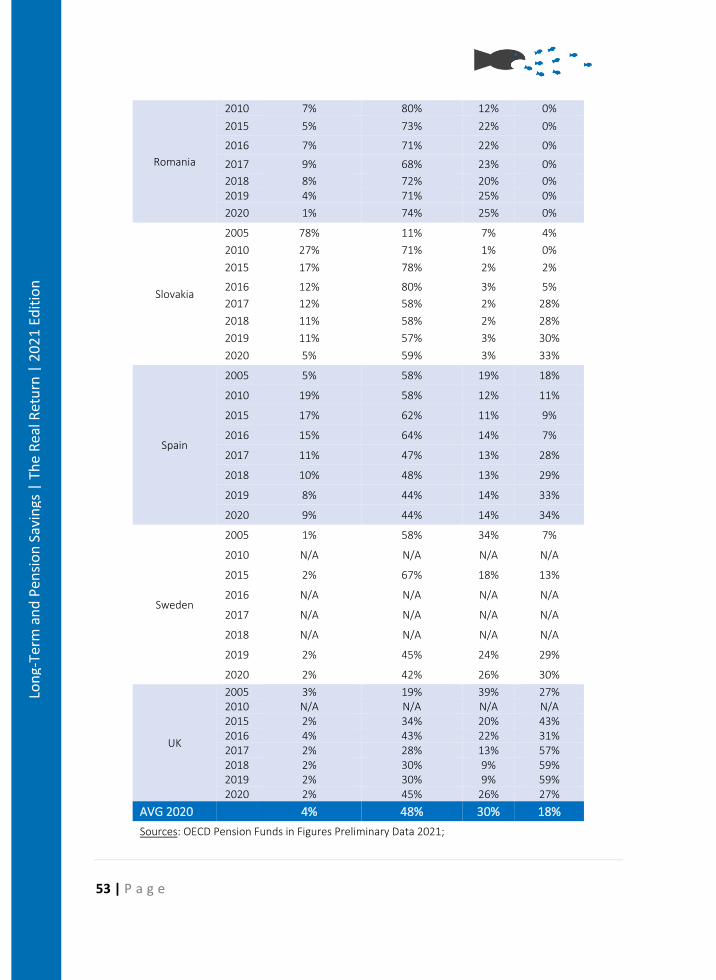
53 | P a g e
Lon
g-Te
rm a
nd
Pen
sio
n S
avin
gs |
Th
e R
eal R
etu
rn |
20
21
Edit
ion
Romania
2010 7% 80% 12% 0%
2015 5% 73% 22% 0%
2016 7% 71% 22% 0%
2017 9% 68% 23% 0%
2018 8% 72% 20% 0% 2019 4% 71% 25% 0%
2020 1% 74% 25% 0%
Slovakia
2005 78% 11% 7% 4%
2010 27% 71% 1% 0%
2015 17% 78% 2% 2%
2016 12% 80% 3% 5%
2017 12% 58% 2% 28%
2018 11% 58% 2% 28%
2019 11% 57% 3% 30%
2020 5% 59% 3% 33%
Spain
2005 5% 58% 19% 18%
2010 19% 58% 12% 11%
2015 17% 62% 11% 9%
2016 15% 64% 14% 7%
2017 11% 47% 13% 28%
2018 10% 48% 13% 29%
2019 8% 44% 14% 33%
2020 9% 44% 14% 34%
Sweden
2005 1% 58% 34% 7%
2010 N/A N/A N/A N/A
2015 2% 67% 18% 13%
2016 N/A N/A N/A N/A
2017 N/A N/A N/A N/A
2018 N/A N/A N/A N/A
2019 2% 45% 24% 29%
2020 2% 42% 26% 30%
UK
2005 3% 19% 39% 27% 2010 N/A N/A N/A N/A 2015 2% 34% 20% 43% 2016 4% 43% 22% 31% 2017 2% 28% 13% 57% 2018 2% 30% 9% 59% 2019 2% 30% 9% 59% 2020 2% 45% 26% 27%
AVG 2020 4% 48% 30% 18%
Sources: OECD Pension Funds in Figures Preliminary Data 2021;
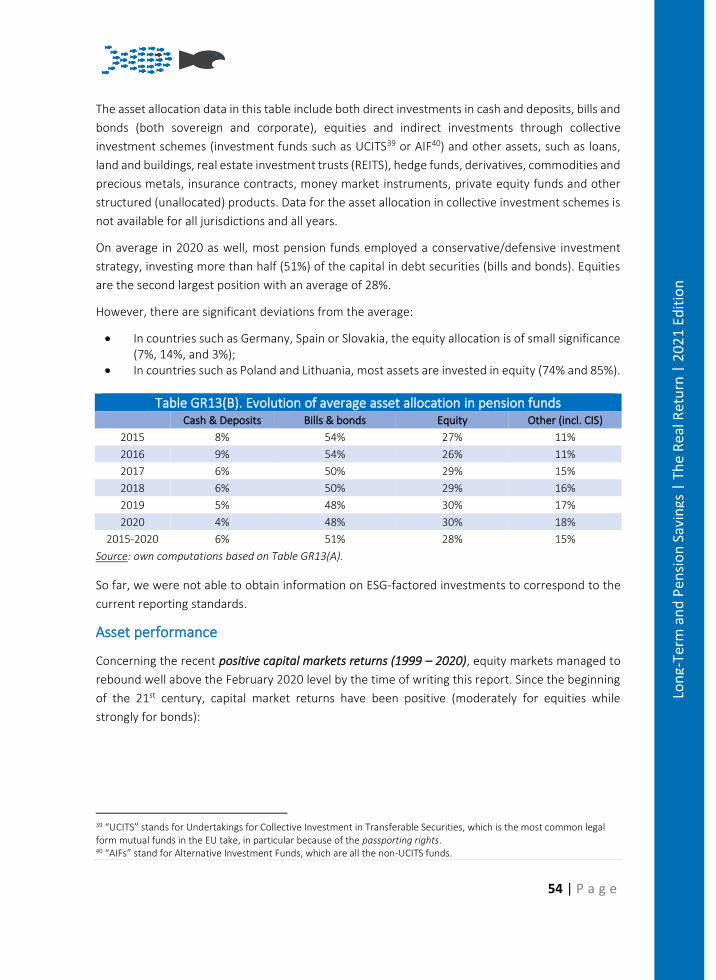
54 | P a g e
Lon
g-Te
rm a
nd
Pen
sio
n S
avin
gs |
Th
e R
eal R
etu
rn |
20
21
Edit
ion
The asset allocation data in this table include both direct investments in cash and deposits, bills and
bonds (both sovereign and corporate), equities and indirect investments through collective
investment schemes (investment funds such as UCITS39 or AIF40) and other assets, such as loans,
land and buildings, real estate investment trusts (REITS), hedge funds, derivatives, commodities and
precious metals, insurance contracts, money market instruments, private equity funds and other
structured (unallocated) products. Data for the asset allocation in collective investment schemes is
not available for all jurisdictions and all years.
On average in 2020 as well, most pension funds employed a conservative/defensive investment
strategy, investing more than half (51%) of the capital in debt securities (bills and bonds). Equities
are the second largest position with an average of 28%.
However, there are significant deviations from the average:
• In countries such as Germany, Spain or Slovakia, the equity allocation is of small significance (7%, 14%, and 3%);
• In countries such as Poland and Lithuania, most assets are invested in equity (74% and 85%).
Table GR13(B). Evolution of average asset allocation in pension funds Cash & Deposits Bills & bonds Equity Other (incl. CIS)
2015 8% 54% 27% 11%
2016 9% 54% 26% 11%
2017 6% 50% 29% 15%
2018 6% 50% 29% 16%
2019 5% 48% 30% 17%
2020 4% 48% 30% 18%
2015-2020 6% 51% 28% 15%
Source: own computations based on Table GR13(A).
So far, we were not able to obtain information on ESG-factored investments to correspond to the
current reporting standards.
Asset performance
Concerning the recent positive capital markets returns (1999 – 2020), equity markets managed to
rebound well above the February 2020 level by the time of writing this report. Since the beginning
of the 21st century, capital market returns have been positive (moderately for equities while
strongly for bonds):
39 “UCITS” stands for Undertakings for Collective Investment in Transferable Securities, which is the most common legal form mutual funds in the EU take, in particular because of the passporting rights. 40 “AIFs” stand for Alternative Investment Funds, which are all the non-UCITS funds.
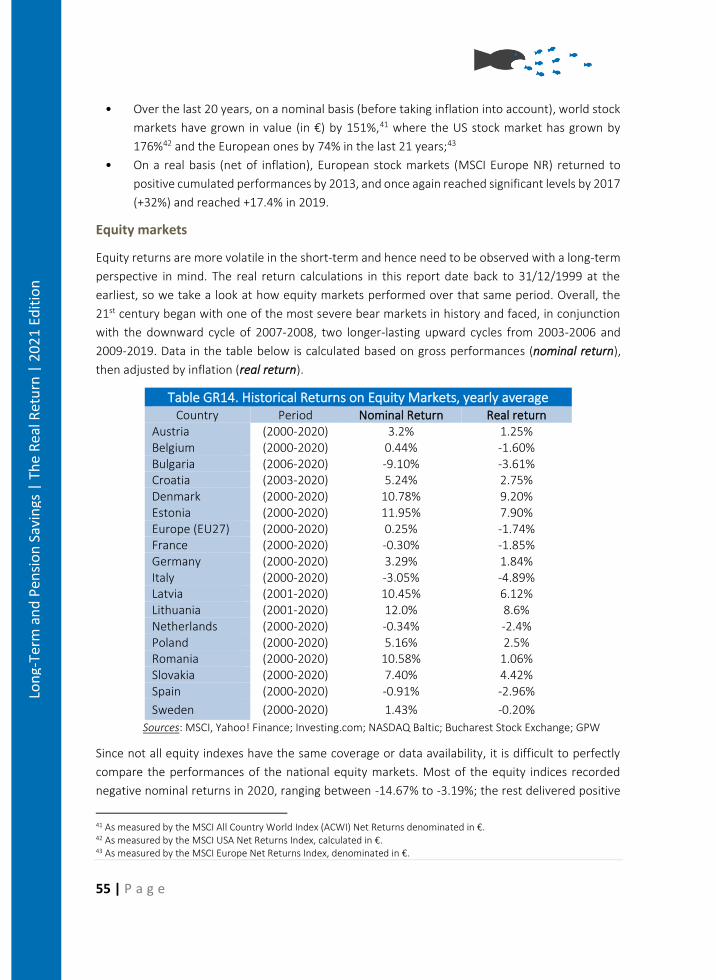
55 | P a g e
Lon
g-Te
rm a
nd
Pen
sio
n S
avin
gs |
Th
e R
eal R
etu
rn |
20
21
Edit
ion
• Over the last 20 years, on a nominal basis (before taking inflation into account), world stock
markets have grown in value (in €) by 151%,41 where the US stock market has grown by
176%42 and the European ones by 74% in the last 21 years;43
• On a real basis (net of inflation), European stock markets (MSCI Europe NR) returned to
positive cumulated performances by 2013, and once again reached significant levels by 2017
(+32%) and reached +17.4% in 2019.
Equity markets
Equity returns are more volatile in the short-term and hence need to be observed with a long-term
perspective in mind. The real return calculations in this report date back to 31/12/1999 at the
earliest, so we take a look at how equity markets performed over that same period. Overall, the
21st century began with one of the most severe bear markets in history and faced, in conjunction
with the downward cycle of 2007-2008, two longer-lasting upward cycles from 2003-2006 and
2009-2019. Data in the table below is calculated based on gross performances (nominal return),
then adjusted by inflation (real return).
Table GR14. Historical Returns on Equity Markets, yearly average Country Period Nominal Return Real return
Austria (2000-2020) 3.2% 1.25% Belgium (2000-2020) 0.44% -1.60% Bulgaria (2006-2020) -9.10% -3.61% Croatia (2003-2020) 5.24% 2.75% Denmark (2000-2020) 10.78% 9.20% Estonia (2000-2020) 11.95% 7.90% Europe (EU27) (2000-2020) 0.25% -1.74% France (2000-2020) -0.30% -1.85% Germany (2000-2020) 3.29% 1.84% Italy (2000-2020) -3.05% -4.89% Latvia (2001-2020) 10.45% 6.12% Lithuania (2001-2020) 12.0% 8.6% Netherlands (2000-2020) -0.34% -2.4% Poland (2000-2020) 5.16% 2.5% Romania (2000-2020) 10.58% 1.06% Slovakia (2000-2020) 7.40% 4.42% Spain (2000-2020) -0.91% -2.96%
Sweden (2000-2020) 1.43% -0.20%
Sources: MSCI, Yahoo! Finance; Investing.com; NASDAQ Baltic; Bucharest Stock Exchange; GPW
Since not all equity indexes have the same coverage or data availability, it is difficult to perfectly
compare the performances of the national equity markets. Most of the equity indices recorded
negative nominal returns in 2020, ranging between -14.67% to -3.19%; the rest delivered positive
41 As measured by the MSCI All Country World Index (ACWI) Net Returns denominated in €. 42 As measured by the MSCI USA Net Returns Index, calculated in €. 43 As measured by the MSCI Europe Net Returns Index, denominated in €.
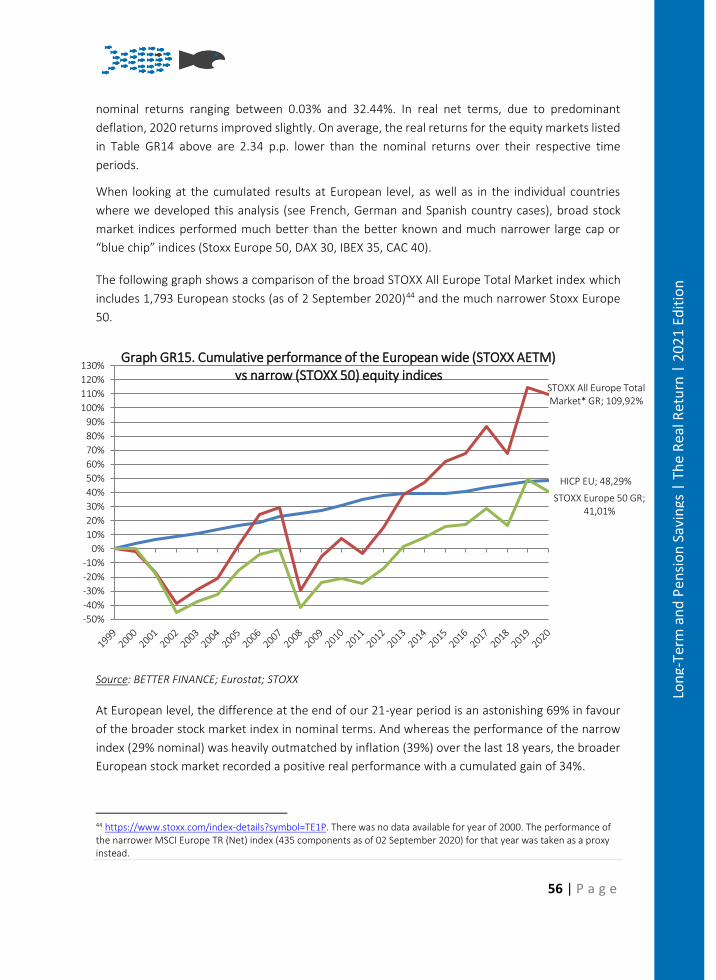
56 | P a g e
Lon
g-Te
rm a
nd
Pen
sio
n S
avin
gs |
Th
e R
eal R
etu
rn |
20
21
Edit
ion
nominal returns ranging between 0.03% and 32.44%. In real net terms, due to predominant
deflation, 2020 returns improved slightly. On average, the real returns for the equity markets listed
in Table GR14 above are 2.34 p.p. lower than the nominal returns over their respective time
periods.
When looking at the cumulated results at European level, as well as in the individual countries
where we developed this analysis (see French, German and Spanish country cases), broad stock
market indices performed much better than the better known and much narrower large cap or
“blue chip” indices (Stoxx Europe 50, DAX 30, IBEX 35, CAC 40).
The following graph shows a comparison of the broad STOXX All Europe Total Market index which
includes 1,793 European stocks (as of 2 September 2020)44 and the much narrower Stoxx Europe
50.
Source: BETTER FINANCE; Eurostat; STOXX
At European level, the difference at the end of our 21-year period is an astonishing 69% in favour
of the broader stock market index in nominal terms. And whereas the performance of the narrow
index (29% nominal) was heavily outmatched by inflation (39%) over the last 18 years, the broader
European stock market recorded a positive real performance with a cumulated gain of 34%.
44 https://www.stoxx.com/index-details?symbol=TE1P. There was no data available for year of 2000. The performance of the narrower MSCI Europe TR (Net) index (435 components as of 02 September 2020) for that year was taken as a proxy instead.
HICP EU; 48,29%
STOXX All Europe Total Market* GR; 109,92%
STOXX Europe 50 GR; 41,01%
-50%
-40%
-30%
-20%
-10%
0%
10%
20%
30%
40%
50%
60%
70%
80%
90%
100%
110%
120%
130%Graph GR15. Cumulative performance of the European wide (STOXX AETM)
vs narrow (STOXX 50) equity indices
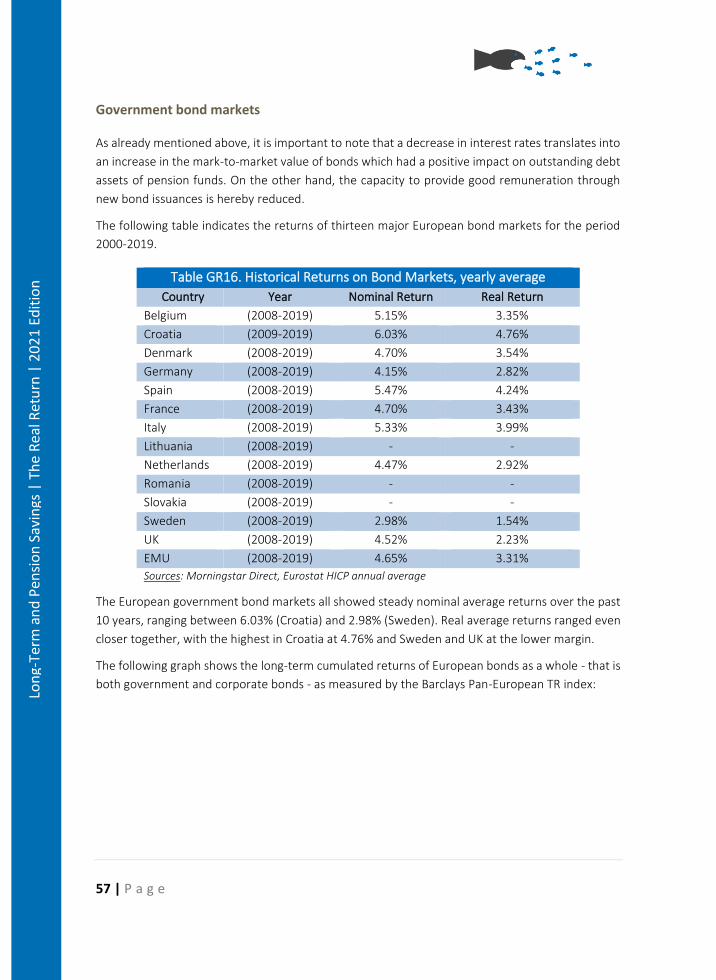
57 | P a g e
Lon
g-Te
rm a
nd
Pen
sio
n S
avin
gs |
Th
e R
eal R
etu
rn |
20
21
Edit
ion
Government bond markets
As already mentioned above, it is important to note that a decrease in interest rates translates into
an increase in the mark-to-market value of bonds which had a positive impact on outstanding debt
assets of pension funds. On the other hand, the capacity to provide good remuneration through
new bond issuances is hereby reduced.
The following table indicates the returns of thirteen major European bond markets for the period
2000-2019.
Table GR16. Historical Returns on Bond Markets, yearly average
Country Year Nominal Return Real Return
Belgium (2008-2019) 5.15% 3.35%
Croatia (2009-2019) 6.03% 4.76%
Denmark (2008-2019) 4.70% 3.54%
Germany (2008-2019) 4.15% 2.82%
Spain (2008-2019) 5.47% 4.24%
France (2008-2019) 4.70% 3.43%
Italy (2008-2019) 5.33% 3.99%
Lithuania (2008-2019) - -
Netherlands (2008-2019) 4.47% 2.92%
Romania (2008-2019) - -
Slovakia (2008-2019) - -
Sweden (2008-2019) 2.98% 1.54%
UK (2008-2019) 4.52% 2.23%
EMU (2008-2019) 4.65% 3.31%
Sources: Morningstar Direct, Eurostat HICP annual average
The European government bond markets all showed steady nominal average returns over the past
10 years, ranging between 6.03% (Croatia) and 2.98% (Sweden). Real average returns ranged even
closer together, with the highest in Croatia at 4.76% and Sweden and UK at the lower margin.
The following graph shows the long-term cumulated returns of European bonds as a whole - that is
both government and corporate bonds - as measured by the Barclays Pan-European TR index:
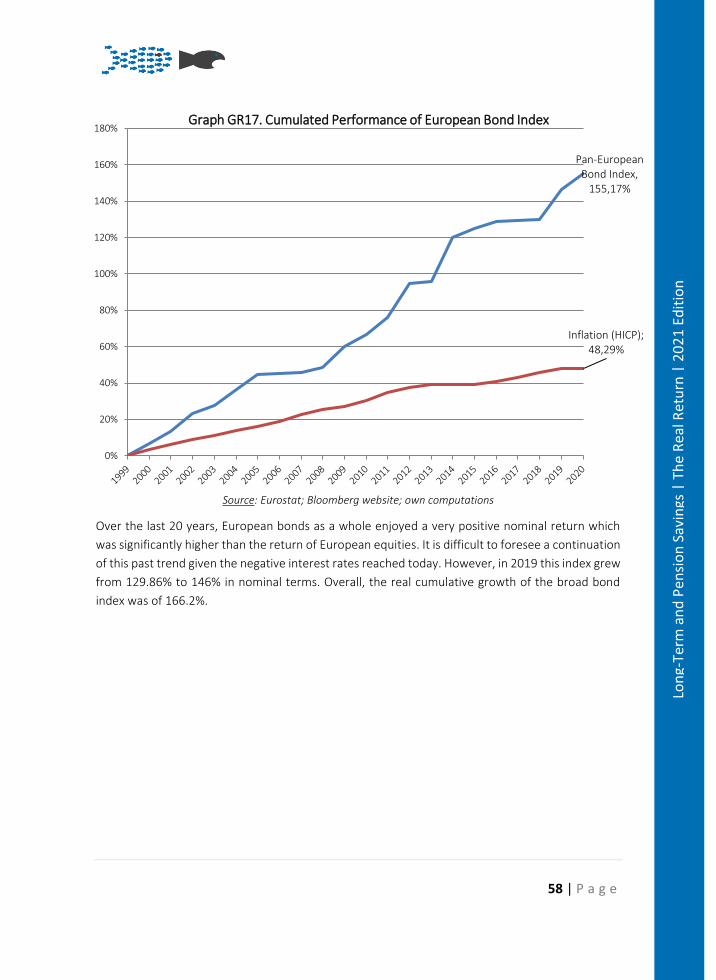
58 | P a g e
Lon
g-Te
rm a
nd
Pen
sio
n S
avin
gs |
Th
e R
eal R
etu
rn |
20
21
Edit
ion
Source: Eurostat; Bloomberg website; own computations
Over the last 20 years, European bonds as a whole enjoyed a very positive nominal return which
was significantly higher than the return of European equities. It is difficult to foresee a continuation
of this past trend given the negative interest rates reached today. However, in 2019 this index grew
from 129.86% to 146% in nominal terms. Overall, the real cumulative growth of the broad bond
index was of 166.2%.
Pan-European Bond Index,
155,17%
Inflation (HICP); 48,29%
0%
20%
40%
60%
80%
100%
120%
140%
160%
180%Graph GR17. Cumulated Performance of European Bond Index
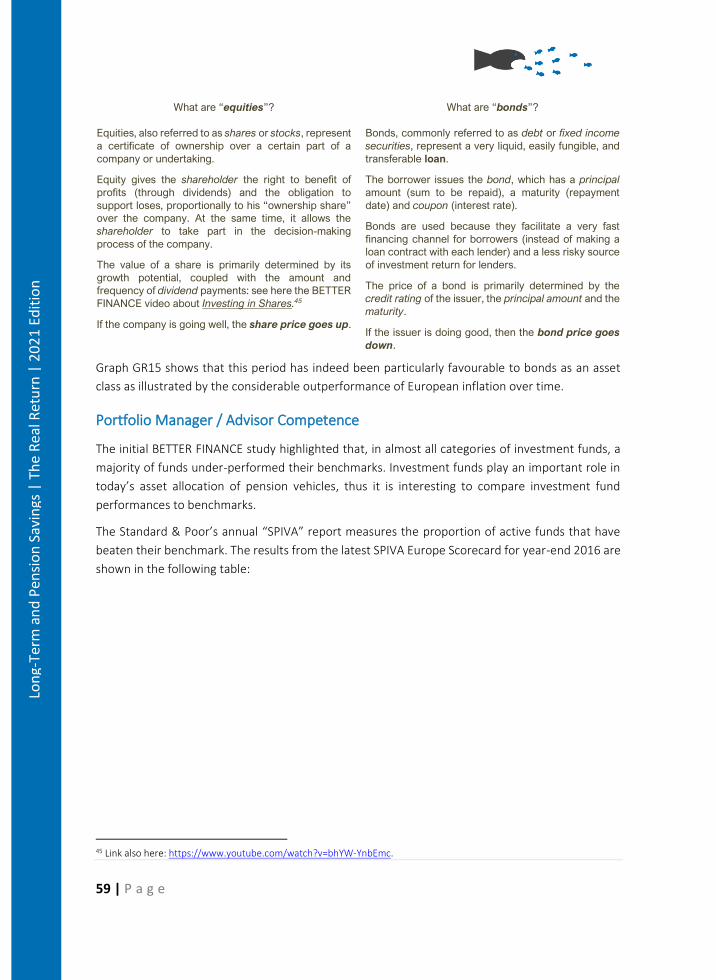
59 | P a g e
Lon
g-Te
rm a
nd
Pen
sio
n S
avin
gs |
Th
e R
eal R
etu
rn |
20
21
Edit
ion
What are “equities”?
Equities, also referred to as shares or stocks, represent
a certificate of ownership over a certain part of a
company or undertaking.
Equity gives the shareholder the right to benefit of
profits (through dividends) and the obligation to
support loses, proportionally to his “ownership share”
over the company. At the same time, it allows the
shareholder to take part in the decision-making
process of the company.
The value of a share is primarily determined by its
growth potential, coupled with the amount and
frequency of dividend payments: see here the BETTER
FINANCE video about Investing in Shares.45
If the company is going well, the share price goes up.
What are “bonds”?
Bonds, commonly referred to as debt or fixed income
securities, represent a very liquid, easily fungible, and
transferable loan.
The borrower issues the bond, which has a principal
amount (sum to be repaid), a maturity (repayment
date) and coupon (interest rate).
Bonds are used because they facilitate a very fast
financing channel for borrowers (instead of making a
loan contract with each lender) and a less risky source
of investment return for lenders.
The price of a bond is primarily determined by the
credit rating of the issuer, the principal amount and the
maturity.
If the issuer is doing good, then the bond price goes
down.
Graph GR15 shows that this period has indeed been particularly favourable to bonds as an asset
class as illustrated by the considerable outperformance of European inflation over time.
Portfolio Manager / Advisor Competence
The initial BETTER FINANCE study highlighted that, in almost all categories of investment funds, a
majority of funds under-performed their benchmarks. Investment funds play an important role in
today’s asset allocation of pension vehicles, thus it is interesting to compare investment fund
performances to benchmarks.
The Standard & Poor’s annual “SPIVA” report measures the proportion of active funds that have
beaten their benchmark. The results from the latest SPIVA Europe Scorecard for year-end 2016 are
shown in the following table:
45 Link also here: https://www.youtube.com/watch?v=bhYW-YnbEmc.
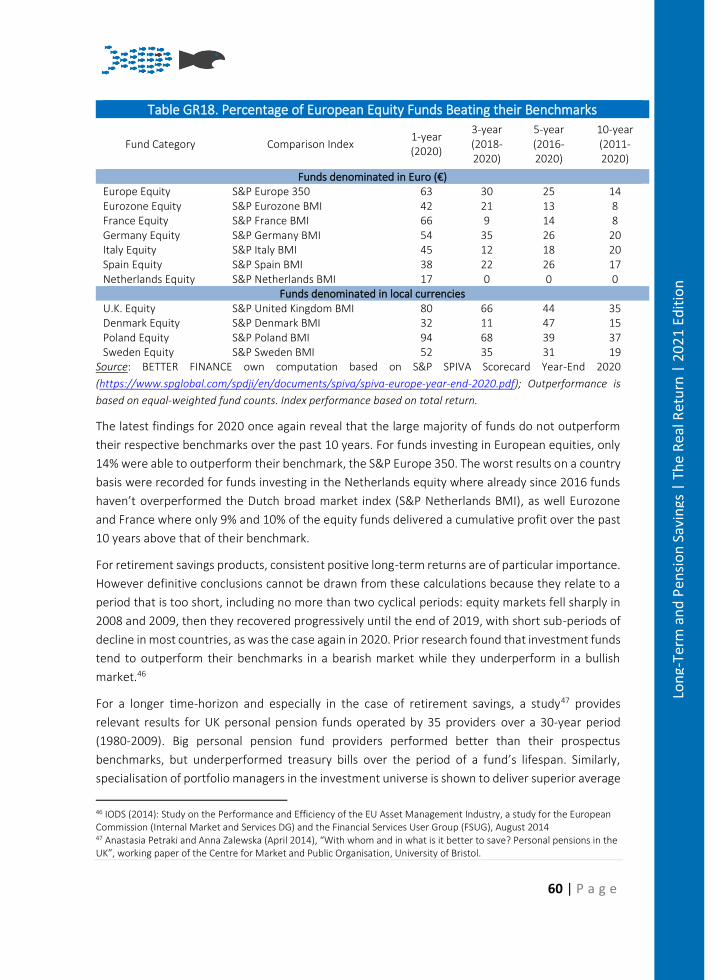
60 | P a g e
Lon
g-Te
rm a
nd
Pen
sio
n S
avin
gs |
Th
e R
eal R
etu
rn |
20
21
Edit
ion
Table GR18. Percentage of European Equity Funds Beating their Benchmarks
Fund Category Comparison Index 1-year (2020)
3-year (2018-2020)
5-year (2016-2020)
10-year (2011-2020)
Funds denominated in Euro (€) Europe Equity S&P Europe 350 63 30 25 14 Eurozone Equity S&P Eurozone BMI 42 21 13 8 France Equity S&P France BMI 66 9 14 8 Germany Equity S&P Germany BMI 54 35 26 20 Italy Equity S&P Italy BMI 45 12 18 20 Spain Equity S&P Spain BMI 38 22 26 17 Netherlands Equity S&P Netherlands BMI 17 0 0 0
Funds denominated in local currencies U.K. Equity S&P United Kingdom BMI 80 66 44 35 Denmark Equity S&P Denmark BMI 32 11 47 15 Poland Equity S&P Poland BMI 94 68 39 37 Sweden Equity S&P Sweden BMI 52 35 31 19
Source: BETTER FINANCE own computation based on S&P SPIVA Scorecard Year-End 2020
(https://www.spglobal.com/spdji/en/documents/spiva/spiva-europe-year-end-2020.pdf); Outperformance is
based on equal-weighted fund counts. Index performance based on total return.
The latest findings for 2020 once again reveal that the large majority of funds do not outperform
their respective benchmarks over the past 10 years. For funds investing in European equities, only
14% were able to outperform their benchmark, the S&P Europe 350. The worst results on a country
basis were recorded for funds investing in the Netherlands equity where already since 2016 funds
haven’t overperformed the Dutch broad market index (S&P Netherlands BMI), as well Eurozone
and France where only 9% and 10% of the equity funds delivered a cumulative profit over the past
10 years above that of their benchmark.
For retirement savings products, consistent positive long-term returns are of particular importance.
However definitive conclusions cannot be drawn from these calculations because they relate to a
period that is too short, including no more than two cyclical periods: equity markets fell sharply in
2008 and 2009, then they recovered progressively until the end of 2019, with short sub-periods of
decline in most countries, as was the case again in 2020. Prior research found that investment funds
tend to outperform their benchmarks in a bearish market while they underperform in a bullish
market.46
For a longer time-horizon and especially in the case of retirement savings, a study47 provides
relevant results for UK personal pension funds operated by 35 providers over a 30-year period
(1980-2009). Big personal pension fund providers performed better than their prospectus
benchmarks, but underperformed treasury bills over the period of a fund’s lifespan. Similarly,
specialisation of portfolio managers in the investment universe is shown to deliver superior average
46 IODS (2014): Study on the Performance and Efficiency of the EU Asset Management Industry, a study for the European Commission (Internal Market and Services DG) and the Financial Services User Group (FSUG), August 2014 47 Anastasia Petraki and Anna Zalewska (April 2014), “With whom and in what is it better to save? Personal pensions in the UK”, working paper of the Centre for Market and Public Organisation, University of Bristol.
61 | P a g e
Lon
g-Te
rm a
nd
Pen
sio
n S
avin
gs |
Th
e R
eal R
etu
rn |
20
21
Edit
ion
annual returns but does not show superior long-term performances. More generally, they found
that short-term performances based on arithmetic annual averages are not relevant indicators of
the long-term performance calculated as geometric compounded returns similar to the
methodology used in the present study. The authors also showed that younger funds perform
better than older ones, which are under lower competitive pressure given the cost of leaving a fund
to join a better performing one.
A research report published by BETTER FINANCE in 2019 analysed the drivers of over- or
underperformance of the comparison or benchmark index of EU Equity Retail Investment funds
domiciled in France, Belgium and Luxemburg. While only 2 funds out of 2,086 managed to
consistently deliver overperformance over 10 years between 2008-2017, the rest that managed to
beat their respective markets seem to have done so by coincidence or luck. 48
In attempting to give an explanation for the latter, the analysis deployed showed that fees are the
most negative factor for fund (over)performance or – in other words – “the more you pay, the less
you get”.49 More information on fees and charges is given in the following section.
IV. INVESTMENT CHARGES
Fees and commissions substantially reduce the performances of pension products, especially for
personal “packaged” pension products, and for unit-linked life-insurance. Charges are often
complex, opaque, and far from being harmonised between different pension providers and
products. Some countries have started to impose overall caps on fees for some pension products
(UK, Romania, Latvia).
Findings of the initial study by BETTER FINANCE on the opacity and weight of charges did not change
dramatically over the successive research reports. Generally speaking, charges are heavier on
personal pension products than on occupational pension funds, as employers are in better position
to negotiate with competing providers than individuals are.
To tackle this complexity, some pension providers - for example, some auto-enrolment schemes in
the United Kingdom – set up fixed costs per member, but this penalises low paid workers.
Following the OFT study, the Department for Work and Pensions issued a regulation which took
effect on 6 April 201550. The default schemes used by employers to meet their automatic enrolment
duties are subject to a 0.75% cap on AMCs. The cap applies to most charges, excluding transaction
costs. Moreover, an audit was conducted on schemes being “at risk of being poor value for money”.
It found that about one third of surveyed schemes had AMCs superior to 1% and that a significant
48 BETTER FINANCE, Study on the Correlation between Cost and Performance of EU Equity Retail Funds (June 2019) https://betterfinance.eu/wp-content/uploads/BETTER1.pdf. 49 Press Release, “New research by BETTER FINANCE on the Correlation between Costs and Performance of EU Retail Equity Funds without a doubt establishes a negative correlation between returns and fees” https://betterfinance.eu/publication/the-more-you-pay-the-less-you-are-likely-to-get/. 50 https://www.legislation.gov.uk/ukpga/2015/8/contents/enacted
62 | P a g e
Lon
g-Te
rm a
nd
Pen
sio
n S
avin
gs |
Th
e R
eal R
etu
rn |
20
21
Edit
ion
number of savers would have to pay exit fees superior to 10% in case they wanted to switch to a
better performing fund. Moreover, starting from October 2017, existing early exit charges in
occupational pension schemes cannot exceed 1% of the member’s benefits and no new early exit
charges can be imposed on members who joined that scheme after 10 October 2017.
V. Taxation
Finally, taxes also reduce the performance of investments. The general model applied to pension
products is deferred taxation, with contributions being deducted from taxable income and pension
pay-outs being taxed then. The accumulated capital can be withdrawn at least partially at
retirement as a lump-sum, which is often not taxable. Our calculations of net returns are based on
the most favourable case, i.e., assuming that the saver withdraws the maximum lump-sum possible.
One of the key elements of a pension system, as designed by the World Bank’s conceptual
framework of 1994,51 is to incentivise savings and private investments by giving fiscal advantages,
either as deferred taxation, exemptions, or tax reductions.
Pension taxation concerns three stages: contributions, investment returns and payments (benefit
drawdowns).
The general model applied to pension products is usually deferred taxation: contributions are
deducted from the taxable income and pensions (pay-outs) are taxed within the framework of
income tax or, usually, at a more favourable rate. Some countries are currently in the middle of a
transitional phase comprising proportionate deferred taxation which will lead to entire deferred
taxation in the future.
The so-called EET regime, “a form of taxation of pension plans, whereby contributions are exempt,
investment income and capital gains of the pension fund are also exempt, and benefits are taxed
from personal income taxation”52, is predominant in the countries covered by this research report.
There are only a few exceptions, like in Poland, where the reverse rule is applied: contributions are
paid from the taxable income while pensions are tax-free (the only exception from the TEE regime
are IKZEs – individual pension savings accounts). Pensions in Denmark are taxed at all three stages
with contributions to occupational pensions being partially deductible as the only exception.
Furthermore, in Bulgaria and for the funded pensions in Slovakia, one can even observe EEE regimes
with no pension taxation at all within defined tax exemption limits. In other countries, such as
France or Poland, specific conditions apply in order to be tax-exempt or not.
51 World Bank, ‘Averting the Old Age Crisis: Policies to Protect the Old and Promote Growth’ (1994) 10, http://documents.worldbank.org/curated/en/973571468174557899/pdf/multi-page.pdf. 52 OECD definition: https://stats.oecd.org/glossary/detail.asp?ID=5225
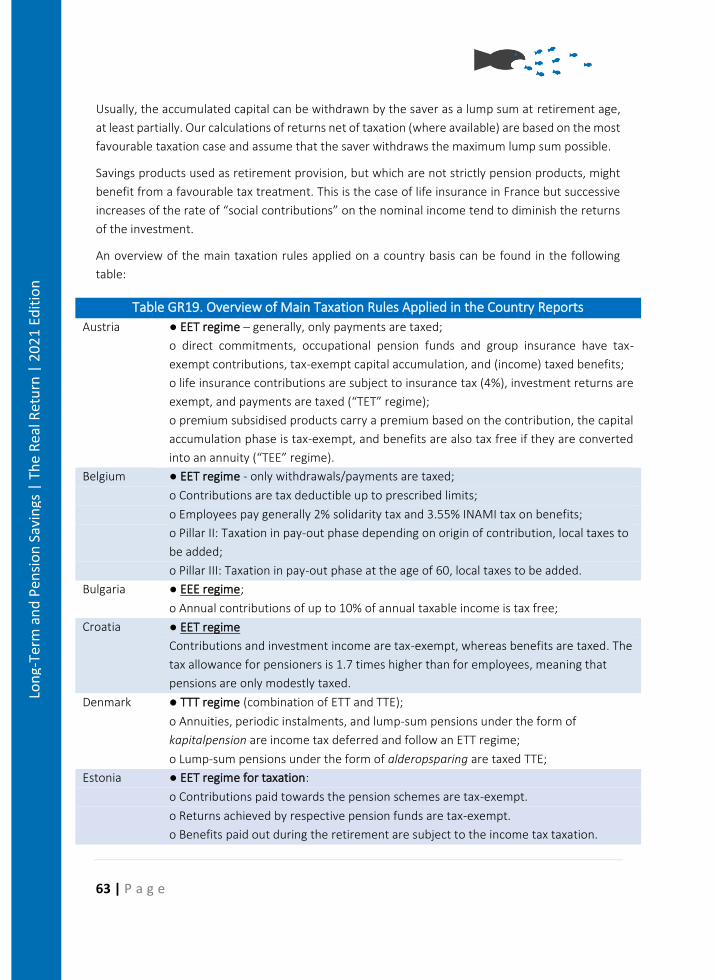
63 | P a g e
Lon
g-Te
rm a
nd
Pen
sio
n S
avin
gs |
Th
e R
eal R
etu
rn |
20
21
Edit
ion
Usually, the accumulated capital can be withdrawn by the saver as a lump sum at retirement age,
at least partially. Our calculations of returns net of taxation (where available) are based on the most
favourable taxation case and assume that the saver withdraws the maximum lump sum possible.
Savings products used as retirement provision, but which are not strictly pension products, might
benefit from a favourable tax treatment. This is the case of life insurance in France but successive
increases of the rate of “social contributions” on the nominal income tend to diminish the returns
of the investment.
An overview of the main taxation rules applied on a country basis can be found in the following
table:
Table GR19. Overview of Main Taxation Rules Applied in the Country Reports
Austria ● EET regime – generally, only payments are taxed;
o direct commitments, occupational pension funds and group insurance have tax-
exempt contributions, tax-exempt capital accumulation, and (income) taxed benefits;
o life insurance contributions are subject to insurance tax (4%), investment returns are
exempt, and payments are taxed (“TET” regime);
o premium subsidised products carry a premium based on the contribution, the capital
accumulation phase is tax-exempt, and benefits are also tax free if they are converted
into an annuity (“TEE” regime).
Belgium ● EET regime - only withdrawals/payments are taxed;
o Contributions are tax deductible up to prescribed limits;
o Employees pay generally 2% solidarity tax and 3.55% INAMI tax on benefits;
o Pillar II: Taxation in pay-out phase depending on origin of contribution, local taxes to
be added;
o Pillar III: Taxation in pay-out phase at the age of 60, local taxes to be added.
Bulgaria ● EEE regime;
o Annual contributions of up to 10% of annual taxable income is tax free;
Croatia ● EET regime
Contributions and investment income are tax-exempt, whereas benefits are taxed. The
tax allowance for pensioners is 1.7 times higher than for employees, meaning that
pensions are only modestly taxed.
Denmark ● TTT regime (combination of ETT and TTE);
o Annuities, periodic instalments, and lump-sum pensions under the form of
kapitalpension are income tax deferred and follow an ETT regime;
o Lump-sum pensions under the form of alderopsparing are taxed TTE;
Estonia ● EET regime for taxation:
o Contributions paid towards the pension schemes are tax-exempt.
o Returns achieved by respective pension funds are tax-exempt.
o Benefits paid out during the retirement are subject to the income tax taxation.
64 | P a g e
Lon
g-Te
rm a
nd
Pen
sio
n S
avin
gs |
Th
e R
eal R
etu
rn |
20
21
Edit
ion
France ● ETT regime;
o PERP, Prefon, Corem, CRH contributions are income tax deductible;
o Contributions to some DC pension plans (PERCO and PERP) are income tax
deductible but no deductibility from social levies. No tax deductibility for life insurance
contracts;
o taxation of employers’ contributions to corporate savings plans (PEE and PERCO) and
defined contribution plans (“Article 83”) increased from 8% to 20%.
o the minimum tax rate on life insurance income is now 23%
o pay-outs are taxed in the retirement phase (sometimes with tax reductions).
Germany ● EET regime, taxation divides retirement savings into three groups:
o Statutory pension insurance and the Rürup pension: deferred taxation; contributions
up to a deduction cap are exempted from taxation and generally subject to tax in its
entirety during the pay-out phase.
o Standard pension insurance or life insurance products: contributions to the products
come from taxed income; benefits are taxed at the personal income tax rate on the
corresponding earnings in the retirement phase
o Occupational pensions and the Riester pension: deferred taxation; contributions up
to a deduction cap are exempted from taxation and generally subject to tax in its
entirety during the pay-out phase.
Italy ● ETT regime, contributions are tax deductible up to prescribed limits;
o Accruals are taxed at 20% (12.5% on income derived from public bonds) in the
capital accumulation phase;
o Taxation in the pay-out phase varies from 9-15%.
● EET regime;
Latvia o Pillar II – Contributions are personal income tax deductible item and therefore the
contributions are not subject to additional personal taxation; Income or profits of the
fund are not subject to Latvian corporate income tax at the fund level; a general
principle for all investment and savings-based schemes to levy the income taxation on
the final beneficiary.
o Pillar III – Voluntary private pensions are generally taxed as Pillar II, however there
are deduction limits in the contribution phase: payments (contributions) made to
funds shall be deducted from the sum amount of annual taxable income, provided that
such payments do not exceed 10 % of the person’s annual taxable income.
Lithuania ● EEE regime;
o Employee contributions are tax-deductible even if they are higher than required; for
pillar III, there is a tax-refund policy during the contribution phase, which means that
the contributions of up to 25% of gross earnings, the income tax (15%) is returned;
Poland ● TEE regime for Employees Pension Programs (PPE) and Individual Retirement
Accounts (IKE); EET for Individual Retirement Savings Accounts (IKZE);
o benefits are taxed with a reduced flat-rate income tax (10%)
65 | P a g e
Lon
g-Te
rm a
nd
Pen
sio
n S
avin
gs |
Th
e R
eal R
etu
rn |
20
21
Edit
ion
● EET regime applies for both mandatory and voluntary pensions;
Romania o for funded pensions (Pillar II), pension benefits paid out during retirement will be
subject to a personal income tax (10% tax rate) above a certain level (€460 in 2018);
the social security contributions have been removed as of 2018 and are supported
completely from the consolidated state budget.
o for voluntary private pensions (Pillar III), contributions are tax deductible up to a
deduction limit, investment income is tax exempted, and benefits are subject to the
personal income tax.
Slovakia ● Funded pensions are usually not taxed (EEE regime);
● Supplementary pensions follow the EET regime with several exceptions and
specifications.
Spain ● EET regime, contributions are tax deductible up to prescribed limits;
● No taxation in the capital accumulation phase;
● Pay-outs are taxed differently depending on whether they take the form of an
annuity or the form of a lump sum payment.
● EET regime for public pensions; ETT regime for private pensions;
Sweden o Employers can partially deduct contributions to the second pillar; returns are subject
to an annual standard rate tax based on the value of the account and the government-
borrowing rate
o Investment return is subject to tax rate on standard earnings at 15%;
o in Pillar III, until 2016 there was a tax deduction of SEK 1,800 per year available;
returns are subject to an annual standard rate tax based on the value of the account
and the government-borrowing rate
Netherlands ● EET regime;
● Contributions paid into pension funds are tax deductible;
● Taxation is applied in the pay-out phase at the personal income tax rate.
UK ● EET regime;
● Allowances and tax relief on contributions with test against lifetime allowance
● Pay-outs are taxed as income, there are three marginal rates in the UK at the
moment.
Source: BETTER FINANCE own composition
VI. RETURNS OVERVIEW
The BETTER FINANCE report now reaches 21 years (or maximum available) of performance
disclosure for some retirement provision products. Unfortunately, in the long run, real returns were
on average quite low and below those of capital markets (equities and bonds). In the context of
negative interest rates and decreasing yields on capital markets, the pensions outlook looks grim.
One has to keep in mind that the diversity of the European pension landscape and the lack of
available data complicate the drawing of straightforward conclusions. Although the aim of
66 | P a g e
Lon
g-Te
rm a
nd
Pen
sio
n S
avin
gs |
Th
e R
eal R
etu
rn |
20
21
Edit
ion
comparability would be to present all results in a harmonised manner (either Pillar II vs Pillar III or
on product categories - investment funds vs insurance products), complete data for all is not
reported, neither the maximum periods available, nor are the concepts (Pillars, occupational vs
supplementary plans) so common in all EU Member States. Therefore, for ease of reference, the
names of the pension vehicles have been used in Graphs 18 (A, B and C) and Table 19 as presented
in each individual country case.
Out of the 15 pension vehicles on which we report performances over at least 18 years (Graph
18(A)):
• only one so far remains on the negative side (-0.66%, French unit-linked life insurances);
• the majority (8) reported less than 1.5% real net return per year, equalling less than 35%
pre-tax profits over the past 20 years.
Considering that an EU capital markets-representative benchmark (50% European Equities – 50%
European bonds) recorded 72% real profits before taxes (2.69% p.a.), the 2020 data update shows
few product categories overperforming this broad market benchmark.
On shorter reporting time frames (Graphs 18(B) and (C)) performances were much higher, but this
may be due to the fact that some products did not pass through the same crises as the long-term
ones (Graph 18(A)) did.
In general, we could observe significant performance differences in each country case, either
between pillars or between types of pension vehicles:
• in Romania, Pillar II mandatory pension funds massively overperformed Pillar III pensions;
• in Austria, pension insurances overperformed pension funds by almost 17 percentage
points;
• in Italy, both PIP-products have turned positive: PIP with profits had positive returns over
the past 13 years (1.36%) unit-linked PIP recorded an average gain of 2.23%; and
• in France, where capital guaranteed insurance products gained 1.6% p.a. and unit-linked
insurance lost -0.7% p.a.
These poor or even negative real returns have led public authorities in some Member States to take
measures in order to ensure transparency and cap the fees charged by certain pension providers
(in countries such as the UK, Romania and Latvia). The issue is crucial, especially in countries like
the United Kingdom where the standard of living of retirees is heavily dependent on pre-funded
pension schemes. The following tables detail the long-term real returns of the main long-term and
pension saving product categories in the 17 European countries analysed. The categorisation in
Graphs GR18(A), (B), (C) AND (D) is by the starting reporting year available in this report.
In Italy, an ambitious reform was implemented (as of 2011) by Minister Elsa Fornero under the
Monti government in order to secure the public PAYG system, despite very unfavourable
demographic trends. As such, the poor returns of the personal pension plans will have a limited
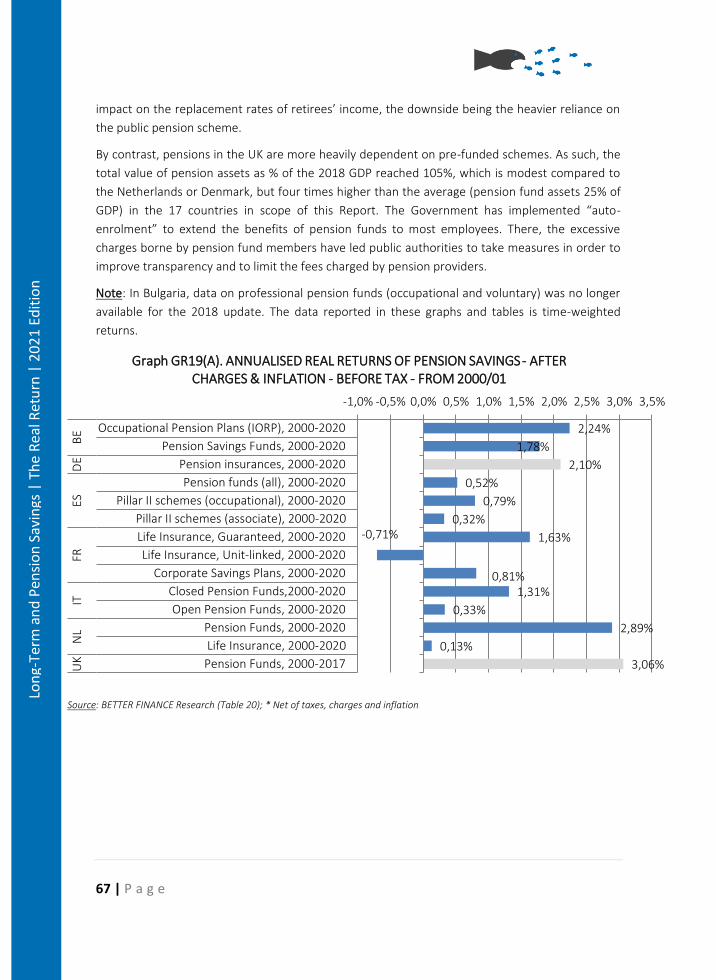
67 | P a g e
Lon
g-Te
rm a
nd
Pen
sio
n S
avin
gs |
Th
e R
eal R
etu
rn |
20
21
Edit
ion
impact on the replacement rates of retirees’ income, the downside being the heavier reliance on
the public pension scheme.
By contrast, pensions in the UK are more heavily dependent on pre-funded schemes. As such, the
total value of pension assets as % of the 2018 GDP reached 105%, which is modest compared to
the Netherlands or Denmark, but four times higher than the average (pension fund assets 25% of
GDP) in the 17 countries in scope of this Report. The Government has implemented “auto-
enrolment” to extend the benefits of pension funds to most employees. There, the excessive
charges borne by pension fund members have led public authorities to take measures in order to
improve transparency and to limit the fees charged by pension providers.
Note: In Bulgaria, data on professional pension funds (occupational and voluntary) was no longer
available for the 2018 update. The data reported in these graphs and tables is time-weighted
returns.
Source: BETTER FINANCE Research (Table 20); * Net of taxes, charges and inflation
2,24%
1,78%
2,10%
0,52%
0,79%
0,32%
1,63%-0,71%
0,81%1,31%
0,33%
2,89%
0,13%
3,06%
-1,0% -0,5% 0,0% 0,5% 1,0% 1,5% 2,0% 2,5% 3,0% 3,5%
Occupational Pension Plans (IORP), 2000-2020
Pension Savings Funds, 2000-2020
Pension insurances, 2000-2020
Pension funds (all), 2000-2020
Pillar II schemes (occupational), 2000-2020
Pillar II schemes (associate), 2000-2020
Life Insurance, Guaranteed, 2000-2020
Life Insurance, Unit-linked, 2000-2020
Corporate Savings Plans, 2000-2020
Closed Pension Funds,2000-2020
Open Pension Funds, 2000-2020
Pension Funds, 2000-2020
Life Insurance, 2000-2020
Pension Funds, 2000-2017
BE
DE
ESFR
ITN
LU
K
Graph GR19(A). ANNUALISED REAL RETURNS OF PENSION SAVINGS - AFTER CHARGES & INFLATION - BEFORE TAX - FROM 2000/01
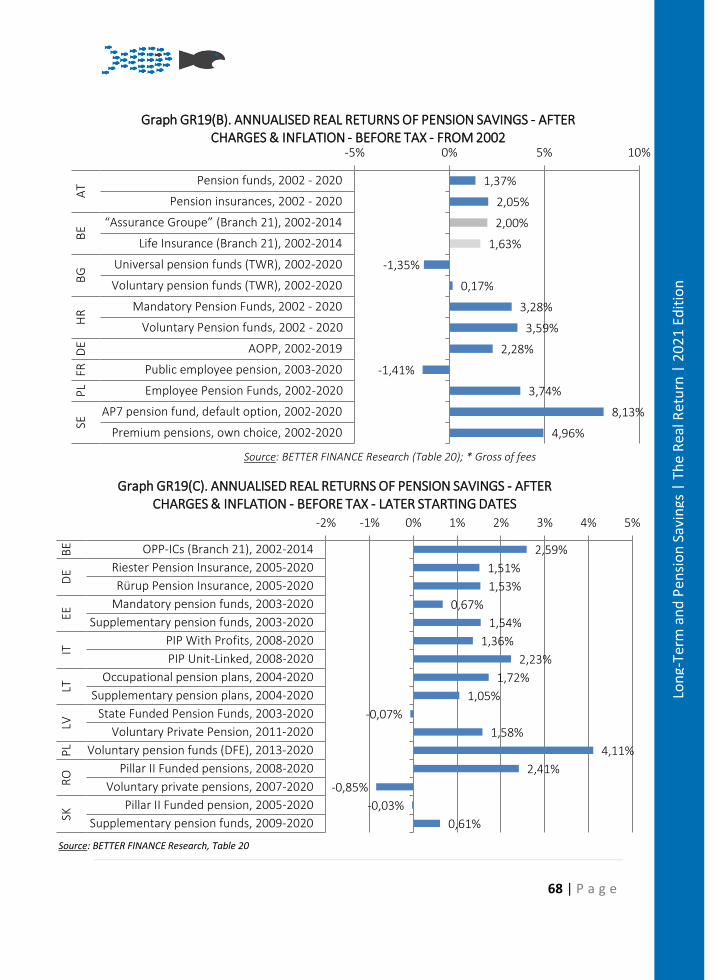
68 | P a g e
Lon
g-Te
rm a
nd
Pen
sio
n S
avin
gs |
Th
e R
eal R
etu
rn |
20
21
Edit
ion
1,37%
2,05%
2,00%
1,63%
-1,35%
0,17%
3,28%
3,59%
2,28%
-1,41%
3,74%
8,13%
4,96%
-5% 0% 5% 10%
Pension funds, 2002 - 2020
Pension insurances, 2002 - 2020
“Assurance Groupe” (Branch 21), 2002-2014
Life Insurance (Branch 21), 2002-2014
Universal pension funds (TWR), 2002-2020
Voluntary pension funds (TWR), 2002-2020
Mandatory Pension Funds, 2002 - 2020
Voluntary Pension funds, 2002 - 2020
AOPP, 2002-2019
Public employee pension, 2003-2020
Employee Pension Funds, 2002-2020
AP7 pension fund, default option, 2002-2020
Premium pensions, own choice, 2002-2020
AT
BE
BG
HR
DE
FRP
LSE
Graph GR19(B). ANNUALISED REAL RETURNS OF PENSION SAVINGS - AFTER CHARGES & INFLATION - BEFORE TAX - FROM 2002
Source: BETTER FINANCE Research (Table 20); * Gross of fees
2,59%
1,51%
1,53%
0,67%
1,54%
1,36%
2,23%
1,72%
1,05%
-0,07%
1,58%
4,11%
2,41%
-0,85%
-0,03%
0,61%
-2% -1% 0% 1% 2% 3% 4% 5%
OPP-ICs (Branch 21), 2002-2014
Riester Pension Insurance, 2005-2020
Rürup Pension Insurance, 2005-2020
Mandatory pension funds, 2003-2020
Supplementary pension funds, 2003-2020
PIP With Profits, 2008-2020
PIP Unit-Linked, 2008-2020
Occupational pension plans, 2004-2020
Supplementary pension plans, 2004-2020
State Funded Pension Funds, 2003-2020
Voluntary Private Pension, 2011-2020
Voluntary pension funds (DFE), 2013-2020
Pillar II Funded pensions, 2008-2020
Voluntary private pensions, 2007-2020
Pillar II Funded pension, 2005-2020
Supplementary pension funds, 2009-2020
BE
DE
EEIT
LTLV
PL
RO
SK
Graph GR19(C). ANNUALISED REAL RETURNS OF PENSION SAVINGS - AFTER CHARGES & INFLATION - BEFORE TAX - LATER STARTING DATES
Source: BETTER FINANCE Research, Table 20
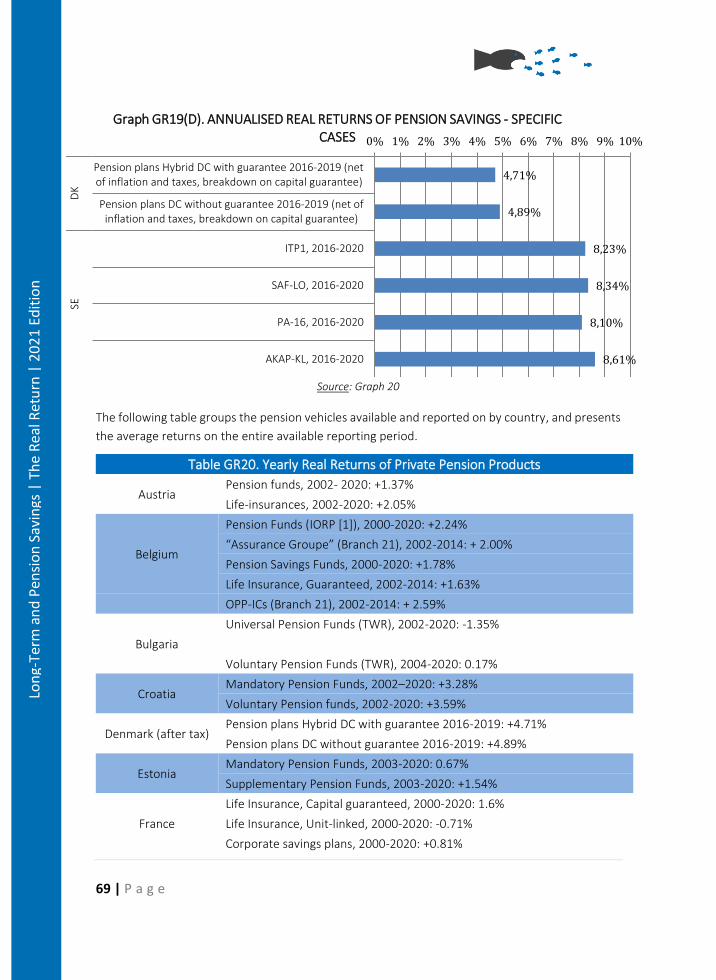
69 | P a g e
Lon
g-Te
rm a
nd
Pen
sio
n S
avin
gs |
Th
e R
eal R
etu
rn |
20
21
Edit
ion
Source: Graph 20
The following table groups the pension vehicles available and reported on by country, and presents
the average returns on the entire available reporting period.
Table GR20. Yearly Real Returns of Private Pension Products
Austria Pension funds, 2002- 2020: +1.37%
Life-insurances, 2002-2020: +2.05%
Belgium
Pension Funds (IORP [1]), 2000-2020: +2.24%
“Assurance Groupe” (Branch 21), 2002-2014: + 2.00%
Pension Savings Funds, 2000-2020: +1.78%
Life Insurance, Guaranteed, 2002-2014: +1.63%
OPP-ICs (Branch 21), 2002-2014: + 2.59%
Bulgaria
Universal Pension Funds (TWR), 2002-2020: -1.35%
Voluntary Pension Funds (TWR), 2004-2020: 0.17%
Croatia Mandatory Pension Funds, 2002–2020: +3.28%
Voluntary Pension funds, 2002-2020: +3.59%
Denmark (after tax) Pension plans Hybrid DC with guarantee 2016-2019: +4.71%
Pension plans DC without guarantee 2016-2019: +4.89%
Estonia Mandatory Pension Funds, 2003-2020: 0.67%
Supplementary Pension Funds, 2003-2020: +1.54%
France
Life Insurance, Capital guaranteed, 2000-2020: 1.6%
Life Insurance, Unit-linked, 2000-2020: -0.71%
Corporate savings plans, 2000-2020: +0.81%
4,71%
4,89%
8,23%
8,34%
8,10%
8,61%
0% 1% 2% 3% 4% 5% 6% 7% 8% 9% 10%
Pension plans Hybrid DC with guarantee 2016-2019 (netof inflation and taxes, breakdown on capital guarantee)
Pension plans DC without guarantee 2016-2019 (net ofinflation and taxes, breakdown on capital guarantee)
ITP1, 2016-2020
SAF-LO, 2016-2020
PA-16, 2016-2020
AKAP-KL, 2016-2020
DK
SE
Graph GR19(D). ANNUALISED REAL RETURNS OF PENSION SAVINGS - SPECIFIC CASES
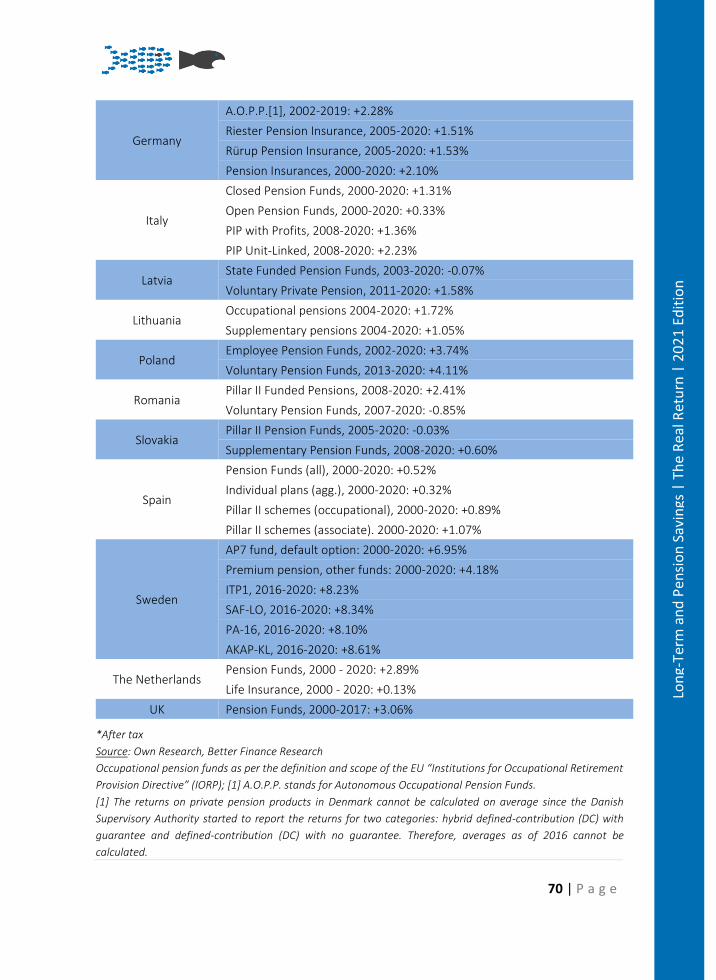
70 | P a g e
Lon
g-Te
rm a
nd
Pen
sio
n S
avin
gs |
Th
e R
eal R
etu
rn |
20
21
Edit
ion
Germany
A.O.P.P.[1], 2002-2019: +2.28%
Riester Pension Insurance, 2005-2020: +1.51%
Rürup Pension Insurance, 2005-2020: +1.53%
Pension Insurances, 2000-2020: +2.10%
Italy
Closed Pension Funds, 2000-2020: +1.31%
Open Pension Funds, 2000-2020: +0.33%
PIP with Profits, 2008-2020: +1.36%
PIP Unit-Linked, 2008-2020: +2.23%
Latvia State Funded Pension Funds, 2003-2020: -0.07%
Voluntary Private Pension, 2011-2020: +1.58%
Lithuania Occupational pensions 2004-2020: +1.72%
Supplementary pensions 2004-2020: +1.05%
Poland Employee Pension Funds, 2002-2020: +3.74%
Voluntary Pension Funds, 2013-2020: +4.11%
Romania Pillar II Funded Pensions, 2008-2020: +2.41%
Voluntary Pension Funds, 2007-2020: -0.85%
Slovakia Pillar II Pension Funds, 2005-2020: -0.03%
Supplementary Pension Funds, 2008-2020: +0.60%
Spain
Pension Funds (all), 2000-2020: +0.52%
Individual plans (agg.), 2000-2020: +0.32%
Pillar II schemes (occupational), 2000-2020: +0.89%
Pillar II schemes (associate). 2000-2020: +1.07%
Sweden
AP7 fund, default option: 2000-2020: +6.95%
Premium pension, other funds: 2000-2020: +4.18%
ITP1, 2016-2020: +8.23%
SAF-LO, 2016-2020: +8.34%
PA-16, 2016-2020: +8.10%
AKAP-KL, 2016-2020: +8.61%
The Netherlands Pension Funds, 2000 - 2020: +2.89%
Life Insurance, 2000 - 2020: +0.13%
UK Pension Funds, 2000-2017: +3.06%
*After tax
Source: Own Research, Better Finance Research
Occupational pension funds as per the definition and scope of the EU “Institutions for Occupational Retirement
Provision Directive” (IORP); [1] A.O.P.P. stands for Autonomous Occupational Pension Funds.
[1] The returns on private pension products in Denmark cannot be calculated on average since the Danish
Supervisory Authority started to report the returns for two categories: hybrid defined-contribution (DC) with
guarantee and defined-contribution (DC) with no guarantee. Therefore, averages as of 2016 cannot be
calculated.
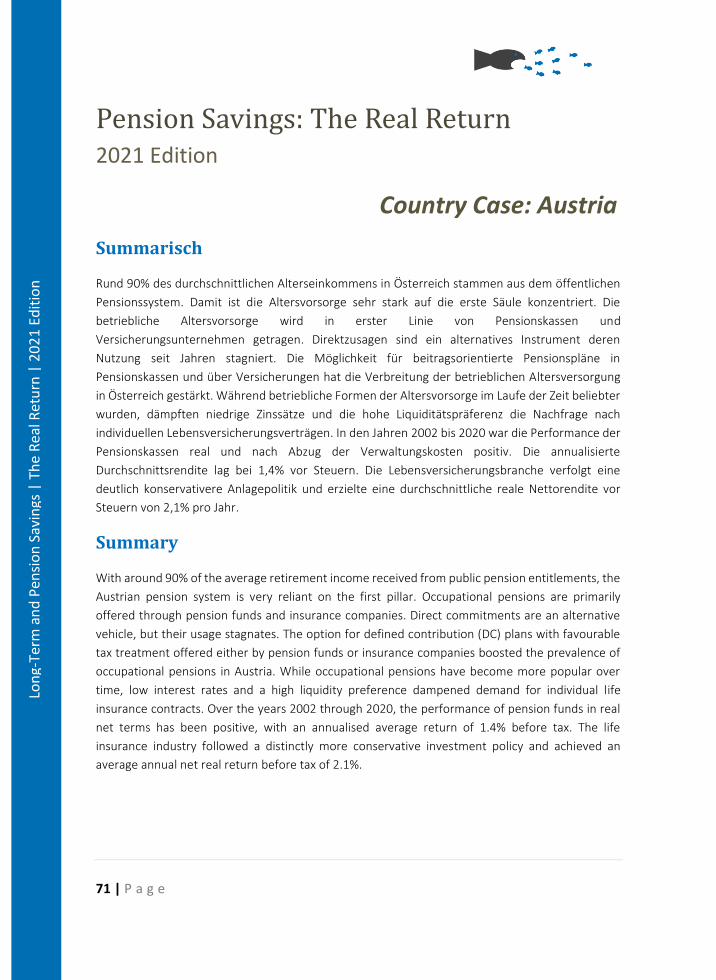
71 | P a g e
Lon
g-Te
rm a
nd
Pen
sio
n S
avin
gs |
Th
e R
eal R
etu
rn |
20
21
Edit
ion
Pension Savings: The Real Return 2021 Edition
Country Case: Austria
Summarisch
Rund 90% des durchschnittlichen Alterseinkommens in Österreich stammen aus dem öffentlichen
Pensionssystem. Damit ist die Altersvorsorge sehr stark auf die erste Säule konzentriert. Die
betriebliche Altersvorsorge wird in erster Linie von Pensionskassen und
Versicherungsunternehmen getragen. Direktzusagen sind ein alternatives Instrument deren
Nutzung seit Jahren stagniert. Die Möglichkeit für beitragsorientierte Pensionspläne in
Pensionskassen und über Versicherungen hat die Verbreitung der betrieblichen Altersversorgung
in Österreich gestärkt. Während betriebliche Formen der Altersvorsorge im Laufe der Zeit beliebter
wurden, dämpften niedrige Zinssätze und die hohe Liquiditätspräferenz die Nachfrage nach
individuellen Lebensversicherungsverträgen. In den Jahren 2002 bis 2020 war die Performance der
Pensionskassen real und nach Abzug der Verwaltungskosten positiv. Die annualisierte
Durchschnittsrendite lag bei 1,4% vor Steuern. Die Lebensversicherungsbranche verfolgt eine
deutlich konservativere Anlagepolitik und erzielte eine durchschnittliche reale Nettorendite vor
Steuern von 2,1% pro Jahr.
Summary
With around 90% of the average retirement income received from public pension entitlements, the
Austrian pension system is very reliant on the first pillar. Occupational pensions are primarily
offered through pension funds and insurance companies. Direct commitments are an alternative
vehicle, but their usage stagnates. The option for defined contribution (DC) plans with favourable
tax treatment offered either by pension funds or insurance companies boosted the prevalence of
occupational pensions in Austria. While occupational pensions have become more popular over
time, low interest rates and a high liquidity preference dampened demand for individual life
insurance contracts. Over the years 2002 through 2020, the performance of pension funds in real
net terms has been positive, with an annualised average return of 1.4% before tax. The life
insurance industry followed a distinctly more conservative investment policy and achieved an
average annual net real return before tax of 2.1%.
72 | P a g e
Lon
g-Te
rm a
nd
Pen
sio
n S
avin
gs |
Th
e R
eal R
etu
rn |
20
21
Edit
ion
Introduction
The Austrian pension system consists of three pillars:
• Pillar I: Mandatory Public Pension Insurance
• Pillar II: Voluntary Occupational Pensions
• Pillar III: Voluntary Individual Pensions
The mandatory public pension insurance covers most of private sector employees (Pillar I). Civil
servants have their own pension system which will gradually converge towards the public pension
insurance system. The self-employed belong to various separate mandatory systems. The public
pension system works as a PAYG scheme (Pay-As-You-Go) and was founded in 1945. The system
covers 4.1 million people or 97% of the gainfully employed (2020). In 2020, all employees – except
civil servants – were subject to a contribution payment of 22.8% of their income before taxes, with
contributions shared between the employer (12.55%) and the employee (10.25%). Civil servants
pay a contribution of 12.55% of their gross wage and the self-employed pay 18.5% of their profit
before taxes into the pension system. The Austrian pension system will be fully harmonized across
all insured persons by 2050. The public pension system has an income ceiling (maximum
contribution basis) up to which contributions apply, income above this level is exempted from
contributions but the ceiling also limits the pension benefit level. In 2020 the ceiling was between
5,370 € and 6,265 €, depending on the employment status. About 8% of the gainfully employed
achieve an income above these ceilings. The theoretical gross pension replacement rate at the
median income level for persons entering the labour market at age 22 corresponds to 76.5% of the
average lifetime income while the net pension replacement rate is at 89.9% (OECD, 2019). Both
theoretical replacement rates will be reached after 43 years of uninterrupted employment with
earnings always at the average income level. Effective replacement rates are likely to be lower
because careers are not continuous and life-time income profiles are not flat. Due to pension
reforms gradually taking effect, the effective replacement rates are expected to fall for future
pensioners. Nevertheless, high replacement rates for many of the gainfully employed limit the
demand for occupational as well as private pension plans.
Accompanying a series of public pension reforms between 2003 and 2006 which implemented
reductions in the expected benefit level, the Austrian government introduced the premium
subsidised pension plan to make private old-age provision more attractive. This scheme became
very popular until 2012 with 1.64 million contracts signed but it lost attraction after the government
halved the premium subsidy in 2012 (to 4.25% of the premium paid) and after investment yields
collapsed during the financial crisis in 2007. By 2020, only 1.1 million contracts were still active.
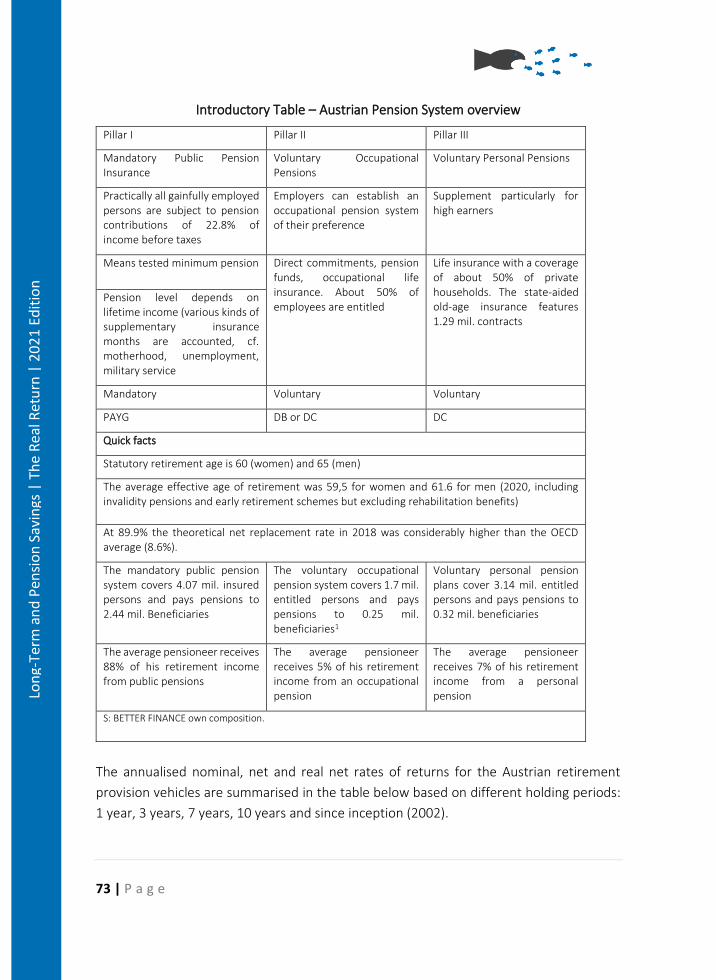
73 | P a g e
Lon
g-Te
rm a
nd
Pen
sio
n S
avin
gs |
Th
e R
eal R
etu
rn |
20
21
Edit
ion
Introductory Table – Austrian Pension System overview
Pillar I Pillar II Pillar III
Mandatory Public Pension Insurance
Voluntary Occupational Pensions
Voluntary Personal Pensions
Practically all gainfully employed persons are subject to pension contributions of 22.8% of income before taxes
Employers can establish an occupational pension system of their preference
Supplement particularly for high earners
Means tested minimum pension Direct commitments, pension funds, occupational life insurance. About 50% of employees are entitled
Life insurance with a coverage of about 50% of private households. The state-aided old-age insurance features 1.29 mil. contracts
Pension level depends on lifetime income (various kinds of supplementary insurance months are accounted, cf. motherhood, unemployment, military service
Mandatory Voluntary Voluntary
PAYG DB or DC DC
Quick facts
Statutory retirement age is 60 (women) and 65 (men)
The average effective age of retirement was 59,5 for women and 61.6 for men (2020, including invalidity pensions and early retirement schemes but excluding rehabilitation benefits)
At 89.9% the theoretical net replacement rate in 2018 was considerably higher than the OECD average (8.6%).
The mandatory public pension system covers 4.07 mil. insured persons and pays pensions to 2.44 mil. Beneficiaries
The voluntary occupational pension system covers 1.7 mil. entitled persons and pays pensions to 0.25 mil. beneficiaries1
Voluntary personal pension plans cover 3.14 mil. entitled persons and pays pensions to 0.32 mil. beneficiaries
The average pensioneer receives 88% of his retirement income from public pensions
The average pensioneer receives 5% of his retirement income from an occupational pension
The average pensioneer receives 7% of his retirement income from a personal pension
S: BETTER FINANCE own composition.
The annualised nominal, net and real net rates of returns for the Austrian retirement
provision vehicles are summarised in the table below based on different holding periods:
1 year, 3 years, 7 years, 10 years and since inception (2002).

74 | P a g e
Lon
g-Te
rm a
nd
Pen
sio
n S
avin
gs |
Th
e R
eal R
etu
rn |
20
21
Edit
ion
Summary Table Austria. Annualised Performance for Various Holding Periods (in %)
Holding period
Nominal return before charges,
inflation, and tax
Nominal return after charges,
before inflation and tax
Real return after charges and
inflation before tax
Pension funds In years In % 1 2.55 2.31 1.31 3 2.80 2.61 1.11 5 3.73 3.55 1.87 7 4.10 3.94 2.47 10 3.90 3.71 1.84 Since 2002 3.49 3.25 1.37
Pension insurance
1 3.20 2.82 1.82 3 3.21 2.84 1.34 5 3.37 3.00 1.32 7 3.53 3.17 1.70 10 3.71 3.36 1.50
Since 2002 4.29 3.93 2.05 S: Compare Tables AT4 and AT5. Annualised performance corresponds to geometric mean over the holding period.
Occupational and voluntary personal pension vehicles
Private pensions are divided into voluntary occupational and voluntary personal pensions. About
6.5% of today’s retirees receive regular benefits from an occupational or personal pension. This
figure is made up by 4% of retirees receiving benefits from an occupational pension and 2.5% of
retirees receiving annuities from a personal pension plan (Pekanov – Url, 2017). Given today’s
numbers of active plan members these shares can be expected to increase substantially over time.
Occupational pension vehicles (Pillar II)
At the beginning of 2003, the system of severance payments has been replaced by mandatory
contributions towards occupational severance and retirement funds (Betriebliche Vorsorgekassen).
While the old severance payment regulations continue to apply to existing employment relations,
employment contracts established after the end of 2002 feature mandatory contributions of 1.53%
of gross wages to these funds. The main characteristics of severance payments have been
transferred to the new system, i.e., in case of dismissal the fund will pay out the accumulated
amount. Beneficiaries, however, may voluntarily opt to use this instrument as a tax-preferred
vehicle for old-age provision. Less than one percent of the beneficiaries use this option. We
therefore do not count occupational severance and retirement funds as pension vehicles in the
following.
75 | P a g e
Lon
g-Te
rm a
nd
Pen
sio
n S
avin
gs |
Th
e R
eal R
etu
rn |
20
21
Edit
ion
Voluntary Occupational Pensions (Pillar III)
Occupational pension plans are typically provided on a voluntary basis by firms, only a few collective
bargaining agreements include an obligation for member firms of the respective sector. Employers
can also choose the coverage and the vehicle of their pension plan. There are three types of
occupational retirement schemes:
• direct commitments funded by book reserves,
• pension funds and
• several types of life insurance schemes.
Each of these schemes has advantages and drawbacks. While direct commitments create a stronger
link between employees and the firm, the future pension payments are subject to bankruptcy risk
and, during the accumulation phase, the firm must either manage the assets backing the book
reserves or seek some sort of reinsurance. External vehicles like pension funds or life insurance
contracts imply less bonding because the vesting period is much shorter, but they also outsource
the effort of investment choice and annuity payments to a financial intermediary. The design of a
voluntary pension plan is at the full discretion of the employer, but usually an arrangement with
the firm’s workers council is necessary.
Over the last decades many firms switched from direct commitment schemes to pension funds. On
the one hand, this was a strategy to reduce the cost of existing defined benefit pension schemes by
switching to defined contribution plans, and on the other hand, these efforts shortened balanced
sheets and cleaned them from items unknown to international investors.
Direct commitments (“Direktzusage”)
Direct commitments are pension promises by the employer to the employee that are administrated
within a firm. These types of arrangements dominated until the 1980s, when several large
bankruptcies or near bankruptcies revealed their fragility. The main two characteristics of this
arrangement are direct administration of the pension obligation within the firm and a defined
benefit type of the pension plan: the pension level is related to the wage level of employees. The
plan administration comprises the computation of individual pension obligations and the respective
book reserves, their coverage by invested assets, as well as the annuity payment. Nevertheless,
many activities can be outsourced to actuaries, investment funds, and insurance companies.
Pension claims based on direct commitments are not subject to any reinsurance requirement, but
the reserve funds dedicated to back book reserves are protected from creditors. Besides
outsourcing, the Insolvenz-Entgelt-Fonds provides a further safeguard for entitled employees and
pensioners to bankruptcy risk. This fund is a public fund covering wage entitlements by employees
in case of bankruptcy. Currently, the Insolvenz-Entgelt-Fonds covers a maximum of 2 years of
benefit payments or accrued entitlements (Insolvenz-Entgeltsicherungsgesetz § 3d). Due to their
76 | P a g e
Lon
g-Te
rm a
nd
Pen
sio
n S
avin
gs |
Th
e R
eal R
etu
rn |
20
21
Edit
ion
voluntary character and a lack of supervision the incidence of direct commitments is hardly
documented.
Pensions funds (“Pensionskassen”)
Pension funds are specialised financial intermediaries providing only services related to
occupational pensions, i.e., they collect contributions, manage individual accounts, invest the
accumulated capital, and they pay out an annuity to beneficiaries. Pension funds were introduced
in 1990 with the Occupational Pension Law and the Pension Fund Law (Betriebspensions- und
Pensionskassengesetz) which established a general legal basis for occupational pension schemes
including pension funds. These laws facilitated the outsourcing of asset management and accounts
administration from direct commitment systems into pension funds. This made individual pension
entitlements transferable between companies, it made possible additional contributions by
employees, but it also enabled firms to switch from defined benefit to defined contribution pension
plans. By now, most pension plans are of the defined contribution type and beneficiaries are directly
exposed to investment risk as well as to changes in mortality risk. For example, plan members
whose entitlement was converted from a direct commitment into an entitlement vis-a-vis a pension
fund still suffer from investment losses shortly after transferring the assets into pension funds
around the year 2000 because the imputed interest rates used at that time were overly optimistic
(Url, 2003B).
Pension funds may be either multi-employer pension funds, i. e. they are open to other firms, or
alternatively, they may be firm specific pension funds (single-employer pension funds)
administrating the pension plan for a single firm or a holding group. Over the last couple of years,
many firm specific pension funds have been merged into multi-employer pension funds building
independent risk and investment pools like UCITS. Pension funds are subject to supervision by the
Austrian Financial Market Authority, and they feature investment advisory boards, where
representatives of workers and employers can advance their opinion on the investment strategy.
Nevertheless, the results from asset-liability management strategies dominate the portfolio choice
of pension funds.
Pension funds offer primarily annuities because lump-sum payments are restricted to accounts with
very small, accumulated assets. Pension funds have to offer accounts with guaranteed long-term
yields on investment linked to the market yield of Austrian government bonds, although this option
lost attractiveness due to the high costs of guarantees and a substantial weakening of the
guaranteed type. The guarantee is backed by the own capital of the pension fund and by a minimum
return reserve fund financed by contributions from beneficiaries (Mindestertragsrücklage). In case
of bankruptcy of the pension fund, all entitlements are protected by separate ownership of the
assets associated to each account (Deckungsstock).
77 | P a g e
Lon
g-Te
rm a
nd
Pen
sio
n S
avin
gs |
Th
e R
eal R
etu
rn |
20
21
Edit
ion
Direct insurance
Firms can alternatively sign a contract with a life insurance company. This contract is either subject
to the regulation covering occupational pensions (Betriebliche Kollektivversicherung) or it is
designed as a life insurance policy and is subject to the regulation for life insurance products.
Insurance companies also underwrite risks embedded in direct commitments. Direct insurance of
occupational pension plans implies that the sponsoring firm will pay contributions into a life
insurance contract with employees as beneficiaries. In this case, the firm outsources the
management of personal accounts and assets, as well as the annuity payments to an insurance
company.
The number of working and retired persons holding a life insurance policy is almost double the
number of members in occupational pension plans. Despite high public pension levels and the
voluntary character of occupational pensions, their use is comparatively widespread in Austria.
There are two reasons for this: (1) the public sector offers an occupational pension scheme, and (2)
occupational life insurance policies benefit from a tax loophole. Contributions up to € 300 annually
(§ 3/1/15 EStG) are tax exempt and as a result almost 645,000 contracts have been signed until
2020. Given the small pension wealth accumulated in these accounts one cannot expect reasonable
annuity payments resulting from this vehicle.
The Betriebliche Kollektivversicherung, on the other hand, provides occupational pensions with a
favourable tax treatment up to 10% of individual gross wages. It is regulated according to the
Occupational Pension Law, but this vehicle allows for more substantial long-term guarantees usually
offered by classic life insurance contracts. Insurers also freeze mortality tables at the date of joining
the pension plan.
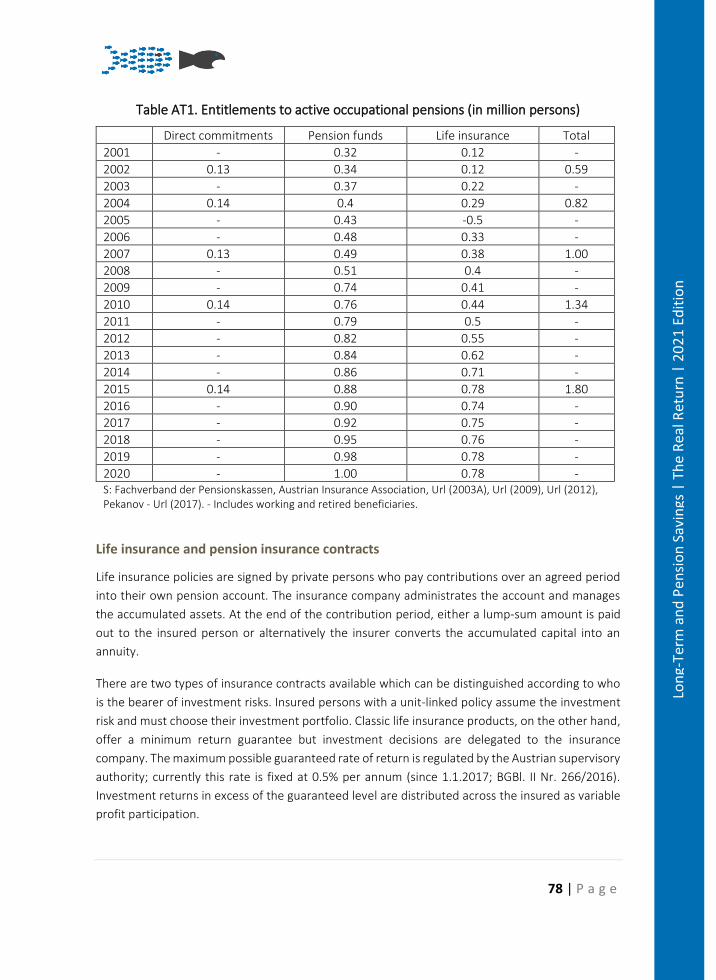
78 | P a g e
Lon
g-Te
rm a
nd
Pen
sio
n S
avin
gs |
Th
e R
eal R
etu
rn |
20
21
Edit
ion
Table AT1. Entitlements to active occupational pensions (in million persons)
Direct commitments Pension funds Life insurance Total
2001 - 0.32 0.12 -
2002 0.13 0.34 0.12 0.59
2003 - 0.37 0.22 -
2004 0.14 0.4 0.29 0.82
2005 - 0.43 -0.5 -
2006 - 0.48 0.33 -
2007 0.13 0.49 0.38 1.00
2008 - 0.51 0.4 -
2009 - 0.74 0.41 -
2010 0.14 0.76 0.44 1.34
2011 - 0.79 0.5 -
2012 - 0.82 0.55 -
2013 - 0.84 0.62 -
2014 - 0.86 0.71 -
2015 0.14 0.88 0.78 1.80
2016 - 0.90 0.74 -
2017 - 0.92 0.75 -
2018 - 0.95 0.76 -
2019 - 0.98 0.78 -
2020 - 1.00 0.78 - S: Fachverband der Pensionskassen, Austrian Insurance Association, Url (2003A), Url (2009), Url (2012), Pekanov - Url (2017). - Includes working and retired beneficiaries.
Life insurance and pension insurance contracts
Life insurance policies are signed by private persons who pay contributions over an agreed period
into their own pension account. The insurance company administrates the account and manages
the accumulated assets. At the end of the contribution period, either a lump-sum amount is paid
out to the insured person or alternatively the insurer converts the accumulated capital into an
annuity.
There are two types of insurance contracts available which can be distinguished according to who
is the bearer of investment risks. Insured persons with a unit-linked policy assume the investment
risk and must choose their investment portfolio. Classic life insurance products, on the other hand,
offer a minimum return guarantee but investment decisions are delegated to the insurance
company. The maximum possible guaranteed rate of return is regulated by the Austrian supervisory
authority; currently this rate is fixed at 0.5% per annum (since 1.1.2017; BGBl. II Nr. 266/2016).
Investment returns in excess of the guaranteed level are distributed across the insured as variable
profit participation.
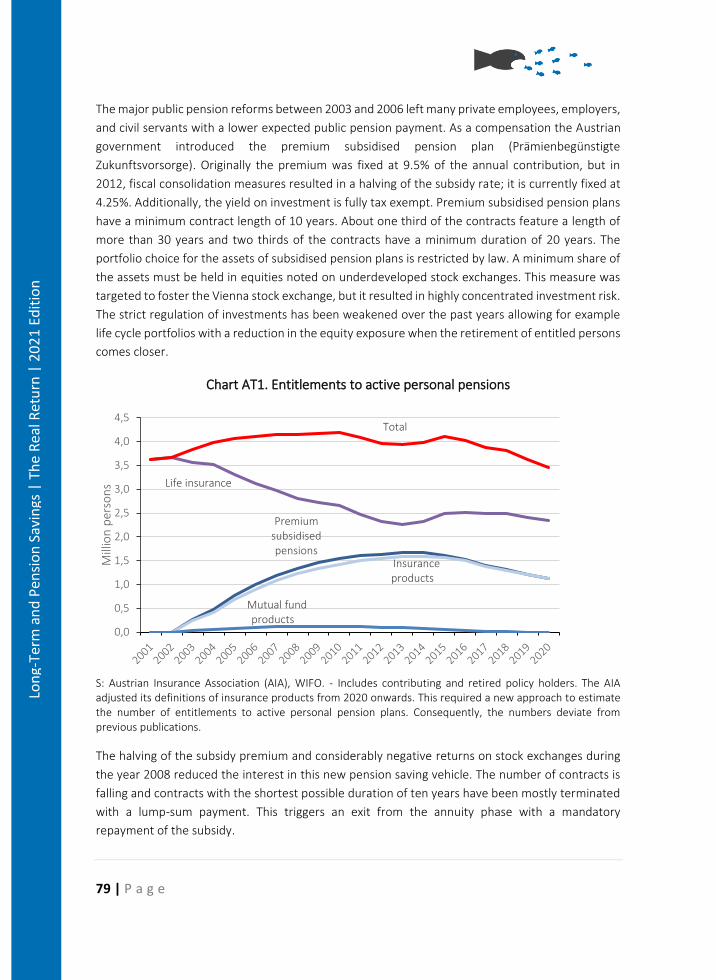
79 | P a g e
Lon
g-Te
rm a
nd
Pen
sio
n S
avin
gs |
Th
e R
eal R
etu
rn |
20
21
Edit
ion
The major public pension reforms between 2003 and 2006 left many private employees, employers,
and civil servants with a lower expected public pension payment. As a compensation the Austrian
government introduced the premium subsidised pension plan (Prämienbegünstigte
Zukunftsvorsorge). Originally the premium was fixed at 9.5% of the annual contribution, but in
2012, fiscal consolidation measures resulted in a halving of the subsidy rate; it is currently fixed at
4.25%. Additionally, the yield on investment is fully tax exempt. Premium subsidised pension plans
have a minimum contract length of 10 years. About one third of the contracts feature a length of
more than 30 years and two thirds of the contracts have a minimum duration of 20 years. The
portfolio choice for the assets of subsidised pension plans is restricted by law. A minimum share of
the assets must be held in equities noted on underdeveloped stock exchanges. This measure was
targeted to foster the Vienna stock exchange, but it resulted in highly concentrated investment risk.
The strict regulation of investments has been weakened over the past years allowing for example
life cycle portfolios with a reduction in the equity exposure when the retirement of entitled persons
comes closer.
Chart AT1. Entitlements to active personal pensions
S: Austrian Insurance Association (AIA), WIFO. - Includes contributing and retired policy holders. The AIA adjusted its definitions of insurance products from 2020 onwards. This required a new approach to estimate the number of entitlements to active personal pension plans. Consequently, the numbers deviate from previous publications.
The halving of the subsidy premium and considerably negative returns on stock exchanges during
the year 2008 reduced the interest in this new pension saving vehicle. The number of contracts is
falling and contracts with the shortest possible duration of ten years have been mostly terminated
with a lump-sum payment. This triggers an exit from the annuity phase with a mandatory
repayment of the subsidy.
Life insurance
Premium subsidised pensions
Insurance products
Mutual fund products
Total
0,0
0,5
1,0
1,5
2,0
2,5
3,0
3,5
4,0
4,5
Mill
ion
per
son
s
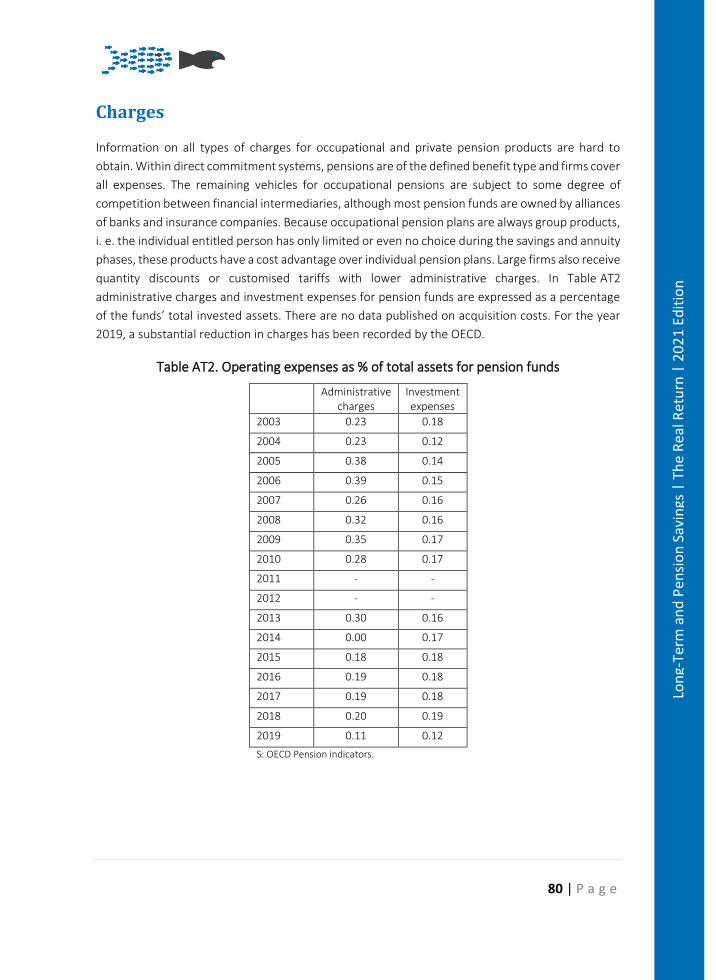
80 | P a g e
Lon
g-Te
rm a
nd
Pen
sio
n S
avin
gs |
Th
e R
eal R
etu
rn |
20
21
Edit
ion
Charges
Information on all types of charges for occupational and private pension products are hard to
obtain. Within direct commitment systems, pensions are of the defined benefit type and firms cover
all expenses. The remaining vehicles for occupational pensions are subject to some degree of
competition between financial intermediaries, although most pension funds are owned by alliances
of banks and insurance companies. Because occupational pension plans are always group products,
i. e. the individual entitled person has only limited or even no choice during the savings and annuity
phases, these products have a cost advantage over individual pension plans. Large firms also receive
quantity discounts or customised tariffs with lower administrative charges. In Table AT2
administrative charges and investment expenses for pension funds are expressed as a percentage
of the funds’ total invested assets. There are no data published on acquisition costs. For the year
2019, a substantial reduction in charges has been recorded by the OECD.
Table AT2. Operating expenses as % of total assets for pension funds
Administrative charges
Investment expenses
2003 0.23 0.18
2004 0.23 0.12
2005 0.38 0.14
2006 0.39 0.15
2007 0.26 0.16
2008 0.32 0.16
2009 0.35 0.17
2010 0.28 0.17
2011 - -
2012 - -
2013 0.30 0.16
2014 0.00 0.17
2015 0.18 0.18
2016 0.19 0.18
2017 0.19 0.18
2018 0.20 0.19
2019 0.11 0.12
S: OECD Pension indicators.
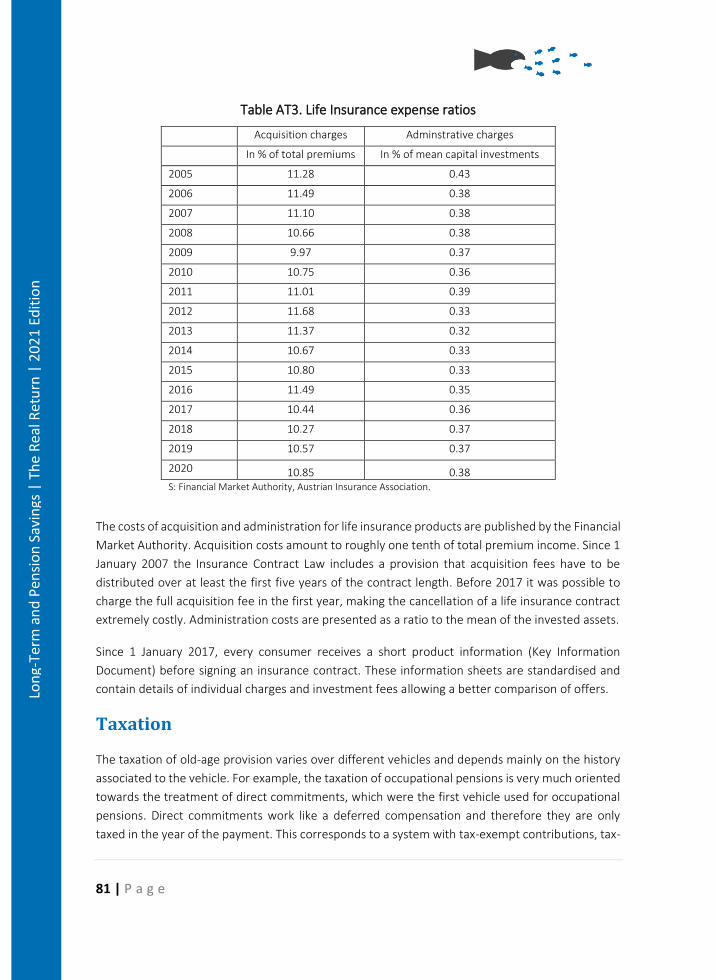
81 | P a g e
Lon
g-Te
rm a
nd
Pen
sio
n S
avin
gs |
Th
e R
eal R
etu
rn |
20
21
Edit
ion
Table AT3. Life Insurance expense ratios
Acquisition charges Adminstrative charges
In % of total premiums In % of mean capital investments
2005 11.28 0.43
2006 11.49 0.38
2007 11.10 0.38
2008 10.66 0.38
2009 9.97 0.37
2010 10.75 0.36
2011 11.01 0.39
2012 11.68 0.33
2013 11.37 0.32
2014 10.67 0.33
2015 10.80 0.33
2016 11.49 0.35
2017 10.44 0.36
2018 10.27 0.37
2019 10.57 0.37
2020 10.85 0.38 S: Financial Market Authority, Austrian Insurance Association.
The costs of acquisition and administration for life insurance products are published by the Financial
Market Authority. Acquisition costs amount to roughly one tenth of total premium income. Since 1
January 2007 the Insurance Contract Law includes a provision that acquisition fees have to be
distributed over at least the first five years of the contract length. Before 2017 it was possible to
charge the full acquisition fee in the first year, making the cancellation of a life insurance contract
extremely costly. Administration costs are presented as a ratio to the mean of the invested assets.
Since 1 January 2017, every consumer receives a short product information (Key Information
Document) before signing an insurance contract. These information sheets are standardised and
contain details of individual charges and investment fees allowing a better comparison of offers.
Taxation
The taxation of old-age provision varies over different vehicles and depends mainly on the history
associated to the vehicle. For example, the taxation of occupational pensions is very much oriented
towards the treatment of direct commitments, which were the first vehicle used for occupational
pensions. Direct commitments work like a deferred compensation and therefore they are only
taxed in the year of the payment. This corresponds to a system with tax-exempt contributions, tax-
82 | P a g e
Lon
g-Te
rm a
nd
Pen
sio
n S
avin
gs |
Th
e R
eal R
etu
rn |
20
21
Edit
ion
exempt capital accumulation, and (income) taxed benefits (EET system). This philosophy carries
over to contributions paid by the employer into a pension fund or a group insurance product
following the pension fund regulation (Betriebliche Kollektivversicherung). Contributions to pension
funds and group insurance products (Betriebliche Kollektivversicherung) are subject to a reduced
insurance tax of 2.5%. Contributions by employees are fully taxed but the resulting annuity is
subject to reduced income taxation.
Contributions to classic life insurance products are not tax deductible and are subject to an
insurance tax of 4%. During the capital accumulation phase all investment returns are tax exempt,
and the taxation of benefits depends on the pay-out mode. Lump-sum payments are tax-free while
annuities are subject to (reduced) income taxation. Additionally, premium subsidised products
carry a premium based on the contribution, the capital accumulation phase is tax-exempt, and
benefits are also tax free if they are converted into an annuity. Pekanov – Url (2017) provide a
survey of the tax treatment of all vehicles for old-age provision using the present value approach
as suggested by the OECD (2015, 2016). This approach compares the tax treatment of each vehicle
to the tax treatment of a standard savings account. Expressed as a ratio to the present value of
contributions, the tax advantage of employer payments into pension funds amount to 20%, i. e. the
value of the tax subsidy corresponds to one fifth of life-time contributions. The lowest tax advantage
results for life insurance products with an annuity payment. In this case, the tax subsidy makes up
for 7% of life-time contributions. The maximum tax preference is associated with occupational life
insurance policies subject to § 3/1/15 EStG. In this case, the subsidy amounts to 60% of life-time
contributions, however, payments into this vehicle are restricted to a negligible € 300 per year.
Austrian Capital market returns
The performance of the Vienna stock exchange is shown in Chart AT2, where we distinguish
between the price development of shares and the total return to equity investments in Austria
including reinvested dividend payments. It is not surprising to observe that both indices have a
positive long-term real return and are well above the cumulated inflation rate in 2020. Because the
Austrian equity market is small, financial intermediaries spread their equity investment throughout
Europe and the rest of the world. Therefore, equity returns of the Vienna stock exchange provide
no guidance for the investment performance of Austrian pension products, except premium
subsidised pension plans carrying an obligation to invest in under-developed equity markets.
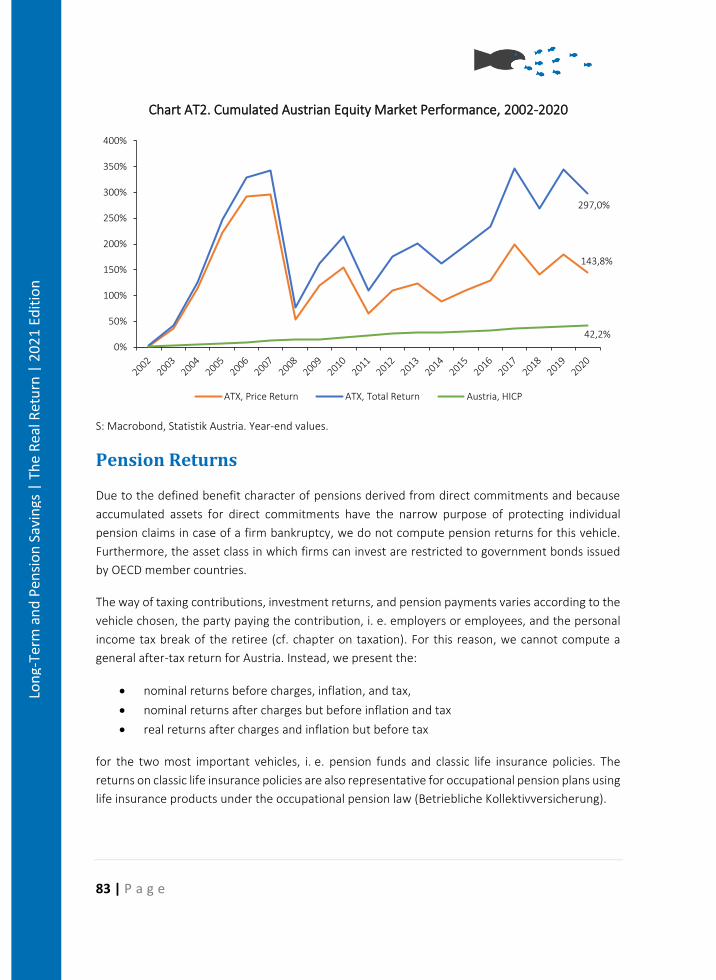
83 | P a g e
Lon
g-Te
rm a
nd
Pen
sio
n S
avin
gs |
Th
e R
eal R
etu
rn |
20
21
Edit
ion
Chart AT2. Cumulated Austrian Equity Market Performance, 2002-2020
S: Macrobond, Statistik Austria. Year-end values.
Pension Returns
Due to the defined benefit character of pensions derived from direct commitments and because
accumulated assets for direct commitments have the narrow purpose of protecting individual
pension claims in case of a firm bankruptcy, we do not compute pension returns for this vehicle.
Furthermore, the asset class in which firms can invest are restricted to government bonds issued
by OECD member countries.
The way of taxing contributions, investment returns, and pension payments varies according to the
vehicle chosen, the party paying the contribution, i. e. employers or employees, and the personal
income tax break of the retiree (cf. chapter on taxation). For this reason, we cannot compute a
general after-tax return for Austria. Instead, we present the:
• nominal returns before charges, inflation, and tax,
• nominal returns after charges but before inflation and tax
• real returns after charges and inflation but before tax
for the two most important vehicles, i. e. pension funds and classic life insurance policies. The
returns on classic life insurance policies are also representative for occupational pension plans using
life insurance products under the occupational pension law (Betriebliche Kollektivversicherung).
143,8%
297,0%
42,2%0%
50%
100%
150%
200%
250%
300%
350%
400%
ATX, Price Return ATX, Total Return Austria, HICP
84 | P a g e
Lon
g-Te
rm a
nd
Pen
sio
n S
avin
gs |
Th
e R
eal R
etu
rn |
20
21
Edit
ion
Pension funds
Table AT4 shows the returns on assets held by pension funds. In the case of a defined benefit
pension plan, investment returns are important for the sponsoring firm because if the return falls
short of the imputed interest rate used for the computation of the expected pension level, the firm
will have to provide additional contributions covering the shortfall. On the other hand, if a defined
contribution pension plan has been established, the beneficiaries bear the risk of a shortfall in the
realised return on investment, and consequently the realised pension level falls below its expected
value.
Information on the performance of pension funds is published continuously by an independent
third party, the Oesterreichische Kontrollbank53, following a standardised procedure. The returns
are available for all pension funds and separately for multi- and single-employer pension funds. The
long-term performance of firm specific pension funds is about 0.5 percentage points higher as
compared to multi-employer pension funds. The difference results probably from a less risk-
oriented investment style followed by multi-employer pension funds, due to the wider usage of
return guarantees in multi-employer pension funds. Nominal investment returns after charges but
before inflation and taxes result from the subtraction of administrative charges of pension funds as
presented in the chapter on charges. Real returns are computed by subtracting the HICP-inflation
rate for Austria.
The Financial Market Authority publishes the asset allocation of pension funds as of year-end (FMA,
2021). The portfolio in 2020 was dominated by debt securities (37.2%) and equity investments
(36.4%). The good performance of equity markets in the second half of 2020 let to continued low
funds held in bank balances (7.9%). Real estate investments accounted for 5.5% of assets while the
remainder was mixed throughout smaller asset categories (Chart AT3, upper panel). Given the
strong exposure to equity, we find several years with negative returns, i. e. investment losses.
Specifically, during the years after the bursting of the dotcom bubble (2000), the international
financial market crisis (2007), and the public debt crisis in the euro area (2011), but also in 2018,
when both bond and equity markets turned downwards. Nevertheless, pension funds achieved
between 2002 and 2020 an annual average net real yield on investment of 1.4%. This corresponds
to an average excess return over Austrian government bonds of 1.5%.
53 https://www.oekb.at/kapitalmarkt-services/unser-datenangebot/veranlagungsentwicklung-der-pensionskassen.html.
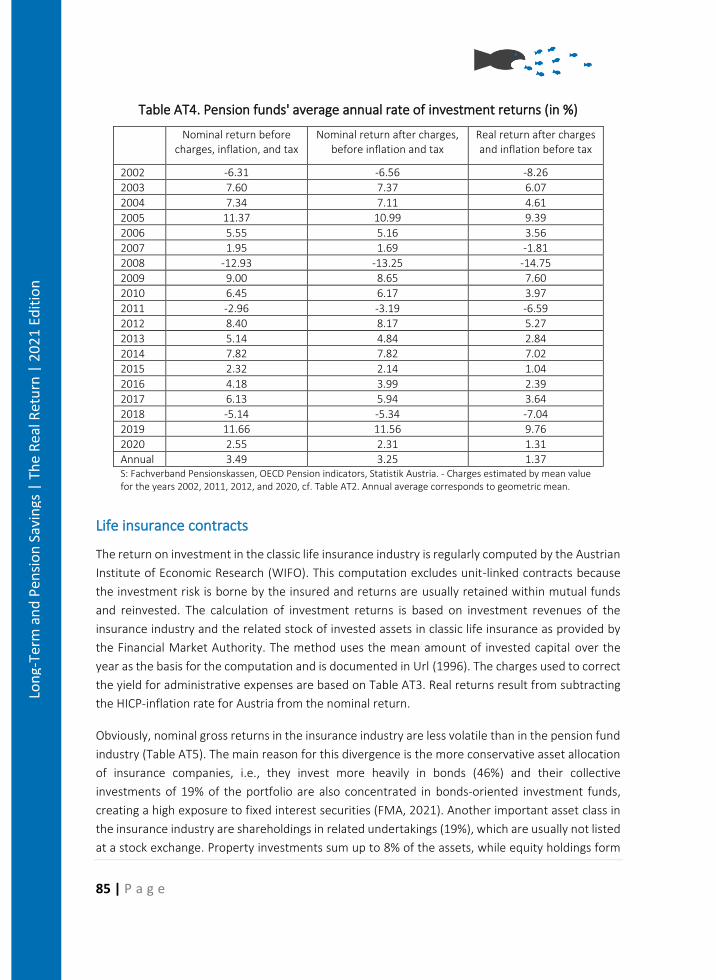
85 | P a g e
Lon
g-Te
rm a
nd
Pen
sio
n S
avin
gs |
Th
e R
eal R
etu
rn |
20
21
Edit
ion
Table AT4. Pension funds' average annual rate of investment returns (in %)
Nominal return before charges, inflation, and tax
Nominal return after charges, before inflation and tax
Real return after charges and inflation before tax
2002 -6.31 -6.56 -8.26
2003 7.60 7.37 6.07
2004 7.34 7.11 4.61
2005 11.37 10.99 9.39
2006 5.55 5.16 3.56
2007 1.95 1.69 -1.81
2008 -12.93 -13.25 -14.75
2009 9.00 8.65 7.60
2010 6.45 6.17 3.97
2011 -2.96 -3.19 -6.59
2012 8.40 8.17 5.27
2013 5.14 4.84 2.84
2014 7.82 7.82 7.02
2015 2.32 2.14 1.04
2016 4.18 3.99 2.39
2017 6.13 5.94 3.64
2018 -5.14 -5.34 -7.04
2019 11.66 11.56 9.76
2020 2.55 2.31 1.31
Annual average
3.49 3.25 1.37 S: Fachverband Pensionskassen, OECD Pension indicators, Statistik Austria. - Charges estimated by mean value for the years 2002, 2011, 2012, and 2020, cf. Table AT2. Annual average corresponds to geometric mean.
Life insurance contracts
The return on investment in the classic life insurance industry is regularly computed by the Austrian
Institute of Economic Research (WIFO). This computation excludes unit-linked contracts because
the investment risk is borne by the insured and returns are usually retained within mutual funds
and reinvested. The calculation of investment returns is based on investment revenues of the
insurance industry and the related stock of invested assets in classic life insurance as provided by
the Financial Market Authority. The method uses the mean amount of invested capital over the
year as the basis for the computation and is documented in Url (1996). The charges used to correct
the yield for administrative expenses are based on Table AT3. Real returns result from subtracting
the HICP-inflation rate for Austria from the nominal return.
Obviously, nominal gross returns in the insurance industry are less volatile than in the pension fund
industry (Table AT5). The main reason for this divergence is the more conservative asset allocation
of insurance companies, i.e., they invest more heavily in bonds (46%) and their collective
investments of 19% of the portfolio are also concentrated in bonds-oriented investment funds,
creating a high exposure to fixed interest securities (FMA, 2021). Another important asset class in
the insurance industry are shareholdings in related undertakings (19%), which are usually not listed
at a stock exchange. Property investments sum up to 8% of the assets, while equity holdings form
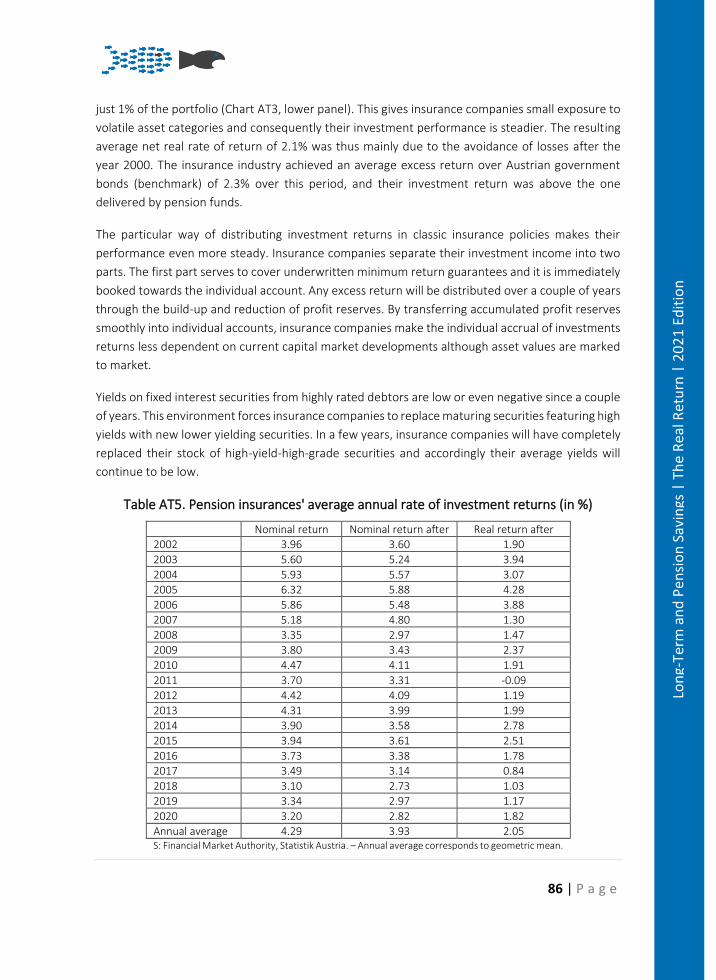
86 | P a g e
Lon
g-Te
rm a
nd
Pen
sio
n S
avin
gs |
Th
e R
eal R
etu
rn |
20
21
Edit
ion
just 1% of the portfolio (Chart AT3, lower panel). This gives insurance companies small exposure to
volatile asset categories and consequently their investment performance is steadier. The resulting
average net real rate of return of 2.1% was thus mainly due to the avoidance of losses after the
year 2000. The insurance industry achieved an average excess return over Austrian government
bonds (benchmark) of 2.3% over this period, and their investment return was above the one
delivered by pension funds.
The particular way of distributing investment returns in classic insurance policies makes their
performance even more steady. Insurance companies separate their investment income into two
parts. The first part serves to cover underwritten minimum return guarantees and it is immediately
booked towards the individual account. Any excess return will be distributed over a couple of years
through the build-up and reduction of profit reserves. By transferring accumulated profit reserves
smoothly into individual accounts, insurance companies make the individual accrual of investments
returns less dependent on current capital market developments although asset values are marked
to market.
Yields on fixed interest securities from highly rated debtors are low or even negative since a couple
of years. This environment forces insurance companies to replace maturing securities featuring high
yields with new lower yielding securities. In a few years, insurance companies will have completely
replaced their stock of high-yield-high-grade securities and accordingly their average yields will
continue to be low.
Table AT5. Pension insurances' average annual rate of investment returns (in %)
Nominal return before charges,
inflation, and tax
Nominal return after charges, before inflation and tax
Real return after charges and
inflation before tax 2002 3.96 3.60 1.90
2003 5.60 5.24 3.94
2004 5.93 5.57 3.07
2005 6.32 5.88 4.28
2006 5.86 5.48 3.88
2007 5.18 4.80 1.30
2008 3.35 2.97 1.47
2009 3.80 3.43 2.37
2010 4.47 4.11 1.91
2011 3.70 3.31 -0.09
2012 4.42 4.09 1.19
2013 4.31 3.99 1.99
2014 3.90 3.58 2.78
2015 3.94 3.61 2.51
2016 3.73 3.38 1.78
2017 3.49 3.14 0.84
2018 3.10 2.73 1.03
2019 3.34 2.97 1.17
2020 3.20 2.82 1.82
Annual average 4.29 3.93 2.05 S: Financial Market Authority, Statistik Austria. – Annual average corresponds to geometric mean.
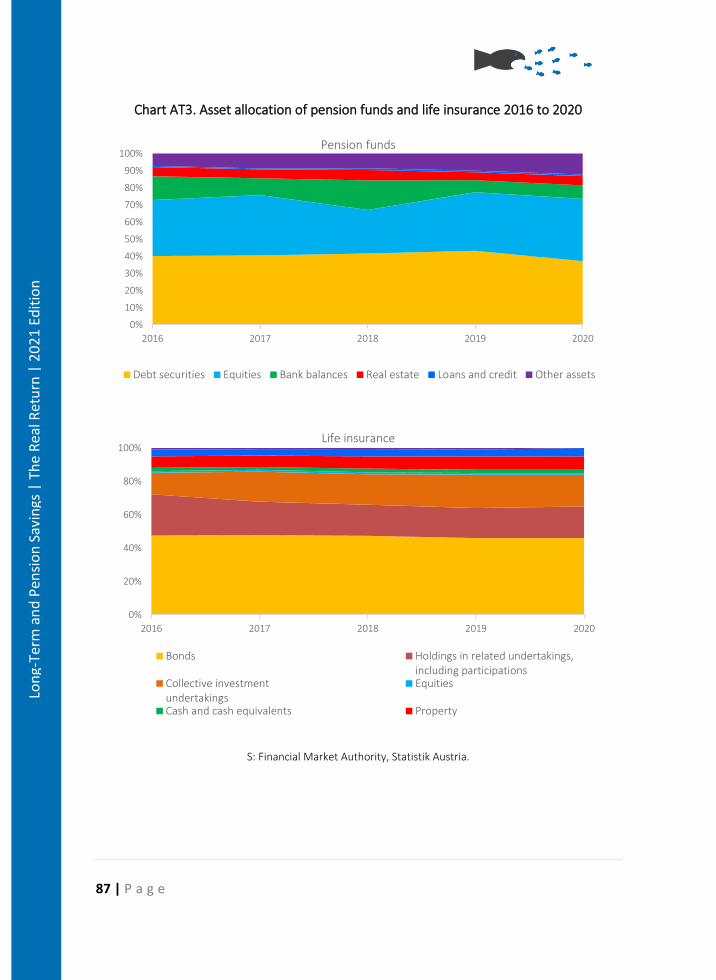
87 | P a g e
Lon
g-Te
rm a
nd
Pen
sio
n S
avin
gs |
Th
e R
eal R
etu
rn |
20
21
Edit
ion
Chart AT3. Asset allocation of pension funds and life insurance 2016 to 2020
S: Financial Market Authority, Statistik Austria.
0%
10%
20%
30%
40%
50%
60%
70%
80%
90%
100%
2016 2017 2018 2019 2020
Pension funds
Debt securities Equities Bank balances Real estate Loans and credit Other assets
0%
20%
40%
60%
80%
100%
2016 2017 2018 2019 2020
Life insurance
Bonds Holdings in related undertakings,including participations
Collective investmentundertakings
Equities
Cash and cash equivalents Property

88 | P a g e
Lon
g-Te
rm a
nd
Pen
sio
n S
avin
gs |
Th
e R
eal R
etu
rn |
20
21
Edit
ion
Conclusions
The performance of pension funds in real terms has been positive over the whole period from 2002-
2020, with an annualised average real return of 1.4% after service charges and before taxation.
Especially the difficult years after 2000, in 2008, 2011, and recently 2018 dampened the investment
performance considerably. The consequences are either additional payments by sponsoring firms
(defined benefit plans) or reduced expected and realised pension levels (defined contribution
plans). A mediocre investment performance will be more intensively felt in risk and investment
pools with a high imputed interest rate used for the computation of the expected pension level. For
example, plan members whose entitlement was transferred from a direct commitment to a pension
fund around the year 2000 still suffer from investment losses after the dotcom bubble because
overly optimistic imputed interest rates had been used at that time.
The average real rate of return on investments by insurance companies benefits from a
conservative asset allocation with strong government bonds holdings. This allowed insurers to avoid
large losses in years with a financial market crisis and reach an average real rate of return of 2.1%
annually after service charges and before taxation. Declining nominal interest rates and higher
inflation increased the pressure on net real rates of return after 2015. Insurance companies benefit
from the long duration of their investment portfolio, i. e. they still own bonds featuring high interest
coupons, but these bonds will expire during the next few years creating a potential for low yield
reinvestments. Consequently, demand for classic life insurance by individual households is shrinking
and even premium subsidised pension insurance is in low demand now because subsidies were
halved in 2012 and investment losses, due to the concentrated investment in small and under-
developed markets, affected this vehicle disproportionally.
The opportunity to offer defined contribution plans has certainly boosted the spread of
occupational pensions in Austria. Within pension funds around three quarters of the entitlements
are defined contributions plans, while occupational pensions based on insurance contracts are all
of the defined contribution type.
The COVID-19 crisis left a significant mark on Austria’s economy. First estimates for the year 2020
show a decline in real output by 6.3% (YoY) and unemployment numbers reaching record levels of
410.000 persons, up 110.000 persons over the previous year’s average. Although redundancies
were concentrated in sectors with traditionally low prevalence of occupational pension plans (like
accommodation, transport, and entertainment) contributions to occupational pensions throughout
all vehicles took the expected hit in 2020 and declined by 23% (YoY); job displacements and the
widespread use of short-time work lowered the wage bill. Given the strong recovery starting in May
2021, the wage bill will surpass its 2019 level by the end of 2021. Nevertheless, given high
uncertainty about the infectiousness of Corona virus mutations. the setup of occupational pension
plans by firms not yet offering them is unlikely in 2021. As of mid-2021, the build-up of pension
89 | P a g e
Lon
g-Te
rm a
nd
Pen
sio
n S
avin
gs |
Th
e R
eal R
etu
rn |
20
21
Edit
ion
funds will benefit from sharply increased equity valuations throughout Europe and the USA, partly
compensating for the bleak prospects for yields on fixed income securities.
Note: The addition of the Austrian Country Case was possible also thanks to our partners from
Pekabe (the Austrian Association for the Protection of Pension Fund Investors), who reviewed the
Country Case and co-funded it with BETTER FINANCE.
References
• FMA (2021): Jahresbericht der Finanzmarktaufsichtsbehörde 2020, Financial Market
Authority, Vienna.
• Pekanov, A., Url, T. (2017): Kosten der privaten und betrieblichen Altersvorsorge für die
öffentliche Hand, Bundesministerium für Soziales, Arbeit und Konsumentenschutz,
Vienna, 2017.
• OECD (2015): Stocktaking of the Tax Treatment of Funded Private Pension Plans in OECD
and EU Countries, Organisation for Economic Development and Cooperation, Paris.
• OECD (2016): Pensions Outlook 2016, Organization for Economic Development and
Cooperation, Paris.
• OECD (2019): Pensions at a Glance 2019, Organization for Economic Development and
Cooperation, Paris.
• Url, T. (1996): Kennzahlen der österreichischen Versicherungswirtschaft, Austrian Institute
of Economic Research (WIFO), Vienna.
• Url, T. (2003A): Die Entwicklung der betrieblichen Altersvorsorge in Österreich, Austrian
Institute of Economic Research (WIFO), Vienna.
• Url, T. (2003B): Einschätzung langfristiger Kapitalrenditen in der Veranlagung zur
Altersvorsorge, Austrian Institute of Economic Research (WIFO), Vienna.
• Url, T. (2009): Die Verbreitung der betrieblichen Altersvorsorge in Österreich 2007,
Austrian Institute of Economic Research (WIFO), Vienna.
• Url, T. (2012): Die Rolle von Lebensversicherungen in der betrieblichen Altersvorsorge,
Austrian Institute of Economic Research (WIFO), Vienna.
Url, T. (2013): Volkswirtschaftliche Daten zur Pensionsvorsorge in Österreich, in Urnik, S., Pfeil, W.,
J., (Eds.), Betriebliche Altersvorsorge in der Krise, Manz, Vienna, 2013, S. 1-18.
90 | P a g e
Lon
g-Te
rm a
nd
Pen
sio
n S
avin
gs |
Th
e R
eal R
etu
rn |
20
21
Edit
ion
Pension Savings: The Real Return 2021 Edition
Country Case: Belgium
Sommaire
En Belgique, le système de retraite est constitué de trois piliers. Le premier pilier par répartition
reste le plus important des trois piliers. Les retraités bénéficient d’un taux de remplacement moyen
de 66.2% en 2018. Les piliers 2 et 3 représentent les pensions complémentaires professionnelles et
individuelles basées sur les cotisations volontaires des individus. Le nombre d’individus couverts
par les véhicules de placements dans ces deux piliers continue de croître rapidement.
Respectivement 75% et 66% de la population active est couverte par ces deux piliers. Dans chacun
de ces piliers, les véhicules de placements peuvent être soit un fonds géré par une IRP dans le pilier
2 ou une banque dans le pilier 3 ou soit un contrat d’assurance groupe dans le pilier 2 ou un contrat
d’assurance vie individuelle dans le pilier 3.
Sur une période de 21 ans (2000-2021), les fonds de pension gérés par les IRP (pilier 2) et les fonds
d’épargne retraite (pilier 3) ont eu un rendement réel annuel moyen après charges de 2,24% et
1,8% respectivement. Au sein du pilier 2, tous les fonds à contributions définies gérés par les IRP et
tous les contrats d’assurance groupe Branche 21 doivent verser un rendement minimum garanti de
1,75% sur les cotisations des employeurs et des employées. Avec la baisse des rendements des
obligations d’Etat à 10 ans, les sociétés d’assurance ont revu à la baisse le rendement minimum
garanti offert sur les nouvelles cotisations versées sur les contrats d’assurance groupe Branche 21.
Cependant, les sociétés d’assurance continuent de garantir les anciens rendements sur les
cotisations passées jusqu’au départ à la retraite. Les provisions passées sont toujours rémunérées
avec des rendements garantis oscillant entre 3.25% et 4.75%. En 2018, le rendement garanti moyen
était légèrement inférieur à 3%. En raison, du manque d’informations publiques, il est plus difficile
de fournir des informations sur les rendements des contrats d’assurance-vie individuels souscrits
dans le cadre du pilier 3.
Summary
The Belgian pension system is divided into three pillars. The first PAYG pillar is still important among
the three pillar and provided on average a replacement rate of 66.2% in 2018. Pillar II and Pillar III
are both based on voluntary contributions. Numbers of individuals covered by pillar II and pillar III
pension schemes continue to grow rapidly. Respectively 75% and 66% of the active population is
covered by these pillars. In both pillar II and pillar III, pension scheme can take the form of a pension
91 | P a g e
Lon
g-Te
rm a
nd
Pen
sio
n S
avin
gs |
Th
e R
eal R
etu
rn |
20
21
Edit
ion
fund (managed by an IORP in pillar II and by a bank in pillar III) or can be an insurance contract
(“Assurance Groupe” contracts in pillar II and individual life-insurance contracts in pillar III).
Over a 21-year period (2000-2021), occupational pension funds managed by IORPs (pillar II), and
pension savings funds (pillar III) had annualized real performance after charges of 2.1
24% and 1.8% respectively. Within the pillar II, all Defined Contributions plans managed either by
IORP and “Assurance Groupe “Branch 21 contracts are required to provide an annual minimum
guaranteed return of 1.75% on both employee and employer contributions. With the decline in the
return on the Belgian 10-year government bonds, insurance companies were forced to decrease
the minimum guaranteed return offered to new contributions on “Assurance Groupe” Branch 21
contracts. However, insurance companies continue to guarantee the previous returns on the past
contributions until the retirement. Past reserves continue to have guaranteed returns range from
3.25% to 4.75%. In 2018, the average guaranteed return was slightly under 3%. Due to a lack of
information, it is more difficult to provide return information on individual life-insurance contracts
subscribed in the framework of pillar III.
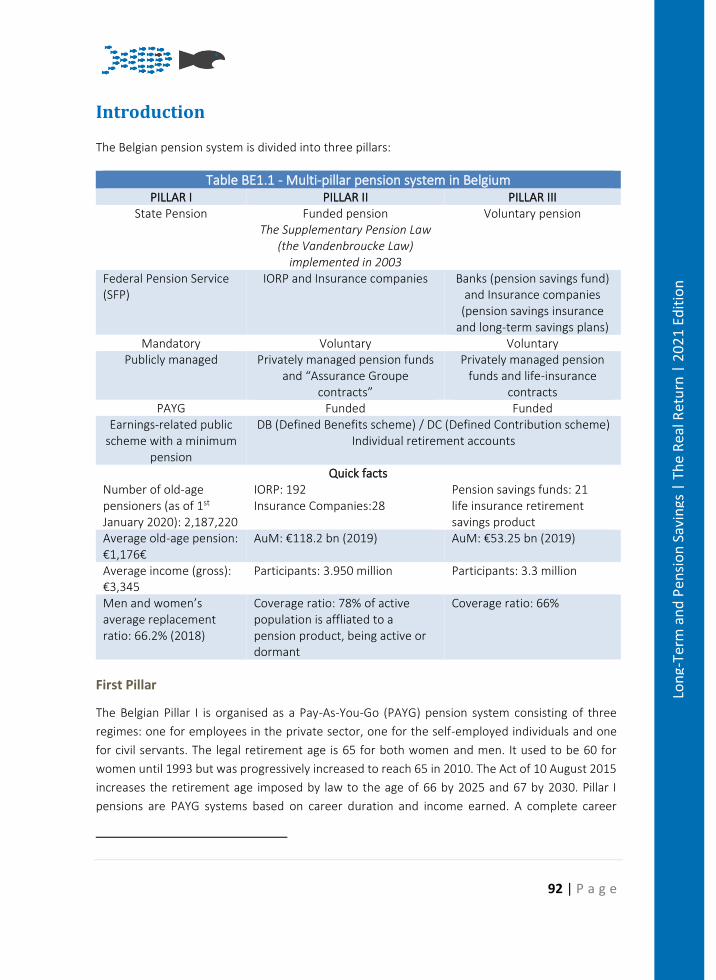
92 | P a g e
Lon
g-Te
rm a
nd
Pen
sio
n S
avin
gs |
Th
e R
eal R
etu
rn |
20
21
Edit
ion
Introduction
The Belgian pension system is divided into three pillars:
Table BE1.1 - Multi-pillar pension system in Belgium PILLAR I PILLAR II PILLAR III
State Pension Funded pension The Supplementary Pension Law
(the Vandenbroucke Law) implemented in 2003
Voluntary pension
Federal Pension Service (SFP)
IORP and Insurance companies Banks (pension savings fund) and Insurance companies
(pension savings insurance and long-term savings plans)
Mandatory Voluntary Voluntary Publicly managed Privately managed pension funds
and “Assurance Groupe contracts”
Privately managed pension funds and life-insurance
contracts PAYG Funded Funded
Earnings-related public scheme with a minimum
pension
DB (Defined Benefits scheme) / DC (Defined Contribution scheme) Individual retirement accounts
Quick facts
Number of old-age pensioners (as of 1st January 2020): 2,187,220
IORP: 192 Insurance Companies:28
Pension savings funds: 21 life insurance retirement savings product
Average old-age pension: €1,176€
AuM: €118.2 bn (2019) AuM: €53.25 bn (2019)
Average income (gross): €3,345
Participants: 3.950 million Participants: 3.3 million
Men and women’s average replacement ratio: 66.2% (2018)
Coverage ratio: 78% of active population is affliated to a pension product, being active or dormant
Coverage ratio: 66%
First Pillar
The Belgian Pillar I is organised as a Pay-As-You-Go (PAYG) pension system consisting of three
regimes: one for employees in the private sector, one for the self-employed individuals and one
for civil servants. The legal retirement age is 65 for both women and men. It used to be 60 for
women until 1993 but was progressively increased to reach 65 in 2010. The Act of 10 August 2015
increases the retirement age imposed by law to the age of 66 by 2025 and 67 by 2030. Pillar I
pensions are PAYG systems based on career duration and income earned. A complete career

93 | P a g e
Lon
g-Te
rm a
nd
Pen
sio
n S
avin
gs |
Th
e R
eal R
etu
rn |
20
21
Edit
ion
equals to 45 working-years. The calculation of the retirement pension depends on the individual’s
status, his/her career and his/her salary earned throughout his/her career. The amounts can
therefore vary greatly from person to person. A guaranteed minimum pension and a maximum
pension have been fixed. A retiree with a complete career will receive at least a guaranteed
minimum pension of €1,690.01 if he/she lives within a household or € 1,352.44 if he/she lives
alone54. In 2018, the net replacement rate from the PAYG system for both men and women (with
an average working wage) was 66.2%.55
Second Pillar
Occupational pension plans are private and voluntary. This pillar exists for both employees and
self-employed individuals. Employees can subscribe to occupational pension plans provided either
by their employer (company pension plans) or by their sector of activity (sector pension plans).
Company pension plans are traditionally dominant in the second pillar in comparison to sector
pension plans. Self-employed individuals can decide for themselves to take part in supplementary
pension plans.
An employer can set up a company pension plan for all its employees, for a group of employees or
even for a single employee. In the case of sector pension plans, collective bargaining agreements
(CBAs) set up the terms and conditions of pension coverage. Employers must join sector pension
plans, unless labour agreements allow them to opt out. Employers who decide to opt out have the
obligation to implement another plan providing benefits at least equal to those offered by the
sector.
Company and sector pension plans can be considered as “social pension plans” when they offer a
clause with solidarity benefits that provides employees with additional coverage for periods of
inactivity (e.g., unemployment, maternity leave, illness). “Social pension plans” are becoming less
and less prevalent, possibly as a result of the relatively high charges associated with these plans in
comparison to pension plans without a solidarity clause.
Occupational pension plans are managed either by an Institution for Occupational Retirement
Provision (IORP) or by an insurance company. Insurance companies predominantly manage them.
The Supplementary Pensions Act reform entered into force as of 1 January 2016. It amended the
Act of 28 April 2003 by introducing the alignment of the supplementary pension age and the legal
pension age (respectively 65, 66 in 2025 and 67 in 2030). Supplementary pension benefits will be
paid at the same time as the legal pension’s effective start. Previously, some occupational pension
plans allowed early liquidation: lump sum payments or annuities from supplementary pension
could be paid from the age of 60. Conversely, employees who decide to postpone their effective
54 These amounts apply starting from the 1st of July 2021 55 OECD, Pension at Glance 2019 Country Profiles – Belgium https://www.oecd.org/els/public-pensions/PAG2019-country-profile-Belgium.pdf
94 | P a g e
Lon
g-Te
rm a
nd
Pen
sio
n S
avin
gs |
Th
e R
eal R
etu
rn |
20
21
Edit
ion
retirement when having reached the legal pension age, have the possibility to claim their
supplementary pension or to continue to be affiliated to the pension scheme until their effective
retirement.
Moreover, many supplementary pension plans provided financial compensations to offset the
income loss employees may encounter when they end prematurely their career. As of January 1st,
2016, all these existing beneficial anticipation measures were abolished. Affiliates who reached the
age of 55 years on or before 31 December 2016, can still benefit from these existing measures. On
the 1st of January 2020, approximatively 3.950 million Belgians (78% of the active population) were
covered by occupational pension plans:
• 3.359 million employees were covered either by their company or by their sector of
activity;
• 360,027 self-employed individuals were covered by supplementary pension plans;
• 229,390 individuals were covered both by their company or by their sector of activity and
by a supplementary pension plan dedicated to self-employed.56
Third Pillar
The third pillar’s purpose is to provide Belgians with individual private and voluntary pension
products, which allow them to have tax reliefs from their contributions. There are two types of
available products for subscription: pension savings products managed either by asset management
companies or by life insurance companies and long-term savings products managed by insurance
companies. This pillar is significant in Belgium when compared to other EU member states. The tax
rate applied to accrued benefits from pension savings products (funds or insurance) was lowered
from 10% to 8% in 2015, in order to encourage savings in the framework of the third pillar.57 The
third pillar covered two thirds of the active population of Belgium in 2017, with 34% of workers
subscribing to a life insurance retirement savings product (1.7 million Belgians) and 33% being
covered by pension savings funds (1.6 million Belgians)58.
The real net returns (before taxes) of the main retirement provision vehicles in Belgium are
presented in the table below based on 5 recommended holding periods: 1 year (2020), 3 years
(2018-2020), 7 years (2014-2020), 10 years (2011-2020), and since the earliest data available.
56 Source: FSMA’s publication: Le deuxième pilier de pension en images. Les pensions complémentaires expliquées. Situation au premier janvier 2020. https://www.fsma.be/sites/default/files/legacy/content/FR/Pension/apercusectoriel_2020.pdf Data presented in this publication were provided by the DB2P who manages the supplementary pensions database. It collects data related to supplementary pension plans such as individualised acquired pension rights of employees, self-employed individuals and civil servants. 57 The lowering of the tax rate does not apply to long-term savings products. 58 There is not more recent data for 2018 and 2019.
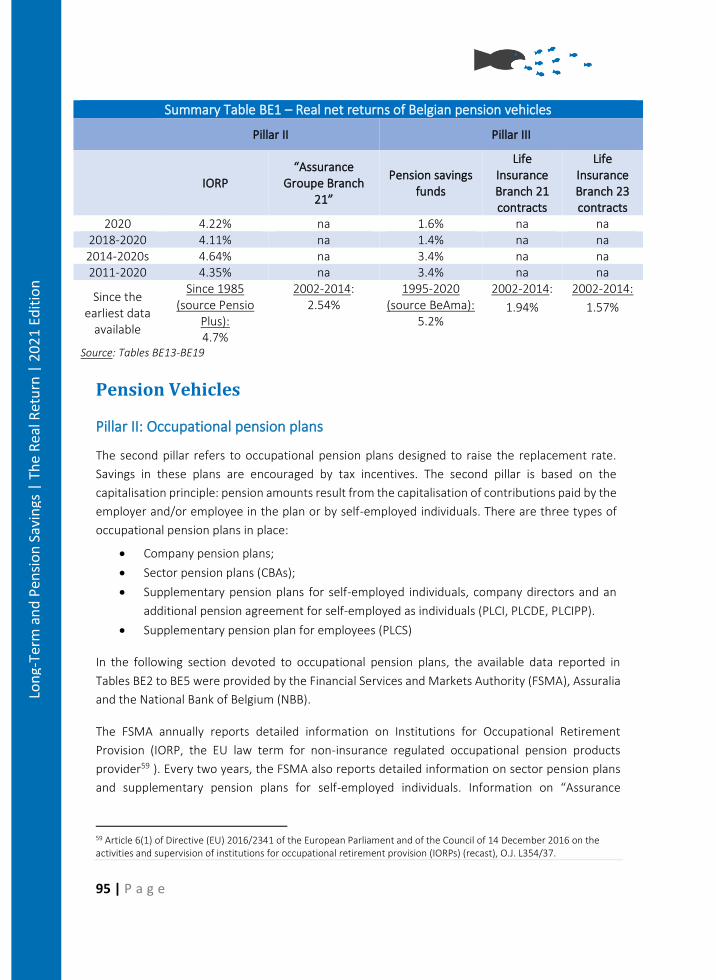
95 | P a g e
Lon
g-Te
rm a
nd
Pen
sio
n S
avin
gs |
Th
e R
eal R
etu
rn |
20
21
Edit
ion
Summary Table BE1 – Real net returns of Belgian pension vehicles
Pillar II Pillar III
IORP “Assurance
Groupe Branch 21”
Pension savings funds
Life Insurance Branch 21 contracts
Life Insurance Branch 23 contracts
2020 4.22% na 1.6% na na 2018-2020 4.11% na 1.4% na na 2014-2020s 4.64% na 3.4% na na 2011-2020 4.35% na 3.4% na na
Since the earliest data
available
Since 1985 (source Pensio
Plus): 4.7%
2002-2014: 2.54%
1995-2020 (source BeAma):
5.2%
2002-2014:
1.94%
2002-2014:
1.57%
Source: Tables BE13-BE19
Pension Vehicles
Pillar II: Occupational pension plans
The second pillar refers to occupational pension plans designed to raise the replacement rate.
Savings in these plans are encouraged by tax incentives. The second pillar is based on the
capitalisation principle: pension amounts result from the capitalisation of contributions paid by the
employer and/or employee in the plan or by self-employed individuals. There are three types of
occupational pension plans in place:
• Company pension plans;
• Sector pension plans (CBAs);
• Supplementary pension plans for self-employed individuals, company directors and an
additional pension agreement for self-employed as individuals (PLCI, PLCDE, PLCIPP).
• Supplementary pension plan for employees (PLCS)
In the following section devoted to occupational pension plans, the available data reported in
Tables BE2 to BE5 were provided by the Financial Services and Markets Authority (FSMA), Assuralia
and the National Bank of Belgium (NBB).
The FSMA annually reports detailed information on Institutions for Occupational Retirement
Provision (IORP, the EU law term for non-insurance regulated occupational pension products
provider59 ). Every two years, the FSMA also reports detailed information on sector pension plans
and supplementary pension plans for self-employed individuals. Information on “Assurance
59 Article 6(1) of Directive (EU) 2016/2341 of the European Parliament and of the Council of 14 December 2016 on the activities and supervision of institutions for occupational retirement provision (IORPs) (recast), O.J. L354/37.
96 | P a g e
Lon
g-Te
rm a
nd
Pen
sio
n S
avin
gs |
Th
e R
eal R
etu
rn |
20
21
Edit
ion
Groupe” contracts was reported by Assuralia (for Branch 21 contracts) and by the National Bank of
Belgium (for Branch 23 contracts).
Management of occupational pension plans
The management of occupational pension plans can be entrusted to an Institution for Occupational
Retirement Provision (IORP) or to an insurance company.
Institutions for Occupational Retirement Provision (IORP)
IORPs are asset management companies set up with the sole purpose of providing occupational
retirement savings products under the form of investment funds, which can either be directly
invested, through tailor-made portfolios, or which can be linked to other funds’ units (unit-linked).
FSMA reported the following data on IORP in 2019.
• 192 occupational pension plans were managed by an IORP and the number of affiliates to
IORPs increased by 15% to 2,055,434. This increase was driven by a rise in the number of
affiliates to DC sector pension plans of which a new plan.
• the number of affiliates to sector pension plans managed by IORPs continued to increase
from 1,328,463 in 2018 to 1,539,170 in 2019 (+15.9%). It still represented the largest part
in the total number of affiliates (74.9%), whereas their reserves (€5.4 billion) represented
only 14.6% of the total reserves.
• Three supplementary pension plans for self-employed individuals (€2.2 billion of reserves)
were managed by IORPs.
Based on the amount of reserves managed out of the total in Pillar II, IORPs had a market share of
31%, the rest being managed by insurance companies through Branch 21 and Branch 23 contracts,
described below.
“Assurance Groupe” (Branch 21 and Branch 23 contracts)
Occupational pension plans are predominantly managed by insurance companies. Such pension
plans are called “Assurance Groupe” contracts and can be divided into two different types of
contracts:
• “Branch 21 contracts” are occupational plans, offering a guaranteed return on
contributions made by employers and employees (1.75% since January 1st, 2016). The
insurance companies who provide these contracts bear the risk and pay the guaranteed
return in addition to a profit-sharing. All sector pension plans and all supplementary
pension plans for self-employed individuals managed by insurance companies take the
form of “Branch 21 contracts”. Most of company pension plans are also managed through
“Branch 21 contracts” rather than “Branch 23 contracts”.

97 | P a g e
Lon
g-Te
rm a
nd
Pen
sio
n S
avin
gs |
Th
e R
eal R
etu
rn |
20
21
Edit
ion
• “Branch 23 contracts” are unit-linked contracts and are invested mainly in investment
funds and equity markets. Insurance companies do not offer a guaranteed return on
contributions made into the plan. Their total returns depend on their portfolio
composition. However, affiliates to “Branch 23 contracts” benefits from the legal minimum
guaranteed return which is 1.75% since January 1st ,2016. In case of a shortfall on the
individual account when paying a benefit or a transfer of reserves, the employer has to pay
the difference. This kind of occupational plans are riskier for employers who bear the risk
and are generally costlier.
In the second pillar, company pension plans and some PLCI are managed through Branch 23
contracts. PLCI managed through Branch 23 contract represent a small part in 2019 (less then €0.5
million euros). All Branch 23 contracts accumulated €4.7 billion in reserves in 2019, representing
5.8% of the total reserves managed within “Assurance Groupe” contracts (see Table BE2).
Table BE2. Total reserves managed in pillar II in (€ billion)
IORP (1)
“Assurance Groupe”: Branch 21
contracts (2)
“Assurance Groupe”: Branch 23
contracts (3)
Total “Assurance Groupe”(2)
+(3)
Total (1)+(2)+(3)
2004 11.7 29.9 na na 41.6 2005 13.4 30.6 1.6 32.2 45.6 2006 14.3 33.5 1.7 35.2 49.5
2007 14.9 37.3 1.7 39.0 53.9
2008 11.1 38.2 1.4 39.6 50.7 2009 11.2 41.2 1.8 43.0 54.2 2010 13.9 44.7 1.8 46.5 60.4 2011 14.0 48.6 1.6 50.2 64.2 2012 16.4 52.3 1.7 54.0 70.4 2013 18.0 56.7 1.9 58.6 76.6 2014 20.7 60.1 2.1 62.2 82.9 2015 21.9 64.2 2.1 66.3 88.2 2016 26.8 67.4 2.4 69.8 96.6 2017 32.0 70.3 3.2 73.5 105.5 2018 31.4 72.6 3.7 76.3 107.7 2019 36.9 76.6 4.7 81.3 118.2
Sources: Assuralia, BNB, BETTER FINANCE research, FSMA
Description of occupational pension plans
The following section provides information and figures for the different occupational pension plans
within Pillar II in Belgium: sector pension plans, private supplementary pensions for self-employed
individuals (PLCI) and company pension plans.
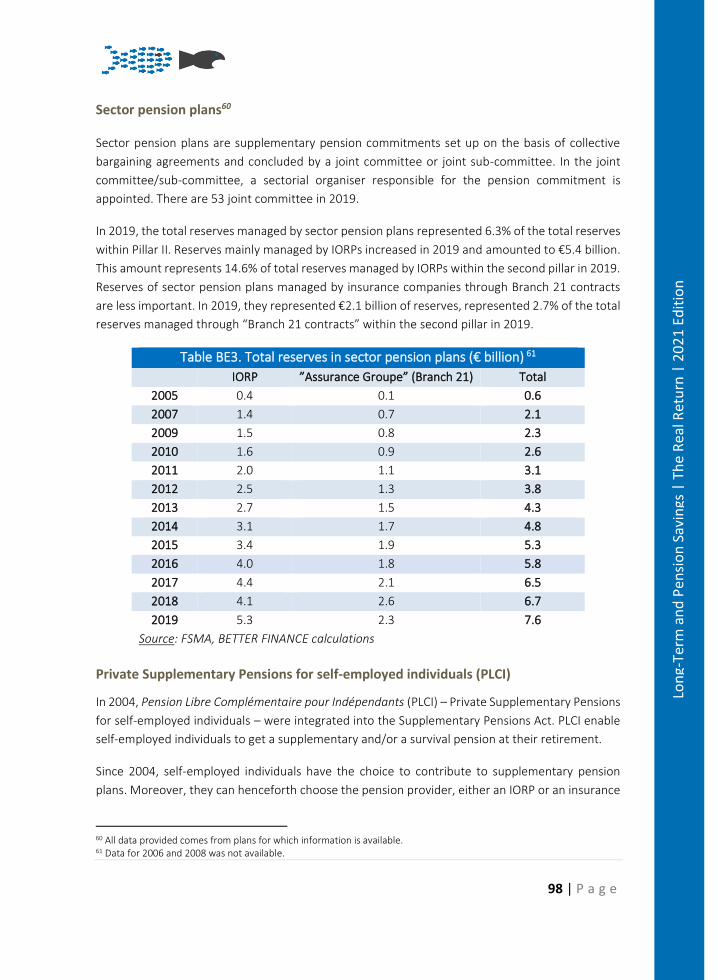
98 | P a g e
Lon
g-Te
rm a
nd
Pen
sio
n S
avin
gs |
Th
e R
eal R
etu
rn |
20
21
Edit
ion
Sector pension plans60
Sector pension plans are supplementary pension commitments set up on the basis of collective
bargaining agreements and concluded by a joint committee or joint sub-committee. In the joint
committee/sub-committee, a sectorial organiser responsible for the pension commitment is
appointed. There are 53 joint committee in 2019.
In 2019, the total reserves managed by sector pension plans represented 6.3% of the total reserves
within Pillar II. Reserves mainly managed by IORPs increased in 2019 and amounted to €5.4 billion.
This amount represents 14.6% of total reserves managed by IORPs within the second pillar in 2019.
Reserves of sector pension plans managed by insurance companies through Branch 21 contracts
are less important. In 2019, they represented €2.1 billion of reserves, represented 2.7% of the total
reserves managed through “Branch 21 contracts” within the second pillar in 2019.
Table BE3. Total reserves in sector pension plans (€ billion) 61
IORP ”Assurance Groupe” (Branch 21) Total
2005 0.4 0.1 0.6
2007 1.4 0.7 2.1
2009 1.5 0.8 2.3
2010 1.6 0.9 2.6
2011 2.0 1.1 3.1
2012 2.5 1.3 3.8
2013 2.7 1.5 4.3
2014 3.1 1.7 4.8
2015 3.4 1.9 5.3
2016 4.0 1.8 5.8
2017 4.4 2.1 6.5
2018 4.1 2.6 6.7
2019 5.3 2.3 7.6
Source: FSMA, BETTER FINANCE calculations
Private Supplementary Pensions for self-employed individuals (PLCI)
In 2004, Pension Libre Complémentaire pour Indépendants (PLCI) – Private Supplementary Pensions
for self-employed individuals – were integrated into the Supplementary Pensions Act. PLCI enable
self-employed individuals to get a supplementary and/or a survival pension at their retirement.
Since 2004, self-employed individuals have the choice to contribute to supplementary pension
plans. Moreover, they can henceforth choose the pension provider, either an IORP or an insurance
60 All data provided comes from plans for which information is available. 61 Data for 2006 and 2008 was not available.
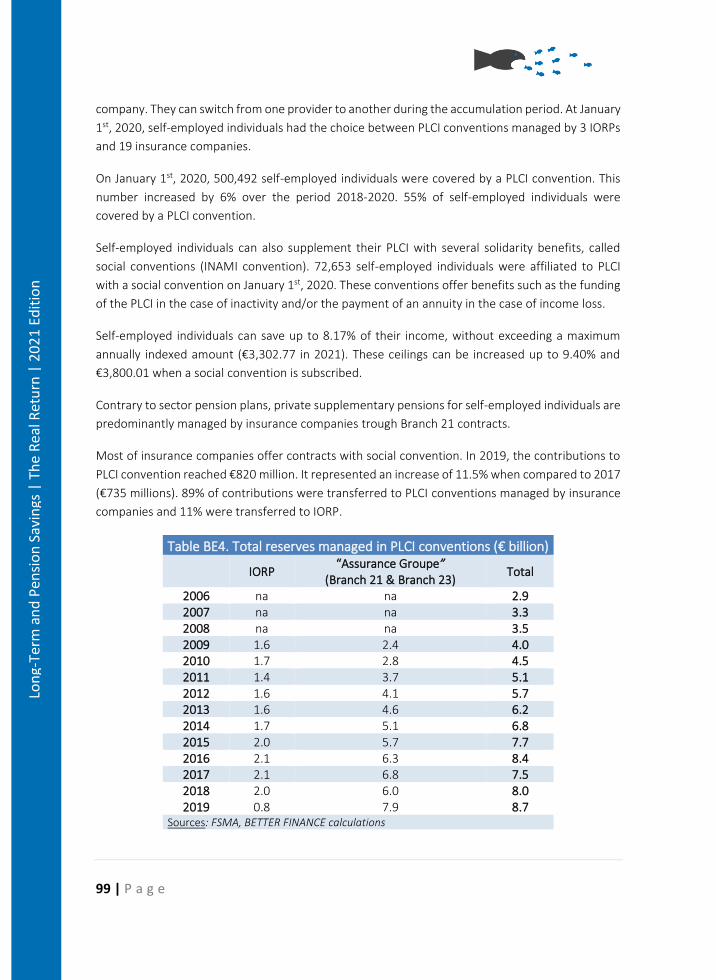
99 | P a g e
Lon
g-Te
rm a
nd
Pen
sio
n S
avin
gs |
Th
e R
eal R
etu
rn |
20
21
Edit
ion
company. They can switch from one provider to another during the accumulation period. At January
1st, 2020, self-employed individuals had the choice between PLCI conventions managed by 3 IORPs
and 19 insurance companies.
On January 1st, 2020, 500,492 self-employed individuals were covered by a PLCI convention. This
number increased by 6% over the period 2018-2020. 55% of self-employed individuals were
covered by a PLCI convention.
Self-employed individuals can also supplement their PLCI with several solidarity benefits, called
social conventions (INAMI convention). 72,653 self-employed individuals were affiliated to PLCI
with a social convention on January 1st, 2020. These conventions offer benefits such as the funding
of the PLCI in the case of inactivity and/or the payment of an annuity in the case of income loss.
Self-employed individuals can save up to 8.17% of their income, without exceeding a maximum
annually indexed amount (€3,302.77 in 2021). These ceilings can be increased up to 9.40% and
€3,800.01 when a social convention is subscribed.
Contrary to sector pension plans, private supplementary pensions for self-employed individuals are
predominantly managed by insurance companies trough Branch 21 contracts.
Most of insurance companies offer contracts with social convention. In 2019, the contributions to
PLCI convention reached €820 million. It represented an increase of 11.5% when compared to 2017
(€735 millions). 89% of contributions were transferred to PLCI conventions managed by insurance
companies and 11% were transferred to IORP.
Table BE4. Total reserves managed in PLCI conventions (€ billion)
IORP
“Assurance Groupe” (Branch 21 & Branch 23)
Total
2006 na na 2.9 2007 na na 3.3 2008 na na 3.5 2009 1.6 2.4 4.0 2010 1.7 2.8 4.5 2011 1.4 3.7 5.1 2012 1.6 4.1 5.7 2013 1.6 4.6 6.2 2014 1.7 5.1 6.8 2015 2.0 5.7 7.7 2016 2.1 6.3 8.4 2017 2.1 6.8 7.5 2018 2.0 6.0 8.0 2019 0.8 7.9 8.7
Sources: FSMA, BETTER FINANCE calculations
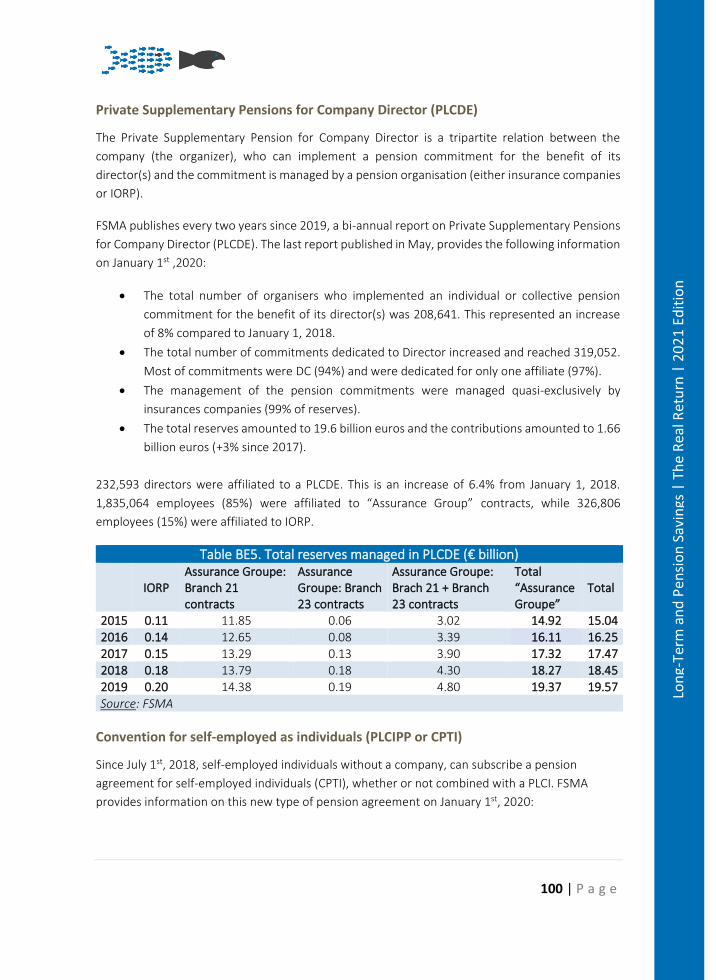
100 | P a g e
Lon
g-Te
rm a
nd
Pen
sio
n S
avin
gs |
Th
e R
eal R
etu
rn |
20
21
Edit
ion
Private Supplementary Pensions for Company Director (PLCDE)
The Private Supplementary Pension for Company Director is a tripartite relation between the
company (the organizer), who can implement a pension commitment for the benefit of its
director(s) and the commitment is managed by a pension organisation (either insurance companies
or IORP).
FSMA publishes every two years since 2019, a bi-annual report on Private Supplementary Pensions
for Company Director (PLCDE). The last report published in May, provides the following information
on January 1st ,2020:
• The total number of organisers who implemented an individual or collective pension
commitment for the benefit of its director(s) was 208,641. This represented an increase
of 8% compared to January 1, 2018.
• The total number of commitments dedicated to Director increased and reached 319,052.
Most of commitments were DC (94%) and were dedicated for only one affiliate (97%).
• The management of the pension commitments were managed quasi-exclusively by
insurances companies (99% of reserves).
• The total reserves amounted to 19.6 billion euros and the contributions amounted to 1.66
billion euros (+3% since 2017).
232,593 directors were affiliated to a PLCDE. This is an increase of 6.4% from January 1, 2018.
1,835,064 employees (85%) were affiliated to “Assurance Group” contracts, while 326,806
employees (15%) were affiliated to IORP.
Table BE5. Total reserves managed in PLCDE (€ billion)
IORP Assurance Groupe: Branch 21 contracts
Assurance Groupe: Branch 23 contracts
Assurance Groupe: Brach 21 + Branch 23 contracts
Total “Assurance Groupe”
Total
2015 0.11 11.85 0.06 3.02 14.92 15.04
2016 0.14 12.65 0.08 3.39 16.11 16.25
2017 0.15 13.29 0.13 3.90 17.32 17.47
2018 0.18 13.79 0.18 4.30 18.27 18.45
2019 0.20 14.38 0.19 4.80 19.37 19.57
Source: FSMA
Convention for self-employed as individuals (PLCIPP or CPTI)
Since July 1st, 2018, self-employed individuals without a company, can subscribe a pension
agreement for self-employed individuals (CPTI), whether or not combined with a PLCI. FSMA
provides information on this new type of pension agreement on January 1st, 2020:
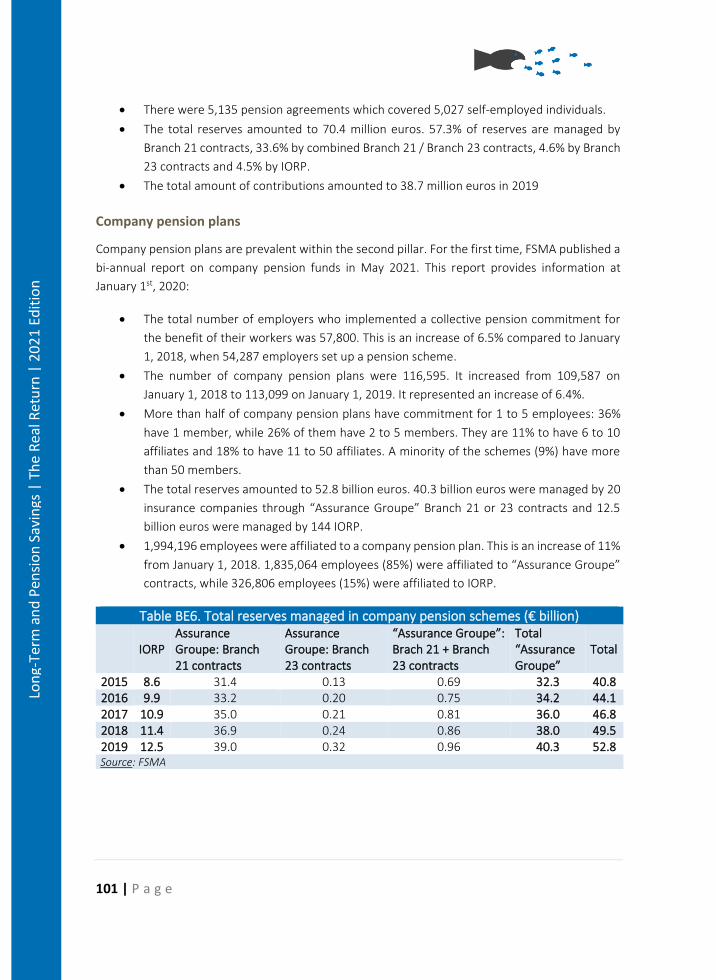
101 | P a g e
Lon
g-Te
rm a
nd
Pen
sio
n S
avin
gs |
Th
e R
eal R
etu
rn |
20
21
Edit
ion
• There were 5,135 pension agreements which covered 5,027 self-employed individuals.
• The total reserves amounted to 70.4 million euros. 57.3% of reserves are managed by
Branch 21 contracts, 33.6% by combined Branch 21 / Branch 23 contracts, 4.6% by Branch
23 contracts and 4.5% by IORP.
• The total amount of contributions amounted to 38.7 million euros in 2019
Company pension plans
Company pension plans are prevalent within the second pillar. For the first time, FSMA published a
bi-annual report on company pension funds in May 2021. This report provides information at
January 1st, 2020:
• The total number of employers who implemented a collective pension commitment for
the benefit of their workers was 57,800. This is an increase of 6.5% compared to January
1, 2018, when 54,287 employers set up a pension scheme.
• The number of company pension plans were 116,595. It increased from 109,587 on
January 1, 2018 to 113,099 on January 1, 2019. It represented an increase of 6.4%.
• More than half of company pension plans have commitment for 1 to 5 employees: 36%
have 1 member, while 26% of them have 2 to 5 members. They are 11% to have 6 to 10
affiliates and 18% to have 11 to 50 affiliates. A minority of the schemes (9%) have more
than 50 members.
• The total reserves amounted to 52.8 billion euros. 40.3 billion euros were managed by 20
insurance companies through “Assurance Groupe” Branch 21 or 23 contracts and 12.5
billion euros were managed by 144 IORP.
• 1,994,196 employees were affiliated to a company pension plan. This is an increase of 11%
from January 1, 2018. 1,835,064 employees (85%) were affiliated to “Assurance Groupe”
contracts, while 326,806 employees (15%) were affiliated to IORP.
Table BE6. Total reserves managed in company pension schemes (€ billion)
IORP
Assurance Groupe: Branch 21 contracts
Assurance Groupe: Branch 23 contracts
“Assurance Groupe”: Brach 21 + Branch 23 contracts
Total “Assurance Groupe”
Total
2015 8.6 31.4 0.13 0.69 32.3 40.8 2016 9.9 33.2 0.20 0.75 34.2 44.1 2017 10.9 35.0 0.21 0.81 36.0 46.8 2018 11.4 36.9 0.24 0.86 38.0 49.5 2019 12.5 39.0 0.32 0.96 40.3 52.8 Source: FSMA
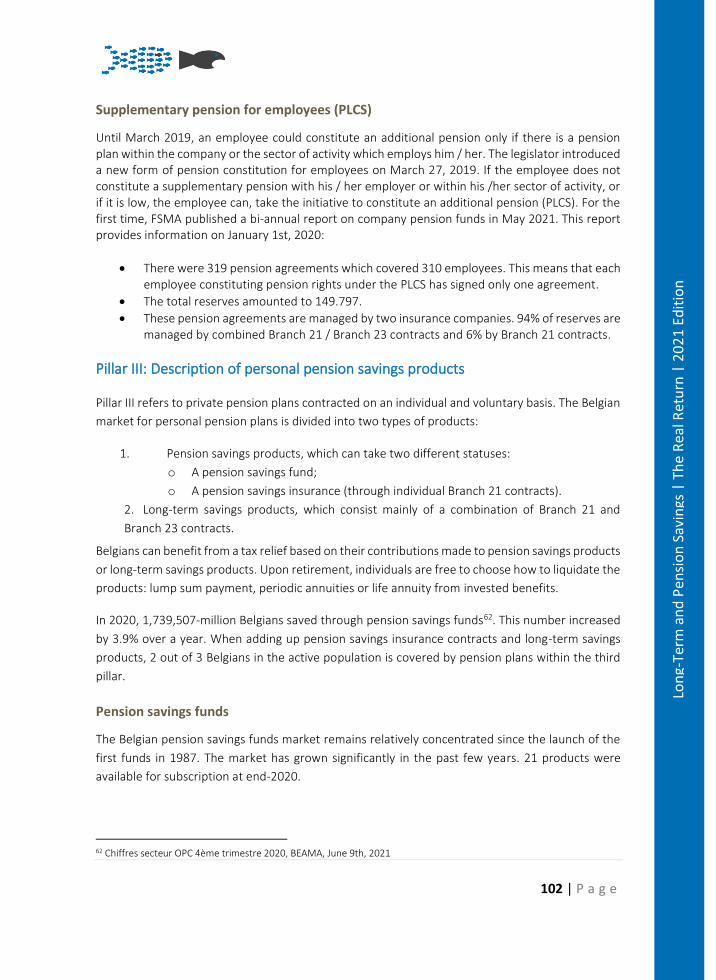
102 | P a g e
Lon
g-Te
rm a
nd
Pen
sio
n S
avin
gs |
Th
e R
eal R
etu
rn |
20
21
Edit
ion
Supplementary pension for employees (PLCS)
Until March 2019, an employee could constitute an additional pension only if there is a pension plan within the company or the sector of activity which employs him / her. The legislator introduced a new form of pension constitution for employees on March 27, 2019. If the employee does not constitute a supplementary pension with his / her employer or within his /her sector of activity, or if it is low, the employee can, take the initiative to constitute an additional pension (PLCS). For the first time, FSMA published a bi-annual report on company pension funds in May 2021. This report provides information on January 1st, 2020:
• There were 319 pension agreements which covered 310 employees. This means that each employee constituting pension rights under the PLCS has signed only one agreement.
• The total reserves amounted to 149.797.
• These pension agreements are managed by two insurance companies. 94% of reserves are managed by combined Branch 21 / Branch 23 contracts and 6% by Branch 21 contracts.
Pillar III: Description of personal pension savings products
Pillar III refers to private pension plans contracted on an individual and voluntary basis. The Belgian
market for personal pension plans is divided into two types of products:
1. Pension savings products, which can take two different statuses:
o A pension savings fund;
o A pension savings insurance (through individual Branch 21 contracts).
2. Long-term savings products, which consist mainly of a combination of Branch 21 and
Branch 23 contracts.
Belgians can benefit from a tax relief based on their contributions made to pension savings products
or long-term savings products. Upon retirement, individuals are free to choose how to liquidate the
products: lump sum payment, periodic annuities or life annuity from invested benefits.
In 2020, 1,739,507-million Belgians saved through pension savings funds62. This number increased
by 3.9% over a year. When adding up pension savings insurance contracts and long-term savings
products, 2 out of 3 Belgians in the active population is covered by pension plans within the third
pillar.
Pension savings funds
The Belgian pension savings funds market remains relatively concentrated since the launch of the
first funds in 1987. The market has grown significantly in the past few years. 21 products were
available for subscription at end-2020.
62 Chiffres secteur OPC 4ème trimestre 2020, BEAMA, June 9th, 2021
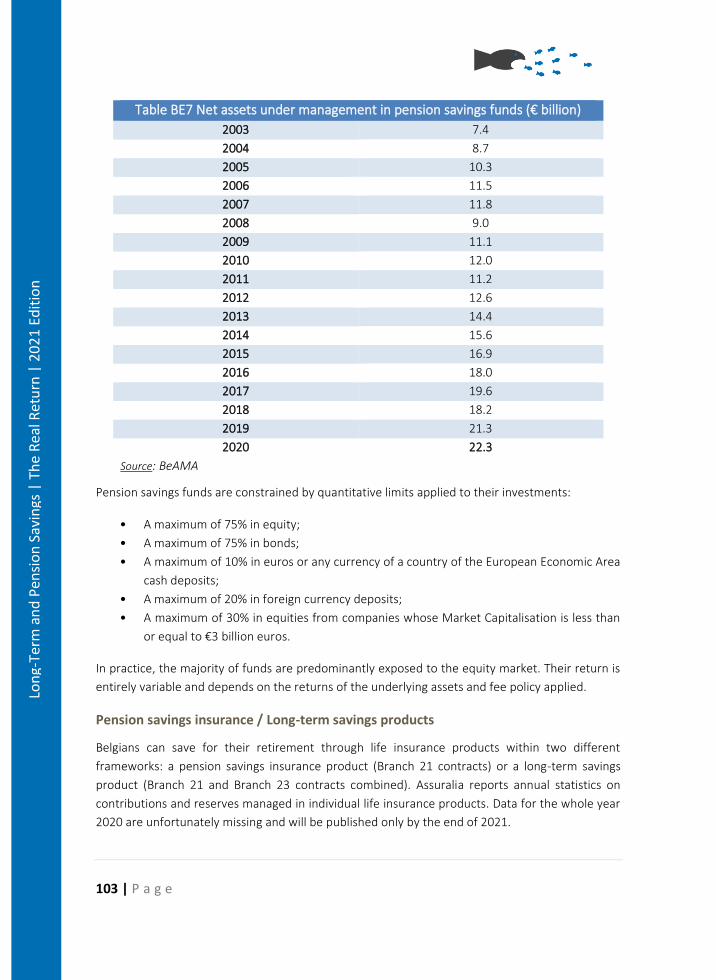
103 | P a g e
Lon
g-Te
rm a
nd
Pen
sio
n S
avin
gs |
Th
e R
eal R
etu
rn |
20
21
Edit
ion
Table BE7 Net assets under management in pension savings funds (€ billion)
2003 7.4
2004 8.7
2005 10.3
2006 11.5
2007 11.8
2008 9.0
2009 11.1
2010 12.0
2011 11.2
2012 12.6
2013 14.4
2014 15.6
2015 16.9
2016 18.0
2017 19.6
2018 18.2
2019 21.3
2020 22.3
Source: BeAMA
Pension savings funds are constrained by quantitative limits applied to their investments:
• A maximum of 75% in equity;
• A maximum of 75% in bonds;
• A maximum of 10% in euros or any currency of a country of the European Economic Area
cash deposits;
• A maximum of 20% in foreign currency deposits;
• A maximum of 30% in equities from companies whose Market Capitalisation is less than
or equal to €3 billion euros.
In practice, the majority of funds are predominantly exposed to the equity market. Their return is
entirely variable and depends on the returns of the underlying assets and fee policy applied.
Pension savings insurance / Long-term savings products
Belgians can save for their retirement through life insurance products within two different
frameworks: a pension savings insurance product (Branch 21 contracts) or a long-term savings
product (Branch 21 and Branch 23 contracts combined). Assuralia reports annual statistics on
contributions and reserves managed in individual life insurance products. Data for the whole year
2020 are unfortunately missing and will be published only by the end of 2021.
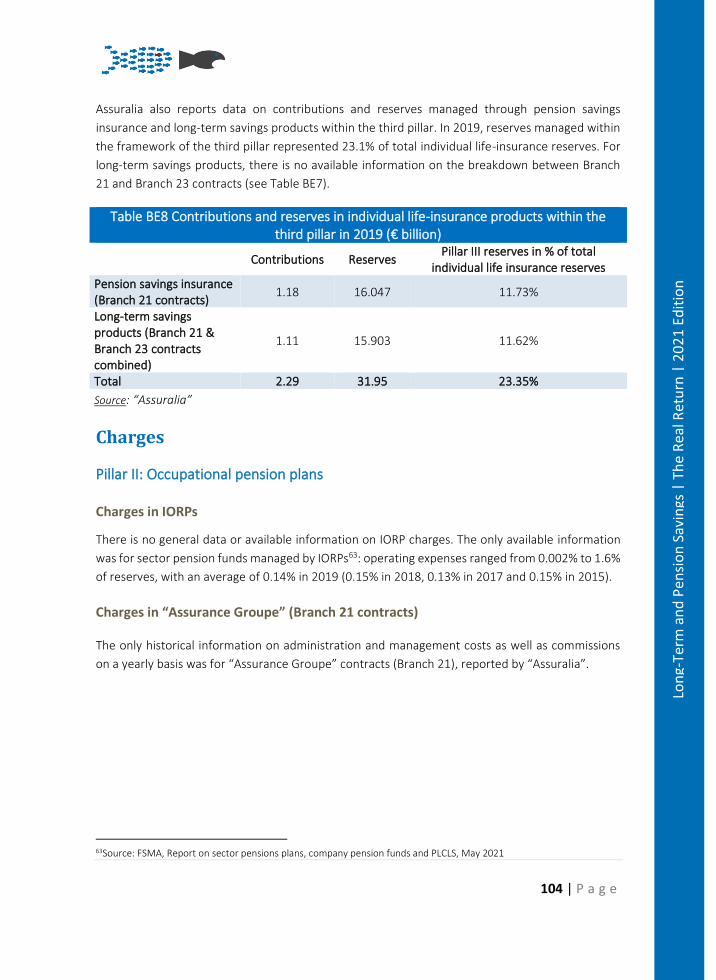
104 | P a g e
Lon
g-Te
rm a
nd
Pen
sio
n S
avin
gs |
Th
e R
eal R
etu
rn |
20
21
Edit
ion
Assuralia also reports data on contributions and reserves managed through pension savings
insurance and long-term savings products within the third pillar. In 2019, reserves managed within
the framework of the third pillar represented 23.1% of total individual life-insurance reserves. For
long-term savings products, there is no available information on the breakdown between Branch
21 and Branch 23 contracts (see Table BE7).
Table BE8 Contributions and reserves in individual life-insurance products within the third pillar in 2019 (€ billion)
Contributions Reserves Pillar III reserves in % of total
individual life insurance reserves Pension savings insurance (Branch 21 contracts)
1.18 16.047 11.73%
Long-term savings products (Branch 21 & Branch 23 contracts combined)
1.11 15.903 11.62%
Total 2.29 31.95 23.35%
Source: “Assuralia”
Charges
Pillar II: Occupational pension plans
Charges in IORPs
There is no general data or available information on IORP charges. The only available information
was for sector pension funds managed by IORPs63: operating expenses ranged from 0.002% to 1.6%
of reserves, with an average of 0.14% in 2019 (0.15% in 2018, 0.13% in 2017 and 0.15% in 2015).
Charges in “Assurance Groupe” (Branch 21 contracts)
The only historical information on administration and management costs as well as commissions
on a yearly basis was for “Assurance Groupe” contracts (Branch 21), reported by “Assuralia”.
63Source: FSMA, Report on sector pensions plans, company pension funds and PLCLS, May 2021
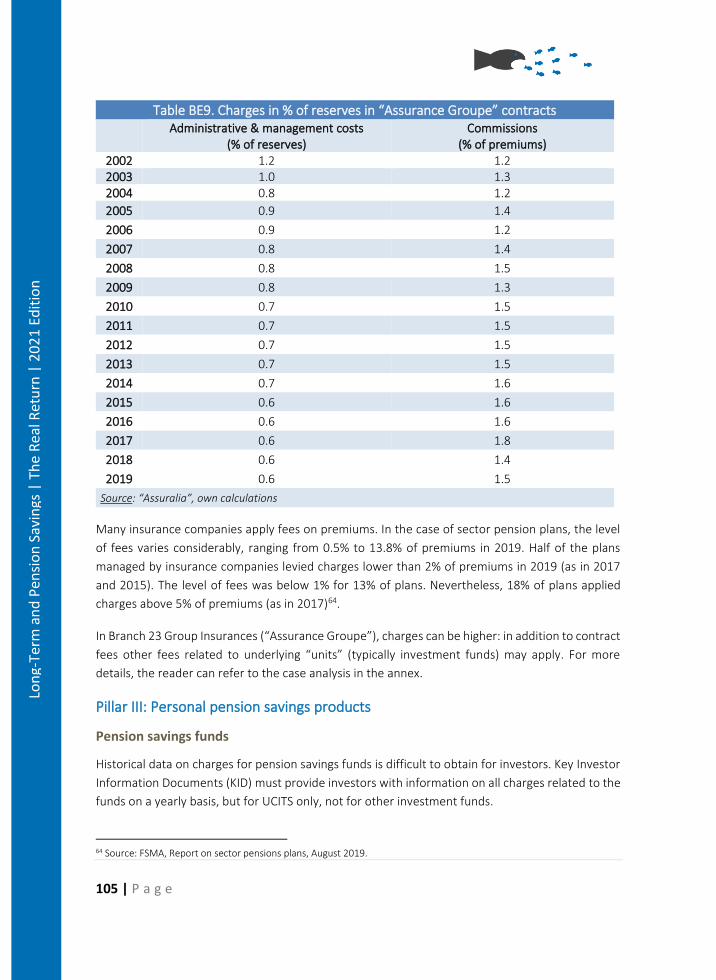
105 | P a g e
Lon
g-Te
rm a
nd
Pen
sio
n S
avin
gs |
Th
e R
eal R
etu
rn |
20
21
Edit
ion
Table BE9. Charges in % of reserves in “Assurance Groupe” contracts
Administrative & management costs (% of reserves)
Commissions (% of premiums)
2002 1.2 1.2 2003 1.0 1.3 2004 0.8 1.2
2005 0.9 1.4
2006 0.9 1.2
2007 0.8 1.4
2008 0.8 1.5
2009 0.8 1.3
2010 0.7 1.5
2011 0.7 1.5
2012 0.7 1.5
2013 0.7 1.5
2014 0.7 1.6
2015 0.6 1.6
2016 0.6 1.6
2017 0.6 1.8
2018 0.6 1.4
2019 0.6 1.5
Source: “Assuralia”, own calculations
Many insurance companies apply fees on premiums. In the case of sector pension plans, the level
of fees varies considerably, ranging from 0.5% to 13.8% of premiums in 2019. Half of the plans
managed by insurance companies levied charges lower than 2% of premiums in 2019 (as in 2017
and 2015). The level of fees was below 1% for 13% of plans. Nevertheless, 18% of plans applied
charges above 5% of premiums (as in 2017)64.
In Branch 23 Group Insurances (“Assurance Groupe”), charges can be higher: in addition to contract
fees other fees related to underlying “units” (typically investment funds) may apply. For more
details, the reader can refer to the case analysis in the annex.
Pillar III: Personal pension savings products
Pension savings funds
Historical data on charges for pension savings funds is difficult to obtain for investors. Key Investor
Information Documents (KID) must provide investors with information on all charges related to the
funds on a yearly basis, but for UCITS only, not for other investment funds.
64 Source: FSMA, Report on sector pensions plans, August 2019.
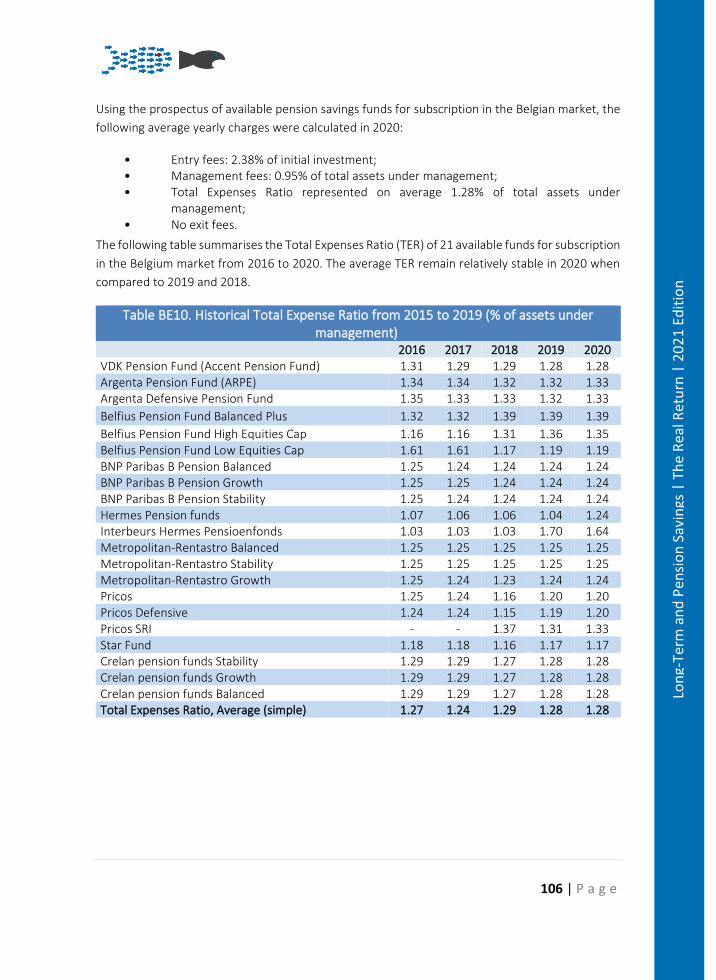
106 | P a g e
Lon
g-Te
rm a
nd
Pen
sio
n S
avin
gs |
Th
e R
eal R
etu
rn |
20
21
Edit
ion
Using the prospectus of available pension savings funds for subscription in the Belgian market, the
following average yearly charges were calculated in 2020:
• Entry fees: 2.38% of initial investment; • Management fees: 0.95% of total assets under management; • Total Expenses Ratio represented on average 1.28% of total assets under
management; • No exit fees.
The following table summarises the Total Expenses Ratio (TER) of 21 available funds for subscription
in the Belgium market from 2016 to 2020. The average TER remain relatively stable in 2020 when
compared to 2019 and 2018.
Table BE10. Historical Total Expense Ratio from 2015 to 2019 (% of assets under management)
2016 2017 2018 2019 2020 VDK Pension Fund (Accent Pension Fund) 1.31 1.29 1.29 1.28 1.28 Argenta Pension Fund (ARPE) 1.34 1.34 1.32 1.32 1.33 Argenta Defensive Pension Fund 1.35 1.33 1.33 1.32 1.33
Belfius Pension Fund Balanced Plus 1.32 1.32 1.39 1.39 1.39
Belfius Pension Fund High Equities Cap 1.16 1.16 1.31 1.36 1.35 Belfius Pension Fund Low Equities Cap 1.61 1.61 1.17 1.19 1.19 BNP Paribas B Pension Balanced 1.25 1.24 1.24 1.24 1.24 BNP Paribas B Pension Growth 1.25 1.25 1.24 1.24 1.24 BNP Paribas B Pension Stability 1.25 1.24 1.24 1.24 1.24 Hermes Pension funds 1.07 1.06 1.06 1.04 1.24 Interbeurs Hermes Pensioenfonds 1.03 1.03 1.03 1.70 1.64 Metropolitan-Rentastro Balanced 1.25 1.25 1.25 1.25 1.25 Metropolitan-Rentastro Stability 1.25 1.25 1.25 1.25 1.25 Metropolitan-Rentastro Growth 1.25 1.24 1.23 1.24 1.24 Pricos 1.25 1.24 1.16 1.20 1.20 Pricos Defensive 1.24 1.24 1.15 1.19 1.20 Pricos SRI - - 1.37 1.31 1.33 Star Fund 1.18 1.18 1.16 1.17 1.17 Crelan pension funds Stability 1.29 1.29 1.27 1.28 1.28 Crelan pension funds Growth 1.29 1.29 1.27 1.28 1.28 Crelan pension funds Balanced 1.29 1.29 1.27 1.28 1.28 Total Expenses Ratio, Average (simple) 1.27 1.24 1.29 1.28 1.28
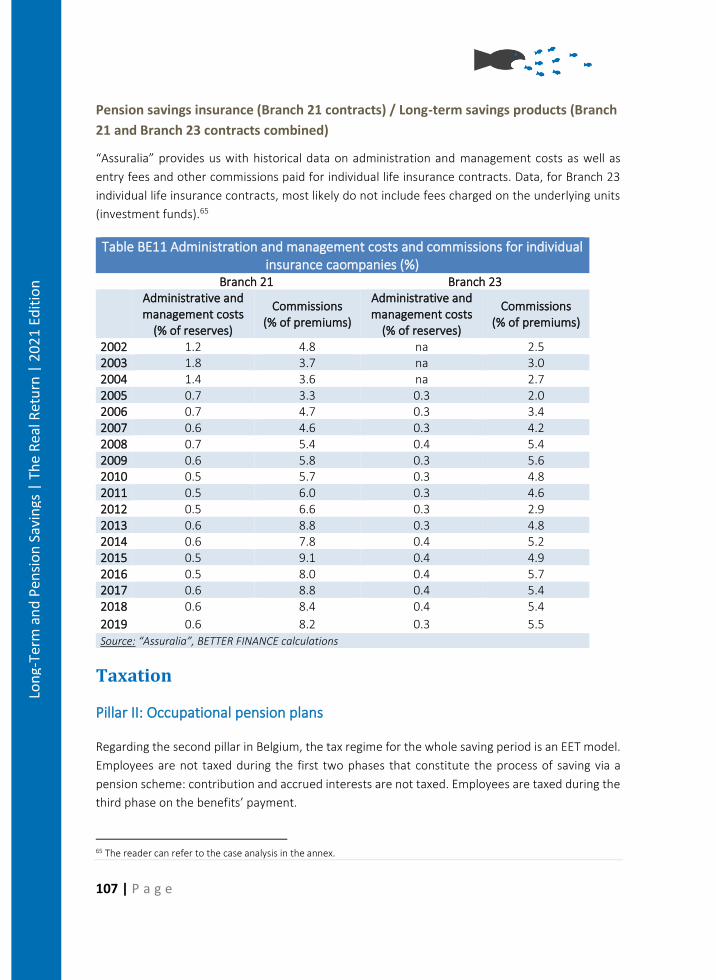
107 | P a g e
Lon
g-Te
rm a
nd
Pen
sio
n S
avin
gs |
Th
e R
eal R
etu
rn |
20
21
Edit
ion
Pension savings insurance (Branch 21 contracts) / Long-term savings products (Branch
21 and Branch 23 contracts combined)
“Assuralia” provides us with historical data on administration and management costs as well as
entry fees and other commissions paid for individual life insurance contracts. Data, for Branch 23
individual life insurance contracts, most likely do not include fees charged on the underlying units
(investment funds).65
Table BE11 Administration and management costs and commissions for individual insurance caompanies (%)
Branch 21 Branch 23 Administrative and
management costs (% of reserves)
Commissions (% of premiums)
Administrative and management costs
(% of reserves)
Commissions (% of premiums)
2002 1.2 4.8 na 2.5 2003 1.8 3.7 na 3.0 2004 1.4 3.6 na 2.7 2005 0.7 3.3 0.3 2.0 2006 0.7 4.7 0.3 3.4 2007 0.6 4.6 0.3 4.2 2008 0.7 5.4 0.4 5.4 2009 0.6 5.8 0.3 5.6 2010 0.5 5.7 0.3 4.8 2011 0.5 6.0 0.3 4.6 2012 0.5 6.6 0.3 2.9 2013 0.6 8.8 0.3 4.8 2014 0.6 7.8 0.4 5.2 2015 0.5 9.1 0.4 4.9 2016 0.5 8.0 0.4 5.7 2017 0.6 8.8 0.4 5.4 2018 0.6 8.4 0.4 5.4
2019 0.6 8.2 0.3 5.5 Source: “Assuralia”, BETTER FINANCE calculations
Taxation
Pillar II: Occupational pension plans
Regarding the second pillar in Belgium, the tax regime for the whole saving period is an EET model.
Employees are not taxed during the first two phases that constitute the process of saving via a
pension scheme: contribution and accrued interests are not taxed. Employees are taxed during the
third phase on the benefits’ payment.
65 The reader can refer to the case analysis in the annex.
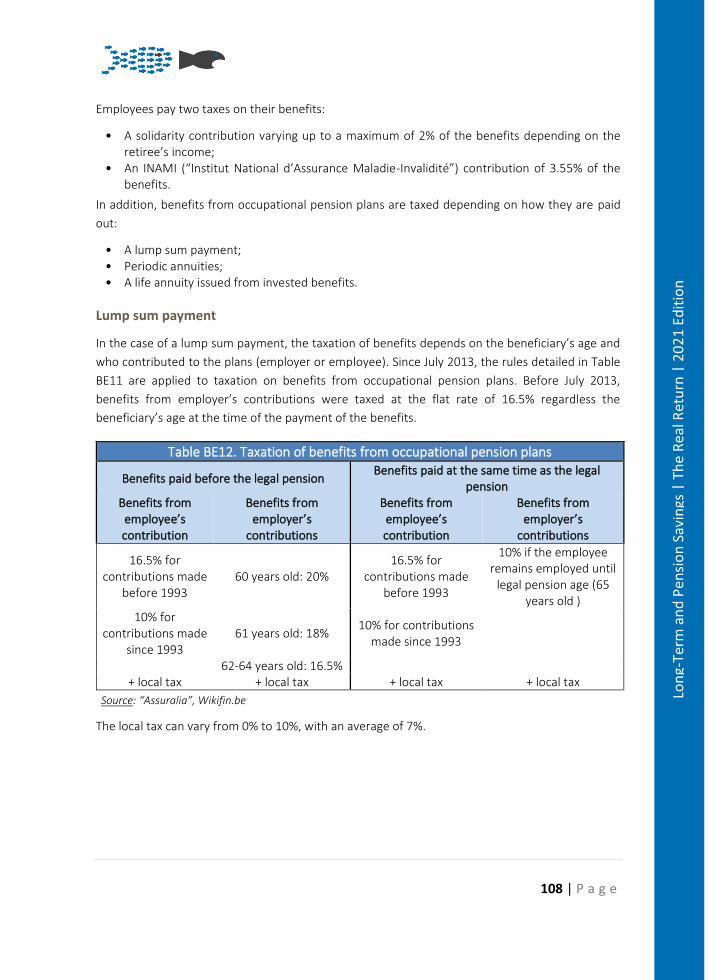
108 | P a g e
Lon
g-Te
rm a
nd
Pen
sio
n S
avin
gs |
Th
e R
eal R
etu
rn |
20
21
Edit
ion
Employees pay two taxes on their benefits:
• A solidarity contribution varying up to a maximum of 2% of the benefits depending on the retiree’s income;
• An INAMI (“Institut National d’Assurance Maladie-Invalidité”) contribution of 3.55% of the benefits.
In addition, benefits from occupational pension plans are taxed depending on how they are paid
out:
• A lump sum payment; • Periodic annuities; • A life annuity issued from invested benefits.
Lump sum payment
In the case of a lump sum payment, the taxation of benefits depends on the beneficiary’s age and
who contributed to the plans (employer or employee). Since July 2013, the rules detailed in Table
BE11 are applied to taxation on benefits from occupational pension plans. Before July 2013,
benefits from employer’s contributions were taxed at the flat rate of 16.5% regardless the
beneficiary’s age at the time of the payment of the benefits.
Table BE12. Taxation of benefits from occupational pension plans
Benefits paid before the legal pension Benefits paid at the same time as the legal
pension Benefits from employee’s contribution
Benefits from employer’s
contributions
Benefits from employee’s contribution
Benefits from employer’s
contributions
16.5% for contributions made
before 1993 60 years old: 20%
16.5% for contributions made
before 1993
10% if the employee remains employed until
legal pension age (65 years old )
10% for contributions made
since 1993 61 years old: 18%
10% for contributions made since 1993
62-64 years old: 16.5% + local tax + local tax + local tax + local tax
Source: “Assuralia”, Wikifin.be
The local tax can vary from 0% to 10%, with an average of 7%.
109 | P a g e
Lon
g-Te
rm a
nd
Pen
sio
n S
avin
gs |
Th
e R
eal R
etu
rn |
20
21
Edit
ion
Periodic annuities66
Periodic annuities are considered to be an income and are taxed at the applicable progressive
personal income tax rate.
Converting the accumulated capital into a life annuity
An employee can convert the lump sum payment into a life annuity. In this case, the INAMI
contribution and the solidarity contribution have to be paid according to the rules applied to the
lump sum payment. Then the retiree has to pay a withholding tax of 15% on the annuity each year.
Pillar III: Personal pension savings products
Regarding the third pillar in Belgium, the tax regime for the whole saving period is an EET model
with a limited ceiling on contributions during the first phase for pension savings products and with
a limited ceiling on the maximum tax benefit depending on the level of the saver’s yearly earnings
for long-term savings products.
Pension savings products (fund or life insurance contracts)
➢ Tax relief on contributions during the accumulation phase
Contributions invested in pension savings products (fund or insurance) are deductible from the
income tax. Individuals can make contributions into pension savings products up to a rather low
annual ceiling (€990 in 2021). The tax ceiling on pension savings products was frozen in 2020. This
is still the case in 2021. The next indexation will take place in 2024
Since 2012 and until 2018, a tax relief rate equal to 30% of the contributions was applied, regardless
of the taxpayer’s income.
In 2018, in order to further promote the third pillar and contributions to pension savings products
(fund or life-insurance contracts), a new tax relief system was introduced. Two tax relief systems
now co-exist, and the amount of the individual contribution determines the tax relief:
• For any contribution less or equal to €990, individuals can still benefit from a 30% tax
relief rate. This may result in a maximum tax relief of €297 per year.
• If the individual chooses to make a contribution above €1,270 and informs the provider
of the product, he / she can benefit from a tax relief rate equal to 25%. The maximum
contribution cannot exceed €1,270, with a maximum tax-relief of €317,5.
66 For pillar II, employees can choose to redeem capital in a lump sum payment or in annuities. In practice, few people choose annuities, and most employees redeem their product in a lump sum payment.
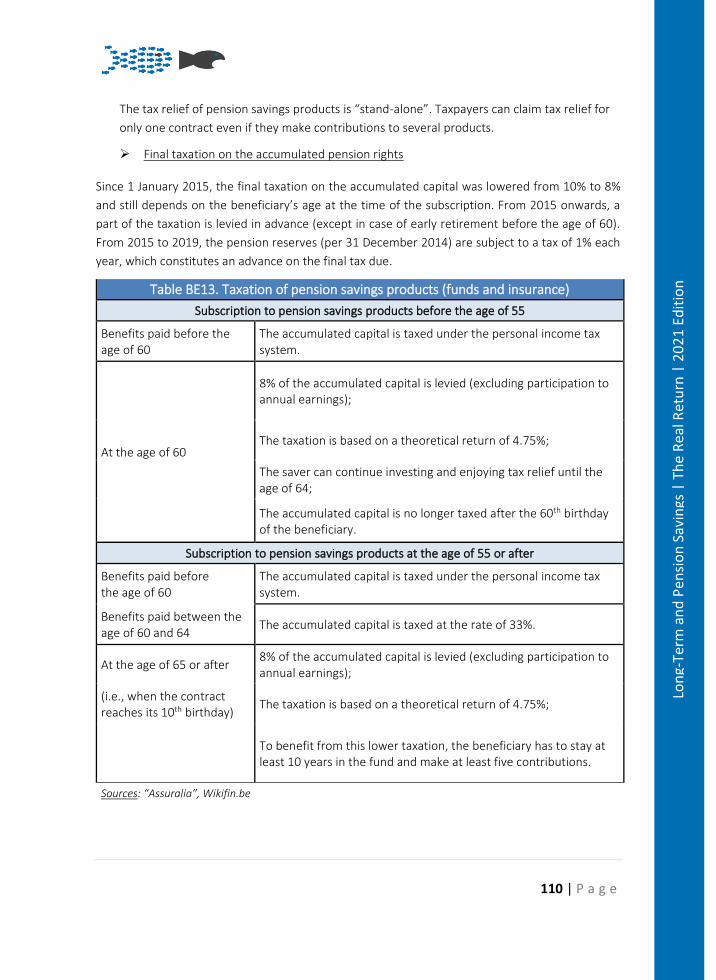
110 | P a g e
Lon
g-Te
rm a
nd
Pen
sio
n S
avin
gs |
Th
e R
eal R
etu
rn |
20
21
Edit
ion
The tax relief of pension savings products is “stand-alone”. Taxpayers can claim tax relief for
only one contract even if they make contributions to several products.
➢ Final taxation on the accumulated pension rights
Since 1 January 2015, the final taxation on the accumulated capital was lowered from 10% to 8%
and still depends on the beneficiary’s age at the time of the subscription. From 2015 onwards, a
part of the taxation is levied in advance (except in case of early retirement before the age of 60).
From 2015 to 2019, the pension reserves (per 31 December 2014) are subject to a tax of 1% each
year, which constitutes an advance on the final tax due.
Table BE13. Taxation of pension savings products (funds and insurance)
Subscription to pension savings products before the age of 55
Benefits paid before the age of 60
The accumulated capital is taxed under the personal income tax system.
At the age of 60
8% of the accumulated capital is levied (excluding participation to annual earnings);
The taxation is based on a theoretical return of 4.75%;
The saver can continue investing and enjoying tax relief until the age of 64;
The accumulated capital is no longer taxed after the 60th birthday of the beneficiary.
Subscription to pension savings products at the age of 55 or after
Benefits paid before the age of 60
The accumulated capital is taxed under the personal income tax system.
Benefits paid between the age of 60 and 64
The accumulated capital is taxed at the rate of 33%.
At the age of 65 or after 8% of the accumulated capital is levied (excluding participation to annual earnings);
(i.e., when the contract reaches its 10th birthday)
The taxation is based on a theoretical return of 4.75%;
To benefit from this lower taxation, the beneficiary has to stay at least 10 years in the fund and make at least five contributions.
Sources: “Assuralia”, Wikifin.be
111 | P a g e
Lon
g-Te
rm a
nd
Pen
sio
n S
avin
gs |
Th
e R
eal R
etu
rn |
20
21
Edit
ion
Long-term savings products (life insurance contracts)
The maximum amount of tax relief based on contributions invested in long-term savings products
depends on the level of the saver’s yearly earnings, without exceeding the ceiling of €2,350 in 2021.
The tax ceiling on long term savings products was frozen at the same level to that of 2018 and it
will be reviewed in 2024 However, the tax relief is determined jointly for long-term savings products
and mortgage deductions. If a saver already receives a tax relief for a mortgage, it may be
impossible to obtain a further tax relief for life insurance products under the third pillar.
The same rules of taxation to that of pension savings products (fund or insurance) apply to long-
term savings products. The taxation depends on the beneficiary’s age at the time of subscription
(before or after 55) (see Table BE12).
However, the taxation differs in two points:
• The pension reserves are taxed by considering the real return of the long-term savings
products over the period of holdings instead of a theoretical return of 4.75%.
• The lowering of the tax rate to 8% does not apply to the capital accumulated through long-
term savings products, which remain taxed at 10%.
Pension Returns
Pillar II: Occupational pension plans
The returns of occupational pension plans depend on how they are managed, either by an IORP or
by an insurance company. From 2004 to 2015, all DC plans managed either by IORP or insurance
companies through Branch 21 contracts were required to provide an annual minimum return of
3.75% on employees’ contributions and 3.25% on employers’ contributions. The Supplementary
Pensions Act reform entered into force as of 1 January 2016, in order to ensure the sustainability
and social character of the supplementary pensions. The level of the minimum guaranteed return
for both employer and employee contribution is set each year according to economic rules
considering the evolution of government bond yields in the future:
• the new guaranteed return must be within the range of 1.75% to 3.75%;
• the new guaranteed return represents 65% of the average of 10-year government bonds
rates over 24 months, rounded to the nearest 25 basis points to prevent it from fluctuating
too frequently.67
In addition, the alignment of the supplementary pension age and the legal pension age (respectively
65, 66 in 2025 and 67 in 2030) affects the minimum guaranteed return offered to employees. When
67 The rate of 65% could be increased to 75% in 2018 and to 85% in 2020 according to the FSMA decision.
112 | P a g e
Lon
g-Te
rm a
nd
Pen
sio
n S
avin
gs |
Th
e R
eal R
etu
rn |
20
21
Edit
ion
the affiliate reaches the age of 60, his/her occupational pension plan is extended until he/she
reaches the age of 65. During the extension period, the minimum guaranteed return continues to
be applied to reserves. Its level corresponds to the new effective minimum guaranteed return that
will be recalculated and published each year by FSMA. In 2020, the legal minimum guaranteed
return remained steady at 1.75%.
In the following sub-sections, the real returns after taxation of occupational pension plans were
calculated under the hereunder assumptions:
• The employee claims his supplementary pension at the same time as the legal pension and
remains employed until the legal age (65 years old);
• The benefits are paid as a lump sum payment;
• Solidarity contributions of 2% of benefits and the INAMI contribution of 3.55% of benefits
are levied;
• Only the employer´s contributions were paid;
• In addition to an average local tax of 7%, a flat tax rate of 10% is applied to the final
benefits.
Occupational pension plans managed by IORPs
In 2019, among the 192 pension plans managed by an IORP, 165 had a promise of returns (DB plans)
or were hybrid plans (Cash Balance, DC + rate), 28 were DC plans. While newly opened plans are
always DC plans, a large part of assets are still managed in plans offering promises of returns.
PensioPlus, the Belgium’s occupational pension plans association reported an average return of
4.59% in 2020. This represents the gross average weighted returns after charges of occupational
pension plans that participated in the annual financial and economic survey of PensioPlus in 2020.68
68 62 IORP participated in the 2020 annual PensioPlus’ survey. They represented 32.4 billion euros under management (81% of the market share)
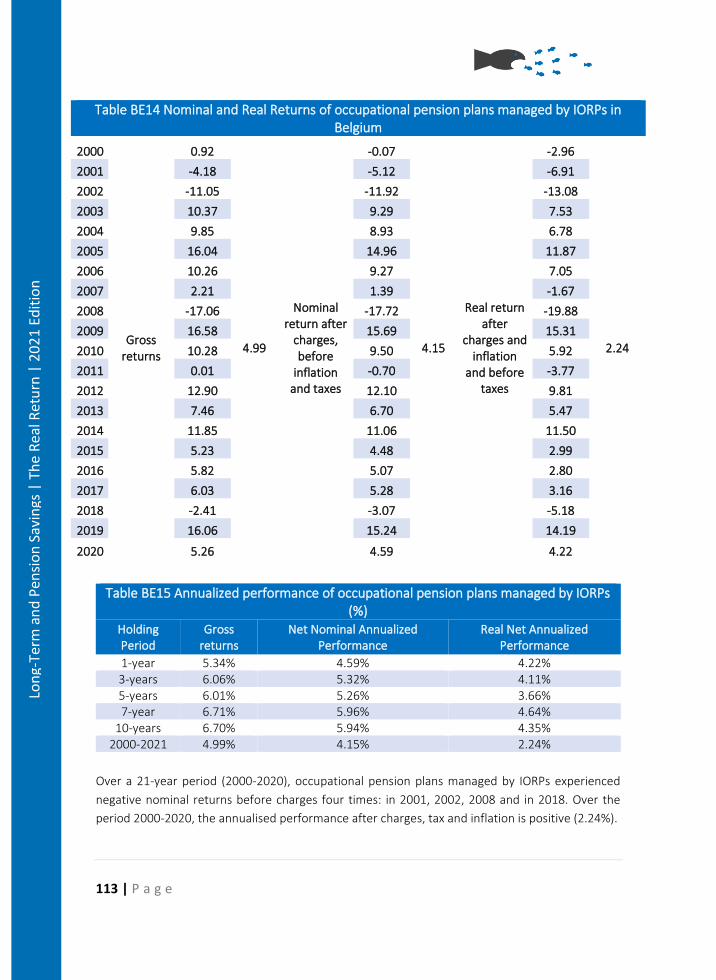
113 | P a g e
Lon
g-Te
rm a
nd
Pen
sio
n S
avin
gs |
Th
e R
eal R
etu
rn |
20
21
Edit
ion
Table BE14 Nominal and Real Returns of occupational pension plans managed by IORPs in Belgium
2000
Gross returns
0.92
4.99
Nominal return after
charges, before
inflation and taxes
-0.07
4.15
Real return after
charges and inflation
and before taxes
-2.96
2.24
2001 -4.18 -5.12 -6.91
2002 -11.05 -11.92 -13.08
2003 10.37 9.29 7.53
2004 9.85 8.93 6.78
2005 16.04 14.96 11.87
2006 10.26 9.27 7.05
2007 2.21 1.39 -1.67
2008 -17.06 -17.72 -19.88
2009 16.58 15.69 15.31
2010 10.28 9.50 5.92
2011 0.01 -0.70 -3.77
2012 12.90 12.10 9.81
2013 7.46 6.70 5.47
2014 11.85 11.06 11.50
2015 5.23 4.48 2.99
2016 5.82 5.07 2.80
2017 6.03 5.28 3.16
2018 -2.41 -3.07 -5.18
2019 16.06 15.24 14.19
2020 5.26 4.59 4.22
Table BE15 Annualized performance of occupational pension plans managed by IORPs (%)
Holding Period
Gross returns
Net Nominal Annualized Performance
Real Net Annualized Performance
1-year 5.34% 4.59% 4.22% 3-years 6.06% 5.32% 4.11% 5-years 6.01% 5.26% 3.66% 7-year 6.71% 5.96% 4.64%
10-years 6.70% 5.94% 4.35% 2000-2021 4.99% 4.15% 2.24%
Over a 21-year period (2000-2020), occupational pension plans managed by IORPs experienced
negative nominal returns before charges four times: in 2001, 2002, 2008 and in 2018. Over the
period 2000-2020, the annualised performance after charges, tax and inflation is positive (2.24%).
114 | P a g e
Lon
g-Te
rm a
nd
Pen
sio
n S
avin
gs |
Th
e R
eal R
etu
rn |
20
21
Edit
ion
PensioPlus reported the average asset allocation of IORP at end-2020, as follows: 36% in equities,
52% in Fixed Income securities, 2% in Real Estate, 3% in cash and 7% in other asset classes. The
asset allocation remained quite steady in 2020. The proportion of fixed income assets still
represented the largest part of assets. The proportion of real estate decreased significantly.
Occupational pension plans managed by insurance companies (Branch 21 contracts)
Assuralia used to annually report net returns after charges in percentage of the total reserves in its
annual report69. Since 2015, this report no longer contains available information on the returns of
“Assurance Groupe” Branch 21 contracts. We are thus unable to update this information for the
whole years after 2015.
FSMA reported an average net return of 2.40% for sector pension funds managed through
“Assurance Groupe” contracts in 2019 (against 1.66% in 108, 2.63% in 2017, 2.91% in 2016 and
3.01% in 2015)70. The downward trend that has been observed for several years is confirmed. One
can observe the same assessment for PLCI conventions.
A self-employed individual who subscribes to a PLCI convention had on average a return of 2.5% on
his /her contracts in 2019 (against 2.64% in 2017 and 2.75% in 2015).
The minimum guaranteed return of PLCI varied between 0% and 4.75%. Some conventions
subscribed before July 1st, 1999, offer a guaranteed return of 4.75% on past and future premiums.
The average (pondéré des reserves acquises) return decreased to 1.79% (against 2.15% in 2017)
and the average participation to benefits was 0.43%, equal to that of 2017.
Assuralia updated information on “Assurance Groupe” contracts with data at the end-201871.
At the end-2018, “Assurance Groupe” contracts and individual contracts through Branch 21
contracts72 were invested with the following assets allocation:
• 73% in fixed income assets (of which 32% in Belgian government bonds);
• 9% in equities and UCITs;
• 16% in loans and real estate;
• 2% in other assets.
With the decline in the return on the Belgian 10-year government bonds since 2011, insurance
companies were forced to decrease the guaranteed return offered to new contributions on
69 In November 2019, Assuralia published its annual report including Statistics for the whole year 2018 .
70 Source FSMA, Report on sector pension, company pension and PLCLS, May 2021. 71 http://assuralia.be/fr/infos-secteur/publications-secteur/775-l-assurance-de-groupe-un-tour-d-horizon-au-niveau-du-secteur 72 The insurance law of March 13, 2016 (Solvency II law) requires that investments relating to “Assurance group” contracts and individual life insurance have to be managed together. In this way, the insurer benefits from economies of scale and more possibilities for diversification, which should benefit the return.
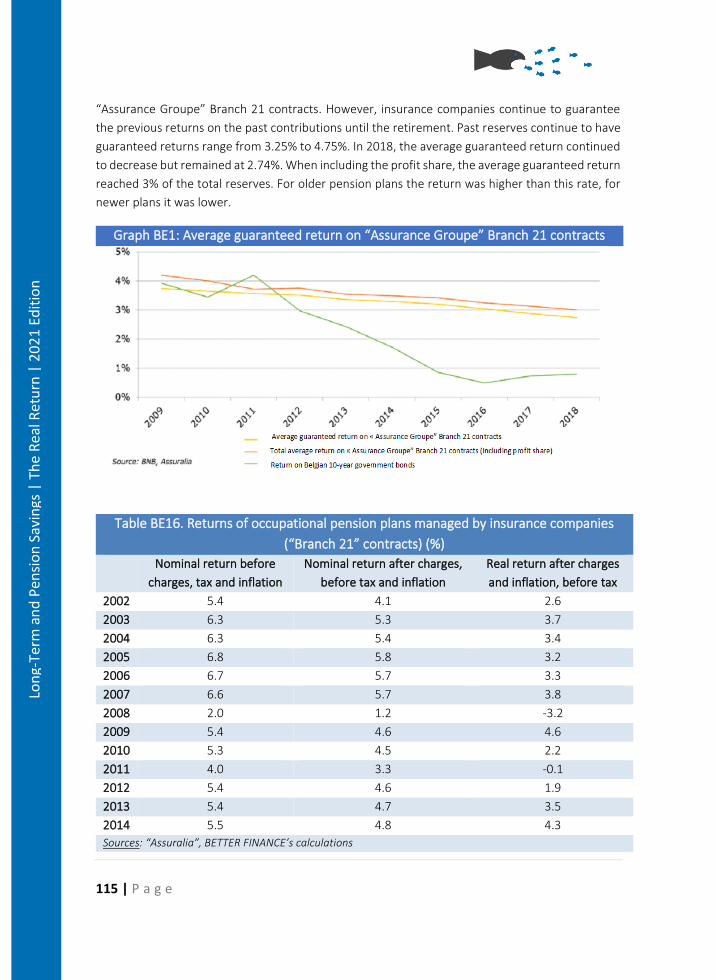
115 | P a g e
Lon
g-Te
rm a
nd
Pen
sio
n S
avin
gs |
Th
e R
eal R
etu
rn |
20
21
Edit
ion
“Assurance Groupe” Branch 21 contracts. However, insurance companies continue to guarantee
the previous returns on the past contributions until the retirement. Past reserves continue to have
guaranteed returns range from 3.25% to 4.75%. In 2018, the average guaranteed return continued
to decrease but remained at 2.74%. When including the profit share, the average guaranteed return
reached 3% of the total reserves. For older pension plans the return was higher than this rate, for
newer plans it was lower.
Graph BE1: Average guaranteed return on “Assurance Groupe” Branch 21 contracts
Table BE16. Returns of occupational pension plans managed by insurance companies
(“Branch 21” contracts) (%)
Nominal return before
charges, tax and inflation
Nominal return after charges,
before tax and inflation
Real return after charges
and inflation, before tax
2002 5.4 4.1 2.6
2003 6.3 5.3 3.7
2004 6.3 5.4 3.4
2005 6.8 5.8 3.2
2006 6.7 5.7 3.3
2007 6.6 5.7 3.8
2008 2.0 1.2 -3.2
2009 5.4 4.6 4.6
2010 5.3 4.5 2.2
2011 4.0 3.3 -0.1
2012 5.4 4.6 1.9
2013 5.4 4.7 3.5
2014 5.5 4.8 4.3
Sources: “Assuralia”, BETTER FINANCE’s calculations
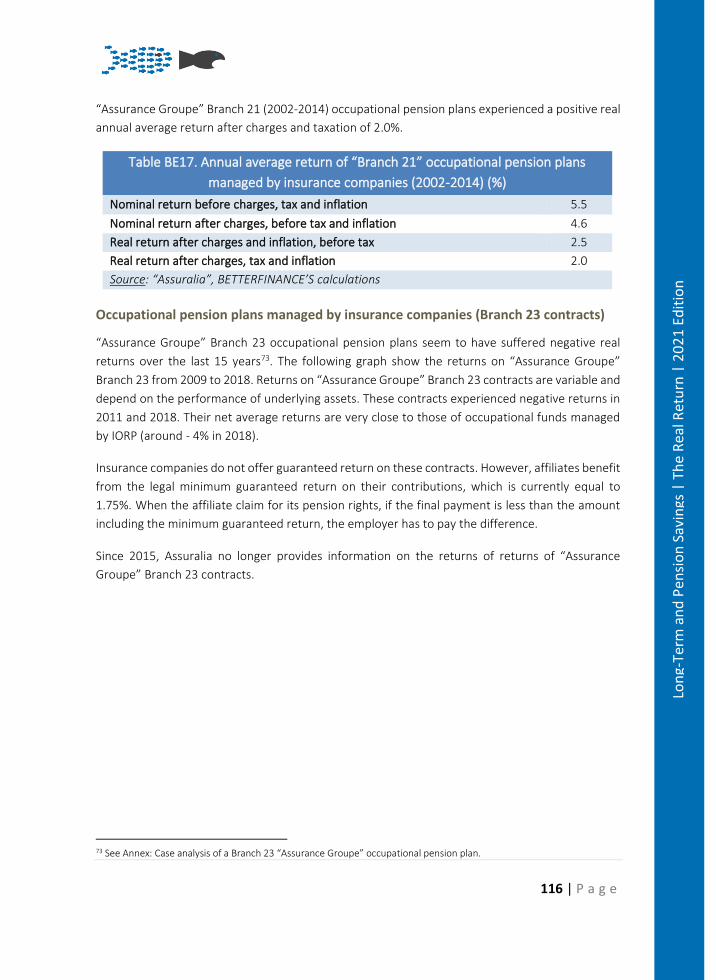
116 | P a g e
Lon
g-Te
rm a
nd
Pen
sio
n S
avin
gs |
Th
e R
eal R
etu
rn |
20
21
Edit
ion
“Assurance Groupe” Branch 21 (2002-2014) occupational pension plans experienced a positive real
annual average return after charges and taxation of 2.0%.
Table BE17. Annual average return of “Branch 21” occupational pension plans
managed by insurance companies (2002-2014) (%)
Nominal return before charges, tax and inflation 5.5
Nominal return after charges, before tax and inflation 4.6
Real return after charges and inflation, before tax 2.5
Real return after charges, tax and inflation 2.0
Source: “Assuralia”, BETTERFINANCE’S calculations
Occupational pension plans managed by insurance companies (Branch 23 contracts)
“Assurance Groupe” Branch 23 occupational pension plans seem to have suffered negative real
returns over the last 15 years73. The following graph show the returns on “Assurance Groupe”
Branch 23 from 2009 to 2018. Returns on “Assurance Groupe” Branch 23 contracts are variable and
depend on the performance of underlying assets. These contracts experienced negative returns in
2011 and 2018. Their net average returns are very close to those of occupational funds managed
by IORP (around - 4% in 2018).
Insurance companies do not offer guaranteed return on these contracts. However, affiliates benefit
from the legal minimum guaranteed return on their contributions, which is currently equal to
1.75%. When the affiliate claim for its pension rights, if the final payment is less than the amount
including the minimum guaranteed return, the employer has to pay the difference.
Since 2015, Assuralia no longer provides information on the returns of returns of “Assurance
Groupe” Branch 23 contracts.
73 See Annex: Case analysis of a Branch 23 “Assurance Groupe” occupational pension plan.
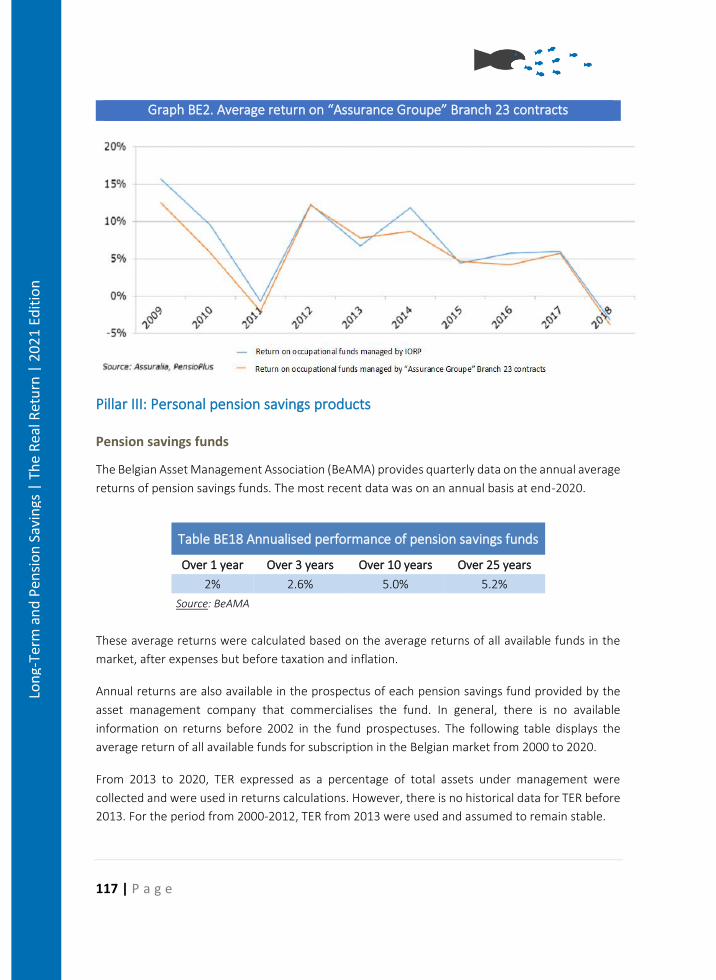
117 | P a g e
Lon
g-Te
rm a
nd
Pen
sio
n S
avin
gs |
Th
e R
eal R
etu
rn |
20
21
Edit
ion
Graph BE2. Average return on “Assurance Groupe” Branch 23 contracts
Pillar III: Personal pension savings products
Pension savings funds
The Belgian Asset Management Association (BeAMA) provides quarterly data on the annual average
returns of pension savings funds. The most recent data was on an annual basis at end-2020.
Table BE18 Annualised performance of pension savings funds
Over 1 year Over 3 years Over 10 years Over 25 years
2% 2.6% 5.0% 5.2%
Source: BeAMA
These average returns were calculated based on the average returns of all available funds in the
market, after expenses but before taxation and inflation.
Annual returns are also available in the prospectus of each pension savings fund provided by the
asset management company that commercialises the fund. In general, there is no available
information on returns before 2002 in the fund prospectuses. The following table displays the
average return of all available funds for subscription in the Belgian market from 2000 to 2020.
From 2013 to 2020, TER expressed as a percentage of total assets under management were
collected and were used in returns calculations. However, there is no historical data for TER before
2013. For the period from 2000-2012, TER from 2013 were used and assumed to remain stable.
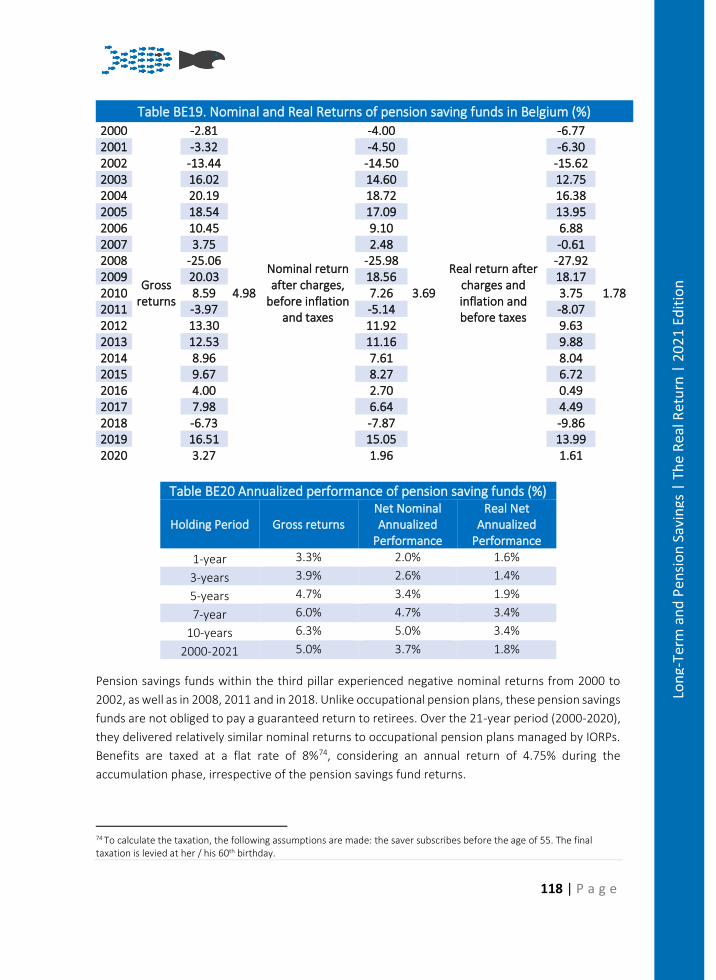
118 | P a g e
Lon
g-Te
rm a
nd
Pen
sio
n S
avin
gs |
Th
e R
eal R
etu
rn |
20
21
Edit
ion
Table BE19. Nominal and Real Returns of pension saving funds in Belgium (%)
2000
Gross returns
-2.81
4.98
Nominal return after charges,
before inflation and taxes
-4.00
3.69
Real return after charges and inflation and before taxes
-6.77
1.78
2001 -3.32 -4.50 -6.30 2002 -13.44 -14.50 -15.62 2003 16.02 14.60 12.75 2004 20.19 18.72 16.38 2005 18.54 17.09 13.95 2006 10.45 9.10 6.88 2007 3.75 2.48 -0.61 2008 -25.06 -25.98 -27.92 2009 20.03 18.56 18.17 2010 8.59 7.26 3.75 2011 -3.97 -5.14 -8.07 2012 13.30 11.92 9.63 2013 12.53 11.16 9.88 2014 8.96 7.61 8.04 2015 9.67 8.27 6.72 2016 4.00 2.70 0.49 2017 7.98 6.64 4.49 2018 -6.73 -7.87 -9.86 2019 16.51 15.05 13.99 2020 3.27 1.96 1.61
Table BE20 Annualized performance of pension saving funds (%)
Holding Period Gross returns Net Nominal Annualized
Performance
Real Net Annualized
Performance
1-year 3.3% 2.0% 1.6%
3-years 3.9% 2.6% 1.4%
5-years 4.7% 3.4% 1.9%
7-year 6.0% 4.7% 3.4%
10-years 6.3% 5.0% 3.4%
2000-2021 5.0% 3.7% 1.8%
Pension savings funds within the third pillar experienced negative nominal returns from 2000 to
2002, as well as in 2008, 2011 and in 2018. Unlike occupational pension plans, these pension savings
funds are not obliged to pay a guaranteed return to retirees. Over the 21-year period (2000-2020),
they delivered relatively similar nominal returns to occupational pension plans managed by IORPs.
Benefits are taxed at a flat rate of 8%74, considering an annual return of 4.75% during the
accumulation phase, irrespective of the pension savings fund returns.
74 To calculate the taxation, the following assumptions are made: the saver subscribes before the age of 55. The final taxation is levied at her / his 60th birthday.
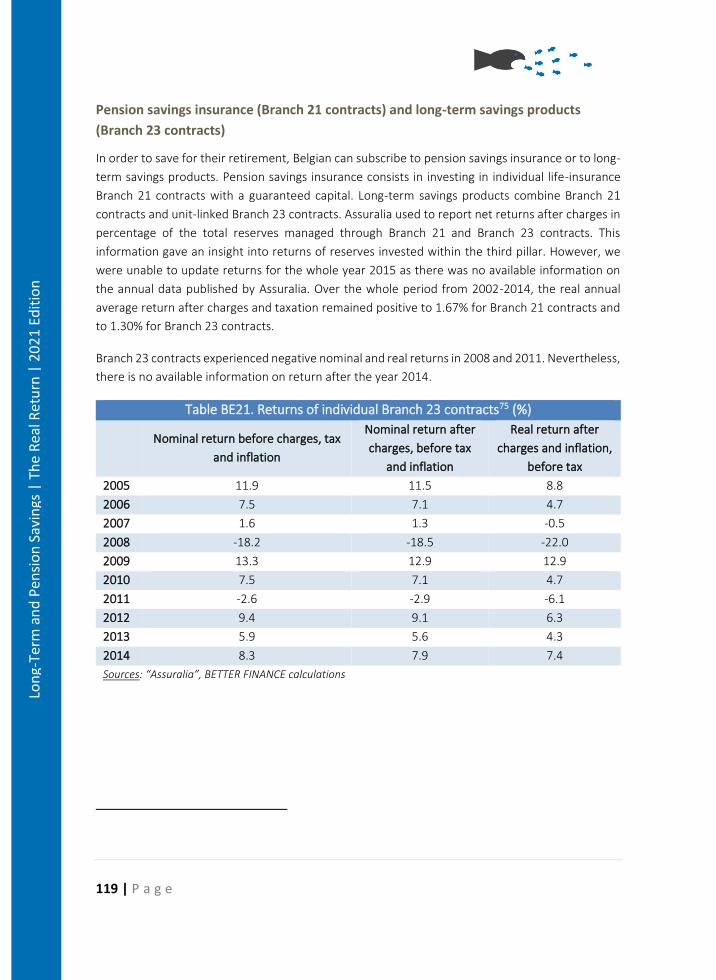
119 | P a g e
Lon
g-Te
rm a
nd
Pen
sio
n S
avin
gs |
Th
e R
eal R
etu
rn |
20
21
Edit
ion
Pension savings insurance (Branch 21 contracts) and long-term savings products
(Branch 23 contracts)
In order to save for their retirement, Belgian can subscribe to pension savings insurance or to long-
term savings products. Pension savings insurance consists in investing in individual life-insurance
Branch 21 contracts with a guaranteed capital. Long-term savings products combine Branch 21
contracts and unit-linked Branch 23 contracts. Assuralia used to report net returns after charges in
percentage of the total reserves managed through Branch 21 and Branch 23 contracts. This
information gave an insight into returns of reserves invested within the third pillar. However, we
were unable to update returns for the whole year 2015 as there was no available information on
the annual data published by Assuralia. Over the whole period from 2002-2014, the real annual
average return after charges and taxation remained positive to 1.67% for Branch 21 contracts and
to 1.30% for Branch 23 contracts.
Branch 23 contracts experienced negative nominal and real returns in 2008 and 2011. Nevertheless,
there is no available information on return after the year 2014.
Table BE21. Returns of individual Branch 23 contracts75 (%)
Nominal return before charges, tax
and inflation
Nominal return after
charges, before tax
and inflation
Real return after
charges and inflation,
before tax
2005 11.9 11.5 8.8
2006 7.5 7.1 4.7
2007 1.6 1.3 -0.5
2008 -18.2 -18.5 -22.0
2009 13.3 12.9 12.9
2010 7.5 7.1 4.7
2011 -2.6 -2.9 -6.1
2012 9.4 9.1 6.3
2013 5.9 5.6 4.3
2014 8.3 7.9 7.4
Sources: “Assuralia”, BETTER FINANCE calculations
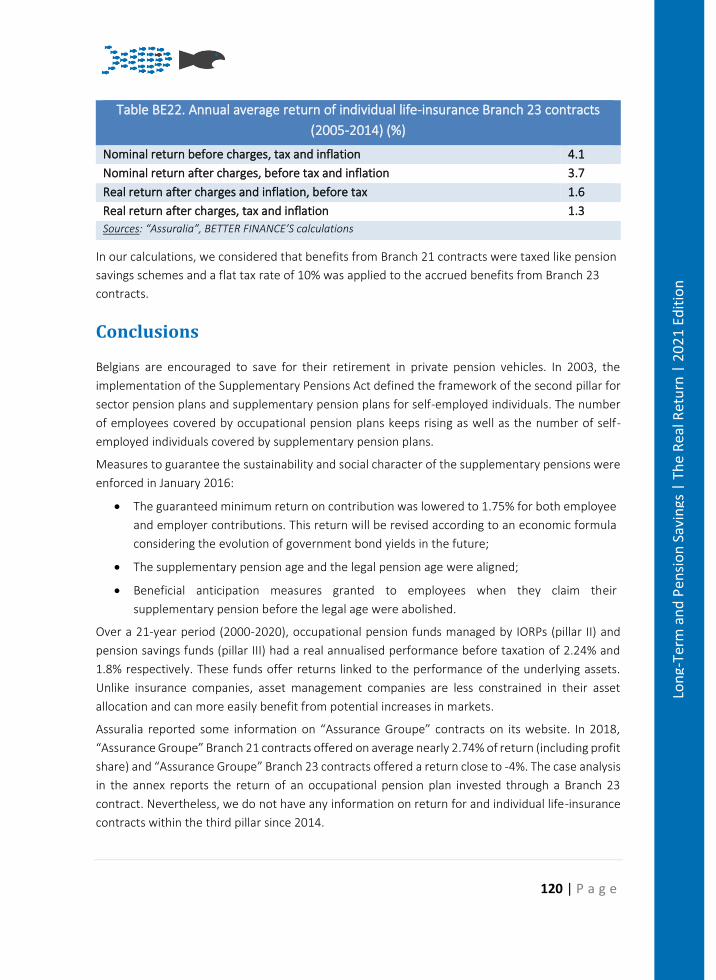
120 | P a g e
Lon
g-Te
rm a
nd
Pen
sio
n S
avin
gs |
Th
e R
eal R
etu
rn |
20
21
Edit
ion
Table BE22. Annual average return of individual life-insurance Branch 23 contracts
(2005-2014) (%)
Nominal return before charges, tax and inflation 4.1
Nominal return after charges, before tax and inflation 3.7
Real return after charges and inflation, before tax 1.6
Real return after charges, tax and inflation 1.3
Sources: “Assuralia”, BETTER FINANCE’S calculations
In our calculations, we considered that benefits from Branch 21 contracts were taxed like pension
savings schemes and a flat tax rate of 10% was applied to the accrued benefits from Branch 23
contracts.
Conclusions
Belgians are encouraged to save for their retirement in private pension vehicles. In 2003, the
implementation of the Supplementary Pensions Act defined the framework of the second pillar for
sector pension plans and supplementary pension plans for self-employed individuals. The number
of employees covered by occupational pension plans keeps rising as well as the number of self-
employed individuals covered by supplementary pension plans.
Measures to guarantee the sustainability and social character of the supplementary pensions were
enforced in January 2016:
• The guaranteed minimum return on contribution was lowered to 1.75% for both employee
and employer contributions. This return will be revised according to an economic formula
considering the evolution of government bond yields in the future;
• The supplementary pension age and the legal pension age were aligned;
• Beneficial anticipation measures granted to employees when they claim their
supplementary pension before the legal age were abolished.
Over a 21-year period (2000-2020), occupational pension funds managed by IORPs (pillar II) and
pension savings funds (pillar III) had a real annualised performance before taxation of 2.24% and
1.8% respectively. These funds offer returns linked to the performance of the underlying assets.
Unlike insurance companies, asset management companies are less constrained in their asset
allocation and can more easily benefit from potential increases in markets.
Assuralia reported some information on “Assurance Groupe” contracts on its website. In 2018,
“Assurance Groupe” Branch 21 contracts offered on average nearly 2.74% of return (including profit
share) and “Assurance Groupe” Branch 23 contracts offered a return close to -4%. The case analysis
in the annex reports the return of an occupational pension plan invested through a Branch 23
contract. Nevertheless, we do not have any information on return for and individual life-insurance
contracts within the third pillar since 2014.
121 | P a g e
Lon
g-Te
rm a
nd
Pen
sio
n S
avin
gs |
Th
e R
eal R
etu
rn |
20
21
Edit
ion
Bibliography
• Rapport bisannuel concernant les régimes de pension sectoriels– FSMA (August 2019) o https://www.fsma.be/fr/rapport-bisannuel-0
• Rapport bisannuel concernant la pension complémentaire libre des indépendants – FSMA (June 2017) o https://www.fsma.be/sites/default/files/public/content/FR/fsma_wapz_2017_fr.pdf
• Le secteur des institutions de retraite professionnelle – FSMA (Reporting sur l’exercice 2017) o https://www.fsma.be/fr/statistiques-des-operations-des-institutions-de-retraite-
professionnelle
• Rapport annuel PensioPlus -2018 o http://pensioplus.be/ABIP/documents/2.Rapportannuel_20182930.pdf
• DB2P website o https://www.db2p.be/nl/resources/bf6bd8a9-b630-4e06-90e4-
1b7e7024ec4e/Cijfers%20persmap%20mijn%20aanvullend%20pensioen_NL.pdf
• Wikifin.be website o http://www.wikifin.be/fr/thematiques/les-pensions/pension-complementaire/quand-
la-demander o http://www.wikifin.be/fr/thematiques/les-pensions/epargne-pension/fiscalite
• Assuralia website: o L’épargne pension - http://assuralia.be/images/docs/stats/FR/02_chiffres-cles-par-
branche/02_07_epargne-pension.htm o L’épargne à long-terme - http://assuralia.be/images/docs/stats/FR/02_chiffres-cles-
par-branche/02_07_epargne-long-terme.htm o Encaissements de l’assurance vie -
http://assuralia.be/images/docs/stats/FR/02_chiffres-cles-par-branche/02_07_encaissement-vie.htm
o Provisions de l’assurance vie - http://assuralia.be/images/docs/stats/FR/02_chiffres-cles-par-branche/02_07_provisions-vie.htm
o Proportion Banques/Assureurs 3ème pillier - http://assuralia.be/images/docs/stats/FR/02_chiffres-cles-par-branche/02_07_banques-assureurs-troisieme-pilier.htm
o Les principaux chiffres du marché belge de l’assurance en 2017 - https://www.assuralia.be/fr/etudes-et-chiffres/etudes-d-assuralia/237-les-principaux-chiffres-du-marche-belge-de-l-assurance-en-2016
o L'assurance de groupe : un tour d'horizon au niveau du secteur - http://assuralia.be/fr/infos-secteur/publications-secteur/775-l-assurance-de-groupe-un-tour-d-horizon-au-niveau-du-secteur
• BeAma’s website: o Chiffres secteur OPC 4ème trimestre 2018, 03 Mai 2019 -
https://www.beama.be/fr/publicaties-fr/persberichten-fr/communique-de-presse-4ieme-trimestre-2018
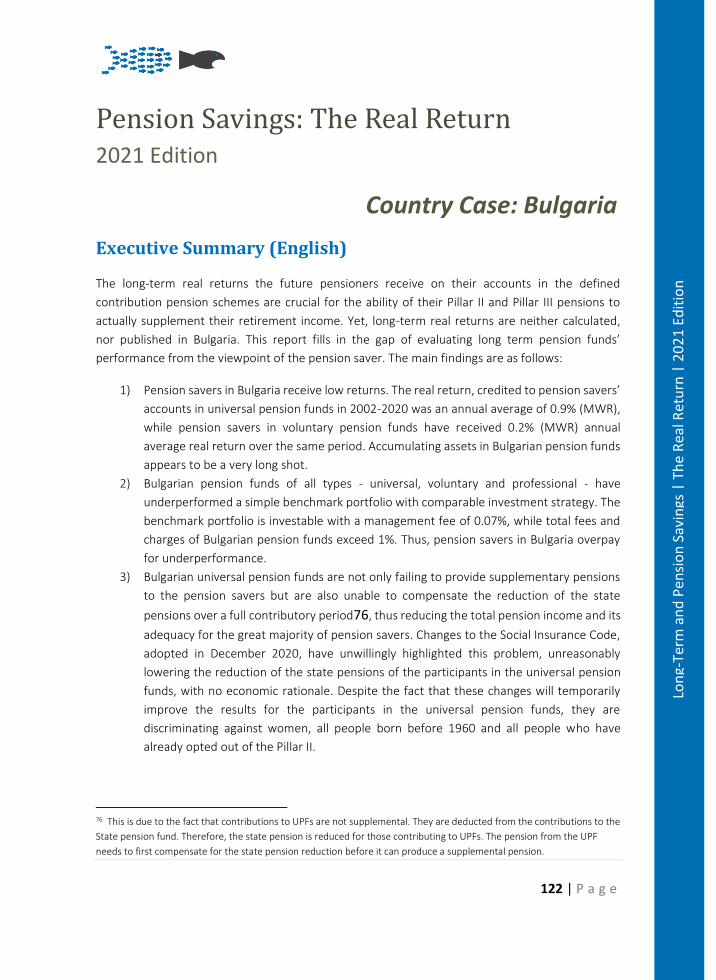
122 | P a g e
Lon
g-Te
rm a
nd
Pen
sio
n S
avin
gs |
Th
e R
eal R
etu
rn |
20
21
Edit
ion
Pension Savings: The Real Return 2021 Edition
Country Case: Bulgaria
Executive Summary (English)
The long-term real returns the future pensioners receive on their accounts in the defined
contribution pension schemes are crucial for the ability of their Pillar II and Pillar III pensions to
actually supplement their retirement income. Yet, long-term real returns are neither calculated,
nor published in Bulgaria. This report fills in the gap of evaluating long term pension funds’
performance from the viewpoint of the pension saver. The main findings are as follows:
1) Pension savers in Bulgaria receive low returns. The real return, credited to pension savers’
accounts in universal pension funds in 2002-2020 was an annual average of 0.9% (MWR),
while pension savers in voluntary pension funds have received 0.2% (MWR) annual
average real return over the same period. Accumulating assets in Bulgarian pension funds
appears to be a very long shot.
2) Bulgarian pension funds of all types - universal, voluntary and professional - have
underperformed a simple benchmark portfolio with comparable investment strategy. The
benchmark portfolio is investable with a management fee of 0.07%, while total fees and
charges of Bulgarian pension funds exceed 1%. Thus, pension savers in Bulgaria overpay
for underperformance.
3) Bulgarian universal pension funds are not only failing to provide supplementary pensions
to the pension savers but are also unable to compensate the reduction of the state
pensions over a full contributory period76, thus reducing the total pension income and its
adequacy for the great majority of pension savers. Changes to the Social Insurance Code,
adopted in December 2020, have unwillingly highlighted this problem, unreasonably
lowering the reduction of the state pensions of the participants in the universal pension
funds, with no economic rationale. Despite the fact that these changes will temporarily
improve the results for the participants in the universal pension funds, they are
discriminating against women, all people born before 1960 and all people who have
already opted out of the Pillar II.
76 This is due to the fact that contributions to UPFs are not supplemental. They are deducted from the contributions to the
State pension fund. Therefore, the state pension is reduced for those contributing to UPFs. The pension from the UPF
needs to first compensate for the state pension reduction before it can produce a supplemental pension.
123 | P a g e
Lon
g-Te
rm a
nd
Pen
sio
n S
avin
gs |
Th
e R
eal R
etu
rn |
20
21
Edit
ion
The report concludes with policy recommendations, aimed at making the Bulgarian pension system
work for all pension savers, without reducing the state pension for anybody.
Executive Summary (Bulgarian)
Дългосрочната реална доходност, която осигурените в пенсионни фондове фактически
получават по партидите си, е критично важна за тяхната способност да натрупат средства и да
теглят пенсии в бъдеще. Въпреки това, тази доходност не се публикува в България. Приносът
на този доклад е в оценката на дългосрочното представяне на пенсионните фондове от
позициите на осигурените. Основните резултати са както следва:
1) Фактическата доходност, получавана от осигурените, е коректно да се изчислява по
парично претегления метод (MWR). Реалната доходност, получена от всички
осигурени в универсални пенсионни фондове (УПФ) между 2002 и 2020г. е 0.9%
годишно), докато осигурените в доброволни пенсионни фондове (ДПФ) са получили
реална доходност от 0.2% годишно. Натрупването на средства по партиди в
пенсионните фондове в България се оказва много трудна задача.
2) Българските пенсионни фондове – универсални, професионални и доброволни –
показват резултати, по-ниски от тези на прост бенчмарк със съпоставима
инвестиционна стратегия. В портфейла-бенчмарк може да се инвестира при такса за
управление от 0.07%, докато таксите на българските пенсионни фондове надвишават
1%. Така осигурените в България плащат такси над пазарните, за да получат
доходност по-ниска от пазарната.
3) Универсалните пенсионни фондове в България не само се провалят в осигуряването
на допълнителна пенсия на осигурените, но и са неспособни да компенсират
намалението на държавните пенсии в течение на целия осигурителен период.77
Измененията в Кодекса за социално осигуряване, , приети през декември 2020 г., се
превърнаха в неволна демонстрация на този проблем, неоснователно редуцирайки
намалението на държавните пенсии на осигурявалите се в УПФ. Въпреки, че тези
промени временно ще подобрят резултатите за осигурените в УПФ, те са
дискриминационни спрямо жените, всички, родени преди 1960г. и всички, вече
прехвърлили вноските си от УПФ в ДОО.
Докладът завършва с предложения за реформиране на пенсионната система така, че
държавната пенсия да не бъде намалявана за никого, а на осигурените в пенсионни фондове
да се гарантира наистина допълнителна пенсия.
77 Това се дължи на факта, че вноските в УПФ не са допълнителни, а се изваждат от вноската в държавното
обществено осигуряване. Съответно и държавната пенсия на осигурените в УПФ ще бъде намалена. Пенсията от
УПФ трябва първо да замести намалението на държавната пенсия, преди да осигури допълнителна.
124 | P a g e
Lon
g-Te
rm a
nd
Pen
sio
n S
avin
gs |
Th
e R
eal R
etu
rn |
20
21
Edit
ion
Methodological disclaimer
The return computations in this report mainly utilise the Money-Weighted Returns (MWR)
methodology, compared to the other country cases which use Time-Weighted Returns (TWR).
Therefore, the cost and inflation data series are also different from the others.
Money-Weighted Returns (or the internal rate of returns) take into account the positive and negative
cash flows (contributions/deposits and pay-outs/withdrawals) to an investment product and, as
such, they are a valuable indicator to analyse the decisions of the investment manager.
Time-Weighted Returns simply show the relative change (%) of the product’s net asset value
between two different points in time.
The contributors for this country case believe MWR are more representative for Bulgarian pension
savers taking into account the specificities of the Bulgarian private pension schemes.
For comparability purposes, we also calculated annualised time-weighted returns in Table BG4,
which are used in the General Report.
125 | P a g e
Lon
g-Te
rm a
nd
Pen
sio
n S
avin
gs |
Th
e R
eal R
etu
rn |
20
21
Edit
ion
Introduction
The Bulgarian pension system, introduced in 2000, rests on three pillars:
• Pillar I – Mandatory, publicly managed, unfunded, defined benefit Social Security;
• Pillar II – Quasi-mandatory privately managed, fully funded, „Supplementary Mandatory
Pension Schemes” (SMPS);
• Pillar III – Voluntary privately managed, fully funded, defined contribution,
„Supplementary Voluntary Pension Schemes” (SVPS).
The aim of the 2000 pension reform was to ease the financial pressure on the public Social Security
in the face of a rising old-age dependency ratio. Currently the pension system relies on combining
the principle of intergenerational solidarity (Pillar I) with the opportunity for pension savers to boost
their retirement income by participating in one or more privately managed supplementary pension
schemes (Pillars II and III).
While it is mandatory for all employed and self-employed to make contributions to the pension
system, it is a matter of individual choice for all, born after 1959, whether to split their mandatory
contribution between Pillar I and Pillar II, or direct all of it to Pillar I instead. Those, born prior to
1960, participate in the Pillar I state pension fund only. Contributions to Pillar III pension schemes
are voluntary.
Since pension insurance is mandatory, the employees covered by Pillar I pension insurance is
universal. The mandatory pension insurance contribution rate is 19.8% of the gross insurable
income for the majority of the working population (up to the maximum monthly insurable income
of €1,534 in 2020). It is split between employer (56%) and employee (44%), while the self-employed
are liable for the full contribution.
The contribution rate is higher for the employed in strenuous and hazardous conditions - “category
I and category II workers”, as well as for those employed in the national security services, who are
eligible for early retirement.
Those born after 1959 are eligible for the two schemes under Pillar II: universal pension funds (UPF)
and professional pension funds (PPF). Participation in universal pension funds was mandatory
between 2002 and 2015, but it has been optional since. Universal pension funds participants could
opt out of those funds and transfer their pension insurance to the Pillar I state pension fund up to
five years before reaching the statutory retirement age.78
The contribution to the universal pension funds is set by law at 5% of insurable income (up to the
maximum insurable income) and is split between the employer and the employee. The contribution
to the universal pension funds is not supplementary. It is rather deducted from the mandatory
pension insurance contribution of 19.8% of the insurable income. Those participating in universal
78 This period has been shortened for the first cohorts of future UPF pensioners in 2021.

126 | P a g e
Lon
g-Te
rm a
nd
Pen
sio
n S
avin
gs |
Th
e R
eal R
etu
rn |
20
21
Edit
ion
pension funds in essence split their contribution between the state pension fund (14.8% of
insurable income) and the universal pension fund of their choice (5% of insurable income). Thus,
the Pillar II universal pension funds are not “supplementary” but rather represent partial
privatization of the state pension insurance.
Correspondingly, those contributing to a universal pension fund will see their state pension
reduced. Until 2020, that reduction was set by law in proportion to the lower level of contributions
to the State Pension Fund they have made and was slated to provide equal state pension for equal
contribution. In December 2020, as changes to the Social Insurance Code were adopted79, lowering
this reduction. A lower than proportional state pension reduction all else equal increases the state
pension only for the participants in UPF. Lowering the state pension reduction has been achieved
by:
1) Treating a part of the budget transfers to the State Pension Fund between 2009 and 2015
as “contributions”
2) Including the period of social insurance of the people participating in UPF, accumulated
before the year 2000, while the same period is excluded for those who have opted out of
UPF.
While these changes will increase the state pension for the first cohort of UPF pensioners, they
treat differently those contributing to the UPFs with the ones contributing to the State Pension
Fund only, discriminating against the latter.
The lowering of the state pension reduction is gender discriminating as well. The state pension of
men and women contributing to UPF, and starting their retirement in the same year, will be reduced
by different percentage points. This percentage will be larger for women, due to the fact that men
have had 3 years more to make contributions to the state pension fund before 2000. (FIG BG1)
79 Art. 70, Social Insurance Code. http://noi.bg/images/bg/legislation/Codes/KCO.pdf
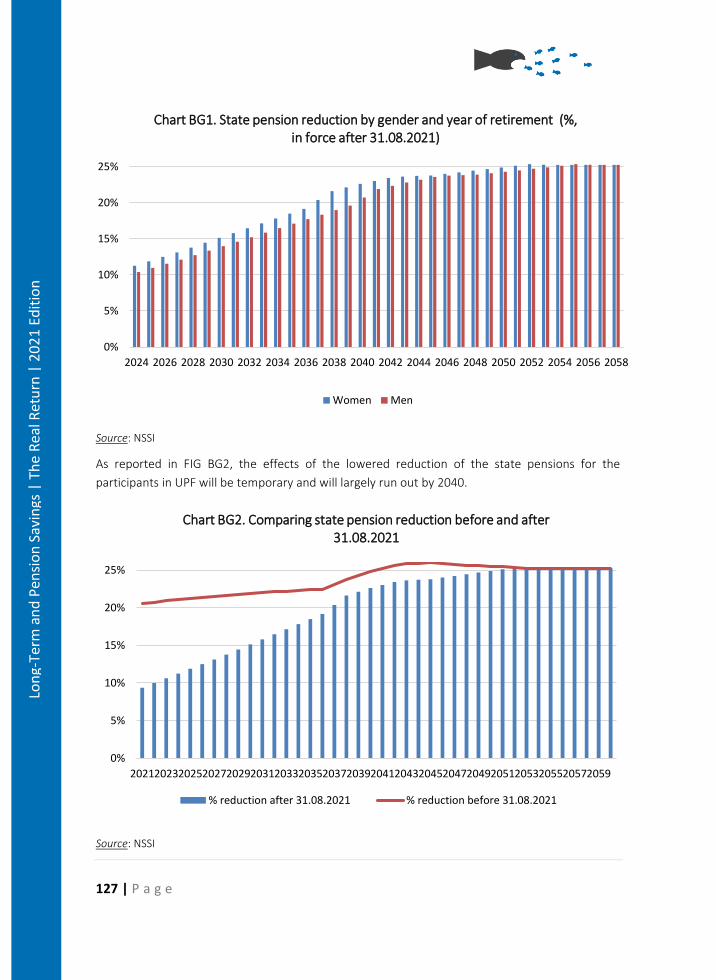
127 | P a g e
Lon
g-Te
rm a
nd
Pen
sio
n S
avin
gs |
Th
e R
eal R
etu
rn |
20
21
Edit
ion
Source: NSSI
As reported in FIG BG2, the effects of the lowered reduction of the state pensions for the
participants in UPF will be temporary and will largely run out by 2040.
Source: NSSI
0%
5%
10%
15%
20%
25%
2024 2026 2028 2030 2032 2034 2036 2038 2040 2042 2044 2046 2048 2050 2052 2054 2056 2058
Chart BG1. State pension reduction by gender and year of retirement (%, in force after 31.08.2021)
Women Men
0%
5%
10%
15%
20%
25%
20212023202520272029203120332035203720392041204320452047204920512053205520572059
Chart BG2. Comparing state pension reduction before and after 31.08.2021
% reduction after 31.08.2021 % reduction before 31.08.2021
128 | P a g e
Lon
g-Te
rm a
nd
Pen
sio
n S
avin
gs |
Th
e R
eal R
etu
rn |
20
21
Edit
ion
Eligible for participating in the professional pension funds are those employed as “category I and
category II” workers. Their participation is non-contributory, meaning that the contributions are
entirely at the expense of the employer. They are eligible to receive a fixed term pension from the
professional pension funds for the period between their early retirement and the statutory pension
age. They too have the right to opt out from the professional pension funds at the time of
application for early state pension.
There are two pension schemes under Pillar III, voluntary pension funds and voluntary professional
pension funds. All persons of at least 16 years of age are eligible to contribute to a voluntary pension
fund. Voluntary professional pension funds are open only to participants of Pillar II professional
pension funds.
The main features of the Bulgarian pension system are summarized in the table below:
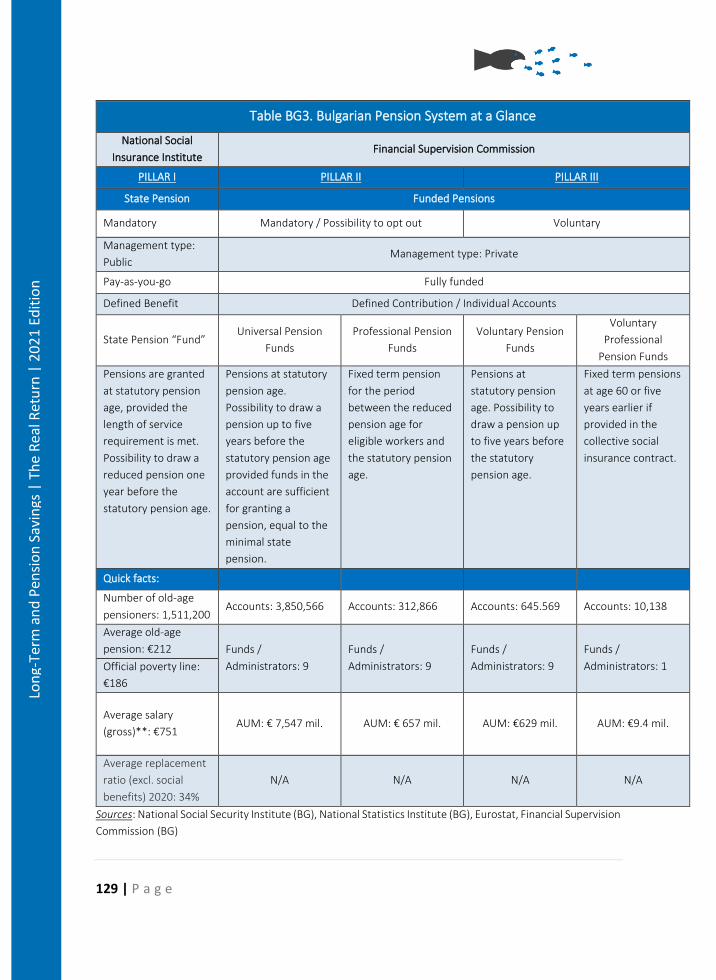
129 | P a g e
Lon
g-Te
rm a
nd
Pen
sio
n S
avin
gs |
Th
e R
eal R
etu
rn |
20
21
Edit
ion
Table BG3. Bulgarian Pension System at a Glance
National Social
Insurance Institute Financial Supervision Commission
PILLAR I PILLAR II PILLAR III
State Pension Funded Pensions
Mandatory Mandatory / Possibility to opt out Voluntary
Management type:
Public Management type: Private
Pay-as-you-go Fully funded
Defined Benefit Defined Contribution / Individual Accounts
State Pension “Fund” Universal Pension
Funds
Professional Pension
Funds
Voluntary Pension
Funds
Voluntary
Professional
Pension Funds
Pensions are granted
at statutory pension
age, provided the
length of service
requirement is met.
Possibility to draw a
reduced pension one
year before the
statutory pension age.
Pensions at statutory
pension age.
Possibility to draw a
pension up to five
years before the
statutory pension age
provided funds in the
account are sufficient
for granting a
pension, equal to the
minimal state
pension.
Fixed term pension
for the period
between the reduced
pension age for
eligible workers and
the statutory pension
age.
Pensions at
statutory pension
age. Possibility to
draw a pension up
to five years before
the statutory
pension age.
Fixed term pensions
at age 60 or five
years earlier if
provided in the
collective social
insurance contract.
Quick facts:
Number of old-age
pensioners: 1,511,200 Accounts: 3,850,566 Accounts: 312,866 Accounts: 645.569 Accounts: 10,138
Average old-age
pension: €212 Funds /
Administrators: 9
Funds /
Administrators: 9
Funds /
Administrators: 9
Funds /
Administrators: 1 Official poverty line:
€186
Average salary
(gross)**: €751 AUM: € 7,547 mil. AUM: € 657 mil. AUM: €629 mil. AUM: €9.4 mil.
Average replacement
ratio (excl. social
benefits) 2020: 34%
N/A N/A N/A N/A
Sources: National Social Security Institute (BG), National Statistics Institute (BG), Eurostat, Financial Supervision
Commission (BG)
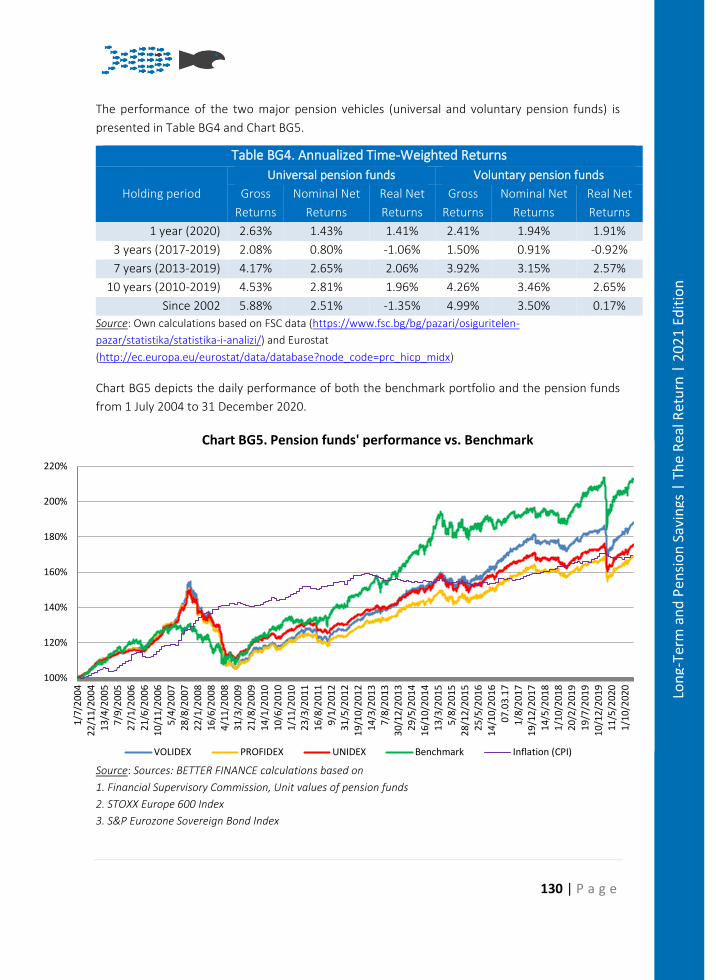
130 | P a g e
Lon
g-Te
rm a
nd
Pen
sio
n S
avin
gs |
Th
e R
eal R
etu
rn |
20
21
Edit
ion
The performance of the two major pension vehicles (universal and voluntary pension funds) is
presented in Table BG4 and Chart BG5.
Table BG4. Annualized Time-Weighted Returns
Holding period
Universal pension funds Voluntary pension funds
Gross
Returns
Nominal Net
Returns
Real Net
Returns
Gross
Returns
Nominal Net
Returns
Real Net
Returns
1 year (2020) 2.63% 1.43% 1.41% 2.41% 1.94% 1.91%
3 years (2017-2019) 2.08% 0.80% -1.06% 1.50% 0.91% -0.92%
7 years (2013-2019) 4.17% 2.65% 2.06% 3.92% 3.15% 2.57%
10 years (2010-2019) 4.53% 2.81% 1.96% 4.26% 3.46% 2.65%
Since 2002 5.88% 2.51% -1.35% 4.99% 3.50% 0.17%
Source: Own calculations based on FSC data (https://www.fsc.bg/bg/pazari/osiguritelen-
pazar/statistika/statistika-i-analizi/) and Eurostat
(http://ec.europa.eu/eurostat/data/database?node_code=prc_hicp_midx)
Chart BG5 depicts the daily performance of both the benchmark portfolio and the pension funds
from 1 July 2004 to 31 December 2020.
Source: Sources: BETTER FINANCE calculations based on
1. Financial Supervisory Commission, Unit values of pension funds
2. STOXX Europe 600 Index
3. S&P Eurozone Sovereign Bond Index
100%
120%
140%
160%
180%
200%
220%
1/7
/20
042
2/1
1/2
00
4
13
/4/2
005
7/9
/20
052
7/1
/200
6
21
/6/2
006
10
/11
/20
06
5/4
/20
07
28
/8/2
007
22
/1/2
008
16
/6/2
008
4/1
1/2
008
31
/3/2
009
21
/8/2
009
14
/1/2
010
10
/6/2
010
1/1
1/2
010
23
/3/2
011
16
/8/2
011
9/1
/20
123
1/5
/201
2
19
/10
/20
12
14
/3/2
013
7/8
/20
13
30
/12
/20
13
29
/5/2
014
16
/10
/20
14
13
/3/2
015
5/8
/20
152
8/1
2/2
01
52
5/5
/201
61
4/1
0/2
01
60
7.0
3.1
71
/8/2
017
19
/12
/20
17
14
/5/2
018
1/1
0/2
018
20
/2/2
019
19
/7/2
019
10
/12
/20
19
11
/5/2
020
1/1
0/2
020
Chart BG5. Pension funds' performance vs. Benchmark
VOLIDEX PROFIDEX UNIDEX Benchmark Inflation (CPI)
131 | P a g e
Lon
g-Te
rm a
nd
Pen
sio
n S
avin
gs |
Th
e R
eal R
etu
rn |
20
21
Edit
ion
The different lines depict the performance of the voluntary and universal pension fund indexes. The
green line represents the benchmark portfolio, constructed as a blend of 35% of the STOXX Europe
600 Index and 65% S&P Eurozone Sovereign Bond Index, in line with the investment constraints,
imposed on pension fund management by law. It is to be noted that the Benchmark portfolio is
investable as there are ETFs that replicate the performance of both indexes, namely Lyxor Core
STOXX Europe 600 (DR) UCITS ETF Lyxor Core Euro Government Bond (DR) UCITS ETF
As is evident, all types of pension vehicles in Bulgaria underperform the market, represented by a
simple, investable portfolio over longer periods at, as we will see below, higher fees and charges.
Bulgarian pension savers overpay for underperformance.
Pension vehicles
The privately managed pension funds in Bulgaria come in four varieties. Universal and professional
pension funds fall under Pillar II, while Pillar III consists of voluntary pension funds and voluntary
professional pension funds.
Pension funds are managed by specially licensed, privately owned and operated pension
companies. As of the end of 2020, a total of nine companies are licensed to manage pension funds
in Bulgaria. They are subject to various governance and capital requirements.
Each pension company is allowed to manage a single fund of each type: universal, professional,
voluntary and voluntary professional. As of end 2020, one company offers all four pension fund
vehicles, and the remaining eight companies offer three pension fund types each (universal,
professional and voluntary).
The insurance industry in Bulgaria is excluded from the mandatory pension savings and investment.
While purchasers of Life Insurance enjoy the same tax advantage as investing in a voluntary pension
fund (investment of up to 10 % of the annual income is tax free), Life insurance does not play any
significant role in the pension system in Bulgaria.
Universal pension funds
The universal pension funds are by far the most important pension vehicle in Bulgaria with over 3.8
million individual accounts and €7.5 billion80 in assets under management (as of end 2020).
Participation in the universal funds was mandatory for employees born after 1959 until August 2015
and has been optional since for those who participated at least one year in a universal pension fund.
Participation in universal pension funds is tied to the employment status of the insured and both
the employee and the employer are required to make contributions. Universal pension funds
operate at national level and not at company or industry level.
80 For the conversion of the Bulgarian Lev (BGN) to euros, the official fixed exchange rate of € 1 = BGN 1.95583 is being
used throughout this report.
132 | P a g e
Lon
g-Te
rm a
nd
Pen
sio
n S
avin
gs |
Th
e R
eal R
etu
rn |
20
21
Edit
ion
Contributions
Contributions to the universal funds are set by law at 5% of insurable income81, which in 2019 was
capped at BGN 3000 (€1,534) per month and remains the same in 2020 and 2021.
Minimum Returns
Pension companies are obliged to manage assets in such a way as to achieve a minimum nominal
return. The minimum nominal return is set quarterly by the regulator, the Financial Supervision
Commission, on the basis of the average return, achieved by all pension companies over a period
of the preceding 24 months. The minimum return is equal to either 60% of the average for all
universal pension funds, or 300 bp (basis points) below the average, whichever is smaller.
In case a fund’s actual performance is weaker than the minimum nominal return determined by the
regulator, the pension company is obliged to top up individual pension accounts to the extent of
the shortage. The source for this obligatory top-up is the pension companies’ own reserves, which
should be maintained at between 1% and 3% of assets under management.
Another source of funds could be reserves accumulated within the respective pension fund. These
reserves are accumulated when the actual fund’s performance exceeds the average industry
performance for the respective period by either 40% or 300 bp, whichever is larger.
Reserves
Pension companies are mandated to maintain pension reserves to cover the actuarial longevity risk
when lifetime pensions are offered. These regulations were amended in 2021.
Distribution
Participants in universal pension funds become eligible for “supplementary” pensions at the
statutory retirement age. However, universal pension plan participants can start drawing on their
account one year prior to reaching full pension age, provided their accumulated assets are sufficient
to ensure a lifetime pension of at least the state-mandated minimum pension.
In the case of a premature death of an insured member or retiree, the universal pension fund
distributes the balance of the account to his or her heirs either as a lump sum or as scheduled
withdrawals. Should there be no heirs, the balance of the account is transferred to the universal
fund’s reserves.
Paying out lifetime pensions contradicts the requirement to preserve individual accounts after
retirement. This has been an issue for urgent legislative intervention, as the first cohorts of women
born in 1960 will start drawing pensions from the universal pension funds in 2021. Draft legislation
to this effect existed in 2020 but was passed in 2021.
81 The 5% statutory contribution to universal pension funds is split between the employee (2.2%) and the employer (2.8%).

133 | P a g e
Lon
g-Te
rm a
nd
Pen
sio
n S
avin
gs |
Th
e R
eal R
etu
rn |
20
21
Edit
ion
Professional pension funds
Only those employees who work under strenuous and hazardous conditions such as miners, air
pilots and similar are eligible to participate in professional pension funds. People working under
these conditions are entitled to an early retirement. The purpose of professional pension funds is
limited to ensuring pensions for a prescribed period of time until those employees become eligible
to draw pensions from the universal pension funds. With €657 million in assets under management
and well over 312 thousand participants (as of end 2020), professional pension funds play a more
limited role in the Bulgarian pension system.
Contributions
Professional pension funds are non-contributory. Only employers pay into the funds.
Minimum returns
The quarterly nominal returns are subject to the same floor as universal pension funds are – either
60% of the average return for the previous 24 months or 300 bp below the average return,
whichever is smaller.
Reserves
The same provisions as for universal pension funds apply.
Distribution
Employees, eligible for a pension from a professional pension fund, are normally promised a fixed-
term pension covering the period starting from the date of their early retirement to the date they
achieve the statutory retirement age.
Should a person who has been insured through a professional pension fund fail to meet the
eligibility criteria for early retirement, he or she has a choice at the time of reaching the regular
retirement age to:
• either withdraw his or her balance from the professional pension fund as a lump sum, or
• transfer the balance of his professional fund account to his or her universal pension fund
account.
Similar to inheritance rights for universal pension funds, the heirs of a deceased insured or retired
person inherit the account balance and may choose to receive the entitlement as either a lump sum
or as a scheduled withdrawal. Contrary to the rule for universal pension funds, should a deceased
insured or retiree leave no heirs, the remaining balance on the account is transferred to the state
budget.
134 | P a g e
Lon
g-Te
rm a
nd
Pen
sio
n S
avin
gs |
Th
e R
eal R
etu
rn |
20
21
Edit
ion
Voluntary pension funds
Voluntary pension funds form the core of pillar III of the Bulgarian pension system. Nine voluntary
pension funds operating in Bulgaria manage 645 thousand individual accounts and €629 million in
assets under management (as of end 2020). Any person 16 years of age or older may contribute to
a voluntary pension fund. Contributions are either personal or made by a third party (such as an
employer) on behalf of the insured.
Minimum returns
The performance of voluntary pension funds is not subject to a minimum return obligation.
Reserves
As a matter of legal obligation, where voluntary pension funds promise lifetime pensions, they are
required to maintain pension reserves to cover the longevity risk. As a matter of practice, currently
voluntary pension funds have accumulated such reserves only for the limited number of lifetime
pension contracts currently extended.
Distributions
Participants in voluntary pension funds have a variety of choices in drawing on their accounts.
One option is for participants to withdraw funds accumulated through their own contributions at
any time prior to reaching the statutory retirement age. This right does not apply to funds
accumulated as a result of any employers’ contributions.
Another option gives them the right to a lifetime pension upon meeting the age and length of
service requirements for a public pension. However, participants may choose to draw a lifetime
pension up to five years prior to meeting these eligibility criteria.
Lastly, participants can choose between drawing the balance from their account as a lump sum or
a scheduled withdrawal over a certain period of time.
The heirs of an insured or retired person who leaves a balance in his or her account at the time of
death, are entitled to the balance as either a lump sum or to scheduled withdrawals over a specified
period of time. Should there be no heirs the balance is transferred to the voluntary pension fund
reserves.
Voluntary professional pension funds
With only two voluntary professional funds with 10,138 participants and €9.4 mln. in assets under
management as of end-2020, this vehicle is a rather insignificant part of the Bulgarian pension
system and will be dropped from the real return analysis. Only participants in professional pension
schemes can contribute to voluntary professional pension funds. Their employers may elect to
make contributions on behalf of employees too.
135 | P a g e
Lon
g-Te
rm a
nd
Pen
sio
n S
avin
gs |
Th
e R
eal R
etu
rn |
20
21
Edit
ion
To meet their future obligations, pension companies set aside technical reserves. The technical
reserves need to be maintained at any moment in time and invested appropriately to ensure
liquidity.
Participants acquire a right to a term pension from a voluntary professional fund upon reaching the
age of 60 for both men and women. They have the choice to either a lump sum or scheduled
withdrawals.
The heirs of a deceased insured or retiree are entitled to receive the remaining balance on the
account as either a lump sum or scheduled withdrawals.
Asset Allocation (Investment Strategy)
Pension companies in Bulgaria are allowed to manage only one pension fund (one portfolio) per
category (universal, professional, voluntary or voluntary professional). Thus, they are prevented by
law from assessing the suitability and appropriateness of any pension fund to the insured. Every
client of the respective type of fund, offered by a pension company, receives the same portfolio
irrespective of his or her time horizon, investment objectives, risk tolerance, financial circumstances
or the ability to bear losses.
At the same time pension funds’ portfolios are subject to investment restrictions. Universal and
professional funds’ investments in 2020 were limited to no more than 60% investments in dynamic
assets and no less than 40% in fixed income and cash equivalents – a slightly more relaxed
investment restrictions in comparison to previous years, when no more than 45% could be invested
in dynamic assets.
Specifically, the limits were as follows:
• No more than 25% in equities;
• No more than 20% in collective investment schemes such as mutual funds and ETFs. Since the investment focus of these collective schemes is not defined, theoretically they can be invested only in equities;
• No more than 10% in REITs (Real Estate Investment Trusts) and
• No more than 5% directly in investment property82.
Investment restrictions for voluntary pension funds are more relaxed and focus primarily on limiting
concentration and exchange rate risk.
We report the asset allocation per major pension category in Table BG6. In the three most recent
years universal and professional pension funds held about 45-56% in government bonds; 9-11 % in
corporate and municipal fixed income instruments and about 21-31% in equities and collective
investment schemes.
82 Art. 176-178. Social Insurance Code. http://noi.bg/images/bg/legislation/Codes/KCO.pdf
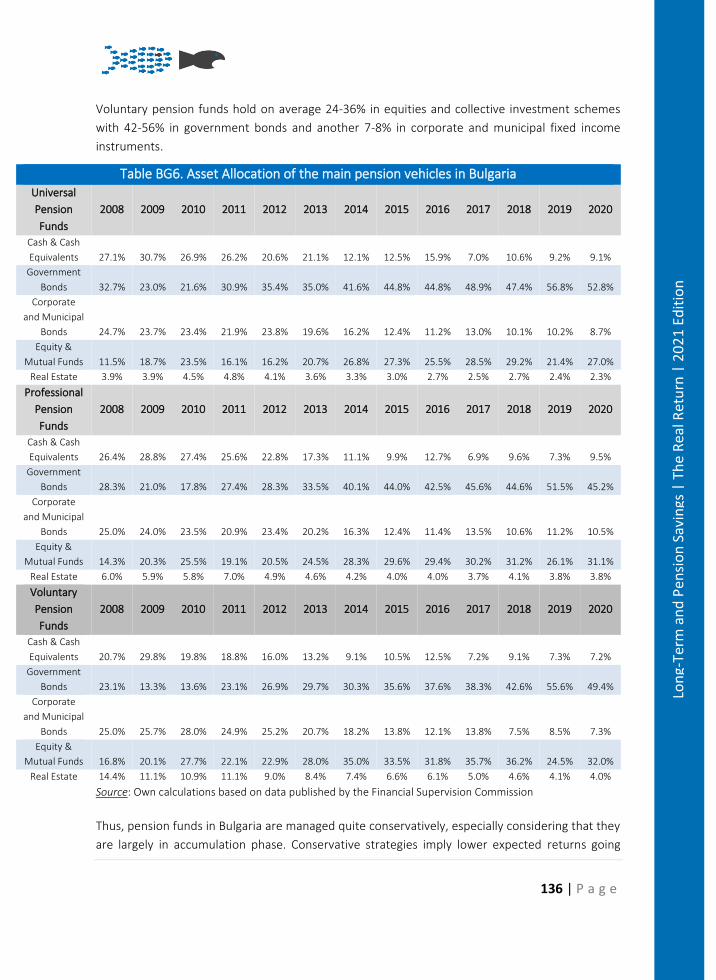
136 | P a g e
Lon
g-Te
rm a
nd
Pen
sio
n S
avin
gs |
Th
e R
eal R
etu
rn |
20
21
Edit
ion
Voluntary pension funds hold on average 24-36% in equities and collective investment schemes
with 42-56% in government bonds and another 7-8% in corporate and municipal fixed income
instruments.
Table BG6. Asset Allocation of the main pension vehicles in Bulgaria Universal
Pension
Funds
2008 2009 2010 2011 2012 2013 2014 2015 2016 2017 2018 2019 2020
Cash & Cash
Equivalents 27.1% 30.7% 26.9% 26.2% 20.6% 21.1% 12.1% 12.5% 15.9% 7.0% 10.6% 9.2% 9.1%
Government
Bonds 32.7% 23.0% 21.6% 30.9% 35.4% 35.0% 41.6% 44.8% 44.8% 48.9% 47.4% 56.8% 52.8%
Corporate
and Municipal
Bonds 24.7% 23.7% 23.4% 21.9% 23.8% 19.6% 16.2% 12.4% 11.2% 13.0% 10.1% 10.2% 8.7%
Equity &
Mutual Funds 11.5% 18.7% 23.5% 16.1% 16.2% 20.7% 26.8% 27.3% 25.5% 28.5% 29.2% 21.4% 27.0%
Real Estate 3.9% 3.9% 4.5% 4.8% 4.1% 3.6% 3.3% 3.0% 2.7% 2.5% 2.7% 2.4% 2.3%
Professional
Pension
Funds
2008 2009 2010 2011 2012 2013 2014 2015 2016 2017 2018 2019 2020
Cash & Cash
Equivalents 26.4% 28.8% 27.4% 25.6% 22.8% 17.3% 11.1% 9.9% 12.7% 6.9% 9.6% 7.3% 9.5%
Government
Bonds 28.3% 21.0% 17.8% 27.4% 28.3% 33.5% 40.1% 44.0% 42.5% 45.6% 44.6% 51.5% 45.2%
Corporate
and Municipal
Bonds 25.0% 24.0% 23.5% 20.9% 23.4% 20.2% 16.3% 12.4% 11.4% 13.5% 10.6% 11.2% 10.5%
Equity &
Mutual Funds 14.3% 20.3% 25.5% 19.1% 20.5% 24.5% 28.3% 29.6% 29.4% 30.2% 31.2% 26.1% 31.1%
Real Estate 6.0% 5.9% 5.8% 7.0% 4.9% 4.6% 4.2% 4.0% 4.0% 3.7% 4.1% 3.8% 3.8%
Voluntary
Pension
Funds
2008 2009 2010 2011 2012 2013 2014 2015 2016 2017 2018 2019 2020
Cash & Cash
Equivalents 20.7% 29.8% 19.8% 18.8% 16.0% 13.2% 9.1% 10.5% 12.5% 7.2% 9.1% 7.3% 7.2%
Government
Bonds 23.1% 13.3% 13.6% 23.1% 26.9% 29.7% 30.3% 35.6% 37.6% 38.3% 42.6% 55.6% 49.4%
Corporate
and Municipal
Bonds 25.0% 25.7% 28.0% 24.9% 25.2% 20.7% 18.2% 13.8% 12.1% 13.8% 7.5% 8.5% 7.3%
Equity &
Mutual Funds 16.8% 20.1% 27.7% 22.1% 22.9% 28.0% 35.0% 33.5% 31.8% 35.7% 36.2% 24.5% 32.0%
Real Estate 14.4% 11.1% 10.9% 11.1% 9.0% 8.4% 7.4% 6.6% 6.1% 5.0% 4.6% 4.1% 4.0%
Source: Own calculations based on data published by the Financial Supervision Commission
Thus, pension funds in Bulgaria are managed quite conservatively, especially considering that they
are largely in accumulation phase. Conservative strategies imply lower expected returns going
137 | P a g e
Lon
g-Te
rm a
nd
Pen
sio
n S
avin
gs |
Th
e R
eal R
etu
rn |
20
21
Edit
ion
forward, which makes it less likely for pension savers to enjoy an adequate income in retirement,
once the temporary effect of the lowered reduction runs out (2037-2040). The asset allocation of
all pension funds in Bulgaria, including the post-crisis period, and the decision to maintain less
exposure to riskier asset classes explains why their investments did not fully participate in stock
market recovery that has occurred since 2009 and their long-term performance still lags the market
return as shown on Figure BG5 above. While conservative portfolios dampen their volatility, they
expose the insured to inflation risk and lower real retirement incomes.
Charges83
Participants in pension funds are subject to fees and charges, defined and capped by law. Four types
of fees and charges apply:
• Entry fee on pension fund contributions;
• Account opening fee (for voluntary funds)
• Annual investment management fees on account balances (or the annual return in the
case of voluntary funds);
• Other fees
The law caps those fees and charges as follows (as of end 2020):
Table BG7. Legal caps on fees and charges in 2020
Fees Universal/ Professional Pension Funds Voluntary Pension Funds
Entry fee 3.75% ≤ 7%
Management fee 0.75% ≤ 10 %*
Account opening fee € 0.00 € 5.11
Other fees € 5.11 € 10.22
Source: Social Insurance Code, * Up to 10% of the positive nominal return to the fund/ individual account.
Pension companies are banned from charging any fees other than the ones listed. The entry fee
applies to each contribution, while the management fee applies to the balance of the account (or
the annual return in the case of voluntary funds). The transfer fee is charged when a participant
initiates a transfer of his or her account to a different pension management company. Only one
transfer of the account per year is permitted. Companies managing voluntary pension funds are
allowed to collect several other administrative fees, as long as those are explicitly allowed and
specified in the law.
In practice, most of the pension companies managing universal and professional funds charge the
maximum loads and fees, but some offer discounts to long-term participants.
83 Data on charges are collected from individual pension companies’ Internal Rules and Regulations for managing pension
funds. These documents are publicly accessible on the web page of each pension company.
138 | P a g e
Lon
g-Te
rm a
nd
Pen
sio
n S
avin
gs |
Th
e R
eal R
etu
rn |
20
21
Edit
ion
The entry fees charged by pension companies for voluntary pension funds vary more widely and
are typically between 2.5 and 4.5%. The amount of the entry fee varies according to the amount of
the contribution, or the number of employees signed up to a voluntary pension fund by their
employer. The majority of pension companies charge the maximum allowed 10% of returns in
investment management fees. Four companies charge lower investment management fees: one
charges 4.5%, the other charges 7% and the remaining two, including the largest company, charge
9% on positive returns.
Administrative charges are normally one-time and nominal.
A gradual reduction of fees and charges for the Pillar II funds was mandated by law84. The reduction
was fully phased in 2019, and they stayed the same in 2020 as follows:
Table BG8. Pension funds fees and charges for Universal/ Professional Funds (2016-
2020)
2016 2017 2018 2019 2020
Front Load 4.50% 4.25% 4.00% 3.75% 3.75%
Management fee 0.90% 0.85% 0.80% 0.75% 0.75%
As reported on Figures BG13 and BG14 below, fees and charges have reduced the yield to pension
savers by 1.7% annual average for universal pension funds and 1.2 % for voluntary pension funds
over the 2002-2020 period.
Taxation - EEE
Individual contributions to pension funds are income tax free. A contribution to voluntary pension
funds of up to 10% of annual taxable income is tax-free, while any additional contributions can be
made from after-tax income. Investment income accrues tax-free to individual pension accounts.
Pension payments are also free of tax.
Employers deduct contributions to pension funds of up to BGN 60 (€30.68) per employee per
month from their annual revenue before taxes. Pension companies’ services and revenues are free
from VAT and tax respectively.
The tax regime of the pension companies and pension funds does not drive a wedge between
nominal and real returns in Bulgaria.
Pension Returns
Pension funds returns can be calculated using one of two methods: time-weighted or money-
weighted returns85. While time-weighted returns are useful when comparing pension funds’
84 National Assembly, (2015), Social Insurance Code, State Gazette, No. 61, 11.08.2015 (In Bulgarian) 85 Feibel, Bruce J., (2003), “Investment Performance Measurement”, John Wiley & Sons, Inc., Hoboken, New Jersey, p. 53
139 | P a g e
Lon
g-Te
rm a
nd
Pen
sio
n S
avin
gs |
Th
e R
eal R
etu
rn |
20
21
Edit
ion
performance to a benchmark, it is only money-weighted returns that matter to participants, since
their accumulated capital before retirement depends on their contributions, the length of the
contributing period and their average money-weighted return they earned on their accounts. For
comparability purposes with other country cases, the General Report and Executive Summary
(where data for Bulgarian pension funds is presented) use Time-Weighted Returns, not the below
returns, which are Money-Weighted Returns. The methodologies differ and Time-Weighted
Returns should not be compared with Money-Weighted Returns.
Note: The computations for the Bulgarian country case include additional data flows on the
contributions paid to the NSSI.
We reported the 1, 3-, 7-, and 10-year time weighted nominal and real returns in the introduction
and observed that all types of pension funds in Bulgaria underperform a simple investable
benchmark portfolio. In this section, we report both the annual nominal and real money-weighted
returns (2002-2020) and the returns over 1, 3-, 7-, 10- year trailing returns and since 2002 for the
two main pension vehicles: universal and voluntary funds.
Money-weighted Returns
The pension savers’ annual returns in the two dominant pension vehicles in Bulgaria: universal and
voluntary pension funds, are reported in Tables BG9 and BG10.
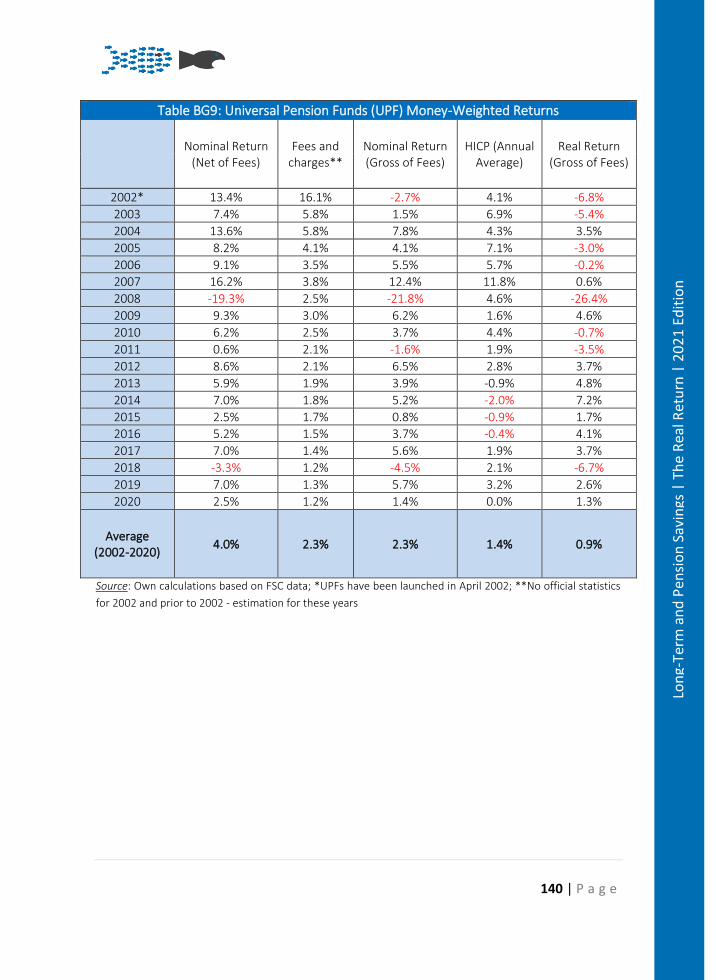
140 | P a g e
Lon
g-Te
rm a
nd
Pen
sio
n S
avin
gs |
Th
e R
eal R
etu
rn |
20
21
Edit
ion
Table BG9: Universal Pension Funds (UPF) Money-Weighted Returns
Nominal Return
(Net of Fees) Fees and
charges** Nominal Return (Gross of Fees)
HICP (Annual Average)
Real Return (Gross of Fees)
2002* 13.4% 16.1% -2.7% 4.1% -6.8%
2003 7.4% 5.8% 1.5% 6.9% -5.4%
2004 13.6% 5.8% 7.8% 4.3% 3.5%
2005 8.2% 4.1% 4.1% 7.1% -3.0%
2006 9.1% 3.5% 5.5% 5.7% -0.2%
2007 16.2% 3.8% 12.4% 11.8% 0.6%
2008 -19.3% 2.5% -21.8% 4.6% -26.4%
2009 9.3% 3.0% 6.2% 1.6% 4.6%
2010 6.2% 2.5% 3.7% 4.4% -0.7%
2011 0.6% 2.1% -1.6% 1.9% -3.5%
2012 8.6% 2.1% 6.5% 2.8% 3.7%
2013 5.9% 1.9% 3.9% -0.9% 4.8%
2014 7.0% 1.8% 5.2% -2.0% 7.2%
2015 2.5% 1.7% 0.8% -0.9% 1.7%
2016 5.2% 1.5% 3.7% -0.4% 4.1%
2017 7.0% 1.4% 5.6% 1.9% 3.7%
2018 -3.3% 1.2% -4.5% 2.1% -6.7%
2019 7.0% 1.3% 5.7% 3.2% 2.6%
2020 2.5% 1.2% 1.4% 0.0% 1.3%
Average (2002-2020)
4.0% 2.3% 2.3% 1.4% 0.9%
Source: Own calculations based on FSC data; *UPFs have been launched in April 2002; **No official statistics
for 2002 and prior to 2002 - estimation for these years
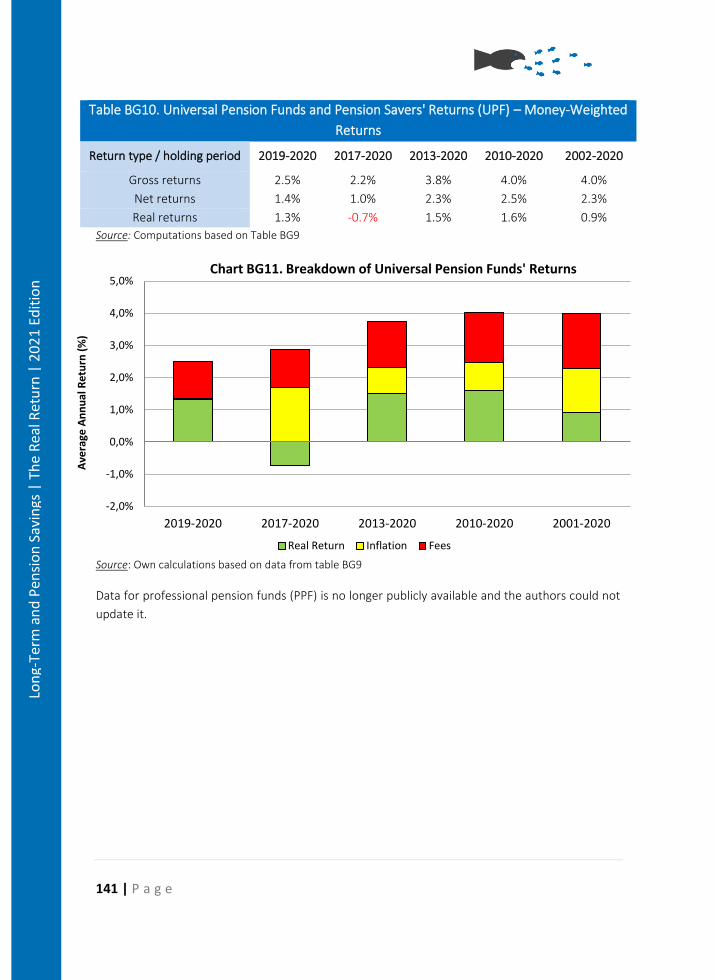
141 | P a g e
Lon
g-Te
rm a
nd
Pen
sio
n S
avin
gs |
Th
e R
eal R
etu
rn |
20
21
Edit
ion
Table BG10. Universal Pension Funds and Pension Savers' Returns (UPF) – Money-Weighted
Returns
Return type / holding period 2019-2020 2017-2020 2013-2020 2010-2020 2002-2020
Gross returns 2.5% 2.2% 3.8% 4.0% 4.0%
Net returns 1.4% 1.0% 2.3% 2.5% 2.3%
Real returns 1.3% -0.7% 1.5% 1.6% 0.9%
Source: Computations based on Table BG9
Source: Own calculations based on data from table BG9
Data for professional pension funds (PPF) is no longer publicly available and the authors could not
update it.
-2,0%
-1,0%
0,0%
1,0%
2,0%
3,0%
4,0%
5,0%
2019-2020 2017-2020 2013-2020 2010-2020 2001-2020
Ave
rage
An
nu
al R
etu
rn (
%)
Chart BG11. Breakdown of Universal Pension Funds' Returns
Real Return Inflation Fees

142 | P a g e
Lon
g-Te
rm a
nd
Pen
sio
n S
avin
gs |
Th
e R
eal R
etu
rn |
20
21
Edit
ion
Table BG12. Voluntary Pension Funds (VPF) Money-Weighted Returns
Nominal Return
(Net of Fees)
Fees and
charges**
Nominal Return
(Gross of Fees)
Inflation (Annual
Average HICP)
Real Return
(Gross of Fees)
2002* 9.2% 5.0% 4.2% 3.9% 0.3%
2003 9.9% 2.8% 7.1% 6.0% 1.0%
2004 12.0% 2.6% 9.4% 4.2% 5.2%
2005 9.6% 2.3% 7.3% 7.4% 0.0%
2006 7.5% 1.9% 5.6% 6.0% -0.4%
2007 17.9% 3.2% 14.8% 11.9% 2.8%
2008 -25.1% 0.5% -25.6% 5.0% -30.7%
2009 8.3% 1.3% 6.9% 1.7% 5.2%
2010 5.7% 1.0% 4.7% 4.5% 0.2%
2011 -0.6% 0.4% -1.0% 2.0% -3.0%
2012 8.9% 1.2% 7.7% 2.9% 4.8%
2013 6.9% 1.0% 6.0% -0.9% 6.9%
2014 7.1% 1.1% 6.1% -2.1% 8.1%
2015 2.0% 0.6% 1.4% -0.9% 2.3%
2016 5.6% 0.8% 4.8% -0.5% 5.3%
2017 7.9% 1.2% 6.8% 1.9% 4.9%
2018 -4.7% 0.3% -5.1% 2.1% -7.2%
2019 7.3% 1.0% 6.3% 3.2% 3.1%
2020 2.4% 0.5% 1.9% 0.0% 1.9%
Annual
Average
(2001-20)
4.0% 1.2% 2.7% 2.6% 0.2%
Source: own calculations based on FSC data; *Voluntary Pension Funds existed prior to 2002 but there are no
official statistics available on the electronic site of the Financial Supervision Commission (FSC); **No official
statistics for 2002 and prior to 2002 - estimation for these years
Pension funds returns vs. pension savers’ nominal and real returns by holding period are reported
in the following tables:
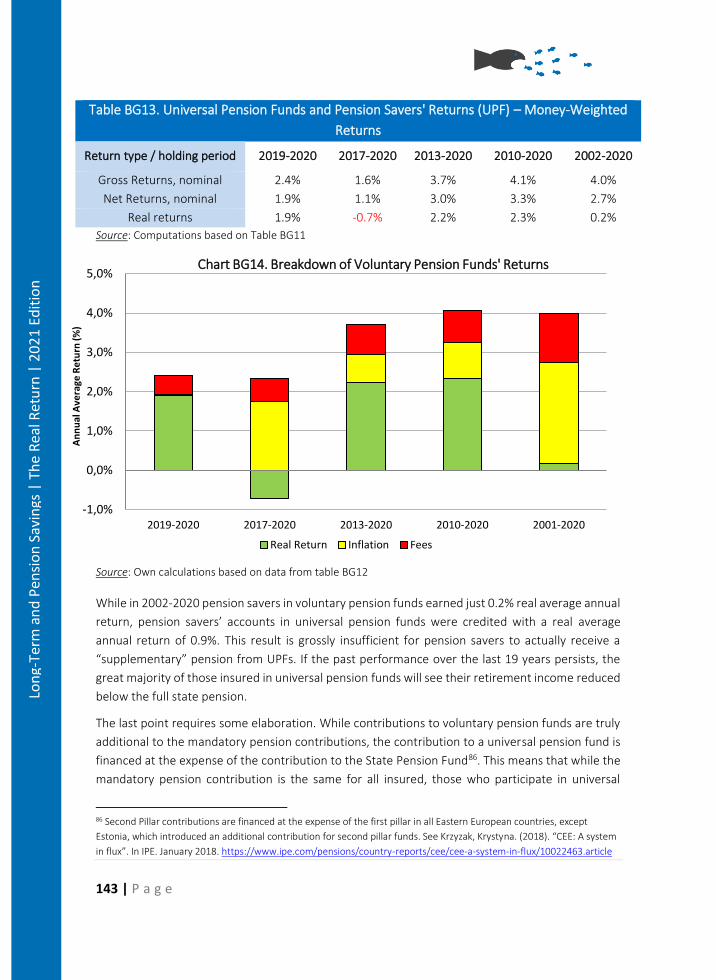
143 | P a g e
Lon
g-Te
rm a
nd
Pen
sio
n S
avin
gs |
Th
e R
eal R
etu
rn |
20
21
Edit
ion
Table BG13. Universal Pension Funds and Pension Savers' Returns (UPF) – Money-Weighted
Returns
Return type / holding period 2019-2020 2017-2020 2013-2020 2010-2020 2002-2020
Gross Returns, nominal 2.4% 1.6% 3.7% 4.1% 4.0%
Net Returns, nominal 1.9% 1.1% 3.0% 3.3% 2.7%
Real returns 1.9% -0.7% 2.2% 2.3% 0.2%
Source: Computations based on Table BG11
Source: Own calculations based on data from table BG12
While in 2002-2020 pension savers in voluntary pension funds earned just 0.2% real average annual
return, pension savers’ accounts in universal pension funds were credited with a real average
annual return of 0.9%. This result is grossly insufficient for pension savers to actually receive a
“supplementary” pension from UPFs. If the past performance over the last 19 years persists, the
great majority of those insured in universal pension funds will see their retirement income reduced
below the full state pension.
The last point requires some elaboration. While contributions to voluntary pension funds are truly
additional to the mandatory pension contributions, the contribution to a universal pension fund is
financed at the expense of the contribution to the State Pension Fund86. This means that while the
mandatory pension contribution is the same for all insured, those who participate in universal
86 Second Pillar contributions are financed at the expense of the first pillar in all Eastern European countries, except
Estonia, which introduced an additional contribution for second pillar funds. See Krzyzak, Krystyna. (2018). “CEE: A system
in flux”. In IPE. January 2018. https://www.ipe.com/pensions/country-reports/cee/cee-a-system-in-flux/10022463.article
-1,0%
0,0%
1,0%
2,0%
3,0%
4,0%
5,0%
2019-2020 2017-2020 2013-2020 2010-2020 2001-2020
An
nu
al A
vera
ge R
etu
rn (
%)
Chart BG14. Breakdown of Voluntary Pension Funds' Returns
Real Return Inflation Fees
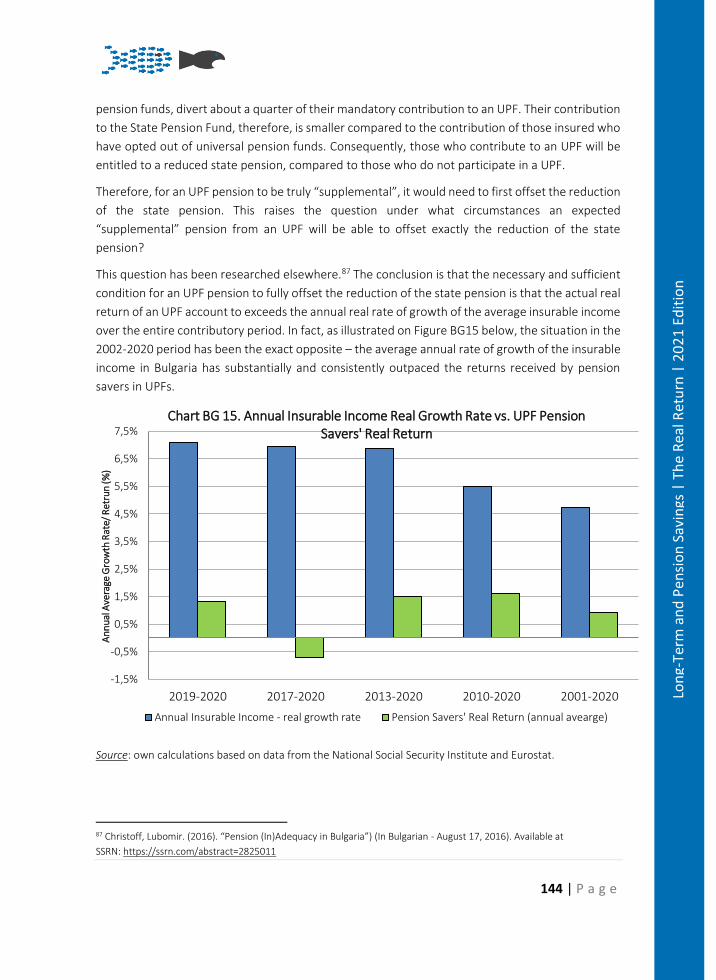
144 | P a g e
Lon
g-Te
rm a
nd
Pen
sio
n S
avin
gs |
Th
e R
eal R
etu
rn |
20
21
Edit
ion
pension funds, divert about a quarter of their mandatory contribution to an UPF. Their contribution
to the State Pension Fund, therefore, is smaller compared to the contribution of those insured who
have opted out of universal pension funds. Consequently, those who contribute to an UPF will be
entitled to a reduced state pension, compared to those who do not participate in a UPF.
Therefore, for an UPF pension to be truly “supplemental”, it would need to first offset the reduction
of the state pension. This raises the question under what circumstances an expected
“supplemental” pension from an UPF will be able to offset exactly the reduction of the state
pension?
This question has been researched elsewhere.87 The conclusion is that the necessary and sufficient
condition for an UPF pension to fully offset the reduction of the state pension is that the actual real
return of an UPF account to exceeds the annual real rate of growth of the average insurable income
over the entire contributory period. In fact, as illustrated on Figure BG15 below, the situation in the
2002-2020 period has been the exact opposite – the average annual rate of growth of the insurable
income in Bulgaria has substantially and consistently outpaced the returns received by pension
savers in UPFs.
Source: own calculations based on data from the National Social Security Institute and Eurostat.
87 Christoff, Lubomir. (2016). “Pension (In)Adequacy in Bulgaria”) (In Bulgarian - August 17, 2016). Available at
SSRN: https://ssrn.com/abstract=2825011
-1,5%
-0,5%
0,5%
1,5%
2,5%
3,5%
4,5%
5,5%
6,5%
7,5%
2019-2020 2017-2020 2013-2020 2010-2020 2001-2020
An
nu
al A
vera
ge G
row
th R
ate/
Ret
run
(%)
Chart BG 15. Annual Insurable Income Real Growth Rate vs. UPF Pension Savers' Real Return
Annual Insurable Income - real growth rate Pension Savers' Real Return (annual avearge)
145 | P a g e
Lon
g-Te
rm a
nd
Pen
sio
n S
avin
gs |
Th
e R
eal R
etu
rn |
20
21
Edit
ion
Going forward, the National Social Insurance Institute expects the real growth of the average
insurable income in Bulgaria to slow down to 3.2% per annum in real terms88.. Under this
assumption, an insured person, who has contributed to an UPF since 2002 and will retire in 2042
after 40 years of uninterrupted contributions, will need to receive a 3.9%89 real annual rate of return
between 2020 and 2041 in order for his “supplemental” UPF pension to just offset the reduction of
his state pension. The required 3.9% real return is not only far in excess of the realized real return
of 0.9% over the 2002-2020 period, but is also unrealistic to expect, given the long-term capital
market expectations90.
Thus, contributing to an UPF over 40 years will reduce pension savers’ retirement income in
comparison with the state pension they would have been entitled to, had they not participated in
an UPF at all. By producing returns below the growth rate of the average insurable income in
Bulgaria, universal pension funds harm pension savers by reducing the adequacy of their pensions
and preventing them from maintaining their living standards after retirement.
While the legislator created an opportunity to opt-out of UPFs at any time up to one year before
reaching the statutory retirement age, contributing to an UPF remains the default option for those,
who enter the labour market for the first time.
Conclusion
With the pay-as-you-go pension pillar in Bulgaria under financial stress and the universal pension
funds being the default option for employees born after 1959, the defined contribution pillars are
growing in importance in securing adequate pensions for future retirees. However, as the analysis
of the real return of pension funds from 2002 to 2020 illustrates, with very low real returns in
universal pension funds and voluntary pension funds, the task of providing Bulgarians with
adequate pensions and old age security is proving beyond reach.
Pension fund charges in Bulgaria are limited in number, capped by law and transparent. They have
proved, however, too high a hurdle for fund managers across all pension vehicles to overcome and
deliver market-like long-term returns.
Bulgarians can choose whether to contribute to universal pension funds but if they do, they don’t
have a choice as to how their savings are to be managed. Their contributions are invested
88 National Social Security Institute. (2019). “Actuarial Report 2019.” Sofia. (In Bulgarian).
p. 31, Table 6 and p. 38, Table 8. https://noi.bg/aboutbg/st/analyses/415-actuerreports 89 Christoff, Lubomir. (2019). “Pension (In)Adequacy in Bulgaria”. (In Bulgarian). Available at
SSRN: https://ssrn.com/abstract=3354170 90 Dobbs Richard, Tim Koller, Susan Lund, Sree Ramaswamy, Jon Harris, Mekala Krishnan and Duncan Kauffman. (2016).
“DIMINISHING RETURNS: WHY INVESTORS MAY NEED TO LOWER THEIR EXPECTATIONS”, McKinsey & Company, p. IX
https://www.mckinsey.com/industries/private-equity-and-principal-investors/our-insights/why-investors-may-need-to-
lower-their-sights
146 | P a g e
Lon
g-Te
rm a
nd
Pen
sio
n S
avin
gs |
Th
e R
eal R
etu
rn |
20
21
Edit
ion
irrespective of their individual time horizon and risk tolerance, which indicates that perhaps a
majority of the Bulgarians invest their pension savings in unsuitable portfolios.
Universal pension funds – by far the largest pension vehicle by number of participants and assets
under management – is detrimental to pension savers interests as it cannot generate the returns
needed to ensure a supplemental pension and on the contrary, will reduce the pension income of
future retirees as two pensions in Bulgaria are less than one, over a full contributory period.
The discriminatory reduction of the state pension introduced in 2020 will soften the blow of the
effect “Two pensions are less than one” in Bulgaria, but only temporarily as shown above. This is
because this measure patches the symptoms but doesn’t address the cause of why UPF pensions
cannot compensate for the reduction of the state pension. The root cause of the inability of UPFs
to deliver supplementary pensions are the low and insufficient real returns they have been
generating over the past 19 years.
147 | P a g e
Lon
g-Te
rm a
nd
Pen
sio
n S
avin
gs |
Th
e R
eal R
etu
rn |
20
21
Edit
ion
Bibliography
• Christoff, Lubomir. (2016). “Pension (In)Adequacy in Bulgaria”) (In Bulgarian - August 17, 2016). Available at SSRN: https://ssrn.com/abstract=2825011
• Christoff, Lubomir. (2017). “Embedded Flaws of the Bulgarian Pension Funds or the Code Against the Insured”) (In Bulgarian - March 10, 2017). Available at SSRN: https://ssrn.com/abstract=2924003
• Christoff, Lubomir, (2019), “Pension (In)Adequacy in Bulgaria”. (In Bulgarian). Available at SSRN: https://ssrn.com/abstract=3354170
• Сhristopherson, Jon A., David R. CariÑo, Wayne E. Ferson, (2009) “Portfolio Performance Measurement and Benchmarking”, The McGraw-Hill Companies, Inc., p. 34.
• Dobbs Richard, Tim Koller, Susan Lund, Sree Ramaswamy, Jon Harris, Mekala Krishnan and Duncan Kauffman. (2016). “DIMINISHING RETURNS: WHY INVESTORS MAY NEED TO LOWER THEIR EXPECTATIONS”, McKinsey & Company https://www.mckinsey.com/industries/private-equity-and-principal-investors/our-insights/why-investors-may-need-to-lower-their-sights
• Feibel, Bruce J., (2003), “Investment Performance Measurement”, John Wiley & Sons, Inc., Hoboken, New Jersey.
• Financial Supervision Commission, (2004), Ordinance No.19 on setting aside pension reserves. (In Bulgarian, accessed at http://www.fsc.bg/public/upload/files/menu/Naredba-19KFN_pens-rezervi.pdf
• Krzyzak, Krystyna. (2018). “CEE: A system in flux”. In IPE . January, 2018. https://www.ipe.com/pensions/country-reports/cee/cee-a-system-in-flux/10022463.article
• National Assembly, (2015), Social Insurance Code, State Gazette, No. 61, 11.08.2015 (In Bulgarian).
• National Social Security Institute. (2019). “Actuarial Report 2019.” Sofia. (In Bulgarian). https://noi.bg/aboutbg/st/analyses/415-actuerreports
• National Social Insurance Institute. (2018). “Social Insurance Contributions and Insurable Income for the Self-insured -Contributions to the Pension Fund”. Sofia. (In Bulgarian) http://www.nssi.bg/images/bg/users/infomaterials/osiguriavane/Samoosigureni.pdf
• Ortiz, I. et. al. (eds.). (2018). Reversing Pension Privatizations: Rebuilding public pension systems in Eastern Europe and Latin America / International Labour Office – Geneva: ILO. https://bit.ly/2UvRhYA
• Palmer, Edward. (2007). “Pension Reform and the Development of Pension Systems: An Evaluation of World Bank Assistance”. Background Paper. Bulgaria Country Study. The World Bank. p. 25 http://ieg.worldbankgroup.org/sites/default/files/Data/reports/bulgaria_pensions_wp.pdf
• Social Security Code. In Bulgarian. http://noi.bg/images/bg/legislation/Codes/KCO.pdf
148 | P a g e
Lon
g-Te
rm a
nd
Pen
sio
n S
avin
gs |
Th
e R
eal R
etu
rn |
20
21
Edit
ion
Pension Savings: The Real Return 2021 Edition
Country Case: Croatia
Croatian summary
Hrvatska je stvorila tipični mirovinski sustav s tri stupa, gdje se državni organizirani mirovinski stup na temelju PAYG-a (preraspodjela doprinosa radno sposobnog starijeg stanovništva) nadopunjuje obveznim financiranim mirovinskim sustavom (II. Stup) i subvencionira se (izravno kao i neizravno) dobrovoljni mirovinski sistem štednje (III. stup).
Povećavajući omjer obuhvata radnog stanovništva od strane II. stub nadoknađuje slaba pokrivenost unutar III. stup. To bi moglo donijeti rastući problem niskog životnog standarda za umirovljenje populacije u budućnosti, jer I. stup pruža samo 30% stopu zamjene, a preostala dva stupa neće moći dodati značajne izvore za pojedince tijekom umirovljenja. Iako su izvedbe oba financirana stupa prilično solidne, prilično mali doprinosi i nizak omjer pokrivenosti III. Stup postavlja pitanja o adekvatnosti mirovinskog sustava u Hrvatskoj.
Summary
Croatia has created typical 3-pillar pension system, where the state organized pension pillar based on PAYG (redistribution of contributions from working to elderly population) is supplemented by mandatory funded pension scheme (II. pillar) and subsidized (directly as well as indirectly) voluntary pension saving scheme (III. pillar).
Increasing coverage ratio of working population by the II. pillar is offset by low coverage within the III. pillar. This might bring the increasing problem of low living standard for retiring population in future as the I. pillar provides only 30% replacement rate and remaining two pillars will not be able to add significant sources for individuals during retirement. Even if the performance of both funded pillars is quite solid, rather small contributions and low coverage ratio of the III. pillar raises questions about the adequacy of the pension system in Croatia.
Introduction
Croatian pension system is since 2002 designed on conventional World bank 3-pillar model.
Croatian pension system was as of 1 January 1999 reformed by introducing a mixed public-private
pension system consisting of three pillars of pension insurance:
I. pillar – compulsory pension insurance based on generational solidarity;
II. pillar – compulsory pension insurance based on individual capitalized savings;
III. pillar – voluntary pension insurance based on individual capitalized savings.
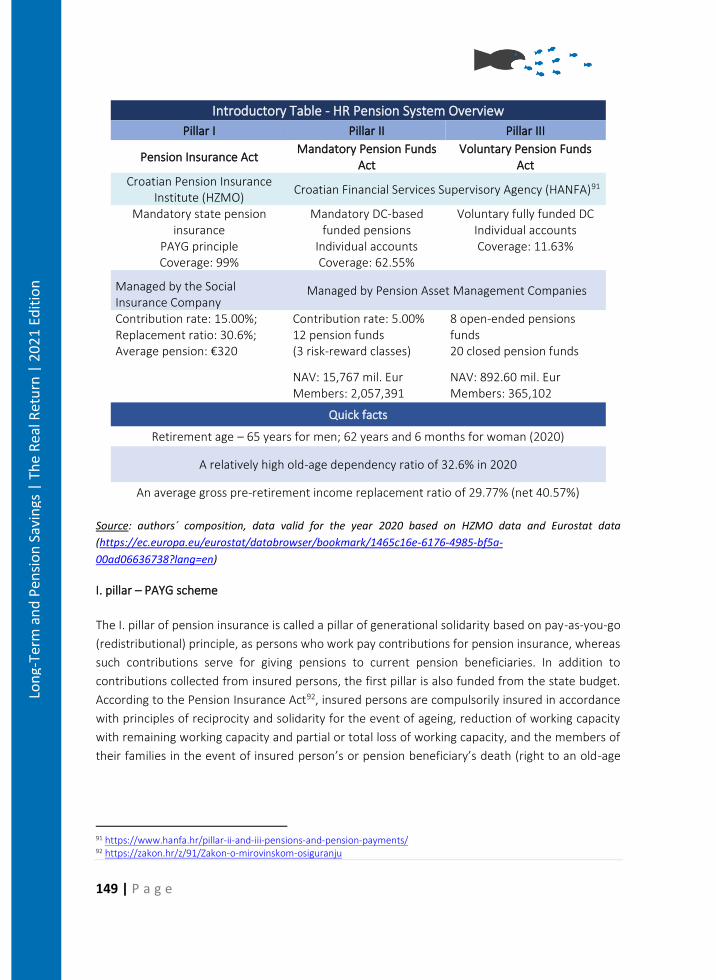
149 | P a g e
Lon
g-Te
rm a
nd
Pen
sio
n S
avin
gs |
Th
e R
eal R
etu
rn |
20
21
Edit
ion
Introductory Table - HR Pension System Overview
Pillar I Pillar II Pillar III
Pension Insurance Act Mandatory Pension Funds
Act Voluntary Pension Funds
Act Croatian Pension Insurance
Institute (HZMO) Croatian Financial Services Supervisory Agency (HANFA)91
Mandatory state pension insurance
PAYG principle Coverage: 99%
Mandatory DC-based funded pensions
Individual accounts Coverage: 62.55%
Voluntary fully funded DC Individual accounts Coverage: 11.63%
Managed by the Social Insurance Company
Managed by Pension Asset Management Companies
Contribution rate: 15.00%; Replacement ratio: 30.6%; Average pension: €320
Contribution rate: 5.00% 12 pension funds (3 risk-reward classes)
8 open-ended pensions funds 20 closed pension funds
NAV: 15,767 mil. Eur Members: 2,057,391
NAV: 892.60 mil. Eur Members: 365,102
Quick facts
Retirement age – 65 years for men; 62 years and 6 months for woman (2020)
A relatively high old-age dependency ratio of 32.6% in 2020
An average gross pre-retirement income replacement ratio of 29.77% (net 40.57%)
Source: authors´ composition, data valid for the year 2020 based on HZMO data and Eurostat data
(https://ec.europa.eu/eurostat/databrowser/bookmark/1465c16e-6176-4985-bf5a-
00ad06636738?lang=en)
I. pillar – PAYG scheme
The I. pillar of pension insurance is called a pillar of generational solidarity based on pay-as-you-go
(redistributional) principle, as persons who work pay contributions for pension insurance, whereas
such contributions serve for giving pensions to current pension beneficiaries. In addition to
contributions collected from insured persons, the first pillar is also funded from the state budget.
According to the Pension Insurance Act92, insured persons are compulsorily insured in accordance
with principles of reciprocity and solidarity for the event of ageing, reduction of working capacity
with remaining working capacity and partial or total loss of working capacity, and the members of
their families in the event of insured person’s or pension beneficiary’s death (right to an old-age
91 https://www.hanfa.hr/pillar-ii-and-iii-pensions-and-pension-payments/ 92 https://zakon.hr/z/91/Zakon-o-mirovinskom-osiguranju
150 | P a g e
Lon
g-Te
rm a
nd
Pen
sio
n S
avin
gs |
Th
e R
eal R
etu
rn |
20
21
Edit
ion
pension, early retirement pension, disability pension, temporary disability pension, survivors’
pension, minimum pension, basic pension).
Funding: the system of generational solidarity is a defined benefits system. The Contribution Act93
prescribes the obligation to pay contributions for funding of compulsory insurance, including
contributions for pension insurance. Contributions are collected by the Tax Administration and the
contribution rate for insured persons who are insured only in the I. pillar amounts to 20% of gross
salary, while the contribution rate for I. pillar for insured persons who are insured in both
compulsory pillars (I. and II. pillar) amounts to 15%.
The implementation of pension insurance based on generational solidarity falls within the
competence of the Croatian Pension Insurance Institute94. The Croatian Pension Insurance Institute
(HZMO) is the competent institution for exercising the right exclusively from pension insurance
based on generational solidarity (I. pillar).
The right to an old-age pension payable from the I. pillar is acquired by an insured person who has
reached 65 years of age, if he/she has completed 15 years of qualifying periods. Insured persons –
women in the period from 2014 to 2029 are entitled to an old-age pension at a lower age. In 2014,
they could retire at the age of 61 (under the condition of 15 years of service), where the age
requirement for each calendar year increases by 3 months until 2029. By way of exception, raising
the retirement age by 4 months every year was stipulated by the law that was in force from 1
January to 31 December 2019. However, the amendments to the law that enter into force on 1
January 2020 introduced a transitional period for women under more favourable conditions again.
Raising of the retirement age is reduced from 4 to 3 months every year, with an exceptional raise
by 2 months in 2020 in relation to 2019. As of 1 January 2030, women and men can exercise the
right to old-age pension benefit under the same conditions, having reached the age of 65 and 15
years of pensionable service, irrespective of the gender of the insured person.
The amount of old-age pension is calculated by multiplying personal points, pension factor and the
actual value of pension. The pension factor is determined by the type of pension to be realised, and
the actual value of the pension is determined by the Governing Board of the Croatian Pension
Insurance Institute (HZMO), based on the data of the Croatian Bureau of Statistics, no later than
two months after the end of each half-year. Personal points are calculated by multiplying the
average value point with achieved qualifying periods and the initial factor. The initial factor affects
the amount of pension in case of old-age pensions and early retirement pensions, so that:
• An old-age pension is increased to insured persons who are granted pension for the first
time after the age of 65, and have 35 years of qualifying periods, by 0.34% for each month
93 https://zakon.hr/z/365/Zakon-o-doprinosima 94 https://www.mirovinsko.hr/
151 | P a g e
Lon
g-Te
rm a
nd
Pen
sio
n S
avin
gs |
Th
e R
eal R
etu
rn |
20
21
Edit
ion
after reaching the prescribed age for acquiring the right to an old-age pension, but no
longer than 5 years,
• An early retirement pension is reduced for the insured persons by 0.2% for each month of
early retirement before reaching the statutory retirement age of the insured person for
the acquisition of the right to an old-age pension.
The average value point is calculated based on salaries earned over the entire working life in
relation to the average annual salary in the Republic of Croatia.
The right to an early retirement pension is acquired by an insured person who has reached 60 years
of age and completed 35 years of qualifying periods. There are again some exceptions for women.
The amount of the old-age pension is permanently reduced for each calendar month of the earlier
exercise of entitlement, up to the completed years of life of the insurer prescribed for the
acquisition of the right to an old-age pension, linearly by 0.2% for each month of early retirement,
i.e., 2.4% per year up to a maximum of 12% for a maximum of 5 years prior to retirement.
Paid old-age pensions are adjusted twice a year in relation to economic trends in the Republic of
Croatia. The adjustment rate, applied starting from 1 January 2015, is determined by the variable
ratio of the consumer price index and gross salaries of all employees in the Republic of Croatia in
the previous year, compared to the year preceding it (70:30, 50: 50 or 30:70, whichever is
preferred). From July 1, 2019, it is aligned as follows: from January 1 to July 1 each calendar year
according to the 70:30 or 30:70 model.
II. pillar
II. pillar has been effectively introduced starting January 2002. The II. pillar represents individual
capitalized savings. Individual savings refer to personal assets of insured persons and the fact that
paid funds are recorded in personal accounts, while capitalized savings refer to return on
investment achieved upon payment to the selected compulsory pension fund. This form of pension
insurance was introduced to expand the source of funding in relation to compulsory pension
insurance based on generational solidarity, which sought to achieve greater individual responsibility
for the safety of the elderly.
II. pillar includes compulsory insured persons of up to 40 years of age. The rate of contributions for
persons insured in II. pillar amounts to 5 % of the gross salary, whereby insured persons may
themselves choose a compulsory pension fund and compulsory pension fund category to which
they will contribute the said amount. Persons compulsorily insured in I. and II. pillar and insured
persons who voluntarily chose II. pillar have the right in the process of exercising the right to a
pension to choose in which system the pension will be realized, that is, the system which is more
favorable for them (opt-out system). Insured persons can:
152 | P a g e
Lon
g-Te
rm a
nd
Pen
sio
n S
avin
gs |
Th
e R
eal R
etu
rn |
20
21
Edit
ion
• Leave the II. pillar and get the pension exclusively from I. pillar;
• Stay in II. pillar and get the pension from both pillars (in this case, the pension from I. pillar
is determined for the years of service completed by December 31, 2001, with a
supplement of 27% and for the years of service completed from January 1, 2002, with a
supplement of 20.25 %, determined by the factor of basic pension (0.75%).
Management of savings within the II. pillar is carried out through compulsory pension management
companies offering pension funds, while the payout phase is carried out exclusively through
pension insurance companies. The pension system based on capitalized savings is regulated by two
statutory regulations, depending on whether they refer to the phase of accumulation and
capitalization of contributions regulated by the Act on Compulsory Pension Funds95 or the phase of
pension payouts regulated by the Act on Pension Insurance Companies96. The Central Register of
Insured Persons (REGOS) is the competent institution for insurance based on individual capitalized
savings (II. pillar).
Compulsory pension fund is established by a pension company that manages such fund on its behalf
and for the joint account of pension fund members. Pension fund may fall under categories A, B or
C, and are managed by the same pension company. Pension funds of different categories have
different investment strategies and vary according to membership limitations (considering life
expectancy of savers/members), investment strategy and investment limitations. The assumed risk
should be the lowest in category C funds, and the largest in category A pension funds.
The right to pension and based on individual capitalized savings – II. pillar is realized based on the
Decision on Retirement Benefits issued by the Croatian Pension Insurance Institute (HZMO). From
January 1, 2019, all insured persons who are insured in both pension pillars can, when they apply
for old-age or early old-age pension, select whether they want to receive pension only from the I.
pillar or pension from both pillars through a personal statement to the Central Register of Insured
Persons (REGOS).
For a member of the fund to choose a more favourable pension, REGOS will collect informative
pension calculations from the Croatian Pension Insurance Institute (HZMO) and the Pension
Insurance Company (MOD) and submit them to the home address. If a member of the fund opts
for pension only from the compulsory pension insurance based on generational solidarity (I. pillar),
the HZMO will determine the pension as if the insured was only insured in the I pillar. The selection
of this pension means that a member of the fund wants to leave II. pillar, i.e., compulsory pension
insurance of individual capitalized savings, and the total capitalized funds from the personal account
of the member of the fund are transferred to the state budget. If a member of the fund opts for a
combined pension from I. and II. pillars, HZMO will determine the basic pension from compulsory
95 https://www.zakon.hr/z/708/Zakon-o-obveznim-mirovinskim-fondovima 96 https://www.zakon.hr/z/712/Zakon-o-mirovinskim-osiguravaju%C4%87im-dru%C5%A1tvima
153 | P a g e
Lon
g-Te
rm a
nd
Pen
sio
n S
avin
gs |
Th
e R
eal R
etu
rn |
20
21
Edit
ion
pension insurance for generational solidarity and submit to REGOS the data from the Decision.
Upon receipt of the Decision, which is provided to REGOS by HZMO, REGOS checks the data from
the Decision regarding the status of the future pension beneficiary. It is checked whether the
personal account of the future pension beneficiary is opened and whether he or she has exited
from the II pillar. After selecting the pension insurance company, REGOS will close the personal
account of the member of the fund and transfer the overall funds to the pension insurance
company which will contact than the beneficiary for the conclusion of the pension agreement. The
compulsory pension company that manages the compulsory pension fund has a deadline of five
working days from the date of initiating the closing of the personal account to allocate funds to the
payment account for II. pillar contributions. Upon settlement of the obligation by the custodian
bank, the following working day it is verified whether the funds have been transferred to the
account of the legal recipient of funds – the Raiffeisen Pension Insurance Company (currently the
only MOD) that will pay the pension on the basis of individual capitalized savings. REGOS informs
the Pension Insurance Company electronically on the data from R-POD form and the amount of
transferred funds. Upon receipt of the aforementioned information, the pension insurance
company will contact the future pension beneficiary regarding the conclusion of the Contract on
pension based on individual capitalized savings.
If the old-age pension from the I. pillar is higher than 15% of the minimum pension from the I. pillar
according to the Pension Insurance Act, the future pension beneficiary from II. pillar can decide on
a partial, one-time cash payment of 15% in the gross amount of the total capitalized funds allocated
to MOD.
III. pillar
Voluntary pension funds were also introduced in 2002 and complete the three-pillar system. III.
pillar is a voluntary pension savings DC-based scheme. Voluntary pension schemes are either
offered by voluntary pension funds or can be set up by trade unions and employers, making open
and closed funds possible. Open-ended pension funds are open for membership to any natural
person interested in becoming a member of an open-ended pension fund, whereas closed-ended
pension funds form their membership out of natural persons who are either employed with an
employer, or are trade union members, members of associations of self-employed persons or self-
employed persons. Voluntary pension funds need to have at least 2,000 members two years after
being established.
The payment of retirement benefits within the framework of mandatory pension insurance based
on individual capitalised savings of members of mandatory pension funds is made by pension
insurance companies only. The payment of retirement benefits within the framework of voluntary
pension insurance based on individual capitalised savings of members of voluntary pension funds
is made by pension insurance companies, but exceptionally, the payment of retirement benefits on
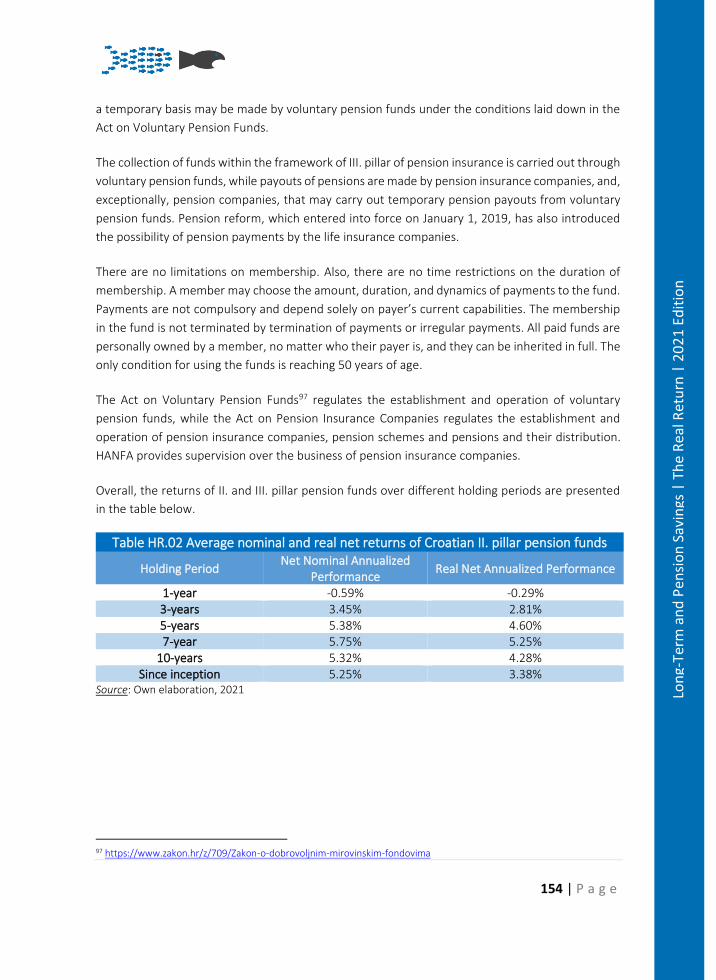
154 | P a g e
Lon
g-Te
rm a
nd
Pen
sio
n S
avin
gs |
Th
e R
eal R
etu
rn |
20
21
Edit
ion
a temporary basis may be made by voluntary pension funds under the conditions laid down in the
Act on Voluntary Pension Funds.
The collection of funds within the framework of III. pillar of pension insurance is carried out through
voluntary pension funds, while payouts of pensions are made by pension insurance companies, and,
exceptionally, pension companies, that may carry out temporary pension payouts from voluntary
pension funds. Pension reform, which entered into force on January 1, 2019, has also introduced
the possibility of pension payments by the life insurance companies.
There are no limitations on membership. Also, there are no time restrictions on the duration of
membership. A member may choose the amount, duration, and dynamics of payments to the fund.
Payments are not compulsory and depend solely on payer’s current capabilities. The membership
in the fund is not terminated by termination of payments or irregular payments. All paid funds are
personally owned by a member, no matter who their payer is, and they can be inherited in full. The
only condition for using the funds is reaching 50 years of age.
The Act on Voluntary Pension Funds97 regulates the establishment and operation of voluntary
pension funds, while the Act on Pension Insurance Companies regulates the establishment and
operation of pension insurance companies, pension schemes and pensions and their distribution.
HANFA provides supervision over the business of pension insurance companies.
Overall, the returns of II. and III. pillar pension funds over different holding periods are presented
in the table below.
Table HR.02 Average nominal and real net returns of Croatian II. pillar pension funds
Holding Period Net Nominal Annualized
Performance Real Net Annualized Performance
1-year -0.59% -0.29% 3-years 3.45% 2.81% 5-years 5.38% 4.60% 7-year 5.75% 5.25%
10-years 5.32% 4.28% Since inception 5.25% 3.38%
Source: Own elaboration, 2021
97 https://www.zakon.hr/z/709/Zakon-o-dobrovoljnim-mirovinskim-fondovima
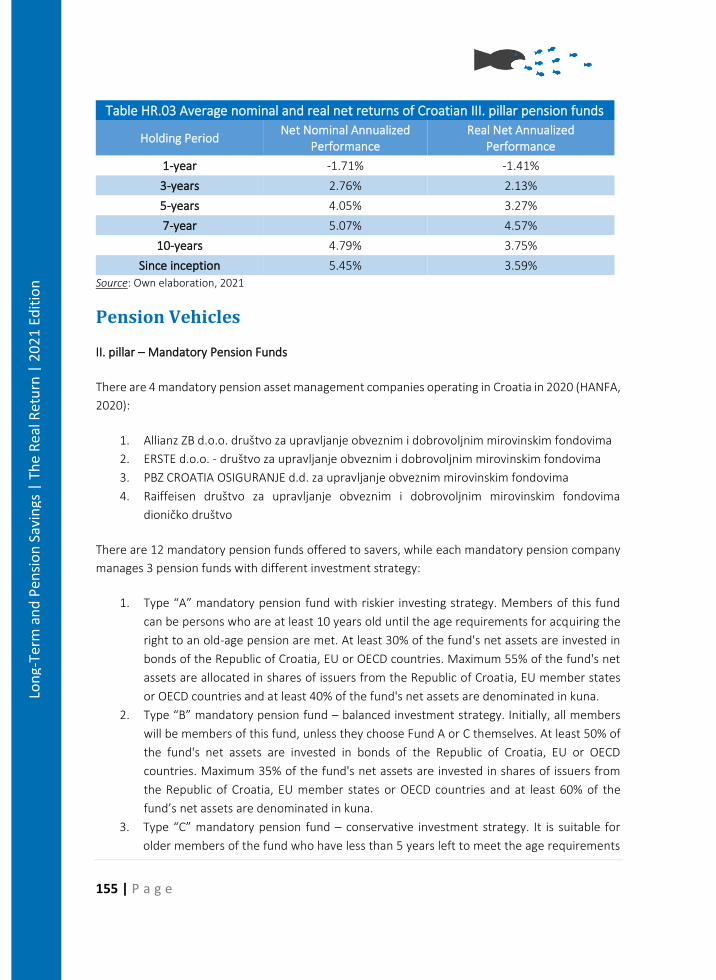
155 | P a g e
Lon
g-Te
rm a
nd
Pen
sio
n S
avin
gs |
Th
e R
eal R
etu
rn |
20
21
Edit
ion
Table HR.03 Average nominal and real net returns of Croatian III. pillar pension funds
Holding Period Net Nominal Annualized
Performance Real Net Annualized
Performance
1-year -1.71% -1.41%
3-years 2.76% 2.13%
5-years 4.05% 3.27%
7-year 5.07% 4.57%
10-years 4.79% 3.75%
Since inception 5.45% 3.59%
Source: Own elaboration, 2021
Pension Vehicles
II. pillar – Mandatory Pension Funds
There are 4 mandatory pension asset management companies operating in Croatia in 2020 (HANFA,
2020):
1. Allianz ZB d.o.o. društvo za upravljanje obveznim i dobrovoljnim mirovinskim fondovima
2. ERSTE d.o.o. - društvo za upravljanje obveznim i dobrovoljnim mirovinskim fondovima
3. PBZ CROATIA OSIGURANJE d.d. za upravljanje obveznim mirovinskim fondovima
4. Raiffeisen društvo za upravljanje obveznim i dobrovoljnim mirovinskim fondovima
dioničko društvo
There are 12 mandatory pension funds offered to savers, while each mandatory pension company
manages 3 pension funds with different investment strategy:
1. Type “A” mandatory pension fund with riskier investing strategy. Members of this fund
can be persons who are at least 10 years old until the age requirements for acquiring the
right to an old-age pension are met. At least 30% of the fund's net assets are invested in
bonds of the Republic of Croatia, EU or OECD countries. Maximum 55% of the fund's net
assets are allocated in shares of issuers from the Republic of Croatia, EU member states
or OECD countries and at least 40% of the fund's net assets are denominated in kuna.
2. Type “B” mandatory pension fund – balanced investment strategy. Initially, all members
will be members of this fund, unless they choose Fund A or C themselves. At least 50% of
the fund's net assets are invested in bonds of the Republic of Croatia, EU or OECD
countries. Maximum 35% of the fund's net assets are invested in shares of issuers from
the Republic of Croatia, EU member states or OECD countries and at least 60% of the
fund’s net assets are denominated in kuna.
3. Type “C” mandatory pension fund – conservative investment strategy. It is suitable for
older members of the fund who have less than 5 years left to meet the age requirements
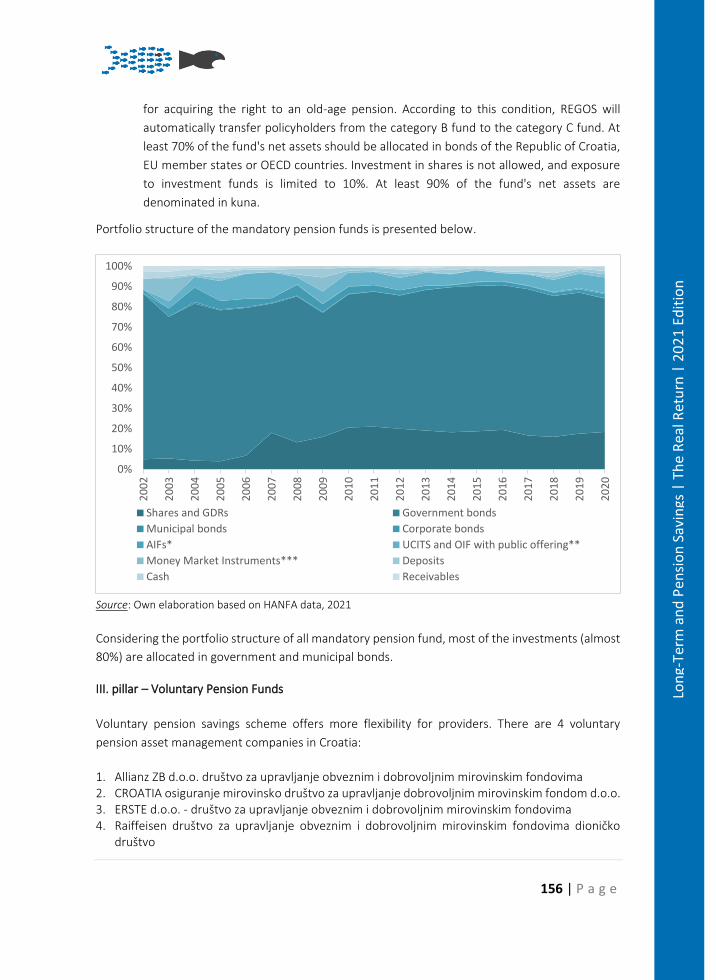
156 | P a g e
Lon
g-Te
rm a
nd
Pen
sio
n S
avin
gs |
Th
e R
eal R
etu
rn |
20
21
Edit
ion
for acquiring the right to an old-age pension. According to this condition, REGOS will
automatically transfer policyholders from the category B fund to the category C fund. At
least 70% of the fund's net assets should be allocated in bonds of the Republic of Croatia,
EU member states or OECD countries. Investment in shares is not allowed, and exposure
to investment funds is limited to 10%. At least 90% of the fund's net assets are
denominated in kuna.
Portfolio structure of the mandatory pension funds is presented below.
Source: Own elaboration based on HANFA data, 2021
Considering the portfolio structure of all mandatory pension fund, most of the investments (almost
80%) are allocated in government and municipal bonds.
III. pillar – Voluntary Pension Funds
Voluntary pension savings scheme offers more flexibility for providers. There are 4 voluntary
pension asset management companies in Croatia:
1. Allianz ZB d.o.o. društvo za upravljanje obveznim i dobrovoljnim mirovinskim fondovima 2. CROATIA osiguranje mirovinsko društvo za upravljanje dobrovoljnim mirovinskim fondom d.o.o. 3. ERSTE d.o.o. - društvo za upravljanje obveznim i dobrovoljnim mirovinskim fondovima 4. Raiffeisen društvo za upravljanje obveznim i dobrovoljnim mirovinskim fondovima dioničko
društvo
0%
10%
20%
30%
40%
50%
60%
70%
80%
90%
100%
20
02
20
03
20
04
20
05
20
06
20
07
20
08
20
09
20
10
20
11
20
12
20
13
20
14
20
15
20
16
20
17
20
18
20
19
20
20
Shares and GDRs Government bonds
Municipal bonds Corporate bonds
AIFs* UCITS and OIF with public offering**
Money Market Instruments*** Deposits
Cash Receivables
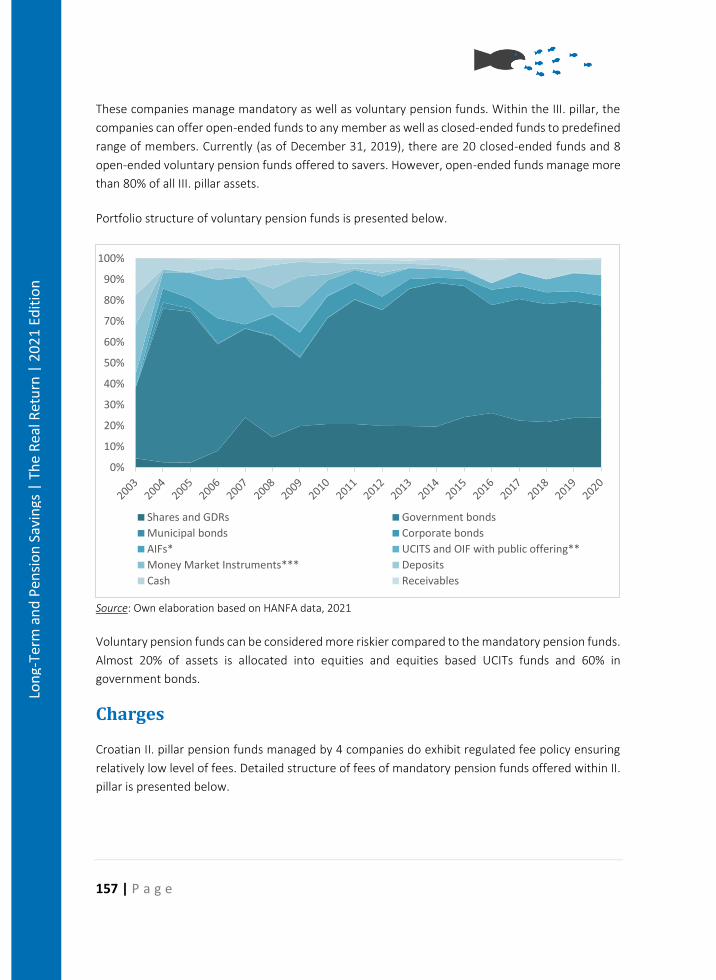
157 | P a g e
Lon
g-Te
rm a
nd
Pen
sio
n S
avin
gs |
Th
e R
eal R
etu
rn |
20
21
Edit
ion
These companies manage mandatory as well as voluntary pension funds. Within the III. pillar, the
companies can offer open-ended funds to any member as well as closed-ended funds to predefined
range of members. Currently (as of December 31, 2019), there are 20 closed-ended funds and 8
open-ended voluntary pension funds offered to savers. However, open-ended funds manage more
than 80% of all III. pillar assets.
Portfolio structure of voluntary pension funds is presented below.
Source: Own elaboration based on HANFA data, 2021
Voluntary pension funds can be considered more riskier compared to the mandatory pension funds.
Almost 20% of assets is allocated into equities and equities based UCITs funds and 60% in
government bonds.
Charges
Croatian II. pillar pension funds managed by 4 companies do exhibit regulated fee policy ensuring
relatively low level of fees. Detailed structure of fees of mandatory pension funds offered within II.
pillar is presented below.
0%
10%
20%
30%
40%
50%
60%
70%
80%
90%
100%
Shares and GDRs Government bonds
Municipal bonds Corporate bonds
AIFs* UCITS and OIF with public offering**
Money Market Instruments*** Deposits
Cash Receivables
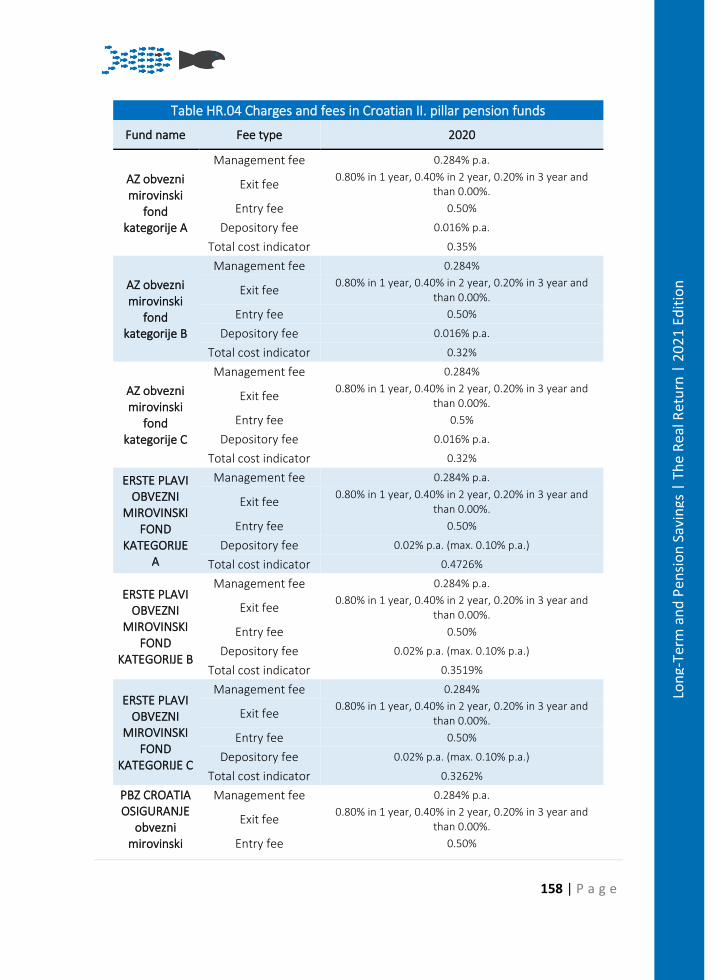
158 | P a g e
Lon
g-Te
rm a
nd
Pen
sio
n S
avin
gs |
Th
e R
eal R
etu
rn |
20
21
Edit
ion
Table HR.04 Charges and fees in Croatian II. pillar pension funds
Fund name Fee type 2020
AZ obvezni mirovinski
fond kategorije A
Management fee 0.284% p.a.
Exit fee 0.80% in 1 year, 0.40% in 2 year, 0.20% in 3 year and
than 0.00%.
Entry fee 0.50%
Depository fee 0.016% p.a.
Total cost indicator 0.35%
AZ obvezni mirovinski
fond kategorije B
Management fee 0.284%
Exit fee 0.80% in 1 year, 0.40% in 2 year, 0.20% in 3 year and
than 0.00%.
Entry fee 0.50%
Depository fee 0.016% p.a.
Total cost indicator 0.32%
AZ obvezni mirovinski
fond kategorije C
Management fee 0.284%
Exit fee 0.80% in 1 year, 0.40% in 2 year, 0.20% in 3 year and
than 0.00%.
Entry fee 0.5%
Depository fee 0.016% p.a.
Total cost indicator 0.32%
ERSTE PLAVI OBVEZNI
MIROVINSKI FOND
KATEGORIJE A
Management fee 0.284% p.a.
Exit fee 0.80% in 1 year, 0.40% in 2 year, 0.20% in 3 year and
than 0.00%.
Entry fee 0.50%
Depository fee 0.02% p.a. (max. 0.10% p.a.)
Total cost indicator 0.4726%
ERSTE PLAVI OBVEZNI
MIROVINSKI FOND
KATEGORIJE B
Management fee 0.284% p.a.
Exit fee 0.80% in 1 year, 0.40% in 2 year, 0.20% in 3 year and
than 0.00%.
Entry fee 0.50%
Depository fee 0.02% p.a. (max. 0.10% p.a.)
Total cost indicator 0.3519%
ERSTE PLAVI OBVEZNI
MIROVINSKI FOND
KATEGORIJE C
Management fee 0.284%
Exit fee 0.80% in 1 year, 0.40% in 2 year, 0.20% in 3 year and
than 0.00%.
Entry fee 0.50%
Depository fee 0.02% p.a. (max. 0.10% p.a.)
Total cost indicator 0.3262%
PBZ CROATIA OSIGURANJE
obvezni mirovinski
Management fee 0.284% p.a.
Exit fee 0.80% in 1 year, 0.40% in 2 year, 0.20% in 3 year and
than 0.00%.
Entry fee 0.50%
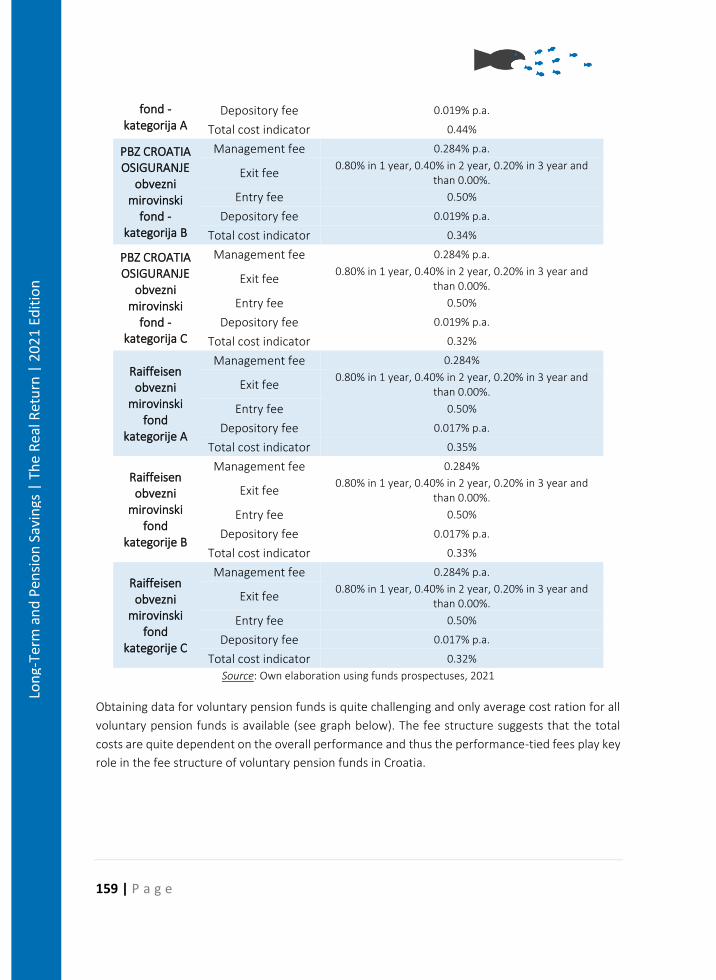
159 | P a g e
Lon
g-Te
rm a
nd
Pen
sio
n S
avin
gs |
Th
e R
eal R
etu
rn |
20
21
Edit
ion
fond - kategorija A
Depository fee 0.019% p.a.
Total cost indicator 0.44%
PBZ CROATIA OSIGURANJE
obvezni mirovinski
fond - kategorija B
Management fee 0.284% p.a.
Exit fee 0.80% in 1 year, 0.40% in 2 year, 0.20% in 3 year and
than 0.00%.
Entry fee 0.50%
Depository fee 0.019% p.a.
Total cost indicator 0.34%
PBZ CROATIA OSIGURANJE
obvezni mirovinski
fond - kategorija C
Management fee 0.284% p.a.
Exit fee 0.80% in 1 year, 0.40% in 2 year, 0.20% in 3 year and
than 0.00%.
Entry fee 0.50%
Depository fee 0.019% p.a.
Total cost indicator 0.32%
Raiffeisen obvezni
mirovinski fond
kategorije A
Management fee 0.284%
Exit fee 0.80% in 1 year, 0.40% in 2 year, 0.20% in 3 year and
than 0.00%.
Entry fee 0.50%
Depository fee 0.017% p.a.
Total cost indicator 0.35%
Raiffeisen obvezni
mirovinski fond
kategorije B
Management fee 0.284%
Exit fee 0.80% in 1 year, 0.40% in 2 year, 0.20% in 3 year and
than 0.00%.
Entry fee 0.50%
Depository fee 0.017% p.a.
Total cost indicator 0.33%
Raiffeisen obvezni
mirovinski fond
kategorije C
Management fee 0.284% p.a.
Exit fee 0.80% in 1 year, 0.40% in 2 year, 0.20% in 3 year and
than 0.00%.
Entry fee 0.50%
Depository fee 0.017% p.a.
Total cost indicator 0.32%
Source: Own elaboration using funds prospectuses, 2021
Obtaining data for voluntary pension funds is quite challenging and only average cost ration for all
voluntary pension funds is available (see graph below). The fee structure suggests that the total
costs are quite dependent on the overall performance and thus the performance-tied fees play key
role in the fee structure of voluntary pension funds in Croatia.
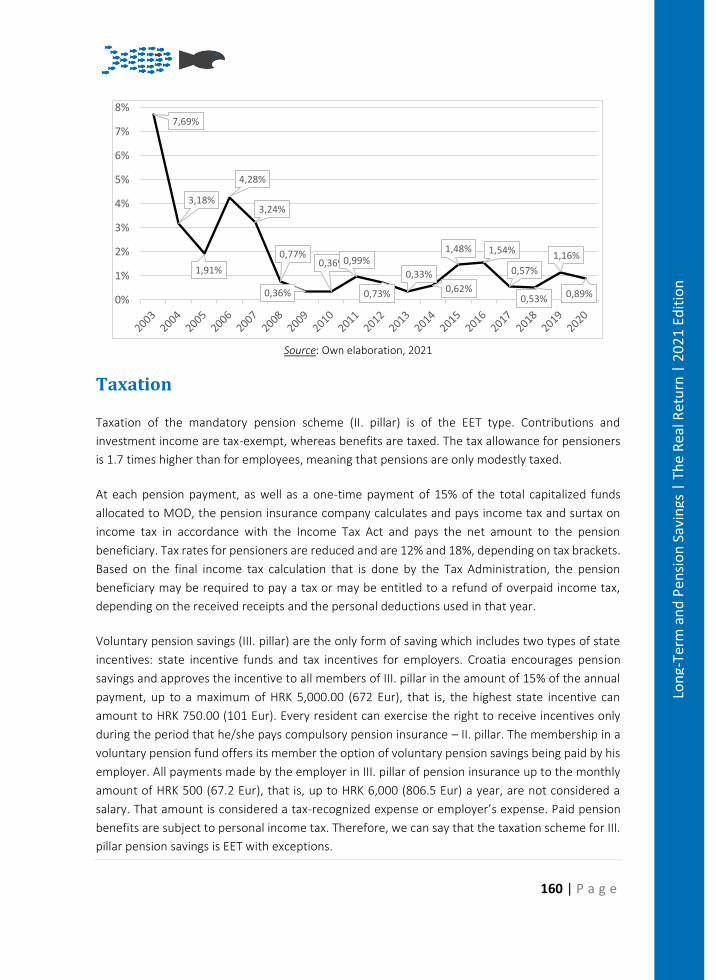
160 | P a g e
Lon
g-Te
rm a
nd
Pen
sio
n S
avin
gs |
Th
e R
eal R
etu
rn |
20
21
Edit
ion
Source: Own elaboration, 2021
Taxation
Taxation of the mandatory pension scheme (II. pillar) is of the EET type. Contributions and
investment income are tax-exempt, whereas benefits are taxed. The tax allowance for pensioners
is 1.7 times higher than for employees, meaning that pensions are only modestly taxed.
At each pension payment, as well as a one-time payment of 15% of the total capitalized funds
allocated to MOD, the pension insurance company calculates and pays income tax and surtax on
income tax in accordance with the Income Tax Act and pays the net amount to the pension
beneficiary. Tax rates for pensioners are reduced and are 12% and 18%, depending on tax brackets.
Based on the final income tax calculation that is done by the Tax Administration, the pension
beneficiary may be required to pay a tax or may be entitled to a refund of overpaid income tax,
depending on the received receipts and the personal deductions used in that year.
Voluntary pension savings (III. pillar) are the only form of saving which includes two types of state
incentives: state incentive funds and tax incentives for employers. Croatia encourages pension
savings and approves the incentive to all members of III. pillar in the amount of 15% of the annual
payment, up to a maximum of HRK 5,000.00 (672 Eur), that is, the highest state incentive can
amount to HRK 750.00 (101 Eur). Every resident can exercise the right to receive incentives only
during the period that he/she pays compulsory pension insurance – II. pillar. The membership in a
voluntary pension fund offers its member the option of voluntary pension savings being paid by his
employer. All payments made by the employer in III. pillar of pension insurance up to the monthly
amount of HRK 500 (67.2 Eur), that is, up to HRK 6,000 (806.5 Eur) a year, are not considered a
salary. That amount is considered a tax-recognized expense or employer’s expense. Paid pension
benefits are subject to personal income tax. Therefore, we can say that the taxation scheme for III.
pillar pension savings is EET with exceptions.
7,69%
3,18%
1,91%
4,28%
3,24%
0,77%
0,36%
0,36%0,99%
0,73%
0,33%
0,62%
1,48% 1,54%
0,57%
0,53%
1,16%
0,89%0%
1%
2%
3%
4%
5%
6%
7%
8%
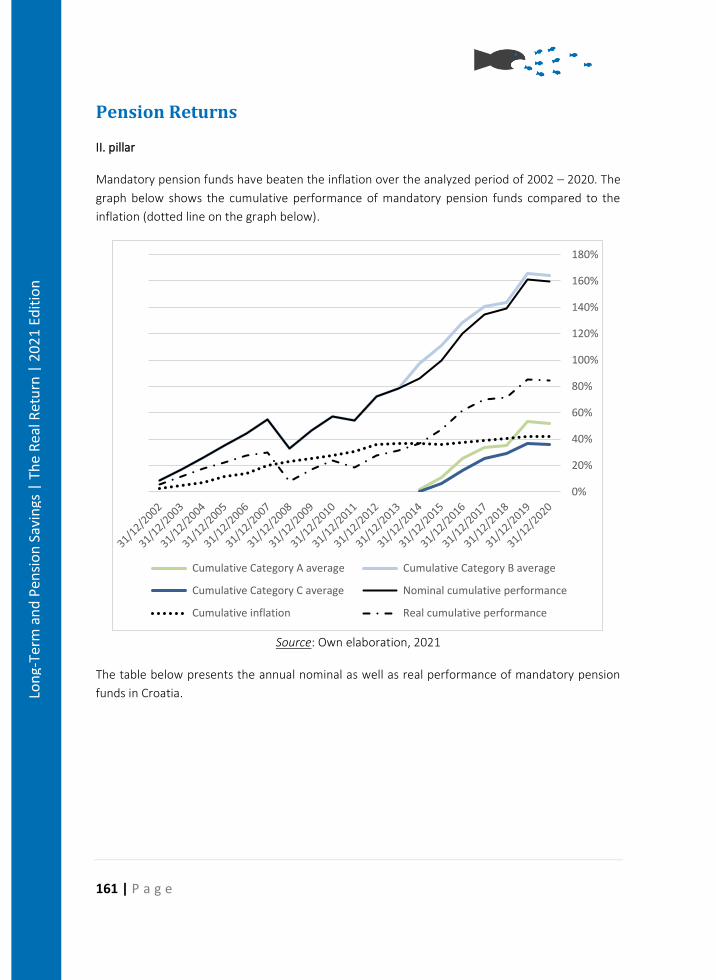
161 | P a g e
Lon
g-Te
rm a
nd
Pen
sio
n S
avin
gs |
Th
e R
eal R
etu
rn |
20
21
Edit
ion
Pension Returns
II. pillar
Mandatory pension funds have beaten the inflation over the analyzed period of 2002 – 2020. The
graph below shows the cumulative performance of mandatory pension funds compared to the
inflation (dotted line on the graph below).
Source: Own elaboration, 2021
The table below presents the annual nominal as well as real performance of mandatory pension
funds in Croatia.
0%
20%
40%
60%
80%
100%
120%
140%
160%
180%
Cumulative Category A average Cumulative Category B average
Cumulative Category C average Nominal cumulative performance
Cumulative inflation Real cumulative performance
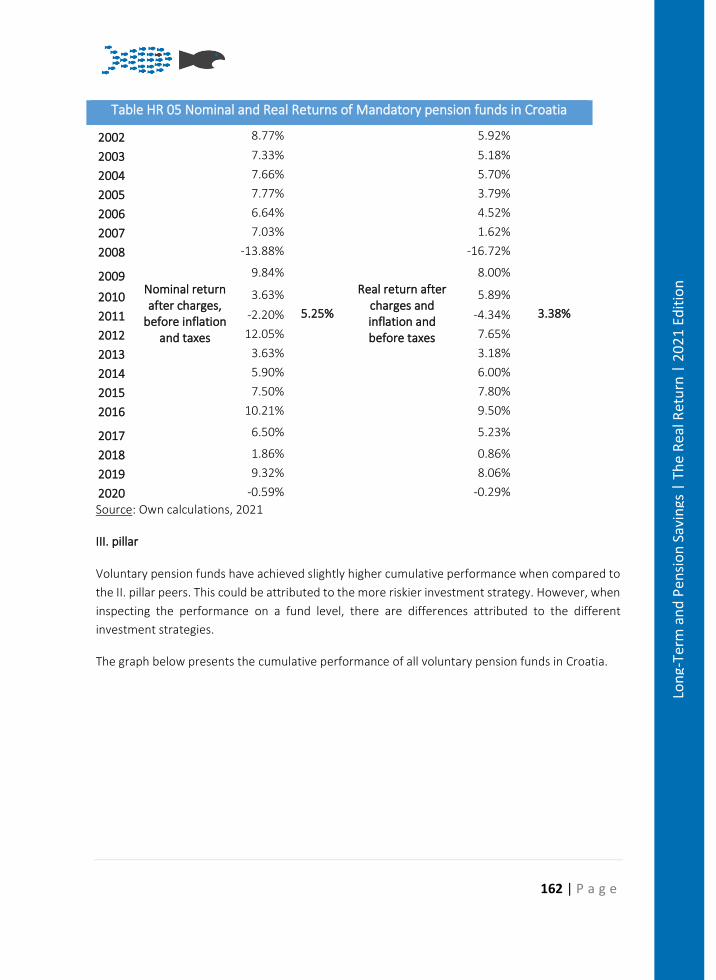
162 | P a g e
Lon
g-Te
rm a
nd
Pen
sio
n S
avin
gs |
Th
e R
eal R
etu
rn |
20
21
Edit
ion
Table HR 05 Nominal and Real Returns of Mandatory pension funds in Croatia
2002
Nominal return after charges,
before inflation and taxes
8.77%
5.25%
Real return after charges and inflation and before taxes
5.92%
3.38%
2003 7.33% 5.18%
2004 7.66% 5.70%
2005 7.77% 3.79%
2006 6.64% 4.52%
2007 7.03% 1.62%
2008 -13.88% -16.72%
2009 9.84% 8.00%
2010 3.63% 5.89%
2011 -2.20% -4.34%
2012 12.05% 7.65%
2013 3.63% 3.18%
2014 5.90% 6.00%
2015 7.50% 7.80%
2016 10.21% 9.50%
2017 6.50% 5.23%
2018 1.86% 0.86%
2019 9.32% 8.06%
2020 -0.59% -0.29%
Source: Own calculations, 2021
III. pillar
Voluntary pension funds have achieved slightly higher cumulative performance when compared to
the II. pillar peers. This could be attributed to the more riskier investment strategy. However, when
inspecting the performance on a fund level, there are differences attributed to the different
investment strategies.
The graph below presents the cumulative performance of all voluntary pension funds in Croatia.
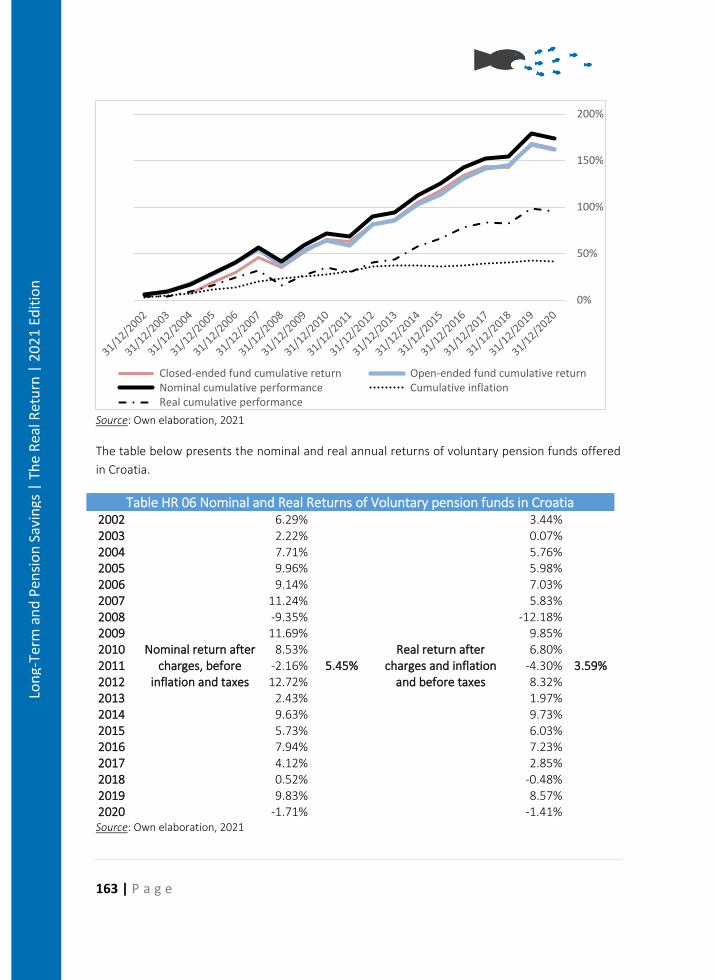
163 | P a g e
Lon
g-Te
rm a
nd
Pen
sio
n S
avin
gs |
Th
e R
eal R
etu
rn |
20
21
Edit
ion
Source: Own elaboration, 2021
The table below presents the nominal and real annual returns of voluntary pension funds offered
in Croatia.
Table HR 06 Nominal and Real Returns of Voluntary pension funds in Croatia 2002
Nominal return after charges, before
inflation and taxes
6.29%
5.45% Real return after
charges and inflation and before taxes
3.44%
3.59%
2003 2.22% 0.07% 2004 7.71% 5.76% 2005 9.96% 5.98% 2006 9.14% 7.03% 2007 11.24% 5.83% 2008 -9.35% -12.18% 2009 11.69% 9.85% 2010 8.53% 6.80% 2011 -2.16% -4.30% 2012 12.72% 8.32% 2013 2.43% 1.97% 2014 9.63% 9.73% 2015 5.73% 6.03% 2016 7.94% 7.23% 2017 4.12% 2.85% 2018 0.52% -0.48% 2019 9.83% 8.57% 2020 -1.71% -1.41% Source: Own elaboration, 2021
0%
50%
100%
150%
200%
Closed-ended fund cumulative return Open-ended fund cumulative return Nominal cumulative performance Cumulative inflation Real cumulative performance
164 | P a g e
Lon
g-Te
rm a
nd
Pen
sio
n S
avin
gs |
Th
e R
eal R
etu
rn |
20
21
Edit
ion
Overall, both mandatory and voluntary pension funds were able to beat inflation on a cumulative
basis and can be considered attractive for savers even if the year 2020 brought negative returns in
both pillars.
Conclusions
Croatian pension system offers rather low replacement rates from the state organized I. pillar. This
leaves the working population to rely on individual savings and thus the importance of mandatory
as well as voluntary pension savings will rise over time and will play a significant role of one´s income
during the retirement.
Mandatory as well as voluntary pension funds have provided the savers with solid returns over the
last 18 years. II. pillar is compulsory for the working population and thus the coverage ratio will be
expected to rise in future. The problem could be seen in rather low coverage ratio within the III.
pillar, where only 12% of working population saves for retirement.
Bibliography
1. https://www.hanfa.hr/pillar-ii-and-iii-pensions-and-pension-payments/registers/mandatory-pension-companies/
2. https://www.hanfa.hr/pillar-ii-and-iii-pensions-and-pension-payments/registers/voluntary-pension-companies/
3. https://www.hanfa.hr/pillar-ii-and-iii-pensions-and-pension-payments/registers/mandatory-pension-funds/
4. https://www.hanfa.hr/pillar-ii-and-iii-pensions-and-pension-payments/registers/voluntary-pension-funds/
5. https://www.hanfa.hr/pillar-ii-and-iii-pensions-and-pension-payments/registers/pension-insurance-companies/
6. https://www.hanfa.hr/pillar-ii-and-iii-pensions-and-pension-payments/ 7. https://www.hanfa.hr/pillar-ii-and-iii-pensions-and-pension-payments/regulations/ 8. https://www.researchgate.net/publication/325475320_The_Croatian_Pension_System_
and_Challenges_of_Pension_Policy 9. https://www.hanfa.hr/publications/statistics/#section2 10. https://www.hanfa.hr/drugi-i-treci-mirovinski-stup-i-isplata-mirovina/ 11. http://www.rmod.hr/default.aspx?id=48
Policy considerations
Understating weak points of Croatian pension system (low coverage ratio and relatively low
contribution rates for funded schemes), the pension system could be improved by:
1. allowing for additional voluntary contributions for mandatory pension pillar on top of 5%
contribution rate envisaged by the current law as the II. pillar offers quite solid
performance with low cost ratio;

165 | P a g e
Lon
g-Te
rm a
nd
Pen
sio
n S
avin
gs |
Th
e R
eal R
etu
rn |
20
21
Edit
ion
2. increase indirect state support and further enhance the tax exemption for III. pillar
contributions in order to increase the coverage ratio.
Overall, the performance of Croatian pension funds could be considered solid, compared to other
peers in other countries. However, the performance is driven mostly by bond yields of domestic
issuers, which would not hold for the longer period.
166 | P a g e
Lon
g-Te
rm a
nd
Pen
sio
n S
avin
gs |
Th
e R
eal R
etu
rn |
20
21
Edit
ion
Pension Savings: The Real Return 2021 Edition
Country Case: Denmark
Danish Summary
Det danske pensionssystem er et veludbygget 3-søjle-system. De tre søjlers betydning har gradvist
ændret sig i løbet af de sidste 30 år. PAYG-systemet i søjle 1 (folkepensionen) er fortsat den
væsentligste indkomstkilde for de fleste pensionister, men arbejdsmarkedspensionerne spiller en
stadig større rolle. Mere end 80 pct. af arbejdsstyrken er medlem af en eller flere
arbejdsmarkedspensioner. Den gennemsnitlige dækningsgrad er på et niveau omring 75%, og
forventes at stige i de kommende år.
Det danske pensionssystem er karakteriseret ved en høj grad af forudgående opsparing og ved en
klar arbejdsdeling mellem de offentlige, skattefinansierede pensioner og de private,
opsparingsbaserede pensionsordninger. Den samlede pensionsopsparing udgør i 2019 4.430 mia.
DKK eller næsten det dobbelte af BNP.
I international sammenligning skille det danske pensionssystem ud ved, at der ermeget få
økonomiske fattige pensionister og pensionernes dækningsgrader er høj. Sytemet er finansielt
sammehængene, og de offentlige finanser er holdbare i forhold til en aldrende befolkning. Der er
således ingen aktutte reformbehov, den grundlæggende struktur er hensigtsmæssig. Der er
imidlertid udfordringer knyttet til incitamenterne til opsparing og senere tilbagetrækning, og der er
også fortsat en restruppe, der kun har en beskeden pensionsopsparing.
Ar´bedsmarkedspensionerne er i de senere år ændret i retning af markedsbaserede produkter, hvor
opsparene mere direkte bærer risikoen knyttet til blandt andet afkast variationer. Det har skabt
mulighed for højere afkast, men rejser spørgsmål om risikoniveauer og risikodeling. Historisk har
afkastene været høje, på gennemsnit tæt på et realt afkast på 5% efter skatter over de sidste godt
10 år. Pensionssektoren har også kunnet håndtere store kriser som fx den finansielle krise og
coronakrisen. En ny normal med lave afkast udfordrer mulighederne for at levere afkast på det
samme niveau som set historisk.,
Summary
The Danish pension system is a well-established 3-pillar system. The role of the pillars has changed
gradually within the last 30 years. The PAYG- system of Pillar I still provides the basic income for
most elderly, but occupational DC pension schemes play an increasingly important role. More than

167 | P a g e
Lon
g-Te
rm a
nd
Pen
sio
n S
avin
gs |
Th
e R
eal R
etu
rn |
20
21
Edit
ion
80% of the Danish labour force is enrolled in one or more occupational schemes. The average
replacement ratio is expected to increase in the years to come from today’s level at around 75%.
The Danish pension system is characterized by a high degree of funding and clear roles for the tax-
based public pensions of Pillar I and the privately funded pensions. The total value of funded
pension schemes in 2019 is close to €600 billion,98 or almost twice the Danish GDP.
In international comparison the Danish pension system stands out. There are few pensioners falling
below the poverty line, and replacement rates are generally high. The system is financially viable,
and public finances satisfy sustainability criteria taking into account an ageing population. There is
thus no urgent need for reforms, the basic structure is sound. However, there are challenges not
least in ensuring sufficiently strong incentives for savings and for later retirement, and there
remains a so-called residual group with low or no pension savings.
The occupational pension schemes have in recent years changed in the direction of so-called
market-based products, where the saver more directly carries the risk arising e.g., due to return
variations. This has created room for higher returns but raises questions on levels of risk and risk
diversification. Historically returns have been high with an average after-tax real return about 5 %
over the last decade. The pension sector has also handled crisis, including the financial crisis and
the corona crisis. A new normal with lower rates of returns challenges the possibilities of reaching
returns at the levels seen in the past.
Introduction
The Danish pension system is in a transition from being largely based on defined-benefit tax
financed pensions to a larger role of defined benefit, funded occupational pensions. The latter have
been expanded to most of the labour market in the 1990s and will mature in two or three decades.
This arrangement both serves to ensure decent pensions for all retired, and pension adequacy in
terms of high replacement rates. The system is financially robust and prepared for an ageing
population.
In international comparisons, the Danish pension system stands out by low poverty rates among
the old and high replacement rates. Conditions for the financially viability is ensured also against
the backdrop of large demographic shifts. This position is reflected in a consistently high ranking
(1st 2012-17, and 2nd 2018-2020) in the Melbourne Mercer Global Pension Index.99.
The challenges for the system included how to ensure an incentive structure supporting savings
and later retirement. The sustainability of the system depends critically on retirement ages
98 All currency conversions are made at the exchange rate provided by the ECB Statistical database for EUR/DKK on 31.12.2019, 1 EUR = 7.4409 DKK. 99 Melbourne Mercer Global Pension Index 2019, https://www.mercer.com.au/our-thinking/global-pension-index.html#contactForm
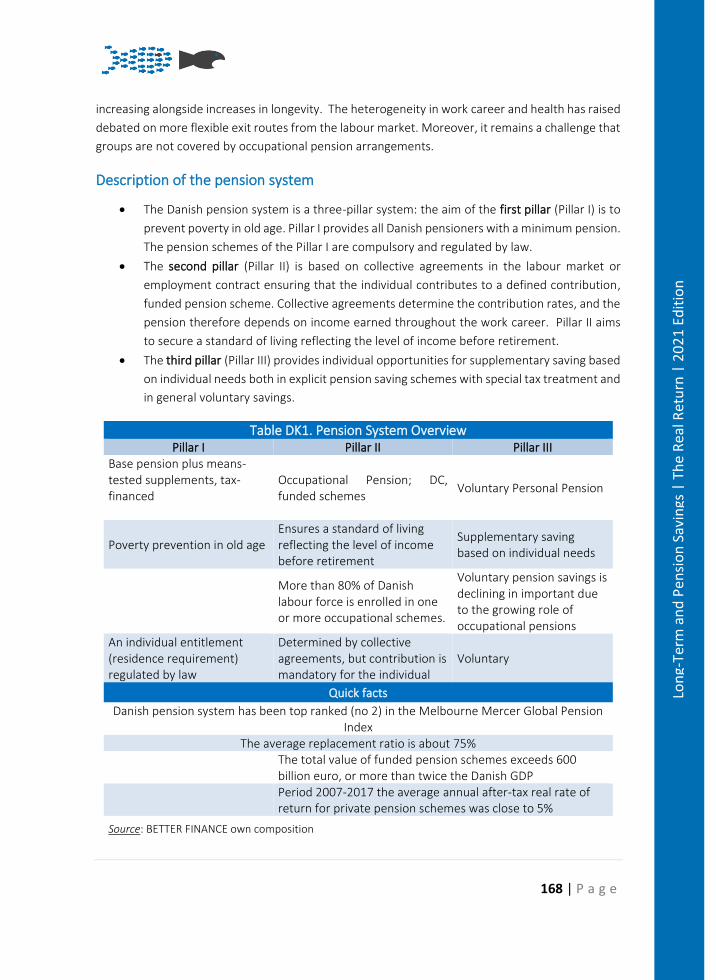
168 | P a g e
Lon
g-Te
rm a
nd
Pen
sio
n S
avin
gs |
Th
e R
eal R
etu
rn |
20
21
Edit
ion
increasing alongside increases in longevity. The heterogeneity in work career and health has raised
debated on more flexible exit routes from the labour market. Moreover, it remains a challenge that
groups are not covered by occupational pension arrangements.
Description of the pension system
• The Danish pension system is a three-pillar system: the aim of the first pillar (Pillar I) is to
prevent poverty in old age. Pillar I provides all Danish pensioners with a minimum pension.
The pension schemes of the Pillar I are compulsory and regulated by law.
• The second pillar (Pillar II) is based on collective agreements in the labour market or
employment contract ensuring that the individual contributes to a defined contribution,
funded pension scheme. Collective agreements determine the contribution rates, and the
pension therefore depends on income earned throughout the work career. Pillar II aims
to secure a standard of living reflecting the level of income before retirement.
• The third pillar (Pillar III) provides individual opportunities for supplementary saving based
on individual needs both in explicit pension saving schemes with special tax treatment and
in general voluntary savings.
Table DK1. Pension System Overview Pillar I Pillar II Pillar III
Base pension plus means-tested supplements, tax-financed
Occupational Pension; DC, funded schemes
Voluntary Personal Pension
Poverty prevention in old age Ensures a standard of living reflecting the level of income before retirement
Supplementary saving based on individual needs
More than 80% of Danish labour force is enrolled in one or more occupational schemes.
Voluntary pension savings is declining in important due to the growing role of occupational pensions
An individual entitlement (residence requirement) regulated by law
Determined by collective agreements, but contribution is mandatory for the individual
Voluntary
Quick facts
Danish pension system has been top ranked (no 2) in the Melbourne Mercer Global Pension Index
The average replacement ratio is about 75%
The total value of funded pension schemes exceeds 600 billion euro, or more than twice the Danish GDP
Period 2007-2017 the average annual after-tax real rate of return for private pension schemes was close to 5%
Source: BETTER FINANCE own composition
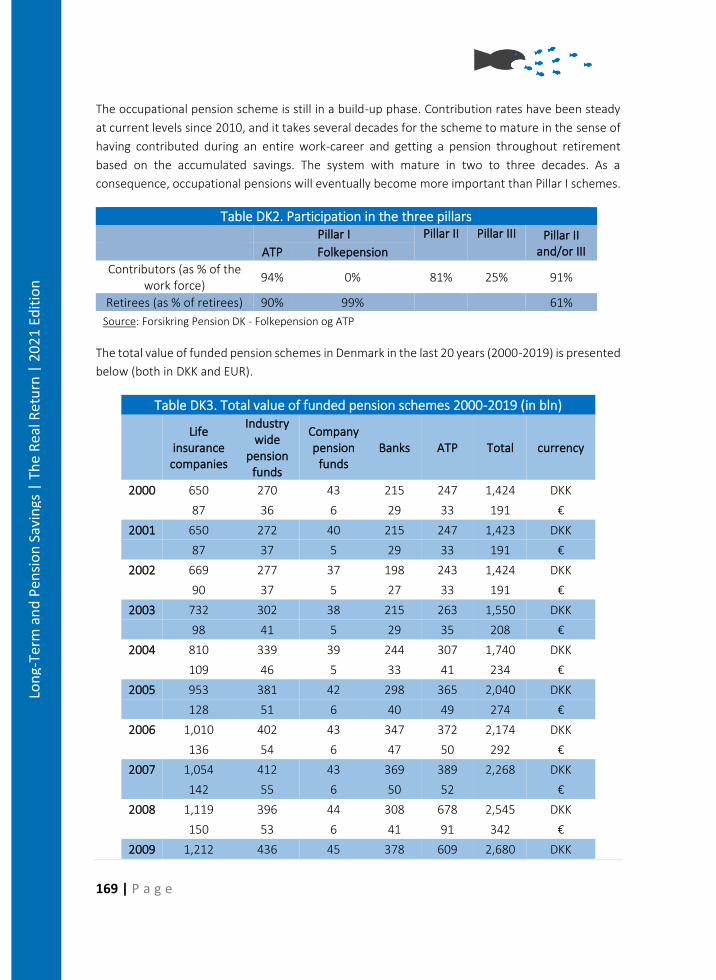
169 | P a g e
Lon
g-Te
rm a
nd
Pen
sio
n S
avin
gs |
Th
e R
eal R
etu
rn |
20
21
Edit
ion
The occupational pension scheme is still in a build-up phase. Contribution rates have been steady
at current levels since 2010, and it takes several decades for the scheme to mature in the sense of
having contributed during an entire work-career and getting a pension throughout retirement
based on the accumulated savings. The system with mature in two to three decades. As a
consequence, occupational pensions will eventually become more important than Pillar I schemes.
Table DK2. Participation in the three pillars Pillar I Pillar II Pillar III Pillar II
and/or III ATP Folkepension
Contributors (as % of the work force)
94% 0% 81% 25% 91%
Retirees (as % of retirees) 90% 99% 61%
Source: Forsikring Pension DK - Folkepension og ATP
The total value of funded pension schemes in Denmark in the last 20 years (2000-2019) is presented
below (both in DKK and EUR).
Table DK3. Total value of funded pension schemes 2000-2019 (in bln)
Life insurance
companies
Industry wide
pension funds
Company pension
funds Banks ATP Total currency
2000 650 270 43 215 247 1,424 DKK 87 36 6 29 33 191 €
2001 650 272 40 215 247 1,423 DKK
87 37 5 29 33 191 €
2002 669 277 37 198 243 1,424 DKK 90 37 5 27 33 191 €
2003 732 302 38 215 263 1,550 DKK
98 41 5 29 35 208 €
2004 810 339 39 244 307 1,740 DKK 109 46 5 33 41 234 €
2005 953 381 42 298 365 2,040 DKK
128 51 6 40 49 274 €
2006 1,010 402 43 347 372 2,174 DKK 136 54 6 47 50 292 €
2007 1,054 412 43 369 389 2,268 DKK
142 55 6 50 52 €
2008 1,119 396 44 308 678 2,545 DKK 150 53 6 41 91 342 €
2009 1,212 436 45 378 609 2,680 DKK
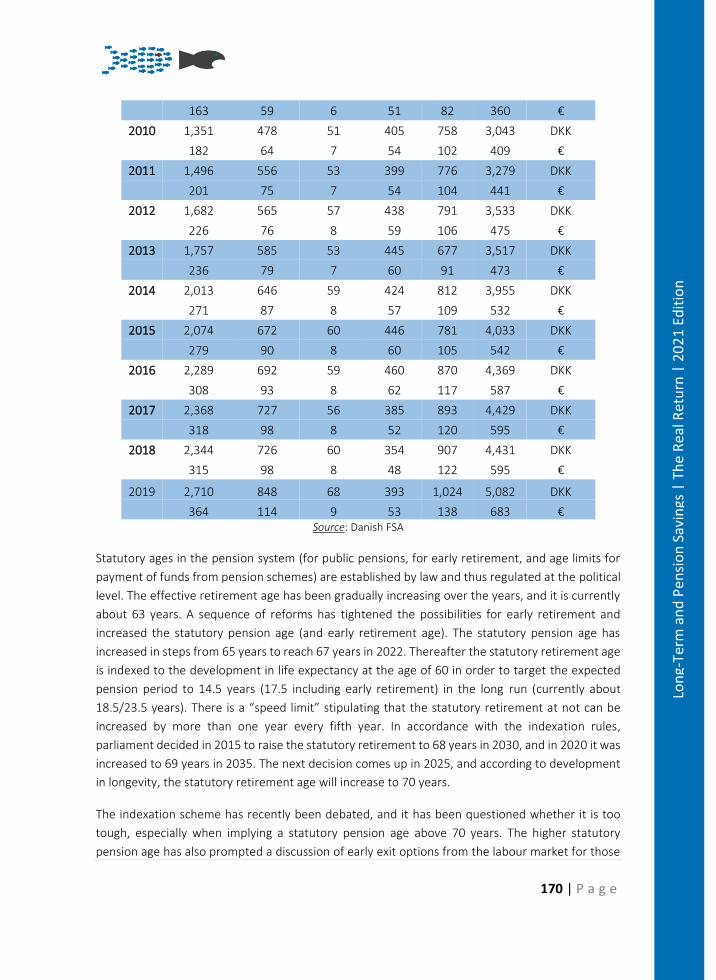
170 | P a g e
Lon
g-Te
rm a
nd
Pen
sio
n S
avin
gs |
Th
e R
eal R
etu
rn |
20
21
Edit
ion
163 59 6 51 82 360 €
2010 1,351 478 51 405 758 3,043 DKK 182 64 7 54 102 409 €
2011 1,496 556 53 399 776 3,279 DKK
201 75 7 54 104 441 €
2012 1,682 565 57 438 791 3,533 DKK 226 76 8 59 106 475 €
2013 1,757 585 53 445 677 3,517 DKK
236 79 7 60 91 473 €
2014 2,013 646 59 424 812 3,955 DKK 271 87 8 57 109 532 €
2015 2,074 672 60 446 781 4,033 DKK
279 90 8 60 105 542 €
2016 2,289 692 59 460 870 4,369 DKK 308 93 8 62 117 587 €
2017 2,368 727 56 385 893 4,429 DKK
318 98 8 52 120 595 €
2018 2,344 726 60 354 907 4,431 DKK
315 98 8 48 122 595 €
2019 2,710 848 68 393 1,024 5,082 DKK
364 114 9 53 138 683 € Source: Danish FSA
Statutory ages in the pension system (for public pensions, for early retirement, and age limits for
payment of funds from pension schemes) are established by law and thus regulated at the political
level. The effective retirement age has been gradually increasing over the years, and it is currently
about 63 years. A sequence of reforms has tightened the possibilities for early retirement and
increased the statutory pension age (and early retirement age). The statutory pension age has
increased in steps from 65 years to reach 67 years in 2022. Thereafter the statutory retirement age
is indexed to the development in life expectancy at the age of 60 in order to target the expected
pension period to 14.5 years (17.5 including early retirement) in the long run (currently about
18.5/23.5 years). There is a “speed limit” stipulating that the statutory retirement at not can be
increased by more than one year every fifth year. In accordance with the indexation rules,
parliament decided in 2015 to raise the statutory retirement to 68 years in 2030, and in 2020 it was
increased to 69 years in 2035. The next decision comes up in 2025, and according to development
in longevity, the statutory retirement age will increase to 70 years.
The indexation scheme has recently been debated, and it has been questioned whether it is too
tough, especially when implying a statutory pension age above 70 years. The higher statutory
pension age has also prompted a discussion of early exit options from the labour market for those
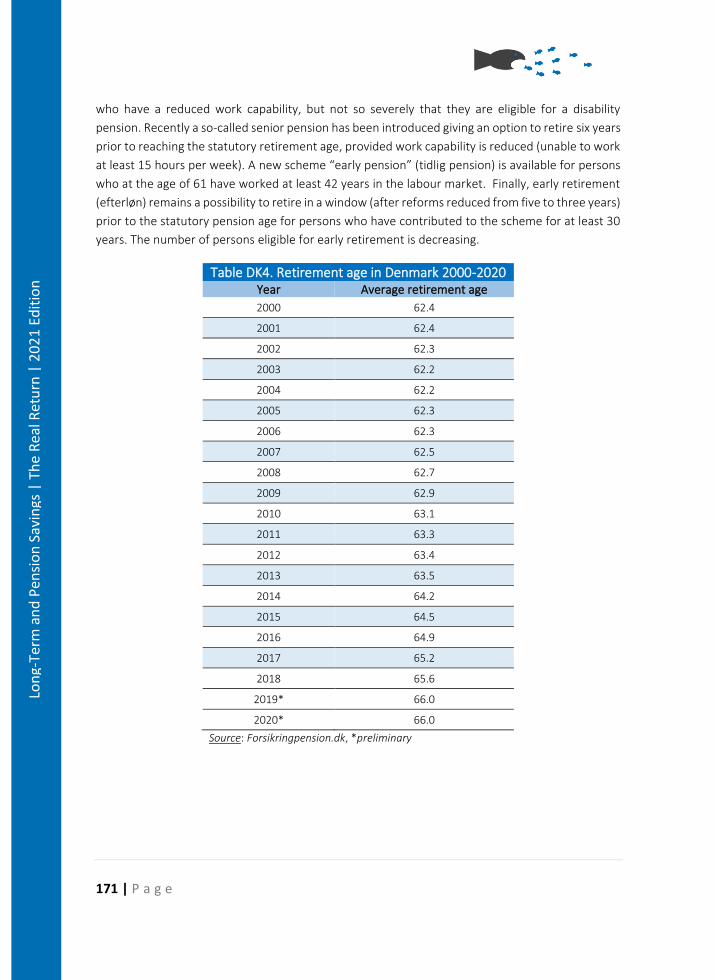
171 | P a g e
Lon
g-Te
rm a
nd
Pen
sio
n S
avin
gs |
Th
e R
eal R
etu
rn |
20
21
Edit
ion
who have a reduced work capability, but not so severely that they are eligible for a disability
pension. Recently a so-called senior pension has been introduced giving an option to retire six years
prior to reaching the statutory retirement age, provided work capability is reduced (unable to work
at least 15 hours per week). A new scheme “early pension” (tidlig pension) is available for persons
who at the age of 61 have worked at least 42 years in the labour market. Finally, early retirement
(efterløn) remains a possibility to retire in a window (after reforms reduced from five to three years)
prior to the statutory pension age for persons who have contributed to the scheme for at least 30
years. The number of persons eligible for early retirement is decreasing.
Table DK4. Retirement age in Denmark 2000-2020 Year Average retirement age
2000 62.4
2001 62.4
2002 62.3
2003 62.2
2004 62.2
2005 62.3
2006 62.3
2007 62.5
2008 62.7
2009 62.9
2010 63.1
2011 63.3
2012 63.4
2013 63.5
2014 64.2
2015 64.5
2016 64.9
2017 65.2
2018 65.6
2019* 66.0
2020* 66.0
Source: Forsikringpension.dk, *preliminary
172 | P a g e
Lon
g-Te
rm a
nd
Pen
sio
n S
avin
gs |
Th
e R
eal R
etu
rn |
20
21
Edit
ion
Pillar I
Pillar I basically consists of two pension plans: the tax financed public pension (Folkepension) and
the ATP, a mandatory pension scheme compromising the larger part of the population. Both
schemes are regulated by law.100
The state pension (Folkepension)
The public pension includes a basic amount (flat-rate pension) and means-tested supplements (I:
supplementary pension (“pensionstillægget”) and II: supplementary pension benefit
(“ældrecheck”)). In addition, there are needs-based supplement, e.g., housing, medical expenses.
The supplements are means-tested on a family basis. All are entitled to the public pension when
reaching the statutory retirement age provided a residence requirement is satisfied and earned
income is below a certain threshold101. Public pensions are indexed to wages.
The state pension consists of a basic pension and a personal supplementary pension. For 2021 the
base pension is DKK 78.0216 a year (€10,500), and the maximum supplement (for a single) is DKK
85.464 (€14.300). The means-testing is relatively complicated depending on family situation and
other sources of income. As an example, for a single the pension supplement is reduced by 30.9%
of income above a lower threshold, and therefore there is no supplement for a sufficiently high
income e.g., from an occupational pension scheme.
ATP
ATP (The Labour Market Supplementary Pension Scheme) is part of the Danish welfare system for
old-age pensioners.
By law, all wage earners and recipients of transfer income contribute to the supplementary labour
market pension (ATP). It is a funded defined contribution scheme to which all contribute the same
monthly amount (depending on working hours) in 2021 DKK 3.408 (Euro 458) The contribution has
been unchanged nominally since 2016. The pension benefit is a guaranteed life-annuity. If the
beneficiary dies prematurely (before reaching an age equal to the statutory pension age plus five
years), a lump-sum amount is paid to the heirs.
For a person with full-time employment, the pension benefit corresponds to about 1/3 of the base
pension in the public pension system. About 40% of current pensioners do not have any pension
beyond the public pension and the ATP. Also in the future, the ATP will constitute a significant part
of the basic provision of pensioners in the Danish system
100 See: ”Lov om sociale pensioner” (http://www.socialjura.dk/content-storage/love/love/pensionslov/) and ”Lov om Arbejdsmarkedets Tillægspension” (https://www.retsinformation.dk/Forms/R0710.aspx?id=164210). 101 To be eligible for the full amount, residence in Denmark for 40 years after the age of 15 is required, otherwise the amount is reduced proportionally to the period of residence. To be eligible for the full amount, labour income cannot exceed DKK 344,600 (2021).
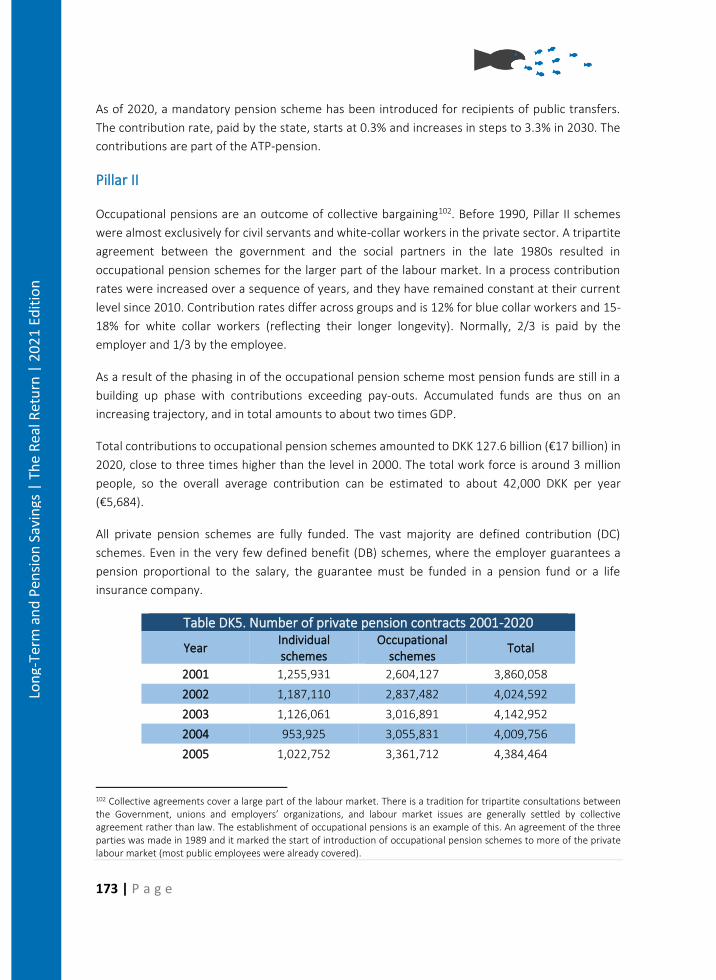
173 | P a g e
Lon
g-Te
rm a
nd
Pen
sio
n S
avin
gs |
Th
e R
eal R
etu
rn |
20
21
Edit
ion
As of 2020, a mandatory pension scheme has been introduced for recipients of public transfers.
The contribution rate, paid by the state, starts at 0.3% and increases in steps to 3.3% in 2030. The
contributions are part of the ATP-pension.
Pillar II
Occupational pensions are an outcome of collective bargaining102. Before 1990, Pillar II schemes
were almost exclusively for civil servants and white-collar workers in the private sector. A tripartite
agreement between the government and the social partners in the late 1980s resulted in
occupational pension schemes for the larger part of the labour market. In a process contribution
rates were increased over a sequence of years, and they have remained constant at their current
level since 2010. Contribution rates differ across groups and is 12% for blue collar workers and 15-
18% for white collar workers (reflecting their longer longevity). Normally, 2/3 is paid by the
employer and 1/3 by the employee.
As a result of the phasing in of the occupational pension scheme most pension funds are still in a
building up phase with contributions exceeding pay-outs. Accumulated funds are thus on an
increasing trajectory, and in total amounts to about two times GDP.
Total contributions to occupational pension schemes amounted to DKK 127.6 billion (€17 billion) in
2020, close to three times higher than the level in 2000. The total work force is around 3 million
people, so the overall average contribution can be estimated to about 42,000 DKK per year
(€5,684).
All private pension schemes are fully funded. The vast majority are defined contribution (DC)
schemes. Even in the very few defined benefit (DB) schemes, where the employer guarantees a
pension proportional to the salary, the guarantee must be funded in a pension fund or a life
insurance company.
Table DK5. Number of private pension contracts 2001-2020
Year Individual schemes
Occupational schemes
Total
2001 1,255,931 2,604,127 3,860,058
2002 1,187,110 2,837,482 4,024,592
2003 1,126,061 3,016,891 4,142,952
2004 953,925 3,055,831 4,009,756
2005 1,022,752 3,361,712 4,384,464
102 Collective agreements cover a large part of the labour market. There is a tradition for tripartite consultations between the Government, unions and employers’ organizations, and labour market issues are generally settled by collective agreement rather than law. The establishment of occupational pensions is an example of this. An agreement of the three parties was made in 1989 and it marked the start of introduction of occupational pension schemes to more of the private labour market (most public employees were already covered).
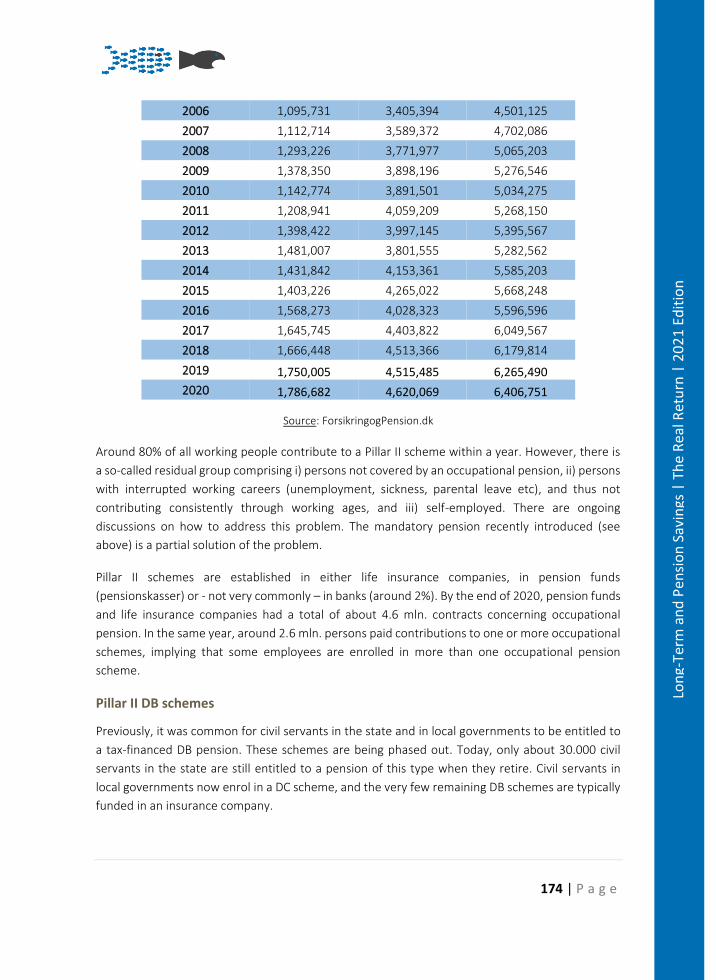
174 | P a g e
Lon
g-Te
rm a
nd
Pen
sio
n S
avin
gs |
Th
e R
eal R
etu
rn |
20
21
Edit
ion
2006 1,095,731 3,405,394 4,501,125
2007 1,112,714 3,589,372 4,702,086
2008 1,293,226 3,771,977 5,065,203
2009 1,378,350 3,898,196 5,276,546
2010 1,142,774 3,891,501 5,034,275
2011 1,208,941 4,059,209 5,268,150
2012 1,398,422 3,997,145 5,395,567
2013 1,481,007 3,801,555 5,282,562
2014 1,431,842 4,153,361 5,585,203
2015 1,403,226 4,265,022 5,668,248
2016 1,568,273 4,028,323 5,596,596
2017 1,645,745 4,403,822 6,049,567
2018 1,666,448 4,513,366 6,179,814
2019 1,750,005 4,515,485 6,265,490
2020 1,786,682 4,620,069 6,406,751
Source: ForsikringogPension.dk
Around 80% of all working people contribute to a Pillar II scheme within a year. However, there is
a so-called residual group comprising i) persons not covered by an occupational pension, ii) persons
with interrupted working careers (unemployment, sickness, parental leave etc), and thus not
contributing consistently through working ages, and iii) self-employed. There are ongoing
discussions on how to address this problem. The mandatory pension recently introduced (see
above) is a partial solution of the problem.
Pillar II schemes are established in either life insurance companies, in pension funds
(pensionskasser) or - not very commonly – in banks (around 2%). By the end of 2020, pension funds
and life insurance companies had a total of about 4.6 mln. contracts concerning occupational
pension. In the same year, around 2.6 mln. persons paid contributions to one or more occupational
schemes, implying that some employees are enrolled in more than one occupational pension
scheme.
Pillar II DB schemes
Previously, it was common for civil servants in the state and in local governments to be entitled to
a tax-financed DB pension. These schemes are being phased out. Today, only about 30.000 civil
servants in the state are still entitled to a pension of this type when they retire. Civil servants in
local governments now enrol in a DC scheme, and the very few remaining DB schemes are typically
funded in an insurance company.
175 | P a g e
Lon
g-Te
rm a
nd
Pen
sio
n S
avin
gs |
Th
e R
eal R
etu
rn |
20
21
Edit
ion
A small number of private companies still offer DB schemes for some of their employees. These
schemes are funded in specific pension funds – firmapensionskasser. Their importance has been
decreasing for many years and so have their numbers, total assets and number of insured. The
number of insured has fallen 1/3 from around 18,000 in 2008 to about 12,000 in 2021. Today, only
four firmapensionskasser hold assets of more than DKK 1,000 million (€134 million), and they only
constitute 1.1% of the total market, and most of the funds do not enrol new members anymore.
About 2,000 persons made contributions in 2019, whereas benefits were paid out to around 10,000
people.
Pillar III
In principle, Pillar III pension schemes provide the same opportunities for the individual citizen as
occupational schemes. Products available and tax rules are approximately identical. Individual
schemes are offered by banks, insurance companies and most pension funds, but only if the saver
is already enrolled through his job.
The strong growth of Pillar II schemes has, to some degree, diminished the interest for individual
savings in explicit pension schemes. Also, changes in tax regulation have negatively influenced the
demand for Pillar III schemes. Moreover, many households hold assets outside the pension scheme,
primarily in the form of real estate.
In 2000, approximately 1 million persons contributed to an individual scheme, but this number has
steadily declined until 2013, and since then increased somewhat to about 630.000 persons in 2019.
The huge fall in 2013 is due to a shift in the lump sum pension from kapitalpension to
alderopsparing. There may take time to get acquainted with the new scheme, and at the cap on the
contributions to the periodic instalments or fixed term annuities (ratepension) in 2012 is also
contributing to explain the decline103.
In 2000, contributions to individual schemes amounted to DKK 16,209 mln (€2,177 mln), or around
30% of total contributions for pension schemes. The figure decreased until 2013 and has been
growing slowly thereafter. In 2020, contributions to individual schemes were nominally DKK 17.195
min (€2.310 mln).
Tax rules have, as already mentioned, especially for periodic instalments and lump sum pensions.
This may also have had an impact on the demand for Pillar III schemes. In Pillar II schemes, the
change of regulations has led to growing contributions to lifelong annuities, but the same
substitution has not been seen in Pillar III.
Savings in banks have played a much more important role for individual schemes than for
occupational schemes. Until 2013, when the tax regulation for lump sum pension was changed,
103 See https://www.forsikringogpension.dk/media/7019/pensionsindbetalinger-cps.pdf
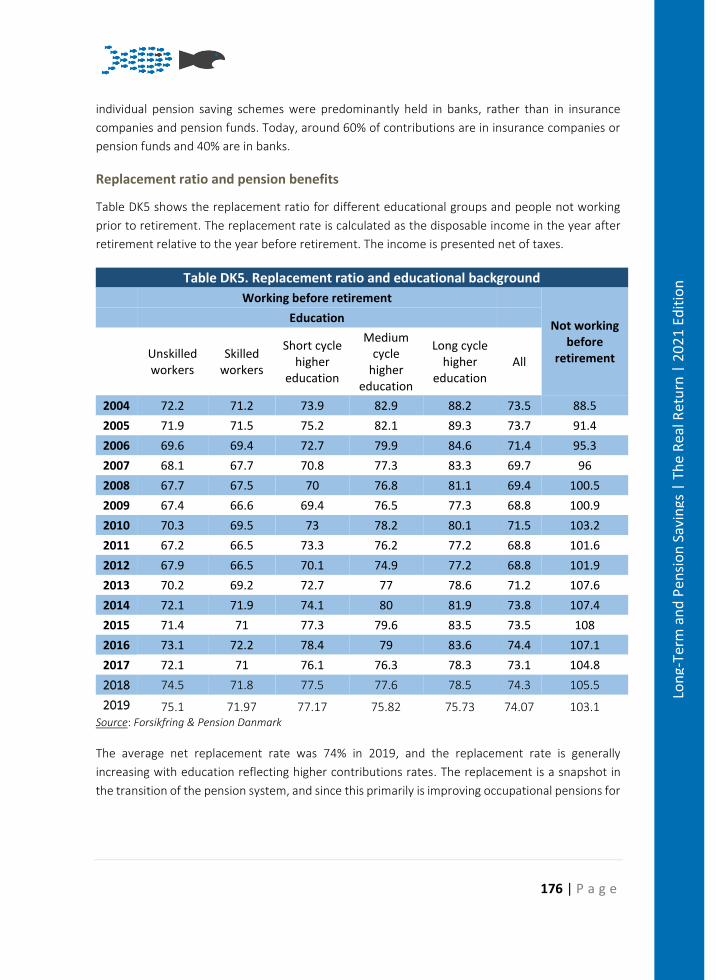
176 | P a g e
Lon
g-Te
rm a
nd
Pen
sio
n S
avin
gs |
Th
e R
eal R
etu
rn |
20
21
Edit
ion
individual pension saving schemes were predominantly held in banks, rather than in insurance
companies and pension funds. Today, around 60% of contributions are in insurance companies or
pension funds and 40% are in banks.
Replacement ratio and pension benefits
Table DK5 shows the replacement ratio for different educational groups and people not working
prior to retirement. The replacement rate is calculated as the disposable income in the year after
retirement relative to the year before retirement. The income is presented net of taxes.
Table DK5. Replacement ratio and educational background
Working before retirement
Not working before
retirement
Education
Unskilled workers
Skilled workers
Short cycle higher
education
Medium cycle
higher education
Long cycle higher
education All
2004 72.2 71.2 73.9 82.9 88.2 73.5 88.5
2005 71.9 71.5 75.2 82.1 89.3 73.7 91.4
2006 69.6 69.4 72.7 79.9 84.6 71.4 95.3
2007 68.1 67.7 70.8 77.3 83.3 69.7 96
2008 67.7 67.5 70 76.8 81.1 69.4 100.5
2009 67.4 66.6 69.4 76.5 77.3 68.8 100.9
2010 70.3 69.5 73 78.2 80.1 71.5 103.2
2011 67.2 66.5 73.3 76.2 77.2 68.8 101.6
2012 67.9 66.5 70.1 74.9 77.2 68.8 101.9
2013 70.2 69.2 72.7 77 78.6 71.2 107.6
2014 72.1 71.9 74.1 80 81.9 73.8 107.4
2015 71.4 71 77.3 79.6 83.5 73.5 108
2016 73.1 72.2 78.4 79 83.6 74.4 107.1
2017 72.1 71 76.1 76.3 78.3 73.1 104.8
2018 74.5 71.8 77.5 77.6 78.5 74.3 105.5
2019 75.1 71.97 77.17 75.82 75.73 74.07 103.1 Source: Forsikfring & Pension Danmark
The average net replacement rate was 74% in 2019, and the replacement rate is generally
increasing with education reflecting higher contributions rates. The replacement is a snapshot in
the transition of the pension system, and since this primarily is improving occupational pensions for
177 | P a g e
Lon
g-Te
rm a
nd
Pen
sio
n S
avin
gs |
Th
e R
eal R
etu
rn |
20
21
Edit
ion
groups with low- and medium-income levels104, the average replacement rate is expected to
increase in the future.
A replacement rate close to 100% for individual not working before retirement reflects the design
of the social safety net in the Danish welfare state. The benefit to non-working is close to the public
pensions (including supplements) reflecting distributional concerns, and by implication the
replacement rate for this group there get close to 100%.
Today, the most important source of income for pensioners is Pillar I. Approximately 40% of all
current pensioners have little or no other income. Pay-outs from the folkepension amounts to DKK
120 billion per year (€16.1 billion). The ATP pays out around DKK 17 billion per year (€2.3 billion).
Total pay-outs from private pensions schemes to pensioners were around DKK 71 billion (€9.5
billion) in 2019.
For the 50% of today’s pensioners with the lowest income, 90% of their income is folkepension
(thus, from Pillar I). But this situation is changing with the growing importance of Pillar II. Today
almost 60 percent of the newly retired people have made contributions to pillar II during their active
years on the labour market. In 2040, private pensions are expected to exceed half of the total
income for about 40% of the pensioners. Even for the lowest income groups of the retired
population, about 20% of their income is expected to come from private pensions under the
condition of an unchanged level for the folkepension (of Pillar I).105 However, at older ages some
pensioners become increasingly dependent on Pillar I pensions, since schemes with period
instalment expire.
Pension Vehicles
Private pension schemes are administered by pension funds, insurance companies or in banks. This
goes for Pillar II as well as for Pillar III.
In the present description, the emphasis is on Pillar II since it is the more important of the two. If
Pillar III differs from Pillar II, it is mentioned in the text.
A Danish industry-wide pensionskasse – or pension fund – is a legal entity owned and governed by
its members. A pensionskasse can provide the same kind of products as a life insurance company
104 Pension schemes for lower educated people in the private sector were not established until 1990. The contribution rates grew gradually thereafter, therefore people who retired today were between 35-40 years old when they enrolled, thus their contributions were low in the first many years. 105 See http://www.atp.dk
178 | P a g e
Lon
g-Te
rm a
nd
Pen
sio
n S
avin
gs |
Th
e R
eal R
etu
rn |
20
21
Edit
ion
and it is subject to the same kind of regulation as a life insurance company – specifically, the
Solvency II Directive.106
The first occupational schemes for civil servants were established in pensionskasser, which provided
pension schemes for a specific profession, e.g., nurses. Occupational pension schemes in the private
sector originally covered employees with different professional backgrounds working in the same
company. Such schemes used a life insurance company as a vehicle. Today, the differences
between the legal forms have lost importance. Many occupational pension schemes for the private
sector are industry-wide and are administered by life insurance companies.
But still, a distinction is often made between industry-wide schemes and company schemes.
Industry-wide schemes are often more standardized and with little freedom of choice left to the
single member. All decisions are made collectively. The pension provider is only indirectly exposed
to competition since customer mobility is low. These characteristics make in general the schemes
relatively cheap. Insurance companies administering company schemes are more exposed to
competition. Company schemes more often change pension providers. In general, company
schemes offer more individual possibilities, e.g., concerning insurance coverage, choosing between
a guaranteed or none-guaranteed scheme etc. Therefore – as a general trend – the insurance
companies have higher costs, especially related to acquisition and to individual counselling.
An occupational pension scheme normally provides coverage for old age, disability and early death.
Critical illness and even health care are other insurance risks that have become typical to offer.
Typically, 15%-25% of the contributions are spent on coverage for social risks other than old age.
The supply of pension products is regulated partly by tax law and partly by the general regulation
for insurance and banking. The regulation is the same for Pillar II and Pillar III. This means that
insurance companies and pension funds on the one hand and banks on the other hand provide
competing products to the market. Products offered by life insurance companies and pension funds
may accumulate savings but must also cover some kind of insurance risk – longevity, death,
disability etc. – whereas banks can only act as an intermediary of insurance coverage
supplementary to a saving product.
Tax regulation defines the products
Tax rules play a crucial role for pension products. The tax regulation defines the distinctions
between the 3 groups of pension products:
106 Directive 2009/138/EC of the European Parliament and of the Council of 25 November 2009 on the taking-up and pursuit of the business of Insurance and Reinsurance (Solvency II) (recast) http://data.europa.eu/eli/dir/2009/138/2014-05-23.
179 | P a g e
Lon
g-Te
rm a
nd
Pen
sio
n S
avin
gs |
Th
e R
eal R
etu
rn |
20
21
Edit
ion
- Annuities (livrente);
- Periodic instalments or fixed term annuities (ratepension);
- Lump sum pension (kapitalpension/aldersopsparing);
All kind of pension savings can be paid out in a window three to five years before reaching the
statutory retirement age.
The general taxation principle is a so-called ETT-scheme, that is, contributions are tax-deductible in
the current income, the return is taxed, and pension income is included in taxable income. More
recently a specific scheme has been introduced which is of the TEE-type.
Annuities (livrenter) provide the beneficiary with a monthly pay out from retirement to death.
Regular contributions to an annuity are deductible in the income tax base without any limit. Pay-
outs are taxed as personal income. The annuity-contract may have contingencies for lump-sum
payments to heir in case of death.
Periodic instalments or fixed term annuities (ratepension) provide monthly instalments of equal
amounts for a period of minimum 10 years and maximum 25 years. A ratepension can be life-
contingent or the capital value can be paid out to the heirs in the case of death107. There is a cap
on the contribution DKK 74,700 (€10.039) in 2021. Pay-outs are taxed as personal income.
Lump sum pensions (kapitalpension/aldersopsparing) provide you with a lump sum in old age. The
lump sum is paid out five years before statutory retirement age at the earliest and 15 years after
this age at the latest. The regulation of this product has changed a lot during the years. Today there
are two products in the market: kapitalpension and aldersopsparing. For a kapitalpension the
income tax is deferred. When paid out the accumulated savings are taxed at 40%. New
contributions to a kapitalpension have not been allowed since 2013, and instead a new scheme,
aldersopsparing, has been introduced. Contributions to an aldersopsparing are not deductible and
the pay outs are not taxed and are not included in means testing for the public pension
supplements. Hence, income tax is no longer deferred when saving in this type of product. The
maximum contribution was DKK 29,600 (4,000 euros) in 2017, but the regulation has been changed,
so the maximum contribution is for 2021 DKK 5,400 per year (€ 726) except for the last 5 years
before retirement age, where the maximum contribution per year is DKK 52,400 (€ 7.042) (see
section on taxation).
107 https://skat.dk/skat.aspx?oid=2559
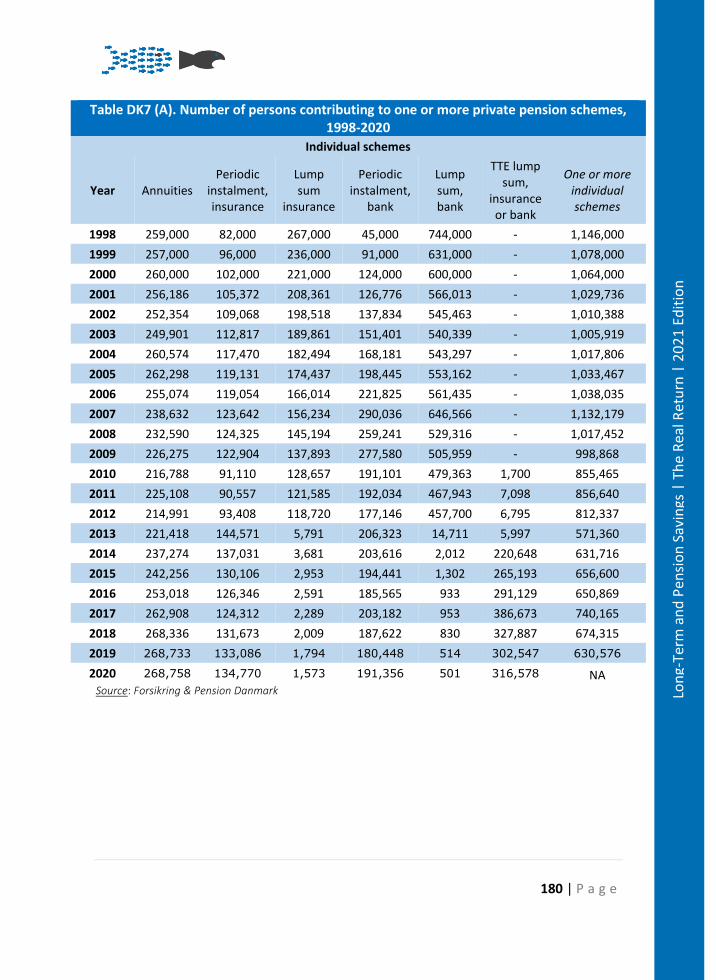
180 | P a g e
Lon
g-Te
rm a
nd
Pen
sio
n S
avin
gs |
Th
e R
eal R
etu
rn |
20
21
Edit
ion
Table DK7 (A). Number of persons contributing to one or more private pension schemes, 1998-2020
Individual schemes
Year Annuities Periodic
instalment, insurance
Lump sum
insurance
Periodic instalment,
bank
Lump sum, bank
TTE lump sum,
insurance or bank
One or more individual schemes
1998 259,000 82,000 267,000 45,000 744,000 - 1,146,000
1999 257,000 96,000 236,000 91,000 631,000 - 1,078,000
2000 260,000 102,000 221,000 124,000 600,000 - 1,064,000
2001 256,186 105,372 208,361 126,776 566,013 - 1,029,736
2002 252,354 109,068 198,518 137,834 545,463 - 1,010,388
2003 249,901 112,817 189,861 151,401 540,339 - 1,005,919
2004 260,574 117,470 182,494 168,181 543,297 - 1,017,806
2005 262,298 119,131 174,437 198,445 553,162 - 1,033,467
2006 255,074 119,054 166,014 221,825 561,435 - 1,038,035
2007 238,632 123,642 156,234 290,036 646,566 - 1,132,179
2008 232,590 124,325 145,194 259,241 529,316 - 1,017,452
2009 226,275 122,904 137,893 277,580 505,959 - 998,868
2010 216,788 91,110 128,657 191,101 479,363 1,700 855,465
2011 225,108 90,557 121,585 192,034 467,943 7,098 856,640
2012 214,991 93,408 118,720 177,146 457,700 6,795 812,337
2013 221,418 144,571 5,791 206,323 14,711 5,997 571,360
2014 237,274 137,031 3,681 203,616 2,012 220,648 631,716
2015 242,256 130,106 2,953 194,441 1,302 265,193 656,600
2016 253,018 126,346 2,591 185,565 933 291,129 650,869
2017 262,908 124,312 2,289 203,182 953 386,673 740,165
2018 268,336 131,673 2,009 187,622 830 327,887 674,315
2019 268,733 133,086 1,794 180,448 514 302,547 630,576
2020 268,758 134,770 1,573 191,356 501 316,578 NA Source: Forsikring & Pension Danmark
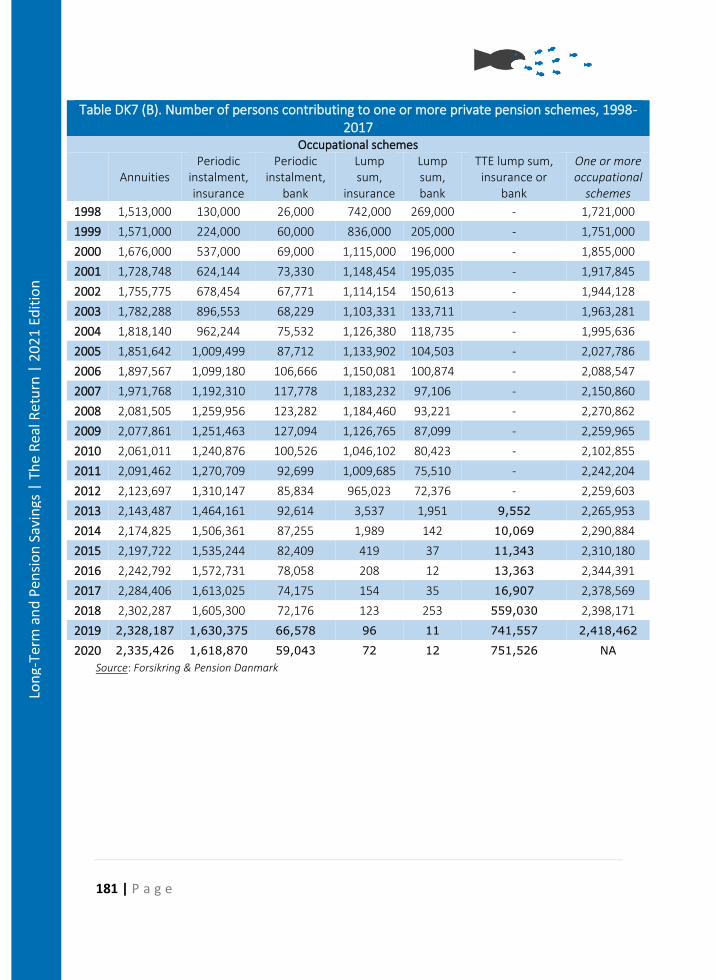
181 | P a g e
Lon
g-Te
rm a
nd
Pen
sio
n S
avin
gs |
Th
e R
eal R
etu
rn |
20
21
Edit
ion
Table DK7 (B). Number of persons contributing to one or more private pension schemes, 1998-2017
Occupational schemes
Annuities Periodic
instalment, insurance
Periodic instalment,
bank
Lump sum,
insurance
Lump sum, bank
TTE lump sum, insurance or
bank
One or more occupational
schemes
1998 1,513,000 130,000 26,000 742,000 269,000 - 1,721,000
1999 1,571,000 224,000 60,000 836,000 205,000 - 1,751,000
2000 1,676,000 537,000 69,000 1,115,000 196,000 - 1,855,000
2001 1,728,748 624,144 73,330 1,148,454 195,035 - 1,917,845
2002 1,755,775 678,454 67,771 1,114,154 150,613 - 1,944,128
2003 1,782,288 896,553 68,229 1,103,331 133,711 - 1,963,281
2004 1,818,140 962,244 75,532 1,126,380 118,735 - 1,995,636
2005 1,851,642 1,009,499 87,712 1,133,902 104,503 - 2,027,786
2006 1,897,567 1,099,180 106,666 1,150,081 100,874 - 2,088,547
2007 1,971,768 1,192,310 117,778 1,183,232 97,106 - 2,150,860
2008 2,081,505 1,259,956 123,282 1,184,460 93,221 - 2,270,862
2009 2,077,861 1,251,463 127,094 1,126,765 87,099 - 2,259,965
2010 2,061,011 1,240,876 100,526 1,046,102 80,423 - 2,102,855
2011 2,091,462 1,270,709 92,699 1,009,685 75,510 - 2,242,204
2012 2,123,697 1,310,147 85,834 965,023 72,376 - 2,259,603
2013 2,143,487 1,464,161 92,614 3,537 1,951 9,552 2,265,953
2014 2,174,825 1,506,361 87,255 1,989 142 10,069 2,290,884
2015 2,197,722 1,535,244 82,409 419 37 11,343 2,310,180
2016 2,242,792 1,572,731 78,058 208 12 13,363 2,344,391
2017 2,284,406 1,613,025 74,175 154 35 16,907 2,378,569
2018 2,302,287 1,605,300 72,176 123 253 559,030 2,398,171
2019 2,328,187 1,630,375 66,578 96 11 741,557 2,418,462
2020 2,335,426 1,618,870 59,043 72 12 751,526 NA
Source: Forsikring & Pension Danmark
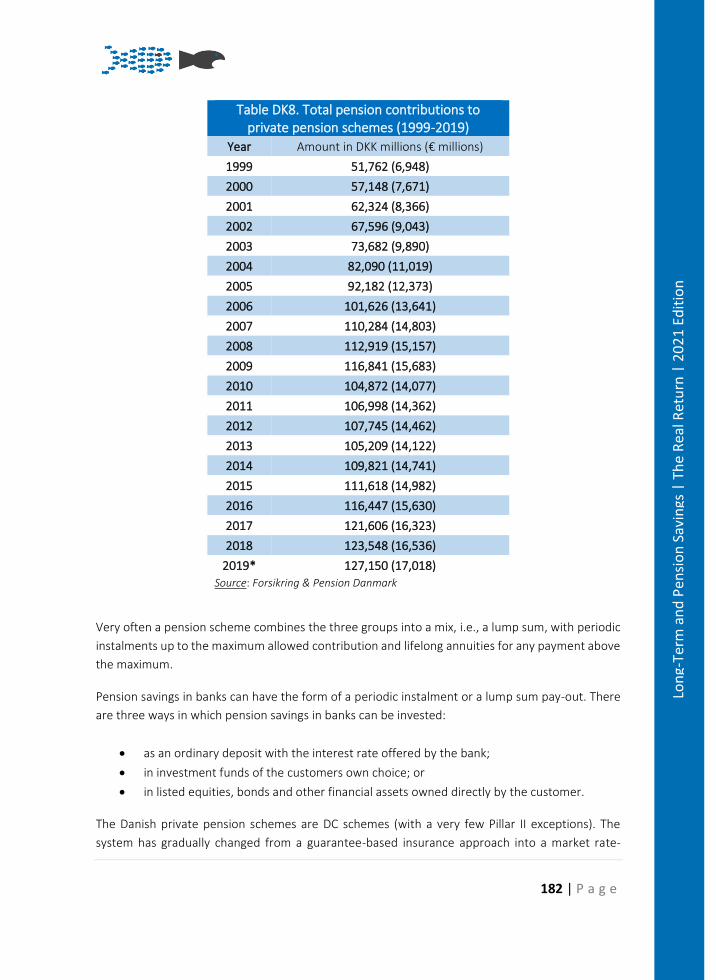
182 | P a g e
Lon
g-Te
rm a
nd
Pen
sio
n S
avin
gs |
Th
e R
eal R
etu
rn |
20
21
Edit
ion
Table DK8. Total pension contributions to private pension schemes (1999-2019)
Year Amount in DKK millions (€ millions)
1999 51,762 (6,948)
2000 57,148 (7,671)
2001 62,324 (8,366)
2002 67,596 (9,043)
2003 73,682 (9,890)
2004 82,090 (11,019)
2005 92,182 (12,373)
2006 101,626 (13,641)
2007 110,284 (14,803)
2008 112,919 (15,157)
2009 116,841 (15,683)
2010 104,872 (14,077)
2011 106,998 (14,362)
2012 107,745 (14,462)
2013 105,209 (14,122)
2014 109,821 (14,741)
2015 111,618 (14,982)
2016 116,447 (15,630)
2017 121,606 (16,323)
2018 123,548 (16,536)
2019* 127,150 (17,018)
Source: Forsikring & Pension Danmark
Very often a pension scheme combines the three groups into a mix, i.e., a lump sum, with periodic
instalments up to the maximum allowed contribution and lifelong annuities for any payment above
the maximum.
Pension savings in banks can have the form of a periodic instalment or a lump sum pay-out. There
are three ways in which pension savings in banks can be invested:
• as an ordinary deposit with the interest rate offered by the bank;
• in investment funds of the customers own choice; or
• in listed equities, bonds and other financial assets owned directly by the customer.
The Danish private pension schemes are DC schemes (with a very few Pillar II exceptions). The
system has gradually changed from a guarantee-based insurance approach into a market rate-
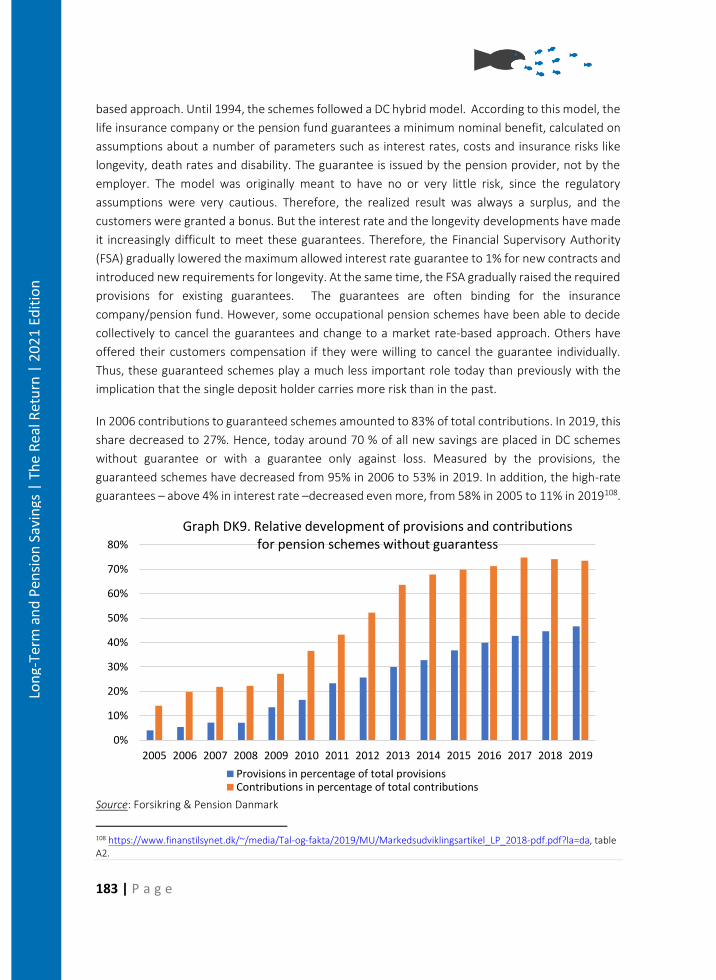
183 | P a g e
Lon
g-Te
rm a
nd
Pen
sio
n S
avin
gs |
Th
e R
eal R
etu
rn |
20
21
Edit
ion
based approach. Until 1994, the schemes followed a DC hybrid model. According to this model, the
life insurance company or the pension fund guarantees a minimum nominal benefit, calculated on
assumptions about a number of parameters such as interest rates, costs and insurance risks like
longevity, death rates and disability. The guarantee is issued by the pension provider, not by the
employer. The model was originally meant to have no or very little risk, since the regulatory
assumptions were very cautious. Therefore, the realized result was always a surplus, and the
customers were granted a bonus. But the interest rate and the longevity developments have made
it increasingly difficult to meet these guarantees. Therefore, the Financial Supervisory Authority
(FSA) gradually lowered the maximum allowed interest rate guarantee to 1% for new contracts and
introduced new requirements for longevity. At the same time, the FSA gradually raised the required
provisions for existing guarantees. The guarantees are often binding for the insurance
company/pension fund. However, some occupational pension schemes have been able to decide
collectively to cancel the guarantees and change to a market rate-based approach. Others have
offered their customers compensation if they were willing to cancel the guarantee individually.
Thus, these guaranteed schemes play a much less important role today than previously with the
implication that the single deposit holder carries more risk than in the past.
In 2006 contributions to guaranteed schemes amounted to 83% of total contributions. In 2019, this
share decreased to 27%. Hence, today around 70 % of all new savings are placed in DC schemes
without guarantee or with a guarantee only against loss. Measured by the provisions, the
guaranteed schemes have decreased from 95% in 2006 to 53% in 2019. In addition, the high-rate
guarantees – above 4% in interest rate –decreased even more, from 58% in 2005 to 11% in 2019108.
Source: Forsikring & Pension Danmark
108 https://www.finanstilsynet.dk/~/media/Tal-og-fakta/2019/MU/Markedsudviklingsartikel_LP_2018-pdf.pdf?la=da, table A2.
0%
10%
20%
30%
40%
50%
60%
70%
80%
2005 2006 2007 2008 2009 2010 2011 2012 2013 2014 2015 2016 2017 2018 2019
Graph DK9. Relative development of provisions and contributions for pension schemes without guarantess
Provisions in percentage of total provisionsContributions in percentage of total contributions
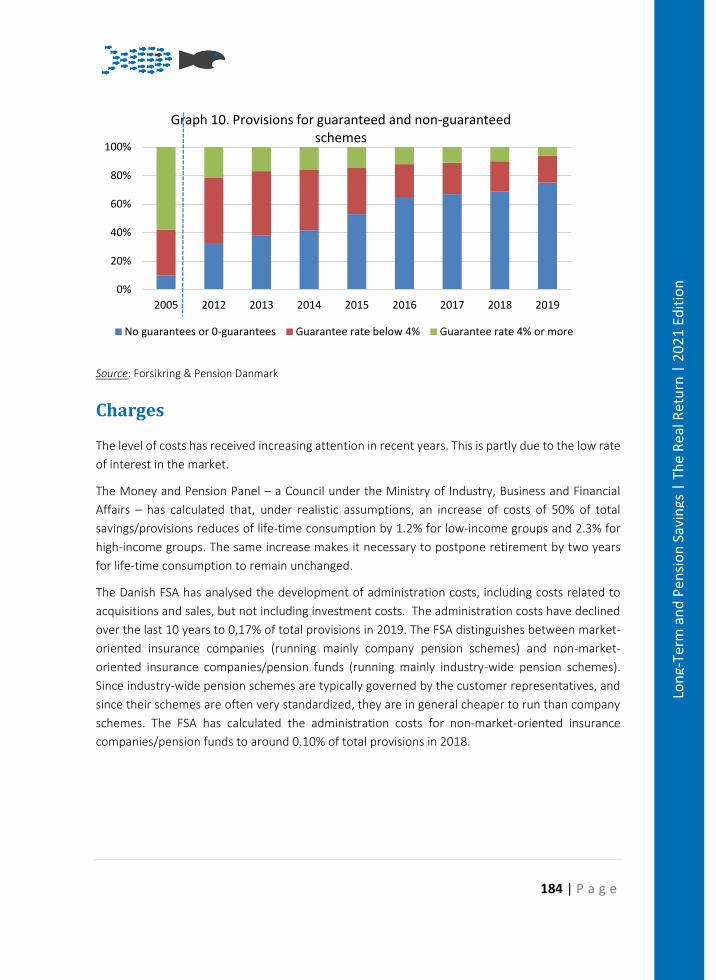
184 | P a g e
Lon
g-Te
rm a
nd
Pen
sio
n S
avin
gs |
Th
e R
eal R
etu
rn |
20
21
Edit
ion
Source: Forsikring & Pension Danmark
Charges
The level of costs has received increasing attention in recent years. This is partly due to the low rate
of interest in the market.
The Money and Pension Panel – a Council under the Ministry of Industry, Business and Financial
Affairs – has calculated that, under realistic assumptions, an increase of costs of 50% of total
savings/provisions reduces of life-time consumption by 1.2% for low-income groups and 2.3% for
high-income groups. The same increase makes it necessary to postpone retirement by two years
for life-time consumption to remain unchanged.
The Danish FSA has analysed the development of administration costs, including costs related to
acquisitions and sales, but not including investment costs. The administration costs have declined
over the last 10 years to 0,17% of total provisions in 2019. The FSA distinguishes between market-
oriented insurance companies (running mainly company pension schemes) and non-market-
oriented insurance companies/pension funds (running mainly industry-wide pension schemes).
Since industry-wide pension schemes are typically governed by the customer representatives, and
since their schemes are often very standardized, they are in general cheaper to run than company
schemes. The FSA has calculated the administration costs for non-market-oriented insurance
companies/pension funds to around 0.10% of total provisions in 2018.
0%
20%
40%
60%
80%
100%
2005 2012 2013 2014 2015 2016 2017 2018 2019
Graph 10. Provisions for guaranteed and non-guaranteed schemes
No guarantees or 0-guarantees Guarantee rate below 4% Guarantee rate 4% or more
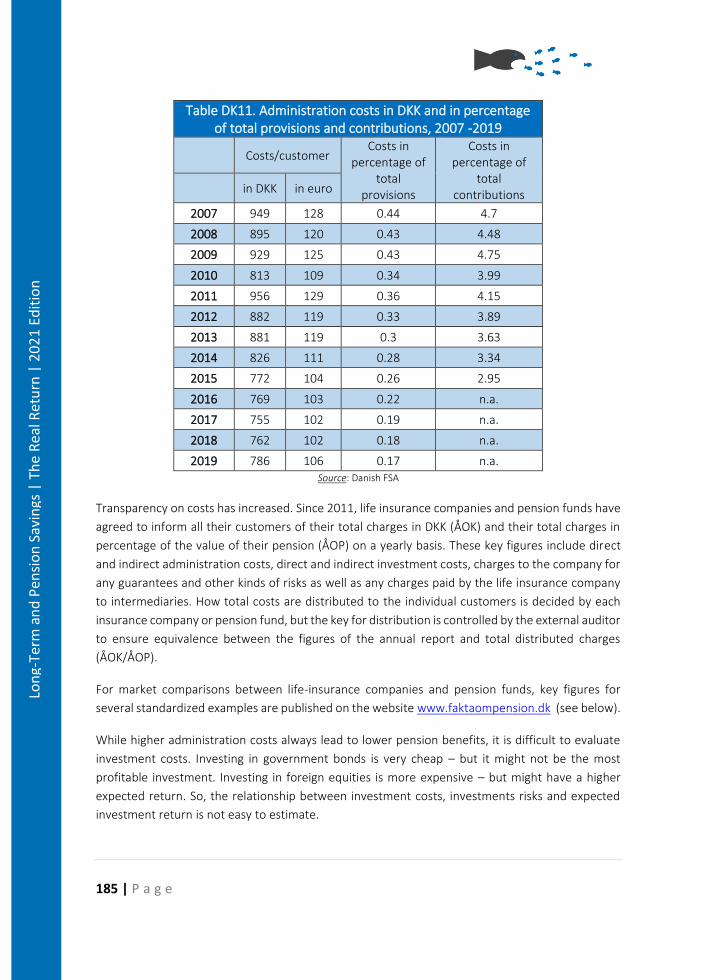
185 | P a g e
Lon
g-Te
rm a
nd
Pen
sio
n S
avin
gs |
Th
e R
eal R
etu
rn |
20
21
Edit
ion
Table DK11. Administration costs in DKK and in percentage of total provisions and contributions, 2007 -2019
Costs/customer Costs in
percentage of total
provisions
Costs in percentage of
total contributions in DKK in euro
2007 949 128 0.44 4.7
2008 895 120 0.43 4.48
2009 929 125 0.43 4.75
2010 813 109 0.34 3.99
2011 956 129 0.36 4.15
2012 882 119 0.33 3.89
2013 881 119 0.3 3.63
2014 826 111 0.28 3.34
2015 772 104 0.26 2.95
2016 769 103 0.22 n.a.
2017 755 102 0.19 n.a.
2018 762 102 0.18 n.a.
2019 786 106 0.17 n.a. Source: Danish FSA
Transparency on costs has increased. Since 2011, life insurance companies and pension funds have
agreed to inform all their customers of their total charges in DKK (ÅOK) and their total charges in
percentage of the value of their pension (ÅOP) on a yearly basis. These key figures include direct
and indirect administration costs, direct and indirect investment costs, charges to the company for
any guarantees and other kinds of risks as well as any charges paid by the life insurance company
to intermediaries. How total costs are distributed to the individual customers is decided by each
insurance company or pension fund, but the key for distribution is controlled by the external auditor
to ensure equivalence between the figures of the annual report and total distributed charges
(ÅOK/ÅOP).
For market comparisons between life-insurance companies and pension funds, key figures for
several standardized examples are published on the website www.faktaompension.dk (see below).
While higher administration costs always lead to lower pension benefits, it is difficult to evaluate
investment costs. Investing in government bonds is very cheap – but it might not be the most
profitable investment. Investing in foreign equities is more expensive – but might have a higher
expected return. So, the relationship between investment costs, investments risks and expected
investment return is not easy to estimate.
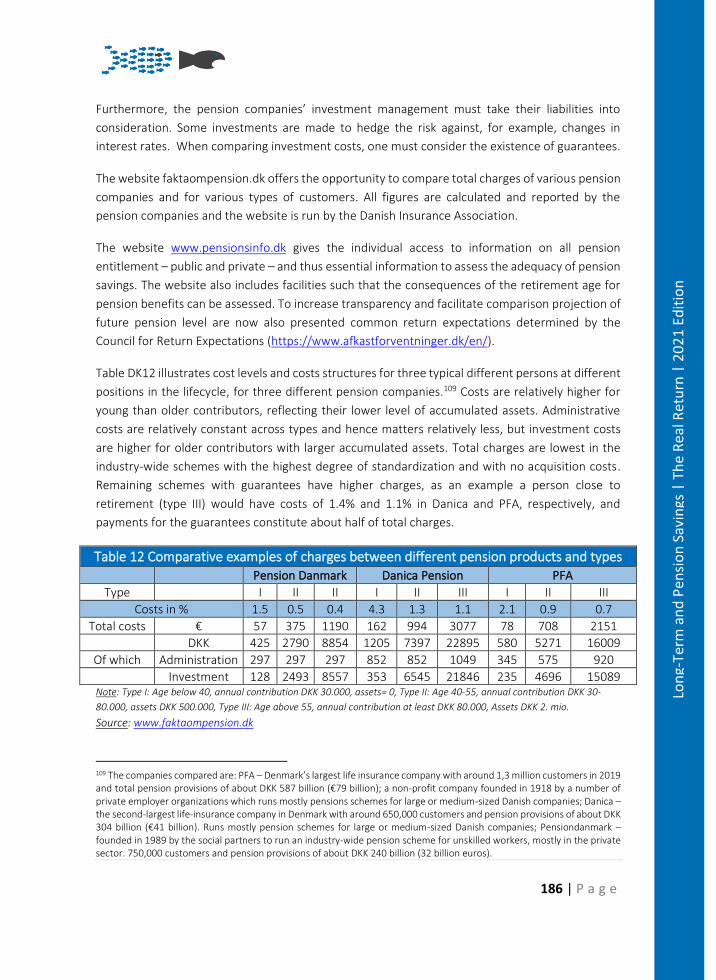
186 | P a g e
Lon
g-Te
rm a
nd
Pen
sio
n S
avin
gs |
Th
e R
eal R
etu
rn |
20
21
Edit
ion
Furthermore, the pension companies’ investment management must take their liabilities into
consideration. Some investments are made to hedge the risk against, for example, changes in
interest rates. When comparing investment costs, one must consider the existence of guarantees.
The website faktaompension.dk offers the opportunity to compare total charges of various pension
companies and for various types of customers. All figures are calculated and reported by the
pension companies and the website is run by the Danish Insurance Association.
The website www.pensionsinfo.dk gives the individual access to information on all pension
entitlement – public and private – and thus essential information to assess the adequacy of pension
savings. The website also includes facilities such that the consequences of the retirement age for
pension benefits can be assessed. To increase transparency and facilitate comparison projection of
future pension level are now also presented common return expectations determined by the
Council for Return Expectations (https://www.afkastforventninger.dk/en/).
Table DK12 illustrates cost levels and costs structures for three typical different persons at different
positions in the lifecycle, for three different pension companies.109 Costs are relatively higher for
young than older contributors, reflecting their lower level of accumulated assets. Administrative
costs are relatively constant across types and hence matters relatively less, but investment costs
are higher for older contributors with larger accumulated assets. Total charges are lowest in the
industry-wide schemes with the highest degree of standardization and with no acquisition costs.
Remaining schemes with guarantees have higher charges, as an example a person close to
retirement (type III) would have costs of 1.4% and 1.1% in Danica and PFA, respectively, and
payments for the guarantees constitute about half of total charges.
Table 12 Comparative examples of charges between different pension products and types Pension Danmark Danica Pension PFA
Type I II II I II III I II III
Costs in % 1.5 0.5 0.4 4.3 1.3 1.1 2.1 0.9 0.7
Total costs € 57 375 1190 162 994 3077 78 708 2151 DKK 425 2790 8854 1205 7397 22895 580 5271 16009
Of which Administration 297 297 297 852 852 1049 345 575 920 Investment 128 2493 8557 353 6545 21846 235 4696 15089
Note: Type I: Age below 40, annual contribution DKK 30.000, assets= 0, Type II: Age 40-55, annual contribution DKK 30-
80.000, assets DKK 500.000, Type III: Age above 55, annual contribution at least DKK 80.000, Assets DKK 2. mio.
Source: www.faktaompension.dk
109 The companies compared are: PFA – Denmark’s largest life insurance company with around 1,3 million customers in 2019 and total pension provisions of about DKK 587 billion (€79 billion); a non-profit company founded in 1918 by a number of private employer organizations which runs mostly pensions schemes for large or medium-sized Danish companies; Danica – the second-largest life-insurance company in Denmark with around 650,000 customers and pension provisions of about DKK 304 billion (€41 billion). Runs mostly pension schemes for large or medium-sized Danish companies; Pensiondanmark – founded in 1989 by the social partners to run an industry-wide pension scheme for unskilled workers, mostly in the private sector. 750,000 customers and pension provisions of about DKK 240 billion (32 billion euros).
187 | P a g e
Lon
g-Te
rm a
nd
Pen
sio
n S
avin
gs |
Th
e R
eal R
etu
rn |
20
21
Edit
ion
Taxation
Numerous changes in taxation have affected pension savings. The general trend has been to
decrease marginal income taxes and broaden tax bases. The ETT scheme implies that the tax value
of the deduction of a marginal increase in the contribution depends on the marginal tax rate when
contributions are made, while the taxation of the resulting pension depends on the marginal tax
rate when retired. With a progressive tax system, the latter marginal tax tends to be lower than the
former (especially for middle-income groups), which is an implicit tax subsidy to pension savings.
The tax reforms reducing the progressivity of the tax system have thus reduced this subsidy.
Taxation of the return was introduced as early as 1984. From this year, all interest earnings in
pension schemes were taxed at a variable tax rate aiming to tax all real interest above 3.5%. From
1998, this real interest rate taxation was replaced by a proportional tax rate on all yields from
pension assets. The tax rate is at present 15.3% and lower than the general taxation of capital
income.
A difficult design issue is how to match public and private pensions. The former are means tested
to target the least well-off pensioners. This distributional consideration creates a disincentive effect
for individuals affected by means testing. Increasing pension savings and thus private pension will
via means testing lower public pensions. This is an implicit tax which increases the effective tax
beyond the tax-rates applying in the ETT-scheme, especially for contributions made close to
retirement. Hence, higher savings or later retirement (implying larger contributions via
occupational scheme) may result in high effective tax rates – in some cases even exceeding 100%.
This is counter-productive to the aim of strengthening savings incentives and providing incentives
for later retirement, and this dilemma has prompted several reforms.
Numerous changes in the tax rules for contribution to lump-sum and periodic instalment schemes
have been made, especially on the cap on contributions. For individuals – e.g., self-employed –
with variable income and thus scope for making pension contributions there is an argument for
allowing large contributions in a single year. However, it is also a way for high-income groups to
lower effective taxation. These two concerns have influenced policies in this area. As discussed
above, the lump-sum pension scheme is closed for contributions (since 2013) and has been
replaced by the aldersopsparing. This scheme follows a TTE principle, and pension payments are
not included in means testing of public pension. This scheme was introduced primarily to reduce
high effective tax rates on pension savings made close to retirement. Therefore, there is a cap on
contributions depending on age relative to the statutory retirement age (see above) with a low cap
for contributions made between 15 and 10 years prior to reaching the statutory retirement age,
and a higher cap for contribution made 5 years or less before reaching the statutory retirement
age.
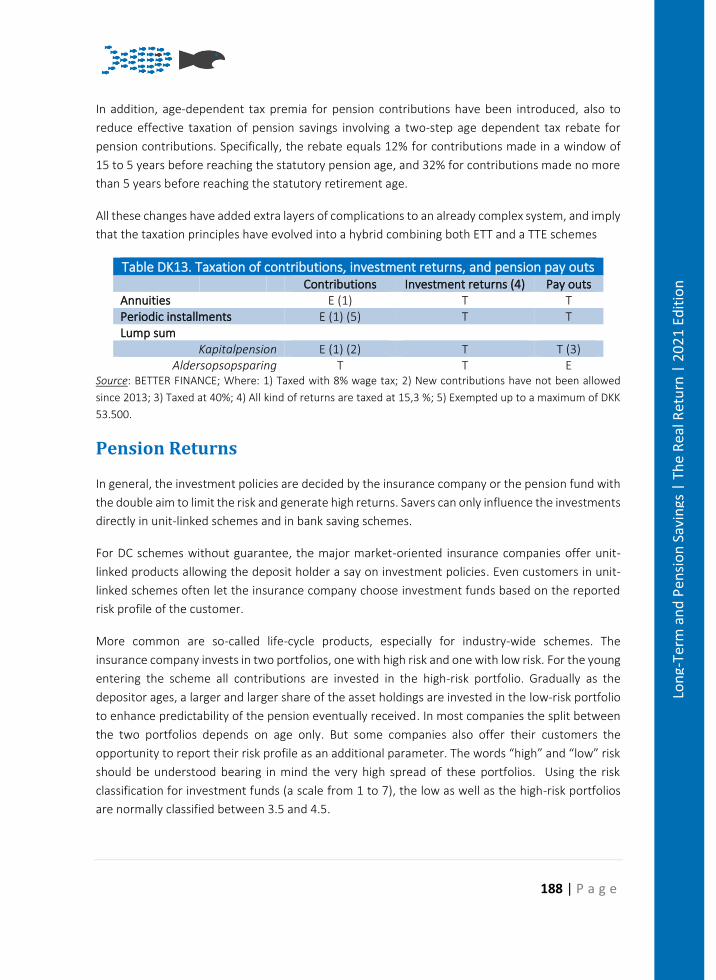
188 | P a g e
Lon
g-Te
rm a
nd
Pen
sio
n S
avin
gs |
Th
e R
eal R
etu
rn |
20
21
Edit
ion
In addition, age-dependent tax premia for pension contributions have been introduced, also to
reduce effective taxation of pension savings involving a two-step age dependent tax rebate for
pension contributions. Specifically, the rebate equals 12% for contributions made in a window of
15 to 5 years before reaching the statutory pension age, and 32% for contributions made no more
than 5 years before reaching the statutory retirement age.
All these changes have added extra layers of complications to an already complex system, and imply
that the taxation principles have evolved into a hybrid combining both ETT and a TTE schemes
Table DK13. Taxation of contributions, investment returns, and pension pay outs Contributions Investment returns (4) Pay outs
Annuities E (1) T T Periodic installments E (1) (5) T T Lump sum
Kapitalpension E (1) (2) T T (3) Aldersopsopsparing T T E
Source: BETTER FINANCE; Where: 1) Taxed with 8% wage tax; 2) New contributions have not been allowed
since 2013; 3) Taxed at 40%; 4) All kind of returns are taxed at 15,3 %; 5) Exempted up to a maximum of DKK
53.500.
Pension Returns
In general, the investment policies are decided by the insurance company or the pension fund with
the double aim to limit the risk and generate high returns. Savers can only influence the investments
directly in unit-linked schemes and in bank saving schemes.
For DC schemes without guarantee, the major market-oriented insurance companies offer unit-
linked products allowing the deposit holder a say on investment policies. Even customers in unit-
linked schemes often let the insurance company choose investment funds based on the reported
risk profile of the customer.
More common are so-called life-cycle products, especially for industry-wide schemes. The
insurance company invests in two portfolios, one with high risk and one with low risk. For the young
entering the scheme all contributions are invested in the high-risk portfolio. Gradually as the
depositor ages, a larger and larger share of the asset holdings are invested in the low-risk portfolio
to enhance predictability of the pension eventually received. In most companies the split between
the two portfolios depends on age only. But some companies also offer their customers the
opportunity to report their risk profile as an additional parameter. The words “high” and “low” risk
should be understood bearing in mind the very high spread of these portfolios. Using the risk
classification for investment funds (a scale from 1 to 7), the low as well as the high-risk portfolios
are normally classified between 3.5 and 4.5.
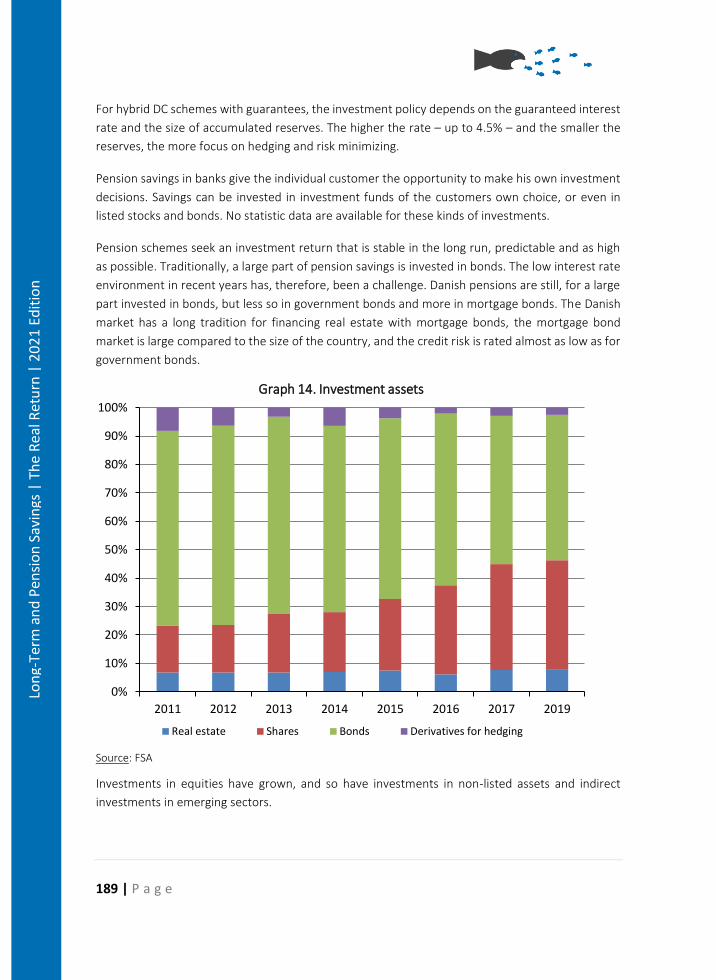
189 | P a g e
Lon
g-Te
rm a
nd
Pen
sio
n S
avin
gs |
Th
e R
eal R
etu
rn |
20
21
Edit
ion
For hybrid DC schemes with guarantees, the investment policy depends on the guaranteed interest
rate and the size of accumulated reserves. The higher the rate – up to 4.5% – and the smaller the
reserves, the more focus on hedging and risk minimizing.
Pension savings in banks give the individual customer the opportunity to make his own investment
decisions. Savings can be invested in investment funds of the customers own choice, or even in
listed stocks and bonds. No statistic data are available for these kinds of investments.
Pension schemes seek an investment return that is stable in the long run, predictable and as high
as possible. Traditionally, a large part of pension savings is invested in bonds. The low interest rate
environment in recent years has, therefore, been a challenge. Danish pensions are still, for a large
part invested in bonds, but less so in government bonds and more in mortgage bonds. The Danish
market has a long tradition for financing real estate with mortgage bonds, the mortgage bond
market is large compared to the size of the country, and the credit risk is rated almost as low as for
government bonds.
Source: FSA
Investments in equities have grown, and so have investments in non-listed assets and indirect
investments in emerging sectors.
0%
10%
20%
30%
40%
50%
60%
70%
80%
90%
100%
2011 2012 2013 2014 2015 2016 2017 2019
Graph 14. Investment assets
Real estate Shares Bonds Derivatives for hedging
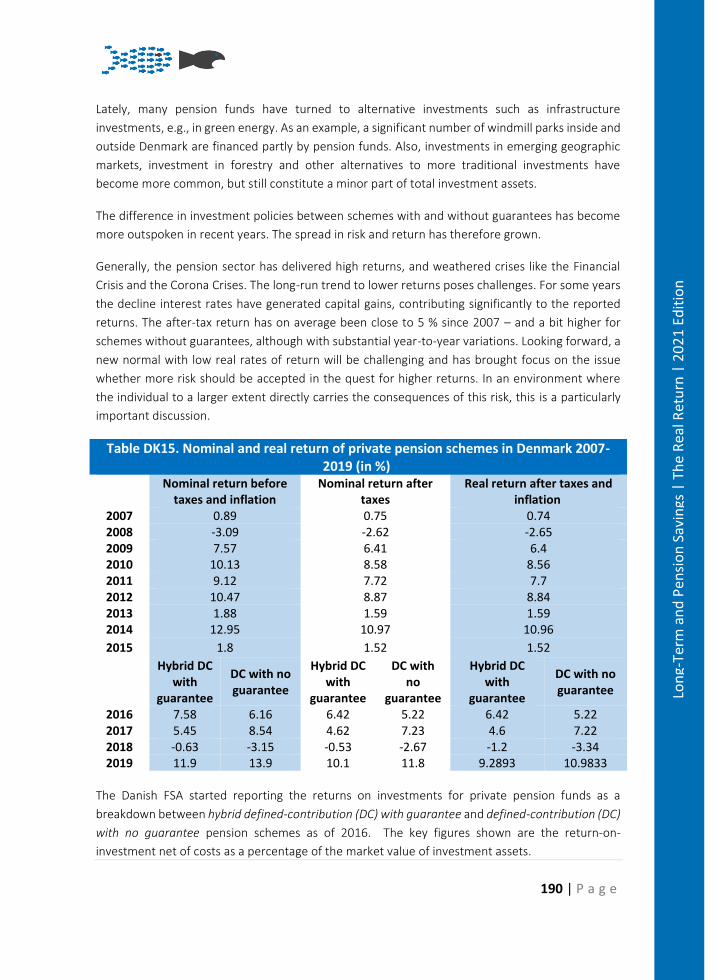
190 | P a g e
Lon
g-Te
rm a
nd
Pen
sio
n S
avin
gs |
Th
e R
eal R
etu
rn |
20
21
Edit
ion
Lately, many pension funds have turned to alternative investments such as infrastructure
investments, e.g., in green energy. As an example, a significant number of windmill parks inside and
outside Denmark are financed partly by pension funds. Also, investments in emerging geographic
markets, investment in forestry and other alternatives to more traditional investments have
become more common, but still constitute a minor part of total investment assets.
The difference in investment policies between schemes with and without guarantees has become
more outspoken in recent years. The spread in risk and return has therefore grown.
Generally, the pension sector has delivered high returns, and weathered crises like the Financial
Crisis and the Corona Crises. The long-run trend to lower returns poses challenges. For some years
the decline interest rates have generated capital gains, contributing significantly to the reported
returns. The after-tax return has on average been close to 5 % since 2007 – and a bit higher for
schemes without guarantees, although with substantial year-to-year variations. Looking forward, a
new normal with low real rates of return will be challenging and has brought focus on the issue
whether more risk should be accepted in the quest for higher returns. In an environment where
the individual to a larger extent directly carries the consequences of this risk, this is a particularly
important discussion.
Table DK15. Nominal and real return of private pension schemes in Denmark 2007-2019 (in %)
Nominal return before
taxes and inflation Nominal return after
taxes Real return after taxes and
inflation 2007 0.89 0.75 0.74 2008 -3.09 -2.62 -2.65 2009 7.57 6.41 6.4 2010 10.13 8.58 8.56 2011 9.12 7.72 7.7 2012 10.47 8.87 8.84 2013 1.88 1.59 1.59 2014 12.95 10.97 10.96
2015 1.8 1.52 1.52
Hybrid DC
with guarantee
DC with no guarantee
Hybrid DC with
guarantee
DC with no
guarantee
Hybrid DC with
guarantee
DC with no guarantee
2016 7.58 6.16 6.42 5.22 6.42 5.22 2017 5.45 8.54 4.62 7.23 4.6 7.22 2018 -0.63 -3.15 -0.53 -2.67 -1.2 -3.34 2019 11.9 13.9 10.1 11.8 9.2893 10.9833
The Danish FSA started reporting the returns on investments for private pension funds as a
breakdown between hybrid defined-contribution (DC) with guarantee and defined-contribution (DC)
with no guarantee pension schemes as of 2016. The key figures shown are the return-on-
investment net of costs as a percentage of the market value of investment assets.
191 | P a g e
Lon
g-Te
rm a
nd
Pen
sio
n S
avin
gs |
Th
e R
eal R
etu
rn |
20
21
Edit
ion
Conclusion
The Danish pension system comprises tax financed public pensions with funded occupational
pensions to deliver pensions preventing poverty among pensioners and high replacement for the
larger part of the population. Importantly the system is financially viable, and public finances meet
requirements for fiscal sustainability even taking into account the ageing of the population.
The pension system is still maturing, and the private pensions will gain in importance relative to the
public pensions, although the latter would still be significant and play an important role in
preventing poverty among pensioners. Despite the attractive track record and the projected
outcomes, the system faces a number of challenges.
Combining public and private pensions addresses distributional objectives but also leaves important
incentive problems. Means testing serves to target the pensions and to minimize public pension
expenditures, but it creates high effective tax rates detrimental to savings incentives and later
retirement. Several reforms – especially tax reforms – reduces this problem but has also
considerably complicated and already complex system.
It is a strength of the occupational pension scheme that it has the support of the social planners. A
drawback is the “residual” groups of individuals who do not (or not to a significant extent)
contribute to an occupational pension scheme. This group is heterogeneous, but it is important to
address the problem. A recently introduced mandatory pension scheme for recipients of transfer
income is a step in this direction, but it is not sufficient to solve the problem.
Higher retirement ages alongside increases longevity is important not only for public finances but
also for sustaining high replacement rates. Formally statutory retirement ages are indexed to
longevity. This is key to the financial viability of the system, but it also raises a problem of exit
routes from the labour market, since not all are capable of prolonging work life alongside increases
in longevity. Recently introduced schemes – “seniorpension” and “tidlig pension” – are addressing
these issues, but it is too early to assess whether they adequately cope with the problem.
The pension system’s high degree of funding is an attractive part of the system, and in the past the
returns on pension savings have been high, which has added to the support to the scheme. Looking
forward to a new normal with low real rate of return, pension funds cannot deliver the same returns
as seen historically, unless more risk is accepted. However, it is not clear that this is in the interest
of pension savers, especially since they now more directly carry the risk.
In a system with mandatory pension contributions, governance structures are particular important
to ensure that pension funds are administered in the interest of their members. This also applies in
relation to charges. They have been decreasing for a long period of time and it is important to keep
focus on this aspect.
192 | P a g e
Lon
g-Te
rm a
nd
Pen
sio
n S
avin
gs |
Th
e R
eal R
etu
rn |
20
21
Edit
ion
Pension Savings: The Real Return 2021 Edition
Country Case: Estonia
Kokkuvõte
Eesti pensionisüsteem on tüüpiline Maailmapanga mitmesambaline süsteem, mis põhineb
personaalsetel pensionikontodel. Aasta 2020 oli pensionifondide jaoks volatiilne, kuid kokkuvõttes
lõppes nii teise kui kolmanda samba fondidele positiivse keskmise tootlusega. Teise samba fondide
kaalutud keskmine tootlus oli 3,76% ja kolmanda samba sama näitaja oli 3,63%. Kuna 2020 aastal
tarbijahinnad keskmiselt langesid, kujunes teise samba fondide inflatsiooniga korrigeeritud
reaaltootluseks 4,64%. Kolmanda samba reaal-tootlus oli 4,51%.
Teise samba fondide pikaajaline kaalutud keskmine reaaltootlus aastatel 2003-2020 oli 0,67%
aastas. Kolmanda samba fondide puhul oli see näitaja samal perioodil 1,54% aastas.
Alates 2017 aastast on Eesti turule lisandunud mitmeid madalate tasudega passiivselt juhitud
pensionfonde (nn. indeksfonde), mis on kiirelt võitnud kliente ja suurendanud turuosa. Madalate
tasudega fondide lisandumine turule on sundinud fondivalitsejaid ka teiste fondide tasusid
alandama. Ühtlasi pakkusid 2021 aasta keskpaigaks kõik turul olevad pensionifondide valitsejad
oma valikus vähemalt üht indeksfondi.
Aastal 2020 jõustus ka pensionireform, mis sisufliselt muutis seni kohustuslikuks olnud teise samba
vabatahtlikuks. Antud reform tekitas ühiskonnas suurt vastukaja. Küsimärgi all oli nii reformi
kasulikkus, selle mõju vähemkindlustatud ühiskonnagruppidele ja isegi reformi vastavus
põhiseadusele. Reformi põhiseaduslikkuse küsimuse lahendas alles Riigikohtu üldkogu, mis otsustas
kaheteist poolt- ja seitsme vastuhäälega, et ei rahulda Vabariigi Presidendi taotlust pensionireformi
seadus põhiseaduse vastaseks kuulutada.
Summary
The Estonian Pension system is a typical World Bank multi-pillar (three-pillar system) based on
individual (personal) pension savings accounts. 2020 saw high volatility but ultimately positive
returns for both the second and third pension pillars, with Pillar II recording average returns of
3.76% and Pillar III funds averaging returns of 3.63%. After adjusting for inflation, which was
negative in 2020, the real returns were: 4.64% for Pillar II funds and 4.51% for Pillar III funds. This
meant that the long-term (since 2003) real returns of Pillar II funds ultimately stayed positive, albeit
193 | P a g e
Lon
g-Te
rm a
nd
Pen
sio
n S
avin
gs |
Th
e R
eal R
etu
rn |
20
21
Edit
ion
low, at asset-weighted average real return since inception of 0.67%, while Pillar III funds have
achieved a more respectable average real return of 1.54% over the same period.
Low-cost passively managed pension funds introduced in 2017 have forced providers to further
decrease the fees charged in Pillar II as well as Pillar III pension funds, with all pension fund
providers offering at least one low-cost passive fund as part of their range by mid-2021.
The year 2020 also saw the implementation of further legal changes significantly restructuring the legal framework surrounding pension funds, especially the formerly mandatory II pillar, which in effect, became a voluntary pension fund with auto-enrolment. These changes generated a great deal of controversy, both regarding their usefulness and impact on vulnerable groups in society or even as to the constitutionality of the reforms.
Indeed, the question of constitutionality was only settled by the Supreme Court of Estonia, which
ruled by 12 votes to 7 that the legal text of the reform did not infringe the constitution, after the
President of the republic had initially refused twice to promulgate the law on constitutionality
grounds and had referred it to the Supreme Court for final decision.
Introduction
The Estonian old-age pension system is also based on the World Bank multi-pillar approach, which
consists of three main pillars:
• Pillar I – State pension organised as a mandatory Pay-As-You-Go (PAYG) scheme; • Pillar II – Funded pension, which was previously organised as a mandatory funded
defined contribution (DC) scheme, starting from January 1, 2021, it is possible to opt-out of the II pillar funded pensions scheme;
• Pillar III – Supplementary pension organised as a voluntary individual pension scheme.
The Estonian multi-pillar pension reform began in 1998 with the introduction of the third
(voluntary) pension pillar in legislation. The formerly mandatory second pillar, which finances
individual private retirement accounts with matching contributions from workers and the
government, was introduced in 2001 and became operational on July 1, 2002. It became possible
to opt-out of the second pillar pension and to liquidate any previous savings held under it, from
January 1, 2021.
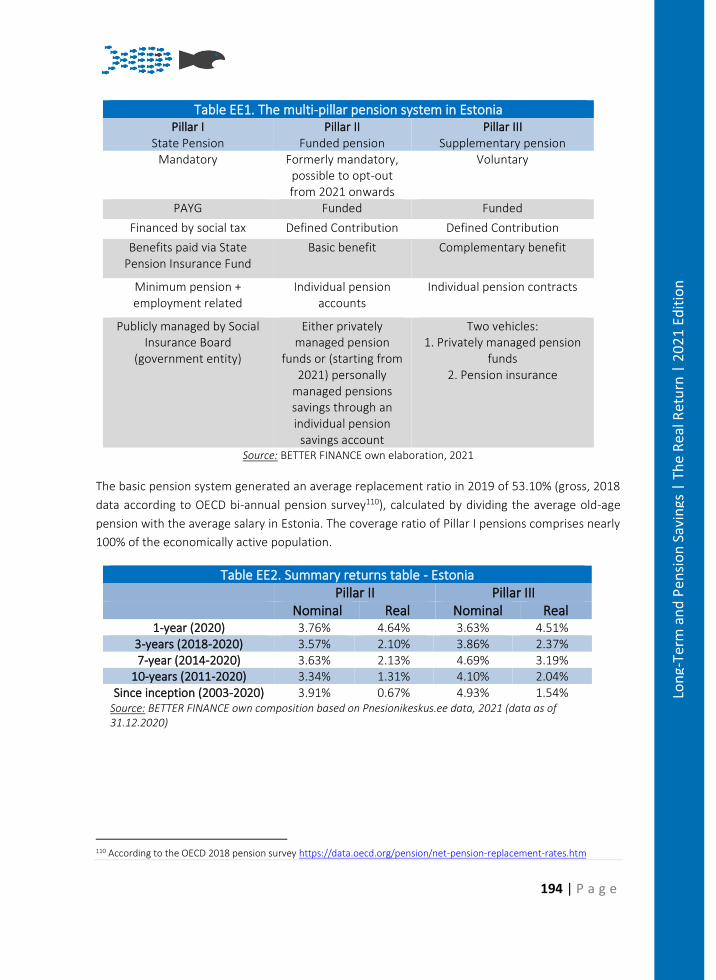
194 | P a g e
Lon
g-Te
rm a
nd
Pen
sio
n S
avin
gs |
Th
e R
eal R
etu
rn |
20
21
Edit
ion
Table EE1. The multi-pillar pension system in Estonia Pillar I
State Pension Pillar II
Funded pension Pillar III
Supplementary pension Mandatory Formerly mandatory,
possible to opt-out from 2021 onwards
Voluntary
PAYG Funded Funded
Financed by social tax Defined Contribution Defined Contribution
Benefits paid via State Pension Insurance Fund
Basic benefit Complementary benefit
Minimum pension + employment related
Individual pension accounts
Individual pension contracts
Publicly managed by Social Insurance Board
(government entity)
Either privately managed pension
funds or (starting from 2021) personally
managed pensions savings through an individual pension
savings account
Two vehicles: 1. Privately managed pension
funds 2. Pension insurance
Source: BETTER FINANCE own elaboration, 2021
The basic pension system generated an average replacement ratio in 2019 of 53.10% (gross, 2018
data according to OECD bi-annual pension survey110), calculated by dividing the average old-age
pension with the average salary in Estonia. The coverage ratio of Pillar I pensions comprises nearly
100% of the economically active population.
Table EE2. Summary returns table - Estonia Pillar II Pillar III Nominal Real Nominal Real
1-year (2020) 3.76% 4.64% 3.63% 4.51% 3-years (2018-2020) 3.57% 2.10% 3.86% 2.37% 7-year (2014-2020) 3.63% 2.13% 4.69% 3.19%
10-years (2011-2020) 3.34% 1.31% 4.10% 2.04% Since inception (2003-2020) 3.91% 0.67% 4.93% 1.54%
Source: BETTER FINANCE own composition based on Pnesionikeskus.ee data, 2021 (data as of 31.12.2020)
110 According to the OECD 2018 pension survey https://data.oecd.org/pension/net-pension-replacement-rates.htm
195 | P a g e
Lon
g-Te
rm a
nd
Pen
sio
n S
avin
gs |
Th
e R
eal R
etu
rn |
20
21
Edit
ion
Pillar I – State Pension
The state pension (Pillar I) should guarantee the minimum income necessary for subsistence after
retirement. It is based on the Pay-As-You-Go (PAYG) principle of redistribution, i.e. the social taxes
paid by today’s employees cover the pensions of today’s pensioners.
Legislatively, the state pension is governed by the State Pension Insurance Act. The act is part of
the pension system reform, which came into force on January 1, 2002. Since then, the act has been
amended more than 30 times. Employers pay 33% of the salary of each employee as social tax, 13%
of which is for health insurance, and 20% (16% in case of participation in Pillar II) is for the pensions
of today’s pensioners.
There are two kinds of state pension: the pensions that depend on work contributions (the old-age
pension, the pension for work incapacity and the survivor’s pension) and the national pension.
Estonians are entitled to the state old-age pension if they have been employed for at least 15 years
in Estonia. If the period of employment is shorter, they are not entitled to the old-age state pension
and might fall under the national pension system.
The national pension (also called National Pension Rate – NPR) provides a minimum pension for
those who are not entitled to a pension that depends on work contributions, provided that they
have lived in Estonia for at least five years before applying for a pension. The amount of the national
pension as of April 1, 2021 (Social Insurance Board, 2021) is €255.18 (up from €221,63 in 2020)111.
Generally, no additional benefits are provided via the state pension scheme.
The old-age pension, available for those who contributed for 15 years or longer, takes into account
the solidarity part (national pension) plus the work and salary-related part. The old-age pension
financed through Pillar I is calculated as a sum of two components:
1. Basic amount (equalling to €235.31)112; 2. Salary based amount calculated as a multiplication of two factors:
o Pensionable service period; o Insurance contributions.
The basic amount, acting as a first component of the state pension, is aimed at achieving basic
solidarity and a minimum pension. The solidarity state pension insurance is represented by the basic
amount (base component) of a pension which is equal to all, irrespective of the person’s salary.
The factor “pensionable service” period represents the part of state pension which depends on the
length of employment (i.e., years of employment and years deemed equal to employment, e.g.,
raising of children, compulsory military service, full-time studies, etc.) of the pensioner, which
entitles him or her to the pension. The period of pensionable service is taken into account up until
111 Estonian Social Insurance Board: www.sotsiaalkindlustusamet.ee/en/pension-benefits/pension-types-pensions-and-benefits 112 Estonian Social Insurance Boar: https://www.sotsiaalkindlustusamet.ee/en/pension-benefits/pension-calculation
196 | P a g e
Lon
g-Te
rm a
nd
Pen
sio
n S
avin
gs |
Th
e R
eal R
etu
rn |
20
21
Edit
ion
December 31, 1998. The monetary value of one year of employment in a monthly pension is €7 .206
since April 1, 2021 (Social Insurance Board of Estonia, 2021)3. This part of the state pension is
deemed to diminish in future years (temporary component) as the third component (insurance
contributions) will account for a larger portion of the total state pension amount.
The factor “insurance contributions” depends on how much social tax has been paid on the salary
of the pensioner since January 1, 1999. The amount of the insurance component is calculated on
the basis of the sum of annual factors of pension insurance. An annual factor shows the ratio of the
social tax paid on the person’s salary during the calendar year to the social tax paid on the average
salary of the state. If social tax is paid on the average salary, the annual factor is 1.0 and its monetary
value in a monthly pension is €7,206 (since April 1, 2021), the same as the pensionable service
period component.
Change in the formula from 2021.
As part of the overall reform of the pensions system, the insurance component has been replaced
by a new “combined component” from January 1, 2021. The combined component is calculated
based on the previously described insurance component (which will make up 50% of the new
combined component), and 50% will be based on a “solidarity component”. The solidarity
component is calculated based on an annual factor that is linked to the minimum wage. If a person
earns at least the minimum annual salary in one year, this factor is 1.0. If they earn less than the
annual minimum salary, the factor is reduced proportionally. After adding up the two factors, they
are in turn divided by two so to obtain the final value. This change is intended to increase solidarity
in the system.
The solidarity principle of public pension insurance involves a mechanism for redistributing income
from high earners to low earners. However, the base component of a pension is equal for all,
irrespective of the person’s salary, while the law also procures the minimum amount of the old-age
pension regardless of the social tax paid.
The statutory retirement age in 2021 is 63 years and nine months for both men and women. On
April 7, 2010, the Estonian Parliament adopted the Act to amend the State Pension Insurance Act113
and related acts, establishing that the general pensionable age of 65 years is to be reached in 2026.
The transition period (starting from 2017) applies to people who were born from 1954 to 1960. For
the latter, the retirement age will be gradually increased by 3 months for every year of birth and
will reach the age of 65 in 2026. The amendment came into effect on January 1, 2017. Further
increases in the retirement age after 2026 will be, by law,114 automatically linked to increases in life
expectancy. From 2027 onwards, any increases to the average life expectancy at age 65 compared
113 Legal text of the State Pension Insurance Act: www.riigiteataja.ee/en/eli/ee/Riigikogu/act/530042020004/ 114 Legal text (in Estonian): www.riigiteataja.ee/akt/103012019001
197 | P a g e
Lon
g-Te
rm a
nd
Pen
sio
n S
avin
gs |
Th
e R
eal R
etu
rn |
20
21
Edit
ion
to the baseline period of 2018-2022115 will lead to an increase in retirement age. However, the
increase in the statutory retirement age will be capped to a maximum of 3 months per year.
Indexation of state pensions is performed by the Social Insurance Board with the aim to adjust the
level of state pensions, so they correspond to the development of the cost of living and receipt of
social tax (growth of the salary fund). Once a year (April 1 of each year), pensions are multiplied by
an index which is 20% dependent on the change in the consumer price index (cost of living) and
80% annual increase in the social tax collected (linked to labour market conditions). The indexation
introduced in 2002 was up until 2008 equally weighted (50% / 50%) on increases in consumers’
price index and social tax contributions. This was changed in 2007 to today’s 20% and 80%,
respectively. According to the Pension Insurance Act, the Government of Estonia has to analyse the
impact of the increase in pensions on financial and social sustainability and suggest every five years
to Parliament any need for indexation change.
In addition to the regular indexation, the “basic amount” component of pensions has been
increased by an additional 7 EUR as of April 1, 2020, as a political initiative.116
The average monthly old-age pension paid from Pillar I in 2020 was €519.10 (€475.9 in 2019, in
total, the average pension has increased 50.4% in the previous six years)117.
Pillar II – Funded pension
Both the funded pension and supplementary funded pension put a person in charge of their own
future; the amount of their pension will depend on how much they put aside for retirement during
their working life. The funded pension is legislated by the Funded Pensions Act, which came into
force on May 1, 2004, and replaced the Funded Pension Act, effective October 1, 2001. The funded
pension pillar (Pillar II) started its operation in July 2002.
The funded pension is based on the accumulation of assets (savings) – a working person themselves
saves for their pension, paying 2% of the gross salary to the selected pension fund. In addition to
the 2% that is paid by the individual, the state adds 4% out of the current social tax that is paid by
the employee and retains 29% (out of 33%). The insurance element of the state pension of a person
who has subscribed to the funded pension is also lower respectively (for the years in which one
receives 16% for the state pension instead of 20%).
Subscription to the funded pension was compulsory for those born in 1983 or later, but it has
become voluntary starting as of January 1, 2021. The funded pension has always been voluntary for
those born between 1942 and 1983. For these people, subscription was possible in seven years;
from May 1, 2001, until October 31, 2010. From January 1, 2021, all persons born in 1970 or later,
115 Technically, the formula will compare the average life expectancy at 65 for the 5 year period that is 4-8 years before the year for which the pension age is being calculated with the life expectancy at 65 for the five years between 2018-2022. 116 Ministry of Social Affairs: https://www.sm.ee/et/uudised/tanasest-touseb-vanaduspension-keskmiselt-45-eurot 117 Own calculation based on data from Statistics Estonia: https://www.stat.ee/en
198 | P a g e
Lon
g-Te
rm a
nd
Pen
sio
n S
avin
gs |
Th
e R
eal R
etu
rn |
20
21
Edit
ion
who are not already subscribed to the II pillar funded pensions, will be able to apply to subscribe to
pillar II pensions. Persons who have previously unsubscribed may re-apply after a period of at least
ten years from the date when they were unsubscribed.
All persons who have turned 18 years old will be auto enrolled into the II pillar on the year after
they turn 18, unless they make an application for exemption. In the case of auto-enrolment, the
person will be randomly drawn a pension fund from among the three pension funds with the lowest
current fees at that time and which invest at least 75% of assets in shares, equity funds and other
equity-like instruments.
Each Pillar II participant has his/her own individual pension account that records contributions and
accumulated savings. A pension account is a special type of securities account in which there are
only units of mandatory pension funds and data related to these units, as well as data about the
unitholder.
In response to the impact of the 2008-2009 financial crisis on the Estonian economy, a temporary
change of contributions’ regime was adopted, which suspended contributions for the period from
June 1, 2009, to December 31, 2010. Interested persons were able to continue to make
contributions to their funded pension themselves upon request from 2010. From 2011,
contributions continued in half-volume, i.e., the state contributed 2% and the savers themselves
1%. Customary contributions to Pillar II (2% - 4%) were restored in 2012. There was a special
mechanism for Pillar II contributions between 2014 – 2017. To those who voluntarily continued
their contributions in 2010 and 2011, the state shall pay an additional 6% during 2014 – 2017 in
order to promote personal saving in Pillar II. However, if a saver did not contribute himself in 2010
and 2011 and submitted an application in 2013, they were required to pay voluntary contributions
of 3% of their salary between 2014–2017. For those avers that did, the state contributed an
additional 6% during those four years. In 2018, the contribution mechanism returned to 2% - 4% in
all cases.
A similar temporary measure was introduced in April 2020 as a result of the COVID-19 crisis and its’
effects on the state budget as well as the overall economy118. The state contribution of 4% was
suspended for the period from July 1, 2020, until August 31, 2021, for all Pillar II savers born after
1960. For those who voluntarily choose to continue with the personal 2% part to their Pillar II fund,
additional 4% state contributions will be made after January 1, 2023.
However, it is not immediately clear why the government chose to take such a radical step, which
amounts to taking a forced, no-interest loan from future pensioners and that will have the effect of
discouraging long-term savings and investment at a time when investment conditions are
favourable, due to relatively low share prices. The arguments given by the ministers in charge that
it was necessary to support the budget balance seem unconvincing, given that both prior to the
118 Overview from Pensionikeskus: www.pensionikeskus.ee/uudis/ii-samba-maksete-ajutine-katkestamine-2020-a/
199 | P a g e
Lon
g-Te
rm a
nd
Pen
sio
n S
avin
gs |
Th
e R
eal R
etu
rn |
20
21
Edit
ion
Covid-19 crisis, as well as by the end of 2020, the State of Estonia had the smallest total government
debt to GDP ratio in the European Union.119
Indeed, in the same period that this measure was debated and adopted, the Treasury of Estonia
was able to take long-term loans at close to 0% nominal interest rates120121 and repeatedly sell short
term (12 months) credit notes at negative interest rates122.
The above underlines the short-sightedness of the (now former) government’s actions and the
lack of real justification for punishing future pensioners at a time when many of them were
anyway suffering large losses to their pensions savings due to the market turmoil. The weighted
average index of Estonian II pillar pension funds grew by 16% during the period when the
government contributions were suspended123.
The partial dismantling of pillar II in 2021
Although there have been many changes to the legal framework surrounding the Estonian second
pension pillar, the most fundamental and controversial of these “reforms” was pushed through
Parliament in 2020, tied to a vote of confidence of the then government. After a protracted legal
battle between the parliamentary majority and the President of the Republic, regarding the
constitutionality of the new law, the Supreme Court eventually ruled by 12 votes to 7 to hold that
the reform didn’t infringe the constitution on October 20, 2020124. This meant that from 2021
onwards, the previously mandatory II pillar, in effect, became a voluntary pension fund with auto-
enrolment. Pension savers who had been enrolled in the II pillar could now take out their savings
before pension age, subject to a 20% income tax.
By the end of March 2021, 152 675 pensions savers (about 20% of all II pillar participants) had
applied for taking their saving out of the II pillar funds125. The total amount withdrawn in this first
round of applications was approximately 1.3 billion euros gross or about 24% of the total assets of
Estonian II pillar funds. The first round of payments was executed in early September 2021.
119 8.4% of GDP on 31/12/2019 and 18.2% of GDP on 31/12/2020: https://ec.europa.eu/eurostat/databrowser/view/sdg_17_40/ 120 The Treasury took a 750 MEUR, 15-year loan from the Nordic Investment Bank (NIB) on the 30th of March, with an
interest rate of 0.32% + the 6-month Euribor (the corresponding Euribor rate was -0.287% on 30 March 2020): see
https://www.rahandusministeerium.ee/sites/default/files/Riigikassa/voetud_laenud_30.04.2020.pdf;
https://www.rahandusministeerium.ee/et/eesmargidtegevused/riigikassa/riigi-finantsvarad-ja-kohustused/riigi-
volakohustused; https://www.euribor-rates.eu/en/current-euribor-rates/3/euribor-rate-6-months/ 121 News item from the Ministry of Finance website: https://www.rahandusministeerium.ee/en/news/high-demand-international-investors-estonias-government-bond-issue 122 The Treasury had issued several short-term government bonds (6-12 months) between March to early May 2020 for a total value of 475 MEUR with fixed interest rates ranging from -0.141% to -0,296%. 124 Constitutional Court judgment 5-20-3: www.riigikohus.ee/en/constitutional-judgment-5-20-3 125 Pensionikeskus statistics on II pillar withdrawals (Estonian): https://www.pensionikeskus.ee/wp-content/uploads/teisest_sambast_raha_valjavotmise_statistika_02.08.2021.pdf
200 | P a g e
Lon
g-Te
rm a
nd
Pen
sio
n S
avin
gs |
Th
e R
eal R
etu
rn |
20
21
Edit
ion
BETTER FINANCE has previously opposed this change, since it increases risk of old-age poverty for
those who liquidate their savings, since they not only lose the tax benefits accorded to the II pillar,
but surveys conducted among people intending to withdraw their II pillar savings showed that the
majority would use the money to cover running costs (such as home renovations or paying back
loans), rather than investing for retirement.126
The risk of increasing old-age poverty due to this reform is significant, given the already low-
income replacement ratio of the first pillar (discussed earlier) and the fact that the largest
proportion of savers who left the system were those on low or average incomes15
Pillar III – Supplementary pension
The supplementary funded pensions scheme, or Pillar III, is a part of the Estonian pension system
and is governed by the same act that governs Pillar II, the Funded Pension Act (Chapter 3 and
following).
This scheme has been introduced with the aim of helping to maintain the same standard of living
and adding more flexibility in securing a higher and/or stable stream of income after one reaches
the age of 55. Therefore, the supplementary pension has been designed to help achieve a
recommended level of 65% gross replacement ratio of an individual’s previous income in order to
maintain the established standard of living.
The supplementary pension participation is voluntary for all persons, who can decide to save either
by contributing to a voluntary pension fund or by entering into a respective supplementary pension
insurance contract with a life insurance company. The amount of the contributions is determined
solely by the free choice of an individual and can be changed during the duration of the
accumulation phase. There is also a possibility to discontinue contributions (as well as to finish the
contract).
The supplementary funded pension contracts can be made with life insurers as pension insurance
or by acquiring pension fund units from fund managers. An individual can choose between three
different pension products:
1. Pension insurance with guaranteed interest;
2. Pension insurance with investment risk (unit-linked); and
3. Pension fund.
126 BETTER FINANCE Press release October 27, 2020: https://betterfinance.eu/wp-content/uploads/PR-Dismantling-the-Estonian-Pension-System-is-not-the-Answer-27102020.pdf
201 | P a g e
Lon
g-Te
rm a
nd
Pen
sio
n S
avin
gs |
Th
e R
eal R
etu
rn |
20
21
Edit
ion
Pension Vehicles
Pillar II – Funded pension
From September 2019, there are two types of mandatory pension funds in Estonia – conservative
funds and non-conservative funds.
For conservative funds, 80% of assets need to be invested into either bank deposits, investment-
grade bonds, money-market instruments trading on regulated markets, other funds which invest
the majority of their assets into the before-mentioned categories, as well as derivative instruments
which are based on the categories of assets listed in this paragraph. In addition, conservative
pension funds may not have an open net foreign exchange position worth more than 25% of total
assets.
All other mandatory pension funds are free to set their investment strategies in their prospectus,
with only the following global limits:
• Not more than 10% of assets can be provided as direct loans, with the additional
requirement that the (legal) persons receiving the loans meet the same requirements as
the issuers of bonds that the pension fund is allowed to buy (“investment grade”);
• Not more than 5% of assets can be invested in precious metals and securities whose
underlying assets are precious metals or which price is dependent on precious metals;
• Not more than 30% of assets can be invested in index funds;
• Not more than 50% of assets can be invested into securities, money market instruments
and funds that are not traded on regulated markets. Direct loans to non-listed entities also
count toward this cap;
• The total open risk position of derivative instruments may not exceed 50% of the assets of
the fund, although derivative instruments designed to mitigate certain types of risks are
exempt from this cap;
• Not more than 40% of assets may be invested in immovables, either directly or through
real estate investment funds or companies investing in real estate or securities directly
tied to the price of immovables;
• Not more than 10% of asset may be invested into a single immovable property, based on
acquisition price;
• Not more than 15% of assets may be invested in the securities and money market
instruments issued by one (legal) person.
Any asset manager wishing to undertake the management of mandatory pension funds, must by
law, manage at least one pension fund that conforms to the legal limits of a conservative pension
fund, as described below.
Interestingly, the above rules make all non-conservative pensions funds significantly more flexible
in their investment choices than any other UCITS which is subject to Estonian law.
202 | P a g e
Lon
g-Te
rm a
nd
Pen
sio
n S
avin
gs |
Th
e R
eal R
etu
rn |
20
21
Edit
ion
In Estonia, more than 706 357 people save under the Pillar II funds, which is almost equal to the
economically active population. Less than 5% of those have opted for conservative pension
funds.127
Wealthier individuals and those with higher earnings tend to prefer conservative funds with less
equity exposure. Lower-income groups, on the other hand, tend to prefer riskier pension funds with
more equity exposure and more market risk.128
This is possibly due to the age distribution of pension fund strategies, with the large majority of
investors in the most aggressive category of pension funds being under 40 years of age, whereas
the proportion of pension savers investing in relatively conservative pension funds (those where
equity exposure is capped at under 50% of assets) goes up dramatically with people over 50 years
of age. Generally, younger people at the start of their careers would be expected to earn less on
average and have accumulated fewer assets on average than those in the last decades of their
working lives.18Comparing the Pillar II market share development in 2019-2020, more contribution
inflows could be seen in aggressive funds (especially of the index fund variety) and less in
conservative and balanced funds.18
From April 1, 2021 it also became possible for pension savers to personally manage their pillar II
investments through a Pension Investment Account. Any saver choosing this option will have their
II pillar contributions (both personal and state contributions) flow into a special securities account
at a bank of their choice129, instead of the same contributions going into an investment fund.130 The
pension saver can then decide themselves which securities or funds to invest their II pillar savings
in. It’s worth noting that aside from direct investments in securities, this system also allows savers
to choose investment funds other than the especially regulated Estonian pillar II funds.
Pillar III – Supplementary pension
According to the law, two types of pension vehicles for supplementary pension (Pillar III) are
allowed:
1. Voluntary pension funds;
2. Supplementary pension insurance contracts.
For the supplementary pension insurance vehicle, two product options are available:
• Pension insurance at a guaranteed interest rate;
• Pension insurance with investment risk (unit-linked).
127 Statistics from Pensionikeskus: https://www.pensionikeskus.ee/statistika/ii-sammas/aktiivsed-investorid/ 128 Estonian Ministry of Finance pension statistics for 2020 (in Estonian): https://www.pensionikeskus.ee/wp-content/uploads/page/rahandusministeeriumi-statistika/012021.pdf 129 Currently, all of the 4 banks which offer II pillar investment funds in Estonia (LHV. SEB, Swedbank and Luminor) also offer the possibility to open a Pension Investment Account. 130 Explanation from Pensionikeskus: https://www.pensionikeskus.ee/ii-sammas/pensioni-investeerimiskonto-pik/
203 | P a g e
Lon
g-Te
rm a
nd
Pen
sio
n S
avin
gs |
Th
e R
eal R
etu
rn |
20
21
Edit
ion
Considering the size of Pillar III based on the coverage of the economically active population, the
Estonian Pillar III amounts to only about 15% of the economically active population. The investment
restrictions for supplementary pension funds are broadly the same as for non-conservative,
mandatory pension funds, with the exception that supplementary funds are allowed to invest up to
70% of assets into immovables (as opposed to 40% for mandatory funds).
In addition, certain conflicts of interest provisions are laxer for voluntary pension funds. For
example, by law, fees charged from a mandatory pension fund for investments made into UCITS
managed by the same fund manager that manages the pension fund, or another fund manager
belonging to the same consolidation group, need to be repaid into the pension fund. No such
provision exists for voluntary pension funds, leaving them more open to conflicts of interest from
the pension fund manager.
Table EE4. Supplementary Pension vehicles market share Supplementary pension
vehicles Assets under management
(AuM) / Reserves (in €) Market share based on AuM /
Reserves (in %)
Voluntary pension funds 252.210.489 46.88%
Supplementary pension insurance
285.739.000 53.12%
TOTAL 537.949.489 100.00%
Source: Own calculations based on pensionikeskus.ee data, 2021 (data as of 31.12.2020)
Charges
Pillar II – Funded pension
Pension funds are offered by asset management companies, which are managed under the
Investment Funds Act and, as such, the funds are considered typical UCITS funds with special
regulation via the Funded Pension Act.
A saver contributing into the pension fund receives the fund units, which represent the unitholder’s
share in the fund’s assets. Each pension fund can have only one class of units. The nominal value of
a unit at the beginning of the fund operation is €1 (up from €0.64 prior to 2021). The rights and
obligations attached to a unit with respect to a unitholder will enter into force upon issuing a unit
and will terminate upon redeeming a unit. A unit is deemed issued upon registration and is
considered redeemed upon cancellation with the register. Ownership of a unit is proved by an entry
in the register.
As the pension funds are considered typical UCITS funds, fees and charges typical for UCITS funds
are applied to the pension funds, but with some legislative restrictions.
According to the paragraphs 58 and 65 of the Investment Funds Act, the following charges can be applied to the expense of a mandatory pension fund:
204 | P a g e
Lon
g-Te
rm a
nd
Pen
sio
n S
avin
gs |
Th
e R
eal R
etu
rn |
20
21
Edit
ion
• management fee,
• exit fee (unit redemption fee),
• transaction costs,
• success fee
Considering the individual saver, additional charges are paid from the individual value of pension
savings:
• unit redemption fee,
• entry fee (unit issuance fee, resp. contribution fee).
As of September 2, 2019, the management fees of mandatory pension funds were legally capped
at 1.2% for conservative pension funds and 2% for all other mandatory pension funds. Redemption
fees were capped at 0.05% for conservative pension funds and 0.1% for all other mandatory
pension funds. No subscription fee may be charged by a mandatory pension fund.
Redemption fees are types of charges that are applied on a one-off basis when a contribution to
the fund is recorded respectively when the saver sells the pension units to the issuer. The effect of
these charges is limited to the transaction, so there is only a cumulative effect that can be calculated
as a simple summation. Redemption fees are also tied to the ability of savers to switch among the
pension funds during the saving period. A fund can be replaced only with another fund of the
mandatory funded pension. The choice of the pension fund can be changed in two ways:
1. Directing contributions to a new fund – the units of the current fund will be retained and
will continue earning in the former fund. After choosing a new fund, your future
contributions will be transferred to it, i.e., units of different funds will appear side by side
in your pension account.
2. Changing the pension fund units – the units of one pension fund will be replaced with the
units of a new pension fund selected.
From January 1, 2011, onwards, there is no minimum limit for units upon changing a fund (before
January 1, 2011, the minimum requirement was 500 units). Since August 1, 2011, it has been
possible to transfer to a new pension fund all or only a part (e.g., 25%, 50% or 75%) of the assets
collected in the former pension fund.
The investment funds act provides an obligatory reduction in the management fees of investment
funds, in line with the growth of assets under management of the fund. Namely, after a
mandatory pension fund reaches 100 million euros of assets under management, the fund
manager is obliged by law to reduce the base management fee for each additional 100 million
euros of assets under management by at least 15 per cent compared to the rate of the base
management fee applicable to the previous 100 million euros. Funds are no longer required to
205 | P a g e
Lon
g-Te
rm a
nd
Pen
sio
n S
avin
gs |
Th
e R
eal R
etu
rn |
20
21
Edit
ion
enforce this reduction when the yearly base management fee for the mandatory pension fund in
question reaches 0.4% of assets under management.
The idea of the maximum management fee caps and obligatory management fee reduction for
mandatory pension funds was to ensure sufficient competition in the mandatory pension funds
market at the time of its launch, despite the initial lack of economies of scale (given the initially low
number of mandatory participants, the low level of salaries in Estonia at the time, as well as the
small population of Estonia), while guaranteeing that the overall level of fees and charges would
decrease when economies of scale are achieved.
The option of applying a success fee became possible as of January 1, 2019 and is unique to
mandatory pension funds in Estonia. No other UCITS listed in Estonia have the right to apply a
success fee.
According to paragraph 652 of the Investment Funds Act, the fund manager of a mandatory pension
fund has the right to charge a success fee if the cumulative increase in the net asset value of a unit
of the fund exceeds the cumulative increase in receipt of the pension insurance part of social tax as
of December 31 of the year of registration of the pension fund (hereafter “reference index”). The
success fee for a given year is limited by law to a maximum of 20% of the excess of the increase in
net asset values over the reference index and to 2% of the asset value of this pension fund,
whichever limit is lower.
Conservative mandatory pension funds do not have the right to apply a success fee.
The introduction of the success fee concept and other changes to the way pension fund fees need
to be disclosed brought changes to the way Estonian pension funds disclose their fees and to how
regulators and statistics agencies collect data on the fees. Given the backwards-looking nature of
the success fee, mandatory pension funds are required to report on their “Total Expense Ratio”
(hereafter referred to as TER) for the previous year.
The TER includes:
1) the fee paid to the fund manager for the management of the fund, or the fees, charges and
expenses directly related to the management of a public limited fund (management fee);
2) the fee paid to the depositary for the services provided (depositary’s charge);
3) the transfer fees and service charges directly related to transactions performed for the
account of the fund and other fees and charges and expenses related to the management
of the fund and specified in the basic documents of the fund;
4) success fees.
The funded pension register (Pensionikeskus AS), which is the main provider of statistics for pension
funds in Estonia, also stopped gathering statistics for separate classes of fees or charges and has
moved to collecting statistics on the TER of mandatory pension funds. While this offers a complete
overview of the costs of pension funds, it unfortunately also has the side-effect, from the point of
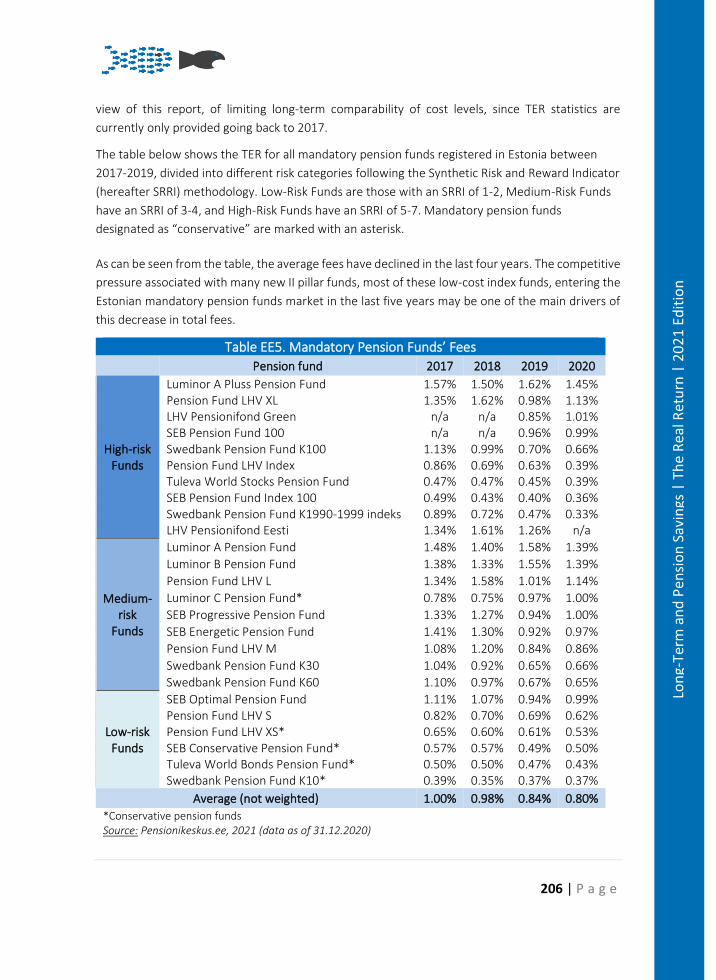
206 | P a g e
Lon
g-Te
rm a
nd
Pen
sio
n S
avin
gs |
Th
e R
eal R
etu
rn |
20
21
Edit
ion
view of this report, of limiting long-term comparability of cost levels, since TER statistics are
currently only provided going back to 2017.
The table below shows the TER for all mandatory pension funds registered in Estonia between
2017-2019, divided into different risk categories following the Synthetic Risk and Reward Indicator
(hereafter SRRI) methodology. Low-Risk Funds are those with an SRRI of 1-2, Medium-Risk Funds
have an SRRI of 3-4, and High-Risk Funds have an SRRI of 5-7. Mandatory pension funds
designated as “conservative” are marked with an asterisk.
As can be seen from the table, the average fees have declined in the last four years. The competitive
pressure associated with many new II pillar funds, most of these low-cost index funds, entering the
Estonian mandatory pension funds market in the last five years may be one of the main drivers of
this decrease in total fees.
Table EE5. Mandatory Pension Funds’ Fees
Pension fund 2017 2018 2019 2020
High-risk Funds
Luminor A Pluss Pension Fund 1.57% 1.50% 1.62% 1.45% Pension Fund LHV XL 1.35% 1.62% 0.98% 1.13% LHV Pensionifond Green n/a n/a 0.85% 1.01% SEB Pension Fund 100 n/a n/a 0.96% 0.99% Swedbank Pension Fund K100 1.13% 0.99% 0.70% 0.66% Pension Fund LHV Index 0.86% 0.69% 0.63% 0.39% Tuleva World Stocks Pension Fund 0.47% 0.47% 0.45% 0.39% SEB Pension Fund Index 100 0.49% 0.43% 0.40% 0.36% Swedbank Pension Fund K1990-1999 indeks 0.89% 0.72% 0.47% 0.33% LHV Pensionifond Eesti 1.34% 1.61% 1.26% n/a
Medium-risk
Funds
Luminor A Pension Fund 1.48% 1.40% 1.58% 1.39%
Luminor B Pension Fund 1.38% 1.33% 1.55% 1.39%
Pension Fund LHV L 1.34% 1.58% 1.01% 1.14%
Luminor C Pension Fund* 0.78% 0.75% 0.97% 1.00%
SEB Progressive Pension Fund 1.33% 1.27% 0.94% 1.00%
SEB Energetic Pension Fund 1.41% 1.30% 0.92% 0.97%
Pension Fund LHV M 1.08% 1.20% 0.84% 0.86%
Swedbank Pension Fund K30 1.04% 0.92% 0.65% 0.66%
Swedbank Pension Fund K60 1.10% 0.97% 0.67% 0.65%
Low-risk Funds
SEB Optimal Pension Fund 1.11% 1.07% 0.94% 0.99% Pension Fund LHV S 0.82% 0.70% 0.69% 0.62% Pension Fund LHV XS* 0.65% 0.60% 0.61% 0.53% SEB Conservative Pension Fund* 0.57% 0.57% 0.49% 0.50% Tuleva World Bonds Pension Fund* 0.50% 0.50% 0.47% 0.43% Swedbank Pension Fund K10* 0.39% 0.35% 0.37% 0.37%
Average (not weighted) 1.00% 0.98% 0.84% 0.80%
*Conservative pension funds Source: Pensionikeskus.ee, 2021 (data as of 31.12.2020)
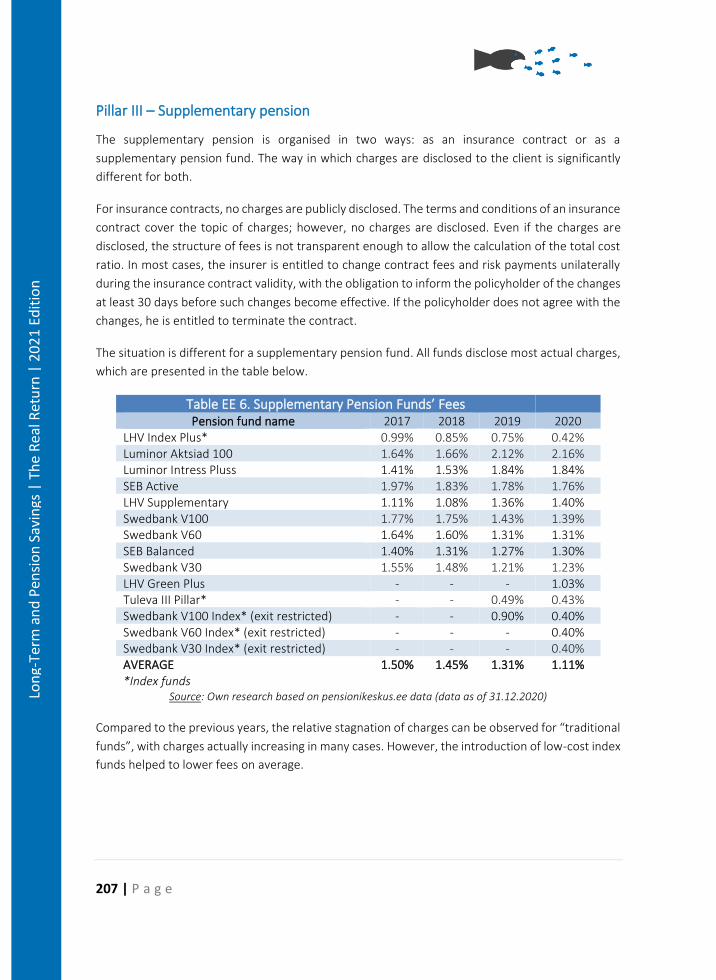
207 | P a g e
Lon
g-Te
rm a
nd
Pen
sio
n S
avin
gs |
Th
e R
eal R
etu
rn |
20
21
Edit
ion
Pillar III – Supplementary pension
The supplementary pension is organised in two ways: as an insurance contract or as a
supplementary pension fund. The way in which charges are disclosed to the client is significantly
different for both.
For insurance contracts, no charges are publicly disclosed. The terms and conditions of an insurance
contract cover the topic of charges; however, no charges are disclosed. Even if the charges are
disclosed, the structure of fees is not transparent enough to allow the calculation of the total cost
ratio. In most cases, the insurer is entitled to change contract fees and risk payments unilaterally
during the insurance contract validity, with the obligation to inform the policyholder of the changes
at least 30 days before such changes become effective. If the policyholder does not agree with the
changes, he is entitled to terminate the contract.
The situation is different for a supplementary pension fund. All funds disclose most actual charges,
which are presented in the table below.
Table EE 6. Supplementary Pension Funds’ Fees Pension fund name 2017 2018 2019 2020
LHV Index Plus* 0.99% 0.85% 0.75% 0.42% Luminor Aktsiad 100 1.64% 1.66% 2.12% 2.16% Luminor Intress Pluss 1.41% 1.53% 1.84% 1.84% SEB Active 1.97% 1.83% 1.78% 1.76% LHV Supplementary 1.11% 1.08% 1.36% 1.40% Swedbank V100 1.77% 1.75% 1.43% 1.39% Swedbank V60 1.64% 1.60% 1.31% 1.31% SEB Balanced 1.40% 1.31% 1.27% 1.30% Swedbank V30 1.55% 1.48% 1.21% 1.23% LHV Green Plus - - - 1.03% Tuleva III Pillar* - - 0.49% 0.43% Swedbank V100 Index* (exit restricted) - - 0.90% 0.40% Swedbank V60 Index* (exit restricted) - - - 0.40% Swedbank V30 Index* (exit restricted) - - - 0.40% AVERAGE 1.50% 1.45% 1.31% 1.11% *Index funds
Source: Own research based on pensionikeskus.ee data (data as of 31.12.2020)
Compared to the previous years, the relative stagnation of charges can be observed for “traditional
funds”, with charges actually increasing in many cases. However, the introduction of low-cost index
funds helped to lower fees on average.
208 | P a g e
Lon
g-Te
rm a
nd
Pen
sio
n S
avin
gs |
Th
e R
eal R
etu
rn |
20
21
Edit
ion
Taxation
Both funded pillars use the “EET” regime for taxation, which means that the contributions paid
towards the pension schemes are tax-exempt. Returns achieved by respective pension funds are
also tax-exempt and the benefits paid out during the retirement are subject to income tax.
Pillar II – Funded pension
Estonia is applying an EET taxation regime for Pillar II with some specifications (deductions) to the
pay-out taxation regime, where generally the “T” regime is applied.
Taxation of the Fund
Income or profits of the Fund are not subject to taxes at the fund level.
Taxation of unitholders
Contributions to the Fund usually consist of two parts:
1. 2% withheld from the wages and other remuneration of a resident natural person
participating in the mandatory funded pension system; in certain cases from the
remuneration paid to a member of the management or supervisory body of a legal person;
from the business income of sole proprietors after deductions relating to business and
permitted in the Income Tax Act have been made, but annually from an amount not more
than 15 times the sum of the minimum monthly wages for the taxable period; in certain
cases from the remuneration or fees paid to a natural person on the basis of a contract for
services, authorisation agreement or another contract under the law of obligations
entered into for the provision of services, and
2. the amount added by the state, which equals 4% of the sum of the resident natural
person’s wages and other remuneration.
The above-mentioned 2% withheld from wages and other remuneration is tax-deductible, i.e., not
subject to income tax. Specifications apply to the procedure of contributions in the years 2014 to
2017.
Exchange of a fund’s unit for another unit of a mandatory pension fund and redemption of a unit
to enter into an insurance contract for funded pension (pension contract) is not taxed. Insurance
contracts for funded pension (pension contract) and pension fund units are not treated as financial
assets for the purposes of income taxation, and taxation of income on these cannot be postponed.
During the pay-out phase, income tax is charged on payments made from the mandatory pension
fund to the unit holder, the successor of the unitholder, as well as on payments made to the
policyholder, an insured person or a beneficiary pursuant to a pension contract provided for in the
209 | P a g e
Lon
g-Te
rm a
nd
Pen
sio
n S
avin
gs |
Th
e R
eal R
etu
rn |
20
21
Edit
ion
Funded Pensions Act. Thus, if a unitholder reaches retirement age, mandatory funded pension
payments will be taxed together with the state (NDC PAYG pillar) pension. Estonian income tax rate
since 2015 is 20%.
The taxation period for natural persons is the calendar year. In Estonia, the annual basic exemption
(non-taxable amount) per year depends on the person’s income, ranging from 6000 EUR for those
earning up to 14 400 EUR per annum and none for those earning above 25 200 EUR per annum.
The same rate applies also to pension payments.
Taxation of successors
Payments to a successor upon redemption of units are taxed with the income tax rate established
by law. Transfer of units into a successor’s pension account is not taxable.
Pillar III – Supplementary pension
The effective Income Tax Act stipulates EET regime (similar to Pillar II) where:
I. Resident natural persons have the right to subtract the amounts paid to acquire
supplementary fund units from their taxable income. The amount that is deducted may be
up to 15% of the income earned in the taxation period, but no more than €6 000.
II. Income or profits of the fund are not subject to taxes at the fund level.
III. Pay-outs from a supplementary pension fund are subject to income tax as follows:
a) 10% income tax if they are made under any of the following circumstances:
(i) after the unitholder reaches the age of 55, but not before five years have
passed from the acquisition of the units;
(ii) in the event of the unit holder’s full and permanent incapacity for work;
(iii) when the fund is liquidated.
b) In all other cases, pay-outs from the fund are subject to income tax valid at the time
the pay-out is made.
IV. Pay-outs made by an insurance company to the policyholder from the assets saved in the
fund as lifelong pension payments after the policyholder turns 55 years of age are exempt
from income tax.
Pension Returns
Pillar II – Funded pension
As was the case in much of the world, 2020 proved a very volatile year for Estonian pensions funds.
With the global securities markets crashing sharply in February and March, amid the panic caused
by the COVID-19 pandemic, but then recovering strongly in the following months. Overall, Estonian
pillar II pensions funds finished the year with moderate positive returns, and the slightly negative
210 | P a g e
Lon
g-Te
rm a
nd
Pen
sio
n S
avin
gs |
Th
e R
eal R
etu
rn |
20
21
Edit
ion
inflation pushed the average real returns for 2020 above 4%. A small error in the return
computations, discovered for the previous edition, has been corrected.
In 2020, the Scandinavian Banks – Swedbank, SEB and Luminor – held close to 68% of the market
between them, with Swedbank being the uncontested market leader, holding a 41% market share.
The biggest local bank, LHV, has the second-largest pillar II market share, with 28%131. The only
pension fund manager in Estonia that is not a wholly owned subsidiary of a bank is the relatively
new mutual fund Tuleva, which entered the market in 2017, branding itself as a “social start-up”
and advocating for passively managed low-fee funds. Although by the end of 2020, it held only
about 4% of the second pillar market, its entry pushed all the other pension fund managers to offer
passively managed funds as part of their range. This, in turn, has contributed significantly to the
reduction of pension fund fees in the Estonian market.
Five asset managers offered 24 pension plans in Estonia in 2020, with the number set to increase
to 25 in 2021, with Luminor launching a new pension fund called “Sustainable Future, Index”. This
makes Luminor the last and final one of the II pillar pension fund providers in Estonia to launch a
passively managed “index” fund, but only the second provider to explicitly market at least one of
its II pillar funds as “sustainable” after the launch of “LHV Green” in March 2020. The pension plans
(funds) can be divided into four groups in accordance with the investment strategy they use:
It should be noted that volatility and performance are closely tied to the structure of the portfolio
and the degree of deviation from the benchmark. Active asset management, while being riskier,
emphasises “stock-picking skills” to optimise returns and deliver overperformance to the market by
the maturity (recommended holding period) of the product. To which extent this is happening in
Estonian mandatory pension funds can be seen in the table below presenting the cumulative,
inflation-adjusted returns. Returns are shown for funds for which at least two years of returns data
is available, and the pension funds are ranked according to the annualised real return since the
inception of the fund.
131 Finantsinspektsioon market overview 2020: https://www.fi.ee/sites/default/files/fi_eft_12_2020_eng.pdf
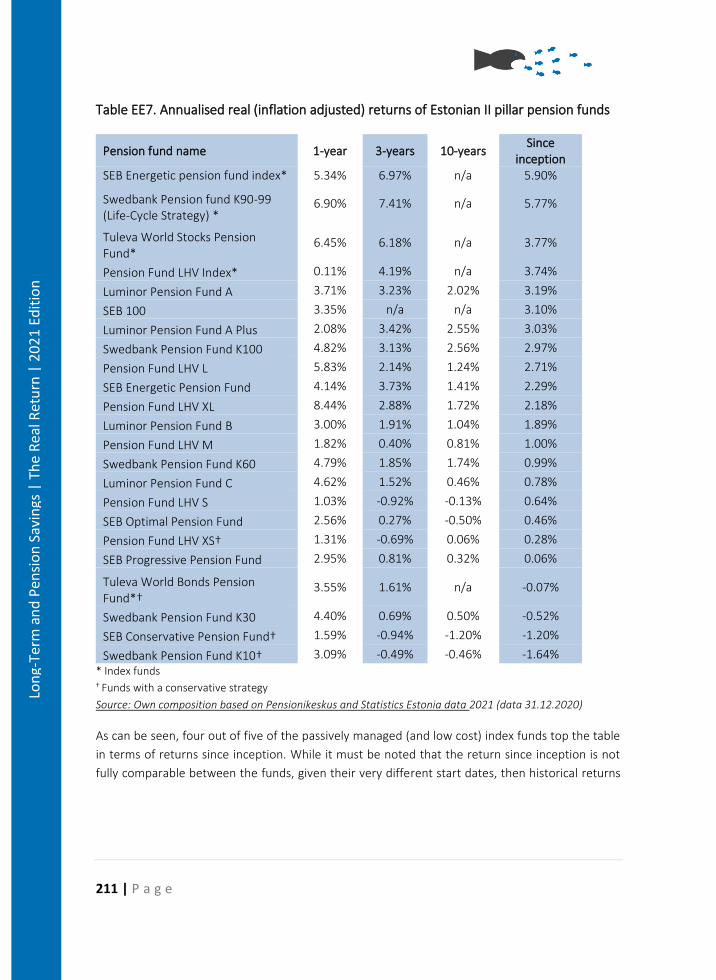
211 | P a g e
Lon
g-Te
rm a
nd
Pen
sio
n S
avin
gs |
Th
e R
eal R
etu
rn |
20
21
Edit
ion
Table EE7. Annualised real (inflation adjusted) returns of Estonian II pillar pension funds
Pension fund name 1-year 3-years 10-years Since
inception SEB Energetic pension fund index* 5.34% 6.97% n/a 5.90%
Swedbank Pension fund K90-99 (Life-Cycle Strategy) *
6.90% 7.41% n/a 5.77%
Tuleva World Stocks Pension Fund*
6.45% 6.18% n/a 3.77%
Pension Fund LHV Index* 0.11% 4.19% n/a 3.74%
Luminor Pension Fund A 3.71% 3.23% 2.02% 3.19%
SEB 100 3.35% n/a n/a 3.10%
Luminor Pension Fund A Plus 2.08% 3.42% 2.55% 3.03%
Swedbank Pension Fund K100 4.82% 3.13% 2.56% 2.97%
Pension Fund LHV L 5.83% 2.14% 1.24% 2.71%
SEB Energetic Pension Fund 4.14% 3.73% 1.41% 2.29%
Pension Fund LHV XL 8.44% 2.88% 1.72% 2.18%
Luminor Pension Fund B 3.00% 1.91% 1.04% 1.89%
Pension Fund LHV M 1.82% 0.40% 0.81% 1.00%
Swedbank Pension Fund K60 4.79% 1.85% 1.74% 0.99%
Luminor Pension Fund C 4.62% 1.52% 0.46% 0.78%
Pension Fund LHV S 1.03% -0.92% -0.13% 0.64%
SEB Optimal Pension Fund 2.56% 0.27% -0.50% 0.46%
Pension Fund LHV XS† 1.31% -0.69% 0.06% 0.28%
SEB Progressive Pension Fund 2.95% 0.81% 0.32% 0.06%
Tuleva World Bonds Pension Fund*†
3.55% 1.61% n/a -0.07%
Swedbank Pension Fund K30 4.40% 0.69% 0.50% -0.52%
SEB Conservative Pension Fund† 1.59% -0.94% -1.20% -1.20%
Swedbank Pension Fund K10† 3.09% -0.49% -0.46% -1.64% * Index funds
† Funds with a conservative strategy
Source: Own composition based on Pensionikeskus and Statistics Estonia data 2021 (data 31.12.2020)
As can be seen, four out of five of the passively managed (and low cost) index funds top the table
in terms of returns since inception. While it must be noted that the return since inception is not
fully comparable between the funds, given their very different start dates, then historical returns
212 | P a g e
Lon
g-Te
rm a
nd
Pen
sio
n S
avin
gs |
Th
e R
eal R
etu
rn |
20
21
Edit
ion
in other markets support the likelihood that low-cost index funds may well continue to outperform
higher-cost actively managed funds in the long term132,133.
Unfortunately, as can be seen from the above table, there are several II pillar investment funds
with significantly negative long-term returns. To put it plainly, these funds have eroded the real
value of their clients’ savings. While the percentages seem small, it is worth noting that, for
example, a constant annual real return of -1.64% would decrease the purchasing power of a
client’s savings by more than half over 43 years (which corresponds to the number of years a 22-
year-old would have to work until the current retirement age).
All the II pillar funds with negative real returns are funds in the legal category of “conservative”
funds, discussed above in the “Pension Vehicles” chapter. This category of funds is subject to
significant restrictions on investment strategy and is often recommended by providers to
investors approaching retirement age as a way to prevent any significant negative effects of short-
term shocks close to retirement age. However, even for funds pursuing such a strategy, negative
real returns over the long term should be considered problematic. In particular, it cannot be
expected that only people close to retirement age are to enrol into conservative pension funds.
Indeed, until June 2019, people for whom it was mandatory to join the 2nd pension pillar, but did
not themselves choose a pension fund, were randomly auto-enrolled into a fund with a
conservative strategy. According to the Ministry of Finance134, about 16 500 people who were
auto-enrolled into a conservative pension fund between 2003 and 2019 had not changed fund as
of 31st as of 31.12.2020.
As the types of underlying assets in which a fund invests are a key determinant of returns, the
graph below demonstrates the overall portfolio structure of mandatory pension funds in Estonia.
As asset classes such as money market instruments, direct loans, derivatives and other assets are
either not invested at all or to a minimum degree, then the chart only shows such asset classes,
which consistently make up at least 0.5% of the overall portfolio structure. However, it should be
noted that, for example, a lack of direct investment of pension funds into real estate does not
mean these funds do not have exposure to that asset class through investments in real estate
funds (which in the underlying dataset would fall under the category “units of other investment
funds”).
132 BF study on cost and performance of EU equity funds: betterfinance.eu/wp-content/uploads/BETTER1.pdf 133 ESMA study on cost and performance of EU investment products: www.esma.europa.eu/sites/default/files/library/esma_50-165-1710_asr_performance_and_costs_of_eu_retail_investment_products.pdf 134 Estonian Ministry of Finance pension statistics for 2020 (in Estonian): https://www.pensionikeskus.ee/wp-content/uploads/page/rahandusministeeriumi-statistika/012021.pdf
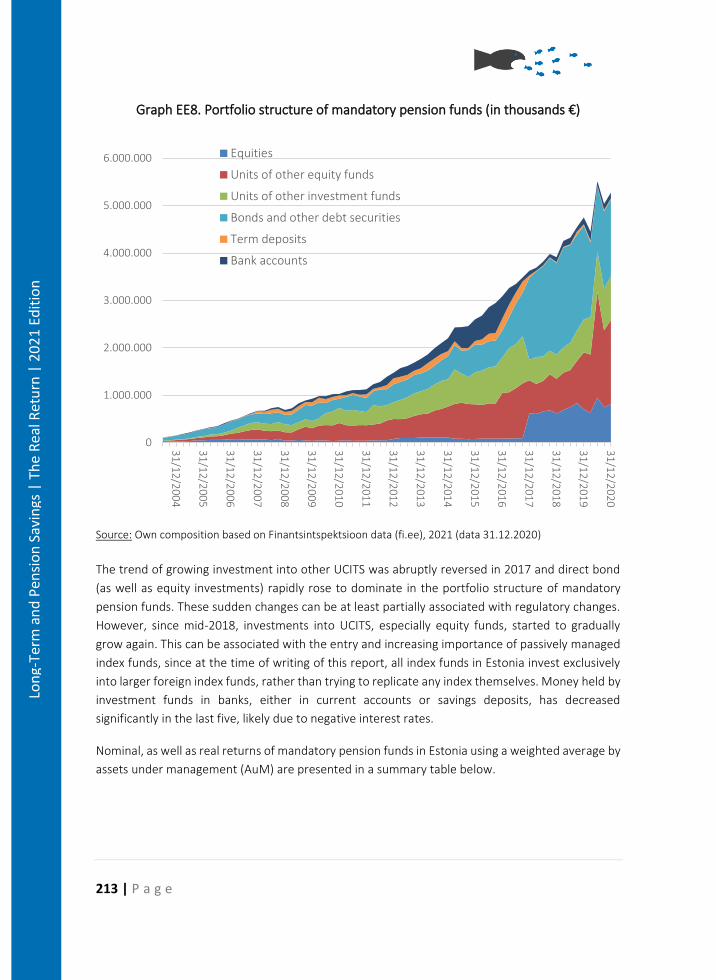
213 | P a g e
Lon
g-Te
rm a
nd
Pen
sio
n S
avin
gs |
Th
e R
eal R
etu
rn |
20
21
Edit
ion
Graph EE8. Portfolio structure of mandatory pension funds (in thousands €)
Source: Own composition based on Finantsintspektsioon data (fi.ee), 2021 (data 31.12.2020)
The trend of growing investment into other UCITS was abruptly reversed in 2017 and direct bond
(as well as equity investments) rapidly rose to dominate in the portfolio structure of mandatory
pension funds. These sudden changes can be at least partially associated with regulatory changes.
However, since mid-2018, investments into UCITS, especially equity funds, started to gradually
grow again. This can be associated with the entry and increasing importance of passively managed
index funds, since at the time of writing of this report, all index funds in Estonia invest exclusively
into larger foreign index funds, rather than trying to replicate any index themselves. Money held by
investment funds in banks, either in current accounts or savings deposits, has decreased
significantly in the last five, likely due to negative interest rates.
Nominal, as well as real returns of mandatory pension funds in Estonia using a weighted average by
assets under management (AuM) are presented in a summary table below.
0
1.000.000
2.000.000
3.000.000
4.000.000
5.000.000
6.000.000
31
/12
/20
20
31
/12
/20
19
31
/12
/20
18
31
/12
/20
17
31
/12
/20
16
31
/12
/20
15
31
/12
/20
14
31
/12
/20
13
31
/12
/20
12
31
/12
/20
11
31
/12
/20
10
31
/12
/20
09
31
/12
/20
08
31
/12
/20
07
31
/12
/20
06
31
/12
/20
05
31
/12
/20
04
Equities
Units of other equity funds
Units of other investment funds
Bonds and other debt securities
Term deposits
Bank accounts
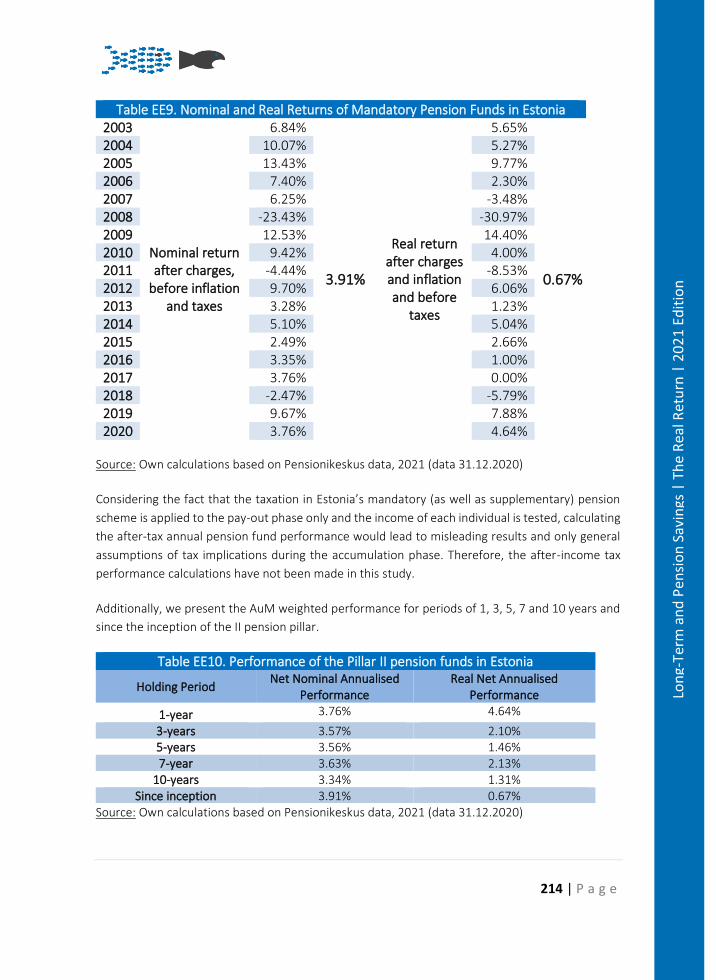
214 | P a g e
Lon
g-Te
rm a
nd
Pen
sio
n S
avin
gs |
Th
e R
eal R
etu
rn |
20
21
Edit
ion
Table EE9. Nominal and Real Returns of Mandatory Pension Funds in Estonia 2003
Nominal return after charges,
before inflation and taxes
6.84%
3.91%
Real return after charges and inflation and before
taxes
5.65%
0.67%
2004 10.07% 5.27% 2005 13.43% 9.77% 2006 7.40% 2.30% 2007 6.25% -3.48% 2008 -23.43% -30.97% 2009 12.53% 14.40% 2010 9.42% 4.00% 2011 -4.44% -8.53% 2012 9.70% 6.06% 2013 3.28% 1.23% 2014 5.10% 5.04% 2015 2.49% 2.66% 2016 3.35% 1.00% 2017 3.76% 0.00% 2018 -2.47% -5.79% 2019 9.67% 7.88% 2020 3.76% 4.64%
Source: Own calculations based on Pensionikeskus data, 2021 (data 31.12.2020)
Considering the fact that the taxation in Estonia’s mandatory (as well as supplementary) pension
scheme is applied to the pay-out phase only and the income of each individual is tested, calculating
the after-tax annual pension fund performance would lead to misleading results and only general
assumptions of tax implications during the accumulation phase. Therefore, the after-income tax
performance calculations have not been made in this study.
Additionally, we present the AuM weighted performance for periods of 1, 3, 5, 7 and 10 years and
since the inception of the II pension pillar.
Source: Own calculations based on Pensionikeskus data, 2021 (data 31.12.2020)
Table EE10. Performance of the Pillar II pension funds in Estonia
Holding Period Net Nominal Annualised
Performance Real Net Annualised
Performance
1-year 3.76% 4.64%
3-years 3.57% 2.10% 5-years 3.56% 1.46% 7-year 3.63% 2.13%
10-years 3.34% 1.31% Since inception 3.91% 0.67%
215 | P a g e
Lon
g-Te
rm a
nd
Pen
sio
n S
avin
gs |
Th
e R
eal R
etu
rn |
20
21
Edit
ion
Pillar III – Supplementary pension
When analysing the performance of supplementary pension vehicles, only the funds should be
considered. Insurance-based vehicles do not disclose this information on a periodical basis, as the
market risk is shifted onto the insurer.
Supplementary pension funds do differ in their strategy, mostly based on the volatility of their
portfolios. In most cases and compared to mandatory pension funds, the investment strategies of
supplementary pension funds’ portfolio managers are more aggressive. By large, the investment
strategies do allow having up to 100% of assets allocated into equities and equity-based structured
products. Some asset management companies have reacted to this and started to also offer
supplementary pension funds with a conservative strategy.
Broadly, the recent tendencies are the same for the supplementary pension fund market as for the
mandatory pension funds market, with more and more providers launching low costs, passively
managed “index” funds, with the only difference being that most providers were considerably
slower to launch supplementary index funds than mandatory ones. At the beginning of 2019, only
LHV was offering a supplementary index fund. However, since then, Swedbank has launched three
exit-restricted index funds, differing on the amount of equity exposure (named V100, V60 and V30,
with the number in each name indicating the maximum equity exposure), and both Tuleva and
Luminor launched supplementary index funds, named “Tuleva III Pillar fund” and “Luminor
Sustainable Future, Index fund” respectively. This leaves SEB bank as the only supplementary
pension fund provider in Estonia not to offer a III pillar index fund.
In addition, again much like in the mandatory funds market, investment funds marketing
themselves as “sustainable” have entered the market, with LHV launching its Green Pluss fund in
late 2020 and Luminor launching its own sustainable index fund (mentioned above) in early 2021.
In table EE11, the performance of supplementary pension funds is shown on a cumulative basis.
Returns are shown for funds for which at least two years of returns data is available, and the pension
funds are ranked according to the annualised real return since the inception of the fund.
The picture is relatively similar to that of mandatory pension fund returns. Those index funds
included in the table, those for which there were at least two years of return data available by the
end of 2020, occupy three out of the top-four slots in terms of average return since inception.
Again, it should be noted that the time horizon of these funds is too short to draw definitive
conclusions and that past performance does not guarantee future returns. However, the high fees
for many of the best performing, actively managed III pillar funds, as shown earlier in table EE6, will
make it difficult for these funds to keep up relatively high net returns in the long term, compared
to funds with similar strategies and lower fees.
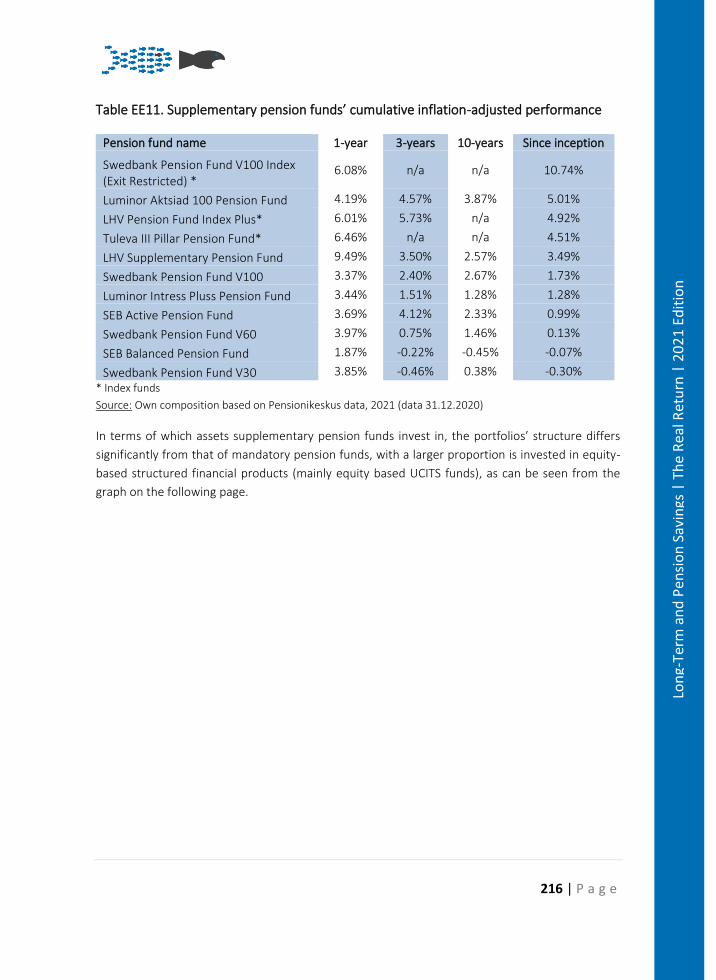
216 | P a g e
Lon
g-Te
rm a
nd
Pen
sio
n S
avin
gs |
Th
e R
eal R
etu
rn |
20
21
Edit
ion
Table EE11. Supplementary pension funds’ cumulative inflation-adjusted performance
Pension fund name 1-year 3-years 10-years Since inception
Swedbank Pension Fund V100 Index (Exit Restricted) *
6.08% n/a n/a 10.74%
Luminor Aktsiad 100 Pension Fund 4.19% 4.57% 3.87% 5.01%
LHV Pension Fund Index Plus* 6.01% 5.73% n/a 4.92%
Tuleva III Pillar Pension Fund* 6.46% n/a n/a 4.51%
LHV Supplementary Pension Fund 9.49% 3.50% 2.57% 3.49%
Swedbank Pension Fund V100 3.37% 2.40% 2.67% 1.73%
Luminor Intress Pluss Pension Fund 3.44% 1.51% 1.28% 1.28%
SEB Active Pension Fund 3.69% 4.12% 2.33% 0.99%
Swedbank Pension Fund V60 3.97% 0.75% 1.46% 0.13%
SEB Balanced Pension Fund 1.87% -0.22% -0.45% -0.07%
Swedbank Pension Fund V30 3.85% -0.46% 0.38% -0.30% * Index funds
Source: Own composition based on Pensionikeskus data, 2021 (data 31.12.2020)
In terms of which assets supplementary pension funds invest in, the portfolios’ structure differs
significantly from that of mandatory pension funds, with a larger proportion is invested in equity-
based structured financial products (mainly equity based UCITS funds), as can be seen from the
graph on the following page.
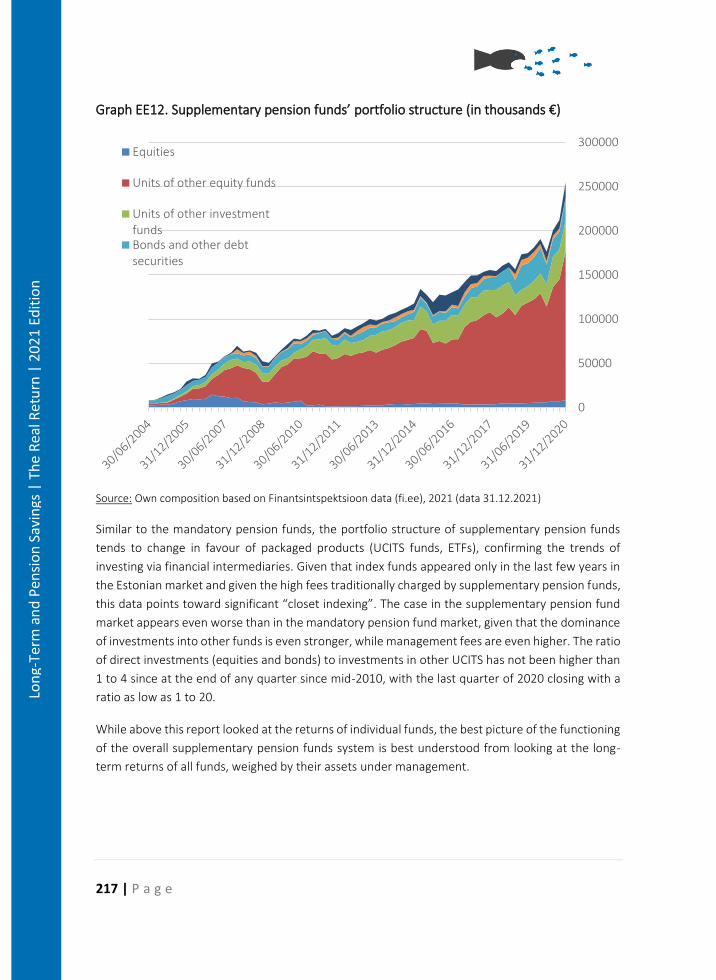
217 | P a g e
Lon
g-Te
rm a
nd
Pen
sio
n S
avin
gs |
Th
e R
eal R
etu
rn |
20
21
Edit
ion
Graph EE12. Supplementary pension funds’ portfolio structure (in thousands €)
Source: Own composition based on Finantsintspektsioon data (fi.ee), 2021 (data 31.12.2021)
Similar to the mandatory pension funds, the portfolio structure of supplementary pension funds
tends to change in favour of packaged products (UCITS funds, ETFs), confirming the trends of
investing via financial intermediaries. Given that index funds appeared only in the last few years in
the Estonian market and given the high fees traditionally charged by supplementary pension funds,
this data points toward significant “closet indexing”. The case in the supplementary pension fund
market appears even worse than in the mandatory pension fund market, given that the dominance
of investments into other funds is even stronger, while management fees are even higher. The ratio
of direct investments (equities and bonds) to investments in other UCITS has not been higher than
1 to 4 since at the end of any quarter since mid-2010, with the last quarter of 2020 closing with a
ratio as low as 1 to 20.
While above this report looked at the returns of individual funds, the best picture of the functioning
of the overall supplementary pension funds system is best understood from looking at the long-
term returns of all funds, weighed by their assets under management.
0
50000
100000
150000
200000
250000
300000Equities
Units of other equity funds
Units of other investmentfundsBonds and other debtsecurities
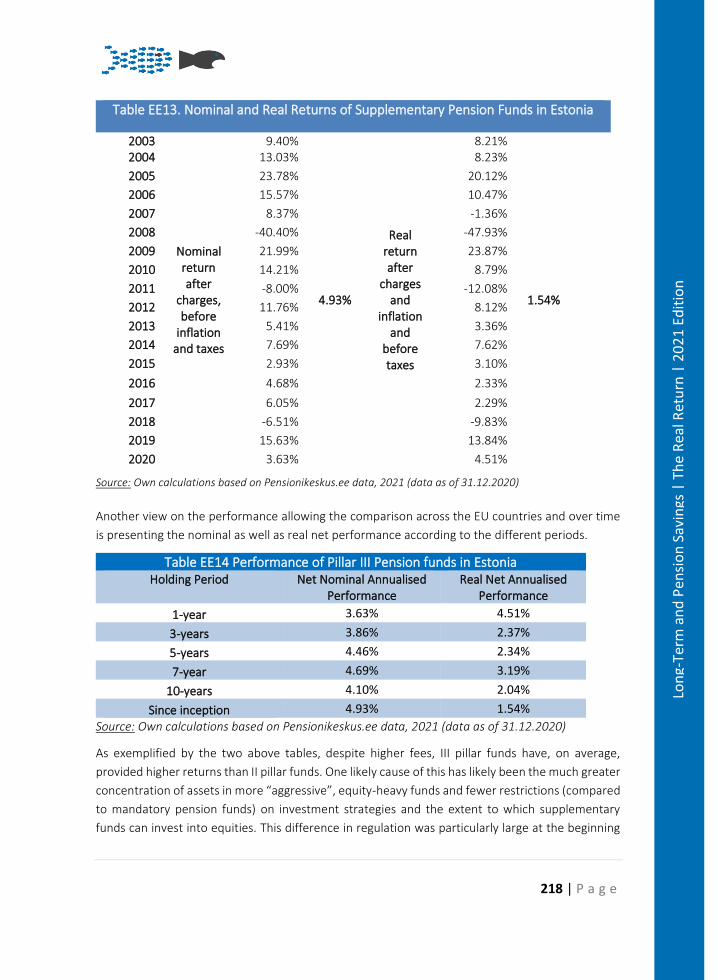
218 | P a g e
Lon
g-Te
rm a
nd
Pen
sio
n S
avin
gs |
Th
e R
eal R
etu
rn |
20
21
Edit
ion
Table EE13. Nominal and Real Returns of Supplementary Pension Funds in Estonia
2003
Nominal return after
charges, before
inflation and taxes
9.40%
4.93%
Real return after
charges and
inflation and
before taxes
8.21%
1.54%
2004 13.03% 8.23%
2005 23.78% 20.12%
2006 15.57% 10.47%
2007 8.37% -1.36%
2008 -40.40% -47.93%
2009 21.99% 23.87%
2010 14.21% 8.79%
2011 -8.00% -12.08%
2012 11.76% 8.12%
2013 5.41% 3.36%
2014 7.69% 7.62%
2015 2.93% 3.10%
2016 4.68% 2.33%
2017 6.05% 2.29%
2018 -6.51% -9.83%
2019 15.63% 13.84%
2020 3.63% 4.51%
Source: Own calculations based on Pensionikeskus.ee data, 2021 (data as of 31.12.2020)
Another view on the performance allowing the comparison across the EU countries and over time
is presenting the nominal as well as real net performance according to the different periods.
Table EE14 Performance of Pillar III Pension funds in Estonia Holding Period Net Nominal Annualised
Performance Real Net Annualised
Performance
1-year 3.63% 4.51%
3-years 3.86% 2.37%
5-years 4.46% 2.34%
7-year 4.69% 3.19%
10-years 4.10% 2.04%
Since inception 4.93% 1.54%
Source: Own calculations based on Pensionikeskus.ee data, 2021 (data as of 31.12.2020)
As exemplified by the two above tables, despite higher fees, III pillar funds have, on average,
provided higher returns than II pillar funds. One likely cause of this has likely been the much greater
concentration of assets in more “aggressive”, equity-heavy funds and fewer restrictions (compared
to mandatory pension funds) on investment strategies and the extent to which supplementary
funds can invest into equities. This difference in regulation was particularly large at the beginning
219 | P a g e
Lon
g-Te
rm a
nd
Pen
sio
n S
avin
gs |
Th
e R
eal R
etu
rn |
20
21
Edit
ion
of the multi-pillar pension system in Estonia but has been decreased gradually through subsequent
reforms of the II pillar.
Conclusions
Estonia, as an early pension system reformer, introduced in 2003 a typical multi-pillar pension
system that combines unfunded state schemes, as well as mandatory and voluntary fully funded
pillars. Different types of pension vehicles in Pillar II (as well as Pillar III) allow savers to choose from
a wide variety of investment strategies. Lower transparency in fee history contrasts with the high
transparency of performance disclosed on a daily basis. The exception is Pillar III insurance
contracts, where no information about performance or fees is publicly disclosed. This resulted in
an inability to confront the nominal as well as real returns of insurance contracts with other options
available to Estonian savers.
Performance volatility of most pension vehicles is relatively high. However, Estonian savers tend to
accept higher risk with regard to their savings. Pillar III vehicles are a typical example of highly
volatile pension vehicles. Yet after the financial crisis, pension asset management companies also
started to offer more conservative funds for Pillar III savers.
Concerning the pension funds’ portfolio structure, one trend is clear. Portfolio managers are
steadily replacing direct investments into bonds and equities with structured financial products.
Thus, the question of potential future returns when using financial intermediaries should be raised.
Most of the pension funds can be seen as passively managed, which raises the question of high
fees.
A new trend emerged in 2016 and continued into 2020 – the introduction of low-cost indexed
pension funds for both pension pillars, which could deliver higher value to savers due to lower
charges compared to peers. The competitive pressure from these new low-cost funds has led to an
overall decrease in fees for II pillar funds, which should increase the ability of the funds to deliver
above-benchmark performances to their clients in future years. Unfortunately, high fees still remain
a problem for pillar III funds.
Overall, achieving an adequate gross salary replacement ratio in retirement remains a challenge in
Estonia. Overcoming this challenge has perhaps been made more difficult by a recent reform that
allows savers to withdraw from the previously mandatory second pillar and liquidate any savings
they had accumulated in it.
220 | P a g e
Lon
g-Te
rm a
nd
Pen
sio
n S
avin
gs |
Th
e R
eal R
etu
rn |
20
21
Edit
ion
Bibliography
• Republic of Estonia. Funded Pensions Act [Online] Available in English:
https://www.riigiteataja.ee/en/eli/ee/Riigikogu/act/529042020002/consolide [Accessed
September 09, 2021]
• Republic of Estonia. Investment Funds Act [Online] Available in English:
https://www.riigiteataja.ee/en/eli/ee/504072017011/consolide [Accessed
September 09, 2021]
• Republic of Estonia. Income Tax Act [Online] Available in English:
https://www.riigiteataja.ee/en/eli/ee/531052021003/consolide/current [Accessed
August 30, 2021]
• Pensionikeskus AS – the central securities depository for the Estonian pillar II and III
pensions – www.pesnionikeskus.ee/en [Accessed September 30, 2021]
• Eurostat – https://ec.europa.eu/eurostat [Accessed September 01, 2021]
• Statistics Estonia – https://www.stat.ee/en [Accessed September 30, 2021]
• Finantsinspektsioon - Estonian Financial Supervision and Resolution Authority –
www.fi.ee [Accessed September 30, 2021]
221 | P a g e
Lon
g-Te
rm a
nd
Pen
sio
n S
avin
gs |
Th
e R
eal R
etu
rn |
20
21
Edit
ion
Pension Savings: The Real Return 2021 Edition
Country Case: France
Résumé
Le système français de retraite continue à reposer majoritairement sur les régimes d’assurance
vieillesse de base et complémentaire par répartition (Piliers I et II), avec un taux moyen de
remplacement du revenu d’activité de 65% en 2019,135 et une valeur totale des actifs représentant
11% du PIB en 2020.136 Malgré une allocation d’actifs plutôt dynamique, les plans d’épargne-
retraite entreprise ont eu un rendement annualisé réel de +1.3% en 2020 et +0.81% en 21 ans entre
2000-2020 (+18.5 en cumulé). L’assurance vie – le produit individuel de loin le plus utilisé pour
l’épargne retraite par les Français – a eu une performance très contrastée : +40,5% (+1,6% en
moyenne annuelle) pour les fonds en euros (à capital garanti) encore dominants, mais -13,9% (-
0,7%) pour les contrats en unités de compte qui sont davantage promus et se développent plus
rapidement. Les produits individuels dédiés spécifiquement à l’épargne retraite (PERP, Préfon,
Corem, etc.) sont beaucoup moins développés, et ont des performances plus opaques et le plus
souvent plus mauvaises.
Summary
The French pension system continues to rely heavily on the “pay as you go” mandatory Pillar I and
Pillar II income streams, with an aggregate replacement ratio for pensions of 65%,137 and a total
value of retirement assets of 11% of the French GDP in 2020.138 Despite a rather dynamic asset
allocation, corporate pension plans have a 20-year average annual real net return of +1.3% in 2020
and +0.81% annually in the 21 years between 2000-2020 (+18.5% cumulative). Life insurance
products - by far the most widely used personal product for pension purposes by French savers -
had very contrasted long term pre-tax real returns: +40.5% (+1.6% annual average) for the still
dominant capital guaranteed ones, but -13.9% (-0.7%) for the more promoted and faster growing
unit-linked ones, despite very positive listed stocks and bonds returns. The personal products
135 Voire Tableau GR9(B) du General Report, dans la section concernant la France - aggregate replacement ratio for pensions, selon les données d’Eurostat. 136 Voir Tableau GR10 du General Report, selon les données d’OECD Preliminary Data 2020 (2021). 137 See Table GR9(B) in the General Report, in the section concerning France – aggregate replacement ratio for pensions, according to Eurostat data. 138 See Table GR10 of the General Report, based on OECD Preliminary Data for 2020 (2021).
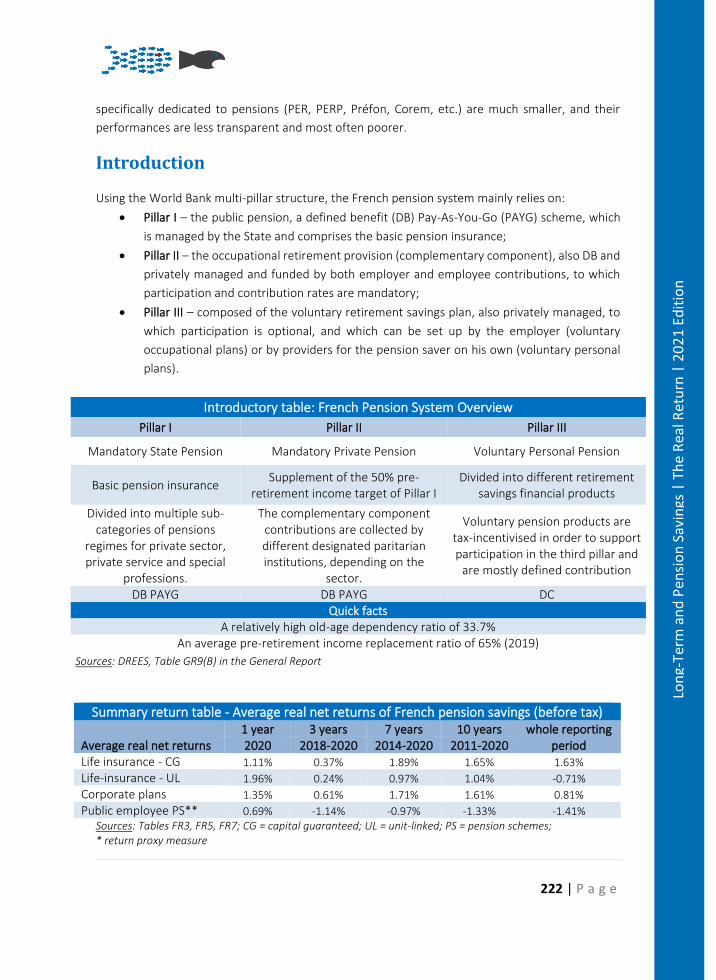
222 | P a g e
Lon
g-Te
rm a
nd
Pen
sio
n S
avin
gs |
Th
e R
eal R
etu
rn |
20
21
Edit
ion
specifically dedicated to pensions (PER, PERP, Préfon, Corem, etc.) are much smaller, and their
performances are less transparent and most often poorer.
Introduction
Using the World Bank multi-pillar structure, the French pension system mainly relies on:
• Pillar I – the public pension, a defined benefit (DB) Pay-As-You-Go (PAYG) scheme, which
is managed by the State and comprises the basic pension insurance;
• Pillar II – the occupational retirement provision (complementary component), also DB and
privately managed and funded by both employer and employee contributions, to which
participation and contribution rates are mandatory;
• Pillar III – composed of the voluntary retirement savings plan, also privately managed, to
which participation is optional, and which can be set up by the employer (voluntary
occupational plans) or by providers for the pension saver on his own (voluntary personal
plans).
Introductory table: French Pension System Overview
Pillar I Pillar II Pillar III
Mandatory State Pension Mandatory Private Pension Voluntary Personal Pension
Basic pension insurance Supplement of the 50% pre-
retirement income target of Pillar I Divided into different retirement
savings financial products
Divided into multiple sub-categories of pensions
regimes for private sector, private service and special
professions.
The complementary component contributions are collected by different designated paritarian institutions, depending on the
sector.
Voluntary pension products are tax-incentivised in order to support participation in the third pillar and
are mostly defined contribution
DB PAYG DB PAYG DC Quick facts
A relatively high old-age dependency ratio of 33.7% An average pre-retirement income replacement ratio of 65% (2019)
Sources: DREES, Table GR9(B) in the General Report
Summary return table - Average real net returns of French pension savings (before tax) 1 year 3 years 7 years 10 years whole reporting
period Average real net returns 2020 2018-2020 2014-2020 2011-2020 Life insurance - CG 1.11% 0.37% 1.89% 1.65% 1.63% Life-insurance - UL 1.96% 0.24% 0.97% 1.04% -0.71% Corporate plans 1.35% 0.61% 1.71% 1.61% 0.81% Public employee PS** 0.69% -1.14% -0.97% -1.33% -1.41%
Sources: Tables FR3, FR5, FR7; CG = capital guaranteed; UL = unit-linked; PS = pension schemes; * return proxy measure
223 | P a g e
Lon
g-Te
rm a
nd
Pen
sio
n S
avin
gs |
Th
e R
eal R
etu
rn |
20
21
Edit
ion
Pillar I
The French state pension system (Pillar I) is divided it into several sub-categories of pension regimes
for:
• Private sector employees;
• Public service; and
• Special professions (such as the army or hospital workers).
Each pension regime is further organised into two sub-components: (1) The base pension insurance,
which incorporates both the non-contributory pillar 0 and the defined benefit Pillar I to which all
employees and self-employed individuals must contribute; and (2) The complementary pension
insurance, which supplements the basic state pension allowance (Pillar II).
To benefit from the basic pension allowance (assurance vieillesse) of the French social insurance
system, a person must reach the standard retirement age, which is currently not the same for all
cohorts, thus birth-date dependent.139
The full pension entitlement from Pillar I is calculated by multiplying the mean annual gross
income,140 by the correction coefficient,141 and by the insurance coefficient, the latter being
calculated by dividing the total insured period (limited by a set ceiling in the form of a maximum
insurable period) by the maximum insurable period (thus, it cannot be higher than 1).142
Pillar II – occupational pensions
The French Pillar II is a mandatory defined benefit, PAYG and privately managed pension scheme,
designed to supplement the 50% pre-retirement income target of Pillar I.143
The complementary component contributions are collected by different designated paritarian
institutions, depending on the sector. The largest part of complementary mandatory contributions,
those for private sector employees, are collected and redistributed by AGIRC-ARRCO (employees’
pension regimes association). Employer and employee participation in Pillar II is mandatory and
usually set up through collective agreements.
139 The standard retirement age for the basic allowance and for the full pension entitlement starts at 60 and 65 years, respectively (for those born before 1951) and grows by 5-months for each later year of birth until 1954. This is to say, all persons born after 1 January 1954 have a standard retirement age of 62 years (for the minimum allowance) and 67 years old (for full entitlement) – see https://droit-finances.commentcamarche.com/contents/1163-age-de-depart-a-la-retraite-en-2018. 140 Which is the average of the highest 25 annual gross salaries. 141 The correction coefficient, in fact, referred to as a rate which can represent a maximum of 50% of the social security income limit. 142 CNAV, “Elements de calcul de la pension” https://www.statistiques-recherches.cnav.fr/les-elements-de-calcul-de-la-pension.html. 143 This is because, as indicated above, the full Pillar I pension entitlement at retirement is calculated by multiplying the average annual gross income and the insurance coefficient (which should be 1 in normal conditions) with a correction coefficient, which in normal conditions is set at 50%.
224 | P a g e
Lon
g-Te
rm a
nd
Pen
sio
n S
avin
gs |
Th
e R
eal R
etu
rn |
20
21
Edit
ion
In France, Pillar I and Pillar II should cover 100 % of employees receiving a salary.
Pillar III – voluntary occupational and personal plans
The third pillar of the French pension system is composed of the voluntary pension plans. It was
reformed in 2019, with the “PACTE” Law creating the “PER” (“Plan d’Epargne Retraite” or Pension
Savings Plan) divided into:
A. occupational PERs are:
• Collective corporate PERs (Corporate plans, for private sector employees at large,
which are set up by employers either through DC pension funds, which are
progressively replacing the existing “PERCOs”; employee participation is voluntary;
• “Mandatory” collective corporate PERs are insurance regulated PERs which are
mandatory for employees or a category of employees, once the employer has set it
up. They are replacing the existing PERE.
• Existing professional or sector-specific personal plans, such as the Contrats Madelin
(for self-employed), Madelin Agricole (for the agricultural sector) or the CRH (for
Public Health sector,) and Préfon (mainly accessible to public employees) have or will
be converted into individual PERs.144
B. Personal pension products unrelated to occupation
• Individual PER (People’s Retirement Saving Plans), sub-divided into insurance -
regulated contracts with capital guarantee (including Préfon and Corem, see below)
or linked to units in collective investment schemes (UCITS or AIFs), and into securities
accounts. The insurance regulated individual PERs are progressively replacing the
“PERPs” (“Plan d’Epargne Retraite Populaire” or ““People pension savings plan”) and
“Contrats Madelin” (for self-employed workers): the existing balances can be
transferred to PERs, and no new such plans can be opened since 1st October 2020.
The PER can be offered both by insurers and by banks / asset management companies, and pay-out
option will be free to choose between annuities and capital withdrawals. All PERs are freely
transferable to other PERs. However, the new law lifted the 15-year ban on inducements for unit-
linked personal pensions in order to try to boost their promotion. French savers organization
FAIDER estimates that this will cost pension savers at the very least €20 billion over the average life
of the PER contract145.
144 Fonpel, Carel-Mudel and RMC are special pension vehicles and not covered by this report. 145 Faider.org, 6 June 2019
225 | P a g e
Lon
g-Te
rm a
nd
Pen
sio
n S
avin
gs |
Th
e R
eal R
etu
rn |
20
21
Edit
ion
The new French Pension savings Plan (PER) default option
Interesting innovation: the one and only default option for the accumulation phase is one simple “life cycle” one:
The share of low investment risk assets is at a minimum:
- 20% of total assets of the plan starting 10 years from the liquidation date envisaged by the Plan participant;
- 50% starting 5 years from then; - 70% starting 2 years from then.
Voluntary pension products are tax-incentivised in order to support participation in the third pillar
and are mostly defined contribution.
Life insurance contracts and bank accounts still represent the two largest blocks of financial savings
products in portfolios held by French households. Total outstanding insurance-regulated savings
reached €2,132 billion in 2020, i.e., 38% of total financial savings. Direct bond holdings continued
to shrink to 0.7% of total.
Table FR 1. Financial assets of French households at the end of 2020 % of total financial savings 2020/2019
Currency and bank deposits 32.2% 4.9% Investment funds* 4.5% 7.6% Life insurance & pension funds 38.0% -2.3% Direct investments (direct holdings of bonds & shares ) 25.3% -3.6% Total 100.0%
* 11,9% when including "units" of insurance-regulated products Source: Banque de France
Pension Saving Vehicles
Life insurance contracts
Ordinary life insurance contracts are not specifically designed for pension purposes. However,
retirement is the main objective of French savers who subscribe to these insurance contracts, and
they are by far the main long-term financial savings products used in France.
From 2013 to 2020, contributions to unit-linked contracts rose more than those to “contrats en
euros” (capital guaranteed contracts – or misleadingly called “with profit policies” in the UK)) and
their share in total mathematical reserves increased from 17% to 23%146. This increase is due
146 BETTER FINANCE estimate, as, as of August 2, 2021, neither the French regulator nor the French Insurance Trade Association had released their key figures for the year 2020.
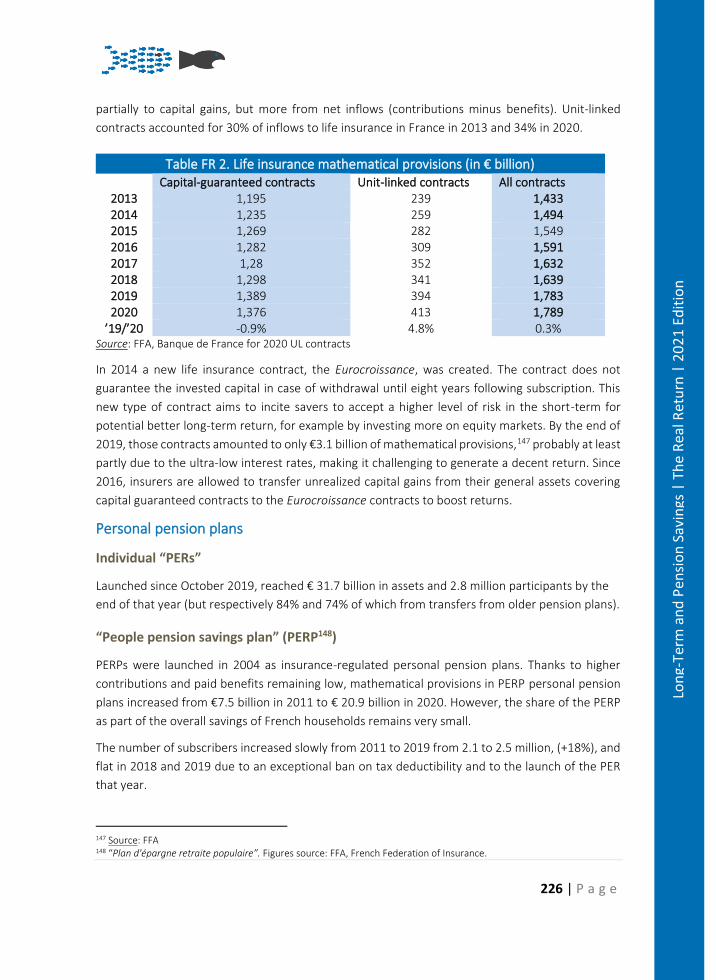
226 | P a g e
Lon
g-Te
rm a
nd
Pen
sio
n S
avin
gs |
Th
e R
eal R
etu
rn |
20
21
Edit
ion
partially to capital gains, but more from net inflows (contributions minus benefits). Unit-linked
contracts accounted for 30% of inflows to life insurance in France in 2013 and 34% in 2020.
Table FR 2. Life insurance mathematical provisions (in € billion)
Capital-guaranteed contracts Unit-linked contracts All contracts 2013 1,195 239 1,433 2014 1,235 259 1,494 2015 1,269 282 1,549 2016 1,282 309 1,591 2017 1,28 352 1,632 2018 1,298 341 1,639 2019 1,389 394 1,783 2020 1,376 413 1,789
’19/’20 -0.9% 4.8% 0.3% Source: FFA, Banque de France for 2020 UL contracts
In 2014 a new life insurance contract, the Eurocroissance, was created. The contract does not
guarantee the invested capital in case of withdrawal until eight years following subscription. This
new type of contract aims to incite savers to accept a higher level of risk in the short-term for
potential better long-term return, for example by investing more on equity markets. By the end of
2019, those contracts amounted to only €3.1 billion of mathematical provisions,147 probably at least
partly due to the ultra-low interest rates, making it challenging to generate a decent return. Since
2016, insurers are allowed to transfer unrealized capital gains from their general assets covering
capital guaranteed contracts to the Eurocroissance contracts to boost returns.
Personal pension plans
Individual “PERs”
Launched since October 2019, reached € 31.7 billion in assets and 2.8 million participants by the
end of that year (but respectively 84% and 74% of which from transfers from older pension plans).
“People pension savings plan” (PERP148)
PERPs were launched in 2004 as insurance-regulated personal pension plans. Thanks to higher
contributions and paid benefits remaining low, mathematical provisions in PERP personal pension
plans increased from €7.5 billion in 2011 to € 20.9 billion in 2020. However, the share of the PERP
as part of the overall savings of French households remains very small.
The number of subscribers increased slowly from 2011 to 2019 from 2.1 to 2.5 million, (+18%), and
flat in 2018 and 2019 due to an exceptional ban on tax deductibility and to the launch of the PER
that year.
147 Source: FFA 148 “Plan d'épargne retraite populaire”. Figures source: FFA, French Federation of Insurance.
227 | P a g e
Lon
g-Te
rm a
nd
Pen
sio
n S
avin
gs |
Th
e R
eal R
etu
rn |
20
21
Edit
ion
“Contrats Madelin” (for self-employed individuals)
Mathematical provisions related to “contrats retraite Madelin” decreased by 3.8% to 39 billion in
2020.149 There were 1.363 million outstanding contracts at the end of 2019 (+2.0%). The “contrats
Madelin” are widely used by self-employed individuals because the PAYG system is less generous
(and contributions lower) than for employees.
“Contrats Madelin agricole”
Mathematical provisions of “contrats Madelin agricole” (plan for persons working in the agricultural
sector) decreased by 1.6% in 2020 to € 6billion. 326,000 farmers had an open contract at the end
of 2018.
Personal pension products exempted from governance rules
All personal pension products in France have to be subscribed by savers associations in which the
participating pension savers are members of the General assembly, have the right to vote at the
general assembly, have the right to propose resolutions to the general assembly. However French
Law exempts the three biggest ones (Préfon, Corem and CRH) from all these governance rules
protecting pension savers’ rights. They could also transform themselves into PERs as soon as 2019
without requiring the approval of their participants as for any other pension savings product.
Préfon
Préfon is a deferred annuity plan open to all current and former public employees and their
spouses, had 399,500 participants at the end of 2019 (flat from 2018). Its assets under management
reached € 18.2 billion (market value) at the end of 2020, up from €17.3 billion at the end of 2019.
Corem
Corem is also a deferred annuity plan open to everyone but so far mainly subscribed to by civil
servants, had 380,674 participants at the end of 2020 (down from 397,515 in 2016). Its assets under
management grew from € 7.6 billion at the end of 2012 to € 11.3 billion (market value) at the end
of 2020150.
CRH
CRH (“Complementaire Retraite des Hospitaliers”), a deferred annuity plan151 open to all public
employees from the public health sector and their spouses, had 353,000 participants in 2019. Its
technical reserves amount to €3.3 billion in 2018.152 We could not find more precise publicly
available information.
149 Source: Federation Francaise de l’Assurance (FFA) 150 Combined participants and assets of Corem and other smaller pension plans managed by the same provider (UMR). 151 Rights acquired before mid-2008 do not provide annuities guaranteed for life, but only for 10 to 15 years. 152 Règlement intérieur CRH 2020 article 18.
228 | P a g e
Lon
g-Te
rm a
nd
Pen
sio
n S
avin
gs |
Th
e R
eal R
etu
rn |
20
21
Edit
ion
Collective deferred annuities
In total, mathematical reserves grew a little, from €118.8 billion to 130.4 billion from the end of
2017 to the end of 2020.
For insurance-regulated corporate defined contribution plans under “Article 83” of the French tax
code (“PER Entreprises” or PERE), mathematical reserves stood at € 69 billion at the end of 2020.
For insurance-regulated defined benefit plans (“Article 39” of the French tax code), mathematical
reserves stood at € 40 billion at the end of 2020.
Corporate long-term savings plans
The total assets of French defined contribution corporate savings plans (PEE153 + PERCO + collective
PER) increased by 1.5% in 2020 to € 147.0 billion. The number of members in those plans increased
to 11.2 million people in 2020.
The “Plan d’Epargne Retraite Collectif” (PERCO), exclusively dedicated to pension investments, is
still less “mature” than other pension plans as it started in 2004 but continues to grow quite rapidly.
Since October 2019, PERCOs have begun to be converted into the new “collective “PERs”. Assets
under management amounted to € 22.5 billion at the end of 2020 (+12.5% over 2019). 3.2 million
employees had a PERCO or collective PER at the end of 2020 and 172,000 companies propose this
type of plan to their employees.
PERCO and collective corporate PER are quite similar to the US Corporate pension plans (“401k”) in
their design. However, it is generally not invested in general purpose investment funds like UCITS,
but mostly in specifically dedicated French-domiciled alternative investment funds (AIFs) called
Fonds Communs de Placement d’Entreprise (FCPEs).
Charges: often opaque, high and rising
Available data on average annual charges for savings products are scarce in France.
• Investment funds – According to AMF154, Overall annual fees for equity funds were 1.55%
on assets, and 1.26% overall in 2019, and they would have gone down slightly from
previous years. However, these averages are not asset-weighted, and include both “retail”
and “institutional” funds. But the majority of investment funds offered to French retail
investors are via insurance contracts’ “units”. For equity funds offered via those, annual
total charges reached 2,03% on average in 2020 and even 2,28% for flexible funds155: much
153 PEE: « Plan d’épargne entreprise » is a corporate savings plan where savings are typically blocked for a minimum of five years. 154 La lettre de l'Observatoire de l'épargne de l'AMF - n° 42 – mars 2021 155 Good Value for Money, newsletter nr. 40, May 2020
229 | P a g e
Lon
g-Te
rm a
nd
Pen
sio
n S
avin
gs |
Th
e R
eal R
etu
rn |
20
21
Edit
ion
more expensive than the overall French fund market estimated by AMF. But the full “units”
cost for the majority of retail investors was even higher: respectively 2,93% and 3,18%,
when including the annual wrapper charge. These charges are very high: the average
ongoing fund charge for all UK domiciled active funds (both equity funds and all other
funds) was only 0.92 % in 2015 (1.38% for retail funds and 0.69% for institutional ones).156
• Insurance capital-guaranteed contracts (“fonds en euros”) - Since2018, the Supervisor
ACPR publishes their annual average charge, based on a sample of 92 insurers: 0.62% of
assets for 2020157, but that does not include:
o profit sharing taken by insurers (0.31% in 2019158),
o underlying fund fees
o and the impact of any entry and exit fees.
• Unit-linked insurance contracts - Neither ACPR nor the industry trade body disclose any
information on their total charges, which cumulate at least two annual fees: the units’
(investment funds) charges plus those of the wrapper contract itself. Contract fees alone
account for 0,90% to 0.95% in fees on average per annum on assets according to private
surveys159.Overall, for unit-linked insurance contracts invested in equity funds, the total
average fees are estimated at 2.93% per annum, 2.08% when invested in bond funds, and
3,18% when invested in flexible multi asset funds160. Multi asset funds and equity funds
combined account for about 70% of all funds in French unit-linked contracts161. The
majority of investment funds held by French households are through these unit-linked
insurance contracts. These actual total annual charges are never disclosed to prospects
and retail clients either.
And these fees do not include the “delegated management” fees which are growing as
more and more savers are directed by insurers and distributors to this “delegated
management” in unit-linked contracts. There are not aggregate data on the amount of this
additional asset-based fees, but it is often and additional 0,30% or more every year on
assets.
156 UK Financial Conduct Authority – Asset Management Market Study, November 2016 https://www.fca.org.uk/publication/market-studies/ms15-2-2-interim-report.pdf 157 ACPR, 2021 158 Source: ACPR, 2020 (did not publish the data for 2020) 159 Dossiers de l’épargne n°152, 2014. A more recent evaluation from Goodvalueformoney.eu (2020) mentions 0,90% but on the rise as newer contracts tend to charge 1,00% or more. 160 Good Value for Money, newsletter nr. 40, May 2020 161 AMF, cartographie des risques, 2021
230 | P a g e
Lon
g-Te
rm a
nd
Pen
sio
n S
avin
gs |
Th
e R
eal R
etu
rn |
20
21
Edit
ion
The total average fees of around 3% per year or more also seem to be rising further. For
example, the biggest life insurance subscribing association announced in 2019 an increase
of its units-linked contract annual fees by 35 basis points162.
• Personal and occupational pension plans - There are very few data available on their
charges as well as for corporate DC plans. When available, the data tell us that they are on
average rather high. For example, Préfon charged 0.54% on assets for asset management
plus 3.90% entry fee in 20120 For unit-linked personal pension products, the French
government has lifted the 15-year ban on commissions in 2019, when deciding to end
“PERPs” for “PERs” (see above, previous sections). This massively increases their charges.
FAIDER estimates the cost impact for French pension savers to be a minimum of € 20
billion over the life of these personal pension plans163. A recent study of the National Public
Advisory Committee CCSF164 estimates that the annual ongoing costs of the new equity
“units” are alone close to 3%, of which close to 0,90 % are coming from commissions
(“inducements”). This represents an increase of more than 40% in annual charges for the
new PER compared to its PERP predecessor, for which commissions on “units” if any have
to be credited back to the PERP itself, i.e., to its participants.
This average annual fees of around 3% compares very unfavourably with the annual 1%
fee cap of the basic option of the future PEPP (“Pan-European Personal Pension) created
by the EU, and with the annual total charges of US IRAs (Individual Retirement Accounts,
which are very often well below 1%.
The CCSF report also points to the opacity on these total annual charges and recommends
the public disclosure of total annual charges of pension unit-linked PERs, i.e., the sum of
the underlying “units’ costs and the wrapper fee. This had been obtained by FAIDER back
in 2005 but this disclosure rule was repealed two years later by the French Authorities.
Since 2018, the French Supervisor ACPR publishes the average annual charges for the
capital guaranteed funds in the personal and occupational insurance regulated pension
products: 0.47% for 2020. But, like for life insurance, this does not include the profit
sharing for the provider (0.24% on average in 2018), the underlying fund fees and the
impact of entry and exit fees. Exit fees can be very heavy on annuities, typically 1 to 3% of
their amounts.
Taxation
For PERs, PERPs and Public Employee schemes (Préfon, Corem, CRH), contributions are deductible
from taxable income up to 10% of total professional income with a tax deduction ceiling (€41,136
162 Afer.fr, 2019 163 Faider.org, June 2019 164 CCSF – Rapport sur les nouveaux plans d’épargne retraite, July 2021
231 | P a g e
Lon
g-Te
rm a
nd
Pen
sio
n S
avin
gs |
Th
e R
eal R
etu
rn |
20
21
Edit
ion
in 2021). For Madelin contracts, the ceiling is higher. Annuities are taxable like pensions with a 10%
fixed haircut (with a ceiling of € 3,850 in 2021). They are also subject to a social contribution,
currently limited to 9,10% (7.4% in 2017). In some cases, capital withdrawals from PERPs are
allowed up to a 20% maximum of total pension rights. In those cases, the current taxation is 7.5%
income tax plus social contributions of 17.2%.
Since August 2012, the taxation of employers’ contributions to corporate savings plans (PEE and
PERCO) and defined contribution plans (“Article 83”) increased from 8% to 20% (with some
exceptions).
The general rise in taxation of savings also impacted life insurance. In 2012 the rate of “social
contributions” increased from 13.5% to 15.5%165, and again in 2018 to 17.2%.
The taxation of all long-term financial savings has again been globally increased from 2018 on, with
the creation of the “PFU” or “flat tax”. It amounts to 30% for most investment income except for
life insurance contracts after eight years (24.7%, or 17.2% for annual divestments below € 4,600 for
an individual, and below € 9,200 for a couple). And direct long-term investments in equities are no
longer taxed at a lower rate than short term ones: the negative impact of inflation on long term
investment values is no longer taken into account except for real estate investments.
On the other hand, the wealth tax has been abrogated on all financial assets from 2018 on (but not
on real estate).
Pension Returns166
Shares and bonds (direct investment in securities)
In 2020, the French equity market (dividends reinvested) suffered the impact of the covid crisis: -
4%% (CAC all tradable GR index). Over the last 21 years (end 1999 to end 2020), it returned a total
of +115% % (+3,7% annual average), while large capitalisations (CAC 40 index, dividends reinvested
as well) returned notably less, +83% (2.9% annual average), demonstrating the very strong over-
performance of small and mid-cap equities. Inflation over the same period was 37% (1.5% annual
average). So, despite two sharp downturns (2000-2002 and 2007-2008) plus other drops in 2011,
2018 and 2020, French equities delivered positive nominal and real returns over the whole period.
However, the real (after inflation) performance of the most liquid stocks (CAC40) started to be
positive only since 2015.
165 Loi de Finance rectificative du 29 Février 2012: LOI n° 2012-354 du 14 mars 2012 de finances rectificative pour 2012 166 Real Returns in the French case are calculated using Eurostat French HICP monthly index annual rate of change (December to December)
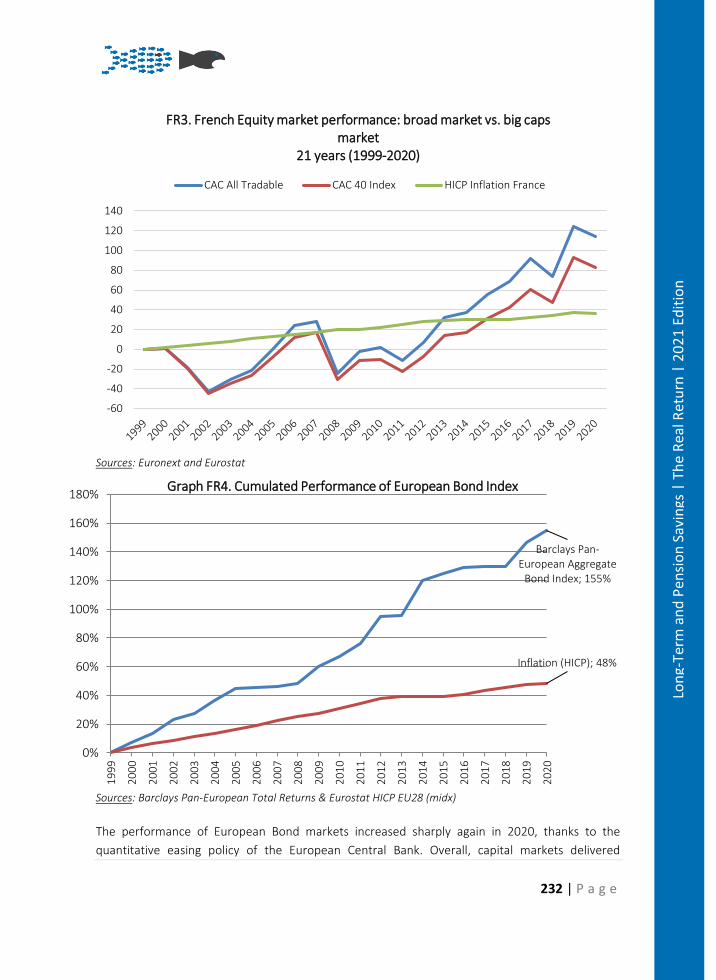
232 | P a g e
Lon
g-Te
rm a
nd
Pen
sio
n S
avin
gs |
Th
e R
eal R
etu
rn |
20
21
Edit
ion
Sources: Euronext and Eurostat
Sources: Barclays Pan-European Total Returns & Eurostat HICP EU28 (midx)
The performance of European Bond markets increased sharply again in 2020, thanks to the
quantitative easing policy of the European Central Bank. Overall, capital markets delivered
-60
-40
-20
0
20
40
60
80
100
120
140
FR3. French Equity market performance: broad market vs. big caps market
21 years (1999-2020)
CAC All Tradable CAC 40 Index HICP Inflation France
Barclays Pan-European Aggregate
Bond Index; 155%
Inflation (HICP); 48%
0%
20%
40%
60%
80%
100%
120%
140%
160%
180%
19
99
20
00
20
01
20
02
20
03
20
04
20
05
20
06
20
07
20
08
20
09
20
10
20
11
20
12
20
13
20
14
20
15
20
16
20
17
20
18
20
19
20
20
Graph FR4. Cumulated Performance of European Bond Index
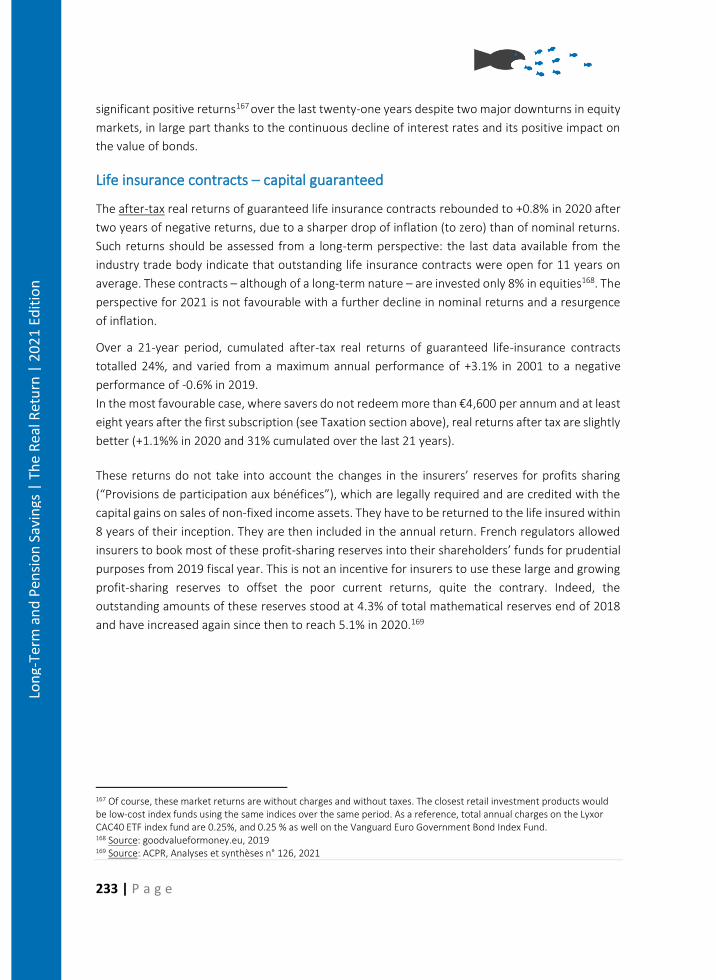
233 | P a g e
Lon
g-Te
rm a
nd
Pen
sio
n S
avin
gs |
Th
e R
eal R
etu
rn |
20
21
Edit
ion
significant positive returns167 over the last twenty-one years despite two major downturns in equity
markets, in large part thanks to the continuous decline of interest rates and its positive impact on
the value of bonds.
Life insurance contracts – capital guaranteed
The after-tax real returns of guaranteed life insurance contracts rebounded to +0.8% in 2020 after
two years of negative returns, due to a sharper drop of inflation (to zero) than of nominal returns.
Such returns should be assessed from a long-term perspective: the last data available from the
industry trade body indicate that outstanding life insurance contracts were open for 11 years on
average. These contracts – although of a long-term nature – are invested only 8% in equities168. The
perspective for 2021 is not favourable with a further decline in nominal returns and a resurgence
of inflation.
Over a 21-year period, cumulated after-tax real returns of guaranteed life-insurance contracts
totalled 24%, and varied from a maximum annual performance of +3.1% in 2001 to a negative
performance of -0.6% in 2019.
In the most favourable case, where savers do not redeem more than €4,600 per annum and at least
eight years after the first subscription (see Taxation section above), real returns after tax are slightly
better (+1.1%% in 2020 and 31% cumulated over the last 21 years).
These returns do not take into account the changes in the insurers’ reserves for profits sharing
(“Provisions de participation aux bénéfices”), which are legally required and are credited with the
capital gains on sales of non-fixed income assets. They have to be returned to the life insured within
8 years of their inception. They are then included in the annual return. French regulators allowed
insurers to book most of these profit-sharing reserves into their shareholders’ funds for prudential
purposes from 2019 fiscal year. This is not an incentive for insurers to use these large and growing
profit-sharing reserves to offset the poor current returns, quite the contrary. Indeed, the
outstanding amounts of these reserves stood at 4.3% of total mathematical reserves end of 2018
and have increased again since then to reach 5.1% in 2020.169
167 Of course, these market returns are without charges and without taxes. The closest retail investment products would be low-cost index funds using the same indices over the same period. As a reference, total annual charges on the Lyxor CAC40 ETF index fund are 0.25%, and 0.25 % as well on the Vanguard Euro Government Bond Index Fund. 168 Source: goodvalueformoney.eu, 2019 169 Source: ACPR, Analyses et synthèses n° 126, 2021
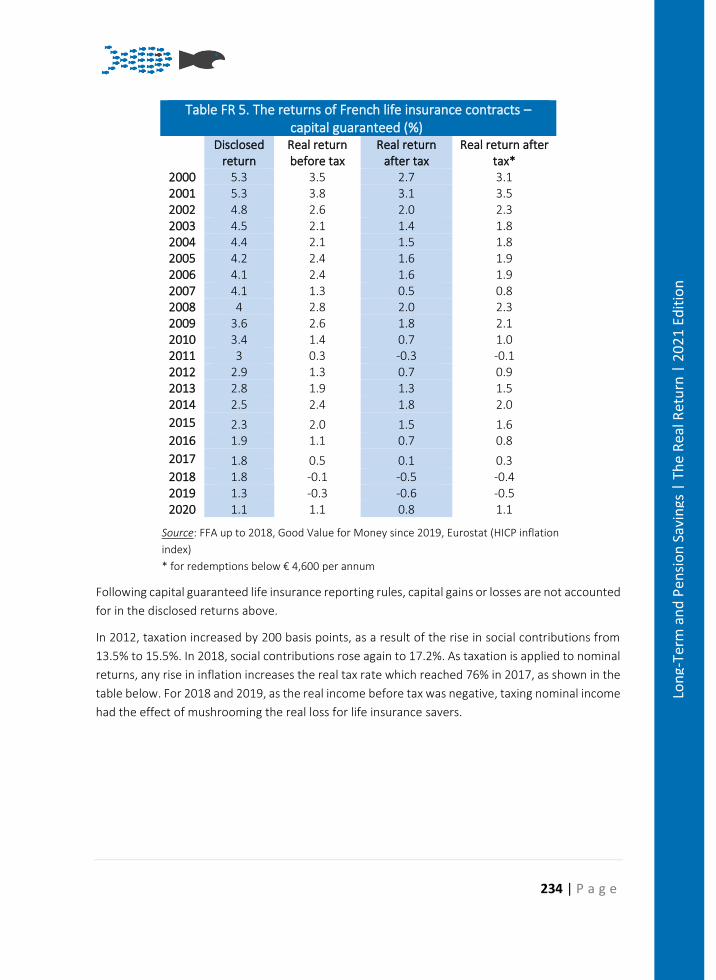
234 | P a g e
Lon
g-Te
rm a
nd
Pen
sio
n S
avin
gs |
Th
e R
eal R
etu
rn |
20
21
Edit
ion
Table FR 5. The returns of French life insurance contracts – capital guaranteed (%)
Disclosed
return Real return before tax
Real return after tax
Real return after tax*
2000 5.3 3.5 2.7 3.1 2001 5.3 3.8 3.1 3.5 2002 4.8 2.6 2.0 2.3 2003 4.5 2.1 1.4 1.8 2004 4.4 2.1 1.5 1.8 2005 4.2 2.4 1.6 1.9 2006 4.1 2.4 1.6 1.9 2007 4.1 1.3 0.5 0.8 2008 4 2.8 2.0 2.3 2009 3.6 2.6 1.8 2.1 2010 3.4 1.4 0.7 1.0 2011 3 0.3 -0.3 -0.1 2012 2.9 1.3 0.7 0.9 2013 2.8 1.9 1.3 1.5 2014 2.5 2.4 1.8 2.0
2015 2.3 2.0 1.5 1.6 2016 1.9 1.1 0.7 0.8
2017 1.8 0.5 0.1 0.3 2018 1.8 -0.1 -0.5 -0.4 2019 1.3 -0.3 -0.6 -0.5 2020 1.1 1.1 0.8 1.1
Source: FFA up to 2018, Good Value for Money since 2019, Eurostat (HICP inflation
index)
* for redemptions below € 4,600 per annum
Following capital guaranteed life insurance reporting rules, capital gains or losses are not accounted
for in the disclosed returns above.
In 2012, taxation increased by 200 basis points, as a result of the rise in social contributions from
13.5% to 15.5%. In 2018, social contributions rose again to 17.2%. As taxation is applied to nominal
returns, any rise in inflation increases the real tax rate which reached 76% in 2017, as shown in the
table below. For 2018 and 2019, as the real income before tax was negative, taxing nominal income
had the effect of mushrooming the real loss for life insurance savers.
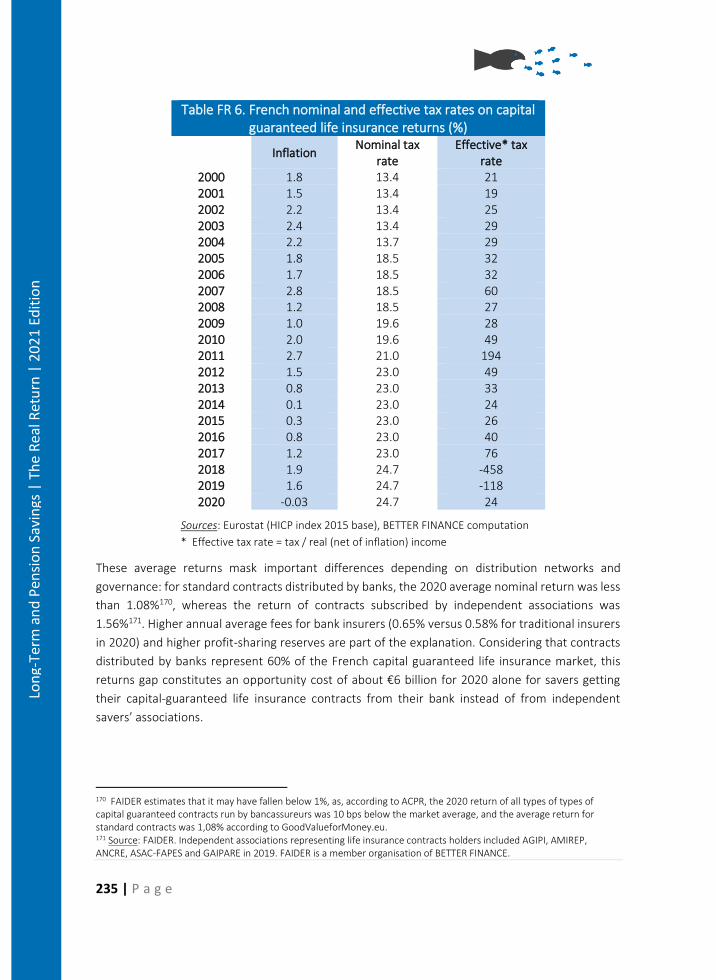
235 | P a g e
Lon
g-Te
rm a
nd
Pen
sio
n S
avin
gs |
Th
e R
eal R
etu
rn |
20
21
Edit
ion
Table FR 6. French nominal and effective tax rates on capital guaranteed life insurance returns (%)
Inflation Nominal tax
rate Effective* tax
rate 2000 1.8 13.4 21 2001 1.5 13.4 19 2002 2.2 13.4 25 2003 2.4 13.4 29 2004 2.2 13.7 29 2005 1.8 18.5 32 2006 1.7 18.5 32 2007 2.8 18.5 60 2008 1.2 18.5 27 2009 1.0 19.6 28 2010 2.0 19.6 49 2011 2.7 21.0 194 2012 1.5 23.0 49 2013 0.8 23.0 33 2014 0.1 23.0 24 2015 0.3 23.0 26 2016 0.8 23.0 40 2017 1.2 23.0 76 2018 1.9 24.7 -458 2019 1.6 24.7 -118 2020 -0.03 24.7 24
Sources: Eurostat (HICP index 2015 base), BETTER FINANCE computation
* Effective tax rate = tax / real (net of inflation) income
These average returns mask important differences depending on distribution networks and
governance: for standard contracts distributed by banks, the 2020 average nominal return was less
than 1.08%170, whereas the return of contracts subscribed by independent associations was
1.56%171. Higher annual average fees for bank insurers (0.65% versus 0.58% for traditional insurers
in 2020) and higher profit-sharing reserves are part of the explanation. Considering that contracts
distributed by banks represent 60% of the French capital guaranteed life insurance market, this
returns gap constitutes an opportunity cost of about €6 billion for 2020 alone for savers getting
their capital-guaranteed life insurance contracts from their bank instead of from independent
savers’ associations.
170 FAIDER estimates that it may have fallen below 1%, as, according to ACPR, the 2020 return of all types of types of capital guaranteed contracts run by bancassureurs was 10 bps below the market average, and the average return for standard contracts was 1,08% according to GoodValueforMoney.eu. 171 Source: FAIDER. Independent associations representing life insurance contracts holders included AGIPI, AMIREP, ANCRE, ASAC-FAPES and GAIPARE in 2019. FAIDER is a member organisation of BETTER FINANCE.
236 | P a g e
Lon
g-Te
rm a
nd
Pen
sio
n S
avin
gs |
Th
e R
eal R
etu
rn |
20
21
Edit
ion
Sources: Own composition based on FAIDER, ACPR, FFA and GVfM data
Life insurance contracts – unit-linked
Nominal returns were pushed upwards by the rise in stock prices from 2012 to 2017 and 2019,
against the background of declining inflation. Despite this current long period of positive equity
returns, unit-linked contracts still have a very negative cumulative return net of inflation since the
end of 1999 (see next section and table FR9).
Over a 21-year period, real returns after tax of unit-linked life-insurance contracts were very
volatile. The worst performance was recorded in 2008 (-23.9%) and the best one in the following
year (+12.2% in 2009).
0,00%
0,50%
1,00%
1,50%
2,00%
2,50%
3,00%
3,50%
4,00%
4,50%
2009 2010 2011 2012 2013 2014 2015 2016 2017 2018 2019 2020
Graph FR7. Nominal returns - all contracts versus independent life insurance associations
Independent associations All contracts Bank contracts Inflation
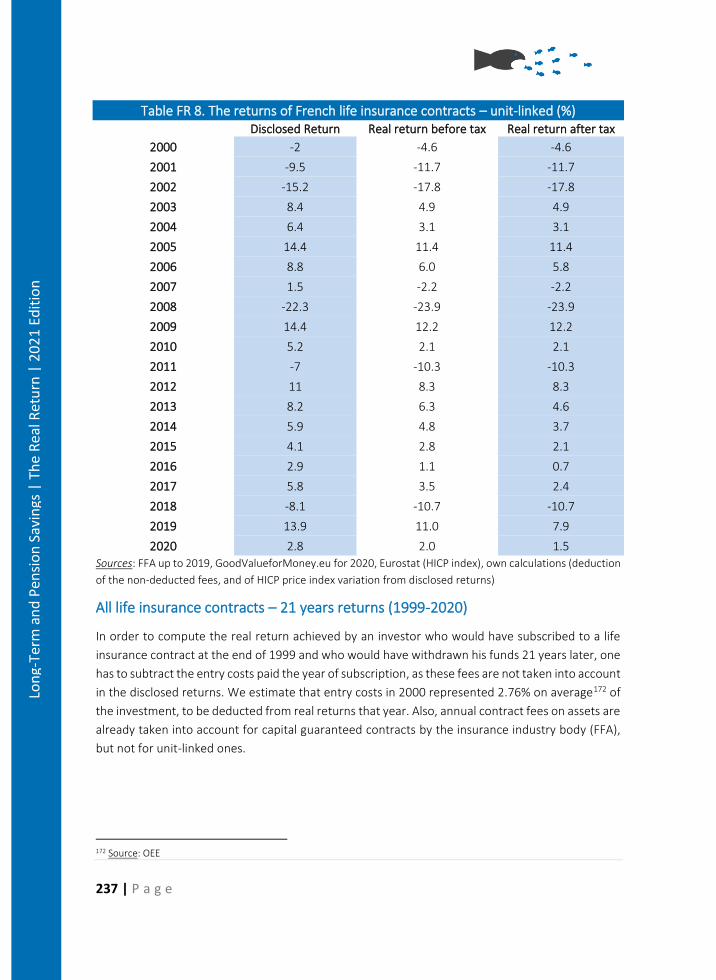
237 | P a g e
Lon
g-Te
rm a
nd
Pen
sio
n S
avin
gs |
Th
e R
eal R
etu
rn |
20
21
Edit
ion
Table FR 8. The returns of French life insurance contracts – unit-linked (%) Disclosed Return Real return before tax Real return after tax
2000 -2 -4.6 -4.6
2001 -9.5 -11.7 -11.7
2002 -15.2 -17.8 -17.8
2003 8.4 4.9 4.9
2004 6.4 3.1 3.1
2005 14.4 11.4 11.4
2006 8.8 6.0 5.8
2007 1.5 -2.2 -2.2
2008 -22.3 -23.9 -23.9
2009 14.4 12.2 12.2
2010 5.2 2.1 2.1
2011 -7 -10.3 -10.3
2012 11 8.3 8.3
2013 8.2 6.3 4.6
2014 5.9 4.8 3.7
2015 4.1 2.8 2.1
2016 2.9 1.1 0.7
2017 5.8 3.5 2.4
2018 -8.1 -10.7 -10.7
2019 13.9 11.0 7.9
2020 2.8 2.0 1.5
Sources: FFA up to 2019, GoodValueforMoney.eu for 2020, Eurostat (HICP index), own calculations (deduction
of the non-deducted fees, and of HICP price index variation from disclosed returns)
All life insurance contracts – 21 years returns (1999-2020)
In order to compute the real return achieved by an investor who would have subscribed to a life
insurance contract at the end of 1999 and who would have withdrawn his funds 21 years later, one
has to subtract the entry costs paid the year of subscription, as these fees are not taken into account
in the disclosed returns. We estimate that entry costs in 2000 represented 2.76% on average172 of
the investment, to be deducted from real returns that year. Also, annual contract fees on assets are
already taken into account for capital guaranteed contracts by the insurance industry body (FFA),
but not for unit-linked ones.
172 Source: OEE
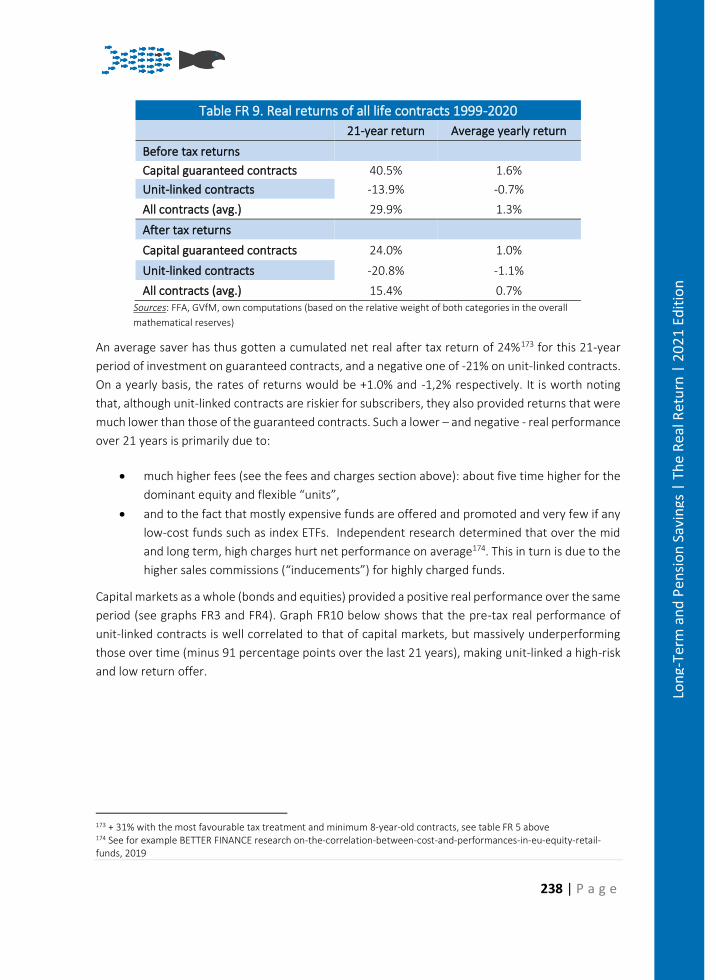
238 | P a g e
Lon
g-Te
rm a
nd
Pen
sio
n S
avin
gs |
Th
e R
eal R
etu
rn |
20
21
Edit
ion
Table FR 9. Real returns of all life contracts 1999-2020
21-year return Average yearly return
Before tax returns
Capital guaranteed contracts 40.5% 1.6%
Unit-linked contracts -13.9% -0.7%
All contracts (avg.) 29.9% 1.3%
After tax returns
Capital guaranteed contracts 24.0% 1.0%
Unit-linked contracts -20.8% -1.1%
All contracts (avg.) 15.4% 0.7% Sources: FFA, GVfM, own computations (based on the relative weight of both categories in the overall
mathematical reserves)
An average saver has thus gotten a cumulated net real after tax return of 24%173 for this 21-year
period of investment on guaranteed contracts, and a negative one of -21% on unit-linked contracts.
On a yearly basis, the rates of returns would be +1.0% and -1,2% respectively. It is worth noting
that, although unit-linked contracts are riskier for subscribers, they also provided returns that were
much lower than those of the guaranteed contracts. Such a lower – and negative - real performance
over 21 years is primarily due to:
• much higher fees (see the fees and charges section above): about five time higher for the
dominant equity and flexible “units”,
• and to the fact that mostly expensive funds are offered and promoted and very few if any
low-cost funds such as index ETFs. Independent research determined that over the mid
and long term, high charges hurt net performance on average174. This in turn is due to the
higher sales commissions (“inducements”) for highly charged funds.
Capital markets as a whole (bonds and equities) provided a positive real performance over the same
period (see graphs FR3 and FR4). Graph FR10 below shows that the pre-tax real performance of
unit-linked contracts is well correlated to that of capital markets, but massively underperforming
those over time (minus 91 percentage points over the last 21 years), making unit-linked a high-risk
and low return offer.
173 + 31% with the most favourable tax treatment and minimum 8-year-old contracts, see table FR 5 above 174 See for example BETTER FINANCE research on-the-correlation-between-cost-and-performances-in-eu-equity-retail-funds, 2019
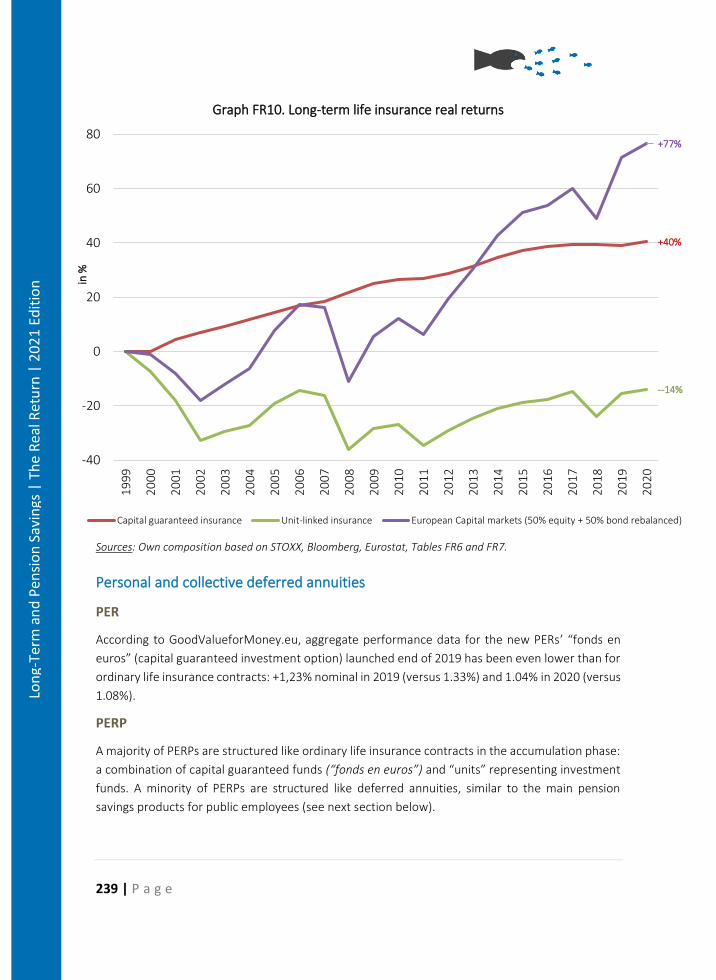
239 | P a g e
Lon
g-Te
rm a
nd
Pen
sio
n S
avin
gs |
Th
e R
eal R
etu
rn |
20
21
Edit
ion
Graph FR10. Long-term life insurance real returns
Sources: Own composition based on STOXX, Bloomberg, Eurostat, Tables FR6 and FR7.
Personal and collective deferred annuities
PER
According to GoodValueforMoney.eu, aggregate performance data for the new PERs’ “fonds en
euros” (capital guaranteed investment option) launched end of 2019 has been even lower than for
ordinary life insurance contracts: +1,23% nominal in 2019 (versus 1.33%) and 1.04% in 2020 (versus
1.08%).
PERP
A majority of PERPs are structured like ordinary life insurance contracts in the accumulation phase:
a combination of capital guaranteed funds (“fonds en euros”) and “units” representing investment
funds. A minority of PERPs are structured like deferred annuities, similar to the main pension
savings products for public employees (see next section below).
+40%
--14%
+77%
-40
-20
0
20
40
60
801
99
9
20
00
20
01
20
02
20
03
20
04
20
05
20
06
20
07
20
08
20
09
20
10
20
11
20
12
20
13
20
14
20
15
20
16
20
17
20
18
20
19
20
20
in %
Capital guaranteed insurance Unit-linked insurance European Capital markets (50% equity + 50% bond rebalanced)
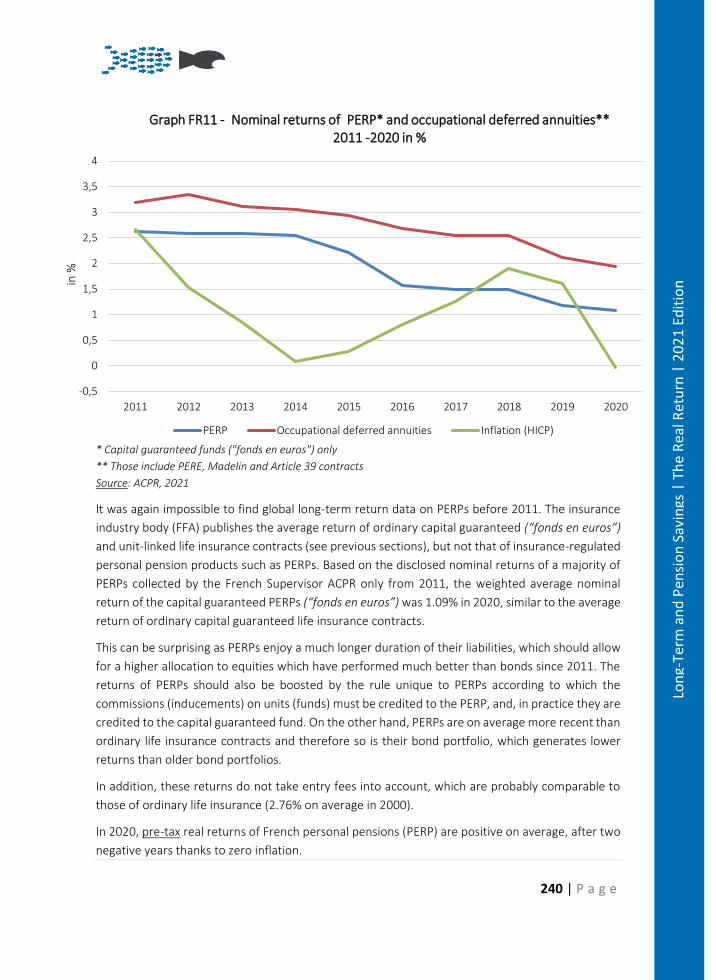
240 | P a g e
Lon
g-Te
rm a
nd
Pen
sio
n S
avin
gs |
Th
e R
eal R
etu
rn |
20
21
Edit
ion
* Capital guaranteed funds ("fonds en euros") only
** Those include PERE, Madelin and Article 39 contracts
Source: ACPR, 2021
It was again impossible to find global long-term return data on PERPs before 2011. The insurance
industry body (FFA) publishes the average return of ordinary capital guaranteed (“fonds en euros”)
and unit-linked life insurance contracts (see previous sections), but not that of insurance-regulated
personal pension products such as PERPs. Based on the disclosed nominal returns of a majority of
PERPs collected by the French Supervisor ACPR only from 2011, the weighted average nominal
return of the capital guaranteed PERPs (“fonds en euros”) was 1.09% in 2020, similar to the average
return of ordinary capital guaranteed life insurance contracts.
This can be surprising as PERPs enjoy a much longer duration of their liabilities, which should allow
for a higher allocation to equities which have performed much better than bonds since 2011. The
returns of PERPs should also be boosted by the rule unique to PERPs according to which the
commissions (inducements) on units (funds) must be credited to the PERP, and, in practice they are
credited to the capital guaranteed fund. On the other hand, PERPs are on average more recent than
ordinary life insurance contracts and therefore so is their bond portfolio, which generates lower
returns than older bond portfolios.
In addition, these returns do not take entry fees into account, which are probably comparable to
those of ordinary life insurance (2.76% on average in 2000).
In 2020, pre-tax real returns of French personal pensions (PERP) are positive on average, after two
negative years thanks to zero inflation.
-0,5
0
0,5
1
1,5
2
2,5
3
3,5
4
2011 2012 2013 2014 2015 2016 2017 2018 2019 2020
in %
Graph FR11 - Nominal returns of PERP* and occupational deferred annuities** 2011 -2020 in %
PERP Occupational deferred annuities Inflation (HICP)
241 | P a g e
Lon
g-Te
rm a
nd
Pen
sio
n S
avin
gs |
Th
e R
eal R
etu
rn |
20
21
Edit
ion
Madelin, PERE and Article 39
The nominal returns of occupational deferred annuities were much higher (1.94% in 2020) and did
not decline as much as for PERPs. This could be explained by older fixed income portfolios yielding
higher rates, and by higher discount rates (“taux techniques”) forcing insurers to deliver higher
returns. Charges may also be lower than for PERPs, but cost data are missing specifically for these
pension products. Since 2018, the French supervisor ACPR publishes the average annual cost
0.47%in 2020) but that is for all personal and collective differed annuity products combined.
Unfortunately, it does not currently identify separately the historical returns and costs of the
pensions products for self-employed individuals (“Madelin” - most of which are subscribed and
supervised by independent pension saver associations), from the employer-sponsored DC plans
(“PERE”) and DB plans (“article 39”). Following the European Commission’s request for the
European financial Supervisory Authorities to improve the transparency of past performances and
fees, it is urgent to collect, analyse and disclose these data.
Deferred annuity plans with less governance rules (Préfon, Corem, CRH)
One difficulty in assessing real returns of deferred annuity plans is that up to 2010, it was not
mandatory for those plans to disclose investment returns. Following action by BETTER FINANCE’s
French member organisations, a 2010 Law175 made this a legal requirement from 2011 onward.
Préfon has also started to give an indication of its economic returns (taking into account the annual
evolution of the market value of all assets in the portfolio) in its annual report.
Préfon
Préfon published an accounting return (net of fees) on its investment portfolio for 2020 of 2.97%
versus 2.88% in 2019. However, as mentioned above, the accounting return does not take into
account the changes in the market value of assets (unrealized capital gains stood at € 4.4 billion
end of 2020 (24 % of the total market value). In 2020 Préfon indicated that this portfolio
performance reached +6.82%, excluding real estate and private equity, with the fixed income
portfolio generating +8% thanks to the continued drop in interest rates. Prefon’s investment
portfolio is still heavily tilted towards fixed income (79% of total, and equity weighing only 12% - in
accounting, not market value terms). This seems an inadequate asset allocation for the long-time
horizon of the pension plan.
Part of the investment return has been set aside in the past in order to replenish reserves. In 2010,
the French Supervisor (ACPR) decided that Préfon reserves were not sufficient and forced Préfon’s
insurers to contribute €290 million of their own funds (as of 31 December 2013) to help Préfon
balance its assets and liabilities176. At the end of 2016, this contribution from the insurers amounted
175 Law n° 2010-737 of 1 July 2010 - art. 35 (V), which modified Article L441-3 of the French Insurance Code. 176 “Les Echos” 27 December 2010. This information was not disclosed by Préfon to the participants.
242 | P a g e
Lon
g-Te
rm a
nd
Pen
sio
n S
avin
gs |
Th
e R
eal R
etu
rn |
20
21
Edit
ion
to €333 million177 despite the massive cuts in pension rights for those who retire after age 60
decided in 2014 and 2017 (see below Graph FR12).
In 2017, in relation to the entry into force of the Solvency II Directive, French Law was modified to
move to use the market value of assets instead of their historical cost (accounting value). This
enabled Préfon to show at last sufficient reserves and solvency ratio, but – up to now – not enough
to allow for reducing or even capping the loss of purchasing power of its pensions since 2002.
Thanks to this change in solvency rules, the ratio of assets to liabilities of Préfon increased from
97.5% in 2016 to 119.6% in 2020, allowing it for the first times in many years to increase the nominal
value of its annuities from 2017 on. In 2020, also thanks to the zero inflation, it even for the first
time since 2002 slightly improved the real value (purchasing power) of its participants pension
rights (+0,21% nominal increase for a -0.03% inflation).
In addition, the value of the participants’ accumulated savings is communicated individually to them
only since 2012, and unfortunately with more than a one-year delay (this essential information
should be released sooner), and just as an “estimate”. It was therefore impossible to compute a
real rate of return individually and for all participants with the data made available by the Plan up
to 2019 (see below the new approach).
Another difficulty for deferred annuity products is to translate the impact of portfolio returns (and
other factors such as the capital conversion rate into annuities, the discount rate and the evolution
of annuities paid) on the actual long-term return for the pension saver. One proxy return indicator
is the one computed by the French association of pension fund participants ARCAF. It has been
collecting the annual rate of pension rights’ and annuities’ increases before tax for several years178
(see graphs FR12 and FR13). Préfon participants who contributed in 2002 and who will retire at the
age of 60 have lost 20% of the real value of their pensions (before tax179). The advertised objective
of Préfon to maintain the purchasing power of pensions has not been fulfilled since 2002 (except in
2020 as mentioned above) and Préfon remains silent on the perspectives to reduce this loss of the
real value of pensions in the future. This key performance information is not publicly disclosed180.
177 Source: Rapport de gestion Préfon Retraite 2016. 178 This key data is very difficult to find, but recently Préfon has been making significant efforts to improve its transparency and disclosures. 179 Savings into Préfon (like into PERPs and into Corem) are income tax deductible, but the annuities are fully taxable. Both savings and annuities bear social levies (“prélèvements sociaux”). 180 ARCAF, 2019
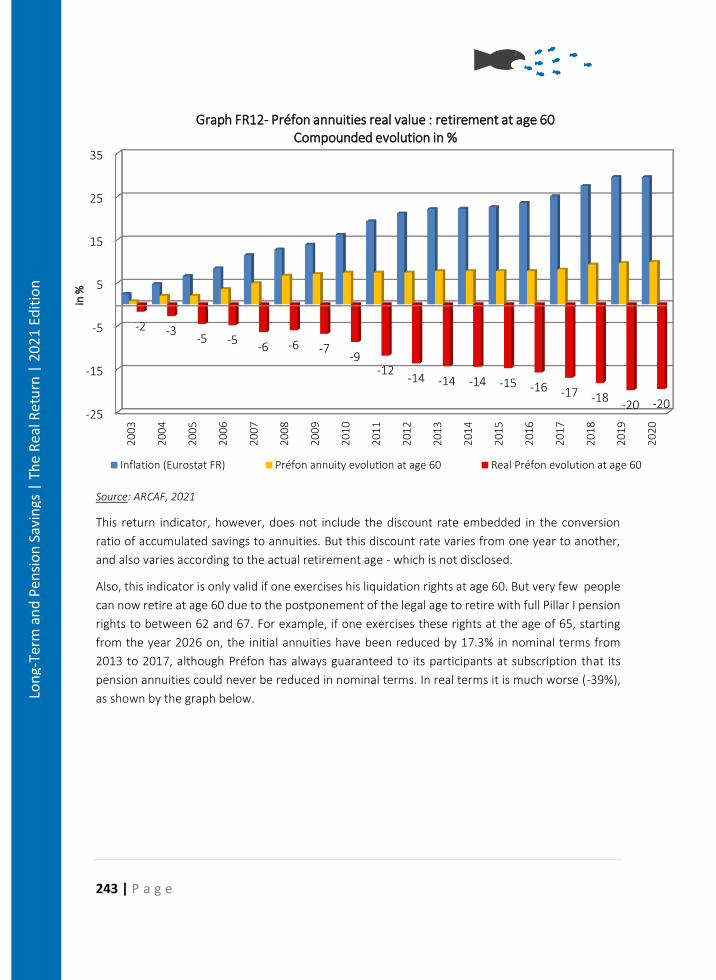
243 | P a g e
Lon
g-Te
rm a
nd
Pen
sio
n S
avin
gs |
Th
e R
eal R
etu
rn |
20
21
Edit
ion
Source: ARCAF, 2021
This return indicator, however, does not include the discount rate embedded in the conversion
ratio of accumulated savings to annuities. But this discount rate varies from one year to another,
and also varies according to the actual retirement age - which is not disclosed.
Also, this indicator is only valid if one exercises his liquidation rights at age 60. But very few people
can now retire at age 60 due to the postponement of the legal age to retire with full Pillar I pension
rights to between 62 and 67. For example, if one exercises these rights at the age of 65, starting
from the year 2026 on, the initial annuities have been reduced by 17.3% in nominal terms from
2013 to 2017, although Préfon has always guaranteed to its participants at subscription that its
pension annuities could never be reduced in nominal terms. In real terms it is much worse (-39%),
as shown by the graph below.
-25
-15
-5
5
15
25
35
20
03
20
04
20
05
20
06
20
07
20
08
20
09
20
10
20
11
20
12
20
13
20
14
20
15
20
16
20
17
20
18
20
19
20
20
-2 -3-5 -5
-6 -6 -7-9
-12-14 -14 -14 -15 -16 -17 -18
-20 -20
in %
Graph FR12- Préfon annuities real value : retirement at age 60Compounded evolution in %
Inflation (Eurostat FR) Préfon annuity evolution at age 60 Real Préfon evolution at age 60
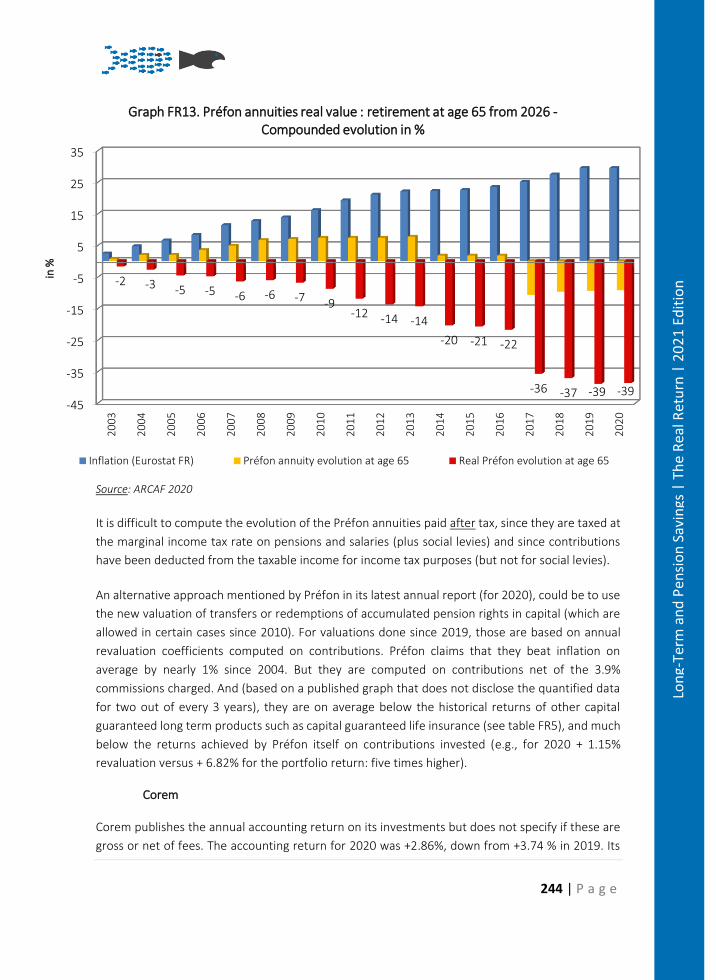
244 | P a g e
Lon
g-Te
rm a
nd
Pen
sio
n S
avin
gs |
Th
e R
eal R
etu
rn |
20
21
Edit
ion
Source: ARCAF 2020
It is difficult to compute the evolution of the Préfon annuities paid after tax, since they are taxed at
the marginal income tax rate on pensions and salaries (plus social levies) and since contributions
have been deducted from the taxable income for income tax purposes (but not for social levies).
An alternative approach mentioned by Préfon in its latest annual report (for 2020), could be to use
the new valuation of transfers or redemptions of accumulated pension rights in capital (which are
allowed in certain cases since 2010). For valuations done since 2019, those are based on annual
revaluation coefficients computed on contributions. Préfon claims that they beat inflation on
average by nearly 1% since 2004. But they are computed on contributions net of the 3.9%
commissions charged. And (based on a published graph that does not disclose the quantified data
for two out of every 3 years), they are on average below the historical returns of other capital
guaranteed long term products such as capital guaranteed life insurance (see table FR5), and much
below the returns achieved by Préfon itself on contributions invested (e.g., for 2020 + 1.15%
revaluation versus + 6.82% for the portfolio return: five times higher).
Corem
Corem publishes the annual accounting return on its investments but does not specify if these are
gross or net of fees. The accounting return for 2020 was +2.86%, down from +3.74 % in 2019. Its
-45
-35
-25
-15
-5
5
15
25
35
20
03
20
04
20
05
20
06
20
07
20
08
20
09
20
10
20
11
20
12
20
13
20
14
20
15
20
16
20
17
20
18
20
19
20
20
-2 -3 -5 -5 -6 -6 -7 -9-12 -14 -14
-20 -21 -22
-36 -37 -39 -39
in %
Graph FR13. Préfon annuities real value : retirement at age 65 from 2026 -Compounded evolution in %
Inflation (Eurostat FR) Préfon annuity evolution at age 65 Real Préfon evolution at age 65
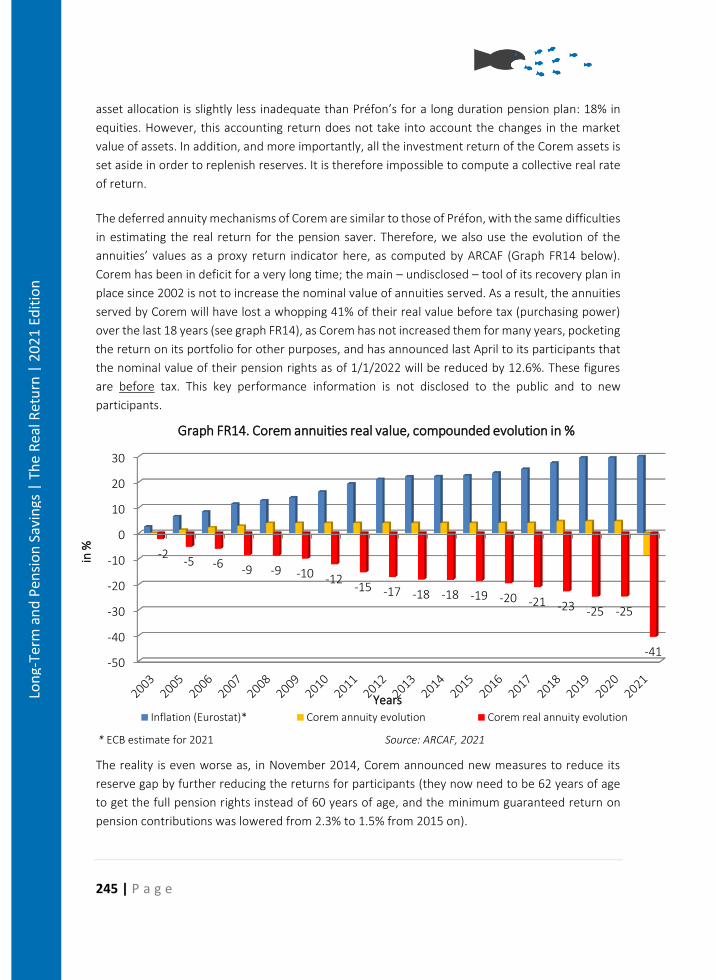
245 | P a g e
Lon
g-Te
rm a
nd
Pen
sio
n S
avin
gs |
Th
e R
eal R
etu
rn |
20
21
Edit
ion
asset allocation is slightly less inadequate than Préfon’s for a long duration pension plan: 18% in
equities. However, this accounting return does not take into account the changes in the market
value of assets. In addition, and more importantly, all the investment return of the Corem assets is
set aside in order to replenish reserves. It is therefore impossible to compute a collective real rate
of return.
The deferred annuity mechanisms of Corem are similar to those of Préfon, with the same difficulties
in estimating the real return for the pension saver. Therefore, we also use the evolution of the
annuities’ values as a proxy return indicator here, as computed by ARCAF (Graph FR14 below).
Corem has been in deficit for a very long time; the main – undisclosed – tool of its recovery plan in
place since 2002 is not to increase the nominal value of annuities served. As a result, the annuities
served by Corem will have lost a whopping 41% of their real value before tax (purchasing power)
over the last 18 years (see graph FR14), as Corem has not increased them for many years, pocketing
the return on its portfolio for other purposes, and has announced last April to its participants that
the nominal value of their pension rights as of 1/1/2022 will be reduced by 12.6%. These figures
are before tax. This key performance information is not disclosed to the public and to new
participants.
The reality is even worse as, in November 2014, Corem announced new measures to reduce its
reserve gap by further reducing the returns for participants (they now need to be 62 years of age
to get the full pension rights instead of 60 years of age, and the minimum guaranteed return on
pension contributions was lowered from 2.3% to 1.5% from 2015 on).
-50
-40
-30
-20
-10
0
10
20
30
-2-5 -6 -9 -9 -10 -12
-15 -17 -18 -18 -19 -20 -21 -23 -25 -25
-41
in %
Years
Graph FR14. Corem annuities real value, compounded evolution in %
Inflation (Eurostat)* Corem annuity evolution Corem real annuity evolution
* ECB estimate for 2021 Source: ARCAF, 2021
246 | P a g e
Lon
g-Te
rm a
nd
Pen
sio
n S
avin
gs |
Th
e R
eal R
etu
rn |
20
21
Edit
ion
The financial situation has been very difficult as its reserve gap (difference between its assets and
the present value of its pension liabilities) reached €2.9 billion at the end of 2014, as measured
using French common prudential rules at that time181. At the end of 2015, Corem obtained
permission from the French Government to use a minimum discount rate of 1.50% (instead of 0.59
% according to the previous rule) to compute the present value of its liabilities, helping it to reduce
its reserve gap to €1.3 billion at the end of 2016.
In 2017, the French Government allowed deferred annuity schemes such as Corem to use the
market value of assets instead of the accounting (acquisition cost mostly) one, to compute its
assets/liabilities coverage ratio. This new rule improved its coverage ratio to 98.2 % at the end of
2018, but it went down again in 2019 and in 2020 to 91.8%. Otherwise, Corem would have been in
breach of its Recovery Plan which required it to cover at least 90% of its liabilities.
Since 2016, the Corem rules also allow it to reduce the nominal value of annuities under certain
conditions, contrary to the commitment that was provided to participants when they joined.
The distribution of new Corem contracts has resumed in 2019, despite the continuously escalating
losses borne by its participants. In 2021, despite complaints to the French supervising Authority
ACPR, the product is still actively distributed and without any visible and intelligible warning about
its catastrophic performances and about its upcoming (1/1/2021) sharp drop in its pension rights.
CRH
CRH does not disclose an annual report or financial data publicly. Even its pre-contractual
publications do not disclose past performance. Because of an on-going restructuring that started in
2008, the real returns of this plan are probably low and below inflation. For the last five years (2014-
2019), CRH annuities value has increased by 2.1%, against an inflation of 6.0%.
Overall, BETTER FINANCE estimates the loss of purchasing power over the last teen years (2002-
2020) of participants to the French Public Employee Pension Schemes (Préfon + Corem) to be at -
21.4% (-1.4% per annum), based on the relative asset portfolio size of Préfon and Corem, and
assuming that Préfon participants retire as early as age 60 and not later. As mentioned above, 2021
will be catastrophic for Corem participants.
Defined contribution corporate plans
With the most appreciated help of AFG, the French asset management industry association, we
combine information provided by “Europerformance” on the performance of each category of
181 Until 2017, Corem’s recovery plan allowed it to exceptionally use a discount rate of 3% and an older mortality table to compute the present value of its pension liabilities instead of the regulatory 0.78% at the end of 2014 and 1.5% end of 2015. Using the 3% discount rate, Corem assets cover 107.5 % of its liabilities at the end of 2015.
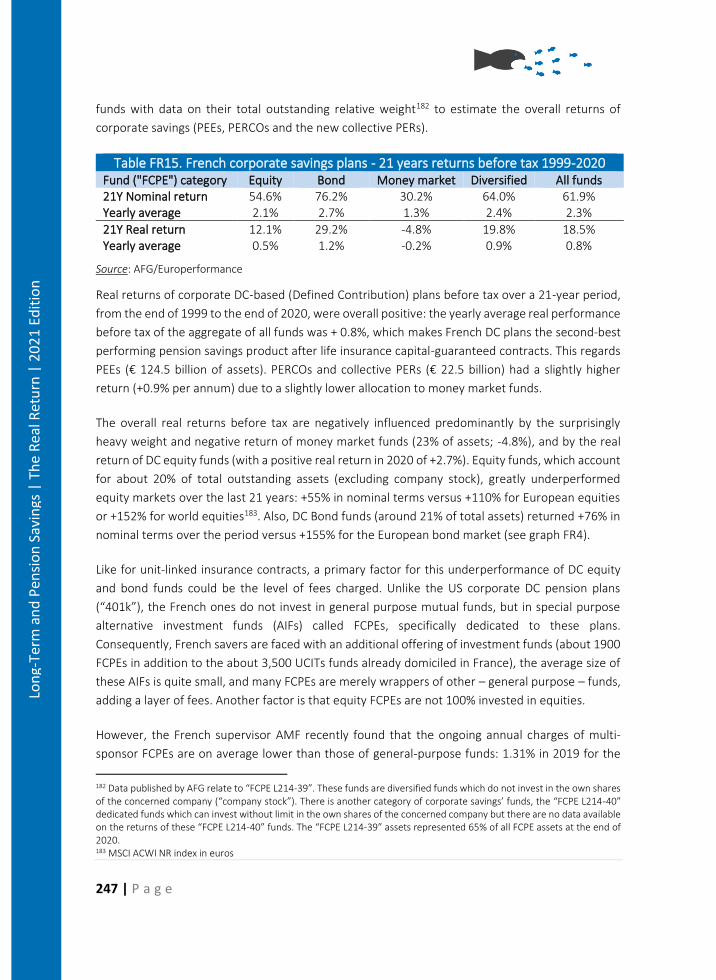
247 | P a g e
Lon
g-Te
rm a
nd
Pen
sio
n S
avin
gs |
Th
e R
eal R
etu
rn |
20
21
Edit
ion
funds with data on their total outstanding relative weight182 to estimate the overall returns of
corporate savings (PEEs, PERCOs and the new collective PERs).
Table FR15. French corporate savings plans - 21 years returns before tax 1999-2020 Fund ("FCPE") category Equity Bond Money market Diversified All funds 21Y Nominal return 54.6% 76.2% 30.2% 64.0% 61.9% Yearly average 2.1% 2.7% 1.3% 2.4% 2.3%
21Y Real return 12.1% 29.2% -4.8% 19.8% 18.5% Yearly average 0.5% 1.2% -0.2% 0.9% 0.8%
Source: AFG/Europerformance
Real returns of corporate DC-based (Defined Contribution) plans before tax over a 21-year period,
from the end of 1999 to the end of 2020, were overall positive: the yearly average real performance
before tax of the aggregate of all funds was + 0.8%, which makes French DC plans the second-best
performing pension savings product after life insurance capital-guaranteed contracts. This regards
PEEs (€ 124.5 billion of assets). PERCOs and collective PERs (€ 22.5 billion) had a slightly higher
return (+0.9% per annum) due to a slightly lower allocation to money market funds.
The overall real returns before tax are negatively influenced predominantly by the surprisingly
heavy weight and negative return of money market funds (23% of assets; -4.8%), and by the real
return of DC equity funds (with a positive real return in 2020 of +2.7%). Equity funds, which account
for about 20% of total outstanding assets (excluding company stock), greatly underperformed
equity markets over the last 21 years: +55% in nominal terms versus +110% for European equities
or +152% for world equities183. Also, DC Bond funds (around 21% of total assets) returned +76% in
nominal terms over the period versus +155% for the European bond market (see graph FR4).
Like for unit-linked insurance contracts, a primary factor for this underperformance of DC equity
and bond funds could be the level of fees charged. Unlike the US corporate DC pension plans
(“401k”), the French ones do not invest in general purpose mutual funds, but in special purpose
alternative investment funds (AIFs) called FCPEs, specifically dedicated to these plans.
Consequently, French savers are faced with an additional offering of investment funds (about 1900
FCPEs in addition to the about 3,500 UCITs funds already domiciled in France), the average size of
these AIFs is quite small, and many FCPEs are merely wrappers of other – general purpose – funds,
adding a layer of fees. Another factor is that equity FCPEs are not 100% invested in equities.
However, the French supervisor AMF recently found that the ongoing annual charges of multi-
sponsor FCPEs are on average lower than those of general-purpose funds: 1.31% in 2019 for the
182 Data published by AFG relate to “FCPE L214-39”. These funds are diversified funds which do not invest in the own shares of the concerned company (“company stock”). There is another category of corporate savings’ funds, the “FCPE L214-40” dedicated funds which can invest without limit in the own shares of the concerned company but there are no data available on the returns of these “FCPE L214-40” funds. The “FCPE L214-39” assets represented 65% of all FCPE assets at the end of 2020. 183 MSCI ACWI NR index in euros
248 | P a g e
Lon
g-Te
rm a
nd
Pen
sio
n S
avin
gs |
Th
e R
eal R
etu
rn |
20
21
Edit
ion
178 diversified (multi-asset) FCPEs analysed versus 1.53% for the general-purpose diversified funds;
and 1.46% for the 145 European equity FCPEs analysed versus 1.53% for the general-purpose
European equity funds184. That is about half the cost of the comparable funds held via unit-linked
insurance contracts. In addition, a part of the FCPE fees can be sometimes paid by the employers,
not by the employees. Therefore (see above the costs and charges section) the differences are even
bigger with investment funds held via insurance contracts. This seems due to the distribution modes
- more “wholesale” for corporate plans, and more “retail” for life insurance (implying commissions
paid out of fund charges to distributors) - and to the double layer of fees in the latter case.
A limitation of such computations is that performance indices provided by “Europerformance” only
relate to diversified funds inside the corporate savings plans. They do not take into account the part
of corporate long-term savings which is invested in shares of the concerned company (“company
stock”), accounting for 35% (€ 50.8 billion end of 2020) of all corporate savings plans.
Return of regular identical investments over 21 years
Also – same rule whenever possible for the whole research report – the computed returns relate to a one-time investment at the end of 1999 and kept up to the end of 2019. Many pension savers will tend to invest regularly every year or every month. With the help of AFG, we computed the annualized returns from 2000 to 2020 for the same amount invested every year over the last 21 years. This generated a similar before tax real return of 17.8% instead of 18.5%. This return is less volatile with time, as it is spread over many years instead of only one.
After-tax returns are often higher
Finally, after-tax returns of French corporate long-term savings plans are difficult to compute
globally, but they can often be very close to - or higher than before-tax ones since their taxation is
the most favourable of all long-term and pension savings products in France (redemptions are
exempt from income tax and are only subject to “social” levies of 17.2% of net gains). Also, most of
these savings come from non-taxable profit-sharing income contributed by employees
(“intéressement”and “participation”) and employers’ matching contributions.
Conclusions
After a year of negative real returns before tax in 2011, for the main long-term and pension savings
product in France, subsequent years were more favourable to pension savers. Against the backdrop
of bullish stock markets and lower inflation, unit-linked life insurance contracts showed a positive
real performance every year from 2012 to 2017. However, their 21-year performance is still quite
negative. The real performance of capital-guaranteed life insurance contracts (“contrats en euros”)
184 La lettre de l’Observatoire de l’Epargne de l’AMF n 042 – mars 2021
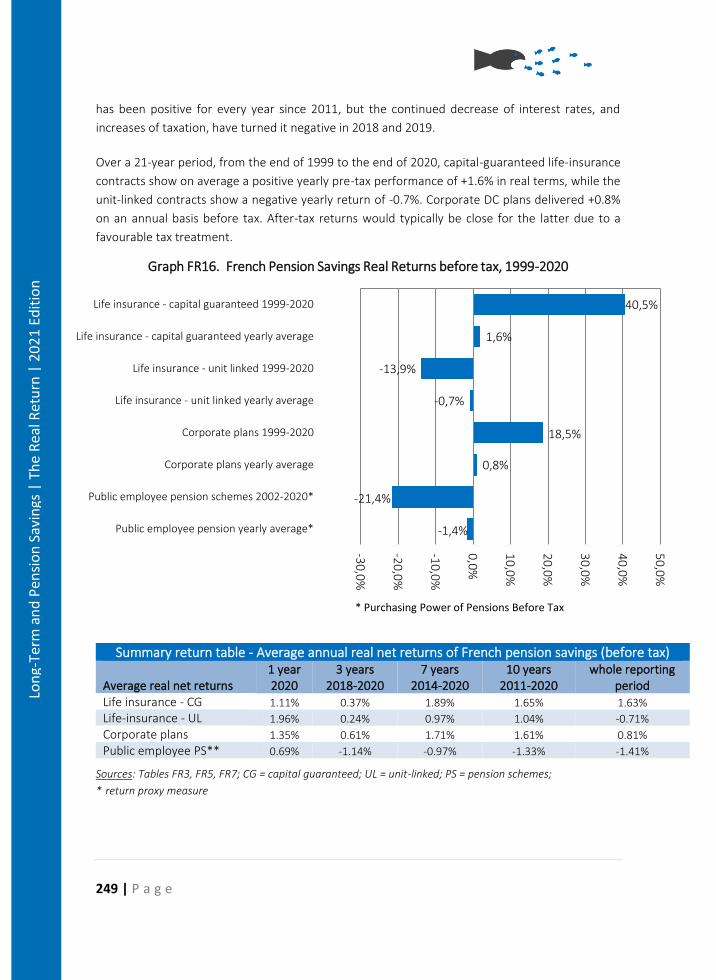
249 | P a g e
Lon
g-Te
rm a
nd
Pen
sio
n S
avin
gs |
Th
e R
eal R
etu
rn |
20
21
Edit
ion
has been positive for every year since 2011, but the continued decrease of interest rates, and
increases of taxation, have turned it negative in 2018 and 2019.
Over a 21-year period, from the end of 1999 to the end of 2020, capital-guaranteed life-insurance
contracts show on average a positive yearly pre-tax performance of +1.6% in real terms, while the
unit-linked contracts show a negative yearly return of -0.7%. Corporate DC plans delivered +0.8%
on an annual basis before tax. After-tax returns would typically be close for the latter due to a
favourable tax treatment.
Summary return table - Average annual real net returns of French pension savings (before tax) 1 year 3 years 7 years 10 years whole reporting
period Average real net returns 2020 2018-2020 2014-2020 2011-2020 Life insurance - CG 1.11% 0.37% 1.89% 1.65% 1.63% Life-insurance - UL 1.96% 0.24% 0.97% 1.04% -0.71% Corporate plans 1.35% 0.61% 1.71% 1.61% 0.81% Public employee PS** 0.69% -1.14% -0.97% -1.33% -1.41%
Sources: Tables FR3, FR5, FR7; CG = capital guaranteed; UL = unit-linked; PS = pension schemes;
* return proxy measure
40,5%
1,6%
-13,9%
-0,7%
18,5%
0,8%
-21,4%
-1,4%
-30
,0%
-20
,0%
-10
,0%
0,0
%
10
,0%
20
,0%
30
,0%
40
,0%
50
,0%
Life insurance - capital guaranteed 1999-2020
Life insurance - capital guaranteed yearly average
Life insurance - unit linked 1999-2020
Life insurance - unit linked yearly average
Corporate plans 1999-2020
Corporate plans yearly average
Public employee pension schemes 2002-2020*
Public employee pension yearly average*
Graph FR16. French Pension Savings Real Returns before tax, 1999-2020
* Purchasing Power of Pensions Before Tax
250 | P a g e
Lon
g-Te
rm a
nd
Pen
sio
n S
avin
gs |
Th
e R
eal R
etu
rn |
20
21
Edit
ion
Pension Savings: The Real Return 2021 Edition
Country Case: Germany
Zusammenfassung
Das deutsche Rentensystem gehört zu jenen, in denen das System der gesetzlichen
Rentenversicheurng (Säule I) eine relativ wichtige Rolle für das Alterseinkommen der deutschen
Rentner spielt. Die Bruttorentenersatzrate aus dem obligatorischen öffentlichen System beträgt
38,7% des individuellen Einkommens (gegenüber durchschnittlich 36,6% im Durchschnitt der
OCED-Länder), während die Ersatzrate aus freiwilligen Systemen (Säule II und Säule III zusammen)
13,5% beträgt. Die Riester- und Rürup-Reformen von 2002 und 2005 zielten auf eine stärkere
Beteiligung deutscher Arbeitnehmer an betrieblichen und individuellen Altersversorgungssystemen
ab, da die akkumulierten Ansprüche relativ gering waren.
Summary
The German pension system is one of those in which the statutory pension system (Pillar I) plays a
relatively important role in the retirement income of German pensioners. The gross pension
replacement rate from the mandatory public system is 38.7% of individual income (compared to an
average of 36.6% in the OCED countries), while the replacement rate from voluntary schemes (Pillar
II and Pillar III together) is 13.5%. The Riester and Rürup reforms of 2002 and 2005 aimed at
increasing the participation of German workers in occupational and individual pension schemes, as
accumulated entitlements were relatively low.
Introduction
In 2007, the German government raised the statutory retirement age from 65 to 67. A transitional
phase to attain the retirement age of 67 for individuals with less than 45 years of contributions was
started in 2012, including a gradual increase of the working life of one month per year until 2029.
For individuals with 45 years of contributions, the pension age had been lowered to 63 years in July
2014 but started to increase again in 2016 until it will reach 65 in 2028. The average effective age
of labour market exit was about 64.6 years for men in 2017 and 64 for women185.
185 BMAS (Federal Ministry of Labour and Social Affairs) - Pension Projections Exercise 2018 - For the attention of the Economic Policy Committees’ Working Group on Ageing Populations and Sustainability, November 2017 https://ec.europa.eu/info/publications/economy-finance/2018-ageing-report-economic-and-budgetary-projections-eu-member-states-2016-2070_en
251 | P a g e
Lon
g-Te
rm a
nd
Pen
sio
n S
avin
gs |
Th
e R
eal R
etu
rn |
20
21
Edit
ion
The contribution rate186 in mandatory public schemes is the same for employees and employers
and is equal to 9.3%. The total contribution rate (salary share + employer share, i.e., 18.6%) is lower
than what can be observed in Italy (33%), France (27.5%), the Netherlands (25.6%) and Sweden
(21.7%) but higher than in Belgium (16.4%).
The German pension system can be divided into three pillars:
• Pillar I: Mandatory Public Pension Scheme
• Pillar II: Voluntary Occupational Pensions
• Pillar III: Voluntary Personal Pensions
The first pillar with the statutory and the civil servant pension system is mandatory for all employees
and civil servants. Currently, the general pay-as-you-go (PAYG) earnings-related first pillar statutory
pension scheme covers about 85% of the employed German population whereas the public civil
servants scheme protects 5%.
In 2018, the gross pension replacement rate187 for average-wage workers form the mandatory
public scheme (38.7%) was below the OECD average (39.6%). Increasing life expectancy and fewer
children being born represents a challenging demographic shift in Europe, forcing younger
generations to assure an adequate retirement income through private savings.
In the early 2000s, the German government executed an important pension reform to promote
private pension savings through subsidies and tax incentives, as well as social security contribution
savings in the case of occupational pension plans. In 2002, company pension plans (Pillar II)
traditionally provided on a voluntary basis by employers, were transformed into an employee’s right
to have a part of its earnings paid into a company pension plan under a deferred compensation
arrangement. That same year, The Riester Reform was introduced to boost personal pension
savings, followed by The Rürup pension in 2005 to further complement personal pension plans.
186 Source: OCDE 2020, including disability Insurance in Germany. 187 OECD (2019), Pensions at a Glance 2019: OECD and G20 Indicators, OECD Publishing, Paris, https://doi.org/10.1787/b6d3dcfc-en
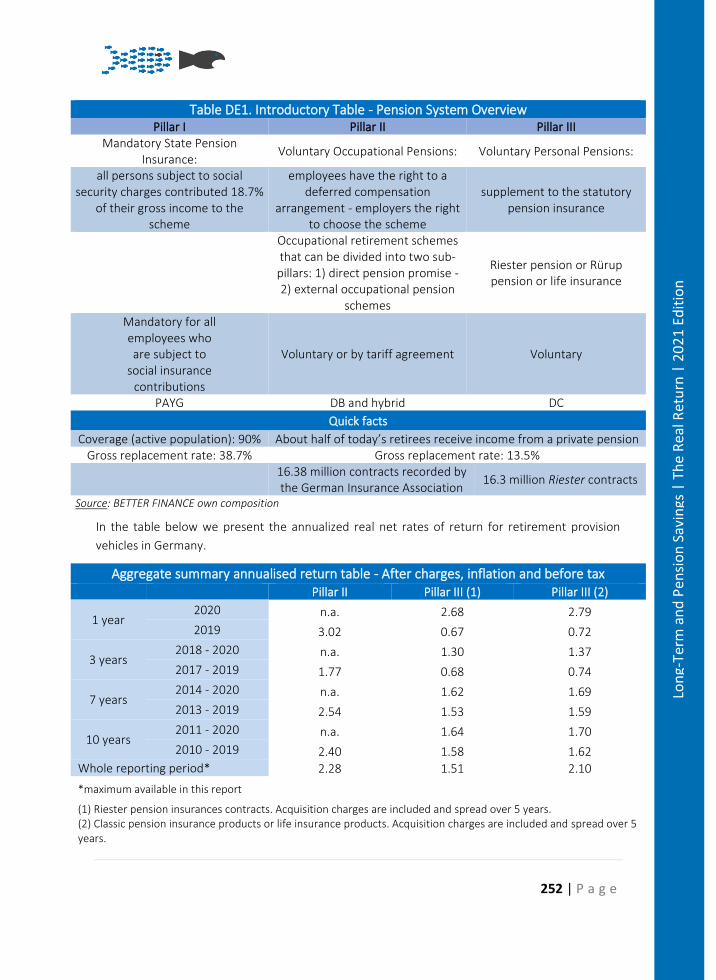
252 | P a g e
Lon
g-Te
rm a
nd
Pen
sio
n S
avin
gs |
Th
e R
eal R
etu
rn |
20
21
Edit
ion
Table DE1. Introductory Table - Pension System Overview Pillar I Pillar II Pillar III
Mandatory State Pension Insurance:
Voluntary Occupational Pensions: Voluntary Personal Pensions:
all persons subject to social security charges contributed 18.7%
of their gross income to the scheme
employees have the right to a deferred compensation
arrangement - employers the right to choose the scheme
supplement to the statutory pension insurance
Occupational retirement schemes that can be divided into two sub-pillars: 1) direct pension promise - 2) external occupational pension
schemes
Riester pension or Rürup pension or life insurance
Mandatory for all employees who are subject to
social insurance contributions
Voluntary or by tariff agreement Voluntary
PAYG DB and hybrid DC
Quick facts
Coverage (active population): 90% About half of today’s retirees receive income from a private pension Gross replacement rate: 38.7% Gross replacement rate: 13.5%
16.38 million contracts recorded by the German Insurance Association
16.3 million Riester contracts
Source: BETTER FINANCE own composition
In the table below we present the annualized real net rates of return for retirement provision
vehicles in Germany.
Aggregate summary annualised return table - After charges, inflation and before tax Pillar II Pillar III (1) Pillar III (2)
1 year 2020 n.a. 2.68 2.79
2019 3.02 0.67 0.72
3 years 2018 - 2020 n.a. 1.30 1.37
2017 - 2019 1.77 0.68 0.74
7 years 2014 - 2020 n.a. 1.62 1.69
2013 - 2019 2.54 1.53 1.59
10 years 2011 - 2020 n.a. 1.64 1.70
2010 - 2019 2.40 1.58 1.62
Whole reporting period* 2.28 1.51 2.10
*maximum available in this report
(1) Riester pension insurances contracts. Acquisition charges are included and spread over 5 years. (2) Classic pension insurance products or life insurance products. Acquisition charges are included and spread over 5 years.
253 | P a g e
Lon
g-Te
rm a
nd
Pen
sio
n S
avin
gs |
Th
e R
eal R
etu
rn |
20
21
Edit
ion
Pension Vehicles
Private pensions are divided into Voluntary Occupational Pensions and Voluntary Personal
Pensions. About half of today’s retirees receive income from a private pension, however the
proportion, currently at 16% (8% from occupational pension and 8% from personal pension) of a
retiree’s gross income, is currently rather low188. However, the coverage rate provided by the OECD
(OECD Pension Markets in Focus 2020) for Voluntary Occupational Pension Schemes is much
higher: 57%. Nevertheless, the “coverage rates are provided with respect to the total working-age
population (i.e., individuals aged 15 to 64 years old), except for Germany (employees aged 25 to
64 subject to social insurance contributions)”. In general, there are no taxes on dividends, income
or capital gains to take into account during the accumulation phase of the real return calculations.
However, the calculations are considerably complicated by the fact that EET and TEE taxation
formulas (or intermixtures) can still be found depending on the effective date of the pension
promise and the type of vehicle. Consequently, the after-tax calculations are simplified and
exclusively simulated as deferred taxation for the occupational Pensionskassen and pension funds,
as well as personal Riester and Rürup insurance contracts. For that reason, the average retiree
income tax rate is estimated from customised data provided by the German Federal Ministry of
Finance for the year of 2012 - the most recent information available189 - and set at 18%.
The classic pension insurance is not subject to deferred taxation but is (partially) taxed during the
capital accumulation phase (see Taxation chapter). Furthermore, performance data is available for
a longer time span, so the results cannot be directly compared to Riester and Rürup insurance
contracts.
Voluntary Occupational Pensions
For a long time, occupational pension plans have typically been provided by employers on a
voluntary basis. Since January 2002, however, employees have the right to occupational pensions
through deferred compensation. This means that future salary or special payments, such as
vocational benefits or salary increases for up to 4% of a variable contribution cap190, can be
converted to entitlements to a pension - if not regulated differently by a labour agreement. While
employers have to comply with the demand for occupational pensions and execute them, they can
choose when it comes to structuring the retirement provision, leaving little to no choice to
188 Bundesministerium für Arbeit und Soziales (2016). 189 Data on income tax for a given year can only be completed three years later and is subsequently reprocessed by State Statistical Offices. The data also includes joint tax assessments. 190 “Beitragsbemessungsgrenze”; there are differences between "West" and "Ost" due to the difference of the general level of salaries, but the variable contribution cap is always 4%. The “Beitragsbemessungsgrenze Ost” will gradually be aligned from 2018 until 2025.
254 | P a g e
Lon
g-Te
rm a
nd
Pen
sio
n S
avin
gs |
Th
e R
eal R
etu
rn |
20
21
Edit
ion
beneficiaries. There are five types191 of occupational retirement schemes that can be divided into
two sub-pillars:
• one direct pension promise (book reserves); and
• four external types of occupational pension schemes (support funds, direct insurance,
Pensionskassen and pension funds).
To some extent, the five different financing methods compete with each other, but it is also possible
to combine two or more types. Both employers’ and employee’s contributions to occupational
pensions are voluntary, however employers have to at least offer a direct insurance pension scheme
so that employees may benefit from tax advantages (deferred taxation) and social security
contribution savings if they choose to contribute. When there is a binding labour agreement,
occupational pensions are generally organised for whole industrial sectors and there is no
employee’s right to demand divergent occupational pension provisions. Many collective
agreements also oblige employers to participate financially in occupational pensions and withdraw
the employer’s right to choose the retirement scheme. Indeed, employer-funded pensions
represent the largest share of occupational schemes, though an increasing number of deferred
compensation arrangements can be found. If the occupational pension is structured as a deferred
compensation and contributions are subsequently exempt from taxation and social security
contributions, this will in turn lower claims from the statutory pension insurance.
Occupational pensions in Germany are managed as defined benefit (DB) plans, either as traditional
or hybrid ones that can take the form of contribution-oriented DB plans with an annual minimum
return guarantee, or as contribution-oriented DB plans with a minimum guarantee of the sum of
nominal contributions at the retirement. The German labour law requires employers to guarantee
employee’s given pension promises. All occupational pensions also have to cover at least one
biometric risk, such as longevity, disability or death192.
Book reserves (“Direktzusage”)
Book reserves are direct pension provisions that the employer realises on the company’s balance
sheet in order to pay an occupational pension once the employee reaches the retirement age. In
recent years, an increasing number of employers’ resorts to external funding of the provisions
through Contractual Trust Arrangements (CTAs). The legislator obliges to protect claims from book
reserves through the “Pensions-Sicherungs-Verein” (PSVaG) in the case of an employer’s insolvency.
Reserves via CTAs are protected from creditors in the case of insolvency through legal
independency. Book reserves are usually designed as pure benefits given by employers, though
191 The aba (Arbeitsgemeinschaft für betriebliche Altersversorgung e.V., German Association for Occupational Pensions) - Occupational Pension Landscape in Germany – January 2015 https://www.aba-online.de/en/docs/attachments/42616471-6d26-4abc-a4de-5aa328b5fc8c/20150121-Occupational-Pension-Landscape-in-Germany.pdf 192 http://www.aba-online.de/glossar.html (Accessed on 14 June 2017).
255 | P a g e
Lon
g-Te
rm a
nd
Pen
sio
n S
avin
gs |
Th
e R
eal R
etu
rn |
20
21
Edit
ion
deferred compensation arrangements are generally also possible. If an employee leaves the
company, there is no possibility to continue the retirement provision through private funding,
though deferred benefits are maintained. Book reserves are the most widely used type of
occupational pension plans in terms of assets under management.
Support funds (“Unterstützungskasse”)
Support funds, one of the oldest forms of occupational pension schemes, are institutions funded
by one or several companies to provide retirement provisions for employees. The latter have no
direct legal claim to benefits from support funds, only from their employers. Support funds invest
the deposited funds to pay a company pension at a later date. If there is not enough money in the
support fund to meet retirement commitments, employers have to compensate for the difference.
The “Pensions-Sicherungs-Verein” (PSVaG) protects employee’s benefits in the case of an
employer’s insolvency.
Direct insurance (“Direktversicherung”)
These types of occupational pensions are life insurance contracts that an employer enters into with
an insurance company for its employees. Only last-mentioned or surviving dependents have claims
to benefits from direct insurances. The insurance contracts can be continued with personal
contributions if the employee leaves the company or, under specific conditions, be transferred to
a new employer. If an employee solely contributes to a direct insurance, exemptions from taxation
and social security contributions can be granted193 or, alternatively, the employee can make use of
the Riester support if the contributions are made from individually taxed income.
Regulated by the German occupational pension law, both the individual transfer of occupational
pension claims and the application of the Riester support under above-mentioned prerequisite also
apply to Pensionskassen and pension funds.
“Pensionskassen”
Pensionskassen are institutions, formed by one or several companies, which take the form of special
life insurance companies. They are legal entities that continue to pay benefits even in the case of
an employer’s insolvency and are supervised by the German Federal Financial Supervisory Authority
(“Bundesanstalt für Finanzdienstleistungsaufsicht”; BaFin). In contrast with direct insurances,
employees become direct insurees and often even members of the Pensionskasse. The traditional
form (“regulierte”) of Pensionskassen offers classic life annuity contracts that may invest a
maximum of 35% of the capital in equity. They are allowed to implement divergent actuarial interest
rates and even to change the applicable mortality table. The new (“deregulierte”) Pensionskassen,
193 For direct insurance, Pensionskassen and pension funds: 4% of the contribution cap “Beitragsbemessungsgrenze West” (BBVG-RV West) + €1,800 are tax exempt; 4% of the BBVG-RV West are exempt from social security contributions.
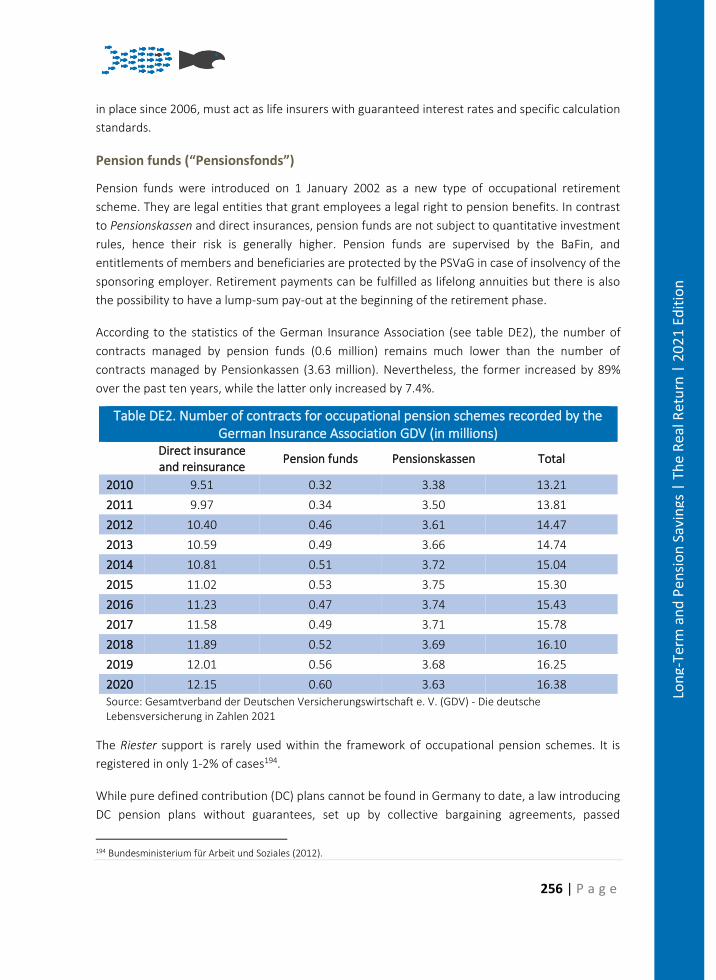
256 | P a g e
Lon
g-Te
rm a
nd
Pen
sio
n S
avin
gs |
Th
e R
eal R
etu
rn |
20
21
Edit
ion
in place since 2006, must act as life insurers with guaranteed interest rates and specific calculation
standards.
Pension funds (“Pensionsfonds”)
Pension funds were introduced on 1 January 2002 as a new type of occupational retirement
scheme. They are legal entities that grant employees a legal right to pension benefits. In contrast
to Pensionskassen and direct insurances, pension funds are not subject to quantitative investment
rules, hence their risk is generally higher. Pension funds are supervised by the BaFin, and
entitlements of members and beneficiaries are protected by the PSVaG in case of insolvency of the
sponsoring employer. Retirement payments can be fulfilled as lifelong annuities but there is also
the possibility to have a lump-sum pay-out at the beginning of the retirement phase.
According to the statistics of the German Insurance Association (see table DE2), the number of
contracts managed by pension funds (0.6 million) remains much lower than the number of
contracts managed by Pensionkassen (3.63 million). Nevertheless, the former increased by 89%
over the past ten years, while the latter only increased by 7.4%.
Table DE2. Number of contracts for occupational pension schemes recorded by the German Insurance Association GDV (in millions)
Direct insurance and reinsurance
Pension funds Pensionskassen Total
2010 9.51 0.32 3.38 13.21
2011 9.97 0.34 3.50 13.81
2012 10.40 0.46 3.61 14.47
2013 10.59 0.49 3.66 14.74
2014 10.81 0.51 3.72 15.04
2015 11.02 0.53 3.75 15.30
2016 11.23 0.47 3.74 15.43
2017 11.58 0.49 3.71 15.78
2018 11.89 0.52 3.69 16.10
2019 12.01 0.56 3.68 16.25
2020 12.15 0.60 3.63 16.38
Source: Gesamtverband der Deutschen Versicherungswirtschaft e. V. (GDV) - Die deutsche Lebensversicherung in Zahlen 2021
The Riester support is rarely used within the framework of occupational pension schemes. It is
registered in only 1-2% of cases194.
While pure defined contribution (DC) plans cannot be found in Germany to date, a law introducing
DC pension plans without guarantees, set up by collective bargaining agreements, passed
194 Bundesministerium für Arbeit und Soziales (2012).
257 | P a g e
Lon
g-Te
rm a
nd
Pen
sio
n S
avin
gs |
Th
e R
eal R
etu
rn |
20
21
Edit
ion
legislation in the summer of 2017. This so-called “Betriebsrentenstärkungsgesetz” likewise allows
for auto-enrolment of employees in a pension plan with voluntary opting-out within a specified
time frame and incorporates measures to strengthen occupational pensions for low-income
workers through e.g., allowances and tax incentives.195
According to a proposal submitted to the Bundesrat by the ministers of the Land of Hesse in April
2018, employees not covered by a professional scheme would automatically be affiliated to an
individual pension scheme created by the government.
Voluntary Personal Pensions
Over the last few years, the German government has undertaken significant communication efforts
to advertise personal provisions for old age to supplement the statutory pension insurance. Since
2002, Riester pension savings are being promoted by the government through two different
channels: subsidies and taxation reliefs. In 2005, the Rürup pension was introduced to specifically
support the self-employed through tax exemptions.
Riester pensions
Riester196 products are formally certified personal pension plans with the objective of building up a
funded retirement pension supplement. They are subject to deferred taxation, and subscribers
receive subsidies from the German state. The amount received depends on personally invested
contributions. Subsidies are at their maximum if the total contributions to a Riester product (that
is, personally invested contributions plus subsidies) reach at least 4% of the individual’s previous
year’s income, up to a maximum of €2,100. The subsidies add up to €175 per adult (according to
the pension law of summer 2017), plus €300 for each child born since 2008 and €185 for those born
before 2008. Subscribers that are younger than 25 receive a bonus of up to €200 at the moment of
subscription to a Riester product. The minimum contribution to receive the full subsidies is €60 per
year. If the calculated minimum contribution for a low-income earner is less than €60, this minimum
contribution of 60 euros must always be paid in order to receive full support. If an individual pays
less than his or her minimum contribution (4% of the individual’s previous year’s income - maximum
€2,100 -, less any subsidies due, but at least €60 per year), his or her subsidies are reduced
proportionately.
Though rarely used in this context, the Riester support is also applicable to occupational pension
plans for the following three types: direct insurances, Pensionskassen and pension funds. Riester
subsidies and tax allowances are personal and can only be passed on to a spouse’s Riester contract
in the case of death.
195 http://dip21.bundestag.de/dip21/btd/18/112/1811286.pdf (Accessed on 14 June 2017). 196 Named after former Federal Minister for Labour and Social Affairs: Walter Riester.
258 | P a g e
Lon
g-Te
rm a
nd
Pen
sio
n S
avin
gs |
Th
e R
eal R
etu
rn |
20
21
Edit
ion
Riester pension benefits can be paid out starting at the age of 62, or at the age of 60 for contracts
concluded before 2012. The subscriber obtains the right to convert the invested capital into a life
annuity, or a programmed withdrawal where up to 30% of the accumulated savings can be paid out
as a lump-sum. Furthermore, one fifth of the accumulated savings is reserved for life annuities
starting at the age of 85.197
The following types of investments are eligible as Riester products:
• Bank savings plan (“Banksparplan”): These contracts are typical long-term bank savings
plans with fixed or variable interest rates.
• Pension insurance contract (“Rentenversicherung”): These Riester plans, offered by
insurance companies, exist in two forms. There are typical pension insurance contracts
consisting of guaranteed returns and a participation in profits. Additionally, there are also
hybrid contracts where a fraction of the retirement savings is invested in investment funds.
They consist of both a guaranteed part and a unit-linked part that depends on the
performance of the investment funds.
• Investment fund savings plan (“Fondssparplan”): Savings are unit-linked, invested into
investment funds chosen by the subscriber from a pool of funds proposed by a financial
intermediary. The intermediary has to at least guarantee that the invested money plus the
state’s subsidies are available at the moment of retirement. In the case of premature
withdrawals, a loss of capital is possible.
• Home loan and savings contract (“Wohn-Riester/Eigenheimrente”): These contracts take
the form of real estate savings agreements. This most recent type of Riester scheme is
based on the notion that rent-free housing at old age is a sort of individual retirement
provision comparable to regular monetary payments.
At the end of March 2021, 16.3 million Riester contracts had been subscribed. After steady
increases in the early periods following its establishment, considerably fewer pension insurance
contract contracts have been subscribed since 2012. The number of open contracts remained
stable since 2015 and even decreased slightly every year since 2018. Suggested explanations
include the current environment of low interest rates along with less favourable media coverage of
Riester products - reinforcing a general mistrust and doubt198 concerning funded retirement
savings. It should be noted that an individual can subscribe to several Riester contracts at the same
time, so a direct inference of the number of individuals possessing a Riester contract is not possible.
However, State subsidies (allocations and income tax reliefs) are only possible for up to 4% of the
individual gross income (maximum €2,100 per year). In fact, a small number of non-subsidised
Riester contracts exist. This is independent from the fact that many Riester policy holders "forget"
to ask for state subsidies, and that others do not get the complete allocations. About two-thirds of
Riester contracts take the form of pension insurance contracts, making it by far the most important
197 Bundesministerium für Arbeit und Soziales (2014). 198 Evidence of this can be found in Hagen, Kleinlein (2012).
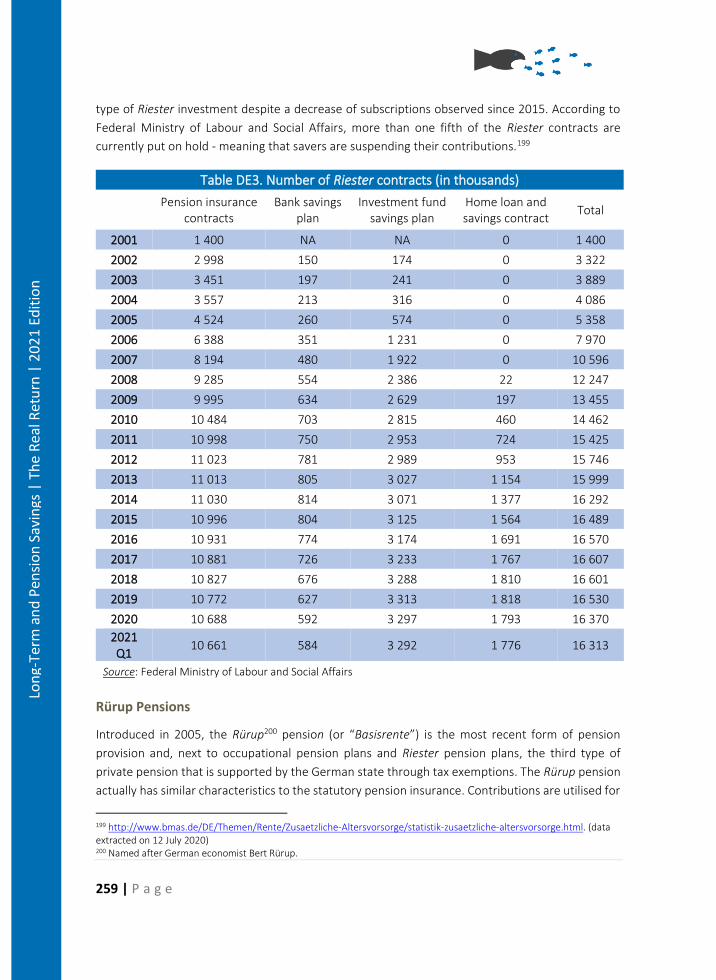
259 | P a g e
Lon
g-Te
rm a
nd
Pen
sio
n S
avin
gs |
Th
e R
eal R
etu
rn |
20
21
Edit
ion
type of Riester investment despite a decrease of subscriptions observed since 2015. According to
Federal Ministry of Labour and Social Affairs, more than one fifth of the Riester contracts are
currently put on hold - meaning that savers are suspending their contributions.199
Table DE3. Number of Riester contracts (in thousands)
Pension insurance contracts
Bank savings plan
Investment fund savings plan
Home loan and savings contract
Total
2001 1 400 NA NA 0 1 400
2002 2 998 150 174 0 3 322
2003 3 451 197 241 0 3 889
2004 3 557 213 316 0 4 086
2005 4 524 260 574 0 5 358
2006 6 388 351 1 231 0 7 970
2007 8 194 480 1 922 0 10 596
2008 9 285 554 2 386 22 12 247
2009 9 995 634 2 629 197 13 455
2010 10 484 703 2 815 460 14 462
2011 10 998 750 2 953 724 15 425
2012 11 023 781 2 989 953 15 746
2013 11 013 805 3 027 1 154 15 999
2014 11 030 814 3 071 1 377 16 292
2015 10 996 804 3 125 1 564 16 489
2016 10 931 774 3 174 1 691 16 570
2017 10 881 726 3 233 1 767 16 607
2018 10 827 676 3 288 1 810 16 601
2019 10 772 627 3 313 1 818 16 530
2020 10 688 592 3 297 1 793 16 370
2021 Q1
10 661 584 3 292 1 776 16 313
Source: Federal Ministry of Labour and Social Affairs
Rürup Pensions
Introduced in 2005, the Rürup200 pension (or “Basisrente”) is the most recent form of pension
provision and, next to occupational pension plans and Riester pension plans, the third type of
private pension that is supported by the German state through tax exemptions. The Rürup pension
actually has similar characteristics to the statutory pension insurance. Contributions are utilised for
199 http://www.bmas.de/DE/Themen/Rente/Zusaetzliche-Altersvorsorge/statistik-zusaetzliche-altersvorsorge.html. (data extracted on 12 July 2020) 200 Named after German economist Bert Rürup.
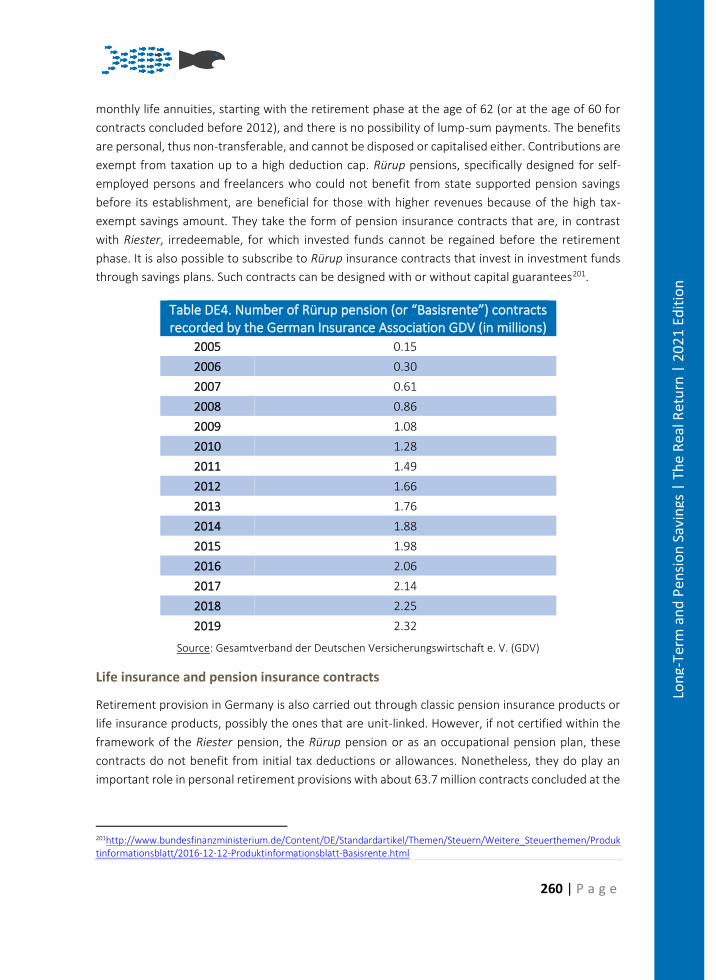
260 | P a g e
Lon
g-Te
rm a
nd
Pen
sio
n S
avin
gs |
Th
e R
eal R
etu
rn |
20
21
Edit
ion
monthly life annuities, starting with the retirement phase at the age of 62 (or at the age of 60 for
contracts concluded before 2012), and there is no possibility of lump-sum payments. The benefits
are personal, thus non-transferable, and cannot be disposed or capitalised either. Contributions are
exempt from taxation up to a high deduction cap. Rürup pensions, specifically designed for self-
employed persons and freelancers who could not benefit from state supported pension savings
before its establishment, are beneficial for those with higher revenues because of the high tax-
exempt savings amount. They take the form of pension insurance contracts that are, in contrast
with Riester, irredeemable, for which invested funds cannot be regained before the retirement
phase. It is also possible to subscribe to Rürup insurance contracts that invest in investment funds
through savings plans. Such contracts can be designed with or without capital guarantees201.
Table DE4. Number of Rürup pension (or “Basisrente”) contracts recorded by the German Insurance Association GDV (in millions)
2005 0.15
2006 0.30
2007 0.61
2008 0.86
2009 1.08
2010 1.28
2011 1.49
2012 1.66
2013 1.76
2014 1.88
2015 1.98
2016 2.06
2017 2.14
2018 2.25
2019 2.32
Source: Gesamtverband der Deutschen Versicherungswirtschaft e. V. (GDV)
Life insurance and pension insurance contracts
Retirement provision in Germany is also carried out through classic pension insurance products or
life insurance products, possibly the ones that are unit-linked. However, if not certified within the
framework of the Riester pension, the Rürup pension or as an occupational pension plan, these
contracts do not benefit from initial tax deductions or allowances. Nonetheless, they do play an
important role in personal retirement provisions with about 63.7 million contracts concluded at the
201http://www.bundesfinanzministerium.de/Content/DE/Standardartikel/Themen/Steuern/Weitere_Steuerthemen/Produktinformationsblatt/2016-12-12-Produktinformationsblatt-Basisrente.html
261 | P a g e
Lon
g-Te
rm a
nd
Pen
sio
n S
avin
gs |
Th
e R
eal R
etu
rn |
20
21
Edit
ion
end of 2020202. These contracts are of a diverse nature. They usually start paying out at the moment
of retirement, though there are also contracts that pay immediately after conclusion
(“Sofortrente”). It is possible to redeem both via lump-sums and annuities.
While the pension law of summer 2017 mainly aimed at strengthening occupational pensions,
personal pensions are likewise impacted as the basic allowances for Riester contracts increased
from €154 to €175 from early 2018.
Charges
Information on the multifaceted types of charges for private pension products are rather hard to
obtain and often non-transparent for individuals, which complicates the decision-making process.
Within Pillar II, due to the DB character of pension schemes, employers have an interest in cost-
efficient pension provision, and the competition among different financing methods creates
pressure on costs. In the case of book reserves and support funds, an employer has to meet the
specified retirement commitments agreed upon, thus charges will not be discussed within the
scope of these two types of occupational pension.
One of the main advantages of occupational pension schemes is that charges are usually lower than
for personal pension plans because they are spread over larger groups. Employers often receive
quantity discounts or customised rates with lower administrative charges. This is especially the case
if rates are defined for whole industry sectors.
The following operating expenses data for autonomous occupational pension funds
(Pensionskassen and pension funds) are available in the OECD Pension indicators database203 and
are provided by the Federal Financial Supervisory Authority (BaFin). Charges are expressed as a
percentage of the funds’ total assets. We did not find any charges data shown separately for
occupational direct insurances. We did not find any data on acquisition costs which are opaque in
the case of occupational schemes and even prohibited by law for traditional Pensionskassen.
Operating expenses comprise all costs arising from the general administration of the plan/fund that
are treated as plan/fund expenses (i.e., investment management costs and administrative costs):
- Investment expenses shall comprise all costs arising from investment management, such as:
internal investment personnel costs; investment management fees (paid to external asset
managers); trading expenses; legal fees (investment management related); custodian,
accounting and performance measurement fees; property maintenance costs; asset
consultant fees; other investment expenses.
202 https://www.gdv.de/de/zahlen-und-fakten/versicherungsbereiche/renten--und-kapitalversicherungen-24038 203 http://www.oecd.org/daf/fin/private-pensions/globalpensionstatistics.htm (data extracted on 9 July 2021)
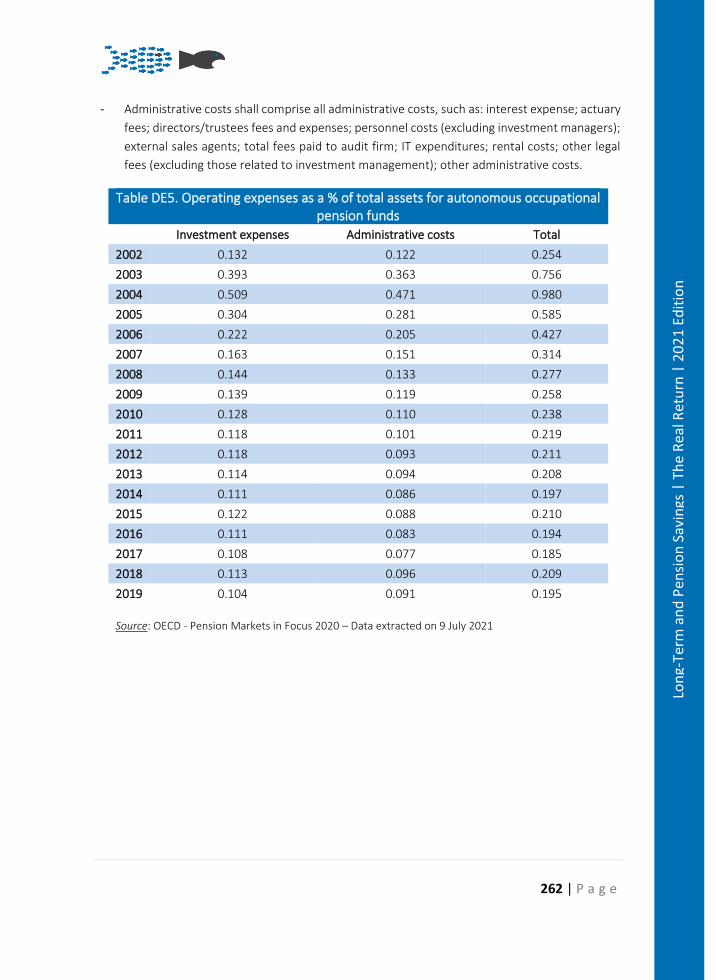
262 | P a g e
Lon
g-Te
rm a
nd
Pen
sio
n S
avin
gs |
Th
e R
eal R
etu
rn |
20
21
Edit
ion
- Administrative costs shall comprise all administrative costs, such as: interest expense; actuary
fees; directors/trustees fees and expenses; personnel costs (excluding investment managers);
external sales agents; total fees paid to audit firm; IT expenditures; rental costs; other legal
fees (excluding those related to investment management); other administrative costs.
Table DE5. Operating expenses as a % of total assets for autonomous occupational pension funds
Investment expenses Administrative costs Total
2002 0.132 0.122 0.254
2003 0.393 0.363 0.756
2004 0.509 0.471 0.980
2005 0.304 0.281 0.585
2006 0.222 0.205 0.427
2007 0.163 0.151 0.314
2008 0.144 0.133 0.277
2009 0.139 0.119 0.258
2010 0.128 0.110 0.238
2011 0.118 0.101 0.219
2012 0.118 0.093 0.211
2013 0.114 0.094 0.208
2014 0.111 0.086 0.197
2015 0.122 0.088 0.210
2016 0.111 0.083 0.194
2017 0.108 0.077 0.185
2018 0.113 0.096 0.209
2019 0.104 0.091 0.195
Source: OECD - Pension Markets in Focus 2020 – Data extracted on 9 July 2021
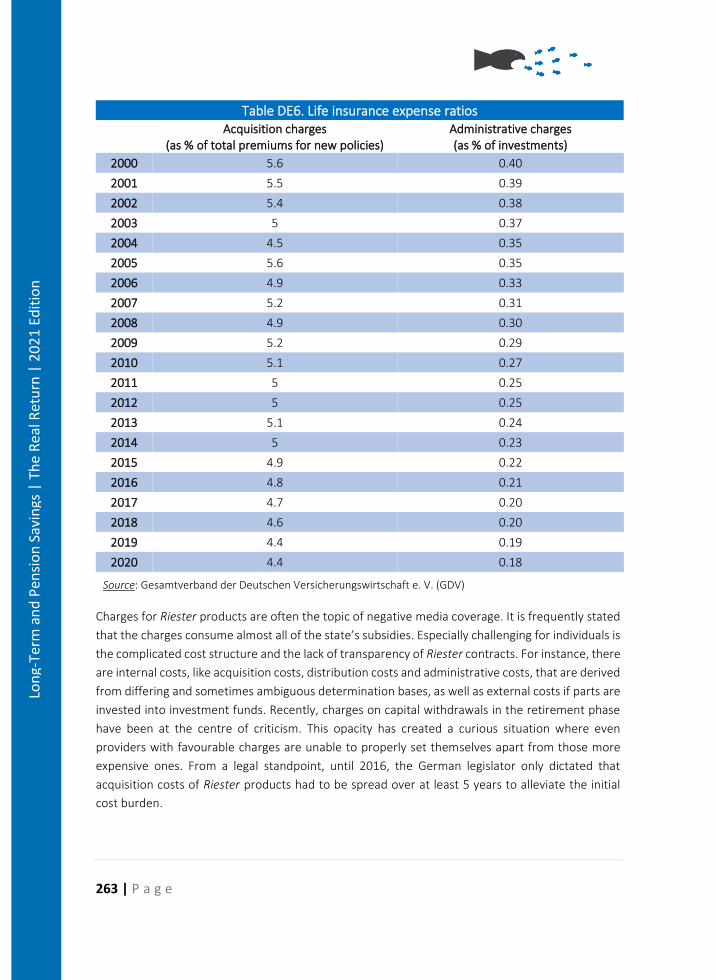
263 | P a g e
Lon
g-Te
rm a
nd
Pen
sio
n S
avin
gs |
Th
e R
eal R
etu
rn |
20
21
Edit
ion
Table DE6. Life insurance expense ratios
Acquisition charges
(as % of total premiums for new policies) Administrative charges (as % of investments)
2000 5.6 0.40
2001 5.5 0.39
2002 5.4 0.38
2003 5 0.37
2004 4.5 0.35
2005 5.6 0.35
2006 4.9 0.33
2007 5.2 0.31
2008 4.9 0.30
2009 5.2 0.29
2010 5.1 0.27
2011 5 0.25
2012 5 0.25
2013 5.1 0.24
2014 5 0.23
2015 4.9 0.22
2016 4.8 0.21
2017 4.7 0.20
2018 4.6 0.20
2019 4.4 0.19
2020 4.4 0.18
Source: Gesamtverband der Deutschen Versicherungswirtschaft e. V. (GDV)
Charges for Riester products are often the topic of negative media coverage. It is frequently stated
that the charges consume almost all of the state’s subsidies. Especially challenging for individuals is
the complicated cost structure and the lack of transparency of Riester contracts. For instance, there
are internal costs, like acquisition costs, distribution costs and administrative costs, that are derived
from differing and sometimes ambiguous determination bases, as well as external costs if parts are
invested into investment funds. Recently, charges on capital withdrawals in the retirement phase
have been at the centre of criticism. This opacity has created a curious situation where even
providers with favourable charges are unable to properly set themselves apart from those more
expensive ones. From a legal standpoint, until 2016, the German legislator only dictated that
acquisition costs of Riester products had to be spread over at least 5 years to alleviate the initial
cost burden.
264 | P a g e
Lon
g-Te
rm a
nd
Pen
sio
n S
avin
gs |
Th
e R
eal R
etu
rn |
20
21
Edit
ion
Calculations by the German government in the early 2000s estimated the total charges to be 10%
of the yearly savings premium, and this has become the standard for Riester charges calculations
ever since204. Our own research shows that estimations of total charges of, on average, 10% to 12%
of the yearly savings premium can be assumed. However, one can observe an enormous cost span
from 2.5% to 20% for insurance contracts205.
With regard to the less-used Rürup contracts and their shorter history, information is even harder
to obtain. For a long time, there has been very little transparency regarding the cost structure, as
there was no obligation by law for detailed disclosures. In contrast to Riester products, there is no
obligation to spread the initial acquisition and distribution charges over a defined period206, but
application of the same conditions as for Riester products is common. The total charges for Rürup
pensions expressed as percentages of the yearly savings premium are estimated by practitioners to
be a little lower than for Riester pensions. Other personal retirement provisions, such as classic
pension insurance and life insurance contracts, are likewise often stated to have slightly lower total
charges than Riester products.
Since 1 January 2017, in order to increase transparency and comparability, every consumer receives
corresponding product information sheets before the subscription to a Riester or Rürup contract.
These information sheets are standardised and contain, along with details of individual charges,
actual costs illustrating a reduction in yield ratio which should allow for a better comparison among
products of the same risk type. Also enforced from this date are charges arising from changes by
Riester or Rürup providers for contracts after 1 January 2017, now subject to hard caps such as
distribution cost application to only 50% of the transferred subsidised capital207.
Average effective costs are not available for the periods under review within this study, hence for
our calculations we only consider two types of charges at our disposal: acquisition and
administrative charges. For the years 2016 and 2017, Assekurata208 calculated average effective
costs of about 0.8%209 per year, which would lead to a heavier charge burden than what our
calculations can capture.
204 Rürup–Kommission (2003). 205 Gasche, Bucher-Koenen, Haupt, Angstmann (2013). 206 ZEW (2010). 207 http://www.bundesfinanzministerium.de/Content/DE/Monatsberichte/2013/07/Inhalte/Kapitel-3-Analysen/3-4-die-gefoerderte-private-altersvorsorge.html (Accessed on 17 July 2018). 208 “ASSEKURATA Assekuranz Rating-Agentur GmbH” (www.assekurata.de) is a private company specialized in the quality assessment of insurance companies from a customer's perspective providing rating and analysis services. For instance, ASSEKURATA is the only rating agency incorporating policy holder’s opinions on their insurers gathered from customer surveys directly into their verdicts. ASSEKURATA, as a licensed European rating agency, is supervised by the European Securities and Markets Authority (ESMA). Calculations by Assekurata are renowned and utilised by governmental, corporate and consumer structures. 209 Assekurata (2017).
265 | P a g e
Lon
g-Te
rm a
nd
Pen
sio
n S
avin
gs |
Th
e R
eal R
etu
rn |
20
21
Edit
ion
Taxation
A reorganisation of retirement savings taxation has been instructed by a Federal Constitutional
Court decision from 2002. This revision came into effect in 2005 whereupon taxation is based on a
model that divides the different forms of retirement savings according to three groups.
The statutory pension insurance and the Rürup pension belong to the first group. Funded pension
schemes like occupational pensions and the Riester pension belong to the second group. The third
group covers the standard pension insurance or life insurance products due to their likewise
existent function as investment products.
Contributions to products from the third group always have to be paid from taxed income. The
products from the first two groups are subject to deferred taxation. Contributions up to a deduction
cap are exempt from taxation and generally subject to tax in its entirety during the pay-out phase.
While products from the second group have already been partially subject to deferred taxation
before 2005, this has not been the case for products from the first group. A transitional phase
towards complete deferred taxation started in 2005 and since then, every year, higher amounts of
contributions can be deducted from taxation and consequently the amount of retirement pay-outs
subject to taxation rises. In 2025, pension savings for up to €20,000 for individual insurees and
€40,000 for spouses will be exempt from initial taxation. 60% of the maximal amount was tax
deductible in 2005 which means the percentage rises 2% each year until the maximum is attained
in 2025. The 50% contribution by employers is already tax exempt, so in 2016, 32% of an employee’s
total contributions to retirement savings were tax exempt.
The percentage of retirement pay-outs subject to taxation was 50% in 2005. Since then, for each
year following, the percentage of retirement pay-outs subject to taxation for new retirees rises at
a rate of 2%. This means that in 2020, new retirees will pay taxes on 80% of their retirement pay-
outs. From 2020 onwards, the rate will rise at 1% annually and consequently retirees from 2040
onwards will have to pay full taxes on their retirement pay-outs210.
Voluntary Occupational Pensions
For occupational pension plans in 2013, and for commitments starting from 2005 on, the following
taxation rules apply for the individual types of occupational pension schemes:
Book reserves and support funds
Book reserve and support fund contributions through deferred compensation are fully tax exempt
while up to 4% of a variable contribution cap is exempt from social security contributions. Benefits
are taxed as income at the personal rate.
210 Deutsche Rentenversicherung (2017).
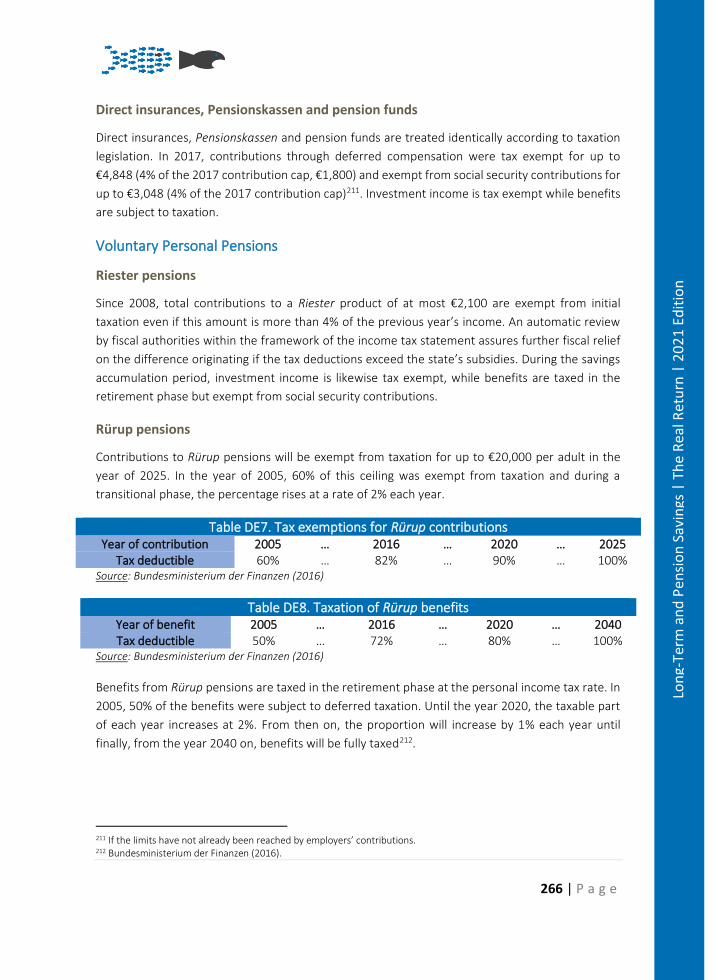
266 | P a g e
Lon
g-Te
rm a
nd
Pen
sio
n S
avin
gs |
Th
e R
eal R
etu
rn |
20
21
Edit
ion
Direct insurances, Pensionskassen and pension funds
Direct insurances, Pensionskassen and pension funds are treated identically according to taxation
legislation. In 2017, contributions through deferred compensation were tax exempt for up to
€4,848 (4% of the 2017 contribution cap, €1,800) and exempt from social security contributions for
up to €3,048 (4% of the 2017 contribution cap)211. Investment income is tax exempt while benefits
are subject to taxation.
Voluntary Personal Pensions
Riester pensions
Since 2008, total contributions to a Riester product of at most €2,100 are exempt from initial
taxation even if this amount is more than 4% of the previous year’s income. An automatic review
by fiscal authorities within the framework of the income tax statement assures further fiscal relief
on the difference originating if the tax deductions exceed the state’s subsidies. During the savings
accumulation period, investment income is likewise tax exempt, while benefits are taxed in the
retirement phase but exempt from social security contributions.
Rürup pensions
Contributions to Rürup pensions will be exempt from taxation for up to €20,000 per adult in the
year of 2025. In the year of 2005, 60% of this ceiling was exempt from taxation and during a
transitional phase, the percentage rises at a rate of 2% each year.
Table DE7. Tax exemptions for Rürup contributions Year of contribution 2005 … 2016 … 2020 … 2025
Tax deductible 60% … 82% … 90% … 100% Source: Bundesministerium der Finanzen (2016)
Table DE8. Taxation of Rürup benefits Year of benefit 2005 … 2016 … 2020 … 2040 Tax deductible 50% … 72% … 80% … 100%
Source: Bundesministerium der Finanzen (2016)
Benefits from Rürup pensions are taxed in the retirement phase at the personal income tax rate. In
2005, 50% of the benefits were subject to deferred taxation. Until the year 2020, the taxable part
of each year increases at 2%. From then on, the proportion will increase by 1% each year until
finally, from the year 2040 on, benefits will be fully taxed212.
211 If the limits have not already been reached by employers’ contributions. 212 Bundesministerium der Finanzen (2016).
267 | P a g e
Lon
g-Te
rm a
nd
Pen
sio
n S
avin
gs |
Th
e R
eal R
etu
rn |
20
21
Edit
ion
Life insurance and pension insurance contracts
Other retirement savings products that are not particularly promoted by the German state are
taxed as follows for all contracts subscribed to since 1 January 2005:
Contributions are no longer tax deductible as special expenses and have to be made from taxed
income. Benefits are taxed at the personal income tax rate on corresponding earnings (the
difference between contributions and total pay-outs) in the retirement phase. Furthermore, one
has to differentiate whether the insurance benefit is carried out as a one-time lump-sum payment
or if a lifetime annuity payment is chosen. In the case of lump-sum pay-outs, if the contract runs
for at least 12 years and the insured is older than 60 years, or 62 years (for contracts subscribed to
after 31 December 2011), only 50% of the earnings are subject to taxation. If these conditions are
not met, the full earnings are taxed. In the case of life annuities, even further tax reliefs are possible
depending on the age of the first retirement pay-out, as defined in the tax table. For instance, if the
retiree is 60 years old, 22% of the earnings are subject to taxation and at the age of 65 only 18%.
Pension Returns
Pension return calculations are not performed for book reserves and support funds. These are
individual commitments to employees that will not increase or decrease depending on asset
performances. The commitments are protected by the PSVaG, hence employees can estimate the
exact amount they can expect in the retirement phase. Furthermore, we do not have data on
performance or charges available for the 2nd pillar direct insurances – thus we cannot perform real
return calculations for this occupational financing vehicle either.
These drawbacks should be kept in mind when interpreting real returns, as well as the impact of
subsidies, such as allowances.
Voluntary Occupational Pensions
Pensionskassen and pension funds
The following table shows real return calculations for Pillar II aggregate Pensionskassen as well as
pension funds supervised by BaFin.
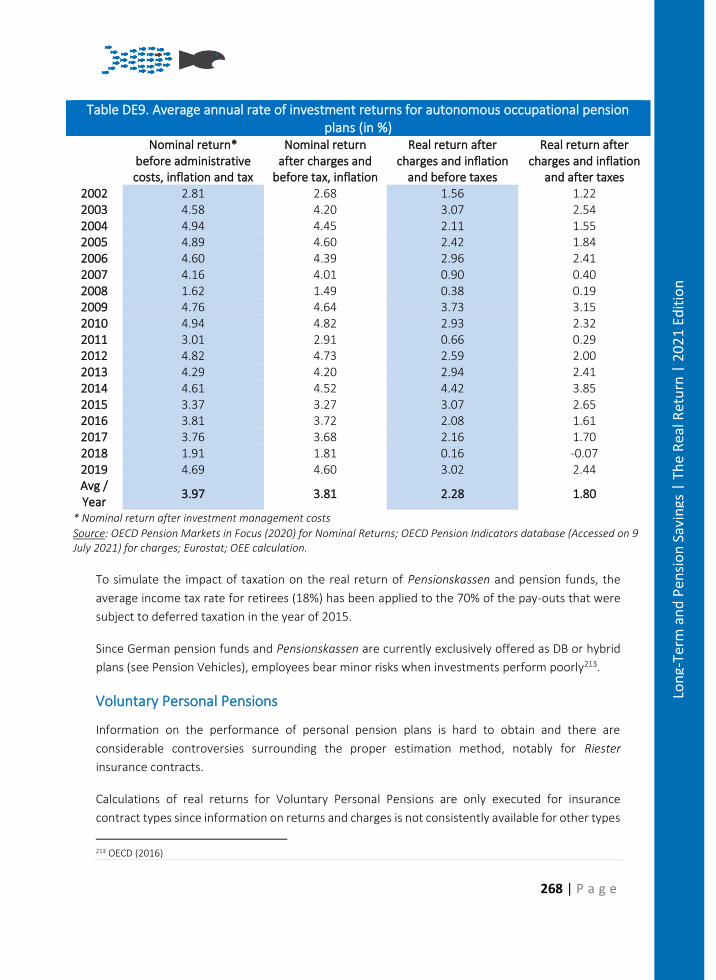
268 | P a g e
Lon
g-Te
rm a
nd
Pen
sio
n S
avin
gs |
Th
e R
eal R
etu
rn |
20
21
Edit
ion
Table DE9. Average annual rate of investment returns for autonomous occupational pension plans (in %)
Nominal return*
before administrative costs, inflation and tax
Nominal return after charges and
before tax, inflation
Real return after charges and inflation
and before taxes
Real return after charges and inflation
and after taxes 2002 2.81 2.68 1.56 1.22 2003 4.58 4.20 3.07 2.54 2004 4.94 4.45 2.11 1.55 2005 4.89 4.60 2.42 1.84 2006 4.60 4.39 2.96 2.41 2007 4.16 4.01 0.90 0.40 2008 1.62 1.49 0.38 0.19 2009 4.76 4.64 3.73 3.15 2010 4.94 4.82 2.93 2.32 2011 3.01 2.91 0.66 0.29 2012 4.82 4.73 2.59 2.00 2013 4.29 4.20 2.94 2.41 2014 4.61 4.52 4.42 3.85 2015 3.37 3.27 3.07 2.65 2016 3.81 3.72 2.08 1.61 2017 3.76 3.68 2.16 1.70 2018 1.91 1.81 0.16 -0.07 2019 4.69 4.60 3.02 2.44 Avg / Year
3.97 3.81 2.28 1.80
* Nominal return after investment management costs Source: OECD Pension Markets in Focus (2020) for Nominal Returns; OECD Pension Indicators database (Accessed on 9 July 2021) for charges; Eurostat; OEE calculation.
To simulate the impact of taxation on the real return of Pensionskassen and pension funds, the
average income tax rate for retirees (18%) has been applied to the 70% of the pay-outs that were
subject to deferred taxation in the year of 2015.
Since German pension funds and Pensionskassen are currently exclusively offered as DB or hybrid
plans (see Pension Vehicles), employees bear minor risks when investments perform poorly213.
Voluntary Personal Pensions
Information on the performance of personal pension plans is hard to obtain and there are
considerable controversies surrounding the proper estimation method, notably for Riester
insurance contracts.
Calculations of real returns for Voluntary Personal Pensions are only executed for insurance
contract types since information on returns and charges is not consistently available for other types
213 OECD (2016)
269 | P a g e
Lon
g-Te
rm a
nd
Pen
sio
n S
avin
gs |
Th
e R
eal R
etu
rn |
20
21
Edit
ion
of personal pension plans. Nonetheless, this provides an important insight into the most important
part of promoted personal pension plans since about two-thirds of all Riester pensions are designed
as pension insurance contracts, as are all Rürup pensions.
The following real return estimations are based on average return rates calculated by Assekurata.
One has to keep in mind that the calculations made by Assekurata are based on voluntary
participations. For instance, in 2021, 78 insurance companies were asked to participate in the
survey representing more than 99% of the market. 47 providers responded, corresponding to 79%
of the market share. This may lead to a bias based on voluntariness. The return rates provided by
Assekurata are composed of a guaranteed interest part (“Höchstrechnungszins” or “Garantiezins”),
set and capped by the German Federal Ministry of Finance, and a surplus sharing part
(“Überschussbeteiligung”)214. Furthermore, the return figures provided are related to the
investment part of the gross premium which is only about 60% to 90% of the total premium
depending on not only deductions of distribution and administrative charges, but also risk
premium215.
Though already introduced in 2002, data on investment return rates has only been available since
2005 for Riester pensions, just like for Rürup pensions which were introduced that year. Return
rates for classic pension insurances are available for a 21-year period. For our real return
estimations, we assumed that acquisition charges are spread over five years for all insurance
contract types. Consequently, the charge burden in the first five years is more severe.
214 Terminal bonuses and participation in valuation reserves are not included in these calculations as they are difficult to compare and not equally applied. Terminal bonuses are usually paid on the maturity of the policy or on death. Similarly, valuation reserves only apply to about 5% of policy holders. One has to keep in mind that they account for, on average, 20% of the total return. 215 In life insurers’ advertisements, the return percentage figures that are published are always linked to the investment part of the premiums and, very often, the insurers do not differentiate between the gross premium and the investment part of the premium which is misleading from a consumer’s perspective.
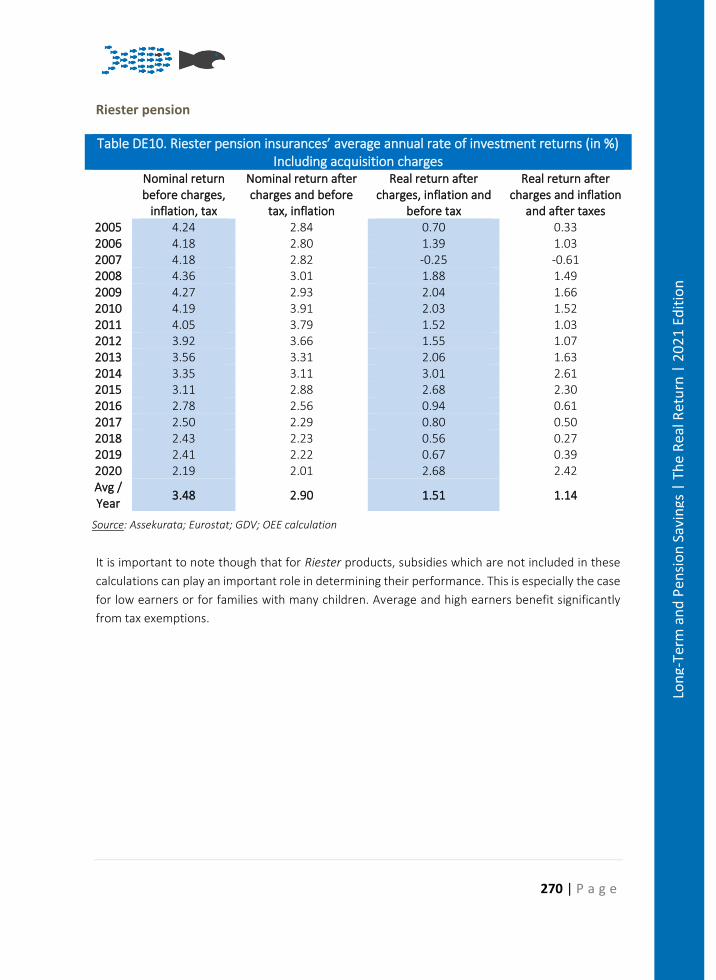
270 | P a g e
Lon
g-Te
rm a
nd
Pen
sio
n S
avin
gs |
Th
e R
eal R
etu
rn |
20
21
Edit
ion
Riester pension
Table DE10. Riester pension insurances’ average annual rate of investment returns (in %) Including acquisition charges
Nominal return before charges,
inflation, tax
Nominal return after charges and before
tax, inflation
Real return after charges, inflation and
before tax
Real return after charges and inflation
and after taxes 2005 4.24 2.84 0.70 0.33 2006 4.18 2.80 1.39 1.03 2007 4.18 2.82 -0.25 -0.61 2008 4.36 3.01 1.88 1.49 2009 4.27 2.93 2.04 1.66 2010 4.19 3.91 2.03 1.52 2011 4.05 3.79 1.52 1.03 2012 3.92 3.66 1.55 1.07 2013 3.56 3.31 2.06 1.63 2014 3.35 3.11 3.01 2.61 2015 3.11 2.88 2.68 2.30 2016 2.78 2.56 0.94 0.61 2017 2.50 2.29 0.80 0.50 2018 2.43 2.23 0.56 0.27 2019 2.41 2.22 0.67 0.39 2020 2.19 2.01 2.68 2.42 Avg / Year
3.48 2.90 1.51 1.14
Source: Assekurata; Eurostat; GDV; OEE calculation
It is important to note though that for Riester products, subsidies which are not included in these
calculations can play an important role in determining their performance. This is especially the case
for low earners or for families with many children. Average and high earners benefit significantly
from tax exemptions.
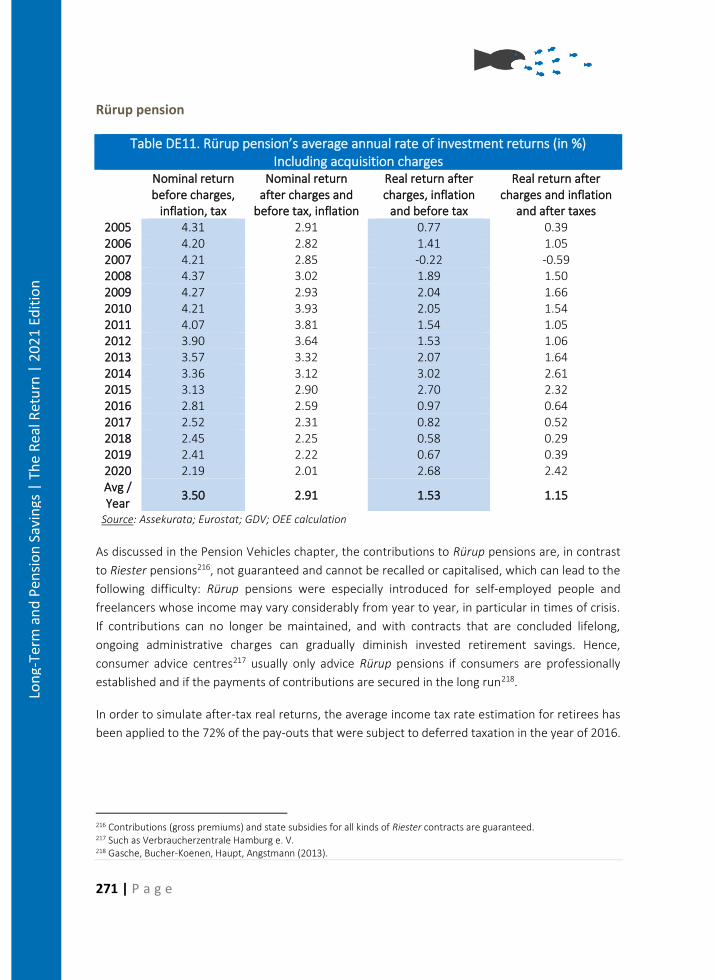
271 | P a g e
Lon
g-Te
rm a
nd
Pen
sio
n S
avin
gs |
Th
e R
eal R
etu
rn |
20
21
Edit
ion
Rürup pension
Table DE11. Rürup pension’s average annual rate of investment returns (in %) Including acquisition charges
Nominal return before charges,
inflation, tax
Nominal return after charges and
before tax, inflation
Real return after charges, inflation
and before tax
Real return after charges and inflation
and after taxes 2005 4.31 2.91 0.77 0.39 2006 4.20 2.82 1.41 1.05 2007 4.21 2.85 -0.22 -0.59 2008 4.37 3.02 1.89 1.50 2009 4.27 2.93 2.04 1.66 2010 4.21 3.93 2.05 1.54 2011 4.07 3.81 1.54 1.05 2012 3.90 3.64 1.53 1.06 2013 3.57 3.32 2.07 1.64 2014 3.36 3.12 3.02 2.61 2015 3.13 2.90 2.70 2.32 2016 2.81 2.59 0.97 0.64 2017 2.52 2.31 0.82 0.52 2018 2.45 2.25 0.58 0.29 2019 2.41 2.22 0.67 0.39 2020 2.19 2.01 2.68 2.42 Avg / Year
3.50 2.91 1.53 1.15
Source: Assekurata; Eurostat; GDV; OEE calculation
As discussed in the Pension Vehicles chapter, the contributions to Rürup pensions are, in contrast
to Riester pensions216, not guaranteed and cannot be recalled or capitalised, which can lead to the
following difficulty: Rürup pensions were especially introduced for self-employed people and
freelancers whose income may vary considerably from year to year, in particular in times of crisis.
If contributions can no longer be maintained, and with contracts that are concluded lifelong,
ongoing administrative charges can gradually diminish invested retirement savings. Hence,
consumer advice centres217 usually only advice Rürup pensions if consumers are professionally
established and if the payments of contributions are secured in the long run218.
In order to simulate after-tax real returns, the average income tax rate estimation for retirees has
been applied to the 72% of the pay-outs that were subject to deferred taxation in the year of 2016.
216 Contributions (gross premiums) and state subsidies for all kinds of Riester contracts are guaranteed. 217 Such as Verbraucherzentrale Hamburg e. V. 218 Gasche, Bucher-Koenen, Haupt, Angstmann (2013).
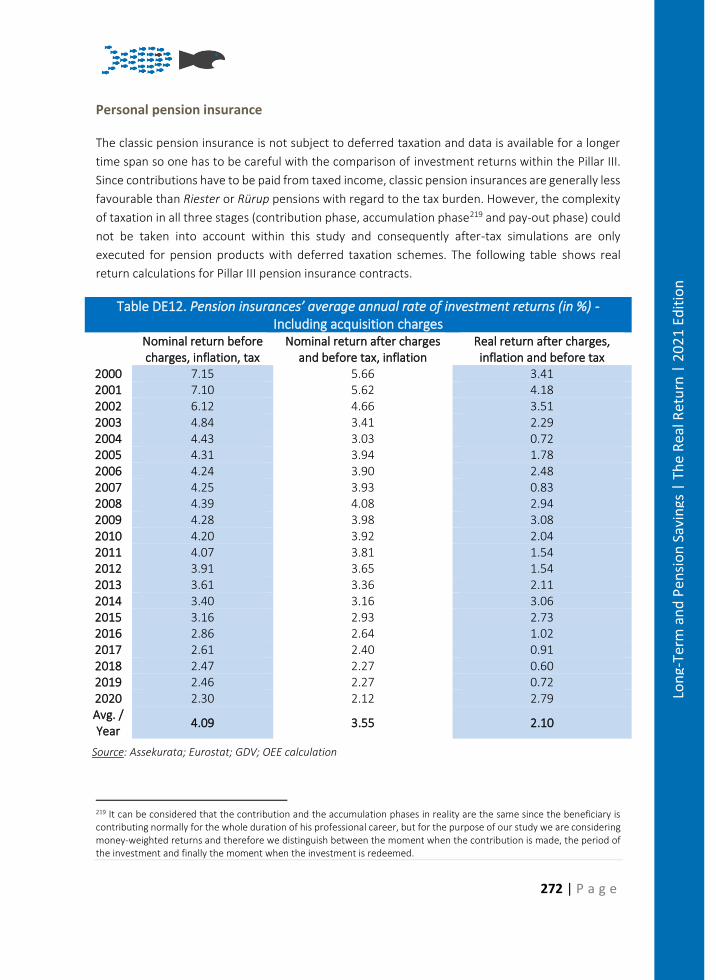
272 | P a g e
Lon
g-Te
rm a
nd
Pen
sio
n S
avin
gs |
Th
e R
eal R
etu
rn |
20
21
Edit
ion
Personal pension insurance
The classic pension insurance is not subject to deferred taxation and data is available for a longer
time span so one has to be careful with the comparison of investment returns within the Pillar III.
Since contributions have to be paid from taxed income, classic pension insurances are generally less
favourable than Riester or Rürup pensions with regard to the tax burden. However, the complexity
of taxation in all three stages (contribution phase, accumulation phase219 and pay-out phase) could
not be taken into account within this study and consequently after-tax simulations are only
executed for pension products with deferred taxation schemes. The following table shows real
return calculations for Pillar III pension insurance contracts.
Table DE12. Pension insurances’ average annual rate of investment returns (in %) - Including acquisition charges
Nominal return before charges, inflation, tax
Nominal return after charges and before tax, inflation
Real return after charges, inflation and before tax
2000 7.15 5.66 3.41 2001 7.10 5.62 4.18 2002 6.12 4.66 3.51 2003 4.84 3.41 2.29 2004 4.43 3.03 0.72 2005 4.31 3.94 1.78 2006 4.24 3.90 2.48 2007 4.25 3.93 0.83 2008 4.39 4.08 2.94 2009 4.28 3.98 3.08 2010 4.20 3.92 2.04 2011 4.07 3.81 1.54 2012 3.91 3.65 1.54 2013 3.61 3.36 2.11 2014 3.40 3.16 3.06 2015 3.16 2.93 2.73 2016 2.86 2.64 1.02 2017 2.61 2.40 0.91 2018 2.47 2.27 0.60 2019 2.46 2.27 0.72 2020 2.30 2.12 2.79 Avg. / Year
4.09 3.55 2.10
Source: Assekurata; Eurostat; GDV; OEE calculation
219 It can be considered that the contribution and the accumulation phases in reality are the same since the beneficiary is contributing normally for the whole duration of his professional career, but for the purpose of our study we are considering money-weighted returns and therefore we distinguish between the moment when the contribution is made, the period of the investment and finally the moment when the investment is redeemed.
273 | P a g e
Lon
g-Te
rm a
nd
Pen
sio
n S
avin
gs |
Th
e R
eal R
etu
rn |
20
21
Edit
ion
The very favourable nominal returns in the early 2000s raise the annual average of classic pension
insurances. Return figures from 2005 on resemble those of Riester and Rürup pensions.
Conclusions
The performance of Pensionskassen and pension funds in real terms has been positive over the
whole period from 2002-2019, with an annualised average return of 2.28% before taxation. Even
the difficult years of 2007, 2008 and 2011 still recorded modest positive real returns. In 2019, they
experienced the strongest performance (3.02%) since 2015, following the good performance of
stock markets that year. That performance will probably, at least partly, be offset in 2020 with the
stock market crash, often referred as the Corona Crash, caused by the start of the Covid crisis in
March 2020. German Voluntary Occupational Pensions are currently exclusively offered as DB or
hybrid plans but pension reforms, including the introduction of DC pension vehicles as early as
January 2018, are under way. It remains to be seen if the abandonment of traditional guarantees
which has already created much debate and uncertainty among employees and providers can boost
participation in occupational pensions, in particular for SMEs.
The real annualised average returns of Voluntary Personal Pensions have also delivered positive
results, 1.51% for Riester, 1.53% for Rürup over a 16-year span and 2.10% for classic pension
insurances over a 21-year span. Voluntary Personal Pensions have somewhat stalled over recent
years and a considerable share of subscribed Riester pensions is put on hold for the time being.
Persistent low interest rates, as reflected in the steadily falling guaranteed interest rate (from 2.75%
in 2005 to 0.9% in 2017), contribute to render new contracts of these pensions less profitable.
While more and more providers already undercut these minimum return guarantees, a definite
abolishment of this regulated interest fraction is still under discussion. The other important return
part of pension insurances, surplus sharing, has likewise been plummeting over the last years, if
nothing else to fulfil commitments of former contracts with higher guarantees. Voluntary Personal
Pensions, especially the bureaucratic and expensive Riester pensions, continue to be at the centre
of controversial debates. In 2020, despite the underperformance of stock markets following the
Corona Crash, the annualised average returns of Voluntary Personal Pensions increased in real
terms, due to the decrease of inflation.

274 | P a g e
Lon
g-Te
rm a
nd
Pen
sio
n S
avin
gs |
Th
e R
eal R
etu
rn |
20
21
Edit
ion
Policy Recommendations
Instead of trying to introduce new forms of old-age provisions, efforts should be focused on
improving the existing products. The “Riester” product, with its licensing process, its strict legal
framework, its exclusive number of categories and its comparability, is already an existing
standardised private product. Nevertheless, the contracts are often criticised for their high costs.
There is a lot of potential for reform within all three systems of old-age provision. Whereas the
public pension system should be focused on its core purpose, both company and private pension
schemes could be revamped by reducing excess bureaucracy, abandoning contradictory legislation
and further enhancing transparency.
Proposals have been made by different stakeholders. It is up to the legislator to take them into
consideration and to propel legislation to increase penetration and to make old age provision more
sustainable.
The discussion on “Riester” should take into account the fact that more than 16 million people have
concluded Riester contracts and trust in this form of private old-age provision. Statutory reforms
should therefore retain the current Riester scheme. The aim should be to maintain the current
Riester-product diversity, to open it up to all citizens and at the same time to simplify the Riester
support and make it more transparent, easier to understand and more attractive for citizens.
An education effort should also be made to encourage people (notably young people) to save for
retirement and to promote existing products. A recent survey among young people highlighted that
a decreasing number of young adults save for their old age, but an increasing number supports a
stronger role of government in additional pension schemes. This obvious contradiction reveals a
lack of knowledge regarding the pension system, options already available and the necessity to take
responsibility for oneself.
275 | P a g e
Lon
g-Te
rm a
nd
Pen
sio
n S
avin
gs |
Th
e R
eal R
etu
rn |
20
21
Edit
ion
Pension Savings: The Real Return 2021 Edition
Country Case: Italy
Sommario
Il sistema pensionistico italiano ha avuto una spesa pubblica del 17% del PIL nel 2020, 0,2 p.p.
aumento rispetto al 2019 (16,8% del PIL). La riforma del sistema pensionistico italiano nel 2011 ha
creato un solido regime di primo pilastro, con un tasso di sostituzione aggregato delle pensioni del
73% nel 2019, uno dei più alti tra i casi nazionali presi in esame in questo Rapporto. Considerando
anche il tasso di partecipazione relativamente basso delle famiglie italiane ai mercati dei capitali,
l'incentivo a indirizzare il reddito disponibile verso il risparmio previdenziale privato oi prodotti di
investimento è basso. Complessivamente il 67,3% dei pensionati italiani percepisce una sola
pensione e il 24,7% percepisce due pensioni (quindi pensioni pubbliche e private). Ciò risulta
evidente se si considera la percentuale del patrimonio dei fondi pensione italiani, pari al 10% del
PIL, nonché il tasso di copertura del secondo pilastro del 20% e del terzo pilastro del 14,2% della
forza lavoro.
Per quanto riguarda le performance, i fondi pensione contrattuali hanno restituito x% annuo in
media negli ultimi 21 anni (2000-2020). I fondi pensione aperti hanno restituito in media x% annuo
nello stesso periodo., PIP (Piani Individuali Pensionistici) con utili realizzati in media x% annuo negli
ultimi 13 anni, mentre i PIP unit-linked hanno registrato % annua in media nello stesso periodo.
Tutti i rendimenti sono espressi al netto di oneri e inflazione.
Summary
The Italian Pension System had a public expenditure of 17% of GDP in 2020, a 0.2 p.p. increase from
2019 (16.8% of GDP). The Italian pension system reform in 2011 created a strong Pillar I scheme,
with an aggregate replacement ratio for pensions of 73% in 2019, one of the highest among the
country cases under review in this Report. Considering also the relatively low participation rate of
Italian households in capital markets, the incentive to direct available income to the private
retirement savings or investment products is low. A A total of 67.3% of Italian pensioners receive
just one pension, and 24.7% received two pensions (meaning public and private pension income).
This becomes apparent when looking at the percentage of Italian pension funds’ assets, of 10% of
GDP, as well as the coverage ratio for Pillar II of 20% and Pillar III of 14.2% of the labour force.
With regards to performances, contractual pension funds returned x% annually on average over
the past 21 years (2000-2020). Open pension funds returned -% annually on average over the same
276 | P a g e
Lon
g-Te
rm a
nd
Pen
sio
n S
avin
gs |
Th
e R
eal R
etu
rn |
20
21
Edit
ion
period., PIP (Piani Individuali Pensionistici) with-profits experienced % annually on average over the
past 13 years, while PIP unit-linked experienced % annually on average over the same period. All
returns are expressed net of charges and inflation.
Introduction
The Italian Pension System is divided into three pillars:
• Pillar I – the public (state) pension scheme; • Pillar II – the occupational (mandatory) pension arrangements; • Pillar III – the individual (voluntary) pension schemes.
Pillar I – State Pension
The first pillar (state and mandatory) is the main pension vehicle in Italy and is made up of two tiers:
the zero and first tiers. The zero tier consists of a social pension ensuring a minimum level of income
for the elderly. The first tier covers employed individuals and it constitutes a notional defined
contribution system for all future generations.220
The Italian pension system used to be a Defined Benefit system. Since 1995, it is based on a Notional
Defined Contribution system. The Italian state pension system went through intensive reforms. The
year 1995 can be seen as a turning point, moving from a defined benefits system towards a defined
contribution system. The Dini reform (law 335/1995) is one of the most important law towards the
restructuring of the Italian pension system. As a result, all workers entering the job market after
1995 have been accruing their pension entitlement according to a defined contributions method,
while before 1995, pension entitlements were computed according to an earnings-related system.
The next pension reform came on the background of an ageing population and a massive pension
expenditure (relative to the GDP). In 2011, the minister of Welfare and Social Policy under the Monti
Government, Elsa Fornero, implemented a state pension reform (law n.214) to bring the system
closer to equilibrium. Under the new system, pension eligibility is based on working years rather
than age. Earlier retirement is possible, but subject to penalties. The public pension system was
thus sustainable. Nevertheless, the Italian Constitutional Court stated in April 2015 that the
suppression of indexation of pensions on inflation included in the “Fornero law” was
unconstitutional. The indexation of pensions on inflation will add unforeseen costs to the first pillar,
estimated at €500 million.
Further followed the “Quota 100” measure. Since January 1st, 2019, the new measure offers the
opportunity for workers aged at least 62 with 38 years of contributions to retire earlier than the
normal retirement age of 67 years. This possibly will remain available for 3 years, until 2021, in
order to see the economic impact, notably on the public expenditures. For the moment, the overall
220 Since the structural reform implemented by Minister Dini in 1995, the Italian pension system has been re-designed according to the Notional Defined Contribution system, in order to guarantee the stability of public finances.
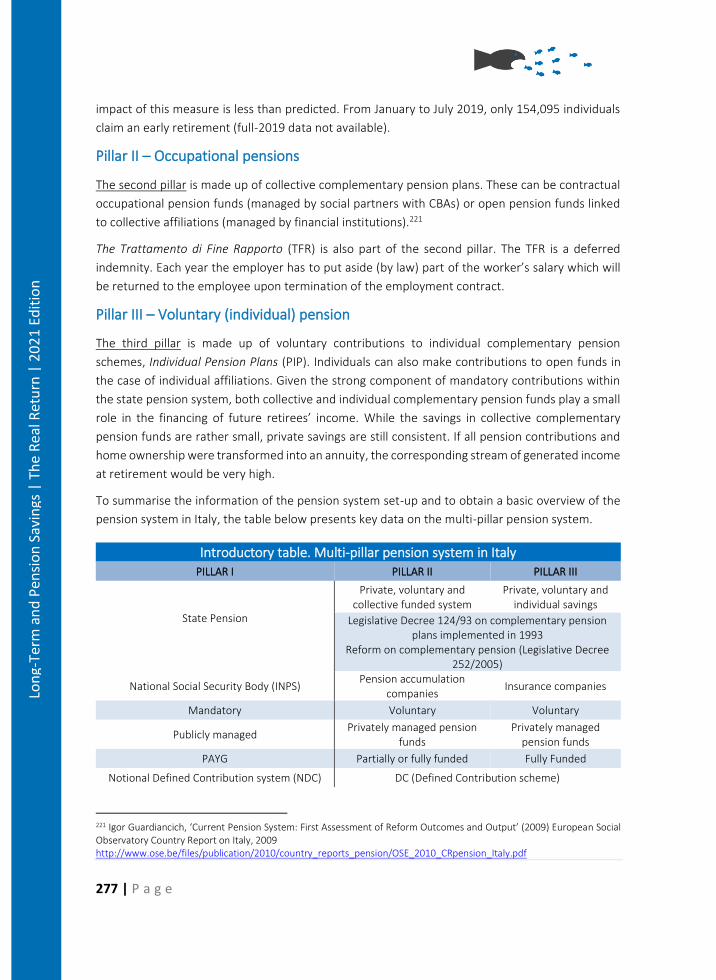
277 | P a g e
Lon
g-Te
rm a
nd
Pen
sio
n S
avin
gs |
Th
e R
eal R
etu
rn |
20
21
Edit
ion
impact of this measure is less than predicted. From January to July 2019, only 154,095 individuals
claim an early retirement (full-2019 data not available).
Pillar II – Occupational pensions
The second pillar is made up of collective complementary pension plans. These can be contractual
occupational pension funds (managed by social partners with CBAs) or open pension funds linked
to collective affiliations (managed by financial institutions).221
The Trattamento di Fine Rapporto (TFR) is also part of the second pillar. The TFR is a deferred
indemnity. Each year the employer has to put aside (by law) part of the worker’s salary which will
be returned to the employee upon termination of the employment contract.
Pillar III – Voluntary (individual) pension
The third pillar is made up of voluntary contributions to individual complementary pension
schemes, Individual Pension Plans (PIP). Individuals can also make contributions to open funds in
the case of individual affiliations. Given the strong component of mandatory contributions within
the state pension system, both collective and individual complementary pension funds play a small
role in the financing of future retirees’ income. While the savings in collective complementary
pension funds are rather small, private savings are still consistent. If all pension contributions and
home ownership were transformed into an annuity, the corresponding stream of generated income
at retirement would be very high.
To summarise the information of the pension system set-up and to obtain a basic overview of the
pension system in Italy, the table below presents key data on the multi-pillar pension system.
Introductory table. Multi-pillar pension system in Italy PILLAR I PILLAR II PILLAR III
State Pension
Private, voluntary and collective funded system
Private, voluntary and individual savings
Legislative Decree 124/93 on complementary pension plans implemented in 1993
Reform on complementary pension (Legislative Decree 252/2005)
National Social Security Body (INPS) Pension accumulation
companies Insurance companies
Mandatory Voluntary Voluntary
Publicly managed Privately managed pension
funds Privately managed
pension funds
PAYG Partially or fully funded Fully Funded
Notional Defined Contribution system (NDC) DC (Defined Contribution scheme)
221 Igor Guardiancich, ‘Current Pension System: First Assessment of Reform Outcomes and Output’ (2009) European Social Observatory Country Report on Italy, 2009 http://www.ose.be/files/publication/2010/country_reports_pension/OSE_2010_CRpension_Italy.pdf
278 | P a g e
Lon
g-Te
rm a
nd
Pen
sio
n S
avin
gs |
Th
e R
eal R
etu
rn |
20
21
Edit
ion
Quick facts
Number of old-age pensioners: 9,778,664 Funds: 311 Funds (new PIP): 71
Average old-age pension (2020): €1,315 AuM: €1,142.5 bn. Old et new PIP, AuM:
€42.5 bn.
Monthly household average income (net, 2018): €2,673
Participants in 2020: 5.4 million
Participants in 2020: 3.7 million
Aggregate pension replacement rate (2019): 73%
Coverage ratio: 21.4% Coverage ratio: 14.6%
Source: BETTER FINANCE composition based on COVIP Annual Report 2021 and INPS data for 2020
The real net returns (before taxes) of the main retirement provision vehicles in Italy are presented
below based on 6 recommended holding periods: 1 year (2020), 3 years (2018-2020), 7 years (2014-
2020), 10 years (2011-2020), and since the earliest data available (21 years for pension funds, 2000-
2020, and 13 years for PIP, 2008-2020).
Summary Table – Real net returns of Italian pension vehicles
Contractual
pension funds Open pension
funds PIP with profits
PIP unit-linked
2020 3.40% 3.20% 1.69% 0.09% 2018-2020 2.06% 1.64% 1.16% 1.71% 2014-2020 2.82% 2.79% 1.59% 3.77% 2011-2020 2.63% 2.69% 1.39% 3.69% 2008-2020 1.95% 1.61% 1.36% 2.23% 2000-2020 1.31% 0.33% n.a. n.a.
Source: Tables IT5 and IT6
Pensions Vehicles
Collective and individual complementary pension funds
Complementary pension funds were introduced in 1993 and are composed of contractual funds,
open funds and individual pension plans provided by life insurance companies. The main features
of complementary pension plans are:
i. voluntary membership;
ii. funded;
iii. managed by banks, financial institutions and insurance companies;
iv. supervised by Commissione di Vigilanza sui Fondi Pensione (Individual Pension Funds
Supervisory Commission - COVIP).
Following the signature of an agreement, all complementary pension funds are managed by an
external financial institution that can only be an insurance company, a bank or a registered asset
management company (Legislative Decree 252/2005). All complementary pension funds now
operate on a defined contribution (DC) basis, as this is the only permitted type of pension plan.
Defined benefit (DB) plans are restricted to pre-existing funds.
279 | P a g e
Lon
g-Te
rm a
nd
Pen
sio
n S
avin
gs |
Th
e R
eal R
etu
rn |
20
21
Edit
ion
At the end of 2020, the total workers enrolled into collective and individual pension plans (Pillar II
and III) amounted to 8.45 million222. The number of individuals covered by a pension plan
represents 33% of the labour force, compared to 31.4% in 2019. The increase in membership was
driven by an increase in the number of affiliates to all categories of schemes except pre-existing
closed pension funds whose membership remained quite stable in 2020.
Table IT1. Number of subscribers in Complementary Pension Funds (in thousands) 2013 2014 2015 2016 2017 2018 2019 2020
Pillar II: Collective complementary pension plans Contractual Pension Funds 1,951 1,944 2,419 2,561 2,763 2,949 3,095 3,184 Open Pension funds 985 1,057 1,150 1,230 1,343 1,429 1,516 1,590 Pre-existing Closed Pension Funds
655 645 646 620 611 613 618 616.6
Pillar III: Private and individual complementary pension plans New PIP 2,134 2,357 2,601 2,759 2,969 3,130 3,264 3,349 Old PIP 505 467 434 411 390 370 354 338.8
Total 6,204 6,585 7,235 7,786 7,585 7,953 8,264 8,445 Source: COVIP Annual Report 2020
The budget law of 11 December 2016 allows members of complementary defined contribution
pension funds, who are close to retirement age, to receive early retirement income from their
accumulated savings in a whole or in part (Rendita integrativa temporanea anticipata or RITA).
Eligible employees are those who benefit from a similar provision in the first pillar (Anticipo
finanziario a garanzia pensionistica or APE).
To be eligible to RITA, an individual must:
• cease his / her professional activity;
• reach the requirements necessary to receive the old-age pension in their mandatory
regime within the next five years or to be unemployed for more than 24 months;
• have contributed at least 20 complete years to the mandatory regime; or / and have
completed five years in the pension scheme.
The individual determines the amount of the accrued capital to use until his / her official retirement.
In 2019, 8,200 individuals benefitted from RITA: 6,900 individuals drawn out their entire accrued
position. In 2018, the first year of application of this package 2,200 individuals benefited from RITA
and 400 individuals drawn out their entire accrued position.
Pillar II
Contractual funds or Closed funds (Net assets at the end of 2020: €60.37 billion)
Contractual funds are also called closed funds as only certain groups of people can join. These are
professional occupational funds. Amongst employees, subscription is reserved only to those whose
222 Covip, 2019 Annual Report.
280 | P a g e
Lon
g-Te
rm a
nd
Pen
sio
n S
avin
gs |
Th
e R
eal R
etu
rn |
20
21
Edit
ion
contracts are regulated by a collective bargaining agreement (CBA). For the self-employed,
contractual agreements are usually provided by professional associations. Thus, only their members
can subscribe to dedicated contractual pension funds.
Contractual pension funds are defined contribution schemes, and the contribution amount is
established by the fund’s bylaws.223 These funds are independent legal entities, with their own
capital. Their governance is based on the principle of equal representation among employers and
employees.
The Board of Directors is responsible for the investment strategies and chooses the investment
manager, as well as the depositary bank and the designated entity dealing with administration. The
fund must report on an annual basis, at least. Given the long-term characteristic of funds, managers’
mandates are usually five years, or even longer for certain types of assets.
Open funds (Net assets at the end of 2020: €25.38 billion)
In contrast to closed funds, membership is not restricted to certain groups. An open fund is not a
legal entity. They can be established for collective or individual members, or both.
Like contractual funds, open funds are defined contribution funds. Alike closed funds, a depositary
bank is required, and administration costs can be outsourced.
The number of subscribers to open funds were 1,590,313. It increased by 4.9% over a year with
111,497 new subscribers.
At the end of 2020, assets managed by open funds amounted €25.38 billion with €2.343 billion of
contributions.
The TFR, Severance Payment (€27.150 billion in 2020)
During his/her whole career, an employee perceives severance payments, which are paid upon
work termination. The severance payments are collected in a specific vehicle for pension asset
accumulation, also known as Trattamento di Fine Rapporto (TFR). The TFR is computed on an annual
basis and is equal to 6.91% of employee’s annual remuneration. The TFR rate of return was 1.5% in
2019. It is mandatorily saved and returned upon termination of employment (such as retirement,
the most common form).
The TFR can also be partially drawn on (70%) before the employee ends his / her professional
activity, but only under very special circumstances, including health problems, first-house
purchases and parental leave. Moreover, the stability law of 2015 enabled employees in the private
sector to receive their severance payments in advance with a state guarantee on bank loans to
companies.
223 Paci S., P. Contaldo, C. Fiorentino, G. Nocera, L. Spotorno, F. Vallacqua, ‘Carefin Report: Pension Funds in Italy’ (2010)
Bocconi University.
281 | P a g e
Lon
g-Te
rm a
nd
Pen
sio
n S
avin
gs |
Th
e R
eal R
etu
rn |
20
21
Edit
ion
The TFR represents a huge savings pot and its management underwent heavy changes from January
2007. Each worker can opt to accumulate their TFR by joining a complementary pension fund. If a
worker does not make such a decision, tacit consent applies for the TFR to be transferred to a
collective contractual pension fund when it exists for specific sectors.
This change represented a small cultural revolution in the Italian pension structure, where pensions
had previously been provided by the public sector, with no active role by workers in choosing how
much to invest. Workers have mandatorily contributed a conspicuous amount of their income,
through the first pillar State system, with no involvement in where to invest their savings. With the
TFR law, workers are now offered the possibility to choose to join any complementary pension
fund224 among contractual pension funds, open pension funds or even PIPs (Individual Pension
Plans). When opting for PIPs, workers can decide the amount they contribute, a new element in the
Italian framework, with no discretion in terms of pension contributions.
If an employee decides to opt-out from complementary pension funds and belongs to a company
with more than 50 employees, his / her accumulated amount of severance payments is transferred
to INPS (National Institute for Social Security), which manages the severance payment according to
the law. For an employee who works in firms with less than 50 employees and who does not opt
for complementary pension funds, his / her TFR remains in the firms he / she works in and
represents a debt for the company.
In 2019 the overall TFR flow generated was estimated at around 27.4 billion euros. €15.2 billion
remained in the books of companies, €6.3 billion were transferred to complementary pension
schemes and 5.9 billion were transferred to INPS.
Third Pillar
PIP, individual pension funds (Net assets at the end of 2020: €39.01 billion)
They are subscribed on an individual basis only, as insurance contracts in the legal framework of
complementary pension funds. Within PIPs policies, two types of insurance contracts are offered:
with-profits or unit-linked. A combination of the two types of contracts is possible with a more
flexible risk-profile.
The with-profits policies guarantee a minimum rate of return (guaranteed and consolidated in the
company’s accounts) which is added to a quota related to the financial performance. The unit-
linked policies do not have a guarantee. Their performance depends on the value of the units in
which contributions are invested.
Public employees
The coverage of public employees by specific retirement products is very limited, as the law
introducing pension funds excluded them. Contractual pension funds are only possible for
224 Cannata and Settimo, 2007
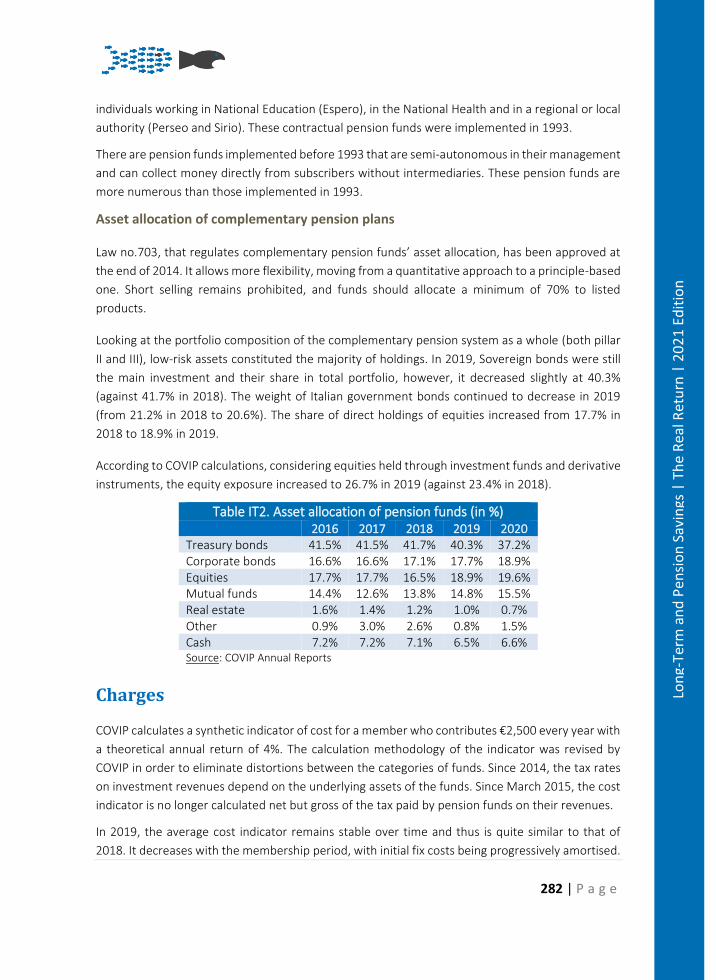
282 | P a g e
Lon
g-Te
rm a
nd
Pen
sio
n S
avin
gs |
Th
e R
eal R
etu
rn |
20
21
Edit
ion
individuals working in National Education (Espero), in the National Health and in a regional or local
authority (Perseo and Sirio). These contractual pension funds were implemented in 1993.
There are pension funds implemented before 1993 that are semi-autonomous in their management
and can collect money directly from subscribers without intermediaries. These pension funds are
more numerous than those implemented in 1993.
Asset allocation of complementary pension plans
Law no.703, that regulates complementary pension funds’ asset allocation, has been approved at
the end of 2014. It allows more flexibility, moving from a quantitative approach to a principle-based
one. Short selling remains prohibited, and funds should allocate a minimum of 70% to listed
products.
Looking at the portfolio composition of the complementary pension system as a whole (both pillar
II and III), low-risk assets constituted the majority of holdings. In 2019, Sovereign bonds were still
the main investment and their share in total portfolio, however, it decreased slightly at 40.3%
(against 41.7% in 2018). The weight of Italian government bonds continued to decrease in 2019
(from 21.2% in 2018 to 20.6%). The share of direct holdings of equities increased from 17.7% in
2018 to 18.9% in 2019.
According to COVIP calculations, considering equities held through investment funds and derivative
instruments, the equity exposure increased to 26.7% in 2019 (against 23.4% in 2018).
Table IT2. Asset allocation of pension funds (in %) 2016 2017 2018 2019 2020
Treasury bonds 41.5% 41.5% 41.7% 40.3% 37.2% Corporate bonds 16.6% 16.6% 17.1% 17.7% 18.9% Equities 17.7% 17.7% 16.5% 18.9% 19.6% Mutual funds 14.4% 12.6% 13.8% 14.8% 15.5% Real estate 1.6% 1.4% 1.2% 1.0% 0.7% Other 0.9% 3.0% 2.6% 0.8% 1.5% Cash 7.2% 7.2% 7.1% 6.5% 6.6% Source: COVIP Annual Reports
Charges
COVIP calculates a synthetic indicator of cost for a member who contributes €2,500 every year with
a theoretical annual return of 4%. The calculation methodology of the indicator was revised by
COVIP in order to eliminate distortions between the categories of funds. Since 2014, the tax rates
on investment revenues depend on the underlying assets of the funds. Since March 2015, the cost
indicator is no longer calculated net but gross of the tax paid by pension funds on their revenues.
In 2019, the average cost indicator remains stable over time and thus is quite similar to that of
2018. It decreases with the membership period, with initial fix costs being progressively amortised.
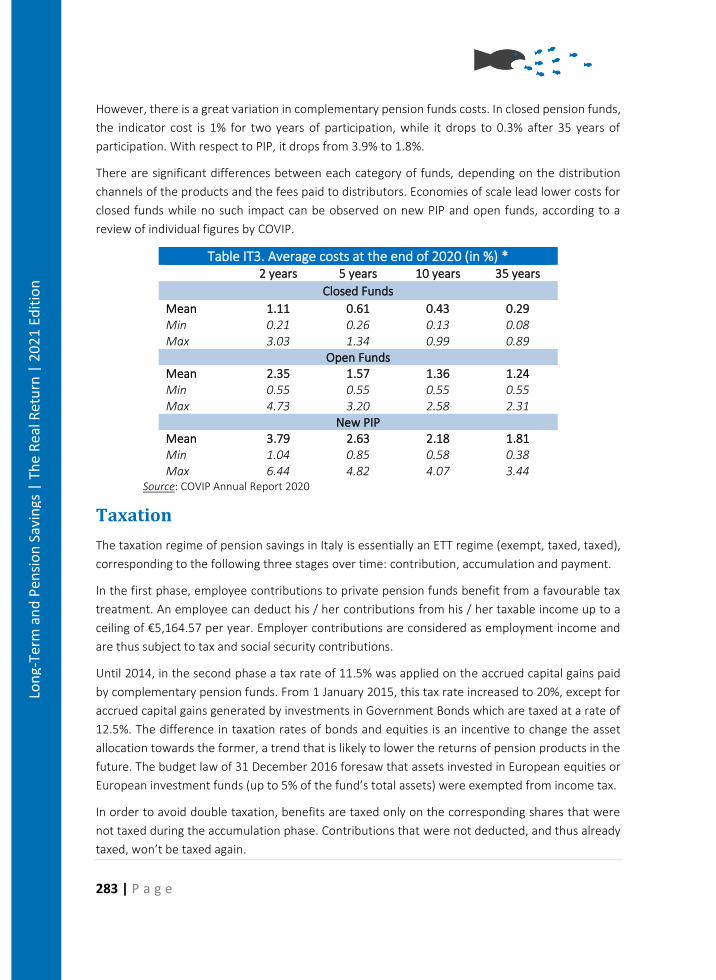
283 | P a g e
Lon
g-Te
rm a
nd
Pen
sio
n S
avin
gs |
Th
e R
eal R
etu
rn |
20
21
Edit
ion
However, there is a great variation in complementary pension funds costs. In closed pension funds,
the indicator cost is 1% for two years of participation, while it drops to 0.3% after 35 years of
participation. With respect to PIP, it drops from 3.9% to 1.8%.
There are significant differences between each category of funds, depending on the distribution
channels of the products and the fees paid to distributors. Economies of scale lead lower costs for
closed funds while no such impact can be observed on new PIP and open funds, according to a
review of individual figures by COVIP.
Table IT3. Average costs at the end of 2020 (in %) * 2 years 5 years 10 years 35 years
Closed Funds
Mean 1.11 0.61 0.43 0.29 Min 0.21 0.26 0.13 0.08 Max 3.03 1.34 0.99 0.89
Open Funds Mean 2.35 1.57 1.36 1.24 Min 0.55 0.55 0.55 0.55 Max 4.73 3.20 2.58 2.31
New PIP Mean 3.79 2.63 2.18 1.81 Min 1.04 0.85 0.58 0.38 Max 6.44 4.82 4.07 3.44
Source: COVIP Annual Report 2020
Taxation
The taxation regime of pension savings in Italy is essentially an ETT regime (exempt, taxed, taxed),
corresponding to the following three stages over time: contribution, accumulation and payment.
In the first phase, employee contributions to private pension funds benefit from a favourable tax
treatment. An employee can deduct his / her contributions from his / her taxable income up to a
ceiling of €5,164.57 per year. Employer contributions are considered as employment income and
are thus subject to tax and social security contributions.
Until 2014, in the second phase a tax rate of 11.5% was applied on the accrued capital gains paid
by complementary pension funds. From 1 January 2015, this tax rate increased to 20%, except for
accrued capital gains generated by investments in Government Bonds which are taxed at a rate of
12.5%. The difference in taxation rates of bonds and equities is an incentive to change the asset
allocation towards the former, a trend that is likely to lower the returns of pension products in the
future. The budget law of 31 December 2016 foresaw that assets invested in European equities or
European investment funds (up to 5% of the fund’s total assets) were exempted from income tax.
In order to avoid double taxation, benefits are taxed only on the corresponding shares that were
not taxed during the accumulation phase. Contributions that were not deducted, and thus already
taxed, won’t be taxed again.

284 | P a g e
Lon
g-Te
rm a
nd
Pen
sio
n S
avin
gs |
Th
e R
eal R
etu
rn |
20
21
Edit
ion
In the third phase the corresponding benefits are taxed at a rate varying from 9% to 15% depending
on the length of membership in the private pension funds. Income received before retirement age
in the framework of the RITA scheme is taxed at 15%, reduced by 0.3% for each year over the
fifteenth year of participation in supplementary pension schemes, with a maximum reduction limit
of six percentage points. If years of enrolment in the supplementary pension scheme are prior to
2007, those years can be considered up to a maximum of 15 years.
The tax rate of pension benefits that come from TFR varies between 9% and 15%, depending on
the length of enrolment in the complementary pension funds.
Pensions Returns
The following tables (IT4 A and B) provide the returns broken down by type of complementary
private pension funds. Returns are calculated net of taxes paid by the pension funds on investment
revenues.
After the drops in returns since 2015, as a consequence of historically low interest rates paid on
bonds, the aggregate returns, net of management costs and taxes, were on average positive for all
complementary pension forms and for all types of sectors in 2020.
In 2020, complementary pension schemes achieved largely positive results thanks also to the
sustained rise in equity prices and the rise in bond yields. For each type of pension form, the best
results were observed in the schemes with a greater exposure to equities.
Table IT4(A). Nominal returns net of charges and taxes on investment revenues by type of funds
Contractual PFs
Guar. Bonds Only
Bonds Mixed
Bal. Equity Open PFs
Guar. Pure
Bonds Mixed Bal. Equity
2005 7.5 - 2.1 6.9 7.9 14.9 11.5 2.9 3.3 6.4 11.4 16.2
2006 3.8 - 2.6 2.7 5.6 8.2 2.4 1.0 -0.2 1.0 2.4 3.7
2007 2.1 2.2 2.1 2.4 1.3 -0.4 1.9 1.6 0.3 -0.3 -1.6
2008 -6.3 3.1 1.6 -3.9 -9.4 -25.0 -14.0 1.9 4.9 -2.2 -14.2 -28.0
2009 8.5 4.6 2.9 8.1 10.4 16.1 11.3 4.8 4.0 6.7 12.6 17.7
2010 3.0 0.2 0.4 3.6 3.6 6.2 4.2 0.7 1.0 2.6 4.7 7.2
2011 0.1 -0.5 1.7 1.1 -0.6 -3.0 -2.4 -0.3 1.0 0.4 -2.3 -5.3
2012 8.2 7.7 3.0 8.1 9.2 11.4 9.1 6.6 6.4 8.0 10.0 10.8
2013 5.4 3.1 1.2 5.0 6.6 12.8 8.1 2.0 0.8 3.6 8.3 16.0
2014 7.3 4.6 1.2 8.1 8.5 9.8 7.5 4.3 6.9 8.0 8.7 8.7
2015 2.7 1.9 0.5 2.7 3.2 5.0 3.0 0.9 0.9 2.2 3.7 4.2
2016 2.7 0.8 0.2 3.2 3.2 4.4 2.2 0.7 1.3 1.4 2.7 3.2
2017 2.6 0.8 -0.2 2.6 3.1 5.9 3.3 0.6 -0.3 0.4 3.7 7.2
2018 -2.5 -1.1 -0.6 -2.4 -2.8 -5.3 -4.5 -1.8 -0.8 -1.8 -4.8 -8.0
2019 7.2 2.0 0.7 7.6 8.6 12.2 8.3 3.0 3.7 4.2 9.2 14.9
2020 3.1 1.0 0.7 3.5 3.3 5.6 2.9 1.1 2.2 1.3 3.6 3.9
Source: COVIP Annual Report 2020; PFs = pension funds; Guar. = guaranteed; Bal. = balanced
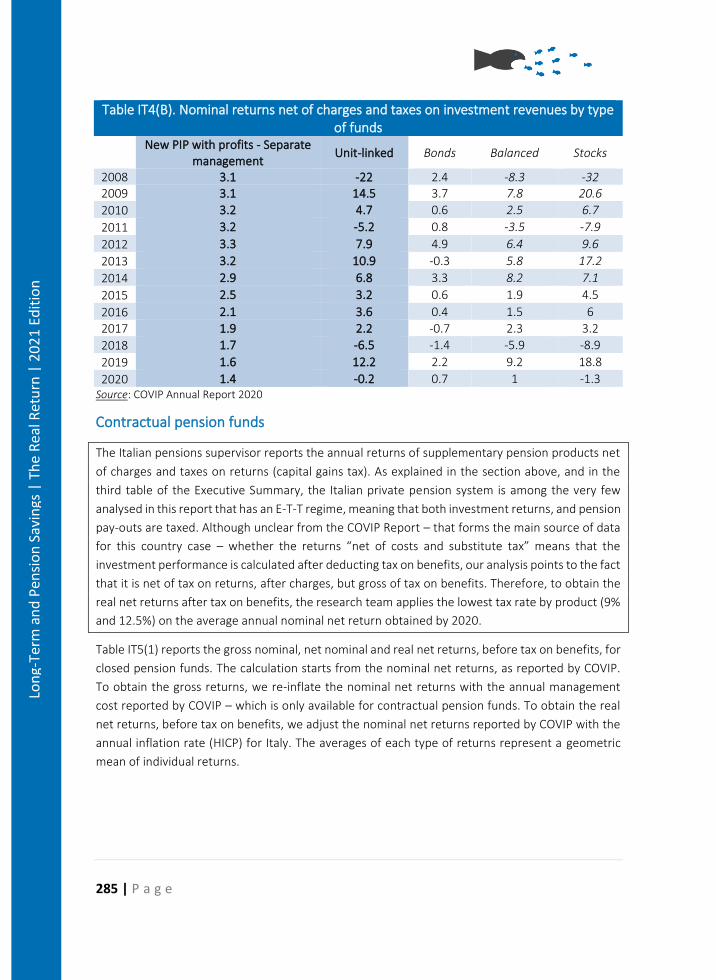
285 | P a g e
Lon
g-Te
rm a
nd
Pen
sio
n S
avin
gs |
Th
e R
eal R
etu
rn |
20
21
Edit
ion
Table IT4(B). Nominal returns net of charges and taxes on investment revenues by type of funds
New PIP with profits - Separate management
Unit-linked Bonds Balanced Stocks
2008 3.1 -22 2.4 -8.3 -32 2009 3.1 14.5 3.7 7.8 20.6
2010 3.2 4.7 0.6 2.5 6.7
2011 3.2 -5.2 0.8 -3.5 -7.9
2012 3.3 7.9 4.9 6.4 9.6
2013 3.2 10.9 -0.3 5.8 17.2
2014 2.9 6.8 3.3 8.2 7.1
2015 2.5 3.2 0.6 1.9 4.5
2016 2.1 3.6 0.4 1.5 6
2017 1.9 2.2 -0.7 2.3 3.2
2018 1.7 -6.5 -1.4 -5.9 -8.9
2019 1.6 12.2 2.2 9.2 18.8
2020 1.4 -0.2 0.7 1 -1.3 Source: COVIP Annual Report 2020
Contractual pension funds
The Italian pensions supervisor reports the annual returns of supplementary pension products net
of charges and taxes on returns (capital gains tax). As explained in the section above, and in the
third table of the Executive Summary, the Italian private pension system is among the very few
analysed in this report that has an E-T-T regime, meaning that both investment returns, and pension
pay-outs are taxed. Although unclear from the COVIP Report – that forms the main source of data
for this country case – whether the returns “net of costs and substitute tax” means that the
investment performance is calculated after deducting tax on benefits, our analysis points to the fact
that it is net of tax on returns, after charges, but gross of tax on benefits. Therefore, to obtain the
real net returns after tax on benefits, the research team applies the lowest tax rate by product (9%
and 12.5%) on the average annual nominal net return obtained by 2020.
Table IT5(1) reports the gross nominal, net nominal and real net returns, before tax on benefits, for
closed pension funds. The calculation starts from the nominal net returns, as reported by COVIP.
To obtain the gross returns, we re-inflate the nominal net returns with the annual management
cost reported by COVIP – which is only available for contractual pension funds. To obtain the real
net returns, before tax on benefits, we adjust the nominal net returns reported by COVIP with the
annual inflation rate (HICP) for Italy. The averages of each type of returns represent a geometric
mean of individual returns.
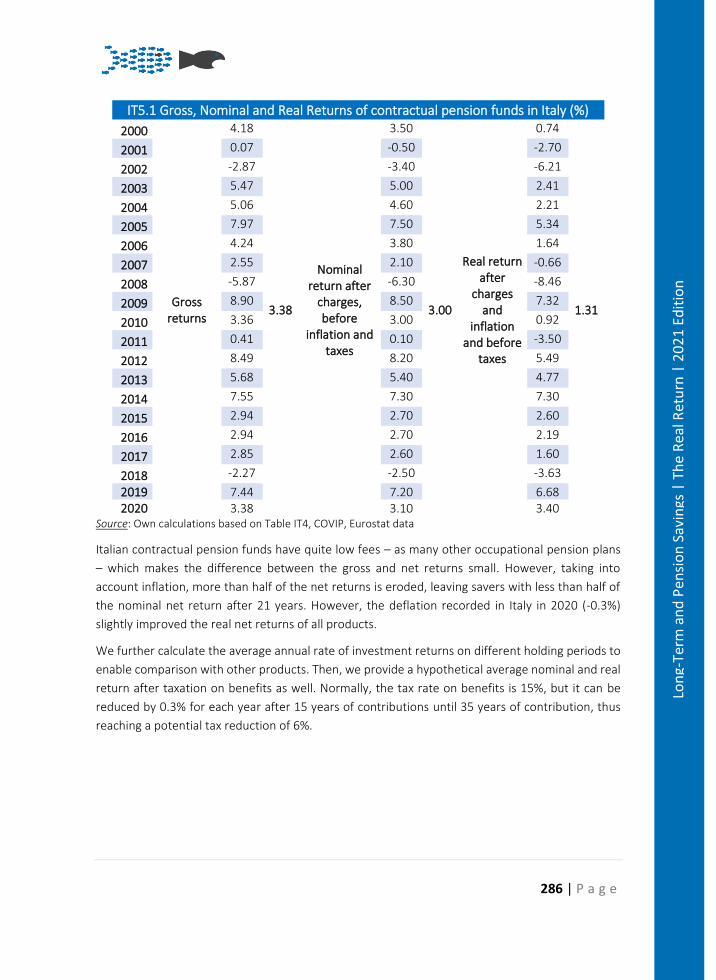
286 | P a g e
Lon
g-Te
rm a
nd
Pen
sio
n S
avin
gs |
Th
e R
eal R
etu
rn |
20
21
Edit
ion
IT5.1 Gross, Nominal and Real Returns of contractual pension funds in Italy (%)
2000
Gross returns
4.18
3.38
Nominal return after
charges, before
inflation and taxes
3.50
3.00
Real return after
charges and
inflation and before
taxes
0.74
1.31
2001 0.07 -0.50 -2.70
2002 -2.87 -3.40 -6.21
2003 5.47 5.00 2.41
2004 5.06 4.60 2.21
2005 7.97 7.50 5.34
2006 4.24 3.80 1.64
2007 2.55 2.10 -0.66
2008 -5.87 -6.30 -8.46
2009 8.90 8.50 7.32
2010 3.36 3.00 0.92
2011 0.41 0.10 -3.50
2012 8.49 8.20 5.49
2013 5.68 5.40 4.77
2014 7.55 7.30 7.30
2015 2.94 2.70 2.60
2016 2.94 2.70 2.19
2017 2.85 2.60 1.60
2018 -2.27 -2.50 -3.63
2019 7.44 7.20 6.68 2020 3.38 3.10 3.40
Source: Own calculations based on Table IT4, COVIP, Eurostat data
Italian contractual pension funds have quite low fees – as many other occupational pension plans
– which makes the difference between the gross and net returns small. However, taking into
account inflation, more than half of the net returns is eroded, leaving savers with less than half of
the nominal net return after 21 years. However, the deflation recorded in Italy in 2020 (-0.3%)
slightly improved the real net returns of all products.
We further calculate the average annual rate of investment returns on different holding periods to
enable comparison with other products. Then, we provide a hypothetical average nominal and real
return after taxation on benefits as well. Normally, the tax rate on benefits is 15%, but it can be
reduced by 0.3% for each year after 15 years of contributions until 35 years of contribution, thus
reaching a potential tax reduction of 6%.
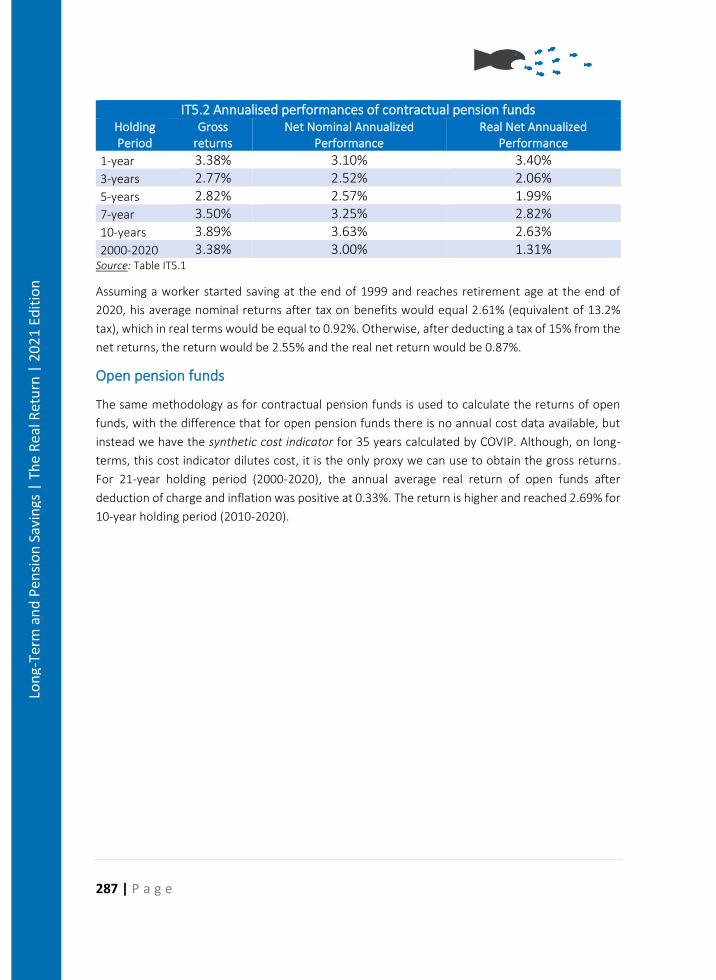
287 | P a g e
Lon
g-Te
rm a
nd
Pen
sio
n S
avin
gs |
Th
e R
eal R
etu
rn |
20
21
Edit
ion
IT5.2 Annualised performances of contractual pension funds Holding Period
Gross returns
Net Nominal Annualized Performance
Real Net Annualized Performance
1-year 3.38% 3.10% 3.40% 3-years 2.77% 2.52% 2.06% 5-years 2.82% 2.57% 1.99% 7-year 3.50% 3.25% 2.82% 10-years 3.89% 3.63% 2.63% 2000-2020 3.38% 3.00% 1.31%
Source: Table IT5.1
Assuming a worker started saving at the end of 1999 and reaches retirement age at the end of
2020, his average nominal returns after tax on benefits would equal 2.61% (equivalent of 13.2%
tax), which in real terms would be equal to 0.92%. Otherwise, after deducting a tax of 15% from the
net returns, the return would be 2.55% and the real net return would be 0.87%.
Open pension funds
The same methodology as for contractual pension funds is used to calculate the returns of open
funds, with the difference that for open pension funds there is no annual cost data available, but
instead we have the synthetic cost indicator for 35 years calculated by COVIP. Although, on long-
terms, this cost indicator dilutes cost, it is the only proxy we can use to obtain the gross returns.
For 21-year holding period (2000-2020), the annual average real return of open funds after
deduction of charge and inflation was positive at 0.33%. The return is higher and reached 2.69% for
10-year holding period (2010-2020).
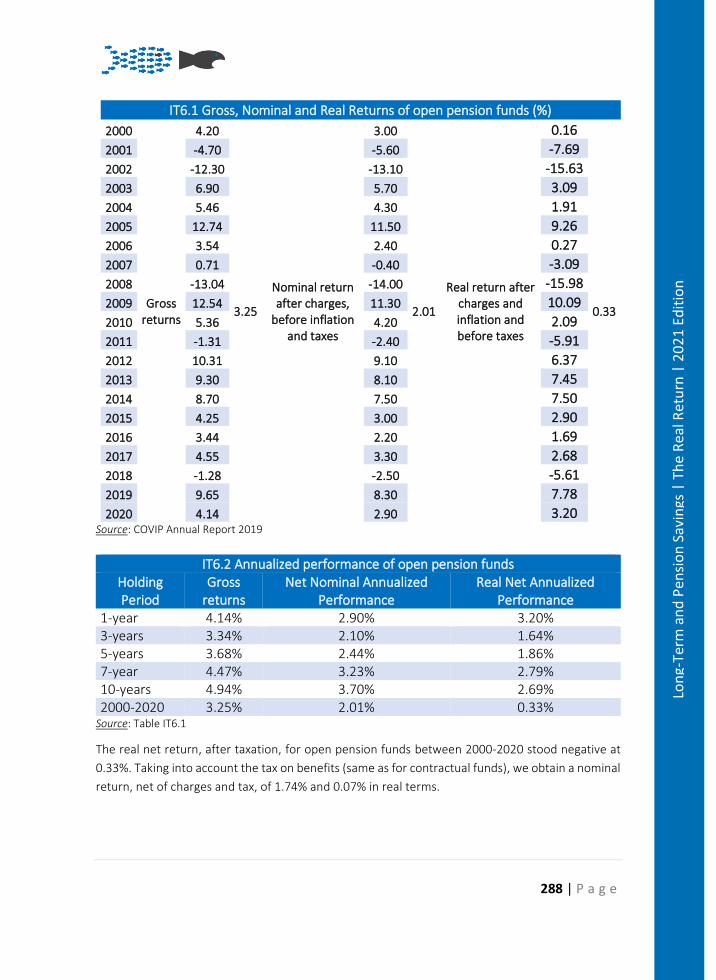
288 | P a g e
Lon
g-Te
rm a
nd
Pen
sio
n S
avin
gs |
Th
e R
eal R
etu
rn |
20
21
Edit
ion
IT6.1 Gross, Nominal and Real Returns of open pension funds (%)
2000
Gross returns
4.20
3.25
Nominal return after charges,
before inflation and taxes
3.00
2.01
Real return after charges and inflation and before taxes
0.16
0.33
2001 -4.70 -5.60 -7.69
2002 -12.30 -13.10 -15.63
2003 6.90 5.70 3.09
2004 5.46 4.30 1.91
2005 12.74 11.50 9.26
2006 3.54 2.40 0.27
2007 0.71 -0.40 -3.09
2008 -13.04 -14.00 -15.98
2009 12.54 11.30 10.09
2010 5.36 4.20 2.09
2011 -1.31 -2.40 -5.91
2012 10.31 9.10 6.37
2013 9.30 8.10 7.45
2014 8.70 7.50 7.50
2015 4.25 3.00 2.90
2016 3.44 2.20 1.69
2017 4.55 3.30 2.68
2018 -1.28 -2.50 -5.61
2019 9.65 8.30 7.78
2020 4.14 2.90 3.20 Source: COVIP Annual Report 2019
IT6.2 Annualized performance of open pension funds Holding Period
Gross returns
Net Nominal Annualized Performance
Real Net Annualized Performance
1-year 4.14% 2.90% 3.20% 3-years 3.34% 2.10% 1.64% 5-years 3.68% 2.44% 1.86% 7-year 4.47% 3.23% 2.79% 10-years 4.94% 3.70% 2.69% 2000-2020 3.25% 2.01% 0.33%
Source: Table IT6.1
The real net return, after taxation, for open pension funds between 2000-2020 stood negative at
0.33%. Taking into account the tax on benefits (same as for contractual funds), we obtain a nominal
return, net of charges and tax, of 1.74% and 0.07% in real terms.

289 | P a g e
Lon
g-Te
rm a
nd
Pen
sio
n S
avin
gs |
Th
e R
eal R
etu
rn |
20
21
Edit
ion
Individual Pension Plans
Individual Pension Plans (PIP) have the highest costs on the pension product market in Italy. The
synthetic cost indicator calculated for PIPs was 1.83% for long-term subscribers in 2019 and it
slightly decreased to 1.81% in 2020.
The performance of the PIPs depends on the type of contracts. With-profits contracts have a
comparable performance to contractual pension funds, while unit-linked PIPs have a lower average
return on the market comparable to open pension funds.
However, performances are highly volatile, potentially associated with the relatively short
timeframe considered, in fact corresponding to the financial crisis years. Moreover, given the
shorter timeframe, the high variability could lead to misleading conclusions. In 2018, the returns of
unit-linked PIPs decreased once again and was even negative at -7.6%.
IT7.1 Gross, Nominal and Real Returns of PIP with profits (%)
2000
Gross returns
-
4.36
Nominal return after charges,
before inflation and taxes
-
2.55
Real return after charges and inflation and before taxes
-
1.36
2001 - - -
2002 - - -
2003 - - -
2004 - - -
2005 - - -
2006 - - -
2007 - - -
2008 4.91 3.10 0.72
2009 4.91 3.10 1.98
2010 5.01 3.20 1.11
2011 5.01 3.20 -0.51
2012 5.11 3.30 0.71
2013 5.01 3.20 2.58
2014 4.71 2.90 2.90
2015 4.31 2.50 2.40
2016 3.91 2.10 1.60
2017 3.71 1.90 0.90
2018 3.51 1.70 0.52
2019 3.41 1.60 1.11
2020 3.21 1.40 1.69 Source: COVIP Annual Report 2019
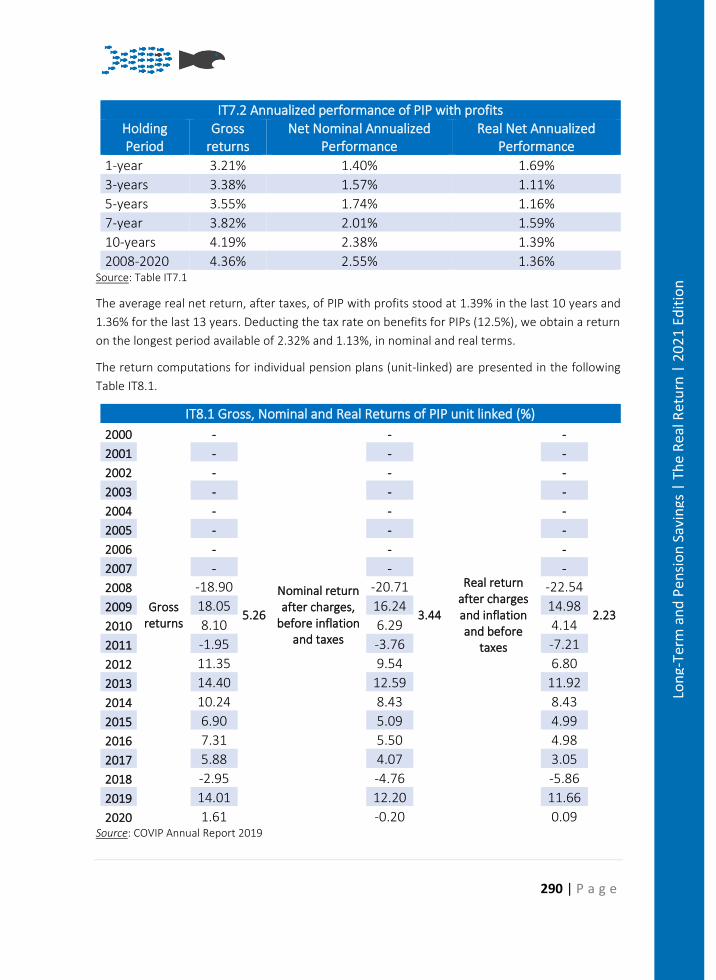
290 | P a g e
Lon
g-Te
rm a
nd
Pen
sio
n S
avin
gs |
Th
e R
eal R
etu
rn |
20
21
Edit
ion
IT7.2 Annualized performance of PIP with profits Holding Period
Gross returns
Net Nominal Annualized Performance
Real Net Annualized Performance
1-year 3.21% 1.40% 1.69%
3-years 3.38% 1.57% 1.11%
5-years 3.55% 1.74% 1.16%
7-year 3.82% 2.01% 1.59%
10-years 4.19% 2.38% 1.39%
2008-2020 4.36% 2.55% 1.36% Source: Table IT7.1
The average real net return, after taxes, of PIP with profits stood at 1.39% in the last 10 years and
1.36% for the last 13 years. Deducting the tax rate on benefits for PIPs (12.5%), we obtain a return
on the longest period available of 2.32% and 1.13%, in nominal and real terms.
The return computations for individual pension plans (unit-linked) are presented in the following
Table IT8.1.
IT8.1 Gross, Nominal and Real Returns of PIP unit linked (%)
2000
Gross returns
-
5.26
Nominal return after charges,
before inflation and taxes
-
3.44
Real return after charges and inflation and before
taxes
-
2.23
2001 - - -
2002 - - -
2003 - - -
2004 - - -
2005 - - -
2006 - - -
2007 - - -
2008 -18.90 -20.71 -22.54
2009 18.05 16.24 14.98
2010 8.10 6.29 4.14
2011 -1.95 -3.76 -7.21
2012 11.35 9.54 6.80
2013 14.40 12.59 11.92
2014 10.24 8.43 8.43
2015 6.90 5.09 4.99
2016 7.31 5.50 4.98
2017 5.88 4.07 3.05
2018 -2.95 -4.76 -5.86
2019 14.01 12.20 11.66
2020 1.61 -0.20 0.09 Source: COVIP Annual Report 2019
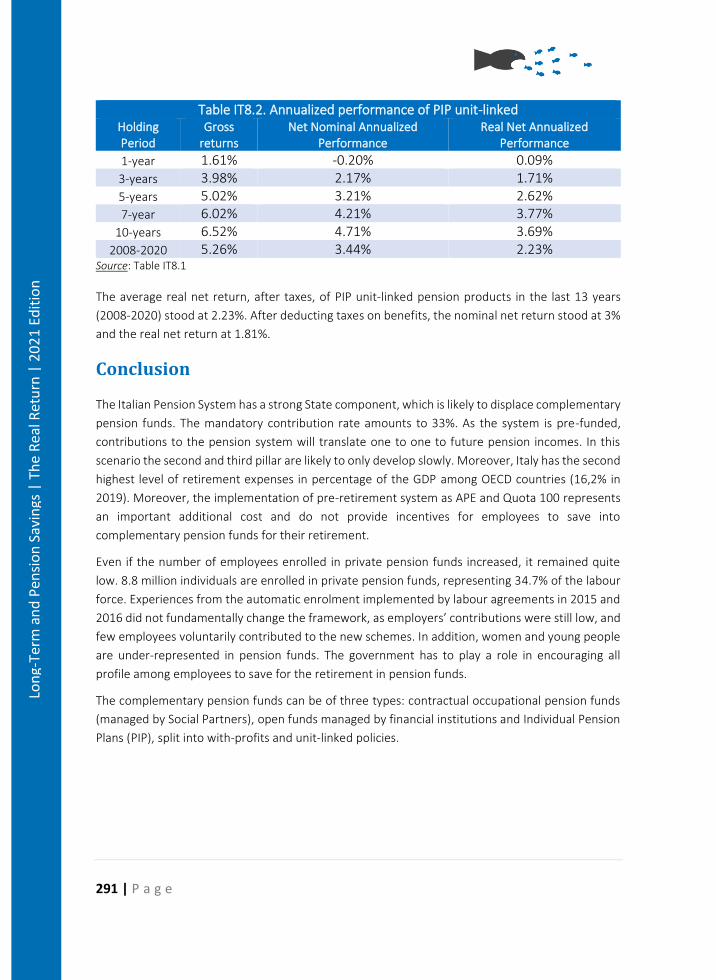
291 | P a g e
Lon
g-Te
rm a
nd
Pen
sio
n S
avin
gs |
Th
e R
eal R
etu
rn |
20
21
Edit
ion
Table IT8.2. Annualized performance of PIP unit-linked Holding Period
Gross returns
Net Nominal Annualized Performance
Real Net Annualized Performance
1-year 1.61% -0.20% 0.09%
3-years 3.98% 2.17% 1.71%
5-years 5.02% 3.21% 2.62%
7-year 6.02% 4.21% 3.77%
10-years 6.52% 4.71% 3.69%
2008-2020 5.26% 3.44% 2.23% Source: Table IT8.1
The average real net return, after taxes, of PIP unit-linked pension products in the last 13 years
(2008-2020) stood at 2.23%. After deducting taxes on benefits, the nominal net return stood at 3%
and the real net return at 1.81%.
Conclusion
The Italian Pension System has a strong State component, which is likely to displace complementary
pension funds. The mandatory contribution rate amounts to 33%. As the system is pre-funded,
contributions to the pension system will translate one to one to future pension incomes. In this
scenario the second and third pillar are likely to only develop slowly. Moreover, Italy has the second
highest level of retirement expenses in percentage of the GDP among OECD countries (16,2% in
2019). Moreover, the implementation of pre-retirement system as APE and Quota 100 represents
an important additional cost and do not provide incentives for employees to save into
complementary pension funds for their retirement.
Even if the number of employees enrolled in private pension funds increased, it remained quite
low. 8.8 million individuals are enrolled in private pension funds, representing 34.7% of the labour
force. Experiences from the automatic enrolment implemented by labour agreements in 2015 and
2016 did not fundamentally change the framework, as employers’ contributions were still low, and
few employees voluntarily contributed to the new schemes. In addition, women and young people
are under-represented in pension funds. The government has to play a role in encouraging all
profile among employees to save for the retirement in pension funds.
The complementary pension funds can be of three types: contractual occupational pension funds
(managed by Social Partners), open funds managed by financial institutions and Individual Pension
Plans (PIP), split into with-profits and unit-linked policies.

292 | P a g e
Lon
g-Te
rm a
nd
Pen
sio
n S
avin
gs |
Th
e R
eal R
etu
rn |
20
21
Edit
ion
Bibliography
• Boeri, T, AL Bovenberg, B Coeuré, and AW Roberts (2006). Dealing with the New Giants:
Rethinking the Role of Pension Funds. CEPR Geneva Reports on the World Economy.
• Bottazzi, R., Jappelli, T., Padula, M., 2009, Pension Reforms and the Allocation of
Retirement Savings, mimeo.
• COVIP, Relazione Annuale (annual report), reports available from 1998 to 2019
• OECD iLibrary, Pensions at a Glance, various years, https://www.oecd-
ilibrary.org/finance-and-investment/oecd-pensions-at-a-glance_19991363
• OECD Data, https://data.oecd.org/
• Fornero E., Economic-Financial Literacy (EFL) and (Sustainable) Pension Reforms, why the
former is a key ingredient for the latter, presentation to the OEE, June 2017
• Guardiancich I., Current pension system: first assessment of reform outcomes and
output, European Social Observatory Country Report on Italy, 2009,
http://www.ose.be/files/publication/2010/country_reports_pension/OSE_2010_CRpensi
on_Italy.pdf
• Guerra Maria Cecilia, Verso un Sistema Monetario e Bancario Europeo? La disciplina
fiscale dei fondi pensione: esperienze nazionali e prospettive per l'Unione europea, Ente
per Gli Studi Monetari, Bancari e Finanziari, Luigi Einaudi, Quaderni di Ricerca #57, 2003
• T. Japelli and Luigi Pistaferri. Tax incentives and the demand for life insurance: evidence
from Italy Journal of Public Economics 87(7-8):1779—1799;
• Paci S., P. Contaldo, C. Fiorentino, G. Nocera, L. Spotorno e F. Vallacqua, Carefin report,
Pension Funds in Italy, Bocconi University, 2010
• Rossi M. 2009, Private Saving and Individual Pension Plan Contributions, Oxford Bulletin
of Economics and Statistics, Volume 71, Issue 2, pages 253–271, April 2009
• Settimo C and R. Cannata, Assicurazioni Generali, Italian Complementary Pension
Reform, 2007.
293 | P a g e
Lon
g-Te
rm a
nd
Pen
sio
n S
avin
gs |
Th
e R
eal R
etu
rn |
20
21
Edit
ion
Pension Savings: The Real Return 2021 Edition
Country Case: Latvia
Summary
Funded pension schemes have experienced negative average returns during their existence even
the portfolio of pension funds in mandatary pension pillar is conservatively oriented. Pillar II pension
funds recorded on average small annual nominal return of 1.4% in year 2020, while Pillar III funds
delivered also on average positive nominal return of 1.64%. A positive development could have
been seen on the Pillar II market, where the introduction of passively managed funds contributed
to further decrease of fees in year 2020. The fees have decreased also in the Pillar III, however,
complex fee structure and still higher fees of Pillar III pension funds play a significant role on the
expected accumulated benefits.
Kopsavilkums
Fondēto pensiju shēmas savas pastāvēšanas laikā ir piedzīvojušas negatīvu vidējo ienesīgumu, pat
ja pensiju fondu portfelis obligāto pensiju pīlārā ir konservatīvi orientēts. II pīlāra pensiju fondi 2020.
gadā uzrādīja vidēji nelielu gada nominālo ienesīgumu 1,4 % apmērā, savukārt III pīlāra fondi
uzrādīja arī vidēji pozitīvu nominālo ienesīgumu 1,64 % apmērā. Pozitīva attīstība bija vērojama II
pīlāra tirgū, kur pasīvi pārvaldīto fondu ieviešana veicināja turpmāku komisijas maksu
samazināšanos 2020. gadā. Maksa ir samazinājusies arī III pīlārā, tomēr III pīlāra pensiju fondu
sarežģītā maksu struktūra un joprojām augstākas maksas būtiski ietekmē gaidāmos uzkrātos
ieguvumus.
Introduction
Latvia is currently operating a multi-pillar pension system based on three pension pillars. The reform
followed World Bank recommendations on creating a pension system with unfunded PAYG and
funded pension pillars. Since 2001, the Latvian multi-pillar pension system includes:
• Pillar I (state compulsory PAYG pension scheme);
• Pillar II (mandatory state funded pension scheme) which is financed by a part of the social
insurance contributions diverted from Pillar I;
• Pillar III (voluntary private pension scheme).
294 | P a g e
Lon
g-Te
rm a
nd
Pen
sio
n S
avin
gs |
Th
e R
eal R
etu
rn |
20
21
Edit
ion
The introduction of the multi-pillar pension system has aimed its overall functionality on a different
approach to each pension pillar operation, but with the overall objective of ensuring an adequate
pension for individuals under the demographic risks of an aging society, as well as the pension
system’s overall future financial stability.
The reform of the Latvian pensions system started in 1995, when it was decided to implement the
three-pillar pension system. Firstly, the shift from the old Soviet-styled PAYG pension system to the
notional defined contribution pension scheme (NDC PAYG Pillar I) was carried out. The new law on
state pensions was adopted by the Parliament in November 1995 and came into force on 1 January
1996. The state mandatory-funded pension scheme (Pillar II) started operating in July 2001. The
private pension funds (Pillar III) have been operating since 1998.225
From the point of view of individual savers, the Latvian pension system combines two aspects:
personal interest in building wealth (based on a level of contributions and the length of the saving
period) and intergenerational solidarity.
The Latvian NDC PAYG-based pension Pillar I has been effectively introduced by a partial reform in
January 1996 and represents a mandatory scheme for all economically active persons who make
social insurance contributions calculated from a monthly gross salary (income). Paid contributions
are used for the payment of old age pensions to the existing generation of pensioners. Pillar I is
organized as a NDC scheme, where the notional value of career contributions is recorded on each
contributor`s personal account. Prior to claiming pension benefits, the pension capital recorded on
individual NDC account is recalculated in accordance with the laws and regulations at the time when
the individual accesses his/her pension.
Pension Pillar II is in fact a state-organized 1bis pillar, meaning that part of the individually paid
social contributions are channeled to Pillar II and recorded on individual pension accounts. Monthly
contributions are invested into individually chosen investment plans (pension funds) managed by
private pension fund management companies. Pillar II was launched in July 2001 and completed
the multi-pillar-based pension reform in Latvia.
Pillar III was launched in July 1998 and is organized as a private voluntary pension scheme. It
accumulates individual contributions, as well as employer contributions made on the behalf of
individual employees, to the selected voluntary pension fund.
225 Groduma, M. 2002. Social insurance in Latvia: Seeking balance between financial stability and equity. In: European
regional meeting “New and revised approaches to social protection in Europe”. Budapest, 13 - 15 November 2002.
[Online] Available: http://www.issa.int/html/pdf/budapest02/2groduma.pdf

295 | P a g e
Lon
g-Te
rm a
nd
Pen
sio
n S
avin
gs |
Th
e R
eal R
etu
rn |
20
21
Edit
ion
Table LV 1: Multi-pillar pension system in Latvia
Pillar I Pillar II Pillar III
State Pensions State Funded pensions Voluntary private pensions
Mandatory Mandatory Voluntary
NDC PAYG Funded Funded
Financed by social insurance contributions
DC DC
Benefits paid via State Social Insurance Agency
Financed by social insurance contributions
Privately managed two types of pension plans:
Publicly managed Individual pension accounts 1. open (individual), Privately (and publicly)
managed pension funds 2. closed (quasi
occupational)
Coverage: generally all population
Coverage: generally entire working population
Coverage: Cannot be calculated due to missing
information about number of participants
Gross replacement ratio: 32% (1,143 Eur average wage; 367 Eur average old-age pension) Source: Own elaboration, 2021
Pillar I – State Pension Insurance
State old-age pension (Pillar I) should guarantee the minimum income necessary for subsistence. It
is based on an NDC PAYG principle of redistribution, i.e., the social tax paid by today’s employees
covers the pensions of today’s pensioners. However, the amount of the paid contributions for each
saver are recorded on individual accounts.
The state old-age pension is paid out of the social insurance contributions. Total level of social
insurance contributions is 34.09% of gross salary for employees (employers contributes 23.59% and
employees 10.5%; self-employed persons pay 27.52%). Of the total contribution in 2020, 14%
funded the Pillar I NDC pension and 6% was redirected to the individual’s account under Pillar II.
The remaining portion of contributions financed social security elements such as disability pension,
sickness and maternity benefits, work injury benefits, parent's benefits, and unemployment
benefits.
The statutory retirement age in Latvia in 2020 is 63 years and 9 months for both men and women.
However, the law stipulates a gradual increase of the retirement age by three months every year
until the general retirement age of 65 years is reached in 2025. Early pension is possible in Latvia if
two conditions are met: 1) an individual in 2020 reaches the age of at least 61 years and 9 months
(gradually rising by three months a year until 2025) and 2) an individual contributed for a period of
at least 30 years.
296 | P a g e
Lon
g-Te
rm a
nd
Pen
sio
n S
avin
gs |
Th
e R
eal R
etu
rn |
20
21
Edit
ion
Old-age pension is based on the insured's contributions, annual capital growth adjusted according
to changes in the earnings index, and average life expectancy. Old age pension is calculated by
considering two parameters:
1. K - accumulated life-time notional pension capital, which is an accrued amount from paid
contributions since the introduction of NDC system (1 January 1996) until the pension
granting month. However, during the transition period to a full the NDC system, these two
aspects are also taken into account:
a. average insurance contribution wage from 1996 until 1999 (inclusive);
b. insurance period until 1 January 1996;
2. G – cohort unisex life-expectancy at the time of retirement.
Annual old-age pension (P) is calculated as follows:
𝑃 =𝐾
𝐺
It can be said that the Latvian NDC PAYG Pillar I has shifted in a direction where the average gross
replacement ratio is lower than 35%. The average income replacement ratios for old-age pension
in Latvia are shown in the table below.
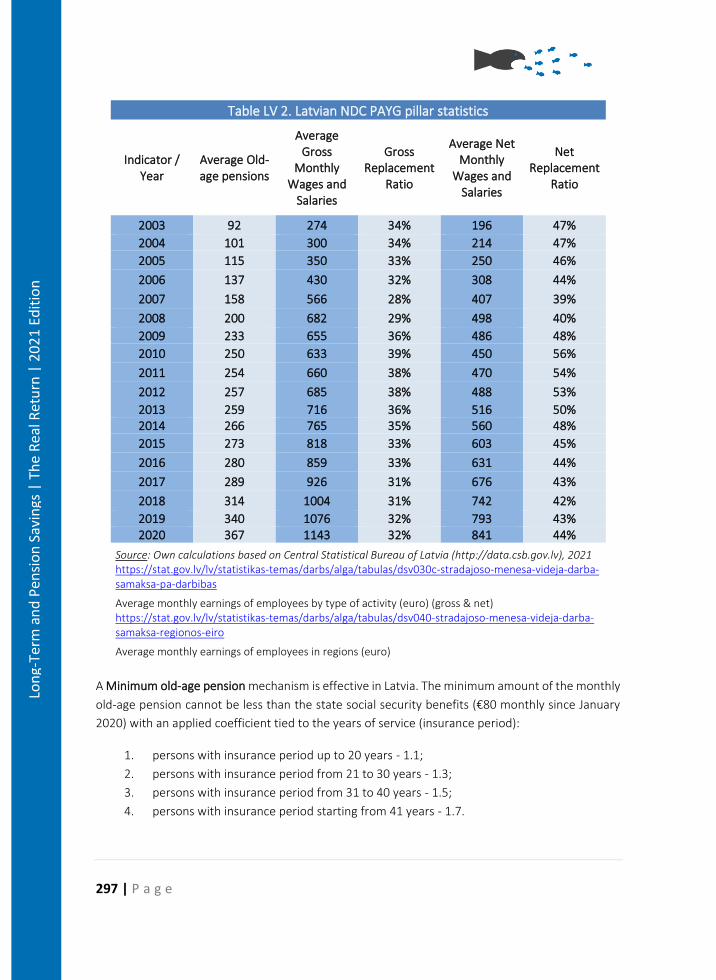
297 | P a g e
Lon
g-Te
rm a
nd
Pen
sio
n S
avin
gs |
Th
e R
eal R
etu
rn |
20
21
Edit
ion
Table LV 2. Latvian NDC PAYG pillar statistics
Indicator / Year
Average Old-age pensions
Average Gross
Monthly Wages and
Salaries
Gross Replacement
Ratio
Average Net Monthly
Wages and Salaries
Net Replacement
Ratio
2003 92 274 34% 196 47%
2004 101 300 34% 214 47%
2005 115 350 33% 250 46%
2006 137 430 32% 308 44%
2007 158 566 28% 407 39%
2008 200 682 29% 498 40%
2009 233 655 36% 486 48%
2010 250 633 39% 450 56%
2011 254 660 38% 470 54%
2012 257 685 38% 488 53%
2013 259 716 36% 516 50% 2014 266 765 35% 560 48%
2015 273 818 33% 603 45%
2016 280 859 33% 631 44%
2017 289 926 31% 676 43%
2018 314 1004 31% 742 42%
2019 340 1076 32% 793 43% 2020 367 1143 32% 841 44%
Source: Own calculations based on Central Statistical Bureau of Latvia (http://data.csb.gov.lv), 2021 https://stat.gov.lv/lv/statistikas-temas/darbs/alga/tabulas/dsv030c-stradajoso-menesa-videja-darba-samaksa-pa-darbibas
Average monthly earnings of employees by type of activity (euro) (gross & net) https://stat.gov.lv/lv/statistikas-temas/darbs/alga/tabulas/dsv040-stradajoso-menesa-videja-darba-samaksa-regionos-eiro
Average monthly earnings of employees in regions (euro)
A Minimum old-age pension mechanism is effective in Latvia. The minimum amount of the monthly
old-age pension cannot be less than the state social security benefits (€80 monthly since January
2020) with an applied coefficient tied to the years of service (insurance period):
1. persons with insurance period up to 20 years - 1.1;
2. persons with insurance period from 21 to 30 years - 1.3;
3. persons with insurance period from 31 to 40 years - 1.5;
4. persons with insurance period starting from 41 years - 1.7.
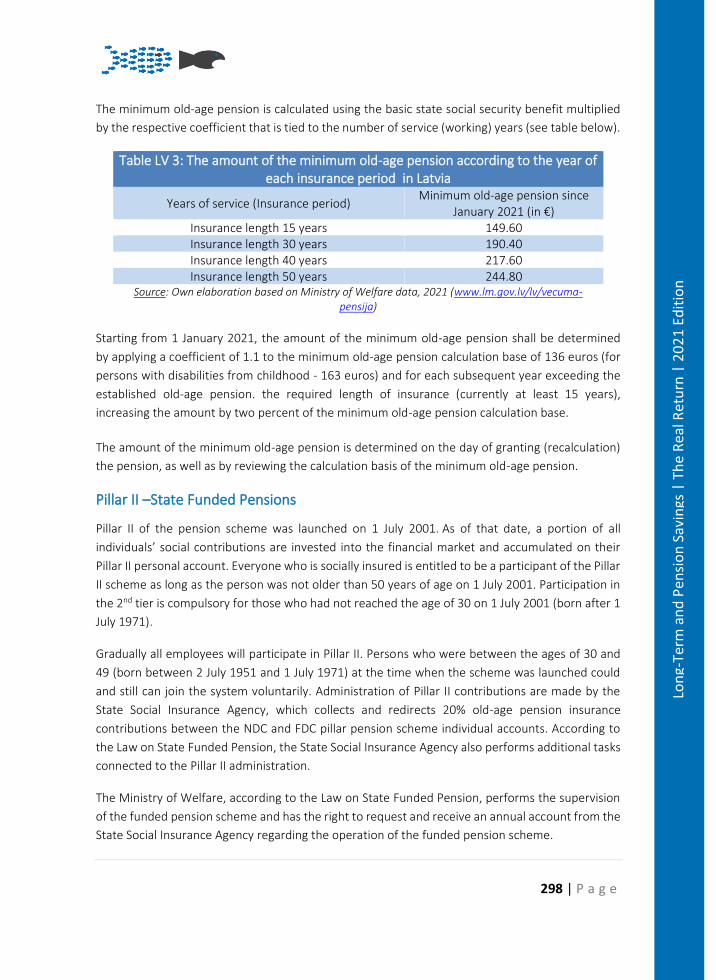
298 | P a g e
Lon
g-Te
rm a
nd
Pen
sio
n S
avin
gs |
Th
e R
eal R
etu
rn |
20
21
Edit
ion
The minimum old-age pension is calculated using the basic state social security benefit multiplied
by the respective coefficient that is tied to the number of service (working) years (see table below).
Table LV 3: The amount of the minimum old-age pension according to the year of each insurance period in Latvia
Years of service (Insurance period) Minimum old-age pension since
January 2021 (in €) Insurance length 15 years 149.60 Insurance length 30 years 190.40 Insurance length 40 years 217.60 Insurance length 50 years 244.80
Source: Own elaboration based on Ministry of Welfare data, 2021 (www.lm.gov.lv/lv/vecuma-pensija)
Starting from 1 January 2021, the amount of the minimum old-age pension shall be determined
by applying a coefficient of 1.1 to the minimum old-age pension calculation base of 136 euros (for
persons with disabilities from childhood - 163 euros) and for each subsequent year exceeding the
established old-age pension. the required length of insurance (currently at least 15 years),
increasing the amount by two percent of the minimum old-age pension calculation base.
The amount of the minimum old-age pension is determined on the day of granting (recalculation)
the pension, as well as by reviewing the calculation basis of the minimum old-age pension.
Pillar II –State Funded Pensions
Pillar II of the pension scheme was launched on 1 July 2001. As of that date, a portion of all
individuals’ social contributions are invested into the financial market and accumulated on their
Pillar II personal account. Everyone who is socially insured is entitled to be a participant of the Pillar
II scheme as long as the person was not older than 50 years of age on 1 July 2001. Participation in
the 2nd tier is compulsory for those who had not reached the age of 30 on 1 July 2001 (born after 1
July 1971).
Gradually all employees will participate in Pillar II. Persons who were between the ages of 30 and
49 (born between 2 July 1951 and 1 July 1971) at the time when the scheme was launched could
and still can join the system voluntarily. Administration of Pillar II contributions are made by the
State Social Insurance Agency, which collects and redirects 20% old-age pension insurance
contributions between the NDC and FDC pillar pension scheme individual accounts. According to
the Law on State Funded Pension, the State Social Insurance Agency also performs additional tasks
connected to the Pillar II administration.
The Ministry of Welfare, according to the Law on State Funded Pension, performs the supervision
of the funded pension scheme and has the right to request and receive an annual account from the
State Social Insurance Agency regarding the operation of the funded pension scheme.
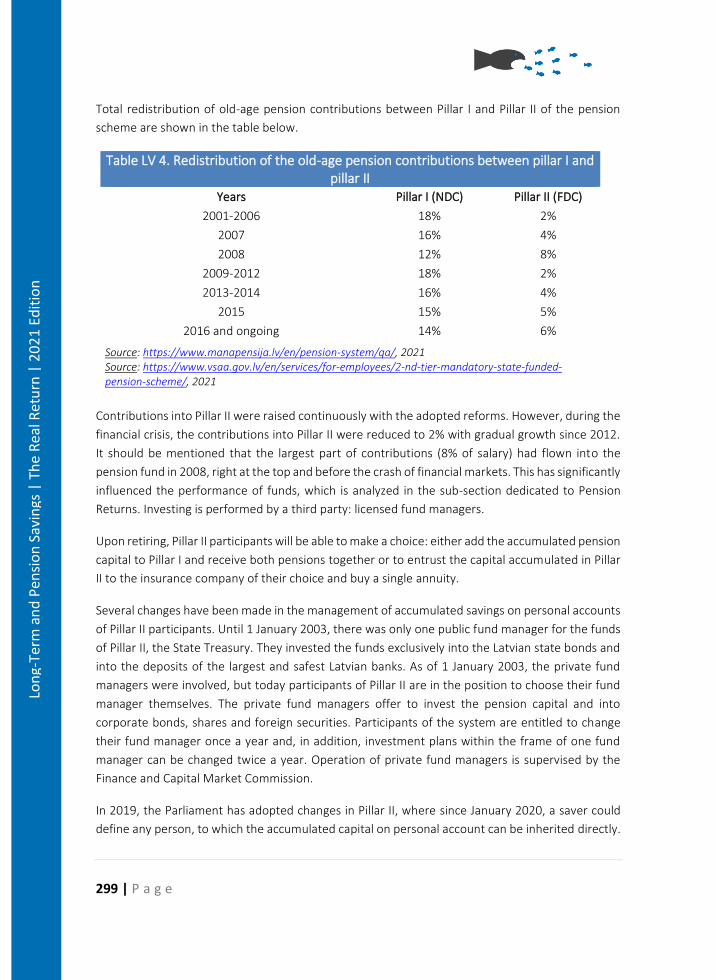
299 | P a g e
Lon
g-Te
rm a
nd
Pen
sio
n S
avin
gs |
Th
e R
eal R
etu
rn |
20
21
Edit
ion
Total redistribution of old-age pension contributions between Pillar I and Pillar II of the pension
scheme are shown in the table below.
Table LV 4. Redistribution of the old-age pension contributions between pillar I and pillar II
Years Pillar I (NDC) Pillar II (FDC)
2001-2006 18% 2%
2007 16% 4%
2008 12% 8%
2009-2012 18% 2%
2013-2014 16% 4%
2015 15% 5%
2016 and ongoing 14% 6%
Source: https://www.manapensija.lv/en/pension-system/qa/, 2021 Source: https://www.vsaa.gov.lv/en/services/for-employees/2-nd-tier-mandatory-state-funded-pension-scheme/, 2021
Contributions into Pillar II were raised continuously with the adopted reforms. However, during the
financial crisis, the contributions into Pillar II were reduced to 2% with gradual growth since 2012.
It should be mentioned that the largest part of contributions (8% of salary) had flown into the
pension fund in 2008, right at the top and before the crash of financial markets. This has significantly
influenced the performance of funds, which is analyzed in the sub-section dedicated to Pension
Returns. Investing is performed by a third party: licensed fund managers.
Upon retiring, Pillar II participants will be able to make a choice: either add the accumulated pension
capital to Pillar I and receive both pensions together or to entrust the capital accumulated in Pillar
II to the insurance company of their choice and buy a single annuity.
Several changes have been made in the management of accumulated savings on personal accounts
of Pillar II participants. Until 1 January 2003, there was only one public fund manager for the funds
of Pillar II, the State Treasury. They invested the funds exclusively into the Latvian state bonds and
into the deposits of the largest and safest Latvian banks. As of 1 January 2003, the private fund
managers were involved, but today participants of Pillar II are in the position to choose their fund
manager themselves. The private fund managers offer to invest the pension capital and into
corporate bonds, shares and foreign securities. Participants of the system are entitled to change
their fund manager once a year and, in addition, investment plans within the frame of one fund
manager can be changed twice a year. Operation of private fund managers is supervised by the
Finance and Capital Market Commission.
In 2019, the Parliament has adopted changes in Pillar II, where since January 2020, a saver could
define any person, to which the accumulated capital on personal account can be inherited directly.
300 | P a g e
Lon
g-Te
rm a
nd
Pen
sio
n S
avin
gs |
Th
e R
eal R
etu
rn |
20
21
Edit
ion
Pillar III – Voluntary private pensions
Voluntary private pension scheme, or pension Pillar III, was launched in July 1998, and it gives the
opportunity to create additional voluntary savings in addition to the state organized Pillar I and II.
Contributions that individuals and/or the employer regularly pay into the pension fund are invested
in different securities, depending on the chosen investment strategy.
The Law on Private Pension Funds foresees that Latvian commercial banks, insurance companies
and legal persons have the right to establish a private fund. Assets are invested by private pension
funds with the aim not only to maintain the value of savings, but to increase it over a long-time
period. There are generally two types of voluntary private pension funds in Latvia:
1. open pension funds (15 operational in Latvia in 2020)
2. closed pension funds (only one operating in Latvia in 2020).
Pension scheme participants can subscribe to a pension scheme by entering directly into a contract
with an open pension fund or via their employer. Pension scheme participants can participate in a
pension scheme through the intermediation of their employer if the employer has entered into a
collective contract with an open or closed pension fund. A collective contract with a closed pension
fund may be entered into only in such cases when the relevant employer is also one of the founders
(stockholders) of the same closed pension fund. Acknowledging the fact that employers might enter
into collective agreement with employees and establish the pension scheme, voluntary private
pension funds might be recognized as a collective pension scheme.
According to the Law on Private Pension Funds, accumulated pension capital in private pension
funds can be accessed by individuals when they reach the age of 55. In order to receive the Pillar III
accrued pension, an individual must submit an application to the respective pension fund. The
supervisory authority for all voluntary private pension funds in Latvia is the Financial and Capital
Markets Commission.
Pension Vehicles
Pillar II – State Funded Pensions
Pension funds are the only pension vehicles allowed by the Law of State Funded Pensions for state-
funded pension scheme. The law states that a funded pension scheme is a state-organized set of
measures for making contributions, administration of funds contributed and payments of pensions
which (without increasing the total amount of contributions for old age pensions) - provides an
opportunity to acquire additional pension capital by investing part of the pensions’ contributions in
financial instruments and other assets in accordance with the procedures specified in the Law.
Currently (as of 31 December 2020), 31 state-funded pension schemes have been operational on
the Pillar II market. Three new equity-based funds emerged during 2019, most of them designed as
301 | P a g e
Lon
g-Te
rm a
nd
Pen
sio
n S
avin
gs |
Th
e R
eal R
etu
rn |
20
21
Edit
ion
target-date funds for savers at certain age. There is no specific legal recognition of types of pension
funds based on their investment strategy, nor any legal requirement to provide a specific
investment strategy for pension funds. It is up to a pension fund manager to provide an in-demand
type of pension fund in order to succeed on the market. However, every fund manager is required
to develop a systematic set of provisions, according to which funds are managed. They are
presented in a prospectus of the relevant pension fund and in a key investor information document
(KIID, specific for UCITS funds, but with particular features) for participants of the scheme. The
prospectus of a pension fund and the key information document for participants are an integral
part of the contract entered into between the Agency and the manager of pension funds. Pension
fund prospectus must clearly define the risk-reward profile and indicate proposed investment
strategy of the respective expected portfolio structure.
Although there is no legal recognition of types of pension funds, they can be divided into three
types based on their risk/return profiles:
1. Conservative funds, with no equity exposure and a 100% share of bonds and money
market instruments;
2. Balanced funds with bonds and money market instrument share of at least 50%; in
addition, a maximum of 15% of the funds’ balances can be invested in equities;
3. Active funds with an equity share (resp. investments in capital securities, alternative
investment funds or such investment funds that may make investments in capital
securities or other financial instruments of equivalent risk) of up to 75% (since 2018) and
no limits on investments in bonds and money market instruments.
The legislation sets relatively strict quantitative investment limits for pension funds, trying to
supplement the prudent principle.
Overall asset allocation in Latvia is fairly conservative despite the possibility of choosing a plan
according to risk preference. The chart below presents the amount of Assets under Management
for types of pension funds according to their investment strategy.
Contrary to many other CEE countries running mandatory pension systems, there is no requirement
for pension funds to guarantee a certain minimum return. On the contrary, doing so is explicitly
forbidden.
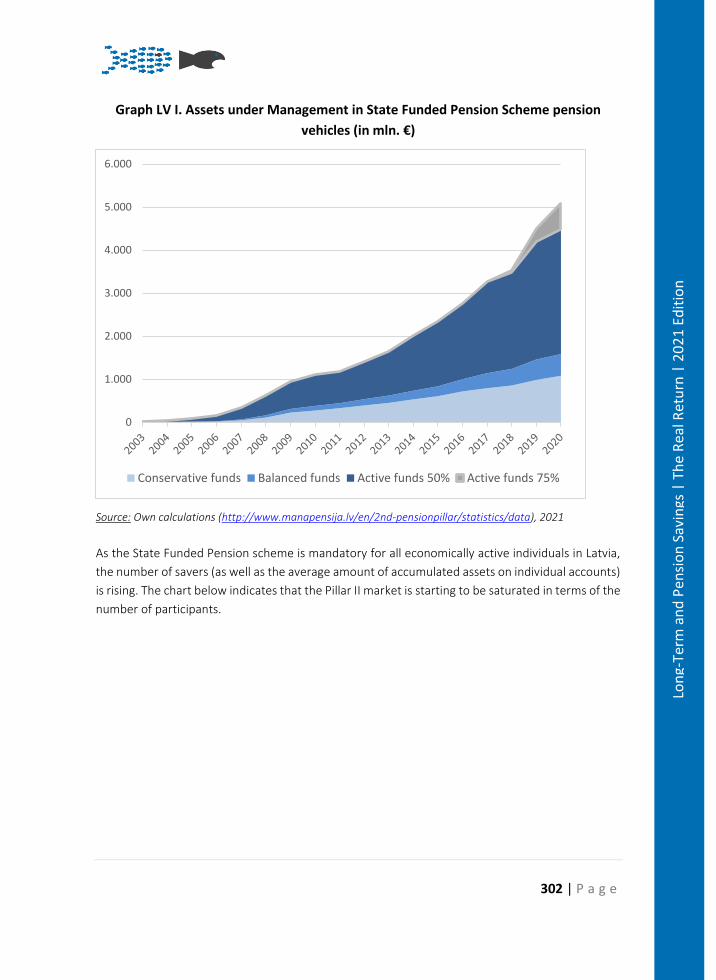
302 | P a g e
Lon
g-Te
rm a
nd
Pen
sio
n S
avin
gs |
Th
e R
eal R
etu
rn |
20
21
Edit
ion
Graph LV I. Assets under Management in State Funded Pension Scheme pension
vehicles (in mln. €)
Source: Own calculations (http://www.manapensija.lv/en/2nd-pensionpillar/statistics/data), 2021
As the State Funded Pension scheme is mandatory for all economically active individuals in Latvia,
the number of savers (as well as the average amount of accumulated assets on individual accounts)
is rising. The chart below indicates that the Pillar II market is starting to be saturated in terms of the
number of participants.
0
1.000
2.000
3.000
4.000
5.000
6.000
Conservative funds Balanced funds Active funds 50% Active funds 75%
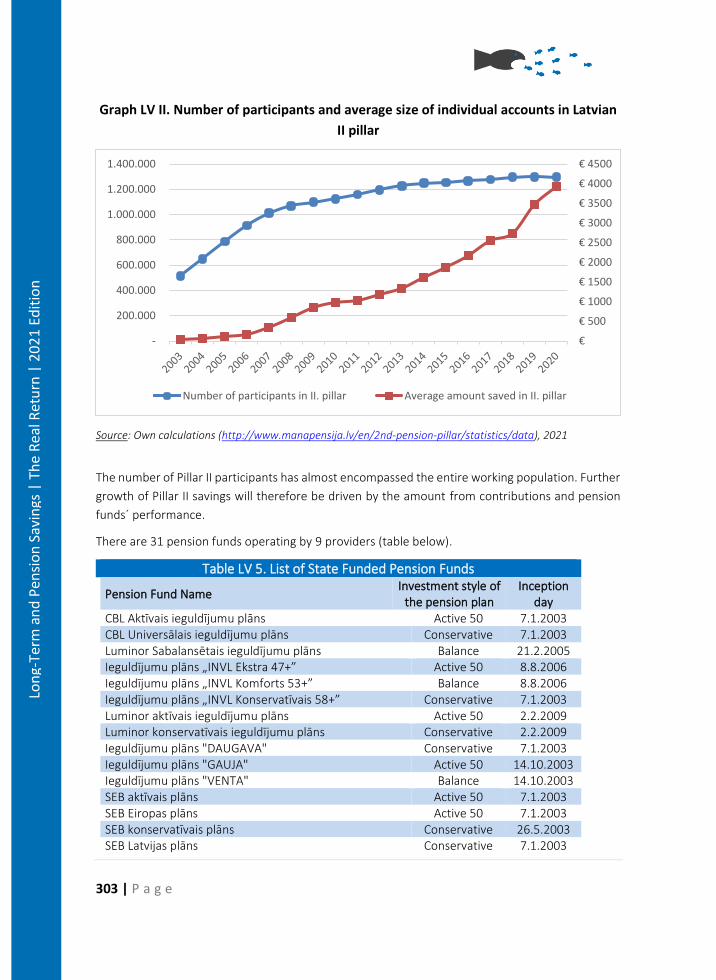
303 | P a g e
Lon
g-Te
rm a
nd
Pen
sio
n S
avin
gs |
Th
e R
eal R
etu
rn |
20
21
Edit
ion
Graph LV II. Number of participants and average size of individual accounts in Latvian
II pillar
Source: Own calculations (http://www.manapensija.lv/en/2nd-pension-pillar/statistics/data), 2021
The number of Pillar II participants has almost encompassed the entire working population. Further
growth of Pillar II savings will therefore be driven by the amount from contributions and pension
funds´ performance.
There are 31 pension funds operating by 9 providers (table below).
Table LV 5. List of State Funded Pension Funds
Pension Fund Name Investment style of
the pension plan Inception
day CBL Aktīvais ieguldījumu plāns Active 50 7.1.2003 CBL Universālais ieguldījumu plāns Conservative 7.1.2003 Luminor Sabalansētais ieguldījumu plāns Balance 21.2.2005 Ieguldījumu plāns „INVL Ekstra 47+” Active 50 8.8.2006 Ieguldījumu plāns „INVL Komforts 53+” Balance 8.8.2006 Ieguldījumu plāns „INVL Konservatīvais 58+” Conservative 7.1.2003 Luminor aktīvais ieguldījumu plāns Active 50 2.2.2009 Luminor konservatīvais ieguldījumu plāns Conservative 2.2.2009 Ieguldījumu plāns "DAUGAVA" Conservative 7.1.2003 Ieguldījumu plāns "GAUJA" Active 50 14.10.2003 Ieguldījumu plāns "VENTA" Balance 14.10.2003 SEB aktīvais plāns Active 50 7.1.2003 SEB Eiropas plāns Active 50 7.1.2003 SEB konservatīvais plāns Conservative 26.5.2003 SEB Latvijas plāns Conservative 7.1.2003
€
€ 500
€ 1000
€ 1500
€ 2000
€ 2500
€ 3000
€ 3500
€ 4000
€ 4500
-
200.000
400.000
600.000
800.000
1.000.000
1.200.000
1.400.000
Number of participants in II. pillar Average amount saved in II. pillar
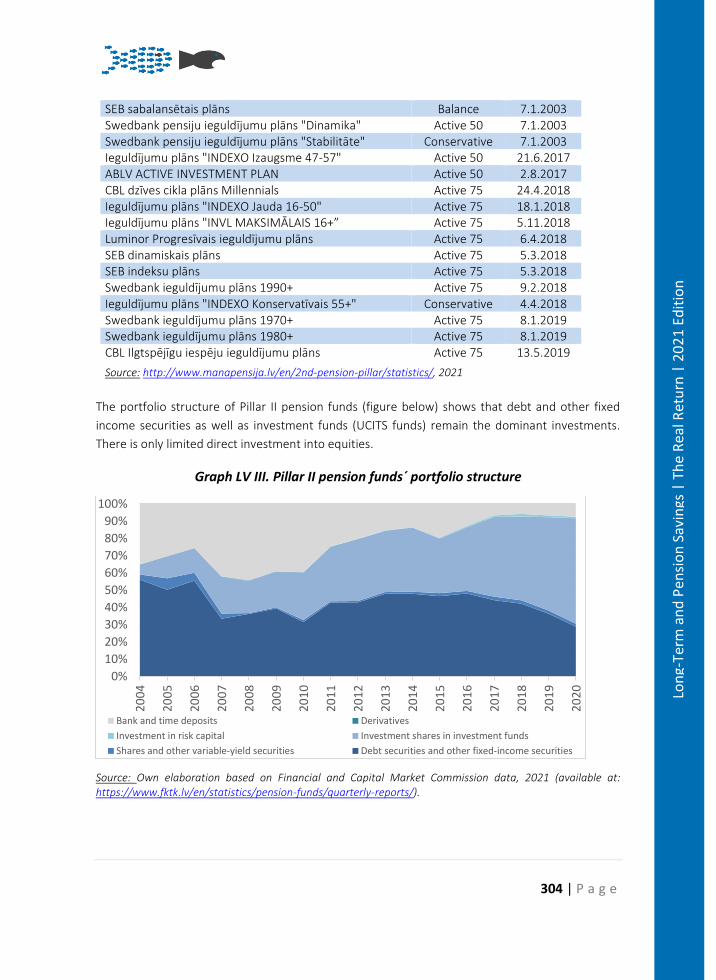
304 | P a g e
Lon
g-Te
rm a
nd
Pen
sio
n S
avin
gs |
Th
e R
eal R
etu
rn |
20
21
Edit
ion
SEB sabalansētais plāns Balance 7.1.2003 Swedbank pensiju ieguldījumu plāns "Dinamika" Active 50 7.1.2003 Swedbank pensiju ieguldījumu plāns "Stabilitāte" Conservative 7.1.2003 Ieguldījumu plāns "INDEXO Izaugsme 47-57" Active 50 21.6.2017 ABLV ACTIVE INVESTMENT PLAN Active 50 2.8.2017 CBL dzīves cikla plāns Millennials Active 75 24.4.2018 Ieguldījumu plāns "INDEXO Jauda 16-50" Active 75 18.1.2018 Ieguldījumu plāns "INVL MAKSIMĀLAIS 16+” Active 75 5.11.2018 Luminor Progresīvais ieguldījumu plāns Active 75 6.4.2018 SEB dinamiskais plāns Active 75 5.3.2018 SEB indeksu plāns Active 75 5.3.2018 Swedbank ieguldījumu plāns 1990+ Active 75 9.2.2018 Ieguldījumu plāns "INDEXO Konservatīvais 55+" Conservative 4.4.2018 Swedbank ieguldījumu plāns 1970+ Active 75 8.1.2019 Swedbank ieguldījumu plāns 1980+ Active 75 8.1.2019 CBL Ilgtspējīgu iespēju ieguldījumu plāns Active 75 13.5.2019
Source: http://www.manapensija.lv/en/2nd-pension-pillar/statistics/, 2021
The portfolio structure of Pillar II pension funds (figure below) shows that debt and other fixed
income securities as well as investment funds (UCITS funds) remain the dominant investments.
There is only limited direct investment into equities.
Graph LV III. Pillar II pension funds´ portfolio structure
Source: Own elaboration based on Financial and Capital Market Commission data, 2021 (available at: https://www.fktk.lv/en/statistics/pension-funds/quarterly-reports/).
0%
10%
20%
30%
40%
50%
60%
70%
80%
90%
100%
20
04
20
05
20
06
20
07
20
08
20
09
20
10
20
11
20
12
20
13
20
14
20
15
20
16
20
17
20
18
20
19
20
20
Bank and time deposits Derivatives
Investment in risk capital Investment shares in investment funds
Shares and other variable-yield securities Debt securities and other fixed-income securities
305 | P a g e
Lon
g-Te
rm a
nd
Pen
sio
n S
avin
gs |
Th
e R
eal R
etu
rn |
20
21
Edit
ion
Pillar III – Voluntary private pensions
There are two types of private pension funds in the Latvian voluntary private pension pillar:
1. closed, for fund founders’ (corporate) staff;
2. open, of which any individual may become a participant, either directly or through an
employer.
This distinction between private pension funds is rather significant, as closed private pension funds
(only one operating in Latvia in 2020) could be recognized as a typical occupational pension fund.
However, open private pension funds are more personal ones.
The law on Private Pension Funds provides a wide range of possibilities to organize and manage
private pension funds. The law prescribes the accumulation of pension benefits (both in the
specified contribution scheme and in the specified pay-out scheme), the types of private pension
funds, the basis for activities thereof, the types of pension schemes, the rights and duties of pension
scheme participants, the management of funds, the competence of holders of funds, and state
supervision of such activities.
Pension vehicles (pension funds) can be created only by limited types of entities in Latvia, namely:
1. employers entering into a collective agreement with a pension fund, technically become
founders of a closed pension fund;
2. for an open pension fund, two types of institutions can establish a fund:
1) bank (licensed credit institution);
2) life insurance company.
These founders usually hire a management company, who creates a different pension plan
managed under one pension fund and manages the investment activities. Pension scheme assets
can be managed only by the following commercial companies:
• a credit institution, which is entitled to provide investment services and non-core investment
services in Latvia;
• an insurance company, which is entitled to engage in life insurance in Latvia;
• an investment brokerage company, which is entitled to provide investment services in
Latvia;
• an investment management company, which is entitled to provide management services in
Latvia.
The level of transparency in providing publicly available data for private pension funds before the
year 2011 is rather low. Therefore, the analysis of the market and main pension vehicles has been
performed with publicly available data starting from 31 December 2011. Currently (as of 31
December 2020), 15 open private pension funds and one closed private pension fund exist on the
market.

306 | P a g e
Lon
g-Te
rm a
nd
Pen
sio
n S
avin
gs |
Th
e R
eal R
etu
rn |
20
21
Edit
ion
Table LV 6. List of Pillar III Supplementary pension funds
Pension Fund Name Investment style of the pension plan Inception day
Swedbank pensiju plāns Stabilitāte+25 Conservative opened pension funds 14.7.2003 INVL KOMFORTS 53+ Conservative opened pension funds 23.10.1998 CBL Sabalansētais Balanced opened pension funds 30.9.1999 Luminor sabalansētais pensiju plāns Balanced opened pension funds 18.10.2011 "SEB - Sabalansētais" pensiju plāns Balanced opened pension funds 31.7.2000 INVL Klasika Balanced opened pension funds 7.3.2008 INVL EKSTRA 47+ Balanced opened pension funds 8.10.2015 CBL Aktīvais Active 50 opened pension funds 21.3.2000 "SEB Aktīvais" pensiju plāns Active 50 opened pension funds 15.9.2004 Swedbank pensiju plāns Dinamika+60 Active 50 opened pension funds 1.8.2003 Swedbank pensiju plāns Dinamika+100 Active 50 opened pension funds 27.12.2006 CBL Aktīvais USD Active 50 opened pension funds 1.4.2006 Swedbank pensiju plāns Dinamika+(USD) Active 50 opened pension funds 14.7.2003 Luminor progresīvais pensiju plāns Active 75 opened pension funds 18.10.2011 INVL MAKSIMĀLAIS 16+ Active 100 opened pension funds 8.10.2015 "Pirmais Pensiju Plāns" Closed pension fund 1.12.1999
Source: Own elaboration based on www.manapensija.lv, 2021
The structure of the pension vehicles according to the type of the fund and investment strategy
offered is presented in the figure below.
Graph LV IV. Type of pillar III pension funds based on assets under management
Source: Own calculation based on Manapensija data (http://www.manapensija.lv/en/3rd-pension-
pillar/history-and-statistics/), 2021
0 €
100.000.000 €
200.000.000 €
300.000.000 €
400.000.000 €
500.000.000 €
600.000.000 €
700.000.000 €
2011 2012 2013 2014 2015 2016 2017 2018 2019 2020Conservative pension funds Balanced pension funds Active 50 pension funds
Active 75 pension funds Active 100 pension funds Closed pension fund
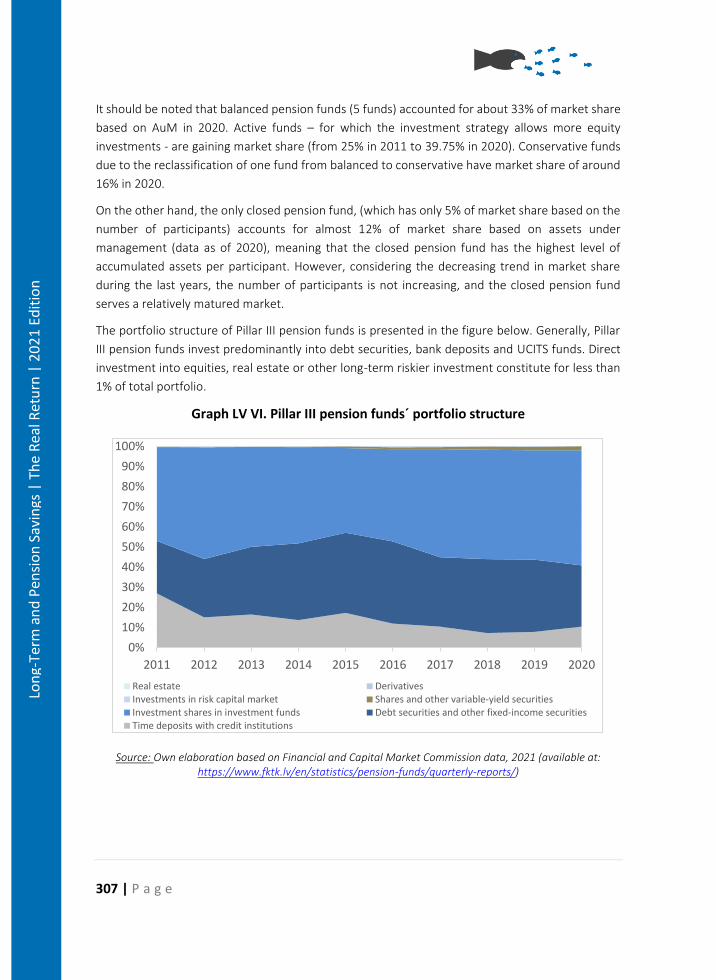
307 | P a g e
Lon
g-Te
rm a
nd
Pen
sio
n S
avin
gs |
Th
e R
eal R
etu
rn |
20
21
Edit
ion
It should be noted that balanced pension funds (5 funds) accounted for about 33% of market share
based on AuM in 2020. Active funds – for which the investment strategy allows more equity
investments - are gaining market share (from 25% in 2011 to 39.75% in 2020). Conservative funds
due to the reclassification of one fund from balanced to conservative have market share of around
16% in 2020.
On the other hand, the only closed pension fund, (which has only 5% of market share based on the
number of participants) accounts for almost 12% of market share based on assets under
management (data as of 2020), meaning that the closed pension fund has the highest level of
accumulated assets per participant. However, considering the decreasing trend in market share
during the last years, the number of participants is not increasing, and the closed pension fund
serves a relatively matured market.
The portfolio structure of Pillar III pension funds is presented in the figure below. Generally, Pillar
III pension funds invest predominantly into debt securities, bank deposits and UCITS funds. Direct
investment into equities, real estate or other long-term riskier investment constitute for less than
1% of total portfolio.
Graph LV VI. Pillar III pension funds´ portfolio structure
Source: Own elaboration based on Financial and Capital Market Commission data, 2021 (available at: https://www.fktk.lv/en/statistics/pension-funds/quarterly-reports/)
0%
10%
20%
30%
40%
50%
60%
70%
80%
90%
100%
2011 2012 2013 2014 2015 2016 2017 2018 2019 2020
Real estate DerivativesInvestments in risk capital market Shares and other variable-yield securitiesInvestment shares in investment funds Debt securities and other fixed-income securitiesTime deposits with credit institutions
308 | P a g e
Lon
g-Te
rm a
nd
Pen
sio
n S
avin
gs |
Th
e R
eal R
etu
rn |
20
21
Edit
ion
Charges
Pillar II – State Funded Pensions
Latvia has adopted the cap on fees within Pillar II, which forces that the maximum amount of
payment for the management of investment plan (including the fixed and variable parts of
payment, calculating for the last 12-month period) to not exceed:
1) 1.50% of the average value of investment plan assets to the investment plans, where the
investment plan prospectuses do not provide for any investments in the shares of commercial
companies, other capital securities and other equivalent securities;
2) 2.00% of the average value of investment plan assets of all other investment plans.
Fees that can be charged to pension funds by fund managers are recognized by law as having a
fixed and variable part. The law stipulates that payment for the management of an investment plan
shall include:
a) fixed component of payment, which is 1% of the average value of investment plan assets
per year and includes payments to the manager of the funds, custodian, as well as
payments to third persons, which are performed from the funds of the investment plans
(except expenses which have arisen upon performing transactions by selling the assets of
the investment plan with repurchase);
b) variable component of payment, which is remuneration to the manager of funds of the
funded pension scheme for performance of investment plan, with its amount depends on
the return of the pension plan.
Year 2020 brought further significant decrease in the fees. Introduction of low-cost passively
managed pension funds has spurred price battle and the charges dropped further in 2020 to an
average of 0.55% p.a.
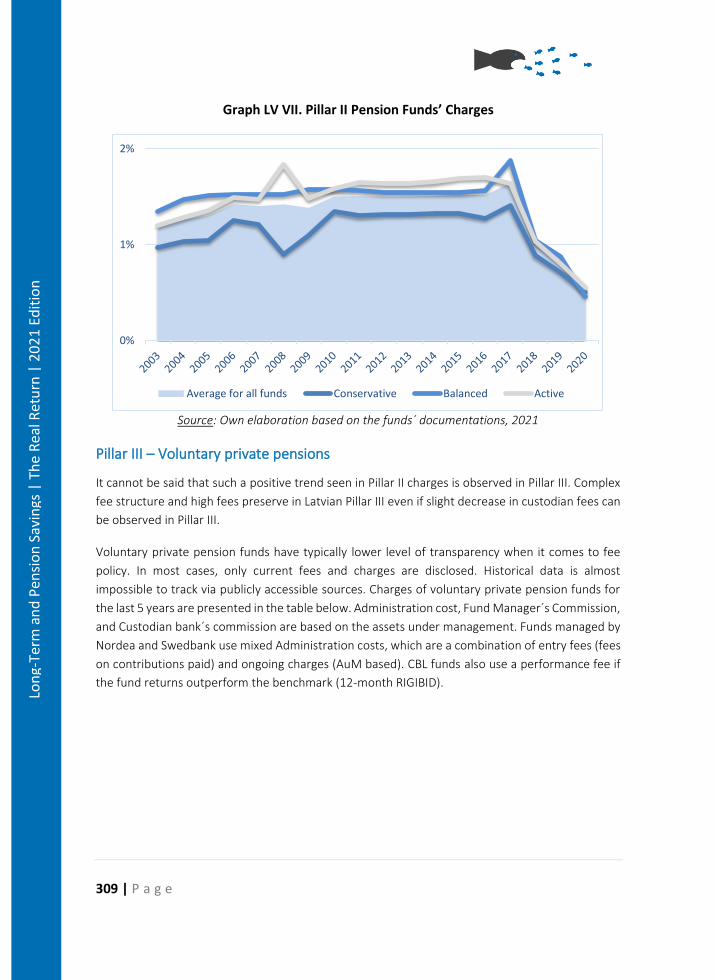
309 | P a g e
Lon
g-Te
rm a
nd
Pen
sio
n S
avin
gs |
Th
e R
eal R
etu
rn |
20
21
Edit
ion
Graph LV VII. Pillar II Pension Funds’ Charges
Source: Own elaboration based on the funds´ documentations, 2021
Pillar III – Voluntary private pensions
It cannot be said that such a positive trend seen in Pillar II charges is observed in Pillar III. Complex
fee structure and high fees preserve in Latvian Pillar III even if slight decrease in custodian fees can
be observed in Pillar III.
Voluntary private pension funds have typically lower level of transparency when it comes to fee
policy. In most cases, only current fees and charges are disclosed. Historical data is almost
impossible to track via publicly accessible sources. Charges of voluntary private pension funds for
the last 5 years are presented in the table below. Administration cost, Fund Manager´s Commission,
and Custodian bank´s commission are based on the assets under management. Funds managed by
Nordea and Swedbank use mixed Administration costs, which are a combination of entry fees (fees
on contributions paid) and ongoing charges (AuM based). CBL funds also use a performance fee if
the fund returns outperform the benchmark (12-month RIGIBID).
0%
1%
2%
Average for all funds Conservative Balanced Active
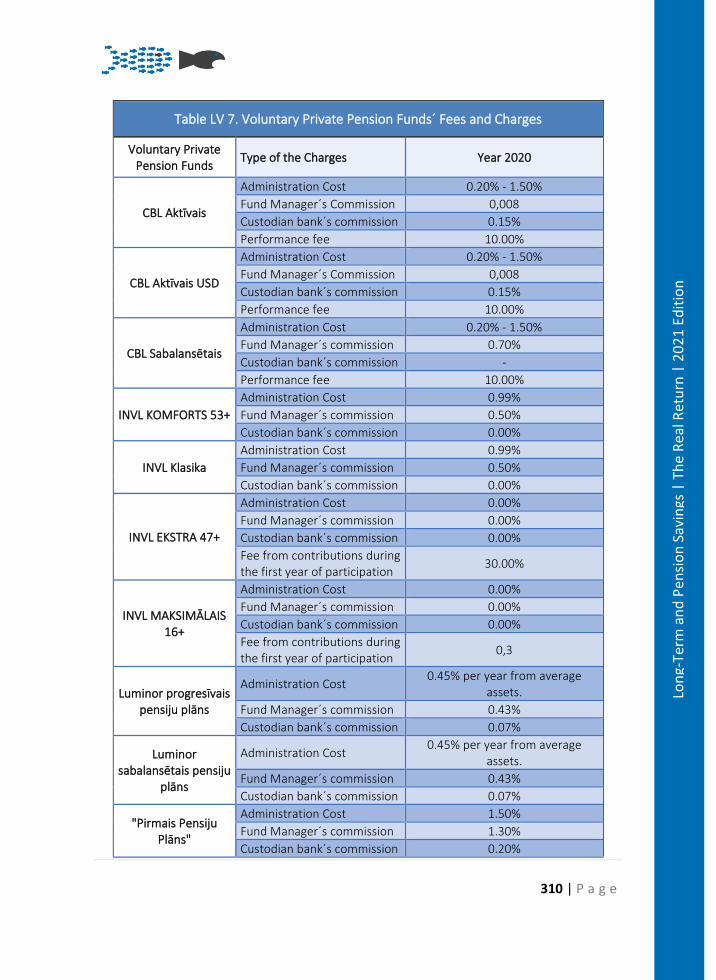
310 | P a g e
Lon
g-Te
rm a
nd
Pen
sio
n S
avin
gs |
Th
e R
eal R
etu
rn |
20
21
Edit
ion
Table LV 7. Voluntary Private Pension Funds´ Fees and Charges
Voluntary Private Pension Funds
Type of the Charges Year 2020
CBL Aktīvais
Administration Cost 0.20% - 1.50%
Fund Manager´s Commission 0,008
Custodian bank´s commission 0.15%
Performance fee 10.00%
CBL Aktīvais USD
Administration Cost 0.20% - 1.50%
Fund Manager´s Commission 0,008
Custodian bank´s commission 0.15%
Performance fee 10.00%
CBL Sabalansētais
Administration Cost 0.20% - 1.50%
Fund Manager´s commission 0.70%
Custodian bank´s commission -
Performance fee 10.00%
INVL KOMFORTS 53+
Administration Cost 0.99%
Fund Manager´s commission 0.50%
Custodian bank´s commission 0.00%
INVL Klasika
Administration Cost 0.99%
Fund Manager´s commission 0.50%
Custodian bank´s commission 0.00%
INVL EKSTRA 47+
Administration Cost 0.00%
Fund Manager´s commission 0.00%
Custodian bank´s commission 0.00%
Fee from contributions during the first year of participation
30.00%
INVL MAKSIMĀLAIS 16+
Administration Cost 0.00%
Fund Manager´s commission 0.00%
Custodian bank´s commission 0.00%
Fee from contributions during the first year of participation
0,3
Luminor progresīvais pensiju plāns
Administration Cost 0.45% per year from average
assets.
Fund Manager´s commission 0.43%
Custodian bank´s commission 0.07%
Luminor sabalansētais pensiju
plāns
Administration Cost 0.45% per year from average
assets.
Fund Manager´s commission 0.43%
Custodian bank´s commission 0.07%
"Pirmais Pensiju Plāns"
Administration Cost 1.50%
Fund Manager´s commission 1.30%
Custodian bank´s commission 0.20%
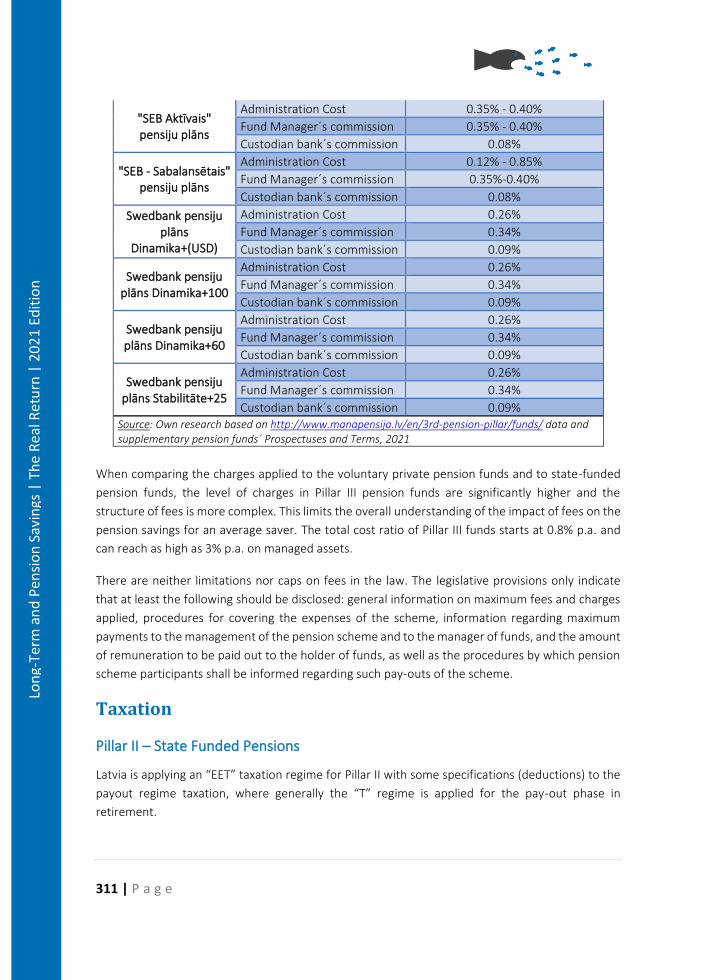
311 | P a g e
Lon
g-Te
rm a
nd
Pen
sio
n S
avin
gs |
Th
e R
eal R
etu
rn |
20
21
Edit
ion
"SEB Aktīvais" pensiju plāns
Administration Cost 0.35% - 0.40%
Fund Manager´s commission 0.35% - 0.40%
Custodian bank´s commission 0.08%
"SEB - Sabalansētais" pensiju plāns
Administration Cost 0.12% - 0.85%
Fund Manager´s commission 0.35%-0.40%
Custodian bank´s commission 0.08%
Swedbank pensiju plāns
Dinamika+(USD)
Administration Cost 0.26%
Fund Manager´s commission 0.34%
Custodian bank´s commission 0.09%
Swedbank pensiju plāns Dinamika+100
Administration Cost 0.26%
Fund Manager´s commission 0.34%
Custodian bank´s commission 0.09%
Swedbank pensiju plāns Dinamika+60
Administration Cost 0.26%
Fund Manager´s commission 0.34%
Custodian bank´s commission 0.09%
Swedbank pensiju plāns Stabilitāte+25
Administration Cost 0.26%
Fund Manager´s commission 0.34%
Custodian bank´s commission 0.09% Source: Own research based on http://www.manapensija.lv/en/3rd-pension-pillar/funds/ data and supplementary pension funds´ Prospectuses and Terms, 2021
When comparing the charges applied to the voluntary private pension funds and to state-funded
pension funds, the level of charges in Pillar III pension funds are significantly higher and the
structure of fees is more complex. This limits the overall understanding of the impact of fees on the
pension savings for an average saver. The total cost ratio of Pillar III funds starts at 0.8% p.a. and
can reach as high as 3% p.a. on managed assets.
There are neither limitations nor caps on fees in the law. The legislative provisions only indicate
that at least the following should be disclosed: general information on maximum fees and charges
applied, procedures for covering the expenses of the scheme, information regarding maximum
payments to the management of the pension scheme and to the manager of funds, and the amount
of remuneration to be paid out to the holder of funds, as well as the procedures by which pension
scheme participants shall be informed regarding such pay-outs of the scheme.
Taxation
Pillar II – State Funded Pensions
Latvia is applying an “EET” taxation regime for Pillar II with some specifications (deductions) to the
payout regime taxation, where generally the “T” regime is applied for the pay-out phase in
retirement.
312 | P a g e
Lon
g-Te
rm a
nd
Pen
sio
n S
avin
gs |
Th
e R
eal R
etu
rn |
20
21
Edit
ion
Taxation of contributions
Contributions paid to the state funded pension scheme are made via social insurance contributions
redirection. As such, these contributions are personal income tax deductible items, so the
contributions are not subject to additional personal taxation.
Taxation of the Fund
The Corporate Income tax rate in Latvia is 15%. However, income or profits of the fund (investment
fund as a legal entity) are not subject to Latvian corporate income tax at the fund level. Latvia
applies a general principle for all investment and savings-based schemes to levy the income taxation
on the final beneficiaries and not on the investment vehicles.
Taxation of pension benefits
Latvia has one of the lowest levels of income redistribution among EU countries. Personal income
tax rate is 23% and the pension benefits paid from the NDC PAYG scheme (Pillar I) and state-funded
pension scheme (Pillar II) are considered taxable income. As such, pension benefits are subject to
personal income tax. Latvia applies a non-taxable minimum, which is recalculated and announced
every year by Cabinet regulation.
Pillar III – Voluntary private pensions
Latvian tax legislation stipulates the use of the “EET” regime (like Pillar II) for voluntary private
pension schemes as well, where the contribution by individuals is treated in a slightly different way.
Payments made to private pension funds established in accordance with the Republic of Latvia Law
on Private Pension Funds or to pension funds registered in another Member State of the European
Union or the European Economic Area State shall be deducted from the amount of annual taxable
income, provided that such payments do not exceed 10 % of the person’s annual taxable income.
However, there is a limit on total income tax base deductible payments. The total of donations and
gifts, payments into private pension funds, insurance premium payments and purchase costs of
investment certificates of investment funds may not exceed 20% of the amount of the payer’s
taxable income.
Pension Returns
Pillar II – State Funded Pensions
Pension funds´ performance is closely tied to the portfolio structure defined by an investment
strategy (as well as investment restrictions and regulations) applied by a fund manager. Investment
regulations differ, depending on whether pension plans are managed by the State Treasury or by
private companies. The State Treasury is only allowed to invest in Latvian government securities,
bank deposits, mortgage bonds and deposit certificates. Moreover, it can only invest in financial
313 | P a g e
Lon
g-Te
rm a
nd
Pen
sio
n S
avin
gs |
Th
e R
eal R
etu
rn |
20
21
Edit
ion
instruments denominated in the national currency. In contrast, private managers are allowed to
invest in a much broader range of financial instruments. The main investment limits include the
following:
• 35% for securities guaranteed by a state or international financial institution;
• 5% for securities issued or guaranteed by a local government;
• 10% for securities of a single issuer, except government securities; for deposits at one credit
institution (investments in debt and capital securities of the same credit institution and
derivative financial instruments may not exceed 15%); and for securities issued by one
commercial company (or group of commercial companies);
• 20% for investments in non-listed securities;
• 5% for investments in a single fund (10% of the net assets of the investment fund).
There is no maximum limit for international investments so long as pension funds invest in securities
listed on stock exchanges in the Baltics, other EU member states, or the European Free Trade Area.
However, the law stipulates a 70% currency matching rule. There is also a 10% limit for each non-
matching currency. Investments in real estate, loans, and self-investment are not permitted.
All data presented on the pension funds’ returns are presented in net values, i.e., after all fees
charged to the fund portfolio. The graphs contain also inflation on an annual and cumulative basis.
Pension reform introduced Pillar II in July 2001. However, pension funds started their effective
operation from January 2003, so only data for the period from 2003 to 2019 is presented.
Conservative mandatory pension funds’ performance on a cumulative basis compared to the
inflation is presented below.
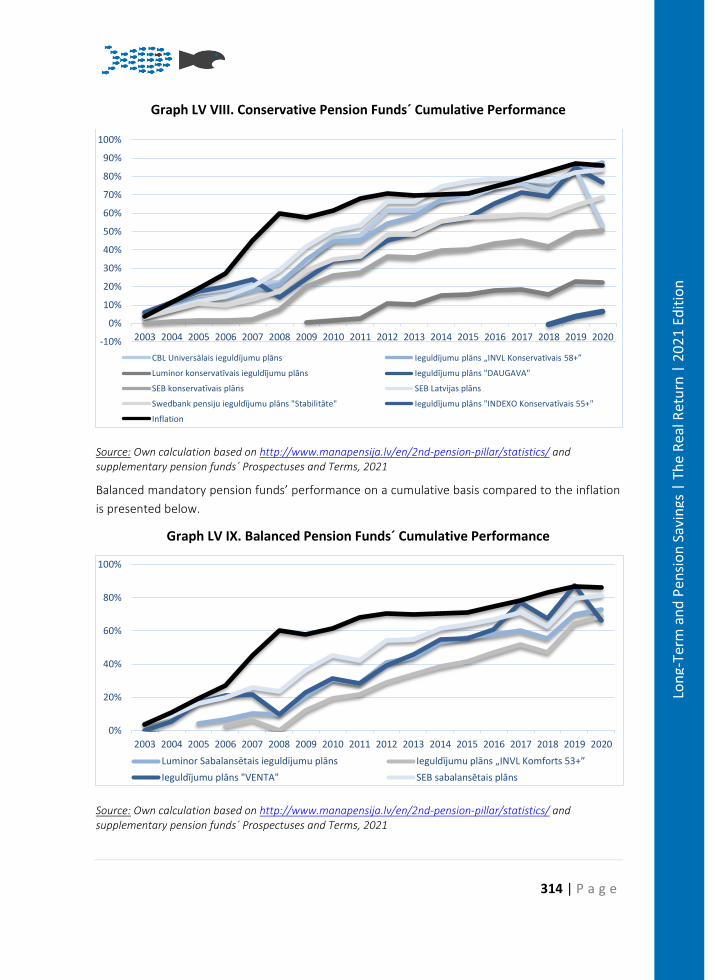
314 | P a g e
Lon
g-Te
rm a
nd
Pen
sio
n S
avin
gs |
Th
e R
eal R
etu
rn |
20
21
Edit
ion
Graph LV VIII. Conservative Pension Funds´ Cumulative Performance
Source: Own calculation based on http://www.manapensija.lv/en/2nd-pension-pillar/statistics/ and supplementary pension funds´ Prospectuses and Terms, 2021
Balanced mandatory pension funds’ performance on a cumulative basis compared to the inflation
is presented below.
Graph LV IX. Balanced Pension Funds´ Cumulative Performance
Source: Own calculation based on http://www.manapensija.lv/en/2nd-pension-pillar/statistics/ and supplementary pension funds´ Prospectuses and Terms, 2021
-10%
0%
10%
20%
30%
40%
50%
60%
70%
80%
90%
100%
2003 2004 2005 2006 2007 2008 2009 2010 2011 2012 2013 2014 2015 2016 2017 2018 2019 2020
CBL Universālais ieguldījumu plāns Ieguldījumu plāns „INVL Konservatīvais 58+”
Luminor konservatīvais ieguldījumu plāns Ieguldījumu plāns "DAUGAVA"
SEB konservatīvais plāns SEB Latvijas plāns
Swedbank pensiju ieguldījumu plāns "Stabilitāte" Ieguldījumu plāns "INDEXO Konservatīvais 55+"
Inflation
0%
20%
40%
60%
80%
100%
2003 2004 2005 2006 2007 2008 2009 2010 2011 2012 2013 2014 2015 2016 2017 2018 2019 2020
Luminor Sabalansētais ieguldījumu plāns Ieguldījumu plāns „INVL Komforts 53+”
Ieguldījumu plāns "VENTA" SEB sabalansētais plāns
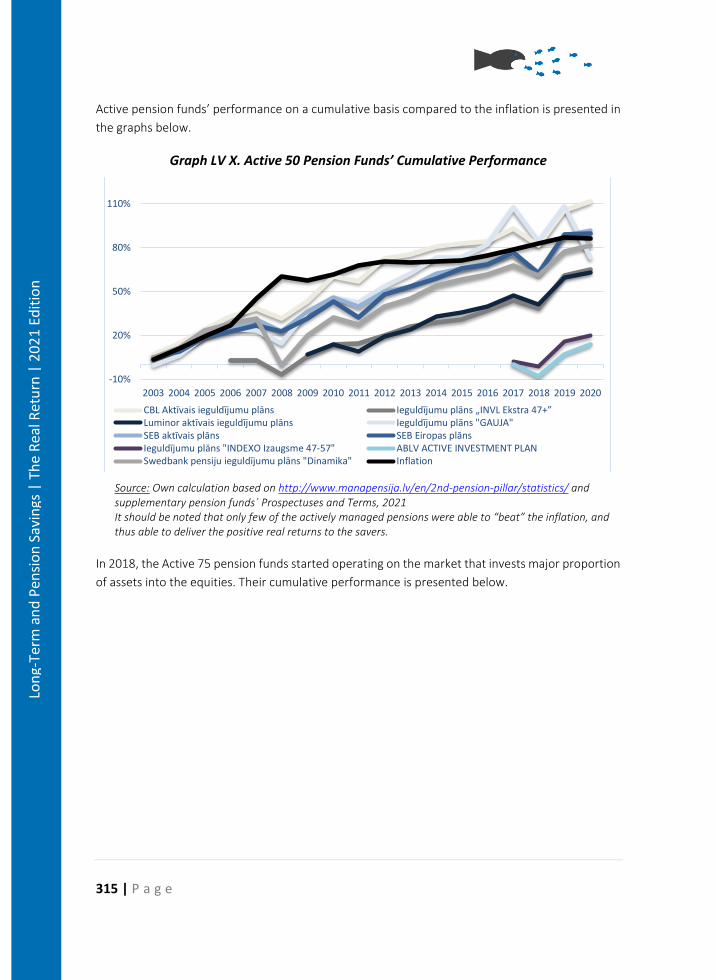
315 | P a g e
Lon
g-Te
rm a
nd
Pen
sio
n S
avin
gs |
Th
e R
eal R
etu
rn |
20
21
Edit
ion
Active pension funds’ performance on a cumulative basis compared to the inflation is presented in
the graphs below.
Graph LV X. Active 50 Pension Funds’ Cumulative Performance
Source: Own calculation based on http://www.manapensija.lv/en/2nd-pension-pillar/statistics/ and supplementary pension funds´ Prospectuses and Terms, 2021 It should be noted that only few of the actively managed pensions were able to “beat” the inflation, and thus able to deliver the positive real returns to the savers.
In 2018, the Active 75 pension funds started operating on the market that invests major proportion
of assets into the equities. Their cumulative performance is presented below.
-10%
20%
50%
80%
110%
2003 2004 2005 2006 2007 2008 2009 2010 2011 2012 2013 2014 2015 2016 2017 2018 2019 2020
CBL Aktīvais ieguldījumu plāns Ieguldījumu plāns „INVL Ekstra 47+”Luminor aktīvais ieguldījumu plāns Ieguldījumu plāns "GAUJA"SEB aktīvais plāns SEB Eiropas plānsIeguldījumu plāns "INDEXO Izaugsme 47-57" ABLV ACTIVE INVESTMENT PLANSwedbank pensiju ieguldījumu plāns "Dinamika" Inflation
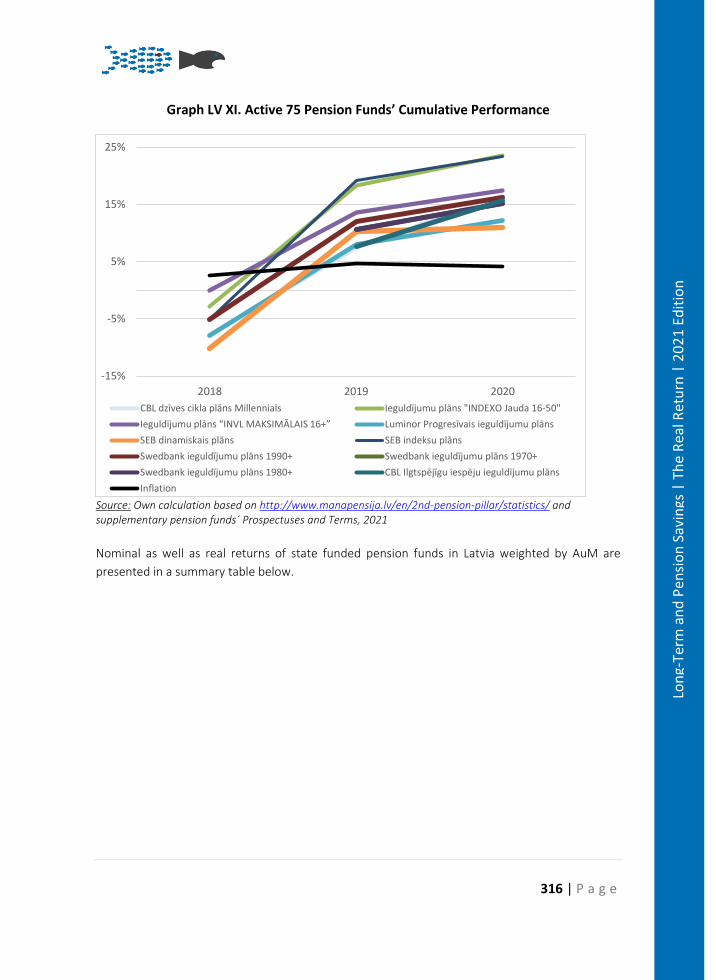
316 | P a g e
Lon
g-Te
rm a
nd
Pen
sio
n S
avin
gs |
Th
e R
eal R
etu
rn |
20
21
Edit
ion
Graph LV XI. Active 75 Pension Funds’ Cumulative Performance
Source: Own calculation based on http://www.manapensija.lv/en/2nd-pension-pillar/statistics/ and supplementary pension funds´ Prospectuses and Terms, 2021
Nominal as well as real returns of state funded pension funds in Latvia weighted by AuM are
presented in a summary table below.
-15%
-5%
5%
15%
25%
2018 2019 2020
CBL dzīves cikla plāns Millennials Ieguldījumu plāns "INDEXO Jauda 16-50"
Ieguldījumu plāns "INVL MAKSIMĀLAIS 16+” Luminor Progresīvais ieguldījumu plāns
SEB dinamiskais plāns SEB indeksu plāns
Swedbank ieguldījumu plāns 1990+ Swedbank ieguldījumu plāns 1970+
Swedbank ieguldījumu plāns 1980+ CBL Ilgtspējīgu iespēju ieguldījumu plāns
Inflation
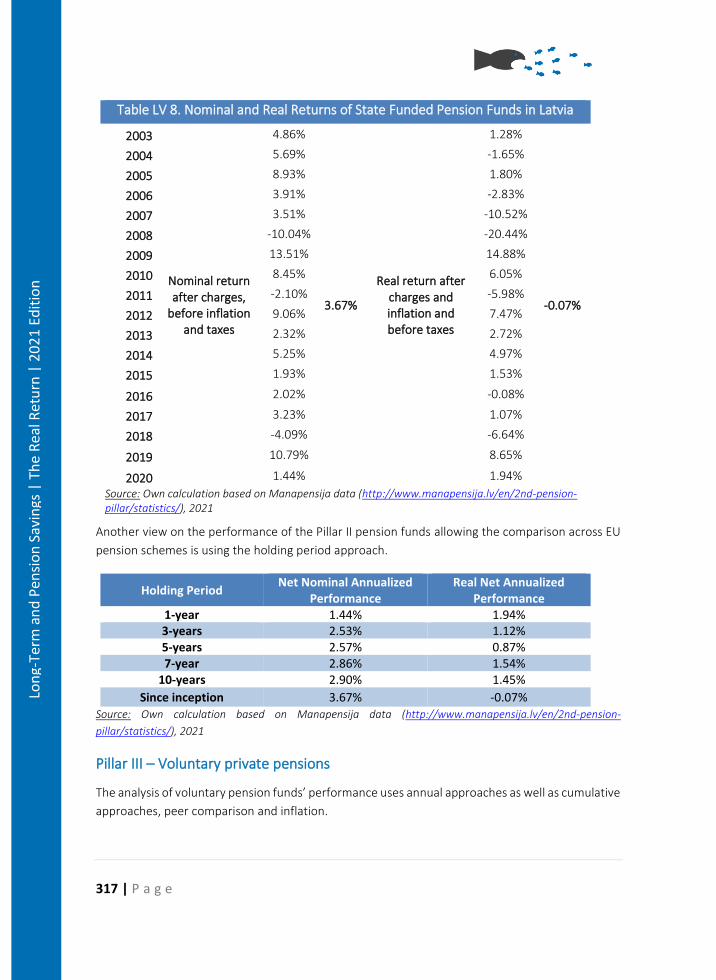
317 | P a g e
Lon
g-Te
rm a
nd
Pen
sio
n S
avin
gs |
Th
e R
eal R
etu
rn |
20
21
Edit
ion
Table LV 8. Nominal and Real Returns of State Funded Pension Funds in Latvia
2003
Nominal return after charges,
before inflation and taxes
4.86%
3.67%
Real return after charges and inflation and before taxes
1.28%
-0.07%
2004 5.69% -1.65%
2005 8.93% 1.80%
2006 3.91% -2.83%
2007 3.51% -10.52%
2008 -10.04% -20.44%
2009 13.51% 14.88%
2010 8.45% 6.05%
2011 -2.10% -5.98%
2012 9.06% 7.47%
2013 2.32% 2.72%
2014 5.25% 4.97%
2015 1.93% 1.53%
2016 2.02% -0.08%
2017 3.23% 1.07%
2018 -4.09% -6.64%
2019 10.79% 8.65%
2020 1.44% 1.94%
Source: Own calculation based on Manapensija data (http://www.manapensija.lv/en/2nd-pension-pillar/statistics/), 2021
Another view on the performance of the Pillar II pension funds allowing the comparison across EU
pension schemes is using the holding period approach.
Holding Period Net Nominal Annualized
Performance Real Net Annualized
Performance 1-year 1.44% 1.94% 3-years 2.53% 1.12% 5-years 2.57% 0.87% 7-year 2.86% 1.54%
10-years 2.90% 1.45%
Since inception 3.67% -0.07% Source: Own calculation based on Manapensija data (http://www.manapensija.lv/en/2nd-pension-
pillar/statistics/), 2021
Pillar III – Voluntary private pensions
The analysis of voluntary pension funds’ performance uses annual approaches as well as cumulative
approaches, peer comparison and inflation.
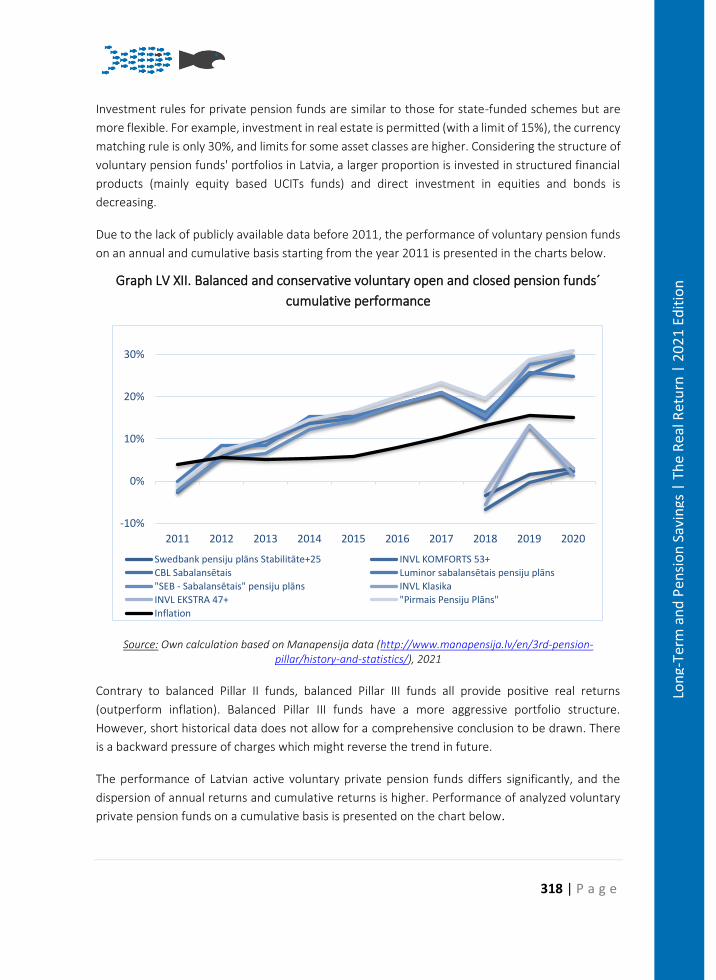
318 | P a g e
Lon
g-Te
rm a
nd
Pen
sio
n S
avin
gs |
Th
e R
eal R
etu
rn |
20
21
Edit
ion
Investment rules for private pension funds are similar to those for state-funded schemes but are
more flexible. For example, investment in real estate is permitted (with a limit of 15%), the currency
matching rule is only 30%, and limits for some asset classes are higher. Considering the structure of
voluntary pension funds' portfolios in Latvia, a larger proportion is invested in structured financial
products (mainly equity based UCITs funds) and direct investment in equities and bonds is
decreasing.
Due to the lack of publicly available data before 2011, the performance of voluntary pension funds
on an annual and cumulative basis starting from the year 2011 is presented in the charts below.
Graph LV XII. Balanced and conservative voluntary open and closed pension funds´
cumulative performance
Source: Own calculation based on Manapensija data (http://www.manapensija.lv/en/3rd-pension-pillar/history-and-statistics/), 2021
Contrary to balanced Pillar II funds, balanced Pillar III funds all provide positive real returns
(outperform inflation). Balanced Pillar III funds have a more aggressive portfolio structure.
However, short historical data does not allow for a comprehensive conclusion to be drawn. There
is a backward pressure of charges which might reverse the trend in future.
The performance of Latvian active voluntary private pension funds differs significantly, and the
dispersion of annual returns and cumulative returns is higher. Performance of analyzed voluntary
private pension funds on a cumulative basis is presented on the chart below.
-10%
0%
10%
20%
30%
2011 2012 2013 2014 2015 2016 2017 2018 2019 2020
Swedbank pensiju plāns Stabilitāte+25 INVL KOMFORTS 53+
CBL Sabalansētais Luminor sabalansētais pensiju plāns
"SEB - Sabalansētais" pensiju plāns INVL Klasika
INVL EKSTRA 47+ "Pirmais Pensiju Plāns"
Inflation
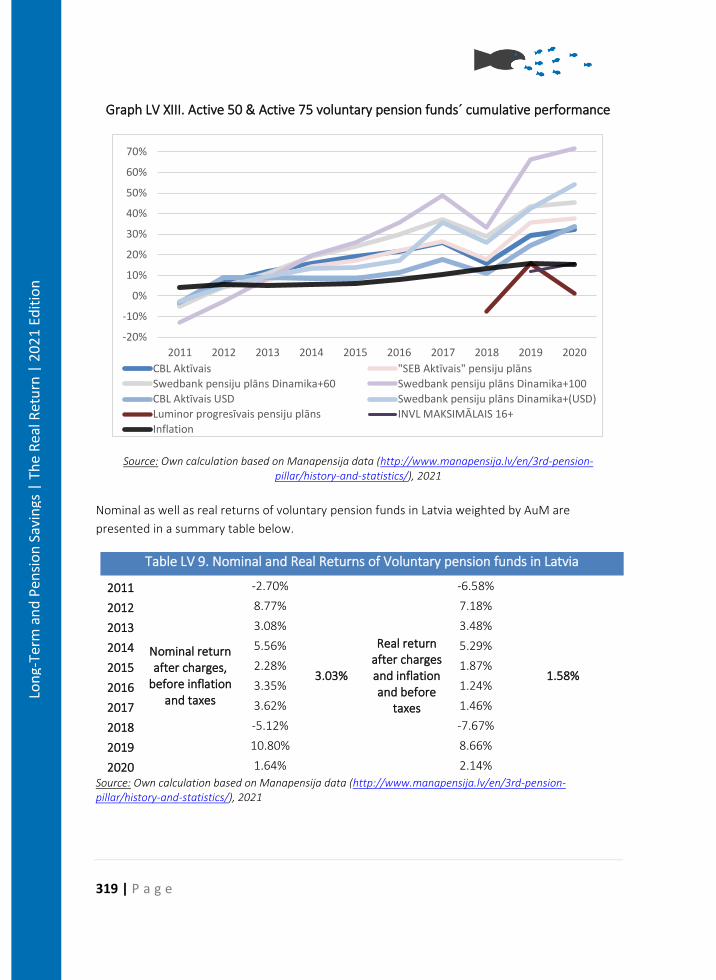
319 | P a g e
Lon
g-Te
rm a
nd
Pen
sio
n S
avin
gs |
Th
e R
eal R
etu
rn |
20
21
Edit
ion
Graph LV XIII. Active 50 & Active 75 voluntary pension funds´ cumulative performance
Source: Own calculation based on Manapensija data (http://www.manapensija.lv/en/3rd-pension-pillar/history-and-statistics/), 2021
Nominal as well as real returns of voluntary pension funds in Latvia weighted by AuM are
presented in a summary table below.
Table LV 9. Nominal and Real Returns of Voluntary pension funds in Latvia
2011
Nominal return after charges,
before inflation and taxes
-2.70%
3.03%
Real return after charges and inflation and before
taxes
-6.58%
1.58%
2012 8.77% 7.18%
2013 3.08% 3.48%
2014 5.56% 5.29%
2015 2.28% 1.87%
2016 3.35% 1.24%
2017 3.62% 1.46%
2018 -5.12% -7.67%
2019 10.80% 8.66%
2020 1.64% 2.14%
Source: Own calculation based on Manapensija data (http://www.manapensija.lv/en/3rd-pension-pillar/history-and-statistics/), 2021
-20%
-10%
0%
10%
20%
30%
40%
50%
60%
70%
2011 2012 2013 2014 2015 2016 2017 2018 2019 2020
CBL Aktīvais "SEB Aktīvais" pensiju plāns
Swedbank pensiju plāns Dinamika+60 Swedbank pensiju plāns Dinamika+100
CBL Aktīvais USD Swedbank pensiju plāns Dinamika+(USD)
Luminor progresīvais pensiju plāns INVL MAKSIMĀLAIS 16+
Inflation
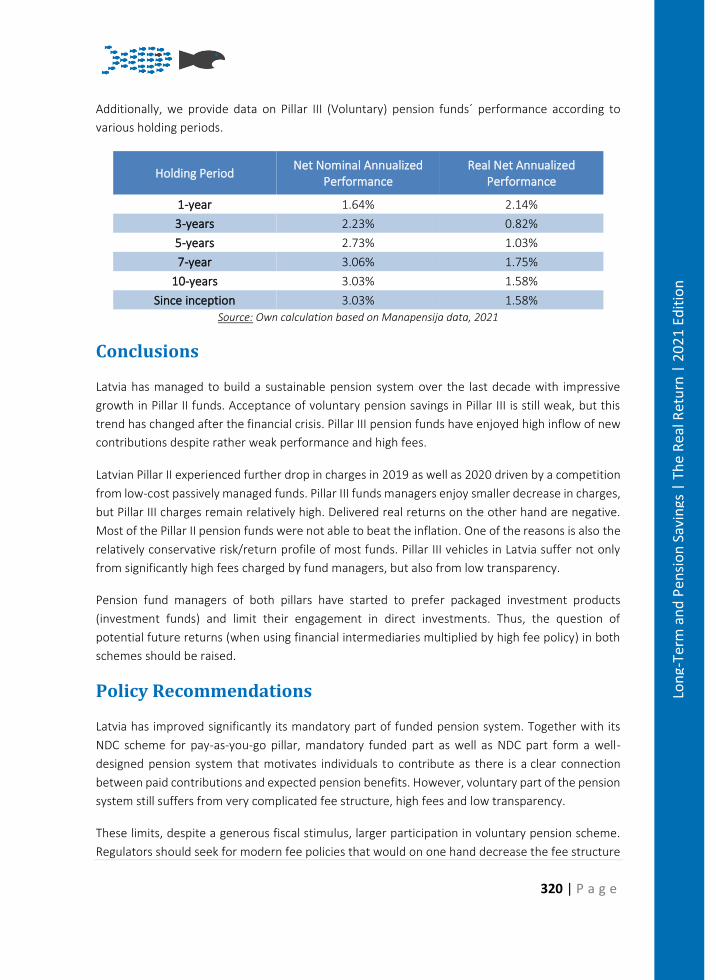
320 | P a g e
Lon
g-Te
rm a
nd
Pen
sio
n S
avin
gs |
Th
e R
eal R
etu
rn |
20
21
Edit
ion
Additionally, we provide data on Pillar III (Voluntary) pension funds´ performance according to
various holding periods.
Holding Period Net Nominal Annualized
Performance Real Net Annualized
Performance
1-year 1.64% 2.14%
3-years 2.23% 0.82%
5-years 2.73% 1.03%
7-year 3.06% 1.75%
10-years 3.03% 1.58%
Since inception 3.03% 1.58% Source: Own calculation based on Manapensija data, 2021
Conclusions
Latvia has managed to build a sustainable pension system over the last decade with impressive
growth in Pillar II funds. Acceptance of voluntary pension savings in Pillar III is still weak, but this
trend has changed after the financial crisis. Pillar III pension funds have enjoyed high inflow of new
contributions despite rather weak performance and high fees.
Latvian Pillar II experienced further drop in charges in 2019 as well as 2020 driven by a competition
from low-cost passively managed funds. Pillar III funds managers enjoy smaller decrease in charges,
but Pillar III charges remain relatively high. Delivered real returns on the other hand are negative.
Most of the Pillar II pension funds were not able to beat the inflation. One of the reasons is also the
relatively conservative risk/return profile of most funds. Pillar III vehicles in Latvia suffer not only
from significantly high fees charged by fund managers, but also from low transparency.
Pension fund managers of both pillars have started to prefer packaged investment products
(investment funds) and limit their engagement in direct investments. Thus, the question of
potential future returns (when using financial intermediaries multiplied by high fee policy) in both
schemes should be raised.
Policy Recommendations
Latvia has improved significantly its mandatory part of funded pension system. Together with its
NDC scheme for pay-as-you-go pillar, mandatory funded part as well as NDC part form a well-
designed pension system that motivates individuals to contribute as there is a clear connection
between paid contributions and expected pension benefits. However, voluntary part of the pension
system still suffers from very complicated fee structure, high fees and low transparency.
These limits, despite a generous fiscal stimulus, larger participation in voluntary pension scheme.
Regulators should seek for modern fee policies that would on one hand decrease the fee structure
321 | P a g e
Lon
g-Te
rm a
nd
Pen
sio
n S
avin
gs |
Th
e R
eal R
etu
rn |
20
21
Edit
ion
and on the other hand introduce success fee tied to the market benchmark. Applying high-water
mark principle could limit the risk appetite of asset managers as they will start to prefer low-risk
investments where constant fee revenue could be expected. If the benchmarking principle is
applied, where the asset manager is rewarded by higher fee when the market benchmark has been
outperformed and penalized by lower fees if the fund performance is lower than the market
benchmark, savers could benefit more and start trusting the voluntary pension providers on a larger
scale.
Bibliography
• Groduma, M. 2002. Social insurance in Latvia: Seeking balance between financial stability
and equity. In: European regional meeting “New and revised approaches to social
protection in Europe”. Budapest, 13 - 15 November 2002. [Online] Available:
http://www.issa.int/html/pdf/budapest02/2groduma.pdf
• Hernandez, D. G and Stewart, F. 2008. Comparison of Costs and Fees in Countries with
Private Defined Contribution Pension Systems. IOPS Working Paper No. 6. 2008.
• Ministry of Welfare of Latvia. 2003. The State Social Insurance System in Latvia. Financial
Analysis. Riga: Ministry of Welfare of Latvia. 2003.
• Rajevska, O. 2013. Funded Pillars in the Pension Systems of Estonia, Latvia and Lithuania.
In: Economics and Business 2013/23.
• Volskis, E. 2012. Reforms of Baltic States Pension Systems: Challenges and Benefits.
EBRD. [Online] Available: www.ebrd.com/downloads/news/pension-system.pdf
• Law on State Funded Pensions
• Law on Private Pension Funds
• Law on State Social Insurance
322 | P a g e
Lon
g-Te
rm a
nd
Pen
sio
n S
avin
gs |
Th
e R
eal R
etu
rn |
20
21
Edit
ion
Pension Savings: The Real Return 2021 Edition
Country Case: Lithuania
Santrauka
Lietuva priėmė tipišką Pasaulio banko daugiapakopę sistemą, kurioje PAYG pakopa (valstybinė
pensija, I pakopa) vis dar atlieka dominuojantį vaidmenį užtikrinant senatvės pensininkų pajamas.
Nuo 2019 m. II pakopos santaupų kaupimas vyksta gyvenimo ciklo pensijų fonduose, kurie patys
keičia investavimo riziką pagal dalyvių amžių. Nuo 2019 m. palaipsniui mažinamas valdymo mokestis
už kaupimą II pakopos gyvenimo ciklo fonduose. 2019 m. jis sudarė 0,8 proc. ir 2020 m. tapo 0,65
proc. Nuo 2021 m. metinis turto valdymo mokestis dar labiau sumažintas iki 0,5 proc. Turto
išsaugojimo fondui turto valdymo mokestis sudarys tik 0,2 proc.
Apskritai 2020 m. abiejų pakopų pensijų fondų veiklos rezultatai visose turto klasėse buvo gražiai
teigiami, tačiau pensijų fondų, kurių rizikos ir grąžos profiliai buvo skirtingi, grąža gerokai skyrėsi.
Summary
Lithuania adopted the typical World-Bank multi-pillar system, where the PAYG pillar (state pension,
Pillar I) still plays the dominant role in ensuring the income for old-age pensioners. As of 2019,
accumulating savings in Pillar II takes place in life-cycle pension funds, which change investment
risk themselves on the basis of participants’ age. Since 2019, management fee for accumulating in
Pillar II life-cycle funds is being gradually reduced. In 2019 it was 0.8 per cent and in became 0.65
per cent in 2020. From the year 2021 the annual asset management fee was further decreased to
0.5 per cent. For the asset preservation fund, the management fee will be just 0.2 per cent.
Overall, pension funds’ performance in both pillars were nicely positive in 2020 across all asset
classes, however there were significant differences among the pension funds´ returns with different
risk-return profiles.
323 | P a g e
Lon
g-Te
rm a
nd
Pen
sio
n S
avin
gs |
Th
e R
eal R
etu
rn |
20
21
Edit
ion
Introduction
Lithuania has undertaken a pension reform in 2004, which was renewed in 2013. This was the
reason to establish private pension funds. Currently, the Lithuanian pension system provides three
distinct sources of accumulation for retirement funds – so-called pension pillars:226
• 1st pillar (Pillar I) – State social insurance funds organized as a PAYG pension scheme. State
social pension is financed from social insurance contributions paid by people who are
currently working.
• 2nd pension pillar (Pillar II) – funded pension scheme mandatory for all economically active
citizens under the age 40 with opt-out operated by the private pension accumulation
companies offering life-cycle pension funds in form of personal savings scheme. The part
of State social insurance fund is redirected from PAYG scheme (until 2019). On top of social
insurance contributions, savers are obliged to co-finance the individual retirement
accounts with additional contributions tied to their salary.
• 3rd pension pillar (Pillar III) – voluntary private funded pension scheme. Accumulation can
be managed by private funds or life-insurance companies.
Lithuania's statutory social insurance pension system is financed at a general rate of 39.5% (without
social insurance for accidents at work and occupational diseases insurance), while 25.3 percentage
points (22.3 p.p. + 3 p.p. employee) is paid towards the social insurance for pensions (Pillar I).
The State social insurance pension system was reformed in 1995 introducing the insurance
principle, extending the requirement for contributory years, abolishing early retirement provisions
and increasing the retirement age. However, Pillar II was introduced by law in 2002 and started
functioning effectively in 2004 when the first contributions of participating individuals started to
flow into the pension funds.
Supplementary voluntary pension provision (Pillar III) is possible through either pension insurance
or special voluntary pension funds (these started operating in 2004, although the law was adopted
in 1999). The voluntary pillar can take two different forms: defined-contribution (DC), if
supplemental contributions are invested into pension funds or unit-linked life insurance or defined-
benefit (DB) when purchasing a classic life insurance product. Contributions to the system may be
made by the individual or his employer.
Basic data on the pension system set-up in Lithuania is presented in the table below.
226 BITINAS, A. (2011). Modern pension system reforms in Lithuania: Impact of crisis and ageing. Jurisprudence, 18(3), 1055–1080.
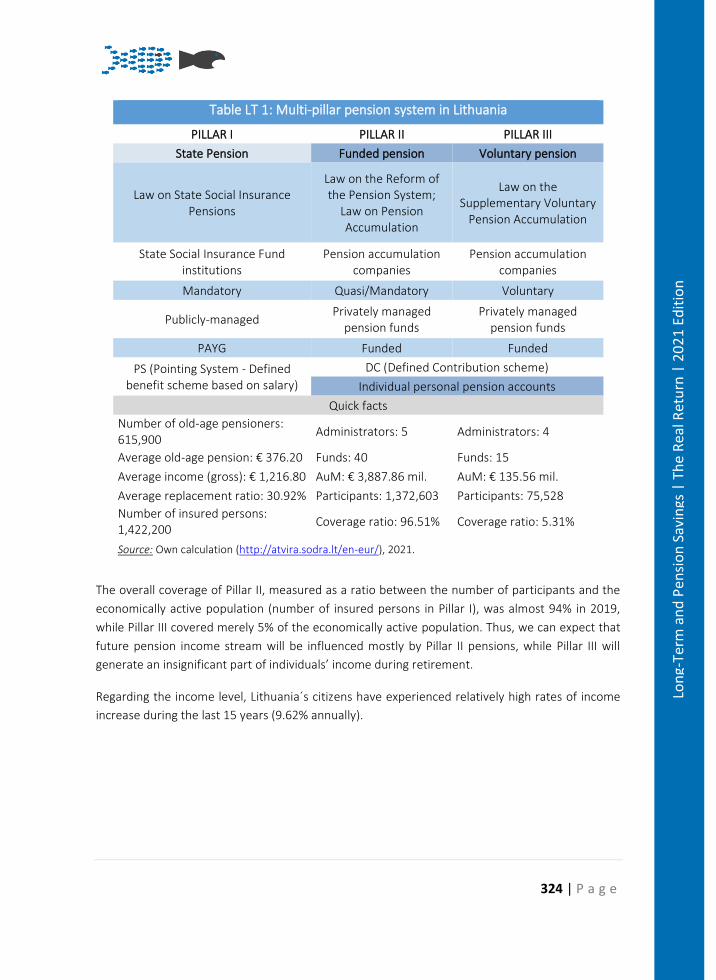
324 | P a g e
Lon
g-Te
rm a
nd
Pen
sio
n S
avin
gs |
Th
e R
eal R
etu
rn |
20
21
Edit
ion
Table LT 1: Multi-pillar pension system in Lithuania
PILLAR I PILLAR II PILLAR III
State Pension Funded pension Voluntary pension
Law on State Social Insurance Pensions
Law on the Reform of the Pension System;
Law on Pension Accumulation
Law on the Supplementary Voluntary
Pension Accumulation
State Social Insurance Fund institutions
Pension accumulation companies
Pension accumulation companies
Mandatory Quasi/Mandatory Voluntary
Publicly-managed Privately managed
pension funds Privately managed
pension funds
PAYG Funded Funded
PS (Pointing System - Defined benefit scheme based on salary)
DC (Defined Contribution scheme)
Individual personal pension accounts
Quick facts
Number of old-age pensioners: 615,900
Administrators: 5 Administrators: 4
Average old-age pension: € 376.20 Funds: 40 Funds: 15
Average income (gross): € 1,216.80 AuM: € 3,887.86 mil. AuM: € 135.56 mil.
Average replacement ratio: 30.92% Participants: 1,372,603 Participants: 75,528
Number of insured persons: 1,422,200
Coverage ratio: 96.51% Coverage ratio: 5.31%
Source: Own calculation (http://atvira.sodra.lt/en-eur/), 2021.
The overall coverage of Pillar II, measured as a ratio between the number of participants and the
economically active population (number of insured persons in Pillar I), was almost 94% in 2019,
while Pillar III covered merely 5% of the economically active population. Thus, we can expect that
future pension income stream will be influenced mostly by Pillar II pensions, while Pillar III will
generate an insignificant part of individuals’ income during retirement.
Regarding the income level, Lithuania´s citizens have experienced relatively high rates of income
increase during the last 15 years (9.62% annually).
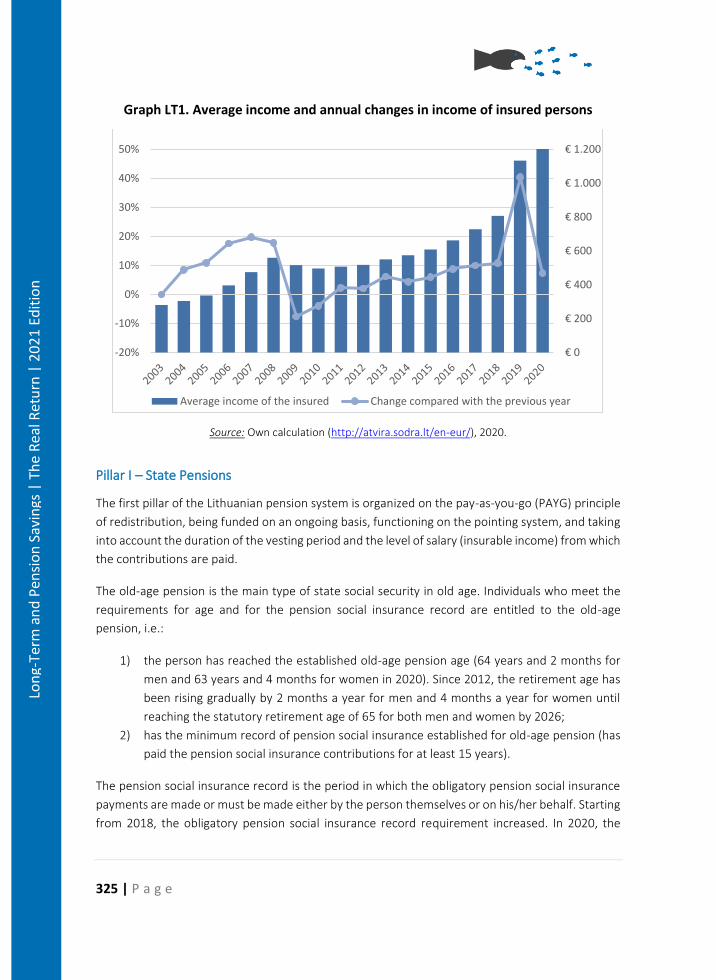
325 | P a g e
Lon
g-Te
rm a
nd
Pen
sio
n S
avin
gs |
Th
e R
eal R
etu
rn |
20
21
Edit
ion
Graph LT1. Average income and annual changes in income of insured persons
Source: Own calculation (http://atvira.sodra.lt/en-eur/), 2020.
Pillar I – State Pensions
The first pillar of the Lithuanian pension system is organized on the pay-as-you-go (PAYG) principle
of redistribution, being funded on an ongoing basis, functioning on the pointing system, and taking
into account the duration of the vesting period and the level of salary (insurable income) from which
the contributions are paid.
The old-age pension is the main type of state social security in old age. Individuals who meet the
requirements for age and for the pension social insurance record are entitled to the old-age
pension, i.e.:
1) the person has reached the established old-age pension age (64 years and 2 months for
men and 63 years and 4 months for women in 2020). Since 2012, the retirement age has
been rising gradually by 2 months a year for men and 4 months a year for women until
reaching the statutory retirement age of 65 for both men and women by 2026;
2) has the minimum record of pension social insurance established for old-age pension (has
paid the pension social insurance contributions for at least 15 years).
The pension social insurance record is the period in which the obligatory pension social insurance
payments are made or must be made either by the person themselves or on his/her behalf. Starting
from 2018, the obligatory pension social insurance record requirement increased. In 2020, the
€ 0
€ 200
€ 400
€ 600
€ 800
€ 1.000
€ 1.200
-20%
-10%
0%
10%
20%
30%
40%
50%
Average income of the insured Change compared with the previous year
326 | P a g e
Lon
g-Te
rm a
nd
Pen
sio
n S
avin
gs |
Th
e R
eal R
etu
rn |
20
21
Edit
ion
mandatory record is at least 31 years and 6 months and will be increased by 6 months every
subsequent year until it reaches 35 years in 2027.
A new version of the Law on Social Insurance Pensions came into force on 1 January 2018. The
pension system was reformed by changing the pension calculation structure, introducing pension
points and setting the indexation rules. A social insurance pension will consist of the general (GP)
and individual parts (IP). The old-age pension is equal to the sum of the general and the individual
parts of pension.
The general part (GP) of the old-age pension takes into account only the duration of insured period.
The general part (GP) of pension is calculated according to the formula:
𝐺𝑃 = 𝛽 × 𝐵
where:
β represents the ratio of the insurance record of the person and the obligatory insurance record
effective in the year of the pension entitlement (for example, if the obligatory insurance record
at year of retirement is 30 years and the person´s insurance record is 40 years, then the value
of β is 40/30 = 1.33333); and
B represents the basic pension (in euros).
The individual part of pension is based on pension point system. Pension points system for the
determination of the individual part of pension was introduced on 1 January 2018. Each insured
person will receive a certain number of pension points for the amount of pension social insurance
contributions paid during the year. If the amount of pension social insurance contributions
deducted from the person‘s income during the year for the individual part of pension is equal to
the amount of the annual pension contribution determined on the basis of the average pay (salary)
during the year, the person will acquire one pension point. A larger or a smaller amount paid will
result, accordingly, in a larger or smaller number of pension points. However, the total number of
pension points acquired during one year may not exceed 5. The pension points acquired will be
summed up and multiplied by the pension point value. The individual part of pension is calculated
according to the formula:
𝐼𝑃 = 𝑉 × 𝑝
where:
V is the number of pension points accumulated by the person during the entire working career;
p is the pension point value (in euros).
For example, if a person´s salary during the whole career (40 years) was equal to the average salary
in the economy (1 point), then the person can acquire 40 x 1 point = 40 points. If the value of one
327 | P a g e
Lon
g-Te
rm a
nd
Pen
sio
n S
avin
gs |
Th
e R
eal R
etu
rn |
20
21
Edit
ion
pension point at moment of retirement is, for example, €10, then the individual part of old-age
pension is: 40 x 10 = 400 Eur.
Old-age pensions are indexed every year. Starting from 1 January every year, the values of the basic
pension, the value of pension points and the basic amount of widows’/widowers’ pensions, used
for the granting and determining social insurance pensions, will be indexed based on the average
7-year wage fund growth rate.
The indexing coefficient (IC) is calculated on the basis of the change in the wage fund during the
past three years, the year for which the IC is being calculated, and three prospective years. The IC
is applied provided that, upon its application, the pension social insurance costs in the year of
indexation do not exceed social insurance revenues and the projected pension social insurance
costs for the next year do not start exceeding the social insurance revenues projected. If, without
indexation, the pension social insurance revenues in the year of indexation exceed the pension
social insurance costs, the IC is calculated in such a way that the pension social insurance expenses
for pension indexing would not exceed 75% of the pension social insurance contribution surplus
planned for the year of indexation in case if no indexation is performed.
Indexation of pensions will not be performed if the determined IC is smaller than 1.01 and/or if the
change in the gross domestic product at comparative prices and/or in the wage funds, expressed
in percentage terms, is negative in the year for which the IC is being calculated and/or for next
calendar year. If no indexation is performed, the values of December of previous year are applied.
In general, we can say that the Pillar I pensions will be subject to the automatic adjustment
mechanism ensuring the balance of the State Social Insurance fund over the longer period.
SoDra has launched the indicative retirement calculator, where an individual can assess his
projected old-age pension including the expected (projected) Pillar II savings. The calculator web
site (in Lithuanian language):
http://www.sodra.lt/lt/skaiciuokles/prognozuojamos_pensijos_skaiciuokle
Pillar II – Funded pensions
Lithuania´s private pensions system (Pillar II) is based on the World Bank’s multi-pillar model. Pillar
II pension scheme can be characterized as an accumulation of a redirected part of social insurance
contributions towards individual retirement accounts managed by private pension accumulation
companies offering and managing private pension funds. All persons with income, from which state
social insurance contributions are calculated on a mandatory basis to receive pension, and yet to
reach retirement age may become fund participants. The contribution to Pillar II pension funds
consists of three parts: a social-security contribution (currently paid to SoDra), salary contribution
and an additional pension contribution from the State Budget.
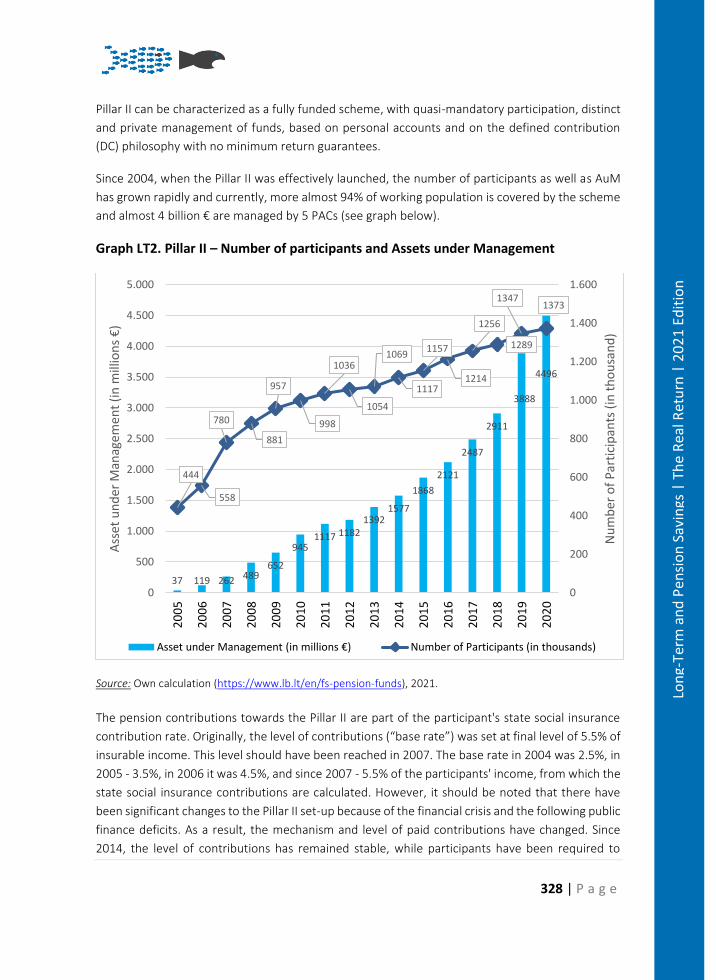
328 | P a g e
Lon
g-Te
rm a
nd
Pen
sio
n S
avin
gs |
Th
e R
eal R
etu
rn |
20
21
Edit
ion
Pillar II can be characterized as a fully funded scheme, with quasi-mandatory participation, distinct
and private management of funds, based on personal accounts and on the defined contribution
(DC) philosophy with no minimum return guarantees.
Since 2004, when the Pillar II was effectively launched, the number of participants as well as AuM
has grown rapidly and currently, more almost 94% of working population is covered by the scheme
and almost 4 billion € are managed by 5 PACs (see graph below).
Graph LT2. Pillar II – Number of participants and Assets under Management
Source: Own calculation (https://www.lb.lt/en/fs-pension-funds), 2021.
The pension contributions towards the Pillar II are part of the participant's state social insurance
contribution rate. Originally, the level of contributions (“base rate”) was set at final level of 5.5% of
insurable income. This level should have been reached in 2007. The base rate in 2004 was 2.5%, in
2005 - 3.5%, in 2006 it was 4.5%, and since 2007 - 5.5% of the participants' income, from which the
state social insurance contributions are calculated. However, it should be noted that there have
been significant changes to the Pillar II set-up because of the financial crisis and the following public
finance deficits. As a result, the mechanism and level of paid contributions have changed. Since
2014, the level of contributions has remained stable, while participants have been required to
37 119 262 489652
9451117 1182
13921577
1868
2121
2487
2911
3888
4496
444
558
780
881
957
998
1036
1054
1069
1117
1157
1214
1256
1289
13471373
0
200
400
600
800
1.000
1.200
1.400
1.600
0
500
1.000
1.500
2.000
2.500
3.000
3.500
4.000
4.500
5.000
20
05
20
06
20
07
20
08
20
09
20
10
20
11
20
12
20
13
20
14
20
15
20
16
20
17
20
18
20
19
20
20
Nu
mb
er o
f P
arti
cip
ants
(in
th
ou
san
d)
Ass
et u
nd
er M
anag
emen
t (i
n m
illio
ns
€)
Asset under Management (in millions €) Number of Participants (in thousands)
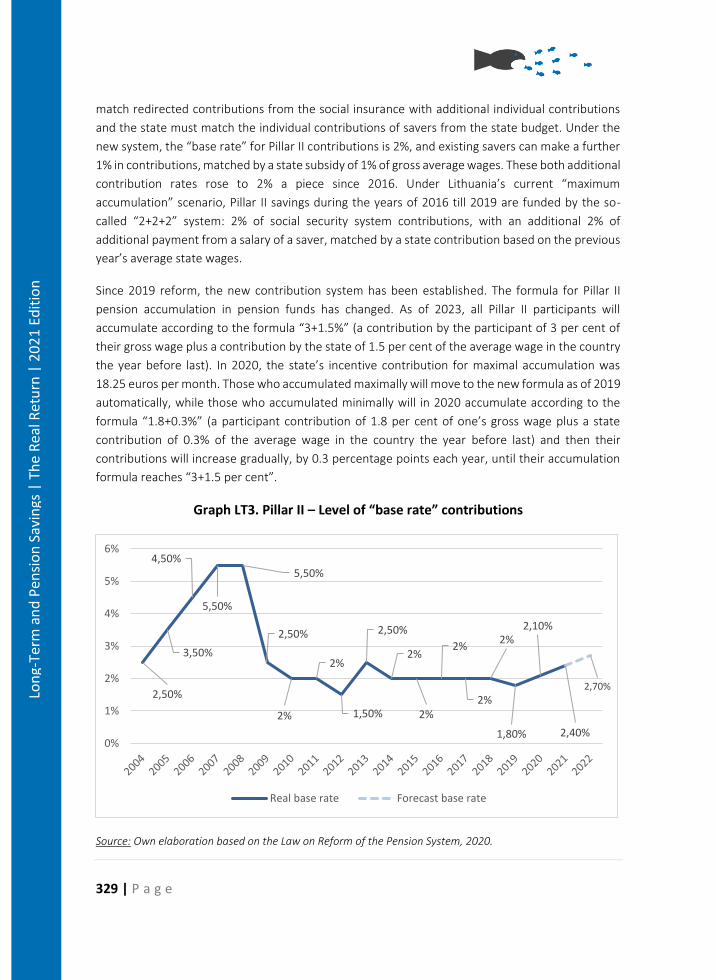
329 | P a g e
Lon
g-Te
rm a
nd
Pen
sio
n S
avin
gs |
Th
e R
eal R
etu
rn |
20
21
Edit
ion
match redirected contributions from the social insurance with additional individual contributions
and the state must match the individual contributions of savers from the state budget. Under the
new system, the “base rate” for Pillar II contributions is 2%, and existing savers can make a further
1% in contributions, matched by a state subsidy of 1% of gross average wages. These both additional
contribution rates rose to 2% a piece since 2016. Under Lithuania’s current “maximum
accumulation” scenario, Pillar II savings during the years of 2016 till 2019 are funded by the so-
called “2+2+2” system: 2% of social security system contributions, with an additional 2% of
additional payment from a salary of a saver, matched by a state contribution based on the previous
year’s average state wages.
Since 2019 reform, the new contribution system has been established. The formula for Pillar II
pension accumulation in pension funds has changed. As of 2023, all Pillar II participants will
accumulate according to the formula “3+1.5%” (a contribution by the participant of 3 per cent of
their gross wage plus a contribution by the state of 1.5 per cent of the average wage in the country
the year before last). In 2020, the state’s incentive contribution for maximal accumulation was
18.25 euros per month. Those who accumulated maximally will move to the new formula as of 2019
automatically, while those who accumulated minimally will in 2020 accumulate according to the
formula “1.8+0.3%” (a participant contribution of 1.8 per cent of one’s gross wage plus a state
contribution of 0.3% of the average wage in the country the year before last) and then their
contributions will increase gradually, by 0.3 percentage points each year, until their accumulation
formula reaches “3+1.5 per cent”.
Graph LT3. Pillar II – Level of “base rate” contributions
Source: Own elaboration based on the Law on Reform of the Pension System, 2020.
2,50%
3,50%
4,50%
5,50%
5,50%
2,50%
2%
2%
1,50%
2,50%
2%
2%
2%
2%
2%
1,80%
2,10%
2,40%
2,70%
0%
1%
2%
3%
4%
5%
6%
Real base rate Forecast base rate
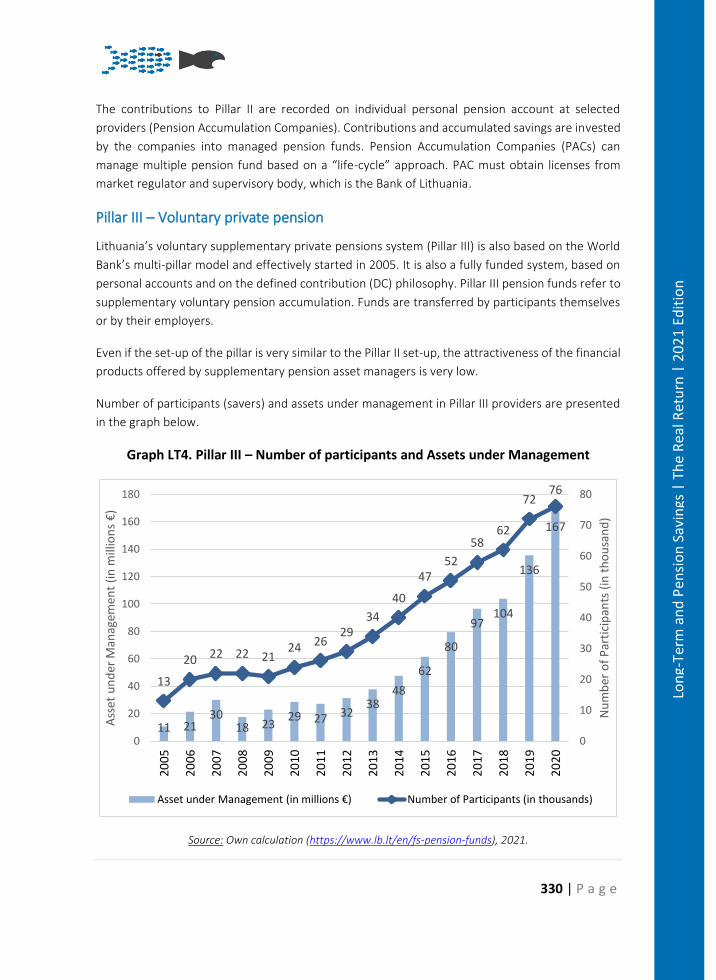
330 | P a g e
Lon
g-Te
rm a
nd
Pen
sio
n S
avin
gs |
Th
e R
eal R
etu
rn |
20
21
Edit
ion
The contributions to Pillar II are recorded on individual personal pension account at selected
providers (Pension Accumulation Companies). Contributions and accumulated savings are invested
by the companies into managed pension funds. Pension Accumulation Companies (PACs) can
manage multiple pension fund based on a “life-cycle” approach. PAC must obtain licenses from
market regulator and supervisory body, which is the Bank of Lithuania.
Pillar III – Voluntary private pension
Lithuania’s voluntary supplementary private pensions system (Pillar III) is also based on the World
Bank’s multi-pillar model and effectively started in 2005. It is also a fully funded system, based on
personal accounts and on the defined contribution (DC) philosophy. Pillar III pension funds refer to
supplementary voluntary pension accumulation. Funds are transferred by participants themselves
or by their employers.
Even if the set-up of the pillar is very similar to the Pillar II set-up, the attractiveness of the financial
products offered by supplementary pension asset managers is very low.
Number of participants (savers) and assets under management in Pillar III providers are presented
in the graph below.
Graph LT4. Pillar III – Number of participants and Assets under Management
Source: Own calculation (https://www.lb.lt/en/fs-pension-funds), 2021.
11 2130
18 2329 27 32
3848
62
80
97104
136
167
13
20 22 22 2124 26
2934
40
4752
5862
7276
0
10
20
30
40
50
60
70
80
0
20
40
60
80
100
120
140
160
180
20
05
20
06
20
07
20
08
20
09
20
10
20
11
20
12
20
13
20
14
20
15
20
16
20
17
20
18
20
19
20
20
Nu
mb
er o
f P
arti
cip
ants
(in
th
ou
san
d)
Ass
et u
nd
er M
anag
emen
t (i
n m
illio
ns
€)
Asset under Management (in millions €) Number of Participants (in thousands)
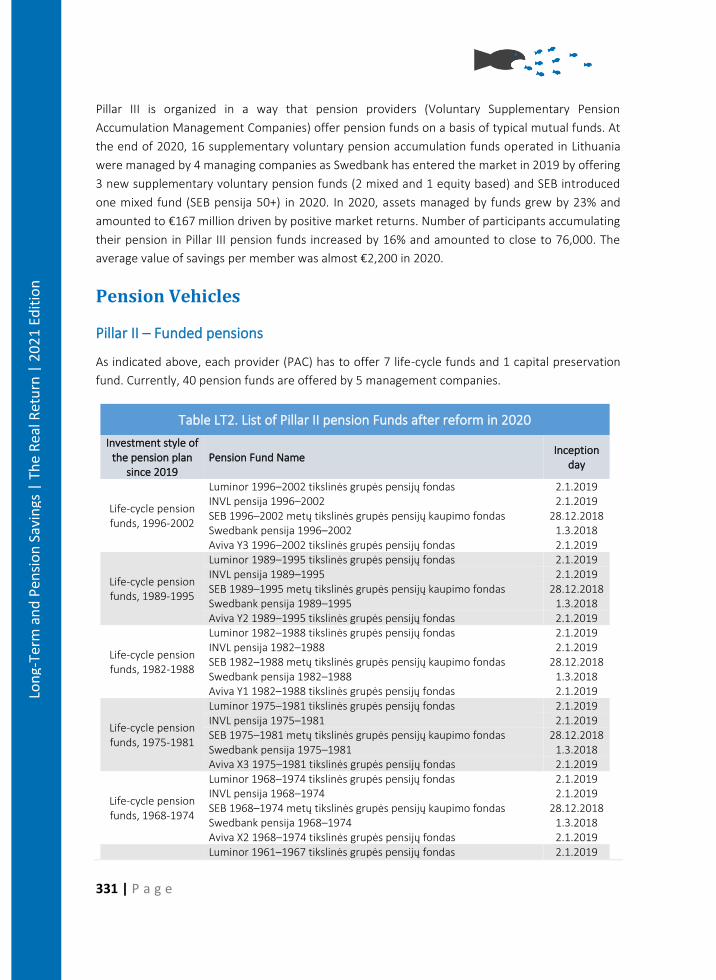
331 | P a g e
Lon
g-Te
rm a
nd
Pen
sio
n S
avin
gs |
Th
e R
eal R
etu
rn |
20
21
Edit
ion
Pillar III is organized in a way that pension providers (Voluntary Supplementary Pension
Accumulation Management Companies) offer pension funds on a basis of typical mutual funds. At
the end of 2020, 16 supplementary voluntary pension accumulation funds operated in Lithuania
were managed by 4 managing companies as Swedbank has entered the market in 2019 by offering
3 new supplementary voluntary pension funds (2 mixed and 1 equity based) and SEB introduced
one mixed fund (SEB pensija 50+) in 2020. In 2020, assets managed by funds grew by 23% and
amounted to €167 million driven by positive market returns. Number of participants accumulating
their pension in Pillar III pension funds increased by 16% and amounted to close to 76,000. The
average value of savings per member was almost €2,200 in 2020.
Pension Vehicles
Pillar II – Funded pensions
As indicated above, each provider (PAC) has to offer 7 life-cycle funds and 1 capital preservation
fund. Currently, 40 pension funds are offered by 5 management companies.
Table LT2. List of Pillar II pension Funds after reform in 2020
Investment style of the pension plan
since 2019 Pension Fund Name
Inception day
Life-cycle pension funds, 1996-2002
Luminor 1996–2002 tikslinės grupės pensijų fondas 2.1.2019 INVL pensija 1996–2002 2.1.2019 SEB 1996–2002 metų tikslinės grupės pensijų kaupimo fondas 28.12.2018 Swedbank pensija 1996–2002 1.3.2018 Aviva Y3 1996–2002 tikslinės grupės pensijų fondas 2.1.2019
Life-cycle pension funds, 1989-1995
Luminor 1989–1995 tikslinės grupės pensijų fondas 2.1.2019 INVL pensija 1989–1995 2.1.2019 SEB 1989–1995 metų tikslinės grupės pensijų kaupimo fondas 28.12.2018 Swedbank pensija 1989–1995 1.3.2018 Aviva Y2 1989–1995 tikslinės grupės pensijų fondas 2.1.2019
Life-cycle pension funds, 1982-1988
Luminor 1982–1988 tikslinės grupės pensijų fondas 2.1.2019 INVL pensija 1982–1988 2.1.2019 SEB 1982–1988 metų tikslinės grupės pensijų kaupimo fondas 28.12.2018 Swedbank pensija 1982–1988 1.3.2018 Aviva Y1 1982–1988 tikslinės grupės pensijų fondas 2.1.2019
Life-cycle pension funds, 1975-1981
Luminor 1975–1981 tikslinės grupės pensijų fondas 2.1.2019 INVL pensija 1975–1981 2.1.2019 SEB 1975–1981 metų tikslinės grupės pensijų kaupimo fondas 28.12.2018 Swedbank pensija 1975–1981 1.3.2018 Aviva X3 1975–1981 tikslinės grupės pensijų fondas 2.1.2019
Life-cycle pension funds, 1968-1974
Luminor 1968–1974 tikslinės grupės pensijų fondas 2.1.2019 INVL pensija 1968–1974 2.1.2019 SEB 1968–1974 metų tikslinės grupės pensijų kaupimo fondas 28.12.2018 Swedbank pensija 1968–1974 1.3.2018 Aviva X2 1968–1974 tikslinės grupės pensijų fondas 2.1.2019 Luminor 1961–1967 tikslinės grupės pensijų fondas 2.1.2019
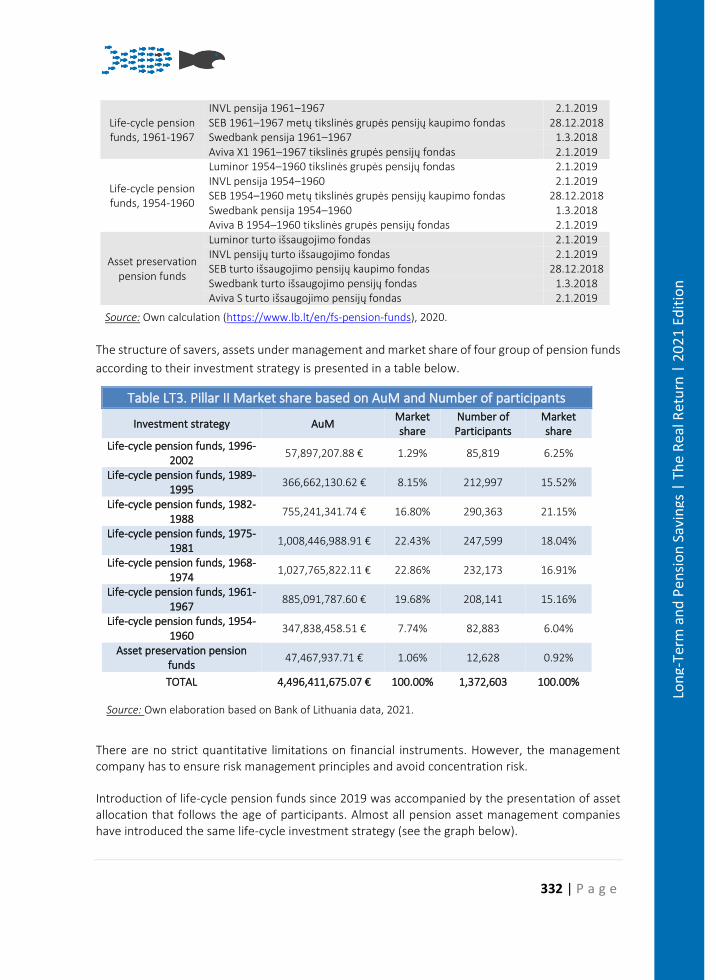
332 | P a g e
Lon
g-Te
rm a
nd
Pen
sio
n S
avin
gs |
Th
e R
eal R
etu
rn |
20
21
Edit
ion
Life-cycle pension funds, 1961-1967
INVL pensija 1961–1967 2.1.2019 SEB 1961–1967 metų tikslinės grupės pensijų kaupimo fondas 28.12.2018 Swedbank pensija 1961–1967 1.3.2018 Aviva X1 1961–1967 tikslinės grupės pensijų fondas 2.1.2019
Life-cycle pension funds, 1954-1960
Luminor 1954–1960 tikslinės grupės pensijų fondas 2.1.2019 INVL pensija 1954–1960 2.1.2019 SEB 1954–1960 metų tikslinės grupės pensijų kaupimo fondas 28.12.2018 Swedbank pensija 1954–1960 1.3.2018 Aviva B 1954–1960 tikslinės grupės pensijų fondas 2.1.2019
Asset preservation pension funds
Luminor turto išsaugojimo fondas 2.1.2019 INVL pensijų turto išsaugojimo fondas 2.1.2019 SEB turto išsaugojimo pensijų kaupimo fondas 28.12.2018 Swedbank turto išsaugojimo pensijų fondas 1.3.2018 Aviva S turto išsaugojimo pensijų fondas 2.1.2019
Source: Own calculation (https://www.lb.lt/en/fs-pension-funds), 2020.
The structure of savers, assets under management and market share of four group of pension funds
according to their investment strategy is presented in a table below.
Table LT3. Pillar II Market share based on AuM and Number of participants
Investment strategy AuM Market share
Number of Participants
Market share
Life-cycle pension funds, 1996-2002
57,897,207.88 € 1.29% 85,819 6.25%
Life-cycle pension funds, 1989-1995
366,662,130.62 € 8.15% 212,997 15.52%
Life-cycle pension funds, 1982-1988
755,241,341.74 € 16.80% 290,363 21.15%
Life-cycle pension funds, 1975-1981
1,008,446,988.91 € 22.43% 247,599 18.04%
Life-cycle pension funds, 1968-1974
1,027,765,822.11 € 22.86% 232,173 16.91%
Life-cycle pension funds, 1961-1967
885,091,787.60 € 19.68% 208,141 15.16%
Life-cycle pension funds, 1954-1960
347,838,458.51 € 7.74% 82,883 6.04%
Asset preservation pension funds
47,467,937.71 € 1.06% 12,628 0.92%
TOTAL 4,496,411,675.07 € 100.00% 1,372,603 100.00%
Source: Own elaboration based on Bank of Lithuania data, 2021.
There are no strict quantitative limitations on financial instruments. However, the management company has to ensure risk management principles and avoid concentration risk.
Introduction of life-cycle pension funds since 2019 was accompanied by the presentation of asset allocation that follows the age of participants. Almost all pension asset management companies have introduced the same life-cycle investment strategy (see the graph below).
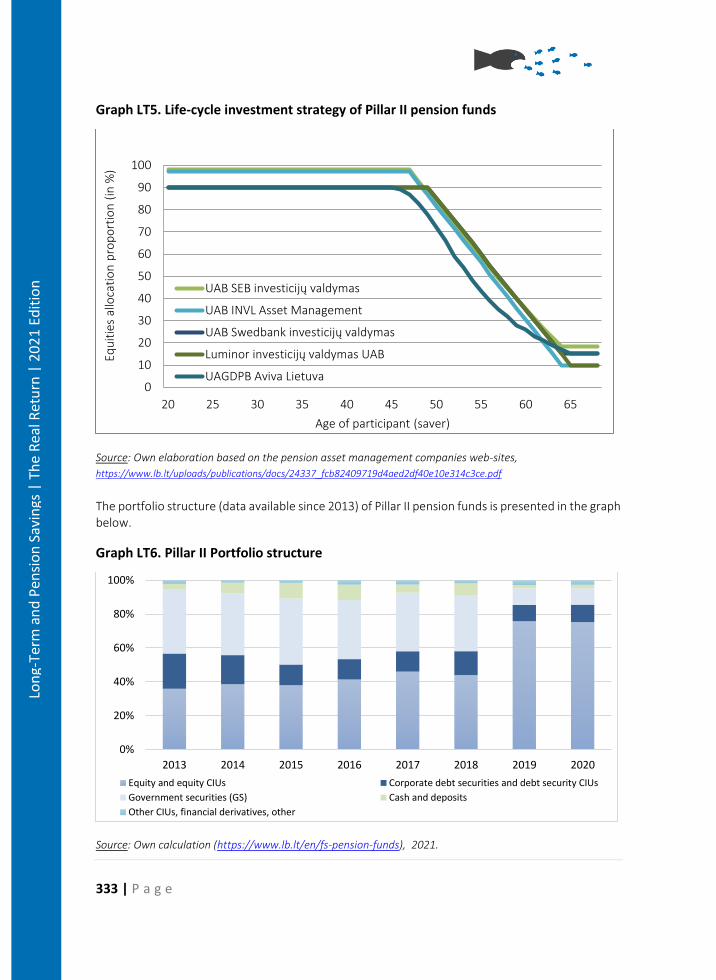
333 | P a g e
Lon
g-Te
rm a
nd
Pen
sio
n S
avin
gs |
Th
e R
eal R
etu
rn |
20
21
Edit
ion
Graph LT5. Life-cycle investment strategy of Pillar II pension funds
Source: Own elaboration based on the pension asset management companies web-sites,
https://www.lb.lt/uploads/publications/docs/24337_fcb82409719d4aed2df40e10e314c3ce.pdf
The portfolio structure (data available since 2013) of Pillar II pension funds is presented in the graph below.
Graph LT6. Pillar II Portfolio structure
Source: Own calculation (https://www.lb.lt/en/fs-pension-funds), 2021.
0
10
20
30
40
50
60
70
80
90
100
20 25 30 35 40 45 50 55 60 65
Equ
itie
s al
loca
tio
n p
rop
ort
ion
(in
%)
Age of participant (saver)
UAB SEB investicijų valdymas
UAB INVL Asset Management
UAB Swedbank investicijų valdymas
Luminor investicijų valdymas UAB
UAGDPB Aviva Lietuva
0%
20%
40%
60%
80%
100%
2013 2014 2015 2016 2017 2018 2019 2020
Equity and equity CIUs Corporate debt securities and debt security CIUs
Government securities (GS) Cash and deposits
Other CIUs, financial derivatives, other
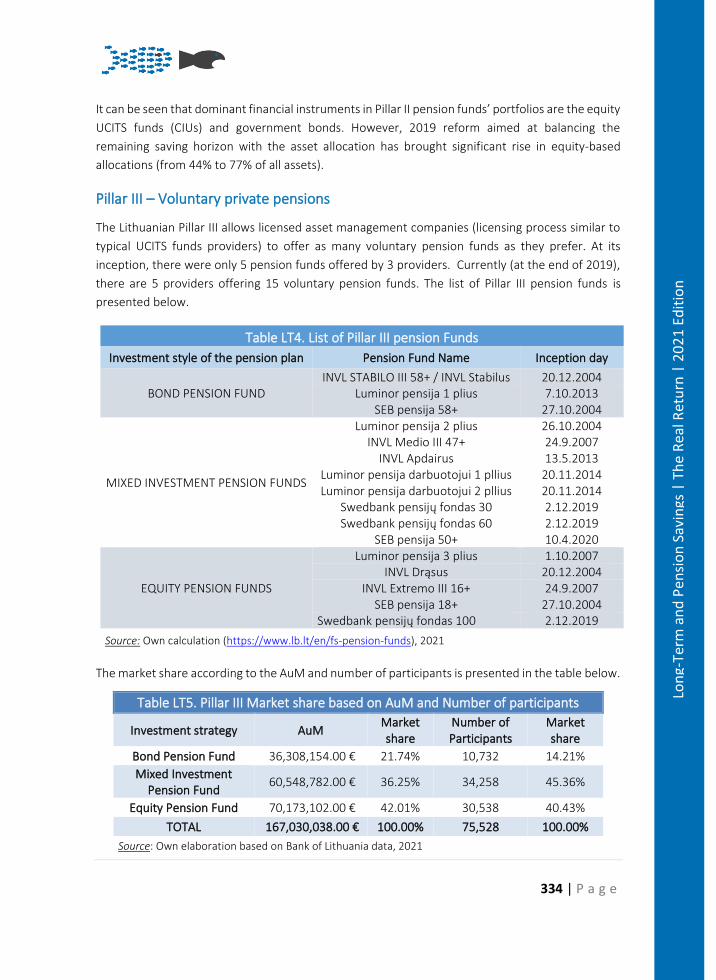
334 | P a g e
Lon
g-Te
rm a
nd
Pen
sio
n S
avin
gs |
Th
e R
eal R
etu
rn |
20
21
Edit
ion
It can be seen that dominant financial instruments in Pillar II pension funds’ portfolios are the equity
UCITS funds (CIUs) and government bonds. However, 2019 reform aimed at balancing the
remaining saving horizon with the asset allocation has brought significant rise in equity-based
allocations (from 44% to 77% of all assets).
Pillar III – Voluntary private pensions
The Lithuanian Pillar III allows licensed asset management companies (licensing process similar to
typical UCITS funds providers) to offer as many voluntary pension funds as they prefer. At its
inception, there were only 5 pension funds offered by 3 providers. Currently (at the end of 2019),
there are 5 providers offering 15 voluntary pension funds. The list of Pillar III pension funds is
presented below.
Table LT4. List of Pillar III pension Funds
Investment style of the pension plan Pension Fund Name Inception day
BOND PENSION FUND INVL STABILO III 58+ / INVL Stabilus 20.12.2004
Luminor pensija 1 plius 7.10.2013 SEB pensija 58+ 27.10.2004
MIXED INVESTMENT PENSION FUNDS
Luminor pensija 2 plius 26.10.2004 INVL Medio III 47+ 24.9.2007
INVL Apdairus 13.5.2013 Luminor pensija darbuotojui 1 pllius 20.11.2014 Luminor pensija darbuotojui 2 pllius 20.11.2014
Swedbank pensijų fondas 30 2.12.2019 Swedbank pensijų fondas 60 2.12.2019
SEB pensija 50+ 10.4.2020
EQUITY PENSION FUNDS
Luminor pensija 3 plius 1.10.2007 INVL Drąsus 20.12.2004
INVL Extremo III 16+ 24.9.2007 SEB pensija 18+ 27.10.2004
Swedbank pensijų fondas 100 2.12.2019
Source: Own calculation (https://www.lb.lt/en/fs-pension-funds), 2021
The market share according to the AuM and number of participants is presented in the table below.
Table LT5. Pillar III Market share based on AuM and Number of participants
Investment strategy AuM Market share
Number of Participants
Market share
Bond Pension Fund 36,308,154.00 € 21.74% 10,732 14.21%
Mixed Investment Pension Fund
60,548,782.00 € 36.25% 34,258 45.36%
Equity Pension Fund 70,173,102.00 € 42.01% 30,538 40.43%
TOTAL 167,030,038.00 € 100.00% 75,528 100.00%
Source: Own elaboration based on Bank of Lithuania data, 2021
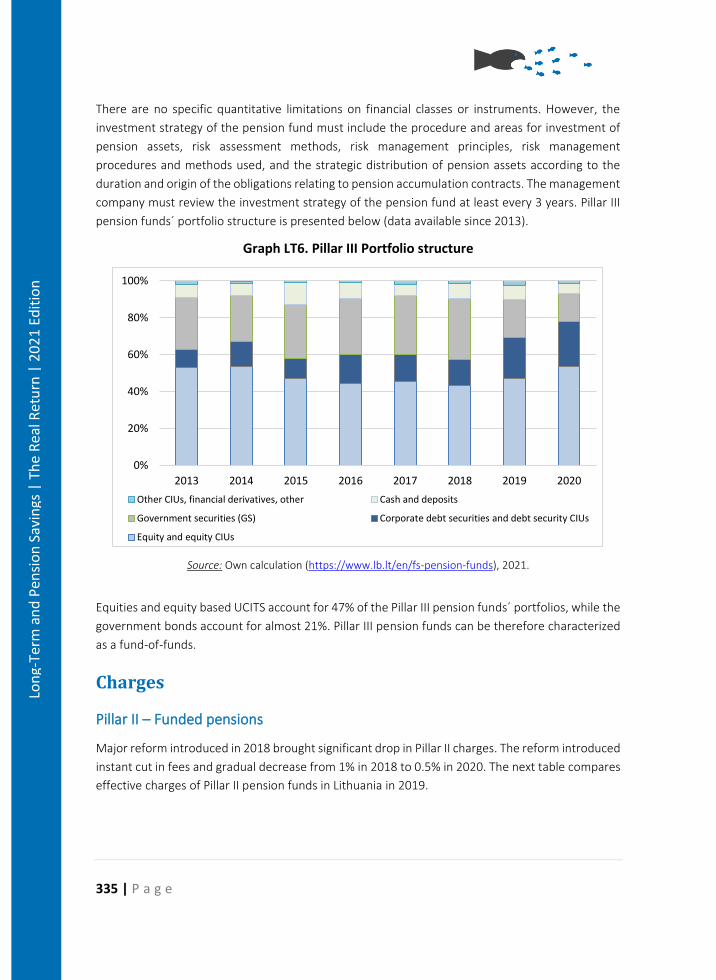
335 | P a g e
Lon
g-Te
rm a
nd
Pen
sio
n S
avin
gs |
Th
e R
eal R
etu
rn |
20
21
Edit
ion
There are no specific quantitative limitations on financial classes or instruments. However, the
investment strategy of the pension fund must include the procedure and areas for investment of
pension assets, risk assessment methods, risk management principles, risk management
procedures and methods used, and the strategic distribution of pension assets according to the
duration and origin of the obligations relating to pension accumulation contracts. The management
company must review the investment strategy of the pension fund at least every 3 years. Pillar III
pension funds´ portfolio structure is presented below (data available since 2013).
Graph LT6. Pillar III Portfolio structure
Source: Own calculation (https://www.lb.lt/en/fs-pension-funds), 2021.
Equities and equity based UCITS account for 47% of the Pillar III pension funds´ portfolios, while the
government bonds account for almost 21%. Pillar III pension funds can be therefore characterized
as a fund-of-funds.
Charges
Pillar II – Funded pensions
Major reform introduced in 2018 brought significant drop in Pillar II charges. The reform introduced
instant cut in fees and gradual decrease from 1% in 2018 to 0.5% in 2020. The next table compares
effective charges of Pillar II pension funds in Lithuania in 2019.
0%
20%
40%
60%
80%
100%
2013 2014 2015 2016 2017 2018 2019 2020
Other CIUs, financial derivatives, other Cash and deposits
Government securities (GS) Corporate debt securities and debt security CIUs
Equity and equity CIUs
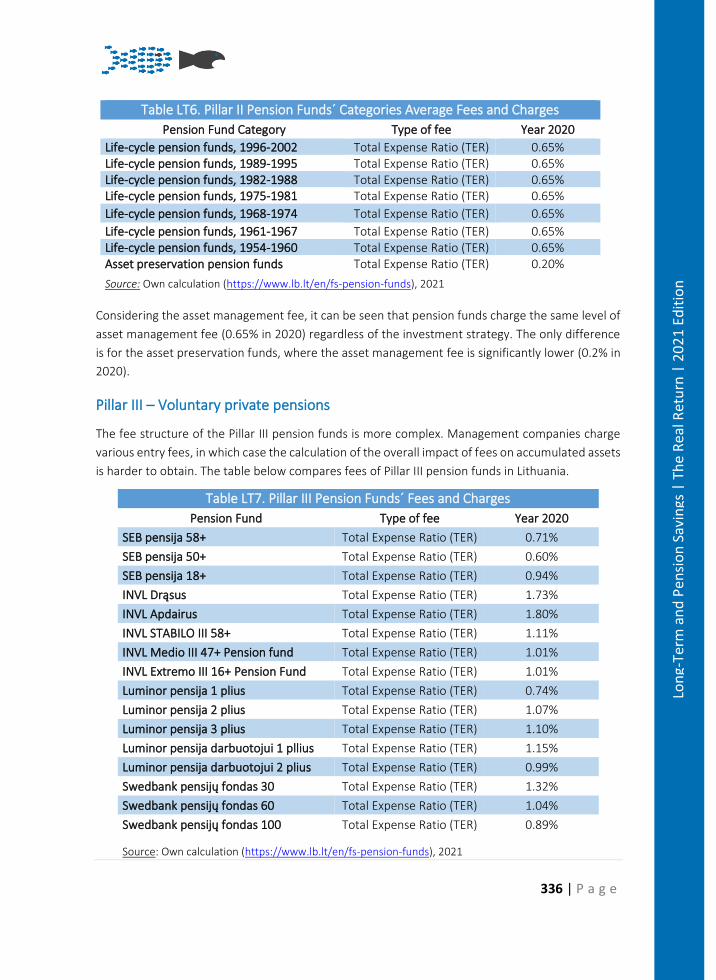
336 | P a g e
Lon
g-Te
rm a
nd
Pen
sio
n S
avin
gs |
Th
e R
eal R
etu
rn |
20
21
Edit
ion
Table LT6. Pillar II Pension Funds´ Categories Average Fees and Charges
Pension Fund Category Type of fee Year 2020
Life-cycle pension funds, 1996-2002 Total Expense Ratio (TER) 0.65% Life-cycle pension funds, 1989-1995 Total Expense Ratio (TER) 0.65% Life-cycle pension funds, 1982-1988 Total Expense Ratio (TER) 0.65% Life-cycle pension funds, 1975-1981 Total Expense Ratio (TER) 0.65%
Life-cycle pension funds, 1968-1974 Total Expense Ratio (TER) 0.65%
Life-cycle pension funds, 1961-1967 Total Expense Ratio (TER) 0.65% Life-cycle pension funds, 1954-1960 Total Expense Ratio (TER) 0.65% Asset preservation pension funds Total Expense Ratio (TER) 0.20%
Source: Own calculation (https://www.lb.lt/en/fs-pension-funds), 2021
Considering the asset management fee, it can be seen that pension funds charge the same level of
asset management fee (0.65% in 2020) regardless of the investment strategy. The only difference
is for the asset preservation funds, where the asset management fee is significantly lower (0.2% in
2020).
Pillar III – Voluntary private pensions
The fee structure of the Pillar III pension funds is more complex. Management companies charge
various entry fees, in which case the calculation of the overall impact of fees on accumulated assets
is harder to obtain. The table below compares fees of Pillar III pension funds in Lithuania.
Table LT7. Pillar III Pension Funds´ Fees and Charges
Pension Fund Type of fee Year 2020
SEB pensija 58+ Total Expense Ratio (TER) 0.71%
SEB pensija 50+ Total Expense Ratio (TER) 0.60%
SEB pensija 18+ Total Expense Ratio (TER) 0.94%
INVL Drąsus Total Expense Ratio (TER) 1.73%
INVL Apdairus Total Expense Ratio (TER) 1.80%
INVL STABILO III 58+ Total Expense Ratio (TER) 1.11%
INVL Medio III 47+ Pension fund Total Expense Ratio (TER) 1.01%
INVL Extremo III 16+ Pension Fund Total Expense Ratio (TER) 1.01%
Luminor pensija 1 plius Total Expense Ratio (TER) 0.74%
Luminor pensija 2 plius Total Expense Ratio (TER) 1.07%
Luminor pensija 3 plius Total Expense Ratio (TER) 1.10%
Luminor pensija darbuotojui 1 pllius Total Expense Ratio (TER) 1.15%
Luminor pensija darbuotojui 2 plius Total Expense Ratio (TER) 0.99%
Swedbank pensijų fondas 30 Total Expense Ratio (TER) 1.32%
Swedbank pensijų fondas 60 Total Expense Ratio (TER) 1.04%
Swedbank pensijų fondas 100 Total Expense Ratio (TER) 0.89%
Source: Own calculation (https://www.lb.lt/en/fs-pension-funds), 2021
337 | P a g e
Lon
g-Te
rm a
nd
Pen
sio
n S
avin
gs |
Th
e R
eal R
etu
rn |
20
21
Edit
ion
* During the first 12 months after becoming a Participant, a 30% entry fee applies to pension contributions,
with the total fee not to exceed € 200 during the period. This fee applies only to new Participants whose
agreements took effect after the fee’s introduction was announced on the website www.invl.com, and to
Participants who have switched from a pension fund managed by another management company. The entry
fee does not apply to Participants who have switched from one of the Management Company’s other pension
funds
In most cases, additional costs, that are charged on the pension fund´s account and not directly
visible to the savers are the audit fees and custodian (depository) fees. On average, they account
for 0.25%, and 0.055% respectively.
Comparing the Pillar II and Pillar III pension funds´ fees, it is obvious, that even if the management
and investment strategies are very similar, the fee structure and overall level of fees in Pillar III is
more than double the fees in Pillar II.
Taxation
Pillar II – Funded pensions
Lithuania applies an “EEE” regime for the taxation of Pillar II pension accounts. Employee
contributions are tax-deductible even if they are higher than required (3+1.5%). Investment income
on the level of the pension fund is tax-exempt. Pension benefits paid out during retirement are tax-
exempt from a personal income tax as the old-age income is considered as a part of social system.
Pillar III – Voluntary private pensions
A similar tax regime is applied on the Pillar III savings, but there are some ceilings on contributions
and withdrawals.
Regarding the contribution phase, there is a tax-refund policy, which means that the contributions
of up to 25% of gross earnings, the income tax (15%) is returned. Therefore, we can conclude that
the contribution phase is a “E” regime.
Positive returns on accumulated savings are tax-exempt, so the investment phase is a “E” regime.
Regarding the withdrawal (pay-out) phase, pension benefits paid from Pillar III voluntary funds can
be received at any age and are levied with 15% income tax, but become tax-free if a person:
1) holds savings in a pillar III pension fund for at least 5 years and reaches the age of 55 at
the time of payment of the benefit (and the pension savings agreement was concluded
before 31 December 2012); or
338 | P a g e
Lon
g-Te
rm a
nd
Pen
sio
n S
avin
gs |
Th
e R
eal R
etu
rn |
20
21
Edit
ion
2) holds savings in a pillar III pension fund for at least 5 years and reaches the age which is
five years earlier than the threshold for the old-age pension at the time of payment of the
benefit (if the pension savings agreement was concluded after 1 January 2013).
Under the optimum set-up, the “EEE” tax regime can be achieved on Pillar III savings.
Pension Returns
Pillar II – Funded pensions
Pension returns of Pillar II pension funds differ according to the life-cycle investment strategy
applied. As the major changes in Pillar II do not allow for direct historical comparison of returns, we
present the returns for the year 2019 only where the returns of offered life-cycle funds are
compared.
Table LT8. Pillar II Pension Funds´ Categories Nominal returns
Pension Fund Category Year 2019 Year 2020
Life-cycle pension funds, 1996-2002 22.68% 6.16%
Life-cycle pension funds, 1989-1995 22.39% 6.24%
Life-cycle pension funds, 1982-1988 22.31% 6.27%
Life-cycle pension funds, 1975-1981 22.86% 6.20%
Life-cycle pension funds, 1968-1974 21.77% 5.69%
Life-cycle pension funds, 1961-1967 14.97% 4.72%
Life-cycle pension funds, 1954-1960 7.99% 2.65%
Asset preservation pension funds 6.19% 2.78%
Source: Own calculation (https://www.lb.lt/en/fs-pension-funds), 2021
When inspecting particular pension funds within each group, only minor changes in performance
were observed in 2019 as well as 2020. Nominal as well as real returns of Pillar II pension funds in
Lithuania are presented in a summary table below.
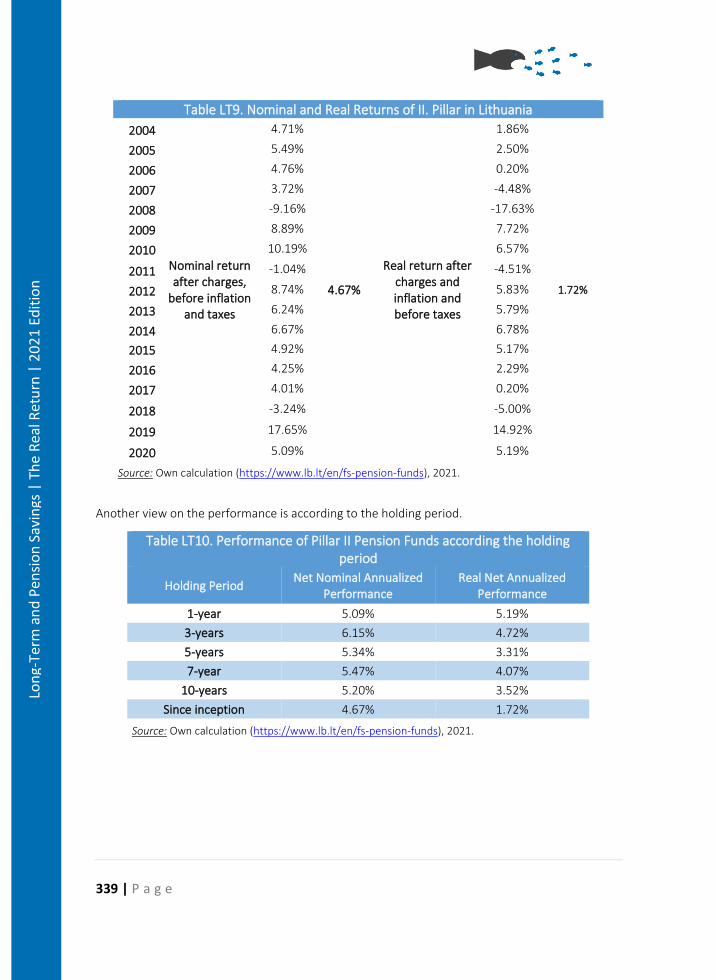
339 | P a g e
Lon
g-Te
rm a
nd
Pen
sio
n S
avin
gs |
Th
e R
eal R
etu
rn |
20
21
Edit
ion
Table LT9. Nominal and Real Returns of II. Pillar in Lithuania
2004
Nominal return after charges,
before inflation and taxes
4.71%
4.67%
Real return after charges and inflation and before taxes
1.86%
1.72%
2005 5.49% 2.50%
2006 4.76% 0.20%
2007 3.72% -4.48%
2008 -9.16% -17.63%
2009 8.89% 7.72%
2010 10.19% 6.57%
2011 -1.04% -4.51%
2012 8.74% 5.83%
2013 6.24% 5.79%
2014 6.67% 6.78%
2015 4.92% 5.17%
2016 4.25% 2.29%
2017 4.01% 0.20%
2018 -3.24% -5.00%
2019 17.65% 14.92%
2020 5.09% 5.19%
Source: Own calculation (https://www.lb.lt/en/fs-pension-funds), 2021.
Another view on the performance is according to the holding period.
Table LT10. Performance of Pillar II Pension Funds according the holding period
Holding Period Net Nominal Annualized
Performance Real Net Annualized
Performance
1-year 5.09% 5.19%
3-years 6.15% 4.72%
5-years 5.34% 3.31%
7-year 5.47% 4.07%
10-years 5.20% 3.52%
Since inception 4.67% 1.72%
Source: Own calculation (https://www.lb.lt/en/fs-pension-funds), 2021.
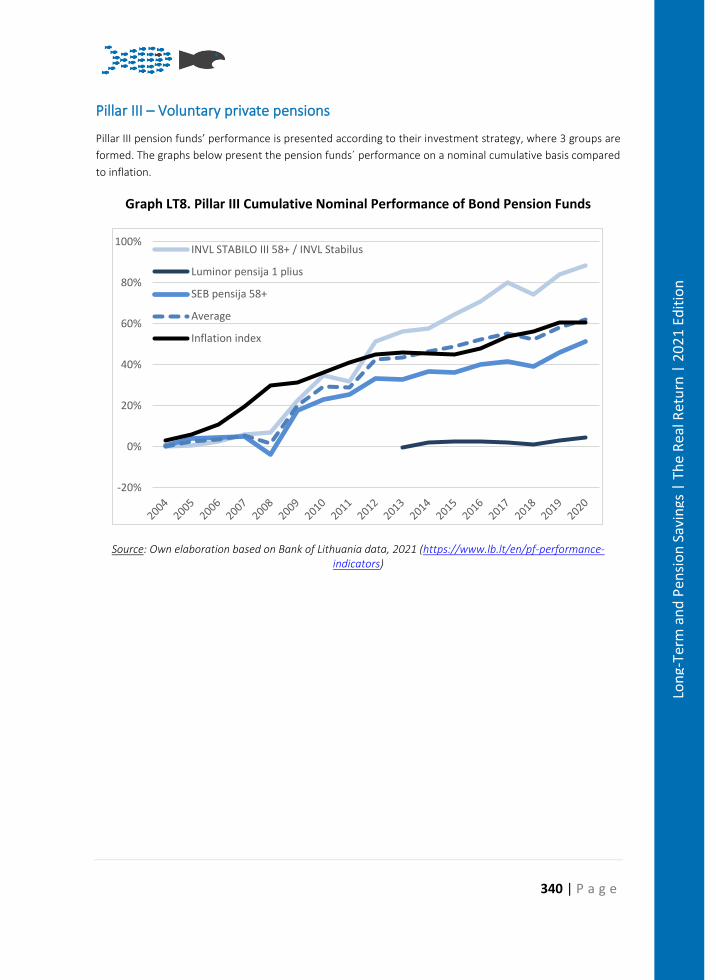
340 | P a g e
Lon
g-Te
rm a
nd
Pen
sio
n S
avin
gs |
Th
e R
eal R
etu
rn |
20
21
Edit
ion
Pillar III – Voluntary private pensions
Pillar III pension funds’ performance is presented according to their investment strategy, where 3 groups are
formed. The graphs below present the pension funds´ performance on a nominal cumulative basis compared
to inflation.
Graph LT8. Pillar III Cumulative Nominal Performance of Bond Pension Funds
Source: Own elaboration based on Bank of Lithuania data, 2021 (https://www.lb.lt/en/pf-performance-indicators)
-20%
0%
20%
40%
60%
80%
100%INVL STABILO III 58+ / INVL Stabilus
Luminor pensija 1 plius
SEB pensija 58+
Average
Inflation index
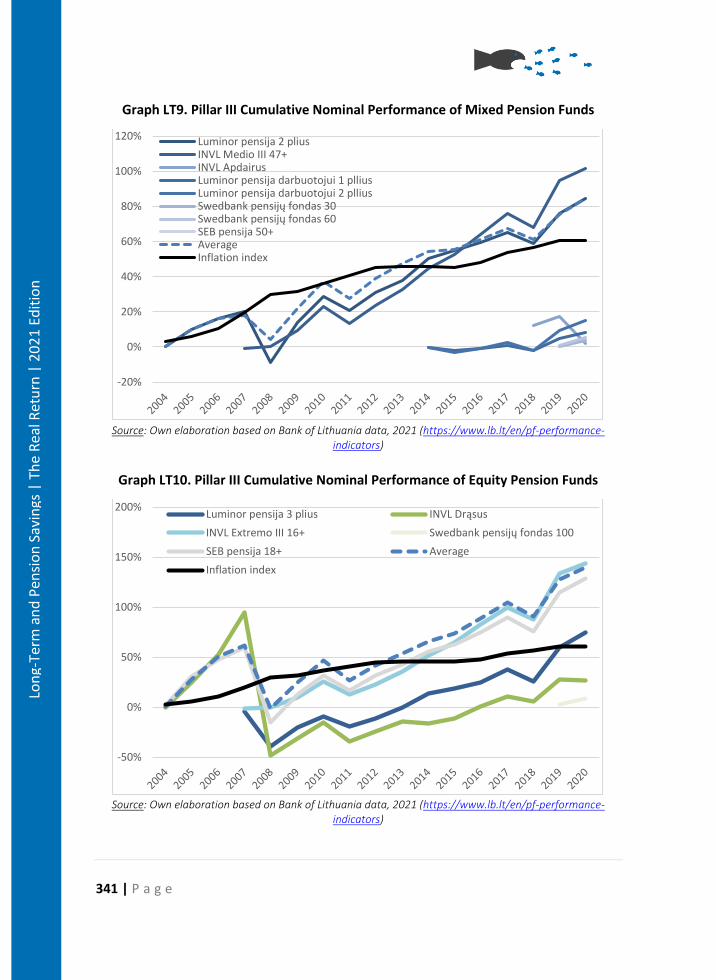
341 | P a g e
Lon
g-Te
rm a
nd
Pen
sio
n S
avin
gs |
Th
e R
eal R
etu
rn |
20
21
Edit
ion
Graph LT9. Pillar III Cumulative Nominal Performance of Mixed Pension Funds
Source: Own elaboration based on Bank of Lithuania data, 2021 (https://www.lb.lt/en/pf-performance-
indicators)
Graph LT10. Pillar III Cumulative Nominal Performance of Equity Pension Funds
Source: Own elaboration based on Bank of Lithuania data, 2021 (https://www.lb.lt/en/pf-performance-
indicators)
-20%
0%
20%
40%
60%
80%
100%
120% Luminor pensija 2 pliusINVL Medio III 47+INVL ApdairusLuminor pensija darbuotojui 1 plliusLuminor pensija darbuotojui 2 plliusSwedbank pensijų fondas 30Swedbank pensijų fondas 60SEB pensija 50+AverageInflation index
-50%
0%
50%
100%
150%
200%Luminor pensija 3 plius INVL Drąsus
INVL Extremo III 16+ Swedbank pensijų fondas 100
SEB pensija 18+ Average
Inflation index
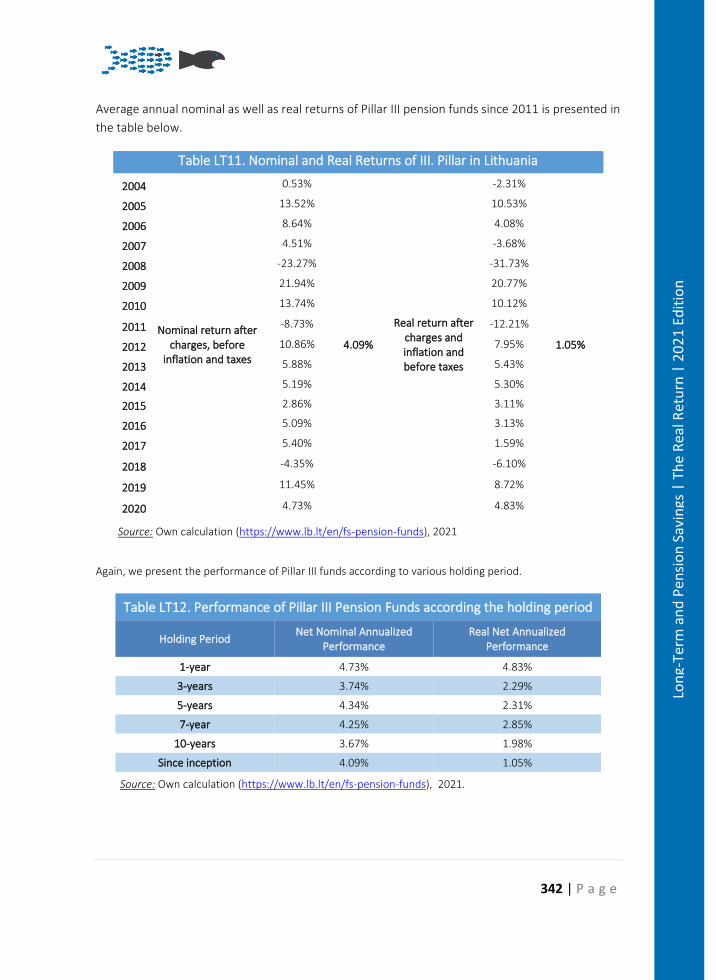
342 | P a g e
Lon
g-Te
rm a
nd
Pen
sio
n S
avin
gs |
Th
e R
eal R
etu
rn |
20
21
Edit
ion
Average annual nominal as well as real returns of Pillar III pension funds since 2011 is presented in
the table below.
Table LT11. Nominal and Real Returns of III. Pillar in Lithuania
2004
Nominal return after charges, before
inflation and taxes
0.53%
4.09%
Real return after charges and inflation and before taxes
-2.31%
1.05%
2005 13.52% 10.53%
2006 8.64% 4.08%
2007 4.51% -3.68%
2008 -23.27% -31.73%
2009 21.94% 20.77%
2010 13.74% 10.12%
2011 -8.73% -12.21%
2012 10.86% 7.95%
2013 5.88% 5.43%
2014 5.19% 5.30%
2015 2.86% 3.11%
2016 5.09% 3.13%
2017 5.40% 1.59%
2018 -4.35% -6.10%
2019 11.45% 8.72%
2020 4.73% 4.83%
Source: Own calculation (https://www.lb.lt/en/fs-pension-funds), 2021
Again, we present the performance of Pillar III funds according to various holding period.
Table LT12. Performance of Pillar III Pension Funds according the holding period
Holding Period Net Nominal Annualized
Performance Real Net Annualized
Performance
1-year 4.73% 4.83%
3-years 3.74% 2.29%
5-years 4.34% 2.31%
7-year 4.25% 2.85%
10-years 3.67% 1.98%
Since inception 4.09% 1.05%
Source: Own calculation (https://www.lb.lt/en/fs-pension-funds), 2021.
343 | P a g e
Lon
g-Te
rm a
nd
Pen
sio
n S
avin
gs |
Th
e R
eal R
etu
rn |
20
21
Edit
ion
Conclusions
Considering the wider factors, it is safe to say that the decreasing labor force and the
implementation of the automatic balancing mechanism within the PAYG pillar will lead to a lower
replacement ratio generated from Pillar I pensions. Therefore, Lithuania can be seen as a strong
advocate of private pension savings where the pillars will grow on importance.
Reforms in the area of PAYG scheme supported with the funded pension schemes that have been
adopted in 2018 and effective since 2019 are started shifting the preferences of the Lithuanian
savers to rely more on their private funded pension schemes.
Performance of the Pillar II as well as Pillar III pension funds can be seen as satisfactory. However,
the dominance of Pillar II funds opens the question on the further changes in the Pillar III, which
cannot compete to the similar and cheaper peers in Pillar II.
The latest changes in the contributory mechanism, where additional individual contributions
towards Pillar II are promoted and tax deductible, puts more pressure on Pillar III fund managers
due to the growing crowding-out effect.
Introduction of life-cycle investment style into the Pillar II since 2019 created significant differences
between the portfolio structure of pension funds within both pillars, which leads to the conclusion
that Pillar III with more conservative approach will need to find its competitiveness against
promoted Pillar II funds.
Lithuania has a favourable tax treatment of private pension savings, where in both cases an “EEE”
tax regime is applied.
Bibliography
• BITINAS, A. (2011). Modern pension system reforms in Lithuania: Impact of crisis and
ageing. Jurisprudence, 18(3), 1055–1080.
• KABAŠINSKAS, A., ŠUTIENĖ, K., KOPA M., VALAKEVIČIUS, E. (2017) The risk–return profile
of Lithuanian private pension funds, Economic Research-Ekonomska Istraživanja, 30:1,
1611-1630, DOI: 10.1080/1331677X.2017.1383169
344 | P a g e
Lon
g-Te
rm a
nd
Pen
sio
n S
avin
gs |
Th
e R
eal R
etu
rn |
20
21
Edit
ion
Pension Savings: The Real Return 2021 Edition
Country Case: Poland
Streszczenie
Dodatkowy system emerytalny w Polsce, który został wprowadzony w 1999 roku, a następnie był
kilkukrotnie reformowany (główne zmiany w 2004, 2012 oraz 2018 roku), jest nadal w początkowej
fazie rozwoju. Obecnie składa się z czterech elementów:
• pracowniczych programów emerytalnych (PPE),
• indywidualnych kont emerytalnych (IKE),
• indywidualnych kont zabezpieczenia emerytalnego (IKZE) oraz
• pracowniczych planów kapitałowych (PPK funkcjonujących od 1 lipca 2019 r.).
Poziom uczestnictwa w wymienionych grupowych i indywidualnych planach oszczędzania na
starość (odpowiednio 3,7%, 4,34%, 2,39% i 8,68%) wskazuje, że bardzo nieliczna część Polaków
zdecydowała się na oszczędzanie w oferowanych zinstytucjonalizowanych formach gromadzenia
kapitału na starość.
PPE mogą być prowadzone w czterech formach: umowy z funduszem inwestycyjnym; umowy z
zakładem ubezpieczeń na życie (grupowe ubezpieczenie na życie z ubezpieczeniowym funduszem
kapitałowym); pracowniczego funduszu emerytalnego (PFE) lub zarzadzania zewnętrznego. Na
koniec 2020 roku w PPE zgromadzono 17,02 mld zł (3,73 mld €).
PPK mogą być oferowane w formie funduszu inwestycyjnego, funduszu emerytalnego i
ubezpieczeniowego funduszu kapitałowego (UFK). Ta forma dodatkowych planów emerytalnych
została dopiero wprowadzona, tj. funkcjonuje od 1 lipca 2019 r. Aktywa PPK miały wartość 2,82 mld
zł (0,62 mld €) na koniec 2020 roku.
IKE i IKZE mogą być oferowane w formie: ubezpieczenia na życie z ubezpieczeniowym funduszem
kapitałowym; funduszu inwestycyjnego; rachunku papierów wartościowych w domu maklerskim;
rachunku bankowego lub dobrowolnego funduszu emerytalnego (DFE). Aktywa zgromadzone na
IKE i IKZE na koniec 2020 roku wyniosły odpowiednio 11,92 mld zł (2,62 mld €) oraz 4,58 mld zł (1
mld €).
Pracownicze programy emerytalne (PPE), pracownicze plany kapitałowe (PPK) i indywidualne konta
emerytalne (IKE) funkcjonują w reżimie podatkowym TEE (podatek pobierany jest na etapie
345 | P a g e
Lon
g-Te
rm a
nd
Pen
sio
n S
avin
gs |
Th
e R
eal R
etu
rn |
20
21
Edit
ion
opłacania składki), podczas gdy w IKZE podatek pobierany jest na etapie wypłaty środków (reżim
EET).
W analizowanym okresie (2002-2020) pracownicze fundusze emerytalne (PFE) wypracowały dość
wysokie stopy zwrotu sięgające 17,41% w skali roku. Straty pojawiły się jednak w latach 2008, 2011,
2015 i 2018 w czasie załamania na rynkach finansowych. Realne stopy zwrotu uwzględniające opłaty
osiągnięte w 15 z 19 lat są pozytywne. Średnia realna stopa zwrotu za cały analizowany okres
wyniosła 3,74%.
Dobrowolne fundusze emerytalne (DFE) osiągnęły natomiast nadzwyczajne wyniki inwestycyjne w
początkowym okresie funkcjonowania, głównie z uwagi na hossę na rynku akcji w pierwszym roku
ich działalności. W 2013 roku najlepsze DFE wygenerowały nominalny zysk przekraczający 50%.
Wyniki te nie zostały jednak powtórzone w kolejnych latach. W 2014 roku część DFE wykazała straty,
które jednak zostały pokryte przez zyski w kolejnych latach. Średnia realna stopa zwrotu z
uwzględnieniem opłat za lata 2013-2020 wyniosła 4,11%.
Summary
Starting in 1999, with significant changes introduced in 2004, 2012 and 2018, the Polish
supplementary pension market is still in its early stage of operation. Pillar III, which supplements
the basic, mandatory pension system, consists of four different elements:
• employee (occupational) pension programmes (pracownicze programy emerytalne, PPE),
• individual retirement accounts (indywidualne konta emerytalne, IKE);
• individual retirement savings accounts (indywidualne konta zabezpieczenia emerytalnego,
IKZE) and
• employee capital plans (pracownicze plany kapitałowe, PPK).
The coverage ratios (3.7%, 4.34%, 2.39% and 8.68% respectively), show that only a small part of
Poles decided to secure their future in old age by joining the occupational pension plan or
purchasing individual pension products.
PPE can be offered in four forms: a contract with an asset management company (investment fund);
a contract with a life insurance company (group unit-linked life insurance); an employee pension
fund run by the employer (pracowniczy fundusz emerytalny, PFE) or external management. PPE
assets amounted to PLN 17.02 bln (€3.73 bln) at the end of 2020.
PPK can operate as investment funds, pension funds or a unit-linked life insurance. These plans
have just started to collect money (introduced in July 2019). PPK assets amounted to PLN 2.82 bln
(€0.62 mln) at the end of 2020.
IKE and IKZE can operate in the form of either: a unit-linked life insurance contract; an investment
fund; an account in a brokerage house; a bank account (savings account) or a voluntary pension
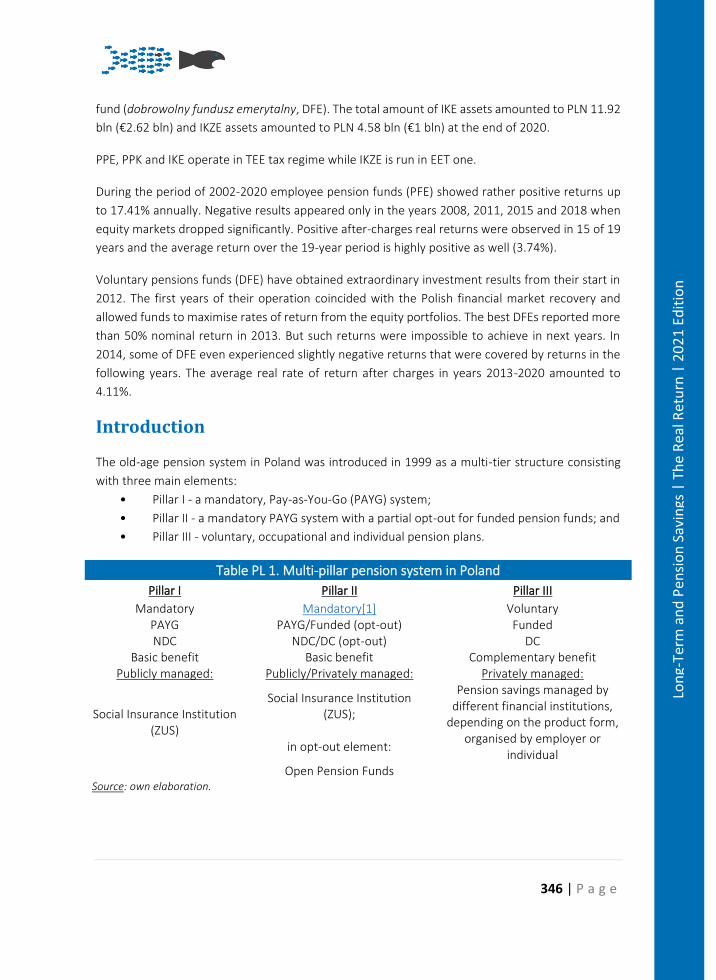
346 | P a g e
Lon
g-Te
rm a
nd
Pen
sio
n S
avin
gs |
Th
e R
eal R
etu
rn |
20
21
Edit
ion
fund (dobrowolny fundusz emerytalny, DFE). The total amount of IKE assets amounted to PLN 11.92
bln (€2.62 bln) and IKZE assets amounted to PLN 4.58 bln (€1 bln) at the end of 2020.
PPE, PPK and IKE operate in TEE tax regime while IKZE is run in EET one.
During the period of 2002-2020 employee pension funds (PFE) showed rather positive returns up
to 17.41% annually. Negative results appeared only in the years 2008, 2011, 2015 and 2018 when
equity markets dropped significantly. Positive after-charges real returns were observed in 15 of 19
years and the average return over the 19-year period is highly positive as well (3.74%).
Voluntary pensions funds (DFE) have obtained extraordinary investment results from their start in
2012. The first years of their operation coincided with the Polish financial market recovery and
allowed funds to maximise rates of return from the equity portfolios. The best DFEs reported more
than 50% nominal return in 2013. But such returns were impossible to achieve in next years. In
2014, some of DFE even experienced slightly negative returns that were covered by returns in the
following years. The average real rate of return after charges in years 2013-2020 amounted to
4.11%.
Introduction
The old-age pension system in Poland was introduced in 1999 as a multi-tier structure consisting
with three main elements:
• Pillar I - a mandatory, Pay-as-You-Go (PAYG) system;
• Pillar II - a mandatory PAYG system with a partial opt-out for funded pension funds; and
• Pillar III - voluntary, occupational and individual pension plans.
Table PL 1. Multi-pillar pension system in Poland
Pillar I Pillar II Pillar III
Mandatory Mandatory[1] Voluntary PAYG PAYG/Funded (opt-out) Funded NDC NDC/DC (opt-out) DC
Basic benefit Basic benefit Complementary benefit Publicly managed: Publicly/Privately managed: Privately managed:
Social Insurance Institution (ZUS)
Social Insurance Institution (ZUS);
Pension savings managed by different financial institutions,
depending on the product form,
in opt-out element: organised by employer or
individual Open Pension Funds
Source: own elaboration.
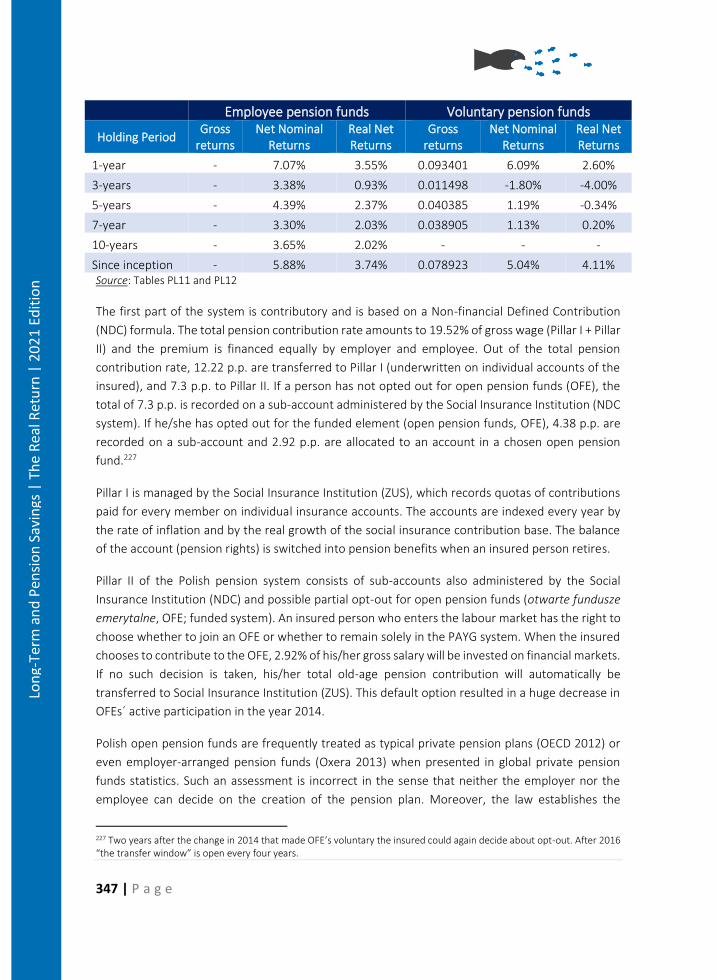
347 | P a g e
Lon
g-Te
rm a
nd
Pen
sio
n S
avin
gs |
Th
e R
eal R
etu
rn |
20
21
Edit
ion
Employee pension funds Voluntary pension funds
Holding Period Gross
returns Net Nominal
Returns Real Net Returns
Gross returns
Net Nominal Returns
Real Net Returns
1-year - 7.07% 3.55% 0.093401 6.09% 2.60%
3-years - 3.38% 0.93% 0.011498 -1.80% -4.00%
5-years - 4.39% 2.37% 0.040385 1.19% -0.34%
7-year - 3.30% 2.03% 0.038905 1.13% 0.20%
10-years - 3.65% 2.02% - - -
Since inception - 5.88% 3.74% 0.078923 5.04% 4.11% Source: Tables PL11 and PL12
The first part of the system is contributory and is based on a Non-financial Defined Contribution
(NDC) formula. The total pension contribution rate amounts to 19.52% of gross wage (Pillar I + Pillar
II) and the premium is financed equally by employer and employee. Out of the total pension
contribution rate, 12.22 p.p. are transferred to Pillar I (underwritten on individual accounts of the
insured), and 7.3 p.p. to Pillar II. If a person has not opted out for open pension funds (OFE), the
total of 7.3 p.p. is recorded on a sub-account administered by the Social Insurance Institution (NDC
system). If he/she has opted out for the funded element (open pension funds, OFE), 4.38 p.p. are
recorded on a sub-account and 2.92 p.p. are allocated to an account in a chosen open pension
fund.227
Pillar I is managed by the Social Insurance Institution (ZUS), which records quotas of contributions
paid for every member on individual insurance accounts. The accounts are indexed every year by
the rate of inflation and by the real growth of the social insurance contribution base. The balance
of the account (pension rights) is switched into pension benefits when an insured person retires.
Pillar II of the Polish pension system consists of sub-accounts also administered by the Social
Insurance Institution (NDC) and possible partial opt-out for open pension funds (otwarte fundusze
emerytalne, OFE; funded system). An insured person who enters the labour market has the right to
choose whether to join an OFE or whether to remain solely in the PAYG system. When the insured
chooses to contribute to the OFE, 2.92% of his/her gross salary will be invested on financial markets.
If no such decision is taken, his/her total old-age pension contribution will automatically be
transferred to Social Insurance Institution (ZUS). This default option resulted in a huge decrease in
OFEs´ active participation in the year 2014.
Polish open pension funds are frequently treated as typical private pension plans (OECD 2012) or
even employer-arranged pension funds (Oxera 2013) when presented in global private pension
funds statistics. Such an assessment is incorrect in the sense that neither the employer nor the
employee can decide on the creation of the pension plan. Moreover, the law establishes the
227 Two years after the change in 2014 that made OFE’s voluntary the insured could again decide about opt-out. After 2016 “the transfer window” is open every four years.
348 | P a g e
Lon
g-Te
rm a
nd
Pen
sio
n S
avin
gs |
Th
e R
eal R
etu
rn |
20
21
Edit
ion
contribution level and guarantees minimum pension benefits that are paid together from the whole
basic system by the public institution (ZUS). Thus, Polish OFEs are just a mechanism of temporary
investing public pension system resources in financial markets (financial vehicles for the
accumulation phase).
The statutory retirement age is 60 for women and 65 for men.228 Prior to retirement the member’s
assets gathered in OFE (if one opted out for funded element) are transferred to the sub-account
administered by ZUS.229 Pension benefits from the basic system are calculated in accordance with
a Defined Contribution (DC) rule and are paid by Social Insurance Institution (ZUS).
The old-age pension from the basic system (Pillar I+II) depends solely on two components: 1) the
insured person’s total pension entitlements accumulated during his/her entire career (balance of
NDC account and sub-account), and 2) the average life expectancy upon retirement. The gross
replacement rate at retirement from the public pension system in Poland is 54.1% (projections for
2019 for an average earner).230
Pillar III supplements the basic, mandatory pension system and represents voluntary, additional
pension savings. It consists of four different vehicles:
• employee (occupational) pension programmes (pracownicze programy emerytalne, PPE);
• individual retirement accounts (indywidualne konta emerytalne, IKE);
• individual retirement savings accounts (indywidualne konta zabezpieczenia emerytalnego, IKZE),
• employee capital plans (pracownicze plany kapitałowe, PPK).
Employee pension programmes (pracownicze programy emerytalne, PPE) are plans organised by
employers for their employees. PPE settlement happens after an employer agrees with the
representatives of the employees on the plan’s operational conditions, signs the contract on asset
management with a financial institution (or decides to manage assets himself) and registers a
programme with the Financial Supervisory Commission (Komisja Nadzoru Finansowego, KNF). The
basic contribution (up to 7% of an employee’s salary) is financed by the employer but an employee
must pay personal income tax on this. Participants to the programme can pay in additional
contributions deducted from their net (after-tax) salaries. There is a yearly quota limit for additional
228 It started to increase in 2013 and was planned to reach 67 for both men and women (in 2020 for men and in 2040 for women) but this reform was cancelled three years later. Hence, since October 2017 the statutory retirement age in Poland is again 60 for women and 65 for men. It may result in a situation where the significant proportion of women will get a minimum pension when retiring at the age of 60. More in: A. Chłoń-Domińczak, P. Strzelecki, ‘The minimum pension as an instrument of poverty protection in the defined contribution pension system – an example of Poland’ (2013) 12(3) Journal of Pension Economics and Finance. 229 Money gathered on individual accounts in OFE is systematically transferred to the Social Insurance Institution (ZUS) during 10 years before retirement (before reaching the statutory retirement age). 230 European Commission, The 2021 Ageing Report: Economic and Budgetary Projections for the EU Member States (2019-2070), Luxembourg2021, p. 86, https://ec.europa.eu/info/sites/default/files/economy-finance/ip148_en.pdf.
349 | P a g e
Lon
g-Te
rm a
nd
Pen
sio
n S
avin
gs |
Th
e R
eal R
etu
rn |
20
21
Edit
ion
contribution amounting to 4.5 times the average wage (PLN 23,665.50 - €5,190.14231 - in 2021).
PPE’s returns are exempt from capital gains tax. Benefits are not taxable and can be paid as a lump
sum or as a programmed withdrawal after the saver reaches 60 years. PPEs cover 631.8 thousand
employees which represents only 3.7% of the working population in Poland.
Employee capital plans (pracownicze plany kapitałowe, PPK) are also organised by employers but
they use auto-enrolment and matching defined contribution mechanisms. They started to operate
in 2019 and their full implementation is staggered in accordance with the given below dates and
depending on the company size:
• since 1 July 2019 – companies employing at least 250 people;
• since 1 January 2020 – companies with at least 50 employees,
• since 1 July 2020 – companies having at least 20 employees,
• since 1 January 2021 – remaining companies, including the entities financed from state budget.
The employee contribution amounts to 2-4% of the gross salary. The minimum matching
contribution financed by employer is 1.5% of the gross salary but can be higher on a voluntary basis
(up to 4%). People earning 120% or less of the average income can save less, namely minimum 0.5%
of the gross salary. In order to encourage individuals to save in PPK, the state budget offers the PLN
250 kick-start payment (€ 54.83) and regular annual state subsidy amounting to PLN 240 (€52.64).
The employee and employer contributions are taxed while the state subsidies remain exempt from
taxation both at accumulation and decumulation stage. PPK’s returns are exempt from capital gains
tax. Benefits can be paid as a lump sum (max. 25% of the accumulated capital) and programmed
withdrawal when a saver reaches 60 years. Savings can be partially withdrawn (25% of the capital)
in the case of the serious disease of the saver, his/her spouse or a child. The accumulated money
can be also borrowed from the account (100% of the capital) to finance an individual commitment
when taking a mortgage. PPKs covered 1.48 mln employees at the end of 2020, which represents
ca. 8.68% of the working population.
Individual retirement accounts (indywidualne konta emerytalne, IKE) were introduced in 2004,
offering people the possibility to save individually for retirement. They are offered by various
financial institutions such as asset management companies, life insurers, brokerage houses, banks
and pension societies. An individual can only gather money on one retirement account at the time
but is free to change the form and the institution during the accumulation phase. Contributions are
paid from the net salary with a ceiling of 3 times the average wage (PLN 15,777 - €3,460.10 - in
2021). Returns are exempt from capital gains tax and the benefits are not subject to taxation. When
a saver reaches 60 years of age (or 55 years, if he/she is entitled by law to retire early), money is
paid in the form of a lump sum or a programmed withdrawal. At the end of 2020 only 741.6
231 For the conversion of PLN to euros, the report uses the "Euro foreign exchange reference rates" provided by the European Central Bank (the exchange rate used for the data is the one of 31st December 2020: 1 EUR = PLN 4.5597), https://www.ecb.europa.eu/stats/policy_and_exchange_rates/euro_reference_exchange_rates/html/eurofxref-graph-pln.en.html
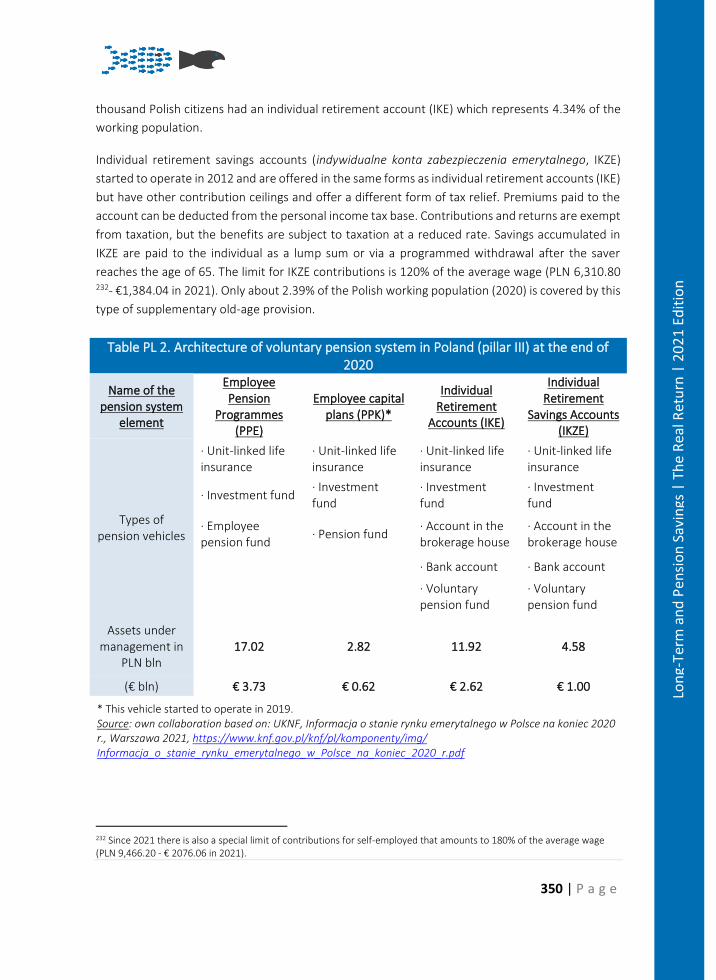
350 | P a g e
Lon
g-Te
rm a
nd
Pen
sio
n S
avin
gs |
Th
e R
eal R
etu
rn |
20
21
Edit
ion
thousand Polish citizens had an individual retirement account (IKE) which represents 4.34% of the
working population.
Individual retirement savings accounts (indywidualne konta zabezpieczenia emerytalnego, IKZE)
started to operate in 2012 and are offered in the same forms as individual retirement accounts (IKE)
but have other contribution ceilings and offer a different form of tax relief. Premiums paid to the
account can be deducted from the personal income tax base. Contributions and returns are exempt
from taxation, but the benefits are subject to taxation at a reduced rate. Savings accumulated in
IKZE are paid to the individual as a lump sum or via a programmed withdrawal after the saver
reaches the age of 65. The limit for IKZE contributions is 120% of the average wage (PLN 6,310.80 232- €1,384.04 in 2021). Only about 2.39% of the Polish working population (2020) is covered by this
type of supplementary old-age provision.
Table PL 2. Architecture of voluntary pension system in Poland (pillar III) at the end of 2020
Name of the pension system
element
Employee Pension
Programmes (PPE)
Employee capital plans (PPK)*
Individual Retirement
Accounts (IKE)
Individual Retirement
Savings Accounts (IKZE)
Types of pension vehicles
· Unit-linked life insurance
· Unit-linked life insurance
· Unit-linked life insurance
· Unit-linked life insurance
· Investment fund · Investment fund
· Investment fund
· Investment fund
· Employee pension fund
· Pension fund · Account in the brokerage house
· Account in the brokerage house
· Bank account · Bank account
· Voluntary pension fund
· Voluntary pension fund
Assets under management in
PLN bln 17.02 2.82 11.92 4.58
(€ bln) € 3.73 € 0.62 € 2.62 € 1.00
* This vehicle started to operate in 2019. Source: own collaboration based on: UKNF, Informacja o stanie rynku emerytalnego w Polsce na koniec 2020 r., Warszawa 2021, https://www.knf.gov.pl/knf/pl/komponenty/img/ Informacja_o_stanie_rynku_emerytalnego_w_Polsce_na_koniec_2020_r.pdf
232 Since 2021 there is also a special limit of contributions for self-employed that amounts to 180% of the average wage (PLN 9,466.20 - € 2076.06 in 2021).
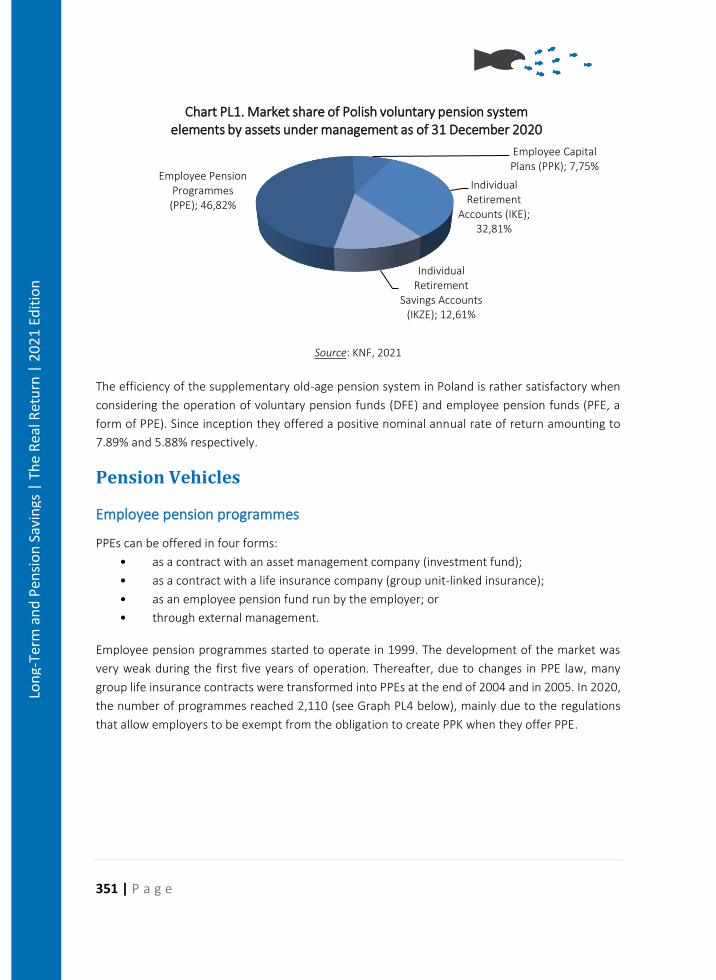
351 | P a g e
Lon
g-Te
rm a
nd
Pen
sio
n S
avin
gs |
Th
e R
eal R
etu
rn |
20
21
Edit
ion
Source: KNF, 2021
The efficiency of the supplementary old-age pension system in Poland is rather satisfactory when
considering the operation of voluntary pension funds (DFE) and employee pension funds (PFE, a
form of PPE). Since inception they offered a positive nominal annual rate of return amounting to
7.89% and 5.88% respectively.
Pension Vehicles
Employee pension programmes
PPEs can be offered in four forms:
• as a contract with an asset management company (investment fund);
• as a contract with a life insurance company (group unit-linked insurance);
• as an employee pension fund run by the employer; or
• through external management.
Employee pension programmes started to operate in 1999. The development of the market was
very weak during the first five years of operation. Thereafter, due to changes in PPE law, many
group life insurance contracts were transformed into PPEs at the end of 2004 and in 2005. In 2020,
the number of programmes reached 2,110 (see Graph PL4 below), mainly due to the regulations
that allow employers to be exempt from the obligation to create PPK when they offer PPE.
Employee Pension Programmes
(PPE); 46,82%
Employee Capital Plans (PPK); 7,75%
Individual Retirement
Accounts (IKE); 32,81%
Individual Retirement
Savings Accounts (IKZE); 12,61%
Chart PL1. Market share of Polish voluntary pension system elements by assets under management as of 31 December 2020
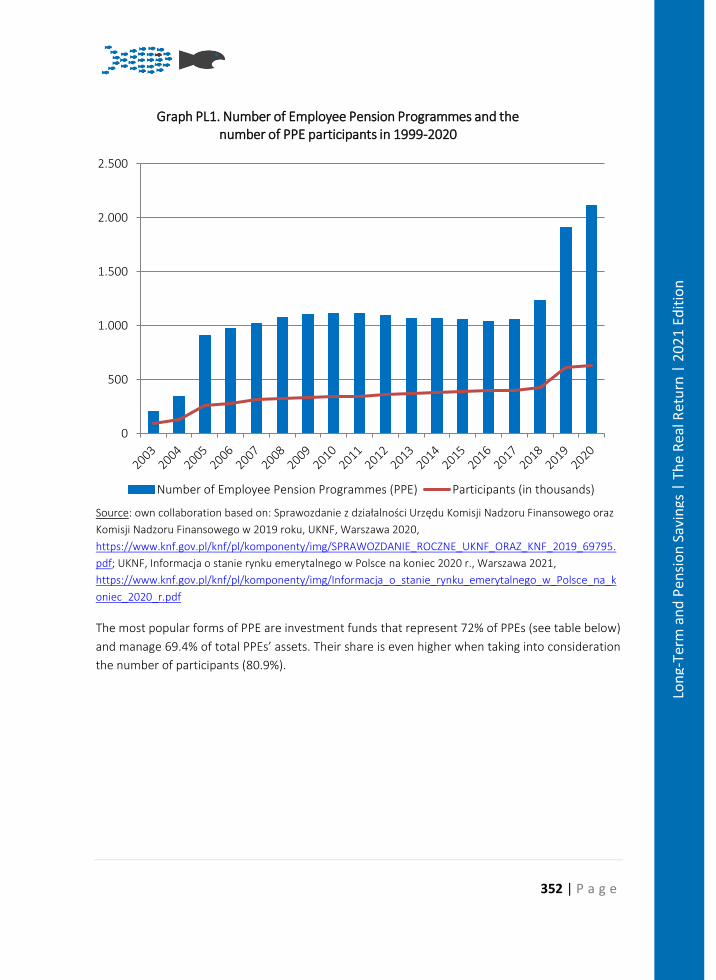
352 | P a g e
Lon
g-Te
rm a
nd
Pen
sio
n S
avin
gs |
Th
e R
eal R
etu
rn |
20
21
Edit
ion
Source: own collaboration based on: Sprawozdanie z działalności Urzędu Komisji Nadzoru Finansowego oraz
Komisji Nadzoru Finansowego w 2019 roku, UKNF, Warszawa 2020,
https://www.knf.gov.pl/knf/pl/komponenty/img/SPRAWOZDANIE_ROCZNE_UKNF_ORAZ_KNF_2019_69795.
pdf; UKNF, Informacja o stanie rynku emerytalnego w Polsce na koniec 2020 r., Warszawa 2021,
https://www.knf.gov.pl/knf/pl/komponenty/img/Informacja_o_stanie_rynku_emerytalnego_w_Polsce_na_k
oniec_2020_r.pdf
The most popular forms of PPE are investment funds that represent 72% of PPEs (see table below)
and manage 69.4% of total PPEs’ assets. Their share is even higher when taking into consideration
the number of participants (80.9%).
0
500
1.000
1.500
2.000
2.500
Graph PL1. Number of Employee Pension Programmes and the number of PPE participants in 1999-2020
Number of Employee Pension Programmes (PPE) Participants (in thousands)
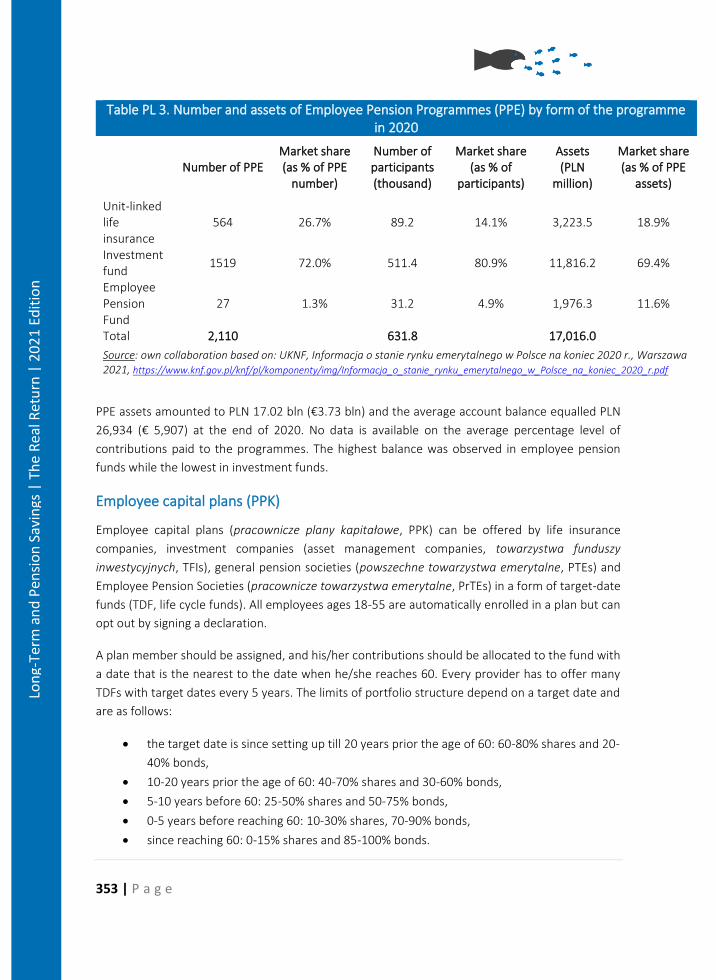
353 | P a g e
Lon
g-Te
rm a
nd
Pen
sio
n S
avin
gs |
Th
e R
eal R
etu
rn |
20
21
Edit
ion
Table PL 3. Number and assets of Employee Pension Programmes (PPE) by form of the programme in 2020
Number of PPE Market share (as % of PPE
number)
Number of participants (thousand)
Market share (as % of
participants)
Assets (PLN
million)
Market share (as % of PPE
assets)
Unit-linked life insurance
564 26.7% 89.2 14.1% 3,223.5 18.9%
Investment fund
1519 72.0% 511.4 80.9% 11,816.2 69.4%
Employee Pension Fund
27 1.3% 31.2 4.9% 1,976.3 11.6%
Total 2,110 631.8 17,016.0
Source: own collaboration based on: UKNF, Informacja o stanie rynku emerytalnego w Polsce na koniec 2020 r., Warszawa 2021, https://www.knf.gov.pl/knf/pl/komponenty/img/Informacja_o_stanie_rynku_emerytalnego_w_Polsce_na_koniec_2020_r.pdf
PPE assets amounted to PLN 17.02 bln (€3.73 bln) and the average account balance equalled PLN
26,934 (€ 5,907) at the end of 2020. No data is available on the average percentage level of
contributions paid to the programmes. The highest balance was observed in employee pension
funds while the lowest in investment funds.
Employee capital plans (PPK)
Employee capital plans (pracownicze plany kapitałowe, PPK) can be offered by life insurance
companies, investment companies (asset management companies, towarzystwa funduszy
inwestycyjnych, TFIs), general pension societies (powszechne towarzystwa emerytalne, PTEs) and
Employee Pension Societies (pracownicze towarzystwa emerytalne, PrTEs) in a form of target-date
funds (TDF, life cycle funds). All employees ages 18-55 are automatically enrolled in a plan but can
opt out by signing a declaration.
A plan member should be assigned, and his/her contributions should be allocated to the fund with
a date that is the nearest to the date when he/she reaches 60. Every provider has to offer many
TDFs with target dates every 5 years. The limits of portfolio structure depend on a target date and
are as follows:
• the target date is since setting up till 20 years prior the age of 60: 60-80% shares and 20-
40% bonds,
• 10-20 years prior the age of 60: 40-70% shares and 30-60% bonds,
• 5-10 years before 60: 25-50% shares and 50-75% bonds,
• 0-5 years before reaching 60: 10-30% shares, 70-90% bonds,
• since reaching 60: 0-15% shares and 85-100% bonds.
354 | P a g e
Lon
g-Te
rm a
nd
Pen
sio
n S
avin
gs |
Th
e R
eal R
etu
rn |
20
21
Edit
ion
At the end of 2020 there were 19 financial institutions (16 asset management companies, 2
general pension societies and 1 insurance company) offering ca. 170 PPK funds on the market. At
the end of 2020 1.48 mln participants gathered PLN 2.82 bln (€0.62 bln) in PPK.
Individual Retirement Accounts (IKE)
According to the Polish pensions law (the Individual Pension Accounts Act of 20 April 2004),
individual retirement accounts (Indywidualne Konta Emerytalne, IKE) can operate in the form of:
• a unit-linked life insurance contract;
• an investment fund;
• an account in a brokerage house;
• a bank account (savings account); or
• a voluntary pension fund.
Pension accounts are offered by life insurance companies, investment companies (asset
management companies), brokerage houses, banks and pension societies. The most recent pension
vehicles are voluntary pension funds that were introduced in 2012 at a time of significant changes
in the statutory old-age pension system.
A voluntary pension fund is an entity established with the sole aim of gathering savings of IKE (or
IKZE) holders. Pension assets are managed by a pension society (powszechne towarzystwo
emerytalne, PTE) that also manages one of the open pension funds (OFE under Pillar II) in Poland.
Assets of the funds are separated to guarantee the safety of the system, as well as due to stricter
OFEs’ investment regulations.
The design of IKE products usually does not vary significantly from the standard offer on financial
markets. The difference relates to the tax treatment of capital gains (exclusion from capital gains
tax) and contribution limits. Moreover, financial institutions cannot charge any cancellation fee
when an individual transfers money or resigns after a year from opening an account.
The most popular IKE products take the form of investment funds and life insurance contracts (unit-
linked life insurance). According to official data (UKNF 2021), these two forms of plans represent
80% of all IKE accounts.
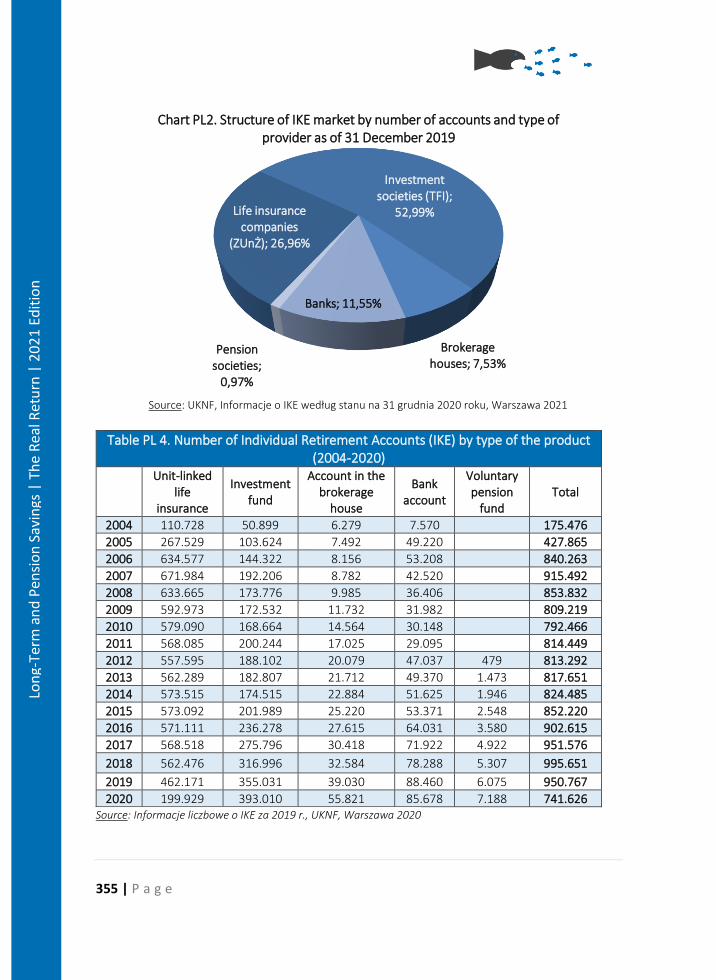
355 | P a g e
Lon
g-Te
rm a
nd
Pen
sio
n S
avin
gs |
Th
e R
eal R
etu
rn |
20
21
Edit
ion
Source: UKNF, Informacje o IKE według stanu na 31 grudnia 2020 roku, Warszawa 2021
Table PL 4. Number of Individual Retirement Accounts (IKE) by type of the product (2004-2020)
Unit-linked
life insurance
Investment fund
Account in the brokerage
house
Bank account
Voluntary pension
fund Total
2004 110.728 50.899 6.279 7.570 175.476
2005 267.529 103.624 7.492 49.220 427.865
2006 634.577 144.322 8.156 53.208 840.263
2007 671.984 192.206 8.782 42.520 915.492
2008 633.665 173.776 9.985 36.406 853.832
2009 592.973 172.532 11.732 31.982 809.219
2010 579.090 168.664 14.564 30.148 792.466
2011 568.085 200.244 17.025 29.095 814.449
2012 557.595 188.102 20.079 47.037 479 813.292
2013 562.289 182.807 21.712 49.370 1.473 817.651
2014 573.515 174.515 22.884 51.625 1.946 824.485
2015 573.092 201.989 25.220 53.371 2.548 852.220
2016 571.111 236.278 27.615 64.031 3.580 902.615
2017 568.518 275.796 30.418 71.922 4.922 951.576
2018 562.476 316.996 32.584 78.288 5.307 995.651
2019 462.171 355.031 39.030 88.460 6.075 950.767
2020 199.929 393.010 55.821 85.678 7.188 741.626 Source: Informacje liczbowe o IKE za 2019 r., UKNF, Warszawa 2020
Life insurance companies
(ZUnŻ); 26,96%
Investment societies (TFI);
52,99%
Brokerage houses; 7,53%
Banks; 11,55%
Pension societies;
0,97%
Chart PL2. Structure of IKE market by number of accounts and type of provider as of 31 December 2019
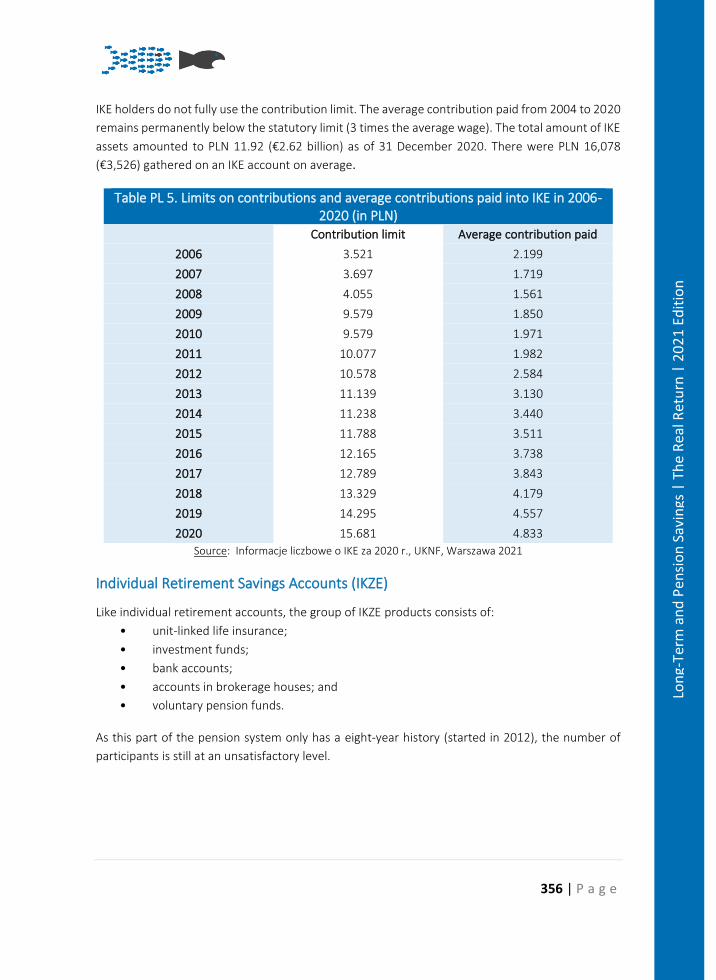
356 | P a g e
Lon
g-Te
rm a
nd
Pen
sio
n S
avin
gs |
Th
e R
eal R
etu
rn |
20
21
Edit
ion
IKE holders do not fully use the contribution limit. The average contribution paid from 2004 to 2020
remains permanently below the statutory limit (3 times the average wage). The total amount of IKE
assets amounted to PLN 11.92 (€2.62 billion) as of 31 December 2020. There were PLN 16,078
(€3,526) gathered on an IKE account on average.
Table PL 5. Limits on contributions and average contributions paid into IKE in 2006-2020 (in PLN)
Contribution limit Average contribution paid
2006 3.521 2.199
2007 3.697 1.719
2008 4.055 1.561
2009 9.579 1.850
2010 9.579 1.971
2011 10.077 1.982
2012 10.578 2.584
2013 11.139 3.130
2014 11.238 3.440
2015 11.788 3.511
2016 12.165 3.738
2017 12.789 3.843
2018 13.329 4.179
2019 14.295 4.557
2020 15.681 4.833
Source: Informacje liczbowe o IKE za 2020 r., UKNF, Warszawa 2021
Individual Retirement Savings Accounts (IKZE)
Like individual retirement accounts, the group of IKZE products consists of:
• unit-linked life insurance;
• investment funds;
• bank accounts;
• accounts in brokerage houses; and
• voluntary pension funds.
As this part of the pension system only has a eight-year history (started in 2012), the number of
participants is still at an unsatisfactory level.
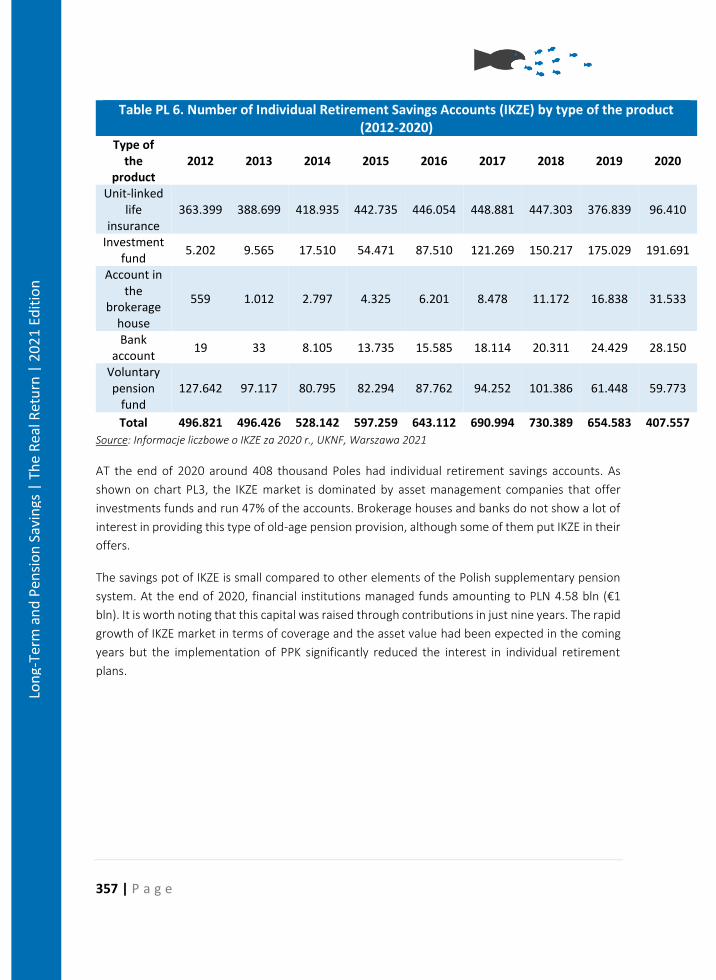
357 | P a g e
Lon
g-Te
rm a
nd
Pen
sio
n S
avin
gs |
Th
e R
eal R
etu
rn |
20
21
Edit
ion
Table PL 6. Number of Individual Retirement Savings Accounts (IKZE) by type of the product (2012-2020)
Type of the
product 2012 2013 2014 2015 2016 2017 2018 2019 2020
Unit-linked life
insurance 363.399 388.699 418.935 442.735 446.054 448.881 447.303 376.839 96.410
Investment fund
5.202 9.565 17.510 54.471 87.510 121.269 150.217 175.029 191.691
Account in the
brokerage house
559 1.012 2.797 4.325 6.201 8.478 11.172 16.838 31.533
Bank account
19 33 8.105 13.735 15.585 18.114 20.311 24.429 28.150
Voluntary pension
fund 127.642 97.117 80.795 82.294 87.762 94.252 101.386 61.448 59.773
Total 496.821 496.426 528.142 597.259 643.112 690.994 730.389 654.583 407.557
Source: Informacje liczbowe o IKZE za 2020 r., UKNF, Warszawa 2021
AT the end of 2020 around 408 thousand Poles had individual retirement savings accounts. As
shown on chart PL3, the IKZE market is dominated by asset management companies that offer
investments funds and run 47% of the accounts. Brokerage houses and banks do not show a lot of
interest in providing this type of old-age pension provision, although some of them put IKZE in their
offers.
The savings pot of IKZE is small compared to other elements of the Polish supplementary pension
system. At the end of 2020, financial institutions managed funds amounting to PLN 4.58 bln (€1
bln). It is worth noting that this capital was raised through contributions in just nine years. The rapid
growth of IKZE market in terms of coverage and the asset value had been expected in the coming
years but the implementation of PPK significantly reduced the interest in individual retirement
plans.
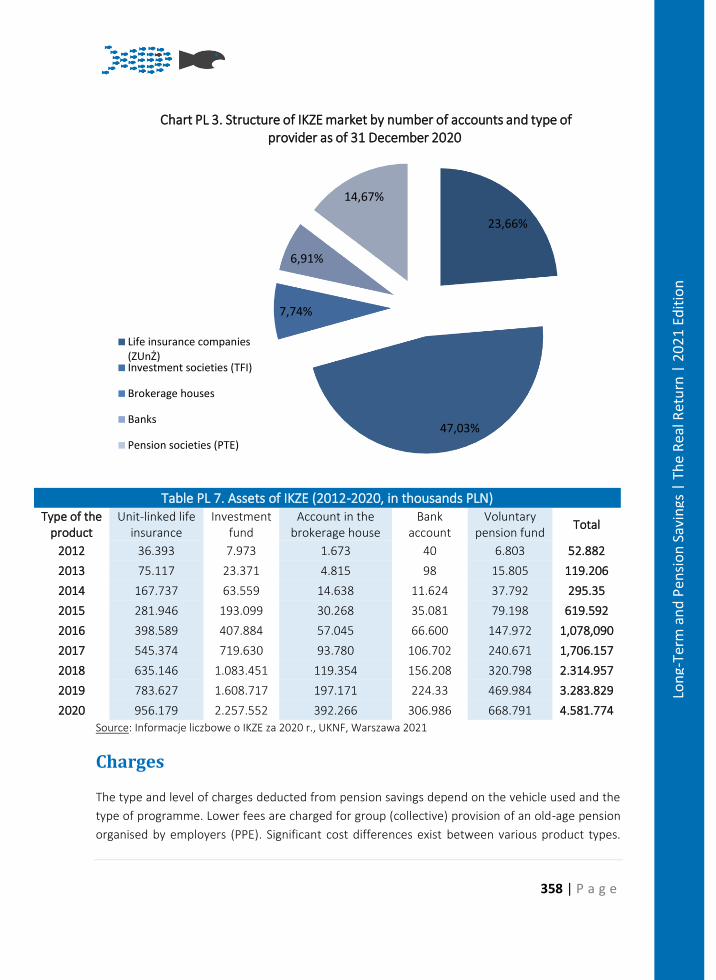
358 | P a g e
Lon
g-Te
rm a
nd
Pen
sio
n S
avin
gs |
Th
e R
eal R
etu
rn |
20
21
Edit
ion
Table PL 7. Assets of IKZE (2012-2020, in thousands PLN) Type of the
product Unit-linked life
insurance Investment
fund Account in the
brokerage house Bank
account Voluntary
pension fund Total
2012 36.393 7.973 1.673 40 6.803 52.882
2013 75.117 23.371 4.815 98 15.805 119.206
2014 167.737 63.559 14.638 11.624 37.792 295.35
2015 281.946 193.099 30.268 35.081 79.198 619.592
2016 398.589 407.884 57.045 66.600 147.972 1,078,090
2017 545.374 719.630 93.780 106.702 240.671 1,706.157
2018 635.146 1.083.451 119.354 156.208 320.798 2.314.957
2019 783.627 1.608.717 197.171 224.33 469.984 3.283.829
2020 956.179 2.257.552 392.266 306.986 668.791 4.581.774
Source: Informacje liczbowe o IKZE za 2020 r., UKNF, Warszawa 2021
Charges
The type and level of charges deducted from pension savings depend on the vehicle used and the
type of programme. Lower fees are charged for group (collective) provision of an old-age pension
organised by employers (PPE). Significant cost differences exist between various product types.
23,66%
47,03%
7,74%
6,91%
14,67%
Chart PL 3. Structure of IKZE market by number of accounts and type of provider as of 31 December 2020
Life insurance companies(ZUnŻ)Investment societies (TFI)
Brokerage houses
Banks
Pension societies (PTE)
359 | P a g e
Lon
g-Te
rm a
nd
Pen
sio
n S
avin
gs |
Th
e R
eal R
etu
rn |
20
21
Edit
ion
Since no comprehensive data regarding the costs of Polish supplementary products is collected or
officially published, the information provided below reflects the costs of selected (exemplary)
pension products and plans functioning on the Polish market.
Employee Pension Programmes (PPE)
Data on PPE charges is hardly available. The Financial Supervisory Commission does not provide any
official statistics on value or the percentage of deductions on assets of employee pension
programmes. Some information can be found in the statutes of PPEs, but they describe rather the
types of costs charged than the level of deductions. Employers must cover many administrative
costs connected with PPE organisation (disclosure of information, collecting employees’
declarations, transfer of contributions, etc.). The savings of participants are usually reduced by a
management fee that varied from 0.5% p.a. to 4% p.a. of AuM and depend on the investment profile
of funds chosen.
The lowest charges are applied to employee pension funds (Pracownicze Fundusze Emerytalne –
PFE), which are set up by employers (in-house management of PPE) and managed by employee
pension societies. For this type of pension fund, no up-front fee is deducted and a rather low
management fee (0.5% - 1% p.a.) applies to assets gathered.
Since 2019 there is a cap on management fee charged by asset management companies. It could
not exceed 3,5% in 2019, 3% in 2020 and 2,5% in 2021. From 2022 the limit will be 2%.
Employee Capital Plans (PPK)
Financial institutions offering PPK can charge management fee (max. 0.5% AuM) and success fee
(max. 0.1% AuM and only if return is both positive and above the benchmark). The fee level depends
on the risk profile of the fund and amounts from 0.16% to 0.47% with 0.42% being the average for
the whole PPK market.
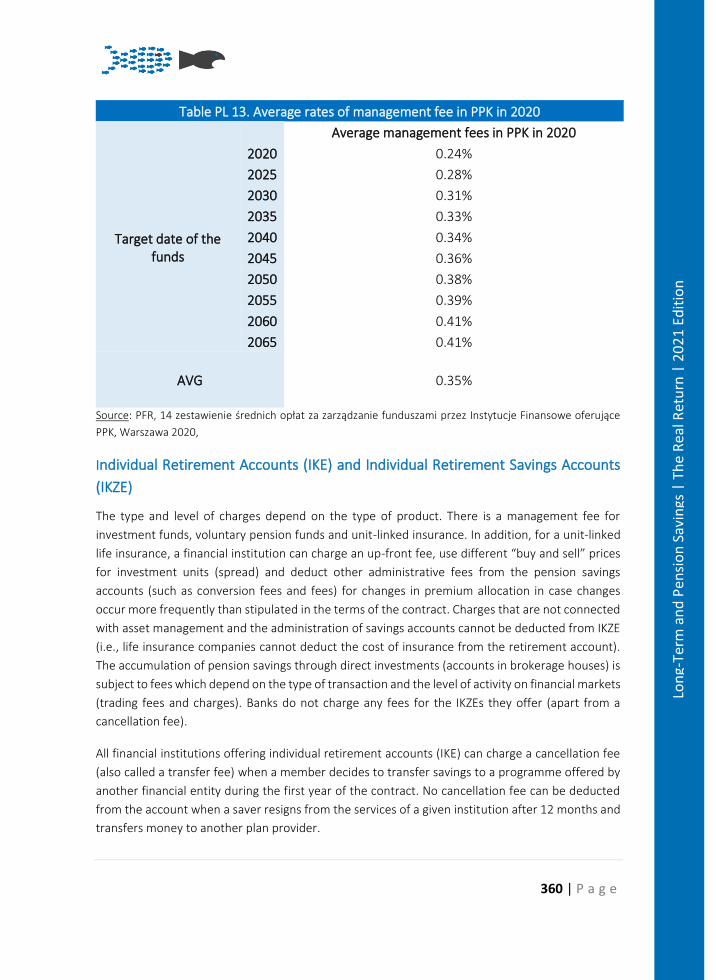
360 | P a g e
Lon
g-Te
rm a
nd
Pen
sio
n S
avin
gs |
Th
e R
eal R
etu
rn |
20
21
Edit
ion
Table PL 13. Average rates of management fee in PPK in 2020 Average management fees in PPK in 2020
Target date of the funds
2020 0.24%
2025 0.28%
2030 0.31%
2035 0.33%
2040 0.34%
2045 0.36%
2050 0.38%
2055 0.39%
2060 0.41%
2065 0.41%
AVG 0.35%
Source: PFR, 14 zestawienie średnich opłat za zarządzanie funduszami przez Instytucje Finansowe oferujące
PPK, Warszawa 2020,
Individual Retirement Accounts (IKE) and Individual Retirement Savings Accounts
(IKZE)
The type and level of charges depend on the type of product. There is a management fee for
investment funds, voluntary pension funds and unit-linked insurance. In addition, for a unit-linked
life insurance, a financial institution can charge an up-front fee, use different “buy and sell” prices
for investment units (spread) and deduct other administrative fees from the pension savings
accounts (such as conversion fees and fees) for changes in premium allocation in case changes
occur more frequently than stipulated in the terms of the contract. Charges that are not connected
with asset management and the administration of savings accounts cannot be deducted from IKZE
(i.e., life insurance companies cannot deduct the cost of insurance from the retirement account).
The accumulation of pension savings through direct investments (accounts in brokerage houses) is
subject to fees which depend on the type of transaction and the level of activity on financial markets
(trading fees and charges). Banks do not charge any fees for the IKZEs they offer (apart from a
cancellation fee).
All financial institutions offering individual retirement accounts (IKE) can charge a cancellation fee
(also called a transfer fee) when a member decides to transfer savings to a programme offered by
another financial entity during the first year of the contract. No cancellation fee can be deducted
from the account when a saver resigns from the services of a given institution after 12 months and
transfers money to another plan provider.
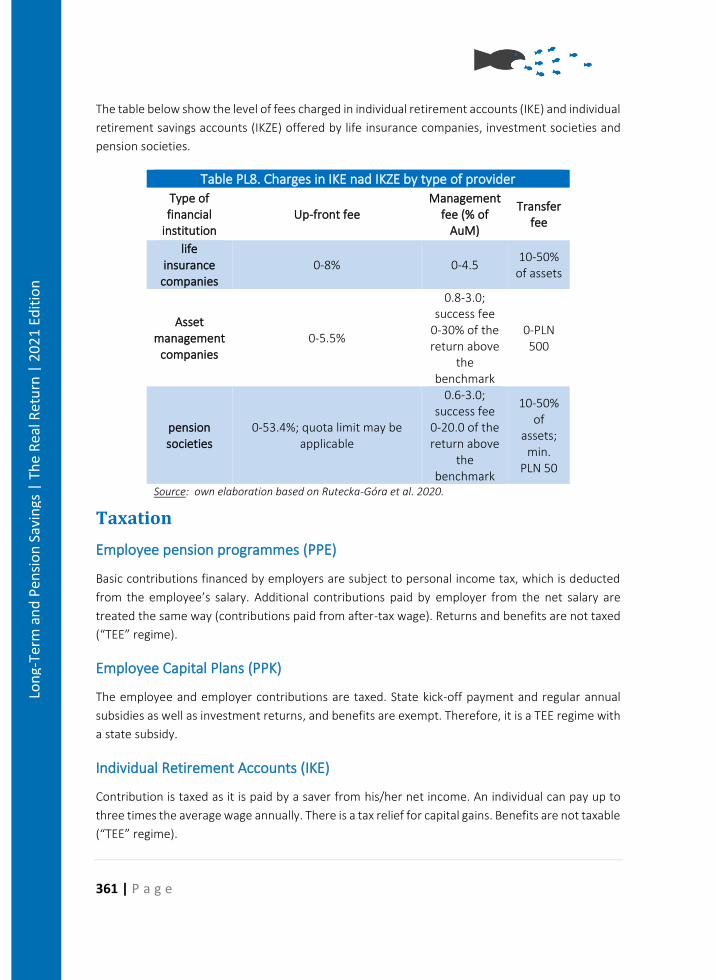
361 | P a g e
Lon
g-Te
rm a
nd
Pen
sio
n S
avin
gs |
Th
e R
eal R
etu
rn |
20
21
Edit
ion
The table below show the level of fees charged in individual retirement accounts (IKE) and individual
retirement savings accounts (IKZE) offered by life insurance companies, investment societies and
pension societies.
Table PL8. Charges in IKE nad IKZE by type of provider
Type of financial
institution Up-front fee
Management fee (% of
AuM)
Transfer fee
life insurance
companies 0-8% 0-4.5
10-50% of assets
Asset management
companies 0-5.5%
0.8-3.0; success fee
0-30% of the return above
the benchmark
0-PLN 500
pension societies
0-53.4%; quota limit may be applicable
0.6-3.0; success fee
0-20.0 of the return above
the benchmark
10-50% of
assets; min.
PLN 50
Source: own elaboration based on Rutecka-Góra et al. 2020.
Taxation
Employee pension programmes (PPE)
Basic contributions financed by employers are subject to personal income tax, which is deducted
from the employee’s salary. Additional contributions paid by employer from the net salary are
treated the same way (contributions paid from after-tax wage). Returns and benefits are not taxed
(“TEE” regime).
Employee Capital Plans (PPK)
The employee and employer contributions are taxed. State kick-off payment and regular annual
subsidies as well as investment returns, and benefits are exempt. Therefore, it is a TEE regime with
a state subsidy.
Individual Retirement Accounts (IKE)
Contribution is taxed as it is paid by a saver from his/her net income. An individual can pay up to
three times the average wage annually. There is a tax relief for capital gains. Benefits are not taxable
(“TEE” regime).
362 | P a g e
Lon
g-Te
rm a
nd
Pen
sio
n S
avin
gs |
Th
e R
eal R
etu
rn |
20
21
Edit
ion
Individual Retirement Savings Accounts (IKZE)
Contributions to IKZE are deductible from the income tax base. In 2012 and 2013 there was an
upper limit of contribution amounting to 4% of the person’s annual salary in the previous year. Due
to the most recent changes in the pension system, the given limit was replaced with a flat-rate limit
in 2014. Every individual can pay up to 120% of the average salary into an account. Since 2021 there
is a higher limit of contribution for self-employed that amounts to 180% of the average salary in the
economy. Returns are not subject to taxation, but benefits are taxed with a reduced flat-rate
income tax (10%). This part of the supplementary pension system is the only one that follows the
EET tax regime.
Pension Returns
Asset allocation
Employee Pension Programmes (PPE) and
Polish law does not impose any strict investment limits on voluntary pension savings accounts (IKE,
IKZE, most forms of PPE, PPK) except for occupational pension programmes offered in the form of
employees’ pension fund (types of asset classes are described by law). Every financial institution
that offers IKE or IKZE provides information on investment policy in the statute of the fund. Since
many existing plans offer PPE participants the possibility to invest in funds from a broad group of
investment funds operating in the market (not only the funds dedicated exclusively to pension
savings), it is impossible to indicate how the portfolios of most PPEs look like.
The tables below present the investment portfolio of employee pension funds, which are the only
types of occupational pension products with official and separate statistics on asset allocation.
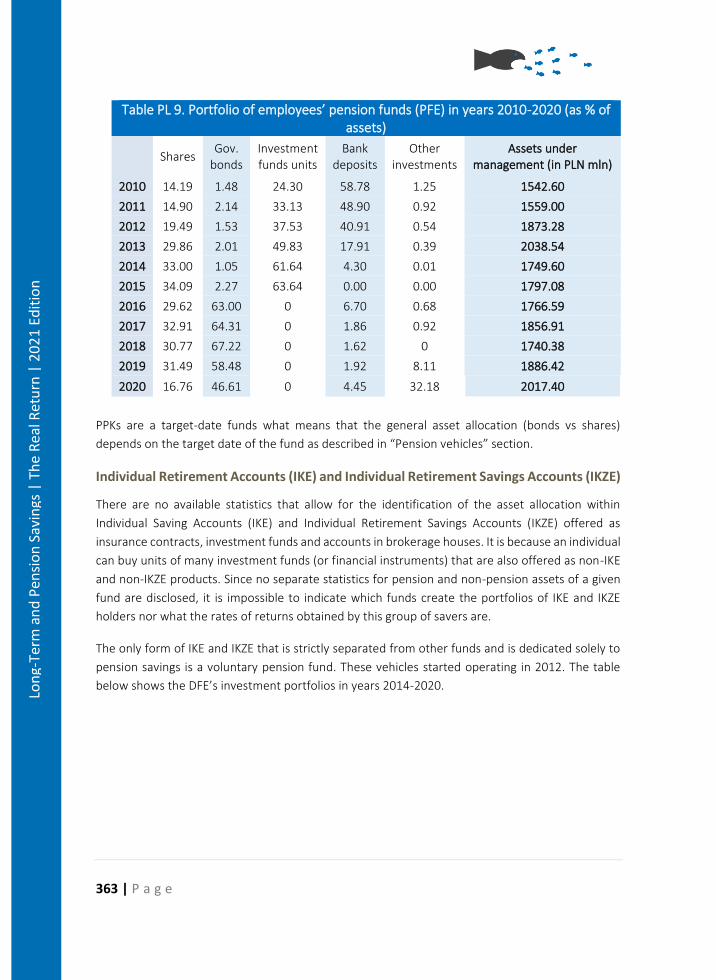
363 | P a g e
Lon
g-Te
rm a
nd
Pen
sio
n S
avin
gs |
Th
e R
eal R
etu
rn |
20
21
Edit
ion
Table PL 9. Portfolio of employees’ pension funds (PFE) in years 2010-2020 (as % of assets)
Shares Gov.
bonds Investment funds units
Bank deposits
Other investments
Assets under management (in PLN mln)
2010 14.19 1.48 24.30 58.78 1.25 1542.60
2011 14.90 2.14 33.13 48.90 0.92 1559.00
2012 19.49 1.53 37.53 40.91 0.54 1873.28
2013 29.86 2.01 49.83 17.91 0.39 2038.54
2014 33.00 1.05 61.64 4.30 0.01 1749.60
2015 34.09 2.27 63.64 0.00 0.00 1797.08
2016 29.62 63.00 0 6.70 0.68 1766.59
2017 32.91 64.31 0 1.86 0.92 1856.91
2018 30.77 67.22 0 1.62 0 1740.38
2019 31.49 58.48 0 1.92 8.11 1886.42
2020 16.76 46.61 0 4.45 32.18 2017.40
PPKs are a target-date funds what means that the general asset allocation (bonds vs shares)
depends on the target date of the fund as described in “Pension vehicles” section.
Individual Retirement Accounts (IKE) and Individual Retirement Savings Accounts (IKZE)
There are no available statistics that allow for the identification of the asset allocation within
Individual Saving Accounts (IKE) and Individual Retirement Savings Accounts (IKZE) offered as
insurance contracts, investment funds and accounts in brokerage houses. It is because an individual
can buy units of many investment funds (or financial instruments) that are also offered as non-IKE
and non-IKZE products. Since no separate statistics for pension and non-pension assets of a given
fund are disclosed, it is impossible to indicate which funds create the portfolios of IKE and IKZE
holders nor what the rates of returns obtained by this group of savers are.
The only form of IKE and IKZE that is strictly separated from other funds and is dedicated solely to
pension savings is a voluntary pension fund. These vehicles started operating in 2012. The table
below shows the DFE’s investment portfolios in years 2014-2020.
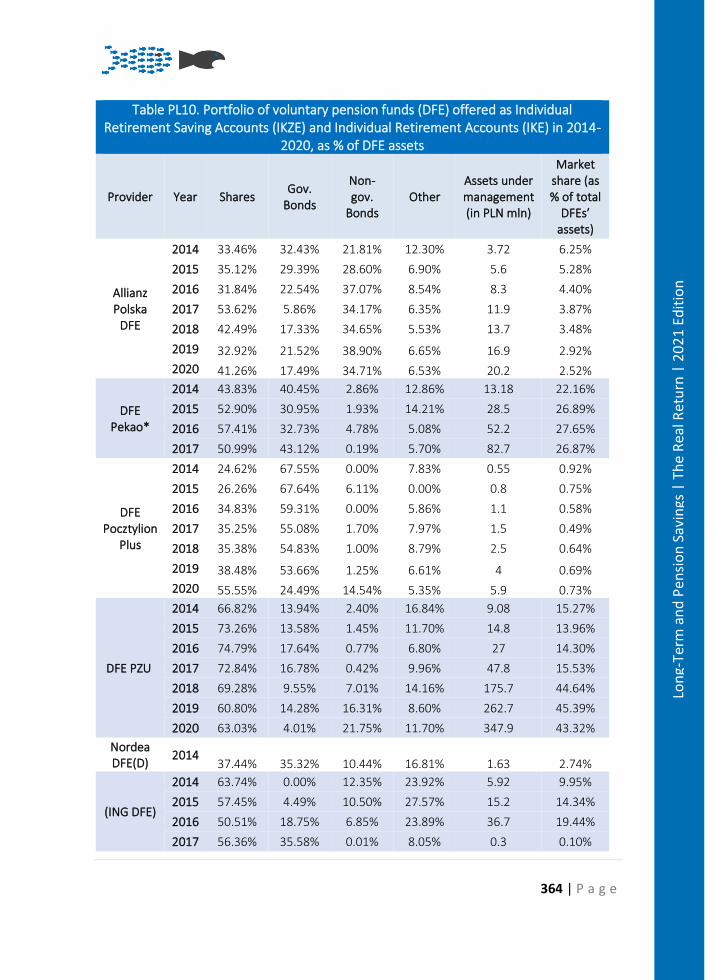
364 | P a g e
Lon
g-Te
rm a
nd
Pen
sio
n S
avin
gs |
Th
e R
eal R
etu
rn |
20
21
Edit
ion
Table PL10. Portfolio of voluntary pension funds (DFE) offered as Individual Retirement Saving Accounts (IKZE) and Individual Retirement Accounts (IKE) in 2014-
2020, as % of DFE assets
Provider Year Shares Gov.
Bonds
Non-gov.
Bonds Other
Assets under management (in PLN mln)
Market share (as % of total
DFEs’ assets)
Allianz Polska
DFE
2014 33.46% 32.43% 21.81% 12.30% 3.72 6.25%
2015 35.12% 29.39% 28.60% 6.90% 5.6 5.28%
2016 31.84% 22.54% 37.07% 8.54% 8.3 4.40%
2017 53.62% 5.86% 34.17% 6.35% 11.9 3.87%
2018 42.49% 17.33% 34.65% 5.53% 13.7 3.48%
2019 32.92% 21.52% 38.90% 6.65% 16.9 2.92%
2020 41.26% 17.49% 34.71% 6.53% 20.2 2.52%
DFE Pekao*
2014 43.83% 40.45% 2.86% 12.86% 13.18 22.16%
2015 52.90% 30.95% 1.93% 14.21% 28.5 26.89%
2016 57.41% 32.73% 4.78% 5.08% 52.2 27.65%
2017 50.99% 43.12% 0.19% 5.70% 82.7 26.87%
DFE Pocztylion
Plus
2014 24.62% 67.55% 0.00% 7.83% 0.55 0.92%
2015 26.26% 67.64% 6.11% 0.00% 0.8 0.75%
2016 34.83% 59.31% 0.00% 5.86% 1.1 0.58%
2017 35.25% 55.08% 1.70% 7.97% 1.5 0.49%
2018 35.38% 54.83% 1.00% 8.79% 2.5 0.64%
2019 38.48% 53.66% 1.25% 6.61% 4 0.69%
2020 55.55% 24.49% 14.54% 5.35% 5.9 0.73%
DFE PZU
2014 66.82% 13.94% 2.40% 16.84% 9.08 15.27%
2015 73.26% 13.58% 1.45% 11.70% 14.8 13.96%
2016 74.79% 17.64% 0.77% 6.80% 27 14.30%
2017 72.84% 16.78% 0.42% 9.96% 47.8 15.53%
2018 69.28% 9.55% 7.01% 14.16% 175.7 44.64%
2019 60.80% 14.28% 16.31% 8.60% 262.7 45.39%
2020 63.03% 4.01% 21.75% 11.70% 347.9 43.32%
Nordea DFE(D)
2014 37.44% 35.32% 10.44% 16.81% 1.63 2.74%
(ING DFE)
2014 63.74% 0.00% 12.35% 23.92% 5.92 9.95%
2015 57.45% 4.49% 10.50% 27.57% 15.2 14.34%
2016 50.51% 18.75% 6.85% 23.89% 36.7 19.44%
2017 56.36% 35.58% 0.01% 8.05% 0.3 0.10%
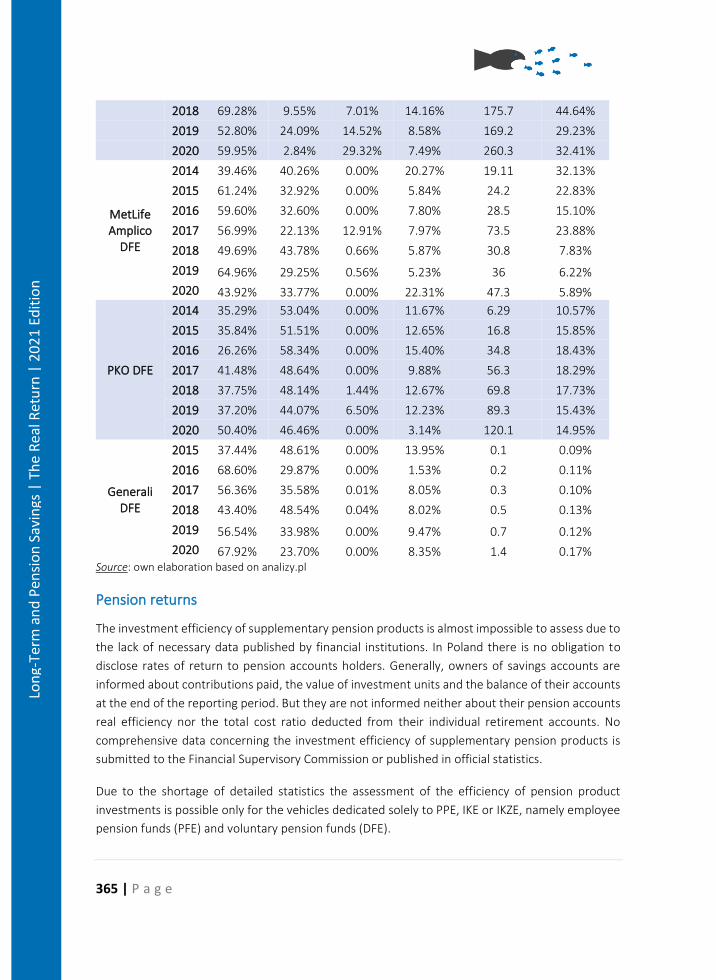
365 | P a g e
Lon
g-Te
rm a
nd
Pen
sio
n S
avin
gs |
Th
e R
eal R
etu
rn |
20
21
Edit
ion
2018 69.28% 9.55% 7.01% 14.16% 175.7 44.64%
2019 52.80% 24.09% 14.52% 8.58% 169.2 29.23%
2020 59.95% 2.84% 29.32% 7.49% 260.3 32.41%
MetLife Amplico
DFE
2014 39.46% 40.26% 0.00% 20.27% 19.11 32.13%
2015 61.24% 32.92% 0.00% 5.84% 24.2 22.83%
2016 59.60% 32.60% 0.00% 7.80% 28.5 15.10%
2017 56.99% 22.13% 12.91% 7.97% 73.5 23.88%
2018 49.69% 43.78% 0.66% 5.87% 30.8 7.83%
2019 64.96% 29.25% 0.56% 5.23% 36 6.22%
2020 43.92% 33.77% 0.00% 22.31% 47.3 5.89%
PKO DFE
2014 35.29% 53.04% 0.00% 11.67% 6.29 10.57%
2015 35.84% 51.51% 0.00% 12.65% 16.8 15.85%
2016 26.26% 58.34% 0.00% 15.40% 34.8 18.43%
2017 41.48% 48.64% 0.00% 9.88% 56.3 18.29%
2018 37.75% 48.14% 1.44% 12.67% 69.8 17.73%
2019 37.20% 44.07% 6.50% 12.23% 89.3 15.43%
2020 50.40% 46.46% 0.00% 3.14% 120.1 14.95%
Generali DFE
2015 37.44% 48.61% 0.00% 13.95% 0.1 0.09%
2016 68.60% 29.87% 0.00% 1.53% 0.2 0.11%
2017 56.36% 35.58% 0.01% 8.05% 0.3 0.10%
2018 43.40% 48.54% 0.04% 8.02% 0.5 0.13%
2019 56.54% 33.98% 0.00% 9.47% 0.7 0.12%
2020 67.92% 23.70% 0.00% 8.35% 1.4 0.17% Source: own elaboration based on analizy.pl
Pension returns
The investment efficiency of supplementary pension products is almost impossible to assess due to
the lack of necessary data published by financial institutions. In Poland there is no obligation to
disclose rates of return to pension accounts holders. Generally, owners of savings accounts are
informed about contributions paid, the value of investment units and the balance of their accounts
at the end of the reporting period. But they are not informed neither about their pension accounts
real efficiency nor the total cost ratio deducted from their individual retirement accounts. No
comprehensive data concerning the investment efficiency of supplementary pension products is
submitted to the Financial Supervisory Commission or published in official statistics.
Due to the shortage of detailed statistics the assessment of the efficiency of pension product
investments is possible only for the vehicles dedicated solely to PPE, IKE or IKZE, namely employee
pension funds (PFE) and voluntary pension funds (DFE).
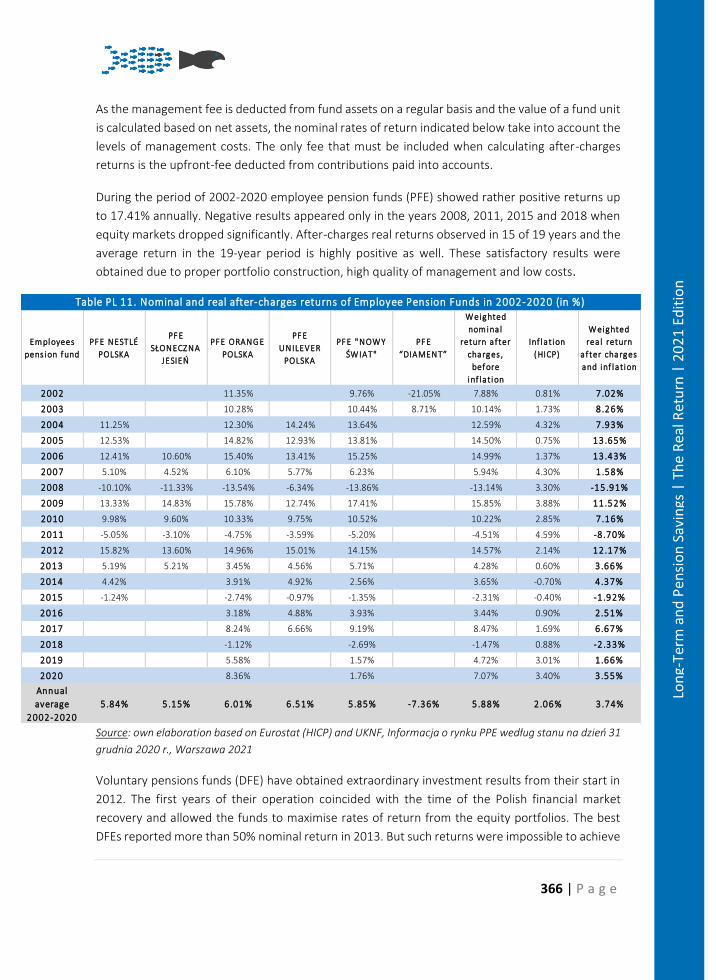
366 | P a g e
Lon
g-Te
rm a
nd
Pen
sio
n S
avin
gs |
Th
e R
eal R
etu
rn |
20
21
Edit
ion
As the management fee is deducted from fund assets on a regular basis and the value of a fund unit
is calculated based on net assets, the nominal rates of return indicated below take into account the
levels of management costs. The only fee that must be included when calculating after-charges
returns is the upfront-fee deducted from contributions paid into accounts.
During the period of 2002-2020 employee pension funds (PFE) showed rather positive returns up
to 17.41% annually. Negative results appeared only in the years 2008, 2011, 2015 and 2018 when
equity markets dropped significantly. After-charges real returns observed in 15 of 19 years and the
average return in the 19-year period is highly positive as well. These satisfactory results were
obtained due to proper portfolio construction, high quality of management and low costs.
Source: own elaboration based on Eurostat (HICP) and UKNF, Informacja o rynku PPE według stanu na dzień 31
grudnia 2020 r., Warszawa 2021
Voluntary pensions funds (DFE) have obtained extraordinary investment results from their start in
2012. The first years of their operation coincided with the time of the Polish financial market
recovery and allowed the funds to maximise rates of return from the equity portfolios. The best
DFEs reported more than 50% nominal return in 2013. But such returns were impossible to achieve
Em ployees
pens ion f und
PF E NESTLÉ
POLSKA
PF E
SŁONECZ NA
JESIEŃ
PF E ORANG E
POLSKA
PF E
UNILEVER
POLSKA
PF E " NOW Y
ŚW IAT"
PF E
“DIAMENT”
W eighted
nom ina l
return a f ter
charges ,
bef ore
inf la tion
Inf la tion
( HICP)
W eighted
rea l return
a f ter charges
and inf la tion
2002 11.35% 9.76% -21.05% 7.88% 0.81% 7.02%
2003 10.28% 10.44% 8.71% 10.14% 1.73% 8.26%
2004 11.25% 12.30% 14.24% 13.64% 12.59% 4.32% 7.93%
2005 12.53% 14.82% 12.93% 13.81% 14.50% 0.75% 13.65%
2006 12.41% 10.60% 15.40% 13.41% 15.25% 14.99% 1.37% 13.43%
2007 5.10% 4.52% 6.10% 5.77% 6.23% 5.94% 4.30% 1.58%
2008 -10.10% -11.33% -13.54% -6.34% -13.86% -13.14% 3.30% -15.91%
2009 13.33% 14.83% 15.78% 12.74% 17.41% 15.85% 3.88% 11.52%
2010 9.98% 9.60% 10.33% 9.75% 10.52% 10.22% 2.85% 7.16%
2011 -5.05% -3.10% -4.75% -3.59% -5.20% -4.51% 4.59% -8.70%
2012 15.82% 13.60% 14.96% 15.01% 14.15% 14.57% 2.14% 12.17%
2013 5.19% 5.21% 3.45% 4.56% 5.71% 4.28% 0.60% 3.66%
2014 4.42% 3.91% 4.92% 2.56% 3.65% -0.70% 4.37%
2015 -1.24% -2.74% -0.97% -1.35% -2.31% -0.40% -1.92%
2016 3.18% 4.88% 3.93% 3.44% 0.90% 2.51%
2017 8.24% 6.66% 9.19% 8.47% 1.69% 6.67%
2018 -1.12% -2.69% -1.47% 0.88% -2.33%
2019 5.58% 1.57% 4.72% 3.01% 1.66%
2020 8.36% 1.76% 7.07% 3.40% 3.55%
Annual
average
2002-2020
5.84% 5.15% 6.01% 6.51% 5.85% -7.36% 5.88% 2.06% 3.74%
Table PL 11. Nominal and real after-charges returns of Employee Pension Funds in 2002-2020 (in %)
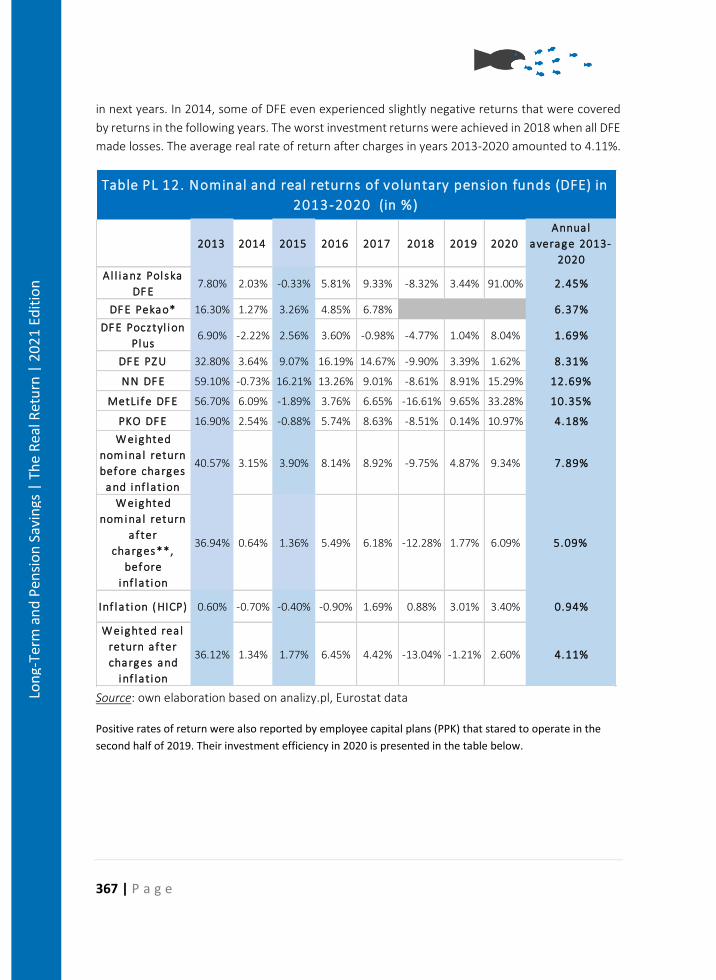
367 | P a g e
Lon
g-Te
rm a
nd
Pen
sio
n S
avin
gs |
Th
e R
eal R
etu
rn |
20
21
Edit
ion
in next years. In 2014, some of DFE even experienced slightly negative returns that were covered
by returns in the following years. The worst investment returns were achieved in 2018 when all DFE
made losses. The average real rate of return after charges in years 2013-2020 amounted to 4.11%.
Source: own elaboration based on analizy.pl, Eurostat data
Positive rates of return were also reported by employee capital plans (PPK) that stared to operate in the
second half of 2019. Their investment efficiency in 2020 is presented in the table below.
2013 2014 2015 2016 2017 2018 2019 2020
Annua l
average 2013-
2020
Al l i anz Pol ska
DF E7.80% 2.03% -0.33% 5.81% 9.33% -8.32% 3.44% 91.00% 2.45%
DF E Pekao* 16.30% 1.27% 3.26% 4.85% 6.78% 6.37%
DF E Pocztyl ion
Plus6.90% -2.22% 2.56% 3.60% -0.98% -4.77% 1.04% 8.04% 1.69%
DF E PZ U 32.80% 3.64% 9.07% 16.19% 14.67% -9.90% 3.39% 1.62% 8.31%
NN DF E 59.10% -0.73% 16.21% 13.26% 9.01% -8.61% 8.91% 15.29% 12.69%
MetLi f e DF E 56.70% 6.09% -1.89% 3.76% 6.65% -16.61% 9.65% 33.28% 10.35%
PKO DF E 16.90% 2.54% -0.88% 5.74% 8.63% -8.51% 0.14% 10.97% 4.18%
W eighted
nom ina l return
bef ore charges
and inf la tion
40.57% 3.15% 3.90% 8.14% 8.92% -9.75% 4.87% 9.34% 7.89%
W eighted
nom ina l return
a f ter
charges**,
bef ore
inf la tion
36.94% 0.64% 1.36% 5.49% 6.18% -12.28% 1.77% 6.09% 5.09%
Inf la tion ( HICP) 0.60% -0.70% -0.40% -0.90% 1.69% 0.88% 3.01% 3.40% 0.94%
W eighted rea l
return a f ter
charges and
inf la tion
36.12% 1.34% 1.77% 6.45% 4.42% -13.04% -1.21% 2.60% 4.11%
Table PL 12. Nominal and real returns of voluntary pension funds (DFE) in
2013-2020 (in %)
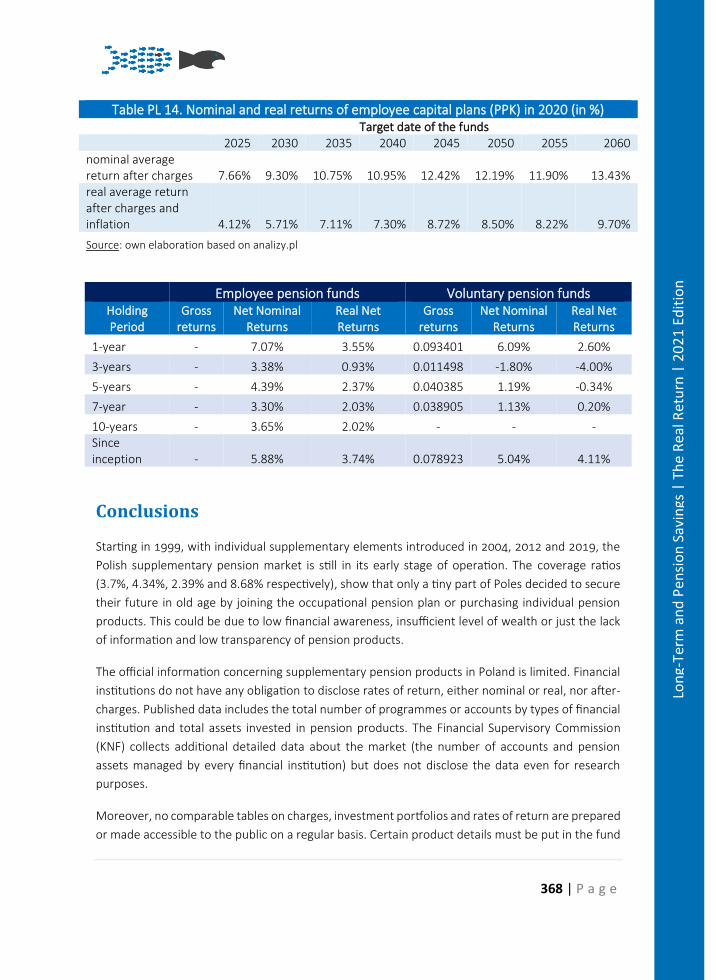
368 | P a g e
Lon
g-Te
rm a
nd
Pen
sio
n S
avin
gs |
Th
e R
eal R
etu
rn |
20
21
Edit
ion
Table PL 14. Nominal and real returns of employee capital plans (PPK) in 2020 (in %)
Target date of the funds 2025 2030 2035 2040 2045 2050 2055 2060 nominal average return after charges 7.66% 9.30% 10.75% 10.95% 12.42% 12.19% 11.90% 13.43% real average return after charges and inflation 4.12% 5.71% 7.11% 7.30% 8.72% 8.50% 8.22% 9.70%
Source: own elaboration based on analizy.pl
Employee pension funds Voluntary pension funds Holding Period
Gross returns
Net Nominal Returns
Real Net Returns
Gross returns
Net Nominal Returns
Real Net Returns
1-year - 7.07% 3.55% 0.093401 6.09% 2.60%
3-years - 3.38% 0.93% 0.011498 -1.80% -4.00%
5-years - 4.39% 2.37% 0.040385 1.19% -0.34%
7-year - 3.30% 2.03% 0.038905 1.13% 0.20%
10-years - 3.65% 2.02% - - - Since inception - 5.88% 3.74% 0.078923 5.04% 4.11%
Conclusions
Starting in 1999, with individual supplementary elements introduced in 2004, 2012 and 2019, the
Polish supplementary pension market is still in its early stage of operation. The coverage ratios
(3.7%, 4.34%, 2.39% and 8.68% respectively), show that only a tiny part of Poles decided to secure
their future in old age by joining the occupational pension plan or purchasing individual pension
products. This could be due to low financial awareness, insufficient level of wealth or just the lack
of information and low transparency of pension products.
The official information concerning supplementary pension products in Poland is limited. Financial
institutions do not have any obligation to disclose rates of return, either nominal or real, nor after-
charges. Published data includes the total number of programmes or accounts by types of financial
institution and total assets invested in pension products. The Financial Supervisory Commission
(KNF) collects additional detailed data about the market (the number of accounts and pension
assets managed by every financial institution) but does not disclose the data even for research
purposes.
Moreover, no comparable tables on charges, investment portfolios and rates of return are prepared
or made accessible to the public on a regular basis. Certain product details must be put in the fund
369 | P a g e
Lon
g-Te
rm a
nd
Pen
sio
n S
avin
gs |
Th
e R
eal R
etu
rn |
20
21
Edit
ion
statutes or in the terms of a contract, but they are hardly comparable between providers. The Polish
supplementary pension market is highly opaque, especially in terms of costs and returns.
Among a wide variety of pension vehicles, there are only a few products with sufficient official
statistics to assess their investment efficiency: employee pension funds (PFE) managed by
employees’ pension societies, voluntary pension funds (DFE) managed by general pension societies
(PTE) and employee capital plans (PPK). Other products are more complex due to the fact that
supplementary pension savings are reported together with non-pension pots. That makes it
impossible to analyse the portfolio allocations and rates of return for individual pension products
separately.
After-charges returns in the “youngest” pension products offered as a form of voluntary pension
fund (DFE) were extremely high in 2013, both in nominal and real terms, and offered relatively high
average real rate of return amounting to 4.11% in the period 2013-2020. The second type of
products analysed, namely employee pensions funds (PFE), delivered significant profits as well, with
the annual average real return of 3.74%. But other pension vehicles may turn out not to be so
beneficial, especially when a wide variety of fees and charges are deducted from contributions
which are paid to the accounts.
To sum up, the disclosure policy in supplementary pension products in Poland is not saver oriented.
Individuals are entrusting their money to the institutions, but they are not getting clear information
on charges and investment returns. Keeping in mind the pure DC character of pension vehicles and
the lack of any guarantees, this is a huge risk for savers. All this may lead to significant failures on
the pension market in its very early stages of development. In the future, some changes in the law
should be introduced, such as imposing an obligation on financial institutions to disclose rates of
return to pension accounts holders. Moreover, there is an urgent need for a full list or even ranking
of supplementary pension products, both occupational and individual ones, published by
independent body. This would help individuals make well-informed decisions and avoid buying
inappropriate retirement products.
370 | P a g e
Lon
g-Te
rm a
nd
Pen
sio
n S
avin
gs |
Th
e R
eal R
etu
rn |
20
21
Edit
ion
References
• Biuletyn Kwartalny. Rynek PFE 4/2017, UNKF, Warszawa 2018,
• Biuletyn roczny. Rynek PPE 2010, UKNF, Warszawa 2011.
• Biuletyn roczny. Rynek PPE 2011, UKNF, Warszawa 2012.
• Biuletyn roczny. Rynek PPE 2012, UKNF, Warszawa 2013.
• Biuletyn roczny. Rynek PPE 2013, UKNF, Warszawa 2014.
• Biuletyn roczny. Rynek PPE 2014, UKNF, Warszawa 2015.
• Biuletyn roczny. Rynek PPE 2015, UKNF, Warszawa 2016.
• Biuletyn Roczny. Rynek PPE 2016, UKNF, Warszawa 2017.
• Biuletyn Roczny. Rynek PPE 2017, UKNF, Warszawa 2018.
• Chłoń-Domińczak A., Strzelecki P., The minimum pension as an instrument of poverty
protection in the defined contribution pension system – an example of Poland, “Journal of
Pension Economics and Finance”, Vol. 12, Issue 3, July 2013.
• European Commission, The 2021 Ageing Report: Economic and Budgetary Projections for
the EU Member States (2019-2070), Luxembourg, 2021,
https://ec.europa.eu/info/sites/default/files/economy-finance/ip148_en.pdf
Indywidualne konta emerytalne oraz indywidualne konta zabezpieczenia emerytalnego w
2018 roku, UKNF, Warszawa 2019,
• Indywidualne konta emerytalne oraz indywidualne konta zabezpieczenia emerytalnego w
2017 roku, UKNF, Warszawa 2018.
• Indywidualne konta emerytalne oraz indywidualne konta zabezpieczenia emerytalnego w
2016 roku, UKNF, Warszawa 2017.
• Indywidualne konta emerytalne oraz indywidualne konta zabezpieczenia emerytalnego w
2015 roku, UKNF, Warszawa 2016.
• Indywidualne konta emerytalne oraz indywidualne konta zabezpieczenia emerytalnego w
2013 roku, UKNF, Warszawa 2014.
• Indywidualne konta emerytalne w 2011 roku, UKNF, Warszawa 2012.
• Informacja o indywidualnych kontach emerytalnych sporządzona na podstawie danych
liczbowych za 2006 r., UKNF, Warszawa 2007.
• Informacje liczbowe o rynku IKZE za 2018 rok, KNF, Warszawa 2019.
• Pracownicze programy emerytalne w 2016 roku, UKNF, Warszawa 2017.
• Pracownicze programy emerytalne w 2017 roku, UKNF, Warszawa 2018.
• Pracownicze programy emerytalne w 2018 roku, UKNF, Warszawa 2019.
• Rocznik Ubezpieczeń i Funduszy Emerytalnych 2004, UKNUiFE, Warszawa 2005.
• System emerytalny w Polsce, Izba Gospodarcza Towarzystw Emerytalnych.
• Sprawozdanie z działalności Urzędu Komisji Nadzoru Finansowego oraz Komisji Nadzoru
Finansowego w 2019 roku, UKNF, Warszawa 2020,
371 | P a g e
Lon
g-Te
rm a
nd
Pen
sio
n S
avin
gs |
Th
e R
eal R
etu
rn |
20
21
Edit
ion
https://www.knf.gov.pl/knf/pl/komponenty/img/SPRAWOZDANIE_ROCZNE_UKNF_ORAZ
_KNF_2019_69795.pdf
• Zbiorcza informacja statystyczna dotycząca funkcjonowania PPK w IV kwartale 2019 roku,
UKNF, Warszawa 2020,
https://www.knf.gov.pl/knf/pl/komponenty/img/WWW_Art52_UoPPK_2019_4Q_69283.
xlsx
• Informacje liczbowe o IKE za 2019 r., UKNF, Warszawa 2020,
https://www.knf.gov.pl/knf/pl/komponenty/img/IKE_122019_69075.xlsx
• Informacje liczbowe o IKZE za 2019 r., UKNF, Warszawa 2020,
https://www.knf.gov.pl/knf/pl/komponenty/img/IKZE_122019_69079.xlsx
• Rutecka-Góra J., Bielawska K., Hadryan M., Kowalczyk-Rólczyńska P., Pieńkowska-
Kamieniecka S., Zrozumiałość, przejrzystość i efektywność indywidualnych produktów
emerytalnych w Polsce, Oficyna Wydawnicza SGH, Warszawa 2020.
• Informacja o stanie rynku emerytalnego w Polsce na koniec 2020 r., UKNF, Warszawa
2021, Informacja_o_stanie_rynku_emerytalnego_w_Polsce_na_koniec_2020_r.pdf
(knf.gov.pl)
• Informacje o IKE według stanu na 31 grudnia 2020 roku, UKNF, Warszawa 2021,
https://www.knf.gov.pl/knf/pl/komponenty/img/IKE_122020www_72709.xlsx
• Informacje o IKZE według stanu na 31 grudnia 2020 roku, UKNF, Warszawa 2021,
https://www.knf.gov.pl/knf/pl/komponenty/img/IKZE_122020www_72711.xlsx
• 14. zestawienie średnich opłat za zarządzanie funduszami przez Instytucje Finansowe
oferujące PPK, PFR Portal, Warszawa 2020, https://www.mojeppk.pl/pliki/repozytorium-
plikow/materialy-do-pobrania/pdf/zestawienie_15122020.pdf
• Kwartalna informacja dotycząca PPK (IV kwartał 2020), UKNF,
https://www.knf.gov.pl/knf/pl/komponenty/img/Informacja_dot_PPK-
_IV_kwartal_2020_73072.xlsx
• Informacja o rynku PPE według stanu na dzień 31 grudnia 2020 r., UKNF, Warszawa
2021, https://www.knf.gov.pl/knf/pl/komponenty/img/Informacja_o_rynku
PPE_wg_stanu_na_31_12_2020_74307.xls
• www.analizy.pl
372 | P a g e
Lon
g-Te
rm a
nd
Pen
sio
n S
avin
gs |
Th
e R
eal R
etu
rn |
20
21
Edit
ion
Pension Savings: The Real Return 2021 Edition
Country Case: Romania
Rezumat
Populaţia României emigrează, scade şi îmbătrâneşte într-un ritm accelerat, ceea ce pune presiune semnificativă asupra sistemului de pensii publice. În 2019 au fost aduse modificări pentru formula de calcul a pensiilor publice, ce a intrat în vigoare în septembrie 2021. Pensiile pentru limită de vârstă vor fi recalculate însa nu vor aduce nicio scădere nivelului de pensii având în vedere că recalcularea va opera doar în favoarea beneficiarului (dacă suma rezultată este mai mare).
Deşi contribuţiile la fondurile de pensii administrate privat (ocupaţionale, pilonul II) sunt obligatorii, fără a distinge forma de angajare (salariaţi sau liber-profesionisti), cetăţenii români trebuie motivaţi să investească mai mult în planuri voluntare de pensie (Pilonul III).
Randamentele reale – calculate în RON - ale planurilor de pensii din România au înregistrat o evoluţie pozitivă până la sfârşitul anului 2020, fiind chiar printe cele mai bune în comparaţie cu alte sisteme de pensii private analizate în acest raport. Această evoluţie se datorează şi faptului că investiţiile au avut loc după căderea, sau îin timpul căderii, indicilor bursieri ca urmare a crizei globale financiare din 2007-2008, astfel că fondurile au reuşit să prindă ciclul de redresare şi creştere a pieţelor de acţiuni si obligaţiuni. Cu toate acestea, ajustate anual cu ratele de schimb valutar în euro, randamentele fondurilor private de pensii din România sunt mai mici. Aceasta ajustare a fost facută pentru a facilita compararea profiturilor obţinute din investiţii cu alte jurisdictii din cadrul Uniunii Economice şi Monetare.
Compunerea portofoliilor ambelor tipuri de fonduri administrate privat este aproape identică şi, prin urmare, generează randamente brute similare. Randamentul net al Pilonului III este influenţat în mod semnificativ de structura costurilor substanţial mai mari (aproape de 4 ori mai mari) şi astfel, pe termen lung, va genera randamente mai mici decât cele aferente Pilonului II. În ansamblu, randamentele produselor de pensie din Pilonul II şi Pilonul III au ramas pozitive şi deasupra nivelului inflaţiei.
O preocupare majoră o ridică şi posibilitatea adoptării unei decizii politice de renunţare la Pilonul II. Având în vedere presiunea asupra sistemelor publice de pensii, fondurile sau schemele de pensii private vor deveni din ce în ce mai importante pentru compunerea venitului după pensionare.
Asociaţia Utilizatorilor Români de Servicii Financiare (AURSF), membră BETTER FINANCE, a atras în permanenţă atenţia asupra riscurilor pe care le presupune o asemenea decizie. Ȋn plus, AURSF a criticat vehement decizia autorităţilor de a reduce contribuţiile virate în contul participanţilor de la 5,1% la 3,75%. De asemenea, AURSF consideră că trebuie identificate măsuri care să încurajeze opţiunea asumată a participanţilor pentru unul dintre fondurile administrate privat (în prezent, numărul celor care optează este extrem de redus, participanţii fiind distribuiţi printr-un mecanism aleatoriu).
373 | P a g e
Lon
g-Te
rm a
nd
Pen
sio
n S
avin
gs |
Th
e R
eal R
etu
rn |
20
21
Edit
ion
Summary
Romania’s population is rapidly decreasing, aging, and migrating, which puts considerable pressure
on the State pension system. In 2019, new changes on calculating old-age pensions from PAYG pillar
have been adopted effective since September 2021. All old-age pension will be recalculated in 2021
and no pensions will decrease, because changes will be made to pensions only if the recalculated
amount is more favourable.
Although Romanian privately managed (occupational) pension funds are mandatory regardless of
the work form (employees and self-employed), Romanian households must be further incentivised
to save in voluntary pension plans (Pillar III). Romanian private pensions’ real net returns –
computed in RON – recorded a positive evolution by the end of 2020, being fact among the best
performing in comparison with other private pension systems analysed in this report. This
performance is also due to the fact that investments started after, or during, the fall of capital
market indices due to the 2007-2009 global financial crisis, thus pension funds managed to capture
the recovery and growth path of equity and stock markets. Nevertheless, adjusted on an annual
basis with the Euro currency conversion rate, the returns of Romanian private pensions are lower.
This adjustment was made to enable a comparison of returns with other jurisdictions part of the
Economic and Monetary Union.
Both schemes (occupational and private) have almost identical portfolio structures and thus
generate similar gross returns. However, Pillar III net performance is significantly influenced by the
high fee structure (almost 4-times higher) and will, in the long-run, deliver lower returns than Pillar
II peers. Overall, the real return of pension funds in Pillar II as well as Pillar III are still positive and
above the inflation.
A major concern was generated by the possibility of a political decision to abandon the occupational
pensions pillar. Considering the growing pressure faced by public pension systems, private pensions
will become more and more important for the composition of retirement income. The Romanian
Financial Services Users’ Association (AURSF), member of BETTER FINANCE, has constantly drawn
the attention to the risks entailed by such a decision. Moreover, AURSF has firmly criticised the
public authorities’ decision to reduce the contribution transfer rate to Pillar II from 5.1% to 3.75%.
In addition, AURSF considers that measures incentivising an active choice of savers with regards to
a mandatory privately administered funds must be found (currently, the number of those making
an active choice is considerably low, the rest being randomly allocated).
Introduction
The Romanian old-age pension system is based on the World Bank’s multi-pillar model, which
consists of three main pillars:
• Pillar I – State pension organized as a mandatory Pay-As-You-Go (PAYG) scheme;
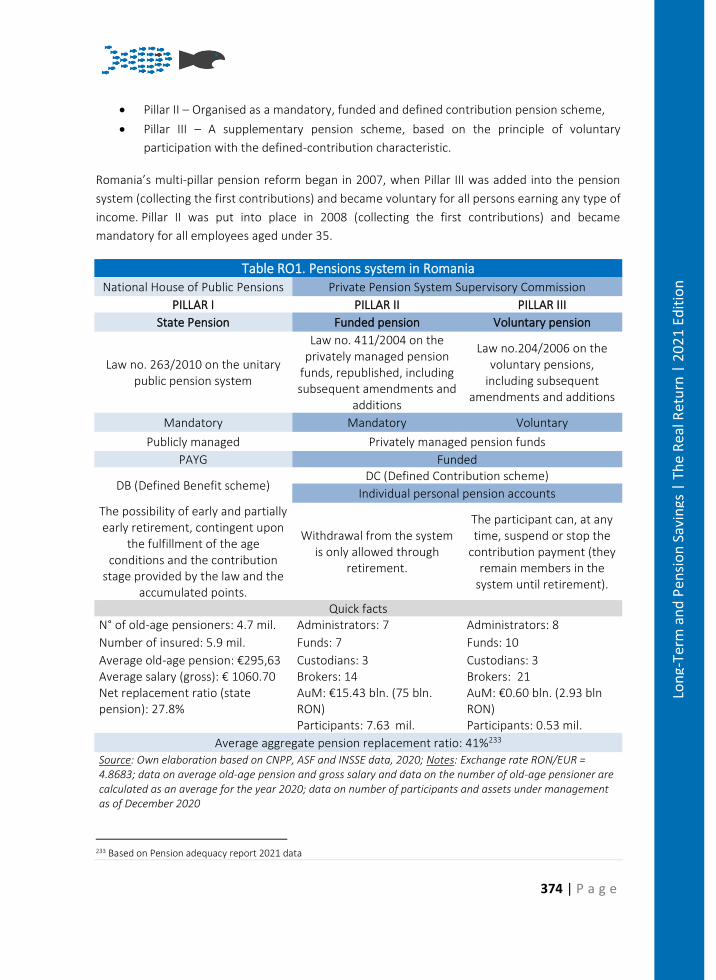
374 | P a g e
Lon
g-Te
rm a
nd
Pen
sio
n S
avin
gs |
Th
e R
eal R
etu
rn |
20
21
Edit
ion
• Pillar II – Organised as a mandatory, funded and defined contribution pension scheme,
• Pillar III – A supplementary pension scheme, based on the principle of voluntary
participation with the defined-contribution characteristic.
Romania’s multi-pillar pension reform began in 2007, when Pillar III was added into the pension
system (collecting the first contributions) and became voluntary for all persons earning any type of
income. Pillar II was put into place in 2008 (collecting the first contributions) and became
mandatory for all employees aged under 35.
Table RO1. Pensions system in Romania National House of Public Pensions Private Pension System Supervisory Commission
PILLAR I PILLAR II PILLAR III
State Pension Funded pension Voluntary pension
Law no. 263/2010 on the unitary public pension system
Law no. 411/2004 on the privately managed pension
funds, republished, including subsequent amendments and
additions
Law no.204/2006 on the voluntary pensions,
including subsequent amendments and additions
Mandatory Mandatory Voluntary
Publicly managed Privately managed pension funds
PAYG Funded
DB (Defined Benefit scheme) DC (Defined Contribution scheme)
Individual personal pension accounts
The possibility of early and partially early retirement, contingent upon
the fulfillment of the age conditions and the contribution
stage provided by the law and the accumulated points.
Withdrawal from the system is only allowed through
retirement.
The participant can, at any time, suspend or stop the
contribution payment (they remain members in the
system until retirement).
Quick facts N° of old-age pensioners: 4.7 mil. Administrators: 7 Administrators: 8
Number of insured: 5.9 mil. Funds: 7 Funds: 10
Average old-age pension: €295,63 Custodians: 3 Custodians: 3 Average salary (gross): € 1060.70 Brokers: 14 Brokers: 21 Net replacement ratio (state pension): 27.8%
AuM: €15.43 bln. (75 bln. RON)
AuM: €0.60 bln. (2.93 bln RON)
Participants: 7.63 mil. Participants: 0.53 mil.
Average aggregate pension replacement ratio: 41%233 Source: Own elaboration based on CNPP, ASF and INSSE data, 2020; Notes: Exchange rate RON/EUR = 4.8683; data on average old-age pension and gross salary and data on the number of old-age pensioner are calculated as an average for the year 2020; data on number of participants and assets under management as of December 2020
233 Based on Pension adequacy report 2021 data
375 | P a g e
Lon
g-Te
rm a
nd
Pen
sio
n S
avin
gs |
Th
e R
eal R
etu
rn |
20
21
Edit
ion
The overall coverage of Pillar II, measured as a ratio between the number of participants and the
economically active population, was almost entire working population in 2019, while Pillar III
covered only 6% of the economically active population. Thus, we can expect than future pension
income stream will be influenced mostly by Pillar II pensions, while Pillar III will generate an
insignificant part of individuals income during retirement.
Summary Return Table
Holding Period
Pillar II Pillar III
Nominal Real Nominal Real
1 year 4.39% 2.59% 2.79% 0.99%
3 years 4.76% 1.81% 3.29% 0.35%
7 years 4.36% 2.68% 3.21% 1.53%
10 years 5.04% 2.95% 3.99% 1.91%
Since inception 5.48% 2.41% 2.56% -0.85% Source: BETTER FINANCE own composition, 2021
Pillar I – State Pensions
The first pillar of the Romanian pension system is organized on the Pay-as-You-Go (PAYG) principle
of redistribution, being funded on an ongoing basis and functioning on the defined-benefit rule.
The state (through the National House of Public Pensions, a public institution constituted for this
purpose in particular234) collects the social pension contribution from the contributors235 and
immediately pays the pensions to the current retirees.236 State pension in Romania is also based on
the principle of solidarity between generations and gives the right to pension entitlement upon
retirement age, following a minimum contribution period (15 years), as provided by law.
This compulsory system is closely connected to the economic activity and income of citizens. It is
88%237 financed from social security contributions made by both employers and by employees,
while generally consuming the biggest part (or entirety) of the social security budget.
Social security contributions are paid to the State’s social security budget at a rate of 20.8% of
payroll for employers and 10.5% of income (gross earnings) for employees. It should be noted that
since 1 October 2014, the employer’s contribution ratio has been reduced to 15.8%. This pillar is
234 In Romanian, „Casa Naţională de Pensii Publice“, hereinafter CNPP, as per Article 4.2 read in conjunction with Article 52 (Chapter IV, Section I) of Law no. 263/2010: http://legislatie.just.ro/Public/DetaliiDocument/124530. 235 According to the principle of contributivity, as per Article 2.c) of Law no. 263/2010. 236 According to the principle of redistribution provided in Article 2.e) of Law no. 263/2010. 237 In 2017, 75% of the budget was constituted from social security contributions and 25% from the consolidated state budget – see Annex no. 1/03 to Law no.7/2017 concerning the social security budget for 2017; in 2018, 88% of the budget was financed from contributions and 12% from the consolidated state budget – see Annex no. 1/03 of Law no. 3/2018 concerning the social security budget for 2018.
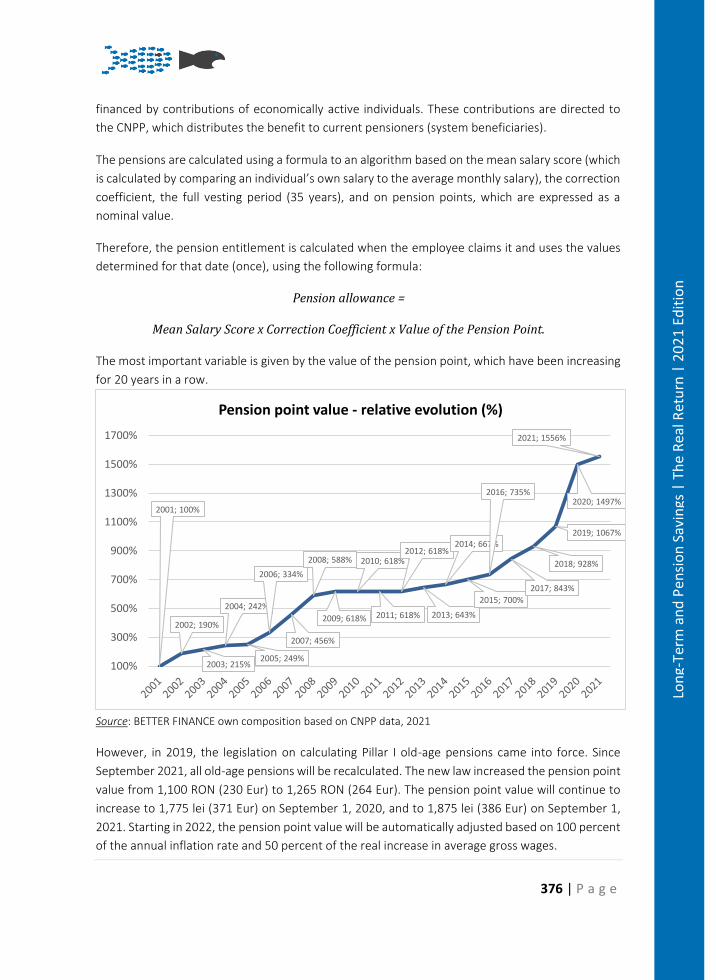
376 | P a g e
Lon
g-Te
rm a
nd
Pen
sio
n S
avin
gs |
Th
e R
eal R
etu
rn |
20
21
Edit
ion
financed by contributions of economically active individuals. These contributions are directed to
the CNPP, which distributes the benefit to current pensioners (system beneficiaries).
The pensions are calculated using a formula to an algorithm based on the mean salary score (which
is calculated by comparing an individual’s own salary to the average monthly salary), the correction
coefficient, the full vesting period (35 years), and on pension points, which are expressed as a
nominal value.
Therefore, the pension entitlement is calculated when the employee claims it and uses the values
determined for that date (once), using the following formula:
Pension allowance =
Mean Salary Score x Correction Coefficient x Value of the Pension Point.
The most important variable is given by the value of the pension point, which have been increasing
for 20 years in a row.
Source: BETTER FINANCE own composition based on CNPP data, 2021
However, in 2019, the legislation on calculating Pillar I old-age pensions came into force. Since
September 2021, all old-age pensions will be recalculated. The new law increased the pension point
value from 1,100 RON (230 Eur) to 1,265 RON (264 Eur). The pension point value will continue to
increase to 1,775 lei (371 Eur) on September 1, 2020, and to 1,875 lei (386 Eur) on September 1,
2021. Starting in 2022, the pension point value will be automatically adjusted based on 100 percent
of the annual inflation rate and 50 percent of the real increase in average gross wages.
2001; 100%
2002; 190%
2003; 215%
2004; 242%
2005; 249%
2006; 334%
2007; 456%
2008; 588%
2009; 618%
2010; 618%
2011; 618%
2012; 618%
2013; 643%
2014; 667%
2015; 700%
2016; 735%
2017; 843%
2018; 928%
2019; 1067%
2020; 1497%
2021; 1556%
100%
300%
500%
700%
900%
1100%
1300%
1500%
1700%
Pension point value - relative evolution (%)
377 | P a g e
Lon
g-Te
rm a
nd
Pen
sio
n S
avin
gs |
Th
e R
eal R
etu
rn |
20
21
Edit
ion
The main retirement income stream is generated by Pillar I and, on average, representing 28% of
the mean annual salary during the economically active period of the retiree in 2020, while the net
replacement rate generated by Pillar I was 51%.238 However, gross replacement ration continues to
decline.
According to Romania’s legislation, starting on 1 January 2011, the standard retirement age is 63
years for women and 65 years for men. These levels will be gradually reached as follow:
• between January 2011 and January 2015, the standard age for the pensioning of women
will grow from 59 years to 60 years and for men from 62 years to 65 years;
• at the end of 2015 period retirement age will gradually increase only for women from 60
years to 63 years until 2030.
Early retirement - According to Law no. 263/2010 regarding the public pension schemes (in force
since 1 January 2011) claiming early pension is possible as of a maximum 5 years before the
standard retirement age, provided the worker has at least eight or more contribution years. The
deduction made on early pension payment is fixed at 0.75% for each month (9% per year), which
might bring a maximum deduction of 45% from the standard pension. The deduction is applied until
the standard age limit is reached.
Pillar II – Funded pensions
Romania’s mandatory private pensions system (Pillar II) is based on the World Bank’s multi-pillar
model. It is a fully funded scheme, with mandatory participation and distinct and private
management of funds based on personal accounts and on the defined contribution (DC) philosophy
with minimum return guarantees. The minimum return guarantee means that participants will
receive at least the sum of contributions, net of fees, at retirement. Each fund has to comply, during
the accumulation phase, with a minimum return mechanism that is set quarterly by national
regulation and based on average market performance of all funds. Pillar II represents the privately
managed mandatory pensions funds or schemes.
The beginning of Pillar II in Romania is connected with three important dates:
- January – July 2007 (Authorizing the administrators),
- 17 September 2007 – 17 January 2008 (Choosing pension fund by participants),
- 20 May 2008 (Collecting the first contributions to Pillar II).
238 See OECD, ‘Pensions at a Glance 2017: OECD and G20 Indicators’ (OECD Library, 2017), page 106, https://www.oecd-ilibrary.org/docserver/pension_glance-2017-en.pdf?expires=1533208010&id=id&accname=guest&checksum=D723E9620BBEC45B10FD956DCF9A420A, data accessible here https://data.oecd.org/pension/net-pension-replacement-rates.htm.
378 | P a g e
Lon
g-Te
rm a
nd
Pen
sio
n S
avin
gs |
Th
e R
eal R
etu
rn |
20
21
Edit
ion
Pillar II has been mandatory since its inception for all employees paying social security contributions
under the age of 35 and voluntary (optional) for employees aged 35 to 45.239
Contribution collection is centralized by CNPP (The National House of Public Pensions), which
collects and directs the contributions towards the mandatory pension funds.
A participant contributes during his active life and will get a pension when reaching the retirement
age of 65 for men and 63 for women. The starting level of contribution was at 2% of the participant’s
total gross salary and it should go up by 0.5 percentage points a year, to reach 6% of total gross
revenues in 2017. However, these values were never reached and the value for 2019 3.75 p.p. The
contribution level is fixed, with no possibility to contribute less or more based on individual
preferences.
The contributions to a pension fund are recorded in individual personal pension account. The
savings are invested by the pension fund administrator, according to the rules and quantitative
limits generally set by the law regulating Pillar II vehicles.240 Participants can choose only one
pension fund.241
Mandatory pension funds are managed by their administrators - Pension Management Companies
(PMCs). Each PMC can manage only one mandatory pension fund. Mandatory pension funds
operations are similar to the investment funds. PMC must obtain several licenses from Romania’s
pension market regulatory and supervisory body, which is the Financial Supervisory Authority (in
Romanian, Autoritatea de Supraveghere Financiară, ‘ASF’).
The ASF is in charge of control, regulation, supervision and information about private pensions as
an independent administrative authority and legal entity under the control of the Romanian
Parliament.
Withdrawal from the system is only allowed at the standard retirement age of participants in the
private pension system.
Pillar III – Voluntary private pension
Romania’s voluntary private pensions system Pillar III is also based on the World Bank’s multi-pillar
model. It is also a fully funded system, based on personal accounts and on the defined contribution
(DC) philosophy. Pillar III represents privately managed supplementary, voluntary pensions.
The beginning of Pillar III in Romania is connected with two important dates:
239 Article 30 of Law no. 411/2004 regarding the privately managed pension funds. 240 Article 23 defines the guiding principles and rules of conduct the fund administrator must follow, Article 25 defines the quantitative limits on asset allocations and Article 28(1) lists the ineligible investments (Law no. 411/2004). 241 Article 31 of Law no. 411/2004.
379 | P a g e
Lon
g-Te
rm a
nd
Pen
sio
n S
avin
gs |
Th
e R
eal R
etu
rn |
20
21
Edit
ion
- October 2006 – May 2007 (Authorizing the administrators),
- May 2007 (Collecting the first contributions to third Pillar).
Participation is open to everybody earning an income, either employees or the self-employed.
Contributions are generally made through the employers in case of employees. In case of self-
employed, the contributions are sent directly on the accounts managed by pension management
companies. The contributions are made by the employee, with the possibility for employers to
contribute a share.
Voluntary pension funds as a special purpose vehicle are managed by their administrators - Pension
Management Companies (PMCs), Life Insurance Companies (LICs) or Asset Management
Companies (AMCs). Each administrator is obliged to establish and operate at least one voluntary
pension fund. However, in contrast to Pillar II, administrators can manage as many funds as they
wish. A voluntary pension fund operates on a similar basis as investment fund. Pension fund
administrators must get several licenses from Romania’s Financial Supervisory Authority.
Participants to such a fund contribute during their active life and will get a pension at the age of 60
(both woman and men) if he had accumulated at least 90 contributions. The contribution is limited
up to 15% of the participant’s total gross income. The contribution level is flexible - it can be decided
upon, changed, and even interrupted and resumed.
Pension Vehicles
Pillar II – Funded pensions
As indicated above, each PMC specifically authorized to provide Pillar II savings products in Romania
is allowed to manage only one mandatory pension fund. At the introduction of the Pillar II, the total
number of authorized administrators (funds) was 18. Consolidation started as early as 2009 and
2010. Currently (end of 2020), there are 7 administrators offering 7 pension funds. The two biggest
mandatory pension funds (AZT and NN) serve almost 48% (according to number of participants) or
57% (according to AuM) of the market.
Each PMC is authorized and supervised by ASF. One of the most important conditions imposed on
PMC is to attract at least 50,000 participants. ASF withdraws the fund's authorization if the number
of participants drops below 50,000 for a quarter.
The structure of savers, assets under management and market share of respective mandatory
pension fund (PMC) is presented in a table below.
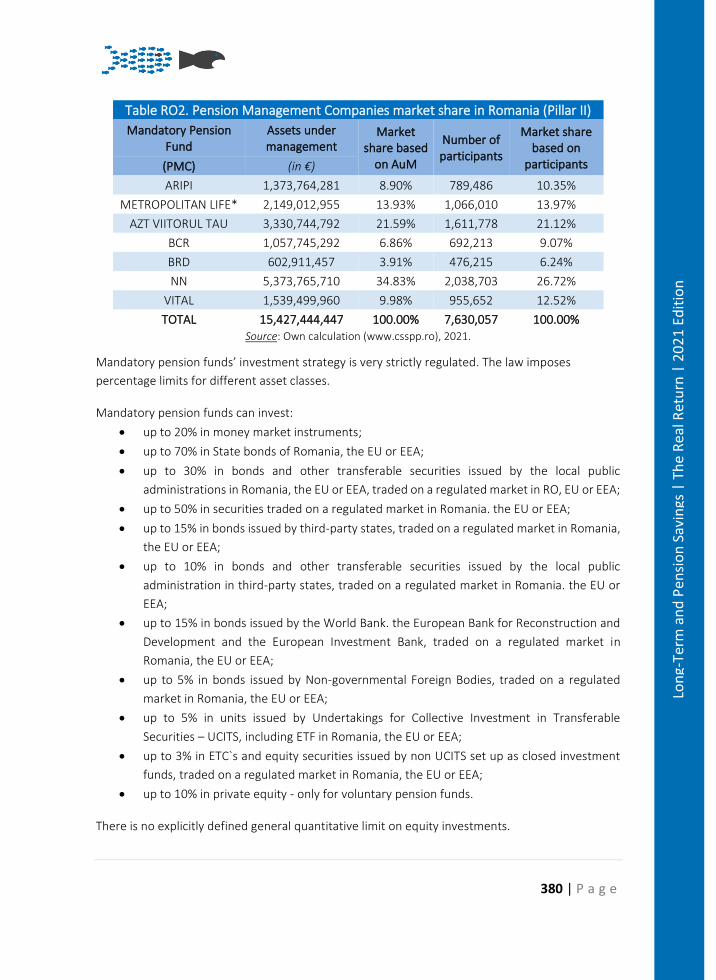
380 | P a g e
Lon
g-Te
rm a
nd
Pen
sio
n S
avin
gs |
Th
e R
eal R
etu
rn |
20
21
Edit
ion
Table RO2. Pension Management Companies market share in Romania (Pillar II)
Mandatory Pension Fund
Assets under management
Market share based
on AuM
Number of participants
Market share based on
participants (PMC) (in €)
ARIPI 1,373,764,281 8.90% 789,486 10.35%
METROPOLITAN LIFE* 2,149,012,955 13.93% 1,066,010 13.97%
AZT VIITORUL TAU 3,330,744,792 21.59% 1,611,778 21.12%
BCR 1,057,745,292 6.86% 692,213 9.07%
BRD 602,911,457 3.91% 476,215 6.24%
NN 5,373,765,710 34.83% 2,038,703 26.72%
VITAL 1,539,499,960 9.98% 955,652 12.52%
TOTAL 15,427,444,447 100.00% 7,630,057 100.00% Source: Own calculation (www.csspp.ro), 2021.
Mandatory pension funds’ investment strategy is very strictly regulated. The law imposes
percentage limits for different asset classes.
Mandatory pension funds can invest:
• up to 20% in money market instruments;
• up to 70% in State bonds of Romania, the EU or EEA;
• up to 30% in bonds and other transferable securities issued by the local public
administrations in Romania, the EU or EEA, traded on a regulated market in RO, EU or EEA;
• up to 50% in securities traded on a regulated market in Romania. the EU or EEA;
• up to 15% in bonds issued by third-party states, traded on a regulated market in Romania,
the EU or EEA;
• up to 10% in bonds and other transferable securities issued by the local public
administration in third-party states, traded on a regulated market in Romania. the EU or
EEA;
• up to 15% in bonds issued by the World Bank. the European Bank for Reconstruction and
Development and the European Investment Bank, traded on a regulated market in
Romania, the EU or EEA;
• up to 5% in bonds issued by Non-governmental Foreign Bodies, traded on a regulated
market in Romania, the EU or EEA;
• up to 5% in units issued by Undertakings for Collective Investment in Transferable
Securities – UCITS, including ETF in Romania, the EU or EEA;
• up to 3% in ETC`s and equity securities issued by non UCITS set up as closed investment
funds, traded on a regulated market in Romania, the EU or EEA;
• up to 10% in private equity - only for voluntary pension funds.
There is no explicitly defined general quantitative limit on equity investments.
381 | P a g e
Lon
g-Te
rm a
nd
Pen
sio
n S
avin
gs |
Th
e R
eal R
etu
rn |
20
21
Edit
ion
Aside from the quantitative restrictions by asset class, fund managers have quantitative limits by
type of issuer:
• 10% of the total number of shares issued by one issuer;
• 10% of the preferential shares issued by one issuer;
• 25% of the equity securities issued by an UCITS, ETF, non UCITS closed investment fund or
ETC;
• 10% of an issuer's bonds, with the exception of the state bonds.
Mandatory pension funds can invest all their assets abroad. There are no explicit restrictions
regarding investments made abroad.
Pension funds can have one of three possible risk profiles, which are calculated on a daily basis
according to a formula established by ASF regulations:
- low risk (risk level up to and including 10%),
- medium risk (risk level between 10%, exclusively, and 25%, inclusively),
- high risk (risk level between 25%, exclusively, and 50%, inclusively).
Pillar III – Voluntary private pensions
The Romanian Pillar III allows each administrator (PMC, LIC or AMC) to manage as many voluntary
pension funds as they prefer. At its inception, there were only four providers and six voluntary
pension funds. Currently (at the end of 2018), there was 8 providers offering 10 voluntary pension
funds. Only two administrators (NN and AZT) are currently offering more than one voluntary
pension fund.
Each administrator in Pillar III (PMC, LIC or AMC) is authorized by ASF and must get several licenses
from ASF. ASF withdraws the fund's authorization if the number of participants drops below 100
for a quarter.
Voluntary pension funds are also constituted by civil contract and authorized by ASF. Accounting of
the voluntary pension fund is separated from the administrator.
Investment rules in the voluntary private pension pillar are the same as in the mandatory pillar (see
quantitative and restriction limits for different asset classes in the text above), with less strict limits
on private equity (5%) and commodities (5%).
The structure of savers, assets under management and market share of respective voluntary
pension fund is presented in a table below.
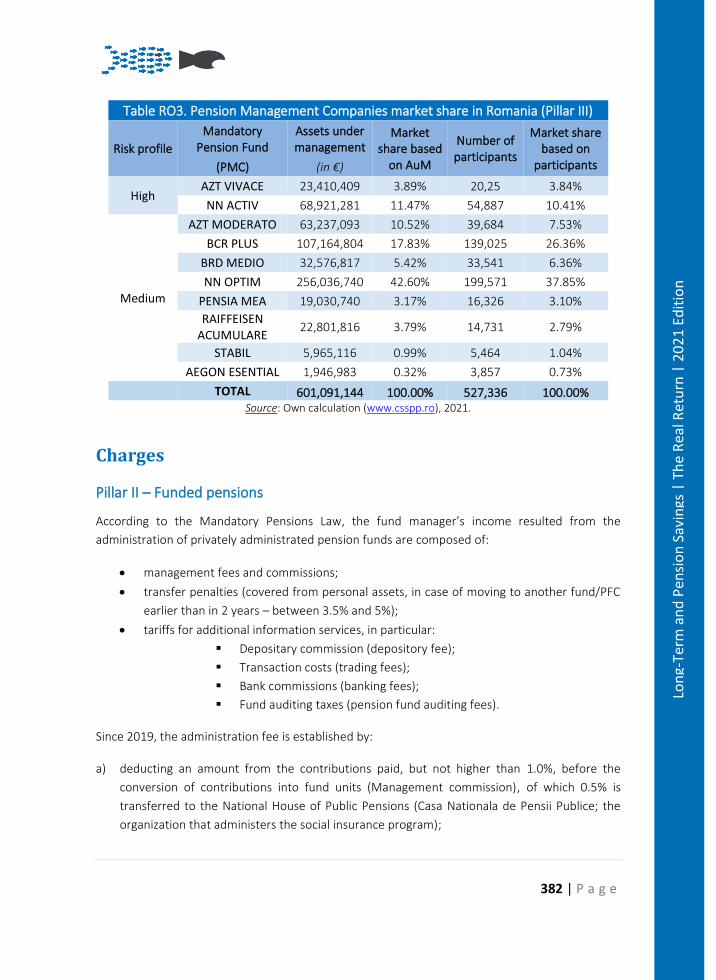
382 | P a g e
Lon
g-Te
rm a
nd
Pen
sio
n S
avin
gs |
Th
e R
eal R
etu
rn |
20
21
Edit
ion
Table RO3. Pension Management Companies market share in Romania (Pillar III)
Risk profile
Mandatory Pension Fund
Assets under management
Market share based
on AuM
Number of participants
Market share based on
participants (PMC) (in €)
High AZT VIVACE 23,410,409 3.89% 20,25 3.84%
NN ACTIV 68,921,281 11.47% 54,887 10.41%
Medium
AZT MODERATO 63,237,093 10.52% 39,684 7.53%
BCR PLUS 107,164,804 17.83% 139,025 26.36%
BRD MEDIO 32,576,817 5.42% 33,541 6.36%
NN OPTIM 256,036,740 42.60% 199,571 37.85%
PENSIA MEA 19,030,740 3.17% 16,326 3.10%
RAIFFEISEN ACUMULARE
22,801,816 3.79% 14,731 2.79%
STABIL 5,965,116 0.99% 5,464 1.04%
AEGON ESENTIAL 1,946,983 0.32% 3,857 0.73%
TOTAL 601,091,144 100.00% 527,336 100.00% Source: Own calculation (www.csspp.ro), 2021.
Charges
Pillar II – Funded pensions
According to the Mandatory Pensions Law, the fund manager’s income resulted from the
administration of privately administrated pension funds are composed of:
• management fees and commissions;
• transfer penalties (covered from personal assets, in case of moving to another fund/PFC
earlier than in 2 years – between 3.5% and 5%);
• tariffs for additional information services, in particular:
▪ Depositary commission (depository fee);
▪ Transaction costs (trading fees);
▪ Bank commissions (banking fees);
▪ Fund auditing taxes (pension fund auditing fees).
Since 2019, the administration fee is established by:
a) deducting an amount from the contributions paid, but not higher than 1.0%, before the
conversion of contributions into fund units (Management commission), of which 0.5% is
transferred to the National House of Public Pensions (Casa Nationala de Pensii Publice; the
organization that administers the social insurance program);
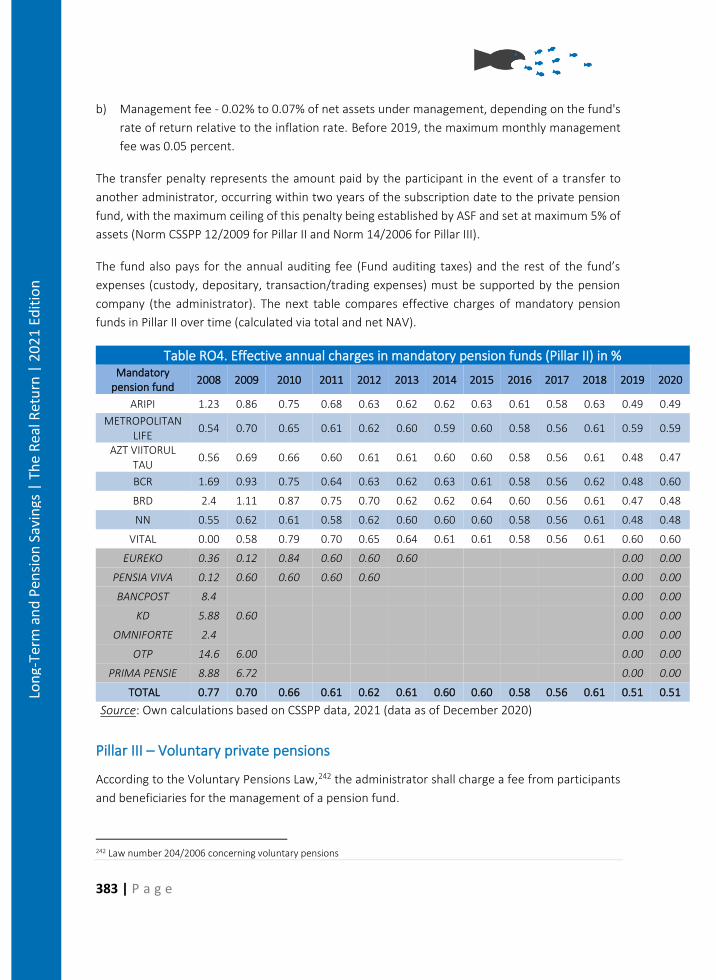
383 | P a g e
Lon
g-Te
rm a
nd
Pen
sio
n S
avin
gs |
Th
e R
eal R
etu
rn |
20
21
Edit
ion
b) Management fee - 0.02% to 0.07% of net assets under management, depending on the fund's
rate of return relative to the inflation rate. Before 2019, the maximum monthly management
fee was 0.05 percent.
The transfer penalty represents the amount paid by the participant in the event of a transfer to
another administrator, occurring within two years of the subscription date to the private pension
fund, with the maximum ceiling of this penalty being established by ASF and set at maximum 5% of
assets (Norm CSSPP 12/2009 for Pillar II and Norm 14/2006 for Pillar III).
The fund also pays for the annual auditing fee (Fund auditing taxes) and the rest of the fund’s
expenses (custody, depositary, transaction/trading expenses) must be supported by the pension
company (the administrator). The next table compares effective charges of mandatory pension
funds in Pillar II over time (calculated via total and net NAV).
Table RO4. Effective annual charges in mandatory pension funds (Pillar II) in % Mandatory
pension fund 2008 2009 2010 2011 2012 2013 2014 2015 2016 2017 2018 2019 2020
ARIPI 1.23 0.86 0.75 0.68 0.63 0.62 0.62 0.63 0.61 0.58 0.63 0.49 0.49
METROPOLITAN LIFE
0.54 0.70 0.65 0.61 0.62 0.60 0.59 0.60 0.58 0.56 0.61 0.59 0.59
AZT VIITORUL TAU
0.56 0.69 0.66 0.60 0.61 0.61 0.60 0.60 0.58 0.56 0.61 0.48 0.47
BCR 1.69 0.93 0.75 0.64 0.63 0.62 0.63 0.61 0.58 0.56 0.62 0.48 0.60
BRD 2.4 1.11 0.87 0.75 0.70 0.62 0.62 0.64 0.60 0.56 0.61 0.47 0.48
NN 0.55 0.62 0.61 0.58 0.62 0.60 0.60 0.60 0.58 0.56 0.61 0.48 0.48
VITAL 0.00 0.58 0.79 0.70 0.65 0.64 0.61 0.61 0.58 0.56 0.61 0.60 0.60
EUREKO 0.36 0.12 0.84 0.60 0.60 0.60 0.00 0.00
PENSIA VIVA 0.12 0.60 0.60 0.60 0.60 0.00 0.00
BANCPOST 8.4 0.00 0.00
KD 5.88 0.60 0.00 0.00
OMNIFORTE 2.4 0.00 0.00
OTP 14.6 6.00 0.00 0.00
PRIMA PENSIE 8.88 6.72 0.00 0.00
TOTAL 0.77 0.70 0.66 0.61 0.62 0.61 0.60 0.60 0.58 0.56 0.61 0.51 0.51
Source: Own calculations based on CSSPP data, 2021 (data as of December 2020)
Pillar III – Voluntary private pensions
According to the Voluntary Pensions Law,242 the administrator shall charge a fee from participants
and beneficiaries for the management of a pension fund.
242 Law number 204/2006 concerning voluntary pensions
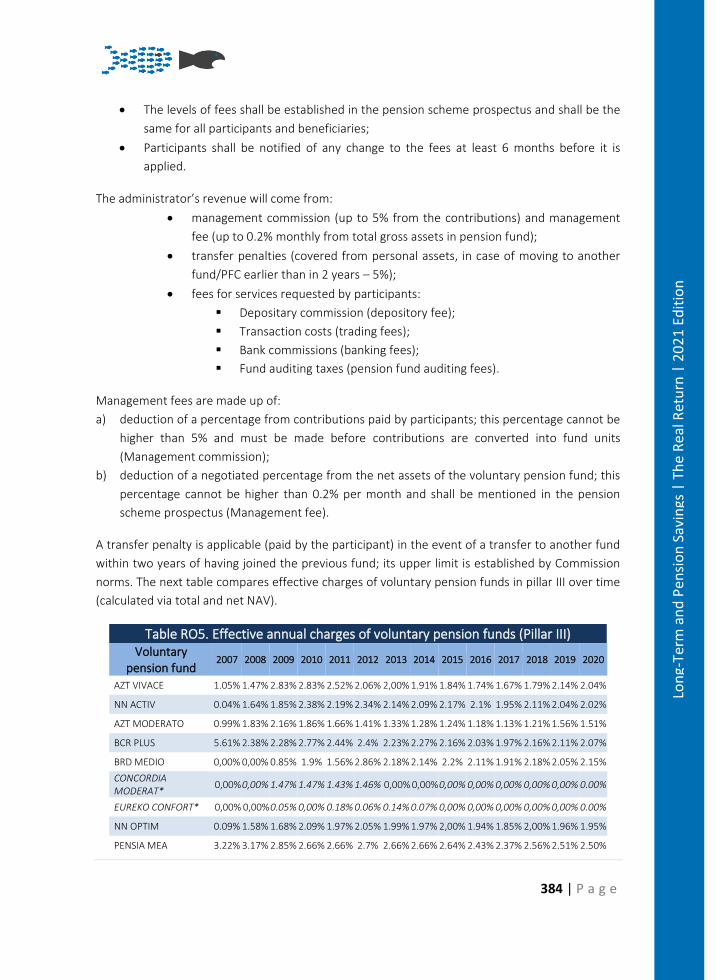
384 | P a g e
Lon
g-Te
rm a
nd
Pen
sio
n S
avin
gs |
Th
e R
eal R
etu
rn |
20
21
Edit
ion
• The levels of fees shall be established in the pension scheme prospectus and shall be the
same for all participants and beneficiaries;
• Participants shall be notified of any change to the fees at least 6 months before it is
applied.
The administrator’s revenue will come from:
• management commission (up to 5% from the contributions) and management
fee (up to 0.2% monthly from total gross assets in pension fund);
• transfer penalties (covered from personal assets, in case of moving to another
fund/PFC earlier than in 2 years – 5%);
• fees for services requested by participants:
▪ Depositary commission (depository fee);
▪ Transaction costs (trading fees);
▪ Bank commissions (banking fees);
▪ Fund auditing taxes (pension fund auditing fees).
Management fees are made up of:
a) deduction of a percentage from contributions paid by participants; this percentage cannot be
higher than 5% and must be made before contributions are converted into fund units
(Management commission);
b) deduction of a negotiated percentage from the net assets of the voluntary pension fund; this
percentage cannot be higher than 0.2% per month and shall be mentioned in the pension
scheme prospectus (Management fee).
A transfer penalty is applicable (paid by the participant) in the event of a transfer to another fund
within two years of having joined the previous fund; its upper limit is established by Commission
norms. The next table compares effective charges of voluntary pension funds in pillar III over time
(calculated via total and net NAV).
Table RO5. Effective annual charges of voluntary pension funds (Pillar III) Voluntary
pension fund 2007 2008 2009 2010 2011 2012 2013 2014 2015 2016 2017 2018 2019 2020
AZT VIVACE 1.05% 1.47% 2.83% 2.83% 2.52% 2.06% 2,00% 1.91% 1.84% 1.74% 1.67% 1.79% 2.14% 2.04%
NN ACTIV 0.04% 1.64% 1.85% 2.38% 2.19% 2.34% 2.14% 2.09% 2.17% 2.1% 1.95% 2.11% 2.04% 2.02%
AZT MODERATO 0.99% 1.83% 2.16% 1.86% 1.66% 1.41% 1.33% 1.28% 1.24% 1.18% 1.13% 1.21% 1.56% 1.51%
BCR PLUS 5.61% 2.38% 2.28% 2.77% 2.44% 2.4% 2.23% 2.27% 2.16% 2.03% 1.97% 2.16% 2.11% 2.07%
BRD MEDIO 0,00% 0,00% 0.85% 1.9% 1.56% 2.86% 2.18% 2.14% 2.2% 2.11% 1.91% 2.18% 2.05% 2.15%
CONCORDIA MODERAT*
0,00% 0,00% 1.47% 1.47% 1.43% 1.46% 0,00% 0,00% 0,00% 0,00% 0,00% 0,00% 0,00% 0.00%
EUREKO CONFORT* 0,00% 0,00% 0.05% 0,00% 0.18% 0.06% 0.14% 0.07% 0,00% 0,00% 0,00% 0,00% 0,00% 0.00%
NN OPTIM 0.09% 1.58% 1.68% 2.09% 1.97% 2.05% 1.99% 1.97% 2,00% 1.94% 1.85% 2,00% 1.96% 1.95%
PENSIA MEA 3.22% 3.17% 2.85% 2.66% 2.66% 2.7% 2.66% 2.66% 2.64% 2.43% 2.37% 2.56% 2.51% 2.50%
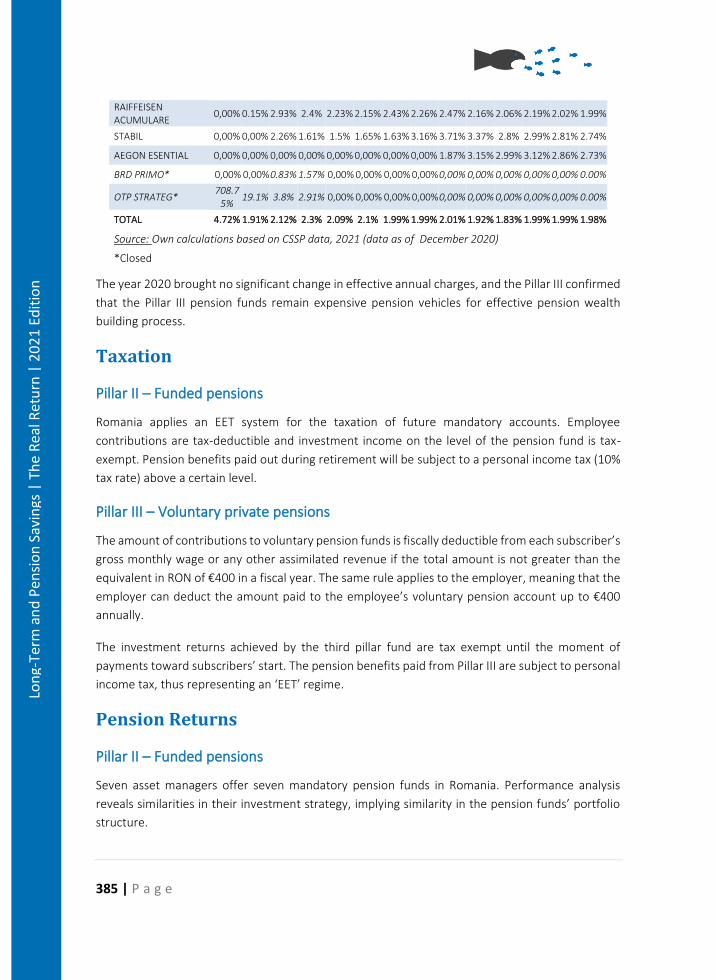
385 | P a g e
Lon
g-Te
rm a
nd
Pen
sio
n S
avin
gs |
Th
e R
eal R
etu
rn |
20
21
Edit
ion
RAIFFEISEN ACUMULARE
0,00% 0.15% 2.93% 2.4% 2.23% 2.15% 2.43% 2.26% 2.47% 2.16% 2.06% 2.19% 2.02% 1.99%
STABIL 0,00% 0,00% 2.26% 1.61% 1.5% 1.65% 1.63% 3.16% 3.71% 3.37% 2.8% 2.99% 2.81% 2.74%
AEGON ESENTIAL 0,00% 0,00% 0,00% 0,00% 0,00% 0,00% 0,00% 0,00% 1.87% 3.15% 2.99% 3.12% 2.86% 2.73%
BRD PRIMO* 0,00% 0,00% 0.83% 1.57% 0,00% 0,00% 0,00% 0,00% 0,00% 0,00% 0,00% 0,00% 0,00% 0.00%
OTP STRATEG* 708.7
5% 19.1% 3.8% 2.91% 0,00% 0,00% 0,00% 0,00% 0,00% 0,00% 0,00% 0,00% 0,00% 0.00%
TOTAL 4.72% 1.91% 2.12% 2.3% 2.09% 2.1% 1.99% 1.99% 2.01% 1.92% 1.83% 1.99% 1.99% 1.98%
Source: Own calculations based on CSSP data, 2021 (data as of December 2020) *Closed
The year 2020 brought no significant change in effective annual charges, and the Pillar III confirmed
that the Pillar III pension funds remain expensive pension vehicles for effective pension wealth
building process.
Taxation
Pillar II – Funded pensions
Romania applies an EET system for the taxation of future mandatory accounts. Employee
contributions are tax-deductible and investment income on the level of the pension fund is tax-
exempt. Pension benefits paid out during retirement will be subject to a personal income tax (10%
tax rate) above a certain level.
Pillar III – Voluntary private pensions
The amount of contributions to voluntary pension funds is fiscally deductible from each subscriber’s
gross monthly wage or any other assimilated revenue if the total amount is not greater than the
equivalent in RON of €400 in a fiscal year. The same rule applies to the employer, meaning that the
employer can deduct the amount paid to the employee’s voluntary pension account up to €400
annually.
The investment returns achieved by the third pillar fund are tax exempt until the moment of
payments toward subscribers’ start. The pension benefits paid from Pillar III are subject to personal
income tax, thus representing an ‘EET’ regime.
Pension Returns
Pillar II – Funded pensions
Seven asset managers offer seven mandatory pension funds in Romania. Performance analysis
reveals similarities in their investment strategy, implying similarity in the pension funds’ portfolio
structure.
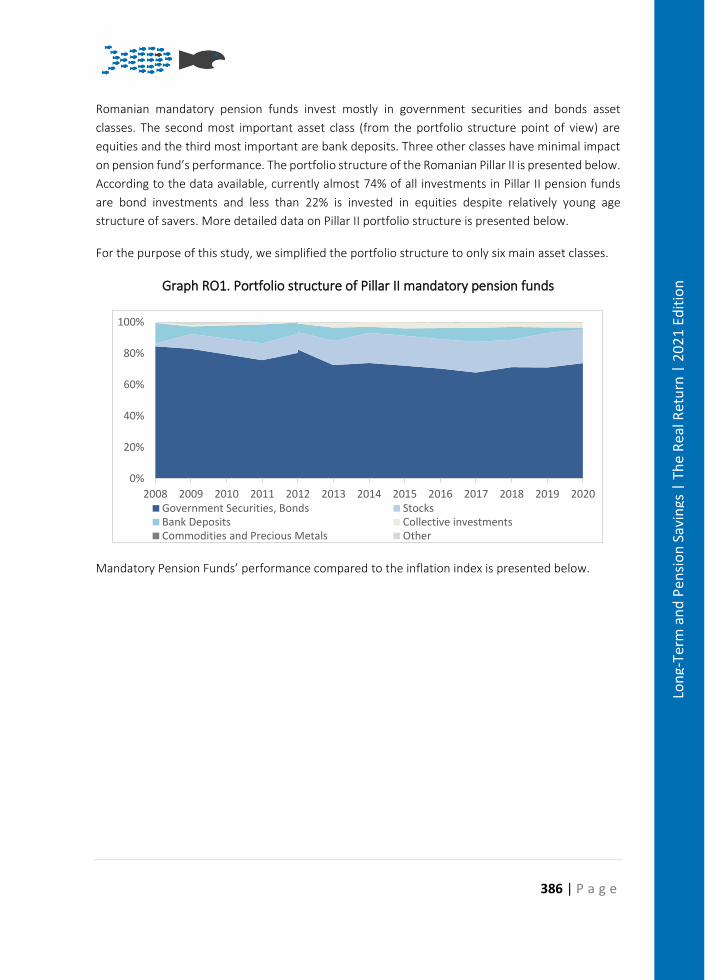
386 | P a g e
Lon
g-Te
rm a
nd
Pen
sio
n S
avin
gs |
Th
e R
eal R
etu
rn |
20
21
Edit
ion
Romanian mandatory pension funds invest mostly in government securities and bonds asset
classes. The second most important asset class (from the portfolio structure point of view) are
equities and the third most important are bank deposits. Three other classes have minimal impact
on pension fund’s performance. The portfolio structure of the Romanian Pillar II is presented below.
According to the data available, currently almost 74% of all investments in Pillar II pension funds
are bond investments and less than 22% is invested in equities despite relatively young age
structure of savers. More detailed data on Pillar II portfolio structure is presented below.
For the purpose of this study, we simplified the portfolio structure to only six main asset classes.
Graph RO1. Portfolio structure of Pillar II mandatory pension funds
Mandatory Pension Funds’ performance compared to the inflation index is presented below.
0%
20%
40%
60%
80%
100%
2008 2009 2010 2011 2012 2013 2014 2015 2016 2017 2018 2019 2020Government Securities, Bonds StocksBank Deposits Collective investmentsCommodities and Precious Metals Other
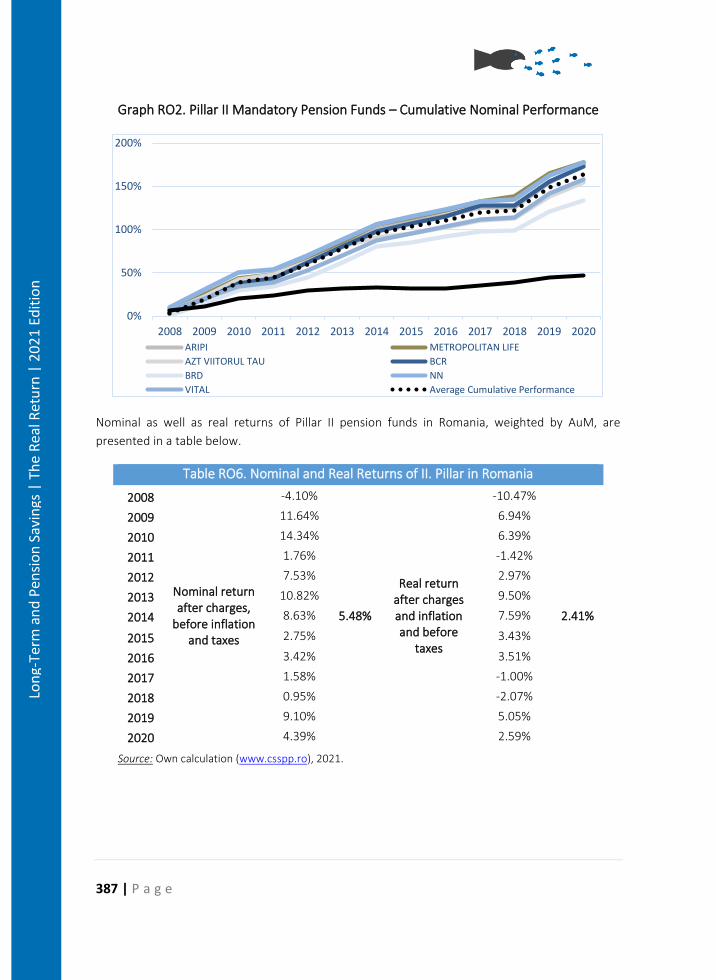
387 | P a g e
Lon
g-Te
rm a
nd
Pen
sio
n S
avin
gs |
Th
e R
eal R
etu
rn |
20
21
Edit
ion
Graph RO2. Pillar II Mandatory Pension Funds – Cumulative Nominal Performance
Nominal as well as real returns of Pillar II pension funds in Romania, weighted by AuM, are
presented in a table below.
Table RO6. Nominal and Real Returns of II. Pillar in Romania
2008
Nominal return after charges,
before inflation and taxes
-4.10%
5.48%
Real return after charges and inflation and before
taxes
-10.47%
2.41%
2009 11.64% 6.94%
2010 14.34% 6.39%
2011 1.76% -1.42%
2012 7.53% 2.97%
2013 10.82% 9.50%
2014 8.63% 7.59%
2015 2.75% 3.43%
2016 3.42% 3.51%
2017 1.58% -1.00%
2018 0.95% -2.07%
2019 9.10% 5.05%
2020 4.39% 2.59%
Source: Own calculation (www.csspp.ro), 2021.
0%
50%
100%
150%
200%
2008 2009 2010 2011 2012 2013 2014 2015 2016 2017 2018 2019 2020
ARIPI METROPOLITAN LIFE
AZT VIITORUL TAU BCR
BRD NN
VITAL Average Cumulative Performance
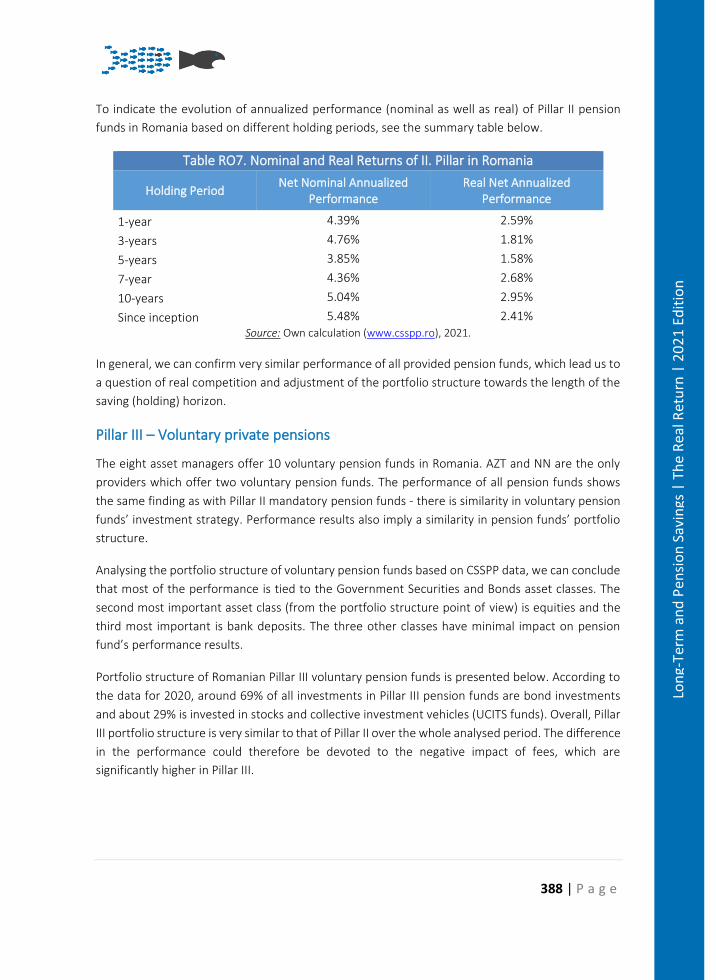
388 | P a g e
Lon
g-Te
rm a
nd
Pen
sio
n S
avin
gs |
Th
e R
eal R
etu
rn |
20
21
Edit
ion
To indicate the evolution of annualized performance (nominal as well as real) of Pillar II pension
funds in Romania based on different holding periods, see the summary table below.
Table RO7. Nominal and Real Returns of II. Pillar in Romania
Holding Period Net Nominal Annualized
Performance Real Net Annualized
Performance
1-year 4.39% 2.59%
3-years 4.76% 1.81%
5-years 3.85% 1.58%
7-year 4.36% 2.68%
10-years 5.04% 2.95%
Since inception 5.48% 2.41% Source: Own calculation (www.csspp.ro), 2021.
In general, we can confirm very similar performance of all provided pension funds, which lead us to
a question of real competition and adjustment of the portfolio structure towards the length of the
saving (holding) horizon.
Pillar III – Voluntary private pensions
The eight asset managers offer 10 voluntary pension funds in Romania. AZT and NN are the only
providers which offer two voluntary pension funds. The performance of all pension funds shows
the same finding as with Pillar II mandatory pension funds - there is similarity in voluntary pension
funds’ investment strategy. Performance results also imply a similarity in pension funds’ portfolio
structure.
Analysing the portfolio structure of voluntary pension funds based on CSSPP data, we can conclude
that most of the performance is tied to the Government Securities and Bonds asset classes. The
second most important asset class (from the portfolio structure point of view) is equities and the
third most important is bank deposits. The three other classes have minimal impact on pension
fund’s performance results.
Portfolio structure of Romanian Pillar III voluntary pension funds is presented below. According to
the data for 2020, around 69% of all investments in Pillar III pension funds are bond investments
and about 29% is invested in stocks and collective investment vehicles (UCITS funds). Overall, Pillar
III portfolio structure is very similar to that of Pillar II over the whole analysed period. The difference
in the performance could therefore be devoted to the negative impact of fees, which are
significantly higher in Pillar III.
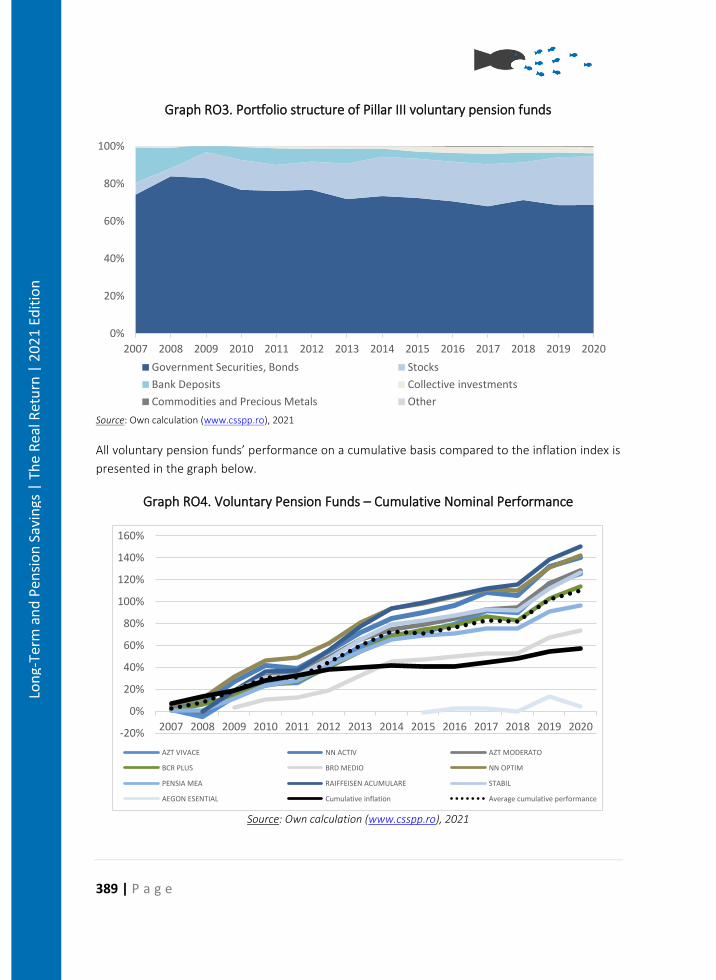
389 | P a g e
Lon
g-Te
rm a
nd
Pen
sio
n S
avin
gs |
Th
e R
eal R
etu
rn |
20
21
Edit
ion
Graph RO3. Portfolio structure of Pillar III voluntary pension funds
Source: Own calculation (www.csspp.ro), 2021
All voluntary pension funds’ performance on a cumulative basis compared to the inflation index is
presented in the graph below.
Graph RO4. Voluntary Pension Funds – Cumulative Nominal Performance
Source: Own calculation (www.csspp.ro), 2021
0%
20%
40%
60%
80%
100%
2007 2008 2009 2010 2011 2012 2013 2014 2015 2016 2017 2018 2019 2020
Government Securities, Bonds Stocks
Bank Deposits Collective investments
Commodities and Precious Metals Other
-20%
0%
20%
40%
60%
80%
100%
120%
140%
160%
2007 2008 2009 2010 2011 2012 2013 2014 2015 2016 2017 2018 2019 2020
AZT VIVACE NN ACTIV AZT MODERATO
BCR PLUS BRD MEDIO NN OPTIM
PENSIA MEA RAIFFEISEN ACUMULARE STABIL
AEGON ESENTIAL Cumulative inflation Average cumulative performance
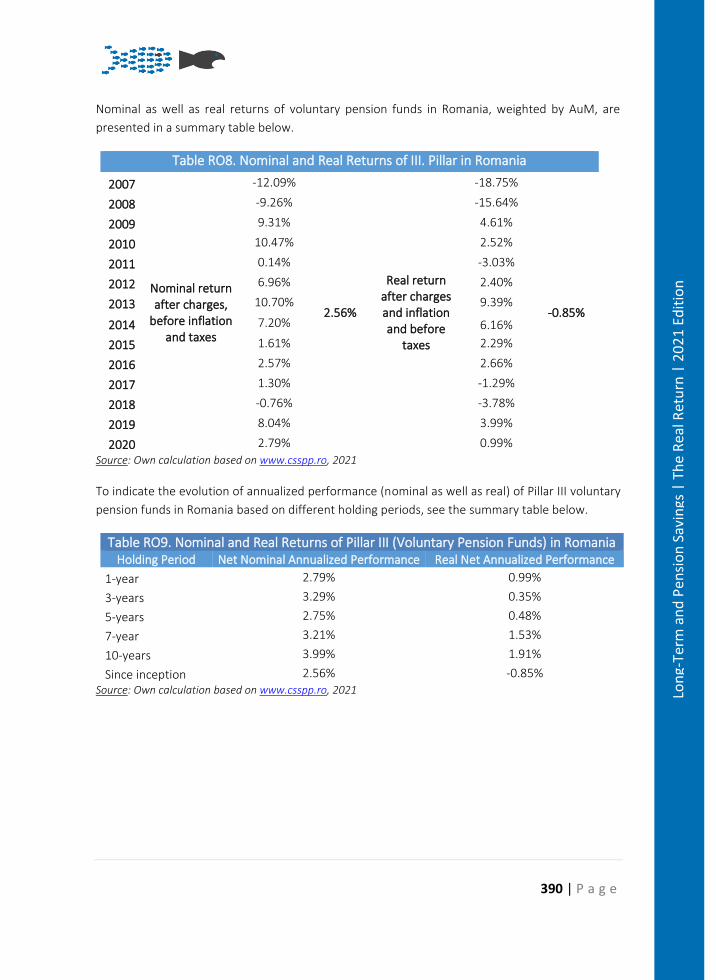
390 | P a g e
Lon
g-Te
rm a
nd
Pen
sio
n S
avin
gs |
Th
e R
eal R
etu
rn |
20
21
Edit
ion
Nominal as well as real returns of voluntary pension funds in Romania, weighted by AuM, are
presented in a summary table below.
Table RO8. Nominal and Real Returns of III. Pillar in Romania
2007
Nominal return after charges,
before inflation and taxes
-12.09%
2.56%
Real return after charges and inflation and before
taxes
-18.75%
-0.85%
2008 -9.26% -15.64%
2009 9.31% 4.61%
2010 10.47% 2.52%
2011 0.14% -3.03%
2012 6.96% 2.40%
2013 10.70% 9.39%
2014 7.20% 6.16%
2015 1.61% 2.29%
2016 2.57% 2.66%
2017 1.30% -1.29%
2018 -0.76% -3.78%
2019 8.04% 3.99%
2020 2.79% 0.99%
Source: Own calculation based on www.csspp.ro, 2021
To indicate the evolution of annualized performance (nominal as well as real) of Pillar III voluntary
pension funds in Romania based on different holding periods, see the summary table below.
Table RO9. Nominal and Real Returns of Pillar III (Voluntary Pension Funds) in Romania Holding Period Net Nominal Annualized Performance Real Net Annualized Performance
1-year 2.79% 0.99%
3-years 3.29% 0.35%
5-years 2.75% 0.48%
7-year 3.21% 1.53%
10-years 3.99% 1.91%
Since inception 2.56% -0.85% Source: Own calculation based on www.csspp.ro, 2021
391 | P a g e
Lon
g-Te
rm a
nd
Pen
sio
n S
avin
gs |
Th
e R
eal R
etu
rn |
20
21
Edit
ion
Methodological note
The nominal gross, net, and real net returns for the Romanian mandatory and supplementary pension funds (Pillar II and Pillar III) differ from the last editions of the Pensions Report. This is due to the fact that the contributors have recalculated the returns using the RON/EUR conversion rate for each particular year. In the previous editions, the performance computations were calculated first in the local currency (RON) - based on the net asset value of the units, as reported by the Financial Supervisory Authority. Then, the annual performance of the entire sector (occupational/mandatory and voluntary/supplementary) were calculated as a weighted average of each pension fund's return, based on the market share it held within each sector (calculated as the ratio between its NAV and the total NAV of the sector). However, following agreements to refine the methodology, the computations should be converted into EUR, in order to ensure comparability. Thus, for this edition, the contributors have converted the unit value of each pension fund from RON into EUR. As such, the fund performances were recalculated already into EUR (not in RON, as in the previous studies) using the formulae.
Conclusions
Romania’s population is rapidly decreasing and aging, which – unless they adopt the necessary
reforms - will lead to the explosion of the demographic bomb in a few decades. That is why Romania
introduced the private pensions system in 2007, which is based on the model tested and
recommended by the World Bank. The multi-pillar private pensions system includes Pillar II
(mandatory schemes) and Pillar III (voluntary schemes).
In the public PAYG pensions system, the state collects contributions from employees and
redistributes the money among existing pensioners. Demographics show that this redistribution
logic is no longer viable, as contributors’ numbers will fall, and the number of pensioners is already
going up. The departure from this dilemma takes the form of the private pensions system, allowing
each active person to save for their own future retirement.
Romanian pillar II is a fully funded system based on personal accounts and on the defined
contribution (DC) philosophy. Pillar II is mandatory for all employees aged under 35 years and
voluntary (optional) for employees aged 35 to 45. The starting level of contribution was set at 2%
of the participant’s total gross income and increases by 0.5 percentage points annually until it
reaches 6 of total gross income in 2017. However, this level has not been reached, and the
contribution system has inversed.
Mandatory pension funds are managed by their administrators - Pension Management Companies
(PMCs). Each PMC is obliged by respective law to administrate and manage just one mandatory
pension fund. Currently, there are seven PMCs managing seven mandatory funds on the Romanian
Pillar II market. The market is dominated by two PMCs (AZT and NN).
392 | P a g e
Lon
g-Te
rm a
nd
Pen
sio
n S
avin
gs |
Th
e R
eal R
etu
rn |
20
21
Edit
ion
Romanian pillar III is also a fully funded system based on personal accounts and on the defined
contribution (DC) philosophy. Pillar III represents privately managed supplementary pensions. This
system is opened to all income cohorts. The tax advantage contribution is limited to 15 of
participant’s total gross income.
Voluntary pension funds in Pillar III are managed by their administrators - Pension Management
Companies (PMCs), Life Insurance Companies (LICs) or Asset Management Companies (AMCs). Each
administrator is obliged to establish and operate at least one voluntary pension fund. Currently,
there are eight providers offering 10 voluntary pension funds. Pillar III market is fairly concentrated,
where three dominant players cover almost 90 of the market.
Mandatory as well as voluntary pension funds’ investment strategy is strictly regulated. The law
imposes percentage limits and restrictions for different asset classes. It must be noted that
investment rules in mandatory and voluntary system are very similar. This fact logically causes
implications on portfolio structure, thus also on performance of mandatory and voluntary pension
funds in Romania. Currently about 70% of all investments in Pillar II as well as Pillar III pension funds
are bond investments (Romanian Government Money market instruments and Bonds) and only
about 22 is invested in equities, which could raise a question about suitability of portfolio structure
with regard to the age structure of savers.
Overall, the real return of pension funds in Pillar II as well as Pillar III are positive and well above the
inflation. However, considering the fee structure, Pillar II savers are better positioned as the charges
are almost 5-times lower than the fees applied in Pillar III.
Policy considerations
We strongly advise Romanian public authorities to not destroy the private managed pensions
system, considering that for 11 and, respectively, 12 years privately managed pension schemes in
Romania have functioned quite well and returned performances above inflation. However,
considering the “lucky timing” of their start, i.e., after the market downfall of the 2008 crisis, some
may argue that Romanian private pension plans must pass a market correction to prove their
resilience. Therefore, these policy considerations are forward looking and meant to further
enhance this system.
First, bearing in mind the general and constant research results on the correlation between cost
and performance in investment funds, one consideration would be to further cap the total costs for
privately managed occupational pension funds (Pillar II).
Second, considering the concentrated market for Pillar II funds and the fact that enrolment is
mandatory, the Romanian public authorities should consider including a mandatory minimum rate
of return for these plans (e.g., inflation + 1%), in order to ensure that this well performing track
record is maintained.
393 | P a g e
Lon
g-Te
rm a
nd
Pen
sio
n S
avin
gs |
Th
e R
eal R
etu
rn |
20
21
Edit
ion
Last, Romanian citizens should be further incentivised through financial education and fiscal
stimulants to increase their savings rate into voluntary pension plans (Pillar III).
Bibliography
• CENAR. I. 2010. The Financial - Accounting Image for The Public Benefits Of Retirement. In: Annals of the University of Petrosani. Economics. 10(3). 2010.
• FRUNZARU. V. Romanian pension system. An evaluation from the European Perspective. Economic Publishing House. 2007.
• MUNTEAN. L. – STANCIU. A. P. 2011. Deductibility of Contributions to Voluntary Private Pensions. In: Annals of the University of Petroşani. Economics. 11(4). 2011.
• NOVAC. L. E. – BADEA. D. G. 2007. The Evolution of Pension Funds on the Romania market. In: Review of Management and Economical Engineering. Vol. 6. No. 6. 2007
394 | P a g e
Lon
g-Te
rm a
nd
Pen
sio
n S
avin
gs |
Th
e R
eal R
etu
rn |
20
21
Edit
ion
Pension Savings: The Real Return 2021 Edition
Country Case: Slovakia
Zhrnutie
Slovenský dôchodkový systém je typickým modelom Svetovej banky založenom na viac-pilierovom
(troj-pilierovom) systéme s individuálnymi (osobnými) účtami sporiteľov. V roku 2019 došlo
výrazným zmenám v I. pilieri, ktoré boli motivované politickým populizmom pred voľbami. Do
dôchodkového systému bol ústavným zákonom zapracovaný dvojpilierový systém a zároveň strop
dôchodkového veku. V roku 2020 boli očakávané výrazné reformné zmeny v I. pilieri, ktoré by mali
zvýšiť finančnú stabilitu I. piliera a vyriešiť problémy v nastavení súkromných dôchodkových schém.
Avšak navrhnuté zmeny skôr pokračujú v trende dôhcodkového populizmu bez výraznejšej snahy o
vytvorenie stabilného dôhcodkového systému.
Summary
The Slovak pension system is a typical World Bank model based on a multi-pillar (three-pillar)
system with individual (personal) accounts of savers. In 2019, there were significant changes in Pillar
I, which were motivated by political populism before the elections. The two-pillar system was
incorporated into the pension system by a constitutional law, as well as a ceiling on the retirement
age. Significant reform changes to Pillar I were expected in 2020, which should increase the financial
stability of Pillar I and resolve problems in the set-up of private pension schemes. However, the
proposed changes are more likely to continue the trend of pension populism without any significant
effort to create a stable pension system.
Introduction
The Slovak old-age pension system is based on the multi-pillar approach, which consists of three
main pillars:
• Pillar I – State pension organized as a mandatory Pay-As-You-Go (PAYG) scheme;
• Pillar II – Funded pension organized as voluntary funded DC based scheme; and
• Pillar III – Supplementary pension organized as a voluntary individual pension DC based
scheme.
The Slovakian pension reform started in 1996 with the introduction of Pillar III, which at that time
(and until 2009) was organized as voluntary pension pillar offering life insurance contracts and as
395 | P a g e
Lon
g-Te
rm a
nd
Pen
sio
n S
avin
gs |
Th
e R
eal R
etu
rn |
20
21
Edit
ion
an occupational pillar as well. Since July 2009, the system was changed to funded saving schemes
and voluntary Pillar III pension funds are offered to the savers (members). The organization of Pillar
III started to become more personal with the financial support of employers.
The World Bank’s approach has been fully implemented by introducing Pillar II at the beginning of
2005, and, from a terminological point of view, it should be called the “1bis pillar”, as individual
retirement accounts are funded via partial redirection of social security contributions on individual
pension savings accounts.
For a person who works a full career (42 years) and retires in 2018, the main income stream derives
from the PAYG (Pillar I) pension scheme. On average, the individual replacement ratio of such a
person could reach 50% of his gross salary. If the person would have participated since 1996 in Pillar
III and contributed on average 3% of his salary into a Pillar III pension scheme, having also entered
Pillar II (1bis pillar) in 2005, his income stream during retirement would have been slightly different
and his replacement ratio would have been a little higher than 50%. However, still more than 90%
of the retirement income stream is provided via the PAYG scheme (Pillar I), around 5% from Pillar II
(1bis pillar) and 5% from Pillar III.
Introductory Table - SK Pension System Overview Pillar I Pillar II Pillar III
State pension (almost 100% coverage) - Mandatory (PAYG)
Occupational pensions - Mandatory DC (funded schemes) - coverage 60%
Individual pensions - Voluntary fully funded DC - coverage 27%
Managed by the Social Insurance Company
Managed by Pension Asset Management Companies
Contribution rate: 14% (employer) and 4% (employee); Gross replacement rate: 51.48% Average pension: €455
Contribution rate: 4.50%; 17 pension funds offerred
15 pensions funds offered
Quick facts Retirement age – 62.4 years
A relatively high old-age dependency ratio of 24.65% in 2020 Aggregate replacement ratio for pensions (excl. social benefits), total, 2019 of 53%
Source: authors´ composition
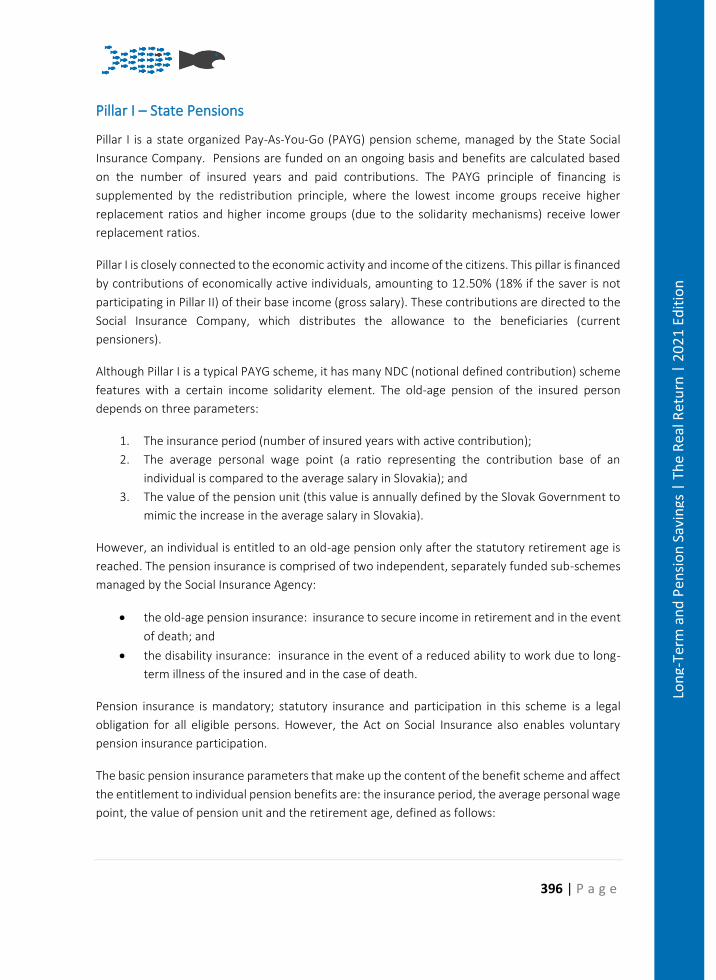
396 | P a g e
Lon
g-Te
rm a
nd
Pen
sio
n S
avin
gs |
Th
e R
eal R
etu
rn |
20
21
Edit
ion
Pillar I – State Pensions
Pillar I is a state organized Pay-As-You-Go (PAYG) pension scheme, managed by the State Social
Insurance Company. Pensions are funded on an ongoing basis and benefits are calculated based
on the number of insured years and paid contributions. The PAYG principle of financing is
supplemented by the redistribution principle, where the lowest income groups receive higher
replacement ratios and higher income groups (due to the solidarity mechanisms) receive lower
replacement ratios.
Pillar I is closely connected to the economic activity and income of the citizens. This pillar is financed
by contributions of economically active individuals, amounting to 12.50% (18% if the saver is not
participating in Pillar II) of their base income (gross salary). These contributions are directed to the
Social Insurance Company, which distributes the allowance to the beneficiaries (current
pensioners).
Although Pillar I is a typical PAYG scheme, it has many NDC (notional defined contribution) scheme
features with a certain income solidarity element. The old-age pension of the insured person
depends on three parameters:
1. The insurance period (number of insured years with active contribution);
2. The average personal wage point (a ratio representing the contribution base of an
individual is compared to the average salary in Slovakia); and
3. The value of the pension unit (this value is annually defined by the Slovak Government to
mimic the increase in the average salary in Slovakia).
However, an individual is entitled to an old-age pension only after the statutory retirement age is
reached. The pension insurance is comprised of two independent, separately funded sub-schemes
managed by the Social Insurance Agency:
• the old-age pension insurance: insurance to secure income in retirement and in the event
of death; and
• the disability insurance: insurance in the event of a reduced ability to work due to long-
term illness of the insured and in the case of death.
Pension insurance is mandatory; statutory insurance and participation in this scheme is a legal
obligation for all eligible persons. However, the Act on Social Insurance also enables voluntary
pension insurance participation.
The basic pension insurance parameters that make up the content of the benefit scheme and affect
the entitlement to individual pension benefits are: the insurance period, the average personal wage
point, the value of pension unit and the retirement age, defined as follows:
397 | P a g e
Lon
g-Te
rm a
nd
Pen
sio
n S
avin
gs |
Th
e R
eal R
etu
rn |
20
21
Edit
ion
• Number of insured years (insurance period): given by the number of working years of an
individual during which social insurance contributions were paid;
• Average personal wage point (APWP): determined as the ratio of the sum of personal wage
points calculated for each calendar year of the reference period and the period of pension
insurance in the relevant period. The average personal wage point shall be rounded up to
four decimal points;
• Value of pension unit: the monetary value of one personal wage point. The pension value
is adjusted on 1 of January each year through indexation, which is determined as the ratio
of the average wage calculated in the third quarter of the previous calendar year and the
average wage calculated in the third quarter of the calendar year two years preceding the
calendar year on which the pension value is calculated. This way the determined pension
value is always valid from 1 January to 31 December of the calendar year. The current
pension value, which is used to calculate pension benefits, is the pension value valid at the
time of a claim for payment of the pension benefits;
• Retirement age – 62 years and 8 months in 2020, valid for both men and women. However,
the automatic mechanism of retirement age adjustment has been abandoned in 2019 and
replaced with the constitutional ceiling of retirement age at 64 years for men. For women,
the retirement age is lower and depends on the number of raised children. For each raised
child the retirement age is lowered by 6 months up to 3 children. The new constitutional
ruling that passed the Parliament in 2020 removes the ceiling on retirement age.
To illustrate the calculation of an old-age pension, let us assume that an individual has the following
individual parameters and reached the statutory retirement age of 62.4 years in 2018:
1. Number of insured years (N) = 42 (full working career);
2. Average personal wage point (APWP) = 1 (for the entire working career, an individual has
been earning on average 100% of average salary in Slovakia)
3. Value of pension unit (VPU) = € 13.6361 (for persons retiring in the year 2020).
The old-age pension is then calculated using the following formula: N x APWP x VPU.
Therefore, considering the abovementioned individual parameters of a person claiming old-age
pension, he/she will be entitled to a monthly pension equal to: 42 x 1 x €13.6361 = €573.
If an individual has earned on average 100% of an average salary during his entire working career
and the average salary in 2020 was €1,113, then the gross individual replacement ratio of such an
individual would be: €573 / €1,113 = 51.48%.
Pillar II – Funded pensions
The Slovak Pillar II was established as a defined contribution (DC) pension saving scheme in 2005.
Since September 2012, the enrolment is fully voluntary (until September 2012 it was a mandatory
398 | P a g e
Lon
g-Te
rm a
nd
Pen
sio
n S
avin
gs |
Th
e R
eal R
etu
rn |
20
21
Edit
ion
one) and eligible for persons up to 35 years of age. The principle of funded pension is based on the
accumulation of savings during employment and investing savings in financial markets via special
purpose vehicles - pension funds, which are managed and administrated by Pension Fund
Management Companies (PFMCs), licensed by National Bank of Slovakia.
The role of old-age pension saving, along with old-age social insurance (Pillar I), is to ensure
retirement income for savers and their survivors in the case of his/her death.
The Pillar II market is fairly concentrated. Each saver can choose one out of six currently existing
providers (PFMCs) on the Slovak market. The PFMCs are private joint-stock companies with a
minimum capital requirement of €10 million and established in the territory of the Slovak Republic.
Their exclusive business is the creation and administration of pension funds. As a further condition,
they must attain at least 50,000 members within a period of 18 months from the establishment of
the pension fund.
According to the applicable law (the Act on Old-Age Saving), each PFMC is obligated to operate at
least two pension funds. We can divide these pension funds into two main groups:
1. Bond guaranteed pension fund (guaranteed scheme);
2. Equity non-guaranteed pension fund (non-guaranteed scheme).
Each PFMC is free to choose (mostly based on their business model) whether it operates additional
pension funds, which are optional. These legislative changes entered into force on 30 April 2013.
Before this date, each PFMC had to operate three (respectively four) obligatory pension funds:
1. Bond (Conservative) pension fund (since March 2005);
2. Mixed (Balanced) pension fund (since March 2005);
3. Equity (Growth) pension fund (since March 2005);
4. Index pension fund (since April 2012).
After the legislative changes became effective in May 2013, mixed and index pension funds became
optional, and some of PFMCs merged these pension funds with obligatory Equity non-guaranteed
pension funds. It is important to say that the first three categories of pension funds are (from an
asset management point of view) actively managed pension funds, and Index pension funds are the
only funds managed entirely passively. However, changes in the fee policy (strictly regulated) forced
providers to change the investment strategy of pension funds towards being passively managed
using mostly ETFs as main financial instruments.
PFMCs are subject to a variety of regulations. The Old-age Pension Savings Act defines the range of
allowed investment instruments and sets maximum limits for portfolio allocations (quantitative
limits). Investment procedures and valuation of investments (daily at market prices) are also
regulated. Thus, each category of pension funds has their own investment strategy, as well as
399 | P a g e
Lon
g-Te
rm a
nd
Pen
sio
n S
avin
gs |
Th
e R
eal R
etu
rn |
20
21
Edit
ion
general or special quantitative limits and operating conditions. PFMCs and managed pension funds
are supervised by the National Bank of Slovakia.
Pillar II as a voluntary DC scheme allows savers to enter the system whenever they wish before the
age of 35. In general, pension fund members (Pillar II savers) are free to choose one or two of the
aforementioned pension funds provided by the same PFMC.
Each saver has an individual retirement account (IRA). His contributions (savings) are redirected
from the Social Insurance Company to the chosen PFMC on his IRA at a rate of 4% of gross salary.
However, since 2017, the contributions have started to increase from 4% to 4.25% and will continue
to grow by 0.25% annually until they reach the final level of 6% in 2024.
With the possibility to save in one or two pension funds at the same time, it is completely up to a
saver how much of his own savings would be invested in one pension fund or another. He can
invest, for example, 70% in a Bond guaranteed pension fund and another part (30%) in an Index
non-guaranteed pension fund. There is no fee or charge to change this allocation ratio or switch
pension funds managed by the same PFMC - even on a daily basis. Switching providers (PFMCs) for
free is possible for savers if the change is made after one year, otherwise a fee of €16 is applied.
The reform of the pay-out phase, introduced in 2015, stipulates the following types of pension
products that are allowed for the pay-out phase:
1. single annuity (for most cases) with guaranteed payment period for 84 months;
2. single indexed annuity;
3. single annuity with survivorship benefits (for up to 2 years);
4. programmed withdrawal (phased withdrawal);
5. perpetuity (withdrawal of only annual gains).
Products 1, 2 and 3 are provided by insurance companies, products 4 and 5 by PFMCs.
The year 2019 brought an introduction of Pension Benefit Statement with pension benefits
projections also into the II. pillar. The providers are obliged to send the pension benefit statements
to all savers since January 2021.
Pillar III – Supplementary pensions
The Supplementary pension is a voluntary funded DC-based pension saving scheme in which the
funds of the participants are administered by Supplementary Pension Fund Management
Companies (SPFMCs). The SPFMCs are private joint stock companies established under the Slovak
law and able to only provide services tied to the management of supplementary pension funds.
SPFMCs and their supplementary pension funds are supervised and regulated by the National Bank
of Slovakia.
400 | P a g e
Lon
g-Te
rm a
nd
Pen
sio
n S
avin
gs |
Th
e R
eal R
etu
rn |
20
21
Edit
ion
The purpose of supplementary pension saving is to allow participants to obtain supplementary
pension income in old-age and the whole Pillar is mostly oriented towards employers and their
employees. However, the coverage ratio is rather low (27% in 2020).
Currently there are four providers (SPFMCs) operating on the market, which could be considered
concentrated. Each SPFMC is obliged by law to operate at least one contributory and one “pay-out”
supplementary pension fund. The legislation does not determine specific types of contributory
pension funds; however, we can divide all existing contributory pension funds according to the
portfolio structure into 3 main groups:
• Conservative supplementary pension funds (no equity investments);
• Balanced supplementary pension funds (small portions of equity investments);
• Growth supplementary pension funds (highest portions of equity investments).
Company “NN” and later on “Axa” have launched the first passively managed equity fund within
the Pillar III. There are no specific investment restrictions regarding asset classes in supplementary
pension funds, but there are some general quantitative limits to restrict the concentration risk of
the fund.
The following benefits are paid from the supplementary pension saving upon the completion of the
saving period:
• supplementary old-age pension in the form of lifelong or temporary supplementary
annuity;
• supplementary pension in the form of programmed withdrawal;
• lump-sum settlement;
• redundancy pay.
Pension Vehicles
Pillar II – Funded pensions
There are five providers - Pension Asset Management Companies (PFMCs) - operating on the
market. In 2019, the NN bought the Aegon. According to the Assets under Management (AuM)
measure, the two biggest, Allianz Slovenska and AXA, represent nearly 60% of the market. More
details on the market share of particular providers are presented in the table below.
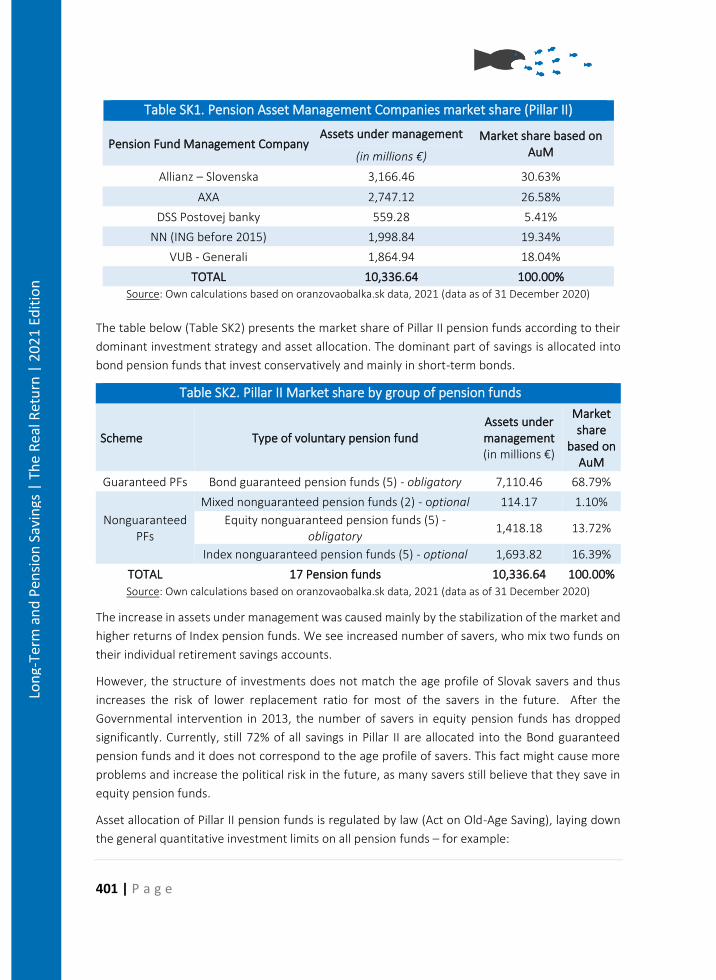
401 | P a g e
Lon
g-Te
rm a
nd
Pen
sio
n S
avin
gs |
Th
e R
eal R
etu
rn |
20
21
Edit
ion
Table SK1. Pension Asset Management Companies market share (Pillar II)
Pension Fund Management Company Assets under management Market share based on
AuM (in millions €)
Allianz – Slovenska 3,166.46 30.63%
AXA 2,747.12 26.58%
DSS Postovej banky 559.28 5.41%
NN (ING before 2015) 1,998.84 19.34%
VUB - Generali 1,864.94 18.04%
TOTAL 10,336.64 100.00%
Source: Own calculations based on oranzovaobalka.sk data, 2021 (data as of 31 December 2020)
The table below (Table SK2) presents the market share of Pillar II pension funds according to their
dominant investment strategy and asset allocation. The dominant part of savings is allocated into
bond pension funds that invest conservatively and mainly in short-term bonds.
Table SK2. Pillar II Market share by group of pension funds
Scheme Type of voluntary pension fund Assets under management (in millions €)
Market share
based on AuM
Guaranteed PFs Bond guaranteed pension funds (5) - obligatory 7,110.46 68.79%
Nonguaranteed PFs
Mixed nonguaranteed pension funds (2) - optional 114.17 1.10%
Equity nonguaranteed pension funds (5) - obligatory
1,418.18 13.72%
Index nonguaranteed pension funds (5) - optional 1,693.82 16.39%
TOTAL 17 Pension funds 10,336.64 100.00%
Source: Own calculations based on oranzovaobalka.sk data, 2021 (data as of 31 December 2020)
The increase in assets under management was caused mainly by the stabilization of the market and
higher returns of Index pension funds. We see increased number of savers, who mix two funds on
their individual retirement savings accounts.
However, the structure of investments does not match the age profile of Slovak savers and thus
increases the risk of lower replacement ratio for most of the savers in the future. After the
Governmental intervention in 2013, the number of savers in equity pension funds has dropped
significantly. Currently, still 72% of all savings in Pillar II are allocated into the Bond guaranteed
pension funds and it does not correspond to the age profile of savers. This fact might cause more
problems and increase the political risk in the future, as many savers still believe that they save in
equity pension funds.
Asset allocation of Pillar II pension funds is regulated by law (Act on Old-Age Saving), laying down
the general quantitative investment limits on all pension funds – for example:
402 | P a g e
Lon
g-Te
rm a
nd
Pen
sio
n S
avin
gs |
Th
e R
eal R
etu
rn |
20
21
Edit
ion
• max. 3% of AuM into one financial instrument (does not apply on bond investments or in
case of passively managed pension funds);
• max. 10% of AuM into one UCITS fund;
• max. 15% of the whole pension fund portfolio into one issuer (does not apply on bond
investments or in case of passive managed pension funds);
• bond investments must have investment grade rating (does not apply in case of passively
managed pension funds).
Pillar II savers can choose from two main types of obligatory and two types of optional voluntary
pension funds.
Obligatory - Bond guaranteed pension funds are actively managed pension funds and are obliged
to invest 100% of the assets into bonds, money market instruments, deposits, investment funds in
which assets must be invested in the above securities and deposits and other similar assets. Bond
guaranteed pension funds are not allowed to invest in equities and real estate, nor respective
investment funds. This conservative strategy focuses on bonds, and its objective is the preservation
of capital and moderate growth primarily on shorter horizons. Bond guaranteed pension funds are
obliged to hedge at least 95% of the whole portfolio against currency exposure. That means that if
the pension fund allocates the assets into the financial instruments that are denominated in a
currency other than Euro, fund managers must open the position (usually swaps or other hedging
instrument) that fixes the value of such investment in Euro.
Obligatory - Equity non-guaranteed pension funds are actively managed pension funds and proceed
in investing in different types of assets from the objective under quantitative limits:
• up to 80% of the assets of the funds can be invested in equities, equity funds and other
instruments similar to equity;
• at least 20% of the whole portfolio has to be hedged against currency risks;
• max. 20% of the whole portfolio can be invested in precious metals.
Optional - Mixed non-guaranteed pension funds are actively managed pension funds and they
invest in different types of assets, according to their objective and under general quantitative limits.
There are no specific limitations applicable.
Optional - Index non-guaranteed pension funds, introduced in April 2012, are the only passively
managed pension funds in Slovak pillar II. There are no general nor specific quantitative limits,
because of the nature of investing. Slovak Index non-guaranteed pension funds track respective
stock market benchmarks (such as MSCI World, Eurostoxx 50, MSCI ACWI, MSCI Euro).
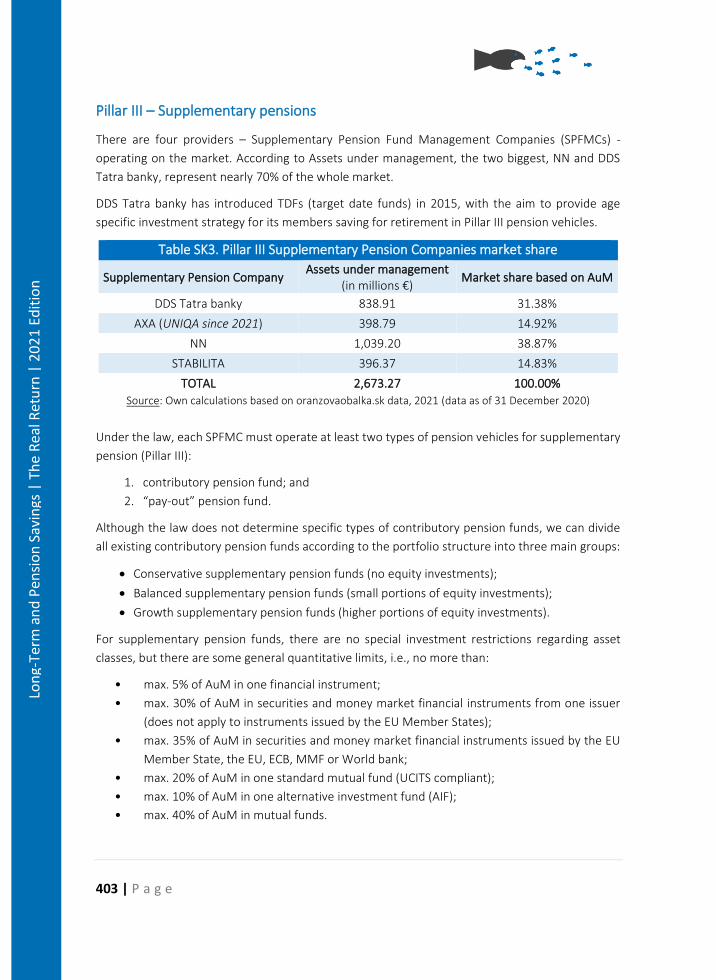
403 | P a g e
Lon
g-Te
rm a
nd
Pen
sio
n S
avin
gs |
Th
e R
eal R
etu
rn |
20
21
Edit
ion
Pillar III – Supplementary pensions
There are four providers – Supplementary Pension Fund Management Companies (SPFMCs) -
operating on the market. According to Assets under management, the two biggest, NN and DDS
Tatra banky, represent nearly 70% of the whole market.
DDS Tatra banky has introduced TDFs (target date funds) in 2015, with the aim to provide age
specific investment strategy for its members saving for retirement in Pillar III pension vehicles.
Table SK3. Pillar III Supplementary Pension Companies market share
Supplementary Pension Company Assets under management
(in millions €) Market share based on AuM
DDS Tatra banky 838.91 31.38%
AXA (UNIQA since 2021) 398.79 14.92%
NN 1,039.20 38.87%
STABILITA 396.37 14.83%
TOTAL 2,673.27 100.00%
Source: Own calculations based on oranzovaobalka.sk data, 2021 (data as of 31 December 2020)
Under the law, each SPFMC must operate at least two types of pension vehicles for supplementary
pension (Pillar III):
1. contributory pension fund; and
2. “pay-out” pension fund.
Although the law does not determine specific types of contributory pension funds, we can divide
all existing contributory pension funds according to the portfolio structure into three main groups:
• Conservative supplementary pension funds (no equity investments);
• Balanced supplementary pension funds (small portions of equity investments);
• Growth supplementary pension funds (higher portions of equity investments).
For supplementary pension funds, there are no special investment restrictions regarding asset
classes, but there are some general quantitative limits, i.e., no more than:
• max. 5% of AuM in one financial instrument;
• max. 30% of AuM in securities and money market financial instruments from one issuer
(does not apply to instruments issued by the EU Member States);
• max. 35% of AuM in securities and money market financial instruments issued by the EU
Member State, the EU, ECB, MMF or World bank;
• max. 20% of AuM in one standard mutual fund (UCITS compliant);
• max. 10% of AuM in one alternative investment fund (AIF);
• max. 40% of AuM in mutual funds.
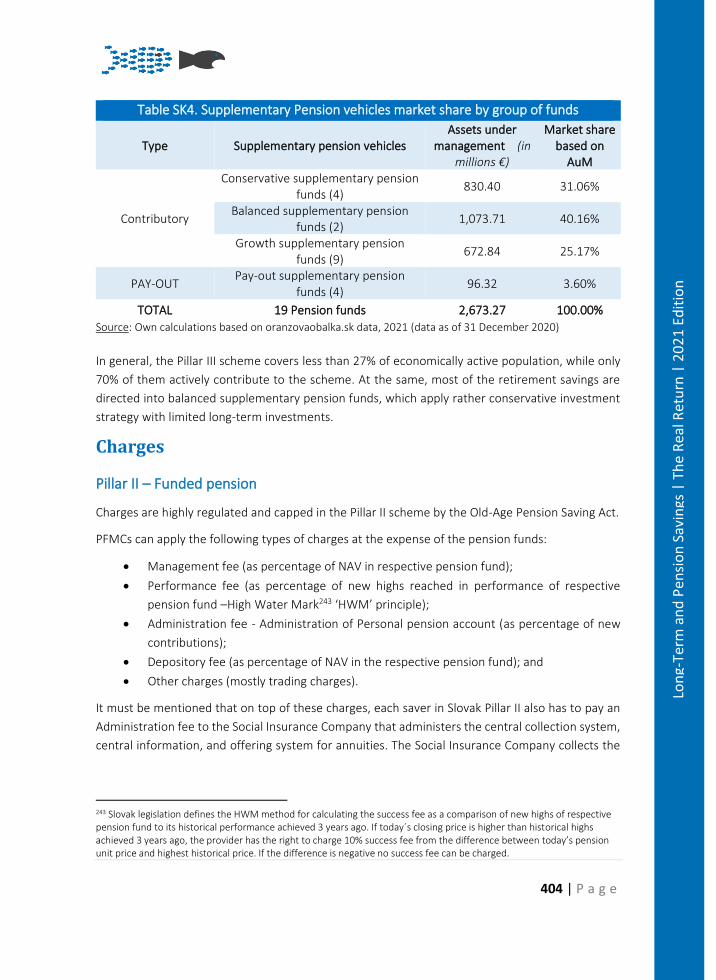
404 | P a g e
Lon
g-Te
rm a
nd
Pen
sio
n S
avin
gs |
Th
e R
eal R
etu
rn |
20
21
Edit
ion
Table SK4. Supplementary Pension vehicles market share by group of funds
Type Supplementary pension vehicles Assets under
management (in millions €)
Market share based on
AuM
Contributory
Conservative supplementary pension funds (4)
830.40 31.06%
Balanced supplementary pension funds (2)
1,073.71 40.16%
Growth supplementary pension funds (9)
672.84 25.17%
PAY-OUT Pay-out supplementary pension
funds (4) 96.32 3.60%
TOTAL 19 Pension funds 2,673.27 100.00%
Source: Own calculations based on oranzovaobalka.sk data, 2021 (data as of 31 December 2020)
In general, the Pillar III scheme covers less than 27% of economically active population, while only
70% of them actively contribute to the scheme. At the same, most of the retirement savings are
directed into balanced supplementary pension funds, which apply rather conservative investment
strategy with limited long-term investments.
Charges
Pillar II – Funded pension
Charges are highly regulated and capped in the Pillar II scheme by the Old-Age Pension Saving Act.
PFMCs can apply the following types of charges at the expense of the pension funds:
• Management fee (as percentage of NAV in respective pension fund);
• Performance fee (as percentage of new highs reached in performance of respective
pension fund –High Water Mark243 ‘HWM’ principle);
• Administration fee - Administration of Personal pension account (as percentage of new
contributions);
• Depository fee (as percentage of NAV in the respective pension fund); and
• Other charges (mostly trading charges).
It must be mentioned that on top of these charges, each saver in Slovak Pillar II also has to pay an
Administration fee to the Social Insurance Company that administers the central collection system,
central information, and offering system for annuities. The Social Insurance Company collects the
243 Slovak legislation defines the HWM method for calculating the success fee as a comparison of new highs of respective pension fund to its historical performance achieved 3 years ago. If today´s closing price is higher than historical highs achieved 3 years ago, the provider has the right to charge 10% success fee from the difference between today’s pension unit price and highest historical price. If the difference is negative no success fee can be charged.
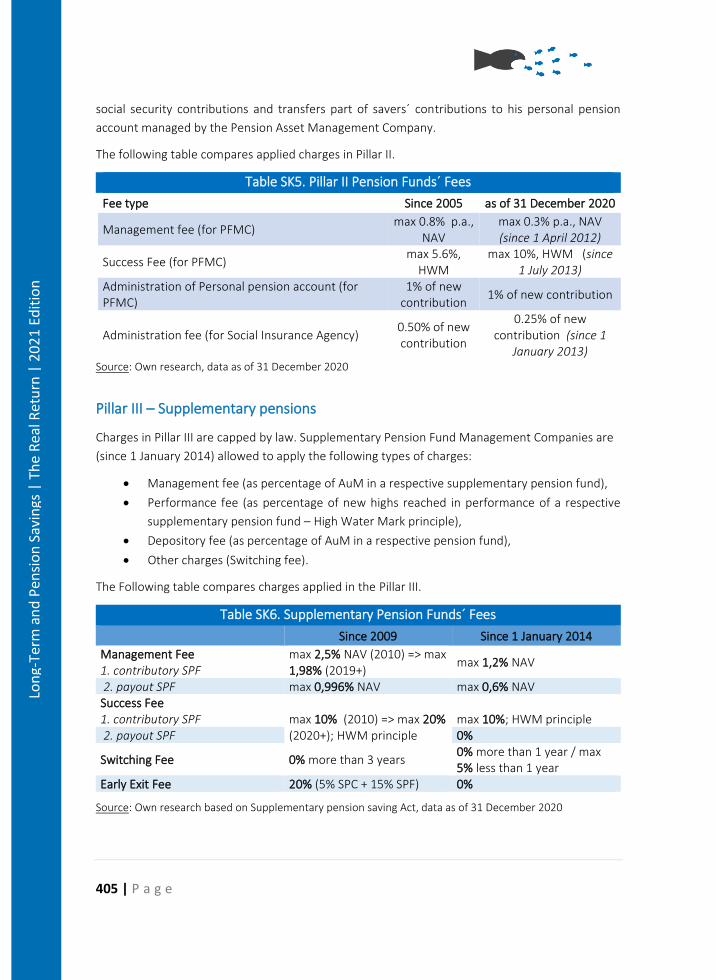
405 | P a g e
Lon
g-Te
rm a
nd
Pen
sio
n S
avin
gs |
Th
e R
eal R
etu
rn |
20
21
Edit
ion
social security contributions and transfers part of savers´ contributions to his personal pension
account managed by the Pension Asset Management Company.
The following table compares applied charges in Pillar II.
Table SK5. Pillar II Pension Funds´ Fees
Fee type Since 2005 as of 31 December 2020
Management fee (for PFMC) max 0.8% p.a.,
NAV max 0.3% p.a., NAV (since 1 April 2012)
Success Fee (for PFMC) max 5.6%,
HWM max 10%, HWM (since
1 July 2013) Administration of Personal pension account (for PFMC)
1% of new contribution
1% of new contribution
Administration fee (for Social Insurance Agency) 0.50% of new contribution
0.25% of new contribution (since 1
January 2013) Source: Own research, data as of 31 December 2020
Pillar III – Supplementary pensions
Charges in Pillar III are capped by law. Supplementary Pension Fund Management Companies are
(since 1 January 2014) allowed to apply the following types of charges:
• Management fee (as percentage of AuM in a respective supplementary pension fund),
• Performance fee (as percentage of new highs reached in performance of a respective
supplementary pension fund – High Water Mark principle),
• Depository fee (as percentage of AuM in a respective pension fund),
• Other charges (Switching fee).
The Following table compares charges applied in the Pillar III.
Table SK6. Supplementary Pension Funds´ Fees
Since 2009 Since 1 January 2014
Management Fee 1. contributory SPF
max 2,5% NAV (2010) => max 1,98% (2019+)
max 1,2% NAV
2. payout SPF max 0,996% NAV max 0,6% NAV Success Fee 1. contributory SPF
max 10% (2010) => max 20% (2020+); HWM principle
max 10%; HWM principle
2. payout SPF 0%
Switching Fee 0% more than 3 years 0% more than 1 year / max 5% less than 1 year
Early Exit Fee 20% (5% SPC + 15% SPF) 0%
Source: Own research based on Supplementary pension saving Act, data as of 31 December 2020
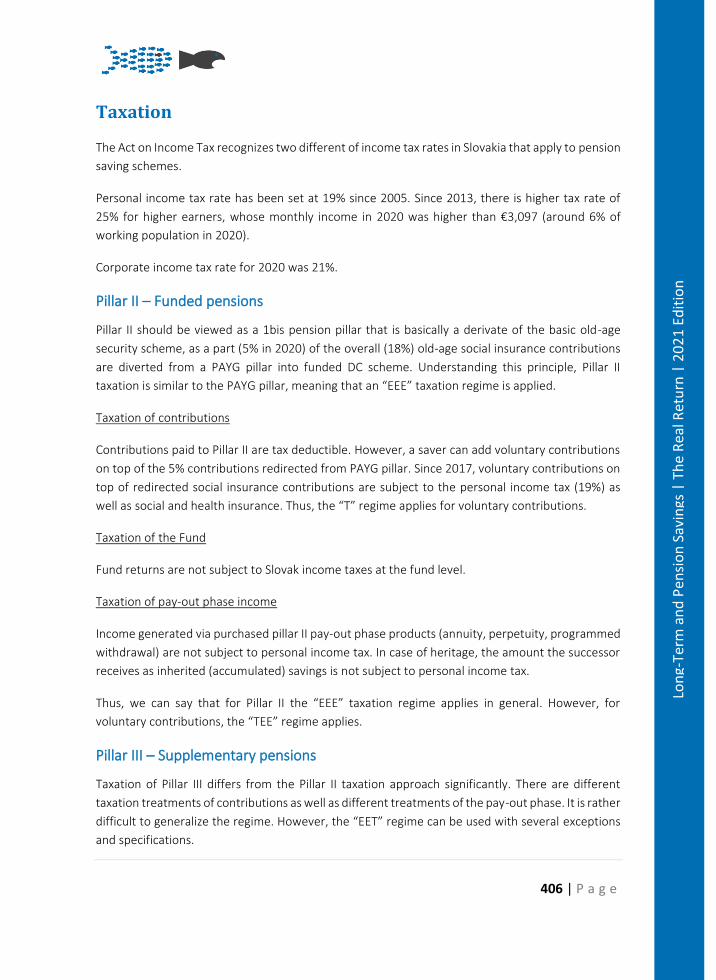
406 | P a g e
Lon
g-Te
rm a
nd
Pen
sio
n S
avin
gs |
Th
e R
eal R
etu
rn |
20
21
Edit
ion
Taxation
The Act on Income Tax recognizes two different of income tax rates in Slovakia that apply to pension
saving schemes.
Personal income tax rate has been set at 19% since 2005. Since 2013, there is higher tax rate of
25% for higher earners, whose monthly income in 2020 was higher than €3,097 (around 6% of
working population in 2020).
Corporate income tax rate for 2020 was 21%.
Pillar II – Funded pensions
Pillar II should be viewed as a 1bis pension pillar that is basically a derivate of the basic old-age
security scheme, as a part (5% in 2020) of the overall (18%) old-age social insurance contributions
are diverted from a PAYG pillar into funded DC scheme. Understanding this principle, Pillar II
taxation is similar to the PAYG pillar, meaning that an “EEE” taxation regime is applied.
Taxation of contributions
Contributions paid to Pillar II are tax deductible. However, a saver can add voluntary contributions
on top of the 5% contributions redirected from PAYG pillar. Since 2017, voluntary contributions on
top of redirected social insurance contributions are subject to the personal income tax (19%) as
well as social and health insurance. Thus, the “T” regime applies for voluntary contributions.
Taxation of the Fund
Fund returns are not subject to Slovak income taxes at the fund level.
Taxation of pay-out phase income
Income generated via purchased pillar II pay-out phase products (annuity, perpetuity, programmed
withdrawal) are not subject to personal income tax. In case of heritage, the amount the successor
receives as inherited (accumulated) savings is not subject to personal income tax.
Thus, we can say that for Pillar II the “EEE” taxation regime applies in general. However, for
voluntary contributions, the “TEE” regime applies.
Pillar III – Supplementary pensions
Taxation of Pillar III differs from the Pillar II taxation approach significantly. There are different
taxation treatments of contributions as well as different treatments of the pay-out phase. It is rather
difficult to generalize the regime. However, the “EET” regime can be used with several exceptions
and specifications.
407 | P a g e
Lon
g-Te
rm a
nd
Pen
sio
n S
avin
gs |
Th
e R
eal R
etu
rn |
20
21
Edit
ion
Taxation of contributions
When considering the taxation treatment of contributions, a slightly different regime is used for
savers´ (employees´) contributions and a different regime for employer´s contributions.
Generally, both contributions are income-tax deductible; however, for employees (savers) there is
a ceiling of €180 per year. This means that the monthly contributions to the Pillar III supplementary
pension fund up to €15 are income tax base deductible. Above this amount, the contributions made
to the individual saving account are subject to personal income tax. Considering that the average
salary (€1,113 in 2020), employee contributions up to 1.35% of the gross average salary can be
deducted from the personal income tax base.
Employer contributions are treated in a slightly different way. Contributions are tied to the monthly
salary of employees. Employer´s contributions up to 6% of monthly salary are treated as tax
expenses. Therefore, employers are motivated to contribute on behalf of employees up to this tax
favourable ceiling. Taking into account the average salary in Slovakia, contributions up to €66.78
per employee per month are considered as tax expenses for contributing employers in 2020. Taking
into account the poor supplementary pension funds´ performance and the relatively high level of
charges, favourable tax treatment of employer´s contributions are the key drivers for the
participants. At the same time, this favourable treatment of employer´s contributions paid on
behalf of its employees exclusively in the Pillar III scheme creates an administrative monopoly in
form of preferred supplementary retirement product in Slovakia.
Taxation of the Fund returns
Fund returns are exempt from income taxes at the fund level.
Taxation of pay-out phase
There are three different types of products used for the Pillar III pay-out phase (according to the
Act on Supplementary Pension Saving):
1) Lump-sum – paid out through SPFMC at maximum of 50% of accumulated savings;
2) Annuities – paid out through insurance company in form of a single annuity;
3) Phased (Programmed) withdrawal – paid out through SPFMC for at least 5 years.
There are 3 general conditions, where at least one should be met when entering the pay-out phase
in order to achieve more favourable tax treatment of income stream from Pillar III savings. They
concern the member´s age, the entitlement for state retirement pension benefits or the
entitlement for early state retirement pension benefits.
When considering the tax treatment of the pay-out phase income stream from the saver’s point of
view, there is a possible way to adjust the personal income tax base. The Act on Income Tax
408 | P a g e
Lon
g-Te
rm a
nd
Pen
sio
n S
avin
gs |
Th
e R
eal R
etu
rn |
20
21
Edit
ion
stipulates that the deduction from income tax base will be applied to the income stream from Pillar
III benefits and life insurance contracts. Personal income tax base shall be lowered by the paid
contributions (Pillar III) or paid premiums (life insurance contract). The Act on Income Tax also
defines the income tax base adjustments in case of paid monthly benefits according to the following
formulas:
• In the case of temporary annuity, the income tax base is calculated as positive balance
between sum of already received benefits and sum of paid contributions;
• In the case of single annuity, the income tax base is calculated as paid monthly benefits
and total paid contributions (or premium) divided by the number of remaining years
calculated as life expectancy and the age of the taxpayer (beneficiary) at the moment of
the first paid benefit.
Therefore, we can conclude that the income tax treatment of pay-out phase is, in fact, a deferred
taxation of investment returns applied not to the supplementary pension fund, but directly to the
saver during the pay-out phase. In general, we can say, that the tax regime for Pillar III is “EET”.
Pension Returns
Pillar II – Funded pensions
The five asset managers offer 17 pension funds in Slovakia (see table below). Pension funds are
divided into 2 main groups:
1. obligatory pension funds
a) bond guaranteed pension funds (5 offered)
b) equity nonguaranteed pension funds (5 offered)
2. optional pension funds
c) mixed nonguaranteed pension funds (2 offered)
d) index nonguaranteed pension funds (5 offered)
Groups a), b) and c) were launched onto the market by the beginning of Pillar II. Index
nonguaranteed pension funds (only passively managed pension funds) were launched in 2012.
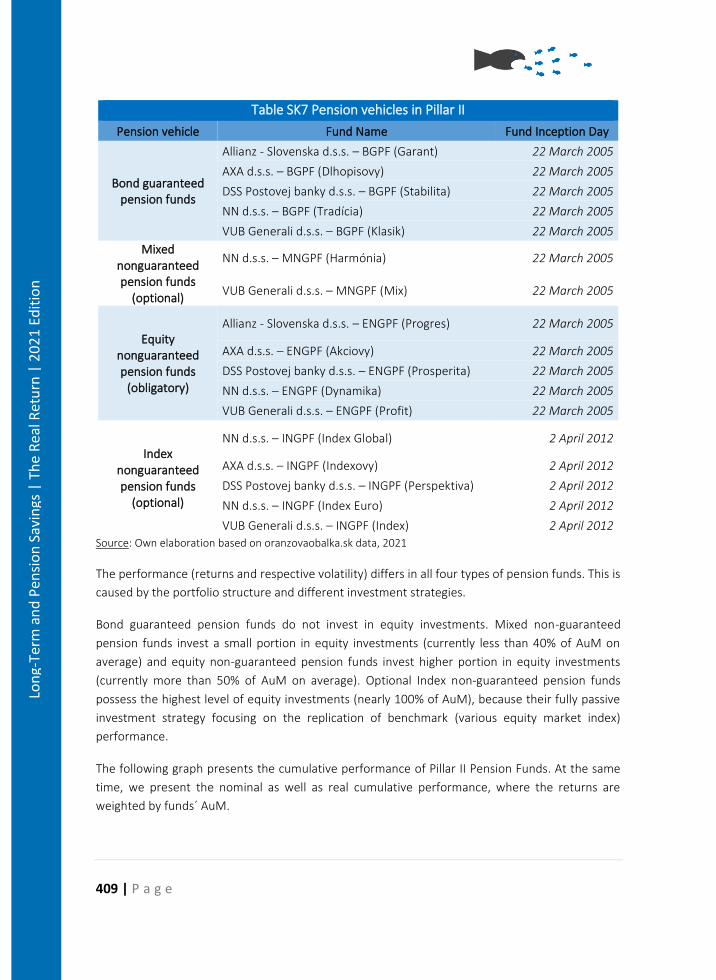
409 | P a g e
Lon
g-Te
rm a
nd
Pen
sio
n S
avin
gs |
Th
e R
eal R
etu
rn |
20
21
Edit
ion
Table SK7 Pension vehicles in Pillar II
Pension vehicle Fund Name Fund Inception Day
Bond guaranteed pension funds
Allianz - Slovenska d.s.s. – BGPF (Garant) 22 March 2005
AXA d.s.s. – BGPF (Dlhopisovy) 22 March 2005
DSS Postovej banky d.s.s. – BGPF (Stabilita) 22 March 2005
NN d.s.s. – BGPF (Tradícia) 22 March 2005
VUB Generali d.s.s. – BGPF (Klasik) 22 March 2005
Mixed nonguaranteed pension funds
(optional)
NN d.s.s. – MNGPF (Harmónia) 22 March 2005
VUB Generali d.s.s. – MNGPF (Mix) 22 March 2005
Equity nonguaranteed pension funds
(obligatory)
Allianz - Slovenska d.s.s. – ENGPF (Progres) 22 March 2005
AXA d.s.s. – ENGPF (Akciovy) 22 March 2005
DSS Postovej banky d.s.s. – ENGPF (Prosperita) 22 March 2005
NN d.s.s. – ENGPF (Dynamika) 22 March 2005
VUB Generali d.s.s. – ENGPF (Profit) 22 March 2005
Index nonguaranteed pension funds
(optional)
NN d.s.s. – INGPF (Index Global) 2 April 2012
AXA d.s.s. – INGPF (Indexovy) 2 April 2012
DSS Postovej banky d.s.s. – INGPF (Perspektiva) 2 April 2012
NN d.s.s. – INGPF (Index Euro) 2 April 2012
VUB Generali d.s.s. – INGPF (Index) 2 April 2012
Source: Own elaboration based on oranzovaobalka.sk data, 2021
The performance (returns and respective volatility) differs in all four types of pension funds. This is
caused by the portfolio structure and different investment strategies.
Bond guaranteed pension funds do not invest in equity investments. Mixed non-guaranteed
pension funds invest a small portion in equity investments (currently less than 40% of AuM on
average) and equity non-guaranteed pension funds invest higher portion in equity investments
(currently more than 50% of AuM on average). Optional Index non-guaranteed pension funds
possess the highest level of equity investments (nearly 100% of AuM), because their fully passive
investment strategy focusing on the replication of benchmark (various equity market index)
performance.
The following graph presents the cumulative performance of Pillar II Pension Funds. At the same
time, we present the nominal as well as real cumulative performance, where the returns are
weighted by funds´ AuM.
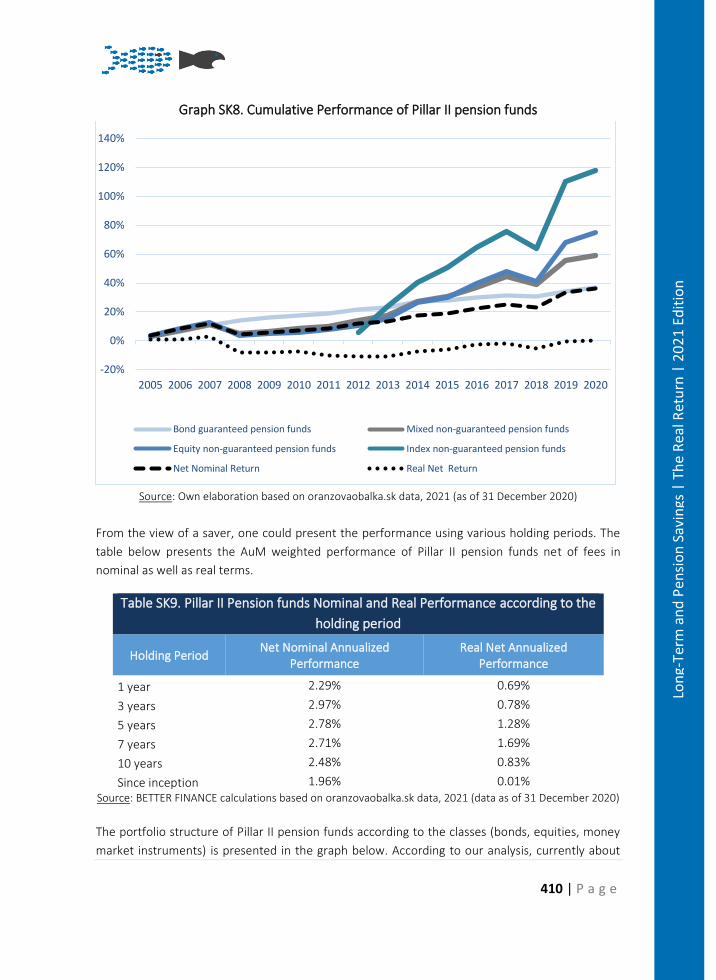
410 | P a g e
Lon
g-Te
rm a
nd
Pen
sio
n S
avin
gs |
Th
e R
eal R
etu
rn |
20
21
Edit
ion
Graph SK8. Cumulative Performance of Pillar II pension funds
Source: Own elaboration based on oranzovaobalka.sk data, 2021 (as of 31 December 2020)
From the view of a saver, one could present the performance using various holding periods. The
table below presents the AuM weighted performance of Pillar II pension funds net of fees in
nominal as well as real terms.
Table SK9. Pillar II Pension funds Nominal and Real Performance according to the
holding period
Holding Period Net Nominal Annualized
Performance Real Net Annualized
Performance
1 year 2.29% 0.69%
3 years 2.97% 0.78%
5 years 2.78% 1.28%
7 years 2.71% 1.69%
10 years 2.48% 0.83%
Since inception 1.96% 0.01% Source: BETTER FINANCE calculations based on oranzovaobalka.sk data, 2021 (data as of 31 December 2020)
The portfolio structure of Pillar II pension funds according to the classes (bonds, equities, money
market instruments) is presented in the graph below. According to our analysis, currently about
-20%
0%
20%
40%
60%
80%
100%
120%
140%
2005 2006 2007 2008 2009 2010 2011 2012 2013 2014 2015 2016 2017 2018 2019 2020
Bond guaranteed pension funds Mixed non-guaranteed pension funds
Equity non-guaranteed pension funds Index non-guaranteed pension funds
Net Nominal Return Real Net Return
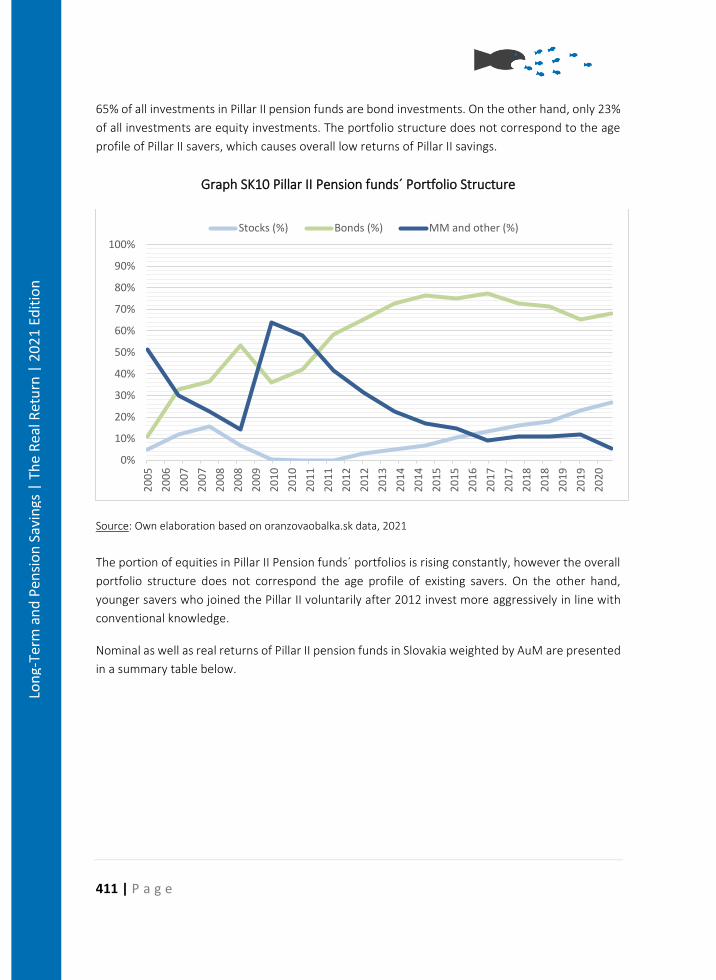
411 | P a g e
Lon
g-Te
rm a
nd
Pen
sio
n S
avin
gs |
Th
e R
eal R
etu
rn |
20
21
Edit
ion
65% of all investments in Pillar II pension funds are bond investments. On the other hand, only 23%
of all investments are equity investments. The portfolio structure does not correspond to the age
profile of Pillar II savers, which causes overall low returns of Pillar II savings.
Graph SK10 Pillar II Pension funds´ Portfolio Structure
Source: Own elaboration based on oranzovaobalka.sk data, 2021
The portion of equities in Pillar II Pension funds´ portfolios is rising constantly, however the overall
portfolio structure does not correspond the age profile of existing savers. On the other hand,
younger savers who joined the Pillar II voluntarily after 2012 invest more aggressively in line with
conventional knowledge.
Nominal as well as real returns of Pillar II pension funds in Slovakia weighted by AuM are presented
in a summary table below.
0%
10%
20%
30%
40%
50%
60%
70%
80%
90%
100%
20
05
20
06
20
07
20
07
20
08
20
08
20
09
20
10
20
10
20
11
20
11
20
12
20
12
20
13
20
14
20
14
20
15
20
15
20
16
20
17
20
17
20
18
20
18
20
19
20
19
20
20
Stocks (%) Bonds (%) MM and other (%)
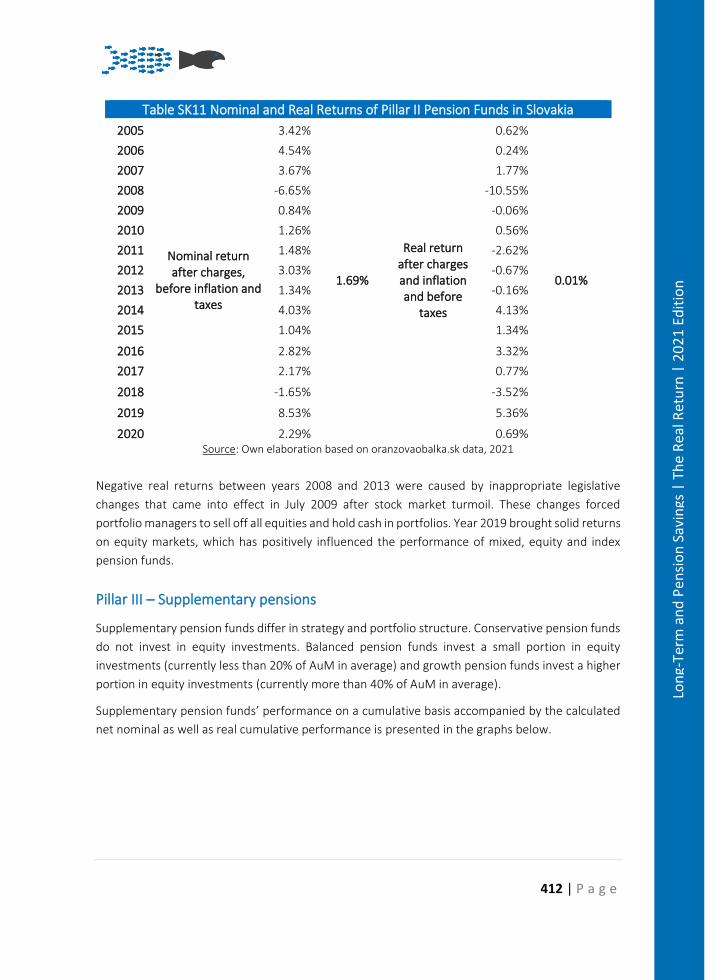
412 | P a g e
Lon
g-Te
rm a
nd
Pen
sio
n S
avin
gs |
Th
e R
eal R
etu
rn |
20
21
Edit
ion
Table SK11 Nominal and Real Returns of Pillar II Pension Funds in Slovakia
2005
Nominal return after charges,
before inflation and taxes
3.42%
1.69%
Real return after charges and inflation and before
taxes
0.62%
0.01%
2006 4.54% 0.24%
2007 3.67% 1.77%
2008 -6.65% -10.55%
2009 0.84% -0.06%
2010 1.26% 0.56%
2011 1.48% -2.62%
2012 3.03% -0.67%
2013 1.34% -0.16%
2014 4.03% 4.13%
2015 1.04% 1.34%
2016 2.82% 3.32%
2017 2.17% 0.77%
2018 -1.65% -3.52%
2019 8.53% 5.36%
2020 2.29% 0.69% Source: Own elaboration based on oranzovaobalka.sk data, 2021
Negative real returns between years 2008 and 2013 were caused by inappropriate legislative
changes that came into effect in July 2009 after stock market turmoil. These changes forced
portfolio managers to sell off all equities and hold cash in portfolios. Year 2019 brought solid returns
on equity markets, which has positively influenced the performance of mixed, equity and index
pension funds.
Pillar III – Supplementary pensions
Supplementary pension funds differ in strategy and portfolio structure. Conservative pension funds
do not invest in equity investments. Balanced pension funds invest a small portion in equity
investments (currently less than 20% of AuM in average) and growth pension funds invest a higher
portion in equity investments (currently more than 40% of AuM in average).
Supplementary pension funds’ performance on a cumulative basis accompanied by the calculated
net nominal as well as real cumulative performance is presented in the graphs below.
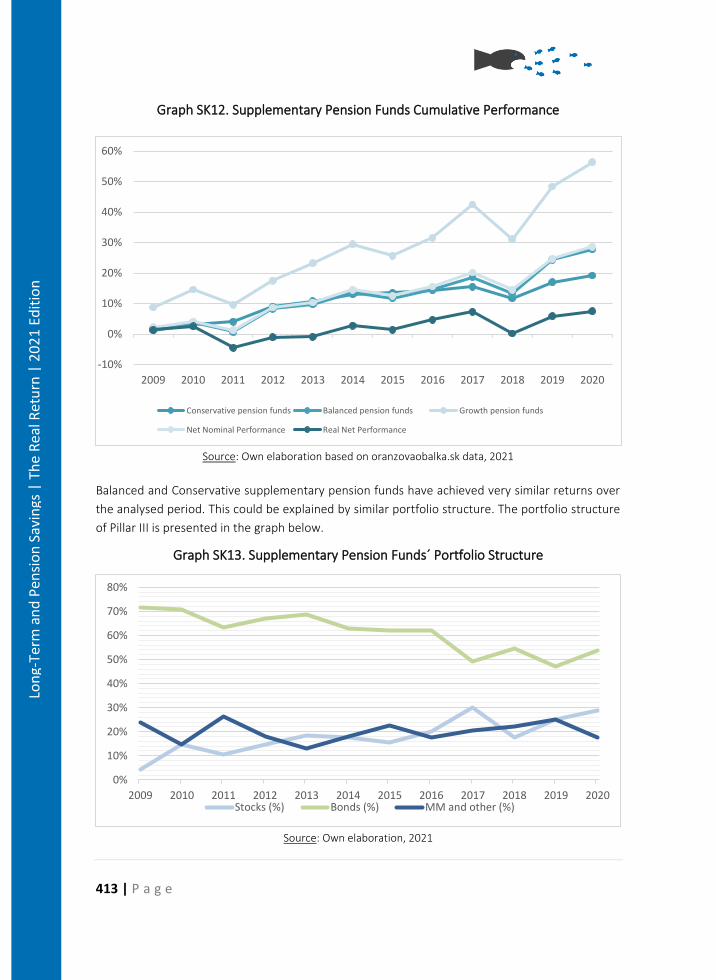
413 | P a g e
Lon
g-Te
rm a
nd
Pen
sio
n S
avin
gs |
Th
e R
eal R
etu
rn |
20
21
Edit
ion
Graph SK12. Supplementary Pension Funds Cumulative Performance
Source: Own elaboration based on oranzovaobalka.sk data, 2021
Balanced and Conservative supplementary pension funds have achieved very similar returns over
the analysed period. This could be explained by similar portfolio structure. The portfolio structure
of Pillar III is presented in the graph below.
Graph SK13. Supplementary Pension Funds´ Portfolio Structure
Source: Own elaboration, 2021
-10%
0%
10%
20%
30%
40%
50%
60%
2009 2010 2011 2012 2013 2014 2015 2016 2017 2018 2019 2020
Conservative pension funds Balanced pension funds Growth pension funds
Net Nominal Performance Real Net Performance
0%
10%
20%
30%
40%
50%
60%
70%
80%
2009 2010 2011 2012 2013 2014 2015 2016 2017 2018 2019 2020Stocks (%) Bonds (%) MM and other (%)
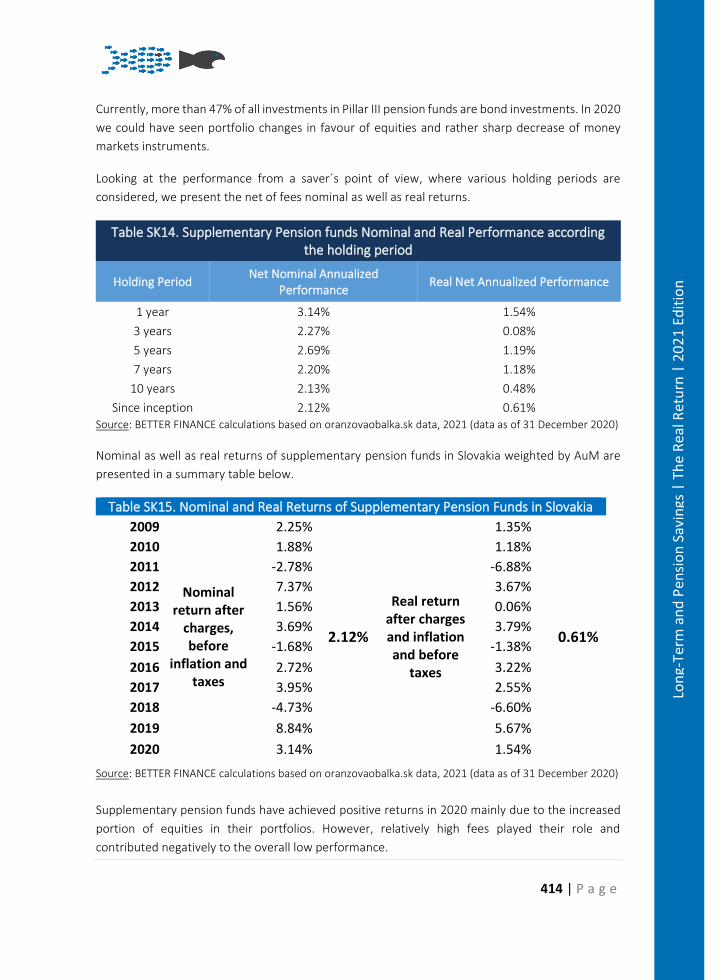
414 | P a g e
Lon
g-Te
rm a
nd
Pen
sio
n S
avin
gs |
Th
e R
eal R
etu
rn |
20
21
Edit
ion
Currently, more than 47% of all investments in Pillar III pension funds are bond investments. In 2020
we could have seen portfolio changes in favour of equities and rather sharp decrease of money
markets instruments.
Looking at the performance from a saver´s point of view, where various holding periods are
considered, we present the net of fees nominal as well as real returns.
Table SK14. Supplementary Pension funds Nominal and Real Performance according the holding period
Holding Period Net Nominal Annualized
Performance Real Net Annualized Performance
1 year 3.14% 1.54%
3 years 2.27% 0.08%
5 years 2.69% 1.19%
7 years 2.20% 1.18%
10 years 2.13% 0.48%
Since inception 2.12% 0.61% Source: BETTER FINANCE calculations based on oranzovaobalka.sk data, 2021 (data as of 31 December 2020)
Nominal as well as real returns of supplementary pension funds in Slovakia weighted by AuM are
presented in a summary table below.
Table SK15. Nominal and Real Returns of Supplementary Pension Funds in Slovakia
2009
Nominal return after
charges, before
inflation and taxes
2.25%
2.12%
Real return after charges and inflation and before
taxes
1.35%
0.61%
2010 1.88% 1.18%
2011 -2.78% -6.88%
2012 7.37% 3.67%
2013 1.56% 0.06%
2014 3.69% 3.79%
2015 -1.68% -1.38%
2016 2.72% 3.22%
2017 3.95% 2.55%
2018 -4.73% -6.60%
2019 8.84% 5.67%
2020 3.14% 1.54%
Source: BETTER FINANCE calculations based on oranzovaobalka.sk data, 2021 (data as of 31 December 2020)
Supplementary pension funds have achieved positive returns in 2020 mainly due to the increased
portion of equities in their portfolios. However, relatively high fees played their role and
contributed negatively to the overall low performance.
415 | P a g e
Lon
g-Te
rm a
nd
Pen
sio
n S
avin
gs |
Th
e R
eal R
etu
rn |
20
21
Edit
ion
Conclusions
The Slovak multi-pillar pension system is not quite favourable for savers. Pillar II suffers from
constant changes and significant political risk therefore not only arises from diverging political
opinions on the pension system. The new phenomena in Slovak pension system is the pension
populism, where political parties reverted stabilization features and decreased the financial stability
and trustworthiness of the PAYG scheme. The year 2020 could therefore be viewed as a year of
expected major changes in Pillar I.
Even though there have been negative interventions in Pillar II from 2008 to 2012 (significant
investment restrictions, a decrease in contributions from 9% to 4%), several positive features have
been introduced in Pillar II. However, unprofessional move of transferring savers´ assets from
equity-based pension funds into bond ones have had detrimental effect on savings, which could
lead to low pension pots and further political pressures on decreasing importance of private
pension savings in Slovakia.
Pillar III pension vehicles are generally poorly performing, costly and without significant tax benefits
for employees´ contributions; Pillar III would never survive competition from Pillar II pension funds
and typical investment funds. The debate on finding an appropriate regime for the Pillar III scheme
is still ongoing, while there are several different views on how to make Pillar III more favourable for
savers. Major governmental spending review in this area is expected to provide a clearer way
forward.
Policy Recommendations
Slovak Pillar II suffers from the misalignment between the remaining saving horizon of savers (age
profile) and applied investment strategy or allocation of savings. Most of the savers allocate their
savings into the bond funds even if their remaining saving horizon is far longer than 15 years.
Pension asset managers and regulators should therefore acknowledge inertia of savers and imply
default investment strategy that would at least recognize the remaining saving horizon of savers
and thus allocate the savings accordingly.
Pillar III faces two main limitations that are in fact deeply interconnected. The first problem is the
small coverage of economically active population, which disqualifies the pillar from being
recognized as universal pension pillar. This problem is however connected to the high fees that
effectively refrain larger participation of employers and employees in this pillar. Regulators should
scrutinize the possibilities to lower the management fees with rising assets under management,
which would show the clear and transparent road map towards the development of supplementary
pension schemes in Slovakia.
However, the key issue of the pension system in Slovakia is the I. pillar managed by state-owned
Social Insurance Company. Pension populism has financially destabilized the I. pillar and decreased

416 | P a g e
Lon
g-Te
rm a
nd
Pen
sio
n S
avin
gs |
Th
e R
eal R
etu
rn |
20
21
Edit
ion
the trustworthiness of the I. pillar, while the private forms of pension savings have increased on
importance. The government should immediately start taking actions to increase the financial
stability of the I. pillar and remove the populist features introduced in 2019 with continuation in
2020 as soon as possible.
Bibliography
Internet sources:
• Eurostat (http://epp.eurostat.ec.europa.eu/)
• National bank of Slovakia (http://nbs.sk)
• Pension Tracking System and Personal Finance Portal – Orange Envelope
(oranzovaobalka.sk)
• Ministry of Labour, Social Affairs and Family SR (http://www.employment.gov.sk/)
• Old age pension saving Act No. 43/2004 (http://www.zakonypreludi.sk/zz/2004-43)
• Supplementary pension saving Act No. 650/2004 (http://www.zakonypreludi.sk/zz/2004-
650)
417 | P a g e
Lon
g-Te
rm a
nd
Pen
sio
n S
avin
gs |
Th
e R
eal R
etu
rn |
20
21
Edit
ion
Pension Savings: The Real Return 2021 Edition
Country Case: Spain
Resumen
Los trabajadores españoles no ahorran para su jubilación. "El ladrillo y el mortero" constituyen más
del 70% de la cartera de un hogar español típico. Y no hay forma de pensar en este activo como
ahorro para la jubilación. Dado que las prestaciones de jubilación de la Seguridad Social sustituyen
más del 80% de los ingresos laborales perdidos en el momento de la jubilación (según la OCDE, ya
que la tasa de sustitución agregada de Eurostat es mucho menor, pero sigue siendo una de las más
altas de las jurisdicciones analizadas en este informe, con un 70%), ¿por qué los empleados
españoles deberían ahorrar con este fin? En consecuencia, la industria española de pensiones
(pilares II y III) es mucho menor que en Dinamarca (la más alta de la UE27) y Paìses-Bajos (la segunda
más alta). Los activos de los Fondos de Pensiones a finales de 2019 alcanzaron el 10,75% del PIB de
ese año, y si a ello se le añaden los vehículos de jubilación asegurada o similares a la jubilación, se
podrían encontrar 15,24 puntos porcentuales más. Estas y otras razones implican que la gestión de
activos en esta limitada industria no puede ser barata. Sin duda, los activos del Pilar II son tan
baratos de gestionar como en los países avanzados, pero no es el caso de los activos del Pilar III. La
fiscalidad de los activos y rentas de jubilación en España responde al régimen de EET, como en la
mayoría de los países de la OCDE. La rentabilidad real neta media acumulada desde el año 2000, en
el sistema estándar de Planes de Pensiones, una vez ajustada la inflación, ha sido de apenas un
0,43% anual. Poco se sabe sobre la rentabilidad media de los activos de los vehículos asegurados, y
su cálculo no ha sido el objetivo de este informe. Todos los datos utilizados pueden encontrarse en
las páginas web de fuentes oficiales fácilmente disponibles (INVERCO, DGSFP y Banco de España).
Summary
Spanish workers don't save for their retirement. “Bricks & Mortar” make more than 70% of a typical
Spanish household’s portfolio. And there is no way to think of this asset as retirement savings. As
Social Security old-age benefits replace more than 80% of lost labour income at retirement
(according to OECD, as the Eurostat aggregate replacement rate is much lower, but still among the
highest of the jurisdictions analysed in this report, at 70%), why Spanish employees should save
with this purpose? As a result, Spanish Pensions Industry (Pillars II and III) is much smaller than in
Denmark (highest in the EU27) and Netherlands (second highest). Pension Funds’ assets at end
2019 reached 10.75% of GDP that year, and if insured retirement or retirement-like vehicles were
added to this, an extra 15.24 percentage points could be found. These and other reasons imply that
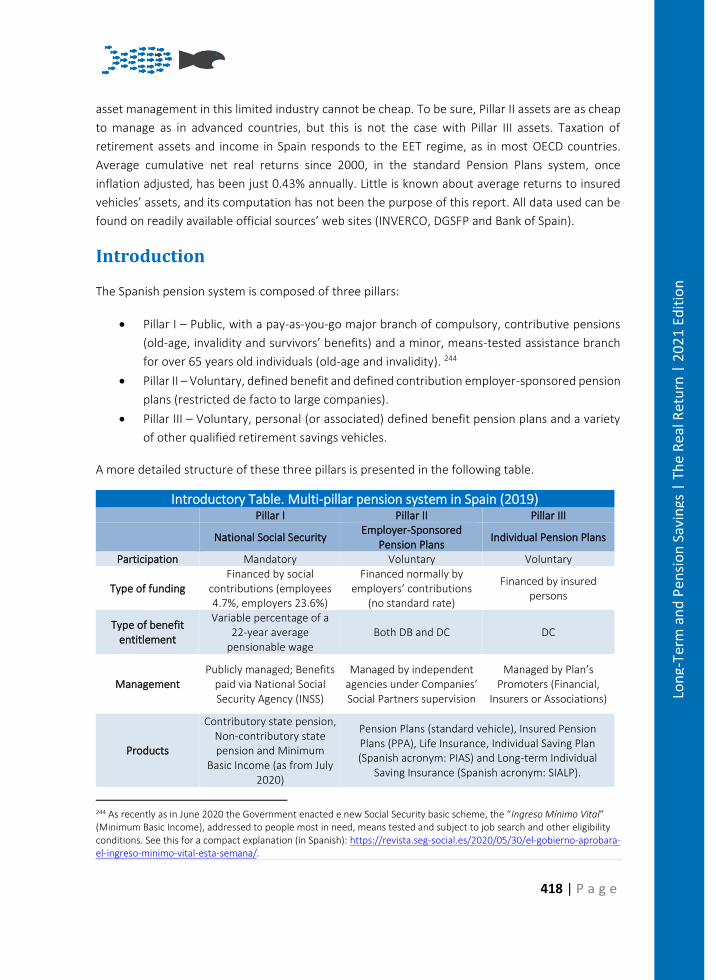
418 | P a g e
Lon
g-Te
rm a
nd
Pen
sio
n S
avin
gs |
Th
e R
eal R
etu
rn |
20
21
Edit
ion
asset management in this limited industry cannot be cheap. To be sure, Pillar II assets are as cheap
to manage as in advanced countries, but this is not the case with Pillar III assets. Taxation of
retirement assets and income in Spain responds to the EET regime, as in most OECD countries.
Average cumulative net real returns since 2000, in the standard Pension Plans system, once
inflation adjusted, has been just 0.43% annually. Little is known about average returns to insured
vehicles’ assets, and its computation has not been the purpose of this report. All data used can be
found on readily available official sources’ web sites (INVERCO, DGSFP and Bank of Spain).
Introduction
The Spanish pension system is composed of three pillars:
• Pillar I – Public, with a pay-as-you-go major branch of compulsory, contributive pensions
(old-age, invalidity and survivors’ benefits) and a minor, means-tested assistance branch
for over 65 years old individuals (old-age and invalidity). 244
• Pillar II – Voluntary, defined benefit and defined contribution employer-sponsored pension
plans (restricted de facto to large companies).
• Pillar III – Voluntary, personal (or associated) defined benefit pension plans and a variety
of other qualified retirement savings vehicles.
A more detailed structure of these three pillars is presented in the following table.
244 As recently as in June 2020 the Government enacted e new Social Security basic scheme, the “Ingreso Mínimo Vital” (Minimum Basic Income), addressed to people most in need, means tested and subject to job search and other eligibility conditions. See this for a compact explanation (in Spanish): https://revista.seg-social.es/2020/05/30/el-gobierno-aprobara-el-ingreso-minimo-vital-esta-semana/.
Introductory Table. Multi-pillar pension system in Spain (2019) Pillar I Pillar II Pillar III
National Social Security Employer-Sponsored
Pension Plans Individual Pension Plans
Participation Mandatory Voluntary Voluntary
Type of funding Financed by social
contributions (employees 4.7%, employers 23.6%)
Financed normally by employers’ contributions
(no standard rate)
Financed by insured persons
Type of benefit entitlement
Variable percentage of a 22-year average
pensionable wage Both DB and DC DC
Management Publicly managed; Benefits
paid via National Social Security Agency (INSS)
Managed by independent agencies under Companies’ Social Partners supervision
Managed by Plan’s Promoters (Financial,
Insurers or Associations)
Products
Contributory state pension, Non-contributory state pension and Minimum
Basic Income (as from July 2020)
Pension Plans (standard vehicle), Insured Pension Plans (PPA), Life Insurance, Individual Saving Plan (Spanish acronym: PIAS) and Long-term Individual
Saving Insurance (Spanish acronym: SIALP).
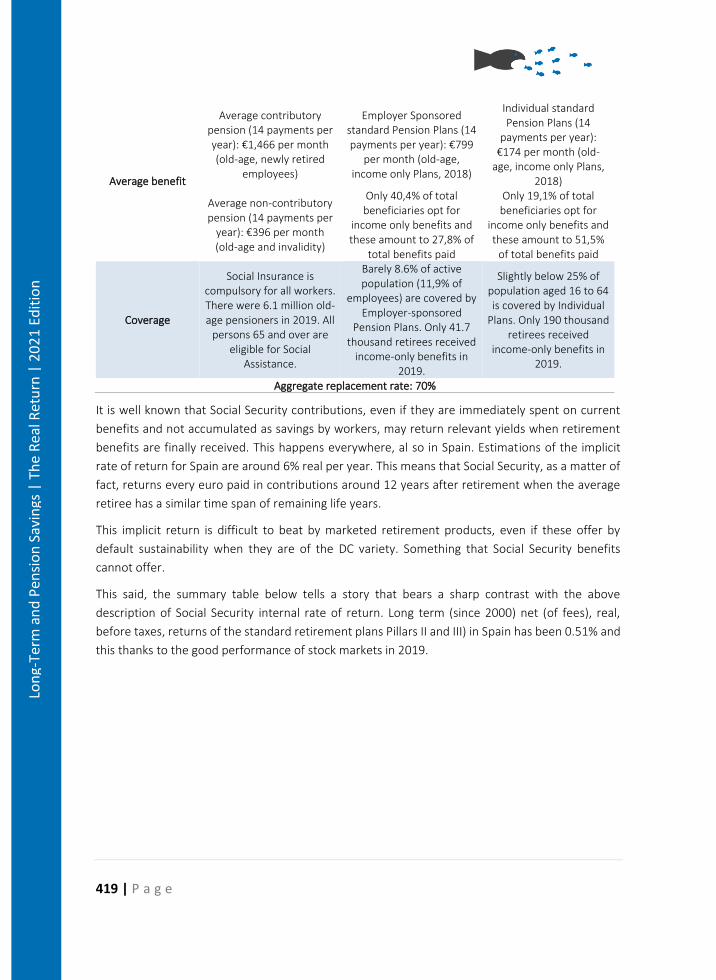
419 | P a g e
Lon
g-Te
rm a
nd
Pen
sio
n S
avin
gs |
Th
e R
eal R
etu
rn |
20
21
Edit
ion
It is well known that Social Security contributions, even if they are immediately spent on current
benefits and not accumulated as savings by workers, may return relevant yields when retirement
benefits are finally received. This happens everywhere, al so in Spain. Estimations of the implicit
rate of return for Spain are around 6% real per year. This means that Social Security, as a matter of
fact, returns every euro paid in contributions around 12 years after retirement when the average
retiree has a similar time span of remaining life years.
This implicit return is difficult to beat by marketed retirement products, even if these offer by
default sustainability when they are of the DC variety. Something that Social Security benefits
cannot offer.
This said, the summary table below tells a story that bears a sharp contrast with the above
description of Social Security internal rate of return. Long term (since 2000) net (of fees), real,
before taxes, returns of the standard retirement plans Pillars II and III) in Spain has been 0.51% and
this thanks to the good performance of stock markets in 2019.
Average benefit
Average contributory pension (14 payments per year): €1,466 per month (old-age, newly retired
employees)
Employer Sponsored standard Pension Plans (14 payments per year): €799
per month (old-age, income only Plans, 2018)
Individual standard Pension Plans (14
payments per year): €174 per month (old-
age, income only Plans, 2018)
Average non-contributory pension (14 payments per
year): €396 per month (old-age and invalidity)
Only 40,4% of total beneficiaries opt for
income only benefits and these amount to 27,8% of
total benefits paid
Only 19,1% of total beneficiaries opt for
income only benefits and these amount to 51,5%
of total benefits paid
Coverage
Social Insurance is compulsory for all workers. There were 6.1 million old-age pensioners in 2019. All
persons 65 and over are eligible for Social
Assistance.
Barely 8.6% of active population (11,9% of
employees) are covered by Employer-sponsored
Pension Plans. Only 41.7 thousand retirees received
income-only benefits in 2019.
Slightly below 25% of population aged 16 to 64 is covered by Individual
Plans. Only 190 thousand retirees received
income-only benefits in 2019.
Aggregate replacement rate: 70%
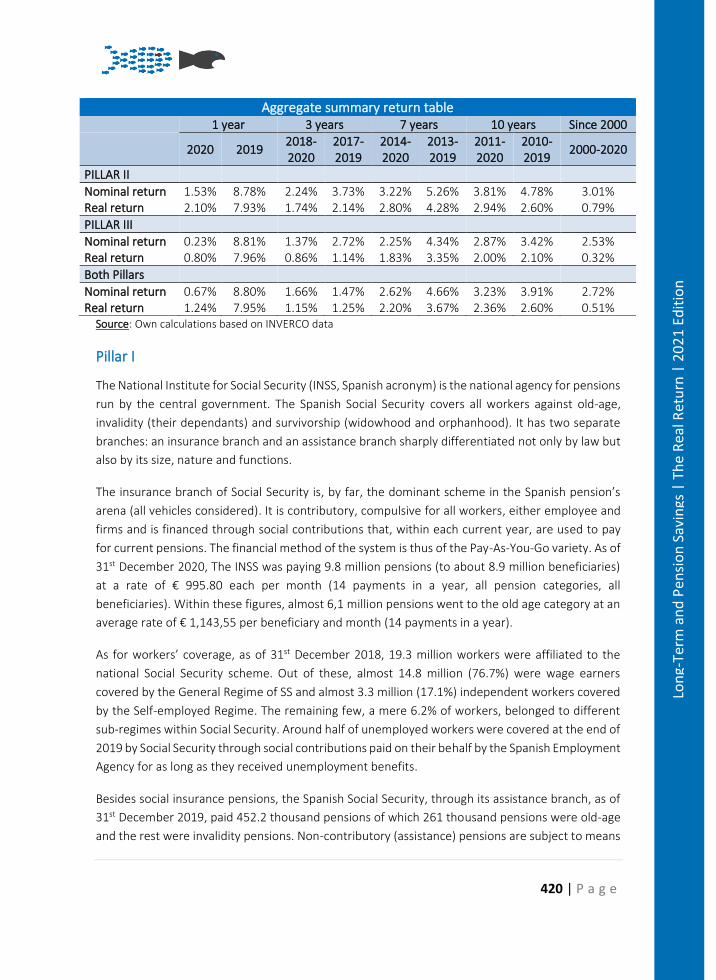
420 | P a g e
Lon
g-Te
rm a
nd
Pen
sio
n S
avin
gs |
Th
e R
eal R
etu
rn |
20
21
Edit
ion
Source: Own calculations based on INVERCO data
Pillar I
The National Institute for Social Security (INSS, Spanish acronym) is the national agency for pensions
run by the central government. The Spanish Social Security covers all workers against old-age,
invalidity (their dependants) and survivorship (widowhood and orphanhood). It has two separate
branches: an insurance branch and an assistance branch sharply differentiated not only by law but
also by its size, nature and functions.
The insurance branch of Social Security is, by far, the dominant scheme in the Spanish pension’s
arena (all vehicles considered). It is contributory, compulsive for all workers, either employee and
firms and is financed through social contributions that, within each current year, are used to pay
for current pensions. The financial method of the system is thus of the Pay-As-You-Go variety. As of
31st December 2020, The INSS was paying 9.8 million pensions (to about 8.9 million beneficiaries)
at a rate of € 995.80 each per month (14 payments in a year, all pension categories, all
beneficiaries). Within these figures, almost 6,1 million pensions went to the old age category at an
average rate of € 1,143,55 per beneficiary and month (14 payments in a year).
As for workers’ coverage, as of 31st December 2018, 19.3 million workers were affiliated to the
national Social Security scheme. Out of these, almost 14.8 million (76.7%) were wage earners
covered by the General Regime of SS and almost 3.3 million (17.1%) independent workers covered
by the Self-employed Regime. The remaining few, a mere 6.2% of workers, belonged to different
sub-regimes within Social Security. Around half of unemployed workers were covered at the end of
2019 by Social Security through social contributions paid on their behalf by the Spanish Employment
Agency for as long as they received unemployment benefits.
Besides social insurance pensions, the Spanish Social Security, through its assistance branch, as of
31st December 2019, paid 452.2 thousand pensions of which 261 thousand pensions were old-age
and the rest were invalidity pensions. Non-contributory (assistance) pensions are subject to means
Aggregate summary return table 1 year 3 years 7 years 10 years Since 2000
2020 2019 2018-2020
2017-2019
2014-2020
2013-2019
2011-2020
2010-2019
2000-2020
PILLAR II
Nominal return 1.53% 8.78% 2.24% 3.73% 3.22% 5.26% 3.81% 4.78% 3.01% Real return 2.10% 7.93% 1.74% 2.14% 2.80% 4.28% 2.94% 2.60% 0.79%
PILLAR III
Nominal return 0.23% 8.81% 1.37% 2.72% 2.25% 4.34% 2.87% 3.42% 2.53% Real return 0.80% 7.96% 0.86% 1.14% 1.83% 3.35% 2.00% 2.10% 0.32%
Both Pillars
Nominal return 0.67% 8.80% 1.66% 1.47% 2.62% 4.66% 3.23% 3.91% 2.72% Real return 1.24% 7.95% 1.15% 1.25% 2.20% 3.67% 2.36% 2.60% 0.51%
421 | P a g e
Lon
g-Te
rm a
nd
Pen
sio
n S
avin
gs |
Th
e R
eal R
etu
rn |
20
21
Edit
ion
tests and are clearly a minor scheme since autonomous regions in Spain offer a wide range of basic
benefits to those individuals and households in need.245 These pensions are paid by Social Security,
although fully financed out of general taxation. The average amount paid under this scheme was €
392 per month and beneficiary (14 payments in the year). This amount can be complemented by
other personal characteristics.
Within the contributory pensions class, social contributions provide, as of 2019, for 87,8% of total
cost of Social Security contributory pensions. The total contribution rate is 28.3% of gross
pensionable wage. This rate splits in 23.6 pp paid by employers and 4.7 pp paid by workers. The
self-employed must pay the whole 28.3% rate on their pensionable earnings. Pensionable wages
(and earnings) track effective wages closely through a scale with a minimum pensionable wage (as
of 2019) of € 1,050 and a maximum pensionable wage of € 4,070.10 per month. Employees cannot
choose their contribution base but self-employed can do it and the majority of them do choose the
minimum pensionable earnings base. This results in their retirement pensions being too small.
Many of these benefits will have to be latter complemented with an assistance top in order to reach
the statutory minimum retirement pension. This resulting, paradoxically, in a larger internal rate of
return for minimum contributory old age pensions recipients, over their past contributions,
compared to retirees receiving higher or maximum contributory pensions payable by Social
Security.
Pillar II
As shown in the Introductory Table above, Social Security old-age benefits in Spain replace pre-
retirement wages with one of the highest rates in the world and against a rather high pay-roll tax
mostly paid by employers246. So, there is little margin left for occupational and personal retirement
accounts to step substantially into the retirement arena247. And, indeed, what we observe in Spain
is a very limited landscape for marketed retirement solutions despite the fact that the modern
regulation for these products was enacted around 1987 last century.
Pillar II in Spain embraces employer-sponsored retirement accounts for wage earners and individual
pension plans for the self-employed (and associate pension plans, a minor category). These
products are financed through contributions mostly paid by employers and employees rarely
participate on a matching basis. Independent workers pay their own Pillar II contributions. There is
a variety of retirement vehicles that employers may offer their employees, or available for self-
employed workers as well. Amongst them, tax-qualified Pension Plans are the standard and most
prevalent vehicle. These Pension Plans are capitalisation retirement accounts of either Defined
Benefit or Defined Contribution type to which employers contribute with a percentage of wage.
245 As recently as June 2020, Social Security is offering a new individual Minimum Basic Income. See footnote no 1 above. 246 This said, however, pay-roll taxes to Social Security or other welfare programs are deferred wages and, were they to be entirely supported by employees, gross wages should be accordingly updated to accommodate this wedge. 247 See Introductory Table above.
422 | P a g e
Lon
g-Te
rm a
nd
Pen
sio
n S
avin
gs |
Th
e R
eal R
etu
rn |
20
21
Edit
ion
Workers can also contribute. Contribution rates to occupational Plans may vary considerably, but
their average rate can be estimated at around a modest 2.6% of average gross wage248, or around
€629 per employee and year (2019). Employers are not obliged by law to offer these accounts,
although some may be obliged by Collective Bargaining agreements in an industry or sector, which
is rare. And indeed, very few companies, but the large ones, offer them to their workers as only
barely 2 million accounts of this type where registered through 2019, to a total active population
of 23 million that same year, a mere 8,6%. In 2019, only 41.7 thousand retired workers received
old-age benefits. Average annual benefit was € 11,180 (gross) and the benefit rate (against average
annual gross pay) was 39.6%. As of 31st December 2019, total assets under management (AuM, in
what follows) to these accounts totalled € 35,7 billion (almost € 2 bn up from one year earlier), that
is, a small 2.9% of Spanish GDP.
Pillar II retirement accounts are fiscally qualified by the government. Contributions by employers or
employees are tax free up to a general limit of €8,000 per person per year. Benefits, no matter
whether retrieved in form of monthly income or as a lump-sum, are taxed under the existing
personal income taxation rules (a dual personal income taxation system). When benefits are
retrieved in form of an income stream, beneficiaries are obliged to buy an annuity (life or term) or
a drawdown.
Often in Spain and in many other countries, and this is a crucial issue of understanding for our
industry, layman savers and even experts refer to this fiscal treatment as “incentives” or even “a
fiscal gift”. The truth is that having contributions tax exempted and taxing benefits (tax deferral) is
the world standard, rather than the opposite or, even worst, double taxation of pensions if both
contributions and benefits were to be taxed. Tax deferral, as opposed to an “incentive”, is not a gift
from government or from the rest of society is a just treatment for income won after decades of
work efforts and frugality.
248 Estimation based on data from INVERCO and INE.
423 | P a g e
Lon
g-Te
rm a
nd
Pen
sio
n S
avin
gs |
Th
e R
eal R
etu
rn |
20
21
Edit
ion
Pillar III
Pillar III embraces personal, or individual Pension Plans, the latter being again the dominant type
within a large variety of types (see the Introductory Table above). These plans are personal,
voluntary and “complementary” to both Pillar I and Pillar II arrangements. These accounts are
equally treated, as Pillar II accounts, from the tax point of view or, in what concerns other features,
are virtually the same product as employer-sponsored Pension Plans. In 2019, only 190 thousand
retired workers received old-age benefits. Average annual benefit was € 2,441 (gross) and the
benefit rate (against average annual gross pay) was 8.6%. As of 31st December 2019, Pillar III
included 7.5 million retirement accounts that belonged to around 6.5 million individuals (or 21,37%
of Spanish population 16-64 years old). AuM for these plans totalled € 79.85 bn (slightly € 7.6 bn
up from one year earlier), that is, a mere 6.4% of Spanish GDP.
Household Savings
Personal (financial) saving in Spain is not a salient feature of its economy’s financial side. But for the
fact that it is so low because Spaniards love to save “autrement”, in “bricks & mortar”. This said,
households are still able to spare some money by the end of the year and have so far managed to
accumulate a financial buffer. Only a small part of these assets, however, are dedicated to
retirement purposes. One of the reasons for this lies in the fact that Social Security forces Spanish
workers to save through pay-roll taxes paid in large part as for employees) by their employers. This
reduces the disposable income households could save. Besides, in exchange for heavy pay-roll
taxation (28.3% of gross -pensionable- wages only for retirement and associated contingencies),
public pensions replace lost wages due to retirement, at a 72.7% (average, effective benefit) rate.
This, definitely, must reduce enormously the desire and/or capacity to save for retirement of
Spanish workers.
As for real estate, it is well known that it is hardly a retirement asset at all. Yet many owners, that
in Spain tend to own more than one house or apartment, think that they could use their houses as
a source of retirement income. However realistic this may be, the fact is that an astonishing three
fourths of Spanish households’ total wealth is made of “bricks & mortar”, its value representing
around four times the value of Spanish GDP. So, housing is “the” retirement asset in Spain and
retirement solutions providers would better think on how to develop sound retirement income
products based on housing rather than hope for households to start accumulating proper
retirement assets, at least for a while.
The overall picture on households’ Gross Disposable Income (year-on-year change), Consumption
(year on year change) and Gross Savings (rate over Disposable Income) is shown in Graph ES1
below. During the crisis (2009-2013), the savings rate oscillated amply around an average of 10.5%
of Gross Disposable Income. 2009 and 2013 were precisely the most recessive years of the period.
Pre-crisis years (since mid-90s in the last century) savings rate was low reflecting the strong
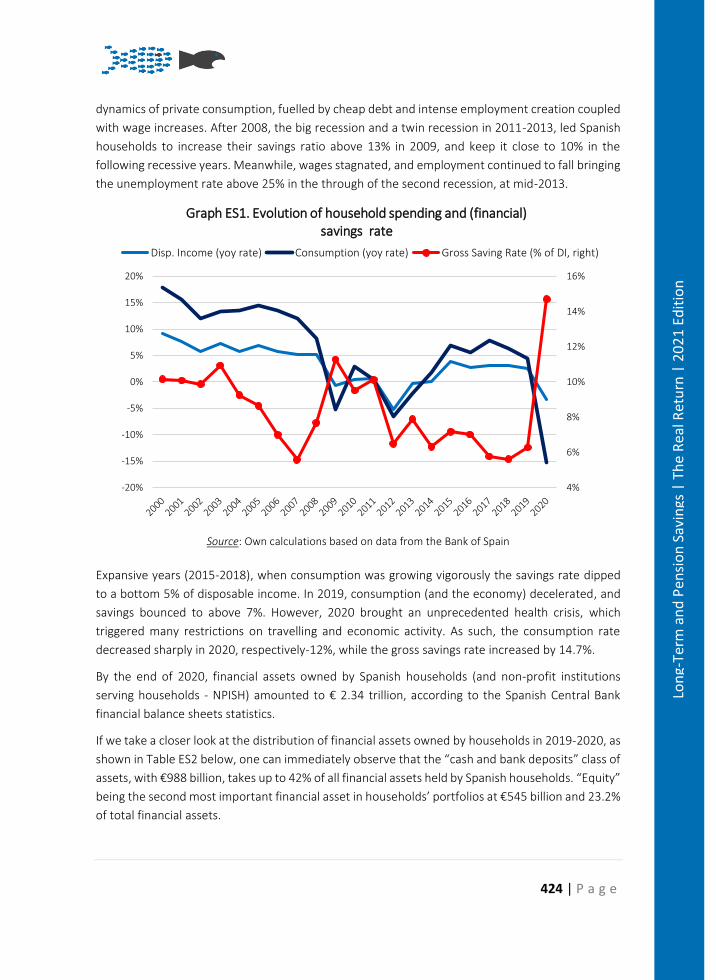
424 | P a g e
Lon
g-Te
rm a
nd
Pen
sio
n S
avin
gs |
Th
e R
eal R
etu
rn |
20
21
Edit
ion
dynamics of private consumption, fuelled by cheap debt and intense employment creation coupled
with wage increases. After 2008, the big recession and a twin recession in 2011-2013, led Spanish
households to increase their savings ratio above 13% in 2009, and keep it close to 10% in the
following recessive years. Meanwhile, wages stagnated, and employment continued to fall bringing
the unemployment rate above 25% in the through of the second recession, at mid-2013.
Source: Own calculations based on data from the Bank of Spain
Expansive years (2015-2018), when consumption was growing vigorously the savings rate dipped
to a bottom 5% of disposable income. In 2019, consumption (and the economy) decelerated, and
savings bounced to above 7%. However, 2020 brought an unprecedented health crisis, which
triggered many restrictions on travelling and economic activity. As such, the consumption rate
decreased sharply in 2020, respectively-12%, while the gross savings rate increased by 14.7%.
By the end of 2020, financial assets owned by Spanish households (and non-profit institutions
serving households - NPISH) amounted to € 2.34 trillion, according to the Spanish Central Bank
financial balance sheets statistics.
If we take a closer look at the distribution of financial assets owned by households in 2019-2020, as
shown in Table ES2 below, one can immediately observe that the “cash and bank deposits” class of
assets, with €988 billion, takes up to 42% of all financial assets held by Spanish households. “Equity”
being the second most important financial asset in households’ portfolios at €545 billion and 23.2%
of total financial assets.
4%
6%
8%
10%
12%
14%
16%
-20%
-15%
-10%
-5%
0%
5%
10%
15%
20%
Graph ES1. Evolution of household spending and (financial) savings rate
Disp. Income (yoy rate) Consumption (yoy rate) Gross Saving Rate (% of DI, right)
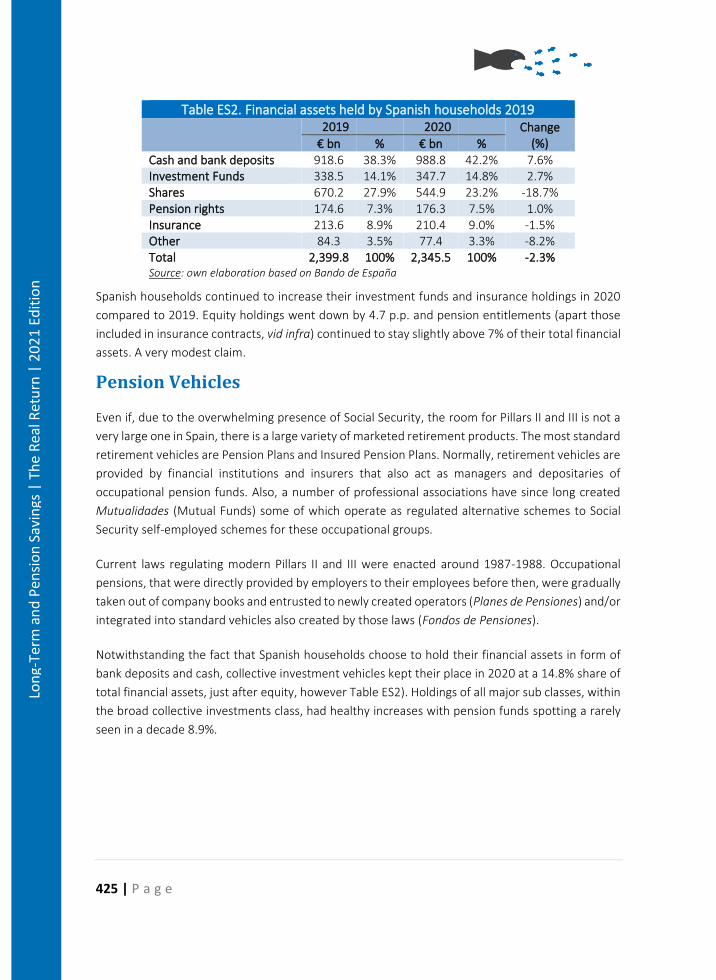
425 | P a g e
Lon
g-Te
rm a
nd
Pen
sio
n S
avin
gs |
Th
e R
eal R
etu
rn |
20
21
Edit
ion
Table ES2. Financial assets held by Spanish households 2019
2019 2020 Change
(%) € bn % € bn % Cash and bank deposits 918.6 38.3% 988.8 42.2% 7.6% Investment Funds 338.5 14.1% 347.7 14.8% 2.7% Shares 670.2 27.9% 544.9 23.2% -18.7% Pension rights 174.6 7.3% 176.3 7.5% 1.0% Insurance 213.6 8.9% 210.4 9.0% -1.5% Other 84.3 3.5% 77.4 3.3% -8.2% Total 2,399.8 100% 2,345.5 100% -2.3% Source: own elaboration based on Bando de España
Spanish households continued to increase their investment funds and insurance holdings in 2020
compared to 2019. Equity holdings went down by 4.7 p.p. and pension entitlements (apart those
included in insurance contracts, vid infra) continued to stay slightly above 7% of their total financial
assets. A very modest claim.
Pension Vehicles
Even if, due to the overwhelming presence of Social Security, the room for Pillars II and III is not a
very large one in Spain, there is a large variety of marketed retirement products. The most standard
retirement vehicles are Pension Plans and Insured Pension Plans. Normally, retirement vehicles are
provided by financial institutions and insurers that also act as managers and depositaries of
occupational pension funds. Also, a number of professional associations have since long created
Mutualidades (Mutual Funds) some of which operate as regulated alternative schemes to Social
Security self-employed schemes for these occupational groups.
Current laws regulating modern Pillars II and III were enacted around 1987-1988. Occupational
pensions, that were directly provided by employers to their employees before then, were gradually
taken out of company books and entrusted to newly created operators (Planes de Pensiones) and/or
integrated into standard vehicles also created by those laws (Fondos de Pensiones).
Notwithstanding the fact that Spanish households choose to hold their financial assets in form of
bank deposits and cash, collective investment vehicles kept their place in 2020 at a 14.8% share of
total financial assets, just after equity, however Table ES2). Holdings of all major sub classes, within
the broad collective investments class, had healthy increases with pension funds spotting a rarely
seen in a decade 8.9%.
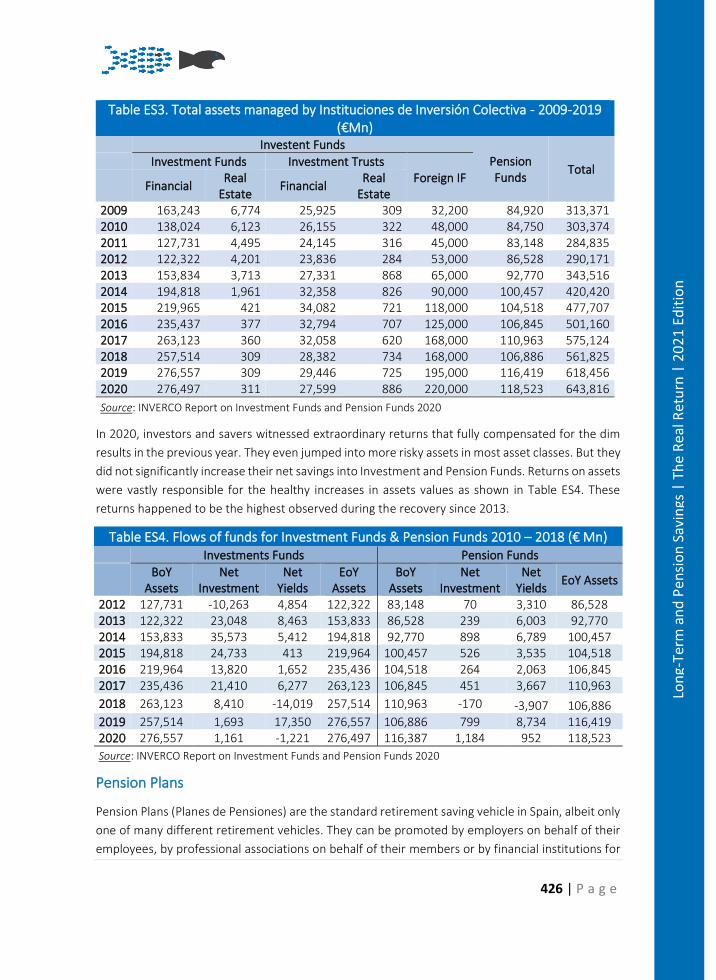
426 | P a g e
Lon
g-Te
rm a
nd
Pen
sio
n S
avin
gs |
Th
e R
eal R
etu
rn |
20
21
Edit
ion
Table ES3. Total assets managed by Instituciones de Inversión Colectiva - 2009-2019 (€Mn)
Investent Funds
Pension Funds
Total Investment Funds Investment Trusts
Foreign IF Financial
Real Estate
Financial Real
Estate 2009 163,243 6,774 25,925 309 32,200 84,920 313,371 2010 138,024 6,123 26,155 322 48,000 84,750 303,374 2011 127,731 4,495 24,145 316 45,000 83,148 284,835 2012 122,322 4,201 23,836 284 53,000 86,528 290,171 2013 153,834 3,713 27,331 868 65,000 92,770 343,516 2014 194,818 1,961 32,358 826 90,000 100,457 420,420 2015 219,965 421 34,082 721 118,000 104,518 477,707 2016 235,437 377 32,794 707 125,000 106,845 501,160 2017 263,123 360 32,058 620 168,000 110,963 575,124 2018 257,514 309 28,382 734 168,000 106,886 561,825 2019 276,557 309 29,446 725 195,000 116,419 618,456 2020 276,497 311 27,599 886 220,000 118,523 643,816
Source: INVERCO Report on Investment Funds and Pension Funds 2020
In 2020, investors and savers witnessed extraordinary returns that fully compensated for the dim
results in the previous year. They even jumped into more risky assets in most asset classes. But they
did not significantly increase their net savings into Investment and Pension Funds. Returns on assets
were vastly responsible for the healthy increases in assets values as shown in Table ES4. These
returns happened to be the highest observed during the recovery since 2013.
Table ES4. Flows of funds for Investment Funds & Pension Funds 2010 – 2018 (€ Mn) Investments Funds Pension Funds
BoY
Assets Net
Investment Net
Yields EoY
Assets BoY
Assets Net
Investment Net
Yields EoY Assets
2012 127,731 -10,263 4,854 122,322 83,148 70 3,310 86,528 2013 122,322 23,048 8,463 153,833 86,528 239 6,003 92,770 2014 153,833 35,573 5,412 194,818 92,770 898 6,789 100,457 2015 194,818 24,733 413 219,964 100,457 526 3,535 104,518 2016 219,964 13,820 1,652 235,436 104,518 264 2,063 106,845 2017 235,436 21,410 6,277 263,123 106,845 451 3,667 110,963
2018 263,123 8,410 -14,019 257,514 110,963 -170 -3,907 106,886 2019 257,514 1,693 17,350 276,557 106,886 799 8,734 116,419 2020 276,557 1,161 -1,221 276,497 116,387 1,184 952 118,523
Source: INVERCO Report on Investment Funds and Pension Funds 2020
Pension Plans
Pension Plans (Planes de Pensiones) are the standard retirement saving vehicle in Spain, albeit only
one of many different retirement vehicles. They can be promoted by employers on behalf of their
employees, by professional associations on behalf of their members or by financial institutions for
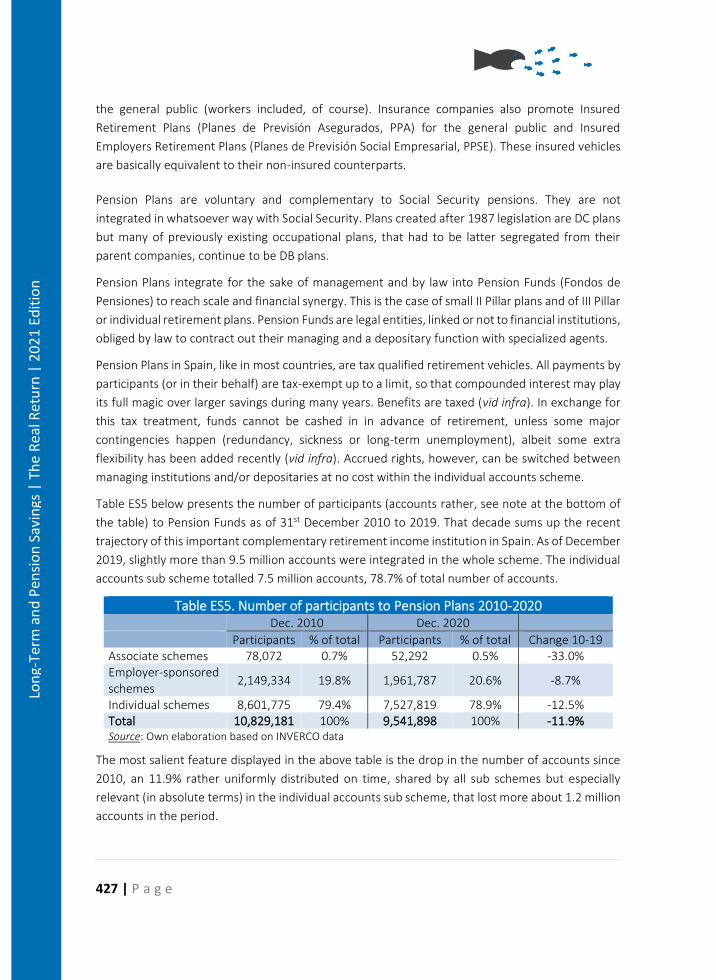
427 | P a g e
Lon
g-Te
rm a
nd
Pen
sio
n S
avin
gs |
Th
e R
eal R
etu
rn |
20
21
Edit
ion
the general public (workers included, of course). Insurance companies also promote Insured
Retirement Plans (Planes de Previsión Asegurados, PPA) for the general public and Insured
Employers Retirement Plans (Planes de Previsión Social Empresarial, PPSE). These insured vehicles
are basically equivalent to their non-insured counterparts.
Pension Plans are voluntary and complementary to Social Security pensions. They are not
integrated in whatsoever way with Social Security. Plans created after 1987 legislation are DC plans
but many of previously existing occupational plans, that had to be latter segregated from their
parent companies, continue to be DB plans.
Pension Plans integrate for the sake of management and by law into Pension Funds (Fondos de
Pensiones) to reach scale and financial synergy. This is the case of small II Pillar plans and of III Pillar
or individual retirement plans. Pension Funds are legal entities, linked or not to financial institutions,
obliged by law to contract out their managing and a depositary function with specialized agents.
Pension Plans in Spain, like in most countries, are tax qualified retirement vehicles. All payments by
participants (or in their behalf) are tax-exempt up to a limit, so that compounded interest may play
its full magic over larger savings during many years. Benefits are taxed (vid infra). In exchange for
this tax treatment, funds cannot be cashed in in advance of retirement, unless some major
contingencies happen (redundancy, sickness or long-term unemployment), albeit some extra
flexibility has been added recently (vid infra). Accrued rights, however, can be switched between
managing institutions and/or depositaries at no cost within the individual accounts scheme.
Table ES5 below presents the number of participants (accounts rather, see note at the bottom of
the table) to Pension Funds as of 31st December 2010 to 2019. That decade sums up the recent
trajectory of this important complementary retirement income institution in Spain. As of December
2019, slightly more than 9.5 million accounts were integrated in the whole scheme. The individual
accounts sub scheme totalled 7.5 million accounts, 78.7% of total number of accounts.
Table ES5. Number of participants to Pension Plans 2010-2020 Dec. 2010 Dec. 2020
Participants % of total Participants % of total Change 10-19 Associate schemes 78,072 0.7% 52,292 0.5% -33.0% Employer-sponsored schemes
2,149,334 19.8% 1,961,787 20.6% -8.7%
Individual schemes 8,601,775 79.4% 7,527,819 78.9% -12.5% Total 10,829,181 100% 9,541,898 100% -11.9% Source: Own elaboration based on INVERCO data
The most salient feature displayed in the above table is the drop in the number of accounts since
2010, an 11.9% rather uniformly distributed on time, shared by all sub schemes but especially
relevant (in absolute terms) in the individual accounts sub scheme, that lost more about 1.2 million
accounts in the period.
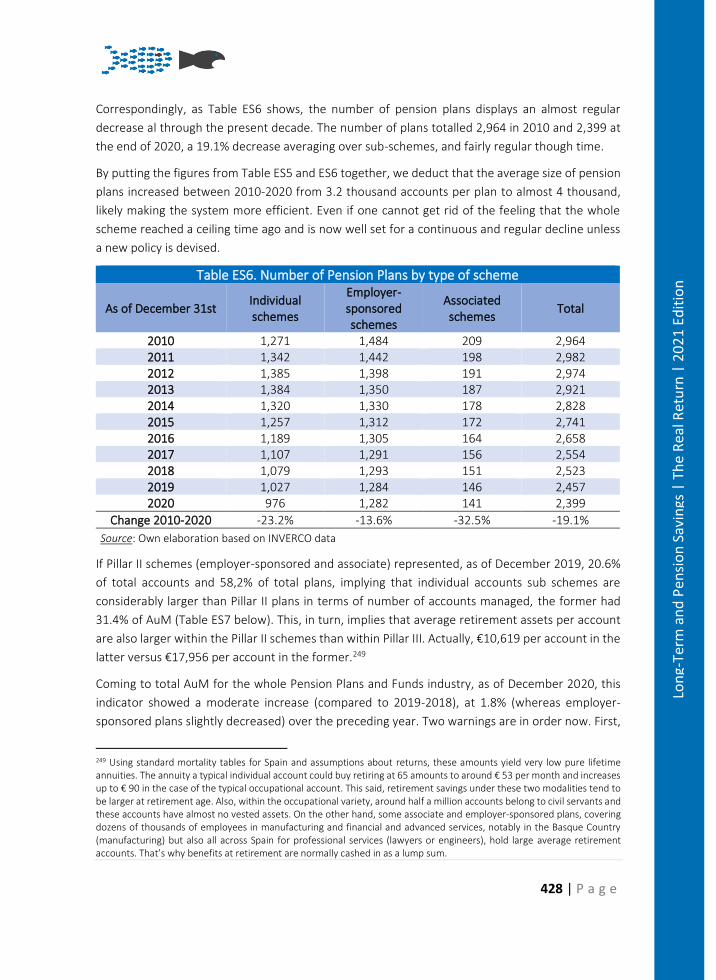
428 | P a g e
Lon
g-Te
rm a
nd
Pen
sio
n S
avin
gs |
Th
e R
eal R
etu
rn |
20
21
Edit
ion
Correspondingly, as Table ES6 shows, the number of pension plans displays an almost regular
decrease al through the present decade. The number of plans totalled 2,964 in 2010 and 2,399 at
the end of 2020, a 19.1% decrease averaging over sub-schemes, and fairly regular though time.
By putting the figures from Table ES5 and ES6 together, we deduct that the average size of pension
plans increased between 2010-2020 from 3.2 thousand accounts per plan to almost 4 thousand,
likely making the system more efficient. Even if one cannot get rid of the feeling that the whole
scheme reached a ceiling time ago and is now well set for a continuous and regular decline unless
a new policy is devised.
Table ES6. Number of Pension Plans by type of scheme
As of December 31st Individual schemes
Employer-sponsored schemes
Associated schemes
Total
2010 1,271 1,484 209 2,964 2011 1,342 1,442 198 2,982 2012 1,385 1,398 191 2,974 2013 1,384 1,350 187 2,921 2014 1,320 1,330 178 2,828 2015 1,257 1,312 172 2,741 2016 1,189 1,305 164 2,658 2017 1,107 1,291 156 2,554 2018 1,079 1,293 151 2,523 2019 1,027 1,284 146 2,457 2020 976 1,282 141 2,399
Change 2010-2020 -23.2% -13.6% -32.5% -19.1%
Source: Own elaboration based on INVERCO data
If Pillar II schemes (employer-sponsored and associate) represented, as of December 2019, 20.6%
of total accounts and 58,2% of total plans, implying that individual accounts sub schemes are
considerably larger than Pillar II plans in terms of number of accounts managed, the former had
31.4% of AuM (Table ES7 below). This, in turn, implies that average retirement assets per account
are also larger within the Pillar II schemes than within Pillar III. Actually, €10,619 per account in the
latter versus €17,956 per account in the former.249
Coming to total AuM for the whole Pension Plans and Funds industry, as of December 2020, this
indicator showed a moderate increase (compared to 2019-2018), at 1.8% (whereas employer-
sponsored plans slightly decreased) over the preceding year. Two warnings are in order now. First,
249 Using standard mortality tables for Spain and assumptions about returns, these amounts yield very low pure lifetime annuities. The annuity a typical individual account could buy retiring at 65 amounts to around € 53 per month and increases up to € 90 in the case of the typical occupational account. This said, retirement savings under these two modalities tend to be larger at retirement age. Also, within the occupational variety, around half a million accounts belong to civil servants and these accounts have almost no vested assets. On the other hand, some associate and employer-sponsored plans, covering dozens of thousands of employees in manufacturing and financial and advanced services, notably in the Basque Country (manufacturing) but also all across Spain for professional services (lawyers or engineers), hold large average retirement accounts. That’s why benefits at retirement are normally cashed in as a lump sum.
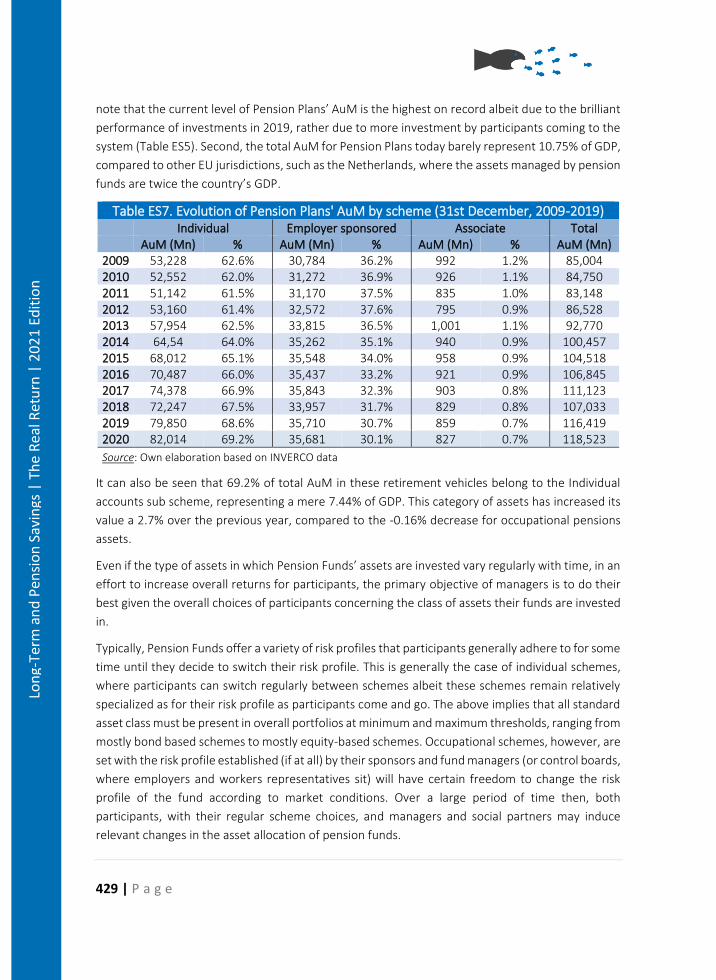
429 | P a g e
Lon
g-Te
rm a
nd
Pen
sio
n S
avin
gs |
Th
e R
eal R
etu
rn |
20
21
Edit
ion
note that the current level of Pension Plans’ AuM is the highest on record albeit due to the brilliant
performance of investments in 2019, rather due to more investment by participants coming to the
system (Table ES5). Second, the total AuM for Pension Plans today barely represent 10.75% of GDP,
compared to other EU jurisdictions, such as the Netherlands, where the assets managed by pension
funds are twice the country’s GDP.
Table ES7. Evolution of Pension Plans' AuM by scheme (31st December, 2009-2019) Individual Employer sponsored Associate Total AuM (Mn) % AuM (Mn) % AuM (Mn) % AuM (Mn)
2009 53,228 62.6% 30,784 36.2% 992 1.2% 85,004 2010 52,552 62.0% 31,272 36.9% 926 1.1% 84,750 2011 51,142 61.5% 31,170 37.5% 835 1.0% 83,148 2012 53,160 61.4% 32,572 37.6% 795 0.9% 86,528 2013 57,954 62.5% 33,815 36.5% 1,001 1.1% 92,770 2014 64,54 64.0% 35,262 35.1% 940 0.9% 100,457 2015 68,012 65.1% 35,548 34.0% 958 0.9% 104,518 2016 70,487 66.0% 35,437 33.2% 921 0.9% 106,845 2017 74,378 66.9% 35,843 32.3% 903 0.8% 111,123 2018 72,247 67.5% 33,957 31.7% 829 0.8% 107,033 2019 79,850 68.6% 35,710 30.7% 859 0.7% 116,419 2020 82,014 69.2% 35,681 30.1% 827 0.7% 118,523
Source: Own elaboration based on INVERCO data
It can also be seen that 69.2% of total AuM in these retirement vehicles belong to the Individual
accounts sub scheme, representing a mere 7.44% of GDP. This category of assets has increased its
value a 2.7% over the previous year, compared to the -0.16% decrease for occupational pensions
assets.
Even if the type of assets in which Pension Funds’ assets are invested vary regularly with time, in an
effort to increase overall returns for participants, the primary objective of managers is to do their
best given the overall choices of participants concerning the class of assets their funds are invested
in.
Typically, Pension Funds offer a variety of risk profiles that participants generally adhere to for some
time until they decide to switch their risk profile. This is generally the case of individual schemes,
where participants can switch regularly between schemes albeit these schemes remain relatively
specialized as for their risk profile as participants come and go. The above implies that all standard
asset class must be present in overall portfolios at minimum and maximum thresholds, ranging from
mostly bond based schemes to mostly equity-based schemes. Occupational schemes, however, are
set with the risk profile established (if at all) by their sponsors and fund managers (or control boards,
where employers and workers representatives sit) will have certain freedom to change the risk
profile of the fund according to market conditions. Over a large period of time then, both
participants, with their regular scheme choices, and managers and social partners may induce
relevant changes in the asset allocation of pension funds.
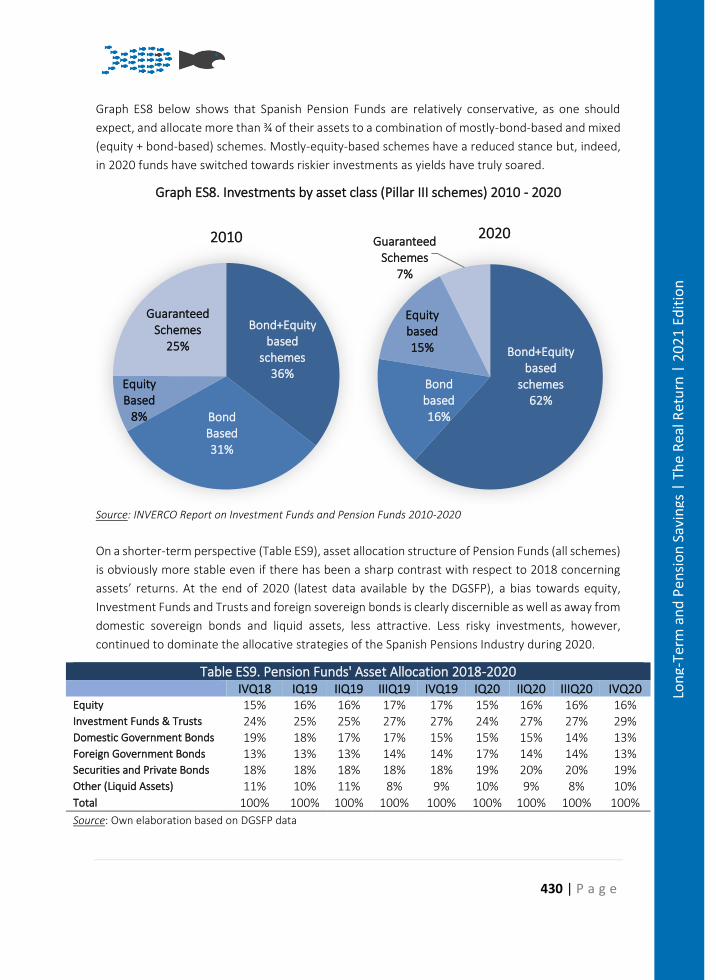
430 | P a g e
Lon
g-Te
rm a
nd
Pen
sio
n S
avin
gs |
Th
e R
eal R
etu
rn |
20
21
Edit
ion
Graph ES8 below shows that Spanish Pension Funds are relatively conservative, as one should
expect, and allocate more than ¾ of their assets to a combination of mostly-bond-based and mixed
(equity + bond-based) schemes. Mostly-equity-based schemes have a reduced stance but, indeed,
in 2020 funds have switched towards riskier investments as yields have truly soared.
Graph ES8. Investments by asset class (Pillar III schemes) 2010 - 2020
Source: INVERCO Report on Investment Funds and Pension Funds 2010-2020
On a shorter-term perspective (Table ES9), asset allocation structure of Pension Funds (all schemes)
is obviously more stable even if there has been a sharp contrast with respect to 2018 concerning
assets’ returns. At the end of 2020 (latest data available by the DGSFP), a bias towards equity,
Investment Funds and Trusts and foreign sovereign bonds is clearly discernible as well as away from
domestic sovereign bonds and liquid assets, less attractive. Less risky investments, however,
continued to dominate the allocative strategies of the Spanish Pensions Industry during 2020.
Table ES9. Pension Funds' Asset Allocation 2018-2020 IVQ18 IQ19 IIQ19 IIIQ19 IVQ19 IQ20 IIQ20 IIIQ20 IVQ20
Equity 15% 16% 16% 17% 17% 15% 16% 16% 16% Investment Funds & Trusts 24% 25% 25% 27% 27% 24% 27% 27% 29% Domestic Government Bonds 19% 18% 17% 17% 15% 15% 15% 14% 13% Foreign Government Bonds 13% 13% 13% 14% 14% 17% 14% 14% 13% Securities and Private Bonds 18% 18% 18% 18% 18% 19% 20% 20% 19% Other (Liquid Assets) 11% 10% 11% 8% 9% 10% 9% 8% 10% Total 100% 100% 100% 100% 100% 100% 100% 100% 100%
Source: Own elaboration based on DGSFP data
Bond+Equitybased
schemes36%
BondBased31%
Equity Based
8%
GuaranteedSchemes
25%
2010
Bond+Equitybased
schemes62%
Bond based16%
Equitybased15%
GuaranteedSchemes
7%
2020
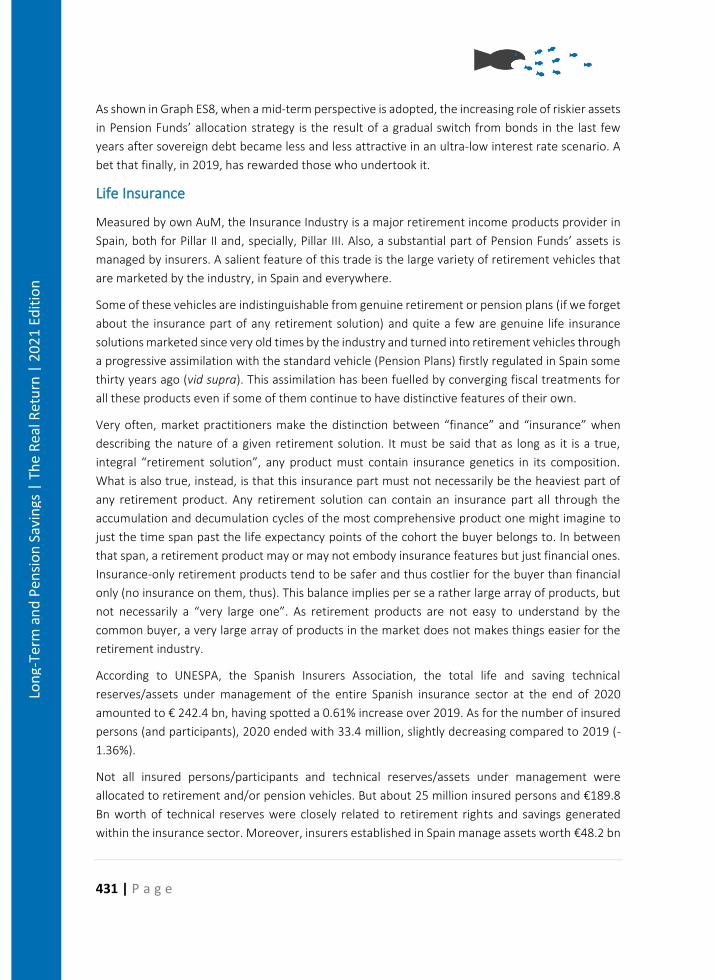
431 | P a g e
Lon
g-Te
rm a
nd
Pen
sio
n S
avin
gs |
Th
e R
eal R
etu
rn |
20
21
Edit
ion
As shown in Graph ES8, when a mid-term perspective is adopted, the increasing role of riskier assets
in Pension Funds’ allocation strategy is the result of a gradual switch from bonds in the last few
years after sovereign debt became less and less attractive in an ultra-low interest rate scenario. A
bet that finally, in 2019, has rewarded those who undertook it.
Life Insurance
Measured by own AuM, the Insurance Industry is a major retirement income products provider in
Spain, both for Pillar II and, specially, Pillar III. Also, a substantial part of Pension Funds’ assets is
managed by insurers. A salient feature of this trade is the large variety of retirement vehicles that
are marketed by the industry, in Spain and everywhere.
Some of these vehicles are indistinguishable from genuine retirement or pension plans (if we forget
about the insurance part of any retirement solution) and quite a few are genuine life insurance
solutions marketed since very old times by the industry and turned into retirement vehicles through
a progressive assimilation with the standard vehicle (Pension Plans) firstly regulated in Spain some
thirty years ago (vid supra). This assimilation has been fuelled by converging fiscal treatments for
all these products even if some of them continue to have distinctive features of their own.
Very often, market practitioners make the distinction between “finance” and “insurance” when
describing the nature of a given retirement solution. It must be said that as long as it is a true,
integral “retirement solution”, any product must contain insurance genetics in its composition.
What is also true, instead, is that this insurance part must not necessarily be the heaviest part of
any retirement product. Any retirement solution can contain an insurance part all through the
accumulation and decumulation cycles of the most comprehensive product one might imagine to
just the time span past the life expectancy points of the cohort the buyer belongs to. In between
that span, a retirement product may or may not embody insurance features but just financial ones.
Insurance-only retirement products tend to be safer and thus costlier for the buyer than financial
only (no insurance on them, thus). This balance implies per se a rather large array of products, but
not necessarily a “very large one”. As retirement products are not easy to understand by the
common buyer, a very large array of products in the market does not makes things easier for the
retirement industry.
According to UNESPA, the Spanish Insurers Association, the total life and saving technical
reserves/assets under management of the entire Spanish insurance sector at the end of 2020
amounted to € 242.4 bn, having spotted a 0.61% increase over 2019. As for the number of insured
persons (and participants), 2020 ended with 33.4 million, slightly decreasing compared to 2019 (-
1.36%).
Not all insured persons/participants and technical reserves/assets under management were
allocated to retirement and/or pension vehicles. But about 25 million insured persons and €189.8
Bn worth of technical reserves were closely related to retirement rights and savings generated
within the insurance sector. Moreover, insurers established in Spain manage assets worth €48.2 bn
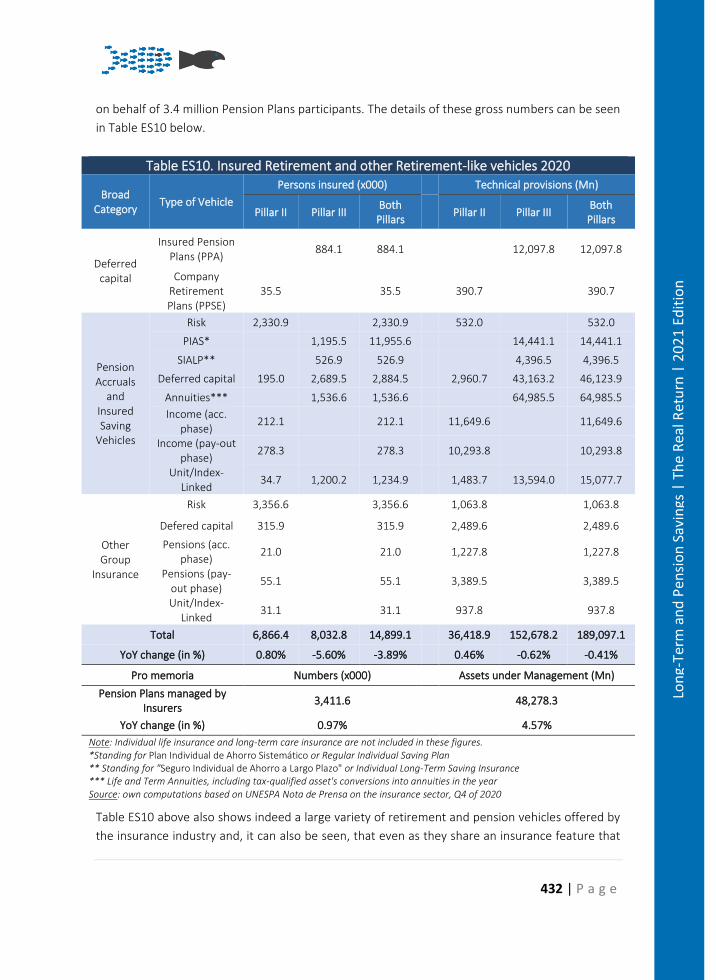
432 | P a g e
Lon
g-Te
rm a
nd
Pen
sio
n S
avin
gs |
Th
e R
eal R
etu
rn |
20
21
Edit
ion
on behalf of 3.4 million Pension Plans participants. The details of these gross numbers can be seen
in Table ES10 below.
Table ES10. Insured Retirement and other Retirement-like vehicles 2020
Broad Category
Type of Vehicle
Persons insured (x000) Technical provisions (Mn)
Pillar II Pillar III Both
Pillars Pillar II Pillar III
Both Pillars
Deferred capital
Insured Pension Plans (PPA)
884.1 884.1 12,097.8 12,097.8
Company Retirement Plans (PPSE)
35.5 35.5 390.7 390.7
Pension Accruals
and Insured Saving
Vehicles
Risk 2,330.9 2,330.9 532.0 532.0
PIAS* 1,195.5 11,955.6 14,441.1 14,441.1
SIALP** 526.9 526.9 4,396.5 4,396.5
Deferred capital 195.0 2,689.5 2,884.5 2,960.7 43,163.2 46,123.9
Annuities*** 1,536.6 1,536.6 64,985.5 64,985.5
Income (acc. phase)
212.1 212.1 11,649.6 11,649.6
Income (pay-out phase)
278.3 278.3 10,293.8 10,293.8
Unit/Index- Linked
34.7 1,200.2 1,234.9 1,483.7 13,594.0 15,077.7
Other Group
Insurance
Risk 3,356.6 3,356.6 1,063.8 1,063.8
Defered capital 315.9 315.9 2,489.6 2,489.6
Pensions (acc. phase)
21.0 21.0 1,227.8 1,227.8
Pensions (pay-out phase)
55.1 55.1 3,389.5 3,389.5
Unit/Index-Linked
31.1 31.1 937.8 937.8
Total 6,866.4 8,032.8 14,899.1 36,418.9 152,678.2 189,097.1
YoY change (in %) 0.80% -5.60% -3.89% 0.46% -0.62% -0.41%
Pro memoria Numbers (x000) Assets under Management (Mn)
Pension Plans managed by Insurers
3,411.6 48,278.3
YoY change (in %) 0.97% 4.57%
Note: Individual life insurance and long-term care insurance are not included in these figures. *Standing for Plan Individual de Ahorro Sistemático or Regular Individual Saving Plan ** Standing for "Seguro Individual de Ahorro a Largo Plazo" or Individual Long-Term Saving Insurance *** Life and Term Annuities, including tax-qualified asset's conversions into annuities in the year Source: own computations based on UNESPA Nota de Prensa on the insurance sector, Q4 of 2020
Table ES10 above also shows indeed a large variety of retirement and pension vehicles offered by
the insurance industry and, it can also be seen, that even as they share an insurance feature that
433 | P a g e
Lon
g-Te
rm a
nd
Pen
sio
n S
avin
gs |
Th
e R
eal R
etu
rn |
20
21
Edit
ion
makes then quite different from the purely financial vehicles (as they try to cope with death
uncertainty through actuarial techniques) each vehicle responds to a different need by consumers
concerning their risk profiles, fiscal rules applying to them, etc.
It is clear that the most popular insured retirement products are Deferred Capitals and Annuities,
commanding, respectively, 2.9 and 1.5 million insured persons and totalling technical reserves of
€46 bn and € 65 bn, respectively. Many other products that emerged when the standard Pension
Plans were regulated in Spain have a rather moderate presence in the insurance industry. In what
follows, some of these different products are explained.
Insured Retirement Plans (PPA)
The Insured Retirement Plans (PPA or Planes de Previsión Asegurados, in Spanish) are the insured
counterpart of standard Pension Plans previously discussed. Among all insured retirement (or
retirement-like) vehicles, PPAs are the most proper for this purpose. Their features concerning
taxes, redeemability or other are thoroughly the same as with Pension Plans, but for the fact that
interest and principal risks are taken by the insurer, at a cost naturally. In particular, a known and
certain interest rate is attached to this product. Once retirement happens, the insured person gets
a life annuity (a lump-sum is also a popular option). In a way, technically at least, a PPA is basically
a pure deferred annuity. Table ES10 shows that, by December 2020, 0.84 million individuals had
adopted this Pillar III retirement vehicle, with total technical reserves amounting to €12.1 bn, a
mere 14.4 thousand euros per account.
Company Retirement Plans (PPSE)
These are employer-sponsored Group Insurance aimed at complementary retirement benefits,
basically a deferred capital product. They are the insured counterpart to the employer-sponsored
Pension Plans (Pillar II), albeit more flexible as they adapt better to SMEs conditions. Table ES10
shows that, as of December 2019, only 35.5 thousand workers have been opted in this Pillar II
retirement vehicle by their employers, with technical reserves amounting to €390.5 Mn, again a
mere €11,000 per account.
Regular Individual Savings Plan (PIAS)
Regular Individual Saving Plans (PIAS or Planes Individuales de Ahorro Sistemático, in Spanish) are,
again, insured saving plans to which individuals can contribute regularly. If certain conditions are
met and savings are not removed after a long period of time, accumulated assets must be converted
into a permanent income at very low (and decreasing with age) fiscal cost (on interest or capital
gains). Table ES10 shows that, as of December 2020, almost 1.2 million individuals remained in this
Pillar III retirement vehicle, with technical reserves amounting to €14.4 bn, or 12 thousand euros
per account, representing an increase of about 1,600 euros compared to 2019.
434 | P a g e
Lon
g-Te
rm a
nd
Pen
sio
n S
avin
gs |
Th
e R
eal R
etu
rn |
20
21
Edit
ion
Long-Term Individual Saving Plans (SIALP)
Long-term Individual Saving Plans (SIALP or Seguro Individual de Ahorro a Largo Plazo, in Spanish)
are PIAS-like retirement vehicles. The major difference with a PIAS being that they can be cashed
both as an annuity or as a lump-sum. As of December 2020, 527 thousand individuals have this
product totalling € 4.4 bn technical reserves, barely €8.3 thousand euros per account.
Charges
Since inception (19987/1988), the current Pension Plans market in Spain has been characterized by
large average charges. This said, there are three aspects that need to be dealt with right away: (i)
the market has always been and continues to be very small and this entails a heavy toll on efficiency,
(ii) Pillar II schemes bear internationally competitive low fees that, given market size, must be cross
subsidized with significantly higher fees charged in Pillar III markets, and (iii) fees have been
decreasing in the last years due to regulatory pressure on companies.
Data discussed below is eloquent enough about the consequences for savers that stem out of these
market conditions. Average fees250 have been oscillating in the last decade at around 1% of assets
under management. Using this figure as a proxy for Total Expense Ratio (TER or total cost ratio for
investors), and under basic assumptions, typical investors could bear a Reduction in Yield (RiY) rate
of 13%.251
As for the insurance part of the retirement market, little is known referring to data directly usable
for harmonized comparison, although all relevant data are available in raw from the regulators and
the industry itself. The large variety of retirement and pension products available in this market
segment, and their varied features complicates enormously the task, however. The work to be done
in order to produce directly comparable data cannot be made in the context of this chapter and
any initiative to reach that goal should be most welcomed.
Even if regulation itself accounts for part of the extra burden that management and depositary fees
pose on consumers, the fact is that too large a chain of intermediaries (managers, commissioners
and retailers) end up by adding to the overall cost for the participant or the insured. Recently, and
regularly, management and depositary fees have been limited by law.252 These regulations however
allow variable fees to be set based on yields, within certain limits.
250 Management and depository, all classes combined, weighted by market shares 251 It is assumed that a typical investor increases his or her annual savings in retirement assets at 2% per year, for 35 years; total annual fees (TER) are 1% of AuM at the end of the year. Gross yields of AuM are assumed at 2% per year. Total Expenses (TE) from previous year are detracted from AuM for the next year. RIY ratio is then computed as accumulated TC at year 35 as a percentage of gross AuM at year 35. 252 Royal Decree 304/2004 established specific limits to management and depositary fees. Royal Decree 681/2014 modified this. More recently, Royal Decree 62/2018, set maximum management fees including fees paid to non-managing retailers, depending on the asset classes under management at 0.85% for mostly bonds funds, 1.3% for mixed bonds funds and 1.5% for the rest of funds. Maximum depositary frees were set at 0.2%.
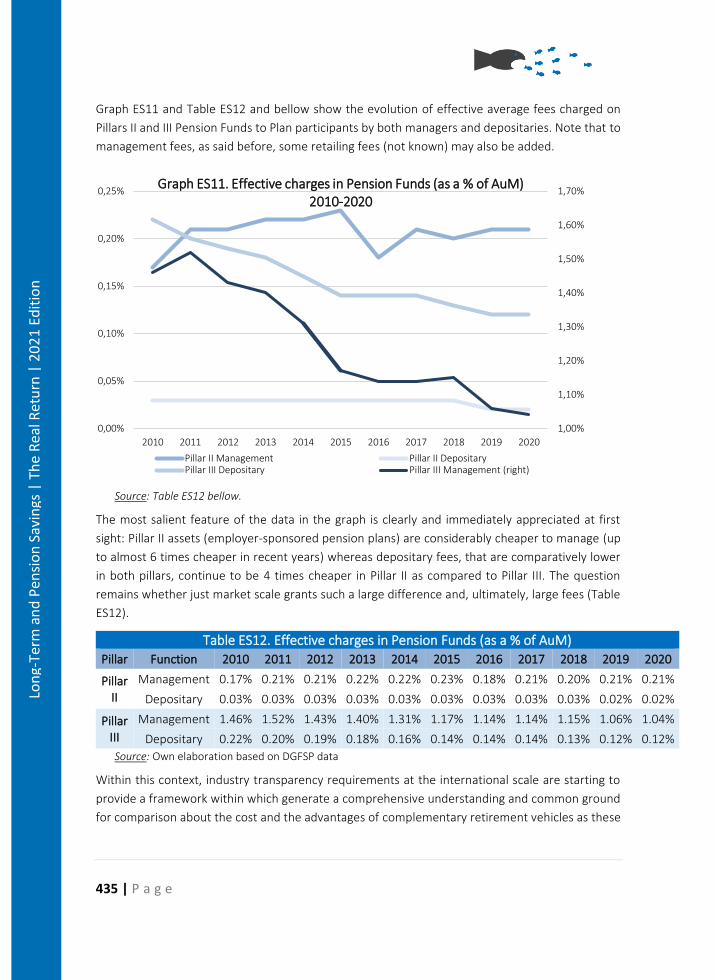
435 | P a g e
Lon
g-Te
rm a
nd
Pen
sio
n S
avin
gs |
Th
e R
eal R
etu
rn |
20
21
Edit
ion
Graph ES11 and Table ES12 and bellow show the evolution of effective average fees charged on
Pillars II and III Pension Funds to Plan participants by both managers and depositaries. Note that to
management fees, as said before, some retailing fees (not known) may also be added.
Source: Table ES12 bellow.
The most salient feature of the data in the graph is clearly and immediately appreciated at first
sight: Pillar II assets (employer-sponsored pension plans) are considerably cheaper to manage (up
to almost 6 times cheaper in recent years) whereas depositary fees, that are comparatively lower
in both pillars, continue to be 4 times cheaper in Pillar II as compared to Pillar III. The question
remains whether just market scale grants such a large difference and, ultimately, large fees (Table
ES12).
Table ES12. Effective charges in Pension Funds (as a % of AuM)
Pillar Function 2010 2011 2012 2013 2014 2015 2016 2017 2018 2019 2020
Pillar II
Management 0.17% 0.21% 0.21% 0.22% 0.22% 0.23% 0.18% 0.21% 0.20% 0.21% 0.21%
Depositary 0.03% 0.03% 0.03% 0.03% 0.03% 0.03% 0.03% 0.03% 0.03% 0.02% 0.02%
Pillar III
Management 1.46% 1.52% 1.43% 1.40% 1.31% 1.17% 1.14% 1.14% 1.15% 1.06% 1.04%
Depositary 0.22% 0.20% 0.19% 0.18% 0.16% 0.14% 0.14% 0.14% 0.13% 0.12% 0.12%
Source: Own elaboration based on DGFSP data
Within this context, industry transparency requirements at the international scale are starting to
provide a framework within which generate a comprehensive understanding and common ground
for comparison about the cost and the advantages of complementary retirement vehicles as these
1,00%
1,10%
1,20%
1,30%
1,40%
1,50%
1,60%
1,70%
0,00%
0,05%
0,10%
0,15%
0,20%
0,25%
2010 2011 2012 2013 2014 2015 2016 2017 2018 2019 2020
Graph ES11. Effective charges in Pension Funds (as a % of AuM) 2010-2020
Pillar II Management Pillar II DepositaryPillar III Depositary Pillar III Management (right)
436 | P a g e
Lon
g-Te
rm a
nd
Pen
sio
n S
avin
gs |
Th
e R
eal R
etu
rn |
20
21
Edit
ion
solutions became increasingly necessary to help cushion the hard landing of Social Security benefits
everywhere.
All Pillar III vehicle providers are obliged to advance a Key Information Document (KID) package to
their customers. These KID packages are firmly rooted on PRIIPS regulation that is not binding
however for pension products. Pillar II products are not obliged to advance a KID package to their
customers, albeit they must of course provide information akin to this package.
Taxation
With charges and returns (vid infra) taxation is one of the hottest issues around retirement
products. But it shouldn't be, think twice. Income must be taxed, this everyone admits, but not
double taxed. This is unjust and inefficient. One could also admit easily that labour and capital
income can be differently taxed, or that tax bases can convey certain policy objectives. But definitely
not that the same income concept is taxed twice.
In the absence of ordinary tax deductibility for retirement vehicles, as practiced by virtually all
countries, that part of income saved for years for future retirement, and the interest earned on that
income, would be taxed twice.
This treatment is often referred to as “tax incentives” or “tax gifts”, and also questioned by certain
social or political agents as unjust or regressive tax benefits. Nothing less true. The conventional tax
treatment to which pension assets and products are subject is generally and admittedly the best
way to avoid what otherwise would be a case of unacceptable double taxation of personal income.
The pensions industry must be clear and strong on this if their members want to be perceived as
truly looking after the best interest of those who entrust their savings to them. As much as they
must be clear and strong, by the way, on transparency, open competition and best-efforts
concerning charges and returns.
Normally, taxing retirement vehicles means exempting income as it is saved (as well as interest
earned on this income) and taxing benefits as they are cashed. That’s the “Exempt-Exempt-Tax” or
EET paradigm most commonly used in the world. Another way to avoid double taxing of income is
to tax contributions and interest and make benefits tax exempt (TTE), but this paradigm is rarely
used. In truth, neither pure extreme is actually being used as all countries have some limits to
deductibility and also some limits to benefits exemption.
Normally too, tax allowances at accumulation of savings are justified because these retirement
savings can’t be cashed or converted into non-retirement savings before retirement age. Yes, this
a legitimate way to justify EET schemes. But again, tax authorities only have to claim unpaid taxes
back when savings conversion occurs instead of forcing savers to stay fixed on their products.
Taxing retirement savings and benefits remains in the literature and in practice a much-debated
issue, just because we don't realize that the best and most fair taxing schedule for these bases
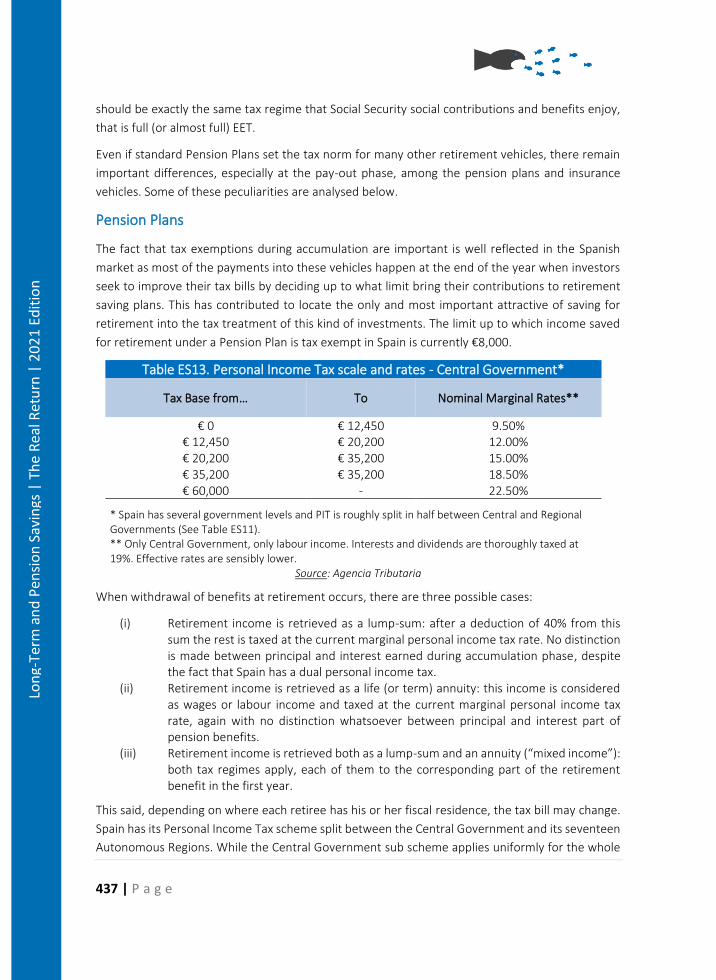
437 | P a g e
Lon
g-Te
rm a
nd
Pen
sio
n S
avin
gs |
Th
e R
eal R
etu
rn |
20
21
Edit
ion
should be exactly the same tax regime that Social Security social contributions and benefits enjoy,
that is full (or almost full) EET.
Even if standard Pension Plans set the tax norm for many other retirement vehicles, there remain
important differences, especially at the pay-out phase, among the pension plans and insurance
vehicles. Some of these peculiarities are analysed below.
Pension Plans
The fact that tax exemptions during accumulation are important is well reflected in the Spanish
market as most of the payments into these vehicles happen at the end of the year when investors
seek to improve their tax bills by deciding up to what limit bring their contributions to retirement
saving plans. This has contributed to locate the only and most important attractive of saving for
retirement into the tax treatment of this kind of investments. The limit up to which income saved
for retirement under a Pension Plan is tax exempt in Spain is currently €8,000.
Table ES13. Personal Income Tax scale and rates - Central Government*
Tax Base from… To Nominal Marginal Rates**
€ 0 € 12,450 9.50%
€ 12,450 € 20,200 12.00%
€ 20,200 € 35,200 15.00%
€ 35,200 € 35,200 18.50%
€ 60,000 - 22.50%
* Spain has several government levels and PIT is roughly split in half between Central and Regional Governments (See Table ES11).
** Only Central Government, only labour income. Interests and dividends are thoroughly taxed at 19%. Effective rates are sensibly lower.
Source: Agencia Tributaria
When withdrawal of benefits at retirement occurs, there are three possible cases:
(i) Retirement income is retrieved as a lump-sum: after a deduction of 40% from this sum the rest is taxed at the current marginal personal income tax rate. No distinction is made between principal and interest earned during accumulation phase, despite the fact that Spain has a dual personal income tax.
(ii) Retirement income is retrieved as a life (or term) annuity: this income is considered as wages or labour income and taxed at the current marginal personal income tax rate, again with no distinction whatsoever between principal and interest part of pension benefits.
(iii) Retirement income is retrieved both as a lump-sum and an annuity (“mixed income”): both tax regimes apply, each of them to the corresponding part of the retirement benefit in the first year.
This said, depending on where each retiree has his or her fiscal residence, the tax bill may change.
Spain has its Personal Income Tax scheme split between the Central Government and its seventeen
Autonomous Regions. While the Central Government sub scheme applies uniformly for the whole
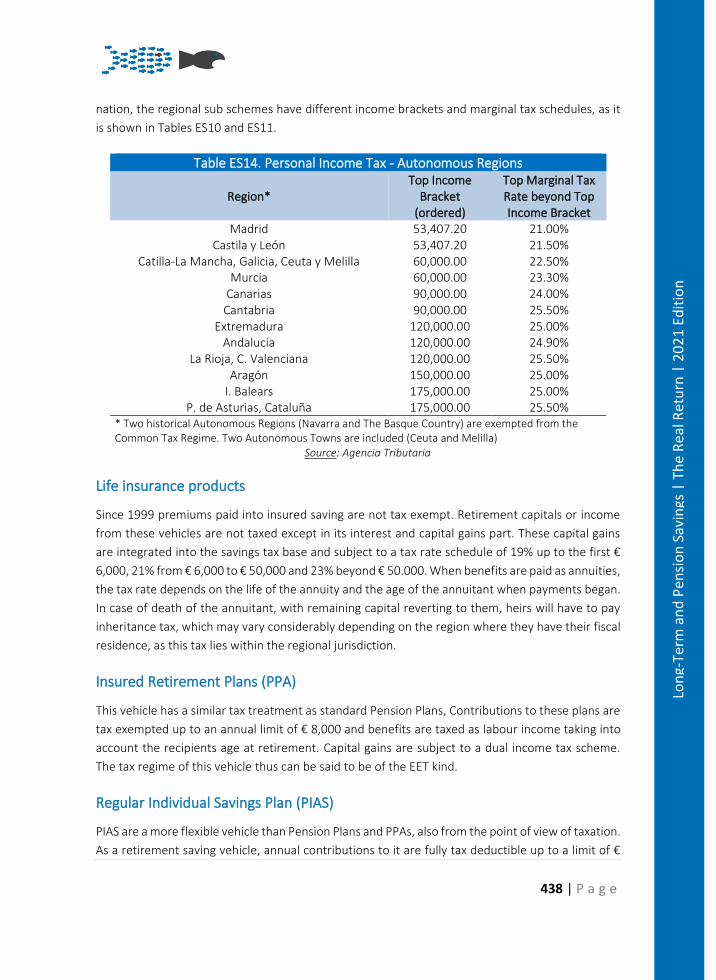
438 | P a g e
Lon
g-Te
rm a
nd
Pen
sio
n S
avin
gs |
Th
e R
eal R
etu
rn |
20
21
Edit
ion
nation, the regional sub schemes have different income brackets and marginal tax schedules, as it
is shown in Tables ES10 and ES11.
Table ES14. Personal Income Tax - Autonomous Regions
Region* Top Income
Bracket (ordered)
Top Marginal Tax Rate beyond Top Income Bracket
Madrid 53,407.20 21.00% Castila y León 53,407.20 21.50%
Catilla-La Mancha, Galicia, Ceuta y Melilla 60,000.00 22.50% Murcia 60,000.00 23.30%
Canarias 90,000.00 24.00% Cantabria 90,000.00 25.50%
Extremadura 120,000.00 25.00% Andalucía 120,000.00 24.90%
La Rioja, C. Valenciana 120,000.00 25.50% Aragón 150,000.00 25.00%
I. Balears 175,000.00 25.00% P. de Asturias, Cataluña 175,000.00 25.50%
* Two historical Autonomous Regions (Navarra and The Basque Country) are exempted from the Common Tax Regime. Two Autonomous Towns are included (Ceuta and Melilla)
Source: Agencia Tributaria
Life insurance products
Since 1999 premiums paid into insured saving are not tax exempt. Retirement capitals or income
from these vehicles are not taxed except in its interest and capital gains part. These capital gains
are integrated into the savings tax base and subject to a tax rate schedule of 19% up to the first €
6,000, 21% from € 6,000 to € 50,000 and 23% beyond € 50.000. When benefits are paid as annuities,
the tax rate depends on the life of the annuity and the age of the annuitant when payments began.
In case of death of the annuitant, with remaining capital reverting to them, heirs will have to pay
inheritance tax, which may vary considerably depending on the region where they have their fiscal
residence, as this tax lies within the regional jurisdiction.
Insured Retirement Plans (PPA)
This vehicle has a similar tax treatment as standard Pension Plans, Contributions to these plans are
tax exempted up to an annual limit of € 8,000 and benefits are taxed as labour income taking into
account the recipients age at retirement. Capital gains are subject to a dual income tax scheme.
The tax regime of this vehicle thus can be said to be of the EET kind.
Regular Individual Savings Plan (PIAS)
PIAS are a more flexible vehicle than Pension Plans and PPAs, also from the point of view of taxation.
As a retirement saving vehicle, annual contributions to it are fully tax deductible up to a limit of €
439 | P a g e
Lon
g-Te
rm a
nd
Pen
sio
n S
avin
gs |
Th
e R
eal R
etu
rn |
20
21
Edit
ion
8,000 per year, as with Pension Plans and PPAs. There is also a global limit for this type of saving
plan: €240,000. Savers can only own one PIAS. At the pay-out phase, if income is received as a lump-
sum, taxation intervenes as usual through the dual income tax for labour income (principal) and
capital gains income (returns).
But if retirement income is retrieved as a life annuity, capital gains are 100% exempt and principal
is taxed according to a rapidly diminishing rates schedule. PIAS can be cashed in well before ordinary
retirement age, but when cashed after age 65 the tax rate is 20% falling to 8% when cashed after
age 70.
The €240,000 limit for total saving under a PIAS is relevant here for, as from 2015, individuals aged
65 or more who liquidate any asset they may own (financial, real estate, art works, etc) to buy a life
annuity have related capital gains fully exempted from the dual income tax.
Returns
Spanish capital and debt markets returns
In 2008 major world stock indexes suffered a 40% loss with respect to the previous year. That was
a catastrophe. All asset classes linked to stock suffered accordingly. Hundreds of thousands of
workers in advanced countries had to postpone their retirement because these losses would mark
the value of their retirement incomes for the rest of their lives nearing them to poverty at old age.
Most of these stock markets recovered the 2007 line by 2012-2013, But the Spanish stock market
has barely recovered the 2008 bottom-line. This can be seen in Graph ES15 below.
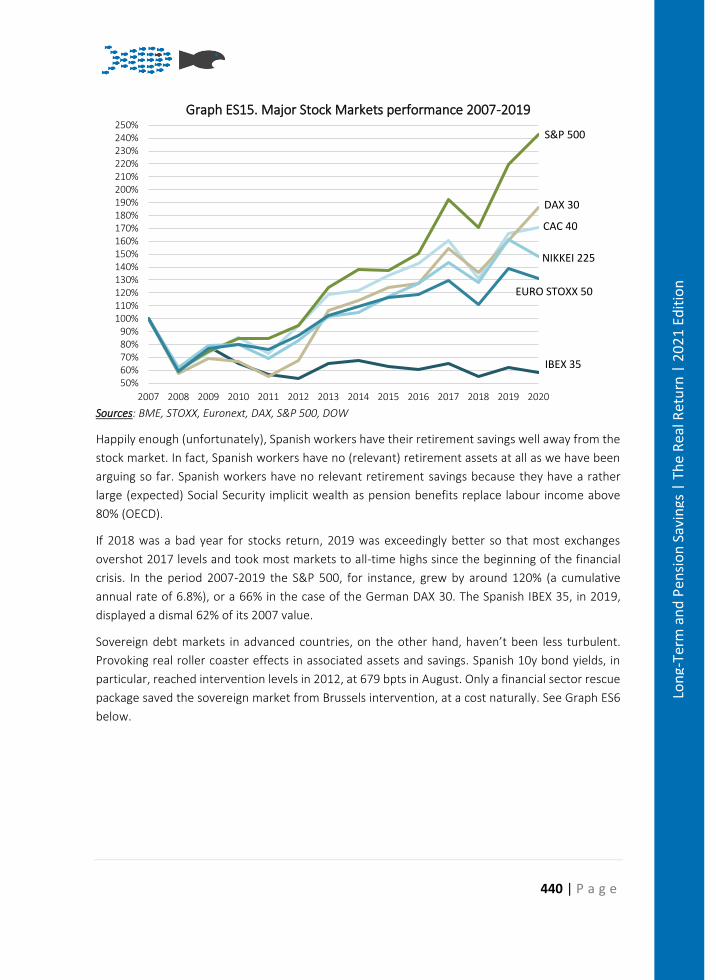
440 | P a g e
Lon
g-Te
rm a
nd
Pen
sio
n S
avin
gs |
Th
e R
eal R
etu
rn |
20
21
Edit
ion
Graph ES15. Major Stock Markets performance 2007-2019
Sources: BME, STOXX, Euronext, DAX, S&P 500, DOW
Happily enough (unfortunately), Spanish workers have their retirement savings well away from the
stock market. In fact, Spanish workers have no (relevant) retirement assets at all as we have been
arguing so far. Spanish workers have no relevant retirement savings because they have a rather
large (expected) Social Security implicit wealth as pension benefits replace labour income above
80% (OECD).
If 2018 was a bad year for stocks return, 2019 was exceedingly better so that most exchanges
overshot 2017 levels and took most markets to all-time highs since the beginning of the financial
crisis. In the period 2007-2019 the S&P 500, for instance, grew by around 120% (a cumulative
annual rate of 6.8%), or a 66% in the case of the German DAX 30. The Spanish IBEX 35, in 2019,
displayed a dismal 62% of its 2007 value.
Sovereign debt markets in advanced countries, on the other hand, haven’t been less turbulent.
Provoking real roller coaster effects in associated assets and savings. Spanish 10y bond yields, in
particular, reached intervention levels in 2012, at 679 bpts in August. Only a financial sector rescue
package saved the sovereign market from Brussels intervention, at a cost naturally. See Graph ES6
below.
50%60%70%80%90%
100%110%120%130%140%150%160%170%180%190%200%210%220%230%240%250%
2007 2008 2009 2010 2011 2012 2013 2014 2015 2016 2017 2018 2019 2020
IBEX 35
EURO STOXX 50
CAC 40
NIKKEI 225
DAX 30
S&P 500
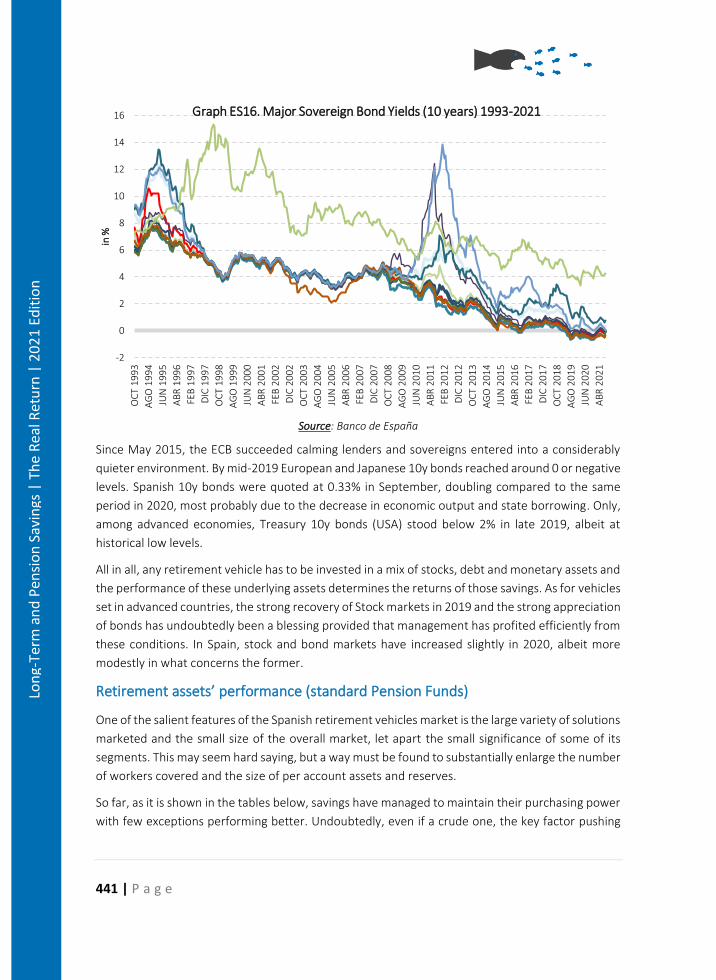
441 | P a g e
Lon
g-Te
rm a
nd
Pen
sio
n S
avin
gs |
Th
e R
eal R
etu
rn |
20
21
Edit
ion
Source: Banco de España
Since May 2015, the ECB succeeded calming lenders and sovereigns entered into a considerably
quieter environment. By mid-2019 European and Japanese 10y bonds reached around 0 or negative
levels. Spanish 10y bonds were quoted at 0.33% in September, doubling compared to the same
period in 2020, most probably due to the decrease in economic output and state borrowing. Only,
among advanced economies, Treasury 10y bonds (USA) stood below 2% in late 2019, albeit at
historical low levels.
All in all, any retirement vehicle has to be invested in a mix of stocks, debt and monetary assets and
the performance of these underlying assets determines the returns of those savings. As for vehicles
set in advanced countries, the strong recovery of Stock markets in 2019 and the strong appreciation
of bonds has undoubtedly been a blessing provided that management has profited efficiently from
these conditions. In Spain, stock and bond markets have increased slightly in 2020, albeit more
modestly in what concerns the former.
Retirement assets’ performance (standard Pension Funds)
One of the salient features of the Spanish retirement vehicles market is the large variety of solutions
marketed and the small size of the overall market, let apart the small significance of some of its
segments. This may seem hard saying, but a way must be found to substantially enlarge the number
of workers covered and the size of per account assets and reserves.
So far, as it is shown in the tables below, savings have managed to maintain their purchasing power
with few exceptions performing better. Undoubtedly, even if a crude one, the key factor pushing
-2
0
2
4
6
8
10
12
14
16
OC
T 19
93
AG
O 1
99
4
JUN
199
5
AB
R 1
996
FEB
19
97
DIC
19
97
OC
T 19
98
AG
O 1
99
9
JUN
200
0
AB
R 2
001
FEB
20
02
DIC
20
02
OC
T 20
03
AG
O 2
00
4
JUN
200
5
AB
R 2
006
FEB
20
07
DIC
20
07
OC
T 20
08
AG
O 2
00
9
JUN
201
0
AB
R 2
011
FEB
20
12
DIC
20
12
OC
T 20
13
AG
O 2
01
4
JUN
201
5
AB
R 2
016
FEB
20
17
DIC
20
17
OC
T 20
18
AG
O 2
01
9
JUN
202
0
AB
R 2
021
in %
Graph ES16. Major Sovereign Bond Yields (10 years) 1993-2021
442 | P a g e
Lon
g-Te
rm a
nd
Pen
sio
n S
avin
gs |
Th
e R
eal R
etu
rn |
20
21
Edit
ion
or keeping Spaniards into the complementary retirement savings system is tax deferral (and the
locking-in effect it creates), and not as much the real, after fees returns of these assets.
However, all the evidence produced below belongs to the standard Pension Plans system, not to
insured retirement vehicles, due to data limitations. All data comes basically form the web site of
INVERCO, the Spanish body representing Mutual Investment Institutions and Pension Funds.
Notice, nevertheless, that retirement products insurance comes at an additional cost (with respect
to purely financial vehicles) due to the intrinsic nature of both guaranteeing assets’ value, on the
one hand, and mutualising longevity, on the other. Even if insurers are good performers also in
terms of assets management and enjoy the very long-term premiums of the underlying matching
assets they invest in, they need to beat the insurance extra cost that these products embody.
Table ES17 contains the basic information concerning Pillars II and III Pension Funds. Returns are
labelled “gross”, “net” and “real”. Gross means before management and depositary fees and
commissions (retailing and other transaction costs are disguised here), net means after
management and depositary fees and commissions, being nominal returns, and real means after
fees and inflation. We obtain the gross returns by adding to the net returns published by INVERCO
the management and depositary fees published by the DGSFP; as such, since data earlier than 2009
is not available, we were not able to compute the gross returns between 2000-2009.
The returns by pillar are calculated as follows: we use the employer-sponsored and associate plans
as a proxy for the Spanish occupational pensions pillar (pillar II) and we calculate, for each year, the
weighted average return, based on the assets under management of associate and employer-
sponsored plans. For the voluntary pillar (pillar III), we use INVERCO’s data for individual pension
plans. To calculate the overall return of Spanish pension funds, we use the same methodology:
weighted returns based on the assets under management of associate, employer-sponsored, and
individual plans.
At first glance, positive net nominal returns dominate the landscape, and even net real returns, with
some years at really good returns on assets invested. On historical basis, average cumulative real
returns continue to be clearly positive (INVERCO).
2018, however, was a bad year for investments returns of all sorts, particularly the stock market.
But returns in 2019 overshot the 2018 ones. This provided for the best year in the current decade.
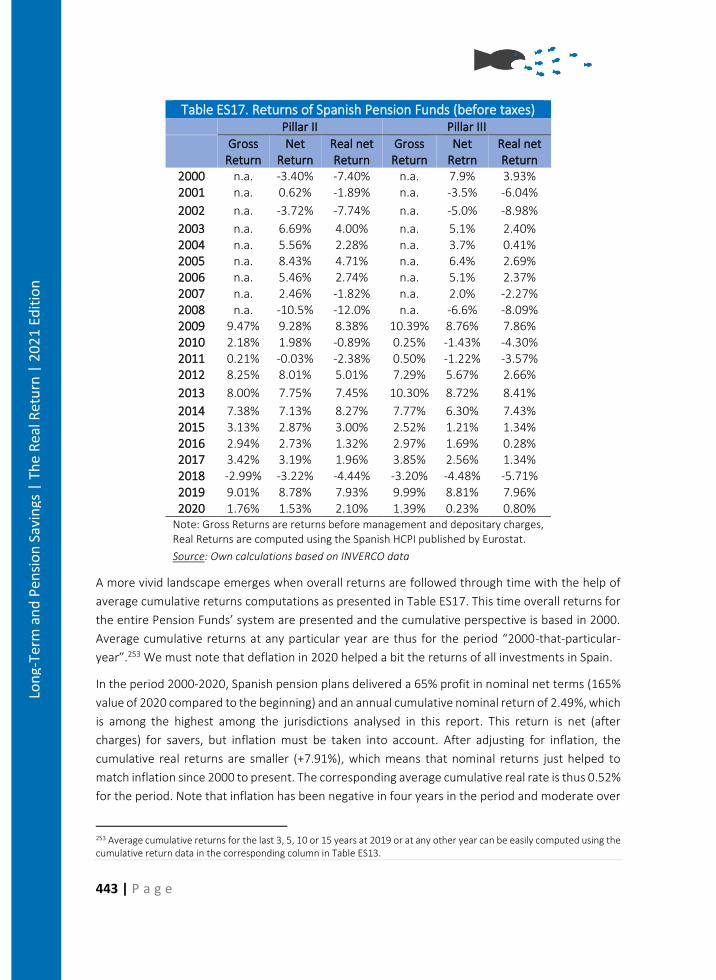
443 | P a g e
Lon
g-Te
rm a
nd
Pen
sio
n S
avin
gs |
Th
e R
eal R
etu
rn |
20
21
Edit
ion
Table ES17. Returns of Spanish Pension Funds (before taxes) Pillar II Pillar III
Gross
Return Net
Return Real net Return
Gross Return
Net Retrn
Real net Return
2000 n.a. -3.40% -7.40% n.a. 7.9% 3.93% 2001 n.a. 0.62% -1.89% n.a. -3.5% -6.04%
2002 n.a. -3.72% -7.74% n.a. -5.0% -8.98%
2003 n.a. 6.69% 4.00% n.a. 5.1% 2.40% 2004 n.a. 5.56% 2.28% n.a. 3.7% 0.41% 2005 n.a. 8.43% 4.71% n.a. 6.4% 2.69% 2006 n.a. 5.46% 2.74% n.a. 5.1% 2.37% 2007 n.a. 2.46% -1.82% n.a. 2.0% -2.27% 2008 n.a. -10.5% -12.0% n.a. -6.6% -8.09% 2009 9.47% 9.28% 8.38% 10.39% 8.76% 7.86% 2010 2.18% 1.98% -0.89% 0.25% -1.43% -4.30% 2011 0.21% -0.03% -2.38% 0.50% -1.22% -3.57% 2012 8.25% 8.01% 5.01% 7.29% 5.67% 2.66%
2013 8.00% 7.75% 7.45% 10.30% 8.72% 8.41%
2014 7.38% 7.13% 8.27% 7.77% 6.30% 7.43% 2015 3.13% 2.87% 3.00% 2.52% 1.21% 1.34% 2016 2.94% 2.73% 1.32% 2.97% 1.69% 0.28% 2017 3.42% 3.19% 1.96% 3.85% 2.56% 1.34% 2018 -2.99% -3.22% -4.44% -3.20% -4.48% -5.71% 2019 9.01% 8.78% 7.93% 9.99% 8.81% 7.96% 2020 1.76% 1.53% 2.10% 1.39% 0.23% 0.80%
Note: Gross Returns are returns before management and depositary charges, Real Returns are computed using the Spanish HCPI published by Eurostat.
Source: Own calculations based on INVERCO data
A more vivid landscape emerges when overall returns are followed through time with the help of
average cumulative returns computations as presented in Table ES17. This time overall returns for
the entire Pension Funds’ system are presented and the cumulative perspective is based in 2000.
Average cumulative returns at any particular year are thus for the period “2000-that-particular-
year”.253 We must note that deflation in 2020 helped a bit the returns of all investments in Spain.
In the period 2000-2020, Spanish pension plans delivered a 65% profit in nominal net terms (165%
value of 2020 compared to the beginning) and an annual cumulative nominal return of 2.49%, which
is among the highest among the jurisdictions analysed in this report. This return is net (after
charges) for savers, but inflation must be taken into account. After adjusting for inflation, the
cumulative real returns are smaller (+7.91%), which means that nominal returns just helped to
match inflation since 2000 to present. The corresponding average cumulative real rate is thus 0.52%
for the period. Note that inflation has been negative in four years in the period and moderate over
253 Average cumulative returns for the last 3, 5, 10 or 15 years at 2019 or at any other year can be easily computed using the cumulative return data in the corresponding column in Table ES13.
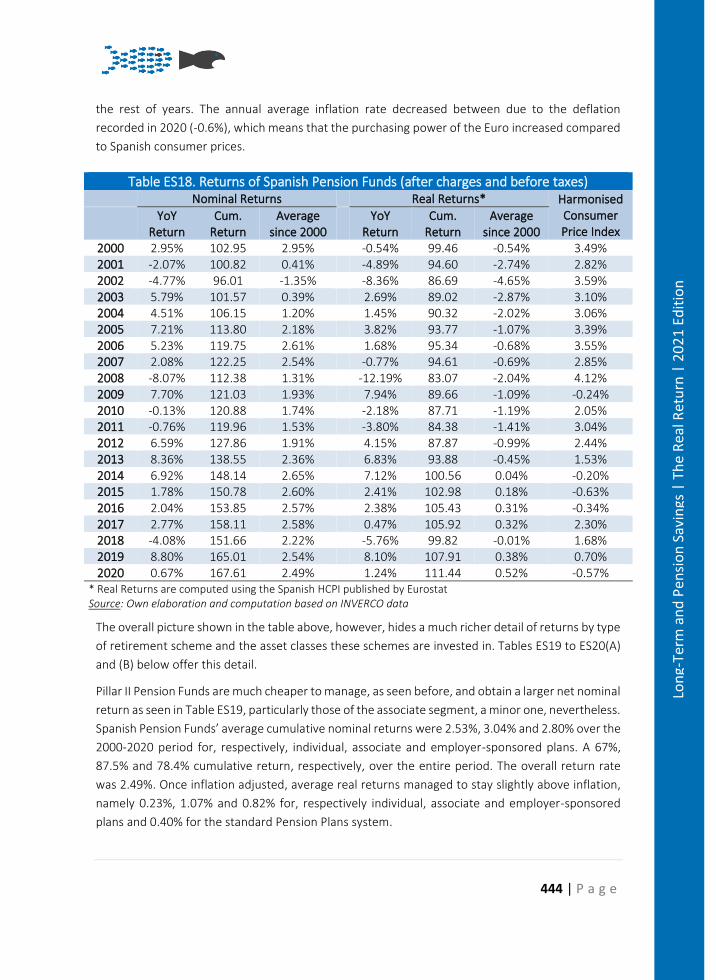
444 | P a g e
Lon
g-Te
rm a
nd
Pen
sio
n S
avin
gs |
Th
e R
eal R
etu
rn |
20
21
Edit
ion
the rest of years. The annual average inflation rate decreased between due to the deflation
recorded in 2020 (-0.6%), which means that the purchasing power of the Euro increased compared
to Spanish consumer prices.
Table ES18. Returns of Spanish Pension Funds (after charges and before taxes) Nominal Returns Real Returns* Harmonised
Consumer Price Index
YoY
Return Cum.
Return Average
since 2000
YoY Return
Cum. Return
Average since 2000
2000 2.95% 102.95 2.95% -0.54% 99.46 -0.54% 3.49% 2001 -2.07% 100.82 0.41% -4.89% 94.60 -2.74% 2.82% 2002 -4.77% 96.01 -1.35% -8.36% 86.69 -4.65% 3.59% 2003 5.79% 101.57 0.39% 2.69% 89.02 -2.87% 3.10% 2004 4.51% 106.15 1.20% 1.45% 90.32 -2.02% 3.06% 2005 7.21% 113.80 2.18% 3.82% 93.77 -1.07% 3.39% 2006 5.23% 119.75 2.61% 1.68% 95.34 -0.68% 3.55% 2007 2.08% 122.25 2.54% -0.77% 94.61 -0.69% 2.85% 2008 -8.07% 112.38 1.31% -12.19% 83.07 -2.04% 4.12% 2009 7.70% 121.03 1.93% 7.94% 89.66 -1.09% -0.24% 2010 -0.13% 120.88 1.74% -2.18% 87.71 -1.19% 2.05% 2011 -0.76% 119.96 1.53% -3.80% 84.38 -1.41% 3.04% 2012 6.59% 127.86 1.91% 4.15% 87.87 -0.99% 2.44% 2013 8.36% 138.55 2.36% 6.83% 93.88 -0.45% 1.53% 2014 6.92% 148.14 2.65% 7.12% 100.56 0.04% -0.20% 2015 1.78% 150.78 2.60% 2.41% 102.98 0.18% -0.63% 2016 2.04% 153.85 2.57% 2.38% 105.43 0.31% -0.34% 2017 2.77% 158.11 2.58% 0.47% 105.92 0.32% 2.30% 2018 -4.08% 151.66 2.22% -5.76% 99.82 -0.01% 1.68% 2019 8.80% 165.01 2.54% 8.10% 107.91 0.38% 0.70% 2020 0.67% 167.61 2.49% 1.24% 111.44 0.52% -0.57%
* Real Returns are computed using the Spanish HCPI published by Eurostat Source: Own elaboration and computation based on INVERCO data
The overall picture shown in the table above, however, hides a much richer detail of returns by type
of retirement scheme and the asset classes these schemes are invested in. Tables ES19 to ES20(A)
and (B) below offer this detail.
Pillar II Pension Funds are much cheaper to manage, as seen before, and obtain a larger net nominal
return as seen in Table ES19, particularly those of the associate segment, a minor one, nevertheless.
Spanish Pension Funds’ average cumulative nominal returns were 2.53%, 3.04% and 2.80% over the
2000-2020 period for, respectively, individual, associate and employer-sponsored plans. A 67%,
87.5% and 78.4% cumulative return, respectively, over the entire period. The overall return rate
was 2.49%. Once inflation adjusted, average real returns managed to stay slightly above inflation,
namely 0.23%, 1.07% and 0.82% for, respectively individual, associate and employer-sponsored
plans and 0.40% for the standard Pension Plans system.
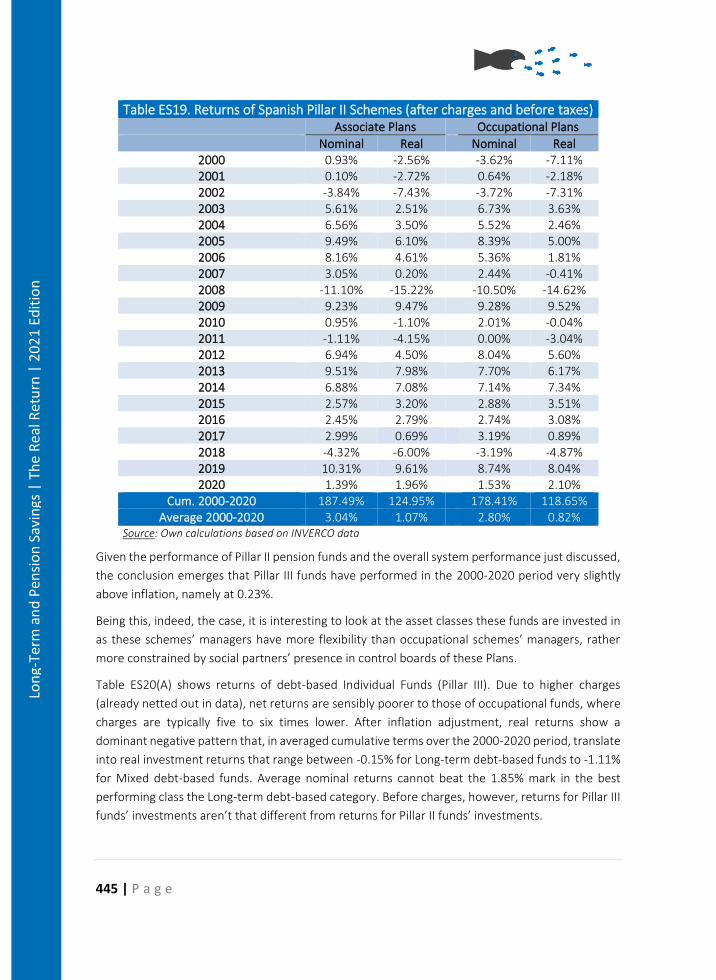
445 | P a g e
Lon
g-Te
rm a
nd
Pen
sio
n S
avin
gs |
Th
e R
eal R
etu
rn |
20
21
Edit
ion
Table ES19. Returns of Spanish Pillar II Schemes (after charges and before taxes) Associate Plans Occupational Plans
Nominal Real Nominal Real 2000 0.93% -2.56% -3.62% -7.11% 2001 0.10% -2.72% 0.64% -2.18% 2002 -3.84% -7.43% -3.72% -7.31% 2003 5.61% 2.51% 6.73% 3.63% 2004 6.56% 3.50% 5.52% 2.46% 2005 9.49% 6.10% 8.39% 5.00% 2006 8.16% 4.61% 5.36% 1.81% 2007 3.05% 0.20% 2.44% -0.41% 2008 -11.10% -15.22% -10.50% -14.62% 2009 9.23% 9.47% 9.28% 9.52% 2010 0.95% -1.10% 2.01% -0.04% 2011 -1.11% -4.15% 0.00% -3.04% 2012 6.94% 4.50% 8.04% 5.60% 2013 9.51% 7.98% 7.70% 6.17% 2014 6.88% 7.08% 7.14% 7.34% 2015 2.57% 3.20% 2.88% 3.51% 2016 2.45% 2.79% 2.74% 3.08% 2017 2.99% 0.69% 3.19% 0.89% 2018 -4.32% -6.00% -3.19% -4.87% 2019 10.31% 9.61% 8.74% 8.04% 2020 1.39% 1.96% 1.53% 2.10%
Cum. 2000-2020 187.49% 124.95% 178.41% 118.65% Average 2000-2020 3.04% 1.07% 2.80% 0.82%
Source: Own calculations based on INVERCO data
Given the performance of Pillar II pension funds and the overall system performance just discussed,
the conclusion emerges that Pillar III funds have performed in the 2000-2020 period very slightly
above inflation, namely at 0.23%.
Being this, indeed, the case, it is interesting to look at the asset classes these funds are invested in
as these schemes’ managers have more flexibility than occupational schemes’ managers, rather
more constrained by social partners’ presence in control boards of these Plans.
Table ES20(A) shows returns of debt-based Individual Funds (Pillar III). Due to higher charges
(already netted out in data), net returns are sensibly poorer to those of occupational funds, where
charges are typically five to six times lower. After inflation adjustment, real returns show a
dominant negative pattern that, in averaged cumulative terms over the 2000-2020 period, translate
into real investment returns that range between -0.15% for Long-term debt-based funds to -1.11%
for Mixed debt-based funds. Average nominal returns cannot beat the 1.85% mark in the best
performing class the Long-term debt-based category. Before charges, however, returns for Pillar III
funds’ investments aren’t that different from returns for Pillar II funds’ investments.
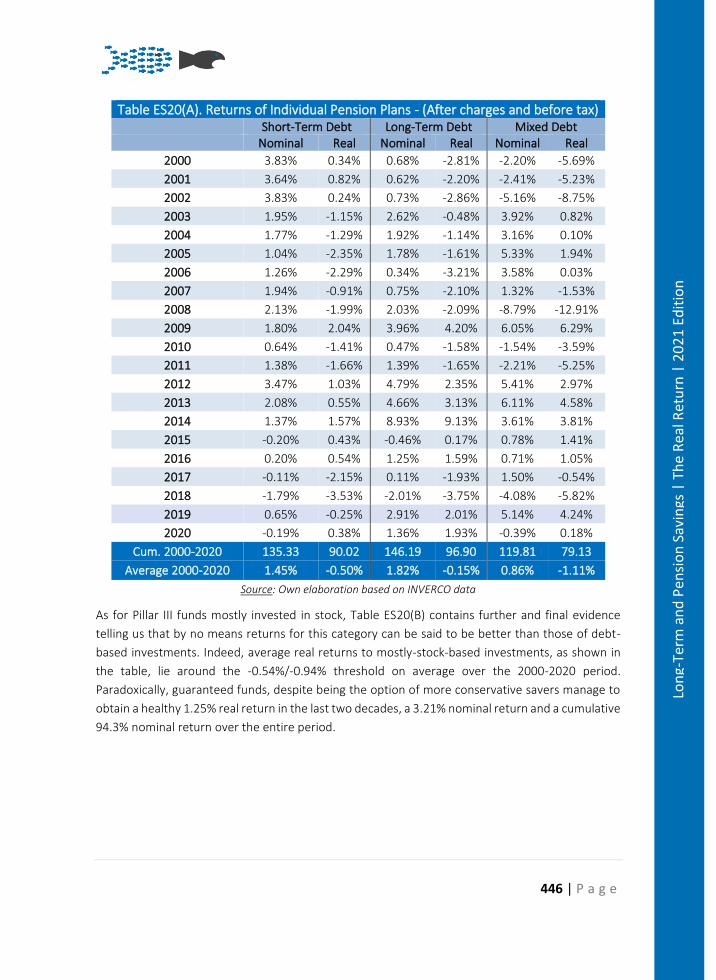
446 | P a g e
Lon
g-Te
rm a
nd
Pen
sio
n S
avin
gs |
Th
e R
eal R
etu
rn |
20
21
Edit
ion
Table ES20(A). Returns of Individual Pension Plans - (After charges and before tax) Short-Term Debt Long-Term Debt Mixed Debt Nominal Real Nominal Real Nominal Real
2000 3.83% 0.34% 0.68% -2.81% -2.20% -5.69%
2001 3.64% 0.82% 0.62% -2.20% -2.41% -5.23%
2002 3.83% 0.24% 0.73% -2.86% -5.16% -8.75%
2003 1.95% -1.15% 2.62% -0.48% 3.92% 0.82%
2004 1.77% -1.29% 1.92% -1.14% 3.16% 0.10%
2005 1.04% -2.35% 1.78% -1.61% 5.33% 1.94%
2006 1.26% -2.29% 0.34% -3.21% 3.58% 0.03%
2007 1.94% -0.91% 0.75% -2.10% 1.32% -1.53%
2008 2.13% -1.99% 2.03% -2.09% -8.79% -12.91%
2009 1.80% 2.04% 3.96% 4.20% 6.05% 6.29%
2010 0.64% -1.41% 0.47% -1.58% -1.54% -3.59%
2011 1.38% -1.66% 1.39% -1.65% -2.21% -5.25%
2012 3.47% 1.03% 4.79% 2.35% 5.41% 2.97%
2013 2.08% 0.55% 4.66% 3.13% 6.11% 4.58%
2014 1.37% 1.57% 8.93% 9.13% 3.61% 3.81%
2015 -0.20% 0.43% -0.46% 0.17% 0.78% 1.41%
2016 0.20% 0.54% 1.25% 1.59% 0.71% 1.05%
2017 -0.11% -2.15% 0.11% -1.93% 1.50% -0.54%
2018 -1.79% -3.53% -2.01% -3.75% -4.08% -5.82%
2019 0.65% -0.25% 2.91% 2.01% 5.14% 4.24%
2020 -0.19% 0.38% 1.36% 1.93% -0.39% 0.18%
Cum. 2000-2020 135.33 90.02 146.19 96.90 119.81 79.13
Average 2000-2020 1.45% -0.50% 1.82% -0.15% 0.86% -1.11%
Source: Own elaboration based on INVERCO data
As for Pillar III funds mostly invested in stock, Table ES20(B) contains further and final evidence
telling us that by no means returns for this category can be said to be better than those of debt-
based investments. Indeed, average real returns to mostly-stock-based investments, as shown in
the table, lie around the -0.54%/-0.94% threshold on average over the 2000-2020 period.
Paradoxically, guaranteed funds, despite being the option of more conservative savers manage to
obtain a healthy 1.25% real return in the last two decades, a 3.21% nominal return and a cumulative
94.3% nominal return over the entire period.
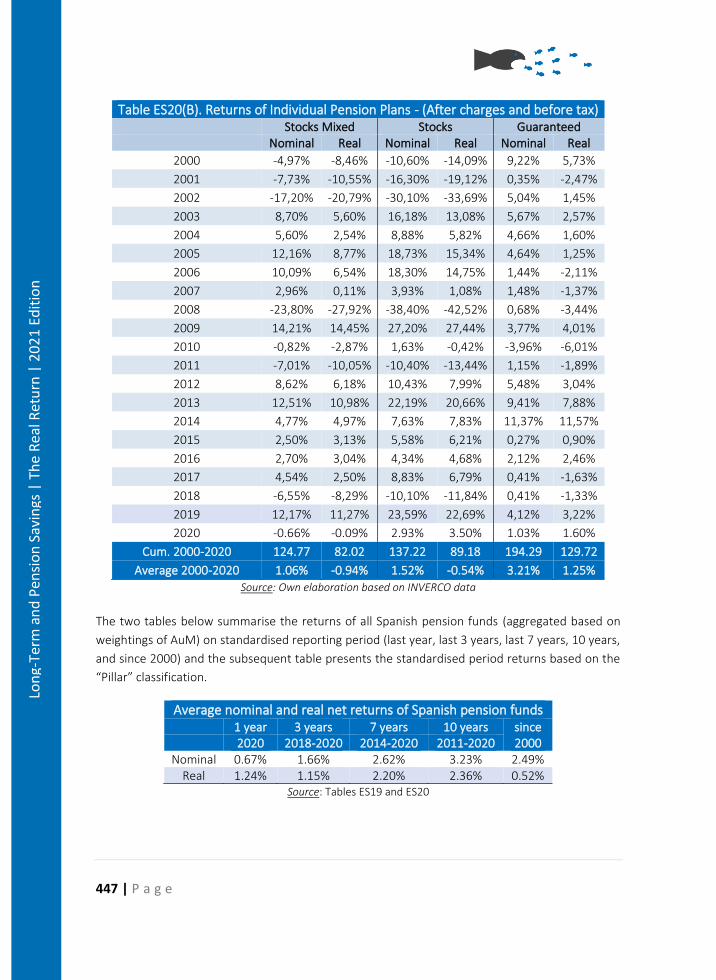
447 | P a g e
Lon
g-Te
rm a
nd
Pen
sio
n S
avin
gs |
Th
e R
eal R
etu
rn |
20
21
Edit
ion
Table ES20(B). Returns of Individual Pension Plans - (After charges and before tax) Stocks Mixed Stocks Guaranteed Nominal Real Nominal Real Nominal Real
2000 -4,97% -8,46% -10,60% -14,09% 9,22% 5,73%
2001 -7,73% -10,55% -16,30% -19,12% 0,35% -2,47%
2002 -17,20% -20,79% -30,10% -33,69% 5,04% 1,45%
2003 8,70% 5,60% 16,18% 13,08% 5,67% 2,57%
2004 5,60% 2,54% 8,88% 5,82% 4,66% 1,60%
2005 12,16% 8,77% 18,73% 15,34% 4,64% 1,25%
2006 10,09% 6,54% 18,30% 14,75% 1,44% -2,11%
2007 2,96% 0,11% 3,93% 1,08% 1,48% -1,37%
2008 -23,80% -27,92% -38,40% -42,52% 0,68% -3,44%
2009 14,21% 14,45% 27,20% 27,44% 3,77% 4,01%
2010 -0,82% -2,87% 1,63% -0,42% -3,96% -6,01%
2011 -7,01% -10,05% -10,40% -13,44% 1,15% -1,89%
2012 8,62% 6,18% 10,43% 7,99% 5,48% 3,04%
2013 12,51% 10,98% 22,19% 20,66% 9,41% 7,88%
2014 4,77% 4,97% 7,63% 7,83% 11,37% 11,57%
2015 2,50% 3,13% 5,58% 6,21% 0,27% 0,90%
2016 2,70% 3,04% 4,34% 4,68% 2,12% 2,46%
2017 4,54% 2,50% 8,83% 6,79% 0,41% -1,63%
2018 -6,55% -8,29% -10,10% -11,84% 0,41% -1,33%
2019 12,17% 11,27% 23,59% 22,69% 4,12% 3,22%
2020 -0.66% -0.09% 2.93% 3.50% 1.03% 1.60%
Cum. 2000-2020 124.77 82.02 137.22 89.18 194.29 129.72
Average 2000-2020 1.06% -0.94% 1.52% -0.54% 3.21% 1.25%
Source: Own elaboration based on INVERCO data
The two tables below summarise the returns of all Spanish pension funds (aggregated based on
weightings of AuM) on standardised reporting period (last year, last 3 years, last 7 years, 10 years,
and since 2000) and the subsequent table presents the standardised period returns based on the
“Pillar” classification.
Average nominal and real net returns of Spanish pension funds 1 year 3 years 7 years 10 years since
2000 2020 2018-2020 2014-2020 2011-2020 Nominal 0.67% 1.66% 2.62% 3.23% 2.49%
Real 1.24% 1.15% 2.20% 2.36% 0.52% Source: Tables ES19 and ES20
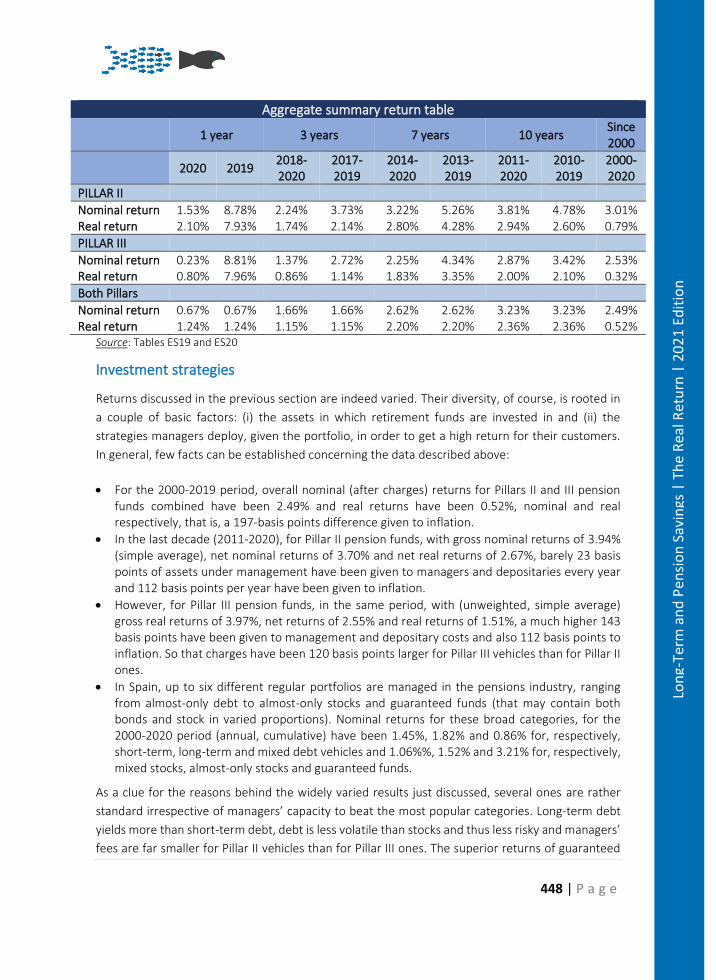
448 | P a g e
Lon
g-Te
rm a
nd
Pen
sio
n S
avin
gs |
Th
e R
eal R
etu
rn |
20
21
Edit
ion
Aggregate summary return table
1 year 3 years 7 years 10 years Since 2000
2020 2019 2018-2020
2017-2019
2014-2020
2013-2019
2011-2020
2010-2019
2000-2020
PILLAR II
Nominal return 1.53% 8.78% 2.24% 3.73% 3.22% 5.26% 3.81% 4.78% 3.01% Real return 2.10% 7.93% 1.74% 2.14% 2.80% 4.28% 2.94% 2.60% 0.79%
PILLAR III
Nominal return 0.23% 8.81% 1.37% 2.72% 2.25% 4.34% 2.87% 3.42% 2.53% Real return 0.80% 7.96% 0.86% 1.14% 1.83% 3.35% 2.00% 2.10% 0.32%
Both Pillars
Nominal return 0.67% 0.67% 1.66% 1.66% 2.62% 2.62% 3.23% 3.23% 2.49% Real return 1.24% 1.24% 1.15% 1.15% 2.20% 2.20% 2.36% 2.36% 0.52%
Source: Tables ES19 and ES20
Investment strategies
Returns discussed in the previous section are indeed varied. Their diversity, of course, is rooted in
a couple of basic factors: (i) the assets in which retirement funds are invested in and (ii) the
strategies managers deploy, given the portfolio, in order to get a high return for their customers.
In general, few facts can be established concerning the data described above:
• For the 2000-2019 period, overall nominal (after charges) returns for Pillars II and III pension funds combined have been 2.49% and real returns have been 0.52%, nominal and real respectively, that is, a 197-basis points difference given to inflation.
• In the last decade (2011-2020), for Pillar II pension funds, with gross nominal returns of 3.94% (simple average), net nominal returns of 3.70% and net real returns of 2.67%, barely 23 basis points of assets under management have been given to managers and depositaries every year and 112 basis points per year have been given to inflation.
• However, for Pillar III pension funds, in the same period, with (unweighted, simple average) gross real returns of 3.97%, net returns of 2.55% and real returns of 1.51%, a much higher 143 basis points have been given to management and depositary costs and also 112 basis points to inflation. So that charges have been 120 basis points larger for Pillar III vehicles than for Pillar II ones.
• In Spain, up to six different regular portfolios are managed in the pensions industry, ranging from almost-only debt to almost-only stocks and guaranteed funds (that may contain both bonds and stock in varied proportions). Nominal returns for these broad categories, for the 2000-2020 period (annual, cumulative) have been 1.45%, 1.82% and 0.86% for, respectively, short-term, long-term and mixed debt vehicles and 1.06%%, 1.52% and 3.21% for, respectively, mixed stocks, almost-only stocks and guaranteed funds.
As a clue for the reasons behind the widely varied results just discussed, several ones are rather
standard irrespective of managers’ capacity to beat the most popular categories. Long-term debt
yields more than short-term debt, debt is less volatile than stocks and thus less risky and managers’
fees are far smaller for Pillar II vehicles than for Pillar III ones. The superior returns of guaranteed
449 | P a g e
Lon
g-Te
rm a
nd
Pen
sio
n S
avin
gs |
Th
e R
eal R
etu
rn |
20
21
Edit
ion
funds however defy common sense as these should bear some extra cost due to the guaranty over
the principal they embody.
So, to what extent managers have been responsible for the rather mild results that pension funds
have obtained in Spain since 2000? To answer this question, one should go fund by fund and
manager by manager, which is not the purpose of this chapter254, but few general comments can
be made. Guaranteed funds, that accounted for 9.53% of Pillar III total assets in 2029 (19,47% in
2010) have been much more profitable for participants than the rest, while assumedly they are
more expensive to run due to the insurance coverage they embody. On the other hand, Pillar III
vehicles are considerably more charged by management fees than their Pillar II counterparts.
Managers in Spain may be restricted by the rigid asset structure in the established portfolios within
Pillar III while being rather freer in what concerns Pillar II vehicles (albeit they may eventually be
the same). But the fact is that gross (before charges) returns in these two broad categories differ
by a mere 3 basis points in favour of the former since 2010. The large difference in (net) returns
(115 bp, same period) being thus entirely attributable to managing fees, much lower within Pillar II
than within Pillar III.
All categories or retirement vehicles in Spain invest rather shyly in foreign assets with only few funds
specialising in these assets’ class. Superior returns in foreign assets however are by no means
assured and this investment strategy has extra costs anyway.
Guaranteed funds’ managers, finally, which are considerably freer than their non-guaranteed
counterparts (being also the same managers eventually) and, besides, do not have to face internal
control bodies like their Pillar II counterparts, seem to have profited from these conditions to obtain
larger returns for their vehicles’ participants.
Conclusion
Spanish retirement assets, through standard Pension Plans are a mere 9.3% of GDP. Insurance
retirement (and retirement-like) assets and provisions, a large array of different products not
equally qualified as retirement vehicles, could add another 15.24% GDP points to standard Pension
Plans. This, by all standards, is a small pensions industry even if some 9.5 million individuals
participate in Pension Plans and some 15.5 million individuals are covered by insurance retirement
or quasi-retirement vehicles. Assets, technical provisions or other retirement rights barely reach
€10,000 per contract or account making the whole system an insufficient complement, let alone an
alternative, to Social Security retirement benefits. Unfortunately, this state of affairs is common to
many other European countries.
The retirement vehicles market in Spain, however, has a rich structure of agents, products and
retirement schemes that, on paper, should be able to cover the entire work force and beyond. Two
254 See Fernández y Fernández-Acín (2019). https://papers.ssrn.com/sol3/papers.cfm?abstract_id=3319461
450 | P a g e
Lon
g-Te
rm a
nd
Pen
sio
n S
avin
gs |
Th
e R
eal R
etu
rn |
20
21
Edit
ion
tightly related factors prevent this to happen: the pervasive presence of Social Security pensions,
whose old-age variety replaces lost labour income at retirement by around 80% and the reluctancy
of employers to sponsor retirement schemes for their employees because of costs reasons,
particularly among SMEs.
This Spanish pension report, apart general descriptions of the landscape, has gone with a certain
detail through some of the most salient features of our Pillars II and III arrangements on, basically,
three crucial dimensions: (i) charges, (ii) taxes and (iii) returns.
On charges, we find that these are rather large on average, only because the Individual schemes
are considerably costlier to manage than occupational ones. The latter keep their charges very low
in line with what is observed in other more advanced and developed markets. Actually, thanks to
intense regulatory effort in the last few years, charges to the Pillar III schemes have decreased
clearly. A continuation of this trend, without a significant increase in market size, continues to look
far less affordable.
On taxation, Spain has an EET, tax-deferral regime for retirement assets and incomes, which is the
standard in most countries in the world. Spain also has deductibility of contributions to retirement
vehicles (up to certain limits), an even more followed standard in most countries in the world. This
is the right way to avoid unacceptable double taxation. No tax expert would have any doubt about
the importance of keeping not only the current deductibility of contributions but also tax deferral.
Tax deferral empowers the accumulation of pension rights and may also turn to be a good business
for tax authorities in the longer run.
This means that the above-mentioned tax treatment of pensions (deductibility cum deferral) should
not be seen as gifts or favours, but as the best policy that can be performed. Some ceilings to tax
deductibility may be too low or even arbitrary. Less understandable is still the push among political
and social agents to dismantle deferral and/or deductibility. The latter would be even worse.
This said, tax deferral in Spain is seen by most agents participating in the retirement market, be
they workers, insured persons or even managers and retailers, as the only reason to buy/sell these
products. A cultural trait that may explain, jointly with other reasons discussed in this report, the
poor development of Pillars II and III in our country.
On returns, it has to be admitted that performance to date has been barely enough to just beat
inflation. A result that many will find poor. Nominal gross returns for more than two thirds of
participants are loaded with heavy charges, as mentioned before, but before charges returns are
not that terrible. Again, it is taxes that come in to help many participants to reach the conclusion
that it is still worth putting their money into this vehicle, despite the illiquid nature of most of these
schemes. Participants’ revanche, however, takes the form of a strategic game in which they allocate
just enough money every year to these investments as to exhaust the fiscal margin, no more. And
this just for some of them, as the rest of participants cannot perhaps afford to put more money
into their complementary pension pots and/or, perhaps, they think that Social Security will always

451 | P a g e
Lon
g-Te
rm a
nd
Pen
sio
n S
avin
gs |
Th
e R
eal R
etu
rn |
20
21
Edit
ion
be there to give them back retirement benefits with a much higher implicit rate of return (on their
contributions) free of management fees and inflation linked.
452 | P a g e
Lon
g-Te
rm a
nd
Pen
sio
n S
avin
gs |
Th
e R
eal R
etu
rn |
20
21
Edit
ion
Pension Savings: The Real Return 2021 Edition
Country Case: Sweden
Swedish summary
Det svenska pensionssytemet består till stor del av avgiftsbestämda/fonderade pensioner. Totalt
förvaltas över 6900 miljarder SEK (€688 miljarder) i pensionskapital. I det allmänna
pensionssystemet sätts 2.5% av lönen av till den så kallade premiepensionen. I premiepensionen
har förvalsalternativet, AP7 Såfa, haft en genomsnittlig realavkastning på 6.95% sedan 2001,
jämfört med 4.18% för alla andra valbara fonder. Tjänstepensionssystemet domineras av fyra stora
avtal som täcker över 90% av alla arbetstagare. Tjänstepensionerna har till största del gått från att
vara PAYG till fonderade pensionssystem.
Summary
The Swedish pension system contains a great variety of different retirement savings products with
over SEK 6,900 trillion (€688 billion) in assets under management (AuM). There are funded
components in each of the three pillars. In the public pension system, 2.5% of earnings are allocated
to the premium pension, whereas the default fund, AP7 Såfa, has had an average real rate of return
of 6.95% compared to the 4.18% of all other funds over the last 19 years. The second pillar is
dominated by four large agreement-based pension plans, covering more than 90% of the
workforce. These have largely transitioned from a pay-as-you-go (PAYG) system to a funded system.
Introduction
The Swedish pension system is divided into three pillars:
• Pillar 1 - The national pension
• Pillar 2 - Occupational pension plans
• Pillar 3 - Private pension
The Swedish pension system is a combination of mandatory and voluntary components. Table 1
shows how the pension capital is distributed between the different types of providers in the pension
system. In 2019, the total pension capital was estimated at SEK 6,900 billion (€688 billion), which
corresponds to fourteen times the size of outgoing pension payments. A share of 46% of the capital
is accounted for by the occupational pension system. The fully funded component in the public
pension system, the premium pension, accounts for 49% of the pension capital in the first pillar. The
remaining 51% is managed by the buffer funds (see next section).
453 | P a g e
Lon
g-Te
rm a
nd
Pen
sio
n S
avin
gs |
Th
e R
eal R
etu
rn |
20
21
Edit
ion
Introductory table: Pension system in Sweden
Pillar I Pillar II Pillar III
State pension Occupational pension Voluntary pension
Mandatory Mandatory* Voluntary
PAYG/funded Funded Funded
DC/NDC DC/DB** DC
Flexible retirement age 62-68 ERA of 55 or 61, paid out at 65 or 67 Tax rebate abolished in 2016***
No earnings test Normally a restriction on working hours
Quick facts Number of old-age pensioners: 2,3 million Coverage: >90%
Share contributing (2015): 24,2%
Coverage (active population): Universal
Pension plans: 4 major (agreement-based) Funds: >30
Average monthly pension: 1797 EUR Average monthly pension: 487 EUR
Average monthly pension: 95 EUR
Average monthly salary (gross, age 60-64): 3,100 EUR
AuM: 688 billions EUR (see Table SE 1)
Average replacement rate: 58%**** * Occupational pension coverage is organized by the employer ** The defined benefit components are being phased out *** Self-employed and employees without occupational pension still eligible **** OECD estimate 54%
Summary returns table. Sweden nominal returns in 1st and 2nd pillar
Public pension Occupational pension*
AP7 Såfa Other funds ITP1 SAF-LO PA-16 AKAP-KL
2020 4.4 8 7.28 7.833 5.5375 7.729
2019 32.2 27.6 22.1 24.6 25.3 25.0
2018 -2.7 -3.8 -0.2 -1.97 -3.2 -2.12 * For each occupational pension plan, the return is an unweighted average among the available funds. Source: Tables SE11 and SE14
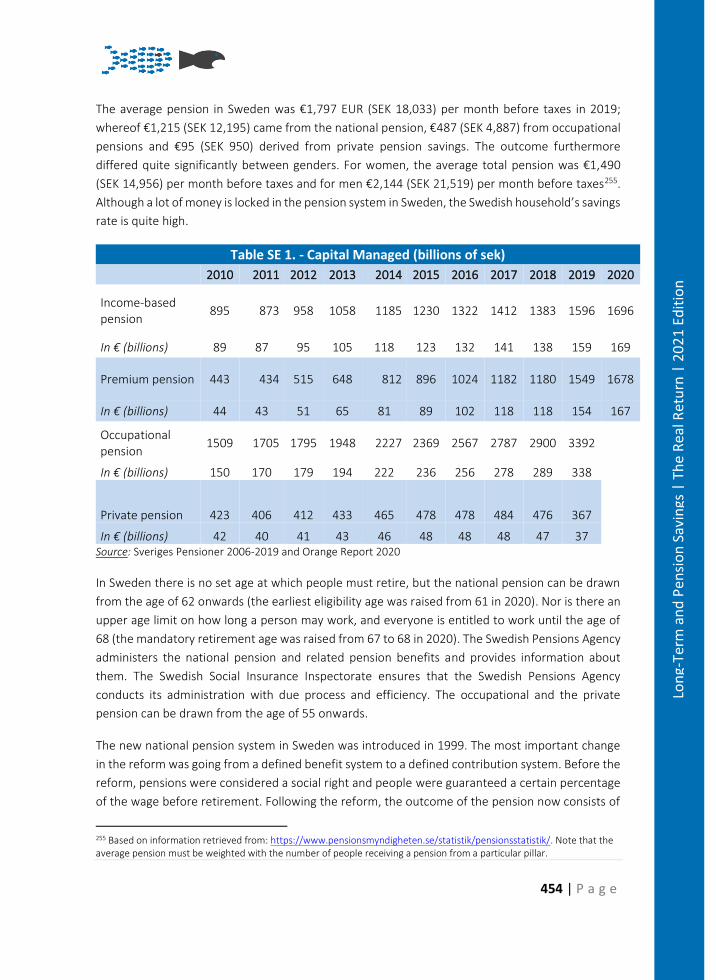
454 | P a g e
Lon
g-Te
rm a
nd
Pen
sio
n S
avin
gs |
Th
e R
eal R
etu
rn |
20
21
Edit
ion
The average pension in Sweden was €1,797 EUR (SEK 18,033) per month before taxes in 2019;
whereof €1,215 (SEK 12,195) came from the national pension, €487 (SEK 4,887) from occupational
pensions and €95 (SEK 950) derived from private pension savings. The outcome furthermore
differed quite significantly between genders. For women, the average total pension was €1,490
(SEK 14,956) per month before taxes and for men €2,144 (SEK 21,519) per month before taxes255.
Although a lot of money is locked in the pension system in Sweden, the Swedish household’s savings
rate is quite high.
Table SE 1. - Capital Managed (billions of sek)
2010 2011 2012 2013 2014 2015 2016 2017 2018 2019 2020
Income-based pension
895 873 958 1058 1185 1230 1322 1412 1383 1596 1696
In € (billions) 89 87 95 105 118 123 132 141 138 159 169
Premium pension 443 434 515 648 812 896 1024 1182 1180 1549 1678
In € (billions) 44 43 51 65 81 89 102 118 118 154 167
Occupational pension
1509 1705 1795 1948 2227 2369 2567 2787 2900 3392
In € (billions) 150 170 179 194 222 236 256 278 289 338
Private pension 423 406 412 433 465 478 478 484 476 367
In € (billions) 42 40 41 43 46 48 48 48 47 37 Source: Sveriges Pensioner 2006-2019 and Orange Report 2020
In Sweden there is no set age at which people must retire, but the national pension can be drawn
from the age of 62 onwards (the earliest eligibility age was raised from 61 in 2020). Nor is there an
upper age limit on how long a person may work, and everyone is entitled to work until the age of
68 (the mandatory retirement age was raised from 67 to 68 in 2020). The Swedish Pensions Agency
administers the national pension and related pension benefits and provides information about
them. The Swedish Social Insurance Inspectorate ensures that the Swedish Pensions Agency
conducts its administration with due process and efficiency. The occupational and the private
pension can be drawn from the age of 55 onwards.
The new national pension system in Sweden was introduced in 1999. The most important change
in the reform was going from a defined benefit system to a defined contribution system. Before the
reform, pensions were considered a social right and people were guaranteed a certain percentage
of the wage before retirement. Following the reform, the outcome of the pension now consists of
255 Based on information retrieved from: https://www.pensionsmyndigheten.se/statistik/pensionsstatistik/. Note that the average pension must be weighted with the number of people receiving a pension from a particular pillar.
455 | P a g e
Lon
g-Te
rm a
nd
Pen
sio
n S
avin
gs |
Th
e R
eal R
etu
rn |
20
21
Edit
ion
the pension savings accumulated during active employment before retirement. In this system,
pensions depend on economic and financial development, which means that it is not possible to
know in advance how much a retiree’s pension will be. With the new pension system, the need for
information about pensions is even more important. The occupational pension system has
developed in the same direction; most of the occupational pension plans are now defined
contribution systems or hybrids with both defined contribution and defined benefit components.256
Pillar I: The national pension
The national pension consists of an income-based pension, a premium pension and a guarantee
pension. A share of 18.5% of the salary and other taxable benefits up to a maximum level of 7.5
income-base amount257 per year is set aside for the national retirement pension. A share of 16% is
set-aside for the income pension, where the value of the pension follows earnings trends in
Sweden. The income-based pension is financed on a pay-as-you-go (PAYG) basis, which means that
pension contributions paid in are used to pay retirees the same year. The remaining 2.5% of the
salary and other taxable benefits are set-aside for the premium pension, for which the capital is
placed in funds. The individual can either choose what fund or funds to place their savings with or,
if no choice is made, contributions will be made in the default alternative fund. This system is unique
to Sweden and the first individual choices (allocations) were made in 2000. The aim was to achieve
a spread of risk in the pension system by placing a part of the national pension on the capital market,
enhance the return on capital and enable individual choices in the national pension system.258 The
Swedish pensions Agency calculates that by 2030 the premium pension will constitute 20% of the
total pension.
The capital for the income-based system is deposited in five buffer funds: the first, second, third,
fourth and sixth national pension funds. The result of the income-based pension system is affected
by several key economic and demographic factors. In the short-term, the development of
employment is the most important factor, but the effect of the stock and bond markets is also of
significance, particularly in case of major changes. In the long-term, demographic factors are most
relevant.
Accumulated pension rights and current benefits in the income-based system grow with the
increase in the level of earnings per capita. If the rate of growth of one salary would be slower than
that of the average salary, for instance as a result of a fall in the size of the work force, total benefits
would grow faster than the contributions financing them, which could induce financial instability. If
the ratio of assets to liabilities in the income-based system falls below a certain threshold, the
automatic balancing mechanism is activated and abandons the indexation by the level of average
salaries. In 2020, the parliament approved a new pension supplement in the national pension. The
supplement will be paid out to pensioners with an income-based national pension of SEK 9,000 –
256 See Hagen (2017) for a more detailed description of the Swedish Pension System 257 49,000 EUR (519,400 SEK) for 2019. 258 Vägval för premiepensionen, Ds 2013:35
456 | P a g e
Lon
g-Te
rm a
nd
Pen
sio
n S
avin
gs |
Th
e R
eal R
etu
rn |
20
21
Edit
ion
17,000 (€896 – €1695) and amounts to maximum SEK 600 per month. The purpose of the
supplement is to increase the living standard for low-income workers during retirement. The
supplement has been criticized for deviating from the so-called life-income principle and the fact
that it is financed from the state budget (as opposed to the income pension which is financed from
pension fees).
The third element of the national pension is the guarantee pension. It is a pension for those who
have had little or no income from employment in their life. It is linked to the price base amount
calculated annually by Statistics Sweden. The size of the guarantee pension depends on how long a
person has lived in Sweden. Residents of Sweden qualify for a guaranteed pension from the age of
65. To receive a full guaranteed pension, an individual must in principle have resided in Sweden for
40 years after the age of 25. Residence in another EU/EEA country is also credited toward a
guaranteed pension. In addition to the national pension, pensioners with low pensions may be
entitled to a housing supplement and maintenance support.
There is agreement in the Swedish Parliament to raise the different statutory retirement ages in
the public pension system (Pillar I). First, the earliest eligibility age was raised from 61 to 62 in 2020,
to 63 in 2023 and to 64 in 2026. Second, the eligibility age for the minimum guarantee will be raised
from 65 to 66 in 2023 and is then expected to increase to 67 in 2026. Those who have worked for
44 years or longer will be exempt from these changes. Third, the mandatory retirement age was
raised from 67 to 68 in 2020, and then to 69 in 2023. There is also a plan to index these retirement
ages to a so-called “target age”. The target age will be based on remaining life expectancy, although
the details are yet to be laid out.
For administering the income-based pension system, a fee is deducted annually from pension
balances by multiplying these balances by an administrative cost factor. In 2020, the fee amounted
to 0.03%259. The deduction is made only until the insured begins to withdraw a pension. At the
current level of cost, the deduction will decrease the income-based pension by approximately 1%
compared to what it would have been without the deduction.
The premium pension system is a funded system for which the pension savers themselves choose
the funds in which to invest their premium pension savings. The premium pension can be
withdrawn, in whole or in part, from the age of 62. The pension is paid out from selling off the
accumulated capital. The individual choice in the premium pension system furthermore results in a
spread on return on the pension capital depending on the choice of fund or funds. Table SE2 shows
the allocation of assets in the premium pension.
259 The Swedish Pensions Agency, Orange report 2020
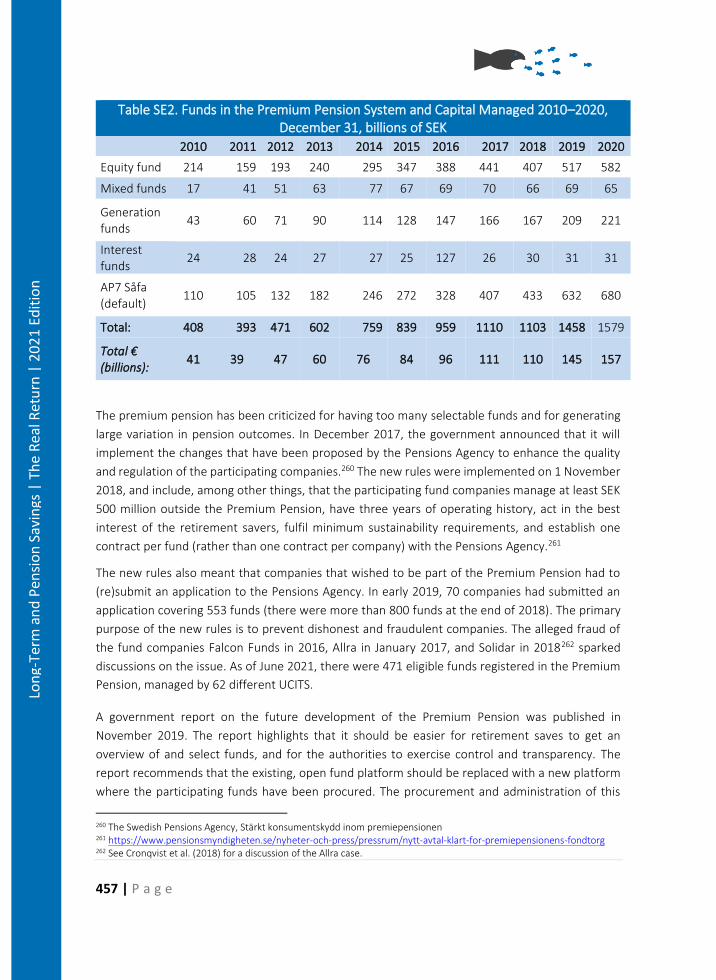
457 | P a g e
Lon
g-Te
rm a
nd
Pen
sio
n S
avin
gs |
Th
e R
eal R
etu
rn |
20
21
Edit
ion
Table SE2. Funds in the Premium Pension System and Capital Managed 2010–2020, December 31, billions of SEK
2010 2011 2012 2013 2014 2015 2016 2017 2018 2019 2020
Equity fund 214 159 193 240 295 347 388 441 407 517 582
Mixed funds 17 41 51 63 77 67 69 70 66 69 65
Generation funds
43 60 71 90 114 128 147 166 167 209 221
Interest funds
24 28 24 27 27 25 127 26 30 31 31
AP7 Safa (default)
110 105 132 182 246 272 328 407 433 632 680
Total: 408 393 471 602 759 839 959 1110 1103 1458 1579
Total € (billions):
41 39 47 60 76 84 96 111 110 145 157
The premium pension has been criticized for having too many selectable funds and for generating
large variation in pension outcomes. In December 2017, the government announced that it will
implement the changes that have been proposed by the Pensions Agency to enhance the quality
and regulation of the participating companies.260 The new rules were implemented on 1 November
2018, and include, among other things, that the participating fund companies manage at least SEK
500 million outside the Premium Pension, have three years of operating history, act in the best
interest of the retirement savers, fulfil minimum sustainability requirements, and establish one
contract per fund (rather than one contract per company) with the Pensions Agency.261
The new rules also meant that companies that wished to be part of the Premium Pension had to
(re)submit an application to the Pensions Agency. In early 2019, 70 companies had submitted an
application covering 553 funds (there were more than 800 funds at the end of 2018). The primary
purpose of the new rules is to prevent dishonest and fraudulent companies. The alleged fraud of
the fund companies Falcon Funds in 2016, Allra in January 2017, and Solidar in 2018262 sparked
discussions on the issue. As of June 2021, there were 471 eligible funds registered in the Premium
Pension, managed by 62 different UCITS.
A government report on the future development of the Premium Pension was published in
November 2019. The report highlights that it should be easier for retirement saves to get an
overview of and select funds, and for the authorities to exercise control and transparency. The
report recommends that the existing, open fund platform should be replaced with a new platform
where the participating funds have been procured. The procurement and administration of this
260 The Swedish Pensions Agency, Stärkt konsumentskydd inom premiepensionen 261 https://www.pensionsmyndigheten.se/nyheter-och-press/pressrum/nytt-avtal-klart-for-premiepensionens-fondtorg 262 See Cronqvist et al. (2018) for a discussion of the Allra case.
458 | P a g e
Lon
g-Te
rm a
nd
Pen
sio
n S
avin
gs |
Th
e R
eal R
etu
rn |
20
21
Edit
ion
platform should be administrated by a new government agency, which also should be responsible
for managing the state-run default fund option, AP7 Såfa. The number of funds is expected to fall
considerably as a result of these changes and the new structure should be in place at the end of
2023.263 Some actors, including the Swedish Investment Fund Association, argue that the proposed
changes may lead to lower pensions, decrease competition among fund providers an limit the
freedom of choice for individual investors.264
Pillar II: Occupational pensions
The occupational pension system in Sweden is mainly driven by collective agreements. A Swedish
company is not required by law to pay a pension to its employees, but an occupational pension plan
is mandatory if there is a collective agreement at the workplace. The occupational pension system
covers over 90% of the workforce. The self-employed are excluded from occupational pension plans
and it is mostly smaller companies in new sectors of business that do not have collective
agreements.265 There are four main collective agreements for the different sectors and each
agreement has its own pension plan. The four collective agreements are: the SAF-LO Collective
Pension (blue-collar workers) with 2.8 million members, the Supplementary Pension Scheme for
Salaried Employees in Industry and Commerce ITP (white collar employees) with 2 million members,
the Collectively Negotiated Local Government Pension Scheme (KAP-KL) with 1 million members
and the Government Sector Collective Agreement on Pensions PA-03/PA-16 with 500,000
members266.
In all four collectively negotiated pension schemes, the employees are allowed to choose a fund
manager for at least part of the pension amount. To ensure that the employees receive an
occupational pension that is as high as possible there is a ‘choice centre’ for each collective pension
plan. The ‘choice centre’s’ task is to contract good managers for the employee’s occupational
pension. The employees can choose between different types of traditional insurance and/or unit-
linked insurance. The size of this individual portion depends on the size of the premiums paid by
the employer in the form of an annual pension provision, the length of the period during which they
are paid, and how the funds are managed. For two of the collective pension schemes, KAP-KL and
SAF-LO, the employees can choose a fund manager for the whole amount. If the individual does not
choose a fund manager, the pension capital will be placed in the default alternative, which in all
four agreements is a traditional insurance procured by the choice centre of the occupational
pension plan.
263 Socialdepartementet, Ett förbättrat premiepensionssystem, SOU 2019:44 264 https://www.fondbolagen.se/aktuellt/pressrum/pressmeddelanden/forslagen-i-utredningen-ett-battre-premiepensionssystem-gar-emot-malen-med-premiepensionen/ 265 AMF, ”Tjänstpensionerna i framtiden – betydelse, omfattning och trender”, p. 17. ISF Rapport 2018:15, ”Vem far avsättningar till tjänstepension”. 266 www.pensionsmyndigheten.se/tjanstepensionen-thml
459 | P a g e
Lon
g-Te
rm a
nd
Pen
sio
n S
avin
gs |
Th
e R
eal R
etu
rn |
20
21
Edit
ion
If there is no collective agreement at the workplace, the company can choose to have an individual
occupational pension plan for their employees. Among the companies that do not have a collective
agreement, some have chosen to have an occupational pension plan, and some do not pay out any
pensions at all to their employees. These individual pension plans can vary in shape and level but
common to them all is that they often have worse provisions and higher costs compared to the
collectively negotiated pension schemes.
In 2017, the Ministry of Finance published a report with several proposals on how to make it easier
and cheaper to move occupational pension capital across pension companies and pension plans.267
Today, the right to move occupational pension is, with some exceptions, limited to pension capital
that has been accumulated after 2007 and that has not started to be paid out. There is typically also
a fee associated with moving the pension capital to another company, especially in the individual
occupational pension plans. Critics argue that this leads to lower competition, lower returns for
retirement savers and lock-in effects. In April 2019, the government published a report that
highlighted the need for lower moving fees in general and a stipulated maximum moving fee (in
SEK).268 The parliament approved the proposals of the government in November 2019 and
recommended the government to pursue the subject further. In March 2020, the Ministry of
Finance proposed that the maximum fee should amount to 0.0127 price base amounts (600
SEK/€59.8 for 2020).269 The new rules were implemented in April 2021.
In December 2016, Sweden transposed the IORP II Directive. The purpose of the new Directive is to
ensure the soundness of occupational pensions and better protect pension scheme members by
means of stricter capital solvency requirements. The new directive also clarifies the legal framework
for actors in the occupational pension business. The new rules have been subject to much
discussion. Critics argue that they distort competition in the occupational pension arena because
not all companies would be affected. The new rules only apply to pension companies that only
provide occupational pension insurance, as opposed to pension companies that also provide other
insurance services. The government supplemented the EU Directive with new national legislation
in November 2019.270
267 Konkurrensverket, Flyttavgifter på livförsäkringsmarknaden – potentiella inlåsningseffekter bland pensionsförsäkringar, Rapport 2016:12. 268 Ministry of Finance, “En effektivare flytträtt av försäkringssparande” 269 Ministry of Finance, “Avgifter vid aterköp och flytt av fond- och depaförsäkringar.” 270 Finansutskottets betänkande, “En ny reglering för tjänstepensionsföretag”. See https://www.fi.se/sv/forsakring/iorp2/ for more information on IORP II.
460 | P a g e
Lon
g-Te
rm a
nd
Pen
sio
n S
avin
gs |
Th
e R
eal R
etu
rn |
20
21
Edit
ion
Pillar III: Private pensions
Private pension saving is voluntary, but it is subsidized via tax deductions. In 2014, 34.5% of those
aged 20 to 64 made contributions to a private pension account.271 The tax deduction for private
pension savings is only profitable for high-income earners.
Private pension savings can be placed in an individual pension savings account (IPS) or in private
pension insurance. Money placed in an IPS and in private pension insurance is locked until the age
of 55. After that the individual can choose over how many years the pension should be paid out.
The minimum pay-out is 5 years in both IPS and private pension insurance. However, only money
in private pension insurance can be paid out for life (annuity).
Unlike the national pension plan and the occupational pension plans, private pension plans are
individual. This results in less transparency both when it comes to offered products within the
private pension plans and the charges on these products.
The deduction for private pension savings has been reduced over the years. From 1 January 2015
it was reduced from €1,195 to €179 (SEK12,000 to SEK 1,800) per year, equivalent to €15 (SEK 150)
in monthly savings. On 1 January 2016 the deduction was abolished. The motive for this is that the
deduction favours high-income earners. In 2015, the share of private pension savers dropped to
24.2 %. Those who still contribute to private pension accounts are thus subject to double taxation.
Several actors in the pension industry advocate the need for new incentives for people to save
privately for retirement. One suggestion is that the government match private contributions,
similar to what is already in place in Germany,272 matching benefits, in particular, for low- and
medium-income earners as opposed to tax subsidies which tend to favour the rich. The problem is
of course that the government has to bear the costs of matching in the future when the contributors
retire. In addition, the redistributional outcome of government-subsidized savings may be different
than the intended if low- and medium-income earners are less likely to contribute. The effect on
total savings may also be limited if there are substitution effects across different saving forms.
ISK
With the abolishment of tax-deductible pension accounts, retirement savers need to find new ways
to save for retirement that are not directly related to the pension. The most popular savings vehicle
today is called “Investeringssparkontot” (Investment and savings account - ISK) and was introduced
in January 2012. The purpose of the new account is to make it easier to trade in financial
instruments. Unlike an ordinary securities account, there is no capital gains tax on the transactions.
271 http://www.statistikdatabasen.scb.se/ 272 OECD Pension Outlook 2018.
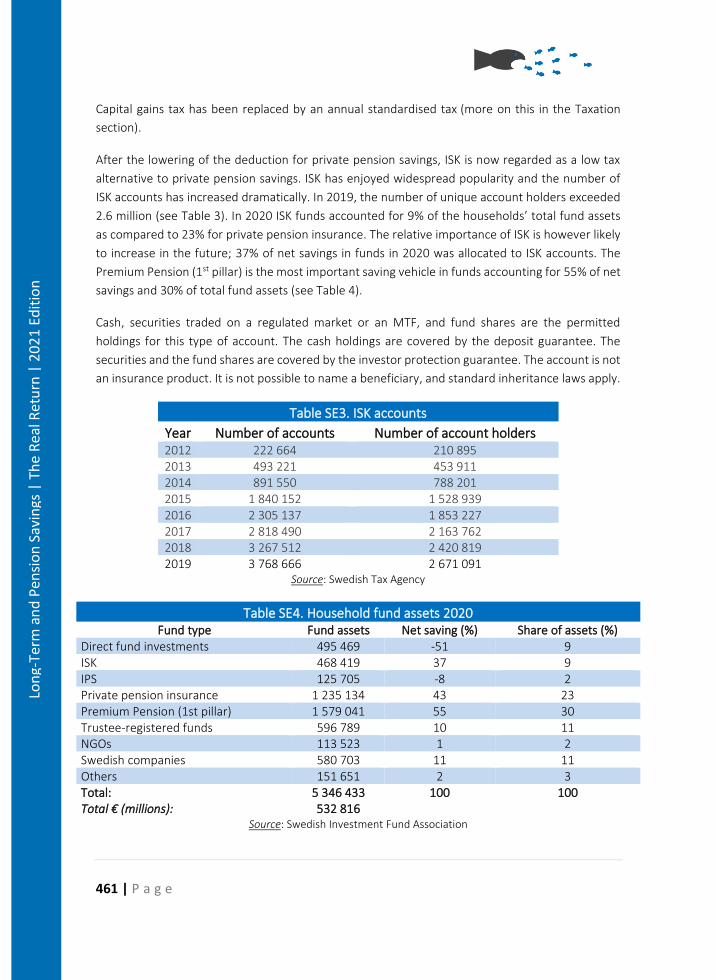
461 | P a g e
Lon
g-Te
rm a
nd
Pen
sio
n S
avin
gs |
Th
e R
eal R
etu
rn |
20
21
Edit
ion
Capital gains tax has been replaced by an annual standardised tax (more on this in the Taxation
section).
After the lowering of the deduction for private pension savings, ISK is now regarded as a low tax
alternative to private pension savings. ISK has enjoyed widespread popularity and the number of
ISK accounts has increased dramatically. In 2019, the number of unique account holders exceeded
2.6 million (see Table 3). In 2020 ISK funds accounted for 9% of the households’ total fund assets
as compared to 23% for private pension insurance. The relative importance of ISK is however likely
to increase in the future; 37% of net savings in funds in 2020 was allocated to ISK accounts. The
Premium Pension (1st pillar) is the most important saving vehicle in funds accounting for 55% of net
savings and 30% of total fund assets (see Table 4).
Cash, securities traded on a regulated market or an MTF, and fund shares are the permitted
holdings for this type of account. The cash holdings are covered by the deposit guarantee. The
securities and the fund shares are covered by the investor protection guarantee. The account is not
an insurance product. It is not possible to name a beneficiary, and standard inheritance laws apply.
Table SE3. ISK accounts
Year Number of accounts Number of account holders 2012 222 664 210 895 2013 493 221 453 911 2014 891 550 788 201 2015 1 840 152 1 528 939 2016 2 305 137 1 853 227 2017 2 818 490 2 163 762 2018 3 267 512 2 420 819 2019 3 768 666 2 671 091
Source: Swedish Tax Agency
Table SE4. Household fund assets 2020 Fund type Fund assets Net saving (%) Share of assets (%)
Direct fund investments 495 469 -51 9 ISK 468 419 37 9 IPS 125 705 -8 2 Private pension insurance 1 235 134 43 23 Premium Pension (1st pillar) 1 579 041 55 30 Trustee-registered funds 596 789 10 11 NGOs 113 523 1 2 Swedish companies 580 703 11 11 Others 151 651 2 3 Total: 5 346 433 100 100 Total € (millions): 532 816
Source: Swedish Investment Fund Association
462 | P a g e
Lon
g-Te
rm a
nd
Pen
sio
n S
avin
gs |
Th
e R
eal R
etu
rn |
20
21
Edit
ion
Pension vehicles
Occupational pension plans
ITP
The ITP agreement consists of two parts: defined contribution pension ITP 1 and defined benefit
pension ITP 2. Employees born in 1979 or later are covered by the defined contribution pension ITP
1. In ITP 1 the employer makes contributions of 4.5 percent of the salary per year, up to a maximum
of 7.5 income base amounts. If the salary exceeds this level, the amount of the contribution is also
30% of the salary above 7.5-income base amount. There is also an additional contribution that the
employer organizations can choose to include, the so-called partial pension contribution. This
contribution currently varies between 0.2%-1.5%.
Half of the ITP 1 pension must be invested in traditional pension insurance, but the individual can
choose how to invest the remaining half. It can be placed in traditional insurance and/or unit-linked
insurance. The premiums of those who do not specify a choice are invested in traditional pension
insurance with Alecta. The eligible insurance companies for traditional insurance are Alecta, AMF,
Folksam, Skandia and SEB and for unit-linked insurance they are Futur Pension (previously Danica
pension), SPP, Handelsbanken, Movestic and Swedbank.
SAF-LO
The SAF-LO occupational pension plan is a defined contribution plan by definition. The terms of the
plan were improved in 2007, mostly in response to perceived unfairness in the terms of the pension
provisions for blue-collar and white-collar workers. Like for ITP 1 the employer now makes
contributions of 4.5 percent of the salary, up to a maximum of 7,5 income base amounts. If the
salary exceeds this level, the amount of the contribution is also 30 percent. SAF-LO also contains a
partial pension contribution that the employer can choose to add. The additional contribution is
currently ranging between 0.7. and 1.7 percent.
The individual can choose how to invest the pension capital and it can be placed in traditional
insurance and/or unit-linked insurance. The eligible insurance companies for traditional insurance
are Alecta, AMF, Folksam and SEB and for unit-linked insurance they are AMF, Futur Pension,
Folksam, Handelsbanken, Länsförsäkringar, Movestic, Nordea, SEB, SPP and Swedbank.
PA 03
The pension plan for central government employees, PA 16 – Avd II (formerly PA 03), is a hybrid of
defined contribution and defined benefit. The defined contribution component in PA 03 consists of
two parts: individual old age pension and supplementary old age pension. The total premium
amounts to 4.5% of the pensionable income up to a ceiling of 30 income base amounts. Of the total
premium, 2.5% and 2% is allocated to the individual pension and the supplementary pension
463 | P a g e
Lon
g-Te
rm a
nd
Pen
sio
n S
avin
gs |
Th
e R
eal R
etu
rn |
20
21
Edit
ion
respectively. The individual can choose how the contribution of the individual retirement pension
should be placed and managed. Contributions to the supplementary pension cannot be invested by
the employee and are instead automatically invested in a traditional low-risk pension insurance
fund.
The defined-benefit pension applies to those who earn more than 7.5 income base amounts. If the
individual earns between 7.5 and 20 income-base amounts, the defined-benefit pension comprises
60% of the pensionable salary on the component of pay that exceeds 7.5 income base amounts. If
the individual earns between 20 and 30 income-base amounts, the defined-benefit pension
comprises 30% of the pensionable salary on the component of pay that exceeds 20 income base
amounts. There is also a defined benefit pension on income less than 7.5 income base amounts in
accordance with transitional provisions due to the implementation of PA 16 – Avd I (below).
In 2016, a new pension plan, PA 16 – Avd I, for central government employees was implemented.
PA 16 covers those born in 1988 or later. Just like PA 16 – Avd II, PA 16 – Avd I has two defined
contribution components. The individual pension (2.5 % of income up to 7.5 income base amounts)
can be invested by the employee, whereas the supplementary pension (2% of income up to 7.5
income base amounts) is invested in a low-risk pension insurance fund. The contribution for
earnings above the ceiling amounts to 20% and 10%, respectively. PA 16 also contains a mandatory
partial pension contribution amounting to 1.5%. These contributions are invested in a low-risk
pension insurance fund.
The eligible insurance companies providing individual retirement pension in the shape of traditional
insurance are Alecta, AMF, Kåpan, and as unit-linked insurance they are AMF, Futur Pension,
Handelsbanken, Länsförsäkringar, SEB and Swedbank.
KAP-KL
The KAP-KL agreement consists of two parts: the defined contribution pension AKAP-KL and defined
benefit pension KAP-KL. Employees born in 1986 or later are covered by the defined contribution
pension AKAP-KL. In AKAP-KL, the employer pays in an amount of 4.5% of the salary towards the
occupational pension. If the salary exceeds 7.5 income base amounts, the amount is increasing with
30% of the salary that exceeds 7.5 income base amounts up to a maximum of 30 income base
amounts. Employees covered by KAP-KL get 4.5% of the salary contributed to their occupational
pension. For a salary over 30 income base amounts, no premium is paid. Instead, there is a defined
benefit old age pension that guarantees a pension equivalent to a certain percentage of the final
salary at the age of retirement.
The individual can choose how to invest the pension capital and it can be placed in traditional
insurance and/or unit-linked insurance. The eligible insurance companies for traditional insurance
in AKAP-KL are Alecta, AMF, KPA and Skandia and for the unit-linked insurance in AKAP-KL they are
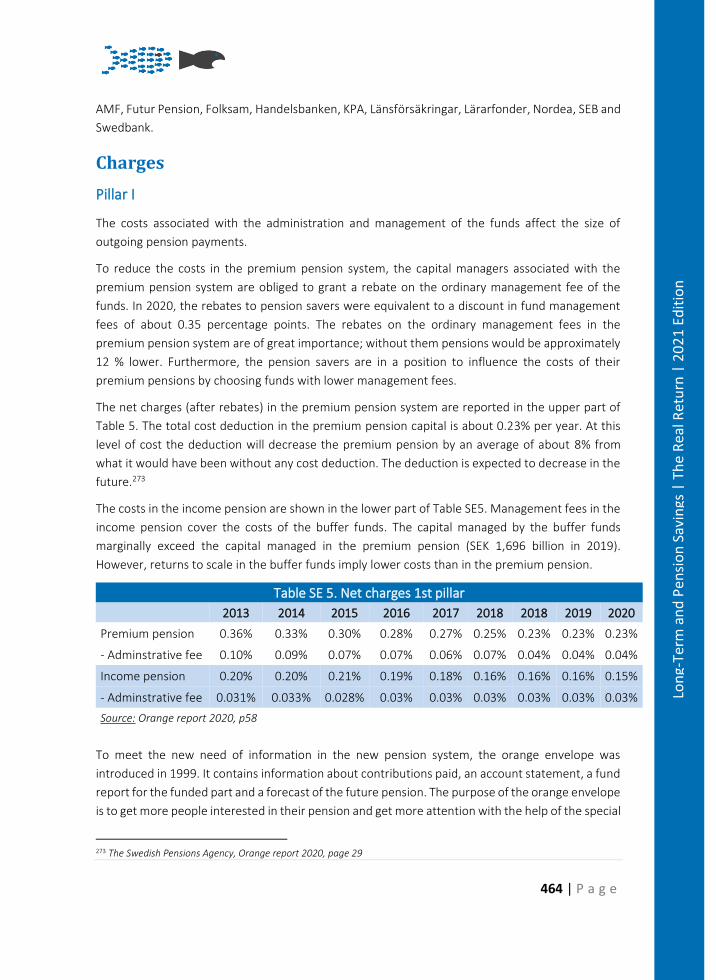
464 | P a g e
Lon
g-Te
rm a
nd
Pen
sio
n S
avin
gs |
Th
e R
eal R
etu
rn |
20
21
Edit
ion
AMF, Futur Pension, Folksam, Handelsbanken, KPA, Länsförsäkringar, Lärarfonder, Nordea, SEB and
Swedbank.
Charges
Pillar I
The costs associated with the administration and management of the funds affect the size of
outgoing pension payments.
To reduce the costs in the premium pension system, the capital managers associated with the
premium pension system are obliged to grant a rebate on the ordinary management fee of the
funds. In 2020, the rebates to pension savers were equivalent to a discount in fund management
fees of about 0.35 percentage points. The rebates on the ordinary management fees in the
premium pension system are of great importance; without them pensions would be approximately
12 % lower. Furthermore, the pension savers are in a position to influence the costs of their
premium pensions by choosing funds with lower management fees.
The net charges (after rebates) in the premium pension system are reported in the upper part of
Table 5. The total cost deduction in the premium pension capital is about 0.23% per year. At this
level of cost the deduction will decrease the premium pension by an average of about 8% from
what it would have been without any cost deduction. The deduction is expected to decrease in the
future.273
The costs in the income pension are shown in the lower part of Table SE5. Management fees in the
income pension cover the costs of the buffer funds. The capital managed by the buffer funds
marginally exceed the capital managed in the premium pension (SEK 1,696 billion in 2019).
However, returns to scale in the buffer funds imply lower costs than in the premium pension.
Table SE 5. Net charges 1st pillar
2013 2014 2015 2016 2017 2018 2018 2019 2020
Premium pension 0.36% 0.33% 0.30% 0.28% 0.27% 0.25% 0.23% 0.23% 0.23%
- Adminstrative fee 0.10% 0.09% 0.07% 0.07% 0.06% 0.07% 0.04% 0.04% 0.04%
Income pension 0.20% 0.20% 0.21% 0.19% 0.18% 0.16% 0.16% 0.16% 0.15%
- Adminstrative fee 0.031% 0.033% 0.028% 0.03% 0.03% 0.03% 0.03% 0.03% 0.03%
Source: Orange report 2020, p58
To meet the new need of information in the new pension system, the orange envelope was
introduced in 1999. It contains information about contributions paid, an account statement, a fund
report for the funded part and a forecast of the future pension. The purpose of the orange envelope
is to get more people interested in their pension and get more attention with the help of the special
273 The Swedish Pensions Agency, Orange report 2020, page 29
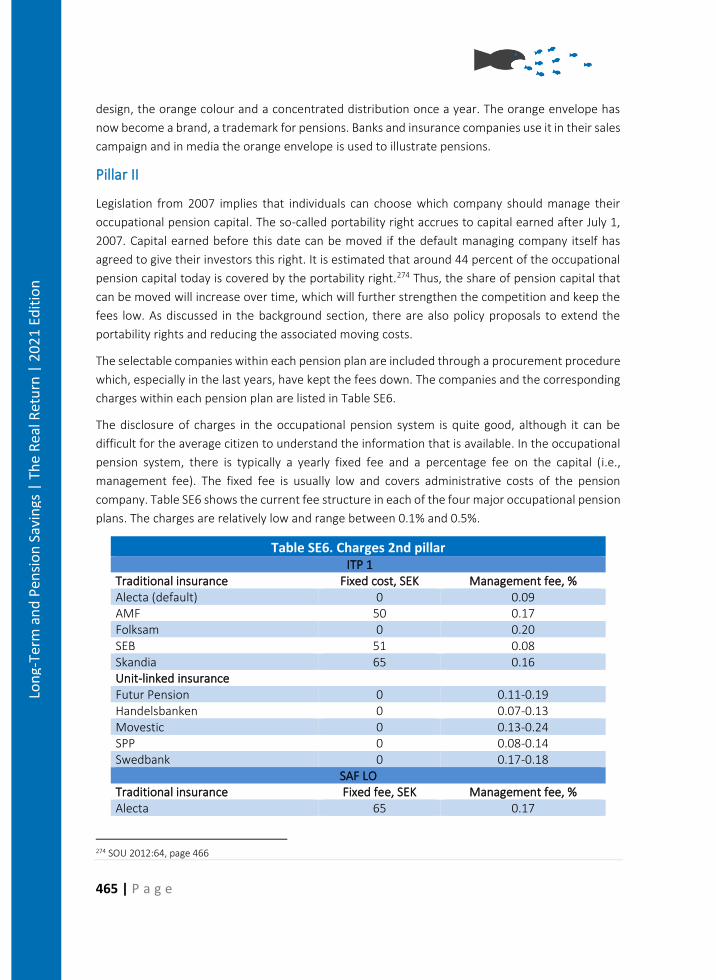
465 | P a g e
Lon
g-Te
rm a
nd
Pen
sio
n S
avin
gs |
Th
e R
eal R
etu
rn |
20
21
Edit
ion
design, the orange colour and a concentrated distribution once a year. The orange envelope has
now become a brand, a trademark for pensions. Banks and insurance companies use it in their sales
campaign and in media the orange envelope is used to illustrate pensions.
Pillar II
Legislation from 2007 implies that individuals can choose which company should manage their
occupational pension capital. The so-called portability right accrues to capital earned after July 1,
2007. Capital earned before this date can be moved if the default managing company itself has
agreed to give their investors this right. It is estimated that around 44 percent of the occupational
pension capital today is covered by the portability right.274 Thus, the share of pension capital that
can be moved will increase over time, which will further strengthen the competition and keep the
fees low. As discussed in the background section, there are also policy proposals to extend the
portability rights and reducing the associated moving costs.
The selectable companies within each pension plan are included through a procurement procedure
which, especially in the last years, have kept the fees down. The companies and the corresponding
charges within each pension plan are listed in Table SE6.
The disclosure of charges in the occupational pension system is quite good, although it can be
difficult for the average citizen to understand the information that is available. In the occupational
pension system, there is typically a yearly fixed fee and a percentage fee on the capital (i.e.,
management fee). The fixed fee is usually low and covers administrative costs of the pension
company. Table SE6 shows the current fee structure in each of the four major occupational pension
plans. The charges are relatively low and range between 0.1% and 0.5%.
Table SE6. Charges 2nd pillar ITP 1
Traditional insurance Fixed cost, SEK Management fee, % Alecta (default) 0 0.09 AMF 50 0.17 Folksam 0 0.20 SEB 51 0.08 Skandia 65 0.16 Unit-linked insurance Futur Pension 0 0.11-0.19 Handelsbanken 0 0.07-0.13 Movestic 0 0.13-0.24 SPP 0 0.08-0.14 Swedbank 0 0.17-0.18
SAF LO Traditional insurance Fixed fee, SEK Management fee, % Alecta 65 0.17
274 SOU 2012:64, page 466
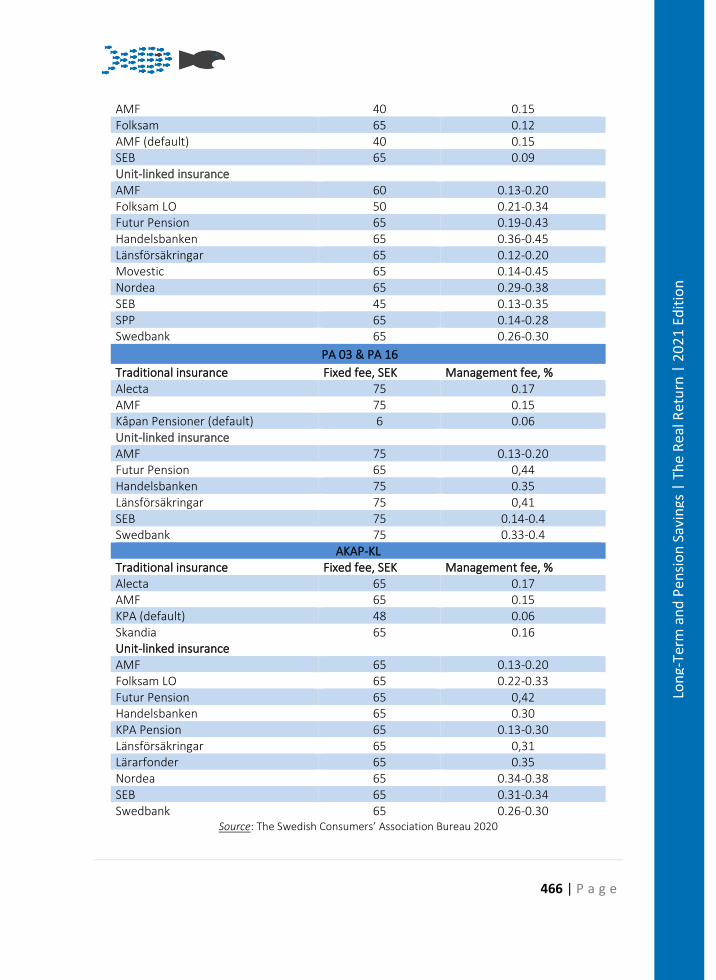
466 | P a g e
Lon
g-Te
rm a
nd
Pen
sio
n S
avin
gs |
Th
e R
eal R
etu
rn |
20
21
Edit
ion
AMF 40 0.15 Folksam 65 0.12 AMF (default) 40 0.15 SEB 65 0.09 Unit-linked insurance AMF 60 0.13-0.20 Folksam LO 50 0.21-0.34 Futur Pension 65 0.19-0.43 Handelsbanken 65 0.36-0.45 Länsförsäkringar 65 0.12-0.20 Movestic 65 0.14-0.45 Nordea 65 0.29-0.38 SEB 45 0.13-0.35 SPP 65 0.14-0.28 Swedbank 65 0.26-0.30
PA 03 & PA 16
Traditional insurance Fixed fee, SEK Management fee, % Alecta 75 0.17 AMF 75 0.15 Kapan Pensioner (default) 6 0.06 Unit-linked insurance AMF 75 0.13-0.20 Futur Pension 65 0,44 Handelsbanken 75 0.35 Länsförsäkringar 75 0,41 SEB 75 0.14-0.4 Swedbank 75 0.33-0.4
AKAP-KL Traditional insurance Fixed fee, SEK Management fee, % Alecta 65 0.17 AMF 65 0.15 KPA (default) 48 0.06 Skandia 65 0.16 Unit-linked insurance AMF 65 0.13-0.20 Folksam LO 65 0.22-0.33 Futur Pension 65 0,42 Handelsbanken 65 0.30 KPA Pension 65 0.13-0.30 Länsförsäkringar 65 0,31 Lärarfonder 65 0.35 Nordea 65 0.34-0.38 SEB 65 0.31-0.34 Swedbank 65 0.26-0.30
Source: The Swedish Consumers’ Association Bureau 2020
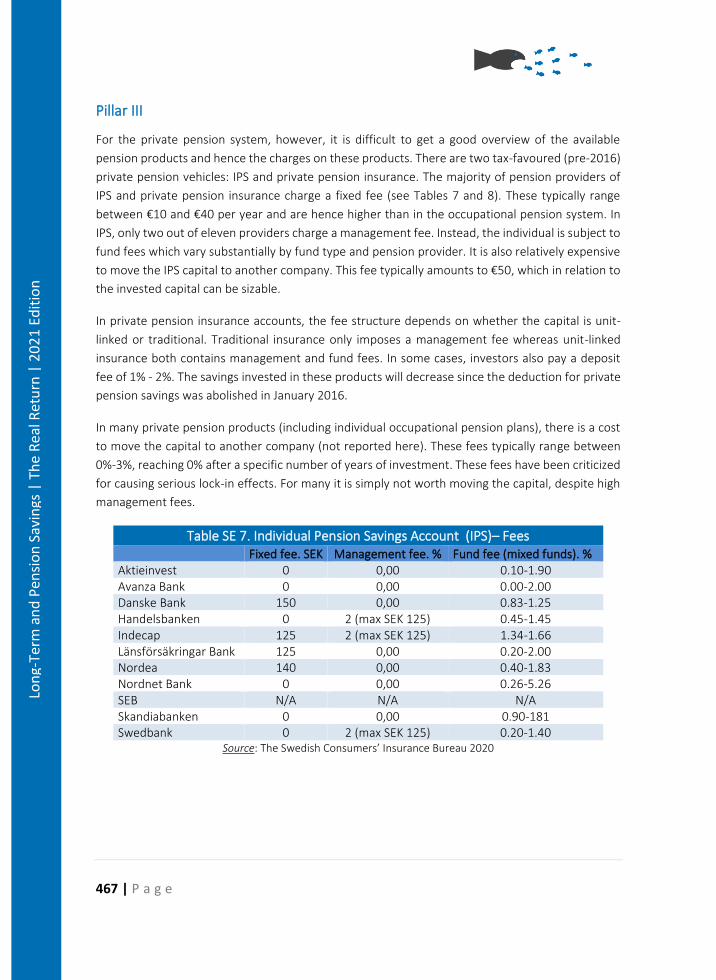
467 | P a g e
Lon
g-Te
rm a
nd
Pen
sio
n S
avin
gs |
Th
e R
eal R
etu
rn |
20
21
Edit
ion
Pillar III
For the private pension system, however, it is difficult to get a good overview of the available
pension products and hence the charges on these products. There are two tax-favoured (pre-2016)
private pension vehicles: IPS and private pension insurance. The majority of pension providers of
IPS and private pension insurance charge a fixed fee (see Tables 7 and 8). These typically range
between €10 and €40 per year and are hence higher than in the occupational pension system. In
IPS, only two out of eleven providers charge a management fee. Instead, the individual is subject to
fund fees which vary substantially by fund type and pension provider. It is also relatively expensive
to move the IPS capital to another company. This fee typically amounts to €50, which in relation to
the invested capital can be sizable.
In private pension insurance accounts, the fee structure depends on whether the capital is unit-
linked or traditional. Traditional insurance only imposes a management fee whereas unit-linked
insurance both contains management and fund fees. In some cases, investors also pay a deposit
fee of 1% - 2%. The savings invested in these products will decrease since the deduction for private
pension savings was abolished in January 2016.
In many private pension products (including individual occupational pension plans), there is a cost
to move the capital to another company (not reported here). These fees typically range between
0%-3%, reaching 0% after a specific number of years of investment. These fees have been criticized
for causing serious lock-in effects. For many it is simply not worth moving the capital, despite high
management fees.
Table SE 7. Individual Pension Savings Account (IPS)– Fees Fixed fee. SEK Management fee. % Fund fee (mixed funds). % Aktieinvest 0 0,00 0.10-1.90 Avanza Bank 0 0,00 0.00-2.00 Danske Bank 150 0,00 0.83-1.25 Handelsbanken 0 2 (max SEK 125) 0.45-1.45 Indecap 125 2 (max SEK 125) 1.34-1.66 Länsförsäkringar Bank 125 0,00 0.20-2.00 Nordea 140 0,00 0.40-1.83 Nordnet Bank 0 0,00 0.26-5.26 SEB N/A N/A N/A Skandiabanken 0 0,00 0.90-181 Swedbank 0 2 (max SEK 125) 0.20-1.40
Source: The Swedish Consumers’ Insurance Bureau 2020
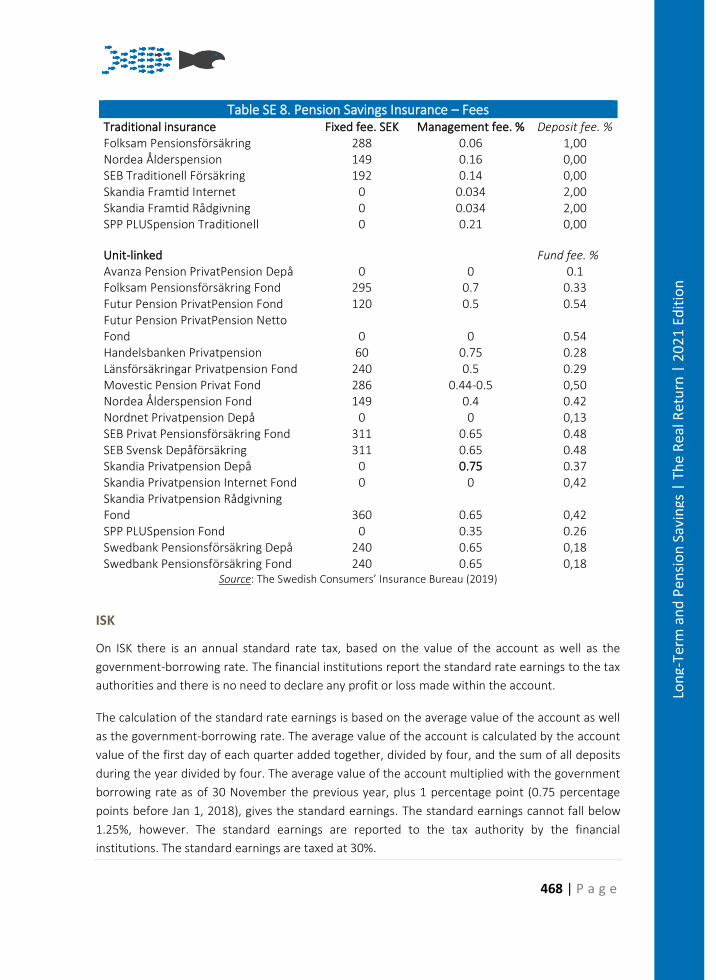
468 | P a g e
Lon
g-Te
rm a
nd
Pen
sio
n S
avin
gs |
Th
e R
eal R
etu
rn |
20
21
Edit
ion
Table SE 8. Pension Savings Insurance – Fees Traditional insurance Fixed fee. SEK Management fee. % Deposit fee. % Folksam Pensionsförsäkring 288 0.06 1,00 Nordea Ålderspension 149 0.16 0,00 SEB Traditionell Försäkring 192 0.14 0,00 Skandia Framtid Internet 0 0.034 2,00 Skandia Framtid Radgivning 0 0.034 2,00 SPP PLUSpension Traditionell 0 0.21 0,00
Unit-linked Fund fee. % Avanza Pension PrivatPension Depa 0 0 0.1 Folksam Pensionsförsäkring Fond 295 0.7 0.33 Futur Pension PrivatPension Fond 120 0.5 0.54 Futur Pension PrivatPension Netto Fond 0 0 0.54 Handelsbanken Privatpension 60 0.75 0.28 Länsförsäkringar Privatpension Fond 240 0.5 0.29 Movestic Pension Privat Fond 286 0.44-0.5 0,50 Nordea Alderspension Fond 149 0.4 0.42 Nordnet Privatpension Depa 0 0 0,13 SEB Privat Pensionsförsäkring Fond 311 0.65 0.48 SEB Svensk Depaförsäkring 311 0.65 0.48 Skandia Privatpension Depa 0 0.75 0.37 Skandia Privatpension Internet Fond 0 0 0,42 Skandia Privatpension Radgivning Fond 360 0.65 0,42 SPP PLUSpension Fond 0 0.35 0.26 Swedbank Pensionsförsäkring Depa 240 0.65 0,18 Swedbank Pensionsförsäkring Fond 240 0.65 0,18
Source: The Swedish Consumers’ Insurance Bureau (2019)
ISK
On ISK there is an annual standard rate tax, based on the value of the account as well as the
government-borrowing rate. The financial institutions report the standard rate earnings to the tax
authorities and there is no need to declare any profit or loss made within the account.
The calculation of the standard rate earnings is based on the average value of the account as well
as the government-borrowing rate. The average value of the account is calculated by the account
value of the first day of each quarter added together, divided by four, and the sum of all deposits
during the year divided by four. The average value of the account multiplied with the government
borrowing rate as of 30 November the previous year, plus 1 percentage point (0.75 percentage
points before Jan 1, 2018), gives the standard earnings. The standard earnings cannot fall below
1.25%, however. The standard earnings are reported to the tax authority by the financial
institutions. The standard earnings are taxed at 30%.
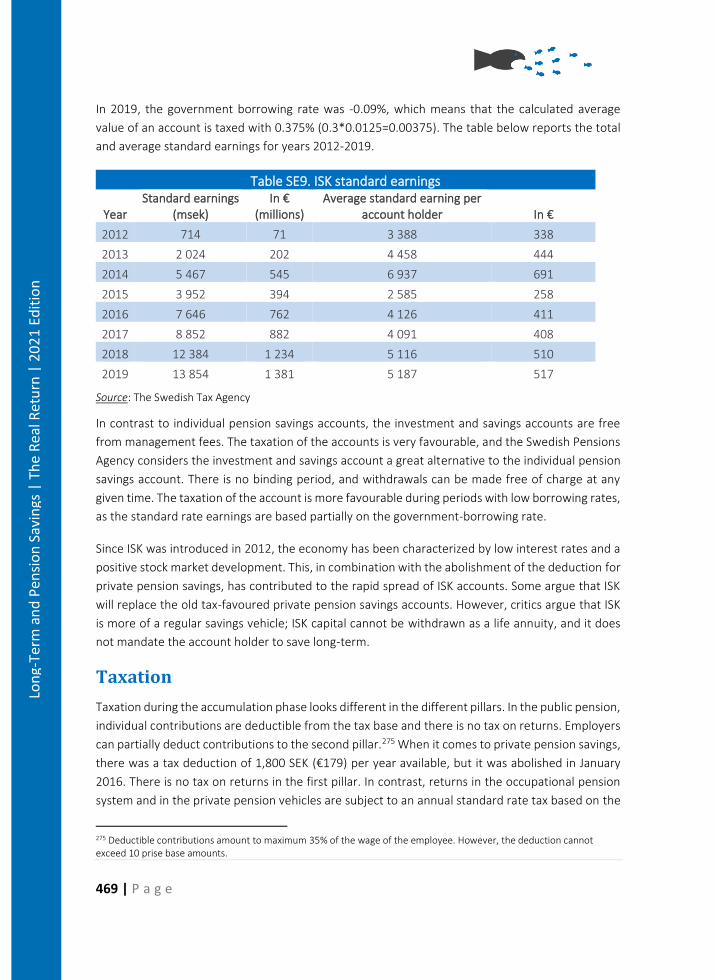
469 | P a g e
Lon
g-Te
rm a
nd
Pen
sio
n S
avin
gs |
Th
e R
eal R
etu
rn |
20
21
Edit
ion
In 2019, the government borrowing rate was -0.09%, which means that the calculated average
value of an account is taxed with 0.375% (0.3*0.0125=0.00375). The table below reports the total
and average standard earnings for years 2012-2019.
Table SE9. ISK standard earnings
Year Standard earnings
(msek) In €
(millions) Average standard earning per
account holder In €
2012 714 71 3 388 338
2013 2 024 202 4 458 444
2014 5 467 545 6 937 691
2015 3 952 394 2 585 258
2016 7 646 762 4 126 411
2017 8 852 882 4 091 408
2018 12 384 1 234 5 116 510
2019 13 854 1 381 5 187 517
Source: The Swedish Tax Agency
In contrast to individual pension savings accounts, the investment and savings accounts are free
from management fees. The taxation of the accounts is very favourable, and the Swedish Pensions
Agency considers the investment and savings account a great alternative to the individual pension
savings account. There is no binding period, and withdrawals can be made free of charge at any
given time. The taxation of the account is more favourable during periods with low borrowing rates,
as the standard rate earnings are based partially on the government-borrowing rate.
Since ISK was introduced in 2012, the economy has been characterized by low interest rates and a
positive stock market development. This, in combination with the abolishment of the deduction for
private pension savings, has contributed to the rapid spread of ISK accounts. Some argue that ISK
will replace the old tax-favoured private pension savings accounts. However, critics argue that ISK
is more of a regular savings vehicle; ISK capital cannot be withdrawn as a life annuity, and it does
not mandate the account holder to save long-term.
Taxation
Taxation during the accumulation phase looks different in the different pillars. In the public pension,
individual contributions are deductible from the tax base and there is no tax on returns. Employers
can partially deduct contributions to the second pillar.275 When it comes to private pension savings,
there was a tax deduction of 1,800 SEK (€179) per year available, but it was abolished in January
2016. There is no tax on returns in the first pillar. In contrast, returns in the occupational pension
system and in the private pension vehicles are subject to an annual standard rate tax based on the
275 Deductible contributions amount to maximum 35% of the wage of the employee. However, the deduction cannot exceed 10 prise base amounts.
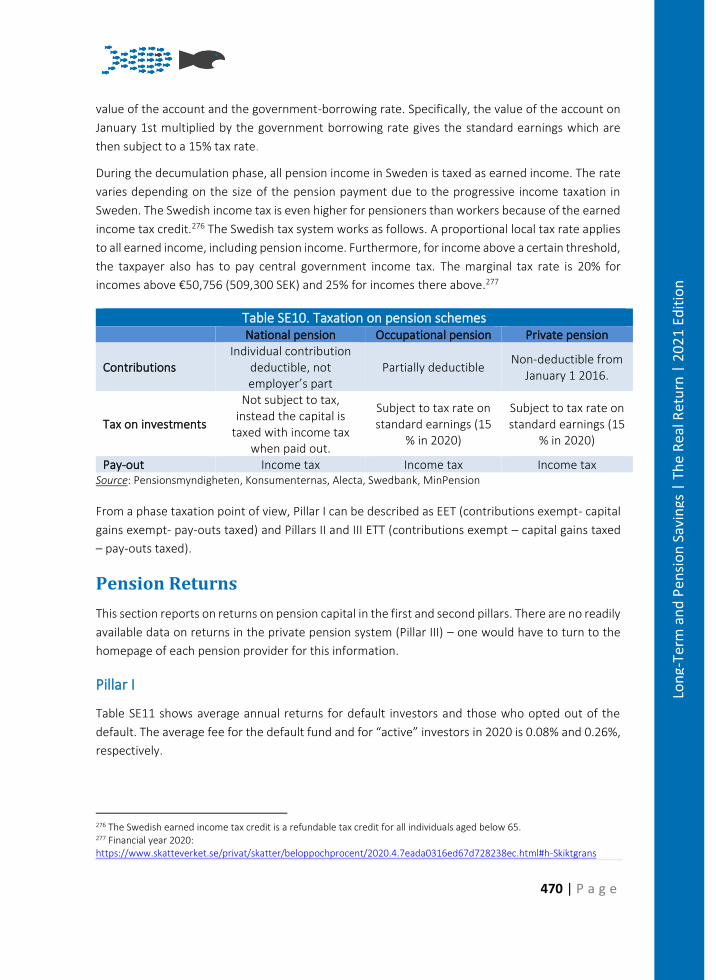
470 | P a g e
Lon
g-Te
rm a
nd
Pen
sio
n S
avin
gs |
Th
e R
eal R
etu
rn |
20
21
Edit
ion
value of the account and the government-borrowing rate. Specifically, the value of the account on
January 1st multiplied by the government borrowing rate gives the standard earnings which are
then subject to a 15% tax rate.
During the decumulation phase, all pension income in Sweden is taxed as earned income. The rate
varies depending on the size of the pension payment due to the progressive income taxation in
Sweden. The Swedish income tax is even higher for pensioners than workers because of the earned
income tax credit.276 The Swedish tax system works as follows. A proportional local tax rate applies
to all earned income, including pension income. Furthermore, for income above a certain threshold,
the taxpayer also has to pay central government income tax. The marginal tax rate is 20% for
incomes above €50,756 (509,300 SEK) and 25% for incomes there above.277
Table SE10. Taxation on pension schemes
National pension Occupational pension Private pension
Contributions Individual contribution
deductible, not employer’s part
Partially deductible Non-deductible from
January 1 2016.
Tax on investments
Not subject to tax, instead the capital is
taxed with income tax when paid out.
Subject to tax rate on standard earnings (15
% in 2020)
Subject to tax rate on standard earnings (15
% in 2020)
Pay-out Income tax Income tax Income tax Source: Pensionsmyndigheten, Konsumenternas, Alecta, Swedbank, MinPension
From a phase taxation point of view, Pillar I can be described as EET (contributions exempt- capital
gains exempt- pay-outs taxed) and Pillars II and III ETT (contributions exempt – capital gains taxed
– pay-outs taxed).
Pension Returns
This section reports on returns on pension capital in the first and second pillars. There are no readily
available data on returns in the private pension system (Pillar III) – one would have to turn to the
homepage of each pension provider for this information.
Pillar I
Table SE11 shows average annual returns for default investors and those who opted out of the
default. The average fee for the default fund and for “active” investors in 2020 is 0.08% and 0.26%,
respectively.
276 The Swedish earned income tax credit is a refundable tax credit for all individuals aged below 65. 277 Financial year 2020: https://www.skatteverket.se/privat/skatter/beloppochprocent/2020.4.7eada0316ed67d728238ec.html#h-Skiktgrans
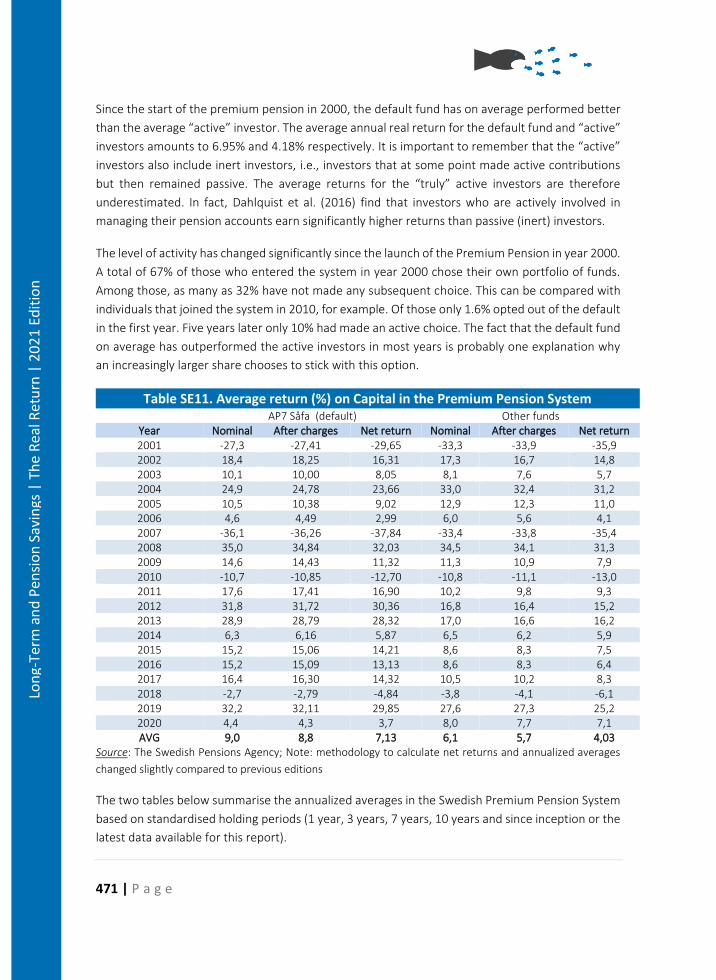
471 | P a g e
Lon
g-Te
rm a
nd
Pen
sio
n S
avin
gs |
Th
e R
eal R
etu
rn |
20
21
Edit
ion
Since the start of the premium pension in 2000, the default fund has on average performed better
than the average “active” investor. The average annual real return for the default fund and “active”
investors amounts to 6.95% and 4.18% respectively. It is important to remember that the “active”
investors also include inert investors, i.e., investors that at some point made active contributions
but then remained passive. The average returns for the “truly” active investors are therefore
underestimated. In fact, Dahlquist et al. (2016) find that investors who are actively involved in
managing their pension accounts earn significantly higher returns than passive (inert) investors.
The level of activity has changed significantly since the launch of the Premium Pension in year 2000.
A total of 67% of those who entered the system in year 2000 chose their own portfolio of funds.
Among those, as many as 32% have not made any subsequent choice. This can be compared with
individuals that joined the system in 2010, for example. Of those only 1.6% opted out of the default
in the first year. Five years later only 10% had made an active choice. The fact that the default fund
on average has outperformed the active investors in most years is probably one explanation why
an increasingly larger share chooses to stick with this option.
Table SE11. Average return (%) on Capital in the Premium Pension System AP7 Såfa (default) Other funds
Year Nominal After charges Net return Nominal After charges Net return 2001 -27,3 -27,41 -29,65 -33,3 -33,9 -35,9 2002 18,4 18,25 16,31 17,3 16,7 14,8 2003 10,1 10,00 8,05 8,1 7,6 5,7 2004 24,9 24,78 23,66 33,0 32,4 31,2 2005 10,5 10,38 9,02 12,9 12,3 11,0 2006 4,6 4,49 2,99 6,0 5,6 4,1 2007 -36,1 -36,26 -37,84 -33,4 -33,8 -35,4 2008 35,0 34,84 32,03 34,5 34,1 31,3 2009 14,6 14,43 11,32 11,3 10,9 7,9 2010 -10,7 -10,85 -12,70 -10,8 -11,1 -13,0 2011 17,6 17,41 16,90 10,2 9,8 9,3 2012 31,8 31,72 30,36 16,8 16,4 15,2 2013 28,9 28,79 28,32 17,0 16,6 16,2 2014 6,3 6,16 5,87 6,5 6,2 5,9 2015 15,2 15,06 14,21 8,6 8,3 7,5 2016 15,2 15,09 13,13 8,6 8,3 6,4 2017 16,4 16,30 14,32 10,5 10,2 8,3 2018 -2,7 -2,79 -4,84 -3,8 -4,1 -6,1 2019 32,2 32,11 29,85 27,6 27,3 25,2 2020 4,4 4,3 3,7 8,0 7,7 7,1 AVG 9,0 8,8 7,13 6,1 5,7 4,03
Source: The Swedish Pensions Agency; Note: methodology to calculate net returns and annualized averages
changed slightly compared to previous editions
The two tables below summarise the annualized averages in the Swedish Premium Pension System
based on standardised holding periods (1 year, 3 years, 7 years, 10 years and since inception or the
latest data available for this report).
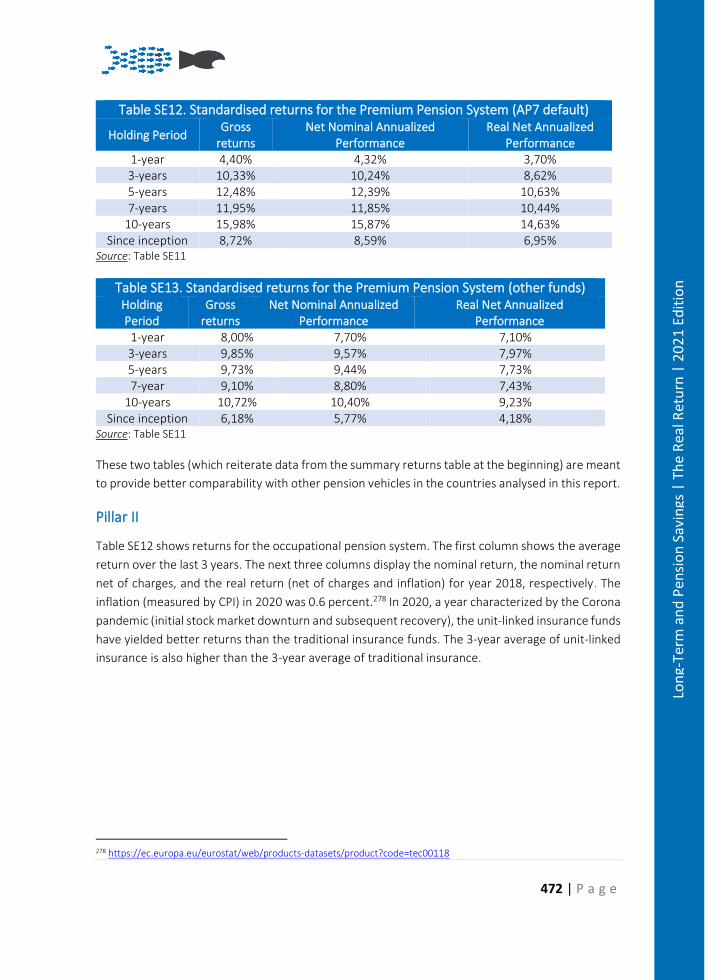
472 | P a g e
Lon
g-Te
rm a
nd
Pen
sio
n S
avin
gs |
Th
e R
eal R
etu
rn |
20
21
Edit
ion
Table SE12. Standardised returns for the Premium Pension System (AP7 default)
Holding Period Gross
returns Net Nominal Annualized
Performance Real Net Annualized
Performance 1-year 4,40% 4,32% 3,70% 3-years 10,33% 10,24% 8,62% 5-years 12,48% 12,39% 10,63% 7-years 11,95% 11,85% 10,44%
10-years 15,98% 15,87% 14,63% Since inception 8,72% 8,59% 6,95%
Source: Table SE11
Table SE13. Standardised returns for the Premium Pension System (other funds) Holding Period
Gross returns
Net Nominal Annualized Performance
Real Net Annualized Performance
1-year 8,00% 7,70% 7,10% 3-years 9,85% 9,57% 7,97% 5-years 9,73% 9,44% 7,73% 7-year 9,10% 8,80% 7,43%
10-years 10,72% 10,40% 9,23% Since inception 6,18% 5,77% 4,18%
Source: Table SE11
These two tables (which reiterate data from the summary returns table at the beginning) are meant
to provide better comparability with other pension vehicles in the countries analysed in this report.
Pillar II
Table SE12 shows returns for the occupational pension system. The first column shows the average
return over the last 3 years. The next three columns display the nominal return, the nominal return
net of charges, and the real return (net of charges and inflation) for year 2018, respectively. The
inflation (measured by CPI) in 2020 was 0.6 percent.278 In 2020, a year characterized by the Corona
pandemic (initial stock market downturn and subsequent recovery), the unit-linked insurance funds
have yielded better returns than the traditional insurance funds. The 3-year average of unit-linked
insurance is also higher than the 3-year average of traditional insurance.
278 https://ec.europa.eu/eurostat/web/products-datasets/product?code=tec00118
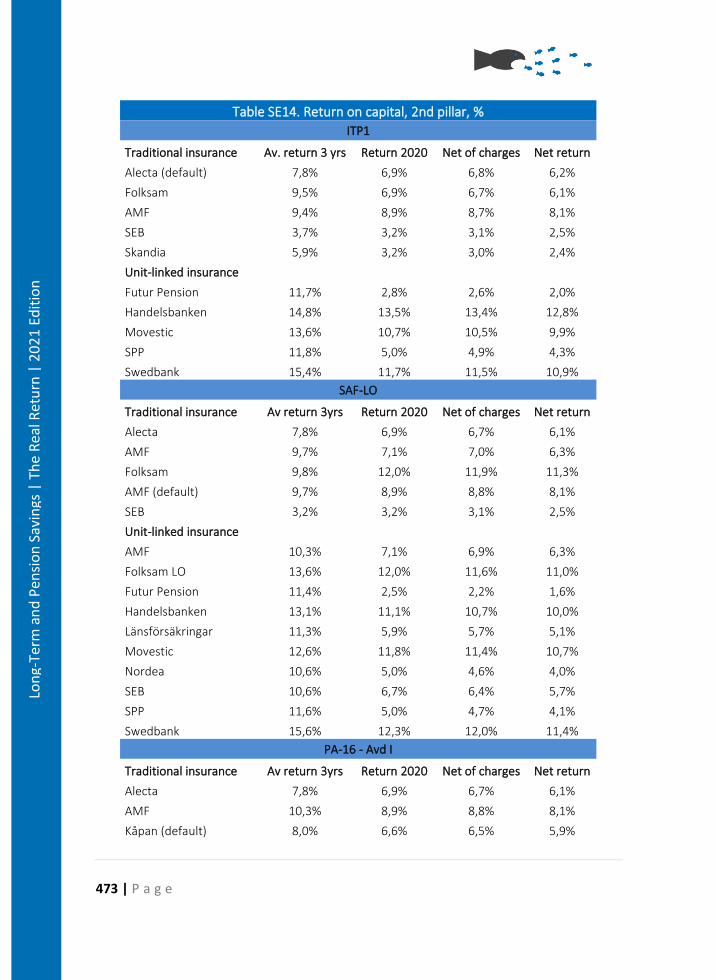
473 | P a g e
Lon
g-Te
rm a
nd
Pen
sio
n S
avin
gs |
Th
e R
eal R
etu
rn |
20
21
Edit
ion
Table SE14. Return on capital, 2nd pillar, %
ITP1
Traditional insurance Av. return 3 yrs Return 2020 Net of charges Net return
Alecta (default) 7,8% 6,9% 6,8% 6,2%
Folksam 9,5% 6,9% 6,7% 6,1%
AMF 9,4% 8,9% 8,7% 8,1%
SEB 3,7% 3,2% 3,1% 2,5%
Skandia 5,9% 3,2% 3,0% 2,4%
Unit-linked insurance
Futur Pension 11,7% 2,8% 2,6% 2,0%
Handelsbanken 14,8% 13,5% 13,4% 12,8%
Movestic 13,6% 10,7% 10,5% 9,9%
SPP 11,8% 5,0% 4,9% 4,3%
Swedbank 15,4% 11,7% 11,5% 10,9%
SAF-LO
Traditional insurance Av return 3yrs Return 2020 Net of charges Net return
Alecta 7,8% 6,9% 6,7% 6,1%
AMF 9,7% 7,1% 7,0% 6,3%
Folksam 9,8% 12,0% 11,9% 11,3%
AMF (default) 9,7% 8,9% 8,8% 8,1%
SEB 3,2% 3,2% 3,1% 2,5%
Unit-linked insurance
AMF 10,3% 7,1% 6,9% 6,3%
Folksam LO 13,6% 12,0% 11,6% 11,0%
Futur Pension 11,4% 2,5% 2,2% 1,6%
Handelsbanken 13,1% 11,1% 10,7% 10,0%
Länsförsäkringar 11,3% 5,9% 5,7% 5,1%
Movestic 12,6% 11,8% 11,4% 10,7%
Nordea 10,6% 5,0% 4,6% 4,0%
SEB 10,6% 6,7% 6,4% 5,7%
SPP 11,6% 5,0% 4,7% 4,1%
Swedbank 15,6% 12,3% 12,0% 11,4%
PA-16 - Avd I
Traditional insurance Av return 3yrs Return 2020 Net of charges Net return
Alecta 7,8% 6,9% 6,7% 6,1%
AMF 10,3% 8,9% 8,8% 8,1%
Kapan (default) 8,0% 6,6% 6,5% 5,9%
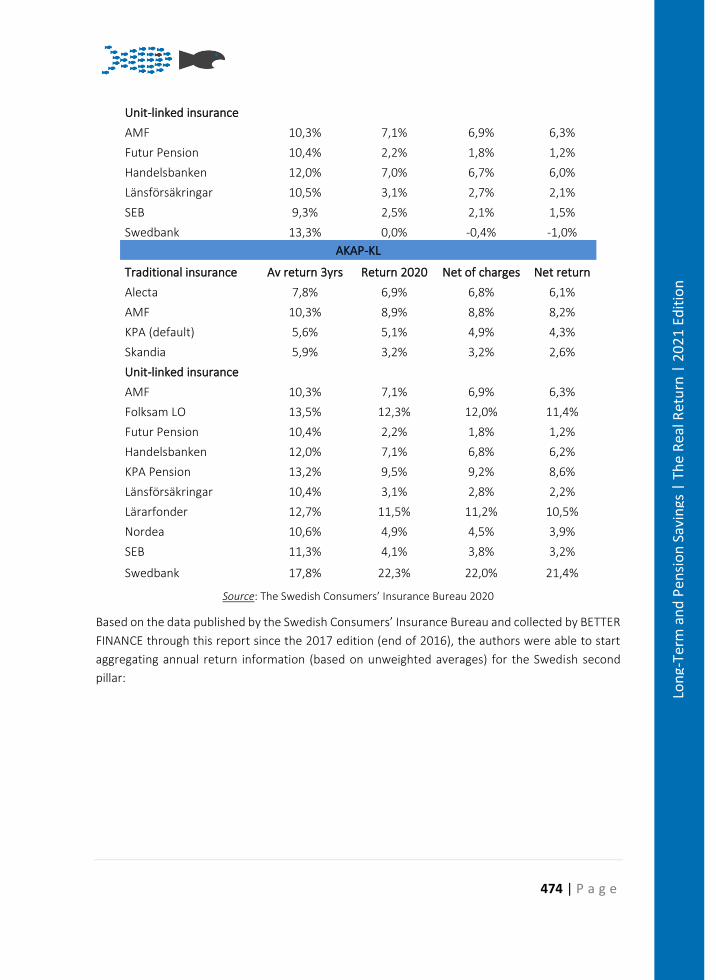
474 | P a g e
Lon
g-Te
rm a
nd
Pen
sio
n S
avin
gs |
Th
e R
eal R
etu
rn |
20
21
Edit
ion
Unit-linked insurance
AMF 10,3% 7,1% 6,9% 6,3%
Futur Pension 10,4% 2,2% 1,8% 1,2%
Handelsbanken 12,0% 7,0% 6,7% 6,0%
Länsförsäkringar 10,5% 3,1% 2,7% 2,1%
SEB 9,3% 2,5% 2,1% 1,5%
Swedbank 13,3% 0,0% -0,4% -1,0%
AKAP-KL
Traditional insurance Av return 3yrs Return 2020 Net of charges Net return
Alecta 7,8% 6,9% 6,8% 6,1%
AMF 10,3% 8,9% 8,8% 8,2%
KPA (default) 5,6% 5,1% 4,9% 4,3%
Skandia 5,9% 3,2% 3,2% 2,6%
Unit-linked insurance
AMF 10,3% 7,1% 6,9% 6,3%
Folksam LO 13,5% 12,3% 12,0% 11,4%
Futur Pension 10,4% 2,2% 1,8% 1,2%
Handelsbanken 12,0% 7,1% 6,8% 6,2%
KPA Pension 13,2% 9,5% 9,2% 8,6%
Länsförsäkringar 10,4% 3,1% 2,8% 2,2%
Lärarfonder 12,7% 11,5% 11,2% 10,5%
Nordea 10,6% 4,9% 4,5% 3,9%
SEB 11,3% 4,1% 3,8% 3,2%
Swedbank 17,8% 22,3% 22,0% 21,4%
Source: The Swedish Consumers’ Insurance Bureau 2020
Based on the data published by the Swedish Consumers’ Insurance Bureau and collected by BETTER
FINANCE through this report since the 2017 edition (end of 2016), the authors were able to start
aggregating annual return information (based on unweighted averages) for the Swedish second
pillar:
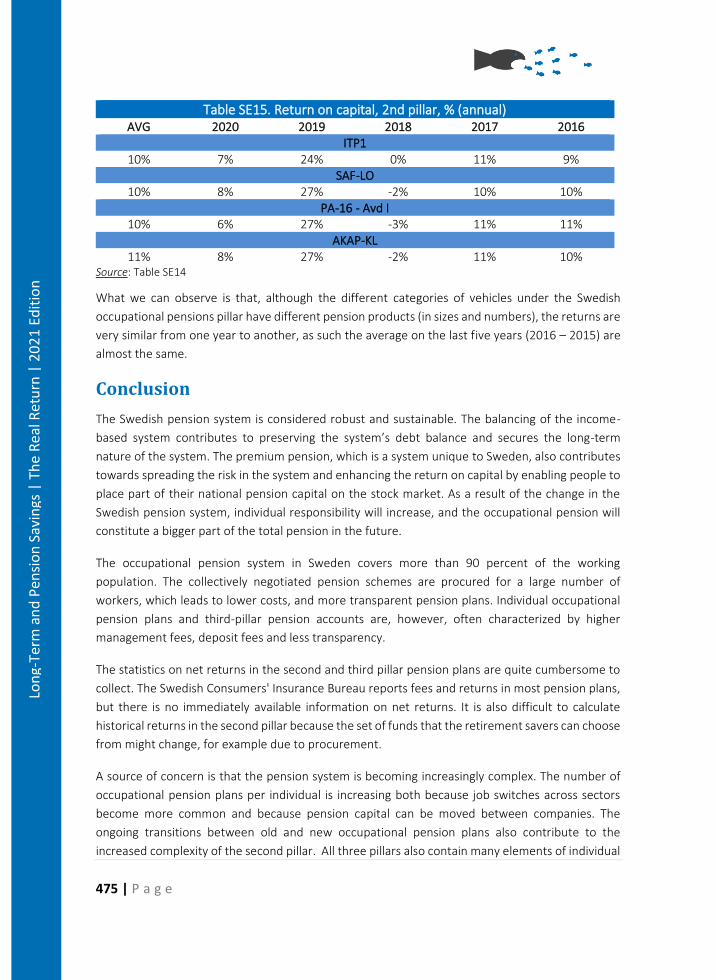
475 | P a g e
Lon
g-Te
rm a
nd
Pen
sio
n S
avin
gs |
Th
e R
eal R
etu
rn |
20
21
Edit
ion
Table SE15. Return on capital, 2nd pillar, % (annual) AVG 2020 2019 2018 2017 2016
ITP1 10% 7% 24% 0% 11% 9%
SAF-LO 10% 8% 27% -2% 10% 10%
PA-16 - Avd I 10% 6% 27% -3% 11% 11%
AKAP-KL 11% 8% 27% -2% 11% 10%
Source: Table SE14
What we can observe is that, although the different categories of vehicles under the Swedish
occupational pensions pillar have different pension products (in sizes and numbers), the returns are
very similar from one year to another, as such the average on the last five years (2016 – 2015) are
almost the same.
Conclusion
The Swedish pension system is considered robust and sustainable. The balancing of the income-
based system contributes to preserving the system’s debt balance and secures the long-term
nature of the system. The premium pension, which is a system unique to Sweden, also contributes
towards spreading the risk in the system and enhancing the return on capital by enabling people to
place part of their national pension capital on the stock market. As a result of the change in the
Swedish pension system, individual responsibility will increase, and the occupational pension will
constitute a bigger part of the total pension in the future.
The occupational pension system in Sweden covers more than 90 percent of the working
population. The collectively negotiated pension schemes are procured for a large number of
workers, which leads to lower costs, and more transparent pension plans. Individual occupational
pension plans and third-pillar pension accounts are, however, often characterized by higher
management fees, deposit fees and less transparency.
The statistics on net returns in the second and third pillar pension plans are quite cumbersome to
collect. The Swedish Consumers' Insurance Bureau reports fees and returns in most pension plans,
but there is no immediately available information on net returns. It is also difficult to calculate
historical returns in the second pillar because the set of funds that the retirement savers can choose
from might change, for example due to procurement.
A source of concern is that the pension system is becoming increasingly complex. The number of
occupational pension plans per individual is increasing both because job switches across sectors
become more common and because pension capital can be moved between companies. The
ongoing transitions between old and new occupational pension plans also contribute to the
increased complexity of the second pillar. All three pillars also contain many elements of individual
476 | P a g e
Lon
g-Te
rm a
nd
Pen
sio
n S
avin
gs |
Th
e R
eal R
etu
rn |
20
21
Edit
ion
choice both during accumulation and decumulation phase. Pension systems that are too complex
risk leading to inertia and distrust, which in turn could lead to worse saving and retirement
outcomes. Well-designed default fund options with low fees and appropriate risk exposure as well
as comprehensive, user-friendly information/choice centres are necessary features in a complex
pension system.
Although the Swedish pension system is considered robust and sustainable there is reason to be
concerned. As life expectancy increases, the gap between wages and pensions will increase. The
total pension amount for people born between 1938 and 1946 shrank from 86 % to 77 % of the
final salary. And the public pension, which every Swedish citizen with a salary or another taxable
benefit is entitled to, shrank from 61 % to 49 % of the final salary for the same age groups. The
average exit age from the labour force has been increasing ever since the new public pension
system was implemented in the late 1990s and is currently 64. However, the average claiming age
has been fairly constant.279 The combination of constant claiming age, later labour force entry
among youths, and indexation of pension benefits to life expectancy unavoidably means lower
pension benefits. The occupational pension makes up an important component of old-age income.
Occupational pensions constitute 28% of outgoing pension payments and play a relatively more
important role for high-income earners. The occupational pension coverage is high in Sweden
(>90% of employees), but certain groups on the labour market that are already at risk of receiving
a low pension (such as gig workers, self-employed and immigrants) are often not eligible.
To encourage later retirement, policy makers have agreed to raise various retirement ages in a
stepwise manner. By 2026, the minimum claiming age, the eligibility age for the minimum
guarantee, and the mandatory retirement are expected to have increased to 64, 67 and 69,
respectively (currently at 62, 65 and 68, respectively). The 65-norm is still strong in the second pillar,
however. Pensions are usually paid out automatically at this age, and pension rights are in most
cases not earned after this age. As replacement rates fall, individuals also need to take more
responsibility for their private pension savings. This makes accessible good pension savings
products with low fees even more important.
Policy recommendations:
• Expand the portability right of second pillar pension capital.
• Improve information on historical net returns and other fund characteristics in second and
third pillar pension plans.
• The digital pension tool www.minpension.se makes it possible for individual retirement
savers to collect information on their total pension savings. A useful extension would be
to allow users to execute their pension fund choices from this site.
279 This is mainly due to reduced disability pension rates (through stricter eligibility rules), which affects the exit age but not necessarily the claiming age if people claim their pension instead. Another explanation is that individuals who work past the age of 65 do not postpone the withdrawal of their pension.
477 | P a g e
Lon
g-Te
rm a
nd
Pen
sio
n S
avin
gs |
Th
e R
eal R
etu
rn |
20
21
Edit
ion
• Replace automatic payment of occupational pensions at a certain age (usually 65) with a
claiming requirement (as in the public pension system). Alternatively, raise the automatic
payment age to 68 or higher.
Bibliography
• AMF (2018), Viktiga frågor som påverkar pensionsområdet,
• Cronqvist, H., Thaler, R. H., & Yu, F. (2018). When Nudges Are Forever: Inertia in the
Swedish Premium Pension Plan. In AEA Papers and Proceedings (Vol. 108, pp. 153-58).
• Dahlquist, M., Martinez, J. V., and Söderlind, P. (2016). Individual investor activity and
performance. The Review of Financial Studies, 30(3), 866-899.
• Hagen, J. (2017). Pension principles in the Swedish pension system, 65(1), 28-51
• Hagen, J. (2013). A History of the Swedish Pension System, UCFS WP 2013:7
• Finansutskottets betänkande, “En ny reglering för tjänstepensionsföretag”,
2019/20:FiU12. https://www.riksdagen.se/sv/dokument-lagar/arende/betankande/en-
ny-reglering-for-tjanstepensionsforetag_H701FiU12
• ISF (2018) ISF Rapport 2018:15, ”Vem far avsättningar till tjänstepension”
• Konkurrensverket, Flyttavgifter på livförsäkringsmarknaden – potentiella
inlåsningseffekter bland pensionsförsäkringar, Rapport 2016:12.
• Ministry of Finance, “En effektivare flytträtt av försäkringssparande”
https://www.regeringen.se/rattsliga-dokument/lagradsremiss/2019/04/en-effektivare-
flyttratt-av-forsakringssparande/
• Ministry of Finance, “Avgifter vid aterköp och flytt av fond- och depåförsäkringar.
Fi2020/01016/FPM https://www.regeringen.se/rattsliga-
dokument/departementsserien-och-promemorior/2020/03/avgifter-vid-aterkop-och-
flytt-av-fond--och-depaforsakringar/
• Ministry of Finance, Ett upphandlat fondtorg för premiepension, Dir 2018:57
• Ministry of Finance, Vägval för premiepensionen, DS 2013:35,
• Orange Report 2020 – Annual Report of the Swedish Pension System,
https://www.pensionsmyndigheten.se/statistik/publikationer/orange-rapport-2020/
• OECD Pension Outlook 2018
• Pensionsmyndigheten, Sveriges pensioner 2006 – 2019
• Pensionsmyndigheten, Stärkt konsumentskydd inom premiepensionen
• Pensionsmyndigheten, Så blir pensionen 2018
• SOU 2012:64, Förstärkt försäkringsskydd, Ministry of Finance
• Swedish Investment Fund Association,
• The Swedish Consumers' Insurance Bureau
• The Swedish Tax Agency
478 | P a g e
Lon
g-Te
rm a
nd
Pen
sio
n S
avin
gs |
Th
e R
eal R
etu
rn |
20
21
Edit
ion
Pension Savings: The Real Return 2021 Edition
Country Case: The Netherlands
Samenvating
In veel opzichten bevinden de Nederlanders zich in een benijdenswaardige positie wat hun
pensioenen betreft. Het Nederlandse pensioenstelsel staat, naast het Deense, voor het derde jaar
op rij op de hoogste plaats in de Mercer CFA Institute Global Pensions Index, en wordt omschreven
als "een eersteklas en robuust pensioeninkomenstelsel dat goede uitkeringen biedt, duurzaam is
en een hoge mate van integriteit heeft". Toch presteert het particuliere pensioenstelsel in
Nederland beter met zijn fondsen dan de verzekeringen - de vergelijking van het reële
nettorendement over 21 jaar tussen bedrijfspensioenfondsen en levensverzekeringen van de derde
pijler spreekt voor zich: 2,83% tegenover 0,13%. Het vertrouwen van Nederlandse werknemers in
de toereikendheid van hun pensioen is de afgelopen 10 jaar echter gedaald van 75% (vertrouwen
dat hun pensioen toereikend zal zijn om hun levensstijl bij pensionering voort te zetten) tot 66%.
Met name in het licht van de geleidelijke verschuiving van Defined-Benefit (DB) regelingen,
gebaseerd op het laatste salaris van de werkenden, naar een Collectief Defined-Contribution (DC)
systeem "zullen pensioenuitkeringsgaranties (...) komen te vervallen".
Een andere belangrijke reden waarom een grote meerderheid van de Nederlanders zich zorgen
maakt over hun pensioeninkomen is het feit dat de wereldwijd historisch lage rente het
Nederlandse pensioenstelsel relatief gezien meer schade toebrengt dan het pensioenstelsel van
andere landen. Dit heeft niet alleen te maken met het feit dat Nederlanders over één van de
grootste pensioenreserves ter wereld beschikken, maar ook met het feit dat De Nederlandsche
Bank (DNB), de nationale pensioentoezichthouder, een van de voorzichtigste en daardoor laagste
disconteringsvoeten ter wereld hanteert voor de berekening van pensioenverplichtingen. Dit
dwingt Nederlandse pensioenfondsen om meer dan de helft (52%) van hun vermogen in obligaties
te beleggen. Obligaties stijgen sterk in waarde (zij het minder sterk dan de pensioenverplichtingen)
wanneer de rente daalt, maar hebben de afgelopen jaren zeer lage reële dividenden opgeleverd.
Door de strenge regelgeving worden Nederlandse pensioenfondsen ontmoedigd om in te spelen
op de stijgende waarde van obligaties. In plaats daarvan zijn zij uit overwegingen van toekomstige
voorzichtigheid verplicht deze laag renderende activa aan te houden.
Uit een recente studie van het Thinking Ahead Institute naar het wereldwijde pensioenvermogen
blijkt dat gemiddeld 27% van het pensioenfondsvermogen in de wereld in obligaties is belegd. In
Nederland was dit percentage eind 2020 bijna het dubbele: 52%. Dit percentage is sinds 2011 niet
meer onder de 50% gezakt. Toch biedt het Nederlandse pensioenstelsel met drie pijlers (of three-
479 | P a g e
Lon
g-Te
rm a
nd
Pen
sio
n S
avin
gs |
Th
e R
eal R
etu
rn |
20
21
Edit
ion
tier) ieder individu ruime mogelijkheden om zijn/haar pensioeninkomen te verhogen. Hoe waar dat
ook moge zijn, uiteindelijk komt het allemaal neer op de allesbepalende vraag van het reële
rendement. Verdienen de Nederlandse pensioenfondsen genoeg om de Nederlandse
gepensioneerden in de toekomst een behoorlijk inkomen te bieden? Deze vraag is voor
Nederlandse pensioenfondsen en beleidsmakers in 2020 nog steeds van centraal belang, ondanks
de overvloedige rendementen (meer dan 16% nominaal) die pensioenfondsen dat jaar behaalden.
De reden hiervoor is dat ook de pensioenverplichtingen in hoog tempo bleven stijgen, waardoor de
financiële positie van pensioenfondsen op lange termijn precair bleef.
Mede om hieraan tegemoet te komen, hebben Nederlandse beleidsmakers, vakorganisaties en
vakbonden in juni 2020 besloten (ter nadere uitwerking van een akkoord dat zij een jaar eerder
hadden gesloten) om het Nederlandse pensioenstelsel zodanig te hervormen dat in de tweede
pijler (zie hieronder) toegezegde-bijdrageregelingen (DC) dominant worden. Hierdoor zullen
pensioenuitvoerders meer kunnen beleggen in risicovollere activa met een potentieel hoger
rendement, maar zal de variabiliteit van de pensioenuitkomsten en de kans op aanzienlijke
verliezen waarschijnlijk toenemen. Het zal ook de vraag doen rijzen of de pensioenbijdragen op een
voldoende voorzichtig niveau zullen blijven om aanvaardbare pensioenresultaten te waarborgen.
In dit rapport geven wij een overzicht van het Nederlandse pensioenstelsel, kijken wij naar de
jaarlijkse rendementen op beleggingen van pensioenfondsen en berekenen wij het reële
rendement, waarbij het nominale rendement wordt gecorrigeerd voor diverse kosten, belastingen
en inflatie.
Summary
In many ways, the Dutch are in an enviable position as far as their pensions are concerned. The
Dutch pension system, next to the Danish one, ranked for the third year in a row highest in the
Mercer CFA Institute Global Pensions Index,280 being described as “a first class and robust
retirement income system that delivers good benefits, is sustainable and has a high level of
integrity”. Nevertheless, while the private retirement system in the Netherlands outperforms with
its funds, insurances lag behind – the 21-year real net return comparison between occupational
pension funds and pillar III life insurances speaks for itself: 2.83% vs 0.13%. However, Dutch
workers’ trust in the adequacy of their pensions has been decreasing from 75% (trusting that their
pension will be sufficient to continue their lifestyle at retirement) to 66% in the last 10 years.281
Particularly, in light of the gradual shift from Defined-Benefit (DB) plans, based on the last salary of
280 Mercer CFA Institute Global Pensions Index, 2020, available at: https://www.mercer.com.au/content/dam/mercer/attachments/private/asia-pacific/australia/campaigns/mcgpi-2020/MCGPI-2020-full-report-1.pdf, p. 5. 281 Frank van Alphen, ‘Dutch Workers Expect Lower Pensions in DC System’ (IPE.com, 29 June 2021), accessed 7 October 2021, available at: https://www.ipe.com/news/dutch-workers-expect-lower-pensions-in-dc-system/10053757.article.

480 | P a g e
Lon
g-Te
rm a
nd
Pen
sio
n S
avin
gs |
Th
e R
eal R
etu
rn |
20
21
Edit
ion
the worked, to a Collective Defined-Contribution (DC) system “pension benefit guarantees (…) will
be abandoned”.282
Another important reason why a large majority of the Dutch worry about their retirement income
is the fact that the historically low interest rates worldwide are causing, relatively speaking, more
harm to the Dutch pension system than to other countries’ pension systems. This is due not only to
the fact that the Dutch boast one of the world’s largest pension reserves, but also to the fact that
the Dutch central bank (DNB), the national pension supervisor, applies one of the world’s most
prudent and therefore lowest discount rates for the calculation of pension liabilities. This forces
Dutch pension funds to invest more than half (52%) of their assets in bonds. Bonds rise sharply in
value (although less so than the pension liabilities) when interest rates drop but have yielded very
low actual dividends over the past several years. Due to the strict regulatory regime, Dutch pension
funds are discouraged to cash in on rising values of bonds. Instead, they are obliged to retain these
low-yielding assets for reasons of future prudence.
A recent study on global pension assets, by the Thinking Ahead Institute,283 showed that on average
27% of pension fund assets in the world are invested in bonds. In the Netherlands the percentage
was almost double that at the end of 2020: 52%. This percentage has not fallen below 50% since
2011. Still, the Dutch three-pillar (or three-tier) pension system does provide every individual with
ample opportunity to increase his/her retirement income. True as that might be, at the end of the
day it all boils down to the all-important question of real return. Are Dutch pension funds earning
enough to provide a decent income to Dutch retirees in the future? This question retained it’s
central relevance to Dutch pension funds and policymakers in 2020, despite the copious returns
(exceeding 16% in nominal terms) that pension funds achieved that year. The reason for this is the
fact that pension liabilities continued to rise at great rates too, ensuring that the long-term financial
position of pension funds remained precarious.
In part to address that concern, Dutch policymakers, trade organizations and unions resolved in
June 2020 (further elaborating an accord they struck a year earlier) to reform the Dutch pension
system so that in Pillar II (see below) defined-contribution (DC) schemes become dominant. This
will allow pension providers to invest more in riskier assets with the potential of higher yields but
will likely increase the variability of pension outcomes and the potential for significant losses. It will
also raise the question whether pension contributions will retain prudent enough levels to ensure
acceptable pension outcomes.
282 Ed Westerhout, Eduard Ponds, Peter Zwaneveld, Completing Dutch Pension Reform (August 2021) CPB Netherlands Bureau for Economic Policy Analysis, available at: https://www.cpb.nl/sites/default/files/omnidownload/CPB-Background-Document-Completing-Dutch-pension-reform.pdf. 283 https://www.willistowerswatson.com/en/insights/2018/02/global-pension-assets-study-2018.
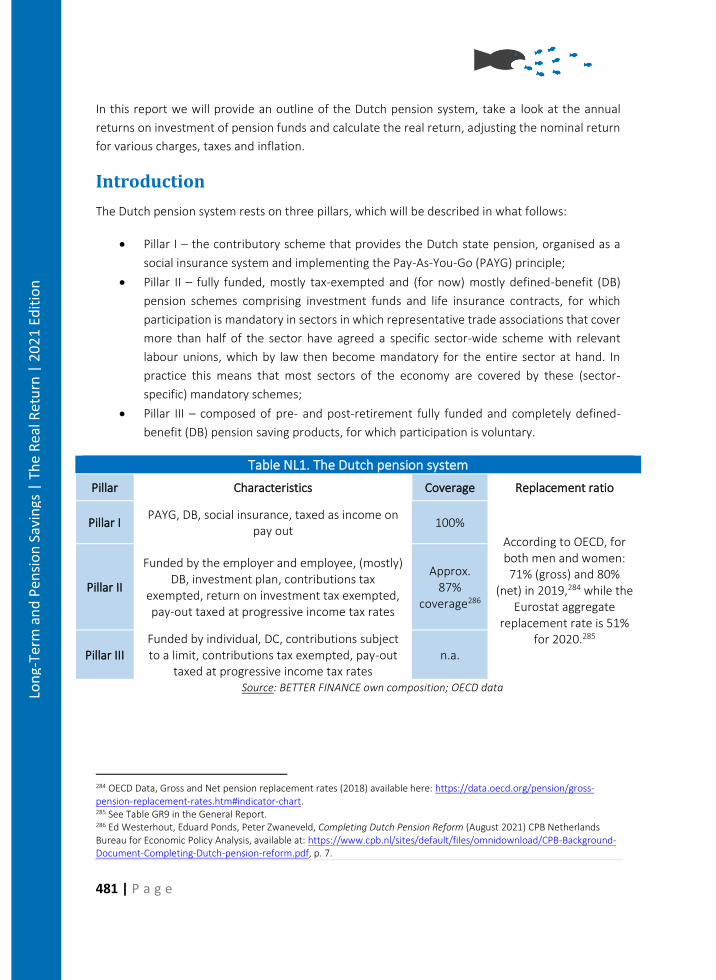
481 | P a g e
Lon
g-Te
rm a
nd
Pen
sio
n S
avin
gs |
Th
e R
eal R
etu
rn |
20
21
Edit
ion
In this report we will provide an outline of the Dutch pension system, take a look at the annual
returns on investment of pension funds and calculate the real return, adjusting the nominal return
for various charges, taxes and inflation.
Introduction
The Dutch pension system rests on three pillars, which will be described in what follows:
• Pillar I – the contributory scheme that provides the Dutch state pension, organised as a
social insurance system and implementing the Pay-As-You-Go (PAYG) principle;
• Pillar II – fully funded, mostly tax-exempted and (for now) mostly defined-benefit (DB)
pension schemes comprising investment funds and life insurance contracts, for which
participation is mandatory in sectors in which representative trade associations that cover
more than half of the sector have agreed a specific sector-wide scheme with relevant
labour unions, which by law then become mandatory for the entire sector at hand. In
practice this means that most sectors of the economy are covered by these (sector-
specific) mandatory schemes;
• Pillar III – composed of pre- and post-retirement fully funded and completely defined-
benefit (DB) pension saving products, for which participation is voluntary.
Table NL1. The Dutch pension system
Pillar Characteristics Coverage Replacement ratio
Pillar I PAYG, DB, social insurance, taxed as income on
pay out 100%
According to OECD, for both men and women: 71% (gross) and 80%
(net) in 2019,284 while the Eurostat aggregate
replacement rate is 51% for 2020.285
Pillar II
Funded by the employer and employee, (mostly) DB, investment plan, contributions tax
exempted, return on investment tax exempted, pay-out taxed at progressive income tax rates
Approx. 87%
coverage286
Pillar III Funded by individual, DC, contributions subject to a limit, contributions tax exempted, pay-out
taxed at progressive income tax rates n.a.
Source: BETTER FINANCE own composition; OECD data
284 OECD Data, Gross and Net pension replacement rates (2018) available here: https://data.oecd.org/pension/gross-pension-replacement-rates.htm#indicator-chart. 285 See Table GR9 in the General Report. 286 Ed Westerhout, Eduard Ponds, Peter Zwaneveld, Completing Dutch Pension Reform (August 2021) CPB Netherlands Bureau for Economic Policy Analysis, available at: https://www.cpb.nl/sites/default/files/omnidownload/CPB-Background-Document-Completing-Dutch-pension-reform.pdf, p. 7.
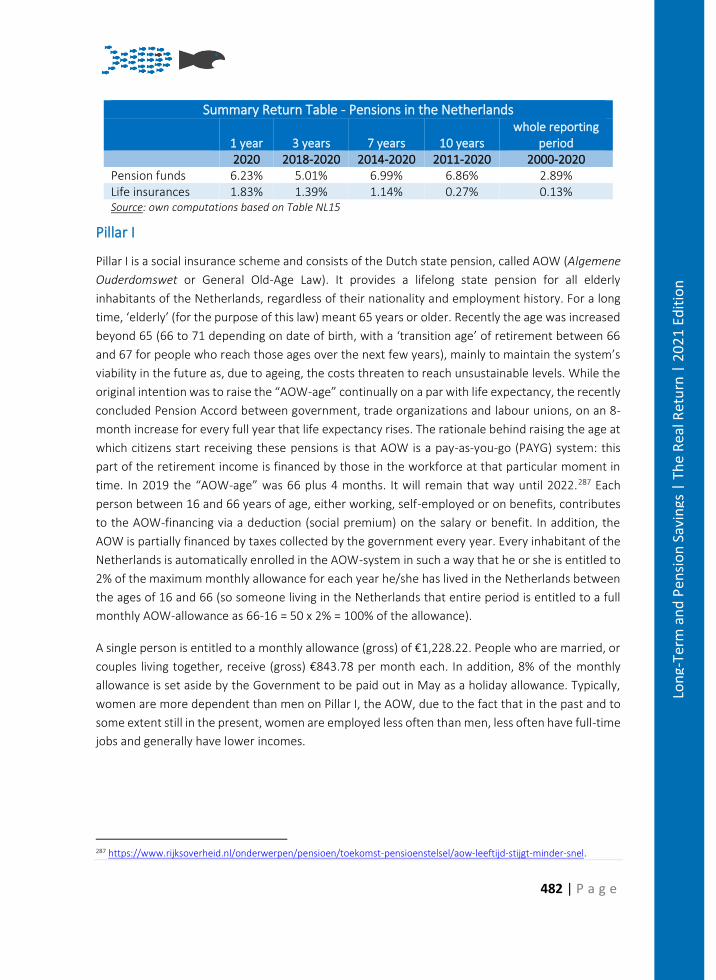
482 | P a g e
Lon
g-Te
rm a
nd
Pen
sio
n S
avin
gs |
Th
e R
eal R
etu
rn |
20
21
Edit
ion
Summary Return Table - Pensions in the Netherlands
1 year 3 years 7 years 10 years whole reporting
period 2020 2018-2020 2014-2020 2011-2020 2000-2020 Pension funds 6.23% 5.01% 6.99% 6.86% 2.89% Life insurances 1.83% 1.39% 1.14% 0.27% 0.13% Source: own computations based on Table NL15
Pillar I
Pillar I is a social insurance scheme and consists of the Dutch state pension, called AOW (Algemene
Ouderdomswet or General Old-Age Law). It provides a lifelong state pension for all elderly
inhabitants of the Netherlands, regardless of their nationality and employment history. For a long
time, ‘elderly’ (for the purpose of this law) meant 65 years or older. Recently the age was increased
beyond 65 (66 to 71 depending on date of birth, with a ‘transition age’ of retirement between 66
and 67 for people who reach those ages over the next few years), mainly to maintain the system’s
viability in the future as, due to ageing, the costs threaten to reach unsustainable levels. While the
original intention was to raise the “AOW-age” continually on a par with life expectancy, the recently
concluded Pension Accord between government, trade organizations and labour unions, on an 8-
month increase for every full year that life expectancy rises. The rationale behind raising the age at
which citizens start receiving these pensions is that AOW is a pay-as-you-go (PAYG) system: this
part of the retirement income is financed by those in the workforce at that particular moment in
time. In 2019 the “AOW-age” was 66 plus 4 months. It will remain that way until 2022.287 Each
person between 16 and 66 years of age, either working, self-employed or on benefits, contributes
to the AOW-financing via a deduction (social premium) on the salary or benefit. In addition, the
AOW is partially financed by taxes collected by the government every year. Every inhabitant of the
Netherlands is automatically enrolled in the AOW-system in such a way that he or she is entitled to
2% of the maximum monthly allowance for each year he/she has lived in the Netherlands between
the ages of 16 and 66 (so someone living in the Netherlands that entire period is entitled to a full
monthly AOW-allowance as 66-16 = 50 x 2% = 100% of the allowance).
A single person is entitled to a monthly allowance (gross) of €1,228.22. People who are married, or
couples living together, receive (gross) €843.78 per month each. In addition, 8% of the monthly
allowance is set aside by the Government to be paid out in May as a holiday allowance. Typically,
women are more dependent than men on Pillar I, the AOW, due to the fact that in the past and to
some extent still in the present, women are employed less often than men, less often have full-time
jobs and generally have lower incomes.
287 https://www.rijksoverheid.nl/onderwerpen/pensioen/toekomst-pensioenstelsel/aow-leeftijd-stijgt-minder-snel.
483 | P a g e
Lon
g-Te
rm a
nd
Pen
sio
n S
avin
gs |
Th
e R
eal R
etu
rn |
20
21
Edit
ion
Pillar II
Pillar II is a system of collective pension schemes operated by pension funds, entities which are
legally independent from their (often corporate) sponsors, or by insurance companies. Little over a
decade ago, there were over 1,000 pension funds operating in the Netherlands. Over the years,
several of these pension funds merged or were liquidated (with their assets and liabilities
transferred to other pension funds or insurance companies). As a consequence, the number of
pension funds (active and dormant) under supervision (DNB) declined to 220 by the end of 2019
and 208 in 2020.288 It is expected that the number of active pension funds will further decline in the
years to come.
Whereas Pillar I (AOW) is a PAYG scheme, the Pillar II is financed by capital funding. Each person
enrolled in a pension fund contributes directly or indirectly to it (with the employer paying the lion’s
share contribution, often 50% to 70%). This money is subsequently invested in order to fund
retirement pay-outs.
Although enrolment in a Pillar II scheme is not compulsory as such, in many cases it in fact is. The
reason for this is that if labour unions and employers in the Netherlands decide to set up a pension
scheme for a company or a sector, the government can make enrolment mandatory for everyone
working in that company or sector. In practice this means that almost every working person is
enrolled in a pension scheme. The government makes it mandatory in order to achieve economies
of scale that, in turn, makes it possible for pension funds to operate more efficiently in terms of
costs and fees. In addition, mandatory sectoral enrolment prevents a ‘race to the bottom’ in paid
pension premiums - an expensive but notoriously oblique wage element - through labour cost
competition between rival companies. In practice, more than 90% of Dutch employees are enrolled
in one or more pension funds.289 An employee can be enrolled in more than one pension fund if
he/she, for example, moves to another job in another sector. In such cases he/she starts building
his/her pension with the pension fund of the new sector or company. The old pension capital can
be left in the former pension fund or subject to specific rules, transferred to the new pension fund.
By law, pension funds are currently required to maintain a funding ratio of at least 105%
(approximately) and even larger reserves are required to allow for increases of pensions in line with
inflation. According to the provisions of the recent Pension Accord, which will go into effect, these
mandated reserves will be scrapped in favour of more flexible pension results.
Under the still current system, the “coverage ratio” (“dekkingsgraad” in Dutch) or funding ratio is
calculated by discounting the future pension liabilities (i.e., future nominal retirement outflows)
with the use of an interest rate curve mandated and regularly updated by the Dutch Central Bank.
The current value of pension liabilities up to 20 years in the future are determined by using the
288 Based on data from the Dutch Central Bank (https://statistiek.dnb.nl/downloads/index.aspx#/details/onder-toezicht-staande-pensioenfondsen-jaar/dataset/fd267edd-3135-4628-8313-85e968197b57/resource/12ac9dff-d047-4803-9fa4-9d31373e9ac0). 289 Statistics Netherlands (CBS), Pensioenaansprakenstatistiek 2015. Verantwoording en de eerste resultaten.
484 | P a g e
Lon
g-Te
rm a
nd
Pen
sio
n S
avin
gs |
Th
e R
eal R
etu
rn |
20
21
Edit
ion
actual market-based interest swap curve. The discount interest rates for periods from 20 years
onwards are calculated by the Dutch central bank. The interest rates calculated in this way are
called Ultimate Forward Rates (UFR) and the Dutch Central Bank imposes a UFR on Dutch pension
funds that is more ‘prudent’ than the European UFR determined by EIOPA. Prior to 2015, this UFR
was fixed at 4.2%. Starting from mid July 2015, the UFR is a 120-month moving average of the 20-
year forward rate which, in effect, means that it is much lower than the 4.2% used previously.
Hence, the funding ratio of the Dutch pension funds fell. The UFR has been lowered even further
as of June 2019 to mirror more closely the trend of falling market rates. The lower the interest rates
on financial markets, and hence the UFR, the higher the value of future liabilities and the greater
the chance that the required coverage ratio (in Dutch “dekkingsgraad”) falls below 105%. When
the coverage ratio falls below this threshold, a pension fund is required to submit a plan detailing
how to restore it to above 105% within a period of five years. It must also submit contingency plans
in case recovery remains elusive. Failure to recover to the 105% threshold means that pensions
must be lowered within the current regime. Furthermore, indexation by pension funds is not
allowed if the funding ratio is lower than 110% and only fully allowed when the funding ratio has
reached the level of a fund-specific “sustainable indexation funding ratio” (toekomstbestendige
indexatie dekkingsgraad), which usually falls somewhere between 120% and 130%. These
indexation-constraining regulations are designed to minimize the risk of future insolvency, thereby
protected younger members within pension funds from the risk of large pension cuts in the future.
However, these regulations are very controversial – both politically and among Dutch pension
experts/professionals – as large financial “buffers” have to be maintained to the detriment of
current pensioners. Under the newly agreed Pension Accord pensions will be raised and lowered
more quickly, although some buffers will still be mandated.
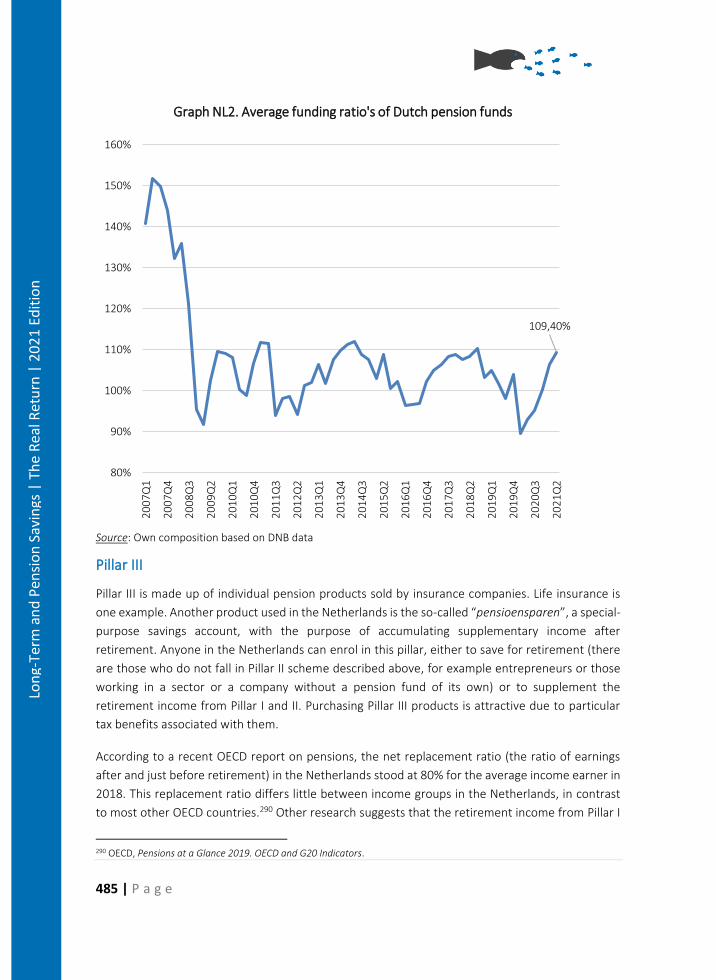
485 | P a g e
Lon
g-Te
rm a
nd
Pen
sio
n S
avin
gs |
Th
e R
eal R
etu
rn |
20
21
Edit
ion
Source: Own composition based on DNB data
Pillar III
Pillar III is made up of individual pension products sold by insurance companies. Life insurance is
one example. Another product used in the Netherlands is the so-called “pensioensparen”, a special-
purpose savings account, with the purpose of accumulating supplementary income after
retirement. Anyone in the Netherlands can enrol in this pillar, either to save for retirement (there
are those who do not fall in Pillar II scheme described above, for example entrepreneurs or those
working in a sector or a company without a pension fund of its own) or to supplement the
retirement income from Pillar I and II. Purchasing Pillar III products is attractive due to particular
tax benefits associated with them.
According to a recent OECD report on pensions, the net replacement ratio (the ratio of earnings
after and just before retirement) in the Netherlands stood at 80% for the average income earner in
2018. This replacement ratio differs little between income groups in the Netherlands, in contrast
to most other OECD countries.290 Other research suggests that the retirement income from Pillar I
290 OECD, Pensions at a Glance 2019. OECD and G20 Indicators.
109,40%
80%
90%
100%
110%
120%
130%
140%
150%
160%2
00
7Q
1
20
07
Q4
20
08
Q3
20
09
Q2
20
10
Q1
20
10
Q4
20
11
Q3
20
12
Q2
20
13
Q1
20
13
Q4
20
14
Q3
20
15
Q2
20
16
Q1
20
16
Q4
20
17
Q3
20
18
Q2
20
19
Q1
20
19
Q4
20
20
Q3
20
21
Q2
Graph NL2. Average funding ratio's of Dutch pension funds
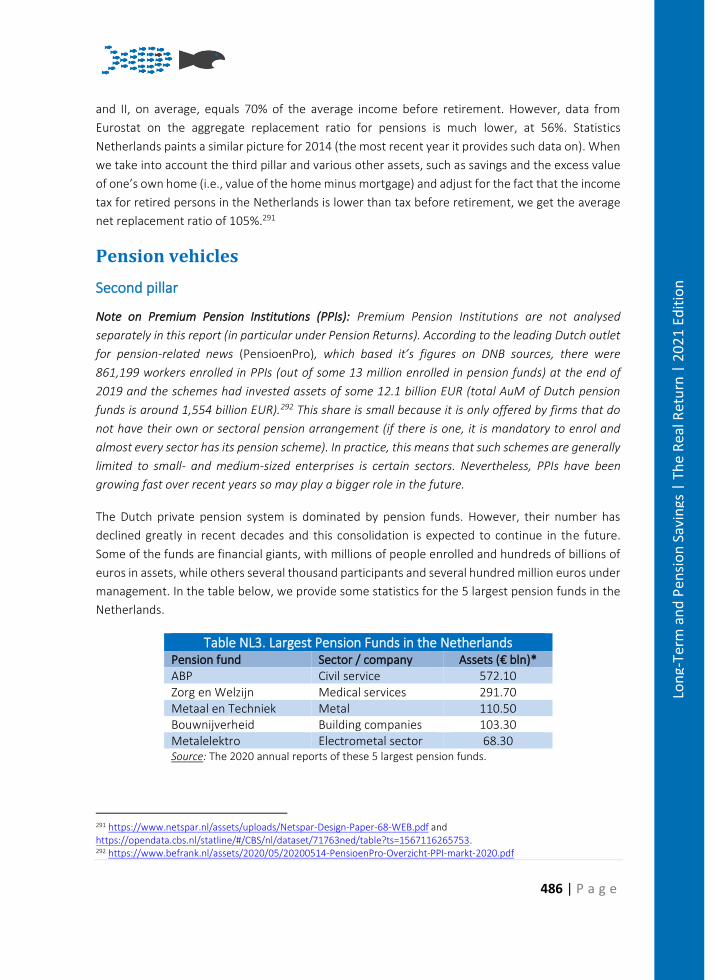
486 | P a g e
Lon
g-Te
rm a
nd
Pen
sio
n S
avin
gs |
Th
e R
eal R
etu
rn |
20
21
Edit
ion
and II, on average, equals 70% of the average income before retirement. However, data from
Eurostat on the aggregate replacement ratio for pensions is much lower, at 56%. Statistics
Netherlands paints a similar picture for 2014 (the most recent year it provides such data on). When
we take into account the third pillar and various other assets, such as savings and the excess value
of one’s own home (i.e., value of the home minus mortgage) and adjust for the fact that the income
tax for retired persons in the Netherlands is lower than tax before retirement, we get the average
net replacement ratio of 105%.291
Pension vehicles
Second pillar
Note on Premium Pension Institutions (PPIs): Premium Pension Institutions are not analysed
separately in this report (in particular under Pension Returns). According to the leading Dutch outlet
for pension-related news (PensioenPro), which based it’s figures on DNB sources, there were
861,199 workers enrolled in PPIs (out of some 13 million enrolled in pension funds) at the end of
2019 and the schemes had invested assets of some 12.1 billion EUR (total AuM of Dutch pension
funds is around 1,554 billion EUR).292 This share is small because it is only offered by firms that do
not have their own or sectoral pension arrangement (if there is one, it is mandatory to enrol and
almost every sector has its pension scheme). In practice, this means that such schemes are generally
limited to small- and medium-sized enterprises is certain sectors. Nevertheless, PPIs have been
growing fast over recent years so may play a bigger role in the future.
The Dutch private pension system is dominated by pension funds. However, their number has
declined greatly in recent decades and this consolidation is expected to continue in the future.
Some of the funds are financial giants, with millions of people enrolled and hundreds of billions of
euros in assets, while others several thousand participants and several hundred million euros under
management. In the table below, we provide some statistics for the 5 largest pension funds in the
Netherlands.
Table NL3. Largest Pension Funds in the Netherlands Pension fund Sector / company Assets (€ bln)* ABP Civil service 572.10 Zorg en Welzijn Medical services 291.70 Metaal en Techniek Metal 110.50 Bouwnijverheid Building companies 103.30 Metalelektro Electrometal sector 68.30 Source: The 2020 annual reports of these 5 largest pension funds.
291 https://www.netspar.nl/assets/uploads/Netspar-Design-Paper-68-WEB.pdf and https://opendata.cbs.nl/statline/#/CBS/nl/dataset/71763ned/table?ts=1567116265753. 292 https://www.befrank.nl/assets/2020/05/20200514-PensioenPro-Overzicht-PPI-markt-2020.pdf
487 | P a g e
Lon
g-Te
rm a
nd
Pen
sio
n S
avin
gs |
Th
e R
eal R
etu
rn |
20
21
Edit
ion
There are four kinds of pension funds in the Netherlands. First, there are the industry-wide pension
funds. Those administer and operate the pensions for an entire sector, such as food companies or
civil service. The civil service pension fund, ABP, is by far the largest in the country (and one of the
world’s largest) with assets worth over half a trillion euros at the end of 2019 and around 3 million
people enrolled. Secondly, there are corporate pension funds, administrating and operating
pension schemes for (often) major corporations. Thirdly, there are several pension funds for
independent professionals, such as medical specialists. Finally, there are the relatively new General
Pension Funds, which are allowed to ringfence and can incorporate several (former) corporate
pension funds under a single administrative umbrella to achieve economies of scale and improve
governance.
Pension funds are independent entities, i.e., they are strictly separated from the company (if
applicable) on whose behalf they administer and run the pension scheme. One of the consequences
is that if a company files for bankruptcy, employees know that their pensions are not affected.
By the end of 2020, Dutch pension funds in Pillar II had assets worth €1,679.4 billion in total, rising
again to €1,724.8 billion by the second quarter of 2021, representing a 8% and, respectively, 3%
increase. Although last year’s turmoil due to COVID-19 restrictions caused losses in the first and
second quarters, stock markets caught up and were, again, the main driving force behind this
increase. Dutch gross domestic product in 2019 was approximately €810 billion, so that assets of
the pension funds were valued at over 210% of Dutch GDP.293 The five largest Dutch pension funds
combined managed 68% of these assets.
293 Eurostat lists Dutch GDP in 2020 as €795.9 billion
(https://ec.europa.eu/eurostat/tgm/refreshTableAction.do?tab=table&plugin=1&pcode=tec00001&language=en).
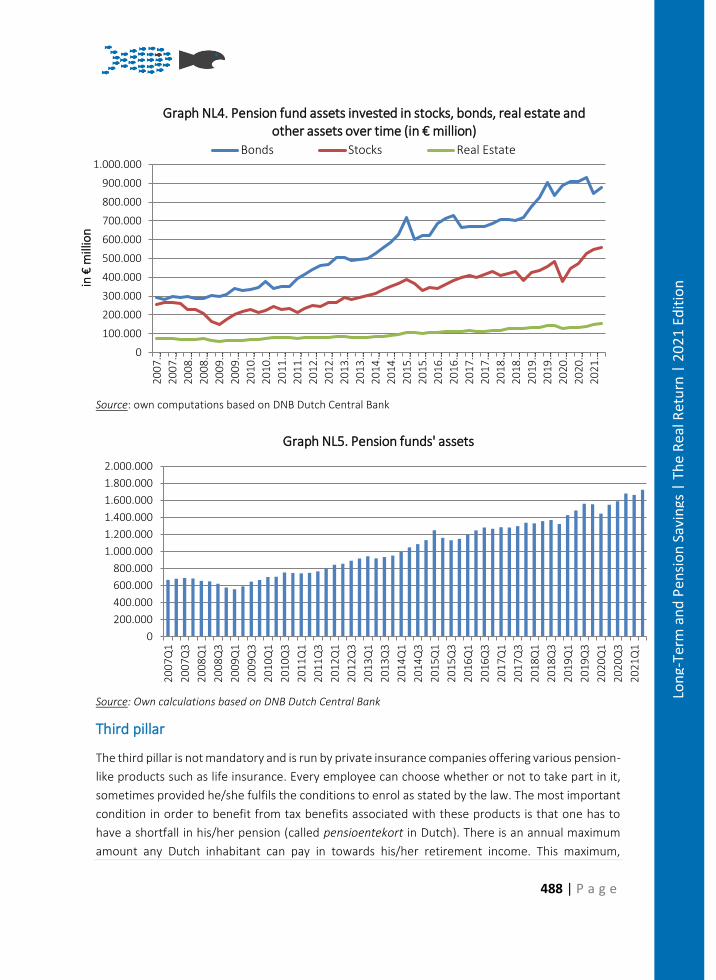
488 | P a g e
Lon
g-Te
rm a
nd
Pen
sio
n S
avin
gs |
Th
e R
eal R
etu
rn |
20
21
Edit
ion
Source: own computations based on DNB Dutch Central Bank
Source: Own calculations based on DNB Dutch Central Bank
Third pillar
The third pillar is not mandatory and is run by private insurance companies offering various pension-
like products such as life insurance. Every employee can choose whether or not to take part in it,
sometimes provided he/she fulfils the conditions to enrol as stated by the law. The most important
condition in order to benefit from tax benefits associated with these products is that one has to
have a shortfall in his/her pension (called pensioentekort in Dutch). There is an annual maximum
amount any Dutch inhabitant can pay in towards his/her retirement income. This maximum,
0
100.000
200.000
300.000
400.000
500.000
600.000
700.000
800.000
900.000
1.000.0002
00
7…
20
07
…
20
08
…
20
08
…
20
09
…
20
09
…
20
10
…
20
10
…
20
11
…
20
11
…
20
12
…
20
12
…
20
13
…
20
13
…
20
14
…
20
14
…
20
15
…
20
15
…
20
16
…
20
16
…
20
17
…
20
17
…
20
18
…
20
18
…
20
19
…
20
19
…
20
20
…
20
20
…
20
21
…
in €
mill
ion
Graph NL4. Pension fund assets invested in stocks, bonds, real estate and other assets over time (in € million)
Bonds Stocks Real Estate
0
200.000
400.000
600.000
800.000
1.000.000
1.200.000
1.400.000
1.600.000
1.800.000
2.000.000
20
07
Q1
20
07
Q3
20
08
Q1
20
08
Q3
20
09
Q1
20
09
Q3
20
10
Q1
20
10
Q3
20
11
Q1
20
11
Q3
20
12
Q1
20
12
Q3
20
13
Q1
20
13
Q3
20
14
Q1
20
14
Q3
20
15
Q1
20
15
Q3
20
16
Q1
20
16
Q3
20
17
Q1
20
17
Q3
20
18
Q1
20
18
Q3
20
19
Q1
20
19
Q3
20
20
Q1
20
20
Q3
20
21
Q1
Graph NL5. Pension funds' assets
489 | P a g e
Lon
g-Te
rm a
nd
Pen
sio
n S
avin
gs |
Th
e R
eal R
etu
rn |
20
21
Edit
ion
determined by the Dutch tax authority on an annual basis, ensures an acceptable retirement
income. If for any reason contributions fall under the maximum amount allowed, the contributor is
considered to have a pension shortfall and can deposit the amount equal to the difference between
the maximum allowed retirement contribution and the paid contributions into a savings account
for retirement income. There is a tax benefit involved since contributions can be deducted from the
taxable income, effectively reducing the income tax one has to pay. Moreover, the pay-off upon
retirement is taxed at a lower tax rate than the current income. Once a pension shortfall has been
identified, and the decision has been taken to deposit the difference on a special-purpose savings
account, the deposit(s) cannot be withdrawn before retirement.
The share of those third-pillar products in the retirement mix of the Dutch households is relatively
low. According to Statistics Netherlands, Pillar III products only account for 6% of the accrued
pension rights of Dutch households. By comparison, Pillar I accounts for around 54% with Pillar II
assuming a share of 40%.
Charges
Obviously, in order to make money, pension funds and insurance companies must spend money,
i.e., there are various fees and other costs involved with investing their assets on the financial
markets.
However, information on these costs was difficult to obtain and where available, they must still be
interpreted with a great deal of caution. For example, even the Dutch central bank stated in an
article from May 2014 that ‘there are reasons to believe that not all costs are reported’. The reason
is not that the pension funds do not want to report them, but rather that even they are not able to
determine them. For example, some companies investing assets of pension funds do not report all
costs separately, because it is not in their interest to do so. The Dutch financial markets supervisor
(Autoriteit van Financiële Markten, AFM) has called upon these companies to disclose all costs.
Another difficulty is that information on transaction costs, i.e., costs associated with transactions in
the financial markets such as purchase or sale of stocks and bonds or shares in investment funds
for example, is not always available.
The consequence is that in previous years when DNB asked the Dutch pension funds to provide the
supervisor with, among others, an analysis and details of all the costs they incur, 70 pension funds
were not able to report all costs associated with their investments. According to the AFM, ‘readers
of annual reports are not able to get a clear picture of the relationship between costs, returns and
risks pension funds are taking294. Just to illustrate how important costs are in the big picture:
294 Research report by AFM on information on various charges pension funds incur and how they report those in their annual reports, entitled ‘Op naar een evenwichtige verantwoording over deze kosten in jaarverslagen van pensioenfondsen’, July 2014
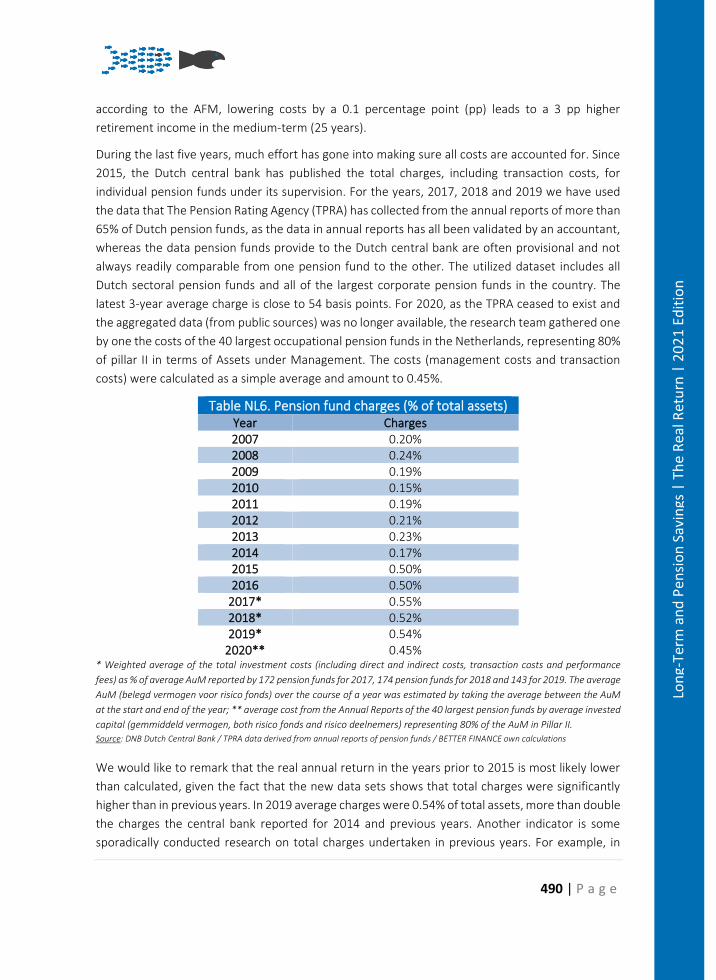
490 | P a g e
Lon
g-Te
rm a
nd
Pen
sio
n S
avin
gs |
Th
e R
eal R
etu
rn |
20
21
Edit
ion
according to the AFM, lowering costs by a 0.1 percentage point (pp) leads to a 3 pp higher
retirement income in the medium-term (25 years).
During the last five years, much effort has gone into making sure all costs are accounted for. Since
2015, the Dutch central bank has published the total charges, including transaction costs, for
individual pension funds under its supervision. For the years, 2017, 2018 and 2019 we have used
the data that The Pension Rating Agency (TPRA) has collected from the annual reports of more than
65% of Dutch pension funds, as the data in annual reports has all been validated by an accountant,
whereas the data pension funds provide to the Dutch central bank are often provisional and not
always readily comparable from one pension fund to the other. The utilized dataset includes all
Dutch sectoral pension funds and all of the largest corporate pension funds in the country. The
latest 3-year average charge is close to 54 basis points. For 2020, as the TPRA ceased to exist and
the aggregated data (from public sources) was no longer available, the research team gathered one
by one the costs of the 40 largest occupational pension funds in the Netherlands, representing 80%
of pillar II in terms of Assets under Management. The costs (management costs and transaction
costs) were calculated as a simple average and amount to 0.45%.
Table NL6. Pension fund charges (% of total assets) Year Charges 2007 0.20% 2008 0.24% 2009 0.19% 2010 0.15% 2011 0.19% 2012 0.21% 2013 0.23% 2014 0.17% 2015 0.50% 2016 0.50%
2017* 0.55% 2018* 0.52% 2019* 0.54%
2020** 0.45% * Weighted average of the total investment costs (including direct and indirect costs, transaction costs and performance
fees) as % of average AuM reported by 172 pension funds for 2017, 174 pension funds for 2018 and 143 for 2019. The average
AuM (belegd vermogen voor risico fonds) over the course of a year was estimated by taking the average between the AuM
at the start and end of the year; ** average cost from the Annual Reports of the 40 largest pension funds by average invested
capital (gemmiddeld vermogen, both risico fonds and risico deelnemers) representing 80% of the AuM in Pillar II.
Source: DNB Dutch Central Bank / TPRA data derived from annual reports of pension funds / BETTER FINANCE own calculations
We would like to remark that the real annual return in the years prior to 2015 is most likely lower
than calculated, given the fact that the new data sets shows that total charges were significantly
higher than in previous years. In 2019 average charges were 0.54% of total assets, more than double
the charges the central bank reported for 2014 and previous years. Another indicator is some
sporadically conducted research on total charges undertaken in previous years. For example, in
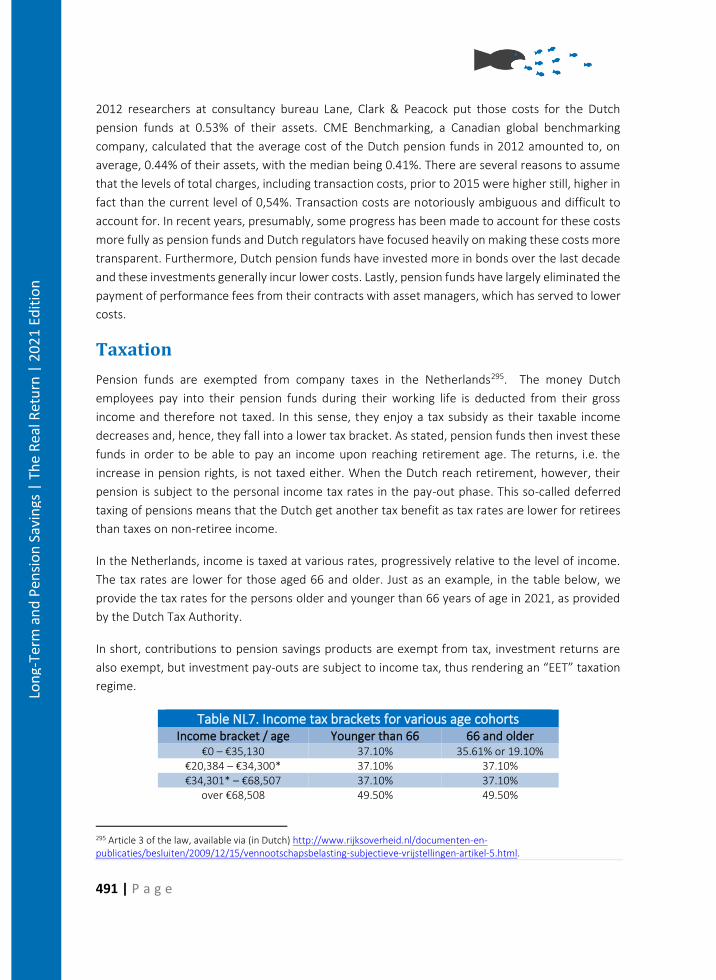
491 | P a g e
Lon
g-Te
rm a
nd
Pen
sio
n S
avin
gs |
Th
e R
eal R
etu
rn |
20
21
Edit
ion
2012 researchers at consultancy bureau Lane, Clark & Peacock put those costs for the Dutch
pension funds at 0.53% of their assets. CME Benchmarking, a Canadian global benchmarking
company, calculated that the average cost of the Dutch pension funds in 2012 amounted to, on
average, 0.44% of their assets, with the median being 0.41%. There are several reasons to assume
that the levels of total charges, including transaction costs, prior to 2015 were higher still, higher in
fact than the current level of 0,54%. Transaction costs are notoriously ambiguous and difficult to
account for. In recent years, presumably, some progress has been made to account for these costs
more fully as pension funds and Dutch regulators have focused heavily on making these costs more
transparent. Furthermore, Dutch pension funds have invested more in bonds over the last decade
and these investments generally incur lower costs. Lastly, pension funds have largely eliminated the
payment of performance fees from their contracts with asset managers, which has served to lower
costs.
Taxation
Pension funds are exempted from company taxes in the Netherlands295. The money Dutch
employees pay into their pension funds during their working life is deducted from their gross
income and therefore not taxed. In this sense, they enjoy a tax subsidy as their taxable income
decreases and, hence, they fall into a lower tax bracket. As stated, pension funds then invest these
funds in order to be able to pay an income upon reaching retirement age. The returns, i.e. the
increase in pension rights, is not taxed either. When the Dutch reach retirement, however, their
pension is subject to the personal income tax rates in the pay-out phase. This so-called deferred
taxing of pensions means that the Dutch get another tax benefit as tax rates are lower for retirees
than taxes on non-retiree income.
In the Netherlands, income is taxed at various rates, progressively relative to the level of income.
The tax rates are lower for those aged 66 and older. Just as an example, in the table below, we
provide the tax rates for the persons older and younger than 66 years of age in 2021, as provided
by the Dutch Tax Authority.
In short, contributions to pension savings products are exempt from tax, investment returns are
also exempt, but investment pay-outs are subject to income tax, thus rendering an “EET” taxation
regime.
Table NL7. Income tax brackets for various age cohorts Income bracket / age Younger than 66 66 and older
€0 – €35,130 37.10% 35.61% or 19.10% €20,384 – €34,300* 37.10% 37.10% €34,301* – €68,507 37.10% 37.10%
over €68,508 49.50% 49.50%
295 Article 3 of the law, available via (in Dutch) http://www.rijksoverheid.nl/documenten-en-publicaties/besluiten/2009/12/15/vennootschapsbelasting-subjectieve-vrijstellingen-artikel-5.html.
492 | P a g e
Lon
g-Te
rm a
nd
Pen
sio
n S
avin
gs |
Th
e R
eal R
etu
rn |
20
21
Edit
ion
Source: Dutch Tax Authority
This means that the tax deferral of pensions constitutes an advantage to an individual, as his/her
tax rate is lower when he/she turns 66. The average tax tariff in 2020 for those age 66 and older
was 37.10%. We have used the tariffs for the first three brackets on income tax as these are the tax
brackets that apply to the vast majority of Dutch retirees in practice (the fourth and highest bracket
only applies to income over €68,508 which is almost twice the modal income level in The
Netherlands).
As stated earlier, contributions towards pensions are deducted from the gross income. In order to
calculate the net tax advantage, we have to compare the average tax rate applied to pensions (as
stated: 37.10%) and the average tax rate that would have applied if contributions towards pension
income was not tax exempt. We can estimate this average tax rate by computing the average of
the first three brackets for people younger than 66 years of age. The second and third bracket are
the same for this age group but are counted separately to establish an average comparable to the
average rate for people aged over 66. The gap between the two averages can be seen as a tax
advantage for the older group. The average for those younger than 66 years of age in 2019 was
37.10% which means that the average person in the Netherlands enjoys nearly a 12pp tax
advantage on his/her pension scheme due to pension contributions being tax exempt and only
pension income is taxed.
Pension returns
As stated, the pensions Dutch employees receive upon reaching the statutory retirement age
depend on their pension funds achieving enough return on their investments. We will report
nominal annual, aggregate returns for all Dutch pension funds from 2000 onwards. This is done by
using the statistics available at the Dutch central bank, which supervises pension funds and
insurance companies. Annual returns will be reported for life insurance companies as well.
We will then focus on various charges and fees pension funds must pay. These costs must be
subtracted from the returns, as only net return is available for retirement income. In order to
establish the real rate of return, we will control for the annual inflation in the Netherlands
(Harmonized Index of Consumer Prices).
Pension funds
The Dutch supervisor of pension funds, the Dutch central bank, provides investment return figures,
in billion euros, for aggregate pension funds296 and also the quarterly return data for DB and DC
pension funds. Occupational pension funds’ average return can either be calculated as the ratio
between the total investment results and AuM or as a weighted average – by quarter – of returns
reported by the DNB. The results are the same.
296 http://www.statistics.dnb.nl/financieele-instellingen/pensioenfondsen/index.jsp
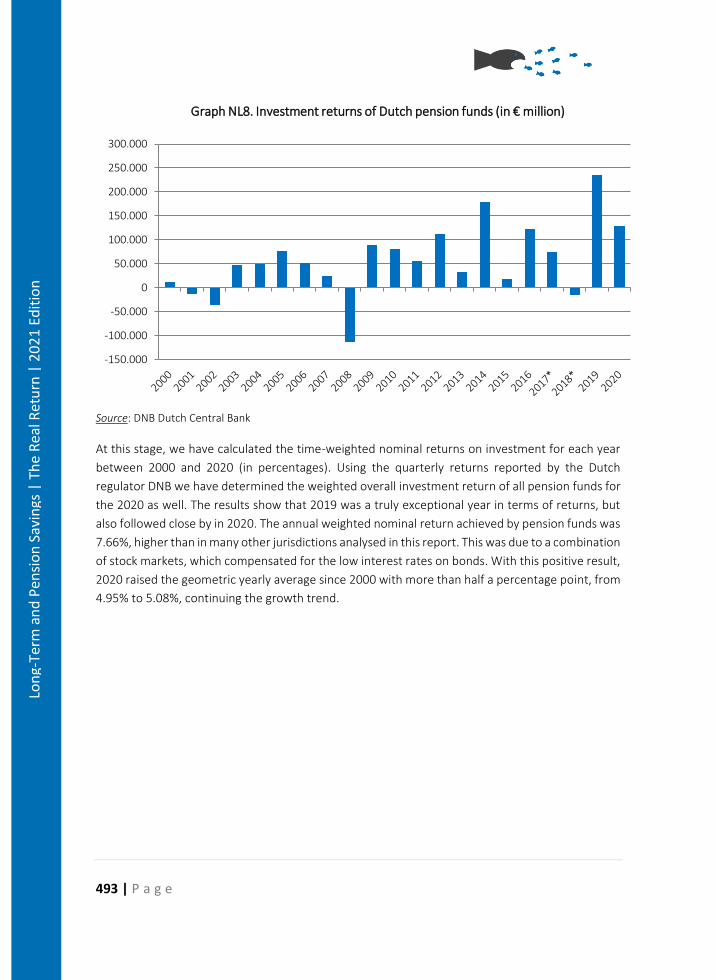
493 | P a g e
Lon
g-Te
rm a
nd
Pen
sio
n S
avin
gs |
Th
e R
eal R
etu
rn |
20
21
Edit
ion
Source: DNB Dutch Central Bank
At this stage, we have calculated the time-weighted nominal returns on investment for each year
between 2000 and 2020 (in percentages). Using the quarterly returns reported by the Dutch
regulator DNB we have determined the weighted overall investment return of all pension funds for
the 2020 as well. The results show that 2019 was a truly exceptional year in terms of returns, but
also followed close by in 2020. The annual weighted nominal return achieved by pension funds was
7.66%, higher than in many other jurisdictions analysed in this report. This was due to a combination
of stock markets, which compensated for the low interest rates on bonds. With this positive result,
2020 raised the geometric yearly average since 2000 with more than half a percentage point, from
4.95% to 5.08%, continuing the growth trend.
-150.000
-100.000
-50.000
0
50.000
100.000
150.000
200.000
250.000
300.000
Graph NL8. Investment returns of Dutch pension funds (in € million)
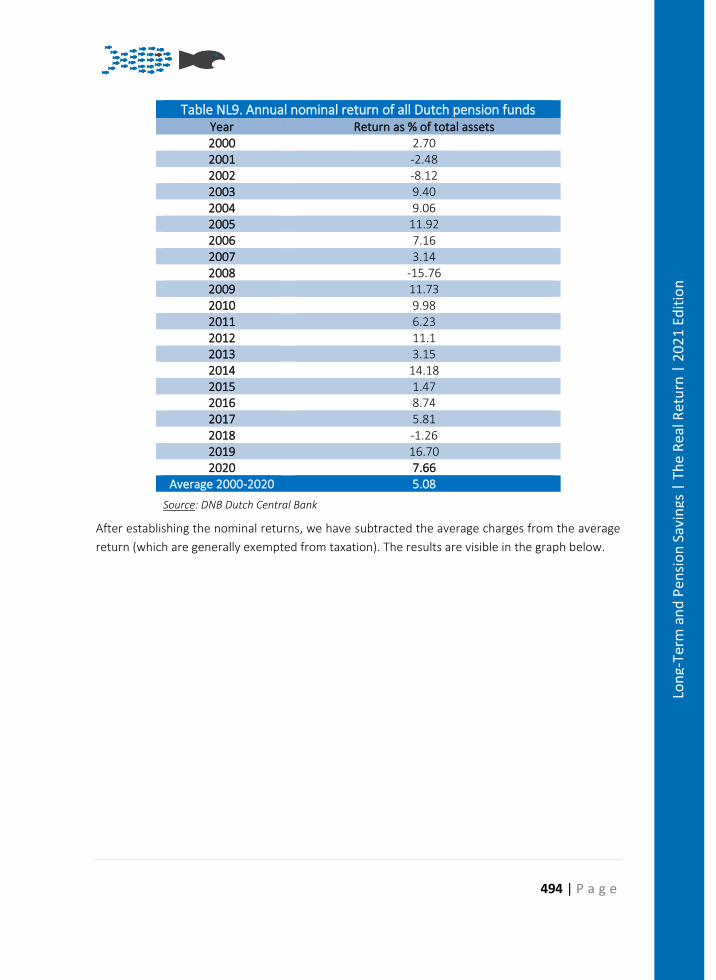
494 | P a g e
Lon
g-Te
rm a
nd
Pen
sio
n S
avin
gs |
Th
e R
eal R
etu
rn |
20
21
Edit
ion
Table NL9. Annual nominal return of all Dutch pension funds Year Return as % of total assets 2000 2.70 2001 -2.48 2002 -8.12 2003 9.40 2004 9.06 2005 11.92 2006 7.16 2007 3.14 2008 -15.76 2009 11.73 2010 9.98 2011 6.23 2012 11.1 2013 3.15 2014 14.18 2015 1.47 2016 8.74 2017 5.81 2018 -1.26 2019 16.70 2020 7.66
Average 2000-2020 5.08
Source: DNB Dutch Central Bank
After establishing the nominal returns, we have subtracted the average charges from the average
return (which are generally exempted from taxation). The results are visible in the graph below.
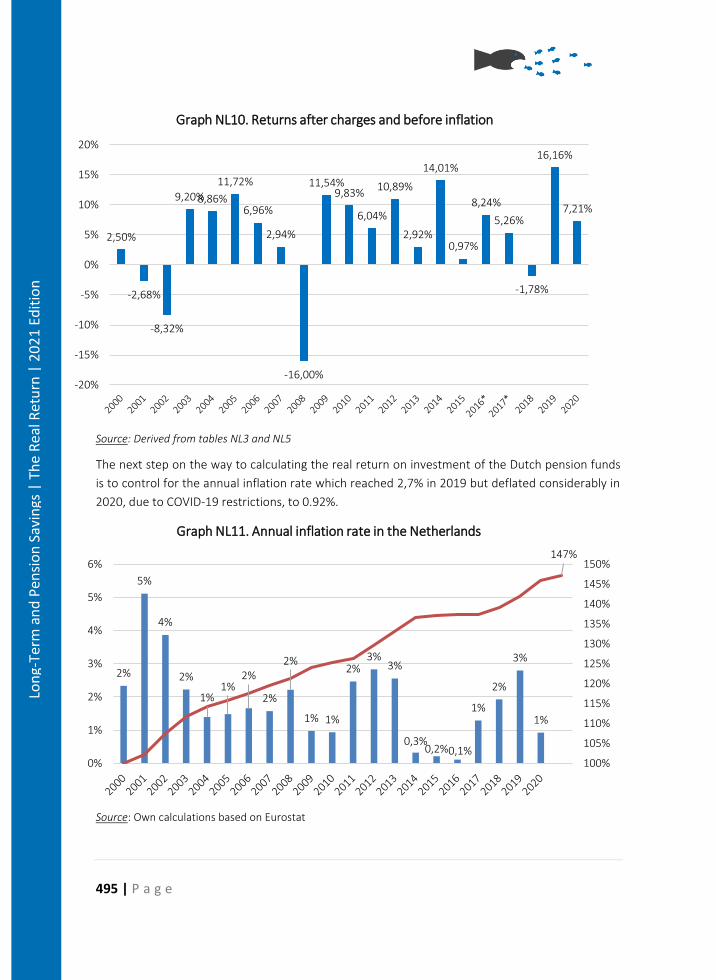
495 | P a g e
Lon
g-Te
rm a
nd
Pen
sio
n S
avin
gs |
Th
e R
eal R
etu
rn |
20
21
Edit
ion
Source: Derived from tables NL3 and NL5
The next step on the way to calculating the real return on investment of the Dutch pension funds
is to control for the annual inflation rate which reached 2,7% in 2019 but deflated considerably in
2020, due to COVID-19 restrictions, to 0.92%.
Source: Own calculations based on Eurostat
2,50%
-2,68%
-8,32%
9,20%8,86%
11,72%
6,96%
2,94%
-16,00%
11,54%9,83%
6,04%
10,89%
2,92%
14,01%
0,97%
8,24%
5,26%
-1,78%
16,16%
7,21%
-20%
-15%
-10%
-5%
0%
5%
10%
15%
20%
Graph NL10. Returns after charges and before inflation
2%
5%
4%
2%
1%1%
2%
2%
2%
1% 1%
2%3%
3%
0,3%0,2%0,1%
1%
2%
3%
1%
147%
100%
105%
110%
115%
120%
125%
130%
135%
140%
145%
150%
0%
1%
2%
3%
4%
5%
6%
Graph NL11. Annual inflation rate in the Netherlands
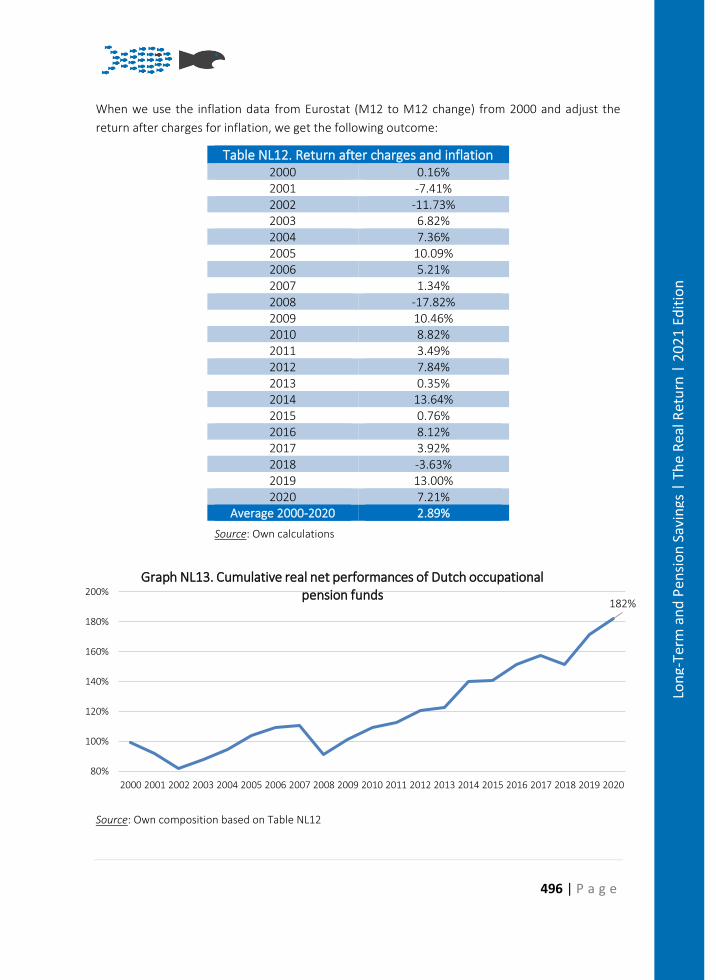
496 | P a g e
Lon
g-Te
rm a
nd
Pen
sio
n S
avin
gs |
Th
e R
eal R
etu
rn |
20
21
Edit
ion
When we use the inflation data from Eurostat (M12 to M12 change) from 2000 and adjust the
return after charges for inflation, we get the following outcome:
Table NL12. Return after charges and inflation 2000 0.16% 2001 -7.41% 2002 -11.73% 2003 6.82% 2004 7.36% 2005 10.09% 2006 5.21% 2007 1.34% 2008 -17.82% 2009 10.46% 2010 8.82% 2011 3.49% 2012 7.84% 2013 0.35% 2014 13.64% 2015 0.76% 2016 8.12% 2017 3.92% 2018 -3.63% 2019 13.00% 2020 7.21%
Average 2000-2020 2.89%
Source: Own calculations
Source: Own composition based on Table NL12
182%
80%
100%
120%
140%
160%
180%
200%
2000 2001 2002 2003 2004 2005 2006 2007 2008 2009 2010 2011 2012 2013 2014 2015 2016 2017 2018 2019 2020
Graph NL13. Cumulative real net performances of Dutch occupational pension funds
497 | P a g e
Lon
g-Te
rm a
nd
Pen
sio
n S
avin
gs |
Th
e R
eal R
etu
rn |
20
21
Edit
ion
Over the last 21 years, Dutch pension funds collectively have had very variable, even volatile, annual
results in terms of real returns. Real annual returns ranged from -17,36% in 2008, the year the
collapse of Lehman Brothers threw global financial markets into a tailspin, to 14,08% in 2014 when
the European Central Bank did its utmost to lift the Eurozone out of its debt crisis and stagnation.
Even as Dutch pension funds invest relatively heavily in bonds and other securities, their returns
have proved greatly dependent on volatile financial markets in an age of low interest rates. This is
partly due to the fact that interest rate changes have a greater impact on the durations and value
of securities when the starting rates are close to zero, compared to situations in which interest rates
at the start of year are at higher levels. Much of these returns, however, remain unrealized as
pension funds hold on to their bond assets to continue matching their long-term liabilities, which
are even more interest-rate dependent.
2019 and 2020 stood out as years of high real returns together with 2009 (a bounce back year) and
2014. During the aftermath of the dotcom bubble in the early 2000s, in 2008 when the financial
crisis was at its height and in 2018, real returns have been disappointingly negative. Overall, the last
21 years have produced solidly positive real returns for Dutch pension funds, with the geometric
annual average real return reaching 2.89% by the end of 2020. While the first decade of the 21st
century was a lost decade in terms of real returns, cumulative yields since the start of 2010 have
added 80% to the real value of pension savings.
Pillar III vehicles
Third-pillar products in The Netherlands have been wrought with problems in The Netherlands. In
2006 the largest financial scandal in Dutch history erupted when it was revealed that commercial
life insurance and pension products had hidden cost structures that greatly penalized savers. This
woekerpolis-affaire (usurious insurance affair) seriously dented the Dutch public’s trust in the
financial sector and sparked a host of regulations designed to increase transparency and limit or
eliminate profiteering. The momentum for such regulations was strengthened even further by the
global financial crisis which started two years later. These regulations threw the market for third
pillar products into turmoil, forced the reform or abolishment of some of these products
themselves, and greatly limited the profits that could be made with them by providers and
(especially) by middlemen. On the upside, consumer interest became better protected and the
impetus to increase transparency has made The Netherlands one of the global forerunners in terms
of detailed and accurate reporting on the fortunes and expenses of financial products and
institutions.
Afterwards, new products were introduced, some of which depended on interest rates. But these
have remained so low over the past decade that all pension products based on guaranteed benefits
have become unsustainably expensive to purchase and have all but disappeared from the Dutch
third-pillar market. Virtually all life insurances and pension products sold to individuals currently
have higher risk profiles. Furthermore, tax regime changes implemented in 2015 have also meant
that pension saving has become less fiscally attractive for those with high incomes. Nevertheless,
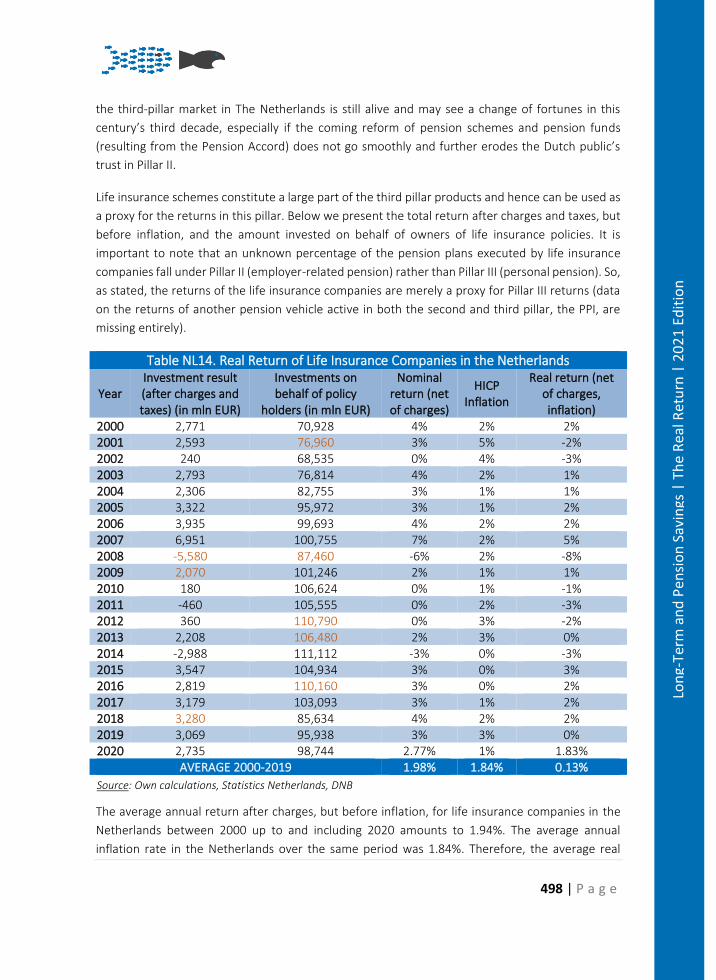
498 | P a g e
Lon
g-Te
rm a
nd
Pen
sio
n S
avin
gs |
Th
e R
eal R
etu
rn |
20
21
Edit
ion
the third-pillar market in The Netherlands is still alive and may see a change of fortunes in this
century’s third decade, especially if the coming reform of pension schemes and pension funds
(resulting from the Pension Accord) does not go smoothly and further erodes the Dutch public’s
trust in Pillar II.
Life insurance schemes constitute a large part of the third pillar products and hence can be used as
a proxy for the returns in this pillar. Below we present the total return after charges and taxes, but
before inflation, and the amount invested on behalf of owners of life insurance policies. It is
important to note that an unknown percentage of the pension plans executed by life insurance
companies fall under Pillar II (employer-related pension) rather than Pillar III (personal pension). So,
as stated, the returns of the life insurance companies are merely a proxy for Pillar III returns (data
on the returns of another pension vehicle active in both the second and third pillar, the PPI, are
missing entirely).
Table NL14. Real Return of Life Insurance Companies in the Netherlands
Year Investment result (after charges and taxes) (in mln EUR)
Investments on behalf of policy
holders (in mln EUR)
Nominal return (net of charges)
HICP Inflation
Real return (net of charges, inflation)
2000 2,771 70,928 4% 2% 2% 2001 2,593 76,960 3% 5% -2% 2002 240 68,535 0% 4% -3% 2003 2,793 76,814 4% 2% 1% 2004 2,306 82,755 3% 1% 1% 2005 3,322 95,972 3% 1% 2% 2006 3,935 99,693 4% 2% 2% 2007 6,951 100,755 7% 2% 5% 2008 -5,580 87,460 -6% 2% -8% 2009 2,070 101,246 2% 1% 1% 2010 180 106,624 0% 1% -1% 2011 -460 105,555 0% 2% -3% 2012 360 110,790 0% 3% -2% 2013 2,208 106,480 2% 3% 0% 2014 -2,988 111,112 -3% 0% -3% 2015 3,547 104,934 3% 0% 3% 2016 2,819 110,160 3% 0% 2% 2017 3,179 103,093 3% 1% 2% 2018 3,280 85,634 4% 2% 2% 2019 3,069 95,938 3% 3% 0% 2020 2,735 98,744 2.77% 1% 1.83%
AVERAGE 2000-2019 1.98% 1.84% 0.13%
Source: Own calculations, Statistics Netherlands, DNB
The average annual return after charges, but before inflation, for life insurance companies in the
Netherlands between 2000 up to and including 2020 amounts to 1.94%. The average annual
inflation rate in the Netherlands over the same period was 1.84%. Therefore, the average real
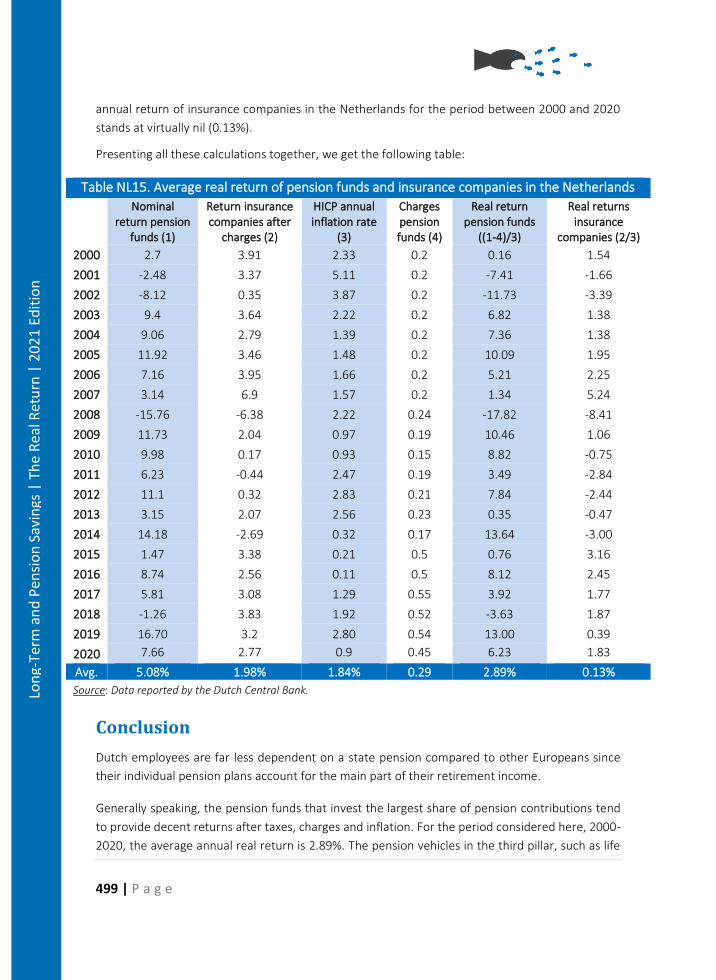
499 | P a g e
Lon
g-Te
rm a
nd
Pen
sio
n S
avin
gs |
Th
e R
eal R
etu
rn |
20
21
Edit
ion
annual return of insurance companies in the Netherlands for the period between 2000 and 2020
stands at virtually nil (0.13%).
Presenting all these calculations together, we get the following table:
Table NL15. Average real return of pension funds and insurance companies in the Netherlands
Nominal
return pension funds (1)
Return insurance companies after
charges (2)
HICP annual inflation rate
(3)
Charges pension funds (4)
Real return pension funds
((1-4)/3)
Real returns insurance
companies (2/3)
2000 2.7 3.91 2.33 0.2 0.16 1.54
2001 -2.48 3.37 5.11 0.2 -7.41 -1.66
2002 -8.12 0.35 3.87 0.2 -11.73 -3.39
2003 9.4 3.64 2.22 0.2 6.82 1.38
2004 9.06 2.79 1.39 0.2 7.36 1.38
2005 11.92 3.46 1.48 0.2 10.09 1.95
2006 7.16 3.95 1.66 0.2 5.21 2.25
2007 3.14 6.9 1.57 0.2 1.34 5.24
2008 -15.76 -6.38 2.22 0.24 -17.82 -8.41
2009 11.73 2.04 0.97 0.19 10.46 1.06
2010 9.98 0.17 0.93 0.15 8.82 -0.75
2011 6.23 -0.44 2.47 0.19 3.49 -2.84
2012 11.1 0.32 2.83 0.21 7.84 -2.44
2013 3.15 2.07 2.56 0.23 0.35 -0.47
2014 14.18 -2.69 0.32 0.17 13.64 -3.00
2015 1.47 3.38 0.21 0.5 0.76 3.16
2016 8.74 2.56 0.11 0.5 8.12 2.45
2017 5.81 3.08 1.29 0.55 3.92 1.77
2018 -1.26 3.83 1.92 0.52 -3.63 1.87
2019 16.70 3.2 2.80 0.54 13.00 0.39
2020 7.66 2.77 0.9 0.45 6.23 1.83
Avg. 5.08% 1.98% 1.84% 0.29 2.89% 0.13%
Source: Data reported by the Dutch Central Bank.
Conclusion
Dutch employees are far less dependent on a state pension compared to other Europeans since
their individual pension plans account for the main part of their retirement income.
Generally speaking, the pension funds that invest the largest share of pension contributions tend
to provide decent returns after taxes, charges and inflation. For the period considered here, 2000-
2020, the average annual real return is 2.89%. The pension vehicles in the third pillar, such as life
500 | P a g e
Lon
g-Te
rm a
nd
Pen
sio
n S
avin
gs |
Th
e R
eal R
etu
rn |
20
21
Edit
ion
insurance companies, return far less, practically nil over the same period. However, one must note
that the third pillar is relatively small, and a relatively small number of individuals are enrolled in it.
Historically, in the post-war period, Dutch employers and employees have invested much in pension
schemes and premiums, with the traditional rule of thumb being that one-fifth of wage benefits
were dedicated to pension investments. Also, the Dutch pension system has maintained an
exceptional degree of compulsion, submitting most sectors of the economy to mandatory sectoral
pension schemes. This, combined with a regulatory framework which utilizes discount rates that
are more prudent (many argue that these are too prudent) than those used by EIOPA, for example,
explains why the Dutch pension system is consistently judged to be (one of the) strongest in the
world.
Like other pension systems in OECD countries and elsewhere, however, Dutch pensions have come
under strain by the combination of an aging population and historically low interest rates. Over the
last decade, Dutch pensions have not kept up with inflation rates despite positive real returns. The
reason for this is the low discount rate that pension funds are forced to employ in their valuation
of pension liabilities, which in the age of low interest rates has made the effective returns of pension
funds (the growth of assets compared to the growth of liabilities) negative. Also, as the labour
market has become increasingly flexible, generational conflict has increased within pension funds
(which utilize cross-generational subsidies in the traditional expectation that employees spend their
entire working lives within a single sectoral or company-based pension fund) and a growing part of
the work force does not fall under any Pillar II pension scheme at all.
The Dutch government, trade unions, and employers’ organizations have signed an accord
(Pensioenakkoord) aimed to address the issue of intergenerational subsidies and financial
difficulties which points towards a general move away from DB towards DC. So far, however, little
has been done to address the growing Pillar II ‘blind spot’ (witte vlek) which may lead to strongly
declining average replacement rates in the future and to growing elderly poverty rates. On a
brighter note, Dutch pension regulators and pension funds, have pioneered a focus on cost-related
transparency over the last few years. Due to the financial clout of Dutch pension funds, this has
forced many (internationally operating) investment firms to clarify the structure of fees and
charges, as well as their policies on sustainable investments. The governance and efficiency of
pension funds themselves has improved as well, partly as a result of an ongoing process of
consolidation driven by mergers between pension funds.

501 | P a g e
Lon
g-Te
rm a
nd
Pen
sio
n S
avin
gs |
Th
e R
eal R
etu
rn |
20
21
Edit
ion
502 | P a g e
Lon
g-Te
rm a
nd
Pen
sio
n S
avin
gs |
Th
e R
eal R
etu
rn |
20
21
Edit
ion
Imprint
Editor and Publisher
The European Federation of Investors and Financial Services Users
Rue d’Arenberg 44
1000 Brussels
Belgium
Coordinators
Aleksandra Mączyńska
Ján Šebo
Ştefan Dragoş Voicu
Contributors
Torben M. Andersen Edoardo Carlucci Laetitia Gabaut Johannes Hagen José Antonio Herce Arnaud Houdmont Matis Joab
Michal Mešťan Gregoire Naacke Dayana Nacheva Yordanka Popova Guillaume Prache Joanna Rutecka-Góra Dr. Thomas Url
All rights reserved. No part of this publication may be reproduced in whole or in part without the
written permission of the editor, nor may any part of this publication be reproduced, stored in a
retrieval system, or transmitted in any form or by any means electronic, mechanical, photocopying,
or other, without the written permission of the editor.
Copyright 2021 @ BETTER FINANCE

Copyright © 2022 FDOKUMEN