ECONOM[C AN . SOCIAL COUNCIL - Repositorio CEPAL
288
UNITED NATIONS ECONOM[C AN . SOCIAL COUNCIL GENERAL E/CN.12/947/Add.1 7 February 1973 ENGLISH ORIGINAL: SPANISH ttttttttttttttttttttttttttttttttt ie ttttttttt I llllllll 1011111111111111111t11111111111111111111.11■10011011111,1111111,1111■ 1111,1111 1 11111 lllll OW101161111111 lllll 10111 lllllllll .11■1111111111111111,101,111111111■11111111.1111111111111 llllll 111111111 ECONOMIC COMMISSION FOR LATIN AMERICA Fifteenth sessíon Quito, Ecuador, 23-30 March 1973 LATIN AMERICA AND THE INTERNATIONAL DEVELOPMENT STRATEGY: FIRST REGIONAL APPRAISAL Part Toni 73-1-036
-
Upload
khangminh22 -
Category
Documents
-
view
2 -
download
0
Transcript of ECONOM[C AN . SOCIAL COUNCIL - Repositorio CEPAL

UNITED NATIONS
ECONOM[C AN
. SOCIAL COUNCIL
GENERAL
E/CN.12/947/Add.1 7 February 1973
ENGLISH ORIGINAL: SPANISH
ttttttttttttttttttttttttttttttttt ie ttttttttt I llllllll 1011111111111111111t11111111111111111111.11■ 10011011111,1111111,1111 ■ 1111,1111 1 11111 lllll OW101161111111 lllll 10111 lllllllll .11■ 1111111111111111,101,111111111■ 11111111.1111111111111 llllll 111111111
ECONOMIC COMMISSION FOR LATIN AMERICA
Fifteenth sessíon Quito, Ecuador, 23-30 March 1973
LATIN AMERICA AND THE INTERNATIONAL DEVELOPMENT STRATEGY: FIRST REGIONAL APPRAISAL
Part Toni
73-1-036

a

TABLE OF CONTENTS
Part Two
Chapter IV. LATIN AMERICA AND INTERNATIONAL ECONOMIC RELATIONS 1
1. Introduction 1
(a) International economic trends and the problems of the developing countries 1
(b) Trade policies of the developed countries 4
2. Relations between Latin America and the United States
(a) Introduction 6
(b) Evolution of trade between Latin America and the United States 7
(c) Co—operation between Latin America and the United States within the inter-American framework 13
(d) Some aspects of the financial assistance provided by the United States 17
3. Latin Americats relations with the European Economia Community 21
(a) Introduction 21 (b) Evolution of trade between Latin America and the EEC 23
(c) The common agricultural policy 29
(d) EEC trade policy and the trend towards the formation of a regional bloc 33
(e) The revision of the agreement of association with the African and' Malagasy States 36
(f) The extension of the regime of association to the member countries of the British Commonwcalth 39
(g) The enlargement of the EEC 42 (h) Adoption of the common agricultural policy regulations 46
(i) EEC financial assistance 50
(j) Situation and prospects for co—operation between Latin America and the EEC 52
4. Trade relations with Japan 53
(a) Evolution of trade 53
(b) Recent activities in the field of reciprocal economic relations 57
5. Trade relations with the socialist countries 58
/Chapter V

iv—
Chapter V. FOREIGN TRADE, MARITIME TRANSPORT, INSURANCE AND TOURISM
67
1. Evolution of foreign trade 67
(a) Composition of exports 69 (b) Exports at the start of the Second United Nations
Development Decade 71 (c) Terms of trade 79
2. Commodity exports 81
(a) Trends and features of commodity exports 81 (b) Price trends for the main commodities 89
3. The International Development Strategy and international trade policy measures , 93 (a) International measures relating to the products
listed in UNCTAD resolution 16 (II) 96 (b) International commodity agreements 97 (c) International buffer stocks 101 (d) Access to markets and pricing policías 102 (e) Other policy measures regarding basic commodities ese* 103
4. Exports of manufactures and general systems of preferences 105
(a) Trends and characteristics of exports of manufactures 105 (b) Systems of general preferences 117
S. Maritime transport 120 (a) The geographical structure of foreign trade and
maritime transport 120 (b) The development of Latín America's merchant fleet 121 (c) The organization of ocean shipping services 132 (d) The evolution of freight rates 134 (e) Ocean shipping and Latín America's balance of
payments 138 (f) Latin American ocean shipping policies 142 (g) The International Development Strategy and
ocean shipping 1111
•
/6. Insurance

6. Insurance 147
(a) Growth of the insurance market 148
(b) Participation of national companies 149
(c) Reduction in the net outflow of foreign exchange 150
(d) Investment of insurance capital and reserves 152
(e) Protection of policy—holders 153
(f) Insurance measures at the regional level 153
7. Tourism . 154
Chapter VI. EXTERNAL FINANCING 161
General considerations 161
A. VOLUME AND TERMS CF FINANCIAL RESOURCES ENTERING THE DEVELOPING COUNTRIES 162
1. The 1 per cent target 162
2. The 0.7 per cent target 167
3. Basic terms of official development assistance 170
4. Othor terms of financial assistance, particularly bilateral 172
5. Multilateral assistance 174
6. Volume and terms of financial resources entering Latin America 176
(a) Trend of the total flow of financial resources 176
(b) Characteristics features of the total flow of financial resources 182
(c) Features of official assistance 185
(d) Bilateral official assistance 188
(e) Multilateral transfers 190
B. SPECIAL ASPECTS OF DEVELOPMENT FINANCING 193
1, The supplementary financing scheme 193
2. Establishment of a link between the allocation of special drawing rights and the provision of additional development finance for developing countries 194
C. THE PROBLEM OF THE EXTERNAL DEBT 200
1. General background 200
2. External indebtedness trends of the developing countries 201
3. Possible solution to the problem of the external debt 207
/D. FOREIGN

vi -
Pa2e.
D. FOREIGN PRIVATE INVESTMENT AND ITS RELATIONS WITH DEVELOPMENT 212
1. Develcpments in the attitude to this issue, particularly in the third world 212
2. Sume data on recent trends in foreign investment in Latin America 213
3. Some observations on foreign investment policy 215
Chapter VII, REGIONAL INTEGRATION 219
1. Introduction 219
(a) Reletionship with international trade 219 (b) Selationship with development and import-substitution
industrializar ion 221 (c) The problems of the balance between countries 223 (d) Transport and telecomunications 225
2. Latin American Free Trade Association (LAFTA) 228
(a) Evolution of intra-area trade 229 (b) The lowering of intra-area trade barriere 233 (c) Sectoral agreements 238 (d) Progress on agreements between central banks and
other financial matters 247
3, Andean Group 248
(a) Background information on the establishment of the Andean Group 248
(b) The achievements 251
4, Central American Common Market 258
(a) Background data on the evolution of area trade 259 (b) The difficulties and crisis in the Central American
Common Market 265 (c) Recent corrective measures 268
5. The Caribbean Free Trade Association (CARIFTA) 271
(e) The background to the Agreement 272 (b) Expansion of trade 274 (c) Recent developments 279
/Chapter IV

PART TINO
Chapter IV
LATIN AMERICA AND INTERNATIONAL ECONOMIC RELATIONS
1. Introduction
(a) International economic troaa111125111211==.W112231122 countries Irrodpgsameamoroams
A number of important developments in the world economic situtation have occurred during the first years of the Second United Nations DevelopmentDecadEre
In the first place, there has becn a search for a new international order capable of solving the serious financial problems that marred the last years of the previous clocado and responding to the new situation and power structure that are emerging at the international level, especially among the countries at the centre.
Secondly, thc latter have mr.de a rapid recovery sine° the so-called monetary crisis, although an institutional and instrumental solution to its underlying causes still seems far off. Whether real or apparent, this ability to ríse above the crisis is another cicar proa? of the vitality these economies have acquired and of the self-sustainitio nature of their polioles 1/. Moreover, their recovery undoubtedly has a positivo
1/ The following (12 December in rocent
GROWTH OF nELL GNP IN SEVEW IIAJOR COUNTRIES (PercentaLe chan:fis seasonally adjusted at annual retes. Estimates and foreoasts)
table, taken 1972), shows
years, tegether
United Kingdom jz., United States France 11./ Germany Italy Canada Japan Total of above
from an OECD publication, the economic growth rato of with e forecast for thc first
Economia Outlook aoven countries
half of 1973:
Avercee
1958-1959
1969-1970
Compared wath previo= year
Compared with previous half-year
to 1971 1972 1973 1971 II
1772 1973 I II 1' Ir
3.1 4.2 -5.8 5.3 5.8 4.8 11.3
5.3
1.4 3*
2.7 di
5.1 5*
2.8 34
1.1 3
5.5 6
6.7 8-1
3.3 5.a
5 64 6 541 5 6 10i
612
5.1 3.7 7.0
-1.3 5.2 7.5 5.7
4.0
0.7 7.3 5.0 5.8 1.2 5.4 8.7
6.3 _
di 7 5 3 41 51
10,1
6
... 6.k 6i 51: 5 64
10-i
di
... 6 6 di 6 6i
11
6-1 countries 32/
1 Gross domes-tic product; la/ 1970 weiáltings and exchange ratea. /significance for

significance for the developing countries, particularly as regards the 'atter% trade and capital transfer prospects.
The third mejor development has to do with the marked tendency for the economies on the periphery to be excluded from current efforts and projects to reorcanize the international institutional structure. Despite the modest progresa mode in this field in the International Monetary Fund, several other foca, and especially UNCTAD III, have mode it olear that their aspirations have little likolihood of materializing in view of the unreceptiveness of the industrializad economies and some specific measures adoptad by the latter.
Taking the first two points, and particularly the economic reviva' of the countries at the centre, it will be appreciated that these countries will have to work out a new modus vivendi in the light of the changos that have taken place in their relativa economic strength. The disappearance pf the bi—polar system is already an aceomplished fact and the trend new is towards e multi—polar system with certain interu.relationships and the distribution of spheres of influence among the central economies. It goas without saying that the procesa is -Par from simple and many obstarles remain to be overcome, but recent developments, and particularly the increasing contacta bring developod with the socialist world, justify the aboye impression.
Be that as it may, this in no way significa that the new arder will bring the developing countries e satisfactory solution to their own problema. On the contrery, a number of ?actora that have come to light in recent years give reason te fear that these may persist or even become more serious.
Moreover, whatever the outcome of the new multi—polar system, which in some ways could oven give the developing countries certain tactical advantages, the fact is that their problema and grievances in respect of external matters will remain fundamentally unchanged. The question thus arisca to what extent the apparent roadjustments are going to facilitate the achievement of their objectíves or actually make this more difficult.
Among other things, it is cloar that in actual fact the prevailing system of international relations — in conjunction of course with such other ?actora as technologirel progresa — has affected not only the direction of trade flows but also their composition and volume, while at
/the same

- 3 -
the same time, the impact has been felt of the "verticalization" of economic ties between the countries at the centre and their spheres of influence, the development of transnational corporations, and the formation of the State-controlled sector.
Recent research shows that, not counting the socialist countries, the proportion of world trade carried out on a most-favoured-nation basis has steadily declined over the past 15 years whíle that based on preferential arrangements has risen. According to GATT: "The share of preferential in total imports of Contracting Panties has ricen continuously during the poriod observed, from 10 per cent in 1955 to 17 per cent in 1961 and almost to 20 per cent in 1961, to attain 24 per cent in 1970. This growth was mainly due to the continued dynamism exhibited by the mutual trade of the member countries of the European Communities. It may be noted that the share of preferential imports other than intra-EEC, intre-EFTA and United States automotíve imports from Canada shows a continued decline" 2/.
This tendency for the share of world trade conducted on a preferential basis to incroase, which will become oven more marked with the enlargement of the European Economic Community, poses a clear threat te the principie of non-discrimination which is the vory foundation of GATT. It may be noted that the United States, which sponsored the trade liberalization movements as a means of furthering its economic interesas throughout the world, also contributed to the gradual undermining of GATT!s usefulness by establishing its own preferential area with Canada and by requesting and chtaining, from March 1955, temporary exoneration from its agricultura) trade commitments. Honce the mejor preoccupation of the developing world: if the countries at the centre, despite their own disagreements, are promoting a new system of international relations, why should there not be a harmonious and effective method of incorporating general and non-reciprocal preferential treatment in external relations - whether commercial, financial, scientific or tochnological - for developing countries too?
The process of technological chango and the speed at which transnational corporations are spreading also has a serious effect en the direction and composition of trade flows. Although it is impossible to enter into details here, the point should at least be made that transnational corporations tend to create or accentuate oligopolistic market conditions and to emphasize the verticalization of relationships between economic centros and their respective spheres of influence.
Mil.011.11as
2/ GATT, "Main findings concerning trade at most-favoured-nation and at other ratos" (L/3708 of 21 Juno 1972 (limited distribution) and L/3789 (general distribution)). /(b) Trade

4
(b) Trade p2119111.9f the develo ed countries
A eles° look at what has happened in the sphere of trade in international economic affairs shows, first of all, that the trade policies of the developed countries have not in recent years changed sufficiently for progross to hg, made towards'the realization of their repeatudly stated intention of co-operating with the Third World. In the last two or there years,.for instance, no significant stops have been taken towards (i) the establishment of agreements on the main primary products exported by the developing countries, save recently in the case of cocea; (ii) the removal or reduction of tariff and non-tariff barriers against agricultural commodities and of,the subsidies which are granted in most developed countries to producers and exporters of agricultura' products with the result that developing countries' possibilitios of finding trade outlets for such products are limited and world markets are distorted; and (iii) the supprepsion of the numerous measures that currently hinder the export of manufactures from developing countries at competitiva erices. In addition to there still unsolved essentially commercial problems there are other problems of a different nature such as the maintenence of the export credit policies of the developed nations.
Secondly, as already indicated, recent devolopments in the EEC hint at a prolíferation of discriminatory preferential arrangements: prior to its recent enlargemunt, the EEC had concluded reciprocal preferential agreements with 28 countries, but a further 20 countries (12 in Africa, 4 in the Caribbean and 4 in the Indian and Pacific Oceans) and 19 dependent territories are now in a position to become associate members of the Conriuníty, while Ceylon, India, Malaysia, Pakistan and Singapore will also be receiving special treatment.
Thirdly, as regards trade in manufactures and semi-manufactures, the entry into effect of the generalizad system of preferences in 1971 and 1972 should theoreticaily be a positivo step, since it is designed to promote developing countries' exports of manufactured products through the reduction or elimination (depending on the country) of the customs duties of the developed countries. However, the advantages accruing from the system have in fact been fairly limited, particularly for Latin America. The agreement has not taken effect, for instance, in the United States, which is the region's biggest market; the concessions granted by the EEC are quite small, partly because the Community has maintained e bígger margin of preferences for its associated members; the advantages under the system are extended to a number of territories that are dependent upen the very countries granting the preferences; all the preference schemes exclude
/the so-called

- 6 -
the so-called sensitivo products, that is tr say, the light or traditional manufactures which actually or potentially represent the bulk of the exporta of manufactures of the developing countries; the developed countries have reservad the right to suspend or modify the concessions at any moment; processed agricultural products, except for a small list of products, are excluded from the preference schcmes; and fínally, the enlargement of the EEC means that the more generous concessions, adopted mainly by the United Kingdom and Denmark, will be replaced by the leas favourable EEC preference scheme.
Fourthly, no solution has yet been found to the difficult problom of reverse preferences; i.e., proferencos granted to products from EEC countries and the United Kingdom by associate membors and by countries of the British Commonwealth, respectively.
Finally, the mejor developed countries cuaterna duties en manufactures and semi-manufactures constitute on average between 7.1 and 13.4 per cent of all dutiable importa 3/. Non-tariff barriera, moreover, have been increasing and thus ralee significantly the real value of tariffs.
These limitations, and others that mainly affect trade between developed countries, have brought an increasing awareness that the existing system of international trade is unsatisfactory; the United States Congress itself has requested a revision of trade machinery. The 1973 multilateral negotiations could thus be an important step towards this much-needed revision and should devote particular attention te the proposals of the developing wcrld.
3/ Sec. GATT, "Main findings concerning trade at most-favoured-nation and at othor ratos", op. cit. From 1 January 1972, tariffs on non-agricultural products ware on average 9.4 per cent in the United Kingdom, 11.0 per cent in Japan, 8.3 per cent in the United States and 7.8 per cent in the EEC (EEC, Document de trovan_ XI/64/71.F of 23 February 1971).
/2. Relations
- 6 -
Relations between Latín America and the United States
(a) Introduction
The pattern of evolution followed in recent years by both the trade and financial relations between Latín America and the United States clearly shows up the veritable stagnation of inter-American co-operation. This is particularly serious considering that the United States continuas to be the principal market for Latin America% products and the mejor source of external financial resources for the region.
As regards trade relations, it may be noted that the slower rete at which Latin American exporte to the United States have grown compared with importe from that country has resultad in en increasing disequilibrium in the trade balance at the region's expense, added to the traditional deficit on financial transactions in Latín America% balance of payments with the United States. As far as financial flows are concerned, a phase of contraction in the authorization of credit began in 1969, and the effects of this, taking into account the customary delay in disbursements, are now becoming evident.
The Consensus of Viña del Mar, adoptad by the Letin American countries in 1969, constituted a collective expression of the region's aspirations for a real improvement in its relations with the United States. However, the practical results of this initiative have been meagre and to a certain extent frustrating for Latin America. The establishment of machinery for contact and negotiation between the two regions within the context of the OAS was effective only on a purely technical plane, and failed to lead to any negotiating process that might result in the elimination of tariff or non-tariff barriers to the access of Latin American products to the United States market. This situation weakened the machinery's real operation, and this helped te create a feeling of frustration in the Latín American countries as regards the development of inter-American co-operation. This situation, of a strictly regional character, has gradually been compounded by other more general factors which are reflectad in the absence of really significant action on the part of the United States and other developed countries in response to the proposals made at the various international forums by the developing countries and the Latin American countries in particular.
/(b) Evolution

(b) Evolution of trade between Latin America and the United States
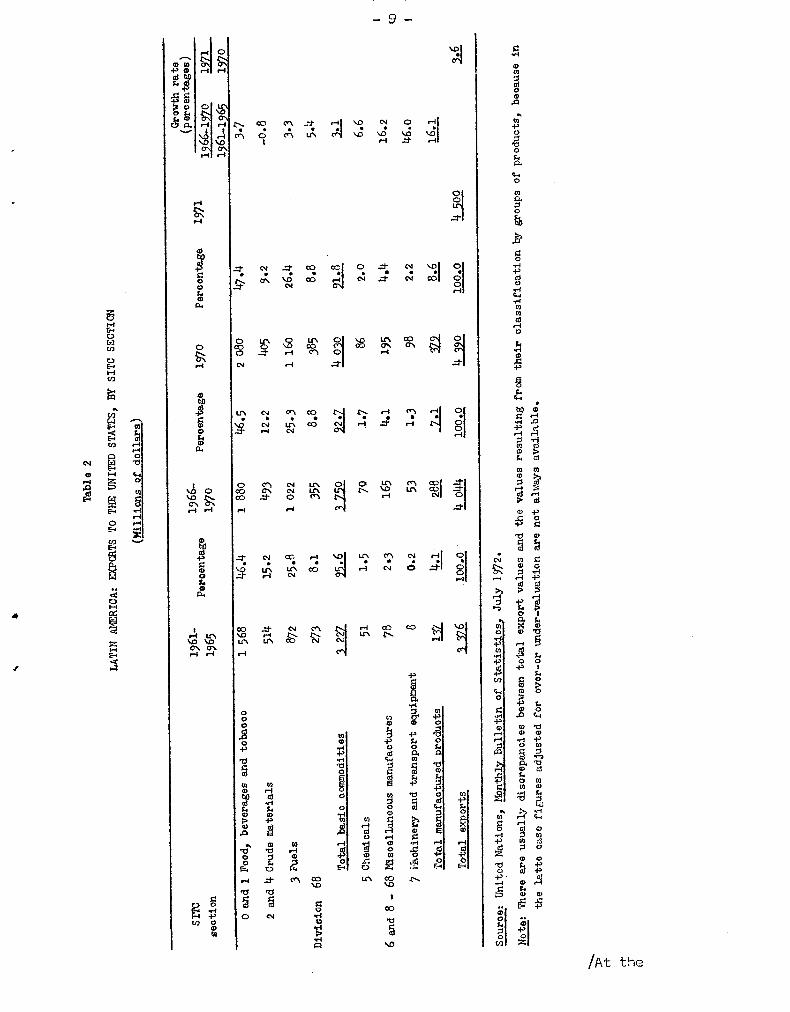
Trade relations between Latin America and the United States were characterized in the last decade by a chronic imbalance between exporte and importe, which resulted in a substantial trade deficit for the region (see tabla I). This was basically due to the low rete of growth of exports to the United States, which averaged 3.5 per cent annually, while imports increased by an average of 5.9 per cent annually. In fact, with the exception of sales to the United Kingdom, which increased by no more than 0,3 per cent annually, and to the group of socialist countries, exporte to the United States representad the least dynamic of Latin America's foreign trade sectors between 1961-1965 and 1966-1970. In 1971 the trend was still more unfavourable, since the increase in exporte was only 2 per cent over 1970.
The structure of Latin America's exporte to the United States did not change significantly during the decade, although in the last few years the share of exports of manufactures increased. Even so, in the periods 1961-1965 and 1966-1970, basic commodities (SITC sections O to 4, and division 68 covering non-ferrous mstals) representad 95.6 and 92.7 per cent, respectively, of exporte to that destination. In other words, commodities still represent virtually all Latin America's exporte to the United States (see table 2). Within this group of products, sections O and 1 (food, beverages and tobacco) have practically maintained their share (46.4 and 46.5 per cent, respectively), while that of raw materials declinad from 15.2 to 12.2 per cent. Generally speaking, the structure of exporte to the United States (even the small change in the proportion of raw materials) is much the same as that of Latin America's total exporte.
/Table 1

Tabla 1
LATZ1 AMERICA: a/ EXPORTS, EIPORTS AND TRADE BALANCE WITH THE PRINCIPAL REGIWS OF THE WORLD
(nillions of dollars)
rercent- Percont-
1961-1965 age of 1966-1970 ajo of 1970
total total
Porac ht- aco of 1971 b/ total
Poroeni- G rowth rete
ase of 1965-1970 1971 total 1961-1965 1970
Exyorts United States 3 332.8 35.9 3 956.5 32.5 4 353.8 30.5 4 274.2 30.8 3.5 -2.0 EEC (6 members) 1 913,0 20.6 2 580.9 21.2 3 179.8 22.2 2 889.3 20.9 6.2 9.1 United Kingdom 690.3 7.4 700.3 5.7 662.9 4.6 714.3 5.2 0.3 7.8 Upan 354.7 3.8 666.o 5.5 962.1 6.7 687.8 5.0 13.4 -28.5 Latin America 799.4 8.6 1 396,4 11,5 1 665.4 11.6 2 009.1 14.5 11.8 20.6 Socialist oountries 250,6 2.7 293.7 2.4 321.0 2.2 370.9 2.6 3.2 15.5 Other 1 942.8 20,9 2 587.0 21.2 3 154.9 22,1 2 910.0 21.0 5.9 -7.8 World 9 283.6 100.0 12 180.8 100,0 14 299.9 100,0 13 855.6 100.0 5.6 -3.1
Importa United States 3 598.3 43.6 4 787.o 41.7 5 752.9 41,1 5 533.2 35.7 5.9 -3.8 ffEC 1 653.1 20.1 2 188.9 19.1 2 657.6 19.0 3 152.8 20.4 5.8 18.6 United Kingdom 442.1 5.4 531.8 4.6 639.6 4.6 770.0 5.o 3.8 20.4 tapan 322.0 3.9 587.1 5,1 870.6 6.2 948.3 6,1 12.8 8.9 Latin America 933.3 11.4 1 5664 13.7 1 849.1 13.2 1 947.6 12.6 10.8 5.3 Socialist oountries 129,2 1.5 147.2 1.3 132.5 0.9 201.8 1.3 2.6 52.3 Other 1 160.5 14.1 1 659.7 14.5 2 100.6 15.0 2 936,2 18.9 7.4 39.8 World 8 243.5 100.0 11 467.7 100.0 14 002.9 100,0 15 489.9 100.0 6.8 10,6
Trade balance United States -265,5 -830.5 -1 399.1 -1 259.0 EEC 259,9 392.0 522.2 -263.5 United Kingdom 248.2 168,5 23.3 -55.7 tapan 32.7 78 .9 91.5 -260.5 Latín America -138,9 -169.6 61.5 Socialist oountries 121.4 146.5 7 111:5 169.1 Other 782.3 927.3 1 054.3 -26.2 World 1 040.1 713.1 297,0 -1 634.3
Source: IMF, Direction of Trade 1960-1964, 1962-1966, 1966-1970; and official foreign trade statistics.
Note: Exporto fob; imports cif.
a/ Exoluding Cuba, 1/Provisional figures.
/Ta bl e 2
LATIN AMERICA:
SITC SECTIO
N
vi
C.0
0
ai
•
1-1 r4 • n
ffl 5 ✓I
0 1-1 E. +-I
8 xa
Monthly Bull
etin of Statistics, July
4-t
o
o R.
o
o
.6% O ri
o
o ft,
o
tki) ri
CR
N IN
c1
1>
O
O O
oo
o
o
export values
between total
usually di
screpancies
avai
lable,
figure
s adjusted
for
o o
r4 co CO
43
o O f••■
Total basic commodities
otal
manufaotured
Total e
xports
6 an
d 8
- 68 Ndscellaneous manufactures
7 Machinery and transpor
t equipment
Qi
o o
O
ri O \
— 9 —
o
o o
o 1 Fo
od, beverages
2 and 4 Cruda materials
O ri .--. t, 0 0 O'N 4. 0 r4 r-I OtO $4 0 43
1
4: O O 5.1 •D f. 0 cr.
c. .5 o, ..4 r4 ,S. CO eN ..d- r4 ‘.0 N O r4 ....... I I • • cA u; • s.4;• \ o • ,...c1
!.9 r-I el O
\ O '4 #.4 ..2- 0.4 O \
vi r-I
O
‘0 CO —1. cc: C.. \ °e co I 2: Ol 04
r,4 04 ri
O
•
r4 o-% O O \O CO 0
CO \ O LIN 0 1.1 \ ln CO
ri
•••4
oi
0
LI\ C,N CQ • • • •
O
•
co r4 N
a.
r4 • • • rl
0 CO Cs1 t■ 1/40 CO " O el Lf O O Le \ \ COI
CO C'l rl \
r4 1,1 r4
O 10 4. CM CO ,I t-r. C:\ 04 r4 O al
o r4 04 ...j 81 Z • • •
N 04 e; • * Ñ trl U-N CO to• rl
V) O r.4 r-li
\O tr, co
•
Cs4
0 \ O\ UN co
ri 4-4
/At the

- 10 -
At the level of specific products, there has been 4 rapid expansion in exporta of some high-cost agricultural commodities such as meat and fresh fruit and vegetables, in contrast with tropical products and various raw materials for industrial use (sea table 3). Between 1961-1965 and 1966-1970 the United States increased its purchases of meat from Latin America at an annual rete of 15.6 per cent, while those of fruit and vegetables, fresh or frezan, grew by 11.1 and 22 per cent annually 4/. In the tropical products group, there were appreciable increases in exports of sugar and cocoa to the United States (7.7 and 8.5 per cent annually), but in the case of sugar it is significant that in spite of chis rete of increase, Latin America has not yet recovered the share of sugar exports to the United States which it enjoyad before that country suspended its trade with Cuba. The value of exports of coffee, which is the mejor Latin American commodity sold to the United States, declinad by 2.3 per cent per year, so that the region's share in that market feil from 79.6 per cent in 1961-1965 to 65.9 per cent in 1966-1970. In the group comprising raw materials for industry, the most unfavourable case was that of wool, importa from Latín America declining in almost the same proportion es total wool importa by the United States.
Gales of manufactures attained high retes of growth, but their absoluta values are very small, as is their share in the region's total exporta. In any case, however, it may be notad that the share of manufactures in exports to the United States rosa between 1961-1965 and 1966-1970 from 4.1 to 8.6 per cent, the most significant feature being the rapid growth of exporta of machinery and transport equipment. The GATT study mentíoned earlier shows that during the period 1966-1970 United States imports of manufactures rase at an average rata of 14.3 per cent annually, comparad with only 4 per cent for agricultural commodities. It is interesting to note that the annual growth of Latin America's exports to the United States followed a very similar trend. However, there is no doubt that Latin American exports of manufactures will have to grow at still higher retes if the traditional prirrary structure of exports is to be modified.
4/ The recent study published by GATT entitled Trends in United Sta::es Merchandise Trade 1953-1990 (Geneva, July 1972) points out that importa considerad to be more or leas directly competitiva with domestic production have grown at a steadily increasing rete in United States trade, with increases af 25 per cent between 1953 and 1965, and 50 per cent over the next five-year period. According to the same study, the items mainly responsible for this expansion have been meat (United Sta-tes imports of which increased six-fold between 1953 and 1970), dairy products, fruit and vegetables, tobacco and beverages (particularly wine). The study expressed the view that if the quantitative restrictions against the entry of several of there products were not in force, the expansion of world exports of those items to the United States market would have been even greater. /Table 3

tr%
2 0, .4 s•-o o bD oN
4-1 1., 0 r4 I
cd tD 0 \ O
-1 .5 1 O \ r4 ...I
r-1 O
a a -P 0 s. 0 O LO CL4 O
a3 o X.41 1)
-01
-I> 1t)
R4 O 03 4:0
o o o
O
O
r-1 •.0 \0 r.1
LA \O 4.4
CT. r4
;31
a
5
cn 4:1
r-IO • 0
O
1-4
O ti
O
(Fob values in m
illt
ons of dzllar
s)
CO O t... «N 1." t.. O g.§ O CO O CV • • • • • • • • •
CO co 04 CV LA .(•••■ 1
•
ri
1.;.14 Z,
VD
c`N e t-4
C4 • CO
--
• Crl r-I
•D * C V
«N
o'N V:1 CV
..t" •
Pi
Crt • CV
cn
• .1,-.
•
e t'V C4
■0 •
t-4
1.-1 j c0
• C4
e
0 •
1---.
Cr\ •
r4 •
.0.. C4 t'... LA ..§ g•ag t.. O Ir% CN CO 01 .d" ri O • • o • • • • o • 11» O * 0
LA CA .t",,, CA CO c0 LA C\ O CA 07) Z... CA LA
ts- ON H r-1 •0 /",.. CO CO Z.... ..4 1." cm .C., c:
.2 N •■ 1 ri ,0 O r4 r4 ..1" 01 0 VD 0-1
r4 rl 1-1 2`...
CV ..d"' M 1 kl) ON. co • e • • • •
rt • • • o • o • •
L. v-4
til cr., LIN D,. o:, 3 .7.1: 3 -A
\O O CA LA 4.4 1..4 N N O ■C) CO 04 I ..1* • • • • • • • • • • • • • o
t". O O LA O'N LA CA CA \O LA O CA '.0 `,0
CV Cr. 00 el .ts, 0'1 .2' 0-■ ,U505 O í r-1 ri csi
0-% co c•-■ o O • • • • • • * • • 44 •
\O• CA ah O 0"".
t's. ars ■o tr. LA O g-§ :A LC1
CV rl t." 0 r4 Cn, g.§ ts-
r1 ri
t" c•-s `.0 04 •.0 Lt> u-. •.o 0-N ! • • • o • • • • e • • c • • •
•0 LA 0 \ as \ 04 CO \ CO Q O • cv •• O C^t o'N cs1 .2 LA UN LCN r-4
Z`• • 1" 0-% LC1 ON tr. r-1 UN I"
Co. 3
e I» •
r0-I
C4 1" CO r-I t's CO r-I
0-1 ■0 CV •.0 O'N 0 -2 1" CO • • • • • • • •
csi c0 rag UN el r4
..O
CO j O I
N
• • cf:
o
0-1 O +' rI
.c3O 49g 1 o 445. ag
4.1 o a ...0 O
4 .4 o
a...4 O g 0 4.)
.4 4, 4, C3 O 4.. o .z 4 O ,t5 0 t
2 4'
o s• 49 O 4.0... 5 f. Le orl
O f.. O
<re .5 .. 44 .0 p
f• ee-4 L3 w
4., 4, : „ y, . o o
O O c. 4> 1 0
0 0 f. 0 0 fa O áf 5 y o Pa 4 ,r. 5 r. .-I *O e>
O O • ca 0 0 f. fa S. O 0 0 al o o o 1 a ...
"4 0 tal c..4 o 0) 4-1 e> o
Z 4 r.... > cía c.) o h.' o c-, at o 4
f. •cl 4. • 0
O N 2 .
0 ... O O 4.> P.
0
,..,c., o. ....„, . co Ti fa P. "tá o g 5. c.. 11, 0
f. t 5 g
0 0 0 7-1 $4 .
e
N
g O P. I ..4 a.
74 \I W. , . . iT. , ,.... o. 1 g . 119. . . . s c., ■ 1) CO.c.31 cec? Fk {; .‘4 et:j aig
O C. O O O O O CV CV CV o'N C,1 ■0 ■C>
o o 0 4.) 4.1
O 0
0 0 0 E-. E-. P.
CV
s.° 0 C" tr• OD CV 0\ CN 04 • • • • • • • • • ..dt C?4, j
g ..tr: gi co .d• C4 g C•1 r--1 .2 14-1 Z' CA 1 I'. 04
t-'1 r-t r4 CO c•J
\ O t., O N C•1 0e e • • • • • • • e
4l \O c4 0 CV LA .4.0 04 C4 s.° O N 04 Crl, 01 01 .O.• ad- OA ri
CO O \ CA 0 cc> CV 1"
• . • • • 11 • • •
c.4(7‘ \«15 t c,-■
col cl• Csl CO %.0 04 CO s
C
O •
CV CV cso
O .r•-• 11 • • H al
\ rl
o -1.1
✓4 .4 0
cr3 -P tfi CA o •ti -rl
45g E-. 5,1 .3 o O o c.
OI O • fa
o Pa O E O .4 O • a3
f
▪
• o
..9
al
/This is
- 12 -
This is the objective of the systems of general preferences approved by UNCTAD at the end of 1970. In a study published in 1972 on the probable impact of general preferences on United States imports 5/, the United States Tariff Commission concluded that, on the basis of a group of 160 manufactured products the value of imports from developing countries might be expected to rise from 1,300 million dollars in 1967 to 3,900 mullían in 1980, whereas if the preferences were not put into effect the increase would be only from 1,300 to 2,300 million dollars between 1967 and 1980. Nevertheless, the United States* system of preferences has not been put into force, despite that countryos repeateddeclarations in UNCTAD and GATT.
An analysis of Latin America's imports in the past decade reveals some changes as regarás their geographical origin (see table 1). The United States continues to occupy first place as a source of supply for Latín America, but its importance continued to decline, from 43.6 per cent in 1961-1965 to 41.7 per cent in 1966-1970 and 35,7 per cent in 1971. The share of imports from the United Kingdom and the socialist countries also declined. The changes which took place in 1971 seem to accentuate the trend towards a more balanced distribution of imports. The United States was the only country affccted by an absolute decrease in Latin American purchases, whereas the United Kingdom and the EEC regained the share they had at the beginning of the pest decade, and imports from Japan continued their rapid growth. Nevertheless, it was in 1970 and 1971 that the deficit in Latín America% balance of payments with the United States reached its highest levels: 1,399 and 1,259 million dollars, respectively.
To sum up, the analysis of trade between Latín America and the United States over the pest decade reveals a steady decline in the United States' share of both total exports to and total importe from the reglan 6/. In spite of this trend, which is obviously due to a number of factcrs 7/, it must be borne in mind that the United States continues to be
5/ United States Tariff Commission, Probable Effect of Tariff Preferentes for Developin. Countries, Staff Research Paper N° 2 (Washington, 1972).
6/ This is clear from the fact that between 1960 and 1970 Latin America% share in the United States' total importe fell from 24 to 11 per cent, and in its total exporte from 17.4 to 13.3 per cent.
7/ In an OAS study entitled "Hacia una mayor participación latinoamericana en el mercado de los Estados Unidos" (CIES/1376) of 12 May 1969, it is considered that the relativa marginalization of Latin America from the United States market during the 1960s is one-third attributable to the region*s shift to other suppliers and two-thirds to the change in the composition of United States importe in favour of manufactured products.
/the principal

-13-
the principal purchaser of Latin American products and even more so the principal supplier of products to the region. On the first points it is
interesting to note that for the United States the Latin American countries play an important role as suppliers of raw materials: in 1970 the region supplied 42.3 per cent of that country's total importe of 14 basic commodities. The proporticns varied between 57 and 80 per cent for coffee, sugar, and fruit and vegetal-Jipe; between 31 and 45 per cent for cocoa, íron ore, copper, leed, and petroleum and petroleum products, and between 18 and 26 per cent for meat (fresh and canned), non-ferrous metal ores and wool 8/.
Latin America is also a very important market for some United States
products. In 19701 exports of chemicals from that country te Latin America totalled 778 million doliere, which is much higher than the value of its exporte to Canada (533 million dollars), Japan (322 million dollars) or the EFTA countries (405 million), and is comparable with its sales to the EEC (945 million doliere). Latín America importad 2,836 million donare, worth
of machinery and transport equipment from the United States in 1970, which is only a líttle less than the value of importe from that country by the EEC (2,954 million dollars) and much higher than that of importe by Japan (1,145 million) and EFTA (1,787 million) 9/. These figures show that in spite cf the weakening trend of both exporte and importe ín trade relations between Latin America and the United States, these relations still retain what might be called "basic" or "strategic" aspects which justify the continuance of efforts to improve the conditions of trade between the
two regions.
(c) Co-o eration betwcen Latin America and the United States within the inter-American framewcrk
Quite apart from the internal factors affecting the United States demand for imported products, the expansion of Latin American sales to that market during the last decade was curbed by the maintenance and, in certain cases, the strengthening of protectionist barriere, notwithstanding the commitments assumed at international and regional forums to improve the conditions of access for products of developing countries in general and
yez....wwwwle".•
8/ See tabla 3.
9/ United Nations., Commodity Trade Statistics, 1970, Series D, vol. XX, Nos 1-20.
/Latin American

-14-
Latin American countries in particular 10/. In fact, not only was there no progress in the liberalization of trade with the Latin American countries, but in certain cases the restrictions were accentuated, particularly as regards non-tariff barriera.
One sucht case was the modification of the 1965 sugar law by virtue of which the share of United States producers in supplying the dwestic market was raised at the expense of Latin American exporters; another was the introduction in 1964 of quotas for imports of beef 11/ ,- a measure which was reinforced by the request to external suppliers in 1968 to impose voluntary restrictions on exports - and similar quotas for imports of dairy products in 1967-1968. In short, the restrictiva mensures adopted by the United States during the past decade obstructed imports of a wide range of products, i.e„ wheat products, cotton, groundnuts, dairy products, sugar, meat (fresh, chilled or frozen), fish, and petroleum and petroleum products. The steps taken to imports such as the suspension in 1965-1966 of the import quotas for leed and zinc established in 1958, and more recently the meat quotas, did little to change this unfavourable situation in the area of trade relations between Latin America and the United States,
In view of this wsekening of inter-American co-cparations which had been manifest not only in trade but also in the field of financial assistance 12/, the Latin American countries, at the meeting of the Special Committee on Latin American Co-ordínation (CELLA) in May 1969, adopted the Consensus of Viña del Mar, in which they submitted te the Government of the United States the elements of a new approach to their reciprocal relations in the trade, financial and technical assistance fields. The Consensus of Viña del Mar, as» the expression of the will of the Latin American countries genuinely to co-ordinate their position vis-á-vis the United States, was intended not merely to recail previously assumed commitments, but also to ensure the
111.1111.1111.11111.3..-41.311.11,01.111WW110011111111M.4•0
10/ It may briefly be recalled here that such commitments are set forth, in particular, in the following documents: (a) at the world level: Ministerial Programme of GATT, 1963; Part IV of the General Agreement on Tariffs and Trade; recommendations A.II.1 and A.III.4 adoptad at the first session ofUNCTAD; and the International Development Strategy; (b) at the inter-American level: Buenos Aires Protocol of 27 February 1967, and Declaration of the Presidenta of- America (punta del Este, 14 April 1967).
11/ In view of the steady risa in meat prices, the import quotas were temporarily suspended in March 1972.
12/ Questions relating to financial assistance for development are dealt with in chapter VI.
/establishment of

- 15 -
establishment of machinery for identifying specific obstacles to exporte of Latin American products to the United States and for the conduct of negotiations for their progressive elimination. In the financial field, the aim of this document was also to define new methods of co-operation between Latín America and the United States.
In resporee to this collective approach by the Latín American countries, the United States Government announced a new type of partnership in which "all voices are heard and none ís predominant", involving "a more balanced relationship" between the two regions 22/, and proposed a new approach to co-operation with Latín America based, inter alía, on the following principies: a firm commitment to the inter-American system and to the compacte between the region and the United States, a formal commitment to continued United States assistance for Hemisphere deve1opment, and,support for Latín American initiatives within the inter-American system. The proposed measures include the decision to leed a vigorous effort to reduce the non-tariff barriers to trade maintained by near:ly all industrialized countries against products of particular interest to Latín America, determined support for the Generalized System of Preferences, and increased technical and financial assistance to promote Latin American exporte. In the financial field, the President of the United States announced that, as from 1 November 1969, AiD luans would be freed to allow purchases not only in the United States but anywhere in Latín America, and that all other onerous conditions and restrictions on United States assistance 1oans would be reviewed, with the objsctive of modifying or eliminating them. Of particular interest was his reference to the establishment within the inter-American system of regular consultaticn on trade matters.
On this last point, and aleo in connexion with finance, the next few months witnessed specific attempts to define the context of a new form of co-operation between the two regions. The establishment in February 1971 of an OAS Special Committee at the ministerial level as an instrument for consultation and negotiation between the Latín American countries and the United States was basically aimed at helping to strengthen inter-American relations 14/.
13/ Speech delivered by President Richard Nixon at the meeting of the Inter-American Press Association on 31 October 1969.
14/ The Special Committee for Consultation and Negotiation (CECON) was established, and its functions in connexion with trade determined, in resolution REM 1-70 adopted at the Eighth Ministerial Meeting of the Inter-American Economic and Social Council.
/The Ad Hoc

- 16 -
The Ad Hoc Group on Trade to Deal with Tariff and Non-Tariff Barriers and Related Matters was set up as an operational instrument of the aboye Special Committee to identify the obstarles in the United States
'market obstructing imports of products of interest to Latin America, and to submit te the Special Committee proposals for their progressíve eliminationr. This Group held several meetings which enabled it to make considerable headway in the identifícation of the tariff and non-tariff barriers existing in the United States, of which it compiled an exhaustiva list. However, it has found it quite impossible to proceed with the second stage of its programme, i.e., to hold negotiations in order te define the conditions for eliminating those barriere. The United States representative stated, in particular, in September 1970, that as regards tariff barriers his country% contribution towards complying with Latin America% requests should be considered on the basic of the offers of concessions formulated within the context of the United States system of general preferences, which included a larga number of products reviewed by the Ad Hoc Group 12/. The difficulties in reeching agreement on the reduction or elimination of tariff and non-tariff barriers, and the fact that UNCTAD III was to be held shortly, caused the member countries of CECON to postpone the meetings that were scheduled for early 1972. This state of affairs continuad until December 1972, when the sixth meeting of the Ad Hoc Group on Trade to Deal with Tariff and Non-Tariff Barriere and Related Matters and the third regular session of CECON were held. Although the report of this session is not yet available, it will be seen from the Report of the Ad Hoc Group on Trade that no agreement was reached on the questions under consideration:
"At the sixth meeting of the Group, the United States Delegation, while recognizing that trade restrictions had been identífied in document CIES/CECON-COMERCIO/45, took note of the Latin American view that the proposals set forth in documents CIES/CECON-COMERCIO/46, 47, 48, 49 and 50 had not been satisfactorily answered,
"For that reason the Group could not consider specific recommendations to the Special Committee for Consultation and Negotiation with a view to e gradual modification, reduction or elimination of non-tariff barriers in the United States market and to improvement of the United States offer under the Generalized System of Preferences.
12/ However, at the end of 1972, i.e., two years after that statement, the draft legislation for putting a system of general preferences into effect had etili not been presented.
/"Regarding the

- 17 -
"Regarding the latter point, the Latin American countries participating in the sixth meeting of the Ad Roe Group emphasized their concern over and disagreement with the fact that the United States had not thus far put into effect its offer under the Generalized System of Preferences, in accordance with the commitments already assumed
in various regional and international forums 16/."
(d) Some asp2cts of the financial assistance provided the
United States
First and foremost it seems useful to consider the financial assistance provided to Latin America by the United Ste.tes within the oyeran context in which the economic relations between the 1-colon and that country have developed. One indicator of the development of these relations is the
balance of payments (see table 4). It will be noted that during the five
years 1966-1970 the net flows of bilateral capital from the United States were not enough te offset that countryls trade and services surplus in its operations with Latin America, so that the United States balance of payments showed a net surplus, while in the five years 1961-1965 the opposite was
the case.
The trend recorded between the two five-year periods was mainly influenced both by the significant growth of the United States trade and services surplus and by the fact that, within the net flows of capital,
official capital grew very slowly (from 432 to 494 million dollars, in terms of annual averages, the latter being much the same as the figure for 1970), a fact which was also observable in the case of unilateral transfers. Although net flows of private capital rase by an average of about 260 million dollars annually between the first and the second five-year period, it must nt be overlooked that this increase was the result of direct investments from which the United States itself obtained an increase in income of 500 million dollars annually between the same periods, i.e., double the aboye figure.
16/Report of the Ad Hoc Group on Trade to Deal with Tariff and Non-Tariff Barriers and Related Matters to the Third Regular Meeting of the Special Committee for Consultation and Negotiation (0EA/Ser.H/XIII, CiES/CECON-COMERCI0/63), 13 December 1972.
/Table 4
- 1.8 -
Table 4 UNITED STATES: SUNMARY OF BALANCE OP PAMIERTS WITH LATIN AMERICA a/
(lillions of dollars)
Annual averages 1969 1970 1961-
1965 1966. , 1970
1. Exporte of goods 3 52o 4 671 4 822 5 650 2. Importe of geoda .3 706 -4 420 -4 470 -4 855 3. Trade balance (1-2) -186 251 352 795 4. Travel and transport balance
-50 72 47 76 5. Investment income (a) Total private 1 165 1 638 1 753 1 693 (b) United States Government 112 138 149 160 (e) Total
1 277 1 776 1 902 1 853 6. Payments on Latín American investment in the United States -249 -312 -332 7. Other services .34 +25 +18 +37 8, United States direot expenditure on defence -77 406 -112 -118 9. Balance on services (4+5e+6+7+8) 1 061 1 518 1 543 1 516 10. Flows of private capitel (a) Direct investment and purohases of seourities .149 -399 -341 -478 (b) Loans (o)
.289 ..276 +13 -558 Total .438 -675 -338 -1 036 11. Movmments of offielal capital from the United States -.432 -494 .540 -506 12. Unilateral transfers (a) From the United States Government -244 -272 -247 -292 (b) Prívate (o) Total
120 -364
-163 .435
-178 -425
-189 -481
13. Net balance of United States capital (5e-10o-11-12c) 67 226 645 .74 14. Latín American capital in the United States 12 27 25 48 15. Total transfiere and flows of capital (10o+11+12o+14) .1 222 -1 577 1 278 -1 975 16. Balance (3+9+15) -347 192 617 336
Souroe: United States Department of Commeree and Department of the Treasury; Inter-American Committee en the Allianoe for Progrese (CIAP), United States Ce -operatiaa with Latín America within the trame- work of the Allianee for Progrese (OEA/Serial/kW, CIAP. 530, eorrel, 2 November 1971), tablee 117.1, IV-4, IV.6 and 111.6.
2/ The data on the balance of payments between the twm regions are presented in this tabla from the stendpoint of the United States, i.e., a plus sign mearas income for the United Sietes (outfloww from Latín America) and a minus sign means outfloWs from the United States (income for Latín America).
/The slow

- 19 -
The slow increase in net official bilateral aid provided by the United States to Latin America - which means that there was actually a significant decline in its share in total official aid to the region - coincided with the progressive weakening of the Alliance for Progress Programme. As stated in the chapter on external financing, the new policy established by President Nixon in 1969 with respect to United States financial assistance amouhted to a large extent to recognition that the original formulation of that programme was being essentially altered. Among the main changes announced at the time was that of giving more priority to official multilateral assistance, while bilateral aid would be reduced.
Another important factor which has influenced this state of affairs is that the United States Government has been fínding it increasingly difficult to obtain prompt approval by Congress, without mejor changes, of the draft external aid legislation submitted to the latter body. On one occasion at the end of 1971, Congress even rejected the bill presented by ths Executive and, in general, the Governmentos proposalli have been subject to delays and cuts.
In these circumstances, the average annual official aid authorized for Latin America, which amcunted to 1,037 million dollars in the three years 1966-1968, was reduced to 740 million in the period 1969-1971 17/. This reduction was due not only to political considerations of a general character, but also in large measure to the impact of the worsening of the United States1 overall balance-of-payments problems, which - as noted previously - had nothing to do with its financial relations with Latin America. The restrictions will primarily affect disbursements from official bilateral sources which may be made in the early part of the 19701s.
On the whole, the prospects with respect to the evolution of official assistance from the United States to the whole of the third world during the next few years are not top bright. It is.estimated, for example, that between the two-year periods 1970-1971 and 1974-1975 the coefficient of United States official development assistance will probably be reduced
17/ See CIAP, Proyecto de informe del CIAP al CIES (CIAP/579/Add.1), 9 November 1972, table 19.
/from about
20
from about 0.31 to 0.25 per cent of its cross national product, in the light of available data on that country% external co-operation policies and budget 18/. This would mean that the real value of United States official development assistance, in absolute terms, would remain constant during that period. Naturaily, whatever happens specifically with respect to Latin America Will be in line with this overall trend and Will depend on the United States externa? co-operation policy with regard to the distribution of official development assistance over the developing regions.
In the chapter on external financing, data are given on the development of some qualitative aspects of United States official assistance, e.g,, basic credit conditions, "tying" of loans, credit for programes, etc., so these matters need not be considerad here. However, it is worth making special mention of the increase recordad in the retes of interest on AID and EXIMBANK loans, Between 1961 and 1970 the rata rose from about 2 per cent to just over 3 per cenit annualiy for the formar, and from 5.5 to 6 per cent annually for the latter, In addition, EXIMBANK credit operations took on an increasingly commwcial character, with this institution covering only half of each credit sale of goods eligible for financing, the other half being financed by private United States banks on the terms currently prevailing in the commercial credit market. In addition, the repayment period for the portion financed by EXIMBANK was reduced from 13 to about 5 years duríng the period considerad.
21/ See the statemenrt made by Mr. Robert S. McNamara, President of the International Bank for Reconstruction and Development, at the third session of UNCTAD, Santiago, 14 April 1972.
/3. Latin

— 21 —
3. Latín America's relations with the Euro ean Econcrhic Comullit
(a) Introduction
Ouring the 1960's, the European Economic Community (EEC) adopted many economic and trade policy measures that are directly related to the current or potential development of Latin Arnerica's exports to the EEC countries. These measures include the regulations that make up the common agricultura' policy; a policy that became even more protectionist and harmful to the trade interests of the majority of the developing countries as it became applied to more and more products. Other measures were connected with the process of institutional transformation that was initiated as a result of there new members joining the EEC: en historie event whose implications for third countries cannot be easily assessed, but which must be considered prejudicial to the Latín American countries in that it means that yet more markets, such as the United Kingdom market (traditionally open to imports from developing countries), will be applying the restrictive regulations in force within EEC. As a result of the adoption of the common agricultural policy (in particular its high price levels) there is a great possibility that there will be drastic changes in the structure of supply and demand for agricultura' products in the new member countries changes that will have an effect on trade flows between Latin America and the new members and the enlarged Community as a whole.
At the same time, a new and vast trade grouping aimed at stepping up economic integration is taking shape, in which the nucleus of the EEC proper is surrounded by a number of industrialized countries (for example, the ex—members of the European Free Trade Association, which are to form a free trade area with the EEC for manufactures) and a considerable number of developing countries (most of the countries of the Mediterranean basin) that are linked to the EEC through preferential—type trade agreements. There are also the ex—members of the British Commonwealth
mostly African countries — that have been given the chance, under the tercos of the treaties of accession, to opt in 1973 for any of several formulas which include association with the Community under the conditions laid down in the existing regime of association with the Associated African and Malagasy States.
/It'is

- 22 -
It is to be expected that each of these changes, which will begin to come into effect starting on 1 January 1973, will have a marked Impact - varying in aach case can the Community's trade flows. It should be borne in mind that the institutional transformations that are being effected are shaping e new structure of world trade based on the formation of a bloc with EEC at the centre surrounded by a group of European. Mediterranean and African countries that are linked to it through preferential agreements and other forms of economic and financial co-operation. To give an idea of the centripetal trends of the EEC it may be useful to note that between 1958 and 1970 the share of intra-area trade among the six EEC members as a proportion of total trade rose from 29.6 to 48.4 per cent, such trade growing annuelly by an average of 16 per cent, compared with 9 per cent for trade with the rest of the world 19/.
In other words, the establishment of this trade bloc will inevitably tend to promete trade within the bloc itself, with a number of consequences for trade with third countries, This situation undoubtedly representa a challenge to the Latin American countries as regards the future of their relations with the enlarged EEC, which has become, through its enlargement, a market for exporta comparable in importance tu the United States, and also extremely important as a source of supply. .In brief, Latin America will have to face e number of situation during the present decade that do not favour its exporta to the enlarged Community, such as an increase in agricultura) self-supply within the EEC; greater competition in the area of tropical-zona products (owing to the fact that the regime of association is being made available to the Commonwealth ccuntries) and in the area of Mediterranean-type products in general; and in addition heightened Competition for its sales of manufactures within the new European free-trade area made up of the ex-members of EFTA. Consequently, it is even more essential and urgent then ever for the Latin American countries to intensify their efforts to develop a joint pelicy vis-á-vis the Community, not only covering general principies, which have already been defined within CECLA, but also, and most important, covering the specific operational modalities on which they wish futura co-operation with the EEC to be basad.
In view of the unfavourable effects of Community regulations on their exporta to the EEC, the Latin American countries have been pressing since 1958 and 1959 for the initiation of a dialogue aimed at securing the adoption of economic and trade co-operation measures between the two regions. These
12/ "Le commerce extérieur de la Communauté", in Bulletin des Communautés européennes, N° 6, 1972.
/efforts did

T 23-
efforts did not bear fruit until 1969, when direct contacts were established between Latin America and the EEC and machinery was set up for consultation, based on periodic meetíngs of representatives of the two groups. Although it is not yet possíbIe to forecast what specific decisions may flow from this machinery, the fact that the Community tpproved it marks the biggest step forward yet in Latin America's relations with the EEC over the past ten years.
(b) Evolution of trade between Latin America and the EEC
Between the periods 1961-1965 and 1966-1970, Latin America's exports to the EEC grew at an annual rete of 6.2 per cent; while this percentage is greater than that for exports to the United States, it is less than that for intra-area exports and exports to Japan.
The nine countries of the expended EEC had a share of 27.7 per cent of total Latin American exports in 1961-1965 and 26.4 per cent in 1966-1970; the annual average rete of expansion was 4.7 per cent as against 6.2 per cent for the EEC itself. This difference was due to the lack of dynamism in exports to the United Kingdom, which only increased by an annual 0.3 per cent during the period under consideration.
The expended EEC has practically the same relative importance as the United States as a market for Latin American products. In 1971, Latin American exports to the nine EEC countries accounted for 27 per cent of the total exports of the region, compared with the 29 per cent share of the United States. If earlier growth retes continue, the Community will within a few years replace the United States as the main market for the products of the reglan.
As regards the evolution of trade by countries, it may be observed that the.group which registered the poorest growth rete was made up of the exporters of temperate-zone agricultura) products (Argentina and Uruguay), whose sales grew only at an annual average rata of 0.2 per cent for Argentina and 0.7 per cent for Uruguay between 1961-1965 and 1965-1970. This state of affairs is closely connected with the drop between 1951 and 1970 in exports of some important products such as beef to the United Kingdom market (see tabla 5) and to the Community of the Six (see table 6). Venezuela is in an even more unpromising situation, since its sales dropped at a rate of 1.8 per cent annually between 1961-1965 and 1966-1970, owing to the stagnation in its exports of petroleum. The devolopment of exports to the expended EEC by other countries, such as Colombia and Paraguay, has been more favourable.
/Tabla 5

04 04
c'd • a, O
rol r4
CO 1.^ Cr% • • •
N ON
o 4> VD O N 0
¿
h g •
O
al al
'04 O 0~4
•P Dp•irirl
r al M
Products
and SITC
olassificati
on
8
1 8
(Millions of d
o 1lars oif)
▪ 4. 1
:I
•
al
1 1 O li o
ri 1 r4 1:1 1
X.
1 4.• r x ._,
44 rf
ef al O
V O
1. r1 $4 O 03 CO d 8 .9 ›«)
.1 I ,-. « g ..4
'0 O O ort 33 1 1/40
r4 .41 r4 •r1 ON
Sa 4. g Le 4> @ rl O ad O O J1 al O
O X o
.4 o
lo ri :1 4-■ 0
.1 ,
1/40
Com mowea
lth .4
e94
ser ies
B y C, 1961-19 65.1970; Overs e
as Tr
ade Statistios of the United Kingdom, Dece mbe
r 1910 and December 1971.
- 24 - Ce1 O'N ‘.0 C4 ..4 c" .r.. oN 10 .t... .2. O'N rl k.0 01/4 01 al O ON ON • • • e • • • • • • e • • • • • • e • •
1/40 r1 1/40 r4 O 42LeN r• c."‘ co rl CV ON CID Ch N •••1 C1/4 t1/4. O\ 1/40 ri .1' 01 ClC ON rt CV ON CO CD r4 ttN N oN {••••, 4.4 ON C*4
• r.... .. CO M .0" ri ON .0' r4 N.7 .4 N cn ..4 ce% mi 4- rl
,x.... CO CN 04 L.r. \0 ON 1••• 04 1/40 0 nt ON j•••■ N .0" O N O- CN • • • • • • • • • • • • • • • • • • • • • .d. t.... O O\ ■0 CO UN C1/41 CO \D
e•-■ 2\ CN r4 el CO r■ V) r4 C"N O N. O tgi UN UN -1' r4 'SO 1/40 01 in 0.1 CO UN 1".. 04
N r4 N r4 r4
Cr\ c• ‘0 t---, UN ON 1".. ON O 'N .7 UN re.. 1-4 UN r4 /••■ 1/40 .1' r4 C4 N ON • • • • • • • • • • • • • • • • • • • e • • • cv ON CO Cr. "4 1/40 N (N rl re ..1" r-,.. ..2» In ON 01/4 O CYN CO -1' d- UN N co c•N r4 CN N 01 o^1 rl U1 N I.0. cr■ rl .1`.. 04 LIN UN ri CO O N rl 4-1 04 4-1 N CV 04
0' %.0 O 01 CV CV ON CO UN 04 t•••. .1' `.4 c0 .r... rl O «N ■0 O.. Lr, O ‘,0 • • • • • • • • • • • • • • • • • • • • • • • CN CoN 1/40 N mi ri ee, p.,. t.. V) ll" 00 t••■ e" r-I e-, ■1) O "I .4' O N 8 .o- .,•■■■ C',4 Csi ..0 5 ts. ri UN UN ..1" 04 el., \o 04 .1- UN
CV CoN 04 1/40 r4 r4 r4 r4 e.i
4sal CD Zt 0 .4 a\ UN CD CO 01 UN a\ :I- 2\ r4 0.4 c1 CD - UN .7' r4 UN ON • •• e • • • • • • • e . • . • • • • e • •
rl CD N W O.
N ri rl j••■ O rl 111 pi \ 0,1 rl O \D \O 4 r4 \
.1 eeN N r•I 04 tn ri ri .41 4.4 r4
04 ON O 1,, O Is4 1.." O co ¿-■ f.r. o■ O ri• • • • • • • • • • • • • • • • • • • •
oo oo o cv o■ o.■ 3 f.> . ri co i■ C1/4 r4 ri ,„„-. N r4
ri rl
O ‘0 U1 cs1 ‘41. O \O tr\ M \O as CV 00 Z... CO c'1 • • • • • • • • • • • • • • • .41 r4 M 1/40 C"1 O\121 \ .7" M O O CO N 0 0 1 /40, 1-1 r4 ts• 1/40 .4 CV
47- ON -1"., CN ri O 4,.. oN ON UN CV re O .7' LrN ..4 I" CO p... 00 \O 00 ..1 • • • • • • • • • • • • • • • • • • • • • • • O", N •[... UN ir ‘ t•-, eN 1/40 144 rt O ,r... Cr% O'N CO CO el rt 11 UN /1/4. 4.4 r. r. , r4 N 4-1 M CV CV N
CV -1' 4•7" 0 0 111 ON N CO 1.1% 4-1 Ch 1/40 131 t•-•• ON • • • • • • • •• •• •• •• •• • • . • • •
rt
\ 1 ' ra r4 0 UN 4-1 01 ON rl 0 0 1/40 1 coa‘ tr‘ON 1 O oo r• O N «N 4-1 O 1/40 ON UN cc2; eN r4
UN Crt rl U1 Lrv • .4. aN a., eo M• • • • • • • • • • • • • • •• • • • • • • • t11
co CO CN crt 04 r4 .7' 1/40 N 1/40 t•••• CN cc 4" t.„, t*". Csi UN %O 04 UN CM r-1 rl
O\ 0 01 • ‘414 Zt •-• CN •C`•• t•rs •••' 11:1 ••1«. • • • ' • • • ♦ • • • e • • • • • • • • UN UN
O O LN O rl CO • c; • c• O co
N rN UN .1' CC.) IX% O'N 4.4
UN CO 4-1 CV ON UN 1/40 0-t 411 ri CD ON 01 ON 441 c 4 O CD ,44 • • • • • • • • • • • • • • • • • • • • • • e CO IX 4-1 CO ON 1/40 1/40 c0 O r4 '.0 ON 1/40 U) OD O) 1/40 00 ri Ul
ers t." oo ...1• Lr■ O'. \O a,,,. Cr/ i',. a.% C.'1 UN ts. ON O -1" CO j••••• 1/40 eo CO ce. • • • • • • • • • • • • • • • • • • • • • • O\ ce‘ cn aN eo 1 \O .,? ks) crs .4 O ON CN 04 CN 1/40 UN «N ctl 0 rt t.„ ON ri C.'\ .-1 (9 tr‘ O el .. n .d• . .e.i r■ 1 UN 7 M.1- t" r.4
0> O 03 tO
O DI CO O> O>
mtt)
0.0 O 04) ta0
o
4 cd
1 11 11
th Oo oo 0 C
% E E E o
•
g g 5 O 0 o 0 t0
r4 Z4 r4 . d O d O d O d O
ri 04 .4 C. 111 C. r4 4.
g t% 4 g l'U g 10). g a 0 03 0
O< > O. 9 1.° 1 E
4 4 4 4 4 4 4 4 4 4 4 4 S 4 4 i•i
/Table 6

Products and SITC olassifioation
0 .n41. o Ir co 0 C4
1.4
.4:1 t. f..1 ti> a '4 1 11 o
1
N
4 e
1.1.
ge) rC*1 O
10
13 N4 1-4 O
qm O .10
í3 á 44 O
744
CJ
d
.4- •
.4 o 414
ko E <8
tE
O
11 CO M O \O UN NO UN
• r4 •
0 •
lt% Q • • •
\ O 1.0 Z*1
N \ O 01 01
•
o t■ o • . • • •
tr% c. 1/40
t, O Lc0A 01 CN1
- 25 -
1/1 11 ts. • - • • O co 1
CO rl
rl 01 04 0• . • • •
e. ',o o 1 UN t". O rl
• • • CO O CO .04 N 1 C4
O CO 11 10 04 • • •
•tr% 1.0• Cal
tce% O s r4
47-. r4
NO rl
o-% 1." co • e • • •
NO Cr■ 00 •A CO .4 C4 C.1 01 ei
CA. 1.0% 1.01 N rl • e e • •
ÑSr404 O O
4' N
• • ON 11 N
CO
rl
N 11 4.4 • • •
1.'"1 04 0 1 pa1,
Lo 04 •C> • • •
a-I 4' .0
O •
:-.■ •
e-1 _e •
04 04
1 L'O 4
...I' .
CNI Cn • •
N C4 1 ri r1
N CO • •
04 r4 ral 04
•0
ri • •
1O 1
O O. • •
C4 CA 01 1
cr, . . • n 2 .1
CA 01 11 CO e • • • •
CO CO \
Lh 5.\> x..\ 01 a-1
NO 0.1 CO 04 LA
01 • • • • •
Cr• O 11. UN CO \ 0 0 r4
Lel 1.1 C'N • • • • • O cr.. 01 rl CsI 0111 11 N
Ln LC1 V) • e •
01. .1-1- 01
o
ri
O al ri
f.
O
5
o. ri
Lel .0 01 0.1
1-1 •0 CIN r4
m
m
T.
O
art
Pri
Cl>
O rn
rade, series B
r4 N
CA CO O 01 O ■0 c,N v) co 4-1 oi LA .,,d- ra4 O 01 04 0 • • • • • • ' • • • • • • ' • • • • •' •
LA LA 01 \0 .1 LA 0'1 CA ...I ' N O .O. 01 '.0 0 CM 04 NO f..1 CA rl C.j11. er■ r4 ,..0 ‘0 04 LA rl I 04 0., 04 LA a-1
ri 11 CO O 4 CO 8.4
• • • e • • • •
O 04 N CO O N CO
CN1 4-1
O O .d» 04 • • •
jj CA g. 04
e-1. 04
LA LA 00 rl 11 N • a • • • •
COCO, 1 1 0.... ..& CO 8 I
CO CO CV 04 o 04 N .C... 04
1-1 •ata CO • • •
01 CO 00 04 I
04 4 ..
UN NO L" 1." 0.-4 u• t-s. r4 N • • • • • • • a •
04 N.." 8 1 ...1" 01 0-% 1 1 c., o .(,... 1 I o 04 trl, c0 LIN .O. U
04 N al 14,5
H LA CA IX1 4 cA CO $.1 .0, \O CA .-1 ON • • • • • • • • • • e • •
Ocr's CO O... 04 C`4 CO CO CO 04 O 2 g. ,,, , 1
c,-, c«, t.t1 04 N H ' 4-1 1.0
1....
d r'
CO CO CN N CO rl 11 01 CA CO 01 0'1...1- O'N O • • • • • • • • e • • • • • •
LA 01 01 LA LA 4' 14.‘ CA O CO CO CO 0 f.., CO Zse. •0 CA ..O. 04 .O- O -1' .N. 04 csi o\ ‘0 -1" rl •-4 c. .-1 c4 -f
04 cr1 u1 rl 11 01 01 O O 4 04 0 f.4 O.. C4 CO ..Z." NO • • • • • • • • • e • • • • • • • •
o\ ..I- C4 C,•■ NO /1 r.1 10 0 0 04 CV NO 1-41 4- 10 ON 04 4.4 UN C4 01 1.4 co .,.. NO 04 ON UN 4 "4 rl r4 cr \ rl
a> o %. e 1
A.
.g .1 i i d so o
o o o 40
49 49 1
1 .a
4 -a
g O O 0 O> LD 0 e o
E „.)0.
, . o d 1 ° W
O 04 k
0 0:1 O O •-I O O
b 1 m s. 1
4d o a>
> 11. > fk 1 P. > l'. ›. 1:14 r.--- tu
t1 o vi
0 11 N 3 U
cv 10 uN • • •
tr1 M CO oo
rri
•-1 co N 00
• • • tr1 o■ 1 1
o 1,0
CO O • • •
LA LA 4 10 ri
rl
• • •
1 1
ri
¿,* O
o
Latin America
9 /Colombia registorod

-26—
Colombia registered an annual export growth rato of 5.9 per cent, and Paraguay 6.9 per cent thanks to improved market conditions for tropical products. Lastly there is a third group of countries with higher export growth ratos, which includes Brazil (9.1 per cent), Mexico (8.5 per cent), Ecuador (8.5 per cent) and Chile (16.3 per cent). These countries have very different export structures, and among the many reasons for this boom are greater diversification (Brazil, Mexico) and a sustained demand for industrial raw materials (Chile) and specific tropical products (Ecuador). An unfavourable trend was observed in the case of the Caribbean countries, whose sales to the expanded Community dropped on average by 3.5 per cent annually between 1961 and 1970, even though they included trade on preferential termo with the United Kingdom.
As regards the evolution of trade by products (seo table 6), tropical agricultural products should be considerad first. Latin American exports of coffee to the Community of the Six increased their relativo share in the Community's total coffee imports from 54.7 per cent in 1961 to 59.7 per cent in 1970 (en annual average increase of 7.5 per cent). Over the same period imports from the associated African countries increased at the rete of 9.3 per cent and in 1970 accounted for 22.1 per cent of total importo of the EEC compared with 19.4 per cent in 1961. The system of special preferences in favour of the African countries has probably led to the increases in their share of trade in the Comron Market. Latin Americals share of epoca exports, which were influenced by mejor fluctuations in the supply, from the region, dropped from 24.9 per cent to 22 per cent. There was, however, a notable increase in banana sales, which doubled between 1961 and 1970 in both absoluto and relativo tormo (an annual average growth rato of 10.3 per cent compared with a rete of barely 3.9 per cent for overall Community imports of this product). The share of Latin American bananas in Community importo rose from 39.9 per cent in 1961 to 60.4 per cent in 1970. At the same time, the share of the associated African countries dropped from 25.8 to 10 per cent.
Among temperate—zone agricultural products, maize takes first place on account of its value in trade between Latin America and the EEC. This is a deficit crop in the EEC, where there is a growing demand for it, Latin American exporto maintained their relative share in total importo by the Community (around.29 per cent), thanks to en average annual growth rete of.11.0 per cent compared with 12.2 per cent for total Community importo. The demand for beef is elven more dynamic, since total EEC imports grew at an annual rete of 23 per cent between 1961 and 1970. Importo from Latin America rose by only 9,9 per cent, and hence could not maintain their relativo importance in the Community market, in which their share dropped frcm 27.3 per cent in 1961 to 13,9 per cent in 1970.
/In the

-27-
In the case of wheat, on the other handl there was an almost complete standstill in Community importe, with an annual rate of growth of 1.2 per cent between 1961 and 1970. Importe from Latin America rose by 6.6 per centannually over the same period, although they always hed a marginal position in Community importe (7.2 per cent in 1970 compared
with 4.5 per cent in 1961).
The third group of important products exportad by Latin America to the EEC consiste of raw materials for industrial use, sales of which have developed very irregularly according to the individual cases. Petroleum exporte practicelly stagnated between 1961 and 1970, and even dropped slightly in absoluta terms during this parlad, so that their relativa share dropped from 8.5 per cent to 2.8 per cent, although total EEC importe grew at an annual rete of 12.8 per cent during this parlad. One of the factors which influenced this drop in the region's relativo share was the financial interest of some members of the enlarged EEC in the expandan of petroleurn production by the countries of North Africa in the 1960Is. Another factor was the failure of Venezuelan production to maintain a rate of growth comparable with that of world production.
Wool exports showed even pobrer trends. Owing to growing competition of synthetic fibres, total imports by the Community dropped by 2.8 per cent annually between 1961 and 1970, and this decline reached 12 per cent annually in the case of importe from Latin America, whose relativa share in the total dropped from 12.4 per cent to 5.1 per cent during this period. As regards cotton, however, Latin American exporte of this commodity to the Community improved their percentage share in the market from 19 to 29.4 per cent between 1961 and 1970, despite a drop in total importe of cotton.
Demand for iron ore and refinad copper grew rapidly in the EEC, and importe from Latin America developed at a rata comparable with that of total supplies to the CoMmunity. Thus, Latin American exporte uf iron ore increased by 6.5 per cent annually, improving to some extent thair share in the Community market, while exporte of refinad copper went up by 14 per cent annually, comparad with the 12.7 per cent annual increase in total Community importe of this metal, and in 1970 they accounted for 20.7 per cent of the market of the Six, compared with 18.7 per ccn -; in
1961. It should be borne in mind that all these retes refer dallar values of the trade flows.
/As regards

22/ If the African countries which are members of the Commonwealth joie the Yaoundé Convention, the members of the Associated African and Malagasy'States will very probably enjoy free access to the markets of the United Kingdom and the other new members of the Community.
/As regards
— 28 —
As regards Latin American exporte to the United Kingdom, which in competition with the CommonweaIth countries, whose exporte play an important role in this trade, the case of coffee exporte is worthy of mention. United Kingdom coffee importe from Latin AMerica increased from 33.8 per cent of total coffee importe in 1961 to 45.8 per cent 1971, but the share of the Commonwealth countries rose from 8.5 per cent to 43.6 per cent. This means that although the position of Latin America improved during the 1960's it is facing growing competition from the Commonwealth countries, and the situation could become still more serious when the United Kingdom market is opened up to néw preferential exporters 20/ and the cemmon externa). tariff is adopted,
The value of the United Kingdomws importe of beef from Latin America dropped from 84,3 million donare in 1961 te 61.8 million in 1971, while the regionEs relative share in that country/s total importe of beef dropped from 54,3 per cent te 24,5 per cent. Imports from the Commonwealth doubled in value (from 28.9 to 56,7 million dollars) and their share in the British, market increased from 18.6 to 22.5 per cent, Trade flows from the preferential suppliers (Commonwealth and Ireland) have thus been strengthened to the detrimeht of other traditional suppliers such as the Latin American countries,
As the entry of the United Kingdom into the European Economic Community will mean the suppression of the preferences of some Commonwealth countries, (Australia and New2ealand), the United Kingdom may well reorient its purchases over the next few years towards the new preferential suppliers of the expended Community, provided these have sufficient export capacity.
As regards cereals, the situation has takén an unfavourable turn fcr Latin America, Its exporte of wheat to the British market have diminished steadily, and in.1970 they accounted for a bare 0.3 per cent of total imports. In this sector, too, the Community preferences Will favour producer countries which are members of the expended Community to the detriment of the Commonwealth countries (Canada and Australia), whose preferences will disappear. Latin American exporte of maize to the United Kingdom have developed more satisfactorily and accounted fcr 8,8 per cent of total importe by this market in 1971 as opposed to 2.7 per cent in 1961,
11•11111~.1.11••■11,

29
As regards the evolution of Latin Americá's imports, during the period 1961-1965 to 1966-1970, those from the EEC of the Six increased by 5.8 per cent per year, while those from the United Kingdom increased by 3.8 per cent per year (see table 1). The share of the Community of the Six in total Latin American imports has thus been maintained at around 19 per cent, but this share declined from 25.5 to 23.7 per cent as far as the expended Community was concerned: this reflects the slower growth rete of imports from the United Kingdom between 1961-1965 and 1966-1970.
The overall evolution of the values of exports and imports between Latin America and the Community countries has resulted in substantial changes in the balance of trade. The positive balance which had been recorded with the Community of the Six increased towards the end of the 1960's but became negative in 1971. During the period 1961-1965, en annual average surplus of 260 million dollars was recorded, and this rose to 392 million dollars during the period 1966-1970, but in 1971 it became a deficit of considerable magnitude (-263 million dollars). This was mainly due to a tendency for earningsfrom Latin American exports during the last year to drop, whereas the same did not occur with imports. It seems that the traditional triangularsystem is disappearing in this sector of Latin American trade.
The general factors which have determined the structure of the international trade fiows between industrialized and developing countries have influenced the development of Latin America's trade with the Community. According to data published by the Community 21/, the value of imports by the EEC from the developing countries dropped from 42 per cent of total imports in 1958 to 35 per cent in 1970, the relative share of imports from Latin America dropping from 10 to 8 per cent. In addition, the overall value of exports by the Community to the developing countries as a whole aleo dropped (26 per cent of the EEC's world'exports in 1970 as opposed to 39 per cent in 1958), the percentage of exports to Latín America dropping from 10 per cent in 1958 to 6.5 per cent in 1970.
219~9.0=121 agricultural,... poli
Since the start of the European Economic Community, Latin America has viewed the comrnon agricultural policy as en obstacle to the regular and satisfactory expansion of its agricultural exports to- the European market.
1/111111.1/
21/ "The external trade of the Community from 1958 to 1970", Bulletin of the European Communities, 1972 (Volume 5), N° 6 pp. 37-48.
/Attention has

-30—
Attention has frequently been drawn to the protectionist nature of the common agricultura' tariff system, the artificial and anti—economic incentive it affords certain sectors that are prone to structural overproduction, the unfair competition it represents for exports from developing countries, and even the ineffectiveness of the policy itself as a means of improving the standard of living of the European rural population.
The strong criticism that the policy has come in for in international forums and the pressure that has resulted from its ínefficiency at the social level have, in recent years, instigated a revision of its basic mechanisms in the Community itself which has taken the form of a programme of structural reform of the European agricultura' sector. The Community's agricultura' policy currently has two fundamental features: on the one hand, there is a tendency to increase the incentive to domestic production provided by a structure offering guaranteed high prices; on the other, there is a move to eliminate marginal enterprises and reduce the number of people active in the sector.
It is believed that the 'atter tendency could pave the way for profound modifications that would reduce the present level of protection of European agriculture. One of the latest developments is the possibility of reshaping the common agricultural policy, as a result of the growing pressure from certain sectors of the Community, and particularly the new member countries, by introducing subsidies and assistance schemes in favour of the less efficient arricultural enterprises in order gradually to promote a greater degree of domestio and extorna' competition. Moreover, in their joint statements in February 1972, the United States, Japan and the EEC stated their intention of including agricultura' products and the agricultura' policies of the developed countries in the forthcoming multilateral trade negotiations. It is most likely, however, that the outside countries supplying the Community with the products covered by the common agricultural policy will have to continue to put up with the existing mechanisms.
Some member countries of the Community hold the view that the agricultura' policy is a necessary complement tc the free circulation of industrial products, while the policy is mentioned in the Treaty of Rome (article 39) as a means of achicving a number of social and economic objectives: to increase agricultural productivity by developing technical progrese and by ensuring the optimum utilization of the fectors of production, particularly labour; to ensure a fair standard of living for the agricultural population; to stabilize markets; to guarantee regular supplies, and to ensure reasonalbe erices for consumers.
/The policy's

- 31 -
The policy's principal instrument has been the organization of the agricultural markets on a Community scale by the standardization of the conditíons governing trade in agricultural products and the adoption of systems of control over and protection against imports of products from abroad. The central mechanism, which has been in use since 1962 when the first market regulations were adoptad (on cereals, fruit and vegetables, eggs, etc.). This consists of a system of Community prices which are used to calculate the levet of variable tariffs levied on imports from abroad and domestic controls and subsidies administered by the European Agricultural Guidance and Guarantee Fund (EAGGF). As a direct outcome of this policy, and under the influence of other technological, economic and political factors, there have been a number of important developments, including (a) the fixing of domestic prices far aboye world market prices; (b) high profits for modere agricultural enterprises, such as wheat farms in France, thanks to the policy of fixing prices to assume a certain mínimum level of income for the less efficient producers; (c) a steady increase in the prices paid by consumer; (d) severa restrictions or elimination of competitiva imports from abroad; (e) a rapid rise in overall average productivity, and (f) a greater increase in production than can be absorbed by domestic demand, resulting in exportable surpluses that are sold on a heavily subsidized basis outside the Community.
The intention of mair►taining the system of high guaranteed prices was confirmad a few months ago when prices were fixed for the 1972/1973 crop year. In March 1972, the Council of Ministers decided in favour of average increases of about 6 per cent, ranging from 4-5 per cent for cereals to 8 per cent for milk. As for beef, a first increase of 4 per cent was decided upon,followed by a second increase of 3 per cent in September 1972, while the Commission was entrusted with the preparation of a programme for promoting production. At the end of October 1972, the Council accordingly adoptad a series of measures to this effect, including a system of subsidies for the rearing and importation of calvas and an allocation of milk for the same purpose. The Community suffers from a growing shortage of beef which was estimated at 600,000 tons in 1972, 14 per cent higher than in 1570-1971 22/. The Commission also feels that existing beef supplies on externa) markets are insufficient to meet the growing warld demand and that the Community must be able to rely on a largar domestic output. It is estimated that this programme will cost 130 mullen units of account, that 40,000 farms will be in a position to benefit from it, and that as a result annual production could go up by 70,000 tons.
22/ In view of the shortage of domestic supply and the growing consumption of beef, the Council of Ministers agreed at the beginning of June 1972 te suspend import duties on beef completely; the following month, however, the decision was modified and the duties restored, though at only half their original level.
/Thus,from

- 32 -
Thus, from the standpoint of the developing countries in general and Latín America in particular, some of the main repercussions of the common agricultural policy are the following:
(a) It represente a trend towards increasing self-sufficiency at the expense of the share of exporte from outside countries, despite the latter's considerable competitive advantages. The special programrne for beef is an example of the firm intentions of the Community in this area.
(b) The domestic price policy and variable duty system are combined with other tariff and non-tariff instrumente for controlling, restricting and preventing importe from non-member countries, and specially from Latin America. The aforementioned reduction in the import duty on beef, which was a temporary measure adopted to cope with a shortage within the Community and to avoid a sharp increase in domestic erices, shows that the common agricultural policy continued to be subjected te interna) influencos without any allowance being made for the interest ofnon-member countries, particularly in the developing world.
(c) Latin American products have to compete on other markets, both new and traditional, with Community exporte, that are heavily subsidized by EAGGF. A recent illustration of this practice was the decision at the end of May 1972 to restare the official subsidy on exports of butter in the light of a new accumulation of surplus stocks. The use of EAGGF funda to enable the exportation at world erices of products whose Community price is much higher is a forro of competition which the developing countries cannot do much against, since they do not possess comparable financial resources.
(d) The adoption of the first steps towards a structural reorganization of the European agricultural sector opens up the possibility of a reshaping of the common agricultural policy. This being so, it is especially important for the Latin American countries that problems connected with trade in agricultura) products should be included in the 1973 multilateral trade negotiations. Other developed countries, particularly the United States, also have a direct ínterest in obtaining concessions in this area. There should therefore be en opportunity for the Latin American countries te engage in co-ordinated joint action against the Community in order to secure the modification of the regulations applicable to products from outside countries.
/(d) EEC

- 33 -
(d) EEC trade olic and the trend towards the formation of a
regional bloc
In addition to the accession of three new members, in recent years the Community has taken a wide variety of measures to extend its institutional relations with a large number of European and developing countries. This process, which has already been placed on an institutional footing in most respects and is growing more widespread, constitutes one of the outstanding features of international trade policy. The first point of note is the formation of a European free trade arce for manufactures with the ex-members of EFTA. The elimination of tariff and non-tariff barriers to trade between the two groups will have an impact on the Community's traditional trade flows and elso on the trade flows that the Latin American countries may enjoy through the generalized system of preferences.
The second point is what is known as the Community's Mediterranean policy, which appears to be aimed at making virtually all the States bordering on the Mediterranean part of a network of preferential
agreements.
The third is the possible modification of the agreement of association between the EEC and the Associated African and Malagasy States to include a group of countries that are currently members of the Commonwealth. This is of special importance, as these countries are exporters of tropical-zone products that are of particular interest to Latin America.
(i) The formation of a European free trade area. On 22 July 1972, agreements were signed in Brussels on the formation of a free trade area between the EEC and each of the five EFTA members that have not joined the Community: Sweden, Switzerland, Austria, Iceland and Portugal. EFTA, which was set up in 1958 under the auspices of the United Kingdom to counteract the impact of the EEC on the trade of the European countries, could not continue to exist after three of its members, in particular the United Kingdom,had joined the EEC. The agreements between the EEC and the five countries in question provide for the elimination of tariff barriers to trade in manufactures over a five-year period starting 1 April 1973, with the exception of certain products that were labelled sensitive, such as paper and paperboard, various metals (aluminium, leed and zinc), and cotton textiles, which will be liberalized somewhat more slowly over a period pf between eight and eleven years. As a general rule, agricultural products have been excluded from the liberalization process, but processed
/and semi-processed

34
and semi—processed agricultura) products have been-included 23/. Furthermore, each agreement containes clauses allowing for the possibility of expanding and intensifying co—operation between each country and the EEC.
This free trade ares between the enlarged EEC and the ex—members of EFTA will probably leed to considerable changes in the evolution of the trade of the European countries, both among themselves and with the rent of the world,-
In the light of experience with the EEC, it is very likely that there will be growing concentration on trade in manufactures within this vast area, probably at a much more rapid rata than with the rest of the world. Moreover, Latin Amrice's exporta to the enlarged Community and the ex—members of EFTA will have to face mounting competition within the framework of the generalized system of preferences.
(ii) "TheEr91sMecham=292.19z, From 1961 onwards, when it signed an agreement of association with Greece, the Community has been developing e trade policy aimed at establishing preferential—type trade relations with a growing number of countries in the Mediterranean area. Agreements were signed in 1963 with Turkey; in 1969 with Tunisia and Morocco; and in 1970 with Spain, Israel and Malta. A trade agreement has also been concluded with Yugoslavia which is officially not a preferential agreement but which nevertheless pontains indirectly discriminatory provisions in respect of beef. In 1972, negotiations took place aimed at the conclusion of preferential trade agreements between the EEC and Algeria, Cyprus, E;gypt and Lebanon. It may thus be assumed that it will not be long before virtuolly all theStates bordering on the Mediterranean are linked through preferential agreements with the EEC.
These preferential agreements, although containing a wide variety of provisions, are essentially based on a series of restrictivo and reciproca' tariff concessions covering a broad ranga of industrial and agricultura' products, both primary products and processed and semi—processed products of export interost to the Mediterranean countries.
22/ The agreement with Portugal contains some special provisions favouring a number of agricultura' and primary commodities of special importance to Portugal, such as wine, preservad fish and tomato concentrate,
/With respect

— 35 —
With respect to agricultural products, the Mediterranean countries have obtained important concessions for fresh and processed citrus fruit, as a result of which their exports to the EEC have increased. In 1971, Israells exports of citrus fruit to the Community were some 20 per cent higher than in 1970, owing to a reduction of 40 per cent on the common external tariff. In general terms, the concessions granted by the Community to the agricultural products of the Mediterranean countries rango between 40 and SO per cent of the duties in the common external tariff. Similar concessions are being considered for many of the agricultural exports of the countries currently negotiating preferential—type agreements with the Community, such as Algeria, Egypt and Cyprus.
In actual fact, the problema caused to third countries by the Community's policy in this respect would seem to be more serious over the medium and long tem, for the expansion of the geographical coverage of preferential relations has been accompanied by a procesa of deepening and strengthening of such relations. After the United Kingdom joined the EEC, severa) of the countries having preferential agreements with the Community, in particular Spain, Israel and Turkey, noted that this would have an adversa effect on their trade with the United Kingdom, as the duties applied by that country to certain products were lower than those it would have to apply as a member of EEC. These countries also noted that their exports would probably suffer when the United Kingdom applied the common agricultural policy, as this would restrict market access for a number of important products. The Community did initially consider the possibility of negotiating additional protocols te being the agreements finto line with the new situation, but subseeuently it opted for a more comprehensive approach to the problem. Some of the member Governments of the Community — France and the Netherlands — suggested in June 1972 that the time was ripe for developing a comprehensive Community policy for the Mediterranean, based on the formation of a free trade anea between the EEC and the Mediterranean countries and covering in principie all manufactures and a wide variety of agricultural products. The French delegation states that it would be possible to negotiate measures on some special products before 1 Janucry 1973, the date when the United Kingdom officially enterad the EEC, and it was agreed that over the medium term comprehensive agreements would be concluded with the Mediterranean countries. In October 1972, the Council of Ministers gave its approvel in principie to a programme preparad by the Commission based on the following points: free movement cf manufactures — except for certain sensitivo articles — by 1 July 1977; a phased reduction of duties on agricultural products up to a limit of SO per cent of the volume traded between each Mediterranean country and the EEC; and the
/provision of

-36-
provision of financial and technical assistance. The examination of these points has been entrustod to the permanent representatives, and it is anticipated that work will proceed rapidly and that the Community will be cibica to negotiate and finalize the agreements in the course of 1973.
This is, in brief, a policy that could mean the development of the free trade area into a customs union (something which is already taking place in the case of Greece and Turkey), and this would considerably accentuate the Communityls discriminatory trade policy against the interests of third countries, since it would strengthen the participation of the Mediterranean countries - which is already extremely significant - in the structure of EEC foreign trade 24/.
Furthermore, these developments will probably accentuate the trend of Community policy towards a growíng and clearly discriminatory verticalization of trade relation$ with developing countries.
It is considered that the agreements signad by the Community are preferential and discriminatory, and therefore violaté both the letter and the spirit of the General Agreement, Several GATT members -.in particular the United States - have severely criticized the Community on the grounds that this type of preferential trade policy is a threat to the institutional bases of world trade that have been defined and applied under the General Agreement.
(e) The revision of the arreement of association with the African
2a592292.22YZ22a
The regime of association between the Community and the African and Malagasy States under the Yaoundé Convention is based on the liberalization of mutual trade and on programmes of financial and technical assistance.
21/ In 1970, EEC expor'cs to Spain, Israel, Albania, Syria, Jordan, Libya and Portugal amounted te 7,300 million dollars, as against 6,600 million to the United States. The corresponding EEC imports in 1970 - including petroleum - were 6,000 and 9,000 million dollars respectively.
/In March

— 37 —
In March 1970, the Community expanded the scope of this regime as regards trade and granted free access to the EEC market for a number of agricultura) products covered by the common agricultura) policy. The Yaoundé Convention has been criticized by the Associated States because they consider it has not yielded satisfactory results, particularly as their exports to the Community have not grown at a satisfactory pace. The Associated African and Malagasy States have callad on a number of occasions for the Community to revise the Yaoundé Convention to include new machinery for trade co—operation.
The joint Parliamentary Conference of the EEC/AASM Association held at the Hague in January 1972 received a report containing recommendations for defining a new EEC trade policy in favour of imports of tropical—zona products from the African associated States. The report considers that, in the light of recent developments, there is no possibility at sil of reaching cammodity agreements of world scope and that it is therefore advisable to work out a regional agreements that account of the interests of the associated African States and that could eventually be made applicable to other developing countries. The central component (pf this new trade policy would be the organization of a market for tropical—zona products based on price stabilization machinery and guaranteed market access. The report invitad the Community to enter into a firm cammitment as regards the purchase of specified quantities of products at pre—established remunerativa and equitable
Prices.
These suggestions were subsequently incorporated into the resolution adopted at the end of the Parliamentary Conference. The resolution stressed the need to find a new direction for relations between the two groups and to conclude commodity agreements on a regional basis as an essential complement to tariff cuts, which by themselves would not promete the expansion of the trade of the associated African States to a sufficient extent 25/. The resolution recommended, that a number of products, such as bananas and cotton$ should have guaranteed access in
••••••.,
25/ On several occasions the associated African States have stated that the successive reductions in the duties of the common externa) tariff on 'products of special interest to them — such as coffee and cocos — have progressively limited the scope and significante of the special preferentes they enjoyed under the Treaty of Rome and the agreements of association.
/specified quantities

- 38 -
specified quantities at fixed prices, which the Community would guarantee to maintain whenever prices fel], below the pre-established Level„ With respect to cocoa, it states that if negotiations on an international agreements failed yet again, it would be advisable to draft en EEC/AASM agreement basad on a system of ceiling and floor erices 26/, Similar measures have been recommended for oilseeds.
In two subsequent meetings £2/1 the African countries reiterated their desire for the conclusion of regional commodity agreements if it remained ímpossible to conclude such agreements at the world level. They also criticized the general system of preferences which - in their view favoured the most developed among the developing countries, They requested the Community not to expand or improve its scheme of preferences until the United States had implemented its scheme.
If new arrangements for trade co-operation of the kind described are included in the Convention of Association, this would have an adverse effect on Latín America's trade with the Community, which has dlready suffered from the impact of special preferences. The fact that Community members would be obliged to absorb specified quantities of certain products under regional agreements would have the effect of eliminating almost completely the small mesure of flexibility that still remains in the Community's trade arrangements covering these products, and would possibly exclude from the Community market products from third countries that are not members of such regional agreements.
26/ The Cocoa Conference concluded with the negotiation of an international agreement, which ís in the process of ratification.
22/ EEC/AASM Council (Brussels, March 1972) and Special Meeting of AASM to examine the question of the entry of the Commonwealth countries into the Association (Nouakchott, April 1972).
/(f) The

— 39 —
(f) The extensíon of the re ime of association to the member countries of the British Commonwealth
The treaty of accession of the United Kingdom to the Community offers the independent developing countries which are members of the British Commonwealth in Africa 28/, the Pacific 29/ and the Caribbeen 30/ the possibility of defining their relations with the EEC within the framework of one of the three following formulas:
(i) Partícipation in the Convention of Association to be agreed upon when the present Convention expires at the end of 1975;
(ii) Special conventíons of association on the basis of article 238 of the Treaty of Reme, with reciprocal rights and obligetions in trade, and
(íii) Trading agrezments with a view to aiding and expanding trade between the Community and the above—mentioned countries.
Although it is still impossible to forecast the decisions which the member countries of the Commonwealth will take during 1973, it is reasonable to suppose that some at least will vote in favour of participation in the regime of association in force between the Community and the associated African States. This would mean extensive trade preferences and financial and technical assistance for them. For their part, when the associated African countries met in Nouakchott (Mauritania) in mid—April 1972 to review the problem of the extension of the Yaoundé Convention to the Commonwealth countries, they declared that the accession of these countries would help to strengthen the political weight of the Euro—African group and would be advantageous to the transformation of the trade content of the Association.
28/ Botswana, Gambia, Ghana, Kenya, Lesotho, Malawi, Nigeria, Sierra Leone,
Swaziland, Tanzania, Uganda and Zambia.
29/ Fiji, Fonga and Western Samoa.
30/ Barbados, Guyana, Jamaica and Trinidad and Tobago.
/In these

— 40 —
In these circumstances, the Latin American countries ought to begin right new to review the possible consequences for their own exports of the new trade flows which might emerge from the extension of the Yaoundé Convention. The most important commodities which the African and Caribbean Commonwealth member countries export under preferential conditions to the United Kingdom are coffee (Kenya, Uganda, Ghana, Nigeria); leaf tobacco (Tanzania); fresh bananas (Ghana, Nigeria, Jamaica); groundnuts (Nigeria, Tanzania, Zambia and Uganda); palmoil (Nigeria) and sugar (Jamaica, Trinidad and Tobago).
The accession of new countries to the Yaoundé Convention will have two series of consequences for trade. Firstiy, markets of the present Community members for products such as bananas, coffee and cocos will be opened up to these cquntries on a duty—free basis. Their participation in the Yaoundé Convention will thus give them an opportunity to share with the associated African states a preferential market for their tropical products in the six countries which at present make up the EEC.
Secondly, the markets of the nine—member enlargod Community will also be opened up, likewise on a preferential basis, te products exported by the associated African states. In the case of the United Kingdom, the existing rango of special preferences, previously reserved for products from the Commonwealth countries, will be extended to the same products coming from the associated African states, hence reducing the export possibilities of third countries.
As regards coffee, Latín America's share, which accounted for 21.6 million doliere' worth out of a total of 65 million donare' worth in 1970, could suffer still stronger competítion from African coffee, which accounted for 36.5 million dollars• worth of EEC imports in 1970.
As regards banana exports, the extension of associated status wouid not alter the preferential situation at present enjoyed by the Caribbean countries, from which practically all British importe of bananas come (33.3 million dallare' worth out of a total of 38.9 million dallare' worth in 1970). The other countries of Latin America have practically no share in this trade.
As regards sugar, the Commonwealth countries are likely to feel inclined te participate in the regime of association as the best means of protecting their current interests in the British market, although this product does not have direct special preferences under the
/Yaoundé Convention

— 41 —
Yaoundé Convention. Of 210 million doliere; worth of importe of sugar in 1970, 76 million dallare' worth cama from the Caribbean (Jamaica, Barbados, Trinidad and Tobago), 13 million dallare' worth from Guyana, and 32.2 million doliere' worth from Mauritius, which acceded to the Yaoundé Convention in 1972. The share of Latin America in 1970 was a bare 2.5 million donare" worth. In a protocol annexed to the treaty of accession, it is stipulated that the United Kingdom may continua to import sugar from the countries and territories which are members of the British Commonwealth Sugar Agreement until this expires (1974), and that thereafter, the necessary steps will be taken to protect the interests of countries whose economy depende to a substantial extent on the export of basic commodities and of sugar in particular 31/1 within the framework of the relations to be determinad between those countries and the Community.
The detrimental effects fár Latin America could be still more serious in the case of the new members which up till now have had no preferential trade relations with developing countries. For Denmark, accession te the Community means granting preferential treatmsnt to the associated African states and to those ex—members of the Commonwealth opting in favour of accession to the Yaoundé Convention. The Danish market will thus discrimínate against third countries — Latin American countries in particular — in a manner which did not exist previously, and which will possibly influence the geographic structure of Danish importo. This could affect the current share of Latin America in Danish imports of coffee (55.5 million doliere' worth out of a total of 63.8 million in 1970) and bananas (Denmark's entire importe, worth 6.7 million doliere).
In conclusion then, the new prospecte and powerful forces to expand and transform the Convention of Association of the African and Malagesy States with the EEC, which are taking chape, will almost certainly leed to radical changes in the trade relations of a larga number of developing countries, and these changes will particularly affect the trade of Latin America. The developing countries acceding to the new Convention export products which compete with Latin American exporte, with the result that the volume of products which will have completely free access to the expanded EEC market will increase substantially, while market possibilities for Latin America will be
111100111.■,
31/ The protocol liste the following countries: Mauritius, Fiji, Tonga, Western Samoa, Barbados, Guyana, Jamaica, Trinidad and Tobago
/reduced. Simultaneously

-42—
reduced. Simultaneously, the possible institution of market organizations between the EEC and its associates will weaken still more the already precarious prospects for the negotiation of commodity agreements of international scope. Lastly, not only will the immediate or potential effects of the special preferences granted by the expended EEC and the reverse preferences which the Associated States grant to the EEC be increased, but a great ares of growing trade discrimination against Latin America and other developing countries will be consolidated, together with an increasingly complete system of vertical trade relations.
(g) The enlargement of the EEC
The enlargement of the EEC, in accordance with the agre,:ments concluded with the United Kingdom, Denmark and Ireland in January 1272, is undoubtedly an historical event of fan-reaching sopee. The various aspects of this event are reviewed briefly below, and its possible repErcussions on Latin American trade are discussed.
(i) The processpf interna" tariff liberalization and the 112Ton of the common External tariff. The entry of new countries into the Community means, on the one hand, the progressive elimination of tariff and non—tariff barriers between the countries acc2ding to and those which were already members of the EEC and, on the other hand, the harmonization of the tariff trcatment to be accorded to third countries, i.e,, the adoption of the nommen external tariff. Reiprocal trade barriere will be eliminated through the gradual reduction of duties applicable to industrial products in 20 per cent stages beginning in April 1973 and ending in July 1977. The duties on agricultura' commodities will also gradually be eliminated concurrently with the adoption of the common external tariff. Furthermcreo as from 1 January 1973, all charges equivalent to duties on imports between the Community and the new members will be progressively eliminated.
The common external tariff will be adopted in four stages: 40 per cent on 1 January 1974, 20 per cent on 1 January 1975, 20 per cent on 1 January 1976 and 20 per cent on 1 July 1977.
/The application

-43—
The application of the comen external tariff to industrial products by the nine member countries will mean a reduction, in certain important cases, of their existing level of tariff protection. The average duties applicable to this group of products in the United Kingdom stand at present at 10.2 per cent, compared with 7.6 per cent in the Community and 11.2 per cent in the United States.
The subsequent stimulus which may derive from this tariff reduction in the futura should be examined in relation to the generalized system of preferences.
The Treaty of Accession provideáthat the nine member countries should implement the EEC generelized system of preferences as from 1 January 1974. Therefore, its substitution for the national systems of general preferences put into effect by the United Kingdom and Denmark on 1 January 1972 would adversely affect the Latin American countries inasmuch as the advantages given by those systems are greater than those offered by the EEC system. This is particularly so in the case of the United Kingdom, whose system includes a whole rango of processed agricultural products (BTN chapters 1 to 25), while the EEC system includes a more limitad list of these products or is cenfined to almost insignificant concessions in respect of some of them. t3uch differing treatment exists for several groups of products of inter-est to Latín America, such as edible fats (BTN 15.13), preservad vegetables (BTN 20.02) and fruit juices (BTN 20.07). In all these cases the system adoptad by the United Kingdom grants total exemption in respect of those products from developing countries, while the concessions included in the EEC system consist of minar reductions in the duties applied within the context of the most—favoured—nation clause 32/.
In addition, the United Kingdom system grants total exemption — except in certain cases where only a partial reduction in the basic tariff is accorded with no quantitative control whatever. In contrast, the Community, while siso granting complete tariff exemption for products included in BTN chapters 25 to 99, has considerably limitad the practical scope of the principie through the establishment of guatas which restrict the system's operation.
32/ For example, the decrease is from 7.8 to 5 per cent in the case of meat juices in cans of more than 1 kilogramo up to 20 kilogrammes, and from 14 to 10 per cent for the same product in 1 kilogramme cans.
/T'o sum

-44-
To sum up, if the EEC system is extended in its present form to the new member countries, the enlargement of the Community would thus constitute an additional factor adversely affecting the conditions of access of the Latin American countries to those markets.
It should also be notad that the competitivo conditions for manufacturad products exportad by Latin America to the enlarged Community within the context of the generalizad system of preferences are likely te become more difficult as a result of the increasingly free circulation in each EEC country of industrial products from the rest of the Community. Similar results may be expected from the recent establishment of the European free trade crea with formar member countries of EFTA.
The_221151112ral commodities not covered b the comen anrdcultural 22111z are mainly tropical products. As from 1 January 1973, the new members of the EEC will have to apply considerably higher dutius than those currently provided for in their respective national taríffs, Thus the duty on coffee beans, which is 2 per tent in the United Kingdom, will be 7 per cent in the EEC; the duty on coffee extructs or essences will he raised from 5 to 18 per cent; en cocea beans, from zuro to 4 per cent; and on cocoa butter, from =o to 12 per cent.
This affects a larga number of Latin American countries which are traditional exporters of this group,of commodities to the United Kingdom. In e recent study 33/ it was concluded that in the case of Orazil, the EEC tariff will be six times higher than that of the United Kingdom for 25 products, which represent 54.6 por cent of total exports to the United Kingdom, and lower only in the case of 11 products which represent only 6.2 per cent of total exports. Three particularly important commodities exported te that market by Brazil which' will be spocially affected are coffee beans (26 million dollars in 1970), coffee extract (12 million dollars) and cocoa butter (4 million dollars).
Colombia will be less affected by the United Kingdom's entry into the EEC, because of the small volume of its exports of coffee beans to that market (leso than 2 per cent of the total) and the duty—free entry of cotton — its most important oxport item — into both the EEC and the United Kingdom.
33/ Sea "In aterra na CEE: ConsecuencilanlóSrasil" Comercio Exterior, Sao Paulo, December 1971 — January 1972.
/The adoption

- 45 -
The adoption of the common external tariff by the United Kingdom will have an adverse effect on Cuba's exporte of molasses to that market (50 per cent of its total exporte of this product), as a result of the application of a 65 per cent duty instead of the free entry this product enjoye under the existing United Kingdom tariff.
There is another group of products not covered by the common agricultural policy which will have to pay higher tariffs as a result of the United Kingdom's entry into the Community. These include tea (650,000 dollars' worth from Brazil in 1970), on which the duty in the eommon external tariff is 11.5 per cent compared with free entry under the United Kingdom tariff; honey (882,000 dollars' worth from Argentina), which will be fiable to a duty of 27 per cent instead of 4 per cent; preserved fish (549,000 dallare' worth exported by Peru in 1970), for which the duties will risa, according to the category, from 2.5-10 por cent to 12-30 per cent as a result of the adoption of the comen external tariff. There will aleo be an unfavourable impact on Latín America's exporte of plywood (1.2 million doliere' worth from Brazil in 1970) and orangos, import duties on which will be 15 or 20 per cent, according to the time of the year, instead of 5 per cent under the United Kingdom tariff.
When it is considerad that, in addition to the effects of the substitution of the common externa-1 tariff for the national tariffs, the agricultural commodities exported by the Latín American countries will also in many cases be subjected to the provisions of the common agricultural policy, as indiCated in the following sectíon, it is to be anticipated that the enlargement of the Community will create more unfavourable conditions of access for this sector of Latín American exporte to the madcets of the new member countries, particularly the United Kingdom. As far as tropical products are concerned, the consequence of this situation could well be the displacement - at least on a partial scale of Latín American products by commodities from the preference arcas: at prosent the associated African States, plus, in the futuro, such formar Commonwealth countries as may decide to accede to the Convention of Association.
/(h)

— 46 —
(h) 122.1121 of the ccmmon a ricultur2122112zjegulations
The Treaty of Accession stipulates that the new member countries will apply the common agricultural regulations from 1 February 1973. All rulos relating to the institution of Community—vide market organizations and the establishment of Community preferentes will have te be in effect in those countries by 31 December 1977. At the same time, they will have to do away with any measures that are incompatible with the market organizations, especially quantitative restrictians on imports both from other member countries and from countries outside the Community.
The gap between the agricultural prices of the new member countries and the official Community prices is scheduled to be closcd in four stages, coming into effect at the beginning of each crop year, within the transitional period ending on 31 December 1977. Where the products concerned are part of reciprocal trade, the difference bctween Prices among the new member countries and official Community erices will be offset during the transitional period by a surcharge on imports or a subsidy on exports. As regards trade in agricultural commodities betwsen the new members and outside countries, the varible levy er Community subsidies scheduled under the common agricultural pclicy will apply, reduced or'increased by the corresponding surcharge or subsidy en trade with the countries of the present Community, the object being to ensure, from the start of the transitional period, that there is Community preferente against the competition of products from ebread.
The adoption of the common agricultural polícy by the new member countries has two main sets of implications. From the external standpoint, the access of outside countries, and especially Latín America, to the markets of the new members, wíll be made mere difficult. At tne domestic level, the adoption of the official Community prices will slow down and oven in some cases reduce local demand for agricuItural products, while simultaneously encouraging production in the new member countries. It will also have a negativo effect on external demand for products imported by the enlarged Community.
/(i) The

— 47 —
(i) The deterioration in conditions of access to the markets of the new member countries. As already noted, from 1973 onwards the new member countries will be required to apply the common agricultural policy progressively to products from outside countries. This policy mainly involves the introduction of a variable levy, in addition to the common external tariff, essentially designed to do away with the price difference Between imported and Community products, i.e., the relative advantage of the former over the latter.
As far as Latin American countries are concerned, the products most affected by this measure are beef and cereáls. As regards chilled or frozen beef (item 011-1 of the SITO), the United Kingdom's imports from Latin America in 1971 amounted to 61.8 million dollars in value, i.e,, 24.5 per cent of total British imports that year. The introduction of the variable levy will undoubtedly raise the price of the Latin American product and encourage a progressive reorientation of United Kingdom purchases towards other countries which are members of the Community.
A more complex situation could aríse in the case of cereals. The tariff franchise which wheat and rice currently enjoy in the United Kingdom is gr,zdually going te be replaced by the EEC's variable levy, which will have the effect of raising prices to the Community level. 1113 United Kingdom's two major suppliers at the moment — Canada and Australia, which together accounted for more than 50 per cent of its imports of cereals, in 1971 — will lose their preferential access and, from 1973, will be subject to the general regime described aboye. A shift in Britain purchases towards the EEC countries — the Netherlands and France — in the context of the Community preference might well have no significant. impact on current Latin American trade in view of the region's marginal role as a supplier of the British market. It should be pointed out, hcwever, that although they represented a mere 0.30 per cent of British imports in 1970, Argentina's wheat sales to the United Kingdom were worth 1.1 million dollars.
Rice is another product whose importation into the United Kingdom will cease to be duty free and come under the variable levy scheme. In 1970, Argentina exported a million dollar's worth of rice to the United Kingdom — 5,7 per cent of the latter's total imports, 60 per cent of which come from the United States. Hitherto, the Community has hardly had any share in the British rice market and will not in the neer future be in any position to offer appreciable exportable surpluses. This being so, it can be assumed that, despite the potential implications of the Community preference, the United Kingdom will have to continua buying from its traditional suppliers.
/Maize occupies

-48-
Maize occupies a more important place in Latin Americats exporta to the United Kingdom; exporta from Argentina emounted to 18.5 million dollars in 1971, although this in fact representa no more than 7.8 per cent of total British imports, the two principal suppliers being currently the United States (11 per cent of the total) and the EEC (22 per cent especially from France). Considering that United Kingdom maize importa ara at present subject to a 10 per cent duty, it can be presumed that the application of the Community regulations is going to strengthen the regional preference and might shift at least part of British purcheses to producers in the Community - though it must be borne in mirad that there is a shortage of maize in the EEC.
(ii) Im lications for the level of domestic rices and consrmall22 of agricultura? commodities in the new member countries The point has already been made that the variable import levy protects the Communityls system of domestic prices, which are much higher than corresponding world market erices. This is quite different from current practico in the United Kingdom, whose policy has traditionally teen tc import agricultural commodities at world prices so as to keep domestic censumer erices down. Under this policy, local producers have received compensatjen in the form Pf deficiency payments based en the difference reccrdee; bet;Aeen the reference prices, established jointly by the Government and t'ie producers' organizations, and the effective market prices. The United Kingdom's adoption of the regulations of the common agricultural por.cy naturally involvos the scrapping of this system and the gradual introduetion of offieíal Community prices; this in turn means a considerable ncrease in consumar prices.
An FAO study on the implications of the enlargement of the EEC for the 1970-1980 agricultural commodity projections conlains a number of estimates pf the probable evolution of agricultural erices ir the new member countries. One of the hypotheses used is that retail prices cf individual products in the new member ccuntries Will have risco by 1980 to the current unweighted average level of consumer prices in the EEC. The "current level" of EEC prices on which the study is based is that of October 1969. According to there estimates, the increase in retail prices in the United Kingdom would be 29.7 per cent for wheat, 67.5 per cent for sugar, 37.5 per cent for cheese, 127.5 per cent for butter, 52.9 per cent for beef and veal and 54 per cent for pig meat 34/. The
4/ See FAO, Committee on Commodity Problema, Forty-Sixth Session, "Implications of the possible enlargement of the EEC for agricultural commodity projections 1970-1980" (CCP 71/W.P.6), 29 September 1971, p. 1 and tabla 3.
/document goes
-49—
document goes on to say: "With the assumed changes producer and consumar
prices, the general effect of the enlargment of the EEC for the products covered in this study would be some expansion in production of and some dampening ín the demand for most agricultural commodities". Generally speaking, demand for the main products of interest to Latin America is likely to decline in the new member countries.
These conclusions are very similar to those reached in a study on the same subject cerned out by Michigán State University 35/, As regards beef, the report indicates that the trend in the. new member countries will be towards increasing self—sufficiency as a result of reduction in consumption and a rise in domestic production. In the United Kingdom, consumption could drop from 1,130,000 tons in 1968 to 1,063,000 in 1980 while, over the same period, production would rise from 906,000 to 1,063,000 tons, meaning that the country would achieve a state of complete self—sufficiencY by 1980. In Denmark, the adoption of Community erices would push production up from 2a7,000 to 325,000 tons which, with a small increase in consumption (from 92,000 to 106,000 tons), would raise the country's exportable surplus from. 155,000 to 219,000 tons. It can be assumed that this surplus would f.nd a regular outlet -in the Community where the coi ,tinuing overall deficit is expected te be only slightly loeer than that would have been the case without enlargement of the EEC, Thu report conciudes that the Community's beef import requirements from outside countries will decline appreciably with the entry of the new countries, possibly dropping from 180,000 to 109,000 tons cespite growing shortages in the current member countries which would be o7fset by an expansion of product.on in Denmark and Ireland.
As regards cereals in general, the same study considero that domand will expand more slowly than production in the United Kingdom and that imports from outside countries will in any case be cut rack. The projections given in the study suggest that the production of cereals in the United Kingdom could rise from 13.3 million tons in 1968 to 22.8 million tons in 1980, leaving an insignificant deficit of 150,000 tons compartid with that of 8.3 million tons recorded in 1968. For the three new member countries, the 1968 cereal deficit of 7.6 million tons could decline to 2.5 million tons as a result of their entry into the EEC. As for the enlarged Community as a whole (fine countries), the
35/Instituto of International Agricultura, Michigan State University, "The impact on US agricultura]. trade of the accession of the United Kingdom, Ireland, Denmark and Norway to the European Economic Community", Research Report, page 11. /projections indicate

projections indicate that the situation could by 1980 be one of almost total self-sufficiency, with a deficit of around 700,000 tons instead of the substantial figure of 10.3 million tons in 1968. This would be the result of a sharp increase in the production of cereals in the United Kingdom and a somewhat smaller increase in the other countries of the Community.
In conclusion, the University of Michigan study considere that the tendency in the principal agricultural production sectors of the enlarged Community will be to attain a greator degree of self-sufficiency. One of the consequences of such a trend could be an intensification of intra-Community trade and a reduction in export opportunities for outside countries,
(i) EEC financial assistance
The material available on the evolution of EEC finanulal assistance to Latin America over the last few years only refers to cfficial bilateral assistance, and not to official multilateral assistance ncr to assistance from private sources. Between the períods 19E0-1965 and 19E8-1970, net official bilateral assistance supplied by the EEC tc the whcle of Latin America rase from 145 to 268 million dollars on an annual average. This significant risa increased the share of this form of EEC assistance in total official loans received by the reglen from 16.1 per cent to 19.1 per cent between the two periods under consideration; this contrats perticularly with the case of bilateral assistance from the United States, which dropped from 61.6 per cent to 46.2 per cent of the total. As regards EEG assistance by countries, it may be observad that the case of Italy was different from the average, since its net assistance was slightly negativa during the whole period 19E0-1970 36/.
Despite this trend, and despite the EEC/s íncreased contríbutions to multilateral institutions as a whole, official EEC assistance has continuad to constitute a relatively small part of the total flows made available, in which private investment and supplier credits predominate. Although no breakdown by developing regions is available of the most recent figures for the total assistance supplied by the Community, it is knownthat in 1970, for example, official assistance to the Third World as a whole carne to about 47 per cent of total assistance provided by the Community. From material available for the early 1960's, it may be estimated that this percentage was probably less for Latin America.
36/ See OECD, Develo ment Assistance 1971 Review, Paris, December 1971, tablo 17.
/As regards

- 51 -
As regards the tercos of official EEC assistance, it may be notad that some quito substantial progress has taken place. In the case of the Federal Republic of Germany, for example, the average rata of interest of official loans was reduced from around 4.3 per cent in 1962-1963 to around 3 per cent in 1969-1970, while during the same penad the average amortization penad increased by approximately 10 years (from 15-18 to 26-27 years). In addition, official bilateral German assistance has been fairly flexible as regards "tying", since a substantial part of the loans granted have been authorized for use in financing purchases of capital goods in other countries, preferably EEC members. A similar though more moderete tendency has been recordad in France and the Netherlands as regards a decrease in average interest ratos while in the official credits granted by these countries there has been a Elight degree of flexibility for financing purchases of equipment from other EEC countries 37/.
An important aspect of the possible evolution over the next few years of EEC financial assistance to the developing wnrld, including Latín America, is that of the overall directions of chango propcsed by the Community itself, Mich are now assuming potentially greater scope with the recent expansion of the Community. 07 importance here, for example, are the steps being taken to co-ordinate assistance frsm the various EEC countries and the tercos on which it is granted. In a document addressed to the Ccuncil of Ministers, the Commission propases with a view to attaining by 1975 a level of officiel assistarce nf 0.7 par cent of the GNP of the whole Community, to programe the assistance commitments of each of its member cuuntrj.ns as an intgral part of its medium-term economic programmes 38/. The roed for sucli programming is particularly urgent in the caso of the Federal Republic of Germany, Italy and the United Kingdom, since it is estimated that in 1975 their coefficients of official development aid wili be only Ou34 per cent, 0.16 per cent and 0.43 per cent of their respective GNP's 39/.
-.11.11111.■~•~1
37/ See OECD, Develo ment Assistance Reviews, 1966 and 1971.
38/ See EEC, Mémorandum sur une oliti ue communautaire de cogeAration 925I1v9192pernent.przomnra psuneremiere série d'actiomx
Brussels, 2 June 1972.
39/ See paga 19 of the speech by Mr. Robert S. McNamara already referred to earlier.
/In the

— 52 —
In the above—mentioned document, the Commission also proposes that the financial assistance granted by the different EEC countries should be progressively untied, so that it could be used to finance purchases of goods anywhere in the Community without distinctions. This is in line with the EEC proposal to move towards achieving true economic and monetary unity. This initiative, which is interesting in itself, could be complementad, for Latín America at least, by a measure similar to that in force in the United States 22/ whereby official credits granted to the region can be used to finance purchases of capital goods produced in any Latín American nation.
Lastly, as regards the adoption of some basic policy orientations designes to secure more appropriate channelling of the multilateral assistance which the EEC may grant to Latín America, there are several different possibilities of action which are not mutually exclusive. One cr7 there is the posible operation in the region of the European Investment Bank (BEI), th.s being a measure which the EEC countries could support. Another formula could be that the Community would contribute resources to the Inter-American Development Bank, to assist the financing of the activities of this institution in Latin America, In the meetings held between EEC representativos and representativos of the - Latir' American countries, particularly the meeting of December 1972, the Latin American representativas proposed several initíntives elong these linos, but have not yet obtained any positiva reply from the EEC.
(j) Situation and prospects for co—operation between Latin America and the EEC
In the middle of last December a third meeting was held in Brussels between representativos of Latin American countries and of the EEC. The agenda included the revíew of the evolution of trade relations betweon the two arcas, the impact of the expansion of the Community, the 1973 multilateral trade negotiations, questions connected with the generalized systems of preferences and the expansion of reciprocal trade, financial and techniwil co—npsration, and other inatters of common interest. According to offioial spkesmen, this third meeting gave an opportuníty for discussing and analysing prohiass which are of particular concern to Latin American countries connected Oommunity policy in a more precise and complete form than had been possible at the two carlier meetings, although no concrete decisions on the matters under discussion could be reached. The most important conclusions may be summed up under the following points:
The EEC considers that discussion on Community should take place — as indeed is ruling out the possibility of dealing with Latín American countries in connexion with was agreed that a joint EEC—CECLA (Special
the effects of the expansion of the the case — within GATT, while not concrete problems raised by the the expansion of the Community. It Committee on Latin Amerian
40/ In this connexion, sea also the chapter on external financing. /Co—ordination)
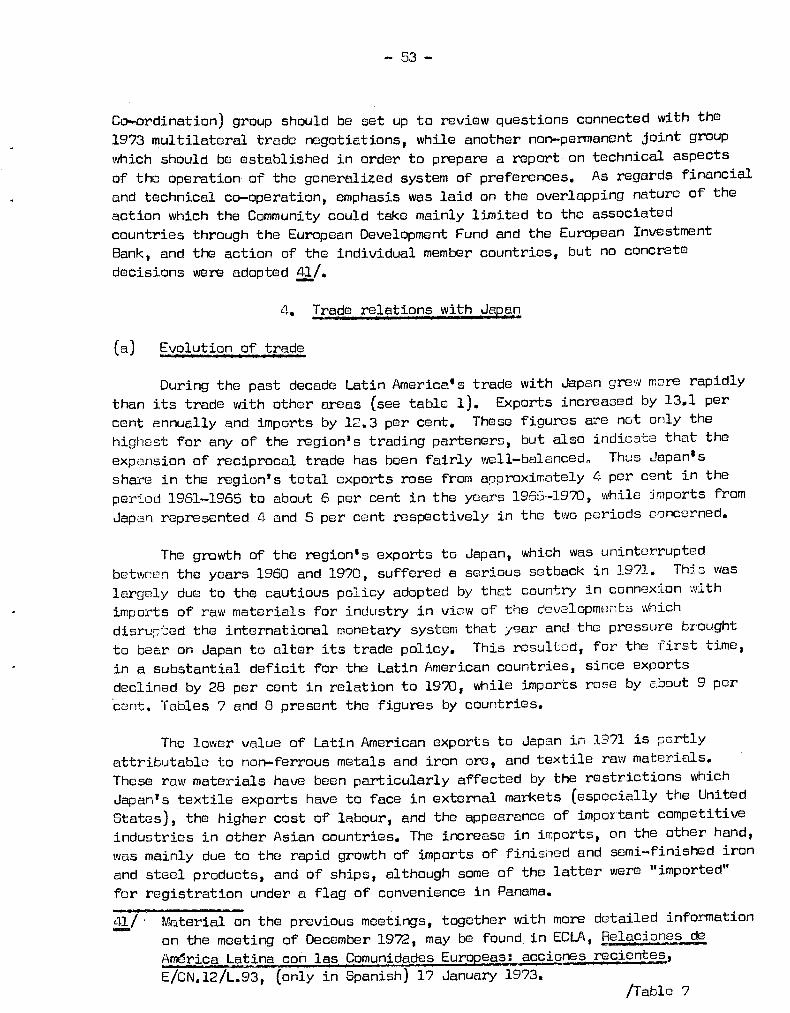
- 53 -
Co.ordination) group should be set up to review questions connected with the 1973 multilateral trade negotiations, while another non-permanent joint group which should be established in order to prepare a report on technical aspects of the operation of the generalizad system of preferences. As regards financial and technical co-operation, emphasis was laid on the overlapping natura of the action which the Community could take mainly limitad to the associated countries through the European Development Fund and the European Investment Bank, and the action of the individual member countries, but no concrete decisions were adoptad 41/.
4. Trade relations with Llagan
(a) Evolution of trade
During the past decade Latin America's trade with Japan greca more rapidly than its trade with other armas (see tabla 1). Exporte increased by 13.1 per cent annually and imports by 12.3 per cent. Theso figures are net only the highest for any of the region's trading parteners, but also indicate that the expansion of reciprocal trade has been fairly well-balanced„ Thus Japan's share in the region's total exports rose from aparoximately 4 per cent ín the penad 1961-1965 to about 6 per cent in the years 1955-1970, while importe from Japan represented 4 and 5 per cent respectively in the two periods concerned.
The growth of the region's exporte to Japan, which was uninterrupted between the years 1960 and 1970, suffered a serious setback in 1971. TWs was largely due to the cautious policy adoptad by that country in connexíon with imports of raw materials for industry in viaw of the developments which disrueted the international monetary system that year and the pressure brought to bear on Japan to alter its trade policy. This resultod, for the first time, in a substantial deficit for the Latin American countries, sinee exports declinad by 28 per cent in relation to 1970, while imports roa° by about 9 per eent. Tables 7 and 8 present the figures by countries.
The lower value of Latin American exporte to Japan in 1971 is pertly attributable to non-ferrous metals and iron ore, and textile raw materials. These raw materials have been particularly affected by the restrictions which Japan's textil° exports have to face in external markets (especially the United States), the hígher cost of labour, and the appearance of important competitive industries in other Asian countries. The increase in imports, on the other hand, was mainly due to the rapid growth of imports of finished and semi-finished iron and steel products, and of ships, elthough some of the latter were "importad" for registration under a flag of convenience in Panama.
41/• Material on the previous meetings, together with more detailed information on the meeting of December 1972, may be found in ECLA, Relaciones de América Latina con las Comunidades Euro eas: acciones recientes, E/CN.12/L.93, (only in Spanish) 17 January 1973.
/Tabla 7

- C.4 -
Tabla 7
LATIN AMERICA: EXPORTS TO JAPAN
of dallare)
1961-1965 1966-1370 1970 1971 a/
Annual growth rata
1966-1970 1961-1965
Argentina 38,2 56,4 109.3 89.0 8.1 Bolivia 2.2 11.4 34,3 12,8 39.0 Brod.' 32.2 91.8 198.1 56.0 23.0 Colombia 3.4 11.7 24.3 20.6 28.0 Chile 45.9 132,7 193.1 183.5 24.0 Ecuador 1243 35.6 77.o 36.6 24.0 Mexico 69.6 80.8 68,o 64,2 3.1 Paraguay - - - - 1.eru 47.3 118.1 141.9 110.5 20.0 Uruguay 2,5 2.2 1.6 1.7 .2.6 Venezuela 23,6 33.8 20.7 12.7 7,5
LAPTA countries 277.2 574.4 868.3 557.6 15.7
Costa Rica o.5 3.5 11.3 9,3 48,o El Salvador 29.7 19.5 25,5 25.2 -8.1 Guatemala 14.5 20,4 20.4 19,5 7.1 Honduras 2.1 6.9 4,0 o,8 274 Nicaragua 26,0 36,9 25.1 32,8 7,,2
CACM countries 72,8 87.2 86.3 00,6 ¿.-.1.- 11
Haiti 2.2 2,3 1,7 1,6 0.9 Panama 0.6 0.8 0.3 1.7 5.9 Dominican Republic 108 1.3 5.5 6.3 .6,3
Total 19 countries 354,6 665.9 962.1 687.8 13.4 Cuba 30.8 47.4 100,6 t.. 9.0
Overall total 385.4 713.3 1 062,2. ... 13.1
Source: Directen of Trade °p. cit.
a/ Preliminary figuras.
/Table 8

- 55 -
Tabla 8
LATIN AW-RICA: IMPORTS FROM JAPAN
(Millions of dollars)
Annual grolgth
1961-1965 1966-1970 1970 1971 2/
rato 1966-1970 1961-1965
Argentina 42.3 53.1 84.9 155.4 4.6 Bolivia 9.4 17.7 17.3 28.1 13.5
Brazil 54,4 91.5 183.4 51.2 11.0
Colombia 17.3 32.0 62.5 55.2 15.1
Chile 13.8 18.4 34.5 44.4 5.9 Eouador 5.4 18.5 30.5 31.9 28.0
Mexico 26.5 75.6 86.o 39.9 23.0 Paraguay - - - - ..•
Peru 33.6 51.0 48.9 71.9 8.7
Uruguay 2.7 1.6 3.4 3.6 -10.0 Venezuela 49.9 93.1 122.6 189,1 13,3
LAPT.J1 countries 22522 452.5 674.0 229.7 12.1
Costa Rica 10.3 19.5 28,5 39.3 13.6
El Sa1va3ar 11.4 18.0 24.6 23.4 9'.5 Guatemala 10.0 23.4 31.5 32.2 17.4
Honduras 6.3 10.4 18,2 21,8 10.6
Nicaragua 7.3 12.6 12.9 17.2 11.5
CACM countries 45.3 83.9 1151 3r:3 U:1.
Haiti 0.4 3.7 6,3 5,0 5C.0
Panama 5.9 14.1 20,5 29.8 19,0
Dominican Republio 8.2 18.5 33,3 53.9 17.7
Total 19 countries 315.1 572,7 845,8 2112 12.7
Cuba 13.5 14.4 43.1 ... 1.3
Overall tgtal 328.6 587.1 872a ... 111.2
Source: Direction of Trade op. cit.
2/ Preliminary figures.
/Japan was

-56-
Japan was the second country to put into effect, in August 1971, the general system of preferences for exports from developing countries. As stated aboye, Latin American exports to Japan dropped sharply that year and, although the preferential system was in force only during the last five months, the size of the decrease (28 per cent compared with 1970) would seem to indicate that the preferential concessions had virtually no effect. This is borne out by the preliminary data for Japanese imports during eight months of the period 1971/1972, which show that the value of imports under preferential treatment represented only 2.7 per cent of total imports from developing countries. This low percentage is basically due to the fact that a high proportion of Japanese imports from developing countries (about 92 per cent) consist of primary products or products with a low degree of processing in respect of which no preferential concessions were granted. Moreover, preferential access is regulated by quotas, which in the first year of the system's operation have shown themselves to be highly restrictive, in that the global quotas were filled within the first few months of the application of the concesions, es were the quotas of countries which had already used up moro than 50 per cent of ths global guata.
The extent to which the Latin American countries were afile to take advantage of the preferential concessions was even more disheartening. During the period referred to aboye, only 1.8 per cent of the total imports from Latin American countries gained preferential access. This minimal percentage is partly due, es mentioned aboye, to the hígh concentration of imports of primary products, and partly to the extrememly restrictiva character of ths quotas, since on the basic of the value of imports of products included in the preferential system, 6.2 per cent of those from Latin American countries should have been admitted under preferential conditions: as the quotas for many products had aiready been filled, however, the actual proportion of importa admitted under the system of preferences was no more than 1.8 per cent.
It should be notad, however, that same countries were able te make better use of the general system of preferences than the Latin American countries: for example, the share of preferential imports in total imports was 38.7 per cent for Israel, 15.1 per cent for Formosa, 11.4 per cent for Pakistan, 11.7 per cent for Spain, 12.6 per cent for Yugoslavia, 10.8 per cent for the Republic of Korea, etc., 42/. It should also be noted that importa from these countries are fairly widely diversified and more than 20 per cent are products included in the general system of preferences.
,11,11•111111MMIMM111.101.
.42/ The only Latin American country which achieved a high proportion was Colombia (22.6 per cent), but imports from that country under the system of preferences consist almost entirely of precious and semi-precious stones (BTN 71.02).
/This reflects

-57—
This reflects the difference in structure of Japanese importo from Latin American countries and from Asian countries. Japan's importo from Latin America of products classified in SITC sections 6, 7 and 8 increased three—and—a—half times in the second half of the 1960's, to a value of 130 million dollars in 1970, but approximately 100 million dollars was accounted for by copper and copper alloys and part of the rest by iron and steel. This is very different from the increase in importo of manufactures from the Asian countries, which are more diversified and includo textiles and other light industry goods.
(b) Recent activities in the field of recl•rocal economic relations
The rapid expansion of reciprocal trade between Latin America and Japan has led in racent years to contact at both the official and the private level, in contrast with the situation prevailing in the last decade, when such contacto were few and far between.
The bilateral links at both the official and the private level were considerably strengthened through meetíngs and missicns. The sigeatory couritries of the Cartagena Agreement decided, in the Declaration of Cuzco (Meroin 1971), to request the Commission and the Board to explore possible charaoteristics of systems of co—operation with other countries, recommending that priority be given to a study in connexion with Japan, becauce of the extensiva prospecto for trade with that country. Accordingly, in October 1971, a mission from the Andean Group visited Japan and an Andean Group/Japan Joint Committee was established at the government level to deal with matters of common interest, exchange views and conclude agreements on
certain issues.
More recently the member countries of CECLA adopted the Declaration on Relations between Latin American and Japan in which they prnposed to the Japanese Government that joint díscussions be initiated.
In line with this Declaration, the countries concernnd examined the subject and placed special emphasis on the role Japan will play in the 1973 trade negotiations. In adopting the aboye Declaration,account was taken of the following factors, which largely sum up the nature of the relations between Latin America and Japan under the new world conditions;
(a) The Joint Japan—United States Statement on International Economic Relations, of 9 February 1972, was one of the key factors in the decision adopted by the Council of GATT last March concerning the holding
of trade negotiations as from 1973;
/(b) Because

- 58 -
(b) Because of the volume and vigorous growth of Japan's foreign trade, it is one of the countries whose action wíll be decisiva in ensuring fuil attention to the interests of the developing countries in those negotiations;
(c) Several Latin American countries have important trade relations with Japan;
(d) Latin Americats trade with Japan has increased in absoluta terms, but is declining in relativa terms;
(e) In view of the different levels of economic and technological development reached by Japan and the Latin American countries, greater mutual collaboration would be beneficial to the reglan Si.
The establishment of proper machinery for consultation between Latin America and Japan would facilítate the identification of problems of interest to both parties and the search for solutions, withuut prejudice to any bilateral or multilateral contacts which may be maintained within the framework of world organizations. It will be recelled that the Latin American countries took similar steps and concluded agreementc, with the United States and the European Economic Community for the establishment of machinery of this type, whose operation is described aboye.
Under existing world conditions, the establishment of machinrry for consultation between the Latin American countries and the main trading areas can play a most useful role, particularly in the stage prior to and during the forthcoming multilateral traes negotiations, Moreover, in 1972 Japan initiated a process of reviewing and reframing its infernal and external economic policy, from which new and greater opportunities may be expected for the Latin American countries to continua to e;mand their trade.
5. Trade relations with the socialist countries
Trade during the 1960's between the Latin American countries (excluding Cuba) and the socialist countries had two main features: the greater part of this trade was limitad to two countries only (Argentina and Brazil), and there were notable annual fluctuations, particularly in exports, which were reflected in a low growth rete during this period.
22/ Special Committee on Latin American Co-ordination (CECLA), Fourteenth Meeting at the Expert Level, Report of the Rapporteur, Santiago, Chile, September 1972,
/For reasons

— 59 —
For reasons which are well known, Cuba's extErnal trade during the 1960's was largely directed tcwards the socialist bloc, especially the Soviet Union. In fact, during most of the decade the value of Cuban exports and importe from the socíalist countries far exceeded the value of trade between the rest of Latin America and the socialist countries. Consequently, when the region (i.e., the group of 20 Latin American countries) is taken as a whole, the value and trend of their trade with the socialist countries basically reflecte the development of Cuban trade, and not that of the remaining countries of the region. The figures given in table 9 illustrate this situation.
Several facts emerge from the figures on the evolution of exporte, broken down by countries (excluding Cuba): (a) Brazil is the country which has achieved the greatest regularity in its exporte, having enjoyad a continued growth trend with few interruptions; (b) from 1964 to 1966, Argentina's exporte reached exceptional values on account of the extraordinarily large purchases of cereals made by the Soviet Union and China, but ín the following years Argentiná's exporte decll.ned to levels comparable with those observed at the biginning of the 19601s and showed
no signe of growing; (e) exporte by Colombia and Peru, which were almost insignificant at the beginring of the 1960's, showed a notable expansion duríng the next few years, although the aboslute values continued to be modct; (d) Mexico's and Uruguay's exporte showed considerable irregularity and (e) for the remaining countries, the market of the socialist countries practically does not exist, (see table 10).
The evolution of importe from the socialist countries may be summed up very briefly. The most important feature is that the Latin American countries as a whole (excluding Cuba) have traditionaliy maintained credit balances in their trade with the socialist countries, The annual value of importe from these countries has shown smaller fluctuation than exporte, and does not show any definite tendency towards an increase. It might be said that importe from the socialist countries rather tend to show relative stagnation asee table 11).
Both the destination of exporte to the various socialist countries and the origin of importe shows more balanced distribution than has been indicated for the Latin American countries. As regards exporte, the main destinations are the Soviet Union, Poland, the German Democratic Republic and Czechoslovakia, and with very low figures for Bulgaria, Rumania and China. The main origine of importe follow more or lees the same pattern.
/Table 9

— 60 —
Tabla 9
LATIN AMERICA: TRADE WITH SCCIALIST COUNTRIES
of dollars)
1961-1965 1966-1970 1970
Latin America, exoluding Cuba
Exporto 241 291 321 36o Importa 119 146 132 188
Cuba Exporta 345 4225/ OOP* e*. Importa 518 705/ **O e..
Source: Averages basad on the annual figures of tablee
1/ Average for the years 1966-1968.
/Tabla 10

O
O
ce.
0 r-1
uroe: International
Mone ta rY Fund, Dir
eoti
on of
10 00 01 ri
01 rl
ri
0 r4
10 rMl
of doll
ars)
LOS. al r-I
ON al rl
e-t
al e-t
ffl O 5
a O r-1
O 1-4 'A 5
9 O fA
O E.
p
E
•4,e-1 al e-1
— 61 —
o o. ctl ce. o. 01 e,. CO CO N • • • ■ • • • • • •
t.41 4 i crN .2 01 4 VD 01 Irs 1O ts.
CO04 el t, ti u'. vi Cc's
el t.. ri M 00 • • • • • • vell • D 1 //1 z•-_ t t cr. i cso co e
Col el CrN N r4
el O ri tes .2 vi 10 Col • • • • • • •
.1.101.`4 0 1 04 1.2.00 O N CV rt 10 04
\Q rol cr. tc. N •
01 01 ri • 4 • • • • •
CV v-1 a 0: 1 co cr) ■1:1 t•-• e CC3
1.C1 ri CV .2
■D coo0'1 O ON 0-1 «U' ...•
e • • • • • é
1 el Cr's 1 ^- rol N 1 O o;) 04 1 fl a .. •. rto
%.0 lo.: ri ri vi 04 ts.. N .2'
ri CV 01 les O .2 r1 CO .1... • • • • lir e • • •
rl
..4. j j 11:4. 1 11■ tr, te, t co t c%, ■ce o o ri 10
O r-1 N ri O co 00
04 et Ch
CV O CO M C4 el <N JC■ • • • • • • • • •
■-c) 410 cr. r1oI t-..te-e 10 §..ocr.e o 1 cm 10
co ceN rl les O CV CO • • • •• . • • • u; do,
11 CO CV o 0-N o e tr■ co r4 cc
ri 016 10
■L) N N ON ts. ri • N O • • • s • w • • • 2, • • • •
Le. N.2 04 .4 Crs 1 CO rl O df. 1 COO
141 CO rl
CV roi••
o e-4 co • • • • • • • •
C.1\co 04 viC)
CO 1 ce. ri r4 1 10 1 N.2 1 ••0 o M
CV O 04 ri 04 CV O'N 121 ■ • • • •
11 4 11 1 0 -0' 1 1 1 ri 1.11 04 ri O 0
1.11 I,. 4-I ..2- .2" '•••0 rl 01
vi Cc% N N.O o ti. eie • • • • • • 1 •
W 1 vi N O 11 vi e 0 e. t I
...o ,t-... vi .2 21 "41rr.‘1
vi ri vi
011 4/ sel o
.0 o P. .4 14J
0 é4 14 0 r-1 .1.: Y 411% car0 4 414 h o0 o.0 o. o. o 1
Total LAPTA

ri
O \CI• • •
rl *-1 **I
O • O • •
10
I C1 N 01 • • , • • O -7 N NO
re ‘0
co 0\
P14 01 10 Rs,
e y3 Cr% rl 1.41
Ce
.0 CJ J
01 • • •
•
4-4
• CO CO •
c • • •
v-4 NO
r-I CV
CI
r-I 1/1
rl
O (iL
tlli
on
a o
f d
oll
aro
)
• o
o Ya
O
o
O
ri
1 Di
reoti
on of
— 62 —
• • • • • • • • • g r4 I C1 -7 O O 04 01 4-1 r4 r4
ri
U1 CO ON 01 r4 Es...
,• • • • • •
r4
• c0
t4N O 10 co o
- N 1 04 r4
• :N CO 10
1.11. 1 01. I11* 1 2 001 % 1/4°‘41 ACP'. .1.01. '4
r4
ON Ls... 111 10 111 NO rl • • .• •' • .•e • • rl 01 04 ts, Le,
• cv r,
01 r4 ri
• r4 cf: • o i
0.1 10 ON EN. NO CN N EN • él • • • • • • •
r4 01 ON a, C4 1 .2' t 4../N N 11.
CO 0,1 e • • • •
rl O NO
v-I
01 r4 rl N 41 rl O 01 • - • • • •
EN 0 • • •
cf1 N c" .-1 01 I c" 1 01 01 CO 1-1 01 ls. 4-4 ..'
re
.d• co■ R1 NO N rl r4 CO N • 0.1 -7 NO • • • • • • • ••• • • rl rl O ri u, *04 NO II 10 O 0'1 ND 04 N 04
r4 r-1 141
NO 01 01 NO .7 cU 111 NO CO Ñ44, • • • • • • rl X01 CO M 1 M 1 el
0• 4 01
0.1 01 NO \O N 04 • • • • •
a.1 _11 •
CO 111 .4' ,L) 1
CN 0 • • •
v1 r4
• • • • • • • • 10 0 C4 N 1 N 1 W 01 0 \
▪ CO CV O C, O ON • • • • • • •
O O O 01 rl 1 0: 1 41 01 4' 1.11 •
rl
01 NO NO v-I O NO cn O O • • • O* erNé 1 c: r4 001:
141 t•••• v-4
07 00 • • • , •
r4 O EN • r4 NO
rl ri
CU
e
•
t. c. lO
4,3McS te r4 r4
Ú C•1
ce o o .4 .4
Tt r4 te g O O g1 1
0 rt 0 I A 3
N ik 1 el o O r4 •4 , r4 N 41
al .2 5 o
e. t N tl 1 j 4 O 411,
bi 1 00 0 . 04 el 424

- 63 -
A more thorough investigation of the nature and extent of the problems affecting trade between the Latín American and the socialist countries is called for. Both groups of countries have frequently referred to the appropriateness of and possibilities for expanding their mutual trade, but as has already been pointed out, only a few Latin American countries have been able to establish trade flows of any magnitude and regularity with the latter countries. The socialist countries consíder that as the Latin American exports are persistently greater than imports, this hardly creates the conditions necessary for a more rapid expansion of reciproca' trade. It is, however, necessary to determine to what extent this low volume of Latin American imports is the result of differences in the groups of goods which make up a great large part of the trade. The Latin American countries export foodstuffs and raw materials of generally known and accepted international specifications, whereas they import manufactures and intermediate and capital goods of téchnical specifications which are generally different from those commonly applied to imports from the industrialized western countries. Even if the differences in the technical specifications were not very great, ignorance of them, or doubts on the servicing and maincenance of socialist equipment could be an important factor in discouraging larger scale acquisitions of such goods and equipment.
The differences between the Latin American and the socialist countries as regards the organizations which enter into the conduct of their trade relations are also very important. In contrast to the state monopoly on external trade and the centralized decisions which are the rule in the socíalist countries, the import trade of the Latin American countries is to a greater or lesser extent in the hands of private enterprises, which have generally shown little interest in expanding their trade relations with the socialist countries. It may be recalled that some credits granted by the Soviet Union have not been fully used.
On the other hand, it must be acknowledged that certain limitations are also to be found on the side of the socialist countries. One is that, as importers of primary products, they are not always willing to transact business in freely convertible currencies, nor to agree to the transfer of balances within their own group, so that trade suffers from excessive bilateral rigidity. This is one of the problems of trade between these two groups of countries which is explicitly mentioned in the International Development Strategy, the last part of paragraph 38 of which recognizes that "no uniform method of introducing multilateralism in payments
/relations between

- 64 -
relations between developing countries and socialist countries is practica? at this time...", and recommends for this reason the introduction of elements of flexibility and multilaterialism in payments agreements, or the holding of consultations to this end. Apparently, however, no progress has been achieved in thís area,
Other recommendations of the International Development Strategy directed at the socialist countries call upan them to take into consideration the trade needs of the developing countries in setting the aims of their long-term economic piens, so that imports from developing countries will constitute a growing element in their total imports of manufactures. Another recommendation is that they should apply, in their relations with the developing countries, the principies and aims contained in UNCTAD resolution 15 (ti) 11/.
Limitations of available information do not allow any verification as to whether the socialist countries have made any progress in applying the recommendations of the resolution in question.
Adequate information is still not available as to the application of generalized systems of preferences by the socialist countries which took part in the work of the UNCTAD Special Committee on Preferences. The Soviet Union stated ín a communication to the Trade and Development Board that on 21 December 1964, by order of the Council of Ministers of the USW, the Soviet Union had completely suppressed the tariff duties on commodities importad from the developing countries of Asia, Africa and Latin America, and that measures merked the beginning of the granting of a new type of tariff preferences to the developing countries, whithin the framework
44/ The above-mentioned resolution recommends, among several other measures, that the sccialist countries should endeavour whenever possible, accelerate the rete of growth of trade exchanges with developing countries; to conclude long-term agreements for the purchase of commodities from the developing countries which would include Suitable provision aimed at a satisfactory solution as to volume and stability of erices of such commodities; to multilateralize payments between them and the developing countries to the fullest extent possible not to encourage the importation of primary commodities from other sources whenever they are available on competitive terms in developing countries, and lastly, to refrain from re-exporting goads purchased from developing countries, unless it is with the consent of the developing countries concerned. See UNCTAD, Second es, Vol. S.
/of UNCTAD

-65-
of UNCTAD 22/, According to this communication, the preferential treatment accorded by the USSR would be applied to all the products included in Chapter O to 99 of the BTN, without guata limitations.
In the preference systems of Bulgaria, Czechoslovakia and Hungary, reductions of between 30 and 90 per cent are granted on the most—favoured—nation customs duty, the products exciuded from preferential treatment are enumerated, and it is Specified that the granting of concessions to countries giving reverse preferences to some developed countries is only of a temporary nature until the latter preferences are done away with within a reasonable period, The generalized systems of preferences of the aboye countries carne into force in the first few months of 1972,
45/ Seo "Generalized System of Preferences: the USSR scheme", TD/B/378/Add.5, 4 May 1972.
/Chapter V

.

- 67 -
Chapter V
FOREIGN TRADE, MARITIME TRANSPORT, INSURANCE AND TOURISM
1. Evolution of
Contrary to what one might expect, world exports of primary products come largely from the developed market-economy countries, which together supply approximately 50 per cent of the world total. As a group„ the developing countries account for about 39 per cent, the remainder coming from the group of socialist countries. Latin America altogether contributes between 12 and 13 per cent of the world exports of these products (see table 1), taken as a whole.
It is a well-known fact that both the developing countries as a whole and the Latin American countries as a group have been experiencing a steady decline in their share of world trade, mainly because of the small proportion of manufactured goods in their exports. The expansion in world trade during the past decade was based essentially on the rapid growth of exports of manufactures, stimulated by the lowering of tariff barriers and the formation of free trade creas and customs unions among the developed countries. As a result, countries exporting primary products were left further and further behind. In addition, however, the developing countries in general and Latin America in particular are even losing ground in the trade in primery products.
This decline in the Latin American countries' share of world exports of primary products (owing to a slower growth than that of other regions) was particularly marked in the fuels sector (petroleum and petroleum products) and, to a lesser extent, in the raw materials and non-ferrous metals sectors. The reduction in their share of the world market in petroelum and petroleum products is especially significant: this is a group of products with one of the highest growth retes in world trade, but for reasons which Will be analysed later most of the expansion of these exports was to the benefit of the countries of the Middle East.
In contrast with this steady decline in Latin America's position in the world market for primary products, the European Economic Community made notable strides, especially in the food and non-ferrous metals sector, where it regístered a greater increase in relative terms than the remaining developed countries.
/Table 1

Food, beverages and 1961-1965 toba000 (sections 0 1966-1970 and 1) 1970
1971
Inedible orude 1961-1965 material* (section 2), 1966-1970
oil* and fato 1970 (section 4) 1971
iuJls and lubrioants 1961-1965 (section 3) 1966-1970
1970
1971
Unworked base moteas 1961-1965 (section 6, division 68)
13664970 1970 1971
Total primary 1961-1965 products 1966-1970
1970 1971
Chemdcals (sectiwn 5) 1961-1965
1966-1970 1970
1971
Manufactured acoda 1961-1965 (sections 6 and 8) 1966-1970 exoluding unworked 1970 base metals
(divisien 68) 1971
Mkohinery and 1961-1965 transport equipment 1966-1970 (seotion 7) 1970
1971
Total manufacturad 1961-1965 goods 1966-197o
1970 1971
Total prima products 1961-1965 and manufacturad góods 1966-1970 (sections O to 9) 1970
1971
-68 _
Table 1
WORLD EXPORTS BY GROUP OP PRODUCTS AND ARFA OF ORIGIN
Groupe of products, by SITO seotion
Year Millions
of
dollars
Peroentage of the total for eaoh ares of origin
Developed United European Developing Latin Other Sooialist Roonomio develeping oountries States Community countries Amerioa countries countries
27 250 56.1 14.9 14.3 34.3 15.6 18.8 35 576 57.9 13.5 18.5 31.9 15.4 16.5 41 430 58.6 12.2 20.6 31.9 15.9 16.0
22 468 54.6 13.4 9.5 34.0 8.7 25.3 119118..39052 28 070 56.9 14.1 11.0 31.2 8.3 22.9
32 960 59.1 15.5 11.3 30.0 7.6 22.5 10.9
15 738 25.4 5.6 13.2 61.5 16.5 454 13.0 23 238 24.5 5.0 11.9 64.3 12.8 51.5 11.2 28 700 26.5 5.5 12.6 62.9 11.3 51.6 10.6
5 242 61.9 8.7 18.4 29.7 12.0 17.7 7.1 9 672 62.7 7.4 22.6 30.4 11.4 19.0 6.9 12 020 64.6 7.5 28.5 28.8 10.6 18.1 6.7
70 698 49.2 11.9 12.8 39.9 13.3 26.6 9.5 96 556 50.1 11.0 15.1 39.3 12.3 27.0 10.6 115 no 51.3 11.o 16.8 38.8 11.8 26.9 9.9
9 794 86.6 21.4 37.7 4.2 1.4 2.8 8.7 17 266 88.6 13.5 41.3 3.6 1.5 2.1 7.7 21 84o 88.9 17.5 41.8 3.7 1.6 2.1 7.4
37 524 79.3 10.7 34.6 7.4 0.6 6.8 11.3 6o 800 81.1 9.1 35.8 8.4 0.9 7.5 10.5 78 280 80.9 8.6 35.3 9.1 1.o 8.1 10.1
37 284 86.o 23.1 34.1 0.8 0.1 0.7 13.1 68 110 87.2 21.3 34.o 1.2 0.3 0.9 11.6 89 570 87.8 20.0 35.1 1.5 0.3 1.1 10.7
84 602 83.1 17.4 26.0 4.1 0.5 3.6 11.8 146 176 84.8 15.9 35.6 4.5 0.7 3.8 10.7 188 990 85.4 15.1 36.0 4.9 0.8 4.1 10.1
157 442 67.9 15.1 24.7 20.2 6.3 14.0 10.8 247 386 70.8 14.1 27.3 18.1 5.2 12.9 11.1 311 390 72.0 13.7 28.4 17.4 5.0 12.5 10.6
Source: United Nations, Monthly Bulletin of Statistioa (April and duna 1972) and direot information from the United Nations Statistioal Office.
/(a) Composition

-69-
(a) Cempsition of ex orts
As already pointed out, one of the main reasons for the slow growth of Latin America's exports is their small proportion of manufacturad goods. It is undeniable, of course, that in three or four countries exports of manufactures have already reached a substantial level; it is els° true that the increase in intré-area trade - in the Central American Common Market and the Latin American Free Trade Association - partly reflects the expansion of exports of manufactures of some of these organizations' members. The fact remains, however, that the export of primary products continues willy-nilly to be the main source of foreign currency for Latin America as a whole, and all policy measures that affect conditions of access to externa" markets, price levels, and diversification prospects regarding these exports therefórá have repercussions en most of the countries of the reglan. The relativa importance of the various groups of products is illustrated in tabla 2.
This tabla shows just how much weight the food group carries in the total exports of the region; a still more important point, however, is that the main products in this group are coffee, sugar and bananas (tropical agricultura' products for which demand increases only slowly), whereas meat and cereals (temperate-zone products with a more dynamic demand) play a comparatively minar role, not just because they are exportad by only a few countries but because they are the products most affected by the protective agricultura' policies of the developed countries and are therefore more vulnerable te all the different restrictions that the latter impose.
The relative share of food in the region's total exports hardly alterate at all during the 1960's, whereas that of the other groups of primary products did change, and substantially. The most striking features, in terms of value, is the relativa decline in exports of fuels, which in Latin America mean petroleum and petroleum products and come almost exclusively from Venezuela. Seth in this group and in that of raw materials, the growth rete of the region's exports was lower than that of world exports of the same products, which means that Latin America is losing ground in terms of world trade. The same applies, albeit te a lesser extent, to non-ferrous metals, although this group did increase its share of total regional exports.
/Tabla 2

-70—
Tabla 2
LATIN AMERICA: TOTAL EXPORTS BY GROUP OF PRODUCTS
(Parcentages of total)
SITC section 1961-1965 1966-1970 1970 1971
Pbod, beverages and toba000 (seotions O and 1) 43.7 42.4 434
Inedible orude materlals (seotion 2), olls and fats (section 4) 19.9 18.0 16.3
Fuels and lyibricants (seotion 3) 2614 234 21.3
Unworked base meta1s (seotion 6, division 68) 6.4 8.5 8.4
Total primary products 95.7 91.9 90.3
Chemioals (section 5) 1.3 2.0 2.2
Manufacturad goods (sectlons 6 and 8) excluding unworked base metals (division 68) 2.3 4.1 5.1
Máchinely and transport equipment (section 7) 0.4 1.4 2.0
Total manufacturedgeods 4.0 7.5 9.3
Total in millions of dollars 9 856.0 12 916,0, 15 290.0
Source: Tabla 1.
/Although, taking

Although, taking the region as a whole, the change in the relativa shares of primary products and manufactured goods in exports is only slight, there has been a rapid expansion of exports of manufactures by certain countries 1/. As already indicated, however, in most countries - and thus in Latin America as a whole primary products continua to dominate the export sector. It is therefore appropriate to consider briefly the changas that have taken place in the distribution of exports of these products among the mejor Markets.
Tabla 3 shows that 75 per cent of the exporte of primary products go to the markets of the developed countries; of these, the United States continuas to be the largest market even though a slight decline in its relativa importance is to bé observed between the two five-year periods shown, owing to the greater diversification of the markets for non-ferrous metals. Apart from this, however, the changes that have occurred in the other markets between the two periods are fairly small, even in the case of the group of socialist countries of Eastern Europe, whose share has not varied to any great extent sinee the beginning of the 19601s, when
Cuba had to redirect much of its foreign trade towards those countries owing to the United States Governmentes trade embargo.
(b) Ex orts at the start of the Second United Nations Develo•ment Decade
In 1971 Latin America did not manage to attain the annual growth target of "somewhat higher than 7 per cent" laid down in the International Development Strategy for the developing countries as a whole. In tercos of dollars at current erices, the increase attained by 20 countries of the region was 3 per cent. If the values in dollars at current prices are adjusted in line with the unít prices of imports, the trend is sean to be definitely unfavourable, since the real combinad purchasing power of these k0 countries remained practically unchanged (sea table 8). Even in tercos of current values, 1971 shows a significart decline from the rata of expansion recordad for total exports from the region during the second half of the 1960's. In the 10-year parlad 1961-1970 there were only two years - 1961 and 1967 - when the annual increase was less than 3 per cent, while in the eight remaining years it was far aboye thís figure. If consideration is given to the 24 countries of the region (including the English- speaking Caribbearl countries), the rato of increase in 1971 was 3.1 per cent.
1/ See section 4.
/Table 3
- 72
Tabla 3
LCD< AMERICA: EXPORTS BY GROUP OF PRODUCTS AND ÁREA OF DESTINATION
Groupe of products, Year by SITO seotion
Millions of
dollars
Peroentage of the total for each area of destination
Develeped oountries
United States
European Developing Economia community oountries
Latin Other Soolalist developing America oountriea oountries
Food, beverages and 1961-1965 4 246 77.6 36.9 23.5 9.3 6.5 2.8 10.1 toba000 (sectiona O 1966-1970 5 476 77.2 34.3 22.6 10.3 7.6 2.7 10.5 and 1) 1970 6 570 77.3 31.7 18.4 9.9 7.4 2.5 11.1
1971
Inedible cruda 1961-1965 1 958 84.6 26.2 28.4 9.1 6.8 2.3 5.7 materials (section 2 ), 1966-1970 2 320 80.9 21.2 26.2 12.4 9.2 3.1 6.5 olla and fato 1970 (section 4) 1971
2 490 78.7 16.3 27.7 11.6 9.0 2.6 9.2
Ande and bibrioants 1961-1965 2 600 62.2 33.5 7.2 37.8 7,8 30.0 (seotion 3) 1966-1970 2 978 61.1 34.3 5.7 39.0 9.0 30.0
1970 3 250 60.9 35.7 5.5 40.0 9.1 30.9 1971
Unworked base metals 1961-1965 628 92.4 43.5 30.4 7.0 6.8 0.2 (section 6, 1966-1970 1 102 91.5 32.2 35.8 8.2 8.0 0.2 0.1 divisien 68) 1970 1 280 91.4 30.1 39.1 8.6 8.6
1971
Total primary 1961-1965 9 432 75.8 34.2 20.5 174 6.9 10.0 5.7 products 1966-1970 11 876 75.2 31.6 20.3 17.7 8.3 9.4 6.1
1970 13 800 73.8 29.2 18.7 17.0 8.1 8.9 7.0 1971
Chemioels (section 5) 1961-1965 133 64.7 38.3 15.8 27.8 25.6 2.3 3.8 1966-1970 256 50.4 27.3 13.7 43.7 40.2 3.5 3.1 1970 54o 54.4 25.3 18.8 41.2 31.2 2.9 2.1 1971
Manufactured goods 1961-1965 222 55.0 35.1 11.3 43.2 39.2 4.1 0.9 (sectiona 6 - and 8) 1966-1970 534 63.3 30.9 11.8 47.4 44.9 2.4 0.9 exoluding unworked 1970 base metals 1971 (division 68)
780 89.7 25.0 14.1 47.4 44.2 3.2 1.2
Máchinery and 1961-1965 43 32.6 18.6 4.6 67.4 65.1 2.3 transport equipment 1966-1970 179 42.5 29.6 7.3 57.0 54.7 2.2 (section 7) 1970 308 51.9 31.8 9.4 48.1 45.5 2.6
1971
Total manufacturad 1961-1965 398 55.8 34.4 12.1 40,7 37.4 3.3 1.8 geoda 1966-1970 969 56.0 29.7 11.5 48.2 45.5 2.7 1.3
1970 1 428 73.2 26.5 14.2 46.1 43.1 3.0 1.1 1971
Total prtmary products 1961-1965 9 856 74.3 34.3 20.1 18.0 8.2 9.8 5.5 and manufacturad geoda 1966-1970 12 916 73.0 31.3 20.1 19.9 11.1 ti 8.9 5.7 (sectiona O to 9) 1970 15 290 71.5 28.7 20.8 19.6 11.4 8.2 6.4
1971 15 500 71.9 29.0 20.5 20.7 12.0 8.7 5.0 Source: United Nations, Monthly Bulletin of Statistios (July 1972) and direot information from the
United Nations Statistioal Office. N.B. The total values of exporte for the 20 Latin American countries indloated in this tabla are higher than
those given in other tablee in this report because they do not inolude the adjustments for evervaluation of exporte of petroleum from Venezuela and other adjustments of lesaer importanoe inoorporated in other souroes of information.
/This would

- 73-
This would seem to indicate that, apart from factors involving one or another of the countries in particular the world markets for the various export commodities were notably affected by speculative movements and the general uncerteinty due to the crisis in the International monetary system, the trade restrictions adopted by the United States in mid-1971 and the changes in monetary parities 2/. Quotations for most of the basic commodities on the main external markets fluctuated to a varying extent during the mejor part of 1971, to the point where the average annual prices for meny of them were below those quoted in 1970. World prices for some of these commodities began to recover early in 1972, reflecting to some extent the agreement concluded among a certain number of developed countries in mid-December 1971 to change the parity of their national currencies.
It should not be forgotten, however, that the significance of the 3 per cent increase for the 20 Latin American countries as e whole is relatively limited in view of the sharp disparities in the value of exporte between the different countries. Table 4 thus shows the growth rete of each country during the period 1969-1971 in terms of respective values in dollars at current erices.
The evolution of exporte during the two years 1961 and 1970 was undoubtedly the most favourable in the whole of the past decade for most of the Latin American countries, so that to maintain a similar rete in 1971 would have required at least that world conditions of demand and the operation of the international payments system should not suffer the disruptions they were subjected to for most of that year (see tables 5 and 6). Although it would not be reasonable to escribe the lower rete of growth recorded by 11 countries in the region and the decline in absolute terms of another 7 countries exclusively to those disruptions, the fact remains that all the countries were affected by those factors to a greater or lesser extent, and in some of them the unfavourable international context aggravated internal problems, with a consequent impact on the export sector.
2/ For a review of these aspects see, inter ella, the following reporte of the UNCTAD secretariat: "Impact of the present international monetary situation on world trade and development, especially of developing countries" (TD/140), 28 January 1972, and "New economic policy in the world economy: simulation of the international transmission mechanism" (TD/140/Supp.4), 18 April 1972.
/Table 4
- 74 -
Tabla 4
LATIR AMERICA: ANNUAL VARIATION IN VALUE OF UPORTS AT CURRENT PRICES, 1969-1971
Country 1969 CountrlY 1970 Country 1971
Growth of 7 per Brasil 22.8 Paraguay 25.7 Venezuela 18.0
oent or more Argentina 17.8 Ecuador 23.6 Haiti 16.6
Jamaica 16.5 Costa Rica 22.7 Dominioan Guatemala 15.6 Peru 21.2 -Republio 15.6
Panana 15.5 Colombia 20.4 .konduras 14.2
Bolivia 14.3 Brazil 18.5 Cuba, 8.o Chile 14.3 Jamaica 17.3 Trinidad and
Mexioo 13.9 Chile 16.6 Tobago 7.9
Dominioan Uruguay 16.2 Republio 12.5 Dominioan
Uruguay 11.8 Republio 16.1
Costa Rica 11.1 Guyana 15.4
Guyana 10.4 Guatemala 13.8
Colombia 8.8 Nidaragua 10.5
Paraguay 7.1 El Salvador 10.2
Argentina 10.0
Cuba 8.4 Haiti 8.3
Growth of leas Haiti 4.5 Bolivia 6.5 Brazil 5.9 than 7 per oent Trinidad and Barbados 5.4 Panana 5.6
Tobago 0.4 Venezuela 5.3 Nicaragua 4.3 Honduras 3.0 Mexioo 4.o Trinidad and El Salvador 3.3 Tobago 1.3 Barbados 2.6
Jamaica 2.1
Paraguay 1.4
Costa Rica 1.2 Guatemala 0.5 Guyana -
Decline Peru -0.1 Mexioo -1.9 Ecuador -0.2
Venezuela -0.6 Panama -2.1 Argentina -1.9 Nicaragua -2.2 Chile -7.5 El Salvador .11.5 Bolivia -8.1 Honduras -5.4 Colombia -9.1 Cuba -6.4 Uruguay -11.6 Barbados -7.5 Peru -15.7 Ecuador -10.7
Total 24 countries 8.8 11.2 2:1
Source: Tabla 5.
/Tabla 5

-75-
'rabie 5
LATIR AMERICA: VALUE OP EXPORTS, BY COUNTRIES
(Milliona of dollars at ourrent price.)
Country 1961-1965 1966-1970 1970 1971
Peroent- age
increase
ti
grawth
Annual
rate
ti
Argentina 1 289.7 1 562.2 1 773.2 1 740.4 21.1 3.9 Brasil 1 409.8 2 065.4 2 738.9 2 900.0 46,5 7.9 Mexioo 970.6 1 285.0 1 400.3 1 456.0 32.4 5.7
Chile 579.2 1 012.6 1 253.3 1 160.0 74.8 11.8 Colombia 486.2 583.o 731.6 664.8 19.9 3.7 Peru 578.5 858.2 1 o47.3 883.0 48.3 8.3 Venezuela 2 484.6 2 530.8 2 656.0 3 134.0 1.9 0.2
Bolivia 79.4 161.2 189.4 174.0 103.0 15.3
Ecuador 151.7 203.2 232.5 232.1 33.9 6.0 Paraguay 42.3 52.1 64.1 65.0 23.2 4.3
Uruguay 172.7 191.3 232.7 205.7 10.8 2.1
Costa Rioa 98.7 173.2 231.2 234.0 75.5 11.9 El Salvador 155.2 206.5 222.7 230.0 33.0 5.9 Guatemala 147.4 244.6 298.3 300.0 65.9 10.7 Honduras 90.4 161.8 170.8 195.0 79.0 12.4
Nicaragua 107.2 175.3 182.8 47.2 8.1
Cuba 617.7 7,8 165314.0
659.0 712.0 4.3 0.9
Haiti 38.6 4 36.5 40.3 47.0 -5.4 -1.1
Panama 56.1 101.1 111.7 118.0 80.2 12.5
Dominioan Republio 158.5 170.8 213.6 247.0 7.8 1.5
Total 20 countries 9 714.4 12 401.4 14 442.2 14 880.8 1:1 5:12
Total, exoluding Venezuela 2 229.8 9 870.6 11 786.2 11 746.8 315 1.2.5.
Barbados 33.6 39.6 39.0 40.0 17.9 3.3 Guyana 97.6 116.2 1354 135.0 19.1 3.6
Jamaica 197.2 284.4 339.0 346.0 44.2 7.6
Trinidad and Tobago 375.0 458.6 480.0 518.0 22.3 4.1
Total 4 countries 703.4 898.8 993.0 1 039.0 27.8
Total 24 countries 10 417.8 13 300.2 15 435.2 15 919.8 VLZ ízSI
Source: ECLA1 on the baste of offioial statistics.
2/ Percentage marease between the two five.year averages.
12/ Cumulativo annual rata of growth between the two five-year averages.
/Table 6

- 76 -
Table 6
LATIN AMERICA: AVERAGE ANNUAL VARIATION IN VALUE OF EXPORTS AT CURRENT PRICES
(Percentages)
Country 1961-1965 1966-1970 1970 1971 Soatering ooeffieient
1961-1965 1966-1970
Argentina 7.4 4.o 10.0 .1.8 161.7 248.5 Brazil 5.? 11.9 18.5 5.9 195.7 80.5 MWxico 8.o 4.8 -1.9 44 23.0 144.6
Chile 7.1 13.1 16.6 -7.4 70.6 70.7 Colombia 3.5 6.7 20.4 -9.1 302.4 132.3 Peru 9.6 9.9 21.2 -15.7 94.7 89.2 Venezuela 0.8 1,4 5.3 18.0 300.0 242.2
Bolivia 17.2 11.2 6.5 -8.1 81.8 55.1 Ecuador 4.3 6.o 23.6 -0.2 222.6 182.9 Paraguay 16.4 3.1 25.9 1.4 30.4 424.9 Uruguay 9.1 4.7 16.2 -11.6 165.6 247.9
Costa Rica 6.5 16.0 22.7 1.2 112.8 39.7 El Salvador 10.2 3.5 10.2 3.3 52.5 162.6 Guatemala 10.6 10.4 13.9 o.6 109.4 115.4 Honduras 15.8 6.5 3.0 14.2 74.1 105.7 Nicaragua 19.1 3.5 10.5 4.3 37.9 172.6
Cuba 3.2 -0.1 8.4 8.1 492.2 412.8 Haiti 3.1 2.0 8.3 16.6 468.4 263.o Panama 25.8 7.7 -2.1 5.6 74.2 83.7
Dominican Republio -5.1 11.3 16.1 15.6 358.7 36.0
Total 20 oountries SI 6.o 111.2 2.t.9. 2112 64.9
Barbados 11.1 0.7 5.4 2.6 164.1 785.4 Guyana 7.1 5.9 15.4 0.0 107.0 130.9 Jamaica 6.2 10.5 17.3 2.1 63.7 128.3 Trinidad and Tobago 7.3 3.7 1.3 7.9 108.5 75.2
Total 4 gountries zzo_ 2,1 6.1 4.6 75.4 79.6
Total 24 countries 11 660 11.2 la. 2.3,16 0_15
Source: ECLA, on the basis of offioial export statistios.
/In these

-77-
In these circumstances, only 6 out of the 24 countries in the region succeeded in attaining or exceeding a 7 per cent growth rata for exports in 1971, among them Venezuela, whose exports had grown at e notably slow rete during the past decade. Other countries in this group - Cuba, Haiti and the Dominican flepublic - are also among those recording lower retes of growth during the period 1961-1970 (in Haití it was even negativa), so that the high growth rete of their exports in 1971 is merely a sign of recovery from a stage of relativa stagnation.
It is useful in this respect to compare the rata of growth of exports during the past decade in each country of the region with the growth targets laid down in national development plana in the last few years (sea table 7).
The figures in table 7 show that at least 10 out of the 24 countries in the reglan succeeded in raising their exports at a rata of at least 7 per cent during the past decade 3/. In 1971, however, nono of these countries except Honduras were able to maintain that minimum rata of expansion. Moreover, of the 11 countries in the region where the national development piens ley down clearly-defined export targets, only 7 have projected their exports at ratas over 7 per cent annually for the first few years of the present decade, and nona of them are among those which actually achieved that target in 1971.
3/The annual growth rete is calculated according to two formulas. o. Column A shows the cumulativo annual rete of growth between the two five-year periods 1961-1965 and 1966-1970 (this slightly reduces the year-to-year fluctuations); column B is an exponential function for the period 1960-1970, according to which 12 countries of the reglan (compared with 10 in column A) attained annual export growth retes of over 7 per cent.
/Tabla 7

- 78 -
Tabla 7
LATIN AMERICA: GROUTH RATE OP EXPORTS AT CURRENT PRICES
Annual growth of 7 per oent or more
Country 1966-1970 1960-1970
B
National plana
C
1961-1965 A
Bolivia Pancas Honduras Costa Rica
15.3 12.5 12.4 11.9
16.3 15.6 12.0 10.6
...
...
... 16.4
Chile 11.8 9.9 3.02/ Guatemala 10.7 10.4 9.1 Peru 8.3 8.4 4.1 Nicaragua 8.1 11.8 ... Braz11 7.9 7.2 10.01.11 Jamaica 7.6 7.0 ...
Grovth of lesa Ecuador 6.0 5.0 16.2 than 7 par oent El Salvador 5.9 7.0 ...
Mexioo 5.7 6.2 ... Paraguay 4.3 7.2 7.0 Trinidad and Tobago 4.1 4.7 1.3 Argentina 3.9 4.8 9,1 Colombia 3.7 3.6 ... Guyana 3.6 4.6 ... Barbados 3.3 4.7 ... Uruguay 2.1 3.6 ... Dominicas Republio 1.5 1.3 13.5 Cuba 0.9 1.8 ,.. Venezuela 0.2 1.5 4.0
Haiti -1.1 0.5 **O
Souroes: Golumn A: Tabla 5. Column B: Handbook of International Trade and Development Statistios (United Nations
publioation, Sales No: E/F.72.II.D.3), pp. 22 and 23. Column C: Data obtained from national plan.
1/ Ekports of goods and services.
/Of the

Of the 11 countries which set their own targets, Chile, Peru and Trinidad and Tobago set targets well below the average achieved in the previous decade. In contrast, Ecuador piens to expand its exports at an average rete of 16 per cent annually (which is considerably higher than the rete attained in the previous decade), on the basis of the possible rapid growth of exports of petroleum from the oilfields whose development has recently been initiated there. Similarly, the relatively high growth targets for exporte From Costa Rica and the Dominican Republic are based on the large-scale expansion of banana plantations in the former and the inclusion of ferro-nickel in the
latter's exports.
(c) Terms of trade
The reduction in the index of unit values of exports in 1971 affected 14 of the 19 Latin American countries for which data are evailable. This reduction was most significant in countries like Chile and Peru (because of the sharp drop in copper prices) and Colombia and Ecuador (owing to a similFr trend in the price of coffee). In the rest of the countries it was more moderate, but the negative effects of the reduction in the unit value of exports viere aggravated in nearly all the countries of the region by the increese in the unit value of importe. These values rose steadily throughout the 1960's, but the rate quickened in 1969, 1990 and 1971 as a result of the inflationary trend which to a greater or lesser extent has affected the developed countries. In 1971, therefore, the terms of trade deteriorated in all the Latin American countries except Argentina and Venezuela. In these twa countries, however, the terms-of-trade index had deelined during most of the past decade, so that the trend in 1971 can scarcely be considered satisfactory, particularly considering that even in that year they were below the base year level (see table 8).
/Tabla: 8

— 80 —
Tabla 8
WITIN AMERICA: INDEXES OF 0NIT vALM OF EXPoRTG ANO imma4Tm AND TERMS OF TRADE, 1960-1971
(1963 = 100)
1960 1961 1962 1963 1964 1965 1966 1967 1968 1969 1970 1971
Argentina
Exporte 39 98 89 100 106 102 105 103 100 105 108 122
Importo 107 105 104 100 103 105 110 109 110 113 118 123
Terme of trade 93 93 86 100 103 97 95 94 91 93 92 99
Bolivia Exporte 86 96 95 100 134 159 145 140 138 149 156 151
Importe 94 97 100 100 103 102 98 101 ' 104 106 110 112
Terme of trade 91 99 95 100 130 156 148 139 133 141 ,142 135
Brazil Exporte 108 108 100 100 117 109 104 100 102 106 120 116
Importe 93 96 100 100 102 101 103 103 103 100 110 116
Terma of trade 116 113 100 100 115 108 101 97 99 106 109 100
Chile 104 97 100 100 105 117 141 145 148 173 186 147 Exporte
Importe 97 91 98 100 103 102 100 108 103 102 108 112
Terme of trade 107 107 102 100 102 115 141 134 144 170 172 131
Colombia Exporte 110 108 101 100 119 113 107 100 102 101 125 113
Importe 97 99 100 100 100 101 102 102 103 105 108 112
Terme of trade 113 109 101 100 119 112 105 98 99 96 116 101
Costa Rios. Exporte 96 94 96 100 107 103 102 98 96 98 115 103
Importe 97 98 99 ioo 97 97 96 100 100 102 104 107
Terma of trade 99 96 97 100 110 106 106 98 96 96 111 96
Eouador Exporte 117 107 111 100 110 101 115 110 105 108 119 108
Importe 101 95 96 100 98 102 100 104 104 107 109 113
Terme of trade 116 113 116 100 112 99 115 106 101 101 109 96
El Salvador Exporte 113 107 102 100 106 112 111 108 106 105 131 130
Importe 92 95 96 100 100 96 95 98 95 95 98 99
Terme of trade 123 113 106 100 106 117 117 110 112 111 134 131
Guatemala Exporte 111 103 102 100 108 111 109 110 106 109 122 119
Importe 95 100 98 100 100 102 102 104 101 102 103 115
Terme of trade 117 103 104 100 106 109 107 106 105 107 118 103
Haiti Exporte 104 104 88 100 116 111 109 105 103 98 124 116
Importe 98 97 100 100 102 103 105 106 106 108 109 112
Terme of trade 106 107 88 100 114 108 104 99 97 91 114 104
/Tabla 8 (oonolusior)

Table 8 (conolusion)
— 61 —
196o 1961 1962 1963 1964 1965 1966 1967 1968 1969 1970 1971
Honduras Exporto 86 93 100 100 106 107 102 104 105 105 108 107
Importa 97 96 95 100 . 96 98 98 98 94 100 105 106
Termo of trade 89 97 105 100 •110 109' 104 " 106' 112 105 103 101
Mexioo Exporta 92 96 95 loo 105 103 106 107 113 113 121 120
Importe 90 95 100 100 110 110 109 112 111 113 111 115
Terms.of trade 102 101 95 100 95 94 97 96 102 100 109 104
Nicaragua Exporta 98 99 100 100 98 96 96 97 105 104 111 no
Importa 101 102 98 100 101 98 95 101 97. 98 103 loo
Terme of trade 97 97 102 100 97 98 101 96 lo8 106 108 110
Panana Exporta 102 100 110 100 107 112 114 117 111 107 107 113
Importa 95 96 96 100 94 95 97 97 97 98 103 106
Tercos of trade 107 104 115 100 114 118 118 118 114 109 104 107
Paraguay Exporta 98 98 95 100 112 115 114 99 102 103 115 115
Importa 105 102 101 100 110 -111 110 115 118 119 125 130
Terna of trade 93 96 94 100 102 104 104 86 86 87 92 88
Peru Exporta 95 94 97 100 112 116 133 127 130 144 164 152
Importo 95 97 100 100 98 111 115 112 108 107 109 113
Termo of trade 100 97 97 Boo 114 105 116 113 120 135 151 135
Dominloan Republio Experta 77 77 90 100 lo6 91 102 101 112 120 115 120
Importa 96 100 98 100 102 101 102 100 100 102 105 109
Terna of trade 80 77 92 100 104 90 .100 101 112 118 110 110
Uruguay Exporta 101 97 101 100 118 103 106 98 '92 101 108 103
Importa 93 94 99 100 99 101 96 99 98 104 105 111
Terma of trade 109 103 102 100 119 102 110 99 94 97 103 93
Venezuela Exporta 110 111 106 100 96 95 93 93 93 91 92 115
Importa 97 99 101 100 109 117 117 115 117 120 126 132
Terma of trade 113 112 105 100 88 81 8o 81 8o 76 73 87
Latin Amerloa, eIcluding Cuba Exporta 103 103 99 100 106 104 106 105 106 109 118 120
Importa 96 98 100 100 104 106 106 107 106 107 112 116
Terno of trade 107 105 99' 100 102 98 100 97 99 101 106 103
Latin Amenos., eXelUding Cuba and Venezuela '
Exporta 100 100 - 96 100 110 108 111 109 110- 114 126 122
Importa 96 98 108 100 103 104 105 106 105 106 110 114
Terme of trade 104 102 89 100 107 104 106 103 105 108 115 106
Source: ECLA, on the basic of °Hiela' trade atatistios. /2, Comr.sElitz

V • rts ex
- 82 -
2. .9122M2121Y...1122,12.1
(a) Trends and features of commodit
At the regional level, the evolution of Latin American exports is determinad to a large extent by the trends and events affecting a group of 21 basic commoditieF,. During the five-year period 1961-1965, this group of commodities accounted for ate average of 74.5 per cent of the total value of the exports of the 20 countries of the region; this percentage dropped to 67.9 per cent during the period 1966-1970 (see tablee 9 and 10). It should be pointed out, however, that the drop in the percentage of total exports accounted for by this group isalmostentirely due to the smaller share of petroleum and petroleum products, exports of which grew during the decade at a considerably slower rete than in other exporting regions. Excluding petroleum and petroleum products, the importance of the other 20 commodities underwent practically no change between the two periods compared; they accounted for 50.2 per cent of exports in the five-year period 1961-1965, and 48.8 per cent in the period 1966-1970.
In the English-speaking Caribbean countries, the situation is similar. A group of 7 commodities accounted for 82.6 per cent of the average value of exports between 1961-1965; this percentage dropped to 77.7 per cent during the period 1966-1970. Exporte of petroleum and petroleum products hold first place in these countries also, and the drop in the relative importance of the group of commodities between the two periods mentioned was likewise largely due to petroleum products, and to some extent to sugar. The decline in the relativa importance of exports of petroleum products (all from Trinidad and Tobago) is linked with the similar tendency recordad in exports of Venezuelan cruda, since it is Venezuelan oil which supplies to a large extent the refineries of Trinidad and Tobago. It may be notad that ifpetroleum and petroleum products are excluded the share of the remaining products in Caribbean exports does not change significantly: in 1961-1965 they accounted for 39.8 per cent of exports, and in 1966-1970 for 40.4 per cent.
Although the periods on which the comparison is basad are not very far apart in time, the conclusion is inescapable: neither the Latin American nor the Caribbean countries have succeeded in reducing to any significant extent the considerable concentration of their exports on a limitad group of prirnary products. Although this is true for the exporte of the region as a whole, however, there are some important exceptions.
/Tabla 9
- 33 -
Table 9
LATIR AMERICA: EXPORTS OF BASIC COMMODITIES
International Annual retes of variation, %
Exports of
total value
prioes Prioes Volume Value
A B A Commodities Years
Volume Value
J 1/
Ray sugar 1961-1965 7 o84 776.0 8.o 6.912/ 4.482/ -0.6 4.8 2.2
1966-1970 7 997 835.9 6.7 7.55 2.66 6.9 2.8 3.6
1970 9 863 898.8 6.2 8.07 3.76 32.1 7.o 3.1
1971 8 802 1 024.0 6.9 8.52 4.55 -10.8 13.9 5.6
Bananas 1961-1965 2 286 192.9 2.0 561.0051/ 4.9 4.9 0.7
1966-1970 3 596 307.8 2.5 552.00 8.7 9.3 2.1
1970 4 097 355.8 2.5 621.00 6.6 10.4 18.3
1971 4 556 379.2 2.5 599.00 11.2 6.6 -3.6
O000a beans 1961-1965 144 63.0 0.6 22402/ -2.8 -14.4 -7.3
1966-1970 184 112.3 0.9 31.60 4.1 20.6 16.3
1970 194 121.3 0.8 32.20 4.9 -23.0 -26.o
1971 202 102.1 0.7 25.60 4.1 -15.8 -20.5
Coffee beans 1961-1965 1 857 1 468.8 15.1 39.102/ 44.302/ -1.6 1.4 5.2
1966-1970 1 984 1 642.2 13.2 42.30 46.70 3.0 5.8 5.2
1970 1 923 1 984.3 13.7 54.60 56.40 -7.8 23.6 33.8
1971 2 025 1 689.3 11.4 44.80 49.30 5.3 -14.9 -17.9
Beef 1961-1965 471 216.7 2.2 30.302/ 7.3 14.2 4.9
1966-1970 449 261.8 2.1 33.40 5.1 5.2 *Ira
1970 483 313.2 2.2 ... -5.9 8.6 1144
1971 321 296.0 2.0 ... -33.6 -5.5 ...
Maize 1961-1965 2 65o 130.5 1.3 23.101/ 8.1 8.4 3.6
1966-1970 4 044 204.8 1.6 24.40 17.0 16.1 1.o
1970 5 232 265.5 1.8 26.50 30.0 36.4 11.8
1971 6 128 348.2 2.3 26.20 17.1 31.2 -1.1
Wheat 1961-1965 3 220 194.1 2.0 26.00f/ 51.1 47.8 0.6
1966-1970 2 837 161.0 1.3 25.90 -14.1 -15.4
1970 2 302 125.9 0.9 25.20 -1.8 -9.6 -0.8
1971 806 48.5 0.3 25.80 -65.0 -61.5 2.4
Linseed oil 1961-1965 246 52.1 0.5 87.001/ 7.7 3.5 -2.8
1966-1970 160 29.6 0.2 79.80 12.3 14.4 3.4
1970 186 37.3 0.2 82.20 10.7 8.4 -5.o
1971 202 37.2 0.2 71.60 8.6 -0.1 -12.9
Cowhides 1961-1965 199 60.0 0.6 14.202/ -0.5 -7.0 2.0
1966-1970 162 53.3 0.4 16.4o 1.o 7.9 2.2
1970 153 50.7 0.4 15.50 -9.5 -7.1 -2.6
1971 68 23.2 0.2 16.70 -55.6 -54.3 7.7
Quebraoho extraot 1961-1965 131 17.0 0.2 6.29a/ -2.3 2.4 5.3
1966-1970 92 15.6 0.1 8.26 -12.1 -7.0 5.7
1970 66 13.4 0.1 9.75 -20.5 -11.6 11.9
1971 8o 16.7 0.1 9.89 21.2 25.1 1.4
/Table 9 (oontinuation)
17.4 14.7
7.7 21.0
2.1
3.7 25.3
-12.6

International Annual rates of variation, priOes
VoltUrte
A B
%of
total value Value
Prices
A B
- 84 -
Table 9 (oontinuation)
Exporta Commodities
Years Volum° Value a )2/
1961-1965 1 187 116.8 1.2 132.011/ 1966-1970 1 874 221.4 1.8 158.3 23.7 35.1 1o.8
1970 1 988 308.9 2.1 188.o 97,6 41:1; 11:: 1971 2 047 316.7 2.1 169.0 3.0 2.5 -10.2 1961-1965 97 55.3 o.6 33.9il 6.5 -5.3 2.2 1966-197o 92 53.2 0.4 ... 2.1 4.2 ... 1970 1o8 67.4 0,5 ... 6.9 12.4 ... 1971 119 79.2 0.5 ... 10.2 17.6 ...
1961-196508 448.8 4.6 29.42/ 26.72/ 11.6 12.1 0.4 - 1966-1970 946 454.6 3.7 29.3 25.6 -0.3 -1.3 1.6 0.8 1970 874 415.3 2.9 30.7 26.6 -25.2 -23.5 8.1 13.7 1971 701 40016 2.7 35.4 32.3 -19.8 -3.5 15.3 21.4
1961-1965 176 190,9 2.0 771/ 1022/ 6.0 0.5 -047 0.6 1966-1970 160 146.1 1.2 51 86 -3.9 -6.1 -6.7 -4.4 1970 139 125.8 0.9 48 71 - -2.5 - -14.5 1971 130 103.3 0.7 50 61 -6.5 -17.9 4.2 -14.1
1961-1965 950 9.6 0.1 8.o 8.7 1966-1970 1 220 13.1 0.1 1.1 3.7 1970 1 302 15.1 0.1 .3.5 3.4 1971 1 321 16.0 0.1 1.5 6.o
1961-1965 767 480.7 4.9 32.2.2/ 1.1 4.9 5.7 1966-1970 850 966.4 7.8 57.6 4.7 17.9 3.6 1970 911 1 221.1 8.4 64.2 9.8 16.0 -3.6 1971 878 897.5 6.0 49.3 -3.6 -26.5 -23.2
1961-1965 23 67.2 0.7 1 o69.£/ 3.8 17.4 12.8 1966-1970 28 96.2 0.8 1 243 3.3 1.9 -1.3 1970 28 101.9 o.,7 1 312 -6.7 -0.5 5.4 1971 24 84.1 o.6 1 272 -14.3 -17.5 -3.0
1961-1965 164 28.5 0,3 80.01/ 5.3 17.0 12.5 1966-1970 177 37.3 0.3 95.9 1.8 1.6 -1.0 197o 185 43.0 0.3 108.5 2.2 4.o 3.2 1971 173 35.7 0.2 91.8 -6.5 -17.1 -15.4
1961-1965 236 27.9 0.3 9o.61/ 13.7 23.9 7.4 1966-1970 4.8 10.6 -1.2 1970 358 61.2 0.4 105.6
329 42.9 0.3 ::::: 6.6 31.2 1.7
1971 371 60.9 0.4 3.6 o.6 6.3 1961-1965 35 522 289.5 3.o 8.591( 5.9 4.6 -2.5 1966-197o 51 861 394.2 3.2 8.13 7.9 7.4 0.9 197o 64 907 488.6 3.4 8.33 16.0 12.6 3.4 1971 65 456 510.3 3.4 8 66 0.8 4.4 4.0
1961..1965 121 344 1708.8 17.6 2.00 3.2 -0.2 -2.1
1966-1970 131 371 1 683.7 13.6 1.82 0.8 -0.6 -1.4 1970 132 454 1647.9 11.4 1.77 .1.8 -3.2 -1.7 1971 124 475 2 009.6 13.5 2.31 -6.o 21.9 30.5
Table 9 (oonclusion)
Pishmeal
Leaf toba000
Rav ootton
Wool
Bauod.te
Copper
Tin
Load
Zino
Iron ore
Crudo petroleum

- 35 -
Tabla 9 (09nolusion) .101.1,11771...•••.-
Exporto of International Annual ratas of variation,$ total prices --------- Príoes
Vol e V ue value Volum Value A A B
•IMNIPIMMabeliome,se-
a Commodities Years
Petroleum products
Value Off commodities selected
Total exporto: 20 oountries
1961-1965 43 600 653.3 6.7 2.22 6.3 3.9 -3.2 1966-1970 51 537 687.6 5.5 4e4 2.6 5.4 1970 55 991 834.9 5.8 elhe 10.6 19.4
1971 55 148 1 035.2 7.0 -1.5 24,o ..•
1950.•-°1965 7 248.4 74.5 1966-1970 3 421.5 67.9 1970 9 497.3 65.7 1971 9 513.5 63.8
1961-1965 9 714.o 100.0 1966-1970 12 401.0 100.0 1970 14 442.0 100.0
1971 14 881.0 100.0
Source: ECLA, on the basis of officio' export statistios. Note: Por the pariods 1961-1965 and 1966-1970, the annual rete of variation is calculated as the simple average
of the algebraic sum of the annual variations. .Volurne in thousands of tono. 1V( Value in millions of dollars. .9./ Canto per pound.
Dentsehmarks per ten. eJ Penoe per puund.
Pounds sterling per long ton. d Dollars per 100 pounds. JI/ Dollars per 2 000 pounds. Aj( Dollars per long ton.
1 Donare per barrel.
•
/Table 10

- 66 -
Tabla 10
CARIBBEAN COUNTRIES: EXPORTS OF BASIC COMMODITIES
,Womin.”.•
Products Years
Ray mear 1961-1965 1966-1970
1970 1971
Bananas 19611565 1966-1970
1;70 1571
C00011 batas 1961-1965 1966-1970
l';70 1971
Coffee beans 1961-1965 1966~1970
1970 1971
Aluminium 1961.1965 1966-1970
1970 1971
Bauxite 1961-1965 1966 -1Y70
1970 1971
Cruda petroleum 1961-1965 1966-1970
1970 1971
Peroentage
Volum .2,/
Value W of total value.
134,7 19.2
119.7 13.3 114.4
134.3 12.9 11.5
161 14.8 2.1 Sao 4.9 , 167 16.4 1.8 -6,6 -3.4 139 14.2 1.4 -5.3 114 18.7 1.8 -18.0 31.2
7.z 4,7 0.7
6.4 4.3 0.5
7.5 5.8 0.6
4.6 3.0 0.3
3.8 2.2 0.3 12.4
3.4 2.1 -2.1
2.9 2.7 0.3 -9.6
4.3 4.0 o.4 49,o 932 62.1 8.8 8.9 7.8 1 365 97.5 10.8 16.7 20.0
2 060 156,1 15,7 39.9 49.o 2 052 151.2 14.6 -0.4 -3,1 7 381 61.4 8,7 7.3 8.9 9 569 123.6 13,8 4,8 17.2
lo 604 137.6 13.9 4.0 12.2 10 297 132.9 12.8 -209 -3.4 1 0f3 23.3 3,3 15.4 19.1 1 873 37.3 4.1 10.7 4.9 2 218 37.0 3.7 3.6 -14.1 2 244 39.1 3.8 1.2 5.5
1 052 997 930 968
1.7
3.3
-3.3 -1.2
-2.3 -3.4
4.1 17.4
-2.4
5.o 13.9
39.8 54.6
-38,6 -48.7 11.0 17.4 62.9 48.8
Annnal ratos of variation
Volume Value
Petroleum products 1961-1965 277.9 39.5 10.2 1966-1970 293.7 33.2 2.1 1970 313.6 31.6 2.3 1971 337.5 32.5 7.6 Value of commodities seleoted 1961-1965 581.0 1966-1970 699.5
197o 781.5 1971 820.7 Value of total exporte 1961-1965 703.0
1966,1970 899.0 1970 993.0 -- ----- 1971 1 039.0 Source.: ECLA, on the basta of official figures. Note: Countries included: Barbados, Guyana, Jamaioa and Trinidad and Tobago. P-Trolume in thousands of tons. ly Value in millions of dallare.
/Some countries
82.6 77.7 78.7 79.1
100.0 100.0 100.0 100.0
— 87 —
Some countries, particularly those with a relatively largo domestic market (Mexico, Argentina and Brazil), have achieved substantial increases in their exports of manufactures and semi—manufactures, thus modifying to en appreciable extent the structure of their exports over the last ten years. This is aleo trua of other economically smaller countries such as El Salvador, Guatemala, Costa Rica, Nicaragua, Uruguay and Barbados. Although the degree of concentration of exports on a few commodities is lees in these countries, however the relativo weight of some traditionsl export products continuos to be important, oven though it is much lees than at the beginning of the 19602s. Coffee may be taken as an example. Despite the reduced importance of this product in the exports of Brazil, Costa Rica, El Salvador and Guatemala in 1971, its percentage share in their exporte continuos to be greater than that of the total exports of manufactures by each of these countries.
In addition to the relativo weight which the basic commodities continuo to have, even in countries which have been able to develop their exporte of manufactures, there is anothsr important aspect to be mentioned: namely, the type of commottLty exported. In Latin American exporte as a whole, agricultural products have the greatest relativo weight, and within this group the most important items are the tropical products, which have the slcwest growth in world trade. Meat and cereals, with their mora dynamic demand, carry little weight in the total exports of the region. Non—ferrous metals constftute a grcup in which copper has an important share in the Latín American countries and aluminium and bauxite in the Caribbean countries; the growth of world exports of these metals during the 19602s was greater than that of tropical agricultura' products. Projections for the 1970's indicate that, generally speaking, similar tendencies will persist, i.e., higher annual growth ratee for metals (especially aluminíum), meat, cereals, oils and fats, while the tropical agricultural products (sugar, cocoal coffee, bananas, cotton, tobacco and vegetable fibres) will continuo to have a much slower growth rete. The estimated figures by mejor groups are given in table 11.
If the evclution of Latin American exports conforme to these projections, the prospecte for the majority of the countries of the region indicate that they will probably not attain the mínimum average growth target laid down in the International Development Strategy. Consequently, the possibilities of all these countries reaching the target will mainly depend on: (a) their success in securing the adoption of policy measures designed to secure price—levels for basic commodities which will guarantee higher incomes for the producer countries; (b) the effective application of existing agreements and undertakings to liberaliza the conditions of access to the markets of the developed countries and promote larger importe by the socialist countries, and (c) the real impact of the tariff concessions provided for in the general systems of preferentes in force, i.e., the degree to which they promote greater flows of exporte of traditional products or new exporte, particularly in the manufactures sector.
/Table 11

-88—
Tabla 11
PROJECTED VARIATION IN THE VOLUME OF E1PORTS OF SOME PRIMARY PRODUCTS FROM THE DEVELOPING COUNTRIES, 1970 TO 1980
W2111322LtV,2°")
In terms of export needs
In terms of exportable stocks
Temperate zona food products 4.3 4.8 Tropical food produots and beverages 2.4 2.7
Agricultural raw materials o.8 241
Total for aboye products 2.9 3.4
Minerals and metals 4.2.
Fuels,il 9.6
Source: UNCTAD, ?Trends in oommodity trade in the 1960Is and prospecta for the 19701sT1 TD 113, supplement 2,7 Maroh 1972.
al Inoludes cotton, rubber, hard fibres, tobaccol jute and wool. Includes aluminium, copper, tina load, sino and iron and manganeso ores. Almost azclusively crudo petroleum and petroleum produots.
/(b) Price

— 69' — :
(b) Price trends for the main commodities
Traditionally, en important variable in determining the total value of Latin America% exports has been the price levet for commodities on world markets. In most countries of the region, the physical volume of exports increases to a greater or lesser extent each year, this growth process being halted only occasionally by serious disturbances in production. Taking the Latin American countries as a whole, the quantum índex of exports shows a virtually uninterrupted upward trend hetween 1950 and 1970. The unit value index of exports, however, shows large and frequent fluctuations reflections the fluctuations that occur ín selling erices abroad for all the products making up the reglen% total exports. The index of export Prices, or more precisely, the index of erices for a representativa group of products in specifigd world markets presentad in tntle 12, may therefore be considerad a reasonable indicator of the way the unit value is likely to move in three or six months' time. Obviously, this index is only useful for considering the situation of the region as a whole, as no single Latin American country exports the whole ranec of products included in the index. Nevertheless, it has some value for countries considered in view of the importance in each country of one or a fsw export products.
It should be notad that the overall index (excluding petroleum and petroleum products) reached its highest levet for ten ysars in 1970, exeeeding the previous high figure set in 1969 by 9 per cena. This increase was attributable first to the risa in coffe erices and secondly t3 price risas for such products as sugar, bananas, maize, cotton and to a very small extent price risas for metals such as tin, leed and zinc. The only Prices to fall were those for cocoa, wool and linseed oil. In 1971, the trend was reversed: coffee erices dropped sharply, cocoa, linseed oil and wool erices continuad to fall, copper erices declinad further, and tin and leed prices dropped slightly. The total index (excluding petroleum), whích staod at 125 in 1970 (1963 = 100), fell to 115 in 1971, a level comparable to that of 1969 but even so one of the highest levels of the decade.
It would be impossible here te summarize all the reasons behind the constant fluctuations in prices for each commodity — or for the different varieties of each commodity — during the 1960's. What can be said, however, is that the traditional instability of commodity erices on world markets was accentuated in 1971 by the crisis of the world monetary system and the uncertainty that prevailed for several months regarding the new international
parties.
/Table 12

Commodity 1960 1961
Po b .22 89
Trapioal zote 22 88 Buzar a 36 34
77 77 Bananas 95 95 Co ooe. 101 85 Coffee §,/ 107 106
113 3.10 Tobaoco 82 81
7 e np orate zone .22 2.8 B e ef 107 101 Raiz e 91 90 Wheat 96 100
bizistatj ralepter92 i 01. la liinseed oil 121 133 cotto ya 2/ 100 103
.11 99 1c6
gi 119 110 Hides 130 121 Quebracho extras- 92 73 Piste mea/ 77 87 Wso1 1/ 86 79
1./ 99 95
Met al 3 ' .....r....... 107 104
Copper 105 98 Pin 88 98 Icon ore 111 115 Lead 114 101 Zinc
kltulturbr Isra
116 101
2.1...9.1.3:122 2...91 11 Cr zde 104 104 Petroleum products 108 3.07
Totz..14 21219.51.z....p2-1:912.2 ant, 1 )e....._troletm...ur.ocLu‘.....:Is 22 .2.4.
22 22
1962 1964 1965 1966 1967 1968 1969
87 io 1.00 2a 29 l02
yo 85 2,2 82 69 35 25 22 24 25 41
79 84 83 85 89 92 % 95 90 96 92 93 89 88 8Q 87 64 87 100 124 164
100 137 131 120 111 110 120 103 123 123 120 106 108 114
84 62 79 ... ..• 044 0144
22 111 16 114 112 26. 120 106 3.22 133 125 121 •.. o..
88 lo]. 108 108 101 94 100 100 105 98 101 107 98 98
28 . 1.9.2 ica io?.. .22 ,,,t 22 120 11.2. 100 91 98 111 112. 100 101. 98 96 105 106 97 101 99 99 92 100 102 88 107 117 105 109 118 127 117 117 106 121 165 121 129 148
89 105 115 116 115 122 135 98 106 128 123 107 111 133 87 111 83 94 83 72 74 82 110 90 84 56 55 59
3.1.3 117 2....22 12z 142 148 .121 183 100 118 136 186 170 227
99 136 155 142 135 125 137 114 96 97 93 98 98 98
89 159 182 150 131 138 2.66 88 154 147 133 131 124 135
102 102 103
22
r
1970 1971
1:1,A io7 y 9 108
54 99 104 96 102
122 97 360 131 142 125 4411* 000
105 rit ... ... 112 111
98 loo
la 104 107 93 105 121 100 .22 123 124 144 144 151 '53 148 133
64 f.75 59 62
3.72 1112 220 168 144 140 101 105 171 14,5 138 146
.t 22 22 s. la 2.o.. 12 94 94 92 91 91 44, 4414
93 92 91 91 94 ... 4414
122 8 108 102 1.92 114 121 115
104 101 102 22 22 106 3.12. 114
— 90 —
Table 12
PRICE INDEXES OP MAJOR LATIR AMERICAN IIXPORTS ON THE Ti0RLD MARI=
(1963=100)
/Table 12 (cono1.)

— 91 —
Tabla 12 (Conolnsion)
Commodity 1971 1972
IV I II III IV
-HPoodbeveres and tebeo= 114 l06 122 1o5 118 12 130 2
Tropical zona 114 1...n 12.5. 12.2„, 122 112, 118
Sugar 2/ h/
57 103
52 103
49 105
56 106
100 111
81 106
74 114
Bananas 107 122 93 85 106 110 105
Cocoa 106 98 100 83 98 106 128
Coffee 2/ 147 126 125 127 132 /38 165
d/ 128 122 121 127 129 133 154
Tobaoco O** • • e• •• • 404 •• • P40
Temperate sone 122 322 10 100 122 106 112
Beef 0410 ••• • .• *O. *O* 4110* 0••
Yaize 116 109 112 104 110 118 127
dhoat 103 101 99 97 97 95 100
Agricultural raw materials 102 104 107 110 115 114 107
Linseed oil Cotton 2/
99 113 113
89 117 120
94 126 124
90 128 130
96 137 140
91 13 1314
101 112 121
il 122 123 122 127 127 129 129
Mides 131 146 146 153 159 165 179
QJ.ebraohe extraot 152 155 150 157 155 163 158
Fish meal 146 131 124 131 134 135 126
Wocl h/ i/
56 57
55 62
55 64
55 614
55 64
55 64
55 65
Metal_ 140 151 146 1142 1r2 1 152 119.
Ccpper 164 179 170 160 173 171 1(3
Tin 138 139 140 142 148 153 162
Ir on ore 97 107 107 109 108 108 no
Leed 151 151 146 131 165 130 156
Zinc 132 138 151 165 184 181 1.86
Pntroleum ^nd petlnum proc7iucts e.. 4.411 44* 4.4 44. 400 •• •
Total exoluding petroleum and 11 115 112 112 124 124 lu nctrolrul produets
Total 21 products 040 ••• 440 0114 044 41141 10 04
$01.1ree: on the basis of official statistios.
Note: Prices quoted in ourroncies other than the dollar have been adjusted in line with the new monetary paritior. The products affoctedare: Bananas, adjusted in accordanoe with the revaluation of the deutschmark on 26 October 1969 and in line with the fluctuations since
Ekren 1971; Maize, Whoat, Linseed oil, Hidest Tin, Lead and Zinc, which are quoted in pounds sterling and have been adjusted to take a000unt of the devaluation of the pound on 18 November 1967 and the fluctuations sinos Earch 1971.
2/ Exoludes exports to the United States.
h/
Exporta to the United States.
2/ Santos (Brazil). Eanizales (Colombia).
2/ Matamoros (Mexico). ly Sao Paulo (Brazil). a/ Pima (Peru). h/ Montevideo (Uruguay). 1/ Buenos Aires (Argentina). ¡As world

- 92 -
As world confidence gradually returned in early 1972, price trends for the various commodities once again mainly reflected the special circumstances of each commodity market. In the first nine months of the year, coffee prices made up the ground lost in 1971 and regained their 1970 level, mainly as result of the decision of the producer countries which are members of the International Coffee Organization to regulate the flow of their exports in a manner compatible with the objective of maintaining prices at a fixed level. Sugar prices fluctuated violently, by remained higher than in 19711 while cocoa prices were making a rapid recovery towards the end of the year, owing to reporte that harvests were not as good as expected and also probably owing to the likelihood that the agreement on cocoa negotiated recently will be ratified. Prices for non-ferrous metals (with the exception of copper, which continuad to fall) remained relatively favourable. In sum, the overall index (excluding petroleum and petroleum produdts) stood in the first half of 1972 at a level only slightly lower than in 1970 (which as noted aboye was the highest for ten years), and in the third quarter it moved slightly aboye this leve], Effectiv3 prices for petroleum and petroleum products improved in 1971 as a result of agreements with producers in Venezuel.a and the Middle East, and in 1972 they apear to have risen again owing to price adjostments to compensate for devaluation of the dallar. As a result of there increases, prices regained their pre-1960 levels, a?ter ten years of steady decline.
Ferhaps the most important conclusion that can be drawn from commodity price trends is the importance of establishing agreements, either between exporting and importing countries, or just between exporting countries, under which a specific pricing policy can be applicd for each commodity. Price instability is cbviously a serious problem, but it is bearable if' fluctuations are less sharp and less frequent and if they range bobween levels that really ensure producers a remunerative income. Hoever, the recommendations of the IDS as regards reaching agreement on a set of principies for pricing policy covering commodities have not yet been implemented.

-93—
3. The Interrqtionalpevek9pment Stratowand international trade spolicxjmeasures
In ordor to meet the targets and objectives of the International Development Strategy, Governments solemnly undertook to adopt and apply a set of policy measures relating to international trade, financial resources for development, transport and othor sectors of international co—operation. Some of the international trade policy measures are general proncuncements that need to be elaborated through exploratory consultations and negotiations among countries as a preliminary to any serious attempt to tako specific steps. As regards the liberalization of trade in primary prometo, for instance, the commitment to lower and remove tariff and non—tariff barriers is so wide in scope as to be virtually meaningless, sinco it is obvious that tho problem of opening up trade in tropical agricultural products is vory different from that of liberalizing trade in temperate—zone products which raise such questions as agriaultural protection policies, rural employmont, income revelo, etc. The same applics to the measures to be adopted as regards natural products that compete against synthetic products or as rogardc minerals that are extracted in both developed and developing countries but aro processod almest exclusively by the former.
In othor fields, of course, the policy measures advocated in tho Strategy constitute clear undertakings to take action by a specific dato. At all evento, regardless of whethor the measures are expressed in general or specific terma, tho truth of the matter is that the Strategy:o t'alele dnrived not from tho novelty of tho targets set or tho policy measuros for meeting these targets, but from the solomn decision which the countries took to apply them, jointly or individually. Indaed, everything in the Strategyls international trade policy measures has actually already been discussed at the international level for many years. The Final Act and annexed recommendations adoptod by UNCTAD in l9G4 cover practically all the measures relating to the trade of the developing countries that are now incorporated in tho Strategy, while Part IV of the GATT, which was adopted specifically to take core of tho problema of the developing countries, contains principios, objectives and undortakings on specific mesures and on joint action to promete the achievement of those objectives. The policy measures in tho Strategy therefore represent a consensus on the function that international co—operation should carry out in furthering the development of the leso developed countries — a consonsus which has been taking shape over the whole of the post decade and which is based essentially en the concepts developed and practica' discussions held at conferences of UNCTAD and its subsidiary bodies.
/At the

-94—
At the end of the second year of the Second Development Decade, the list of achievements is not particularly impressive. Although the decade bogan with high hopos built around the advantages that would ensue from the application of the generalizad system of preftrences by the developed nations, it was a source of frustration for the Latin American countries that the biggest market for their exports of manufactures and semi—manufactures, i.e., the United States, should be precisely the one country which was net in a position to apply a system of preferentes or oven announce a date for doing so. The dollar crisis and the 10 per cent surcharge on United States imports that was imposed in the middle of 1971 seemed to render oven more remoto the possibility of embarking upan e concentrated effort to introduce trade liberalization measures in favour of the developing countries in accordance with the provisions of the International Development Strategy. Not until the end of 1971 and boginning of 1972, when agreement was reached on a readjustment of monetary parities and the removal of the United States import surcharge, did a climato of international confidente begin to be restored, with the issue of joint United States—European Econmdc Community and United States—tapan statements in which the panties concerned affirmed that they "recognizo the need for proceeding with a cemprehensive review of international econmic relations with a view to nogotiaUng improvements in the light of structural changos which have takon place in recent years. The review shall cover inter alia all elements 0f trade, including measures which impede or distort agricultural, row material and industrial trade. Special attention shall be given to the problems of developing countries" 4/.
Ever cinco the end of the Kennedy Round negotiations in the m!ddle of 1967, the possibility had !men mooted and the advisability considored of holffng a further series of trade negotiations devoted specifically to the trade problems of the developing countries. The above—menticned joint statements set in motion a process whereby these new nogotiations can probably begin in 1973, preferably with the participation of the developing countries whether members of GNTT or not. It is therefore usoful to consider some of the effects which the proposed negotiations may have on the developing countries — especially in Latin America.
4/ Press release (GATT/1106) of 11 February 1972.
/1. The

-95—
1. The joint statements sem te lay stress en the study of problems affecting the reciprocal trade of the principal trade arcas (European Economic Community, United States and Japan). Consequently, such special attention as can be devoted to the problems of the developing countries will depend largely upen the negotiating capecity of specific groups of developing countries with common interest and
on proper preparation for the negotiations.
2. During the períod between the preparation and initiation of the negotiations and their completion, a kind of "freezing" will occur as regards any trade liberalization initiatives in favour of the developing countries. This happened during the Kennedy Round 5/ and could well happen again, so that if, as anticipated, the negotiations do net end befar° 1975, it might be that no majar decision regarding the trade of the developing countries will be adopted before that date. This would mean that half of the Second Development Decade would have passed without any of the Strategyls trade liberalization measures in respect to the developing countries having becn put into practico.
3. The concessions in favour of the developing countries established under the generalized system of preferences are based on the tariff levels prsvailing at the end of the last stage of the reducion agreed upen in the Kennedy Round, which come into effect on 1 January 1972. Consequently, insofar as the forthcoming trade negotiations reduce or remove the customs tariffs negotiated in the Kennedy Round, the margin of preference established for products oxported by the developing countries under the generalized system of preferences will be correspondingly reduced or eliminated. The developing countries' participation in the negotiations could thus have two main objectives: (i) to ensure that the margins of preference established under the schemcs of the individual countries are maintained or, where this is impossible owing tc the reduction of the tariff to zero, to obtain equivalent new concessions; (ii) to negotiate the inclusion of new
products in the preference schemes.
TIIMIMMINSCIMMMIDG
Between 196a and 1967, wMile the Kennedy Round was in progress nothing come to any trade liberalization initiative in respect of any products of interest to the developing countries. Worthy of mention in this connexion is the refusal of the developed countries
to eliminato duties on cocoa.
/The lesson

-96—
The lesson which has been learnt from the Kennedy Round with regard to the positive results that were achieved for the developing countries should serve as a guide for the action of the developing countries in the forthcoming negotiations 6/. If the implementation of the trade policy measures contained in the Strategy is paralysed pending the results of these negotiations, however, it will be more difficult for the developing countries to achieve the economic growth targets and social development objectives of the Second Development Decade. It would therefore be useful to take a brief look at these policy measures.
(a) International measures relatin to the roducts listed in UNCTAD resolution 16111.1
As far as commodities are concerned, resolution 16 (II) was virtuaily the only positive agreement that was arrived at during the second session of UNCTAD, since all the questions of pricing policy and access to markets remained unsettled. Broadly speaking, the resolution set out a programme of activities calling, on the one handl for the negotiation of the international agreements onE.,ugar and cocea anda on the other, for the carrying outof studies in arder to establish what action could be taken in respsct of a certain number of commodities. The negotiation of the international sugar agreement was completed in 1.963 and tho agreement itself carne into force in 1969. Negotietions cn COCOS were concluded in October 1972: the corresponding agreement is currently being ratified by the countries that took part in the negotiating conference and, provided the required number of ratifications by importing and exporting countries are received, it is expected to become effective in the middle of 1973. As to the other products, little real progress was made between the second and third sessions of UNCTAD; the latter session accordingly adopted resolution 83 (III) which, after recognizing the need for the intensification of intergovernmental consultations on trade liberalization and pricing policy, and in view of the failure to reach agreement on the draft resolutíons submitted by the developed and developing countries on the subject, requested that the seventh session of the Committee on Commodities should be convened as a special session
6/ The Latin American countries have already started on the preparations for the forthcoming trade negotiations. See the report on the fourteenth meeting of the Special Committee on Latin American Co—ordination (CELLA) (Santiago, Chile, September 1972) and resolution 1 (XIV) adopted at that meeting.
/"for the

-97—
"for the purpose of organizing intensive intergovernmental consultations, including the setting up, as may be appropriate, of ad hoc consultative groups on agreed commodities or groups of commodities, with the aim of reaching concrete and significant results on trade liberalization and pricing policy early in the 1970es" 7/. In actual fact, apart from studies and consultations, the only international action on commodities during the first two years of the Second Development Decade, or rather, during the four years between the second and third sessions of UNCTAD, was the renegotiation of the international sugar agreement and the negotiation of the cocoa agreement which is still awaitíng ratification.
(b) International commodit agreements
International action on commodities has mostly taken the forro of discussion and adoption of measures for directlY or indirectly influenoing the volume of exports or price level of a specific product when the world market in that product has suffered a setback affecting the foreign currency earnings cf the exporting countries. In most cases, this international action has tended towards the neoctiation of international commodity agreements. Commodity agreements of this kind — with the parí lcipation of both exporting and importing countries •-• wero established during the 1950's for wheat, sugar and tin and, in the 1960's, for cofres, but thoy failed to be extended to other products (except in the rscont case of cocoa) partly because not all products are suitable for this type of arrangement for regulating world markets and partly because the countries interested in the trade in particular products have not all managed to agree on the need to take such action. The advisability of establishing international commodity agreements has, however, been recognized and ratified in numerous recommendations of United Nations agencies and has been reiterated in the International Development Strategy. In spite of this, the past two years have witnessed a mejor change of attitude towards commodity agreements in certain countries. The clearest example occurred during the renewal of the international wheat agreement, from which the clauses referring to floor and ceiling prices and to the rights and commitments of the participants were deleted. Thus, what is currently known as the 1971 international wheat agreement is merely an administrativa organization for compiling information on the state of the world wheat market and holding consultations among partícipating countries.
2/ The seventh session of the Committee on Commodities is scheduled to be held between 27 February and 9 March 1973.
/Almost at

-98-
Almost at the same time, at the tenth session of the Trade and Development Board, the United States stated its intention not to encourage the negotiation of agreements:
"The United States representative explained that his delegation had associated itself with the resolution so that the UNCTAD Committee on Commodities could be relieved of the further necessity of trying to negotiate policy guidelines oh those two subjects and could 'concentrate on new and more practical areas of activity, such as the proposed diversifidation studies and surveys of research and development needs. The compromise text did not precisely or fully reflect his country's position, particularly with regard to pricing policy; in that connexion, his Government did not wish to emphasize international agreements directly influencing prices, but domestic paneles that promoted healthy, stable and expanding comercial markets. Having gained considerable experience of the results of domestic price intervention, the United States Government was becoming increasingly sceptical ebout the merits of direct price regulation as a means of income support, since that policy top often resulted in production for storage rather than production for consumption Nor did it interpret the rference to international action, "national action" or "international arrangemonts" ... as implytng encouragement for international commodity agoeement. It belieoed that technical and economic factors limited the scope for formal agreements and that consultative arrangements or other informal types of international co-operation were indicated in most cases" 8/.
This positon was confirmed more recently in the joint United States-European Economic Community statement:
"The United States and the Community undertake to initiate and actively support multilateral and comprehensive negotietions in the framework of GATT beginningin 1973 (subject to such internal autnorization as may be required) with a view to the expansion and the ever greater liberalization of world trade and improvement in the standard of living of the people of the world, aims which can be achieved inter alia through the progressive dismantling of
a/ This statement of the United States apparently refers te the Trade and Development Board's resolution 73 (X) on pricing policy and trade liberalization, which was adopted on the basis of the drafts on which the second session of UNCTAD failed to reach agreement and on which discussion had continued in the Committee on Commodities. See the report of the first part of the tenth session of the Trade and Development Board (TD/B/327), Annex II.
/obstacles to

obstacles to trade and the improvement of the international framework for the conduct of would trade. The Community states that in appropriate cases the conclusion of international commodity agreements are also ene of the means to achieve these aims. The United States states that such agreements do not offer a useful approach to the achievement of these aims" 9/..
The United States did, however, partipipate in the recent cocos conference at which it announced that, for constitutional reasons, it would not be able te ratify the agreement within the scheduled time (before April 1973). This could be taken as meaning that the United States position on commodity agreements is not inflexible, although it will only be sean in the course of 1973 whether such an interpretation is correct, for apart from the question of whether the United States ratifíes the cocea agreement or not, 1973 is aleo the year of expiry of the international coffee agreement, vhose operation has come up against serious difficulties in the past year, especially where some of the most important importing countries and certain exporting col.:ntries are coneerned. The following are some of the problems that have arisen in operating the agreement:
1. The importing countries are pressing for export cuotas te be fixed at levels which the exporters consider undesirable because cf their effect on prices. For the 1972/1973 quota—year, no agreement could be reached between importers and exporters on the size of the quotas, which are therefore governed only by a provisional decision.
2. The exporting countries have raised the question of the need to revise the agreementgs indicativa price scale and to increase it, by Tour cents per pound in order to compensate for the lose of purchasing power of the dollar foliowing the readjustment of the parities with other currencies. Agreem3nt failed to be reached on this point owing te the opposition of the United States, although other countries (Federal Republic of Germany, Netherlands and the United Kingdom) were preparad to accept en iricrease of two cents per pound at the upper end of the scale of prices 10/.
21 Press release (GATT/1106), 22u£1.12.
10/ Panamerican Coffee Bureau, Boletín mensual (March 1972).
/3. At

— 100 —
3. At the preparatory meetings for the renegotiation of the agreement, groups of medium-sized producing countries asserted that the new agreement should incorporate changes regarding basic quotas, distribution of votes, production targets and other operational aspects of the agreement.
4. The most serious points of disagreement Between the importing and exporting countries arase in connexion with the decisions adoptad by the countries that subscribed te the "Geneva Document". On the one hand, this document committed the participating countries not to meet any additional export quota that they might receive as a result of the selective adjustment of quotas, so as to help maintain equitable price levels for producers; on the other hand, it established a committee on the co-ordination of coffee marketing policies which was empowered to fix specific price objectives and apply the necessary measures to achieve them.
5. As a result of the application of the agreements contained in the Geneva Document, the Fínance Committee of the United States Sonata ordered e federal investigation of the international coffee agreement to be carried out by the Comptroller General of the United States, the Taríff Commission and the Federal Trade Commission, who are to submit their report before 1 June 1973, lee., barely three months before the expiry of the agreement 11/.
In view of these events, it will be appreciated that the ciridnuation of the international coffee agreement is not absolutely certain, at least on the terms on which it has been operating since 1964. Furthermore, it is to be noted that the producing countries are pursuing a more effective and co-ordinated policy in defence of the price levels of coffee on the international market, in an attempt to compensate for the depreciation of the dallar both in terms of United States inflaticn and in terms of its parity with other foreign currencies. Finally, the Point should also be made that the producing countries are considering the establishment of a coffee buffer stock which would marease the effectiveness of a policy aimed at securing remunerative and stable prices for the producers.
11/ It will be recalled that in 1969 the Comptroller General submitted a report to the United States Congress in which he took the view that the participation of the United States in the coffee agreement was a form of financial assistance to the exporting countries.
/(c) International

— 101 —
(c) International buffer stocks
In referring to buffer stocks, the Strategy limits itself to stating that all possible resources for their pre—financing will be considerad. Although financing is essential for their establishment, this would not so far appear to have been the biggest obstacle, especially in view of the decision of the International Monetary Fund te grant member Governments credits to pay for their contribution to buffer stocks. A study by the UNCTAD secretariat suggested a list of products for which the creation of buffer stocks would be feasible, including coffee, cocoa, sugar, natural rubber, jute, hard fibres, copper, leed, zinc, tungsten and manganese ore 12/. Apart from the international tin stock which has already been operating for many years as part of the international tin agreement, it was not until 192 that negotiations began on a cocoa buffer stock,, the creation of which will depend on the ratification of the agreement by the required number of importing and exporting countries. No steps have been taken towards the creation of buffer stocks of other products.
The cocoa buffer stock will be financed by means of a contribution of one cent per pound of cocoa exported and will be eine te acquire up to 250,000 tons, slightly less than 26 per cent of world exports of cocea beans in recent years. Its operation will differ from that of the tin buffer stock, thus confirming the decision adopted in the Trade and Development Board to the effect that, for each commodity agreement involving a buffer stock, the conditions governing its operations on the market should be determined separately. Furthermore, the decision of the International Monetary Fund to grant countries loans to finance their participation in buffer stocks is supported by a World Bank decision to give consideration to the additional financial requirements that may derive from a country's participation in a buffer stock, such as the construction of suitable warehousing facilities, etc.
The coffee—producing countries are considering the possibility of establishing a multinational enterprise operating as a buffer stock insofar as its function would be to buy and sell coffee on the world market. If this carne about, a new type of buffer stock might come into being that wculd open up new prospects for the stabilization of commodity prices.
12/ See "The dovelopment of an international commodity policy", Proceedings of the United Nations Conference on Trade and Development, Second Session, Vol. II, p. 26.
/(d) Access

-102-
Access to markets and pricing policies
As the draft resolutions on access to markets and pricing policies presented at the third session of UNCTAD could not be adopted, it was agreed to transmit them to the standing machinery, i.e., the Trade and Development Board. Consequently, the recommendations contained in paragraphs 24 and 26 of the International Development Strategy to the effect that it was hoped that agreement could be reached, before UNCTAD III, on a set of general principies on pricing policy for commodities, and that before the end of 1972 concrete results would be achieved in the process of liberalizing conditions of access to markets, could not be achieved during the first two years of the Second Development Decade. It may be recalled that the same thing happened at UNCTAD agreement could not be reached on questions of access to markets and pricing policy. The discussion on these topics was continued in the permanent agency, the Trade and Development Board, which in 1970 adopted resolution 73 (X) on pricing policy and liberalization of trade. This resolution recommended that efforts towards the elimination of excessive short-term fluotuations should be actively pursued, and that when prices stood at a level which was not considered remunerative to producers, efforts malle at the International level to improve prices should be reinforced by appropriate national and international measures to alter the underlying supply demand situation. It also recommended that the price mechanisms established in International commodity arrangements should remain in force for a sufficiently long period in order to facilitate their defence by all the participants in the agrnement, to achieve greater predirtability es to the export earnims of developing countries, and to promote programmes designed to correct instances of structural disequilibrium.
Resolution73 (X), regarding which the United States advanced the reserves mentioned in the foregoing paragraphs, also drew observations from some developing countries. This explains why at UNCTAD III the countries of the Group of 77 again put forward the nned to adopt - as the International Development Strategy requests - a set of general principies on commodity pricing policy, considering that the formulation of the above-mentioned resolution 73 (X) is inadequate. Indeed, although this resolution confirms that one of the aims of the pricing policy "should be to obtain stable prices at levels remunerative to producers and equitable to consumers, with a view to improving the rete of growth of foreign exchange earnings...", other aims being the promotion of increased productivity, the maintenance of fair labour standards and the improvement of the trade balance of the developing countries, it is true that the methods or instruments which would make it possible to achieve
/thesc aims
(d)

— 103 —
these aims are not defined. In principie, it could be understood that commodity agreements ánd buffer stocks would be the most appropriate mechanisms for the operation of a specific pricing policy, but the number of commodities covered by such agreements is extremely small and still fewer commodities are protected by buffer stocks, while moreover the prospects for negotiating new agreements or establishing new buffer stocks seem fess favourable now than some years ago, so that it would not be prudent to rely on the possíbility af such mechanisms actually being used for any significant number of export products from the developing countries. The conclusion to be drawn from the foregoing considerations is that the problem of commodity pricing polioles should be classified, once and for all, as the responsibility of the producer countries,
along the ,Dame fines as the decision of the members of the Organization
of Petrole:Am Ex.r)erting Countries and, more recently, the member countries of the "Geneva Group" within the International Coffee Organization.
As regards the liberalization of trade or the improvement of conditions of access to markets, resolution 73 (x) does not go heyond reiterating general principies, such as the observation of the standstill principie (non—imposition of new barriera nor increase of existing barriers) and the need to intensify intergovernmental consultations, in line with the programe laid down in UNCTAD resolution 16 (II). As has already been pointed out, however, the problem which already calla for clarification at the end of the second year of existence of the International Development Strategy is whether the proposed trade negotiations will hoid up any new initiatives connected with the liberalization of trade for the developing countries, or whether substantive decisions will be teken on liberalization before the
negotiations are completad.
(e) Other olio measures re•ardi ■ basic commodities
The competitiveness of natural products vis —á—vis synthetic and substituta products and the problems of disposing of surpluses and stocks on the international market constitute other major fields for international action in connexion with the developing countries' exports of basic commodities. The measures recommended to deal with the problem of the substitution of synthetics for some natural products are generally limited to the execution of research programes or projects aimed at increasing productivity, reducing costa, improving quality and seeking new uses for natural products. International co—operation in this crea would mainly take the forro of financial and technical assistance and could also extend to the reduction on suppression of
/existing tariffs

- 104 -
existing tariffs on natural products which compete with synthetics. Recent action in this field has mainly been the responsibility of the World Bank, as a result of a decision taken in mid-1969 to give greater support to the agricultural research programmes of the developing countries; this decision was strengthened in May 1971 with the creation of the Consultative Group on International Agricultural Research, in which the World Bank, FAO and UNDP all participate. The first credit operation for agricultural research took place in the economic year 1971/1972 and involved a total of 12.7 mullen dollars; this credit was made available to a European country (Spain), and was the only credit operation of this type in that year. In the cconomic year 1970/1971, there is no record of any credits for agricultural research. Consequently, the credit granted to Spain is the only operation of this kind cerned out by the World Bank so far. The Consultative Group on International Agricultural Research agreed at meetings held in December 1971 to grant financial support to five mejor international research centres specializing in maize and wheat in Mexico; rice ín the Philippines; tropical agricultura in Colombia and Nigeria, and potatoes in Peru 13/.
As regards the disposal of surpluses and stocks, the. International Development Strategy recommended the expansion and strengthening of existing consultative machinery. This machinery, the FAO Sub-Committee on Surplus Disposal, reviewed the notification and consultation procedures, mainly taking into account the fact that during the past few years the notion of the disposal of surpluses has been extended te other operations including the sale of current production on concessionary terms. According to a recent report on the activities of this Sub-Committee, the notification and consultation procedures have been expended and improvod, and more countries are participating in thom 14/.
This body is, of course, responsible only for agricultural products. No permanent machinery for consultation and notification has been set up for non-agricultural products, so that the sale of surpluses or stocks of these is not subject to procedures similar to those for agricultural products. In some cases, however, countries which have cerned out this type of operation have agreed to participate in bilateral consultations with other countries interested in the preduct in question.
.111101.ZIP
13/ See World Bank - International Development Association, Ann29111222r1 1971, p. 9; World Bank - International Development Association, Annual 922ort 1972, p. 66.
14/ FAO, "Report of the forty-sixth session of the Committee en Commodity Problems", Rome, October 1971, pp. 22-23.
/4. ElmEll

-105—
4. Exnorts of manufactures and general systems, of preferentes
(a) Trends and characteristics of ex orts of manufactures
The efforts of the Latin American countries to expand and diversify their sales of manufactures and semi-manufactures abroad have led to a significant increase ín exports of these items 11/, which grew at a cumulativa annual rete of 18 per cent between 1960 and 1970, with a spurt towards the second half of the decade. This rete shows the great dynamism of Latin American industrial exports; but it should be borne in mind that values are still relatively low„ as may be seen from the figures for world trade by creas, to be found in table 13. For the region as a whole, these exports have shown a relative growth much greater than that of traditional exports, suggesting the existence of a diversification procesa which is of substantial importance in some countries. Their share in total exports shows an increase from 3.1 per cent in 1960 to 9.3 per cent in 1970. As regards the development of industrial exports in the accounts of the developing countries, here too the position of Latin America shows an improvement. Latin America increased its share in this group from 10 to 15 per cent during the 1960's; it should, however, be mentioned that while industrial products accounted for 17 per tent of.the total exports of the developing world, in Latin America they only accounted
for the 9.3 per cent indicated 16/.
(i) Destination of Latin American exports of manufactures. In 1970 Latin America's exports within the region amounted to 655 million dollars. The share of intra-regional trade in Latin America's total exports of manufactures rosa from only 22 per cent in 1960 to an average of 38 per cent in the period 1961-1965 and 46 per cent aince 1966.
Table 14 shows the growth of intra-regional exporta of Latin American manufactures and the trend of the region's exporta of manufactures to developed, socialist and non-Latin American developing countries between
1960 and 1970,
11/ SITC sections 5, 6, 7 and 8, excluding division 68. This method of classification tends to lead to underestimation of exports of manufactures, since it excludes food, which appears in other SITC sections.
16/ The larger proportion of manufactures for the developing countries as a whole ie attributable to the huge volume exported from south-east Asia, especially Hong Kong.
/Table 13

-106-
Table 13
TRE1VDS AND CHARACTERISTICS OF UORLD TRADE IN MANUFACTURED PRODUCTS e/
World Developed Developing Sooialist Latín
total oountries countries oountries America
A.World trade in manufactures (i) World exporte of manufactures
(millions of dollars fob) 1960 65 6o8 55 046 2 519 7 321 269 1961-1965 84 593 70 211 3 460 ... 392 1966-1970 146 176 120 394 6 534 15 632 969 1969 165 110 140 170 7 700 17 230 1 080 1970 189 690 161 33o 9 220 19 120 1 428 (u) Peroentage share of world exporte 1960 100.0 83.9 3.8 11.2 0.4 1970
(iii) Cumulative annual grovirth ratee, 1960-1970
100.0 85.0 4.9 10.1 0.7
Mánufaotured products 11.2 11.4 13.9 10.1 18.1 Primary products
(iv) Peroentage share of exporte of manu- factures in total exporte of goods
1960
6.3
51.3
7.0
64.4
6.1
9.2
9.2
56.4
5.0
3.1 1970 60.9 72.0 17.0 58.1 903 D. Ilitra-reZ.onal trade in manufacures
(i) Intra -regional exporte of manufactures (millions of dollars fob)
1960 35 316 1 075 4 794 58 1970 121 250 3 005 13 310 655 (11) Percentages share of total exporte
64.2 42.7 65.5 21.7 75.2 32.6 69.6 45.9
13.1 10.8 10.7 28.0 7.3 15.7 8.7 13.8
Source: United Nations, Monthly Bulletin of Statistics, March 1967, Mkrch and May 1971, July 1972, and data supplied 41, the United Nations Statistical Office.
1/ Includes SITO sections 5, 6. 7 and 8, exoept for division 68.
/Table 14
1960 1970
(iii) Growth rate 1960-1970 Intra-regional exporte
Exporte to countries outside the reglan

-307-
Table 14
LATIN AWRICA: 1CPORTS OF HANUPACTURED PRODUCTS, BY DESTINATION
Period or
year
World
total
Develophd Developing Socialist Latin
countries oountries countries America
United
States
Western
Europe Upan
1960 1961-1965 1966-1970 1969 1970
269 392 969
1 080 1 428
A. Millions of dollars fob
149 288 328 379
- 52 165 177 300
10 20 22 4o
197 68 4 58 215 163 9 150 483 467 20 450
536 520 24 500 745 659 24 655
B. Peroentage share of each ares of destination in the total
1960 100 73 25 1 22 - - -
1961-1965 100 55 42 2 38 38 13 3 1966-1970 100 5o 148 2 46 3o 17 2
1969 100 5o 48 2 46 30 16 2
1970 100 52 46 2 46 27 21 3
C. Cumulativo annual growth rato
1960-1970 18.1 14.2 25.0 19.6 28.0 14.3 h/ 26.0 b/ 20.01
Souroe: 'United Nations, M11111122.11etin of Statis-Aos, March 1967, Earch and May 1971, u1y 1972, and data
supplied by the United Nations Statistioal Office.
a/ Includes SITC sections 5, 6, 7 and 8, exoept for division 68. IV 1961-1970
/Latin America's

-108-
Latín America's exports of manufactures are divided approximately equally between the regiOnal markets and the rest of the world, (see tabla 15), although the LAFTA countries have recordad an increased growth rete outside the region in the Last few years.
The three mejor countries - Argentina, Brazil and Mexico - contributed towards this trend: Brazil's share in intra-regional trade in manufactures shrank from nearly 60 per cent in 1960 to 43 per cent in 1970 and 1971, while its exports to the rest of the world increased. In 1971 Argentina's exporta of manufactures to the rest of the world amounted to 56 per cent of its total exports. Of Mexico's industrial exports, 72 per cent went to the rest of the world in 1965 and 77 per cent in 1971 (although this incluies products completad with imported parts in bordar areas).
Intra-regional trade is predominant in the medium-sized countries (although nearly half of Colombia's exports are to the rest of the world). The same is true of the smaller countries, especially those of Central America, 90 per mrt of whose trade is conducted within the Central American Common It should be noted that Parauay ard UrullJay show high figures for exports to the rest of the world, mainly es3chtial oils and quebrachL: extract, and wool toas, respectively.
(ii) parts by...z7.ntry of oriqin. To facilítate this analysis the reglen has been divided into three groups of countries (see tabla 16).
1-j,n9„...uulitzie.g.. In 1965 Argentina, Brazil and Mexico accounted for 60 per cent totrl manufactures exportad by Latin America, in 1970, 65 per cent, mainly due to the increase in Brazil's exports, and in 1971, 70 per cent (1,334 million dallara). As pointed out earlier„ an appreciable part of Mexico's exports ware accounted for by the assembly of importad components in frontier areas, while in Argentina and Brazil national statistics gine higher figuras than those quoted here, due to differences in the definition of manufactures products (Argentina is supposed to have exportad 644 million dollarst worth of manufactures in 1970 and 653 million in 1971, and Brazil 665 million in 1970 and 822 million in 1971). Official estimates for Brazil forecast exports of manufactures and semi-manufactures worth more than 1,000 million doliera in 1972. In this group of countries, exports of manufactures form a significant part of total exports: 9 per cent in 1965, 17.6 per cent in 1970, and 21.9 per cent (25 per cent according to national classification) in 1971.
/Table 15

- 109 -
Tabla 15
SHARE OF LATIN AMERICA AND THE REST OF THE WRLD IN TOTAL WORTS
(hroontaae)
Latín America 2/ Rest of the world
Year
products Products Total products products Total PrimarY Manufacturad Primary Manutaoture
Latín America 12/
Central American Common Market
LA1PTA
1960 7,4 33.7 8.2 92.6 66,3 91.8 1965 9.4 48.9 11.7 90.6 51.1 88.3 1969 10.3 50.4 14.0 89.7 49.6. 86.0 1970 9.6 48.4 13.8 90.4 51.6 86.2 1971 9.5 45.5 14.1 90.5 54.5 85.9
1960 6.7 65.2 8.8 93.3 34,8 91.2 1965 8.3 95.0 18.4 91.7 5.0 81.6 1969 10.7 95.8 28.0 89.3 4.2 72.0 1970 10.4 96.2 28.4 89.6 3.8 71.6 1971 8.9 96.6 26.9 91.1 3.4 73.1
1960 7.8 31.1 8.5 92.2 68.9 91.5 1965 10.2 44.o 11.9 89.8 56,0 88.1 1969 10.9 43.5 13.6 89.1 56.5 86.4 1970 10.0 40.6 13.1 90.0 59.4 86.9 1971 10.0 38.5 13.6 90.0 61.5 86.4
Source: Official foreign trade r;;atistics.
2/ Including e;-ports to the 24 countries in the region.
h/ Exoluding Cuba and Haiti.
/Table 16

o 'a ..a• c.\ c4 O O co tr• co cr• N •
+2 • • • • • o • • • 01 t e-1 01 cm() UN O N r-1 00 +2 0 01 \114 CO O o as. •4 as. as. cr■ ro O 1.•0
• O C" ••3 111 LA tr• Lre 1,11 •-1 e-4 e.-1 r-1
W tt\ O\ r..1 ..1- •0 cr, c0 00 -I- •• ts... • al 0 e • • • • e a • • • • •
• h 04 •--1 r-1 c0 c0 .'..4 5 t. -, -1, 4.., ...iln ,....
... ...., -d- cc> .r.,.. CO oo, o, .,.... • 1 ..,› ...... ... N tre CO
N r-4 ,4 ..1 t. . O 01
ri 1-1
Pero
ontag e s har
e O
CP•
O
O
••
o 44 • o ad @ o
O 02 ID a) cd 45 a o
O m r-1
Z1. Q.
tra de stati
s ties.
bas is of offioia l fore ign
O tr• 01 <" Cw aN c•-• csi LA-1" N • 0\.r.-1 • N.o •,0 .... • a) co .a- a• est e0 as, • • • e • • O • do. cz • • • • • • • • • • • • • • e • • .1 4 GO ..*" ... C., CrN j',.. I" • 04 01 \O • CINCO u-. • O\ O ..? Ce1 04 04 tr• ...? r-4 .Z.1.- ..W \O .d. \O cr• 4^% •-■ co •,0 co •„o O oN, rr.‘i COi.r, t...z. t....., 1.., r-4 01 ei O t.. LC 1 CO t. oi a\ er■ co 0 ...4 \O CO CO O 1.-1 01 01 tn.4* 4- - ' . d - - '' Le1 r-1 r-I cs/ cm N N r.4 r.4 e-4
tr. o. 0 r-1 tr, o■ o N 141 \ 0 '1/40 ‘0 •-0 Off o‘s a‘ O \ <7 \ 01 01, N N N r-1 e-.1 e-4 r-1
01 o
UN O\ O e.4 111 crs OO •-■ us, 0\ O ••• 12-1 Cr. O sgéfr■ CN C1\Ce \ZT CT O \ Ces
N ."4 N e-4 e-1 r4 N r4 N r-1 e-1 r4 ..4
Oroups of o o
untr ies
— 110 —
O 01e,
\D • • • • • •
CO • • N
,04 O• 01 \01.
i. Lel r-1
• et .I 04 v.+ Ce• N
r
• O CO O O Ce%
• • • • • ti> ÑN r4 r-4 r-1
r.... G • • .
..... ...' N O CO -1. • • • • 1,41 r.4 N 01 \O ri e-
In4 .....i .....• N .......
•
O
141 r.1 • •
\ 1.1\ 00
CO O \O CO r.1 1.4\ N t.„ 01 01 \ a• _rt o cr• • • • • • • • • • • • • II • Q á 4 fl r 4 ir% O N N Nc", a‘ 14;) •O as. CO \O \e" r-1 r4 rel r-1 r-I rri
1/1 \O • • • •
ts,str.' .Z 8
ON N r-1
t... r-1 Ce% • • • • •
45'j‘ O CA a 04 N
..." O 1.11 o • •
ts: as
CO Lf• w-1 • • •
LCA CCI<" CO
• •
a
O\ •
c\
...e •
:1•Í
N t".. O • • •
Z..■ a0 f...<..
.... 01 0.4 • • •
k 5 5
O \ O
e • • ScS,
01 t. 04 N M
\O O\ j«., • • •
-•,/, -7,•:,,
o a o 02 o O o o •4 ••• .4 la co O .4: 4.2 O +2 a. a. ca. js
$. .0 u o 5 .,.. 0, s g o g oo 2 J : 3 lb 11) th ce 1 51
o tO -. .9 45 2, 0 r.
4> O
4;
1 £ 11.) o
1
EXPO RTE OP
PRIB
A RY PRO
DUC T
S AND
/Medium—sized

— 111 —
Medium-sized countries. The countries classified as medium-eized - Colombia, Chile, Peru and Venezuela - have had a relatively small share in regional exporte of manufactures, considering the industrial basis behind them. In 1965, their exporta of industrial products were worth barely 78 million donare and in 1970 only 178 million, of which more than 40 per cent was accounted for by Colombia, which has been applying a vigorous export promotion policy. In 811, this group of countries lost ground in comparison with the reglan as a whole, since its share in the regional total dropped from 12.7 per cent in 1965 to 11.2 per cent in 1970.
In the case of Colombia, the netional classification of non-traditional exporte gives figures of 221 million dallara in 1970, 254 million in 1971, and 157 million during the first five moths of 1972. But these "minar" exporte (so called to distinguish them from coffee and petroleum) are made up of 64 per cent of basic commodities of animal vegetable, or mineral origino and only 36 per cent of semi-manufactures•end manufactures. In Chile and Peru, the inclusion of the non-traditional basic commodities increases exporte to more than twice the figure attained.on tne basic of the SITC list, and it also raises Venezuela's exporte considerably.
The share of exporte of manufactures in the total exports of this group of countries is not very significant (3.1 per cent in 1970 comparad with 1.8 per cent in 1965), since taken as a whole it does not reach the level of the share of this sector in any of the countries classified as larga. At the same time, the exporta of primary products by this group are relatively large and exceed those of the larga countries as a whole, partly on account of Venezuelals petroleum exporta and Chilets exporte of copper. Pressure to diversify exporte does not seem to have been any leas intense in this group of countries - except perhaps in Colombia - on account of their high earnings from traditional exporte, nor does the Andeen Pact seem to have had any pronounced effect yet en the exporta of manufactures between the countries in this group.
Small countries. These form three sub-groups: the Central American and Caribbean countries, excluding CARIFTA; the CARIFTA countries, and the sub-group made up of Bolivia, Ecuador, Paraguay and Uruguay. The group of small countries as a whole increased its exporta of manufactures from 165 million dollars worth in 1965 to 372 million in 1970. Despite the considerable increase in absolute terma, and the relatively high level of these exporte in relation te the degree of industrial development of these countries, the share of the group in Latin American exporta dropped from 26.8 per cent in 1965 to 23.4 per cent in 1970. In the latter year, exporte
/of manufactures
- 112 -
of manufactures constituted 12 per cent of the total exports of these countries: a favourable development since 1965 when these exports accounted for 7.4 per cent of the total. It may be noted that this group of countries exports a higher percentage of manufactures than the medium-sized countries, and these exports in absolute tercos are twice those of the medium countires. Exports between the countries of the Central American Common Market influence this situation considerably, since they constitute around 60 per cent of the trade in manufactures of this group.
A review of the trends of the three sub-groups reveals rather dissimilar features, Sub-group A, which includes the Central American countries, the Dominican Republic and Haiti, showed the most rapid growth for 1965-1970, and its exports of manufactures amounted to 238 million dollars in 1970. This expansion was similar to that of Latin America as a whole, where, as alreadY noted, the three largest countries of the region had a considerable influence, and it allowed the sub-group to maintain its overal3 position with 15 per cent of the total exports of manufactures. The majar part of the exports of manufactures of the sub-group went to countries of the sub-group itself, which absorbed 90 per cent of them. The effect of the Central American Common Market is reflected both in the absolute trade figures and in their growth and contribution to the total exports of these countries, which between 1965 and 1970 rose from 9.5 per cent to 16.7 per cent. These percentages are very similar to those recorded in the same period for the three largest countries of Latin America, where the level of industrialization is far higher than that of the Central American countries.
Sub-group B, made up of Barbados, Guyana, Jamaica and Trinidad and Tobago, did not show any clear-cut trends in the period referred te. While there was some expansion from 1965 onwards, there was also a decline between 1969 and 1970. Consequently, this group of countries lost ground in the region as a whole and accounted for only 5.6 per cent of exports of manufactures in 1970, comparad with 8.6 per cent in 1965. The share of exports of manufactures in the sub-group's total exports increased slightly from 7.3 te 8,9 per cent in this period.
Lastly, sub-group C, made up of Bolivia, Ecuador, Paraguay and Uruguay, exported manufactures to the value of 44 million dollars in 1970; this figure was more than double that of 1965, but it was less than the overall growth of the region, so that the regional share of these countries dropped te 2.0 per cent. The share of manufactures in total exports, however, while remaining modest, rose from 3.5 per cent in 1965 te 6.2 per cent in 1970 and 6.5 per cent in 1971.
/(iii) Main

- 113 -
(iii) 22122alyts of manufactures. Among Latin America's exporte of manufactures, thosu which have registered the greatcst progress during the last five years, accounting for more than 60 per cent of the recordad total, are the products figuring in sections 6 and 7 of the SITC
manufactured goods classified chiefly by material, and machinery and transport equipments. Exporte of chemicals (section 5) and miscellaneous manufactured articles (section 8) account for 25 and 14 per cent respectively.
In the three largest countries 12/, exporte from sections 6 and 7 take on an even greater importance and constitute nearly 75 per cent of the total. Notable in volume among the main export products figuring in section 6 are those belonging to division 67 - semi-manufactures of iron and steel such as blanks sheets, sections, tubas, etc. In 1970, Brazil exportad 98 million dolieres worth of this type of product, Mexico 30 million and Argentina 28 million, If these are comparad with the figures for 1965 (Brazil doubled its 1965 figure, Mexico íncreased it by 40 per cent and Argentina quintúpled it), it may be observed that the rete of growth is closely linked to the investments made in the steel sector in these three countries, which made pcssible a rapid reduction of inports of these products to only a few products for which the domestic market was still small, accompanied by the generation of surpluses which have been disposed of in the regional market and even outside the region.
Exporte of traditional semi-manufactures - textiles, leather and wood - have lost some relativa importance but continua to represent a considerable proportion of the total. Figures for some of these exporte give the impression that some steps are being taken in the countries to strengthen industrial supply, with the aim of adding value to export products from the agricultural sector. Exporte of cotton and wool textiles by these countries generally showed lower growth ratee than metal products; in Brazil they accounted for 32 million dallare, in Mexico 27 million and in Argentina only 5 million for the same year. The leather tanning industry in Argentina multiplied its exporte more than seven-fold between 1965 and 1970 (from 5 to 36 million donare), while in Brazil exporte
12/ Important among agro-industrial and fishery exporte in 1971 were feash meal, fish fats and oils and sugar from Peru (277.5, 52.3, and 69.7 million dallare respectively); packed meat, soluble coffee and fruit and vegetable juices from Brazil (50,9, 49.7 and 36.9 million doliere); sugar and packed sea ?coda from Ecuador (13.5 and 3.8 million dollars respectively); packed meat and cattle feed from Argentina (124.2 and 15.5 million dollars).
/increased rather

— 114 —
increased rather more than three times, amounting to 16 million dollars in 1970. It is in exporte of semi—manufactures of wood, however (sawn wood, boards, veneers, plywood, etc.), that Brazil has made notable progrese, having reached the figure of 24 million dollars (four times the figure for 1965), although this result is not so remarkable if Brazil's wood exporting potential is borne in mind. It may be notad that exporte of pulp and papar have still not reached significant figures in these countries.
Within this same group, exporte of considerable value have been achieved over the past few years in the case of a number of products such as glass and glass manufactures (nine million donare'. worth in Mexico and caven in Brazil); hand tools (five million dallare' worth in Brazil and two in Argentina), and metal containers and household goods (four million donare' worth in Mexico and the same amount in Argentina).
The dynamic products figuring in section 7 of the SITC did not show aquel progrese in all the countries. In exports of electrical machinery, Mexico reached 54 million dallare in 1970, comparad with only 2 million in 1965; Brazil reached 21 million (four times the value of such exports in 1965) and Argentina reached eight million. In the case of Mexico, in such items as tblevision sets, gramophone pickups, sewing machines, radio parte, etc., the figures are distorted because the data for 1970 include exports from the free perimeter and frontier areas, which include a high percentage of goods assembled from importad parte.
In exporte of non—electrical machinery and equipment it was Argentina which recordad the highest absoluta figure in 1970 (48 Minan dallare) and the greatest increase (four times the figure for 1965). Approximately half of this figure corresponded to exporte of office machines (typewriters and calculating machines), in which the complementarity agreements signad within LAFTA had a considerable influence, the other items being, in order of importencc agricultura) machinery (five million dallare) and machina tools and equipment for various industries (food, plastics, etc.). Mexico exportad 40 million dallare' worth of non—electrical machinery, mainly parte and componente for office machines (12 million dallare). Brazil had lower figures in this category, its 1970 figure of 35 million dallare being only twice the figure for 1965, but of this sum 11 million dollars was accounted for by machinery and equipment for special industries.
For transport equipment, the figures reached were also promising. Mexico exported 26 million donare' worth in 1970, this figure having been built up almost from nothing during the last five years of the 1960's. While the motor industry contributed the mejor part (27 million), the aviation industry is
/making interesting

-115—
making interesting progrese and in 1970 recordad exporte of 6 million dollars. In Brazil, transport equipment accounted for 15 million dallare, of which vino million was contributed by the motor industry. In Argentina, over 96 per cent of the 10 million dollars/ worth of transport equipment exporte carne from the motor industry. These achievoments are due mainly to the complementarity agreements in this industry, to some bilateral agreements, and to decisions by the parent firme of the local enterprises concerning investment and market—division policies.
The most important of the many and varied products included in section 8 are clothing, footwear and printed matter, but in many cases (with the exception of printed matter) they did not reach oven ene million dallare/ worth of exporte in each country. In the clothing industry, the resulte of en intelligent promotion policy could be observad: Argentina attained Export figures of 16 million dollars in 1970, Mexico 11 million and Brazil three million. In the footwear industry, similar offorts are aleo giving encouraging resulte: Brazil exportad eight million dallare' worth and Mexico three million. The progrese achieved in both industries stoms from the adequate incentivos established by the countries and the efforts made to adjust the supply of manufactures to the conditions which the new markets require and to overcomo, at least in the main enterprises, the problems of scale and efficiency inherited from the traditional structure. Trade in printed matter continuad to increase, reaching a value of 38 million dollars in Mexico and 17 million in Argentina. Another branch which is important on account of the technological complexity of its operations, although its figures are still modest, is the production of scientific and precision instrumente; the three countries as a wholo exportad around caven million dallare' worth of such instrumente in 1970.
In 1970, Mexico exportad 31 million dallare' worth of a very larga group of products in which the main items were medicinal and organotherapeutic products (antibiotics, vitamins, hormones), manures and fertilizara, tolueno and xylene, phosphoric acid and various special products for the use of industry. Argentina attained oxport figures of 55 million dallare (in antibiotics, medicines and plasmas), and Brazil 39 million.
The exporte of manufactures of the four medium—sized countries —Colombia, Chile, Peru and Venezuela — ware made up of 66 per cent from section 6, 16 per cent from section 5 (chemicals), 11 per cent from section 7, and the remaining ? per cent from section 3 of the SITC.
Among the products in section 6 — manufacturad classified chiefly by material — exportad by this group of countries, the most important wero intermediate products of iron and steel, pule and paper, and yarns, fabrica and made—up articles. /In exporte

- 116 -
In exports of iron and steel semi-manufactures by these countries, Venezuela stands out by reason of its exports of 15 million donarse worth of surplus production (especially ingots, blanks and tubing fittings) which it was able to market in 1970 as a result of the investment made in the iron and steel sector. Chile, on the other hand, only sold rather more than three million dollars: worth in 1970, and its annual marketing volume has tended to fluctuate. In textile semi-manufactures (cotton fabrics and yarns), Colombia continues to keep up high export figures, although they do not seem to be increasing according to the expectations of the early 1950's, since from slightly less than 11 million dollars'' worth in 1965 they rose to nearly 13 million in 1970, with same sharp declines in intermediate years. In this branch of industry, it has not been possible to separate exports from the fluctuations of the domestic market, and this hampers the expansion of the sector.
As regards pulp and paper, Chile is the Latín American country which heads exports of these products: in 1970, its exports were worth over 15 million dollen more than double the figures reached in 1965; more than 60 per cent of this figure corresponds to paper (newsprint) and paperboard and the rest to sulphate chemical pulp, mainly long-libre. In 1969, Colombia exported 1-3ther more than five million dollars' worth in this field, which was less than during the three preceding years (seven$ fine and ten million dollars' worth, respectively) and Peru attained rather more than 2 million dollars' worth of exports in this sector in the same year.
Chile exported 16 million dollars' worth of chemicals (especially chemical products for industrial use), while Colombia achieved exports worth 10 million dollars.
Lastly, in exports of machinery and transport equipment, the only progress worth mentioning is that of Chile, which increased its 1965 figures two and a half times, its 1970 exports reaching a value of rather more than 10 million dollars, of which seven million correspond to transport equipment, the majar part of this being accounted for by parts and components produced for the motor industry under agreements with Argentina.
Colombia attained five million dollars/ worth of exports under section 7 of the SITC, of which slightly less than four million dollars' worth was for mechinery (office, textile and leather mechinery and parts and components).
In the group of small countries (with the exception or the five countries belonging to the Central American Common Market), only Uruguay requires special mention, on account of its exports of semi-manufactured leather products tanned and semi-tanned), which accounted for 19 million dollarst worth of exports. This was the result of a policy to modernize and equip the leather-tanning industry and of government incentives aimed at promoting the industry by improving production facilities and discouraging exports of unmanufactured leather to the point of prohibiting the exports of tanned hides. As regards yarns, fabrics and made-up articles, the only increase noted was in exports of wool tops. /(
b) 122Z

— 117 —
(b) 211221194f—raUggialeara=
By the first few months of 1972, the general systems of preferences accorded by the developed countries in respect of exports of manufactures and semi—manufactures from developing countries in accordance with the Agreed Conclusions of the Special Committee on Preferences of UNCTAD were practically all in force 18/. As stated earlier, the United States is the only country which has not taken the necessary steps to obtain legislativa approval to put the system into effect. Consequently, not only have the Latin American countries been deprived of the possibility of increasing their exports to that country, but in addition a state of uncertainty has arisen concerning the prospects of other countries maintaining their systems, and still more so regarding the possibilities of improving the concessions granted.
There is as yet no adequate information on the value of preferential importa by developed countries, except for overall data for eight months on Japan's importa. According to this information, Japanese importa from Latin American countries benefitting from preferential treatment representad 1.8 per cent of total importa from the region12/. This minute percentage is attributable, inter alia, to the following factors: (a) Japan's importa from Latin America oonsist mainly of primary products in respect of which no concessions were granted; (b) of Japants total importa from Latin America, 6.2 per cent represented products covered by the preferential system, but not all could be admitted under preferential conditions because the quotas established for individual commodities had already been filiad, some of them during the first two months in which the system was in force.
It would be rash to forecest that in the other countries extending preferential treatment the resulta of the first year of implementation of the respective systems will be as disappointing as those indicated by the figures for the first eight months of implementation of Japan's preferential system, but the truth is that this would not be surprising . In view of the structure of Latin American exports (90 per cent of which are primary products or products with a scant degree of processing) and the limitations and safeguards known to characterize the preferential systems, it must inevitably be recongnized that berely two or three countries in the region will be alba to obtain some real benefits under these systems. This would
18/ See resolution 75 (S—IV) of the Trade and Development Board, in the report of the fourth special session (TD/B/330), 14 October 1970.
12/ See chapter TV.
/seem to

-113-
seem to bear out the view expressed in some circles when the question of preferences was being discussed, to the offect that thé concession of preferences had more of a political than a commercial value:
"The prefe ronce question being as mucha political issue as an economic one, there are those whoo while recognizing the the limits of the economic case, have argued for favourable action on essentially pragmatic and political grounds. Since the less developed countries have focused so heavily on this issue - and precisely because its trade effects are likely to be limitad or, at least, amenable to some form of limitation - the argument that it is politically wise and not too costly for the world's rich countries te accede to less developed countries' demands has had considerable force" 20/.
The main limitations of the preferential systems have been pointed out on other occasions and need not be repreated here, but it is useful te roaffirm that one of the most important is undoubtedly the rango of products covered. Although in principie preferential treatment is extended to the manufactures and semi-manufactures included in BTN chapters 25 to 99, nearly all the systems exclude textile products, footwear and leather articles. At the same time, sine en the products included in BTN chapters 0 to 24 are in principie excluded, not only is the selectivo list of products (processed and semi-processed agricultura' products) in respect of which preferential trcatment is accordcd extremely limited, but the concessions gunerally consist of only a small reduction in the customs duty. It should be borne in mind that those are the products en which the highest customs tariffs are imposed in the developed countries, to say nothing of non-tariff' restrictions. In orle of the most important markets for the Latín American countries - the European Economic Community - the concessions granted for processed agricultura) products are oven more limitad because of the need to retain a more favourable margin of proference for the exports of the Associated States and other countries with which preferential trade agroements have been negotiated 21/.
Another important point which should be examined in relation to the systems of general preferences is that of the forthcoming multilateral trade nogotiations. It soems clear that until these negotiations are initiated, and during the whole time they last, the developed countries are .11•111111•11110«..ael
20/ W. Michael Blumenthal, "A world of preferences", Fallan Affairs, Now York, April 1970.
21/ See "The European Community and the countries of the third world", Documents of the Euro ean Economic Commuitz, No. 13, September 1972.
/hardly likely

- 119 -
hardly likely to take any action towards improving the preferential systems. Furthermore, to the extent that these trade negotiations achieve their objective of reducing customs tariffs, the margin of advantage accorded to the developing countries under the systems of preferences will tend to shrink or even disappear. Thus if the new trade negotiations achieve their objective of further liberalizing trade not only in industrial byt also in agricultural products, and not only through the reduction or elimination of customs duties but also through the elimination or lowering of non-tariff barriers, the systems of general preferences will obviausly have to be completely revisad. The paint to be clarified is whether the developing countries must wait until the end of the negotiations before endeavouring to obtain any improvement in the existing preferential systems, which in terms of trade opportunities have very little to offer and that only to a very few countries.
There are other aspects of the preference systems which also limit the possibilities of the developing countries to take full advantage of them. One of these concerns non-tariff barriers; another involves the use of, or recourse had to escape clauses. As regards non-tariff barriere it may be mentioned that their application has neither been modified nor limitad in any of the preference systems. This is important, not only because there exist non-tariff barriere for products of importance to the developing countries, but because as the reduction or elimination of customs tariffs has progressed, non-tariff barriere have tended to replace customs tariffs. The other aspect perhaps more important still is the use of escape clauses. In the systems of preferences of the EEC and Japan, preferential importe are subject to quotas, but in the other systems, there is no a priori limitation, although each of these countries has the right to make use of the general escape cluse to suspend totally or partially preferential treatment for the product or products imported in quantities which are detrimental, or threaten to be detrimental to domestic production. Recourse to this escape clause is not subject to pre-established or uniforme criteria or norme, which means that its use is entirely according to the unilateral judgment of the country granting the preferences. While this unilateral aspect of the application of the escape clauses survives, the developing countries will always be under the threat of any increased attempt to step up their exporte under the protection of the preferences suddenly meeting with the suspension of the preference. It seems extremcly important, then, that the escape mechanism should be subject to a multilateral decision. It should be remembered that one of the problems to be reviewed in the multilateral trade negotiations of 1973 is precisely the problem of trade restrictions applied by the countries under article XIX of GATT, which determines the conditions and procedures by which these restrictions may be applied to importe.
/5. Maritime

-120—
5. Maritime transport
(a) The •eo• J.hical structure of foreign trade and maritime transport
During the decade which ended in 1969 there ware significant changas in the direction of Latin America's trade, While Western Europe maintained its participation in Latin America's foreign trade at around 32 per cent, North America's participation decreased from around 44 per cent in 1959 to around 36 per cent in 1969. Japan*s participatíon doubled from around 2.6 per cent to around 5.6 per cent and in 1969 the socialíst countries of Eastern Europe and the USW received 4.2 per cent of Latin America's exporte and provided 5.5 per cent of the region*s importe, although trade with such countries was insignificant in 1959. As a result of the changing geographical pattern of Latin America's foreign trade, new shipping routes were established between the region and Japan and Eastern Europe, and Latin Amrican shipping linee gave increasing importante to routes to Western Europe.
Between 1959 and 1969 the physical volume of goods transportad by sea in International commerce increased 133 per cent: nearly the same as the increase in the value of world trade, The physical volume of goods loaded and unloaded in Latin America, however, increased only 47 per cent during the same period, while that in Japan increased 447 per cent.
The sharp disparity between the increase in the value of Latin America's foreign trade and the physical quantities of goods shipped and received can be explained partly by separating petroleum and petroleum products from dry cargo traded. Between 1959 and 1969 world petroleum loaded increased 164 per cent, while that in Latin America increased only 32 per cent. In 1959 Latín America loaded 39 per cent of the world trade in petroleum and petroleum products, but this fell to 19 per cent in 1969. As the regionlis tanker fleet did not transport a substantial share of these exporte in 1959, an ample margin existed (and still existe) for the petroleum—exporting countries to increase theír fleets.
Dry cargo loadings and unloadings in Latin America increased around 83 per cent between 1959 and 1969: lees than the world increase of around 100 per cent during the same period, and considerably lees than the 379 per cent increase in dry cargo unloaded in Japan. The substantial increase in dry cargo shipped and received by Latin America provided an ample opportunity for the region to increase its carryings in its own chips, but by and larga this did not occur.
/The regiones

— 121 —
The regiones participation in the physical quantity of goods transportad in the world's trade is still considerably greater than its participation in the value of trade, especiall:, in the case of exports. In 1969 the region's exports represented 5.9 per cent of the value of world trade and 17 per cent of the tonnage of trade, owing to the low average unit value of the products exported. The value of the average ton of cargo which enterad into world trade in 1969 was 120 dollars„ while the value of the average ton importad by Latin America was 115 dollars. The value of the average ton exportad by the regia.), however, was only 42 dollars.
In 1969 Latin America exported 139 million tons of dry cargo. Of this, 63 per cent was contributed by only four products: íron ore (58.9 million tons), bauxite and alumina (19.8 million tons), grain (6.5 million tons) and sugar (9.1 million tons). These raw materials, as well as zinc and manganesa ore exports, coal and phosphate imports, etc., are transported primarily in bulk, so that Latín America must give special emphasis to the development of its bulk carrier fleet and assure íts effícient utilization.
The destination of Latin America's dry cargo exports and the origin of its imports is not known in detall. Of the 94 million tons of the four products notad which formed the basis of the region's dry cargo export tonnage in 1969, however, 39 million tons were transportad to North America, 24 million tons to Western Europe and 22 million tons to Japan. Thus Japan is a far more important importar of Latin America's raw materials, especially iron ore, than its participation in the value of the region's foreign trade would imply.
(b) The develo ment of Latin America's merchant fleet
Between 1959 and 1969 the gross registered tonnage of the world fleet, excluding the United States reserve fleet, increased 89 per cent: considerably less than the increase in the value of world trade and the total tonnage of sea—borne cargo, which was around 135 per cent during the same period. The disparity was especially larga between the growth of the tanker fleet, which increased 108 per cent te reach 77 million GRT in 1969, and the increase in loadings of petroleum and petroleum products, which was around 165 per cent during the period. In addítion, the average distante that petroleum was transportad increased. The disparity between the growth of the dry cargo fleet, which increased 79 per tent between 1959 and 1969 to 125 million GRT, and the increase in dry cargo transportad (101 per cent during the same period) was also significant.
/Part of

-122-
Part of the disparity between these different retes of increase can be explained by the existence of substantiel laid-up tonnage in 1959, amounting to 8.6 million GRT (excluding the United State reserve fleet) out of a total world fleet of 107 million GRT. As shipping demand increased, these ships were put back into service, and by 1969 the laid-up tonnage wls only 0.4 million GRT, If only the tonnage of the active fleet is considerad, the tanker fleet increased 132 per cent between 1959 and 1969 while the non-tanker fleet increased 91 per cent.
Another part of the explanation is to be found in the increasing use during the decade of progressively larger tankers and bulk carriers, whose effective cargo-carrying capacity is not well represented by gross registered tonnage. As the ratio of deadweight tons to gross registered tons is largar in the case of these ships than for the average ship, the effective capacity of the world fleet increased more rapidly than the figures given aboye would indicate. Finally, not all the world fleet is engaged in international trade, a substantial part being usad for cabotage and non-trade purposes, but the statistical series of Lloyd's Register of Shipping includes all ships of more than 100 GRT.
After growing at a rete of less than 6 per cent a year between 1959 and 1968, the world fleet increased rapidly in the years thereafter: 9.2 per cent between mid-1968 and mid-1969, 7.6 per cent in 1969/1970, 8,7 per cent in 1970/1971 and 8,7 per cent in 1971/1972. The shipping boom at the end of the 1960's also led to a sharp increase in orders for new construction: 22 per cent in 1969 and 31 per cent in 1970. The growth in the order book in 1971, however, was only 6.7 per cent, reflecting the collapse in the freight markets in that year„
The world fleet changad its composition substantially during the last decade, There has been a great increase in the size of individual tankers and bulk carriers, Tankers had tended to increase in size since the end of the Second World War, but it was in 1959 that the first tanker of more than 100,000 tons deadweight was put into service. In 1966 the largest tanker afloat was slightly moré than 200,000 tons and anly two years later more than 300,000 tons. In 1972 a tanker of 477,000 tons was launched in Japan and speculation confines about the probability that there will be a tanker of one million tons before the end of the decade„ In June of 1970, 93 per cent of the existing tankers were less than 100,000 DWT, but at the same date only 39 per cent of the tankers on order were in the same size range and 52 per cent were of more than 200,000 DWT.
/Combined carriers,
— 123 —
Combined carriers, vessels designed to transport either oil or minerals and vessels which can transport oil, minerals or other bulk cargo (0805), became increasingly important during the decade of the 1960's. By the end of June 1970 the combined cerner fleet had Brown to 204 vessels totalling 14 million deadweight tons and averaging 68,000 tons. An additional 117 combined carriers, totalling 17 million tons, were scheduled for delivery between June 1970 and the end of 1973. Early in 1972 the biggest ore/oil vessel in service was of 245,000 DWT, while the largest ore/bulk/oil ship was of 169,000 tons.
In the second place, the use of specialized ships became increasingly coman. This was especially so in the case of ore carriers, which tended to replace the traditional tramp ship in the carriage of products transported by entire shipload, such as iron ore, grain, coal, bauxíte and alumina, and phosphate. Between 1960 and 1970 the tonnage of these products carried by bulk carriers increased from 17 to 74 per cene of the total, and in tercos of ton—miles of transport accounted for 81 per cent of the total
transport in 1970.
During the past decade increasing use was also made of ships especially designed to transport commodities traditionally carried by liner conference vessels, such as lumber, automobiles and chemical products, owing to the economic advantages of such specialized carriers, especially in regard to
loadíng and unloading costs.
The increasing use of specialized carriers in ocean shipping reflects in part a growing tendency for maritime transport to be íntegrated into the total production and distribution process. The systems approach to all transport, in which the objective is to minimize the total door—to—door transport cost rather than the cost on a specific link within the transport chain, has now been extended to ocean shipping. With the growing importance of transnational industrial concerns which control the entire productive and distribution process, much ocean shipping is reduced to inter—plant industrial transport. This tendency toward vertical integration will affect the role of the traditional liner services in the future.
A third important change during the last decade was the increasing importance assumed by ships which carry unitized cargo. The same factors which contributed to the increasing use of specialized carriers, namely increasing port costs and the incorporation of ocean transport into an integrated transport system, were also responsible for the unitization of cargo, especially through the use of containers. By mid-1970 the world fleet included 167 fully cellular container ships with a total tonnage of
/two million

-124-
two million gross registered tons, and container transport was clearly to dominate general cargo transport between Europe, the United States, Japan and Australia. By mid-1972 the container fleet had doubled to 312 fully cellular ships, totailing more than 4 million GRT. In addition, the tendency towards ever larger and faster container ships was accelerating. Early in 1972 the Japanese-owned "Kamakura Maru" enterad service between Japan and Europe. With a service speed of more than 26 knots, this 35,406 DWT vessel can transport 1,838 twenty-foot containers. It is the first of 17 similar vessels which will operate under Japanese, German and British flags on a single service.
Despite the impact which containerization has had on traditional break-bulk cargo transport among the developed countries, its significance in Latin American trades has been slight, partly because of the composition and disequilibrium of the region's exports and imports and the lack of the port and inland transport infrastructure required for the efficient use of containers. Undoubtedly, however, containerized cargo will become increasingly important in Latin America in the future.
Potentially even more important for Latin America will be the introduction of a different concept of unitization, LASH (lighter-aboard-ship), in which a large mother ship transports a number of barges of some 350 tons capacity and leaves them in different ports among its route without having to dock. This new technique was introduced at the very end of the last decade with the initiation of services between the United States and Europe. Since then, services have also been established between the West Coast of the United States and the Far East. At least three companies which offer services to Latin America have LASH ships presently under construction or have announced plans to provide LASH services in the futura. While this technique does not require costly port investments, the enormou3 productivity of an individual LASH ship presents serious problems. If a foreign company offers sufficiently frequent service to be attractive to shippers, it will in effect be providing such a larga amount of shipping capacity that on a number of routes there would be little cargo left for the Latin American fines now providing services. 1f Latin America does not particípate in this new technique, it will either miss the benefits of this new type of service', or its shipping fines will be at a severe disadvantage in relation to their foreign competitors.
If only the global figures for the Latin American region are examined, it would appear that the region was left far behind by the growth of the world merchant marine and the dramatic changas in its composition. In 1955 Latin America possessed 4.1 per cent of the world fleet, but by
/1972 this

-125-
1972 this participation had dropped to only 2.4 per cent. In addition, as can be sean in tabla 17, Latín America's fleet in mid-1972 was heavily concentrated in general cargo shíps and only 9 per cent of its fleet was compasad of bulk carriers, without a single container or LASH ship.
The picture improves somewhat if Latin Americals ships on arder are taken into eccount. At the end of April 1972 the region had only 1.9 per cent of the world tonnage on arder, even leas than its participation in the world fleet on that date. As can be eppreciated from table 18, however, the region did have a substantiel amount of bulk cerner tonnage on arder, as well as combined cerner tonnage. In this 'atter category, Latin American orders representad 5.6 per cent of world orders, while 57 per cent of the tonnage on order for Latin America consisted of bulk and combinad carriers - considerably more than the 27 per cent at the world level. Nevertheless, this difference between the composition of Latin American and world orders is due primarily to the fact that only 25 per cent of the region's tonnage on arder was for tankers, whereas 66 per cent of world orders were for these ships. With the collapse of the dry cargo freight markets in 1971-1972, shipowners around the world concentrated new buildings in tankers while Latin America invested heavily in bulk and combinad carriers.
To appreciate developments in the Latin American fleet over the last years, it is essential to divide the fleet into the ships usad primarily for international commerce, those used principally for coastwise services, and the river fleet. This information fortunately is available for Latín America since 1963 through the studies and statiscal yearbooks of the Instituto de Estudios de la Marina Mercante Iberoamericana (Ibero-American Merchant Marine Research Institute - IEMMI) in Buenos Aires. The statistics compilad by the IEMMI include only ships of 1,000 GRT and over, so that they are not directly comparable with the fleet statistics preparad by Lloyd's Register of Shipping, which include ships of 100 GRT and over. In addition, as some ships combine international ocean transport and cabotage, the assignment of ships to services is based on the most frequent use of the ships and so may vary for a particular ship from year to year.
/Tabla 17

o
41
r4
411
44411 44
o
ee
E5 8 o
á
N 8
Ñ g
— 126 —
01 O CO N l41 ON /44 r4 C•N r4 r4 01 444
10 ..14.4 CIN 0 04 01 sO N sO r4 1/40 00 10 •V '42
01 O cr. ,42 04
01 M 01 1.4 '41) N
1 r4 `s% 15; cli
LA 141 01 04 re 01 01 " eg s g CR.
18 .1.; S' V% 01 W1.
o .c) Mr1 .0
oé c•■• I 1 1 1 t I 1 •.0 1
141 01 OS 1 t" 1 1 "I e'tg • N CC)
1\? 41 M r4
...0* ri oi
Wor
ld t
otal
sciNi c,4 C4 C1 141 .0.4 .- 1 0 M 1 0
eca ‘1., CO r¿ris
ce% ON r4 cC) r•I C4 V:1 r-I r-t
C4 I 01
g; Ñ `e9-, c11 1,1 1,1 11 1
91 10 CO r4 t11 LO 0 r4 Irt ra cC:;1 r4 4.4 CO 1,41 , 04
O tsj oo si ces e-4
r4 ✓4 .‘"
‘ 1 11
-§‘
I
rcIsi 'L Ni 11.1 455‘ I I( Cr% In O LA t 04 ir 01 N U1 tR .44
r4
Cr, 01 ,d.• N.0 ri r4 ti • r4 .111 r4
O 44 r4
.01:
h u-N 41' N
• 4 • .0'
.44 O 43 d
r4 o 1. 0,9 o • • o
...› 0 44
O 11. 1 j I ..
.4
44
Y 41 oah 45 01 5 1 sr 1 1
0 0 O
glig ..5 .5
.4 e a 92 0
11 54 O
0.
a
.1>
44 O O
O • O O ..
4i 4>
4 o 44 0 C1 5.7 1 ) o ••-t .D o 5 t. E 11 0 o. 0 ...) 0 0 II" ..1 1 5E"' 15c-"a 04 5 r
▪
i
▪
" -I»
A 1 o o 11 1
.c, 1.■ O O to 1 v03 44 01 LA
O gi. -01
? 04 44 "2 0 4.4•• o to) r4 0 0 0 0 0 .1
a
)
.
t
o
l
, .
10 - . 4.
a40 ..1 .. 1
1
40 1.90 al 'SI :III "al ... .Cilt
/Tabla 16

- 127 -
Table 18
WORLD SHIPS ON ORDER, 30 APRIL 1972 1/
(Number of ships and thousends of,deadweight tons)
World
Dry Container
oargo ships Tankers
Combined Bulk oarriers 2/ oarriers o
Total
1 176 207 8 845.51 3 881.7
1 006 117 237.0
151 22 525.9
599 24 917.6
3 1391 177 407.7
Number of ships
Tons
Latín America Argentina
Number of ships 19 - 2 21
Tons
brazil
187.6 6.0 - 193.6
Number of ships 40 11 9 8 68 Tono 357.7 693.2 1 259.3 318.7 2 628.9
Chile Number of ships 1 1
Tons 30.0 30.0
Colombia Number of ships 3 3 Tons 6.9 6.9
Colombia/Ecuador
Number cf ships 3 3 Tons 29.1 29.1
Cuba Number of ships 1 1 Tons 16.3 16.3
Honduras Number of ships 1 1 Tono 3.6 3.6
Mexioo Number of ships 7 7 Tons 150.5 150.5
Peru Number of ships 2 14 16 Tons 22.0 - . 358.0 380.0
Total number of ships 68 21 9 23 121 Total tons 606.9 - 866.0 1 259.3 7064 3 433.9
Percentage of world tons 6.9 0.7 5.6 2.8 1.9
Source: Fairplaj International Shipping Journal, Quarterly Supplement No 31 (1 June 1972). 2/ Ships of 1 000 gross registe:« tons and over. / Ore/oil and ore/bulk/oll oarriers of 12 000 tons deadweight and over. 2( Single-deok vessels of 12 000 DWT and over, with machinery aft. 2/ Includes 23 ships for which no deadweight available.
Includes barge-oarrying ships. trable 19

- 128 -
Table 19 presents the Latin American fleet by country and by service at the end of December 1971, separating tankers from other vessels, and compares the regional total with that in 1963. While the increase in the total fleet was slight over the eight-year period - only 35 per cent -there were sharp divergences among the fleets used for different services, as can be sean from the following tabla, which shows percentage changas in gross registered tons between 1963 and 1971:
Ocean-going fleet
Coastal fleet
Inland watorway fleet
Total fleet
Oil and gas tankers +110
no change +8
+28 Other vessels +97 -34
+19
+39
Total fleet
+100 -16
+14
+35
In 1963 Latin America's merchant fleet was predominantly usad for coastwise services (52 per cent of total tonnage). By the end of 1971, however, tonnage devoted to international services had risen from 42 per cent in 1963 to 63 per cent of the total. The modest increase of 35 per cent in the region's total tonnage masks the far more dramatic increase of 100 per cent in tonnage used for international trade, elthough part of this tonnage, especially in the case of tankers, is also usad for cabotage.
It should be notad, however, that the increase in the regional fleet was contributed by only a few countries: Brazil, Cuba and Mexico were responsible for 64 per cent of the increase in regional tonnage, and when Chile, Colombia, Ecuador and Peru are added, the contribution of the seven countries is 91 per cent. One of the reasons why the regional fleet did not increase more rapidly over the period is that the total tonnage of one country which in 1963 owned one-third of the regional tonnage actually declinad.
/Tabla 19

r4
a1
W c=1
1 s=.1 PA
e.
r
- s
" Cf
o \
a> 4-4 C.4 .0 Z O .4 E. Z
C>
HV
z 1-4
(Ton
s s
n d_u
nits)
bar
ges
ea
oh o
f 1 5
22 GR
T.
1 4> 1
1 o 1 o 0,
E"... el. Te NI el
1 • U\ • CO
0 ..11 g 1 • O
...I ' /) cl
oo ts. \ 0
• 0
.--o".4 cou.‘ cr. 4- ..4 co
r. O 4
3 C..‘
r-f 4> `.0 %.° 744 coN
UN o-1 1.
o 4.. 4... c.0 4., l• cr'' " o •-•
• e) O 144 44 4> N > o o
o t o o c.
Ñ
•
lo o> 110 o f. 14 ...1 •C/ •
O O 14 .M 01114 <o o o
11 al o
al I. la .0 á al
-g .14 olD %..
+, ai 0 g al a g,- a g"« 8 bo 00 o 4• •,, o o o ›. 0 o •
10 U) 4 ox 41-4 Sr 0 0 0 4-. I' ' ,.., 0
Le 01 U) o o O
1-.1 II '111 .0 1E/ • • a, 4-1
1 O O 4 . > 0 0 4-44 4.4 F.. 2 2 2 0 o o o 0 o
E ffi g .... c.:V 4 b-• S S 4 S S S
> o o- O 0 O -.4 con o 441 0 O 0 43 0 <e V) U) O te V) e> 0 4> e> 0 0
1:$ 10'O 'cl -O 'cl
r. 0 erl s--I
0 4-4 r. .-.1
111"-Z-C
- 129 -
Inla
nd
wat
erusy
fle
et
T
ota
l f
leet
T
ank
ers 5/
Oth
er v
esse
ls
;
0
IX \ C" <7\ al ..I EN. O O\ r4 eN O O O O • e 4 • cj: ...: • e: • • • •
opa
e, ..
aD ■
INI. CO U. EN*. L'N. CO C" r. 01 '1/40 EN... ,..0 0 0 oi
t." C•4 01 C,N 111 tr■ I r. 1/40 \O \O t-4 u'. el CV el C" N ...I el CO 4-4 4-1 -7'
el ,C., ....1 ln
O '-O C'''
1
1 0
8-4 \O EN, el IN4 N 0.4 e4 t-. i.c. ....* co crt 1 Cr. o 4- \O ,I c.-% .-4 -.. C4 (1) .-4 N
01) \C> -1- EN, O 04
e; C•,/ 0\
1 t 1 I 1 e O e .4. o c 10
g I r4 CO 10 ON4 Cll 4.1
CO 4.1 el
10 L" iiiiiiiiiii C4.-419, g M •-•
E.
c.>
o‘ *.1-1 11
..it c" t...CO • •
CZ 1 e: , 1D EN.
.CV.., co el 04 4d-
CO •-• O 4-4
1:7\
.-: .-1
EN, Cr%
O Z E"... 0.•4 o".% 1 .,. e NI <91
N e.. 4-1
o ..-e 44 .-I al s> U) 4 C o
Oth
er v
ess
els
O
...li ■D cr \ C" O 01 ...? CV \D LIN • • • • •
4.0 03
"... I 1 1 s . 4
0 e o I oz
COi
4-1 c■-; 4
4 r 1,.. CO CO ... 10 e4 \O O.. co cm .-4 01 t-, ..d. e4 e\ .-4 04 \O ...I C" UN
O
10 \O go
1 N ON Lt-, LIN 4- o t I 4- I 4 1 .-4 c., v,I .4- co 4.4 r-I \
r-I N 0 \ O
- T
anker
s 5/
1 0
s \p1 11 U1 UN EN.. 4-4 r-I el en c.4 ■O 131 • • • • • . • • • •
r. C" r`4 C1\ CV I 1 1 Csi 1 I CO el 04 O O O O cn cm c•-■ N O LIN 01 01 0 L'••• CO O cr‘ oo .--e .4.-.. op o. C. 11\ C.1 \O NI N Crs COr. N1 O
...)
0 • CV t`s. .2- NI O .-4
O c■i O\ 10 .4' \0 4 4 1 -. " t.' ...4 Z? 1¿%1 ' e\ 14 .-I .-4
Oce
an-g
oin
g f
leet
Oth
er v
ess
els
97 o
O\ co Lts. 10 ■-•1 C"... O Cr\ tw. Cn 40' cr. co 1,0 • • • • • • • • • . • • • •
,4 crN trl. ••e •--e .. co CY .0' C" 1 .-4 .0* n4 CV 4- C.1
g. el g 1?) , ON 04 C" 3 '.....2- t.... c•,, ..., •••• o. 0,....1- O o. -. r.4 \O 40. EN. UN -0" \ID N CV N yr. 4,44 C4
CV
o \ •
CV _t- 40- r-I n4
z ro N mi Cs1 \O 1 e 4 00 14, :E,/ i ..4. .1:1 N el, UN 4-1 CV cc4 cs4
o:l
co 44 0
..Y
e. Z O
-'1 ' o o co C4 EN. O ts. co O aD • • • • ..4-. t o e o cr■ c; e 9 op
O\ Q O e" e\ til O -7' N O .4- 111 0 ,..0 CM 4-4 0 4444 4-4 4.4 ',0 el 4-4 o CV r-I ON
C" e. .-4
j
f. Z
4-44 4-4 .44 •41 1 t o t o \ .-4 1 (••••■ N.O •-• 11 •-• 4-4
U) 0 -.4 14
+.-.> 5 O
c.>
o 444
P•
.• ■-o o
••0 § al . r4 .O t-
O 1
.c> al al al ..
1. 0
1 d aj 0 444 >11
.1 o ›-d 9 and y, o al 44 -4 O .4 O t .5 1 141 : 14 s , 1 ... 0 $4 ,4 o al •A 0) +., 444 al 0 e .0 . E. lo. 1 4.. >4 o r. 7
•trcle CS8c12114 c.g Ali olltil"
\O 0\ ..-1
O t E.
/For the

- 130 «.
For the purpose of the regional review and appraisal of the International Development Strategy, the ocean-going fleet is of special interest. Tabla 20 presents the fleet by countries at the end of December 1971, broken clown by type of ship, and compares the regional totals with those in 1963. The following data will facilitate the interpretation of this tabla.
Total regional ocean-going
% of total GRT in 1963
% change'in GRT betwéen
1963 and 1971
% of total GRrin 1971
fleet 100 +100 100 Passenger vessels 8 -60 2 Cargo ships of 18 knots
and more 1 +2 879 13 Cargo ships of less than 18 knots 63 +25 39
Refrigerated ships +1 310 3 Bulk and specialized carriers • . 3 +600 11 Combinad carriers nona 6 Petroleum and gas tankers 25 +110 26 wormusomaamwsollris
Especially noteworthy is the rapid increase in modern cargo liners of 13 knots and more and in bulk and specialized carriers. Nevertheless, anly six of the countries in the region owned bulk, combinad or specialized carriers in 1971, and 81 per cent of the regionss tonnage in these categories was owned by Brazil, Argentina and Chile, despite the fact that many more countries of the region generate bulk cargoes Mich wculd justify expanding their fleets to transport the% While it would not apee= to be desirable to continue to invest in break-bulk cargo liners at a time when the rest of the world is turning to new transport systems, the acquisition of additional bulk, specialized, combinad and refrIgerated carriers is clearly warranted. In addition, the time has also come for serious considération of the purchase, either at the national or multinational level, of unitized cargo ships such'as LASH, roll-on/roll-off and pallet ships.
The importance of governmental initiative and clear and consistent policies regarding investment in new ships is pointed up by the fact that 62 per cent of the' regional tonnage engaged in international services is owned by State enterprise. In Argentina, Brazil, Cuba, Mexico, Nicaragua, Peru and Venezuela, State enterprises own more tonnage engaged in international commerce than do private shipping lines. Governmental policies are therefore needed to ensure that sales and purchase contracts for bulk commodities permit the participation of national flag vessels in their transport.
/Table 20

02
•
1 .4
o 4a
Ca
E.
cdo t.
o
o o
5
uN
.... c.,
'.0 0 O N 1.
c01 01 o
21
%) .
ni .4 CO .4 -4 O d .$ .9 al
4-4
44 0 0
4. O 4» las
o .4 lis
e Si .4
o ..14 re 4.
't DI .$ C.
O 114
E. b o 0 N g 0 go .41.. t•-.. 1 +a S. a. ON 0 O 4 .-+ .4
O d ..N1 O O 4.
✓ 4. o i> e
o +a A o o O o
- > o 0 E
eO
zi, ...» 03 o • LO o
- 131 -
..4 O 4. o H
as -2- «N c0 ,..4 2•••• O al -" 01 4. j',... CO .3- • • • • • • • • • • • • • •
L41 O O LIN r4 mi CO C4 -^ «N 1 N ■,cs 0 c.4
00 '0 .-4
al .M g.' fr's ..41% lir? 4\ 91 4%. gis 0.20. 01 .2' C•••
5; co.3 7,s, {',` N ,4 co tts O ,4'
es r4 re 04 O e.
CM N
...-1
r.... I u... ro l■ t ... 4•1 111 te?' C4 "4 C4 01 - 1\1- 7-4 -..-4 1 I.C1
N
• re E la .1 O ••.....
0 1 Le 0
1 a íNo !
OBT
ÍI
::.11
O ••OO CO N r`.. O t,. co O co • • • • • • •• •
..X, 4" .4. S 1 1 1 as 0 1 O 9 z.
O 01 01 LC1
LI1 O •0 04 .4 a. re .4
r. \ 0 4,1 4-1 0 0.4 re Co%
01 C•1 re
\ O
.4 r4 .4 re 4 I 1 I as r4 a cm% U/ mi .4 .4 II
.......-.......-.
1:0 VI e 0
or4 le
1 to• O O 0 O
O O 03 03 • • • e
Cs.
r4 03 O 1,.. \O
.4 C4 01
.4 ..
..04.41111114111 1 .2> 1
Bul
k '
,arri
ara
gs sO ...7 r0 C. No0 • • • • • •
ro.o. 0 a trs O I a •...1 t 1 oN 1 I Cc
11 1, . 1.4 .1 fr , 54, 4' ps. t"
C.---.......
CO •
t.ts \0
L".4 O z '.0 03 .3' II 1 I lel! te4 a 1 4
"00, 4>
O 0 0 04 bo •4 44
44 0
Ce
co O -1" 0 .-; .4 CV • • • • • • •
04 04 Lr■ th 1 1 1 1 1 lo o-4 t 0\ O \ tse. N C.% •A re 01
O 01 441 C1
CV re .4 N
4.... ..d. .-4 04 (N. 1 1 1 e 1 I 4-4 .4 1 C01 04 ) CV
Car
go
sh
ips
of
leso
th
an
18 kno
ts
:No 1
GR
a. so as co 03 t■., o oN. ,-+ 01 so O Cs. \O • lo • • • • • • • • • • • •
gi 2 1^ °t'o- -1 co, .1 ',".: :0" ! 7: I, (..:4` EZ . ... 04 111 •O N 141 C1 .4 C41 N .3' sO 0 csi CO
,.. O O 04 o1 ca% u", .4.3- ....? U1 CV 04 .-4 ,il .4 -4
•.4
• .--.
tr, Lts U\ N \O Cst o-1 C4 cq ‘0 I o". rs. u■ C.,:zi eCtl o" \ c-% .-4 C4 IN 41 1-1 "4 .411 .4
Car
go s
hip
s o
f 18
kn
ots a
nd
mor
e
JAID
•0 O CO sí) N N ..o-
I r: j ..o .4 o o o o.7 a 1 e I O. CV
cc; O \ 01
trs «N 04 1.11 O 18
.4' «N 04 04 .4 co . re 4 .7
co 10 cn re
103 .3. O\ 01 1 I 1 04 1 I I 1 04 94 04 I
Pas
sen
ger
vess
eis
01 01 ccl e i e a a a s e a fea a 03' g
o
ON .d! z.
ed...........- .~.....,-.
4- 14111111 44444 .340 04
o o t 4.4
o Ú
o .4
E. .-+ o 11 S
Cia ..4 S t'... O. I2 le
t44 0 CIN re
4, -...... Z 44 4 vi +-4
al O .. O > 4 I 1 .-4 r1
4 ad
1 ..1 .1. E O S 1 o o N O
0 0 o cd *44 +4 +.1 4 4 1 O S. te Id .1 r .0 E 4 X 5. e .1 1 6868U3Alctrtct>
C. \ • O 0\ re re la O E...
e4 o
O
PLRP
T,
1971
*
CS
LAT
IN A
ME
RIC
A: O
C (T
ons
an
d u
nit
s)
The

- 132 -
(o) Thc oroonization of ocean shipping
The sweeping technological changos in ocean transport during the last docade led te changos in the organization of shipping services. Traditionally, ocean transport was dividod into three separata markets: general cargo was transported by liner companies which provided regular services and were loosely linked together in freight conferences to set and maintain freight cates and to prevent competition from non-conferences linos. Pctroleum was transported in part by vessels owned by the oil companies, while another important part of tanker tonnage was chartered by those companies for fairly long periods of time. Finally, bulk cargoes, such as grain, coal, ores, etc., were transported by tramp ships, often obsoleto general cargo ships owned by independent operators, which sailed to any ports in the world where cargo could be obtained.
Of the three markets, the one that will probably chango the most in the near futuro is the transport of general cargo, with direct effects on the role of the liner conferences. On the one hand, the development cf container services by the industrialized countries has led to the development of container consortia. Whereas shipping linos within liner conferences compete with each other for cargo and confine their activities to transport from one port to another, container consortia are frequently managed as though they were a single enterprise. In arder to reduce port time to a minimum, container ships opérate under a rigid sailing schedule and transport all the containers which are available when they touch port and which have been obtained by the agents of the consortium. In addition, the consortia frequently opérate inland consolidating terminals for containers and channel the latter through a single container port, oven renting'block railway trains for this purpose. Individual shipping linos no longer solicit cargo for their own line and shippers no longer designate the line on which their containerized cargo is to be transported. Furthermore, there are indications that the traditional rato structure established and maintained by liner conferences is likely to chango, with a tendency for containers to be transported at a fíat rato per container.
When container services become more prevalent in the reglen, government polioles basad on the use of conference agreements to assure adequate participation by national flag ships in the transport of the country's foreign trade will be in jeopardy. 2ocause of the importance of the integration between ocean and inland transport of containers, developing countries will practically be forced to become members of a container consortium in order to obtain cargo. Lastly, should the trend towards fíat ratos per container continuo, the aspirations of developing countries with regard to promotional freight ratos for non-traditional exports would also be more difficult to attain.
/Container consortia,

— 133 —
Container consortia, together with specialized and bulk carriers, will continue to erode the position of the linar companies, which have had to reduce service on some routes, thus further weakening their already precarious financial position and leading to addítional pressure for linar freight rato increases.
The tanker market has been least affected by these technological changos, although long—term charters may become increasingly important because of the largo investment required for the construction of super—tankers. The oil companies traditional practice of owning or chartering for long term a significant arnount of their tonnage requirements may spread, however, to other commodities, especially ores. As transnational, fully integrated industrial concerns continue to expand, it is probable that more and more transport will be absorbed by them. In this situation, developing countries will find it increasingly difficult to obtain cargo on the opon market for their bulk carriers even cargo generatod by their own foreign trade.
The tramo market is changing from the traditional single—ship company to companies which own larga fleets of bulk carriers and specialized vessels, such as refrigerated ships, and which participate in consortia for the joint operation of oven larger fleets. As traditional tramo ships ware highly flexible in regard to the cargoes which they could carry, there wore few opportunities for exploiting economies of scale by operating largo fleets. With the shift towards more specialized ships, economies of scale have appeared on the marketing sido, as the consortium mechanism enables owners to obtain more continuous utilization of their vessels. In these circumstances, the Latin American countries are likely to find it difficult to obtain cargo as they continue efforts to build up their bulk carrier fleets unless they succeed in integrating their bulk carriers in consortia formad by a number of developing countries or of developing and developed countries.

— 134 —
(d) The evolution of freisht retes
Latin America and the develoPing nations of Africa and Asia have emphasized in the differcnt international ferums that the frequent increases in linar freight retes adversely affect their foreign trade. Between 1960 and 1969 the German liner index, the only such index in the world, which covers retes to and from ports in the Antwerp—Hamburg rango, increased by an average of 2.7 per cent per year, probably less than the rete of world inflation during the same period. In 1970 the linar index increased more sharply, 6.3 per,cent, but this coincided with a serge of inflation in the industrializad countries: wholesale Prices in France, the Federal Republic of.Germany, Italy, Japan, the United Kingdom and the United States increased by an average of 5.8 per cent in that year. In 1971, however, while wholesale prices in these same countries increased 3.4 per cent and consumar erices 5.9 per cent, the German linar index rose 12 per cent. Ratos on most linar routes affecting Latin American trade rose by around 15 per cent during 1971 and increases in excess of 25 per cent occurred. Shipping linos citad íncreasing costs as the justification for these sharp increases, but in the face of the reluctante of conference Unes to publish detallad cost information, the misgivinos of the Latin American countries regarding the way in which conference freight ratos are set would seem well founded.
Linar cargo represents, by value, perhaps two—thirds of world dry cargo ocean—borne trade, the remainder being bulk cargo transported under charter. In the case of Latin America, it is probable that bulk cargo represents a higher proportion of dry cargo trade than the world average, so that changos in time and voyage charter ratos are especially important for the region, in terms of the effect of freight costs on the balance of payments, the competitiveness of Latin American exports in world markets, and the receipts of Latin American producers.
Tabla 21 shows the evolution of dry cargo ratas for time charters of less than onc year and individual voyage charters from 1960 to 1972. Both series tended to fluctuate bctween 1960 and 1969, although time charter retes ware higher towards the and of the decade than at the beginning. Since the composition of the world fluct was changing significantly during this period and the time charter index is basad on a sample of ships, the trip charter index, which is basad on a sample of freight retes paid for the transport of selected bulk commodities on mejor trading routos, may represent better the evolution of transport costs.
/Tabla 21

— 135 —
Tablo 21
DIU= OP DRY CANCIO CHARTER BATES
(1960=100)
Time oharters for
less than one year Trip charters
15,60 100 100
1961 109 104
1962 88 90
1963 107 102
1964 119 102
1965 134. 113
1966 120 99
1967 120 106
1968 126 103
1969 122 96
1970 177 134
1971 141 91
December 1969 128 102
June 1970 180 136
September 1970 203 144
December 1970 186 124
June 1971 155 83
December 1971 107 78
June 1972 2/ 77
September 1972 91 86
Source: Norwegian Shipping News, 28, 17D (22 September 1972).
1 A ~time charter index which is not comparable with the previous index was initiated in
January 1972.
/According to
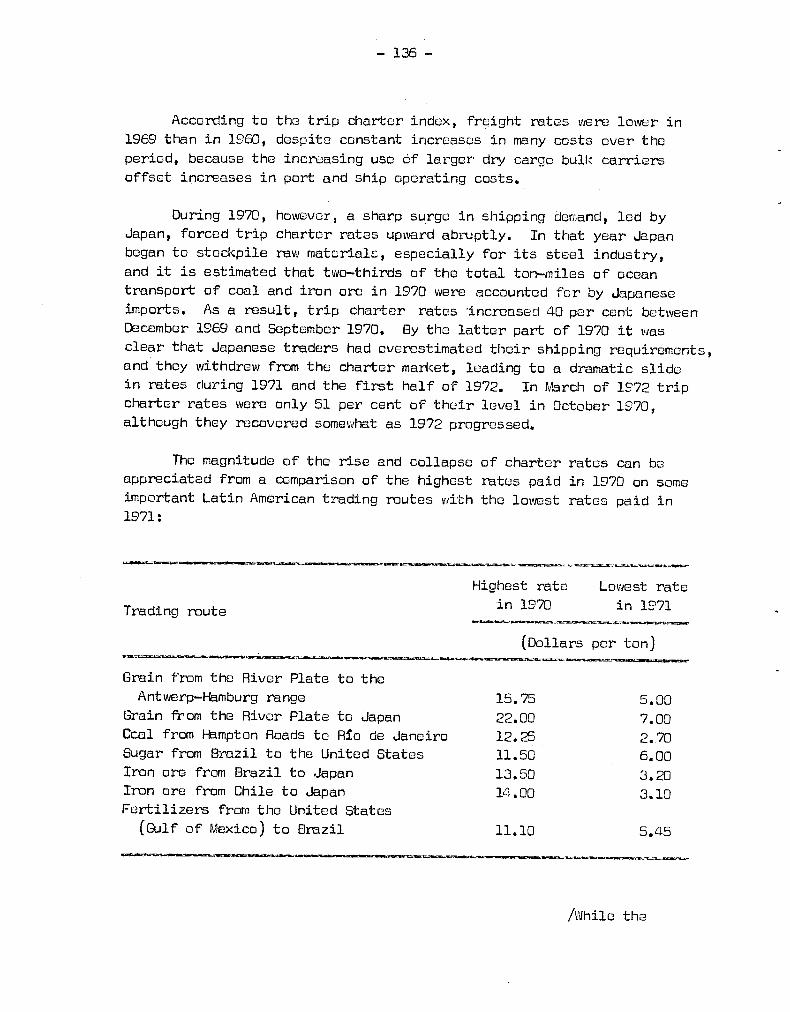
— 136 —
According to the trip charter index, freight ratos were lower in 1969 than in 1960, despite constant mercases in many costs over the period, because the increasing use óf largor dry cargo bulle carriers offset increases in port and ship operating costs.
During 1970, however, a sharp surge in shipping demand, led by Japan, forced trip charter ratos upward abruptly. In that year Japan bogan to stockpile raw materials, especially for its steel industry, and it is estimated that two—thirds of the total ton—miles of ocean transport of coal and iron ore in 1970 were accountod for by Japanese imports. As a result, trip charter ratos dncreased 40 por cent between December 1969 and Soptember 1970. By the latter part of 1970 it was clear that Japanese traders had cverestimated their shipping requirements, and they withdrew from the charter market, leading to a dramatic slido in ratos during 1971 and the first half of 1972. In March of 1972 trip charter ratos Overo only 51 per cent of their levet in October 1970, although they recovored somewhat as 1972 progressed.
The magnitude of the rise and collapse of charter ratos can be appreciated from a comparison of the highest ratos paid in 1970 on some important Latin American trading routes with the lowost ratos paid in 1971:
Trading route
Highest rete in 1970
Lowest rato in 1971
(Dollars per ton)
Grain from the River Plato to the Antwerp—Hamburg rango 15.75 5.00
Grain from the River Plato to Japan 22.00 7.00 Coal from Hampton Roads te Río de Janeiro 12.25 2.70 Sugar from Brazil to the United States 11.50 6.00 Iron ore from Brazil to Japan 13.50 3.20 Iron ore from Chile to Japan 14.00 3.10 Fertilizers from the United States (Golf of Mexico) te Brazil 11.10 5.45
/While the
— 137 —
While the risa in charter ratos during 1970 was undoubtedly harmful to Latin America, and the fall in 1971-1972 was unquestionably beneficial, it is difficult te make a quantitative estimate of the net impact. The region exports and imports considerably more than 100 million taus of bulk dry cargo, so that a shift of five dollars per ton in the average charter rato would signify a chango of mora than 500 million dollars in the total freight bill. Nevertheless, the distribution of the freight Bill betwoen suppliers and consumers of these products depends in the long run on the relativo price—elasticities of supply and demand of the products and in the short run on the provisions of the sales and purchase contracts which govern prices and the conditions of carriage. While studíes have indicated that supply and demand elasticities for Latin American exports are such that the region would benefit considerably from reductions in the price of transport, little is known about whether individual contracts for the saleof the region's exports, take into account sharp changos in charter'rates. Those countries which have made extensivo use of chartering for the transport of thoir bulk imports, such as Brazil, uvero especially affectod by the wide swing in charter ratos during the past three years, but it is difficult to generalizo for the region as a whole.
If the changes in charter retes were a temporary phenomenon, they would be of little concern. Indications are, however, that charter retes will continuo to be deoressed for several years more, partly because of the largo amount of new bulk tonnage which is coming into the shipping market. While this will benofit Latin American oxporters and importers, it will have a negativo impact on those Latin American shipping linos which have acquired bulk carriers during the past few years at a time when ship construction prices were especially high. By August of 1971 there were already more than 1 million GRT of bulk and ore carriers laid up in the world for lacé of employment, and by Juno of 1972 this figure had increased to more than 1.5 million GRT.
The argument that considerable competition botween linar :services and trame ships has kept linar companies from exploiting thoir monopoly position, appears to have foundored during 1971-1972, when general cargo tramp ships and small bulk carriers had great difficulty finding profitable employment; either such competition is weak, or else shippers did not know how to take advantage of the changed competitive relationships.
/(e) Ocean

- 138 -
(e) OcearLIIImina_andLatin America's balance of_Eqyments
Since the International Development Strategy states that the mejor objective as regares ocean shipping is the promotion of the earnings of developing countries and the reduction of the net outflow of foreign exchange from those countries to a minimum, a key tasé of the regional review and appraisal should be a quantification of changos in the impact of ocean shipping on Latin America's balance of payments. Unfortunately, the information at present submitted by many Latin American countries to the International Monetary Fund as representing the net impact of ocean shipping on their balance of payments is incompleto and unreliable. For the design, implementation and evaluation of maritime shipping policies in the region it is essential to have up-to-date information on the total freight bill paid for the carriage of each country's exports and imports, the distribution of these freight payments between national and foreign shipping lines, the distribution by flag of the physical quantities of the commodities exportad and importad, and supplementary data concerning payments by national and foreign shipping linos for port expenses, ship charters, bunkers, etc.
The only recent estimate for the total freight bill generated by Latin America's seaborne foreign trade corresponds to the year 1967. Estimates.for that year for 19 countries in Central and South America, plus Haiti and the Dominican Republic, indicate that freight retes paíd on the region's imports roached 645 million dollars (10 per cent of the total FOB value of imports), while on exports they amounted to 1,920 million (18 per cent of the corresponding FOB value), a total of 2,765 million dollars.
No estimate for the distribution of freight payments by the nationality of the ocean carrier is available after 1967 for Latin America as a whole. In that year it is estimated that 25 per cent of the freight payments generated by the region's imports accrued to national flag ships of the importing countries, but only 7 per cent of the freight payments for exports were received by national flag ships of the corresponding exporting countries, giving a combinad total of 13 per cent for total foreign trade. If only the LAFTA countries are considerad (with the exclusion of Bolivia), the percentage on importa increases to 30 per cent but that for exports to only 8 per cent, giving a combinad total of 14 per cent. Incomplete data for 1962 indicate that there was no significant chango between 1962 and 1967. If the physical quantities of exports and imports are considerad, rather than freight payments, the LAFTA countries (excluding Bolivia and Venezuela) transportad 32 per cent of their imports in 1967, 8 per cent of their sxports, and 16 per cent of their total foreign trade.
/Incompleto data

- 139 -
Incomplete data for the LAFTA countries for 1969-1971 indicate that the participation of LAFTA shipping companies in the transport of the physical quantities of intra-LAFTA trade is considerably higher than in the case of trade with the rest of the world. In these three years LAFTA ships, either transporting exports and importo of the country of their registry or acting as third-flag carriers between other LAFTA countries, carried from 60 to 73 per cent of total intra-LAFTA trade. In part this high percentage is due te the importance of trade between Argentina and Brazil, which is transported almost entirely by Argentinian and Brazilian ships.
Table 22 presento a very rough estimate of the impact of ocean shipping on Latin America's balance of payments in 1970, mainly en the basis of data published by the International Monetary Fund. According to these estimates, the reglen had a total deficit, including marine insurance, of 850 million dollars, in 1970. This deficit is the total of the deficit on freight payments alone of 723 million dollars, insurance dubits of 82 million, and a net debit en other transport items (pont disbursements, ship charters, bunkers, etc., but also including some air transport items) of 44 million.
A subtotal is given in tabla 22 for Latin America excluding the Caribbean which shows a net deficit of 760 million dollars in 1970. This total can be compared with that in tabla 23, which presento an estimate of ocean shipping and the balance of payments for 1967 and shows a deficit of 400 million dollars. This apparent increasc in the net deficit of 90 per cent is probably an over-estimate, and additional analysis would be required of the largo increases in the deficit of Brazil, Colombia, México and Venezuela. Nevertheless, considering that the period coincides with sharply increasing charter rateo, it appears that Latin Amorica's deficit for cocan freight, insurance and other transport items has. increased significantly. Despite the efforts made by many of the countries in the reglen te expand their merchant fleets and to transport a significant part of their own imports and exporto, the region's balance-of-payments deficit in respect of ocean transport continues to grow. For this tendency to be reversed, a concertad effort at both the national and regional level is essential.
/Tabla 22

Tabla 22
LATIN AMERICA: MARITIME TRANSPCRT IN THE BALANCE OF PAYEENTS, 1970
of dallare)
Country Freight Insuranoe
debite
Other transport ítems 1/ Total
defioit Credits 12/ Debite 2/ Credits Debits
Argentina 87.0 140.7 3.0 83.0 50.0 23.7 Bolivia - 20.6 3.2 0.9 2.3 25.2 Brazil 87.0 135.0 13.0 72.0 209.0 1/ 198.0 Chile 34.0 92.0 -0.5 Cred. 13.2 26.2 70.5 Colombia 404 68.o . 22.0 81.0 87.0 Costa Rica 4.5 24.2 2.0 5.3 2.5 18.9 Bonifican Republio 5.0 27.5 5.1 4.o 1.8 25.4 Ecuador 34.1 1.4 - 35.5 El Salvador 17.5 2.0 1.5 18.o Guatemala 0.3 23.1 1.6 5.0 19.4 Haiti - 7.9 0.5 0.3 8.1 Honduras 1.0 18.4 0.9 4.1 1.2 15.4 Mexico 9.2 70.o 2/ 60.8 Nicaragua 4.7 12.1 0.9 4.2 5.5 9.6 Panama - 30.1 1.5 31.9 4.1 3.8 Paraguay 1.2 6.7 1.2 - 6.7 Peru 20.0 67.0 14.0 27.0 14.0 43.0 Uruguay 1.4 26.4 1.8 4.o 3.o 25.8 Venezuela 24.0 86.o 18.0 35.0 15.6 60.6
Subtotal 21212 927.3 69.6 313.4 416.2 760.4 Guyana 13.0 1.3 3.1 - 11.2 Trinidad and Tobago 50.0 4.o 40.1 4.5 13.4 Barbados 11.7 2.0 7.4 6.3 Jamaica 5.5 66.1 5.2 16.9 4.5 53.4
Total 324.8 1 048.1 82.1 380.9 425.2 849.7
Source: International ilonetaryFund, Balance of Payments Yearbook, vols. 23 and 24, an ECU, estimates. 1/ Mainly port and harbour charges and ship charters in some Cases. 2/ Freights paid to national flag ships for transport of exporte and for transport between third countries. 2/ Freights paid to foreign ships for transport of imports.
Inoludes US$ 146 milliondollors for ship charters. Projected on the basis of estimates for 1967.
/Table 23

- 141 -
Tabla 23
LATIR AMERICA: MARITIME TRANSPORT IN THE BALAiTCE OF PAYIENTS, 1967
(Millions of dollars)
Country
Freight Insurance
debite
Other transport iteras R/ Total
deficit Credits .12/
Debita Credits Debite
Argentina 30113 Ji 74.9 3.0 67.3 2/ 25.6 5.9 Bolivia - 19.3 2.9 2.3 24.5
Brasil 33.6 126.4 1.0 41.0 4.0 f 56.8 Chile 12.1 51.5 - 5.0 25.0 59.4
Colombia 31.2 g/ 30.6 16.0 38.0 14:1 Costa Rica 0.8 15.8 1.2 3.5 1.8
Dominican Republic 3.8 16.5 3.5 2.7 0.6 14.1 Ecuador 3.0 13.1 1.0 - . 11.1
El Salvador 19.0 2.2 - 16.8
Guatemala 0.1 19.7 1.4 4.0 - 17.0
Haiti - 3.7 0.3 0.8 - 3.2
Honduras 0.2 14.3 0.7 3.0 1.1 12.9
Mexico 8.o 41.0 . 33.0
Nioaragua 5.2 /1/ 22.6 1.6 1.3 3.1 20.8
pante 21.2 0.9 16.1 1/ 0.4 6.4 Paraguay 1.8 6.7. 0.9 - 5.8
Peru 5.0 56.0 19.0 1/ 25.0 9.0 54.0
Uruguay Venezuela
1.7 41.8
16.3 62.8
1.0 1.7 27.0
4.1 10.0 4.0
18
Total 178.6 631.4 11111 216.6 125.0 122:6
Source: International Monetary Fund, Balance of Payments Yearbook, vol. 22; and the OAS/LAFTA TransportProgramse.
2/ Mainly port and harbour charges, sinos inoome and expenditure for air freight have been deducted in nearlY
every case. 12/ Freights paid to national flag ships for transport of exporte and for transport between third countries.
2/ Freights paid to fcreign ships for transport of importe. 2/ Including 12.3 million dollars for services between third countries.
y Instituto de Estudios de la Marina Mercante, La Marina Mercante Iberoamericana, 1968, p. 67.
1 This is probably an under..estimate. g/ Including 26 million dollars DI:, services between third oountries. L i/ Including 3.1 million dollars for servioes betwen third oountries. 1/ Including 14.7 Minan dollars in respeot of sales of bunker oil and lubricante and expenditures by chips*
preve. 1/ This is probably an over-estimate.
/(f) Latin

142
(f) Latín ricen ocean —
The measures adopted by many Latin American governments since 1960 in the field of ocean shipping have tended to be sporadic, unco-ordinated and insufficient. Few countries in the region have established specific objectives for ocean shipping, adopted adequate policies to attain them, or made use of polícy options already opon to them to bring about, at least partially, the changas they desire.
While three Latin American countries have substantial installed capacity for ship construction, only late in the 1960's did twa of them initiate a long-tem programme of assured orders and adequate financing, and the adoption of a similar programme by the third country is oven more recent.
Attempts to improve the officiency of national flag shipping Unes, including State shipping enterprises, are also of recent date in several of the largar countries, but nonetheless significant advances have becn made, both in terms of the quality of the service and the financial resulte of operations. Because of the predominance of State-owned tonnage ín the region, continuing efforts along these linos are within the scope of governmental policies and measures ánd Governments are ultimately responsible for the results.
Throughout most of the 19601s, shipping linos in Latin America, including State-owned companies, concentrated most of their efforts on the development of thcir tanker and generel carzo,fleets. In addition to budgetary subsidies and special credit for this purpose, Governments also favoured their liner companies through regulations and measures which channelled to them, or resúrved for thom, a parí of the country's trade, despite vigorous opposition from traditional maritime nations, especially those which provide extensivo third-flag services in Latin America. The results of this emphasis on liner services, which in many countries still prevails, are easily seen in the tables presented earlier on the composition of the regional merchant fleet, as well as in the data cited on the participation of national shipping Unes in the transport of imports and exports. While the rest of the world was experiencing a boom in the construction and use of bulk and combined carriers, it was only at the end of the 1960's that a few Latin American countries took measures to build up their own bulk carrier fleets. With the collapse of charter retes in 1971 and the probability of low retes for several years to come, the efficient use of the region's bulk carriers will not be easy. Nevertheless, a sound development of Latin America's merchant marine requires much greater emphasis on the growth of its bulk and specialized carriers, including the possibility of liquid gas carriers, unitized cargo ships, etc.
/The failure
•-• 143 s-
The failure of the Latin American Governments to adopt co-ordinated policies is especially evident in the case of the LAFTA Ccnvention on Transport by Water. Despite an apparent consensus among the members of LAFTA that intra-area cargo should be transported in LAFTA ships, the convention which was drafted to achieve this objective has not yet come into force because it has not been ratified by the necessary five countries. Latin America has stressed the need for international regulations to govern the practices of the liner conferences, including the distribution of cargo shares and freight retes. The ratification and implementation of this Convention, which contains provisions along these linos, would demonstrate the feasibility of the measures proposed.
In view of the absence of more general international agreements on ocean shipping once again bilateral agreements between Latin American countries are becoming frequent, and there is an increasing trend towards bilateralism in relations between Latin America and the rest of the world. Bilateral agreements between countries in the region usually reserve all transport to the signatcry countries, whereas agreements with the rest of the world commonly mace provision for the participation of third-flag ships.
Latin American Governments have also devoted attention to the problem of port capacity, efficiency and cost. The countries of the region that lacé port capacity have managed to expand port infrastructure and to acquire port equipment, with the assistance of international financial agencies and some developed countries. Their efforts, however, have not been adequately reflected in the freight retes established by the liner conferences.
Where port inefficiency has been due to peor adhinistration, inadequate co-ordination with inland transport and low labour productivity, advances during the 1960's were slower. Scveral countries of the reglen, especially on the Atlantic coast and in Central America, reorganized their ports and obtained significant benefits. In other cases, however, political fears have impeded required changos and port inefficiency has contínued.
An arca where results have been largely disappointing is the establishment of users' councils, organizations rcpresenting exporters and importers which negotiate with liner conferences on freight /lates and other matters of common interest. Attention has been drawn within UNCTAD to the potontial usefulness of these councils, but experience has shown that government support is essential to place the councils in a posítion to negotiate with the conferences. As such assistance has been forthcoming solely in
/isolated instances

- 144 *-
isolated instances, however, at the ond of the 1960's users• councils were in most cases completely ineffective. In recognition of this problem, both the LAFTA Transport Advisory Committee at its seventh meeting in September 1972 and the Ad Hoc Group on Maritime Transport of the Special Committee for Consultation and Negotiation (CECCN-TRANS) at its first meeting in December 1972 recommended that Latin American Governments should support the creation and strengthening of users' councils.
(g) The Internation ualDevinomUtnItlayánd ocean sn;allna
The fruit of more than five years of intense work within UNCTAD, and especially within the Committee on Shipping, is synthesized in paragraph 53 of the International Development Strategy. The moasures presented there have an explicit objective: to promete the earnings of developing countries from invisible trade and minimizo the net outflow of foreign exchange from those countries.arising from invisible transactions, including shipping. Neverthelees, in the course of setting out proposed policies and moasures, other objectives are introduced implicitly: the promotion of non-traditional exports, the encouragement and promotion of the import and export interests of the least developed among the developing countries, and the general facilitation of the foregin commerce of the developing countries.
The Strategy proposes improving the balance-of-payments situation relatad to maritime transpert through moasures which would improve the position of the developing countries both as suppliers and users of maritime services. These moasures would incJ.ude:
(a) Mitigating the frequent increases in the level of freight ratos by:
(i) Improving the port facilities of developing countries;
(ii) Establishing effective consultation machinery under which shippersi councils can consult with linar conferences before freight rete increase are implementad; and
(iii) Giving due considoration to technological developments in maritime transport and improvements in the organization of trade.
(b) Promoting

-145-
(b) Prómoting non-traditional exports through the establishment of suitable freight retes and the improvement of maritime
services.
(e) Ensuring that the déveloping countries have an increasing and substantial participation in the carriage of cargoes generated by their foreign trade through:
(i) The expansion of the national and multinational merchant marines of the developing countries, including their tanker and bulk cerner fleets, through financial and technical assistance, improved financial terms for the acquisition of ships, and training programmes;
The admission of the national shipping lineS of developing countries as full members of the liner conferences Operating in their maritime trades and of the way-port conferences related to these trades; and
iii) The acceptance by the developed countries of the measures which the developing countries adopt to permit their shipownors te compete in the international freight market.
The International Development Strategy is not, nor does it purport to be, strategy for maritime transport containirig all the elements which are necessary for the developing countries te echieve their objectives in this field. Instead, it concentrates en those aolicies and measures which the developed countries must adopt in arder not to block the efforts of the developing countries in this respect.
In addition, the Strategy heavily emphasizes liner conference transport, referring only peripherally to tanker and bulk transport and ignoring the repid technological changes which are taking place in this field and the importance of the developing countries' participation in the new technology. It is true that for the great majority of the developing countries the important issue is liner conference transport, but for some developing countries, especially in Latin America, the new technology may cause irreparable damage to the national merchant marines which have been laboriously developed since the end of the Second World War.
Unfortunately, the Latin American countries have not complementad the International Development Strategy with a document which provides the remaining elements required for an integrated and coherent strategy.
/It woúld

146
It would thus seem essential for the Latin American countries to make a concerted effort to develop a broader strategy for ocean shipping, basad, of course, on the International Development Strategy. However, it would have to be broader and at the same time more specific; it would have to consider in detall such issues as the transfer of new technology and its implications, laying down a blueprint for the participation of the region in both new types of vessels and new institutional arrangements in maritime transport.
Latin American countries have emphasized the importance of a new international division of labour in the world, and this concept is equally valid in the case of ocean shipping. These activities include the following specialized items: ship design; ship construction and maintenance; production of ship's gear and equipment; interest on capital; insurance; provision of ship's crew, fuel and supplies; storage; ship management; ship brokerage; freight forwarding; stevedoring and longshore operations; shipbreaking, etc. For the region to obtain real benefits from expanding its activities in this field, however, each country must analyse carefully the functions involved so as to determine which of these it can profitably undertake, and it must establish its own specific objectives and targets in a country programme, which in turn can be incorporated into a regional programme and help to forge a link totween the objectives of the IDS in the field of ocean shipping and the development plans of the individual countries. World objectives are of limited value unless complementad by compatible regional and national objectives.
A strategy for merchant marine development in Latin America must also face squarely the various implications posed by technological innovation in ocean shipping, in order to ensure Latín American participation in this new technology. Because of the large amount of investment required for the new technology (a LASH ship, for example, costs around 28 million dallar=), it is not possible for most of the L7tin American countries to participate fully at this time. Gut a beginning must be made, either on a national or regional levet, or in collaboration with foreign shipping linos, such as by participating in International container or bulk carrier consortia.
A Latin American strategy would probably also extend the sections of the IDS which are related to the international regulation of shipping linos and services. As many aspects of ocean shipping affect more than one country, regulations adopted by one country may also affect the foreign commerce of its trading partner. Vhile the importance of this factor has often been exaggerated, it should be noted that there are many measures which can be adopted by one country or region without harming its trading partners, as is the case when liner conferences are required to register their tariffs in the countries whose trades they serve. An important task facing Latin America at this timo is to identify areas where action of this type can be taken at the national, sub-regional or regional leve'.
/6. Insurance

-147--
6. Insurance
The principal objectives of the developing countries in the field of insurance, as set out in the International Development Strategy 22/ and pertinent UNCTAD resolutions, include the following: to develop national insurance markets and promete their diversification, wiht attention to the cost of insurance; to increase the participation of national companíes in the insurance market, while assuring their solvency; to reduce the net outflow of foreign exchange; to channel the investment of insurance capital and reserves towards socially desirable objectives compatible with the solvency of the insurance companies, and to protect the interests of policy
holders.
A regional evaluation of the extent to which Latin America has moved towards attaining these cbjectives is not possible at present because of the great diversity which exists among countries regarding the definition of the field of insurnace and reinsurance, including the distinction between this field and that of social insurance (for example, social security and workments compensation). An evaluation is also greatly hampered both by the lack of adequate statistics in many countries and by the widely differing
criteria used in their preparation.
There have also been substantial differences among those countries with governmental supervision of insurance regarding the relative importance given to the different objectives of this supervision. When only one or two objectives are explicitly adopted, and particularly when an increase in the participation of national companies in the insurance market is given exclusive emphasis, difficulties frequently arise because the attainment of other important objectives is not safeguarded.
Many countries in Latin America, however, are now aware of these dangers, in part because of the initiatives of UNCTAD in the field of insurance. There is also growing interest in the field because of concern regarding the activities of international companies in general. Several countries have begun to make overall roappraisals of their polioles with regard to insurance, and are especially concerned about the balance—of—
payments aspects.
22/ See paragraph 54.
/(a) Growth

-148-
(a) _............ suranguttazGrettrtofth market
At.the world Level (excluding the socialist countries), total insurance premiums are estimated to have -inereased at around 8 or 9 por cent per year during the-19601s. Of the total-volume of premiums, estimated at 100,000 million dallare in 1969, 90 Perleent were collected.in- rine-countries, each with over 1,000 million donare-1 worth. In Latin America, Argentina (with 260 mallen dollars1 worth of premiums in 1969) and Brazil.(with 500 minium dellers1 worth in 1971) handle-the largest volume of insurance.
In both Argentina and Brazil the total insurance market, as measured by-annual.premiums, experiencedlittle growth during much of the past decaes,, and insurance authorities attributed this-largely te inflation. In Argentina there was even a decline in direct premiums collected in real_terms over -a period of some years. Nevertheless,in both countries there was an upsurge in the market in recent years:- premiums collectéd in Argentina inereased 26 per cent. between-1968 and 1969, and_in Erazil nearly-50 per pont ne -.- *ezn 1970 and 1991. In the latter case the increase is largely due to new types of insurance being offered, rete reductions--resulting from government measures to reorganize the insurance market, a new requirement that cargo insurance on imports be placed in Brazil, and a sha-^p rise in automobile insurance.
The factors that determine market growth or stagnation appear to vary greatly from country te country. Both Chile and Paraguay experienced. a vi-gorous growth in insurance, as measured- by annual premiums, during the-19601s but whereas Chile had a high rete of inflation and exercised considerable control over insurance companies, Paraguay had a low nate of inflation and exercised relatively lees control. In Guatemala the relatively low rete of increase in annual premiums is attributable to transition and adjustment follcwing insurance nationalization measures.
Annual direct premiums are a poor-indicator of market growth and development, since they are the product ef -the number of policies which is often poorly relatad to the number of- policy-holders - and the premium per policy. A higher premium per policy-can be the retult of a price increase (rete per thousand of the faca-value of the policy) rather than an increase in the average value of policies, and in effect can reduce the number of people able to take out insurance, as appears to have occurred in Guatemala in 1968..
Governments have acted in differentweys to promete an increase in the insurance market and its diversification. In Brazil, types of insurance currently of limitad importance are being-etudied to increase their attractiveness to potential policy-holders, including farm insurance, credil
/and machina

— 149 —
and machine breakdown insurance for industry, group life insurance, "performance bond" insurance, export credit insurance, and insurance ageinst losses due to inactivity of productive elements. Other countries are promoting the expansion of the insurance market by extending the range of compulsory insurance, as in the case of the third—party automobile insurance required in Brazil, the Dominican Republic and Jamaica. Some countries also require third—party liability insurance on public transport vehicles.
Proposals have been made in some countries that insurance companies
should offer social insurance, such as workments compensation. Private
insurance companies tend to copase these proposals, however on the ground that they would leed to en increase in the cost of traditional insurance, which would have to subsidize the new types of social insurance. Proposals
have also been made that governments should establish insurance companies
which would offer social insurance, rather than have social payments
included within the government budget. While it is not possible to
generalize on the relative merits of these different possibilities, a
linking of social insurance with traditional insurance does represent
diversification and permits e wider spreading of risks so that more
insurance can be written for a given amount of capital or reserves.
(b) Partici ation of national companies
In the prcmotion of the participation of national companies in the
insurance market, the large countries have an obvious advantage. In
Argentina, for example, the participation of foreign companies in total premiums
was only 25 por cent in 1944 and duclinod from 6 por cont to 3 per cont between 1959 and 1969. In Brazil, the national companies" share of the insurance market
remained at around 85 por cont during 1960's.
Two Latin American countries established state insurance monopolies
many years ego: Costa Rica, through the National Insurance Institute
in 1924, and Uruguay, through the State Insurance Bank in 1911 (for fire
and life insurance). Guatemala ruled that beginning in 1967 all new
insurance should be issued by national companies. In 1965 Venezuela required that within three years there should bu 51 por ccnt local ownership,of foreign companies and while foreign investment in insurance declined for
a time, by 1970 it had risen again to a higher level than in 1966.
In some countries, such as Colombia, Mexico and Panama, which enacted
legislation before 1960 to promote the participation of national insurance
companies, there has been active discussion of new legislation to permit more effective enforcement and to correct some of the consequences of
/earlier laves.
— 150 —
earlier laws. Of special concern is the stability and solvency of national companies and avoidance of continuing dependence, by indirect means, on foreign capital. Earlier laws led in many cases to proliferation of small insurance companies tied to particular labour union, communities, ethnic groups, etc., each with small capital and inadequate administrative and technical resources.
Several Latin American countries have responded to these problems by adopting various measures and policies, such as the following:
(1) Imposing higher capital and stricter investment requirements on natioanl and foreign insurance companies.
(ii) Encouraging the professionalization of insurance agents and brokers.
(iii) Controlling the periods of time allowed for payment of premiums and regulating payment procedures.
(iv) Applying price controls, especially on polioles for the most important types of insurance, such as fíre and automobile insurance.
(v) Promoting self—regulation within the insurance industry.
(vi) Encouraging the fusion of small insurance companies.
(vii) Applying exchange control to reduce the amount of clandestine insurance.
(c) Reduction in the net outflow of forei n exchans e
Insurance transactions give rise to an outflow of foreign exchange when direct premiums are paid to foreign insurance companies and when national insurance companies reinsure with foreign companies. In order to determine the net impact on the balance of payments, however, the claims accepted by foreign companies, must be credited against these payments,
While nearly all the South and Central American countries have adopted measures to increase the participation of national companies in the insurance markets, there is a sharp distinction between the countries which have attempted simultaneously to reduce the net outflow of foreign exchange and those which are still highly dependent on foreign reinsurance. Throughout
/the 1960's

— 151 —
the 1960's, the percentage of premiums reinsured abroad by Argentina remained at about 3 per cent, a very low percentage in comparison with other Latin American countries. On the other hand, over 50 por cent of annual premiums in Ecuador and Paraguay were reinsured abroad, even though national insurance companies play an important role in the insurance markets of both countries.
The size of the national market is a principal factor in determining the impact on the balance of payments of insurance and reinsurance transactions. Two other important factors are the structure of the market, i.e., the relative importance of different types of insurance, and the measures adopted in relation te the development of national reinsurance.
Fire insurance and insurance on ships and aircraft normally involve a considerable amount of reinsurance, especially in comparison with automobile insurance. The importance of the size and structure of the insurance market in relation to the balance of payments can be appreciated by comparing the situation in Argentina and Chile, and by tracing the
structural changos in recent years in Paraguay.
In Argentina automobile insurance eccounted for one—third of direct
premiums (excluding workmenls compensation) in 1963 and one—half in 1969. During
the same period fire insurance dropped from 23 per cent to 18 per cont of the total. In Chile, on the other hand, fire insurance accounted for 53 per cent of total premiums in 1971 and automobile insurance for only 17 por cent. The greater relative importance of fire insurance in Chile, together with the smaller total insurance market (about 50 million dollars in direct premiums in 1971), leed to a higher rato of reinsurance abroad (about 25 per cent of direct premiums) as compared with Argentina. Still hichcr levels of foreign reinsurance have been avoided in Chile by channellir.g considerable reinsurance through the national Reinsurance Instituto (21 per cent of direct premiums in 1971) and by means of reinsurance transactions among national
companies (24 per cent of direct premiums).
In Paraguay automobile insurance increased its share considerably during the last decade. This factor contributed significantly te the fall in the percentage of premiums ceded for reinsurance (almost entirely to foreign companies) from 67 per cent in 1963 te 52 per cent in 1970.
In Argentina, Brazil, Chile, and Peru, reinsurance institutes have been established to regulate reinsurance and te strengthen the national reinsurance base, while also consolidating cessions for reinsurance abroad. All these are measures which can reduce the net outflow of foreign exchange.
/In 1963,

— 152 —
In 1963, insurance companies in six Central American countries established the Central American Reinsurance Pool, solely for fire insurance, the administration of which rotated among the member companies.
The increase in the relative importance of automobile insurance, the consolidation of national insurance companies and the formation reinsurance institútions all help to retain a higher percentage of annual premiums within the country. Nevertheless, because of the growth of the national insurance market, greater absoluto amounts of reinsurance abroad can be generated at the same time that the percentage of foreign cessions falls. It is not easy to solve the problem of expanding the national market and reducing the net outflow of foreign exchange in many countries, including the largest in the reglan, bodies responsible for supervising insurance. In several countries, no policías have been adopted for efficiently co—ordinating the activities of the bodies responsible for supervising insurance, and of reinsurance institutes.
(d) Investment of insurance capital and reserves
Insurance capital and reserves can be en important source of investment financing within developing countries, and the use which is made of reserves by foreign companies can affect the balance of payments. In addition, the way in which national companies administer their reserves can affect their solvency and the interests of the policy—holders.
Mexico was one of the first developing countries to establish detailed regulations for the use of reserves, and in 1935 it laid down requirements regarding the type of assets which insurance companies may or must acquire with their reserves. During the 19601s, Argentina, Brazil, Ecuador and Venezuela enacted laws with the same objective. In Venezuela as a result of this legislation, the insurance companies are now among the most important buyers of public securities. Also notable in this regard is the action taken by some Caribbean countries, which traditionally have tended to offer the most liberal régimes for foreign insurance companies. Trinidad and Tobago, for example, has established incentives to encourege insurance companies to build up their reserves with the country.
/(e) Protection

— 153 —
(e) Protection of olio —holders
While the protection of policy—holders is a major objective, surprisinglylittle has been written in the region concerning measures to help policy—holders to gain a better understanding of their insurance options and benefits and to exercise their rights. Nevertheless, the establishment of bodies responsible for supervisíng insurance in a number of countries responds in parts to this objective.
(f) Insurance r casares at the regional level
Measures talen at the regional level could make an important contribution towards attaining the objectives of the developing countries in the field of insurance, but most proposals are still in the study stage. Regional reinsurance, for example, could help to reduce the net outflow of foreign exchange and assist in the development of national insurance markets. This possibility is being studied by the members of the Cartagena Agreement with a view to establíshing a sub—regional reinsurance institute. Similarly, the Latin American Shipowners' Association (ALAMAR) is studying the possible establishment of a mutual protection and indemnity club for its members.
Also worthy of study is the Guaternalan precedent of permitting insurance companies to invest part of their reserves in other countries of the sub—region, as an alternative to a requirement that all reserves be invested nationahly.
Finally, a key factor for developing national insurance markets and reducing the net outflow of foreign exchange is the collection of standardized statistics on insurance throughout Latin America. An important initiatíve in this regard is the work of the Group of Experts on Insurance Activities of the Latin American Free Trade Association.
/7. Tourism

154
7. Tourism
The importance of tourism is recognized in the International Development Strategy,paragraph55 of which states that:
"Developing countries will sxpand their tourist industry through the building of tourist infrastructure, adoption of promotional measures and relaxation of travel restrictions. Developed countries will assist in this endeavour. They will try to avoid exchange restrictions on the travel of their residents to developíng countries and, where restrictions do exist, to remove them as soon as practicable and to facilítate such travel in other ways".
In several developing countries gross income from tourism represente over 20 per cent of the value of their exports of goods, and in Mexico and some of the Caribbean islands it now constitutes the most important item of their experta of goods, and services* Between 1960 and 1968, while the developing countriess exporte excluding petroleum — rose by 7.6 per cent annually, income from tourism grew at an annual rate of 11 per cent. The number of tourists visiting Latin America in the 19609s increased by 11.6 per cent, and income under this head by 12 per cent. For many countries tourism is a useful means of diversifying their sources of foreign exchange, while for others it represente one of the few possibilities they have of expanding their exporte.
For traditional reasons, both economic and social, only a few countries in the reglan Mexico and part of the Caribbean — have participated in the world trend towards large—scale tourism, In South America tourism is still on a small scale, with the tourists coming . rom noighbouring countries and making little impact on the balance of payments. The underlying causes of this Jack of development include the scanty knowledge abroad regarding the South American countries (their economy, and infrastructure, climate, historical and cultural monuments, art and social conditione).
Moreover, there are still more tourists leaving South America than arriving, which is the opposite of what happens in Mexico, Central America and the Caribbean. This trend may be reversed in the near future, when the infrastructure is improved and passengers can travel in groups in large modern aircraft on attractive teme.
The futura prospecte cannot but be encouraging considering the potential demend that is bound to derive from the huge increase in the world population, the contemplated reduction in working hours and the trend towards a decrease in the cost of tourism, with fixed programmes and the use of charter flights.
/In 1969,

— 155 —
In 1969, about 181 million persons from North America and Europe visited countries outside their regions, and this number will increase in coming years. To attract these groups to Latin America they must be offered a minimum basic programme of package tours, with additional programmes for visits to two or three countries at a time. In Addition, tax legislation in the industrialized countries, which allows professionals to deduct the expenses incurred in attending international meetings from their taxable income is contributing to the increasing importance of "study" tourism. In 1968 only 230 international meetings were held in Latin America
out of a total of 4,000 in the whole world.
Tourism in Latin America (number of toúrists entering) increased by 11.6 per cent annually Between 1961 and 1970, as already mentioned, and by 12.8 per cent from 1970 to 1971, which represents a share in world tcurism of 2.9 per cent in 1961, 3.5 por cent in 1970 and 3.6 per cent in 1971. Moxico alone absorbed 2.5 million out of the total of 6.6 million tourists who visited Latin America in 1971. Accordingly, in tabla 24 the countries have been classified in two groups: Group A comprisos the ncrthern countries with a developed tourist trade which ore increasing their share of tourism in Latin America, and Group B with a far loss developed tourist trade. Tabla
25 and 26 show the engin of the tcurists.
Working on the basis of different criteria, the IUOTO 23/ reached the conclusion that world tourism is likely to increase from 181 million tourists in 1971 to 280 million in 1980, at the end of the Second Development Decade, or by 5 per cent annually. Taking these figures into account, Latin America-1s
share would increase from 6.6 million tourists in 1971 to 12.1 million in 1980, at an annual rete of 7 per cent. The separate growth rates would be 7.4 per cent for Group A and 6.2 per cent for Group B.
Nearly all the Latin American countries have development corporations and national banks which take an active part in the development and promotion of tourism, their activities being co—ordinated by the respective national planning offices and tourism departments. Their duties include the construction of physical infrastructure, such as new tourist centres, means of access, airports, the development of historical and cultural areas, the building of hotels, and centres for training personnel engaged in the hotel industry. The policies of the individual countries differ according to
their economic possibilities and established priorities.
~111%.1•1110,
23/ International Union of Official Travel Organizations.
/Table 24

- 156 -
Pablo 24
LATIN SIIARE OF WORLD TOURISM ,
Growth rate
Number of Share of Number of Share of 1961-1970 persona world tourism persono world tourism , ., . i ,
(thousands) (peroentages) (thousands) . (percentages) kpercentages)
1961 1970
First deoade
WorldsIouriem 75 300.0 100.0 169 000.0 100.0 9.4 Total Latín America 2 188.1 (100.0) 2.9 5 853.2 (100.0) 3.5 11.6 Group A 1/ 1 166.8 (53.3) 1.5 3 599.1 (61.5) 2.1 13.3 Group B 111 1 021.3 (46.7) 1.4 2 254.1 (38.5) 1.4 9.2
Second decade
1971 . Forecast for 1980 Growth
Number of persona
(thousands)
Share of Growth rata Number of world tourism 19701371 . persone (peroentages)(Percentages)lhousands)
rato Share of 1961-
world tourism 1380 (pertentages )(percent
ages)-
181 oon.o 6 600.7 (100.0)
4 135.5 (62.7)
2 465.1 (37.3)
100.0 7.1
3.6 12.8
2.3 14.9 1.3. , 9.4
280 000.0 12 135.4 7 888.o 4 247.4
1 (100.0)
(65.0) j/ (35.0) W
100.0 5.0
4.3 7.0 2/
2.8 7.4
1.5 6.2
Worlds tourism
Total Latin America Group A 2/ Group B 12/
Source: International Union of Official Travel Organizations (UIOOT), the Organization of American Otates (OAS), and ECLi, estimates.
á/ Arkomioo, and Central :,merica and the Oaribbean, excluding Honduras and MicaraGua. 1 South Amsrioa. 21 WOOT estimate.
Feroentage estimated by ECLA.
/Tabla 25

Country North
America Europe
Latin América Other
regions Total
South America
Central Arerica
Costa Rica 1/ 44.o 12.2 12.6 96.4 5.0 170.4
El Salvador 23.5 3.4 4.5 92.2 14.2 137.8
Mexioo 2 070.8 27.0 37.5 71.7 38.5 2 245.5
Panama 45.7 4.6 39.1 4,.9 23.9 155.2
Jamaica 270.7 14.9 - - 23.5 309.1
Trinidad and Tobago 38.2 7.5 7.4 13.7 15.1 86.9
Total Group A 12/ 2 492.9 69.6 101.3 520.9 120.2 3 104.9
Percentages 80,3 2.2 3.3 10.2. Id 100.0 13.6
o
North America
80.3
- 157 -
Table 25
LATIN AMERICA: ORIGIN OF TOURISTS VISITING NEXICO,
CENTRAL AMERICA AND THE CARIBBEAN (GROUP A), 1970
Source: UTOOT, OAS, and official statistics. Note: A comparison with the following table clearly shows the differenoe between the figures
for Group A
and Group B, with widely differing percentages for the origin of the tourists. Owing to the short
distanoe between the Group A countries and North America, the entry of 2.5 million tourists from
the United States, Canada and Europe has enabled these countries to develop their infrastructure
and superstruoture much more rapidly than the Group B countries, which relyrnainly on regional and
internal tourism, with far less stable movements and much slower development, as is reflectad in
the balance of payments.
17 1971.
h( Thousands of persons.
/Table 26

lu
1.5/NIts
d41,7 i/
se:e ynoeS
Latin America
72.3%
- 158 -
Table 26
LATIN AMERICA: ORIGIN OF TOURISTS VISITING SOUTH AMÉRICA 9/(CROUP B), 1970
Country North
America Europe Latin
America Other
regions Total
Argentina 43.2 42.8 580.4 28.5 694.9 Bolivia 7.1 4.7 6.8 3.6 22.2 Brazil 33.1 40.5 101.2 19.3 194.1 Colombia 52.1 19.4 67.0 23.1 161.6 Chile 121 32.4 20.9 108.5 15.9 178.0 Paraguay 2/ 8.0 3.6 91.5 8.5 111.6 Peru 39.9 22.1 62.2 9.3 133.5 Uruguay 12.5 - 51;.4 35.3 567.2 Venezuela 51.7 22.8 38.5 3.9 116.9 Total Group 8 dl 280.0 Vi6.8 1 575.8 147.4 2 180.0 Percentages 12.3 8.1 ZU.1 6.8 100.0
Source: UIOOT, OAS,and official statistics.
Note: International tourism bogan to be developed in South America towards the end of the 19601s, much later tiran in the Group A oountries; 8.1 per cent of the tourists come from Europe, compared with only 2.2 per oent in the Group A countries. In view of the special features of immigration from Europe to South America, and for cultural and historioal reasons, it would be desirable to explore new methods of increasing the flow of tourists from Europe and, as a new source, from Japan.
Excluding Ecuador. y 1967. 12/ 1969. d/ Thousands of persone.
/Mexico, Colombia

- 159 -
Mexico, Colombia, Venezuela, Brazil and Argentina are allocating a considerable portion of their budgets to improving the national infrastructure, and there are State incentivos to privato enterpriso for the building of hotels. An example of the tax measures adopted to stimulate tourism may be found in the signatory countries of the Cartagena Agreement. Bolivia, Ecuador and Peru accord tariff reductions in respect of goods for hotels and tourist companies. Ecuador established a 75 per cent tax exemption for sales by new tourist companies, and Colombia, Chile, Ecuador and Peru have reduced or eliminated taxes on the net worth of air, hotel and tourist companies. These organizations are also favoured by income and stamp tax exemptions.
Four of the countries of the Andean Agreement - Chile, Colombia, Bolivia and Peru - have established taxes payable by nationals and foreign residents departing frr-J the country. The main purpose of these taxes is to reduce foreign exchange expenditure under the head of travel.
At its meetings with the directors of tourism in the Andean Group, the Board of the Cartagena Agreement has taken highly positive measures to improve land transport and facilitote Perder control. It has recommended a standard system of statistics on tourism, instituted a standard embarkation and disembarkation card, and called for e standard set of regulations and system of classification for hotels and travel agencies.
Besides these and other measures, the Board is recommending that a system of travellers' cheques be adopted for the Andean area. In addition, it is preparing proposals for new air fares for the Andean countries, for submission to IATA which establish a 30 per cent discount on three different circuits. On the basis of this initiative, the Board will propose that the International air transport companies for their part, should establish cheap excursion retes from Europe and North America as a contribution to the development of tourism in the area, which is geographically farthest away from the sources of world tourism.
Other Latin American countries are promoting International tourism through special offers by their own air unes for travel from Europe and North America, providing for stays of 14 to 26 days for groups of at least 20 persons.
All the countries in the region are studying a draft agreement for facilitating tourism, which will be submitted for approval at the next inter-American tourism congress. This document contains a definition of the tourist and the excursionist, covers the requirements in terms of visas, health certificates and vaccination, and lays down regulations regardíng money exchange and the taxes, duties and charges levied in connexion with fares on arrival and departure.
/Chapter VI

.

Chapter VI
EXTERNAL FINANCING
General considerations
Paragraphs 42 to 52 of the International Development Strategy define a number of policy measures called for by the objectives which the international community should fulfil in granting financial assistance to the developing countries. The vital importance of theEle measures is all the greater because the majority are laid down in a fairly specific
form o although this seems to have been the very feature that has led numerous developed countries to express reservations regarding snme
paragraphs.
The treatment the International Development Strategy gives to external financing covers four distinct major topics, which wíll be conaidered in the present chapter. Firstly, paragraphs 42 trJ 47 and 49 c)' the Strategy discuss the volume and conditions of entry of fínancial resurces to the developing countries. Secondly, in paragraphs :51 and 52, some special aspects of the financing of developmpnt (the mechanism of npolementary financing and the possibility nf estéL,iblishj.ng a link
betwgen the allocation of Special Drawing Rights and the provision uf
financial resources)are referred to. Thirdly, paragraph 48 Ocals with
the problem of the external debt of the developing world, and lastly, paregraph 50 deals with private foreign investmnnt and its relation to
develupment.
Naturally, the appraisal of External financing For America
in the arcas covered by the International Development Etratsgy cannot be separated from the context in which the financial relations of the Third World with other countries, especially the industrialized courriGs, have devsloped For this reason, it seems appropriato to bsgin th0 revi.,;w of
each topic nentiwled by describing the main features of its avolutisn in the group of developing countries as a whole, going on to describe the particular features characterizing Latin America.
¡A. VOLUME

— 162 —
A. VOLUME AND TERMS OF FINANCIAL RESOURCES. EN' tRIAJG1 THE DEVELOPING COUNTRIES
1. The 1 per cent ter et
The aim set out in paragraph 42 of the International Development Strategy that each economically advanced country should endeavour to provide annually to developing countries financial resource transfers of a minimum net amount of 1 per cent of its gross national product goes back to UNCTAD I (1964), although then the target referred to national income. The time limit for this target has undergone changes, but it was reaffirmed in the International Development Strategy and in UNCTAD III that "those developed countries which are unable to achieve this target by 1922 will endeavour to attain it not later than 1975".
Today, all the member countries of the Development Assistant: Committee (DAC) have accepted the target of 1 per cent, but some of them have made no undertaking as regards dates. Austria, Canada, Denmark, the United States, Italy, the Federal Republic of Germany and Switzerland are in this situation (as is Australia, although in 1970 and 1971 its coefficient pf total assistance was around1,per cent of the gross national product). In brief, seven uf the sixteen member countries of DAC, with a joint cross national produ.Jt equivalent to more than 70 per cent of the total nrcs national product of the members of the Committee, have not responded satisfactorily to the target of 1 per cent.
In 1971, the total net assistance granted by tho member countries of DAC 1/ amourted to 0.73 per cent of their total grasa national product; this percentage was slightly higher than that recorded in 1979 but cnly much the same as the volume observed throughout a large part o,' the 1960/s and was manifestly less than the average of 0.61 per cent achieved in the two—year period 1961-1962 (see table 1). The coefficient recorded for 1971 does not give any grounds for supposing that this rz7presents any relatively olear tendency indicating that the target of 1 per cent will be reached in 1975.
The structure of the net financial flows has undergone substantial changes. Between 1961-1965 and 1971, the share of official disbursements in the total fell from 65.5 per cent to 52.1 per cent, with a noticeable drop in official development assistance. Within the sharp increase in
1/ Estimate available only for DAC as e whole, not for each member country.
/Table 1

Anual average
Country
Proportion of total
GNP of the DAC
oountries 1970 1971
1961-1965 1966-1970
- 163 -
Une 1
MEMBERCOUNTRIES OP DAC$ PEBOENTAGE OF GNP ACHIEWJD BY THE TOTAL NET FINANCIAL FLOWS
(Peroentages)
Australia 0.51 0,87 1.14 ... 1.7
Austria 0.19 0.46 0.48 ... 0.7
Belgium 1.09 0.99 1.33 ... 1.2 4.0
Canada 0,30 0.52 0,69 ...
Denmerk 0.16 0.55 0.63 ... 01,7
United States 0,72 0,58 0.514 ... 51.5
Franoe 1.64 1.19 1.22 ... 7.6 4.5
Italy 0,51 0.70 0,80 ...
Japan 0.42 0.69 0,90 ... 9.0
Norway 0,23 0.51 0.62 .•• 0,5
Netherlands 1.05 1.14 1e43 ... 1.5
Portugal 1.40 1.11 1.04 ... 0.3
United Kingdom 0.92 0.82 0.91 ... 6,o
Federal RepuLlie ef Germany 0.67 0.82 0.62 ... 8.3
Sweden 0.27 0.52 0.58 ... 1.5
Switzerland 1.31 0.71 0.54 ... 1.0
Total for DAC oountries 0.75 0.70 0,71 0.73 100,0
Source 1961,1970, UNCTAD, Financial resourees for development, TD/118/supp. 2, Joauov 1972, table 3;
1971, estímate on the basta of figures taken from the OECD preso release of 5 July 1972,
table 7. 2/ Estimate a000rding to 1969 data.
/Private disbursements

— 164 —
private disbursements, the very rapid growth of export credits, which between 1961-1965 and 1971 more than doubled their share in the total of financial flows, is particularly noteworthy. Also of notable interest is the largar share which direct investments carne to have (sea tabla 2). In other words, in addition to the qualitative and quantitative limitations on the attainment of the overall target of 1 per cent, a growing share of the financial flows have been for basically commercial ends: while at the beginning of the 1960's one—third of the total flow was of this natura, the proportion in the early 1970's is estimated to be approximately SO per cent.
The socialist countries did not accept the target of 1 per cent adoptad in the International Development Strategy. They declarad explicitly that the socialist countries "are in no way involved in colonial or neccolonialist exploitation and have been consistently fighting for the political and economic liberation of developing countries. In this connexion the obligation of an annual contribution of 1 per cent of the gross national product of economically developed countries to assist developing countries cannot apply to the socialist countries" 2/. They laten confirmed this position at UNCTAD III.
According to the figures available, the foreign resource transfers from the socialist countries between 1961 and 1969 remained at around 700 million dollars annually. In 1970, however, the figure rase to 1,700 million dollars; this sharp increase may largely be explained by the largar loans made by the Peoplels Republic of China. There ware also significant increases in the assistance commitments undertaken by the Soviet Union, Bulgaria and Hungary (sea tabla 3).
Despite the limited progresa made towards the 1 per cent target, some ground has been gained since this target was adopted by the International Development Strategy, although only slowly and with difficuty. It has been accepted, for example, that the target of 1 per cent should not include elements not counting as assistance, such as direct private investments and supplierss or purchasers' credits, and that it should be net of the return flows of interest. In the context of a broader—based draft resolution presentad by the Group of 77 to UNCTAD III, this point received special consideration, and was fully
1.101110,1.1.a......11,.■•■■••..1.11~00141■•■•■■.111,..
2/ See the leiter datad 21 September 1970 sant to the Secretary—General of the United Nations by the representativas of Bulgaria, Czechoslovakia, Hungary, Mongolia, Poland, Byelorussia, the Ukraine and the Soviet Union (document A/8074, paragraph 12).
/Table 2

- 165 -
Tabla 2
NEMER COUNTRIES OF DAC: SIMUTURE OF TOTAL NET FINAWIAL MONS
(Porcentajes)
Aráro.....1■•••■••••
Annual average 1970 RI 1971 1/
1961-1965 1966.1970
I. Official development assistance (9DA) U.sZ 5.235 145., 44.6
1. Bilateral Brants (danations) , 42.1 26.9 22.4 21.4
2. Bilateral loans 14.4 17.5 16.0 15.9 3. Multilateral oontributions 4.7 6.1 7.5 7'3
II. Other nous of otficial capital 5.32 Z. Zi5.
1. Bilateral 3.8 4.8 5.8 5.9 2. Multilateral 0.5 0.5 1.8 1.6
III. Total. official disbursements
L..:t211 65.5 252. 15.11. 52.1
IV. Total private disbursements 2t5 44.2 1.55 47.9
1. Dircat investment 19.4 21.5 23.7 23.7
2. Bilateral portfolio investment 5.6 6.6 5.2 4.6
3. Multilateral portfolio invastment 2.2 5.6 3.2 44
4. Export aredits 7.3 12.5 1,,,.4 15.6
Total net financial nous 100.0 100.0 100.0 19.922
Source: OECD presa release of 5 July 1972, tale 1. 2/ Excluding,donations made by voluntary agencies of the private sector, as in the per5.ud 1961-
1969.
/Table 3

— 166 —
Cuadro 3
BILATERAL ECONOMIC ASSISTAHCE COMTMENTS TOWARDS 1HE DEMCLOPIN, COUNTRIES BY THE
SOCIALISTCOUNMIES OF EASTERN EUROPE AND ASIA, 1961. 1970 2/
of doliera)
Annual average Cohnt7 1970
1961-1965 1966.1970
Bulgaria 8 4o 82
Czeohoslovekia 66 112 45
Peoplets Republio of China 127 149 695
Hungary 35 47 79 Poland 6o 28 25
German Demooratic Republio 50 100 125
Rumia 35 4o 10
USSR 334 514 633
Total
7.11 1 0 04
Source: UNCTAD, op.oit. (TD/118/SuPP.2), tabla 6. 2/ Exoluding commitments to Cuba.
isupported by

- 167 -
supported by some industrialized nations (the Ucandinavian countries and the Netherlands). Finally, it was agreed.in re3olution 61 (III) to instruct the Trade Development Board to "examine the concepts of the present aíd and flow targets in arder to prepare for a discussion thereon in the mid-term'review of the implementation of the International Development Strategy". Even so, this text, which emerged from a long process of neootiations, caused three member countries of DAC to enter reservations. Although it is probable that it will be a long time before the position of the Group of 77 in this matter is universally accepted, it is interesting to note the process of redefinition which has begun.
2. 22 2.22232:centta22' et
Paragraph 43 of the International Development Strategy places special emphasis on official development assistance and also states that 'each economically advanced country will progressively increase its official development assistance to the developing countries and will exert its best efforts to reach a minimum net amount of 0.7 per cent oU'its gross national product at market prices by the middle of the Decade no This
parajr,lph, however, received markedly poor supporta cmcIng the member countres of DAC, only Belgium, Norway, the Netherlands, Pcr:ugal and Swedah accepted this aim in its totality, while the rest formulated reservations as regards the aim itself and the time-limit fixed for its attainment. France accepted.the aim in principie, but stated that it propased to maintz.j.n its level of official assistance rfc betws71-1 0.6 and
0.7 p:-x. cent. In brief, six countries have undertakeri ta achieve this
aim, their joint gross national product amounts to :711y aLcut one-sghth of the total for DAC. The reservations of Australia; Austria,
Canada, Denmark, the Federal Republic of Germany and Switzerland concern the time-limit laid down in the International Strategy, and they reitarated there when recolutan 61 (III) was adopted in UNCTAD III,, The reservations of thc, United Status, Italy, Japan and the United Kingdm, howaver, are particnlarly impartant and were also repeated at UNCTAD III. Thesefaur countries, whose joint gross national product constitutcs more than 70 per cent of the total for DAC, accepted neither the target of 0.7 per cent nor
any dates for its attainment.
This mcans that the corner-stone of the chapter of the International Development Strategy on financial resources for development is very insecure right from the start and in practica involves very little obligation for the majority of the developed nations. The great importance of this fact is olear if it is borne in mind that official development
/assistance is

— las —
assistance is the only source of resources which are granted aisentíally for development, under favourable conditions, and are directly controlled by Governments. Its importance also lies in the fact that the degree of success which can be attained in carrying out other policy measures on external financing is subject to the progress which can be achieved in implementing the aim of 0.7 per cent. It may be mentioned, for example, that the improvement of the average conditions on which the developing countries are able to secure external resources, and the alleviation of the problem of the Third World's debt, depend directly and very largely on the rapid attainment of this aim.
In 1971, the coefficient of official development assistance of the member countries of DAC reached 0.35 per cent, slightly more than in 1970. This percentage, however, is not sufficiently significant to allow it to be assumed that the downward trend observed throughout the period 1961-1970 has been interrupted or reversed, quite apart from the fact that it is very much lower than the average of 0.5 per cent recorded over the five—year period 1961-1965 (see table 4).
In order to appreciate the true importance of the 0.7 per cent target for official development assistance, it may be pcint2J out that a diese approach to this target would mean — using 1971 figures — an increasad annual inflow of around 7,500 million dallare, Of tris sum, the United States would contribute around 3,950 million; Japan, 1,050 million; the Federal Republic of Germany, 730 million; Italy, 540 million; the United Kingdom, 400 million, and Canad, 300 million. These six countries thus account for more than 93 per cent of the estimated amnunt used as a point of reference to calculae the additional effort required.
According to the various aspects which have been reviewed and other available data regarding the policies and external co—cosration budgets which the majority of the industrialized countries will maintain in the neer futuro, official financial development assistance fron the DAC countries is likely to remain at around 0.35 per cent up to and including 1975 3/. This is basically because the planned increases in the shares of official development assistance granted by several countries (mainly the Scandinavían countries, Belgium, Canada and the Netherlands) would be cancelled out by the decrease in the coefficient for the United States and the static position of Italy, the United Kingdom and the Federal Republic of Germany. .2111...101Iiii41~1119111471.i.1.0011111.:1•111100111
3/ Seo, for example, pagos 7-10 and 19 of President of the World Bank, Robert S. Santiago, on 14 April 1972.
the statement made by the McNamara, at UNCTAD III,
/Table 4
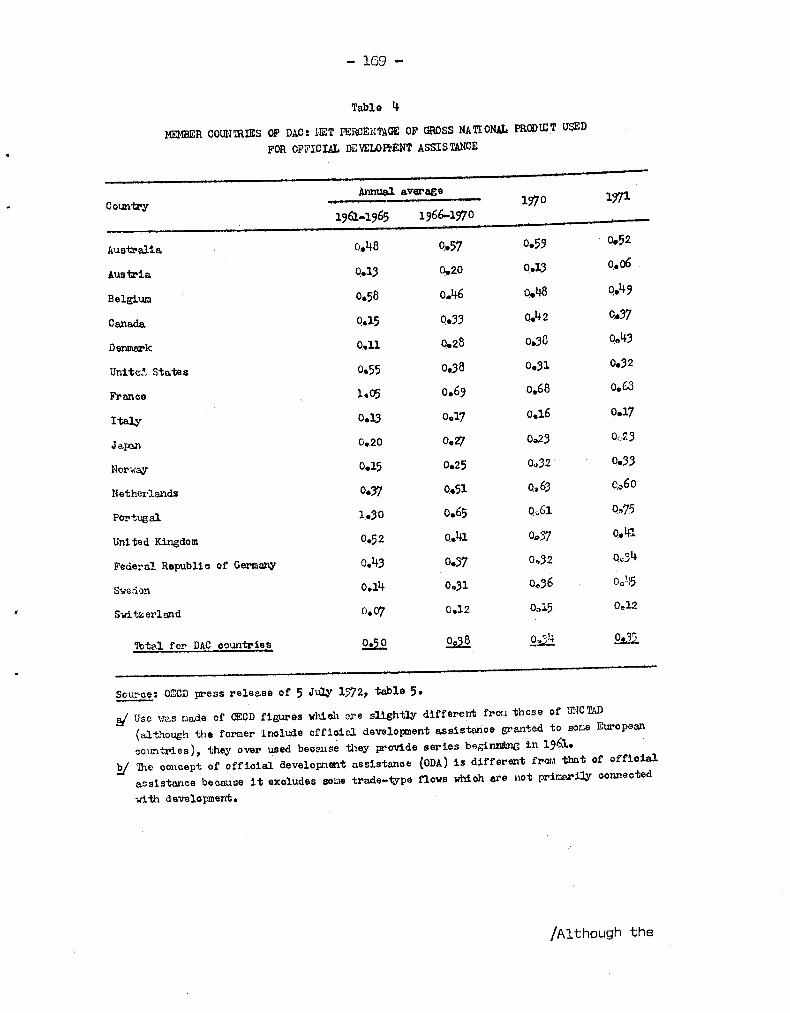
- 169 -
Table 4
MEMBER COUNTRIES OF DAC: NET PERCENTAGE OF GROSS NATIONAL PRODUCT USED FOR OFFICIAL DEVELOPDENTASSISTANCE
Country Annual average 1970
1961-1965 1966.1970
Australia 0.48 0.57 0.59 0.52
Austria 0.13 0.20 0.13 0.o6 .
Belgium 0.58 0.46 0.48 0.49
Canada 0.15 0.33 0,142 0.37
Denmark 0.11 0,28 0.38 0043
Units,', States 0059 0.38 0.31 0.32
Frenas 1.05 0.69 0.68 0.63
Italy 0.13 0017 0.16 0.17
Japan 0.20 0027 0a23 0c23
Norway 0.15 0.25 0,032 0.33
Netherlands 0437 0.51 0063 c,6o
Portugal 1.30 0.65 0,61 0075
United Kingdom 0.52 0.41 0037 0.41
Federal Republio of Germany 0.43 0.37 0.32 0034
Sweden 0.14 0031 0,36 0016
Switzerland 0.07 0.12 0.15 0012
Total for DAC aountries 2252 092 _022 52122.
Source: OECD press release of 5 Jay 1572, tabla 5.
á/ Use was nade of OECD figures whioh are slightiy different fror.i thoso of UNCTAD (although the former inolude offieial development assistance granted to some European
countries), they over used beoause they provide series beginxIng in 1961.
1/ The oonoept of official development assistanoe (ODA) is different from that of offieial assistance beoause it exoludes some trade-type flows whioh are not primarily conneoted
with develapment.
Pathough the

— 170 —
Although the estimates made may contain some margin of error, it is undeniable that the evolution of the Second United Nations Development Decade is likely to be affected by the fact that halfway through the penad only half of the proposed objective 411 have been achieved. This poor outlook makes it doubly imperativa that there should be a basic change in the external co—operation policies of some member countries of DAC, since this would be the only feasible way of increasing the official development assistance coefficient in the second half of the decide covered by the International Development Strategy. Similarly, the negotiating strategy of the Group of 77, efforts aimed at bringing about this change in the policies of a number of industrialized countries should have priority.
3. Basic tercos of official development assistance
In essence, paragreph 44 of the International Development Strategy states that the member countries of DAC should exert their best efforts to reach before 31 December 1971 the norms set out in the Su:nriement to the 1965 Recommendation on Financial Terms and Conditions adopted by the Development Assistance Committee in February 1959. These norms deal especially with the grant element in official development assistance and determine the proportion of donations in such assistance, as weli as the conditions regarding amortization and space periods and ratas of interest on which official loans are granted. Operative paragraphs 1, 2 and 3 of part A of resolution 60 (III) of UNCTAD III also deal with thcse espscts.
In 1971, eleven DAC countries complied with the recommendations made, but the remaining five (Austria, Italy, Japan, Portugal and Switzerland) remained quite far from the target. Moreover, the completeness with which some nations were complying with the DAC's principies had diminished 4/. In this connexion, it can be seen from table 5 that in 1971 the gront element of the total undertakings of official development assistance by DAC countries dropped (from 84.1 per cent in 1970 to 61.9 per cent). The amortization and grace periods were quite close to the minimum limits laid down in UNCTAD resolution 60 (III) (25 and 7 years, respectively, compared with 28.6 and 6.4 years actually achieved), but interest retes were significantly higher (the target was not more than 2 per cent annually, whilG the real average rete was 2.7 per cent).
4/ See OECD press release of 5 July 1972, pp. 23-28.
/Dable 5

— 1'71 —
Tains 5
MEMBER COUNTRIESOF DAC: INDICATORS OF TERMS OF OFFICIAL DEVELOWENT
Annua1 aVW0003
19657_1970
Grants (donations) as a peroentage of the net expenditure on offioial development assistance (%) 66.1
Average amortization perled for offialal development assistance loens (years) 12/
Weighted average greco period of offiotal development assistanoe loans (years)
Weighted average rate of interest on officia1 development assistance loans (%) tí
Grant element in -total oficial development assistanoe eommitments (%) 1
1969 1970 1.171 ate/
65.0 65.2 64.3
28.4 30.2 28.6
6.7 7.3 6.4
3.o 2.8 2.7
84.4 84.1 81.9
Source: World Bank, Annual_Report 1572, tabla 3.
5( Preliminary. 12/ Commitments. 2/ Updated at 10 per oent per year.
/In short
- 172 -
In short, then, as regards officíal development assistance and excluding the countries already mentioned which did nct fulfil the recommendations of DAC within the time-limit laid down in the International Development Strategy, it ís clear that the problem basically in the scarcity of resources for this purpose rather than the wasic terms on which they are granted. This is assuming, of course, tlat there terms do not continue to deteriorate in the futura as they dit' in 1991. Otherwise, it would be necessary to seek fulfilment of z‘iat the International Development Strategy calls for in paragraph 44, where it says that "developed countries will consider measures almed at the further softening of the terms and will endeavour to arrive at a more precise assessment of the circumstances of the individual developing countries and at a greater harmonization of terms given by individual developed countries to individual developing countries ". SO= progress was made in this direction in October 1972 when the DAC adopted a new recommendation, simpler then the previous recommendations, laying dewn as a basic targot for official devolopment assistance an av2rage grant element of 84 per cent. In addition, the recommendation provides for special treatment for the relatively less developed countries, i.e., the "hard core" defined by the United Nations.
4. atherternsoffirencialassistanwartjcularl-------------------______TP Y
Paragraph 45 of the International Develomnnt Strategy which was unreservedly sanctioned by the developed countries - relates to the desirability of untying financial assistance and contains some specific recommendations for cases where untied loans are not pocsible. Nevertheless, since the International Strategy was adoptad, there have been changes in the approach to this question, the suggestion now being that a bread International agreement should be concluded on the general untyinp of assistance. The Group of 77 has insisted that this agreement shouI be signed not Tater than 1976, but in the negotiations at the third spsion of UNCTAD and in operative paragraph 4, Part A, of resolution 60 (I:1, adopted there, the developed countries, while accepting the idea of euch an international agreement, díd not commit themselves to any specific date.
It is interesting to note that this manner of pursuing the aim of untied assistance, though conceptually correct, will probably limit some partial advances that were being achieved in this field, since any specific arrangements arrived at with donar countries or connected with a particular aspect of the question will be overshadowed by the scope of the proposed general agreement. This makes it doubly urgent to conclude the aboye agreement as soon as possible.
/A supplementary

— 173 —
A supplementary point approved in the International Strategy and at the third session of UNCTAD is the recommendation that, as an immediate step, the developed countries should gradually untie part of the assistance they provide, so that the resources concerned could be utilizad for purchases in developing countries. It may be noted in this connexion that since 1969 the United States has authorized the making of purchases in developing nations with funds drawn from its bilateral credit programmes.
The International Strategy stipulates in paragraph 46 that "financial and technical assistance should be aimed exclusively at promoting the economic and social progress of developing countries and should not in any way be usad by the developed countries to the detriment of the nacional sovereignty ef recipient countries". In view of the general terms in which this paragraph is couched it would seem difficult to attempt an appraisal of it, especially as regards its impact on international financial relations.
Paragraph 47 states that "developed countries will provide, to the greatest extent possible, an increased flow of aid on a long—term and continuing basis and by simplifying the procedure of the granting and effective and expeditious disbursement of aid". This paragraph was unreservedly approved by the member countries of the Development Assistance Committee (DAC).
There are no statistics available to show the frequency and scale of the assistance provided by developed countries in accordance with set programmes. It is merely known that several member countries DAC have granted such assistance, albeit only occasionally and on terms varying according to circumstances. It is therefore impossible to evaluate the progress made in complying with the relevant provision of the International Strategy.
The United States1 assistance for programes is provided throu‹,11h the Agency for International Development (AID); it may therefore be reUuced in the futura because of the chango in United States government policy on AID's activities. The new policy might result in a shift in government assistance from the bilateral to the multilateral approach, amounting in practica to a smaller flow of resources to AID and a largar flow to international credit institutions, and in en increasingly important role for private investment in United States assistance to developing countries.
/5. Multilateral

- 174 -
5. Multilateral assistance
Paragraph 49 of the International Development Strategy states that "the volume of resources made available through multilateral institutions for financial and technical assistance will be increased to the fullest extent possible and techniques will be evolved to enable them to fulfil their role in the most effective manneru. This recommendation was endorsed by all the developed countries without exception and was repeated at the third session of UNCTAD (resolution 60(III), Part 8, operativa paragraphs 1-9).
Total multilateral contributions increased their share in the net financial flows from DAC member countries from 7.4 per cent in 1961-1965 to 12.9 per cent in 1971 (see tabla 2). If account is taken only of offícial development assistance during this period, the relativa increase was less, and there was even a small reduction between 1970 and 1971. In abcolute terms the increase was from an annual average of 430 million dollars in 1961-1965 to 1,260 million dollars in 1971, the latter figure representing 16.4 per cent of total offícial development assistance. If the official development assistance coefficient for that year (0.35 par cene) had been closer to the 0.7 per cent target, the multilateral contributions required to maíntain an acceptable proportion would have bien net less than 2,500 million dollars. This would have helped towards atteining the goal, suggested by the Pearson Commission, that by 1975 not less than 20 per cent of total offícial development assistance should be channelled through multilateral institutions. In other words, although admíttedly multilateral contributions increased their share in official asistance, the increase would seem to fall short of the objectives laid clown for the mid-1970es.
The limitation of offícial development assistance furnish2d through multilareal institutions has essentially had the effect of restricting at the world level 5/ the possibilities of expansion of all the United Natj,_,ns agencies and the International Development Association (IDA), which have virtually no other sources of financing 6/. IDA's position is particularly significant: after granting net loans totalling over 300 million dollars annually :11-ring the two years 1965-1967, these were reduced by approximately half in the period 1970-1971 7/. In this connexion, IDA has had serious difficulties in securing the prompt payment of contributions from a group of nations 8/. Its activities
5/ RIgional institutions, particularly the Inter-American Development Bank, will be considered later.
6/ Except for grants extended to IDA by the World Bank out of its profits.
7/ See UNCTAD, "Financial resources for development" (rD/118/Supp.2), 4 January 1972, annexed table 4; and World Bank, /111111111=.122E.
a/ Part I member countries of IDA, which - excluding Portugal and Switzerland -Luxembourg and South Africa.
/were particularly
comprise the DAC countries plus Finland, Iceland, Kuwait,

- 175 -
were particularly jeopardized by the delay in approving the third replenishment of funds by the United States. The shortage of resources over the last few years also seems to have affected the scope of IDA's operations, which have been increasingly concentrated on the provision of loans to relatively less developed countries. The high proportion of loans granted to some Asian countries has been maintained /, but at the same time a large number of other developing countries have failed to secure new credit, in spite of the fact that they had a number of investment projects with social priority but a low financial return which they could have presentad for external financing on grant-like terms.
The World Bank was able to manage better than IDA with the limited supply of international financial assistance funds because it succeeded in tapping a subsrantial volume of resources from various financial institutions in the industrializad countries and the international capital markets. Because of the increasing cost of these resources, however, the annual intarest rata on the Bankls loans rose from 5-1/2 per cent to 7-1/4 per cent Between 1966 and 1970, this 'atter rete being still in force today. Even so, it was not until 1970-1971 that the Bank was able to increase its net loans over the levels reachgd ten years before.
As regards the operational techniques used by multilateral institutions to "enable them to fulfil their role in the most effective manner", special mentían should be mode of the trend followed by programes loans. The importance attached to this type of operation by developing countries was further stressed at the third session of UNCTAD (resolution 50(III), Part B, operativa paragraph 5). The advantages it brings tu developing countries are also well known 10/.
Up to and including 1972, the World Bank and IDA have devoted only a relatively small volume of their resources to programmes loans. Less than 10 per cent of the cumulative credit extended by these institutions has been usad for this purpose, and a large part of thís represento reconstruction loans granted to developed countries after the Second World Mar and credit extended by IDA to some Asían countries. In other words, the great majority of developing countries have received no programme loans from the World Bank or IDA 11/. However, the World Bank Group has announced that it is currently contemplating a change in its credit policy with the aim of appreciably increasing the proportion of resources earmarked for programme loans. If this comes into effect soon it will help to salve the developing countriest balance-of-payments problems, especially by financing the local coste involved in programme loans.
2/ As at 30 June 1972, three Asian countries contracted two-thirds of the total volume of credit extended by IDA. See World Bank, Annual Report 1972.
10/ See "Financial resources for development", pagas 22 and 23.
11/ See World Bank, Annual Report 1972, appendix 1.
/6. Volume

— 176 —
6. Volume and terms of financial resources enterin• Latin America
(a) Trend of the total flow of financial resources 12/
The net inflow of financial resources into Latín America in 1970 was 36 per cent higher than the average for the period 1966-1970. The highest increases were in total net official and private loans and, to a lesser degree, foreign investment, whereas grants decreased (sea tabla 6). It will be noticed, however, that the rice in the net official assistance component of loans and grants was a modest 20 per cent and most of the increase therefore carne from private loans, which were up by an estimated 74 per cent (sea tablas 7 and 8).
In recent years (see tablas 6, 7 and 8), the trend has been towards an accentuation of the tendency, already apparent for some time, for Latin America to rely too much on such private sources of credit — largely because of the difficulty of obtaining official assistance in sufficient quantity — and te suffer the inevitable consequences. Thus, for example, in other developing areas gross disbursements from private sources accounted for. between 10 and 39 per cent of the loans received at the end of the 1960's, whereas the corresponding figure for Latín America was 50 per cent; conversely, the Share of resources it received in the form of bilateral and multilateral official credits is the lowest of all developing areas (see table 9).
The relativa shares of private loans and foreign investment in the flow of financial resources to Latín America mean that a large proportion of the region's net income has te go towards repaying foreign capital through payments of interest on loans and remittances of profits on investments. Though several aspects of this question will be dealt with in greater detail below, it should already be pointed out that the net overall contribution of foreign capital was negativa for the whole of the 1:60's, mainly because of the large remittances of profits, and between the períods 1960-1964 and 1965-1969 the net transfer of loans declinad owing to the fact that the increase in interest paid was greater in absoluta terms than the increase in the net inflow. Between these two five—year periods, moreover, the proportion of export earnings from goods and services that had to be spent on'servicing foreign capital es a whole rose from 33.6 to 37.0 per cent (see tabla 10).
12/ Currently, data are only available up to 1970, but preliminary figures for 1971 suggest a similar pattern to that of 1970.
/Dable 6

— 177 —
Table 6
LATIN ANERICA 1/: YO TAL NET INFLOWS OF FINANCIAL RESOMOES
(IUlllions of dollars)
Annual average
1966-1970 1970
Loans and transfers 2 067.6 2 834.4
Offioial and priva:te loana 1 996.1 2 764.5
Offioial grants 131.5 130.4
Foreing investments (less amortization paymmats) 84o.6 1 045,9
Total net inflow 2 908.2 3 34o,8
Source: ECLA, on the basis of official statisties.
1/ Exoluding Cuba.
/Table 7

— 178 —
Tnble 7
LATIN AM RICA ,2/: NET INFLOWS OF OFFICIAL ASSISTAIJCE FROM DAC COUNTRIES AND FROM EOLTILATERAL INS TITUTIONS
of doliere)
Annual average 1970
1961-1965 1966-1970
Net officio," assistanoe 941.1 1 300.5 1 555.4
Bilateral 785.5 958.6 956.9
Multilateral 155.6 341.9 598.5
Source: UNCTAD, Financial Resources for Development, TD/118/Supp, 2, January 1972, annexed tablea 6, 8 and 9.
Inauding Cuba and various non-independent territories.
/Tablo 8

— 179 —
Talo 8
LATO AI•ERICA NET INFLOWS OF FINANCIAL RESOURCES FUE FRIViTE SOURCES
(Ndllions of doliera)
Animal average
1966-1970 1970
Prívate loans h/ 770.0 1 3144
Foreign investments(less amortization payments) 84o.6 1. 0115.9
Total private inflov 1 610,6 2 385,9
Source: ECLA, on the basis of offioial statistios.
2/ Exoluding Cuba. 1/ Rough estimates.
/jable 9

— 130 —
Tabla 9
DISTRIBUTION OF LOANS AND GRANTS TO DEVELOPING COLHTRIES BY REGION, SOtRCE AM) CATEGGRY OF 1RANSACTION
(GROSS DISBURSEIENTS), 1965, 1967 AND 1969
(Parcentages)
Offícial bilateral loans and oredits
Other Official Other ':lecion and year Suppliers' DAC prívate Total Crants counries Total
credits countries loans 2(
Private loans and credits Multi- Total
lateral (percent-
loans ego
and by
orodits region)
Africa
1965 9 3 12 48 22 11 33 7 22 1967 9 10 19 42 24 7 31 8 17 1369 7 3 lo 53 18 6 24 13 16
East Asia
1965 20 16 36 41 13 3 16 7 lo 1967 26 4 3o 33 31 - 31 6 12 1969 27 8 35 25 33 - 33 7 15
Eiddle East
9 20 29 36 15 15 30 5 7 1969 1967 16 26 42 13 26 17 43 2 8 1969 14 25 39 9 29 17 41 6 8
South Asia
4 1 5 35 38 9 47 13 25 1965 1967 6 1 7 31 38 10 48 14 24 1969 10 1 11 18 48 10 58 13 17
Southern Eurgre
19 6 25 9 51 2 53 13 7 1965 1967 19 12 31 5 45 3 48 16 8 1969 6 28 34 2 44 6 50 14 10
Latin America 2/ 15 32 47 21 20 1 21 12 29 1965
1967 18 31 49 15 22 1 23 13 31 1969 18 32 50 18 20 .. 20 12 34
Total (percentage by category)
1965 11 12 23 33 27 7 34 10 loo 1967 14 13 27 26 3o 6 36 11 100 1969 14 16 3o 22 31 5 36 12 100
Source: World Bank, Annual Report, 1971, talle 4, 2/ hainly loans from private banks, bonds ard other fundad debt. 12/ Mainly Sino-Soviet aountries.
1/ Exoluding Barbados, Cuba and Haiti.
/Tabla 10

Tabla 10
LATIN AMERICA FIVE-YEAR CUMULATIVE VALUES OF INFLOMS CF FOREIGN CAPITAL AND THEIR NET
OVERALL CONTRIBUTION TO EXTERNAL FINANCING
of dollars)
External loans utilizad
1950-1954 -1955-1959 1960-1964 1965-1919
and eorresponding service
payments
Disbursements 4 028.5 8 141.2 15 133.3 19 267.7
Rmimbursements 2 289.9 5 256.2 9 041,1 12 476.0
Balance 1 738.6 2 885.0 6 0/7.2 6 791.7 Dntercst paid 436.9 823.8 1 80046 3 565.6
Net transfer of loans 1 301.7 2 061.2 4 286.6 3 226.1
Directfo rrents
and corresponding servíos
payments
Direct invnstments 1 826,6 4 062.2 2 393-.6 3 628.3 Arrortization payments 272.7 270.6 83607 871.6
Balance 1 553.9 3 791.6 1 41649 2 756.7
Profits 3 9e1.,8 5 306.4 5 513.7 8 021.5
Net ecntribution o direot
investments -2 427,9 -1 514.8 -4 096.8 -5 204.8
effielml Rranto 110.4 452,0 642.3 696.6
Net ovnrall contribution of -1 015.8 998.4 832,1 -1 342,1
foreig,a oapital
As a percentaRe of axports
of goods and servioes
Service payments on
extornal c1: 1-, t
Service paymcnts on inveatments
Service paymouts on foreign capital
171.23
18.5
15.4
124
25.7
21.1
125
33.6
23.8
13.2
37.0
Source: ECLA, on the basta of official statistics. 2/ Exoluding Barbados, Cuba, Guyana, Jamaica and Trinidad and Tobago.
/(b) Characteristics

— 182 —
(b) Characteristic features of the total flow of financial resources
As regards the Characteristics of the total flow of external resources to Latin America, the point should first of all be made that these resources include assistance from socialist countries, although it is impossible to distinguish the corresponding amounts in the overall figures given in tabla 6 13/. The vast majority of Latin American countries have not in fact received financial assistance from socialist States; in the cases of those which have, such assistance has most often been in the form of machinery and equipment supply agreements entailing a down payment of about 10 per cent of the value, the remaining 90 per cent being payable over periods and at interest ratee that have variad from one lending country to another. Generally speaking, however, repayment periods have ranged from 10 to 25 years, grace periods from 2 to 5 years and interest retes from 3 to 6 per cent — terms which are not as soft as the minimum acceptable limits established in UNCTAD resolution 60 (III). Thess supply agreements are entirely tied and there has been no sign of any inclination to untie them. Moreover, they have not been greatly utilized in the region, since in most countries where they have been available national importers have shown little enthusiasm for purchasing goods from the socialist world and the lending countries thumseives f:equently scem to have made little attempt to promote sales of t--,e machinery and equipment they produce.
Secondly, analysis of the total flow of external resources to Latin America reveals the marked relativa importante of direct private investment and suppliers* or buyers1 credit; in addition, it suggests — as will be confirmad later — that payments on Latin Americars debts have been high comparad with other developing areas, owing to the high annual interest retes countries of the region have had in arder to obtain credit. As a result, the region has a special interest in the position adoptad by the Group of 77, and supported by certain industrializad countries, to the effect that the target of 1 per cent for devolopment assistance should not include such extraneous elements as direct private investment and suppliers' or buyers' credit and should be net of reverse flows of interest payments. It therefore seems only logical that Latin America should stress the need for studies and negotiations so that the process of redefining the development assistance target, which has already begun, can make rapid progrese.
13/ Cuba is in any case not included in the figures indicated. Chile for its part, bagan receiving substantial assistance from these countries only from 1971 onwards; it includes essentially grant—like assistance provided by the People's Republic of China.
/For the

— 183 —
For the most part, Latin Americals public sector resort to private external credit when official assistance for the purchase of imported capital goods on credit is not forthcoming. Indeed, on grounds of urgency that are not always fully justified, they sometimes fail to explore thoroughly the possibilities that do exist of obtaining some kind of official assistance for their purpose.
Furthermore, judging from information supplied by Latin American Governments, very little is known in most countries ábout loans which the private sector contracts with private external sources, though the unfavourable terms on which they are ,unusually signed and the corresponding increase in price of the goods imported are no secret. Only when the loans require some kind of official guarantee are Governments able to gain a better idea of the kind of operations being conduoted. Sometimes, in countries where the prevailing exchange legislation imposes certain requirements that must be fulfilled in order to gain access to the foreign currency needed to service the loans, toa, central banks maintain some form of control or record. At all events, hcwever, :h.re is a definite lack of organization in everything that has te do with ne7otiating, contracting and servicing thcse credits, and it would therefore be advisable
for a serious effort to be. made to salve the problem.
One fundamental aspect that requires special attention is the fact that the trend observed as regards development assistance loans is clearly reflectad in the rapid worsening of the average terms of the loan commitments of Latin American countries. Between 1965 and 1970, for example, the average annual rete of interest rase from 5.2 to 7.2 per cent whereas the 1970 rete in other developing areas ranged from 2.4 to ,5 per
cent with an overall average of lees than 5 per cent. In addition to this high interest rete, which is not far from normal comercial levels, Latin America has continued to receive credit with relatively short repayment and grace periods — around 14.5 years and slightly over 3 years, respectively. These factors have reduced the grant element of the region's loan commitments from 27 per cent in 1965 already a very low figure — to 16
per cent in 1970. Including straight grants received by Latin America, the drop in this element was from 39 to 25 per cent. The decline was less sharp in the developing world as a whole, largely because the average terms of loan commitments of South Asian and African countries remained virtually unchanged between 1965 and 1970 (see table 11).
The worsening of the average terms on which Latin America received its total credit is attributable not only to an increase in the share of private loans in total commitments and the worsening of the terms of this
/Table 11

Tablc 11
AVERAGE TERMS OF LOAN COMITMENTS AND GRANT ELEMENT OF LOANS AND GRANTS, 1965-1970 BY REGION
of dollars)
Lean Commitments
Amot
of grants
1(
unlgment Grant
Amount of e
loans usad of loans
for termo calcula-
grants /
(%) tion 21
Amount Maturity
, (years)
Graos pee ars
Grant Interest ele-
(S) me1114-11' ) (%)
1 331.70 23.4 3.0 3 729 44 861.72 67 1 204.49 1 077.24 17.8 0 3.9 3 847 39 731.94 65 962.25 1 142.37 4.9 3 135 47 75592 69 1 040.81 1 220.72 22.5 5.0 4 005 43 830.05 67 1 101.78 1 207.28 23.o 5.7 4 141 43 846.25 68 1 053.53 1 821.60 23.5 5.4 3 845 45 699.02 61 1 700.45 789.64 15.4 3.6 4 849 30 363..36 57 590.13 756.68 17.6 4.3 4 619 34 308.09 54 706.64
1 190.26 14.6 3.9 5 41c 27 394.67 46 1 126.94 1 263.35 20.0 5.5 4 452 39 427.21 54 1 259.56 1 785.34 20.0 5.4 4 990 35 3/8.35 46 1 724.30 1 664.34 21.9 5.8 5 048 36 351.29 47 1 628.78 493.80 17.1 2.7 3 346 4o 82.86 43 493.8o 322.18 14,3 3.4 4 081 34 90.87 48 321.96 575.08 480.84
10.5 11.4
2.8 2.9
4 699 4 467
25 27 6664:12589 33
575.08 448.19
732.35 1i 9 2.5 6 359 18 67.95 25 720.56 920.82 11.8 2.6 5 974 20 78.43 26 912.82
1 724.29 26,4 6.2 2 939 54 827,29 73 1 647.44 2 110.21 29.6 7.2 2 545 6o 859.95 72 1 977.08 1 496.96 25.o 6.1 3 002 53 7/7.83 70 1 416.41 1 808.86 29.1 6.9 3 107 55 519.89 65 1 507.74 28.3 6.7 2 716 58 340.00 66 ;291: 1 31 1 736.28 31.5 7.4 2 373 63 340.42 69 1 537.65 911,51 18.0 4.3 3 858 40 61.42 43 908.07 634.87 22.0 4.9 4 063 42 38.25 45 631.36
1 191.61 18.5 4.1 4 140 38 50.32 4o 1 185.52 870.78 15.5 4.4 5 310 29 47.67 32 841.63
1 129.10 16.7 3.9 4 757 32 57.74 36 1 126.58 1 058.81 14.8 4.2 5 438 27 59.75 31 1 048.82 1 792.39 14.5 3.3 5 223 27 328.85 39 1 710.12 2 035.76 16.7 3.5 5 539 27 307.16 37 1 999.31 2 741.64 13.5 3.1 5 986 22 278.71 30 2 551.72 2 800.05 14.9 3.4 6 104 23 319.99 31 2 742.12 2 745.59 13.4 3.8 6 655 19 363.92 28 2 680.22 2 804.28 14.8 3.1 7 157 16 320.76 25 2 715.09 7 043.33 19.9 4.2 4 010 4o 2 525.5o 57 6 554.05 6 936.94 21.2 4.8 4 o84 41 2 336.26 57 6 598.60 8 337.92 17.1 4.1 4 622 34 2 323.58 49 7 896.48 8 444.6o 19.6 4.8 4 754 36 2 209.50 49 8 107.35 9 107.40 18.6 4.7 5 120 33 2 044.21 46 8 696.49
lo 006.13 20.0 4.7 5 134 34 1 849.67 44 9 543.61
Reglen Year
Africa 1965 1966 1967 1968 1969 1970
East Asia V 1965 1966 1967 1968 1969 1970
Middle East 21 1965 1966 1967 1968 1969 1970
South Asia s/ 1965 1566 '967 1968 1969 1970
Southern Europe E/ 1965 1966 1967 1968 1969 1970
Latin America y 1965 1966 1967 1968 1969 1970
Total 1965 1966 1967 1968 1969 1970
Source: World Bank,nuse0An ,...:_,tr 1972, tabla 9. y The grand element is the faca value of loan commitments lesa the discounted present value of the futuro flow of repayments of principal and interest, using the customary rate of 10 and expressed as a peroentage of the faoe value; 11/ Data from grants are taken from OECD(DAC) and IDB souroes. Included are grand-like flows(loans repaya-ble in local currenoies) bilateral grants, and UN sgency grants. Figures Por grants are on a disbursed basis,while figures for leona are on a oommitment basis. The grand element of a grant is 100%; c./ This oolumn shows the amount of loans for which repayment terma are known; cy Does not include publiclY guaranteed prívate debt of the Philip. pinos; j/Excludes Israel; 1/ Exoludes some supPliersioredits to India for whieh terma data aro not available.;É Does not inolude non.guarentesd debt of the "social sector" oontraoted afterlMaroh 31, 1966 by Yugoslavia;
Exoludes Brazil, Barbados, Cuba and Haiti.
in-17"t"i't <1 r r rrrs,

- 185 -
particular source, but also a general hardening of the conditions governing official loans to the region: ECLA estimates show that, between 1966-1967 and 1968-1970, the average amortization period of official loans fell from 19.7 te 18.9 years and the grace period from 5.5 to 5.4 years, while the annual rete of interest rase from 4.2 to 5.2 per cent 14/. This state of affairs is quite different from that
prevailing in the developing world as a whole.
(c) Features of official assistance
In addition to the analysis of the trends in the net flow of official assistance to Latin America, there are some complementary aspects that
are worth looking into.
In the first place, a classification has been made showing the comparativa rank in 1968-1970 of 23 Latin American countries out of a total of 94 developing nations, as regards net official received considered as a proportion of imports of goods and services, as a proportion of the gross national product, and in terms of dollars per inhabitant. The first two indicators reveal that 16 of the 23 countries of the region rank in the half of the developing world that received proportionately less official assistance. Only in the case of the per capita indicator does Latin Americaes ranking correspond more or less to that of the developing world as a whole (see table 12). It seems
blatantly obvious, therefore, that the official assistance received by Latin America has not been particularly high compared with other developing areas: indeed, available data suggest quite the opposite.
Secondly, the distribution among DAC countries and credit agencies of the net official assistance granted to Latín America shows that, in 1960-1970, the United States, France, the V!orld Bank and the Inter-American Development Bank accounted for some 31 per cent of the total. The corresponding figure for 1960-1966 was 35 per cent, despite the fact 'that IDB's contribution was negativa during the period, as it was just beginning to build up its capital resources. The considerable subsequent increase in the assistance provided by IDB did not offset the sharp decline in net financing from the United States. The degree of concentration is considerably less merked in the developing world as a whole; moreover, in practice several DAC countries offer substantial official assistance to the rest of the third world - in contrast with the small amounts of such assistance which they channel to Latin America
(see tabla 13}. 14/ Soe ECLA, "Latin America and the Third Session of UNCTAD"
(E/CN.12/932/Add.1), p. 367. /Table 12

- 186 -
Table 12
LATIN AMERICA V: INDICATORS OF THE RELATIVE MAGNITUDE OF NET OPPICIAL ASSISTANCE, 1968-197n
(,Annual averages)
Proportion of importo of goods and services
Proportion of gross national product
Official assistance per capita
Percent- age
Rank y Percent- Rank
age Dollars Rank
Argentina -0.15 90 -0.01 89 -0.11 89 Barbados 1.15 86 1.02 77-78 4.48 58 Bolivia 24.27 20 5.88 25-26 8.83 31 Brazil 9.18 54 0.97 79 2.42 76 Colombia 20.33 30 2.83 48 8.78 32 Costa Rica 6.38 64 1.78 61 8.01 36 Chile 13.80 41 2.93 45 14.08 35 Ecuador 10.78 51 1.94 59 4.26 61-62 El Salvador 4.78 72 1.23 72 3.45 68 Guatemala 8.14 57 1.39 69 4.45 59 Guyana 12.12 45 6,63 21 22.56 9 Haiti 11.64 48 1.69 62 1,38 84.85 Honduras 11,60 49 3.63 40 9.44 3o Jamaica 5.97 67 2.62 50 12.03 19 Mexico 5.30 70 0.56 84-85 2.95 74 Nicaragua 11.74 47 3.31 44 12.25 18 Panana 4.88 71 1.98 5',-58 11,119 22 Paraguay 32.38 15 4.26 36-37 9.80 27 Peru 6.49 63 1.14 74 4.33 6o Dominioan Republic 19.43 31 4.42 33 12,83 17 Trinidad and Tobago 1.05 87 0.66 82 5.70 49 Uruguay 6.16 65 1.07 76 5.56 50 Venezuela 1,97 81 0.56 84-85 5.35 52-53
Summary of rank Number Number Number of Latina American of Percent-
of Percent- of
Percent- age
1-23 2 8.7 1 4.3 6 26.1 24-47 5 21.7 6 26.1 5 21.7 48-71 11 47.9 7 30.4 8 34.8 72-94 5 21.7 9 39.2 4 17.4
Total 2.3 100.0 2.2 100.0 22 100.0
Source: OECD, Development Assistance, 1971 Review (Paris, December 1971), table 20. Exoluding Cuba.
y Out of 94 developing oountries; N° 1 corresponda- to the highest proportion noted.
countries countries age age countries countries
/Table 13

-187-
Table 13
DISTRIBUTION AMONG DAC COUNTRIES AND CREDIT AGENCIES OF NET OFFICIAL ASSISTANCE
TO LATIN AMERICA AND DEVELOPING COUNTRIES AS A WHOLE,
1960-1966 AND 1968-1970
(Annual averages)
Australia
Latin America y All developing countries
1960-1966 1968-1970 1960-1966 1968-1970
- . 1.4 2.2
Austria 0.2 . 0.2 0.1
Belgium 0.1 0.5 1.3 1.2
Canada 1.6 0.9 1.5 2.9
Denmark - 0.2 - 0.4
United States 61.6 46.2 54.5 39.8
France 11.0 12.0 13.2 11.4
Italy - -0.5 1.2 1.4
Japan o.4 2.6 2.3 9.6
Norway - - - 0.2
Netherlands 1.5 2.8 o6 1.7
Portugal - - o„..6 0.7
United Kingdom 3.0 2.3 6.7 5.0
Federal Republiz of Germany 3.5 4.3 6.2 6.7
Sweden - 0.2 0.7
Switzerlal,d 1,0 - 0.1 0,2
Bilateral total 83.9 71.3 90.0 34.2
IBRD 13.3 11.7 4.3 3.9
IFC 0,7 1.0 0.2 o.6
IDA 0.7 1.4 2.7
IDB -1.0 10.8 -0.2 1.9
African Development Bank - - - -0.1
Asian Development Bank - - - -0.3
EEC 0.3 0.5 1.2 2.4
United Nations 2.8 4.0 3.1 4.7
Multilateral total 16.1 28.7 10.2 15.8
Overall total 100.0 100.0 100.0 100.0
Source: OECD, Development Assistanoe, 1971 Review (Paris, Dezember 1971), table 17.
( Including Cuba and various non-independent territories.
/The likelihood

- 188 -
The likelihood is that the relativo volume of United States direct net official assistance will continuo to.declíne in futuro, in line with that countryls aforementioned policy of reducing bilateral aid. This. prospect is especially significant for Latin America because of its close financial connexions with the United States. Reference will be made below to the possible trend of multilateral assistance from the United States, which is mainly provided through the Inter-American Development Bank.
As to bilateral official assistance from other DAC countries, the only members that registered any substantial increase between the two periods considerad were France, Japan, the Netherlands, the Feceral Republic of Germany and, to a lesser degree, Belgibm. Two countries - Canada and the United Kingdom - ruduced their relativo share significantly, while the combinad contribution of the remaining eight - Australia, Austria Denmark, Italy, Norway, Portugal, Sweden and Switzerland - continued to be nil in the case of Latin America, although the position of these countries was quite different as regards other parts of the developing world.
Tis state of affairs suggests certain possibilities for futuro action, in the sonso that the countries of the region should try to establish closer financial ties insofar as they are able and can afford to do so - with various DAC countries showing the most favcurable trends as regards the quantity and quality of direct official assistance. This does not mean, of course,•that they should not also try to improve their existing financial links with countries which have traditionally been their mejor source of loáns - quite apart from the fact that several of these are the largest members of DAC.
(d) Bilateral official assistance
Although no quantitativedata are available on certain specific features of bilateral official assistánce, Latin American'Governmehts have supplied ECLA with enough background information to give an idea of several important qualitative aspects.
In the first place, almost every Latin American country expressed the opinion that the procesl of negotiating this type of assistance was slow and depended upon a variety of circumstances oven when the necessary requirements had been properly met. They further pointed out that such
/assistance provided

-189-
assistance provided only partial financing for specific individual investment projects and that negotiations were just as slow in respect of projects that were clearly complementary te others that had already
been financed.
Moreover, a large majority of Latin American countries reported that one of the fundamental characteristics of bilateral official assistance is its extreme variability from one period te another and
the relatively short time for which it is granted. Assistance for
whole programmes has been granted only to very few countries and, generally speaking, has been on a yearly basis, thereby removing almost
any sense of continuity. Only one Latin American country indicated
that it was currently in contact with two European countries with a view to cbtaining assistance for a longer period. Furthermore, some countries pointed out that assistance for programmes has been tied to the acceptance and/or implementation of certain global economic policy mensures, and this has tended to complícate and, delay the necessary
negotiations.
As regards the tying of bilateral assistance, the countries of the region were unanimous in 5tressing that the utilization of bilateral loans was nearly always directly tied to the purchase of machinery and equipment from ths donor country. Only recently has a certain partial flexihility been introduced in the use of credits granted by a few rare industrialized countries, but this does not appear to reprssent the opening up of new prospecta in this direction. There was also a lnrge mensure of egreement to the effect that indirect or unofficial tying could have far-reaching effects, especially when the signing and/or oPeration of an agreement for partly untied bilateral assistance was dependent upon the employment of consultant enterprises from the donor country which, in the course of the project's exeaution, frequently recommended the purchase of machinery or equipment from that country. All these methods of tying credits increase the real cost of loans.
Finally, very few countries considered the shortage of specific investment projects to be a limiting factor of any real importance in
obtaining bilateral external assistance. it was noted, however, in
some cases that a bigger source of concern was the possibilitY that the offer of externa]. financial assistance te execute certain projects and not others might mean giving preference to projects which, from the national standpoint, were not of priority importance in promoting
economic and social development.
/(e) Multilateral

- 190 -
(e) Multilateral transfers
As we have already sean, the growth in net official assistance to Latin America during the 1960's and in 1970 and 1971 was basically due to the expansion of multilateral credits to the region, with IDO and the United Nations providing the most notable examples (see Cable 13).
In the eleven years between 1961 and 1971, IDO authorized loans for a total of 4,745 million dollars, 2,615 million of which had actually been disbursed by 31 December 1971, 37 per cent of the financing for these loans carne from its ordinary capital resources, 51 per cent from the Fund for Special Operations, 9 per cent from the Social Progress Trust Fund and the remaining 3 per cent from other resources. In the three-year period 1969-1971, the Bank authorized new loans at the reste of over 630 million dollars per year, and ín 1973 this rata is expected to reach around 900 million dollars 15/.
However, the likelihood of the Bankis operations expandirg as planned has been affected by the fact that only in December 1972 was the United States Government authorized by Congress to make the contribution of 1,000 million dollars to the increase in ths Fund for EpY.dal Operations approved in 1970 which under the original agreement, it was supposad to have nade between 30 June 1971 and 30 June 1973. This delay was responsible for a break in the continuity of expansion of the Bank, which found itself in a situation where its entire available special funda were comrnitted and it was obliged to depend more than usual on increases in its ordinary capital and, aboye all, on the internacional capital markets. Because of its high cost, this latter type of financing has meant that the annual rate of interest which IDB applies to its ordinary loans to Latin American countries has been over 8 per cent.
With one recent exception 16/, multilateral institutions have not granted Latin America any assistance for programmes; consequently, all resources have been usad to finance specific investment projects, with all the limitations that this implies. Some of the smaller countries made the interesting observation that this type of financing is particularly detrimental to them because many of their individual investment projects involve small amounts and multilateral agencies are
15/ See IDB, Annual Report, 1971, pp. 14-22.
16/ A loan of 60 million dollars which IBRD granted Colombia ín June 1972.
/therefore not

— 191 —
therefore not interested in studying and financing them. Assistance for programmes, on the other hand, would erable them to define a series of projects and sub—programmes which would bring the volume of assistance needed up to a more acceptable leve'.
In the opinion of the Colombian with the Consultative Group headed by insofar as the Group has apparently external financial assistance as well
Government, that countryls experience the World Bank has been positiva afforded greater and easier access to as more efficient co—ordination in
contracting new debts. Moreover, this system of organization would seem to have increased the possibility of obtaining assistance for programmes.
Most Latin American countries felt that the submission of requests for credits to multilateral institutions was a very long drawn—out bureaucratic process and pointed out that the period of negotiation ranged from one to three years — oven longer than bilateral negotiations. They also considered that the project—by—project requirements regarding the availability of counterpart funds, which are the main reason for the slowness of ncgotiations were often excessive. Some countries referred to the commitment commissions (payable on the balance of the credits not disbursed), no-tino that charges under this leading were very hígh, and proposed that commissions should be calculated, where necessary, on the basic of a projection of the disbursements previously agreed to between th9 institution and the debtor country.
The problem of tied assistance scarcely arises in connexion with multilateral credits, but some countries remarked that IDB special funds still carry strong pressure to purchase in the United States, since the use of funds to acquire goods in some other member country of the Bank, aithough permitted, entails fairly complicated administrativo work for each specific authorization.
One outctanding feature of the trend in the World Bankts credit activities during the financial years 1970/1971 and 1971/1972 was the increasing concentration of new credits among certain borrower countries. Compared with the accumulated balance of credits at 30 June 1970, for example, the last two years have shown a substantial increase in the proportion absorbed by one of the largar countries of the region, while that of three medium—sized countries has been substantially reduced. Moreover, five of the smaller countries did not conclude any new credit arrangements at all during these two years 17/. In 1970 and 1971, IDB distributed its new loaras
bewl.10~•■•••■
17/ See World Bank, Annual Report, 1970, 1971 and 1972.
/among Latin

-192-
among Latin American countries in a less concentrated manner than the
World Bank, thus following a trend that had become apparent previously. During the two years under consideration, however, there was a sharp drop in the amount and proportion of credits granted by IDO to one of the medium-sized countries - which had suffered similar treatment from IBRD
whereas another country from the same group increased.its share DF the total substantially 13/.
During the financial years 1970/1971 and 1971/1972, IDA authorized new loans for approximately 45 million dollars to fíve medium-sized Latín American countries, bringing the regiones share in the total velume of credits allocated by IDA to the developing world to around 3 por cent. In the middle of 1970, the corresponding figure was 5.5 per cent, and in 1965 it was over 8 per cent. It can thus be seen that IDA has peen cutting back its development credits to Latin America: indeed, SOM3 countries in the reglan have ceased altogether to receive ioans from that institution.
18/ See IDO, Annual Report, 1970 and 1971.
/O. SPECIAL
- 193 -
B. SPECIAL ASPECTS OF DEVELOPMENT FINANCING
1. The supselomenryjInancing scheme —1,.•0•1,MMISIS ,
Paragraph 51 of the International Development Strategy states the following: "In the context of the search for appropriate means for dealing
with the problom of disruption of development arising from adverso movements in the export proceeds of developing countries, the International Bank for Roconstruction and Development has been roquostod to pursue its efforts at working out a scheme of supplementary financing. Tho bank is invitod to give further consideration to tho adoption of supplementary financial measures at the earliest practicable opportunity". Only one
DAC country expressed any reservations on this paragraph.
Ever since the first session of UNCTAD, there have !poen recommendations that a scheme of this typo should be set up with a view to complementing the schomes designad to reduce the impact of shortfalls in tho export earnings of the developing countries caused by unforeseeable factors. Such shortfalls have a number of unfavourable effects on the growth enssibilities of thn develoOng countries. Little progreso has been made, however, rege,rding tho study and implementation of a supplementary financing scheme because the World Bank has stated on several occasions that it cannot commit itsolf to undertaking a study on the matter unless it has assurances that it will be providod with additional resources for this purposo. Tho Bank has also indicated that, in the light of tho consultations it has carried out, it would apocar that the developed countries would at test provide only very United amount of support for the idea of contriubting funds to a supplomentary financing scheme. Nevertheless, although this is the Bankgs general position, the President of the Bank has stated that tho World Bank Group would examine tho case of an unexpected shortfall in a doveloping country's income having regard to the particular circumstances with a view to determining whether its operatiens in the form of loans or othor transactions could be adaptad or modified in such a way as to hola tho country overcome its difficulties 19/.
The Group of 77 has asserted that tho Bank's position completely blocks any possibility of establishing the scheme, for additional funds can only be sought once a study has been mado giving a more detailed, alboit approximate, idea of how tho schen° would operate and the amount of resources it would requiro. In line with this position, the Group submitted a draft resolution to tho third session of UNCTAD which, after
01■1111~MIMeMi!
19/ Seo letter from President of IBRD to Secretary-General of UNCTAD
deted 4 May 1971. /a great

— 194 —
a great deal of negctiation was eventually adopted without objection and without a vote as resolution 55 (III). Several industrializad countries (Australia, Canada, France, Italy and the United States) stated for the record, however, that they would have abstained had the resolution been formally votad upon. Furthermore, during discussions at the third session of UNCTAD, the representativas of the World Bank reiterated what they had said on several earlier occasions, so that there is scant likelihood of this initiative being brought to fruition in the neer futura.
The case—by—case formula of the Bank would appear to be clearly inadequate and inflexible, for it could only be implemented subject to a certain degree of mobility as regards the funds destinad for projects or programmes in the developing countries that are already being financed by the Bank. The degree of flexibility could of course be largar where countries were receiving loans from the Bank for fairly largo—scale programes. As notad earlier, however, there are very few developing countries that have secured loans of this type (Colombia is one example).
For Latin Arerica, as for the other developing regions, a supplementary financing scheme is of great importance, because the exports of the countries of the region have been and still are subject te unforesaeable fluctuations. In this connexion, it should be noted that even during 1960-1971, when Latin America's exports of goods and services grew fairly steadily, there were a number of occasions when individual countries' exports dropped by more than 5 per cent between one year and the next. This happened in two of the largar countries, in two of the medium—sized countries, and in seven of the smaller countries (sea tabla 14). Although in most cases recovery was reasonably quick, there were so some adversa effects on the domestic economies of these countries which could be prevented in the futura if supplementary assistance were available from the World Bank.
2. Establishment of a link between the allodation of special drawing rlghts and the Provision of edditional development finance
10.1mblawres
for developing countries
Paragraph 52 of the International Development Strategy states the following: "As soon as adequate experience is available on the working of the scheme of Special Drawing Rights, serious consideration will be given to the possibility of the establishment of a link between the allocation of new reserve assets under the scheme and the provision of
¡Tabla 14

Nrsig • -I I
O\
ri
Co
O CO
e-4
a\ N 1.... Cr\ 0 ON (o .7 1",.. L'',. ON .‘,... t" r-4
04 el
c0 co \ID r4
O 1." N
ri ).0 N CV 04 1,11
LC% t." ts, 0.1 COM ri ° Cl 0 CM e-N g 1.4% ‘0 O L.r)
Ni C4 CV 1-1 ♦ CV t"
1:N CV ri 1.11
U\ el CO cr,
r4 CC) N Cr \
CV e-4 1.4 (P. \O CI`. CO CV U \ CV IP
co
0 \ O er.4 \ O 01 0 0
CO C4
rt \ Ce 0 ri \ co. in"
O\11' \
NI N c4 r-4 O\
O. 0N O 0,1 CO
C1 CV \O 1 N N e-1 04
1-4 Cr, N
L'", r-4
4-4 CO L"
r-4
co CNI
04 1-^1 04 0 r4 I el 1.0 0-■1 OD CT,
J,..!
Ñ- ,0 04 O -3` co54
CV c4 r-i CN 19 s4:
CO (NI c0 CN t''s •e'•-•
NI NI ISNI e-4 e-4 N Cr\
5 p
er c
ent in
one
or
mo
re y
ears
.
• CD CO O o •r/ E -P
4-4
-P
r-4
o re-e o -P 04.4 0
0 0 ri
1-4 d
o
-P O .4
03 o
-r4 W
-P
;I
o o -al
shor
tfa
lls
- 195 -
31 e.
co .3"
.3" • •
CO
C1 cz.-4 COc4 LO'
oa -91 O\
CN 1-4 O 0-%
•-4 r4 01 -3*
CtD co \
cv N 04
csi er,
04 Cl e-4
Cr, Irc O Cr\ r-I
Es& N in, CO
;-/-
CV e \ cIrt, UN u- \
C4 '‘.0 CV 0's
ri
-0 1 \O
c0
o
U\ 411 04
C4 Cr,
•••
° I " c0 \O CV 'S" co ,-4 o0
CV C \ --3- ...T rs. c4 cO. CN \0 , ri 'O CV CV ri r4 .d" r4 CV
CO1.1 I" c4 c'.'
01 Q ,-i ■-.4 CN c4 Cl N t" 1"... 00 O
-7-
csi us.1 CV 0-N r-4
CN O\ T Cr, N C0c C.\ 0\ ou.„ \ o 74
ri Ñ \ r.4 I" CV co N e, co c0
c4 O r --4" r-4 tr,,
4,, C•4
\ O e-4 CV
•C'
04 0 "N
\ I\ Z-3" \O `43 0 \ CO \D 1.21 r-I \
it11 rt .2"
Cr'• CO
05 1~ 0 rt
UN 011
CV C4
\ O
`.0 CS\ r-1
NI -.3- O tr. O u". co sz) co O\ Ir, co
r4 r•I C C•1 .7.3". \ O I O ers O\ O c'21 11 ,49 etC'1'41\ 9,4 1111 _II:- cs,
ri ri e-4 CV C4
e-4 1-4
e-4
\ Ce'N
ri 0 \
-3- N N N -31 CM N, 1
O\ 01 ,--t I O\ \O csa en .-§ \ 0 c0 CN cs. O\ cm , O ..d- \ o N CN r4 e-4 I"
r-1 1-4 +.0 ir, O r4
c0 r4 ri
•ss. Es, E.,„ 1-0,, tr. \Q \ 0 \ Cut • C1 L".
'0 1. O Cs1 ,í U1
r4 e-1 r4 -T CV CV
\Or-1 ri tr‘ \ n c0
ri crs tx,„ cr■
'. CO CO O
•- 1"---
r-I CV e1 O O Lt. el \IP
C) 0 4 ONO
N CO ri e-4 e-4 1-1 01 CO UN O CN
CO LC \ O G" O\ O c4
rl O
c0 uN uN O \
1-1 1-1
t..N .^4 csá 01 co
N-1 N C> I
,4 U\1-4 r-I
C4 -4- r-Z••••
i Cn ■-1 r o
01 .."11
O O O t...3
-IV .1 d T. ri 0 -P .0
O E.
Pte d o
O 03 O .0 ni
'11 U .-I
O 5. "al 11 Pll 5 ,
5 "ai E. al -....„ 0 sal 1
-ri -■-■ N -11 ...,e1 . el -P
o O O
d M S. >
o di Tde r-4 aill sal
cd '2 %) d 5 d
c)
+) 4-1 O A 0 '0 rt a ori 1. 0 1 Ea CD C4 O d d .- al a) d E %) ..54 .1 N-I
r.. ,--1 tas 5 ' Id •r:C LO •cs c.., 0 O. > 0 PC1 P9 0,0 r.50 c54 1 cl il ] 1 Z"Icl 1 11:°3 glIhO El 14
N •rl El c, r4 O A .,-4
U cd >1 O ■-,-1 ,j Le rt "-I 0 S. 0 O e...1 Cff
CI) 1
d
4., -P O
• cil • E4 U
se\
: I aN
\O ON
1,.... ..N.... CO 5-4 O i ‘4,) oN1 oo t... Cl ',O l ,,,o ).0
5-4 (.411 .-4 1-4 CV 1.41I
CI1 CN CV rH r-1 ri CV CV
a\ N a \ a' o 01 a ejr‘ \ t., 4.0 -73 Ol
\ r-I •-; 04 r4
M tc, t■ O CO CO
ON o N CN \ C4 O cv
1-4 r-4 r-4 ..d"N 4",
1-4
Cr \ts. MC,S3 rs, rl Cr \
O
.0 Cr
r4
O O \
.7 r4 ■0 CO a 'N c•
r-I I cc,
1 tr, cs!
1 oN. cn. ir\ CO O 1 CV -3- 0,, e-1 1..11
.-4 r-I ..d"
r4 \ GO ChN c10 Lestzl, E t"1-3-
N N
5-4 _I-n .31‘
o
o
1 O
ri
1-1
ti) C1,
d
1 r-4 f=1 0 o
I- E. O o.
O Z9
1-4
C.1
z 1-1

- 196 -
additional development finance for the benefit of all developing countries. The question will, in any case, be exarnined before the allocation of Special Drawing Rights in 1972." Most of the industrialized countries expressed reservations on this paragraph, so that their approval of it is formal rather than substantive. The Group of 77, however, indicated, in an official joint declaration that it attached high priority to the establishment of such a link.
After the adoption of the International Development Strategy, the importance of the link mechanism was further heightened as a result of the crisis of the international monetary system and the suggestions made for its reform. In this latter respect, the current trend is to increase the relative importance of Special Drawing Rights as the base curroncy of the system, in addition to which the first allocation of SDR, was completad in 1972, and a further allocation is due in 1973 20/.
In this broader context, the establishment of the link mechanism has been wbject of wide-rarging negotiations between the third world and the developed countries as a group, notably at the third session of UNCTAD and at the recent meetJng of the Board of Governors of the IMF heid in Washington in September 1972. On both these occesians, it seemed that suveral developed countries are, to some extent at least, softening their position vis-á-vis the link, and there hes been soma improvement in the prospects for identifying and approving a viable system for its operation. It appears, however, that there is still a long way to go before the link becomes a reality, irrespective of the formula that is eventually adopted.
The arguments advanced in favour of the establishment of the link are toa well known to require repetition here. It may be useful, however, to look in detail at some of the main issues that have gradually emerged in the negotiations and with respect to which the recently established Group of 20 has a very important role.
First of all, it is clear that the link must form an integral part of the new monetary system from the moment that this system entera into operation. In this respect, the granting of assistance to the developing countries in the form of Special Drawing Rights would substantially help
•10MCV ■•■■•■■••••••■■•■•■■11i....
20/ According to recent reports, however, the Board of Directors of IMF has been unable to reach agreement regarding the new allocations, so that they have been suspended for the time being.
/to bring

- 197 -
to bring about a regular, adequate and continuous rise in world liquidity, which should be. in step with the dynamic and more balanced growth of world trade, albeit without generating any potential inflationary effects. It may be noted that assistance in the form of SDRs would make it easier to handle the trade surpluses of the developed countries and the trade deficits of the developing countries, for it would provide the latter with more suitable resources to finance their deficits.
Secondly, there has been a reaffirmation of the original idea that the financial assistance given through the establishment and operation of the link should consist of additional developrnent finance. This means
that the resources provided under the link must be additional to the 1 per cent and 0.7 per cent targots set in paragraphs 42 and 43 of the
International Development Strategy.
Thirdly, although a number of types of institutional arrangenents have been suggested for the application of the link, thare'seems to be widespread support for the idea that whatever al-rangemonts are decided upon (some of these possibilities envisage resources flowino towards multilateral credit institutions) the logical course ís for the new fundo made available to be distributed in a belanced mannor emong the varibus developing countrios. Since Latin America, as nuted esrlier, has suffered serious limitations as regards access to official development assistance, the early availability of this kind of "soft" assistance is of great importance.
Fourthly, it is crystal clear that the establishment of the link is something quite separate from the very necessary modification of the procedure used so far for the regular allocation of SDRs. The allocations made in 1970-1972 were based on the size of each country's IMF quota, the result being a pattern of proportional distribution which gave comparatively more SDRs to many countries that probably had least need for them, and vice versa. The future method of allocation could
be changed by modifying the quotas of the developing countries in the IMF, or by basing regular allocations of SDRs on more than simply the proportions set by the quotas, or by a combination of both approaches.
Lastly, the impression sometimos gained that the amount of the additional resources channelled through the link would in any case be negligible is gradually disappearing. If it is assumed that, at current values, such resources would amount to not less than 1,000 million dollars
/per year,
-198-
per year 21/, then it suffices to contrast this figure - which moreover represents grant-like aid - with the current level of official development assistance, namely 7,500 million, to show what kind of a contribution such additional assistance could make. This contribution, moreover, is potentially even greater if it is borne in mind that the new SDRs channelled through the link would be highly flexible and inexpensive financial resources, and that the futura needs for the creation of SDRs are likely to grow rapidly as the rapid growth of world trade gradually reduces the role of the dallar as the universally accepted means of payment.
To give a clearer idea of the background against which the link would have to opereta, table 15 sets out information on the allacation and use of SDRs during the period 1970-1972 (sea table 15). The developing countries received only one-quarter of the total allocated during this period, and by 31 July 1972 they had made use of a net total of 800 million dollars worth of SDRs, Latin America's share being less than one-tenth of the total allocated SDRs, of which it had used less than 270 million dollars worth by the data in question. The United
States and the United Kingdom, however, received allocations of SDRs that together amounted to more than 35 per cent of the total, and up to the
same date they had made use of 940 million dollars worth.
In other words, the SOR mechanism is operating rather strangely in that the twa industrialized countries whose currencies are the basis of the existing monetary system have been the countries that have benefitted most from it. Moreover, the amount of resources these countries made use of was greater than the amount usad by the entire third world. This situation - which is mainly attributable to the continuing balance-of-payments deficits of the United States and the United Kingdom - does not seem at all equitable, and hence it is to be hoped that the establishment of the link will be one way of helping to counteract such situations in the future.
21/ This figure is calculated on the basis of a total normal expansion of the world supply of SDRs by approximately 4,000 million. In the
period 1970-1972, the annual average of allocations was 3,170 million.
/Table 15

- 199 -
Tabla 15 SPECIAL DRAWING amos: STRUCTURE OF ALLOCATION AND USE IN 1970-1972
(As of 91 July of SDRs)
Allocations Not acquisition or net use(-)
Percentage net aoquisition or net use (-)
Percentage sbare of allocation of SDRs
Industrial countries 6 177.7 350.6 6 66.3 24.6
United States 2 294.0 -490.9 -21 10.8
United Kingdom 1 006.3 -448.3 -45 23.0
Industrial Europe á/ 2 141.4 1 136.0 53 3.8
Canada 358.6 106.7 30 4.1
Japan 377.4 47.1 12
Other developed countries / 789.1 -147.1 -19 8.5
Developing ecuntries 2 348.0 -805.6 -34 25.2
Total 9 314.8 -602.1d - 100.0
Latin America 879.1 -266.8 -31 9.4
Argentina 152,5 -104.0 -68 -
Barbados 2.8 - O - -
Bolivia 12.8 -8.6 .67
Brazil 152.5 4.5 3 - -
Colombia 54.4 -39.0 -72
Costa Rica 11.0 -7.0 -64 -
chile 54.7 .54.7 100 - -
Ecuador 11.2 -4.5 -40 -
El Salvador 11.7 -7.9 -68
Guatemala 11.9 -0.2 -2 -
Guyana 6.8 -2.5 -38 -
Haiti 6.6 -3.5 -53 -
Honduras 8.5 -3.1 -36
Jamaica 17.7 0.7 4 -
- Mexico 124.2 3.5 3
Nicaragua 8.9 -2.6 -29 - ..
Panama 12.4 -9.6 -78 -
Paraguay 6.6 - o
Peru 40.5 0.5 1 ..•
Dominican Republic 14.5 -7.6 -52 -
Trinidad and Tobago 20.8 -7.0 -34 -
Uruguay 23.9 20.1 -84 - -
Venezuela 112.3 5.8 5
Source: International Monetary Fund, International Financial Statistics, Vol. XXV, N° 9, September 1972, tabla 1.
Y Austria, Belgium, Denmark, Federal Republic of Germany, France, Italy, Netherlands, Norway, Sweden and
Switzerland. I/ Australia, Finland, Greece, Iceland, Ireland, New Zealand, Portugal, South Africa, Spain, Turkey and Y ugoslavia. 1 As of 31 July 1972 this amount was held by the IMF, as net acquisitions amounted to a total of 1 345 millions
SDRs, while net use come to a total of 1947 *1 tillion.
/C. THE

— 200 —
C. THE FROBLEM OF THE EXTERNAL DEBT
1. ansziLJIllsw22:11. Paragraph 40 of the International Development Strategy defines various
línea of action of a fairly general nature designad to case the difficulties encountered by the developing countries as a result of the growing burden of their external debt. The paragraph states that "Arrangements for forecasting, and if possible, forestalling debt crises will be ímproved. Developed countries will help in preventing such crises by providing assistance on appropiate terms and conditions, and developing ceuntriee by undertaking sound policies of debt management. Where difficulties do arise, the countries concerned will stand ready to deal reasonably with them within the framework of an appropriate forum in co—operation with the international institutions concerned, drawing upen the full range of the available methods innluding, as may be required, measures such as arrangements for reseheduling and refinancing of existing debts on approprinte terms and conditions". The developed countries approved this paragraph without reservations.
Since the adoption of the International Development Strategy, and particularly at UNCTAD III, the developing countries have taken up a position rather different from, and of greater scope than, that agreed upen in the International Development Strategy, since they feel that the problem of their indebtedness has become more serious and more generalized in the last few years and that the prospecte for the 1970es are even worse. The Group of 77 therefore presentad a draft resolution on this subject at UNCTAD IZZo
the main points being: (a) debt relief should not be limited to crisis situations, but should be tackled in the light of the development plans and asaistance requirements of the developing countries; (b) some general norms should be established for the application, as necessary, of measures to alleviate the burden of debt, and (c) it would be appropriate'to create a special body within the machinery of UNCTAD in order to find practical solutions to the debt servicing problems of the developing countries". In the discubsions during the Conference, the majority of the developed countries manifested their disagreement with'the basic aspects of the draft resolution, maintaining that the problem is not a general ene and should be dealt with, in very special crisis situations, through discussions and the forums which operate for such purposes. As no consensus was reached on the terms of the resolution, the draft of the Group of 77 was finally adoptad as resolution 59 (III), but it was voted against by a majority of the member countries of DAC with the abstention of the rest and of various socíalist countries. The manner in which this resolution was adopted obviously gives
/it very

-2C1 -
it very little practical value, but its importance lies ín the fact that it gave the Third World an opportunity to accumulate criteria on a position which it may continua to negotiate in the futura with the developed
countries.
2. .112£29.1.11111221111.11.2.1.=.11/.12ELUU countries
In 1970, the outstanding external public debt (spent and unspent) of 30 developing countries increased by around 11 per cent 21/; between 1965 and 1070 the annual average rete of increase was approximately 12 per cent. Indeed, the 1970 increase was actually 15 per cent, if the end-of-year balance is expressed at the new exchange ratas in force on 31 December 1971, so the unfavourable influence on the external debt of the exchange rata realignrnentsat the end of 1971 is obvious. It may be observad from a review of the structure of the debt by type of credit or that between 1967 and 1970 the share of official assistance fell slightly, owing exclusively to the drop in bilateral assistance, since the share of multilateral assistance increased. In the increase recordad in the figure for the prívate debt, the rapid increase in indebtedness to banks is of particular note.(see tabla 16).
As regards Latin America, the rete of increase in the public debt during the past few years has been less than that for the developing countries as a whole: in 1970 and between 1965 and 1970 the annual rata was less than 10 per tent. In addition ta this, the share of official assistance in the total debt is considerably less than the average for the Third World in 1970 it was 59.6 per cent compared with an average of 71.7 per cent for the developing countries as a group. The drop between 1967 and 1970 ín the share of bilateral assistance in the regiontsindebtedness was particularlv significant: it fell from 39.4 per cent to 34.1 per cent of the total (seo tabla 16 and 17). In other words, the structural tendencias of the Latín American debt confirm what was indicated aboye as regards the growing limitations which Latín America is encountering in trying to gain access to official assistance, particularly that provided diroctly by the developed countries.
22/ The data on the external public debt are those of the World Bank. Data for 1971 are not yet available, but the Bank has stated that it
is improbable that the changes which took place between 1970 and 1971 have modified to any great extent the tendencies recordad up to 1070, in the light of the information on financial flows for the most recent period available.
¡Tabla 16

- 202 - Tabla 16
80 DEVELOPING COUNTRIES: EXTERNAL PUBLIC DEBT OUTSTANDING BY ÁREA, 1965.1970 of dollars)
December 31, 1967 Bilateral official Multilateral Privatt Suppliers Banks Other
December 31, 1968 Bilateral official Multilateral Private Suppliers Bank Other
Deoember 31, 1969 Bilateral offioial Multilateral Private Suppliers Banks Other
December 31, 1970 Bilateral offioial Multilateral Prívate
Suppliers Hanks Other
3 895.4 2 178.9 8 854.7 4 096.5 12 228.1 37 402.4 -
4 347.7 2 514.0 10 517.5 4 324.4 13 181.0 42 o86.8 -
5 289.7 3 677.9 11 294.9 5 115.8 14 743.1 48 302.5 -
6 295.4 4 364.4 12 666.4 5 601.0 16 368.9 54 314.6 -
7 776.4 5 017.8 13 653.6 6 367.5 17 671.0 6o 174.1 .
9 195.3 5 732.8 14 741.6 6 963.2 19 372.1 66 698.52( -
6 738.1 3 909.2 11 847,9 5 165.5 15 331.6 5o 617.8 -
2 750.2 1 560.5 8 264.1 3 104.6 5 808.4 26 522.8 54.9
727.4 367.2 2 284.9 879.6 3 279.0 8 584.0 17.8
1 074.7 1 348.3 638.8 604.1 628.9 2 655.7 6 950.6 14.4
281,4 107.9 387.8 122.8 215.4 1 272.6 2 387.3 4.9
744.o 356.0 723.6 19.0 287.3 1 728.0 3 857.8 8.o
5 485.5 3 317.4 1 943.5 9 323.3 3 197.8 6 242.6 29 510.1 54.3
1 282.9 867.0 381.7 2 465.6 1 0107 3 868.2 9 876.9 18.2
1 161.1 1 617.5 769.6 707.5 557.6 2 684.2 7 497.4 13.8
349.7 149.9 448.5 154.4 469.9 1 495.7 3 068.1 5.7
739.4 343.5 821.0 15.7 365.0 2 077.5 4 362.1 8.0
5 845.5 3 973.5 2 143.0 10 019.6 3 6o4.6 6 541.2 32 127.4 53.4
1 662.8 1 221.4 455.2 2 717.4 1 165.6 4 272.0 11 494.4 19.1
1 053.8 1 867.6 826.2 749.9 543.1 2 873.4 7 914.0 13.2
403.0 264.6 673.5 153.9 674.7 1 744.9 3 914.5 6.5
722.9 449.3 919.8 12,8 379.5 2 239.5 4 723.8 7.8
6 052.4 4 820.5 2 179.7 lo 766.1 3 816.0 6 612.8 34 247.5 51.3
2 011.3 1 686.o 590.9 3 012.8 1 390.2 4 937.0 13 628.2 20.4
1 208.0 1 753.5 887.6 787.7 484.5 3 271.1 8 392.4 12.6
425.9 491.7 967.9 165.6 875.3 1 977.8 4 904.2 7.4
995.9 443.6 1 106,7 9.3 397.2 2 573.5 5 526.2 8.3
Africa
Total debt outstanding end of year 1965
6 148.8 1966
7 202.2 1967
8 181.0 1968
9 018.6 1969 9 688.o 1970 10 693.5 1970(disbursement over) 7 625.5
Debt outstanding by type of creditor
East Middle Asia east lí
South Asia
Southern Latín Europed
America Total Total
(pernent- age)
5 035.0 1 045.9
Source: World Bank, Annual Report 1972, tabla 4. kote: Usos moy not add to totals due to rounding. Includes the oountries listad below.
Africa: Botswana, Burundi, Cameroon, Central African Republio, Chad, Dahomey, Egypt, Ethiopia, Gabon, Ghana, Guinea, Ivory Coast, Kenya, Lesotho, Liberia, Malagasy Republio, Malawi, Mali, Mauritania, Hauritius, Morocco, Niger, Nigeria, Rwanda, Senegal, Sierra Leone, Somalia, Southern Rhodesia, Sudan, Swaziland, Tanzania, Togo, Tunicia, Uganda, Upper Volta, Zaire, Zambia, and the East African Communitcy. EastAsia: Indonesia, Malasya, Philippines, Republio of China, Republic of Korea, Singapore, Thailand. Middle East: Iran, Iraq, Israel, Jordan, Syrian Arab Republio. South Asia: Afghanistan, Ceylbn, India Pakistan (including what then mas East Pakistan). Southern Europe: Cyprus, Greeoe, Malta, Spain,
India, YngIslavia. Latín America: Arcentina, Bolivia, Brun, Chile, Colombia, Costa Rica, Dominicen Rtrublic, Ecuador, El Salvador, Guatemala, Guyana, Honduras, Jamaica, Maxioo Nicaragua, Panana, Paraguay, Peru, Trinidad and Tobago, Uruguay, Venezuela. Exaludes Barloados, Cuba and Haiti.
1 Does not include publioly-guaranteed private debt of the Philippines Estimated at 600 million dollars in 1970; Does not inolude undisbursed portion of the debt of Israel; Y Does not include non-guaranteed debt of the "social sector" of Yugoslavia contrastad atter Maroh 31, 1966;Y Debt outstanding of Brazil inoludes some non• guara Leed debt of the private sector to suppliers; exoludes the undisbursed portion of suppliersloredits and of bilateral official loaras except for those owed to the U.S. Government. It exoludes financial (medita whioh are mostly to the private seotor; 2/ At 31 December 1971 «chango ratee this corresponde to 69 102.9 million dollars.
/Tabla 17

- 203 -
Tabla 17
LATIN AMERICA: EXTERNAL PUBLIC DEBT BY COUNTRY AND TYPE OF CREDITOR, AS AT 31 DECEMBER 1970
(Millions of doliera)
Disbursed portion only
Inoiudes undisbursed portion
Total Bilateral official
Multila- teral
Prívate financing
Suppliers Banks Other
Total Latin America 15 331.6 19 372.1 6 612,8 4 937.0 3 271.1 1 977.8 2 573.5 488.4
Argentina 2 108.2 2 457.3 484,6 534.8 838.1 111.4
Bolivia 459.3 529.2 273.3 54.5 49.4 1.5 150.5
Brazil 1/ 2 982‘3 3 808.5 1 926.5 934.1 621.9 - 326.o
Chile 2 004.6 2 503.4 1101.6 243.1 534.5 366.3 257.9
Colombia 1 229.5 1 720.4 778.0 713.2 111.0 63.7 54.5
Costa Rica 124,3 216.8 76.2 105.2 5.4 18.0 11.9
Dominican Republic 226.8 281.6 224.3 28.4 19.7 9.3 - Ecuador 199.5 337.1 117.2 80.9 107.2 12.7 19.0
El Salvador 86.1 119.7 43.7 60.6 - 14.4 1.0
Guatemala 109.0 176.1 63.3 50.4 3.6 42.7 16.0
Guyana 70.2 113.0 93.0 13.0 .. .. 6.9
Honduras 85.6 1389 38.3 96.9 3.8 - .
Jamaica 136.0 179.6 45.5 45.6 - 214.0 64.6
Mexico 3 252.1 3 791.2 538.6 1 116.7 486.7 830.7 818.6
Nicaragua 146.0 223.8 74.o 80.1 23.6 44.0 2.1
Panama 156.3 234.4 89.8 52.1 17.2 5.8 69.5
Paraguay 96.8 142.4 63.1 44.7 32.1 o,6 1.8
Peru 871.9 1 184.4 267.8 214.1 362.3 125.8 214.5
Trinidad and Tobago 67.8 90.0 24,6 41.4 4.4 5.9 13.6
Uruguay 239.4 318.1 112.4 104.5 23.9 6o.8 16.6
Venezuela 680.0 806.1 176.8 322.8 26.3 240.1 40.1
Total Latin America
100.0 39.4 22.3 184 8.6 11.7 (percentages) 1967 1970 100.0 34.1 25.5 16.9 10.2 13.3
Source: World Bank, Annus' Report 1972, tabla 5. Inoludes some non-guaranteed debt of the private sector to suppliers and excludes the undisbursed portion of
suppliers' credits and of bilateral official loan exeept for tiloso owed to the United States Government.
Also excludes financial (n'edita, mostly to the private sector.
/The net

- 204 -
The net flow of external loaras and grants to the developing countries remained relatively stable between 1967 and 1970, while the net transfers 23/ dropped by 3 per cent. This occurred - despite the fact that during the same period the growing outstanding debt made possible loan withdrawals which in 1970 amounted to around 3,000 million dollars more than in 1967 -because of the drop recorded in grants and the sharp increase in debt servicing, particular payments of interest. It can thus be seen that in the Third World the repercussions of the difficulties stemming from an inadeouate flow of official assistance and from the rapid accelaration of vihat is usually known as the spiral of indebtedness have been very considerabl (sea tabla lo).
In Latin America a phenomenon similar to that recorded in all the developing countries has occurred, but with an important aggravating factor. The net transfers of resources represent a relatively low percentage of total expenditure (around one-third, in comparison with 55 per cent for the rest of the developing world), firstly because the grant element is relatively small compared with the total inflow and secondly because Latin AmeriCals coefficient of debt servicing is high comparad with the total indebtedness. It may be noted in this connexion, for example, that in 1970 this coefficient (calculated on the debt outstanding at the end of 1969) was around 15 per cent for Latín America compared with slightly more than 6 per cent for the other developing countries as a whole. The great differenc between these two percentages shows in its true light the impact of the unfavourable average conditions under which the external debt of the region is contracted.
In recent years, the problem of debt servicing has tended to become generalizad among the Latín American countries. A glance at the evolution of une indicator (i.e., the ratio between amortization and interest payments and exports of goods and services) shows that in 1970 it was Glose to or more than 10 per cent in twelve countries (Argentina, Bolivia, Brazil, Colombia, Costa Rica, Chile, Ecuador, Mexico, Nicaragua, Paraguay, Peru and Uruguay), while in 1965 only severa countries viere in this situation. Moreover, during the period 1965-1970 the debt-servicing percentage in five countries (Argentina, Brazil, Chile, Mexico and Uruguay) was around 20 per cent (sea tabla 19).
23/ These are calculated by deducting the interest from the net flow.
/Table 13

- 205 - Tabla 18
EXTERNAL RESOURCE PLOWS AND SERVICE PAYMENTS ON EXTERNAL PUBLIC DEBT, 1965-1970
of dallara)
WaYnrsements Debt servios Net
flow lit Net
transfer Y Ares and year Roan
Orante and grant-like
Total AMorthe zation
Interest Total
Atrios
2 2 2 2 2 1
861.7 731.9 755.9 830.1 846.3 699.0
363.4 308.1 394.7 427.2 368.3 351.3
195.0.215 77.8 64.9 70.6 79.0
827.3 860.0 777.9 519.9 340.0 340.4
61.4 38.3 50.3 47.7 57.7
396.5 380.3 373.8 404.1 483.3 358.3
705.2 440.0 430.4 293.9 166.2 887.9
-7.0
1 595.1 1 428.5 1 566.6 1 658.4 1 635.5 2 029.4
872.3 794.5
1 203.5 1 410.7 1 717.1 1 536.0
551.7 516.6 639.9966.8 800.1 627.4
2 177.7 2 143.4 2 413.7 2 129.9 1 832.8 1 929.7
666.9 803.5 835.8 926.3
1 061.5 999.7
2 528.6 2 545.7 3 085.9 3 127.0 3 606.5 3 837.9
8 392.1 8 232.2 9 745.4
10 219.0 lo 653.5 11 160.2
5.9
1 1 1 1 1 1
2 2 2 3 3 4
Middle east
301.4308.9 285.6 409.7 473.9 553.5
155.1 178.5 205.3 206 9 277.4 443.9
220.3 235.9 168.3 252.6 355.4 382.6
231.1 279.4344,6 367.6 428.3 466.4
346.8 340.7 326.2 359.9365.6 472.5
297.5 4744 545.2 656.9 646.8 792.5
552.3 817.5 875.3 253.4 547.4 111.5
,10.0
165.8
65 17::3 186.5
234,3
38.5 46.754.1
109.4792 170.3
47.0
2:81.7 96.1 96.6
157.6 188.6 216.1 227.4 260.6
21281219i1.°13
142.7 176.3
423.8 453.4 512.8 554.0 599.6 767.5
924.9 1 013.8 1 136.4 1 271.7 1 450.1 1 778.0
14.0
1 1 2 2 2 2
3 3 4 4 4 5
467.2 477.4 460.9 596.2 681.9 787.8
193.6 225.2 259.4 286.1 386.8 614.2
267.3 286.4 229.6334.3
119.:
388.7 468.0 56047 595.0 688.9 746.4
439.0 446.7 443.0 502.649
701.8
721.3 927.4 058.0 210.9 246.4 560.0
477.1 831.2 011.7 525.1 997.4 889.5
11.1
208.0
1 1 1 1 1 1
1 1 1
1 1 2 1 1 1
1 1 1 1 1 2
5 5 6 6 7 7
293.7 119.6 281.0 248.7 161.6 475.9
717.2 616.0 998.2 203.8 439.7 092.1
331.4
241.;..75 714.2 44,6 444.8
946.6 864.0 069.1 762.3 404.5 463.4
320.1
45129:: 566.4 696.0
::::: 071.7 540.7 470.1 959.7 045.4
839.9 414.8 870.1 965.5 106.1 048.7
-
1
1 1
1
1 1
1 1 1 1 1 1
1
1 1
4 4 5 5 5 5
127.9 951.1 105.7 062.2 953.6 241.6
678.7 569.3 944.1 124.6 330.3 921.8
284.4 230.2
11341.1 348.1
789.0 675.4 853.0 534.9 143.9 183.3
227.9 356.8 392.8
1167 297.9
807.2 618.3 091:91
360.1 277.9
915.0 401.0 733.7 693.9 656.1 270.6
-
1965 733.4 1966 696.6 1967 810.7 1968 828.3 1969 789.2 1970 1 330.4
East Asith 11/
1965 508.9 1966 486.4 1967 808.8 1968 983.5 1969 1 348.8 1970 1 184.7
1965 356.7 1966 395.1 1967 562.1 1968 901.9 1969 729.5 1970 748.4
South Asia
1965 1 350.4 1966 i 283.4 1967 1 635.8 1968 1 6104 1969 1 492.8 1974 1 589.3
Southern Europe /
1965 605.5 1966 765.2 1967 785.5 1966 878.6 1969 1 003.8 1970 939.9
Latín Amerioa / 1965 2 132.1 1966 2 165.4 1967 2 712.1 1968 2 722.8 1969 3 123.2 1970 3 479.6
80 Developing countries 1965 5 686.9 1966 5 792.2 1967 7 315.0 1968 7 925.1 1911 8 487.3 1970 9 272.3
Annual rete of growth average 1965-1970 10.3
Source: World Bank, Annual Report 1972, table 8 21/ Urente consist of grant and grant-like oontributions by DAC countries and grants by multilateral agencies as
oompiled by OECD, as well as disbursements by the Inter-Amerioan Development Bank on loans repayable in the
recipiente' ourrenoies. 17 Disbursements on loans, grants and grant-like loans minus amortization on loans. Y Net flow minus interest on loans. / Does not include publielp.guaranteed prívate debt of the Philippines. Y Does not include the non-guaranteed debt of the "social sector" of Yugoslavia oontraoted after Maroh 31, 1966. fi Service payments for Brazil include some nonguaranteed debt of the private sector to suppliers. Exoludes
Barbados, Cuba and Haiti. /Tabla 1.9

- 206 -
Tabla 19
LATIR AMERICA: SERVICE PAYMENTS ON EXTERNAL PUBLIC DEBT AS PER'ESTAGES OF EXPORTS OF GOODS AND SERVICES, 1965-1970
1965 1966 1967 1968 1969 1970
Argentina 20,4 25.4 26.7 27.1 23.5 20.9
Bolivia 4.8 4,8 5.8 5.6 5.7 10.3
Brasil 25.1 25.2 31.5 18.7 15.2 16.6
Chile 14.7 11.8 12.6 20.0 18.4 ...
Colombia 14.4 16.5 14.0 12.8 11.3 11,4
Costa Rica 10.1 11.9 11.8 11.9 10.7 9.8
Dominicas Republio 19,3 12.5 6.6 7.8 8.5 5.1 Ecuador 6.3 6.4 6.3 8.3 9.3 9.3 El Salvador 3.6 3.6 2.6 2.6 2.8 3.7 Guatemala 5.2 5.7 7.4 7.8 7.9 8.8
Guyana 4.1 3.9 3.7 4,6 3.5 3.1 Honduras 2.4 2.1 2.0 1.7 2.3 2.8 jnmnica 1.8 1.8 2.1 3.1 2,9 3.1 Mexico 24,7 21.2 21.5 25.1 22.3 22.7
Nicaragua 4.3 5.6 6.4 7.1 10.0 10.6 Panama a/ 2.5 2.3 2.3 2.5 2.5 7.4
Pare.guay 6.6 5.4 7.2 10.0 9.1 10,4 Peru 6.9 10.0 11.1 15.1 13.9 14,5
Trinidad and Tobago 1.9 2,0 1.9 1.5 2.1 2.1 Uruguay 6.7 12.3 19.5 19.1 18.9 22.5 V en azuela.. 1.8 2,6 2,0 2.0 2.0 2.8
Source: World Bank, Annual Report 1972, table 6.
Note: The debt service ratio is, by itself, a ratherinadequate indicator of the seriousness of a countryts debt problem. Mány other factors must also be considered, such as the stability and diversification of the countryYs export structure, the prospecto for futuro.growth, the extent te whioh importe can be redueed without adversely affeoting current production, the time-profile of the country's debt outstanding the size of foreign exchange reserves and avnilable compensatory financing facilities, and the debt service record of the country. For this reason, International comparisons of debt service ratios have only limited meaning.
/ Because of speoial monetary arrangements peculiar to countries such as these, the debt service ratio must be regardod with more than usual caution in oonsidering the cauntry's external financial situation,
/The projections

— 207 —
The projections of the service costs of the outstanding external public debt as at 31 December 1970 makes it possible to identify the repercussions which each of the areas makir the debt will have on debt servicing. In the three—year period 1971-1973, for example, the total owed by Latin America to private sources would account for more than 61 per cent of the service costs which would be paid during this period, while the actual amount owed to them would constitute around 40 per cent of the total debt. A similar imbalance was recordad for the whole group of the developing countries but at a lower level: 26 per cent of the outstanding debt generated 43 per cent of the service costs (sea tabla 20). The large—scale drain on external resources causad by the servicing of debts contracted with private sources will increase in the next few years if the developing world, and Latin America in particular, resort increasingly (as has been the case in the post) to this type of credit when adequate volumes of official development assistance are not available.
Since the developing world has continuad to increase its external debt on terms which do not permit of its receiving a growing net I'low — much less net transfers — of resources from abroad, it is understandable that in many countries the burden of debt servicing has reached such levels that it is difficult to obtain and allocate the foreign exchange resources neccssary to pay the amortization and interest costs due year, especially when these countries are subject to frequent extwnal and internal phenomena detrimentol to the level of their exporte, Ancther adverse factor is the fact that the amount of foreign exchanue avnilable for servicing the external debt is generally restricted by the rl-lcd to apply large amounts of resources to the remuneration of foreign in“astments.
3. Possible solutions to the .roblem of the external Hs'it PaollIMB
In the face of this general tendency, which occurs with varying degrees of severity in every developing country, the Group of 77 has been calling, as already mentioned, for the adoption of broad solutions that do more than cover only the cases where real crisis situations have arisen, i.e., where the country concerned has already begun to suffer the numerous detrimento' effects resulting from these situations. Instead, it is felt, an attempt should be mode to prevent the crises or, where they have already appeared, to adopt measures of quite broad scope to prevent the same phenomenon happening again in the short terco.
/Tabla 20

2 co
r.O
9 o o (.4
ria) 2 ci E. t0 Fr.
co
PL1
5
aÑ
Va
WF
pQ
he,
•
CO. • •
O-COZ" 0 O'N
Cr\ t
•
■ CO
r4 •.0
UN cm CM N Ir't • e • 3 ‘ije
co C4 CO
...t" N ON 04 01
N 10 01 g LA ‘I2
-. 1 r4 CO ..* UN ‘45 •■•0
O S. o -4
O ri ...m«1 54 4.> ko. 0 o. P. 0 5 .2 4., .4 x co O
0. Bil
ate
ral
off
ioia
l
- 200 -
o ■0 CO Co1 CO • • e • • •
L.0 C4 N t•••• C% ...7"
ri
O O-% 121 e4 UN 1.f1 • • • • • •
c0ON N V)
M C's '1% a LA
c.-N _d- •.4 rl rl
rl
ts. • •
ri s 01 • "
▪ 1
•
N rl LA cncn
e-1
.-1 cr. O ...1- ■0 O1 • • • tz 0 • zz
01 10 1 1 UN UN
O O W0% r4 . S
■D
04 si .,O"
CO 01 r4
CYN H
CO Cr% ri
r4
1". Ori
O \ -4
0 rl
C:; 1`.. O,. ri Lo 0 .0 Z • 0
t.... O O O A r4
01 c-I
VI •
1
4.4 •-1 " O • L..
rl ▪ -1L
c3 •-•I O ,I c3 O
11 X -P O
0. O / 1 .rl
. o
Cd .14 453 5. o 1 "0
o u
..> 1 e O -1
cl
1 9 o r3 O
130 id
5 1:0 CO
1 : .5 ri • rl
ri rl
W.
• 'L.
0 0 O
I
>< • H P.1 Lo
y di 41 0
▪
1
trt O O Cr% CN. CO C4 Cc N CO H i" 01
3 \ clo • • tz. ....4.■ • • • e . r: ...z1 N UN CO
01 1L1 CO .N. CO 01 X" ao‘ 114 3 11-
Cc N -.7 ri M N C4 O
r4 C4 .1 .."
C'd M 10 CP, 01 04 .e* • • • • • • 10
• • cl 0 c0 CO
CQ01 CO 10
) N
a s.0 C4
l O t‘• jss. c. 2
01 O X- -7- o rl UN LA h M .0 .0 0
• • • a •
tz ...1. • • • • • •
CC) UN l
0N cr. 4. 01 o p.. co \D 2
..• 4' 01 r,-1 IN .1' 0 CO 4' CV
rl N 4-1 LIN
.(1. L.0 UN .4' 11- • • • • •
ON ON cO r4 CM 10 0
UN r4 rl < ..s fp, ,..o
04 r4 r-4 tr,
04 10 h. UN
0' • • ..r e •
UN
CM t. CO CO LO 04
4.1 L.0
CL) rl rl V1
ri CO • • 09.. r:1. •01 rl O ad - t-.. (*N c. c.
cc i aN, LA c.1 ▪ COI .d.' d' 01 • 1.21e r: .‘-' ..1. UN ▪ UN
▪
111 "o CNC% 00I 10
1`
,.. CLIcr,
CM N r4 r4 10
CO CO O UN O r.1 LO CV. 04 •-.1 04
. • • • • • • e
LO CO co O c0 O ...IN ril LIN ,-.1 ‘:
01 ..4 '.0 (A LIN ...1" ri el I.,
In ,,» ■0 4- ..0" 1,-. Ch LO 0 h. C
N CM e.1 ri r--.
l'... ■0 Ce■ 11.UN 0O • • • • •• ..!
.0» o••• r4 a pc,.... zz r\ C LIN CO LC1 CC%`. O UN X- UN
+1 I ota
CO o o • r1.1"... LIN .--1
r: e Ole • 4 CM
O 0 C (3 1.--c'.‘ as ..> .0 ""... .r.... .N. t-.. (N tt... Cm n. cn co O el
.d" e-% ...1 Cl c. o r4
o
9 o o
•-4
O
o co
'VI 01 •0 Cs1 • • • •
N 01 -S
N
c0 CO cr. e \• •Z • e
t-, UN01 al CM
Lat
in A
mer
ica
1/
Bil
ate
ral
off
ioia
l
Mul
tila
teral
P.
/This position

— 209 —
This position has been welcomed neither in concept — as may be gathered from the discussions in UNCTAD III — nor, in the mojority of cases, in practice. Many nations have run into very seríous difficulties and have had to renogotiate their external debt once or even severa]. times. Nine countries (Argentina, Brazil, Chile, Ghana, India, Indonesia, Pakistan, Peru and Tur:wy) have done this multilaterally while at least eleven have made bilateral arrangements 24/. In all these renegotiations, only in India, Indonesia, Turkey and Pakistan (en account of very special recent circumstances in the last country) has a partial policy been applied to try to relieve the debt problem by granting new loans, defering payments, or applying both measures at the same time, on relatively easy terms.
In all other multilateral cases, espeCially as regards the Latin American countries, the renogotiations were of a basically commercial nature, as may be seen from various features. In the first place, the renogotiations assumed an individual farm, and were not governed by generally accepted criterial which they took place in a forum which has no permanent existence and where tha developing countries appear before the "club" of creditors with little capacity for negotiation, simply to present and justify their aleas. It is, however, important to mention the technical advisory services which the IMF provides on such occasions. Secondly, the solutions adopted — even though it may take months to reach agreement generally refer to a debt servicing period varying between one and three years: this is obviously too short a time for the developing country to correct the factors which oroduced the crisis, particularly when the low level of flows of official development assistance persists. Moreover, proposais to ellow developing countries to make use of what is known as the "bisque clause", which allowo borrower countries to defer debt servicing when they undergo crises in their balance of payments, have been very coldly received and their clause has never been permitted to a Latin American country. Thirdly, in nearly all cases, the renegotiations only covered certain categories of debts, with the result that the relief obtained has been quentitatively limited. Lastly, the defernent or refinancing agreed upen have generally meant an increase in the original interest retes oP the loans covered by the agreements reached.
As long as this way of dealing with the difficulties stemming from the growing burden of debt servicing continues to predominate in the future there Will be little hope of achieving the objectives set out in the relevant paragraph in the International Development Strategy and more especially in the position expressed by the Group of 77 at UNCTAD III.
~,11V
24/ No detailed information is available on these bilateral agreements.
//ithin this
— 210 —
Within this general context, Latin America's bilateral relations with the United States of America are of special importance, sinos in the early 1970's around one—third of the debt service payments identifiable by destination were due to that country(the comparable percentage for the whole of the developing world is approximately 24 per cent)(see table 21). In this connexion, a proposal made by the Rockefeller Mission 25/ in August 1969 but not accepted by the United States Government takes on further significance. This proposal was that a general moratorium for a relatively lengthy period, e.g.,5 to 10 years, should be granted in respect of payments by the region to the United States for amortization and interest on the external debt. This would give immediate relief as regards the outflow of foreign exchange, while at the same time the local currency equivalent of the deferred service payments could be used for development purposes. The acceptance of this proposal would saos numerous countries from having to continue to contract new loans at increasingly high retes of interest in order to service loans contracted at lower retes of interest.
During the last few years, some Latin American countri:s have adopted domestic measures designed to give them a better control over their external debt, mainly by entrusting some public body with the centralization, registration and control of the granting of authorizations to contract external credits, so as to be able to assess in advance the need for and grounds for authorizing each credit, within the framework of a debt programme covering a given period. In very few cases, however, are such bodies empowered te play a dominant part in the actual negotiations of the loans, and this limits to some extent their possibilities for discharging their duties to the full. In addition, the capacity for action of the controlling organs which have been set up is restricted, as already indicated earlier, by the fact that their attributes do net usually include the authorization of direct operations for contracting external debts without public guarantee cerned out by the private sectors of the countries, this situation being made still worse by the fact that this type of loan is generally obtained on the worst financial terms.
25/ The idea was originally put forward by Mr. George Woods, ex—President of the World Bank.
/Table 21

- 211 -
Table 21
COMPCSITION OF CUTSTANDENG PUBLIC DEBT AND DEBT SERVICING, BY COUNTRIES AND TYPE OF CREDITCR
(Peroentages)
Latín Amerioa 2/ 80 developing countries
Outstanding debt as of 31 December
1969
Total projected debt
service 1970.4975
Outstanding debt as of 31 December
1969
Total Projeoted debt
service 1970-1975
Bilateral official 28za 212 5.2á 1-1248 . Canada 0.8 0,6 14 0.6 United States 30.3 19.8 25.5 16.8 France 1.6 2.0 2.6 2.6 Italy 0,4 0.6 1.1 1.6 Upen 0,4 0.6 2,4 2.4 United Kingdom 0.5 0.5 3,7 2,6 Federal Republio of Germany 2.7 2.6 5,5 5.6 Other 1.4 1.7 11.6 11.5
Multilateral 24.0 20.0 12.1 15.6 World Bank 17.2 14.0 12.5 12.3 IDA 0.7 0.1 3.9 0.4 IDB 5.5 9.6 1.6 1.9 Other 0.5 0,3 1.1 1.0
PrimIte 21.12 33.7 1/.5 30.8 Canada 0.6 0.9 0.3 0.4 United States 8.1 10.8 4.5 7.4 France 1.7 2.2 2.0 3,0 Italy 3.2 4.5 2.2 3.6 Jipan 1.4 1.3 2.0 3.0 United Kingdom 2.2 3.2 1.9 2.9 Federal Republio of Germany 2,3 3.4 2.6 4.3 Other 5.3 7.4 3.9 6,0
Other, including bonds 1212 184 2L11 22'8- Total 100.0 100.0 100.0 100.0
Source: ECLA, on the basis of World Bank statistios.
a/ Excluding Barbados, Cuba and Haiti. b/ Including the Latín American countries.
/D. FOREIGN

-212-,
D. FOREIGN PRIVA TE INVESTMENT AND ITS RELATIONS WITH DEVELOPMENT
1. Devellements in the attitude to this issue, gprli942/91jIthe third world
Paragraph 50 of the International Development Strategy, which deals with this issue, begins by saying that:
"Doveloping countries will adopt appropriate measures for inviting, stimulating and making effective use of foreign prívate capital, taking into account the arcas in which such capital should be sought and bearing in mind the importance for its attraction of conditions conducive to sustained investment", and ends with the following statemont:
"Efforts will be made to foster better understanding of the rights and obligations of both host and capital-exporting countries, as well as of individual investors." This paragraph was approved without reservations by the industrializad countries, but three Latin American countries expressed reservations on it because in their view the emphasis placed on this policy measure does not take due account of the fundamental interests of the developing countries.
In 1969, before the International Development Strategy was adopted, Latin America had adopted a position on this issue in the Latin American Consensus of Viña del Mar in which it was docided:
"To agro° that private foreign investment should not be considered as aid or calculated as part of financial co-operation for development purposcs. Foreign private investment, subject to national decisions and priorities, should try to promote the mobilization of internal resources create income and prevent outflows of foreign currency, promote savings and national technical research, make a real technological contribution, and act as a complementary factor in national investment, preferably in association with it. This has not always been so in the past":.
/At the
- 213 --
At the third session of UNCTAD, the Group of 77 submitted a draft resolution which closely followed the points made in the Consensus and thus in some aspects, and in its emphasis, differed from the approach taken in the International Development Strategy. The draft.was not negotiated with the industrialized countries, and was eventually adopted, with some additional paragraphs added at the proposal of the socialist countries, as resolution 56(111), with three developed countries voting against and three countries, most of them developed, abstaining. Although this resolution may be expected to have relatively little impact on international relations, it is significant in that it shows a growing consensos of opinion among the countries of the third world regarding the role of foreign investment in their development.
An importaet and complementary aspect of this issue is to be found in Economu and social Council resolution 1721(L111), ndopted in July 1972, entit'efed impact of multinational corpuratione on the development procese and on international relations". The main opTrative parcegraph of the resolution recommends the appointment of a wroup of emir ent persons:
...to study the role of multinational corporations and their impact on process of development, espenially that of developing countries, and elso their implications for international relations, to fnrmulate conclusions which may possibly be :sed by Governments in makieg their sovcreign decisions regarding national policy in this respect, and to submit recommendations for appropriate international action ..." This resolution has the merit of bringíng into international forums the question of evaluating the role played by multinational corporations in foreign investment.
2. Scene data on recent trands in fornign 4VEMMIIMIO
investment in Latin America
Between the periods 1960-1964 and 1965-1969, the net inflow of direct foreign investment into Latin America doubled, although without returning to the absolute levels recorded in the period 1955-1959. Nevertheless, owing to the sharp increase in withdrawals of profits (which rase from 5,510 to 8,020 million dollars), the net contribution of such investment changed from -4,100 million dallare in the first period to -5,266 million in the second (see table 10).
/Since total

-214-
Since total accumulated direct foreign investment in Latin America amounted in 1969 to some 18,000 million dollars 26/, it may be estimated that withdrawals of profits, net of reserve obligations and taxes on earnings, amounted to an annual average of 10 per cent on capital invested» This is quite a high percentage when compared with the net annual dividends paid to shareholders by major companies in the principal industrialized countries - which are generally not more than 5 per cent - and also when it is borne in mind that foreign capital generates additional returns, which are not calculated as part of profits, in respect of the sale of patents, know-how, spare parts and inputs by parent companies to their subsidiaries or associate companies abroad. By way of illustration, suffice it to say that at the beginning of the 1960's payments in respect of patents and licenses used in connexion with United States investment in the region represented about one-fifth of the outflows correspcnding to remittances of profits, while by the beginning of the 19701s this proportion had ricen to one-third, owing to the fact that payments for patents and licenses had ricen by cicse to 100 per cent in absolute terms 27/. Anothsr factor that has helped te raise the level of withdrawals of profits is the fact that foreign investment has expended mainly on basic of
the surpluses generated by subsidiary companies in the countries receiving the investment, and these surpluses have been reinvested, as a general rule, under an umbrella of incentives and preferential treatment. A further contributory factor has been the tapping of domestic resources. As a result of these two sources, only 17 per cent of total investment by the United States in Latin America in the period 1957-1965 was financed out of resources originating in the United States 28/..
At the end of the 1960's, more than GO per cent of the foreign investment in Latin America was United States investment, the proportion in 1950 having been around 50 per cent. It is to be noted, moreover, that new investment has tended to be concentrated on the manufacturing industry. In 1968, for example, almost one-third of total United States direct investment in the region was in manufacturing 29/.
Wrill.21•11C■141•21110.
26/ Seo ECLA, "Trends and structures of the Latin American economy" (E/CN.12/884 and Add.1), part B, table 22.
27/ See ECLA, "Las relaciones económicas entre América Latina los Estados Unidos en los años sesenta" (ECLA/IDE/DRAFT/69), 20 November 1972.
28/See ECLA, "The expansion of international enterprises and their influerrce on development in Latin America" (E/CN.12/868/Add.2), table 11.
29/ See ECLA, 29..sit.,(E/CN.12/084 and Add.1), part B, table 22; and op._cit., (E/CN.12/868/Add.2), table 2. /3. Some

— 21S —
3. Some observations on foreign investmquljelUay, mx,Itarmosslasseowsucm...-
Under specific conditions, foreign investment — combined with the operations of transnational corporations — can influence economic growth, help to promote industrial development (particularly in the ares of new modern branches of activity) and facilitate the introduction of advanced techniques and the expansion of the infrastructure. Together with this favourable contribution, however, it can also raise a variety of new economic development problems connected, in particular, with the balance of payments, the kind of technological development it promotes, and the freedom of action of the national economías 30/.
Naturally, the scope and intensity of some unfavourable effects of foreign private investment and the action of transnational corporations depend largely on the rules which the recipient countries lay down for its treatment. From the information provided by the Latín American countries it is clear that in most of them there has been considerable freedom with regard to the entry and withdrawal of investments, and in some cases there have been virtually no laws, regulations or administratíve provisions to regulate them. In the last few years, however, a number of countries have considerad it desirable to institutionalize their relations with foreign investors and have established or are studying the establishment of the necessary guidelines and legal machinery for the purpose. Of particular interest in this respect, in addition to some national measures, is the regional agreement concluded by the member countries of the Andean Group. This agreement, which is known as the Coman Régime, entered into force ín 1971.
The following general guidelines, many of which are followed in the Andean Common Régime, may be taken into account in establishing a foreign investment policy:
(a) In arder to prevent more and more firms from passing into foreign hands and at the same time establish sufficiently clear rules for the foreign investor, it is imperative for countries to determine the areas in which foreign investment is considerad desirable (either because of the contribution of resources involved or because it brings in its train technical knowledge and other elements which are not at the time accessible
For further information, sea ECLA, "Latín America and the third session of UNCTAD" (E/CN.12/932/Add.1), 13 April 1972, pagas 374-377.
/to national

- 216 -
to national enterprise). Among the practical forms of institutional solutions is that of the joint enterprise, or the combination of private foreign enterprise with public or private entrepreneurs of the developing country. Also in many cases private foreign investment may be advantageously replaced by formulas whereby the new investment is made by national entrepreneurs, who contract external loans and acquire technical assistance and know-how temporarily from foreign enterprises.
(b) Having reaffirmed that the primary responsibility for the accelerated economic and social development of developing countries rests upan themselves, as stated in the International Development Strategy, it is olear that the centres for adopting decisions regarding national issues should be located in the developing countries and not elsewhere. Foreign enterprises must therefore be subordinated to the policies, goals and objectives established by the governments of the developing countries. In addition, other provisions may be included, providing for the reversion of foreign property into the developing country's hands after a previously stipulated period.
(e) Prívate foreign investment should effectively contribute towards bridging the technological gap between developing and developed countries rather than towards widening this gap or prolonging its existence, without prejudice to the important part which should be played by other methods of transferring technology. It is necessary, therefore, to séek adequate formulas for en effective transfer of technology, both as regards its complete assimilation by the recipient country (including the carrying out of research in developing countries and the training of technical and administrative personnel) and as regards fair payment for the technology concerned.
(d) In viere of the serious balance-of-payments problems which exist, it will be necessary to evaluate in greater depth, within the context of national plans, the real contribution of direct foreign investment te the solution of these problems. The rete of profits on foreign investments and the withdrawal of profits should be subject to certain previously established permanent limitations, so that an acceptable community of interests may be created between the investors and the recipient countries.
f(e) These

— 217 —
(e) These evaluations should, of course, extend to other economic, social and political aspects which are intimately linked with the nature and objectives of development strategy in the Latin American countries. Among these, the impacts on employment and income distribution are particularly important, as also are questions relatad to the transfer, incorporation and absorption of technological advances.
Although details of other more specific guiding principies could be given, this does not appear necessary. It is worthwhile, however, to stress that the possibility of the Latin American countries, and developing countries in general, coming to better terms with foreign investment — and with transnational corporations — is largely dependent upon whether the whole of the third world gradually adopts similar polioles in the matter.
/Chapter VII

A
II

— 219 —
Chapter VII
REGIONAL INTEGRATION
1. Introduction
In reviewing the progress mode in Latin American integration it is useful te focus attention nn three basic questions: international trade and the position of the Latin American economies in this connexion; progress in development and industrialization based on import substítution; and problems regarding the distribution of integration benefits (aspects of equality). In addition te those three questions, consideration must be given tc short—tcrm problems vis—á—vis long—tcrm problems and the essentially national problems which give a different slant to each of those bread questions.
A review of the relationship between each of these questions and the various integration processes permits the construction of an overall image
in which each of the integration processes currently taking place in the region can be situated on the basis of certain common denominators.
From a different standpoint, integration can be analysed from two points of view. First, the main developmunts which have taken place may be contrasted with the original tergets of each of the integration agreements or of their guiding bodies. Secondly, the importance of theso integra-ti= processes may be assessed in terms of the effects they are having on the °nem:my, trade, production structure and rato of development of the countries concerned.
(a) RelatimeiwIth international trade
In 19W, when the Montevideo Treaty carne into force, the volume of reciprocal trade between the countries forming the Latin American Free Trade Association had reached a very low ebb, in contrast to the largor share accounted for by such trade around 1953 and in the post—war period. In the case of Central America, intra—area trade, whích represented barely 3 por cent of the total, appeared to fall for short of the possibilities offe_cd by bordering countries linked by strong traditional and historical tics.
/Thus, the

— 220 —
Thus, the original objoctives in connexion with trade consisted to some extent in regaining the levéis previously achieved and attaining reasonable close relations — a matter of special significance in view of the difficulties already being encountered by exports and the balance of payments problems which were evident at the time. Nevertheless, the intra—area trade of the member countries of LAFTA has only recently regained roughly the same share of total trade which it enjoyad in the post—war period. It took s whole decade to achieve this objoctive, and there has been no trend towards attaining a largor share in recent years. The importante of these advances must not be overlooked, however, especially if if it is borne in mind that concurrently with the expansion of intra—area trade, an important changa has taken place in its structuro, with an increase in the proportion of manufactures, These have recently íncluded some capital goods which in the past were exported only by a select group of highly developod non—Latin American countries. Besicles the great significance of thi new avenue and the important prospects it opens up, it has involved some problems which should be duly considered.
Today the internatienal trade situation has alterad considerably. In some Lotin American economies there has been a process of opening up which
is almost unprocedented. Moreover, the situation and trends display mnrked differences between one country and another. At the same time, an important change has taken place in the trend of exports of manufactures and in the attitudo of the public and private sectors in the various countries, which have reached the conviction that it is both possible and noceseary ta increase these exports nye only within the reglen but also to the rest of the world. The rete of growth of trade with third countries has risen. Consequently, exports within the reglan have not increased their share in the total. However, in view of the composition of íntra—ares trade comparad with the total, and taking finto account certain manufactures of great significance in terma cf technology and capital formation, the regional market remains very important, particularly as in many cases it seems to be more difficult to sell these goods to other regions.
The important coefficient, which for many years declinad or remained at the same level, can no longer be kept down. Eíther because of the need to rationalize those economies which have mide considerable progress in import substitution on th basis of high and indiscriminato levels of protection, or becair.,,e oF success in foreign trade, which is reflocted in a Sharp risa in purohal-:es abroad, the import coofficient in the largest
countries of the rc$on is gradually rising and is thus creating new pressures on the balance of payments. This new trend holds out favourable prospects for progress in integration, while at the same time it raises problems which are of a different natura from those encountered in the early stages of the intogration processes.
/At present

-221-
At present intra—regional trade represents about 12 per tent of the total volume of trade of the LAFTA countries. This proportion compares favourably with the share of other more traditional markets and also, as mentioned aboye, it has a deepor significance for some important manufactures.
At all events, what could be interpreted yesterday as a direct and simple solution to the problern of external strangulation has gredually acquired more complex characteristics and wider prospecte. This helps to explain the different nuances in the various countries' attitudes te integration and their preferences for different policies and instrumente. The liberelization instruments which predominated for a time in LAFTA played their role efficiently as regards the recovery of previous trade flows and facilitating specialization on the !oasis of conditions which already existed or which developed along with the procese of integration, but quite apart from the fact that the rete of progress was insufficient, it is now evident that the countries are endeavouring to find new and more flexible instruments te supplement the previous ones te deal effectively with new situations.
(b) Rolationshi with development and industrialization
The development of import-substitution industries is another basic factor which helps to explain the development and integration of Latin America. Two olear cases are to be found in the largest countries of the regíon and in the Central American Common Market.
When the Montevideo Treaty was signed, the most industrializad Latin American economies were still in the midst of en import-substitution procese geared to damestic markets and ware making cdnsiderable progress comparad with the other countries of the reglen in the production of the more dynamic and complex manufactures. Import-substitution still plays a highly important role, but a different approach is now callad for since it must be compatible with a greater opening-up of the economice and must also support exports of manufactures. It is thorefore necessary to re-examine the nature of the items replaced and to consider weys of finding more efficient and highly specialized policies in new areas of industry as some of those already developed. The more sophisticated capital goods with their more complex technology and many of the modern chemicals constitute new barriere to be overeome by those countries which have made most progrese in import-substitution industries. Economice of scale seem closer than before, but they are still difficult to obtain in view of the size of the domestic market oven in the largest countries. This is another urgent
/ccnsideration. Thc

- 222 -
consideration. The engineering industries (particularly,the production of investment goods) and the Chemical industry still account for 60 per cent of total imports, despite the progress achieved in manufacturing. Over 50 per cent of domestic demand for machinery other than Electric, even in the most advanced countries, is supplied by imports. Oomestic erices are higher than world erices, and the correction of this state of affairs would involve an oven higher proportion of importa.
These, however, are problems involved in reaching a state of maturity. Meanwhile, the most important and advanced economies in the region account for a high percentage of the intra-regional trade in manufactures and have begun to enter the field of the more important items with a view te increasing their share in world trade. Oespite the significant increase in the proportion of manufactures in Latin American trade, however, the traditional agricultura) and petroleum products still reoresent nearly half the volume of regional trade.
Import substítution has progressed considerably in the countries of the Central American Common Market alai-1g the same linos as those proviously established.in óther Latin American económies, i.e., concentration on substitútion of consumer goods, some intermediate products and consumer durables. There has been less progress in intermediate geoda, which require largor markets, and still less in capital goods. Central Americals trade has increased rapidly, thanks especially te liberalization measures, and it has advanced simultaneously with import substitution, thus making for more rapid, extensivo and far-reaching progress in both fields. Such progress, however, is leading to problema of continuity in the substítution process which are already noticeable and have been oven more evident earlier en in the more advanced countries.
Between these twe situations, which differ so widely in tcrms of market and state of industrial development, comes the more rocent integration procesa of the Andean Group and Venezuela, which has been able to take advantage of the other groups pravicus experience. The problems of industrial development through import substitution are moro difficult and occur sooner because of these countries' comparatively small domestic markets. The Group market, on the other hand, is highly promising, and the fact that the member countries were at a more backward state of industrial development leaves a greater margin for progress. These countries' situation within LAFTA, however, has in some cases resulted in tracia déficits and, until recently, in less chance to malee use of the instrumenta available.
/(c) The

- 223 -
(c) The roblems of the balance between countries
There are many differences from one country te another as regards the benefits which each one is able to gain from the current integration processes and as regards the instruments which they consider most appropriate for serving benefits.
Diversity should not necessarily be regarded as a negativo factor, since, it may create a degree of potential complementarity which favours trade and specialization. Insofar as diversity originates in the different levels of development at which the countries involved are situated when integration is begun, however, it may give rise to problems in ensuring that the benefits of integration go to all the countries alike. This is particularly important in the case of the relatively leas developed countries.
Differences in the degree of.industrial progress have different effects on trade and integration. The most developed countries with advanced substitution are in a position to take advantage more easily of the bigger regional market created by the reduction or elimination of internal barriers. Countries with a modium degree of development need te malee progress in developing their industry, and this may be aided by the expansion of the market, but they must take decided action to develop the production of capital and intermodiate goods for which their production facilities are weakest; the Cartagena Agreement answers this need, with its fecus on the devélopment of basic industry in the regional context and in a programad farm.
As regards the relatively less developed countries, the experience of LAFTA and the Central American Common Market shows that they have difficulty in taking proper advantage of the numerous instruments designed te aid them, and in a considerable number of cases deficit situation have persistod for very long periods. This problem is also to be found in CARIFTA. The causes of these,difficulties include the precarious structure of production (especially industrial production), the scercity of skilled labour and entrepreneurial experience, problems of infrastructure, peor technological capacity and the scant support provided by the domestic market for industrial growth. Thcse problems are an obstacle te proper use being made of the measures taken to provide opportunities under economic, tax, exchange, credit and tariff policies. Even the establishment of new feo-tarjes may not be sufficient. In the case of these countries, the policies should contain an adeeuate direct action component and in addition attack the basic problems simultaneously on several fronts, attempting to create a minimum critical mass of dynamic activities which can sweep along
/the rest

— 224 —
the rest of the economy in its wake. In this arca of the problem of integrationi previous experience is apparently being put to good use: aparco/siete soluticns are being sought in both Central America and the Andean Group and, especially in the case of the latter, there are already some promising, although only partial, proposals for tackling the problem.
It is interesting to note that the definition of the concept of equality of treatment in development has scarcely been discussed, and the detailed analysis of this problem at the conceptual level might well be useful.
A point which could be important both as regards the balance between countries and the general conduct of the integration processes is the periodic technical appraisal, from an econamíc standpoint, of the progress made and the problems encountered, Up till now, no sufficiently systematic or concentrated efforts have been made to carry out such appraisal. This Jack has meant that problems have not been anticipated in time and full awareness of them has only come when they became acute — i.e., precisely when the solution is more difficult and when, even in the best of cases, it is already too late to avoid crises or a tendency to come to a standstill, even temporarily. The problems which have arisen in recent years in the Central American Common Merket and the stagnation experienced by LAFTA are of this type. The moves to establish regular appraisal procodures in each integration process and in each country deserve full support, although it cannot be denied that there are conceptual and technícal difficulties which stíll have to be solved in order to carry out such appraisals.
The recent appraisal of the four integration processes taking place in Latin America has brought out several aspects of particular importance which are presentad in the following sections. The rest of the present section will consider, very briefly, some aspects of transport and communications.
/(d) Trahlpprt

— 225 —
(d) Transport and telecommunications
Between the LAFTA countries of South America there are 19 international frontiers, 9 of which are crossed by 13 rail connexions, of which 9 are of the same gauge. There are also twelve navigable river connexions of varying quality, a similar number of mejor all—weather mountain passes, and four more mejor passes which can only be used during the dry season.
Although the service provided by these transport links is of varying standard, only two frontiers (in the jungles of Amazonia) are not crossed by any road link.
It would therefore sopear to be important to make the maximum use of all these physical links, but this has not yet been achieved. This is the aim of the verious agreements and negotiations in force and all the measures aimed at simplifying formalities and cutting down frontier delays. In a longer—term perspective, and as part of a scheme with the requisito degree of forward planning, it will certainly be necessary to make considerable investments in order to ímprove the quality of all these connexions or increase their number.
Despite progress over the last few years in road—building and road improvement 1/, the mejor part of íntra—Latin American transport is still by sea. With the tremendous increase in the trade in manufactures, vegetables and other products of higher value per unit of weight, and with the availability of more efficient means of road transport and enterprises specializing in this type of international traffic, however, there has been a considerable expansion in road transport. Table 1 gives a breakdown of trade between some South American countries according to the means of transport. This shows the considerable importance which motor transport has acquired for valuable loads, although in the case of Argentina—Chile this type of transport cannot be clearly distinguished from rail transport because of the combinad transport system used.
1/ Between 1963 and 1969, the payad section of the Pan—American highway system increased by 60 per cent. In 1969,the Pan—American paved highways covered 21,000 km, while the main unpaved all—weather roads covered 10,000 km.
/Table 1

- 226 -
Tabla 1
TRABE BETdEEN SOUTH AMERICAN COUNTRIES ACCORDING TO MEANS OP TRANSPORT IN 1971
(Thousands of tons, millions of dollars, and peroentages)
Exporter
Air Rail Road Ship Total
(1) (2) (1) (2) Importar
(1) (2) (1) (2) (1) (2)
Brazil
Argentina Tonnage 1.3 0.5 1.5 0.5 96.6 15 538.2 84 637.6 100 Value 3.9 4 1.2 1 34.3 32 67.3 63 106.7 100
Argentina
Brazil Tonnage 1.1 0.5 14.7 0.5 155.8 7 1 998.7 92 2 170.3 100 Value 18.3 9 2.0 1 37.9 19 142.0 71 200.2 100
Argentina
Chile Tonnage 0.4 1 56.1 23 185.2 76 241.7 100 Value 0.9 2 11.6 28 29.5 70 42.o 100
Chile
Argentina Tonnage 19.8 4 99.7 18 432.4 78 551.9 100 Value 24.1 19 57.9 45 47.0 36 129.0 100
Source: Jaime Undurraga: "Servioios multinacionales de transporte en el Cono Sur: el easo de Transportadora
CORAL S.A.", Seminar on International Road Transport in South America, Washington, D.C., 1972.
(1) Absoluta value. (2) Percentage.
/The advent
The advent of road transportas a growing means of transport for regional trade undoubtedly off ere important prospects which still do not seem to have spread to other types of international traffic; this implies the need for a series of studies and for efforts to organize enterprises and increase the manufacture of goods vehicies all matters which give renewed interest to integration.
As regards teleoommunications, the dévelopment of the installations has been rapid. Also notable is the development of modern complementary communication techniques, such as surface microwave systems and satellite communications systems.
Along with progress in the traditional communications systems - which these new systems complement and reinforce - and the appearance of new systems, especially from the last years of the 1960's onwards, an institutional change has occurred, taking the forro of an adjustment to new, more specialized, responsibilities. For this reason, national telecommunícations enterprisel have been at up in almost all the countries. These entities are not only responsible for planning the development of national netwcrks, and improving and managing them, but aleo for supervising all aspects relatad to their connexion te the Inter-American Telecommunications System and, of course, the world system.
The efforts made by the countries of the reglen in this field are aimed at completing, improving and consolidating the Inter-American Telecommunications System, whose principies; main characteriatics and planning are being co-ordinated by the Inter-American Telecommunications Commission. Work is at present concentrated on the two modern means of communication mentioned aboye, which have reached a state of considerable development in quite a number of the countries of the region. Some 80 per cent of the international traffic of Latin American telecommunications goes by satellite. This percentage will be reduced, and communications will be less dependent on a single means of communication howeVer, when the microwave system is completad in the mid-1970's.
/2. Latin

-228 —
2. La....t.L.12.21,19. 11
With a view to imbuing the LAFTA integration process with renewed impetus as regards both trade liberalization and complementarity agreements, It would seem advisable to search for new forms of action during the transitional period laid down in the plan of action for the 1970's adoptad by LAFTA in resolution 262 (IX). Ouring this period, new basic approaches are te) be developed to integration, and these should be completad by 1974.
Trade liberalization, as conceived so far, has virtually come to a halt, as can be sean not only in the radical reduction in the number of additional concessions granted at each round of negotiations in recent years, but also in the recent decline in the share of intra—area trade as a proportion of total trade.
The stagnation of the trade liberalizatíon process has been accompanied by an increase in complementarity agreements, althcugh these toa have recently shown signs of losing ímpetus. Complementarity agreements initially played a relatively secondary role in LAFTA, but became more important between 196? and 1970. These agreements cover co—ordination and trade in specific industries, some of which are large in scale and potential.
In addition to complementarity agreements proper, similar although less formal arrangements have been concluded covering motor vehicle parts and components and government purchases. Complementarity and other similar agreements have a fairly important role, for they cavar sectors such as the chemical and metal manufactures and machinery industries which generate substantial out—of—area imports and have the greatest potential for import substitution, although also the most serious problems as regards maintaining the progress of industrial development. The reason why these agreements have not to date yielded more substantial results is because they basically cover types of goods that were already being produced in the signatory countries, and because they have been limitad in acope and have not contained arrangements to set up new plant or undertake fresh investment on a substantial scale. It has been the larger countries at a more advanced stage of industrial development that have made most use of these agreements as regards geoda they were already producing or were about to produce, while the medium—sized and relatively leas developed countries have secured much leas benefit from the agreements, even in relativa terma. Even the more advanced countries need to make more intensiva use of these agreements as regards both number of sectors covered and amount of new investment if they are to make any real impact on the rata of groWth of their total trade. This, so far, does not appear to have happened. Since 1970, the number of new agreements has
/declinad. Expanding

- 229 -
declined. Expanding complementarity agreements in both scope and number Will possibly require a more explicit identification of certain aspects relating to national policies for industrial development, not only the short-term policies but the longer-run policies as well.
(a) Evolution of intra-area trade
Intra-area trade among the LAFTA Contracting Parties represented 12 per cent of total trade in 1953, somewhat less in 1955, and only 7 per cent in 1960. After the entry into force of the Montevideo Treaty, the share of intra-area trade (calculated on the basic of import figures) in total trade made a recovery and approached 13 per cent in 1965, only to fali back and stagnate between 11 and 12 per cent up to 1971.
The intra-area trade of all the LAFTA members has increased considerably, but with appreciable differences. In addition to the growth trade, however, it is useful to look at movements in trade balances and the trend of trade in manufactures, since both are factors that illustrate problems of equilibrium and structure that must be borne in mind when forecasting the prospecta for 5ntegration.
The movement of trade balances in individual countries reveals certain points that are worthy of consideration. For purposes of comparability, the figures given below refer to the intra-area import balances of each country. The trade balances of the largar countries in the region have been relatively favourable. Mexico's balance has been positiva since 1961, and although the proportion has declined it still represents 50 per cent of that country's area imports. Brazil has moved from a larga deficit to a consístent surplus in recent years, while Argentina has fluctuated between moderate deficits and surpluses.
Colombia, Chile, Peru, Uruguay, Ecuador and Bolivia have run a long series of deficits, generally at quite considerable levels of about one-third or more of imports. This situation appears to have changed only in the case of Colombia, whidh has shown a small surplus since 1970.
Venezuela has a considerable although steadily declining surplus which was equivalent to 70 per cent of imports in 1971.
Figure I shows the individual trade balances in absoluto terma.
/Figure I(a)

- 230 -
,..1 L.-..
,. —...0 1.1"... N.. 1-11
■, \
../
./7. )4 i 1
. N \ . 1 L.r. \ ' . \ 1 +0
.:4d), / ' 1 '
Lo
o
9
O CO \ O
H O
-.4 W 1g
m 1
••
14
o
:400
1.,
o
O C\ I
O O N
CO O \ O
.1\
O CV
1 o
--1
le \ \
‘1,6 cr. N
o S. o O. e IN
t d
O O
O CO
O O 0 \ O
""1". t"-•
I I o
°
\IL4. 174: ) •0
(
LC \ \0
I 11.1 I Li
1 :11
iN CNI
/Figure 1 (b)

o
■
o 3
4 o
A 11 o
- W A W o o
a 1 1 N M
d
pO 8
40
O O Oo o o cr1 o
-231—
.-.I 1 — o \ 1 _ ,..
hi o 1 \ 1 h. , o ) o / .1".. \
i _ 1 \
0 0 o tr, Cr% N
1.11 \O
O O 111
l.. Coi O oo o a■
0 0 ✓i al 0
N mi
dW
/The situation

— 232 —
The situation described aboye points up certain problema of a structural character, particularly as regards the medium—sized and small economies, for which solutions should be found in the context of the new studies that are to be undertaken.
Some data are given below to help to explain the way that trade in manufactures has evolved. There is one difficulty, however: how to define, for purposes of separate analysís, the different types of manufactures, each of which has a different impact on development.
The existente of the LAFTA market itself has led to a considerable expansion of exports of manufactures by the LAFTA countries. The proportion of intra—area exports of manufactures has more than tripled since 1960 2/. In the comparatively largor countries the proportion of goods destined to Latin America (chiefly the LAFTA countries) has increased even more than this or has reMaihed aboye the average. The proportion of exporte of manufactures by the medium—sized countries is significantly smaller, the only country in a slightly more favourable position being Colombia.
Compared with manufactures exported to countries outside the region, intra—regional exporte have tema: progressively more sophisticated. Intra—area trade in manufactures in 1970 comprised 11 per cent chemical products, 21 per cent products of the basic metals industries, and 12 per cent machinery and equipment other than electrical. Compared with 1963, the proportion of chamicel products has ricen by more than one—third and that of machinery other than olectrical has tripled, while the proportion of metal manufactures has doubled. As a result of these movements, the structure of intra—area trade has become roughly similar to that of ama imports from the developed countries.
The groups of manufactures that have entered regional trade are extremely significant, including tractors, machine—tools, vehicles and components, offíce machines, electrical equipment and similar products. This trade, hcwevor, corresponda for the most part to intra—area exporte by the relatively more developed LAFTA countries.
Exporta of manufactures are particularly important for the larger countries, whose industrial development is dependent on oxpanding the manufacturing sector. Importa to satisfy domestic demand for chemicals and metal—manufactures and machinery have shrunk to fairly small proportions and a growing gap is already noticeable that will create pressure on the balance
`1011101,111*~1~.
2/ Includes chemicals, manufacturad goods of a variety of meteríais, machinery and transport equipment, but not non—ferrous metals (SITO sections 5-8, except division 68).
/of payments.

- 233 -
of payments. Hence, the possibility of expanding the merket represents not only en economy of scale but also the ability to embark upon the necessary specialization, and this, together with an increase in competition, should help to increase efficiency substantially.
(b) The trnde barr_ders
One of the fundamental nbjectives of the Montevideo Treaty is to establish a free trade ares. Accordingly, "the Contracting Parties shall gradually eliminate, in respect of substantially all their reciproca) trade, such duties, charges and restrictions as may be applied to imports of goods originating in the territory of any Contracting Party". (Article 3.)
A trade liberalization programme was accordingly devised consisting of periodic selective negotiations of two kinds, leading to the establishment of (a) national schedules containing the annual rcductions of duties and of other restrictions granted by each Contracting Party to the others, and (b) a common schedule of products which the Contracting Parties jointly undertake to free from all intra-area duties and other restrictions during the transitional period which the Caracas Protocol extended to 31 December 1960.
In the past, progress towards trade liberalization has usually been measured by the number of concessions added to the national schedules each year. Table 2 shows that, despite e fairly easy and encouraging stert, more and more obstacles began to crop up after the first three-year parlad. It was of course foreseeable that the removal of duties and restrictions would require increasingly complex and laborious negotiation. As the Cable indicates, developments confirmed the most cautious and pessimistic forecasts, since the marked decline in the number of tariff reductions after 1965 was only interrupted on two occasions - 1966 and 1969 - the second of these being the year when Bolivia and Venezuela took part in the negotiations following their accession to the Treaty.
/Table 2

— 234 —
Table 2
LAPTA: ANNUAL EVOLUTION OF THE NUMEN OF CONCESSIONS GRANTED, 1962-1973
Number of conoessions granted in:
Year of entry into effeot National
sohedules
Special schedules of conoes- sions not open to third
parties 2/
Comple- mentarity agreements
bJ
Extension of oomple-mentarity agreements
1/
Total
1962 3 246 20 (1) 3 266
1963 4 347 5 622 - 9 969 1964 655 315 85 (1) 1 055 1965 226 61 - 287 1966 580 47 37 (2) - 664 1967 339 135 - 474 1968 2/ 989 770 332 (2) - 2 091 1969 487 210 142 (1) 839 1970 149 35 63 (2) 247 1971 25 69 780 (7) 235 (2) 1 109 1972 37 -22 1/ 150 (1) 85 (4) 250 1973 eJ 34 100 597 (3) jj 263 (3) 994
Total number of concessions 11 114 7 342 2 206 (20) 511 (7) 21 245
Source: ECLA, on the basis of offioial statistios.
eJ Cenoessions enjoyed by Bolivia, Ecuador, Paraguay and Uruguay.
12/ The figure in braokets indioates the number of agreements that oame into effeot or were extended in eaoh year (agreements 15 and 16 were extended twice in 1972 and 1973; as a result, the total does not oorrespond to the sum of the figures shown).
2/ Aocession of Bolivia and Venezuela.
J Inoludes the agreement on pigmente and oolouring materials signad on 13 December 1972 whioh has not yet been implemented by the participating countries. The same is true of agreement 18 (and its first extension), agreement 19 and the extension of agreements 15 and 16. They are expeoted to become effective in the course of 1973.
2/ Granted at the twelfth session at the end of 1972 and soheduled to enter into effeot in 1973 (document ALALC/C.XII/do.25 of 15 November 1972).
r/ The LAPTA secretariat gives annual acoumulated figures that do not neoessarily coincide with the annual conoessions resulting from eaoh paar's conference, owing to modifioation of nomenolatures, unifioation of NABALALC items, etc. As a result of suoh adjustments, the figure for speoial oonoessions in 1972 is negative.
/It would

- 235 -
It would be extremely useful to compare the increase in the number of concessions granted with the real trade which the concessions promoted. A recent LAFTA study reveals that 85 per cent of liberalized intra-area trade owes its origin to 39 per cent of the total volume of concessions granted 3/. Although a largo share of the concessions have been offered by the biggest countries of the reglen, there are also countries like Ecuador which have offered a considerable number of concessions that have not been taken advantage of to the same extent. Similarly, a look at the chapters of the Brussels Táriff Nomenclature in respect of which the largest number of concessions were granted between 1962 and 1969 will show, for example, that boilers, machinery and mechanical appliances, which account for 15 per cent of the concessions listed in the national schedules, make up only 2.4 per cent of intre-area imports. The second item en which most concessions were offered organic chemicals - accounts for 9 per cent of those listed in the national schedules but is not oven among the top 20 products from the point of view of intra-area trade. Other similar examples can be given.
All this indicates that the degree of effectiveness of the concessions verías considerably and that no proper evaluation can therefore be basad simply on their number: a more detallad analysis must be made in terms of the trade to which they gave risa and the trade that existed before.
It is true, of course, that certain of the least developed countries received concessions not opon to thírd countries in several arcas of less advanced technology such as wood and articles of wood, animal and vegetables fats and oils, preparations of vegetables, fruit, etc.
Be that as it may, imports resulting from the liberalization programmes now represent about 62 per cent of the total intra-area trade of the LAFTA countries, although towards 1968 they rase as high as 64 per cent. This decline in the share attributable to the liberalization is undoubtedly due in part to the increase in the number of complementarity agreements, but there are other explanations which should be analysed at greater length.
As regards compliance with the rate of tariff reductions established in the Montevideo Treaty, it was clear that the slow-moving negotiations would make it difficult te achieve the annual rete of reduction stipulated in article 5 (8 per tent) Dr even the lower rete of 2.9 per cent which was introduced by the Caracas Protocol at the same time as the original transitional period was extended.
0.0.01111■MMIII■
LAFTA, Programa de liberación del intercambio (Montevideo, January 1072).
/With regard

- 236 -
With regard to the procesal of measures for resolving the problem of failure to fulfil the commitments deriving from the trade liberalization programme, the Standing Executive Committee suggested that the reasons for this state of affairs should be studied in detail in the course of the critical analysis of the programme's,existing instrumenta which is scheduled under the plan of action for 1970-1980 (resolution 262 (IX) of the Conference).
It would seem, then, that the streightforward trade liberalization stage has had positivo commercial resulta and has meant a substantial recovery of the member countries' former share of Latin American trade, the entry into that trade and increasing importance of countries like Mexico and Colombia that previously played a smaller role and, aboye all, the development of trade flows in fast-expandíng and technologically significant manufactured products. These achievements have been wrought, however, without fulfilling more than a very limited part of the original commitments in the Montevideo Treaty. Various kinds of measures are currently being studied in order to breath new tifo into the integration procese, including modification to the liberalization procedure itself.
Quite apart from the causes usted in the studies that have been cerned out in an attempt to find new roads to integration, certain imbalances continue to exist in the balance of payments and industrial development of LAFTA countries.
After the LAFTA integration process has been evaluated and the Caracas Protocol ratified, the situation can be clarified only in 1974, when decisions are to be taken regarding the Association's plan of action for the rest of the decade.
At present, the clearest guidelines are the priorities set for implementing this plan, which, for the initial stage (1970-1973), will be devoted almost exclusively to preparatory studies and activities that will serve as a basis for discussion and decision-making on substantive matters.
It is also interesting to note the volution of the special schedules of ccncessions not opon to third panties which the Contracting Parties have granted countries recognized as being least developed - Bolivia, Ecuador and Paraguay. Uruguay is aleo temporarily enjoying similar treatment. Officially, these schedules are not part of the liberalization programme, although they do undoubtedly contribute to its implementation.
/The tariff

- 237 -
The tariff reductions granted in the special schedules constitute an exception to the most-favoured-nation clause and, in theory, are not subject to reciprocity. In practice, however, the beneficiary countries frequently make counterpart concessions and Enter into regular trade negotiations.
Tabla 2 shows that the total number of these concessions is fairly large compared with the national schedules but that no significant progress has been made since the accession of Uruguay in 1968. To a considerable extent, the number would seem te be so large because the countries concerned have in the past rather indiscriminately requested a Very wide range of conessions.
The least developed countries have now changed their approach and tend to concentrate on a small range of priority products which have immediate export prospects or whích are connected with more or leas export-orientad production projects. Some countries, like Paraguay, have also made an effort to obtain concrete support from the more developed countries (Study Programme in favour of Paraguay, Standing Executive Committee resolution 222).
After a series of delays and complications, the first common schedule, covering the first three-year period, was eventually brought to a satisfactory conclusion. The first section included 175 tariff items and, on the date the Treaty was signed, representad slightly over 25 per cent of the value of trade among the Contracting Parties. The negotiations on the second section of the common schedule, which bagan at the end of 1967, were not a success and thus introduced another mejor obstacle to the liberalization process and made it necessary to reconsider futura action.
All the problems that had arisen as a result of the liberalization of trade were studied and debated, aboye all during the evaluation of the LAFTA integration movement which its Standing Executive Committee cerned out, in 1969. Following the evaluation, the Contracting Perties adopted the Caracas Protocol which amended the Treaty and introduced some new provisions regarding the coman schedule.
In the first place, they agreed to extend the transitional period to 31 December 1980 and recommended that the Standing Executive Committee should carry out studies with a view to fulfilling more effectively the purposes of the Treaty and, if desirable, to adapting it to a new stage of economic integration, in accordance with its articles 54 and 61. The
/Protocol further

— 238 —
Protocol further provides that the Contracting Parties should establish, not later than 31 December 1974, new norms for compliance with the commitment to adopt the comen schedule. It also specifies that, by the same date, they will revise article 5 of the Treaty and the provisions of title T of the Protocol on Norme and Procedures for Negotiations. The document goes on to say that compliance with the periods and percentages laid down in article 7 of the Treaty shall not be comulsory until such time as the norme referred to have been adopted. In other words, until the Caracas Protocol becomes effective compliance with the common schedule commitments will be suspended and a timetable will be set for futura action regarding the critical analysis of the existing instrumente of the liberalization programme, with a view to the possible revision of its targets and mechanisms.
The present year, 1973, marks the end of the period which the Association has set itself for defining and adopting decisions on :he basic pattern which the LAFTA integration procese will henceforth observe. On the basis of past experience and studies which are now almost completed, it will consider how regional integration can be given a new loase of life in the light of the countries' development requirements. This year could thorefore prove to be crucial for LAFTA and for Latin American integration.
(c) Sectoral az£rulatl
The complementarity agreements noarly twenty of which are in effect and a similar number projected farm one of the most important achievements in the procese carried out by LAFTA and merit a more detailed review.
Table 3 liste all the agreements adopted up till now, while table 4 liste the projects being studied or awaiting approval.
The complementarity agreements by industrial sectors were only of secondary importance in practice during the first years of application of the Montevideo Treaty. Each of them was to farm the basis for a programme of liberalization of the products of the sector concerned, and it was also planned that they should include other clauses for harmonizing tariff and fisical treatment so as to create equitable conditions of competition. According to the most—favoured-nation clause, however, the concessions granted in these agreements were not only to be given te the participante but to all other countries es well, and were to be assimilated into the respective national schedules.
4/ So far, the Caracas Protocol has been ratified by the Governments of Argentina, Bolivia, Brazil, Ecuador, Mexico, Paraguay and Venezuela.
/Dable 3

o e a> 4) t.
.1°
.03 0 0
00 4) 4. 4. f.
00E0 3 4)
Vene
zuela Bo
livia
o
e o
o
O O 0
o o
Arg
enti
na
Bra
zil
el
M 41
03
4 02 ID 4.4 itt 4)1) 0 O
03 4. o O
0 te a>
.10
LAFT
A:
LIST
OF
COM
PLE
MEN
TAB
ITY
AG
REE
EEN
TS
CO
NC
LUD
ED
AND
OF
THE
CCN
CE
SSIO
NS
GRA
fiTE
D B
Y EA
CH
COUN
TRY
t. o o T. e>
Ea> o
w. 1-• o N
u O +,
o g
cw. 44 II O 0 14 N 0 0
+4
Numberof concessi
ons gra
nted by eaoh part
ioip
ant
4.4 o
k0 Cr." w.C\VD m u1 c0 rt-4 N N D en Li1
16
have two extensions each.
Ag r
eem
ents
15
O
tA
••■
a>
t.
• o O
1 o
0
0. E o 44
F.
e>
aa
O \O +4 el
e ..r. 4, ral
+I o ri
4 Z
tg «Pg 02 E
0 0
o a. +4 02 .0 • 01 ei 4., E o E E Z •0
o 21 o •-t
.mol -I, 1-1 .0
4-'
• ••1 ts, >, 0 .0
el 0) a) 'O -1> 10
N 0 0 00 1ir O
O X o o o O.
s•
N E 44 O o
Z 5 E
h)
111
Ch
ile r
ecen
exte
nsi
ons to
/4
1 O 1 01 t
r-I
.e,
• 1 '1.?. 8 8
-4 03
o a> E .1 -.. .E 4., o a>
g 11 U)
1 ° r-4 0 4-, t. o o O d .--4 ni N 43 N al 4-, R. Ei. -rt o o
o N ¢) 0 nl trt 00 0 e o 0 1. O 0 0 el 0'
ej a> ,.011 41 e> 'O o > o E .--> e> C. TI o O -0 at 6 ° g g
tD > Cl O O el 0) 0 4. •etft
5 .,-. E d al +I al 0 0 E O
4-, E. o *4 E ..-1 o u u d •rt OD •P O •-■ 4. g 4. E o 0 el O E
E 4. 0 N el O, N O 0) O 44 r•1 ed r=1 o C
hem
ical products
U) O
O
O Itt
t.
0.
Petr
oohe
mio
al
Hou
seho
ld g
ood
s
1:1 g
O O el 0) 1. CO 0 N O
0
e 4-« VI 0 0 -P E
o •P 03 +4 E E
+-1 al 04 0, 0 0 4. -.4 c) Ce
el 0 N 4. O 0 .12 O Of
fice m
ohin
es
• • • 1.1\ \ O N el •-4
ocl: • dil;
el N 04
- 239 -
0 u-N O c0 Co4 e. cs, 0D 04 M. ue. en N
un e, r•-• cr. ts. 1.11 o el N
ir
u 11
\t) CO á. e", t-- U1 N et N .O el O r-t 01 N el 04 0 u■ o'N
t.0 N
00 LL1 N r4 N CO et4 .-1
u-% oo s.o I c+-%
::1,1 u-% '44
1" 0 0 c9 c0 cc> ts, \O \O 04
.....tr)1 er, o`N Cet CO C4 _1- ,..0 1..r\ t... ,..0 0 1.21C0 «N • Of
el el ttr4 04 01 01 U1 04 01 \O 04 N N 1,...0- \ 0 • CO 04 04 01 ......
1 I 1 11.11 I t 1 c> u", 0 \
\ r1-. 04 CO CO 00 04 el LIN
rti el CV 01 01 " 4,‘
04 CO 00 O O el el el el N N
\12 \ O '.0 .'O \0 '.0 t..
C1 \ a. O. O. O\ 0\ 0. off. 0 \ 0\ \
r-4 el el el f■•• e`i 1•• N N el el el N
CM .0. \O \O co c0 oD \ O. 0 0 r-4 t-4 N 01 04
N42 \O \O \O \24 \O \O \D \O t•-• t.-.
\ \ 01. O. <7, C'N O\ O\ \ 0% \ 0% 0\ 01 0\
N el .4 el el el N .4 el el N N N N el el
04 -ti' \O • D 1\ r-4 NI N 04 op co o o o o o cr. O 0
\O s.0 \O .O ‘414 '40 \ O
\ CN \ elCh eta'. eCr.-Í 0\ 01 t.'r-1°‘ 'Neta
r1crs t1.0., t1.0.,
N el cr. \ cr. .4 el el el N N el el el rl
rt ai
ID 40 o
E o E.1 •-■ o •el 0 U)
0 O 0 0 el
.`?. 5 +4 0
0 .0 0 ,
.4 e> t.
C .1 r-1 +I ig 0
0) 15 51, rt, •-■ E 0 .... O. 0 .. o •-■ O
o 4 •-• o O el 0 d44 o 4
•-■ e> 4 0 e-4 d o 0 en ••■ o bD f• s cr 5., N gj I. 5..1 4. 0. o N i4 E
0 -P 8..4 O -P
0 •-1 O -4. ••• o ...•
E g ad s• o 4-, g o ...4 t.
0 E o 0 0 TI 0 al o ,-4 or o -42 ad 4 ,g 0 N N o. o
+, al o 40 0. 1 12 0 00 03 a) 0 N
trl 0 0 02 we4 1-40.
O.
0) O) tel g ..-f 42 o 0
o -P 0. 4. N 4. 0 .4 o, .--• 0 ..-1 0 8.1 N 0 +4 0 N el E li cd O e> E o ei o "c% o 5 5 .9 "" 5 0 o o
*1 1 .C2h 1.93 41 g i tel 4. O 0 4. O
E el 4., 0 ...e o
0 +4 i• 0 0 N 0 5.4 1.0 93 0 o o
L. 4 bd) e z o .z 0 41) 0 +4 "tt 0 tr4 4,
4, 0 TI +4 or. 03 TI o 00 a 4 O ID f. 4 0
o Ei 0 t. •-• .4 ga U e. g t.) t.
O.
440 0.0.: 00 : ..44. O0 .40)
f. L ..-i 04.0Erb r-4 0 0 0 (7' 0 0
-4. 4.017E* mE a. o o di 15 0. t..1 o o. f...7 0 o cg o a ,....
:171 • • • $ • • • • • • • • •
N M LC\ s.0 tem. c0 ON N el O el NI lel -d- el el el
/T a ble 4
O. t` CO N N

Arg e
ntina, Brazil,
declarad its
dec lar
a d its
Possible
start of neg otiatio
n s.
Negotia tio
n s suspe
n ded
• 11 L O O
P-4 O o
Argen tin
a has
in tention of
owa, ea., 1,4
O
E
0
A
Arg entina, Brazi l a
nd Mexioo
0
A Argentina, Brazi1,
Bra zil, Co
lombia,
oo rl 03 03 0.0 O 0
m-1 12Q/
+a a-4 O 4. +1 0 S. 40 • cs. a> 0
• +> o S. O • 6.1) S, +4 O 4>
.44 11. al 0 O +I +0 O cd O.
Pr esen t state
o tia tio
ns ha v
e offioial
Sector
of industry
•
O
o ,-f
O O
so 43
e P.
a g.
a> 4 O o 'O 4)
a
•
l o o +4
o
o U o +1 o o o o 0 o
for domestic
use
Refr igeration and
a ir
- Plastios
- Chem ica
l fibras
and vegeta
bles
(Dr
aft 2)
ao
e O Ti
e 0.
- Prese
rva d f
ruits an
d ve
g eta bles ( Draft 1)
to start in the
O
sta
r ted or a re
- 240 -
Arg entin
a, Brazil, Me
xioo
• 43 ,,,,
2 e. 0 .4. e e
+4 "O .4 cd I ed 4-,
+I cd ... 40 r4 +0 'O o TI 0 • RO o 10 1 h 1 O 0 .4 0 al •■-■ P. 4. 473. T.9 14 o O cd o .-4Z o O o sa 1
•
.) S. o O t ul co al
•
O 4w al ai o
•
0 +
0 5 o O 0 5 .4 0
e ..4 -P +4 4
+:4 +a „
•
O 4 0 +4 -110 0 0 0 CA O
1I0 +1 0 00 o go o U Z 0. W +4 0 0. . i
n ten tion of so
_4 CV
t., . ...... ...- r.. ..-.. ..... o
+a +a
A A 1 1 TI
g TI E E
1 o.
+., +á +á
o o o s.
o 44 4.
o a> 'o o 40 O o
O ...
▪
4
Z a
▪
? 40
03
a tIO» CA O
4D Le 1:0
1). .4 .-4 g
0 ''A 15) • ...
" o 41 C
40 ... • 1 ii; t.
1 g 432 . 13 0. O0 4 451
,-, 0 0 0 O +a 0 .0 „4
0. .4 +a O Le +4 AD
O 0 L1 .0 •■ +o+ Le 0 +4
0 0 4.1 4-. ..W -1. 4 O S
O "a : t><á 1
2 0 W
t -if. %. o ...I 0
O +> o .0 o o
11 ..0 o o o
o ct 1 II I -
Toi l
et p
rep a
rations, soaps
/rabie 1+ (conolusion)

1 e e A Ti e
o TI
••-• .4 5 a l o
41 X Eo o 1 r.41
r-1
.. d 44
14 a .. „,,, 1-4
r r1 n1 .- 1
na .,-4 C. ¿ o
O I .re
/1 M 4-4 0
14
E o E A ro
4 t § 1 CQ
cddi ccr r 0 al Ti ar
.... ...4 ..4 44 44 g 0 44
C' cd Z 4 4
O A 44 44 +4 r-1 44
g g z g .4 z o O ,.> 0 0
03 1-4 10 110 10 'd 0
„.. 0 8-,
.4 . .4 .1 .4 ,c, .4
r >> 01 04 g en. r4
o a> 0 o rr gg .4 .4
0 0 0 N O 1
C-. M 4 o 59
140 A. a. D 2 al o, c...)
4 1 4 4
M ......1 o" /4, 4." In 1:1 .-4 cm .3 g
44 O i, 44 O
4-1 0 1 e e b 1 e g Ti 44 44
0 cd 01g g R. A 0 A A ........ ........ ......
O 50 a t> :1
TI 0 r4
0 44 41 o 5 44
.1 o 4-1 0 0 o-1 O r.., 0 4-, 41:1 '1
ni Ti c. E - a ) •--.. 4
o o g c,1 cd 44 .4
g O 44 02 cd
td Z'› 5 11 «, 4., ...., 01 01 03 a o Y .
o ..... 44
re-1 0 0 40 4-1 44 10
4,54 0.F r40 03 .0•444 0 40 a> 0 0 0 01 O
4.,
r-1 0 0 t. h 4.,
O o W W 0 03 14 44 0 .0
O ni o o o 4 fb 44 o .p ti 4 ta. .4
14 5 '' o g 5 o 4, g to
E. 4 0 0 o
o W
O 44 O 0 .g 0 111
44 44 4.1"4 44il° +4 ;150 al° Ti Ti 41 E ... t., g CO•tmg t0.101 5 5 > R. O 0 .0 4. 0 44 r4 1.4
01 04 3. e ,./ 0 E 44 r4 41 E o o 0 44 .1
44 r4
C a) 0 4.4 41 01. 14 11 0. td 0 o ce nal o
01 r4 _10 44 cd a. 4.1
01 10 41 0 XI 02 Id 4.4
.1 hl. ..<5> +4
E. 0
MI al 0 r-1
I 1 1 1 ll 1 1 t
E
8 o
o 4.› o 0
o
CEP sinoe July
In CEP sino July 1972
In CE P
sin
os August 1972
r-4
H
a) o
No pr ogres
e sinos Ju
ly 1971
No progr,Jss
o 44 h.! 0
'3
,• 1: 44
ni 43 .0 lid
o
0.
0
o
110
4.4 cd
0-1 04 05 0
44 144 c,
Feble 4
(oonolusion)
Present state
Seotor of industry
submitted
to the S tanding Exsoutiv
e
CC 11
O Brazil
and Mexico
tf)
ro
Od
Argentina, Mexioo
the qu
estion have
not bee
n in
olu ded.
o 4. o
0
o 4'
o ca al a> 14
o O 44 U
O 44
ro
a>
o oo o 0
U
•
o I
44
Negotiatiora to
Negotiations to
-241-
O C 0 0 e 44 o 44 O 0 d o o o 0 0
1 .1 clall 0.4 t•-.<„, 40 .p.,.. l'....0 \ r40. 1. c., C. ...4 4 c.-1 si e-1 0 o o .,. a) 4, o .4 A 0 4, I, ,,-, 4. *-1 g g
...54 ,T, g 01 49 ..°) "4 -4 N o -P 4-, 4,› . M 1-:`, 11 44 4 , f.. I. al 44 0 44 -11 e-1 e-4 -P 44
44 0 11) •
474 01 0 42 411 44 .4 .4 04 el 44 04
0 o '0 10 00 -O t/ .1. .1 TI O o o 4.
41 44 g 0 .1 4. g 704 1 44 0 :1 g 0 O ed 44 g el --I 44 44 40 0 0 'O 0 Ir 14
z -a r. p.. •yrJ n 0 o
, g .), g o, z ... 9, 4-1 g 411 cd cd -P 0 0.%-°, e'zi,,, p.1.0 l'...40", r4 44 1' .4 M %4
4.i r4 44 g a. o .4
0 w4 4> 0 C=1 0 44 0 0 14 >1 14 04
44 4-1 1 O C-1 44 0 44
40 ig z 11 o 4C 4
0 pQ g E. 44 44 44 al .1 rml .'D
e r-4 O 03
.r-, ij 0 z >, 44 ^, 41 44 "CA 1 orl 0 4. 44 0 O al 011 H
o 'O
g .1 o
o 40 f. 03 t. g o .,m ..... .p o o ü 03 ..4 • O 40 r 0 0 0
a> TI 0 4' rl ,...... ...... 0 z ...1 o a> 0 0 4
g ‘ g g 0 4
0 g o 4. 4-1 TI o al T3
44 44 U g g .g 0 0
ge. g0 4.4 4.. 4-1 O
4.> E 4> +'
O
.-4 44.0 04' ID rea) 2-1 ..4 o o cd 0 5.4 0.44.444044040 OD o o o 44 t. 44 0 44 0 44 .4 4' CD 44 44 a .... . 0 R. 44 U 0 44 H 44 441 04 4.4 o El C. .4 .1.0 s.
r-1 44 o e 0 o.
044 bg° 1.o"4 all .02 t.; 211 t:2 al ,.,1 ....... a. --... 0 0 ........ ....... a• ....... .....
..-1 O .41
/41 ■.(x..., •444- 111
Cr% OS g o, .d.- 0 0 r4 TI
O as. o r4 2 .-4 o
54 r4 .--i o O
T1 o o O o o o g 44 0 0 g 0
Z 2 Z O Z 4-1 Z 401 Z Z 4-1 4-1 44 01 44
4.1424,42104244424204.) O o 44 444404404444 0 44I~ 44 g o 0
a a I ,45 0
0 vi I 1 : ! °' o o .4 0 e
0 0 01 ID 0 el/ 0. ,n4 o o El 1
ad
.4 --. .1 i., Za ll APIII..V hg , , , , .
/This regulation

-242-
This regulation turnad out to be restrictiva and it was only possible to sign two agreements in the circumstances: the first on statistical and similar punched-card machines, and the second on electronic valves. In these first agreements there was some consolidation of concessions previously granted under the national schedules and, to a lesser extent, new complementarity proposals.
Simultaneously with the renewal of interest within LAFTN for industrial developrnont and ercgramming, a new system was set up for complementarity agreements late in 1964. Sasically, an exception was malle to the application of the most-favourod-nation clause in arder to aid the Implementation of these agreements by limiting the application of concessions to the countries particjpating. The application of this clause in faveur of the relatively leso coveloped countries, which thus receive non-reciprocal concessions, remained in force. This did away with the obligation te inelude the concessions in the national schedules of each country and with their irrevocability. The change of system was aimed at croating appropriate conditions for increasing the use of this instrument.
Several agreements were signad between 1966 and 1969. Among those which are beginning to be particularly significant because of their importance for ovaran trade are the agrceents on petrochemIcals and elcotrical machinery. In 1970, howover, an oven largor number of agreements was signed, including in particular agreements on the chemical industry and some metal manufactures industries, especially those producing the electrical and electronic goods frequently referred to as consumer durables, Subsequently, new agreements or extensions of earlier agreements have continuad to be drawn up, although to a lesser extent.
Apart from the complementarity agreements, other mechanisms have been developed to promete trade in industrial goods in the region, such as the agreement on spares and parts for the motor industry and government purchases, which have Also Leen extended to private enterprises. The first of these has a good leal in coman with the complementarity agreements, although strictly speaking it is not one, and hence does not have the same implications as regards the undertakings of the countries. This agreement has led to considerable trade owing to its volume and structure, and it will be reviewed together with the complementarity agreements.
The number ofconcessionsgranted in the complementarity agreements has grown to constitute an appreciable volume in comparison with the concessions of the national and special schedules, as may be sean from table 2; meanwhile, earlier mechanisms have fallen into disuse.
/It may

- 243 -
It may be asked what volume of trade results from the complementarity agreements. Some estimates are given in table 5, and are also compared with total liberalized trade. Trade from the national schedules has been included with trade generated by the complementarity agreements in the case of goods which appea.r on both liste. Also included are the transactions generated by the motor industry agreement and the recent trade in complete or semi-assembled vehicies,. The figures in the table should be treated with caution, since several egruements only carne into force in 1921, and in order to gain a complete idea of thcir repercussions it would be necessary to have the trade figures for these goods previous to the agreements.
Bearing in mind all the foregoing observatiws, it may be seen from table 5 that trade in goods included in the complementarity agreements, related goods, and goods included in similar agrsomentb comes to a figure of the order of 100 million dallare. This representa a considerable percentage of intra-regional trade. Of oven greater interest howover, is the considerable dynamism of this trade, which is largely due to the development of the metal manufactures and machinory and chemical industries. It should be borne in mínd that it is precisely these sectors which have a decisivo weight in imports and which have been developing on the basis of import substitution. This .sHpstitution is facing soma profiems which require a more detallad review of new projects and sane degree of openness. In these same sectors in the most developed countries of the region there still exist considerable substitution margins of which more effective use may be modo if the market is expended through exporte to the rest of the
region.
It le, of course, the most developed countries of the region which are making most use of the complementarity agreements mechanism. This may be observe(
in table 3 in terms pf the number of concessíons. It should be added that during the last few years the countries of the Andean Group have had a smaller share, and have striven to create other instrurnents of integration within the context of the sub-region. It is te be hoped that these instruments will finally be brought finto line with those used by the rest
of the LAFTA countries.
/Table 5

- 244 -
Table 5
LAFTA: SHARE IN IMPORTS OF THE PRODUCTS INCLUDED IN COMPLENENTARITY AGREEMENTS Nos 1 TO 11
AND IN THE REGULATIONS FOR THE MOTOR VEHICLE TRADE, 1963-1971
Millions of dollars at ourrent prioes
Peroentages
Total Imptrts Imports importa Cumulatl.ve
Total under the direotly ineluoed Motor total of Years intra- liberal,,c- lirkd directly Total agreements
LAFTA ttion with oom- or in- vehiole
(6) aotually importe programme plemen- direotly trade (1) (2) tarity by oomple. 12./ (4) and (5) °P9rating
agreements mentarity(5)
(7) (3) agreegents
(8) (9) (4)1(2) (6)/(2)
(4)
1963 717.0 397.9 0.5 0.5 ... 0.5 1 0.1 (-)
1964 839.7 512.1 0.6 0.6 &4111 0.6 2 0.1 (-)
1965 980.9 620.5 2.0 2.0 ... 2.0 2 0.3 0.2
1966 985.9 635.2 3.0 3.0 ... 3.o 3 0.5 0.3
1967 993.0 622.5 9.2 9.2 12.2 21.4 4 1.5 3.4
1968 1 083.1 684.4 209 41.8 14.5 56.3 6 6.1 8.2
1969 1 301.4 832.01/ 24.0 45.4 16.3 61.7 7 5.51/ 7.4
1970 1 351.6 851.02/. 30.8 51.2 18.7 69.9 9 6.04/ 8.2
1971) 1 456.1 934.0o/ 55.6 78.5 22.4 100.9 102/ 8.41/ 10.8
Souroe: LAFTA dolumenf; C.X11/Co.25 c,f 15 Nolrember 1972 for importa, plus unpublYshed ECLA/ILPES studies.
2/ In addition to importa direotly induoed by the agreement, these figures aso inoluds imports of produots not negotiated by the importing country in the agreement's liberalization programe (el-en if negotiated by en other paft1olpant oountry or oountries) but inoluded in its national schedule. These importo are attributed to this latter instrument.
1/ Inoludes parte and apares, as well as assembled vehioles.
2/ Estimated on the basis of indioes published by LAFTA (doo.C.XII/do.25), beowzse no figures are available
for Colrmbia, Ecuador or Peru fel- these years; there are no data for Bolivia or Uruguay thrcughout the period.
4/ Preliminary figures.
Agreement N° 4 between Brasil and Uruguay expirad in 1970.
/The fact
- 245 -
The fact that the small and medium-sized countries are less prepared than the largo countries to use the agreements suggests that this may create an unbalanced situation whereby some countries will tend to export the most highly-processed goods for which there is the most dynamic demand, while others will tend to export the simplest types of goods, demand for which grows more slewly. This tendency must be corrected in arder to achieve equitahle dovelcpment, and it is towards this objective that many current offorts at intes:dtion are directed.
It is interesting to note the regional import substitution potential contained in the agreements. Under the first agreement, the proportion of locally-produced statistical machines in total imports of such machinas by the participant countries rose from 6 per cent in 1963 to 25 per cent in 1967. The agreement on electronic valves accountee for nearly 20 per cent of total imports in 1967.
Another quantitative indication of the potential importante of the complementarity agreements, as may be observed from table 6, is that imports of chemicals under complementarity agreements account for two-thirds of the total chemical imports of Argentina and Brazil and more than one-half in Mexico. In Chile, they account for 40 per cent.
As regards the metal manufactures and machinory industries, the complementarity agreements plus the motor vehicle agreements account for more than 50 por cent of imports of these goods from the regían itself for Argentina, Brazil and Chile, and account for more than 20 per cent of the total in Mexico.
There can be no doubt that in comparison with total exports of manufactures by the regían, those to LAFTA itself are of substantíal importante and are linked to a considerable extent with the complementarity agreements. This importance is oven more evídent in the dynamic sectors of the chemical and metal manufactures and machinery industries, both as regards the complementarity agreements and outside them. In arder to achieve greater accuracy in the figures, more detailed definition and discussion of the terms "manufactures" and "semi-manufactures" is callad for. The facts referred to hold good quite independently of this, howevor, since although the figures may change this does not basically affect the conclusions.
/Table 6

— 246 —
Tabla 6
LUTA: PROPORTION OF GOODS COMING UNDER COMPLEEENTARITY AGREEMENTS IN INTRA-AREA
IMPORTS FROM SOME MANUFACTURING SECTORS, 1970
(Percentages)
Argentina 2/ Brasil Chile Ehxioo
Mambla' products 121 64.7 66.3 39.3 53.5
Mechan/cal products 2/
exoluding the motor vohlole agreement 35.1 40.7 4.3 13.7
- including the motor vehiole agreement 50.8 43.0 47,5 23.2
Note: Thess peroentages are preliminary estl.mates, subjeot to revision.
11./ In 1971.
12/ Agreement No 5.
2/ Agreements Nos 1, 2, 3, 4, 7, 9, 10 and 11.
I/ Including spares, parts and vehioles.
/A review

— 247 —
A review of the draft agreements and those already concluded shows that mejor amas of industry still remain untouched, e.g., the mechanical engineering sector itsolf, which accounts for nearly half the total industrial imports of Latin America. Hence, to judge by the percentage of area trade which the agreements in force cover, it is possible that this instrumont will be considerably expended and will generate a much larger trade in manufactures. But it is equally obvious that although there is a margin for increased trade operating under extremelyflexib3.e conditions along linos similar to those of the present agrements, this very progress would lend into the most vital branches for economic development. The production of investment goods and some basic intermediate goods, which are not being manufacture) on a full scale even in the largest countries of the region, calle for a greater degree of programming in order that it may be properly developed. Progrese in the integration of theso typos of goods would therefore aleo require that programming elements should be taken into eccount moro than at present.
(d) Emargss on agreements between central banks and other financial matters
The most important financial instrumont of LAFTA is the reciprocal payments and credits agreement signed in 1965, which provides a mechanism for multilateral co—operation in effecting reciprocal payments and credits in convertible currency.
This machinery consists of a network of bilateral agroements between the central banks of LAFTA countries, whereby reciprocal credits for agreed sume are provided according to payments needs.
This system has been gradually perfected and its use has increased substantially, securing a dcgroo of speed and security in payments nover before ach±eved in the region. The time limit for clearing balances has been extended to four months and it has been decided to charge interest to the debit balances of each central bank. Consequently, the amounts involved in those agroements have risen from around 25 million doliera in 1967 to nearly 140 million at the end of 1972. Much progrese has aleo been made towards the possiblo establishment
of links with the Central American countries.
In September 1970, another important financial step was taken when a multilateral agreement was signed in Santo Domingo between the central banks to alleviate temporary loases of liquidity. This is a financial mechanism designen to help the balance of payments and to prevent the deterioration of the extorna:1
sector by providing for the granting of credits from aren funde for period of up to 18 months. The main difference between this mechanism and the multilatera: payments and credit system — apart from the repayment periods lies in the fact that the main objective is the provision of credit and not the settloment of
amounts. /Also worthy

— 248 —
Also worthy of mention are the efforts being made to establish an area market in bankerls acceptances, which are among the most effective credit instruments for the financing of intra—area trade. Careful studies have been made on this matter.
3. z....lea2Grj192
(a) Gaclz=linformation on the establishment of the Andean Group
As noted earlier, the medium—sized countries at a relatively less advanced stage of development which today form the Andean Group have in general shown a deficit in their intra—regional trade. Their economies are on the whole more opon than those of the largor Latin American countries, and they have substantially increased their trade with the cther LAFTA countries to the point where they trade more with the rnst cf' the Association than among themselves (seo table 7), although reciprocal trade between the countries of the Andean Group has been growing at significant retes (over 40 per cent in a recent year). The Andean Group countries as a whole represent a considerable market for the rest of LAFTA.
A fact connected with the Andean Group which is of considerable interest to the integration agencies is that it combines accelerated progress towards integration with a. process of otructurel changos which, in diffemnt degrees and ways, each country is pursuing in the economic and the social field. Integration can thus have a broader scope than if exclusively economic objectives are pursued, since it enables the dynamic element of the new market and the various instruments provided by the Agreement to be brought into action to tackle more effi7:acioübly such problems as unemployment, which, in spite of clearly—dsfined national policies, have shown a marked tendency to get worse in recent years.
This and other social situations common to many Latin American countries largely explain the main factures and modalities of the Agreement. Another point to bear in mine' is that it was drawn up in the light of the experience of the previous systems, the results of which clearly reveal some limitations of the more traditional methods of approaching integration.
For a proper study of the Andean Group it is important to nota some of its basic features: the important role assigned to programming as en integration and development instrument; the treatment accorded to the economically relatively less developed countries; the automatic system of liboralization and the adoption of a common external tariff; and the powers of initiative and decision given to the bodies directing the process.
/Tabla

.
- 249 -
Table 7
LATIR AMERICA: STRUCTURE OF IN.PORTS 2/
(Peroentagee on the basic of ourrent prives)
Importer
Exporter Year LAFTA
exoluding the Andean
Group
Andean Group
LAFTA CACM
Other Latin
American oountries
Latin Amerioa
Rest of the world
Total exporta
LAFTA exoluding the
A. By erigin
Andean Group 1960 8.9 5.4 8.1 2.5 0.8 7.5
Andean Group 1.2 3.1 1.6 0.2 1.5
LAFTA 10.1 8.-1./ 222 .11 0.8 2151
Central American Common Market (CACM) - 0,,2 0.1 6.4 0.4 0.5
Other Latin iruerican oountries 0.2 1.0 0.4 1.6 1.2 0.5
Rest of the worJd 89.7 90.3 89.4 99.3 97.6 90.0
Total importe 100.0 100.0 100.0 100.0 100.0 3C0.0
LAFTA exoluding the Andean Group 1971 7.2 11.0 8.0 5.7 12.8 9.3
Andean Group 2.2 5.4 3.0 0.8 0.7 2.4
LUTA 921 16.4 11.0 L5 12:1 11.7
Central American Common Market - 0.1 - 21.7 2.0 1.7
Other Latin American countries 0.4 0.4 o.4 1.0 0.1 0,4
Real; of the world 90.3 83.1 88.6 70.8 84.5 86.2
Total importa 100.0 100.0 100.0 100.0 100.0 100.0
B. By destination
LAFTA exoluding the 100.0 Andean Group 1960 8.2 1.5 9.7 0.2 90.1
Andean Group 3.9 3.0 6.9 0.1 93.o 100.0
LAFTA 223. 1.8 2d 0.2 - 90.7 100.0
Central American Common Market 0.7 0.7 1.4 7.5 91.1 100.0
Other Latin American countries 5,9 7,9 13.9 4.o 1.5 80.6 100.0
'fetal Latin Arerina 6.8 111 la 0.2. 0.1 90.5 100.0
LAFTA exoluding the 100.0 Andean Group 1971 8.0 3.6 11.6 0.8 1.1 86.5
Andean Group 7.4 5.3 12.7 0.3 0.2 86.8 100.0
LAFTA 7•8 4.o 11.8 II 0.8 86.7 100.0
Central American Common 100.0 Market 0.4 0.2 0.6 25.3 1.4 72.7
Other Latin American countries 8.o 2.8 10.8 2.8 0.2 86.2 100.0
Total Latin America 7.12. 2.L.2 11.0 212 211 85.11, 100.0
t/ In CIF terma.
/The Agreement

— 250 —
The Agreement is designed to harmonize economic polioles and co—ordinate national development plans "with a view to developing a joint planning system for the integrated development of the sub—region" 5/. It is hoped that these instruments can be successfully used to tackle the most acute problems of the region and of each individual country, and that an important part will be played in this task by the sub—regional development strategy which the ccuntries plan to adopt in the future — a strategy aimed not only at achieving thG cdmmon nbjectives of regional scope but also at intensifying and supporting the efforts which the countries may make to solve their own development problems. This would confirm not only the value of integration as en instrument of development, but also the close relation between the sub—regional strategy and the problems of the member countries and their solution.
Ever since the establishment of the Andean Group, which is composed of three countries of medium economic size and two of small economic size, appreciable differences in thG stage of development of the member countries have been apparent (the ratio of per capita income between the countries with the lowest and the highest incomes is 1 to 3. These disparities, coincide with differences in the level of industrial development between countries in which the structure of industry is incipient or fairly in complete.
Balanced development is one of the focal points of the Agreement and is reflected in different ways in the liberalization programme, the sectoral industrial development programmes, the sub—regional financíng machinery and the prosees of establis'hing a common tariff. A reason for thís may be what happened in the case of ether systems which, sinos they mainly used preferential trade and financial instruments, did not succeed in preventing the spontctneous trend towards a widening gap. Although this gap was, it is true, more marked because of the rices in levels of income, even so it caused serious problems. In the Andean area the objsctíve of balanced development is visualized in broader terms, and in the case of industrial development it is expressed in specific programmes in pre—determinad locations.
The Andean Development Corporation was set up as the Group's financial mechanism to play a direct role in the promotion of activities. This Corporation has thus far had en integrationist policy, on the one handl and a preferential policy with respect to the smaller countries, on the other. Although the financial support provided has not yet reached very large
5/ Article 26 of the Cartagena Agreement. /proportions, it

— 251 —
proportions, it must be borne in mind that the first industrial programme was approved only in the last few months, and now that it has been approved a substantial demand may arise for financind specifically linked to integration aims — a trend which may be stepped up once new integrated development programmes are approved and the effects of free trade are more clearly manifest.
Anothgr important reature is the wide powers of action of the Commission and the Board of the Agreement. The Board has been given great scope for initiative: it has been assigned responsibility for studying the different problems and possibiiities deriving from integration and fnr presenting proponals for consideration and adoption by the governmonts. The Commission, for ins part, has been given wide negotiating and deoision—making powers. As a rule, the proposals have so far culminated in decisions which in mane cases are automatically implemented and require no furthgr consideration or decisions by the parties. This has helped to provide Andean integration with a basis for rapid actinn.
It would, however, be wrong to believe that the integration procese requires only agencies of regional scope or that it is enough for them te operate efficiently. On the cnntrary, as the procese edvances and its irnpact is felt in the various eountries, the national mechanj.sms will have to operate in a regional context if they are to be effective. In this respect, en intensiva effort would seem to be required in order progressively to regionalizo the action of the national mechanisms and introduce sub—regiónal options in their scale of decisions.
(b) The achievements
The principal achievements of the Andean Group can be grouped under the following headings: tariff cuts and the common external tariff; industrial procrommino; progrese in agriculture; and the common rejime for the treatment of foreign capital, covsring trade marks, patents, licences and royolties, and multinational corporations.
The liberalization programme is automatic and applies te all products. It has been in effect since the beginning of 1971 and applies automatically, subject to time—limite, to four types of product:
(i) Products included in the first section of the Common Schedule of LAFTA. These were liberalized 180 days after the entry into force of the Cartagena Agreement, concluded in May 1969;
/(ii) Products

— 252 —
(ii) Products now being produced in any country of the sub—region and not reserved for sectoral industrial development programmes. The list of such products contained a number of reservations, which may be expended, covering products to be produced in Bolivia and Ecuador. The products in the list were completely liberalized in February 1971.
(iii) Products reservad for the sectoral industrial development programmes. Ths of these was approved in 1970, and these products are to be liberalizad under the provisions of the respective sectoral programmes, as is currently the case with the metal manufactures and machinery sector.
(iv) All other products are subject to tariff cuts of 10 per cent Each year, with Chile, Colombia and Peru, starting this procesa in 1972 and Bolivia and Ecuador starting in 1976. Hence, liberalization will be complete in the three more developed countries by 1980, and in the other two countries by 1985.
Similar time—limits apply to the coman external tariff, which should be fully in operation by 31 December 1980 at the latest. In 1976, the member States are to begir to being their duties appliceble to imports from outside the subregion gradually into line with tea common external tariff.
In additicn to the items which have already been completely liberalized, the tariff applicable to the products of the relatively les: developed countries was reduced by 40 per cent in 1971 and is to be reduced by further annual reductions of 33 per cent, which means that exports by Solivia and Ecuador will be totally liberalized vis-11—vis the other three Andean countries in January 197a, with the exception of the products reserved for special programmes or those eligible for special treatment.
It is worth noting that all the provisions of the Aareement covering these important issues have been fulfilled within the deadlines set.
Industrial programming is an ínstrument which the Andean Group, comparad with other integration movements both in Latin America and the rest of the world, has employed in a very special and intensive manner.
While free trade inherently stimulates economic activity, it is not in itself a sufficient instrument for directing it. The use of plans and programmes, and the intensive efforts being made to co—ordinate policies, are a consequence of the need to develop the sectors that are lagging behind, and this need has been ever—present in the Andean Group's thinking since its formation,
/Problema have

— 253 —
Problems have had to be solved in order to prepare and approve these programmes, as is clearly demonstrated by the fact that roughly a year and a half elapsed before the adoption of the ifrst agreement, covering products of the metal manufactures and machinery sector. The adoption of this agreement, however, payes the way for others covering important sectors which are at
diferrent stages of preparation.
The first deadline for the approval of this type of programme expires at the end of 1073, but it can be extended until 1975. The work programme of the Board provides for the completion in 1973 of several draft programmes, now in course of preparation, covering a very large proportion of the basic capital goods industries and the intermediate goods industries (mostly metal
manufactures, machinery and c.hemicals).
It is worth while noting that, side by side with the industrial programmes, the Board of the Agreement has prepared the first version of an outline development strategy, as an overall instrument for policy guidance, in caeoperation with ILPES and ECLA. The strategy covers .sacro—economic, social, industrial and agricultura' issues. In the field of industry it lays special emphasis en the development of industries that play a key role in foreign trade, and sets targets that are linked, inter alia, to an import substitution process that differs from the traditional Latin American pattern
(sea figures in table 8).
The agreement on the metal manufactures and machinery industry approved during 1972 marks an entry into the key area of the production of investment goods, which endows it with special significante. So far, ectivities in this branch of industry in the Andean countries have in general fcllowed the development pattern of Latin American import substitution. Consumer durables production has been developed quite substantially, with only 20 per cent of demand now being imported, the rest being produced in the region. The situation is different, however, with respect to investment goods, domestic production of which has grown very slowly, with imports still predominant in supplying demand. Some specific instances are particularly striking. For example, under the head of machinery other than electrical, which accounts for 40 per cent of metal manufactures and machinery imports, investment is dependent on imports in proportions of up to 80 per cent or more, depending on the country. In other words, the proportions of demand supplied by imports and domestic production are exactly the opposite of those corresponding
to consumer durables.
/Table 8

— 254 —
Tabla 8
ANDEAN GROUP: CONPARATIVE INIPORT COEPFICIENTS 1/FOR THE PRINCIPAL
SECTORS OP BASIC INDUSTRY
(Peroentages)
Andean Group LAPTA
Projeoted Current
1985 Argentina 1967
Brazil 1967
Mexioo 1967
Prinoipal seotors
Papar and pulp 24 8 22 6 13
Chemioal industry 37 16 24 13 16
Basic metals 27 15 27 14 11
Metal products 24 10 12 16 • 18
Machinery other than electrical 80 52 71 57 87
Eleotrioal equipment 51 27 8 14 34
Transport equipment 63 101/ 5 8 32
Srbtotal 46 22 14 1.2. 24
Other sactors
Industries substantially produoing non-durable consumer geoda 5 2 14
Industries subatantially produoing intermediate goods 2/ 18 11 7 6
Total 214 14 8 lo 14
Source: Board of the Cartagena Agreement, Bases generales para una estrategia subregional de
desarrollo, Rearmen. Separata N° 11, May 1972.
t/ Importe as a proportion of do:nestio demand.
1/ In view of the development options open to the motor industry, this ooeffioient should be
oonsidered the net sum of importa and exports.
.2/ Exoluding the paper, chemioal and basic metais industries.
/A look

— 255—
A look at the composition of the capital goods produced in the sub-region shows up even more clearly the weekness that exist in this respect. Domestic supply of general-purpose capital goods may be considerad relatively satisfactory. But only a tiny fraction of capital goods for specific purposes, which are the key component of investment in industry or other sectors of the economy, are produced domestically. This is reflected in the figures for machinery other than electrical referred to aboye, and is quite a revealing indication of the state of technology in the Andean Group countries.
The Programe approved covers a large number of capital goods, so that once the motor industry, which also produces capital goods, is íncluded, it will range over the vast bulk of investment in the Andean Group, with the exception of tho goods included in the liberalization programe. The programe approved covers machinery and electrical equipment, machine-tools, machinery for mining, the food industry and agricultura, and also cer'cain intermediate and consumer goods. Demand for the goods included is estimatsd at slightly more than 1,000 million dollars by 1900, and anticipated sub-regional production at some 500 million, distributed amang the five countries.
A significant aspect of this programe is the fact that its implementation does not depend cn subsequent agrcements cr negotiations. Thirty days cfter the conclusion pf the agreement, the countries other than the one essignod a particular prcductive unit are to elimina-te all dutics and other
impr7t rostrictions on the products corresponding to that unit and originating in the country to which it has bcon assigned.
The units assigned under the agreement to the relatively less developed members are similar as regards industrial features and technology to those assigned to the other countries, so that they help to the foundations for balanced development within the sub-region. The fact that the less developed countries are starting off at a great disadvantage, however, raises problems that must be borne in mind. Te tackle these problems the Andean Group can bring into play a number of instruments that are complsmentary to this type of agreement, such as the harmonization of development policies, co-ardination of national plans, and action by the Andean Development Corporation. At the same time, it is clear that solutions depend cn more than just the integration procese. A very great effort is needed to overcome differences that are of such long standing. Hence, the success of the measures adoptad is also linked to the development polícy adoptad by the lees developed countries, for which integration, with this programming component, opens up great prospecte.
Goods produced by the agricultural sector have been made subject to a good many exceptions, but nevertheless it is hoped that there will be a considerable amount of liberalization. The area established for programming in agricultura is small compared with industry. The Cartagena Agreement does, however, contain provisions for programmes of agricultural specialization, although the main emphasis as regards agricultura is on free trade.
/Many agricultural

— 256 —
Many agricultural products come under the general system of eutomatic liberalization, taking as the base level the lowest duty or charge applicable in Chile, Colombia or Peru te each product. Goods from Bolivia and Ecuador enjoy preferential treatment, and from 1973 are exempt from all duties of charges in the other Andean countries. It has also been agreed that duties arE to be eliminated from the outset on a specified group oF products.
Bolivia and Ecuador are to begin to lower their national tariffs in 1976.
A practical first step towards setting agricultural development programmes in motion might be to conclude bilateral commodity agreements and then later on te take the necessary joint Action to meke such agreements multilateral in scope, in accordance with the specific requirements of each case.
The Board of the Agreement has initiated some basic studie on commodities in the five countries of the sub—region, and progress has been made in a study of fats and oils, which reaches the conclusion that the sub—region can be self—sufficient in these products by 1980.
The adoption of a common system for the treatment of foreign investment is a key event in the Andean integration process and is unprecedented in LaUn America. Decision 24 adopted by the five countries lays the basis for this as it indicates that activities connected with capital originating outside the sub—region will in the future have to be in line with specific common norms that ensure they are in the interest of the sub—region as a whole and of each country in particular.
The decision defines the sectors of activíty which foreign capital may enter and the terms governing its entry; it reserves sectors for national enterprises and prohibits foreign investment in activities that are considered to be adoquately served by national enterprises; it defines the form in which investment is accepted and states that profits repatriated infreelyconvertibic currency in any year cannot exceed 14 per cent of the value of the registered capital; it stipulates that each country may establish treatment of a differeni type for certain activities, but that if it does the corresponding goods will not benefit from the liberalization process or any other benefits derivinc from the expansion of markets, since fulfilment of the provisions regarding treatment of investment forms part of the requirements relating to the origin of goods; and lastly it provides that established foreign enterprises must become national or mixea enterprises within no more than 15 years in Chile, Colombia and Peru, and no more than 20 years in Ecuador and Bolivia.
/As e

— 257 —
Asa complement to the systam governing foreign capital,the Commission of the Cartagena Agreemont els° decidoc: upan a standard regime for multinational corporation (Decision 43), designed to encourage sub—regional entrepreneurs to take advantage of the expended market, channel sub—regional savings towards the sectors of highest priority, and facilitate sub—regional programming.
A corporation is considered multinatiorial under the regime if it is located in one of the Andean countries and has capital stock owned by two or more Andean countries. Capital from outside the sub—region may not exceed 45 per cent of the total, and the Share of each participating member country may not be lens than 15 per cent of the total sub—regional capital in the corporation.
The regime for the treatment of capital, in additior to regulating foreign investment, contains provisions governing trade mars, patente, licences and royalties, and the transfer of technology. The aim in this respect is to promote a new policy for technology and to prevent the indiscriminate transfer of types of technology that contribute little to development or that involve unnecessary outflows of foreign exchange. There are very precise provisions covering the clauses that may not be included in zlqreements for the transfer of foreign technology, and agreements on patents, licences and trade merks. For example, the enterprises established in tne sub—region may not restrict the origin of foreign supplies of capital goods or raw materials, since the concept of competition as regards price and quality must be paramount in seeking supplies from abroad. The regime aleo prohibits clauses that curtail the internal decieion—making ability of enterprises that have acquirud technology and laye down that no restrictions may t,e placed or established from outside on the volume or type of production, final erices of products, or the markets to which they will be sent, whether these be domestic, sub—regional or third countries.
The regime makes special reference to the incentives that the Andean counries should provide for the acquisition of products incorporating technology of sub—regional origin, and states that the Commission should approve a programme to promote the development and generation of technology in the sub—region.
The negotiations for the entry of Venezuela into the Andean Group are at a very advanced stage. If Venezuela does enter the Group, the combined market of the six countries as regards the main manufacturing sectors will compare favourably, as integration becomes more effective, with that of any of the larger countries in Latin America, and will offer possibilities for rapid and sustained progrese and development.
/4. Central
-258-
4, Central American Common Market
The notable success of the Central American Common Market during most of the 1960's, which raised reciproca) trade from negligible levels to one-quartor of the total volume of trade, for a time concealed the problems that were hatching within this process. The dífficulties experienced in different ways and to different degrees by some of the Central American economies culminated in the period when the conflict broke out between Honduras and El Salvador. The experience of the Common Market included different kinds of complementary measures. Some were linked to the area of trade policy and others to the design of instruments for the harmonization of policies or of investment in and development of production sectors. However, the trade liberalization measures predominated and, in the terms in which they were applied, they have tended to exhaust their possibilities, to the extent that any subsequent progress involves facing more complex problems which are closely bound up with the process of industrial development. It may also be affirmed that the imbalances in the trade flows are largely attributable to the greater or lesser extent and depth of tia production base which the different member States had at their díeposal in arder to take advantage of the establishment of the free trade area and the levels of production established throegh the common external tariff. Since there was no appropriate supplementapry machinery for i:vproving the structure of production, or inadequete use was made of that.provided by the regional agreements, the countries with the soundest industrial and entrepreneurial capacity in time carne to record increasing surpluses in in-bre-regional transactions, while the least developed countries showed deficits. In other cases there were disparities even between countries whose inicial development had been similar - resul-L-ing from different polieies in regard to the degree of importance attached to projects directly linked to the Common Market. While some countries centrad their attention on regional import substitution, others channelled their main efforts towards the traditional. external sector or activities designad to meet the requirements of the domestic marketn This helped to create trade imbelanere between member States with similar income levels, In addition, monetery, credit and development policies were not sufficiently co-ordínated, which causad delays in the integration programmes.
Nevertheless, the Common Market has brought net benefits to each and all of the Central American countries, and these benefits wculd probably have outweighed the above-mentioned factors of disequilibrium had they not coincided with the heighteníng of national tensions and the weakening of trade with third countries. The fact that the accumulation of adversa factors affected each economy differently was the cause of a succession of
/crises which,

-259-
crises which, besides halting the formulation and implementation of common basic measures, led - together with the accentuation of the tensions to a possibly exagaerated evaluation of the integration coste for individual countries. This trend was aleo influenced by the lack of a system of evaluation for determining, in accordance with jointly esteblished criteria, the net benefits and long-term advantages deriving from regional co-operation practices for each and sil of the countries concerned.
It is aleo clear that in some cases the policy of taking concerted action was not adopted in time to forestall the problems, and these had to be dealt with cnly after they had arisen. In other cases, measures were adopted but the necessary instrumente were not provided for carrying them out. Therefore, attention to basic questions connected with bringing the multinational co-operation programe into line with the changing conditions of integrated development was either insufficient or too long delayed.
In the meantime, the development of the national ecoremies, brought about to a considerable extont by the integration process stself, was carrying them to the beginning of a new stage of development and industrialization which required that new and aperopriate instrumente be found, while the equitable distribution of integration benefits was becoming more and more urgente Thus, Central America too has now enterGd on a stage of reflection and of foemulation of new integration instrumenta designed to solve the sub-region's increasingly serious problems within a more comprehensive and far-reaching system of integration.
(a) Eackareund data on the evolution of area trade
The growth of inter-Central American trade has been among the most outstanding in Latin America. Table 9 shows that its Share in the total trade of these countries rosa from about 6 per cent in 1950 to over 20 per cent in 1971, having attained average ratee of approximately 20 and 30 per cent annually over a period of several years. The volume of trade, measured in tercos of common imports, is already close to the unprecedented figure of 300 million dollars. It should be noted that the deficit position with respect to LAFTA has deteriorated over the years.
Table 10 shows some anumalies in 1971, which are due to the effects of the border closure after the outbreak of hostilities between El Salvador and Honduras. It aleo shows the main trade flows within the sub-region.
/Table 9

0 0 0 0 0 0 • • • • • 0 ,000
00000 8
tr. 111 • • • • •
O\ O \ O \ \ O o‘
• •\ • • Ul
O O O 1 O O \ O
cr 1 l '...0 n L1\ ..- co \O1 u1 O
r■ O 01 \ O e-e dr • • • • • • •
ro. O
u
R. +) e., O, e
( PP
r o
enta
g es )
o s.o a•s.
L1\ CYJ r*. , • N 1 1 N co co 01 o
co O .-Y11
\c) c,"N crs O O O • • • • • . NI t'Y O
O L1-1 121 cr. • 1.1-N I co I „o z.Z.'
N
\O Lt", O • y
Lr■ \ el O e.. O • • • e • • • •
1 \O t". O O eq t., O
tjL11 .d• r*. c0 • • • • • • • N rY1 rY1 O \O N O O
F. :
\ O o
É N
V:> coic o o
co O N • • c,4
O L -z0j CIN 01
• • • • • N O O 0
O \ O
\O CON h \o' CD OT 1 CT 1L11 C1,1
•
a*. O
Cn N N 1-4 t". N 0 r • r..41
rt • ezi , • c3
4..4 CO O H
O\ \O r-4 \O \ O e
• • • o-N
cr, O
0.1 01 o
u`, • O I
Cos
ta
Rio
a
E. Iu +o o E 0.
1.4 o o.
cía
o
o 4 4
1:5 Nfy ...4 Cri
O O
Ú O
e -P 5
o g
/-4 L4
111d O
r-1 cd
a
rt
O itt
N ,4 E. 1:1 a. o o
O CD
O \O \
ra
<lo z" 'co
o e.
O
e.
-P
cd V) o
O
•O
Lr■ csi • • • •••+ O O I O
— 260 —
O o in • • • • •
ts. C7\ o-4 I LC C•4 Cr'y O • • •
\ O O O r+4
CO CO e4 O\ cr• o. • • •
cr\ c0 e' ‘ ri 01 01 N N
Cos
ta R
ica
CO h N o \I • • • •
\O
\ h trl • e: 1 c., I r-1 oY4j
o
c0 u-N o \O • •
u-, O e sjj
co h col • e ,; u; ul
cw o ci o; o
r-1 ri
O 0 O 0 0 0 • • • •
O O O O O O 0 O 0 0 0 o
ri N r-4
\O O\ CO 111 • .
co N 1r, O\ CO O\ QD
CO r-j1 •1 \
N N O\ co -± • • a • o
N O O CM r4
o■ el 1,0 =l LI - o • • ••• csi o VD r-
r-1
r-4 141 Crs N CY11 •
• • I O • oo:
O en O
cr*, 0 • •
O \ t
O LC • •
C.D I .-1 11, N
• c • CNI CO 01
I O O O 0 \ O
o -ce
u
en
o
Oyo U)
i. 1,4
o
U) m 5 ri
43
O
2
O 1-4 fs-1 (0 0
.-4 cel 4>
e. t.
4o.
O 0 4
.1-1
M ai 4.•
o O o e
or 4 ai • 4. N
O O Lo O o
N LY ori O E U) .o o N o -
4P
40 o E E o ,r4
tn E
PI o 4. O• 1.-1 0 .4
-P
la° C1 1
o • • o 1,
-111
/Table 10
Gua
tem
ala

- 261 -
Table 10
CENTRAL AMERICAN COMMON MUT: STRUCTURE OF INTRA-ÁREA IMPORTS
OF INDUSTRIAL «CDS, 1960-1971
(As peroentages of total importo of industrial goods)
1960 1964 1968 1970 1971
Traditional goods 2,/ 57.6 52.2 52.9 47.8 44.6
Food (24.0) (15.7) (17.4) (15.5) (12.9)
Textiles (15.7) (16.8) (19.4) (162) (17.4)
Intermediate goods hl 29.5 34.8 28.5 32.3 34.1
Chemical products (20.3) (20.8) (17.7) (21.5) (24.2)
Metal manufactures and 9.7 8.1 13.7 14.6 15.5 machinery 2/
Machinerj, exoept elentrioal machinery (3.7) (1.0) 0.9 (1.6) (0.9)
Eleotrical maohinery (-) (2.2) (4.7) (5.0) (5.3)
Misoellaneous manufactures y 3.2 4.9 4.9 5.3 5.8
Source: ILPES and ECLA.
Note: The industrial goods inoluded here correspond to the United Nations International Standard Industrial Classification (ISIC ). This olassification inoludes more geoda than those considerad as manufactures in other parte of this dooument.
Food, beverages, tobacoo, textiles, made-up textile goods and footwear, wood and furniture, and leather manufactures.
1/ Pulp and papar, rubber manufactures, chemioal products, petroleum products, oement and glass.
Basio metal industries, metal manufactures, machinery other than electric, eleotrioal machinery and transport equipment. Inaludes durable consumer goods.
di Printed matter and miseellaneous manufactures.
/Not only

- 262 -
Not only have the volume and proportion of trade increased rapidly, however: there has also been a radical change in the structure of ares trade. Table 10 shows the structure of trade in industrial goods, which already representa a high proportion of intra-area trade. The share of traditional products dropped from nearly 60 per cent to just over 40 per cent, although within this group the proportion of textiles increased slightly. Meanwhile, intermediate goods, particularly, chemicals, substantially increased their share. The proportion of metal manufactures and machinery rose even more sharply, from 10 to 16 per cante outstanding among these products being electrical machinery. There can be no doubt that manufacturing industry has introduced new trade items, which have also simultaneously entered the production field, so that production has developed to a significant extent on the basic of integration. However, a more detailed examination of the type of goods included in each of these categories, such as chemicals and metal manufactures and machinery, reveals as yet a relatively simple structure in comparison with the items of trade in LAFTA. Chief among chemical products, for example are some fertilizers, and toilet articles and similar products, whilc the metal manufactures consist primaríly of durable consumer gocds, many of which are no doubt merely assembled locally.
These features relate to a type of development in line with Latin Americals tradition of import substitution, with a predominance of durable and non-durable consumer goods, some intermediate products, and an abundance of assembly industries. As in other Latin American countries of similar size, the production of basic capital and intermediate goods is very backward.
The share of Central American trade with respect to total industrial production is shown in table 11. It will be seen here that in the dynamic sectors, such as electrical machinery or the chemical industry, area trade accounts for over 35 per cent of production, while the share of rubber manufactures is 26 per cent, and of pulp and paper 20 per cent. The same applies to some of the traditional industries, such as textiles, where the proportion rose to almost 40 per cent, although more recently it dropped to 30 per cent. These figures show quite clearly that integration is indissoluble from the development of import substitution industries which is taking place in Central America.
/Table 11

e
- 263 -
Table 11
CENTRAL AMERICAN CONMON MARICET: PERCENTAGE SHARE OF INTRA-MEA EXPORTS OF
MANUFACTURES IN THE GROSS VALUE OF PRODUCTION
1960 Average 1960-1964
Average 1965-1969
1970 1971
Traditional goods 1.7 3.0 8.0 9.o 7.0
Food 1.4 2.2 4.1 5.3 3.6
Textiles 6.3 13.2 24.2 38.6 29.9
Made-up textile goods and food-wear 1.5 6.3 10.1 11.6 12.8
Intermediate goods 7.9 12.5 19.8 23.6 21.2
Pulp and papar 11.8 17.1 17.3 20.3 17.2
Rubber manufactures 16.7 14.8 22.5 26.4 25.6
Chemical products 9.8 17.4 26.6 58.3 36.9
Metal manufactures and 6.6 8.4 21.4 24.7 21.6 maohinery
Machinery, except eleotrioal maohinery 10.2 9.9 11.8 18.5 8.8
Eleotrical maohinery 30.3 40.7 48.3 40.7
Misoellaneous manufactures 3.5 11.1 15.2 15.7 13.7
Manufaoturing sector 2.5 5.3 9.9 13.1 11.0
/The fact

The fact that such a high proportion of production is absorbed by intra-area trade indicates that the production effort is mainly directed towards the trade flow. An analysis of the import substitution process shows that there are still promising margins for production. The degree of self-supply is as yet fairly limited in many fields. Nevertheless, the utilization of such margins would necessitate a change in the industrial development policy hitherto adopted, since the impetus would be provided by different sectors, there would be different problems to face„ and different ways would have to be found to solve them. For example, a clearer role could be played than in the past both by an opening up of the economy - with increases exports of manufactures - and especially by co-operation within Latin America.
In a sense it could be affirmed that the spectacular development of regional transactions has not been in keeping with the range of instruments for concerted action or the relative inflexibility of the machinery for controlling, regulating and successfully implementing the integration process. The intensiva process of development and trade expansion afFTzted ín less than a decade, without any adequate concomitant improvement in the systems of co-ordination of production, development and government finance policies, is a sign of this discrepancy.
It would, moreover, be inaccurate to maintaín that the conflicting situations within the Central American economic co-operation programme have been manifest only since the second half of the 1960's, or that attempts have not been made at various times to enlarge the scope of integration, to anticipate the problems, and to take full advantage of the opportunities offered by integrated development.
Examples of these endeavours are the agreements on the régime for integration industries and the standard system of fiscal incentives, which continue to be basic elements in the co-ordination of industrial policies; the discussions on equalization of benefits for workers in the various countries; the establishment of criteria for regulating trade in agricultural consumer goods; and the efforts to harmonize national development programmes.
An analysis of the period 1966-1972 reveals the existence not only of the biggest crises, but also of the most extensive and integrated efforts to give a new dimension ta the regional economic co-operation programme. An appraisal of the difficulties and the action taken to salve them has thus far shown an unfavourable balance, since this action has usually been adopted too late or in the long run has proved insufficient, Nevertheless, these experiences may be considered to have been fruitful in that they clarified
/the approaches

- 266 -
the approeches needed and highlighted the need to restructure the Common Market and provide it with the necessary machinery and instrumento for concerted action so that it can graduallY be improved and the obstacles in the way of its normal operation can be overcome.
(b) The difficulties and crisis in the Central American Common Market
The first serious sign of structural imbalances appeared in 1966 when the Government of Honduras strongly restated the complaint it had made in Central American Sub-regional bodies to the effect that it had received lees benefits than the other member States of the CACM and drew attention to its outsize trade deficit and, in general, to the virtual meaninglessness of the principie of balanced development, despite the fact that this had been one of the main objectives of the General Treaty. Following these complaints, a preferential scheme was devised for Honduras which, though it got off to a gond start, failed to remedy or make up for the weakness of the country% productive apparatus, owing to delays in applying the measures contained in the scheme and to the absence of any active policy for development or for the regional allocation of resources to investment projects, An examination of certain indicators of Honduras' situation does indeed reveal a fairly steady decline since the early 1960%. The ratio of Honduras• per capita industrial product to that of the rest of Central America, for example, has been worsening more or lees systematically during the period, albeit .not as dramatiCally as the ratio of per capita intra-area exporte. In contrast, per capita intra-area importo increased in relative terma up to 1970. A more detailed study of indicators in important industrial sub-sectors would undoubtedly reveal a similar comperative decline. The slow progreso of Honduras comparad with other countries should not, however, obscure the fact that, thanks to integration, the country% performance in termo of rete of development and transformation of its industrial Otructure and exporto was far better than it couid have achieved on its own.
The external strangulation of several Central American countries, particularly Costa Rica, aleo became more serious after 1966 and had economic repercussions which spread to the field of integration. However, the decline of trade with outside countries did have the positiva effect of instigating the adoption of a set of measures aimed at the combined defence of the balance of payMents, the promotion of exporto and the bolstering up of public finances, which represented a mejor step forward in the design of joint policies and decision-making mechanisms,
/Similar integration

- 26E -
Similar integration problems of a commercial and financial natura, togéther with external problems, continued to hihder intra-area trade and generally slow down the economic development of the countries themselves. Complications also arase with Nicaragua, which introduce internal taxes on consumption that affected its trade with the rest of Central America. Then carne the conflict between El Salvador and Honduras which not only halted vital progress in the Common Market but gave risa to polioles of self-sufficiency that were coritrary to the spirit of the integration treaties and introduced elements of uncertainty and instability into regional transactions. As a result, trade flows were interrupted and reduced, and this set off a chain reaction of negativa repercussions that seriously agyruvated the problems facing the Common Market.
From the foregoing it is apparent that part of the reason for the present difficulties of the CACM is the political problem of fair distribution of the benefits and cost of integration. The fact that the countries have reached a certain point in import-saving industrialization has not directly restricted trade flows, since trade margine still exist in this field and various measures could have been adoptad with a view to tackling new or more specialized branches of industry. Consequently, it was the breakdown of the first negotiations aimed at reorganizing the integration programmes that resulted in the Government of Honduras taking legal steps that in practica signified its virtual withdrawal from the Common Market. The effect of these measures has been to reduce the absoluta value of comercial transactions by 10 per cent, down to a level of around 275 million dollars in 1971, though this was also partly the result of the signing of agreements following the conflict, to regulate the sale of certain products and avoid the ill-effects of the disruption of markets.
In 1972, some of the Impact of the drop in regional demand was absorbed and trade flows recovered, though under less stable conditions. The new situation offers lens inducemem to expand supply, and entails a readjustment of production and keener competition among enterprises and individual countries. The Governments have found themselves constrained to adopt temporary measures that have affected regional trade, but without doing anything to get to the bottom of the problem. The burden of the new situation has been borne principally by Costa Rica, which, in addition te suffering a serious setback in its overall balance-of-payments position, has seen its trade deficit with the rest of the CACM increase extremely fast. Domestic inflation has aleo been partly to blame for this state of affairs.
/The shortcomings

- 267 -
The shortcomings and difficulties which have come to light in the integration procese and which have affected every single country go some way towards explaining why, from the second half of the 1960's, the growth rete of the product bagan to fluctuate and decline within the context of a definite downward trend, reflecting the deterioration of the external sector, which affected each economy differently, and the problems that arose in the Coman Market itself.
Thus, for example, whereas the anntel growth rete of the product' and of investments between 1960 and 1965 was 6.5 and 10 per cent respectively, the corresponding figures for the next five years were only 5.4 and 5.8 per cent, and they dropped even lower between 1969 and 1971.
A pattern thus bagan to emerge of insufficient growth of the motive elements of Central American development, and this can be expected to bring serious problems in the neer futura. Not only has the move to establish new productiva activities lost its impetus, but a reverse trend is becoming increasingly apparent in the region's import-substitution policy on which the prospect of transforming the economies of the member countries of the Common Market depended.
This loes of impetus of the productive systems has furthermore had major repercussions on labour markets and income distribution patterns. The lack of dynamism of traditional agricultura, the fluctuations in external demand for basic commodities, and the indiscriminate introduction of technology, together with rapid population growth and the increasing clamour for mobility, employment and political and social participation, have inevitably causad a certain amount of pressure to build up and, most of all, aggravated the problem of unemployment and underemployment.
The full acope of the problém can be appreciated from the fact that, even in times of economic boom, larga segments 0f- the labour force have continuad tú earn extremely low wages, or, in other words, to be clearly underemployed.
The Governments of the area have recently started taking steps to increase the number of employment opportunities. Both in research work and at meetings of Central American bodies such as the Labour and Social Security Council and the Cultural and Educational Councillmatters connected with employment policy have been tackled and attention has been drawn to the need for long-term programmes aimed at reshaping the pattern of development, with specific reference te employment objectives. The impression is that if labour market problema could be solved there would be a notable
jimprovement in
-268-
improvement in the distribution of income anda considerable increase in the participation of large sections of the population in the economic and political life of the countries of the crea.
(c) Recent corrective measures
After many consultations and agreements between two or more members of the Common Market, in July 1971 Guatemala, El Salvador, Nicaragua and Costa Rica decided te establish, as a transnational measure, a Regulatory Commission to provide an institutional framework for regulating their economic relations.
This Commission was assigned on a transitional basis, until the situation in the Common Market becomes normal, powers similar to those conferred on the Economic Council and the Executive Council of the General Treaty, and hence its activities as regards integration are carried out in the context of the principies and norms of the regional legal framework.
The Commission has operated in two main creas. .It has intervened in matters relating to improving the legal basis of integration and regional economic policy; and it has endeavoured te solve the problems that affect or may affect the normal development of trade.
In economic affairs, the Commissionls activities have been directed in the main towards the definition of policies for agricultura, industry and trade.
As regards agriculture, it has convened a meeting of directors of agencies responsible for stabilizing prices for basic grains, as a first step towards reactivating the Co-ordinating Committee on Marketing and Price Stabilization, and it has helped to set up a Central American fund for price regulation in which the World Food Programme is expected to participate.
It has also recommended the signature of a protocol te provide more flexibility in the application of the common external tariff, the elimination of unnecessary exemptions from income tax, and the use of tax instruments to discourage the manufacture of articles that are not necessary to development.
/In addition,

— 269 —
In addition, it has devoted priority attention to the question of the diversion of trade in textiles, clothing, footwear and eggs from Guatemala, El Salvador and Nicaragua te Costa Rica, and has recommended that trade should gradually be regularized in line with the situation of each product. It has put finto effect a flexible system for the self—regulation of exports by these three countries to Costa Rica,and sponsored meetings of entrepreneurs to work out direct arrangements among themselves on this point.
Thanks to this machinery, it was not long before it was possible to lift the restrictions on trade in these products, and trade in them was resumed among the countries mentioned except in the case of textile products, with respect to which the Commission recommended that a protocol should be signed establishing the measures required for rationalizíng the integrated development of the Central American textile industry.
In addition to the aboye, the Commission • has dealt with a number of problems affecting individual products or enterprises, íncludlng problems relating te caustic soda, powdered milk, oilseeds, resins, polyvinyl plastics and containers. The Permanent Secretariat of the General Trsaty for Central American Economia Intogration (SIECA) hos submitted to Governments a copr2hansive and detailed study on a regional strategy í=or integrated development which will give an idea of the sectoral inter—relationships involved in the restructuring of the Common Market. The conclusions of the :study are contained in twelve specialized rePorts that supplement the general presentation in the main document.
The diagnosis included in this study considers that as a result of integration, income grew appreciably more rapidly than it would have been able to do without integration, and that the combination of regional and national efforts appreciably broadened the physical base of production and encouraged laheur te acquire a higher level of skills than otherwise would have been the case. Furthermor'e, the analysis of the mejor obstacles to national development in the 19602s and the main problems hampering integration shows that the aboye two factors supported each other and heightened the adverse effects on economic trends in Central America.
This diagnosis, and the examination of the options opera for the development of the countries of the regían in the immediate futuro, show once again that the prospects are much more favourable if the growth pattern includes integration, for this makes it possible to move towards a more advanced stage of industrialization and in general to overcome the obstacles that have traditionally stood in the way of a steady and rapid improvement in the standard of living of the Central American population.
/The study

-270—
The study submitted by SIEGA suggests a basis on which Governments could begin multilateral negotiations fairly soon and agree en guidelines for regulating the futura operation and scope of the integration programme. What is needed, in the final analysis, is to move on to a more advanced stage of economic integration, with the possibility of eliminating some of the most important structural problema that have so far curbed the development of each of the countries in particular and the Common Market in general.
The agreements signed in the future can hardly be confinad to the design and operation of trade policy instruments. They will presumably have to deal with new and more complicated fields and involve the participation of largar groups in both public and prívate sectors, and will thus require the development of more sophisticated co—ordinating machinery at the regional and national levels before they can be»implemented.
Clearly, these new commitments will lead to little progress if they are basad on half—hearted.or short—term solutions. .0wing te the structurel natura of the problems of integrated development, the present cituation cannot continua without jeopardizing the progress achieved and without reduc4eig the acope of regional co—operation. In other words, as long as these problems are not tackled and no egreement is reached en the implementation of active pelicies capable of attacking the causes of imbalances, rather than their superficial monifestationa, the only result will be to increase difficultíes and crises and eventually to destroy the Common Market.
Negotiations aimed at finding solutions te these problema began with the Meeting of Ministers of Economy and Finance and Central Bank Presidenta, heid at the end of 19717. The purpose of these negotiations is to remodel the Central American Common Market, bearing in mind the strategy proposed by SECA and each countryls expectations as regards the economic integration process. It was agreed that all matters relating to the restructuring of the Market would be examinad by two pieces of machinery: a High—Level Committee for the Irprovement and Restructurine of the Central American Common Market; and the Meeting of Ministers of Economy and Finance and Central Bank Presidenta, which. would decide on matters put before it by the High—Level Committee.
The other important recent development is the earthquake that struck Managua, which will probably have an unfavourable effect on Nicaragua's trade balance with the rest of Central America. In the first place, it will create supply problema which will curb exporta, and in the secand place it will stimulate a risa in importa of both the geoda required for reconstruction and foodstuffs. Nicaragua might then become the third country with trade balance problems in the sub—region, which would make the task of rebuilding the Common Market even more difficult.
/5. The

- 271 -
5. The Caribbean Free Trade Association (CAR1F111W
The Association is made up of 12 economías with small markets whose combinad population is around 5 million inhabitants and which are widely different in character, dependent like many Latín American econonies upen exporta of primary products, and at en early stage of industrial development.
The trade liberalization measures that have been adopted involve the rapid removal of barriera to intra-aren trade, except in the case of certain products for which there is a longer transitional period. Obviously, the adoption of there measures and the proposal of a common external tariff structure (rather similar to that adopted by Latín American ceuntries) may provido the means of taking advantage of the free trade potential that comes with the initial stage of import-saving industrialization. The resulting type of industrialization would presumably recambio that of other Latín American countries with similar markets: the early stages would be marked by the production of non-durable consumar goods, foliowed by the production of certain durable and intermédiate goods, while continuing to depend on other countries for basic capital intermediate goods. This pattern is already emerging in the new trade flows, in which certain types of industrial geoda are rapidly joíning the still predominant primary products. The CARIFTA countries started out with an intya-area 'credo which was as small as that which originally existed among Central American countries, and they have achieved a similarly rapid annual growth rato of 20 per cent since 1967 compared with a previous 6 per cent. For soma of
its member countries, CARIFTA is already an extremely important export outlet compared with individual markets outside the crea.
Though special provisions and instrumenta have been devised in favour of the least developed countries, which could give risa to the rapid integration of some of them, Latín Americaos experience in such matters suggests that it might also be necessary to apply a further set of instrumenta and policías, as well as more direct assistance for this purpose. The least developed GARIFTA countries are perhaps unable to benefit properly
6/ The ECLA secretariat believes it might be desirable to analyse more fully at some point in the futura certain particularly interesting items dealt with in this section, including the common external tariff problems of fiscal incentives and their standardization (especially as regards potential competition in tapping foreign capital), the role of the Caribbean Development Bank, and the salient aspects of the agricultura) sector and of the East Caribbean Common Market.
/from the
4

-272—
from the increase in trade beccuse of their lack of industrial development. One of the steps being contemplated is the creation of a body to finance investments specifically geared to the requirements of the least devoloped countries.
There is thus a very striking similarity between the integration prospecte of CARIFTA and what has occurred in certain Latin American countries. One mejor difference, however, is the possibility these economies have of association with the European Economic Community as a result of the accession of the United Kingdom. Various options are opon to them, both jointly and individually: these partly amount to a continuation of previous ties but could aleo have the effect of preventing valuable additional trade with Latin American countries.
(a) 27.29.2922.1191111921LI9-tha Agreem9nt
All the economies of this sub-region produce primary commodities and depend to a largo extent en agriculture and mining. For the most part, these sectors furnish raw materials for industries located outside the reglen. Import capacity is strongly inf.uenced by prices obtained for their exporte, and this in turn affects all production inputs and consumer gnods. As a resulit, the countries have te compete among themselves en the world market and are all similarly affected by fluctuations in the terne of trade. To a considerable degree, their trade has been governed by various kinds of preferential arrangements for their exporte, in return for which they have had to grant reciprocal treatment to goods coming from the metropolitan centres.
In addition, their individual markets are quite small, so that there is ample scope for co-operation. The deliberate introduction of co-operation policies became more apparent when the four largest English-speaking countries (Jamaica, Trinidad and Tobago, Guyana and Barbados) achieved independence and tho possibilities for collaboration increased when certain other islands obtained a greater mensure of autonomy.
It is notoworthy that this integration procese concome countries with quite different institutional and political structures, The difference in size and level of economic development of the countries is aleo considerable, and there can be no doubt that their diversity will place certain obstarles in the way of their intogreted and harmonious development. It is indeed a challengo, that may provide valuable integration experience for the regiona
/The tariff

— 273 —
The tariff reductions will be spread over five years for the more developef countrios and ten years for the least developed countries. Two criterio were applied in selccting the goods centained in the roserved li;t: first, the prevention of any mejor disruption in the output of "sensítive industries" and, sccond, the avoidance of any sudden loss of fiscal revenue asa result of the removal of tariffs on goods playing an important part in such revenue.
The transitional arrangements by which the "effective protective element" in revenue duties that are of fiscal importance ís to be phased out mainly concern alcoholic beverages, among which rum reeives special treatment
particularly favourable to the least developed countries.
The Agreement prohibits quantitative restrictions among CARIFTA members,,
whether on imports (Dr exports. Some restrictions are however permítted in the interests of hemlth and public arder, in accordance with the provisions of the Agricultura) Marketing Protocol, or so as to facilitate measures that may have to be taken to remedy balance—of—payments probloms or serious
disruptions in production or employment.
The Agreement also refers to certain'measures for ensuring the harmcrization of incentives to industrial production, although to start with it is more concerned with maintaining the status quo. In other words, no country may introduce incentives, subsidies or tax exemptions that are more advantageous that than those already in force nor establish a tax or tariff
drawback on products destined for CARIFTA countries. It was also decided
that domestic tax systems must no discriminate against goods produced within
the CARIFTA oreo.
Having recognized that free trade olerle would not suffice to expand
intra—area trade in agricultura) commodities, the CARIFTA countries drew
up specific agreements on 22 items annexed to the Agricultura) Marketing Protocol. Briefly, the application of the Protocol means that each member country must buy from within the arca before looking elsewhere for its importa. In addition, the Protocol provides for price fixing and allocation of markots. The administration of the Agreement has tended to be more favourably disposed towards the relatively less developed countries. It was decided, for example, that all supplies from the least developed countries should be allocated before considering the allocations of the others. The exports of the least developed have not, however, expended as rapidly as expected, partly because of the peor quality and quantity of means of transport. A number of problems have also arisen over quality standards and the difficulty of co—ordinating supplies from inside and outside the crea according to
seasonal variations. /Under the

— 274 —
Under the Agreement and in the course of its subsequent administration, the least developed countries received a number of special benefíts, such as longer transitional periods for tariff reductions, additional advantages for the promotion of industrial development, and provision for the formation within CARIFTA of a sub—group of countries which are to remove tariff barriers more quickly among themselves while maintaining such tariffs as are permitted in respect of the more developed countries.
There is one important exception in the Agreement, and it has to do with contractual agreements with outside countries entered into by member countries prior to the formation of CARIFTA and, providing for the granting of preferences in respect of certain products on the domestic market. The Agreement provides that initially such goods are to be excluded from the process of trade liberalization, but although member States are thus allowed to respect these pre—CARIFTA bilateral agreements, they are required to submit a list of them te the Association Councíl so that a record can be kept. So far, all the members of CARIFTA, except for Grenad? and Selize, have registered such agreements affecting a total of 30 products.
Acsreement regarding tariff reductions on products contained in the reserved list are boing carneo out in accordance with the commitments entered into, which affect the largor countries first.
All the CARIFTA countries participate in the Protocol on 011s and Fats, and the original agreement has been extended to cover refined products which wrre previcusly outside its sopee. This Protocol, which i3 VOry much on the same linos as the Agricultural Mnrketing Pretecol, rzser,L2s the sub—regional market for domestic output of these goods.
(b) Expansion of trade
As zight be expected from the fcregoing details, intra—area trade was at a low ubb. In 1967, before CARIFTA was set up, the Share of intra—area trade in total imports was estimated at less than 5 por cent. Recent trends would seem to indicate that the situation has improved, although it is not possible to give exact figures for the evolution of this coefficient. It is, however, clear that intra—area trade on average has been increasing by 20 per cont annually, whereas before 1967 it only íncreased at an annual rete of 6 per cent.
/The largor

-275-
The largor economies have predominated markedly in entra-area trade,
41. and have apparently come to predominate even more with the growth of this trade. Moreover, while their reciprocal trade increased rapidly and the rote of their exports to the relatively less developed countries was high, the wport trade of the lattor countries does not seem to have Brown so
fast.
From the point of view of intra-area exports, the economies which have benefitted most in absoluto torras have been Trinidad and Tobago, Jamaica, Barbados and Guyana, in that order. Taken together, these economies have doubled their trade with CARIFTA since 1967, and in 1968-1972 they accounted for more than 70 per cent of intra-area imports and 95 per cent of ántrEi-
arca experts.
Table 12 illustrates the relatively elevated importance of the four
largest economías in CARIFTA trade and how their Share appears to be growing.
In order to make them more comparable, the indicators appoaring in the table should be reduced to relativo tercos, e.g., with respect to the product or popdlation, since the relatively less developed countries account for a smallor proportion of ;:he population and product. Although the information availablo does not enable such a comparison to be mode, it is ebviouO that it would lessen the differences to some extent. There would still, however, be some discrepancies which could systematically influenco the davelooment of trade and could be detrimental to the relatively less developed countries. One of these is the percentage of manufacturing ectivities concentrated in these countries, which only accounts for 2 por cent of the total manufacturing
production of CARIFTA; oven in relativo terrns this figure is well bolea What an uxpansion of trade in manufactures on a more equitable bELsis should
actually produce.
Ucing fragmentary data from several sources, it has been possible to construct table 13 which shows the relativo volume of intra-area trade in
each of che majar CARIFTA economies. This table also gives an idea of the
differences between countries.
At the same time, the growth of intra-area trade has increased the importance of the CARIFTA market in comparison with markets outside the area. In fact, for most member States it constítutes the second most important source of imports after the United Kingdom, although its importance is
slightly less for the largor member countries. The CARIFTA market has also
acquired a considerable degree of importance for exports.
/Table 12

• O• O• • 2 c.„. CO ,2;
o1 O O .0- • • • • •
O\ 01. O\
Ce% CJ
C11
\ ri r-1 • • •
O \ 00 \ 1,1
01
10 \D • •
\O N
of imp or ta.
Es tima ted in terma
— 276 —
• • • e"•\ N N
, rts.
1 CV 1 cm
i ,mei
^.1
N 0 ri
0 rol
0 C 0 era
0
0 ,1
0
0 r-1
0 C) 0
O O 0 .i
O o 0 ,/
I 0 0 TI g
cp 'O o o 00 43
O CV lof \ e,1 01 01 • • • • coo: •
COrol
1.4 1-1 ."4 01 ,4 0ti
e 03
.4.>
g c 4A
d 4
.Q1 Id o
O
›,0
.co al
«4 74' 1 t: E. .3
I o N o TI a>
N ••1 42 o O. o Le Tí 0 0 44
ri
Á O
11
cd
o
9
cd
o O
a3
-I- O ,s o ir. tr, • • • • « • . t's. cs».0 O O ro-1 Csí ••1 o-•1 \ 4 O
O 11 \
I co N O
co O 0 0
•0 a S
O C11 el O • • •
1 N CA •
r-1 01 O" CO ,1 O
CO CO > o o. • • • 2. • c0 0 I
N \O 8
rs, O co co co N o-1
r4 N \ • • • •
O 1" O o>...
Or Me 1-1
c0 co c> • . • • c*\ a. \ \D o o rat N ,1 \ Cc \ O.4
\ Cr 1 o 01 O 0 • • l
ri
s•O CO O • • • • •
1.11 1\-. 1 O \O 0
ni CV 0.1 N
C\ tr, CO " CO O C a; 01 71.1 8
CO • • • O\
1 ,1 8
\O U CO • • •
CV do
41 CO 1 \ CO 11\
CO O \ I CO 1 O; Al
erl 01 c•1
O\
1
Q\ N. • • •
rd • - 01 CV CO N
Lr fel 0‘ OZ) U1 • • • • •
e CM CP\ CP \ P•1
o 0 0 0 S 8 0 c: O9 O
1 o 0 O 0 rof o-1
L.11 Ov N \ a • • •
CV ro1
\ O el
• 3.3-% CO • • • • \D
CO \ O\ CO
M\40 P, 01 O\
U'. C7 .d." \0 L11
e-1 LC \ • •
CO Z•so
N CV Cr■ zs I CA .:0 \ Cd .-4
■A ■0 • I c•\
\D .•
N Cr \ M CO1 erN I cl; O\ 04 .0
• •
O\
\ O "1„0* o
0
tD
1-1 O\ O • • •
r1141
111
1.1
ao4 •
\ 01
r-1 pr1 04
fr
o o E
Tr in ida d and To bag o
Less de
veloped coun tries
Tr inida d a nd Tobag
Leas develop ed countr ies
To tal CARIF TA
To tal
CARI FTA
N o1 O 21
a3
44 1 Li Q3 12 0
,1
oo 4)
ri
O 4.
fA
/Table 13

— 277 —
Table 13
CARIPTA: SHARE OF INTRA-AREA IMPORTS IN TOTAL IMPORTS
(Millions of East Caribbean dollars) á/
1967 1970 1971
Country Iluuol'ts Imports %
Imnorts
Intra- Totals
ares Totals i- letra ama
Totals Intra- anea
Barbados 144 11 7.6 236 25 10.6 356 29 8.2
Guyana 260 25 9.6 268 36 13.4 25/b/ 41 16.0
Jamaica 698 8 1.2 1 044 17 1.6 1 0941 24 2.2
Trinidad and Tobago 834 14 1.7 1 078 23 2.1 1 304 29 2.2
Total 1 91'.5 21 2,2 2 626 101 2,1 3 011 1/2 4.1
Source: The Caribbean Integratir:n PrograYKJ (1968-1972) (POS/INT 72/8), 6 December 1972, p. 18;
United Nations, Monthly Bulletin of Statistios, July 1972.
/ Two East Caríbbean dollars are worth one United States dollar.
Estimated on the basis of eine months.
/It is

- 278 -
It is possible to study the type of changes taking place in the structure of intra-CARIFTA trade by distinguishing between the geoda traditionally marketod and some new products which have recently made their appearance in that trade. The traditional goods included petroleum products from Trinidad and Tobago, fertilizers, some chemical products and cement from Tri:lidad and Tobago and Jamaica, rice from Guyana and root crops from otbor countries, The products which have recently appeared in the areals tr(AJe for tc first time are of several kinds. There are some manufactures the wide range of which includes clothing, plastic articles, bags and other papar and cardboard packaging material, a growing variety uf household utensils, processed foods, aninal feod preparations and °num. There are also new products marketod under the Agricultura) Marketing Protocol, whilo processed coffeo, cocea and chocolate have also como on the market. Some vegetable products not marketod have made their appearance. The creation of CARIFTA has made possible the expansion both of trade in traditional goods and trade in new products.
Among the goods which make up the intra-area trade, foodstuffs form the largest category sine° they account for 31 por cent of the total. Petrolcum products follow with a Share of 24 per cent, chemical products with le por cent, and other manufactures with a total of 17 pez- cert.
The main exportar of foodstuffs is Guyana.. There account for 70 per cent of Guanals total exports te CARIFTA and are almost exclusively composed of rice and molasses. Trinidad and Tobago mainly exports petreleum products, which wecount for 45 per cent of its sales te CARIFTA countries. Jamaica and Trinidad and Tobago account for more than 80 por cnnt of exports of chemical products to the area, and these products constitute more or less half of Jamaicals exports to the area. The main exportar of manufactures is Trinidad and Tobago, although Jamaica and Barbados are making rapid progresa.
The effect of the increase in arca trade on the production of traditional goods, which are generally for export, has not been significant. The effect on the production of other groups of products, however, especially those which have only recently come on the market, seem to have been substantial.
In the agricultural sector, export products, which account for a considerable percentage of production, have not been significantly 'affected by area trade. In the sub-sector producing rootcrops, vegetables and agricultural products for consumption within the area, however, the information
/available suggests

- 279 .-
available suggests that intra-area trade has causad a more rapid expansion of production than in traditional export agricultura. Once again, however, it appears that in the smaller countries agricultural production is growing more slowly than in the bigger ones.
The incroase in CARIFTA trade seems to be making itself felt in the production of manufactures, but there are no figures available which permit an adequate evaluation of this. It is clear, however, that tho planning of new industrial installations is very explicitly taking into account expended market available, and not first the size of national markets.
(c) Recent develooments
It is not top surprising to note that the largor countries have obtained considerable benefit from the expansion of sub-regional trade, while the less developed have not done so woll. Despíto all the mcasures and decisions favouring tho rolatively loss developed countries, there is still some conern that disequilibrium will continuo, in contradiction of the objectives of equity contained in the CARIFTA Agreement. This fact has been taken into account in all recent decisions on tariffs, the harmonization of industrial development policies, and financial matters. The objective of favouring the less developed countries is statod explicitly in the Agreement establishing the Caribbean Development Bank. In formulating its crodit policies, the Bank grants priority to investment in productivo onterprises or the infrastructure in the loss developed countries.
The creation of CARIFTA, that is to say, of a free trade arca, was viewed as the first stago of a comprehensivo programme of economic integration. Work has been under way since 1963 on the preparation of a uniform tariff system covering the entire crea and having a common classification. The first step towards the establishment of a common external tariff was taken by a group of the less developed CARIFTA countries, which adoptad a common tariff in October 1972. In this tariff, very low or zero tariff levols are set for machinery and equipment, and for many raw materials; tariffs are highcr for finished products similar to those produced in the arca, which the highest tariffs are imposed on luxury goods. With a view to offsetting the drop in their fiscal income, some countries have introduced texation on domestic consumption.
The entry into operation of this tariff stimualted work an this issue throughout CARIFTA, and in drafting the common exturnel tariff for the entire crea the same basic principies were used, namely, the protecticn of sub-regional production, the avoidance of adversa effects on erices, and the application of favourable treatment to goods of social importance.
/In view

-280—
In view of the wide range of .circumstances that each country will have to face when it applies the common externa? tariff, a transitional period has inch set before it enters into full operation. However, the tariff will be applied without delay to those products which do not prosent immediato probloms. The dato for the entry into force of the common externa? tariff is 1 May 1973, and machinery has been incorporated into the tariff to protect the rather weaker position of the relatively lens developed countries, which have tariff levels that are generally lower than those in the largor countries and lower than the leve? proposed for the CARIFTA common externa? tariff.
Ever since the question of a common externa? tariff was first raised, it has been thought locical to give attention to the harmonization of fiscal incentivos in order to maintain a proper degree of homegeneity in development policies.
An agreement has !Joon concluded on this issue which includes special treatment for the loss developed countries. A central poínt of the agreement is that concessions should be granted en the basis of the contribution of the industry concerned te the national and sub—regional economy. For such purposes, the contributicn of each industry ís measured in terms of national valué added, doducting all payments to non—CARIFTA citizens, the value of imported raw meteríais, depreelation of equipment, and similar ítems. Another important aspoct 07 the harrnonization machinery is a periodic evaluation which is to be undertaken te compare forecasts with achievements. It is hoped that the harmonization of policies will help to reduce competititon for external invement finance and constitute a basis for formulating a co—ordinated industrial development policy.
The various measures listed aboye will probably give rise to a sub—regional import substitution process within CARIFTA that, judging by the instruments used and the prevailing circumstances, ís likely to be very similar to that which has taken place in the rest of the region.
It should be noted that the CARIFTA countries are endeavouring to negotlate as a single group in their externa? relations, in particular as regards their forro of associato membership in the European Economic Community, now enlarged with the entry of the United Kingdom.
/There is

- 281—
There is fruitful co-operation among them as regards transport. Having maintained and subsidizad a common shipping service and chartered private shipping services, attempts are now boing mado to rationalize the service using largor and more specialized ships. Furthermore, after the foilure of conversations uith the liner conferences, the CARIFTA countries are thinking of setting up thoir own long-distance maritime transport service.
The level of co-ordination attained in the sub-region can els° be seen in a variety of other arcas such as monetary and exchange affairs, the establishment of a mutual technical assistance service, health matters, etc.

A
e