The Efficiency of Drones Usage for Safety and Rescue ... - MDPI
Ecological monitoring of arid rangelands using fixed-wing micro-UAVs (drones) in the MENA region Dr David Gallacher, Zayed University, Dubai UAE Email: [email protected]
Mr Tamer Khafaga, Dubai Desert Conservation Reserve, Dubai UAE Email: [email protected]
Keywords Ecology monitoring; arid rangeland; unmanned aerial vehicle; drone; conservation
Extended Abstract
Statement of the Problem Arid rangelands throughout the Middle East / North Africa (MENA) region are currently
managed without clear information of long term trends in vegetation, stocking rates, or
ecological health. It is often stated that rangelands suffer from overgrazing and excess water
extraction, but there is a lack of reliable historical data to support these claims. Data exists in
well managed reserves such as the Dubai Desert Conservation Reserve (DDCR), but it is labor
intensive and expensive to maintain a routine system of monitoring.
Recent years have seen the rapid emergence of low-altitude unmanned aerial vehicles
(micro-UAVs) for civilian use. Dramatic developments in the platforms (drones) have been
accompanied by the development of lightweight specialty sensors (e.g.; infra-red and
multispectral cameras) and orthomosaic software. These new platform / sensor combinations
present a dramatic new tool for the management of conservation zones as well as agricultural
areas. Micro-UAVs have clear potential use for spatial ecology studies (Anderson and Gaston
2013) and for biodiversity assessments (Getzin, Wiegand, and Schöning 2012). They offer the
potential of providing far more detailed information than previous technologies (from satellite
and manned aircraft platforms) at a much lower cost (Walton et al. 2013), and with greater
flexibility to gather information at specific times or frequencies. Aerial monitoring is now
feasible at pixel resolutions that range from meters to millimeters, which brings imagery to a
scale that is relevant to many ecological processes (Anderson and Gaston 2013).
This presentation will review how this emerging technology can be applied to better
manage rangelands in the Middle East, and will draw on preliminary results from the author.
Significance and relevance of the work The long-term aims of this project are to (1) reduce the cost of rangeland monitoring for
organizations that are already doing this work manually, and (2) to provide a tool that non-
specialists in the region can use, thus encouraging the gathering of much better information for
land management decisions.
Applications of the technology for the Dubai Desert Conservation Reserve (DDCR) have
been identified as follows:
Habitat classification
Animal population monitoring via aggregated sites (water / feeding sites) dispersed
areas (open rangeland) and indirect methods (e.g.; lizard holes, carcasses)

Animal condition monitoring. Mammalian body width is indicative of good health
and/or pregnancy
Plant monitoring, including estimations of biodiversity and biomass.
Anthropogenic monitoring; evaluation of whether safari companies are compliant
with regulations for operation within the DDCR.
Tools that are developed for the DDCR will be directly applicable to rangelands
throughout the MENA region. The region is highly suited to aerial monitoring, since success
of classifying individual plants to species level is inversely proportional to biodiversity within
a size class (Féret and Asner 2012), and is improved when individuals are discretely separated
by bare ground. Larger herbivores are rarely obstructed by trees. Privacy and safety
regulations are of less concern in rangelands due to their remoteness and low human population
densities (Laliberte 2012).
Description of research method Preliminary research has been conducted using a DJI s1000 octocopter equipped with a
24MP RGB and a 3.2 MP multispectral camera, and a SenseFly eBee fixed-wing drone
equipped with 12 MP RGB and multispectral cameras. Preliminary trials were conducted to
identify the maximum ground sampling distance (related to drone altitude and camera
resolution) required to be able to identify individual species with reasonable accuracy. Images
were collected at 10 m intervals from 10 to 300m above animal and plant species. From this,
trials will be conducted at selected altitudes, and species observation from resulting images
will be checked for accuracy against ground-based data.
Results At time of writing, observational data of known species taken from different altitudes has
been collected, illustrating the viability of the technology. By the time of the conference
presentation, results should include at least one structured study evaluating the reliability of the
technology at a specific ground sampling distance.
Conclusions Micro-UAVs have an enormous potential for improving rangeland management in the
MENA region. However, much work still needs to be done to streamline processes and
evaluate the enormous amount of data produced.
Introduction Aerial photography of land surfaces is a rapidly developing field due to recent advances
in unmanned aerial vehicles (UAVs). Civilian aerial platforms were until recently limited to
orbital satellite and manned aerial vehicles (MAVs), although military photogrammetry has a
long history involving kites, hot-air balloons, and many types of UAVs and remotely piloted
aircraft (Watts, Amrosia, and Hinkley 2012). Many new low-altitude platforms are now
available, causing sensor manufacturers to also produce new cameras specifically for mounting
on UAVs. Robotic monitoring is now well established for large scale environmental issues and
disasters, such as volcanos, tsunamis, and oil spills (Dunbabin and Marques 2012). UAV
monitoring has clear potential use for spatial ecology studies (Anderson and Gaston 2013) and
for biodiversity assessments (Getzin, Wiegand, and Schöning 2012).
Initial surveying and subsequent monitoring is one of the key tasks of a rangeland manager
(Holechek, Pieper, and Herbel 2010). Effective conservation requires knowing what changes
are taking place in the ecosystem, and whether observed changes require intervention.
However, ecological monitoring is highly labor intensive of trained personnel, and thus
expensive. Arid rangelands throughout the Middle East / North Africa (MENA) region are
currently managed without clear information of long term trends in vegetation, stocking rates,
or ecological health. It is often stated that these rangelands suffer from overgrazing and excess
water extraction, but there is a lack of reliable historical data to support these claims. Adoption
of UAV technology has the potential to reduce the cost of existing monitoring, as well as to
encourage a much wider adoption of monitoring practices throughout the MENA region.
Privacy and safety regulations for UAVs are less of a concern in rangelands due to their
remoteness and low human population densities (Laliberte 2012).
Achieving this goal will require a meeting of hardware (platforms, sensors), software
(automated image recognition) and interpretation (arranging data into meaningful information).
The aim of this review is to identify the potential of UAVs for ecological monitoring in arid
rangelands, and the research that is needed to realize the potential.
An overview of hardware (platforms and sensors) is provided, primarily to show that new
platform / sensor configurations are still being developed. It would be premature to evaluate
the cost-effectiveness of current configurations since price, usability, and applications are all
in a state of flux. Two competing directions for UAV development that currently seem viable
include:
Semi-permanent platforms operating at a medium altitude (e.g.; 1-10 km), powered
by solar and carrying several sensors.
Swarms of low-altitude UAVs (e.g.; 100 m), each carrying a single sensor for a
short (<1 hour) period.
Currently, however, the typical configuration is a single low-altitude battery powered
UAV; either a fixed-wing or multirotor. Hence, research is needed to assist rangeland
managers to get the most information from this hardware by applying appropriate sampling
methods.
Platform classes There is a confusing range of UAV classes currently available, necessitating a high
learning curve for anyone entering this field (Watts, Amrosia, and Hinkley 2012). Platforms
can be broadly categorized into four classes based on altitude, or by their mechanism of lift
(Table 1).
The US military has its own UAV classification specific to its own needs and regulations
(Watts, Amrosia, and Hinkley 2012). Early civilian photogrammetry developed from MAVs,
typically operating at the lower end of their altitudinal range of 1 – 15 km. Satellites, which
operate above 160 km altitude, advanced the field by providing large amounts of low-resolution
data. UAVs now provide a new platform category in the 0-25 km altitude range. While the
military have developed UAVs that operate throughout this range (Watts, Amrosia, and
Hinkley 2012), airspace restrictions have resulted in the civilian market being divided into
classes below and above commercial airspace. Micro-UAVs operating in the lower category
are often capable of operating up to 1000 m, but are legally restricted in many jurisdictions to
below 400 feet (122 m). Likewise, stratospheric UAVs are being planned for operation at
around 20 km. Technological developments are occurring in all classes, but the greatest
innovation is currently occurring in the near-ground and stratospheric altitude classes. Each of
the platform categories fills a niche. Higher altitudes enable data to be gathered over a wider
area, but with lower quality of data (Table 2).
A loose definition of a UAV is any aerial vehicle that operates without a human on board,
but this would include paper planes and remote controlled aircraft. A more practical definition
is a vehicle capable of autonomous cruising from one GPS coordinate to another. Many UAVs
are also capable of landing at the launch point without human assistance, which is a legal
requirement of multi-rotor UAVs in Europe and North America.
Stratospheric Several companies have entered the race to provide stratospheric platforms (Table 1), with
purported aims to extend Internet access across the developing world, as well as to better serve
communication hotspots over cities. Solar UAVs are light and maneuverable, while the
Stratobus airship is being designed as a platform capable of a 200 kg payload. Stratospheric
projects have several advantages over satellites:
Lower price
Retrievable, hence can be maintained or upgraded, and will not become space junk
Lower altitude, hence lower GSD (ground sampling distances) s and less
atmospheric interference
Short response time, to quickly respond to service gaps or peaks in data
requirements
Such platforms are likely to remain outside the budget of rangeland managers in the near
future, but will likely become available for rental, or for use across multiple government
departments.
Commercial airspace UAVs that operate within commercial airspace are usually launched by catapult and
require the same clearance procedures as MAVs. Their larger size enables them to carry
multiple, larger sensors. However, their product is undifferentiated from that of MAVs, and
consequently most aerial imagery produced from this level is produced from the latter. In fact,
a product was recently launched that attaches to the underside of a MAV wing and streamlines
processing.1
Near-ground There are currently two broad categories of near-ground UAVs; the multi-rotor micro
UAV, capable of short flights at altitudes as low as 1 meter, and the fixed wing micro UAV,
which operates from 80 m to the legal upper limit and is usually launched by hand. A third
lighter-than-air (LTA) category is in development (Table 1). Micro UAVs are not currently
permitted to be used for commercial purposes under US regulations, but LTA platforms bypass
this restriction.
1 For details of the XCAM, see the WaldoAir Corporation website (waldoair.com).

Multi-rotor UAVs are more stable, thus improving the quality of images (Anderson and
Gaston 2013) and have no minimum speed, but fixed-wing UAVs have longer flight times.
Legally, most countries treat micro-UAVs as hobbyist aircraft, setting a maximum altitude
limit and other requirements that may include flying only over private property, and remaining
in line-of-sight of the operator. The cheapest multi-rotor models are available from retail
outlets and are therefore highly accessible to anyone wanting to stream video from the sky.
Concerns about privacy are warranted, yet easily overstated. Most people already have a high
definition camera built into their phone, and aerial platforms exist that are not UAVs (kites,
balloons, hobby craft).
By operating at the lowest altitude, micro-UAVs produce imagery with the least
interference and the highest resolution GSD of all classes. This enables aerial monitoring at
ecological scales that were previously impossible.
Sensors Most micro-UAVs are limited by weight to carrying a single sensor, though this may
change in the future, as many manufacturers are now designing specifically for the UAV
market. All sensors except LiDAR measure a subset of the electro-magnetic spectrum. LiDAR
sensors project a lazer beam and record its reflection, and are used for sensing three-
dimensional structures. They have been widely used for determining topography and forest
canopy heights. LiDAR sensors are now available at weights suitable for UAVs but their
higher price remains a barrier.
Visible light / RGB Sensors for visible light (380 – 750 nm) are widely available and have been miniaturized
for the retail sector. These sensors record the intensity of the three wavelengths (red, green
and blue) that human eyes are able to see. Micro-UAVs typically carry an off-the-shelf 10 to
24 megapixel mirrorless camera.
Multispectral and infra-red Multispectral cameras record a small pre-set number of broad bands. In biology they are
mainly used to measure photosynthetic activity by calculating the Normalized Difference
Vegetation Index (NDVI), a contrast of red (670-680 nm) and near infra-red (750 – 850 nm)
wavelengths (Cho et al. 2008). Heat sensors, or night vision cameras, operate at much longer
wavelengths (8 – 15 µm) and can detect subtle differences in temperature, such as the presence
of mammals or water flows. Miniature versions of both multispectral and infra-red sensors
have recently become available for use in micro-UAVs. A description of their calibration and
data processing workflow is described (Berni et al. 2009).
Hyperspectral Hyperspectral sensors record a larger number of narrow bands from the visible through to
the mid-infrared range of the electromagnetic spectrum (Vane and Goetz 1993). The most
powerful record all radiation within a defined range (typically 0.4 – 2.5, or 0.4 – 0.9 µm)
separated into 100 – 300 bands (Shippert 2003). These models are expensive, heavy, and their
output is demanding of storage and computation. They are typically flown at high altitudes (20
km) over large areas, requiring further computation to correct for atmospheric, topographic,
and time of day effects. High-end sensors are being produced with ever greater capacity (Ustin
et al. 2004), but there is also a demand for lighter models with reduced functionality that can
be marketed for precise agricultural purposes. Some current models can be mounted on UAVs
capable of carrying payloads greater than 1 kg2, but it must be noted that these models blur the
distinction between hyperspectral and multispectral.
Hyperspectral information is highly dimensional since each radiation band is recorded for
each pixel, creating an image cube3. It has been widely used for broad scale monitoring of
weeds (He et al. 2011), and offers promise for monitoring drought, wildfire susceptibility,
carbon storage, soil conservation, and vegetation change (Ustin et al. 2004). Although it is
possible that specific bands might identify the presence of a molecule produced by a disease or
condition, disease (Reynolds et al. 2011) and water stress (Kim et al. 2010; Weckler, Maness,
and Stone 2004) is currently observed indirectly through a reduction in chlorophyll. Uptake of
the technology has been limited by a typical data cost of at least US$60 000 (Lass et al. 2005),
and analysis that requires expert knowledge and technical support (He et al. 2011). Several
spectral libraries are publicly available to assist in the interpretation of data, with a focus on
geological and anthropocentric features4.
Within a species, hyperspectral images may produce a reliable estimate of total
chlorophyll, the ratio of chlorophyll A to B, and carotenoids. Solar energy captured through
these molecules is passed to chlorophyll A for conversion to chemical energy, hence
Chlorophyll A may be considered the bottleneck molecule (Blackburn 2007). A review of 73
vegetation indexes to predict chlorophyll content concluded that index performance varied with
species, but that the most reliable were red-edge5 based, such as the red-edge position linear
extrapolation (Cho and Skidmore 2006) and the Modified Red-Edge Inflection Point (Miller,
Hare, and Wu 1990).
Sensing in 3D Coarse three-dimensional structure, including plant canopy height, can be sensed either by
LiDAR or by structure from motion (SfM) image processing. SfM requires the same object to
be detected across multiple images taken at different angles. These images are then
orthorectified into a composite, enabling the calculation of altitude points. SfM can be
processed from images of any spectral range, though is most commonly applied to the visible
spectrum. Field studies of tree canopies have indicated a reliability similar to LiDAR, at lower
cost (Dandois and Ellis 2013).
Fine three-dimensional images can be generated from multiple, overlapping photographs
taken with any sensor, enabling the production of topographic maps. Creating a three
dimensional image of a plant or animal is far more difficult than for anthropogenic structures
due to the more complex surface geometry. Use of hyperspectral data has produced some
promising results for seedlings in laboratory conditions (Liang et al. 2013). Algorithms for 3D
2 For one company's examples of UAV mounted hyperspectral sensors, see PrecisionHawk
(PrecisionHawk.com) 3 An image cube is a conceptualization of data gathered, in which a two-dimensional image of
a land surface contains several hundred data points for each pixel, rather than the three
(red/green/blue) that are needed to represent visible light. Hence, the third dimension is the
quantity of radiation received within each measured band at that pixel. For an example, see
aviris.jpl.nasa.gov/data/image_cube.html 4 ASTER Spectral Library, hosted by NASA, (speclib.jpl.nasa.gov); United States Geological
Survey Spectral Library (speclab.cr.usgs.gov/spectral.lib04/spectral-lib04.html) 5 Red-edge refers to the dramatic change in absorption between red and infra-red spectra.
Red is absorbed by chlorophylls and other molecules during photosynthesis, while infra-red
is reflected by cellular structures. The points at which this change begins and ends adds more
information than the NDVI, which just measures the (normalized) difference between
absorptive red and reflective infra-red.
construction are almost the same as for assembling an orthorectified terrain model, and so both
services are typically offered by the same commercial software6. Care should be taken to not
confuse software for 3D computerized images, and software to produce images or video for
3D monitors. The latter are stereoscopic, rather than true 3D images.
Video Multirotor UAVs can record video, and also transmit a video signal ‘live’ to a ground
station. Live video transmission enables multirotor micro-UAVs to be piloted manually, and
thus respond to a moving animal or navigate a complex terrain (e.g.; surveying a cliff face or
moving under a canopy).
Recorded video might be superior for estimating populations of some animals, since
movement may make them more visible. Commercial and open-source software is available
to detect and track a moving object within a video stream (Buchanan and Fitzgibbon 2006).
This may make it possible to survey hard-to-find species by using the UAV to both ‘flush’
(frighten the animal from its cover) and record the species.
Applications for arid rangeland ecological monitoring Aerial monitoring is now feasible for GSDs that range from meters to millimeters, which
brings imagery to a scale that is relevant to many ecological processes (Anderson and Gaston
2013). Monitoring at the larger scale (1000 km2 and more) will remain the domain of high
altitude platforms for the foreseeable future (Thorp, French, and Rango 2013). Micro-UAVs
operate at a scale of <10 km2, thus enabling complete coverage of most farms, but most
rangelands and conservation reserves in the MENA region are considerably larger, sometimes
by several orders of magnitude7. Hence a UAV monitoring program will involve partial
sampling, though at lower cost than it would take to pay a ground based observer to sample the
same area.
Ecological monitoring by UAV could address six general areas:
Plant biomass
Plant biodiversity
Animal population
Animal fitness
Anthropogenic influences
Habitat zonation
The hyper-arid biome prevalent across the Arabian Peninsula is suited to monitoring by
UAV for several reasons:
Vegetation is dominated by woody shrubs with a low overlap of root zone, and an
even lower overlap of canopy. Therefore it is relatively easy to identify individual
plants.
Ecological components are sparsely distributed across vast areas, making other
forms of monitoring expensive (ground, satellite)
6 Examples include Pix4D (pix4d.com) and Agisoft Photoscan (www.agisoft.ru). Autodesk 123D (www.123dapp.com/catch) is a free service for making 3D digital models from photographs, with links to a paid 3D printing service. 7 For a map of conservation reserves recognized by the United Nations Environment Program, see the World Database on Protected Areas (www.protectedplanet.net)
Field work can largely be performed by a non-specialist, allowing the trained
ecologist to better allocate their time, and to perform data analysis offsite if desired.
Traditional ground-based ecological surveys are normally performed by a
postgraduate degree-holder.
It is now technically feasible for a nature reserve to contain a geographic database of each
fixed item, including perennial plants and fixed animal artifacts (e.g.; burrows, tracks, nests).
Repeated measures of each item would enable an assessment of change over time, both of
biomass and of composition. Such a database would reduce the time required for on-ground
verification, since a perennial plant need only be identified to species level once in its lifetime.
Plant biomass Assessment of available forage within a habitat is inaccurate by satellite and expensive by
ground operations (Walton et al. 2013), yet is a necessary aspect of livestock management.
Options for assessment include the measurement of photosynthesis using a multispectral
camera, green surface area using a visible camera, and plant volume using LiDAR. Currently
the most promising of these is the multispectral camera to measure the NDVI (see above).
However, no research has yet been done to correlate NDVI with measurements from
destructive plant biomass sampling. This ground-truthing must be done for each of the main
plant species within a reserve before the technique can be applied.
Plant biodiversity Desert ecosystems are highly suited to biodiversity study through aerial monitoring.
Success of classifying individual plants to species level is inversely proportional to biodiversity
within a size class (Féret and Asner 2012), and is improved when individuals are discretely
separated by bare ground.
Several options are available for remote classification to species level (Table 3) but none
of these options currently approaches the accuracy of a ground survey performed by a trained
botanist. The advantage of using UAVs is to be able to survey larger areas more quickly, and
therefore to produce a moderately accurate biodiversity assessment at a much lower cost, and
with a reduced reliance on highly trained field specialists. It should be possible to identify all
trees and larger shrubs in the Arabian Peninsula to species level with close to 100% accuracy,
but smaller species will be considerably more difficult.
Research and development is needed to automate the processing of drone images into a
georeferenced database of perennial plants. Research is also needed to train pattern analysis
software in plant recognition, and to validate their accuracy.
Animal population Performing a complete population count of an animal species is rarely an option in arid
rangelands due to the vast areas, and to animal movement. Nevertheless there are several
possible approaches to estimating a population size.
Perform a complete count of aggregation points, such as feed or water points, or
high traffic areas.
Conduct a transect survey (e.g.; 30 x 0.15 km2) over dispersed areas regularly, and
determine a moving average.
Perform a complete count of fixed artifacts related to the species (e.g.; burrow
entrances of the lizard Uromastyx aegypticus).
Use video from a low-flying UAV to flush animals from hiding.

Statistical techniques to estimate actual population from the above methods are well
established. There is commercial and open-source software available that could be used to
automate searching for and counting of individuals from the images. Research is needed into
the accuracy of detection both by human eye, and by automated analysis, for each species of
interest.
Animal fitness Animal size can be determined from photographs or video at known GSDs. Body width
of many species is correlated to pregnancy and body condition. The traditional method of
scoring ungulates is to observe hip bone prominence, which can be photographed at ground
level as an animal runs away. The same scoring method could be performed using UAV video
footage, enabling more animals to be scored per day and with less disturbance to the animals.
No research is needed to verify the use of UAV video footage for scoring ungulates, since
the method is the same as ground based methods already in use. To determine herd fitness
from higher altitudes, however, requires research to correlate body width with fitness and
pregnancy.
Anthropogenic influences There are many applications that fall within this category, each requiring their own
research and development to perfect the methods used. Three example techniques are given
here:
Line monitoring.
Fence-lines must be routinely checked for breaks and dune burial. Roads within
nature reserves must be checked to ensure users are keeping their vehicles to the
assigned tracks. In both cases, a UAV could be programmed to routinely collect
video footage along a set route, which could then be viewed at high speed.
Disturbance transects.
Assessing the amount of litter or damage from recreational driving can both be
done through sample transects. Periodic evaluation would enable the impact of
new management strategies to be tested.
Heritage preservation.
Archaeological sites can be digitally preserved in a three-dimensional
orthorectified file, for future reference and to aid maintenance.
Habitat zonation Traditionally, habitats have been defined only on the macro-scale that is available from
satellite data, or less often from MAV generated data. By using UAVs it becomes viable to
map habitats on a smaller scale, as well as develop localized contour maps and three-
dimensional landscape images. Such work requires commercial software and specialized
computers in addition to the airborne hardware. However the techniques are well established
and routinely applied at the macro-scale.
Conclusion UAVs offer much promise for ecological monitoring in arid rangelands. Many of the
potential uses still require research and development to validate techniques and to improve
their automation. Nevertheless there are some applications that can be applied immediately

using off-the-shelf hardware and software. There is a very high learning curve in both the data
collection, and the analysis and interpretation of results.
Acknowledgement Many thanks Greg Simkins of the Dubai Desert Conservation Reserve for his support, and
to Zayed University for providing seed funds.
Reference Citation Anderson, Karen, and Kevin J Gaston. 2013. “Lightweight Unmanned Aerial Vehicles Will
Revolutionize Spatial Ecology.” Frontiers in Ecology and the Environment 11 (3): 138–46.
doi:10.1890/120150.
Berni, J., P.J. Zarco-Tejada, L. Suarez, and E. Fereres. 2009. “Thermal and Narrowband Multispectral
Remote Sensing for Vegetation Monitoring From an Unmanned Aerial Vehicle.” IEEE
Transactions on Geoscience and Remote Sensing 47 (3): 722–38.
doi:10.1109/TGRS.2008.2010457.
Blackburn, George Alan. 2007. “Hyperspectral Remote Sensing of Plant Pigments.” Journal of
Experimental Botany 58 (4): 855–67. doi:10.1093/jxb/erl123.
Bryson, Mitch, Alistair Reid, Calvin Hung, Fabio Tozeto Ramos, and Salah Sukkarieh. 2014. “Cost-
Effective Mapping Using Unmanned Aerial Vehicles in Ecology Monitoring Applications.” In
Experimental Robotics, edited by Oussama Khatib, Vijay Kumar, and Gaurav Sukhatme, 509–23.
Springer Tracts in Advanced Robotics 79. Springer Berlin Heidelberg.
http://link.springer.com/chapter/10.1007/978-3-642-28572-1_35.
Buchanan, A., and A. Fitzgibbon. 2006. “Interactive Feature Tracking Using K-D Trees and Dynamic
Programming.” In 2006 IEEE Computer Society Conference on Computer Vision and Pattern
Recognition, 1:626–33. doi:10.1109/CVPR.2006.158.
Cho, Moses Azong, and Andrew K. Skidmore. 2006. “A New Technique for Extracting the Red Edge
Position from Hyperspectral Data: The Linear Extrapolation Method.” Remote Sensing of
Environment 101 (2): 181–93. doi:10.1016/j.rse.2005.12.011.
Cho, Moses Azong, I Sobhan, Andrew K. Skidmore, and J de Leeuw. 2008. “Discriminating Species
Using Hyperspectral Indices at Leaf and Canopy Scales.” The International Archives of the
Photogrammetry, Remote Sensing and Spatial Information Sciences XXXVII (B7): 369–76.
Dandois, Jonathan P., and Erle C. Ellis. 2013. “High Spatial Resolution Three-Dimensional Mapping
of Vegetation Spectral Dynamics Using Computer Vision.” Remote Sensing of Environment 136
(September): 259–76. doi:10.1016/j.rse.2013.04.005.
Dunbabin, M., and L. Marques. 2012. “Robots for Environmental Monitoring: Significant
Advancements and Applications.” IEEE Robotics Automation Magazine 19 (1): 24–39.
doi:10.1109/MRA.2011.2181683.
Féret, Jean-Baptiste, and Gregory P. Asner. 2012. “Semi-Supervised Methods to Identify Individual
Crowns of Lowland Tropical Canopy Species Using Imaging Spectroscopy and LiDAR.” Remote
Sensing 4 (8): 2457–76. doi:10.3390/rs4082457.
Getzin, Stephan, Kerstin Wiegand, and Ingo Schöning. 2012. “Assessing Biodiversity in Forests
Using Very High-Resolution Images and Unmanned Aerial Vehicles.” Methods in Ecology and
Evolution 3 (2): 397–404. doi:10.1111/j.2041-210X.2011.00158.x.
He, Kate S., Duccio Rocchini, Markus Neteler, and Harini Nagendra. 2011. “Benefits of
Hyperspectral Remote Sensing for Tracking Plant Invasions.” Diversity and Distributions 17 (3):
381–92. doi:10.1111/j.1472-4642.2011.00761.x.
Holechek, Jerry L., Rex D. Pieper, and Carlton H. Herbel. 2010. Range Management: Principles and
Practices. 6 edition. Boston: Prentice Hall.
Hung, Calvin, Mitch Bryson, and Salah Sukkarieh. 2012. “Multi-Class Predictive Template for Tree
Crown Detection.” ISPRS Journal of Photogrammetry and Remote Sensing 68 (March): 170–83.
doi:10.1016/j.isprsjprs.2012.01.009.
Kim, Yunseop, D. Michael Glenn, Johnny Park, Henry Ngugi, and Brian Lehman. 2010.
“Hyperspectral Image Analysis for Plant Stress Detection.” In Proceedings of the American
Society of Agricultural and Biological Engineers International (ASABE).
Laliberte, Andrea. 2012. “Mapping Rangelands with Unmanned Aircraft.” Professional Surveyor.
http://www.profsurv.com/magazine/article.aspx?i=71086.
Lass, Lawrence W., Timothy S. Prather, Nancy F. Glenn, Keith T. Weber, Jacob T. Mundt, and
Jeffery Pettingill. 2005. “A Review of Remote Sensing of Invasive Weeds and Example of the
Early Detection of Spotted Knapweed (Centaurea Maculosa) and Babysbreath (Gypsophila
Paniculata) with a Hyperspectral Sensor.” Weed Science 53 (2): 242–51. doi:10.1614/WS-04-
044R2.
Liang, Jie, Ali Zia, Jun Zhou, Xavier Sirault, Mohammadreza Hosseini, Arcot Sowmya, Pascal
Vallotton, Tomasz Bednarz, Alessio Del Bue, and Francesca Cella Zanacchi. 2013. “3D Plant
Modelling via Hyperspectral Imaging$}$.” In The IEEE International Conference on Computer
Vision (ICCV) Workshops$}$. http://www.cv-
foundation.org/openaccess/content_iccv_workshops_2013/W06/papers/Liang_3D_Plant_Modellin
g_2013_ICCV_paper.pdf.
Martin, Julien, Holly H. Edwards, Matthew A. Burgess, H. Franklin Percival, Daniel E. Fagan, Beth
E. Gardner, Joel G. Ortega-Ortiz, Peter G. Ifju, Brandon S. Evers, and Thomas J. Rambo. 2012.
“Estimating Distribution of Hidden Objects with Drones: From Tennis Balls to Manatees.” PLoS
ONE 7 (6): e38882. doi:10.1371/journal.pone.0038882.
Miller, J. R., E. W. Hare, and J. Wu. 1990. “Quantitative Characterization of the Vegetation Red Edge
Reflectance 1. An Inverted-Gaussian Reflectance Model.” International Journal of Remote
Sensing 11 (10): 1755–73. doi:10.1080/01431169008955128.
Reynolds, Gregory J., Carol E. Windels, Ian V. MacRae, and Soizik Laguette. 2011. “Remote Sensing
for Assessing Rhizoctonia Crown and Root Rot Severity in Sugar Beet.” Plant Disease 96 (4):
497–505. doi:10.1094/PDIS-11-10-0831.
Shippert, Peg. 2003. “Introduction to Hyperspectral Image Analysis.” Online Journal of Space
Communication 3 (Winter). http://spacejournal.ohio.edu/issue3/abst_shippert.html.
Sun, Y., X. Liu, Y. Wu, and C. Liao. 2008. “Identifying Hyperspectral Characters of Wetland Species
Using in Situ Data.” Int Arch Photogramm Remote Sens Spa Inf Sci 107: 459–65.
Thorp, K. R., A. N. French, and A. Rango. 2013. “Effect of Image Spatial and Spectral Characteristics
on Mapping Semi-Arid Rangeland Vegetation Using Multiple Endmember Spectral Mixture
Analysis (MESMA).” Remote Sensing of Environment 132 (May): 120–30.
doi:10.1016/j.rse.2013.01.008.
Ustin, Susan L., Dar A. Roberts, John A. Gamon, Gregory P. Asner, and Robert O. Green. 2004.
“Using Imaging Spectroscopy to Study Ecosystem Processes and Properties.” BioScience 54 (6):
523–34. doi:10.1641/0006-3568(2004)054[0523:UISTSE]2.0.CO;2.
Ustin, Susan L, and Maria Joao Santos. 2010. “Spectral Identification of Native and Non-Native Plant
Species.” In Proceedings of ASD and IEEE GRS; Art, Science and Applications of Reflectance
Spectroscopy Symposium, Vol. II, 17. Boulder, CO.
Vane, Gregg, and Alexander F. H Goetz. 1993. “Terrestrial Imaging Spectrometry: Current Status,
Future Trends.” Remote Sensing of Environment, Airbone Imaging Spectrometry, 44 (2–3): 117–
26. doi:10.1016/0034-4257(93)90011-L.
Walton, Kelly M., Donald E. Spalinger, Norman R. Harris, William B. Collins, and James J.
Willacker. 2013. “High Spatial Resolution Vegetation Mapping for Assessment of Wildlife
Habitat.” Wildlife Society Bulletin 37 (4): 906–15. doi:10.1002/wsb.344.
Watts, Adam C., Vincent G. Amrosia, and Everett A. Hinkley. 2012. “Unmanned Aircraft Systems in
Remote Sensing and Scientific Research: Classification and Considerations of Use.” Remote
Sensing 4 (June): 1671–92. doi:10.3390/rs4061671.
Weckler, Paul R., Niels O. Maness, and Marvin L. Stone. 2004. “Estimating Water Stress in Plants
Using Hyperspectral Sensing.” System 1: 4.

Zarco-Tejada, P. J., R. Diaz-Varela, V. Angileri, and P. Loudjani. 2014. “Tree Height Quantification
Using Very High Resolution Imagery Acquired from an Unmanned Aerial Vehicle (UAV) and
Automatic 3D Photo-Reconstruction Methods.” European Journal of Agronomy 55 (April): 89–99.
doi:10.1016/j.eja.2014.01.004.
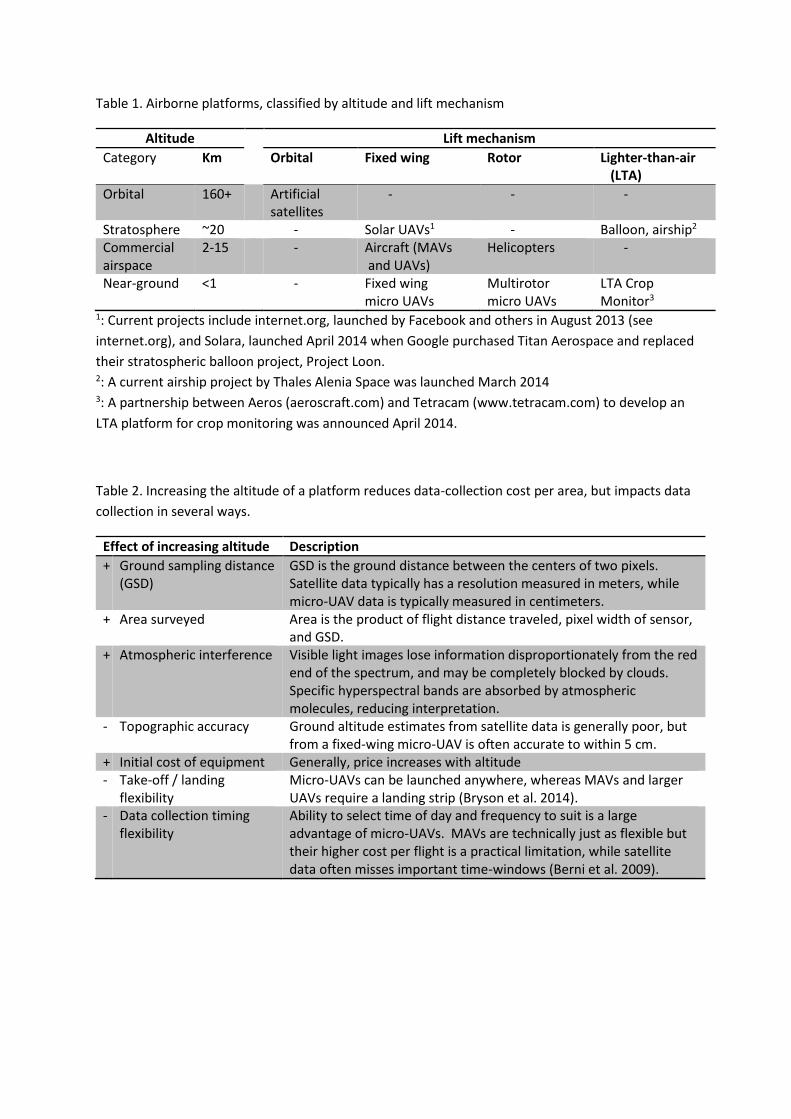
Table 1. Airborne platforms, classified by altitude and lift mechanism
Altitude Lift mechanism
Category Km Orbital Fixed wing Rotor Lighter-than-air (LTA)
Orbital 160+ Artificial satellites
- - -
Stratosphere ~20 - Solar UAVs1 - Balloon, airship2 Commercial airspace
2-15 - Aircraft (MAVs and UAVs)
Helicopters -
Near-ground <1 - Fixed wing micro UAVs
Multirotor micro UAVs
LTA Crop Monitor3
1: Current projects include internet.org, launched by Facebook and others in August 2013 (see
internet.org), and Solara, launched April 2014 when Google purchased Titan Aerospace and replaced
their stratospheric balloon project, Project Loon. 2: A current airship project by Thales Alenia Space was launched March 2014 3: A partnership between Aeros (aeroscraft.com) and Tetracam (www.tetracam.com) to develop an
LTA platform for crop monitoring was announced April 2014.
Table 2. Increasing the altitude of a platform reduces data-collection cost per area, but impacts data
collection in several ways.
Effect of increasing altitude Description
+ Ground sampling distance (GSD)
GSD is the ground distance between the centers of two pixels. Satellite data typically has a resolution measured in meters, while micro-UAV data is typically measured in centimeters.
+ Area surveyed Area is the product of flight distance traveled, pixel width of sensor, and GSD.
+ Atmospheric interference Visible light images lose information disproportionately from the red end of the spectrum, and may be completely blocked by clouds. Specific hyperspectral bands are absorbed by atmospheric molecules, reducing interpretation.
- Topographic accuracy Ground altitude estimates from satellite data is generally poor, but from a fixed-wing micro-UAV is often accurate to within 5 cm.
+ Initial cost of equipment Generally, price increases with altitude - Take-off / landing
flexibility Micro-UAVs can be launched anywhere, whereas MAVs and larger UAVs require a landing strip (Bryson et al. 2014).
- Data collection timing flexibility
Ability to select time of day and frequency to suit is a large advantage of micro-UAVs. MAVs are technically just as flexible but their higher cost per flight is a practical limitation, while satellite data often misses important time-windows (Berni et al. 2009).
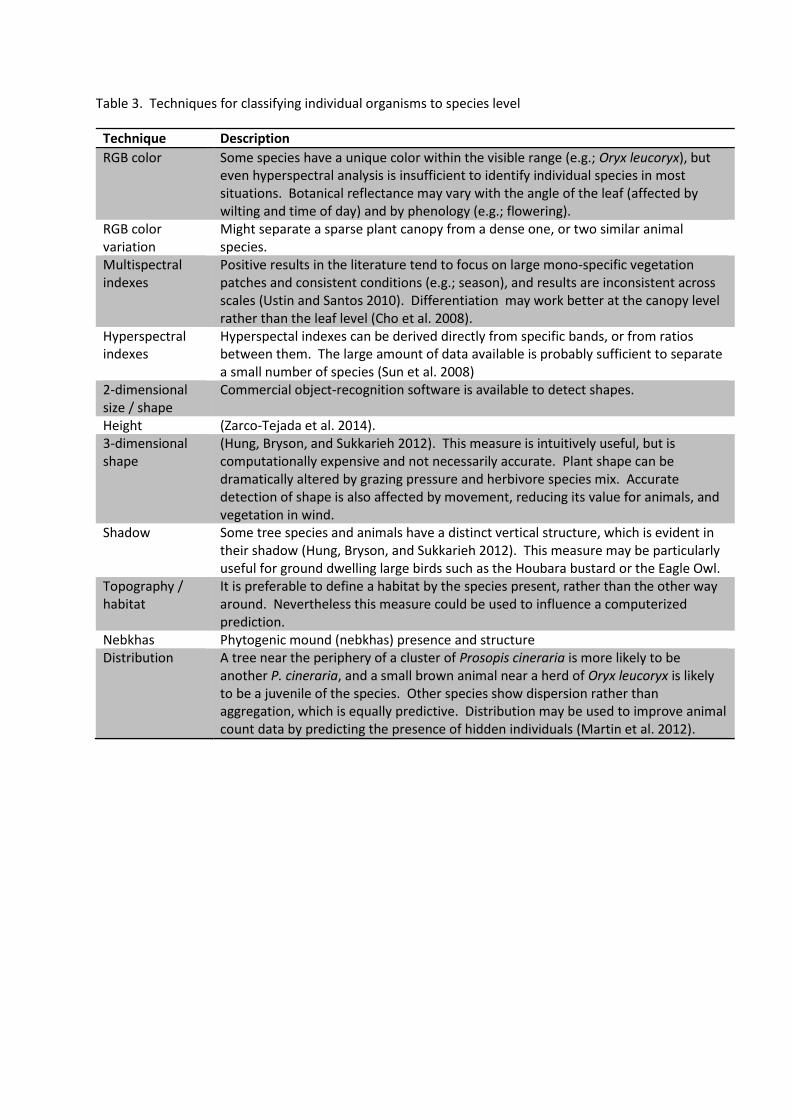
Table 3. Techniques for classifying individual organisms to species level
Technique Description
RGB color Some species have a unique color within the visible range (e.g.; Oryx leucoryx), but even hyperspectral analysis is insufficient to identify individual species in most situations. Botanical reflectance may vary with the angle of the leaf (affected by wilting and time of day) and by phenology (e.g.; flowering).
RGB color variation
Might separate a sparse plant canopy from a dense one, or two similar animal species.
Multispectral indexes
Positive results in the literature tend to focus on large mono-specific vegetation patches and consistent conditions (e.g.; season), and results are inconsistent across scales (Ustin and Santos 2010). Differentiation may work better at the canopy level rather than the leaf level (Cho et al. 2008).
Hyperspectral indexes
Hyperspectal indexes can be derived directly from specific bands, or from ratios between them. The large amount of data available is probably sufficient to separate a small number of species (Sun et al. 2008)
2-dimensional size / shape
Commercial object-recognition software is available to detect shapes.
Height (Zarco-Tejada et al. 2014). 3-dimensional shape
(Hung, Bryson, and Sukkarieh 2012). This measure is intuitively useful, but is computationally expensive and not necessarily accurate. Plant shape can be dramatically altered by grazing pressure and herbivore species mix. Accurate detection of shape is also affected by movement, reducing its value for animals, and vegetation in wind.
Shadow Some tree species and animals have a distinct vertical structure, which is evident in their shadow (Hung, Bryson, and Sukkarieh 2012). This measure may be particularly useful for ground dwelling large birds such as the Houbara bustard or the Eagle Owl.
Topography / habitat
It is preferable to define a habitat by the species present, rather than the other way around. Nevertheless this measure could be used to influence a computerized prediction.
Nebkhas Phytogenic mound (nebkhas) presence and structure Distribution A tree near the periphery of a cluster of Prosopis cineraria is more likely to be
another P. cineraria, and a small brown animal near a herd of Oryx leucoryx is likely to be a juvenile of the species. Other species show dispersion rather than aggregation, which is equally predictive. Distribution may be used to improve animal count data by predicting the presence of hidden individuals (Martin et al. 2012).
Copyright © 2022 FDOKUMEN