ECM Degradation Assays for Analyzing Local Cell Invasion
365
-
Upload
independent -
Category
Documents
-
view
4 -
download
0
Transcript of ECM Degradation Assays for Analyzing Local Cell Invasion


Extracellular Matrix Protocols
Second Edition
Series EditorJohn M. Walker
School of Life SciencesUniversity of Hertfordshire
Hatfield, Hertfordshire, AL10 9AB, UK
For other titles published in this series, go to www.springer.com/series/7651

M E T H O D S I N M O L E C U L A R B I O L O G Y ™
Extracellular Matrix Protocols
Second Edition
Edited by
Sharona Even-Ram* and Vira V. Artym†
* Institute of Gene Therapy, Hadassah Hebrew University Hospital, Jerusalem, Israeland
† Laboratory of Cell and Developmental Biology, NIDCR, National Institutes of HealthBethesda, MD, USA

EditorsSharona Even-Ram Vira V. ArtymInstitute of Gene Therapy Laboratory of Cell and Developmental BiologyHadassah Hebrew University Hospital NIDCR, National Institutes of HealthJerusalem, Israel Bethesda, MD, USA
ISBN: 978-1-58829-984-0 e-ISBN: 978-1-59745-413-1ISSN: 1064-3745 e-ISSN: 1940-6029DOI: 10.1007/978-1-59745-413-1
Library of Congress Control Number: 2008942787
© Humana Press, a part of Springer Science+Business Media, LLC 2009All rights reserved. This work may not be translated or copied in whole or in part without the written permission of the publisher (Humana Press, c/o Springer Science+Business Media, LLC, 233 Spring Street, New York, NY 10013, USA), except for brief excerpts in connection with reviews or scholarly analysis. Use in connection with any form of information storage and retrieval, electronic adaptation, computer software, or by similar or dissimilar methodology now known or hereafter developed is forbidden.The use in this publication of trade names, trademarks, service marks, and similar terms, even if they are not identified as such, is not to be taken as an expression of opinion as to whether or not they are subject to proprietary rights.While the advice and information in this book are believed to be true and accurate at the date of going to press, neither the authors nor the editors nor the publisher can accept any legal responsibility for any errors or omissions that may be made. The publisher makes no warranty, express or implied, with respect to the material contained herein.
Printed on acid-free paper
springer.com
Preface
The study of the extracellular matrix (ECM) and its diverse roles in tissue scaffolding and cellular signaling in both physiological and pathological processes has significantly expanded over the past decade. Although well appreciated, the structural and biochemical complexity and the dynamic nature of the living matrix are still under extensive inves-tigation, yielding a growing number of methods with varying degree of sophistication and intricacy. In this edition of Extracellular Matrix Protocols, we compiled a variety of methods that can be readily reproduced in most cell biology laboratories, as well as several cutting-edge technologies that are indeed available in a limited number of centers, but are well worth the awareness and exposure to the ECM research community.
As in the previous edition, the book chapters are divided into sections that repre-sent molecular biology techniques to study gene expression, biophysical and biochemical methods for the analysis of structure and composition, cell biology methods for the assess-ment of cell behavior and matrix assembly and tissue engineering applications.
All chapters were contributed by scientists who developed the methods or mastered and perfected methods that were routinely used in their laboratories. An effort was made to provide practical working details and helpful notes for the nonexpert user in order to assist reproducibility and accuracy. We hope that these valuable protocols will become helpful tools for ECM researchers and will be further developed and tailored to the spe-cific needs of a growing number of applications.
Jerusalem, Israel Sharona Even-RamWashington, DC Vira V. Artym
v
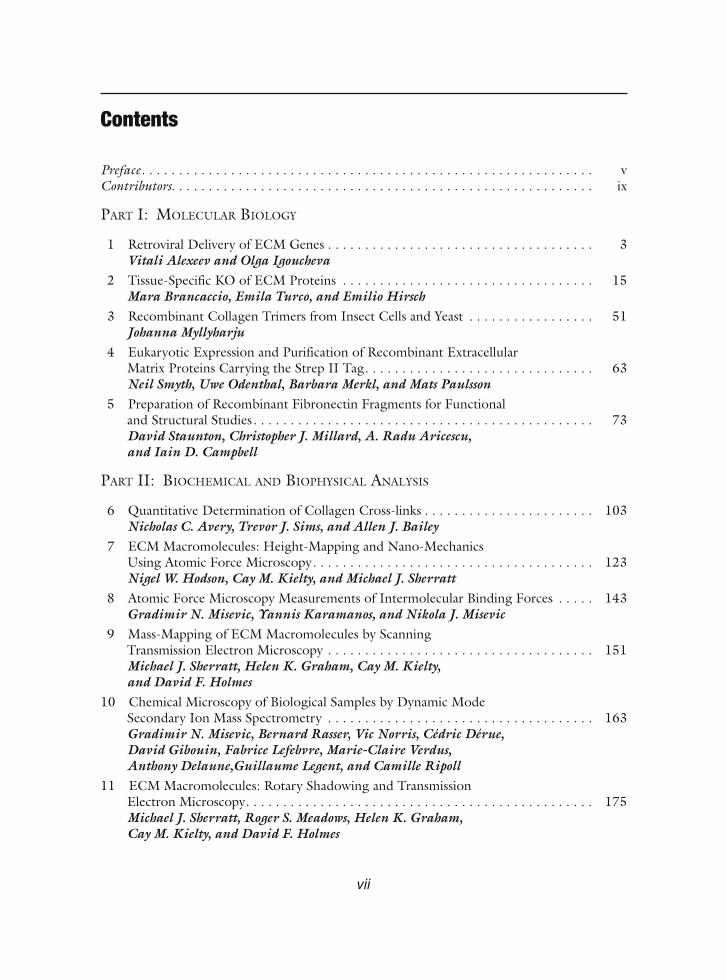
Contents
Preface. . . . . . . . . . . . . . . . . . . . . . . . . . . . . . . . . . . . . . . . . . . . . . . . . . . . . . . . . . . . . vContributors. . . . . . . . . . . . . . . . . . . . . . . . . . . . . . . . . . . . . . . . . . . . . . . . . . . . . . . . . ix
PART I: MOLECULAR BIOLOGY
1 Retroviral Delivery of ECM Genes . . . . . . . . . . . . . . . . . . . . . . . . . . . . . . . . . . . . 3Vitali Alexeev and Olga Igoucheva
2 Tissue-Specific KO of ECM Proteins . . . . . . . . . . . . . . . . . . . . . . . . . . . . . . . . . . 15Mara Brancaccio, Emila Turco, and Emilio Hirsch
3 Recombinant Collagen Trimers from Insect Cells and Yeast . . . . . . . . . . . . . . . . . 51Johanna Myllyharju
4 Eukaryotic Expression and Purification of Recombinant Extracellular Matrix Proteins Carrying the Strep II Tag. . . . . . . . . . . . . . . . . . . . . . . . . . . . . . . 63Neil Smyth, Uwe Odenthal, Barbara Merkl, and Mats Paulsson
5 Preparation of Recombinant Fibronectin Fragments for Functional and Structural Studies. . . . . . . . . . . . . . . . . . . . . . . . . . . . . . . . . . . . . . . . . . . . . . 73David Staunton, Christopher J. Millard, A. Radu Aricescu, and Iain D. Campbell
PART II: BIOCHEMICAL AND BIOPHYSICAL ANALYSIS
6 Quantitative Determination of Collagen Cross-links . . . . . . . . . . . . . . . . . . . . . . . 103Nicholas C. Avery, Trevor J. Sims, and Allen J. Bailey
7 ECM Macromolecules: Height-Mapping and Nano-Mechanics Using Atomic Force Microscopy. . . . . . . . . . . . . . . . . . . . . . . . . . . . . . . . . . . . . . 123Nigel W. Hodson, Cay M. Kielty, and Michael J. Sherratt
8 Atomic Force Microscopy Measurements of Intermolecular Binding Forces . . . . . 143Gradimir N. Misevic, Yannis Karamanos, and Nikola J. Misevic
9 Mass-Mapping of ECM Macromolecules by Scanning Transmission Electron Microscopy . . . . . . . . . . . . . . . . . . . . . . . . . . . . . . . . . . . . 151Michael J. Sherratt, Helen K. Graham, Cay M. Kielty, and David F. Holmes
10 Chemical Microscopy of Biological Samples by Dynamic Mode Secondary Ion Mass Spectrometry . . . . . . . . . . . . . . . . . . . . . . . . . . . . . . . . . . . . 163Gradimir N. Misevic, Bernard Rasser, Vic Norris, Cédric Dérue, David Gibouin, Fabrice Lefebvre, Marie-Claire Verdus, Anthony Delaune,Guillaume Legent, and Camille Ripoll
11 ECM Macromolecules: Rotary Shadowing and Transmission Electron Microscopy. . . . . . . . . . . . . . . . . . . . . . . . . . . . . . . . . . . . . . . . . . . . . . . 175Michael J. Sherratt, Roger S. Meadows, Helen K. Graham, Cay M. Kielty, and David F. Holmes
vii

viii Contents
12 Using Self-Assembled Monolayers to Pattern ECM Proteins and Cells on Substrates . . . . . . . . . . . . . . . . . . . . . . . . . . . . . . . . . . . . . . . . . . . . . 183Emanuele Ostuni, George M. Whitesides, Donald E. Ingber, and Christopher S. Chen
13 Solid Phase Assays for Studying ECM Protein–Protein Interactions . . . . . . . . . . . 195A Paul Mould
PART III: CELL BIOLOGY ASSAYS
14 Cell Adhesion Assays . . . . . . . . . . . . . . . . . . . . . . . . . . . . . . . . . . . . . . . . . . . . . . 203Martin J. Humphries
15 ECM Degradation Assays for Analyzing Local Cell Invasion . . . . . . . . . . . . . . . . . 211Vira V. Artym, Kenneth M. Yamada, and Susette C. Mueller
16 Fluorescence-Based Assays for In Vitro Analysis of Cell Adhesion and Migration. . . . . . . . . . . . . . . . . . . . . . . . . . . . . . . . . . . . . . . . . . . . . . . . . . . . 221Paola Spessotto, Katia Lacrima, Pier Andrea Nicolosi, Eliana Pivetta, Martina Scapolan, and Roberto Perris
17 Fibrin Gel Model for Assessment of Cellular Contractility. . . . . . . . . . . . . . . . . . . 251Sharona Even-Ram
18 Fluorescent Labeling Techniques for Investigation of Fibronectin Fibrillogenesis (Labeling Fibronectin Fibrillogenesis) . . . . . . . . . . . . . . . . . . . . . . 261Roumen Pankov and Albena Momchilova
19 Stromagenesis During Tumorigenesis: Characterization of Tumor-Associated Fibroblasts and Stroma-Derived 3D Matrices . . . . . . . . . . . . 275Remedios Castelló-Cros and Edna Cukierman
PART IV: ORGAN MODELS
20 Tissue Recombinants to Study Extracellular Matrix Targeting to Basement Membranes. . . . . . . . . . . . . . . . . . . . . . . . . . . . . . . . . . . . . . . . . . . . 309Patricia Simon-Assmann, Anne-Laure Bolcato-Bellemin, Annick Klein, and Michèle Kedinger
21 ECM and FGF-Dependent Assay of Embryonic SMG Epithelial Morphogenesis: Investigating Growth Factor/Matrix Regulation of Gene Expression During Submandibular Gland Development. . . . . . . . . . . . . . 319Ivan T. Rebustini and Matthew P. Hoffman
22 Analyzing how Cell Adhesion Controls Mammary Gland Functionby Transplantation of Embryonic Mammary Tissue from Knockout Mice . . . . . . . 331Teresa C.M. Klinowska and Charles H. Streuli
PART V: TISSUE ENGINEERING
23 Characterizing ECM Production by Cells Encapsulated in Hydrogels . . . . . . . . . . 349Iossif A. Strehin and Jennifer H. Elisseeff
24 Tissue Engineering and Cell-Populated Collagen Matrices . . . . . . . . . . . . . . . . . . 363Paul D. Kemp
Index . . . . . . . . . . . . . . . . . . . . . . . . . . . . . . . . . . . . . . . . . . . . . . . . . . . . . . . . . . . . . . . . . . 371

Contributors
VITALI ALEXEEV • Department of Dermatology and Cutaneous Biology, Thomas Jefferson University, Philadelphia, PA, USA
RADU ARICESCU • Division of Structural Biology, University of Oxford, Oxford, UKVIRA V. ARTYM • Laboratory of Cell and Developmental Biology, NIDCR,
National Institutes of Health, Bethesda, MD, USANICHOLAS C. AVERY • Division of Molecular and Cellular Biology, University of
Bristol, Langford, Bristol, UKALLEN J. BAILEY • Division of Molecular and Cellular Biology, University of Bristol,
Langford, Bristol, UKANNE-LAURE BOLCATO-BELLEMIN • Polyplus-transfection, Illkirch, FranceMARA BRANCACCIO • Department of Genetics, Biology and Biochemistry,
University of Torino, Torino, ItalyIAIN D. CAMPBELL • Department of Biochemistry, University of Oxford, Oxford, UKREMEDIOS CASTELLÓ-CROS • Tumor Cell Biology-Basic Science, Fox Chase Cancer
Center, Philadelphia, PA, USACHRISTOPHER S. CHEN • Department of Bioengineering, University of Pennsylvania,
Philadelphia, PA, USAEDNA CUKIERMAN • Tumor Cell Biology/Basic Science, Fox Chase Cancer Center,
Philadelphia, PA, USAANTHONY DELAUNE • AMMIS, University of Rouen, Rouen, FranceCÉDRIC DÉRUE • AMMIS, University of Rouen, Rouen, FranceJENNIFER H. ELISSEEFF • Department of Biomedical Engineering, Johns Hopkins
University, Baltimore, MD, USASHARONA EVEN-RAM • Institute of Gene Therapy, Hadassah Hebrew University
Hospital, Jerusalem, IsraelCHARLES FFRENCH-CONSTANT • Department of Pathology, University of Cambridge,
Cambridge, UKDAVID GIBOUIN • AMMIS, University of Rouen, Rouen, FranceHELEN K. GRAHAM • Faculty of Medicine, University of Manchester, Manchester, UKEMILIO HIRSCH • Department of Genetics, Biology and Biochemistry,
University of Torino, Torino, ItalyNIGEL W. HODSON • Faculty of Life Sciences, University of Manchester,
Manchester, UKMATTHEW P. HOFFMAN • Laboratory of Cell and Developmental Biology,
NIDCR, National Institutes of Health, Bethesda, MD, USADAVID F. HOLMES • Faculty of Life Sciences, University of Manchester,
Manchester, UKMARTIN J. HUMPHRIES • Faculty of Life Sciences, University of Manchester,
Manchester, UK
ix
x Contributors
OLGA IGOUCHEVA • Department of Dermatology and Cutaneous Biology, Thomas Jefferson University, Philadelphia, PA, USA
DONALD E. INGBER • Departments of Surgery and Pathology, Children’s Hospital and Harvard Medical School, Boston, MA, USA
YANNIS KARAMANOS • University of Artois, Arras, FranceMICHÈLE KEDINGER • Development and Physiopathology of the Intestine and Pancreas,
INSERM, Strasbourg, FrancePAUL D. KEMP • Intercytex Ltd, Manchester, UKCAY M. KIELTY • Faculty of Life Sciences, University of Manchester, Manchester, UKANNICK KLEIN • Development and Physiopathology of the Intestine and Pancreas,
INSERM, Strasbourg, FranceTERESA C.M. KLINOWSKA • AstraZeneca plc, Alderley Park, Cheshire, SK10 4TG,
UKKATIA LACRIMA • Department of Genetics, Microbiology and Anthropology,
University of Parma, Parma, ItalyFABRICE LEFEBVRE • AMMIS, University of Rouen, Rouen, FranceGUILLAUME LEGENT • AMMIS, University of Rouen, Rouen, FranceROGER S. MEADOWS • University of Manchester, Manchester, UKBARBARA MERKL • Institute for Biochemistry, University of Cologne, Cologne, GermanyCHRISTOPHER J. MILLARD • Department of Biochemistry, University of Oxford,
Oxford, UKGRADIMIR N. MISEVIC • Faculté des Sciences, University of Rouen, Rouen, FranceNIKOLA J. MISEVIC • University of Bremen, Bremen, GermanyALBENA MOMCHILOVA • Faculty of Biology, University of Sofia, Sofia, BulgariaPAUL A. MOULD • Faculty of Life Sciences, University of Manchester, Manchester, UKSUSETTE C. MUELLER • Department of Oncology, Georgetown University, Washington,
DC, USAJOHANNA MYLLYHARJU • Biocenter and Department of Medical Biochemistry
and Molecular Biology, University of Oulu, Oulu, FinlandPIER ANDREA NICOLOSI • Division for Experimental Oncology, University of Parma,
Parma, ItalyVIC NORRIS • AMMIS, University of Rouen, Rouen, FranceUWE ODENTHAL • Institute for Biochemistry, University of Cologne, Cologne, GermanyEMANUELE OSTUNI • Department of Chemistry and Chemical Biology,
Harvard University, Cambridge, MA, USAROUMEN PANKOV • Faculty of Biology, University of Sofia, Sofia, BulgariaMATS PAULSSON • Institute for Biochemistry, University of Cologne, Cologne, GermanyROBERTO PERRIS • Department of Genetics, Microbiology and Anthropology,
University of Parma, Parma, ItalyELIANA PIVETTA • Division for Experimental Oncology, Department of Genetics,
Microbiology and Anthropology, University of Parma, Parma, ItalyBERNARD RASSER • Orsay Physics, Fuveau, FranceIVAN T. REBUSTINI • Laboratory of Cell and Developmental Biology, NIDCR,
National Institutes of Health, Bethesda, MD, USACAMILLE RIPOLL • AMMIS, University of Rouen, Rouen, France

Contributors xi
MARTINA SCAPOLAN • Division for Experimental Oncology, University of Parma, Parma, Italy
MICHAEL J. SHERRATT • Faculty of Medicine, University of Manchester, Manchester, UK
PATRICIA SIMON-ASSMANN • Development and Physiopathology of the Intestine and Pancreas, INSERM, Strasbourg, France
TREVOR J. SIMS • Division of Molecular and Cellular Biology, University of Bristol, Langford, Bristol, UK
NEIL SMYTH • Institute for Biochemistry, University of Cologne, Cologne, GermanyPAOLA SPESSOTTO • Division for Experimental Oncology, University of Parma,
Parma, ItalyDAVID STAUNTON • Department of Biochemistry, University of Oxford, Oxford, UKIOSSIF A. STREHIN • Department of Biomedical Engineering, Johns Hopkins University,
Baltimore, MD, USACHARLES H. STREULI • Faculty of Life Sciences, University of Manchester,
Manchester, UKEMILA TURCO • Department of Genetics, Biology and Biochemistry, University
of Torino, Torino, ItalyMARIE-CLAIRE VERDUS • AMMIS, University of Rouen, Rouen, FranceGEORGE M. WHITESIDES • Department of Chemistry and Chemical Biology,
Harvard University, Cambridge, MA, USAKENNETH M. YAMADA • Laboratory of Cell and Developmental Biology, NIDCR,
National Institutes of Health, Bethesda, MD

Chapter 1
Retroviral Delivery of ECM Genes
Vitali Alexeev and Olga Igoucheva
Summary
The use of recombinant DNA has become a powerful tool in the analysis of functional and structural properties of the extracellular matrix proteins. During last decade, various procedures of plasmid DNA delivery using liposome-based or electroporation-based transfection have been developed. However, in many instances, these procedures were shown to be not effective in DNA transfer or toxic for the mammalian cells. On contrary, retrovirus-mediated infection represents a superior mode of gene delivery with a success rate and viability of the cells approaching 100% in in vitro conditions. The use of the retroviral system also allows permanent insertion of the gene of interest into the chromosome of the infected cell, resulting in efficient gene transfer in which most recipient cells will incorporate and express the transduced gene. In this chapter, we will describe several retrovirus-based systems and provide step-by-step protocols applicable for the production of the recombinant virus and efficient delivery of the ECM genes.
Key words: Extracellular matrix , Recombinant retrovirus , Gene delivery , Gene expression .
The introduction of recombinant DNA has become a common tool for studying functional and structural properties of the extra-cellular matrix proteins. Functional analysis of these protein can be studied by suppression of gene expression via introduction of a plasmid coding for an antisense RNA, small interfering RNA (siRNA), or dominant-negative mutant proteins that have been characterized for many human diseases associated with extracel-lular matrix dysfunction. On contrary, supplementation of the missing (or defective) protein has also been widely used in the development of gene therapy approaches for the treatment of extracellular matrix-associated disorders.
1. Introduction
Sharona Even-Ram and Vira Artym (eds.), Methods in Molecular Biology, Extracellular Matrix Protocols, vol. 522© Humana Press, a part of Springer Science + Business Media, LLC 2009DOI: 10.1007/978-1-59745-413-1_1
3

4 Alexeev and Igoucheva
In these studies, an efficient delivery of DNA into appropriate target cells represents a critical step. Although many procedures of plasmid DNA transfection into mammalian cells are available, retrovirus-mediated infection represents a far superior mode of delivery with a success rate approaching 100% in in vitro conditions. Another advantage of using retroviral system is that retrovirus inserts the viral genome into the chromosome of the infected cell permanently, usually without any measurable effect on the viability of the infected cells, resulting in efficient gene transfer in which most recipient cells will incorporate and express the transduced gene.
The retrovirus genome consists of an RNA molecule of 8,500 nucleotides packaged into each viral particle (1) . The retrovirus enters the cells via interaction between the viral envelope protein and the appropriate viral receptor protein on the target cell. Once inside the cell, viral enzyme, reverse transcriptase that is brought into the cell with a capsid, makes a DNA copy of the viral RNA molecule to form a DNA–RNA hybrid duplex. After degradation of RNA, the reverse transcriptase completes a second DNA strand synthesis, generating a doublestranded DNA copy of the RNA genome and two long terminal repeats (LTRs) at both 5 ′ and 3 ′ ends. Catalyzed by the viral integrase, this double-stranded DNA is integrated into the host chromosome. Once DNA is integrated, new viral RNA synthesis is carried out by the host-cell RNA polymerase producing a large number of viral RNA molecule. These RNAs are translated to produce the capsid, enve-lope, and reverse transcriptase proteins. Initiation of viral assembly begins by binding of capsid proteins to the RNA packaging signal ( ψ signal) of the viral RNA. Mature viral particles bud out from the host cells containing two copies of RNA genome, capsid, envelope, and reverse transcriptase proteins.
The single most important advance in the development of retroviruses as gene-transfer vectors was achieved by complemen-tation of two systems: packaging cells and retroviral vectors (2) . A specialized cell line (termed “packaging cells”) was generated in order to permit the production of high titers of replication-defective recombinant virus, free of wild-type virus (Fig. 1 ) . For this purpose, the structural genes necessary for particle formation and replication, gag , pol , and env , were integrated into cell lines without the packaging ψ signal. Thus, viral RNA in packaging cells provides proteins necessary for particle formation that can-not be packaged into a viral particle. The other component is a retroviral vector in which most viral genes have been deleted for insertion of the gene of interest. The retroviral vector contains the ψ signal for RNA packaging and two LTRs that provide transcription, polyadenylation of viral RNA, and integration of double-stranded viral genome (Fig. 2 ) . When the retroviral vector is transfected into the packaging cells, the viral RNA containing

Retroviral Delivery of ECM Genes 5
the gene of interest is transcribed and packaged into viral particle by gag, pol, and env proteins provided by the packaging cells. This recombinant virus is utilized to infect the target cells, deliv-ering a gene of interest at high efficiency. In principle, because no genetic information for virus production is transferred from the packaging cells, transduced cells are unable to perpetuate an infection and spread virus to other cells.
Many different packaging cells are available currently: NIH3T3 -based packaging cells, ( PA317 and PT67 ), and 293-based packaging cells, ( BOSC23 and Φ NX ) (2– 5) . The viral env
Fig. 1. Packaging of infectious but replication incompetent virus. The retroviral vector is transfected into packaging cells that provides viral proteins, gag, pol, and env, neces-sary for particle formation, which have been deleted in the recombinant viral vector. The full-length viral transcript containing the gene of interest is packaged into viral particle upon binding of capsid protein to the ψ sequence. The virus, released from packaging cells, is infectious but lacks viral genes, thus preventing retroviral production from subsequently infected cells.
Fig. 2. Diagram of a recombinant retroviral vector. Retroviral vectors consist of the 5 ′ LTR containing viral promoter and enhancer, an extended ψ sequence for efficient RNA packaging, a drug-resistant gene, a multiple cloning site (MCS) where a cDNA can be inserted, and the 3 ′ LTR containing polyadenylation site. Upon transfection into packa-ging cells, a retroviral vector can transiently express (or integrate and stably express) a transcript containing the ψ sequence, the puromycin resistance gene and the inserted gene of interest. In this vector the 5 ′ LTR controls the drug resistance gene ( Puro R ), whereas the CMV early promoter controls the expression of the inserted gene.

6 Alexeev and Igoucheva
protein expressed by the packaging cell line determines the cellular host range of the packaged virus and allows infection of different cell types through recognition of specific cellular receptors. The PT67 packaging cells, a NIH3T3 -based line expressing the 10A1 viral envelope, can enter cells via two different surface molecules, the amphotropic retrovirus and the gibbon ape leukemia virus receptors (3) . Thus, they exhibit a broader host range than other packaging cells. Among many packaging cells, we found Φ NX (Phoenix) cells to be most convenient for a small-scale generation of a high-titer recombinant virus. These cells can be obtained from Dr. Nolan at Stanford University (http://www.stanford.edu/group/nolan/index.html). Previously, a production of high-titer recombinant virus required laborious and lengthy processes: transfection of retroviral vector into the packaging cells, selec-tion of transfected cells by antibiotic resistance, and cloning of a high-titer producer cells. The Φ NX packaging cells are based on the 293T cell line, human embryonic kidney line transformed with adenovirus E1a and carrying a temperature sensitive simian virus large T antigen (5) . The unique feature of this cell line is that a high frequency of transfection (greater than 60%) can be achieved by either calcium phosphate or lipid-based transfection. Owing to an efficient transfection, high-titer recombinant virus can be generated by transient transfection of retroviral vector into the Φ NX packaging cells. The advantages over previous, stably integrated systems are that virus could be produced in days rather than months. The Φ NX packaging cells contain integrated gag–pol and env coding sequences driven by two different promoters.
A newer variant of these cells contains simply the gag and pol genes, allows pseudotyping with alternative envelope pro-teins such as VSV-G. Separate introduction and integration of the structural genes into the packaging cells minimize the chances of producing replication-competent virus because of recombination events. In addition, the CD8 surface marker cDNA sequence was placed downstream of the reading frame of the gag–pol con-struct. Thus, monitoring of CD8 expression reflects directly an intracellular gag–pol expression and the stability of the packaging cell population’s ability to produce gap–pol production. Two cell lines, Φ NX -eco and Φ NX -ampho are used to infect rodent host and all host target cells, respectively.
Most retroviral vectors are derived from Moloney murine leukemia virus and consist of the 5 ′ LTR containing viral pro-moter and enhancer, an extended ψ signal for efficient RNA packaging, drug-resistant gene for selection, a cDNA of a gene of interest, and the 3 ′ LTR containing polyadenylation site (Fig. 2 ). In addition, it contains the β -lactamase gene and a plasmid origin of replication for bacterial propagation. Two promoters of different strength are incorporated to allow cloning and expression of the gene of interest and antibiotic resistant gene, neoR or puroR , for

Retroviral Delivery of ECM Genes 7
selection of transfected cells. The cytomegalovirus (CMV) early promoter is typically a stronger promoter than the viral LTR, but both promoters exhibit cell line-specific variation. A self-inactivating (SIN) retroviral vector was originally developed as a safer alternative to be used in human gene therapy (6) and was recently shown to sustain a prolonged gene expression in vivo (7) . Deletion of promoter and enhancer sequences at the 3 ′ LTR in SIN vector results in inactivation of transcription by viral promoter since the 5 ′ LTR is ultimately replaced by the deleted 3 ′ LTR during viral replication. Thus, an internal promoter drives gene expression. Absence of enhancer and promoter sequences in both LTRs of the integrated provirus minimizes the possibility of activating cellular protooncogenes and provides a safer vector for gene therapy (6) . Prolonged expression of SIN vector was attributed to the lack of methylation of the LTR and to the absence of a heterochromatin-induced inactivation of transcrip-tion, which occurs frequently in the integrated viral sequence in mammalian cells (7, 8) . An important feature of the gene delivery system is the ability to regulate the expression of a delivered gene. Efficient delivery of regulatable genes by retroviral vectors makes it possible to analyze the population of transduced cells, circum-venting a lengthy process and clonal variation, often observed in transfection of plasmids in mammalian cells. Several inducible gene-expression systems such as those controlled by heat shock, steroids, or metallothionein suffer from either high basal levels of gene expression or pleiotropic effects on host cell genes (9) . Tetracycline (Tc)-inducible gene expression is restricted to the regulation of the gene of interest only because DNA response elements were derived from Escherichia coli , thus preventing plei-otropic effects on host cell genes.
The tetracycline-resistance operon of the Tn10 transposon are negatively regulated by the Tet repressor ( TetR ), which blocks transcription by binding to the tet operator sequences ( tetO ) in the absence of Tc (10, 11) . There are two components in the Tc-inducible system. The first one is a hybrid regulatory protein base on TetR under the control of the SV40 promoter. To convert TetR from a repressor into a Tc-controlled transactivator, amino acids 1–207 were fused to the C-terminal 127 amino acids of the VP16 protein of herpes simplex virus (10, 11) . The hybrid protein binds to the tetracycline-responsive element (TRE) and thereby activates transcription in the absence of Tc (Tet-off system). The second component is the response element which expresses the gene of interest, cloned in the multiple cloning site, under the control of TRE. The TRE consists of seven copies of the 42-bp tetO sequence and is located upstream of the minimal immediate early promoter of CMV. These two components can reside in the same retroviral vector or can be divided into two retroviral vectors (11, 12) . Regulation of gene expression can be

8 Alexeev and Igoucheva
turned off by Tc (Tet-off system) as described above or turned on by Tc (Tet-on system). The four amino acid changes in TetR results in a “reverse” Tet repressor ( rTetR ), which binds the TRE sequence in the presence of Tc (11, 13) . Therefore, when fused to the VP16 activation domain, rTetR activates transcription in the presence of Tc (Tet-on).
Selection of the retroviral vectors will depend on the system where gene expression will be studied. In general, constitutive vectors are likely to yield a high-titer virus in comparison to a self-inactivating or a Tc-regulatable vector. Once the retroviral vector is chosen, viral transduction can proceed by transfection of the retroviral vector into packaging cells, virus production, and infection of target cells ( see Subheading 3 and Note 1 ).
Retroviral vectors listed below are available from Clontech (Palo Alto, CA; http://www.clontech.com ). 1. Constitutive retroviral vector: pLXSN (#631509), pLNCX2
(#631503). 2. Tc-regulatable vector: RevTet -On vector (#631007), RevTet -
Off and RevTet-Off-IN vector (#631003, #631001). 3. Self-inactivating vector: pQCXIN (#631514). 4. Retro-X system (Clontech #631508) is also available.
1. 293-based packaging cells: Φ NX -eco, Φ NX -ampho. 2. NIH3T3-based packaging cells: PA317 (ATCC #f-13677,
9078-CRL), PT67 (Clontech # 631510), Ampho-Pack 293 (Clontech # 631505).
1. Tissue culture: Dulbecco modified Eagle medium (DMEM), fetal bovine serum (FBS), glutamine, streptomycin, penicillin, trypsin, PBS. All standard tissue culture reagents can be obtained from Invitrogen (Carlsbad, CA).
2. Transfection of packaging cells: CalPhos Mammalian trans-fection kit™ (Clontech # 631312), ProFection mammalian transfection system – calcium phosphate (Promega, Madison, WI, #E1200). In addition, you can make transfection reagents as follows. Dissolve the mixture listed below in 80 mL of H 2 O and adjust the pH exactly to 7.0–7.05 using 5 M NaOH or HCl ( see Note 2 ). Adjust the volume up to 100 mL. Steri-lize the 2× HBS solution through 0.22- μ m filter. All reagents should be at room temperature prior to use. The following chemicals are used to make 100 mL of 2× HBS solution: 1.6 g
2. Materials
2.1. Retroviral Vectors
2.2. Packaging Cells
2.3. Tissue Culture, Transfection, and Selection
Retroviral Delivery of ECM Genes 9
NaCl, 0.2 g KCl, 1 g dextrose, 0.027 g HEPES acid, 0.074 g Na2HPO4 · 2H 2 O. Other, liposome-based transfection reagents can be used successfully for the delivery of the viral vectors into most of packaging cells.
3. Selection of mammalian cells: Hygromycin B (Clontech # 631309), Puromycin (Clontech # 631305).
Culture medium for target cells, 0.45- μ m Millipore filters, 5- or 10-mL syringes, Polybrene (Hexadimethrine Bromide) (Sigma #H9268).
Doxycycline (Clontech # 631311) (Tetracycline analog, works better than tetracycline). Dissolve in 1 mg/mL in H 2 O, filter sterilize (0.22–22 mm filter) and store at 4°C in dark (stable within 1 month). Small aliquots can be frozen at −20°C.
1. Reagents for b -gal assay . Staining kit is available from Strategene (#200383). You can also make the solution by using the following chemicals for 5 mL of staining solution: 0.008 g potassium ferricyanide, 0.01 g potassium ferrocyanide, 1.5 mL 2 M MgCl 2 , 75 μ L X-gal (40 mg/mL in DMF stock solution).
2. Reagents for fixation of cells . PBS containing 1% glutaralde-hyde (Sigma #G-5882).
3. Alkaline phosphatase can be used as a reporter. pLAPSN con-trol retroviral vector containing cDNA for human placenta alkaline phosphatase (AP) is available in Retro-X system (Clontech #631508).
1. Cloning . All standard reagents for cloning, restriction enzymes, T4 ligase, alkaline phosphatase, Klenow DNA polymerase.
2. E. coli competent cells: DH5 α (Invitrogen Carsbad, CA, #C4040-10, #C4040-50), SURE ® Electroporation-Competent Cells (Stratagene #200227), SURE ®2 Super Competent Cells (Stratagene #200152).
3. Plasmid preparation: l -broth, ampicillin, gel extraction kit (Qua-gen, Chatsworth, CA, #28704), Mini Prep kit (Quagen #27104), Maxi Prep kit (Quagen #12162), CHROMASPIN + TE-1000 Column (Clontech #K1324-1, 2).
1. Choose one of the desirable retroviral vectors ( see Subheading 2 ).For a large-scale preparation of plasmid, transform a plas-mid into a suitable E. coli strain (e.g., DH5 α or SURE ® ) in
2.4. Infection of Target Cells
2.5. Regulation of Gene Expression
2.6. Measurement of Infection Using Reporter Gene (Lacz)
2.7. Cloning and Plasmid Preparation
3. Methods
3.1. Preparation of Recombinant Retroviral Vector

10 Alexeev and Igoucheva
accordance with manuals. High homology between 5 ′ and 3 ′ LTRs of retroviral vectors may cause various plasmid DNA alterations in E.coli . Therefore, the use of SURE cells is highly recommended. Perform a large-scale DNA preparation using QIAGEN Plasmid Maxi Kit (Qiagen, #12162) or PureYield™ Plasmid Maxiprep System (Promega, #A2392).
2. Digest the retroviral vector with suitable restriction enzymes and check the digestion of the vector on agarose gel. If a blunt-ligation is required, both 5 ′ and 3 ′ ends of the vector can be filled up by addition of 1 U of the Klenow large frag-ment of DNA polymerase and dNTPs at 50 μ M. Incubate a reaction mixture for 15 min at room temperature and inacti-vate the enzyme at 75°C for 10 min. To prevent self-ligation of the vector, incubate the digested retroviral vector with the calf intestine (CIP) or the shrimp (SAP) alkaline phosphatase and purify DNA using phenol/chloroform/isoamylalcohol (24/23/1) solution.
3. Prepare the insert (cDNA for a gene of interest) using similar procedures described above. Insert should not be dephospho-rylated.
● It is important that the 5 ′ and 3 ′ overhang sequences of the insert and the retroviral vector are compatible for ligation. If available restriction sites are not compatible, a blunt ligation can be carried out after filling the overhangs of both insert and vector.
4. Set up the ligation reaction. Calculate the amount of vector and insert needed for ligation reaction in accordance with the size and the molar ratio of vector and insert. For example, 1:1 molar ratio (vector/insert) requires 100 ng of 5 kb vector and 20 ng of 1 kb insert. It can be calculated by the formula: ng vector × kb insert/kb vector. For cohesive or blunt ligations follow the instructions, provided with T4 DNA ligase.
5. Transform the ligation mixture to a competent E. coli strain according to the manufacturer’s instruction ( see Note 3 ). Iso-late and purify plasmid DNA from many bacterial colonies using Mini Prep kit and identify the desirable recombinant plasmid by restriction digestion, PCR, and sequencing.
6. Perform a large-scale plasmid preparation of a recombinant retroviral vector.
A detailed description of Φ NX cells is available from Dr. Nolan’s laboratory Web site (http://www.stanford.edu/group/nolan/index.html). The Φ NX cells are maintained in growth media containing DMEM, 10% FBS, 50,000 U/500 mL penicillin, 50 mg/500 mL streptomycin, 1% glutamine and splitted 1:4 or 1:5 every 3–4 days. The Φ NX cells are seeded at 3 million cells per 100 mm in diameter plate in growth medium, 18–24 h prior
3.2. Preparation of Packaging Cells

Retroviral Delivery of ECM Genes 11
to transfection. A high-transfection efficiency is achieved when cells reach 50–60% confluency. Transfection of the confluent cul-ture may result in significant reduction in transfection efficiency.
1. Change the medium with a solution containing 0.1% of BSA instead of serum 3 h prior to transfection. For the Tet-off system, add tetracycline (1–2 μ g/mL) or doxycycline (20 ng/mL to 1 μ g/mL) at this point ( see Note 4 ).
2. Transfer 0.5 mL of 2× HBS into an Eppendorf tube. 3. Into another Eppendorf tube, add H 2 O + DNA + CaCl 2 . We
suggest using 2 M CaCl 2 (62.5 μ L/mL of reaction mixture). The best results were obtained using 20 μ g of DNA/1 mL of the reaction mixture. Dilute DNA in H 2 O and add CaCl 2 drop-wise. The final volume of this mixture should be 0.5 mL.
4. Add the DNA/CaCl 2 mixture to 0.5 mL 2× HBS dropwise with vigorous bubbling using an automatic pipetter (keep eject button depressed) for 15–45 s (the length of bubbling time depends on each batch of 2× HBS).
5. Add HBS/DNA solution dropwise onto media, gently and quickly, by spreading across cells in media.
6. Observe cells under microscope. Good transfection efficiency is expected when the particle size is small and uniform. Big or aggregated particle usually indicates that the pH is not opti-mized, resulting in a poor transfection efficiency.
7. Put plates in 37°C incubator and shake plates back and forth to distribute DNA/CaPhosphate particles evenly.
8. After 24 h, change the media to 5 mL fresh DMEM contai-ning 10% FBS (virus is more stable if cells are incubated at 32°C).
Currently, Amaxa nucleofection system (Amaxa, Köln, Germany; http://www.amaxa.com ) provides over 90% efficacy of plasmid DNA delivery into Φ NX packaging cells and is superior over other plasmid DNA delivery methods.
1. Split the appropriate cells (which you would like to infect) at 200,000 cells per 60-mm plate in 2 mL of appropriate culture media. For suspension cells, they should be growing in a log phase at the time of infection (for Jurkats, ideal density at time of infection is 5 × 10 5 cells/mL).
2. Collect supernatant from transfected Φ NX cells 48 h after transfection. Centrifuge the supernatant at 1,000 × g for 5 min to pellet cell debris and filter through 0.45- μ m filter to remove cellular debris as well. Add Polybrene (4 μ g/mL). Virus containing supernatant can be frozen at −80°C for later infection ( see Note 5 ).
3. Remove 1 mL of media from each plate with cells you are going to infect.
3.3. Transfection
3.4. Infection of Target Cells
12 Alexeev and Igoucheva
4. Add 4 μ g/mL polybrene (stock solution is 4 mg/mL) to each plate with gentle agitation.
5. Add 1 mL of viral supernatant to the “target” cells and place them at 37°C. For suspension cells, pellet 5 × 10 5 suspension cells and resuspend cell pellets in 1 mL of viral supernatant containing 4 mg/mL polybrene. Spin cells and wash away virus supernatant after incubation for 8–24 h. Suspension cells, especially some B cells and T cells, are sensitive to poly-brene and it may be necessary to titrate down polybrene.
6. Aspirate virus-containing media 24 h after infection and feed cells with fresh medium. For suspension cells, spin down cells and resuspend in 2 mL of fresh media.
7. As reverse transcription and integration take place within first 36 h, after 48 h of infection cells are ready to be assayed for a biochemical event of interest. Expression of the gene of interest usually reaches its maximum at 48 h after infec-tion. For the Tc-regulatable retroviral system, add or remove doxycycline depending on Tet-on or Tet-off viral vector, respectively.
The viral titer produced by packaging cells is determined as follows. 1. Prepare the target cells by plating 5 × 10 4 target cells per well
into a six-well plates. 2. Collect virus-containing medium from the Φ NX cells trans-
fected with a retroviral vector. 3. Centrifuge the supernatant at 1,000 × g for 5 min to spin-
down cell debris and filter through a 0.45- μ m filter to remove cell debris. Add polybrene to a final concentration of 4 μ g/mL.
4. Prepare serial dilution of a virus-containing media using fresh culture medium containing 4 μ g/mL polybrene (six 10-fold serial dilutions are usually prepared).
5. Infect target cells by adding virus-containing medium to the wells.
6. Change the media with virus to a normal one and add appro-priate antibiotic (depending on the drug selection marker) 24 h postinfection. The optimal concentration should be determined for each cell line. Puromycin selection takes less than 1 week at 0.5–1.5 μ g/mL, while G418 takes 3 weeks at 0.1–1.0 mg/mL.
7. The titer of virus corresponds to the number of colonies present at a given dilution multiplied by the dilution factor. For example, the presence of four colonies in the 10 5 dilution would represent a viral titer of 4 × 10 5 ( see Note 6 ).
3.5. Determination of the Viral Titer

Retroviral Delivery of ECM Genes 13
In order to measure an efficacy of retroviral transduction, ret-roviral vector containing reporter gene (alkaline phosphatase, β -galactosidase, luciferase, or Green Fluorescent Protein (GFP expression can be easily visualized via direct fluorescent microscopy) should be utilized in parallel experiments. The following procedure describes the detection of cells transduced by the retroviral vector containing the β -galactosidase gene: 1. Remove media from adherent cells. 2. Add 2 mL of fixative solution to a 60-mm plate of adherent
cells at 4°C for 5 min. 3. Remove medium and wash three times with PBS. 4. Transfer 1 mL of prepared staining solution into cells. 5. Optimal staining will occur 12–18 h later.
1. The viral supernatants produced by these methods might contain potentially hazardous recombinant virus. The user of these systems must exercise caution in the production, use, and storage of recombinant retroviral virions, especially those with amphotropic host ranges. This consideration should be applied to all genes expressed as amphotropic and polytropic retroviral vectors. The user is strongly advised NOT to create retroviruses capable of expressing known oncogenes in ampho-tropic or polytropic host-range viruses. NIH guidelines require that retroviral production and transduction be performed in a Biosafety Level 2 facility.
2. For efficient transfection using calcium phosphate method, pH of 2× HBS solution should be 7.0–7.05. Because pH is so important, it would be useful to make and to test 2× HBS with pH 6.95, pH 7.0, and pH 7.05.
3. We found frequent rearrangements (mainly large deletions) in the retroviral vector when the ligation mixture was trans-formed into DH5 α cells. Thus, it is necessary to screen many colonies to find a clone containing a correct insert. Usually, smaller colonies had a higher probability of maintaining a desirable insert. Other E. coli strains, which are deficient in recombination, UV repair, and SOS repair (SURE cells) may be used in order to stabilize the insert.
4. For the Tet-off system, Tc or Dox need to be maintained throughout transfection and infection. The presence of Tc does not interfere with transfection or infection. In order to investigate
3.6. Measurement of Transduction Using Reporter Gene (Lacz)
4. Notes

14 Alexeev and Igoucheva
gene regulation by Tc , infected cells can be split into two plates and maintained in the absence and presence of Tc .
5. Virus containing supernatant can be frozen at −80°C for later infection, although viral titer is decreased to 50% when the virus is frozen and thawed.
6. Retroviral titers vary widely depending upon different retro-viral vector and packaging cells. In general, constitutive vectors are likely to yield a high-titer virus (10 6 infectious particles/mL) in comparison to a self-inactivating or a Tc-regulatable vector (10 4 infectious particles/mL). In order to avoid multi-ple infections, which increase the number of integration events per cell, transduction is usually performed at the multiplicity of infection of 0.1 (for example, 10 4 infectious particles per 10 5 cells). This condition is likely to yield one viral integration per genome.
References
1. Weiss , R. , Teich , N. , and Coffin , J. (1984 and 1985) RNA Tumor Viruses . Cold Spring Harbor Laboratory , Cold Spring Harbor, NY .
2. Cone , R. D. , and Mulligan , R. C. (1984) High-efficiency gene transfer into mammalian cells: generation of helper-free recombinant retrovirus with broad mammalian host range . Proc. Natl Acad. Sci. USA 90 , 8033 – 8037 .
3. Miller , A. D. , and Chen , F. (1996) Retrovirus packaging cells based on 10A1 murine leukemia virus for production of vectors that use multiple receptors for cell entry . J. Virol. 70 , 5564 – 5571 .
4. Warren , S. P. , Nolan , G. P. , Scott , M. L. , and Baltimore , D. (1993) Production of high-titer helper-free retroviruses by transient transfection . Proc. Natl Acad. Sci. USA 90 , 8392 – 8396 .
5. Kinsella , T. M. , and Nolan , G. P. (1996) Epi-somal vectors rapidly and stably produce high-titer recombinant retrovirus . Hum. Gene Ther. 7 , 1405 – 1413 .
6. Yu , S. F. , Ruden , T. , Kantoff , P. W. , Garber , C. , Seiberg , M. , Ruther , U. , et al. . (1986) Self-inactivating retroviral vectors designed for transfer of whole genes into mammalian cells . Proc. Natl Acad. Sci. USA 83 , 3194 – 3198 .
7. Deng , H. , Lin , Q. , and Khavari , P. A. (1997) Sustainable cutaneous gene delivery . Nat. Bio-technol. 15 , 1388 – 1391 .
8. Hoeben R. C. , Migchielisen , A. A. , van der Jagt , R. C. , van Ormondt , H. , and van der Eb , A. J. (1991) Inactivation of the Moloney murine leukemia virus long terminal repeat in murine fibroblast cell lines is associated meth-ylation and dependent on its chromosomal position . J. Virol. 65 , 904 – 912 .
9. Yarranton , G. T. (1992) Inducible vectors for expression in mammalian cells . Curr. Opin. Biotechnol. 3 , 506 – 511 .
10. Gossen , M. , and Bujard , H. (1992) Tight control of gene expression in mammalian cells by tetracycline-responsive promoters . Proc. Natl Acad. Sci. USA 89 , 5547 – 5551 .
11. Gossen , M. , Freundlies , S. , Bender , G. , Muller G. , Hillen , W. , and Bujard , H. (1995) Transcriptional activation by tet-racyclines in mammalian cell . Science 268 , 1766 – 1769 .
12. Hoffman , A. , Nolan , G. P. , and Blau , H. M. (1996) Rapid retroviral delivery of tetracy-cline-inducible genes in a single autoregula-tory cassette . Proc. Natl Acad. Sci. USA 93 , 5185 – 5190 .
13. Hillen , W. , and Berens , C. (1994) Mecha-nisms underlying expression of Tn10-encoded tetracycline resistance . Annu. Rev. Microbiol. 48 , 345 – 369 .

Chapter 2
Tissue-Specific KO of ECM Proteins
Mara Brancaccio, Emila Turco, and Emilio Hirsch
Summary
Nearly 20 years after its first description, gene targeting and generation of transgenic mice by homologous recombination in embryonic stem cells still are cutting edge tools for the postgenomic era. Understand-ing the function of the large number of genes encoding extracellular matrix proteins and their cellular receptors appears a daunting task that can very much profit from a genetic approach. The generation of new mutant alleles remains essential to define the different biochemical properties of such proteins. While in the past, gene targeting represented a complex procedure, restricted to few laboratories, recent breakthroughs, such as the publication of the mouse genome sequence and the perfection of recom-bineering techniques in bacteria, made generation of transgenic mice faster and easier. This chapter will thus focus on the recent advances in gene-targeting technology with a special eye on the study of genes involved in cell adhesion and migration.
Key words : Gene targeting , Cre-lox , Conditional mutagenesis , Mutagenesis , Recombineering , Adhesion , Extracellular matrix.
The analysis of phenotypes caused by null and mutant alleles is a very powerful means to understand gene function in vivo. Thanks to the gene-targeting technology in ES cells, the genome of a mammalian organism such as the mouse can be artificially modified by precise alterations. The system exploits the abil-ity of ES cells to be cultured and manipulated in vitro without losing their totipotency (1, 2) . Mutations in specific genes can be achieved by in vitro selection of ES cell clones in which the locus of interest has been targeted by homologous recombina-tion (3, 4) . The peculiar property of being totipotent, allows ES cells, once injected in the cavity of a blastocyst, to contribute to
1. Introduction
1.1. Gene Targeting
Sharona Even-Ram and Vira Artym (eds.), Methods in Molecular Biology, Extracellular Matrix Protocols, vol. 522© Humana Press, a part of Springer Science + Business Media, LLC 2009DOI: 10.1007/978-1-59745-413-1_2
15
16 Brancaccio, Turco, and Hirsch
the formation of all cell types of a chimeric embryo. Whenever a chimeric mouse possesses ES-derived germ cells, the mutation can be propagated to its offspring. Heterozygous mice are then mated to generate the homozygous mice needed for phenotypic analysis.
Conditional knock out technology allows the creation of induc-ible mutations in a tissue specific manner and at a precise devel-opmental stage. Whereas the phenotype caused by germ-line mutations can be biased by epigenetic adaptation, induction of gene alteration in differentiated cells can result in clearer effects. Moreover, via this method, it is possible to study the conse-quences of ablating genes essential for cell survival (5) , identify-ing functions for distinct splice variants (6) , or tracking different gene functions during different developmental stages (7) . The technique is based on the introduction of two or more short sequence tags recognized by particular recombinases able to cat-alyze recombination and excision of the sequence between the two recognition sites. Two recombinase systems are currently used for this purpose: Cre/loxP from bacteriophage P1 (8) and Flp/FRT (9) from Saccharomyces cerevisiae . Both recombinases can recognize 34 bp consensus sequences; cut the intervening sequence and rejoin the extremities. Inducible gene targeting can thus be achieved by mating a mouse in which important sites in the locus of interest have been flanked by recombinase recognition sites with a transgenic mouse that expresses the recombinase in a restricted pattern (8, 10, 11) . Similarly, the conditional allele can be silenced by infection with a virus that transduces the recombi-nase gene (12) . In this way, a variable percentage of cells ranging from 10 to 100% (13) can be induced to undergo a controlled DNA rearrangement only when and where the recombinase is expressed.
Gene targeting has been widely used to study the function of ECM genes (14) and these experimentally induced mutations greatly extended the knowledge derived from the analysis of natural-occurring mutations (15) . Interestingly, several of the knock-out mouse strains closely reproduce phenotypes of human hereditary disorders (16– 19) . For instance fibrillin-1 mutations recapitulate the lethal form of Marfan syndrome (20, 21) ; fibu-lin-5 null mice reproduce the clinical signs of cutis laxa (22, 23) , and collagen VI null mice develop Betlem myopathy (24) . More-over, comparison of knockout of specific laminin chains demon-strates a role for the different isoforms during development and in particular tissues (25) .
Conditional knockouts also allowed clarifying the specific func-tion of extracellular matrix receptors in different tissues. Integrin β 1 condi tional knockout in the skin demonstrated an important role for
1.2. Conditional Gene Targeting
1.3. Gene Targeting of ECM Proteins

Tissue-Specific KO of ECM Proteins 17
β 1 integrin in the maintenance of the basement membrane and in the organization of the different layers of the hair follicle. Moreover, mice lacking β 1 integrin in skeletal muscles die at birth with severe muscle defects (26) .
1. Neomycin resistance cassettes: – Plasmid PL452 loxP–PGK–EM7–NeobpA–loxP with strong
PGK (eukaryotic)–EM7 (prokaryotic) promoters driving the neomycin resistance gene in eukaryotic and prokaryotic cells.
– Plasmid PL451 FRT–PGK–EM7–NeobpA–FRT–loxP. The FRT sites will be used to delete the Neo cassette in mice carrying the floxed gene crossing them with a strain carrying the FRT recombinase.
2. Bacterial strains EL350 DH10B [λcl857 (cro-bioA < > araC-PBADcre] (27) , TOP 10 plus (Invitrogen Corp., Carlsbad, CA).
3. BAC clone can be ordered from Geneservice ( http://www.geneservice.co.uk ).
4. Kanamycin or ampicillin or chloramphenicol. 5. LB: 10 g bactotryptone (Difco, Detroit, MI), 5 g bacto-
yeast extract (Difco), 5 g NaCl. Fill to 1 L with deionized water, adjust pH to 7.0, and autoclave. LB can be stored for a long time at room temperature (RT). Turbid, contami-nated media must be discarded.
6. LB agar: Add 15 g agar (Sigma, St. Louis, MO) to LB, auto-clave, and allow medium to cool to 50°C before adding antibiotics and pouring plates. Plates can be stored for 1 month at 4°C. Dry the plates in 37°C incubator overnight before use.
7. Taq amplification kit Promega, WI, USA. 8. T4 ligase. 9. Gene PulserTM (Bio-Rad, Richmond, CA). 10. Electroporation cuvette 0.1 cm Biorad. 11. QIAGEN gel extraction kit QIAquick, Hilden cat. no.
28706. 12. QIAGEN Plasmid Midi Kit (cat. no.12143). 13. Arabinose (Sigma A-3256).
2. Materials
2.1. Generation of Constructs
18 Brancaccio, Turco, and Hirsch
1. Restriction enzymes and buffers (store at −20°C). 2. T7 sequencing kit (Pharmacia, Uppsala, Sweden).
1. Mice expressing a neomycin (or hygromycin or puromycin) resistance gene.
2. C57BL6 female mice. 3. 70% ethanol. 4. Sterile dissecting equipment. 5. 10× phosphate-buffered saline (10× PBS): 80.06 g NaCl,
2.01 g KCl, 14.42 g Na 2 HPO 4 , 2.04 g KH 2 PO 4 . Fill to 1 L with DDW and autoclave (store at RT).
6. Trypsin/EDTA solution: 10× stock (Invitrogen Gibco, cat. no. 15400-054) (store at −20°C) diluted to 1× with 1× PBS (aliquot and store at −20°C, store aliquots in use at 4°C).
7. Feeder medium: DMEM with Glutamax-1 (Invitrogen Gibco, cat. no. 61965-026) supplemented with 10% fetal bovine serum (FBS) (Invitrogen Gibco, cat. no. 10270-106) and with penicillin/streptomycin (Invitrogen Gibco, cat. no. 15140-122) at the final concentration of 100 U/mL and 100 μ g/mL, respectively.
8. Freezing medium: 70% DMEM, 20% FBS, 10% DMSO (Sigma D2650).
9. ES medium: DMEM with Glutamax-1 (Invitrogen Gibco, cat. no. 61965-026) + Na-pyruvate (Invitrogen Gibco, cat. no. 11360-039) supplemented with 20% FBS (FBS needs to be tested for ES cell use, or can be bought from Hyclone already tested, cat. no. SH30071.03), 0.1 mM 2-mercap-toethanol, 5 mL 100× nonessential amino acids (NEA) (Invitrogen Gibco, cat. no. 11140-035), and 1,000 U/mL leukemia inhibitory factor (LIF) (ESGRO from Chemicon, cat. no. ESG1106).
10. Mycoplasma PCR Primer Set (Stratagene, cat. no. 302008).
1. Feeder medium ( see Subheading 2.3 ). 2. Feeder cells ( see Subheading 2.3 ). 3. Restriction enzymes and buffers. 4. Chloroform. 5. Phenol/chloroform: mix 1 volume of Phenol (equilibrated
with 10 mM Tris–HCl, 1 mM EDTA, pH 8.0) with 1 vol-ume of chloroform.
6. 3 M Na-acetate pH 5.2, adjust pH with glacial acetic acid (can be stored at RT).
7. 100% ethanol.
2.2. Definition of the Probe
2.3. Isolation of Feeder Cells
2.3.1. Electroporation and Selection

Tissue-Specific KO of ECM Proteins 19
8. 70% ethanol. 9. Trypsin/EDTA ( see Subheading 2.3 ). 10. ES cells. 11. ES medium ( see Subheading 2.3 ). 12. 1× PBS ( see Subheading 2.3 ). 13. Burker’s chamber. 14. Mouse Embryonic Stem Cells Nucleofector kit cat. no.
502VPH1001(Amaxa GmbH, Cologne, Germany). 15. NucleofectorTM II (Amaxa GmbH).
1. ES medium ( see Subheading 2.3 ). 2. G418 (Geneticin) (Gibco or Sigma). 3. Feeder cells ( see Subheading 2.3 ). 4. Feeder medium ( see Subheading 2.3 ). 5. 24-Well plates (Falcon, Los Angeles, CA). 6. 96-Well plates (Falcon). 7. Trypsin/EDTA ( see Subheading 2.3 ). 8. Stereomicroscope. 9. Cryovials (Sarstedt, Germany). 10. Cryovial rack (Sarstedt). 11. 1× PBS ( see Subheading 2.3 ). 12. Freezing medium ( see Subheading 2.3 ). 13. Dry ice.
1. Lysis buffer: 100 mM Tris–HCl, pH 8.5, 5 mM EDTA, 0.2% SDS, 200 mM NaCl, 100 μ g/mL proteinase K (Sigma, USA, P2308). Keep proteinase K stock solution (10 mg/mL) at −20°C and always add freshly.
2. Isopropyl alcohol. 3. Restriction enzymes and buffers. 4. DNase-free bovine serum albumin (BSA) (New England
Biolabs, Beverly, MA). 5. Agarose and ethidium bromide. 6. 10× TBE-buffer: 108 g Tris-base, 55 g boric acid, 9 mL 0.5
M EDTA pH 8.0, adjust to 1 L with deionized water (can be stored at RT).
7. Nylon membrane: for example, Amersham Hybond-XL cat. no. RPN203S (GE Healthcare, UK).
8. Denaturation solution: 1.5 M NaCl, 0.5 M NaOH (can be stored at RT).
2.3.2. Picking and Freez-ing of Resistant Clones
2.3.3. Identification of Homologous Recombinants
20 Brancaccio, Turco, and Hirsch
9. 20× SSC: 175.3 g NaCl, 88.2 g Na-citrate, adjust pH to 7.0, autoclave (can be stored at RT).
10. Hybridization plastic bags. 11. Church buffer: 500 mL 1 M NaPi, 330 mL 20% SDS,
1 mL 0.5 M EDTA, 10- μ L sheared salmon sperm DNA, 10 g bovine serum albumin (BSA). Fill to 1 L with deionized water (can be stored at RT).
12. Random priming labeling kit for DNA. For example, Amer-sham Rediprime II (GE Healthcare, UK).
13. 32 P-CTP (GE Healthcare, UK). The half-life of 32 P is approx-imately 14.3 days. Care should be taken when handling radi-oactive isotopes. Refer to local safety rules.
14. Wash solution 1: 2× SSC, 1% SDS (can be stored at RT). 15. Wash solution 2: 0.4× SSC, 1% SDS (can be stored at RT). 16. Autoradiography film.
1. Mice for vasectomy: 8- or more week-old FVB males. 2. Avertin 100% stock: Dissolve 10 g 2,2,2-tribromoethyl alco-
hol (Fluka, Switzerland, cat. no. 90710) in 10 mL tert-amyl alcohol. For use, dilute the stock solution to 2.5% in PBS. Store both stocks and use solutions at 4°C wrapped in aluminium foil to protect them from light.
3. 75% Ethanol. 4. Surgical equipment: fine dissection scissors; two pairs of watch-
maker #5 forceps (sometimes manually sharpened); blunt, fine-curved forceps; serrefine clamp (1.5 in. or smaller); sur-gical silk or catgut suture with curved needle (e.g., size 10), 1-mL syringes with 26-gage hypodermic needle.
1. Injection glass needles: with (Narishige #GD-1, Japan) and without (Narishige #G-1) internal filament.
2. Diamond glass cutter. 3. Needle puller (Narishige). 4. Microforge with 0.22-mm-thick platinum wire (Narishige,
Japan). 5. Micropipette grinder (Narishige). 6. Teflon tube linked to a syringe. 7. 10% hydrofluoric acid (Sigma). 8. 100% ethanol.
1. C57B6 mice. 2. Vasectomized males. 3. CBA × C57B6 F1 females.
2.4. Generation of Mutant Mouse Lines
2.4.1. Generation of Vasectomized Males
2.4.2. Preparation of Needles for Microinjection
2.4.3. Mouse Matings

Tissue-Specific KO of ECM Proteins 21
1. C57B6 females. 2. 70% ethanol. 3. Surgical equipment ( see Subheading 2.4.1 ). 4. Stereomicroscope. 5. Flush medium: High glucose DMEM, buffered with 20 mM
HEPES pH 7.4. 6. 10-mL syringe. 7. 0.60 × 30 mm syringe needle. 8. Transfer pipette. 9. ES medium ( see Subheading 2.4.1 ).
1. ES cells. 2. Feeder cells. 3. 6-cm tissue-culture dishes. 4. ES medium ( see Subheading 2.3 ). 5. 1× PBS ( see Subheading 2.3 ). 6. Trypsin/EDTA ( see Subheading 2.3 ). 7. 10-mL sterile tubes.
1. Microinjection setup: microscope with Hoffman or Nomarski optics (e.g., Olympus, Japan, or equivalent). Left and right, water-driven micromanipulators (Narishige, Japan). Two 10-mL syringes, each linked to a metal glass capillary holder (Narishige, Japan) via a silicon tube.
2. Injection chamber: lid of a 3-cm tissue-culture dish with a hole in the middle (about 1 cm in diameter).
3. Vaseline without any additives. 4. Siliconized coverslip: rinse the coverslips in chloroform 2%
dimetildiclorosilane for 30 s and air-dry. 5. M2 medium: 94.66 mM NaCl, 4.78 mM KCl, 1.71 mM
CaCl 2 , 1.19 mM KH 2 PO 4 , 1.19 mM MgSO 4 , 4.15 mM NaHCO 3 , 20.85 mM HEPES, 23.28 mM sodium lactate, 0.33 mM sodium pyruvate, 5.56 mM glucose, BSA 4 g/L.
6. Petri dish (Falcon, Los Angeles, CA). 7. Ice. 8. Dimethylpolysiloxan (Sigma, cat. no. DMPS-5X).
1. Microinjected blastocysts. 2. Pseudopregnant female mouse. 3. Avertin ( see Subheading 2.4.1 ). 4. Two stereomicroscopes. 5. Optic fibers illuminators.
2.4.4. Isolation of Blastocysts
2.4.5. Preparation of ES Cells for Microinjection
2.4.6. Microinjection of ES Cells
2.4.7. Embryo Transfer

22 Brancaccio, Turco, and Hirsch
6. Surgical equipment ( see Subheading 2.4.1 ). 7. Transfer glass pipette.
1. Adult chimeric males. 2. C57B6 females. 3. Adult 129 females.
1. 20–30-day-old mice. 2. Ear-clips (National Band and Tag Co.). 3. Rotary wheel. 4. Tail buffer-PK: 1 mM Tris–HCl, pH 7.5, 1 mM EDTA, 250
mM NaCl, 0.2% SDS, and 0.1 mg/mL of freshly added Pro-teinase K (Sigma, cat. no. P0390).
5. Phenol/chloroform (Phenol, Sigma cat. no. 77613 and Chloroform, Sigma cat. no. C2432).
6. Chloroform. 7. Isopropyl alcohol. 8. Sterile DDW.
1. Lysis buffer: PCR buffer X1 and 0.1 mg/mL proteinase K in DDW.
2. Thermomixer. 3. Sterile DDW. 4. Taq DNA polymerase (for example, Promega, WI, USA, cat.
no. M8305). 5. Agarose and ethidium bromide.
1. ES cells. 2. ES medium ( see Subheading 2.3 ). 3. Feeder cells ( see Subheading 2.3 ). 4. 9-cm tissue-culture dishes (Falcon). 5. G418 (Geneticin).
1. ES cells. 2. ES medium ( see Subheading 2.3 ). 3. Feeder cells ( see Subheading 2.3 ). 4. Feeder medium ( see Subheading 2.3 ). 5. 1× PBS ( see Subheading 2.3 ). 6. Trypsin ( see Subheading 2.3 ). 7. Burker’s chamber. 8. 9-cm Petri dish.
2.5. Mating of Chimeras
2.6. Genotyping Offspring
2.6.1. Southern Blot Analysis of Tail DNA
2.6.2. DNA Preparation for PCR Analysis
2.7. Generation and Analysis of Double KO ES Cells
2.8. Analysis of Differ-entiation Abilities of Homozygous ES Cells in Embryo Bodies and Teratomas
2.8.1. Generation of ES Cells-Derived Embryoid Bodies

Tissue-Specific KO of ECM Proteins 23
1. ES cells. 2. ES medium ( see Subheading 2.3 ). 3. Feeder cells ( see Subheading 2.3 ). 4. Feeder medium ( see Subheading 2.3 ). 5. 1× PBS ( see Subheading 2.3 ). 6. Trypsin ( see Subheading 2.3 ). 7. Sterile tubes (Falcon). 8. Burker’s chamber. 9. 1-mL syringe. 10. Avertin ( see Subheading 2.8 ).
The first step to produce a knock-out or a conditional knock-out mouse is to obtain a targeting vector in which the genomic locus to be mutated is subcloned in a cloning vector and then modi-fied adding loxP sites in specific positions ( see Subheading 1.2 ). Thanks to the sequencing of mouse genome and the commercial availability of BAC clones carrying known genomic sequences, it is possible to easily obtain BAC clones containing the gene of interest. To target 129sv ES cells it is important to order BAC clones from pure 129SV background in order to avoid decrease in recombination efficacy due to DNA polymorphism (28) .
Constructs for conditional knockouts should usually contain at least two recombinase recognition sites that flank a DNA seg-ment, which once deleted, leads to gene inactivation. For this purpose, recombinase recognition sites can be placed in noncod-ing regions that flank one or more exons ( Fig. 1 ). The presence of the selection cassette flanked by recombinase recognition sites allows eliminating heterologous DNA from the targeted locus, leaving a bona fide functional allele.
The targeting vector can be obtained with a conventional approach, i.e., using restriction endonucleases and DNA ligase, to cut and insert loxP sites and selection markers. However, this approach is complicated by the length of the genomic DNA to be handled and the mutation strategy is limited by the position of the restriction sites present in the sequence. A second possibil-ity is to exploit homologous recombination in E. coli (27) . This approach allows to quickly insert loxP sites and selectable mark-ers anywhere in the DNA locus. Homologous recombination system in E. coli takes advantage from phage-encoded proteins like exo, bet, and gam. Exo encodes exonuclease producing 3 ′
2.8.2. Induction of ES Cells-Derived Teratomas
3. Methods
3.1. Generation of Constructs

24 Brancaccio, Turco, and Hirsch
single-strand overhangs; bet encodes pairing proteins, and gam inhibits the RecBCD exonuclease acitivity of E. coli that destabi-lize linear dsDNA.
To obtain homologous recombination, DNA has to be electroporated in the EL350 bacterial strain (27) containing an integrated defective prophage carrying the recombination genes exo , bet , and gam. The expression of these genes is undetectable at 32°C and can be induced at 42°C. Moreover, the defective prophage contains also a Cre gene under the control of an arab-inose-inducible promoter that will be used to excise the neomy-cin resistance gene ( see Subheading 3.1.3 ).
Fig. 1 . Example of conditional gene targeting construct. The wild-type allele is replaced by a targeting vector in which the Neo resistance cassette is flanked by two FRT sites ( white triangles ) and the first coding exon (exon1) is flanked by two loxP sites ( filled triangles ). Transient expression of Frt allows excision of Neomicin resistance cassette in ES cells. The null allele will be obtained crossing floxed homozygous mice with Cre expressing mice. R indicates a restriction enzyme site. After digestion with R, probe 1 allows the identification of homologous recombinant clones, while probe 2 allows the identification of the null and the conditional null alleles. Gray arrows indicate the position of a forward and a reverse primer that can be used for genotyping of the mouse offspring ( see Subheading 3.6.2 ) .

Tissue-Specific KO of ECM Proteins 25
The procedure consists of the following steps ( Fig. 2 ): 1. Subcloning of a portion of genomic DNA carried by the
BAC (10–15 kb) in pBluescript: (a) Amplification by PCR of two homology arms and clon-
ing in pBluescript. (b) Electroporation of this first construct in EL350 together
with the BAC clone. (c) Selection and characterization of the recombinant
clone. 2. Insertion of the fist loxP site:
(a) Insertion of a floxed Neo cassette by homologous recom-bination.
(b) Excision of the floxed Neo cassette by arabinose-induced expression of Cre recombinase in EL350.
(c) Selection and characterization of the clone. 3. Insertion of the second loxP site and of the Neo cassette
flanked by FRT sites:
Fig. 2 . Flow chart showing the steps necessary for the generation of the conditional knockout construct by homologous recombination in bacteria .

26 Brancaccio, Turco, and Hirsch
(a) Insertion of a Neo cassette flanked by FRT sites by homologous recombination.
(b) Selection and characterization of the final conditional knock-out vector.
For each of these different steps EL350 bacteria are made electrocompetent with distinct protocols ( see Subheadings 3.1.1 – 3.1.4 ).
The following protocol is suitable for production of electrocom-petent EL350 cells for BAC and plasmid DNA electroporation as needed in Subheading “ Cloning the Retrieval Minivector ”. 1. Grow EL350 cells ON in 5 mL of LB broth in a Falcon
14-mL polypropylene round-bottom tube at 32°C with shaking.
2. Collect the cells (OD 600 = 1.2) by centrifuging at 2700 g (0°C) for 5 min in falcon tube.
3. Resuspend cell pellets in 888 μ L of ice-cold water. 4. Transfer cells into a 1.5-mL Eppendorf tube (on ice) and
centrifuge using a bench-top centrifuge for 15–20 s at room temperature.
5. Place the tubes on ice, and aspirate the supernatant fluid. 6. Repeat the process two more times. 7. Resuspend, finally, the cell pellet in 50 μ L of ice-cold water. 8. Transfer to a precooled electroporation cuvette (0.1-cm gap). 9. Add 1 μ L of BAC DNA (100 ng) or plasmid DNA (1.0 ng)
and mix well. 10. Perform electroporation was using a BIO-RAD electropora-
tor under the following condition: 1.75 kV, 25 μ F with the pulse controller set at 200. Set the time constant at 4.0.
11. Add then 1.0 mL of LB to each cuvette. 12. Incubate at 32°C for 1 h. 13. Spread cells on plates with the appropriate antibiotics.
The following protocol is suitable for production of electrocom-petent EL350 cells for electroporation of a plasmid in EL350 that already contain the BAC clone in order to obtain homolo-gous recombination and retrieve the genomic sequence of inter-est as described in Subheading “ Retrieving the Sequence of Interest ”. 1. Inoculate EL350 cells containing BAC of interest (prepared
in the previous step) into 5 mL of LB broth in a Falcon 14-mL polypropylene round-bottom tube and grown at 32°C overnight with shaking.
3.1.1. Preparation of Electrocompetent Cells for BAC or Plasmid DNA Electroporation
3.1.2. Preparation of Electrocompetent Cells for Retrieving the Sequence of Interest from the Selected BAC Clone

Tissue-Specific KO of ECM Proteins 27
2. Transfer, the next day, 1.0 mL of the overnight culture to 20 mL of LB.
3. Incubated for 2 h with shaking at 180 rpm. 4. When the cells have reached OD 600 = 0.5 transfer, 10 mL of
the cells to a new flask and shake in a 42°C water bath for 15 min.
5. Put the cells into wet ice and shake the flask to make sure that the temperature of the flask dropped as fast as possible.
6. Left the flask in wet ice for another 5 min. 7. Transfer the cells to 25-mL glass centrifuge tubes and spun
at 2700 g (0°C) for 5 min. 8. Resuspend cells in 888 μ L of ice-cold water and transferred
to a 1.5-mL Eppendorf tube (on ice) and wash three times with ice-cold water as described above.
9. Resuspend, finally, the cell pellet in 50 μ L of ice-cold water, and add 1–2 μ L, 10–50 ng DNA, of the purified plasmid fragment and electroporate as described above in Subhead-ing 3.1.1 ( see Note 1 ).
The following protocol is suitable for production of electrocom-petent EL350 cells for the cotransformation of BAC and lox targeting vectors as described in Subheadings “ Targeting the First Lox Site in the Sequence of Interest ” and “ Cloning the Second Targeting Minivector ”: 1. Grow ON EL350 cells in two Falcon 14-mL polypropylene
round-bottom tube with 5 mL of LB broth at 32°C with shaking.
2. Add 10-mL overnight culture of EL350 to 500 mL of LB broth in a 2-L flask.
3. Place the culture in a water bath shaker at 32°C until OD 600 = 0.5 ( ∼ 2.0 h).
4. Transfer the flask to a 42°C water bath shaker and incubated for 15 min.
5. Put immediately the flask into an ice slurry and shake for 5 min by hand to make sure the temperature dropped as fast as possible.
6. Put the flask on ice for an additional 10 min. 7. Collected cells at 4,000 rpm at 0°C for 5 min and wash three
times with sterile ice-cold water and once with sterile cold 15% glycerol in water.
8. Resuspend cells were in 4 mL of ice-cold 15% glycerol in water.
9. Aliquot 50 μ L of the cells to pre-cooled Eppendorf tubes (80 tubes total) and stored at −0°C.
3.1.3. Preparation of Frozen EL350 Electrocom-petent Cells for Cotransfor-matiom BAC DNA and Lox Targeting Vectors

28 Brancaccio, Turco, and Hirsch
10. Thaw the frozen cells at room temperature and quickly put on ice.
11. Transform the purified targeting cassette, 100 ng in 1 μ L and the template plasmid DNA (10 ng in 1 μ L) vector using a BIO-RAD electroporator as described previously.
1. Add a 10 mL overnight culture of EL350 cells to 500 mL of LB broth in a 2-L flask.
2. Placed the culture in a water bath shaker at 32°C until OD 600 = 0.4 (2.0 h, 180 rpm).
3. Add 5 mL of 10% l (+) arabinose in H 2 O to the culture to a final concentration of 0.1% and shake at 32°C for another hour.
4. Collect cells and wash and froze cell pellets as described above.
The aim of this step is to subclone 10–15 kb of the genomic DNA carried by the BAC in pBluescript using homologous recombina-tion in bacteria. 1. Amplify the two homologous arms (around 300 bp) cor-
responding to the two ends of the sequence to be retrieved using the BAC clones as template. Include sites for restric-tion enzymes in the amplification primers to permit direc-tional cloning of the PCR products into pBluescript. (for the left arm: in the forward primer insert sequence for the enzyme “A,” in the reverse primer for the enzyme “C”; for the right arm: in the forward primer insert sequence for the enzyme “C,” in the reverse primer the enzyme “B”).
2. Digest the amplified fragments with the appropriate restric-tion enzymes (A and C for the left arm and C and B for the right arm), purify them using a gel extraction kit.
3. Ligate the two amplified arms with pBluescript DNA linear-ized with the appropriate restriction enzymes (in the example “A” and “B”).
4. Transform competent frozen cells (Top10 plus), prepared as described in Subheading 3.1.1 .
5. Plate on LB plate plus ampicillin. 6. Grow 12 single colonies ON. 7. Extract and digest DNA to check the presence of the correct
retrieval vector. 8. Inoculate the colony carrying the correct construct in 100
mL LB broth and grow overnight. 9. Purify DNA from bacteria. 10. Linearize the retrieved vector, using the restriction enzyme “C.” 11. Purify digest vector DNA on agarose gel slice the band and
extract it.
3.1.4. Preparation of Frozen EL350 Electrocom-petent Cells Induced for Cre Expression
3.1.5. Retrieving the Sequence of Interest from the Selected BAC Clone
Cloning the Retrieval Minivector

Tissue-Specific KO of ECM Proteins 29
1. Electroporate the purified linearized retrieval vector into electrocompetent EL350 cells (prepared as described in Subheading 3.1.2 ) containing the BAC clone of interest.
2. Plate the electroporated cells on ampicillin containing LB agar plates.
3. Test the right retrieved sequence by restriction.
The aim of this step is to introduce a loxP site into the targeting vector, by introducing the floxed Neo cassette by homologous recombination in bacteria. 1. Amplify two arms (300 bp) homologous to the left and the
right site where has to be inserted the first lox site. Engineer the PCR primer pairs to contain restriction sites to allow for the directional cloning of the left homology arm, the floxed Neo gene and the right homology arm, into pBluescript. Place also in one of these primers a restriction site useful to analyze the recombined DNA in ES cells (left arm: in the forward primer insert the sequence for the enzyme “D” and in the reverse for “E”; right arm: in the forward primer insert the sequence for the enzyme “F” and in the reverse for “G”).
2. Isolate the floxed Neo cassette from the plasmid PL425 digesting it with enzyme “E” and “F.”
3. Purify the floxed Neo cassette on agarose gel, slice the band, and extract it.
4. Ligate the two homologous arms and the purified floxed Neo cassette in pBluescript linearized with enzymes “D” and “G.”
5. Select for the first lox containing targeting vector plating on Ampicillin and Kanamycin plates (the kanamycin resistance is given by the Neo gene that is under the control of a hybrid promoter able to drive its expression both in bacterial and mammalian cells).
6. Extract DNA from 12 colonies. 7. Check for a correct DNA with restriction enzymes. 8. Inoculate the good colony in 100 mL LB broth and grow ON. 9. Purify plasmid DNA. 10. Isolate the Neo cassette with, at the right and the left ends,
the two homologous arms by digestion with restriction enzymes (in the example “D” and “G”) and purify it from agarose gel.
1. Coelectroporate the purified Neo cassette with the flanking homologous arms in electrocompetent EL350 cells prepared as described in Subheading 3.1.3 .
Retrieving the Sequence of Interest
3.1.6. Targeting the First Lox Site in the Plasmid Containing the Subcloned Sequence of Interest
Cloning the First Targeting Minivector
Targeting the First Lox Site in the Sequence of Interest

30 Brancaccio, Turco, and Hirsch
2. Select for the colonies targeted with the first lox sequence plating on Ampicillin and Kanamycin containing plates.
3. Test the lox Neo targeted clones by restriction. 4. Prepared DNA from the selected colony.
The aim of this step is to remove the Neo gene by expressing the arabinose-induced Cre recombinase in EL350, so to leave the first loxP site in the targeting vector. 1. Electroporate 1 ng of lox Neo targeted DNA into 50 μ L of
Cre expressing arabinose induced frozen competent cells as described in Subheading 3.1.4 .
2. Add 1.0 mL of LB broth to the electroporation cuvette. 3. Plate 10–100 μ L of the cells on an ampicillin plate and 100 μ L
on a kanamycin plate and incubated at 32°C overnight: the ampicillin plate should have 10–100 colonies, and no colonies should be present on the kanamycin plate. The Cre enzyme induces recombination between the two lox sites removing the Neo gene and leaving a lox site ( see Note 2 ). Check that positive clones do not grow on kanamycin.
4. Pick up 12 colonies from ampicillin plate and grow them in LB ON.
5. Extract DNA. 6. Check for restriction map. 7. Choose a correct colony and use its plasmid DNA for coelec-
troporation in the next step.
The aim of this step is to introduce into the subcloned DNA a second loxP site and a Neo resistance cassette to be used as selection marker both in bacteria and in mouse ES cells. This can be achieved using a Neo cassette under the control of a hybrid promoter. The cassette has also to be flanked by two Flp recom-binase recognition sites (FRT) and followed by a loxP site. For further details refer to (27) . The excision of the Neo cassette can be obtained by expression of Flp recombinase either by ES cell transient transfection or by crossing of mice with transgenic strains (29) .
1. Amplify two arms (around 300 bp) homologous to the left and the right sites where has to be inserted the second loxP site. Engineer the PCR primer pairs to contain restriction sites to allow for the directional cloning of the homology arms, together with the Neo cassette, into pBluescript. Place also in one of these primers a restriction site useful to analyze the recombined DNA in ES cells (example, the left arm: in
3.1.7. Excising the Floxed Neo Leaving the First Lox Site
3.1.8. Targeting the Second Lox Site in the Sequence with the First Lox
Cloning the Second Targeting Minivector

Tissue-Specific KO of ECM Proteins 31
the forward primer insert the sequence for the enzyme “D” and in the reverse for “E”; right arm: in the forward primer insert the sequence for the enzyme “F” and in the reverse for “G”) ( see Note 3 ).
2. Ligate the two homologous arms, the Neo cassette, contain-ing a loxP and two FRT sites (obtained from plasmid PL451 digested with enzyme “E” and “F”) in pBluescript linearized with enzymes “D” and “G.”
3. Select for the lox targeting vector plating on plates Ampicillin and Kanamycin.
4. Isolate the Neo cassette flanked by the two homologous arms by digestion with restriction enzymes (in the example “D” and “G”).
1. Coelectroporate the Neo cassette obtained in Subheading 3.1.8 , step 4 with the subcloned genomic DNA in electro-competent EL350 cells prepared as described in Subhead-ing 3.1.3 .
2. Select for the clones targeted with the second lox sequence plating on Ampicillin and Kanamycin plates.
3. Test the lox Neo targeted clones by restriction. 4. Extract DNA from a colony carrying the correct construct.
To initially establish a gene-targeting strategy, a probe that per-mits the identification of the mutants by Southern blot analysis must be isolated. Genomic DNA is interspersed by repetitive ele-ments, which give high backgrounds in hybridization analysis. It is therefore essential to test several fragments of the BAC clone to isolate a probe encoding a single genomic sequence. The probe must generate a diagnostic signal that distinguishes the targeted allele from the wild-type counterpart. This result can be obtained by finding a restriction enzyme that cuts outside the construct and generates a fragment that encompasses the probe. In the best situation, this same enzyme cuts the targeted allele inside the resistance cassette and generates a fragment that is shorter than the wild-type ( Fig. 1 ). Generation of shorter segments is recommended because the identification of a recombinant clone will not be confused by the presence of partially digested DNA. If the search for a probe with the above features fails, it will be nec-essary to change the strategy outlined above and find alternatives such as extending the restriction map to new enzymes and con-sidering other exons, deletions, or resistance cassettes. Because cloning steps involved in construct preparation are often complex and time consuming, it is wise to start to build the construct only if a good probe has been found.
Targeting the Second Lox Site
3.2. Definition of the Probe

32 Brancaccio, Turco, and Hirsch
ES cells to be used for knock-out experiments must be kept in an undifferentiated state. ES cells are small and round, with a large nucleus and few cytoplasm; they strongly adhere to each other and grow as aggregates. They are very sensitive to cell-culture conditions and, if not properly handled, tend to sponta-neously differentiate in various cell types. Good ES cell colonies can be judged by microscopic analysis: they must be a multilay-ered aggregate that shows a clear cut, shiny boundary. On the contrary, differentiated ES cell colonies lose the glossy perimeter, tend to flatten, and/or to darken in the middle. Whenever such colonies are detected, it is advisable to discard the culture. The totipotency of the cells is correlated to the number of passages in culture and it is known to strongly decrease after 30 cycles of trypsinization/freezing. ES cell must be fed every day and, in certain critical concentrations, even twice a day. Colonies are, in fact, sensitive to density on the culture dish and as soon as they touch each other, cells start to differentiate. Thus, ES cell colo-nies must be split when they reach about 50–75% of confluency. It is important to passage colonies as a single cell suspension: if not properly dissociated they form large aggregates that are very prone to differentiation. Several ES cell lines are currently avail-able and most require a specific technique handling. Consistent results have been obtained using the R1 (30) and the E14 (1) ES cell lines. They grow on the top of a feeder layer of primary embryonic fibroblasts in a medium containing LIF. These cell culture conditions assure very high levels of chimerism and an optimal rate of germ line transmission.
Feeder cells provide a basal level of LIF production and a number of yet unidentified factors that sustain ES cells growth in the totipotent state. Feeder cells are derived from the carcass of a 14-days-old embryo. To allow selection of recombinant ES clones with antibiotics, embryos must derive from a transgenic mouse that expresses the proper resistance gene. 1. Mate a male homozygous for the resistance cassette trans-
gene ( see Note 4 ) with a C57BL6 female. 2. The following day, check for the presence of the vaginal plug,
a whitish, solid sperm residue that indicates that the female mated during the night ( see Note 5 ). Separate these females and keep them until needed.
3. After 14 days, sacrifice the pregnant females by cervical dis-location.
4. Thoroughly wet the animal in 70% ethanol and put it under a sterile hood above a paper towel.
5. Cut the skin with sterile scissors and carefully expose the abdomen. Grasp with fine forceps one end of the uterine
3.3. Manipulation of ES Cells
3.3.1. Isolation of Feeder Cells

Tissue-Specific KO of ECM Proteins 33
horn and free with scissors the uterus together with embryos from mesometrium and cervix. Immediately transfer embryos (still inside the uterus) in a 10-cm bacterial culture Petri dish filled with sterile PBS.
6. With scissors separate, each implantation site from the other. With fine forceps, carefully free embryos from the uterine wall, yolk sac, and placenta. Repeatedly wash them in sev-eral Petri dishes filled with fresh sterile PBS, until bleeding stops.
7. With fine scissors, cut and discard the head. Open the abdo-men with fine forceps and remove all internal organs.
8. Hold the carcass with forceps above a Falcon tube filled with trypsin (1 mL/embryo) and mince it with fine scissors to very small pieces that are let to fall into the trypsin solution.
9. Incubate the suspension at 37°C for 15 min. Break tissue pieces by pipetting up and down with a large gage pipette (e.g., 10-mL pipette). Incubate again at 37°C for 15 min.
10. Thoroughly, dissociate cell clumps by pipetting up and down with a small gage pipette (e.g., a 2 mL or a Pasteur pipette).
11. Fill the falcon tube with feeder medium and let it stand for 5 min to let large aggregates sink. Transfer the supernatant to a fresh falcon tube and centrifuge it at 120 × g for 5 min. Discard the supernatant and dissolve the pellet with 2 mL/embryo of feeder medium. Seed 1 mL into a 15-cm cell-culture Petri dishes filled with 14 mL of feeder medium (two Petri dishes/embryo).
12. Grow to confluency without changing medium in a 37°C, 5% CO 2 incubator. Wait for another 3 days. Wash plates with 15 mL PBS and incubate for 5 min inside the incu-bator with 2 mL of trypsin. Resuspend detached cells with 2 mL of feeder medium. Reseed the plate with 0.5 mL of cell suspension.
13. Pellet cells in a Falcon tube. Discard supernatant and irradi-ate the cell pellet with 6,000 rad to inhibit cell division.
14. Resuspend the irradiated pellet with freezing medium (3 mL/Petri dish). Aliquot 1 mL of cell suspension per cryovial and freeze in a box kept in frozen carbon dioxide. Keep fro-zen stocks either at −80°C or in liquid nitrogen.
15. Add 14 mL of feeder medium to reseeded cells and repeat from step 11 for a maximum of two times.
16. To check for sterility, thaw frozen aliquots at 37°C. Add cells to 5 mL of feeder medium in a 10-mL sterile tube. Centrifuge 5 min at 120 × g . Decant supernatant, resuspend pellet, and seed it in a 10-cm cell-culture Petri dish. Culture cells for few days and then test supernatant for mycoplasma infection.

34 Brancaccio, Turco, and Hirsch
17. Frozen feeder fibroblasts can be thawed and plated in advance or just together with ES cells (in the presence of ES medium). To obtain a confluent layer of irradiated cells, thawing one frozen vial normally gives enough cells to cover the surface of a 10-cm diameter Petri dish. All other areas should be calculated using that rule of thumb.
Before transfection, ES cells must be expanded and kept growing minimizing passages. The construct is transfected into ES cells by electroporation. This method assures that in most cases only one copy of the exogenous DNA is inserted. In an average transfec-tion experiment, 2 × 10 7 cells (the content of a full 10-cm Petri dish) are transfected with 30 μ g of DNA. 1. Using feeder medium, plate irradiated fibroblasts (about nine
cryovials) onto nine 10-cm tissue-culture dishes. Change to ES medium when cells are adherent and spread.
2. Linearize 30 μ g of the construct digesting with a single cutter enzyme (usually Not I) that cleaves at the boundary between one homology arm and the vector. Keep a final DNA con-centration of at least 50 ng/ μ L. Incubate 1 h at the suitable temperature, using 30 or more enzyme units.
3. Extract the reaction mixture once with an equal volume of phenol/chloroform. Spin at maximum speed for 5 min. Collect the supernatant and extract it once with chloroform. Spin at maximum speed for 30 s. Save the supernatant.
4. Add to the supernatant 1/10 of the volume of 3 M Na acetate pH 5.2 and two volumes of 100% ethanol. Mix thoroughly. A white DNA precipitate particle must appear. Using a yellow tip, transfer the precipitate in a sterile screw cap tube contain-ing 1 mL of 70% ethanol/DDW. Keep in ice until needed.
5. Wash ES cells two times with PBS. Add 1 mL of warm trypsin. Incubate 5 min at 37°C. After adding 2 mL of ES Medium, dissociate colonies by pipetting up and down, avoiding the production of bubbles.
6. Dilute cells to 10 mL and count them using a Burker’s cham-ber. Cells with large cytoplasm derive from the feeder layer and should thus be omitted from the count.
7. Spin 2 × 10 7 cells in a sterile 10-mL tube 5 min at 120 × g . Resuspend 5 mL of PBS. Repeat this step twice.
8. Spin again and resuspend in PBS to reach a final volume of 600 μ L.
9. Spin the DNA precipitate for 30 s. Discard the supernatant under sterile conditions and let the pellet dry out for few min inside the hood. Resuspend DNA in 200 μ L PBS.
3.3.2. Electroporation and Selection
Tissue-Specific KO of ECM Proteins 35
10. Mix the cell suspension with DNA. Using a Pasteur pipette, transfer the mixture into a sterile cuvette for electroporation. Electroporate cells at 3 μ F and 0.8 kV. The time constant should correspond to 0.1 ms. Electroporation leads to about 50% of cell death.
11. Quickly and carefully transfer electroporated cells into 8.5 mL of ES Medium. Mix and distribute 1 mL of transfected cells to each feeder plate.
Twenty-four hours after electroporation, medium is changed to Selection Medium. In case a neomycin resistance cassette is used, cells can be selected by the addition of G418 antibiotic powder to ES Medium at a concentration of 400 μ g/mL ( see Note 6 ). In these conditions, resistant colonies appear within 5–6 days after transfection ( see Note 7 ). In a typical experiment, enough recom-binant clones can be detected in about 2–300 picked colonies. Not all colonies grow at the same rate, therefore picking and freezing steps can take 2–3 days each. 1. Thaw one cryovial of feeder cells at 37°C. Dilute cells in
10 mL of feeder medium. Spin 5 min at 120 × g . Decant supernatant and resuspend cells in 25 mL of feeder medium. Aliquot 1 mL of cell suspension into each well of a 24-well dish. Repeat this step for ten or more (depending on the number of colonies that are to be picked) 24-well dishes. Let fibroblasts adhere and spread overnight.
2. Just before starting to pick the colonies, change medium of 24-well dishes to ES Medium.
3. With a 5-mL pipette, transfer two drops of trypsin into each well of a 96-well microtiter dish. Warm at 37°C.
4. Using a stereomicroscope under a laminar flow hood, gently scrape a colony with a P200 pipette equipped with a sterile yellow tip. Suck the cell aggregate in a maximum volume of 10 μ L and transfer it in a 96-well filled with trypsin. Repeat this step for 12 colonies ( see Note 8 ).
5. Incubate the 96-well dish at 37°C for 5 min. Open one 24-well dish with feeder and the 96-well dish under the hood.
6. With a fresh, sterile yellow tip, collect about 100 μ L of ES Medium from a feeder cells-containing well. Add it to a trypsin well. Dissociate the trypsinized colony by gentle pipetting. Carefully transfer the cell suspension to the same well from which ES Medium was taken. Make a few air bub-bles to mark the well. Repeat this step for all trypsinized colonies ( see Note 8 ).
7. Repeat steps 4–6 until enough colonies have been picked.
3.3.3. Picking and Freez-ing of Resistant Clones
36 Brancaccio, Turco, and Hirsch
8. The day after, change to fresh ES Medium all wells that received a colony.
9. Wait 3–4 days for ES cells to expand. As soon as the number and the size of colonies are suitable for sibling, cells from each well can be frozen.
10. Mark cryovials with progressive numbers. Mark the same numbers on the bottom of each well to be passaged.
11. Set an empty cryobox into dry ice. Put labeled cryovials into the holding device.
12. Wash all marked wells of a 24-well dish with 1 mL PBS. Add two drops of trypsin into each well and incubate 5 min at 37°C.
13. Collect 900 μ L of freezing medium with a P1000 equipped with a fresh, sterile blue tip. Thoroughly resuspend trypsinized cells of one well by gentle pipetting. Retrieve only about 600 mL of cell suspension and transfer it into the cryovial with the corresponding number. Place the cryovial into the box in dry ice. Repeat this step for all trypsinized wells.
14. Fill each well to maximum with feeder medium to dilute DMSO, which can eventually be toxic for cells.
15. Repeat steps 12–14 until all clones have been frozen. 16. The day after freezing, it is extremely important to change
medium to feeder medium.
1. When medium inside a well turns to yellow, wait an addi-tional day. Then discard the medium and add 500 μ L of Lysis buffer. Keep at 37°C until all wells have been kept with Lysis buffer for at least one night.
2. Add 500 μ L of isopropyl alcohol and shake overnight at room temperature.
3. Label Eppendorf tubes correspondingly to lysed clones. Add 100 μ L of sterile DDW to each tube.
4. Prepare a glass rod by flaming the tip of a Pasteur pipette. Collect with this instrument the white DNA precipitate that formed on the bottom of a 24-well dish well. Disperse the DNA in the water of the corresponding tube. Clean the glass rod in sterile DDW and dry it with a paper towel. Repeat this step for the precipitates of all different clones.
5. Let DNA dissolve overnight at 56°C. Store genomic DNA at 4°C.
6. Digest 15 μ L of genomic DNA with the suitable restriction enzyme in 30 μ L of a final reaction volume containing 0.3 μ L BSA, 3 μ L buffer, 30–40 U enzyme. Incubate overnight in an oven at 37°C.
3.3.4. Identification of Homologous Recombinants

Tissue-Specific KO of ECM Proteins 37
7. Load digested DNA on a 0.8% agarose gel in 1× TBE, 1 μ g/mL ethidium bromide. Separate for 6–8 h at 3 V/cm.
8. Photograph gel on an UV-table together with a ruler. 9. Blot the digested DNA onto Nylon membrane in alkaline
conditions. 10. Mark the position of the wells on the nylon membrane with
a pencil. Neutralize the membrane twice in 2×SSC. 11. Place filters in a plastic bag containing the minimum amount
of Church buffer to thoroughly wet them. Prehybridize for 1 h at 65°C. Radioactively label the probe by random prim-ing following the instructions provided in the kit. Hybridize filters overnight at 65°C in Church buffer containing at least 1 × 10 6 cpm/mL of 32 P-labeled probe.
12. Wash filters at 65°C in 250–500 mL of hot Washing Solu-tion 1 and 2 for 30 min each.
13. Expose with an autoradiography film until clear bands are visible.
Chimeric mice are generated by microinjection of mutant ES cells into the cavity of a blastocyst (31) (see Note 9) . Chimeras are then mated to generate an offspring that carries the ES cells genotype. To establish these techniques, an animal care facility must be available and treatment of mice must proceed in agree-ment to local laws regulating in vivo experimentation.
1. Anesthetize a male mouse by intraperitoneal injection of 0.5 mL of diluted Avertin solution. Wash skin of lower abdomen (at the level of the top of the legs) with 75% ethanol and make a 1-cm cut with sharp scissors (1.5-cm large). Similarly cut the muscle of the body wall, avoiding the fat pad surround-ing the genitals.
2. With bent blunt forceps, gently push the scrotum to move the right testicle into the abdominal cavity (until the white testicular fat pad appears at the edge of the incision). Expose the testicle by pulling the white fat pad. Note that around the testicle, the white coiled epididymis prolongs in a wider tube: the vas deferens.
3. Pierce with the tip of the forceps the thin membrane linking the vas deferens to the testicle and blood vessel. Apply two stitches around the freed tube, at a distance of about 5 mm from each other. With scissors, cut the vas deferens between the two stitches. By gently grasping the fat with forceps, reposition the testicle inside the abdomen. The same procedure is repeated for the left testicle.
3.4. Generation of Mutant Mouse Lines
3.4.1. Generation of Vasectomized Males

38 Brancaccio, Turco, and Hirsch
4. Separately stitch two or three times the muscle and skin, then put the mouse alone back into a fresh cage. Vasect-omized mice can be used 15–30 days after surgery. Testing for residual breeding capacity is advisable.
Two needles are needed: one is used to hold the blastocyst and the other to suck and inject cells ( Fig. 3 ). Making such micro-injection needles is a laborious task. It is therefore advantageous to prepare sets of these tools in advance and store them until needed.
1. Heat the middle of a tube on a flame until the glass starts to melt. Quickly move out of the flame and pull the extremities of the tube by hand.
2. Select capillaries with a 2–3-cm long, 0.1-mm-wide tip. 3. With the help of a diamond tip, cut sharp and flush the end of
the tip. 4. Adjusting the tip near the heating filament of the microforge,
slowly melt the glass until the opening narrows to 1/4 of the original diameter.
5. Placing the capillary orthogonal to the heating filament bend the last 3–4 mm of the tip to form a 30° angle.
1. Using a puller, pull tubes so that they form a 1-cm long 1- μ m wide tip.
2. Make a small ball of melted glass on the tip of the heating fila-ment of the microforge.
3.4.2. Preparation of Nee-dles for Microinjection
Preparation of Holding Capillaries
Preparation of Micro-injection Capillaries
Fig. 3 . Lateral view of the injection chamber. On the left : holding capillary used to block a blastocyst ( dark gray ). Edges of the glass walls have been rounded by flaming. The opening can vary from 50 to 100 μ m. On the right : injection capillary holding some ES cells. The opening should be not smaller than the diameter of a cell (about 20 μ m). A view of the tip from the above (as seen on the microscope) is shown below. Note the shape of the tip. Both holding and injecting capillaries should be bent (about 120°) so that they remain parallel to the bottom of the injection chamber .

Tissue-Specific KO of ECM Proteins 39
3. Place the tip of the pulled capillary on the filament. Heat to a moderate temperature (when the ball gets a reddish glow) until the needle slightly fuses with the glass ball. Immediately switch the heating off. The capillary breaks leaving a sharp and flush opening ( see Note 10 ).
4. Place capillaries with 20–30 μ m-wide tips onto the grinding wheel at an angle of about 20–45°. Leave until a beveled end is formed.
5. Connect the needle to a Teflon tube linked to a syringe and wash it by sucking in and out at least three times with the following solution: 10% hydrofluoric acid, DDW 1, DDW 2, DDW 3, 100% ethanol.
6. Make a sharp fine tip at the beveled end. Heat the glass ball on the microforge filament to a moderate temperature. Gently push the needle against the ball and quickly withdraw it. The tip fuses with the glass ball and makes a sharp spike.
7. Place the capillary orthogonal to the heating filament and with the opening toward the operator. Bend the last 3–4 mm of the tip to form a 30° angle.
Blastocysts are obtained by natural mating of a relatively large number of C57B6 mice. The presence of the vaginal plug the morning following mating is considered 0.5 days postcoitum (dpc). Microinjected blastocysts are transferred to the uteri of a pseudopregnant female. To help embryos recover from the trauma of injection and to ensure a high rate of births, recipient females are one day delayed with respect to blastocysts. 1. Mate, at late afternoon, about 25 C576 males with two C57B6
females each ( see Note 11 ). 2. The following morning check for plugs ( see Note 5 ) and keep
pregnant females in a separate cage. 3. At late afternoon of the same day, mate vasectomized males
with 2 CBA × C57B6 F1 females each. 4. The following morning check for plugs ( see Note 5 ) and keep
pseudopregnant females in a separate cage.
1. To isolate blastocysts, sacrifice by cervical dislocation C57B6 females at 3.5 dpc.
2. Flush hair with 70% ethanol. Open the belly with scissors and expose the uterus below bowels.
3. Put the mouse under the stereomicroscope. Cut cervix (the single tube where uterine horns join) with sharp, fine, and curved scissors. Grasp the cervix with forceps and gently lift the uterine horns. With fine curved scissors, cut mesometrium and vessels along the uterine horns, and also being sure to
3.4.3. Mouse Matings
3.4.4. Isolation of Blastocysts

40 Brancaccio, Turco, and Hirsch
avoid hurting the muscular wall. Free the uterus by cutting at the uterotubal junction. Place the uterus in a drop of flushing medium.
4. With forceps, hold a uterine horn near the uterotubal junction. Using scissors, with the other hand open the tip by making a cut parallel to the horn. Repeat this procedure for the other horn. Place the uterus in a fresh drop of flushing medium.
5. Place the uterus in a dry, sterile watch glass under the ster-eomicroscope. With one hand, use forceps to hold the cervix. With the other hand, hold a 10-mL syringe filled with flushing medium. Insert the needle in the cervix toward one horn. Flush with about 0.5–1 mL, tightening the muscular wall around the needle with forceps. If the uterine tube does not let liquid out, repeat the procedure in step 4 .
6. Collect blastocysts under the stereomicroscope by sucking them into a transfer pipette. Transfer blastocysts in a watch glass containing ES Medium and keep them in the incubator until needed.
1. Plate ES cells and feeder on a 6-cm large tissue-culture dish 2–3 days before microinjection. Change ES Medium every day. ES cell colonies should reach an optimal density (75–90% confluency) without being passaged.
2. Wash cells two times with 5 mL PBS. Add 0.5 mL trypsin. Incubate 5 min at 37°C.
3. Add 3 mL ES Medium. Carefully dissociate colonies by pipet-ting up and down. Transfer the cell suspension to a 10-mL sterile tube. Spin for 5 min at 150 g .
4. Resuspend pellet in 5 mL ES Medium. Discard about 4 mL and spin the rest for 5 min at 120 × g .
5. Discard the supernatant leaving just a drop medium. Resus-pend cells by gently flickering the tube with fingers.
Blastocyst injection requires an inverted microscope equipped with phase contrast or Nomarski’s optics. Two micromanipula-tors are set at the left and the right sides of the microscope’s stage. Each micromanipulator controls movements of a glass cap-illary. One needle (on the left) is used to hold the blastocyst and the other (on the right) to collect and inject cells. Each capillary is held through a hollow metal rod connected via silicon tubing to an air-filled syringe. Sucking and blowing of cells and embryos is controlled only by a gentle action on this device. 1. With Vaseline grease, fix a siliconized coverslip to the injection
chamber.
3.4.5. Preparation of ES Cells
3.4.6. Microinjection of ES Cells

Tissue-Specific KO of ECM Proteins 41
2. Put a large drop of M2 medium on the coverslip and, using the transfer pipette, add blastocysts at the upper left corner. In a similar way, add the suspension of ES cells in stripes along the drop.
3. Cool the stage of the microscope to about 10°C by placing on its top a glass Petri dish filled with ice. Put the injection chamber on the cooled stage.
4. Connect capillaries to their metal holder and syringe. Fill the pipettes with M2 medium ( see Note 12 ).
5. Adjust holding and injection pipettes on micromanipulators. Put capillaries in focus. Pipettes should be carefully turned until they show a straight horizontal orientation.
6. Overlay the M2 drop with dimethyl polysiloxan. 7. Collect about 150 healthy ES cells. Healthy ES cells are
round and of medium size. They must have a smooth sur-face and a bright nucleus. Feeder cells can be easily avoided by their larger size and spiked shape.
8. Using the holding pipette, gently suck a blastocyst. Moving the injection needle, turn the blastocyst until a thin depres-sion between two cells is in focus. Hold the embryo in this position by delicate sucking ( Fig. 3 ).
9. By a rapid horizontal movement, insert the injection needle into the blastocyst cavity. Inject about 15 cells. Gently withdraw the glass capillary and place the injected blasto-cyst on the lower right corner. After injection, blastocysts may collapse.
10. Repeat from step 8 until cells are exhausted then repeat from step 7 until all blastocysts were used.
After microinjection, blastocysts should recover in the incubator for at least 1 h. Generally, embryos can be transferred as soon as they start to re-expand to form again their cavity. The number of transferred blastocysts for each pseudopregnant female can vary from 7 to 12. 1. Anesthetize a pseudopregnant female mouse by intraperito-
neal injection of 0.5 mL of diluted Avertin solution. Put the mouse with the head facing 12 o’clock under the stereomi-croscope equipped with optic fibers illuminators.
2. Disinfect the skin of the back and cut with scissors at about 1–2 cm above the hind leg. Wipe off hairs with a paper nap-kin. Detach the cut skin from the underlying muscle and displace it around to localize the underneath ovary (a red-dish ball surrounded by a white fat pad). Expose the ovary by cutting the above body wall muscle, avoiding blood ves-sels (red) and nerves (white). Hold the fat with blunt-ended
3.4.7. Embryo Transfer

42 Brancaccio, Turco, and Hirsch
curved forceps and gently force the uterine horn out of the cavity.
3. On a second stereomicroscope, prepare the transfer pipette by filling it with a series of small air bubbles followed by ES Medium. Cautiously suck 3–6 embryos, minimizing the liquid in-between. Add a very small last air bubble at the tip. Store the transfer pipette undisturbed nearby the first ster-eomicroscope.
4. Using the fine forceps in one hand, hold the uterine horn near its apical end and gently stretch it outside the abdom-inal cavity. With the other hand, quickly grab the syringe needle and puncture the uterine wall avoiding the rupture of blood vessels. Insert the needle so that it reaches the lumen of the uterine horn without piercing again the mus-culature. Using this same hand, remove the needle and take the mouth pipette, possibly avoiding to leave the binoculars. Locate the hole again and insert the transfer pipette. Gently blow embryos until air bubbles are seen to move inside the uterus. Slowly withdraw the pipette ( see Note 13 ). If liquid is expelled from the hole, quickly suck it into the pipette ( see Note 14 ).
5. Put the ovary and uterus back inside the abdomen. Using surgical catgut thread, apply a few stitches to the muscle and to the skin.
6. Repeat the same procedure from step 2 on the other uterine horn.
7. When finished, put the mouse back to the cage and keep it warm by covering it with straw.
To check for germ line transmission, adult chimeric males are mated to 2–3 adult C57B6 females. Transmission of the ES cell genotyope is evidenced by the birth of agouti pups. The agouti coat color, characteristic of the 129 mouse strain (from which ES cells derive), is dominant over the black coat color shown by C57B6 mice. The higher the chimerism is, the better the chances for germ line transmission. If a chimera generates at least three litters of black pups, it is presumably not able to transmit the ES cell genotype. When chimeras show about 100% of ES cell contribution, it can happen to obtain agouti pups only. Trans-mission of the mutant allele should show a normal Mendelian distribution among the agouti offspring. Mice obtained by this mating strategy possess a mixed 129 and C57B6 genetic back-ground. An easy way to obtain heterozygous animals of pure 129 inbred strain is to cross the chimera with an adult 129 female. In this case, the litter obtained shows only the agouti coat color. To identify 129 inbred animals, it is necessary to test the genotype
3.5. Mating of Chimeras

Tissue-Specific KO of ECM Proteins 43
for the presence of the mutant allele. Mice that bear the muta-tion virtually derive from the mating of two 129 inbred mice and being of pure 129 genetic background, they can be used to generate a 129 inbred mouse colony.
Agouti pups must be genotyped to assess whether they are het-erozygous for the mutation. For this purpose, genomic DNA must be extracted from tail biopsies and analyzed for the pres-ence of the targeted allele. The high reliability of Southern blot techniques makes this the system of choice for identification of heterozygotes in the very first litters. Faster but more prone to errors is PCR analysis, a procedure that is then suitable for geno-typing of assessed mutant mouse strains. 1. Label 20–30-days-old mice by applying numbered ear clips.
Mark number, sex, and mouse coat color in a notebook for further reference.
2. Cut the tail with sharp, strong scissors at about 1 cm from the tip and collect the tissue sample in a labeled sterile 1.5-mL tube. Dissolve tail tissue by incubation on a rotary wheel with 0.5 mL of tail buffer-PK overnight at 56°C.
3. Add 0.5 mL of phenol–chloroform. Incubate samples for 10 min on the rotary wheel at RT, then spin them at maximum speed on a bench centrifuge for 5 min.
4. Collect the DNA containing supernatant, avoiding precipi-tates at the interface, with a 1-mL disposable tip (cut to make the opening wider). Add the supernatant to a fresh tube con-taining 0.5 mL of chloroform. Incubate samples again on the rotary wheel for 10 min, then spin them for 5 min at maxi-mum speed.
5. Collect the DNA containing supernatant as in step 4 and add it to a fresh tube containing 0.5 mL of isopropyl alcohol. Invert the tube a few times and pellet the white DNA pre-cipitate to the bottom by a short spin. Carefully eliminate the alcohol and air-dry the DNA for a couple of minutes.
6. Add to the DNA pellet 100 μ L of sterile DDW and resuspend it overnight at 56°C. Store the DNA solution at 4°C.
7. Analyze the DNA samples as described in Subheading 3.3.4 , steps 6–13 . Using the probe defined for the screening of tar-geted ES clones, homozygous and heterozygous mice show one or two bands, respectively.
1. Design a forward primer upstream the floxed exon and reverse primer downstream the floxed exon, in this way distinct diag-nostic fragments will be obtained for wild type and floxed or null allele ( Fig. 1 ). Best results are obtained with 20-mers hav-ing at least a 50% GC content.
3.6. Genotyping of Offspring
3.6.1. Southern Blot Analy-sis of Tail DNA
3.6.2. DNA Preparation for PCR Analysis

44 Brancaccio, Turco, and Hirsch
2. Label mice as in Subheading 3.6.1 , step 1 . Collect no longer than 2–3 mm of the tip of the tail in a 1.5-mL tube containing 50 μ L of lysis buffer.
3. Incubate samples at 60°C shaking in the Thermomixer for 2–3 h. Smash remnants of tail using a fresh yellow tip for each tube. Inactivate proteinase K by 6-min incubation at 95°C. Spin at maximum speed for 5 min. Dilute 5 μ L of the supernatant into 10 μ L of sterile DDW.
4. Set up a PCR reaction following standard procedures (32) using 5 μ L of the diluted sample in a final volume of 50 μ L ( see Note 15 ).
5. Amplify using the following cycle profile: – Ten cycles 95°C, 30 s – 65°C–1°C each cycle, 30 s – 72°C, 30 s 25 cycles 94°C, 30 s – 55°C, 30 s – 72°C, 30 s
6. Check the reaction on 2% agarose gel. Amplification of one band with both combinations of oligonucleotides indicates heterozygosity. Samples showing a band with either one of the two couples of oligos are to be considered wild-type or mutant homozygous depending on the length of the diagnostic frag-ment detected and on the presence of the wild-type or mutant allele specific oligonucleotide in the productive reaction.
Knocking-out genes essential for embryonic development leads to lethality before birth and in many cases precludes the analysis of gene function in adult tissues. To overcome this limitation, it is necessary to generate Cre/lox conditional mutagenesis. A sim-pler alternative is to isolate ES cells homozygous for the muta-tion, which can be used to generate chimeras. The analysis of the potential of these double mutant cells to contribute to the forma-tion of different organs may give essential information on gene function in established tissues (33) . Homozygous ES cells can be generated by electroporation of a second targeting construct that bears a different selection cassette (e.g., hygromycin in place of neomycin resistance gene). Alternatively, cells bearing a null allele generated by Cre -mediated excision of the selection marker gene ( Fig. 1 ) can be transfected again with the same construct. In these two situations, about 50% of the recombinant clones should show by Southern blot hybridization a homozygous-specific pattern of bands. The simplest method, however, consists of growing heterozygous ES cells in a medium containing very high levels of selection drug (34) ( see Note 16 ).
3.7. Generation and Analysis of Double KO ES Cells
Tissue-Specific KO of ECM Proteins 45
1. Thaw heterozygous ES cells carrying a neomycin resistance cassette on one allele.
2. Grow and expand on feeder to obtain at least 10 5 cells. 3. Plate ES cells on ten 9-cm tissue-culture dishes with 10 4 cells
each. 4. The next day, change medium with ES medium supple-
mented with 4 mg/mL G418. 5. Change medium every day. Check for dying cells. If cells do
not start to die in 4–5 days, it is likely that the technique will not succeed.
6. Wait for 6–7 days to start to see colonies. Treat resistant clones as described in Subheading 3.6.3
7. Analyze the genotype as described in Subheading 3.6.4
Genetic differences between ES and host embryo derived cells can be exploited to measure contribution of the injected cells in a chimeric tissue. Allelic variants of glucose phosphate isomer-ase (GPI) enzymes are often utilized for these measurements because they show distinct electrophoretic mobility on a cellu-lose acetate plate. The C57B6 derived GPI-B presents a higher electrophoretic mobility compared to the 129 derived GPI-A ( see Note 17 ). 1. Dissect a small piece of tissue (10 mg or less) from the chi-
meric mouse. 2. Lyse the sample in 100–200 μ L of extraction buffer using a
small pestle. Lysates can be stored indefinitely at −20°C. 3. Mark the upper side of the plastic back of the plate. Soak the
Titan III plate in Supre Heme buffer avoiding the formation of air bubbles inside the cellulose acetate.
4. Dilute the sample to the desired concentration and load 8 μ L on the Super Z well plate.
5. Recover the Titan III plate and blot it dry between two paper towels. Fix the plate on the loading device with the cellulose on the top and so that samples will be loaded near the marked side.
6. Collect some sample by pressing the applicator inside the wells. Blot the applicator on tissue paper. Reload in the same way the applicator and finally press it against the cellulose acet-ate plate.
7. Fill buffer tanks of an electrophoresis device with Supre Heme buffer. Place a piece of filter paper in both buffer tanks so that they do not touch each other.
8. Overlay the plate onto the two pieces of filter paper so that the cellulose side faces the bottom of the chamber. In this
3.7.1. Analysis of ES Cell Contribution in Chimeric Mice

46 Brancaccio, Turco, and Hirsch
way, the plate is electrically connected to the buffer tanks. Take care to place the marked side near the anode. Stabilize the extremities of the gel with 5–8 glass slides. Run (from anode to cathode) at 200 V, 4°C for 3 h.
9. Place the Titan III slab onto a glass plate. Melt the agarose and cool 10 mL at 55°C. Add 200 μ L of each developing reaction component, mix well and pour it over the cellulose acetate plate. Leave the reaction in the dark for 2–15 min, depending on the concentration of samples.
10. Place the plate in stop solution as soon as the bands reach the desired intensity.
11. Photograph immediately.
In addition to the study of chimeric tissue formation, the dif-ferentiation abilities of ES cells can also be tested by in vitro differentiation assays and by the induction of ES-derived tera-tomas. The extraordinary potential of ES cells to differentiate in vitro can be utilized to study particular aspects of mutant phenotypes that cannot be easily approached in vivo models. The case of embryonic lethal phenotypes provide the typical situation in which the study of the developmental abnormalities can be greatly extended with biochemical and cellular studies on dif-ferentiated homozygous cells. Analysis of the differentiation state at different time-points and comparison of mutant and wild-type cultures may give essential clues on the effects of the mutation (35) . Several protocols have been developed to differentiate cul-tured ES cells and most of them are specialized to generate a par-ticular cell type. Nonetheless, ES cells can be aggregated in vitro to form so-called embryo bodies in which various tissues with distinct embryonic origin start to form. These cell aggregates can then be grown for several days and the formed tissues may be analyzed with the classical tools of biochemistry and cell biology. An alternative method to generate ES cells-derived differentiated tissues, consists of injecting ES cells ectopically in syngeneic male mice (for example, under the skin). In these conditions, ES cells can form a teratoma, a noninfiltrating, benign tumors containing large numbers of highly differentiated cells often organized in epithelia, glands, vessels, and even nerves.
1. Grow ES cells with standard methods to obtain at least 10 6 cells.
2. Wash cells two times with PBS and incubate with trypsin for 5 min at 37°C. Add ES medium and disperse aggregates by gently pipetting cells up and down. Add ES medium if needed and let feeder cells attach to the culture dish for 30 min in the incubator.
3.8. Analysis of Differ-entiation Abilities of Homozygous ES Cells in Embryo Bodies and Teratomas
3.8.1. Generation of ES Cells-Derived Embryoid Bodies

Tissue-Specific KO of ECM Proteins 47
3. Gently wash the plate to collect nonadherent ES cells and save the supernatant in a sterile tube. Count the cells with a Burcker’s chamber. Dilute cells to 500–1,000 in 20 μ L.
4. Pipette on the inside the lid of a sterile 9-cm Petri dish several 20 μ L drops of cells. Fill the Petri dish with 5–10 mL of PBS. Gently turn the lid upside down and close the Petri dish so that cells are held in suspension in the hanging drops.
5. Wait for 2 days until aggregates of ES form. Collect aggre-gates (embryoid bodies) by washing the lids with EF medium. Plate aggregates on bacterial culture Petri dishes in EF medium (supplement of serum to 20% may be required).
6. Embryoid bodies can be grown in suspension up to 30 days. Alternatively, they can be trypsinized and cells can be plated in tissue-culture dishes.
1. Grow ES cells with standard methods to obtain at least 10 8 cells.
2. Wash cells two times with PBS and incubate with trypsin for 5 min at 37°C. Add ES medium and disperse aggregates by gently pipetting cells up and down. Add ES medium if needed and let feeder cells attach to the culture dish for 30 min in the incubator.
3. Gently wash the plate to collect nonadherent ES cells and save the supernatant in a sterile tube. Count the cells with a Burcker’s chamber.
4. Centrifuge 10 7 cells for 5 min at 120 × g . Resuspend the pellet in PBS.
5. Spin cells down and resuspend the pellet in 300 μ L. Load the cell suspension in a 1-mL syringe.
6. Anesthetize a 129 male mouse and inject cells subcuta-neously.
7. The tumor should be clearly visible after 15–20 days. When it has reached the desired dimension, excise it and treat it for histological analysis. As with embryoid bodies, teratomas can be collected in sterile conditions and trypsinized in order to culture differentiated cells.
1. Using excessive amounts of DNA would lead to some undi-gested DNA and cause severe background after transfor-mation.
3.8.2. Induction of ES Cells-Derived Teratomas
4. Notes
48 Brancaccio, Turco, and Hirsch
2. We used the following antibiotic concentrations in our experiments: kanamycin and chloramphenicol, 12.5 μ g/mL for BACs, 25 μ g/mL for multicopy plasmids; ampicillin, 25 μ g/mL for BACs, 100 μ g/mL for pBluescript.
3. The restriction enzyme sites can be the same used in the preparation for the first mini targeting vector but not necessarily.
4. A viable homozygous knock-out mouse is often suitable for such purpose. The expression of a resistance gene (usually the neo gene) is guaranteed by the fact that the mutant ES cells, from which the mouse line has been derived, had been selected in a similar way.
5. Plugs are unstable and easily lost during the day that follows mating. It is therefore important to check for plugs early morning and not later than 11 a.m . To ease inspection, it is useful to use a blunt, sterile probe such as a flame-sealed tip of a Pasteur pipette.
6. In commercial preparations of G418, only a fraction of the total weight is the real active compound. The routine use of high concentration (400 μ g/mL) of crude powder has proven to be adequate to avoid testing of different antibiotic batches.
7. Colonies should be picked as soon they start to be detect-able by eye inspection. Choosing the picking time is a critical step: whereas waiting too long can result in differentiation of colonies, retrieval of small aggregates supplies too few cells for the subsequent expansion.
8. It is extremely important to put each colony in a separated well. Keeping track of the number of used yellow tips can help to avoid mistakes.
9. Obviously, it is essential to test that the floxed allele is fully functional before starting the conditional deletion experiments.
10. Keep the glass ball clean. Wipe debris away with a piece of cloth. By accumulating glass debris, the ball eventually changes its size and subsequently the temperature at which it can fuse with the needle.
11. Keep females well distributed in more than one cage. In this way, females will not show a synchronized oestrus, thus enhancing the chance of finding individuals able to mate.
12. Making a few small air bubbles in the thinner part of the injection needle can strongly increase the control over cell sucking and blowing.
13. Do not generate high pressure in the pipette. In this way, transfer cannot be controlled and often results in the loss of

Tissue-Specific KO of ECM Proteins 49
the embryos. If the pipette becomes clogged, remove from the uterus and gently wash it in ES Medium, paying atten-tion not to lose the blastocysts.
14. Immediately after embryos are blown into the uterine cav-ity, the muscular wall sometimes contracts and expels the transferred liquid together with injected blastocysts. It is, therefore, useful to suck into the transfer pipette the liquid that tends to overflow from the hole. In case embryos are expelled, they can be recovered in the pipette.
15. Initially test DNA of a proven heterozygous animal in two different reaction tubes each containing a separate combina-tion of the two couples of oligonucleotides (common, wild-type, or common, mutant allele). To simplify the procedure, test whether all three oligonucleotides can work in one same reaction.
16. The success rate of this technique can vary depending on the nature of the targeted locus and must therefore be empiri-cally tested.
17. The GPI enzymes are homodimers and because dimerization occurs inside the cell, chimeric tissues show only two distinct bands. Three bands can be seen in particular situations such as in skeletal muscle extracts. Myofibers containing nuclei of distinct genotype can generate all three combinations of subunits.
References
1. Evans MJ , Kaufman MH . (1981) Establish-ment in culture of pluripotential cells from mouse embryos . Nature ; 292 : 154 – 156
2. Martin GR . (1981) Isolation of a pluripotent cell line from early mouse embryos cultured in medium conditioned by teratocarcinoma stem cells . Proc Natl Acad Sci U S A ; 78 : 7634 – 7638
3. Smithies O , Gregg RG , Boggs SS , Koralewski MA , Kucherlapati RS . (1985) Insertion of DNA sequences into the human chromosomal beta-globin locus by homologous recombina-tion . Nature ; 317 : 230 – 234
4. Thomas KR , Capecchi MR . (1987) Site-directed mutagenesis by gene targeting in mouse embryo-derived stem cells . Cell ; 51 : 503 – 512
5. Gu H , Marth JD , Orban PC , Mossmann H , Rajewsky K . (1994) Deletion of a DNA polymerase beta gene segment in T cells using cell type-specific gene targeting . Science ; 265 : 103 – 106
6. Baudoin C , Goumans MJ , Mummery C , Son-nenberg A . (1998) Knockout and knockin of the beta1 exon D define distinct roles for
integrin splice variants in heart function and embryonic development . Genes Dev ; 12 : 1202 – 1216
7. Nagy A , Moens C , Ivanyi E , et al. (1998) Dissecting the role of N-myc in development using a single targeting vector to generate a series of alleles . Curr Biol ; 8 : 661 – 664
8. Kuhn R , Schwenk F , Aguet M , Rajewsky K . (1995) Inducible gene targeting in mice . Science ; 269 : 1427 – 1429
9. Dymecki SM . (1996) Flp recombinase pro-motes site-specific DNA recombination in embryonic stem cells and transgenic mice . Proc Natl Acad Sci USA ; 93 : 6191 – 6196
10. Kilby NJ , Snaith MR , Murray JA . (1993) Site-specific recombinases: tools for genome engi-neering . Trends Genet ; 9 : 413 – 421
11. Rajewsky K , Gu H , Kuhn R , et al. (1996) Conditional gene targeting . J Clin Invest ; 98 : 600 – 603
12. Akagi K , Sandig V , Vooijs M , et al. (1997) Cre-mediated somatic site-specific recom-bination in mice . Nucleic Acids Res ; 25 : 1766 – 1773
50 Brancaccio, Turco, and Hirsch
13. Betz UA , Vosshenrich CA , Rajewsky K , Muller W . (1996) Bypass of lethality with mosaic mice generated by Cre-loxP-mediated recombination . Curr Biol ; 6 : 1307 – 1316
14. Aszodi A , Legate KR , Nakchbandi I , Fassler R . (2006) What mouse mutants teach us about extracellular matrix function . Annu Rev Cell Dev Biol ; 22 : 591 – 621
15. Morrison-Graham K , Weston JA . (1989) Mouse mutants provide new insights into the role of extracellular matrix in cell migration and differentiation . Trends Genet ; 5 : 116 – 121
16. Aszodi A , Pfeifer A , Wendel M , Hiripi L , Fassler R . (1998) Mouse models for extracel-lular matrix diseases . J Mol Med ; 76 : 238 – 252
17. Fassler R , Schnegelsberg PN , Dausman J , et al. (1994) Mice lacking alpha 1 (IX) col-lagen develop noninflammatory degenerative joint disease . Proc Natl Acad Sci USA ; 91 : 5070 – 5074
18. Mundlos S , Olsen BR . Heritable diseases of the skeleton . (1997) Part II: Molecular insights into skeletal development-matrix components and their homeostasis . FASEB J ; 11 : 227 – 233
19. Bruckner-Tuderman L , Bruckner P . (1998) Genetic diseases of the extracellular matrix: more than just connective tissue disorders . J Mol Med ; 76 : 226 – 237
20. Pereira L , Andrikopoulos K , Tian J , et al. (1997) Targeting of the gene encoding fibril-lin-1 recapitulates the vascular aspect of Mar-fan syndrome . Nat Genet ; 17 : 218 – 222
21. Judge DP , Biery NJ , Keene DR , et al. (2004) Evidence for a critical contribution of hap-loinsufficiency in the complex pathogen-esis of Marfan syndrome . J Clin Invest ; 114 : 172 – 181
22. Nakamura T , Lozano PR , Ikeda Y , et al. (2002) Fibulin-5/DANCE is essential for elastogenesis in vivo . Nature ; 415 : 171 – 175
23. Yanagisawa H , Davis EC , Starcher BC , et al. (2002) Fibulin-5 is an elastin-binding protein essential for elastic fibre development in vivo . Nature ; 415 : 168 – 171
24. Bonaldo P , Braghetta P , Zanetti M , Piccolo S , Volpin D , Bressan GM . (1998) Collagen VI deficiency induces early onset myopathy in the mouse: an animal model for Bethlem myopa-thy . Hum Mol Genet ; 7 : 2135 – 2140
25. Miner JH , Yurchenco PD . (2004) Laminin functions in tissue morphogenesis . Annu Rev Cell Dev Biol ; 20 : 255 – 284
26. Schwander M , Leu M , Stumm M , et al. (2003) Beta1 integrins regulate myoblast fusion and sarcomere assembly . Dev Cell ; 4 : 673 – 85
27. Liu P , Jenkins NA , Copeland NG . (2003) A highly efficient recombineering-based method for generating conditional knockout muta-tions . Genome Res ; 13 : 476 – 484
28. te Riele H , Maandag ER , Berns A . (1992) Highly efficient gene targeting in embryonic stem cells through homologous recombina-tion with isogenic DNA constructs . Proc Natl Acad Sci U S A ; 89 : 5128 – 5132
29. Rodriguez CI , Buchholz F , Galloway J , et al. (2000) High-efficiency deleter mice show that FLPe is an alternative to Cre-loxP . Nat Genet ; 25 : 139 – 140
30. Nagy A , Rossant J , Nagy R , Abramow-Newerly W , Roder JC . (1993) Derivation of completely cell culture-derived mice from early-passage embryonic stem cells . Proc Natl Acad Sci USA ; 90 : 8424 – 8428
31. Hogan B, Beddington R, Costantini F, Lacy E. Manipulating the Mouse Embryo. A Labora-tory Manual. Second Edition. Cold Spring Harbor Laboratory, Cold Spring Harbor, NY, 1994
32. Sambrook J, Fritsch EF, Maniatis T. Molecular Cloning. A Laboratory Manual. Second Edi-tion. Cold Spring Harbor Laboratory, Cold Spring Harbor, NY, 1989
33. Hirsch E , Iglesias A , Potocnik AJ , Hartmann U , Fassler R . (1996) Impaired migration but not differentiation of haematopoietic stem cells in the absence of beta1 integrins . Nature ; 380 : 171 – 175
34. Mortensen RM , Zubiaur M , Neer EJ , Seidman JG . (1991) Embryonic stem cells lacking a functional inhibitory G-protein subunit (alpha i2) produced by gene targeting of both alleles . Proc Natl Acad Sci USA ; 88 : 7036 – 7040
35. Sasaki T , Forsberg E , Bloch W , Addicks K , Fassler R , Timpl R . (1998) Deficiency of beta 1 integrins in teratoma interferes with basement membrane assembly and laminin-1 expression . Exp Cell Res ; 238 : 70 – 81

Chapter 3
Recombinant Collagen Trimers from Insect Cells and Yeast
Johanna Myllyharju
Summary
At least 28 proteins have now been defined as collagens (Trends Genet. 20:33–43, 2004; J. Biol. Chem. 281:3494–3504, 2006), but many of those recently discovered are present in tissues in such small amounts that their isolation for characterization at the protein level has so far been impossible. Some of the fibril-forming collagens are used as a biomaterial in numerous medical applications and as a delivery system for various drugs (3,4 ). The collagens used in all these applications have been isolated from animal tissues and are liable to cause allergic reactions in some subjects and carry a risk of disease-causing contaminants (3,4 ). An efficient recombinant expression system for collagens can thus be expected to have numerous scientific and medical applications. The systems commonly used for expressing other proteins in lower organisms are not suitable as such for the production of recombinant collagens, however, as bacteria and yeast have no prolyl 4-hydroxylase activity and insect cells have insufficient levels of it. Prolyl 4-hydroxylase, an α 2 β 2 tetramer in vertebrates, plays a central role in the synthesis of all collagens, as 4-hydroxyproline-deficient collagen polypeptide chains cannot form triple helices that are stable at 37°C (5,6). All attempts to assem-ble an active prolyl 4-hydroxylase tetramer from its subunits in vitro have been unsuccessful, but active recombinant human prolyl 4-hydroxylase has been produced in insect cells, yeast, and Escherichia coli by coexpression of its α - and β -subunits (7–9).
Key words: Collagen , Biomaterial , Prolyl 4-hydroxylase , Recombinant , Coexpression , Baculovirus , Insect cells , Yeast , Pichia pastoris .
At least 28 proteins have now been defined as collagens (1, 2) , but many of those recently discovered are present in tissues in such small amounts that their isolation for characterization at
1. Introduction
Sharona Even-Ram and Vira Artym (eds.), Methods in Molecular Biology, Extracellular Matrix Protocols, vol. 522© Humana Press, a part of Springer Science + Business Media, LLC 2009DOI: 10.1007/978-1-59745-413-1_3
51
52 Myllyharju
the protein level has so far been impossible. Some of the fibril-forming collagens are used as a biomaterial in numerous medical applications and as a delivery system for various drugs (3, 4) . The collagens used in all these applications have been isolated from animal tissues and are liable to cause allergic reactions in some subjects and carry a risk of disease-causing contaminants (3, 4) . An efficient recombinant expression system for collagens can thus be expected to have numerous scientific and medical applications. The systems commonly used for expressing other proteins in lower organisms are not suitable as such for the production of recom-binant collagens, however, as bacteria and yeast have no prolyl 4-hydroxylase activity and insect cells have insufficient levels of it. Prolyl 4-hydroxylase, an α 2 β 2 tetramer in vertebrates, plays a central role in the synthesis of all collagens, as 4-hydroxypro-line-deficient collagen polypeptide chains cannot form triple helices that are stable at 37°C (5, 6) . All attempts to assemble an active prolyl 4-hydroxylase tetramer from its subunits in vitro have been unsuccessful, but active recombinant human prolyl 4-hydroxylase has been produced in insect cells, yeast, and Escherichia coli by coexpression of its α - and β -subunits (7– 9) . We have developed efficient expression systems to pro-duce recombinant human collagens with stable triple helices in insect and yeast cells by simultaneous coexpression with the recombinant human collagen prolyl 4-hydroxylase (8, 10– 15) . This chapter describes detailed procedures for the production of stable recombinant human type III collagen in insect cells and in the yeast Pichia pastoris . These methods can be applied to the expression of other recombinant collagen types, both homotrimeric and heterotrimeric.
1. pVL1392 and p2Bac baculovirus expression vectors (Invitro-gen, San Diego, CA).
2. Full-length cDNAs for the (16) and (17) subunits of human prolyl 4-hydroxylase and the pro1 chain of human type III procollagen [pro1(III)] (18) .
3. Wizard Plus Maxiprep DNA purification system (Promega, Madison, WI).
4. Sf9 and High Five (H5) insect cells (Invitrogen). 5. TNM-FH medium (Sigma, St. Louis, MO) supplemented
with 10% fetal bovine serum. 6. 6-well plates and 60- and 100-mm tissue culture Petri dishes.
2. Materials
2.1. Materials for Expression of Human Type III Procollagen in Insect Cells (10)

Recombinant Collagen Trimers from Insect Cells and Yeast 53
7. BaculoGold DNA and Transfection Buffers A (Grace’s Medium with 10% fetal bovine serum) and B (25 mM Hepes, pH 7.1, 125 mM CaCl 2 , 140 mM NaCl) (Pharmingen, San Diego, CA).
8. 3% Seaplaque low-melting-point agarose (FMC, Rockland, ME) in H 2 O (autoclaved).
9. L -Ascorbic acid phosphate (Wako, Osaka, Japan). 10. PBS (0.15 M NaCl, 20 mM phosphate, pH 7.4). 11. Homogenization buffer (300 mM NaCl, 0.2% Triton X-100,
and 70 mM Tris-HCl , pH 7.4). 12. SDS-polyacrylamide gel electrophoresis (SDS-PAGE) appa-
ratus. 13. PIIINP radioimmunoassay (Farmos Diagnostica, Turku,
Finland). 14. Pepsin (Boehringer Mannheim, Mannheim, Germany),
trypsin type XIII (Sigma), chymotrypsin type VII (Sigma), trypsin inhibitor type II-S (Sigma).
1. pAO815, pPIC9, and pPICZ B P. pastoris expression vectors (Invitrogen). pYM25 containing the Saccharomyces cerevisiae ARG4 selection marker (obtained from Dr. James Cregg, Oregon Graduate Institute of Science and Technology, Port-land, OR).
2. his4, arg4 P. pastoris host strain (obtained from Dr. James Cregg).
3. Yeast extract peptone dextrose medium (YPD: 1% yeast extract, 2% peptone, 2% dextrose), minimal dextrose medium [MD: 1.34% yeast nitrogen base with ammonium sulfate and without amino acids (YNB), 4 × 10 −5 % biotin, 1% dex-trose], buffered glycerol-complex medium (BMGY: 0.1% yeast extract, 0.2% peptone, 100 mM potassium phosphate, pH 6.0, 1.34% YNB, 4 × 10 −5 % biotin, 1% glycerol), buffered minimal methanol medium (BMM: 100 mM potassium phos-phate, pH 6.0, 1.34% YNB, 4 × 10 −5 % biotin, 0.5% methanol). Recipes for various Pichia media can be found in Version 3.0 of the Invitrogen Pichia Expression Kit Manual (19) .
4. Zeocin (Invitrogen). 5. Triple-baffled Erlenmeyer flasks and silicone sponge closures
(Sigma). 6. Electroporation device and cuvettes. 7. Acid-washed glass beads (Sigma). 8. 1 M sorbitol. 9. 5% glycerol, 50 mM sodium phosphate buffer, pH 7.4.
2.2. Materials for Expression of Human Type III Procollagen in the Yeast Pichia pastoris (8)
54 Myllyharju
1. A double promoter baculovirus expression vector for recom-binant human prolyl 4-hydroxylase (p2Bac4PHαβ) was gener-ated by cloning the cDNAs for its α and β subunits into the Not I site downstream of the p10 promoter and the Bam HI site downstream of the polyhedrin promoter of p2Bac, respec-tively (12) . A Not I site was generated in the subunit cDNA 46 bp upstream of the translation initiation (ATG) codon by PCR ( see Note 1 ).
2. A Bgl II site was created 16 bp upstream of the translation initiation codon to the full-length cDNA for the pro1 chain of human type III procollagen ( see Note 1 ). The cDNA was digested with Bgl II and Xba I and the insert was ligated to Bgl II– Xba I-digested pVL1392, generating pVLrhproCIII.
3. The recombinant expression vectors p2Bac4PHαβ and pVL-rhproCIII were isolated using the Wizard Plus Maxiprep DNA purification system and sterilized with a 0.22-μm syringe filter.
1. The recombinant baculoviruses 4PHαβ and rhproCIII were generated by cotransfection with BaculoGold baculo-virus DNA ( see Note 2 ). 2 × 10 6 Sf9 cells were seeded on 60-mm tissue culture Petri dishes. Cells were allowed to attach for at least 30 min. The culture medium was then removed from the plates and 1 ml of Transfection Buffer A was added. BaculoGold DNA, 0.5 μg, was mixed with 5 μg of the bacu-lovirus expression vector DNA and incubated for 5 min at room temperature. One milliliter of Transfection Buffer B was mixed well with the DNA mixture, and added dropwise to the 60-mm insect cell plate. The plate was gently rocked after the addition of every 3–5 drops of the transfection solution.
2. The plates were incubated at 27°C for 4 h, the transfection solutions were removed, and 4 ml of TNM-FH medium sup-plemented with 10% fetal bovine serum was added.
3. The plates were incubated at 27°C for 4 days. The medium containing the recombinant virus was collected and amplified once by infecting 6 × 10 6 Sf9 cells in a 100-mm Petri dish with 500μ l of the collected transfection medium. The plates were incubated at 27°C for 3 days before the amplification medium was harvested.
4. The amplified recombinant viruses were plaque-purified ( see Note 3 ). 2 × 10 6 Sf9 cells were seeded on 60-mm Petri dishes and allowed to attach for at least 30 min. Three millilitres of serial dilutions (10 −4 , 10 −5 , 10 −6 , 10 −7 ) of the recombinant
3. Methods
3.1. Expression of Recombinant Human Type III Procollagen in Insect Cells
3.1.1. Generation of Recombinant Baculovirus Expression Vectors (10)
3.1.2. Generation of Recombinant Baculovi-ruses (20)
Recombinant Collagen Trimers from Insect Cells and Yeast 55
viruses in TNM-FH supplemented with 10% fetal bovine serum were prepared. The medium from the 60-mm plates was removed and 1 ml of the virus dilutions was added on duplicate plates. The plates were incubated at 27°C for 1 h. Three percents of SeaPlaque agarose was melted in a microwave oven, cooled to 37°C, and two volumes of the culture medium preheated to 37°C was added to obtain a 1% agarose overlay. The virus dilutions were removed and 4 ml of the agarose overlay was added. The plates were incubated in a humid environ-ment at 27°C for 6 days. Agar plugs containing single clear plaques were removed with a sterile pasteur pipette ( see Note 4 ) into 1 ml of the culture medium and the virus particles were eluted by incubation at 4°C overnight.
5. The plaque-purified viruses were amplified three times for 3 days at 27°C (amplifications I, II, and III) to obtain high-titer virus stocks ( see Note 5 ). After the first amplification test infections were performed to screen the viruses for the production of the recombinant proteins of interest ( see Sub-heading 3.1.3). AI (amplification I): 1 × 10 6 Sf9 cells were seeded on the wells of a 6-well plate and 200 l of the eluted plaque-purified virus was used for infection, AII: 6 × 10 6 Sf9 cells were seeded on a 100-mm Petri dish and infected with 100μ l of the AI virus, and AIII: 6 × 10 6 Sf9 cells were seeded on a 100-mm Petri dish and infected with 5–10μ l of the AII virus. The titer of the AIII virus should be about 10 8 PFU (plaque forming units/ml).
1. 6 × 10 6 H5 cells ( see Note 6 ) were seeded on a 100-mm Petri dish and infected with the rhproCIII and 4PH viruses, the former was used in a five- to tenfold excess over the latter. Plates were incubated at 27°C and L -ascorbic acid phosphate (80 μg/ml) was added to the culture medium daily.
2. Cells were harvested ( see Note 7 ) 72 h after infection, washed with PBS and homogenized in the homogenization buffer (500 μl/6 × 10 6 cells). The cell homogenates were centri-fuged at 10,000 × g for 20 min and the soluble fractions were collected. Samples were analyzed with SDS-PAGE under reducing conditions, followed by staining with Coomassie Brilliant Blue or Western blotting using polyclonal antibo-dies to the α and β subunits of human prolyl 4-hydroxy-lase (21) , the N-propeptide of human type III procollagen (Farmos Diagnostica) or a monoclonal antibody 95D1A rec-ognizing the collagenous region of various collagen chains (22) . The amount of recombinant human type III procolla-gen was studied by means of a PIIINP radioimmunoassay for the trimeric N-propeptide of human type III procollagen, and the amount of prolyl 4-hydroxylase activity was assayed
3.1.3. Expression of Recombinant Human Type III Procollagen in Insect Cells (10)
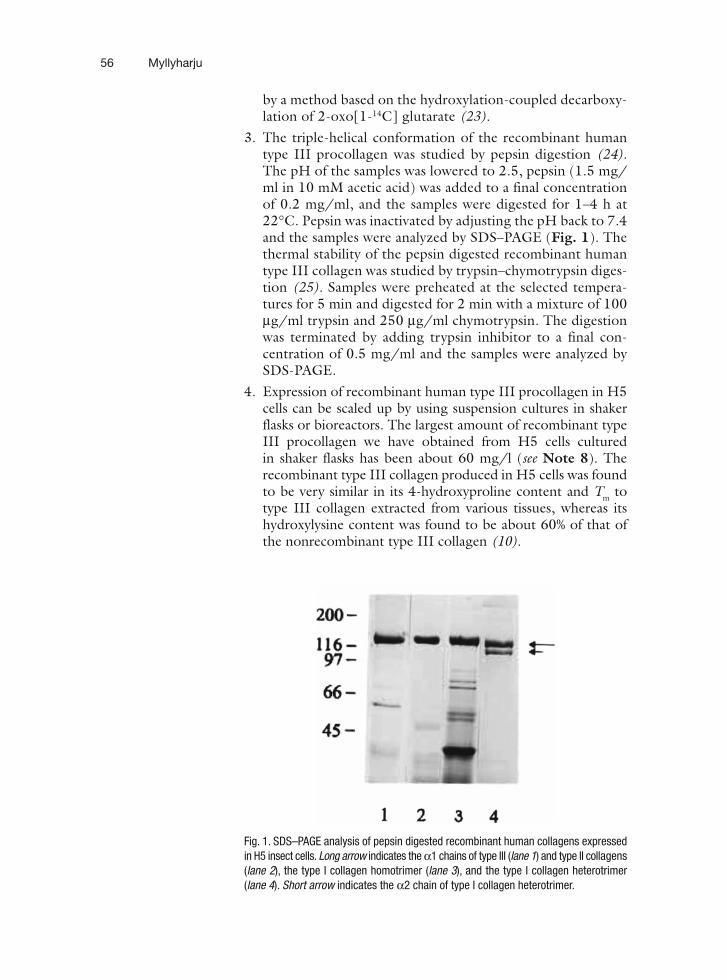
56 Myllyharju
by a method based on the hydroxylation-coupled decarboxy-lation of 2-oxo[1- 14 C] glutarate (23) .
3. The triple-helical conformation of the recombinant human type III procollagen was studied by pepsin digestion (24) . The pH of the samples was lowered to 2.5, pepsin (1.5 mg/ml in 10 mM acetic acid) was added to a final concentration of 0.2 mg/ml, and the samples were digested for 1–4 h at 22°C. Pepsin was inactivated by adjusting the pH back to 7.4 and the samples were analyzed by SDS–PAGE (Fig. 1 ). The thermal stability of the pepsin digested recombinant human type III collagen was studied by trypsin–chymotrypsin diges-tion (25) . Samples were preheated at the selected tempera-tures for 5 min and digested for 2 min with a mixture of 100 μ g/ml trypsin and 250 μ g/ml chymotrypsin. The digestion was terminated by adding trypsin inhibitor to a final con-centration of 0.5 mg/ml and the samples were analyzed by SDS-PAGE.
4. Expression of recombinant human type III procollagen in H5 cells can be scaled up by using suspension cultures in shaker flasks or bioreactors. The largest amount of recombinant type III procollagen we have obtained from H5 cells cultured in shaker flasks has been about 60 mg/l ( see Note 8 ). The recombinant type III collagen produced in H5 cells was found to be very similar in its 4-hydroxyproline content and T m to type III collagen extracted from various tissues, whereas its hydroxylysine content was found to be about 60% of that of the nonrecombinant type III collagen (10) .
Fig. 1. SDS–PAGE analysis of pepsin digested recombinant human collagens expressed in H5 insect cells. Long arrow indicates the α 1 chains of type III ( lane 1 ) and type II collagens ( lane 2 ), the type I collagen homotrimer ( lane 3 ), and the type I collagen heterotrimer ( lane 4 ). Short arrow indicates the α 2 chain of type I collagen heterotrimer .
Recombinant Collagen Trimers from Insect Cells and Yeast 57
1. A modified Pichia expression vector pARG815 was generated by replacing the HIS4 selection marker in pAO815 with the S. cerevisiae ARG4 selection marker. pYM25 containing the ARG4 gene was digested with Hpa I, and the ARG4 Hpa I fragment was ligated into Eco RV-digested pAO815.
2. The 5 ′ end of the human prolyl 4-hydroxylase α subunit cDNA, extending from the translation initiation codon to an internal Hind III site, with Hind III and Sma I sites flanking the initiation codon, and the 3 ′ end, extending from an internal Pst I site to the translation stop codon, with Sma I and Bam HI sites following the stop codon, were synthesized by PCR. These PCR fragments were used to replace the 5 ′ and 3 ′ ends of the original α subunit cDNA to generate a cDNA without any 5 ′ and 3 ′ untranslated regions. The Sma I– Sma I α subunit insert was ligated into the Eco RI site of pARG815, generating pARG815 α .
3. The signal sequence of the human prolyl 4-hydroxylase β sub-unit was replaced with the S. cerevisiae α mating factor ( α MF) prepro sequence ( see Note 9 ). Human prolyl 4-hydroxylase β subunit cDNA, extending from the codon for the first amino acid after the signal peptide cleavage site to the stop codon and flanked by Eco RI sites, was synthesized by PCR and ligated into the Eco RI site following the ( α MF) prepro sequence of pPIC9, generating pPIC9 β .
4. The 3 ′ end of the pro α 1(III) cDNA used in the generation of the recombinant baculovirus pVLrhproCIII ( see step 2 in Subheading 3.1.1 ) was replaced by a PCR fragment extend-ing from an internal Eco RI site to the translation stop codon, with a Xba I site following the stop codon. The Bgl II– Xba I pro α 1(III) cDNA was ligated into the Eco RI– Xba I site of pPICZ B, generating pPICZ Bpro α 1(III).
1. To obtain a recombinant P. pastoris strain expressing human prolyl 4-hydroxylase, pARG815 α and pPIC9 β were linearized with Dra III and Stu I, respectively, and cotransformed into the his4, arg4 P. pastoris host strain by the electroporation method (19) . Five milliliters of the his4, arg4 P. pastoris host strain was cultured in YPD in a 50-ml conical tube at 30°C overnight. Five hundred milliliters of YPD was inoculated with 0.1–0.5 ml of the overnight culture and grown to an OD 600 of 1.3–1.5 ( see Note 10 ). The cells were centrifuged at 4°C at 1,500 × g for 5 min and washed twice, with 500 ml and 250 ml of ice-cold, sterile water. They were then resus-pended in 20 ml of ice-cold 1 M sorbitol, centrifuged, and resuspended in ice-cold 1 M sorbitol to obtain a final volume of 1.5 ml. Three microliters (approximately 0.6 μ g) of the linearized pARG815 α and pPIC9 β were mixed with 40 μ l of the P. pastoris cells, transferred to an ice-cold electroporation
3.2. Expression of Recombinant Human Type III Procollagen in Pichia pastoris
3.2.1. Generation of Recombinant Pichia Expression Vectors (8)
3.2.2. Generation of the Recombinant Pichia Strain and Expression of the Recombinant Human Type III Procollagen (8, 19 )

58 Myllyharju
cuvette and incubated on ice for 5 min. The cells were pulsed using the parameters 1,500 kV, 25 μ F, and 400 Ω ( see Note 11 ), and 1 ml of ice-cold 1 M sorbitol was added immediately afterward. Aliquots of 50–200 μ l of the cells were spread on MD plates and incubated at 30°C until colonies appeared. Selection for His + , Arg + colonies was repeated twice by streaking single colonies on MD plates.
2. The recombinant His + , Arg + colonies obtained above were cultured at 30°C in 25 ml of BMGY in 250-ml shaker flasks to an OD 600 of 5–10. The cells were centrifuged at 1,500 × g for 5 min and resuspended to an OD 600 of 1–3 in BMM to induce expression. Methanol was added every 24 h to a final concentra-tion of 0.5%. Cells were harvested after a 60-h methanol induc-tion, washed once and resuspended to an OD 600 of 250–350 in cold 5% glycerol in 50 mM sodium phosphate buffer, pH 7.4. An equal volume of glass beads was added and the samples were vortexed eight times for 30 s at 4°C with 30 s intervals. They were then centrifuged at 15,000 × g for 30 min at 4°C, the supernatants were collected and screened for expression of the prolyl 4-hydroxylase α and β step 2 of Subheading 3.1.3. A recombinant strain expressing prolyl 4-hydroxylase was selected and termed α / β α -MF.
3. A recombinant strain coexpressing human prolyl 4-hydroxylase and pro α 1(III) chains was generated by transforming Pme I-linearized pPICZ Bpro α 1(III) into the α / β α -MF strain by electroporation as in step 1 . The transformants were selected in YPD (+100 μ g/ml zeocin) ( see Note 12 ). The cells were cultured, induced and harvested as in step 2 , and expression of human prolyl 4-hydroxylase and type III procollagen was assayed in the soluble fraction of cell lysates as in step 2 of Subheading 3.1.3 ( see Note 13 ). A recombinant strain produc-ing human type III procollagen was selected based on these assays and termed α / β α -MF/pro α 1(III).
4. For the production of recombinant human type III procol-lagen, the α / β α -MF/pro α 1(III) Pichia strain was cultured in shaker flasks and induced with methanol. Cells were harvested 60 h after methanol induction and broken with glass beads as in step 2 . The purified recombinant type III collagen produced in shaker flasks was essentially identical in its amino acid composition to nonrecombinant human type III collagen, except that the degree of 4-hydroxylation of the proline residues was 44.2% while the corresponding value for nonrecombinant type III collagen is 51.6% (8) . However, essen-tially fully hydroxylated recombinant human procollagens can be produced in P. pastoris in bioreactors under optimal oxygena-tion conditions (13) . The Pichia -derived recombinant human type III collagen contains no hydroxylysine, whereas nonre-combinant type III collagen has five hydroxylysine residues per

Recombinant Collagen Trimers from Insect Cells and Yeast 59
1,000 amino acids (8) . Expression levels of stable recombinant human collagens have ranged up to 1.5 g/l in P. pastoris in bioreactor cultures (3, 4) .
1. In the p2Bac and pVL1392 vectors the ATG translation initia-tion codons of polyhedrin and p10 have been altered to ATT, which means that the inserts must provide their own ATG initiation codons. The 5 ′ cloning site in the inserts should be as close to the translation initiation codon as possible (less than 100 bp) (20) . Since translation starts from the first ATG codon downstream of the polyhedrin and p10 promoters, no additional ATG codons should exist upstream of the initiation codon of the gene of interest. For example, the polyhedrin multiclon-ing site in the p2Bac vector has a Nco I recognition sequence (CC ATG G), and therefore none of the downstream cloning sites can be used. The length or sequence of the 3 ′ untranslated region of an insert usually has no effect on the expression levels. The p2Bac and pVL1392 vectors provide the polyhedrin or SV40 polyadenylation signals, and therefore the genes of inter-est do not have to include any polyadenylation signals.
2. BaculoGold DNA is a modified baculovirus DNA which contains a lethal deletion (20) , and viable virus particles are obtained only by cotransfection with a complementing bac-ulovirus expression vector. When BaculoGold DNA is used, the expression vectors must therefore include at least 1.7 kbp of baculovirus DNA downstream of the polyhedrin stop codon to counteract the lethal deletion. The recombination frequency with BaculoGold DNA is at least 99%, which is a major improvement over the 0.1% recombination frequency obtained with the wild-type baculovirus DNA.
3. In spite of the high recombination frequency with the Bacu-loGold DNA and the fact that wild-type baculovirus DNA expressing polyhedrin cannot be formed during recombi-nation, it is still advisable to plaque-purify the recombinant virus stocks, as aberrant crossing over during transfection can lead to total or partial deletions of the recombinant gene of interest. The resultant virus stock after plaque-purification is derived from a single virus clone.
4. If plaques are not clearly visible, the plaque assay plates can be stained with Neutral Red or MTT (thiazolyl blue), for example (26) .
5. The MOI (multiplicity of infection = plaque-forming units/cell number) should be below 1 during all amplifications, as
4. Notes

60 Myllyharju
values greater than 1 can lead to deletions in the recom-binant virus particles (\20) . The PFU/ml of a virus stock can be obtained from a plaque assay by the formula: PFU/ml = 1/virus dilution (e.g., 10 −5 ) × number of plaques × 1/ml virus dilution added to the plate.
6. H5 cells consistently give three- to tenfold higher expression levels than Sf9 cells for recombinant human type III procol-lagen (10) .
7. Most of the recombinant fibril-forming human type I, II, or III procollagens produced (70–90%) is retained within the insect cells (10– 12) .
8. The highest expression levels obtained for type I and II col-lagens in suspension culture have been 20–40 and 50 mg/l, respectively (11, 12)
9. The signal sequence of the prolyl 4-hydroxylase β subunit was found to play a major role in enzyme assembly in Pichia (8) . The authentic human signal sequence was ineffective for transport of the β subunit into the lumen of the endoplasmic reticulum, as only trace amounts of an active α 2 β 2 enzyme tetramer were produced. The highest tetramer assembly level was obtained with the S. cerevisiae α mating factor pre–pro sequence, while that obtained with the P. pastoris acid phosphatase 1 signal sequence was about 40% of this value.
10. The doubling time of the his4, arg4 P. pastoris strain is approximately 2 h in YPD.
11. P. pastoris cells can be pulsed using the parameters suggested for S. cerevisiae by the manufacturer of the electroporation device.
12. Zeocin is active only at a low salt concentration (<90 mM) and at pH 7.5. Therefore, screening for His + , Arg + phenotype and zeocin resistance must take place in parallel plates, as the pH of MD plates is not suitable for zeocin selection.
13. As in the case of insect cells ( see Note 7 ), the vast majority of the recombinant human type III procollagen in the Pichia expres-sion system, too, is retained within the cells and can thus be obtained from the soluble fraction of the cell lysates (8) .
References
1. Myllyharju , J. , and Kivirikko , K.I. (2004) Collagens, modifying enzymes and their mutations in humans, flies and worms . Trends Genet. 20 , 33 – 43
2. Veit , G. , Kobbe , B. , Keene , D.R. , Paulsson , M. , Koch , M. , and Wagener , R. (2006) Collagen XXVIII, a novel von Willebrand factor a domain-containing protein with many imperfections
in the collagenous domain . J. Biol. Chem. 281 , 3494 – 3504
3. Olsen , D. , Yang , C. , Bodo , M. , Chang , R. , Leigh , S. , Baez , J. , Carmichael , D. , Perälä , M. , Hämäläinen , E.-R. , Järvinen , M. , and Polarek , J. (2003) Recombinant collagen and gelatin for drug delivery . Adv. Drug Deliv. Rev. 55 , 1547 – 1567

Recombinant Collagen Trimers from Insect Cells and Yeast 61
4. Baez , J. , Olsen , D. , and Polarek , J. (2005) Recombinant microbial systems for the pro-duction of human collagen and gelatin . Appl. Microbiol. Biotechnol. 69 , 245 – 252
5. Kivirikko , K.I. , and Pihlajaniemi , T. (1998) Collagen hydroxylases and the protein disulfide isomerase subunit of prolyl 4-hy-droxylases . Adv. Enzymol. Relat. Areas Mol. Biol. 72 , 325 – 398
6. Myllyharju , J. (2003) Prolyl 4-hydroxylases, the key enzymes of collagen biosynthesis . Matrix Biol. 22 , 15 – 24
7. Vuori , K. , Pihlajaniemi , T. , Marttila , M. , and Kivirikko , K.I. (1992) Characterization of the human prolyl 4-hydroxylase tetramer and its multifunctional protein disulfide-isomerase subunit synthesized in a baculovirus expres-sion system . Proc. Natl Acad. Sci. USA 89 , 7467 – 7470
8. Vuorela , A. , Myllyharju , J. , Nissi , R. , Pihla-janiemi , T. , and Kivirikko , K.I. (1997) Assem-bly of human prolyl 4-hydroxylase and type III collagen in the yeast P. pastoris : Formation of a stable enzyme tetramer requires coexpres-sion with collagen and assembly of a stable collagen requires coexpression with prolyl 4-hydroxylase . EMBO J. 16 , 6702 – 6712
9. Neubauer , A. , Neubauer , P. , and Myllyharju , J. (2005) High-level production of human collagen prolyl 4-hydroxylase in Escherichia coli . Matrix Biol. 24 , 59 – 68
10. Lamberg , A. , Helaakoski , T. , Myllyharju , J. , Peltonen , S. , Notbohm , H. , Pihlajaniemi , T. , and Kivirikko , K.I. (1996) Characterization of human type III collagen expressed in a baculovirus system. Production of a protein with a stable triple helix requires coexpression with the two types of recombinant prolyl 4-hydroxylase subunit . J. Biol. Chem. 271 , 11988 – 11995
11. Myllyharju , J. , Lamberg , A. , Notbohm , H. , Fietzek , P.P. , Pihlajaniemi , T. , and Kivirikko , K.I. (1997) Expression of wild-type and modi-fied pro chains of human type I procollagen in insect cells leads to the formation of sta-ble [α1(I)] 2 α2(I) collagen heterotrimers and [α1(I)] 3 homotrimers but not [α2(I)] 3 homot-rimers . J. Biol. Chem. 272 , 21824 – 21830
12. Nokelainen , M. , Helaakoski , T. , Myllyharju , J. , Notbohm , H. , Pihlajaniemi , T. , Fietzek , P.P. , and Kivirikko , K.I. (1998) Expression and characterization of recombinant human type II collagens with low and high contents of hydroxylysine and its glycosylated forms . Matrix Biol. 16 , 329 – 338
13. Nokelainen , M. , Tu , H. , Vuorela , A. , Not-bohm , H. , Kivirikko , K.I. , and Myllyharju , J. (2001) High-level production of human type
I collagen in the yeast Pichia pastoris . Yeast 18 , 797 – 806
14. Myllyharju , J. , Nokelainen , M. , Vuorela , A. , and Kivirikko , K.I. (2000) Expression of recombinant human type I-III collagens in the yeast Pichia pastoris . Biochem. Soc. Trans. 28 , 353 – 357
15. Pakkanen , O. , Hämäläinen , E.-R. , Kivirikko , K.I. , and Myllyharju , J. (2003) Assembly of stable human type I and III collagen molecules from hydroxylated recombinant chains in the yeast Pichia pastoris . Effect of an engineered C-terminal oligomerization domain foldon . J. Biol. Chem. 278 , 32478 – 32483
16. Helaakoski , T. , Vuori , K. , Myllylä , R. , Kivirikko , K.I. , and Pihlajaniemi , T. (1989) Molecular cloning of the a-subunit of human prolyl 4-hydroxylase: The complete cDNA-derived amino acid sequence and evidence for alternative splicing of RNA transcripts . Proc. Natl Acad. Sci. USA 86 , 4392 – 4396
17. Pihlajaniemi , T. , Helaakoski , T. , Tasanen , K. , Myllylä , R. , Huhtala , M.-L. , Koivu , J. , and Kivirikko , K.I. (1987) Molecular cloning of the -subunit of human prolyl 4-hydroxylase. This subunit and protein disulphide isomerase are products of the same gene . EMBO J. 6 , 643 – 649
18. Tromp , G. , Kuivaniemi , H. , Shikata , H. , and Prockop , D.J. (1989) A single base mutation that substitutes serine for glycine 790 of the 1(III) chains of type III procolla-gen exposes an arginine and causes Ehlers–Danlos syndrome IV . J. Biol. Chem. 264 , 1349 – 1352
20. Crossen , R. , and Gruenwald , S. (1998) Bacu-lovirus Expression Vector System Manual , 5th Edition , Pharmingen , San Diego, CA
21. Veijola , J. , Pihlajaniemi , T. , and Kivirikko , K.I. (1996) Co-expression of the a subunit of human prolyl 4-hydroxylase with BiP polypep-tide in insect cells leads to the formation of soluble and insoluble complexes . Biochem. J. 317 , 613 – 618
22. Snellman , A. , Keränen , M.-R. , Hägg , P.O. , Lamberg , A. , Hiltunen , J.K. , Kivirikko , K.I. , and Pihlajaniemi , T. (2000) Type XIII colla-gen forms homotrimers with three triple heli-cal collagenous domains and its association into disulfide-bonded trimers is enhanced by prolyl 4-hydroxylase . J. Biol. Chem. 275 , 8936 – 8944
23. Kivirikko , K.I. , and Myllylä , R. (1982) Post-translational enzymes in the biosynthesis of collagens: Intracellular enzymes . Methods Enzymol. 82 , 245 – 304
24. Bruckner , P. , and Prockop , D.J. (1981) Prote-olytic enzymes as probes for the triple-helical

62 Myllyharju
conformation of procollagen . Anal. Biochem. 110 , 360 – 368
25. Sieron , A.L. , Fertala , A. , Ala-Kokko , L. , and Prockop , D.J. (1993) Deletion of a large domain in recombinant human procol-lagen II does not alter the thermal stability
of the triple helix . J. Biol. Chem. 268 , 21232 – 21237
26. Guide to Baculovirus Expression Vector Systems (BEVS) and Insect Cell Culture Techniques. Instruction Manual. Gibco BRL, Life Tech-nologies, 2002.
Chapter 4
Eukaryotic Expression and Purification of Recombinant Extracellular Matrix Proteins Carrying the Strep II Tag
Neil Smyth , Uwe Odenthal , Barbara Merkl, and Mats Paulsson
Summary
For recombinant expression of extracellular matrix (ECM) proteins or their individual domains, the use of transformed mammalian cells offers two major advantages. First, eukaryotic expression can be expected under optimum conditions to produce a large proportion of correctly folded molecules. ECM proteins are made from a group of 25 structurally known (Rev. Biophys. 29:119–167, 1996) and about 200 cDNA derived domains many of which regularly reappear in the different proteins. These have often a complex secondary structure, maintained by multiple disulfide bonds. Whereas by denaturing and then carefully renaturing, an approximation to the native structure may be obtained using prokaryotic expres-sion systems, and the best that may be expected is that a small percentage of the protein folds into such a conformation. Second, most ECM proteins are at least to some extent glycosylated and often heavily so, and the use of the mammalian system offers the best approximation to the sugar structures present in the native form of the molecule.
Key words: Extracellular matrix , Recombinant protein , Human embryonic kidney 293 , Cells , Transfection , Cell culture , Secretion , Protein purification , Affinity chromatography , Strep II tag.
For recombinant expression of extracellular matrix (ECM) pro-teins or their individual domains, the use of transformed mamma-lian cells offers two major advantages. First, eukaryotic expression can be expected under optimum conditions to produce a large proportion of correctly folded molecules. ECM proteins are made from a group of 25 structurally known (1) and about 200 cDNA derived domains many of which regularly reappear in the
1. Introduction
Sharona Even-Ram and Vira Artym (eds.), Methods in Molecular Biology, Extracellular Matrix Protocols, vol. 522© Humana Press, a part of Springer Science + Business Media, LLC 2009DOI: 10.1007/978-1-59745-413-1_4
63

64 Smyth et al.
different proteins. These have often a complex secondary struc-ture, maintained by multiple disulfide bonds. Whereas by dena-turing and then carefully renaturing, an approximation to the native structure may be obtained using prokaryotic expression systems, the best that may be expected is that a small percent-age of the protein folds into such a conformation. Second, most ECM proteins are at least to some extent glycosylated and often heavily so, and the use of the mammalian system offers the best approximation to the sugar structures present in the native form of the molecule.
Although the use of the mammalian systems has the above advantages, it also has major drawbacks. They are relatively slow to set up as opposed to those using yeast, bacteria, or baculovirus/insect cells. It takes up 2 weeks to obtain 1L of culture medium from mammalian cells, as opposed to 8–12 h from bacteria. Tissue culture over such periods is labor intensive and expensive. Finally, the level of the secreted protein in the media is variable (50 μ g to 3 mg/L of medium) and where no antibody exists to the protein or domain, this can lead to problems in its identifica-tion and in following its progress during subsequent purification steps. A tag fused either on the N ′ or C ′ terminus can act as an aid in the immunological identification of the expressed protein. It may also be used in a variety of affinity chromotography methods leading to its purification.
We use a modified version of the system described previously for expression of a variety of matrix proteins in human embryonic kidney 293 cells (2– 4) . The human cytomegalovirus immediate early gene enhancer-promoter is used to drive the expression of the recombinant protein. This gives potentially high expression of the product in primate cells; however, levels in rodent lines may be minimal. The BM40 (SPARC/osteonectin) signal pep-tide is placed downstream of the promoter and fused in frame to the protein with the tag. The plasmid contains the cassette for the puromycin N -acetyltransferase gene allowing selection in transfected eukaryotic cells and also an ampicillin resistance gene for use in selection and plasmid manipulation in Escherichia coli. Further, these plasmids also contain the Epstein Barr virus (EBV) origin of replication. This is sensitive to the action of the EBV nuclear antigen, which is expressed in 293-EBNA cells leading to the maintenance of the plasmid extrachromosomally, with it replicating independently of the host cells division. Hence, such plasmids can be used either to give stably integrated clones or to produce cells with possibly higher protein production by expres-sion of the protein coded on the episomal plasmid. By maintaining the selection pressure from the puromycin, these episomal plas-mids are retained for prolonged periods in such cells. There is, however, the possibility that with time the plasmid may be lost leading to a progressive reduction in the yield of recombinant
Eukaryotic Expression and Purification of Recombinant 65
protein, though we have failed to see this even over 30 cell passages.
Many fusion tags have been successfully used to aid in the purification of recombinant proteins. The tag peptide is a small sequence, usually 6–10 amino acids long, which acts either as an antibody epitope or as an affinity ligand or both. The first prob-lem encountered with the use of a tag is that its activity depends either upon it being immunogenic or participating in some other form of molecular interaction. As generally, the production of recombinant proteins is to derive antisera or monoclonal anti-bodies or to study interactions, and this may be a handicap. This problem may be overcome by the addition of a protease cleavage site between the tag and the protein to allow the removal of the tag ( see Note 1 ). Second, the position of the tag may affect the activity of the expressed protein by altering folding or other post-translational modifications. Finally, the tag itself may be masked by the tertiary structure of the protein. Hence, care should be taken in deciding whether the tag should be placed to the N or C-terminus. We have successfully used the Strep II tag to give a single step purification of recombinant proteins from the media of 293-EBNA cells. This tag was initially found by screening a peptide library with streptavidin and is highly specific, not bind-ing to the closely-related protein avidin (5) . Crystallization of the peptide with its ligand showed that it bound to the same pocket as biotin, though in a more superficial position. The original peptide WRHPQFGG only bound strongly when placed C-terminally, as the final Gly–Gly–COO– was used to form a salt bridge with the streptavidin molecule. By mutating the penultimate glycine to a glutamic acid, which can donate a COO– to form such a bridge, a new form of the peptide was produced that is active both C and N-terminally (6) . Further mutations led to the formation of an optimized binding sequence of WSHPQFEK (Strep II) (6) . Ran-dom mutation of the gene for streptavidin has since produced a form of this protein “StrepTactin,” which binds to the Strep II tag also highly specifically but with a greater affinity (7) . Binding can be competed with biotin or its derivatives leading to the elution of the Strep-tagged protein under gentle conditions giving a native protein. Although the biotin–StrepTactin interaction is for practical purposes irreversible, desthiobiotin, a homolog of biotin, which can also displace the Strep tag from StrepTactin, binds relatively weakly to StrepTactin. It may then be eluted simply allowing the reuse of the StrepTactin matrix.
We have produced two vectors CMVNstrep and CMVCstrep with the same frame at the 5 ′ end (Fig. 1 ) for N or C-terminal tagging. cDNA is amplified by PCR with primers containing modified ends. The 5 ′ end of the sense primer carries a Spe I, Nhe I, or Xba 1 site placed to bring the codon alignment of the amplified fragment in frame with the signal peptide (+/− tag).

66 Smyth et al.
On the antisense primer, a stop codon is followed by a Not 1 site in the case of CMVNstrep and a Not 1 site, bringing the linking alanines of the tag into frame in the case of the CMVCstrep. The choice of the primers should be checked carefully: first, to keep frame, and second, as the selection of the wrong domain borders will probably lead to misfolding of the expressed protein and possibly lead to its intracellular degradation. Where the bor-ders are unknown, we suggest making a series of constructs of increasing size integrating successive likely border cysteines and
Fig. 1 . Vectors for expression of secreted proteins with N- and C-terminal Strep tags in mammalian cells .
Eukaryotic Expression and Purification of Recombinant 67
leaving a small linker region between the cysteine and the tag or signal peptide. The PCR is carried out on preexisting cDNA, using a proofreading enzyme to limit polymerase-induced errors and, after cloning into the relevant vector, it is sequenced in its entirety. We transfect by electroporation, which is simple and effi-cient and we generally use 293-EBNA cells to obtain episomal plasmid replication.
These vector systems have proven to be generally applicable. We have used them to produce both extracellular matrix proteins such as laminin domains (8) , matrilins (9, 10) , and AMACO (11) as well as the intracellular transglutaminases 2 (12) and 3 (13) in mammalian cells. With a modification of the procedure a Strep II tagged form of the intracellular protein FHL2 was produced in insect cells (14) . The specific publications contain additional documentation of the procedures.
1. Serum-free media; Dulbeccos MEM-nutrient mix F-12 (Gibco, Gaithersburg, MD) with final concentrations of 2 mM glutamine (Gibco) and 100 U/mL penicillin, 100 μ g/mL streptomycin (Gibco).
2. Growth media; serum-free media with 10 % fetal calf serum ( not heat-inactivated serum) and 175 μ g/mL active G418 (Gibco).
3. Selection media; serum-free media with 10% fetal calf serum, 175 μ g/mL active G418 and 0.5 μ g/mL puromycin (Sigma, St. Louis, MO) ( see Note 1 ).
1. Protease inhibitors; 100 × stock of NEM ( N -ethylmaleimide, Fluka, Buchs, Switzerland) and PMSF (phenylmethylsulfonyl fluoride, Fluka) are dissolved together both at 100 mM in methanol and stored at –20°C.
2. Washing buffer; 100 mM Tris/HCl, 1mM EDTA (pH 8.0). Elution buffer; washing buffer with 2.5 mM desthiobiotin (Sigma). Regeneration buffer; washing buffer with 1mM HABA (4-hydroxyazobenzene–2-carboxylic acid) (Sigma). The above buffers are filtered through a 0.2- μ m sterile filter prior to use.
3. StrepTactin (IBA, Göttingen) may be bought as free Strep-Tactin Sepharose or as a ready-to-use column (1mL column volume) and is claimed to bind up to 350 nmol of biotin per mL gel matrix.
2. Materials
2.1. Media for 293-EBNA Cells
2.2. Materials for Puri-fication of Protein

68 Smyth et al.
1. 293 EBNA cells (Invitrogen, San Diego, CA) are cultured in growth media on 10-cm culture dishes at 37°C and in 5% CO2 until 80% confluent.
2. The cells are trypsinized and dispersed by trituration. They are then pelleted at 150× g for 3min, resuspended in 5 mL of growth media, and counted (a 10-cm dish gives about 2×10 7 cells).
3. Cells are diluted to 6 × 10 5 per mL in growth media and 800 μ L of cells are mixed with 10 μ g of purified circular plasmid DNA, (Qiagen or equivalent) and left for 5min at room temperature. A control electroporation with no DNA added to the cells is also carried out.
4. The cells are placed in a 4-mm electrode gap cuvette (Bio-Rad, Richmond, CA) and electroporated with the following settings:
Capacitance 500 μ F. Voltage 230V. 5. After electroporation, the cells are left for 5min to recover and
then plated out on a 10 cm culture dish in growth medium. 6. Medium is changed daily and puromycin selection is initiated 48 h
after transfection. After 6 days of selection, the negative control cells are dead, whereas the test plate is 60–70% confluent with obvious areas of clonal growth having been observed earlier.
7. The plate is trypsinized and the cells split on to two 10-cm dishes, which are allowed to grow for a further 2 days before the cells of one plate are cryopreserved in liquid nitrogen.
8. The other plate is allowed to grow for another 2 days until highly confluent. There should be no gaps between cells, and the cell sheet should appear thick and undulating. As most of the contaminating proteins tend to be serum-derived, washing to remove the selection media should be thorough. The plates should be drained by being left at an angle for a minute to remove all residual medium. They are washed twice with PBS with care taken to remove all the PBS. 8 mL of serum free medium is added to the plate. The serum free media is replaced after 2, 4, and 6 days and the harvested media cleaned of debris by centrifugation and stored at −20°C until analyzed by SDS–PAGE and/or immunoblotting.
If the protein is expressed, cells can be thawed and the culture scaled up. Generally, we grow the cells at this stage upon 5–20 dishes of 15-cm diameter and produce between 0.2 and 1L of
3. Methods
3.1. Transfection of 293-EBNA Cells
3.2. Purification of Expressed Recom-binant Protein

Eukaryotic Expression and Purification of Recombinant 69
medium depending upon expression levels and experimental requirements. 1. Medium is harvested and stored at −20°C until required. 2. Upon thawing, the protease inhibitors NEM and PMSF are
added and as both are sensitive to hydrolysis they are readded fresh every 24 h and the protein is maintained above freez-ing. To further reduce degradation, EDTA is added to give a final concentration of 10 mM. All subsequent purification steps are carried out at 4°C.
3. Where large volumes are being used, the protein solution may be concentrated 5–10 times using an ultrafiltration cell (Amicon, Danvers, MA) with a membrane pore size chosen according to the molecular mass of the recombinant protein (protein binding to the membrane may be reduced by ini-tially rinsing the membrane in 5% Tween-20 overnight and then rinsing it extensively with water before use.).
4. The StrepTactin column is equilibrated with five column volumes of washing buffer passed through at 0.2 mL per min for a 1-mL column.
5. The protein is loaded on the column at the same flow rate and is recirculated over 12–24 h.
6. The column is washed with at least five column volumes of washing buffer at 0.2 mL per min.
Fig. 2 . Affinity purification of the IV domain from laminin b2 chain of transfected 293-EBNA cells. The protein carried an N-terminal Strep II tag and was chromatographed on StrepTactin column as described in the text. The product occurs in different glyco-sylation forms. ( A ) Purification from serum-free medium: ( lane 1 ) cell culture superna-tant; ( lane 2 ) flowthrough; ( lane 3 ) wash; ( lane 4 ) eluate. (B ) Purification from medium containing 10% FCS: ( lane 1 ) cell-culture supernatant; ( lane 2 ) eluate. SDS–PAGE was performed on 15% polyacrylamide gels that were immunoreactive with an antibody specific for the laminin b2 chain .
70 Smyth et al.
7. Elution of the protein occurs upon the addition of three column volumes of elution buffer and 0.5-mL aliquots are collected and analyzed (Fig. 2a,b ).
8. The column is cleaned using 15 column volumes of HABA-containing regeneration buffer. HABA has a yellow color and displaces the desthiobiotin. Upon interaction with avidin homologs, it has a color shift from yellow to red that can be used to indicate the removal of desthiobiotin from the column.
9. Finally, the column is washed free of the HABA using 10 column volumes of the wash buffer. The matrix should now loose its red pigmentation. The column can be stored at 4ï, °C when maintained in wash buffer containing 0.02% w/v sodium azide.
10. A number of problems with recombinant protein purifica-tion may be encountered, and these are discussed in Notes 3 – 5 .
1. Tags may not always be innocuous (15) . We have produced the CMVNstrep with protease sites for factor X, enteroki-nase, or thrombin to allow the removal of the Strep tag if it is felt to be a problem for later studies.
2. New batches of puromycin should be tested for their activity, to determine the minimum concentration able to give total cell death after 5 days of selection of the untrans-fected control.
3. Low or no expression of the protein may be caused by a number of causes. (a) Frame shifts either owing to an error in choosing prim-
ers or an artifact in cloning. (b) A PCR-induced mutation introducing a stop codon
or leading to a major amino acid substitution affecting the structure of the expressed protein and leading to its intracellular degradation.
(c) Incorrect estimation of the domain borders may lead to an incorrectly folded and nonsecreted protein.
(d) Poor transfection efficiency with the survival of non-transfected cells gives low levels of the protein in the media. This may be corrected by hard (1:20) splitting
4. Notes
Eukaryotic Expression and Purification of Recombinant 71
of the cells and this is indicated when many dead cells are seen after routine passaging.
(e) A low plasmid copy number in the 293-EBNA cells may produce low expression levels. Increasing the amount of puromycin in the selection media two or threefold may raise yields of the recombinant protein.
(f) The formation of insoluble deposits may occur where the secreted protein precipitates out of the media or is incorporated into a matrix around the cells or upon the plate. It is worthwhile immunoblotting the cell extract after the cells have been removed from the plate by prolonged washing with EDTA/PBS as well as trying to extract any proteins in the matrix laid on to the plate by treating it with SDS–PAGE sample buffer.
4. Expression of the protein as multiple bands when run on a SDS–PAGE gel may have numerous causes. (a) Intra or extracellular degradation of the protein may be
occurring, the latter can be reduced by protease inhibi-tors, more frequent harvesting of media from the cells, or the use of different cell lines (e.g., COS cells) perhaps not expressing the protease.
(b) Variable levels of protein glycosylation may occur, this can be analyzed by treatment of the protein with N -glycosidase F, which should give an unglycosylated product of a single molecular mass if the differences are caused by N-linked carbohydrates. This may be caused by very high expression of the protein leading to exhaustion of the posttranslational mechanisms of the cell. If it is a major hindrance, stable clones expressing at lower levels may reduce these prob-lems.
5. The protein is expressed, but does not bind when added to the StrepTactin column. (a) There has been insufficient cleaning of the column pos-
sibly owing to using low volumes of the regeneration and washing buffers.
(b) The medium was passed over the column at too great a speed for efficient binding.
(c) The tag is masked by folding of the protein, a tag placed on the opposite terminal may be more effective.
(d) The protein solution loaded is too dilute. Try concen-trating the sample in a stirred ultrafiltration cell.

72 Smyth et al.
The authors gratefully thank the Centre for Molecular Medicine Cologne and the Köln Fortune Programme of the Medical Faculty, University of Cologne for their financial assistance.
Acknowledgments
References
1. Bork , P. , Downing , A. K. , Kieffer , B. , and Campbell , I. D. (1996) Structure and distri-bution of modules in extracellular proteins. Rev. Biophys. 29 , 119 – 167
2. Pöschl , E. , Fox , J. W. , Block , D. , Mayer , U. , and Timpl , R. (1994) Two noncontiguous regions contribute to nidogen binding to a single EGF-like motif of the laminin γ 1 chain. EMBO J. 13 , 3741 – 3747
3. Kohfeldt , E. , Maurer , P. , Vannahme , C. , and Timpl , R. (1997) Properties of the extracellu-lar calcium binding module of the proteogly-can testican. FEBS Lett. 414 , 557 – 561
4. Kohfeldt , E. , Gohring , W. , Mayer , U. , Zweck-stetter , M. , Holak , T. A. , Chu , M. L. , and Timpl , R. (1996) Conversion of the Kunitz-type module of collagen VI into a highly active trypsin inhibitor by site-directed mutagenesis. Eur. J. Biochem. 238 , 333 – 340
5. Schmidt , T. G. , and Skerra , A. (1993) The random peptide library-assisted engineering of a C-terminal affinity peptide, useful for the detection and purification of a functional Ig Fv fragment. Protein Eng. 6 , 109 – 122
6. Schmidt , T. G. , Koepke , J. , Frank , R. , and Skerra , A. (1996) Molecular interaction between the Strep-tag affinity peptide and its cognate target, streptavidin. J. Mol. Biol. 255 , 753 – 766
7. Voss , S. , and Skerra , A. (1997) Mutagen-esis of a flexible loop in streptavidin leads to higher affinity for the Strep-tag II peptide and improved performance in recombinant pro-tein purification. Protein Eng. 10 , 975 – 982
8. Odenthal , U. , Haehn , S. , Tunggal , P. , Merkl , B. , Schomburg , D. , Frie , C. , Paulsson , M. , and Smyth , N. (2004) Molecular analysis of laminin N-terminal domains mediating self-interactions. J. Biol. Chem. 279 , 44504 – 44012
9. Klatt , A. , Nitsche , D.P. , Kobbe , B. , Macht , M. , Paulsson , M. , and Wagener , R. (2001) Molecular structure, processing and tissue distribution of matrilin-4. J. Biol. Chem. 276 , 17267 – 17275
10. Otten , C. , Wagener , R. , Paulsson , M. , and Zaucke , F. (2005) Matrilin-3 mutations that cause chondrodysplasias interfere with protein trafficking while a mutation linked to hand oste-oarthritis does not. J. Med. Genet. 42 , 774 – 779
11. Sengle , G. , Kobbe , B. , Mörgelin , M. , Paulsson , M. , and Wagener , R. (2003) Identification and characterization of AMACO, a new member of the von Willebrand factor A-like domain pro-tein superfamily with a regulated expression in kidney. J. Biol. Chem. 278 , 50240 – 50249
12. Sardy , M. , Odenthal , U. , Karpati , S. , Pauls-son , M. , and Smyth , N. (1999) Recombinant human tissue transglutaminase ELISA for the diagnosis of gluten sensitive enteropathy. Clin. Chem. 45 , 2142 – 2149
13. Sardy , M. , Karpati , S. , Merkl , B. , Paulsson , M. , and Smyth , N. (2002) Epidermal trans-glutaminase (TGase-3) is the autoantigen of dermatitis herpetiformis. J. Exp. Med. 195 , 747 – 757
14. El Mourabit , H. , Müller , S. , Tunggal , L. , Paulsson , M. , and Aumailley , M. (2004) Analysis of the adaptor function of the LIM domain-containing protein FHL2 using an affinity chromatography approach. J. Cell. Biochem. 92 , 612 – 625
15. Ledent , P. , Duez , C. , Vanhove , M. , Leje-une , A. , Fonze , E. , Charlier , P. , Rhazi-Filali , F. , Thamm , I. , Guillaume , G. , Samyn , B. , Devreese , B. , Van Beeumen , J. , Lamotte-Brasseur , J. (1997) Unexpected influence of a C-terminal-fused His-tag on the processing of an enzyme and on the kinetic and folding parameters. FEBS Lett. 413 , 194 – 196

Chapter 5
Preparation of Recombinant Fibronectin Fragments for Functional and Structural Studies
David Staunton , Christopher J. Millard , A. Radu Aricescu , and Iain D. Campbell
Summary
Fibronectin, an ubiquitous extracellular matrix (ECM) glycoprotein, plays a major role in fundamen-tal biological processes such as cell adhesion and migration, maintenance of normal cell morphology, cytoskeletal organization, and cell differentiation. Fibronectin is constructed from three types of inde-pendently folding protein module (Fn1, Fn2, and Fn3) and is found as a Fibrillar network in the ECM where it interacts with other ECM components and provides anchorage sites for cell surface integrin receptors. The mosaic nature of fibronectin permits it to be analyzed by a “dissection” strategy, where protein fragments generated by recombinant expression in E. coli , P. pastoris , and human cell lines are employed in structural and functional investigations. We describe methods suitable for the production of various fibronectin fragments for study by a variety of techniques including crystallography and electron microscopy but special mention is made of methods suitable for the production of samples for NMR studies.
Key words: Fibronectin , Recombinant expression , E. coli , Cell-free expression , P. pastoris , Transient expression .
The various molecules of the extracellular matrix (ECM) are noto-riously difficult to study because of their large size and heteroge-neity, compounded by diverse posttranslational modifications and difficulties of extraction from an insoluble, cross-linked matrix. Recombinant expression methods are thus particularly valuable for defining the structure and function of many ECM molecules.
1. Introduction
Sharona Even-Ram and Vira Artym (eds.), Methods in Molecular Biology, Extracellular Matrix Protocols, vol. 522© Humana Press, a part of Springer Science + Business Media, LLC 2009DOI: 10.1007/978-1-59745-413-1_5
73

74 Staunton et al.
This is illustrated here by a discussion of methods suitable for the preparation of defined fragments of fibronectin (Fn).
Fn is an essential ECM glycoprotein in higher organisms (1, 2) . Its role in cell adhesion and migration has implications for a wide range of important functions, including embryo development and cancer metastasis. Fn is made up almost entirely of three types of protein domain, or module, called as Fn1, Fn2, and Fn3. The structures of these three types of module were determined some time ago using protein expression methods and NMR (3) . The major structural and functional question for today has moved to how these modules assemble in the ECM to form structures that interact with other molecules, such as collagen and cell surface integrins.
The main purpose of this brief review is to describe meth-ods suitable for the production of various Fn fragments for study by a variety of techniques including crystallography and electron microscopy but, as in our previous report (4) , special mention is made of methods suitable for the production of samples suitable for NMR studies. The methods described relate to recent struc-tural and functional work from this laboratory.
A successful expression system is defined by the nature of the protein expressed. We thus start with a brief consideration of the structure of the constituent Fn modules. Fn1 modules are of approximately 45 amino acids with two conserved disulphide bonds, and the Fn2 modules are of approximately 60 amino acids with again two conserved disulphide bonds, while the Fn3 moles are of approximately 90 amino acids with no disulphide bonds. Some of these modules may be glycosylated or posttranslation-ally modified in some other way, which will affect the choice of expression system.
Although the number and range of expression systems avail-able can be daunting, the choice is simpler when isotopic labeling is required. The ability to grow on minimal media is limited to a few systems that include E. coli , yeast, algae, and fungi. For most research groups, the only realistic ones are E. coli , and yeast. E. coli gives good yields with efficient incorporation of label but lacks an efficient mechanism for refolding of proteins contain-ing disulphide bonds. Yeast has efficient chaperone systems for disulphide formation and has the ability to glycosylate, a modi-fication that can have important roles in the refolding and func-tion of extracellular proteins. For these reasons, the expression of Fn modules can be divided into those that can be efficiently expressed in E. coli (Fn3) and those that require the chaperone properties of yeast (Fn1 and Fn2). In cases where larger fragments of several domains are to be produced, a different expression system may be required, such as transient expression in human cells. In general, such systems are much less amenable to isotopic
1.1. Strategies for Expression of Fibronectin Fragments

Preparation of Recombinant Fibronectin Fragments 75
labeling, although they can provide the fragments essential for functional studies. Proteolytic fragments of the native protein, which is available in relatively large amounts in plasma may also be used for functional and structural studies. Yet another strategy that is often convenient especially for selective labeling is a cell-free system (5) .
E. coli expression systems are well established, and there are good sources of protocols and media recipes (6) . We generally use a glutathione-S-transferase (GST) fusion system for expressing Fn3 modules as this provides soluble, purified protein, and the fusion protein can be used in pull down assays for studying function. Fn3 constructs are cloned into the BamH I and EcoR I sites of the vector pGEX-6P-2 (GE Healthcare).
Human Fn cDNA (clone 150785) is obtainable from the Mammalian Gene Collection ( http://mgc.nci.nih.gov/ ) and the modules are defined by the Pfam ( http://www.sanger.ac.uk/Software/Pfam/ ) (7) or Smart ( http://smart.embl-heidelberg.de/ ) (8) databases. Given the codon usage differences between humans and E. coli , we routinely transform strain BL21 Codon plus RP and RIL (Stratagene) with the constructs for protein production. These cells contain plasmids encoding extra copies of genes for rare tRNAs, e.g., codons AGA and AGG that code for arginine. A shortage of correctly charged tRNA will result in the misincorporation of amino acids such as lysine for arginine result-ing in a characteristic change in the expected molecular weight (a reduction of 75 Da in the case of lysine for arginine substi-tutions) that can be detected by mass spectroscopy. To increase expression yields, we normally only select for the Codon plus plasmid with chloramphenicol in the overnight starter cultures and express the protein in the absence of chloramphenicol.
Normal media such as Luria Broth (LB) can be used for ini-tial expression and protein characterization studies. An expres-sion level of at least 1 mg/L of culture should be obtained before attempting isotopic labeling, and conditions must be optimized with the minimal media since the growth rates are very medium-dependent. For growth in minimal medium, we use freshly trans-formed bacteria or glycerol stocks spread on a fresh LB plate with the appropriate selection not only for the pGEX vector but also for the plasmid carrying the human tRNA in the bacterial strain. The minimal media used for isotopic labeling is a variation on M9 but with the trace elements and vitamins replaced with the com-mercial preparation of Yeast Nitrogenous Base without amino acids or ammonium sulphate (Difco).
It is crucial that the bacteria adapt to the minimal media and establish a dense culture in exponential growth before trying to passage the culture onto the next stage of fermentation. For this reason, it is best to grow the inoculum over a 36-h period rather
1.1.1. Expression in E. coli
76 Staunton et al.
than the one overnight growth required in LB. Growth in mini-mal medium also requires aerobic respiration, and so all fermen-tations should be done in baffled flasks with the media taking up no more than 25% of the volume to ensure sufficient aeration.
The following protocols have used successfully by our group to produce labeled protein for a number of Fn3 modules (9– 12) .
1. 5 × M9 medium: 30.0 g Na 2 HPO 4 , 15 g KH 2 PO 4 , 2.5 g NaCl. Dissolve in 1 L H 2 O and autoclave.
2. Media additions: (a) M CaCl 2. (b) M MgSO 4 .
Make up separately and autoclave. (c) 10% (w/v) NH 4 Cl. (d) 20% (w/v) glucose. (e) 8.5% (w/v) yeast nitrogenous base (YNB) without amino
acids or ammonium sulphate.
Glutathione 4B Sepharose (GE Healthcare). DNAse I (Sigma). MgSO 4 . Triton-X100. Econo-Pac Chromatography Column (Bio-Rad).
3C protease PreScission Protease (GE Healthcare). DTT.
PBS. HiPrep 26/10 Desalting column (GE Healthcare) or disposable
PD10 columns (GE Healthcare). 4B Sepharose column equilibrated with PBS. AmiconUltra-15 ultrafiltration device (Millipore).
6 × 500 mL of 2× TY (in 2 L baffled flask). 1 × 100 mL of 2× TY (in 500 mL culture flask). Chloramphenicol.
2. Materials
2.1. Expression in E. coli
2.1.1. M9 Minimal Media and Growth
2.1.2. Protein Purification
2.1.3. 3C Protease Cleavage
2.1.4. Target Protein Purification
2.2. Cell-Free Expression
2.2.1. S30 Extract Preparation

Preparation of Recombinant Fibronectin Fragments 77
S30 buffer A: 10 mM Tris-acetate buffer pH 8.2, 14 mM Mg Acetate, 60 mM K Acetate, 1 mM DTT, 0.5 mL/L 2-mercaptoethanol. S30 buffer B : as above but without 2-mercaptoethanol. Preincubation buffer : 293 mM Tris-acetate buffer pH 8.2, 9.2 mM Mg Acetate, 13.2 mM ATP, 84 mM phosphoenol-pyruvate (PEP), 4.4 mM DTT, 40 μ M of each 20 amino acids. 1× 70 mL glass homogenizer bottle (B. Braun AG). 4 × 50 mL centrifuge tubes. 1 L glass-beaker (for dialysis). (The glassware and centrifuge tubes should be rendered RNAse free immersing in 2% (v/v) AbSolve (DuPont/NEN) overnight. Tubes for S30 storage (Nunc, Cryotube Vials-1.8 mL). All solutions should be made in Milli-Q water. Make up separately and filter sterilize.
Hepes-KOH pH 7.5. Polyethylene glycol (PEG) 8000. Potassium glutamate. DTT. ATP, CTP, GTP, UTP. Cyclic AMP. Folinic acid. Ammonium acetate. Creatine phosphate. Creatine kinase. Sodium azide. Escherichia coli total tRNA. Mg acetate. Methionine. 35 S labeled methionine (15 mCi/mL GE Healthcare). T7 RNA polymerase (200 U/ μ L, Ambion). Polypropylene 96-well plate (Anachem). PCR machine (e.g., Dyad DNA Engine thermocycler (MJ Instru-ments).
Microfiber filter Type GF/C (Whattman). Beckman Centrifuge with JS-5.9 rotor. Trichloroacetic acid (TCA). 1% sodium pyrophosphate.
2.2.2. Optimization of Expression and Small Scale Expression
2.2.3. Assay for Protein Expression

78 Staunton et al.
Methanol. Phosphorimager (e.g., Storm 820, Amersham Bioscience) with quantification tools (e.g., Image Quant software, Amersham Bio-science).
RTS Amino Acid Sampler (Roche). Glycine labeled with 13 C at the 1 carbon position (Cambridge Isotopes Limited). 15 N aspartate (Spectra Stable Isotopes). Dialysis bag (Spectra/Por 2.1, 50 kDa MWCO).
HisTrap FF column (GE Healthcare). HiTrap Desalting column (GE Healthcare). NaCl. Na Phosphate buffer pH 7.4. Na Acetate buffer pH 4.8. Ammonium acetate pH 6.7. Imidazole.
For unlabeled preparations, reagents need only be standard labo-ratory reagent grade and made up using milli-Q water. 15 N-ammonium sulphate (99 At%) (Goss scientific – Great
Baddow, UK). U-[ 13 C]-glucose (99 At%) (Goss scientific – Great Baddow, UK). 13 C-methanol (99 At%) (Goss scientific – Great Baddow, UK). Potassium phosphate. Ammonium sulphate. Glucose. D-biotin. 10 mM sodium hydroxide. Yeast nitrogen base without amino acids or ammonium sulphate (Difco, UK). Calcium sulphate. Magnesium sulphate heptahydrate. Potassium hydroxide. Orthophosphoric acid. Copper (II) sulphate. Sodium iodide. Manganese sulphate monohydrate. Sodium molybdate dehydrate.
2.3. Scale up of Expression
2.3.1. Purification from Reaction Mix
2.4. Expression of Recombinant Proteins in Pichia pastoris

Preparation of Recombinant Fibronectin Fragments 79
Boric acid. Cobalt chloride. Zinc chloride. Iron (II) sulphate. Sulphuric acid (98%). Methanol. Polypropylene glycol 1025 (Antifoam – Merck, Beeston, UK). L glass fermentation vessel (Electrolab Ltd, Tewkesbury, UK). PTM 1 . Fermentation control system (e.g., Electrolab Fermentation Manager, software version 1.4 Electrolab, Tewksbury). Cation exchange column. HCl. 0.2- μ m filtration membrane.
13 C-glycerol. 15 N-ammonium hydroxide.
QIAprep Spin Miniprep kit (Qiagen). Endotoxin-Free Plasmid Mega kit (Qiagen). HEK-293 T cells. DMEM medium (Sigma). L -Glutamin (Invitrogen). Nonessential amino acids (Invitrogen). Fetal Calf Serum (Invitrogen). Methionine-free DMEM. Selenomethionine. N -glycosylation processing inhibitors (e.g., kifunensine or swain-sonine). Optional: glycosylation-deficient cell lines (e.g., 293 S GnTI).
Lipofectamine 2000 reagent (Invitrogen). Optional: polyethyleneimine (PEI) (Aldrich). PentaHis monoclonal antibody (Qiagen).
Expanded-surface polystyrene roller bottles (2,125 cm 2 , Greiner Bio-One). 0.22 μ m bottle-top filter.
Nickel-coated chelating sepharose beads (GE Healthcare). Cobalt-coated TALON beads (Clontech).
2.5. Isotopic Labeling in P. pastoris
2.6. Transient Expres-sion in Human Cells for Large Fragments
2.6.1. Small Scale Transfection
2.6.2. Large-Scale Transfection Protocol
2.6.3. IMAC Affinity Chromatography

80 Staunton et al.
2.5 cm diameter BioRad Econocolumn. Sodium phosphate. NaCl. Imidazole.
1. Make up 200 mL of Minimal as follows in a baffled 500 mL flask. 150 mL dH 2 O. 40 mL 5 × M9 medium. 0.2 mL 0.1 M CaCl 2 . 0.4 mL 1 M MgSO 4 . 4 mL 20% glucose. 4 mL 8.5% YNB. 200 μ L 100 mg/mL Carbenicillin. 200 μ L 17 mg/mL Chloramphenicol.
2. Add ammonium chloride to a final concentration of 0.15% w/v i.e. 0.3 g in total.
3. Add 10 mL of complete media to a 50 mL Falcon tube and inoculate with one colony from a fresh LB plate. Store the rest of media at 4°C.
4. Leave shaking overnight at 37°C. 5. Ensure the culture has grown, i.e. opaque, and transfer the 10
mL culture to the rest of the media to give 200 mL. 6. Leave shaking overnight at 37°C. 7. Make up 4 × 2 L baffled conical flasks with 1 × M9 450 mL
and autoclave. 8. To each cool flask of M9 add:
0.5 mL 0.1 M CaCl 2 . 1 mL 1 M MgSO 4 . 2 g glucose, unlabeled or 13 C labeled. 10 mL 8.5% YNB. 500 μ L 100 mg/mL Carbenicillin. 0.75 g 15 N Ammonium chloride.
9. Centrifuge overnight culture 5,000 × g for 10 min and resus-pend cell pellets in fresh labeled media. Split the overnight inoculum between the flasks, and incubate at 37°C 200 rpm .
3. Methods
3.1. Expression in E. coli

Preparation of Recombinant Fibronectin Fragments 81
10. When the optical density at 600 nm approaches 0.7 add IPTG to final concentration of 0.1 mM.
11. Leave shaking at 37°C for 3–4 h. 12. Spin down cells 6,000 × g for 10 min and resuspend pellets
in 40 mL PBS (Phosphate buffered saline).
Purification can be achieved by affinity chromatography of the clarified lysate on a glutathione resin e.g. Glutathione 4B Sepha-rose with elution by reduced glutathione. The use of the rhi-novirus thiol protease 3C allows cleavage of the fusion protein at 4°C, and the recognition sequence avoids nonspecific cleav-age associated with other commonly used proteases (13) . The fusion protein is cleaved in this solution overnight, the glutath-ione removed and the mixture of GST and target protein passed through the glutathione resin once again. The flow-through from the resin contains the target protein normally at sufficient purity for NMR. 1. Freeze/thaw samples three times, i.e., allow sample to thaw
completely and then flash freeze in liquid nitrogen to disrupt cells.
2. Add MgSO 4 to 10 mM final concentration, DNAse I to 10 μ g/mL, incubate at room temperature to digest chromo-somal DNA until viscosity disappears. Add detergent Triton-X100 to final concentration of 1% (w/v), vortex and incubate on ice for 5 min. Centrifuge at 10,000 × g for 10 min at 15°C.
3. Take cell lysate supernatant without disturbing pellet. 4. Make a 4 mL column of glutathione 4B Sepharose in a Bio-
Rad Econo-Pac Chromatography Column. Wash with 40 mL PBS.
5. Apply cell lysate to column and allow to flow via gravity. Wash with 20 mL PBS. Elute with reduced 10 mM glutath-ione in 50 mM Tris pH 8.5 (20 mL).
6. Collect 5 mL fractions and determine where the protein has eluted by SDS-PAGE. The GST has an apparent molecu-lar weight of 23 kDa, and so the fusion protein will have an expected size of this plus the target protein. If there is a high proportion of free GST in the samples, this suggests proteolytic cleavage or degradation of the fusion protein and protease inhibitors should be added to the resuspended cell pellets before freezing.
7. Pool the most concentrated samples. Store at 4°C or pro-ceed to 3c cleavage.
The 3C protease is a thiol protease and requires reducing con-ditions for it to work. If your sample is in fresh elution buffer
3.1.1. Protein Purification
3.1.2. 3C Cleavage
82 Staunton et al.
containing glutathione this is fine. Otherwise add DTT to 1 mM final conc. The 3C protease can be bought as PreScission Pro-tease but it is easy to produce as a GST fusion and can be aliq-uoted and stored at −20°C in the GST column elution buffer (10 mM glutathione in 50 mM Tris pH 8.5) until required (13) . 1. Take 5 mL of fusion protein on ice. Take an aliquot as control
(50 μ L). 2. To 5 mL add 10 μ L GST-3C protease 1 mg/mL, mix by
inverting, and incubate at 4°C overnight. 3. Check digestion is complete by running a protein gel of sample
and control.
1. Exchange buffer for the digested target protein and the GST into PBS to remove glutathione. The most efficient method we find is to use a desalting column, either a HiPrep 26/10 Desalting column or disposable PD10 columns for multiple, parallel processing of samples.
2. Pass the sample through the 4 mL glutathione 4B Sepharose column equilibrated with PBS.
3. Collect flow through and wash with 10 mL PBS. 4. Determine where the target protein has eluted and that it is
free of GST by SDS-PAGE, concentrate by an AmiconUl-tra-15 ultrafiltration device and characterize by amino terminal sequencing and electrospray mass spectroscopy if possible.
A recent development in protein expression is cell-free or in vitro expression to levels applicable to structural studies. Although more complicated than expression in bacteria, these systems have distinct advantages for proteins that express poorly or not at all under standard conditions. They also provide a very cost-efficient method of labeling proteins if the usual expression in minimal media is not an option. Although kits are available they can be expensive for many research groups and are not optimized for labeling a particular protein of interest. There has also been a tendency to regard these methods as purely appli-cable to large scale structural genomic projects rather than as a complimentary technique that can be used with existing expres-sion strategies. The same constructs can be used as those for expression in E. coli .
Cell free expression allows selective labeling of amino acid residues for NMR assignment if triple-resonance experiments are not feasible or the spectra are crowded. Instead it is possible to assign a specific residue in a protein by selectively labeling amino acids separately with 13 C and 15 N. If there is a 13 C labeled resi-due (n) preceding a 15 N labeled one (n + 1) in the sequence, it is possible to specifically transfer magnetization from n + 1 to n through an HNCO experiment or a HSQC spectra without
3.1.3. Target Protein Purification
3.2. Cell-Free Expression

Preparation of Recombinant Fibronectin Fragments 83
carbon decoupling. This method was used to specifically label the integrin binding site in the tenth Fn3 module.
The ninth and tenth Fn3 (9FIII-10FIII) module pair from human Fn is smallest construct exhibiting full activity with respect to α 5 β 1-integrin adhesion with the binding site located to the residues RGD (residues 1493–1495 of Fn) of the tenth Fn3. The two modules have been expressed in the pRSET-A vector with an amino terminal His tag and a mutation L97P (corresponding to L1408P in Fn) that confers better conformational stability to give pRSET-A 9FIII’10FIII (14) . As transcription of this con-struct is driven by a T7 promoter and terminator this vector is suitable for direct use in cell-free expression.
To specifically label the aspartic residue in the RGD motif, the protein was made with glycine labeled with 13 C solely at the carbonyl position and 15 N-labeled aspartic acid so that spin coupling only occurs at D184 within the RGD motif. The key reagent for cell-free expression is the S30 extract containing the ribosomal machinery for protein production. The protocol we use is based on that of Kigagwa et al. (15) . An important step is to compare the expression of a standard protein construct (e.g., pIVEX GFP) against a positive control, which can be a commer-cial S30 extract. The activity of the S30 extract used should be equal or greater than this. 1. Inoculate 100 mL of 2× TY Chloroamphenicol 34 μ g/mL in
500 mL flask with 200 μ L of E. coli BL21 Codon Plus RIL glycerol stock. Incubate at 37°C and 160 rpm overnight.
2. Inoculate 6 × 500 mL of 2× TY Chloroamphenicol 34 μ g/mL with 5 mL each from the overnight culture.
3. Incubate at 37°C and 200 rmp. 4. Chill centrifuge and rotors for 1 L and 250 mL centrifuge
bottles. 5. Prepare 4 L of S30 buffer. 6. Continue incubation till optical density at 600 nm is 0.6 (at
five times dilution with 2× TY). 7. Immediately chill the culture flasks on ice. 8. Transfer culture medium into 4 × 1 L centrifuge tubes and
centrifuge (7,500 × g for 10 min at 4°C). 9. Discard supernatant; resuspend cells in 250 mL S30 buffer A
in each bottle. Collect cells by centrifugation (7,500 × g for 6 min at 4°C).
10. Wash cells three times with S30 buffer A and centrifuge 7,500 × g for 6 min at 4°C.
11. Discard supernatant, add 250 mL of S30 buffer A, suspend cells well, and transfer to the 250 mL centrifuge bottle, cen-trifuge (7,500 × g for 20 min at 4°C).
3.2.1. S30 Extract Preparation
84 Staunton et al.
12. Discard supernatant, and weigh cells (should be approxi-mately 16 g of loosely packed cells from 3 L culture).
13. Flash freeze cells in liquid nitrogen at least for 2 min. 14. Store frozen cells at −80°C for no longer than 3 days. Longer
storage results in lower activity of S30 extract. 15. Prepare 3 L of S30 buffer (B). 16. Thaw frozen cells in water bath at room temperature. 17. Resuspend thawed cells in approximately 20 mL of S30
buffer A. Mix gently. Pour into a prechilled 50 mL centri-fuge tube.
18. Collect cells by centrifuge 16,000 × g for 30 min, 4°C. 19. Dispense 22.7 g (for 16 g of loosely packed cells) glass beads
(B. Braun AG, 0.17–0.18 ) into 70 mL glass homogenizer bottle, and place on ice.
20. Completely discard supernatant with pipette, and weigh cells of each tube (about 12 g of tightly packed cells from 16 g of loosely packed cells).
21. Dispense (12.7 mL for 10 g of tightly packed cells) S30 buffer B into each centrifuge tube and suspend cells. Trans-fer to the 70 mL glass homogenizer bottle with the glass beads.
22. Replace air of the homogenizer bottle with argon gas to reduce oxidation.
23. Close caps of homogenizer bottle tightly, and seal with rub-ber retainer to avoid leakage.
24. Chill the cryogenic tube of the MSK cell homogenizer (B. Braun AG) with liquid CO 2 . While chilling, set the glass homogenizer bottle into the cell homogenizer and disrupt cells: 30, 30, and 20 s (in total 80 s).
25. Transfer disrupted cells and beads from glass homogenizer bottle to chilled 50 mL centrifuge tube.
26. Immediately centrifuge disrupted cells (30,000 × g for 30 min 4°C).
27. Prepare preincubation buffer. Add pyruvate kinase just before using.
28. Transfer supernatant to prechilled centrifuge tube. 29. Centrifuge disrupted cells (30,000 × g for 30 min, 4°C.
Transfer supernatant to 50 mL Falcon centrifuge tube. Measure the volume of this crude extract by pipette (about 7 mL of crude extract from 10 g of tightly packed cells).
30. Add 0.3 volume of preincubation buffer into crude extract, and mix well by gentle pipetting.
Preparation of Recombinant Fibronectin Fragments 85
31. Incubate at 37°C for 80 min (preincubation). During the preincubation, prepare dialysis tube (Spectra/Por 2.1 MWCO 15 K): cut tube to 15 cm in length, and wash with Milli-Q H 2 O.
32. Chill the preincubated extract on ice. 33. Transfer the extract into dialysis membrane. Dialyze the
extract four times against 750 mL S30 buffer B for 45 min at 4°C. Transfer dialyzed extract into chilled 50 mL centrifuge tube. Centrifuge (4,000 × g for 10 min, 4°C).
34. Transfer supernatant to prechilled 50 mL Falcon tube (S30 extract).
35. Mix well by gentle pipetting. 36. Dispense 1.0 mL of S30 extract into 2 mL Nunc tube and
immediately freeze in liquid nitrogen. Keep the extracts immersed in liquid nitrogen for 2 min.
37. Store S30 extract at −80°C.
An essential step in cell-free expression is the initial characteri-zation and optimization of the expression conditions and yield. Unless the yields approach 1 mg/mL, the system will be unsuit-able for expression except in extreme circumstances where the protein cannot be obtained by any other means.
We have developed a quick and simple assay for expression that allows conditions and constructs to be processed and ana-lyzed in parallel and can also be used for comparing the activity of S30 extracts and optimizing magnesium concentrations for particular preparations and constructs (16) .
For batch-mode expression in 96-well plates, the reaction mix (30 μ L) consists of: 55 mM Hepes-KOH pH 7.5, 4% poly-ethylene glycol (PEG) 8000, 210 mM potassium glutamate, 1.8 mM DTT, 1.2 mM ATP, 0.8 mM each of CTP, GTP, UTP, 0.64 mM 3 ′ ,5 ′ -cyclic AMP, 35 μ g/mL folinic acid, 27.5 mM ammo-nium acetate, 80 mM creatine phosphate, 0.25 mg/mL creatine kinase, 175 μ g/mL Escherichia coli total tRNA, 0.05% sodium azide, 5–16 mM magnesium acetate, 1 mM each amino acid, 0.5 mM methionine ( see Note 1 ), 0.5 μ L of 35 S labeled methionine, 0.27 μ L T7 RNA polymerase (200 U/ μ L, Ambion), 7.2 μ L S30 extract, 60–250 ng of pET14b RBP template DNA.
The reactions were incubated within a polypropylene 96-well plate in a Dyad DNA Engine thermocycler ( see Note 2 ).
1. Mix and spot 2 μ L of each radio-labeled reaction from cell-free synthesized samples using multi-channel pipette onto a Glass microfiber filter Type GF/C (this is the Total protein expressed, soluble and insoluble).
3.2.2. Optimization of Expression and Small Scale Expression
3.2.3. Assay for Protein Expression
86 Staunton et al.
2. Centrifuge the plate at 6,500 × g in a Beckman JS-5.9 rotor for 30 min.
3. Spot 2 μ L of the supernatant of each radio-labeled onto the Glass microfiber filter (this is the Soluble fraction).
4. Allow the filters to air-dry for approximately 5–10 s. 5. Place filter in a tray and wash once with cold 10% TCA, 1%
sodium pyrophosphate for 10 min at room temperature while shaking gently (use approximately 10–20 mL per sample).
6. Wash with 5% TCA for 5 min at room temperature while shaking gently.
7. Repeat the wash. 8. Rinse the filter with methanol to facilitate drying. 9. Allow filters to dry. 10. Cover with Saran-wrap. 11. The dried filters were exposed for 10–20 min to 20 by 25 cm
general purpose phosphor screens, which were subsequently read with a Storm 820 phosphoImager and the images proc-essed with Image Quant software.
12. Grid objects were created that matched the position of spots on the filter, and the volume reports calculated. This quanti-tative data was transferred to an Excel spreadsheet for further processing.
13. Background and negative control samples were subtracted from all samples and the mean and standard deviations cal-culated for each triplicate.
14. For comparing volume reports from different proteins, the values were normalized by dividing by the number of methionine residues in each protein.
15. The proportions of protein expressed as soluble and insolu-ble can be calculated from the normalized values by Soluble fraction/Total and Total-Soluble/Total, respectively.
A comparison of the different expression levels of soluble pro-teins, as determined by the above assay indicated that 9,10Fn3 is a good candidate for cell-free expression with expression 80% of the positive control, GFP.
To make amino acid mixtures with specific labels, we have found the RTS Amino Acid Sampler (Roche) very useful since it allows any amino acid to be substituted while simplifying the process of making a complete mixture. Glycine labeled with 13 C at the 1 carbon position (Cambridge Isotopes Limited) and 15 N aspar-tate (Spectra Stable Isotopes) were each made up to 168 mM in Reconstitution Buffer from the Sampler and used to make a complete mixture of all 20 amino acids.
3.2.4. Scale up of Expression

Preparation of Recombinant Fibronectin Fragments 87
For large scale expression, the batch reaction is prolonged by supplying reagents and regenerating ATP from a feeder solution separated from the reaction by a dialysis membrane. 3 mL of the reaction mix without radioactive label was placed in a dialysis bag (Spectra/Por 2.1, 50 kDa MWCO) in 30 mL of external solution consisting of the same composition as the reaction mix except for the creatine kinase, the plasmid DNA, the T7 RNA polymerase, the S30 extract and also containing an additional 4.2 mM mag-nesium acetate. Glycine and aspartate in the external and internal solutions were replaced with 13 C and 15 N labelled versions. The reaction was incubated at 30°C at 160 rpm for 12 h.
1. Dilute reaction mixture with column buffer (50 mM Na Phos-phate buffer 0.3 M NaCl pH 7.4).
2. Equilibrate 1 mL HisTrap FF column with 5 mL column buffer.
3. Load cell-free sample three times onto column. 4. Wash column with 10 mL 50 mM Na Phosphate buffer 0.3 M
NaCl pH 7.4, 10 mM imidazole. 5. Wash column with 10 mL 50 mM Na Phosphate buffer 0.3 M
NaCl pH 7.4, 20 mM imidazole. 6. Elute column with 5 mL 50 mM Na Phosphate buffer 0.3 M
NaCl pH 7.4, 250 mM imidazole (Protein normally elutes in this buffer so take 1 mL fractions).
7. Buffer exchange sample into 100 mM ammonium acetate pH6.7 using 5 mL HiTrap Desalting column.
8. Lyophilize sample and resuspend in 50 mM Na Acetate buffer pH 4.8 for NMR ( see Fig. 1 ).
Pichia pastoris has been applied to produce recombinant pro-teins originating from bacteria (17) , plants (18) , viruses (19) , and humans (20) . P. pastoris is an attractive eukaryotic expression system because it is far easier to genetically manipulate and cul-ture than mammalian cells. Most of the molecular manipulation techniques, first developed in Saccharomyces cerevisiae, have been adapted and optimized for P. pastoris (21) .
The protein of interest may be targeted for export from the cell by coexpression with a secretion signal. There are relatively few endogenous proteins secreted by P. pastoris , so that the recom-binant material can be extracted with relative ease in the first purification step. The eukaryotic cell machinery results in the heterologous protein undergoing many of the posttranslational modifications seen in higher eukaryotes. In successful cases, the resulting protein is fully folded, proteolytically processed, disul-phide linked, and glycosylated in a similar way to that of the original host. It is thus particularly suitable for expression of
3.2.5. Purification from Reaction Mix
3.3. Expression of Recombinant Proteins in Pichia pastoris

88 Staunton et al.
glycosylated extracellular proteins containing S–S bridges, as are often found in the ECM.
P. pastoris is also a suitable host for the production of iso-topically labeled proteins for study by NMR, where the simplic-ity of the cell culture media allows relatively cheap and efficient isotope incorporation. P. pastoris is now the second most widely used expression system in the NMR community, following E. coli (22) .
Fragments of Fn have been successfully expressed in both labeled and unlabeled forms. The usual procedure is to start with shake flasks to optimize the expression conditions, and then scale up for fermenter expression and isotope incorporation. High level protein expression in P. pastoris will typically yield 1–40 mg/L depending on the size and nature of the construct (23) . It is possible to produce protein using shake flasks but yields tend to be two to three times lower than fermenters largely due to poor aeration.
This chapter focuses on high yield, low cost protein produc-tion after insertion of the gene of interest. Molecular biology protocols describing shuttle vector choice and P. pastoris DNA manipulation can be found elsewhere. Fermentation of P. pastoris is relatively straightforward but consultation with a fermentation scientist is advised before handling yeast cultures.
Fig. 1 . The 1 H- 15 N HSQC spectrum without carbon decoupling of 13 C glycine and 15 N aspartic acid labeled ninth and tenth Fn3 showing nine peaks corresponding to the nine aspartate residues. One peak ( circled ) exhibits splitting in the 15 N dimension and can be identified as D187 of the RGD loop (from (5) copyright 2006 John Wiley & Sons Ltd) .

Preparation of Recombinant Fibronectin Fragments 89
Before starting the fermentation, it is worth making up stock solutions for consistency and convenience ( see Notes 3 and 4 ). 1. 1 M Potassium phosphate (KPi) pH 6.0 (per liter): Dissolve
118.1 g potassium dihydrogen phosphate and 30.1 g di-po-tassium hydrogen phosphate in water. Autoclave and store at room temperature for up to 1 year.
2. Yeast Nitrogen Base (10× YNB) (per liter): Dissolve 100 g ammonium sulphate and 34 g yeast nitrogen base without amino acids or ammonium sulphate in water. For 15 N fermen-tation (10 × 15 N -YNB) (per 5 mL): Dissolve 0.5 g 15 N -ammo-nium sulphate and 0.17 g yeast nitrogen base without amino acids or ammonium sulphate in water to make enough 15 N-labeled reagent for one fermentation. Both can be autoclaved and stored at 4°C for up to 1 year.
3. Ammonium sulphate solution ([NH 4 ] 2 SO 4 ) (per 250 mL): Dissolve 50 g ammonium sulphate in water. For 15 N fermen-tation ([ 15 NH 4 ] 2 SO 4 ) (per 25 mL): Dissolve 4.8 g 15 N -ammo-nium sulphate in water to make enough 15 N-labeled reagent for one fermentation. Filter sterilize and store at room tem-perature for 1 year.
4. Glucose solution (20× G) (per liter): Dissolve 200 g glucose in water. Reduce the stock solution size for a single U-[ 13 C]-glucose fermentation (per 25 mL): Dissolve 5 g U-[ 13 C]-glu-cose in water to make enough 13 C-labeled material for one fermentation. Both can be autoclaved (or filter sterilized) and stored at room temperature for up to 1 year.
5. Biotin solution (500 × B) (per 100 mL): Dissolve 20 mg D-biotin in 10 mM sodium hydroxide. Filter sterilize and store at 4°C for up to 1 year.
6. Basal Salt Media (BSM) pH 3.5 (per liter): Dissolve 0.92 g calcium sulphate, 1 g magnesium sulphate heptahydrate, 22 g potassium hydroxide (corrosive), and 26.8 mL orthophos-phoric acid (85 wt % – corrosive) in water. Adjust pH to 3.5 before autoclaving to reduce the precipitation of inorganic salts.
7. Pichia Trace Metals (PTM 1 ) (per litre): Dissolve 6 g copper (II) sulphate, 0.08 g sodium iodide, 3 g manganese sulphate monohydrate, 0.2 g sodium molybdate dehydrate, 0.02 g boric acid, 0.5 g cobalt chloride, 20 g zinc chloride, 65 g iron (II) sulphate, 5 mL sulphuric acid (98% – corrosive) in water. Filter sterilize before use and store at room temperature and for up to 1 year.
8. Methanol solution (toxic) (per liter): Prepare a 50% methanol solution with 500 mL methanol, 1 mL polypropylene glycol 1025 (Antifoam) and fill to 1,000 mL with water. For 13 C-methanol (per 120 mL): Prepare a 50% methanol solution with
3.3.1. Day 1; Part 1: Stock Solutions and Starter Culture

90 Staunton et al.
60 mL 13 C-methanol, 0.12 mL polypropylene glycol 1025 and fill to 120 mL with water. This should be enough mate-rial for a single 13 C-labeled fermentation. Autoclave and store at room temperature and for up to 1 year.
9. Base control solution: Prepare and autoclave 2 M potas-sium hydroxide (corrosive) and store at room temperature indefinitely. The starter culture provides the initial biomass for the fer-
mentation and should be 10% of the final fermentation volume. This first stage of growth allows the health of the clone to be assessed before fully committing to fermentation. The salt con-centration is kept low during this initial growth phase to encour-age growth from a single colony, and reduces waste of labeled salts, if the batch has to be abandoned at this early stage. A higher biomass culture in log growth phase is also preferable as it makes the next stage of the fermentation far more predictable with a doubling time of around 2 h. 1. A 250 mL baffled flask containing 37.3 mL milli-Q water is ster-
ilized by autoclaving. Using sterile technique add: 5 mL KPi, 5 mL of 10× YNB (0.5 g [NH 4 ] 2 SO 4 ), 2.5 mL 20 × G (0.5 g glu-cose), and 0.2 mL of 500× B. For 15 N fermentation, substitute 5 mL of 10× YNB with 5 mL of 10× 15 N-YNB (0.5 g labeled ammonium sulphate). For 13 C fermentation, substitute 2.5 mL 20× G with 2.5 mL U-[ 13 C]-glucose (0.5 g labeled glucose).
2. Inoculate with a single P. pastoris colony from a fresh plate and grow shaking at 30°C, for 16–24 h, until the biomass has increased to OD 600 = 2–6.
The fermenter vessel is prepared and autoclaved well in advance of inoculation (with the 50 mL starter culture) allowing the media to cool, aerate, and be adjusted to the desired pH. A 1-L glass fermentation vessel is filled with 450 mL BSM, and is prepared for fermentation following the “preparation of the vessel” pro-tocol in (4) . Delay adding glucose, ammonium sulphate, biotin, PTM 1 and antifoam to the vessel at this point (step 7). The pro-tocol can be stopped after autoclaving the vessel (step 3), and resumed at a later point in time, making sure the media within the vessel is isolated by clamping off the air inlet.
1. Set the impeller speed to 150 rpm , set air flow to ~2 L/min, and introduce 25 mL of 10× G solution (5 g total), 25 mL ammonium sulphate solution (5 g total), 2.5 mL biotin solu-tion, 2.5 mL PTM 1 and 1 mL antifoam solution.
2. Set remote fermentation parameters on a desktop PC with Electrolab Fermentation Manager software. Set desired pH, desired temperature, desired dO 2 (dissolved oxygen) level, and impeller speed limits.
3.3.2. Day 1; Part 2: Setting up the Fermenter Vessel
3.3.3. Day 2–6/7: The Fermentation
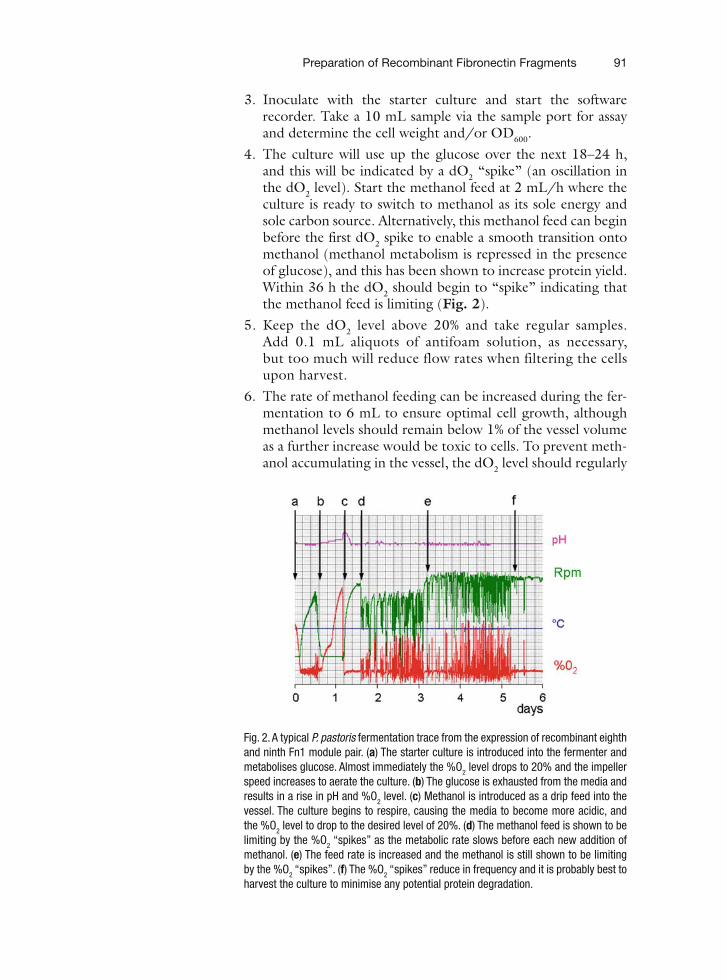
Preparation of Recombinant Fibronectin Fragments 91
3. Inoculate with the starter culture and start the software recorder. Take a 10 mL sample via the sample port for assay and determine the cell weight and/or OD 600 .
4. The culture will use up the glucose over the next 18–24 h, and this will be indicated by a dO 2 “spike” (an oscillation in the dO 2 level). Start the methanol feed at 2 mL/h where the culture is ready to switch to methanol as its sole energy and sole carbon source. Alternatively, this methanol feed can begin before the first dO 2 spike to enable a smooth transition onto methanol (methanol metabolism is repressed in the presence of glucose), and this has been shown to increase protein yield. Within 36 h the dO 2 should begin to “spike” indicating that the methanol feed is limiting (Fig. 2 ).
5. Keep the dO 2 level above 20% and take regular samples. Add 0.1 mL aliquots of antifoam solution, as necessary, but too much will reduce flow rates when filtering the cells upon harvest.
6. The rate of methanol feeding can be increased during the fer-mentation to 6 mL to ensure optimal cell growth, although methanol levels should remain below 1% of the vessel volume as a further increase would be toxic to cells. To prevent meth-anol accumulating in the vessel, the dO 2 level should regularly
Fig. 2 . A typical P. pastoris fermentation trace from the expression of recombinant eighth and ninth Fn1 module pair. ( a ) The starter culture is introduced into the fermenter and metabolises glucose. Almost immediately the %O 2 level drops to 20% and the impeller speed increases to aerate the culture. ( b ) The glucose is exhausted from the media and results in a rise in pH and %O 2 level. ( c ) Methanol is introduced as a drip feed into the vessel. The culture begins to respire, causing the media to become more acidic, and the %O 2 level to drop to the desired level of 20%. ( d ) The methanol feed is shown to be limiting by the %O 2 “spikes” as the metabolic rate slows before each new addition of methanol. ( e ) The feed rate is increased and the methanol is still shown to be limiting by the %O 2 “spikes”. ( f ) The %O 2 “spikes” reduce in frequency and it is probably best to harvest the culture to minimise any potential protein degradation .

92 Staunton et al.
“spike” as the respiration rate rises and falls as methanol is constantly depleted then replenished within the vessel.
7 . The amount of methanol consumed is proportional to the yield of recombinant protein but after 5 days of fermenta-tion, the integrity of this protein may begin to deteriorate. A healthy culture will acidify the media but as soon as the pH starts to rise, the cells will start to die, and release proteases. Therefore, a culture unable to acidify the media is ready for harvest.
In the case of all the Fn fragments expressed in P. pastoris in this laboratory, the protein is targeted to be secreted into the media. Secretion into the supernatant produces relatively pure recom-binant protein, as there are relatively few endogenously secreted proteins, and therefore serves as the first round of purification. The cells must be removed and the solution clarified immediately to minimize proteolytic degradation. The protein should then be purified as soon as possible, preferably same day or next day after storage at 4°C overnight. All of our recently expressed Fn fragments are then passed through a cation exchange column to concentrate and further purify the protein. 1. Pellet the cells by centrifugation at 10,000 × g for 15 min at
4°C. Remove the yellow-green supernatant, measure its vol-ume, and store at 4°C.
2. Wash the cells by resuspending in a similar volume of 100 mM HCl. Pellet the cells at 10,000 × g for 15 min at 4°C. Remove the supernatant and add to the original supernatant.
3. If the supernatant still appears cloudy, centrifuge again at 10,000 × g for 20 min at 4°C. Clarify by filtration through a 0.2- μ m membrane. The salt concentration of the media will still be high so the solution must be diluted 2× further before adjusting the pH to 3.0 for cation exchange or similar.
Isotopic labeling in P. pastoris demands that standard fermenta-tion protocols are adjusted to maximize isotope incorporation without wasting reagents. The batch phase of fermentation is kept short to ensure that labeled reagents are used to synthe-size protein and not used simply to increase biomass during the growth phases. Traditionally 13 C-glucose and 15 N-ammonium sulphate are used but instead are replaced with 13 C-glycerol and 15 N-ammonium hydroxide, respectively, as they are gener-ally cheaper without any loss in yield. A pair of Fn1 modules expressed, purified and 15 N-labeled in P. pastoris is shown to be fully folded and without degradation (Fig. 3 ).
Growth of P. pastoris in 2 H-labeled media is much slower than 13 C and 15 N as the cells are quite sick. Initially the seed culture is conditioned with 70% D 2 O before growth on 100% D 2 O to
3.3.4. Day 6/7: Harvesting the Fermentation
3.4. Isotopic Labeling in P. pastoris

Preparation of Recombinant Fibronectin Fragments 93
encourage the transition between reagents. Cells require longer induction and longer growth periods before protein harvesting. Whether the cells are growing on labeled or unlabelled media, a healthy culture should acidify and deplete the media of oxygen. For further information on isotopic labeling, we would refer the reader to (22) .
Although our structural knowledge of individual and small num-bers of contiguous modules is known to atomic resolution, the role of biologically relevant fragments derived from whole Fn is just being addressed. Previous studies have relied on proteo-lytic fragments that historically have defined functions. However, although the proteolytic dissection has been used successfully to identify functional components of proteins, it can lead to artifacts if it cleaves within a functionally relevant structure rather than at its periphery. An alternative approach is to use splice variants as guides to a dissection of protein structure. Although splice vari-ants of Fn (presence or absence of EDA and B and the variable splicing pattern for CSIII) have been known for years, it is only recently that variants consisting of the amino half of the protein have been identified e.g., migratory stimulating factor (MSF) (24) and the splice form first observed in zebrafish consisting of the amino terminus up to the third Fn3 module that we call the 90 kDa fragment (25) .
3.5. Transient Expres-sion in Human Cells for Large Fragments
Fig. 3 . 1 H- 15 N heteronuclear single quantum correlation ([ 1 H- 15 N]-HSQC) spectrum of a 15 N-labeled sample of the eighth and ninth Fn1 module pair. The sample was expressed in P. pastoris at 20 mg/L −1 , purified, and concentrated to 1.0 mM (11 mg/mL) before recording the spectrum on a spectrometer operating at 600.1 MHz .

94 Staunton et al.
To make these forms we have used transient expression in human cells where Fn constructs were cloned into the pHLsec expression vector and the plasmid DNA was transfected into human cell lines with polyethylenimine (PEI) (26) . Overexpressed proteins are secreted into the media and purified using a carboxy terminal hexahistidine tag. The advantage of this system over the creation of stable transfectants is that it does not require lengthy selection and cloning steps, and so is suitable for the production of a variety of protein constructs and mutants in a short period of time. In addition, protein complexes can be easily produced by cotransfection. Protein expression in mammalian cells also allows the study of posttranslational modifications, for example N and O-linked glycosylation, hydroxylation, and sulphation.
pHLsec belongs to a series of plasmids designed for large scale transient expression of secreted protein constructs and was previ-ously described (26) . Its main benefits are the small size allow-ing easy cloning of large inserts, the very high copy number in E. coli (for efficient DNA production), a powerful promoter/enhancer combination (chick β -actin promoter and cytomega-lovirus enhancer), an efficient secretion signal sequence, and a hexahistidine tag allowing straightforward protein purification. Constructs corresponding to the amino terminus to the fifth type 1, ninth type 1, and third type 3 were inserted into the AgeI, KpnI sites of pHLsec.
High quality DNA preparations (OD 280/260 rations of 1.8 or higher) are crucial for efficient expression in mammalian cells. We use the QIAprep Spin Miniprep kit for small scale expression tri-als and the Endotoxin-Free Plasmid Mega kit (Qiagen) for large scale expression.
For routine maintenance, HEK-293 T cells are grown in a stand-ard humidified incubator (37°C, 5% CO 2 ) in DMEM medium (Sigma) supplemented with l -glutamin, nonessential amino acids, and 10% fetal bovine serum. During expression, the concentra-tion of serum is lowered, to 2% or below to reduce bovine serum albumin contamination during subsequent protein purification steps. Efficient selenomethionine incorporation (for crystallo-graphic phasing) can also be obtained by using methionine-free DMEM and supplemented with 30 mg/L SeMet. (26) Where removal of glycans is desirable (often necessary for protein crys-tallization) N -glycosylation processing inhibitors such as kifun-ensine or swainsonine (27) are added to the culture media after transfection. Alternatively, glycosylation-deficient cell lines such as 293 S GnTI (28) .
3.5.1. The Expression Vector
3.5.2. DNA Purification
3.5.3. Cell Lines and Media

Preparation of Recombinant Fibronectin Fragments 95
For small-scale (construct screening) expression tests cells are transfected using the very efficient Lipofectamine 2000 reagent (Invitrogen). At the large-scale (litre) production stage, this is not a financially viable solution, therefore an alternative reagent, polyethyleneimine (PEI) is used (26) . In our experience, protein yields obtained using PEI are around 50% of those obtained when cells are transfected with Lipofectamine. The PEI stock solution is prepared as follows: 1. In a 50 mL Falcon tube pour straight from the bottle any-
thing between 1 and 5 g of 25 kDa branched PEI (Aldrich). 2. Add water to make a 100 mg/mL solution. 3. Mix overnight by rotation. 4. Further dilute to 1 mg/mL, neutralize with HCl, and filter
sterilize. 5. Store 10 mL aliquots frozen.
Constructs are typically screened by transient transfection in 96, 24 or 6-well plates. The protocol below corresponds to 6-well plates, but for smaller surface areas quantities should be scaled down proportionally. 1. 24 or 48 h in advance, seed cells to be 90% confluent on the
day of transfection. 2. For each well (construct) dilute 4 μ g plasmid into 250 μ L
serum-free DMEM medium. In a separate tube, dilute 10 μ L Lipofectamine 2000 in 250 μ L serum-free DMEM and incu-bate for 5 min at room temperature.
3. Mix the two solutions and incubate 20 min to allow DNA-Lipofectamine complex formation.
4. Remove old medium from the cells. 5. Add 2 mL fresh medium (containing 2% serum) into each well
and then add the DNA-Lipofectamine mix. 6. Allow 3–4 days for expression, and then collect the condi-
tioned medium, centrifuge to remove any cellular debris and store supernatant at 4°C.
7. Test expression levels by Western blotting (or dot-blot). For detection we use the PentaHis monoclonal antibody.
For large scale protein expression, cells are grown attached in expanded-surface polystyrene roller bottles (2,125 cm 2 ). Two milligrams of endotoxin-free plasmid DNA are required for each liter of conditioned medium (four roller bottles). 1. 48–72 h in advance seed cells to be 90% confluent on the day
of transfection. Use 250 mL medium per bottle.
3.5.4. Transfection
3.5.4.1. Small-Scale Transfection
3.5.5. Large-Scale Transfection
96 Staunton et al.
2. For one bottle, dilute 500 μ g plasmid DNA in 50 mL serum-free DMEM and mix well. Add 1 mL PEI stock solution (1 mg/mL) and mix. Incubate 20 min to allow DNA-PEI com-plex formation.
3. Discard old medium from the roller bottle and replace with 200 mL fresh DMEM (containing 2% serum), then add the 50 mL DNA–PEI mix.
4. Allow 4–7 days for protein expression, depending on con-struct and yields needed.
5. Collect conditioned medium, centrifuge to remove cellular debris, and filter sterilize (using a 0.22 μ m bottle-top filter). It is possible to refill the bottles and perform a second collec-tion, usually this will have a lower yield though and increased contamination with debris due to cell death.
6. Filtered media can typically be stored at 4°C for several weeks without significant protein degradation.
Typically, the only significant contaminant in the conditioned medium is the bovine serum albumin. An IMAC purification step of hexahistidine-tagged proteins, using nickel-coated chelat-ing sepharose beads or cobalt-coated TALON beads is typically sufficient to yield 90% or higher purity. 1. Set up a 5 mL column bed (10 mL of slurry) in a 2.5 cm
diameter BioRad Econocolumn. 2. Equilibrate column with 10 column volumes of 50 mM
sodium phosphate pH 7.0, 300 mM NaCl. 3. Apply filtered media (500 mL to 1 L) by gravity feed to obtain
a flow rate of approximately 100 mL/h at 4°C. 4. Wash column with 10 column volumes of 50 mM sodium
phosphate pH 7.0, 300 mM NaCl. 5. Wash column with 10 column volumes of 5 mM imidazole,
50 mM sodium phosphate pH 7.0, 300 mM NaCl. 6. Elute protein with 10 column volumes of 100 mM imidazole,
50 mM sodium phosphate pH 7.0, 300 mM NaCl in approxi-mately 5 mL fractions. Protein should elute in second fraction onwards ( see Note 5 ).
The proteins were compared against the fragments obtained by proteolysis where possible in terms of binding activity to the Fn binding protein SfbI from S. pyogenes (29) and, in the case of 30 kDa fragment the mass was determined by electrospray mass spectroscopy and gave a molecular weight of 27060.76 Da com-pared with the predicted weight for the expressed protein with ten disulphide bonds of 27,061 Da.
3.5.5.1. IMAC Affinity Chromatography
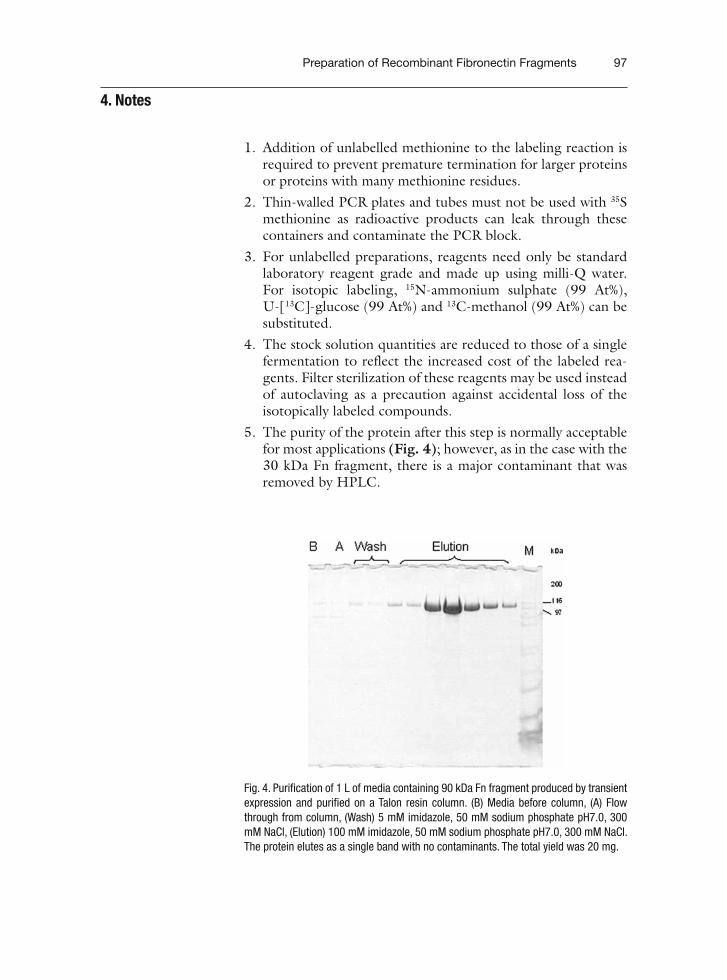
Preparation of Recombinant Fibronectin Fragments 97
1. Addition of unlabelled methionine to the labeling reaction is required to prevent premature termination for larger proteins or proteins with many methionine residues.
2. Thin-walled PCR plates and tubes must not be used with 35 S methionine as radioactive products can leak through these containers and contaminate the PCR block.
3. For unlabelled preparations, reagents need only be standard laboratory reagent grade and made up using milli-Q water. For isotopic labeling, 15 N-ammonium sulphate (99 At%), U-[ 13 C]-glucose (99 At%) and 13 C-methanol (99 At%) can be substituted.
4. The stock solution quantities are reduced to those of a single fermentation to reflect the increased cost of the labeled rea-gents. Filter sterilization of these reagents may be used instead of autoclaving as a precaution against accidental loss of the isotopically labeled compounds.
5. The purity of the protein after this step is normally acceptable for most applications (Fig. 4 ); however, as in the case with the 30 kDa Fn fragment, there is a major contaminant that was removed by HPLC.
4. Notes
Fig. 4 . Purification of 1 L of media containing 90 kDa Fn fragment produced by transient expression and purified on a Talon resin column. (B) Media before column, (A) Flow through from column, (Wash) 5 mM imidazole, 50 mM sodium phosphate pH7.0, 300 mM NaCl, (Elution) 100 mM imidazole, 50 mM sodium phosphate pH7.0, 300 mM NaCl. The protein elutes as a single band with no contaminants. The total yield was 20 mg .

98 Staunton et al.
The authors thank the Wellcome Trust, BBSRC and Cancer Research UK for financial support and Professor S. Yokoyama for the S30 extract and cell-free methodologies.
Acknowledgments
References
1. George , E. L. , Baldwin , H. S. & Hynes , R. O. (1997) . Fibronectins are essential for heart and blood vessel morphogenesis but are dispensable for initial specification of precur-sor cells . Blood 90 , 3073 – 3081
2. Hynes , R. O. (1986) . Fibronectins . Sci Am 254 , 42 – 51
3. Potts , J. R. & Campbell , I. D. (1996) . Struc-ture and function of fibronectin modules . Matrix Biol 15 , 313 – 320 ; discussion 321
4. Bright , J. R. , Pickford , A. R. , Potts , J. R. & Campbell , I. D. (2000) . Preparation of iso-topically labeled recombinant fragments of fibronectin for functional and structural study by heteronuclear nuclear magnetic resonance spectroscopy . Methods Mol Biol 139 , 59 – 69
5. Staunton , D. , Schlinkert , R. , Zanetti , G. , Colebrook , S. A. & Campbell , L. D. (2006) . Cell-free expression and selective isotope labelling in protein NMR . Magn Reson Chem 44 , S2 – S9
6. Ausubel. F.M., Brent, R., Kingston, R.E., Moore, D.D., Seidman, J.G., Smith, J.A., & Struhi, K. (Eds.) (2007). Current Protocols in Molcular Biology. John Wiley and sons, Inc, New York
7. Finn , R. D. , Mistry , J. , Schuster-Bockler , B. , Griffiths-Jones , S. , Hollich , V. , Lassmann , T. , Moxon , S. , Marshall , M. , Khanna , A. , Durbin , R. , Eddy , S. R. , Sonnhammer , E. L. L. & Bate-man , A. (2006) . Pfam: clans, web tools and services . Nucleic Acids Res 34 , D247 – D251
8. Schultz , J. , Milpetz , F. , Bork , P. & Ponting , C. P. (1998) . SMART, a simple modular architecture research tool: identification of signaling domains . Proc Natl Acad Sci U S A 95 , 5857 – 5864
9. Gao , M. , Craig , D. , Lequin , O. , Campbell , I. D. , Vogel , V. & Schulten , K. (2003) . Structure and functional significance of mechanically unfolded fibronectin type III1 intermediates . Proc Natl Acad Sci U S A 100 , 14784 – 14789
10. Pickford , A. R. , Smith , S. P. , Staunton , D. , Boyd , J. & Campbell , I. D. (2001) . The hairpin structure of the (6)F1(1)F2(2)F2 fragment from human fibronectin enhances gelatin binding . EMBO J 20 , 1519 – 1529
11. Sachchidanand , Lequin , O. , Staunton , D. , Mulloy , B. , Forster , M. J. , Yoshida , K. & Campbell , I. D. (2002) . Mapping the heparin-binding site on the (13–14)F3 fragment of fibronectin . J Biol Chem 277 , 50629 – 50635
12. Vakonakis , I. , Staunton , D. , Rooney , L. M. & Campbell , I. D. (2007) . Interdomain asso-ciation in fibronectin: insight into cryptic sites and fibrillogenesis . EMBO J 26 , 2575 – 2583
13. Walker , P. A. , Leong , L. E. C. , Ng , P. W. P. , Tan , S. H. , Waller , S. , Murphy , D. & Porter , A. G. (1994) . Efficient and rapid affinity puri-fication of proteins using recombinant fusion proteases . Biotechnology 12 , 601 – 605
14. van der Walle , C. F. , Altroff , H. & Mardon , H. J. (2002) . Novel mutant human fibronec-tin FIII9–10 domain pair with increased con-formational stability and biological activity . Protein Eng 15 , 1021 – 1024
15. Kigawa , T. , Yabuki , T. , Matsuda , N. , Matsuda , T. , Nakajima , R. , Tanaka , A. & Yokoyama , S. (2004) . Preparation of Escherichia coli cell extract for highly productive cell-free protein expression . J Struct Funct Genomics 5 , 63 – 68
16. Neerathilingam , M. , Greene , L. , Colebrooke , S. , Campbell , I. D. & Staunton , D. (2005) . Quantitation of protein expression in a cell-free system: efficient detection of yields and F-19 NMR to identify folded protein . J Biomol NMR 31 , 11 – 19
17. Tschopp , J. F. , Brust , P. F. , Cregg , J. M. , Stillman , C. A. & Gingeras , T. R. (1987) . Expression of the lacZ gene from two meth-anol-regulated promoters in Pichia pastoris . Nucleic Acids Res 15 , 3859 – 3876
18. Juge , N. , Andersen , J. S. , Tull , D. , Roepstorff , P. & Svensson , B. (1996) . Overexpression, puri-

Preparation of Recombinant Fibronectin Fragments 99
fication, and characterization of recombinant barley alpha-amylases 1 and 2 secreted by the methylotrophic yeast Pichia pastoris . Protein Expr Purif 8 , 204 – 214
19. Sugrue , R. J. , Fu , J. , Howe , J. & Chan , Y. C. (1997) . Expression of the dengue virus struc-tural proteins in Pichia pastoris leads to the generation of virus-like particles . J Gen Virol 78(Pt 8) , 1861 – 1866
20. Millard , C. J. , Campbell , I. D. & Pickford , A. R. (2005) . Gelatin binding to the 8F19F1 module pair of human fibronectin requires site-specific N -glycosylation . FEBS Lett 579 , 4529 – 4534
21. Higgins , D. R. & Cregg , J. M. (1998) . Intro-duction to Pichia pastoris . Methods Mol Biol 103 , 1 – 15
22. Pickford , A. R. & O’Leary , J. M. (2004) . Isotopic labeling of recombinant proteins from the methylotrophic yeast Pichia pastoris . Methods Mol Biol 278 , 17 – 33
23. Cereghino , J. L. & Cregg , J. M. (2000) . Het-erologous protein expression in the methylo-trophic yeast Pichia pastoris . FEMS Microbiol Rev 24 , 45 – 66
24. Schor , S. L. , Ellis , I. R. , Jones , S. J. , Bail-lie , R. , Seneviratne , K. , Clausen , J. , Motegi , K. , Vojtesek , B. , Kankova , K. , Furrie , E. , Sales , M. J. , Schor , A. M. & Kay , R. A. (2003) . Migration-stimulating factor: a genetically truncated onco-fetal fibronectin
isoform expressed by carcinoma and tumor-associated stromal cells . Cancer Res 63 , 8827 – 8836
25. Liu , X. Y. , Zhao , Q. S. & Collodi , P. (2003) . A truncated form of fibronectin is expressed in fish and mammals . Matrix Biol 22 , 393 – 396
26. Aricescu , A. R. , Lu , W. & Jones , E. Y. (2006) . A time- and cost-efficient system for high-level protein production in mammalian cells . Acta Crystallographica Section D 62 , 1243 – 1250
27. Chang , V. T. , Crispin , M. , Aricescu , A. R. , Harvey , D. J. , Nettleship , J. E. , Fennelly , J. A. , Yu , C. , Boles , K. S. , Evans , E. J. , Stuart , D. I. , Dwek , R. A. , Jones , E. Y. , Owens , R. J. & Davis , S. J. (2007) . Glycoprotein structural genomics: solving the glycosylation problem . Structure 15 , 267 – 273
28. Reeves , P. J. , Callewaert , N. , Contreras , R. & Khorana , H. G. (2002) . Structure and function in rhodopsin: high-level expression of rhodopsin with restricted and homogeneous N-glycosyla-tion by a tetracycline-inducible N-acetylglu-cosaminyltransferase I-negative HEK293S stable mammalian cell line . Proc. Natl. Acad. Sci. U.S.A. 99 , 13419 – 13424
29. Schwarz-Linek , U. , Werner , J. M. , Pickford , A. R. , Gurusiddappa , S. , Kim , J. H. , Pilka , E. S. , Briggs , J. A. G. , Gough , T. S. , Hook , M. , Camp-bell , I. D. & Potts , J. R. (2003) . Pathogenic bacteria attach to human fibronectin through a tandem beta-zipper . Nature 423 , 177 – 181

Chapter 6
Quantitative Determination of Collagen Cross-links
Nicholas C. Avery , Trevor J. Sims , and Allen J. Bailey
Summary
The primary functional role of collagen is as a supporting tissue and it is now established that the aggregated forms of the collagen monomers are stabilised to provide mechanical strength by a series of intermolecular cross-links. In order to understand the mechanical properties of collagen, it is necessary to identify and quantitatively determine the concentration of the cross-links during their changes with maturation, ageing and disease. These cross-links are formed by oxidative deamination of the ε -amino group of the single lysine or hydroxylysine in the amino and carboxy telopeptides of collagen by lysyl oxidase, the aldehyde formed reacting with a specific lysine or hydroxylysine in the triple helix. The divalent Schiff base and keto-amine bonds so formed link the molecules head to tail and spontaneously convert during maturation to trivalent cross-links, a histidine derivative and cyclic pyridinolines and pyr-roles, respectively. These latter bonds are believed to be transverse inter-fibrillar cross-links, and are tissue rather than species specific. We describe the determination of these cross-links in detail.
Elastin is also stabilised by cross-linking based on oxidative deamination of most of its lysine residues to yield tetravalent cross-links, desmosine and iso-desmosine, the determination of which is also described.
A second cross-linking pathway occurs during ageing (and to a greater extent in diabetes mellitus) involving reaction with tissue glucose. The initial product glucitol-lysine can be determined as furosine and pyridosine, and determination of advanced glycation end-products believed to be cross-links, such as pentosidine, are also described.
Key word: Collagen , Cross-linking , Aldimine , Keto-imine , Maturation , Pyridinoline , Pyrrole , Elastin , Glycation , Pentosidine .
The primary functional role of collagen is as a supporting tissue and it is now well established that the aggregated forms of the collagen monomers are stabilised to provide mechanical strength by a series of intermolecular cross-links. These links are formed by
1. Introduction
Sharona Even-Ram and Vira Artym (eds.), Methods in Molecular Biology, Extracellular Matrix Protocols, vol. 522© Humana Press, a part of Springer Science + Business Media, LLC 2009DOI: 10.1007/978-1-59745-413-1_6
103

104 Avery, Sims, and Bailey
oxidative deamination of the ε -amino group of the single lysine in the amino- and carboxy-telopeptides by lysyl oxidase. The alde-hyde thus formed reacts with an ε -amino group of a lysine at a specific point in the triple helix due to the quarter-staggered end-overlap alignment of the molecules in the fibres. The chemistry of these cross-links is dependent on both the nature and the age of the collagenous tissue (1, 2) . Differences in the cross-links are due to the degree of hydroxylation of both the telopeptide and the specific lysine in the triple helix. Thus, the amounts of inter-mediate cross-links present in immature tissue, dehydro-hydrox-ylysinonorleucine (Δ-HLNL) and hydroxylysino-keto-norleucine (HLKNL) may vary considerably between tissues, e.g., rat tail tendon and skin contain Δ-HLNL whilst cartilage and bone con-tain predominantly HLKNL.
These divalent cross-links are only intermediates and are sub-sequently converted into stable trivalent cross-links that accumu-late in the tissue as collagen turnover decreases during maturation (2) . The Schiff base aldimine Δ-HLNL is stabilised by reaction with histidine to form the trivalent cross-link, histidino-hydrox-lysinonorleucine (HHL). The keto-imine HLKNL, on the other hand, reacts with a second hydroxylysyl aldehyde to form the pyridine derivatives, hydroxylysyl-pyridinoline (Hyl-Pyr) and lysyl-pyridinoline (Lys-Pyr) (see Fig. 1 ). The proportion of these three known mature cross-links, again varies with the age and with the type of tissue. For example, HHL is the major, known, mature cross-link of human and bovine skin (3) , whilst the pyridinolines are the major, mature cross-links of bone and cartilage (4) ; ten-don, however, contains a mixture of both mature cross-links. An additional mature cross-link may be formed if the keto-imine reacts with a lysine-aldehyde in which case a pyrrole structure is favoured (see Fig. 1 ) Although the structure of the so-called “pyrrole” cross-link has not been confirmed there is mounting evidence for its presence in bone and tendon collagen (2) . A high value for the immature cross-links indicates predominantly new collagen synthesis, as in growing tissue, fibrosis, wound heal-ing and bone fracture repair. Conversely a predominance of the mature cross-links indicates low collagen turnover. An accurate determination of the ratio of the immature to mature cross-links therefore provides a valuable indication of the degree of turnover of a collagenous tissue. It is important in any study of changes to the collagen in a pathological tissue to understand the nature of the normal, age-related changes that occur in the particular tissue under investigation.
The intermediate cross-links may be radio-labelled by reduction of the tissue with tritiated sodium borohydride, thus facilitating their location and identification during subsequent chromatography (5) . However, their quantification requires either ninhydrin, or a similar post-column derivatisation technique,

Quantitative Determination of Collagen Cross-links 105
following their separation from the acid hydrolysate of the tissue by ion-exchange chromatography. Pre-column derivatisation of these polyvalent cross-links for subsequent analysis by reversed phase high performance liquid chromatography (HPLC) can produce multiple derivatives that elute as separate peaks throughout
Fig. 1 . Schematic representation of the formation of collagen cross-links. (a) The divalent Schiff base (aldimine) dehydro-hydroxylysinonorleucine (Δ-HLNL) which subsequently reacts with histidine to give the trivalent cross-link histidinohydroxylysinonorleucine. (b) The intermediate keto-imine cross-link (hydroxy-lysinoketonorleucine; HLKNL) can react with hydroxylysine aldehyde to give hydroxylysyl-pyridinoline (Hyl-Pyr) or with lysine aldehyde to give the hydroxylysyl-pyrrole .
106 Avery, Sims, and Bailey
the subsequent analysis and is therefore not recommended. The mature cross-links HHL, Hyl-Pyr and Lys-Pyr can be simultane-ously quantified using the same ion-exchange column (6) . Hyl-Pyr and Lys-Pyr can also be determined, with greater sensitivity, by HPLC utilising their natural fluorescence to facilitate their detection and quantification (7) . It has not yet been possible to analyse the pyrrole cross-link by ion exchange or HPLC chroma-tography and until this is possible a rather non-specific colorimet-ric method is employed (8) .
The other major connective tissue protein, elastin, is also stabilised by lysine-derived cross-links based on the same enzymic mechanism but yields two tetravalent pyridine compounds, desmo-sine (DES) and iso-desmosine (I-DES) (9) . Both these compounds can be detected by ninhydrin after elution, under the same condi-tions, from the same ion-exchange column.
A second cross-linking mechanism occurs when the turnover of collagenous tissues decreases following maturation and involves the reaction of glucose with the ε -amino group of lysine and subsequent oxidation reactions (10) . Generally known as glyca-tion, the addition of glucose is non-enzymic, adventitious, and possibly random. Early Maillard reaction products, such as glu-citol-lysine form furosine and pyridosine on acid hydrolysis (11) and their detection on HPLC can be used as a monitor of the early glycation products. Cross-links formed by this mechanism, such as pentosidine (12) , could provide good bio-markers of low metabolism and possible damage to the functional properties of collagen during ageing and in diabetic subjects. However, to date none of the glycation cross-links have been directly related to changes in the functional properties of collagen, hence we have only considered pentosidine as a marker of glycation. Recently a cross-link referred to as glucosepane (13) has been reported to be present in sufficient quantities to affect the physical properties of the collagen fibre (14) . However, the method of isolation is not quantitative involving enzyme digestion and mass spectrometry and will not be considered here.
1. Unless stated otherwise all reagents should be of Analar grade.
2. Sodium borohydride should be dissolved in 0.01 M sodium hydroxide solution at 5°C immediately prior to use. The dry solid is deliquescent producing an explosive gas (hydrogen)
1.1. Cross-link Changes During Aging; Glycation Cross-links
2. Materials

Quantitative Determination of Collagen Cross-links 107
when wet, consequently care with storage and handling is essential.
3. The hydrochloric acid used for protein hydrolysis is a con-stant boiling mixture. This can be purchased commercially (BDH, Poole, UK) or prepared in the laboratory by distil-lation of a 50% mixture of hydrochloric acid with distilled water and collecting the distillate that separates at 110°C.
4. Fibrous cellulose, CF-1, is a commercially available product from Whatman (Maidstone, Kent, UK).
5. Filters for sample preparation and for both HPLC and amino acid analyser buffer filtration are commercially available (HPLC Technology, Macclesfield, UK). 4- or 13-mm PVDF syringe filters are used for sample filtration.
6. A steel “mortar and pestle”. The “mortar” consists of a cylindrical block of stainless steel (40 × 40 mm) with a flat-bottomed 10-mm diameter hole drilled into it to a depth of 30 mm. The “pestle” is also made from stainless steel and measures 9.5 mm in diameter and 100 mm in length. These dimensions provide a close sliding fit into the “mortar”.
7. A source of liquid nitrogen. 8. An Amino Acid Analyser equipped with a post-column nin-
hydrin detection system. 9. A HPLC system linked to programmable fluorescence and
ultraviolet (UV) detectors. 10. Ideally, both of the above should be equipped with compu-
ter-based chromatography data handling software. 11. The reagents and buffers for use with the amino acid analyser
are best purchased from the equipment supplier. Any altera-tion to the concentration or pH of such buffers should be done with great care and any buffers modified in this way should be passed through a 0.2- μ m filter prior to use to remove particulate matter. The buffers should incorporate 0.01% phenol to prevent bacterial spoilage and should be stored at 15–20°C.
12. All HPLC reagents need to be HPLC grade and 0.2 μ m filtered prior to use.
13. A microtitre plate reader fitted with a 570-nm filter and a number of flat-bottomed 96-well microtitre plates are required for the pyrrole assay.
14. The following reagents are also required for measuring the pyrrole cross-ink, ingredients for which can all be obtained from Sigma-Aldrich (Poole, UK).
– TAPSO buffer : 2.81 g of 3-[N-tris(hydroxymethyl)methylamino]-2-hydroxy-propanesulphonic acid (TAPSO) is dissolved in 80

108 Avery, Sims, and Bailey
mL of distilled water, adjusted to pH 8.2 with 1 M sodium hydroxide and then made up to 100 mL.
– TPCK/TAPSO enzyme inactivator : 1.6 mg N-tosyl- l -pheny-lalanine chloromethyl ketone (TPCK) is dissolved in 100 μ L of ethanol and then taken up to 5 mL in TAPSO buffer.
– TPCK-trypsin reagent : TPCK is added to trypsin to inactivate any residual chymotrypsin activity, which would otherwise destroy the pyrrole. This reagent should be freshly prepared on the day of use.
– Trypsin is dissolved in the TPCK inactivator solution (1,000 units per 200 μ L) and left at room temperature for 25 min to inactivate any chymotrypsin. Alternatively TPCK pre-treated trypsin is also commercially available.
– DAB reagent : 500 mg of 4-dimethylaminobenzaldehyde (DAB) is dissolved in 4.4 mL 60% perchloric acid and made up to 10 mL with water.
– Reagent blank is prepared as above minus the DAB. – Pyrrole standards : A standard curve is prepared using 1-methyl
pyrrole. This is obtainable as a liquid from Aldrich (Cat no. M7, 880-1). 11.1 μ L is made up to 2.5 mL in ethanol from which 20 μ L is diluted to 100 mL in TAPSO/TPCK rea-gent to give a final concentration of 10 μ M pyrrole. This stock solution is used to produce a series of solutions in the concentration range 1–5 μ M by dilution according to the following table:
1. The weighed sample is finely comminuted ( see Note 2 ) and evenly dispersed in a volume of phosphate buffered saline (0.15 M sodium chloride, 0.05 M sodium phosphate pH 7.4) equal to between 5 and 10 times the volume of the sample ( see Note 3 ).
2. A weight of sodium borohydride equal to 1% of the sample wet weight is dissolved in 0.001 M sodium hydroxide at 4°C and this is added to the sample ( see Note 4 ).
3. Methods (see Note 1)
3.1. Borohydride Reduction of Sample
10 μ M Stock pyrrole ( μ L) 20 40 60 80 100
TAPSO/TPCK buffer ( μ L) 180 160 140 120 100
Pyrrole concentration ( μ mol/L) 1 2 3 4 5

Quantitative Determination of Collagen Cross-links 109
3. The temperature of the reduction mixture is raised to approxi-mately 20°C and reduction allowed to proceed for 1 h in a fume hood with occasional stirring. After this period the mix-ture is acidified to approximately pH 3 by addition of glacial acetic acid. (pH paper accuracy is sufficient) ( see Note 5 ).
4. The acidified reducing reagents are now discarded either by filtration or after centrifugation; however, it can often be sim-ply achieved by carefully decanting the reagents. The sample is then washed three times with distilled water in order to remove both the acetic acid and salts from the reduction mix-ture prior to freeze-drying ( see Note 6 ).
1. The weighed, dry sample is placed in a suitable vessel and hydrolysed in a volume of constant boiling hydrochloric acid to give a concentration of approximately 5 mg of sample per millilitre of acid ( see Notes 7 and 8 ).
2. Seal the hydrolysis vessel and heat to 110°C for 24 h ( see Note 9 ). 3. After hydrolysis the sample is allowed to cool, the seal is bro-
ken and the sample then bought to between −20 and −80°C prior to lyophilisation to remove all residual 6N hydrochloric acid ( see Note 10 ).
4. After drying the sample can be re-hydrated in water (usually 0.5 mL) and divided according to the requirements of the subsequent analyses ( see Note 11 ).
1. A portion of the re-hydrated hydrolysate which is estimated to contain about 16 nmol of hydroxyproline (representing 15 μ g of collagen) can be analysed on the same ion-exchange column as that used for the analysis of the collagen cross-links ( see Sub-heading 3.6 ) but using a different set of elution buffers.
2. The column is equilibrated in 0.2 M sodium citrate buffer pH 2.65 and held at 50°C throughout the run. After the sample has been applied, the column is eluted with 0.2 M sodium citrate buffer pH 3.20.
3. Hydroxyproline elutes early from the column (before aspartic acid) and reacts with ninhydrin to produce a yellow colour that can be detected at 440 nm. The column and detection system are calibrated using an external standard consisting of a solution of pure hydroxyproline of known concentration.
4. Collagen is generally considered to contain 14% hydroxypro-line by weight, so the collagen content of the sample can now be calculated from the measured hydroxyproline value.
1. The CF1 cellulose powder (50 g) is first thoroughly wetted with 400 mL distilled water in a 2 L measuring cylinder, to which is subsequently added 400 mL glacial acetic acid and
3.2. Hydrolysis of the Sample
3.3. Measurement of Hydroxyproline (see Note 12) Chromato-graphic Method
3.4. Preparation of a CF-1 Pre-fractionation Column (see Note 13)

110 Avery, Sims, and Bailey
finally 1,600 mL of butan-1-ol. The resulting 2.5 L of thin slurry is shaken carefully to ensure complete mixing and suspen-sion of the cellulose and then left to settle (about 20 min) until the bulk of the cellulose is below the 500 mL mark. The superna-tant containing suspended cellulose fines is then poured to waste leaving approximately 600–800 mL of the 4:1:1 organic mixture of butan-1-ol:acetic acid:water containing the bulk of the origi-nal 50 g of CF-1. The slurry is now topped up to 1 L with fresh 4:1:1 organic mixture to yield an approximately 5% CF-1 slurry which is decanted into a screw cap container and stored at room temp until required ( see Note 14 ).
2. The pre-fractionation procedure requires the production of a mini-column of CF-1. The top of a 3-mL plastic, Pasteur pipette bulb is cut off and the flow from the tip reduced, but not blocked, with glass wool or non-absorbent cotton wool. The CF1 slurry is poured into the pipette through the cut bulb and the cellulose is allowed to settle, adding more slurry as necessary to produce a settled bed height of 8 cm. The 3-mL graduation mark on the pipette is a useful guide. Care should be taken to avoid fluid filled cavities in the column bed, as this will adversely affect the chromatographic properties of the column. The newly prepared column should then be con-ditioned by passing 2 × 3 mL of fresh 4:1:1 eluant through the column. CF-1 columns made in this fashion do not readily dry-out although this should be guarded against.
1. The dried sample is re-hydrated in 0.5 mL water followed by 0.5 mL glacial acetic and finally 2 mL butan-1-ol. It is necessary to ensure thorough mixing of the sample by using a vortex mixer after the addition of each component of the solvent ( see Note 15 ).
2. The 3 mL of sample is applied to the CF-1 column and its containment vessel washed with 2 × 1 mL of fresh 4:1:1 eluant which is also loaded onto the column after the initial sample load has run to waste.
3. 6 × 3 mL of 4:1:1 eluant are now run through the column resulting in the elution of the bulk of the standard amino acids whilst the collagen cross-links remain adsorbed to the cellu-lose. This portion of the eluate can therefore be discarded.
4. After the 4:1:1 eluant has passed through the column a col-lection vessel is placed under the Pasteur pipette and 3 × 3 mL of water passed through the column to desorb the cross-links from the cellulose. This aqueous eluate should now be taken to dryness ( see Note 16 ).
1. The freeze-dried aqueous phase eluate from the CF-1 column is re-constituted in 120 μ L of 0.01 M hydrochloric acid by
3.5. CF-1 Pre-fractionation
3.6. Ion-Exchange Chromatography with Ninhydrin Detection

Quantitative Determination of Collagen Cross-links 111
thorough vortex mixing of the tube to ensure complete dispersion of the solution around the walls of the vessel.
2. The tube is then centrifuged briefly (30 s) to bring the solution to the bottom of the tube and ensure maximum recovery.
3. The sample should be passed through a 4 or 13 mm 0.2- μ m PVDF syringe filter to remove particulate matter. The sample is now ready for analysis on the amino acid analyser ( see Note 17 ).
4. The analytical column used for the analysis is the high resolution column supplied by Pharmacia measuring 270 × 4 mm and filled with their UltroPac 8 resin in the sodium form. The column should be maintained at 90°C throughout the analysis.
5. Prior to application of the sample the column should be equil-ibrated in 0.2 M sodium citrate buffer pH 4.25.
6. After the sample has been applied, the column should be eluted with 0.4 M sodium citrate buffer pH 5.25 ( see Note 18 ) for 46 min during which time data is collected ( see Note 19 ). The column is then washed for 6 min in 0.4 M sodium hydroxide and re-generated for 23 min in 0.2 M sodium citrate buffer pH 4.25 when it is ready for running the next sample.
7. At the completion of the run the area of each peak is com-puted from the collected data and the concentration of each cross-link is determined by comparison with the peak area of a leucine external standard of known concentration ( see Note 20 for a detailed explanation of the calculations).
8. A typical elution profile using authentic collagen cross-linking amino acids is shown in Fig. 2 .
20
0.5
1.0
Hyl
-Pyr
Abs
orba
nce
units
at 5
70 n
m
Lyr
-Pyr
I-D
ES
DE
SH
HL
HL
KN
L HL
NL
30 40 50 Time(min)
Fig. 2 . Relative elution positions of hydroxylysyl-pyridinoline (Hyl-Pyr); lysyl-pyridinoline (Lys-Pyr); iso-desmosine (I-DES); desmosine (DES); histidinohydroxylysinonorleucine (HHL); dihydroxylysinonorleucine (DHLNL); and hydroxylysinonor-leucine (HLNL) on an ion-exchange amino acid analyser using modified buffers. (DHLNL and HLNL are the sodium borohydride reduction products of hydroxylysino-ketonorleucine, HLKNL and dehydro-hydroxylysinonorleucine, Δ-HLNL respectively) .

112 Avery, Sims, and Bailey
1. After hydrolysis and lyophilisation each sample is re-hydrated in an acidified aqueous solution at a concentration of approx-imately 1 μ g of collagen per microlitre. The HPLC system used for analysis dictates the solvent used for re-hydration.
2. This laboratory originally used a 250 × 4.6 mm, 5 μ m, octa-decyl silane (ODS) column eluted with a 5–35% acetonitrile (MeCN) gradient in water at 1 mL/min over 70 min (0.5%/mL/min) (a modification of (4)). Both aqueous and organic solvents contained 0.05 M heptafluorobutyric acid (HFBA), ion pairing agent. Samples destined for this system were hydrated in 5 or 10% HFBA ( see Note 21 ).
3. Currently we use a Thermo Fisher (Hemelhempstead, UK) Hypercarb S, 100 × 4.6 mm, graphitic carbon column eluted with a 0–12% tetrahydrofuran (THF) gradient in water at 1 mL/min. Both aqueous and organic solvents contain 0.5% tri-fluoroacetic acid (TFA). Samples destined for analysis by this system are hydrated in 1% TFA ( see Note 22 ).
4. Following re-hydration the samples are 0.2 μ m filtered into tapered glass sample vials (Chromacol, Welwyn Garden City, UK), sealed and stored at 4°C. An aliquot of up to 90 μ L is loaded onto the analytical column via an autosampler or a larger volume can be manually loaded via a Rheodyne valve with a 500- μ L sample loop (Anachem, Luton, UK).
5. Prior to use the HPLC buffers are degassed either under vac-uum (for 10 min) or by helium sparging (1–2 min).
6. After an 8-min isocratic period in water a 0–12% THF linear gradient in water is applied over 60 min at a flow rate of 1 mL/min (0.2%/mL/min). Furosine elutes at 22 min, hydroxy-lysyl and lysyl-pyridinoline elute at approximately 26 and 29 min respectively, desmosine and isodesmosine do not resolve from each other and elute at approximately 32 min, pyrido-sine at 35 min and the glycation cross-link pentosidine elutes at 62 min.
7. The pyridinium cross-links are detected by means of their natural fluorescence at 405 nm emission after excitation at 295 nm. Pentosidine is also naturally fluorescent but at 385 nm emis-sion after excitation at 335 nm. We program a wavelength shift into our Perkin-Elmer LS-5 fluorimeter (Bucks, UK) to take place after the pyridinolines have eluted. All other amino acids are detected by their UV absorbances at 280 nm. A typi-cal HPLC elution profile of these novel amino acids is shown in Fig. 3 .
8. In this laboratory data is collected during the analytical run using a computing integrator and stored to disc at the end of the analysis.
3.7. HPLC Techniques

Quantitative Determination of Collagen Cross-links 113
9. The area under each peak of interest is calculated as a propor-tion of that derived from known concentrations of standards prepared within this laboratory or purchased commercially. Where possible the concentration of the standards should be confirmed by amino acid analysis.
10. Column integrity and detector efficiency is confirmed by regularly running a standard mixture and calculating the respective yield per pmol of each component.
11. Alternatively pyridoxamine, a commercially available fluoro-phore not naturally present in protein hydrolysates, can be added to all samples. Fluorescing at the same wavelengths as pyridinoline, but migrating earlier, it acts as an internal fluorescent standard to provide a constant monitor of both column and fluorimeter efficiency and helps locate the pyrid-inium cross-links.
1. Bone or tendon is powdered ( see Note 2 ) and approximately 100 mg of the powder is then suspended either in 5 mL of 0.5 M acetic acid, sealed in a tube and left to decalcify for about 2 weeks, or in two changes of 10 mL of 0.5 M tetra-sodium ethylenediamine-tetraacetic acid, pH 7.5 and decal-cified over 48 h at room temperature. Whichever reagent is selected it is then decanted at the end of the relevant period, the sample washed with 4 mL distilled water and then com-bined with 400 μ L of TAPSO buffer pH 8.2.
3.8. Pyrrole Cross-link (see Note 23)
Fig. 3 . Relative elution positions of the standards, pyridoxamine, furosine, hydroxylysyl-pyridinoline (Hyl-Pyr); lysylpyridi-noline (Lys-Pyr), desmosine and isodesmosine combined (Des + Ides), pyridosine and the glycation cross-link pentosi-dine on a Hypercarb S reversed phase HPLC column using fluorescence and UV detection .
ElutionTime
Pyridosine
Flu
ores
cenc
e
LysPyr
Hy1Pyr
Furosine
Des + IdesPyridoxamine
Programmed fluorescencewavelength shift
Pentosidine
UV
Abs
orba
nce
114 Avery, Sims, and Bailey
2. The container should be re-sealed and the sample denatured by heating in an oven or dry-block at 110°C for 35 min, fol-lowing which it is placed in a shaking water-bath and left to equilibrate at 37°C.
3. 200 μ L of the trypsin-TPCK solution is added to the sam-ple tube and this digest mixture shaken gently for 18 h at 37°C.
4. After that period, 400 μ L of a 3:1 chloroform: methanol ( see Note 2 ) mixture is added and the resultant two phases vigor-ously mixed.
5. The digest is then centrifuged for 10 min at 10,000 × g to sediment particulate material and the chloroform:methanol mixture which now contains any fat in the digest that would have made the subsequent assay solutions cloudy.
6. 40 μ L of dimethylaminobenzaldehyde (DAB) reagent is added to 200 μ L of the sample digest and to each of the cali-bration standards. Similarly, 40 μ L of reagent blank is added to a further 200 μ L of digest, to provide a sample blank. 180 μ L of each sample, blank and calibration standard are pipetted into a 96-well micro-titre plate and read after 10 min as the pink/purple colour develops. NB. This time period is criti-cal, so not all samples should be loaded and read at the same time but can be read in batches of 20.
7. The plate is scanned using a microtitre plate reader set at 570 nm and sample blank values subtracted from the test sample values. A standard curve is prepared from the calibration standard readings by plotting absorbance against concentra-tion of 1-methyl pyrrole and corrected values for the test samples are read off this curve.
1. Before undertaking the collagen cross-link analysis of an extracellular matrix, consideration should be given to the amount of tissue available for the multiple analytical proce-dures and the likely collagen content of that tissue.
There exists an approximately tenfold difference in sensitivity between HPLC using fluorescence detection and amino acid analysis using ninhydrin detection in favour of HPLC. In addition, the HPLC procedure is non-destructive allowing complete recovery of sample for further analysis. However, the intermediate cross-links cannot be readily quantified by HPLC without prior derivatisation, with the previously
4. Notes

Quantitative Determination of Collagen Cross-links 115
discussed associated problems of multiple peaks for each component. Likewise, the advanced glycation end-product pentosidine cannot be quantified by ion-exchange chroma-tography as it is retained on the column. Ideally both analyti-cal procedures should be adopted but occasionally samples are so small, e.g. at biopsy, that the limitations of the HPLC procedure alone have to be accepted. In which case reduc-tion of the sample with borohydride and CF1 pre-treatment can be ignored but it will not then be possible to quantify the intermediate cross-links, deH-HLNL and HLKNL as these are destroyed by acid hydrolysis. However, the mature cross-links hydroxylysyl and lysyl pyridinoline, and the advanced glycation end-product pentosidine, plus the unreduced hydrolysis products of glucosylated collagen, furosine and pyridosine, and the combined elastin cross-links desmosine and isodesmosine can all be quantified after hydrolysis with-out prior reduction.
In summary, amino acid analysis by ion-exchange chroma-tography using ninhydrin detection can be used to assay the following cross-links:
Hyl-Pyr, Lys-Pyr, HHL, DES and I-DES, HLNL and HLKNL can also be assayed after reduction of the sample with borohydride prior to acid hydrolysis.
Reversed phase HPLC using fluorescence and UV detection can be used to assay Hyl-Pyr, Lys-Pyr, furosine, pyridosine, plus the combined desmosine and isodesmosine and pento-sidine. (None of these components require prior reduction with borohydride, nor is it essential to use the CF1 clean-up procedure.)
2. Various methods of homogenisation are available and the one chosen should be appropriate to the tissue under analysis: Skin or Hide. These should first be cleaned of subcutaneous fat and adhering muscle, and any hair removed with a scal-pel or a razor blade. The cleaned skin can then be chopped very finely with a blade, or alternatively homogenised in phosphate-buffered saline ( see Subheading 3 , step 1 ). We use a Polytron (Kinematica AG, Lucerne, Switzerland) for this purpose which works well for most soft tissues, except tendon which has a tendency to accumulate at the end of the homogeniser probe. Tendon is best treated by being chopped finely with a blade, or cryomilled (see below).
Bone and cartilage . These are probably best comminuted in a steel “mortar and pestle” ( see Subheading 2 , item 6 ) at the temperature of liquid nitrogen (cryomilling). The sam-ple, in a cryothermic container, is frozen in a bath of liquid nitrogen as is the steel mortar and pestle. This usually takes
116 Avery, Sims, and Bailey
about 5–10 min. After removal from the nitrogen bath the sample is placed in the mortar and the pestle hammered onto the sample, causing it to shatter. With a suitably sized mortar and pestle very small samples such as biopsies can be handled in this way with good recovery of the powdered sample.
Fatty tissues . Lipids are readily removed from tissues with a high fat content by repeated extraction in 3:1 chloroform:methanol at 4°C until the sample no longer floats. The chloroform mixture can then be decanted and the tissue rehydrated by prolonged treatment with phosphate-buffered saline.
Muscle . The collagen content of muscle is very low (1–5%) so it is necessary to remove the bulk of the myofibrillar proteins prior to analysis. This can be achieved by brief ultrasonic homogenisation in Hasselbach–Schneider buffer consist-ing of 0.6 M potassium chloride, 0.1 M disodium hydrogen phosphate, 0.01 M sodium pyrophosphate, 0.001 M mag-nesium chloride and 0.005 M dithiothreitol according to the method of Avery and Bailey (15) . The insoluble collagenous network which remains is recovered by filtration through a 380- μ M copper sieve.
3. This volume is not critical although too much could result in under reduction due to over dilution and too little could result in the sample being carried out of the reducing reagent by gaseous hydrogen.
4. The volume of hydroxide should be as small as possible ( μ L) to avoid altering the pH of the sample buffer. The weight of borohydride used for reduction, assume 30% dry matter in the sample, is 100% collagen. As a consequence the propor-tion of sodium borohydride to collagen will be 1 part to 30 parts of collagen. For tissues with a lowe r percentage of collagen, the borohydride ratio will be greater, hence in tis-sues known to be collagen depleted, less than say 20%, the borohydride weight should be reduced proportionately. For convenience, with multiple reductions, the requisite amount of borohydride for all samples can be dissolved in a volume of ice-cold sodium hydroxide and then appropriate volumes immediately pipetted into each sample as required.
5. At this point excess sodium borohydride will rapidly release gaseous hydrogen with a potential risk of sample loss. This should be born in mind when selecting the vessel for the reduction procedure.
6. If the sample is very small it is better to carry out all the above procedures in a vessel suitable for subsequent acid hydrolysis, to avoid loss of sample during transfer.
7. The hydrolysis vessel is classically of borosilicate glass and can be re-used after cleaning with chromic acid, or a commercially

Quantitative Determination of Collagen Cross-links 117
available alternative, although our laboratory chooses to dispose of the hydrolysis tubes after a single use.
8. The ratio of sample to volume of acid is not critical provided the sample concentration does not exceed 10 mg/mL when certain resistant peptide bonds may not be cleaved.
9. It is customary to perform hydrolysis under a barrier of nitro-gen gas (elimination of oxygen), however, the presence of oxygen is not known to influence collagen cross-link assays, though certain other amino acids are effected.
10. Even at −80°C the hydrolysate will not be frozen, however, without prior chilling there is a considerable risk of sample loss due to boiling in the reduced pressure of the dryer. The freeze-drying apparatus must be rigorously defended from attack by hydrochloric acid vapour that will destroy seals, welds and pump valves very rapidly. We use a glass vapour trap at −110°C to protect the vacuum pump, which itself is of a specialist design to resist corrosion. We also maintain a strict monthly vacuum pump oil-change regime.
11. 50 μ g of collagen is sufficient for measurement of cross-links by HPLC but for ion-exchange 1 mg of collagen or more is required with a CF-1 pre-fractionation step. It is impor-tant that the CF-1 column is not overloaded so it is recom-mended that not more than 30 mg dry weight of sample be run on a CF1 column.
12. The amino acid hydroxyproline is almost unique to colla-gen; present in mammalian collagen at about 95 residues per 1,000, it is used to determine the total collagen content. This determination is crucial to subsequent procedures since the final cross-link quantification is expressed as moles of cross-link per mole of collagen. The most accurate method is to use the ion-exchange column used for cross-link analysis, but using the standard buffer gradient for amino acid analy-sis as described in the text. However, other analytical tech-niques are available, for example, an automated flow analyser (ChemLab, Great Dunmow, UK) based on the method of Grant (16) or a Microtitre plate method (17) , employing the same chemistry, can also be used for rapid determination of multiple samples.
13. The collagen cross-links represent about 1 mol/mol of colla-gen, consequently locating these novel amino acids amongst the excess of normal amino acids has historically proved dif-ficult. Pre-fractionation is therefore carried out to enhance the relative proportion of the cross-linking amino acids. The preferred method used in this laboratory is fibrous cellulose although several other methods have been reported with varying success, Sell and Monnier (12) , Dyer et al. (18) , Takahashi et al. (19) and Avery (20) .

118 Avery, Sims, and Bailey
14. It is important to record the date of the slurry production as prolonged storage, e.g. longer than 2 months, gives rise to an aggregated product that is unusable and must be dis-carded. On long-term storage, the 4:1:1 eluant also tends to separate into two layers and must not be used once this has occurred as the two layers will not re-mix into a single phase.
15. Re-hydration in this fashion prevents the formation of an “oily” residue that occasionally occurs if the samples are hydrated with the 4:1:1 eluant directly.
16. This is best done in a centrifugal evaporator as the sample is then maintained as a small volume at the bottom of the tube. Care must be taken not to overheat the eluate as the cross-links may become esterified rendering them undetectable with ninhydrin. However, if an evaporator is not available then the sample can be freeze-dried in the following man-ner. The vessel containing the column effluent is capped and a small hole pierced in the lid. The vessel should then be frozen at an angle of 45° in a −80°C freezer. This minimises the chance of sample loss due to its rising up the container during the freeze-drying process.
17. The technique is based on the use of an automatic amino acid analyser; we use an Alpha PlusII (Pharmacia) as previ-ously described (21) but the technique can be applied to other amino acid analysers. The supplier of such equipment obviously provides instructions on its use, so detailed expla-nations will not be provided here except for information spe-cific to the analysis of cross-links.
18. This can be prepared by dilution of Pharmacia’s 1.2 M sodium citrate buffer pH 6.45 to a molarity of 0.4 M with water containing 0.1% phenol followed by adjustment to pH 5.25 with concentrated hydrochloric acid.
19. Our laboratory uses both the AI-450 and Chromeleon data handling software from Dionex UK Ltd (Camberley, Surrey, UK) to collect and manipulate the data generated by the amino acid analysers, although any alternative chromatogra-phy data handling software should do. In fact a simple strip chart recorder linked to the analyser would suffice, however, integration of the peak areas would then have to be per-formed by manual measurement of the peaks or by cutting out and weighing the peaks.
20. The cross-link peaks should be identified by comparison with authenticated cross-link standards and expressed as moles of cross-link per mole of collagen or as the reciprocal of this value, i.e. one cross-link molecule every “x” molecules of collagen.
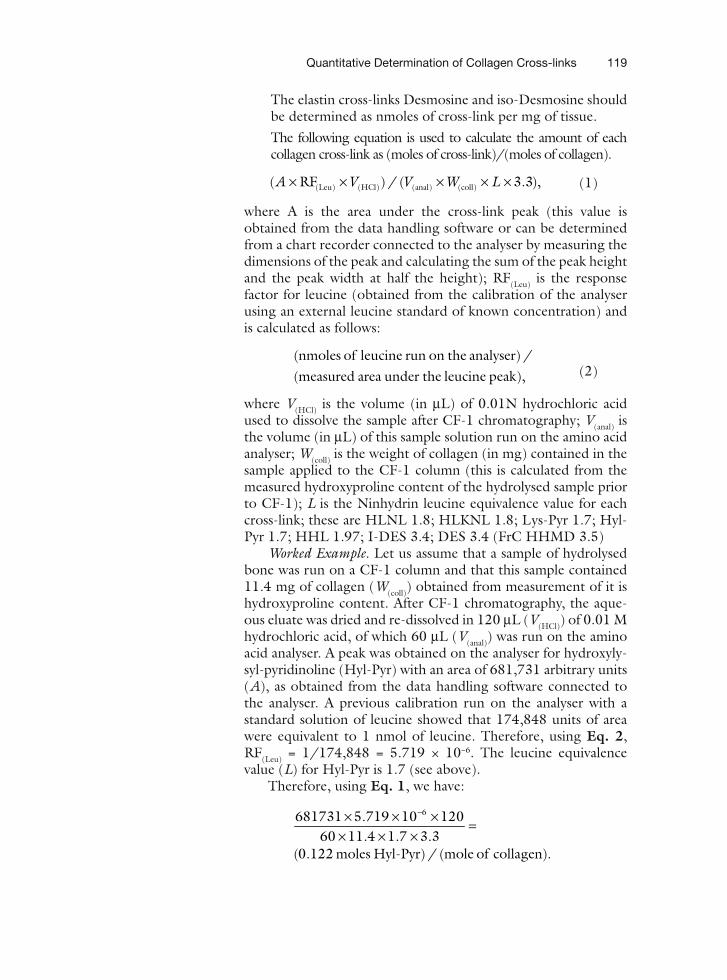
Quantitative Determination of Collagen Cross-links 119
The elastin cross-links Desmosine and iso-Desmosine should be determined as nmoles of cross-link per mg of tissue.
The following equation is used to calculate the amount of each collagen cross-link as (moles of cross-link)/(moles of collagen).
(Leu) (HCl) (anal) (coll)( RF ) / ( 3.3),A V V W L× × × × × (1)
where A is the area under the cross-link peak (this value is obtained from the data handling software or can be determined from a chart recorder connected to the analyser by measuring the dimensions of the peak and calculating the sum of the peak height and the peak width at half the height); RF (Leu) is the response factor for leucine (obtained from the calibration of the analyser using an external leucine standard of known concentration) and is calculated as follows:
(nmoles of leucine run on the analyser) /(measured area under the leucine peak), (2)
where V (HCl) is the volume (in μ L) of 0.01N hydrochloric acid used to dissolve the sample after CF-1 chromatography; V (anal) is the volume (in μ L) of this sample solution run on the amino acid analyser; W (coll) is the weight of collagen (in mg) contained in the sample applied to the CF-1 column (this is calculated from the measured hydroxyproline content of the hydrolysed sample prior to CF-1); L is the Ninhydrin leucine equivalence value for each cross-link; these are HLNL 1.8; HLKNL 1.8; Lys-Pyr 1.7; Hyl-Pyr 1.7; HHL 1.97; I-DES 3.4; DES 3.4 (FrC HHMD 3.5)
Worked Example . Let us assume that a sample of hydrolysed bone was run on a CF-1 column and that this sample contained 11.4 mg of collagen (W (coll) ) obtained from measurement of it is hydroxyproline content. After CF-1 chromatography, the aque-ous eluate was dried and re-dissolved in 120 μ L (V (HCl) ) of 0.01 M hydrochloric acid, of which 60 μ L (V (anal) ) was run on the amino acid analyser. A peak was obtained on the analyser for hydroxyly-syl-pyridinoline (Hyl-Pyr) with an area of 681,731 arbitrary units (A), as obtained from the data handling software connected to the analyser. A previous calibration run on the analyser with a standard solution of leucine showed that 174,848 units of area were equivalent to 1 nmol of leucine. Therefore, using Eq. 2, RF (Leu) = 1/174,848 = 5.719 × 10 −6 . The leucine equivalence value (L) for Hyl-Pyr is 1.7 (see above).
Therefore, using Eq. 1, we have:
6681731 5.719 10 12060 11.4 1.7 3.3
(0.122 moles Hyl-Pyr) / (mole of collagen).
−× × × =× × ×
120 Avery, Sims, and Bailey
21. Silica-based columns are degraded by prolonged exposure to both high and low pH solvents. The working life of such columns is very short (months) although they can be regen-erated once or twice by a repacking procedure Avery and Light (22) .
22. TFA and HFBA are strong (fuming) organic acids, addition-ally HFBA has a pungent smell, MeCN and THF are both flammable, consequently buffer preparation should be in a fume cupboard and care during handling and disposal is important.
23. The structure of the pyrrole cross-link has been confirmed by mass spectrometry of the biotinylated derivative (23) but at the present time is quantified by a modification of the procedure for Ehrlich chromogens as described above The method is not specific, coloured products are also being formed with imidazoles, polyhydroxyphenols and indoles (24) .
References
1. Bailey , A.J. , Light , N.D. and Atkins , E.D.T. (1980) Chemical cross-linking restrictions on models for the molecular organization of the collagen fibre. Nature 288 , 408 – 410.
2. Knott , L. and Bailey , A.J. (1998) Collagen cross-links in mineralising tissues: a review of their chemistry, function and clinical rel-evance. Bone 22 , 181 – 187.
3. Yamauchi , M. , Lo ndon, R.E. , Guemat , C. , Hashimoto , F. and Mechanic , G.L. (1987) Structure and function of a stable histidine-based tri-functional cross-link in skin collagen. J. Biol. Chem. 262 , 11428 – 11434 .
4. Eyre , D.R. and Oguchi , H. (1980) The hydrox-ypyridinium cross-link of skeletal collagen. Biochem. Biophys. Res. Commun. 92 , 403 – 410 .
5. Light , N.D. and Bailey , A.J. (1982) Covalent cross-links in collagen. Methods Enzymol. 82A , 360 – 372 .
6. Sims , T.J. and Bailey , A.J. (1992) Quantita-tive analysis of collagen and elastin cross-links using a single-column system. J. Chromatogr. 582 , 49 – 55.
7. Robins , S.P. (1982) Analysis of the cross-link-ing components in collagen and elastin. Methods Biochem. Anal. 28 , 329 – 379 .
8. Scott , J.E. , Hughes , E.W. and Shuttleworth , A. (1981) A collagen associated Ehrlich chro-mogen: a pyrrollic cross-link? Biosci. Rep. 209 , 263 – 264.
10. Paul , R.G. and Bailey , A.J. (1996) Glycation of collagen. The basis of its central role in the
late complications of ageing and diabetes. Int. J. Biochem. Cell Biol. 28 , 1297 – 1310.
11. Finot , P.A. , Viani, R. , B ricout, J. , and Mau-ron , J. (1969) Detection and identification of pyridosine, a second lysine derivative obtained upon acid hydrolysis of heated milk . Experien-tia . 25 , 134 – 135.
12. Sell , D.R. and Monnier, V.M. (1989) Struc-ture elucidation of a senescence cross-link from human extracellular matrix – implica-tion of pentoses in the ageing process. J. Biol. Chem. 264 , 21597 – 21602.
13. Biemel , K.M. , Friedl , D.A. and Lederer , M.O. (2002) Identification and quantification of the major Maillard cross-liks in human serum albumin and lens protein. J. Biol. Chem. 277 , 24907 – 24915.
14. Sell , D.R. , Biemel , K.M. , Reihl , O. , Lederer, M.O. , Strauch , C.M. and Monnieer, V.M. (2005) Glucosepane is a major protein cross-link of the senescent human extracellular matrix. J. Biol. Chem. 280 , 12310 – 12315.
15. Avery , N.C. and Bailey , A.J. (1995) An effi-cient method for the isolation of intramuscu-lar collagen. Meat Sci. 41 , 97 – 100.
16. Grant , R.A. (1964) Application of the auto-analyser to connective tissue analysis. J. Clin. Pathol. 17 , 685 – 691.
17. Riley , G. , Harrall , R.L. , Constant , C.R. , Chard , M.D. , Cawston , T.E. and Hazleman , B.L. (1994) Tendon degeneration and chronic shoulder pain: changes in the collagen com-

Quantitative Determination of Collagen Cross-links 121
position of the human rotator cuff tendons in rotator cuff tendinitis. Ann. Rheum. Dis. 53 , 359 – 366.
18. Dyer , D.G. , Blackledge, A. , Thorpe , S.R. and Baynes , J.W. (1991) Formation of pentosidine during non-enzymatic browning of proteins by glucose. J. Biol. Chem. 268 , 11654 – 11660.
19. Takahashi , M. , Ohishi , T. , Aoshima , H. , Kush-ida , K. , Inoue , T. and Horiuchi , K. (1993) Pre-fractionation with cation exchanger for determination of intermolecular cross-links, pyridinoline and pentosidine, in hydrolysates. J. Liq. Chrom. 16 (6) , 1355 – 1370.
20. Avery , N.C. (1996) The use of solid phase cartridges as a pre-fractionation step in the quantitation of intermolecular collagen cross-links and advanced glycation end-products. J. Liq. Chrom. 19 , 1831 – 1848.
21. Bailey , A.J. , Sims , T.J. , Avery , N.C. and Hal-ligan , E.P. (1995) Non-enzymic glycation of fibrous collagen; reaction products of glucose and ribose. Biochem. J. 305 , 385 – 390.
22. Avery , N.C. and Light , N.D. (1985) Re-packing reversed-phase high performance liquid chromatography columns as a means of regenerating column efficiency and pro-longing packing life. J. Chromatogr. 328 , 347 – 352.
23. Brady , J.D. and Robins , S.P. (2001) Structural characterization of the pyrrolic cross-links in collagen using a biotinylated Ehrlich’s rea-gent. J. Biol. Chem. 276 , 18812 – 18818.
24. Dawson, R.M.C., Elliott, D.C., Elliott, W.H. and Jones, K.M. (1986) Data for Bio-chemical Research. 3rd edition, Clarendon, Oxford.
Chapter 7
ECM Macromolecules: Height-Mapping and Nano-Mechanics Using Atomic Force Microscopy
Nigel W. Hodson , Cay M. Kielty , and Michael J. Sherratt
Summary
The atomic force microscope (AFM) may be used to collect quantitative height data from extracellular matrix molecules and macro-molecular assemblies adsorbed to a wide range of solid substrates. The advantages of atomic force microscopy include rapid specimen preparation, which does not rely on chemical fixation, dehydration or heavy-metal staining, and sub-nanometre resolution imaging with a high signal–noise ratio. In combination with complimentary techniques such as molecular combing and by exploiting the ability to act as a force spectrometer, the AFM can provide valuable information on the nano-mechanical properties of extracellular matrix components.
Key words: Atomic force microscopy , Fibrillin microfibrils , Type VI collagen microfibrils , Col-lagen fibrils , Fibronectin , Surface roughness , Surface amphiphilicity , Protein adsorption , Tip deconvolution .
The atomic force microscope (AFM) belongs to a large family of instruments (collectively termed scanning probe microscopes (SPM)) which scan a solid probe across a surface. Interactions between the probe and the surface are recorded to produce a map of surface properties. The first SPM, the scanning tunnelling micro-scope (STM), employed a weak tunnelling current to not only map conductive surfaces at the atomic scale (1) but also manipulate indi-vidual atoms (2) . The reliance of the STM on both sample and tip conductivity, however, precludes the use of this instrument in bio-logical applications and Binnig and colleagues went on to develop an SPM which was capable of imaging insulating materials; the AFM
1. Introduction
Sharona Even-Ram and Vira Artym (eds.), Methods in Molecular Biology, Extracellular Matrix Protocols, vol. 522© Humana Press, a part of Springer Science + Business Media, LLC 2009DOI: 10.1007/978-1-59745-413-1_7
123

124 Hodson, Kielty, and Sherratt
(3) . In the AFM, a sharp probe mounted on a flexible cantilever is scanned across the sample surface. Interactions between the probe and the surface deflect the cantilever and the magnitude of these deflections is detected optically (Fig. 1 ). Keeping the probe in con-stant contact with the surface during scanning (contact mode) runs the risk of deforming soft biological samples. Intermittent contact mode (ICM) AFM ( see Note 1 ) reduces lateral forces on the sample by rapidly oscillating the cantilever (4) . ICM is routinely employed in our laboratory to image extracellular matrix (ECM) molecules. The AFM is also able to operate in aqueous solution, eliminating the capillary forces which complicate imaging in air ( see Note 2 ) and allowing for the imaging and manipulation of biological systems such as living cells (5) . For an excellent review of the principles of AFM imaging as applied to biological structures see Fotiadis et al. (6) .
For visualising isolated ECM components, the AFM has some distinct advantages over conventional transmission electron micro-scopy (TEM) techniques. AFM is non-destructive, yields high signal–noise ratio images and can be carried out on unstained/unshadowed samples. Specimen preparation is simple and rapid compared to EM protocols and the absence of sample processing procedures (e.g. chemical fixation and staining) reduces the inci-dence of image artefacts in comparison with other techniques. In addition, comparisons of the absolute height data between experi-mental samples may reveal subtle variations in molecular structure.
A number of studies have concentrated on components of the ECM, using AFM to investigate aspects of assembly, function and ultrastructure (Fig. 2 ) . The molecular properties of fibrillin and
Fig. 1 . Schematic diagram illustrating the operation of an AFM. A tip, located at the end of a flexible cantilever, is scanned over a sample deposited on a substrate surface. Laser light, reflected from the back of the cantilever, is detected by a set of photodetectors. As the tip travels over the surface of the sample, variations in height result in changes in the amount of laser light reaching each of the photodetectors .

ECM Macromolecules: Height-Mapping 125
Fig. 2 . ICM AFM is capable of imaging ECM components which may range in size from individual monomeric proteins <100 kDa in molecular weight to extremely large multimeric assemblies whose mass per unit length may be measured in MDa/nm. ( A ) AFM height image (height scale = 1 nm) of recombinant MAGP-2 proteins adsorbed on mica substrates. ( B ) AFM height image (height scale = 4 nm) of fibrillin microfibrils (single beaded, 56 nm periodicity) and type VI collagen microfibrils (double-bead, 105 nm periodicity) adsorbed to mica–PLL. ( C ) AFM height image (height scale = 1.5 nm) of fibronectin dimers adsorbed to mica substrates ( inset 200 × 200 nm). ( D ) Axial height profile extracted from the arrowed fibronectin dimer in ( C ). Analysis of AFM height images can reveal identify subtle changes in height and lateral dimen-sions of ECM components. The distance between the globular regions of fibronectin dimers (in this case 42.5 nm) may be influenced by the surface chemistry of the substrate (7) . ( E ) 2D representation of AFM height (i) and phase (ii) data for a collagen fibril adsorbed to a mica substrate. The height image is scaled to 250 nm. ( F ) 3D representation the same height data demonstrates that the collagen fibril retains its tubular conformation on adsorption to the substrate.

126 Hodson, Kielty, and Sherratt
collagen VI have both been investigated by AFM, using molec-ular combing to elucidate structural rearrangements found in these species as they are placed under stresses similar to those found in physiological conditions (8, 9) . A combination of AFM and rotary shadowing was used by Stephan et al. (10) to study the ultrastructural organisation of the supramolecular assem-bly of collagen VIII homotrimers whilst Knupp et al. (11) used AFM images of isolated ECM molecules to identify structures observed in tissue sections by TEM. Non-filamentous ECM pro-teins may also be imaged by AFM. Bergkvist et al. (7) observed that fibronectin adopted either an elongated or a compact con-formation dependent on the substrate chemistry. Similarly the morphology of adsorbed laminin monomers has been shown to vary with the surface density of –OH groups (12) .
In addition to simple imaging , AFM derived height data can be used to assess the physical characteristics of a protein. For example, Sherratt et al. (13) reported the age-related deterioration of the mechanical properties of fibrillin microfibrils isolated from skin biopsies. Height data can also be used to investigate specific points of molecular interaction such as the location of SPARC binding sites on collagen I and pro-collagen I (14) . The non-destructive nature of AFM combined with the ability to image in fluid has been exploited to image both the sequential assembly (15, 16) and proteolysis (17) of collagen fibrils in vitro.
The protocols in this chapter will concentrate on imaging semi-dehydrated ECM macromolecules and macromolecular assemblies by ICM AFM ( see Note 3 ). Items covered include substrate preparation and characterisation, specimen deposition, AFM imaging and quantitative data analysis.
AFM instruments capable of ICM imaging are available from a number of manufacturers including Veeco Metrology, Inc. (Santa Barbara, CA, USA), Asylum Research (Santa Barbara, CA, USA) and Nanotec Electronica S.L. (Madrid, Spain). Analysis of AFM data may be carried out using software supplied by the AFM manufacturer or by third party image analysis programs such ImageJ (National Institutes of Health; available on the internet at http://rsb.info.nih.gov/ij/ ) and WSxM developer 3.0 (Nan-otec Electronica S.L., Madrid, Spain; available on the internet at http://www.nanotec.es/ ). 1. Muscovite mica sheets. 2. 15 mm diameter AFM specimen discs.
2. Materials

ECM Macromolecules: Height-Mapping 127
3. Clamping tweezers (Agar Scientific Ltd, Stansted, UK). 4. Round borosilicate glass coverslips (15-mm diameter) (Sci-
entific Laboratory Supplies, Nottingham, UK). 5. Sigmacote (chlorinated organopolysiloxane in heptane),
0.01% Poly- L -lysine solution ( M w 70,000–150,000), colloidal gold suspension (10-nm diameter) (Sigma-Aldrich, Poole, UK).
6. 100% Ethanol and concentrated H 2 SO 4 (BDH, Poole, UK).
7. 100% Methanol and concentrated HCl (Fisher Scientific UK, Loughborough, UK).
8. Distilled water, passed through ion exchange cartridge (Pur-ite Ltd, Thame, UK) and 0.22 μ m filtered (Millipore Corp., Bedford, MA, USA).
9. Whatman No. 1 filter paper (Whatman International Ltd, Maidstone, UK).
10. Motorised table (at least 15 mm diameter) capable of rotat-ing at speeds of ∼ 1,500 rpm.
11. Clear nail varnish (nail polish). 12. Single and double-sided adhesive tape. 13. Compressed air source.
Freshly cleaved mica presents a clean, atomically flat substrate which has found wide-spread use as a substrate for the adsorption of molecules and molecular assemblies for EM techniques such as rotary shadowing ( see chapter “ECM Macromolecules: Rotary Shadowing and Transmission Electron Microscopy”). Expo-sure of mica to distilled water dissociates loosely bound potas-sium ions (K + ) rendering the surface highly negatively charged. Conversely, exposure to salt buffers containing divalent cations renders the surface positively charged ( see Note 4 ). Recent stud-ies conducted in our laboratory on fibrillin and type VI collagen microfibrils, and by other laboratories on fibronectin, have iden-tified surface charge as a major influence on the structure (7, 18) and hence biological function (19, 20) of adsorbed ECM components. These substrate-induced effects on protein mor-phology and function vary between ECM species. Hydrophilic substrates promote cell attachment and spreading on adsorbed fibronectin (19) but inhibit cell spreading on adsorbed fibrillin microfibrils (20) . The sensitivity of the AFM reveals structural
3. Methods
3.1. Substrate Preparation

128 Hodson, Kielty, and Sherratt
changes due to substrate adsorption which may not be revealed by other techniques. Only by varying the substrate amphiphilicity (hydrophilicity/hydrophobicity) it is possible to gain insight into the effects of surface adsorption on a particular molecular species (Fig. 3 ).
Freshly cleaved (stripped) mica is suitable for most AFM applica-tions; however, the highly hydrophilic nature of the surface (con-tact angle 21° Fig. 3 ) may induce extensive changes in molecular morphology during adsorption. Coating the mica with poly- L -lysine (PLL) reduces surface hydrophilicity (contact angle ∼ 43°; Fig. 3 ) but increases surface roughness. On mica–PLL substrates, for example, PLL forms structures which are similar in height (0.5 nm) to fibronectin dimers ( ∼ 0.5 to 1.0 nm). Mica–PLL is not, therefore, a suitable substrate for imaging fibronectin (Fig. 2A ) but is suitable for larger structures such as fibrillin microfi-brils (with a bead height of 6–8 nm) (Fig. 2B ).
3.1.1. Mica Substrates
Fig. 3 . The relationship between surface chemistry and surface roughness of treated and untreated mica and glass substrates. Freshly cleaved mica is extremely smooth ( R q = 0.04 nm) and highly hydrophilic ( q app = 21.2°) chemical modification of the mica with PLL increases both surface roughness and water contact angle (indicating that the sur-face is less hydrophilic). Various washing and coating regimes have little effect on the surface roughness of glass substrates but have profound effects on the surface chem-istry producing highly hydrophilic (glass-MHS), hydrophilic (glass-E) and hydrophobic (glass-ES i ) substrates. Sessile drop contact angle ( θ ) measurements were performed with a drop size of 10 μ l. RMS roughness values ( R q ) were calculated for regions meas-uring 10,000 nm 2 (100 × 100 nm). AFM height images of surfaces were extracted (900 × 310 nm) from 2 × 2 μ m scans .

ECM Macromolecules: Height-Mapping 129
1. Trim mica sheets to the shape of 15-mm AFM sample discs. Attach the trimmed mica to the discs using nail varnish and allow to set for 1 h before use.
2. Immediately prior to use, strip the top layer of the mica using adhesive tape ( see Note 5 ). Press the tape on to the surface of the mica and then carefully peel off ( see Note 6 ). A disc of mica should be evident on the tape after removal.
To prepare mica–PLL substrates stripped surfaces are treated as follows: 1. Apply 80 μ l of 0.01%, w/v PLL to the stripped mica surface
and incubate for 2 min. 2. Wash the excess PLL from the surface with five consecutive
applications of 200 μ l H 2 O ( see Note 7 ), tipping the liquid off in-between applications (do not remove excess at these points).
3. After five washes, remove excess H 2 O by capillary action at the edge of the disc using a folded piece of Type 1 Whatman filter paper. Allow to dry for 30 min prior to use.
Glass coverslips are rougher than cleaved mica substrates but variations in washing procedures and chemical modification with silane solutions can produce chemically homogeneous, topo-graphically similar substrates which exhibit a large range of sur-face amphiphilicity (Fig. 3 ). Highly hydrophilic glass surfaces (Glass-MHS) may be prepared by alcohol and acid washes: 1. Immerse the glass coverslips in 1:1 solution of 100%
methanol:concentrated HCl for 30 min. Briefly wash with distilled H 2 O.
2. Immerse the coverslips in concentrated H 2 SO 4 for 30 min then wash rigorously in distilled H 2 O ( see Note 8 ) and dry at 75°C prior to use. Hydrophilic glass surfaces (Glass-E) may be prepared by
alcohol washing alone: 1. Wash coverslips by immersing in 100% ethanol for at least 1 h
(but preferably overnight). 2. Rinse coverslips with distilled H 2 O and then allow to air dry
for 1 h prior to use. Hydrophobic glass surfaces (Glass-ES i ) may be prepared by alcohol washing followed by silanization with a chlorinated orga-nopolysiloxane (such as Sigmacote). 1. Prepare ethanol cleaned glass coverslips as above but dry at
75°C. 2. Silanize coverslip surface by placing on a raised surface in a
closed trough containing 5 ml Sigmacote. After 15 min, briefly
3.1.2. Glass Substrates

130 Hodson, Kielty, and Sherratt
wash coverslips in 100% ethanol and allow to air dry prior to use.
Choosing a sample substrate with an appropriate topography and surface chemistry is a vital step in developing a successful AFM imaging strategy. In order to characterise a potential AFM sur-face, it is vital to quantify both surface roughness and the dynamic water contact angle.
Although ECM structures may be imaged on very rough surfaces such as tissue culture plastic (Fig. 4 ), meaningful height data may only be collected on smoother surfaces such as mica or glass. 1. Capture ICM AFM height images of the surface of interest. In
most cases scan sizes of 2–5 μ m should be sufficient. 2. Measure the root mean square (RMS) roughness (denoted
R q ) using either the supplied AFM software or by evaluating Eq. 1 , where Z ave is the average Z -value within a given area, Z i is the current Z -value, and N is the number of points within
3.2. Substrate Characterisation
3.2.1. Roughness
Fig. 4 . Visualisation of ECM components on “rough” surfaces. ( A ) The surface rough-ness and depth of the surface scratch (S) is more clearly seen in the 3D representation . ( B ) AFM height image of a fibrillin microfibril (MF) adsorbed on tissue culture plastic (2 × 2 μ m scan). Although tissue culture plastic is rough ( R q = 1.94 nm) compared with cleaved mica ( R q = 0.04 nm) it is still possible to identify relatively large filamentous structures such as microfibrils.
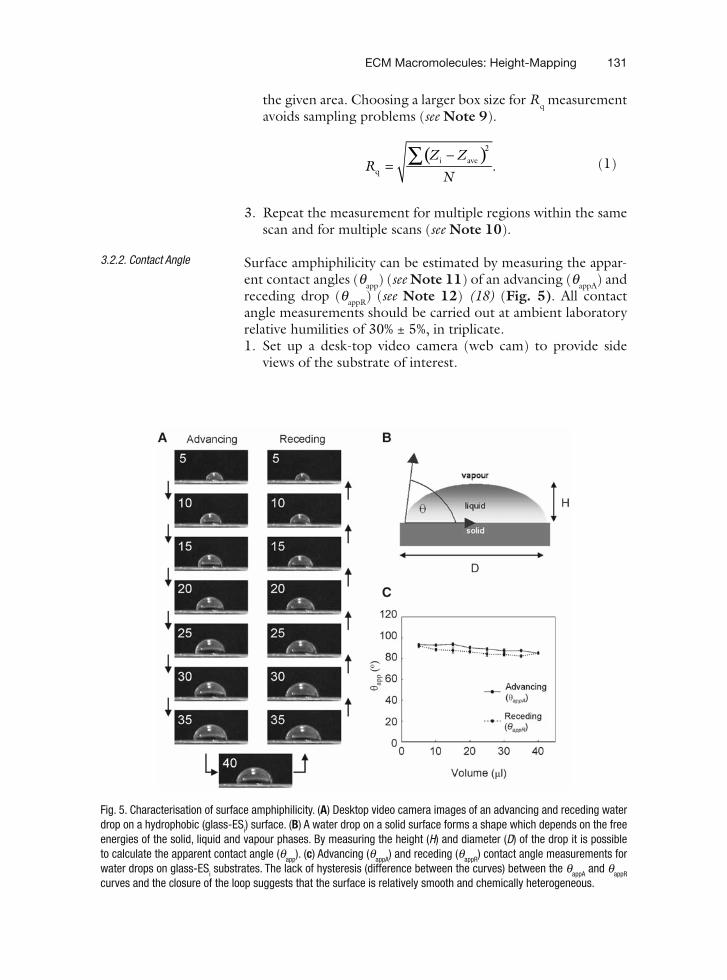
ECM Macromolecules: Height-Mapping 131
the given area. Choosing a larger box size for R q measurement avoids sampling problems ( see Note 9 ).
( )−= ∑ 2
i aveq .
Z ZR
N (1)
3. Repeat the measurement for multiple regions within the same scan and for multiple scans ( see Note 10 ).
Surface amphiphilicity can be estimated by measuring the appar-ent contact angles ( q app ) ( see Note 11 ) of an advancing ( q appA ) and receding drop ( q appR ) ( see Note 12 ) (18) (Fig. 5 ) . All contact angle measurements should be carried out at ambient laboratory relative humilities of 30% ± 5%, in triplicate. 1. Set up a desk-top video camera (web cam) to provide side
views of the substrate of interest.
3.2.2. Contact Angle
Fig. 5 . Characterisation of surface amphiphilicity. ( A ) Desktop video camera images of an advancing and receding water drop on a hydrophobic (glass-ES i ) surface. ( B ) A water drop on a solid surface forms a shape which depends on the free energies of the solid, liquid and vapour phases. By measuring the height ( H ) and diameter ( D ) of the drop it is possible to calculate the apparent contact angle ( q app ). ( c ) Advancing ( q appA ) and receding ( q appR ) contact angle measurements for water drops on glass-ES i substrates. The lack of hysteresis (difference between the curves) between the q appA and q appR curves and the closure of the loop suggests that the surface is relatively smooth and chemically heterogeneous .

132 Hodson, Kielty, and Sherratt
2. For measurements of q appA use the video camera to capture images as the drop volume is sequentially increased from 5 to 40 μ l (in steps of 5 μ l).
3. For q appR measurements reduce the drop volume (in steps of 5 μ l) by capturing an image at each step.
4. Calculate advancing and receding θ app angles from captured images using Eq. 2 , where H is the drop height and D is the length of the section in contact with the surface ( see Note 13 ). Measure H and D using an image analysis program such as ImageJ.
q − ⎛ ⎞= ×⎜ ⎟⎝ ⎠
1 2tan 2.
HD
(2)
This approach may be used regardless of the chosen substrate. 1. Using forceps, gently clasp the edge of the disc and apply
60–80 μ l of sample ( see Note 14 ) to the surface. Allow 60 s for sample deposition and then pour liquid off the disc sur-face. Remove excess liquid by capillary action at the edge of the disc using a folded piece of Type 1 Whatman filter paper.
2. Wash the specimen/substrate surface with five consecutive applications of 200 μ l H 2 O ( see Note 7 ), tipping the liquid off in-between applications (do not remove excess at these points). After the final rinse, remove excess water with a filter paper (as above) ( see Note 15 ).
3. Allow to air dry for 30 min prior to examination in AFM ( see Note 16 ).
Molecular combing techniques employ a receding meniscus to align and stretch partially adsorbed molecules such as DNA (21) , intracellular proteins such as titin (22) and ECM components including fibrillin (8) and type VI collagen (9) microfibrils. By quantifying changes in molecular morphologies induced by sur-face tension forces it is possible to gain insights into the mechani-cal properties of ECM assemblies (Fig. 6 ) . 1. Choose an appropriate sample substrate. Molecular comb-
ing is inhibited on highly hydrophilic substrates such as mica but filamentous molecules or molecular assemblies may be combed on hydrophobic (silanized glass; glass-ES i ) or slightly hydrophilic (mica–PLL) substrates ( see Note 17 ).
2. Attach the substrate to the surface of a rotating table using double-sided adhesive tape. Place a shield (such as a filter-paper lined cardboard box) around the table to catch any air-borne sample drops.
3. Pipette an ink drop onto the sample substrate and rotate the table at ∼ 1,500 rpm. The speed of the receding meniscus may
3.3. Specimen Preparation
3.3.1. Standard Procedure
3.3.2. Molecular Combing

ECM Macromolecules: Height-Mapping 133
be estimated from profiles extracted from video images of the movement of the ink drop across the substrate (8) .
4. The viscous drag force ( F drag ) acting on a filamentous structure during molecular combing may be determined from Eq. 3 (8, 22) , where x is the non-tethered molecular distance ( ∼ 1 × 10 −6 m for fibrillin microfibrils), v is the solvent velocity ( ∼ 1.25 × 10 −3 m/s for a water drop on a table rotating at 1,500 rpm) and η is the solvent viscosity (1 × 10 −3 N S/m 2 for water at 20°C).
h=drag .F vx
(3)
5. Pipette a sufficient volume of sample onto the surface to cover the central region of the disc and incubate for 1 min.
6. Rotate the table at 1,500 rpm. After 10 s remove excess liquid from the edge of the sample disc with a filter paper and allow the table to rotate for a further 2 min ( see Note 18 ).
7. Allow the sample to dry overnight before washing with dis-tilled water. Apply 300 μ l of distilled water, immediately rotate at 1,500 rpm, and remove excess water by capillary action. Repeat the washing step three times and allow to dry before AFM imaging.
8. The force due to the surface tension of a liquid ( F st ) acting on a filamentous structure during molecular combing may be determined from Eq. 4 , where g is the surface tension of the liquid ( ∼ 7.3 × 10 −2 N/m for water or physiological salt buffers) and D is the mean diameter of the filament ( ∼ 1.6 × 10 −8 m for fibrillin microfibrils) ( see Note 19 ).
gp=st .F D (4)
We predominantly image samples using ICM AFM in air. The AFM used in our laboratory is a Veeco Multimode with a Nano-scope IIIa controller and an “E” scanner. This apparatus is slightly different from many systems in that the tip is held immobile whilst the sample is placed on the scanner unit beneath it, which then scans from side to side. As such the scanning mechanism is located under the cantilever holder rather than the cantilever being held within the scan unit. 1. Prior to imaging the AFM is set up as directed in the instru-
ment handbook. The sample is then placed on the scanner and the cantilever holder is placed above it.
2. The surface of the substrate is located using an optical micro-scope positioned above a view port and connected to a CCTV system. The optical image is then slightly defocused (away
3.4. AFM Imaging

134 Hodson, Kielty, and Sherratt
from the substrate) and the tip is coarsely lowered towards the surface until it is in focus.
3. At this point the output signal and horizontal/vertical differ-ence readouts are zeroed in contact mode before switching the microscope into tapping mode.
4. Subsequent operations are performed using the Nanoscope software. First, the resonant frequency of the cantilever is determined using the “autotune” facility (this is used to deter-mine the drive frequency); we normally zero the phase line at this point ( see Fig. 7 ).
5. The motor is then engaged and the software finely adjusts the cantilever until the substrate/sample surface is detected. At this point the piezomotors are initiated and the scanning starts automatically; the drive amplitude and frequencies are determined by the software.
6. We usually adjust the setpoint to just below the point at which tip-sample interaction is lost. All images are captured at a rela-tive humidity of < 45% ( see Note 20 ).
Fig. 6 . Nano-mechanical testing of ECM assemblies by molecular combing. ( A ) Type VI collagen microfibrils adsorbed to mica–PLL substrates in the absence of molecular combing. The globular domains form double-beads (DB) which are separated by triple helical regions. ( B ) Molecular combing applies a tensile force to the microfibril which increases the periodicity and induces a structural rearrangement to a triple-beaded morphology (TB) (9) . ( C ) Non-combed fibrillin microfibrils have a relatively uniform periodicity of ∼ 56 nm. ( D ) Molecular combing can significantly increase microfibril periodicities up to ∼ 160 nm (8) Image size = 1 μm .
A B
DB
TB
D C
56nm
143nm

ECM Macromolecules: Height-Mapping 135
7. Height images are normally captured at a scan rate of 1.49 Hz with scan sizes of 5 or 2 μ m 2 and consist of 512 × 512 data points ( see Note 21 ).
8. We periodically calibrate the instrument using a grating with 180-nm deep, 10- μ m 2 depressions. Tip deconvolution may be per-formed using 10-nm Au particles deposited on mica (see below).
AFM height data may be used to accurately determine molecular dimensions such as height, width and axial periodicity.
The AFM tip is not infinitely sharp and the end of the tip may be thought of as a sphere with a radius of curvature ( R ) which is usually less than 10 nm. Interactions between the tip and the sample pro-duce height images in which surface-bound objects appear broader than their real dimensions (20, 23) . For approximately spherical objects (such as globular proteins) and cylindrical objects (such as collagen fibrils) measured heights will be accurate but measured widths must be corrected for these “tip broadening” effects.
3.5. AFM Image Analysis
3.5.1. Correcting for “Tip Broadening” Effects
Fig. 7 . In order to ascertain the resonant frequency of a cantilever the “autotune” facil-ity of the AFM controller software isntroller software is used. Normally this produces a curve with only one peak (the apex of which represents the resonant frequency) ( A ); the software normally sets the drive frequency slightly to the left of the apex. However, occasionally, due to the mechanical properties of an individual cantilever, double peaks are observed ( B ). In such cases the AFM software is used to manually relocate (or “off-set”) the drive frequency to the left hand shoulder of the leftmost peak ( dashed line ) .
a
b Am
plitu
de
Frequency

136 Hodson, Kielty, and Sherratt
1. Adsorb colloidal gold particles on a mica–PLL surface. Wash with distilled water and allow to dry.
2. Capture AFM height images of the adsorbed gold particles (Fig. 8A ) .
Fig. 8 . Quantitative analysis of AFM height data. ( A ) AFM height image of colloidal gold particles adsorbed to a mica–PLL substrate. ( B ) Height profile (P) of a single gold particle (extracted at the dotted line in ( A )). The particle height ( W t ) and width at half maximum height ( W m ) can be derived from a unimodal Gaussian (G) fitted to the profile data. ( C ) AFM height image (1 × 1 μ m extracted region from a 2 × 2 μ m scan) of a human fibrillin microfibril. Axial height profiles (AHP) and transverse bead (B) and interbead (IB) height profiles may be extracted using WSxM image analysis software. ( D ) Fibrillin microfibril bead (B) and interbead (IB) profiles. ( E ) Fibrillin microfibril axial height profile. Total microfibril length, perio-dicity (bead to bead distance) and relative bead and interbead heights can be measured from AHP. ( F ) Power spectral density analyses of the fibrillin microfibril AHP, calculated in WSxM. The mean spacing of repeating structures within filamentous assemblies such as fibrillin microfibrils can be determined from the fundamental frequency ( f ) of power spectral density plots .

ECM Macromolecules: Height-Mapping 137
3. Extract height profiles of the gold particles using WSxM. 4. The radius of curvature of an AFM tip ( R ) may be calculated
from the height profile (20, 24) using Eq. 5 ; where W m is the width at half particle height and W t is the particle height.
⎛ ⎞ −⎜ ⎟⎝ ⎠=
2 2tm
t
2 4.
WW
RW
(5)
5. Once R has been determined for a given AFM tip, measured widths of ECM structures, such as fibrillin microfibril bead diameter (Fig. 8c , d) , can be corrected for tip broadening to yield the true width ( W t ) using Eq. 6 ( see Note 22 ).
= × +
2t
m t .4
WW R W
(6)
Many ECM structures form filaments. The AFM is well suited to imaging ECM filaments such as fibrillin microfibrils, type VI collagen microfibrils, and type I collagen fibrils. Analysis of AFM height data can quantify molecular diameters and periodicities ( see Note 23 ). 1. The profile tool in WSxM can extract both linear and curved
profiles from AFM filaments (Fig. 8C ). 2. Extracting transverse height profiles within distinct regions of
fibrillin microfibrils reveals the relative distribution of molecu-lar mass in the microfibril bead and interbead (Fig. 8D ).
3. Length and periodicity can be accurately determined from axial height profiles (Fig. 8E ).
4. The mean spacing of repeating structures within filamentous assemblies such as fibrillin microfibrils can be determined from the fundamental frequency ( f ) of power spectral density plots (Fig. 8F ). These approaches are particularly useful where the underlying periodicity is not readily apparent visually.
1. Depending on the manufacturer ICM AFM may be referred to as tapping mode, dynamic mode, AC mode or magnetic AC mode AFM.
2. In practice, imaging in liquid is technically challenging when compared to imaging in air. Difficulties faced when imaging
3.5.2. Characterising Fila-mentous ECM Structures
4. Notes

138 Hodson, Kielty, and Sherratt
in liquid include tip/sample interactions, cantilever tuning and problems in maintaining sample/substrate binding.
3. In ambient laboratory conditions, all surfaces will be coated with a thin layer of adsorbed water molecules. The thick-ness and distribution of this layer will vary with the relative atmospheric humidity and the surface chemistry.
4. Although beyond the scope of this chapter, it should be noted that when using negatively charged surfaces such as mica, the divalent cation concentration in the sample buffer may have a profound effect on both molecule/substrate affinity and molecular morphology. For a detailed discussion of this subject see Sherratt et al. (25) .
5. Stripped mica discs should be used (for sample preparation or subsequent PLL coating) within 1–2 min. Freshly cleaved mica adsorbs moisture and particulate matter from the atmosphere with unpredictable effects on surface chemistry.
6. The surface should be free from mica flakes and scratches particularly within the central region of the disc.
7. It is important to ensure that water used to wash the sam-ples has been passed through a 0.22- μ m filter prior to use in order to minimise the presence of particulate matter. We have noted that in some instances background contamina-tion can be related to the wash rather than to the sample.
8. It is important to ensure that the acid has been fully washed off the surface before attempting to adsorb sample proteins. This can be ascertained by checking the pH of the water after the wash procedure.
9. On very flat substrates such as mica values of R q are invariant with measurement area. On more heterogeneous surfaces, such as mica–PLL, R q is critically dependent on measure-ment area at dimensions less than 100 × 100 nm (18) .
10. R q values of mica and glass substrates should be similar to those reported in Fig. 3 . Substrates such as tissues culture plastic may have much larger R q values such as 1.94 nm (Fig. 4 ).
11. Hydrophilic surfaces have water drop contact angles of <90°. On hydrophobic surfaces the water drop contact angle is ≥ 90°.
12. On many surfaces q app measured as a drop advances across a surface is different from measurements of q app as the drop recedes. Such “contact angle hysteresis” may be induced by surface roughness or chemical heterogeneities (18) .
13. As calculations of contact angle rely on the relative length of H and D only these distance may be expressed in arbitrary units such as pixels.

ECM Macromolecules: Height-Mapping 139
14. Routinely we dilute samples to approximately 1–5 μ g/ml of protein prior to precipitating on to the substrate surface. This may require “fine-tuning” but, as a rule-of-thumb, is a good starting concentration.
15. In addition to the use of filter paper, a stream of compressed air can be gently passed across the stub surface to acceler-ate the drying process. We have noted that the background is often much cleaner when this procedure is employed. It is important to use this approach with caution; however, as rapid drying under an air stream may result in the molecular combing of large, filamentous proteins.
16. To further accelerate the air drying process, the sample can be located beneath the laser in the AFM immediately follow-ing preparation.
17. Molecular combing is possible on highly hydrophilic sub-strates such as mica when the buffer contains high concen-trations of glycerol (22) . Coating the mica surface with PLL (8) or silanizing glass coverslips (21) reduces the surface charge (also referred to as surface energy) and promotes molecular combing in buffers which more closely resemble physiological conditions.
18. During this time the sample will dry onto the surface. Sub-sequent washing steps are not thought to alter the molecular conformation (8) . Washing the sample immediately before drying may have unpredictable effects on the morphology due to variations in buffer concentration.
19. During molecular combing viscous drag forces ( ∼ 1 pN for fibrillin microfibrils) are unlikely to play a major role in stretching adsorbed molecules. In contrast, surface tension-induced forces will be much greater in magnitude ( ∼ 4,000 pN for fibrillin microfibrils).
20. We find that it is important to measure the relative humid-ity of the instrument room prior to imaging. With relative humilities greater than 45% we find that imaging is unreli-able due to the thickness of the adsorbed water layer that covers air-dried samples.
21. Pixel size in AFM height image depends on the number of data points and the image size. For a 2 × 2 μ m scan collected with 512 × 512 data points each pixel is 3.91 nm (2,000/512).
22. Solving Eq. 6 for W t may be carried out numerically by using the goal seek facility of a spreadsheet program.
23. Although beyond the scope of this chapter, it is theoretically possible to estimate the molecular weight of globular pro-teins from the protein volume. Yang and co-workers identi-fied a linear relationship between protein volume, derived from AFM images, and molecular weight (26) .
140 Hodson, Kielty, and Sherratt
References
1. Binnig , G. and Rohrer , H. (1982) Scanning tunnelling microscope . Helv. Phys. Acta 55 , 726 – 735 .
2. Eigler , D.M. and Schweizer , E.K. (1990) Positioning single atoms with a scanning tun-neling microscope . Nature 344 , 524 – 526 .
3. Binnig , G. , Quate , C.F. and Gerber , C. (1986) Atomic force microscope . Phys. Rev. Lett. 56 , 930 – 935 .
4. Zhong , Q. , Inniss , D. , Kjoller , K. and Ell-ings , V.B. (1993) Fractured polymer/sil-ica fiber surface studied by tapping mode atomic force microscopy . Surf. Sci. Lett. 290 , L688 – L692 .
5. Kasos , S. , Gotzos , V. and Celio , M.R. (1993) Observation of living cells using the atomic force microscope . Biophys. J. 64 , 539 – 544 .
6. Fotiadis , D. , Scheuring , S. , Muller , S.A. , Engel , A. and Muller , D.J. (2002) Imaging and manipulation of biological structures with the AFM . Micron 33 , 385 – 397 .
7. Bergkvist , M. , Carlsson , J. and Oscarsson , S. (2003) Surface-dependent conformations of human plasma fibronectin adsorbed to silica, mica, and hydrophobic surfaces, studied by Atomic Force Microscopy . J. Biomed. Mater. Res. 64A , 349 – 356 .
8. Sherratt , M.J. , Baldock , C. , Haston , J.L. , Hol-mes , D.F. , Jones , C.J.P. , Shuttleworth , C.A. , Wess , T.J. and Kielty , C.M. (2003) Fibrillin microfibrils are stiff reinforcing fibres in com-pliant tissues . J. Mol. Biol. 332 , 183 – 193 .
9. Baldock , C. , Sherratt , M.J. , Shuttleworth , C.A. and Kielty , C.M. (2003) The supramo-lecular organization of collagen VI microfi-brils . J. Mol. Biol. 330 , 297 – 307 .
10. Stephan , S. , Sherratt , M.J. , Hodson , N. , Shuttleworth , C.A. and Kielty , C.M. (2004) Expression and supramolecular assembly of recombinant alpha 1(VIII) and alpha 2(VIII) collagen homotrimers . J. Biol. Chem. 279 , 21469 – 21477 .
11. Knupp , C. , Pinali , C. , Munro , P.M. , Gru-ber , H.E. , Sherratt , M.J. , Baldock , C. and Squire , J.M. (2006) Structural correlation between collagen VI microfibrils and col-lagen VI banded aggregates . J. Struct. Biol. 154 , 312 – 326 .
12. Hernandez , J.C.R. , Sanchez , M.S. , Soria , J.M. , Ribelles , J.L.G. and Pradas , M.M. (2007) Substrate chemistry-dependent con-formations of single laminin molecules on polymer surfaces are revealed by the phase signal of atomic force microscopy . Biophys. J. 93 , 202 – 207 .
13. Sherratt , M.J. , Bastrilles , J.Y. , Bowden , J.J. , Watson , R.E.B. and Griffiths , C.E.M. (2006) Age-related deterioration in the mechanical function of human dermal fibrillin microfi-brils . Br. J. Dermatol. 155 , 240 – 241 .
14. Wang , H. , Fertala , A. , Ratner , B.D. , Sage , E.H. and Jiang , S.Y. (2005) Identifying the SPARC binding sites on collagen I and pro-collagen I by atomic force microscopy . Anal. Chem. 77 , 6765 – 6771 .
15. Raspanti , M. , Congui , T. and Guizzardi , S. (2001) Tapping-mode atomic force micros-copy in fluid of hydrated extracellular matrix . Matrix Biol. 20 , 601 – 604 .
16. Cisneros , D.A. , Hung , C. , Franz , C.M. and Muller , D.J. (2006) Observing growth steps of collagen self-assembly by time-lapse high-resolution atomic force microscopy . J. Struct. Biol. 154 , 232 – 245 .
17. Lin , H. , Clegg , D.O. and Lal , R. (1999) Imaging real-time proteolysis of single colla-gen I molecules with an atomic force micro-scope . Biochemistry 38 , 9956 – 9963 .
18. Sherratt , M.J. , Holmes , D.F. , Shuttleworth , C.A. and Kielty , C.M. (2004) Substrate-dependent morphology of supramolecular assemblies: fibrillin and type-VI collagen micro-fibrils . Biophys. J. 86 , 3211 – 3222 .
19. Garcia , A.J. , Vega , M.D. and Boettiger , D. (1999) Modulation of cell proliferation and differentiation through substrate-dependent changes in fibronectin conformation . Mol. Biol. Cell. 10 , 785 – 798 .
20. Sherratt , M.J. , Bax , D.V. , Chaudhry , S.S. , Hodson , N. , Lu , J.R. , Saravanapavan , P. and Kielty , C.M. (2005) Substrate chemistry influ-ences the morphology and biological function of adsorbed extracellular matrix assemblies . Biomaterials 26 , 7192 – 7206 .
21. Bensimon , A. , Simon , A. , Chiffaudel , A. , Cro-quette , V. , Heslot , F. and Bensimon , D. (1994) Alignment and sensitive detection of DNA by a moving interface . Science 265 , 2096 – 2098 .
22. Tskhovrebova , L. and Trinick , J. (2001) Flex-ibility and extensibility in the titin molecule: analysis of electron microscope data . J. Mol. Biol. 310 , 755 – 771 .
23. Bustamante , C. , Vesenka , J. , Tang , C.L. , Rees , W. , Guthold , M. and Keller , R. (1992) Circu-lar DNA molecules imaged in air by scanning force microscopy . Biochemistry 31 , 22 – 36 .
24. Engel , A. , Schoenenberger , C.-A. and Muller , D.J. (1997) High resolution imaging of native biological sample surfaces using scanning probe microscopy . Curr. Opin. Struct. Biol. 7 , 279 – 284 .

ECM Macromolecules: Height-Mapping 141
25. Sherratt , M.J. , Baldock , C. , Morgan , A. and Kielty , C.M. (2007) The morphology of adsorbed extracellular matrix assemblies is criti-cally dependent on solution calcium concentra-tion . Matrix Biol. 26 , 156 – 166 .
26. Yang , Y. , Wang , H. and Erie , D.A. (2003) Quantitative characterization of biomolecular assemblies and interactions using atomic force microscopy . Methods 29 , 175 – 187 .

Chapter 8
Atomic Force Microscopy Measurements of Intermolecular Binding Forces
Gradimir N. Misevic , Yannis Karamanos , and Nikola J. Misevic
Summary
Atomic force microscopy (AFM) measurements of intermolecular binding strength between a single pair of complementary cell adhesion molecules in physiological solutions provided the first quantita-tive evidence for their cohesive function. This novel AFM-based nanobiotechnology opens a molecu-lar mechanic approach for studying structure- to function-related properties of any type of individual biological macromolecules. The presented example of Porifera cell adhesion glyconectin proteoglycans showed that homotypic carbohydrate to carbohydrate interactions between two primordial proteogly-cans can hold the weight of 1,600 cells. Thus, glyconectin type carbohydrates, as the most peripheral cell surface molecules of sponges (today’s simplest living Metazoa), are proposed to be the primary cell adhesive molecules essential for the evolution of the multicellularity.
Key words: Atomic force microscopy , Intermolecular binding strength/force , Cell adhesion , Ana-tomical integrity , Multicellular organism , Cell recognition , Morphogenesis , Self-non-self-discrimi-nation , Nanobiotechnology , Molecular mechanics , Proteoglycans–glyconectins– , carbohydrates .
Intermolecular binding forces are intrinsic properties of cohe-sive structures defining the form and physical state of all entities. Differences in the degree of binding strengths between diverse types of molecules at the given environmental thermodynamic conditions determine selectivity of their associations which is the physicochemical basis for the evolution of cellular life forms. We proposed to use the intermolecular binding forces as a main quan-titative criterion for assessing and defining their functional con-tribution to processes essential for the evolution, maintenance,
1. Introduction
Sharona Even-Ram and Vira Artym (eds.), Methods in Molecular Biology, Extracellular Matrix Protocols, vol. 522© Humana Press, a part of Springer Science + Business Media, LLC 2009DOI: 10.1007/978-1-59745-413-1_8
143
144 Misevic, Karamanos, and Misevic
and diversity of the biological life. Following are several examples that are relevant to life sciences: selective intracellular and extra-cellular supramolecular assemblies that are related to the evolu-tion and maintenance of cellular structures and life processes, cell adhesion as a prerequisite for the maintenance of anatomi-cal integrity in multicellular organisms, cell recognition, guiding morphogenesis, self-non-self-discrimination, fertilization, blood cell adhesiveness in normal and pathological conditions, tumor cell adhesion, parasite–host interactions, and cellular associations in symbiotic organism.
The novel technology of atomic force microscopy (AFM) that was developed in 1995 (1) can measure the binding strength between a single pair of cell adhesion molecules in various physi-ological solutions ( see Note 1 ), and is complementary to binding studies, calorimetric, and spectroscopic analyses that are kinetic methods for measurement of large number of molecules (not on single pairs of molecules) and do not provide direct information about binding forces.
The AFM was initially built and is used mostly by physicists as a superb atomic imaging instrument for examination of solid-surface topography (2) . To be able to determine intermolecular binding forces with AFM complementary cell adhesion, mole-cules have to be covalently crosslinked to a siliconnitride sensor tip and an atomically flat mica–silicon surface (1) . Because the AFM tip has a 10–20-nm diameter and most of the cell-adhesion molecules are over 20 nm in diameter, not more than one mole-cule could be attached to the tip assuring measurements between the single molecular pair. The crosslinking process consists of deposition of 10–30-nm gold on the two surfaces by evaporation in high vacuum, followed by formation of self-assembled mon-olayer of either 11-thio-undecanol or 11-thio-undecanoic acid . A very high density of hydroxyl and carboxyl groups is com-pletely converted with carbonyldiimidazole in dry methanol to give highly reactive imidazole carbamate and acylimidazoles, respectively. Amine-containing molecules (proteins, glycopro-teins, proteoglycans, and glycans containing linkage amino acid) will be rapidly and quantitatively coupled to these groups to yield stable carbamate and amide linkages, respectively. Unreacted imi-dazole carbamate will hydrolyze in the presence of water to the hydroxyl groups and imidazole. The cantilever tip with attached cell-adhesion molecule is carefully moved at subnanometer preci-sion with AFM piezoelectric scanner toward the complementary receptor on the mica surface in the physiological solution, until contact between two molecules is made (Fig. 1 ). This contact is followed by retraction of the cantilever tip. During such a dis-placement, the cantilever bends until the pulling force becomes equivalent to the intermolecular binding strength between adhesion molecules that are crosslinked to the tip and the

Atomic Force Microscopy Measurement of Intermolecular Binding Force 145
receptor attached to the mica. When the power applied by AFM electric scanner tube exceeds ligand–receptor binding force, the lever jumps off the contact and straightens. The cantilever deflec-tion and distance from the surface is permanently monitored by deflection of the laser from the cantilever and transferred to the position-sensitive photodetector. The degree of the cantilever stiffness is provided by the manufacturer and can also be directly determined by AFM. Thus, the registered cantilever hysteresis on the calibrated position-sensitive photodetector is a direct meas-ure of the adhesion force and distance between molecules. Typi-cally, such approach–retract cycles, sometimes also referred to as force–distance curves or force plots, are repeated 50 times at five different points, with a speed of 0.01–1 Hz at room temperature, and in various physiological solutions. Although the long-range electrostatic interaction between tip and mica solid gold-coated surfaces are shielded by self-assembled uncharged monolayer in order to characterize and verify that the measured forces origi-nate from an interaction between complementary cell adhesion molecules, measurements of both the force required to separate the ligand-functionalized sensor tip from the analogous receptor on the surface (final “jump-offs”) and the percentage of interac-tion events should be investigated under different ionic condi-tions and using control measurements with nonfunctionalized tip and/or surface (1) . A further line of evidence that the AFM-measured interactions originate from ligand–receptor binding can be provided by the use of specific monoclonal antibodies capable of blocking cell adhesion. Also, activators and other blockers of
Fig. 1 . Schematic representation of AFM measurements of intermolecular binding strength between glyconectin 1 prote-oglycans in physiological solution. Yellow force distance curve represent measurements in artificial sea water with physi-ological 10 mM Ca 2+ and the red curve was obtained with 2 mM Ca 2+ . Adhesion molecule represents glyconectin 1 .

146 Misevic, Karamanos, and Misevic
adhesion molecule-receptors binding can be added to the liquid cell during the course of experiment. More than 1,000 meas-urements should be performed on the same preparation. The rupture force of a single covalent C–C bond is about 10 nN, whereas the strongest noncovalent binding forces measured with adhesion proteoglycan are about 25 times weaker (400 pN) (1) . These findings explain why the adhesion structures remain intact throughout AFM experiments.
1. Atomic force microscope equipped with a liquid cell. 2. Cantilevers with silicon nitride tip 10–50-nm diameter with
spring constant 0.01–0.1 N/m. ( see Notes 2 and 3 ). 3. Mica. 4. Single and double stick Scotch tape, forceps. 5. Gold wire. 6. Turbo vacuum evaporator. 7. Cantilever holders consisting of Teflon stub with slit for
attaching cantilever. Teflon ring for fixing cantilevers into slit and mechanical protection (self-made).
8. Flat bottom glass beakers (1–5 mL) with shift glass cover. 9. Plastic dishes filter paper and parafilm for humid chambers. 10. Analytical grade dry methanol. 11. 11-thio-undecanol, or 11-thio-undecanoic acid. Self-
synthesized. Keep it dry at 4°C. 12. Carbonyldiimidazole. Keep it sealed in dry place at room
temperature. 13. Crosslinking buffers. Choice depends of the nature of the
molecule. Recommended is 0.1–0.5 M NaCl, 20 mM HEPES buffer pH 7.4.
1. Attach cantilevers and freshly cleaved mica 1.5 × 1.5 cm with double-stick Scotch tape into a holder of a turbo vacuum evapo-rator equipped with a quartz crystal for monitoring thickness of gold ( see Notes 4 and 5 ). Place gold wire in an evaporation slot,
2. Materials
3. Methods
3.1. Crosslinking
Atomic Force Microscopy Measurement of Intermolecular Binding Force 147
turn vacuum on and adjust current of turbo vacuum evaporator for a designated time. Coat cantilevers and freshly cleaved mica to give thickness of 10–20-nm gold.
2. Immediately after gold coating, mount cantilevers in the Teflon holders and place mica in a 1–5-mL glass beaker with a shift glass cap.
3. Add 1–2 mL of freshly prepared 1 mM solution of 11-thio-undodecanol in analytical-grade methanol and incubate for 12 h at room temperature to form self-assembled monolayer.
4. Wash cantilevers and mica five times with analytical grade methanol.
5. Add 1–2 mL of 50 mg/mL of freshly prepared carbonyldi-imidazole in analytical grade methanol and incubate for 20 min at room temperature.
6. Wash four times with 1 mL of methanol. 7. Dismount cantilever from the Teflon holder and place them
on stretched parafilm in plastic nonhumid chamber with tip facing upward. Immediately add 10–20 μ L of 1–20 μ g of molecules to be crosslinked in 0.1–0.5 M NaCI, 10 mM HEPES buffer pH 7.4. With forceps, take mica and do the same as with the cantilevers. Incubate 30 min to 1 h at room temperature in a humid chamber. ( see Notes 6, 7 and 8 )
8. Wash five times with the buffer that will be used for the measurements.
1. Mount by double Scotch tape the back side of mica crosslinked with adhesion molecule to the AFM base. The upper part of mica with crosslinked molecules should always be covered with 10–20- μ L buffer.
2. Rapidly mount cantilevers with crosslinked molecules on an AFM equipped with a liquid cell filled with buffer in order to prevent drying. ( see Notes 8, 9 and 10 )
3. Ensure that no bubbles are trapped in the liquid cell between cantilever tip and mica.
4. Use contact mode soft approach. ( see Note 9 ) 5. Perform about 50 force distance measurements of intermolecu-
lar binding strength at 0.01–1 Hz on 5–10 different locations (molecules on mica) ( see Notes 11 and 12 ). Change solution to use blockers and/or activators of binding and repeat the same number of measurements. Return to original solution and repeat to test the reversibility of blocking or activation.
6. At the end of the experiment measure the spring constant of the cantilever.
3.2. AFM Measurements

148 Misevic, Karamanos, and Misevic
1. The author has used three following types of commercial AFMs equipped with a liquid cell: Digital Instruments Nano-scope III, Topolvletrix, and Park Instrument AutoProbe CPo.
2. Some manufacturers glue cantilevers to a base. Test whether the glue is soluble in methanol before performing the crosslinking.
3. Cantilever with different spring constant with and with-out coating for better laser reflection, as well as variety of sizes, shapes, and material of tips are available. Principally, contact-mode silicon nitride cantilevers with spring constant 0.01–0.1 N/m, coated with gold on the topside for better reflection of the laser with tips of 10–50-nm diameter should be used. For smaller molecules, smaller and sharper tips are recommended in order to match the size of molecule. This ensures that only one molecule can be accommodated on the tip and that the measurements reflect adhesion forces between individual molecular pairs.
4. Different brands of turbo vacuum evaporator are available. Follow the manufacturer’s instruction for proper coating of gold.
5. To keep gold more firmly attached to mica and silicon nitride, a 10–30-nm chromium layer can be deposited before gold coating (1) .
6. Other crosslinking buffers such as 0.1 M bicarbonate pH 8.0 or 50–100 mM phosphate buffer pH 7.0–9.0 can also be used.
7. Different types of crosslinking procedures are possible with a variety of commercially available bifunctional crosslinkers for carboxyl amino and sulfhydryl groups (1, 3) . It is essential to form a self-assembled monolayer to shield long-range elec-trostatic forces between gold-coated surfaces.
8. Care should be taken when manipulating the cantilevers. The tips should never be touched and not dried during crosslinking of adhesion molecules or during mounting to the AFM.
9. Each AFM manufacturer has slightly different computer soft-ware procedures for calibrating the scanners, adjusting the photodetector, optimizing the signal of the reflected laser and for the contact mode approach, acquisition of force–distance curves, and direct determination of the spring con-stant of the cantilevers. Manufacturer instructions should be
4. Notes

Atomic Force Microscopy Measurement of Intermolecular Binding Force 149
carefully read to avoid crashing the tip on the surface and to ensure quantitative measurements.
10. Different brands and models of AFMs have different designs of liquid cells. Some are more complicated and require patient following of the procedure to avoid bubble forma-tion. The simplest liquid cell operates in a droplet of solu-tion. In this case, exchange is easy and bubble formation can be avoided, however, caution should be taken for evapora-tion after extensively long work, which can lead to changes of concentration. Thus, more frequent exchanges of solution are necessary. Prevent heating of the small volume of liquid by strong-illumination optical-microscope devices available with some AFM brands.
11. It is essential to covalently crosslink ligands and receptors to base supports and to the cantilevers via self-assembly layer of lipids and NOT to use (quick and dirty) noncova-lent adsorptions of ligands. The use of covalent crosslinking and lipid shielding procedure ensures optimal measure-ments of intermolecular binding strength by minimizing the influence of unwanted and unrelated forces resulting from de-adsorption/adsorption of ligands and receptors and long-distance electrostatic forces between the mica and the cantilever and/or their interactions with the lig-and and receptor. Unfortunately, several studies are ignor-ing this chemical–-physical facts and are using adsorption methods without shielding where adsorption forces are wrongly declared as covalent attachment on gold (4, 5) . Do NOT use such procedure because they result in mean-ingless results, which poisons the literature and are very confusing and discouraging for biologists who are seek-ing to use these superb techniques of measurements of intermolecular binding strength and evaluation for their functional contribution.
12. Ideally, measurements between single pair of ligand to a receptor should be performed by AFM. Considering the size of the AFM tip and its curvature angle in comparison with the size of the crosslinked molecule, caution must be taken when determining the number of molecules that are crosslinked to the tip. Usually few nanometer diameter of smaller protein molecule will allow crosslinking under the standard described conditions of at least ten molecules per 10 nm 2 surface of available curvature of the tip. Therefore, under these conditions it will be difficult to interpret how many ligand–receptor molecules will be contributing to the measured force (4– 6) . Use serial dilution experiments in order to solve this problem.
150 Misevic, Karamanos, and Misevic
This work was supported by the private funds of Dr. G. N. Misevic, Conseil Regional Nord-Pas de Calais, CNRS, Marcel Merieux Foundation, Swiss National Science Foundation, Cancer League Basel, and sixth framework programme Network of Excellence Nanobeams.
Acknowledgments
References
1. Dammer , U. , Popescu , O. , Wagner , P. , Anselrnetti , D. , Guntherodt , H. I. , and Misevic , G. N. (1995) Binding strength between cell adhesion proteoglycans meas-ured by atomic force microscopy . Science 267 , 1173 – 1175 .
2. Binnig , G. , Quare , C. F. , and Gerber , C. (1986) Atomic force microscopy . Phys. Rev. Lett. 56 , 930 .
3. Hermanson , G. T. , Mallia , K. A. , and Smith , P. K. (1992) Immobilised Affinity Techniques . Academic , New York .
4. Bucior , I. , Scheuring , S. , Engel , A. , Burger , M. M. (1994) Carbohydrate–carbohydrate interaction provides adhesion force and spe-cificity for cellular recognition . J Cell Biol. 165 , 529 – 537 .
5. Lee , G. U. , Kidwell , D. A. , and Colton , R. C. (1994) Sensing discrete streptavidin–biotin interactions with atomic force microscopy . Langmuir 10 , 354 – 357 .
6. Florin , E. L. , Moy , V. T. , and Gaub , H. E. (1994) Adhesion forces between individual ligand–receptor pairs . Science 264 , 415 – 417 .
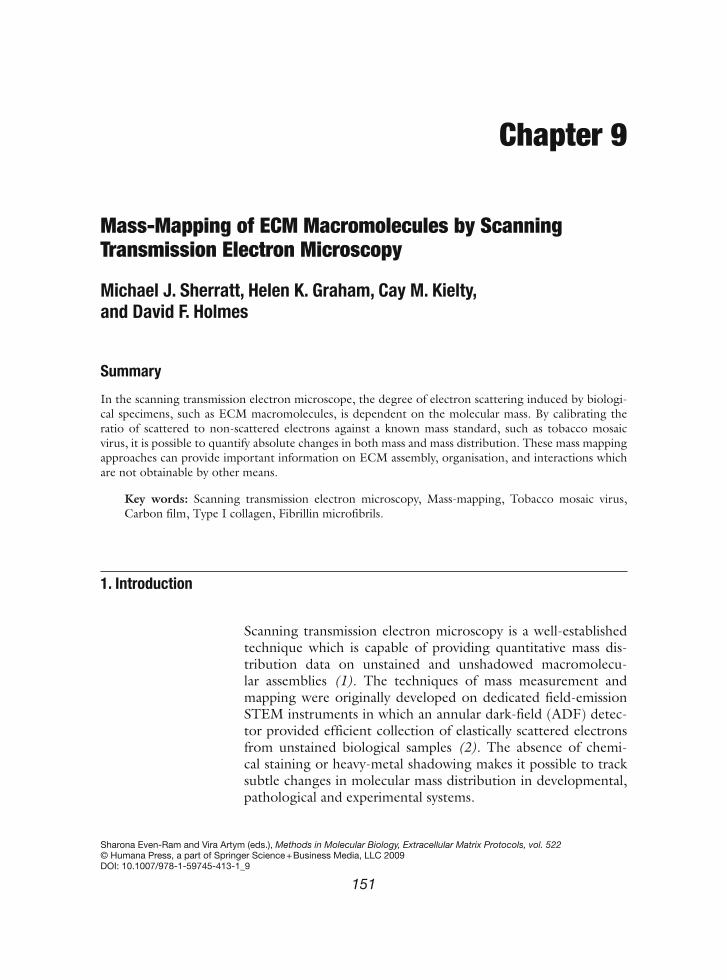
Chapter 9
Mass-Mapping of ECM Macromolecules by Scanning Transmission Electron Microscopy
Michael J. Sherratt , Helen K. Graham , Cay M. Kielty , and David F. Holmes
Summary
In the scanning transmission electron microscope, the degree of electron scattering induced by biologi-cal specimens, such as ECM macromolecules, is dependent on the molecular mass. By calibrating the ratio of scattered to non-scattered electrons against a known mass standard, such as tobacco mosaic virus, it is possible to quantify absolute changes in both mass and mass distribution. These mass mapping approaches can provide important information on ECM assembly, organisation, and interactions which are not obtainable by other means.
Key words: Scanning transmission electron microscopy , Mass-mapping , Tobacco mosaic virus , Carbon film , Type I collagen , Fibrillin microfibrils .
Scanning transmission electron microscopy is a well-established technique which is capable of providing quantitative mass dis-tribution data on unstained and unshadowed macromolecu-lar assemblies (1) . The techniques of mass measurement and mapping were originally developed on dedicated field-emission STEM instruments in which an annular dark-field (ADF) detec-tor provided efficient collection of elastically scattered electrons from unstained biological samples (2) . The absence of chemi-cal staining or heavy-metal shadowing makes it possible to track subtle changes in molecular mass distribution in developmental, pathological and experimental systems.
1. Introduction
Sharona Even-Ram and Vira Artym (eds.), Methods in Molecular Biology, Extracellular Matrix Protocols, vol. 522© Humana Press, a part of Springer Science + Business Media, LLC 2009DOI: 10.1007/978-1-59745-413-1_9
151
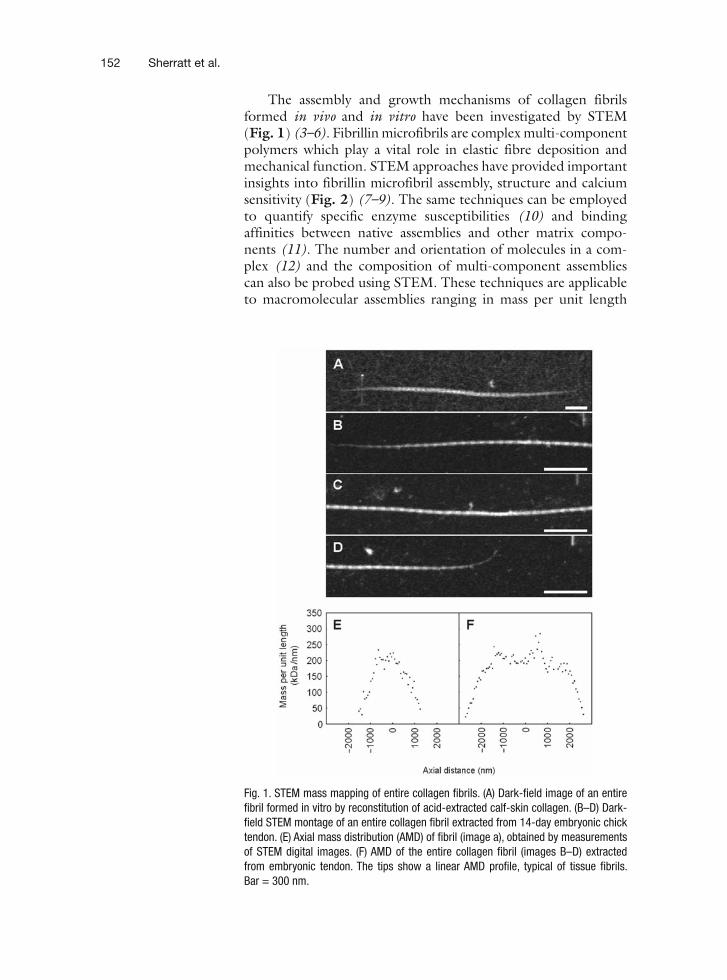
152 Sherratt et al.
The assembly and growth mechanisms of collagen fibrils formed in vivo and in vitro have been investigated by STEM (Fig. 1 ) (3– 6) . Fibrillin microfibrils are complex multi-component polymers which play a vital role in elastic fibre deposition and mechanical function. STEM approaches have provided important insights into fibrillin microfibril assembly, structure and calcium sensitivity (Fig. 2 ) (7– 9) . The same techniques can be employed to quantify specific enzyme susceptibilities (10) and binding affinities between native assemblies and other matrix compo-nents (11) . The number and orientation of molecules in a com-plex (12) and the composition of multi-component assemblies can also be probed using STEM. These techniques are applicable to macromolecular assemblies ranging in mass per unit length
Fig. 1 . STEM mass mapping of entire collagen fibrils. ( A ) Dark-field image of an entire fibril formed in vitro by reconstitution of acid-extracted calf-skin collagen. ( B–D ) Dark-field STEM montage of an entire collagen fibril extracted from 14-day embryonic chick tendon. ( E ) Axial mass distribution (AMD) of fibril (image a ), obtained by measurements of STEM digital images. ( F ) AMD of the entire collagen fibril (images B–D ) extracted from embryonic tendon. The tips show a linear AMD profile, typical of tissue fibrils. Bar = 300 nm .

Mass-Mapping of ECM Macromolecules 153
from 10 to over 9,000 kDa/nm (Fig. 3 ). The protocols in this chapter cover the production of carbon-coated grids and sub-sequent sample preparation, acquisition of calibrated STEM images and the quantitative analysis of macro-molecular mass distributions.
Fig. 2 . Isolated fibrillin-containing microfibrils visualised by dark-field STEM ( B , D , F ). Mean axial mass distributions of microfibrils ( A , C , E ). Intact native bovine aorta microfibrils were visualised directly ( A , B ), after incubation with 5 mM EDTA ( C , D ) and after incubation with 5 mM calcium chloride (E,F). STEM analysis revealed that Ca 2+ removal or addition caused significant changes in microfibrillar mass distribu-tion and periodicity .

154 Sherratt et al.
Materials and preparative equipment for electron microscopy may be purchased from Agar Scientific (Essex, UK). 1. Carbon rods (6-mm diameter). 2. Electron microscope grids (400 mesh copper or nickel). 3. Mica sheets (25 × 25 mm, 0.15-mm thick). 4. Diffraction grating (2,160 lines/mm). 5. Fine tweezers with clamping ring. 6. High-vacuum coating unit.
1. Prepare thin carbon films by thermally evaporating a 1-mm long, 0.8-mm diameter spindle from a carbon rod using the geometry shown in Fig. 4 ( see Notes 1 and 2 ). Using a clean ricochet cylinder (13) , evaporate the carbon onto a
2. Materials
2.1. Ultrastructural Investigations
3. Methods
3.1. Preparation of Carbon Coated EM Grids
Fig. 3 . STEM analysis of macromolecular assemblies within the mass range 10 kDa/nm to 9 MDa/nm. ( A ) Type VI collagen microfibrils, ( B ) fibrillin-containing microfibrils. ( C ) Type I collagen fibrils of embryonic chick tendon and ( D ) collagen fibrils from sea-urchin ligament (sea-urchin ligament micrograph courtesy of Prof. J. Trotter, Albuquerque, New Mexico, USA) .

Mass-Mapping of ECM Macromolecules 155
freshly cleaved sheet of mica ( see Note 3 ). The film thickness should lie within the range 2.0–3.0 nm (3) . This is a clearly visible brown/grey deposit on filter paper ( see Note 4 ). Film thickness may be determined using a film thickness monitor, assuming a carbon density of 1.9 g/cm 3 .
2. Incubate the carbon-coated mica in a humid atmosphere over-night to facilitate separation of the film.
3. Using watchmakers forceps, carefully space the electron micro-scope grids 1–2 mm apart on the carbon film.
4. Using the forceps slowly slide the mica at an angle of 10–20° into a reservoir of ultrapure water. The carbon film should detach from the mica and remain intact on the surface of the water.
5. Break the carbon film into sections of approximately five grids per side. Cut strips of newspaper slightly larger than the raft of grids ( see Note 5 ). Gently lay the paper onto the grids and car-bon film. When the water has completely soaked through the newspaper, lift the paper and grids onto a piece of filter paper to dry. Store carbon films on dry filter paper in a petri-dish.
Fig. 4. Place the freshly cleaved mica sheet ( A ) within a clean ricochet cylinder ( B ) and below a mask ( C ) which shields the mica from direct carbon evaporation. Carbon rods ( D and E ), held in contact by a spring during the evaporation, are positioned 1.5 cm above the mask .

156 Sherratt et al.
1. For the molecular suspension of interest, prepare a range of sample dilutions (e.g. undiluted, 1/3, 1/6 and 1/9) in the appropriate buffer (e.g. fibrillar collagen extraction buffer for type I collagen or column buffer for microfibril suspensions) (see accompanying Chapter by Sherratt et al.).
2. Fold a circular filter paper into quarters. Using tweezers, with a clamping ring, grip the edge of the carbon-coated micro-scope grid. Pipette 5–6 μ l of the sample onto the centre of the grid. Allow the sample to adsorb for 30–60 s ( see Note 6 ).
3. Gently wick off excess sample against the folded side of the filter paper. Wash the grid with three successive drops of water then drain excess water from below the grid.
4. Allow the grid to air dry for 5 min prior to examination in the microscope ( see Note 7 ).
The dark-field digital STEM system employed in our laboratory is a Tecnai 12 electron microscope with TWIN objective lens (FEI, Eindhoven, The Netherlands) and is equipped with a high-angle ADF detector and digital scanning unit ( see Note 8 ). The FEI-supplied software controls the digital scan, signal acquisition, beam blanking and digitisation of the signal from the ADF detec-tor (3) . The annular detector geometry is illustrated in Fig. 5 . Digital images are acquired using a spot size 9 (approximately 3 nm). No correction for beam-induced mass loss is required where the specimen is exposed to an electron dose of less than 10 3 e/nm 2 . Where a greater electron dose is used, a mass loss curve can be plotted from measurements on multiple exposures of the same field of view and a correction applied for the given dose (12) .
Standard STEM images consist of 1,024 × 1,024 points with an acquisition time of 30 s. Magnification calibration can be car-ried out with a carbon replica of a diffraction grating ruled at 2,160 lines/mm. Analysis of raw image data may be carried out using macros and plugins for the public domain image analysis program ImageJ ( see Note 9 ).
The following protocol demonstrates the steps in calibrating a Tecnai 12 STEM system using tobacco mosaic virus (TMV) particles which have a well-defined mass per unit length of 131 kDa/nm (1) . When calibrated, the system may be used to deter-mine the absolute mass characteristics of a large range of ECM macromolecules and assemblies. 1. Capture dark-field STEM images of TMV supported on car-
bon film ( Fig. 6A ) at a magnification appropriate for the spec-imen of interest ( see Note 10 ). For each image, record the small screen exposure signal and the film emulsion setting and keep the defocus to within ±5 μ m (using the specimen stage height control). Capture sufficient images to provide data on 20–30 TMV particles.
3.2. Preparation of Sample Grids
3.3. Scanning Transmission Electron Microscopy
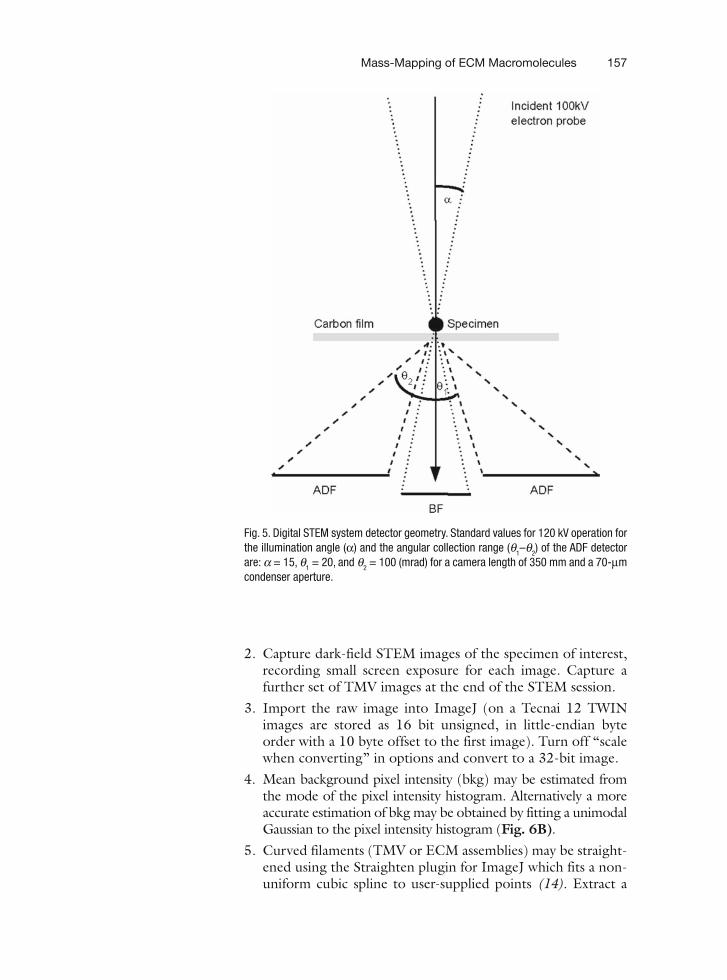
Mass-Mapping of ECM Macromolecules 157
2. Capture dark-field STEM images of the specimen of interest, recording small screen exposure for each image. Capture a further set of TMV images at the end of the STEM session.
3. Import the raw image into ImageJ (on a Tecnai 12 TWIN images are stored as 16 bit unsigned, in little-endian byte order with a 10 byte offset to the first image). Turn off “scale when converting” in options and convert to a 32-bit image.
4. Mean background pixel intensity (bkg) may be estimated from the mode of the pixel intensity histogram. Alternatively a more accurate estimation of bkg may be obtained by fitting a unimodal Gaussian to the pixel intensity histogram (Fig. 6B ).
5. Curved filaments (TMV or ECM assemblies) may be straight-ened using the Straighten plugin for ImageJ which fits a non-uniform cubic spline to user-supplied points (14) . Extract a
Fig. 5 . Digital STEM system detector geometry. Standard values for 120 kV operation for the illumination angle ( α ) and the angular collection range ( q 1 – q 2 ) of the ADF detector are: a = 15, q 1 = 20, and q 2 = 100 (mrad) for a camera length of 350 mm and a 70- μ m condenser aperture .

158 Sherratt et al.
box encompassing the centre of the filament and flanking car-bon film and determine the mean pixel intensity (mpi) using the Measure function (Fig. 6C ).
6. The pixel intensity sum ( Σ int ) within a region can be deter-mined from Eq. 1 where ba is the area of the extracted box in pixels.
Σ = − ×int (mpi bkg) .ba (1)
7. Calculate the mean mass calibration factor (mcf) for TMV particles captured at the start and end of the STEM session. Use Eq. 2 where n L is the box length (pixels), SS exp the small screen exposure and p is the pixel size (in nm)
× ×=
Σ ×
Lexp
int
100131
SSmcf .
n
p (2)
8. The mass in kDa/nm 2 within any given area of the specimen (to a minimum size of one pixel) may be quantified using Eq. 3 where E TMV is the TMV image film emulsion setting, E SPC is the specimen film emulsion setting and Σ int is the specimen pixel intensity sum (calculated using Eq. 1 )
= × × ×⎛ ⎞⎜ ⎟⎝ ⎠
∑2 int TMV
SPC
exp
mass mcf .100SS
E
pE
(3)
Fig. 6 . ( A ) TMV particle supported on thin carbon film imaged by STEM. ( B ) Calculating background intensity due to the carbon film. The carbon film background (bkg) may be estimated from the mode of the pixel intensity histogram or more accurately calculated from a fitted unimodal Gaussian. ( C ) Extracted box from ( A ) with dimensions 370 × 130 nm. Mean pixel intensity (mpi) within the box can be calculated using the integrated Meas-ure function in ImageJ. Scale bar = 100 nm .

Mass-Mapping of ECM Macromolecules 159
9. Using these approaches it is possible to quantify mass distri-bution and total mass within macromolecular assemblies (Fig. 7 ). Comparisons of observed and theoretical mass distribution are invaluable in assessing the validity of macro-molecular assem-bly models (Fig. 7B iii; (15, 16) ).
1. Indirect carbon-coating using a ricochet cylinder ( Fig. 4 ) produces a smoother carbon film than direct deposition methods.
2. Using a lathe cut a 6-mm diameter carbon rod to form a tip approximately 0.8 mm in diameter and 1 mm in length. Form the tip by progressively cutting concentric circles of decreasing diameter.
4. Notes
Fig. 7 . ( A ) Quantifying mass distribution within ECM assemblies. ( A ) STEM image of a fibrillin microfibril extracted of from the skin of a 27-year old human. ( B -i Nineteen microfibril repeats (extracted from the dotted box in ( A )) and straightened using a plugin for ImageJ based on an algorithm described in Kocsis et al. (14) . ( B -ii) Axial mass distribution of microfibril repeats per unit length. ( B -iii) Experimentally observed and theoretically predicted microfibril mass per repeat (15) . Scale bar = 100 nm .

160 Sherratt et al.
3. Cut a 2-cm 2 sheet of mica and trim 1 mm from each edge. Using the side of a pair of forceps flatten one edge of the mica. Gently insert one blade of the forceps into the flat-tened side until the mica cleaves.
4. Where no monitor is available, a carbon-coating apparatus of the dimensions detailed in Fig. 4 should produce films within the required film thickness range. Films should be self-supporting but not too thick. A thin carbon film signifi-cantly enhances the signal to noise ratio for low mass samples such as microfibrils and collagen fibril tips.
5. An absorbent newspaper is ideal. Avoid areas of ink, particu-larly colour printing.
6. The sample drop should spread over the surface of the grid. If problems are encountered, gently circle the pipette over the grid to spread the sample evenly. Adsorption times of greater than 30–60 s increase background contamination.
7. Alternatively samples may be freeze dried. 8. Combined STEM/TEM instruments (capable of producing
a 2–3 nm spot in STEM mode and equipped with efficient photomultiplier/scintillator ADF detectors) are available from a number of suppliers including JEOL Ltd (Tokyo, Japan), FEI Ltd (Eindhoven, The Netherlands) and Carl Zeiss Ltd (Oberkochen, Germany).
9. Our laboratory uses the public domain image analysis pro-gram ImageJ, developed at the NIH by Wayne Rasband ( http://rsb.info.nih.gov/ij/ ).
10. Instrumental magnification should be chosen to achieve a final pixel size of 2.5 nm (suitable for microfibrillar struc-tures) to 5 nm (suitable for collagen fibrils). Capture TMV images at the same magnification as the specimen.
References
1. Muller , S.A. , Goldie , K.N. , Burki , R. , Haring , R. , and Engel , A. (1992) Factors influencing the precision of quantitative scanning transmis-sion electron microscopy . Ultramicroscopy 46 , 317 – 334 .
2. Engel , A. (1982) Quantitative acquisition and evaluation of electron micrography using a STEM . Ultramicroscopy 9 , 421 .
3. Holmes , D.F. (1995) Mass mapping of extra-cellular assemblies . Biochem. Soc. Trans. 23 , 720 – 725 .
4. Graham , H.K. , Holmes , D.F. , Watson , R.B. and Kadler , K.E. (2000) Identification of
collagen fibril fusion during vertebrate ten-don morphogenesis. The process relies on unipolar fibrils and is regulated by collagen–proteoglycan interaction . J. Mol. Biol. 295 , 891 – 902 .
5. Holmes , D.F. and Kadler , K.E. (2005) The precision of lateral size control in the assembly of corneal collagen fibrils . J. Mol. Biol. 345 , 773 – 784 .
6. Holmes , D.F. and Kadler , K.E. (2006) The 10 + 4 microfibril structure of thin carti-lage fibrils . Proc. Natl Acad. Sci. USA. 103 , 17249 – 17254 .

Mass-Mapping of ECM Macromolecules 161
7. Sherratt , M.J. , Holmes , D.F. , Shuttleworth , C.A. and Kielty , C.M. (1997) Scanning trans-mission electron microscopy mass analysis of fibrillin-containing microfibrils from foetal elastic tissues . Int. J. Biochem. Cell Biol. 29 (8–9) , 1063 – 1070 .
8. Baldock , C. , Koster , A.J. , Ziese , U. , Rock , M.J. , Sherratt , M.J. , Kadler , K.E. , Shuttle-worth , C.A. and Kielty , C.M. (2001) The supramolecular organization of fibrillin-rich microfibrils . J. Cell Biol. 152 , 1045 – 1056 .
9. Wess , T.J. , Purslow , P.P. , Sherratt , M.J. , Ash-worth , J. , Shuttleworth , C.A. and Kielty , C.M. (1998) Calcium determines the supramolecu-lar organisation of fibrillin-rich microfibrils . J. Cell Biol. 141 (4) , 829 – 837 .
10. Ashworth , J.L. , Murphy , G. , Rock , M.J. , Sherratt , M.J. , Shapiro , S.D. , Shuttleworth , C.A. and Kielty , C.M. (1999) . Fibrillin degradation by matrix metalloproteinases: implications for connective tissue remodelling . Biochem. J. 340 , 171 – 181 .
11. Freeman , L.J. , Lomas , A. , Hodson , N. , Sherratt , M.J. , Mellody , K.T. , Weiss , A.S. ,
Shuttleworth , A. and Kielty , C.M. (2005) Fibulin-5 interacts with fibrillin-1 molecules and microfibrils . Biochem. J. 388 , 1 – 5 .
12. Liversage , A.D. , Holmes , D. , Knight , P.J. , Tskhovrebova , L. and Trinick , J. (2001) Titin and the sarcomere symmetry paradox . J. Mol. Biol. 305 , 401 – 409 .
13. Baumeister , W. and Hahn , M. (1978) in Prin-ciples and Techniques of Electron Microscopy ( Hayat, M.A. , ed.), pp. 1 – 112 , Van Nostrand-Reinhold , New York .
14. Kocsis , E. , Trus , B.L. , Steer , C.J. , Bisher , M.E. and Steven , A.C. (1991) Imaging aver-aging of flexible fibrous macromolecules: the clathrin triskeleton has an elastic proximal seg-ment . J. Struct. Biol. 107 , 6 – 14 .
15. Baldock , C. , Koster , A.J. , Ziese , U. , Rock , M.J. , Sherratt , M.J. , Kadler , K.E. , Shuttleworth , C.A. and Kielty , C.M. (2001) The supramo-lecular organisation of fibrillin-rich microfi-brils . J. Cell Biol. 152 , 1045 – 1056 .
16. Kielty , C.M. , Sherratt , M.J. , Marson , A. and Baldock , C. (2005) Fibrillin microfibrils . Adv. Protein Chem. 70 , 405 – 436 .

Chapter 10
Chemical Microscopy of Biological Samples by Dynamic Mode Secondary Ion Mass Spectrometry
Gradimir N. Misevic , Bernard Rasser, Vic Norris , Cédric Dérue , David Gibouin , Fabrice Lefebvre , Marie-Claire Verdus , Anthony Delaune, Guillaume Legent , and Camille Ripoll
Summary
3D chemical microscopy is one of the emerging applications of secondary ion mass spectrometry (SIMS) in biology. Tissues, cells, extracellular matrices, and polymer films can be imaged at present with a lateral resolution of 50 nm and depth resolution of 1 nm using the latest generation of CAMECA magnetic sector NanoSIMS 50 or with a lower lateral resolution (above 100 nm) using IMS 4f Cameca SIMS equipped with cold stage. Dynamic mode SIMS analysis is performed in ultrahigh vacuum and thus requires specific and careful preparation of biological samples aimed at preserving and minimizing destruction of the original structural and chemical properties of the samples. Here we describe a meth-odology based on the ultrafast plunge-freezing of biological tissues, preparation of the sample for SIMS analyses and transfer to the SIMS cold stage without interruption of the cold chain during the mount-ing procedure and subsequent SIMS analyses. Using this strategy, SIMS chemical microscopy can be performed on biological tissue in which unwanted molecular and/or structural reorganization, loss of constituents and chemical modifications are minimized and in which structures are therefore optimally preserved.
Key words: Secondary ion mass spectrometry , Biological sample preparation , Cryofixation , Plunge-freezing , Cold-stage .
Motivation of the authors was to provide (a) necessary informa-tion about dedicated biological sample preparation for secondary ion mass spectrometry (SIMS) 3D chemical microscopy and (b)
1. Introduction
Sharona Even-Ram and Vira Artym (eds.), Methods in Molecular Biology, Extracellular Matrix Protocols, vol. 522© Humana Press, a part of Springer Science + Business Media, LLC 2009DOI: 10.1007/978-1-59745-413-1_10
163

164 Misevic et al.
to inform life science community about applications of SIMS in biology.
A secondary ion mass spectrometer consists of a source emitting primary ions in the energy range from few to tens keV (Fig. 1 ). The primary ion beam (which determines lateral resolution of the SIMS chemical microscope) can be at present focused down to a diameter of 50 nm (in the case of CAMECA NanoSIMS 50 equipped with Cs source; http://www.cameca.com ) on the sur-face of a solid sample in ultrahigh vacuum. The sample surface is scanned with the primary beam at the desired speed. The primary ions at the impact point sputter the most superficial molecular layer by the complex and not yet completely understood proc-ess of atomization and ionization. The degree and mechanism of sputtering depend on the chemical nature of the primary ion source, their energy and chemical nature of the analyzed sample. Secondary ions are collected and separated in a high-performance magnetic sector mass spectrometer and detected with an electron multiplier (Fig. 1 ). The value of counts collected for each selected secondary ion mass at each scanned point provides information for the construction of a series of images, each representing the selected ion mass of a constituent chemical element (Fig. 1 ). The focus diameter and the precision of the primary ion beam at each scanned point determine the lateral resolution of the chemical image. Since the scanning process can be repeated several times, 3D, but destructive, analyses of the samples can be achieved with a depth resolution of 1 nm. Typically SIMS allows the detection of a few ppm of any isotope of most elements with a mass resolu-tion, defined as M /Δ M , of few 10 4 .
Examination of tissues and of cellular and extracellular matrix structures is always based on the combination of two independ-ent approaches using (1) imaging technologies, which provide information about the 2D and 3D forms and shapes of individual cellular and subcellular structures in tissues with very limited and indirect chemical data. (2) biochemical techniques, which pro-vide direct information about the chemical and physicochemical properties of constituents in a large number of cells in tissues.
It is obvious that ideally one would wish to obtain direct chemical information about all molecular entities during imag-ing and if possible at a resolution on the nanometer scale. In this case, all individual molecules (not just few of them) in indi-vidual cells would be identified. Interdisciplinary collaborations between physicists, chemists, biologists, and engineers in the field of nano-bio-technology have resulted in the development of novel approaches that indeed enable direct 3D chemical imaging of tissues on the nanometer scale using SIMS. Although initially developed for surface chemical analyses and depth profiling in
1.1. Principle of SIMS Imaging
1.2. Why Chemical Microscopy of Biologi-cal Samples by SIMS?

Chemical Microscopy of Biological Samples 165
material science, SIMS is now being increasingly used for analyti-cal 3D chemical imaging in biology. Two types of spectrometers are commonly used in commercially available SIMS (a) magnetic sector and (b) time of flight ( see Note 1 ). Currently available magnetic sector SIMS technology operating in the dynamic mode allows the chemical imaging of tissues, cells, extracellular matrices,
Fig. 1 . Schematic presentation of SIMS: The thick arrow represents focused high energy (few keV) Cs + primary ion beam, which is sputtering secondary ions of a solid sample content, by cutting molecules into atoms and/or fragments. Colored circles and squares represent different ionized elements in the sample which are sputtered in the spectrometer where they are separated and detected. ( A ) NanoSIMS 50 images of cos7 cells. Four images represented in pseudocolor are generated from spatial distribution of the amount of four analyzed ions: first image is 12 C with green color scale display-ing concentration of this element; second is 16 O with red color scale display; third is 12 C 14 N recombinant ion with yellow color scale display, and fourth is 31 P with blue color scale display. ( B ) IMS 4F images of distribution of four cations in Fucus zygote .
A
Primary Ion Beam(Cs+) of few keV
Sample
Secondary ions
12C160 160
160
31P31P
31P
12C14N
12C14N
12C14N
12C
12C
Mass spectrometerSeparation of Secondary Ions
Mass DetectorsCounting the number of Secondary Ions
CountsCountsCounts
469 nm
4 μm 4 μm 4 μm
color scale display
color scale display
color scale display
color scale display
469 nm 469 nm 469 nm
Counts
23Na 24Mg 39K 40Ca
Sputters secondary ionsof a solid sample contentby cutting molecules intoatoms and /or fragments
B

166 Misevic et al.
and polymer molecular films on ultraflat surfaces with 50-nm lateral and 1-nm depth resolution (which is being improved toward 10 nm lateral resolution, close to that needed for a single protein molecule). It should be noted that in the dynamic 3D mode SIMS imaging is a destructive method using the complete sample for mass spectrometric analyses so as to provide a quanti-tative and complete elemental composition of the analyzed sam-ple. Since SIMS operates at an ultrahigh vacuum, it requires the special preparation of biological samples in which the primary aim is to preserve the original structural and chemical properties of tissues. This is a particularly challenging task into which much pioneering research was done during the early development of electron microscopy (EM) applications for imaging biological samples. Although many techniques of EM biological sample preparations could be adopted and/or modified for SIMS they are not ideal because SIMS chemical microscopy requires both preservation of cellular form and minimal chemically modifica-tion by fixation, embedding, and coating procedures. Here we describe ultrafast plunge-freezing methods for biological tissues and further sample processing and transfer to the SIMS cold stage without the interruption of the cold chain for dynamic mode SIMS chemical microscopy at low temperature.
Most biology laboratories have neither the funds to buy SIMS machines, since they are expensive, nor the capacity to operate them, since they are complex. Nevertheless, many of these labo-ratories may need to use this novel chemical microscopy in order to solve some of the fundamental questions about cells and extra-cellular matrices. To achieve the goal of applying SIMS in biology it is obvious that the biologist should contribute their expertise in sample preparation and in the interpretation of results, where those in the SIMS community, usually physicists and material scientists, should contribute their skills in analysis, interpreta-tion of data, and instrument development. A list of institutions where useful contacts may be made is published on http://www.nanobeams.org ( see Note 1 ).
Tissues, cells, and molecules obtained from in vitro or in vivo samples ( see Note 2 ).
Magnetic sector SIMS machines such as the CAMECA IMS and the nanoSIMS 50 in a dynamic mode provide images of the distribution of any constituent element of the ana-lyzed sample. Therefore, chemical microscopy of either small molecules, e.g., ions and drugs, or any macromolecules, e.g., proteins nucleic acids, lipid, and carbohydrates can be obtained in analyzed tissues, cells, and extracellular matrices ( see Note 2 ).
1.3. What Type of Biological Samples Can Be Analyzed by SIMS?
1.4. What Kind of Chemical Detection Produces the Image?

Chemical Microscopy of Biological Samples 167
SIMS imaging does not require any labeling. NanoSIMS50 or IMS 4F are simultaneously detecting ppm quantities of any of the five selected elements masses at the precision of forth decimal and are generating five 3D images for each of these elements. SIMS analyses also provide images of ratios of different elements that are present in the sample, and thus help the analyst to chemi-cally identify molecules. SIMS, as being a mass spectrometer, is also a superb tool for imaging spatial distribution of specifically labeled molecules in tissues. This can be achieved with stable isotopes marking (chemically or metabolically) of the particular macromolecules or drugs with, e.g., 15 N and following their cel-lular or extracellular matrix localization.
SIMS technology, although complementary to fluorescence and radioactive isotope usage in biochemistry and electron microscopy, has few important advantages in terms of resolu-tion, precision, and sensitivity for 3D quantitative imaging. In conclusion, SIMS is the only available imaging instrument which is directly providing quantitative information about the distribution of macromolecular elements, ions, and metabo-lites in tissues in 3D.
The most exciting emerging application of SIMS in Biology is measurements of colocalization of macromolecules in matrices and cells. In terms of spatial resolution and sensitivity, SIMS tech-nology is superior to the currently used fluorescent technology.
From the time that electron microscopy was first used for the high resolution imaging of biological samples under the vacuum conditions, biologists have been confronted with the problem of sample preparation. Many different variants of fixation pro-cedures and embedding were developed where good structural preservation was achieved despite an obvious loss of small mol-ecules, e.g., ions and the chemical modifications of tissue constit-uents. In order to optimally preserve biological tissue structures and hence avoid unwanted molecular and/or structural reor-ganization, loss of constituents, and chemical modifications, it is imperative to rapidly and uniformly deep-freeze biological sam-ples and to process them further and to analyze them without interruption of the cold chain. There are basically three strategies available; each starts with an ultrafast freezing type of fixation of the original state of the biological sample. Two of the proce-dures involve water removal from the sample (this is undesirable if structures are to be preserved well) by either (a) freeze-drying under vacuum with or without cryoembedding or (b) with freeze-substitution by cryoembedding. The third and more rec-ommended procedure retains the water and thus requires con-tinuous cold chain processing and analyses of the sample which will be described here.
1.5. What Are Possible Methods for Biological Sample Preparation?

168 Misevic et al.
1. Rivet assembly at the tip of stainless steal tweezers (Figs. 2 and 3 ).
2. Home made device for ultra fast plunge-freezing with stainless steel Dewar assembly ( see Fig. 3 ).
3. Propane. 4. Liquid nitrogen. 5. Cryoultramicrotome (Leica EM FCS or similar). 6. Cold stage for SIMS. (This is not necessary in the case of col-
laborative work with groups possessing SIMS equipped with cold stage and stainless steel Dewar assembly.)
7. Silicon wafers 1-cm diameter (Siltronix). 8. Scanning electron microscope and/or ultrahigh vacuum AFM
equipped with a cold sample stage.
1. Carefully take a fresh tissue piece of few mm 3 volume and place it in the rivet. (Fig. 2 ).
2. Fix rivet with sample at the tip of the tweezers (1– 4) .
2. Materials
3. Methods
3.1. Plunge-Freezing of Tissue Samples
Fig. 2 . Sample preparation. Device used to obtain a flat surface of the frozen-hydrated sample. P sample; CFM conducting filling mixture; R rivet; FPS flattened polished surface of the rivet; GK glass knife (not shown at scale); and SFS sample flattened surface.

Chemical Microscopy of Biological Samples 169
3. Place tweezers onto spring device for rapid plunging (Fig. 3 ). 4. Rapidly plunge-freeze the sample in cooled propane at the
temperature of 77 K (boiling nitrogen temperature). 5. After freezing, mount the rivet containing the frozen sample
on the specimen holder of a cryoultramicrotome (Leica EM FCS, Ultracut UCT).
6. Progressively trim the small part of the specimen emerging from the polished rivet extremity at a temperature of 90–100 K, using the glass or diamond knives of the cryoultramicrotome, until a perfectly flat surface was obtained exactly at the level of the polished rivet extremity (Fig. 2 ) ( see Notes 3 and 4 ). It is also possible to cut histological sections approximately 1–8 μ m in thickness; however, it is difficult to obtain perfectly flat surfaces. This may not be essential for all types of SIMS analy-ses. Please note that mounting of the sections must be done on Silicon wafers adapted to the cold stage.
7. Mount rivet or histological sections in the cold sample holder of our SIMS analyzer at 77 K under liquid nitrogen, and intro-duce into the specimen chamber equipped with a cold stage built in our laboratory (3) . Thus, mounting and transferring
Fig. 3 . Device for ultrafast plunge-freezing of the samples. S shaft with spring, here shown in high position with compressed spring ready for shooting the sample into liquid propane; TW tweezers holding the rivet containing the sample ( see Fig. 1 ); SSD stain-less steel Dewar; and PG propane gas tank ( see Note 5 ) .

170 Misevic et al.
the frozen sample were carried out without interruption of the cold chain. For a complete description of the cold stage and of the associated cryotransfer system ( (3) ; see Subheading 3.2 ).
The setup developed to analyze frozen-hydrated samples was designed and built in a collaboration of AMMIS Laboratory (University of Rouen) with the CAMECA and Oxford Instru-ments companies. Cold stage consists of the attachment of a modified Oxford Instruments CT 1500 transfer and freeze-fracturing system (Oxford Instruments CT 1500 Cryotrans system) to the specimen chamber of the CAMECA IMS 4f ion analyzer. The system is composed of a cryochamber and of two electronic racks: the CT 1511 preparation controller (control of the vacuum system) and a CT 1501 temperature controller mon-itoring the temperatures of the cryopreparation cold block, of the anticontaminator and of the new cold stage of the CAMECA IMS 4f instrument ( see Note 6 ).
During SIMS imaging, the sample temperature has to be regu-lated to 100 K. At such temperature the vapor pressure of the ice is low enough not to alter the high vacuum in the specimen chamber ( see Note 7 ). SIMS settings such as focusing of the primary beam, adjustments of spectrometer magnet, primary ion current, resolution and dwell time settings, pixel size, etc. are complex and must be done by specialized engineers and scien-tists. Since the conditions of the analyses depend on the type of sample and selection of secondary ion masses we recommend that biologist who are providing samples are present during the setting procedures and analyses ( see Note 2 ).
1. Nanobeams, one of the European Networks of Excellence funded by the sixth framework, has set up a PhD school dedi-cated to focused ion beam technologies (this includes SIMS) with an interdisciplinary consortium of leading scientists in the SIMS field. In addition to the PhD school, Nanobeams’ activities are dedicated to spreading information about SIMS and to the applications of SIMS in material and biological sci-ences as well as to the improvement of SIMS technology in terms of lateral resolution and sensitivity detection http://www.nanobeams.org.
2. Samples for SIMS analyzes can be prepared from whole cells, monolayers, sections of frozen cells or tissues, thin single cell
3.2. Description of the Cold Stage
3.3. SIMS Analysis of Plunge-Frozen Biological Samples
4. Notes

Chemical Microscopy of Biological Samples 171
layers, e.g., part of epithelium, extracellular matrices with or without cells obtained in vitro or in vivo, molecular multi- or monolayers of individual species or mixtures of biological molecules. It is more difficult to prepare cell monolayers and their extracellular matrices because cells must be grown either on removable tissue culture plastic discs or on mem-branes so they can be mounted in the rivet. Ultrafast freez-ing procedures described here allow optimal preservation of all molecular structures with tissues, cells, and extracellular matrices, without chemical change or loss of macromolecules, ions, and metabolites. These procedures can be performed in any averagely equipped biology lab with small investments in homemade devices. Transport of samples must be done at low temperature (100 K) and cold chain should remain unin-terrupted. Alternative is sample preparation in the SIMS lab. Samples stored under liquid nitrogen can last “forever.”
3. Surface contamination of the first layer due to environmen-tal influences, cutting knives, dirty and mistreated wafers and samples during freezing and/or mounting to the cold stage should be avoided.
4. We controlled the surface flatness of the planed samples pre-pared according to this “rivet method” and the degree of mor-phological preservation of cells by using a scanning electron microscope and/or ultrahigh vacuum AFM equipped with a cold sample stage (Fig. 2 ).
5. Using external pumping, vacuum is created in the space between the two walls of the Dewar. The Dewar contains a stainless steel disk, the diameter of which is about 10% smaller than the inner diameter of the Dewar. The disk is set on a holder that maintains it at about 10 cm from the top of the Dewar, which is filled with liquid nitrogen (LN2) up to the level of the disk. The disk is used to maintain the frozen sam-ples and the small tools used to manipulate them under the LN2 vapors during the time between their freezing and their subsequent processing. The disk has been drilled to permit the setting of a cylindrical stainless steel vessel (35 mm in diameter, 100 mm in height) in the axis of the shaft-tweezers assembly. Propane from a propane gas tank (PG) is gently flowed through the propane inlet (PI) into the vessel where it is liquefied. When relaxed, the spring projects rapidly the sample into the liquid propane. The freely rotating lid of the Dewar (L) is made of polymethylmethacrylate and thus allows the experimenter to monitor the process and the LN2 level.
6. The original vacuum flange was replaced by a flanged struc-ture (16.4 cm in total length) composed of a pipe of 8.2 cm in diameter and 7.4 cm in length (side attached to the cryocham-ber) connected to a second pipe of 4.5 cm in diameter and 9

172 Misevic et al.
cm in length (side attached to the IMS 4f instrument). The reason for this modification of the original flange was to gain access to different knobs on the primary column of the IMS 4f instrument (4) . This modified cryochamber was used as an air-lock instead of that originally present in the ion analyzer, even when performing analyses at room temperature. This technical option has led us to substitute the Oxford Instru-ments specimen holder for the CAMECA standard holder.
Cold stage was build to allow the accurate and reproducible positioning of the Oxford Instruments sample holder parallel to the front face of the immersion lens, inside the specimen cham-ber of the IMS 4f analyzer. This system allows the regulation of the temperature of the specimen down to 100 K and ensures a perfect electrical insulation relative to the electrical ground (the specimen holder in the IMS 4f instrument is connected to the high voltage). It comprises a pipe within which a flow of cold nitrogen gas is controlled. Before entering the pipe, the gas is cooled to 95 K by a heat exchanger immersed in liquid nitrogen. The cooling capacity and the flexibility of this system are suf-ficient and, above all, it does not vibrate. The electrical insula-tion is provided by a ceramic material. The cold nitrogen gas supply system is completely automated and is used for cooling both the sample support and the modified CT 1500 transfer and freeze-fracturing device; this supply system comprises a tank of liquid nitrogen 190 L in volume which provides both nitrogen gas and liquid nitrogen for the different Dewar containers (which are used for the heat exchanger and for the cold guard around the sample). The Dewar container which acts as heat exchanger is made of stainless steel and contains 20 L of liquid nitrogen; the nitrogen level is controlled automatically by carbon probes that monitor the upper and lower levels of nitrogen and that operate an electrical valve to allow nitrogen entry.
7. We suggest using frozen hydrated standards when imaging the ion content of tissues (4) . The Oxford Instruments specimen holder was therefore used in place of the Cameca standard holder. Holes were drilled (3-mm deep, 0.7 mm in diameter) in the Oxford sample holder perpendicular to its surface in four places along the axis of the holder. These drilled holes allowed the introduction, under liquid nitrogen, of small cop-per tubes (3-mm long, 0.25-mm inner diameter) filled with frozen aqueous solutions containing a mixture of Na, Mg, K, and Ca chlorides at known concentrations (frozen-hydrated standards). With this setup, when a 3-mm-long copper tube containing a frozen solution is dropped into a hole, its upper end is flush with the surface of the holder. Thin films of a fro-zen mixture of H 2 O and D 2 O were also prepared by filling the meshes of a standard microscopic grid with the liquid mixture,

Chemical Microscopy of Biological Samples 173
depositing the grid on a polished aluminium disk and freezing the whole assembly in melting isopentane.
This work was supported by the Région de Haute Normandie, the Ministère de la Recherche et de la Technologie, the CNRS, the University of Rouen, and the sixth framework programme Network of Excellence Nanobeams.
Acknowledgments
References
1. Dérue , C. , Giboun , D. , Demarty , M. , Verdus , M.C. , Lefebvre , F. , Thellier , M. , and Ripoll , C. (2006) Dynamic-SIMS imaging and quanti-fication of inorganic ions in frozen-hydrated plant samples . Microscopy Research and Tech-niques 69 , 53 – 63 .
2. Dérue , C. , Giboun , D. , Verdus , M.C. , Lefe-bvre , F. , Demarty , M. , Ripoll , C. , and Thellier , M. (2002) Appraisal of SIMS applicability to boron studies in plants . Microscopy Research and Techniques 58 , 104 – 110 .
3. Dérue , C. , Gibouin , D. , Lefebvre , F. , Rasser , B. , Robin , A. , Le Sceller , L. , Verdus , M.-C. , Demarty , M. , Thellier , M. , and Ripoll , C. (1999) A new cold stage for SIMS analysis and imaging of frozen-hydrated biological samples . Journal of Trace and Microprobe Techniques 17 , 451 – 460 .
4. Dérue , C. , Gibouin , D. , Lefebvre , F. , Studer , D. , Thellier , M. , and Ripoll , C. (2006) Relative sen-sitivity factors of inorganic cations in frozen-hy-drated standards in secondary ion MS analysis . Analytical Chemistry 78 , 2471 – 2477 .

Chapter 11
ECM Macromolecules: Rotary Shadowing and Transmission Electron Microscopy
Michael J. Sherratt , Roger S. Meadows, Helen K. Graham, Cay M. Kielty, and David F. Holmes
Summary
Conventional preparation techniques for electron microscopy employ contrast enhancing heavy metal stains in solution to visualize isolated macromolecules. In rotary shadowing electron microscopy, the heavy metal is evaporated onto surface adsorbed molecules and macromolecular assemblies. High reso-lution shadowing remains a valuable method for the visualization and characterization of extracellular matrix macromolecules including fibrillar collagens, microfibrillar elements, and glycoproteins.
Key words: Rotary shadowing , Electron microscopy , Carbon film , Type I collagen , Fibrillin micro-fibrils , Type VI collagen microfibrils .
Rotary shadowing (RS-TEM) allows high-contrast visualization of both individual macromolecules and the surface structure of mac-romolecular assemblies. Heavy metal atoms are evaporated in a vac-uum from a source set at an oblique angle relative to the substrate on which the specimen is mounted. The gaseous metal is deposited on the specimen and substrate in layers of varying thickness. The thickness of these layers is determined by the relief of both the speci-men and the substrate. The image resolution of shadowed biological specimens is limited by both the specimen preparation techniques, (which rely on dehydration), and by the granularity of the shadowed metal. High melting-point metals (e.g., platinum or tungsten) are
1. Introduction
Sharona Even-Ram and Vira Artym (eds.), Methods in Molecular Biology, Extracellular Matrix Protocols, vol. 522© Humana Press, a part of Springer Science + Business Media, LLC 2009DOI: 10.1007/978-1-59745-413-1_11
175

176 Sherratt et al.
used to minimize grain size. Recent examples of ECM component visualization by RS-TEM include type XV collagen (1) , type VI collagen (2) , tenascin X (3) , fibulins −3, −4, and −5 (4) , integrin binding to type III collagen (5) , and cartilage oligomeric matrix
Fig. 1 . ( A ) Procollagen molecules after freeze-drying on mica and low-angle (4°) rotary shadowing with Pt/C. The molecule consists of a 300 nm long triple helix (semi-flexible rod) flanked by a globular C-propeptide (~100 kDa) and an elongated N -propeptide (~40 kDa). Scale bar = 50 nm. ( B ) Collagen fibrils from 18-day embryonic chick metatarsal tendon. The low angle (4°) Pt/C shadowing cleary reveals the 67 nm axial periodicity and gap overlap structure of each repeat period. A lateral microfibrillar substructure is also evident on these freeze-dried samples. Scale bar = 100 nm .
Fig. 2 . Rotary shadowed foetal bovine dermal microfibrils using platinum evaporated at an angle of 4°. ( A ) Type VI collagen microfibrils; ( B ) “Beads on a string” morphology of fibrillin-containing microfibrils. Scale bars = 200 nm .

ECM Macromolecules 177
protein (6) . Examples of TEM images of rotary shadowed type I collagen, type VI collagen microfibrils, fibrillin microfibrils, and cartilage oligomeric matrix protein (COMP) are shown in Figs. 1 – 3 . The protocols in this chapter cover the isolation of fibrillar collagens and microfibrils, deposition on mica, rotary shadowing of the mica, collection of replicas and image acquisition.
All reagents are obtainable from BDH or Sigma except where stated. All solutions use ultrapure water and may be stored at room temperature unless otherwise stated. 1. Fibrillar collagen extraction buffer: 50 mM Tris-HCl (pH
7.4), 50 mM EDTA, 100 mM sucrose, 150 mM sodium chlo-ride (stable at room temperature for up to 2 weeks).
2. Dounce homogenizer (Agar Scientific, Essex, U.K.). 3. Inactive collagenase buffer: 50 mM Tris-HCl (pH 7.4), 0.4
M sodium chloride, 10 mM calcium chloride (stable at room temperature for up to 2 weeks).
4. Protease inhibitors: Prepare 100× stock of 2 mM phenylmeth-anesulphonyl fluoride (PMSF) and 10 mM N -ethylmalemide (NEM) in methanol. Weigh out in a fume-hood or wear a face mask. Stock solution may be stored at 4°C for 4–5 days.
2. Materials
2.1. Extraction and Isolation of Collagen Fibrils, Fibrillin Micro-fibrils, and Type VI Collagen Microfibrils
Fig. 3 . Cartilage oligomeric matrix protein (COMP) molecules after adsorption to mica and low-angle rotary shadowing. Each oligomer consists of five 83 kDa subunits arranged in a radial pattern. ( A ) A selected oligomer with five uniformly spaced subunits. At this magnification the granularity of the background platinum becomes apparent. ( B ) A field of view showing a variety of conformations of the oligomer after adsorption and drying on the mica surface. Scale bar = 50 nm .

178 Sherratt et al.
5. Active collagenase buffer: to a 20 mL plastic universal tube add 10 mL collagenase buffer and 100 μ L protease inhibitor stock. Weigh out 5 mg bacterial collagenase (type 1A) and add to mix to produce active collagenase buffer. The buffer may be stored at 4°C for 4–5 days.
6. Column buffer: 0.4 M sodium chloride, 50 mM Tris-HCl (pH 7.4) (stable at room temperature for up to 2 weeks).
7. Sepharose CL-2B column: equilibrate 30 mL Sepharose CL-2B with column buffer in a column of dimensions 1.5 × 25 cm 2 at a flow rate of 0.2 mL/min overnight.
8. Peristaltic pump, fraction collector, U.V. detector, and chart recorder or proprietary protein purification system such as the ÄKTAprime plus (GE Healthcare, Buckinghamshire, UK).
Materials and preparative equipment for electron microscopy may be purchased from Agar Scientific (Essex, U.K.). 1. Carbon rods (6 mm diameter). 2. Electron microscope grids (400 mesh copper or nickel). 3. Mica sheets (25 × 25 mm 2 , 0.15 mm thick). 4. Tungsten wire (0.75 mm diameter). 5. Platinum wire (0.1 mm diameter). 6. Diffraction grating (2,160 lines/mm). 7. Fine tweezers with clamping ring. 8. 0.2 M ammonium acetate (pH 6.0) (stable at room tempera-
ture for up to 2 weeks). 9. Liquid nitrogen. 10. Freeze-drying table (0.5 cm thick copper sheet supported by
legs with a central handle). 11. High vacuum coating unit: large bell jar (30 cm diameter),
rotating table with variable speed control (50–200 rpm), power supply providing 10 V/100 A.
1. Dissect 0.5 g of the tissue sample (tendon, skin, cornea). Wash in fibrillar collagen extraction buffer ( see Note 1 ) and cut into 1 mm 2 pieces.
2. Homogenize 0.5 g of the tissue sample in 0.5 mL fibril-lar collagen extraction buffer using a hand held Dounce homogeniser for 45 s ( see Note 2 ).
2.2. Ultrastructural Investigations
3. Methods
3.1. Extraction and Isolation of Fibrillar Collagens

ECM Macromolecules 179
3. Fibril rich-solutions are stable at room temperature for 2 weeks.
1. Dissect 1 g of tissue (skin, aorta, nuchal ligament, ciliary zonules) into 1 mm 3 pieces.
2. Incubate the tissue fragments with 1–2 mL active collagenase buffer on a rotary mixer until no visible fragments of tissue remain ( see Note 3 ).
3. Following digestion, centrifuge the samples at 5,000 g for 5 min. The centrifugation step removes remaining aggre-gated material, which may block the Sepharose column.
4. Chromatograph the supernatant on the preequilibrated Sepharose CL-2B gel filtration column at a flow rate of 0.5 mL/min and a fraction size of 1 mL. High-M r material in the excluded volume (Vo) includes fibrillin-containing and type VI collagen microfibrils ( see Note 4 ).
5. Isolated microfibrils suspended in column buffer may be stored at 4°C for 7 days with no changes in morphology as determined by RS-TEM.
This protocol for rotary shadowing is based on the mica sandwich technique originally described by Mould (7) . Alternatively, the sam-ple macromolecules or assemblies may be adsorbed and dried on carbon-filmed grids (as described in the chapter 10 on STEM mass mapping) and subsequently shadowed as described below. 1. Prepare a range of sample dilutions (e.g. undiluted and dilutions
of, 1/3, 1/6, and 1/9) in 0.2 M ammonium acetate ( see Note 5 ). 2. Cleave a 2 × 2 cm 2 mica sheet ( see Note 6 ). 3. Submerge the freeze-drying table in a liquid nitrogen bath
to cool. Replenish the liquid nitrogen frequently maintain-ing a layer of nitrogen over the table.
4. Pipette 5 μ L of the sample onto the inner surface of one mica sheet. Lay the second mica sheet onto the first (inner surface to inner surface) overlapping the edge by 1–2 mm.
5. After 2 min at room temperature split the mica sandwich under 0.2 M ammonium acetate. Keeping the mica pieces immersed in the buffer, wash by gentle agitation for one min before reclosing the sandwich with a 1–2 mm overlap.
6. Plunge the closed mica sandwich into a liquid nitrogen bath. Using a pair of forceps in each hand, grip the opposing mica sheets and split open. Transfer the mica sheets onto the sub-merged freezing table, inner surfaces facing upwards.
7. Freeze-dry the mica sheets on the cold table. Vent the cham-ber with dry nitrogen gas when all the ice has sublimed from the table. Freeze-dried mica sheets may be stored in a clean/dry environment indefinitely.
3.2. Extraction and Isolation of Microfibrils
3.3. Rotary Shadowing
180 Sherratt et al.
8. Cut a length of the tungsten wire to a length appropriate to the dimensions of the holding jig. Cut 8 cm of the plati-num wire and wind in a spiral around the tungsten. Squeeze the wound platinum to cover a length of 1 cm. Place the tungsten/platinum wire in a jig at a distance of 10 cm from the rotating table. Adjust the wire/rotating table angle to 4°–10° ( see Note 7 ).
9. Attach mica sheets to the rotating table with double-sided adhesive tape.
10. Follow manufacturer’s instructions to evacuate the coating unit. Rotate the table to a speed of about 60 rpm. Increase the voltage across the tungsten/platinum wire until the plat-inum begins to bubble ( see Note 8 ). Continue evaporation until nearly all of the silver-coloured platinum has evapo-rated ( see Note 9 ).
11. Carbon coat the shadowed mica sheets in the vacuum coat-ing unit by thermal evaporation from carbon rods. One rod is sharpened and held in spring-loaded contact with the sec-ond rod. The carbon film thickness should be ~5 nm (clearly visible as a brown-grey deposit on filter paper).
12. Leave the shadowed and carbon-coated mica over an atmosphere of 10% (v/v) acetic acid for 24 h to aid release of the film.
13. Float the carbon films onto distilled water and pick up the carbon on 400 mesh copper or nickel grids.
Imaging of rotary shadowed macromolecules may be carried out in any conventional TEM. Sufficient images should be recorded to get a representative sampling of the macromolecules or mac-romolecular assemblies. The specimen height should be adjusted to eucentric position and the magnification should be calibrated with a diffraction grating replica or grid preparation of negatively stained catalase (Agar Scientific, Stanstead, U.K.)
1. Fixing the tissue in 2% formaldehyde prior to homogeniza-tion may help to minimise loss of associated macromolecules during the extraction procedure.
2. Homogenization for 45 s using a Dounce homogeniser is usually sufficient to enable extraction of macromolecules from young embryonic or foetal tissue. Additional ultrasonic treatment and repeated Dounce homogenization may be
3.6. Rotary Shadowing Transmission Electron Microscopy
4. Notes
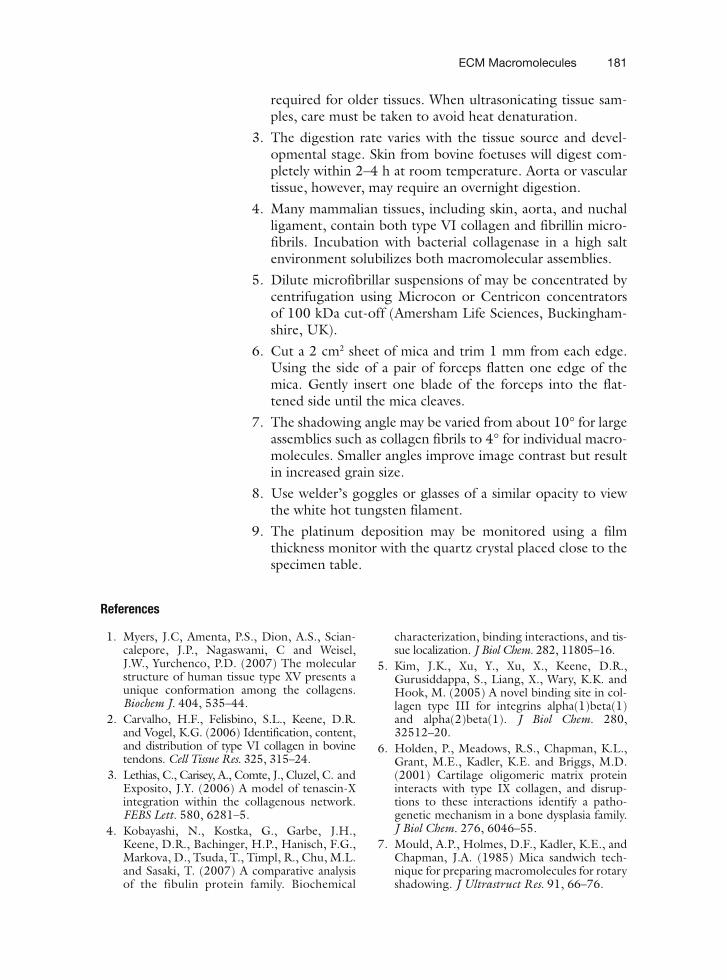
ECM Macromolecules 181
required for older tissues. When ultrasonicating tissue sam-ples, care must be taken to avoid heat denaturation.
3. The digestion rate varies with the tissue source and devel-opmental stage. Skin from bovine foetuses will digest com-pletely within 2–4 h at room temperature. Aorta or vascular tissue, however, may require an overnight digestion.
4. Many mammalian tissues, including skin, aorta, and nuchal ligament, contain both type VI collagen and fibrillin micro-fibrils. Incubation with bacterial collagenase in a high salt environment solubilizes both macromolecular assemblies.
5. Dilute microfibrillar suspensions of may be concentrated by centrifugation using Microcon or Centricon concentrators of 100 kDa cut-off (Amersham Life Sciences, Buckingham-shire, UK).
6. Cut a 2 cm 2 sheet of mica and trim 1 mm from each edge. Using the side of a pair of forceps flatten one edge of the mica. Gently insert one blade of the forceps into the flat-tened side until the mica cleaves.
7. The shadowing angle may be varied from about 10° for large assemblies such as collagen fibrils to 4° for individual macro-molecules. Smaller angles improve image contrast but result in increased grain size.
8. Use welder’s goggles or glasses of a similar opacity to view the white hot tungsten filament.
9. The platinum deposition may be monitored using a film thickness monitor with the quartz crystal placed close to the specimen table.
References
1. Myers , J.C , Amenta , P.S. , Dion , A.S. , Scian-calepore , J.P. , Nagaswami , C and Weisel , J.W. , Yurchenco , P.D. (2007) The molecular structure of human tissue type XV presents a unique conformation among the collagens . Biochem J. 404 , 535 – 44 .
2. Carvalho , H.F. , Felisbino , S.L. , Keene , D.R. and Vogel , K.G. (2006) Identification, content, and distribution of type VI collagen in bovine tendons . Cell Tissue Res. 325 , 315 – 24 .
3. Lethias , C. , Carisey , A. , Comte , J. , Cluzel , C. and Exposito , J.Y. (2006) A model of tenascin-X integration within the collagenous network . FEBS Lett. 580 , 6281 – 5 .
4. Kobayashi , N. , Kostka , G. , Garbe , J.H. , Keene , D.R. , Bachinger , H.P. , Hanisch , F.G. , Markova , D. , Tsuda , T. , Timpl , R. , Chu , M.L. and Sasaki , T. (2007) A comparative analysis of the fibulin protein family. Biochemical
characterization, binding interactions, and tis-sue localization . J Biol Chem. 282 , 11805 – 16 .
5. Kim , J.K. , Xu , Y. , Xu , X. , Keene , D.R. , Gurusiddappa , S. , Liang , X. , Wary , K.K. and Hook , M. (2005) A novel binding site in col-lagen type III for integrins alpha(1)beta(1) and alpha(2)beta(1) . J Biol Chem. 280 , 32512 – 20 .
6. Holden , P. , Meadows , R.S. , Chapman , K.L. , Grant , M.E. , Kadler , K.E. and Briggs , M.D. (2001) Cartilage oligomeric matrix protein interacts with type IX collagen, and disrup-tions to these interactions identify a patho-genetic mechanism in a bone dysplasia family . J Biol Chem. 276 , 6046 – 55 .
7. Mould , A.P. , Holmes , D.F. , Kadler , K.E. , and Chapman , J.A. (1985) Mica sandwich tech-nique for preparing macromolecules for rotary shadowing . J Ultrastruct Res. 91 , 66 – 76 .

Chapter 12
Using Self-Assembled Monolayers to Pattern ECM Proteins and Cells on Substrates
Emanuele Ostuni, George M. Whitesides, Donald E. Ingber, and Christopher S. Chen
Summary
We present a method that uses microcontact printing of alkanethiols on gold to generate patterned substrates presenting “islands” of extracellular matrix (ECM) surrounded by nonadhesive regions such that single cells attach and spread only on the adhesive regions. We have used this micropatterning tech-nology to demonstrate that mammalian cells can be switched between growth and apoptosis programs in the presence of saturating concentrations of growth factors by either promoting or preventing cell spreading (Science 276:1425–1428, 1997). From the perspective of fundamental cell biology, these results suggested that the local differentials in growth and viability that are critical for the formation of complex tissue patterns may be generated by local changes in cell–ECM interactions. In the context of cell culture technologies, such as bioreactors and cellular engineering applications, the regulation of cell function by cell shape indicates that the adhesive microenvironment around cells can be carefully optimized by patterning a substrate in addition to using soluble factors (Biotech. Prog. 14:356–363, 1998). Micropatterning technology is playing a central role both in our understanding how ECM and cell shape regulate cell physiology and in facilitating the development of cellular biosensor and tissue engineering applications (Science 264:696–698, 1994; J. Neurosci. Res. 13:213–20, 1985; Biotech. Bioeng. 43:792–800, 1994).
Key words: SAMs , Microfabrication , Cell adhesion , Cell shape , Micropatterning , Alkanethiols , Extracellular matrix , PDMS .
We present a method that uses microcontact printing of alkanethiols on gold to generate patterned substrates presenting “islands” of extracellular matrix (ECM) surrounded by nonadhe-sive regions such that single cells attach and spread only on the
1. Introduction
Sharona Even-Ram and Vira Artym (eds.), Methods in Molecular Biology, Extracellular Matrix Protocols, vol. 522© Humana Press, a part of Springer Science + Business Media, LLC 2009DOI: 10.1007/978-1-59745-413-1_12
183

184 Ostuni et al.
adhesive regions. We have used this micropatterning technology to demonstrate that mammalian cells can be switched between growth and apoptosis programs in the presence of saturating concentrations of growth factors by either promoting or pre-venting cell spreading (1) . From the perspective of fundamental cell biology, these results suggested that the local differentials in growth and viability that are critical for the formation of complex tissue patterns may be generated by local changes in cell–ECM interactions. In the context of cell culture technologies such as bioreactors and cellular engineering applications, the regulation of cell function by cell shape indicates that the adhesive microen-vironment around cells can be carefully optimized by patterning a substrate in addition to using soluble factors (2) . Micropattern-ing technology is playing an important role both in our under-standing how ECM and cell shape regulate cell physiology and in facilitating the development of cellular biosensor and tissue engineering applications (3– 5) .
Historically, investigations of cellular responses to various adhesive environments were limited by a lack of control over the interfacial properties and the topology of available substrates. It was particularly difficult to generate substrates patterned with adjacent adhesive and nonadhesive regions. In the past decade, the technology to engineer the properties of a surface with molec-ular-level control and to pattern these substrates with ligands suitable for biological experiments has advanced rapidly. This progress was obtained as a result of the modification of microfab-rication techniques used in the electronics industry in conjunc-tion with polymer science and surface science. This powerful class of “micropatterning” techniques makes it possible to pattern sur-faces with defined reactivity and topography with various degrees of precision, depending on the methods used.
Surfaces with spatially-patterned chemical functionalities can be formed using several techniques: vapor deposition, photoli-thography, and microcontact printing. Vapor deposition of metals through a patterned grid onto poly-hydroxyethyl methacrylate (pHEMA) produces a substrate that presents complementary patterns of metal and pHEMA (6, 7) . Cells attach selectively to the metallic regions because they adhere to the metal (or more prop-erly, to proteins adsorbed on the metals), but not the pHEMA; however, the edge resolution of this method is low (5 μ m). Pho-tolithography, which uses ultraviolet light to illuminate pho-tosensitive materials through a patterned mask, can routinely produce patterns of defined chemical properties with resolu-tions better than 1 μ m. To generate surfaces with only selected regions that promote cell attachment, various investigators have lithographically photoablated proteins preadsorbed to a silicon or glass surface (4) ; uncovered protein-adsorbing regions of a substrate previously coated with photoresist (8) ; or covalently

Using Self-Assembled Monolayers to Pattern ECM 185
linked proteins onto photoactivatable chemicals on the surface (9) . A major limitation of these approaches is that the “nonadhe-sive” regions of the pattern are usually surfaces that actually pro-mote the adsorption of protein, and require passivation (blocking of adhesive sites) with a protein such as albumin that prevents the adsorption of ECM proteins and the adhesion of cells. Over a period of days, however, cells are able to migrate onto these regions, probably as a result of degradation of the albumin and deposition of ECM by cells. Several investigators have tried to avoid these problems by using photolithography to pattern mon-olayers of trichloroalkylsilanes chemisorbed on the surface of SiO 2 . Self-assembled monolayers (SAMs) of alkylsiloxanes, which present regions of perfluoro- and amino-terminated moieties, promote cells to attach in patterns onto the surface; the amino-terminated siloxane promotes the preferential adhesion of cells and the perfluoro-terminated regions resist adhesion without pas-sivation with albumin (5, 10– 12) . Several technical issues remain in using this approach. This type of SAM is not easy to form, and a variety of biologically relevant organic functional groups (e.g., peptides and carbohydrates) are not compatible with the condi-tions used for its formation, thus limiting the range of surface chemistries available. The mechanism by which cells adhere to SAMs of alkylsiloxanes terminated with amine groups has not been elucidated, although, again, adsorption of proteins from the culture medium onto the charged surface is a plausible first step. Despite these shortcomings, this approach is still a viable one to be used for patterning the adhesion of cells.
Advances in the study of SAMs of alkanethiolates on gold sur-faces have provided a more versatile approach to the patterning of cells. These SAMs are highly ordered molecular assemblies that chemisorb on the surface of gold with nearly crystalline packing to produce a new interface whose properties are determined solely by those of the head-group of the alkanethiol (13) . This system makes it possible to control the interfacial properties of surfaces exposed to cells with greater molecular-level detail than other methods, and it affords the chance to influence cellular adhesion with greater specificity than with other methods (14, 15) . The synthetic procedures used to make alkanethiols are compatible with complex ligands that interact biospecifically on the cell, and in recent years the more common alkanethiols can be obtained from commercial suppliers (15, 16) . Alkanethiols can be patterned eas-ily on a gold surface using microcontact printing ( μ CP), a tech-nique in which a flexible polymeric stamp is used to print the alkanethiols in a specified pattern; the size of the stamped regions can be defined arbitrarily with dimensions from 500 nm (or, with greater experimental difficulty from 200 nm) and up (17) . After printing a hydrophobic alkanethiol, the remaining bare surface of the gold is exposed to an alkanethiol that presents tri(ethylene

186 Ostuni et al.
glycol) groups (e.g., HS(CH 2 ) 11 O(CH 2 CH 2 O) 2 CH 2 CH 2 OH) that resist the adsorption of proteins. Thus, a pattern of these two SAMs presented on a substrate defines the pattern of ECM that adsorbs from solution onto the substrate (3, 18) . The hydropho-bic SAMs created on flat gold substrates pattern the otherwise nonspecific adsorption of ECM proteins (fibronectin, fibrinogen, vitronectin, collagen I, and laminin) that promote the adhesion of different cell types (bovine capillary endothelial and rat hepa-tocytes) to the surfaces, while the tri(ethylene glycol) SAMs resist protein adsorption and cell adhesion (1, 3, 18– 22) .
Here, we describe how to use μ CP to fabricate substrates that present patterned SAMs with features >500 nm; features as small as 200 nm can be obtained in special cases but they are not necessary for most conventional biological applications (23) . This technique uses an elastomeric stamp with bas-relief to transfer an alkanethiol to the surface of gold in the same pattern defined by the stamp. The stamps are usually fabricated by pouring a prepolymer of polydimethylsiloxane (PDMS) onto a master relief pattern, which is often formed by photolithographic methods. Because μ CP relies on self-assembly of an alkanethiol, it does not require a dust-controlled laboratory environment, and can produce patterned gold substrates at relatively low cost.
1. Microscope slides (Fisher, no. 2). 2. Titanium (Aldrich 99.99+% purity). 3. Gold (Materials Research Corporation, 99.99%+ purity). 4. Electron beam evaporator. 5. Sonicator. 6. Trichloroethylene. 7. Acetone. 8. Methanol. 9. Test grade N type, 9–13 mils thick silicon wafers with <100>
orientation, phosphorus dopant, and 1–10 resistivity (Silicon Sense; Nashua, NH).
10. Hexamethyldisilazane (Shipley). 11. Shipley 1813 positive photoresist. 12. Shipley 351 developer. 13. Mask aligner (typically a Karl Suss model). 14. Photomask with features etched in chrome deposited on quartz
(Advance Reproductions Corp., North Andover, MA).
2. Materials

Using Self-Assembled Monolayers to Pattern ECM 187
15. Nitrogen for drying. 16. (Tridecafluoro-1, 1, 2, 2,-tetrahydro-octyl)-1-trichlorosilane
(United Chemical Technologies, Bristol, PA). 17. Polydimethylsiloxane (PDMS) prepolymer and initiator (Syl-
gard 184, Dow Chemical Co.).
Microscope slides ( see Note 1 ) are loaded on a rotating carousel in an electron beam evaporator (most of these are partially home built). Evaporation ( see Note 2 ) is performed at pressures <1 × 10 −6 Torr. Occasionally, during the evaporation of titanium, the pressure increases above 1 × 10 −6 Torr, but decreases after allowing the chamber to stabilize for ca. 2 min. Allow the metals to reach evapo-ration rates of 1 Å/s. Allow 400–500 Å of each metal to evaporate before opening the shutters and exposing the glass slides to 15 Å of titanium and 115 Å of gold ( see Note 3 ).
Basic lithographic techniques, concepts, and terminology are described by Madou (24) . Procedures that result in thicker features are available from the manufacturers of other types of photoresists such as SU-8; for the sake of brevity, we do not describe them here.
In a clean room (preferably Class A), clean the wafers by soni-cating for 5 min successively in trichloroethylene, acetone, then methanol. Bake at 180°C for 10 min to dry thoroughly. Spin coat on a commercial spincoater (e.g., Laurell WS-400) (40 s × 4,000 rpm) the wafers with ca. 1–2 mL hexamethyldisilazane) followed by Shipley 1813 positive photoresist (40 s × 4,000 rpm produces a layer of 1.3 μ m); bake the resist at 105°C for 3.5 min. Expose the wafer on a mask aligner through a photomask with features etched in chrome deposited on quartz for 5.5 s at 10 mW/cm 2 . Develop the features by immersing in Shipley 351 for 45 s, then rinse with distilled water and dry with a stream of nitrogen ( see Note 4 ). The proper development of the features should be checked under a microscope using a red filter in front of the light source to avoid unwanted exposure of the photoresist. Place the wafers in a desiccator under vacuum for 2 h with a vial (ca. 1–2 mL) of (tridecafluoro-1, 1, 2, 2,-tetrahydro-octyl)-1-trichlorosilane (United Chemical Technologies, Bristol, PA).
Polydimethylsiloxane (PDMS) (Sylgard 184, Dow Chemical Co.) prepolymer is made by mixing ten parts of monomer and one part of initiator thoroughly in a plastic container and degassing it under vacuum for ca. 1 h until air bubbles no longer rise to the top. Pour the prepolymer mixture in a Petri dish that contains the patterned silicon wafer, and cure for at least 2 h at 60°C ( see Note 5 ). Peel the PDMS from the wafer and cut the stamps to the desired size with a razor blade ( see Note 6 ).
2.1. Glass Substrates Coated with Titanium then Gold
2.2. PDMS Stamp with Patterns Molded from a Photolithographic Master
2.2.1. Generating Silicon Master with Desired Pattern Using Photolithog-raphy
2.2.2. Molding PDMS Stamp
188 Ostuni et al.
1. 0.25 mm TLC silica gel plates (Merck or VWR). 2. Silica gel (60–200 mesh, Mallinckrodt). 3. Organic solvents, unless specified, are HPLC grade (Mallinck-
rodt). 4. Tetrahydrofuran. 5. Benzophenone (Aldrich). 6. Sodium (Aldrich). 7. Dichloromethane. 8. Calcium hydride (Aldrich). 9. Chloroform- d (Cambridge Isotope Laboratory). 10. Hexadecanethiol (HDT) (Aldrich). 11. Hexane. 12. 2 mM (1-mercaptoundec-11-yl) triethylene glycol in ethanol. 13. Dichloromethane. 14. Methanol. 15. Triethylene glycol (Aldrich). 16. 50% aqueous sodium hydroxide. 17. 11-bromoundec-1-ene (Pfaltz and Bauer). 18. Recrystallized 2, 2 ¢ -azobisisobutyronitrile (Aldrich). 19. Thiolacetic acid (Aldrich). 20. 450-W, medium-pressure mercury lamp (Ace Glass). 21. Sodium methoxide (Aldrich). 22. DL-camphor-10-sulfonic acid (Aldrich). The progress of reactions is monitored by thin layer chromatogra-phy (TLC) using silica gel. Column chromatography is performed under nitrogen with 60–200 mesh silica gel. Reactions in nonaque-ous solvents are carried out under nitrogen or argon. Tetrahydro-furan (THF) that was used as a reaction solvent is distilled freshly on a still that contains 1 g/L benzophenone and 1 g/L sodium. Dichloromethane used as a reaction solvent is distilled freshly on a still that contains 1 g/L calcium hydride. NMR spectra were collected on samples dissolved in chloroform- d (Cambridge Iso-tope Laboratory). General synthetic procedures are described; the specified quantities of material can be varied by keeping the molar ratios constants to fit the needs of each laboratory ( see Note 7 ). More detailed descriptions of basic organic laboratory techniques are found in Zubrick (25) .
Hexadecanethiol (HDT) is purified by flash chromatography using hexane as the eluant or by distillation at reduced pressure. The major impurity is a disulfide. The R f of the product is ca. 0.4. The typical 1 H NMR spectrum has the following peaks: δ 1.25 (broad singlet, 29 H), 1.6 (quintet, 2 H), 2.5 (quartet, 2 H).
2.3. Synthesis and Purification of Alkanethiols
2.3.1. Purification of Hexadecanethiol (HDT; 2 mM in ethanol)

Using Self-Assembled Monolayers to Pattern ECM 189
Reaction mixtures are concentrated by rotary evaporation at reduced pressure. The purification of the final product and of the intermediates is carried out using flash column chromatography with silica gel and 98:2 dichloromethane/methanol as the eluant; typical values of R f are provided.
Mix 0.34 mL (4.3 mmol) of 50% aqueous sodium hydroxide with 3.2 g (21 mmol) of tri(ethylene glycol) (Aldrich) and stir for 30 min in an oil bath at 100°C. Add 1 g (4.3 mmol) of 11-bromoundec-1-ene (Pfaltz and Bauer) and stir at 100°C for 24 h under argon. After cooling, the reaction mixture is extracted six times with hexane (50–100 mL aliquots), and dried with sodium sulfate (Aldrich). Combine the hexane portions, concentrate them, and purify the resulting yellow oil ( R f = 0.3): a typical yield is ca. 70%. 1 H NMR (250 MHz) d 1.2 (broad singlet, 12 H), 1.55 (quintet, J = 7 Hz), 2.0 (quartet, 2 H, J = 7 Hz), 2.7 (broad sin-glet, 1 H), 3.45 (triplet, 2 H, J = 7 Hz), 3.5–3.8 (multiplet, 12 H), 4.9–5.05 (multiplet, 2 H), 5.75–5.85 (multiplet, 1 H).
Dissolve 0.6 g (2 mmol) of the previous compound in 20 mL of freshly distilled THF; add 10 mg of recrystallized 2, 2 ¢ -azobisisobutyronitrile (Aldrich) and 1.4 mL (20 mmol) of thiolacetic acid (Aldrich) and irradiate for 6–8 h with a 450-W, medium-pressure mercury lamp (Ace Glass) filtered through Pyrex. Check that the reaction has reached completion before work-up. Take out a 0.1 mL aliquot, reduce under pressure and take an NMR spectrum. The signal from the protons of the alkene group at d = 4.8–6 ppm should disappear if the reaction has gone to completion. Concentrate the reaction mixture and purify ( R f = 0.3): a typical yield is ca. 80%. 1 H NMR (250 MHz) d 1.2 (broad singlet, 14 H), 1.6 (multiplet, 4H), 2.3 (singlet, 3 H), 2.85 (triplet, 2 H, J = 7 Hz), 3.45 (triplet, 2 H, J = 7 Hz), 3.5–3.75 (multiplet, 12 H).
Dissolve 0.4 g (1 mmol) of the previous compound in 2 mL of freshly distilled dichloromethane and 8 mL of degassed (argon or nitrogen for 30 min) methanol. Add 0.9 mL (1.2 mmol) of 1.3 M sodium methoxide in degassed methanol. After 45 min, bring the reaction mixture to neutral pH using DL -camphor-10-sulfonic acid, concentrate and purify ( R f = 0.25); a typical yield is 50%. 1 H NMR (250 MHz) d 1.1 (broad singlet, 14 H), 1.2 (triplet, 1 H, J = 7 Hz), 1.5 (multiplet, 4H), 2.3 (singlet, 3 H), 2.5 (quartet, 2 H, J = 7 Hz), 3.0 (broad singlet, 1 H), 3.4 (triplet, 2 H, J = 7 Hz), 3.5–3.75 (multiplet, 12 H).
2.3.2. (1-Mercaptoundec-11-yl)tri(ethylene glycol) (EGT; 2 mM in ethanol) (26– 28)
Undec-1-en-11-yl(triethyleneglycol)
[1-[(Methylcarbonyl) Thio] Undec-11yl] Triethylene Glycol
(1-Mercaptoundec-11-yl) Triethylene Glycol
2.4. Ethanol 200 Proof2.5. Q-Tips2.6. Nitrogen Gas2.7. Blunt Forceps
190 Ostuni et al.
1. Lay substrate on clean and flat surface, with gold facing upwards. Take care not to scratch the surface with sharp for-ceps, or by placing substrate upside down. If there is dust visible on the substrate, blow gently with pressurized air or nitrogen.
2. Rinse the PDMS stamp with ethanol, and blow off vigor-ously with a stream of pressurized air or nitrogen for at least 10 s. If any dust remains on the stamp, repeat this procedure.
3. Dip a Q-tip into a 2 mM solution of hexadecanethiol in eth-anol, and gently paint a layer of the solution onto the PDMS stamp. Use a stream of air or nitrogen to gently evaporate the ethanol off the stamp.
4. Gently place the stamp face down onto the gold-coated substrate. Allow the stamp to adhere. This step may require putting gentle pressure on the stamp to press it against the substrate ( see Note 8 ). Let the fully adhered stamp remain on the substrate for at least 10 s.
5. Using forceps, gently peel away the stamp from the substrate, being certain not to smear the stamp against the substrate or to let the stamp readhere to the substrate.
6. Return to step 2 to continue stamping more substrates. After all substrates are stamped, proceed to step 7 .
7. Using a pasteur pipette, deliver a solution of EGT dropwise onto each substrate until the liquid covers it entirely. This usually requires ca. 0.5–1 mL per square inch of substrate. Incubate with EGT for 30 min.
8. Using forceps cleaned with ethanol and blown dry, grasp the corner of the substrate, and rinse with a stream of ethanol on both sides of the pattern for 20 s. Place the substrate on a clean surface, and rinse the forceps with ethanol. Grasp the substrate again in a different location and rinse again with ethanol to wash the area previously masked by the forceps.
9. Blow the ethanol off the substrate with pressurized air or nitrogen.
10. The stamped substrates should be placed into containers taking care not to allow the patterned surface to rub against coarse surfaces. They are stored under nitrogen gas in a cool, dark location. Place the containers in ziplock bags that are filled with nitrogen.
3. Methods
3.1. Micropattern Stamping Procedure

Using Self-Assembled Monolayers to Pattern ECM 191
1. To coat the substrates with ECM, make a solution of the protein (25 μ g/mL) in PBS. Typically, 0.25 mL solution per square inch of substrate is sufficient.
2. Place a 0.25 mL drop of ECM solution onto bacteriological Petri dishes or another disposable hydrophobic surface. Float each substrate, with patterned side face down, onto the drops. Leave it for 2 h at room temperature.
3. After 2 h, add a large amount (5–15 mL) of 1% bovine serum albumin (BSA, Fraction V, Sigma) dissolved in PBS directly to dish ( see Note 9 ). Remove substrates and place directly into plating medium (remember to flip slide so pattern is facing up again).
4. Plate cells directly on substrates using standard experimental technique ( see Notes 10 and 11 ).
1. Gold Slide: Choice of glass: We find No. 2 glass coverslips to be less likely to break than No. 1, at the same time not too heavy to pick up with forceps. We have successfully used standard histology mounting slides as well.
2. Gold Slides: Evaporation: We recommend using an evapora-tor rather than a sputter coating system to coat the substrates for several reasons. Most sputterers are single source, and are impractical for coating two different metals (Ti and Au) on a substrate. Sputtering also gives less homogeneous films that would require an additional annealing step to correct. And lastly, sputtering systems generally produce films with higher quantities of metal oxides and other impurities that would interfere with the generation of the SAM surface.
3. Gold Slides: Storage: Typically, gold-coated substrates become “mottled” after 4–5 weeks and are no longer deemed suit-able for experiments; streaks with heterogeneous transpar-ency develop (they are obvious to the naked eye). This may be caused by rearrangements in the thickness of the gold layer that are related to impurities present on the glass before evaporation of the gold. Gold substrates that are stamped immediately after evaporation are generally more stable over time (ca. 3 months) perhaps because the SAM acts as a resist against impurities (29) .
4. Wafers: Rinse only with water and avoid all contact with organic solvents.
3.2. Coating Stamped Substrates with ECM Proteins and Plating Cells
4. Notes
192 Ostuni et al.
5. PDMS Stamp: Pouring and curing: Often small air bubbles form in the PDMS after it is poured on the master. Cover the dish and gently tap it to allow the bubble to diffuse out of the prepolymer. Typically, stamps are 0.5–1 cm tall.
6. PDMS Stamp: Peeling off of silicon: During curing, a layer of PDMS forms underneath the wafer and holds it to the dish. Invert the dish and gently press on the bottom side of it until the cured PDMS dewets from the surface of the dish. Invert the dish and use a dull edge to trace the contour of the PDMS so as to lift it off the dish. Often the PDMS remains attached to the wafer. Carefully cut the layer of PDMS found under the wafer and gently peel the two surfaces away from each other.
7. Thiol Storage: Typically, alkanethiols that are kept in eth-anolic solutions for more than 3 months become oxidized and form significant amounts of disulfides. Disulfides of EGT are detected by TLC as spots with an R f of ca. 0.15, while the thiol has an R f of 0.25 (using 98:2 CH 2 Cl 2 /CH 3 OH as the elu-ant). By NMR, disulfides can be distinguished from alkanethi-ols by the presence of a triplet of peaks (from the methylene group adjacent to the sulfur atom) at ca. 2.6 ppm instead of a quartet at 2.5 ppm. Although disulfides are known to form SAMs with interfacial properties similar to those formed with alkanethiols, their assembly is 75 times slower (30) .
8. Thiol Stamping: Over and understamping. Observe the play of light, at an angle, on the micropattern to ensure that the stamp has fully adhered to the substrate. Usually, a pink color will ensure that full adhesion has occurred. Both under and overstamping results in a loss of this interference pattern. Make sure that no patches of nonadhesion remain. Always stamp the hexadecanethiol; stamping the EGT results in less efficient pattern transfer, incomplete formation of SAM, and nonspecific adsorption of proteins in the EGT regions.
9. Protein coating: When adding the BSA solution to bring the substrates out of fibronectin coating, the slides sink onto the dish and adhere to it; since the substrates face the bottom of the dish, the pattern may be damaged. To avoid this, add the BSA solution around the edges of the substrate so that the slides remain afloat.
10. Cell culture: For cell culture, cells should ideally be plated without serum (at least for 1 h), before washing serum media back in. The serum activates certain cell types to attach where they should not. This is cell-type specific, so some exploration may be necessary.
11. Cell culture: The actual surface area that is adhesive on pat-terned slides is a fraction of that of a regular substrate; there-fore, cells should be accordingly seeded at seemingly very low concentrations.

Using Self-Assembled Monolayers to Pattern ECM 193
The authors thank Drs. Rahul Singhvi, Milan Mrksich, and Laura Dike for their dedication to the development of these techniques. This work was supported by NIH grants CA55833, HL57699, EB00262, the Defense Advanced Research Projects Agency, and the National Science Foundation.
Acknowledgments
References
1. Chen , C. S. , Mrksich , M. , Huang , S. , White-sides , G. M. , Ingber , D. E. (1997) Geomet-ric control of cell life and death . Science , 276 , 1425 – 1428
2. Chen , C. S. , Mrksich , M. , Huang , S. , White-sides , G. M. , Ingber , D. E. (1998) Micropat-terned surfaces for control of cell shape, position, and function . Biotech. Prog. , 14 , 356 – 363
3. Singhvi , R. , Kumar , A. , Lopez , G. , Stepha-nopoulos , G. N. , Wang , D. I. C. , Whitesides , G. M. , Ingber , D. E. (1994) Engineering cell shape and function . Science , 264 , 696 – 698
4. Hammarback , J. A. , Palm , S. L. , Furcht , L. T. , Letourneau , P. C. (1985) Guidance of neurite outgrowth by pathways of substratum-adsorbed laminin . J. Neurosci. Res. , 13 , 213 – 20
5. Healy , K. E. , Lom , B. , Hockberger , P. E. (1994) Spatial distribution of mammalian cells dictated by material surface chemistry . Biotech. Bioeng. , 43 , 792 – 800
6. Letourneau , P. C. (1975) Cell-to-substratum adhesion and guidance of axonal elongation . Dev. Biol. , 44 , 92 – 101
7. O’Neill , C. , Jordan , P. , Riddle , P. (1990) Evi-dence for two distinct mechanisms of anchorage stimulation in freshly explanted and 3T3 Swiss mouse fibroblasts . J. Cell Sci. , 95 , 577 – 586
8. Bhatia , S. N. , Toner , M. , Tompkins , R. G. , Yarmush , M. L. (1994) Selective adhesion of hepatocytes on patterned surfaces . Ann. N. Y. Acad. Sci. , 745 , 187 – 209
9. Matsuda , T. , Sugawara , T. (1995) Develop-ment of surface photochemical modification method for micropatterning of cultured cells . J. Biomed. Mat. Res. , 29 , 749 – 56
10. Stenger , D. A. , Georger , J. H. , Dulcey , C. S. , Hickman , J. J. , Rudolph , A. S. , et al. (1992) Coplanar molecular assemblies of amino-and perfluorinated alkylsilanes: Characterization and geometric definition of mammalian cell adhesion and growth . J. Am. Chem. Soc. , 114 , 8435 – 42
11. Britland , S. , Clark , P. , Connolly , P. , Moores , G. (1992) Micropatterned substratum adhesive-
ness: A model for morphogenetic cues con-trolling cell behavior . Exp. Cell Res. , 198 , 124 – 129
12. Kleinfeld , D. , Kahler , K. H. , Hockberger , P. E. (1988) Controlled outgrowth of dissociated neurons on patterned substrates . J. Neurosci. , 8 , 4098 – 120
13. Whitesides , G. M. , Gorman , C. B. (1995) Self-assembled monolayers: Models for organic surface chemistry . In “Handbook of Surface Imaging and Visualization” ed. Hub-bard , A.T. CRC Press , Boca Raton , 713 – 732
14. Tidwell , C. D. , Ertel , S. I. , Ratner , B. D. (1997) Endothelial cell growth and protein adsorption on terminally functionalized, self-assembled monolayers of alkanethiolates on gold . Langmuir , 13 , 3404 – 3413
15. Roberts , C. , Chen , C. , Mrksich , M. , Marti-chonok , V. , Ingber , D. , Whitesides , G. M. (1998) Using mixed self-assembled monolay-ers presenting RGD and (EG)3OH groups to characterize long-term attachment of bovine capillary endothelial cells to surfaces . J. Am. Chem. Soc. , 120 , 6548 – 6555
16. Rao , J. , Whitesides , G. M. (1997) Tight bind-ing of a dimeric derivative of vancomycin with dimeric l-Lys-d-Ala-d-Ala . J. Am. Chem. Soc. , 119 , 10286 – 10290
17. Wilbur , J. L. , Kim , E. , Xia , Y. , Whitesides , G. (1995) Lithographic molding: A conven-ient route to structures with sub-micrometer dimensions . Adv. Mat. , 7 , 649 – 652
18. Mrksich , M. , Dike , L.E. , Tien , J. , Ingber , D.E. , Whitesides , G.M. (1997) Using micro-contact printing to pattern the attachment of mammalian cells to self-assembled monolayers of alkanethiolates on transparent films of gold and silver . Exp. Cell Res. , 235 , 305 – 313
19. López , G. P. , Biebuyck , H. A. , Härter , R. , Kumar , A. , Whitesides , G. M. (1993) Fabri-cation and imaging of two-dimensional pat-terns of proteins adsorbed on self-assembled monolayers by scanning electron microscopy . J. Am. Chem. Soc. , 115 , 10774 – 10781

194 Ostuni et al.
20. López , G. P. , Albers , M. W. , Schreiber , S. L. , Carroll , R. W. , Peralta , E. , Whitesides , G. M. (1993) Convenient methods for pattern-ing the adhesion of mammalian cells to sur-faces using self-assembled monolayers of alkanethiolates on gold . J. Am. Chem. Soc. , 115 , 5877 – 5878
21. Mrksich , M. , Chen , C. S. , Xia , Y. , Dike , L. E. , Ingber , D. E. , Whitesides , G. M. (1996) Con-trolling cell attachment on contoured surfaces with self-assembled monolayers of alkanethi-olates on gold . Proc. Natl. Acad. USA , 93 , 10775 – 10778
22. DiMilla , P. , Folkers , J. P. , Biebuyck , H. A. , Harter , R. , Lopez , G. , Whitesides , G. M. (1994) Wetting and protein adsorption of self-assembled monolayers of alkanethiolates supported on transparent films of gold . J. Am. Chem. Soc. , 116 , 2225 – 2226
23. Xia , Y. , Mrksich , M. , Kim E. , Whitesides , G.M. (1995) Microcontact printing of siloxane monolayers on the surface of silicon dioxide, and its application in microfabrication . J. Am. Chem. Soc. , 117 , 9576 – 9577
24. Madou , M. (1997) In Fundamentals of Micro-fabrication , 1st ed. , CRC Press : New York , pp 1 – 52
25. Zubrick , J. W. (1992) The Organic Chemistry Lab Survival Manual , 3rd ed. , John Wiley & Sons, Inc. : New York
26. Pale-Grosdemange , C. , Simon , E. S. , Prime , K. L. , Whitesides , G. M. (1991) Formation of self-assembled monolayers by chemisorp-tion of derivatives of oligo(ethylene glycol) of structure HS(CH 2 ) 11 (OCH 2 CH 2 ) m OH on gold . J. Am. Chem. Soc. , 113 , 12 – 20
27. Prime , K. L. , Whitesides , G. M. (1991) Self-assembled organic monolayers: Model systems for studying adsorption of proteins at surfaces . Science , 252 , 1164 – 1167
28. Prime , K. L. , Whitesides , G. M. (1993) Adsorption of proteins onto surfaces con-taining end-attached oligo(ethylene oxide); a model system using self-assembled monolay-ers . J. Am. Chem. Soc. , 115 , 10714 – 10721
29. Zhao , X. M. , Wilbur , J. L. , Whitesides , G. M. (1996) Using two-stage chemical ampli-fication to determine the density of defects in self-assembled monolayers of alkanethiolates on gold . Langmuir , 12 , 3257 – 3264
30. Bain , C. D. , Biebuyck , H. A. , Whitesides , G. M. (1989) Comparison of self-assembled monolayers on gold: Coadsorption of thiols and disulfides . Langmuir , 5 , 723 – 727

Chapter 13
Solid Phase Assays for Studying ECM Protein–Protein Interactions
A Paul Mould
Summary
Solid-phase assays provide a simple, rapid and robust method for the analysis of protein–protein interac-tions; i.e., does protein A interacts with protein B? In this assay, protein A (here termed as ‘receptor’) is adsorbed to the wells of an enzyme-linked immunosorbent assay (ELISA) plate (solid phase). The plate is then blocked using bovine serum albumin (BSA), and biotin-labelled protein B (here termed as ‘ligand’) is added. After washing the wells to remove unbound ligand, bound ligand is detected by addition of an avidin–peroxidase conjugate followed by a colorimetric detection step. This type of assay is particularly well suited for studying the interaction of ECM proteins with integrins. The screening of antagonists of integrin–ligand interactions in the pharmaceutical industry is an important area in which this assay is finding use.
Key words: Protein–protein interaction , Solid phase assay , Extracellular matrix , Integrin , Ligand binding , Divalent cations , Antagonists , Pharmacology .
Solid-phase assays provide a simple, rapid and robust method for the analysis of protein–protein interactions; i.e., does protein A interacts with protein B? In this assay, protein A (here termed as ‘receptor’) is adsorbed to the wells of an enzyme-linked immu-nosorbent assay (ELISA) plate (solid phase). The plate is then blocked using bovine serum albumin (BSA), and biotin-labelled protein B (here termed as ‘ligand’) is added. After washing the wells to remove unbound ligand, bound ligand is detected by addition of an avidin peroxidase conjugate followed by a colori-metric detection step.
1. Introduction
Sharona Even-Ram and Vira Artym (eds.), Methods in Molecular Biology, Extracellular Matrix Protocols, vol. 522© Humana Press, a part of Springer Science + Business Media, LLC 2009DOI: 10.1007/978-1-59745-413-1_13
195

196 Mould
This type of assay is particularly well suited for studying the interaction of ECM proteins with integrins. The first solid-phase integrin–ligand binding assay was described by Charo et al. (1) for studying fibrinogen binding to α IIb β 3. In our laboratory, we have developed an extremely sensitive and highly versatile assay for fibronectin binding to α 5 β 1 (2) . For example, we have described how the assay can be used to investigate the effects of divalent cations, activating and inhibitory MAbs, peptide inhibitors and mutations on ligand binding (2– 5) . The pharmacological screen-ing of inhibitors of integrin–ligand interactions is an important area in which this particular type of assay is finding use.
Our preferred method for labelling of ligands is biotinylation because of its safety and simplicity. One potential drawback is that if one or more lysyl residues in the ligand are crucial for receptor binding, and their modification may render the ligand inactive. In this case, a possible solution may be to reduce the amount of biotinylation reagent so that some of the lysyl residues remain unmodified. Other labelling methods such as radioiodination can also be used. Alternatively, if the ligand is a recombinant protein, a ‘tag’ such as an epitope sequence or the Fc region of IgG can be incorporated for use in the detection of bound ligand. It should also be noted that solid-phase assays can only give a qualitative measure of the affinity of receptor–ligand binding; other tech-niques, such as surface plasmon resonance, must be used to cal-culate actual binding parameters. It is essential that the specificity of the assay is tested carefully. The most important test for spe-cificity is the ability of unlabelled ligand to compete with labelled ligand for binding to the receptor. Hence, in the presence of a large excess of unlabelled ligand, very little binding of labelled ligand should be observed. Some receptor–ligand interactions are divalent-cation dependent.
Here, omitting divalent cations from the binding buffer should reduce binding to similar levels as to wells coated with BSA alone. Further tests for specificity can also be carried out, e.g., attempting to block the interaction using monoclonal anti-bodies to either receptor or ligand. If a specific interaction is observed, the sequences in the receptor and ligand involved in this recognition can be identified, using, e.g., proteolytic frag-mentation, synthetic peptides and site-directed mutagenesis.
1. Coupling buffer: 0.5 M NaCl, 0.1 M NaHCO 3 . Dissolve 29.2 g of NaCl and 8.4 g of NaHCO 3 in 1 L of water; the pH should be approximately 8.0 without further adjustment. Prepare fresh.
2. Materials
2.1. Biotinylation of Ligand
Solid Phase Assays for Studying ECM Protein 197
2. Sulfo-NHS-LC biotin (Pierce). 3. Tris-buffered saline (TBS). Dissolve 8.77 g of NaCl and 3.03 g
of Tris in ~900 mL H 2 O, adjust pH to 7.4 using conc. HCl, and adjust final volume to 1 L by further addition of H 2 O.
4. TBS-azide: Add 2.5 mL of 20% (w/v) sodium azide stock solution to 1 L of TBS.
1. Dulbecco’s PBS (Gibco-BRL, Gaithersburg, MD). 2. Blocking solution: TBS, 5% (w/v) BSA, 0.05% (w/v) sodium
azide. This is conveniently made from TBS to which sodium azide is added from a 20% stock solution. BSA (Sigma, Madison, WI, fraction V) is added and dissolved by vigor-ous stirring. The solution is then centrifuged in 50-mL tubes (Becton-Dickinson, Rutherford, NJ) for 5 min at 3,500 × g , and filtered through a 20-mL disposable column (Bio-Rad, Richmond, CA). Store for <3 months at 4°C.
3. Binding buffer: TBS containing 0.1% (w/v) BSA. Divalent cations 1 mM MgCl 2 , 1 mM CaCl 2 , or 1 mM MnCl 2 may be added. This buffer is conveniently prepared from TBS and stock solutions of 1 M MgCl 2 (20.3 g MgCl 2 ·6H 2 O/100 mL), 1 M CaCl 2 (14.7 g CaCl 2 ·2H 2 O/100 mL), or 1 M MnCl 2 (19.8 g MnCl 2 ·4H 2 O/100 mL; MnCl 2 is used in assays involving integrins). BSA (Sigma 99% pure grade) is then added and dissolved by stirring. Prepare fresh.
4. Extravidin peroxidase reagent (Sigma). 5. ABTS reagent: Prepare ABTS buffer: 0.05 MNa 2 HPO 4 (0.69 g
Na 2 HPO 4 ·2H 2 O/100 mL), 0.1 M sodium acetate (1.36 g CH 3 COONa·3H 2 O/100 mL). Adjust pH to 5.0 using conc. HCl. Store at room temperature for <3 months. ABTS solu-tion: Dissolve 11 mg ABTS (Sigma) in 0.5 mL water. Prepare fresh. H 2 O 2 solution: 67 μ L 30% (w/w) H 2 O 2 (Sigma) mixed with 7 mL water. Prepare fresh. Add 0.5 mL of ABTS solution to 10 mL of ABTS buffer and 100 μ L of H 2 O 2 solution. Mix thoroughly. This amount of reagent is sufficient for one full 96-well plate assay.
6. 2% (w/v) SDS. Dissolve 2 g sodium dodecyl sulfate in 100 mL water.
1. Dialyze ligand into coupling buffer. About 0.5 mL of ligand at a concentration of approximately 0.5 mg/mL gives sufficient material for a large number of assays.
2.2. Solid-Phase Assay
3. Methods
3.1. Biotinylation
198 Mould
2. Add an equal mass of sulfo-NHS-LC biotin: protein (approxi-mately 0.25 mg) to the dialysate in a 1.5-mL Eppendorf tube and mix on a rotating platform for half hour at room tempera-ture.
3. To remove unincorporated biotin, dialyze the solution against two changes of 1 L of TBS, and once against 1 L of TBS-azide.
4. Centrifuge the dialysate in a 1.5-mL Eppendorf tube for 15 min at maximum speed in a microcentrifuge. This removes any large aggregates or precipitate from the solution.
5. Store the supernatant at 4°C for <6 months. Alternatively, many biotinylated proteins can be stored in aliquots at −70°C.
6. Measure the concentration of biotinylated protein using, for example, the BCA assay (Pierce).
1. Dilute purified receptor to 1–10 μ g/mL with Dulbecco’s PBS ( see Note 1 ).
2. Add the diluted receptor to the wells of an ELISA plate (100 μ L/well) ( see Note 2 ).
3. Leave a set of wells empty for measuring binding of the lig-and to BSA. We normally perform the assay using 4–6 rep-licates for each set of binding conditions. Cover the plate with plastic film and store at room temperature overnight. Alternatively, the plate can be stored at 4°C for up to 1 week.
4. Add 25 μ L of blocking solution to each receptor-containing well using a multi-channel pipette. Then remove the solution by aspiration, or by inverting the plate over a sink and flicking out the liquid ( see Note 3 ).
5. Add 200 μ L of blocking solution to each well (including those used for testing binding to BSA alone) using a multi-channel pipette. Leave at room temperature for 1–3 h ( see Note 4 ).
6. Aspirate or flick out the blocking solution, and wash the wells three times with 200 μ L of binding buffer.
7. Aspirate or flick out the final wash. Remove residual liquid by inverting the plate and striking it hard several times onto adsorbent paper toweling.
8. Dilute the biotin-labelled ligand in binding buffer. Add 100 μ L of this solution to each experimental well ( see Note 5 ).
9. Cover the plate with plastic film and incubate at room tem-perature or 37°C for 3 h. A cell-culture incubator is suitable for incubation at 37°C.
3.2. Solid-Phase Assay

Solid Phase Assays for Studying ECM Protein 199
10. Aspirate the wells to remove unbound ligand. 11. Wash the wells three times with 200 μ L of binding buffer.
Remove residual buffer as in step 7 . 12. Dilute Extravidin-peroxidase reagent 1:500 in binding buffer.
Add 100 μ L to each well using a repeating pipette. Incubate the plate for 10–15 min at room temperature. During this time prepare the ABTS reagent.
13. Aspirate the wells to remove unbound Extravidin-peroxidase. 14. Wash the wells twice with 200 μ L of binding buffer and then
twice with 400 μ L of binding buffer. Remove residual buffer as in step 7 .
15. Add 100 μ L of ABTS reagent to each well using a repeating pipette. Allow the reaction to proceed until a strong (but not dark) green color is obtained (typically 10–30 min).
16. Stop the reaction by adding 100 μ L of 2% SDS solution to each well using a repeating pipette.
17. Read the plate using an automatic plate reader at 405 nm. Maximum absorbance values should be in the range 0.5–1.5.
18. Calculate mean and standard deviations of ligand binding to experimental wells. Subtract the level of binding to wells coated with BSA only.
1. In initial experiments, the concentrations of both recep-tor and ligand should be varied so that the conditions for optimal signal to background binding can be determined. Detailed protocols for the purification of integrin receptors have previously been described (2, 6) . For receptors contain-ing detergents (e.g., Triton X-100), it is necessary to dilute the solution so that the detergent concentration is <0.002% (w/v), otherwise the detergent interferes with adsorption of the receptor to the plate. Plates can be coated with receptor several days in advance.
2. Immulon 4HBX ELISA plates (Dynatech, Chantilly, VA) are suitable. However, we now prefer half area EIA/RIA plates (Costar, Cambridge, MA), which have the advantage that similar results can be obtained with half as much receptor (i.e., 50 μ L/well) and other reagents (7) .
3. A small amount of blocking solution is added to the wells before aspirating the receptor solution because we have
4. Notes

200 Mould
found that this renders the wells hydrophilic and prevents them drying out when they are aspirated. Drying out of the wells may destroy the activity of some of the receptor. For the aspiration we use a 21-gage hypodermic needle attached by tubing to a Buchner flask, which is connected to a water pump or vacuum line.
4. Longer blocking times (e.g., overnight) or alternative block-ing reagents may be used if the background level of binding is high.
5. A concentration of ligand in the range 0.1–10 μ g/mL should give a good response if the interaction is of high to moderate affinity. Other reagents (e.g., MAbs, peptides or synthetic compounds) can be added simultaneously with the ligand at this stage to test for their effects on binding.
References
1. Charo , I. F. , Nannizzi , L. , Phillips , D. R. , Hsu , M. A. , and Scarborough , R. M. (1991) Inhibition of fibrinogen binding to GP IIb-IIIa by a GP IIIa peptide . J. Biol. Chem. 266 , 1415 – 1421
2. Mould , A. P. , Akiyama , S. K. , and Humphries , M. J. (1995) Regulation of integrin α 5 β 1-fibronectin interactions by divalent cations. Evidence for distinct classes of binding sites for Mn 2+ , Mg 2+ , and Ca 2+ . J. Biol. Chem. 270 , 26270 – 26277
3. Mould , A. P. , Garratt , A. N. , Askari , J. A. , Akiyama , S. K. , and Humphries , M. J. (1995) Identification of a novel monoclonal antibody that recognises a ligand induced binding site epitope on the β 1 subunit . FEBS Lett. 363 , 118 – 122
4. Mould , A. P. , Akiyama , S. K. , and Humphries , M. J. (1996) The inhibitory anti- β 1 integrin monoclonal antibody 13 recognises an epitope that is attenuated by ligand occupancy.
Evidence for allosteric inhibition of integrin function . J. Biol. Chem. 271 , 20365 – 20374
5. Mould , A. P. , Askari , J. A. , Aota , S. , Yamada , K. , Irie , A. , Takada , Y. , et al. (1997) Defin-ing the topology of integrin α 5 β 1-fibronec-tin interactions using inhibitory anti- α 5 and anti- β 1 monoclonal antibodies. Evidence that the synergy sequence of fibronectin is recognised by the amino-terminal repeats of the α 5 subunit . J. Biol. Chem. 272 , 17283 – 17292
6. Mould , A. P. (1998) Analyzing integrin-de-pendent adhesion unit 9-4 , in Current Protocols in Cell Biology ( Yamada , K. M. and Lipincott-Schwartz , J. , eds.), Wiley , New York
7. Mo u l d , A. P . , A s k a r i , J . A. , B a r t o n , S . , K l i n e , A. D. , M c E w a n , P . A. , C r a i g , S . E. , e t a l . (2002) I n t e g r i n a c t i v a t i o n i n v o l v e s a c o n-f o r m a t i o n a l c h a n g e i n t h e α 1 helix of the β subunit A-domain . J. Biol. Chem. 277 , 19800 – 19805
Chapter 14
Cell Adhesion Assays
Martin J. Humphries
Summary
This chapter will outline in detail the two standard assays used in the author’s laboratory for quantitating the adhesion of cells to an immobilized substrate. The attachment assay, which employs a colorimetric detection of bound cells, is based on Kueng et al. (Anal Biochem 182:16–19, 1989), and the spreading assay, which employs phase contrast microscopy to measure the flattening of adherent cells, is based on the method of Yamada and Kennedy (J Cell Biol 99:29–36, 1984).
It is important to realize that cell adhesion is a complex process that involves many different molecu-lar interactions, including receptor–ligand binding, changes in the fluxes through intracellular signaling pathways, and modulation of cytoskeletal assembly. Consequently, adhesion assays not only measure the contacts between a cell and extracellular adhesion proteins, but also provide information about other cellular events. For this reason, care needs to be taken before choosing to perform adhesion assays. The most common uses of adhesion assays are (a) to test the ability of a specific type of cell or cell line to adhere to a specific adhesive substrate, and (b) to test the sensitivity of a specific cell–substrate interaction to inhibitors, but it is also apparent that adhesion assays can be used to probe the contribution of other cellular processes.
Key words: Cell , Adhesion , Fibronectin , Extracellular matrix , Integrin , Spreading , Attachment , Divalent cations .
This chapter will outline in detail the two standard assays used in the author’s laboratory for quantitating the adhesion of cells to an immobilized substrate. The attachment assay, which employs a colorimetric detection of bound cells, is based on Kueng et al. (1) , and the spreading assay, which employs phase contrast microscopy to measure the flattening of adherent cells, is based on the method of Yamada and Kennedy (2) .
1. Introduction
Sharona Even-Ram and Vira Artym (eds.), Methods in Molecular Biology, Extracellular Matrix Protocols, vol. 522© Humana Press, a part of Springer Science + Business Media, LLC 2009DOI: 10.1007/978-1-59745-413-1_14
203

204 Humphries
It is important to realize that cell adhesion is a complex proc-ess that involves many different molecular interactions, including receptor-ligand binding, changes in the fluxes through intracel-lular signaling pathways, and modulation of cytoskeletal assem-bly. Consequently, adhesion assays not only measure the contacts between a cell and extracellular adhesion proteins, but also pro-vide information about other cellular events. For this reason, care needs to be taken before choosing to perform adhesion assays. The most common uses of adhesion assays are (a) to test the ability of a specific type of cell or cell line to adhere to a spe-cific adhesive substrate, and (b) to test the sensitivity of a specific cell–substrate interaction to inhibitors, but it is also apparent that adhesion assays can be used to probe the contribution of other cellular processes.
A number of factors will affect the decision whether to use a cell-spreading assay or a cell-attachment assay. Spreading assays take longer to perform but are less prone to nonspecificity. For example, many molecules can mediate attachment of cells in a non-physiological manner, but very few of these molecules are able to mediate spreading. In addition, information can be gained about the ways in which the cells respond to the substrate by observing cells in a spreading assay. For example, the morphology of cells can differ on different substrates even if the level of spreading is the same, and now that our understanding of the signaling mecha-nisms that control cell morphology has improved, and spreading assays can give indirect indications of the intracellular events that are triggered by certain substrates. A further advantage of spread-ing assays is that they are more sensitive when used to measure inhibitory activity because the read-out from the assay is more reliant than attachment assays on multiple adhesive interactions and partial disruption by an inhibitor is sufficient to see blockade. Finally, because spreading assays do not need replicate wells, they are more economical in their use of substrates. As described below, both types of adhesion assay are relatively quick to carry out.
The actual assays can be performed in half a day; however, the quantitation of spreading assays can take a similar length of time. Sometimes there is no alternative to an attachment assay, because some cells are unable to spread at all, whereas other cells can only spread on specific substrates. Although attachment assays still require multiple cell–substrate contacts to allow the cell to withstand the washing steps in an attachment assay, fewer contacts are needed than for a cell to spread.
Both the spreading and attachment assays are expressed as percent adhesion, and it can be expected that the level of adhe-sion obtained will vary depending upon the cell type and adhesive substrate under study. In spreading assays, a level of 80% is common,

Cell Adhesion Assays 205
and often higher levels can be obtained. Most importantly, the background level of spreading on BSA-coated plastic should be as low as possible. Frequently, this is actually zero, but certainly this should not rise above a few percent. The level of attachment observed by the dye-staining method is usually not as high as for spreading, but 60–70% should be attainable. A low figure for the BSA background is also important for attachment assays, but generally it is difficult to reduce this level below 5% without adversely affecting the experimental signal ( see Note 1 ).
1. 10 mg/mL heat-denatured BSA in divalent cation-free Dul-becco’s PBS. This is a better blocking agent than native BSA solutions. After dissolving the BSA, filter through a 0.22- μ m filter to remove undissolved protein, and incubate in a water bath at 85°C for 10–12 min. The solution should be slightly hazy; it should not be clear, as this will contain insufficiently aggregated BSA, nor should it be white, because here the aggregates will be too large. After cooling, it is ready for use. Occasionally, some cell types find heat-denatured BSA toxic and therefore care should be taken to wash the wells of the microtiter plate after blocking.
2. 96-well tissue-culture-treated microtiter plate (Costar, Cambridge, MA) ( see Note 2 ).
3. Dulbecco’s PBS (Gibco-BRL, Gaithersburg, MD). 4. Dulbecco’s MEM with 25 mM HEPES (Gibco-BRL). 5. 5% (w/v) glutaraldehyde. This solution is hazardous and
skin contact should be avoided.
1. 0.1% (w/v) crystal violet, 200 mM MES, pH 6.0. It is important to filter this solution, as its intense blue color can make it difficult to determine whether it has dissolved properly. If the solution is not filtered, specks of solid crystal violet can also be added to the experimental wells, resulting in high absorbance readings. This solution is hazardous and skin contact should be avoided.
2. 10% (v/v) acetic acid.
Dulbecco’s divalent cation-free PBS (Gibco-BRL), 0.05% (w/v) sodium azide. This solution is hazardous.
2. Materials
2.1. Common to Both Assays
2.2. For Attachment Assay Only
2.3. For Spreading Assay Only

206 Humphries
1. Dilute adhesion molecule with Dulbecco’s PBS. 2. Add the diluted adhesion molecule to the wells of the micro-
titer plate (100 μ L/well). 3. Leave a blank well or wells for measuring background spread-
ing on blocked plastic ( see Note 3 ). 4. Incubate at room temperature for 60 min or at 4°C over-
night ( see Note 4 ). 5. Aspirate, add 200 μ L 10 mg/mL heat-denatured BSA in
divalent cation-free PBS and incubate at room temperature for 30 min.
6. While the blocking is underway, prepare a suspension of the cells to be examined ( see Note 5 ).
7. Count the cell density on a hemocytometer, resuspend the cells to a concentration of 5 × 10⁵/mL for fibroblasts and similarly sized cells and 107/mL for lymphoid cells in warm DMEM/HEPES (gassed with 5% [v/v] CO2), and incubate at 37°C in a 15-μL polypropylene tube for 10 min. For exper-iments examining the effects of inhibitory agents, aspirate the BSA, add 50 μ L of 2× agent diluted into PBS followed by 50 μ L cells. Add 50 μ L PBS followed by 50 μ L cells for control wells ( see Note 6 ).
8. The incubation time chosen for attachment assays depends on the cell type, as some cells adhere more quickly than oth-ers, but 15–20 min is usually adequate.
9. Fix cells in the wells to be used for determining 100% attach-ment value by addition of 100 μ L 5% (w/v) glutaraldehyde. Assays are usually performed in triplicate or quadruplicate.
10. Remove nonadherent and loosely attached cells by either tapping the plate or gently washing the wells with one or more 100- μ L aliquots of PBS ( see Notes 7 – 9 ).
11. Aspirate the final wash and fix attached cells by addition of 100 μ L 5% (w/v) glutaraldehyde for 20 min at room tem-perature (or at 4°C overnight if necessary).
12. Wash wells with 3 × 100 μ L water. 13. Stain with 100 μ L 0.1% (w/v) crystal violet, 200 mM MES,
pH 6.0 for 60 min at room temperature ( see Note 10 ). 14. Wash wells with 3 × 400 μ L water. 15. Solubilize dye in 100 μ L 10% (v/v) acetic acid and incubate
on orbital shaker at 150 rpm for 5 min at room temperature. 16. Measure absorbance at 570 nm using a plate reader. As
described below in Subheading 4 , use the data from 20, 50,
3. Methods
3.1. Attachment Assay

Cell Adhesion Assays 207
and 100% inocula to determine the value for 100% attach-ment, and then express experimental data as a percentage.
1. The coating and blocking of microtiter plate wells is exactly as described for the cell-attachment assay.
2. Preparation of cells is also the same, with the exception that the working cell density should be 1 × 10⁵/mL ( see Note 11 ). Again, for experiments examining the effects of inhibi-tory agents, add 50 μ L of 2× agent diluted into PBS fol-lowed by 50 μ L cells. Add 50 μ L PBS followed by 50 μ L cells for control wells ( see Note 12 ).
3. Incubate at 37°C in a CO 2 incubator for 60–90 min. 4. Fix cells by direct addition of 10 μ L of 50% (w/v) glutaral-
dehyde and leave at room temperature for 30 min. 5. Aspirate fixative and store cells in PBS (without divalent cati-
ons), 0.05% NaN 3 . 6. Determine the percentage of cells that adopt a spread mor-
phology using an inverted phase contrast microscope ( see Note 13 ).
1. The major problem likely to be encountered in both assays is that cells do not adhere. Many reasons could explain this, including coating plates with insufficient amounts of adhe-sive substrate, bad batches of adhesive substrate, use of poor protein-binding microtiter plates or badly constructed plates with uneven wells, squirting liquids too vigorously onto the bottom of the wells, mycoplasma infection, or a poorly growing cell culture, and (for attachment assays) too much washing.
2. Most tissue-culture treated microtiter plates are adequate for adhesion experiments, although we find Costar to be excel-lent. Immulon 4 plates have higher protein-binding capacity and are particularly good for assays involving small proteins. Usually there is no need to carry out spreading assays with replicate wells, because quantitation is performed by count-ing multiple fields from within the same well.
3. The concentration of adhesion molecule required for coating will depend on a number of factors, including the efficiency with which it coats plastic, the size of the molecule, and the apparent affinity with which it is bound by cellular receptors. In most cases, adhesion assays are used to measure the adhe-sion of cells to extracellular matrices or purified extracellular
3.2. Spreading Assay
4. Notes

208 Humphries
matrix molecules. The key components of such matrices are usually large macromolecules that coat plastic relatively well; they are also bound with at least moderate affinity by cells. For these reasons, a concentration range between 1 and 20 μ g/mL is usually adequate, although it is advisable to carry out a range-finding dose-response experiment before focus-ing on a narrow range. If a non-matrix molecule or a com-plex mixture is to be tested, a higher concentration should be used. The handling of adhesion molecules prior to dilu-tion will vary; some molecules, such as fibronectin, are best thawed quickly at 37°C, whereas others, such as laminin, are best thawed slowly on ice.
4. Time-course studies have shown substantial coating of pro-teins onto plastic within an hour at room temperature, and this allows the assay to be performed quickly. However, if the adhesion molecule binds weakly to plastic, or if it is more convenient to carry out the experiment the next day, wells can be coated overnight usually without detrimental effects.
5. Trypsin, EDTA, or trypsin/EDTA solutions are commonly used to detach adherent cells. The action of these reagents must be terminated prior to using the cells in spreading assays (e.g., by resuspending the cells in DMEM with 10% [v/v] fetal calf serum); however, the use of these agents usu-ally has no deleterious effect on adhesive activity provided the cells are not over-trypsinized. It is important to guard against clumping or aggregation of cells, therefore, gentle conditions should be used when centrifuging and resus-pending cells. All solutions used during the preparation of cell suspensions should be warmed to 37°C.
6. Cells are left upright in a polypropylene tube in a humidi-fied 5% humidified CO 2 atmosphere with the lid off to allow them to recover from the process of detachment. Alterna-tively, the tube can be capped and left on its side in an incu-bator to stop the cells from settling and aggregating into a large clump at the bottom of the tube (they should not be left too long or there may be some nonspecific adhe-sion to the sides of the tube). The cells should be pippeted gently prior to use to ensure dispersion. Finally, gassing of the cell suspension with CO 2 can sometimes give enhanced spreading, although this is not always needed. It is impor-tant that the DMEM/PBS mixture has the opportunity to equilibrate as rapidly as possible with gaseous CO 2 to rees-tablish the buffer. This process can be aided by leaving the lid off the microtiter plate in the incubator. It is also our experience that the adhesion of some cell types is improved by raising the concentration of gaseous CO 2 from the usual

Cell Adhesion Assays 209
5% (v/v) to 7% (v/v). This can be particularly effective at increasing binding to poorly adhesive substrates. It may also be advisable to use a particular incubator and/or time of day when the door to the incubator will not be opened, as this helps prevent alkalinization of the medium. Ensure that the shelves holding the microtiter plates are horizontal, as uneven shelves lead to uneven settling of cells.
7. For attachment assays, the key parameter is the washing pro-tocol as this is the major determinant of the signal/noise ratio. This is the most critical stage in an attachment assay, and needs to be optimized for each cell type used. Differ-ent cells respond differently to tapping and washing, and we recommend varying the number of tapping or washing cycles to obtain the best signal/noise ratio (i.e., attachment to an adhesive substrate compared with attachment to BSA-blocked plastic). Sometimes this can even be judged by eye in a pilot experiment.
8. More specific problems include cell death in the assay, which could be caused by exposure of sensitive cells to heat-denatured BSA, and clumping of cells either in the centre of a well, or around the perimeter, which is caused by swirling of the plate. In addition, large errors in attachment assays can result from (a) inaccurate pipetting, which can come from use of multichannel pipettors, or (b) suboptimal washing of wells (note that the volume of BSA blocking solution is higher than the volume of adhesive substrate, and that the wash step after crystal violet staining is larger still).
9. It is advisable to use pipette tips that have their ends cut off for attachment assays. This is to prevent coated proteins and/or cells being washed off directly by a fine stream of liquid. Wells should be included to estimate a value for 100% attach-ment: here, cells are added directly to uncoated plastic or to polylysine-coated plastic and fixed without washing. The most accurate way of determining this value is to add cell aliquots corresponding to 20%, 50%, and 100% of the experi-mental inoculum and then extrapolate the resulting graph. It is also possible that the absorbance value for 100% may be off the linear range of the plate reader. Attachment assays rely much more on the accuracy of pipetting than spreading assays, and therefore it is advisable to use a P200 pipettor rather than a multichannel pipettor wherever possible.
10. Staining can also be performed overnight without detriment to the final results. Blank wells should be included to subtract the background binding of crystal violet to plastic. Avoid get-ting crystal violet solution on the rims of the wells, as this dries during incubation and can be difficult to remove by washing.

210 Humphries
11. For cell-spreading assays, an important parameter is the health of the cells. Cultures should be actively growing, but should have been passaged more than 24 h previously. We have observed relatively poor spreading responses in cells that were passaged the day before a spreading assay.
12. Spreading can sometimes be increased by incubating the plate containing the initial 50- μ L aliquots at 37°C for sev-eral min to allow them to warm up prior to addition of cells. To ensure good spacing of cells, guard against swirling, tap-ping, or shaking the wells once cells have been added. In our experience, a single pipetting of cells down the side of the well into the PBS solution produces good dispersal.
13. Understandably, the optical quality of the plastic that is used to make microtiter plates is not ideal for phase contrast micro-scopy. However, the observation of adherent cells can be greatly improved by adding sufficient PBS/azide to form an inverted meniscus at the top of the well and then carefully placing a glass cover slip over the plate. Quantitation of percent spreading is usually carried out by counting three separate lots of 100 cells selected from random areas of the well. Both the selection of cells and minimization of double counting are aided by the use of an eyepiece graticule. Different methods can be used to determine whether a cell is spread or not. Perhaps the most quantitatively accurate way is to use image analy-sis software to measure average cell area; however, this tends to produce small differences that may be hard to interpret without the application of other criteria relating to cell shape. Instead, we prefer to assign specific criteria to a definition of spreading and apply these to each cell. The usual criteria are that the cell body should be phase-dark and that cyto-plasm should be visible around the entire circumference of the nucleus. Different cells adopt different morphologies and therefore these criteria might need to be slightly modified on a case by case basis.
References
1. Kueng , W. , Silber , E. , and Eppenberger , U. (1989) Quantification of cells cultured on 96-well plates . Anal. Biochem. 182 , 16 – 19
2. Yamada , K. M. and Kennedy , D. W. (1984)
Dualistic nature of adhesive protein func-tion: fibronectin and its biologically active peptide fragments can autoinhibit fibronectin function . J. Cell Biol. 99 , 29 – 36

Chapter 15
ECM Degradation Assays for Analyzing Local Cell Invasion
Vira V. Artym , Kenneth M. Yamada , and Susette C. Mueller
Summary
Proteolytic degradation of extracellular matrix (ECM) is a critical step during cell invasion and tissue trans-migration that is required for many physiological and pathological processes. Cellular structures that medi-ate cell adhesion to, degradation of, and invasion into ECM are invadopodia of transformed and tumor cells and podosomes of normal monocytic, endothelial, and smooth muscle cells. Detecting the ability of the cell to form invadopodia and podosomes and to degrade ECM is required for studying the invasive capability of the cell. We have developed ~50 nm thick fluorescent gelatin matrices that provide a rapid, sensitive, and reliable in vitro system for detection of invadopodia and podosomes, and measurements of the extent of ECM degradation. In this chapter, we provide a detailed protocol for preparation of thin fluorescent gelatin matrices and for evaluation of the results from this degradation assay.
Key words: Fluorescent-gelatin degradation assay , Invadopodia , Podosomes , Invasion.
Cell transmigration through extracellular matrix (ECM) is a hall-mark of many normal physiological and pathological processes, and it often involves proteolytic degradation of ECM components. Localized pericellular proteolysis is mediated by specialized actin-rich membrane protrusions of cell membranes adherent to ECM. These cell-surface structures are invadopodia and podosomes. Cell types that form podosomes include monocytic, endothelial, and smooth muscle cells, whereas invadopodia are formed by transformed and invasive cancer cells (1) . The formation of invadopodia and podo-somes capable of ECM degradation is thought to contribute to cellular invasiveness. Presence of invadopodia in breast cancer cell lines, for example, correlates with other measures of invasion includ-ing chemoinvasion through Matrigel and phagocytosis (2, 3) .
1. Introduction
Sharona Even-Ram and Vira Artym (eds.), Methods in Molecular Biology, Extracellular Matrix Protocols, vol. 522© Humana Press, a part of Springer Science + Business Media, LLC 2009DOI: 10.1007/978-1-59745-413-1_15
211

212 Artym, Yamada, and Mueller
Two-dimensional fluorescent matrix degradation assays provide convenient methods to study invadopodia and podosome formation, to elucidate their function in ECM degradation, and to assess the invasive potential of the cell. This assay can be followed
Fig. 1 . Degradation of fluorescent gelatin matrices by invadopodia of breast carcinoma MDA-MB-231 cells and podosomes of macrophage IC-21 cells. ( A ) Electron microscopy of fluorescent gelatin-Alexa Fluor 568 matrix. Bar, 2 μ m. ( B ) Invadopodia-mediated proteolysis of fluorescent gelatin matrix. MDA-MB-231 carcinoma cells expressing wild type c-Src were incubated on gelatin-Alexa Fluor 568 matrix overnight. Invadopodia were labeled for F-actin with phalloidin-Alexa Fluor 488. An invadopodium and the site of matrix degradation that is associated with this invadopodium are shown by arrows . Bar, 10 μ m. ( C ) Podosome-mediated degradation of fluorescent gelatin matrix. Macrophage IC-21 cells were incubated on gelatin-Alexa Fluor 568 matrix overnight. The actin cytoskeleton was labeled with phalloidin-Alexa Fluor 488. A podosome and its corresponding site of pericellular matrix degradation are shown by arrows . Bar, 10 μ m. Fluorescence images in ( B ) and ( C ) were acquired with confocal laser scanning micro-scopy using a 63×/1.4 N.A. objective .

ECM Degradation Assays for Analyzing Local Cell Invasion 213
by other in vitro and in vivo tests of invasion and metastasis to determine the potential impact of manipulating invadopodia function during invasion in physiological settings. In this assay, the cells are incubated on glass coverslips coated with a uniformly fluorescent matrix, and cellular invasion is detected by the appear-ance of foci of degradation, i.e., dark areas of degraded fluores-cent matrix underneath the cell. Historically, thick matrices of gelatin cross-linked with glutaraldehyde were coated with fluo-rescently-labeled fibronectin and used to detect invadopodia and their function in matrix degradation (4, 5) . Thick fluorescently-labeled and crosslinked gelatin matrices have also been employed in an alternative phagocytosis assay (2) . We have developed very thin fluorescently-conjugated gelatin matrices that are not cross-linked with glutaraldehyde but are coupled covalently to the sub-stratum (6) . According to electron microscopy, the thickness of our matrices is 48.9 ± 2.9 nm (Fig. 1A ). These matrices allow sensitive and rapid detection of proteolytic activity associated with invadopodia and podosomes (Fig. 1B , C ). Combination of the fluorescent-gelatin degradation assay with immunolabeling of cel-lular cytoskeleton and different cellular proteins allows studying the role of these proteins during invadopodium and podosome formation in parallel with their function in matrix degradation. Our matrices can be used for studies involving fixed cell samples or in vitro live-cell imaging ( see Note 1 ).
1. Glass coverslips: round, 18 mm in diameter, acid-washed ( see Note 2 ).
2. 12-well tissue-culture plate (Costar, Corning Inc.). 3. Dulbecco’s PBS with calcium and magnesium (GIBCO, Inv-
itrogen). 4. 50 μ g/mL poly- L -lysine (Sigma, catalog number P-7405)
solution in Dulbecco’s PBS. 5. 0.5% glutaraldehyde (Electron Microscopy Sciences) solu-
tion in Dulbecco’s PBS ( see Note 3 ). 6. Alexa Fluor 568 protein labeling kit (Molecular Probes/Inv-
itrogen, catalog number A-10238). 7. 5 mg/mL sodium borohydride (Sigma) solution in Dulbec-
co’s PBS ( see Note 4 ). 8. Phalloidin-Alexa Fluor 488 (Molecular Probes/Invitrogen).
Prepare phalloidin-Alexa Fluor 488 solution by adding 1.5 mL
2. Materials
214 Artym, Yamada, and Mueller
of methanol to 300 units of lyophilized protein in the vial supplied by the manufacturer.
9. 0.2% gelatin (Sigma, catalog number G-2500; porcine skin gel-atin, 300 Bloom) solution in Dulbecco’s PBS ( see Note 5 ).
10. Alexa Fluor 568-gelatin. Label 0.2% gelatin with fluorescent Alexa Fluor 568 dye using Alexa Fluor 568 protein labeling kit ( see Note 6 ).
11. 3.7% paraformaldehyde in 5% sucrose in Dulbecco’s PBS. 12. 0.5% Triton X-100 in Dulbecco’s PBS. Filter this solution
through the filter membrane with 0.22 μ m pore size to remove particulate impurities present in Triton X-100.
13. Gel/Mount, aqueous mounting medium with anti-fading agents (Biomeda).
14. Glass slides for microscopy, precleaned.
1. Place acid-washed and flamed 18 mm glass coverslips on the wells of 12-well tissue-culture plate.
2. Chill 50 μ g/mL solution of poly- L -lysine on ice. 1 mL of 50 μ g/mL solution of poly- L -lysine per one coverslip is needed.
3. Coat each coverslip with poly- L -lysine by adding 1 mL of prechilled 50 μ g/mL poly- L -lysine to the well. Incubate for 20 min at room temperature.
4. Aspirate poly- L -lysine solution. Wash coverslips three times by adding 1 mL of Dulbecco’s PBS to the well and gently aspirating it. Always add PBS to the side of the well, and do not pour PBS directly on the coverslip. When aspirating, also keep the pipette tip at the side wall of the well.
5. After the third wash, cover the coverslip with 1 mL of 0.5% glutaraldehyde and incubate for 15 min at room temperature.
6. Mix 0.2% gelatin and Alexa Fluor 568-gelatin at an 8:1 ratio and place the tube in a 37°C water bath to heat the mixture to 37°C. You will need 80 μ L of the fluorescent gelatin mix-ture for each coverslip.
7. Aspirate the glutaraldehyde and wash coverslips three times by adding 1 mL of Dulbecco’s PBS to the well and gently aspirat-ing it. Do not aspirate Dulbecco’s PBS after the third wash.
8. Cut a sheet of Parafilm (approximately 10 cm by 15 cm) and put it on the bench top. Press edges of the Parafilm to the bench to prevent sliding.
3. Methods
3.1. Coating Coverslips with Thin Fluorescent Gelatin Matrix

ECM Degradation Assays for Analyzing Local Cell Invasion 215
9. Deposit 80 μ L of preheated (37°C) fluorescent gelatin mix-ture on the Parafilm.
10. Using a needle to gently lift a side and forceps to grasp the coverslip, remove each coverslip from the wells of the tissue-culture plate and invert them on the drops of gelatin matrix. Incubate for 10 min at room temperature.
11. Using the needle and forceps, lift the coverslips one-by-one from the Parafilm and submerge each in Dulbecco’s PBS in separate wells of a 12-well tissue-culture plate. The surface of the coverslip coated with the matrix should face up. Be very careful not to scratch the matrix.
12. Wash coverslips three times by adding 1 mL of Dulbecco’s PBS to the well and gently aspirating it.
13. The residual reactive groups in the gelatin matrix should be quenched with sodium borohydride. Prepare a fresh solution of 5 mg/mL sodium borohydride and as it starts bubbling add 1 mL of the solution to each well. Incubate for 15 min at room temperature. Gently shake or rock the tissue-culture plate to keep the coverslips submerged in the sodium boro-hydride solution, making sure that gas bubbles are released from underneath the coverslips. Do not allow bubbles to settle on the top side of the coverslip that is coated with fluorescent gelatin matrix, since they can damage the gelatin matrix and create splotches.
14. Wash the coverslips three times by adding 2 mL of Dul-becco’s PBS to the well and gently aspirating it. You should wash away all of the bubbles. Perform additional one or two washes if required to eliminate bubbles.
15. Coverslips coated with fluorescent gelatin matrix can be used for the matrix degradation assay immediately, or they can be stored at 4°C for up to 6 days. Care should be taken to prevent bacterial contamination. Bacteria express gela-tinases that will damage the fluorescent gelatin matrix and leave dark areas lacking fluorescence.
1. Count cell suspension using a hemocytometer and resuspend the cells to a concentration of 2 × 10 4 /mL for breast carci-noma MDA-MB-231 cells and cells of similar sizes in tissue culture medium and 5 × 10 4 /mL for mouse macrophage IC-21 cells ( see Note 7 ).
2. Aspirate the Dulbecco’s PBS from the wells of a tissue-culture plate containing coverslips coated with fluorescent gelatin matrix. Plate 1 mL of cell suspension per well on top of the fluorescent gelatin matrix.
3. Place the plate in a 37°C cell-culture incubator. The incu-bation time for gelatin matrix degradation depends on the
3.2. Preparation of Samples for Fluores-cent Gelatin Degrada-tion Assay

216 Artym, Yamada, and Mueller
cell type and can vary from 3 h to overnight. For breast carcinoma MDA-MB-231 cells, an incubation time of 3 h is usually adequate for the appearance of foci of gelatin matrix degradation. For mouse macrophage IC-21 cells overnight incubation is required ( see Note 8 ).
4. Close to the end of the cell incubation period, place a bottle of 3.7% paraformaldehyde in 5% sucrose in Dulbecco’s PBS in a water bath to heat to 37°C.
5. At the end of the incubation period, aspirate cell-culture medium from the well and add 1 mL of 3.7% paraformalde-hyde in 5% sucrose in Dulbecco’s PBS preheated to 37°C. Incubate the cells in fixative for 20 min at room temperature.
6. Wash cells with 1 mL of Dulbecco’s PBS three times. 7. Permeabilize-fix cells with 1 mL of 0.5% Triton X-100
solution in Dulbecco’s PBS: incubate for 5 min at room temperature.
8. Wash cells three times with 1 mL of Dulbecco’s PBS. 9. To label cells with Alexa Fluor 488-conjugated phalloidin,
add 5 μ L of phalloidin-Alexa Fluor 488 solution to 500 μ L of Dulbecco’s PBS in the well. Incubate for 30 min at room temperature.
10. Wash cells with 1 mL of Dulbecco’s PBS three times. 11. Mount coverslips on slides with mounting solution. Gently
lift glass coverslips using needle and forceps and drain all the liquid onto a Kimwipe. Place a drop (~150 μ L) of gel/mount on the coverslip side that contains fluorescent matrix and cells. Invert this coverslip on a microscope slide.
12. Leave the mounting solution to polymerize for at least 1 h at room temperature. Examine slides using confocal laser scan-ning microscope. The samples can be stored light protected at 4°C for 1 week.
1. Locate the cells using phase contrast or differential interfer-ence contrast (DIC) microscopy.
2. Examine fluorescence of the gelatin matrix and cellular actin cytoskeleton by wide-field fluorescence or confocal micro-scopy. Excitation/emission at 490 nm/520 nm permits visualization of Alexa Fluor 488-labeled F-actin in the cells, whereas excitation/emission at 568 nm/600 nm allows visu-alization of Alexa Fluor 568-labeled gelatin matrix ( see Note 9 ). Because the fluorescent gelatin is a very thin layer, find the correct focal point for the gelatin matrix by focusing up and down. The entire field of view should show uniform bright flu-orescence of the gelatin matrix. The foci of degraded matrix are dot-like areas of degraded matrix that can range from 0.5
3.3. Fluorescence Microscopy of Samples

ECM Degradation Assays for Analyzing Local Cell Invasion 217
to 2 μ m in diameter. Foci of pericellular proteolysis can be best observed with 40× or higher magnification objectives. Look for colocalization of bright F-actin cores of invadopodia and podosomes with dark areas of degraded matrix underneath the cell. Examples of gelatin matrix and actin cores of inva-dopodia and podosomes are depicted in Fig. 1B,C . Image analysis software can be used to overlay fluorescent images of matrix and cell cytoskeleton.
1. For live-cell imaging studies, coat the glass portions of glass-bottom tissue culture dishes (e.g., MatTek Corporation, Ashland, MA) or Lab-Tek chambered coverglass systems (VWR). When considering which dish to use for live-cell imaging, check the quality of the coverglass used by the manufacturer. A clean, acid-washed coverglass is required for uniformly smooth coating with the fluorescent-gelatin matrix. Scale up or down all of the materials listed for coat-ing glass surfaces with fluorescent gelatin matrix depending on the surface area to be coated.
2. To acid-wash coverslips, gently put coverslips into a glass beaker and cover them with 20% nitric acid. Keep coverslips submerged in acid for 30 min and gently swirl them three to four times during this treatment period. Then, pour out the acid solution and extensively wash the coverslips with deion-ized water for 2 h with frequent changes of deionized water. Flame the glass coverslips and store them in a sterile beaker. Nitric acid is hazardous and corrosive. When working with it, use gloves, laboratory coat, and safety glasses to protect your skin, eyes, and clothing. Prepare nitric acid solution and perform acid-washing procedures in a chemical hood.
3. This 0.5% glutaraldehyde solution should be prepared imme-diately before use. This solution is hazardous, and skin contact should be avoided.
4. Sodium borohydride solution must be prepared immediately before use. When dissolving it in Dulbecco’s PBS, bubbles of free hydrogen form and rise in the solution. Always dilute sodium borohydride in the tube with enough free space to accommodate bubbles and prevent spills. This solution is hazardous, and skin contact should be avoided.
5. To make a 0.2% gelatin solution, weigh the gelatin, add appro-priate amount of Dulbecco’s PBS, vortex, and place in a 37°C water bath for 30 min. As the solution heats to 37°C, the
4. Notes
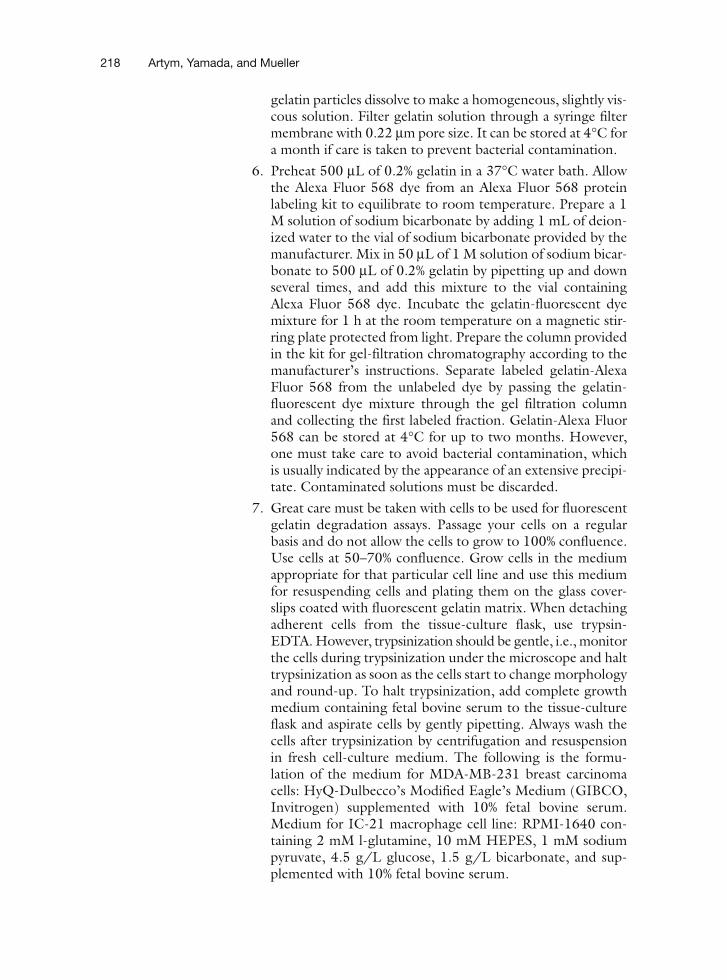
218 Artym, Yamada, and Mueller
gelatin particles dissolve to make a homogeneous, slightly vis-cous solution. Filter gelatin solution through a syringe filter membrane with 0.22 μ m pore size. It can be stored at 4°C for a month if care is taken to prevent bacterial contamination.
6. Preheat 500 μ L of 0.2% gelatin in a 37°C water bath. Allow the Alexa Fluor 568 dye from an Alexa Fluor 568 protein labeling kit to equilibrate to room temperature. Prepare a 1 M solution of sodium bicarbonate by adding 1 mL of deion-ized water to the vial of sodium bicarbonate provided by the manufacturer. Mix in 50 μ L of 1 M solution of sodium bicar-bonate to 500 μ L of 0.2% gelatin by pipetting up and down several times, and add this mixture to the vial containing Alexa Fluor 568 dye. Incubate the gelatin-fluorescent dye mixture for 1 h at the room temperature on a magnetic stir-ring plate protected from light. Prepare the column provided in the kit for gel-filtration chromatography according to the manufacturer’s instructions. Separate labeled gelatin-Alexa Fluor 568 from the unlabeled dye by passing the gelatin-fluorescent dye mixture through the gel filtration column and collecting the first labeled fraction. Gelatin-Alexa Fluor 568 can be stored at 4°C for up to two months. However, one must take care to avoid bacterial contamination, which is usually indicated by the appearance of an extensive precipi-tate. Contaminated solutions must be discarded.
7. Great care must be taken with cells to be used for fluorescent gelatin degradation assays. Passage your cells on a regular basis and do not allow the cells to grow to 100% confluence. Use cells at 50–70% confluence. Grow cells in the medium appropriate for that particular cell line and use this medium for resuspending cells and plating them on the glass cover-slips coated with fluorescent gelatin matrix. When detaching adherent cells from the tissue-culture flask, use trypsin-EDTA. However, trypsinization should be gentle, i.e., monitor the cells during trypsinization under the microscope and halt trypsinization as soon as the cells start to change morphology and round-up. To halt trypsinization, add complete growth medium containing fetal bovine serum to the tissue-culture flask and aspirate cells by gently pipetting. Always wash the cells after trypsinization by centrifugation and resuspension in fresh cell-culture medium. The following is the formu-lation of the medium for MDA-MB-231 breast carcinoma cells: HyQ-Dulbecco’s Modified Eagle’s Medium (GIBCO, Invitrogen) supplemented with 10% fetal bovine serum. Medium for IC-21 macrophage cell line: RPMI-1640 con-taining 2 mM l -glutamine, 10 mM HEPES, 1 mM sodium pyruvate, 4.5 g/L glucose, 1.5 g/L bicarbonate, and sup-plemented with 10% fetal bovine serum.

ECM Degradation Assays for Analyzing Local Cell Invasion 219
8. The recommended time of incubation for different cell lines can be established experimentally by checking cell samples for matrix degradation using a fluorescence microscope at different time points. The optimal time is when the larg-est number of cells shows degradation of the fluorescent matrix.
9. Gelatin used for preparation of the fluorescent matrix can be conjugated to any appropriate Alexa Fluor dye that is available on the market. Using dyes that can be excited by a mercury arc lamp (or any other nonlaser excitation light source) and that emit in the green or red spectrum is convenient for quick visual specimen scanning. Examples of such dyes that can be directly observed are Alexa Fluor 488 and Alexa Fluor 568.
References
1. Linder , S. (2007) The matrix corroded: podo-somes and invadopodia in extracellular matrix degradation . Trends. Cell. Biol. 17 (3) , 107 – 117
2. Coopman , P. J. , Do , M. T. , Thompson , E. W. , and Mueller , S. C. (1998) Phagocytosis of cross-linked gelatin matrix by human breast carcinoma cells correlates with their invasive capacity . Clin. Cancer. Res. 4 (2) , 507 – 515
3. Thompson , E. W. , Paik , S. , Brunner , N. , Sommers , C. L. , Zugmaier , G. , Clarke , R. , Shima , T. B. , Torri , J. , Donahue , S. , Lippman , M. E. , et al. (1992) Association of increased basement membrane invasiveness with absence of estrogen receptor and expression of vimen-tin in human breast cancer cell lines . J. Cell Physiol. 150 (3) , 534 – 544
4. Chen , W. T. , Olden , K. , Bernard , B. A. , Chu , F. F. (1984) Expression of transformation-associated protease(s) that degrade fibronectin at cell contact sites. J. Cell Biol. 98 (4) , 1546 – 1555
5. Chen , W. T. (1989) Proteolytic activity of specialized surface protrusions formed at rosette contact sites of transformed cells . J. Exp. Zool. 251 (2) , 167 – 185
6. Artym , V. V. , Zhang , Y. , Seillier-Moisei-witsch , F. , Yamada , K. M. , Mueller , S. C. (2006) Dynamic interactions of cortactin and membrane type 1 matrix metalloproteinase at invadopodia: defining the stages of inva-dopodia formation and function . Cancer. Res. 66 (6) , 3034 – 3043

Chapter 16
Fluorescence-Based Assays for In Vitro Analysis of Cell Adhesion and Migration
Paola Spessotto , Katia Lacrima , Pier Andrea Nicolosi , Eliana Pivetta , Martina Scapolan , and Roberto Perris
Summary
Cell adhesion and cell migration are two primary cellular phenomena for which in vitro approaches may be exploited to effectively dissect the individual events and underlying molecular mechanisms. The use of assays dedicated to the analysis of cell adhesion and migration in vitro also afford an efficient way of conducting larger basic and applied research screenings on the factors affecting these processes and are potentially exploitable in the context of routine diagnostic, prognostic, and predictive tests in the biological and medical fields. Therefore, there is a longstanding continuum in the interest in devising more rationale such assays and major contributions in this direction have been provided by the advent of procedures based on fluorescence cell tagging, the design of instruments capable of detecting fluorescent signals with high sensitivity, and informatic tools allowing sophisticated elaboration of data generated through these instruments. In this report, we describe three representative fluorescence-based model assays for the qualitative and quantitative assessment of cell adhesion and cell locomotion in static and dynamic conditions. The assays are easily performed, accurate and reproducible, and can be automated for high-to-medium throughput screenings of cell behavior in vitro. Performance of the assays involves the use of certain dedicated disposable accessories, which are commercially available, and a few instruments that, due to their versatility, can be regarded as constituents of a more generic laboratory setup.
Key words: Cell adhesion , Cell migration , In vitro , Fluorescent assay .
Cell adhesion is a complex process that involves different molecu-lar interactions between adjacent cells or their surrounding ECM, which are mediated by integrins, cell surface proteoglycans, non-integrin receptors, and a variety of cell adhesion molecules.
1. Introduction
1.1. The Phenomenon of Cell Adhesion
Sharona Even-Ram and Vira Artym (eds.), Methods in Molecular Biology, Extracellular Matrix Protocols, vol. 522© Humana Press, a part of Springer Science + Business Media, LLC 2009DOI: 10.1007/978-1-59745-413-1_16
221

222 Spessotto et al.
The phenomenon of cell adhesion is a prerequisite for the execu-tion of the process of cell movement: in a moving cell adhesion sites have to be established, broken up, and new ones formed in conjunction with the generation of traction and contractile intracellular forces in order to propel a cell forward. In certain circumstances, adhesive interactions must be more avid and stable, for instance in stationary cells to preserve integrity of organized epithelial structures, whereas in others they are weaker and tran-sient, such as for instance in the case of those formed by rap-idly locomoting cells and circulating lymphocytes. A number of recent studies have provided information about the relative force of cell adhesion exhibited by diverse cell types binding to cellular and ECM substrates, both under static (1– 8) and dynamic con-ditions (i.e., under shear stress; (9, 10) ). Analysing cell adhesion provides an efficient way of assessing the occurrence of cell–cell and cell–substratum contacts and allows for the dissection of the signal transduction events associated with the interaction of cells with their microenvironment through engagement of cell sur-face component with the extracellular ligands and the subsequent mobilization of the cytoskeleton.
A number of procedures to quantify the process of cell adhesion are described in the literature, and all of them are based on the use of mechanical forces to remove the nonbound or weakly bound cells (11) . Adhesion between individual cells has been measured using rather simple mechanical methods, such as micropipette manipu-lation (12) , or more sophisticated instruments such as scanning force microscopy. The use of the latter equipment has facilitated the development of piconewton-scale procedures, which provides force resolution and positional precision to allow for measure-ments at the single molecule-level (8, 13) . Other investigators have developed a unique method for the measurement of adhe-sion forces between individual cells, using a light microscope of a custom-made force spectrometer (14) . A cell is picked up with a tipless cantilevel, the end of which has been covalently function-alised with a lectin, resulting in firm attachment of the cell to the cantilever. A target cell at the bottom of a Petri dish was positioned underneath the cantilever-mounted cell, and was approached until a predefined repulsive contact force was established. Upon retrac-tion of the cantilever, these investigators recorded the force as a function of the distance that the cantilever was moved until the contact between the cells was broken.
Similar binding force information is also possible to obtain with the use of atomic force microscopy, acting as a sensitive force transducer capable of detecting subnanometer deflections of its cantilever (15) . The scanning or atomic force microscope-based systems used to measure the relative or absolute strength of adhesion are sensitive, but involve elevated costs associated
1.2. Cell Adhesion Assays Under “Static” Conditions

Fluorescence-Based Assays for In Vitro Analysis of Cell Adhesion and Migration 223
with the acquisition and maintenance of the instruments to be employed. Hence, these procedures are incompatible with the performance of routine cell adhesion assays to be performed in conventional research laboratories in institutions that use such assays for applied purposes. More readily approachable methods for studying adhesion forces include simple fluid flushing, the application of buoyancy (16) or rotating motions (5, 17) , and centrifugation (2– 6, 18, 19) . Under static conditions, the appli-cation of a strictly perpendicular removal force, exerted through centrifugation, could yield a precise way to exert a definable and measurable detachment forces onto a population of cells (2– 6) . Thus, although considering the intrinsic biophysical constrains and variables, this method still emerges in our opinion as the preferred one. However, the previously proposed centrifugation assay procedure, devised with the intent of assessing weak cell bindings and the forces with which cells could bind to a given substratum (20) , presents a number of drawbacks and limita-tions. We, therefore a number of years ago, devised an alternative cell adhesion procedure that we have denoted Centrifugal Assay for Fluorescence-based Cell Adhesion (CAFCA) (21 ; Fig. 1 ) .
Fig. 1. The procedure for CAFCA. Fluorescently-labeled cells may be aliquoted into each well of the CAFCA strips at a minimal density of 200–500 cells/well to guarantee a fluorescent signal above the threshold of resolution of the currently available microplate readers, including the SPECTRAFluor instrument recommended here. The centrifugal force to use in both centrifugation steps is arbitrarily determined according to the cell type and experimental conditions. Addition of India ink to the cell adhesion medium is a prerequisite for optimal separation of the “top” and “bottom” fluorescent signals, but may be replaced with analogous inert compounds. The most critical step of the procedure is the assembly of the two CAFCA units, where care should be taken to not introduce air bubbles. Once the cells have been centrifuged in contact with the substrate, incubation times prior to the reversed centrifugation may be varied according to the scope of the experiment .
CENTRIFUGATION
BOTTOMCAFCA MINIPLATE
MOLECULAR ORCELLULAR SUBSTRATE
ADHESION MEDIUM+INK
TOPCAFCA MINIPLATE
PEEL-OFFADHESIVE TAPE
CAFCA HOLDER
REVERSED
FLUORESCENCEDETECTION
CENTRIFUGATION
FLUORESCENCEDETECTION
CALCEIN AMLABELLED CELLS

224 Spessotto et al.
The assay exploits the use of differential centrifugal forces to achieve maximal accuracy and reproducibility of the cell bind-ing events, while maintaining the possibility to precisely estimate the relative cell adhesion strengths. What we arbitrarily denote as adhesion force ( A fd ) can be calculated as dynes/cell, following the generation of a suitable “force-dependent curve” to retrieve the force required to detach 50% of the bound cells. The formula to adopt is then: A fd = ( D c – D m ) × V c × F c (where D c is the specific cell density, intermediate value = 1.07 mg/cm 3 ; D m is the specific density of the medium, 1 mg/cm 3 ; V c is the volume of the cell; and F c is the centrifugal force yielding 50% cell detachment).
CAFCA is based on two centrifugation steps: first to allow for a synchronised cell–substratum contact; and second (in the reverse direction) to allow for removal of the unbound/weakly bound cells under controlled conditions ( Fig. 1 ). The assay is unique in that it combines the possibility to accurately estimate the cell-binding avidity while allowing for a precise assessment of the ratio bound vs. nonbound cells within a given cell popu-lation. CAFCA is a rapid assay (total performance time may be less then 1 h) and is applicable to a small number of cells, with-out limiting the total number of samples/conditions that can be examined. It is based on the use of a commercially available stand-ard microplate fluorometer and a few accessories including, for maximal convenience, dedicated Excel-based softwares. Finally, as previously suggested for other types of cell–cell adhesion assays (22– 24) , the employment of vital fluorophores to label the test cells adds to the above advantages characterising CAFCA. This renders this procedure an ideal assay for the analysis of freshly isolated normal and diseased cells.
The adhesive interactions of normal and transformed hematopoi-etic cells, solid tumour cells and other diseased circulating cells with the endothelium of the vessel wall, their secretory products or the underlying ECM can effectively be analyzed using “flow” systems that more closely reproduce the situations found in the hematic and lymphatic vasculature in vivo. These are based on the use of specifically devised chambers, conventionally denoted as “parallel-flow chambers.” They are connected to semi or entirely close circuits within which a suitable solution or whole blood is allowed to circulate with a given velocity to simulate the rheo-logical conditions found in various hematic and lymphatic vessels of the animal and human body. In such devices, relative flow rates may be controlled by peristaltic or syringe pumps allowing for varying pressure forces over a wide range and thereby produc-ing diverse shear rates in the system. The chamber is designed such as to accommodate a solid support (e.g., a coverslip) onto which isolated molecules, complex ECM, or cell monolayers can be deposited ( Fig. 2 ) . The chamber unit is then placed under an
1.3. Cell Adhesion Assays Run Under “Dynamic” Conditions

Fluorescence-Based Assays for In Vitro Analysis of Cell Adhesion and Migration 225
Fig. 2. Complete parallel flow chamber system. Ideal simulation of the natural conditions may be achieved by utilizing whole blood as an assay solution. Either syringe or peristaltic pumps may be used for generating the wanted shear rates, which are also influenced by the design of the “parallel flow chamber” (e.g., there are a number of flow chamber models described in the literature and differing in the rheological conditions that they can generate). Depending upon whether there is an interest in monitoring cell behavior under phase-contrast or fluorescence microscopy, a normal, digital or CCD intensified camera may be used to record the behavior of the flowing cells transversing the test substrate at the bottom of the chamber. The camera should be connected through a PC (1) to a monitor (2) for effective viewing of the cells in real-time. For convenience and maximal efficiency, experiments should be recorded on video tapes (3) and through an apposite software digitalized to be further processed singly or in sequence through the use of an adequately potent PC workstation (4). At that point, for the same reason and for storage purposes, they can be saved on optical disc units (5) and printed singly or in composites with a suitable black/white or color printer (6). Various image analysis softwares are currently present on the market, but a good alternative may also be to acquire a custom designed one that more closely may satisfy the individual needs .
inverted microscope equipped with a normal or intensified CCD video camera, depending upon whether the cell tracking is to be monitored under phase-contrast or fluorescence, or under a con-focal laser microscopic setup for higher resolution and 3D moni-toring of the tagged cells. Images recorded under the microscope during continuous flow of the cells over the substrate are then elaborated by dedicated computer software for image analysis.

226 Spessotto et al.
Such softwares may be of varying complexity according to the needs and type of analyses that are intended. For instance, we are currently using a specifically elaborated multiparametric soft-ware that allows for automatic tracking (within the microscopic view field) of an unlimited number of particles simultaneously in time and space. Through this system we can then assess a large number of qualitative and quantitative subcellular and paracel-lular parameters that may involve multiple cell types examined simultaneously.
The ability of circulating cells, such as leukocytes and platelets, to adhere to the vessel wall requires specialized adhesion mechanisms capable of withstanding the mechanical challenge of flowing blood. This is a multistep process that involves several types of interactions starting from that allowing for the initial tethering, the subsequent rolling, and the eventual irreversible stationary contacts that precede extravasation in the case of lymphocytes, leukocytes, and tumor cells, or that is the prerequisite for platelet activation and aggregation in the case of thrombus formation. Thus, a major advantage of the “flowing chamber” systems is the possibility to dissect the individual cellular and molecular events responsible for the extravasation and thrombotic phenomena. Assays based on controlled hydrodynamic flows allow, for instance, to disclose the nature of the contacts between molecular and cellular ligands, the biophysical parameters that facilitate cell–cell interactions under shear stress, and the role exerted by interactions mediated by diverse cell–cell adhesion molecules and the intracellular signalling cascades ensuing following cell–substratum and cell–cell contacts (10, 25– 29) . An example of how a flow chamber system may be used for molecular screening purposes is that reported by Li et al. (30) , in which hybridomas were assayed for their production of antibodies capable of perturbing cell adhesion phenomena. We described here a chamber flow procedure that provides a powerful method for investigating the nature of the interactions regulating platelet adhesion to ECM components at low and high shear rates.
Cell movement is a complex process involving a coordinated interplay between signals emanating from sources external to the moving cell, and perceived through its plasma membrane components, and signals transmitted by these components to intracellular compartments including the nucleus. There are two aspects to consider when contemplating the phenomenon of cell migration: the cell locomotion itself and the modes by which this locomotion can be directed to allow the moving cell to reach a specific target site. Accordingly, in the absence of guiding cues, a cell would move in random directions, provided that it is equipped with the proper locomotory machinery and that
1.4. Fundamentals of Cell Migration Assays

Fluorescence-Based Assays for In Vitro Analysis of Cell Adhesion and Migration 227
the environmental conditions allow for its movement to ensue. Two principal mechanisms are governing directionality of cell movement. It can either occur as a chemotactic/chemokinetic response to gradients of soluble factors emanating from the target site, or alternatively, it can occur as a consequence of a haptotactic response to components associated with the cell surface and/or extracellular matrix (ECM). This is still a rather simplified view of the actual situation, since cell movement in vivo takes place in a three-dimensional setting, and other parameters are then more crucially (than in a artificial bidimensional setting) implicated in its regulation. For instance, the proteolysis of the surrounding substrate induced by the moving cell at its cell surface is critical for the cell’s capability to invade a complex matrix, change its architecture, or generate fragmented versions of the individual constituents of this matrix that now change their nature as guiding cues (this may for instance occur through the unfolding of cryptic cell interactive sites or through an altered relative arrangement of these modified molecules within the matrix network). Guidance of cell movement is also finely controlled by (bio)physical parameters that may include mechanotransduction phenomena. Since cell movement is a primary cellular process during embryonic development, the maintenance of a healthy adult organism, and the progression of a number of pathological events such as inflammation and tumor metastasis, there is an insurmountable interest in defining adequate ways to analyze this process by qualitative and quantitative means in vitro. Especially interesting is the possibility to combine high-resolution analyses in real time with higher throughput screening paradigms.
In parallel, formidable advances have been made in the design and elaboration of the various modalities for monitoring cell movement in vivo and the most intriguing ones probably include sophisticated fluorescent video time-lapse techniques (31– 33) , intravital videomicroscopy (34– 39) , positron emission tomog-raphy (PET; (40– 42) ), and nuclear magnetic resonance (NMR; (43– 47) ). However, since these systems require elaborate instru-ments and animal models, cannot be used for high-throughput approaches, and may hamper the investigation of the detailed molecular events of migration and their control mechanisms, one still has to resort to cell migration assays in vitro. This may addi-tionally be designed to as closely as possible mimic the in vivo situations. A variety of such assays have been described during the years and these have been exploited to generate a certain type of qualitative and/or quantitative “cell migration data,” which per se may not be deemed to be sufficient to fully characterize the migratory event of interest. Thus, when working in vitro, we rec-ommend investigators to strive for applying several complemen-tary migration assays to assure to gain the maximal information about a given cell migratory phenomenon.
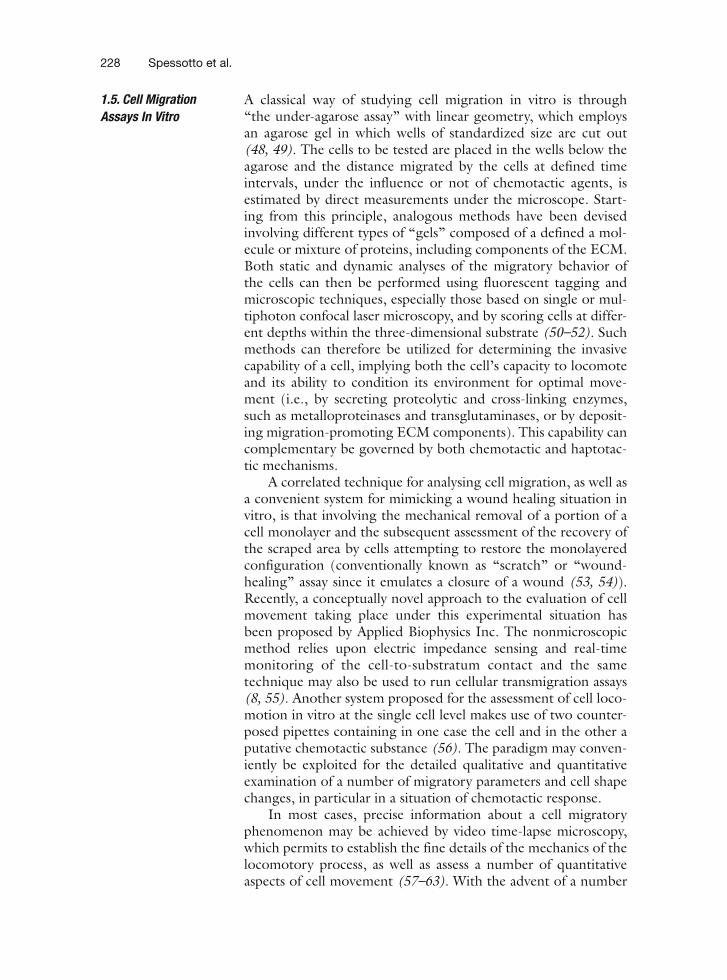
228 Spessotto et al.
A classical way of studying cell migration in vitro is through “the under-agarose assay” with linear geometry, which employs an agarose gel in which wells of standardized size are cut out (48, 49) . The cells to be tested are placed in the wells below the agarose and the distance migrated by the cells at defined time intervals, under the influence or not of chemotactic agents, is estimated by direct measurements under the microscope. Start-ing from this principle, analogous methods have been devised involving different types of “gels” composed of a defined a mol-ecule or mixture of proteins, including components of the ECM. Both static and dynamic analyses of the migratory behavior of the cells can then be performed using fluorescent tagging and microscopic techniques, especially those based on single or mul-tiphoton confocal laser microscopy, and by scoring cells at differ-ent depths within the three-dimensional substrate (50– 52) . Such methods can therefore be utilized for determining the invasive capability of a cell, implying both the cell’s capacity to locomote and its ability to condition its environment for optimal move-ment (i.e., by secreting proteolytic and cross-linking enzymes, such as metalloproteinases and transglutaminases, or by deposit-ing migration-promoting ECM components). This capability can complementary be governed by both chemotactic and haptotac-tic mechanisms.
A correlated technique for analysing cell migration, as well as a convenient system for mimicking a wound healing situation in vitro, is that involving the mechanical removal of a portion of a cell monolayer and the subsequent assessment of the recovery of the scraped area by cells attempting to restore the monolayered configuration (conventionally known as “scratch” or “wound-healing” assay since it emulates a closure of a wound (53, 54) ). Recently, a conceptually novel approach to the evaluation of cell movement taking place under this experimental situation has been proposed by Applied Biophysics Inc. The nonmicroscopic method relies upon electric impedance sensing and real-time monitoring of the cell-to-substratum contact and the same technique may also be used to run cellular transmigration assays (8, 55) . Another system proposed for the assessment of cell loco-motion in vitro at the single cell level makes use of two counter-posed pipettes containing in one case the cell and in the other a putative chemotactic substance (56) . The paradigm may conven-iently be exploited for the detailed qualitative and quantitative examination of a number of migratory parameters and cell shape changes, in particular in a situation of chemotactic response.
In most cases, precise information about a cell migratory phenomenon may be achieved by video time-lapse microscopy, which permits to establish the fine details of the mechanics of the locomotory process, as well as assess a number of quantitative aspects of cell movement (57– 63) . With the advent of a number
1.5. Cell Migration Assays In Vitro

Fluorescence-Based Assays for In Vitro Analysis of Cell Adhesion and Migration 229
of unique cell labeling agents and procedures, including meta-bolic labelling through the reporter gene green fluorescent pro-tein (GFP (64) ), this procedure can now effectively be exploited also in conjunction with fluorescence microscopy. In particular, recordings of cell movement during given time periods can be performed in cells migrating to bi-dimensional substrates or through three-dimensional substrates (as described earlier). The trajectories of individual cells can then be reconstructed, elabo-rated, and quantified from the stored images by relying upon apposite computer softwares. Video-time lapse microscopy is not restricted to adherent cells, but may efficiently be utilized also to monitor the translocation of blood cells in vivo, i.e., in con-junction with intravital microscopy (see earlier), and in vitro ( see Subheading 1.3 ).
One has to bear in mind that although direct visualization of cell behavior using video microscopy may allow for an accu-rate analysis of cell locomotion, other methods may be preferable for rapid screenings of cell migration when examining a larger number of samples. Thereby, it would be possible to approach the concept of high-throughput migration assays. Presently, assays devoted to such scope are primarily based on the use of culture plate inserts containing a porous membrane to be transversed by the migrating cells. These devices, conventionally known as “Transwells,” were originally proposed for studies of the chemo-tactic motility response of leukocytes (65, 66) , and later on also found to be suitable for the assessment of similar phenomena in mesenchymal/epithelial cells (67, 68) . The basic concept of these assays, which involve the transmigration of the cells through a porous, inert micromembrane of polycarbonate or polypropylene, also implies the potential to assay single cell adhesion and ECM molecules, or complex matrices such as Matrigel, Vitrogen 100, and Humatrix . Matrigel consists mainly of basement membrane molecules (laminin, type IV collagen, and heparan sulphate pro-teoglycan) (69) , Vitrogen 100 consists mainly of nonbasement membrane molecules (type I and III collagen), and Humatrix contains significant amounts of both basement and nonbasement molecules (70) . Matrigel can be dried and reconstituted on filters to form a uniform barrier to the penetration of tumour cells. Assay systems using Matrigel have been used to determine the invasiveness of tumor cells under a variety of experimental condi-tions (67, 68) .
Scoring chemotaxis, migration, and invasion through a porous filter using substrate-attached cells has relied upon visual counting of stained cells. However, such approach is subjective and time-consuming and strongly impedes the investigators to determine the true percentage of cells migrated. This is primarily due to the obvious difficulties in assessing the total cells intro-duced into the system. Colorimetric assays based on dyes, such

230 Spessotto et al.
as toluidine blue (71) , or cell viability tracers, such as 3-(4,5-dimethylthiazol-2-yl)-2,5-diphenol tetrazolium bromide (MTT) (72) , have been widely used in conjunction with absorbance readings in the attempt to correlate those values with the number of cells present at the underside of the porous membranes. Draw-backs of these colorimetric methods are the potential for variable background staining associated with protein-coated membranes, the variable toluidine blue-binding for different cell types, addi-tional incubation times, and to generate reliable calibration curves. If the assay intends to address the migratory capacity of hematopoietic cells, other technical inconveniences are intro-duced. It could, for instance, be necessary to centrifuge the plate carrying the inserts to allow for the migrated cells to be displaced to the bottom of the well, which in turn would allow to replace the cell culture medium with a suitable dye. In contrast, radioac-tive assays are sensitive and provide an efficient means of assessing the number of cells that have penetrated through the filter barrier into the lower portion of the well (68) . However, besides the health and cost-related aspects of using radioactivity, additional pitfalls include the possibility that the lower portion of the wells may contain free label, not properly incorporated into the cells, or deriving from spontaneous release. The presence of the free isotope could then cause an overestimation of the actual number of migratory/invasive cells.
During recent years, several protocols employing fluorescently-labeled cells have been developed and proposed to circumvent the above described technical and health-hazard problems. The ample spectrum of potential fluorophores to use for cell labeling is also progressively increasing, and many of these agents currently provide superior tools for fluorescence cell tagging in compari-son to those originally used (i.e., Calcein-AM and BCECF-AM, (73, 74) ). These are fluorogenic esterase substrates that can be passively loaded into adherent and nonadherent cells and com-monly serve as viability probes and probes for assessing plasma membrane integrity. In original protocols involving the use of these fluorescent dyes, cells on the upper side of the membrane (i.e., cell that did not transmigrate) were mechanically removed, and cells that had passed across the filter were tagged with the fluorescent dye. The fluorescent signal could then be directly measured with and without prior lysis of the cells with detergent or solubilising agents to release the dye. The sensibility of this method is high. However, since these dyes cannot be incorpo-rated into the premigratory cells because of the high fluorescence decay and spontaneous release, these labels are not suitable for distinguishing the actual migrated cells by differential detection of the upper (nonmigrated) and lower (migrated) cells, as well as yields false values due to the strong tagging of cells replicated after migration. We, therefore, recommend to utilize vital lipophilic
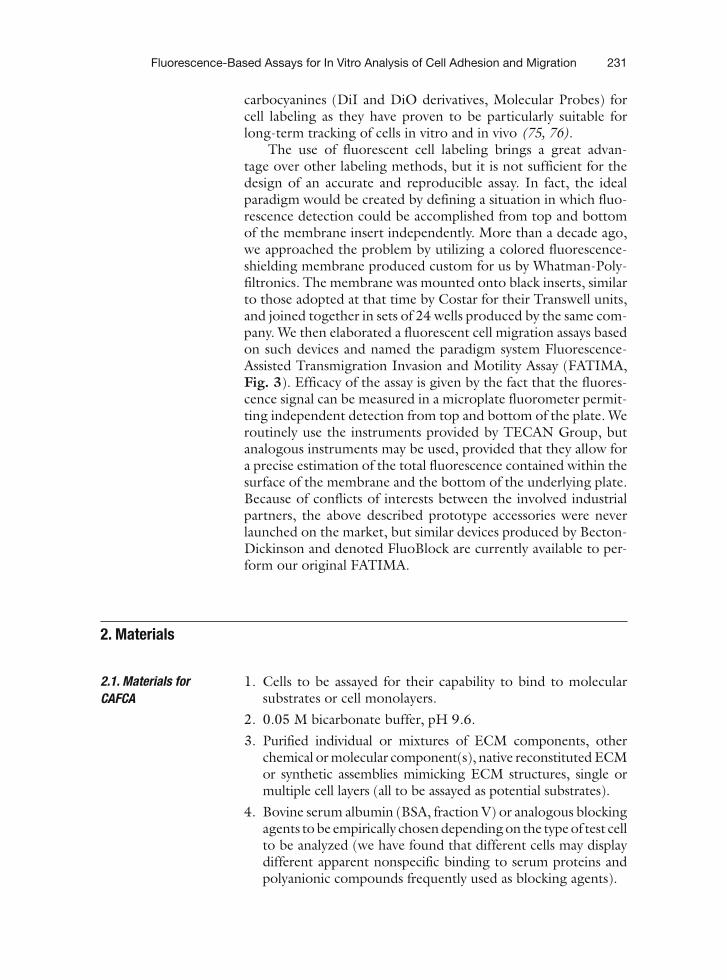
Fluorescence-Based Assays for In Vitro Analysis of Cell Adhesion and Migration 231
carbocyanines (DiI and DiO derivatives, Molecular Probes) for cell labeling as they have proven to be particularly suitable for long-term tracking of cells in vitro and in vivo (75, 76) .
The use of fluorescent cell labeling brings a great advan-tage over other labeling methods, but it is not sufficient for the design of an accurate and reproducible assay. In fact, the ideal paradigm would be created by defining a situation in which fluo-rescence detection could be accomplished from top and bottom of the membrane insert independently. More than a decade ago, we approached the problem by utilizing a colored fluorescence-shielding membrane produced custom for us by Whatman-Poly-filtronics. The membrane was mounted onto black inserts, similar to those adopted at that time by Costar for their Transwell units, and joined together in sets of 24 wells produced by the same com-pany. We then elaborated a fluorescent cell migration assays based on such devices and named the paradigm system Fluorescence-Assisted Transmigration Invasion and Motility Assay (FATIMA, Fig. 3 ). Efficacy of the assay is given by the fact that the fluores-cence signal can be measured in a microplate fluorometer permit-ting independent detection from top and bottom of the plate. We routinely use the instruments provided by TECAN Group, but analogous instruments may be used, provided that they allow for a precise estimation of the total fluorescence contained within the surface of the membrane and the bottom of the underlying plate. Because of conflicts of interests between the involved industrial partners, the above described prototype accessories were never launched on the market, but similar devices produced by Becton-Dickinson and denoted FluoBlock are currently available to per-form our original FATIMA.
1. Cells to be assayed for their capability to bind to molecular substrates or cell monolayers.
2. 0.05 M bicarbonate buffer, pH 9.6. 3. Purified individual or mixtures of ECM components, other
chemical or molecular component(s), native reconstituted ECM or synthetic assemblies mimicking ECM structures, single or multiple cell layers (all to be assayed as potential substrates).
4. Bovine serum albumin (BSA, fraction V) or analogous blocking agents to be empirically chosen depending on the type of test cell to be analyzed (we have found that different cells may display different apparent nonspecific binding to serum proteins and polyanionic compounds frequently used as blocking agents).
2. Materials
2.1. Materials for CAFCA

232 Spessotto et al.
5. PBS (8 g NaCl, 0.2 g KCl, 1.44 g Na 2 HPO 4 . H 2 O, 0.2 g
KH 2 PO 4 in 1 L apyrogen H 2 O), pH 7.4. 6. PBS containing 5 mM EDTA (to be used only for anchorage-
dependent cells). 7. Cell culture media or physiological buffers with the desired
supplements (sera, mitogens or other stimulating factors, ions, antibodies, drugs, or other components to be tested).
Fig. 3. The FATIMA system applicable to any cell type and based on the use of inserts with a fluorescence-blocking membrane. Such insert allows for independent fluorescence detection from the top ( nontransmigrated cells ) and bot-tom ( transmigrated cells ) side of the plate and from these values can then be extrapolated the exact percentage of transmigrated cells out of the total amount of cells introduced into the system. Moreover, kinetic studies may readily be performed for both anchorage-dependent and suspension-growing cells within the same well. This system is well-suited for large-scale analyses of cell migration. On the basis of the different ways to coat the membrane and introduce soluble agents into the system, we can evaluate “migratory” phenomena corresponding to chemotaxis (when a putative chemotactic agent is added to the lower portion of the well), haptotaxis (when the upper and underside of the membrane are coated with different concentrations of the substrate molecule), invasion (when the membrane is covered with a 3D ECM layer or a thin tissue section), and transmigration (when the membrane is covered with a cell monolayer) .
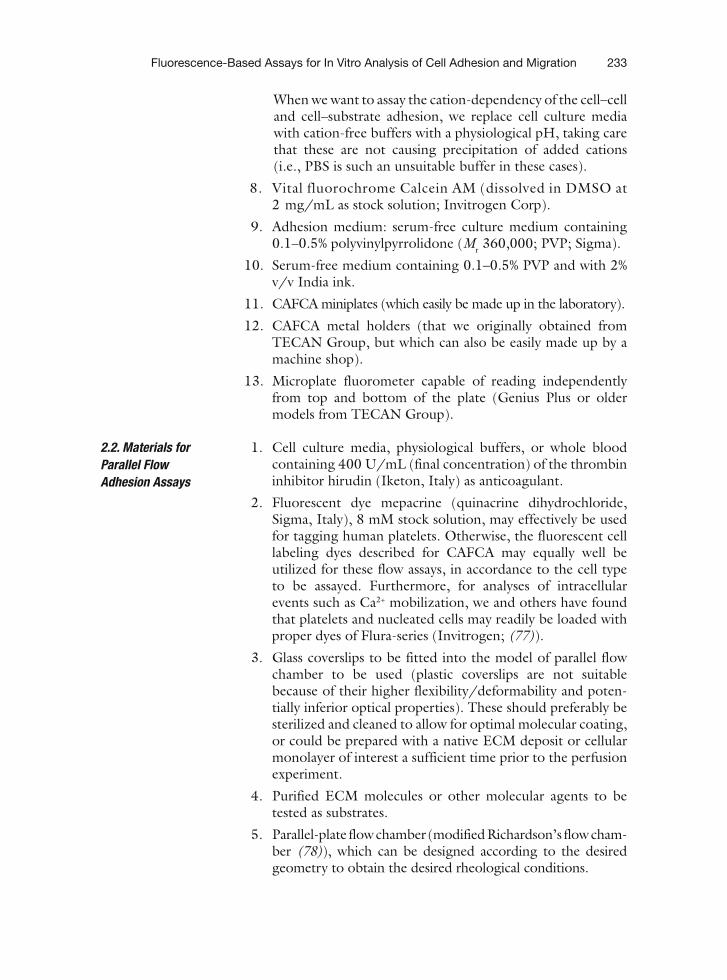
Fluorescence-Based Assays for In Vitro Analysis of Cell Adhesion and Migration 233
When we want to assay the cation-dependency of the cell–cell and cell–substrate adhesion, we replace cell culture media with cation-free buffers with a physiological pH, taking care that these are not causing precipitation of added cations (i.e., PBS is such an unsuitable buffer in these cases).
8. Vital fluorochrome Calcein AM (dissolved in DMSO at 2 mg/mL as stock solution; Invitrogen Corp).
9. Adhesion medium: serum-free culture medium containing 0.1–0.5% polyvinylpyrrolidone ( M r 360,000; PVP; Sigma).
10. Serum-free medium containing 0.1–0.5% PVP and with 2% v/v India ink.
11. CAFCA miniplates (which easily be made up in the laboratory).
12. CAFCA metal holders (that we originally obtained from TECAN Group, but which can also be easily made up by a machine shop).
13. Microplate fluorometer capable of reading independently from top and bottom of the plate (Genius Plus or older models from TECAN Group).
1. Cell culture media, physiological buffers, or whole blood containing 400 U/mL (final concentration) of the thrombin inhibitor hirudin (Iketon, Italy) as anticoagulant.
2. Fluorescent dye mepacrine (quinacrine dihydrochloride, Sigma, Italy), 8 mM stock solution, may effectively be used for tagging human platelets. Otherwise, the fluorescent cell labeling dyes described for CAFCA may equally well be utilized for these flow assays, in accordance to the cell type to be assayed. Furthermore, for analyses of intracellular events such as Ca 2+ mobilization, we and others have found that platelets and nucleated cells may readily be loaded with proper dyes of Flura-series (Invitrogen; (77) ).
3. Glass coverslips to be fitted into the model of parallel flow chamber to be used (plastic coverslips are not suitable because of their higher flexibility/deformability and poten-tially inferior optical properties). These should preferably be sterilized and cleaned to allow for optimal molecular coating, or could be prepared with a native ECM deposit or cellular monolayer of interest a sufficient time prior to the perfusion experiment.
4. Purified ECM molecules or other molecular agents to be tested as substrates.
5. Parallel-plate flow chamber (modified Richardson’s flow cham-ber (78) ), which can be designed according to the desired geometry to obtain the desired rheological conditions.
2.2. Materials for Parallel Flow Adhesion Assays

234 Spessotto et al.
6. Silicon rubber gaskets of varying heights and designed to pro-vide different flow paths that could mimic diversities of the wall shear rates found in venular and arterial vessels in vivo.
7. Pumps of the syringe, peristaltic or pulsating type (the latter specifically designed in our laboratory).
8. Inverted microscope equipped with heated stage, CO 2 -equilibrated chamber, computer-interfaced video (CCD) camera.
9. Suitable software for image acquisition and analysis.
1. Cells to be assayed for their capability to transmigrate/invade a bi and three-dimensional molecular substrate ( see Note 1 ).
2. Bicarbonate buffer as used for CAFCA. 3. Fluorescent cell labeling reagents : (A) Labelling dye solution :
0.25 M sucrose (0.85 g per 10 mL apirogen H 2 O), store at 4°C. The solution should be sterilized using a 0.2 μ m filter. (B) Stock dye solution : Fast DiI™ and Fast DiO™ (Molecular Probes, Inc.) are prepared in ethanol at 1–5 mg/mL and stored at −20°C. Centrifugation of the concentrated solu-tion before addition to the cells is recommended to remove the undissolved dye crystal ( see Note 2 ).
4. BD Falcon™® HTS FluoroBlok™ Inserts carrying mem-branes with different pore sizes ( see Note 3 ).
5. Purified ECM molecules. Matrigel should be handled as indicated in the instructions provided by the supplier ( see Note 4 ).
6. PBS and EDTA (or trypsin) as used for CAFCA. 7. Serum-free DMEM or RPMI as used for CAFCA. 8. 2% bovine serum albumin (BSA; stock solution) in PBS. Ster-
ilize using a 0.2- μ m filters and store in aliquots at −20°C. 9. Working assay solution : RPMI or DMEM containing 0.1–
0.5% BSA. 10. Conditioned medium from fibroblastic cells to use as
generic chemoattractant. We normally use the conditioned medium from the NIH 3T3 fibroblasts grown in DMEM containing 10% FCS. When cells are at 70–80% confluency, remove the supernatant gently, wash with PBS, and replace medium with 10 mL serum-free DMEM. After 24 h collect the supernatant, centrifuge, sterilize using a 0.2- μ m filter, add BSA (0.1–0.5% final concentration) and store at −20°C until use.
11. Microplate fluorometer capable of reading independently from top and bottom of plate.
2.3. FATIMA

Fluorescence-Based Assays for In Vitro Analysis of Cell Adhesion and Migration 235
1. Prepare the “coating solution” composed of the ECM molecule(s) of interest dissolved at 0.01–100 μ g/mL (total protein concentration) in the bicarbonate buffer and aliquot 50 μ L in each well of the bottom CAFCA miniplate ( see Fig. 1 and Note 5 ).
2. Incubate the bottom CAFCA miniplates at 4°C for 8–16 h ( see Note 6 ).
3. Dissolve the BSA at 1% (w/v) in PBS and heat up the solution to 56°C for 15 min to denatured the protein ( see Note 7 ).
4. Remove the coating solution from the wells, wash them at least 2–3 times with PBS, and fill them with 200 μ L of the BSA blocking solution (or analogous solution). Incubate at room temperature for at least 2 h ( see Note 8 ).
5. Suspension-growing cells: Rinse once the cells and resuspend them in 300 μ L of RPMI with 15% FCS. Add calcein AM (at final concentration of 1–10 μ M; the recommended calcein AM-cell ratio is 2 μ M/10 6 cells) and incubate the cells at 37°C for 10–20 min to allow the calcein AM to be metabolized. The incubation time with calcein AM may in some cases need to be extended, especially when working with ex vivo cells. The optimal labeling is achieved when the cell pellet attains a yellowish colour. In alternative to calcein AM, other fluorescent cell labeling dyes, e.g. those of the CellTracker of lipophilic DiI series (Invitrogen), may be equally well be used. CAFCA may also effectively be performed with cells genetically labeled with a fluorescent reporter gene (GFP, YFP, etc.). Anchorage-dependent cells : Remove the culturing medium and rinse extensively the plates with PBS, followed by incubation with 2 mL PBS (for a 35 mm plate) containing 5 mM EDTA. Incubate the cells in the presence of the EDTA for up to 15 min (most cells should detach from the culture dish within 5 min, but we have found that some cells may require somewhat longer incubation times). Collect the cell suspension, wash the cells by centrifugation to remove all EDTA, and resuspend them in 300 μ L of DMEM (or another preferred medium). Cells can then be labeled with calcein AM as indicated for suspension-growing cells. If it is necessary to use trypsin to detach the cells, after a very short incubation time with the enzyme (no more than 5 min), pipette with energy for collecting all cells, wash and resuspend the cells in complete medium. Leave the cells in the incubator at 37°C for 30 min to obtain the normal expression of surface receptors before labelling ( see Note 9 ).
6. Remove the blocking agent from the wells and wash them at least twice with 200 μ L of the cell adhesion medium
3. Methods
3.1. Methods for CAFCA
3.1.1. Reference Procedure for a Conventional Cell–Substratum Adhesion Experiment Involving Molecular Substrates

236 Spessotto et al.
containing PVP. Fill then the wells with 200 μ L of the cell adhesion medium in which 2% (v/v) India ink has been added ( Fig. 1 ) ( see Note 10 ).
7. Collect the fluorescently-labelled cells through a centrifuga-tion step, rinse them twice with cell adhesion medium con-taining PVP and resuspend them in the chosen cell adhesion medium at the appropriate concentration. Inoculate 50 μ L of the cell suspension in each well ( see Note 11 ).
8. Place the bottom CAFCA miniplates in the apposite bottom CAFCA black holder and centrifuge them at 142 × g for 5 min, followed by incubation 37°C for 20 min ( Fig. 1 ) ( see Note 12 ).
9. Fill the wells of the top CAFCA miniplate (containing the tape at the borders) with the same PVP and India ink-containing medium as used for the bottom CAFCA mini-plates, such as to assure to form a bulging meniscus (Fig. 1 ). Fill also the wells of the bottom CAFCA miniplates with a similar excess of liquid ( see Note 13 ). Take a top CAFCA miniplate and reverse it upside down in the air by holding it from the ends. Avoid touching the tape, especially when wearing gloves (e.g. such as those that may be worn when handling infectious cells and/or solutions). Because of the high liquid surface tension in such a narrow well, the liq-uid will not fall out from the reverted well. Bring the top CAFCA miniplate in this reversed orientation in proxim-ity of the corresponding bottom CAFCA miniplate, making sure to align perfectly the “ top” and “ bottom” wells. Bring first gently in contact the two liquid meniscuses and then press the top CAFCA miniplate onto the bottom one allow-ing the former to attach firmly to the bottom plate. At this point an “air-bubble-free” communicating chamber should have formed ( Fig. 1 ).
10. Place the assembled CAFCA miniplate unit into the assem-blable black CAFCA hard-plastic holders and tighten the holders. These units can now be reversed centrifuged for 5 min at the desired centrifugal force (standard force = 46 × g ; Fig. 1 ) ( see Note 14 ).
11. Measure the fluorescence signal emitted by cells in wells of the top ( nonbound cells ) and bottom ( substrate-bound cells ) sides of the CAFCA miniplates independently ( Fig. 1 ), ide-ally using a microplate fluorometer such as one of the Gen-ius series of TECAN Group, or an analogous reader capable of detecting the fluorescence emanated from both the top and bottom side of the microplate. The percentage bound cells, out of the total amount of cells introduced into the

Fluorescence-Based Assays for In Vitro Analysis of Cell Adhesion and Migration 237
system, can be calculated as: bottom fluorescence value/bottom fluorescence + top fluorescence values. If a compu-ter-interfaced instrument as that indicated above is used, a dedicated CAFCA software is provided by the supplier that automatically runs the calculations.
1. Seed the cells aimed to be used as the “substrate” cell mon-olayer into the CAFCA miniplate wells (make sure to use the presterilised type) at a concentration previously estimated to yield confluence by the following day, or whenever the experi-ment is intended to be performed. If of interest, treat the cells during this expansion phase or prior to performing the exper-iment. For instance, on the one hand, when working with endothelial cell monolayers, these can be suitably activated by addition of cytokines or similar agents. On the other hand, when we want to perform control experiments for verifying the specificity of a given cell–cell interaction we are using PFA-fixed cell monolayers ( see Note 15 ).
2. At the time to run the experiment, the procedure is the same as described for cell–substratum adhesion, i.e., steps 5–11 ( see Note 16 ).
1. Prepare the “coating solution” composed of single or mix-tures of ECM molecule(s) of interest dissolved at 10–100 μ g/mL in bicarbonate buffer as described for CAFCA, or allow cell monolayers to form prior to initiate the experiment.
2. For molecular coating aliquot 100 μ L on the center part of the coverslip (a silicone ring can be useful to allow the coating of the desired area of investigation.).
3. Wash the coated coverslip with PBS three times and saturate with BSA blocking solution or a similar solution as described for CAFCA, for 1 h at room temperature. Cell monolayers may be (pre)treated as described fro CAFCA.
1. Assemble the saturated coverslip in the parallel flow chamber. 2. Mount the chamber on the inverted microscope equipped
with temperature and gas control, fluorescent illumination, and video camera.
3. Connect the perfusion chamber to the aspiration system and fill the chamber with isotonic saline or a suitable cell culture medium/buffer if cell monlayers are to be used. Aspiration and effluxes should be controlled through the pump con-nected to the system. For short-run perfusion experiments, we normally use a syringe pump (Harvard Apparatus, Boston, MA) or a properly constructed pulsatile pump.
3.1.2. Standard Procedure for a Conventional Cell–Cell Adhesion Assay Involving a Cellular Substrate
3.2. Parallel Flow Adhesion Assay
3.2.1. Preparation of the Substrate
3.2.2. Standard Procedure for Perfusion Experiments

238 Spessotto et al.
4. Aspirate the fluid through the chamber at a constant flow rate for 1–10 min before being perfused with whole blood.
5. Incubate the cell suspension at 37°C for 30 min to reequili-brate the system to physiological temperature.
6. Label the cells (in the whole blood) by direct incubation with 5–8 μ M mepacrine (it becomes concentrated in the dense intracellular granules and has no effect on platelet function at the concentration used) for platelets or with other cell tagging dyes that have empirically been previously established to be optimal for labeling of the given cell type to be analyzed.
7. Aspirate the labeled sample through the chamber at the con-stant desired flow rate. According to the pump apparatus used, the flow rates (i.e., mL/min) can be converted in wall shear rates (s −1 ).
8. Capture images of the optical field at the frequency and inten-sity desired and/or allowed by the image system available. For high temporal-spatial resolution analyses, we currently make use of a high-speed intensified CCD camera capturing 25 frames per second.
9. Elaborate and analyze the collected images with the available image analysis software.
1. Cell motility (haptotaxis): Coat the membrane of the inserts as indicated for CAFCA (considering that polycarbonate or polyethylene terephthalate adsorb protein 10- to 50-fold less efficiently than the PVC plastic). To create a gradient for the ECM molecules of interest, coat the underside part of the insert membrane. The amount of coating solution should be sufficient to cover the entire membrane surface (50–100 μ L volume can be used for this type of inserts). After coating (16–18 h at 4°C), leave the inserts to air dry under laminar flow. Wash the inserts twice with serum-free DMEM or RPMI.
2. Cell invasion: Dilute the thawed Matrigel to the desired final concentration using cooled serum-free medium. Make a 50 μ g/mL and aliquot 100 μ L into the upper surface of the membrane of the inserts. Make sure to keep all undiluted solu-tions on ice to avoid undesired gelification. Leave the plates in a cell culture hood to allow the Matrigel solution to air dry. It takes about 3 h to dehydrate the indicated amount of Matrigel under a continuous laminar flow. For convenience, it is possible to leave the inserts to air-dry overnight in the absence of laminar flow. Reconstitute Matrigel with 100 μ L of serum-free DMEM or RPMI at room temperature for 90 min under constant rotation. Remove the excess medium from the membranes before adding the cells.
3.3. Methods for FATIMA
3.3.1. Preparation of the Membranes

Fluorescence-Based Assays for In Vitro Analysis of Cell Adhesion and Migration 239
1. When assaying anchorage-dependent cells, rinse the adherent cells with PBS, add 5 mM EDTA in PBS (or trypsin), and incubate at 37°C in 5% CO 2 for 2–5 min ( see Note 17 ).
2. Collect the detached cells and wash them twice in serum-free DMEM. When assaying suspension-growing cells, collect the cells directly from the flask, and wash them twice with serum-free RPMI.
3. Prepare the working dye solution by diluting the concentrated stock solution in 0.25 M sucrose to reach the final concentra-tion of 1–10 μ M ( see Note 18 ).
4. Resuspend the cell pellet ( ≤ 5 × 10 6 cells) in 200 μ L of dye solution.
5. Incubate the cell suspension at 37°C in 5% CO 2 for 30–45 min. 6. Wash the cells twice with the working assay solution.
1. Resuspend the cells in working solution at 2 × 10 6 cells/mL (leukocytes), or at 1 × 10 6 cells/mL (anchorage-dependent) and fill the upper portion of the membrane with 100 μ L of the cell suspension.
2. Fill the lower part of the unit through the openings in the insert wall, with 600 μ L of control medium (working assay solution); conditioned medium (as a positive control); and/or other poten-tial stimulating agents diluted in working assay solution.
3. Incubate the plates at 37°C in 5% CO 2 for the desired time ( see Note 19 ).
4. Measure the fluorescence from the top (corresponding to nonmigrated cells) and bottom (corresponding to transmi-grated cells) side of the plate ( see Note 20 ).
5. Repeat the fluorescence measurement at different time-inter-vals (kinetic analysis). The supplier of the FATIMA system provides a dedicated software that automatically performs the calculations of the ratios transmigrated cells/time unit ( see Note 21 ).
1. FATIMA is a versatile in vitro “cell migration assay” based on the transversing of tagged cells through an inert porous micro-membrane. This serves the sole purpose to function as a physi-cal barrier for differentiating “motile” vs. “nonmotile cells”; meaning cells that have exhibited the capability to actively
3.3.2. Cell Labeling
3.3.3. Procedure for FATIMA
4. Notes
240 Spessotto et al.
locomote under the influence, or in the absence, of a chem-oattracting agent. According to our definitions, Transmigra-tion ( T ) in the acronym refers to the process whereby a cell is penetrating a single-cell monolayer (e.g., an endothelium or epithelium) or a thin tissue section (<5–10 μ m in thickness). Invasion ( I ) refers to the process whereby a cell penetrates and move through a multicellular structure, i.e., a cellular multi-layer, an explanted/in vitro reconstituted tissue, a thick tissue section (<20 μ m in thickness), or a three-dimensional ECM. Motility ( M ) refers to the movement of a cell on a bidimen-sional ECM substrate.
2. Presently there is a vast assortment of fluorochromes for intra-cellular labeling (see the Molecular Probes’ catalogue). We have recently carried out an extended comparison between the pres-ently available main categories of fluorescent dyes having the capability to become taken up spontaneously by nonneuronal cells (i.e., neurons may also be tagged by retrograde transport of single fluorochromes or fluorescent microspheres through their axons/projections). These include vital dyes based on intracellular esterase activity, thiol-reactive fluorescent com-pounds, and numerous lipophilic dyes. On the one hand, when carrying out long-term migration assays, the otherwise very convenient vital dyes based on esterase activity and thiol-reactivity are improper as they are completely released by the migrating cells within less than 24 h. On the other hand, the lipophilic dyes, which remain within cells for weeks, diffuse passively into the cells and may be taken up to a significant extent also by dying cells. On the basis of this unavoidable trade-off concerning the fluorochrome choice, we find that lipophilic dyes are the optimal cell labeling agents to use for long-term assays. The wide variety of lipophilic tracers cur-rently available also provides a great flexibility as well as the possibility to accomplish experiments involving multiple labe-ling of two or more cell populations.
3. BD Falcon™® HTS FluoroBlok™ Inserts contain a polyeth-ylene terephthalate (PET) membrane impregnated with light absorbing dyes that absorb visible light from 490 to 700 nm at >99% efficiency. This membrane quenches any fluorescent emission passing through it. An extended list of the fluoro-phores compatible with the BD Falcon™® HTS FluoroB-lok™ inserts is provided by the manufacturer. Alternatively, it may be possible to use the conventional single-well Transwell units, which can be combined in the number desired by being inserted into the wells of a conventional 24-well plate. The conventional transwells may be suited for migration analyses in which there is a specific interest in monitoring the process by combined fluorescence and phase-contrast microscopy.
Fluorescence-Based Assays for In Vitro Analysis of Cell Adhesion and Migration 241
In all cases, the choice of pore size of the membrane of the insert depends largely upon the cell type and its relative size. For example, if granulocytes, or smaller lymphocytes are studied, inserts carrying 3–5 μ m pore size membranes are recommended. For anchorage-dependent cells, it is prefer-able to use 8–12 μ m pore size membranes. It is advisable to run some pilot assays to determine the type of membrane that allows the minimal “passive” transmigration rate, i.e., in the absence of membrane-coating and chemoattracting agent.
4. Matrigel is currently the most commonly used three-dimensional ECM substrate. However, it should be emphasized that it is a poorly characterized murine sarcoma-derived basement mem-brane ECM. If there is a specific need to work with human material, the isolation of a human homologue to Matrigel, Humatrix (70) , has recently been described from smooth muscle cells. Interstitial-like ECMs of desired compositions may readily be prepared by incorporating selected ECM mol-ecules during in vitro fibrillogenesis of interstitial collagens (mainly collagen type I, III, and V; normally used at 0.5–1.5 mg/mL; (79, 80) ). Other possibilities to produce interstitial ECM-like structures are through the generation of fibrin clots from fibrinogen or the use of artificial biopolymeric matrices (81) . Finally, if there is a specific interest in assaying native ECMs, several protocols are described in the literature for the production of such matrices in vitro derived from cultured cells or tissues.
5. The ideal coating concentration to use for each individual ECM molecule may largely vary depending upon the cell type to analyze and the intrinsic capacity of the ECM molecule to become adsorbed onto plastic. We find that a coating concentration range of 0.01–10 μ g/mL is suitable for a wide range of ECM proteins when carrying out dose-dependency tests of cell–substrate attachment. In our experience, a coating concentration of 0.01 μ g/mL can be adopted as a starting concentration when designing a coating concentration curve. This since a concentration lower usually yields insufficient amounts of the ECM molecule (we have tested >30 different ones) to become bound to plastic and thereby fails to promote a significant, i.e., measurable, cell adhesion. If there is a specific interest in preparing a cell adhesion substratum containing a mixture of ECM molecules, the total protein concentration in the coating solution may obviously be raised to assure that a sufficient amount of the less represented molecules in the mixture is obtained. However, caution should be taken when coating with single or mixtures of ECM components that have an intrinsic propensity to self-assemble spontaneously (or form

242 Spessotto et al.
heterogenous assemblies), even in the absence of divalent cations, physiological pH and temperature, or other assembly-promoting factors. Examples of ECM components with this tendency are fibronectin, vitronectin, von Willebrand factor, laminins, and collagens. The precise amount of protein bound to the specific PVC-based CAFCA miniplates has previously been determined for a number of ECM components (3, 4, 21) .
6. We find that protein coating at 4°C overnight in the indicated bicarbonate buffer yields the optimal adsorbance of the molecules onto plastic both in terms of amount and “active” configuration of the immobilized molecule. It also largely prevents unwanted multimeric complex formation of the molecules.
7. A 1% solution of denatured BSA is a suitable blocking agent, i.e., it acts well in saturating areas of the plastic left uncoated by the ECM molecule (this is especially important when car-rying out accurate dose-dependency tests), and it is preferred over native BSA for most cell types. Our experience, however, and that reported by others, indicate that this may not always be the case. Alternative blocking agents to consider are human serum albumin, α -casein, and ovalbumin, in their native or denatured form. Avian neural crest cells, for instance, bind to some extent to BSA (3, 4) , but not to ovalbumin, whereas human and murine lymphocytic cells may bind to α -casein and ovalbumin, but fail to bind to denatured BSA. Fibroblas-tic cells such as the human rhabdomyosarcoma RD-KD and the human embryonic kidney 293 cells bind to both native BSA and ovalbumin, but do not interact with α -casein and denatured BSA. Thus, it may be necessary to empirically identify the suitable blocking agent for each given cell type. In this contest, the most difficult situation that we have faced has been that of B lymphocytes freshly isolated from patients affected by chronic lymphocytic B cell leukaemia or myeloid leukaemia. In these cases, we have found that 1% human serum albumin plus 0.5% Tween 20 was the sole saturating agent that consistently yielded a low background binding (21) . Finally, we find that when the adhesion assays are run in the presence of the stimulating Mn 2+ divalent cation, or activating anti-integrin antibodies, the nonspecific interaction of the cells with these blocking proteins has a tendency to be overly enhanced. Cautiousness should be taken when carrying out cell adhesion assays under these conditions.
8. Use wells filled only with blocking agent as negative control. We normally adopt a “background” cell binding of <10% to these control wells as threshold value for judging the experi-ment to have been successfully accomplished.
9. Calcein AM is a colorless polyanionic fluorescein derivative that, upon digestion by cytoplasmic esterases, becomes

Fluorescence-Based Assays for In Vitro Analysis of Cell Adhesion and Migration 243
fluorescent ( λ ex 485, λ em 535). The cleavage of the AM group by acetylases causes the calcein molecule to become nega-tively charged and prevents it from rapidly diffuse out of the cells. In fact, on the one hand, in comparison with the thiol-reactive fluorescent dyes CellTrackers (InVitrogen), which can alternatively be used as vital cell tracers, we find that cal-cein AM exhibits higher retention time. On the other hand, CellTracker generally produces a somewhat more intense cell tagging and can effectively be used for multiple cell labeling. Calcein AM is innocuous to the cells and is not known to influence their adhesive behavior.
10. The function of the PVP is to provide a higher viscosity of the medium, such as to match the relative density of the cells, and is an inert substitute to the previously utilized BSA (2– 6) . Thus, the exact concentration of PVP may vary depend-ing upon the cell type analysed. In most cases, the range of 0.1–0.5% would satisfy the viscosity equilibrium require-ment. For lymphocytes, we normally use 0.1%, whereas for larger cells such as fibroblasts, epithelial cells, endothelial cells, and various tumour cells, we use 0.5%. When analyses of cation-dependency of cell binding are to be carried out, we recommend using as cell adhesion medium: 0.25 mM Tris–HCl, pH 7.4, with 0.15 M NaCl to which the differ-ent cations can be added at the desired concentrations. In this condition, there is no detectable precipitation of cati-ons, even when applied at rather high concentrations. For optimal fluorescent measurements purposes (Fig. 1 ), India ink (at the optimal concentration of 2%) turns out to be the most effective, inert fluorescence quencher. We have ascer-tained for a number of cell types that incubation in medium containing this concentration of India ink does not affect the proliferation rate or cell adhesion behavior of cells.
11. The number of cells seeded per well may vary depending upon the size of the specific cell type. We find that a con-centration of 30,000 cells/well is ideal for suspension-growing cells, whereas 1,000–5,000 cells/well are optimal when examining larger anchorage-dependent cells. The minimal amounts of cells per well that can be used in CAFCA are ≤ 1,000/well and ≤ 100/well, for lymphocytes and fibroblas-tic cells, respectively.
12. This is one of the first critical steps of the procedure. First, we find that a force of 142 × g is an ideal centrifugation force to bring all cells (both lymphocytic and fibroblastic) contained by each well in simultaneous contact with the substratum. Moreover, we find that the centrifuges sold by Juan Instruments are the most convenient ones since they are precise and can accommodate 4 × 4 CAFCA miniplates
244 Spessotto et al.
(i.e., 4 × 96-well plates) per centrifugation. The length of the subsequent incubation at 37°C may be varied as desired, although 15–20 min is the time-period that we find neces-sary to allow for a stable cell adhesion to ensue. If there is a specific interest in analysing the receptor–ligand interac-tion without involvement of the cytoskeleton or signal trans-duction phenomena, we find that the entire procedure of CAFCA may effectively be accomplished at 4°C, as shown for its parental simpler version (2, 3, 6) . In such case, all the solutions should be precooled to 4°C and the centrifuga-tions run at 4°C in a cooled centrifuge. Here, there is no need to perform an incubation of the cells after the centrifu-gation step, but if there is a specific reason to do so, it obvi-ously should be carried out at 4°C.
13. This is an extremely important step that may determine the final outcome of the experiment. Care has to be taken to adequately fill the wells of the bottom and top CAFCA miniplates such as to invariably avoid air-bubble formation during the subsequent assembly of the plates. This means that wells of both plates have to contain an excess of liquid (forming a bulging meniscus), such as to assure that no air is trapped between the upper surfaces of the wells during face-to-face assembly ( Fig. 1 ).
14. Differential centrifugation forces to detach the “weakly bound” or nonbound cells are used to determine the rela-tive binding avidity of the cells to the substratum. It should be noted that firmly bound cells, i.e., those binding with high avidity may not be removed with forces below those ascertained to retain viable cells (we have determined the threshold to be a force of ≤ 750 × g). Thus, when a “force-dependent” centrifugation curve is generated, a suitable force range to adopt is ~10–750 × g . We have observed that forces <40 × g may not be sufficient to displace the non-bound fibroblastic cells to the top CAFCA miniplate wells: this is an absolute requirement for being to able to detect physically separated fluorescence signals (i.e., those emitted by substrate-bound cells in the wells of the bottom CAFCA miniplates and those emitted by cells in the wells of the top CAFCA miniplate), and thereby accurately determine the ratio bound vs. nonbound cells (see below). When working with small cells, such as lymphocytes and neutrophils, weak binding interactions are detectable by lowering the centrifu-gal force down to ∼ 10 × g.
15. For the achievement of optimal results, care should be taken to produce a cell monolayer as homogeneous as possible, i.e., avoiding in as much as possible to leave uncovered areas of the plastic. This would minimize the possibility to have
Fluorescence-Based Assays for In Vitro Analysis of Cell Adhesion and Migration 245
nonspecific bindings to areas of the well not covered by cells. It has to be taken in consideration that in most cases, serum components that passively adsorb onto uncoated plastic may promote cell adhesion (even when using fibronectin and/or vitronectin-depleted serum). Thus, it may generally be advantageous using minimal concentrations of serum dur-ing the pregrowing of the cell monolayer. Moreover, if the underlying cell monolayer can be produced by grow-ing the cells in serum-free medium, there is a possibility to carry out a “substrate saturation” with a suitable blocking agent, similar to that described for cell–substrate adhesion (step 4) . However, if this is not possible, it is advisable to select a substrate molecule allowing for the attachment of the cells forming the underlying monolayer, but not bind-ing to the cells to assayed for their ability to adhere to the monolayer. For instance, when we run the assay for examin-ing the lymphocyte-endothelium interaction, we find that we can pregrow most types of endothelial cells on a von Willebrand factor substrate, whereas most lymphocytes fail to significantly interact with this ECM molecule, independ-ently of whether or not serum components in the endothe-lial growth medium have been bound to it. Alternatively, it may be possible to pregrow the underlying cell monolayer in a “panning-like fashion” onto wells precoated with a suit-able antibody direct against a cell surface-component spe-cific for these cells. This provides that antibody ligation of the targeted cell surface component does not cause signifi-cant changes in the cell–cell adhesion behavior of the cells. It is also important to ascertain that cells of the underly-ing cell monolayer do not detach from the substrate dur-ing the reverse centrifugations, and hence, that the levels of nonbound cells are falsed by a concurrent dislodgement of the underlying cells to which they are linked. This is effi-ciently controlled for each single experimental situation by pretagging cells of the underlying cell monolayer with a red or blue-fluorescent CellTracker dye (Molecular Probes, Inc) and then determine the respective fluorescent signals in each well. Most microplate fluorometers are equipped with sev-eral filter sets to allow for multiple fluorescence detection.
16. The procedure for cell–cell adhesion requires a more delicate parameter setting due to the marked variability when two or more cell types are involved in the assay. Thus, it is preferable to run the first centrifugation step at a lower force than that used for cell–substratum adhesion, and additionally, this has to be empirically set according to the cell type. In the case of lym-phocytes binding to the endothelium, for instance, we have observed that a force of 8–10× g is an adequate force to allow

246 Spessotto et al.
synchronised contact with the endothelial cell monolayer, while minimizing the number of lymphocytes that are becoming constrained between the single endothelial cells. The reversed centrifugal force may similarly need to be differently adjusted when compared with cell–substratum adhesion. Normally, a higher force is required to discriminate between true and non-specific cell binding. To ascertain that the parameter settings are optimal for each individual experimental condition, it is advisable to observe the bound cells under an inverted micro-scope, with or without fluorescence equipment.
17. Some experimental protocols suggest that labeling of anchorage-dependent cells while attached to plastic is ideal. This should result in an improved viability compared with labeling in suspension after detachment of the cells from their growth substrate. We have noticed, however, that for several anchorage-dependent cell lines labeling in mobilized phase was less efficient than in suspension. Therefore, we recommend to carry out cell labeling after detachment and by diluting the fluorochrome in sucrose as indicated.
18. In some cases, it may be advantageous to label the cells on ice to allow the dye to incorporate into the plasma membrane under reduced rate of endocytosis, thus reducing the potential of dye accumulation in cytoplasmatic vesicles. Cell tagging at this lower temperature requires a longer labeling time and may lead to a compromising tagging. Leukocytes normally prefer a physiological labeling temperature and a higher dye concen-tration. They also incorporate more efficiently DiI-derivatives than other lipophilic dye variants, but, in some cases, may also be refractory to these dyes. Labeling at 4°C may, however, be preferable when working with freshly isolated human leu-kocytes in which the tendency to self-aggregate and become metabolically activated has to be prevented.
19. For highly migratory cells incubation times can be rather short, i.e. 2–4 h, whereas poorly migratory cells may require up to 72 h to accomplish significant transmigrations. Kinetics of the trans-migration/invasion process is possible when using inserts with fluorescence shielding membrane, which allow for inde-pendent top and bottom fluorescence measurements. This time-related information can be used as a valuable parameter for establishing the migratory capacity of the cells. When a gel is present in the upper part of the insert (e.g., collagen or Matrigel), it could be interesting to record the decrease of the top fluorescence (corresponding to the cell invasion of the cells into the gel), irrespectively of the lack of fluorescent signal from the bottom (when the cells have not crossed the filter).

Fluorescence-Based Assays for In Vitro Analysis of Cell Adhesion and Migration 247
20. Microplate fluorometers produced by TECAN Group and other vendors are capable of acquiring fluorescence values from distinct points within the same well. For a 24-well plate, it is possible to obtain the integrated main values from data derived from 25 distinct measurement points/well.
21. Suitable softwares for evaluation of FATIMA may be designed through Excel or other program of the Microsoft environ-ment, in combination with specific softwares provided with the instruments by the vendors.
We are grateful for the financial support from the Italian Ministry of Health and the Italian Ministry of University, Associazione Italiana per la Ricerca sul Cancro (AIRC), ABO Project 2010, Mizutani Glycoscience Foundation (Japan) and research funds from the University of Parma. We are also grateful to a number of collaborators that during the years have assisted us in the devel-opment and refinement of the cell adhesion and migration assays described in this article. Associazione Casa via di Natale, Aviano.
Acknowledgments
References
1. Roy , P. , Petroll , W.M. , Cavanagh , H.D. , Chuong , C.J. , and Jester , J.V. (1997) An in vitro force measurement assay to study the early mechanical interaction between corneal fibroblasts and collagen matrix . Exp. Cell Res. 232 , 106 – 117
2. Lotz , M.M. , Burdsal , C.A. , Erickson , H.P. , and McClay , D.R. (1989) Cell adhesion to fibronec-tin and tenascin: quantitative measurements of initial binding and subsequent strengthening response . J. Cell. Biol. 109 , 1795 – 1805
3. Lallier , T. , and Bronner-Fraser , M. (1991) Avian neural crest cell attachment to laminin: Involvement of divalent cation dependent and independent integrins . Development 113 , 1069 – 1084
4. Perris , R. , Kuo , H.J. , Glanville , R.W. , and Bronner-Fraser , M. (1993) Collagen type VI in neural crest development: distribution in situ and interaction with cells in vitro . Dev. Dyn. 198 , 135 – 149
5. Lallier , T. , Deutzmann , R. , Perris , R. , and Bronner-Fraser , M. (1994) Neural crest cell interactions with laminin: structural require-ments and localization of the binding site for α 1 β 1 integrin . Dev. Biol. 162 , 451 – 464
6. Yin , Z. , Gabriele , E. , Leprini , A. , Perris , R. , and Colombatti , A. (1997) Differential cation regulation of the α 5 β 1 integrin-mediated adhesion of leukemic cells to the central cell-binding domain of fibronectin . Cell. Growth Differ. 8 , 1339 – 1347
7. Garcìa , A.J. , Huber , F. , and Boettiger , D. (1998) Force required to break α 5 β 1 integrin-fibronectin bonds in intact cells is sensitive to integrin activation state . J. Cell. Biol. 273 , 10988 – 10993
8. Hug , T.S. (2003) Biophysical methods for monitoring cell–substrate interactions in drug discovery . Assay Drug Dev. Technol. 1 , 479 – 488
9. Puri , K.D. , Chen , S. , and Springer , T.A. (1998) Modifying the mechanical property and shear threshold of L-selectin adhesion independ-ently of equilibrium properties . Nature 329 , 930 – 933
10. Jadhav , S. , Eggleton , C.D. , and Konstantopou-los , K. (2007) Mathematical modeling of cell adhesion in shear flow: application to targeted drug delivery in inflammation and cancer metastasis . Curr. Pharm. Des. 13 , 1511 – 1526

248 Spessotto et al.
12. Evans , E.A. (1985) Detailed mechanics of membrane-membrane adhesion and separa-tion II. Discrete kinetically trapped molecular cross-bridges . Biophys. J. 48 , 185 – 192
13. Gimzewski , J.K. , and Joachim , C. (1999) Nanoscale science of single molecules using local probes . Science 283 , 1683 – 1688
14. Benoit , M. , Gabriel , D. , Gerish , G. , and Gaub , H.E. (2000) Discrete interactions in cell adhe-sion measured by single-molecule force spec-troscopy . Nat. Cell Biol. 2 , 313 – 317
15. Binnig , G. , Quate , C. F. , and Gerber , C. (1986) Atomic force microscope . Phys. Rev. Lett. 56 , 930 – 933
16. Goodwin , A.E. , and Pauli , B.U. (1995) A new adhesion assay using buoyancy to remove non-adherent cells . J. Immunol. Methods 187 , 213 – 219
17. St John , J.J. , Schroen , D.J. , and Cheung , H.T. (1996) An adhesion assay using minimal shear force to remove nonadherent cells . J. Immunol. Methods 170 , 159 – 166
18. Segat , D. , Pucillo , C. , Marotta , G. , Perris , R. , and Colombatti , A. (1994) Differential attachment of human neoplastic B cells to purified extracellular matrix molecules . Blood. 83 , 1586 – 1594
19. Perris , R. , Perissinotto , D. , Pettway , Z. , Bron-ner-Fraser , M. , Mörgelin , M. , and Kimata , K. (1996) Inhibitory effects of PG-H/aggrecan and PG-M/versican on avian neural crest cell migration . FASEB J. 10 , 293 – 301
20. Mc Clay , D.R. , Wessel , G.M. , and Marchase , R.B. (1981) Intercellular recognition: quantitation of initial binding events . Proc. Natl. Acad. Sci. U.S.A. 78 , 4975 – 4979
21. Giacomello , E. , Neumayer , J. , Colombatti , A. , and Perris , R. (1998) CAFCA - A centrifu-gal assay for fluorescence-based cell adhesion adapted to the analysis of ex vivo cells and capable of determining relative binding avidi-ties . Biotechniques 26 , 758 – 766
22. Maeda , Y. , Tanaka , K. , Koga , K. , Zhang , X.Y. , Sasaki , M. , Kimura , M. , and Nomoto , K. (1993) A simple quantitative in vitro assay for thymocyte adhesion to thymic epithelial cells using a fluorescein diacetate . J. Immunol. Methods 157 , 117 – 123
23. Vaporciyan , A.A. , Jones , M.L. , and Ward , P.A. (1993) Rapid analysis of leukocyte-endothelial adhesion . J. Immunol. Methods. 159 , 93 – 100
24. De Clerck , L.S. , Bridts , C.H. , Mertens , A.M. , Moens , M.M. , and Stevens , W.J. (1994) Use of fluorescent dyes in the determination of adherence of human leukocytes to endothelial cells and the effect of fluorochromes on cellular function . J. Immunol. Methods 172 , 115 – 124
25. McEver , R. , and Cummings , R.D. (1997) Role of PSGL-1 binding to selectins in leukocyte recruitment . J. Clin. Invest. 100 , 485 – 492
26. Schmuke , J.J. , and Welply , J.K. (1995) A method for measuring leukocyte rolling on the selectins . Anal. Biochem. 226 , 197 – 201
27. Hiraoka , N. , Petryniak , B. , Nakayama , J. , Tsuboi , S. , Suzuki , M. , Yeh , J-C. , Izaka , D. , Tanaka , T. , Miyasaka , M. , Lowe , J.B. , and Fukuda , M. (1999) A novel, high endothe-lial venule-specific sulfotransferase expresses 6-sulfo sialyl Lewisx, an l-selectin ligand dis-played by CD34 . Immunity 11 , 79 – 89
28. Siegelman , M.H. , Stanescu , D. , and Estess , P. (2000) The CD44-initiated pathway of T-cell extravasation uses VLA-4 but not LFA-1 for firm adhesion . J. Clin. Invest. 105 , 683 – 691
29. Khiabani , K.T. , Stephenson , L.L. , Gabriel , A. , Nataraj , C. , Wang , W.Z. , and Zamboni , W.A. (2004) A quantitative method for determin-ing polarization of neutrophil adhesion mol-ecules associated with ischemia reperfusion . Plast. Reconstr. Surg. 114 , 1846 – 1850
30. Li , X. , Rawn , J. , DeCamp , M.M. , and Mentzer , S.J. (1996) Hybridoma screening for cell adhesion molecules using multiple parallel comparisons in conditions of flow . Hibridoma 15 , 43 – 47
31. Kulesa , P. , Bronner-Fraser , M. , and Fraser , S.E. (2000) In ovo time-lapse analysis after dorsal neural tube ablation shows rerouting of the chick hindbrain neural crest . Development 127 , 2843 – 2852
32. Kulesa , P. , and Fraser , S.E. (1998) Neural crest cell dynamics revealed by time-lapse video microscopy of whole embryo chick explant cultures . Dev. Biol. 204 , 327 – 344
33. Knight , B. , Laukaitis , C. , Akhtar , N. , Hotchin , N.A. , Edlund , M. , and Horwitz , A.R. (2000) Visualizing muscle cell migration in situ . Curr. Biol. 10 , 576 – 585
34. Scherbarth , S. , and Orr , W. (1997) Intravital microscopic evidence fro regulation of metas-tasis by the hepatic microvasculature: effects of interleukin-1 α on metastasis and the loca-tion of B16F1 melanoma cell arrest . Cancer Res. 57 , 4105 – 4110
35. Vajkoczy , P. , Ullrich , A. , and Menger , M.D. (2000) Intravital fluorescence videomicros-copy to study tumour angiogenesis and micro-circulation . Neoplasia 2 , 53 – 61
36. Andre , P. , Denis , C.V. , Ware , J. , Saffaripour S. , Hynes , R.O. , Ruggeri , Z.M. , and Wagner , D.D. (2000) Platelet adhere to and translo-cate on von Willebrand factor presented by endothelium in stimulated veins . Blood 96 , 3322 – 3328

Fluorescence-Based Assays for In Vitro Analysis of Cell Adhesion and Migration 249
37. Becker , M.D. , Nobiling , R. , Planck , S.R. , and Rosenbaum , J.T. (2000) Digital video-imaging of leukocyte migration in the iris: intravital microscopy in a physiological model during the onset of endotoxin-induced uveitis . J. Immunol. Methods. 240 , 23 – 37
38. Halin , C. , Rodrigo Mora , J. , Sumen , C , and von Andrian , U.H. (2005) In vivo imaging of lymphocyte trafficking . Annu. Rev. Cell. Dev. Biol. 21 , 581 – 603
39. Boissonnas , A. , Fetler , L. , Zeelenberg , I.S. , Hugues , S. , and Amigorena , S. (2007) In vivo imaging of cytotoxic T cell infiltration and elimina-tion of a solid tumor . J. Exp. Med. 204 , 345 – 356
40. Koike , C. , Watanabe , M. , Oku , N. , Tsukada , H. , Irimura , T. , and Okada , S. (1997) Tumor cells with organ-specific metastatic ability show distinctive trafficking in vivo: Analyses by positron emission tomography and bioim-aging . Cancer Res. 57 , 3612 – 3619
41. Phelps , M.E. (2000) Positron emission tom-ography provides molecular imaging of bio-logical processes . Proc. Natl. Acad. Sci. U.S.A. 97 , 9226 – 9233
42. Voura , E.B. , Jaiswal , J.K. , Mattoussi , H. , and Simon , S.M. (2004) Tracking metastatic tumor cell extravasation with quantum dot nanocrystals and fluorescence emission-scan-ning microscopy . Nat. Med. 10 , 993 – 998
43. Jacobs , R.E. , and Fraser , S.E. (1994) Imaging neuronal development with magnetic reso-nance imaging (NMR) microscopy . J. Neuro-sci. Methods 54 , 189 – 196
44. Bulte , J.W. , Zhang , S. , van Gelderen , P. , Herynek , V. , Jordan , E.K. , Duncan , I.D. , and Frank , J. (1999) Neurotransplantation of magnetically labeled oligodendrocyte progen-itors and magnetic resonance tracking of cell migration and myelination . Proc. Natl. Acad. Sci. U.S.A. 96 , 15256 – 15261
45. Weissleder , R. , Moore , A. , Mahmood , U. , Bhorade , R. , Benveniste , H. , Chiocca , A. E. , and Basilon , J.P. (2000) In vivo magnetic res-onance imaging of transgene expression . Nat. Med. 6 , 351 – 354
46. Modo , M. , Hoehn , M. , and Bulte , J.W. (2005) Cellular MR imaging . Mol. Imaging 4 , 143 – 164
47. Kim , D. , Hong , K.S. , and Song , J. (2007) The present status of cell tracking methods in animal models using magnetic resonance imaging technology . Mol. Cells 23 , 132 – 137
48. Nelson , R.M. , Quie , P.G. , and Simmons , R.L. (1975) Chemotaxis under agarose: a new and simple method for measuring chemotaxis and spontaneous migration of human polymorphonuclear leukocytes and monocytes . J. Immunol. 115 , 1650 – 1663
49. Rupnick , M.A. , Stokes , C.L. , Williams , S.K. , and Lauffenburger , D.A. (1988) Quantitative analysis of random motility of human micro-vessel endothelial cells using a linear under-agarose assay . Lab Invest. 59 , 363 – 372
50. Maaser , K. , Wolf , K. , Klein , C.E. , Niggermann , B. , Zanker , K.S. , Brocker , E.B. , and Friedl , P. (1999) Functional hierarchy of simultaneously expressed adhesion receptors: integrin α 2 β 1 but not CD44 mediates MV3 melanoma cell migration and reorganization within three-dimensional hyaluronan-containing collagen matrices . Mol. Biol. Cell 10 , 3067 – 3079
51. Knapp , D.M. , Helou , E.F. , and Tranquillo , R.T. (1999) A fibrin or collagen gel assay for tissue cell chemotaxis: assessment of fibroblast chemotaxis to GRGDSP . Exp. Cell Res. 247 , 543 – 553
52. Gunzer , M. , Friedl , P. , Niggermann , B. , Brocker , E.B. , Kampgen , E. , and Zanker , K.S. (2000) Migration of dendritic cells within 3-D collagen lattices is dependent on origin, state of maturation, and matrix structure and is maintained by proinflammatory cytokines . J. Leukoc. Biol. 67 , 622 – 629
53. Gotlieb , A.J. , and Spector , W. (1981) Migra-tion into an in vitro experimental wound. A comparison of porcine aortic endothelial and smooth muscle cells and the effect of cul-ture irradiation . Am. J. Pathol. 103 , 271 – 282
54. Morla , A. , Zhang , Z. , Ruoslahti , E. (1994) Superfibronectin is a functionally different form of fibronectin . Nature 367 , 193 – 196
55. Sapper , A. , Wegener , J. , and Janshoff , A. (2006) Cell motility probed by noise analy-sis of thickness shear mode resonators . Anal. Chem. 78 , 5184 – 5191
56. You , J. , Mastro , A.M. , and Dong , C. (1999) Application of the dual-micropipet technique to the measurement of tumor cell locomotion . Exp. Cell Res. 248 , 160 – 171
57. Grunwald , J. (1987) Time-lapse video micro-scopic analysis of cell proliferation, motility and morphology: application for cytopathology and pharmacology . Biotechniques 5 , 680 – 687
58. Dickinson , R.B. , McCarthy , J.B. , and Tran-quillo , R.T. (1993) Quantitative characteriza-tion of cell invasion in vitro: formulation and validation of a mathematical model of colla-gen gel invasion assay . Ann. Biomed. Eng. 21 , 679 – 697
59. Perris , R. , Kuo , H.-J. , Glanville , R. , Leibold , S. , and Bronner-Fraser , M. (1993) Neural crest cell interaction with collagen type VI is medi-ated by cooperative interaction sites within triple-helix and globular domains . Exp. Cell Res. , 209 , 103 – 117

250 Spessotto et al.
60. Moghe , P.V. , Nelson , R.D. , and Tranquillo , R.T. (1995) Cytokine-stimulated chemotaxis of human neutrophils in 3-D conjoined fibrin gel assay . J. Immunol. Methods 180 , 193 – 211
61. Chon , J.H. , Vizena , A.D. , Rock , B.M. , and Chaikof , E.L. (1997) Characterization of single-cell migration using a computer-aided fluorescence time-lapse videomicroscopy sys-tem . Anal. Biochem. 252 , 246 – 254
62. Maede-Tollin , L.C. , and van Noorden , C.J. (2000) Time lapse phase contrast video micro-scopy of directed cell migration of human microvascular endothelial cells on matrigel . Acta Histochem. 102 , 299 – 307
63. Friedl , P. , and Wolf , K. (2003) Tumour-cell invasion and migration: diversity and escape mechanisms . Nat. Rev. Cancer 3 , 362 – 374
64. Ballestrem , C. , Wehrle-Haller , B. , Hinz , B. , Imhof , B.A. (2000) Actin-dependent lamel-lipodia formation and microtubule-dependent tail retraction control-directed cell migration . Mol. Biol. Cell. 11 , 2999 – 3012
65. Harvath , L. , Falk , W. , and Leonard , E.J. (1980) Rapid quantitation of neutrophil chemotaxis: use of a polyvinylpyrrolidone-free policarbonate membrane in a multiwell assembly . J. Immunol. Methods 37 , 39 – 45
66. Sunder-Plassmann , G. , Hofbauer , R. , Sen-golge , G. , and Hore , W.H. (1996) Quantita-tion of leukocyte migration: improvement of a method . Immunol. Invest. 25 , 49 – 63
67. Albini , A. , Iwamoto , Y. , Kleinman . H.K. , Mar-tin , G.R. , Aaronson , S.A. , Kozlowski , J.M. , and McEwan , R.N. (1987) A rapid in vitro assay for quantitating the invasive potential of tumor cells . Cancer Res. 47 , 3239 – 3245
68. Repesh , L.A. (1989) A new in vitro assay for quantitating tumor cell invasion . Invasion Metastasis 9 , 192 – 208
69. Kleinman , H.K. , McGarvey , M.L. , Hassell , J.R. , Star , V.L. , Cannon , F.B. , Laurie , G.W. , and Martin , G.R. (1986) Basement mem-brane complexes with biological activity . Bio-chemistry 25 , 312 – 318
70. Kedeshian , P. , Sternlicht , M.D. , Nguyen , M. , Shao , Z.M. , and Barsky , S.H. (1998) Humatrix, a novel myoepithelial matrical gel with unique biochemical and biological prop-erties . Cancer Lett. 123 , 215 – 226
71. Muir , D. , Sukhu , L. , Johnson , J. , Lahorra , M.A. , and Maria , B.L. (1993) Quantitative methods for scoring cell migration and invasion in filter-based assays . Anal. Biochem. 215 , 104 – 109
72. Imamura , H. , Takao , S. , and Aikou , T. (1994) A modified invasion-3-(4,5-dimethylthiazole-2-yl)-2,5-diphenyltetrazolium bromide assay for quantitating tumor cell invasion . Cancer Res. 54 , 3620 – 3624
73. Schratzberger , P. , Kahler , C.M. , and Wieder-mann , C.J. (1996) Use of fluorochromes in the determination of chemotaxis and hapto-taxis of granulocytes by micropore filter assays . Ann. Hematol. 72 , 23 – 27
74. Garrido , T. , Riese , H.H. , Quesada , A.R. , Mar Barbacid , M. , and Aracil , M. (1996) Quantita-tive assay for cell invasion using the fluorogenic substrate 2’,7’-bis(2-carboxyethyl)-5(and-6)-carboxyfluorescein acetoxymethylester . Anal. Biochem. 235 , 234 – 236
75. Godement , P. , Vanselow , J. , Thanos , S. , and Bonhoeffer , F. (1987) A study in developing visual system with a new method of staining neurons and their processes in fixed tissue . Development 101 , 697 – 713
76. Ragnarson , B. , Bengtsson , L. , and Haegerstrand , A. (1992) Labeling with fluorescent carbocya-nine dyes of cultured endothelial and smooth muscle cells by growth in dye-containing medium . Histochemistry 97 , 329 – 333
77. Mazzucato , M. , Cozzi , M.R. , Pradella , P. , Ruggeri , Z.M. , and De Marco , L. (2004) Dis-tinct roles of ADP receptors in von Willebrand factor-mediated platelet signaling and activa-tion under flow . Blood 104 , 3221 – 3227
78. Alevriadou , B.R. , Moake , J.L. , Turner , N.A. , Ruggeri , Z.M. , Folie , B.J. , Phillips , M.D. , Schreiber , A.B. , Hrinda , M.E. , and McIntire , L.V. (1993) Real-time analysis of shear-de-pendent thrombus formation and its blockade by inhibitors of von Willebrand factor binding to platelets . Blood 81 , 1263 – 76
79. Perris , R. , Krotoski , D. , and Bronner-Fraser , M. (1991) Collagens in avian neural crest development: Distribution in vivo and migra-tion-promoting ability in vivo . Development 113 , 969 – 984
80. Turley , E.A. , Erickson , C.A. , and Tucker , R.P. (1985) The retention and ultrastructural appearances of various extracellular matrix molecules incorporated into three-dimen-sional hydrated collagen lattices . Dev. Biol. 109 , 347 – 369
81. Kim , B.S. , and Mooney , D.J. (1998) Devel-opment of biocompatible synthetic extracel-lular matrices for tissue engineering . Trends Biotechnol. 16 , 224 – 230

Chapter 17
Fibrin Gel Model for Assessment of Cellular Contractility
Sharona Even-Ram
Summary
Multiple cell types have an inherent ability to contract the extracellular matrix to which they are attached and grow on. Cells exert contractile forces on a compliant substrate, increase the tension, and deform it. Numerous intracellular as well as environmental factors are involved in determination of cellular con-tractility, which can be precisely measured by atomic force microscopy, laser tweezers, or other complex apparatus. These, however, are far from being standard equipment in most cell biology labs. Fibrin gels provide a simple and affordable alternative for evaluation of changes in cell contractility by either quantitation of end-point gel contraction or in a dynamic mode by time-lapse imaging. They also pro-vide a flexible system in which the physical properties, such as density and compliance, as well as their biochemical composition can easily be altered to suit the special requirements of various cell types and experimental models.
Key words: Fibrin gels , Contraction , Tension , Extracellular matrix , Contractility , Compliance , Time-lapse imaging .
Cellular contractility plays an essential role in wound healing, where platelets and fibroblasts contract the fibrin clot and bring the wound edges close together to facilitate tissue repair. Many factors are involved in the induction and relaxation of cellular contractility, including the actin and the microtubule cytoskel-etal systems (1) , the associated molecular motors such as myosin (2) and kinesin (3) integrin receptors (4) ion channels (5) , and effector proteins like the Rho family of small GTPases (6) . Fibroblasts form more actin stress fibers on rigid surfaces while attempting to overcome the resistance of the substrate and con-tract it, concomitant with robust recruitment of integrins into
1. Introduction
Sharona Even-Ram and Vira Artym (eds.), Methods in Molecular Biology, Extracellular Matrix Protocols, vol. 522© Humana Press, a part of Springer Science + Business Media, LLC 2009DOI: 10.1007/978-1-59745-413-1_17
251

252 Even-Ram
focal adhesion clusters and reinforcement of cell adhesion. This in turn increases tension within the matrix/substrate that is held by the surrounding tissue or in vitro by either the walls or the bottom of a culture dish or a coverslip. Tension also results in deformation of the matrix and in increased stiffness (7) . Certain pathologies involve overly contractile cells, aberrant deposition of ECM by these cells and alteration of the physical properties of the matrix/stroma. Two examples of such pathological conditions are hypertrophic scarring (8) and stiffening of the stroma around tumors that may enhance malignant behavior (9, 10) . A growing list of natural compounds, synthetic and small molecule designed drugs are being used to alter the function of various cellular fac-tors that are involved in propelling or attenuating contractility and tension. For example, the Vinca alkaloid vinblastine disrupts microtubules and causes a cellular response of robust stress fiber formation and increased contractility (11) . On the other hand, the synthetic Rho kinase inhibitor Y27632 (12) or the myosin II inhibitor blebbistatin (1) act to reduce contractility. In vitro test-ing methods like the fibrin gel contraction model are simple to employ and very useful for screening and assessment of changes in cellular contractility. Fibrin is a well-studied physiological sub-stance that binds various extracellular proteins like fibronectin (13) and vitronectin (14) as well as growth factors such as bFGF (15) and VEGF (16) via specific domains. This offers a consid-erable flexibility in adjustment of the system to various experi-mental requirements. The first method described here is based on end-point measurement of the fibrin gel contracted by top-loaded cells, which reflects the sum activity of all plated cells. The second method is based on time-lapse tracking of embedded beads. Although this method is more elaborate, requires special-ized time-lapse equipment and more complex analysis, it allows detection of the contraction dynamics, and can reveal differences across the sample. This might be useful for testing nonhomoge-neous cell populations, for example, clusters of stem cells.
1. Fibrinogen (human, essentially plasminogen-free, Sigma #F4883). 2. Thrombin (from human plasma, ~1,000 NIH units/mg,
Sigma). 3. 1% Bovine Serum Albumin (BSA) in PBS buffer, 0.22 μ m-filter
steriled. 4. CaCl 2 . 5. Aprotinin, from bovine lung, 100 KU solution (Calbiochem).
2. Materials
2.1. Fixed Samples

Fibrin Gel Model for Assessment of Cellular Contractility 253
6. 24-well culture plate. 7. 25G syringe needle. 8. Paraformaldehyde (32%, EMS). 9. Ponceau S, 0.1% (w/v) in 5% acetic acid (v/v) (Sigma-Aldrich). 10. Binocular equipped with a camera ( see Note 5 ).
1. 2–5-micron-diameter beads (for example Dynabeads M-450 Tosyl-activated, Invitrogen).
2. Phenol Red-free medium (recommended). 3. Cover glass-bottom 35 mm culture plate with 20 mm open-
ing, glass thickness 0 (Cat#P35G-0-20-C, MatTek Corpora-tion).
4. Time-lapse microscopy system that includes: (a) Microscope compatible with phase imaging, with 4× or
5× objectives. (b) CCD video camera mounted to the microscope (e.g.,
XC-ST50, Sony). (c) Environmental chamber (microscope cage incubator)
with controlled temperature, humidity, and CO 2 flow. (d) Optional (if humidifier is not available): Two 250 mL
wide-mouth beakers with sponges immersed in water. 5. Image sequence analysis software (e.g., MetaMorph, Molecular
Devices).
In principal, the fibrin gels can be polymerized with the cells, or alternatively, cells can be plated on top of the gels after polymeriza-tion. From our experience, cells contract the gels more efficiently when plated on top. Moreover, top plating is recommended for testing of small numbers of cells; their inability to freely migrate and extend long protrusions within the fibrin dense matrix often results in insufficient formation of connections between cells, and this may cause low contractile performance. In contrast, cells even in small numbers do well when plated on top of the fibrin gel; therefore, the following method describes the top plating option. 1. Dissolve fibrinogen in the normal growing medium of your
cells (DMEM supplemented with 10% fetal bovine serum is commonly used for fibroblasts) to a concentration of 10 mg/mL ( see Note 1 ). Fibrinogen solution must be freshly prepared. Important: do not attempt to use refrigerated solutions.
2.2. Time-Lapse Detection
3. Methods
3.1. Fibrin Gel-Endpoint Measurement

254 Even-Ram
2. Dissolve the lyophilized thrombin in a 1% BSA PBS solution to a concentration of 0.1 unit/ μ L. Prepare small aliquots and freeze ( see Note 2 ).
3. In 1.5 mL Eppendorf vials prepare aliquots in a volume sufficient for casting four gels at a time ( see Note 3 ): Add 500 μ L of the 10 μg/μL fibrinogen solution. If the medium does not contain sufficient Ca ++ ions, add 5 μ L of 20 μM CaCl 2 per 1 mL of final volume. At this stage, add any additional ECM proteins (e.g., fibronectin, vitronectin) and/or growth factors, add medium to a final volume of 1,010 μ L and mix well. Avoid bubbles and foaming. The final fibrinogen concentration is 5 mg/mL (other concentrations between 2 and 10 mg/mL can also be used).
4. Add 1 unit (10 μ L) of thrombin to 1mL of fibrinogen solution and mix well. Immediately dispense 250 μ L into each well of a 24-well dish, tap the dish for even spreading, and check that the solution has solidified after 30s. Incubate 30min at 37°C to allow complete polymerization.
5. Trypsinize the cells; wash well with serum-containing medium to inactivate the trypsin (or with a solution of trypsin inhibi-tor if serum should be avoided). Resuspend the cells in their normal medium and add 1 mL of cell suspension to each well. The optimal cell number should be determined by the user. Typically, fibroblasts are used at 2–5×10 4 cells/well. Mouse or human embryonic stem cells (ESC) are smaller and used at 1–5×10 5 cells/well. Some cells (human ESC, for example) have the capability of degrading the fibrin matrix. To overcome this, aprotinin, a serine protease inhibitor, can be used at 1:1,000 of the commercial solution (approx. 5–11 KIU/ μ L). Substrates without plated cells serve as a control of noncontracted gel, to which the other samples will be compared ( see Note 4 ).
6. Let cells adhere to the substrate for 2–4 h in 37°C, and then carefully release the fibrin gel from the walls of the well to allow uniform contraction. To do that, insert a 25G needle between the wall and the fibrin and slowly circle the gel with the needle couple of times (press to ensure that it releases the bottom part). Be careful not to tear the gels or distort them (working under a binocular is recommended). Put back in the incubator for 24 h. If the gels are not sufficiently contracted, incubation may be continued for additional 24 h.
7. Wash the contracted gels with PBS and fix with 0.5 mL of 4% paraformaldehyde/PBS (freshly prepared) solution for 30 min, wash again with PBS, add 500 μ L of PBS to each well. Samples can be stored in refrigeration at this stage.
8. The contracted gels are visible but translucent; to enhance the contrast for imaging and measurement, add 500 μ L of Ponceaue S solution (undiluted, sold as 0.1% (w/v) in 5% acetic acid) to

Fibrin Gel Model for Assessment of Cellular Contractility 255
each well for 30 min. This stains the gels in a deep red color whereas the cell-covered contracted area will appear brighter. Wash excess of dye couple of times with tap water and leave in PBS ( see Note 5 ).
9. Use a binocular equipped with camera to image the gels (they will be too big to image by microscope ( see Note 6 ). Measure the average diameter of the contracted gel area only (gels may contract asymmetrically). Ignore the “skirt” of the bottom layer noncontracted fibrin. The control value of 100% is that of a gel that does not contain any cells and thus fills the entire well area (unless over-dried and shrunk during the incubation period). Imaging should be carried out soon after staining since the Ponceau stain will slowly sap from the gels to the PBS and increase background, although gels will remain clearly stained for days.
1. Prepare the fibrinogen solution as described above ( Subhead-ing 3.1 , steps 1–3 ) but plan to use 200 μ L per sample. It is recommended to use Phenol Red-free medium to reduce color background during imaging.
2. Tosyl-activated 450 Dynabeads suspension ( see Note 7 ) is commercially available at a concentration of 4×10 5 beads/ μ L. Use 10 μ L of the suspension for 1mL of fibrinogen solution. Add 10 μ L beads to the fibrinogen solution and mix well.
3. Add thrombin as described above. Quickly dispense 200 μ L of fibrinogen/bead mix on each cover-glass plate, mix the beads by pipetting (without forming bubbles) before dispensing each sample. Incubate 30 min at 37°C for complete polymerization.
4. Alternatively, the beads can be scattered on the gel after the initial rapid polymerization step at room temperature, when the gel is firm enough ( see Note 8 ). Mix 10 μ L of bead sus-pension in 1.5 mL PBS and add drop-wise to the gel. Do not swirl the plates. Incubate 1h at 37°C to allow complete polym-erization and attachment of the beads. Remove the excess of beads that are not attached to the gel and change from PBS to growth medium. The advantage of laying the beads on top of the gel over trapping them by copolymerization is that most of the beads will stay in the same focal plan. The disadvantage is probability of sliding and shifting of the beads unrelated to the contraction. Analysis should exclude beads that were ran-domly shifted.
5. Plate cells as described above, but note that since the total sur-face of the dish is 35 mm, the cell number should be adjusted by a ratio of 2.5:1 from that of a 24 well. Incubate 2h in 37°C to allow maximal cell adherence. Use a 25G needle to gently release the gel from the edges of the opening ( see Note 9 ).
3.2. Time-Lapse Based Measurement of Contraction

256 Even-Ram
6. Warm up the time-lapse system and make sure that there is sufficient humidity in the chamber to avoid gel drying (if the chamber is not equipped with a humidifier, place two ~250 mL wide containers of water, each with soaked sponge, on the stage near the sample). Place the cells in the microscope envi-ronmental chamber to equilibrate for 15 min before start and check that no condensation occurs. View sample with a 4× or a 5× objective. Choose an area that contains a partial view of the edge, not the center, since beads located near the center of the gel will show lower displacement rates and will go out of focus more rapidly.
7. Select the sequence setting for the time-lapse imaging. Cap-ture images at intervals of 10 min. Total length should be at least 24 h. Note that not all the beads are going to be in the same focal plan and some might go out of focus as the gel contracts.
8. The contraction rate is in correlation with the distance of displacement from the start to the end position of a given bead (Fig. 1A ). A graph of the trajectory lengths over time shows the dynamics of contraction ( see Fig. 1B for example of untreated vs. myosin inhibitor-treated gels). Some software (e.g., MetaMorph, Molecular Device) enable automatic track-ing of objects but tend to loose tracks when beads go slightly out of focus. In this case, manual tracking of points is favorable.
Fig. 1. Time lapse imaging of contraction. ( A ) A scheme showing the precontracted ( left ) and the contracted gel ( right ) with the expected trajectories of the beads after analysis of the time-lapse sequence. ( B ) An example of contraction progression over time as reflected by the trajectory length of a bead in gels with untreated ( black squares ) vs. myosin inhibitor-treated cells ( grey triangles-dashed ) .

Fibrin Gel Model for Assessment of Cellular Contractility 257
1. Fibrinogen powder should be kept frozen at −20°C. The bot-tle should be brought to room temperature before opening to avoid water absorption by the cold powder.
2. Thrombin solutions show activity loss of 10% a year even when frozen. Make working-size aliquots to avoid freeze and thaw cycles that can further reduce the activity. Thrombin solution will stay active at least a week when stored refrigerated at 4°C.
3. Polymerization of fibrinogen to fibrin occurs within couple of seconds. This requires working quickly and with small batches of solutions. The number of samples that can be prepared depends on the speed of work. For non-experienced users, it is advised not to exceed four samples per batch.
4. When cells other then fibroblasts are used in this model, it is advised to include a positive control of fibroblasts for technical verification.
5. Do not attempt to take the contracted gel out of the well before you measure it, since every touch can potentially dis-tort its shape and skew the results. If the gel must be taken out of the well, fix first and then cut blunt the tip of a plastic Pasteur pipette and manually pipette the gel only to the point
4. Notes
Fig. 1. ( B ) An example of contraction progression over time as reflected by the trajectory length of a bead in gels with untreated ( black squares ) vs. myosin inhibitor-treated cells ( grey triangles-dashed ) .

258 Even-Ram
where it touches the tip edge but not sucked in. Quickly lift and transfer.
6. In some stereoscope models, a 0.45× or a 0.6× adaptor should be used to capture the full size of the well. If adaptors are not available, measure diagonally between corners ( see Fig. 2 arrow “ a ”). Make sure to have a calibrated field or include a microscope ruler for calibration.
7. The reason to select tosyl-activated beads is their ability to bind protein functional groups covalently. This helps to avoid slipping and sliding of beads, especially if they are scattered on the top of the gel. However, other types of beads that are clearly visible can work as well. Do not use smaller beads as some cells tend to opsonize them.
8. Be careful not to touch the gel surface with the tip when applying the bead suspension, and let the beads settle slowly without disturbing the plate. Any contact of an instrument with the polymerized gel can cause wrinkles that distort the surface and cause clustering or aligning of cells along them.
9. If the gels are not released from the edges, they will contract vertically instead of horizontally and will be hard to evaluate by the described method. Nonetheless, z-scanning of gels by confocal microscopy to measure changes in gel thickness can resolve this problem and provide an alternative method. This will require prelabeling the fibrin with fluorescent fibrino-gen such as Alexa Fluor 488- or Alexa Fluor 594-conjugated fibrinogen (Molecular Probes/Invitrogen): 5 μ L of the stock preparation per each mL of 5 mg/mL of unlabeled fibrinogen solution should suffice to give a bright labeling of the gel.
Fig. 2. Fibrin gels after 24 h contraction. ( A ) Fibrin gel with no plated cells as a noncontracted control ( arrow “ a ” measures the 100% diameter). ( B ) Fibrin gel contracted by human foreskin fibroblasts that were plated on top of the polymerized gel ( arrow “ b ” measures the diameter of the contracted area) .

Fibrin Gel Model for Assessment of Cellular Contractility 259
References
1. Even-Ram , S. , Doyle , A.D. , Conti , M.A. , Matsumoto , K. , Adelstein , R.S. & Yamada , K.M. (2007) . Myosin IIA regulates cell motil-ity and actomyosin-microtubule crosstalk . Nat Cell Biol 9 , pp. 299 – 309
2. Leon , C. , Eckly , A. , Hechler , B. , Aleil , B. , Fre-und , M. , Ravanat , C. , Jourdain , M. , Nonne , C. , Weber , J. , Tiedt , R. , Gratacap , M.P. , Sev-erin , S. , Cazenave , J.P. , Lanza , F. , Skoda , R. & Gachet , C. (2007) . Megakaryocyte-restricted MYH9 inactivation dramatically affects hemos-tasis while preserving platelet aggregation and secretion . Blood 110 , pp. 3183 – 3191
3. Kuo , S.C. & Sheetz , M.P. (1993) . Force of single kinesin molecules measured with opti-cal tweezers . Science 260 , pp. 232 – 234
4. Jenkins , A.L. , Nannizzi-Alaimo , L. , Silver , D. , Sellers , J.R. , Ginsberg , M.H. , Law , D.A. & Phillips , D.R. (1998) . Tyrosine phosphoryla-tion of the beta3 cytoplasmic domain medi-ates integrin-cytoskeletal interactions . J Biol Chem 273 , pp. 13878 – 13885
5. Clark , K. , Langeslag , M. , van Leeuwen , B. , Ran , L. , Ryazanov , A.G. , Figdor , C.G. , Moo-lenaar , W.H. , Jalink , K. & van Leeuwen , F.N. (2006) . TRPM7, a novel regulator of actomy-osin contractility and cell adhesion . EMBO J 25 , pp. 290 – 301
6. Omelchenko , T. , Vasiliev , J.M. , Gelfand , I.M. , Feder , H.H. & Bonder , E.M. (2002) . Mechanisms of polarization of the shape of fibroblasts and epitheliocytes: Separation of the roles of microtubules and Rho-dependent actin-myosin contractility . Proc Natl Acad Sci U S A 99 , pp. 10452 – 10457
7. Ozerdem , B. & Tozeren , A. (1995) . Physi-cal response of collagen gels to tensile strain . J Biomech Eng 117 , pp. 397 – 401
8. Desmouliere , A. , Chaponnier , C. & Gabbiani , G. (2005) . Tissue repair, contraction, and the myofibroblast . Wound Repair Regen 13 , pp. 7 – 12
9. Huang , S. & Ingber , D.E. (2005) . Cell ten-sion, matrix mechanics, and cancer develop-ment . Cancer Cell 8 , pp. 175 – 176
10. Paszek , M.J. , Zahir , N. , Johnson , K.R. , Lakins , J.N. , Rozenberg , G.I. , Gefen , A. , Reinhart-King , C.A. , Margulies , S.S. , Dembo , M. , Boettiger , D. , Hammer , D.A. & Weaver , V.M. (2005) . Tensional homeostasis and the malignant phenotype . Cancer Cell 8 , pp. 241 – 254
11. Bershadsky , A. , Chausovsky , A. , Becker , E. , Lyubimova , A. & Geiger , B. (1996) . Involve-ment of microtubules in the control of adhe-sion-dependent signal transduction . Curr Biol 6 , pp. 1279 – 1289
12. Birukova , A.A. , Smurova , K. , Birukov , K.G. , Usatyuk , P. , Liu , F. , Kaibuchi , K. , Ricks-Cord , A. , Natarajan , V. , Alieva , I. , Garcia , J.G. & Verin , A.D. (2004) . Microtubule disassembly induces cytoskeletal remodeling and lung vas-cular barrier dysfunction: role of Rho-depend-ent mechanisms . J Cell Physiol 201 , pp. 55 – 70
13. Matsuka , Y.V. , Migliorini , M.M. & Ingham , K.C. (1997) . Cross-linking of fibronectin to C-terminal fragments of the fibrinogen alpha-chain by factor XIIIa . J Protein Chem 16 , pp. 739 – 745
14. Preissner , K.T. (1990) . Specific binding of plasminogen to vitronectin. Evidence for a modulatory role of vitronectin on fibrin(ogen)-induced plasmin formation by tissue plasmino-gen activator . Biochem Biophys Res Commun 168 , pp. 966 – 971
15. Peng , H. , Sahni , A. , Fay , P. , Bellum , S. , Prudovsky , I. , Maciag , T. & Francis , C.W. (2004) . Identification of a binding site on human FGF-2 for fibrinogen . Blood 103 , pp. 2114 – 2120
16. Sahni , A. & Francis , C.W. (2000) . Vascular endothelial growth factor binds to fibrinogen and fibrin and stimulates endothelial cell pro-liferation . Blood 96 , pp. 3772 – 3778

Chapter 18
Fluorescent Labeling Techniques for Investigation of Fibronectin Fibrillogenesis (Labeling Fibronectin Fibrillogenesis)
Roumen Pankov and Albena Momchilova
Summary
Fibronectin fibrillogenesis is a cell-mediated, step-wise process that converts soluble fibronectin into insoluble fibronectin matrix. The deposition of fibronectin fibrils occurs at specific sites on the cell surface and depends on the unfolding of the fibronectin dimer. Fibronectin matrix provides positional information for cell migration during early embryogenesis and plays an important role in cell growth, differentiation, survival, and oncogenic transformation. Here we present simple techniques, based on the use of fluorescently labeled fibronectin and species-specific antifibronectin antibodies that allow deter-mination of the fibronectin fibril growth in conventional in vitro cell cultures and in three-dimensional matrix environment.
Key words: Fibronectin , Fibronectin fibrillogenesis , Extracellular matrix , Fluorescent labeling , Immunofluorescence .
The substance that fills the extracellular space and ensures the con-tinuation of different tissues is known as the extracellular matrix (ECM). It consists of a complex of structural and functional mac-romolecules secreted and organized by cells into a highly ordered meshwork. The ECM is not only a cell product but also at the same time plays an active role, providing structural support and supplying molecular cues, guiding cell migration, proliferation, and differenti-ation. Thus, a dynamic and reciprocal flow of structural interactions and information exists between cells and the ECM. This interde-pendence is vital for maintaining proper cellular functioning in the mature organisms, during development and in tissue repair (1– 4) .
1. Introduction
Sharona Even-Ram and Vira Artym (eds.), Methods in Molecular Biology, Extracellular Matrix Protocols, vol. 522© Humana Press, a part of Springer Science + Business Media, LLC 2009DOI: 10.1007/978-1-59745-413-1_18
261

262 Pankov and Momchilova
Four major classes of molecules have been documented as building constituents of the ECM in vertebrates – the collagens, proteoglycans, elastin, and glycoproteins (5) . Much has been learned about matrix organization and assembly through analy-ses of fibronectin (FN) – the most prominent member of the glycoprotein group. FN is widely expressed by multiple cell types and is critically important in vertebrate development, as dem-onstrated by the early embryonic lethality of mice with targeted disruption of the fibronectin gene (6) .
FN is secreted by cells in a soluble form and is subsequently assembled into insoluble multimeric fibrils as part of the ECM. Soluble fibronectin is a compact dimer in a nonfunctional, closed conformation (7) that unlike other ECM components like lam-inin and collagen does not self-polymerize under physiologically relevant conditions. Fibronectin polymerization takes place only on the surface of competent cells like fibroblasts. This polymeri-zation process, termed fibronectin fibrillogenesis, or fibronectin matrix assembly (8) , is facilitated by multiple binding sites that have been identified along the molecule (9) . Some of these FN self-interaction sites are exposed and available for binding while others are cryptic and become accessible only after conforma-tional changes. Exposure of the cryptic sites is obligatory for fibronectin fibrillogenesis to occur. Unfolding of the fibronectin molecule and uncovering of the hidden self-association binding sites is a cell-regulated process dependent on integrin receptors and cellular contractility (10) . Most investigators agree that the first steps comprise binding of FN to the cell surface. This is mediated predominantly by α 5 β 1 integrins and/or other mem-bers of the integrin family, that are capable of supporting FN matrix assembly. For fibroblasts, the preferential place for bind-ing soluble fibronectin to the integrin receptors appears to be at focal adhesions (8) . Using focal adhesions as anchors, cells apply dynamic, directional integrin movements along bundles of actin filaments to stretch bound fibronectin and generate long FN fibrils. This process requires cellular actomyosin contractility.
Given enough time, fibroblastic cells are capable of elabo-rating an increasingly dense matrix that can eventually become three-dimensional (3D) and resemble 3D matrices in vivo. Cells within such 3D matrices form a distinct type of cell adhesion termed “3D-matrix adhesion” (11, 12) . These 3D adhesions were found to differ in morphology and molecular composition from focal adhesions. Nevertheless, they are still the most probable sites where cells in 3D environment can apply tensile forces, nec-essary for continuous fibronectin fibrillogenesis in 3D matrix.
Exploration of the molecular mechanisms of ECM assem-bly is essential not only for fundamental cell biology but also for further advancement in tissue engineering, which strongly depends on the ability to control the rate and the pattern of ECM formation. Although fibronectin matrix assembly is studied primarily
Fluorescent Labeling Techniques for Investigation of Fibronectin Fibrillogenesis 263
by biochemical approaches, a particularly fruitful approach has been to study the dynamics of fibril formation by tracing the movement of fluorescently tagged fibronectin or fibronectin receptors (10) . In this chapter, we describe a simple methodo-logical approach, based on fluorescently labeled probes – FN and anti-FN antibodies, for studying the mechanism of fibronectin matrix formation.
1. Fluorescein-5-isothiocyanate (FITC “Isomer I,” Invitrogen) ( see Note 1 ). Prepare stock solution by dissolving 1 mg FITC in 1 mL 0.1 M sodium bicarbonate buffer, pH 9. Spin down at 3,000 × g for 5 min to remove any undissolved dye. Use the FITC stock solution within 2 h.
2. Tetramethylrhodamine-5-isothiocyanate (5-TRITC; “G iso-mer,” Invitrogen) ( see Note 2 ). Dissolve 1 mg TRITC in 100 μ L anhydrous dimethylsulfoxide (DMSO) ( see Note 3 ). Pipette up and down to mix and solubilize. Add 0.9 mL of 0.1 M sodium bicarbonate buffer, pH 9 and vortex. Spin down at 3,000 × g for 5 min to remove any undissolved dye. Use the TRITC stock solution within 2 h.
3. Sodium bicarbonate buffer. Dissolve 0.84 g of NaHCO 3 in 9 mL of deionized H 2 O and vortex or pipette up and down until fully dissolved. Adjust to pH 9 with 2N NaOH and cor-rect the volume to 10 mL with water. The bicarbonate buffer can be stored at 4°C for up to 2 weeks.
4. Phosphate buffered saline (PBS: 137 mM NaCl, 2.7 mM KCl, 10 mM Na 2 HPO 4 , 1.8 mM KH 2 PO 4 ). Dissolve 8 g NaCl, 0.2 g KCl, 1.44 g Na 2 HPO 4 , and 0.24 g KH 2 PO 4 in 800 mL deionized H 2 O, adjust pH to 7.4 with HCl (if necessary) and complete the final volume to 1 L with H 2 O. Sterilize by auto-claving and store at 4°C.
5. Bovine plasma fibronectin (Bfn) (5 mg, Sigma-Aldrich) lyophilized powder, cell culture tested.
6. PD-10 desalting columns (Amersham Biosciences, prepacked, disposable columns containing Sephadex G-25 medium).
1. Gelatin Sepharose 4B (Amersham Biosciences). 2. Cycloheximide 100 mg/mL in DMSO (0.2 μ m filtered,
Sigma-Aldrich). 3. Glass coverslips (12 mm, Assistent). 4. Vitronectin from human plasma (cell culture tested, Sigma-
Aldrich).
2. Materials
2.1. Reagents for Tagging of Fibronectin with FITC and TRITC
2.2. Reagents for Studying Fibronectin Fibrillogenesis
264 Pankov and Momchilova
5. Dulbecco’s Modified Eagle’s Medium (DMEM) (Gibco/BRL) supplemented with 10% fetal bovine serum (FBS, HyClone), 100 units/mL penicillin, and 100 m g/mL strep-tomycin (complete medium).
6. Dulbecco’s Modified Eagle’s Medium supplemented with 1% fibronectin-depleted fetal bovine serum, 25 m g/mL cycloheximide, 100 units/mL penicillin, and 100 m g/mL streptomycin (labeling medium).
7. Fixation solution: 4% paraformaldehyde (from 16% parafor-maldehyde, EM grade, Electron Microscopy Sciences), 5% sucrose in PBS. Prepare before use.
8. Mounting medium (Biomeda). 9. 0.2% gelatin solution (Sigma-Aldrich). Prepare a 0.2% (w/v)
gelatin solution in PBS and autoclave. 10. DNase solution: Dissolve DNase I (Roche) at concentration of 10
units/mL in PBS containing 1 mM CaCl 2 and 1 mM MgSO 4 . 11. Extraction buffer: PBS containing 0.5% (v/v) Triton X-100
and 20 mM NH4OH. Store up to 1 month at 4°C. 12. L -Ascorbic acid sodium salt (Sigma): Prepare ascorbic acid
stock solution at 50 mg/mL in distilled H 2 O just prior to use. Sterilize by filtration with a 0.2- m m filter.
13. Quenching solution: 50 mM NH 4 Cl in PBS. 14. Bovine serum albumin (BSA, EIA, and RIA grade, Appli-
Chem): 1% in PBS. Prepare fresh. 15. Anti-human fibronectin and antiactivated β 1 integrin anti-
bodies. Several human-specific anti-FN antibodies are offered by different suppliers – mouse anti-human FN, clone N-294 (Calbiochem), anti-human FN, clone Fn-3 and clone P5F3 (Chemicon), mouse anti-human FN, clone 568 and clone P1F11 (Santa Cruz) that can be used with this protocol. A good commercially available rat antiactivated β 1 integrin antibody, recognizing both mouse and human integrin receptors is rat monoclonal antibody 9EG7 (BioSource).
16. Normal donkey serum (Jackson Immunoresearch) ( see Note 4 ). 17. Species-specific secondary antibodies, conjugated with fluo-
rescent dyes (Jackson Immunoresearch).
The conversion of soluble fibronectin into insoluble fibronectin fibrils on the cell surface can be visualized by feeding cell culture with medium containing prelabeled exogenous FN (e.g., FN-FITC).
3. Methods

Fluorescent Labeling Techniques for Investigation of Fibronectin Fibrillogenesis 265
Activated integrin receptors will bind tagged fibronectin and through tensin-dependent and actomyosin-driven centripetal translocation will initiate its assembly into FN fibrils. Consequently, the sites of fibrillogenesis on the cell surface can be observed under fluores-cent microscope and the speed of the process can be calculated (10) . However, these experiments do not provide information for the position of the active sites along the fibronectin fibril, where the incorporation of the new FN molecules occurs. Such data can be obtained if live cells are consecutively labeled with FN mol-ecules tagged with different fluorescent dyes (e.g., FN-FITC, followed by FN-TRITC). Observation of samples, prepared after such sequential labeling of live cells allows identifying the direc-tion of FN fibril growth and the places of inclusion of new, soluble fibronectin molecules ( see Fig. 1 ).
The described approach provides valuable information for the early steps of fibronectin fibrillogenesis occurring on the sur-face of cells, plated in vitro. However, the natural environment of most cells in living organisms is the 3D ECM. Formation of new FN fibrils in such 3D environment can be studied by a dif-ferent approach, involving tracing of fibronectin, secreted by the cells, with species-specific antibodies. Simultaneous staining, for identification of active integrin receptors, allows identification of the active sites on the cell surface where fibrillogenesis takes place. Such experiments require plating of cells from one species
Fig. 1. Cell surface dynamics of fibronectin. Primary human fibroblasts were cultured overnight on vitronectin-coated cov-erslips in FN-free medium with 25 μ g/mL cycloheximide to prevent endogenous fibronectin synthesis and secretion. Cells were labeled for 30 min in succession with 20 μ g/mL FITC-conjugated FN (FN-FITC), followed by TRITC-conjugated FN (FN-TRITC). The “Merged” panel shows a digital overlay of images obtained from the green and red channels. The last panel rep-resents schematically some of the characteristics of early fibronectin fibrillogenesis – direction and sequence of fibril growth ( green and red arrows ) and the site of incorporation of the free soluble FN molecules ( red circles and black arrows ) .

266 Pankov and Momchilova
(e.g., human) on prelabeled 3D matrices, produced by another type of organism (e.g., mouse) ( see Fig. 2 ).
Here we describe two simple procedures for (a) visualization of the early steps of fibronectin fibrillogenesis and (b) imaging of fibrillogenesis within pre-existing, 3D ECM. Since both methods require the use of labeled FN, we are also providing an easy pro-cedure for tagging of fibronectin with FITC and TRITC.
1. Dissolve lyophilized FN in PBS at 2 mg/mL. Vortexing and excessive agitation are not recommended since FN tends to form precipitates at the air/liquid interface.
2. Dialyze for 8–10 h with two changes against PBS at 4°C ( see Note 5 ).
3. Dispense 1 μL dialyzed FN (about 2 mg) into two microcen-trifuge tubes.
4. Add 40 μ L of FITC stock solution to the first tube and 40 μ L of TRITC stock solution to the second one. Label clearly and incubate for 1 h at room temperature on a slow rocking platform, covered with foil.
5. Purify each of the labeled FN samples from the free dyes trough PD-10 desalting columns, pre-equilibrated with PBS (approximately 25 mL PBS/column). Allow the excess buffer
3.1. Tagging Bovine Plasma Fibronectin with FITC and TRITC
Fig. 2. Fibronectin fibrillogenesis in three–dimensional (3D) matrices. Primary human fibroblasts were cultured overnight on prelabeled three-dimensional fibronectin matrix (FN-FITC matrix) produced by mouse NIH 3T3 fibroblasts. Human cells were stained with anti-integrin (anti- β 1 integrin) antibodies for visualization of the position of 3D matrix adhesions and anti-FN antibodies (anti-human FN) for imaging the newly formed fibronectin fibrils. The “Merged” panel shows a digital overlay of the confocal images obtained from the green , blue , and red channels. Note that the new fibronectin fibrils overlap with the 3D matrix adhesions and stretched fibrils of the preexisting 3D matrix ( arrows ) .
Fluorescent Labeling Techniques for Investigation of Fibronectin Fibrillogenesis 267
to drain from the column and carefully add the FN/FITC reaction mixture. When the sample has run into the column add additional 1.5 mL of PBS and discard the flow-through. Elute FITC labeled FN with 3.5 mL of PBS collecting 1 mL fractions. Labeled fibronectin elutes first, followed by the free dye. Repeat step 5 with the second equilibrated PD-10 col-umn for purification of the TRITC labeled FN.
6. Calculate the concentration of fibronectin in the sample by measuring the absorbance of the conjugate solution at 280 nm/494 nm for FN-FITC, and 280 nm/555 nm for FN-TRITC. Use a cuvette with a 1 cm pathlength. If initial absorb-ance measurements exceed 2.0, dilute the sample to obtain absorbance values less than 2.0.
7. Calculate the molarity of fibronectin in the samples by using the following formulas ( see Note 6 ):
For fibronectin, we found that labeling with 4–6 moles of FITC or TRITC per mole protein is optimal.
8. Store the labeled FN at 4°C, protected from light. The con-jugates should be stable for at least 2 months. For long-term storage, divide the solution into small aliquots and freeze at −70°C. Avoid repeated freezing and thawing.
1. Prepare fibronectin-depleted fetal bovine serum (FNdFBS). Wash 10 mL of Gelatin Sepharose 4B by dispensing the beads into two sterile 50 mL tubes (5 mL beads per tube) containing 20 mL sterile PBS (work should be performed under sterile conditions in tissue culture hood). Mix well, cap, centrifuge at 200 × g for 1 min and remove the buffer. Repeat the wash-ing two more times. After the third wash, remove as much as possible PBS from the first tube and add 10 mL FBS. Cap well and leave on rocking platform for 30 min at room tempera-ture. After the incubation, pellet the beads, collect FBS, and repeat the incubation with the washed Gelatin Sepharose 4B
3.2. Visualization of the Early Steps of Fibronectin Fibrillo-genesis
Calculate the degree of labeling (dye:protein or F / P molar ratio) ( see Note 7 ):
= − × ×280 494FN - FITC (M) {[ ( 0.30)] / 677,800} dilution factor,A A
= − × ×280 555FN - TRITC (M) {[ ( 0.34)] / 677,800} dilution factor.A A
= × ×494Moles FITC per mole FN ( dilution factor) / (68,000 FN - FITC (M)),A
= × ×555Moles TRITC per mole FN ( dilution factor) / (65,000 FN - TRITC (M)),A

268 Pankov and Momchilova
beads from the second tube ( see Note 8 ). Collect fibronectin-depleted serum, aliquot and store at £ −20°C.
2. Sterilize glass coverslips by dipping into 100% ethanol and passing through the flame of a Bunsen burner (take care to keep the flame away from the ethanol bottle).
3. Insert the coverslips into the wells of a sterile 24 well-plate and add 0.5 mL of vitronectin solution (10 μ g/mL). Incubate the plate for 1 h at 37°C. Wash coated coverslips with sterile PBS (two washes, 1 mL PBS each). Prepare and use the coverslips on the same day. Coating with vitronectin is necessary for stimulation of cell attachment and spreading in the absence of fibronectin.
4. Detach exponentially growing primary human foreskin fibroblasts (HFF) ( see Note 9 ) with trypsin-EDTA, wash with warm sterile PBS, count, and resuspend in warm labe-ling medium (DMEM supplemented with 1% FNdFBS, antibiotics, and 25 μ g/mL Cycloheximide) ( see Note 10 ) at a concentration of 8 × 10 3 cells/mL. Make sure to have enough cells for the whole experiment, having in mind that 4 × 10 3 cells per coverslip will be necessary. The basic experi-ment requires a minimum of six coverslips (triplicates of cells labeled with FN-FITC and cells labeled sequentially with FN-FITC and FN-TRITC). If some additional treatments are planned, the initial number of cells should be increased correspondingly ( see Note 11 ).
5. Incubate the cell suspension for 20 min at 37°C on a slow rocking platform, pellet and resuspend in labeling medium at the same density.
6. Plate 0.5 mL of the cell suspension in each well containing vitronectin-coated coverslips (4 × 10 3 cells per coverslip) and culture overnight.
7. On the next morning, remove culture medium and change with prewarmed freshly prepared labeling medium, contain-ing 20 μ g/mL FN-FITC (0.5 mL medium per well). Incu-bate cells for 30 min at 37°C in a humidified atmosphere. Addition of fluorescently tagged fibronectin will initiate FN fibrillogenesis and will mark the sites on the cell surface where this event occurs ( see Note 12 ).
8. After the incubation period, transfer three of the coverslips into a new 24 well-plate, wash quickly with PBS, and fix for 30 min with fixing solution at room temperature. Wash with PBS and keep at room temperature until the last three samples reach this stage of the procedure.
9. Wash the remaining three coverslips with prewarmed labe-ling medium to remove any traces of FN-FITC and add pre-warmed labeling medium, containing 20 μ g/mL FN-TRITC (0.5 mL medium per well). Incubate for additional 30 min at 37°C in a humidified atmosphere ( see Note 13 ).
Fluorescent Labeling Techniques for Investigation of Fibronectin Fibrillogenesis 269
10. After the last incubation, transfer the coverslips into the 24 well-plate, containing the first three samples, wash quickly with PBS, fix for 30 min at room temperature, and wash with PBS.
11. Mount coverslips on glass slides with mounting medium (Biomeda) containing 1 mg/mL 1,4 phenylenediamine to minimize photobleaching. Dry coverslips for 2 h at room temperature covered with foil.
12. Examine the samples using fluorescent microscope equipped with filters for viewing FITC (green emission) and TRITC (red emission) signals. Use suitable software to merge obtained digital images. Examples of the signals from FN-FITC and FN-TRITC are shown in Fig. 1 .
1. Sterilize 12-mm glass coverslips as described in Subheading 3.1 , step 2 .
2. Insert the coverslips into the wells of sterile 24 well-plate and add 0.5 mL 0.2% gelatin solution. Incubate the plate for 1 h at 37°C. Wash coated coverslips with sterile PBS (two washes, 1 mL PBS each). Prepare and use the coverslips on the same day. Coating with gelatin is necessary for stabiliza-tion of fibronectin matrix, which otherwise tends to detach from glass surface.
3. Trypsinize exponentially growing NIH 3T3 cells (ATCC) ( see Note 14 ), wash and resuspend at 1 × 10 5 cells/mL in complete medium containing, 50 μ g/mL ascorbic acid ( see Note 15 ), 10 μ g/mL FN-FITC ( see Note 16 ).
4. Plate 0.5 mL of cell suspension in each well containing gela-tin-coated coverslips (5 × 10 4 cells per coverslip) and culture overnight.
5. Continue culturing NIH 3T3 cells for 4 days changing the medium with a new one (add FN-FITC and freshly prepared ascorbic acid before use) every day.
6. On the fifth day remove medium, wash carefully with pre-warmed (37°C) PBS and add 0.5 mL of prewarmed extrac-tion buffer. Change solutions by touching the pipette against the dish wall rather than at the bottom of the dish where the cells are located ( see Note 17 ). Observe the process of cell lysis using an inverted microscope. Incubate until no intact cells are visualized (about 10 min).
7. Dilute the cellular debris by adding 1 mL PBS. Cautiously aspi-rate the diluted cellular debris, but without completely remov-ing the liquid layer. Repeat the washing two more times.
8. Remove the debris of DNA by adding 0.5 mL of DNAse solution. Incubate for 20 min at 37°C and wash three times with PBS.
3.3. Visualization of New Fibrillogenesis in Three-Dimensional Extracellular Matrix
3.3.1. Preparation of Pre-Labeled Three-Dimensional Fibronectin Matrices

270 Pankov and Momchilova
9. Transfer the matrix-coated coverslips into a new 24 well-plate pre-filled with PBS supplemented with 100 U/mL penicillin, 100 μ g/mL streptomycin, and 0.25 μ g/mL Fungizone (Sig-ma-Aldrich, 1 mL/well) and seal with Parafilm. The matrices can be stored for up to 3 weeks at 4°C.
1. Detach exponentially growing primary human foreskin fibrob-lasts with trypsin-EDTA, wash with warm sterile PBS, count, and resuspend in warm complete medium at 5 × 10 3 cells/mL. Make sure to have enough cells for the whole experi-ment, having in mind that 2.5 × 10 3 cells per coverslip will be necessary. The basic experiment requires a minimum of six coverslips (triplicates of control and cells labeled with anti-human FN and anti- β 1 integrin antibodies). If some additional treatments are planned, the initial number of cells should be increased correspondingly.
2. Plate 0.5 mL of the cell suspension in each well containing vitronectin-coated coverslips (2.5 × 10 3 cells per coverslip) and culture for overnight. If using different cell line, adjust the culturing period to give the cells enough time to start depositing their own matrix.
3. On the next morning, remove culture medium and wash with 1 mL of PBS. Fix for 30 min with fixing solution at room temperature ( see Note 18 ).
4. Quench the residual formaldehyde by incubation with 0.5 mL of quenching solution for 10 min at room temperature, followed by two washes with PBS. Block the samples by incu-bation with 0.5 mL of 1% BSA in PBS for 20 min at room temperature.
5. Incubate three of the coverslips with mixture of appropriately diluted (usually 10 μ g/mL in PBS, containing 1% BSA) first antibodies for 1 h at room temperature in a humidified cham-ber. In our experiment, we used a mixture of rat anti-human fibronectin antibody 3B8, and mouse antiactivated human β 1 integrin antibody 12G10 (13) (both kindly provided by Ken-neth Yamada, NIDCR/NIH), but other appropriate antibod-ies may also be used ( see Subheading 2.2 , step 14 ). Leave the remaining three coveslips in PBS. They will be used as a control for nonspecific cross reaction and will be stained only with secondary antibodies.
6. Remove the primary antibodies and wash five times with PBS, 5 min each.
7. Block the possible nonspecific reaction of the secondary anti-bodies by incubating the samples with 0.5 mL of 1% normal donkey serum in PBS for 20 min at room temperature.
3.3.2. Immunofluorescent Staining of New Fibronectin Fibrils in Three-Dimensional Extracellular Matrix

Fluorescent Labeling Techniques for Investigation of Fibronectin Fibrillogenesis 271
8. Incubate all six samples (the three stained with the first anti-bodies and the three controls) for 1 h at room temperature with mixture of suitable species-specific antibodies, conjugated with fluorescent dyes (bare in mind that the matrix is already labeled with FN-FITC). In our experiment, we used a mixture of donkey anti-rat IgG, conjugated with CY3 (for visualiza-tion of human FN, red emission) and donkey anti-mouse IgG, conjugated with AMCA (for visualization of β 1 integrin, blue emission) diluted according to manufacturers recommenda-tions in PBS, containing 1% normal donkey serum.
9. Remove the secondary antibodies mixture and wash five times with PBS, 5 min each.
10. Mount coverslips on glass slides by inverting them on a drop of mounting medium (Biomeda) containing 1 mg/mL 1,4 phenylenediamine to minimize photobleaching. Dry cover-slips for 2 h at room temperature covered with foil.
11. Examine the samples using confocal microscope equipped with filters for viewing FITC (green emission), CY 3 (red emission) and AMCA (blue emission) signals. Example of the particular staining, described in this protocol is shown in Fig. 2 .
1. Despite the availability of alternative amine-reactive fluores-cein derivatives that yield conjugates with superior stability and comparable spectra (e.g., Alexa dyes from Invitrogen), fluorescein isothiocyanate (FITC) remains one of the most popular fluorescent labeling reagents, probably due to the low cost of the material. 5-FITC reagent is prominently used to label proteins, peptides, oligonucleotides, and other small organic ligands.
2. 5-TRITC is a single isomer of the TRITC labeling reagent that is predominantly used in labeling peptides and proteins.
3. Since the solubility of TRITC in aqueous solutions is low, we have obtained better results by initial solubilization of the dye in DMSO.
4. The nonspecific reaction of the secondary fluorescently labeled antibodies can be blocked by incubation with normal serum from the same animal species in which the secondary antibodies are raised. In this protocol, we used blocking with normal donkey serum because the secondary antibodies are raised in this species.
4. Notes
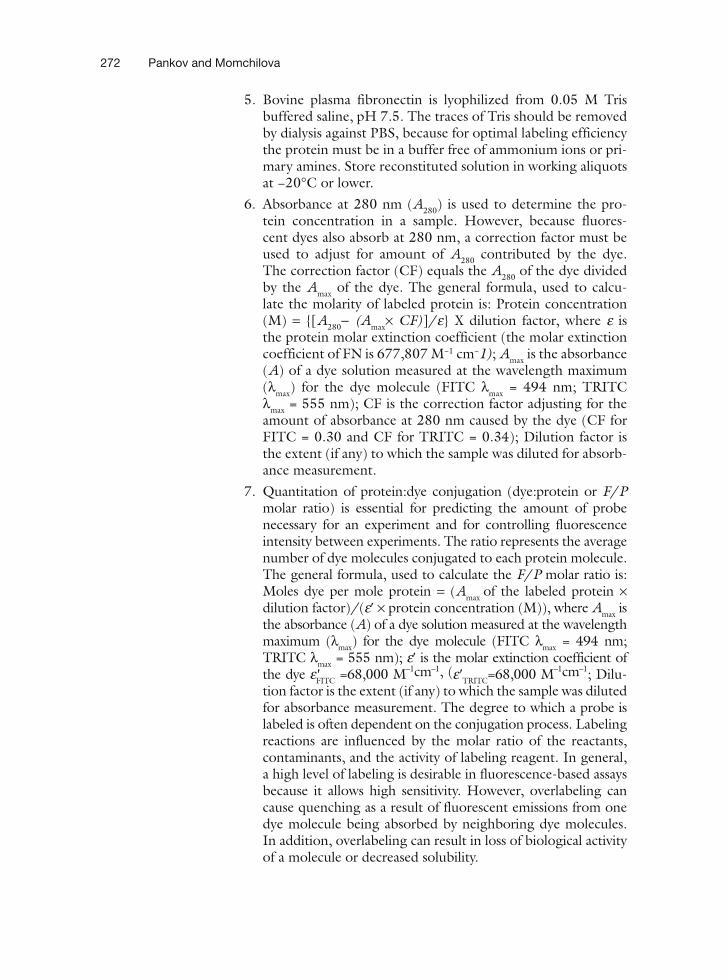
272 Pankov and Momchilova
5. Bovine plasma fibronectin is lyophilized from 0.05 M Tris buffered saline, pH 7.5. The traces of Tris should be removed by dialysis against PBS, because for optimal labeling efficiency the protein must be in a buffer free of ammonium ions or pri-mary amines. Store reconstituted solution in working aliquots at −20°C or lower.
6. Absorbance at 280 nm ( A 280 ) is used to determine the pro-tein concentration in a sample. However, because fluores-cent dyes also absorb at 280 nm, a correction factor must be used to adjust for amount of A 280 contributed by the dye. The correction factor (CF) equals the A 280 of the dye divided by the A max of the dye. The general formula, used to calcu-late the molarity of labeled protein is: Protein concentration (M) = {[A280− (Amax× CF)]/e} X dilution factor, where e is the protein molar extinction coefficient (the molar extinction coefficient of FN is 677,807 M −1 cm − 1) ; A max is the absorbance ( A ) of a dye solution measured at the wavelength maximum ( λ max ) for the dye molecule (FITC λ max = 494 nm; TRITC λ max = 555 nm); CF is the correction factor adjusting for the amount of absorbance at 280 nm caused by the dye (CF for FITC = 0.30 and CF for TRITC = 0.34); Dilution factor is the extent (if any) to which the sample was diluted for absorb-ance measurement.
7. Quantitation of protein:dye conjugation (dye:protein or F / P molar ratio) is essential for predicting the amount of probe necessary for an experiment and for controlling fluorescence intensity between experiments. The ratio represents the average number of dye molecules conjugated to each protein molecule. The general formula, used to calculate the F / P molar ratio is: Moles dye per mole protein = (Amax of the labeled protein × dilution factor)/(e¢ × protein concentration (M)), where A max is the absorbance ( A ) of a dye solution measured at the wavelength maximum ( λ max ) for the dye molecule (FITC λmax = 494 nm; TRITC λ max = 555 nm); e ¢ is the molar extinction coefficient of the dye e'FITC =68,000 M–1cm–1, (e¢TRITC=68,000 M–1cm–1; Dilu-tion factor is the extent (if any) to which the sample was diluted for absorbance measurement. The degree to which a probe is labeled is often dependent on the conjugation process. Labeling reactions are influenced by the molar ratio of the reactants, contaminants, and the activity of labeling reagent. In general, a high level of labeling is desirable in fluorescence-based assays because it allows high sensitivity. However, overlabeling can cause quenching as a result of fluorescent emissions from one dye molecule being absorbed by neighboring dye molecules. In addition, overlabeling can result in loss of biological activity of a molecule or decreased solubility.
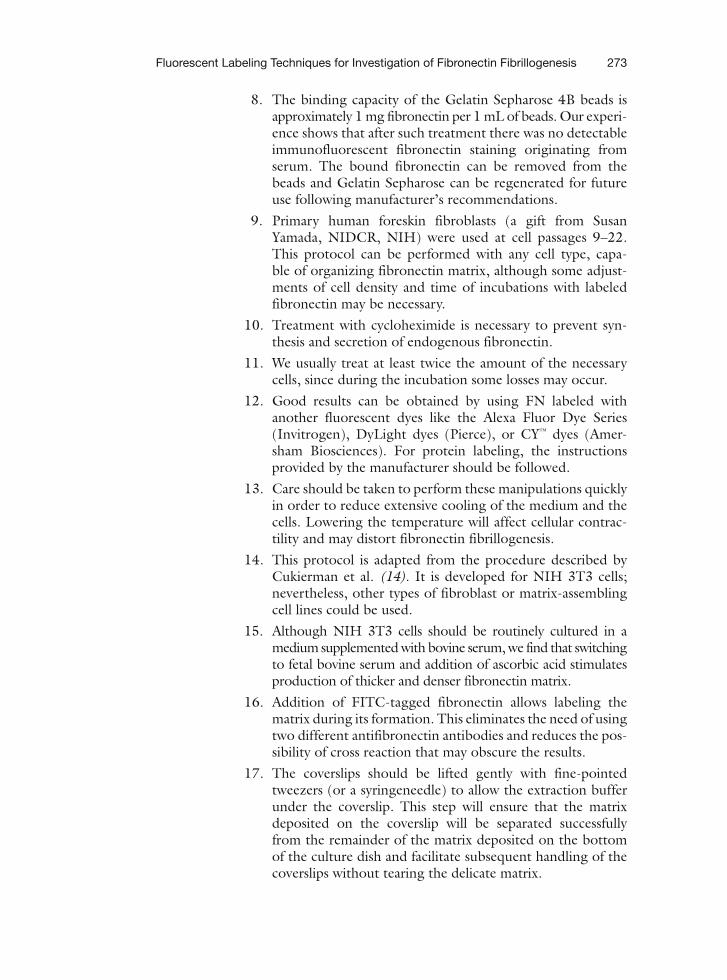
Fluorescent Labeling Techniques for Investigation of Fibronectin Fibrillogenesis 273
8. The binding capacity of the Gelatin Sepharose 4B beads is approximately 1 mg fibronectin per 1 mL of beads. Our experi-ence shows that after such treatment there was no detectable immunofluorescent fibronectin staining originating from serum. The bound fibronectin can be removed from the beads and Gelatin Sepharose can be regenerated for future use following manufacturer’s recommendations.
9. Primary human foreskin fibroblasts (a gift from Susan Yamada, NIDCR, NIH) were used at cell passages 9–22. This protocol can be performed with any cell type, capa-ble of organizing fibronectin matrix, although some adjust-ments of cell density and time of incubations with labeled fibronectin may be necessary.
10. Treatment with cycloheximide is necessary to prevent syn-thesis and secretion of endogenous fibronectin.
11. We usually treat at least twice the amount of the necessary cells, since during the incubation some losses may occur.
12. Good results can be obtained by using FN labeled with another fluorescent dyes like the Alexa Fluor Dye Series (Invitrogen), DyLight dyes (Pierce), or CY ™ dyes (Amer-sham Biosciences). For protein labeling, the instructions provided by the manufacturer should be followed.
13. Care should be taken to perform these manipulations quickly in order to reduce extensive cooling of the medium and the cells. Lowering the temperature will affect cellular contrac-tility and may distort fibronectin fibrillogenesis.
14. This protocol is adapted from the procedure described by Cukierman et al. (14) . It is developed for NIH 3T3 cells; nevertheless, other types of fibroblast or matrix-assembling cell lines could be used.
15. Although NIH 3T3 cells should be routinely cultured in a medium supplemented with bovine serum, we find that switching to fetal bovine serum and addition of ascorbic acid stimulates production of thicker and denser fibronectin matrix.
16. Addition of FITC-tagged fibronectin allows labeling the matrix during its formation. This eliminates the need of using two different antifibronectin antibodies and reduces the pos-sibility of cross reaction that may obscure the results.
17. The coverslips should be lifted gently with fine-pointed tweezers (or a syringeneedle) to allow the extraction buffer under the coverslip. This step will ensure that the matrix deposited on the coverslip will be separated successfully from the remainder of the matrix deposited on the bottom of the culture dish and facilitate subsequent handling of the coverslips without tearing the delicate matrix.

274 Pankov and Momchilova
18. Although most protocols for immunofluorescent staining include permeabilization of the cells, the described proce-dure does not include such step. Omitting permeabilization allows visualization only of cell-produced fibronectin depos-ited outside cell membrane and eliminates a possible obscur-ing of the results by the intracellular fibronectin.
Part of this work was supported by the Bulgarian National Fund for Scientific Research (Grant By-Б-1/05 and 1404/04).
Acknowledgments
References
1. Dallas SL , Chen Q , Sivakumar P . (2006) Dynam-ics of assembly and reorganization of extracellu-lar matrix proteins . Curr Top Dev Biol ; 75 : 1 – 24
2. Trelstad RL. (1984) The Role of Extracellular Matrix in Development . New York : Alan R. Liss
3. Larsen M , Artym VV , Green JA , Yamada KM . (2006) The matrix reorganized: extracellular matrix remodeling and integrin signaling . Curr Opin Cell Biol ; 5 : 463 – 471
4. Hay , E.D. Editor. (1991) Cell Biology of Extracel-lular Matrix , 2nd edn . New York : Plenum Press
5. Piez KA , Reddi HA. (1984) Extracellular Matrix Biochemistry . New York : Elsevier
6. George EL , Georges-Labouesse EN , Patel-King RS , Rayburn H , Hynes RO . (1993) Defects in meso-derm, neural tube and vascular development in mouse embryos lacking fibronectin . Development ; 119 : 1079 – 1091
7. Williams EC , Janmey PA , Ferry JD , Mosher DF . (1982) Conformational states of fibronectin. Effects of pH, ionic strength, and collagen binding . J Biol Chem ; 257 : 14973 – 14978
8. Geiger B , Bershadsky A , Pankov R , Yamada KM . (2001) Transmembrane crosstalk between the extracellular matrix–cytoskeleton crosstalk . Nat Rev Mol Cell Biol ; 2 : 793 – 805
9. Pankov R , Yamada KM . (2002) Fibronectin at a glance . J Cell Sci ; 115 : 3861 – 3863
10. Pankov R , Cukierman E , Katz BZ , Matsumoto K , Lin DC , Lin S , Hahn C , KM. Yamada (2000) Integrin dynamics and matrix assem-bly: tensin-dependent translocation of alpha (5)beta(1) integrins promotes early fibronec-tin fibrillogenesis . J Cell Biol ; 148 : 1075 – 1090
11. Cukierman E , Pankov R , Stevens DR , Yamada KM . (2001) Taking cell-matrix adhesions to the third dimension . Science ; 294 : 1708 – 1712
12. Cukierman E , Pankov R , Yamada KM . (2002) Cell interactions with three-dimensional matrices . Curr Opin Cell Biol ; 14 : 633 – 639
13. Mould AP , Garratt AN , Askari JA , Akyiama SK , Humphries MJ . (1995) Identification of a novel anti-integrin monoclonal anti-body that recognizes a ligand-induced bind-ing site epitope on the beta 1subunit . FEBS Lett ; 363 : 118 – 122
14. Cukierman E. Preparation of extracellu-lar matrices produced by cultured fibrob-lasts. In: Dasso BM, Lippincott-Schwartz J, Yamada KM (eds.), Current Protocols in Cell Biology , vol 2. New York: Wiley, pp. 10.9.1–10.9.14

Chapter 19
Stromagenesis During Tumorigenesis: Characterization of Tumor-Associated Fibroblasts and Stroma-Derived 3D Matrices
Remedios Castelló-Cros and Edna Cukierman
Summary
It is increasingly recognized that interactions between cancer cells and their surrounding stroma are criti-cal for promoting the growth and invasiveness of tumors. For example, cancer cells alter the topography and molecular composition of stromal extracellular matrix by increasing paracrine regulation of fibro-blastic stromal cells during early tumor development. In turn, these physical and biochemical alterations of the stroma, profoundly affect the properties of the cancer cells. However, little is known about the cross-talk between stroma and cancer cells, and it is mainly due to the lack of a suitable in vitro system to mimic the stroma in vivo. We present an in vivo-like 3D stromal system derived from fibroblasts har-vested from tissue samples representing various stages of stroma progression during tumorigenesis. The chapter describes how to isolate and characterize fibroblasts from a plethora of tissue samples. It describes how to produce and characterize fibroblast-derived 3D matrices. Finally, it describes how to test matrix permissiveness by analyzing the morphology of cancer cells cultured within various 3D matrices.
Key words: Extracellular matrix , Tumor (or cancer)-associated fibroblasts , Fibroblast-derived 3D matrix , Cell morphology , Tumor stroma .
One of the fundamental differences between transformed and normal cells is the manner in which they interact with their imme-diate environment. Benign epithelial tumors are constrained by a surrounding stroma (1, 2) consisting, in part, of fibroblastic cells and fibrillar extracellular matrix (ECM). This normal stroma inhibits or contains tumorigenicity (3, 4) . However, at a critical point in transformation, tumors overcome this stromal barrier, induc-
1. Introduction
Sharona Even-Ram and Vira Artym (eds.), Methods in Molecular Biology, Extracellular Matrix Protocols, vol. 522© Humana Press, a part of Springer Science + Business Media, LLC 2009DOI: 10.1007/978-1-59745-413-1_19
275

276 Castelló-Cros and Cukierman
ing changes that promote rather than impede tumor progression (1, 5– 13) . Changes in the stroma accompanying tumor progression include appearance of discontinuities in the basement membrane surrounding the growing tumor, several immune responses, and the formation of new blood vessels (angiogenesis). Among these host responses are additional alterations to the mesenchymal connective tissue in the vicinity of the tumor (14) . Mesenchymal alterations, known as “stromagenesis,” occur in parallel to tum-origenesis and resemble tissue responses during wound healing or fibrosis (12, 14– 19) . Quiescent fibroblasts (also known as stellate cells in pancreatic and hepatic stromas (20, 21) ) are the predomi-nant cell type within a “normal stroma,” and secrete an ECM that is believed to provide a natural barrier that constrains tumor progression (1, 16, 22– 25) . In contrast, the ECM produced by a primed stroma either genetically or epigenetically modified can provoke, stimulate, and support (instead of constraining) tumor progression (5, 8, 12, 25– 29) . The primed fibroblasts engage in paracrine and autocrine feedback signaling with the developing tumor cells (11, 30) , causing the eventual loss of normal tissue homeostasis (11) . In the course of this parallel progression, dif-ferentiated myofibroblastic stromal cells, now termed activated cancer or tumor-associated fibroblasts (TAFs), begin to express a set of proteins including collagen-I, fibronectin (15, 31) , desmin, α -smooth muscle actin ( α -SMA) (16, 32) , and others, grossly altering the protein constituents and architecture of the ECM. During this later “activated stroma” phase or desmoplasia, the tumor becomes invasive and metastatic (33, 34) .
As a result of the interactions between stroma and cancer cells, the cancer cells modify their morphology and, thus, their migratory mechanism (35– 37) . Examples of these modifications include, among others, epithelial to mesenchymal and epithelial to amoeboid transitions (35, 38) . The cancer cells that present amoeboid morphology present a “lymphocytic” type of move-ment that is driven by weak interactions with the ECM, it is independent of proteases, and is controlled by the small GTPase RhoA and its effector ROCK to generate cortical tension, stiff-ness, and the maintenance of round cell morphology (36, 39) . However, cells that undergo epithelial to mesenchymal transition present mesenchymal or spindle morphology and migrate guided by the matrix fibers or strands. The migration of cells with a mes-enchymal morphology is dependent on integrin-mediated adhe-sion and ECM degradation by proteases (40) .
In this chapter, we describe protocols to isolate stromagenic fibroblasts from various tissue samples and to obtain three-dimensional (3D) matrices derived from these fibroblasts. The chapter includes methods for characterizing both fibroblasts and their derived matrices to sort them as normal, primed, or acti-vated, also known as desmoplastic (tumor-associated). The last
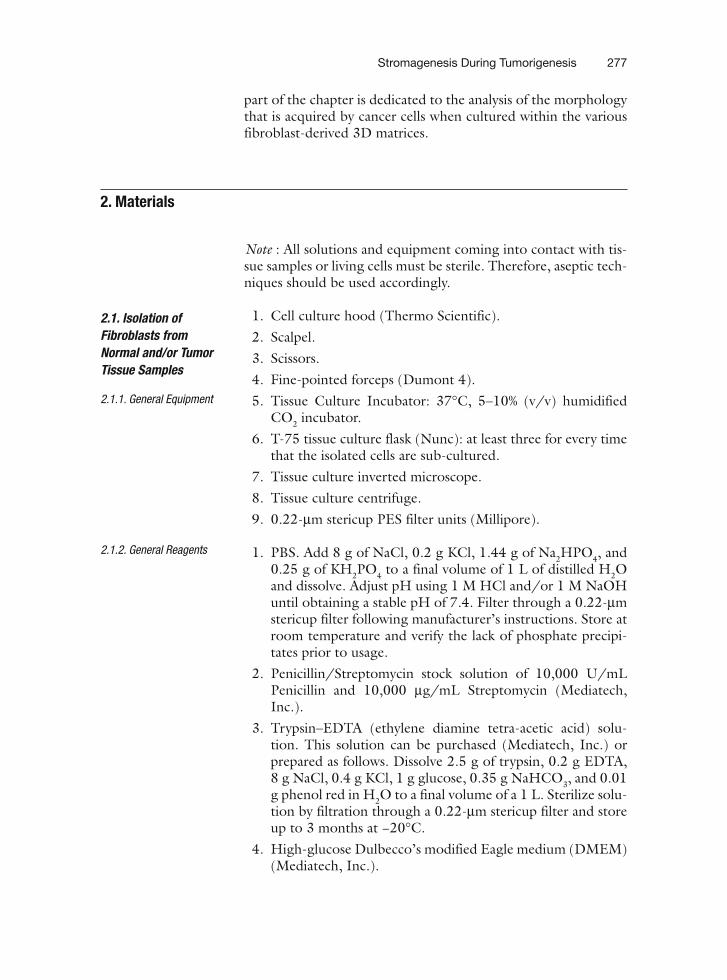
Stromagenesis During Tumorigenesis 277
part of the chapter is dedicated to the analysis of the morphology that is acquired by cancer cells when cultured within the various fibroblast-derived 3D matrices.
Note : All solutions and equipment coming into contact with tis-sue samples or living cells must be sterile. Therefore, aseptic tech-niques should be used accordingly.
1. Cell culture hood (Thermo Scientific). 2. Scalpel. 3. Scissors. 4. Fine-pointed forceps (Dumont 4). 5. Tissue Culture Incubator: 37°C, 5–10% (v/v) humidified
CO 2 incubator. 6. T-75 tissue culture flask (Nunc): at least three for every time
that the isolated cells are sub-cultured. 7. Tissue culture inverted microscope. 8. Tissue culture centrifuge. 9. 0.22- μ m stericup PES filter units (Millipore).
1. PBS. Add 8 g of NaCl, 0.2 g KCl, 1.44 g of Na 2 HPO 4 , and 0.25 g of KH 2 PO 4 to a final volume of 1 L of distilled H 2 O and dissolve. Adjust pH using 1 M HCl and/or 1 M NaOH until obtaining a stable pH of 7.4. Filter through a 0.22- μ m stericup filter following manufacturer’s instructions. Store at room temperature and verify the lack of phosphate precipi-tates prior to usage.
2. Penicillin/Streptomycin stock solution of 10,000 U/mL Penicillin and 10,000 μ g/mL Streptomycin (Mediatech, Inc.).
3. Trypsin–EDTA (ethylene diamine tetra-acetic acid) solu-tion. This solution can be purchased (Mediatech, Inc.) or prepared as follows. Dissolve 2.5 g of trypsin, 0.2 g EDTA, 8 g NaCl, 0.4 g KCl, 1 g glucose, 0.35 g NaHCO 3 , and 0.01 g phenol red in H 2 O to a final volume of a 1 L. Sterilize solu-tion by filtration through a 0.22- μ m stericup filter and store up to 3 months at −20°C.
4. High-glucose Dulbecco’s modified Eagle medium (DMEM) (Mediatech, Inc.).
2. Materials
2.1. Isolation of Fibroblasts from Normal and/or Tumor Tissue Samples
2.1.1. General Equipment
2.1.2. General Reagents
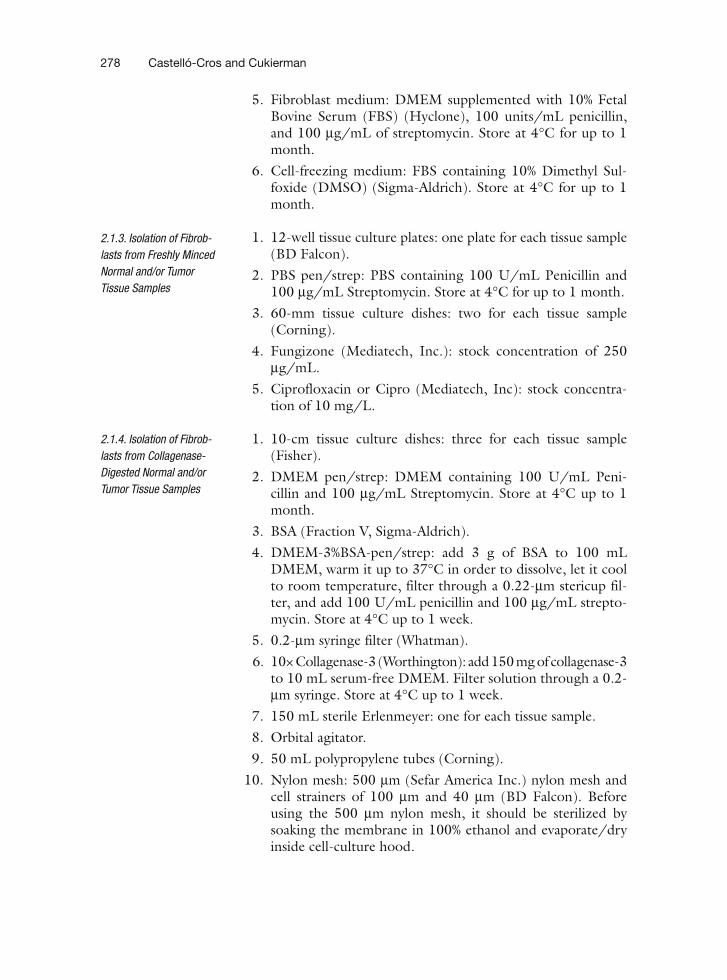
278 Castelló-Cros and Cukierman
5. Fibroblast medium: DMEM supplemented with 10% Fetal Bovine Serum (FBS) (Hyclone), 100 units/mL penicillin, and 100 μ g/mL of streptomycin. Store at 4°C for up to 1 month.
6. Cell-freezing medium: FBS containing 10% Dimethyl Sul-foxide (DMSO) (Sigma-Aldrich). Store at 4°C for up to 1 month.
1. 12-well tissue culture plates: one plate for each tissue sample (BD Falcon).
2. PBS pen/strep: PBS containing 100 U/mL Penicillin and 100 μ g/mL Streptomycin. Store at 4°C for up to 1 month.
3. 60-mm tissue culture dishes: two for each tissue sample (Corning).
4. Fungizone (Mediatech, Inc.): stock concentration of 250 μ g/mL.
5. Ciprofloxacin or Cipro (Mediatech, Inc): stock concentra-tion of 10 mg/L.
1. 10-cm tissue culture dishes: three for each tissue sample (Fisher).
2. DMEM pen/strep: DMEM containing 100 U/mL Peni-cillin and 100 μ g/mL Streptomycin. Store at 4°C up to 1 month.
3. BSA (Fraction V, Sigma-Aldrich). 4. DMEM-3%BSA-pen/strep: add 3 g of BSA to 100 mL
DMEM, warm it up to 37°C in order to dissolve, let it cool to room temperature, filter through a 0.22- μ m stericup fil-ter, and add 100 U/mL penicillin and 100 μ g/mL strepto-mycin. Store at 4°C up to 1 week.
5. 0.2- μ m syringe filter (Whatman). 6. 10× Collagenase-3 (Worthington): add 150 mg of collagenase-3
to 10 mL serum-free DMEM. Filter solution through a 0.2- μ m syringe. Store at 4°C up to 1 week.
7. 150 mL sterile Erlenmeyer: one for each tissue sample. 8. Orbital agitator. 9. 50 mL polypropylene tubes (Corning). 10. Nylon mesh: 500 μ m (Sefar America Inc.) nylon mesh and
cell strainers of 100 μ m and 40 μ m (BD Falcon). Before using the 500 μ m nylon mesh, it should be sterilized by soaking the membrane in 100% ethanol and evaporate/dry inside cell-culture hood.
2.1.3. Isolation of Fibrob-lasts from Freshly Minced Normal and/or Tumor Tissue Samples
2.1.4. Isolation of Fibrob-lasts from Collagenase-Digested Normal and/or Tumor Tissue Samples
Stromagenesis During Tumorigenesis 279
1. Cell culture hood (Thermo Scientific). 2. Tissue Culture Incubator: 37°C, 5–10% (v/v) humidified
CO 2 incubator. 3. 0.22- μ m stericup-PES filter units (Millipore). 4. Trypsin–EDTA solution. 5. Inverted microscope. 6. Fibroblast medium: DMEM supplemented with 10% FBS,
100 units/mL penicillin, and 100 μ g/mL of streptomycin. Store at 4°C for up to 1 month.
7. Hematocytometer. 8. 35-mm tissue culture dishes (Corning). 9. PBS. 10. RIPA Buffer: 5 mL of 1 M Tris (pH 8.0), 1 mL of 5 M NaCl,
1 g Deoxycholate salt, 0.2 g NaF, 1 mL of Glycerol and 1 mL of Triton X-100, and add distilled H 2 O to attain final volume of 100 mL. Store at 4°C.
11. 1.5 mL Eppendorf microcentrifuge tubes. 12. Cell scraper (BD Falcon). 13. Sonicator equipped with a small enough probe to fit in 1.5
mL microcentrifuge tubes (Branson). 14. Refrigerated microcentrifuge. 15. Isopropanol (Sigma-Aldrich).
1. β -mercaptoethanol (Sigma-Aldrich). 2. 5× SDS Sample Buffer: 3.125 mL of 1 M Tris–Cl (pH 6.8),
0.3 g of EDTA (100 mM in 5×), 1.0 g of SDS, 5 mL of Glycerol and 0.05 g of Bromophenol Blue dissolved in dis-tilled H 2 O to a final volume of 10 mL. Store at 4°C without reducing agents. To effectively reduce disulfides, add 10% β -mercaptoethanol to the 5× stock just prior to use.
3. Precast 8–16% gradient Tris–glycine gel (Invitrogen). 4. Prelabeled molecular weight marker (Invitrogen). 5. 10× Running Buffer: add 144 g of Glycine, 30 g of Tris, and
10 g of SDS to a final volume of 1 L using distilled H 2 O. Store at room temperature. To make 1× solution, add 100 mL of 10× buffer to 900 mL ddH 2 O.
6. 1× Transfer Buffer: add 14.4 g of Glycine, 3.0 g of Tris, and 200 mL of Methanol to a final volume of 1 L using distilled H 2 O. Store at 4°C up to 1 month.
7. PVDF membranes (Millipore): need two membranes per cell type.
8. Methanol (Sigma-Aldrich).
2.2. Characterization of Isolated Fibroblasts
2.2.1. Lysis of Isolated Cells
2.2.2. Western Blotting to Test the Expression of Specific Cell Markers

280 Castelló-Cros and Cukierman
9. Ponceau’s Solution (Sigma-Aldrich). 10. TBS: add 100 mL of 1 M Tris and 60 mL of 5 M NaCl to 840
mL of distilled H 2 O to obtain the final concentration of 10 mM Tris–HCl (pH 8.0) and 150 mM NaCl). Store at 4°C and verify the lack of phosphate precipitates prior to use.
11. TBST: add Tween-20 (Polyoxyethyelesorbitan–monolaurate) to TBS to the final concentration of 0.05%. Store at 4°C and verify the lack of phosphate precipitates prior to use.
12. Blocking Solution: TBS containing BSA at final concentra-tion of 5%. Dissolve BSA completely using a magnetic bar and stirrer. Store at 4°C up to 1 month, confirm the lack of precipitates prior to use.
13. Primary antibodies : mouse anti-vimentin (Sigma-Aldrich, Catalog number: V-5255), mouse anti-pan-keratin (Abcam, Catalog number: Ab8068), mouse anti- Glutaraldehyde-3-Phosphate Dehydrogenase (GADPH) (Chemicon, Catalog number: MAB374).
14. Incubation Solution: TBST containing a final concentration of 3% BSA. Dissolve BSA completely using a magnetic bar and stirrer. Store at 4°C up to 1 month, confirm the lack of precipitates prior to use.
15. Secondary antibody: peroxidase-conjugated goat anti-mouse (Sigma-Aldrich, Catalog number: A4416).
16. ECL Detection Kit: ECL plus Western Blotting Detection System (Amersham, Catalog number: RPN2132).
17. Heat sealable polyester pouches (Kapak). 18. Heat plastic-pouch sealer (Kapak). 19. Plastic wrap (Saran). 20. Autoradiography film (Kodak). 21. X-ray film processor (Kodak).
1. Cell culture hood (Thermo Scientific). 2. 35-mm tissue culture dish (Corning). 3. 22-mm round high quality coverslips (Carolina Biological
Supply, Catalog number: 63–3035). 4. Anhydrous absolute ethanol (Pharmco-AAPER). 5. 0.22- μ m stericup-PES filter unit (Millipore). 6. PBS. 7. 0.2% gelatin: add 1 g of gelatin (Fisher) to 500 mL of PBS.
Autoclave the solution, let it cool at room temperature and sterilize by filtration using a 0.22- μ m stericup filter. This solution can be stored at 4°C up to 6 months.
2.3. Production of Fibroblast-Derived 3D Matrices
2.3.1. Preparation of Fibroblast-Derived 3D Matrices

Stromagenesis During Tumorigenesis 281
8. Tissue Culture Incubator: 37°C, 5–10% (v/v) humidified CO 2 incubator.
9. 1% glutaraldehyde: dilute 1 mL of 25% stock glutaraldehyde (Sigma-Aldrich) into 24 mL PBS to obtain 1% solution. Sterilize by passing through a 0.22 μ m stericup filter unit and store in aliquots at −20°C.
10. 1 M ethanolamine: prepare 1 M solution of ethanolamine (Sigma-Aldrich) in sterile H 2 O by adding 0.062 mL of eth-anolamine per mL of H 2 O. Filter-sterilize passing through a 0.22 μ m stericup filter unit.
11. Hematocytometer. 12. Trypsin–EDTA. 13. Inverted microscope. 14. Penicillin/Streptomycin (Mediatech, Inc.): 10,000 U/mL
Penicillin and 10,000 μ g/mL Streptomycin. 15. Fibroblast medium: DMEM supplemented with 10% FBS,
100 units/mL penicillin, and 100 μ g/mL of streptomycin. Store at 4°C for up to 1 month.
16. 0.2- μ m syringe filters (Whatman). 17. L -ascorbic acid sodium salt: prepare a stock solution of 50
mg/mL of tissue culture grade l -ascorbic acid in PBS and sterilize through a 0.2 μ m syringe filter. This stock solution cannot be stored and should be prepared just prior to use.
18. Small sterilized fine-pointed tweezers. 19. 6-well bacterial (not treated for tissue culture) plate: one
plate is needed for each two cell lines (Greiner bio-one). 20. Parafilm. 21. 50 mM of ethylenediamine tetra-acetic acid (EDTA)
(Fisher). 22. Sterile MilliQ ddH 2 O. 23. Extraction buffer: PBS containing 0.5% Triton X-100 and
20 mM NH 4 OH (Sigma-Aldrich). The solution of 0.5% Tri-ton X-100 in PBS can be stored at 4°C for up to 1 month, while NH 4 OH needs to be added just prior to use.
24. PBS pen/strep: PBS containing 100 U/mL Penicillin and 100 μ g/mL Streptomycin. Store at 4°C for up to 1 month.
1. Fixing Solution: inside a chemical hood, add 2 g of sucrose (Fluka) and 10 mL of electron-microscopy (EM) grade 16% para-formaldehyde (Electron Microscopy Sciences) to a final volume of 40 mL of PBS and mix to dissolve. Store in the dark at room temperature for up to 1 week.
2.4. Characteriza-tion of Unextracted Fibroblast-Derived 3D Matrices by Indirect Immunofluorescence

282 Castelló-Cros and Cukierman
2. Fixing and Permeablizing Solution: add 100 μ L of Triton X-100 to 20 mL of Fixing Solution. Store in the dark at room temperature for up to 1 week.
3. PBST: add 50 μ L Tween-20 (Sigma-Aldrich) into 100 mL PBS to a final concentration of 0.05%. Store at 4°C and ver-ify the lack of phosphate precipitates prior to use.
4. 100% Donkey serum stock (Jackson ImmunoResearch Lab-oratories).
5. 20% Donkey serum: add 0.4 mL of donkey serum stock to 1.6 mL PBS. Store at 4°C.
6. Block Vector Solution: add one drop of M.O.M Mouse IgG Blocking Reagent (from M.O.M Kit BMK-2202, Vector Lab-oratories) to 1.25 mL of 20% donkey serum. Store at 4°C.
7. Antibody Incubation Media: PBS containing a final concen-tration of 8% M.O.M Protein Concentrate (from M.O.M Kit BMK-2202, Vector Laboratories) and 5% donkey serum. Add 80 μ L of M.O.M Protein Concentrate and 50 μ L of 100% donkey serum stock to a final volume of 1 mL of PBS.
8. Primary Antibody Solution: add 1 μ L of mouse anti α -Smooth Muscle Actin ( α -SMA) antibody (Sigma-Aldrich, Catalog number: A2547) and 4 μ L rabbit anti-fibronectin antibody (for human samples use Sigma, Catalog number: F3648, for murine samples use Abcam, Catalog number: ab23750) to 400 μ L of Antibody Incubation Media.
9. PBST containing 10% donkey serum: add 20 μ L of 100% donkey serum stock to 180 μ L of PBST.
10. Secondary Antibody Solution: for nuclei staining use SYBR green reagent (Invitrogen, Catalog number: S7567) at 1:8,000 dilution ( see Note 1 ). For fibronectin and α -SMA detection, use anti-rabbit Cy5-conjugated and anti-mouse Rhodamine-red-conjugated affinity purified F(ab ′ )2 donkey fragments (Jackson ImmunoResearch Laboratories, Catalog number: 54557 and Catalog number:54831), respectively. Use both secondary antibodies at the dilution of 1:100. Antibody and SYBR green dilutions are made in PBST con-taining 10% of donkey serum. Before usage, preclear the sec-ondary antibody solution to remove insoluble precipitates by centrifugation at 16,100 g for 15 min at 4°C.
11. Forceps. 12. Prolong Gold anti-fade reagent (Invitrogen). 13. Microscope glass slides (Fisher) 14. Confocal microscope equipped with a Krypton/Argon laser
with three lines, 488, 568, and 647 nm, for fluorescence excitation of dye-labeled samples. This will allow the use of

Stromagenesis During Tumorigenesis 283
fluorescein-like (SYBR green for nuclei), TRITC-like (Rhod-amine-red for α -SMA)and far-red-like (Cy5 for fibronectin) ( see Note 2 ).
1. Heat-denatured 2% bovine serum albumin (BSA): dissolve 2 g of bovine serum albumin (Fraction V, Fisher) in 100 mL distilled H 2 O and sterilize using the 0.22 μ m filter . This solution can be stored indefinitely at 4°C. Just prior to use, aliquot the amount needed into a 50-mL polypropylene tube and heat for 7 min in boiling water, allow to cool back to room temperature. Heat-denatured BSA should appear translucent but not opaque or milky. Heat-denatured BSA cannot be stored.
2. PANC1 (pancreatic cancer cell line) or any normal epithelial and/or cancer cell to be analyzed.
3. PANC1 medium: 440 mL of RPMI-1640 (Mediatech, Inc.), 50 mL of FBS (Hyclone), 5 mL of Penicillin/Streptomycin and 5 mL of L -glutamine (Mediatech, Inc.). Note that if a different cell-line is to be used appropriate media needs to be prepared.
4. 60-mm tissue culture dish: one for each cell line to be ana-lyzed (Corning).
5. Sterile 15 mL polypropylene conical tubes: two per each cell line (Corning).
6. 35-mm dishes containing the desired fibroblast-derived 3D matrix samples for analyses: minimum of two for each cell line ( see Subheading “ Primary Fibroblast-Derived 3-D Matrices ”).
7. 35-mm tissue culture dishes: minimum of two for each cell line (Corning).
8. CFDA−SE dye (carboxyfluorescein diacetate, succinimidyl ester dye). Prepare a 20 mM stock solution of CFDA−SE dye (Vybrant R CFDA−SE Cell Tracer Kit from Invitrogen) using the high-quality DMSO that is included with the kit. Store in the dark at −20°C.
9. Hoechst 33342: Bisbenzimide H 33342 fluorochrome, tri-hydrochloride (Calbiochem). Prepare 2 mM stock solution in water. Store at 4°C protected from light.
10. Fixing Solution: inside a chemical hood, add 2 g of sucrose (Fluka) and 10 mL of EM grade 16% paraformaldehyde (Electron Microscopy Sciences) to a final volume of 40 mL of PBS and mix to dissolve. Store in the dark at room tem-perature for up to 1 week.
11. Parafilm.
2.5. Morphological Analyses of Cancer Cells Replated within Various Stromagenic Fibroblast-Derived 3D Matrices
2.5.1. Fluorescent Labeling of Normal and/or Cancer Cell-Bodies and Nuclei

284 Castelló-Cros and Cukierman
12. PBS pen/strep: PBS containing 100 U/mL Penicillin and 100 μ g/mL Streptomycin. Store at 4°C for up to 1 month.
13. Epifluorescence microscope, equipped with UV (excitation 360–370 nm and emission 420 nm) and FITC (excitation 460–500 nm and emission 510–560 nm) filters, CCD cam-era and acquisition software.
Image-files in .tiff format to be analyzed. Analysis software: Microsoft Excel and/or MetaMorph 7.0r1 (Molecular Devices, Sunnyvale, CA). Girded see-through paper. Stage Micrometer.
1. GraphPad Instant software or any other simple statistical software.
Notes : All solutions and equipment coming into contact with tis-sue samples or living cells must be sterile and aseptic techniques should be used accordingly. All cell-culture incubations are per-formed using a 37°C, 5 – 10% CO 2 humidified incubator.
Fibroblasts synthesize and maintain the ECM of mesenchymal tissues. The main function known for fibroblasts is maintaining the structural integrity of all connective tissues by continuously secreting components (e.g., soluble cytokines, latent factors, and matrix glycoproteins) and actively incorporating them to the ECM. The composition of a given ECM determines the specific physical and biochemical properties of each connective tissue.
This section describes two methods used to harvest primary fibroblasts from normal and/or neoplastic tissue samples ( see N ote 3 ). The first method, minced tissue method ( see Subhead-ing 3.1.1 ), is based on the capability of fibroblasts to crawl out of tissue samples, thus facilitating their harvest. Minced tissue method provides fairly homogenous fibroblastic cell-cultures. Therefore, this method assures the isolation of a variety of different subpopulations of fibroblasts present in a given (nor-mal or tumor-associated) tissue. The second method, enzymatic digestion method ( see Subheading 3.1.2 ), is faster and yields a higher recovery rate of cells from the tissue. Since this is a much faster method, contaminations are less common than in the first method. Fibroblast cultures obtained using the second method are heterogeneous and probably better represent the fibroblastic
2.5.2. Digital Analysis to Measure Cell Morphologya
2.5.3. Statistical Analysis
3. Methods
3.1. Isolation of Fibroblasts from Normal and/or Tumor Tissue Samples
Stromagenesis During Tumorigenesis 285
population of a given tissue. Unfortunately, the heterogeneous aspect of this procedure often results in cultures that contain additional types of cells (e.g., epithelial). This method is adequate for fibroblasts that are impaired in their motile capabilities, or when heterogeneous cultures are needed.
In the minced tissue method (first method), the tissue sam-ples are cut into small pieces and each of these pieces is separately placed in a tissue culture plate until fibroblasts migrate out of the tissue. In the enzymatic method (second method), tissue samples are actively digested and cells sorted by size exclusion. Once the fibroblast cultures reach confluence (in both methods), they can be frozen for later or expanded for immediate experimental use.
1. Using sterile dissecting scissors and/or sterile needles make several scratches on the plastic surface of a 12-well tissue cul-ture plate in a star-like or grid configuration. These rough surfaces will facilitate tissue adherence to the plates allowing the fibroblasts to crawl out into the culturing plates. The scratches need to be made while the plate is inside a tissue-culture hood, thus avoiding contaminations and the plates need to be rinsed with sterile PBS, following scratching of the surface, to eliminate the plastic-debris.
2. Rinse the human or murine normal or tumor tissue samples (obtained fresh immediately after surgery) in a 60-mm tissue culture dish that contains cold (4°C) sterile PBS pen/strep.
3. Using scissors and assisting with tweezers put the rinsed tis-sue in a second 60-mm dish and chop into 1 mm 2 pieces using a sterile scalpe l ( see Note 4 ).
4. Place the tissue pieces onto the indentations created by the scratches in step 1 (one piece per well).
5. Allow samples to dry by leaving the plates uncovered inside the tissue-culture hood in the proximity of an open Bunsen-burner flame for a period of 5–8 min. This will ensure adher-ence of the tissue samples to the scratched bottom of the dishes.
6. Carefully, add 1 mL of fibroblast medium to each well con-taining a minced piece of tissue, preventing the tissue sam-ples from detaching ( see Note 5 ). Place dishes inside the incubator.
7. Replace half of the fibroblast medium with fresh fibroblast medium three times per week until primary fibroblasts migrate (or crawl out) of the tissue pieces. This process should be regularly monitored using an inverted micro-scope, and it normally takes 2 – 8 weeks depending on the tissue source (e.g., ovarian tissues take about 2 weeks while pancreatic samples vary between 4 and 8 weeks
3.1.1. Isolation of Fibrob-lasts from Freshly Minced Normal and/or Tumor Tissue Samples

286 Castelló-Cros and Cukierman
depending whether tumors were untreated or irradiated prior to surgery).
8. When the fibroblasts occupy most of the dish surface, remove the piece of tumor with sterile tweezers, trypsinize cells ( see Note 6 ), and replate into a T-75 tissue culture flask. The piece of tissue removed can be replaced on a new scratched plastic dish to obtain more fibroblasts repeating procedures starting from step 4 .
9. Once fibroblasts reach confluence within the T-75 tissue culture flask, they can be expanded (passaged) into addi-tional dishes at a ratios between 1:3 and 1:5 ( see Note 6 ) for experimental analyses and be used for production of fibroblast-derived matrices (between passages 2 and 6, see sections below) or be frozen using freezing medium ( see Note 7 ). The isolated fibroblasts can be immortalized using SV40 large T antigen. If the fibroblasts are immortal-ized, cultures would need to be recharacterized later on ( see Subheading 3.2 ).
1. Place human (or murine) normal or tumor tissue samples (fresh from surgery) into a 10-cm plastic dish containing 10 mL DMEM pen/strep and rinse briefly.
2. Transfer samples into a 10-cm plastic dish containing 10 mL DMEM-3%BSA-pen/strep.
3. Using a sterile scalpel and assisting with tweezers cut the tumor tissue in small pieces to facilitate the enzymatic diges-tion that will follow.
4. Transfer the material into a sterile 150 mL Erlenmeyer. Add 8 mL DMEM-3%BSA pen/strep into the 10-cm plastic dish and collect the remaining tissue pieces, transferring them into the same 150 mL Erlenmeyer.
5. Add 2 mL of Collagenase-3 (10×) to the samples, thus, dilut-ing the collagenase tenfold.
6. Place the Erlenmeyer in an orbital shaker for 1 h and agitate at 100 g at 37°C ( see Note 8 ). After 1 h, most of the tumor pieces should be digested. If tumor-pieces still remain undigested, continue the agitation until complete digestion is evident ( see Note 9 ).
7. Transfer the digested tissue into 50 mL polypropylene tubes and centrifuge it at 200 × g for 10 min to collect the cells ( see Note 10 ).
8. Remove the supernatant containing the collagenase to pre-vent further degradation, thus, avoiding damaging the cells.
9. Resuspend the cell-pellet in 10 mL fibroblast medium.
3.1.2. Isolation of Fibrob-lasts from Collagenase-Digested Normal and/or Tumor Tissue Samples

Stromagenesis During Tumorigenesis 287
10. Filter the cell-suspension through 500 μ m nylon mesh fol-lowed by filtrations through 100 μ m and 40 μ m cell strain-ers, thus removing remaining tissue pieces.
11. Transfer the final filtrate into a 10-cm tissue culture dish and incubate for 2 h inside the incubator ( see Note 11 ).
12. At the end of 2 h incubation period, change the medium to remove nonadherent cells and other material.
13. Once fibroblasts reach confluence within the T-75 tissue culture flask, they can be expanded (passaged) into addi-tional dishes at a ratios between 1:3 and 1:5 ( see Note 6 ) for experimental analyses and be used for production of fibrob-last-derived matrices (between passages 2 and 6, see sections below) or be frozen using freezing medium ( see Note 7 ).
14. The isolated fibroblasts can be immortalized using SV40 large T antigen. If the fibroblasts are immortalized, cultures would need to be recharacterized later on (see below).
Although most contaminant cells (epithelial and/or endothelial) perish after a few passages, it is always recommended to assure that the harvested cell population contains only fibroblastic cells. This can be assessed using specific cell markers, as well as by phe-notypic analysis. Typically, fibroblasts are large, flat, and relatively elongated cells with branched bodies that surround an oval and speckled nucleus. Fibroblasts express, among others, vimentin. In contrast, cytokeratin is an epithelial cell marker. In this sec-tion, we describe how to assess the homogeneity and exclusiv-ity of the harvested fibroblastic cell population using microscopy and a Western blot techniques, respectively ( see Note 12 ). The isolated cells are plated onto 35-mm dishes and incubated over-night. Their morphology and homogeneity are analyzed under a microscope, while cellular proteins are extracted and separated by SDS PAGE, followed by transfer into PVDF membranes and sub-jected to Western blot analyses using marker-specific antibodies.
1. If the harvested cells to be characterized are from a stock that was frozen, quickly thaw the cells by placing the vial, containing frozen cells, on a 37°C water bath. Immediately after thawing, dry the vial and rinse it with ethanol.
2. Inside the tissue-culture hood, open the vial and transfer the cells into a T-75 tissue culture flask containing 10 mL of fibroblast medium preheated to 37°C. To remove the DMSO that is present in the freezing medium, let the cells attach for about 2–3 h then remove the medium and add 10 mL of fresh and preheated to 37°C fibroblast medium. For cells already in culture start from step 2 .
3.2. Characteriza-tion of the Isolated Fibroblasts
3.2.1. Lysis of Isolated Cells

288 Castelló-Cros and Cukierman
3. Once cells reach 70–80% confluence, the homogeneity of the cell culture can be assessed using an inverted microscope.
4. For further characterization, split cells ( see Note 6 ) and count using a hemacytometer. Calculate the cell concentration and dilute with fibroblast medium to a final concentration of 1 × 10 5 cells/mL.
5. Add 2 mL of cell suspension (2 × 10 5 cells) into each of three 35 dishes. Place the three dishes in the incubator overnight.
6. Remove the dishes from the incubator and place them onto a tray containing ice ( see Note 13 ). Wash the cells twice using ice-cold PBS. After the second wash, tilt the plate slightly to remove all liquid . This will minimize final-volume variability.
7. Add 250 μ L of cold RIPA Buffer onto each plate ( see Note 14 ). 8. Incubate on ice for 5 min while gently rocking. 9. While keeping the dish on ice, scrape the dish using a cell
scraper to collect all the protein lysate. Transfer all the mate-rial into a 1.5 mL tube prechilled on ice.
10. While on ice, sonicate the sample for 30 s, using a small probe at medium power.
11. Optional: leave the tubes on ice for additional 30 s and repeat step 9 .
12. Centrifuge the lysates at 16,100 g for 15 min at 4°C. 13. Collect the supernatant and transfer into a clean 1.5 mL tube.
If not used immediately for Western blot analysis, quickly freeze the lysates by placing the tubes within a precooled isopropanol bath on dry-ice and store at −80°C for up to 2 weeks ( see Note 15 ).
1. Add a fifth of the final volume of 5× Sample Buffer contain-ing 10% of β -mercaptoethanol to the cell lysate sample to be analyzed (e.g., 20 μ L 5× Sample Buffer to 80 μ L cell lysate thus obtaining a final volume of 100 μ L).
2. Mix and then boil the samples at 100°C for 5 min. 3. For sodium dodecyl sulfate polyacrylamide gel electrophore-
sis (SDS–PAGE), load about 30 μ L of each sample ( see Note 16 ) and 10 μ L of prelabeled molecular weight marker onto separate wells of 8–16% Tris–glycine gel ( see Note 17 ).
4. Repeat step 3 to obtain a second identical gel ( see Note 18 ). 5. Using 1× Running Buffer, separate the proteins in both gels
by electrophoresis at 100 V for 2 h or until the bromophenol blue from the samples reaches the bottom of the gels.
6. Activate the PVDF membranes (one for each gel) by soaking in methanol for 30 s, then ddH 2 O for 1 min and incubate in Transfer Buffer until ready to transfer.
3.2.2. Western Blotting to Test the Expression of Specific Cell Markers

Stromagenesis During Tumorigenesis 289
7. Transfer the proteins from the gels to the PVDF membrane at 4°C using a transfer apparatus containing Transfer Buffer for 2 h at 25 V or overnight at 15 V ( see Note 19 ).
8. Optional: to visualize and assess the quality of the proteins transferred rinse the PVDF membranes with ddH 2 O and place it in 10 mL Ponceau’s Solution. Rock gently for 5 min. Wash the membrane with ddH 2 O for about 5 min to remove the excess of Ponceau’s solution (at this point, the membrane can be scanned or photographed for your records). Finally, wash membranes with PBS to remove the remaining dye.
9. Block the membranes by incubating in Blocking Solution for 1 h at room temperature or overnight at 4°C while rocking gently ( see Note 20 ).
10. Remove the Blocking Solution and add 10 mL of Incuba-tion Solution containing: 2 μ L anti-GAPDH (to be used as a total protein control) and 2 μ L anti-vimentin (used as spe-cific fibroblastic marker) to one of the membranes. To the other membrane, add 10 mL of Incubation Solution con-taining 2 μ L of anti-GAPDH (to be used as a total protein control) and 2 μ L of anti-pan-keratin (used as specific epi-thelial marker; it recognizes most types of keratins). Incubate each membrane with its specific antibody-cocktail, by gently rocking for 1 h at room temperature (or overnight at 4°C with, see Note 20 ).
11. Wash the PVDF membrane four times, 5 min each time, using extensive amounts of TBST.
12. Incubate each membrane with secondary antibody; 10 mL Incubation Solution containing 2 μ L of goat peroxidase-conjugated anti-mouse. Rock gently at room temperature for 1 h.
13. Wash membranes four times, 5 min each time, using copious amounts of TBS.
14. Drain excess TBS by dabbing the edge of the PVDF mem-branes onto a paper towel, then position the PVDF mem-brane onto plastic wrap with the protein side facing up.
15. Use Amersham Detection ECL Kit adding 50 μ L of Solu-tion B into 2 mL Solution A. Add 1 mL of this Detection Solution (drop wise) onto each PVDF membrane and incu-bate for 30 s to 1 min.
16. Drain off excess Detection Solution by dabbing the edge onto paper towel and transfer membranes onto a clean plas-tic wrap or plastic pouch.
17. Place the covered membrane into an X-ray film cassette. In the dark, expose the membrane to autoradiography film and develop using an X-ray film processor to visualize the protein bands.

290 Castelló-Cros and Cukierman
18. The individual protein bands corresponding to vimentin, keratin, and GADPH can be identified within the samples in question by comparing their molecular weights to the posi-tive control samples ( see example in Fig. 1 ).
This section describes a method for generating cell-derived 3D matrices produced by a plethora of primary fibroblasts. The resultant matrices can be used as substrates for culturing cells, since they closely resemble in vivo mesenchymal matrices (41, 42) . Utilizing in vivo - like 3D matrices as substrates allows to study, in a physiologically relevant manner, how cells interact with their natural ECMs, as well as their microenvironmental induced structures, functions, and signaling, which differ from observa-tions obtained by culturing cells on conventional 2D substrates in vitro (43– 48) .
In the protocols described in this section, the fibroblasts used are the primary fibroblasts harvested from the assorted nor-mal and tumor tissue-samples described in previous Subhead-ings 3.1.1 and 3.1.2 . Following the description for 3D matrix production, we describe how to extract cellular debris from the matrices.
3.3. Production of Fibroblast-Derived 3D Matrices
Fig. 1. Western blot analysis for the characterization of fibroblastic and/or epithelial cell populations. Protein lysates were loaded on two identical gels and proteins were sepa-rated by SDS–PAGE and then transferred to PVDF membranes. Membranes were blot-ted using antibodies against epithelial marker, pan-keratin ( top ) or fibroblastic marker, vimentin and loading control, GAPDH ( bottom ). Positive controls for both fibroblastic and epithelial cells, as well as three samples characterized as fibroblastic are shown. Molecular weight markers are stated .
Stromagenesis During Tumorigenesis 291
The basic approach is to allow fibroblasts to produce their own 3D matrices. For this, fibroblasts are plated and maintained at a confluent state, while fresh ascorbic acid that stabilizes the secreted matrices is added every other day for a period of 5–9 days. Matrices are extracted, using an alkaline detergent treat-ment, thus removing cellular debris and leaving the 3D matrices intact and stably attached to the culture dishes. The fibroblast-derived 3D matrices contained within the dishes are then stored at 4°C for a couple of months.
1. Optional: for immunofluorescence experiments 22-mm cov-erslips are to be used. Coverslips need to be sterilized by flaming after dipping into absolute anhydrous ethanol. Pro-ceed by placing the coverslips at the bottom of a 35-mm tis-sue culture dishes and rinse with PBS. Remove the PBS and continue to step 1 .
2. Add 2 mL of 0.2% gelatin solution to each 35-mm tissue culture dish to be used ( see Note 21 ) and incubate for 1 h at 37°C or overnight at 4°C.
3. Aspirate gelatin and wash with 2 mL PBS. 4. Cross-link the gelatin by adding 2 mL 1% glutaraldehyde to
each dish and incubate plates for 30 min at room temperature. 5. Aspirate glutaraldehyde and wash plates three times, 5 min
each time, with 2 mL of PBS. 6. Add 2 mL of 1 M ethanolamine to each dish and incubate at
room temperature for 30 min. This will block the remaining glutaraldehyde, thus avoiding damaging the cells later on.
7. Aspirate ethanolamine and wash plates three times, 5 min each time, with 2 mL PBS.
8. Remove PBS and replace with 2 mL of fibroblast medium. If the medium appears purple, repeat steps 6 and 7 to remove any trace amounts of ethanolamine.
9. Remove media from a T-75 semiconfluent tissue culture flask (80% confluent) containing the primary fibroblasts harvested fol-lowing protocols in Subheadings 3.1.1 or 3.1.2 . These fibrob-lasts will be used for matrix production and should be at a passage between 2 and 6. A single semiconfluent T-75 flask should con-tain enough fibroblasts for the production of matrices coating about 11–14 of 35-mm dishes. As many as five flasks, contain-ing primary fibroblasts, can be used in this procedure, rendering 55–70 of 35-mm matrix-covered plates ( see Note 21 ).
10. Trypsinize cells ( see Note 6 , in Subheading 3.1.1 ), count and dilute to a final concentration of 2.5 × 10 5 cells/mL.
11. Add 2 m of cell suspension (5 × 10 5 cells) to each 35-mm dish where matrices will be produced.
3.3.1. Preparation of Fibroblast-Derived 3D Matrices
Primary Fibroblast-Derived 3D Matrices

292 Castelló-Cros and Cukierman
12. Place the dishes overnight in the incubator ( see Note 22 ). 13. Confirm that cells are confluent, remove the media and
replace with fibroblast media containing freshly added 50 μ g/mL ascorbic acid. Place cells back into the incubator and count this day as “2.” Repeat this step on the mornings of days, “4” and “6” ( see Note 23 ).
1. On the morning of day 8 ( see Note 24 ), carefully wash the dish with 2 mL of PBS then remove the PBS.
2. Slowly and very carefully add (drop wise) 1 mL of preheated to 37°C extraction buffer and observe under a tissue culture micro-scope until the fibroblasts are completely lysed (5 – 10 min).
3. Optional: when matrices produced are too thick (more than 17 μ m thick), it is possible that following the above steps will not suffice for complete extraction. In that case, one of two possible approaches can be used. On the first approach, after removing the PBS from step 1 , add 1 mL of 50 mM EDTA and incubate at 37°C for 10 min, wash twice with PBS and proceed to step 2 . On the second approach, after removing the PBS from step 1 , add 2 mL of sterile Millipore ddH 2 O, and incubate for 5 – 10 min at room temperature, carefully remove the ddH 2 O and add additional 2 mL of fresh sterile Millipore ddH 2 O and incubate for 30 min at room tempera-ture. Carefully discard the ddH 2 O and continue to step 2 .
4. Very carefully, without removing the extraction buffer, add 2 mL PBS avoiding turbulence as much as possible.
5. Optional: at this point the matrix can be placed at 4°C over-night. This will assure the stability of the newly extracted matrices and will minimize matrix detachment. Make sure to warm matrices back to room temperature before continuing to the next step.
6. To avoid damaging the matrices, slowly tilt the plate and carefully, without touching them, remove approximately 2.5 mL of the solution.
7. Slowly and carefully add 2.5 mL of PBS. 8. Repeat steps 6 and 7 twice. 9. Remove 2.5 mL of the PBS and add 2 mL of PBS pen/strep,
seal the dish using parafilm strips, and store matrices at 4°C for up to 3 months.
Tumor-associated (e.g., desmoplastic) stroma has been associated with a variety of invasive cancers (15, 49) . This stroma presents a scar-like phenotype, is highly fibrotic and can constitute more than 50% of the tumor mass. The desmoplastic stroma is char-acterized by the presence of activated myofibroblasts, which
Extraction of Primary Fibroblast-Derived Matrices
3.4. Characteriza-tion of Unextracted Fibroblast-Derived 3D Matrices by Indirect Immunofluorescence

Stromagenesis During Tumorigenesis 293
are highly proliferative and express alpha-smooth muscle actin ( α -SMA). Three-dimensional matrices derived from primary fibroblasts harvested at different stages of tumor development differ in their orientation of fibronectin fibers, expression and organization of α -SMA and the morphology of both their cell body and nucleus (42) . Therefore, characterization of the above-mentioned features can be used to sort unextracted 3D matrix cultures as normal, primed, or tumor-associated. For example, matrices derived from primary tumor-associated fibroblasts that are desmoplastic, present a parallel patterned matrix with high and homogenous α -SMA expression localized on stress fibers and elongated elliptical nuclei morphology (Fig. 2 ). Matrices produced by primary primed fibroblasts present a more random organization of fibronectin fibers, relatively rounded nuclei and either lack α -SMA expression or express α -SMA at relatively low levels. Primary fibroblasts isolated from normal tissues nor-mally produce very thin matrices and the majority of these do not overcome growth inhibition by contact, therefore, cultures are mono-layered. Nevertheless, some normal fibroblasts iso-lated from specific cites, such as normal ovaries, grow multi-layers when maintained in vitro as confluent cultures. Similarly to primed matrices, 3D matrices obtained from normal primary
Fig. 2. Representative tumor-associated unextracted 3D matrix culture. Reconstituted confocal images obtained from indirect immunofluorescence of a tumor-associated unextracted 3D culture. ( A ) Homogenous α -SMA expression along stress fibers ( red ); ( B ) Parallel patterned matrix labeled with fibronectin ( green ); ( C ) Organized, condensed, and ellipti-cally-shaped nuclei characteristic of myofibroblastic cells ( blue ). ( D ) Merged image of all three monochromatic images. Note that monochromatic images were arbitrarily designated with the colors shown .

294 Castelló-Cros and Cukierman
fibroblasts are greatly disorganized and the unextracted nuclei also appear relatively round. However, in comparison to primed unextracted cultures, normal unextracted 3D cultures vary on the expression of α -SMA from cultures that homogenously express high levels of α -SMA (e.g., normal ovarian-derived 3D cultures (50) ) to heterogeneous or low homogenous expression levels of this protein (e.g., skin and pancreas-derived 3D cultures).
The classification of unextracted in vivo-like 3D stromal matri-ces produced by assorted isolated fibroblasts ( see Subheadings 3.1.1 and 3.1.2 ) as normal, primed, or tumor-associated (desmo-plastic) can be questioned using indirect immunofluorescent stain-ing. In this section, unextracted 3D stromal matrices, prepared onto coverslips ( see Subheading “ Primary Fibroblast-Derived 3-D Matrices ”), are fixed and permeabilized, and subjected to multichannel simultaneous fluorescent labeling of matrices (e.g., fibronectin), nuclei and α -SMA. Following fluorescent labeling, the unextracted 3D cultures are analyzed under a multichannel fluorescence scanning or spinning disk confocal microscope.
1. Wash coverslips containing unextracted 3D matrices (cul-tures obtained from step 1 in Subheading “ Extraction of Primary Fibroblast-Derived Matrices ”) with 2 mL of PBS ( see Note 25 ).
2. Add 0.8 mL Fixing/Permeablizing Solution to each cover-slip and incubate at room temperature for 3 min.
3. Carefully without damaging the sample, aspirate solution and add 0.8 mL of Fixing Solution to each coverslip and incubate at room temperature for 20 min.
4. Replace solution with 2 mL of PBST and incubate for 5–10 min.
5. Remove all solution by slightly tilting the plate containing the samples and carefully aspirate all liquid and replace with 50 μ L Block Vector Solution adding directly onto the sample (drop wise). Incubate coverslips for 1 h at room temperature while assuring that samples stay moist ( see Note 26 ).
6. Rinse twice, 2 min each time, with 2 mL of PBST. 7. Similar to the procedure described in steps 4 and 5 , remove
all liquid and add 50 μ L of Antibody Incubation Media directly onto each coverslip. Let sit for 5 min at room tem-perature.
8. Tip-off the excess of Antibody Incubation Media, remove and replace with 50 μ L of Primary Antibody Solution directly onto each coverslip and incubate for 1 h at room temperature.
9. Wash coverslips three times, for 8 min each time, using 2 mL of PBST at room temperature.
3.4.1. Indirect Multichan-nel Immunofluorescent Labeling of Unextracted 3D Stromal Matrices

Stromagenesis During Tumorigenesis 295
10. Carefully replace solution with 50 μ L of Secondary Anti-body Solution and incubate 30 min at room temperature.
11. Wash coverslips three times, for 8 min each time, using 2 mL of PBST at room temperature.
12. Rinse once using 2 mL PBS and once using 2 mL ddH 2 O. 13. Carefully, remove coverslips (one by one) from ddH 2 O, get
rid of excess of liquid and mount coverslips face down onto a microscope slide using a drop ( ∼ 12 μ L) of prolong mount-ing medium.
14. Let samples dry for 1–2 h (or overnight), in the dark and store at −80°C until ready to analyze.
15. For analysis, use a confocal microscope (or epifluores-ence microscope that can capture images along the z -axis). Acquire an image for each color (channel) and repeat on dif-ferent locations per sample at least five times ( see Note 27 ).
Listed below are some characteristics that will assist to classify fibroblastic unextracted 3D cultures as “normal,” “primed,” or “tumor-associated” (42) by using the three channel images acquired in the previous section ( see Subheading 3.4.1 ) ( see Note 28 and Fig. 2 ).
Unextracted 3D “tumor-associated” and “primed” cultures are multilayered and, therefore, they produce matrices that range between 7 and 25 μ m in thickness ( see Note 29 ).
“Normal” unextracted cultures range between mono (e.g., human and murine skins) (42) and multilayers (e.g., human ovary) and, therefore, their average thickness vary from just a few micrometers to thickness similar to the one seen in primed and tumor-associated cultures.
Matrices that present a patterned parallel organization (revealed by fibronectin staining) are matrices-derived from “tumor-associated” (e.g., myofibroblastic) fibroblasts. “Nor-mal” and “primed” matrices are mesh-like and disorganized. “Tumor-associated” cultures are characterized by high expres-sion of endogenous α -SMA containing stress fibers. “Primed” 3D cultures either do not express α -SMA or express very low homogenous levels of α -SMA; these cells are also known as pro-to-myofibroblastic cells, which down-regulate α -SMA expression prior to myofibroblastic differentiation associated with desmo-plastic reactions. “Normal” 3D cultures vary on their levels of α -SMA expression ranging from nonexpressing cells, to heter-ogeneous (e.g., some cells express high levels while others do not express α -SMA) or homogeneous, expressing high levels of α -SMA (e.g., normal human ovary). “Normal” and “primed” cells have relatively rounded nuclei. “Tumor-associated” myofi-broblastic cells have elliptical and condensed nuclei, which are
Image Analysis for Sorting In Vivo-Like 3D Cultures as Normal, Primed, or Tumor-Associated

296 Castelló-Cros and Cukierman
organized in parallel patterns following the same orientation as both α -SMA positive stress fibers and fibronectin rich 3D matri-ces. Some examples of the above-mentioned characteristics for “tumor-associated” 3D cultures are shown in Fig. 2 .
One of the main features of cancer progression resides in the fact that when tumors become invasive the basement membrane that normally isolates epithelium from mesenchyme becomes degraded and, therefore, invasive cancer cells directly interact with the mesenchymal stromal components both prior to intrava-sation and after extravasation at the secondary sites. The specific morphological phenotype acquired by invasive cancer cells while migrating within mesenchymal tissues is predictive of their inva-sive strategy behavior (35– 37) . For example, it is well known that tumor cell migration and metastasis can occur by multiple mecha-nisms (e.g., epithelial–mesenchymal transition, or mesenchymal–amoeboid transition) (35– 37) . These various mechanisms require different signaling pathways, directly induced by the stroma, and are clearly distinguished by specific cell morphologies (e.g., mes-enchymal vs. amoeboid). Therefore, testing whether cells acquire differential morphologies within different stromagenic staged 3D matrices could predict how the specific cells would invade within specific microenvironmental settings (e.g., normal, primed, or tumor-associated stroma). Amoeboid cells are relatively rounded, while mesenchymal cells are spindled-shaped. Mesenchymal cell invasion requires the function of integrins and specific matrix-proteases while amoeboid invasion is independent of integrins and matrix-proteases functions and instead requires the activa-tion of the ROCK pathway (39, 40) .
In this section, we provide a method for evaluating 3D matrix-induced epithelial cancer cell morphology. Prior of cell replating within the assorted 3D matrices, the nuclear and cytosolic com-partments of the epithelial cancer cells are fluorescently labeled. Then cells are replated within the assorted matrices overnight, and their morphologies are measured following the acquisition of several representative double-channeled monochromatic images using an epifluorescence microscope equipped with filters for the acquisition of the specific fluorophores used.
1. Block the matrices by adding 2 mL of heat-denatured 2% BSA onto a 35-mm plates containing fibroblast-derived 3D matrices ( see Subheading “ Extraction of Primary Fibroblast-Derived Matrices ”) and incubate at 37°C for 1 h ( see Note 30 ).
2. After incubation, carefully rinse the matrices twice with 2 mL of PBS.
3. Use a semiconfluent 60-mm culture dish containing PANC-1 (or any other epithelial cells for analysis (e.g., normal or cancer cells)) and aspirate the media.
3.5. Morphological Analyses of Cancer Cells Replated within Various Stromagenic Fibroblast-Derived 3D Matrices
3.5.1. Fluorescent Labeling of Normal and/or Cancer Cell-Bodies and Nuclei
Stromagenesis During Tumorigenesis 297
4. Add 4 mL of corresponding medium containing 4 μ L of Hoechst 33342 Stock Solution. Incubate 15 min at 37°C.
5. Rinse five times with PBS. 6. Trypsinize the cells ( see Note 6 ) and centrifuge at 250 g for
3 min at room temperature obtaining a cell pellet. 7. Remove the supernatant and resuspend cells by gently pipet-
ting up and down, using 1 mL of preheated to 37°C PBS containing 1 μ L CFDA−SE dye stock solution.
8. Incubate at 37°C for 15 min. 9. Centrifuge cells at 250 g for 3 min at room temperature and
remove the supernatant. 10. Carefully resuspend the pellet by gently pipetting with 5 mL
PBS. 11. Repeat steps 8 and 9 three times thus removing residual free
dye. 12. Resuspend cells using 3 mL of their corresponding epithelial
medium (e.g., PANC-1 medium), count cells using a hem-acytometer, and dilute to a final concentration of 1 × 10 4 cells/mL.
13. Carefully remove the PBS from a 35-mm plate containing fibroblast-derived 3D matrix and add 2 mL of cells from the previous step.
14. Optional: regular, uncoated 2D plates can be used in parallel as controls in order to assess the effects that mesenchymal 3D matrices have on the epithelial normal or cancer cell mor-phology.
15. Place cells in the incubator overnight. 16. Rinse cells carefully with 2 mL of PBS. 17. Aspirate the PBS, add 2 mL of Fixing Solution and incubate
for 20 min at room temperature, in the dark. 18. Remove the Fixing Solution and wash with 5 mL PBS. 19. Aspirate the PBS, add 2 mL of fresh PBS pen/strep and seal
the dishes using parafilm. Store at 4°C in the dark until ready for image acquisition (up to 1 week).
20. Place the dishes under the epifluorescence microscope and acquire three simultaneous monochromatic images using the 10× or 20× objectives. The first image should be acquired using filters for CFDA−SE dye (similar to FITC, or green dyes). The second image should be acquired at exactly the same position using the filter for Hoechst 33342 (similar to DAPI, or blue dyes). The third image (again at exactly the same position) should be acquired using transmitted, instead of fluorescent, light (e.g., phase contrast). A minimum of five

298 Castelló-Cros and Cukierman
random locations should be acquired for each sample and samples should be prepared in duplicate rendering a total of ten images per condition analyzed. All images should be saved as .tiff files for digital analysis ( see Subheading 3.5.2 ).
1. The digital analysis can be carried out manually or automati-cally, this section describes how to measure cell morphology using the MetaMorph 7.01 software (Molecular Devices).
2. Using the Metamorph software, open the three files contain-ing the monochromatic images acquired in the previous sec-tion corresponding to the cytosolic (CFDA−SE) and nuclear (Hoechst) compartments, as well as the transmitted light channel (e.g., phase contrast) image.
3. Go to the “Apps” menu and select “Cell scoring.” Select the image corresponding to the Hoechst staining as the “W1 Source image” (All nuclei) and the CFDA−SE staining for “W2 Source image” (Positive marker). Select a representa-tive nucleus and cytoplasm, respectively.
4. Determine the minimum and maximum width of the nuclei and cytoplasm, using the single line tool, while pointing at it to determine the intensity above the background for both images.
5. Click on “Preview” for each image to assess if your selected areas depict the correct nuclei (Hoechst positive) and cytosolic (CFDA−SE positive) fractions. If correct, continue to step 5 ; otherwise, modify the parameters until accurate previews are obtained.
6. Select “Apply;” an accurate image named “segmentation” will appear and both nuclei and cytosols will be evident in it ( see Fig. 3 ).
3.5.2. Digital Analyses to Measure Cell Morphology
Fig. 3. Example of nuclei and cytosolic images rendering segmented file for morphometry analyses. Left panel shows the nuclei staining, while the middle panel shows the cytosolic compartment of the same cells. The resultant right panel image is the computer version of the cells selected for analyses that will render the cell’s morphometric quantifications.

Stromagenesis During Tumorigenesis 299
7. “Threshold” the resulting “segmentation” image by select-ing “Auto Threshold for Light Objects” (localized on the left toolbar of the image).
8. Open the “Measure” menu and select “Integrated Morphol-ogy Analysis.”
9. In the list of parameters to be measured, select “Area,” “Breadth,” “Length,” and “Elliptical Form Factor.” Make sure that these parameters are selected under the Show/Log Data section.
10. Log the data to an Excel file. 11. Analyze the Excel data by averaging and questioning the
variation of the samples. Cells that present amoeboid like morphologies will present elliptical form factors near 1 while mesenchymal spindle-shape factors will render smaller number results.
12. Optional: for manual measurements print each image onto grided (see-through) paper and determine the length (the span of the longest chord of the cell) and the breadth (the caliper width of the cell, perpendicular to the longest chord) for each cell. Then, calculate length over breadth and esti-mate as in step 10 .
1. A minimum of 12 cells are needed for statistical analyses and many more are expected. Each experimental condition should have been repeated at least once more.
2. The elliptical form factors should be compared using a Welch corrected t -test. The unpaired t -test assumes that the two populations have the same variances. Since the variance equals the standard deviation squared, this means that the populations have the same standard deviation. A modifica-tion of the t -test (developed by Welch) can be used when you are unwilling to make that assumption. These values can be calculated using any statistical software (e.g., Instat).
3. The resultant number will be indicative of the p value: (a) p value greater than 0.05 should be stated not signifi-
cant. (b) p value between 0.05 and 0.001 is regarded as statisti-
cally significant. (c) p value between 0.001 and 0.0001 should be stated
“very” significant. (d) p value equal or lower to 0.0001 should be regarded as
statistically “extremely” significant.
3.5.3. Statistical Analysisa

300 Castelló-Cros and Cukierman
1. To stain the nuclei, other dyes can be used (e.g., Hoechst or DAPI) but since most confocal microscopes do not have UV filters to detect the signal of these fluorescent dyes, we pro-posed to use the fluorescent SYBR Green dye, which absorbs blue light ( λ max = 498 nm) and emits green light ( λ max = 522 nm) and whose fluorescence staining can be analyzed using the 488 nm channel available in most of the confocal microscopes.
2. Instead of a confocal microscope, an epifluorescent micro-scope equipped with a motorized Z-motor and deconvolu-tion software can be used.
3. Primary fibroblast cultures may be obtained from different tissues, normal or tumor, including but not limited to human tumor tissue from ovary, pancreas, lung, or breast and from tissues of other species such as mouse and rat.
4. The tissue tumor sample can be cut into two pieces, one can be used to obtain fibroblasts and the other can be frozen for further analysis, such as protein localization using immuno-histochemistry or immunofluorescence techniques. To freeze half of the sample, put the tissue sample inside a plastic mold and cover with embedding medium (e.g., Tissue-Tek). Using tweezers, freeze the sample by floating the mold on liquid N 2 , avoiding the liquid N 2 to directly contact the sample, once frozen, store at −80°C.
5. If the tumor tissue is detached from the dish, it can be placed in a new scratched dish repeating steps 4–6 of Subheading 3.1.1 .
6. When subculture or recovery of the cells from a plate is required, remove the medium from the flask and rinse cells briefly using pre-warmed to 37°C trypsin–EDTA to remove trypsin inhibitors contained in the serum used for cultur-ing the cells. Then, add enough trypsin–EDTA to slightly cover the cells on the flask and observe under an inverted microscope until the cells detach from the culture dish and become rounded and not clustered to each other (1–3 min). Once the cells have completely detached from the bottom of the flask, add 10 mL of fibroblast medium to neutralize the trypsin and collect the cells. Pipette up and down carefully to mechanically disrupt the remaining cell aggregates. At this point, cells can be subcultured or frozen.
7. Before freezing, the fibroblasts should be actively proliferat-ing therefore ensuring that no contaminations will be held within the frozen samples.
8. If the starting amount of tissue sample is large, the volumes can be scaled up; use a bigger Erlenmeyer assuring that the
4. Notes

Stromagenesis During Tumorigenesis 301
solution will not be spilled out while stirring. For instance, if the final volume of DMEM will be 40 mL, a 250 mL Erlen-meyer should be used and 4 mL Collagenase-3 (10×) should be added (for details see Subheading 3.2.1 ).
9. When the pieces of the tissue are not dissolved after a period of 1 h agitation, fresh collagenase-3 can be added or, alter-natively, the tissue pieces can be mechanically dissociated by carefully pipetting up and down.
10. Prior to centrifugation, the centrifuge should be equilibrated by preparing another 50 mL polypropylene tube that weighs the same as the 50 mL polypropylene tube containing the digested sample and then, samples should be placed on opposite sides of the centrifuge.
11. This method renders a heterogeneous fibroblastic population. If homogenous clones are needed, then dilute cell concen-tration at this point, and plate them within multiwell tissue culture plate (96 or more wells), for subclonal selection.
12. The Western blot technique described to determine the cell expression of specific markers is based on the use of a modi-fied secondary antibody linked to a reporter enzyme, which when exposed to an appropriate substrate drives a colori-metric reaction and produces a color or precipitate, or a luminescent reaction (ECL) allowing detection by exposing onto photographic films. Nowadays, a variety of conjugated secondary antibodies are commercially available, and blot-ted proteins can even be detected by infrared emitted fluo-rescence (e.g., using the Li-cor’s Odyssey Infrared Imaging System and its preconjugated secondary antibodies).
13. From this point on, no sterile conditions are required. Instead, it is very important to keep all material on ice at all times, to minimize protease activity to avoid protein degradation.
14. For larger dishes, scale up the volume of RIPA buffer. (e.g., for 60 mm dishes use 500 μ L instead of the suggested 250 μ L for 35 mm dishes).
15. To quickly freeze cell lysates, prepare a dry-ice/isopropanol bath by placing a 400 mL beaker containing about 100 mL isopropanol within an ice bucket filled with dry ice. For safety, do this inside the chemical hood. Allow the isopro-panol to cool for 30 min. Place the tubes containing freshly prepared and aliquoted lysates to a tube-rack and slowly lower the rack into the isopropanol assuring that the lysate volume is immersed in the isopropanol. The lysates should be frozen almost immediately and smaller aliquots are bet-ter. Finally, quickly place the tubes on dry-ice for imme-diate transfer to a −80°C freezer. Samples should remain stable for 2 weeks.

302 Castelló-Cros and Cukierman
16. To assure that the Western blot technique has properly worked, known fibroblastic and epithelial cell lysates should be loaded as positive controls ( see Fig. 1 ).
17. In these protocols, we propose to use commercially avail-able precast gels. Nevertheless, gels can be poured at the lab just prior to use. For more information about SDS–PAGE technique consult a student’s biochemistry text book or a molecular cloning laboratory manual.
18. Since the molecular weight of vimentin is similar to keratins, it is necessary to use two gels. One of them will be used to detect the presence of vimentin and GAPDH and the other to detect the keratins. If Li-cor’s Odyssey Infrared Imaging System is used, only one gel will be required since vimentin and keratin could be labeled by different fluorophores. In that case, the anti-vimentin antibody recommended is one that was generated in rabbit (Biovision, Catalog number: 3634-100).
19. Depending on the equipment used, different voltages, times and/or buffers may be required. Therefore, check the man-ufacturer’s instructions prior of using any SDS–PAGE or transfer equipment.
20. After a 4°C overnight incubation step, membranes should be brought back to room temperature before moving on to the next step.
21. The desired final number of plates to be used should be cal-culated before starting. The protocols describe the amount of volume needed for an individual 35-mm dish. Final volumes need to be calculated in respect to the final amount of desired 3D matrix-coated plates and their types. For example, for 12, 24, or 48-well tissue culture plates scale down the volumes of all reagents from 2 mL (35-mm dish) to 1, 0.5, and 0.250 mL per well, respectively. Alternatively, for the use of 60-mm or 10-cm dishes scale up the volumes of added reagents from 2 mL per dish to 4 and 10 mL, respectively.
22. Do not proceed to next step if cultures have not reached 100% confluence the following morning. If, after 24 h, the dish does not appear completely confluent, change medium and wait until cultures reach 100% confluence. The lack of confluence prior to the next step can cause poor matrix pro-duction or quality or avoid matrix production all together.
23. If coverslips are used, transfer the coverslip to a 6-well bac-terial (instead of a regular tissue-culture) petri dish before adding the ascorbic acid. This will minimize the growth of fibroblasts on the plate area outside of the coverslip and will, especially, facilitate lifting the coverslip and avoiding tearing off the matrices at the final steps.

Stromagenesis During Tumorigenesis 303
24. Leave at least two dishes unextracted to use in Subhead-ing 3.4.1 for the characterization of matrices resulting in categorizing the fibroblasts that produced the matrices as normal, primed or tumor-associated.
25. At least two coverslips containing unextracted 3D matrices should be analyzed for each isolated fibroblastic cell line.
26. Before adding the Block Vector Solution make sure that the coverslips are not touching the well walls. This will prevent loss of blocking solution due to capillarity, which could result in sample drying. If samples appear to be drying compensate with Block Vector Solution and continue with the incubation.
27. Before acquiring pictures make sure samples are at room temperature.
28. The classification described in this section is based on the char-acteristics of the unextracted cultures (42) , which are matrix-dependent and, therefore, are not evident in 2D cultures.
29. Matrix thickness can vary in different cultures of the same cell-line. It often depends on passage-number and quality of reagents used (e.g., FBS).
30. Make sure that matrices are prewarmed to room temperature after storage at 4°C by placing the plates containing extracted matrices at room temperature for at least one hour prior to use.
We thank M. Valianou for critical comments and K. Buchheit for assertive proof reading. This work was supported by the American Association of Cancer Research (AACR) Pennsylvania Depart-ment of Health (the Department specifically disclaims respon-sibility for any analyses, interpretations, or conclusions), the National Institutes of Health/National Cancer Institute (grants CA006927, and RO1-CA113451), the Ovarian Cancer Research Foundation (OCRF), the W.W. Smith Charitable Trust and an appropriation from the Commonwealth of Pennsylvania.
Acknowledgments
References
1. Abelev , G. I. (2003) Differentiation antigens: dependence on carcinogenesis mechanisms and tumor progression (a hypothesis) . Mol Biol 37 , 2 – 8
2. Wong , Y. C. and Tam , N. N. (2002) Dediffer-entiation of stromal smooth muscle as a factor in prostate carcinogenesis . Differentiation 70 , 633 – 645
3. Wong , Y. C. , Cunha , G. R. and Hayashi , N. (1992) Effects of mesenchyme of the embry-onic urogenital sinus and neonatal seminal vesicle on the cytodifferentiation of the Dun-ning tumor: ultrastructural study . Acta Anat (Basel) 143 , 139 – 150
4. Hayashi , N. , Cunha , G. R. and Wong , Y. C. (1990) Influence of male genital tract
304 Castelló-Cros and Cukierman
mesenchymes on differentiation of Dunning prostatic adenocarcinoma . Cancer Res 50 , 4747 – 4754
5. Mueller , M. M. and Fusenig , N. E. (2002) Tumor-stroma interactions directing pheno-type and progression of epithelial skin tumor cells . Differentiation 70 , 486 – 497
6. Pupa , S. M. , Menard , S. , Forti , S. and Tagliabue , E. (2002) New insights into the role of extracellular matrix during tumor onset and progression . J Cell Physiol 192 , 259 – 267
7. Skobe , M. and Fusenig , N. E. (1998) Tumor-igenic conversion of immortal human kerati-nocytes through stromal cell activation . Proc Natl Acad Sci U S A 95 , 1050 – 1055
8. Olumi , A. F. , Grossfeld , G. D. , Hayward , S. W. , Carroll , P. R. , Tlsty , T. D. and Cunha , G. R. (1999) Carcinoma-associated fibrob-lasts direct tumor progression of initiated human prostatic epithelium . Cancer Res 59 , 5002 – 5011
9. Glick , A. B. and Yuspa , S. H. (2005) Tissue homeostasis and the control of the neoplastic phenotype in epithelial cancers . Semin Cancer Biol 15 , 75 – 83
10. Campisi , J. (2005) Senescent cells, tumor sup-pression, and organismal aging: good citizens, bad neighbors . Cell 120 , 513 – 522
11. Bhowmick , N. A. and Moses , H. L. (2005) Tumor-stroma interactions . Curr Opin Genet Dev 15 , 97 – 101
12. Mueller , M. M. and Fusenig , N. E. (2004) Friends or foes - bipolar effects of the tumour stroma in cancer . Nat Rev Cancer 4 , 839 – 849
13. Li , G. , Satyamoorthy , K. , Meier , F. , Berking , C. , Bogenrieder , T. and Herlyn , M. (2003) Function and regulation of melanoma-stro-mal fibroblast interactions: when seeds meet soil . Oncogene 22 , 3162 – 31671
14. Bissell , M. J. and Radisky , D. (2001) Putting tumours in context . Nat Rev Cancer 1 , 46 – 54
15. Kunz-Schughart , L. A. and Knuechel , R. (2002) Tumor-associated fibroblasts (Part I): active stromal participants in tumor develop-ment and progression? Histol Histopathol 17 , 599 – 621
16. Kunz-Schughart , L. A. and Knuechel , R. (2002) Tumor-associated fibroblasts (Part II): functional impact on tumor tissue . Histol Histopathol 17 , 623 – 637
17. Silzle , T. , Randolph , G. J. , Kreutz , M. and Kunz-Schughart , L. A. (2004) The fibroblast: sentinel cell and local immune modulator in tumor tissue . Int J Cancer 108 , 173 – 180
18. Beacham , D. A. and Cukierman , E. (2005) Stromagenesis: the changing face of fibroblas-tic microenvironments during tumor progres-sion . Semin Cancer Biol 15 , 329 – 341
19. Cukierman , E. (2008) Stromagenesis . In: Encyclopedia of Cancer (ed. M. Schwab ). Springer , Heidelberg/Germany , 2843–2845
20. Pinzani , M. (2006) Pancreatic stellate cells: new kids become mature . Gut 55 , 12 – 14
21. Guyot , C. , Lepreux , S. , Combe , C. , Doud-nikoff , E. , Bioulac-Sage , P. , Balabaud , C. , et al. (2006) Hepatic fibrosis and cirrhosis: the (myo)fibroblastic cell subpopulations involved . Int J Biochem Cell Biol 38 , 135 – 151
22. Bauer , G. (1996) Elimination of transformed cells by normal cells: a novel concept for the control of carcinogenesis . Histol Histopathol 11 , 237 – 255
23. Kuperwasser , C. , Chavarria , T. , Wu , M. , Magrane , G. , Gray , J. W. , Carey , L. , et al. (2004) Reconstruction of functionally normal and malignant human breast tissues in mice . Proc Natl Acad Sci U S A 101 , 4966 – 4971
24. Maffini , M. V. , Soto , A. M. , Calabro , J. M. , Ucci , A. A. and Sonnenschein , C. (2004) The stroma as a crucial target in rat mam-mary gland carcinogenesis . J Cell Sci 117 , 1495 – 1502
25. Mintz , B. and Illmensee , K. (1975) Normal genetically mosaic mice produced from malig-nant teratocarcinoma cells . Proc Natl Acad Sci U S A 72 , 3585 – 3589
26. Elenbaas , B. and Weinberg , R. A. (2001) Het-erotypic signaling between epithelial tumor cells and fibroblasts in carcinoma formation . Exp Cell Res 264 , 169 – 184
27. Mareel , M. and Leroy , A. (2003) Clinical, cel-lular, and molecular aspects of cancer invasion . Physiol Rev 83 , 337 – 376
28. Park , C. C. , Bissell , M. J. and Barcellos-Hoff , M. H. (2000) The influence of the microen-vironment on the malignant phenotype . Mol Med Today 6 , 324 – 329
29. Quaranta , V. and Giannelli , G. (2003) Cancer invasion: watch your neighbourhood! Tumori 89 , 343 – 348
30. Sung , S. Y. and Chung , L. W. (2002) Prostate tumor-stroma interaction: molecular mecha-nisms and opportunities for therapeutic tar-geting . Differentiation 70 , 506 – 521
31. Bachem , M. G. , Schunemann , M. , Ram-adani , M. , Siech , M. , Beger , H. , Buck , A. , et al. (2005) Pancreatic carcinoma cells induce fibrosis by stimulating proliferation and matrix synthesis of stellate cells . Gastroenterology 128 , 907 – 921
Stromagenesis During Tumorigenesis 305
32. Desmouliere , A. , Guyot , C. and Gabbiani , G. (2004) The stroma reaction myofibroblast: a key player in the control of tumor cell behav-ior . Int J Dev Biol 48 , 509 – 517
33. Noel , A. , Kebers , F. , Maquoi , E. and Foidart , J. M. (1999) Cell-cell and cell-matrix interac-tions during breast cancer progression . Curr Top Pathol 93 , 183 – 193
34. Tuxhorn , J. A. , Ayala , G. E. and Rowley , D. R. (2001) Reactive stroma in prostate cancer progression . J Urol 166 , 2472 – 2483
35. Friedl , P. (2004) Prespecification and plas-ticity: shifting mechanisms of cell migration . Curr Opin Cell Biol 16 , 14 – 23
36. Sahai , E. and Marshall , C. J. (2003) Differ-ing modes of tumour cell invasion have dis-tinct requirements for Rho/ROCK signalling and extracellular proteolysis . Nat Cell Biol 5 , 711 – 719
37. Yamaguchi , H. , Wyckoff , J. and Condeelis , J. (2005) Cell migration in tumors . Curr Opin Cell Biol 17 , 559 – 564
38. Carragher , N. O. , Walker , S. M. , Scott Car-ragher , L. A. , Harris , F. , Sawyer , T. K. , Brun-ton , V. G. , et al. (2006) Calpain 2 and Src dependence distinguishes mesenchymal and amoeboid modes of tumour cell invasion: a link to integrin function . Oncogene 25 , 5726 – 5740
39. Wyckoff , J. B. , Pinner , S. E. , Gschmeissner , S. , Condeelis , J. S. and Sahai , E. (2006) ROCK- and myosin-dependent matrix deformation enables protease-independent tumor-cell invasion in vivo . Curr Biol 16 , 1515 – 1523
40. Wolf , K. , Mazo , I. , Leung , H. , Engelke , K. , von Andrian , U. H. , Deryugina , E. I. , et al. (2003) Compensation mechanism in tumor cell migration: mesenchymal-amoeboid tran-sition after blocking of pericellular proteolysis . J Cell Biol 160 , 267 – 277
41. Cukierman , E. , Pankov , R. , Stevens , D. R. and Yamada , K. M. (2001) Taking cell-matrix adhesions to the third dimension . Science 294 , 1708 – 1712
42. Amatangelo , M. D. , Bassi , D. E. , Klein-Szanto , A. J. and Cukierman , E. (2005) Stroma-derived three-dimensional matrices are neces-sary and sufficient to promote desmoplastic differentiation of normal fibroblasts . Am J Pathol 167 , 475 – 488
43. Cukierman , E. , Pankov , R. and Yamada , K. M. (2002) Cell interactions with three-dimensional matrices . Curr Opin Cell Biol 14 , 633 – 639
44. Griffith , L. G. and Swartz , M. A. (2006) Cap-turing complex 3D tissue physiology in vitro . Nat Rev Mol Cell Biol 7 , 211 – 224
45. Kim , J. B. , Stein , R. and O’Hare , M. J. (2004) Three-dimensional in vitro tissue cul-ture models of breast cancer – a review . Breast Cancer Res Treat 85 , 281 – 291
46. Larsen , M. , Artym , V. V. , Green , J. A. and Yamada , K. M. (2006) The matrix reorganized: extracellular matrix remodeling and integrin signaling . Curr Opin Cell Biol 18 , 463 –4 71
47. Smalley , K. S. , Lioni , M. and Herlyn , M. (2006) Life isn’t flat: taking cancer biology to the next dimension . In Vitro Cell Dev Biol Anim 42 , 242 – 247
48. Yamada, K. M., Cukierman, E. (2007) Mod-eling tissue morphogenesis and cancer in 3D. Cell 130, 601–610.
49. Tuxhorn , J. A. , Ayala , G. E. and Rowley , D. R. (2001) Reactive stroma in prostate cancer progression . J Urol 166 , 2472 – 2483
50. Santini , D. , Ceccarelli , C. , Leone , O. , Pas-quinelli , G. , Piana , S. , Marabini , A. , et al. (1995) Smooth muscle differentiation in nor-mal human ovaries, ovarian stromal hyperpla-sia and ovarian granulosa-stromal cells tumors . Mod Pathol 8 , 25 – 30

Chapter 20
Tissue Recombinants to Study Extracellular Matrix Targeting to Basement Membranes
Patricia Simon-Assmann , Anne-Laure Bolcato-Bellemin, Annick Klein, and Michèle Kedinger
Summary
Several techniques have been used to study the expression of basement membranes molecules but none of them allow distinguishing the cellular origin of the deposition of a single molecule at the subepithe-lial basement membrane. For this purpose, we designed an experimental model using recombinants between chick and mouse embryonic intestines. Following constructions of interspecies endodermal/mesenchymal associations in culture, developmental growth was achieved by in vivo transplantation in the chick embryo. Immunocytochemistry, using species-specific antibodies recognizing either chick or mouse basement membrane molecules, was then performed on cryosections made through the devel-oped hybrid intestines.
The use of this experimental design permits determination of the precise expression/secretion in the intestinal basement membrane region of the individual constituents: interestingly some of them are strictly of epithelial or of mesenchymal origin, while others are of dual origin. Furthermore, we could show that each of these molecules is expressed in a peculiar development-dependent pattern. Such inter-species as well as heterotopic recombinants (from different levels of the gastrointestinal tract) can also be used successfully to approach the regulation of the expression of functional markers, i.e., digestive enzymes.
Key words: Subepithelial basement membrane , Interspecies intestines , Grafting , Immunodetec-tion , Cellular origin .
The basement membrane structure that separates an epithelium or other parenchymal tissues from the connective tissue has been postulated for a long time to be of epithelial origin. Because of
1. Introduction
Sharona Even-Ram and Vira Artym (eds.), Methods in Molecular Biology, Extracellular Matrix Protocols, vol. 522© Humana Press, a part of Springer Science + Business Media, LLC 2009DOI: 10.1007/978-1-59745-413-1_20
309

310 Simon-Assmann et al.
the difficulties in interpreting results obtained mostly by auto-radiographic labeling at the light microscopy level, new analyti-cal tools and models were important to develop. In particular, Lipton (1) using an in vitro coculture system was probably the first to provide evidence for a dual origin of the basement mem-brane: indeed a distinct basement membrane structure devel-oped in myoblast cultures only after the addition of muscle fibroblasts.
Various experimental techniques are currently used to study the expression of basement membrane molecules. They include immunohistochemistry, biochemical approaches, or detection of transcripts by in situ hybridization or RT-PCR on isolated tissue compartments or cell lines. Apart from the minor limitations of each model (such as cellular contamination in the case of isolated epithelial or mesenchymal cell preparations, abnormal cell behavior or loss of differentiation of cultured cells, threshold sensitivity), they all share a major drawback. Indeed, the fact that a tissue compartment expresses a given basement membrane molecule does not necessarily imply that this molecule is deposited at the basement membrane region. Autoradiographic studies (incorpo-ration of radioactive precursors), which circumvent this problem, unfortunately do not allow discrimination between individual components. The strategy designed by Sariola et al. (2, 3) that is grafting of avascular murine embryonic kidneys onto quail chorioallantoic membrane deserves special attention. The major advantage of this model is that it allows the authors to follow the capillary ingrowth in these interspecies chimeric kidneys using species-specific antibodies.
To distinguish the deposition of a single molecule at the subepithelial basement membrane, we designed an experimental model using recombinants between chick and mouse embryonic intestines. Isolation of pure intestinal endodermal and mesenchy-mal compartments was performed by enzymatic and mechanical treatments. Following constructions of interspecies endodermal/mesenchymal associations, developmental growth was achieved by in vivo transplantation. Immunocytochemistry using species-specific antibodies recognizing either chick or mouse basement membrane molecules was then performed on cryosections made through the developed hybrid intestines.
The use of this experimental design permits determination of the precise chronological expression/deposition at the intes-tinal basement membrane region of the individual constituents: some of them are strictly of epithelial or of mesenchymal origin and others of dual origin (4, 5 and for a review see 6) . More recently, this strategy was used to explain the lack of possi-ble intestinal epithelial defects in laminin alpha5−/− mutants. In particular, the creation of chick/mouse laminin alpha5−/− grafted epithelial/mesenchymal interspecies associations shows
Tissue Recombinants to Study Extracellular Matrix 311
that a compensation process has occurred and was attribut-able to mesenchyme-derived molecules (7) . This specific tech-nique can be completed by the use of cocultures in vitro, in which one of the tissue compartments can be modified (over-expression or inhibition of basement membrane components or of regulatory molecules) to analyze the consequences on the basement membrane composition and on the resulting extracellular matrix-cell signaling (8– 11) . Interspecies or het-erotopic (from different levels of the gastrointestinal tract) recombinants have also been used successfully to approach the regulation of the expression of functional markers, i.e., diges-tive enzymes (12– 14) .
1. Paraffin support : Mix melted paraffin (Histomed standard; Labo Moderne, Paris) with activated charcoal (Merck, Darm-stadt, Mannheim, Germany). Pour the mixture into small glass dishes. After cooling, cover them with aluminium foil. Sterilize at 110°C for 1 h. Let it cool at room temperature. These supports provide accentuated contrast for the dissec-tion of transparent embryos.
2. 9‰ NaCl solution : 9 g NaCl made up to 1 L. Sterilize by autoclaving.
75% Ham’s F-10 medium (Gibco, Life Technologies, Gaithers-burg, MD), 25% agar solution at 1 g/100 mL, and 2 mg/mL gentamicin (Septigen 40, Schering Plough, Kenilworth, NJ). 1. Hank’s solution: 137 mM NaCl, 5 mM KCl, 2 mM CaCl 2 ,
1 mM MgCl 2 , 0.8 mM Na 2 H PO 4 , 0.22 mM KH 2 PO 4 , 0.28 mM MgSO 4 , 5 mM glucose.
2. Dissolve 1 g agar (Bacto-Agar, Difco Laboratories, E. Mole-sley, Surrey, UK) per 100 mL Hank’s solution in a boiling water bath; sterilize solution by autoclaving. Once cooled, the solution can be kept at 4°C until use.
3. The day before the experiment, prepare the number of dishes required containing the gelified medium. Melt the agar solu-tion in a boiling water bath. Then rapidly add to the Ham’s F10 solution (+ antibiotic) the adequate amount of melted agar. Mix thoroughly.
4. Dispense approximately 2 mL Ham’s F10/agar/antibiotic mixture into 3-cm diameter culture dishes.
5. Allow to gel overnight at 4°C.
2. Materials
2.1. Dissection of the Embryos
2.2. Preparation of Gelified Medium

312 Simon-Assmann et al.
1. Prepare chick embryo extracts by mechanical homogenization of 9-day-old embryos. Clarify by centrifugation. Store by aliq-uots at −20°C.
2. Mix 9 mL of Dulbecco’s Modified Eagle’s Medium (DMEM; Gibco, Life Technologies), 1 mL of 9-chick embryo extract, 2 mg/mL gentamicin to 2.5 mL of agar solution (as prepared in Subheading 2.2 ). To be prepared the day before the experi-ment. Keep at 4°C.
1. Collagenase solution-make fresh each time: dissolve 2.5 mg colla-genase A (0.5 U/mg) from Clostridium histolyticum (Boehringer Mannheim, Germany) in 10 mL CMRL 1066 medium (Gibco, Life Technologies) ( see Note 1 ).
2. Blocking solution: mix Ham’s F10 medium to newborn bovine serum (1:1) (Gibco, Life Technologies).
1. 0.1 M phosphate buffered saline solution (PBS): dissolve 13.6 g KH 2 PO 4 and 14.2 g Na 2 HPO 4 in 1 L H 2 O. Adjust pH to 7.2. Store at 4°C.
2. Antibody dilution solution: add 0.01% NaN 3 as a preservative agent to the 0.1 M PBS solution.
3. Mounting and antifading solution: • Solution A: dissolve 0.136 g KH 2 PO 4 and 0.876 g NaCl in
100 mL water. Adjust pH to 7.4. Store at 4°C. • Solution B: dissolve 1.59 g Na 2 CO 3 and 2.93 g NaHCO 3
in 100 mL water. Adjust pH to 9.0. Store at 4°C. • Mix 10 mL of solution A with 100 mg p -phenylenediamine
(Sigma, Madison, WI): caution – toxic and carcinogenic. Adjust pH to 8.0 with solution B. Then add 90 mL glyc-erol. Store in aliquots at −20°C.
• The solution should be discarded when it turns violet.
1. Careful planning is required to get embryos at the correct stages on the day of the experiment. In particular, incubate fertilized eggs from white Leghorn chicken at 38°C in a humidified incubator 5 days before the experiment.
2. Remove the 5-day-old chick embryos from the eggs (day 0 being the first day of incubation). At the same day, 12/13 day fetal mice are removed from the placenta after laparotomy of the anaesthetized pregnant mothers (day 0 being the day
2.3. Pregrafting Culture: Preparation of Enriched Gelified Medium
2.4. Dissociation of Embryonic Intestines
2.5. Immunocyto-chemistry
3. Methods
3.1. Creation of Intestinal Interspecies Associations (Fig. 1)
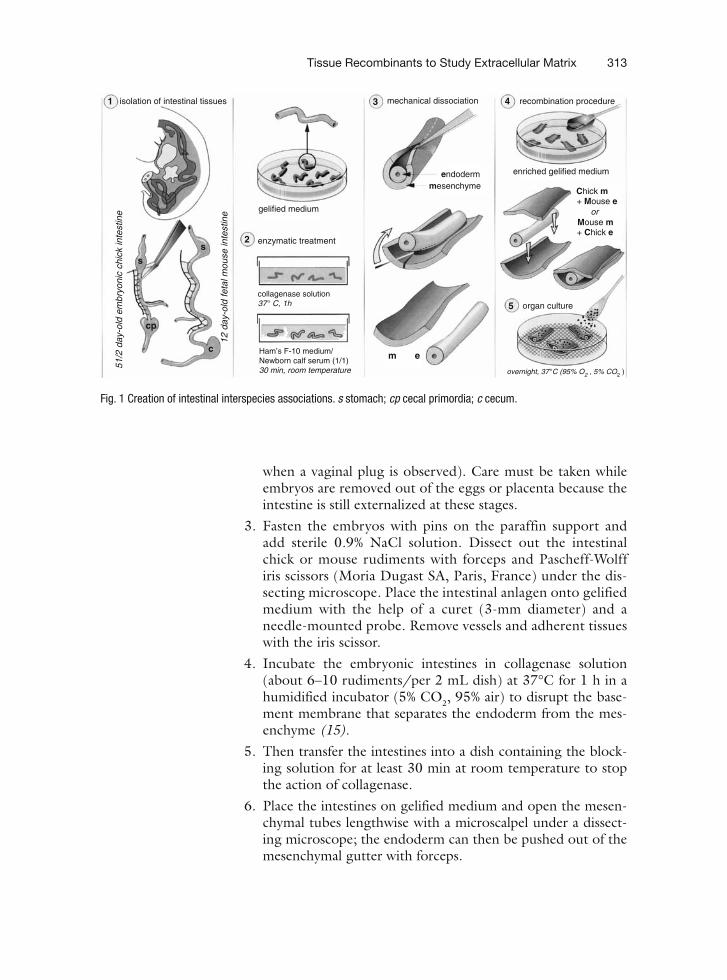
Tissue Recombinants to Study Extracellular Matrix 313
when a vaginal plug is observed). Care must be taken while embryos are removed out of the eggs or placenta because the intestine is still externalized at these stages.
3. Fasten the embryos with pins on the paraffin support and add sterile 0.9% NaCl solution. Dissect out the intestinal chick or mouse rudiments with forceps and Pascheff-Wolff iris scissors (Moria Dugast SA, Paris, France) under the dis-secting microscope. Place the intestinal anlagen onto gelified medium with the help of a curet (3-mm diameter) and a needle-mounted probe. Remove vessels and adherent tissues with the iris scissor.
4. Incubate the embryonic intestines in collagenase solution (about 6–10 rudiments/per 2 mL dish) at 37°C for 1 h in a humidified incubator (5% CO 2 , 95% air) to disrupt the base-ment membrane that separates the endoderm from the mes-enchyme (15) .
5. Then transfer the intestines into a dish containing the block-ing solution for at least 30 min at room temperature to stop the action of collagenase.
6. Place the intestines on gelified medium and open the mesen-chymal tubes lengthwise with a microscalpel under a dissect-ing microscope; the endoderm can then be pushed out of the mesenchymal gutter with forceps.
Fig. 1 Creation of intestinal interspecies associations. s stomach; cp cecal primordia; c cecum .
isolation of intestinal tissues
enzymatic treatment
collagenase solution
Ham’s F-10 medium/Newborn calf serum (1/1)30 min, room temperature
37 � C, 1h
12 d
ay-o
ld fe
tal m
ouse
inte
stin
e
51/2
day
-old
em
bryo
nic
chic
k in
test
ine
2s
s
c
cp
gelified medium
endodermmesenchyme
mechanical dissociation recombination procedure
enriched gelified medium
Chick m
+ Chick e
organ culture
overnight, 37�C (95% O2 , 5% CO2 )
+ Mouse e
Mouse mor
3 4
5
m e
1

314 Simon-Assmann et al.
7. Cut the mesenchymes into small fragments ( ≈ 1–2 mm length) and transfer them with the help of the curet and of the needle-mounted probe onto a dish containing the enriched jellified medium.
8. Place in each individual mouse mesenchymal segment an equally-long endoderm derived from the chick intestine. Cover with a second mouse mesenchymal segment. In paral-lel, the inverse associations are performed in between chick mesenchymes and mouse endoderms. Control chick or mouse intestinal segments are prepared by reassociating endoderm of each species with its own mesenchyme ( see Note 2 ).
9. Label the interspecies mesenchymal/endodermal recom-binants and control segments with a few carbon particles to identify grafted tissue; incubate overnight in a humidified incubator (5% CO 2 , 95% air) at 37°C.
1. Three-day-old chick embryos are used for grafting experi-ments. Put a mark on the upper part of the shell to check that the egg is maintained in the correct position through-out the experiment. Incubate the fertilized eggs at 38°C in the humidified incubator in an horizontal position. The day before grafting, make a hole at the sharp end of the egg and then drop the chorioallantoic membrane by aspirating about 5 mL of albumen with a sterile syringe. Cover the opening with sterile scotch tape and incubate the eggs at 38°C for an additional 24 h in the same position ( see Notes 3 and 4 ).
2. Grafting procedure: (a) Cut an opening of approximately 1.5-cm diameter in the
shell above the chorioallantoic membrane using forceps and curved scissors.
(b) To gain access to the embryo, open tactfully the vitellin and the amniotic membranes with the needle-mounted probe and with the help of forceps.
(c) Make a sharp incision in the celom of the chick embryos near the intersection of the major blood vessels and then carefully and gently implant the graft.
(d) Seal the opening in the shell with sterile scotch tape and reincubate the eggs at 38°C in the humidified incubator up to the wished developmental stage of the explants.
3. The grafts are recovered at various times after implantation. (a) Decapitate the chick embryo after its removal out of the
egg. (b) Fasten the embryo laterally with pins on both sides;
make an incision longitudinally along the middle of the embryo.
3.2. Grafting Proce-dure: Intracelomic Grafting (Fig. 2)

Tissue Recombinants to Study Extracellular Matrix 315
(c) Locate the grafts with the aid of the carbon particles; the implants, which have developed their own vascularization, can be found anywhere within the lateral celom, the vis-ceral loops or underneath the lungs. Recover the grafts and handle for subsequent analysis.
1. Preparation of the sections ( Fig. 2 ): (a) Prepare a cork support of about 1 cm 2 ; deposit on it a
drop of Tissue-Tek compound (O.C.T. Compound, Miles Inc., USA).
(b) Embed the hybrid intestine vertically in the Tissue-Tek compound and immediately freeze in isopentane (Pro-labo) prealably cooled in liquid nitrogen. These inclusions can be kept for several years at –40°C.
(c) Cut transverse sections of about 5–6 μ m thick at −25°C using a cryostat and place the sections on SuperFrost/Plus Microscope slides (Menzel-Gläser, Germany). Store at −20°C until use.
2. Immunofluorescence: (a) Prepare the required amount of antibody dilutions in
NaN 3 -containing PBS. These aliquots can be kept up to 1–2 months at 4°C.
(b) Add onto each section, an aliquot of first antibodies and incubate the sections for 1–2 h at room temperature in a humidified chamber.
3.3. Immunodetection of Basement Mem-brane Molecules on Interspecies Intestines
Fig. 2 . Grafting procedure and recovery of the grafts. e epithelium derived from the endoderm; m mesenchyme-derived tissues .
Recovery of the graftsRemoval of albumen2 day-old chick embryo
albumen
Implantation
1
2
basement membrane
cryosections
m
Tissue-Tekembedding
3
3 day-old chick embryo
316 Simon-Assmann et al.
(c) Wash the sections several times with PBS. (d) Add the corresponding secondary trimethyl-rhodamine-
(TRITC)), fluorescein isothiocyanate-(FITC) or Alexa-labeled antibodies at the optimal dilution indicated by the manufacturer. Place the humidified chamber in dark or cover it with an aluminium foil.
(e) Wash the sections thoroughly several times with PBS. (f) Add a drop of the antifading solution and mount under a
coverslip. (g) The slides can be kept at −20°C until observation under a
photomicroscope equipped with an epi-illumination fluo-rescent system.
Note : Prior to immunocytochemical analysis of the hybrid intestines, check the antibody specificity on control chick and mouse intestinal fragments.
1. The quality and activity of the collagenase batch used for the dissociation of the endoderm from the mesenchyme are very important. Indeed, after enzymatic treatment, the endo-derm must be easily removed mechanically using microsurgicalinstruments to avoid mesenchymal cell contamination. The use of quail rudiments makes it possible to confirm that there is no contamination during the dissociation step, as quail cells can be recognized by nuclei marker (16) .
2. The techniques of dissociation/reassociation of rudiments and of grafting need some dexterity and experience.
3. Because of a severe lethality of the chick embryos as a conse-quence of the grafting procedure, plan to incubate twice as much host eggs as needed.
4. There are multiple variations of this method: (a) The endoderm or the mesenchyme can be replaced by
established cell lines or by primary cell cultures (17, 18) . (b) Associations can be grafted under the kidney capsule (5) or
under the skin (14) of adult nude mice (nu/nu Swiss mice); in these conditions, exogenous regulation of basement mem-brane formation and of epithelial cell differentiation is sub-mitted to the hormonal supply provided by the adult host.
(c) The associations can be deposited directly on the chorio-allantoic membrane of two successive 9-day host embryos allowing a longer developmental growth (19) .
4. Notes
Tissue Recombinants to Study Extracellular Matrix 317
(d) Such heterospecific associations can also be performed using rat or human tissues: in these cases, the intestines have to be taken at 14 days and 8 weeks of gestation, respectively, to get the optimal conditions for dissociation.
The authors thank Dr. Katy Haffen for the major contribution in the development of this technique. They also thank Chris-tiane Arnold for her continuous help within the team. A special thank to Bernard Lafleuriel (Curri Visualisation, Université Louis Pasteur, Strasbourg, France) for generating the figures. Leonor Eleuterio is gratefully acknowledged for secretarial help.
Acknowledgments
References
1. Lipton , B.H. (1977) Collagen synthesis by normal and bromodeoxyuridine-modulated cells in myogenic culture . Dev. Biol. , 61 , 153 – 165
2. Sariola , H. , Timpl , R. , Von Der Mark , K. , Mayne , R. , Fitch , J.M. , Linsenmayer , T.F. , Ekblom , P. (1984a) Dual origin of glomerular basement membrane . Dev. Biol. , 101 , 86 – 96
3. Sariola , H. , Peault , B. , Le Douarin , N. , Buck , C. , Dieterlin-Lievre , F. , Saxen , L. (1984b) Extracellular matrix and capillary ingrowth in interspecies chimeric kidneys . Cell Differ. , 15 , 43 – 51
4. Simon-Assmann , P. , Bouziges , F. , Arnold , C. , Haffen , K. , Kedinger , M. (1988) Epithelial-mesenchymal interactions in the production of basement membrane components in the gut . Development , 102 , 339 – 347
5. Simon-Assmann , P. , Bouziges , F. , Vigny , M. , Kedinger , M. (1989) Origin and deposition of basement membrane heparan sulfate pro-teoglycan in the developing intestine . J. Cell Biol. , 109 , 1837 – 1848
6. Simon-Assmann , P.M. , Kedinger , M. , De Arcangelis , A. , Orian-Rousseau , V. , Simo , P. (1995) Extracellular matrix components in intestinal development . Experientia , 51 , 883 – 900
7. Bolcato-Bellemin, A.L. , Lefebvre , O. , Arnold , C. , Sorokin , L. , Miner , J.H. , Kedinger , M. Simon-Assmann , P. (2003) Laminin alpha5 chain is required for intestinal smooth muscle devel-opment . Dev. Biol. , 260 , 376 – 390
8. De Arcangelis , A. , Neuville , P. , Boukamel , R. , Lefebvre , O. , Kedinger , M. , Simon-Assmann , P. (1996) Inhibition of laminin α 1 chain expres-sion leads to alteration of basement mem-brane assembly and cell differentiation . J. Cell Biol. , 113 , 417 – 430
9. Lorentz , O. , Duluc , I. , De Arcangelis , A. , Simon-Assmann , P. , Kedinger , M. , Freund , J.N. (1997) Key role of the Cdx2 homeobox gene in the extracellular matrix-mediated intestinal cell differentiation . J. Cell Biol. , 139 , 1553 – 1565
10. Fritsch , C. , Swietlicki , E.A. , Lefebvre , O. , Ked-inger , M. , Iordanov , H. , Levin , M.S. , Rubin , D.C. (2002) Epimorphin expression in intesti-nal myofibroblasts induces epithelial morpho-genesis . J. Clin. Invest. , 110 , 1629 – 1641
11. Zapatka , M. , Zboralski , D. , Radacz , Y. , Bock-mann , M. , Arnold , C. , Schoneck , A. , Hoppe , S. , Tannapfel , A. , Schmiegel , W. , Simon-Ass-mann , P. , Schwarte-Waldhoff , I. (2007) Base-ment membrane component laminin-5 is a target of the tumor suppressor Smad4 . Onco-gene , 26 , 1417 – 1427
12. Kedinger , M. , Simon , P.M. , Grenier , J.F. , Haffen , K. (1981) Role of epithelial-mes-enchymal interactions in the ontogenesis of intestinal brush-border enzymes . Dev. Biol. , 86 , 339 – 347
13. Yasugi , S. (1993) Role of epithelial-mesen-chymal interactions in differentiation of epi-thelium of vertebrate digestive organs . Dev. Growth Differ. , 35 , 1 – 9

318 Simon-Assmann et al.
14. Duluc , I. , Freund , J.N. , Leberquier , C. , Ked-inger , M. (1994) Fetal endoderm primarily holds the temporal and positional information required for mammalian intestinal develop-ment . J. Cell Biol. , 126 , 211 – 221
15. Gumpel-Pinot , M. , Yasugi , S. , Mizuno , T. (1978) Différenciation d’épithéliums endo-dermiques associés à du mésoderme splanch-nique . C. R. Acad. Sci. Paris , 286 , 117 – 120
16. Le Douarin , N. (1973) A Feulgen-positive nucleolus . Exp. Cell Res. , 77 , 459 – 468
17. Haffen , K. , Lacroix , B. , Kedinger , M. , Simon-Assmann , P.M. (1983) Inductive properties
of fibroblastic cell cultures derived from rat intestinal mucosa on epithelial differentiation . Differentiation , 23 , 226 – 233
18. Kedinger , M. , Simon-Assmann , P. , Lacroix , B. , Marxer, A , Hauri , H.P. , Haffen K. (1986) Fetal gut mesenchyme induces differentiation of cultured intestinal endoderm and crypt cells . Dev. Biol. , 113 , 474 – 483
19. Kramer , B. , Andrew , A. , Rawdon , B.B. , Becker , P. (1987) The effect of pancreatic mesenchyme on the differentiation of endo-crine cells from gastric endoderm . Develop-ment , 100 , 661 – 671

Chapter 21
ECM and FGF-Dependent Assay of Embryonic SMG Epithelial Morphogenesis: Investigating Growth Factor/Matrix Regulation of Gene Expression During Submandibular Gland Development
Ivan T. Rebustini and Matthew P. Hoffman
Summary
Epithelial-mesenchymal interactions during organogenesis are regulated by dynamic and reciprocal interactions between growth factors and extracellular matrix (ECM) components. Mouse embryonic submandibular gland (SMG) epithelium, isolated from its endogenous mesenchyme, undergoes branch-ing morphogenesis when cultured ex vivo in a basement membrane extract in serum-free medium with growth factor stimulation. The resulting three-dimensional epithelial morphogenesis in the defined culture system makes this a useful model to analyze cell–cell and cell–matrix interactions, growth factor-mediated signaling and gene expression, proliferation, apoptosis, migration, lumen formation, and epithelial morphogenesis in a primary organ culture system. SMG epithelial culture is robust, reproduc-ible, uses small amounts of reagents, and changes in gene expression are measured by real-time PCR using a limited amount of embryonic tissue. In this chapter, we describe a detailed protocol for isolating primary embryonic SMG epithelium and setting up an ECM and growth factor-dependent, serum-free assay of epithelial morphogenesis, with subsequent analysis of gene expression by real-time PCR.
Key words: Submandibular gland , Morphogenesis , FGFR signaling , Laminin , Epithelium .
Branching morphogenesis of embryonic mouse submandibularglands (SMGs) is a complex process involving multiple cell types including epithelial, mesenchymal, endothelial, and neuro-nal cells, and is influenced by multiple growth factors (recently reviewed in (1, 2) ). However, a simplified organ culture system
1. Introduction
Sharona Even-Ram and Vira Artym (eds.), Methods in Molecular Biology, Extracellular Matrix Protocols, vol. 522© Humana Press, a part of Springer Science + Business Media, LLC 2009DOI: 10.1007/978-1-59745-413-1_21
319

320 Rebustini and Hoffman
has been developed and refined over the years to specifically study SMG epithelial morphogenesis. This involves isolation of embry-onic day 13 (E13) SMG epithelium, which undergoes growth factor-dependent branching morphogenesis when cultured in a basement membrane extract (3, 4) . Both EGF and FGF7 were originally described to promote SMG epithelial morphogenesis when cultured in serum-containing medium (5) . Since SMG development is particularly sensitive to FGF signaling (reviewed in (1) ), we have modified the culture conditions and use serum-free conditions to investigate the mechanisms by which FGF and ECM interactions regulate salivary gland development. We have focused on FGFR-dependent signaling and gene expression (6, 7) and the role of laminin isoforms in the basement membrane duringSMG morphogenesis (8) . This assay can be used to investigate cell–matrix and cell–cell interactions, growth factor-mediated signaling and gene expression, proliferation, apoptosis, migra-tion, and lumen formation during epithelial morphogenesis.
Branching morphogenesis of the intact SMG in culture involves duct elongation, epithelial bud expansion, clefting of the epithelial bud, and then repeated rounds of branching, with formation of new end buds and lateral branches of the main duct. The morphogenesis that occurs when the epithelium is cultured with individual growth factors does not replicate the intact gland, but discrete steps in the process are mimicked using either FGF10 or FGF7 in a laminin-111 matrix (7) . FGF7 treatment results in end bud expansion, while FGF10 treatment produces duct elon-gation, making this culture system useful to investigate the role of individual growth factors, specific morphogenic events, and cell–ECM interactions during epithelial morphogenesis.
Isolated SMG epithelial culture has also been used to investigate cell migration and ECM dynamics during epithelial morphogenesis using adenovirus-GFP labeling of individual cells and fluorescent labeling of exogenous fibronectin in combina-tion with a live-imaging confocal microscope to track both cell and matrix migration (9) . The isolation of epithelial rudiments, followed by their dissociation in a single cell layer, is also used to investigate mechanisms of embryonic tissue assembly and sub-sequent functional differentiation (10) , which are relevant to understanding functional organ regeneration.
Quantitative real-time PCR (qPCR) is a powerful tool for analyzing changes in gene expression using small amounts of embryonic tissue. We used SYBR-green qPCR to measure the expression levels of both the targeted gene as well as other changes in downstream gene expression in SMG organ cultures treated with antisense oligonucleotides (6, 7) or siRNA (8, 11) . Additionally, quantitative whole-mount immunofluorescence or Western blot analysis can be used to assess changes at the protein level (8) .

ECM and FGF-Dependent Assay of Embryonic SMG Epithelial Morphogenesis 321
The time and effort to isolate E13 SMGs, separate the epi-thelium from the mesenchyme, and perform primary organ cul-ture, all of which are technique-sensitive, require an optimized protocol to obtain a maximal amount of information from a very small amount of tissue. The E13 SMG is less than 1 mm across and the isolated epithelium only a few hundred microm-eters across. The SMG epithelia are cultured in a 15 μ L drop of basement membrane extract on top of a filter floating in a 200 μ L culture well. The simplification and standardization of pro-tocols with commercially available kits and SYBR-green qPCR analysis has made this a reproducible and routine procedure in the laboratory. In this chapter, we describe a detailed protocol to isolate SMG epithelial rudiments, perform ex vivo epithelial organ culture in a basement membrane extract, and analyze gene expression by qPCR.
1. Culture medium DMEM-F12/PS: DMEM-F12 (catalog # 11320, Invitrogen Corporation) supplemented with 100 U/mL penicillin, 100 μ g/mL streptomycin (catalog # 4545, Invitrogen Corporation). The culture media is supplemented with 150 μ g/mL vitamin C (various sources), and 50 μ g/mL bovine transferrin (catalog # 11105-012, Invitrogen Corpo-ration) ( see Note 1 ).
2. Dispase I neutral protease (catalog number 11284908001, Roche Applied Sciences) stock solution. Prepare stock solu-tion by diluting 5 mg of Dispase I neutral protease in 6.0 mL of H 2 O. Make aliquots of 133 μ L each and store at −20°C.
3. Protease-free BSA, 30% stock solution (catalog number A8577, SIGMA) ( see Note 2 ).
4. Cultrex 3D Culture Matrix, either laminin-I at ~3.0 mg/mL (catalog number 3446-005-01, Trevigen) or Cultrex growth factor-reduced BME 13–16 mg/mL (catalog number 3431-005-01, Trevigen) ( see Note 3 ).
5. Dissecting microscopes with a transmitted light base, such as the Zeiss StemiSV-6.
6. An inverted microscope with a 5× objective and a digital camera attached for photographing the glands, such as a Zeiss Axiovert 25 microscope with a Fuji FinePix SLR camera. We find that using a digital SLR camera is quicker and easier for multiple users than using a computer-controlled digital camera.
2. Materials
2.1. Dissection of Embryonic Mouse SMGs and Preparation of Epithelial Cultures Using Basement Membrane Extract (Matrigel) or Purified Laminin-111 as an Extracellular Matrix

322 Rebustini and Hoffman
7. Whatman Nuclepore Track-etch 13-mm filters with 0.1 μ m pore size (catalog number 110405, Whatman VWR).
8. 50-mm glass-bottom microwell dishes (catalog number p50G-1.5–14F, MatTek).
9. Tissue culture dishes: 150 × 25 mm (catalog number 353025, Falcon) and 35 × 10 mm (catalog number 430165, Corning).
10. Micropipettes, RNase-free barrier tips, and 1.5-mL eppen-dorf tubes (various sources).
11. Dissection instruments: fine forceps No. 5 (catalog number OF-224-027.0003, Dumont), surgical scissors (many sources), dressing forceps 5″ (catalog number REF V96-6, McConnell Group) and sterilized carbon steel surgical blades (Miltex).
12. Ethanol 70% solution. Prepare prior to use adding 30.0 mL of MiliQ H 2 O in 70.0 mL of ethanol.
13. Pyrex 3-depression spot plates (catalog number 7223-34 Corning).
1. Micro RNAqueous reagent kit (catalog number AM1931, Ambion).
2. DEPC-H 2 O (multiple sources). 3. Spectrophotometer Nanodrop ND-1000 (Nanodrop Tech-
nologies). 4. Heating blocks (Eppendorf Thermomixer R). 5. I-Script cDNA synthesis kit (catalog # 170-8891, BioRad)
or TaqMan reverse transcription reagents (catalog # N808-0234, Applied Biosystems).
6. iQ SYBR-Green PCR master mix (catalog number 170-8880, BioRad).
7. Oligonucleotides for PCR are designed using Beacon Design Software (Premier Biosoft International). Importantly, the design parameters should be consistent; we typically design primers with a 3 ′ bias, 18–30 bp long, with amplicons at 75–150 bp, with Tm of 65 ± 5°C. All primers must be tested for amplification efficiency and that they amplify a single product, usually by melt-curve analysis.
8. 96-well unskirted PCR plate (catalog number MLP-9601, BioRad).
9. Optical tape microseal B film (catalog number MSB-1001, BioRad).
10. Real-time PCR machine such as MyiQ PCR Thermocycler (BioRad).
11. Eppendorf repeater plus automatic pipette.
2.2. Analysis of Gene Expression in Epithe-lial Cultures by Real-Time PCR
ECM and FGF-Dependent Assay of Embryonic SMG Epithelial Morphogenesis 323
1. Prepare culture medium prior to use ( see Subheading 2.1, item 1 ).
2. Sterilize all dissection instruments by rinsing with 70% etha-nol.
3. Prepare 10% BSA working solution by diluting BSA stock solution in DMEM-F12/PS and keeping it on ice.
4. In a 3-well glass dish, fill two wells with 700 μ L of 10% BSA and one well with DMEM-F12/PS.
5. Prepare Dispase I working solution by diluting 133 μ L of Dispase stock solution in 367 μ L of DMEM-F12/PS (keep on ice prior to use).
6. Preparation of culture dishes: pipette 200 μ L of culture medium into a 50 mm glass-bottom microwell dish and float a Whatman Nuclepore Track-Etch membranes on top of the media. Pipette 10 μ L of ECM (either BME or laminin-111) in the center of the filter, and spread it out over the surface with the pipette tip, being careful not to form bubbles. Generally we spread 15 μ l of laminin into a 5 mm diameter drop ( see Note 4 ). The culture medium must be supplemented with recombinant growth factors: FGF7 (200 ng/mL), FGF10 (1,000 ng/mL), and HB-EGF (20 ng/mL) ( see Note 5 ). The dish is covered at room temperature until the dissections are completed, by which time (more than 30 min) the laminin-1 or BME has polymerized. A diagram of the culture dish is shown in the Fig. 1D .
1. Remove embryos ICR mice at embryonic day 13 (E13). The fur of the pregnant mouse must be liberally sprayed with 70% ethanol before removing the embryo sacs to decrease potential contamination of the cultures.
2. Place the embryo sacs into a 100 mm plastic dish containing DMEM-F12/PS, open each sac and remove the embryos, and then place them in another dish with fresh medium. The SMGs should have 3–5 buds at this stage( see Note 6 ).
3. Remove the head of the embryo and dissect out a 1 mm dorsal-ventral section of the mandible containing the tongue as shown in the Fig. 1A . Separate SMGs from the mandible slice using fine forceps and place them in a glass-bottom microwell dish containing 200 μ L DMEM-F12/PS.
3. Methods
3.1. Dissection of Embryonic Mouse SMGs and Preparation of Epithelial Cultures Using Laminin-111 Basement Membrane Substrate
3.1.1. Prepare in Advance Solutions and Materials Necessary to Start and Terminate SMG Dissections
3.1.2. Harvest Embryos at 13 Days of Development, Dissect Out SMGs, and Place Them in 200 μL of DMEM-F12/PS

324 Rebustini and Hoffman
1. Carefully aspirate the DMEM-F12/PS using a pipette, and incubate SMGs in 200 μ L of Dispase working solution for 20 min at 37°C ( see Note 7 ).
2. Carefully remove Dispase working solution with a pipette, and add BSA 10% to the glands to wash the dispase away.
3.1.3. Separate SMG Epi-thelial Rudiment from the Mesenchyme and Culture Them in Different Extracel-lular Matrices
Fig. 1 . Dissection of embryonic mouse SMGs and epithelial tissue and ex vivo organ culture system. ( A ) After harvesting embryos at 13 days of development ( left panel ) the glands are dissected as follows: the head of the embryo ( left panel ) is removed at the neck and ~1 mm slice of the inferior mandible is removed ( middle panel ), the posterior half of the slice is removed ( dotted bar ), and the tongue is separated from the mandible ( right panel ). The two SMGs, positioned at the base of the tongue, are finally separated with fine forceps. Scale bar = 1 mm. ( B ) This shows a range of different SMGs morphologies found at E13 depending on the time of mating. Earlier glands, shown in the left and middle panels, are suitable for epithelial-mesenchyme dissections; glands at late E13 are not suitable since a lot of branching has occurred and the epithelial buds are difficult to separate. After dissection, SMGs are placed in media and the epithelial rudiments separated from the mesenchyme as shown in ( C ). The diagram in ( D ) shows the epithelial rudiments plated in a culture dish containing laminin-111 substrate .
ECM and FGF-Dependent Assay of Embryonic SMG Epithelial Morphogenesis 325
Repeat this washing step twice, remove the SMGs with a pipette and transfer them to the first well of a previously prepared 3-well depression dish ( see Subheading 3.1.1 and Note 8 ).
3. Mechanically separate the epithelium from the mesenchyme using fine forceps by holding the mesenchyme with one pair of forceps and carefully peeling off the mesenchyme from the epithelial tissue with the other. Transfer the epithelial rudiments using a P20 pipette to the second BSA-containing well in the dish (never grasp the rudiments with forceps). After separating 10–15 rudiments, wash them by pipetting up and down a few times to remove residual mesenchymal cells, and transfer them to the third well containing DMEM-F12/PS where the BSA is washed away by pipetting up and down again. Figure 1b shows the intact SMGs before dispase treatment, and Fig. 1c shows the epithelium after dissecting from the mesenchyme.
4. Aspirate the epithelial rudiments (3–5 at a time) using a P2 pipette in a minimal volume (0.5–2 μ l) of DMEM-F12/PS, and transfer them to the laminin-1 matrix where they can be separated in the matrix with the tip of fine forceps ( see Note 9 ).
5. Incubate the epithelial rudiments at 37°C in 5% CO2 for up to 48 h, and monitor the epithelial for up to 48 h, and monitor the epithelial morphology triggered by different growth factors, and create RNA lysates at different times: 0, 6, 18, 24, 30, and 48 h ( see Note 10 ). After 48 h, dif-ferent morphologies are induced by FGF7 and FGF10, respectively, as shown in Fig. 2 .
1. Aspirate the epithelial rudiments with a P20 pipette and place them in a 1.7 mL eppendorf tube containing 100 μ L of lysis solution from the RNAqueous kit, and vortex the tube for a few seconds ( see Note 11 ).
2. Purify the RNA following the manufacturer’s instructions ( see Note 12 ) and elute the spin-columns with at least 10 μ L of elution buffer previously heated to 75°C.
3. Treat all RNA samples with DNase for 45 min at 37°C using the reagents in the RNAqueous kit ( see Note 13 ), followed by a 2 min incubation with 3.0 μ L of DNase inactivation reagent. Collect the DNase-free RNA samples in a new tube and assess the quality and quantity using 1 μ l of RNA sample and a Nanodrop spectrophotometer. The expected quantity of RNA/E13 epithelial rudiments is ~40-ng and after 48 h of FGF7 or FGF10-induced culture, this increases to ~60–80-ng RNA/rudiment, respectively.
3.2. Analysis of Gene Expression in Epithe-lial Cultures by Real-Time PCR
3.2.1. Prepare Total RNA Using a Micro-RNAqueous Kit for PCR

326 Rebustini and Hoffman
1. Use 100–1,000 ng of total RNA for cDNA synthesis accord-ing to the manufacturer’s specifications. Briefly, dilute the RNA aliquots using DEPC-H 2 O to complete a volume of 15 μ L, and then add 1.0 μ L of Reverse Transcriptase and 4.0 μ L of the appropriate RT-buffer, followed by incubations at room temperature for 5 min, 42°C for 30 min, and inactiva-tion at 85°C for 5 min. Adjust the volume of each cDNA aliquot using DEPC-H 2 O to obtain cDNA solutions at 1.0 ng/ μ L ( see Note 14 ).
2. Design PCR primers using Beacon Design Software ( see Note 15 ), and once having the primers dilute them in DEPC H 2 O to make a stock solution of 20 μ M each forward and reverse primer.
3. Perform PCR reactions in 96-well plates using an Eppendorf Repeater Pipettor to add 10.0 μ L of cDNA (total of 0.5–1.0 ng) and 15 μ L of PCR master mix reaction to a final reaction volume of 25 μ L. The PCR mix contains 0.5 μ L of oligonu-cleotides (forward and reverse, each one at final concentra-tion 2.5 μ M), 12.5 μ L of SYBR-Green PCR master mix and 2.0 μ L of DEPC-H 2 O. There are three technical replicates/sample.
4. Typically the PCR cycle program is 10 min at 94°C, followed by 40 cycles at 62°C for 45 s and 94°C for 15 s ( see Note 16 ).
3.2.2. Prepare cDNA Reactions Using Either the i-Script cDNA Synthesis or TaqMan RT Kits Prior to Use for Quantification of Gene Expression Using Real-Time PCR
2-A
FGF10 1500 ng /mL
FGF7 200 ng /mL
0h
0h
18h
18h
24h
24h
48h
48h
2-B
Fig. 2 . SMG epithelial rudiments cultured with FGF7 or FGF10. ( A ) This shows epithelial rudiments cultured for 48 h and the corresponding bud expansion or duct elongation promoted by FGF7 or FGF10, respectively. ( B ) This illustrates how to quantify morphological events during SMG epithelial morphogenesis. The upper figure shows how the width is measured (indicated by arrowheads ) and the number ( asterisk ) of end buds is counted; the bottom figure shows that the diameter ( dotted circle ) and the length of the ducts ( arrow ) can be measured.

ECM and FGF-Dependent Assay of Embryonic SMG Epithelial Morphogenesis 327
5. Fold change in gene expression is calculated using the deltaCt-deltaCt method, comparing threshold cycle numbers (Cts) ( see Note 17 ). Briefly, normalize the gene expression of each cDNA to a housekeeping gene (such as GAPDH or 29S ) and then to the control levels of expression for each gene analyzed. Transform the profiles of gene expression to a fold change and plot the data in a graph in a time-course dependent manner, as visualized in Fig. 3 .
1. For each experiment, add 10.0 μ L of single-use aliquots from frozen stock solutions of vitamin C (75 mg/mL in H 2 O) and transferrin (25 mg/mL in H 2 O) to 5.0 mL of DMEM/F12 (supplemented with penicillin and streptomycin).
2. It is important to use high-grade protease-free BSA, as lower grades will result in loss of epithelial viability.
3. Laminin-111 and growth factor-reduced BME are liquid at 4°C and form a 3D gel at 37°C, therefore they must be
4. Notes
Fig. 3 . Time-course of gene expression during SMG epithelial cultures. Total RNA is collected at the times indicated to make cDNA and perform real-time PCR to assess FGF7 ( solid line ) or FGF10-induced ( dashed line ) gene expression. The expression of each gene of interest is compared with a housekeeping gene 29S , which does not change with FGF7 or FGF10 treatment, and then the corresponding values of fold change in gene expression at different times (6, 18, 24, and 30 h) are compared with the respective fold change in gene expression in a control group (time 0 h). For more details, see Subheading 3.2.2 .
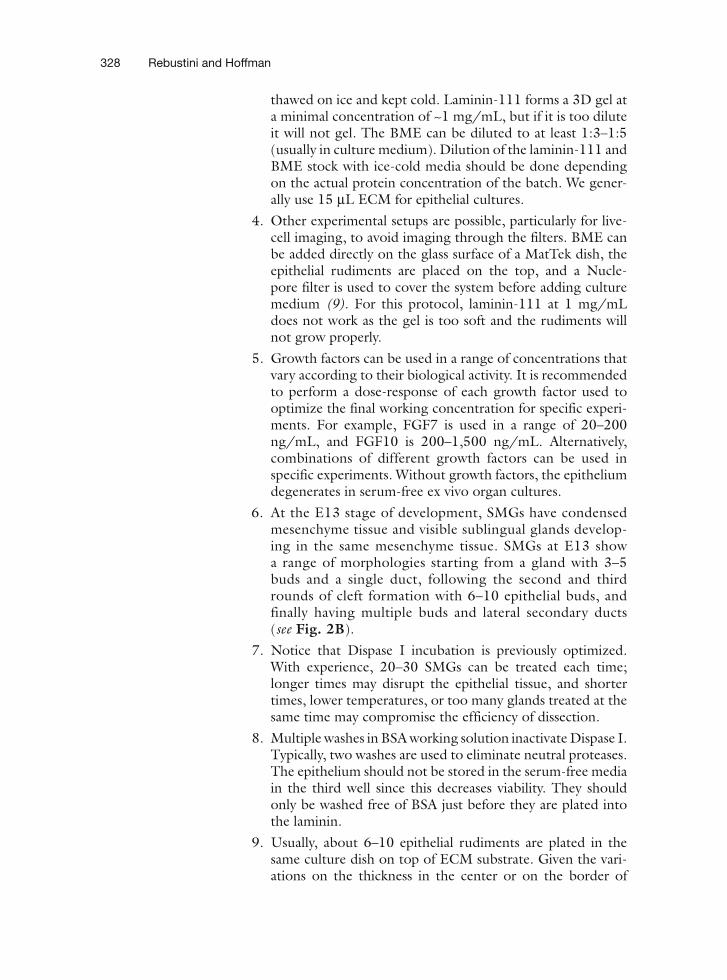
328 Rebustini and Hoffman
thawed on ice and kept cold. Laminin-111 forms a 3D gel at a minimal concentration of ~1 mg/mL, but if it is too dilute it will not gel. The BME can be diluted to at least 1:3–1:5 (usually in culture medium). Dilution of the laminin-111 and BME stock with ice-cold media should be done depending on the actual protein concentration of the batch. We gener-ally use 15 μ L ECM for epithelial cultures.
4. Other experimental setups are possible, particularly for live-cell imaging, to avoid imaging through the filters. BME can be added directly on the glass surface of a MatTek dish, the epithelial rudiments are placed on the top, and a Nucle-pore filter is used to cover the system before adding culture medium (9) . For this protocol, laminin-111 at 1 mg/mL does not work as the gel is too soft and the rudiments will not grow properly.
5. Growth factors can be used in a range of concentrations that vary according to their biological activity. It is recommended to perform a dose-response of each growth factor used to optimize the final working concentration for specific experi-ments. For example, FGF7 is used in a range of 20–200 ng/mL, and FGF10 is 200–1,500 ng/mL. Alternatively, combinations of different growth factors can be used in specific experiments. Without growth factors, the epithelium degenerates in serum-free ex vivo organ cultures.
6. At the E13 stage of development, SMGs have condensed mesenchyme tissue and visible sublingual glands develop-ing in the same mesenchyme tissue. SMGs at E13 show a range of morphologies starting from a gland with 3–5 buds and a single duct, following the second and third rounds of cleft formation with 6–10 epithelial buds, and finally having multiple buds and lateral secondary ducts ( see Fig. 2B ).
7. Notice that Dispase I incubation is previously optimized. With experience, 20–30 SMGs can be treated each time; longer times may disrupt the epithelial tissue, and shorter times, lower temperatures, or too many glands treated at the same time may compromise the efficiency of dissection.
8. Multiple washes in BSA working solution inactivate Dispase I. Typically, two washes are used to eliminate neutral proteases. The epithelium should not be stored in the serum-free media in the third well since this decreases viability. They should only be washed free of BSA just before they are plated into the laminin.
9. Usually, about 6–10 epithelial rudiments are plated in the same culture dish on top of ECM substrate. Given the vari-ations on the thickness in the center or on the border of

ECM and FGF-Dependent Assay of Embryonic SMG Epithelial Morphogenesis 329
the laminin-111 gel, the rudiments may grow more or less three-dimensionally, respectively.
10. Additionally, the distinct morphologies promoted by FGF7 and FGF10 can be measured using image analysis software such as NIH Image ( http://rsb.info.nih.gov/nih-image ) or Metamorph 7 (Molecular Devices, http://www.molecular.devices.com ). Take Photographs of the epithelial rudiments after times of FGF7 or FGF10 treatments to evaluate the morphology by counting the number of epithelial end buds, measuring the length of epithelial ducts, the radius of epithe-lial rudiment, or the width of end bud, as shown in Fig. 2B .
11. For RNA preparations, all materials such as pipettes, tips, and Eppendorf tubes must be RNase-free following appro-priate decontamination protocols. Wear gloves during all proceedings.
12. Alternatively, lysates for RNA extraction can be stored at −80°C from 6 to 12 months prior to RNA extractions.
13. The time of DNase treatment of RNA samples varies accord-ing to specific experiments. Usually 45 min is sufficient to eliminate SMG DNA contamination using 5–10 epithelial rudiments. Longer DNase treatments using a small amount of tissue may compromise the quality and the final RNA concentration.
14. The final concentration of cDNA is calculated by approxima-tion based on the initial RNA amount used for RT reactions. cDNAs should be stored as concentrated stock solutions and, once diluted to 0.5–1.0 ng/10 μ l, should be used as soon as possible with minimal freeze/thaws.
15. Design the PCR oligonucleotides using the SYBR-Green Design Option in the Beacon Design software. For templates, use sequences of mRNA of interest from NCBI ( http://www.ncbi.nlm.nih.gov ), and perform primers search limit-ing the sizes of the forward and reverse oligonucleotides to between 18 and 30 base pairs, and the PCR amplification product to between 75 and 150 base pairs. Preferentially, oligonucleotides are designed at the 3 ¢ end of the corre-sponding mRNA of interest. The annealing temperature is typically 65 ± 5°C. Finally, compare oligonucleotides to a data bank of known genes using the BLAST option in the software to determine the specificity of the gene of interest.
16. Before using primers to calculate the fold change in gene expression, melt-curve analysis and the efficiency of the oligonucleotides for PCR amplification must be determined. First, perform an additional heating cycle to generate melt-curves after running the PCR amplification cycles. Melt-curve analysis of the amplification products must show a

330 Rebustini and Hoffman
single PCR product corresponding to each pair of oligonu-cleotides tested. Then perform PCR using a serial dilution of a standard cDNA sample to verify the efficiency of product amplification by linear regression analysis. Oligonucleotides that fail in either melt-curve analysis or amplification effi-ciency must not be used to calculate fold change in gene expression and should be redesigned.
17. Fold change in gene expression reflects an indirect compari-son based on Threshold Cycle (Ct) numbers obtained after PCR amplifications. The relative abundance of each cDNA is inversely proportional to Ct numbers, and usually house-keeping genes show low Ct values compared with regulatory genes such as transcription factors, for example.
References
1. Patel , V. N. , Rebustini , I. T. , and Hoffman , M. P. (2006) . Salivary gland branching mor-phogenesis . Differentiation 74 , 349 – 64 .
2. Tucker , A. S. (2007) . Salivary gland develop-ment . Semin. Cell Dev. Biol. 18 (2) , 237 – 44 .
3. Nogawa , H. and Takahashi , Y. (1991) . Sub-stitution for mesenchyme by basement-membrane-like substratum and epidermal growth factor in inducing branching mor-phogenesis of mouse salivary epithelium . Development 112 , 855 – 61 .
4. Takahashi , Y. and Nogawa , H. (1991) . Branch-ing morphogenesis of mouse salivary epithe-lium in basement membrane-like substratum separated from mesenchyme by the membrane filter . Development 111 , 327 – 35 .
5. Morita , K. and Nogawa , H. (1999) . EGF-dependent lobule formation and FGF7-depend-ent stalk elongation in branching morphogenesis of mouse salivary epithelium in vitro . Dev. Dyn. 215 , 148 – 54 .
6. Hoffman , M. P. , Kidder , B. L. , Steinberg , Z. L. , Lakhani , S. , Ho , S. , Kleinman , H. K. , and Larsen , M. (2002) . Gene expression profiles of mouse submandibular gland development: FGFR1 regulates branching morphogenesis
in vitro through BMP- and FGF-dependent mechanisms . Development 129 , 5767 – 78 .
7. Steinberg , Z. , Myers , C. , Heim , V. M. , Lathrop , C. A. , Rebustini , I. T. , Stewart , J. S. , Larsen , M. , and Hoffman , M. P. (2005) . FGFR2b signaling regulates ex vivo sub-mandibular gland epithelial cell proliferation and branching morphogenesis . Development 132 , 1223 – 34 .
8. Rebustini , I. T. , Patel , V. N. , Stewart , J. S. , Layvey , A. ; Georges-Labouesse , E. ; Miner , J. H. , and Hoffman , M. P. (2007) Laminin α 5 is necessary for submandibular gland epithelial morphogenesis and influences FGFR expres-sion through β 1 integrin signaling . Dev. Biol. 308 (1) , 15 – 29 .
9. Larsen , M. , Wei , C. , and Yamada , K. M. (2006) . Cell and fibronectin dynamics during branching morphogenesis . J. Cell Sci. 119 , 3376 – 84 .
10. Wei , C. , Larsen , M. , Hoffman , M. P. , and Yamada , K. M. (2007) . Self-organization and branching morphogenesis of primary salivary epithelial cells . Tissue Eng. 13 , 721 – 35 .
11. Sakai , T. , Larsen , M. , and Yamada , K. M. (2003) . Fibronectin requirement in branch-ing morphogenesis . Nature 423 , 876 – 81 .

Chapter 22
Analyzing how Cell Adhesion Controls Mammary Gland Function by Transplantation of Embryonic Mammary Tissue from Knockout Mice
Teresa C.M. Klinowska and Charles H. Streuli
Summary
Understanding how cell adhesion to the extracellular matrix controls mammalian development has been explored extensively using gene knockout technology. However, in some knockout mice, animals die during late embryogenesis or shortly after birth. In such cases, it is possible to analyze embryonic devel-opmental phenotypes, but it is less easy to determine the in vivo role of cell–matrix interactions in adult tissues. Although this problem has been partially solved by the development of tissue-specific knockouts, the approach relies on appropriate tissue-specific promoters. In many cases, genes that uniquely char-acterize specific cell types within complex tissues have not been identified. Thus, knockout technology can be restrictive when analyzing cell–matrix interactions in specific cases of tissue development and/or homeostasis. Here we describe how transplantation of mammary tissue into recipient hosts can be used to extend the understanding of cell adhesion functions in developmental processes.
Key words: Cell–matrix interactions , Integrins , Tissue-specific knockout , Mammary gland , Mammary-tissue transplantation .
Understanding the function of ECM and cell–matrix interactions in mammalian development has been explored extensively using gene knockout technology. Indeed, two of the chapters in this volume provide detailed methods for producing mice with dele-tions in specific ECM genes ( see Chaps. 13 and 14). However, in some knockout mice, animals die during late embryogenesis or shortly after birth. In such cases, it is possible to analyze embryonic
1. Introduction
1.1. Background
Sharona Even-Ram and Vira Artym (eds.), Methods in Molecular Biology, Extracellular Matrix Protocols, vol. 522© Humana Press, a part of Springer Science + Business Media, LLC 2009DOI: 10.1007/978-1-59745-413-1_22
331

332 Klinowska and Streuli
developmental phenotypes, but it is less easy to determine the in vivo role of cell–matrix interactions in adult tissues.
Although this problem has been partially solved by the devel-opment of tissue-specific knockouts ( see Chap. 13), the approach relies on appropriate tissue-specific promoters. For example, it has been used to study the role of beta1-integrin in normal mam-mary gland development, (12-14). However, in many cases, genes that uniquely characterize specific cell types within complex tis-sues have not been identified. Thus, knockout technology can be restrictive when analyzing cell–matrix interactions in specific cases of tissue development and/or homeostasis.
Epithelial cells within mammary gland tissue are organized as two-layered ductal structures consisting of a central layer of luminal epithelial cells and a basal layer of myoepithelial cells contacting basement membrane. These ductal networks are embedded within mammary stroma. The formation of ducts and development of lac-tational alveoli are highly dynamic events that occur during various developmental stages of the mammary gland. The mechanism of tissue morphogenesis, the biochemical signal transduction path-ways that regulate transcription of mammary specific genes, and the survival of mammary cells (i.e., suppression of apoptosis) are all dependent on cell–matrix interactions within the tissue (1– 6) . Thus, the tissue has great potential for deciphering the roles of specific ECM proteins and their cellular receptors, e.g., integrins, in the control of many aspects of phenotype.
One significant advantage of studying the mammary gland is that the mammary epithelium from one mouse can be transplanted into the stroma of a syngeneic host (7) . Transplanted epithelium forms a ductal network within the mammary stroma, and, if the recipient mice are mated the epithelium develops lactational alveoli. The host mammary epithelium is poorly developed until puberty, thus if it is surgically removed prior to transplantation, all the new transplanted epithelium which populates the stroma will have the genotype of the donor. This transplantation strategy is particularly powerful for examining the role of ECM proteins and their receptors in the mammary glands of transgenic or knockout animals, which would otherwise suffer embryonic mortality. We have used the technique to analyze the function of α 6 integrin using mammary epithelium from knockout mice (8, 9) . These mice have a severe skin blistering defect and die at or shortly after birth. However, by transplanting mammary epithelium from the embryos of affected animals to syngeneic hosts, it has been possible to analyze the role of α 6 integrin in mammary development. Such a technique is equally applicable to the analysis of ECM function.
A further advantage of transplantation and retransplantation is that it allows considerable expansion of the epithelial cell population derived from just one mammary rudiment, and is now being used for generating mammary epithelium from stem cells (15).

Analyzing how cell Adhesion Controls Mammary 333
This is particularly useful when large numbers of cells are needed for subsequent analysis ( see Note 1 ). More recently, new gene transfer methods, including the use of lentiviruses, have come into use for repopulating mammary gland with genetically-modified cells (16). This is particularly powerful in combination with inducible promoters such as the Tet-On system (17).
At birth, the murine mammary gland consists of a small epithe-lial rudiment located under the nipple. Development then pro-ceeds very slowly until the onset of puberty (approximately 3 week postpartum) when the epithelium grows rapidly into the subcutaneous fat pad and subsequently populates the entire avail-able stroma (18). To enable transplantation, the endogenous mammary rudiment of the host gland is removed at 21 days after birth leaving the fat pad devoid of epithelium. This is known as a “cleared” fat pad. Mammary tissue from another syngeneic animal is then transplanted into the cleared fat pad where it will grow and form a functional glandular epithelium ( see Note 2 ).
1. Eared (blunt tipped) scissors. 2. Thick forceps. 3. Fine forceps (#5). 4. Watchmaker’s springbow scissors. 5. Dissecting microscope (Leica). 6. Adjustable fiber optic lights (Euromex, Arnhem, Holland). 7. Phosphate buffered saline (PBS): 10 mM Na 2 HPO 4 , 1.76
mM KH 2 PO 4 , 137 mM NaCl, 1.33 mM KCl pH 7.0. 8. L15 medium (Sigma, Madison, WI, #L4386). 9. Petri dishes. 10. Cryovials (Nalgene). 11. Freezing mix (3 parts medium, 1 part serum, 1 part DMSO). 12. Cryo 1°C freezing container “Mr Frosty” (Nalgene). 13. Glass microscope slides. 14. Telly’s fix: 70% ethanol, 5% formalin, 5% glacial acetic acid. 15. Acetone. 16. Ethanol. 17. Meyer’s hematoxylin stain for whole mounts: 0.25 g haema-
toxylin, 50 mg sodium iodate, 12.5 g aluminium potassium sulphate per liter distilled water.
1.2. Summary of the Technique
2. Materials
2.1. Isolation of Embryonic Mammary Tissue

334 Klinowska and Streuli
18. Acidified 50% alcohol (50% ethanol acidified with 25 mL 1N HCl per liter).
19. Methyl salicylate.
1. Gaseous anesthetic: Anesthetic box perfused with O2 (2 L/min), NO 2 (1 L/min), 2% halothane .
2. Liquid anesthetic: One part Hypnorm (Janssen, Beerse, Belgium) and one part Midazolam (Hypnovel; Roche, Basel, Switzerland) to six parts of sterile water for injection (Fresenius Health Care Group, Basingstoke, UK). Use 10 μ L/g body weight by intraperitoneal injection. Anesthesia should last around 40 min, which is adequate for a transplantation experiment. If necessary, the period of anesthesia can be extended by additional doses of 0.3 μ L/g Hypnorm alone every 30–40 min and additional doses of Midazolam every 4 h.
3. Needles (27-gage 1/2 in) and 1-mL syringes. 4. Shaver (Wahl). 5. Cotton wool. 6. Chlorhexidine gluconate solution (Preston Pharmaceuticals,
Preston, UK). 7. Cork board (Fisons). 8. Elastic bands. 9. Pins. 10. Cauterizer with fine tip (Rimmer Bros., London). 11. Sterile swabs. 12. Glass slides, Telly’s fix, acetone, ethanol, Meyer’s haematox-
ylin, acidified 50% alcohol, and methyl salicylate for whole mounts ( see Subheading 2.1 ).
13. Trypan blue solution: 0.1% in saline. 14. Needle holders. 15. Sutures: 5/0 Vicryl 13 mm 3/8 curved needle (Ethicon,
Sommerville, NJ). 16. Analgesia: Bupranorphine (Temgesic, Reckit and Colman)
1:100 in sterile water for injection. Use 10 μ L/g body weight by subcutaneous injection. Bupranorphine also has the effect of reversing the action of the anesthesia.
17. Heated pads (International Market Supplies, Congleton, UK).
18. Vetbed (Petsmart).
1. Scissors, forceps, and cotton swabs ( see Subheadings 2.1 and 2.2 ).
2.2 .Transplantation of Mammary Tissue into Recipient Mice
2.3. Analysis of Phenotype

Analyzing how cell Adhesion Controls Mammary 335
2. Glass slides, Telly’s fix, acetone, ethanol, Meyer’s haematox-ylin, acidified 50% alcohol, and methyl salicylate for whole mounts ( see Subheading 2.1 ).
3. Cryovials, freezing mix, cryo 1°C freezing container ( Sub-heading 2.1 ).
4. 4% paraformaldehyde in PBS. 5. 0.2 M glycine in PBS. 6. Alcohol. 7. Chloroform. 8. Paraffin wax. 9. Xylene. 10. EM fix: 2.5% gluteraldehyde, 2% paraformaldehyde, 0.1 M
sodium cacodylate pH 7.4. 11. 1M sodium cacodylate buffer pH 7.4. 12. 1% osmium tetroxide in cacodylate buffer. 13. Desiccated alcohol. 14. Propylene oxide. 15. Agar100 resin (Agar Scientific, UK). 16. 2% uranyl acetate. 17. 3% lead citrate. 18. Aluminium foil. 19. O.C.T mounting medium (TissueTec). 20. Small metal block. 21. Polystyrene container (for liquid nitrogen). 22. Liquid nitrogen. 23. BrdU labeling and detection kit e.g., BD-Biosciences BrdU
in-situ detection kit, #550803 .
1. Embryos are obtained by caesarian section from mothers killed by cervical dislocation at the appropriate age of gesta-tion ( see Note 3 ).
2. The ventral flank of the female is opened to expose the bicornate uterus. This is then gently opened using scissors and fine forceps to reveal the embryos.
3. The embryos should be removed from their fetal mem-branes and killed by cervical dislocation before dissection.
3. Methods
3.1. Isolation of Embryonic Mammary Tissue
3.1.1. Isolation of Embryos
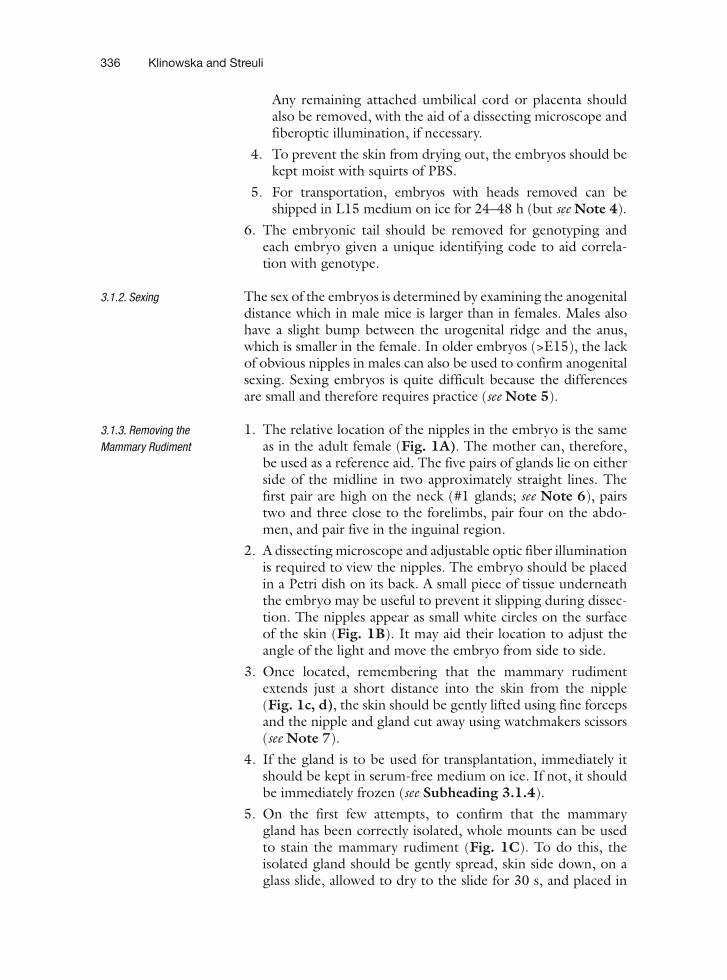
336 Klinowska and Streuli
Any remaining attached umbilical cord or placenta should also be removed, with the aid of a dissecting microscope and fiberoptic illumination, if necessary.
4. To prevent the skin from drying out, the embryos should be kept moist with squirts of PBS.
5. For transportation, embryos with heads removed can be shipped in L15 medium on ice for 24–48 h (but see Note 4 ).
6. The embryonic tail should be removed for genotyping and each embryo given a unique identifying code to aid correla-tion with genotype.
The sex of the embryos is determined by examining the anogenital distance which in male mice is larger than in females. Males also have a slight bump between the urogenital ridge and the anus, which is smaller in the female. In older embryos (>E15), the lack of obvious nipples in males can also be used to confirm anogenital sexing. Sexing embryos is quite difficult because the differences are small and therefore requires practice ( see Note 5 ).
1. The relative location of the nipples in the embryo is the same as in the adult female (Fig. 1A ) . The mother can, therefore, be used as a reference aid. The five pairs of glands lie on either side of the midline in two approximately straight lines. The first pair are high on the neck (#1 glands; see Note 6 ), pairs two and three close to the forelimbs, pair four on the abdo-men, and pair five in the inguinal region.
2. A dissecting microscope and adjustable optic fiber illumination is required to view the nipples. The embryo should be placed in a Petri dish on its back. A small piece of tissue underneath the embryo may be useful to prevent it slipping during dissec-tion. The nipples appear as small white circles on the surface of the skin (Fig. 1 B). It may aid their location to adjust the angle of the light and move the embryo from side to side.
3. Once located, remembering that the mammary rudiment extends just a short distance into the skin from the nipple (Fig. 1 c, d) , the skin should be gently lifted using fine forceps and the nipple and gland cut away using watchmakers scissors ( see Note 7 ).
4. If the gland is to be used for transplantation, immediately it should be kept in serum-free medium on ice. If not, it should be immediately frozen ( see Subheading 3.1.4 ).
5. On the first few attempts, to confirm that the mammary gland has been correctly isolated, whole mounts can be used to stain the mammary rudiment (Fig. 1 C). To do this, the isolated gland should be gently spread, skin side down, on a glass slide, allowed to dry to the slide for 30 s, and placed in
3.1.2. Sexing
3.1.3. Removing the Mammary Rudiment

Analyzing how cell Adhesion Controls Mammary 337
Telly’s fixative. The subsequent procedure is exactly the same as for whole mount of adult mammary glands ( see Subhead-ing 3.3.2 ), although because the tissue is much smaller, the time in each solution may be reduced.
1. As mentioned in Note 4 , it is highly preferable to transport dissected mammary rudiment frozen. It may also be necessary to keep the gland frozen until a suitable recipient is available. To do this, the tissue should be placed in a cryovial containing 0.5 mL freezing mix and frozen slowly to −80°C ( see Note 8 ).
2. Liquid nitrogen should be used for longer term storage.
1. Frozen tissue should be rapidly thawed and washed several times in serum-free medium (e.g., L15) to remove any traces of serum or DMSO before transplantation.
2. Thawed tissue should be kept in serum-free medium on ice until transplantation.
3.1.4. Freezing Mammary Rudiment for Transport or Storage
3.1.5. Recovery of Frozen Tissue
Fig. 1. Location and morphology of murine mammary glands. ( A ) Location of adult mammary glands and nipples; ( B ) Embryonic nipples of glands #2 and #3 in situ (E17.5). Arrows indicate the pale circular nipples on the skin; ( C ) Whole mount of embryonic rudiment (E17.5) stained with haematoxylin; ( D ) Wax section of rudiment in ( C ) stained with hae-matoxylin and eosin .
A
Gland #1
Gland #2
Gland #3
Gland #4
Gland #5
Nipples (#5 not seen)
B C D
50 μm 25 μm

338 Klinowska and Streuli
To avoid tissue rejection, transplantation should always be into syngeneic recipient animals. Nude mice can be used as recipients; however, their mammary glands are small and postoperative infections may cause problems. Most transgenic animals are a cross between C57BL6 and 129 strains of mice and, therefore, F1 progeny of 129×C57BL6 are ideal recipients ( see Note 9 ).
1. Recipient mice must have their endogenous mammary epi-thelium removed by 21 days after birth. As this is normally the time of weaning from the mother, it is usual to wait until 21 days before operating. The #4 or abdominal glands are the easiest to clear for transplantation. Clearing the fat pad can be done at the same time as transplanting tissue, and this is preferable because the animal then only undergoes one opera-tion. However, if this is not possible for logistical reasons, the fat pad can be cleared and the animal left until required for transplantation.
2. We routinely use 21-days-old F1 progeny C57BL6×129 mice which are quite skittish. To minimize the stress of an intraperi-toneal (IP) injection, the mice are subdued in an anesthetic box perfused with halothane, N 2 O, and O 2 before IP injection of 10 μ L/g body weight anesthetic.
3. Once anaesthetized, the abdomen is shaved and swabbed with a small amount of chlorhexidine solution.
4. The mouse is then restrained on its back on a cork dissecting board using small elastic bands tied in a slip knot around each paw and secured at the other end with a small pin.
5. A small Y-shaped incision is then made in the ventral skin from just under the rib cage to slightly down each of the hind limbs using eared scissors. If any small blood vessels are accidentally nicked, they are immediately cauterized to minimize blood loss.
6. The skin is gently retracted on one side using a sterile swab until the lymph node of the #4 gland is visible as a small oval in the center of the gland (Fig. 2A ) . To secure the skin out of the way, a small-gage needle may be used to pin it to the board. The major blood vessel which forks over the lymph node is cauter-ized, and the fatty tissue distal to the lymph node is removed using the cauterizer, taking care not to damage the skin.
7. The removed tissue can be whole mounted for examina-tion to check that all the epithelium has been cleared ( see Subheading 3.3.2 ). On the first few attempts, it is prudent to leave this cleared gland untransplanted and check after some weeks that it remains epithelium free (Fig. 2B , C ) . This gives confidence for the future that any epithelium seen after transplantation is likely to be the result of a successful transplant rather than a failed clearing. Once this has been
3.2. Transplantation of Mammary Tissue into Recipient Mice
3.2.1. Breeding of Recipient Mice
3.2.2. Clearing the Fat Pad and Transplantation
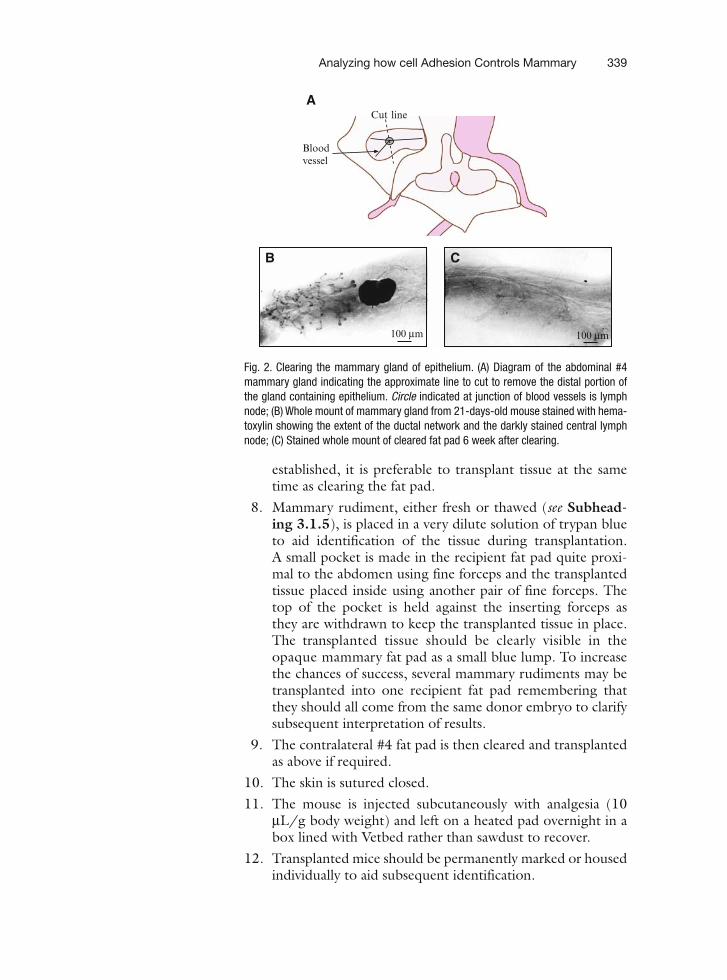
Analyzing how cell Adhesion Controls Mammary 339
established, it is preferable to transplant tissue at the same time as clearing the fat pad.
8. Mammary rudiment, either fresh or thawed ( see Subhead-ing 3.1.5 ), is placed in a very dilute solution of trypan blue to aid identification of the tissue during transplantation. A small pocket is made in the recipient fat pad quite proxi-mal to the abdomen using fine forceps and the transplanted tissue placed inside using another pair of fine forceps. The top of the pocket is held against the inserting forceps as they are withdrawn to keep the transplanted tissue in place. The transplanted tissue should be clearly visible in the opaque mammary fat pad as a small blue lump. To increase the chances of success, several mammary rudiments may be transplanted into one recipient fat pad remembering that they should all come from the same donor embryo to clarify subsequent interpretation of results.
9. The contralateral #4 fat pad is then cleared and transplanted as above if required.
10. The skin is sutured closed. 11. The mouse is injected subcutaneously with analgesia (10
μ L/g body weight) and left on a heated pad overnight in a box lined with Vetbed rather than sawdust to recover.
12. Transplanted mice should be permanently marked or housed individually to aid subsequent identification.
Fig. 2 . Clearing the mammary gland of epithelium. ( A ) Diagram of the abdominal #4 mammary gland indicating the approximate line to cut to remove the distal portion of the gland containing epithelium. Circle indicated at junction of blood vessels is lymph node; ( B ) Whole mount of mammary gland from 21-days-old mouse stained with hema-toxylin showing the extent of the ductal network and the darkly stained central lymph node; (C ) Stained whole mount of cleared fat pad 6 week after clearing .
100 μm
B
100 μm
C
Cut line
Bloodvessel
A

340 Klinowska and Streuli
1. Transplanted tissue should be left in situ for a minimum of 5–6 weeks to see significant growth. To stimulate maximum proliferation the recipient animal can be mated once it reaches 6 week of age, and the mammary tissue harvested during late pregnancy.
2. To access the transplanted glands, the mouse is killed by cervi-cal dislocation and the ventral skin opened and gently retracted using scissors, forceps, and a cotton swab to reveal the abdomi-nal #4 glands. The distal end of the gland can be separated gently from the skin using scissors and, held with forceps, lifted to aid separation of the rest of the gland from the skin.
3. Once removed, the entire gland can be spread on a glass micro-scope slide for whole mount analysis or dissected into smaller pieces for wax histology, electron microscopy, cryosectioning, and immunostaining or protein/RNA/DNA analysis.
4. Alternatively, if passaging the tissue for serial retransplanta-tion is required ( see Note 1 ), small pieces (approximately 1–2 mm 3 ) of gland-containing epithelium ( see Note 10 ) should be cut and frozen ( see Subheading 3.1.4 ) or immediately retransplanted.
1. This technique is used on whole gland or pieces of gland to reveal the epithelial architecture ( see Figs. 1C and 2B ). The mammary tissue is gently spread on an uncoated glass micro-scope slide and allowed to dry for approximately 1 min. It is then placed in Telly’s fix for at least 2 h.
2. The tissue is defatted in three changes of acetone (1 h each) and rehydrated through 100, 95, and 70% alcohol (at least 1 h each).
3. The nuclei are stained with Meyer’s hematoxylin for approxi-mately 30 min. The exact time depends on the age of the staining solution. The hematoxylin is “blued” in running tap water for approximately 20 min. To improve contrast, the tis-sue may require destaining with acidified 50% alcohol before dehydration through 70%, 95%, and 2× 100% alcohol.
4. Finally, the tissue is cleared for examination with 50% methyl salicylate/50% alcohol overnight and stored in 100% methyl salicylate.
1. Wax-embedded material can either be obtained directly from fresh tissue or alternatively pieces of interest can be cut from stained whole mounts and subsequently embedded in wax.
2. If sections are required for in situ hybridization, care should be taken to ensure all solutions are RNase free.
3. Fresh tissue is fixed in 4% paraformaldehyde in PBS for 1 h at 4°C. Free-aldehyde groups are blocked by incubation in 0.2 M glycine for 2 h at 4°C.
3.3. Analysis of Phenotype
3.3.1. Harvesting Transplanted Mammary Tissue
3.3.2. Whole Mount Analysis
3.3.3. Wax Embedding
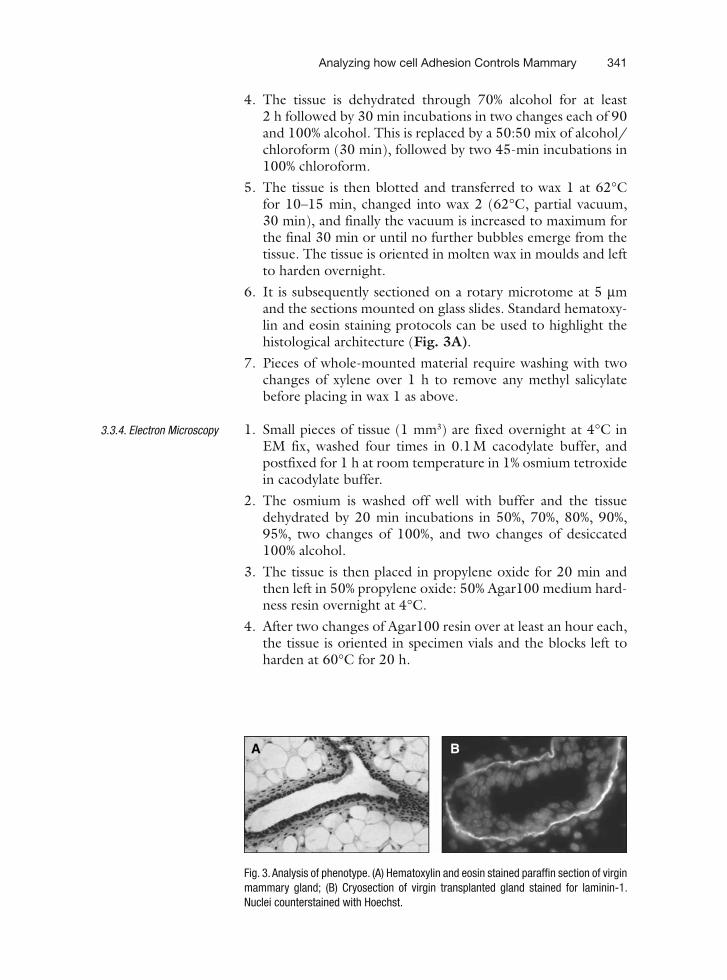
Analyzing how cell Adhesion Controls Mammary 341
4. The tissue is dehydrated through 70% alcohol for at least 2 h followed by 30 min incubations in two changes each of 90 and 100% alcohol. This is replaced by a 50:50 mix of alcohol/chloroform (30 min), followed by two 45-min incubations in 100% chloroform.
5. The tissue is then blotted and transferred to wax 1 at 62°C for 10–15 min, changed into wax 2 (62°C, partial vacuum, 30 min), and finally the vacuum is increased to maximum for the final 30 min or until no further bubbles emerge from the tissue. The tissue is oriented in molten wax in moulds and left to harden overnight.
6. It is subsequently sectioned on a rotary microtome at 5 μ m and the sections mounted on glass slides. Standard hematoxy-lin and eosin staining protocols can be used to highlight the histological architecture (Fig. 3A ) .
7. Pieces of whole-mounted material require washing with two changes of xylene over 1 h to remove any methyl salicylate before placing in wax 1 as above.
1. Small pieces of tissue (1 mm 3 ) are fixed overnight at 4°C in EM fix, washed four times in 0.1 M cacodylate buffer, and postfixed for 1 h at room temperature in 1% osmium tetroxide in cacodylate buffer.
2. The osmium is washed off well with buffer and the tissue dehydrated by 20 min incubations in 50%, 70%, 80%, 90%, 95%, two changes of 100%, and two changes of desiccated 100% alcohol.
3. The tissue is then placed in propylene oxide for 20 min and then left in 50% propylene oxide: 50% Agar100 medium hard-ness resin overnight at 4°C.
4. After two changes of Agar100 resin over at least an hour each, the tissue is oriented in specimen vials and the blocks left to harden at 60°C for 20 h.
3.3.4. Electron Microscopy
Fig. 3 . Analysis of phenotype. ( A ) Hematoxylin and eosin stained paraffin section of virgin mammary gland; ( B ) Cryosection of virgin transplanted gland stained for laminin-1. Nuclei counterstained with Hoechst .
A B

342 Klinowska and Streuli
5. Ultrathin sections can be stained with 2% uranyl acetate (16 min) followed by 3% lead citrate (6 min) with thorough wash-ing in water between and after staining.
1. Pieces of tissue or even the entire gland can be frozen for cry-osectioning. The tissue is frozen in a foil cup of an appropriate size (just bigger than the tissue) made by molding aluminium foil over a suitable object such as a marker pen lid or the cap of a small bottle. This cup is filled with O.C.T mounting medium and the tissue inside oriented appropriately for sectioning.
2. The cup is then placed on a metal block precooled in a bath of liquid nitrogen and left until the O.C.T has become hard and opaque.
3. Tissue is stored at −20°C until required. 4. Cryosections (7 μ m) are used for immunostaining using
standard fixation and staining protocols (Fig. 3B ).
Small pieces of tissue can be snap frozen in aluminium foil parcels in liquid nitrogen and kept under nitrogen until required. The tissue is then ground down and protein, RNA, or DNA extracted using standard protocols.
Mammary epithelial cells can be isolated from transplanted mam-mary glands using established protocols (10) and their biology studied in tissue culture.
If information on the proliferative index of the mammary gland is required, then the mouse can be injected i.p. with 5 micro-litres/g mouse weight of 200 micro-gram/ml (in water) bromodeoxyu-ridine (BrdU), 2 h before death. This will incorporate into the DNA of any cells in S-phase during this period. The tissue is then harvested as normal and processed either for wax embedding and sectioning or cryosectioning and the incorporated BrdU detected by immunocytochemistry.
1. Transgenic or knockout mammary epithelium can be serially transplanted, once it has been established that it can form ductal networks within mammary gland. Tissue should be harvested around 8 week after initial transplantation, cut into small pieces, and then used to repopulate more host mam-mary gland. Serial transplantation of mammary tissue is only successful for a limited number of generations because of cellular senescence. The proliferative potential of normal
3.3.5. Cryoembedding
3.3.6. Protein/RNA/DNA Analysis
3.3.7. Cell Culture
3.3.8. Proliferation Indices
4. Notes
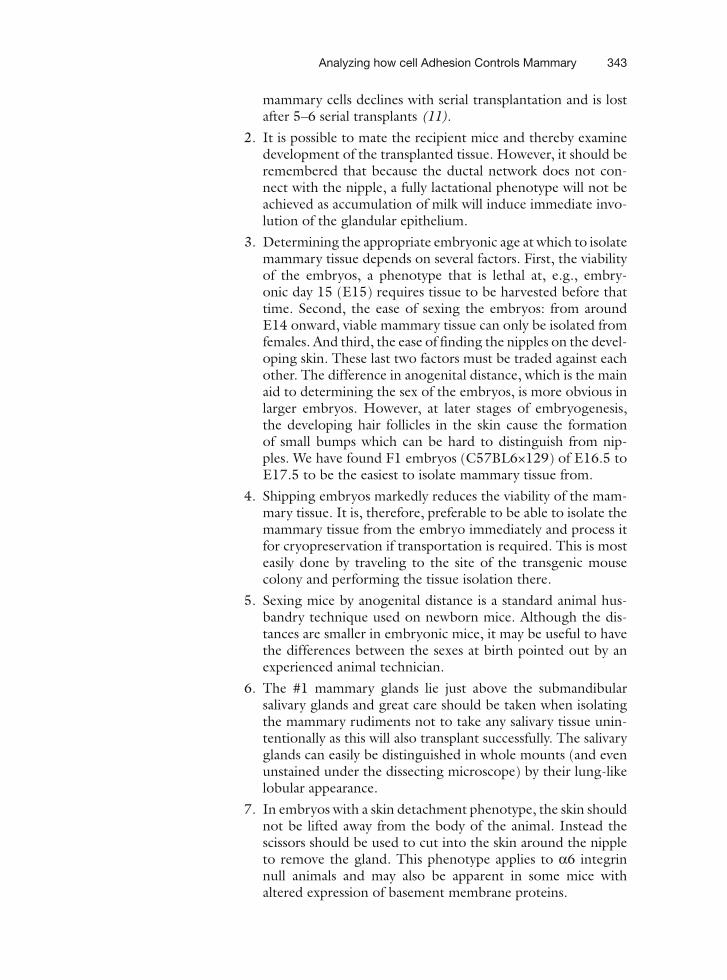
Analyzing how cell Adhesion Controls Mammary 343
mammary cells declines with serial transplantation and is lost after 5–6 serial transplants (11) .
2. It is possible to mate the recipient mice and thereby examine development of the transplanted tissue. However, it should be remembered that because the ductal network does not con-nect with the nipple, a fully lactational phenotype will not be achieved as accumulation of milk will induce immediate invo-lution of the glandular epithelium.
3. Determining the appropriate embryonic age at which to isolate mammary tissue depends on several factors. First, the viability of the embryos, a phenotype that is lethal at, e.g., embry-onic day 15 (E15) requires tissue to be harvested before that time. Second, the ease of sexing the embryos: from around E14 onward, viable mammary tissue can only be isolated from females. And third, the ease of finding the nipples on the devel-oping skin. These last two factors must be traded against each other. The difference in anogenital distance, which is the main aid to determining the sex of the embryos, is more obvious in larger embryos. However, at later stages of embryogenesis, the developing hair follicles in the skin cause the formation of small bumps which can be hard to distinguish from nip-ples. We have found F1 embryos (C57BL6×129) of E16.5 to E17.5 to be the easiest to isolate mammary tissue from.
4. Shipping embryos markedly reduces the viability of the mam-mary tissue. It is, therefore, preferable to be able to isolate the mammary tissue from the embryo immediately and process it for cryopreservation if transportation is required. This is most easily done by traveling to the site of the transgenic mouse colony and performing the tissue isolation there.
5. Sexing mice by anogenital distance is a standard animal hus-bandry technique used on newborn mice. Although the dis-tances are smaller in embryonic mice, it may be useful to have the differences between the sexes at birth pointed out by an experienced animal technician.
6. The #1 mammary glands lie just above the submandibular salivary glands and great care should be taken when isolating the mammary rudiments not to take any salivary tissue unin-tentionally as this will also transplant successfully. The salivary glands can easily be distinguished in whole mounts (and even unstained under the dissecting microscope) by their lung-like lobular appearance.
7. In embryos with a skin detachment phenotype, the skin should not be lifted away from the body of the animal. Instead the scissors should be used to cut into the skin around the nipple to remove the gland. This phenotype applies to α 6 integrin null animals and may also be apparent in some mice with altered expression of basement membrane proteins.

344 Klinowska and Streuli
8. We achieve slow freezing using a Nalgene “Mr Frosty” tub containing isopropanol, which cools at 1°C per minute ( see Subheading 2.1 ).
9. Complications can arise if later progeny are backcrossed onto another strain, which is sometimes done to increase fecun-dity. If this is the situation, providing all strains are inbred, at least six generations of backcrossing are required before transplantation is possible.
10. It is usually quite difficult to see unstained mammary epi-thelium through the fatty stroma, even with the aid of a dissecting microscope. However, sometimes (especially in thinner areas of the gland), it is possible to check the suc-cess of transplantation and establish which areas of the gland have been populated by outgrowing epithelium.
CHS is funded by the Wellcome Trust.
Acknowledgments
References
1. Barcellos-Hoff , M. H. , Aggeler , J. , Ram , T. G. , and Bissell , M. J. (1989) Functional differen-tiation and alveolar morphogenesis of primary mammary cultures on reconstituted basement membrane . Development 105 , 223 – 235 .
2. Steuli , C. H. , Bailey , N. , and Bissell , M. J. (1991) Control of mammary epithelial dif-ferentiation – basement membrane induces tissue-specific gene expression in the absence of cell-cell interaction and morphological polarity . J. Cell Biol. 115 , 1383 – 1395 .
3. Pullan , S. , Wilson , J. , Metcalfe , A. , Edwards , G. M. , Goberdhan , N. , Tilly , J. , et al . (1996) Requirement of basement membrane for the suppression of programmed cell death in mam-mary epithelium . J. Cell Sci. 109 , 631 – 642 .
5. Farrelly , N. , Lee , Y.-J. , Oliver , J. , Dive , C. , and Streuli , C. H. (1999) Extracellular matrix regulates apoptosis in mammary epithelium through a control on insulin signaling . J. Cell Biol. 144 , 1337 – 1348 .
6. Klinowska , T. C. M. , Soriano , J. V. , Edwards , G. M. , Oliver , J. M. , Valentijn , A. J. , Montesano , R. , and Streuli , C. H. (1999) Laminin and beta 1 integrins are crucial for normal mammary gland development in the mouse . Dev. Biol. 215 , 13 – 32 .
7. DeOme , K. B. , Faulkin , L. J. , Jr. , Bern , H. A. , and Blair , P. E. (1959) Development of mam-mary tumors from hyperplastic alveolar nod-ules transplanted into gland-free mammary fat pads of female C3H mice . Cancer Res. 19 , 515 – 520 .
8. Georges Labouesse , E. , Messaddeq , N. , Yehia , G. , Cadalbert , L. , Dierich , A. , and Le Meur , M. (1996) Absence of integrin alpha 6 leads to epidermolysis bullosa and neonatal death in mice . Nat. Genet. 13 , 370 – 373 .
9. Klinowska , T. C. M. , Alexander , C. , Georges-Labouesse , E. , Van der Neut , R. , Sonnenberg , A. , and Streuli , C. H. (2001) Epithelial devel-opment and differentiation in the mammary gland is not dependent on alpha 3 or alpha 6 integrin subunits . Dev. Biol. 233 (2) , 449 – 67
10. Pullan , S. and Streuli , C. H. (1996) The mam-mary gland epithelial cell . In Epithelial Cell Culture ( Harris , A. , ed.), Cambridge University Press , Cambridge, UK , pp. 97 – 121 .
11. Daniel , C. W. , De Ome , K. B. , Young , J. T. , Blair , P. B. , and Faulkin , L. J., Jr. (1968) The in vivo life span of normal and preneoplastic mouse mammary glands: a serial transplan-tation study . Proc. Natl. Acad. Sci. USA 61 , 53 – 60 .

Analyzing how cell Adhesion Controls Mammary 345
12 Li, N., Zhang, Y., Naylor, M. J., Schatzmann, F., Maurer, F., Wintermantel, T., Schuetz, G., Mueller, U., Streuli, C. H., and Hynes, N. E. (2005) Beta1 integrins regulate mammary gland proliferation and maintain the integrity of mammary alveoli. Embo J. 24, 1942–1953
13 Naylor, M. J., Li, N., Cheung, J., Lowe, E., Lambert, E., Marlow, R., Wang, P., Schatz-mann, F., Winntermantel, T., Schuetz, G., Clarke, A. R., Mueller, U., Hynes, N. E., Streuli, C.H. (2005). Ablation of beta1-integrin in mammary epithelium reveals a key role for integrin in glanular morphogenesis and differentation. J. Cell Biol. 171, 717–728
14 Taddei, I., Deugnier, M. A., Faraldo, M. M., Petit, V., Bouvard, D., Medina, D., Fassler, R., Thiery, J. P., and Glukhova, M. A. (2008). Beta1 integrin deletion from the basal com-partment of the mammary epithelium affects stem cells. Nat Cell Biol 10, 716–22.
15 Sleeman, K. E., Kendrick, H., Robertson, D., Isacke, C. M., Ashworth, A., Smalley, M. J. (2007) Dissociation of estrogen receptor expression and in vivo stem cell activity in the mammary gland. J. Cell Biol. 176, 19–26.
16 Welm, B. E., Dijkgraaf, G. J., Bledou, A. S., Welm, A. L., Werb, Z. (2008) Lentivira/transduction of mammary stem cells for analy-sis of gene function during development and cancer. Cell stem cell 2, 90–102.
17 Herold, M. J., van den Brandt, J., Seibler, J., Reichardt, H. M. (2008) Inducible and reverible gene silencing by stable integration of an rhRNA-encoding lentivirus in trans-genic rats. Proc Natl. Acach. Sci. USA. 105, 18507–18515
18 Hinck, L., Silberstein, G. B., (2005) Key stages in mammary gland development: the mam-mary end bud as a motile organ. Breast Cancer Res. 7, 245–251.

Chapter 23
Characterizing ECM Production by Cells Encapsulated in Hydrogels
Iossif A. Strehin and Jennifer H. Elisseeff
Summary
Hydrogels composed of hydrophilic polymers such as polyethylene glycol and alginate have been used as scaffolds for various tissue engineering applications. This chapter describes procedures for encapsula-tion of cells in hydrogels and subsequently characterizing the extracellular matrix (ECM) production by those cells using biochemical assays, gene expression analysis, and histology. In particular, the biochemi-cal assays described here are used to quantify collagen, glycosaminoglycan (GAG), and DNA content in each scaffold. The methods for analyzing the level of gene expression of specific ECM molecules such as collagen I, collagen II, and aggrecan are also described. Finally, included are protocols for histologi-cal methods used to analyze overall matrix production and GAG synthesis via hematoxylin and eosin staining and Safranin-O, respectively. These methods can be modified so that other scaffolds apart from hydrogels can be used.
Key words: Chondrocytes , PEG-DA , Hydrogels , Collagen , Glycosaminoglycans , DNA , Gene expression , mRNA , cDNA , Gel electrophoresis , Histology , Safranin-O .
The field of tissue engineering focuses on the restoration, main-tenance, or improvement of tissue function through the develop-ment of biological substitutes (1– 3) . Two main constituents of these biological substitutes are scaffolds and cells. Scaffolds play a critical role in tissue engineering by guiding cell response and ultimately tissue development. There are a large number of scaf-folds that have been used for tissue engineering purposes.
An ideal scaffold has to perform physical functions in a spe-cific environment and interact with cells to efficiently induce new
1. Introduction
Sharona Even-Ram and Vira Artym (eds.), Methods in Molecular Biology, Extracellular Matrix Protocols, vol. 522© Humana Press, a part of Springer Science + Business Media, LLC 2009DOI: 10.1007/978-1-59745-413-1_23
349

350 Strehin and Elisseeff
tissue development, characterized by an ECM that closely resem-bles the native tissue (4) . These scaffolds are designed to perform a number of biological functions including stimulation of cells to synthesize ECM, proliferate, migrate, prevent apoptosis, and/or differentiate. They can be composed of natural or synthetic mate-rials or a combination of both. Scaffolds composed of biological polymers (natural scaffolds) can communicate or interact with cells to induce desired biological responses.
Characterizing the extracellular matrix in scaffolds is criti-cal to evaluating the success of a tissue engineering system. A challenge that can arise when using natural materials is to dis-tinguish between ECM molecules synthesized by cells and the natural material in the scaffold. For example, if a natural ECM molecule normally found in the tissue is a component in the scaffold, differentiating between matrix produced by the cells and matrix integrated as a part of the scaffold may be difficult. Degradation of natural materials also changes depending on the environment. Furthermore, depending on the characteristics of cells present or the rate of tissue growth, degradation rate will be different.
When characterizing an engineered tissue, one must evaluate gene expression, matrix production, and organization. Particu-larly, when stem cells are used, even if correct gene expression of desired tissue specific molecules is induced, synthesis and organi-zation of the extracellular matrix may be lacking. Therefore, a number of different methods must be used to evaluate and char-acterize newly synthesized matrix. For example, GAG production can be evaluated by three types of analysis: biochemical assay, histology, and gene expression.
In this chapter, we will describe protocols used to assess production of cartilage tissue by cells (including chondrocytes, mesenchymal stem cells (MSCs), and embryonic stem cells) encapsulated in polyethylene glycol-diacrylate (PEG-DA) hydro-gels (Fig. 1 ) (5– 7) . Our lab usually works with human, goat, and bovine cells, which we isolate and expand ourselves. We have found that it is best to use primary or passage zero chondrocyte cells when possible. Any further expansion will lead to loss of appropriate gene expression and the cells will act less like the primary cells and more like fibroblasts. With MSCs, and possibly other adult stem cells, higher passage cells can be used (passage five or below). Embryonic stem cells are an exception because theoretically they can be expanded indefinitely; however, they must be expanded in very strict conditions to prevent them from differentiating and losing their “stemness” (the appropriate cul-turing conditions for ESCs can be found elsewhere).
Here we describe the biochemical assays, gene expression, and histology protocols needed to evaluate ECM synthesis by the cells. For the biochemical assays, the tissue constructs are
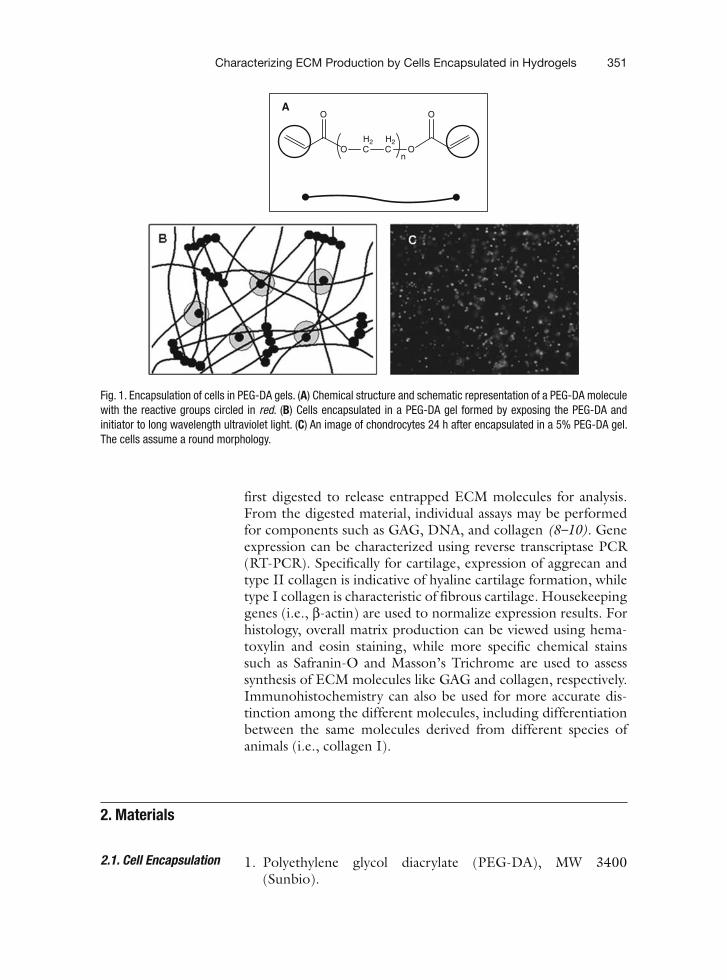
Characterizing ECM Production by Cells Encapsulated in Hydrogels 351
first digested to release entrapped ECM molecules for analysis. From the digested material, individual assays may be performed for components such as GAG, DNA, and collagen (8– 10) . Gene expression can be characterized using reverse transcriptase PCR (RT-PCR). Specifically for cartilage, expression of aggrecan and type II collagen is indicative of hyaline cartilage formation, while type I collagen is characteristic of fibrous cartilage. Housekeeping genes (i.e., β -actin) are used to normalize expression results. For histology, overall matrix production can be viewed using hema-toxylin and eosin staining, while more specific chemical stains such as Safranin-O and Masson’s Trichrome are used to assess synthesis of ECM molecules like GAG and collagen, respectively. Immunohistochemistry can also be used for more accurate dis-tinction among the different molecules, including differentiation between the same molecules derived from different species of animals (i.e., collagen I).
1. Polyethylene glycol diacrylate (PEG-DA), MW 3400 (Sunbio).
2. Materials
2.1. Cell Encapsulation
Fig. 1 . Encapsulation of cells in PEG-DA gels. ( A ) Chemical structure and schematic representation of a PEG-DA molecule with the reactive groups circled in red . ( B ) Cells encapsulated in a PEG-DA gel formed by exposing the PEG-DA and initiator to long wavelength ultraviolet light. ( C ) An image of chondrocytes 24 h after encapsulated in a 5% PEG-DA gel. The cells assume a round morphology .
AO
O On
CH2
CH2
O
352 Strehin and Elisseeff
2. Irgacure Solution: 10% (w/v) Irgacure 2959 (Ciba) in 140 Proof Ethanol.
3. Initiator Solution: Prepare 0.05% Irgacure 2959 (w/v) in PBS by adding Irgacure solution to PBS (1:200).
4. Phosphate Buffer Saline (PBS) (Gibco). 5. UV Lamp (320–400 nm, 4 mW/cm 2 ). 6. Gel Molds: Caps cut from 0.5 mL microcentrifuge tubes
(USA Scientific).
1. PBE Buffer: 0.1 M Na 2 HPO 4 , 10 mM EDTA Na 2 ·2H 2 O, pH 6.5, filter sterilize. Store at 4°C for up to 3 months.
2. PBE/Cys Solution: 10 M L -Cysteine hydrochloride monohy-drate in PBE, filter-sterilize.
3. Papain Buffer: 9.3 units papain type III (Worthington) per 1 mL of PBE.
4. Pellet pestles (Kimble Kontes).
1. 10× TNE Buffer : 0.1 M Tris Base, 2 M NaCl, and 10 mM EDTA Na 2 ·2H 2 O, pH 7.4. Store at 4°C for up to 3 months.
2. Standard Solution : 10 μ L Calf Thymus DNA stock solution (Invitrogen), 890 μ L dH 2 O, 100 μ L 10× TNE Buffer (100 μ g/mL final concentration).
3. Hoechst Dye Stock: 1 mg/mL Hoechst 33258 (Sigma). Store at 4°C.
4. Assay Solution : 10 μ L Hoechst 33258 stock solution, 10 mL 10× TNE buffer, 90 mL of ddH 2 O ( see Note 1 ).
5. Papain digests ( see Subheading 2.2 ). 6. Standard disposable transfer pipettes (Fisherbrand). 7. DyNA Quant TM 200 Fluorometer. 8. Cuvettes (Fisher NC9156883) ( see Note 2 ).
1. PBE Buffer : 0.1 M Na 2 HPO 4 , 10 mM EDTA Na 2 ·2H 2 O, pH 6.5, filter sterilize. Store at 4°C for up to 3 months.
2. PBE/Cys Solution : 10 M L -cysteine hydrochloride monohy-drate in PBE, filter-sterilize.
3. Chondroitin Sulfate (CS) Stock Solution : 50 mg/mL CS in PBE/cys solution. Store at −20°C.
4. CS Working Solution : 25 μ L CS stock solution, 12.5 mL PBE/cys.
5. 1,9-Dimethylmethylene blue (DMMB) dye stock solution : 40 mM Glycine, 40 mM NaCl, pH 3. Dissolve 16 mg DMMB and check that the OD 525 is between 0.31 and 0.34 (use a
2.2. Papain Digestion
2.3. DNA Assay
2.4. GAG Assay

Characterizing ECM Production by Cells Encapsulated in Hydrogels 353
blank cuvette as a reference). Store in dark at 25°C for up to 3 months.
6. Papain digests (for preparation see Subheading 2.2 ). 7. Standard disposable transfer pipettes (Fisherbrand). 8. UV Spectrophotometer. 9. Cuvettes (Fisher NC9156883) ( see Note 2 ).
1. pH 6 Buffer: 0.57 M NaOH, 0.16 M citric acid, 0.59 M sodium acetate, 0.8% (v/v) glacial acetic acid, 20% (v/v) iso-propanol, 79.2% (v/v) ddH 2 O, pH 6, 100 μ L (~5 drops) tol-uene ( see Note 3 ). Store at room temperature.
2. Hydroxyproline Stock Solution: 100 μ g/mL hydroxyproline. Store at room temperature.
3. Hydroxyproline Working Solution: 10 μ g/mL hydroxyproline. 4. Acids and Bases: 6N HCl; 0.5N HCl; 2.5N NaOH, and 0.5N
NaOH. 5. Chloramine T Solution: 69 mM Chloramine-T hydrate (Aldrich
85,731-9) in 89% (v/v) pH 6 Buffer and 11% (v/v) isopropanol. Shake well and leave at room temperature for 24 h.
6. pDAB Solution: 1.17 M 4-(Dimethylamino)benzaldehyde (pDAB) (Sigma D2004), 70% (v/v) isopropanol, 30% (v/v) 60% perchloric acid. Slowly add the perchloric acid while the pDAB/isopropanol solution is on ice and stirring; continue stirring for 10 min after adding the acid. Leave pDAB solution at room tem-perature in the dark for 24 h before use ( see Note 4 ).
7. Cuvettes (VWR 58017-847) ( see Note 2 ). 8. Hydroxyproline (Aldrich H5440-9).
1. Centrifuge equipped with temperature control. 2. UV spectrophotometer. 3. Pellet pestles (Kimble Kontes). 4. RNase, DNase, DNA Free and non-pyrogenic 1.5 mL centri-
fuge tubes (USA Scientific). 5. RNAse free solvents: Trizol (Invitrogen), DEPC-H 2 O, chlo-
roform, isopropanol, ethanol.
1. Superscript 1st Strand S.ystem (Invitrogen). 2. PCR Tubes (USA Scientific). 3. PCR machine, for example: iCycler (BioRad).
1. 3 μ M ethidium bromide (Invitrogen) in PBS. 2. DNA gel loading dye (Quality Biological, Inc).
2.5. Collagen Assay
2.6. mRNA Extraction
2.7. cDNA Synthesis
2.8. PCR and Gel Elec-trophoresis

354 Strehin and Elisseeff
3. 10 mM dNTP (Invitrogen). 4. Taq DNA/10× PCR/50 mM MgCl 2 (Invitrogen). 5. 100 bp DNA Ladder (Invitrogen). 6. DEPC H 2 O (Quality Biological, Inc.). 7. Agarose. 8. Primers (MWG). 9. PCR tubes (USA Scientific). 10. iCycler (BioRad). 11. Dimethyl sulfoxide. 12. TAE buffer. 13. Parafilm. 14. A scanner equipped with UV light.
1. Dehydrating solvents: Xylene and 70, 80, 95, and 100% (w/v) Ethanol.
2. PBS (Invitorgen). 3. 4% paraformaldehyde (w/v) in PBS, pH 7.4. Several steps
involving temperature and pH changes are necessary to dis-solve this chemical ( see Note 5 ).
4. Embedding Equipment: (a). Paraffin. (b). Embedding cassettes (Fisher). (c). Stainless steel base molds 30 mm L × 24 mm W × 5 mm
H (Fisher). (d). Tissue embedding system (i.e., Leica EG1150).
1. 0.1% (w/v) Gelatin in ddH2O ( see Note 6 ). 2. Harris hematoxylin w/glacial acetic acid (Polyscientific). 3. Eosin Y Solution (Sigma). 4. Rehydrating Solvents: xylene and 70, 80, 95, and 100%
(v/v) Ethanol. 5. Acid ethanol: 1% (v/v) 12N HCl in 70% ethanol. 6. Glass slides (Fisherbrand, 75 × 25 mm), Cover slips (Fisher-
brand, 40 × 22 mm). 7. Permount (mounting solution) (Fisher SP15-100). 8. Microtome (i.e., Leica RM2125RT). 9. Hot bath (i.e., Leica HI1215). 10. Hot plate.
2.9. Fixation, Dehydra-tion, and Embedding of Hydrogels
2.10. H & E Staining
Characterizing ECM Production by Cells Encapsulated in Hydrogels 355
1. 0.1% (w/v) Gelatin in ddH 2 O ( see Note 6 ). 2. 0.1% (w/v) Safranin-O (ScholAR Chemistry) in dH 2 O. 3. 0.001% (w/v) Fast Green, FCF (Sigma) in 1% (v/v) Glacial
Acetic Acid in ddH 2 O. 4. Rehydrating Solvents: xylene and 70, 80, 95, and 100%
(v/v) Ethanol. 5. Glass Slides (Fisherbrand, 75 × 25 mm), Cover Slips (Fisher-
brand, 40 × 22 mm). 6. Permount (mounting solution) (Fisher SP15-100). 7. Microtome (i.e., Leica RM2125RT). 8. Hot bath (i.e., Leica HI1215). 9. Hot plate.
1. Precut the sides of the 0.5 mL tube cap that will be used as molds, so that the cured gel can be pushed out from the bot-tom. Autoclave the caps (Fig. 2).
2. Prepare 10% (w/v) PEG-DA by dissolving PEG-DA in ini-tiator solution. (Irgacure 2959 was tested to be nontoxic for the embedded cells.)
3. Resuspend the cells in 100 μ L of 10% PEG-DA to a final concentration of 2 × 10 7 cells/mL.
4. Add the cell suspension to the gel molds and expose to UV light for 5 min. Exposure to UV light initiates crosslinking by radical polymerization that will turn the liquid cell sus-pension into a firm gel.
5. Release the gels by bending the molds and breaking them, and the gel can be pushed from the bottom. Transfer the gels to wells of a 24-well plate with 2 mL medium per well. Change the medium every other day.
6. The cells should be cultured for at least 3 weeks with analysis done at different time points of culture, depends on the type of cells. Typical analysis is performed at 1, 21, and 42 days after plating.
1. Weigh the wet and dry weights of the hydrogel constructs. To obtain the wet weight, remove the constructs from media, lightly dry them with a delicate task wipe (i.e., Kimwipe TM ) and weigh them. Then lyophilize the samples for 2 days and weigh them again to obtain the dry weights.
2.11. Safranin-O Staining
3. Methods
3.1. Cell Encapsulation
3.2. Papain Digestion
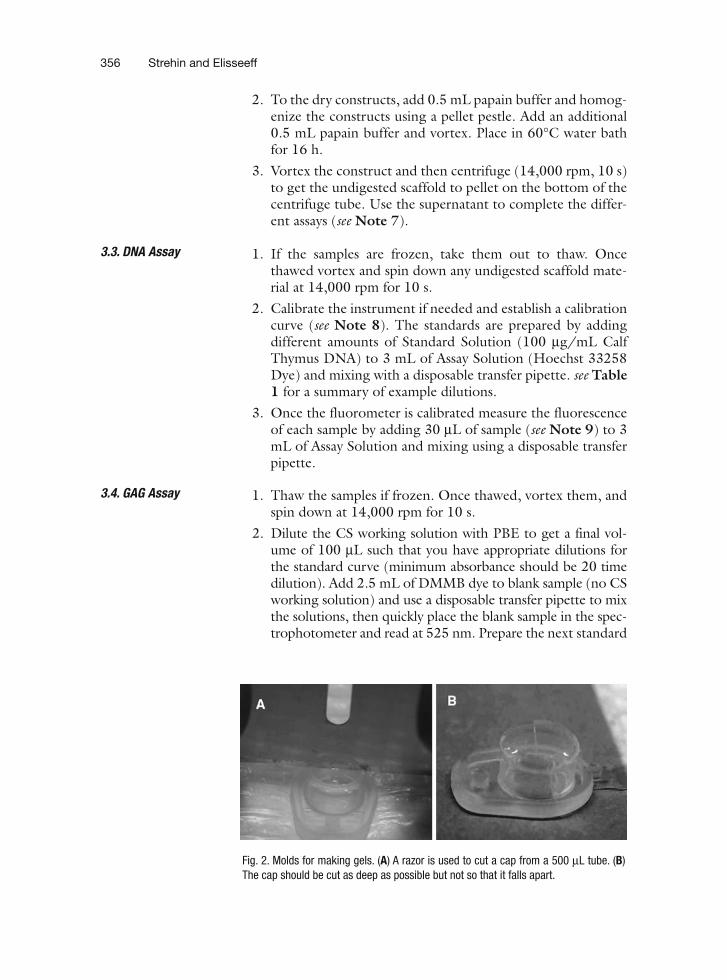
356 Strehin and Elisseeff
2. To the dry constructs, add 0.5 mL papain buffer and homog-enize the constructs using a pellet pestle. Add an additional 0.5 mL papain buffer and vortex. Place in 60°C water bath for 16 h.
3. Vortex the construct and then centrifuge (14,000 rpm, 10 s) to get the undigested scaffold to pellet on the bottom of the centrifuge tube. Use the supernatant to complete the differ-ent assays ( see Note 7 ).
1. If the samples are frozen, take them out to thaw. Once thawed vortex and spin down any undigested scaffold mate-rial at 14,000 rpm for 10 s.
2. Calibrate the instrument if needed and establish a calibration curve ( see Note 8 ). The standards are prepared by adding different amounts of Standard Solution (100 μ g/mL Calf Thymus DNA) to 3 mL of Assay Solution (Hoechst 33258 Dye) and mixing with a disposable transfer pipette. see Table 1 for a summary of example dilutions.
3. Once the fluorometer is calibrated measure the fluorescence of each sample by adding 30 μ L of sample ( see Note 9 ) to 3 mL of Assay Solution and mixing using a disposable transfer pipette.
1. Thaw the samples if frozen. Once thawed, vortex them, and spin down at 14,000 rpm for 10 s.
2. Dilute the CS working solution with PBE to get a final vol-ume of 100 μ L such that you have appropriate dilutions for the standard curve (minimum absorbance should be 20 time dilution). Add 2.5 mL of DMMB dye to blank sample (no CS working solution) and use a disposable transfer pipette to mix the solutions, then quickly place the blank sample in the spec-trophotometer and read at 525 nm. Prepare the next standard
3.3. DNA Assay
3.4. GAG Assay
Fig. 2 . Molds for making gels. ( A ) A razor is used to cut a cap from a 500 μ L tube. ( B ) The cap should be cut as deep as possible but not so that it falls apart .
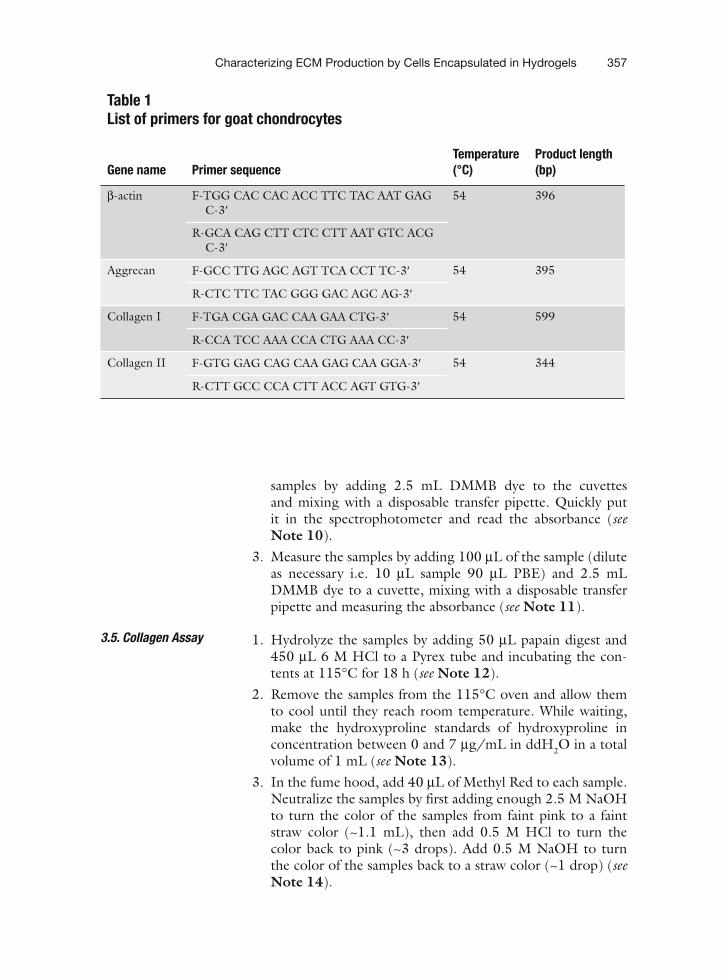
Characterizing ECM Production by Cells Encapsulated in Hydrogels 357
samples by adding 2.5 mL DMMB dye to the cuvettes and mixing with a disposable transfer pipette. Quickly put it in the spectrophotometer and read the absorbance ( see Note 10 ).
3. Measure the samples by adding 100 μ L of the sample (dilute as necessary i.e. 10 μ L sample 90 μ L PBE) and 2.5 mL DMMB dye to a cuvette, mixing with a disposable transfer pipette and measuring the absorbance ( see Note 11 ).
1. Hydrolyze the samples by adding 50 μ L papain digest and 450 μ L 6 M HCl to a Pyrex tube and incubating the con-tents at 115°C for 18 h ( see Note 12 ).
2. Remove the samples from the 115°C oven and allow them to cool until they reach room temperature. While waiting, make the hydroxyproline standards of hydroxyproline in concentration between 0 and 7 μ g/mL in ddH 2 O in a total volume of 1 mL ( see Note 13 ).
3. In the fume hood, add 40 μ L of Methyl Red to each sample. Neutralize the samples by first adding enough 2.5 M NaOH to turn the color of the samples from faint pink to a faint straw color (~1.1 mL), then add 0.5 M HCl to turn the color back to pink (~3 drops). Add 0.5 M NaOH to turn the color of the samples back to a straw color (~1 drop) ( see Note 14 ).
3.5. Collagen Assay
Table 1 List of primers for goat chondrocytes
Gene name Primer sequence Temperature (°C)
Product length (bp)
β -actin F-TGG CAC CAC ACC TTC TAC AAT GAG C-3 ¢
54 396
R-GCA CAG CTT CTC CTT AAT GTC ACG C-3 ¢
Aggrecan F-GCC TTG AGC AGT TCA CCT TC-3 ¢ 54 395
R-CTC TTC TAC GGG GAC AGC AG-3 ¢
Collagen I F-TGA CGA GAC CAA GAA CTG-3 ¢ 54 599
R-CCA TCC AAA CCA CTG AAA CC-3 ¢
Collagen II F-GTG GAG CAG CAA GAG CAA GGA-3 ¢ 54 344
R-CTT GCC CCA CTT ACC AGT GTG-3 ¢

358 Strehin and Elisseeff
4. Add ddH 2 O to the samples to a final volume of 2 mL. Then transfer 1 mL of the diluted samples to new 16-mL Pyrex tubes. In the fume hood, add 0.5 mL Chloramine T solu-tion to each tube (standard and sample) while vortexing and incubate at room temperature for 20 min.
5. In the fume hood add 0.5 mL pDAB solution to each tube (standard and sample) while vortexing (until white color disappears), recap the tubes tightly and incubate them in a 60°C water bath for 30 min.
6. Place the tubes in cold water for 5 min and then record the absorbance at 557 nm. Use water only as a blank ( see Note 15 ).
1. Wash the constructs with PBS and transfer them to sepa-rate 1.5 mL centrifuge tubes. Then homogenize the con-structs by adding 500 μ L Trizol to the tubes and use the pellet pestles to grind them into a homogeneous mixture. Add another 500 μ L Trizol to bring to a final volume of 1 mL ( see Note 16 ).
2. Add 0.2 mL of chloroform to homogenates, shake well for 15 s, and leave at room temperature for 5 min. Then centri-fuge at 15,000 RCF, 4°C for 20 min ( see Note 17 ). Transfer the top clear layer to a new e-tube being careful not to dis-turb the bottom layer and add 500 μ L of isopropanol to the clear solution. Mix well by shaking and leave at room tem-perature for no more than 5 min ( see Note 18 ). Centrifuge at 15,000 RCF, 4°C for 20 min. Pour out supernatant and add 1 mL 75% ethanol. Shake well for 1–2 s. Centrifuge at 10,000 RCF, 4°C for 10 min. Pour out ethanol and air dry the RNA pellets for 10–30 min.
3. Add 30–50 μ L DEPC-H 2 O and pipette well (avoid creating bubbles). Denature RNA pellet in 60°C for up to 10 min. Place on ice immediately to cool and maintain denatured structure ( see Note 19 ). Determine RNA concentration using a UV spectrophotometer ( see Note 20 ).
1. For each sample add 1 μ g RNA and DEPC H 2 O to a PCR tube to have a final volume of 7.0 μ L.
2. Prepare enough Master Solution for all the samples plus one extra and add 3 μ L of it to each sample. Master Solution = 1.0 μ L OligodT, 1.0 μ L Random Hexamer and 1.0 μ L 10 mM dNTP.
3. Prepare enough RNaseout Mix for all the samples plus one extra and place it on ice until needed (9.0 μ L/sam-ple). RNaseout Mix = 2.0 μ L of 10× RT buffer, 4.0 μ L of 25 mM MgCl 2 , 2.0 μ L of 0.1 M DTT and 1.0 μ L RNa-seout.
3.6. mRNA Extraction
3.7. cDNA Synthesis

Characterizing ECM Production by Cells Encapsulated in Hydrogels 359
4. Synthesize the cDNA using the iCycler. Mix the 10 μ L mRNA + Master Solution by tapping and centrifuging briefly to spin down any solution stuck to the walls and remove any bubbles. Put the 10 μ L mRNA + Master Solution in the thermocycler and incubate at 65°C for 5 min. Place on ice for 1 min. Add 9.0 μ L of RNaseout Mix, mix well by tapping and centrifuge briefly. Incubate at 25°C for 5 min. Incubate at 42°C for 5 min. Place on ice for 1 min. Add 1.0 μ L of SuperScript TM II RT (SSRTII), mix well by tapping and centrifuge briefly. Incubate at 42°C for 30 min. Place on ice for 1 min. Add 1.0 μ L of SSRTII, mix well by tapping and centrifuge briefly. Incubate at 42°C for 30 min. Incu-bate at 72°C for 15 min. Place on ice for 1 min. Add 1.0 μ L of RNase H, mix well by tapping and centrifuge briefly. Incubate at 37°C for 20 min.
1. Prepare enough PCR Mix for all the samples plus one extra. PCR Mix: 10 mM dNTP – 2 μ L, 10× PCR – 2.5 μ L, 50 mM MgCl 2 – 1.25 μ L, DEPC H 2 O – 15.75 μ L, DMSO – 1.25 μ L, Primer F – 0.5 μ L, Primer R – 0.5 μ L, Taq DNA – 0.25 μ L. See Table 1 for sequence of forward (F) and reverse (R) primers.
2. Add 24 μ L of PCR Mix and 1 μ L cDNA to each PCR tube. Then run the following PCR program: 1× (95°C 4 min), 35× (95°C 30 s, primer temperature (i.e., 55°C) 30 s, 72°C 1 min), 1× 72°C 7 min, 1× 4°C¥.
3. Make 2% (w/v) agarose gel in TAE buffer. To dissolve put in the microwave for 1 min, observe the flask and when the solu-tion starts to bubble open the microwave. Swirl the solution around to mix it and continue microwaving. Repeat until the solution completely dissolves (~50 s). Pour the hot gel into the gel box with the appropriate size combs. Allow for the gel to cool for 30 min after which remove the combs. Place the gel into the electrophoresis chamber and add enough TAE buffer to cover the wells.
4. Load the wells: 1 μ L of DNA gel loading dye plus 5 μ L PCR product ( see Note 21 ).
5. Load the DNA ladder: 1 μ L ladder, 1 μ L DNA gel loading dye, and 4 μ L TAE buffer.
6. Finish assembling the electrophoresis chamber and run the gel for 30 min.
7. Soak the gel in Ethidium Bromide (EtBr) solution for 20 min in the dark ( see Note 22 ). Put access EtBr back into its con-tainer and rinse gel three times with DI water. Make sure to dispose of the DI water appropriately. Soak the gel in DI water for 10 min after which expose it to UV light and take pictures.
3.8. PCR and Gel Electrophoresis

360 Strehin and Elisseeff
1. Fix the hydrogel by incubating it in 500 μ L of 4% parafor-maldehyde overnight (~12 h). Then dehydrate the hydrogel using the following sequence: 70% EtOH × 1 h, 80% EtOH × 1.5 h, 95% EtOH × 12 h, 100% EtOH × 1.5 h-repeat twice, Xylene × 1 h.
2. Place the hydrogel in a metal mold (see materials) and embed in paraffin at 60°C overnight (~12 h). The paraffin should be poured out and replaced with fresh paraffin. Place an embed-ding cassette on top of the mold and add additional paraffin to fill the cassette. Cool for 1 h using the cold surface of the embedding station ( see Note 23 ).
1. Cut 5 μ m sections of paraffin-embedded hydrogels using a microtome (i.e., Leica RM2125RT), transfer them to a 0.1% gelatin bath at 40°C for few seconds so that they float (i.e. Leica HI1215), then fish them out on glass slides. Leave the slides on a 40°C hot plate overnight.
2. Rehydrate the sample using the following sequence: xylene × 1 min – repeat twice, 100% EtOH × 1 min – repeat twice, 95% EtOH × 1 min – repeat twice, 80% EtOH × 1 min, dH 2 O × 5 min – repeat twice, dry slide with a deli-cate task wipe.
3. Stain the samples with hematoxalin: Harris hematoxylin × 3 min, ddH 2 O × 10 s, tap water × 5 min, acid ethanol dip – repeat 8–12 times, tap water × 1 min – repeat twice, ddH 2 O × 2 min, dry slide with delicate task wipe.
4. Stain the sample with eosin: Eosin Y × 30 s, 95% EtOH × 1 min, 100% EtOH × 1 min, xylene × 1 min. Place mounting solution next to the sample and cover it with a glass slide such that no air bubbles are visible.
1. Cut 5 μ m sections of paraffin-embedded hydrogels, place them in a 40°C 0.1% gelatin bath for a few seconds, and then fish them out on glass slides. Leave the slides on a 40°C hot plate overnight.
2. Rehydrate the sample using the following sequence: xylene 1 min for twice, 100% EtOH 1 min for twice, 95% EtOH 1 min for twice, 80% EtOH 1 min for one time, dH 2 O 5 min for two times, dry slide with a delicate task wipe.
3. Stain the samples using the following sequence: Fast Green × 3 min, 1% acetic acid × 10 s, dry slide with a delicate task wipe, 0.1% Safranin-O × 10 min, dH 2 O × 1 min-repeat three times, 95% EtOH × 1 min, 100% EtOH × 1 min, xylene × 1 min. Mount the sample.
3.9. Fixation and Dehydration of Hydrogels
3.10. H & E Staining
3.11. Safranin-O Staining

Characterizing ECM Production by Cells Encapsulated in Hydrogels 361
1. Hoechst 33258 assay solution must be prepared on the day of the assay. Also, Hoechst is a toxic substance please read the MSDS sheet carefully and dispose of this chemical appropriately.
2. It is critical to use the right cuvette when doing the DNA, GAG, and collagen assays.
3. For the pH 6 Buffer, first dissolve the powders using glacial acetic acid diluted with water. Then add the rest of the sol-vents. For example, for a final volume of 750 mL dissolve the powders in 6 mL glacial acetic acid and 250 mL ddH2O. Also, adjust the pH to 6 after adding all the solvents but before adding the five drops of toluene.
4. Perchloric acid is highly reactive with all organic substances. Please refer to the MSDS sheet and attached information for how to handle this product and how to clean up properly.
5. To dissolve the paraformaldehyde, heat the solution to 55°C while stirring. Once dissolved, add 1N NaOH drop by drop to the solution until it becomes clear. Use dilute HCl to lower the pH to 7.4.
6. Autoclave the gelatin solution to help dissolve the gelatin and to prevent future contamination.
7. After the 60°C incubation step, you can store the papain digests in a –20°C freezer.
8. The DNA assay described here was performed using a DyNA Quant 200 Flourometer, but the assay can be modified for use with different instrument. The Hoechst 33258 dye absorbs at 350 nm and emits at 461 nm.
9. You can increase the volume of sample added so that the reading falls within the standard curve. Also write down how much sample is added so that you can calculate the amount of DNA in the total solution.
10. Do the GAG assay in the dark if possible because the DMMB dye is light sensitive.
11. Each sample should be measured at least twice to make sure that you get the same values. Repeat until you measure two values within four units of each other.
12. When doing the collagen assay, make sure that you use Pyrex culture tubes or any glass tubes strong enough to withstand the pressure. Also, the cap should be tightly screwed on to ensure no evaporation occurs during the 115°C incubation step.
13. When doing the collagen assay, it is advisable to do no more than 20 samples at a time. If you have more than 20 samples then split them into separate batches with each batch having its own standard curve.
4. Notes

362 Strehin and Elisseeff
14. When neutralizing the samples in step 7 of the collagen assay, make sure to vortex while adding either NaOH or HCl. This ensures adequate mixing.
15. When measuring the absorbance of the samples for the col-lagen assay, make sure to finish within 1 h from removing the samples from the water bath.
16. At this point of the mRNA extraction, the samples can be left in a –80°C freezer for up to 6 months.
17. Two layers will form. The top layer will be clear and contains the mRNA. The bottom layer will be pinkish and contains the proteins, gel, and other nucleic acids like DNA.
18. At this point the samples can be left at 4°C overnight. 19. At this point the samples can be stored at –80°C for 1 year. 20. Usually there is a program already built into the UV spectro-
photometer to measure RNA concentration. The concentra-tion should be above 150 μ g/mL.
21. Mixing is best done on top of a sheet of parafilm. 22. EtBr is extremely carcinogenic. Please read the MSDS sheet
carefully and dispose of this chemical appropriately. 23. The embedding system we use (Leica EG1150) comes with
two surfaces, one surface is cooling when turned on while the other is heating. The hot surface is used to melt the paraffin and help with embedding and setting up the construct, while the cold surface is used to cool and solidify the paraffin.
References
1. Vacanti , C. A. (2006) . The history of tissue engineering . J Cell Mol Med 10 (3) : 569 – 76 .
2. Vacanti , J. P. (1988) . Beyond transplantation. Third annual Samuel Jason Mixter lecture . Arch Surg 123 (5) : 545 – 9 .
3. Langer , R. and J. P. Vacanti (1993) . Tissue engineering . Science 260 (5110) : 920 – 6 .
4. Lutolf , M. P. and J. A. Hubbell (2005) . Syn-thetic biomaterials as instructive extracellular microenvironments for morphogenesis in tis-sue engineering . Nat Biotechnol 23 (1) : 47 – 55 .
5. Sharma , B. , C. G. Williams , et al. (2007) . In vivo chondrogenesis of mesenchymal stem cells in a photopolymerized hydrogel . Plast Reconstr Surg 119 (1) : 112 – 20 .
6. Hwang , N. S. , S. Varghese , et al. (2006) . Enhanced chondrogenic differentiation of
murine embryonic stem cells in hydrogels with glucosamine . Biomaterials 27 (36) : 6015 – 23 .
7. Sharma , B. , C. G. Williams , et al. (2007) . Designing zonal organization into tissue-engi-neered cartilage . Tissue Eng 13 (2) : 405 – 14 .
8. Woessner , J. F. , Jr. (1961) . The determina-tion of hydroxyproline in tissue and protein samples containing small proportions of this imino acid . Arch Biochem Biophys 93 : 440 – 7 .
9. Kim , Y. J. , R. L. Sah , et al. (1988) . Fluorometric assay of DNA in cartilage explants using Hoechst 33258 . Anal Biochem 174 (1) : 168 – 76 .
10. Farndale , R. W. , D. J. Buttle , et al. (1986) . Improved quantitation and discrimination of sulphated glycosaminoglycans by use of dimethylmethylene blue . Biochim Biophys Acta 883 (2) : 173 – 7 .

Chapter 24
Tissue Engineering and Cell-Populated Collagen Matrices
Paul D. Kemp
Summary
Tissue engineering seeks to produce living, three-dimensional cellular constructs that can be used as clinical replacements of damaged tissues and organs as well as research tools to study cell and matrix interactions that occur in higher-order systems. To organize the cells into a three-dimensional structure in vitro, a provisional extracellular matrix support is required. The two main methods to achieve this are (a) to culture the stromal cells on a three-dimensional synthetic meshwork, or else (b) embed the cells within a three-dimensional lattice, for example type I collagen. The contracted collagen lattice can be used for a variety of practical applications including the support of epithelial growth and differentiation to produce a skin replacement (Toxic In vitro 5:591–596, 1991; J. Biomech. Eng. 113:113–119, 1991; Parenteau, 1994, Keratinocyte Methods, 1994, Cambridge University Press, Cambridge, pp.45–55; Dermatol. Surg. 21:839–843, 1995; Biomaterials 17:311–320, 1996). This has been used successfully to treat patients with chronic ulcers. However, this model system can also be exploited for experiments to study cell–matrix interactions such as the influence of tension on cell phenotype (Exp. Cell Res. 193:198–207, 1991).
Key words: Fibroblast , Keratinocyte , Collagen , Chronic-wound , Tissue-engineering , Organogenesis .
Tissue engineering seeks to produce living, three-dimensional cellular constructs that can be used as clinical replacements of damaged tissues and organs as well as research tools to study cell and matrix interactions that occur in higher-order systems. To organize the cells into a three-dimensional structure in vitro, a provisional extracellular matrix support is required. The two main methods to achieve this are (a) to culture the stromal cells on a three-dimensional synthetic meshwork, or else (b) embed the cells within a three-dimensional type I collagen lattice. The contracted collagen lattice can be used for a variety of practical
1. Introduction
Sharona Even-Ram and Vira Artym (eds.), Methods in Molecular Biology, Extracellular Matrix Protocols, vol. 522© Humana Press, a part of Springer Science + Business Media, LLC 2009DOI: 10.1007/978-1-59745-413-1_24
363

364 Kemp
applications including the support of epithelial growth and differentiation to produce a skin replacement (1– 5) .
However, this model system can also be exploited for experi-ments to study cell–matrix interactions such as the influence of tension on cell phenotype (6) . The cell contracted collagen matrices was one of the first Tissue Engineering methods devel-oped and came from the laboratory of Eugene Bell then at MIT. This became the basis of the clinical product Apligraf. This was the first manufactured living multicell system that was approved by the FDA and has treated more patients than any other Tissue Engineered products. It is now routinely used to treat venous stasis and diabetic ulcers.
1. PBS: Water: Mix one part phosphate-buffered saline with two parts of purified water. Filter-sterilize the solution through an appropriate 0.22-mm filter into a sterile screw cap stor-age vessel(s).Store the solution at 2–8°C before use (stable for 1 year).
2. 0.5 M Acetic Acid: Carefully make up 286 mL of glacial acetic acid to 10 L with purified water. Filter-sterilize the solution through an appropriate 0.22-mm filter into a sterile screw cap storage vessel(s).Store the solution at 2–8°C before use (stable for 1 year).
3. 8.75 mM Acetic Acid: Add 12.5 mL of glacial acetic acid to 25 L of purified water. Mix well and filter the solution through a 0.22-mm filter into sterile, screw cap storage vessel(s).
4. Store the solution at 2–8°C before use (it is not recommended to store this solution as large volumes are required and main-tenance of sterility can be an issue).
All solutions must be sterilized by passing through an appropriate sterile 0.22-mm filter before use. 1. Antimicrobial solution: PBS containing 100 μ g/mL Gen-
tamicin sulphate; 250 μ g/mL. 2. Amphotericin B (store at −20°C, stable for 1 year). 3. Enzyme solution: PBS containing 2 mg/mL trypsin, 5 mg/mL
collagenase,50 μ g/mLof Gentamicin sulphate, and 1.25 mq/mL of amphotericin B (store at −20°C, stable for 1 year).
4. Trypsin/versene: 500 μ g/mL trypsin; 200 μ g/mL versene (store at −20°C, stable for 1 year).
5. Sterile filtered aqueous solution of 95% (v/v) ethanol.
2. Materials
2.1. Production of the Collagen Solution
2.2. Production of Fibroblasts

Tissue Engineering and Cell-Populated Collagen Matrices 365
6. Dulbecco’s modified Eagle’s medium (DMEM) containing 10% newborn calf serum (NBCS).Store at 2–8°C (stable for 1 month).
All solutions must be sterilized by passing through an appropriate sterile, 0.22-mm filter before use. 1. 71.2 mg/mL sodium bicarbonate. Once filter sterilized, the
solution can be stored in 50-mL aliquots at −20°C before use. 2. 7.25 mM L -glutamine. Once filter sterilized, the solution can
be stored in 15-mL aliquots at −20°C before use. 3. 50 μ g/mL gentamicin sulphate. Once filter-sterilized, the solu-
tion can be stored in 15-mL aliquots at −20°C before use. 4. Premix: Add the following in sequence to a 15-mL conical
tube: 2.2 mL of 10× MEM, 0.2 mL of L -glutamine, 0.025 mL of gentamicin sulphate, 0.7 mL of sodium bicarbonate, and 2.5 mL of newborn calf serum. The premix must be stored on ice and used on the day of preparation.
The mechanical properties of cell-contracted collagen gels is mark-edly superior if the type I collagen used contains intact telopeptides. Atelopeptide collagen in which the telopeptides have been enzy-matically digested contracts more rapidly and extensively and the resulting lattice has inferior tensile strength (7) ( see Note 1 ). Bovine digital extensor tendons provide a suitable yield of high-purity acid-extracted collagen (7) . This solution is stable for a year if stored in a sterile condition at 2–8°C. To minimize the bio-burden, sterile tech-nique should be used throughout the process and all open transfers of the collagen solution should take place in a tissue-culture hood. 1. Dissect out the digital extensor tendon from calf hooves ( see Note 2 )
by making two lateral incisions and peeling back the dorsal flap of skin to expose the common digital extensor tendon.
2. Cut the tendon from the surrounding tissue and sheath. Place the tendons in ice water until all are collected. The tendons can be stored at −70°C until used.
3. Grind the tendon with an equivalent volume of ice ( see Note 3 ). Wash the tendon pieces three times in three volumes of ice water and store at −70°C until used.
4. Take 150 g of tendon pieces and add to 15 L of cold (2–8°C), sterile PBS: water in a Belco (Model 7764-00110) top stirring reaction vessel. Mix the solution (set motor to setting 10) for 2 h at 2–8°C ( see Note 4 ).
2.3. Production of Cell-Populated Collagen Matrix
3. Methods
3.1. Production of Collagen Solution

366 Kemp
5. Aspirate off the buffer and repeat the washing step three more times ( see Note 5 ).
6. Add 15 L of cold (2–8°C), sterile 0.5 M acetic acid to the Belco vessel and mix gently (motor setting 5) for 72 h at 2–8°C.
7. Decant the acetic acid into 250-mL centrifuge bottles and spin at 25,000 × g for 30 min at 4°C in a Beckman J2-21 centrifuge, or equivalent.
8. Very carefully decant just the uppermost layers and combine them in another 15 L Belco vessel ( see Note 6 ).
9. Pass the solution through an open mesh 5–6 μ m filter to remove any tendon particles.
10. Make the solution 0.9 M with respect to NaCl by slowly add-ing one-third the volume of sterile room temperature 3.6 M NaCl with continuous gentle mixing (motor speed 5). After the NaCl has been added, continue mixing for 30 min.
11. Decant the solution into 500-mL centrifuge bottles and col-lect the precipitate by centrifugation at 10,000 × g for 30 min at 4°C.
12. Discard clear supernatants ( see Note 7 ) and combine the precipitates in a 15 L Belco flask.
13. Add 2 L of cold, sterile 0.5 M acetic acid to the Belco flask and mix at 2–8°C until the precipitate has completely dissolved.
14. Repeat the precipitation step once more by making the solu-tion 0.9 M NaCl. Redissolve this precipitate completely in 1 M acetic acid by vigorous mixing.
15. Transfer the collagen solution to 1 m lengths of sterilized dialysis tubing.
16. Place the dialysis tube sections in 20 volumes of 8.75 mM acetic acid at 2–8°C.
17. Saturate the solution with chloroform (~0.5 mL/L) and mix the acetic acid solution gently at 2–8°C for 24 h ( see Note 8 ).
18. Discard the acetic acid/chloroform solution to waste and replace with 20 volumes of fresh, cold 8.75 mM acetic acid. Mix for 24 h.
19. Repeat step 17 twice. 20. Using sterile technique, spray one end of the dialysis tub-
ing liberally with 70% ethanol solution. Use a sterile wipe to remove excess, cut open the dialysis tube and carefully poor into a suitable, sterile, screw cap container ( see Note 9 ).
A number of methods exist for the culture of fibroblasts. One con-venient method for the production of these cells from discarded foreskin tissue for use in organotypic culture is described below (3) .
3.2. Production of Fibroblast Culture

Tissue Engineering and Cell-Populated Collagen Matrices 367
1. Wash the foreskin several times with the antimicrobial wash solution.
2. While holding the foreskin with sterile forceps, wash the foreskin for 1 min (no longer) in 95% ethanol with constant agitation.
3. Immediately remove the ethanol by washing in the antimi-crobial solution.
4. Dissect away any subcutaneous tissue and wash the remain-ing tissue again in antimicrobial solution.
5. Transfer the foreskin to a 100-mm Petri dish containing antimicrobial solution.
6. Mince the tissue into 1–3 mm two pieces ( see Note 10 ). 7. Place a sterile microstir bar into a round bottom tube and
add 5 mL of the enzyme solution. 8. Transfer the minced tissue and cap the tube. Incubate the
tube at 37°C with gentle stirring. After 20 min, vigorously shake the tube.
9. After 30 min, allow the material to settle. Remove as much of the enzyme solution and discard. Add 4 mL of fresh enzyme solution and continue to incubate as above, shaking the tube periodically.
10. After further 30 min incubation, allow the material to settle again and transfer the supernatant solution to a sterile 15-mL conical tube.
11. Add 5 mL of DMEM-10% NBCS to the 15-mL conical tube containing the supernatant and centrifuge for 5 min at 600 × g . Aspirate the supernatant, resuspend the pellet in 2 mL DMEM-10% NBCS and place the tube on ice.
12. Add an additional 4 mL of enzyme solution to the tissue remnants from step 9 .
13. Repeat steps 9 and 10 . 14. Repeat step 11 until all the tissue is digested and only the
stratum corneum of the epidermis remains. 15. Pool the cell fractions from step 10 . Count the cells and
determine viability. Add 1 × 10 6 cells to each of several T-75 flasks. Add 10 mL of DMEM-10% NBCS to each flask. Incu-bate at 37°C, 10% CO 2 . Replace the media every 2–3 days.
16. When the cells are confluent, aspirate off the media and add 5 mL of trypsin/versene. Incubate the flask at 37°C, 10% CO 2 . Strike flask sides sharply to dislodge the cells. Examine the cells to ensure they have rounded and left the dish.
17. Add 5 mL of DMEM-10% NBCS to each flask. 18. Transfer the solution containing the cells to a sterile 15-mL
conical tube and centrifuge 5 min at 600 × g.

368 Kemp
19. Discard the medium and replace with 10 mL of DMEM-10% NBCS.
20. Suspend the cells and recentrifuge at 5 min at 600 × g . 21. Count the cells and transfer 1 × 10 6 cells to each of several
T-150 flasks. Add 20 mL of DMEM-10% NBCS. Incubate at 37°C, 10% CO 2 .
22. Cells can continue to be passaged at confluence as described above ( see Note 11 ).
The following volumes are sufficient to produce six cell-populated collagen lattices using 2.5-cm diameter lattice inserts ( see Note 12 ). 1. Measure out 18.5 mL of the collagen solution into a 50-mL
conical tube and place on ice. 2. Prepare a suspension of dermal fibroblasts at a concentration
of 2.5 × 10 5 cells/mL in DMEM with 10% NBCS. 3. Add 5.6 mL of cold (2–8°C) premix solution to the tube
containing the collagen. Mix well by swirling ( see Note 13 ). 4. Immediately place 1 mL of the neutralized collagen solu-
tion into each of six 2.5-cm diameter,3 μ m pore size culture inserts (Corning Costar, Cambridge, MA) ( see Note 14 ) and ensure that the filter surface is completely covered. Allow this acellular layer to gel at room temperature ( see Note 15 ).
5. Add 2 mL of the fibroblast suspension to the remainder of the neutralized collagen solution, swirl to mix ( see Note 13 ) and immediately add 3-mL aliquots of the cellular collagen solution on top of the collagen gels in each of the culture inserts. Allow the collagen to gel without any disturbance or vibration ( see Note 15 ).
6. Add sufficient DMEM with 10% NBCS to cover the top of the collagen gels and incubate at 37°C, 10% CO 2 until the lattices have contracted away from the sides of the culture insert ( see Note 16 ).
7. Replace the medium with fresh DMEM with 10% NBCS at 2–3 days intervals.
1. Different collagen preparations (such as acid extracted rat tail tendon collagen) may be used, but these need to be carefully screened for gelation properties as well as cellular interac-tions and possible toxicity.
2. Rat tail tendon may also be used in place of the bovine digital extensor tendon.
3.3. Production of Cell-Populated Col-lagen Matrix
4. Notes

Tissue Engineering and Cell-Populated Collagen Matrices 369
3. As an alternative to grinding, either tendon can be sliced into pieces ~1–3-mm thick. It is easier to achieve this if the tendon is partially frozen and a number 22 scalpel blade is used.
4. As an alternative to the Belco vessel, a conical flask and large magnetic stir bar may be used for volumes around 2 L. If the mixing is too vigorous then small insoluble particles can be produced, which are difficult to remove at later stages.
5. The final PBS: water wash should have negligible UV absorb-ance at 280 nm. If this is not the case, repeat the wash step until the UV absorbance is negligible.
6. The material should separate into three layers: an upper layer, a middle layer that contains gelatinous particles, and a lower layer containing the insoluble tendon pieces.
7. If air bubbles have been introduced at the precipitation step, this can cause some of the precipitated collagen to float at the end of the centrifugation step. This material may be removed with a sterile instrument and added to the rest of the precipitate.
8. The acetic acid may be mixed by either using a large stir bar or else recirculating the solution through a peristaltic pump.
9. Great care needs to be taken at this stage, and it is worth practicing with water-filled tubing to develop a good tech-nique. It is easier if two people work together so as one sup-ports the tubing to control the flow and the other opens the tubing and pours the collagen.
10. The tissue may be minced by using a sterile pair of forceps and either a scalpel or a pair of scissors.
11. Frozen vials of primary cells should be established and work-ing cell stocks developed from this primary source, which can then be frozen at passage 5 or 6 and stored before use. Fibroblasts may be frozen using routine methods.
12. Various systems may be used to support the lattice. Tissue-culture treated dishes are not suitable as the collagen adheres to the base and walls, and the lattice is only able to con-tract slightly. Petri dishes enable the lattice to contract with-out restraint (sometimes the collagen needs to be carefully released from the walls using a blunt instrument such as a fine glass rod or spatula.). The preferred method is to use Transwell inserts produced by Corning Costar.
13. Care needs to be taken at this stage to not introduce air bub-bles, which may become trapped as the collagen gels.
14. If smaller pore sizes are used, the collagen may release from the base, larger pores may allow the collagen to leak into the lower chamber before it gels.

370 Kemp
15. Care needs to be taken here to keep the system free from vibrations, which may interfere with, or disrupt the collagen gels as they are forming.
16. It will be necessary to release the collagen from the sides of the transwell by using a blunt, sterile instrument such as fine glass rod or spatula.
The author thanks all the Research Staff of Organogenesis, Inc. for their help. This chapter dedicated to Eugene Bell (1918–2007).
Acknowledgments
References
1. Bell , E. , Parenteau , N. , Gay , R. , Nolte , P. , Kemp , P. , Bilbo , P. , et al. (1991) The living skin equivalent: its manufacture, its organo-typic properties and its responses to irritants . Toxic In vitro 5 , 591 – 596 .
2. Bell , E. , Rosenberg , M. , Kemp , P. , Gay , R. , Green , G.D. , Muthukumaran , N. , and Nolte , C. , (1991) Recipes for reconstituting skin . J. Bio-mech. Eng. 113 , 113 – 119 .
3. Parenteau , N.L. , (1994) Skin equivalents . In Keratinocyte Methods ( Leigh , I and Watt , F. eds.), Cambridge University Press , Cambridge , pp. 45 – 55 .
4. Eaglestein , W.H. , Iriondo , M, and Laszlo , K. (1995) A composite skin substitute (graftskin) for surgical wounds: a clinical experience . Dermatol. Surg. 21 , 839 – 843 .
5. Sabolinski M.L. , Alvarez , O. , Auletta , M. , Mulder G. , and Parenteau , N.L. (1996) Cul-tured skin as a ‘Smart material’ for healing wounds: experience in venous ulcers . Biomate-rials 17 , 311 – 320 .
6. Mochitate , K. , Pawelek , P. , and Grinnel , F. (1991) Stress relaxation of contracted colla-gen gels: disruption of actin filament bundles, release of cell surface fibronectin, and down-regulation of DNA and protein synthesis . Exp. Cell Res. 193 , 198 – 207 .
8. Wong , T. , McGrath , J.A. , Navsaria , H. (2007) The role of fibroblasts in tissue engineering and regeneration . Br. J. Dermatol . 156 (6) , 1149 – 55 .
9. Ehrenreich , M. , Ruszczak , Z. (2006) Update on tissue-engineered biological dressings . Tissue Eng. 12 (9) , 2407 – 24 .

371
A
Adhesion ....................................................................... 223AFM................................................................ 123–130assays ....................................................................... 203blocking (AFM) ...................................................... 145cell adhesion assays ...................................223, 224, 242cell-cell adhesion assay............................................. 237Centrifugal Assay for Fluorescence-based Cell
Adhesion (CAFCA) .......................................... 223circulating cells ........................................................ 226CO2 concentrations ................................................. 206control of mammary gland function ........................ 3313D matrix adhesions ................................................ 266extracellular matrix (ECM)
patterning .................................................. 183–186fibronectin ........................................................... 73, 74fluorescent assays ..................................................... 221focal adhesions ......................................................... 262forces ............................................................... 222, 223gene targeting ............................................................ 15glyconectin 1 ............................................................ 145parallel flow adhesion assay ..................................... 237
Alkanethiols .................................................................. 193elastomeric stamp .................................................... 186head-group of .......................................................... 185μCP ......................................................................... 186microcontact printing .............................................. 183storage ..................................................................... 192study of self-assembled monolayers ......................... 185synthesis and purification of .................................... 188
Apligraf ......................................................................... 364Atomic force microscopy (AFM) ..........................124, 125,
128, 130–132, 134, 152applications .............................................................. 128development ............................................................ 144force transducer ....................................................... 222height data ....................................................... 135–137height-mapping ....................................................... 123ICM ........................................................................ 133imaging .....................................................124, 130, 133intermolecular binding forces .................................. 143measurement of interactions .................................... 145molecular combing .................................................. 126non-destructive ........................................................ 124probe ........................................................................ 124sensitivity ................................................................. 127
Attachment ........................................................... 137, 139vs. adsorption ........................................................... 149assay ..........................................................203, 204, 206vitronectin ................................................................ 268
B
Baculovirus ...........................................................51, 54, 64BaculoGold.......................................................... 54, 59expression in Pichia .....................................................57expression vector .............................................54, 57, 59
Basement membraneex-vivo ..................................................................... 315immunodetection ..................................................... 315integrins ..................................................................... 17intestinal .......................................................... 309, 310laminin-111 ............................................................. 321Matrigel ................................................................... 321regulation of ............................................................. 309submandibular gland culture .................................... 319targeting of ECM .................................................... 309tumor stroma ........................................................... 275
Biotinylation .......................................................... 196, 197Blastocyst
collection ................................................................... 40injection of ES cells ........................................15, 37, 40isolation ............................................................... 21, 39mouse mating ............................................................ 39transfer to pseudopregnant
female .................................................................. 41
C
CAFCA. See Centrifugal assay for fluorescence-based cell adhesion
Cartilageaggrecan and collagen I expression in ...................... 351bone and cartilage handling ..................................... 115cross-links ................................................................ 114fibrous vs. hyaline .................................................... 351production by cells ................................................... 349
Cartilage oligomeric matrix protein. See COMPCentrifugal assay for fluorescence-based cell adhesion
(CAFCA) .......................................................... 223Chemical microscopy .................................................... 166Chemotaxis
assay ......................................................................... 242scoring ..................................................................... 229
INDEX

372 EXTRACELLULAR MATRIX PROTOCOLS
Index
Chondrocytes ................................................................ 350encapsulation ........................................................... 351PCR primers............................................................ 326primary cells ............................................................ 350production of collagen by ........................................ 365
Collagen .......................................................................... 51borohydride reduction ............................................. 111collagen assay ........................................................... 353collagen cross-links .................................................. 110collagen I, II .................................................... 351, 361collagen matrices ..................................................... 363glycation .................................................................. 115RS-TEM analysis .................................................... 179STEM analysis of microfibrils ................................. 154type III procollagen ................................................... 52
COMP, TEM image ..................................................... 177Contractility .................................................................. 262
factors involved in .................................................... 251fibronectin ............................................................... 272methods for evaluation ............................................ 251pathological conditions ............................................ 252temperature effect .................................................... 283time-lapse detection of .................................... 253, 256
Cre-Lox ........................................................................... 15Cre/lox conditional mutagenesis ................................ 44excising ...................................................................... 30lox targeting ............................................................... 31
D
Degradation ................................................................... 212assays ....................................................................... 211in ECM patterning .................................................. 184of extracellular matrix (ECM) ..................211, 212, 309of fusion protein ........................................................ 81of gelatin ...................................................211, 215, 218intracellular protein ................................66, 67, 70, 132proteolytic .................................................................. 92
E
ECM macromoleculesrotary shadowing TEM ........................................... 180TEM ....................................................................... 124
Elastin ....................................................103, 106, 115, 262cross-links ................................................................ 103
Electron microscopy .......................................151, 156, 341equipment for .......................................................... 154of gelatin matrix....................................................... 212of mammary tissue ................................................... 331mass mapping .......................................................... 151rotary shadowing ............................................. 175, 180scanning TEM ......................................................... 156transmission (TEM) .................................124, 127, 151
Embryo dissection ......................................................... 311Embryoid bodies
generation of ES-derived ................................22, 46, 47
Embryonic intestines ..................................................... 312Embryonic stem (ES) cells .............................................. 32
electroporation ........................................................... 34freezing clones ........................................................... 35microinjection ............................................................ 40
Embryo transfer .............................................................. 41Encapsulation of cells .................................................... 351Epithelial morphogenesis .............................................. 319Epithelium mammary ................................................... 332
F
FATIMA. See Fluorescence-assisted-transmigration invasion and motility assay
Feeder cells ...................................................................... 18Fibrillin .........................................................125, 134, 136,
153, 154, 159, 176AFM height image of .............................................. 130AFM-molecular combing ................................ 126, 132diameter of the filament .......................................... 133extraction and isolation of........................................ 178mechanical properties of fibrillin microfibrils .......... 126mutations, Marfan syndrome ..................................... 16rotary shadowing ..................................................... 175STEM ..................................................................... 151surface charge .......................................................... 127
Fibrillogenesis ....................................................... 265, 266cryptic sites .............................................................. 262in 3D matrix .................................................... 262, 269early steps .................................................265, 266, 267investigation of ........................................................ 261in-vitro ..................................................................... 241
Fibrin ..................................................................... 256, 257cell-loaded ............................................................... 252clots ................................................................. 241, 251degradation .............................................................. 254fluorescent labeling .................................................. 258model for assessment of cellular
contractility ........................................................ 251polymerization ......................................................... 257
Fibroblasts ..................................................................... 266characterization of ................................................... 279co-culture with myoblasts ........................................ 310conditioned medium ................................................ 234contraction of fibrin clot .......................................... 251dermal ...................................................................... 368feeders ........................................................................ 34fibronectin binding .................................................. 262FN matrix production ...................................... 262, 266irradiated ................................................................... 34isolation of stromagenic ................................... 276, 283myofibroblasts .......................................................... 292NIH3T3-based packaging cells ........................... 5, 6, 8positive control for contraction assay ....................... 257preparation of 3D matrix ......................................... 290primary embryonic .................................................... 32

EXTRACELLULAR MATRIX PROTOCOLS
373
Index
primed ..................................................................... 276production of ................................................... 364, 366quiescent .................................................................. 276stress fibers............................................................... 251tumor associated ...................................................... 275
Fibronectin .............................................125, 265, 266, 293AFM................................................................ 123, 126antibodies .................................................264, 270, 282binding to gelatin sepharose .................................... 273cell-free expression ............................................... 82–83cycloheximide inhibition ......................................... 273expression by stromal cells ....................................... 276expression in Pichia pastoris ....................................... 87expression on E.coli .........................................75–76, 80fiber orientation ............................................... 293, 295fibrillogenesis ........................................................... 262fibronectin binding to α5β1 .................................... 296fluorescent staining of new fibrils ............................ 270integrins and focal adhesions ................................... 262isotopic labeling ......................................................... 74preparation of pre-labeled
3D matrices ....................................................... 266recombinant fragments ........................................ 85–97soluble to insoluble .................................................. 264tagging with fluorophores ........................................ 263transient expression in human cells............................ 74
Fluorescence-assisted-transmigration invasion and motility assay (FATIMA) ......................... 231, 232, 234, 238, 242
Fluorescent labeling/taggingin CAFCA ............................................................... 233of cell-bodies and nuclei .................................. 283–284of matrices ............................................................... 294in measuring efficacy of retroviral
transduction ......................................................... 13reagents .................................................................... 271in SMG epithelial culture ........................................ 320for studying FN fibrillogenesis ........................ 263–264of unextracted 3D stromal matrices ................. 294–295
G
Gelatin ........................................................................... 222coating ..................................................................... 217degradation assay ..............................213, 215–216, 218matrix .............................................................. 217, 218microscopy ............................................................... 216
Glycation ............................................................... 106, 113advanced glycation end product ....................... 103, 115cross-links ........................................................ 106, 113
Glycosaminoglycans (GAG) ................................. 349–351assay ..................................................352–353, 356–357evaluation of production .......................................... 350
Grafting ................................................................. 313, 315of interspecies intestines .................................. 315–316protocol.................................................................... 319
H
Hexadecanethiolpurification .............................................................. 188stamping .................................................................. 192
High performance liquid chromatography (HPLC) ............................................................. 113
collagen cross-links analysis ..................................... 105technique ................................................................. 112
Homologous recombination ............................................ 24in E.coli ..................................................................... 23in ES cells .................................................................. 15generation of conditional KO .................................... 25gene targeting ............................................................ 15identification of ................................................... 19, 36introducing loxP site .................................................. 29obtaining of ............................................................... 24subcloning of genomic DNA ..................................... 28
Hydrogels ...................................................................... 351encapsulated cells ..................................................... 349fixation and dehydration .......................................... 360fixation, dehydration, and embedding of ................. 354
I
Integrins .........................................................195, 196, 262α6... ................................................................. 332, 343antibodies .................................................242, 264, 270β1... .................................................................. 266, 271α2β2 .......................................................................... 52α5β1 ...........................................................83, 196, 262binding site ................................................................ 83binding to type III collagen ..................................... 176in contractility.......................................................... 251in focal adhesions ..................................................... 262identification of active receptors .............................. 265interaction with ECM ..............................195–196, 221in mammary development ....................................... 332in migration/invasion ....................................... 276, 296purification .............................................................. 199translocation along actin .......................................... 265
K
Keratin ........................................................................... 290cytokeratin ............................................................... 287detection on gel ....................................................... 302
Keratinocytes ................................................................. 363Knockout
cell-matrix interactions in ........................................ 331conditional ........................................................... 16, 23construct generation .................................................. 25ECM proteins ........................................................... 15laminin chains............................................................ 16in mammary gland ................................................... 331tissue specific ........................................................... 332transplantation of KO tissue ............................ 332, 342

374 EXTRACELLULAR MATRIX PROTOCOLS
Index
L
LacZmeasurement of infection ............................................ 9measurement of transduction ..................................... 13
Laminin .................................. 111, 320, 321, 323, 324, 328AFM........................................................................ 136expression vectors ...................................................... 57KO of laminin chains................................................. 16laminin α5 mutant ..................................................... 74Matrigel ................................................................... 238purification of IV domain from β2 chain .................. 69self-assembly ............................................................ 186in submandibular development ........................ 319, 343thawing .................................................................... 267
Live imaging (time-lapse microscopy) .................................237, 257, 320, 328
AFM........................................................................ 124assessment of contractility ........................251, 253, 255cell migration ................................................... 228, 229
M
Mammary gland ............................. 331, 332, 337, 339, 341development ............................................................ 332embryonic ................................................................ 335epithelial cells .......................................................... 332freezing mammary rudiment ................................... 337harvesting ................................................................ 340isolation ................................................................... 333mammary stroma ..................................................... 332primary cell culture .................................................. 342repopulating ............................................................. 333rudiment ...................................................332, 333, 336transplantation ......................................................... 338transplantation of ............................................. 334, 338
μCP. See Microcontact printingMicrocontact printing (μCP) ........................................ 195Microinjection ......................................................20, 37, 38
of ES cells .................................................21, 37, 38, 40generation of chimeric mice ...................................... 37preparation of microinjection capillaries .................... 38preparation of needles ................................................ 20setup .......................................................................... 21
Micropatterning .................................................... 190–191Migration .............................................. 15, 74, 83, 84, 221.
See also Fluorescence-assisted-transmigration invasion and motility assay
cell migration capability ........................................... 228ECM guidance ........................................................ 261in epithelial morphogenesis ..................................... 320fibronectin ............................................................... 261fluorescence-based assays ................................. 221, 231fundamentals of cell migration assays ...................... 227long-term migration assays ...................................... 240mechanism ....................................................... 276, 296
rapid screenings ....................................................... 229transmigration ................................................. 211, 246tumor cell and metastasis ......................................... 296the under-agarose assay ........................................... 228
Molecular combing .........................................123, 132, 134of collagen VI .......................................................... 126drag force ......................................................... 133, 139on mica .................................................................... 139technique ................................................................. 132
N
Nuclear magnetic resonance (NMR)distinguishing disulfides from alkanethiols .............. 192expression in Pichia pastoris ...................................87–88fibronectin fragments ........................................... 74–75protein purification .................................................... 81selective labeling of amino acid residues .................... 82spectrum .......................................................... 188, 189
O
Organ cultureembryonic intestinal ........................................ 312–313organ models ................................................... 309–345organotypic culture .......................................... 366–368submandibular glands (SMGs) ................................ 319
P
Parallel flow adhesion assay ....................233–234, 237–238Photolithography ............................................184, 185, 187Pichia pastoris (yeast) ........................................................ 52
culture ........................................................................ 57generation of the recombinant
Pichia strain ................................................... 57–59media ......................................................................... 53recombinant fibronectin fragments ...........78–79, 87–92
Podosomes ............................................................. 211–219fluorescent matrix assay ................................... 214–217imaging .................................................................... 217
Polydimethylsiloxane (PDMS) .............................. 186, 187molding PDMS Stamp ........................................... 187stamping procedure ................................................. 190
Prolyl 4-hydroxylase .......................................52, 55, 57, 58activity ................................................................. 55–56expression vector ............................................ 54–55, 57recombinant ................................................... 52, 54–56
Pyrroleanalysis............................................................. 105–106in collagen cross-links ............... 104, 106, 107, 113, 120hydroxylysyl-pyrrole ................................................ 105measurement method ...................................... 109, 110
R
Retrovirus .......................................................................... 5delivery of ECM Genes .......................................... 4, 7

EXTRACELLULAR MATRIX PROTOCOLS
375
Index
determination of the Viral Titer .......................... 12, 14genome ........................................................................ 4LTRs ...................................................................... 6, 10packaging cells ................................................. 8, 10–11retroviral vector ...................................................... 8–10self inactivating (SIN) retroviral vector ........................ 7
Rotary shadowing ...........................................126, 176, 177protocol............................................................ 179–180
S
Safranin-O .................................................................... 355Scanning transmission electron microscopy
(STEM) ...................... 151, 152, 154, 157, 158, 159fibrillin microfibril ................................................... 152mapping of entire collagen fibrils ............................ 162protocol.................................................................... 166
Secondary ion mass spectrometry (SIMS) ............ 163–165. See also Chemical microscopy
dynamic 3D Mode .................................................. 166labeled molecules in tissues ...................................... 167plunge-freezing ........................................................ 168principles ................................................................. 164sample preparation ................................................... 167type of biological samples ........................................ 166
Self assembled monolayers (SAM) ................................ 185Small interfering RNA (siRNA) ............................... 3, 320Solid-phase assay ........................................................... 195
fibronectin binding to α5β1, 196protocol............................................................ 197, 198
Spreading (cell)hydrophilic substrates .............................................. 127spreading assay ................................................. 203–207study with micropatterning .............................. 184–186vitronectin ................................................................ 268
StrepTactin ................................................................ 65, 67Streptavidin/Strep II Tag/StrepTactin ...... 63, 65, 67, 69, 71Stroma ................................................................... 252, 275
mammary ................................................................. 332stroma-derived matrix ..................................... 275, 294tissue engineering .................................................... 363tumor-associated ...................................................... 292tumorigenesis ................................................... 275, 276
Stromagenesis ........................................................ 275, 276Submandibular gland (SMG) .........................319, 324, 326
epithelial morphogenesis ......................................... 320isolation ........................................................... 320, 333
SV40 (simian virus)large T antigen ..............................................6, 286, 287polyadenylation signal ............................................... 59promoter ...................................................................... 7
T
Telopeptides ...................................................103, 104, 365Tendon
collagen cross-links .................................................. 104collagen preparation ..........................114, 116, 366–369extracted collagen fibril .....................152, 154, 176, 178
Tensile force .......................................................... 134, 262Tensile strength ............................................................. 365Tension
cellular ......................................251–252, 276, 363–364surface tension forces ........................132, 133, 139, 236
Teratoma ........................................................22–23, 46–47Tet–Tetracycline 9 ........................................................... 11
Tet-on/off system ........................... 7, 8, 11, 12, 13, 333tetracycline resistance operon ...................................... 7Tet repressor ............................................................ 7, 8TRE–Tet responsive element .................................. 7, 8
Three-dimensional (3D) chemical microscopy ......................................................... 163
imaging ............................................................ 164–167Three-dimensional (3D) extracellular matrix ................ 293
FATIMA ................................................................. 232in fluorescent FN labeling ............................... 263, 265protocol............................................................ 276–299stroma-derived matrix ............................................. 275
Three-dimensional (3D) matrix adhesions ............ 262, 266Time-lapse. See Live imagingTissue engineering ................................................. 184, 262
cell-populated collagen matrices ...................... 363–370cells encapsulated in hydrogels ........................ 349–362
TMV. See Tobacco mosaic virus particlesTobacco mosaic virus (TMV) particles ......................... 156Transfection ....................................................................... 5
adenovirus .................................................................... 6calcium phosphate ....................................................... 8confluency .................................................................. 11of 293-EBNA cells .................................................... 68electroporation ....................................................... 3, 34of insect cells ........................................................ 52–53liposome/ lipid ..................................................... 3, 6, 9in recombinant FN fragments ............................. 73–97retroviral .............................................................. 4–6, 8
Transmission electron microscopy (TEM)mass-mapping ......................................................... 151rotary shadowing ..................................................... 175
Transplantation............................................................. 341. See also Grafting
in chick embryo ....................................................... 309embryonic mammary tissue ............................. 331–344protocol............................................................ 334–340
Tumorigenesis ............................................................... 275
V
Vapor deposition ............................................................ 184Vasectomy/vasectomised mice ............................. 20, 37–39Vitronectin ....................................................186, 242, 245,
252, 254, 263, 268