Echocardiographic integrated backscatter for assessing reduction of aortic valve calcifications by...
8
RESEARCH Open Access Echocardiographic integrated backscatter for detecting progression and regression of aortic valve calcifications in rats Bram Roosens 1,2* , Gezim Bala 1,2 , Kris Gillis 1,2 , Isabel Remory 2 , Steven Droogmans 1,2 , Joan Somja 3 , Eléonore Delvenne 3 , Joeri De Nayer 4 , Johan Schiettecatte 4 , Philippe Delvenne 3 , Patrizio Lancellotti 5 , Guy Van Camp 1 and Bernard Cosyns 1,2 Abstract Background: Calcification is an independent predictor of mortality in calcific aortic valve disease (CAVD). The aim of this study was to evaluate the use of non-invasive, non-ionizing echocardiographic calibrated integrated backscatter (cIB) for monitoring progression and subsequent regression of aortic valvular calcifications in a rat model of reversible renal failure with CAVD, compared to histology. Methods: 28 male Wistar rats were prospectively followed during 21 weeks. Group 1 (N=14) was fed with a 0.5% adenine diet for 9 weeks to induce renal failure and CAVD. Group 2 (N=14) received a standard diet. At week 9, six animals of each group were killed. The remaining animals of group 1 (N=8) and group 2 (N=8) were kept on a standard diet for an additional 12 weeks. cIB of the aortic valve was calculated at baseline, 9 and 21 weeks, followed by measurement of the calcified area (Ca Area) on histology. Results: At week 9, cIB values and Ca Area of the aortic valve were significantly increased in the adenine-fed rats compared to baseline and controls. After 12 weeks of adenine diet cessation, cIB values and Ca Area of group 1 decreased compared to week 9, while there was no longer a significant difference compared to age-matched controls of group 2. Conclusions: cIB is a non-invasive tool allowing quantitative monitoring of CAVD progression and regression in a rat model of reversible renal failure, as validated by comparison with histology. This technique might become useful for assessing CAVD during targeted therapy. Keywords: Aortic valve calcifications, Calcific aortic valve disease, Echocardiography, Integrated backscatter, Renal failure, Small animal Background Calcific aortic valve disease (CAVD) is currently the most frequent valvular heart disease in the western world [1]. The extent of calcification has been shown to be an inde- pendent predictor of morbidity and mortality in CAVD [2,3]. Medical therapies to attenuate or even prevent pro- gression of CAVD are being increasingly investigated [4]. Evaluation of medication-induced reversibility of valvular calcifications with non-invasive imaging modalities is promising. Computed tomography (CT) is considered as the reference technique for the quantification and follow- up of calcifications in patients at increased cardiovascular risk [5]. However, cardiac CT raises concerns about irra- diation, which may limit repetitive scanning [6]. Recently, we have validated the non-invasive and non-ionizing tech- nique of echocardiographic integrated backscatter (IB) for the quantification of both normal, age-related and vitamin D-induced aortic valve calcifications in rats [7,8]. Animal models such as rats are increasingly used to study the pathophysiology of CAVD and to test potential medical * Correspondence: [email protected] 1 Department of Cardiology, Centrum Voor Hart- en Vaatziekten (CHVZ), UZ Brussel, Laarbeeklaan 101, Brussels B-1090, Belgium 2 In Vivo Cellular and Molecular Imaging (ICMI), Faculty of Medicine and Pharmacy, Vrije Universiteit Brussel (VUB), Laarbeeklaan 103, Brussels B-1090, Belgium Full list of author information is available at the end of the article CARDIOVASCULAR ULTRASOUND © 2013 Roosens et al.; licensee BioMed Central Ltd. This is an Open Access article distributed under the terms of the Creative Commons Attribution License (http://creativecommons.org/licenses/by/2.0), which permits unrestricted use, distribution, and reproduction in any medium, provided the original work is properly cited. Roosens et al. Cardiovascular Ultrasound 2013, 11:4 http://www.cardiovascularultrasound.com/content/11/1/4
Transcript of Echocardiographic integrated backscatter for assessing reduction of aortic valve calcifications by...

CARDIOVASCULAR ULTRASOUND
Roosens et al. Cardiovascular Ultrasound 2013, 11:4http://www.cardiovascularultrasound.com/content/11/1/4
RESEARCH Open Access
Echocardiographic integrated backscatter fordetecting progression and regression of aorticvalve calcifications in ratsBram Roosens1,2*, Gezim Bala1,2, Kris Gillis1,2, Isabel Remory2, Steven Droogmans1,2, Joan Somja3,Eléonore Delvenne3, Joeri De Nayer4, Johan Schiettecatte4, Philippe Delvenne3, Patrizio Lancellotti5,Guy Van Camp1 and Bernard Cosyns1,2
Abstract
Background: Calcification is an independent predictor of mortality in calcific aortic valve disease (CAVD). The aimof this study was to evaluate the use of non-invasive, non-ionizing echocardiographic calibrated integratedbackscatter (cIB) for monitoring progression and subsequent regression of aortic valvular calcifications in a ratmodel of reversible renal failure with CAVD, compared to histology.
Methods: 28 male Wistar rats were prospectively followed during 21 weeks. Group 1 (N=14) was fed with a 0.5%adenine diet for 9 weeks to induce renal failure and CAVD. Group 2 (N=14) received a standard diet. At week 9, sixanimals of each group were killed. The remaining animals of group 1 (N=8) and group 2 (N=8) were kept on astandard diet for an additional 12 weeks. cIB of the aortic valve was calculated at baseline, 9 and 21 weeks,followed by measurement of the calcified area (Ca Area) on histology.
Results: At week 9, cIB values and Ca Area of the aortic valve were significantly increased in the adenine-fed ratscompared to baseline and controls. After 12 weeks of adenine diet cessation, cIB values and Ca Area of group 1decreased compared to week 9, while there was no longer a significant difference compared to age-matchedcontrols of group 2.
Conclusions: cIB is a non-invasive tool allowing quantitative monitoring of CAVD progression and regression in arat model of reversible renal failure, as validated by comparison with histology. This technique might becomeuseful for assessing CAVD during targeted therapy.
Keywords: Aortic valve calcifications, Calcific aortic valve disease, Echocardiography, Integrated backscatter, Renalfailure, Small animal
BackgroundCalcific aortic valve disease (CAVD) is currently the mostfrequent valvular heart disease in the western world [1].The extent of calcification has been shown to be an inde-pendent predictor of morbidity and mortality in CAVD[2,3]. Medical therapies to attenuate or even prevent pro-gression of CAVD are being increasingly investigated [4].
* Correspondence: [email protected] of Cardiology, Centrum Voor Hart- en Vaatziekten (CHVZ), UZBrussel, Laarbeeklaan 101, Brussels B-1090, Belgium2In Vivo Cellular and Molecular Imaging (ICMI), Faculty of Medicine andPharmacy, Vrije Universiteit Brussel (VUB), Laarbeeklaan 103, Brussels B-1090,BelgiumFull list of author information is available at the end of the article
© 2013 Roosens et al.; licensee BioMed CentraCommons Attribution License (http://creativecreproduction in any medium, provided the or
Evaluation of medication-induced reversibility of valvularcalcifications with non-invasive imaging modalities ispromising. Computed tomography (CT) is considered asthe reference technique for the quantification and follow-up of calcifications in patients at increased cardiovascularrisk [5]. However, cardiac CT raises concerns about irra-diation, which may limit repetitive scanning [6]. Recently,we have validated the non-invasive and non-ionizing tech-nique of echocardiographic integrated backscatter (IB) forthe quantification of both normal, age-related and vitaminD-induced aortic valve calcifications in rats [7,8]. Animalmodels such as rats are increasingly used to study thepathophysiology of CAVD and to test potential medical
l Ltd. This is an Open Access article distributed under the terms of the Creativeommons.org/licenses/by/2.0), which permits unrestricted use, distribution, andiginal work is properly cited.

Roosens et al. Cardiovascular Ultrasound 2013, 11:4 Page 2 of 8http://www.cardiovascularultrasound.com/content/11/1/4
therapies [9]. In that perspective, echocardiographic IBmight be of interest to monitor the progression and regres-sion of aortic valve calcifications in animals and humans.Rats fed with an adenine and high phosphate diet are a
validated model of renal failure and secondary hyperpara-thyroidism with subsequent CAVD. A previous study hasshown that discontinuation of such a diet led to progressiverecovery of the renal function and spontaneous regressionof aortic valve calcifications [10].The aim of the present study was to evaluate the use of
echocardiographic IB as a non-invasive and non-ionizingimaging technique for monitoring progression and subse-quent regression of aortic valvular calcifications in a vali-dated rat model of reversible renal failure with CAVD,compared to histology.
MethodsStudy designTwenty-eight male Wistar Unilever rats (Harlan, TheNetherlands, 7 weeks old) were prospectively divided intwo groups and followed for 21 weeks. Group 1 (N=14)was fed with a 0.5% adenine, 1.5% phosphorus, 0.6% cal-cium diet (ssniff Spezialdiaten GmbH, Soest, Germany) for9 weeks to induce renal failure. Group 2 (N=14) of controlrats was fed with a standard diet (rat maintenance diet,SAFE, France). At week 9, six animals of each group werekilled for histopathological analysis. For the regressionphase, all remaining animals of group 1 (N=8) and group 2(N=8) were kept on a standard diet and followed for anadditional 12 weeks. At baseline, week 9 and week 21,echocardiography was performed and a blood sample wastaken. At the end of the study the remaining animals werekilled with 120 mg/Kg sodium pentobarbital intravenously.The hearts were excised within 30 minutes of death andfixed in neutral buffered formalin 4% for 24 hours, fol-lowed by histology. The observers were blinded to thegroup identity for all analysis. The Ethics Committee foranimal studies of the Vrije Universiteit Brussel approvedthe study protocol. Guidelines of the National Institute ofHealth’s Guide for the Care and Use of Laboratory Ani-mals (NIH publication 86–23, revised 1985) were followed.
Animal handlingDuring the whole study, all rats were housed in stainlesssteel cages with sawdust bedding. They were kept at atwelve hour day/night cycle, an average room temperatureof 24°C and a relative humidity of 50%. Food and waterwere provided ad libitum.
Physiological parametersBody weight was determined weekly. Physical conditionof the animals was assessed daily.
EchocardiographyRats were anaesthetized with 5% isoflurane gas (S.A. AbbottN.V., Ottignies, Belgium). Subsequently, the animals wereput under continuous isoflurane gas (2.5%) anaesthesia with2L O2/min as carrier gas. The anterior chest wall wasshaved and the rat was placed in left lateral decubitus on awooden bench in order to obtain optimal image quality andviews, as previously described [11]. Electrocardiogram elec-trodes were fixed on the paws. A 10 MHz neonatal probe(10S) operated a 10 MHz was used, connected to a Vivid 7Pro system (GE Medical Systems, Milwaukee, WI, USA).
Left ventricular and aortic valve functionAs previously described [11], left ventricular (LV)volumes were calculated from the M-mode tracings inthe short-axis view (papillary muscle level, average of 3cycles) using an ellipsoid model: Pi × D3/3 (where D isthe diameter of the ventricle in the short-axis view). LVejection fraction (EF) was calculated from the LV end-diastolic volume (LVEDV) and LV end-systolic volume(LVESV): LVEF=([(LVEDV – LVESV)/LVEDV] × 100).Heart rate was determined from the R-R interval on theelectrocardiogram. Cardiac output (CO) was calculated asstroke volume × heart rate, with stroke volume deter-mined from the LV EDV - LV ESV. The peak diastolicearly (E) and late (A) velocities were assessed from the mi-tral valve pulsed wave Doppler inflow pattern in the apical4-chamber view. The deceleration time (Dec Time) wasmeasured. The parasternal long axis view was used tomeasure the diameter of the LV outflow tract (LVOT).The aortic valve (AV) area was calculated using the con-tinuity equation: [LVOT (TVI) × LVOT area] / Aortic(TVI). Mean and peak transaortic valve pressure gradients(Aortic Mean PG, Aortic Peak PG) were measured in theapical 5-chamber view.
Integrated backscatter analysisIB of tissue ultrasound reflectivity, measured in decibels(dB), was used for the quantification of aortic valve calcifi-cations [8]. IB is the integrated average power of thesquared radiofrequency component of the reflected back-scatter signal from a region of interest (ROI) within thetissue [12]. Two-dimensional standard transthoracic para-sternal short- and long-axis ultrasound images wereobtained at a constant angle of insonification in all rats.Control settings such as image zoom, focus position,frame rate, lateral- and time-gain compensation were keptconstant for every measurement to obtain uniform bright-ness and to facilitate reproducible sampling of backscattervalues [13]. IB values were acquired and averaged over 3cardiac cycles off-line with a tissue quantification analysispackage (Echopac 110.0.0 (BT10), GE Vingmed) by pla-cing fifteen 1×1-mm circle-shaped sample volumes (ROIs)on the aortic valve in all images. Moreover, global ROIs I
Roosens et al. Cardiovascular Ultrasound 2013, 11:4 Page 3 of 8http://www.cardiovascularultrasound.com/content/11/1/4
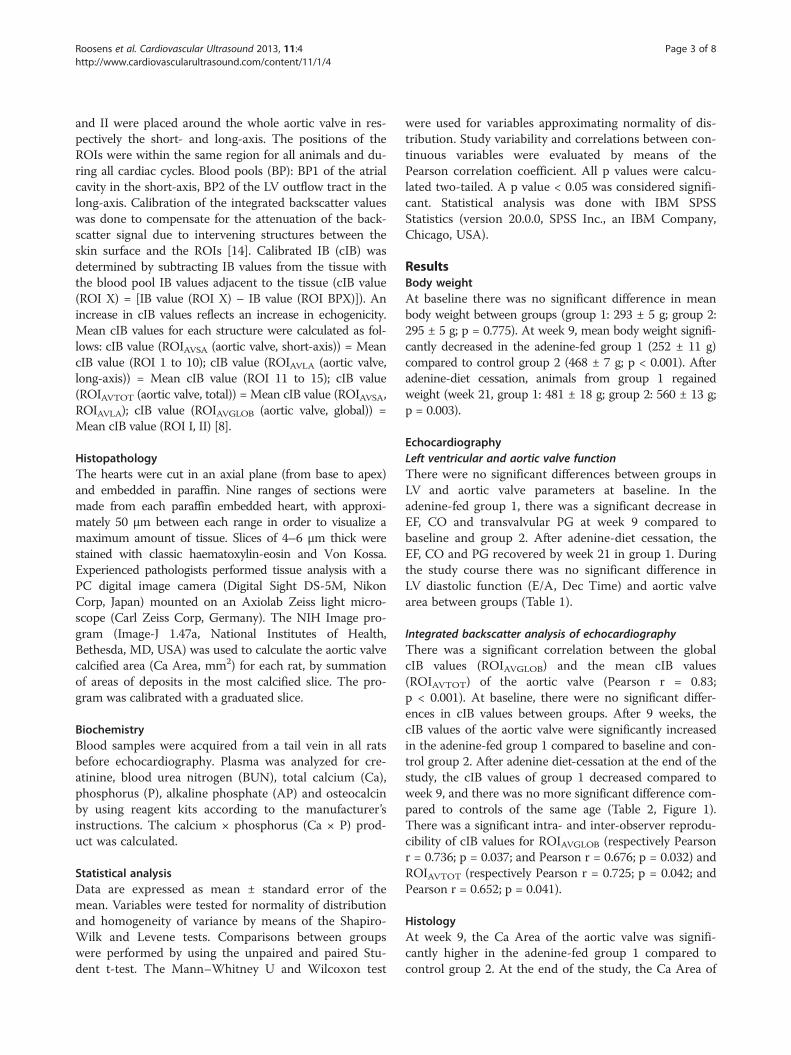
and II were placed around the whole aortic valve in res-pectively the short- and long-axis. The positions of theROIs were within the same region for all animals and du-ring all cardiac cycles. Blood pools (BP): BP1 of the atrialcavity in the short-axis, BP2 of the LV outflow tract in thelong-axis. Calibration of the integrated backscatter valueswas done to compensate for the attenuation of the back-scatter signal due to intervening structures between theskin surface and the ROIs [14]. Calibrated IB (cIB) wasdetermined by subtracting IB values from the tissue withthe blood pool IB values adjacent to the tissue (cIB value(ROI X) = [IB value (ROI X) – IB value (ROI BPX)]). Anincrease in cIB values reflects an increase in echogenicity.Mean cIB values for each structure were calculated as fol-lows: cIB value (ROIAVSA (aortic valve, short-axis)) = MeancIB value (ROI 1 to 10); cIB value (ROIAVLA (aortic valve,long-axis)) = Mean cIB value (ROI 11 to 15); cIB value(ROIAVTOT (aortic valve, total)) = Mean cIB value (ROIAVSA,ROIAVLA); cIB value (ROIAVGLOB (aortic valve, global)) =Mean cIB value (ROI I, II) [8].
HistopathologyThe hearts were cut in an axial plane (from base to apex)and embedded in paraffin. Nine ranges of sections weremade from each paraffin embedded heart, with approxi-mately 50 μm between each range in order to visualize amaximum amount of tissue. Slices of 4–6 μm thick werestained with classic haematoxylin-eosin and Von Kossa.Experienced pathologists performed tissue analysis with aPC digital image camera (Digital Sight DS-5M, NikonCorp, Japan) mounted on an Axiolab Zeiss light micro-scope (Carl Zeiss Corp, Germany). The NIH Image pro-gram (Image-J 1.47a, National Institutes of Health,Bethesda, MD, USA) was used to calculate the aortic valvecalcified area (Ca Area, mm2) for each rat, by summationof areas of deposits in the most calcified slice. The pro-gram was calibrated with a graduated slice.
BiochemistryBlood samples were acquired from a tail vein in all ratsbefore echocardiography. Plasma was analyzed for cre-atinine, blood urea nitrogen (BUN), total calcium (Ca),phosphorus (P), alkaline phosphate (AP) and osteocalcinby using reagent kits according to the manufacturer’sinstructions. The calcium × phosphorus (Ca × P) prod-uct was calculated.
Statistical analysisData are expressed as mean ± standard error of themean. Variables were tested for normality of distributionand homogeneity of variance by means of the Shapiro-Wilk and Levene tests. Comparisons between groupswere performed by using the unpaired and paired Stu-dent t-test. The Mann–Whitney U and Wilcoxon test
were used for variables approximating normality of dis-tribution. Study variability and correlations between con-tinuous variables were evaluated by means of thePearson correlation coefficient. All p values were calcu-lated two-tailed. A p value < 0.05 was considered signifi-cant. Statistical analysis was done with IBM SPSSStatistics (version 20.0.0, SPSS Inc., an IBM Company,Chicago, USA).
ResultsBody weightAt baseline there was no significant difference in meanbody weight between groups (group 1: 293 ± 5 g; group 2:295 ± 5 g; p = 0.775). At week 9, mean body weight signifi-cantly decreased in the adenine-fed group 1 (252 ± 11 g)compared to control group 2 (468 ± 7 g; p < 0.001). Afteradenine-diet cessation, animals from group 1 regainedweight (week 21, group 1: 481 ± 18 g; group 2: 560 ± 13 g;p = 0.003).
EchocardiographyLeft ventricular and aortic valve functionThere were no significant differences between groups inLV and aortic valve parameters at baseline. In theadenine-fed group 1, there was a significant decrease inEF, CO and transvalvular PG at week 9 compared tobaseline and group 2. After adenine-diet cessation, theEF, CO and PG recovered by week 21 in group 1. Duringthe study course there was no significant difference inLV diastolic function (E/A, Dec Time) and aortic valvearea between groups (Table 1).
Integrated backscatter analysis of echocardiographyThere was a significant correlation between the globalcIB values (ROIAVGLOB) and the mean cIB values(ROIAVTOT) of the aortic valve (Pearson r = 0.83;p < 0.001). At baseline, there were no significant differ-ences in cIB values between groups. After 9 weeks, thecIB values of the aortic valve were significantly increasedin the adenine-fed group 1 compared to baseline and con-trol group 2. After adenine diet-cessation at the end of thestudy, the cIB values of group 1 decreased compared toweek 9, and there was no more significant difference com-pared to controls of the same age (Table 2, Figure 1).There was a significant intra- and inter-observer reprodu-cibility of cIB values for ROIAVGLOB (respectively Pearsonr = 0.736; p = 0.037; and Pearson r = 0.676; p = 0.032) andROIAVTOT (respectively Pearson r = 0.725; p = 0.042; andPearson r = 0.652; p = 0.041).
HistologyAt week 9, the Ca Area of the aortic valve was signifi-cantly higher in the adenine-fed group 1 compared tocontrol group 2. At the end of the study, the Ca Area of
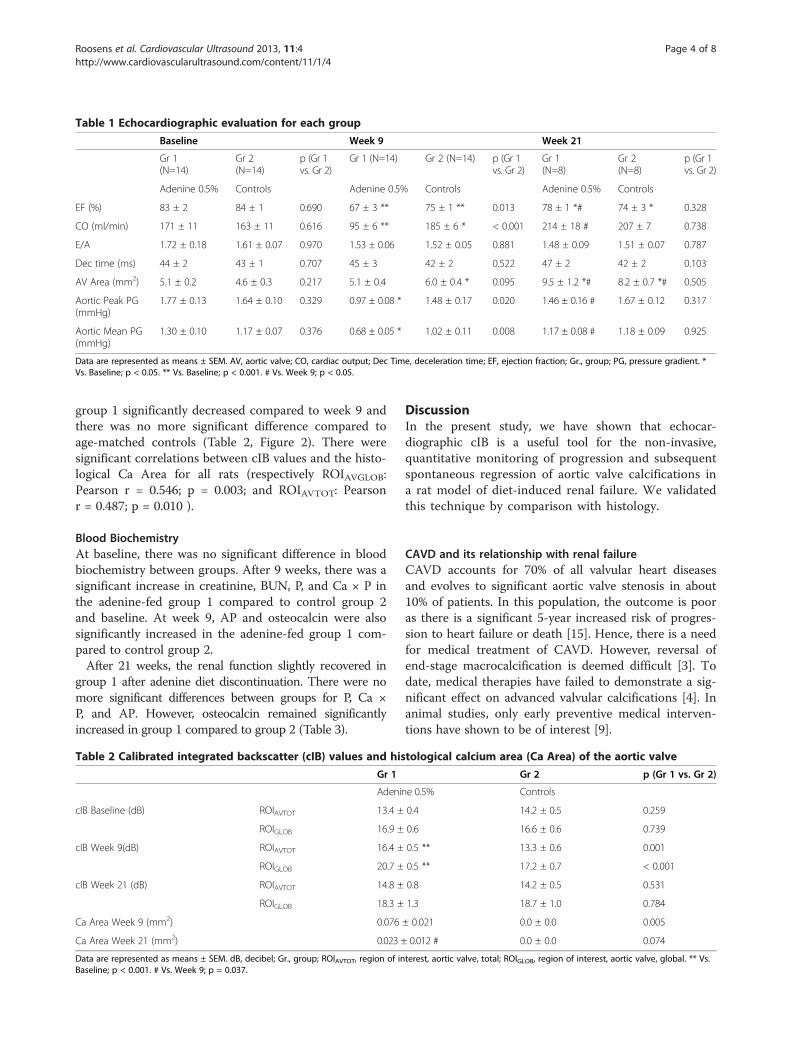
Table 1 Echocardiographic evaluation for each group
Baseline Week 9 Week 21
Gr 1(N=14)
Gr 2(N=14)
p (Gr 1vs. Gr 2)
Gr 1 (N=14) Gr 2 (N=14) p (Gr 1vs. Gr 2)
Gr 1(N=8)
Gr 2(N=8)
p (Gr 1vs. Gr 2)
Adenine 0.5% Controls Adenine 0.5% Controls Adenine 0.5% Controls
EF (%) 83 ± 2 84 ± 1 0.690 67 ± 3 ** 75 ± 1 ** 0.013 78 ± 1 *# 74 ± 3 * 0.328
CO (ml/min) 171 ± 11 163 ± 11 0.616 95 ± 6 ** 185 ± 6 * < 0.001 214 ± 18 # 207 ± 7 0.738
E/A 1.72 ± 0.18 1.61 ± 0.07 0.970 1.53 ± 0.06 1.52 ± 0.05 0.881 1.48 ± 0.09 1.51 ± 0.07 0.787
Dec time (ms) 44 ± 2 43 ± 1 0.707 45 ± 3 42 ± 2 0.522 47 ± 2 42 ± 2 0.103
AV Area (mm2) 5.1 ± 0.2 4.6 ± 0.3 0.217 5.1 ± 0.4 6.0 ± 0.4 * 0.095 9.5 ± 1.2 *# 8.2 ± 0.7 *# 0.505
Aortic Peak PG(mmHg)
1.77 ± 0.13 1.64 ± 0.10 0.329 0.97 ± 0.08 * 1.48 ± 0.17 0.020 1.46 ± 0.16 # 1.67 ± 0.12 0.317
Aortic Mean PG(mmHg)
1.30 ± 0.10 1.17 ± 0.07 0.376 0.68 ± 0.05 * 1.02 ± 0.11 0.008 1.17 ± 0.08 # 1.18 ± 0.09 0.925
Data are represented as means ± SEM. AV, aortic valve; CO, cardiac output; Dec Time, deceleration time; EF, ejection fraction; Gr., group; PG, pressure gradient. *Vs. Baseline; p < 0.05. ** Vs. Baseline; p < 0.001. # Vs. Week 9; p < 0.05.
Roosens et al. Cardiovascular Ultrasound 2013, 11:4 Page 4 of 8http://www.cardiovascularultrasound.com/content/11/1/4
group 1 significantly decreased compared to week 9 andthere was no more significant difference compared toage-matched controls (Table 2, Figure 2). There weresignificant correlations between cIB values and the histo-logical Ca Area for all rats (respectively ROIAVGLOB:Pearson r = 0.546; p = 0.003; and ROIAVTOT: Pearsonr = 0.487; p = 0.010 ).
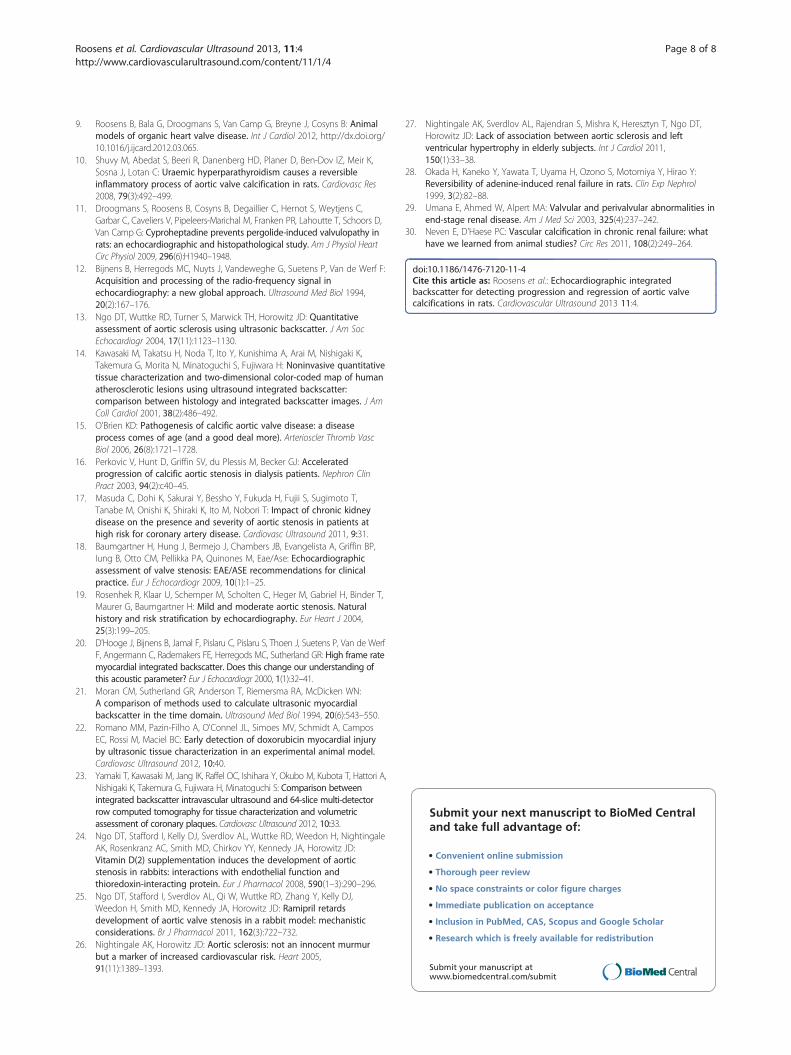
Blood BiochemistryAt baseline, there was no significant difference in bloodbiochemistry between groups. After 9 weeks, there was asignificant increase in creatinine, BUN, P, and Ca × P inthe adenine-fed group 1 compared to control group 2and baseline. At week 9, AP and osteocalcin were alsosignificantly increased in the adenine-fed group 1 com-pared to control group 2.After 21 weeks, the renal function slightly recovered in
group 1 after adenine diet discontinuation. There were nomore significant differences between groups for P, Ca ×P, and AP. However, osteocalcin remained significantlyincreased in group 1 compared to group 2 (Table 3).
Table 2 Calibrated integrated backscatter (cIB) values and his
Gr 1
Adenin
cIB Baseline (dB) ROIAVTOT 13.4 ±
ROIGLOB 16.9 ±
cIB Week 9(dB) ROIAVTOT 16.4 ±
ROIGLOB 20.7 ±
cIB Week 21 (dB) ROIAVTOT 14.8 ±
ROIGLOB 18.3 ±
Ca Area Week 9 (mm2) 0.076
Ca Area Week 21 (mm2) 0.023 ±
Data are represented as means ± SEM. dB, decibel; Gr., group; ROIAVTOT, region of inBaseline; p < 0.001. # Vs. Week 9; p = 0.037.
DiscussionIn the present study, we have shown that echocar-diographic cIB is a useful tool for the non-invasive,quantitative monitoring of progression and subsequentspontaneous regression of aortic valve calcifications ina rat model of diet-induced renal failure. We validatedthis technique by comparison with histology.
CAVD and its relationship with renal failureCAVD accounts for 70% of all valvular heart diseasesand evolves to significant aortic valve stenosis in about10% of patients. In this population, the outcome is pooras there is a significant 5-year increased risk of progres-sion to heart failure or death [15]. Hence, there is a needfor medical treatment of CAVD. However, reversal ofend-stage macrocalcification is deemed difficult [3]. Todate, medical therapies have failed to demonstrate a sig-nificant effect on advanced valvular calcifications [4]. Inanimal studies, only early preventive medical interven-tions have shown to be of interest [9].
tological calcium area (Ca Area) of the aortic valve
Gr 2 p (Gr 1 vs. Gr 2)
e 0.5% Controls
0.4 14.2 ± 0.5 0.259
0.6 16.6 ± 0.6 0.739
0.5 ** 13.3 ± 0.6 0.001
0.5 ** 17.2 ± 0.7 < 0.001
0.8 14.2 ± 0.5 0.531
1.3 18.7 ± 1.0 0.784
± 0.021 0.0 ± 0.0 0.005
0.012 # 0.0 ± 0.0 0.074
terest, aortic valve, total; ROIGLOB, region of interest, aortic valve, global. ** Vs.
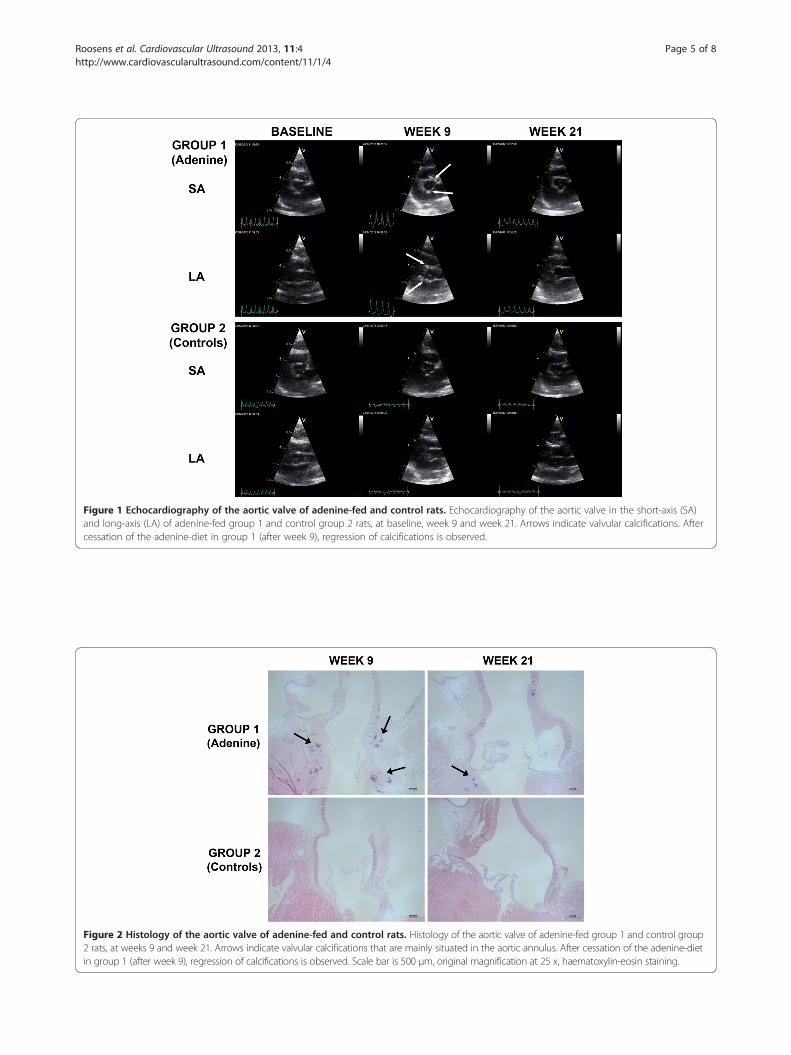
Figure 1 Echocardiography of the aortic valve of adenine-fed and control rats. Echocardiography of the aortic valve in the short-axis (SA)and long-axis (LA) of adenine-fed group 1 and control group 2 rats, at baseline, week 9 and week 21. Arrows indicate valvular calcifications. Aftercessation of the adenine-diet in group 1 (after week 9), regression of calcifications is observed.
Figure 2 Histology of the aortic valve of adenine-fed and control rats. Histology of the aortic valve of adenine-fed group 1 and control group2 rats, at weeks 9 and week 21. Arrows indicate valvular calcifications that are mainly situated in the aortic annulus. After cessation of the adenine-dietin group 1 (after week 9), regression of calcifications is observed. Scale bar is 500 μm, original magnification at 25 x, haematoxylin-eosin staining.
Roosens et al. Cardiovascular Ultrasound 2013, 11:4 Page 5 of 8http://www.cardiovascularultrasound.com/content/11/1/4
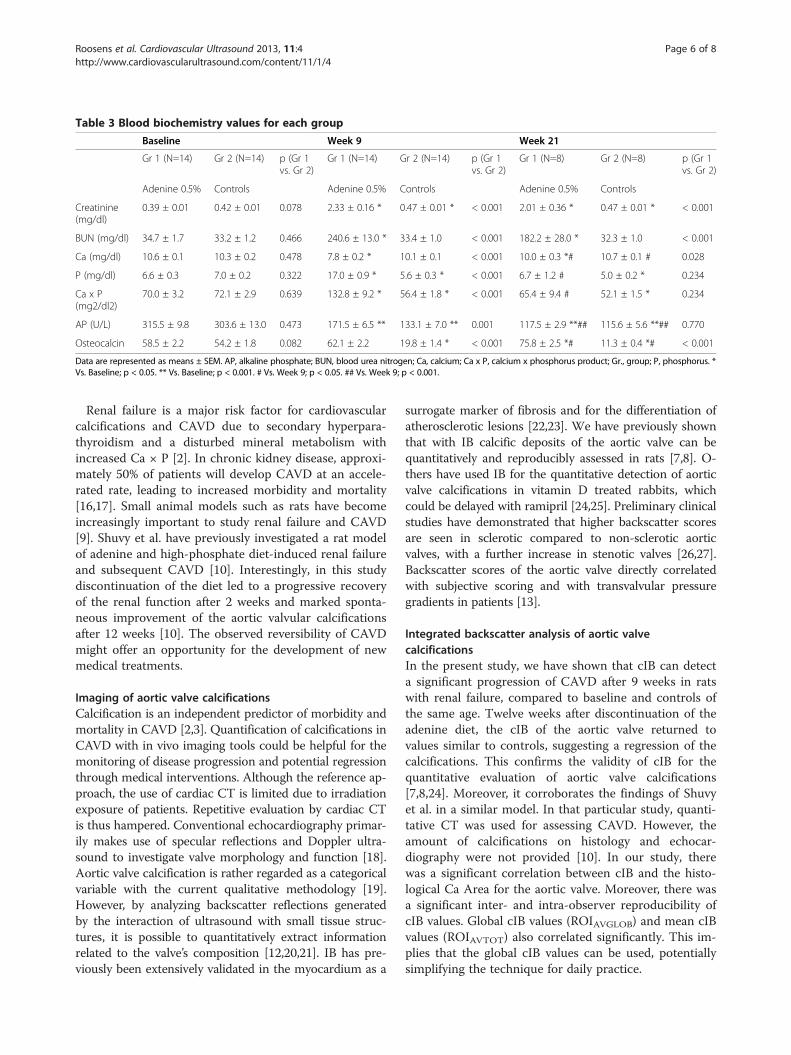
Table 3 Blood biochemistry values for each group
Baseline Week 9 Week 21
Gr 1 (N=14) Gr 2 (N=14) p (Gr 1vs. Gr 2)
Gr 1 (N=14) Gr 2 (N=14) p (Gr 1vs. Gr 2)
Gr 1 (N=8) Gr 2 (N=8) p (Gr 1vs. Gr 2)
Adenine 0.5% Controls Adenine 0.5% Controls Adenine 0.5% Controls
Creatinine(mg/dl)
0.39 ± 0.01 0.42 ± 0.01 0.078 2.33 ± 0.16 * 0.47 ± 0.01 * < 0.001 2.01 ± 0.36 * 0.47 ± 0.01 * < 0.001
BUN (mg/dl) 34.7 ± 1.7 33.2 ± 1.2 0.466 240.6 ± 13.0 * 33.4 ± 1.0 < 0.001 182.2 ± 28.0 * 32.3 ± 1.0 < 0.001
Ca (mg/dl) 10.6 ± 0.1 10.3 ± 0.2 0.478 7.8 ± 0.2 * 10.1 ± 0.1 < 0.001 10.0 ± 0.3 *# 10.7 ± 0.1 # 0.028
P (mg/dl) 6.6 ± 0.3 7.0 ± 0.2 0.322 17.0 ± 0.9 * 5.6 ± 0.3 * < 0.001 6.7 ± 1.2 # 5.0 ± 0.2 * 0.234
Ca x P(mg2/dl2)
70.0 ± 3.2 72.1 ± 2.9 0.639 132.8 ± 9.2 * 56.4 ± 1.8 * < 0.001 65.4 ± 9.4 # 52.1 ± 1.5 * 0.234
AP (U/L) 315.5 ± 9.8 303.6 ± 13.0 0.473 171.5 ± 6.5 ** 133.1 ± 7.0 ** 0.001 117.5 ± 2.9 **## 115.6 ± 5.6 **## 0.770
Osteocalcin 58.5 ± 2.2 54.2 ± 1.8 0.082 62.1 ± 2.2 19.8 ± 1.4 * < 0.001 75.8 ± 2.5 *# 11.3 ± 0.4 *# < 0.001
Data are represented as means ± SEM. AP, alkaline phosphate; BUN, blood urea nitrogen; Ca, calcium; Ca x P, calcium x phosphorus product; Gr., group; P, phosphorus. *Vs. Baseline; p < 0.05. ** Vs. Baseline; p < 0.001. # Vs. Week 9; p < 0.05. ## Vs. Week 9; p < 0.001.
Roosens et al. Cardiovascular Ultrasound 2013, 11:4 Page 6 of 8http://www.cardiovascularultrasound.com/content/11/1/4
Renal failure is a major risk factor for cardiovascularcalcifications and CAVD due to secondary hyperpara-thyroidism and a disturbed mineral metabolism withincreased Ca × P [2]. In chronic kidney disease, approxi-mately 50% of patients will develop CAVD at an accele-rated rate, leading to increased morbidity and mortality[16,17]. Small animal models such as rats have becomeincreasingly important to study renal failure and CAVD[9]. Shuvy et al. have previously investigated a rat modelof adenine and high-phosphate diet-induced renal failureand subsequent CAVD [10]. Interestingly, in this studydiscontinuation of the diet led to a progressive recoveryof the renal function after 2 weeks and marked sponta-neous improvement of the aortic valvular calcificationsafter 12 weeks [10]. The observed reversibility of CAVDmight offer an opportunity for the development of newmedical treatments.
Imaging of aortic valve calcificationsCalcification is an independent predictor of morbidity andmortality in CAVD [2,3]. Quantification of calcifications inCAVD with in vivo imaging tools could be helpful for themonitoring of disease progression and potential regressionthrough medical interventions. Although the reference ap-proach, the use of cardiac CT is limited due to irradiationexposure of patients. Repetitive evaluation by cardiac CTis thus hampered. Conventional echocardiography primar-ily makes use of specular reflections and Doppler ultra-sound to investigate valve morphology and function [18].Aortic valve calcification is rather regarded as a categoricalvariable with the current qualitative methodology [19].However, by analyzing backscatter reflections generatedby the interaction of ultrasound with small tissue struc-tures, it is possible to quantitatively extract informationrelated to the valve’s composition [12,20,21]. IB has pre-viously been extensively validated in the myocardium as a
surrogate marker of fibrosis and for the differentiation ofatherosclerotic lesions [22,23]. We have previously shownthat with IB calcific deposits of the aortic valve can bequantitatively and reproducibly assessed in rats [7,8]. O-thers have used IB for the quantitative detection of aorticvalve calcifications in vitamin D treated rabbits, whichcould be delayed with ramipril [24,25]. Preliminary clinicalstudies have demonstrated that higher backscatter scoresare seen in sclerotic compared to non-sclerotic aorticvalves, with a further increase in stenotic valves [26,27].Backscatter scores of the aortic valve directly correlatedwith subjective scoring and with transvalvular pressuregradients in patients [13].
Integrated backscatter analysis of aortic valvecalcificationsIn the present study, we have shown that cIB can detecta significant progression of CAVD after 9 weeks in ratswith renal failure, compared to baseline and controls ofthe same age. Twelve weeks after discontinuation of theadenine diet, the cIB of the aortic valve returned tovalues similar to controls, suggesting a regression of thecalcifications. This confirms the validity of cIB for thequantitative evaluation of aortic valve calcifications[7,8,24]. Moreover, it corroborates the findings of Shuvyet al. in a similar model. In that particular study, quanti-tative CT was used for assessing CAVD. However, theamount of calcifications on histology and echocar-diography were not provided [10]. In our study, therewas a significant correlation between cIB and the histo-logical Ca Area for the aortic valve. Moreover, there wasa significant inter- and intra-observer reproducibility ofcIB values. Global cIB values (ROIAVGLOB) and mean cIBvalues (ROIAVTOT) also correlated significantly. This im-plies that the global cIB values can be used, potentiallysimplifying the technique for daily practice.

Roosens et al. Cardiovascular Ultrasound 2013, 11:4 Page 7 of 8http://www.cardiovascularultrasound.com/content/11/1/4
Blood results showed a significant decrease of the renalfunction during adenine feeding in group 1 compared tocontrols, associated with a significant increase of P, Ca × P,AP and osteocalcin. After diet cessation in group 1, P, Ca ×P and AP normalized at 21 weeks. Interestingly, in ourstudy there was only a minor improvement of the renalfunction after diet cessation in group 1, in contrast to thecomplete recovery seen in the study of Shuvy et al. [10].This could be due to a difference in susceptibility of therat strain (Wistar versus Sprague–Dawley). Our resultsconfirm a previous study by Okada et al., suggestingirreversible renal failure after 4 weeks of treatment withadenine (0.75%) [28]. As a regression of CAVD was seenin spite of the remaining elevated creatinine values, itseems that the metabolic changes induced by renal failureand secondary hyperparathyroidism may be the majormediators of CAVD, rather than renal failure per se [10].The elevation and subsequent regression of AP might
confirm a role of increased bone turnover with mobilisationof Ca and P in secondary hyperparathyroidism-associatedCAVD [29]. Osteocalcin levels remained high at the end ofthe study in group 1, even 12 weeks after diet cessation.This calcification inhibitor might be produced by differen-tiated osteoblast-like cells in the calcifying cardiovascula-ture in an attempt to further prevent and/or reducecalcifications [4]. In the adenine-fed group 1, there was aweight loss as previously described [30], with a reduction inEF, CO and transvalvular PG on echocardiography. How-ever, LV performance returned to normal after diet cessa-tion in group 1.
Future perspectivesBackscatter software is now widely available on recentechocardiography packages, which makes this tool feasiblefor clinical application. In daily practice, cIB may be usedfor the detection of early aortic valve calcifications, for theassessment of disease severity and progression as well asfor evaluating the effectiveness of potential medical inter-ventions in prospective and longitudinal trials.
ConclusionsCalibrated integrated backscatter is a promising, non-invasive echocardiographic tool to quantitatively monitorprogression and regression of aortic valve calcifications ina rat model of diet-induced renal failure, as validated bycomparison with histology. This technique might becomeuseful for assessing CAVD during targeted therapy.
AbbreviationsA: Peak diastolic late velocity; AP: Alkaline phosphate; AV: Aortic valve;BP: Blood pool; BUN: Blood urea nitrogen; Ca: Calcium; Ca x P: Calcium xphosphorus; Ca Area: Calcified area; CAVD: Calcific aortic valve disease;cIB: Calibrated integrated backscatter; CO: Cardiac output; CT: Computedtomography; dB: Decibel; Dec Time: Deceleration time; E: Peak diastolic earlyvelocity; EF: Ejection fraction; Gr.: Group; IB: Integrated backscatter; LA: Long-axis; LV: Left ventricle; LVEDV: LV end-diastolic volume; LVESV: LV end-systolic
volume; LVOT: LV outflow tract; P: Phosphorus; PG: Pressure gradient;ROI: Region of interest; ROIAVGLOB: Region of interest aortic valve, global;ROIAVLA region of interest: Aortic valve, long-axis; ROIAVSA region ofinterest: Aortic valve, short-axis; ROIAVTOT: Region of interest aortic valve,total; SA: Short-axis.
Competing interestsThe authors declare that they have no competing interests.
Authors’ contributionsBR, SD, GVC and BC conceived the study design and planned thecoordination. BR, KG, and GB followed the animals’ condition daily, acquiredechocardiographic measurements and analyzed the ultrasound data. JS, ED,PD and IR prepared and analyzed the histological data. JDN and JS carriedout the biochemistry. BR, KG, SD and BC interpreted the data and wrote themanuscript. PD, GVC, PL, SD and BC revised the manuscript critically forimportant intellectual content. All authors have given approval of the finalversion of the manuscript to be published.
AcknowledgementsThis study was supported with a grant from AstraZeneca and Pfizer, Belgium.Bram Roosens has received a scholarship from the Onderzoeksraad (OZR),Vrije Universiteit Brussel (2008–2009). Bernard Cosyns is supported by theWetenschappelijk fonds Willy Gepts, UZ Brussel. The funding sources had noinvolvement in the preparation or execution of the study. The authors wishto thank Mr. Patrick Roncarati, Mrs. Cindy Peleman, Mr. Jan Sadones and theteam of the laboratory of Clinical Chemistry & Radioimmunology of the UZBrussel for their outstanding technical assistance.
Author details1Department of Cardiology, Centrum Voor Hart- en Vaatziekten (CHVZ), UZBrussel, Laarbeeklaan 101, Brussels B-1090, Belgium. 2In Vivo Cellular andMolecular Imaging (ICMI), Faculty of Medicine and Pharmacy, VrijeUniversiteit Brussel (VUB), Laarbeeklaan 103, Brussels B-1090, Belgium.3Department of Pathology, University of Liège, CHU Sart Tilman, LiègeB-4000, Belgium. 4Laboratory of Clinical Chemistry & Radioimmunology, UZBrussel, Laarbeeklaan 101, Brussels B-1090, Belgium. 5GIGA CardiovascularSciences, Heart Valve Clinic, University of Liège, CHU Sart Tilman, LiègeB-4000, Belgium.
Received: 10 January 2013 Accepted: 21 January 2013Published: 26 January 2013
References1. Nkomo VT, Gardin JM, Skelton TN, Gottdiener JS, Scott CG, Enriquez-Sarano M:
Burden of valvular heart diseases: a population-based study. Lancet 2006,368(9540):1005–1011.
2. Wang AY, Wang M, Woo J, Lam CW, Li PK, Lui SF, Sanderson JE: Cardiac valvecalcification as an important predictor for all-cause mortality andcardiovascular mortality in long-term peritoneal dialysis patients: aprospective study. J Am Soc Nephrol 2003, 14(1):159–168.
3. New SE, Aikawa E: Cardiovascular calcification: an inflammatory disease.Circ J 2011, 75(6):1305–1313.
4. Akat K, Borggrefe M, Kaden JJ: Aortic valve calcification: basic science toclinical practice. Heart 2009, 95(8):616–623.
5. Messika-Zeitoun D, Aubry MC, Detaint D, Bielak LF, Peyser PA, Sheedy PF,Turner ST, Breen JF, Scott C, Tajik AJ, Enriquez-Sarano M: Evaluation andclinical implications of aortic valve calcification measured by electron-beam computed tomography. Circulation 2004, 110(3):356–362.
6. Willmann JK, Weishaupt D, Lachat M, Kobza R, Roos JE, Seifert B, Luscher TF,Marincek B, Hilfiker PR: Electrocardiographically gated multi-detector rowCT for assessment of valvular morphology and calcification in aorticstenosis. Radiology 2002, 225(1):120–128.
7. Roosens B, Bala G, Droogmans S, Hostens J, Somja J, Delvenne E, Schiettecatte J,Delvenne P, Lahoutte T, Van Camp G, Cosyns B: Occurrence of cardiovascularcalcifications in normal, aging rats. Exp Gerontol 2012, 47(8):614–619.
8. Roosens B, Droogmans S, Hostens J, Somja J, Delvenne E, Hernot S, Bala G,Degaillier C, Caveliers V, Delvenne P, Lahoutte T, Van Camp G, Cosyns B:Integrated backscatter for the in vivo quantification of supraphysiologicalvitamin D(3)-induced cardiovascular calcifications in rats. Cardiovasc Toxicol2011, 11(3):244–252.
Roosens et al. Cardiovascular Ultrasound 2013, 11:4 Page 8 of 8http://www.cardiovascularultrasound.com/content/11/1/4
9. Roosens B, Bala G, Droogmans S, Van Camp G, Breyne J, Cosyns B: Animalmodels of organic heart valve disease. Int J Cardiol 2012, http://dx.doi.org/10.1016/j.ijcard.2012.03.065.
10. Shuvy M, Abedat S, Beeri R, Danenberg HD, Planer D, Ben-Dov IZ, Meir K,Sosna J, Lotan C: Uraemic hyperparathyroidism causes a reversibleinflammatory process of aortic valve calcification in rats. Cardiovasc Res2008, 79(3):492–499.
11. Droogmans S, Roosens B, Cosyns B, Degaillier C, Hernot S, Weytjens C,Garbar C, Caveliers V, Pipeleers-Marichal M, Franken PR, Lahoutte T, Schoors D,Van Camp G: Cyproheptadine prevents pergolide-induced valvulopathy inrats: an echocardiographic and histopathological study. Am J Physiol HeartCirc Physiol 2009, 296(6):H1940–1948.
12. Bijnens B, Herregods MC, Nuyts J, Vandeweghe G, Suetens P, Van de Werf F:Acquisition and processing of the radio-frequency signal inechocardiography: a new global approach. Ultrasound Med Biol 1994,20(2):167–176.
13. Ngo DT, Wuttke RD, Turner S, Marwick TH, Horowitz JD: Quantitativeassessment of aortic sclerosis using ultrasonic backscatter. J Am SocEchocardiogr 2004, 17(11):1123–1130.
14. Kawasaki M, Takatsu H, Noda T, Ito Y, Kunishima A, Arai M, Nishigaki K,Takemura G, Morita N, Minatoguchi S, Fujiwara H: Noninvasive quantitativetissue characterization and two-dimensional color-coded map of humanatherosclerotic lesions using ultrasound integrated backscatter:comparison between histology and integrated backscatter images. J AmColl Cardiol 2001, 38(2):486–492.
15. O'Brien KD: Pathogenesis of calcific aortic valve disease: a diseaseprocess comes of age (and a good deal more). Arterioscler Thromb VascBiol 2006, 26(8):1721–1728.
16. Perkovic V, Hunt D, Griffin SV, du Plessis M, Becker GJ: Acceleratedprogression of calcific aortic stenosis in dialysis patients. Nephron ClinPract 2003, 94(2):c40–45.
17. Masuda C, Dohi K, Sakurai Y, Bessho Y, Fukuda H, Fujii S, Sugimoto T,Tanabe M, Onishi K, Shiraki K, Ito M, Nobori T: Impact of chronic kidneydisease on the presence and severity of aortic stenosis in patients athigh risk for coronary artery disease. Cardiovasc Ultrasound 2011, 9:31.
18. Baumgartner H, Hung J, Bermejo J, Chambers JB, Evangelista A, Griffin BP,Iung B, Otto CM, Pellikka PA, Quinones M, Eae/Ase: Echocardiographicassessment of valve stenosis: EAE/ASE recommendations for clinicalpractice. Eur J Echocardiogr 2009, 10(1):1–25.
19. Rosenhek R, Klaar U, Schemper M, Scholten C, Heger M, Gabriel H, Binder T,Maurer G, Baumgartner H: Mild and moderate aortic stenosis. Naturalhistory and risk stratification by echocardiography. Eur Heart J 2004,25(3):199–205.
20. D'Hooge J, Bijnens B, Jamal F, Pislaru C, Pislaru S, Thoen J, Suetens P, Van de WerfF, Angermann C, Rademakers FE, Herregods MC, Sutherland GR: High frame ratemyocardial integrated backscatter. Does this change our understanding ofthis acoustic parameter? Eur J Echocardiogr 2000, 1(1):32–41.
21. Moran CM, Sutherland GR, Anderson T, Riemersma RA, McDicken WN:A comparison of methods used to calculate ultrasonic myocardialbackscatter in the time domain. Ultrasound Med Biol 1994, 20(6):543–550.
22. Romano MM, Pazin-Filho A, O'Connel JL, Simoes MV, Schmidt A, CamposEC, Rossi M, Maciel BC: Early detection of doxorubicin myocardial injuryby ultrasonic tissue characterization in an experimental animal model.Cardiovasc Ultrasound 2012, 10:40.
23. Yamaki T, Kawasaki M, Jang IK, Raffel OC, Ishihara Y, Okubo M, Kubota T, Hattori A,Nishigaki K, Takemura G, Fujiwara H, Minatoguchi S: Comparison betweenintegrated backscatter intravascular ultrasound and 64-slice multi-detectorrow computed tomography for tissue characterization and volumetricassessment of coronary plaques. Cardiovasc Ultrasound 2012, 10:33.
24. Ngo DT, Stafford I, Kelly DJ, Sverdlov AL, Wuttke RD, Weedon H, NightingaleAK, Rosenkranz AC, Smith MD, Chirkov YY, Kennedy JA, Horowitz JD:Vitamin D(2) supplementation induces the development of aorticstenosis in rabbits: interactions with endothelial function andthioredoxin-interacting protein. Eur J Pharmacol 2008, 590(1–3):290–296.
25. Ngo DT, Stafford I, Sverdlov AL, Qi W, Wuttke RD, Zhang Y, Kelly DJ,Weedon H, Smith MD, Kennedy JA, Horowitz JD: Ramipril retardsdevelopment of aortic valve stenosis in a rabbit model: mechanisticconsiderations. Br J Pharmacol 2011, 162(3):722–732.
26. Nightingale AK, Horowitz JD: Aortic sclerosis: not an innocent murmurbut a marker of increased cardiovascular risk. Heart 2005,91(11):1389–1393.
27. Nightingale AK, Sverdlov AL, Rajendran S, Mishra K, Heresztyn T, Ngo DT,Horowitz JD: Lack of association between aortic sclerosis and leftventricular hypertrophy in elderly subjects. Int J Cardiol 2011,150(1):33–38.
28. Okada H, Kaneko Y, Yawata T, Uyama H, Ozono S, Motomiya Y, Hirao Y:Reversibility of adenine-induced renal failure in rats. Clin Exp Nephrol1999, 3(2):82–88.
29. Umana E, Ahmed W, Alpert MA: Valvular and perivalvular abnormalities inend-stage renal disease. Am J Med Sci 2003, 325(4):237–242.
30. Neven E, D'Haese PC: Vascular calcification in chronic renal failure: whathave we learned from animal studies? Circ Res 2011, 108(2):249–264.
doi:10.1186/1476-7120-11-4Cite this article as: Roosens et al.: Echocardiographic integratedbackscatter for detecting progression and regression of aortic valvecalcifications in rats. Cardiovascular Ultrasound 2013 11:4.
Submit your next manuscript to BioMed Centraland take full advantage of:
• Convenient online submission
• Thorough peer review
• No space constraints or color figure charges
• Immediate publication on acceptance
• Inclusion in PubMed, CAS, Scopus and Google Scholar
• Research which is freely available for redistribution
Submit your manuscript at www.biomedcentral.com/submit