Possibilities and limits of X-ray microtomography for in vivo and ex vivo detection of vascular...
10
ORIGINAL PAPER Possibilities and limits of X-ray microtomography for in vivo and ex vivo detection of vascular calcifications A. A. Postnov P. C. D’Haese E. Neven N. M. De Clerck V. P. Persy Received: 19 September 2008 / Accepted: 25 March 2009 / Published online: 11 April 2009 Ó Springer Science+Business Media, B.V. 2009 Abstract In the present paper, vascular calcifica- tions due to chronic renal failure in rats are studied by X-ray microtomography (l-CT). Although l-CT is traditionally used as an imaging technique, a quan- titative analysis of data obtained by in vivo and ex vivo l-CT is described and discussed. By comparison with traditional destructive methods, such as histo- morphometry and atomic absorption, the detection limits for calcium were determined in living rats and in extracted aortas. l-CT proved to be an effective non-invasive imaging technique allowing non- destructive quantification of ectopic calcifications. Keywords Vascular calcifications Á Chronic renal failure Á X-ray microtomography Á Image analysis Introduction X-ray microtomography (l-CT), a downscaled ver- sion of computed tomography (CT) is being increasingly used in animal research since the late 1990s [1–3]. In laboratory rodents this technique allows non-invasive in vivo and ex vivo imaging of body structures, ranging from ultra soft tissues with densities close to air such as lungs [4] up to dense metal implants [5]. Recently, l-CT scanning has been used to examine lung cancer [6], lung emphysema [7], osteoporosis [8], cochlear implants [9] as well as in dental research [10]. Visualization by laboratory tabletop l-CT systems and subsequent image analysis are most successful in calcified tissues like bones due to the X-ray energy range, which is used. Moreover, it was shown previously that this method could also be applied to detect and to quantify ectopic calcifi- cations in the vasculature of rats with chronic renal failure (CFR) [11]. l-CT is of particular interest for long-term experimental follow-up and intervention studies, as it allows the assessment of changes that take place over time without the need of sacrificing the animals [11, 12]. The main purpose of the present study is to demonstrate and to evaluate the analytical perfor- mance of l-CT in the in vivo and ex vivo detection and quantification of vascular calcifications in aortas of an adenine-induced chronic renal failure rat model. In addition, emphasis is put on the correlation between quantitative data obtained by l-CT and the tissue calcium content assessed by atomic absorption spectrometry (AAS) as well as histomorphometric scoring of Von Kossa-stained sections, which are still considered as the ‘‘gold standard’’. The possibilities A. A. Postnov (&) Á N. M. De Clerck Laboratory of Microtomography, University of Antwerp, Universiteitsplein 1, Campus Drie Eiken, Gebouw N, lokaal 010, 2610 Antwerp, Belgium e-mail: [email protected] P. C. D’Haese Á E. Neven Á V. P. Persy Laboratory of Pathophysiology, University of Antwerp, Antwerp, Belgium 123 Int J Cardiovasc Imaging (2009) 25:615–624 DOI 10.1007/s10554-009-9459-9
-
Upload
independent -
Category
Documents
-
view
0 -
download
0
Transcript of Possibilities and limits of X-ray microtomography for in vivo and ex vivo detection of vascular...
ORIGINAL PAPER
Possibilities and limits of X-ray microtomography forin vivo and ex vivo detection of vascular calcifications
A. A. Postnov Æ P. C. D’Haese Æ E. Neven ÆN. M. De Clerck Æ V. P. Persy
Received: 19 September 2008 / Accepted: 25 March 2009 / Published online: 11 April 2009
� Springer Science+Business Media, B.V. 2009
Abstract In the present paper, vascular calcifica-
tions due to chronic renal failure in rats are studied by
X-ray microtomography (l-CT). Although l-CT is
traditionally used as an imaging technique, a quan-
titative analysis of data obtained by in vivo and ex
vivo l-CT is described and discussed. By comparison
with traditional destructive methods, such as histo-
morphometry and atomic absorption, the detection
limits for calcium were determined in living rats and
in extracted aortas. l-CT proved to be an effective
non-invasive imaging technique allowing non-
destructive quantification of ectopic calcifications.
Keywords Vascular calcifications �Chronic renal failure � X-ray microtomography �Image analysis
Introduction
X-ray microtomography (l-CT), a downscaled ver-
sion of computed tomography (CT) is being
increasingly used in animal research since the late
1990s [1–3]. In laboratory rodents this technique
allows non-invasive in vivo and ex vivo imaging of
body structures, ranging from ultra soft tissues with
densities close to air such as lungs [4] up to dense
metal implants [5]. Recently, l-CT scanning has been
used to examine lung cancer [6], lung emphysema
[7], osteoporosis [8], cochlear implants [9] as well as
in dental research [10]. Visualization by laboratory
tabletop l-CT systems and subsequent image analysis
are most successful in calcified tissues like bones due
to the X-ray energy range, which is used. Moreover,
it was shown previously that this method could also
be applied to detect and to quantify ectopic calcifi-
cations in the vasculature of rats with chronic renal
failure (CFR) [11]. l-CT is of particular interest for
long-term experimental follow-up and intervention
studies, as it allows the assessment of changes that
take place over time without the need of sacrificing
the animals [11, 12].
The main purpose of the present study is to
demonstrate and to evaluate the analytical perfor-
mance of l-CT in the in vivo and ex vivo detection
and quantification of vascular calcifications in aortas
of an adenine-induced chronic renal failure rat model.
In addition, emphasis is put on the correlation
between quantitative data obtained by l-CT and the
tissue calcium content assessed by atomic absorption
spectrometry (AAS) as well as histomorphometric
scoring of Von Kossa-stained sections, which are still
considered as the ‘‘gold standard’’. The possibilities
A. A. Postnov (&) � N. M. De Clerck
Laboratory of Microtomography, University of Antwerp,
Universiteitsplein 1, Campus Drie Eiken, Gebouw N,
lokaal 010, 2610 Antwerp, Belgium
e-mail: [email protected]
P. C. D’Haese � E. Neven � V. P. Persy
Laboratory of Pathophysiology, University of Antwerp,
Antwerp, Belgium
123
Int J Cardiovasc Imaging (2009) 25:615–624
DOI 10.1007/s10554-009-9459-9

and limits of l-CT in the detection and quantitative
analysis of vascular calcifications are discussed in
detail.
Methods
Animal procedures
In this study chronic renal failure was induced in 50
male Wistar rats of 250 g (Iffa Credo, Brussels,
Belgium) by feeding them an adenine diet. As we
aimed to use in vivo l-CT for selecting positive
animals out of non-calcified rats, all animals were
scanned for the first time after 6 weeks of CRF. Rats
showing vascular calcification were further followed
until week 9, at which time they were scanned for the
second time. Negative animals were sacrificed. This
study set-up is summarized in Fig. 1. Eight animals
that died spontaneously during the experiment also
underwent histomorphometrical studies. Results from
47 animals from which l-CT and histological data
are available are reported here (three rats died before
scanning was started). All experimental procedures
were carried out in accordance with the NIH guide
for the care and use of laboratory animals No. 85-23
(1985) with approval of the University of Antwerp
Ethics Committee.
The animals were housed in pairs, in plastic cages,
with a 12 h light/dark cycle and with tap water and
food available ad libitum. CRF was induced by a diet
containing 0.75% adenine (0.92% P and 1.0% Ca) for
4 weeks. This has been shown to induce a stable,
moderate to severe renal function impairment in rats
[13]. During further follow-up, rats received a
pelleted diet containing 1.06% Ca and 1.03%
P. Diets were custom made by SSNIFF Spezialdiaten
(Soest, Germany).
The adenine model of CRF is characterized by a
stable, moderate to severe renal function impairment,
with serum creatinine values increasing from
0.45 ± 0.06 mg/dl in normal animals to 2.61 ±
0.52 mg/dl after 4 weeks of CRF and remaining
stable afterwards. Although the degree of renal
failure and its associated biochemical characteristics,
such as increased PTH and low 1.25(OH)2 vitamin D,
are similar in all animals, vascular calcification is
only observed in about half of the animals [14].
Similar results were obtained by Price et al. [15].
Mineral deposits in the aorta and large arteries were
present by week 6 after induction of CRF and did not
increase significantly afterwards [14].
Microtomography
An in vivo X-ray l-CT scanner (Skyscan-1076,
Kontich, Belgium) was used. This instrument is
equipped with a 100 kV/100 lA micro focus tungsten
X-ray tube with a 5 lm focal spot size. A 10-mega-pixel
CCD camera (Hamamatsu ORCA-HRF) was used as
an X-ray detector. The smallest pixel size on the
radiography projection is 9 lm. Binning of 4 or 16
camera pixels in one image pixel results in 18
and 35 lm image pixel sizes providing better signal-
to-noise ratio.
For our experiments a 35-lm image pixel was
selected. A 25-lm titanium filter and a 90 kV X-ray
tube voltage were chosen for the in vivo scanning
whilst an aluminum filter and 100 kV were applied
for the ex vivo experiments. Application of a Ti filter
removes the softest part of X-ray spectra that would
be completely absorbed in the animal and hence
reduces radiation dose received by the rat. The Al
filter leaves the restricted high-energy part of
Fig. 1 Flow diagram of the experimental set-up
616 Int J Cardiovasc Imaging (2009) 25:615–624
123
Bremsstrahlung generated by the tungsten X-ray tube
and therefore reduces beam hardening which is
important for quantification.
In vivo detection of calcifications
For in vivo studies, rats anesthetized with 35 mg/kg IV
sodium pentobarbital (Nembutal, Ceva Sante Animale,
France) were placed on their back in the 60 mm wide
animal bed of the scanner. These conditions allowed
scanning of 18 mm axial length of the thorax during a
20 min exposure time. The scanned region started at
the top of the fourth rib, with radiographic X-ray
images of the scanned region saved as an anatomical
reference for follow-up scans. These conditions proved
to be safe for the animals and allowed serial scanning
with some time interval. The temporal evolution of the
shape and volume of the mineral precipitate was
analyzed from tomographic slices [11].
Transverse virtual cross-sections were recon-
structed from the raw dataset by the Feldkamp cone
beam algorithm [16]. In each rat, a region containing
the aorta was reconstructed. The presence of calci-
fications was evaluated de visu and scored as follows:
-: negative, ?: focal calcification or partially
circumferential dense delineation of the aortic wall
in at least two cross-sections, ??: circumferential
calcification of the aortic wall, ???: excessive
circumferential calcification with regional increases
in wall thickness.
Tissue calcium content (AAS)
The proximal part of the abdominal aorta was
weighed with a precision balance and digested
overnight in 65% nitric acid at 65�C. Subsequently,
the tissue digests were adjusted to a final volume of
2.5 ml with milliQ water. Tissue calcium content was
measured by flame atomic absorption spectrometry
(Model 3110, Perkin-Elmer) after appropriate further
dilution of the samples in 0.1% lanthanum nitrate to
avoid chemical interferences. Results are expressed
as mg Ca/g wet tissue weight.
Histomorphometric measurement of Von Kossa
positivity
Prior to embedding in paraffin, formalin-fixed aortic
tissue was sectioned perpendicular to its length axis
into 1–2 mm long segments. Segments from the
aortic arch (6–10 per animal) and thoracic aorta
segments (10–19 per animal) were embedded upright
in two separate paraffin blocks. Sections each 4 lm
thick were stained with Von Kossa’s method to
visualize calcium-containing precipitates and coun-
terstained with hematoxilin and eosin.
Vascular calcifications were evaluated histomor-
phometrically on digital images obtained with an
Axiocam HRm (Carl Zeiss Imaging Solutions)
coupled to a Leitz-Aristoplan microscope (WildLeitz
Co., Rockleigh, NJ, USA) with the Axiovision 4.5
image analysis software (Carl Zeiss Imaging solutions,
Germany). Sections were analyzed at a magnifica-
tion of 62.59 with two different color separation
thresholds, one to measure the area fraction in
percent of the slide covered with tissue, and another
to measure the area fraction in percent of Von Kossa
positivity. The possibility for manual user interven-
tion was built into the program to eliminate artifacts
(contaminations, other tissues that should not be
taken into account) outside the aorta, which falsely
increase the tissue area, and tissue folds, which can
give rise to overestimation of the calcified tissue
area. The absolute areas of tissue and calcified tissue
were summed for each animal and the ratio was
expressed as area fraction in percent of aortic
calcification.
l-CT measurements of extracted tissue
Extracted aortas were fixed in neutral buffered
formalin for 90 min at room temperature, subse-
quently rinsed in 70% isopropanol and stored at 4�C
until l-CT scanning was performed. The same
material was then processed for paraffin embedding
and microscopic analysis.
In contrast to the in vivo situation, where motion
artifacts are unavoidable and where scanning times
should be kept relatively short, Ca density and
mineral content can be estimated in isolated fixed
calcified aortas.
A map of linear attenuation coefficients recon-
structed from radiographic projections is used to
define these parameters. The method is fully
described in [17].
Atomic absorption spectrometry, being a com-
pletely independent analytical method was applied to
validate observations by l-CT.
Int J Cardiovasc Imaging (2009) 25:615–624 617
123

The density measured by l-CT is not equivalent to
the Ca concentration measured by AAS because it
only relates to the calcified part of the aorta, whereas
AAS takes into account the total amount of tissue;
i.e., calcified as well as non-calcified regions of the
aorta. For example, one small but dense deposit in the
aorta will have a high density in l-CT measurement
whereas with AAS the Ca concentration of this
deposit will be averaged over the whole non-calcified
aortic mass and will only marginally contribute to the
integral density value assessed by l-CT.
Results
In Table 1 the results of different methods used to
evaluate vascular calcification are summarized: i.e.,
traditional post-mortem techniques (histomorphome-
try and AAS), in vivo l-CT and ex vivo l-CT.
Animals are sorted by decreasing Ca content mea-
sured by AAS. In the in vivo experiment a total of 47
animals were scanned to collect sufficient statistical
data to establish the analytical performance of l-CT
in terms of detection limits, precision and accuracy.
Out of the total number of rats, observations from 32
animals were reported in Table 1. Rats that died
before the end of the experiment and did not undergo
all measurements were excluded, with exception of
five animals (#1, 2, 5, 6 and 10) that showed a high
calcification rate during in vivo l-CT studies. Ani-
mals where no calcification was detected by any of
the methods used, were also omitted from the table.
In vivo detection of early calcifications
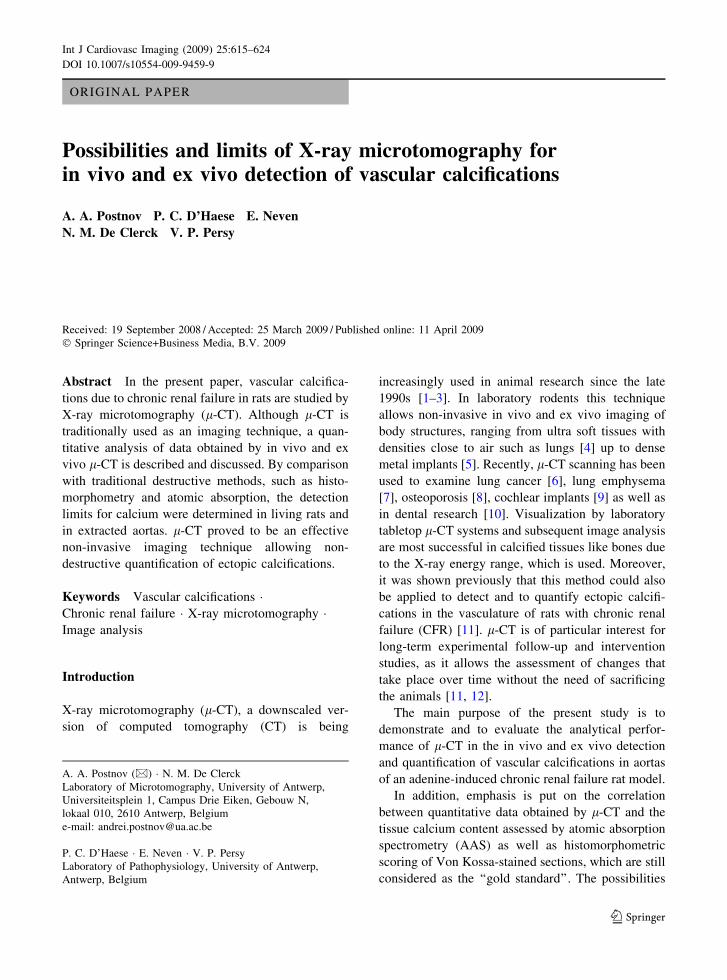
Figure 2 shows a sagittal virtual cross-section recon-
structed from a set of radiographic projections. The
calcified wall of the aorta is much denser than the
surrounding soft tissues. If no calcifications are
present, the aorta cannot be distinguished separately.
In this and all following cross-sections dark colors
correspond to high attenuation, and light colors
correspond to low attenuation.
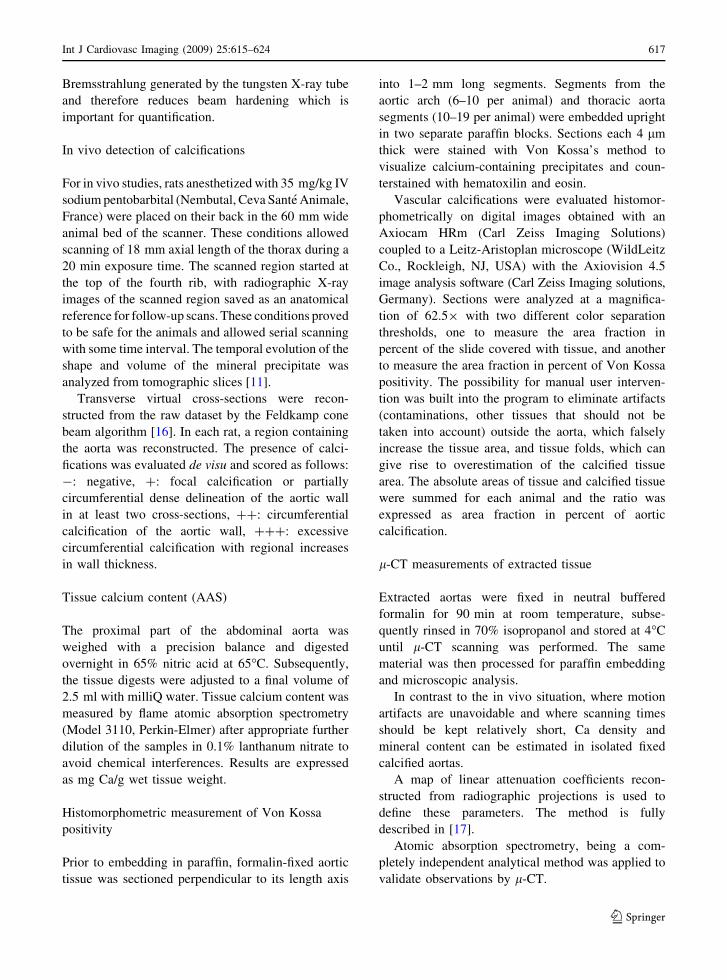
In one rat, an aneurysm was observed as illustrated
in Fig. 3, where a transverse virtual cross-section is
shown.
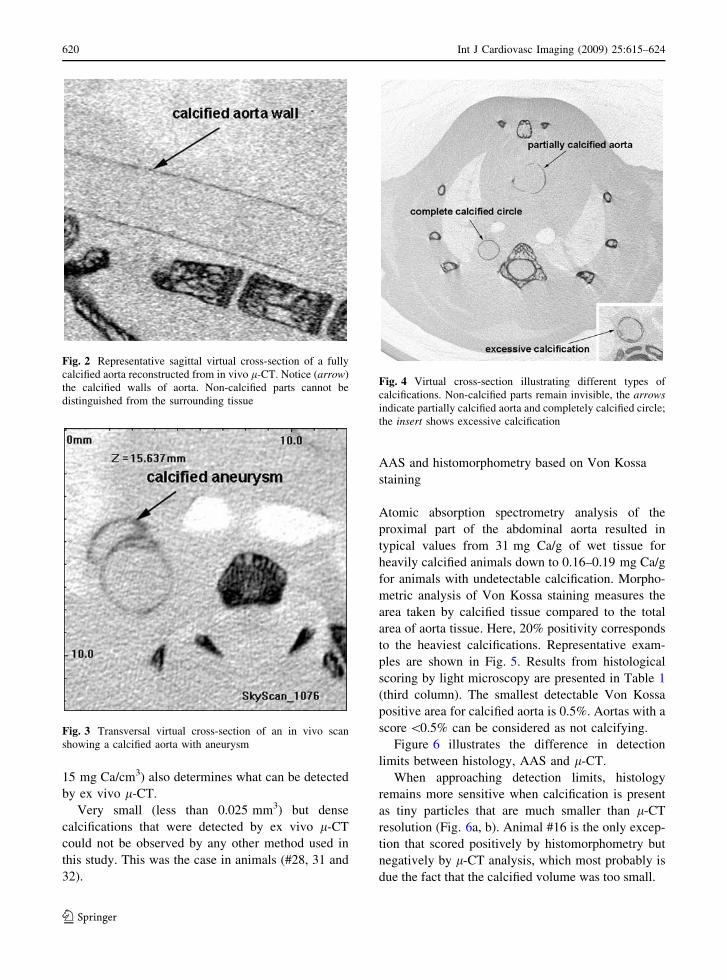
The results in Fig. 4 illustrate that aortic calcifi-
cations can appear in different shapes and degrees
such as a partially calcified aorta, a completely
calcified circle or excessive calcification. These latter
observations were confirmed by histology as shown
in Fig. 4.
To determine the detection limits of in vivo l-CT,
scanning was started at week 6 of treatment when
stable chronic renal failure is present and vascular
calcification is at its height. Although all rats suffer
from chronic renal insufficiency after being treated
with the 0.75% adenine diet for 4 weeks, calcifica-
tions were not observed in all of them. Indeed, in this
animal model the percentage of animals with calci-
fications varies around 50–60% [11]. Fourteen
animals were scored positive by l-CT scanning.
Additional assessment of vascular calcifications by ex
vivo l-CT, AAS and histomorphometry (Von Kossa
staining) indicated that the total number of affected
animals was 20. Thus, using in vivo l-CT scanning,
70% of the animals having calcifications could be
detected before sacrifice.
The detection limit of in vivo l-CT analysis was
determined by comparison to ex vivo techniques
(AAS, histomorphometry and ex vivo scanning). The
minimum amount of calcium that could be detected
in a scanned region in a live rat corresponded to
50 lg (see animals #13–15). The minimum volume
of calcified tissue detected in a live animal was
1.2 mm3 (animal #13). Measurement of the bulk Ca
concentration in the samples scored positively in vivo
is generally higher than 5 mg Ca/g wet weight tissue.
The lowest degree of calcification detected with l-CT
corresponded to a bulk Ca concentration of 4.55 mg/
g (animal #15). This value is approximately 20 times
higher than that noted in non-calcifying animals with
abnormal renal function. Hence slightly affected
animals can be missed with in vivo l-CT. On the
other hand, our follow-up study in rats indicates that
calcification, once started, develops rapidly and that
Ca concentrations in general quickly reach values up
to 30 mg/g. In one animal calcifications could not be
detected by l-CT despite the relatively high Ca
content measured by AAS (11.49 mg/g, animal #9).
Ex vivo quantitative analysis of calcification
In contrast to in vivo l-CT, ex vivo scanning proved
to be a much more sensitive method. In preserved
material, calcification becomes visible if the volume
of a calcified unit exceeds 0.025 mm3 (animal #19).
However, the density of calcifications (minimum
618 Int J Cardiovasc Imaging (2009) 25:615–624
123

Table 1 Comparison of in vivo and ex vivo l-CT with AAS and histomophometric analysis of Von Kossa-stained microscopy
sections
Post-mortem techniques X-ray microtomography
Animal
#
AAS wet
tissue
(mg/g)
Von
Kossa
(area %)
Histology
scoring
Visual
l-CT
(in vivo)
Visual
l-CT
(ex vivo)
Volume
of calcified
tissue, l-CT, mm3
Ca, l-CT (lg) Ca density l-CT (mg/cm3)
1 31.38 21.33 ? ?? NA NA NA NA
2 28.96 26.39 ? ??? NA NA NA NA
3 26.28 10.4 ? ? ? 5.989 330 55.3
4 22.38 22.65 ? ??? ? 30.321 1,990 65.8
5 19.98 20.35 ? ?? NA NA NA NA
6 19.26 22.95 ? ?? NA NA NA NA
7 16.94 17.83 ? ?? ? 27.479 1,520 55.3
8 13.02 9.334 ? ?? ? 16.121 650 40.6
9 11.49 3.896 ? - ? 0.784 23 29.05
10 10.66 17.98 ? ?? NA NA NA NA
11 8.55 13.25 ? ? ? 8.999 350 39.2
12 8.15 10.24 ? ? ? 11.442 400 35.35
13 6.15 10.01 ? ? ? 3.177 65 20.65
14 5.46 1.313 ? ? ? 1.276 50 39.9
15 4.55 5.14 ? ? ? 1.752 61 34.65
16 4.16 1.107 ? - - 0.019 0.35 18.55
17 3.68 1.767 ? - ? 0.137 2.6 19.25
18 3.11 4.552 ? - ? 0.174 3.6 21
19 2.62 1.404 ? - ? 0.025 0.45 18.55
20 2.04 0.512 ? - ? 0.093 2.6 28.35
21 1.57 0.012 - - - 0.018 0.21 12.6
22 1.4 2.479 ? - ? 0.060 1 17.15
23 0.98 0.003 - - - 0.005 0.035 6.65
24 0.8 0.08 - - - 0.003 0.01 3.15
25 0.76 0.011 - - - 0.010 0.14 14
26 0.37 0.002 - - - 0.006 0.07 8.4
27 0.33 0.012 - - - 0.001 0.06 6.3
28 0.31 0.002 - - - 0.014 0.175 12.25
29 0.26 0 - - - 0.006 0.035 5.95
30 0.23 0 - - - 0.001 0.00035 0.35
31 0.19 0.002 - - - 0.020 0.315 15.05
32 0.19 0.009 - - - 0.025 0.315 13.3
Animals are sorted by the decrement of Ca content measured by AAS
NA not analyzed
Scoring system for in vivo visual l-CT is the following: -, negative; ?, focal calcification or partially circumferential dense
delineation of the aortic wall in at least two cross-sections; ??, circumferential calcification of the aortic wall; ???, excessive
circumferential calcification with regional increases in wall thickness. Volume, amount of calcium and calcium density were
calculated from ex vivo l-CT data
Int J Cardiovasc Imaging (2009) 25:615–624 619
123
15 mg Ca/cm3) also determines what can be detected
by ex vivo l-CT.
Very small (less than 0.025 mm3) but dense
calcifications that were detected by ex vivo l-CT
could not be observed by any other method used in
this study. This was the case in animals (#28, 31 and
32).
AAS and histomorphometry based on Von Kossa
staining
Atomic absorption spectrometry analysis of the
proximal part of the abdominal aorta resulted in
typical values from 31 mg Ca/g of wet tissue for
heavily calcified animals down to 0.16–0.19 mg Ca/g
for animals with undetectable calcification. Morpho-
metric analysis of Von Kossa staining measures the
area taken by calcified tissue compared to the total
area of aorta tissue. Here, 20% positivity corresponds
to the heaviest calcifications. Representative exam-
ples are shown in Fig. 5. Results from histological
scoring by light microscopy are presented in Table 1
(third column). The smallest detectable Von Kossa
positive area for calcified aorta is 0.5%. Aortas with a
score \0.5% can be considered as not calcifying.
Figure 6 illustrates the difference in detection
limits between histology, AAS and l-CT.
When approaching detection limits, histology
remains more sensitive when calcification is present
as tiny particles that are much smaller than l-CT
resolution (Fig. 6a, b). Animal #16 is the only excep-
tion that scored positively by histomorphometry but
negatively by l-CT analysis, which most probably is
due the fact that the calcified volume was too small.
Fig. 2 Representative sagittal virtual cross-section of a fully
calcified aorta reconstructed from in vivo l-CT. Notice (arrow)
the calcified walls of aorta. Non-calcified parts cannot be
distinguished from the surrounding tissue
Fig. 3 Transversal virtual cross-section of an in vivo scan
showing a calcified aorta with aneurysm
Fig. 4 Virtual cross-section illustrating different types of
calcifications. Non-calcified parts remain invisible, the arrowsindicate partially calcified aorta and completely calcified circle;
the insert shows excessive calcification
620 Int J Cardiovasc Imaging (2009) 25:615–624
123

This situation is highlighted by Fig. 6c, d. On the
other hand, l-CT analyzes and visualizes the entire
sample and can detect individual spots that are too
small to give contribution to AAS signal and can
easily be missed on histology (Fig. 6e). Visualization
by l-CT also helps to detect contaminations (Fig. 6f)
that are present in some preparations and can confuse
AAS measurements.
Discussion
In line with previous studies [11], the present report
clearly shows that vascular calcification in rats with
chronic renal failure (CRF) can be detected and
visualized by in vivo X-ray microtomography. By
validation and comparison with standard ex vivo
techniques, the detection limits for both in vivo and
ex vivo l-CT were determined.
The results presented in Table 1 summarize
observations by traditional techniques and by l-
CT. Data indicate that although the typical total Ca
concentration of non-calcified tissue is around
0.18 mg/g (AAS), only those samples having a total
Ca concentration above 1 mg/g were confirmed
positive by histomorphometric analysis. Whereas
AAS and histomorphometry were applied to differ-
ent tissue samples, only one animal (#21) had
significantly different calcification and could have
been missed if only histological scoring had been
performed.
Von Kossa staining is a very sensitive dying
technique, but histomorphometric measurement of
the sections is influenced by both staining and cutting
artifacts. Hence, the animals that were considered
positive actually have a positive area that exceeds
0.5%.
Out of 20 animals identified as having calcifica-
tions by ex vivo analysis, 14 were also found positive
by in vivo l-CT corresponding with a successful
detection of calcifications in 70% of the cases. The
only animal showing a high Ca content as assessed by
AAS, which was not detected in vivo, was animal #9
(see Table 1). This can be explained by a focal
distribution of the calcifications. The analysis of
extracted aortas proved that the estimated calcified
volume in animal #9 is 0.78 mm3 being below the in
vivo detection limit (1.2 mm3 as detected in animal
#14). This volume is relatively large because of aorta
contractions. The lower the calcification level is, the
more is the amplitude of the contractions; so calcified
area should be high enough to overcome the blurring
Fig. 5 Histological images
of different degrees of
calcification (von Kossa
staining). a Aorta cross-
section without calcification
(0%), b calcified spot
(1–3%), c completely
circumferential calcification
(*10%, compare to Fig. 3),
d excessive calcification
(*20%)
Int J Cardiovasc Imaging (2009) 25:615–624 621
123

effect. Data in Table 1 further demonstrate that for a
reliable detection of vascular calcifications, Ca con-
centration/density in the sample should be high
enough together with the presence of a sufficiently
large volume of calcified tissue. Strict border condi-
tions are difficult to define because of the limited
number of experimental data. But it should be taken
into account that the number of photons that form the
shadow projections and hence lower signal-to-noise
ratio restricts accuracy of in vivo analysis. In our
study the lowest Ca density detected in vivo was
20.65 mg/cm3 for animal #13 (volume of calcified
tissue was 3.2 mm3).
The possibility of early in vivo detection of
calcification is of particular interest for follow-up
and intervention studies in which for example the
effect of therapeutics on the reversibility of vascular
calcifications has to be evaluated. In such experi-
ments, in vivo l-CT analysis on the one hand allows
withdrawal of non-calcifying animals, and follow-up
of calcifying animals on the other hand, as previously
demonstrated in a feasibility study [11].
Fig. 6 Demonstration of the difference in detection limits
between histology, AAS and l-CT: a ‘‘sand-type’’ Von Kossa
positivity. Sizes of each grain are too small to be detected by
l-CT. Nevertheless, the total amount of calcified tissue is
enough to be visualized by histology and add to AAS signal.
b Magnified image of the affected area. Notice a lot of tiny
calcifications. c Small calcified spot that is detected histomor-
phometrically, but can be considered as statistical noise during
l-CT analysis. It also contributes marginally to AAS.
d Magnified image of individual spot. e l-CT detects a single,
focal Ca deposit that brings a very small contribution to AAS
signal and can be easily missed in histology due to sampling
bias. f l-CT image showing a dense focus outside the aorta
wall. This calcification is excluded during histomorphometry
as well as during quantification of l-CT cross-sections, but can
add to AAS signal
622 Int J Cardiovasc Imaging (2009) 25:615–624
123
The fact that two of three calcified animals were
detected in vivo means that the major part of affected
animals could be selected for follow-up studies and
we believe it is a positive contribution in biomedical
research. These animals can serve as their own
control and dramatically reduce total number of rats
involved in the experiment.
When comparing in vivo l-CT to AAS, different
distribution patterns of calcifications (heteroge-
neously localized dense spots vs. an homogeneous
distribution) leads to different detection limits of in
vivo l-CT. A given density of e.g., 5 mg Ca/g tissue
measured by AAS can easily be detected with in vivo
l-CT in case calcifications are present as high density
focal spots whereas measurement will not be possible
when the same amount of Ca would be uniformly
distributed over the whole tissue section. It might be
the reason why an animal #15 with an aortic Ca
concentration as low as 4.5 mg/g calcifications could
be detected in vivo.
Selection of the parameters for early in vivo
detection by l-CT is complicated by the following
factors: radiation dose, scanning time and motion
artifacts. Radiation dose restricts scanning time and
consequently signal-to-noise ratio that leads to a
limited detection level, which obviously remains
lower than in ex vivo situations. Motion artifacts are
inherent to a living animal and are always a limiting
factor for in vivo l-CT. Three main motion types can
be distinguished in an anesthetized animal: cardiac
contractions, respiration and motility. In view of this,
one will always be confronted with some blurring and
artifacts in reconstructed cross-sections.
Finally, the detection limit of in vivo l-CT in the
detection of vascular calcification was found to be
equivalent to a Ca concentration of 5 mg/g measured
by AAS. Further improvement of the limit of
detection can be achieved by either increasing the
acquired signal, for example, by increasing scanning
time, and/or reducing blurring resulting from motion
artifacts.
In ex vivo studies the sensitivity of the method
improves dramatically. Results of visual inspection of
reconstructed cross-sections of ex vivo studies corre-
lated with histological observations with the exception
of one animal #16. The smallest detected volume of
calcified tissue detected by ex vivo l-CT was
0.025 mm3 and the smallest amount of Ca was
0.45 lg (animal #19). Since there is only one animal
that showed discrepancies between traditional meth-
ods and l-CT, we can estimate the detection accuracy
ex vivo to be [95%. Signal-to-noise ratio can be
improved by increasing scanning time while the flat
field correction of X-ray CCD detector remains valid.
Although results of l-CT analysis look very
similar to histological and AAS scoring, there are
some peculiarities in what is measured and in what
defines the detection limits.
The calcified fraction of the aorta and its average
density cannot be determined by any other method than
l-CT. Histomorphometry only measures calcium
volume in a limited number of sections and hence a
significant error can be introduced due to sampling
bias, especially in case of a very limited calcification
level. A direct comparison remains impossible because
animal focused l-CT analysis can be completely
isotropic in contrast to histomorphometry that always
analyzes a restricted part of the sample volume.
AAS being the most accurate method of calcium
density measurement per wet weight is limited to an
integral value. As a result, there is no difference for
AAS whether calcium was concentrated in some
dense spots or uniformly distributed in the prepara-
tion. However, this latter information can be essential
for the investigator.
Another critical drawback of AAS is that, due to
its destructive character, this technique does not
allow comparing the results to histomorphometry
directly. It is not possible to perform AAS on fixed
tissue, since tissue processing may influence the
calcium content in the sample.
Previous feasibility studies of human coronary
artery wall in autopsy specimens [18] have shown that
in addition to the quantification of ectopic calcifica-
tions in the present report, l-CT can be successfully
applied in the field of atherosclerosis for plaques
visualization and coronary wall analysis. Again, a full
3D isotropic dataset provides an advantage of finding
and visualizing the most important spots and regions
that might be missed during histological sectioning.
The problem of in vivo observations of the same
plaque is complicated by the insufficient contrast of
clinical CT. To enhance soft tissue contrast a dual-
energy CT is emerging as a novel clinical instrument
[19, 20]. In this case CT utilizes the fact that relative
absorption of different elements is changing dramat-
ically as a function of X-ray photon energy. As a
future development l-CT may use the same principle
Int J Cardiovasc Imaging (2009) 25:615–624 623
123

for laboratory animal studies although the limitation
of lower signal-to-noise ratio compared to medical
CT remains valid.
Conclusions
In conclusion, l-CT proves to be a promising non-
invasive imaging technique allowing quantification of
ectopic calcification both in living animals and in
extracted tissues. This study is the detailed compar-
ison between l-CT (in vivo as well as ex vivo) and
traditional methods such as histomorphometry and
AAS.
In vivo investigations allow selecting ‘‘positive’’
animals from those that did not calcify when the
calcification level was higher than 5 mg/g of wet
tissue. In vivo l-CT was successful in 70% of the
animals.
l-CT analysis on prepared tissues proved to be
accurate to quantify aorta calcification with more that
95% reliability, providing a complete analysis of both
degree and distribution of the calcification while
remaining much less time consuming.
References
1. Davis GR, Wong FSL (1996) X-ray microtomography of
bones and teeth. Physiol Meas 17:121–146. doi:
10.1088/0967-3334/17/3/001
2. Paulus MJ, Gleason SS, Kennel SJ, Hunsicker PR, Johnson
DK (2000) High resolution X-ray computed tomography :
an emerging tool for small animal cancer research. Neo-
plasia 2:62–70. doi:10.1038/sj.neo.7900069
3. Ritman EL (2002) Molecular imaging in small animals:
roles for l-CT. J Cell Biochem 39(Supp):116–124. doi:
10.1002/jcb.10415
4. Namati E, Chon D, Thiesse J, Hoffman EA, de Ryk J, Ross
A, McLennan G (2006) In vivo l-CT lung imaging via a
computer-controlled intermittent iso-pressure hold (II-
BBH) technique. Phys Med Biol 51(23):6061–6075. doi:
10.1088/0031-9155/51/23/008
5. Marechal M, Luyten F, Nijs J, Postnov A, Schepers E, van
Steenberghe D (2006) Histomorphometry and micro-
computed tomography of bone augmentation under a tita-
nium membrane. Clin Oral Implants Res 16(6):708–714.
doi:10.1111/j.1600-0501.2005.01205.x
6. De Clerck NM, Meurrens K, Weiler H, Van Dyck D,
Vanhoutte G, Terpstra P, Postnov AA (2004) High reso-
lution X-ray microtomography for the detection of lung
tumors in living mice. Neoplasia 6:374–379. doi:10.1593/
neo.03481
7. Postnov A, Meurrens K, Weiler H, Van Dyck D, Xu H, Terpstra
P, De Clerck NM (2005) In vivo assessment of emphysema in
mice by high resolution X-ray microtomography. J Microsc
220:70–75. doi:10.1111/j.1365-2818.2005.01510.x
8. Waarsing JH, Day JS, van der Linden JC, Ederveen AG,
Spanjers C, De Clerck N, Sasov A, Weinans H (2004)
Detecting and tracking local changes in the tibiae of individual
rats : a novel method to analyse longitudinal in vivo l-CT data.
Bone 34(1):163–169. doi:10.1016/j.bone.2003.08.012
9. Postnov A, Zarowski A, De Clerck NM, Vanpoucke F, Offe-
ciers W, Van Dyck D, Peeters S (2006) High Resolution M-CT
scanning as innovatory tool for evaluation of the surgical
positioning of cochlear implant electrodes. Acta Otolaryngol
126(5):467–474. doi:10.1080/00016480500437377
10. Nair MK, Nair UP (2007) Digital and advanced imaging in
endodontics: a review. J Endod 33(1):1–6. doi:10.1016/j.
joen.2006.08.013
11. Persy V, Postnov A, Neven E, Dams G, De Broe M,
DHaese P, De Clerck NM (2006) Detection of vascular
calcifications by high resolution X-ray microtomography in
living rats with chronic renal failure. Arterioscler Thromb
Vasc Biol 26:2110–2116
12. De Clerck N, Postnov A (2007) High resolution X-ray
microtomography: applications in biomedical research. In:
Tavitian B, Leroy-Willig A, Ntziachristos V (eds) Inter-
national textbook of in vivo imaging in vertebrate. Wiley
& Sons, London, pp 57–77
13. Katsumata K, Kusano K, Hirata M, Tsunemi K, Nagano N,
Burke SK, Fukushima N (2003) Sevelamer hydrochloride
prevents ectopic calcification and renal osteodystrophy in
chronic renal failure rats. Kidney Int 64(2):441–450
14. Neven E, Dauwe S, De Broe ME, D’Haese PC, Persy V
(2007) Endochondral bone formation is involved in media
calcification in rats and in men. Kidney Int 72(5):574–581
15. Price PA, Roublick AM, Williamson MK (2006) Artery
calcification in uremic rats is increased by a low protein
diet and prevented by treatment with ibandronate. Kidney
Int 70:1577–1583
16. Feldkamp LA, Davis LC, Kress JW (1984) Practical cone-
beam algorithm. J Opt Soc Am A 1:612–619. doi:
10.1364/JOSAA.1.000612
17. Postnov A, Vinogradov A, Van Dyck D, Saveliev SV, De
Clerck NM (2003) Quantitative analysis of bone mineral
content by X-ray microtomography. Physiol Meas 24:165–
178. doi:10.1088/0967-3334/24/1/312
18. Langheinrich A, Bohle R, Greschus S, Hackstein G, von
Gerlach S, Rau W, Hoelschermann H (2004) Ahteroscle-
rotic lesions at micro-CT: feasibility for analysis of
coronary artery wall in autopsy specimens. Radiology
231:675–681. doi:10.1148/radiol.2313021718
19. Barreto M, Schoenhagen P, Nair A, Amatangelo S, Milite
M, Obuchowski N, Lieber M, Halliburton S (2008)
Potential of dual-energy computed tomography to charac-
terize atherosclerotic plaque: ex vivo assessment of human
coronary arteries in comparison to histology. J cardiovasc
comput Tomogr 2:234–242
20. Schwarz F, Ruzzics B, Schoepf J, Bastarrika G, Chiarmida S,
Abro J, Brothers Rm, Vogt S, Schmidt B, Costello P, Zwerner P
(2008) Dual-energy CT of the heart—principles and protocols.
Eur J Radiol 68:423–433. doi:10.1016/j.ejrad.2008.09.010
624 Int J Cardiovasc Imaging (2009) 25:615–624
123