
Longitudinal characteristics of spread F backscatter plumes observed with the EAR and Sanya VHF...
14
Longitudinal characteristics of spread F backscatter plumes observed with the EAR and Sanya VHF radar in Southeast Asia Guozhu Li, 1,2 Baiqi Ning, 1,2 M. A. Abdu, 3 Yuchi Otsuka, 4 T. Yokoyama, 5 M. Yamamoto, 6 and Libo Liu 1 Received 3 June 2013; revised 4 September 2013; accepted 17 September 2013. [1] The development of equatorial plasma irregularity plumes can be well recorded by steerable backscatter radars operated at and off the magnetic equator due to the fact that the vertically extended plume structures are tracers of magnetically north-south aligned larger scale structures. From observations during March 2012, using two low latitude steerable backscatter radars in Southeast Asia, the Equatorial Atmosphere Radar (EAR) (0.2°S, 100.3°E; dip lat 10.4°S) and the Sanya VHF radar (18.4°N, 109.6°E; dip lat 12.8°N), the characteristics of backscatter plumes over the two sites separated in longitude by ~1000 km were simultaneously investigated. The beam steering measurements reveal frequent occurrences of multiple plumes over both radar sites, of which two cases are analyzed here. The observations on 30 March 2012 show plume structures initiated within the radar scanned area, followed by others drifting from the west of the radar beam over both stations. A tracing analysis on the onset locations of plasma plumes reveals spatially well-separated backscatter plumes, with a maximum east-west wavelength of about 1000 km, periodically generated in longitudes between 85°E and 110°E. The postsunset backscatter plumes seen by the Sanya VHF radar are found to be due to the passage of sunset plumes initiated around the longitude of EAR. Most interestingly, the EAR measurements on the night of 21 March 2012 show multiple plume structures that developed successively in the radar scanned area with east-west separation of ~50 km, with however no sunset plasma plume over Sanya. Colocated ionogram measurements show that spread F irregularities occurred mainly in the bottomside F region at Sanya, whereas satellite traces in ionograms that are indications of large-scale wave structures were observed on that night at both stations. Possible causes for the longitudinal difference in the characteristics of radar backscatter plumes are discussed. Citation: Li, G., B. Ning, M. A. Abdu, Y. Otsuka, T. Yokoyama, M. Yamamoto, and L. Liu (2013), Longitudinal characteristics of spread F backscatter plumes observed with the EAR and Sanya VHF radar in Southeast Asia, J. Geophys. Res. Space Physics, 118, doi:10.1002/jgra.50581. 1. Introduction [2] The Equatorial Spread F (ESF)/plasma bubble irregu- larity phenomenon has been extensively studied through observations of a variety of its manifestations, such as spread echoes in ionograms [Abdu et al., 2012, and the references therein], backscatter plumes from VHF radar range-time-intensity (RTI) maps [Woodman and LaHoz, 1976], pronounced ion-density depletions observed by sat- ellites, and magnetic field line elongated airglow depletions observed by optical imagers [e.g., Kil and Heelis, 1998; Otsuka et al., 2002]. The plasma bubbles and the associated irregularity plumes are known to result from nonlinear evolution of plasma instability by the generalized Rayleigh- Taylor (R-T) instability mechanism that depends on the external driving forces (e.g., neutral wind and electric fields) and the background ionospheric properties (e.g., flux tube integrated Pedersen conductivity) [Kelley, 1989; Sultan, 1996; Abdu, 2001, and the references therein]. When some initial seeding perturbations exist, the R-T instability may be excited at the upward density gradient region of the F layer bottomside, so that the density perturbations evolve into plasma depleted flux tubes that penetrate the F layer peak to the topside iono- sphere, reaching altitudes as high as 1500 km or more, and extending to dip latitudes greater than ±15° [e.g., Otsuka et al., 2002; Kil et al., 2009]. That the towering radar plasma 1 Key Laboratory of Ionospheric Environment, Institute of Geology and Geophysics, Chinese Academy of Sciences, Beijing, China. 2 Beijing National Observatory of Space Environment, Institute of Geology and Geophysics, Chinese Academy of Sciences, Beijing, China. 3 Divisão de Aeronomia, Instituto Nacional de Pesquisas Espaciais, São Paulo, Brazil. 4 Solar-Terrestrial Environment Laboratory, Nagoya University, Nagoya, Japan. 5 National Institute of Information and Communications Technology, Tokyo, Japan. 6 Research Institute for Sustainable Humanosphere, Kyoto University, Uji, Japan. Corresponding author: G. Li, Key Laboratory of Ionospheric Environment, Institute of Geology and Geophysics, Chinese Academy of Sciences, Beijing 100029, China. ([email protected]) ©2013. American Geophysical Union. All Rights Reserved. 2169-9380/13/10.1002/jgra.50581 1 JOURNAL OF GEOPHYSICAL RESEARCH: SPACE PHYSICS, VOL. 118, 1–14, doi:10.1002/jgra.50581, 2013
Transcript of Longitudinal characteristics of spread F backscatter plumes observed with the EAR and Sanya VHF...
Longitudinal characteristics of spreadF backscatter plumes observedwith the EAR and Sanya VHF radar in Southeast Asia
Guozhu Li,1,2 Baiqi Ning,1,2 M. A. Abdu,3 Yuchi Otsuka,4 T. Yokoyama,5
M. Yamamoto,6 and Libo Liu1
Received 3 June 2013; revised 4 September 2013; accepted 17 September 2013.
[1] The development of equatorial plasma irregularity plumes can be well recorded bysteerable backscatter radars operated at and off the magnetic equator due to the fact that thevertically extended plume structures are tracers of magnetically north-south aligned largerscale structures. From observations during March 2012, using two low latitude steerablebackscatter radars in Southeast Asia, the Equatorial Atmosphere Radar (EAR) (0.2°S,100.3°E; dip lat 10.4°S) and the Sanya VHF radar (18.4°N, 109.6°E; dip lat 12.8°N), thecharacteristics of backscatter plumes over the two sites separated in longitude by ~1000 kmwere simultaneously investigated. The beam steering measurements reveal frequentoccurrences of multiple plumes over both radar sites, of which two cases are analyzed here.The observations on 30 March 2012 show plume structures initiated within the radarscanned area, followed by others drifting from the west of the radar beam over both stations.A tracing analysis on the onset locations of plasma plumes reveals spatially well-separatedbackscatter plumes, with a maximum east-west wavelength of about 1000 km, periodicallygenerated in longitudes between 85°E and 110°E. The postsunset backscatter plumes seenby the Sanya VHF radar are found to be due to the passage of sunset plumes initiated aroundthe longitude of EAR. Most interestingly, the EAR measurements on the night of 21 March2012 show multiple plume structures that developed successively in the radar scanned areawith east-west separation of ~50 km, with however no sunset plasma plume over Sanya.Colocated ionogram measurements show that spread F irregularities occurred mainly in thebottomside F region at Sanya, whereas satellite traces in ionograms that are indications oflarge-scale wave structures were observed on that night at both stations. Possible causes forthe longitudinal difference in the characteristics of radar backscatter plumes are discussed.
Citation: Li, G., B. Ning, M. A. Abdu, Y. Otsuka, T. Yokoyama, M. Yamamoto, and L. Liu (2013), Longitudinalcharacteristics of spread F backscatter plumes observed with the EAR and Sanya VHF radar in Southeast Asia, J. Geophys.Res. Space Physics, 118, doi:10.1002/jgra.50581.
1. Introduction
[2] The Equatorial Spread F (ESF)/plasma bubble irregu-larity phenomenon has been extensively studied throughobservations of a variety of its manifestations, such as
spread echoes in ionograms [Abdu et al., 2012, and thereferences therein], backscatter plumes from VHF radarrange-time-intensity (RTI) maps [Woodman and LaHoz,1976], pronounced ion-density depletions observed by sat-ellites, and magnetic field line elongated airglow depletionsobserved by optical imagers [e.g., Kil and Heelis, 1998;Otsuka et al., 2002]. The plasma bubbles and the associatedirregularity plumes are known to result from nonlinearevolution of plasma instability by the generalized Rayleigh-Taylor (R-T) instability mechanism that depends on theexternal driving forces (e.g., neutral wind and electric fields)and the background ionospheric properties (e.g., flux tubeintegrated Pedersen conductivity) [Kelley, 1989; Sultan, 1996;Abdu, 2001, and the references therein]. When some initialseeding perturbations exist, the R-T instability may be excitedat the upward density gradient region of the F layer bottomside,so that the density perturbations evolve into plasma depletedflux tubes that penetrate the F layer peak to the topside iono-sphere, reaching altitudes as high as 1500 km or more, andextending to dip latitudes greater than ±15° [e.g., Otsukaet al., 2002; Kil et al., 2009]. That the towering radar plasma
1Key Laboratory of Ionospheric Environment, Institute of Geologyand Geophysics, Chinese Academy of Sciences, Beijing, China.
2Beijing National Observatory of Space Environment, Institute ofGeology and Geophysics, Chinese Academy of Sciences, Beijing, China.
3Divisão de Aeronomia, Instituto Nacional de Pesquisas Espaciais, SãoPaulo, Brazil.
4Solar-Terrestrial Environment Laboratory, Nagoya University, Nagoya,Japan.
5National Institute of Information and Communications Technology,Tokyo, Japan.
6Research Institute for Sustainable Humanosphere, Kyoto University,Uji, Japan.
Corresponding author: G. Li, Key Laboratory of Ionospheric Environment,Institute of Geology and Geophysics, Chinese Academy of Sciences, Beijing100029, China. ([email protected])
©2013. American Geophysical Union. All Rights Reserved.2169-9380/13/10.1002/jgra.50581
1
JOURNAL OF GEOPHYSICAL RESEARCH: SPACE PHYSICS, VOL. 118, 1–14, doi:10.1002/jgra.50581, 2013
irregularity plumes do indeed represent equatorial plasmabubbles has been confirmed through overwhelming evidencefrom observation by combinations of multiple instruments[e.g., Tsunoda and White, 1981]. The zonal scales of theplumes are dependent on the wavelength of the initial pertur-bations, which generally range from tens of kilometers to afew hundred kilometers [Ossakow, 1981]. The plumes occurmost often during the postsunset hours driven dominantly bythe evening prereversal enhancement in the eastward electricfield (PRE) [Fejer et al., 1999; Yokoyama et al., 2004], whichdevelops under the eastward thermospheric zonal wind andwhen the E region conductivity rapidly decreases so that alarge westward longitudinal gradient of the conductivity isestablished across the terminator. They can occur successivelyat a large longitudinal span of more than 180° [Li et al., 2010]as the result of enhanced eastward electric fields associatedwith geomagnetic activity. The plumes can occur also laterat night even near sunrise [e.g., Fukao et al., 2003].[3] With respect to the occurrence characteristics of the
equatorial plasma plumes (bubbles), much work has beendone related to their global longitudinal and seasonal distri-butions. For example, in situ observations from satelliteshave revealed that in Southeast Asia, a high occurrence prob-ability of plasma bubbles exists in equinoctial months. Thiscan be well understood since the sunset terminator makes agood alignment with the local magnetic meridian, therebyenhancing the PRE and hence the ESF occurrence [Abduet al., 1992; Su et al., 2008]. It is well known that, in general,the bubble occurrence on a global scale is correlated climato-logically with the postsunset rise of the equatorial F layer dueto the PRE [e.g., Fejer et al., 1999; Li et al., 2008; Oyekola,2009]. However, from the viewpoint of day-to-day variabil-ity, the plasma bubble development is known to be relatedalso to additional important factors other than the PRE.Measurements by transequatorial HF radio wave propaga-tion, airglow imager, and coherent and incoherent scatterradars have revealed quasi-periodic occurrence of equatorialplasma plumes in the east-west direction, with zonal scales ofa few hundred kilometers [e.g., Röttger, 1973; Tsunoda andWhite, 1981; Singh et al., 1997; Makela and Miller, 2008],which are far less than the longitudinal dimension of the
PRE (>3000 km) [Saito and Maruyama, 2007]. Specifically,using east-west scans of the Advanced Research ProjectAgency Long-Range Tracking and Instrumentation Radar,Tsunoda and White [1981] found that electron density con-tours in the bottomside of F layer were altitude modulatedwith an average zonal wavelength of about 400 km, similarto the zonal spacing of the periodic plasma plumes.Considering the close association between the developmentof backscatter plumes and the presence of wave structures inthe bottomside of F layer, the spatially separated plumes inthe east-west direction are believed to be caused by thelarge-scale wave structures (LSWS). Tsunoda and Ecklund[2007] found that there is a beam-dependent appearancefor the LSWS upwellings, which led them to suggest thatthe polarization electric fields associated with LSWScontributed to the local plasma vertical drift around sunset.From a statistical study of ionosonde data at two sites,Chumphon and Bac Lieu separated by ~740 km in longitude,Saito and Maruyama [2007] demonstrated a significantinfluence of LSWS on the sunset rise of the F layer. Thestrong variability of the virtual height of F layer (h’F)detected in their study was related to whether ESF existedat one or both stations. However, the ionosonde is unableto diagnose some important aspects of the generation andevolution processes of equatorial plasma plumes. The dif-ferences in the characteristics of ESF that must be presentin such a longitudinal range were not investigated.[4] In the present work, we have investigated the temporal
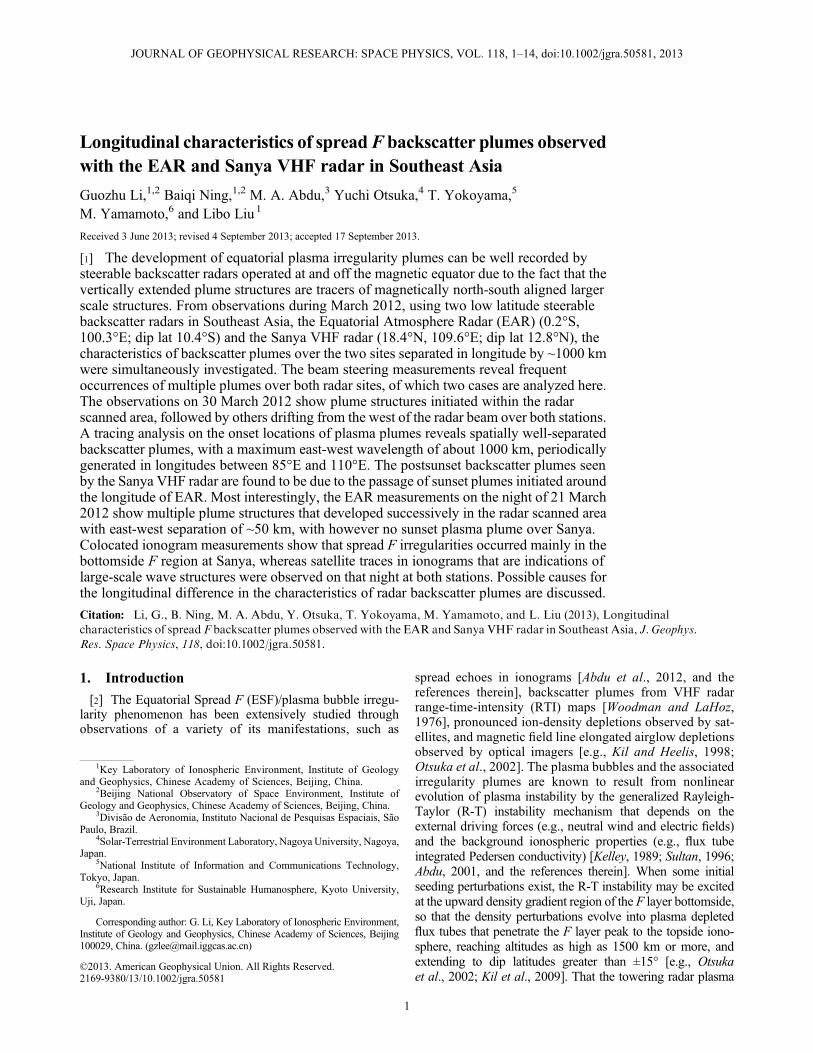
and spatial evolutions of plasma irregularity plumes and theirsmaller scale longitudinal differences in Southeast Asia,using the beam steering capability of the two radars, theEquatorial Atmosphere Radar (EAR) located at Kototabang(0.2°S, 100.3°E; dip lat 10.4°S) and the Sanya VHF radar(18.4°N, 109.6°E; dip lat 12.8°N), that were operated inan observational campaign conducted in March 2012. Thetwo radars are separated in longitude by 9.3° (~1000 km,Figures 1a–1b). It is worth pointing out that due to themagnetic north-south aligned characteristics of the plasmadepletions, both radars (in opposite hemispheres) can detectin sequence the plume structures associated with the zonallydrifting bubbles that rise to high enough altitude. Based on
95 100 105 110 115
−10
−5
0
5
10
15
20
Geo
.Lat
(de
g)
Geo.Lon (deg)−10 −5 0 5 10 15 20 25
200
400
600
800
Hei
ght (
km)
Geo.Lat (deg)−200 0 200 400 600 800 10001200
50
100
150
200
250
300
350
Hei
ght (
km)
Zonal distance (km)
Sanya
EAR
16 beams 5 beams
EAR Sanya EAR Sanya
northwardbeamsouthward
beam
520 km
650 km
magnetic field(c)
110105100Geo. Lon (deg)
(b)(a)
West East
magnetic equator
Figure 1. (a) Locations and (b) beam directions of the Equatorial Atmosphere Radar (EAR) and SanyaVHF radar. (c) Magnetic field geometry depicting how different altitude (latitude) regions are connectedto each other through the conducting magnetic field lines. Note that for the southward (northward) beamof EAR (Sanya radar), the 300 km altitude is connected to 520 km (650 km) altitude over the magneticequator (apex altitude).
LI ET AL.: LONGITUDINAL CHARACTERISTICS OF PLUMES
2
the IGRF-2010 model, an altitude of 300 km over theEAR and Sanya stations can be mapped to magnetic equato-rial apex heights of ∼520 km and ~650 km, respectively(Figure 1c). In the beam steering mode of operation, thescanned area at a height of 300 km covers approximately360 km and 280 km in east-west direction for the EARand the Sanya radar, respectively (Figure 1b). Thus, thebeam steering measurements by the two radars provide agood spatial coverage and can be used to study the occur-rence and dynamics of equatorial plasma plumes in theregion of Southeast Asia and possible short longitudinalscale differences in their characteristics. Understanding thespatial structures of plasma plumes and their variations withlongitude is very important for a better understanding of theESF vis-à-vis, the LSWS since recent observations revealedthat the ESF do not always occur following the appearanceof LSWS at a single site [e.g., Narayanan et al., 2012; Liet al., 2012]. In this study, we present observations ofperiodic backscatter plume structures with the EAR andSanya radar during geomagnetic quiet days and examinethe mechanism responsible for the generation of these struc-tures. We use “large scale” and “small scale” to describestructures with the wavelength of several hundreds to onethousand kilometers and tens of kilometers, respectively.The overall analysis focuses mainly on the following issues:(1) Can the initiation of sunset plasma plumes and thepremidnight periodic plasma plume structures, which is of-ten observed at a single site, be continuously detected at twolongitudes separated by about 1000 km? How the periodicplume structures seen in RTI maps of the two radars dependon longitude. (2) Whether there are any differences in thegeneration of sunset plasma plumes at stations closelyspaced in longitude and what can cause such differences.
2. Instrumentation
[5] The Sanya VHF radar, with an operating frequency of47.5 MHz and a peak power of 24 kW, has the capability todetect 3 m scale field-aligned irregularities of the low-latitudeE region, and of the valley and the F region [Li et al., 2011].
The radar beam can be steered within ±45° in azimutharound north. The antenna pattern, with a 3 dB beam widthof 10° in east-west and 24° in north-south, satisfies the radarbeam-magnetic field line perpendicularity condition in theheight regions of interest. During the March 2012 observa-tions, the radar beam was steered among five directionsfrom east to west through north. Unlike fixed beam radarmeasurements, the multiple beam steering observationscan uniquely distinguish between a locally forming back-scatter plumes from a plume that drifted from west andcan obtain the accurate drift velocity without slit-camerainterpretation. Details of the observational parameters forSanya radar are listed in Table 1.[6] The EAR operates at 47MHz with a peak power of 100
kW and a 3 dB beam width of 3.4°. The EAR uses an activephased array antenna system and can steer the beam on apulse-to-pulse basis. The rapid beam scanning ability enablesthe EAR to detect the temporal and spatial variations ofbackscatter plumes [Fukao et al., 2003]. In March 2012,the radar was operated with two sets of an eight-beam mode.Combining the backscatter echo intensity from all 16 beamssummarized in Table 1, a two-dimensional map of equatorialplasma plumes in a fan sector can be obtained every 2–3 min.[7] At the EAR station, ionograms were received also
from the Southeast Asia low-latitude ionospheric network.At Sanya, the colocated digital ionosonde (Digital PortableSounder 4d, DPS-4d) was operated every 5 min to obtain anionogram. The satellite traces shown in ionograms [Abduet al., 1981] are oblique echoes, produced by reflections froma tilt in isodensity contours associated with LSWS [Tsunodaet al., 2013]. The Spread F types and the occurrence ofsatellite traces in ionograms were manually identified. The vir-tual heights of F layer (h’F) at 5 MHz were manually scaled.
3. Results
[8] Out of 26 nights of simultaneous observations by theEAR and the Sanya radar in March 2012, equatorial plasmairregularity plumes have been detected on 15 nights. Out ofthe 15 plume events, we found 12 events in which plasmaplumes were observed by both radars and three events inwhich plasma plumes were observed only by one of the ra-dars. Most days of the month are geomagnetically disturbeddays. In order to eliminate the geomagnetic storm effects onthe ESF plume development, we have selected two exam-ples typical for geomagnetic quiet days to present here: 21and 30 March 2012.
3.1. Observations on 30 March 2012
[9] Figure 2 shows an example of equatorial plasma plumeevent observed on 30 March 2012. A series of isolated plumestructures were observed by both radars. The Kp indices onthat day were 3�, 2, 1+, 1�, 1, 1�, 0, and 0+. Backscatterecho intensity profiles obtained from the EAR and Sanyaradar on that day are shown in Figures 2a–2e and 2f–2j, re-spectively. These height-time-intensity (HTI) plots showthe signal-to-noise ratio (SNR) as a function of height anduniversal time (UT). The black solid and red dashed linesrepresent the local and apex sunset terminators (the sunsetterminator at the apex altitude of the geomagnetic field lineconnected with the observed area), respectively. The super-posed red vertical axes show apex altitude. The local time
Table 1. The Parameters of Equatorial Atmosphere Radar (EAR) andSanya VHF Radar Used for the Present Observations of EquatorialPlasma Plumes
Value
Parameter EAR Sanya
Location 0.2°S, 100.3°E 18.4°N, 109.6°EFrequency 47 MHz 47.5 MHzPeak power 100 kW 24 kWPulse repetition frequency 250 Hz 160 HzNumber of coherentintegrations
1 4
Range resolution 2.4 km 4.8 kmTime resolution 1.5 min 5 minBeam directions(azimuth, zenith)
125.0, 37.5) (130.0, 34.3) (45°, 33°)
(137.0, 30.9) (144.0, 28.4) (32°, 29°)(151.0, 26.6) (158.0, 25.3) (0°, 23°)(165.0, 24.5) (172.0, 24.0) (328°, 29°)(180.0, 23.8) (188.0, 24.1) (315°, 33°)(195.0, 24.7) (202.0, 25.7)(209.0, 27.2) (216.0, 29.3)(223.0, 32.1) (230.0, 35.9)
LI ET AL.: LONGITUDINAL CHARACTERISTICS OF PLUMES
3
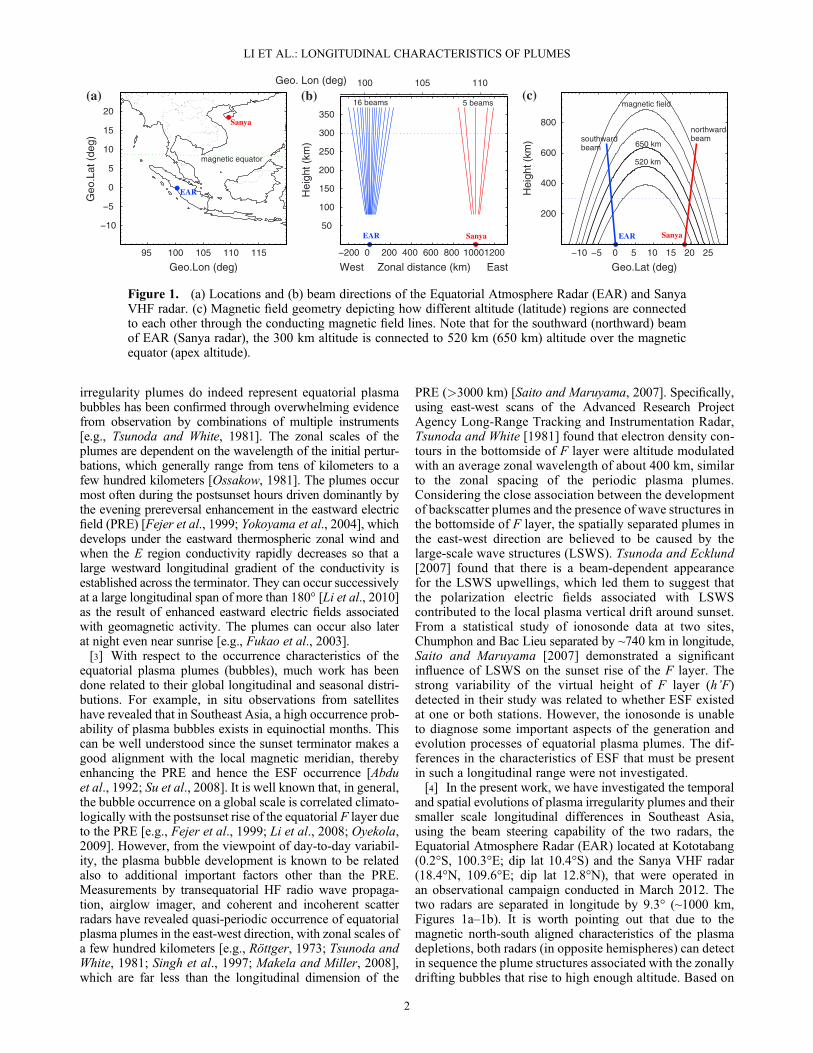
for EAR (LT =UT + 6 h 41 min) and Sanya (LT =UT + 7 h18 min) stations are shown Figures 2e and 2j, respectively.It is relevant to mention that for EAR observations, onlyecho measurements from five selected beams are shown inthe figure. The azimuth and zenith angles for each beamare shown in the right top of each panel.[10] As seen in Figure 2, in general, the morphology of
backscatter plume groups observed by the EAR, in a periodicbehavior, is quite similar to that of the plume groupsobserved at Sanya. The isolated, periodic plumes withouthaving bottomside structures are divided into several groups.For the EAR, the backscatter plumes that occurred around1230–1350 UT, 1330–1500 UT, 1545–1645 UT, and1700–1800 UT are labeled A, B, C, and D shown inFigures 2a and 2c, respectively. For the Sanya radar, thebackscatter plumes that occurred around 1200–1300 UT,1400–1610 UT, and 1700–1800 UT, are labeled A′, B′, andC′ shown in Figures 2f and 2h, respectively. Two featuresof interest may be noted here. Notice first that for group B,C, B′, and C′, the plume structures appeared from the westbeam and were sequentially detected by other beams to theeast. This indicates that the initial appearance of plasmaplumes must have occurred to the west of the radar field ofview. They drifted eastward (as indicated by the slant dashed
lines) into and out of the radar beam following their develop-ment at a westward longitude. By the time the plume groupsB and C passed over the EAR, however, the smaller plasmaplume D disappeared in the radar field of view. Earlier radarobservations at equatorial and low-latitude sites have shownthat the periodic plume structure is a regular feature.Observations from Gadanki [Patra and Phanikumar, 2009],Kototabang [Fukao et al., 2006], and Kwajalein [Hysellet al., 1994] revealed that periodic plume structures couldbe observed during postsunset and postmidnight hours.Specifically,Hysell et al. [1994] observed many plume struc-tures, as large as 11 in number, at Kwajalein. The present ob-servations by the EAR and Sanya radar show that somewhatsimilar periodic backscatter plume groups (A to D, and A′ toC′) can be detected at two stations separated by about 1000km in longitude. It is of further interest to note that the overallintensity of the eastward drifting plume structures show agradual decay from the westernmost to the easternmostbeam, both in the EAR and Sanya radar results. This mayindicate the rate of decay of the 3 m scale irregularities intheir eastward drifting phase (that follows their initial growthphase). The zonal drifts of plasma plumes observed by bothradars are estimated according to the plume pattern timedelay and the horizontal separations of the easternmost and
Figure 2. Height-time-intensity (HTI) plots of backscatter plume echo observed with the (a–e) EAR andthe (f–j) Sanya radar during 1100–2000 UT on 30 March 2012. The superposed red vertical axes indicateapex altitudes. The black solid and red dashed lines in the left of each panel indicate local and apex sunsetterminators, respectively. The beam direction (azimuth and zenith) is shown in the right top of each panel.The zones of rapidly intensified backscatter echoes within plume group A are produced by plasma bubblebifurcation. The well-separated plume groups (marked with A to D and A′ to C′) in HTI maps, corre-sponding the spatially separated plumes in the east-west direction, are triggered by large-scale wavestructures (LSWS).
LI ET AL.: LONGITUDINAL CHARACTERISTICS OF PLUMES
4
westernmost beams around 300 km altitude. The zonal driftvelocities of plume structures B, C, D, B′, and C′ areapproximately 110 ms�1, 100 ms�1, 55 ms�1, 105 ms�1,and 95 ms�1, respectively. Using the time it takes for aplume to drift through the radar beam and the drift velocity,the zonal dimensions of the plumes B, C, B′, and C′ areestimated to be about 600 km, 350 km, 850 km, and 580km in the east-west direction, respectively.[11] Another feature is the beam-dependent appearance of
the backscatter plumes. The plumes labeled as A and A′werenot detected by the west beams of EAR and Sanya radar,respectively. In contrast to the feature of plume groups B toD and B′ to C′ (that the corresponding echo strength is mostintense in the westernmost beam), the intensity of the irregu-larity plumes (A and A′) near the apex sunset terminator isthe strongest in the easternmost beam decreasing in intensitytoward the western beamswhere the influence of solar radiationand hence the E layer conductivity tends to increase as to beexpected. As is evident from Figures 2a and 2f, both the plumesA and A′ initiated at a height of ~250 km, and at around 1930LT which corresponds to apex sunset time. This feature agrees
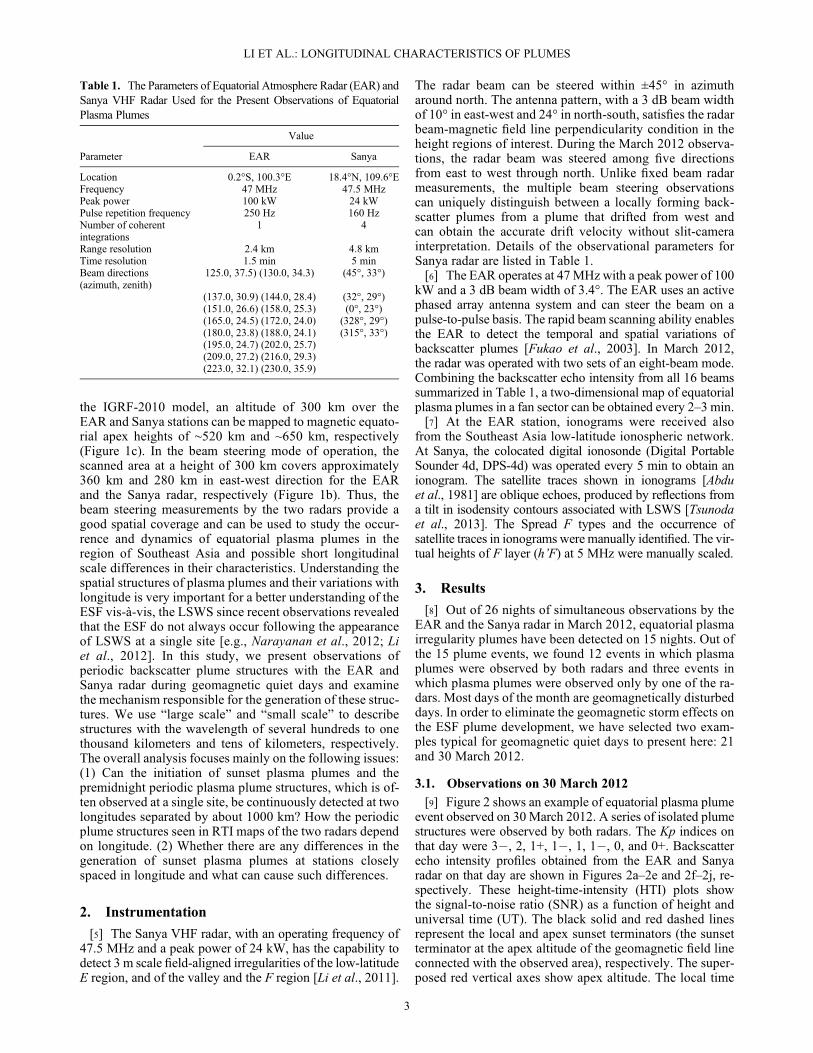
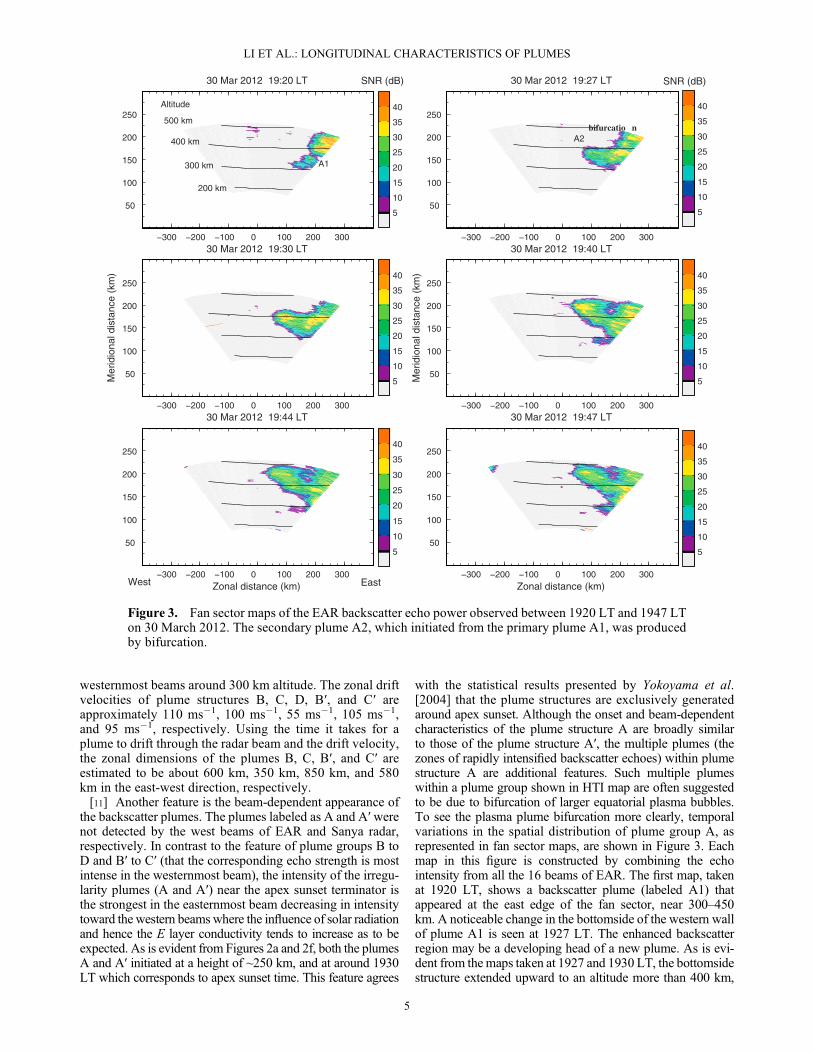
with the statistical results presented by Yokoyama et al.[2004] that the plume structures are exclusively generatedaround apex sunset. Although the onset and beam-dependentcharacteristics of the plume structure A are broadly similarto those of the plume structure A′, the multiple plumes (thezones of rapidly intensified backscatter echoes) within plumestructure A are additional features. Such multiple plumeswithin a plume group shown in HTI map are often suggestedto be due to bifurcation of larger equatorial plasma bubbles.To see the plasma plume bifurcation more clearly, temporalvariations in the spatial distribution of plume group A, asrepresented in fan sector maps, are shown in Figure 3. Eachmap in this figure is constructed by combining the echointensity from all the 16 beams of EAR. The first map, takenat 1920 LT, shows a backscatter plume (labeled A1) thatappeared at the east edge of the fan sector, near 300–450km. A noticeable change in the bottomside of the western wallof plume A1 is seen at 1927 LT. The enhanced backscatterregion may be a developing head of a new plume. As is evi-dent from themaps taken at 1927 and 1930 LT, the bottomsidestructure extended upward to an altitude more than 400 km,
Figure 3. Fan sector maps of the EAR backscatter echo power observed between 1920 LT and 1947 LTon 30 March 2012. The secondary plume A2, which initiated from the primary plume A1, was producedby bifurcation.
LI ET AL.: LONGITUDINAL CHARACTERISTICS OF PLUMES
5
indicating the appearance of a new developing backscatterplume (identified as A2). We believe that the appearance ofthis secondary plume A2 did result from the primary plumeA1 seen at 1920 LT. The two plumes evolved to look like a“Y” shaped structure shown in the maps taken between 1940and 1947 LT. With regard to the plume bifurcation, there aretwo possible ways: If a plume stream is significantly wide, itwould suffer bifurcation due to differential motion, or if aplume stream encounters an obstruction, it could also lead tothe bifurcation [Aggson et al., 1996].[12] On the other hand, the beam-dependent appearance
of the sunset plasma plumes near the terminator detectedby both radars could be associated with the beam depen-dence of sunset upwelling of bottomside F layer. Usingthe PRO radar multiple beam steering measurements,Tsunoda and Ecklund [2007] found a close relationshipbetween the upwelling layers and radar backscatter plumes.They suggested that both the modulated upwelling depthand beam-dependent plasma plume structures were pro-duced by LSWS. The satellite traces and multiple reflectedechoes on ionograms are evidence for the existence oflarge-scale wave structures in ionization and can be takenas a signature of LSWS at the F region heights [Tsunodaet al., 2013, and the references therein]. Further, it has beenidentified that the satellite traces can occur simultaneouslyat low-latitude conjugate points [Abdu et al., 2009b]. Byexamining the digisonde observations made on 30 March2012, multiple satellite traces are found to occur near sunsetat both radar sites (Figure is not shown here). The presenceof satellite traces could indicate that the upwellings or crestsof LSWS occurred around the Sanya and EAR longitudinal
sectors. Considering that the LSWS is a necessary precursorfor the occurrence of plasma plumes [e.g., Tsunoda andEcklund, 2007; Abdu et al., 2009; Li et al., 2012; Patraet al., 2013], the sequences of the sunset plasma plumesand the periodicity of plume groups simultaneously detectedby the EAR and Sanya radar may suggest a wide span ofconsecutive LSWS.
3.2. Observations on 21 March 2012
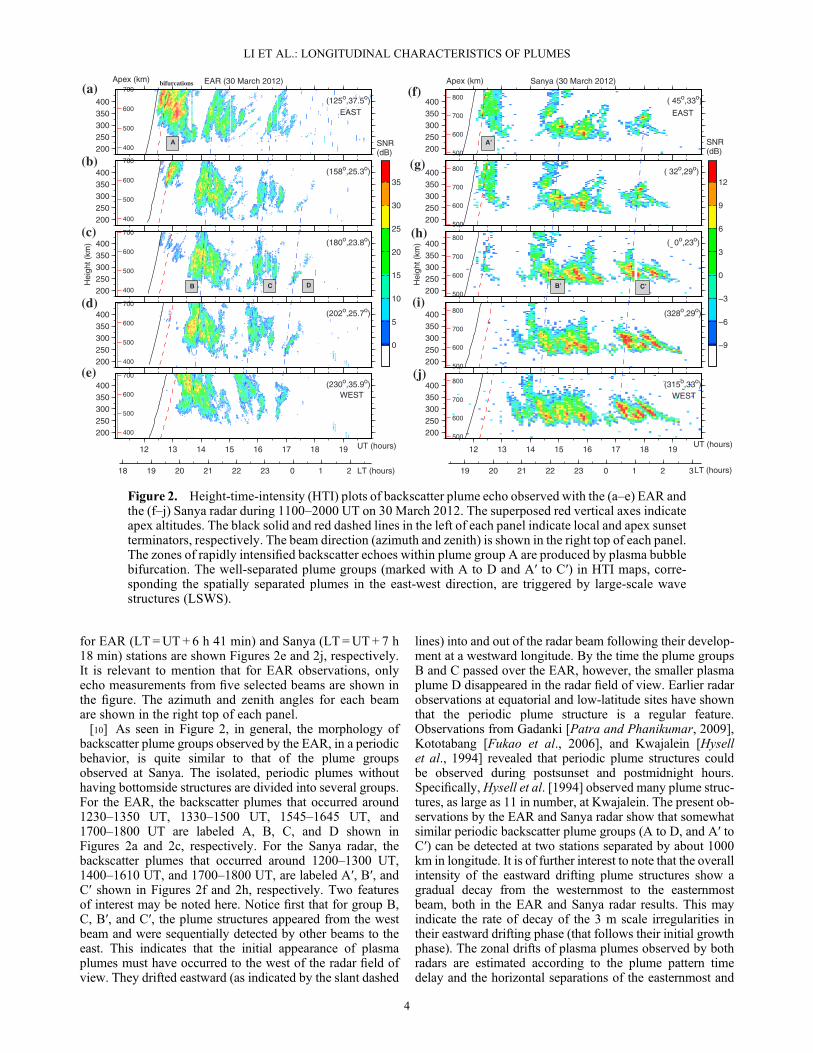
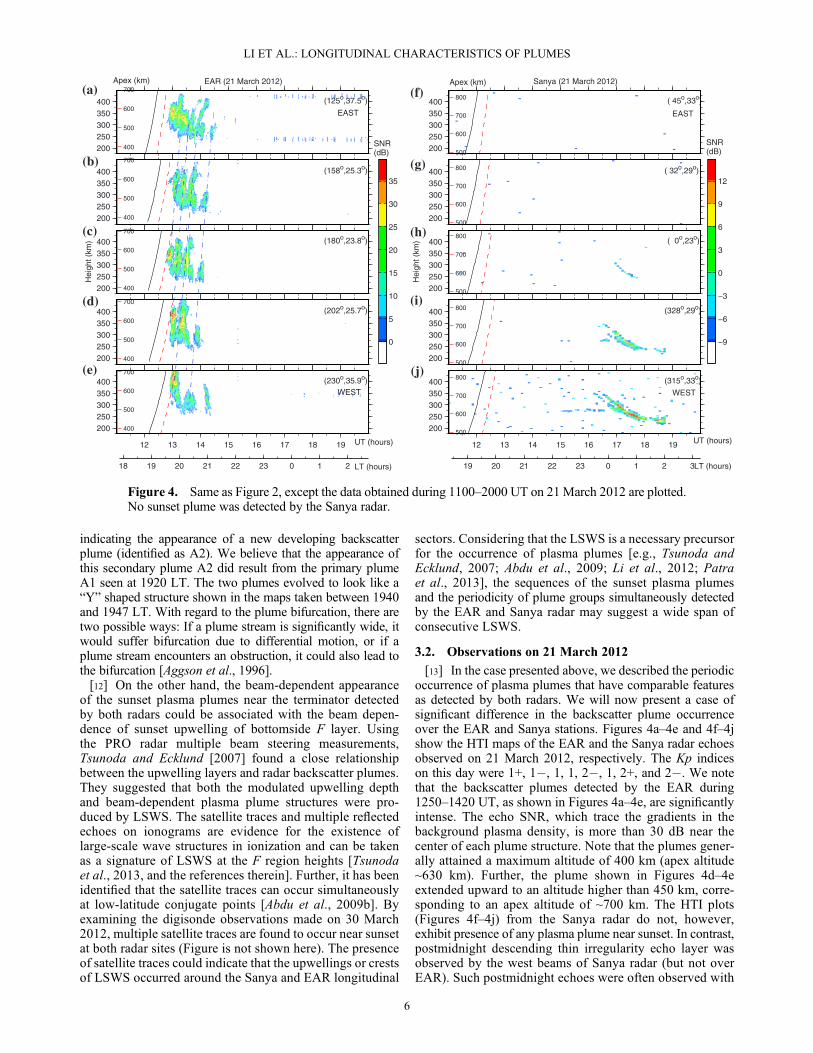
[13] In the case presented above, we described the periodicoccurrence of plasma plumes that have comparable featuresas detected by both radars. We will now present a case ofsignificant difference in the backscatter plume occurrenceover the EAR and Sanya stations. Figures 4a–4e and 4f–4jshow the HTI maps of the EAR and the Sanya radar echoesobserved on 21 March 2012, respectively. The Kp indiceson this day were 1+, 1�, 1, 1, 2�, 1, 2+, and 2�. We notethat the backscatter plumes detected by the EAR during1250–1420 UT, as shown in Figures 4a–4e, are significantlyintense. The echo SNR, which trace the gradients in thebackground plasma density, is more than 30 dB near thecenter of each plume structure. Note that the plumes gener-ally attained a maximum altitude of 400 km (apex altitude~630 km). Further, the plume shown in Figures 4d–4eextended upward to an altitude higher than 450 km, corre-sponding to an apex altitude of ~700 km. The HTI plots(Figures 4f–4j) from the Sanya radar do not, however,exhibit presence of any plasma plume near sunset. In contrast,postmidnight descending thin irregularity echo layer wasobserved by the west beams of Sanya radar (but not overEAR). Such postmidnight echoes were often observed with
Figure 4. Same as Figure 2, except the data obtained during 1100–2000 UT on 21March 2012 are plotted.No sunset plume was detected by the Sanya radar.
LI ET AL.: LONGITUDINAL CHARACTERISTICS OF PLUMES
6
the EAR during June solstice of the solar minimum period[Yokoyama et al., 2011]. A comparison of postmidnightechoes between EAR and Sanya stations should be investi-gated in the future. It is worth pointing out that if sunsetequatorial plasma plume developed upward to ~600 km atthe magnetic equator over Sanya longitude on 21 March(as that observed over EAR), it should be detected by theSanya radar. The absence of sunset plumes by the Sanyaradar indicates that no sunset equatorial plume was gener-ated over Sanya longitude. Further, the colocated ionogrammeasurements showed that the bottom type spread F did notevolve into strong range type spread F (which will be shownin Figure 6).[14] Notably, the plume patterns shown in Figures 4a–4e
are significantly different from those well-separated plumegroups observed on 30 March 2012 (Figure 2). In this case(on 21 March 2012), a series of plumes that are closely
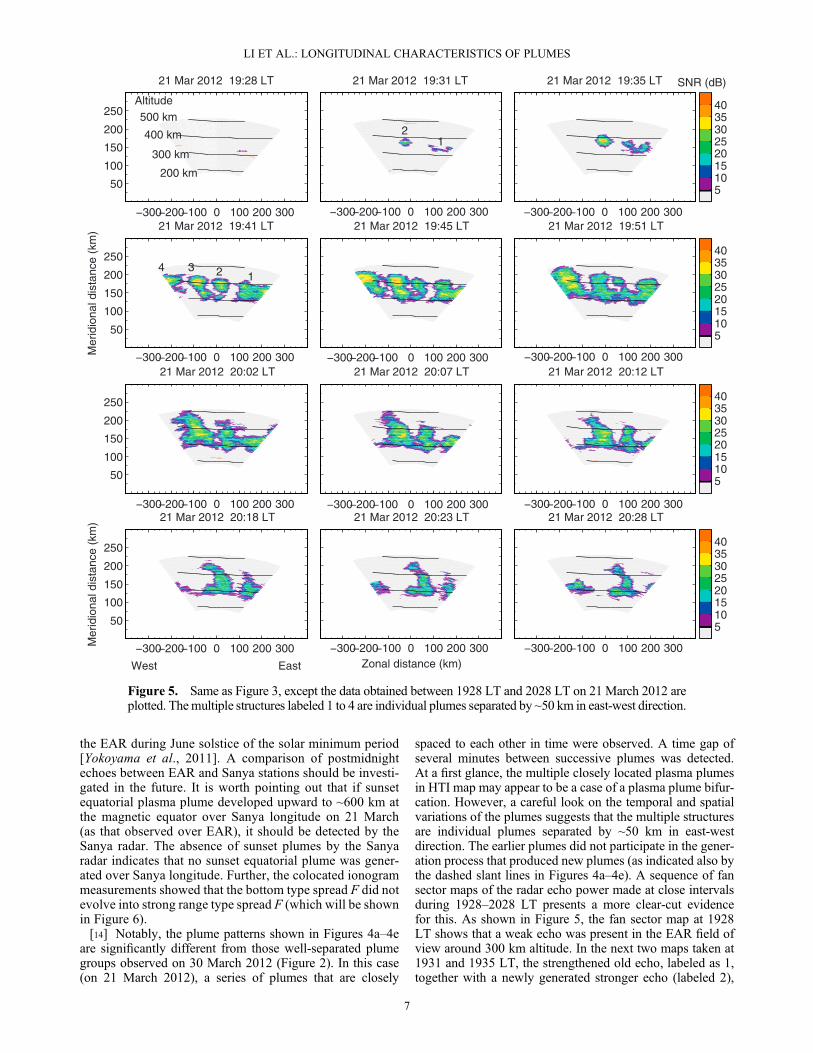
spaced to each other in time were observed. A time gap ofseveral minutes between successive plumes was detected.At a first glance, the multiple closely located plasma plumesin HTI map may appear to be a case of a plasma plume bifur-cation. However, a careful look on the temporal and spatialvariations of the plumes suggests that the multiple structuresare individual plumes separated by ~50 km in east-westdirection. The earlier plumes did not participate in the gener-ation process that produced new plumes (as indicated also bythe dashed slant lines in Figures 4a–4e). A sequence of fansector maps of the radar echo power made at close intervalsduring 1928–2028 LT presents a more clear-cut evidencefor this. As shown in Figure 5, the fan sector map at 1928LT shows that a weak echo was present in the EAR field ofview around 300 km altitude. In the next two maps taken at1931 and 1935 LT, the strengthened old echo, labeled as 1,together with a newly generated stronger echo (labeled 2),
Figure 5. Same as Figure 3, except the data obtained between 1928 LT and 2028 LT on 21 March 2012 areplotted. Themultiple structures labeled 1 to 4 are individual plumes separated by ~50 km in east-west direction.
LI ET AL.: LONGITUDINAL CHARACTERISTICS OF PLUMES
7
attests to the stronger irregularity growth conditions. Themap taken at 1941 LT shows two more new echoes, one(labeled 3) generated within the scanned area and the other(labeled 4) moved in from outside of the fan sector. Theeast-west spacing among the plumes 1 to 4 is about 50 km.Examination of the maps taken at later times 1945–1951LT revealed that the tilt of the echoing regions 2–4 is gener-ally identical (~ west of vertical) to each other. Such tiltedstructures are often attributed to the vertical shears of Fregion zonal drifts [Zalesak et al., 1982]. As is evident fromthe map taken at 2002 LT, the plume 4 penetrated up to muchhigher altitudes than the other plumes shown in the fan sectormaps. After 2012 LT, one may note that the structure ofplume 4 presents a reversal of the initial westward tilt tobecome increasingly eastward below ~380 km, while abovethis altitude, the westward tilt progressively increased. Thisproduced a reversed “C” shaped plume. It is relevant to pointout that the present “C” shape is different from that seen inthe optical data which comes from the mapping of theequatorial plasma plumes (above the F peak) to both hemi-spheres [e.g., Kil et al., 2009]. The development of east-westspaced plumes separated by 50 km as seen in Figure 5 mayreveal the presence of small-scale wave-like seed structure inthe bottomside F layer.
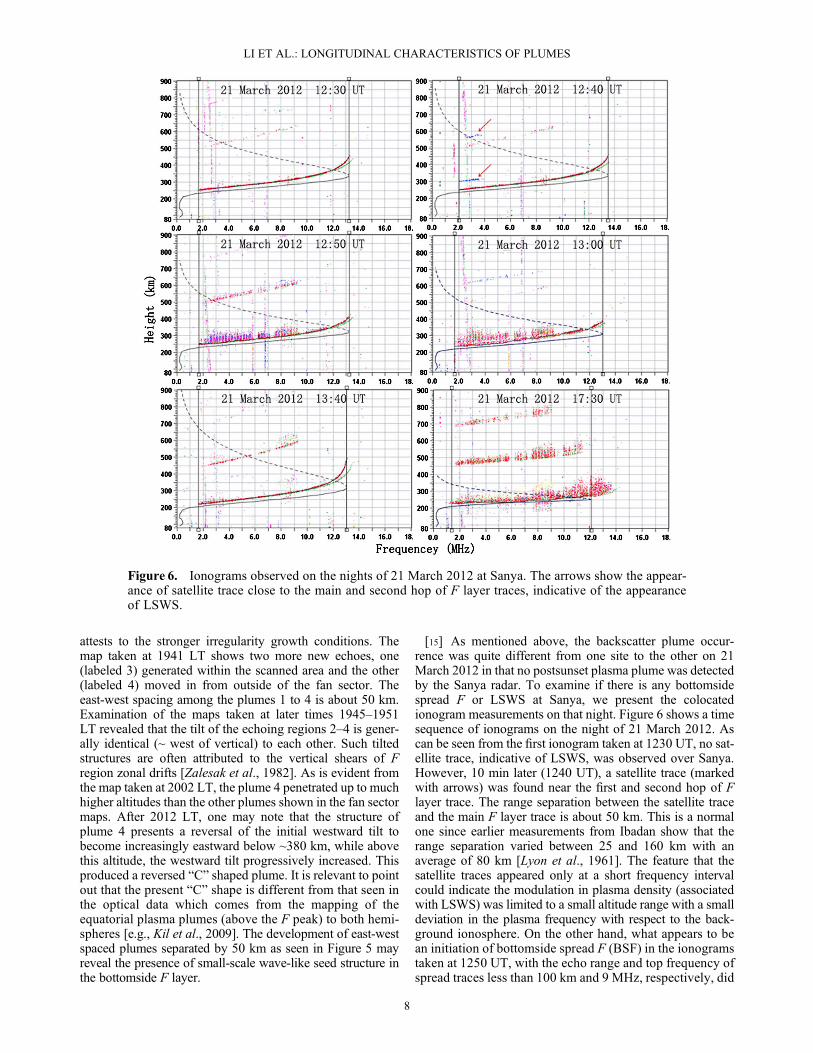
[15] As mentioned above, the backscatter plume occur-rence was quite different from one site to the other on 21March 2012 in that no postsunset plasma plume was detectedby the Sanya radar. To examine if there is any bottomsidespread F or LSWS at Sanya, we present the colocatedionogram measurements on that night. Figure 6 shows a timesequence of ionograms on the night of 21 March 2012. Ascan be seen from the first ionogram taken at 1230 UT, no sat-ellite trace, indicative of LSWS, was observed over Sanya.However, 10 min later (1240 UT), a satellite trace (markedwith arrows) was found near the first and second hop of Flayer trace. The range separation between the satellite traceand the main F layer trace is about 50 km. This is a normalone since earlier measurements from Ibadan show that therange separation varied between 25 and 160 km with anaverage of 80 km [Lyon et al., 1961]. The feature that thesatellite traces appeared only at a short frequency intervalcould indicate the modulation in plasma density (associatedwith LSWS) was limited to a small altitude range with a smalldeviation in the plasma frequency with respect to the back-ground ionosphere. On the other hand, what appears to bean initiation of bottomside spread F (BSF) in the ionogramstaken at 1250 UT, with the echo range and top frequency ofspread traces less than 100 km and 9 MHz, respectively, did
Figure 6. Ionograms observed on the nights of 21 March 2012 at Sanya. The arrows show the appear-ance of satellite trace close to the main and second hop of F layer traces, indicative of the appearanceof LSWS.
LI ET AL.: LONGITUDINAL CHARACTERISTICS OF PLUMES
8
not evolve further in the subsequent ionograms. By ~1340UT, the BSF totally disappeared. This indicates that theirregularities that caused the BSF over Sanya did notevolve into postsunset strong range type spread F on thisevening. Also, it may be noted that the ionograms taken at1730 UT (Figure 6, bottom right) showed the appearanceof postmidnight spread F. While in the 1250 UT ionogram(near sunset), the top frequency of the spread trace extendedto ~9 MHz, in the postmidnight ionogram, it was more than13 MHz. This ionogram feature is consistent with the pres-ence (absence) of postmidnight (sunset) backscatter echoshown in Figures 4f–4j. It is relevant to point out that thepostmidnight spread F (that is seen as a single descendingecho layer in radar HTI maps) is not induced by processesrelated equatorial plasma bubbles but seems to be associatedwith the middle latitude type spread F, which could betriggered by medium-scale traveling ionospheric distur-bance [Yokoyama et al., 2011]. The ionograms taken overthe EAR site (not presented here) show that multiplesatellite traces were present at 1225 UT after which boththe range type spread F and plasma plumes were detected.From these observations, it seems unlikely that the longi-tudinal difference in plasma plume occurrence betweenthe two sites can be ascribed simply to the appearance ornot of LSWS.
4. Discussion
[16] In the preceding sections, we presented case studies oftwo events of backscatter plumes, one on 30 March and theother on 21 March 2012, observed with the EAR and theSanya VHF radar that are separated in longitude by ~1000km. It is noted that on 30 March 2012, the sunset backscatterplumes, preceded by LSWS, was concurrently detected byboth radars around 1920–2020 LT. This was followed by pe-riodic backscatter plume structures with similar characteris-tics at the two sites, which continued to exist until midnightwith inter periods of about 30–60 min. For the event of 21March 2012, however, the plume occurrence is significantlydifferent from one site to the other. Different from the EARobservation that showed the bottomside spread F evolvinginto multiple backscatter plumes (separated by 50 km in
the east-west direction) after sunset, the bottomside spreadF (shown in ionograms) over Sanya promptly decayed anddisappeared, not developing to topside and forming back-scatter plumes. On the other hand, postmidnight irregular-ity structure in the form of thin descending layer wasobserved over Sanya with no irregularities present overthe EAR site. These results illustrate the existence ofsignificant regional scale differences in the plasma plumegeneration and evolution, and the potential for studying themusing the two closely spaced radars. Possible causes responsi-ble for the similarities or the differences in the characteris-tics of equatorial backscatter plumes are discussed in thefollowing section.
4.1. Zonal Structure of Periodic Backscatter Plumes
[17] From a statistical study, Yokoyama et al. [2004] dem-onstrated that the plasma plumes initiate exclusively nearapex sunset during geomagnetic quiet conditions. The radarbackscatter plumes observed later at night might be due tothe passage of the sunset plume structures that were gener-ated westward of the radar and then drifted eastward intothe radar beam. The periodic backscatter plumes as usuallyseen by a single beam radar HTI map may represent equato-rial plasma irregularity formations spatially separated ineast-west direction, through an interpretation of slit-cameraor frozen-in assumption of plasma plumes. Because theeastward drift velocity and duration of plasma plumes aregenerally on the order of 100 ms�1 and 3 h, respectively,parts of the plumes would decay and disappear before beingseen by a radar far away from the onset location. With thescanning ability of the EAR and the Sanya radar, a muchlarger span of plume structure in east-west direction canbe obtained without the slit-camera assumption. Comingback to the periodic plume structures observed on 30March 2012 (Figure 2), we note that the structures A andA′ were generated within the radar scanned area, and theothers were due to spatially separated plasma plumesmoving into the radar field of view by their eastward drifts.To investigate the zonal irregularity structures associatedwith the generation of plasma plumes, we used the methoddeveloped by Fukao et al. [2006] to trace the generationlocation of periodic backscatter plumes. Briefly, throughassuming that the plume has an eastward drift velocity ofVg at the initial stage (Tg) and the velocity linearly decay,the onset location Dg of the plume structure can be deter-
mined using the equationDg ¼ �V sun To�T sunð Þ VoþVgð Þ=2VoþVgð Þ=2�V sun
, where
Vsun is the westward velocity for the sunset terminator,about 464 ms�1, Tsun, To, and Vo are sunset time, the timewhen the plume was detected, and the eastward driftvelocity of the plume over the radar site, respectively. TheVg can be estimated from the linear regression of driftsand Vo at radar site. By using the linear regression value(about 12 ms�1/h) presented by Fukao et al. [2006] and thecharacteristic parameters (To and Vo) of backscatter plumesobserved by the EAR and Sanya radar (summarized inTable 2), we estimated the onset locations of the periodicplumes observed on 30 March 2012.[18] As shown in Figure 7, the symbols A to D, A′ to C′
correspond to the plume structures shown in Figure 2.Interestingly, the plume structure B′ detected by the Sanyaradar and the plume A detected by the EAR are found to
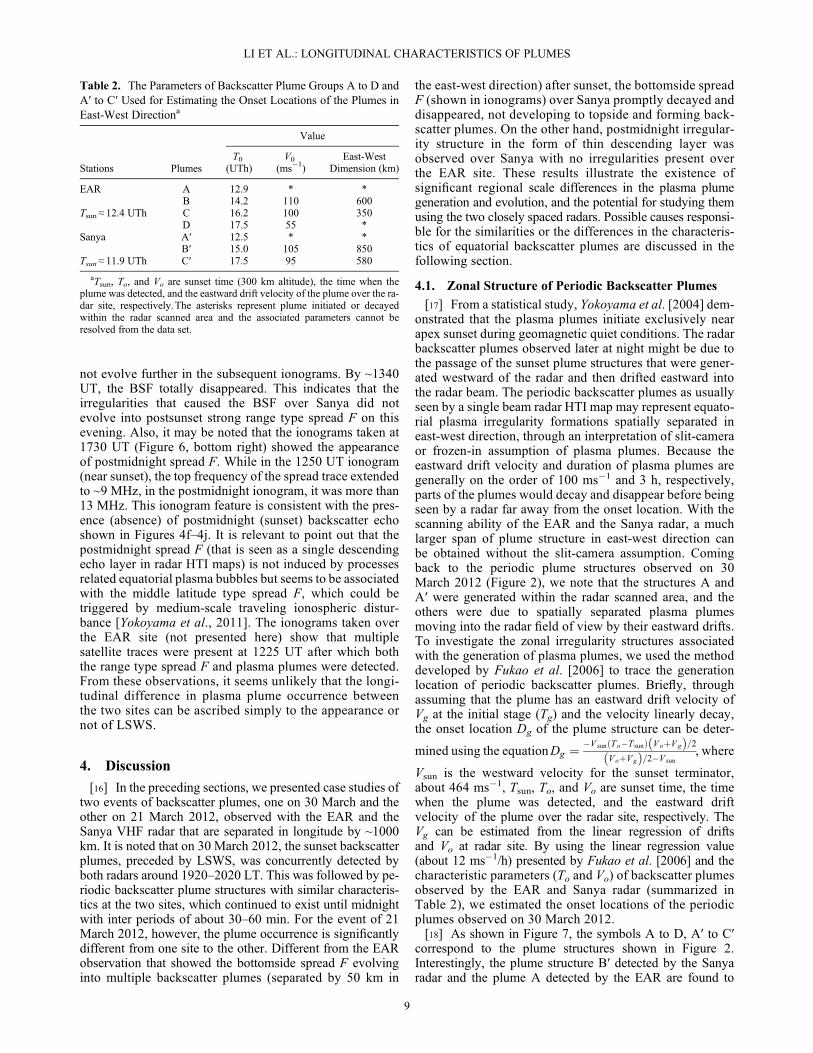
Table 2. The Parameters of Backscatter Plume Groups A to D andA′ to C′ Used for Estimating the Onset Locations of the Plumes inEast-West Directiona
Value
Stations PlumesT0
(UTh)V0
(ms�1)East-West
Dimension (km)
EAR A 12.9 * *B 14.2 110 600
Tsun ≈ 12.4 UTh C 16.2 100 350D 17.5 55 *
Sanya A′ 12.5 * *B′ 15.0 105 850
Tsun ≈ 11.9 UTh C′ 17.5 95 580
aTsun, To, and Vo are sunset time (300 km altitude), the time when theplume was detected, and the eastward drift velocity of the plume over the ra-dar site, respectively.The asterisks represent plume initiated or decayedwithin the radar scanned area and the associated parameters cannot beresolved from the data set.
LI ET AL.: LONGITUDINAL CHARACTERISTICS OF PLUMES
9
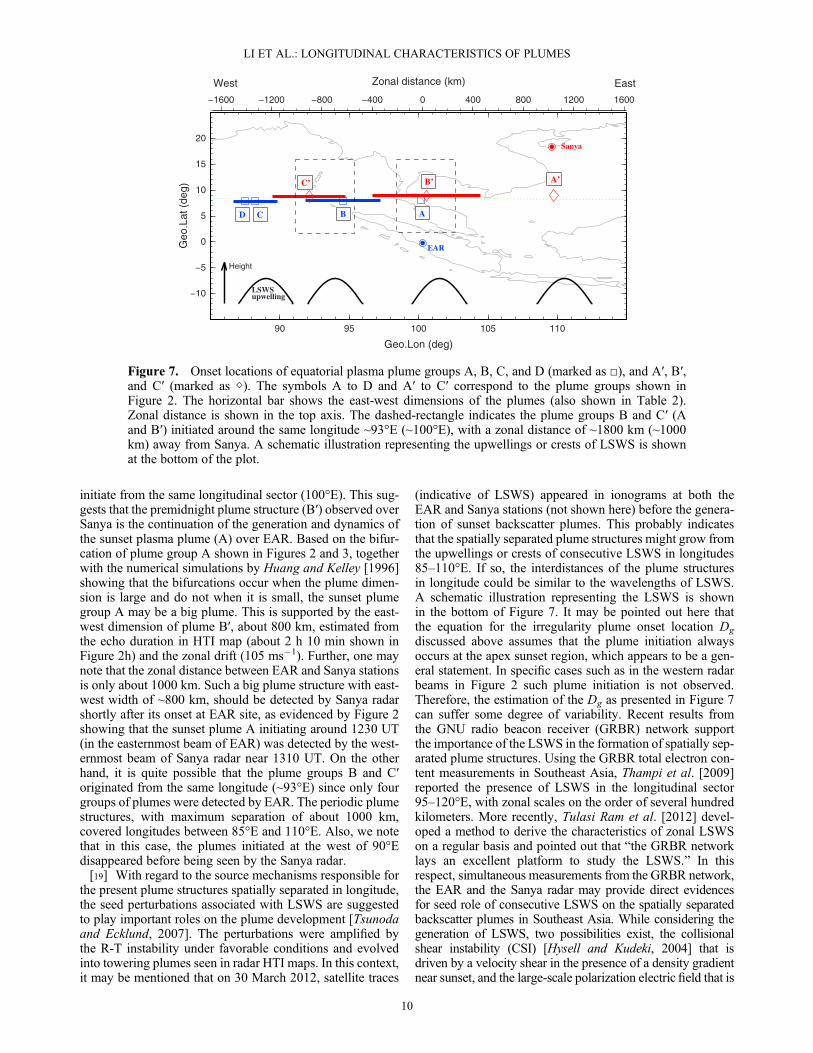
initiate from the same longitudinal sector (100°E). This sug-gests that the premidnight plume structure (B′) observed overSanya is the continuation of the generation and dynamics ofthe sunset plasma plume (A) over EAR. Based on the bifur-cation of plume group A shown in Figures 2 and 3, togetherwith the numerical simulations by Huang and Kelley [1996]showing that the bifurcations occur when the plume dimen-sion is large and do not when it is small, the sunset plumegroup A may be a big plume. This is supported by the east-west dimension of plume B′, about 800 km, estimated fromthe echo duration in HTI map (about 2 h 10 min shown inFigure 2h) and the zonal drift (105 ms�1). Further, one maynote that the zonal distance between EAR and Sanya stationsis only about 1000 km. Such a big plume structure with east-west width of ~800 km, should be detected by Sanya radarshortly after its onset at EAR site, as evidenced by Figure 2showing that the sunset plume A initiating around 1230 UT(in the easternmost beam of EAR) was detected by the west-ernmost beam of Sanya radar near 1310 UT. On the otherhand, it is quite possible that the plume groups B and C′originated from the same longitude (~93°E) since only fourgroups of plumes were detected by EAR. The periodic plumestructures, with maximum separation of about 1000 km,covered longitudes between 85°E and 110°E. Also, we notethat in this case, the plumes initiated at the west of 90°Edisappeared before being seen by the Sanya radar.[19] With regard to the source mechanisms responsible for
the present plume structures spatially separated in longitude,the seed perturbations associated with LSWS are suggestedto play important roles on the plume development [Tsunodaand Ecklund, 2007]. The perturbations were amplified bythe R-T instability under favorable conditions and evolvedinto towering plumes seen in radar HTI maps. In this context,it may be mentioned that on 30 March 2012, satellite traces
(indicative of LSWS) appeared in ionograms at both theEAR and Sanya stations (not shown here) before the genera-tion of sunset backscatter plumes. This probably indicatesthat the spatially separated plume structures might grow fromthe upwellings or crests of consecutive LSWS in longitudes85–110°E. If so, the interdistances of the plume structuresin longitude could be similar to the wavelengths of LSWS.A schematic illustration representing the LSWS is shownin the bottom of Figure 7. It may be pointed out here thatthe equation for the irregularity plume onset location Dg
discussed above assumes that the plume initiation alwaysoccurs at the apex sunset region, which appears to be a gen-eral statement. In specific cases such as in the western radarbeams in Figure 2 such plume initiation is not observed.Therefore, the estimation of the Dg as presented in Figure 7can suffer some degree of variability. Recent results fromthe GNU radio beacon receiver (GRBR) network supportthe importance of the LSWS in the formation of spatially sep-arated plume structures. Using the GRBR total electron con-tent measurements in Southeast Asia, Thampi et al. [2009]reported the presence of LSWS in the longitudinal sector95–120°E, with zonal scales on the order of several hundredkilometers. More recently, Tulasi Ram et al. [2012] devel-oped a method to derive the characteristics of zonal LSWSon a regular basis and pointed out that “the GRBR networklays an excellent platform to study the LSWS.” In thisrespect, simultaneous measurements from the GRBR network,the EAR and the Sanya radar may provide direct evidencesfor seed role of consecutive LSWS on the spatially separatedbackscatter plumes in Southeast Asia. While considering thegeneration of LSWS, two possibilities exist, the collisionalshear instability (CSI) [Hysell and Kudeki, 2004] that isdriven by a velocity shear in the presence of a density gradientnear sunset, and the large-scale polarization electric field that is
90 95 100 105 110
−10
−5
0
5
10
15
20
Geo
.Lat
(de
g)
Geo.Lon (deg)
Sanya
EAR
A’B’
A
C’
BCD
−1600 −1200 −800 −400 0 400 800 1200 1600
West EastZonal distance (km)
Height
LSWSupwelling
Figure 7. Onset locations of equatorial plasma plume groups A, B, C, and D (marked as □), and A′, B′,and C′ (marked as ◇). The symbols A to D and A′ to C′ correspond to the plume groups shown inFigure 2. The horizontal bar shows the east-west dimensions of the plumes (also shown in Table 2).Zonal distance is shown in the top axis. The dashed-rectangle indicates the plume groups B and C′ (Aand B′) initiated around the same longitude ~93°E (~100°E), with a zonal distance of ~1800 km (~1000km) away from Sanya. A schematic illustration representing the upwellings or crests of LSWS is shownat the bottom of the plot.
LI ET AL.: LONGITUDINAL CHARACTERISTICS OF PLUMES
10
generated by gravity waves (GW) [e.g., Abdu et al., 2009a;Tsunoda, 2013]. In terms of the horizontal scales (hundredkilometers) of periodic plume structures and the onset time ofsatellite traces on 30 March 2012, both the CSI and GW couldseed the R-T instability and produce the observed zonalstructures of backscatter plumes.[20] In this context, it needs to be noted that the plume
generation near the apex sunset (originally discussed byYokoyama et al. [2004]) is evident in the eastern beams ofboth the EAR and Sanya radar. But, interestingly, suchplume initiation does not occur in the western beams of bothradars. This has to do with the fact that the instability growthfavored by the combined presence of the PRE and theLSWS is operative in the eastern beams of both radarssimultaneously. In view of the fact that the PRE has muchlarger zonal scale than the LSWS and is tied to the localtime, whereas the LSWS, originating from zonally propa-gating gravity wave perturbation (of lesser scale sizes),has no clear coherence with the PRE, the “simultaneous”plume onsets in the eastern beams would suggest that theLSWS crest region happened to occur in those beams atboth the radar sites also simultaneously. The LSWS crestappears to have been shifted unfavorably with respect thePRE for the western beams of both radars where plumesdid not develop. This might suggest that there is an integralnumber of gravity wavelengths in the 1000 km separationbetween the EAR and Sanya radar.
4.2. Longitudinal Difference in the Occurrence ofSunset Backscatter Plumes
[21] Returning to Figure 4, it is noted that on 21 March2012, over the EAR, the plumes attained an apex altitude of~700 km around 1310 UT, but over Sanya no sunset plumeswere detected. Further, the plumes observed over EAR on21March decayed at earlier local time (as shown in the bottompanels of Figure 5) than they did on 30 March and did notpropagate enough eastward to be observed over Sanya. Thiscould indicate that the background condition to initiate/sustainradar plumes on 21 March was favorable only around EARlongitude near sunset. On the basis of our current understand-ing derived frommodel and observational studies, the general-ized R-T instability mechanism is believed to be responsiblefor the generation and growth of ESF. The primary causes
for the equatorial plasma plume development at a givenlongitudinal sector can be stated briefly in terms of (1) eve-ning vertical plasma drift and height of the F layer ascribedto the prereversal enhancement of zonal electric field (PRE);(2) density perturbations for seeding the R-T instability atthe bottomside F layer; and (3) the flux tube integratedPedersen conductivity controlled by thermospheric meridi-onal winds (TMWs). The TMW, whether directed north-ward or southward, has the potential to suppress or eventotally inhibit the nonlinear development of the instabilitiesto form postsunset ESF plumes [Maruyama, 1988; Abduet al., 2009b], even when the linear growth rate of R-T insta-bility is sufficiently positive for the initiation of bottomsideirregularities. This could indicate the presence of weak ornearly zero meridional wind on the two evenings of 21and 30 March over equatorial latitude at the EAR longitude,where the meridional wind during the equinoctial month(March) is expected to be very weak, as verified also fromthe horizontal wind model 93 (HWM93) [Hedin et al.,1996]. The HWM93 also shows that the TMWs at the longi-tudinal sectors of EAR and Sanya (separated by ~1000 kmin longitude) are very similar. Therefore, it is unlikely thatthe absence of equatorial plasma plumes on 21 March2012 (Figure 4) over Sanya longitude can be caused by anenhanced TMW. Even so, the possible role of the meridio-nal component of a zonally propagating gravity wave windin modulating the TMW and thus to contribute to the h’Fvariation cannot be excluded.[22] To investigate the possible dependence of backscatter
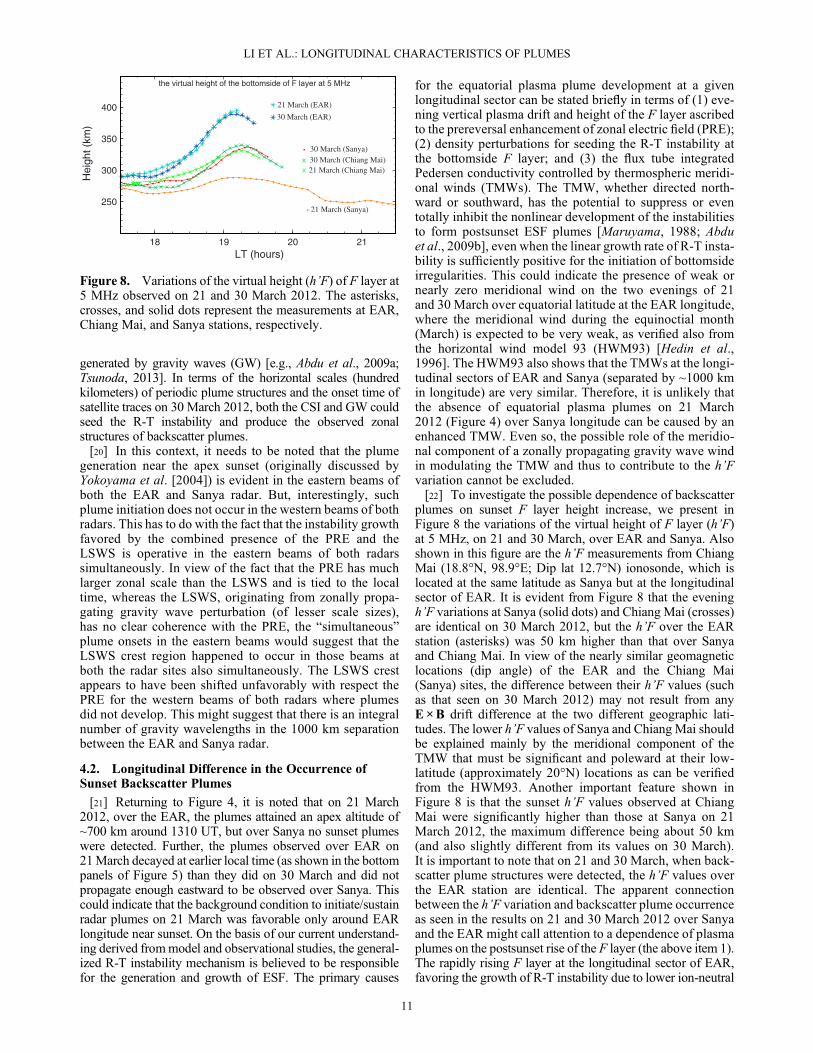
plumes on sunset F layer height increase, we present inFigure 8 the variations of the virtual height of F layer (h’F)at 5 MHz, on 21 and 30 March, over EAR and Sanya. Alsoshown in this figure are the h’F measurements from ChiangMai (18.8°N, 98.9°E; Dip lat 12.7°N) ionosonde, which islocated at the same latitude as Sanya but at the longitudinalsector of EAR. It is evident from Figure 8 that the eveningh’F variations at Sanya (solid dots) and Chiang Mai (crosses)are identical on 30 March 2012, but the h’F over the EARstation (asterisks) was 50 km higher than that over Sanyaand Chiang Mai. In view of the nearly similar geomagneticlocations (dip angle) of the EAR and the Chiang Mai(Sanya) sites, the difference between their h’F values (suchas that seen on 30 March 2012) may not result from anyE×B drift difference at the two different geographic lati-tudes. The lower h’F values of Sanya and Chiang Mai shouldbe explained mainly by the meridional component of theTMW that must be significant and poleward at their low-latitude (approximately 20°N) locations as can be verifiedfrom the HWM93. Another important feature shown inFigure 8 is that the sunset h’F values observed at ChiangMai were significantly higher than those at Sanya on 21March 2012, the maximum difference being about 50 km(and also slightly different from its values on 30 March).It is important to note that on 21 and 30 March, when back-scatter plume structures were detected, the h’F values overthe EAR station are identical. The apparent connectionbetween the h’F variation and backscatter plume occurrenceas seen in the results on 21 and 30 March 2012 over Sanyaand the EAR might call attention to a dependence of plasmaplumes on the postsunset rise of the F layer (the above item 1).The rapidly rising F layer at the longitudinal sector of EAR,favoring the growth of R-T instability due to lower ion-neutral
18 19 20 21
250
300
350
400
Hei
ght (
km)
LT (hours)
21 March (EAR)
30 March (EAR)
30 March (Sanya)30 March (Chiang Mai)21 March (Chiang Mai)
21 March (Sanya)
the virtual height of the bottomside of F layer at 5 MHz
Figure 8. Variations of the virtual height (h’F) of F layer at5 MHz observed on 21 and 30 March 2012. The asterisks,crosses, and solid dots represent the measurements at EAR,Chiang Mai, and Sanya stations, respectively.
LI ET AL.: LONGITUDINAL CHARACTERISTICS OF PLUMES
11

collision frequency, becomes unstable to density perturbationsleading to the growth of equatorial plasma plumes. However,the h’F difference may not have a proportional impact on thelongitudinal occurrence of bottomside spread F. Then a ques-tion arises as to what caused the sunset h’F difference betweenthe two longitudinal sectors of EAR (Chiang Mai) and Sanya.[23] According to theoretical studies, the PRE that drives
the sunset F layer to high altitudes is controlled mainly bytwo factors, the thermospheric zonal wind (TZW) and thelongitudinal gradient in the integrated E layer conductivitynear sunset. Due to the same magnetic declination angleand the magnetic equator offset from the geographic equatorin Southeast Asia, and the close longitudinal proximity of theEAR and Sanya stations, the PRE should be, in the first order,identical for the two stations on the same day. Thus, it seemsunlikely that the h’F difference (on 21 March) in the two lon-gitudinal sectors can be explained by the background PRE.As pointed out above, due to their large latitudinal separationfrom the geographic equator, the Sanya/Chiang Mai sitesshould experience significant meridional wind which is nor-mally poleward in the evening hours so that the h’F shouldbe generally reduced over these sites as compared to that ofthe EAR site, as the observations also show. But on theevening of 21 March, there is an additional decrease in theevening h’F over Sanya that is associated with the absenceof radar plumes, but with the presence of bottomside spreadF. The cause of the reduced h’F is not clear to us. But wemay speculate on the following possibilities. Dependingupon its propagation direction, a gravity wave can modifythe TZW and/or the TMW thereby modifying also the PREand/or the h’F, respectively. For example, a gravity wavefrom a local (tropospheric convective) source propagatingin slant upward direction can produce zonal as well as merid-ional wind perturbations at thermospheric heights. The TZWmodulated by such a gravity wave can produce a correspond-ing zonal modulation in the PRE in the required sense tocause a reduced h’F over Sanya longitude. At the same time,the meridional component of the gravity wave perturbationwind could modify more directly the h’F variation in thelongitude of Sanya. These or other possible causes, however,need to be investigated further using direct TZW/TMWmea-surements. Another source of the h’F difference may be seenin terms of sunset polarization electric fields associated withthe presence of LSWS [e.g., Saito and Maruyama, 2007;Tsunoda and Ecklund, 2007]. The Satellite traces, indicativeof LSWS in the bottomside F layer, were observed at theEAR and Sanya stations on 21 March 2012. The h’F mea-sured overhead would depend on the upwelling depth andzonal distance away from the crest of LSWS. Therefore, thepresence of LSWS and the longitudinal variations in TZWand TMW (in varying degrees depending upon the natureof the gravity waves) might have played roles on the h’Fdifference between the longitudinal sectors of EAR andSanya. In any case, the reduced h’F over Sanya appears tobe an important factor that contributed to the inhibition ofplume development over this station on 21 March.[24] As regard the item 2, the seed perturbations that must
exist in the bottomside F layer is an important factor for the de-velopment of the plasma bubbles that manifest as backscatterplumes seen in radar HTI maps. It has been established frommulti-instrument measurements that ESF occur exclusivelyon the days when LSWS exist. Considering that the satellite
traces indicative of LSWS were detected at both the EARand Sanya stations, we could expect that the difference inplume occurrence on 21 March 2012 is unlikely to be associ-ated with the LSWS. Using coordinated observations with anall-sky airglow imager, narrow bandwidth photometer, VHFradar, and ionosonde, Narayanan et al. [2012] have shown thatthough the presence of LSWS is important, they alone are notsufficient for the triggering of plasma bubbles. However, thecoexistence of both LSWS and small-scale waves may havethe potential to trigger plasma bubbles. Numerical simulationsby Sekar et al. [2001] revealed that the evolution of well devel-oped plasma bubbles is possible while the shorter and longwavelength perturbations coexist, and the spatial separation ofthe plasma plumes is decided by the shorter-wavelength pertur-bation. For the EAR backscatter plumes observed on 21 March2012, one note that the interdistances between successiveplumes are about 50 km (Figure 5), indicating the presence ofsmall-scale waves. This couldmean that while long wavelengthgravity waves and/or evening vortex shear flow [e.g., Tsunoda,2013] produced the large-scale plasma upwellings in thebottomside F layer (LSWS) over a larger longitudinal span,the small-scale waves, which might occur at the longitude ofEAR but not at Sanya, riding on the LSWS, might have aidedfurther intensification of the seeding process and triggered thedevelopment of multiple backscatter plumes. Moreover, theobservations indicate that unlike the LSWSwhich continuouslyoccurred at a larger longitudinal span of more than 1000 km(since satellite traces were detected over EAR and Sanya) on21 March, the small-scale waves might occur at a narrowerlongitudinal range only around EAR site. It is quite possiblethat a longitudinal difference in the occurrence of small-scalewaves may complement our explanation for the difference inthe backscatter plume development observed over EAR andSanya longitudes. This, however, may bring a further questionas to whether the occurrence of small-scale waves is alwaysconfined to a narrower longitudinal range or not. This issueneeds to be addressed in future studies with a larger databaseof simultaneous beam steeringmeasurements by the two radars.
5. Conclusions
[25] The simultaneous observations by the EAR and SanyaVHF radar offer a new insight into our understanding of the1000 km scale longitudinal differences in the occurrence ofVHF backscatter plumes and their variability. The scanningcapability available for both the radars makes it possible tostudy the changes in the generation and evolution of theequatorial plasma irregularity plumes at their closely locatedlongitudinal sectors. Case study by the simultaneous radarbeam steering measurements on 30 March 2012 revealed thatsunset plasma plumes could be initiated concurrently at theapex sunset region for eastern beams of both the EAR andSanya VHF radar. The postsunset plasma plume observedover Sanya was due to the passage of sunset plasma plumethat was generated over EAR longitude. This provides fur-ther evidence that the premidnight periodic towering plumesseen in radar HTI maps do represent equatorial plasma irreg-ularity formations spatially separated in east-west direction.Moreover, the observations that ionogram satellite tracesoccurred prior to the onset of sunset plumes and the presenceof periodic plume structures at both sites indicate that theLSWS could trigger, in this case, the sunset equatorial plasma
LI ET AL.: LONGITUDINAL CHARACTERISTICS OF PLUMES
12
plumes occurring quasi-periodically at a wide longitudinalspan of about 25° in Southeast Asia.[26] More importantly, and in contrast, obvious difference
in the sunset backscatter plume occurrence over EAR andSanya stations was also observed. Our result on 21 March2012 showed that multiple backscatter plumes (spatiallyseparated by ~50 km) occurred around sunset and extendedup to 450 km over the EAR site even though no plumeoccurred over Sanya where the bottomside spread F thatoccurred decayed and disappeared rapidly. The virtual heightof the F layer (h’F) over Sanya that was smaller (by 50 km)than that over Chiang Mai was pointed out as contributing tothe inhibition of the plume development over Sanya. Suchdifference in the virtual height was suggested as caused bypossible zonal modulation of the thermospheric winds andthe F layer height by gravity waves. A consideration onthe presence of small-scale structures in the sunset plumeover the EAR with the absence of sunset plumes overSanya indicated that the LSWS alone could not cause theplume development under weak post sunset rise of F layer.The appearance of small-scale wave structure in the bottomsideF region may be required for further evolution of bottomsidespread F or plumes. Further, the observations indicate that thesmall-scale waves, unlike the LSWSwhich occurred at a largerlongitudinal span of more than 1000 km, might occur at anarrower longitudinal range as characterized by its presenceonly over the EAR. Considering that the lower atmosphere isthe most likely source of gravity waves that seed plasma bub-bles/plumes, and that the EAR is located at a convectivelyactive atmospheric zone, the difference in the occurrence ofthe sunset backscatter plumes over EAR and Sanya stationsmay not be an uncommon feature. In this respect, however, alarger database from the EAR and Sanya radar is needed fora more detailed study of the potential sources, especially, forthe longitudinal difference in the occurrence of small-scalewaves, responsible for the longitudinal variations in the sunsetESF over Southeast Asia.
[27] Acknowledgments. Wewould like to thank the Research Institutefor Sustainable Humanosphere of Kyoto University, and the NationalInstitute of Information and Communications Technology of Japan for pro-viding the EAR data and the SEALION ionogram data, respectively. This re-search is supported by the Natural Science Foundation of China (41374163,41374164, 41174136, and 41074113), Chinese Academy of Sciences(KZCX2-YW-Y10 and KZZD-EW-01-3), and National Important BasicResearch Project of China (2011CB811405).[28] Robert Lysak thanks the reviewers for their assistance in evaluating
this paper.
ReferencesAbdu,M. A. (2001), Outstanding problems in the equatorial ionosphere ther-mosphere electrodynamics relevant to spread F, J. Atmos. Sol.-Terr. Phys.,63, 869–884.
Abdu, M. A., I. S. Batista, and J. A. Bittencourt (1981), Some characteristicsof spread F at the magnetic equatorial station Fortaleza, J. Geophys. Res.,86(A8), 6836–6842, doi:10.1029/JA086iA08p06836.
Abdu, M. A., I. S. Batista, and J. H. A. Sobral (1992), A new aspect of mag-netic declination control on equatorial spread F and F region dynamo,J. Geophys. Res., 97(A10), 14,897–14,904, doi:10.1029/92JA00826.
Abdu, M. A., E. Alam Kherani, I. S. Batista, E. R. de Paula, D. C. Fritts,and J. H. A. Sobral (2009a), Gravity wave initiation of equatorial spreadF/plasma bubble irregularities based on observational data from theSpreadFEx campaign, Ann. Geophys., 27, 2607–2622, doi:10.5194/angeo-27-2607-2009.
Abdu, M. A., I. S. Batista, B. W. Reinisch, J. R. de Souza, J. H. A. Sobral,T. R. Pedersen, A. F. Medeiros, N. J. Schuch, E. R. de Paula, andK. M. Groves (2009b), Conjugate Point Equatorial Experiment (COPEX)campaign in Brazil: Electrodynamics highlights on spread development
conditions and day-to-day variability, J. Geophys. Res., 114, A04308,doi:10.1029/2008JA013749.
Abdu, M. A., I. S. Batista, B. W. Reinisch, J. W.MacDougall, E. A. Kherani,and J. H. A. Sobral (2012), Equatorial range spread F echoes fromcoherent backscatter, and irregularity growth processes, from conju-gate point digital ionograms, Radio Sci., 47, RS6003, doi:10.1029/2012RS005002.
Aggson, T. L., H. Laakso, N. C. Maynard, and R. F. Pfaff (1996), In situ ob-servations of bifurcation of equatorial ionospheric plasma depletions,J. Geophys. Res., 101(A3), 5125–5132, doi:10.1029/95JA03837.
Fejer, B. G., L. Scherliess, and E. R. de Paula (1999), Effects of the verticalplasma drift velocity on the generation and evolution of equatorialspread F, J. Geophys. Res., 104(A9), 19,859–19,869, doi:10.1029/1999JA900271.
Fukao, S., Y. Ozawa, M. Yamamoto, and R. T. Tsunoda (2003), Altitude-extended equatorial spread F observed near sunrise terminator overIndonesia, Geophys. Res. Lett., 30(22), 2137, doi:10.1029/2003GL018383.
Fukao, S., T. Yokoyama, T. Tayama, M. Yamamoto, T. Maruyama, andS. Saito (2006), Eastward traverse of equatorial plasma plumes observedwith the Equatorial Atmosphere Radar in Indonesia, Ann. Geophys., 24,1411–1418, doi:10.5194/angeo-24-1411-2006.
Hedin, A. E., et al. (1996), Empirical wind model for the upper, middle andlower atmosphere, J. Atmos. Sol.-Terr.. Phys., 58, 1421–1447.
Huang, C. S., and M. C. Kelley (1996), Nonlinear evolution of equatorialspread F: 2. Gravity wave seeding of Rayleigh-Taylor instability,J. Geophys. Res., 101(A1), 293–302, doi:10.1029/95JA02210.
Hysell, D. L., and E. Kudeki (2004), Collisional shear instability in the equa-torial F region ionosphere, J. Geophys. Res., 109, A11301, doi:10.1029/2004JA010636.
Hysell, D. L., M. C. Kelley, W. E. Swartz, and D. T. Farley (1994), VHF ra-dar and rocket observations of equatorial spread F on Kwajalein,J. Geophys. Res., 99(A8), 15,065–15,085, doi:10.1029/94JA00476.
Kelley, M. C. (1989), The Earth’s Ionosphere: Plasma Physics andElectrodynamics, Academic Press, San Diego.
Kil, H., and R. A. Heelis (1998), Global distribution of density irregularities inthe equatorial ionosphere, J. Geophys. Res., 103(A1), 407–417, doi:10.1029/97JA02698.
Kil, H., R. A. Heelis, L. J. Paxton, and S.-J. Oh (2009), Formation of aplasma depletion shell in the equatorial ionosphere, J. Geophys. Res.,114, A11302, doi:10.1029/2009JA014369.
Li, G., B. Ning, L. Liu, B. Zhao, X. Yue, S.-Y. Su, and S. Venkatraman(2008), Correlative study of plasma bubbles, evening equatorial ionizationanomaly, and equatorial prereversal E ×B drifts at solar maximum, RadioSci., 43, RS4005, doi:10.1029/2007RS003760.
Li, G., et al. (2010), Longitudinal development of low-latitude ionosphericirregularities during the geomagnetic storms of July 2004, J. Geophys.Res., 115, A04304, doi:10.1029/2009JA014830.
Li, G., B. Ning, A. K. Patra,W.Wan, and L. Hu (2011), Investigation of low-latitude E and valley region irregularities: Their relationship to equatorialplasma bubble bifurcation, J. Geophys. Res., 116, A11319, doi:10.1029/2011JA016895.
Li, G., B. Ning, M. A. Abdu, W. Wan, and L. Hu (2012), Precursor signa-tures and evolution of post-sunset equatorial spread-F observed overSanya, J. Geophys. Res., 117, A08321, doi:10.1029/2012JA017820.
Lyon, A. J., N. J. Skinner, and R. W. Wright (1961), Equatorial spread F atIbadan, Nigeria, J. Atmos. Terr. Phys., 21, 100–119.
Makela, J. J., and E. S. Miller (2008), Optical observations of the growth andday-to-day variability of equatorial plasma bubbles, J. Geophys. Res., 113,A03307, doi:10.1029/2007JA012661.
Maruyama, T. (1988), A diagnostic model for equatorial spread F: 1.Model de-scription and application to electric field and neutral wind effects,J. Geophys. Res., 93(A12), 14,611–14,622, doi:10.1029/JA093iA12p14611.
Narayanan, V. L., A. Taori, A. K. Patra, K. Emperumal, and S. Gurubaran(2012), On the importance of wave-like structures in the occurrence ofequatorial plasma bubbles: A case study, J. Geophys. Res., 117, A01306,doi:10.1029/2011JA017054.
Ossakow, S. L. (1981), Spread-F theories – A review, J. Atmos. Terr. Phys.,43, 437–452.
Otsuka, Y., K. Shiokawa, T. Ogawa, and P. Wilkinson (2002), Geomagneticconjugate observations of equatorial airglow depletions, Geophys. Res.Lett., 29(15), 1753, doi:10.1029/2002GL015347.
Oyekola, O. S. (2009), A study of evolution and suppression parameters ofequatorial postsunset plasma instability, Ann. Geophys., 27, 297–301,doi:10.5194/angeo-27-297-2009.
Patra, A. K., and D. V. Phanikumar (2009), Intriguing aspects of F regionplasma irregularities revealed by the Gadanki radar observations duringthe SAFAR campaign, Ann. Geophys., 27, 3781–3790, doi:10.5194/angeo-27-3781-2009.
Patra, A. K., A. Taori, P. P. Chaitanya, and S. Sripathi (2013), Direct detec-tion of wavelike spatial structure at the bottom of the F region and its role
LI ET AL.: LONGITUDINAL CHARACTERISTICS OF PLUMES
13

on the formation of equatorial plasma bubble, J. Geophys. Res. SpacePhysics, 118, 957–1350, doi:10.1002/jgra.50148.
Röttger, J. (1973), Wave-like structures of large-scale equatorial spread-Firregularities, J. Atmos. Terr. Phys., 35, 1195–1206, doi:10.1016/0021-9169(73)90016-0.
Saito, S., and T. Maruyama (2007), Large-scale longitudinal variation in iono-spheric height and equatorial spread F occurrences observed by ionosondes,Geophys. Res. Lett., 34, L16109, doi:10.1029/2007GL030618.
Sekar, R., E. A. Kherani, P. B. Rao, and A. K. Patra (2001), Interaction oftwo long-wavelength modes in the nonlinear numerical simulation modelof equatorial spread F, J. Geophys. Res., 106(A11), 24,765–24,775,doi:10.1029/2000JA000361.
Singh, S., F. S. Johnson, and R. A. Power (1997), Gravity wave seeding of equa-torial plasma bubbles, J. Geophys. Res., 102(A4), 7399–7410, doi:10.1029/96JA03998.
Su, S.-Y., C. K. Chao, and C. H. Liu (2008), On monthly/seasonal/longitu-dinal variations of equatorial irregularity occurrences and their relation-ship with the postsunset vertical drift velocities, J. Geophys. Res., 113,A05307, doi:10.1029/2007JA012809.
Sultan, P. J. (1996), Linear theory and modeling of the Rayleigh Taylor in-stability leading to the occurrence of equatorial spread F, J. Geophys. Res.,101(A12), 26,875–26,891, doi:10.1029/96JA00682.
Thampi, S. V., M. Yamamoto, R. T. Tsunoda, Y. Otsuka, T. Tsugawa,J. Uemoto, and M. Ishii (2009), First observations of large-scale wavestructure and equatorial spread F using CERTO radio beacon on theC/NOFS satellite, Geophys. Res. Lett., 36, L18111, doi:10.1029/2009GL039887.
Tsunoda, R. T. (2013), On seeding equatorial spread F: Parallel or transversetransport?, J. Atmos. Sol.-Terr. Phys., doi:10.1016/j.jastp.2012.10.016.
Tsunoda, R. T., and W. L. Ecklund (2007), On the post-sunset rise of theequatorial F layer and superposed upwellings and bubbles, Geophys.Res. Lett., 34, L04101, doi:10.1029/2006GL028832.
Tsunoda, R. T., and B. R. White (1981), On the generation and growth ofequatorial backscatter plumes, 1, Wave structure in the bottomside F layer,J. Geophys. Res., 86(A5), 3610–3616, doi:10.1029/JA086iA05p03610.
Tsunoda, R. T., S. V. Thampi, T. T. Nguyen, and M. Yamamoto (2013), Onvalidating the relationship of ionogram signatures to large-scale wavestructure, J. Atmos. Sol.-Terr. Phys., doi:10.1016/j.jastp.2012.11.003.
Tulasi Ram, S., M. Yamamoto, R. T. Tsunoda, S. V. Thampi, andS. Gurubaran (2012), On the application of differential phase measurementsto study the zonal large scale wave structure (LSWS) in the ionosphericelectron content, Radio Sci., 47, RS2001, doi:10.1029/2011RS004870.
Woodman, R. F., and C. LaHoz (1976), Radar observations of F region equa-torial irregularities, J. Geophys. Res., 81(31), 5447–5466, doi:10.1029/JA081i031p05447.
Yokoyama, T., S. Fukao, and M. Yamamoto (2004), Relationship of the on-set of equatorial F-region irregularities with the sunset terminator observedwith the Equatorial Atmosphere Radar, Geophys. Res. Lett., 31, L24804,doi:10.1029/2004GL021529.
Yokoyama, T., M. Yamamoto, Y. Otsuka, M. Nishioka, T. Tsugawa,S. Watanabe, and R. F. Pfaff (2011), On post-midnight low-latitude iono-spheric irregularities during solar minimum: 1. Equatorial AtmosphereRadar and GPS-TEC observations in Indonesia, J. Geophys. Res., 116,A11325, doi:10.1029/2011JA016797.
Zalesak, S. T., S. L. Ossakow, and P. K. Chaturvedi (1982), Nonlinearequatorial spread F: The effect of neutral winds and backgroundPedersen conductivity, J. Geophys. Res., 87(A1), 151–166, doi:10.1029/JA087iA01p00151.
LI ET AL.: LONGITUDINAL CHARACTERISTICS OF PLUMES
14