Channel defect detection in food packages using integrated backscatter ultrasound imaging
11
30 ieee transactions on ultrasonics, ferroelectrics, and frequency control, vol. 45, no. 1, january 1998 Channel Defect Detection in Food Packages Using Integrated Backscatter Ultrasound Imaging Kay Raum, Ayhan Ozguler, Scott A. Morris, and William D. O’Brien, Jr., Fellow, IEEE Abstract—Hermetically-sealed flexible food packages re- quire very effective seal integrity testing to extend the shelf stability of thermally processed food. The initial goal of this study was to estimate the detection limits of laboratory- generated channels which simulate defects in food pack- ages using pulse-echo ultrasonic imaging techniques. Pack- ages with well characterized (via transmission optical mi- croscopy) laboratory-generated channels that simulate de- fects with diameters between 9 and 325 m in the seal plane traversing the major axis of the heat seal were gener- ated in heat-sealed microwavable retort-pouch plastic film (trilaminate). Pulse-echo techniques in the 13–17 MHz cen- ter frequency range were investigated. The samples were examined with a conventional B-mode imaging technique, which was found to be inadequate for subwavelength imag- ing of the types of typical channel defects found in shelf- stable food packages. Based on conventional B-mode image features, a new goal of this study was established to de- velop and evaluate an imaging technique which would ex- hibit subwavelength imaging capabilities. The new imaging technique called backscattered amplitude integral (BAI) is introduced here. It was observed that BAI-mode imaging has the ability for subwavelength detection of channel de- fects, e.g., detection of a 10- m diameter channel defect at a center frequency of 13.1 MHz ( = 182 m). I. Introduction R etort pouches and trays are constructed of poly- meric laminates and coextrusions, with little or no metallic content [at most, an extremely thin (< 25 μm) foil layer laminated in the interior of the material]. They are hermetically sealed and may be flexible pouches or semirigid trays sealed with a laminated film. These new types of packages offer a combination of the advantages of metal cans, microwaveable trays, and boil-in bags [1], [2]. For both the consumer and the manufacturer, preservation of the food product in retort pouches and trays has many Manuscript received June 3, 1996; accepted July 14, 1997. This work was supported in part by the Value-Added Research Opportuni- ties Program, Agricultural Experiment Station, University of Illinois. K. Raum is with the Institute of Medical Physics and Biophysics, Martin-Luther-University Halle-Wittenberg, D-06097 Halle/Saale, Germany. A. Ozguler is with the Department of Food Science and Human Nutrition, University of Illinois, Urbana, IL 61801. S. A. Morris is with the Department of Food Science and Human Nutrition and the Department of Agricultural Engineering, Univer- sity of Illinois, Urbana, IL 61801. W. D. O’Brien, Jr. is with the Bioacoustics Research Laboratory, Department of Electrical and Computer Engineering, University of Illinois, Urbana, IL 61801 (e-mail: [email protected]). advantages over canning or freezing. Some of these are improved food quality and reduced energy consumption through reduced thermal processing requirements as well as concurrent energy savings through the products’ life- cycle [3], [4], on-line package forming, increased material efficiencies, ease of access to product, and faster heating of product via boiling or microwaving. As with all shelf- stable thermally processed foods, the integrity of the pack- age is vital to human safety and product quality. Retort pouches have a fusion weld of two comparable polymeric film surfaces, and the integrity of these seals is central to the utility and safety of the package and product. Currently 9CFR§381.301(d) [5] requires that producers manually inspect each container, once after the post-fill sealing and again after thermal treatment in a steam re- tort. The most common types of compromised seals involve a seal which has wrinkled or failed to seal or has included a foreign material. In most cases, the two layers of mate- rial are not torn or otherwise broken, but the fusion seal has been contaminated or has not been properly formed. In extreme cases, the void may be much larger than the combined thicknesses of the materials, because the opened section in the fusion seal can be as large as the seal area it- self. Additionally, a seal with an incomplete seal may pass existing fusion tests (if applicable), but fail later during handling and shipping [6]. Four main methods of testing seal performance have been defined [6], viz., fusion testing, burst testing, tensile testing, and visual examination. Fusion, burst, and tensile test methods cannot detect any microleaks which are not clearly visible to the naked eye (< 50 μm in diameter) [6], [7]. Microchannels as small as 17 μm in diameter have been detected by using a helium leak test though the tech- nique is slow (> 30 min) and spatially imprecise [8]. More- over, few if any of these methods can detect a leak plugged with food, which may provide a path for microorganisms to “grow through” the seal. The food processing industry commonly uses destructive testing such as burst testing to perform spot checks of materials and sealing equipment, but an on-line, nondestructive inspection method is neces- sary to supplant the costly and inefficient manual inspec- tion which restrict economical use of these packages. Many of the current nondestructive methods available for inspection of materials have been evaluated [7]. These techniques included simple ultrasound (using a simple, low resolution, transmission method to measure large-scale seal formation without imaging capability [9]), ultrasound 0885–3010/97$10.00 c 1998 IEEE
-
Upload
charite-de -
Category
Documents
-
view
0 -
download
0
Transcript of Channel defect detection in food packages using integrated backscatter ultrasound imaging

30 ieee transactions on ultrasonics, ferroelectrics, and frequency control, vol. 45, no. 1, january 1998
Channel Defect Detection in Food PackagesUsing Integrated Backscatter
Ultrasound ImagingKay Raum, Ayhan Ozguler, Scott A. Morris, and William D. O’Brien, Jr., Fellow, IEEE
Abstract—Hermetically-sealed flexible food packages re-quire very effective seal integrity testing to extend the shelfstability of thermally processed food. The initial goal of thisstudy was to estimate the detection limits of laboratory-generated channels which simulate defects in food pack-ages using pulse-echo ultrasonic imaging techniques. Pack-ages with well characterized (via transmission optical mi-croscopy) laboratory-generated channels that simulate de-fects with diameters between 9 and 325 �m in the sealplane traversing the major axis of the heat seal were gener-ated in heat-sealed microwavable retort-pouch plastic film(trilaminate). Pulse-echo techniques in the 13–17 MHz cen-ter frequency range were investigated. The samples wereexamined with a conventional B-mode imaging technique,which was found to be inadequate for subwavelength imag-ing of the types of typical channel defects found in shelf-stable food packages. Based on conventional B-mode imagefeatures, a new goal of this study was established to de-velop and evaluate an imaging technique which would ex-hibit subwavelength imaging capabilities. The new imagingtechnique called backscattered amplitude integral (BAI) isintroduced here. It was observed that BAI-mode imaginghas the ability for subwavelength detection of channel de-fects, e.g., detection of a 10-�m diameter channel defect ata center frequency of 13.1 MHz (� = 182 �m).
I. Introduction
Retort pouches and trays are constructed of poly-meric laminates and coextrusions, with little or no
metallic content [at most, an extremely thin (< 25 µm)foil layer laminated in the interior of the material]. Theyare hermetically sealed and may be flexible pouches orsemirigid trays sealed with a laminated film. These newtypes of packages offer a combination of the advantages ofmetal cans, microwaveable trays, and boil-in bags [1], [2].For both the consumer and the manufacturer, preservationof the food product in retort pouches and trays has many
Manuscript received June 3, 1996; accepted July 14, 1997. Thiswork was supported in part by the Value-Added Research Opportuni-ties Program, Agricultural Experiment Station, University of Illinois.
K. Raum is with the Institute of Medical Physics and Biophysics,Martin-Luther-University Halle-Wittenberg, D-06097 Halle/Saale,Germany.
A. Ozguler is with the Department of Food Science and HumanNutrition, University of Illinois, Urbana, IL 61801.
S. A. Morris is with the Department of Food Science and HumanNutrition and the Department of Agricultural Engineering, Univer-sity of Illinois, Urbana, IL 61801.
W. D. O’Brien, Jr. is with the Bioacoustics Research Laboratory,Department of Electrical and Computer Engineering, University ofIllinois, Urbana, IL 61801 (e-mail: [email protected]).
advantages over canning or freezing. Some of these areimproved food quality and reduced energy consumptionthrough reduced thermal processing requirements as wellas concurrent energy savings through the products’ life-cycle [3], [4], on-line package forming, increased materialefficiencies, ease of access to product, and faster heatingof product via boiling or microwaving. As with all shelf-stable thermally processed foods, the integrity of the pack-age is vital to human safety and product quality. Retortpouches have a fusion weld of two comparable polymericfilm surfaces, and the integrity of these seals is central tothe utility and safety of the package and product.
Currently 9CFR§381.301(d) [5] requires that producersmanually inspect each container, once after the post-fillsealing and again after thermal treatment in a steam re-tort. The most common types of compromised seals involvea seal which has wrinkled or failed to seal or has includeda foreign material. In most cases, the two layers of mate-rial are not torn or otherwise broken, but the fusion sealhas been contaminated or has not been properly formed.In extreme cases, the void may be much larger than thecombined thicknesses of the materials, because the openedsection in the fusion seal can be as large as the seal area it-self. Additionally, a seal with an incomplete seal may passexisting fusion tests (if applicable), but fail later duringhandling and shipping [6].
Four main methods of testing seal performance havebeen defined [6], viz., fusion testing, burst testing, tensiletesting, and visual examination. Fusion, burst, and tensiletest methods cannot detect any microleaks which are notclearly visible to the naked eye (< 50 µm in diameter)[6], [7]. Microchannels as small as 17 µm in diameter havebeen detected by using a helium leak test though the tech-nique is slow (> 30 min) and spatially imprecise [8]. More-over, few if any of these methods can detect a leak pluggedwith food, which may provide a path for microorganismsto “grow through” the seal. The food processing industrycommonly uses destructive testing such as burst testing toperform spot checks of materials and sealing equipment,but an on-line, nondestructive inspection method is neces-sary to supplant the costly and inefficient manual inspec-tion which restrict economical use of these packages.
Many of the current nondestructive methods availablefor inspection of materials have been evaluated [7]. Thesetechniques included simple ultrasound (using a simple,low resolution, transmission method to measure large-scaleseal formation without imaging capability [9]), ultrasound
0885–3010/97$10.00 c© 1998 IEEE

raum et al.: defect detection in food packages 31
imaging (Scanning Laser Acoustic Microscopy), machinevision imaging, infrared imaging, infrared laser/fiber opticarray, capacitance, spectrophotometer, X-ray, eddy cur-rent probe, and magnetic resonance imaging (MRI). Opti-cal machine vision will detect only surface artifacts of de-fects and inclusons in the heat seal, and not the defect orinclusion itself. X-ray and MRI techniques can identify ac-tual defects smaller than 50 µm, but both techniques havesignificant disadvantages. X-ray imaging does not detectthe fusion seal in the polymeric materials, and X-ray mea-surements’ need for imaging contrast require the microleakin the seal to contain only materials with markedly higherelectron density than the hydrocarbons of the package, aswell as the water and carbohydrates of the food in thepackage (because there are still two layers of intact ma-terial in the image), and thus it cannot detect an air- orproduct-filled channel. MRI cannot detect empty channelsand has insufficient resolution and imaging speed.
Microbiological tests have attempted to quantify theapproximate minimum size of a critical defect [7], [10]–[12]. The minimum leak size through which a microorgan-ism might penetrate was shown to be 33 µm in diameter;however, this technique is still unreliable because 10% ofpierced pouches which have the same defect size failed toshow contamination. Other data about the minimum di-ameter of the microleak which permit microbial penetra-tion are still inconclusive and quite variable. Defect sizesbetween 0.2 and 80 µm in diameter for bacterial penetra-tion have been summarized, and the most common size waspresumed to be around 10 µm [7]. In addition, the incuba-tion period of test microorganisms is quite lengthy, makingthis on-line inspection technique impractical (although itis common manufacturing practice to hold finished lotsof filled packages for a period of time and to inspect forswelling or other signs of failure). Simple measurement ofthe microorganisms yield little useful data because it doesnot consider means of transport and effects of secondaryfactors such as fluid surface tension and viscosity.
A recent study [13] using a scanning laser acoustic mi-croscope (SLAM) operating at 100 MHz showed that chan-nel defects as small as 10 µm in diameter can be detected.However, for transmission-mode imaging, the inspectedsample has to be placed between the transmitting and re-ceiving components of the system, which is not practicalfor many industrial applications due to the variety of dif-ferent shapes of food packages. For the high frequenciesrequired to detect 10-µm diameter defects, the insertionloss may be too great, thus further limiting the methodto very thin samples. For example, at 100 MHz, the am-plitude attenuation coefficients for commercially availablepolyethylene film (Ziplocr brand, DowBrands L. P., Indi-anapolis, IN) and plastic microwaveable retort pouch ma-terial (Fuji Tokushu Shigyo Co. Ltd., Seto Aichi, Japan)are 58 and 90 dB/mm, respectively [13]. High-frequencytransmission technology, therefore, may have only limitedapplication for the detection of defects in food packages.For lower-frequency pulse-echo technology, the sample hasto be probed from one side only, and thick materials can be
inspected if the area of interest is located close (≈ 1 mm)to the surface, making it ideal for imaging film-film andfilm-molding seals from the film side.
In this study, laboratory-generated channel defects inthe range from 9 to 325 µm in diameter in transparent plas-tic film with a total thickness of about 220 µm were used toevaluate relatively low-frequency pulse-echo imaging capa-bilities for defect detection. A new technique called BAI-mode imaging is introduced for the detection of defects.The BAI-mode imaging technique was found to be supe-rior to conventional B-mode imaging for this application.
II. Sample Preparation and Validation
Thirty-four samples with laboratory-generated channeldefects based on actual defect shapes and sizes known tolead to contamination of food within retort pouches wereprepared. The channels were filled with either air or waterin order to simulate high or low contrast cases, respec-tively; these are typical acoustic properties of channel de-fect materials. Microwaveable retort trilaminate poucheswere used as a packaging material (Fuji Tokushu ShigyoCo., Ltd., Seto Aichi, Japan). The average propagationspeed in the plastic trilaminate had been previously mea-sured (2380 m/s [13]) and found to be in reasonable agree-ment with literature propagation speed values for the threeindividual materials, that is, 2600 m/s for oriented nylon[14], 2380 m/s for polyvinylidene chloride (PVDC) [15]and 2660 m/s for polypropylene [14]. This material is usedcommercially in Japan and was chosen for this study be-cause it is optically transparent to allow for independentchannel defect verification; generally the retort pouch cancontain an aluminum layer or the surface of the packagemight be printed, thus rendering it opaque.
Each channel defect sample was prepared by placing asmooth, sapphire-die-drawn tungsten wire (10, 25, 37, 50,75, 100 or 220 µm; California Fine Wire Company, GroverCity, CA) between two layers of the trilaminate [Fig. 1(a)].An automatic heat sealer (Doboy HS-C42051, Doboy Co.,New Richmond, WI) was used to seal the tungsten wireinto place at a sealing temperature of 132◦C. After 5 min-utes the wire was axially removed. The wire was removedwith the sample either submersed in a water bath in orderto fill the channel with water, or in air. Both ends of thechannel were then fused to contain the contents within theformed channel. Optical micrsocopy was used as an inde-pendent check of the channel contents, especially for thosechannels smaller than 50 µm in diameter.
Visible small needle pricks were placed on opposingsides of the channel as reference marks [Fig. 1(b)] for boththe ultrasound images and the light transmission micro-scope validation images.
Light transmission microscope images with a calibra-tion grid (Reichert Jung: 2 mm divisions into subdivisionsof 10 µm) were used to determine the exact cross-sectionalchannel defect dimensions (Fig. 2). Images were capturedusing a Nikon Optiphot-2 light microscope, Sony CCD

32 ieee transactions on ultrasonics, ferroelectrics, and frequency control, vol. 45, no. 1, january 1998
Fig. 1. (a) Three-dimensional, cut-away representation of two layersof the trilaminate retort pouch material with a channel defect shownschematically between the two layers, and (b) schematic top view. Anindividual trilaminate consists of three layers, viz., oriented nylon,polyvinylidene chloride (PVDC), and polypropylene (PP).
color video camera, RasterOps frame-grabber board, Mac-intosh IIci computer, and Adobe Photoshop software. Theimage area was 420 by 316 µm for the cross-sectional im-ages and 2.1 by 1.6 mm for the top-view images, respec-tively. The cross-sectional channel shape was elliptical forall channel defects with the ellipse’s major and minor axesgenerally parallel and perpendicular, respectively, to theplastic trilaminate surfaces. For definition purposes, theellipse’s major axis is the value quoted herein for the chan-nel’s diameter, that is, the dimension yielded from the topview. The defect dimensions were in a range from 9 to325 µm in diameter and for channel diameters less than
Fig. 2. Cross-sectional optical microscope images of water-filled chan-nels with (a) 220-µm and (b) 95-µm channel diameters.
about 100 µm, the major axis to minor axis ratio rangedbetween 0.97 and 1.44. For channel diameters greater than100 µm, this ratio had a greater range because delamina-tion and distortion of the trilaminate structure occurred,presumably due to the wire removal process of the largerwire diameters.
These samples were prepared as a simple-case test ofthe imaging capabilities of the method. Real-world defectswould potentially have much different paths and geome-tries, but it is surmised that the elliptical configurationof the simulated defects are the shortest path length withthe least number of obstructions to microbial penetration,
raum et al.: defect detection in food packages 33
Fig. 3. System block diagram. The bold lines with arrows at bothends designate GPIB connections.
and therefore a worthwhile “worst case” model. Deforma-tion of the channel cross-section due to the surface shearforce imparted as the wire is withdrawn appears (from op-tical and confocal microscopy assessment of cross sections)to be minimal.
III. System Description and Characteristics
and Data Acquisition
Fig. 3 shows the block diagram of the main systemcomponents. The channel-defect sample was placed in awater tank (≈ 20◦C) with the defect oriented approx-imately normal to the sound beam direction, that is, atop view [Fig. 1(b)]. Spherically focused ultrasonic trans-ducers with manufacturer-quoted center frequencies of 15and 20 MHz (Panametrics V319 and V317, respectively,Waltham, MA) were shock excited by a 300-V pulse pro-duced by a computer-controlled pulser/receiver (Model5800, Panametrics, Waltham, MA). The received echosignal was amplified (20 dB) and band-pass filtered (1to 35 MHz) by the pulser/receiver, and then displayed(500 Ms/s) on a digitizing oscilloscope (Tektronix Model11401) with a 10-bit resolution.
The measured transmit-receive spatial characteristicsof the two transducers were in general agreement withthe manufacturer’s specifications [16]. The lateral acous-tic pressure distribution in the focal plane of a sphericalfocusing source is described by [17], [18]:∣∣∣∣p(r)p(0)
∣∣∣∣ =
∣∣∣∣∣2J1(kDr
2ROC
)kDr
2ROC
∣∣∣∣∣ (1)
where p(r) is the peak acoustic pressure as a function of theoff-axis lateral distance r, p(0) is the on-axis peak acoustic
pressure at z = ROC, k is the wave number, D is thetransducer’s diameter and ROC is the transducer’s radiusof curvature where ROC also is considered the focal lengthat the geometrical focus; the true focus (maximum axialintensity location) is located closer to the transducer (z <ROC) due to diffraction effects. J1(x) is a Bessel functionof the first kind of order one. From (1) the−6-dB transmit-receive beam width (diameter) in the geometrical focalplane (z = ROC) is:
Dlateral (−6dB) = 1.028 · λ · f# (2)
where f# is the f-number (= ROC/D) and λ is the acous-tic wavelength (= c/fc) where fc is the ultrasonic centerfrequency. The experimental assessment of the lateral res-olution was made in the true focal plane; the experimen-tally determined focal length (denoted F ) was assumed tobe equal to the ROC. This is a reasonable assumption forthe strongly focused spherical sources used herein.
The axial acoustic pressure distribution of a sphericalfocusing source is described by [17], [18]:∣∣∣∣p(z)p(0)
∣∣∣∣ =ROCz
∣∣∣∣sinc(
D2
8λROC
(ROCz− 1))∣∣∣∣ (3)
where p(z) is the peak acoustic pressure as a function ofthe axial distance z and sinc(x) is defined as sin(πx)
πx . From(3) the approximate−6-dB transmit-receive depth of focusis:
Fz = 7.08 · λ · f#2. (4)
The pulse duration (τ(−20dB)) is defined as the timeduration between the times when the pulse amplitude isat −20 dB of its maximum values. From the spatial extentof the pulse duration, the axial resolution is:
Daxial =c · τ(−20dB)
2. (5)
The measured transmit-receive spectral characteristicsof the two transducers yielded estimated center frequen-cies at slight variance with the manufacturer’s quotedcenter frequencies. Fig. 4 (solid line) shows an RF ac-quired pulse-echo signal from the 20-MHz transducer. Thepulser/receiver used in this study appeared to attenuatethe higher frequency components, which resulted in theestimated center frequencies in the focal plane for the twotransducers to be lower than the manufacturer-quoted fre-quencies, that is, 13.1 MHz for the 15-MHz transducerand 17.3 MHz for the 20-MHz transducer. Also assessedwere the transducer’s pulse-echo −6-dB bandwidths andfractional bandwidths, that is, respectively, 11.1–15.1 MHzand 30.7% for the 15-MHz transducer and 13.7–21.0 MHzand 42.4% for the 20-MHz transducer.
Table I gives an overview of measured and calculatedacoustic field properties and resolution limits for the twotransducers used in this study. The beam quantities wereexperimentally obtained using a 25-µm tungsten wire tar-get [16]. Fig. 5 compares the calculated axial and lateral

34 ieee transactions on ultrasonics, ferroelectrics, and frequency control, vol. 45, no. 1, january 1998
TABLE IMeasured and Calculated Acoustic Field Properties and Resolution Limits.
V319 15-MHz V317 20-MHzTransducer or field quantity Transducer Transducer
*Source diameter, D 12.7 mm 6.35 mm*Focal length, F 19.05 mm 12.70 mmMeasured focal length (water, 20◦C), F 18.70 mm 12.44 mm*f-number 1.5 2.0Measured center frequency (water, 20◦C), fc 13.1 MHz 17.3 MHzMeasured pulse duration (water, 20◦C), τ(−20 dB) 250 ns 155 nsCalculated wavelength (water, 20◦C), λwater 113 µm 86 µmCalculated wavelength (plastic, 20◦C), λplastic 182 µm 138 µmCalculated axial resolution [(5) in water, 20◦C],Daxial (using measured τ(−20 dB)) 185 µm 115 µmCalculated axial resolution [(5) in plastic, 20◦C],Daxial (using measured τ(−20 dB)) 298 µm 184 µmMeasured lateral resolution (water, 20◦C), Dlateral (−6 dB) 187 µm 173 µmCalculated lateral resolution [(2) in water, 20◦C], Dlateral (−6 dB) 174 µm 177 µmMeasured depth of focus (water, 20◦C), Fz 1800 µm 2150 µmCalculated depth of focus [(4) in water, 20◦C], Fz 1800 µm 2436 µm
*Denotes provided by manufacturer.Propagation speeds at 20◦C: cplastic = 2380 m/s [13], cwater = 1483 m/s [21].
Fig. 4. A 17.3-MHz, RF signal, and the absolute value of the Hilbert-transformed signal (envelope) from an undisturbed region of the tril-aminate plastic retort of thickness 220 µm. The integration bound-aries for envelope (right-hand axis) to determine the BAI value arebetween t1 and t2 and, for this RF signal, the BAI value is 0.543 V-µs.
beam distributions [(3) and (1), respectively] under CW(17.3 MHz) and pulsed (spectrum obtained from the 20-MHz transducer—see Fig. 4) conditions, and demonstratesthat the respective distributions are similar in the focalregion. For pulsed-wave conditions used herein, the dis-tributions beyond the focal region are relatively smoothcompared to the CW distributions.
The image data were acquired by moving the transducerrelative to the fixed-position sample in a rectangular gridpattern with a computer-controlled micro-precision posi-tioning system (Daedal Inc., Harrison City, PA) which hasa linear positional accuracy of about 2 µm and a rota-tional accuracy of about 0.02◦. The angle of incidence ofthe ultrasound beam was intentionally oriented at a known
Fig. 5. Calculated axial (top) and off-axis lateral (bottom) distribu-tions at the axial maximum distance for CW (17.3 MHz) and pulsed(spectrum obtained from the 20-MHz transducer) conditions.
angle either normal or slightly oblique (≤ 10◦) to theplane of the plastic surface (small wrinkles in the surfacewere neglected). The positioning system, oscilloscope, andpulser/receiver were connected to a GPIB-board and con-trolled by a 486-66 PC. The grid spacings in the directionparallel to the channel’s major axis (channel’s diameter)was 30 µm and in the direction parallel to the long axisof the channel defect was 100 µm, thus yielding, respec-

raum et al.: defect detection in food packages 35
tively, with the step sequence of 100 by 40 used for the “in-plane” scan, a 3-mm by 4-mm field of view. The numberof RF data acquisitions per data set was 4000 (100 by 40).This three-dimensional data set containing all 4000 512-point RF data acquisitions was stored to the PC’s harddisk and transferred to a SUN Sparc 20 workstation foroff-line processing. All computations were performed withMATLABr software (The MathWorks, Inc., Natick, MA).
The B-mode images were processed from one row ofeach acquired RF data acquisition, where, as seen in Fig. 6,the row was perpendicular to the channel’s long axis, thatis, the plane of the B-mode image cut across the chan-nel defect. Each RF data acquisition was filtered using a400th order Remez-bandpass filter (3 to 27 MHz cutofffrequencies) and envelop detected using the absolute valueof the Hilbert-transformed, filtered RF signal. The built-in MATLABr function was used to process the Hilbert-transformation. The detected signal was linearly interpo-lated in the lateral direction by a factor of two to yield thelateral pixel dimension of 15 µm. The axial dimension wasdetermined from
z(t) =c · TOF
2(6)
where c is the measured plastic propagation speed(2380 m/s [13]) and TOF is time of flight. The axial pixeldimension was 2.38 µm, which corresponds to a 2 ns TOF.
IV. BAI-Mode Imaging
The motivation for developing a different imaging pro-cedure was prompted by results and observations fromthe B-mode images (two-dimensional image plane paral-lel to the direction of the transmitted ultrasonic signalpath). Theoretical considerations and experimental find-ings demonstrated that resolution limited conventionalB- or C-mode image detection for channel defects lessthan the acoustic wavelength (see discussion below). Fornormal-incidence 17.3-MHz B-mode images of water-filledchannels, the defect was approximately resolved for the220-µm diameter channel, but was not resolved for the95-µm diameter channel (Fig. 6). However, a characteris-tic shadow at the location beyond (posterior to) the ex-pected channel location was observed, as is seen in the95-µm channel defect B-mode image. Also, this character-istic shadow resulted in the absence of the echo from thebottom water-plastic surface immediately posterior to thechannel location. The characteristic shadow region in thenormal-incidence B-mode images suggested that any dis-continuity in the plastic layer could affect the received RFecho signal and possibly the total reflected echo energy.A means to quantify the reflected RF echo signal (solidline in Fig. 4) is to integrate the detected signal (the ab-solute value of the unfiltered Hilbert-transformed RF data
Fig. 6. Normal-incidence 17.3-MHz B-mode images of water-filledchannels with (a) 220-µm and (b) 95-µm channel diameters (seeFig. 2 for their optical images). The reference needle marks are seenas shadow-like features on each side of the channel in (a). The imagedimensions are 2.5 mm laterally (horizontally) and 0.7 mm axially(vertically).
acquisition), that is,
BAI =
t2∫t1
|env(RF(t))| dt (7)
where BAI denotes the backscattered amplitude integraland yields a single BAI value for each RF data acquisition(Fig. 4). The built-in MATLABr function was used toprocess the Hilbert transformation. Because the Hilbert-transformed signal represents the envelope of the RF-signal amplitude, the BAI value is proportional to thesquare root of the backscattered energy. The integration
36 ieee transactions on ultrasonics, ferroelectrics, and frequency control, vol. 45, no. 1, january 1998
boundaries t1 and t2 define times prior to and beyond thelocations of the sample’s top and bottom surfaces, respec-tively, that is, the times between when the envelope ofthe received signal is nonzero (Fig. 4). Because the enve-lope of the signal is zero before and after the echoes occurfrom the sample, a wide time interval—for instance thedepth of focus—may be chosen for the integration bound-aries. Unlike conventional C-scan processing, which mayinclude only a portion of the sample under investigation,the BAI time interval t2 − t1 includes the entire samplethickness. As long as the trilaminate material is flawlessand its surfaces are smooth and parallel, the echoes fromthe sample surfaces and interfaces contribute a constantvalue to the integral. However, any imperfections withinthe material or on the surfaces can cause a variation inthe total reflected signal received by the transducer andhence BAI-value variations are affected by alterations inthe sample structure, such as channel defects, inclusions,delaminations, or surface wrinkles.
The entire acquired three-dimensional RF data set wasused to process the BAI-mode image, that is, every 512-point RF data acquisition was processed by (7) to yield4000 BAI values. The limits of integration in (7) weremaintained constant. The two-dimensional (100× 40) ma-trix of BAI values was then linearly interpolated (using thebuilt-in MATLABr function) by a factor of two in the di-rection perpendicular to the channel’s long axis (30 µm/2)and by a factor of seven in the direction parallel to thechannel’s long axis (100 µm/7) to yield a 200× 280 BAI-value matrix with a respective pixel size of 15.0 by 14.3 µm.Finally, the normalized matrix was displayed as a two-dimensional gray-scale map to yield a BAI-mode image. ABAI-mode image showed clearly not only a 95-µm channeldefect, but also the reference needle marks, wrinkles, anddelaminations (Fig. 7).
To provide a contrast descriptor for the BAI-mode im-age, it was observed that, for a normal-incidence BAI-mode image, the magnitude of the BAI value was lowerwithin the region of the channel defect compared to the ad-jacent area (Fig. 7). This suggested that the total reflectedecho signal, as assessed by (7), was lower in the region ofthe channel defect. This observation was further supportedby the two weakly reflective reference marks (the dark-spotfeatures—lower BAI values) and by the two strongly reflec-tive delamination areas (the bright features—higher BAIvalues).
The BAI value also can be affected by varying the an-gle of incidence between sample surface and beam axis asobserved by the horizontal surface wrinkling noted at thebottom of Fig. 7 (the faint horizontal features); this fur-ther suggested that data acquisition at an oblique angleof incidence (relative to the undisturbed plastic surface)could affect the BAI value and also the BAI-mode imageappearance. Two BAI scans were acquired for two anglesof incidence, viz., 0◦ and 6◦; both scans traversed the samepath across a 95-µm diameter water-filled channel defect(Fig. 8). A BAI scan is a one-dimensional display of, forthis case, 100 normalized BAI values. Note that the BAI
Fig. 7. Normal-incidence 17.3-MHz BAI-mode image of a 95-µmwater-filled channel defect. The reference needle marks are seen asdark-spot features on each side of the channel. The bright spots onboth lower corners are delaminations where the two trilaminate plas-tic layers were not sealed. The slightly darker horizontal bands nearthe bottom are surface wrinkles.
value is a minimum at the center of the channel defect forthe normal-incidence case whereas there is an increase inthe BAI value at the mid-channel location for the oblique-incidence case. The lateral shift of the detected channellocation (in Fig. 8) is caused by the inclination of the trans-ducer for the oblique incidence case.
An example of a contrast descriptor for channel defectsin BAI-mode images can be defined as:
∆BAI = BAIundisturbed − BAImid-channel (8)
where BAIundisturbed is the unnormalized BAI value fromthe undisturbed region adjacent to the channel defect andBAImid-channel is the unnormalized BAI value from the cen-ter location of the channel defect, and where BAIundisturbedand BAImid-channel are calculated from (7). The quantity∆BAI can be thought of as a measure of contrast in theBAI-mode image for the channel defect. The ∆BAI valuecan be either positive or negative. This appears to be de-pendent on the angle of incidence wherein the ∆BAI valueis typically positive for normal incidence and negative foroblique incidence (Fig. 8). The dependence of ∆BAI as
raum et al.: defect detection in food packages 37
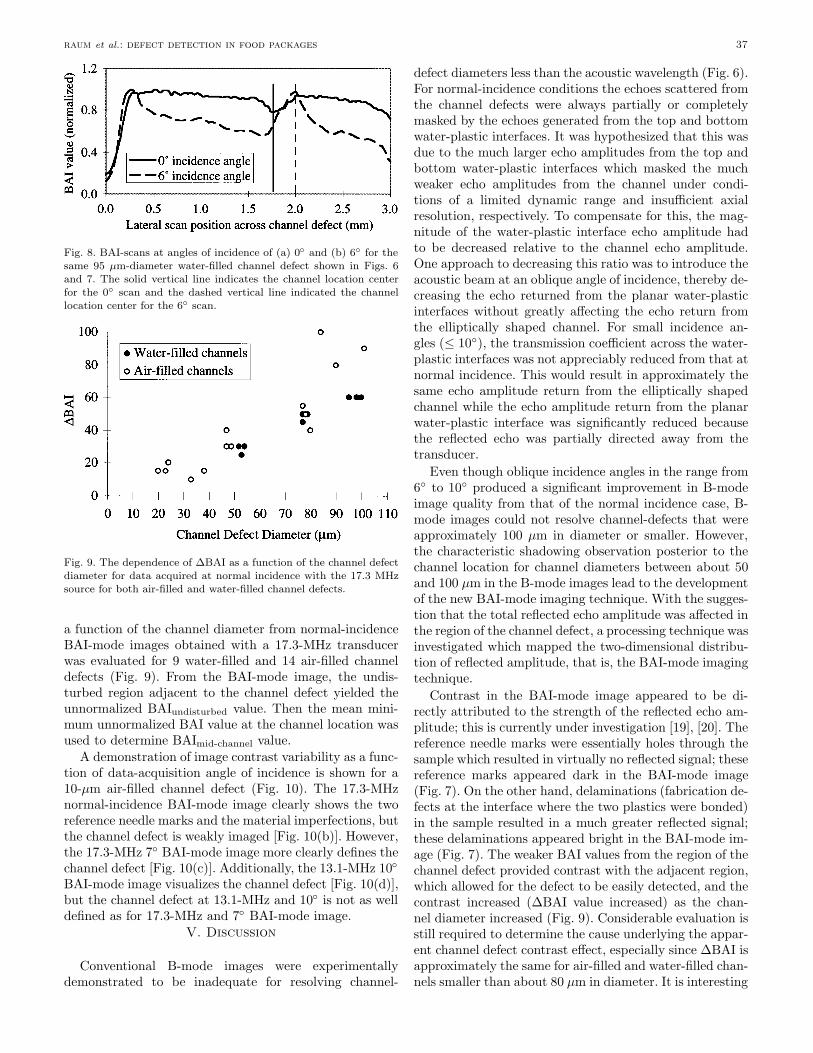
Fig. 8. BAI-scans at angles of incidence of (a) 0◦ and (b) 6◦ for thesame 95 µm-diameter water-filled channel defect shown in Figs. 6and 7. The solid vertical line indicates the channel location centerfor the 0◦ scan and the dashed vertical line indicated the channellocation center for the 6◦ scan.
Fig. 9. The dependence of ∆BAI as a function of the channel defectdiameter for data acquired at normal incidence with the 17.3 MHzsource for both air-filled and water-filled channel defects.
a function of the channel diameter from normal-incidenceBAI-mode images obtained with a 17.3-MHz transducerwas evaluated for 9 water-filled and 14 air-filled channeldefects (Fig. 9). From the BAI-mode image, the undis-turbed region adjacent to the channel defect yielded theunnormalized BAIundisturbed value. Then the mean mini-mum unnormalized BAI value at the channel location wasused to determine BAImid-channel value.
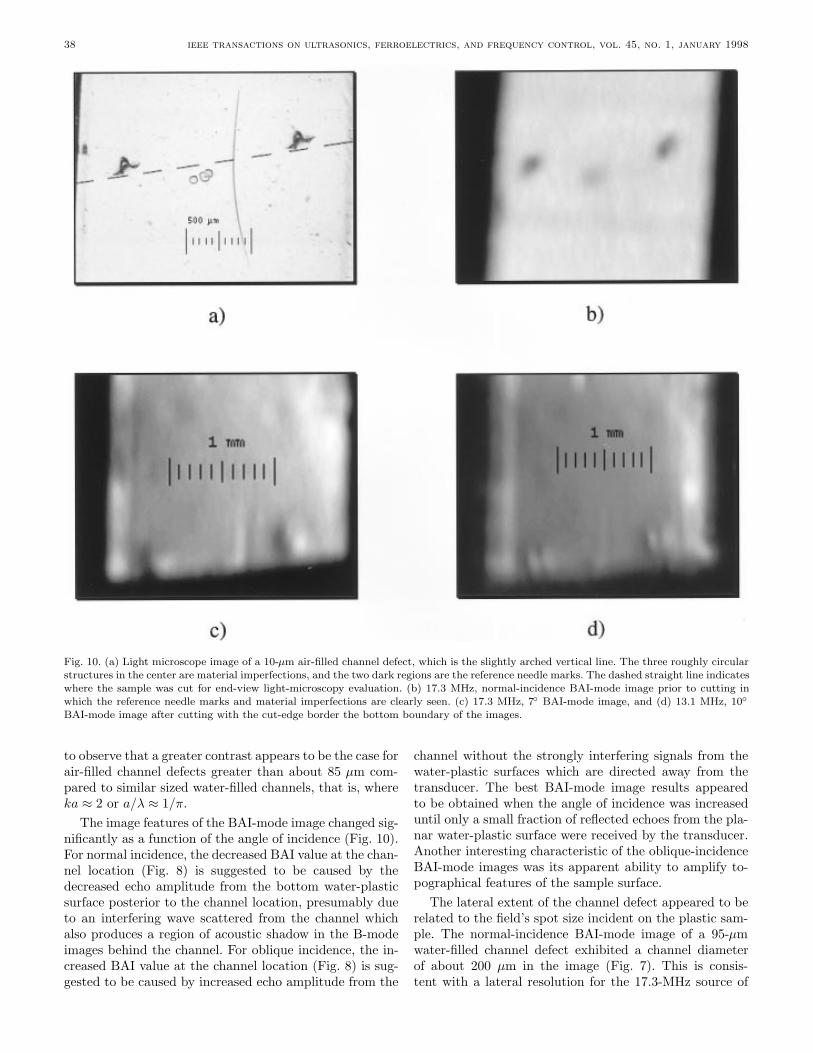
A demonstration of image contrast variability as a func-tion of data-acquisition angle of incidence is shown for a10-µm air-filled channel defect (Fig. 10). The 17.3-MHznormal-incidence BAI-mode image clearly shows the tworeference needle marks and the material imperfections, butthe channel defect is weakly imaged [Fig. 10(b)]. However,the 17.3-MHz 7◦ BAI-mode image more clearly defines thechannel defect [Fig. 10(c)]. Additionally, the 13.1-MHz 10◦
BAI-mode image visualizes the channel defect [Fig. 10(d)],but the channel defect at 13.1-MHz and 10◦ is not as welldefined as for 17.3-MHz and 7◦ BAI-mode image.
V. Discussion
Conventional B-mode images were experimentallydemonstrated to be inadequate for resolving channel-
defect diameters less than the acoustic wavelength (Fig. 6).For normal-incidence conditions the echoes scattered fromthe channel defects were always partially or completelymasked by the echoes generated from the top and bottomwater-plastic interfaces. It was hypothesized that this wasdue to the much larger echo amplitudes from the top andbottom water-plastic interfaces which masked the muchweaker echo amplitudes from the channel under condi-tions of a limited dynamic range and insufficient axialresolution, respectively. To compensate for this, the mag-nitude of the water-plastic interface echo amplitude hadto be decreased relative to the channel echo amplitude.One approach to decreasing this ratio was to introduce theacoustic beam at an oblique angle of incidence, thereby de-creasing the echo returned from the planar water-plasticinterfaces without greatly affecting the echo return fromthe elliptically shaped channel. For small incidence an-gles (≤ 10◦), the transmission coefficient across the water-plastic interfaces was not appreciably reduced from that atnormal incidence. This would result in approximately thesame echo amplitude return from the elliptically shapedchannel while the echo amplitude return from the planarwater-plastic interface was significantly reduced becausethe reflected echo was partially directed away from thetransducer.
Even though oblique incidence angles in the range from6◦ to 10◦ produced a significant improvement in B-modeimage quality from that of the normal incidence case, B-mode images could not resolve channel-defects that wereapproximately 100 µm in diameter or smaller. However,the characteristic shadowing observation posterior to thechannel location for channel diameters between about 50and 100 µm in the B-mode images lead to the developmentof the new BAI-mode imaging technique. With the sugges-tion that the total reflected echo amplitude was affected inthe region of the channel defect, a processing technique wasinvestigated which mapped the two-dimensional distribu-tion of reflected amplitude, that is, the BAI-mode imagingtechnique.
Contrast in the BAI-mode image appeared to be di-rectly attributed to the strength of the reflected echo am-plitude; this is currently under investigation [19], [20]. Thereference needle marks were essentially holes through thesample which resulted in virtually no reflected signal; thesereference marks appeared dark in the BAI-mode image(Fig. 7). On the other hand, delaminations (fabrication de-fects at the interface where the two plastics were bonded)in the sample resulted in a much greater reflected signal;these delaminations appeared bright in the BAI-mode im-age (Fig. 7). The weaker BAI values from the region of thechannel defect provided contrast with the adjacent region,which allowed for the defect to be easily detected, and thecontrast increased (∆BAI value increased) as the chan-nel diameter increased (Fig. 9). Considerable evaluation isstill required to determine the cause underlying the appar-ent channel defect contrast effect, especially since ∆BAI isapproximately the same for air-filled and water-filled chan-nels smaller than about 80 µm in diameter. It is interesting
38 ieee transactions on ultrasonics, ferroelectrics, and frequency control, vol. 45, no. 1, january 1998
Fig. 10. (a) Light microscope image of a 10-µm air-filled channel defect, which is the slightly arched vertical line. The three roughly circularstructures in the center are material imperfections, and the two dark regions are the reference needle marks. The dashed straight line indicateswhere the sample was cut for end-view light-microscopy evaluation. (b) 17.3 MHz, normal-incidence BAI-mode image prior to cutting inwhich the reference needle marks and material imperfections are clearly seen. (c) 17.3 MHz, 7◦ BAI-mode image, and (d) 13.1 MHz, 10◦
BAI-mode image after cutting with the cut-edge border the bottom boundary of the images.
to observe that a greater contrast appears to be the case forair-filled channel defects greater than about 85 µm com-pared to similar sized water-filled channels, that is, whereka ≈ 2 or a/λ ≈ 1/π.
The image features of the BAI-mode image changed sig-nificantly as a function of the angle of incidence (Fig. 10).For normal incidence, the decreased BAI value at the chan-nel location (Fig. 8) is suggested to be caused by thedecreased echo amplitude from the bottom water-plasticsurface posterior to the channel location, presumably dueto an interfering wave scattered from the channel whichalso produces a region of acoustic shadow in the B-modeimages behind the channel. For oblique incidence, the in-creased BAI value at the channel location (Fig. 8) is sug-gested to be caused by increased echo amplitude from the
channel without the strongly interfering signals from thewater-plastic surfaces which are directed away from thetransducer. The best BAI-mode image results appearedto be obtained when the angle of incidence was increaseduntil only a small fraction of reflected echoes from the pla-nar water-plastic surface were received by the transducer.Another interesting characteristic of the oblique-incidenceBAI-mode images was its apparent ability to amplify to-pographical features of the sample surface.
The lateral extent of the channel defect appeared to berelated to the field’s spot size incident on the plastic sam-ple. The normal-incidence BAI-mode image of a 95-µmwater-filled channel defect exhibited a channel diameterof about 200 µm in the image (Fig. 7). This is consis-tent with a lateral resolution for the 17.3-MHz source of

raum et al.: defect detection in food packages 39
174 µm (Table I). Thus, it should be noted that the ob-served channel size is larger than the actual channel defectsize. Therefore, the BAI-mode imaging technique has po-tential for detecting channel defects, but it may be limitedfor characterizing the channel defect in term of its size.
The BAI-mode imaging technique has been shown todetect subwavelength (λwater ≈ 86–113 µm, λplastic ≈ 138–182 µm) channel defects in plastic trilaminate. Air-filledand water-filled channel defects as small as 10 µm in di-ameter could be detected in the BAI-mode images at anultrasonic center frequency of 17.3 MHz under oblique-incidence conditions. At 13.1 MHz, 10-µm air-filled and20-µm water-filled channel defects appeared to be mini-mally detectable. Under normal-incidence conditions, thesmallest detectable defect in BAI-mode images appearedto be about 25 µm in diameter.
BAI-imaging technology at 17.3 MHz appears to havethe capability to detect channel defects in the 10-µmrange regardless of whether low impedance (air) or highimpedance (water) material resides within the channel de-fect; it is not known whether this is the smallest channeldefect that can be imaged because the manufacturing ofsmaller defects represents considerable challenges. Com-bining this imaging capability with a reasonable depthof penetration and the ability to inspect opaque mate-rials, BAI-technology has clear advantages compared toother nondestructive methods. At the ultrasonic frequen-cies evaluated, the capability of BAI-mode images alreadymeets the requirements for safe food package inspectionin terms of the critical channel size, that is, it can de-tect channel defects reliably for diameters less than 50 µm.Also, there is still the added potential to increase the ul-trasonic frequency beyond that used in this study (i.e.,up to, say, 100 MHz) to achieve an even better detectionlimit (i.e., < 10 µm) while, at the same time, maintaininga reasonable depth of penetration sufficient for commonthicknesses of food packages (i.e., ≈ 0.2–0.4 mm).
Application of the results of this study will require im-provements in the speed and spatial range of the scanningdevice used. Large commercial canning lines typically op-erate at speeds ranging from 250 cans per minute for largefood cans, to more than 2600 cans per minute for beerand soft drinks. If the new types of packages are to be eco-nomically competitive, the inspection system should notrepresent the limiting factor on production speed. It maybe possible to design a multitransducer or array-based unitwhich processes many units at production speed. There isand always will be a premium on increasing the speed andefficiency of the scanners used. Additionally, more infor-mation about the criticality of different types of defectsand their attributes (path length, tortuosity, and posi-
tional variability) must be incorporated into the methodin order to make the inspection device adaptable to real-world applications.
Acknowledgments
The authors would like to acknowledge the professionalassistance with the sample validation by James F. Zachary,Department of Veterinary Pathobiology, University of Illi-nois.
References
[1] F. E. Long, “Flexible packages now withstand heat processingtemperatures of foods,” Package Eng., vol. 7, no. 3, pp. 63–65,69–72, 74, 76–77, 79–80, 1962.
[2] N. H. Mermelstein, “The retort pouch in the U.S.,” Food Tech-nol., vol. 30, no. 2, pp. 28–37, Feb. 1976.
[3] A. F. Badenhop and H. P. Milleville, “Institutional size retortpouches,” Food Proc., vol. 41, no. 2, pp. 82–86, 1980.
[4] J. F. Steffe, J. R. Williams, M. S. Chinnan, and J. R. Black,”Energy requirements and costs of retort pouch vs can packagingsystem,” Food Technol., vol. 34, no. 9, pp. 39–44, 1980.
[5] United States Code of Federal Regulations. Published by theOffice of the Federal Register. Superintendent of Documents,U. S. Government Printing Office, Washington, DC.
[6] R. A. Lampi, G. L. Schulz, T. Ciavarani, and P. T. Burke, “Per-formance and integrity of retort pouch seals,” Food Technol.,vol. 30, no. 2, pp. 38–48, Feb. 1976.
[7] C. L. Harper, B. A. Blakistone, J. B. Litchfield, and S. A. Mor-ris, “Developments in food packaging integrity testing,” FoodTechnol., vol. 6, no. 10, pp. 336–340, 1995.
[8] J. E. Gilchrist, B. S. Dhirendra, C. R. Dave, and W. D. Roger,“Leak detection in flexible retort pouches,” J. Food Prot., vol.52, no. 6, pp. 412–415, June 1989.
[9] D. Jarmon, B. Farahbakhsh, and R. Herzig, U.S. Patent5,343,042, “Ultrasonic inspection of seal integrity of bond linesin sealed containers,” Dec. 13, 1994.
[10] D. T. Maunder, J. F. Folinazzo, and J. J. Killoran, “Bio-testmethod for determining integrity of flexible packages of shelf-stable foods,” Food Technol., vol. 22, no. 5, pp. 615–618, May1968.
[11] L. Axelson, S. Cavlin, and J. Nordstrom, “Aseptic integrity andmicrohole determination of packages by electrolytic conductancemeasurement,” Packaging Technol. Sci., vol. 3, pp. 141–162,1990.
[12] J. W. Szczeblowski and F. J. Rubinate, “Integrity of food pack-ages,” Modern Packaging, vol. 38, no. 10, pp. 131–134, 1965.
[13] A. A. Safvi, H. J. Meerbaum, S. A. Morris, C. L. Harper, andW. D. O’Brien, Jr., “Acoustic imaging of defects in flexible foodpackages,” J. Food Prot., vol. 60, pp. 309–314, Mar. 1997.
[14] A. R. Selfridge, “Approximate material properties in isotropicmaterials,” IEEE Trans. Sonics Ultrason., vol. SU-32, no. 3,pp. 381–395, May 1985.
[15] R. E. Bolz and G. L. Tove, Handbook of Tables for Applied En-gineering Science. Boca Raton, FL: CRC Press, 1981.
[16] K. Raum and W. D. O’Brien, Jr., “Pulse-echo field distribu-tion measurement of high-frequency ultrasound sources,” IEEETrans. Ultrason., Ferroelect., Freq. Contr., vol. 44, no. 4, pp.810–815, July 1997.
[17] B. G. Lucas and T. G. Muir, “The field of a focusing source,”J. Acoust. Soc. Amer., vol. 72, no. 4, pp. 1289–1296, 1982.
[18] G. S. Kino, Acoustic Waves: Devices, Imaging, and Analog Sig-nal Processing. Englewood Cliffs, NJ: Prentice-Hall, 1987.
[19] A. Ozguler, S. A. Morris, and W. D. O’Brien, Jr., “Evaluation ofdefects in seal region of food packages using the backscatteredamplitude integral (BAI) technique,” Proceedings of the 1997IEEE Ultrasonics Symposium (in press).
[20] C. H. Frazier, A. Ozguler, S. A. Morris, and W. D. O’Brien, Jr.,“High-contrast images of defects in material seals,” Proceedingsof the 1997 IEEE Ultrasonics Symposium (in press).
[21] W. D. Wilson, “Speed of sound in distilled water as a functionof temperature and pressure,” J. Acoust. Soc. Amer., vol. 31,pp. 1067–1072, 1959.
40 ieee transactions on ultrasonics, ferroelectrics, and frequency control, vol. 45, no. 1, january 1998
Kay Raum was born in Halle/Saale, Ger-many, on March 1, 1972. He received hisVordiplom in Physics from the Martin LutherUniversity of Halle-Wittenberg in 1993. From1995–1996 he was with the Bioacoustics Re-search Laboratory at the University of Illinoisat Urbana-Champaign as a Visiting Scholar.Currently he is pursuing his Diplom degree inPhysics from the Martin Luther University ofHalle-Wittenberg.
His interests are in high frequencyacoustic imaging and characterization of
biological tissues.
Ayhan Ozguler was born in Ankara, Turkey,in 1968. He earned a B.S. degree from theFood Engineering department at the MiddleEast Technical University in Ankara, Turkey,in 1991, and received a M.S. degree from theFood Science and Human Nutrition Depart-ment at the University of Illinois, Urbana-Champaign in 1995. Currently he is enrolledin the Ph.D. program of the same departmentat the University of Illinois, and has been em-ployed as a research assistant since 1994.
He was awarded the government scholar-ship of Turkey to pursue master and Ph.D. degrees in the area offood packaging in the US in 1993.
Scott A. Morris received the B.S., M.S., andPh.D. degrees in 1981, 1987, and 1992 fromMichigan State University.
While employed at Michigan State Univer-sity, he worked with a variety of problemsrelated to the packaging industry. Develop-ment of an experimental permeation modelingtechnique utilizing a combination of numericalmodelling, optical measurement techniques,and laboratory analytical testing methods.Microwave cooking of frozen and shelf-stablefoods, and the redesign of their related pack-
age systems. Improved shipping designs for retortable-pouch packag-ing systems. Development of chromatographic methods for the eval-uation of volatile extractables from packaging materials. Determina-tion of oxygen-barrier requirements of products that had been previ-ously packaged in impermeable cans, and the evaluation of the suit-ability of producer-supplied polymeric replacements. Developmentof a research program in conjunction with a major packaging corpo-ration, to test the ability of their 2-liter aseptic package to surviveshipping and distribution. A survey of the state-of-the-art of pack-aging in the United States, and significant trends in the technicaland economic aspects of the packaging industry commissioned bythe Congressional Office of Technical Assessment (OTA). Investi-gating the relationship of package design to the effects of shock, vi-
bration and compression on fresh and controlled-atmosphere-storedproduces gaseous metabolic by-products.
Since 1992 he has been at the University of Illinois as an assistantprofessor in the departments of Food Science and Human Nutritionand Agricultural Engineering. He currently is developing a packagingresearch and teaching program. Current research projects within theprogram include: leak detection in shelf-stable food packages usinghigh-frequency ultrasound, predictive modeling of package-structurepermeation properties; static and dynamic structural modeling fordesign strength, and material-use optimizaton; packaging line effi-ciency optimization; product quality degradation from mechanical in-put and thermal variation; time-dependent material properties fromstress-strain histories using recursive finite element algorithms; andmicrowave energy dispersion in food packages.
Dr. Morris is a member of the executive committee of the Insti-tute of Food Technologists (IFT) Food Packaging Division, a memberof the American Society of Agricultural Engineers (ASAE), Societyof Professional Engineers (SPE), Institute of Packaging Profession-als (IoPP), American Society for Engineering Education (ASEE), PiKappa Gamma, and Gamma Sigma Delta.
William D. O’Brien, Jr. (S’64–M’70–SM’79–F’89) received the B.S., M.S., andPh.D. degrees in 1966, 1968, 1970, from theUniversity of Illinois, Urbana-Champaign.
From 1971 to 1975 he worked with theBureau of Radiological Health (currently theCenter for Devices and Radiological Health)of the U.S. Food and Drug Administration.Since 1975, he has been at the University ofIllinois, where he is a Professor of Electricaland Computer Engineering and of Bioengi-neering, College of Engineering, and Profes-
sor of Bioengineering, College of Medicine. He is the Director of theBioacoustics Research Laboratory and the Program Director of theNIH Radiation Biophysics and Bioengineering in Oncology TrainingProgram. His research interests involve the many areas of acousticsand ultrasound, including spectroscopy, risk-assessment, biologicaleffects, tissue characterization, dosimetry, blood-flow measurements,acoustic microscopy, and imaging. He has published more than 180papers.
Dr. O’Brien is Editor-in-Chief of the IEEE Transactions on Ul-trasonics, Ferroelectrics, and Frequency Control. He is a Fellow ofthe Institute of Electrical and Electronics Engineers (IEEE), theAcoustical Society of America (ASA), and the American Instituteof Ultrasound in Medicine (AIUM), and he is a Founding Fellow ofAmerican Institute of Medical and Biological Engineering. He wasrecipient of the IEEE Centennial Medal (1984), the AIUM Presi-dential Recognition Awards (1985 and 1992), the AIUM/WFUMBPioneer Award (1988), the IEEE Outstanding Student Branch Coun-selor Award (1989), and the AIUM Joseph H. Holmes Basic SciencePioneer Award (1993). He has been President (1982–1983) of theIEEE Sonics and Ultrasonics Group (currently the IEEE UFFC So-ciety), Co-Chairman of the 1981 IEEE Ultrasonic Symposium, andGeneral Chairman of the 1988 IEEE Ultrasonics Symposium, Presi-dent of the AIUM (1988–1991), and Treasurer of the World Federa-tion for Ultrasound in Medicine and Biology (1991–1994). He is the1997–1998 IEEE UFFC Society’s Distinguished Lecturer.