Microbial communities on flower surfaces act as signatures of pollinator visitation

EB SYMPOSIUM
Search for Microbial Signatures within Human and Microbial
Calcifications Using Soft X-Ray Spectromicroscopy
Karim Benzerara, Virginia M. Miller, Gerard Barell, Vivek Kumar, Jennyfer Miot,
Gordon E. Brown Jr, and John C. Lieske
Background: The origin of advanced arterial and renal calcification remains poorly understood. Self-replicating,
calcifying entities have been detected and isolated from calcified human tissues, including blood vessels and kidney
stones, and are referred to as nanobacteria. However, the microbiologic nature of putative nanobacteria continues to be
debated, in part because of the difficulty in discriminating biomineralized microbes from minerals nucleated on anything
else (eg, macromolecules, cell membranes). To address this controversy, the use of techniques capable of characterizing
the organic and mineral content of these self-replicated structures at the submicrometer scale would be beneficial.
Methods: Calcifying gram-negative bacteria (Caulobacter crescentus, Ramlibacter tataouinensis) used as references and
self-replicating calcified nanoparticles cultured from human samples of calcified aneurysms were examined using a
scanning transmission x-ray microscope (STXM) at the Advanced Light Source at Lawrence Berkeley National
Laboratory. This microscope uses a monochromated and focused synchrotron x-ray beam (80–2,200 eV) to yield
microscopic and spectroscopic information on both organic compounds and minerals at the 25 nm scale.
Results: High-spatial and energy resolution near-edge x-ray absorption fine structure (NEXAFS) spectra indicative of
elemental speciation acquired at the C K-edge, N K-edge, and Ca L2,3-edge on a single-cell scale from calcified C.
crescentus and R. tataouinensis displayed unique spectral signatures different from that of nonbiologic hydroxyapatite
(Ca10(PO4)6(OH)2). Further, preliminary NEXAFS measurements of calcium, carbon, and nitrogen functional groups of
cultured calcified nanoparticles from humans revealed evidence of organics, likely peptides or proteins, specifically
associated with hydroxyapatite minerals.
Conclusion: Using NEXAFS at the 25 nm spatial scale, it is possible to define a biochemical signature for cultured
calcified bacteria, including proteins, polysaccharides, nucleic acids, and hydroxyapatite. These preliminary studies
suggest that nanoparticles isolated from human samples share spectroscopic characteristics with calcified proteins.
However, additional STXM work on these nanoparticles at the N K-edge in particular is needed to determine if they are
calcified bacteria or hydroxyapatite nanoparticles that precipitated on proteins.<
Key words:
Journal of Investigative Medicine JIM_2006_06016.3d 12/10/06 13:25:39The Charlesworth Group, Wakefield +44(0)1924 369598 - Rev 7.51n/W (Jan 20 2003)
Presented at Experimental Biology 2006, San Francisco, CA,
April 1–5, 2006.
Address correspondence to: Dr. Karim Benzerara, IMPMC, Bat
7, 140 Rue de Lourmel, 75015 Paris, France. e-mail:
Journal of Investigative Medicine 2006; 54:000–000.
DOI 10.2310/6650.2006.06016
We gratefully acknowledge the support of National Science
Foundation Grant CHE-0431425 (Stanford Environmental
Molecular Science Institute) (G.E.B.), as well as support from
the Stanford Institute for the Environment (G.E.B. and K.B.)
and the France-Stanford Center for Interdisciplinary Studies
(K.B. and G.E.B.). The work at the Advanced Light Source
beam line 11.0.2 was supported in part by the Office of
Science, Office of Basic Energy Sciences, Division of
From the Institut de Mineralogie et de Physique des Milieux
Condenses, UMR 7590 and Institut de Physique du Globe de
Paris (K.B., J.M.), Paris Cedex, France; Surface and Aqueous
Geochemistry Group (K.B., G.E.B.), Department of Geological
and Environmental Sciences, Stanford University, Stanford,
CA; Departments of Surgery and Physiology and Biomedical
Engineering (V.M.M.) and Division of Nephrology (G.B., V.K.
J.C.L.), Mayo Clinic College of Medicine, Rochester, MN.
Materials Sciences, and Division of Chemical Sciences,
Geosciences, and Biosciences of the US Department of
Energy at Lawrence Berkeley National Laboratory under
contract No. DE-AC03-76SF00098. We acknowledge the
support of the National Institutes of Health (DK 62021), The
Ralph C. Wilson, Sr., and Ralph C. Wilson, Jr. Medical
Research Foundation, and the Mayo Clinic and Foundation.
;;;;;;;;;;;;;;;;;;;;;;;;;;;;;;;;;;;;;;;;;;;;;;;;;;;;;;;;;;;
1
; Calcification of arterial tissue is usually considered
a strong indicator of chronic inflammatory disease,
typically atherosclerosis. Despite its clinical impor-
tance, the mechanisms of mineral deposition in arteries
are still debated. Nucleation sites facilitating hydro-
xyapatite (HAP) precipitation are indeed usually
needed even under supersaturated conditions, but the
nature of such sites is still unclear. Among various
hypotheses proposed for pathologic tissue calcification
(eg, calcification of mitochondria or of extracellular
matrix vesicles), some suggest that microbes can
sometimes contribute to such calcification. These
hypotheses are based on histologic observations of
calcified aortic tissues from patients that sometimes
reveal the presence of bacteria.1 They are also based on
many experimental studies that show that some
bacterial strains enhance calcium phosphate precipita-
tion partly by promoting crystal nucleation.2–4
Folk observed the presence of nanoparticles in
natural calcium carbonate deposits by scanning elec-
tron microscopy (SEM) and proposed, based only on
their morphologies, that they were very small micro-
organisms, called nanobacteria (NB), that enhanced
calcium carbonate precipitation.5 Several years later,
Kajander and Cıftcıoglu reported the isolation of
infectious agents of an unusually small size (typically
0.2 to 0.5 mm in diameter, with some even smaller
forms of diameter 0.05 to 0.2 mm) from human and
bovine blood and human kidney stones that produced
a mineralized outer shell–like structure under physio-
logic conditions.6 They observed that when a few
drops of this culture were transferred to a fresh
medium, precipitation of calcium phosphate occurred
in the fresh medium after a few days (ie, transferable
biomineralization activity). These nanoforms were
characterized by transmission electron microscopy
(TEM) and were identified by nucleic acid stains and
16S ribosomal deoxyribonucleic acid (rDNA) sequen-
cing with a sequence ascribed to Nanobacterium sp and
Nanobacterium sanguineum. Since this work, several
studies have appeared on this topic supporting the
existence of NB and suggesting their involvement in a
large number of pathogeneses.7–11 However, other
studies propose an alternative nonmicrobial nature for
these calcified nanoparticles. Their small size, which is
theoretically too small for viable autonomous life, has
been a major argument against them being bacteria.12
In addition, Cisar and colleagues reported that they
were unable to reproduce the microbiology and
molecular biology experiments performed by
Kajander and Cıftcıoglu6; in particular, they noticed
that the 16S rDNA sequences were indistinguishable
from those of an environmental microorganism that
could have been a contaminant in the polymerase
chain reactions.13 As a result, Cisar and colleagues
proposed that the biomineralization processes studied
by Kajander and Cıftcıoglu6 may be attributed to
nonliving macromolecules and that nanocrystals of
HAP were simply transferred between cultures,
resulting in the growth of nanocrystalline HAP in
the new culture medium.13 Based on systematic
TEM observations of these nanoparticles and using
monoclonal antibodies, Vali and colleagues proposed
that NB were actually a novel form of protein-
associated mineralization and not living forms per
se,14 which supports the conclusion of Cisar and
colleagues.13
In our opinion, an insufficient level of character-
ization of these calcified nanoparticles and the use of
nondefinitive criteria for life forms are partly respon-
sible for the ambiguity concerning whether they were
microbial organisms. For example, the morphology of
calcified nanoparticles, including the description of a
purported cell wall–like structure, cannot be used as
reliable criteria proving that they are life forms.15,16 In
addition, the effective specificity of various probes used
to detect biomolecules can be contested as a definitive
criterion.13 For example, the detection of proteins
alone by antibodies does not demonstrate that a
nanoparticle is (or once was) a microbial organism.14
Moreover, fluorescent deoxyribonucleic acid (DNA)
probes are detected by optical microscopy, but this
method has insufficient spatial resolution to resolve
objects smaller than 0.2 mm. As mentioned by Cisar
and colleagues, most of the studies of NB ultimately
rely on targeting the HAP coatings or some macro-
molecule labeling and not the organism itself.13 Here
we demonstrate the capacity of scanning transmission
x-ray microscopy (STXM) for characterizing directly
both the mineral and the organic content of reference
bacteria that were experimentally calcified. The
objective of this study is to determine if spectroscopic
signatures for calcified microbes can be used to
decipher the nature of submicrometer-sized calcified
particles isolated from pathogenic calcifications. We
compare the results with those obtained in our
previous STXM study of experimentally calcified
Caulobacter crescentus cells17 and study another gram-
negative bacterium, Ramlibacter tataouinensis, which we
calcified in the laboratory4 and stored in this calcified
state for 4 years. These data are compared with STXM
data from sphere-shaped particles ranging in size from
30 to 150 nm that were isolated by Miller and
colleagues from calcified human aneurysms.18 This
earlier study found that sphere-shaped nanoparticles
were transferable (ie, when transferred to a new
Journal of Investigative Medicine JIM_2006_06016.3d 12/10/06 13:26:02The Charlesworth Group, Wakefield +44(0)1924 369598 - Rev 7.51n/W (Jan 20 2003)
2 Journa l o f Invest iga t ive Medic ine N volume 54 number 7 N November 2006
medium, calcium phosphate grew in the new med-
ium), stained positively with antibodies, and dyed
positively with DNA-specific probes. The researchers
also found that the cultures incorporated radiolabeled
uridine. These observations provide permissive evi-
dence for the nanoparticles being NB and offer ideal
targets for the STXM observations presented in this
study.
Materials and Methods
Bacterial Cultures in Calcifying Conditions
The calcification medium of R. tataouinensis
TTB310 was described in Benzerara and colleagues.4
The strain was kindly provided by T. Heulin (CEA
Cadarache, France= ). R. tataouinensis was cultured on
10-fold diluted tryptic soy broth agar medium (TSA/
10, Difco Laboratories> , agar concentration 15 g/L21)
supplemented with CaCl2 at a final concentration of 10
mM. Owing to the high concentration of phosphates
in TSA/10, which buffers the pH to 7.1, the culture
medium was highly supersaturated with respect to
calcium phosphate phases. To avoid extensive pre-
cipitation in the medium, the sterile CaCl2 solution
was added after autoclaving of the TSA/10 medium.
Cultures were incubated at 30uC for 3 weeks. One
plate dried after several weeks and was kept under
ambient conditions for 4 years. Even after this
extended period of time, microbial colonies could still
be discerned as 1 to 2 mm large yellow calcium
phosphate concretions.
Cultures of Calcified Nanoparticles
Segments of explanted tissue were collected as
surgical waste from patients undergoing elective repair
of abdominal aortic aneurysm18 or an S90 nanoparticle
culture of bovine origin obtained from Dr. Olavi
Kajander (Univeristy of Kuopio, Finland). All cultures
were maintained in a 150 cm2 tissue culture flask
containing 10 mL of Dulbecco’s Minimal Essential
Media supplemented with triple-filtered 10% fetal calf
serum, 50 mmol/L b-? mercaptoethanol, and 3.6 mmol/
L CaCl2. After 3 weeks, the calcified nanoparticles
were washed five times with physiologic buffered
saline solution (PBS at pH 7.4), and then the
nanoparticles were harvested with a rubber cell-scraper
and pooled together in 1.5 mL microtubes for washing,
such that each wash consisted of 1 mL PBS
centrifugation at 15,000g for 10 minutes. One sample
(N1) was the same grid used for TEM experiments in a
previous study.18
Sample Preparation for STXM and TEM
Calcified colonies of R. tataouinensis were col-
lected from the dried agar plates with tweezers and
ground in an agate mortar. The powder was suspended
in sterile water, deposited on an Si3N4 STXM sample
holder, and dried in air. Liquid suspensions of the
human-derived and S90 nanoparticles were washed
with a sterile ionic strength buffer (0.01 M NaNO3,
pH 5 7). One drop of each solution was deposited on
an Si3N4 STXM sample holder and dried in air. The
same sample holders were used in both STXM and
TEM studies.
TEM and STXM Observations
TEM observations were performed on a Jeol
2010F transmission electron microscope operating at
200 kV and equipped with a field emission gun, a
high-resolution UHR pole piece, and a Gatan GIF 200
energy filter. @STXM characterization studies were performed at
the Advanced Light Source (Berkeley, CA) on branch
line 11.0.2.219 with the synchrotron storage ring
operating at 1.9 GeV and 200 to 400 mA stored
current. STXM is a type of transmission microscopy
using a monochromated x-ray beam produced by
synchrotron radiation. The energy of the beam can be
varied by increments of less than 0.1 eV over a wide
energy range (80–2,200 eV). The beam is focused on
the sample using a condenser zone plate down to a spot
size of <40 nm, which is the spatial resolution
achieved in this study. A two-dimensional image is
collected by scanning the sample stage at a fixed
photon energy. The image contrast results from
differential absorption of x-rays, which depends on
the chemical composition of the sample. Maps of
calcium, nitrogen, and carbon distributions were
obtained by subtracting the image below the Ca
L2,3-edge (<350 eV) or N (<400 eV) or C (<280 eV)
K-edge, respectively, from the image of the same area
above the edge. Near-edge x-ray absorption fine
structure (NEXAFS) spectra were collected at the C
K-edge, the N K-edge, and the Ca L2,3-edge on
calcified C. crescentus cells, on R. tataouinensis cells, and
on calcified nanoparticles isolated from human aneur-
ysms. NEXAFS spectra provide information on the
different functional groups present in the selected area
for a given element. For example, various functional
groups can be discriminated at the C K-edge, including
aromatic, ketonic or phenolic, amide, carboxyl, and
carbonate groups. Identification of these different
functional groups permits discrimination among var-
ious biochemical compounds, such as proteins, poly-
saccharides, or DNA.4,20,21 AXis2000 software
Journal of Investigative Medicine JIM_2006_06016.3d 12/10/06 13:26:02The Charlesworth Group, Wakefield +44(0)1924 369598 - Rev 7.51n/W (Jan 20 2003)
Microbial Signatures in Human Calcif ications/Benzerara et al 3
(version 2.1n)22A was used to extract NEXAFS spectra
from our measurements. A 150 L/mm grating and 20
mm exit slit were used for carbon K-edge imaging and
spectroscopy; a 1,200 L/mm grating and 30 mm slit
were used for nitrogen K-edge and calcium L2,3-edge
measurements. Energy calibration was accomplished
using the well-resolved 3p Rydberg peak at 294.96 eV
of gaseous CO2 for the C K-edge, the Rydberg peaks
at 406.150 eV and 407.115 eV of gaseous N2 for the N
K-edge,23 and the L3 NEXAFS peak in the calcite Ca
L-edge NEXAFS spectrum, which occurs at 349.3
eV.24
Results
STXM capabilities relevant to the search for
microbial signatures within calcifications were
obtained through the observation of 4-year-old
calcified R. tataouinensis cells. We know from a
previous TEM study that this strain calcifies in less
than 3 weeks, with HAP crystals forming in the
periplasm and inside the cell.4 The old samples (4 years
after calcification) were used to test the effect of aging
on the preservation of the organic content within the
calcified cells. The STXM results presented here are
very similar to those previously obtained on C.
crescentus at the C K-edge and at the Ca L2,3-edges.17
NEXAFS data at the N K-edge for those two bacteria
are also presented.
STXM Observations of Calcificied R. tataouinensis Cells at
the Ca L2,3-Edge
Figure 1 shows two images of a cluster of calcified
R. tataouinensis cells taken at a single energy with a
spatial resolution of <40 nm, one at an energy below
(342 eV, Figure 1A) and one above the edge (349.3
eV, Figure 1B). By converting both images into optical
density units and subtracting one from the other, it is
possible to obtain an enhanced calcium distribution
map (Figure 1C). This energy-filtered imaging proce-
dure is a very useful first step in locating specific
calcifications in samples of interest. Moreover, it
provides a semiquantitative estimate of the element
content as the intensity of each pixel on the
distribution map is linearly related to the mass of
calcium (ie, the concentration of calcium in the object
times the thickness of the object) present in the pixel
volume. Hence, it is interesting to note the intensity
values provided by the distribution maps for each
element to eventually compare them between calcified
microbes and calcified nanoparticles. Here, the mean
Ca L3-edge intensity value for the calcified R.
tataouinensis cells is 1.8. A Ca L2,3-edge NEXAFS
spectrum was collected as well on the R. tataouinensis
cells (Figure 1D). This spectrum is compared with one
collected on 3-week-old calcified C. crescentus cells and
reference abiotic HAP and shows an exact match with
the C. crescentus spectrum regarding the number,
position, and intensity of all the peaks that are at the
following energies (see arrows on Figure 1D): 347.1
eV, 347.7 eV, 348.2 eV, 348.6 eV, 349.3 eV, 351.6
eV, and 352.5 eV.
STXM Observations of Calcificied R. tataouinensis Cells at
the C K-Edge
The same approach as in the Ca L2,3-edge study
was used on the calcified R. tataouinensis sample at the
C K-edge on the same sample area, and the results are
shown in Figure 2. One image was taken at an energy
below the C K-edge (280 eV; see Figure 2A) and one
was taken above the edge (288.2 eV; see Figure 2B),
which corresponds to the maximum absorption energy
for various calcified and noncalcified bacterial cells and
proteins that were analyzed in previous studies. A
difference (distribution) image is shown in Figure 2C,
which clearly shows one (and possibly three) R.
tataouinensis cell(s). The mean intensity value on the
R. tataouinensis cell displaying the highest contrast is
about 0.5. The C K-edge NEXAFS spectrum
measured on the calcified R. tataouinensis cell display-
ing the highest contrast showed four prominent
peaks at 285.2 eV, 288.2 eV, 289.5 eV, and 290.3
eV and one peak at 286.8, which is barely distinguish-
able as a shoulder on the peak at 288.2 eV (Figure 2D).
This spectrum is compared with spectra collected
on (1) 2-day-old noncalcified C. crescentus cells, (2)
3-week-old calcified C. crescentus cells, (3) noncalcified
gram-positive Bacillus subtilis cells, and (4) the C
K-edge NEXAFS spectra of DNA, albumin taken as
a reference for proteins, and calcium carbonate
(calcite polymorph). As noted previously,4 the peak
at 290.3 eV could be observed only on calcified
bacteria.
STXM Observations of Calcified R. tataouinensis Cells at
the N K-Edge
Two images, one below the N K-edge (395 eV;
Figure 3A) and one above the N K-edge (410 eV;
Figure 3B), were taken on another area of the same
sample as discussed above showing two R. tataouinensis
cells. A mean intensity value of 0.12 was estimated
from the difference map (Figure 3C). The N K-edge
NEXAFS spectra measured on the R. tataouinensis cell
located near the top of Figure 3 show three prominent
peaks at 399 eV, 399.9 eV, and 401.2 eV (Figure 3D).
This spectrum is compared Cwith one collected on 2-
Journal of Investigative Medicine JIM_2006_06016.3d 12/10/06 13:26:02The Charlesworth Group, Wakefield +44(0)1924 369598 - Rev 7.51n/W (Jan 20 2003)
4 Journa l o f Invest iga t ive Medic ine N volume 54 number 7 N November 2006

day-old noncalcified C. crescentus cells and one
collected on microorganisms entombed in calcium
carbonate in a microbialite (Lake Van, Turkey,
microbialites; Benzerara and colleagues25).
These analyses on reference calcified bacteria
provide a framework for subsequent analyses of
calcifications that are believed to be involved in
pathogeneses. The presence of calcium, carbon, and
nitrogen and a semiquantitative estimate of their
quantities can be evaluated on submicrometer-sized
objects by STXM mapping. NEXAFS spectra at the
Ca L2,3-edges and the C and N K-edges can be
compared with those obtained from the reference
calcified bacteria. This comparison is presented in the
following section.
STXM Observations of Calcified Nanoparticles at the C and
N K-Edges and the Ca L2,3-Edge
TEM and STXM observations were combined to
characterize three different cultures of calcified nano-
particles: one (named N1 in this study) was used for
TEM described by Miller and colleagues18 and was
isolated from calcified abdominal aortic aneurysms; A2
also was isolated from human aneurysm but was
Journal of Investigative Medicine JIM_2006_06016.3d 12/10/06 13:26:02The Charlesworth Group, Wakefield +44(0)1924 369598 - Rev 7.51n/W (Jan 20 2003)
Figure 1 Spectromicroscopy on calcified Ramlibacter tataouinensis cells. A, Scanning transmission x-ray microscope
(STXM) image of a cluster of R. tataouinensis cells (see dark spots marked by arrows) at 342 eV (below the Ca L2,3-edge). B,
STXM image of the same area at 349.3 eV, that is, at the L3 resonance energy. Particles appear to be much darker, showing
the presence of calcium. C, Calcium map obtained by subtraction of A and B converted into optical density units. D, Calcium
L2,3-edge near-edge x-ray absorption fine structure (NEXAFS) spectra of calcified R. tataouinensis cells, Caulobacter
crescentus cells,4 and abiotic hydroxyapatite (HAP). The arrows show the different peaks. B
Microbial Signatures in Human Calcif ications/Benzerara et al 5

prepared as a fresh culture isolate, and S90 nanoparticle
cultures were obtained from O. Kajander.
TEM observations show the presence of sub-
micrometer-sized calcium phosphate nanoparticles in
all of the samples (Figure 4). The texture of the N1
culture (Figure 4, A and B) differs slightly from those
of the A2 (Figure 4, C and D) and S90 (Figure 4, E and
F) cultures. N1 shows concentric structures that are
reminiscent of cells composed of 80 nm–wide spheres
surrounded by clusters of nanocrystals with the same
plate-like morphology as usually observed for HAP.
The A2 and S90 cultures show 300 nm–wide spheres
and rod-shaped forms of the dimensions 120 nm 3
350 nm. All of these nanoparticles are composed at
least partly of HAP crystals, as shown by EDX EXanalyses
and electron diffraction patterns (data not shown).
Journal of Investigative Medicine JIM_2006_06016.3d 12/10/06 13:26:17The Charlesworth Group, Wakefield +44(0)1924 369598 - Rev 7.51n/W (Jan 20 2003)
Figure 2 Spectromicroscopy on the same area as in Figure 1 at the carbon K-edge. A, Scanning transmission x-ray
microscope (STXM) image taken at 280 eV, below the carbon K-edge. B, STXM image taken at 288.2 eV, that is, the
resonance energy of carboxylic groups in proteins. C, Map of carbon functional groups absorbing at 288.2 eV, that is, mostly
proteins, obtained by subtraction of A and B converted into optical density units. D, Carbon K-edge near-edge x-ray
absorption fine structure spectra of calcified Ramlibacter tataouinensis cells (this study), calcified and noncalcified
Caulobacter crescentus cells,4 and noncalcified Bacillus subtilis cells. Reference spectra of deoxyribonucleic acid (DNA),21
albumin (taken as a model for protein; see Lawrence and colleagues21), and calcium carbonate (calcite) are shown for
comparison. Letters a, b, c, d, and e denote peaks at 285.2, 286.5, 288.2, 289.5, and 290.3 eV, respectively.
6 Journa l o f Invest iga t ive Medic ine N volume 54 number 7 N November 2006

The same areas were studied by STXM. Mapping
at the Ca L2,3-edge supported TEM observations and
showed the pervasive presence of calcium on the three
sets of samples (the results for S90 are shown in Figure
5). NEXAFS spectra were acquired at the Ca L2,3-edge
on several calcified nanoparticles from different loca-
tions in the three sets of samples. They were all
identical and showed the same seven peaks as observed
on the NEXAFS spectra measured on calcified bacteria
and on abiotic HAP (see Figure 5DEO ).
Mapping at the C K-edge showed the presence of
carbon associated with the HAP nanoparticles. Carbon
concentrations were much higher in the N1 samples,
with intensities on the distribution map up to 0.4
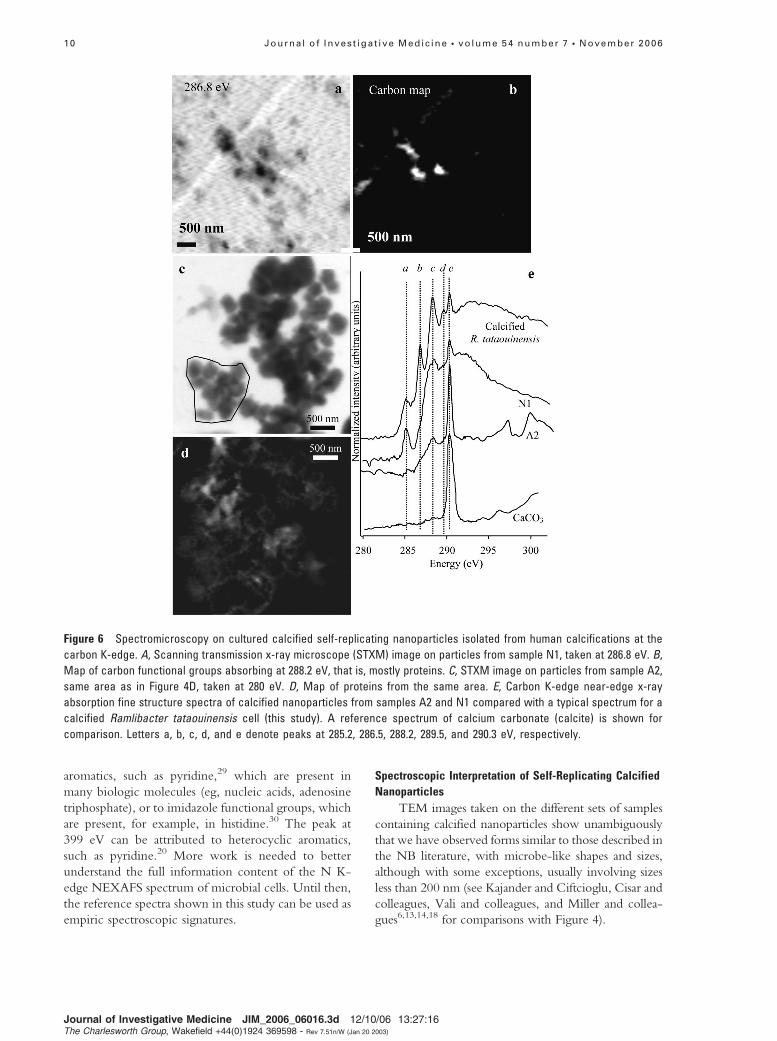
(Figure 6B).EP Carbon concentrations were, however,
lower in the A2 and S90 samples, with intensities of
about 0.07 and 0.03, respectively, as indicated by the
distribution maps. NEXAFS spectra at the carbon
K-edge were similar for the different samples but with
much more noise for A2 and S90, which correlates
with the relatively low carbon concentrations in these
samples. Three peaks can be easily distinguished at
285.2 eV, 288.2 eV, and 290.3 eV. Peaks at 286.5 eV
and 289.5 eV could not be detected in these two
samples, however.
Mapping at the N K-edge was performed on the
S90 sample. The map distribution showed some
particles with intensities up to 0.04. NEXAFS spectra
were obtained from such areas and are shown in Figure
7. The spectra are different from N K-edge NEXAFS
Journal of Investigative Medicine JIM_2006_06016.3d 12/10/06 13:26:33The Charlesworth Group, Wakefield +44(0)1924 369598 - Rev 7.51n/W (Jan 20 2003)
Figure 3 Spectromicroscopy on calcified Ramlibacter tataouinensis cells at the nitrogen K-edge. A, Scanning transmission
x-ray microscope (STXM) image taken at 395 eV, below the nitrogen K-edge. B, STXM image taken at 410 eV, above the
nitrogen K edge. C, Nitrogen distribution map generated by subtracting A and B; D, Nitrogen K-edge NEXAFS spectra of
calcified R. tataouinensis cells (this study), noncalcified C. crescentus cells,25 and a microbe entombed in calcium
carbonates from a natural environment (Lake Van, Turkey; see Benzerara and colleagues25). Vertical dotted lines at 399 eV,
399.9, and 401.2 eV show correlations between the spectra.
Microbial Signatures in Human Calcif ications/Benzerara et al 7

spectra measured on calcified R. tataouinensis cells,
noncalcified C. crescentus cells, or microorganisms from
natural environments, with only two pronounced
peaks, at 399.8 and 401 eV.
Discussion
Spectroscopic Signatures for Calcified Microbes
In a previous study of calcified C. crescentus cells,17
we demonstrated the ability of STXM to provide a
good signature for microorganisms versus simple
macromolecules such as proteins or polysaccharides.
We now have an extended set of data on noncalcified
cells, including C. crescentus, B. subtilis, Shewanella
oneidensis (data not shown), and the cyanobacteria
Synechococcus leopoliensis (data not shown), all of which
have identical C K-edge NEXAFS spectra, with four
peaks at 285.2, 286.5, 288.2, and 289.5 eV. We also
have an extended set of data on calcified cells,
including C. crescentus and R. tataouinensis, which
display C K-edge spectra almost identical to those of
noncalcified cells except for the presence of an
additional peak at 290.3 eV. As explained in
Benzerara and colleagues, and in agreement with the
indications provided by the NEXAFS spectra at the Ca
L2,3-edge, which perfectly matches the reference HAP
Ca L2,3-edge NEXAFS spectrum, it is likely that
carbonate groups systematically detected in calcified
cells are incorporated into the HAP structure by
substitution for phosphate groups and, to a lesser
Journal of Investigative Medicine JIM_2006_06016.3d 12/10/06 13:26:44The Charlesworth Group, Wakefield +44(0)1924 369598 - Rev 7.51n/W (Jan 20 2003)
Figure 4 Transmission electron microscopic images of cultured calcified nanoparticles isolated from human calcifications.
A and B are from sample N1; C and D are from sample A2; E and F are from sample S90.
8 Journa l o f Invest iga t ive Medic ine N volume 54 number 7 N November 2006

extent, OH ions, as is usually inferred for HAP.17,26
Besides, it is postulated that the C K-edge NEXAFS
spectra presented in Figure 2 can be used as an empiric
but operative spectroscopic signature to detect the
presence of microbes in calcifications.
A first step in a less empiric approach, however,
consists of identifying the different peaks detected in
the NEXAFS spectra. Based on assignments previously
made,20,21,27 peaks at 285.2, 286.5, 288.2, and 290.3
eV can be attributed to aromatic groups, phenolic and/
or ketonic groups, peptide bonds, and carbonate
groups, respectively. The peak at 289.5 eV is more
uncertain but can be tentatively attributed to carbonyl
groups. A second step consists of relating these
electronic transitions to relevant biomolecules present
in bacterial cells. Based on fingerprinting, the 285.2
and 288.2 eV peaks can be tentatively attributed to
proteins, whereas the 286.5 eV is usually associated
with sugars. The 289.5 eV is at the same energy
position as the C 5 O groups in nucleic acids. From
that perspective, it is worth noting, in agreement with
Benzerara and colleagues,17 that although it may be
theoretically possible to design nonmicrobial organic
mixtures in the laboratory displaying such a complex
spectrum at the C K-edge, we believe that the C K-
edge spectrum of bacteria is likely unique and specific
and that it is conserved in aged calcified cells.
The N K-edge NEXAFS spectrum of a microbial
cell can be discussed in a similar way. Despite variations
in relative intensities among the different peaks
comprising the N K-edge NEXAFS spectra of calcified
versus noncalcified bacterial cells, all of the N K-edge
NEXAFS spectra of reference bacteria cells display
three peaks at 399, 399.9, and 401.2 eV. The
attribution of these peaks to functional groups,
however, is much more speculative and will require
more work. Based on the N K-edge NEXAFS data
presented in Gordon and colleagues,28 the peak at
401.2 eV can be attributed to amide groups. The peak
at 399.9 eV can be related either to heterocyclic
Journal of Investigative Medicine JIM_2006_06016.3d 12/10/06 13:27:01The Charlesworth Group, Wakefield +44(0)1924 369598 - Rev 7.51n/W (Jan 20 2003)
Figure 5 Spectromicroscopy on cultured calcified nanoparticles isolated from human calcifications at the Ca L2,3-edge. A,
Scanning transmission x-ray microscope (STXM) image of particles from sample S90 at 340 eV (below the Ca L2,3-edge). B,
STXM image of the same area at 349.3 eV, that is, at the L3 resonance energy. C, Calcium distribution map of the same area
generated by subtracting A and B. D, Calcium L2,3-edge near-edge x-ray absorption fine structure (NEXAFS) spectra of
calcified nanoparticles from samples A2, S90, and N1 compared with the NEXAFS spectrum from abiotic hydroxyapatite
(HAP).
Microbial Signatures in Human Calcif ications/Benzerara et al 9
aromatics, such as pyridine,29 which are present in
many biologic molecules (eg, nucleic acids, adenosine
triphosphate), or to imidazole functional groups, which
are present, for example, in histidine.30 The peak at
399 eV can be attributed to heterocyclic aromatics,
such as pyridine.20 More work is needed to better
understand the full information content of the N K-
edge NEXAFS spectrum of microbial cells. Until then,
the reference spectra shown in this study can be used as
empiric spectroscopic signatures.
Spectroscopic Interpretation of Self-Replicating Calcified
Nanoparticles
TEM images taken on the different sets of samples
containing calcified nanoparticles show unambiguously
that we have observed forms similar to those described in
the NB literature, with microbe-like shapes and sizes,
although with some exceptions, usually involving sizes
less than 200 nm (see Kajander and Ciftcioglu, Cisar and
colleagues, Vali and colleagues, and Miller and collea-
gues6,13,14,18 for comparisons with Figure 4).
Journal of Investigative Medicine JIM_2006_06016.3d 12/10/06 13:27:16The Charlesworth Group, Wakefield +44(0)1924 369598 - Rev 7.51n/W (Jan 20 2003)
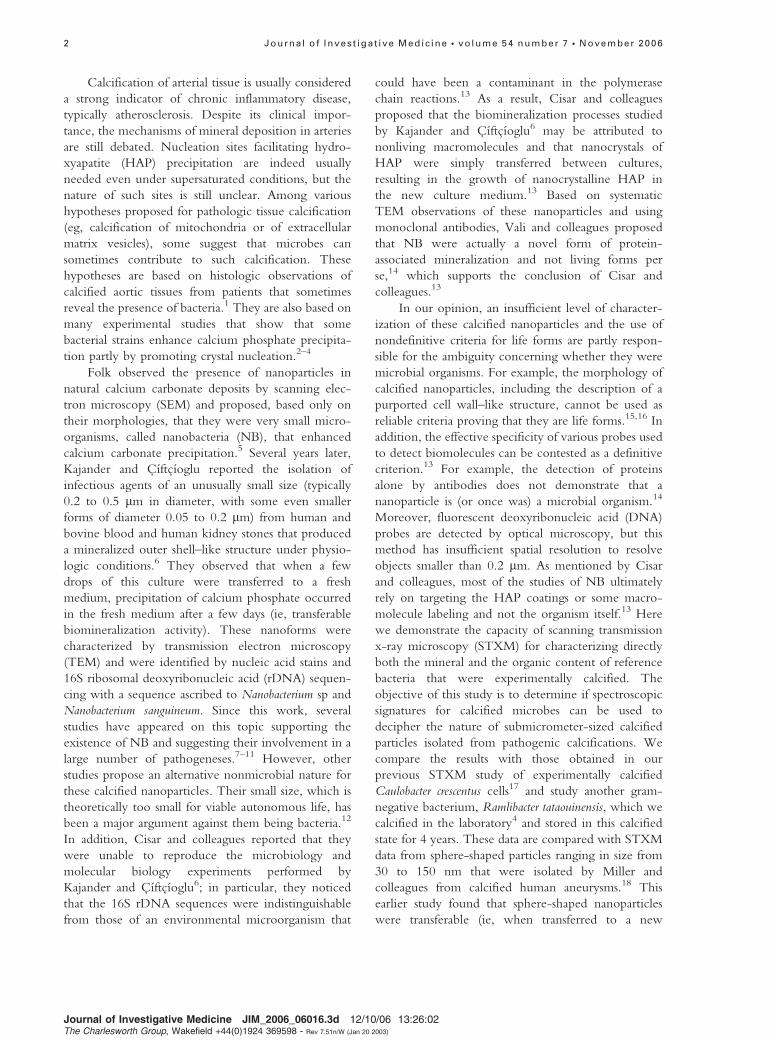
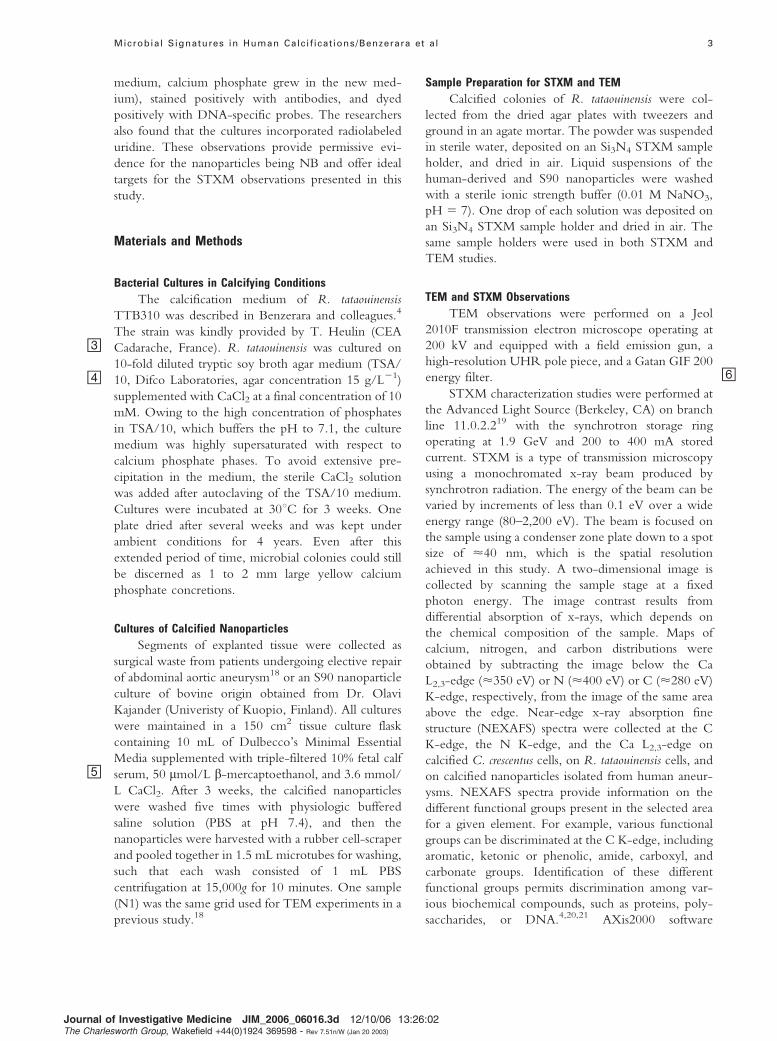
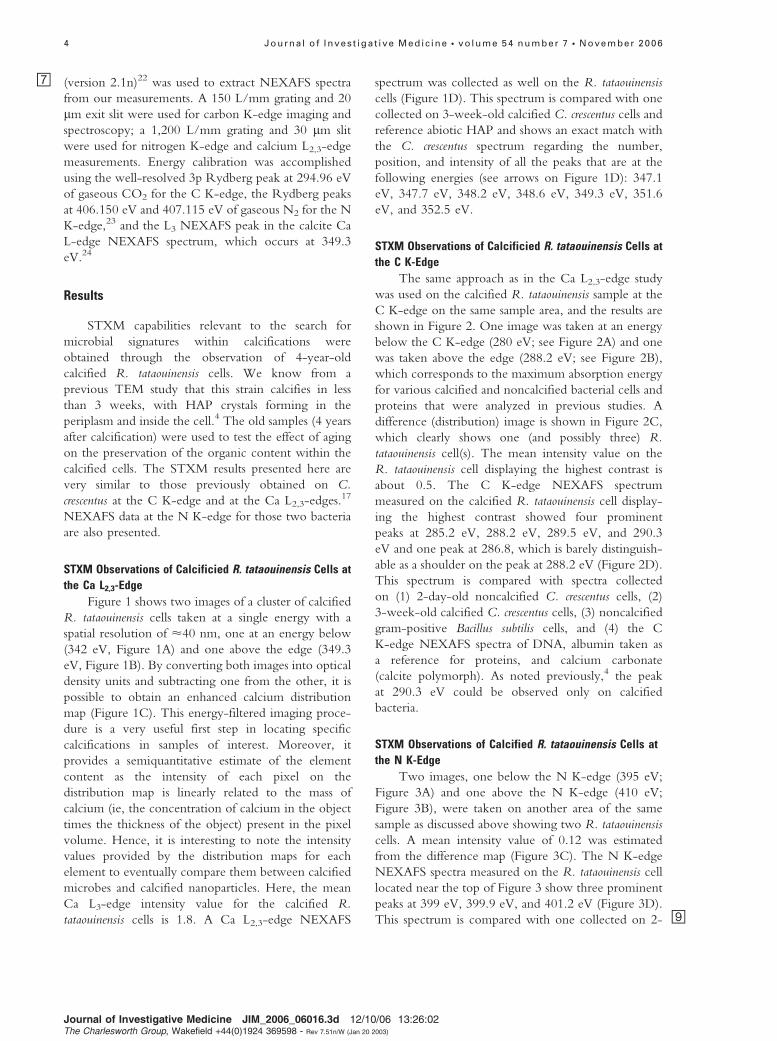
Figure 6 Spectromicroscopy on cultured calcified self-replicating nanoparticles isolated from human calcifications at the
carbon K-edge. A, Scanning transmission x-ray microscope (STXM) image on particles from sample N1, taken at 286.8 eV. B,
Map of carbon functional groups absorbing at 288.2 eV, that is, mostly proteins. C, STXM image on particles from sample A2,
same area as in Figure 4D, taken at 280 eV. D, Map of proteins from the same area. E, Carbon K-edge near-edge x-ray
absorption fine structure spectra of calcified nanoparticles from samples A2 and N1 compared with a typical spectrum for a
calcified Ramlibacter tataouinensis cell (this study). A reference spectrum of calcium carbonate (calcite) is shown for
comparison. Letters a, b, c, d, and e denote peaks at 285.2, 286.5, 288.2, 289.5, and 290.3 eV, respectively.
10 Journa l o f Invest iga t ive Medic ine N volume 54 number 7 N November 2006

NEXAFS spectra at the Ca L2,3-edge, electron
diffraction patterns, and the systematic detection of a
carbonate peak in the C K-edge NEXAFS spectra of
the nanoparticles show that carbonate HAP is one
of their fundamental constituents, in agreement with
previous mineralogic characterizations of these
objects.14 We also found evidence for a carbon- and
nitrogen-containing compound almost systematically
associated with the nanoparticles. On the basis of
NEXAFS spectroscopy at the C and N K-edges, we
suggest that this compound is a protein or possibly a
mixture of proteins. This suggestion is in agreement
with previous studies, which showed staining of the
calcified nanoparticles by antibodies and/or extracted
candidate protein fractions from them.6,13,14,18
However, the present study provides the first direct
evidence for the presence of proteins in association
with these particles, which eliminates potential non-
specific labeling issues. Moreover, based on semiquan-
titative estimates of carbon and nitrogen contents, we
deduce that carbon and nitrogen contents are three to
five times lower in the nanoparticles compared with R.
tataouinensis cells. An exception to this statement is the
N1 sample, which displayed a carbon content almost
identical to that of R. tataouinensis cells. It is more
appropriate to compare concentrations, which requires
knowledge of the thickness of the sample areas that
were probed. Although the anticipated thickness of R.
tataouinensis is 500 nm, TEM images show that the
calcified nanoparticles in the A2 and S90 culture
samples have an average thickness of 200 nm. The
concentration of proteins may thus be roughly similar
for all of these objects. It is not known, however, how
aging or the composition of the culture medium might
influence protein concentration, which may thus not
be diagnostic of microbial cells. It is important to note
Journal of Investigative Medicine JIM_2006_06016.3d 12/10/06 13:27:36The Charlesworth Group, Wakefield +44(0)1924 369598 - Rev 7.51n/W (Jan 20 2003)
Figure 7 Spectromicroscopy on cultured calcified self-replicating nanoparticles isolated from human calcifications at the
nitrogen K-edge. A, Scanning transmission x-ray microscope (STXM) image on particles from sample S90, taken at 390 eV
(below the N K-edge). B, STXM image of the same area at 407 eV (above the N K-edge). C, Map of nitrogen distribution
generated by subtracting A and B; D, Nitrogen K-edge near-edge x-ray absorption fine structure spectra of calcified
nanoparticles from sample S90 compared with a typical spectrum from a calcified Ramlibacter tataouinensis cell (this study)
and noncalcified Caulobacter crescentus cells. Vertical lines are positioned at 399, 399.9, and 401.2 eV.
Microbial Signatures in Human Calcif ications/Benzerara et al 11

that we found no evidence for any protein-rich
globules that were not associated with carbonate
HAP at the submicrometer scale.
Significantly, we did not detect peaks at the C K-
edge in the calcified human nanoparticles other than
those unambiguously attributed to proteins and
carbonates (285.2, 288.2, and 290.3 eV). In contrast,
a number of peaks attributable to a variety of
biomolecules were detected in the C K-edge spectra
of the reference noncalcified and calcified microbial
cells (including peaks at 286.5 and 289.5 eV in addition
to those at 285.2, 288.2, and 290.3 eV). Similarly, we
did not detect in N K-edge NEXAFS spectra on
calcified S90 nanoparticles the peak at 399 eV, which
was detected in calcified and noncalcified reference
microbial cells. Hence, on an empiric basis, NEXAFS
spectroscopy does not support the earlier suggestion
that the calcified nanoparticles are calcified bacteria.
The NEXAFS spectra of these nanoparticles do not
provide evidence for biochemical compounds other
than proteins, with the possible exception of the peak
at 399.9 eV in the N K-edge spectrum. Additional
work is required to understand whether this peak is
related to proteins or nucleic acids and whether the
nanoparticles are a unique organism distinct from other
calcified forms of bacteria we have studied or an
interesting example of protein-driven biomineraliza-
tion.
Conclusions
STXM offers very useful capabilities for imaging
submicrometer-scale organomineral assemblages of
interest to the medical sciences. X-ray imaging at the
Ca L2,3-edge allows quick location of calcified areas in
a microbial or human sample. NEXAFS spectroscopy
at the C and N K-edges provides signatures for major
classes of biochemical compounds (eg, proteins,
polysaccharides, nucleic acids) and as proposed in this
study a signature for microbial cells. The calcified
nanoparticles studied here display C K-edge and N K-
edge NEXAFS spectra different from those of
reference calcified bacteria. Based on still somewhat
limited knowledge of the meaning of these reference
NEXAFS spectra, particularly those for nitrogen, we
found evidence for the presence of only carbonate
HAP and proteins in the calcified nanoparticles.
Spectroscopy hence casts doubt on earlier suggestions
that these nanoparticles are calcifying bacteria and
instead suggests that HAP nanoparticles nucleated and
grew in association with a protein matrix in these
samples. More work is thus needed to reconcile the
biochemical and spectroscopic data on those objects to
determine the true nature of these entities and the
forces driving the mineralization. Additional funda-
mental work is needed to fully deconvolute the
NEXAFS spectra from these samples. In any event,
the calcified nanoparticles remain a very interesting
system to study the process of biomineralization and
their mechanism of formation, and the conditions
controlling their size and morphology still need to be
elucidated. This study also illustrates how STXM can
provide an efficient approach to the study of
pathogenic calcifications both in vitro and in vivo at
the 25 to 40 nm spatial scale with elemental and
functional group specificity and thus is complementary
to TEM and epifluorescent microscopy.
Acknowledgments
We wish to thank Tolek Tyliszczak (Advanced Light
Source) for his help in optimizing the scanning
transmission x-ray microscope on branch line
11.0.2.2 at Advanced Light Source that was used in
this study. We also thank Martin Obst and Maria
Dittrich for providing samples of S. leopoliensis cultures.
References
1. Ghidoni JJ. Role of Bartonella henselae endocarditis in the
nucleation of aortic valvular calcification. Ann Thorac Surg
2004;77:704–6.
2. Moorer WR, Ten Cate JM, Buijs JF. Calcification of a
cariogenic Streptococcus and of Corynebacterium (Bacterionoma)
matruchotii. Dent Res 1993;72:1021–6.
3. Ennever J, Vogel JJ, Streckfuss JL. Calcification by
Escherichia coli. J Bacteriol 1974;119:1061–2.
4. Benzerara K, Menguy N, Guyot F, et al. Biologically
controlled precipitation of calcium phosphate by Ramlibacter
tataouinensis. EPSL 2004;228:439–49.
5. Folk RL. SEM imaging of bacteria and nannobacteria in
carbonate sediments and rocks. J Sediment Petrol 1993;63:
990–9.
6. Kajander EO, Ciftcioglu N. Nanobacteria: an alternative
mechanism for pathogenic intra- and extracellular calcifica-
tion and stone formation. Proc Natl Acad Sci U S A 1998;
95:8274–82.
7. Ciftcioglu N, Bjorklund M, Kuorikoski K, et al.
Nanobacteria: an infectious cause for kidney stone forma-
tion. Kidney Int 1999;56:1893–8.
8. Hjelle JT, Miller-Hjelle MA, Poxton IR, et al. Endotoxin
and nanobacteria in polycystic kidney disease. Kidney Int
2000;57:2360–74.
9. Hudelist G, Singer CF, Kubista E, et al. Presence of
nanobacteria in psammoma bodies of ovarian cancer:
evidence for pathogenetic role in intratumoral biominer-
alization. Histopathology 2004;45:633–7.
10. Sommer AP. Could reduced bone mineral densities in HIV
be caused by nanobacteria? J Proteome Res 2004;3:670–2.
Journal of Investigative Medicine JIM_2006_06016.3d 12/10/06 13:27:48The Charlesworth Group, Wakefield +44(0)1924 369598 - Rev 7.51n/W (Jan 20 2003)
12 Journa l o f Invest iga t ive Medic ine N volume 54 number 7 N November 2006

11. Wood HM, Shoskes DA. The role of nanobacteria in
urologic disease. World J Urol 2006;24:51–4.
12. Nealson KH. Nannobacteria: size limits and evidence.
Science 1997;276:1776.
13. Cisar JO, Xu DQ, Thompson J, et al. An alternative
interpretation of nanobacteria-induced biomineralization.
Proc Natl Acad Sci U S A 2000;97:11511–5.
14. Vali H, McKee MD, Ciftcioglu N, et al. Nanoforms: a new
type of protein-associated mineralization. Geochim
Cosmochim Acta 2001;65:63–74.
15. Benzerara K, Menguy N, Guyot F, et al. Nanobacteria-like
calcite single crystals at the surface of the Tataouine
meteorite. Proc Natl Acad Sci U S A 2003;100:7438–42.
16. Garcia-Ruiz JM, Hyde ST, Carnerup AM, et al. Self-
assembled silica-carbonate structures and detection of
ancient microfossils. Science 2003;302:1194–7.
17. Benzerara K, Yoon TH, Tyliszczak T, et al. Scanning
transmission x-ray microscopy study of microbial calcifica-
tion. Geobiology 2004;2:249–59.
18. Miller VM, Rodgers G, Charlesworth JA, et al. Evidence of
nanobacterial-like structures in calcified human arteries and
cardiac valves. Am J Physiol Heart Circ 2004;287:H1115–24.
19. Bluhm H, Andersson K, Araki T, et al. Soft x-ray
microscopy and spectroscopy at the molecular environ-
mental science beamline at the Advanced Light Source. J
Elec Spectr Relat Phenom 2006;150:86–104.
20. Myneni SCB. Soft x-ray spectroscopy and spectromicro-
scopy studies of organic molecules in the environment. Rev
Mineral Geochem 2002;49:485–579.
21. Lawrence JR, Swerhone GDW, Leppard GG, et al.
Scanning transmission x-ray, laser scanning, and transmis-
sion electron microscopy mapping of the exopolymeric
matrix of microbial biofilms. Appl Environ Microbiol 2003;
69:5543–54.
22. Hitchcock AP. Soft x-ray spectromicroscopy of polymers
and biopolymer interfaces. J Synchrotron Radiat 2001;8:
66–71.
23. Chen CT, Ma Y, Sette F. K-shell photoabsorption of the
N2 molecule. Physiol Rev A 1989;40:6737–40.
24. Rieger D, Himpsel FJ, Karlsson UO, et al. Electronic-
structure of the CaF2/SI(111) interface. Physiol Rev B
1986;34:7295–306.
25. Benzerara K, Menguy N, Lopez-Garcıa P, et al. Nanoscale
detection of organic signatures in carbonate microbialites.
[Submitted] EQ.
26. Mathew M, Takagi S. Structure of biological minerals in
dental research. J Res Natl Inst Stand 2001;106:1035–44.
27. Boese J, Osanna A, Jacobsen C, Kirz J. Carbon edge
XANES spectroscopy of amino acids and peptides. J
Electron Spectrosc Relat Phenom 1997;85:9–15.
28. Gordon ML, Cooper G, Morin C, et al. Inner-shell
excitation spectroscopy of the peptide bond: comparison of
the C 1s, N 1s and O 1s spectra of glycine, glycyl-glycine,
and glycyl-glycyl-glycine. J Phys Chem A 2003;107:6144–
59.
29. Vairavamurthy A, Wang S. Organic nitrogen in geoma-
cromolecules: insights on speciation and transformation
with K-edge XANES spectroscopy. Environ Sci Technol
2002;36:3050–6.
30. Zubavichus Y, Shaporenko A, Grunze M, Zharnikov M.
Innershell absorption spectroscopy of amino acids at all
relevant absorption edges. J Phys Chem Lett A 2005;109:
6998–7000.
Journal of Investigative Medicine JIM_2006_06016.3d 12/10/06 13:27:49The Charlesworth Group, Wakefield +44(0)1924 369598 - Rev 7.51n/W (Jan 20 2003)
Microbial Signatures in Human Calcif ications/Benzerara et al 13
Copyright © 2022 FDOKUMEN