Neural signatures of conciousness abolition and recovery ...
185
HAL Id: tel-02078687 https://tel.archives-ouvertes.fr/tel-02078687 Submitted on 25 Mar 2019 HAL is a multi-disciplinary open access archive for the deposit and dissemination of sci- entific research documents, whether they are pub- lished or not. The documents may come from teaching and research institutions in France or abroad, or from public or private research centers. L’archive ouverte pluridisciplinaire HAL, est destinée au dépôt et à la diffusion de documents scientifiques de niveau recherche, publiés ou non, émanant des établissements d’enseignement et de recherche français ou étrangers, des laboratoires publics ou privés. Neural signatures of conciousness abolition and recovery from coma Brigitta Malagurski To cite this version: Brigitta Malagurski. Neural signatures of conciousness abolition and recovery from coma. Neuro- science. Université Paul Sabatier - Toulouse III, 2018. English. NNT : 2018TOU30039. tel-02078687
-
Upload
khangminh22 -
Category
Documents
-
view
2 -
download
0
Transcript of Neural signatures of conciousness abolition and recovery ...

HAL Id: tel-02078687https://tel.archives-ouvertes.fr/tel-02078687
Submitted on 25 Mar 2019
HAL is a multi-disciplinary open accessarchive for the deposit and dissemination of sci-entific research documents, whether they are pub-lished or not. The documents may come fromteaching and research institutions in France orabroad, or from public or private research centers.
L’archive ouverte pluridisciplinaire HAL, estdestinée au dépôt et à la diffusion de documentsscientifiques de niveau recherche, publiés ou non,émanant des établissements d’enseignement et derecherche français ou étrangers, des laboratoirespublics ou privés.
Neural signatures of conciousness abolition and recoveryfrom coma
Brigitta Malagurski
To cite this version:Brigitta Malagurski. Neural signatures of conciousness abolition and recovery from coma. Neuro-science. Université Paul Sabatier - Toulouse III, 2018. English. �NNT : 2018TOU30039�. �tel-02078687�


2
Acknowledgments
Firstly, I would like to express my gratitude to my supervisors, Stein Silva and Patrice Péran,
for their patient guidance, enthusiastic encouragement and fruitful scientific discussions. Your
passion for science is truly inspirational. Patrice, thank you for guiding me through all the
subtleties of neuroimaging data analysis and for providing the opportunity to collaborate on
other research projects, thus allowing me to grow as a research scientist.
Besides my advisors, I would like to thank the rest of my thesis committee, for their insightful
comments and encouragement, but also for their hard questions and useful critiques of this
research work.
My sincere thanks also goes to Jérémie Pariente, and Emmanuel Barbeau, who provided me an
opportunity to enroll in a master's program and join their research teams, here in Toulouse.
Without your help, this would not have been possible.
I would like extend my gratitude to Sophie Achard, who helped oversee my training, and
offered me invaluable advice and expertise regarding the application of graph theory in the field
of neuroscience.
I wish to thank my fellow labmates and all of those with whom I have had the pleasure to work
during this and other related projects.
Finally, I would like to express a deep sense of gratitude to my parents whose unconditional
love and support are with me in whatever I pursue. Last but not the least, I wish to thank my
loving partner, Daniel, for his encouragement and continual support throughout this experience,
without which I would be lost. Your support keeps me going even on the toughest days.

3
Abstract
Recent advances in clinical care have resulted in an increasing number of patients who survive
severe brain injury, however, many of these patients initially show a complete absence of
arousal and awareness of one self and their surroundings. From this initial state of unarousable
unresponsiveness, defined as coma, patients can fully regain consciousness or evolve into other
(chronic) disorders of consciousness. The aim of the present thesis was to characterize the
functional and structural neural correlates of acute consciousness abolition (i.e. coma) and
identify early neural signatures of long-term neurological recovery. To do so, we studied
severely brain-injured patients, recruited in the acute stage of coma, using resting-state
functional and structural MRI.
We have conducted our analysis at a three-fold level: i) global level, in exploring brain’s
residual ability to segregate and integrate information across several high-order resting-state
functional networks (RSNs) (i.e. default-mode network, executive control network and salience
network), known to be involved in self-related processing and potentially critical for
consciousness emergence; ii) regional level, in investigating resting-state functional
interactions between the hub nodes of high-order RSNs, with a primary focus on posteromedial
cortex (PMC) and the medial prefrontal cortex (mPFC) inter-connectivity; iii) multi-modal
level, in exploring the association between the PMC-mPFC functional disruption and
corresponding gray and white matter (i.e. cingulum) structural damage.
The global-level analysis indicated a significant topological reorganization of high-order
resting-state networks in the acute stage of coma. This reorganization, assessed using graph
theory, was reflected in dedifferentiated and less resilient patients’ functional brain networks,
accompanied with a loss of long-range fronto-parietal connections. On a regional level, we
found a complex pattern of voxel-wise decrease and increase in resting-state functional
connection density between the posteromedial cortex and the medial prefrontal cortex. These
connection density patterns seemed to permit outcome prediction in patients, assessed three
months post-coma. Furthermore, the multi-modal analysis demonstrated a significant
association between the antero-posterior functional connectivity and structural integrity
between/within these two regions.
In conclusion, our results imply significant heterogeneity in both functional and structural brain
integrity in coma patients irrespectively of their apparent behavioral homogeneity. Regarding

4
functional connectivity at rest, patients’ brains appear to be radically reorganized at both global
and regional level, with some of these patterns seeming to be related to neurological recovery.
As such, these findings hold a significant promise towards the application of neuroimaging in
early outcome prediction and could inspire novel personalized therapeutic approaches aiming
to promote the re-emergence of consciousness and long-term neurological recovery.
Key words: coma, brain-injury, neuroimaging, resting-state functional connectivity, structural integrity, graph theory, prognosis.

5
Résumé
Les progrès récents dans les soins cliniques ont entraîné un nombre croissant de patients qui
survivent à une lésion cérébrale grave, cependant, beaucoup de ces patients montrent
initialement une absence totale d'éveil et de conscience de soi et de leur environnement. À partir
de cet état initial, défini comme un coma, les patients peuvent reprendre complètement
conscience ou évoluer vers d'autres états plus chroniques d’altération de cette capacité
cognitive.
L’objectif de cette thèse était de caractériser les corrélats neuronaux fonctionnels et structurels
de l'abolition de la conscience dans le coma induit par une lésion cérébrale sévère et d'identifier
les signatures neuronales précoces de la récupération neurologique à long-terme. Pour atteindre
ce but, nous avons étudié des patients cérébrolésés, recrutés au stade aigu du coma, à l'aide de
l'IRM fonctionnelle au repos et IRM structurale.
Nous avons mené notre analyse à trois niveaux: i) niveau global, en explorant la capacité
résiduelle du cerveau à ségréger et à intégrer l'information à travers plusieurs réseaux
fonctionnels au repos (RFR) d'ordre élevé (i.e. le réseau du mode par défaut, réseau de contrôle
exécutif, réseau de saillance) connus pour être impliqués dans l’émergence de la notion de soi;
ii) au niveau régional, en étudiant les interactions fonctionnelles à l'état de repos entre les nœuds
centraux des RFR (cortex postéromédial (CPM) et le cortex préfrontal médian (CPFM)); iii)
selon une approche multimodale, en explorant l'association entre la perturbation fonctionnelle
du CPM-CPFM et les lésions structurelles. L'analyse au niveau global a indiqué une
réorganisation topologique significative des réseaux d'état de repos d'ordre élevé dans le stade
aigu du coma. Cette réorganisation mise en évidence par l’analyse des graphes, semble associée
à une importante dédifférenciation et à une réduction de la résilience des réseaux fonctionnels
au repos d'ordre élevé. Une perte de connexions fronto-pariétales à longue distance a été aussi
observée.
Au niveau régional, nous avons caractérisé un schéma complexe de diminution et
d'augmentation de la densité de connexion fonctionnelle à l'état de repos entre le CPM et CPFM.
L’importance de ces anomalies de densité de connexion, semble liée à la récupération des patients
dans le coma, à trois mois après l’agression cérébrale initiale. En outre, l'analyse IRM
multimodale a permis de monter une association significative entre la connectivité fonctionnelle
et l'intégrité structurelle entre/dans ces deux régions.

6
En conclusion, en ce qui concerne la connectivité fonctionnelle au repos, le cerveau des patients
semble être radicalement réorganisé au niveau global et régional, et certaines de ces anomalies
semblent liées à la récupération neurologique. En tant que tels, ces résultats représentent une
promesse importante pour l'application de la neuroimagerie multimodale dans la prédiction
précoce des résultats cliniques et pourraient inspirer de nouvelles approches thérapeutiques
personnalisées visant à promouvoir la réémergence thérapeutique de la conscience à partir du
coma.
Mots clés : coma, lésion cérébrale, neuroimagerie, connectivité fonctionnelle au repos,
intégrité structurelle, théorie des graphes, pronostic.

7
Table of Contents
1 Chapter I – Conceptual framework ........................................................................................... 16
1.1 Theories of consciousness: neural networks and brain complexity....................................... 16
1.1.1 Connectionists models ................................................................................................... 16
1.1.2 Neural correlates of consciousness ................................................................................ 20
1.1.3 Clinical models of consciousness .................................................................................. 21
1.2 Behavioral assessment of consciousness ............................................................................... 27
1.2.1 Behavior Rating Scales.................................................................................................. 27
1.2.2 The challenges of diagnosis and prognosis in DOC ...................................................... 29
1.3 Neuroimaging and conscious processing: (re)framing paradigms ........................................ 30
1.3.1 Magnetic Resonance Imaging ....................................................................................... 31
1.3.2 Diffusion weighted imaging (DWI) .............................................................................. 32
1.3.3 Functional MRI (fMRI) ................................................................................................. 35
1.3.4 Resting-state fMRI (rs-fMRI) ........................................................................................ 36
1.3.5 Network-based analytical approach: graph theory ........................................................ 37
1.4 The restless brain: resting-state functional brain networks (RSNs) in healthy subjects ........ 44
1.4.1 Functional differentiation .............................................................................................. 44
1.4.2 Functional integration .................................................................................................... 48
2 Chapter II – State of the art ....................................................................................................... 52
2.1 Resting-state functional connectivity in acquired disorders of consciousness ...................... 52
2.1.1 DOC neuroimaging-based diagnosis ............................................................................. 52
2.1.2 Prognostic value of resting-state functional connectivity in DOC ................................ 60
2.1.3 Resting-state FC-related signatures of brain injury mechanisms .................................. 63
2.2 Structural network integrity in coma, UWS and MCS .......................................................... 64
2.2.1 Diagnosis and patient’s stratification ............................................................................ 64
2.2.2 DOC patient’s neuroprognostication ............................................................................. 68
2.2.3 Structural MRI and brain injury mechanisms ................................................................ 69
2.3 Neural structure-function relationship in DOC – multimodal neuroimaging studies ............ 72
2.4 Summary of neuroimaging findings – develop in more detail .............................................. 75
3 Chapter III – The ACI-COMA project ..................................................................................... 76
3.1 ACI-COMA ........................................................................................................................... 76
3.1.1 Project design ................................................................................................................ 76
3.1.2 MRI data acquisition parameters ................................................................................... 77
3.1.3 The recruited participants .............................................................................................. 78
3.1.4 Main goals and objectives ............................................................................................. 79
4 Chapter IV – Methods and Results ............................................................................................ 80

8
4.1 Neural signature of coma revealed by posteromedial cortex connection density analysis .... 80
4.1.1 Scientific justification .................................................................................................... 80
4.1.2 Objectives and hypotheses ............................................................................................ 81
4.1.3 Materials and methods ................................................................................................... 81
4.1.4 Results ........................................................................................................................... 86
4.1.5 Discussion ..................................................................................................................... 93
4.2 Topological reorganization of high-order resting state networks in coma ............................ 97
4.2.1 Scientific justification .................................................................................................... 97
4.2.2 Objectives and hypotheses ............................................................................................ 97
4.2.3 Methods ......................................................................................................................... 98
4.2.4 Results ......................................................................................................................... 103
4.2.5 Discussion ................................................................................................................... 112
4.3 The PMC-mPFC structure-function association in coma – an exploratory study ............... 116
4.3.1 Scientific justification .................................................................................................. 116
4.3.2 Objectives and hypotheses .......................................................................................... 117
4.3.3 Methods ....................................................................................................................... 117
4.3.4 Results ......................................................................................................................... 121
4.3.5 Discussion ................................................................................................................... 126
5 Chapter V - General discussion and future perspectives ....................................................... 131
6 Appendices ................................................................................................................................. 135
6.1 Paper I.................................................................................................................................. 135
6.2 Appendices for Chapter I..................................................................................................... 145
6.3 Appendices for Chapter IV .................................................................................................. 147
7 References .................................................................................................................................. 159

9
List of commonly used abbreviations
AD Axial diffusivity MCS Minimally conscious state
ADC Apparent diffusion coefficient MD Mean diffusivity
BI Brain injury mPFC Medial prefrontal cortex
BOLD Blood-oxygen-level dependent MRI Magnetic Resonance Imaging
CDN Connection density negative correlation NCC Neural correlates of consciousness
CDP Connection density positive correlation P.SAL Posterior salience network
CRS-R Coma Recovery Scale – Revised PCC Posterior Cingulate cortex
dDMN Dorsal default mode network PET Positron emission tomography
DOC Disorders of consciousness PMC Posteromedial cortex
DTI Diffusion Tensor Imaging PreCu Precuneus
DWI Diffusion Weighted Imaging RD Radial diffusivity
ECN Executive control network RECN Right executive control network
EEG Electroencephalography ROI Region of interest
FA Fractional anisotropy Rs-fMRI Resting-state functional MRI
FC Functional connectivity RSN Resting-state network
FPN Frontoparietal network SAL/SN Salience network
GCS Glasgow Coma Scale TBI Traumatic brain injury
GM Gray matter UWS Unresponsive wakefulness syndrome
HDI Hub disruption index VBM Voxel-based morphometry
ICA Independent component analysis vDMN Ventral default mode network
LECN Left executive control network WM White matter
LIS Locked-in syndrome

10
List of figures
Figure 1.1.1. Schema of the global neuronal workspace (GNW) model. .............................................. 17 Figure 1.1.2. Seeing a face: Global Neuronal Workspace Theory (GNWT) vs. IIT. ............................ 20 Figure 1.1.3. Interaction between arousal and awareness in different states of (un)consciousness. ..... 22 Figure 1.1.4. Different conditions that may follow acute brain injury. ................................................. 24 Figure 1.1.5. Diagnostic criteria for DOC. ............................................................................................ 27 Figure 1.3.1. Three diffusion ellipsoids represent the diffusion profile of 3 different structures. ......... 33 Figure 1.3.2. Major white matter structures of the human brain. .......................................................... 34 Figure 1.3.3. A. Schematic illustration of the origins of the BOLD effect in fMRI. B. Illustration of the typical BOLD hemodynamic response function. .................................................................................. 35 Figure 1.3.4. An example of a a) binary graph, b) self-loop, c) weighted graph, d) directed graph, e) signed graph and a f) fully connected graph. ........................................................................................ 38 Figure 1.3.5. A simple binary graph and its representation by an adjacency matrix. ........................... 39 Figure 1.3.6. The processing pipeline for functional graph analysis. .................................................... 40 Figure 1.3.7. A graphical example of global and local metrics. ............................................................ 42 Figure 1.3.8. Table of the most basic global and local metrics and associated interpretation.............. 43 Figure 1.3.9. Graphical representation of different types of networks. ................................................. 44 Figure 1.4.1. Multiple cerebral networks that can be identified with ICA applied on rs-fMRI. ........... 45 Figure 1.4.2. Functional connectivity reflects structural connectivity in the DMN. ............................. 47 Figure 1.4.3. A summary of functional connectivity of different sub-areas of the precuneus. ............. 50 Figure 1.4.4. Illustration of the proposed theoretical account of the PCC, combining the three dimensions of (i) arousal; (ii) internal/external focus; and (iii) breadth of attentional focus. ............... 51 Figure 2.1.1. Hub disruption of functional networks in comatose patients. .......................................... 54 Figure 2.1.2. Predictive role of PCC-mPFC coupling measured during coma state and neurologic outcome. ................................................................................................................................................ 63 Figure 2.2.2.2.1. Individual tract analysis comparing FA values between DOC patients and healthy controls. ................................................................................................................................................. 65 Figure 3.1.1. ACI-COMA project design. ............................................................................................. 76 Figure 3.1.2. The MRI sequences. ......................................................................................................... 77 Figure 4.1.1. Overview of the data analysis pipeline. ........................................................................... 84 Figure 4.1.2. Differences in changes in connection density between PreCu and PCC and between traumatic and anoxic brain injury. ......................................................................................................... 87 Figure 4.1.3. Spatial maps of changes in PMC-to-mPFC connection density in the patient group. ..... 88 Figure 4.1.4. Intra-group spatial homogeneity differences between the traumatic and anoxic brain injury patients (threshold 33%). ............................................................................................................ 90 Figure 4.1.5. The prognostic value of changes in PMC-to-mPFC connection density. ........................ 92 Figure 4.2.1.Global topology in controls and patients. ....................................................................... 104 Figure 4.2.2. Brain node reorganization - the difference between groups in the HDI of global (nodal) efficiency and local efficiency............................................................................................................. 105 Figure 4.2.3. Local network topology. ................................................................................................ 106 Figure 4.2.4. The analysis pipeline for the edge probability map. ...................................................... 108 Figure 4.2.5. Brain regions with a significantly lower local efficiency in patients in comparison to controls. ............................................................................................................................................... 110 Figure 4.2.6. Network resilience. Network resilience to targeted attack (A and B) and random failure (C and D) in controls and patients. ...................................................................................................... 111 Figure 4.3.4.3.1. Gray matter and white matter ROIs included in our analysis. ................................. 118

11
Figure 4.3.4.3.2. Group differences in structural metrics of averaged ROIs. ...................................... 121 Figure 4.3.4.3.3. Group differences in DTI metrics of the left and right cingulum. ........................... 122 Figure 4.3.4.3.4. Group differences in structural metrics of PMC and mPFC sub-regions................. 123 Figure 4.3.4.3.5. Group differences in mean functional connectivity between the entire PMC and mPFC region........................................................................................................................................ 124 Figure 4.3.4.3.6. Functional connectivity between each of the PMC and mPFC sub-regions in patient and control groups.. ............................................................................................................................. 124 Figure 4.3.4.3.7. Structure-function association in anoxic and traumatic brain injury comatose patients. ............................................................................................................................................................. 126 Figure 6.3.1. Individual traumatic brain injury patients’ connection density spatial maps. ................ 147 Figure 6.3.2. Individual anoxic brain injury patients’ connection density spatial maps. .................... 148 Figure 6.3.3. Differences in Calcarine-mPFC connection density changes between traumatic and anoxic brain injury. .............................................................................................................................. 149 Figure 6.3.4. Connection density changes in the Calcarine-mPFC control pathway (threshold 33%). ............................................................................................................................................................. 149 Figure 6.3.5. Logistic regression model. ............................................................................................. 150 Figure 6.3.6. Global topology in controls and patients – evidence of randomization. ........................ 153 Figure 6.3.7. Global efficiency (axis y) and HDI GE (axis x) at multiple thresholds (10-20%). ........ 154 Figure 6.3.8. Functional connectivity (Pearson’s r) over all pairs of nodes, in controls and patients. 155 Figure 6.3.9. Nodal topology in non-random patients at different connection density thresholds. ..... 158

12
List of tables
Table 2.1.1. Resting-state functional connectivity in DOC. .................................................................. 55 Table 2.1.2. Prognostic value of resting-state FC in chronic DOC patients. ......................................... 61 Table 2.1.3. Prognostic value of resting-state FC in coma patients. ..................................................... 62 Table 2.2.1. Structural changes in DOC. ............................................................................................... 66 Table 2.2.2. Prognostic value of structural changes in chronic DOC.................................................... 70 Table 2.2.3. Prognostic value of structural changes in coma. ............................................................... 70 Table 2.3.1. Multimodal studies – structure-function association in DOC. .......................................... 73 Table 3.1.1. Criteria for patient recruitment. ......................................................................................... 78 Table 3.1.2. Demographic and clinical characteristics of participants. ................................................. 79 Table 4.4.1.1.1. Spatial homogeneity of changes in PMC connection density in the patient group. .... 90 Table 6.2.1. EEG studies with the graph theoretical approach ............................................................ 146 Table 6.3.1. Individual patient results – the total number of hypo/hyper-CDP and hypo/hyper-CDN voxels for PMC (Panel A), PreCu (Panel B) and PCC (Panel B). ...................................................... 150 Table 6.3.2. MNI center-mass coordinates of each of the nodes used in the analysis. ....................... 155 Table 6.3.3. Exclusion criteria. ............................................................................................................ 157

13
General introduction
Recent advances in clinical care have resulted in an increasing number of patients who survive
severe brain injury (i.e. trauma, cardiac arrest, stroke etc.). Unfortunately, many of these
patients initially show complete absence of arousal and awareness of one self and their
surroundings. From this initial state of unarousable unresponsiveness, defined as coma, patients
can fully regain consciousness or evolve into other disorders of consciousness such as the
unresponsive wakefulness syndrome (UWS) and the minimally conscious state (MCS).
Currently, there are no objective and reliable acute-stage prognostic markers that can help
predict the evolution of disorders of consciousness. Estimating the likelihood of recovery in
acutely comatose patients is very difficult due to behavioral non-responsiveness, differences in
nature of brain injury (i.e. traumatic versus anoxic brain injury) and potential confounding
factors such as medication and metabolic disturbance. More importantly, it has been implied
that the lack of a complete understanding of neural characteristics of acute stage coma and
reliable prognostic markers significantly contributes to practice variation in the withdrawal of
life-sustaining therapy, which can be considered as soon as few days after the initial coma-
inducing brain injury.
On a more positive note, recent advances in neuro-technologies implied that structural (e.g.
diffusion MRI) and functional (resting-state; rs-fMRI) neuroimaging strategies, hold a
significant promise in the detection of residual neural and cognitive processes indicative of
consciousness, independently of behavioral responsiveness of patients.
Following this lead, we decided to focus our analysis on the intrinsic brain “activity” in the
form of functional connectivity and structural integrity of brain-injured patients in the acute
stage of coma. Therefore, the aim of the present thesis was to characterize the neural correlates
of acute consciousness abolition (i.e. coma) and identify early neural signatures of neurological
recovery. To do so, we longitudinally studied severe brain-injured patients using multimodal
MRI methodology and standardized behavioral assessment.
My education background includes a MA in Psychology from the Faculty of Philosophy,
University of Novi Sad (Serbia), and a MSc in Neuropsychology and Clinical Neurosciences
from the Faculty of Medicine Purpan, University of Toulouse III – Paul Sabatier.
I have joined the already ongoing ACI-COMA project soon after I have finished my master’s
degree in Toulouse. I have never worked with neuroimaging data before, so this thesis was
challenging for me in the beginning, with all its difficulties related to data acquisition (and

14
processing) in the population of severely brain-injured patients in coma. Nevertheless, I very
much appreciated the cross-domain collaboration with all its advantages and difficulties, as I
worked alongside researchers with different backgrounds and clinicians who assured the safe
and successful inclusion of our patients. I strongly believe that this research-clinic collaborative
effort was an integral part in the evolution of the ACI-COMA project.
Outline
In chapter I we describe the behavioral profile of disorders of consciousness (DOC), various
theories of consciousness, and available behavioral and neuroimaging paradigms used for the
diagnostic and prognostic assessment of brain-injured patients with impairments in
consciousness.
In chapter II we review previous neuroimaging studies, upon which our research draws. This
section is divided into three sub-chapters, describing resting-state functional connectivity,
structural integrity and structure-function association in chronic and acute stages (i.e. coma) of
disorders of consciousness. In this chapter, we attempted to organize previous research based
on its contribution to the domains of diagnostics, prognostics or pathology mechanisms related
to different etiologies (i.e. traumatic and anoxic brain injury) in DOC.
In chapter III, we briefly describe the research design of the ACI-COMA project which served
as the basis for this thesis.
In chapter IV, we present the results that we have achieved to date. This section is subdivided
into three main sections, each describing a specific study conducted within the scope of this
thesis.
The first study focuses on the voxel-wise resting-state functional connectivity (FC) between
two regions of interest (i.e. posteromedial cortex and the medial prefrontal cortex), previously
described to have a critical role in conscious processing. We also attempt to relate the identified
FC changes in the acute stage of DOC – coma - to the neurological outcome registered three
months after the initial inclusion.
In the second study we investigate the resting-state FC on a more global level, by applying the
graph theoretical methods to analyze the topological organization of several high-order resting-
state networks (i.e. DMN, SN, ECN), known to have an important role in high-level cognitive

15
functions including consciousness. This study was conducted in collaboration with Sophie
Achard from the GIPSA-lab (CNRS) in Grenoble, France.
Finally, in the third study, we explore the association between the functional disruption and
underlying structural damage, encompassing the regions of interest included in the first study.
In the chapter V, we review the contributions of the thesis and list possible directions of future
research.

16
1 Chapter I – Conceptual framework
1.1 Theories of consciousness: neural networks and brain complexity
1.1.1 Connectionists models
The last few decades have given a myriad of philosophical and scientific theories attempting to
account for the origin and nature of consciousness (Cavanna & Nani, 2014). Crucially, these
theoretical frameworks have provided several concepts that could be empirically tested in
physiology and pathological conditions.
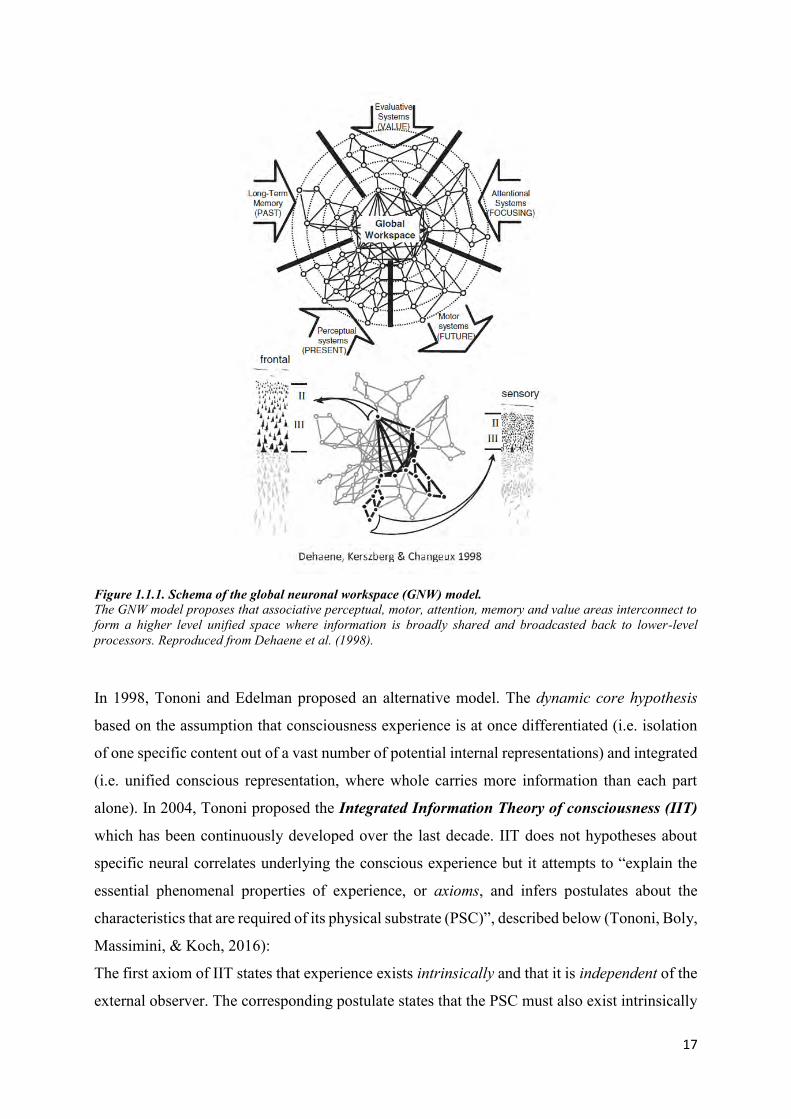
The Global Neuronal Workspace (GNW) model was inspired by the theory of Baars (1988),
which states that consciousness is represented within a global workspace, a widespread
architecture of neuronal networks with the capacity to coordinate and integrate information
between a set of specialized brain sites – processors. The main idea behind the GNW is that
conscious access, depends on global information availability encompassing selection,
amplification, sustainability and global broadcasting of salient information between brain-wide
processors.
From the neuronal architecture standpoint, this theory proposes two main computational brain
spaces (Dehaene, Changeux, & Naccache, 2011): 1) a processing network which refers to a set
of functionally specialized, automatic, and non-conscious processors (i.e. visual, auditive,
verbal modules) with highly specific local or medium range connection which “encapsulate”
information relevant to the function of a given processor; 2) global neuronal workspace
consisting of a subset of distributed cortical pyramidal neurons with long-range excitatory
axons (i.e. particularly dense in prefrontal, cingulate, parietal cortices) interconnecting multiple
specialized processors (Figure 1.1.1).
It is worth noting that GNW neurons are widely distributed, so there is no single brain center
where the conscious information is stored and broadcasted but rather a conscious synthesis
achieved when multiple brain processor “converge to a coherent metastable state” (Dehaene et
al., 2011). Nevertheless, empirical data suggest that the global ignition related to conscious
experience is supposedly linked to the fronto-parietal network, and the state of activation of
GNW neurons is assumed to be globally regulated by vigilance signals from the ascending
reticular activating system which is involved in regulating the sleep-week cycle.
17
Figure 1.1.1. Schema of the global neuronal workspace (GNW) model. The GNW model proposes that associative perceptual, motor, attention, memory and value areas interconnect to form a higher level unified space where information is broadly shared and broadcasted back to lower-level processors. Reproduced from Dehaene et al. (1998).
In 1998, Tononi and Edelman proposed an alternative model. The dynamic core hypothesis
based on the assumption that consciousness experience is at once differentiated (i.e. isolation
of one specific content out of a vast number of potential internal representations) and integrated
(i.e. unified conscious representation, where whole carries more information than each part
alone). In 2004, Tononi proposed the Integrated Information Theory of consciousness (IIT)
which has been continuously developed over the last decade. IIT does not hypotheses about
specific neural correlates underlying the conscious experience but it attempts to “explain the
essential phenomenal properties of experience, or axioms, and infers postulates about the
characteristics that are required of its physical substrate (PSC)”, described below (Tononi, Boly,
Massimini, & Koch, 2016):
The first axiom of IIT states that experience exists intrinsically and that it is independent of the
external observer. The corresponding postulate states that the PSC must also exist intrinsically
18
and that it must have a cause-effect power on itself. A minimal system composed of two
interconnected neurons can satisfy the criteria, because it can make a difference to itself through
its reciprocal connections.
The axiom of composition states that consciousness is structured, being composed of several
phenomenal distinctions which exist within it. For example, within an experience I can
distinguish an olive tree, a rose flower, green grass and many other sub-elements constituting a
hypothetical “garden” scene. The corresponding postulate implies that elements that constitute
the PSC must also have a cause-effect power upon PSC, either alone (first-order mechanism)
or in various combinations (high-order mechanism).
The axiom of information states that conscious experience is specific, being composed of a set
of phenomenal distinctions (qualia), thereby differing from other possible experiences
(differentiation). For example, in a “garden” scene, a content of my conscious experience might
be composed of me seeing a rose flower (in opposed to not seeing it) which is red (in contrary
to not being red). The corresponding postulate states the PCS must specify a cause-effect
structure, a specific set of cause-effect repertoires, differing it from all other possible structure.
The axiom of integration states that each conscious experience is unified and irreducible to non-
interdependent sub-sets of phenomenal distinctions. For example, my visual experience of the
garden can’t be subdivided into independent experience of the left and right sides of the visual
field. The corresponding postulate implies that cause–effect structure specified by the PSC must
also be unitary and intrinsically irreducible to non-interdependent sub-systems (Φ>0). The
irreducibility of a conceptual structure is measured as integrated information - Φ, the minimum
distance between an intact and a partitioned cause–effect structure.
Finally, the axiom of exclusion states that an experience is definite in its content and spatio-
temporal grain, implying that its phenomenal content and duration are definite. For example, I
do not perceive the garden with more flowers than there are, nor do I perceive it in grey if it has
colorful flowers. The corresponding postulate states that the cause-effect structure specified by
the PCS must also be definite, with definite set of elements with definite spatio-temporal grain,
maximally irreducible intrinsically (Φmax), called a conceptual structure, made of maximally
irreducible cause-effect repertoires (concepts).
Thus, the physical substrate of consciousness is called a complex and it is consisted of a set of
elements in a state that satisfies all the postulates. According to IIT, the quality (content) of
consciousness corresponds to the form of the conceptual structural and the quantity of
consciousness refers to its irreducibility Φmax.

19
Although both theories put an emphasis on (global) integration of information, there are some
important differences between the GNW and the IIT theory.
Perhaps the most notable one is that the GNW implies underlying neuronal structure (“ignition”
of fronto-parietal workspace neurons), while IIT starts from experience itself, rather than from
a specific brain area or network. A comparative example between the two theories is given in
an article of Tononi and colleagues (2016) (Figure 1.1.2).
In GNW, information which is relayed through sensory pathways remains unconscious until it
enters the global workspace and is broadcasted to specialized processors (Figure 2– upper
panel). In IIT, the information content of consciousness is specified intrinsically (by the system
for the system, rater then extrinsically) and is a conceptual structure – “a form in a cause-effect
space specified by the elements of the PSC” (Tononi et al., 2016; Figure 1.1.2– lower panel).
Thus, in IIT neurons shape the overall form of the conceptual structure specified by the PSC,
in oppose to processing, encoding or broadcasting an information as in GNW. In addition,
GNW defines consciousness as all-or-none phenomenon, while IIT implies that it is graded,
that it increases in accordance to a system’s repertoire of available states.
Further, the association between the complexity (widespread and differentiated) of brain
network activity and the state of consciousness (Koch et al., 2016) has been demonstrated in
natural, pharmacological and pathological alterations of consciousness using coupled
transcranial magnetic stimulation and EEG recordings (Casali et al., 2013; Casarotto et al.,
2016), and dynamics of spontaneous activity measured using fMRI (Barttfeld et al., 2015;
Hudetz et al., 2015; Tagliazucchi, et al., 2016). Moreover, the cerebral cortex is ideally suited
for integrating information, due to a coexistence of functional specialization in form of multiple
brain sub-networks (fronto-parietal) and hub-node integration (i.e. hub regions; PCC), often
disrupted in brain injury and disorders in consciousness as we will see in the following chapters.

20
Figure 1.1.2. Seeing a face: Global Neuronal Workspace Theory (GNWT) vs. IIT. The experience of seeing a face is contrasted with seeing visual noise following presentation of a degraded image. The top panel is a schematic rendition according to GNWT, the bottom panel according to IIT. In both panels a ‘face’ neuron in the fusiform gyrus turns from high firing (red) to burst firing (yellow) when the face is seen. (Top panel) In GNWT, a “piece” of information becomes conscious if it is broadcast (blue radio waves) to a broad neural audience. (Bottom panel) In IIT, when the “face” neuron within the PSC turns to burst firing it changes the form of the conceptual structure. Stars linked to the PSC by black dotted lines highlight a small subset of these concepts, and a blue line between ‘face’ and ‘woman’ indicates a relation. Here, the information content of consciousness is specified intrinsically (by the system for the system itself). Reproduced from Tononi et al. (2016).
1.1.2 Neural correlates of consciousness The neural correlates of consciousness (NCC) are defined as the “minimum neuronal mech-
anisms jointly sufficient for any one specific conscious percept” (Koch, Massimini, Boly, &
Tononi, 2016). The NCC can be further interpreted in two ways, depending if we refer to a
specific content (i.e. transitive word use) of consciousness or the overall state (i.e. intransitive
word use) of consciousness (Koch et al., 2016).
The content-specific NCC are the neural mechanisms which determine a phenomenal
distinction within an experience (e.g. conscious experience of observing a rose flower in the

21
garden). The full NCC, are the neural substrates supporting conscious experience in its entirety,
irrespective of a specific content.
The full NCC is usually investigated through such state-based comparisons, by contrasting
brain activity when consciousness is present, as in healthy subjects or recovered patients, with
brain activity in UWS or coma patients, in anesthesia or dreamless sleep. It is important to note,
that during such states of complete consciousness abolition induced by brain injury, alterations
in conscious processing occur alongside damage to multiple cognitive functions (and brain
regions), frequently yielding confounding results in terms of consciousness-related neural
correlates. Nevertheless, the clinical models have been proved to be indispensable in the
ongoing “quest” for neural substrates of conscious processing, as we will see in the following
chapter.
1.1.3 Clinical models of consciousness The clinical definition of consciousness (e.g. as a physiopathological state) comprises two
major components (Posner, Plum, & Saper, 2007): i) the arousal (the level of consciousness)
implying behavioral alternation of sleep and wakefulness and the ii) awareness (content of
consciousness) referring to conscious perception which includes collective thoughts and
feelings of a given individual (Laureys, Owen, & Schiff, 2004; Laureys, 2005; Soddu et al.,
2011). Awareness can further be subdivided into awareness of the external world (e.g., sensory
perception of the environment) and of self that is the internal world (e.g., mind-wandering,
mental imagery, inner speech). At a clinical level, the wakefulness or level of arousal is inferred
by a prolonged period of spontaneous eye opening, while awareness is assessed by evaluating
the command following and by observing non-reflex contingent behavior (i.e. eye tracking,
oriented movement to pain) toward specific environmental stimuli (Demertzi, Sitt, & Sarasso,
2017).
At a neuroanatomical level, the level of arousal (and in particular of sleep-wake cycles) is
controlled by the subcortical arousal systems in the brainstem, midbrain, and thalamus
(Demertzi et al., 2017; Lin, 2000; Schiff, 2008). Awareness is thought to be supported by the
functional integrity of the cerebral cortex and its subcortical connections, although its
supporting neural correlates still need to be elucidated (Demertzi et al., 2017).

22
1.1.3.1 Acquired disorders of consciousness Consciousness is not an all-or-none phenomenon but lies on a continuum of states, and it can
range from normal consciousness where arousal and awareness level are high, to disorders of
consciousness (DOC) where arousal can be present, while awareness is absent or fluctuating
(Figure 1.1.3).
Figure 1.1.3. Interaction between arousal and awareness in different states of (un)consciousness. REM, rapid eye movement; EMCS, emergence from a minimally conscious state; MCS+, minimally conscious state plus; MCS-, minimally conscious state minus; VS/UWS, vegetative state/unresponsive wakefulness syndrome; LIS, locked-in syndrome. Reproduced from Heine, Demertzi, Laureys, & Gosseries (2015).
We will briefly define the different states of consciousness such as coma, unresponsive
wakefulness syndrome (UWS; previously known as vegetative state) and minimally conscious
state (MCS), and the main causes of pathological impairment in consciousness such as
traumatic and anoxic brain injury. We will also describe the locked-in syndrome (LIS), which
is not a disorder of consciousness but is commonly misdiagnosed as a DOC.

23
1.1.3.1.1 Brain injury (BI) leading to DOC The main etiologies of coma, and thus disorders of consciousness, are traumatic brain injury
(e.g. motor vehicle accident, falling) and non-traumatic BI, such stroke, or anoxia (e.g., cardiac
arrest). We will focus on two etiologies, traumatic and anoxic BI, as these were the main
underlying causes of coma in our patients.
Anoxia refers to a complete reduction of oxygen supply or utilization, which is a direct
result of reduced oxygen supply, reduced ambient oxygen pO2, low hemoglobin or impaired
tissue utilization following poisoning of the mitochondrial cytochrome enzymes (Howard et al.,
2012). Hypoxia is a milder form where there is available oxygen but at reduced levels for a
period of time. Many anoxic comatose (i.e. post cardiac arrest) patients die or survive with
severe disability after a prolonged stay in the intensive care unit (ICU) associated with
important cost burden. Brain damage occurring after anoxia is related to diffuse and severe
structural damage encompassing brain swelling, cortical laminar necrosis, basal ganglia
necrosis, and delayed white matter degeneration and atrophy (Howard et al., 2012; Weiss,
Galanaud, Carpentier, Naccache, & Puybasset, 2007). Gray matter seems to have greater
vulnerability to anoxia/hypoxia in comparison to white matter, especially in brain regions that
show high basal metabolic levels (Howard et al., 2012; Nolan et al., 2010).
Traumatic brain injury (TBI) occurs by the impact of an external force, with leading
causes being falling and motor vehicle accidents (Sharp, Scott & Leech, 2014). TBI can be
classified based on severity, ranging from mild trauma to severe brain injury resulting in
prolonged coma or death. The primary injury can cause both focal and diffuse effects depending
on the mechanism of brain injury (i.e. direct contact and acceleration–deceleration) (Sharp et
al., 2014).
Focal injuries include skull fractures, hematomas, while diffuse injuries involve damage to
long-distance white matter connections via diffuse axonal injury (DAI) and blood vessel
damage via diffuse vascular injury (Mckee & Daneshvar, 2015; Sharp et al., 2014). Studies
show that severe TBI with poor outcome and impaired consciousness, have diffuse damage to
cortical, subcortical white matter and thalamic nuclei (Adams, Graham, & Jennett, 2000; Sharp
et al., 2014).
Anoxic brain injury has been associated with high mortality rate in non-traumatic coma
(Horsting, Franken, Meulenbelt, van Klei, & de Lange, 2015; Posner et al., 2007), and worse
functional outcome following rehabilitation in comparison to traumatic brain injury (Cullen,
Park, & Bayley, 2008; Cullen, Crescini, & Bayley, 2009; Cullen & Weisz, 2010). Also,

24
outcome (and prognostic markers) in disorders of consciousness has been shown to vary
depending on etiology. Thus, brain injury mechanisms need to be taken into account during
clinical management, diagnosis and prognosis of DOC patients.
1.1.3.1.2 Coma Recent advances in clinical care have resulted in an increasing number of patients who survive
severe brain injury such as trauma, cardiac arrest, stroke, infection or metabolic disruption.
However, many of these patients initially show complete absence of arousal and awareness of
one self and their surroundings (Laureys, 2005). This state of unarousable unresponsiveness, in
which patients never open their eyes even if intensively stimulated, is defined as coma.
Autonomic functions, such as breathing and thermoregulation, are reduced, which often
requires respiratory assistance. Nevertheless, coma needs to be distinguished from brain death
(Wijdicks, 2001) resulting from irreversible brainstem damage. In this case neuroimaging
shows “hollow skull phenomenon”, indicative of the permanent loss of neuronal function in the
whole brain (Laureys, 2005). In general, coma persists from 2-4 weeks. From this initial state
patients can fully regain consciousness or evolve into other disorders of consciousness such as
the unresponsive wakefulness syndrome (UWS) and minimally conscious states (MCS) (Figure
1.1.4).
Figure 1.1.4. Different conditions that may follow acute brain injury. The unresponsive wakefulness syndrome (UWS) was previously defined as the vegetative state. Reproduced from Gosseries et al. (2011).
25
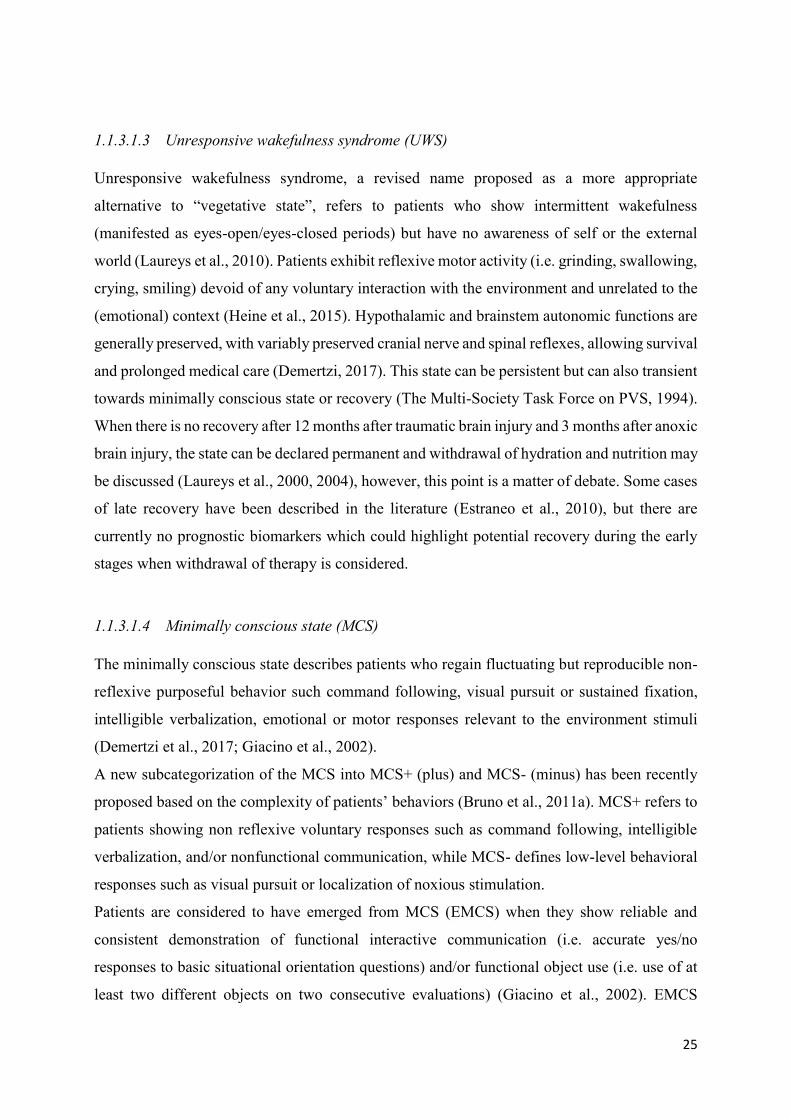
1.1.3.1.3 Unresponsive wakefulness syndrome (UWS) Unresponsive wakefulness syndrome, a revised name proposed as a more appropriate
alternative to “vegetative state”, refers to patients who show intermittent wakefulness
(manifested as eyes-open/eyes-closed periods) but have no awareness of self or the external
world (Laureys et al., 2010). Patients exhibit reflexive motor activity (i.e. grinding, swallowing,
crying, smiling) devoid of any voluntary interaction with the environment and unrelated to the
(emotional) context (Heine et al., 2015). Hypothalamic and brainstem autonomic functions are
generally preserved, with variably preserved cranial nerve and spinal reflexes, allowing survival
and prolonged medical care (Demertzi, 2017). This state can be persistent but can also transient
towards minimally conscious state or recovery (The Multi-Society Task Force on PVS, 1994).
When there is no recovery after 12 months after traumatic brain injury and 3 months after anoxic
brain injury, the state can be declared permanent and withdrawal of hydration and nutrition may
be discussed (Laureys et al., 2000, 2004), however, this point is a matter of debate. Some cases
of late recovery have been described in the literature (Estraneo et al., 2010), but there are
currently no prognostic biomarkers which could highlight potential recovery during the early
stages when withdrawal of therapy is considered. 1.1.3.1.4 Minimally conscious state (MCS) The minimally conscious state describes patients who regain fluctuating but reproducible non-
reflexive purposeful behavior such command following, visual pursuit or sustained fixation,
intelligible verbalization, emotional or motor responses relevant to the environment stimuli
(Demertzi et al., 2017; Giacino et al., 2002).
A new subcategorization of the MCS into MCS+ (plus) and MCS- (minus) has been recently
proposed based on the complexity of patients’ behaviors (Bruno et al., 2011a). MCS+ refers to
patients showing non reflexive voluntary responses such as command following, intelligible
verbalization, and/or nonfunctional communication, while MCS- defines low-level behavioral
responses such as visual pursuit or localization of noxious stimulation.
Patients are considered to have emerged from MCS (EMCS) when they show reliable and
consistent demonstration of functional interactive communication (i.e. accurate yes/no
responses to basic situational orientation questions) and/or functional object use (i.e. use of at
least two different objects on two consecutive evaluations) (Giacino et al., 2002). EMCS

26
patients are no longer considered to suffer from DOC, however, they often have severe
disability, and might continue to need full-time care. The MCS may be transitory, chronic or
permanent, just like UWS. Interestingly, late recoveries have been noted, with one patient
regaining reliable expressive language after 19 years in MCS (Voss et al., 2006). Importantly,
the high rate of misdiagnosis in DOC has significant implication for prognosis, as it has been
shown that MCS patients have significantly greater potential for recovery in comparison to
UWS patients (Faugeras et al., 2017; Giacino & Kalmar, 1997; Hirschberg and Giacino, 2011;
Luauté et al., 2010).
1.1.3.1.5 Locked-in syndrome (LIS) This syndrome is not considered as a disorder of consciousness, but can be easily mistaken as
a DOC due to patients’ loss of voluntary motor control and thus the ability to effectively
communicate with the environment (Heine et al., 2015; Laureys, 2005). However, these patients
are awake and aware, with no loss of cognitive function, in most cases. The most common cause
of the LIS is ventral brainstem stroke. The primary mode of interaction is eye movements and
blinking, however, recent advances in brain-computer interfaces (BCI) are of great help in
providing more direct and spontaneous means of communication (Chaudhary, Xia, Silvoni,
Cohen, & Birbaumer, 2017).

27
Figure 1.1.5. Diagnostic criteria for DOC. Reproduced from Heine et al. (2015).
1.2 Behavioral assessment of consciousness There are multiple standardized behavioral scales (Bruno et al., 2011b; Seel et al., 2010)
routinely used in the clinical assessment of consciousness in brain injured patients. Among
them, we will describe the scales used in our study (which are also routinely used in clinical
practice).
1.2.1 Behavior Rating Scales
1.2.1.1 Glasgow Coma Scale (GCS) GCS (Teasdale & Jennett, 1974; Teasdale et al., 2014) is simple and short scale, used mainly
in intensive care settings. The GCS has three subscales that measure eye opening, verbal and
motor responses. Each of the scales can be communicated separately or summed to create a
total score. Each level of response is assigned a number—the worse the response, the lower the
number. The total score varies between 3 and 15. In acute stages, brain damage is described as

28
severe if the score is less than or equal to 8, moderate if the score is between 9 and 12, and mild
if the score is between 13 and 15. However, there have been some concerns with the GCS. The
verbal response is impossible to assess in the case of intubation or tracheotomy, and the eye
opening may not be sufficient to assess brainstem function (Laureys, Majerus, & Moonen,
2002).
1.2.1.2 The Full Outline of Unresponsiveness (FOUR) FOUR has been proposed as a replacement to the GCS as it can detect subtler neurological
changes (Wijdicks, Bamlet, Maramattom, Manno, & McClelland, 2005). It consists of four
subscales (eye, motor, brainstem, and respiration), and each subscale has a maximal score of 4.
The scale has been translated and validated in French language (Bruno et al., 2011b). FOUR is
suitable for differentiating between VS and MCS, because it assesses visual pursuit, and can
diagnose LIS and brain death.
1.2.1.3 The Coma Recovery Scale-Revised (CRS-R) CRS-R is a recently developed clinical scale (Giacino, Kalmar, & Whyte, 2004), currently
considered the most reliable and sensitive test for differential diagnosis of DOC (Seel et al.,
2010).
The CRS consists of 25 hierarchically arranged items that comprise 6 subscales addressing
auditory, visual, motor, oromotor, communication, and arousal processes. The lowest item on
each subscale represents reflexive activity, whereas the highest items represent cognitively
mediated behaviors (Giacino et al., 2004). CRS has been shown to have acceptable standardized
administration and scoring, excellent content validity and test-retest reliability, and good
internal consistency and inter-rater reliability (Giacino, Fins, Laureys, & Schiff, 2014; Seel et
al., 2010). The scale has been translated and validated in French language (Schnakers et al.,
2008). However, repeated CRS-R testing is advisable to minimize the risk of misclassification
(Cortese et al., 2015), with one study suggesting at least 5 assessments within a short time
interval (e.g., 2 weeks) to reduce the risk of misdiagnosis (Wannez, Heine, Thonnard,
Gosseries, & Laureys, 2017).

29
1.2.2 The challenges of diagnosis and prognosis in DOC
1.2.2.1 Limitations of behavioral-based diagnosis Diagnostic accuracy is critical in this field, in regard to appropriate everyday medical
management (e.g. pain medication) and the decision of withdrawal of life-sustaining care
(Turgeon et al., 2011). In addition, it could be expected that more accurate diagnosis holds the
promise for personalized medicine, including individually-targeted therapeutic
pharmacological (e.g. amantadine, zolpidem; Gosseries, Zasler, & Laureys, 2014) and/or
nonpharmacological (e.g., deep brain stimulation, transcranial direct current stimulation)
(Schiff et al., 2007; Thibaut et al., 2014, 2015, 2017; Cavaliere et al., 2016)
Diagnostic accuracy depends on multiple factors associated with the environment, examiner
and/or patient. Differential diagnosis requires repeated standardized assessment by well-
experienced and trained medical staff. Nonetheless, voluntary and reflexive behavior could be
difficult to distinguish, as motor responses can be very small, quickly exhaustible and
inconsistent, potentially leading to diagnostic error (Schnakers, Majerus, & Laureys, 2004).
Environmental factors, such as paralytic and sedative medication, can significantly constrain
voluntary behavioral responses, inducing bias in the diagnostic process. Furthermore,
fluctuation in level arousal, fatigue, pain, severe central and peripheral damage leading to
sensory deficits (e.g., cortical blindness/deafness), motor impairment (e.g., paralysis) or
cognitive deficits (e.g., aphasia, apraxia, agnosia), (Bodien & Giacino, 2016) also pose a major
problem in administrating and accurately interpreting the results of current clinical tests focused
on overt patient behavior.
These problems are highlighted in studies that show that around 40% of patients diagnosed as
UWS have some conscious awareness (Schnakers et al., 2009; van Erp, et al., 2015). LIS
patients can also easily be mistaken as unconscious (Bruno et al., 2011a).
1.2.2.2 Limitations of behavioral-based prognosis It must be stressed that prognostic markers for accurate long-term DOC patients’ assessment of
recovery do not exist or are extremely limited (Haenggi, Z’Graggen, & Wiest, 2014; Weijer et
al., 2016). Estimating the likelihood of recovery in acutely comatose patients is extremely
difficult, due to behavioral non-responsiveness, differences in nature of brain injury (i.e.
traumatic vs. anoxic BI) and potential confounding factors such as medication and metabolic
disturbance. Also, patient outcome after severe brain injury is highly variable (Sharp et al.,

30
2014), especially in traumatic brain injury, as some patients regain independence, while others
have serious cognitive deficit and are unable to function without personal care assistance.
The prediction accuracy of current prognostic markers used in the clinical setting (for brief see
Weijer et al., 2016) remains generally low, and is defined according to a binary outcome
(survival vs. death) without any distinction between different DOC categories or the degree of
functional impairment at long-term. More importantly, the lack of objective and reliable
prognostic markers might significantly contribute to practice variation in the withdrawal of life-
sustaining therapy. This was highlighted in a study of Turgeon and colleagues (2011), including
720 patients with severe traumatic brain injury in six level I trauma centers. The authors found
a mortality rate of 32%, with 70% of death attributable to withdrawal of life-sustaining therapy,
with half occurring within the first 72 h of injury. In addition, the hospital mortality rates
differed substantially, ranging from 10.8% to 44.1%, partially due to physicians’ different
perceptions of long-term prognosis (Turgeon et al., 2011).
Therefore, the importance of conducting coma-related research is two-fold: a) fundamental -
coma presents a unique model for the research of neural correlates of consciousness; and b)
clinical - there is an urgent need for acute-stage markers serving the purpose of diagnosis (e.g.
brain’s residual capacity for conscious processing), monitoring (e.g. changes of brain
function/structure), and prognosis (e.g. identifying patients with a potential for recovery). Once
these markers are identified, they can be applied in the development and application of novel
personalized treatments aiming to restore consciousness and neurocognitive function.
1.3 Neuroimaging and conscious processing: (re)framing paradigms The increasingly powerful neuroimaging technologies have been leading to a significant
paradigm shift and have helped surpass some limitations posed by behavioral testing (Laureys
& Schiff, 2012). Functional neuroimaging strategies (i.e. fMRI, EEG) have enabled the
detection of convert awareness in patients previously thought to be in unresponsive wakefulness
syndrome (i.e. fMRI-based active paradigms) (Peterson, Cruse, Naci, Weijer, & Owen, 2015;
Monti et al., 2010) and permitted “non-communicative” and locked-in patients to communicate
their though and interact with the environment through willfully modulated brain activity (i.e.
EEG paradigms; Luauté et al., 2015).
However, due to the complexity of disorders of consciousness, as described earlier, patients
may not be able to participate (via brain activity or motor/behavior responsiveness) in

31
neuroimaging-based tasks, and could therefore be wrongfully identified as unconscious despite
preserved capacity for conscious processing. Thus, an alternative approach has been proposed
to active paradigms, in the form of resting-state functional and structural neuroimaging
strategies, which serve to detect residual neural and cognitive processes indicative of
consciousness, independently of behavioral responsiveness of patients. These advanced
(resting-state) neuroimaging techniques hold significant promise in providing diagnostic and
prognostic information for DOC patients, however, much work is needed before they can be
used in clinical setting. The following chapters will provide more detail on the MRI basics,
current state and methodological advancement in the application of neuroimaging in DOC
assessment.
1.3.1 Magnetic Resonance Imaging Neuroimaging includes the use of various techniques to either directly or indirectly image the
structure or function of the brain. Magnetic Resonance Imaging (MRI) was developed in late
1970s, by researchers including Peter Mansfield and Paul Lauterbur, and is widely used today
to image the brain both in health and disease. MRI is non-invasive imaging technique that uses
magnetic fields, radio waves, and field gradients to generate images of internal organs, without
exposure to ionizing radiation.
1.3.1.1 Acquisition methods The MRI scanner consists of a large, powerful magnet placed in a horizontal tube in which the
patients enters. The strength of a magnet in an MRI system is rated using a unit of measure
known as a tesla (T), which can range from 0.5T to 7T, with most today’s scanners working at
3T. MRI is based on the magnetization properties of hydrogen nuclei (protons), mainly
contained in water molecules. These protons are randomly spinning, or precessing, on their
axis, around their individual magnetic fields. When the patient enters the MRI scanner a very
strong magnetic field (B0) is applied to align the proton spins in the direction of the field (z
direction). Next, a radio frequency (RF) pulse that is specific only to hydrogen (Larmour
frequency) is applied, perturbing the alignment (or magnetization) of protons. The protons
absorb the energy from the variable field and flip their spins into the xy plane, a process called
excitation. When the RF pulse is turned off, the protons gradually return to their normal spin
(equilibrium) releasing the energy absorbed from the RF pulses, creating a signal that is picked

32
up by the coils placed in the MRI tube. This process is called relaxation and occurs in different
rates depending on the tissue type. There are two different relaxation times - T1 and T2. T1 is
the time constant which determines the rate at which excited protons return to equilibrium, that
is align with the external magnetic field in the z direction (longitudinal relaxation). T2 is the
time constant which determines the rate at which excited protons reach equilibrium or go out
of phase with each other in the xy plane (transverse magnetization) (external factors such as
magnetic field inhomogeneity can increase the T2, as captured in T2*).
By varying several MRI sequence parameters, images can be acquired with varying contrast
between different brain tissues. Some of the adjustable parameters are the: repetition time (TR)
- time between successive pulse sequences - and echo time (TE) - time between the RF pulse
and the sampling of the echo signal. T1-weighted images are produced by short TE and TR
times. Tissues with short T1 appear bright on the image because they regain most of their
longitudinal magnetization during the TR interval (such as white matter (WM)) and produce a
stronger MR signal. Tissues that seem much darker on the image, therefore have longer
longitudinal relaxation times (such as cerebro-spinal fluid (CSF)). T2-weighted images are
produced using longer TE and TR. Therefore, tissue, such as WM, with a short T2 will appear
dark on T2-weighted images, while CSF will appear bright on T2-weighted images.
1.3.2 Diffusion weighted imaging (DWI) DWI is a variant of conventional MRI sensitive to diffusion of water protons. This technique is
based on the molecular diffusion, or Brownian motion, referring to thermally driven random
motion of water molecules (Soares, Marques, Alves, & Sousa, 2013; Hagmann et al., 2006).
This movement is described by the diffusion coefficient, which also depends on the properties
of the liquid, such as viscosity, molecular size and temperature. In an unrestricted environment,
such as glass of water, the motion is completely random and only limited by the boundaries of
the glass. However, biological tissue is a highly heterogeneous media, in which the random
movement of molecules is impeded by compartmental boundaries and other molecular
obstacles and thus restricted in various directions. The combination of these factors, produces
measured signal changes that reflect the apparent diffusion coefficient (ADC) or mean
diffusivity (MD) which can significantly differ from the diffusion coefficient of the unrestricted
liquid (like in the glass of water).
DWI images are acquired by applying a diffusion sensitizing gradient that increases the strength
of magnetic field evenly in one direction. The gradients are applied across large number of

33
different directions (minimum 6) to ensure a robust estimation of diffusion. For each direction,
the first gradient pulse dephases the magnetization, and the second pulse rephases the
magnetization. For stationary molecules, the second gradient will refocus the protons perfectly,
resulting in maximally coherent magnetization and sampling of a high MRI signal. In case of a
diffusion in the direction of applied gradient, the second gradient will cause a random phase
shift resulting in an attenuation of the MRI signal. Thus the WM fiber tracts parallel to the
gradient direction will appear dark on the DWI images in that direction (O’Donnell & Westin,
2011; Mori, & Zhang, 2006).
Diffusion tensor imaging is an extension of DWI which refers to a specific modelling of data,
allowing the inference of directional dependencies of the diffusion signal, resulting in a 3D
representation of the water molecule movement. The spatial dependence of the diffusion is
characterized by a 3x3 matrix, called the diffusion tensor, that describes the diffusion along
some combination of the 3 different spatial direction (x,y,z), assuming that the displacement
distribution is Gaussian. The diffusion tensor is usually represented by an ellipsoid, where the
axes represent three principal diffusion directions (eigenvectors – v1, v2, v3) and the
corresponding diffusion magnitude (eigenvalues - λ1, λ2, λ3). Eigenvalues are ordered
λ1>λ2>λ3, with an anisotropic diffusion (restricted diffusion) characterized by λ1≥λ2≥λ3 and
isotropic diffusion by λ1~λ2~λ3 (Figure 1.3.1).
Figure 1.3.1. Three diffusion ellipsoids represent the diffusion profile of 3 different structures. The axes represent the x- (left-right, red), y- (posterior-anterior, green), and z-(inferior-superior, blue) directions. (A) Isotropic diffusion ellipsoid, representing a region of cerebral spinal fluid. (B) Anisotropic diffusion ellipsoid, representing a white matter tract parallel to the y-axis (superior longitudinal fasciculus). (C) Anisotropic diffusion ellipsoid, representing a white matter tract parallel to the x-axis (corpus callosum. Reproduced from Feldman, Yeatman, Lee, Barde, & Gaman-Bean (2010).
The degree to which diffusion is directionally dependent can be expressed as the fractional
anisotropy (FA), a parameter which is calculated comparing each eigenvalue with the mean of
all the eigenvalues as in the following equation:

34
The values of FA range from 0 (isotropic) to 1 (anisotropic). In the brain white matter, diffusion
is anisotropic as it greater along the axis of the axons and not across. Thus, DTI also allows
fiber tracking that is reconstruction of major white matter tracts in the brain, which are made
up of densely packed myelinated axons (high values of FA). One of these major tracts is the
cingulum which nestles in the WM of the cingulate gyrus and will be mentioned in following
chapters (Figure 1.3.2).
Figure 1.3.2. Major white matter structures of the human brain. ACR, anterior corona radiata; ALIC, anterior limb of internal capsule; ATR, anterior thalamic radiation; CC, corpus callosum; CG, cingulum; CPT, corticopontine tract; CST, corticospinal tract; EC, external capsule; Fmajor, forceps major; Fminor, forceps minor; FX, fornix; GCC, genu corporis callosi; ILF, inferior longitudinal fasciculus; PLIC, posterior limb of internal capsule; PTR, posterior thalamic radiation; RLIC, retrolentricular part of internal capsule; SCC, splenium corporis callosi; SFO, superior fronto-occipital fasciculus; SLF, superior longitudinal fasciculus; SS, sagittal striatum; ST, stria terminalis; TAP, tapetum. Reproduced from Toga, Thompson, Mori, Amunts, & Zilles. (2006).
Other measures can be calculated such as mean diffusivity (λ1+λ2+λ3)/3), axial (longitudinal)
diffusivity (λ1) that is the rate of diffusion in the direction that is parallel to the white matter,
and radial diffusivity (λ2+λ3)/2) or perpendicular diffusivity to white matter.
More importantly, DWI/DTI is a sensitive (but non-specific) marker of neuropathology and
microstructural architecture. The combination of described measures has received growing
popularity in clinical diagnosis and characterization of various pathological process such as
acute ischemic lesions (decrease in MD, increase in FA), inflammation and edema (increase in
MD, decrease in FA), and demyelination/dysmyelination (increase MD, decrease FA, increase
RD) (Alexander, Lee, Lazar, & Field, 2007).

35
1.3.3 Functional MRI (fMRI) Functional magnetic resonance imaging (fMRI) measures the spontaneous (resting-state) or
stimulus-driven fluctuation in the blood oxygenation level-dependent (BOLD) signal. The idea
that changes in blood oxygenation could drive measurable signal changes in brain MR images
was introduced by Ogawa and colleagues in 1990.
In brief, fMRI is based on the principle that an increase in neural activity in a brain region
stimulates an increase in a local blood flow needed for a higher supply of oxygen and glucose.
Consequently, there is a change in blood flow that exceeds the demand in the adjacent
capillaries, resulting in an increase in the balance of the oxygenated arterial blood to
deoxygenated venous blood (Gore, 2003). This phenomenon is called the hemodynamic
response (Figure 1.3.3).
Oxygenated and deoxygenated hemoglobin present different magnetic attributes, therefore, the
higher concentration of oxyhemoglobin in the venous compartment (and decreased
deoxyhemoglobin) changes the paramagnetic properties of the tissue which can be detected
during a T2* acquisition. An increase in blood oxygen concentration at capillary level will
locally reduce magnetic field inhomogeneities leading to increased T2*-weighted signal.
Figure 1.3.3. A. Schematic illustration of the origins of the BOLD effect in fMRI. B. Illustration of the typical BOLD hemodynamic response function. Figure A reproduced from Gore (2003). Figure B reproduced from Siero et al. (2013).

36
1.3.4 Resting-state fMRI (rs-fMRI) RS-fMRI investigates synchronous activations between regions that are spatially distinct,
without applying a task or a controlled stimulus (Lee, Smyser & Shimony, 2013). Rs-fMRI
focuses on spontaneous low frequency fluctuations (<0.1 Hz) in the BOLD signal (Van Dijk et
al., 2010). Relative to task-based fMRI, it requires minimal patient compliance, it can be
acquired under anesthesia and it is well suited for difficult clinical populations such as
Alzheimer’s disease or DOC patients (Fox & Greicius, 2010; Orringer, Vago, & Golbycole,
2012; Lee et al., 2013). Recently, there have been some advances in the application of rs-fMRI
in prediction of individual differences (Calhoun, Lawrie, Mourao-Miranda, & Stephan, 2017;
Dubois & Adolphs, 2016), which hold significant promise in obtaining diagnostic and
prognostic information in a single subject, especially important in heterogeneous groups, such
as the population of traumatic brain injury patients.
1.3.4.1 Rs-fMRI analysis methods After image preprocessing steps, a number of methods can be applied in the analysis of the rs-
fMRI data, each with its own inherent advantages and disadvantages.
The two main approaches to analyzing rs-fMRI are the: a) model-driven and b) the data-driven
analysis (Cole, Smith, & Beckmann, 2010).
The first approach consists (Poldrack, 2007) of the a priori selection of a voxel, cluster or atlas
region, from which to extract time series (i.e. BOLD signal) data which is then used to calculate
whole-brain, seed-based, or voxel-wise functional connectivity maps of co-variance with the
seed region (Cole et al., 2010).
The seed-based approach was used in the study of Biswal and colleagues (1995) in which the
low-frequency coherent, spontaneous BOLD fluctuations were identified bilaterally in the
somatomotor cortical regions, suggesting, for the first time, the functional importance of the
resting-state activity. However, as described, this approach is hypothesis-driven, requiring a
priori selection of ROIs based on the assumption of a functional dependency.
In contrast, the data-driven approach such as the independent component analysis (ICA) serves
to estimate the component maps of maximal spatial independence (from each other) without
the need for a prior selection of brain regions (Beckmann, DeLuca, Devlin, & Smith, 2005).
Importantly, the application of seed-based and ICA analysis led to the identification of several
resting-state networks (RSNs) representing spatially distant but functionally connected regions,

37
comparable to known sensory and cognitive processing systems shown to be activated during
different task-based fMRI studies (Heine et al., 2012; Rosazza, & Minati, 2011).
Another, distinct but interesting alternative to seed-based and ICA analysis is the graph theory
analysis which formulates the resting-state networks as a collections of nodes connected by
edges (i.e. links) (Lee et al., 2013). This approach is not so widely used as the previous ones,
but is rapidly gaining interest in the neuroimaging community. The graph analysis is an
advanced mathematical approach which consists of several steps of analysis, and will be
explained in more detail in the following chapters.
1.3.5 Network-based analytical approach: graph theory
1.3.5.1 Graph definitions Brain’s anatomical and functional organization can be approached from the perspective of
complex networks, which has led to a growing interest in the application of graph theoretical
methods in the neuroscientific community (Bullmore & Sporns, 2009; Bullmore & Basset,
2011). Graph theory is a mathematical study of complex systems/networks that is graphs.
Within this framework a complex system (brain) is formalized as a mathematical object
consisting of a set of vertices (ex. neurons, brain regions, electrodes) and edges that is pairwise
relationships between those vertices (ex. synaptic connections, interregional pathways,
functional dependencies) (i.e. G = (V, E)). Using these two components, nodes and edges, graph
topology can be quantitatively described by a wide variety of measures organized according to
their ability to characterize large (whole network), intermediate (sub-networks) or small (nodes)
topological scales (Fallani et al., 2014). Two nodes are adjacent if they are connected with an
edge, and two adjacent nodes are called neighbors. A self-loop is an edge that connect a node
to itself, and it is usually not present in simple graphs. A cycle is a path of edges and nodes
where a node is reachable from itself. Graphs can be unweighted (i.e. binary), representing
networks in which edges are either present or absent, or weighted – when each link has an
assigned weight (numerical value). Graphs are directed when edges have a direction
association with them, and undirected when links are symmetrical. A signed graph is a graph
in which each edge has a positive or negative sign.

38
Figure 1.3.4. An example of a a) binary graph, b) self-loop, c) weighted graph, d) directed graph, e) signed graph and a f) fully connected graph.
A fully connected graph contains nodes that are connected with at least one edge. To generate
a complete or fully connected graph, the minimum spanning tree (MST) can be applied
(Alexander-Bloch et al., 2010; Prim, 1957). MST or minimum weight spanning tree consist of
connecting all nodes, without any cycles and with minimum possible total edge weight (in
weighted networks). The maximum number of edges are removed iteratively from a fully
connected graph until all the nodes remain connected. In a graph with N nodes, the MST has
N-1 edges. A graph can have many minimum spanning trees.
Graph theory offers many more concepts that will not be explored in detail, for further
information please refer to a book written by Fornito, Zalesky & Bullmore (2016). In the second
study (Chapter IV) we define our graphs as fully-connected, loop-less, undirected, unsigned
(absolute) and unweighted.
1.3.5.2 Graph representation Every graph is associated with an adjacency matrix – square matrix in which the elements
indicate whether pairs of nodes are adjacent or not in the graph. In an undirected
binary/unweighted graphs, the adjacency matrix is a symmetric (0, 1) - matrix with zeroes on
its diagonal (no self-loops) (Figure 1.3.5).

39
Figure 1.3.5. A simple binary graph and its representation by an adjacency matrix.
1.3.5.3 Graph analysis The analysis of graphs entails several processing steps that need to be applied to each subject
individually (Figure 1.3.6). The most important step for valid results is the accurate definition of
nodes (Fornito, 2010; Fornito, Zalesky, & Breakspear, 2013; Hayasaka & Laurienti, 2010;
Zalesky et al., 2010) and edges (Meskaldji et al., 2013; van Wijk, Stam & Daffertshofer, 2010),
as these are the building blocks of any network and have a large impact on the extracted graph
metrics (Stanley et al., 2013; Fornito et al., 2016).
In voxel-based modalities, such as fMRI, there are several ways to define brain nodes, mostly
depending on the spatial scale (single voxels versus cluster of voxels) and the choice of how to
combine voxels (anatomical, data-driven or hybrid parcellation) (Fornito et al., 2016). The most
common approach in rs-fMRI is the choice of brain regions that are considered functionally
homogeneous, as shown in task-evoked (i.e. cognitive task) or resting–state spontaneous
synchronous activity (i.e. RSNs identified with ICA). Undirected functional links are mostly
commonly defined using the Pearson correlation coefficient between the BOLD time courses
extracted from different ROIs. However, the obtained functional adjacency matrix is always
fully connected (except the diagonal/self-connections) and most probably contains weak and
potentially spurious connections that could significantly influence the network topology.
Therefore, the matrix needs to be thresholded before the graph metrics are calculated. To do
this, we can apply a fixed cut-off value or threshold, τ, to the connectivity matrix in order to
determine which connections should be retained. In the case of functional matrices, we could

40
set a value of the correlation coefficient to r=0.2, deciding to keep only the connection that have
a higher value then r. This approach is useful in separating signal from noise, however, it usually
results in a different in number of connections retained for each subject, rendering inter-
individually comparison difficult. Another approach that addresses this problem is the
connection density (cost) threshold. The cost (k) represent the ratio between the actual number
of edges and the total number of possible edges in the graph. In the case of undirected graphs,
the number of possible edges is divided by 2. The corresponding formula is:
𝑘 =𝐸
𝑁(𝑁−1)/2,
where E is the actual number of edges and N the number of nodes in the network (N-1 is the
number of off-diagonal elements).
After applying the threshold, the remaining elements can be binarized (0, 1 matrix). Binary
functional matrices assure the analysis of topological patterns of connection between nodes
without the influence of variation in their weights (Fornito et al., 2016). Filtered and binarized
matrices can then be used to calculate graph metrics.
Figure 1.3.6. The processing pipeline for functional graph analysis.
Reproduced from Fallani et al. (2014).

41
1.3.5.4 Graph metrics Graph theory offers a multitude of measures that can be used to explore relationships between
nodes in brain networks. We will describe only the ones that we used in our second study. The
metrics and corresponding formulas are integrated in the R-based libraries: brainwaver
(http://cran.rproject.org/web/packages/brainwaver/index.html2) and igraph
(http://cran.rproject.org/web/packages/brainwaver/index.html2http://cran.rproject.org/web/pac
kages/igraph/index.html). For additional metrics and formulas, please see Rubinov & Sporns
(2010).
1) The most basic property of a node i is the degree (ki) that is the number of its adjacent
edges that connect it to rest of the nodes in the graph. It is defined as:
where aij is the connection status between i and j, and N is the set of all nodes in the network.
2) Minimum path length (distance) is the minimum number of edges that must be traversed
to go from one node to another. It is a basic measure of integration within a network. It is
calculated as:
where gi↔j is the shortest path (geodesic) between i and j (lij = ∞ for all disconnected pairs i, j). 3) The global efficiency (E) is also a metric for efficiency of integrative information transfer
across the network (Latora & Marchiori, 2001). This measure is inversely related to the
harmonic mean of the shortest path length (Watts & Strogatz, 1998), but is adapted to
disconnected graphs. It is computed as:

42
4) Clustering coefficient is a measure of the degree to which nodes in a graph tend to cluster
together (Watts & Strogatz, 1998). It’s a basic measure of segregation within a network. It is
calculated as:
where ti is the number of triangles around a node i, (Ci = 0 for ki < 2).
5) The local efficiency measures the integration capacity between immediate neighbors of a
given node (Latora & Marchiori, 2001). This metric also reflects the network resilience by
indicating how efficiently neighbors of a given node communicate when this node is disrupted.
It is defined as:
Where, Gi is the sub-graph of G (graph) obtained from a set of nodes which are nearest
neighbors (directly connected) of node i. NGi is the number of nodes in Gi.
Figure 1.3.7. A graphical example of global and local metrics.

43
Figure 1.3.8. Table of the most basic global and local metrics and associated interpretation.
1.3.5.5 Small-word topology Watts and Strogatz (1998) introduced a generative model for graphs which provided first
evidence that neural networks have small-world (SW) properties. SW networks have high levels
of clustering, like lattice (regular) networks, combined with low average path length, much like
in random networks (Figure 1.3.9). The association of these two characteristics seems to provide
a substrate for simultaneous segregation and integration at minimal wiring-cost (Fornito et al.,
2016).
Since the Watts-Strogatz model, multiple studies have suggested that brain networks are small-
world, representing functionally associated clusters with high density of local connections and
few long-range connections between segregated areas supported by the integrative properties
of highly connected hub nodes (Bullmore & Sporns, 2009; Collin et al., 2014).
These brain hub nodes can be defined using a range of topological measures (van den Heuvel
& Hulshoff Pol, 2010; van den Heuvel & Sporns, 2013). Accordingly, the combination of
different metrics, such as degree and betweenness centrality can distinguish nodes that are
highly connected and have a particularly high influence on network-wide process (Fornito et
al., 2016).

44
Figure 1.3.9. Graphical representation of different types of networks. The healthy human brain has a SW organization, which consists of dense local connections (i.e. as in regular networks), short path lengths (i.e. as in random networks) and the presence of highly connected hubs (i.e. as in scale free networks). Thus, the human brain is also a hierarchical, modular network. Reproduced from Stam (2014).
Interestingly, several disorders, such as Alzheimer’s disease and schizophrenia, have been
associated with either more regular or random topology (Bassett & Bullmore, 2009; Bassett,
Nelson, Mueller, Camchong, & Lim, 2012; Liu et al., 2008; Stam, 2014) in comparison to
healthy controls who had preserved SW organization. Additionally, severe brain-injury has
been shown to have a high impact on individual nodes - hubs - highly connected, central brain
nodes, essential for regulating and maintaining the delicate balance between segregation and
integration essential for efficient brain functioning (Fornito, Zalesky & Breakspear, 2015;
Seeley et al., 2009).
1.4 The restless brain: resting-state functional brain networks (RSNs) in healthy subjects
1.4.1 Functional differentiation The human brain is composed of a large number of regions that differ in their task and function
but communicate with each other through dynamic interactions forming brain networks that

45
underlie complex cognitive processes. Thus, the human cerebral cortex seems to have attributes
that promote modularity (differentiation) and efficient brain-wide communication (integration)
(van den Heuvel & Sporns, 2013).
As previously described, rs-fMRI studies have identified multiple RSNs comprised of spatially
remote but functionally connected regions underlying specialized cognitive processing. The
RSNs consistently reported across studies include: the default mode network (DMN), visual
networks, auditory and sensorimotor network, bilateral executive control and the salience
network (Figure 1.4.1; Damoiseaux et al., 2006; Heine et al., 2012; Laird et al., 2011; Rosazza,
& Minati, 2011; Shirer, Ryali, Rykhlevskaia, Menon, & Greicius, 2012; Smith et al., 2009).
Figure 1.4.1. Multiple cerebral networks that can be identified with ICA applied on rs-fMRI. Data acquired in healthy controls. Reproduced from Heine et al. (2012).
DMN has been studied extensively, and is the network that received the most attention in
clinical and research setting (Hannawi, Lindquist, Caffo, Sair, & Stevens, 2015; Heine et al.,
2012; Rosazza, & Minati, 2011). It consists of midline precuneus/posterior cingulate, lateral
parietal cortex/angular gyrus and mesial prefrontal/anterior cingulate cortex. DMN was initially

46
identified in PET studies, which showed less activation in the corresponding regions during
demanding cognitive tasks compared to resting-state condition (Mazoyer et al., 2001; Raichle
et al., 2001). Since then, fMRI studies have consistently found synchronous activation in these
regions (van den Heuvel & Hulshoff Pol, 2010; Lee et al., 2013), and structural MRI studies
have indicated underlying anatomical connections (Figure 1.4.2; Greicius, Supekar, Menon, &
Dougherty, 2009; van den Heuvel et al., 2009). Activity in the DMN has been related to self-
related and internally directed cognition (Andrews-Hanna, Smallwood, & Spreng, 2014;
Raichle, 2015), such as stimulus-independent (spontaneous) cognition and mind-wandering
(Fox et al., 2015), autobiographical memory (Buckner, Andrews-Hanna, & Schacter, 2008) and
social cognition (Andrews-Hanna & Spreng, 2015).
Multimodal rs-fMRI/DTI studies suggest that the DMN inter-regional resting-state functional
connectivity is facilitated through the cingulum bundle (Wang, Dai, Gong, Zhou, & He, 2014),
principally connecting the PCC/PreCu and the mPFC (Figley, Bhullar, Courtney, & Figley,
2015; Greicius, Supekar, Menon, & Dougherty, 2009; Van Den Heuvel, Mandl, Kahn, &
Hulshoff Pol, 2009; Honey et al., 2009; Khalsa, Mayhew, Chechlacz, Bagary, & Bagshaw,
2014). Moreover, the microstructural organization (i.e. FA) of this white matter tract has been
directly related to the level of functional connectivity between these two regions (van den
Heuvel, Mandl, Luigjes, & Hulshoff Pol, 2008). In fact, structural-functional coupling seems
to be highest in the regions of the DMN, especially in the posteromedial region (Collin et al.,
2014; Horn, Ostwald, Reisert, & Blankenburg, 2014; Segall et al., 2012), in comparison to other
brain areas.

47
Figure 1.4.2. Functional connectivity reflects structural connectivity in the DMN. DTI fiber tractography in a single subject demonstrates the cingulum bundle (blue tracts) connecting the PCC to the mPFC. Reproduced from Greicius et al. (2009).
The executive control network (ECN) is mainly identifiable in the medial and superior frontal
gyrus, anterior cingulate and super parietal cortex. It has been related to externally-directed
cognition, working memory, decision-making in goal directed behavior (Menon & Udin, 2010),
with left ECN being more involved in language processing, and the right ECN in perceptual,
somesthetic, and nociception processing (Smith et al., 2009; Laird et al., 2011). The salience
network (SN), anchored in the anterior insula and dorsal anterior cingulate cortex is implicated
in transient detection of salient stimuli, initiation of attentional control and allocation of
cognitive resources towards salient stimuli (Uddin, 2014; Menon & Uddin, 2010; Menon,
2015).
During cognitively demanding tasks, executive control network usually shows an increase in
activation, whereas DMN shows a decrease, resulting in negative (anticorrelation) relationship
between these two networks (Greicius, Krasnow, Reiss, & Menon, 2003; Greicius & Menon,
2004). Some research even suggests that the SN mediates this ‘switching’ between the
activation of the DMN and of the ECN to guide appropriate responses to salient stimuli (Uddin,
2014; Menon & Uddin, 2010).

48
1.4.2 Functional integration The human brain sub-networks do not work in isolation but are interconnected and coordinated
through a set of brain regions capable of cross-modal complex responses (Tomasi & Volkow,
2011; Wu et al., 2011) serving to distribute and converge specialized information (van den
Heuvel & Sporns, 2013). These highly central hub regions maintain long-distance anatomical
and functional connections and are metabolically costly, but essential for efficient brain
function and cognition (Collin et al., 2014). Also, these regions seem to be more densely
interconnected, forming a brain core or rich club (van den Heuvel & Sporns, 2011) serving as
the backbone for functional integration across the brain.
Structural and functional “connector” hub regions have been mainly identified in parietal and
frontal cortical regions, with some of them spatially overlapping with midline DMN nodes,
suggesting its central role in the overall brain network structure (van den Heuvel & Sporns,
2013).
More specifically, the PCC/PreCu complex is frequently identified as a key hub node at DMN
and whole brain level, with high correspondence between rs-fMRI and DTI fiber-tracking
studies (Hagmann et al., 2008; Horn, Ostwald, Reisert, & Blankenburg, 2014; Van Oort, van
Cappellen van Walsum, & Norris, 2014). The importance of posteromedial cortex in the overall
brain network interaction was also demonstrated in a lesion stimulation study, where lesions
along the cortical midline caused large and widely distributed changes in functional
connectivity, in opposed to lesions of primary sensory or motor regions whose effects remained
more localized (Alstott, Breakspear, Hagmann, Cammoun, & Sporns, 2009).
1.4.2.1 Key hubs for consciousness emergence: PMC-PCC/PreCu complex
The posteromedial cortex (PMC) has been recently termed as a posterior “hot zone” zone and
a good candidate for both full and content-specific NCC (Koch et al., 2016; Tononi et al., 2016).
This architectonically discrete region, has been recognized as a critical site integrating an
important range of multimodal information (Dehaene & Changeux, 2011). This highly dynamic
functional core seems to participate in multiple transitional connectivity networks seemingly
playing a critical role in internally/externally directed high-level cognition (Cavanna &
Trimble, 2006; Leech & Sharp, 2014). Converging data from physiological, pharmacological
(Heine et al., 2012; Siclari et al., 2017) and pathological models (Hannawi et al., 2015), suggest
the implication of PMC and its long-range functional connections in conscious processing.

49
Interestingly, a growing body of literature on animal and human studies, suggests a significant
heterogeneity in cytoarchitectonic (Vogt & Laureys, 2005; Vogt, Vogt, & Laureys, 2006),
structural (Parvizi, Van Hoesen, Buckwalter, & Damasio, 2006; Zhang et al., 2014) and
functional connectivity maps characterizing different sub-region of the PMC (Bzdok et al.,
2015; Zhang and Li, 2013). Recent studies highlighted that the “metastable” functional
connectivity detected in this region follows a complex ventral/dorsal and anterior/posterior
gradient, partially overlapped across anatomically defined sub-regions (i.e. precuneus (PreCu)
and posterior cingulate cortex (PCC)) (Bzdok et al., 2015; Cauda et al., 2010; Margulies et al.,
2009; Zhang & Li., 2012).
On the other hand, findings in human and non-human primates also suggest functional unity
within the PMC given the strong local interconnections among its components and their shared
connections with other neural structures (Cauda et al., 2010; Parvizi et al., 2006).
In healthy subjects, most rs-fMRI studies suggest a subdivision of PMC on dorsal and ventral
portions, the dorsal corresponding to the PreCu and further divided into anterior, central and
posterior subareas (Cauda et al., 2010; Margulies et al., 2009). A rs-fMRI study with 225
healthy individuals showed three functional subdivisions of the PreCu, the dorsal-anterior,
dorsal-posterior, and the ventral PreCu shown to connect to other regions of the DMN (Figure
1.4.3; Zhang & Li, 2012). Multiple studies also indicate that the anterior and posterior portions
of the PreCu are differentially associated with several cognitive functions such as visuo-
spatially guided behavior, mental imagery and episodic memory retrieval (Cavanna & Trimble,
2006).

50
Figure 1.4.3. A summary of functional connectivity of different sub-areas of the precuneus. Connectivity of the dorsal-anterior (DA, red), dorsal-posterior (DP, green), and ventral (V, yellow) precuneus, with blue indicating connectivity with all three regions. Positive and negative connectivities are each indicated by solid and dashed line. Reproduced from Zhang & Li (2012).
The ventral PMC most often corresponds to the PCC (Cauda et al., 2010; Margulies et al., 2009)
and is further segregated into dorsal (dPCC) and ventral portions (vPCC) (Vogt et al., 2006; Yu
et al., 2011; Zhang & Li, 2012). Recent study (Cha, Gibson, & Lee, 2017) suggested that PCC
could be separated into two sub-regions (i.e. dPCC and vPCC) based on global functional
connectivity, or four sub-regions based on local functional connections and hierarchical
clustering. As the PreCu, the PCC also shows a complex pattern of connectivity with other
intrinsic networks (Leech & Sharp, 2014; Figure 1.4.4), with the ventral PCC showing strong
functional connectivity with the DMN, and the dorsal PCC exhibiting a more transitional
connectivity, linking and coordinating the activity across multiple resting state networks such
as the frontoparietal control network, dorsal attentional network, sensorimotor and salience
network (Leech, Braga, & Sharp, 2012).
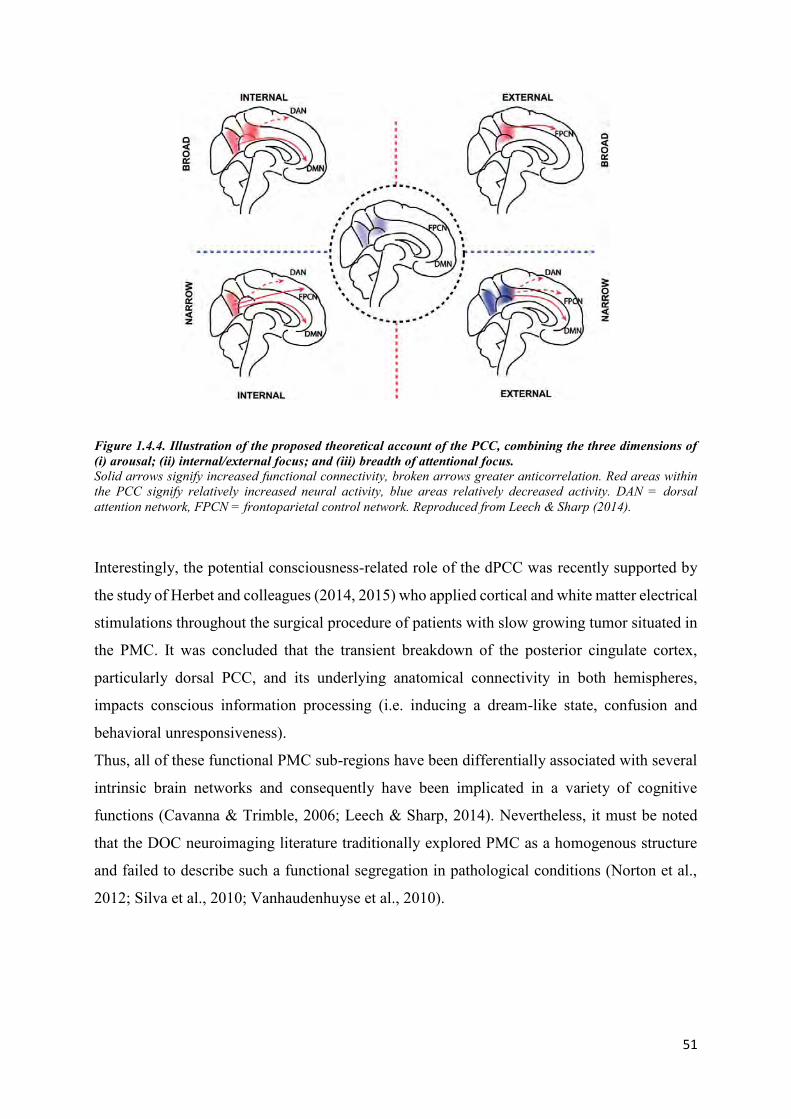
51
Figure 1.4.4. Illustration of the proposed theoretical account of the PCC, combining the three dimensions of (i) arousal; (ii) internal/external focus; and (iii) breadth of attentional focus. Solid arrows signify increased functional connectivity, broken arrows greater anticorrelation. Red areas within the PCC signify relatively increased neural activity, blue areas relatively decreased activity. DAN = dorsal attention network, FPCN = frontoparietal control network. Reproduced from Leech & Sharp (2014).
Interestingly, the potential consciousness-related role of the dPCC was recently supported by
the study of Herbet and colleagues (2014, 2015) who applied cortical and white matter electrical
stimulations throughout the surgical procedure of patients with slow growing tumor situated in
the PMC. It was concluded that the transient breakdown of the posterior cingulate cortex,
particularly dorsal PCC, and its underlying anatomical connectivity in both hemispheres,
impacts conscious information processing (i.e. inducing a dream-like state, confusion and
behavioral unresponsiveness).
Thus, all of these functional PMC sub-regions have been differentially associated with several
intrinsic brain networks and consequently have been implicated in a variety of cognitive
functions (Cavanna & Trimble, 2006; Leech & Sharp, 2014). Nevertheless, it must be noted
that the DOC neuroimaging literature traditionally explored PMC as a homogenous structure
and failed to describe such a functional segregation in pathological conditions (Norton et al.,
2012; Silva et al., 2010; Vanhaudenhuyse et al., 2010).

52
2 Chapter II – State of the art
2.1 Resting-state functional connectivity in acquired disorders of consciousness
2.1.1 DOC neuroimaging-based diagnosis Rs-fMRI studies with DOC patients most frequently indicate a decrease in activity and
connectivity within the midline and subcortical regions associated with the default mode
network (Table 2.1.1; Hannawi et al., 2015; Heine et al., 2012). Importantly, the magnitude of
reduction in DMN functional connectivity (FC) seems related to the degree of consciousness
impairment, with a greatest decrease in coma and UWS compared to MCS (Demertzi et al.,
2015; Rosazza et al., 2016; Roquet et al., 2016; Soddu et al., 2011, 2012; Vanhaudenhuyse et
al., 2010).
Reduced functional connectivity within other RSNs has also been associated with the loss of
consciousness. These include the left and right executive control, frontoparietal, auditory,
attention and salience networks (Demertzi et al., 2014, 2015; Qin et al., 2015; Ovadia-Caro et
al., 2012; Kirsch et al., 2017; Roquet et al., 2016; Soddu et al., 2016; Tsai et al., 2014). It has
recently been implied that the FC within the salience network (supragenual anterior cingulate
cortex, left anterior insula) correlates with the current level of consciousness (UWS vs. MCS),
whereas DMN (PCC, left lateral parietal cortex) connectivity predicts recovery of
consciousness (Qin et al., 2015).
Additionally, several fMRI studies with passive speech processing tasks, suggested that patients
with higher consciousness levels and better recovery have a larger response in the language-
related brain network coupled with a deactivation in the DMN (Crone et al. 2011; Tomaiuolo
et al., 2016; Wang et al., 2015).
There results imply that interactions within a single RSN cannot be regarded independently
from the functional dynamics in other networks. Accordingly, a recent study has shown that
UWS and MCS patients don’t only have a decrease in positive correlation within the DMN, but
also in negative correlation between the external (task-positive) network and DMN, which
seems to reappear in EMCS patients (di Perri et al., 2016). The importance of network

53
interaction and balance between positive and negative connectivity within RSNs was also
demonstrated in the study of Amico and colleagues (2017). They showed that patients with
lower levels of consciousness and higher functional disability exhibit a reduction in positive
visual-sensory motor connectivity and a decrease in DMN-FPN negative connectivity (Amico
et al., 2017).
In addition to hypoconnectivity, pathological hyperconnectivity in UWS and coma patients has
been found in regions involved in externally directed cognition (di Perri et al., 2016; He et al.,
2014a; Wu et al., 2015). Hyperconnectivity may be related to compensatory brain plasticity
processes (di Perri et al., 2014; Fornito, Zalesky, & Breakspear, 2015; Hillary et al., 2015),
however, the significance of pathology-related increase in functional connectivity is still under
debate (Hillary et al., 2015). In addition, cross-hemispheric integration of information seems to
play an important role, as some studies implied a loss of inter-hemispheric connections in
extrinsic and DMN networks in DOC patients, irrespective of the etiology (Amico et al., 2017;
Ovadia-Caro et al., 2012; Zhang et al., 2017).
Finally, the study of Achard and colleagues (2012), has been the first and only rs-fMRI study
to investigate the global and local network topology in the acute DOC patients. Their findings
showed conserved global network properties (e.g. efficiency, clustering, small-worldness,
modularity), but a radical reorganization of high degree or highly efficient hub nodes. Cortical
regions (i.e. fusiform gyrus and precuneus) that were hubs in controls were non-hubs in
comatose patients, and non-hub regions (i.e. angular gyrus) in controls displayed hub-like
properties in patients (Figure 2.1.1). These findings suggested that whole-brain global properties
may be homeostatically conserved under severe brain injury, and that consciousness likely
depends on the anatomical location of hub nodes in human brain networks.

54
Figure 2.1.1. Hub disruption of functional networks in comatose patients. The mean degree of each node in the healthy volunteer group (healthy (x axis)) is plotted versus the difference between groups in mean degree of each node (coma−healthy (y axis)). Reproduced from Achard et al. (2012).

Table 2.1.1. Resting-state functional connectivity in DOC. Author Method Type of DOC Etiology Delay
injury(DOC)/imaging (Mean±SD)
Findings
Cauda et al. (2009) ICA 3 UWS 2 TBI; 1 mixed
20 months Dysfunctional DMN, reduced right-hemisphere connectivity.
Vanhaudenhuyse et al. (2010)
ICA 5 coma; 4 UWS; 4 MCS; 1 LIS
2 TBI; 1 anoxia; 11 other
159.8±473.8 days Reduced DMN connectivity in proportion to severity of consciousness impairment. PreCu connectivity stronger in MCS in comparison to UWS and coma.
Achard et al. (2012)
Seed; Graph theory
17 DOC 12 anoxia; 5 other
3 – 32 days No significant abnormality of global metrics, but radical reorganization of hub nodes and abnormal variability in modular structure between comatose patients.
Ovadia-Caro et al. (2012)
Seed 1 BI; 2 coma; 2 VS; 2 MCS; 1 LIS
1 TBI; 2 anoxia; 5 other
207±542 days; coma: 13-14 days
Reduced inter-hemispheric extrinsic network connectivity in subjects with impaired versus intact consciousness.
Soddu et al. (2012) ICA 8 UWS; 1 MCS; 2 LIS
5 TBI; 3 anoxia; 3 other
349.8±462.1 days; Fewer connections in the DMN regions in UWS in comparison to controls and LIS; Intact right lateralized DMN connectivity in MCS.
He et al. (2014) ICA; ALFF
9 UWS; 3 MCS 4 TBI; 3 anoxia; 5 other
2 – 7 months ICA – diminished activity in the DMN, mainly in the MPFC. ALFF – decrease in PCC/PreCu, ACC, parahippocampal areas (DMN); increase in the insula, lingual gyrus and paracentral gyri (external network).

56
Crone et al. (2014) Seed; Graph theory
34 UWS; 25 MCS
10 TBI; 6 anoxia; 5 SAH; 3 mixed; 6 hemorrhage; 13 CPR; 16 other
7 - 9900 days Reduced modularity in DOC compared to healthy controls. Reduced degree in the medial FR regions and bilateral thalamus. Increased degree in left superior and inferior FR gyrus. Reduced CC in PCC and right insular cortex. LE of the PMC (PreCu) differed between the UWS and MCS patients. CC in the right middle FR gyrus and the FR pole correlated with the CRS-R score.
Huang et al. (2014) Voxel-wise; Seed
6 UWS; 5 MCS 6 TBI; 5 non-TBI
90±42.4 days FCS and ALFF decreased in ACC, MPFC and PCC.
Tsai et al. (2014) ICA; ReHo; ALFF
3 coma patients; 12 not classified
7 ischemic stroke; 8 hemorrhagic stroke
Within 24h Lower ALFF and ReHo in PCC and PreCu, respectively. Decrease in DMN FCS, correlated with level of consciousness. Lower FCS in executive and attention networks.
Liu et al. (2014) Graph theory
5 UWS; 8 healthy controls undergoing propofol anesthesia
2 TBI; 3 other 42 - 66 days Scale-free distributions of node size and node degree were present across wakefulness, propofol sedation, and recovery, despite FC changes. In UWS, the scale-free distribution of node degree was absent, suggesting absent self-organizing processes underlying adaptive reconfiguration of functional interaction.
He et al. (2015) ICA and Seed
7 UWS ; 2 MCS
2 TBI; 2 anoxia; 5 other
3 – 7 months Decrease in FCS between the mediodorsal thalamus and DMN regions, predominantly in mPFC and PCC/PreCu.
Demertzi et al. (2014)
ICA 5 Coma ; 24 VS; 24 MCS
17 TBI; 11 anoxia; 30 other; Coma - 4 CVA; 1 TBI
816.8±1783 days; coma: 5-38 days
More neuronal components in RSNs in healthy compared to UWS and coma patients.

57
Demertzi et al. (2015)
ICA 6 Coma; 19 UWS; 26 MCS
Coma – 2 TBI; 3 SAH; 1 Stroke
2 - 7814 days; coma: 2 -38 days
Reduced to absent connectivity in six RSNs (DMN, FPN, SAL, AUD, SM, VIS) in coma patients.
DiPerri et al. (2016)
Seed 21 UWS; 24 MCS; 13 EMCS
29 TBI; 14 anoxia; 7 mixed; 8 other
1-312 months Lower positive DMN connectivity in DOC compared to controls. Negative DMN connectivity present only in healthy and EMCS. UWS and MCS showed pathological between-network positive connectivity.
Roquet et al. (2016) ICA 12 UWS; 5 LIS
2 TBI; 9 anoxia; 1 ischemia; 5 other
3-180 days Number of RSNs, total RSNs and high-level cognitive RSNs differentiated controls and LIS from UWS. DMN had the highest accuracy, FPN had maximum specificity but more limited sensitivity.
Amico et al. (2017) connICA 2 coma; 17 UWS; 21 MCS; 13 EMCS; 4 LIS
28 TBI; 29 non-TBI
>28 days Decrease in positive visual- sensorimotor network connectivity and DMN-FPN negative connectivity, associated with lower levels of consciousness.
Kirsch et al. (2017) Seed 6 UWS; 2 MCS 2 TBI; 6 other 23–693 days Decreased FC in DMN, salience, left and right ECN, auditory, sensorimotor RSNs. Lower connectivity between thalamus and RSNs.
ACC – anterior cingulate cortex; ALFF - amplitude of low-frequency fluctuation; AUD – auditory network; CC – clustering coefficient; CPL – characteristic path length; CPR - cardiopulmonary resuscitation; CVA – cardiovascular accident; DMN – default mode network; FCS – functional connectivity strength; FPN – frontoparietal network; FR – frontal; HBI – hypoxic-ischemic brain injury; LE – local efficiency; PC – participation coefficient; ReHo - regional voxel homogeneity; SAH - subarachnoid hemorrhage; SAL – salience network; SM – sensorimotor network; TPJ – temporoparietal junction; VIS – visual network.

58
The potential consciousness-related hub nodes have been identified in a recent coordinate-based
meta-analysis (13 studies: 272 patients, 259 healthy controls), which pointed to the medial
dorsal thalamus (mDor) and the PCC/PreCu complex as most frequently affected in DOC
(Hannawi et al., 2015), with the FC of the latter correlating with the magnitude of impairment
of consciousness (Soddu et al., 2012; Vanhaudenhuyse et al., 2010). Other regions with
disrupted functional connectivity included the left cingulate gyrus, medial temporal lobe,
middle frontal lobe, and bilateral medial dorsal nuclei of the thalamus. In fact, all DOC patients
showed a disruption in the cingulate gyrus, whereas UWS patients showed impairment in
bilateral mDor thalamus compared with the right mDor thalamus in MCS. In a separate study,
He and colleagues (2015) found a significant reduction in DOC in the functional connectivity
between the mDor thalamus and the regions within the DMN, including PCC/PreCu and mPFC,
illustrating the potential role of cortico-thalamic circuits in conscious processing. In addition,
fMRI studies imply low frequency fluctuations (ALFF) or regional voxel homogeneity (ReHo)
(He et al., 2014; Tsai et al., 2014; Huang et al., 2014) in the PreCu/PCC complex, suggesting
low activity in these sub-regions. This is supported by PET studies showing a significant
reduction in DMN-PCC/PreCu metabolism, related to clinical severity (Kim, Kim, An, & Im,
2010; Silva et al., 2010; Thibaut et al., 2012).

59
Anticorrelation in rs-fMRI
Although there has been an overwhelming number of studies investigating resting-state functional
connectivity, negative correlation or anticorrelation has frequently been ignored or not assessed
properly. This is partially due to some studies showing that these anticorrelation can be artificially
induced by conventional fMRI preprocessing methods like global signal regression (Murphy et al.,
2009; Weissenbacher et al., 2009). Other studies emphasized greater between-subject variability,
higher temporal fluctuations (dynamic changes) and a weaker connectivity strength of negative in
comparison to positive correlations, therefore making them harder to interpret (Chang & Glover,
2010; Cole et al., 2010).
Chai and colleagues (2012) compared the two preprocessing methods, the global signal regression
and the component base noise reduction method (CompCor, Behzadi et al., 2007) and showed robust
anticorrelation between the default and task-positive network regions independently of the choice
of the preprocessing method. Specificity of negative correlations was equal or higher under the
CompCor method, and the sensitivity and the specificity of positive correlations detection was better
when combining this method with band-pass filtering and the movement parameter regression (Chai
et al., 2012).
Furthermore, anticorrelation between individual brain hubs and resting state networks has
consistently been reported in healthy subjects with and without global signal regression (Chang &
Glover, 2009; Fox et al., 2009; Fox & Greicius, 2010; Fransson, 2005; Gopinath et al., 2015; Liu et
al., 2015; Parente et al., 2017; Uddin et al., 2009) and it has been shown to increase with age (Chai
et al., 2014). These findings suggest a potential biological origin of negative correlations, as further
implicated in studies showing anticorrelated electrophysiological fluctuations (Keller et al., 2013;
Popa et al., 2009) and structural connections between regions shown to be functionally
anticorrelated (Fox et al., 2009; Honey et al., 2009; Skudlarski et al, 2008).
A recent study suggested (Chen et al., 2017) that the inconsistency regarding DMN anticorrelation
across different studies, might be due to differences in seed-coordinates used in the analysis, in
addition to differences in preprocessing steps. The same authors showed that the ventral branch of
the DMN (vDMN) yielded significantly weaker anticorrelations in opposed to the dorsal branch of
the DMN (dDMN).
Nevertheless, there is an ongoing debate on the qualitative interpretation of these anticorrelations
as there has not yet been a consensus on their exact significance in the whole-brain organization.

60
2.1.2 Prognostic value of resting-state functional connectivity in DOC The association between functional neuroimaging data and outcome in disorders of
consciousness was assessed in a small number of studies (Table 2.1.2) (Table 2.1.3).
Studies with chronic DOC implied a relatively preserved DMN connectivity in patients who
recovered as opposed to patients who remained in UWS (Rosazza et al., 2016; Kondziella et
al., 2017), with an emphasis on PCC/PreCu connectivity (Qin et al., 2015; Wu et al., 2015).
In another graph theoretical project, a group of recovered patients exhibited significantly
increased connectivity degree in the mPFC, as compared to patients who had not recovered
consciousness 3 months after the initial MRI scan (Liu et al., 2017), suggesting a potential
beneficial compensatory role of functional hyperconnectivity.
To our knowledge, there have only been four rs-fMRI studies aiming to assess the prognostic
value of FC changes in the acute stage of DOC (i.e. coma) (Table 2.1.3).
Two of these studies indicated preserved DMN connectivity (Norton et al., 2012), with a greater
PCC/PreCu connectivity strength in anoxic BI patients who eventually regained consciousness
as opposed to those who did not (Koenig et al., 2014). Another study, including anoxic and TBI
patients, concluded that comatose patients who went to recover had a stronger connection
between the PCC-centered seed (not the PreCu-centered seed) and the mPFC as opposed to
patients who had an unfavorable outcome (Silva et al., 2015; Figure 2.1.2).
Finally, the most recent study, including cardiac arrest coma patients, showed higher within-
DMN connectivity and greater anticorrelation between the salience network (SN) and DMN,
and SN and the executive control network in patients with a 1-year favorable outcome compared
to patients who did not regain consciousness (Sair et al., 2017).
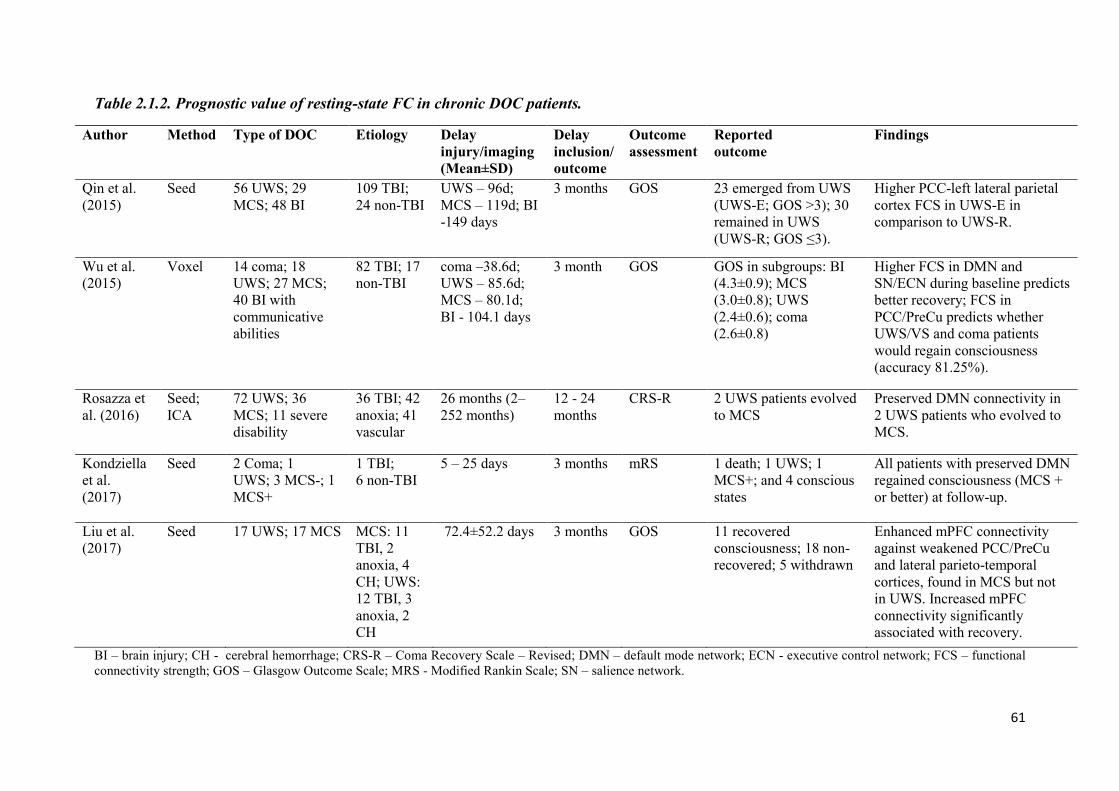
61
Table 2.1.2. Prognostic value of resting-state FC in chronic DOC patients.
Author Method Type of DOC Etiology Delay injury/imaging (Mean±SD)
Delay inclusion/outcome
Outcome assessment
Reported outcome
Findings
Qin et al. (2015)
Seed 56 UWS; 29 MCS; 48 BI
109 TBI; 24 non-TBI
UWS – 96d; MCS – 119d; BI -149 days
3 months GOS 23 emerged from UWS (UWS-E; GOS >3); 30 remained in UWS (UWS-R; GOS ≤3).
Higher PCC-left lateral parietal cortex FCS in UWS-E in comparison to UWS-R.
Wu et al. (2015)
Voxel 14 coma; 18 UWS; 27 MCS; 40 BI with communicative abilities
82 TBI; 17 non-TBI
coma –38.6d; UWS – 85.6d; MCS – 80.1d; BI - 104.1 days
3 month GOS GOS in subgroups: BI (4.3±0.9); MCS (3.0±0.8); UWS (2.4±0.6); coma (2.6±0.8)
Higher FCS in DMN and SN/ECN during baseline predicts better recovery; FCS in PCC/PreCu predicts whether UWS/VS and coma patients would regain consciousness (accuracy 81.25%).
Rosazza et al. (2016)
Seed; ICA
72 UWS; 36 MCS; 11 severe disability
36 TBI; 42 anoxia; 41 vascular
26 months (2–252 months)
12 - 24 months
CRS-R 2 UWS patients evolved to MCS
Preserved DMN connectivity in 2 UWS patients who evolved to MCS.
Kondziella et al. (2017)
Seed 2 Coma; 1 UWS; 3 MCS-; 1 MCS+
1 TBI; 6 non-TBI
5 – 25 days 3 months mRS 1 death; 1 UWS; 1 MCS+; and 4 conscious states
All patients with preserved DMN regained consciousness (MCS + or better) at follow-up.
Liu et al. (2017)
Seed 17 UWS; 17 MCS
MCS: 11 TBI, 2 anoxia, 4 CH; UWS: 12 TBI, 3 anoxia, 2 CH
72.4±52.2 days 3 months GOS 11 recovered consciousness; 18 non-recovered; 5 withdrawn
Enhanced mPFC connectivity against weakened PCC/PreCu and lateral parieto-temporal cortices, found in MCS but not in UWS. Increased mPFC connectivity significantly associated with recovery.
BI – brain injury; CH - cerebral hemorrhage; CRS-R – Coma Recovery Scale – Revised; DMN – default mode network; ECN - executive control network; FCS – functional connectivity strength; GOS – Glasgow Outcome Scale; MRS - Modified Rankin Scale; SN – salience network.

62
Table 2.1.3. Prognostic value of resting-state FC in coma patients.
Author Method Number of patients
Etiology Delay injury/imaging
Delay inclusion/outcome (M±SD)
Outcome assessment
Reported outcome
Findings
Norton et al. (2012)
ICA 13 coma 13 CA ~ 1 week 3 months GOS 2 Good (GOS -5); 11 Bad (GOS -1)
DMN not observed in those who remained unconscious.
Koenig et al. (2014)
ICA 17 coma 17 CPA 4 – 7 days 36.3±41.7 days
CPC 8 Good (CPC 1-2); 9 Bad (CPC 3-5)
Higher FCS in the PCC and PreCu in patients with good outcome.
Silva et al. (2015)
Seed 27 coma 14 TBI; 13 anoxia
3 – 9 days 3 months CRS-R 12 UWS; 11 MCS; 4 REC
Higher FCS between PCC (not PreCu) and mPFC in patients with good outcome.
Sair et al. (2017)
46 coma 46 CA 12.6±5.6 days
12 months
CPC 11 Good (CPC 1-2); 35 Bad (CPC 3-5)
Higher within-DMN connectivity and greater anticorrelation between SN and DMN and between SN and ECN, in FO compared with UFO patients.
CA – cardiac arrest; CPA – cardiopulmonary arrest; CPC - Cerebral Performance Category; CRS-R – Coma Recovery Scale – Revised; DMN – default-mode network; ECN – executive control network; FO – favorable outcome; GOS - Glasgow Outcome Scale; SN – salience network; UFO – unfavorable outcome.

63
Figure 2.1.2. Predictive role of PCC-mPFC coupling measured during coma state and neurologic outcome. Reproduced from Silva et al. (2015).
2.1.3 Resting-state FC-related signatures of brain injury mechanisms Most of the functional connectivity studies performed the analysis without considering the
differences in DOC etiology (traumatic, anoxic or vascular brain injury) (Hannawi et al., 2015).
Some studies included patients with the same etiology (Koenig et al., 2014; Norton et al., 2012)
or used it as a nuisance variable in their analysis (Amico et al., 2017), in order to control for
possible confounding effects of pathology-related mechanisms. In a recent multimodal study
with structural MRI, FDG-PET and rs-fMRI data, the level of DMN integrity had comparable
diagnostic power of impairment in consciousness irrespective of etiology (Rosazza et al., 2016).
Nevertheless, the diagnostic value of rs-fMRI was consistently highest for anoxic, followed by
traumatic, and then by vascular etiology. Silva and colleagues (2015) showed the prognostic
value of PCC-centered functional connectivity in both TBI and anoxic BI patient groups,
implying the involvement of the posteromedial cortex in conscious processing irrespectively of
coma etiology.

64
2.2 Structural network integrity in coma, UWS and MCS
2.2.1 Diagnosis and patient’s stratification
Findings from fMRI studies are supported with evidence of structural disconnections
within/between midline cortical (Annen et al., 2016; Fernández-Espejo et al., 2012; Lant et al.,
2016) and thalamo-cortical networks (Weng et al., 2017; Zheng et al., 2017), associated with
the degree of impairment of consciousness (Di Perri et al., 2016; Fernández-Espejo et al., 2012;
Lant, Gonzalez-Lara, Owen, & Fernández-Espejo, 2016) (Table 2.2.1).
Voxel based morphometry studies indicate widespread structural damage to cortical (i.e. lateral
hemispheres, midline structures) and subcortical areas (i.e. brainstem, thalami, cerebellum) (Di
Perri et al., 2016), with more injury to the bilateral PCC/PreCu and vmPFC in non-traumatic
UWS compared to non-traumatic MCS (Guldenmund et al., 2016).
A recent DTI study, explored the structural integrity of fiber tracts connecting the nodes of the
mesocircuit and the DMN in patients with DOC (Lant et al., 2016). There findings suggested
extensive damage to the PreCu/PCC-related connections, but relatively spared subcortico-
subcortical connections (Figure 20). According to authors, the preservation of the striato-
pallidal connections and the disconnection between the PreCu and these two regions may
indicate the role of the PreCu in the dysregulation in the mesocircuit system1 and more generally
in the disrupted functional brain network dynamics in DOC patients.
1 Anterior forebrain mesocircuit” hypothesis (Schiff, 2010, Giacino et al., 2014) suggests that a loss of excitatory output from the central thalamus to diffuse cortical areas has a causative role in the disorders of consciousness. Such circuit dysfunction is thought to be caused by the loss of the inhibitory striatal output to the globus pallidus (interna) resulting in pallidal disinhibition and subsequent excessive inhibition of the thalamus.

65
Figure 2.2.2.2.1. Individual tract analysis comparing FA values between DOC patients and healthy controls. HC: healthy control, FMC: frontal medial cortex, DLPFC: dorsolateral prefrontal cortex, Stri: striatum, GP: globus pallidus, Tha: thalamus, TPJ: temporoparietal junction, PCu: precuneus, L: left hemisphere, R: right hemisphere. PCu–FMC tract is considered midline. Reproduced from Lant et al. (2016).

66
Table 2.2.1. Structural changes in DOC.
Reference Method Type of DOC
Etiology Delay injury(DOC)/imaging (M±SD)
Findings
Coma van der Eerden et al. (2014)
DTI/Seed-based
89 coma patients
40 TBI ; 49 CA 5–57 days Aberrant AD and RD in TBI and CA patients compared to controls in almost all of the explored ROIs (i.e. brainstem, CP, CC). AD in cerebral hemispheres lower in CA than in TBI in 6/12 ROIs. Higher RD in TBI in 8/12 ROIs (i.e. IC, SS, SLF, EC, CR). Diffusivity values were symmetrically distributed in CA, but not in TBI.
Chronic DOC
Newcombe et al. (2010)
DTI/Seed-based analysis; whole-brain tractography; task fMRI
12 UWS
7 TBI; 5 HBI 105-1518 days FA significantly decreased and ADC increased in all patients compared with controls, in whole-brain WM, anterior and posterior CC. Higher ADC in whole-brain GM and thalamic ROIs. Increased ADC in brainstem regions (dorsal and ventral midbrain and pons) only in TBI. CRS-R positively correlated to central WM and negatively correlated to central ADC in all patients, irrespective of etiology.
Fernández-Espejo et al. (2012)
DTI/ROI-based fiber tracking
19 UWS; 27 MCS; 6 EMCS
32 TBI; 21 non-TBI
1–191 days Decrease in FA in the WM pathway connecting the PCC/PreCu with the thalamus, in DOC vs. controls. FA in this pathway and other posterior WM connections (PCC/PreCu–TPJ; TPJ–thalami) correlated with the level of consciousness.
Yao et al. (2015)
DTI (TBSS); rs-fMRI
11 DAI patients with DOC
11 TBI 2 - 11 days Lower FA in genu of the CC, right EC and SCR, left SCP and PTR. Significant positive correlation between FA in left PTR and SCP, and GCS.
Guldenmund et al. (2016)
Structural MRI - VBM
16 UWS; 45 MCS
26 TBI; 12 anoxia; 15 CVA; 4 mixed; 4 other
5 – 3342 days TBI related to more injury in the brainstem, midbrain, thalamus, hypothalamus, basal forebrain, cerebellum, and posterior CC, in comparison to non-TBI. Bilateral PCC/PreCu and vmPFC more injured in non-TBI UWS compared to MCS. Left cerebral cortex more damaged in MCS- in comparison to MCS+.

67
Di Perri et al. (2016)
FDG-PET; rs-fMRI; structural MRI-VBM
21 UWS; 24 MCS; 13 EMCS
29 TBI; 14 anoxia; 7 mixed; 8 other
1 - 312 months Consciousness-dependent increase in GM volume in almost the whole of lateral hemispheres, in the midline structures, including thalami and the cerebellum.
Lant et al. (2016)
DTI/ROI-based probabilistic tractography;
4 UWS; 3 MCS; 1 EMCS
3 TBI; 5 HBI 3523±2914 days Lower FA in bilateral subcortico-cortical fiber tracts in DOC patients, in all tracts involving the PreCu, right hemisphere thalamus–FMC, bilateral DLPFC–FMC, left DLPFC–TPJ, and left striatum–DLPFC. Higher FA in left striatum–globus tract. Significant correlation between FA in left subcortico-cortical, bilateral cortico-cortical fiber tracts and CRS-R scores.
Weng et al. (2017)
DTI/ROI-based probabilistic tractography; Graph theory/NBS
6 UWS; 7 MCS
4 TBI; 7 HBI 3 – 40 weeks Reduced connectivity between the BG, thalamus, and frontal cortex; Reduced FA and increased RD in WM of the DOC patients - decreased FA in the bilateral anterior and posterior limbs of the IC and the bilateral superior, anterior, and posterior CR; Decreased nodal efficiency in BG and left amygdala. Decreased degree in the BG, left frontal, temporal, parietal, and occipital cortex. Nodal degree in the right angular gyrus negatively correlated with the CRS-R score.
Zheng et al. (2017)
DTI/ROI-based probabilistic tractography
10 UWS; 7 MCS-; 8 MCS+
17 TBI; 8 non-TBI
3 - 30 months UWS patients had reduced WM connectivity in thalamocortical circuits (frontal, temporal, sensorimotor), as compared to MCS+, but more pulvinar-occipital connections when compared to MCS-. MCS- had less thalamo-premotor and thalamo-temporal connectivity than MCS+. Thalamo-cortical tracts (frontal, parietal, temporal) had 100% accuracy in DOC group discrimination.
M – mean; SD – standard deviation; BG – basal ganglia; HBI- hypoxic ischemic BI; NBS – network-based statistics; AD – axial diffusivity; RD – radial diffusivity; MD – mean diffusivity; ADC – apparent diffusion coefficient; FA – fractional anisotropy; TBSS - Tract-Based Spatial Statistics; GM – gray matter; WM – white matter; CC – corpus callosum; EC - external capsule; SCR - superior corona radiate; SCP - superior cerebellar peduncle; PTR - posterior thalamic radiation; IC – internal capsule; EC – external capsule, CR – corona radiate; SLF- superior longitudinal fasciculus, BG – basal ganglia; DLPFC– dorsolateral prefrontal cortex; FMC – frontal medial cortex; TPJ - temporo-parietal junction; IP – inferoparietal.

68
2.2.2 DOC patient’s neuroprognostication Despite the growing number of studies and some recent advances in structural MRI, we are still
lacking a complete understanding of structural substrates of loss and recovery of consciousness.
The first study that raised the possibility of DTI being able to detect axonal regrowth and
neuronal plasticity potentially underlying late recovery, was the one of Voss and colleagues
(2006). Their case-report described a patient who recovered reliable expressive language after
19 years in MCS. This remarkable improvement was coupled with a notable increase in resting
metabolism and anisotropy within the midline cerebral (medial parietal, occipital) white matter.
One recent study implied an increase in radial diffusivity in the left superior cerebellar peduncle
and a decrease in fractional anisotropy in the right sagittal stratum in coma and UWS patients
who did not regain consciousness at a 3-month follow up (Wu et al., 2016).
However, not many studies have explored the prognostic value of structural integrity in DOC
patients, and none have focused on the prognostic value of DMN structural connectivity (Table
2.2.2). Some research did include coma patients, but the analyses were primarily focused on
predicting a dichotomized outcome (favorable neurological recovery vs. unfavorable outcome
or death) without distinguishing different DOC diagnostic categories (UWS vs. MCS+/- vs.
REC), with some patients exhibiting impairment in consciousness and others having normal
consciousness levels with some neurocognitive difficulties.
Nevertheless, the present chapter will briefly describe the existing structural-diffusion MRI
studies in coma patients, as some show promising results in terms of prognostics and better
understanding of brain injury mechanisms in DOC patients (Table 2.2.3).
In recent years, there have been some interesting studies assessing whether the patterns of DWI
abnormalities and quantitative regional apparent diffusion coefficient (ADC) values may have
prognostic value in post cardiac arrest coma patients (Cavaliere et al., 2015; Greer & Wu, 2017;
Stevens & Hannawi, 2016). Regional low diffusion values have been found in cortical (i.e.
parietal and occipital cortex) and subcortical regions (i.e. thalamus and basal ganglia) in patients
with poor outcome (Choi et al., 2010; Hirsch et al., 2014; Ryoo et al., 2015; Youn et al., 2015).
In one study, the structural integrity in major WM tracts (i.e. internal capsule, corpus callosum)
had higher predictive power in comparison to GM diffusivity coefficient in relation to 1-year
functional outcome in cardiac arrest patients (Luyt et al., 2012). Finally, multiple studies have
indicated a significant association between a baseline disruption in selected WM tracts (i.e.
corpus callosum, cerebral peduncle, corona radiate, internal capsule, inferior longitudinal

69
fasciculus) and worse functional outcome at 1 year after traumatic brain injury (Dinkel et al.,
2014; Galanaud et al., 2012; Perlbarg et al., 2009; Sidaros et al., 2008).
2.2.3 Structural MRI and brain injury mechanisms A recent ROI-based DTI study showed significant white matter abnormalities in coma patients
with anoxic and traumatic brain injury (van der Eerden et al., 2014). Cardiac arrest patients had
changes consistent with primary axonal damage (decrease in AD) related to energy depletion
from anoxic ischemia, and potential secondary myelin damage (increase in RD). Conversely,
structural damage in TBI was most consistent with primary myelin damage, related to
mechanical forces exerted on the brain in trauma, and axonal damage, caused either directly by
trauma or secondary ischemic damage. The distribution of damage was also different between
the etiologies, with anoxic injury mainly affecting the cerebral hemispheres (i.e. sagittal strata,
superior longitudinal fasciculus, internal capsule, external capsule, corona radiate), and TBI
mostly present in the left hemisphere and central brain (i.e. brainstem, cerebral peduncles,
corpus callosum) structures. However, another study found broadly similar DTI abnormalities
(diffuse reduction of FA) in the cerebral hemispheres in both TBI and ischemic hypoxic brain
injury in UWS patients at minimum 3 months post-injury (Newcombe et al., 2010).
Nonetheless, TBI patients had greater damage in brainstem regions (dorsal and ventral midbrain
and pons), as indicated by an increase in the apparent diffusion coefficient. These results
suggest that the damage in the lower brainstem (and cerebral peduncles), found in the acute
stages (van der Eerden et al., 2014), may persist through chronic stages of DOC (Newcombe et
al., 2010). This was also suggested in a recent VBM study (Guldenmund et al., 2016), which
showed a significant association between time spent in DOC and widespread structural brain
injury, with TBI related to more injury in the brainstem, midbrain, thalamus, hypothalamus,
basal forebrain, cerebellum, and posterior corpus callosum, compared to non-traumatic cases.

70
Table 2.2.2. Prognostic value of structural changes in chronic DOC.
Author Method Type of DOC
Etiology Delay injury/imaging
Delay inclusion/outcome
Outcome assessment
Reported outcome
Findings
Voss et al. (2006)
DTI/Seed-based; PET
2 MCS 2 TBI 6 and 19 years
18 months
Motor, oculomotor, language, verbal fluency
Neurological improvement in one patient
Increased FA within midline cerebral (medial parietal, occipital) WM was correlated with improvement in motor function and an increase in PET resting metabolism in one MCS patient (19y).
Wu et al. (2016)
DTI/Seed-based
8 Coma; 8 UWS; 14 MCS;
Coma - 8 TBI; UWS - 6 TBI, 2 non-TBI; MCS - 13 TBI, 1 non-TBI
10-182 days
3 months GOS 8 regained consciousness (GOS > 2); 8 did not regain consciousness
Increased RD of left superior CP and decreased FA of right SS in patients who did not regain consciousness.
CP- cerebellar peduncle; FA – fractional anisotropy; GOS – Glasgow Outcome Scale; RD – radial diffusivity; SS – sagittal stratum; WM – white mater.
Table 2.2.3. Prognostic value of structural changes in coma.
Author Method Type of DOC
Etiology
Delay injury/imaging (M±SD)
Delay inclusion/outcome
Outcome assessment
Reported outcome
Findings
Perlbarg et al. (2009)
DTI/Voxel-based; TBSS
30 patients; 24 with GCS ≤ 8;
TBI 23 days (5–53 days)
1 year GOS 15 FO (GOS>3); 15 UFO (GOS≤3)
Decreased FA in ILF, CP, posterior limb of the IC, and posterior CC in UFO compared to FO group.
Luyt et al. (2012)
DTI/ROI-based
57 coma patients
CA Median=11 (7–17) days
1 year GOS-E 8 FO (GOS-E ≥5); 49 UFO (GOS-E ≤4)
The prognostic model based on FA values in selected WM tracts (20 ROIs) predicts accurately UFO (94% sensitivity, 100% specificity).

71
Galanaud et al. (2012)
DTI/ROI-based
105 severe TBI patients who remained in coma ≥7 days
TBI 21 ± 9 days 1 year GOS-E 65 FO (GOS-E ≥5); 40 UFO (GOS-E ≤4) of which: 21 D, 5 with UWS, 14 MCS
A composite DTI score increased the accuracy of outcome prediction compared with available clinical/radiographic prognostic score.
Silva et al. (2017)
Structural MRI/ROI-based
126 coma patients; additional testing sample of 18 coma patients
CA 16 ± 8 days 1 year GOS-E 37 survivors; FO: GOS-E ≥5; UFO: GOS-E ≤4)
Decrease of cortical thickness in the frontal cortex and the volume in the thalamus, putamen, and pallidum in patients with UFO. Significant discriminative power of volume changes in frontal cortex, posterior cingulate cortex, thalamus, putamen, pallidum, caudate, hippocampus, and brain stem.
FA – fractional anisotropy; FO – favorable outcome; GOS-E - Glasgow Outcome Scale Extended; TBSS - Tract-Based Spatial Statistics; UFO – unfavorable outcome.

72
2.3 Neural structure-function relationship in DOC – multimodal neuroimaging studies
Little is known about how structural integrity allows the emergence of functional connectivity
in brain-injured patients, as not many multimodal studies have attempted to directly investigate
this function-structure relationship in disorders of consciousness (Table 2.3.1). Bruno and
colleagues (2011c) showed a highly asymmetrical pattern in FDG-PET and fMRI in two
patients, with mostly left lateralized changes, which were complemented with DTI results.
Another study indicated a decline in regional metabolism and WM integrity in the DMN, but
preserved function–structure relationship within most regions from this network in DOC, which
was even stronger in the thalamus (i.e. thalamo-inferoparietal tract) of those who emerged from
the MCS (Annen et al., 2016). The structural integrity of PreCu/PCC-thalamic pathway, as well
as that of those connecting the posterior areas of the network, was previously found to be higher
in EMCS patients in opposed to MCS and UWS patients (Fernández-Espejo, et al., 2012).
The implication that abnormal brain function may be the consequence to white matter injury,
was also demonstrated in a study showing positive correlation between the dysfunction in the
postcentral gyrus and structural damage of the left posterior thalamic radiation tract (Yao et al.,
2015).
Finally, a recent study found an association between the decrease in effective functional
connectivity and global white matter damage in brain-injured patients, and this structure-
function relationship was proposed as a potential mechanisms preventing the emergence of
consciousness in chronic DOC (Bodart et al., 2017).

73
Table 2.3.1. Multimodal studies – structure-function association in DOC.
Author Method Type of DOC Etiology Delay injury(DOC)/imaging
Findings
Bruno et al. (2011c)
DTI (whole-brain tractography); resting-state FDG-PET, fMRI, and EEG
Case report with 1 UWS and 1 MCS patient
2 TBI 6 months and 3 months Residual right-lateralized hemispheric function on FDG-PET, fMRI, and EEG measurements. Reduction in the number of identified WM tracts in the left hemisphere for UWS patient and a much more symmetrical image for MCS patient.
Yao et al. (2015)
DTI (TBSS); rs-fMRI
11 DAI patients with DOC
11 TBI 2 - 11 days ALFF of the amygdala and postcentral gyrus correlated with FA of the right EC and left PTR, respectively.
Annen et al. (2016)
FDG-PET; MRI-DWI
7 UWS; 12 MCS; 6 EMCS
12 TBI; 11 anoxia; 1 mixed; 1 infection
31 - 2424 days FA and metabolic function (standardized metabolic rates) significantly diminished in DMN, in DOC compared with controls. Sig. association between functional metabolism of IP, PreCu, and frontal regions and structural integrity of the frontal-IP, PreCu-IP, thalamo-IP, and thalamo-frontal tracts. Stronger relationship between thalamo-IP tract and thalamic metabolism in EMCS compared with DOC.
Di Perri et al. (2016)
FDG-PET; rs-fMRI; structural MRI-VBM
21 UWS; 24 MCS; 13 EMCS
29 TBI; 14 anoxia; 7 mixed; 8 other
1 - 312 months Significant positive correlation between the positive DMN connectivity in the PCC/PreCu, and the brain metabolism. Significant negative correlation between negative DMN connectivity in the PCC/PreCu and the brain metabolism. Only UWS patients had decreased metabolism coupled with pathological between-network hyperconnectivity.

74
Bodart et al. (2017)
DWI (whole brain FA); TMS/EEG
9 UWS; 11 MCS; 2 EMCS; 2 LIS
12 TBI; 10 non-TBI; 2 mixed
5 -1371 weeks Negative correlation between structural integrity (i.e. global FA) and effective functional connectivity. Global FA could predict 56% of PCI variance in the patients' group.
ALFF - amplitude of low-frequency fluctuation; DAI - diffuse axonal injury; EC – external capsule; FA – fractional anisotropy; IP – inferoparietal; PCI - perturbational complexity index - a transcranial magnetic stimulation (TMS) derived marker of effective connectivity; PTR - posterior thalamic radiation; TBSS - Tract-Based Spatial Statistics.

75
2.4 Summary of neuroimaging findings The review of neuroimaging studies demonstrated functional and structural disruption in DOC
patients most consistently observed within (and between) high-order resting-state networks (i.e.
DMN, SN, ECN), mainly encompassing midline cortical brain regions (i.e. PMC, mPFC) and
their corresponding white matter connections (i.e. corpus callosum, cingulum).
These findings were observed across a range of DOC etiologies and imaging modalities with
more severe alterations in coma and UWS as opposed to MCS patients.
A few studies that investigated the relationship between neuroimaging data and patients’
prognosis showed reduced functional connectivity in the DMN and PCC/PreCu, and damaged
structural integrity in some of the major white matter tracts (i.e. corpus callosum, cerebral
peduncle), in coma patients with poor outcome. The importance of cortical hub nodes ensuring
efficient global brain functioning was also highlighted in a few graph theoretical studies.
Several multimodal neuroimaging studies indicated the potential role of the structure-function
relationship in the emergence of consciousness, however, further research is required in order
to better understand this association in the context of disorders of consciousness.
Nonetheless, there haven’t been many cases with acquired data in early stages of coma, which
is urgently needed in order to find reliable markers serving to predict coma emergence and
potential for long-term recovery. Early identification of patients who have a high chance of
recovery is important, to avoid withdrawal of life sustaining treatment and ensure the
administration of pharmacologic and non-pharmacological therapies aimed at restoring
consciousness. Also, better understanding of etiology differences may prove to be essential in
early prediction and understanding of patient’s outcomes, as the identification of etiology-
related factors may ameliorate the predictive value of consciousness-related markers, and help
guide more effective therapy adapted to individual patient needs.
In summary, the reviewed results imply great potential in clinical application of (multimodal)
neuroimaging data in early prediction of long-term outcome in coma and chronic DOC patients
and in increasing our knowledge about the neural correlates of consciousness.
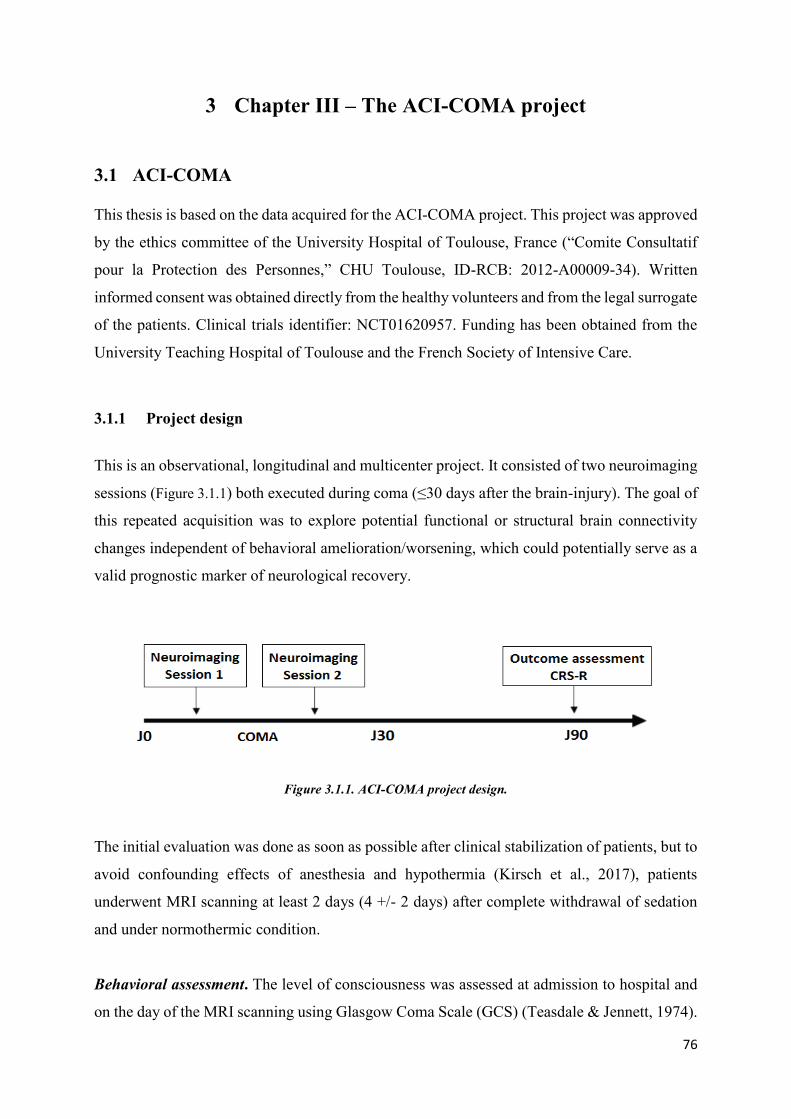
76
3 Chapter III – The ACI-COMA project
3.1 ACI-COMA This thesis is based on the data acquired for the ACI-COMA project. This project was approved
by the ethics committee of the University Hospital of Toulouse, France (“Comite Consultatif
pour la Protection des Personnes,” CHU Toulouse, ID-RCB: 2012-A00009-34). Written
informed consent was obtained directly from the healthy volunteers and from the legal surrogate
of the patients. Clinical trials identifier: NCT01620957. Funding has been obtained from the
University Teaching Hospital of Toulouse and the French Society of Intensive Care.
3.1.1 Project design
This is an observational, longitudinal and multicenter project. It consisted of two neuroimaging
sessions (Figure 3.1.1) both executed during coma (≤30 days after the brain-injury). The goal of
this repeated acquisition was to explore potential functional or structural brain connectivity
changes independent of behavioral amelioration/worsening, which could potentially serve as a
valid prognostic marker of neurological recovery.
Figure 3.1.1. ACI-COMA project design.
The initial evaluation was done as soon as possible after clinical stabilization of patients, but to
avoid confounding effects of anesthesia and hypothermia (Kirsch et al., 2017), patients
underwent MRI scanning at least 2 days (4 +/- 2 days) after complete withdrawal of sedation
and under normothermic condition.
Behavioral assessment. The level of consciousness was assessed at admission to hospital and
on the day of the MRI scanning using Glasgow Coma Scale (GCS) (Teasdale & Jennett, 1974).

77
and Full Outline of Unresponsiveness (FOUR) (Wijdicks et al., 2005). The outcome
(neurological recovery) was assessed 3-months post coma using the Coma Recovery Scale-
Revised (CRS-R) (Schnakers et al., 2008). The standardized clinical examination was
performed by raters blinded to neuroimaging data. The behavioral tests were translated and
validated in French language.
Neuroimaging. This is a multimodal neuroimaging project. The MRI machine used for the
acquisition of data was MRI 3T Philips ACHIEVA scanner. Functional and structural imaging
sequences and their order of acquisition are presented in Figure 3.1.2.
The instructions for the rs-fMRI were: “Close your eyes, try to move as little as possible and
let your thoughts run freely“. The passive-movement task consisted of the passive movement
of the wrist extension between 0° and 30° from the right hand index finger with a frequency of
1 Hz. The total duration of the MRI exam was around 60 minutes.
Figure 3.1.2. The MRI sequences.
3.1.2 MRI data acquisition parameters
T1
A high-resolution structural image was acquired for each subject using three-dimensional MRI
sequences with following parameters: 170 contiguous slices; TR=8.1 ms, TE = 3.7 ms, FOV=
220x232x170mm, flip angle = 8°, resolution= 1mm3 isovoxel.
Rs-fMRI
In all participants, 11 min resting state fMRI was obtained. Two hundred and fifty multislice
T2*- weighted images were retrieved with a gradient echo-planar sequence using axial slice
orientation: 37 slices; voxel size: 2 x 2 x 3.5 mm; TR = 2,600 ms; TE = 30 ms; flip angle = 90°;
FOV = 240 mm.

78
DTI
DTI data was collected using a gradient echo planar imaging sequence with the following
parameters: 32 gradient orientations, TE=76ms, TR=12000ms, flip angle= 90°, FOV =
230x188x143, image matrix = 152 x 124, slice thickness = 1.5mm, and b value=1000 s/mm2.
3.1.3 The recruited participants
The patients were recruited (Table 3.1.1) at 4 Intensive Critical Care Units affiliated with the
University Teaching Hospital (CHU de Toulouse, France) in Toulouse. The inclusion of
patients started in the early 2013 and finished in August 2016.
Table 3.1.1. Criteria for patient recruitment.
Criteria of inclusion Criteria of exclusion
Men or woman between 18 and 80 years;
Diagnosis of coma (GCS at the admission to
hospital < 8, with motor responses < 6; FOUR
score < 10);
Etiology - traumatic or anoxic BI;
Acute stage – first 30 days after initial BI;
Informed consent from the legal surrogate of
the patients;
Interruption of administration of any sedative
or hypnotic agent from >24h
(propofol/ketamine/clonidine/morphine) or >
72h (benzodiazepines). The administration of
non-morphine analgesic drugs is compatible
with inclusion (i.e. absence of sedative effect).
History of neurological or psychiatric
illness;
Subject not affiliated to a social security
scheme;
Subject under legal protection;
Pregnant or nursing women;
Subjects with pacemakers or metallic and
other electrically conductive medical
devices may interfere with the magnetic
field of the MRI;
Subjects susceptible to attacks of
claustrophobia.
To this day, we have included 58 comatose patients in total. We have also included 34 healthy
subjects serving as controls. Demographic and clinical characteristics of all the subjects are
reported in Table 3.1.2

79
Table 3.1.2. Demographic and clinical characteristics of participants.
Patients (N=58) Controls (N=34)
Age Mean=49y (18-81y); STD=18y Mean=50y (22-74y); STD=20y Sex 39M; 19F 13M; 21F Etiology Traumatic 19
/
Anoxic 35 Mixed (TBI + Anoxic) 4
Outcome Death 11 /
UWS/Vegetative state 22 Minimally conscious state
18
Recovery 7 Sessions Session 1 N = 58 /
Session 2 N = 19
3.1.4 Main goals and objectives
This thesis is centered on the analysis of intrinsic brain “activity” in the form of functional
connectivity and structural brain integrity of brain-injured patients in the acute stage of coma.
The aim of the present thesis is to characterize the neural correlates of acute consciousness
abolition (i.e. coma) and identify early neural signatures of neurological recovery. To do so, we
longitudinally studied severe brain-injured patients using multimodal MRI methodology and
standardized behavioral assessment.
The outcome of this project will hopefully contribute to: (i) a development of reliable
multimodal neuroimaging battery of tests serving to improve severely brain injured patient’s
early diagnosis and prognosis (ii) the assessment of the impact of novel pharmacological and
non-pharmacological therapeutic interventions in future studies.

80
4 Chapter IV – Methods and Results
4.1 Neural signature of coma revealed by posteromedial cortex connection density analysis
Based on the article: “Neural signature of coma revealed by posteromedial cortex connection
density analysis”. Malagurski. B, Péran, P., Sarton, B., Riu, B., Gonzalez, L.,…Silva, S.
(2017). NeuroImage: Clinical, 15, 315–324. (Paper I)
4.1.1 Scientific justification
Converging data from physiological, pharmacological (Heine et al., 2012) and pathological
models (Hannawi et al., 2015), suggest the implication of the posteromedial cortex (PMC) and
its long-range functional connections in conscious processing. Patients with disorders of
consciousness consistently demonstrate a reduced activity (He et al., 2014; Silva et al., 2010;
Tsai et al., 2014) and/or diminished connectivity between this posterior brain structure and other
cortical hubs (Hannawi et al., 2015; Vanhaudenhuyse et al., 2010; Qin et al., 2015; Wu et al.,
2015), in particular the medial prefrontal cortex (mPFC) (Lant et al., 2016; Silva et al., 2015).
As we have seen in the chapter titled: “Key hubs for consciousness emergence: PMC-
PCC/PreCu complex”, the posteromedial cortex (PMC) is considered as a heteromodal cortical
region, as its sub-regions have been differentially functionally associated with several intrinsic
brain networks and consequently have been implicated in a variety of cognitive processes
(Cavanna & Trimble, 2006; Leech & Sharp, 2014).
Nevertheless, the DOC neuroimaging literature traditionally explored PMC as a homogenous
structure and failed to describe such a functional segregation in pathological conditions (Norton
et al., 2012; Silva et al., 2010; Vanhaudenhuyse et al., 2010). This important issue is probably
due to (anatomical) seed-based approaches that are currently used in this setting to evaluate the
functional connectivity among non-parcelled brain regions, by using correlation analyses of
spontaneous fluctuations of brain activity in resting state conditions (Hannawi et al., 2015).

81
4.1.2 Objectives and hypotheses
We suggest that a better understanding of intrinsic PMC functional topology (Silva et al., 2015)
could significantly expand our understanding of how this cortical hub contributes to the
generation and the maintenance of conscious awareness and might considerably improve DOC
patient's clinical management. To explore this, we used a recently developed voxel-based
unbiased approach that does not rely on a priori selection of the seed regions, named functional
connectivity density (CD) (Tomasi & Volkow, 2010). This voxel-based method, accurately
enables the identification of functional connectivity hubs and permits to specifically investigate
within brain regions parcellation, in both healthy and pathological conditions. Thus, we aimed
to investigated the functional impact of acute brain injures responsible of coma at the level of
PMC and intended to study in this setting: (i) the specific interactions of the PMC anatomical
(PCC and PreCu) or functional (ventral/dorsal gradient) sub-regions, with a distant cortical hub
(medial prefrontal cortex; mPFC) in resting state conditions (ii) a complete assessment of the
whole range of increase/decrease of both positive/negative, i.e. corresponding to
positive/negative correlation, connection patterns that could theoretically be detected by this
approach, (iii) the impact of injury mechanisms (i.e. traumatic or anoxic), on brain functional
connectivity patterns (iv) the prognostic value of functional connection density data for
neurological recovery.
4.1.3 Materials and methods 4.1.3.1 Participants We compared 27 patients, 15 with traumatic and 12 with anoxic brain injury, who met the
clinical definition of coma (Glasgow Coma Scale score (Teasdale & Jennett, 1974) at the
admission to hospital< 8, with motor responses< 6; age range: 19–70 years) to 14 approximately
age-matched healthy controls (age range: 22–37 years). Patients underwent rs-fMRI scanning
at least 2 days (4 ± 2days) after complete withdrawal of sedation and under normothermic
condition. Standardized clinical examination was performed on the day of the scanning using
the Glasgow Coma Scale and the Full Outline of Unresponsiveness (Wijdicks et al., 2005) and
3 months later using Coma Recovery Scale-Revised (Schnakers et al., 2008).

82
4.1.3.2 Pre-processing The rs-fMRI data was preprocessed using SPM 8 (http://www.fil.ion.ucl.ac.uk/spm/) and
CONN toolbox ver. 13f (http://www.nitrc.org/projects/conn) (Whitfield-Gabrieli & Nieto-
Castanon, 2012). In order to reduce the motion effects on our data, we only included subjects
characterized by motion parameters smaller than 3 mm translation and 3° rotation. First, the
echo-planar images were realigned (motion corrected), slice-time corrected and normalized to
the Montreal Neurological Institute echo-planar imaging template. Second, non-neuronal
sources of noise were estimated and removed using the anatomical CompCor method
(aCompCor) integrated in the CONN toolbox. Principal components of the signals from the
white matter and the CSF voxels, alongside the motion parameters estimated during
realignment were removed with regression. Finally, a temporal band-pass filter was applied to
the residual blood oxygen level–dependent (BOLD) time course in order to obtain a low-
frequency range of interest (0.008-0.09 Hz).
4.1.3.3 Region of interest selection Using a home-made MATLAB (MATLAB and Statistics Toolbox Release 2011a, The
MathWorks Inc., Natick, Massachusetts, United States) script, the BOLD time series was
extracted from voxels in two main regions of interest (ROI), the Posterior Medial Cortex (PMC)
and the Medial Prefrontal Cortex (mPFC), defined by the Automated Anatomical Labeling atlas
(Tzourio-Mazoyer et al., 2002) (voxel size 2× 2× 2 mm). The PMC (size = 12,862 voxels)
consisted of the Precuneus L/R (size = 11,222 voxels) and the Posterior Cingulate Cortex L/R
(size =1640 voxels), and the mPFC (size = 13,389 voxels) comprised the Frontal Superior
Medial L/R (size =8373 voxels) and the Anterior Cingulate Cortex L/R (5016 voxels). As
preliminary step, T2* mean images were used the extract the mean value of voxels in the PMC
region, and a two-sample t-test was performed to compare values between the control and the
patient group. Additionally, to investigate if the potential changes in connection density are
specific to the PMC-mPFC interactions, we have also included the bilateral Calcarine L/R (size
= 7134 voxels; part of the primary visual cortex) as a control region, currently not considered
to be relevant for conscious awareness.

83
4.1.3.4 Voxel-based connection density The data analysis pipeline is presented in Figure 4.1.1. Pearson correlation coefficients were
computed between the BOLD time course of all the possible pairs of voxels from PMC and
mPFC. Correlation coefficients were then normalized using Fisher's r-to-z transformation. A
subject-specific threshold of p<0.05 was applied to each correlation coefficient in order to retain
only a subset of connections with higher in further analysis. We labelled the obtained
connections as positive and negative depending on the sign of the obtained z coefficients and
we treated them separately. Importantly, to avoid the artificial induction of negative correlations
(anticorrelations) by the global signal regression (Murphy et al., 2009; Weissenbacher et al.,
2009) we adopted the CompCor method in the preprocessing step, which has been reported as
a reliable approach for the exploration of both positive and negative correlations (Chai et al.,
2012, 2014). The resulting z coefficients were binarized and then summed to obtain the density
of connections between every voxel belonging to PMC and every voxel within the mPFC. These
would represent the number of significant positive and negative connections from PMC to
mPFC. The number of significant connections obtained for a single PMC voxel was then used
to compute a Z-score for every voxel in the patient group using the mean (M) and the standard
deviation (SD) of the healthy control group. This will represent the significant deviation of each
voxel from the corresponding control. Thus, the number of PMC voxels with a Z-score higher
or equal to 2 SD or less or equal to −2 SD (for positive and negative connections) were counted
for each patient individually and further used to investigate the changes (significant deviations)
in functional connectivity between the PMC to the mPFC. The same analysis was repeated for
the control pathway (i.e. representing the connections between the bilateral calcarine and the
mPFC). Furthermore, in order to facilitate the discussion of our results (Fig. 1), a significant
decrease (Patients < Controls, Z-score≤−2) in connection densities is designated as “hypo”
connection density or hypo-CDP and hypo-CDN, for positive and negative correlation based
connection densities, respectively. The opposite - increase in connection densities (Patients >
Controls, Z-score ≥ 2) is denoted by “hyper” connection density e.g. hyper-CDP and hyper-
CDN for positive and negative correlation based connections, respectively. Lastly, to allow an
easier description of our findings and to test our hypothesis on the differences in functional
connectivity changes between the PreCu and PCC, we present the results from these two ROIs
separately.

84
Figure 4.1.1. Overview of the data analysis pipeline. 1) First, the rs-fMRI data was pre-processed using SPM8 and CONN13f, respectively. 2) Using a home-made MATLAB script, the BOLD time series was extracted from voxels in two main regions of interest then used in 3) calculation of Pearson correlation coefficients between the BOLD time course of all the possible pairs of voxels from PMC and mPFC. Then, a subject-specific threshold of p ≤ 0.05 was applied to include only the significant connections in further analysis. 4) The obtained significant connections were split on positive and negative (based on the sign of the normalized z coefficients), binarized and used to 5) obtain the density of connection between PMC and mPFC voxels. 6) A Z-score was calculated for each single PMC voxel as explained in the figure. 7) Voxels with a significant Z score were summed and characterized as hypo/hyper-CDP and hypo/hyper- CDN as presented in the figure.
4.1.3.5 Spatial homogeneity In addition to the individual results, we were interested in the spatial similarity (overlap) of
these changes between patients within groups (intra-group) and between different coma
etiology groups (inter-group). This allowed us to investigate if these changes were spatially
scattered thus highly heterogeneous between subjects or if they were organized in functional
clusters shared among multiple participants within/between the two etiology groups. The intra-
group spatial congruity of single voxel Z-score results was explored at two thresholds: a
criterion of 33% and 67% was used to define the total number of disconnected voxels spatially
shared between 1/3 and 2/3 of the patient group, respectively. This was explored in the group
with all the patients and with two coma etiology groups separately. To explore the inter-group
similarity, we have calculated the Jaccard similarity coefficient (index) to further test the spatial
overlap in connectivity changes between these two groups. The Jaccard index (JI) is defined as
the intersection divided by the union of the number of voxels representing significant changes

85
in PMC-mPFC connection density in given groups. The values of JI range from 0 (0%),
indicating no overlap, to 1 (100%) suggesting full spatial overlap.
4.1.3.6 Statistical analysis We have conducted the Mann-Whitney U test to investigate the differences in PMC-to-mPFC
connection density changes between the PreCu and PCC. The same test was used to compare
the changes in functional connectivity between our two coma etiology groups – traumatic and
anoxic brain injury patients. This analysis was also repeated for the control pathways. The
resulting p values were corrected for multiple comparison using a false discovery rate at the
level of p = 0.05. We have also calculated the effect size for the Mann-Whitney U test by
dividing the z value (test statistic) by the square root of N (sample size). This is analogous to
Cohen's d for parametric group testing. Spearman's correlation analysis was performed to
explore the link between the number of PMC voxels with significant changes in connection
density and the CRS-R score. The same correlation analysis was done to test the association
between the connection density changes in the control pathway - Calcarine-mPFC - and the
CRS-R score. The resulting p values were corrected for multiple comparison using a false
discovery rate. Additionally, in order to explore the non-linear association between the outcome
and the significant changes in PMC-mPFC connection density, and thus the predictive value of
these changes in relation to recovery, we have conducted the binary/logistic regression analysis.
Patients were divided into two outcome groups (based on the CRS-R score): good outcome -
comprising patients who had recovered or progressed to minimally conscious state (MCS) (N
= 12); and the bad outcome – incorporating patients with unresponsive wakefulness
syndrome/vegetative state (UWS/VS) (N = 15). This analysis was not done separately for the
two etiologies due to small sample size. All of the above mentioned analyses were performed
using the IBM SPSS (IBM SPSS Statistics for Windows, Version 20.0. Armonk, NY: IBM
Corp.) statistical package.

86
4.1.4 Results
4.1.4.1 Induced functional topological changes in the PMC
4.1.4.1.1 Anatomical sub-regions — precuneus and posterior cingulate cortex In Figure 4.1.2 we report the induced changes in functional connectivity of the entire PMC and
the differences between its anatomical sub-regions, the PreCu and PCC, between the patient
and the control group. The changes in connection density are presented as the percentage of
voxels more or less connected within a given region/sub-region in order to take into account
the differences in size (total number of voxels) of different ROIs.
The PCC exhibited significantly more voxels with hypo-CDP (U = 202, p = .004; r=0.38; Figure
4.1.2 – subpanel A-1) in comparison to PreCu, which is in accordance to previous research. The
PreCu showed a tendency toward a higher number of voxels with hyper-CDP (Figure 4.1.2 -
subpanel A-2) in comparison to PCC, but these results were not statistically significant (p=
.074). There were no statistically significant differences in the number of hyper-CDN and hypo-
CDN voxels between these two sub-regions, after the multiple comparisons correction (fdr
corrected p=.005) (Figure 4.1.2- subpanel A-3).

87
Figure 4.1.2. Differences in changes in connection density between PreCu and PCC and between traumatic and anoxic brain injury. Panel A) PCC showed significantly more hypo-CDP (subpanel 1) in comparison with the PreCu. Panel B) Traumatic BI patients had more hyper-CDP (sub-panel 2) within the PCC and hyper-CDN voxels in both PreCu and PCC (sub-panel 4) in comparison to anoxic BI patients; Boxplots represent medians with interquartile range and whiskers signify minimum and maximum values (excluding the outliers) (*p < 0.05, (**p < 0.005, ns: non-significant).
4.1.4.1.2 Functional sub-regions — ventral/dorsal segregation of the PMC
In order to investigate the spatial architecture of the observed changes in the density of
connections, in Figure 4.1.3 we report the spatial topography of the obtained connections. This
figure represents the group-wise changes in functional connectedness. The individual spatial
topography maps of these changes (with etiology and prognostic information) are presented in
the supplementary Figure 6.3.1 and Figure 6.3.2. It can be noted that: (i) the ventral PCC and the
ventral PreCu form a functional cluster of hypo-CDP voxels (Figure 4.1.3 A), (ii) the hyper-CDP
voxels are primarily located in the dorsal PreCu and dorsal PCC, alongside a portion of the
ventral PCC (Figure 4.1.3 B), (ii) the hyper-CDN voxels are widespread (suggesting high inter-

88
individual variability) and cover large portions of both PMC sub-regions (Figure 4.1.3. D),
including almost the entire PCC, (iv) finally, the hypo-CDN PMC voxels are barely present and
are mostly found in the posterior ventral PreCu (Figure 4.1.3. C). There is a significant spatial
overlap between voxels with hypo-CDP and hyper-CDN, equivalent to almost the total number
of hypo-CDP voxels (see Table 1.) in the entire patient group. However, this overlap is not
homogeneous between patients and is characterized by important inter-individual differences,
as demonstrated in the supplementary Table 6.3.1. Individual patient results – the total number of
hypo/hyper-CDP and hypo/hyper-CDN voxels for PMC (Panel A), PreCu (Panel B) and PCC (Panel B).
Figure 4.1.3. Spatial maps of changes in PMC-to-mPFC connection density in the patient group. Patients seem to show significant hypo-CDP changes in the ventral portions of both PreCu and PCC (panel A). Hyper-CDP voxels are more specific to the dorsal sub regions of the PreCu and PCC, and slightly border on the ventral PCC (panel B). Hypo-CDN changes are barely noticeable (panel C), and hyper-CDN voxels seem wide-spread and highly heterogeneous between patients (panel D). Individual results of patients are summed and presented in a single image; Purple and blue outlines reflect the borders of the anatomical PreCu and PCC respectively. Gradient bars (%) reflect the percentage of patients sharing the same voxel with a sig. Z-score (hypo/hyper CDP/CDN) at given anatomical location (spatial homogeneity).
4.1.4.2 Control pathways — Calcarine-mPFC The changes in the control pathway connection density are fully presented in the supplementary
Figure 6.3.3. Differences in Calcarine-mPFC connection density changes between traumatic and anoxic
brain injury. The results showed only a small percentage of Calcarine hypo-CDP voxels in
patients, representing reduced connectivity between this region and the mPFC (Mdn=0.04%,
range 0-0.7%). The same result was found for the hypo-CDN voxels (Mdn=0, range 0-0.2%).
In contrary to these result, hyper-CDN (Mdn=22%, range 0.08-63) and hyper CDP (Mdn=4%,
range 0.04-22%) voxels were present in this control pathway.

89
4.1.4.3 Impact of brain injury mechanisms
4.1.4.3.1 PMC-mPFC connection density changes
The impact of the patients' etiology on the observed changes is reported in Figure 4.1.2 –
subpanel B. The group-level statistical analysis showed significant differences between the two
etiologies in the percentage of PMC voxels with hyper-CDN (U = 32, p= .004; r=.55).
There were no significant differences in hypo-CDP (U= 63, p = .200 r= .25), hyper-CDP (U=
49, p = .045 r= .39) and hypo-CDN voxels (U= 66, p= .249; r= .23).
These significantly higher percentage of PMC hyper-CDN voxels, was present in both PreCu
(U =32, p= .004; r=.55) and PCC (U = 33.5, p = .005; r=.53) sub-regions, in TBI in comparison
to the anoxic BI patient group (Figure 4.1.2 – subpanel B-4). Additionally, the results showed a
higher percentage of hyper-CDP voxels in the PCC sub-region (but not in the PreCu) in the TBI
group (U = 27, p = .001; r=.59) (Figure 4.1.2 - subpanel B-2).
4.1.4.3.2 Connection density changes in control pathways We wanted to test if the hyper-CDP and hyper-CDN voxels, found in the control pathways,
were more specific to one of the etiologies. The group-level statistical analysis showed a
significantly higher percentage of Calcarine-mPFC hyper-CDP (U =37, p = .009; r =.5), and
hyper-CDN voxels (U = 33, p = .004; r= .54) voxels in traumatic in comparison to anoxic brain
injury patients (Supplementary Figure 6.3.3 and Figure 6.3.4).
4.1.4.4 Spatial homogeneity The intra-group spatial similarity in voxels with changes in connection density are presented in
Table 4.4.1.1. The hypo-CDN voxels were not included in the analysis, because there were no
significant differences between the control and patient group. The results are reported without
a threshold and with the threshold of 33% and 67% of patients having the same voxel changes.
First, there seemed to be a lower spatial congruity in the entire group of patients, as opposed to
the groups of same etiology. Second, in comparison with traumatic patients, anoxic brain injury
patients seem to have a slightly higher spatial homogeneity in PMC voxels with hypo-CDP.
Third, TBI patients showed a higher intra-group similarity in hyper-CDP and hyper-CDN in
comparison to anoxic patients.

90
The Jaccard index showed a similarity of 65% for hypo-CDP, 46% for hyper-CDP, and 47%
for hyper-CDN spatial maps between traumatic and anoxic BI patients. The similarity between
the spatial maps of anoxic BI and the spatial maps of all patients (including TBI) was 69% for
hypo-CDP, 57% for hyper-CDP, and 49% for hyper-CDN voxel results. Finally, the comparison
between the TBI and the group of all patients, suggested a similarity of 96% for hypo-CDP,
89% for hyper- CDP and 98% for hyper-CDN spatial maps. These results, along the spatial
homogeneity results within different sub-groups, indicates that the results are more spatially
heterogeneous and more widely distributed in the TBI group in comparison to the anoxic
groups, further confirming differences in the pathological processes.
The spatial homogeneity differences between separate etiologies are visually presented in Figure
4.1.4.
Table 4.4.1.1.1. Spatial homogeneity of changes in PMC connection density in the patient group. Threshold – at least 33% or 67% of subjects spatially share the same voxel with sig. Z-score. The percentages present the proportion of voxels with significant Z-score out of the total number of voxels in PMC spatially shared between patients.
Figure 4.1.4. Intra-group spatial homogeneity differences between the traumatic and anoxic brain injury patients (threshold 33%).

91
Anoxic BI patients show a higher intra-group similarity in hypo-CDP in comparison to TBI patients, while TBI patients show a higher spatial congruity in hyper-CDN voxels. Purple and blue outlines reflect the borders of the anatomical PreCu and PCC respectively. Gradient bars (%) reflect the percentage of patients sharing the same voxel with a sig. Z-score (hypo/hyper CDP/CDN) at given anatomical location. The minimum spatial homogeneity is set to at least 33% of patients in a given group.
4.1.4.5 Prognostic value
4.1.4.5.1 Spearman correlation analysis with PMC-mPFC voxels The number of PMC voxels with hypo-CDP showed a significant negative association with the
CRS-R score assessed 3 months after the coma onset (rs= −.72, p = .00002), indicating that if a
patient had a higher number PMC voxels with hypo-CDP he was less likely to recover (Figure
4.1.5.). We did not find a significant correlation between hyper-CDP (rs= .29, p =.14) and hyper-
CDN (rs= −.35, p = .07) voxels and the CRS-R score for the entire patient group.
At the etiology level, it is worth noting that in the traumatic brain injury group, we found a
highly significant link between number of hypo-CDP voxels (rs= −.80, p= .0004) and the CRS-
R score (Figure 4.1.5 A).
Interestingly, a highly statistically relevant association was found between the number of hyper-
CDN voxels and the CRS-R score (rs= −.86, p= .00005). Therefore, TBI patients with a high
number of hypo-CDP and hyper-CDN PMC voxels had less chance for recovery 3 months after
the initial fMRI scan (Figure 4.1.5 B). Additionally, given the significant spatial overlap between
voxels with hypo-CDP and hyper-CDP voxels, and the significance of these voxels in relation
to the neurological recovery in TBI patients, we performed the same analysis on overlapping
voxels. The results showed the same highly significant negative association between the
number of spatially overlapping hypo-CDP and hyper-CDN voxels and the 3-month outcome
(rs= −.73, p =.002; Figure 4.1.5 C).
The analysis in the anoxic group did not show a significant association between the CRS-R
score and the hyper-CDP (rs= .43, p =.16), hyper-CDN (rs= .20, p = .54) nor the hypo-CDP
voxels (rs= −.38, p = .22). However, this result should be interpreted in caution due to small
sample size of anoxic BI patients.

92
Figure 4.1.5. The prognostic value of changes in PMC-to-mPFC connection density. Panel A) There was a sig. negative link between the number of PMC voxels with hypo-CDP and the patient outcome (rs= −0.72; p =0.00002); Panel B) TBI patients showed a significant negative association between the number of voxels with hypo-CDP (rs =−0.80; p =0.0004; panel A), hyper-CDN and the CRS-R score (rs =−0.86; p =0.00005); Panel C) In TBI patients, there was highly significant negative association between the number of spatially overlapped hypo-CDP and hyper-CDN voxels and the 3-month outcome (rs = −0.73, p =0.002; Fig. 6.C). The x axis represents the 3-month CRS-R score, the y axis represents the number of voxels with changes in connection density.
4.1.4.5.2 Spearman correlation analysis with the control pathway voxels The Spearman correlation analysis did not show any significant association between the CRS-
R score assessed 3 months after the coma onset and any of the number of voxels with significant
connection density changes in the Calcarine-mPFC control pathways. This was true for the
entire group of patients, and for the anoxic and traumatic BI groups separately.
4.1.4.5.3 Logistic regression analysis with PMC-mPFC voxels A logistic regression analysis was conducted to ascertain the effects of the number of hypo-
CDP, hyper-CDN and hyper-CDP PMC voxels on the likelihood that the patients had a good
outcome (recovery and MCS) or bad outcome (UWS/VS). Due to significant collinearity
between the hyper-CDP and hyper-NCD (r =−.91), two models were tested, the first including
hypo-CDP and hyper-CDP and the second hypo-CDP and hyper-CDN as independent/predictor
variables. The first model was significant (chi square = 10.204, p = .006 with df= 2), however

93
the number of hyper-CDP voxels did not significantly contribute to the prediction (Wald, p=
.296). Thus, we decided to keep the second model, where both predictors had a significant effect
on the outcome. The full model against the constant only model was statistically significant,
suggesting that the predictors as a set reliably distinguished between patients with good and bad
outcome (chi square =16.701, p < .001 with df= 2). The model explained 62% (Nagelkerke's
R2) of the variance in outcome, and correctly classified 78% of cases (sensitivity – 80%;
specificity – 75%) (Supplementary Figure 6.3.5). The Wald criterion demonstrated that both
variables, hypo-CDP (p = .02) and hyper-CDN (p= .044) had a weak but significant contribution
to prediction. Increase in both predictors was associated with decreased likelihood of good
outcome. Accordingly, Exp (B) indicates that the for every extra unit (number of voxels) of
hypo-CDP and hyper-NCD, the odds of recovery decrease by a factor of 0.988 and 0.999,
respectively, all other factor being equal.
4.1.5 Discussion
Our findings demonstrate that a comparative analysis of voxel-wise connection density
disruptions between the PMC and the mPFC, might constitute a reliable and fine-grained study
approach, permitting to accurately address the brain functional network changes, which are
critically related to consciousness abolition during coma. Crucially, built upon statistical
analysis at a single subject level - a necessary condition to make reliable inferences in individual
patients - this voxel-wise connection density approach, enabled the description of a novel
PMC/mPFC dysconnectional taxonomy, permitting the identification of specific markers
related to brain injury mechanism and useful for neuroprognostication. The current study,
confirms and expands previous finding through seed-based analysis method (Silva et al., 2015),
and permits: (i) a precise topological description of the PMC sub-regions (ventral PreCu and
the PCC) which seems implicated in the consciousness impairment observed in this setting, (ii)
identification of useful and accurate neuroimaging biomarker for prognostication in this setting,
as the number of PMC voxels with hypo-CDP to mPFC, had significant predictive value in
relation to patients neurological outcome assessed 3 months after the coma onset in the current
study. It is worth noting that such adaptive changes, characterized by a reduction of CDP, were
barely observed in the control pathway (Calcarine/mPFC). Crucially, the number of voxels with
any significant connection density changes within this control pathway, was not correlated with
patient's neurological outcome. These points strongly support the critical role of PMC/mPFC

94
functional connections in consciousness emergence, and consolidate the specific use of
PMC/mPFC functional connectivity to predict coma patient's neurological outcome. Our data
strongly support the concept of a significant structural and functional PMC heterogeneity,
which could be implicated in the “tuning” of the whole-brain metastable status (Hellyer, Scott,
Shanahan, Sharp, & Leech, 2015). Furthermore, our results are in line with the hypothesis of a
dysfunctional mesocircuit (Schiff, 2010) in DOC patients, build upon anterior and posterior
critical disruption of neural communication. For example, tract-tracing studies conducted in
non-human primates (Vogt & Laureys, 2005) and diffusion tensor tractography in humans
(Hagmann et al., 2008) have clearly identified structural connections between dorsal PCC to
the mPFC along the cingulum bundle (Greicius et al., 2009). Interestingly, structural injuries
within this tract have been described as related to neurological outcome of severely brain
injured patients (Fernández-Espejo et al., 2012). Furthermore, our findings suggest a higher
prevalence of hypo-CDP voxels in comatose patients, specifically located in the ventral
subdivision of both the PCC and the PreCu. This result seems compatible with the findings of
the rs-fMRI study of Silva and colleagues (2015), suggesting stronger functional connectivity
between PCC-centred seed and the mPFC in patient who eventually recovered. However, our
voxel-wise connection density method further elucidated the importance of the total number of
PMC voxels in prediction of patient's outcome and allowed us to explore the intra-regional
topological changes in connectivity which is not possible in seed based analysis. Additionally,
previous resting-state fMRI (Bzdok et al., 2015; Cauda et al., 2010; Margulies et al., 2009; Vogt
et al., 2006; Zhang & Li, 2012), and DTI studies (Zhang et al., 2014) indicate that both these
PMC sub-regions are densely connected to other brain regions that participate to DMN network
and appears to be implicated in internally directed cognition (i.e. self-referential information
processing, social cognition, mind-wandering, episodic memory retrieval) (Andrews-Hanna et
al., 2010; Cavanna & Trimble, 2006; Fox et al., 2015; Leech & Sharp, 2014). In contrast with
this hypo-CDP restricted to ventral parts of PreCu/PCC, we demonstrated that dorsal PreCu and
anterior dorsal (and a part of ventral) PCC, encompasses specific voxels with hyper-CDP in
coma patients. These dorsal PMC structures are known to support and connect to other regions
involved in externally directed cognitive processes (Margulies et al., 2009; Zhang & Li, 2012)
such as spatially-guided behaviour, visual/motor mental imagery (Cavanna & Trimble, 2006),
control of attentional focus (Leech & Sharp, 2014) and high-level sensorimotor functions
(Balestrini et al., 2015; Herbet et al., 2015). Overall, the observed rostro-caudal functional
segregation between increase and decrease of CDP, seems in line with the hypothesis of the
central role played by an imbalance between internal and external awareness systems in the

95
genesis of consciousness disorders (Demertzi, Soddu, & Laureys, 2013; Di Perri et al., 2014;
He et al., 2014). Actually, as described in chronic DOC patients (He et al., 2014), this imbalance
could reflect overcompensation in the external network due to the loss of input from internal
self-networks. Additionally, we sought for functional signatures of the brain injury mechanisms
that were responsible of coma. Regarding, the hypo-CDP voxels, our findings indicate that
within the PMC, hypo-CDP voxels were slightly more pronounced in anoxic patients (although
not statistically significant), probably representing a neural underpinning of the overall worse
prognosis of this group (Horsting et al., 2015; Koenig et al., 2014). Furthermore, in line with
recent studies, suggesting that hyperconnectivity patterns are a common network response to
traumatic brain injury (Bharath et al., 2015; Hillary et al., 2014, 2015; Stevens et al., 2012) we
observed that hyper-CDP (in the PCC subregion) and hyper-CDN voxels were more frequently
detected in the traumatic group. This was true for the PMC-mPFC connectivity patterns, but
also for the control pathway, representing connections between the Calcarine and the mPFC.
We hypothesize that the higher prevalence of hyperconnectivity patterns in this group could be
the consequence of compensatory brain plastic processes (Di Perri et al., 2014) possibly
reflecting resilient connections massively disrupted, but not totally interrupted by traumatic
brain injury (i.e. diffuse axonal injury). These resilient connections might have engaged residual
critical neural resources, otherwise normally distributed through efficient brain network
connections, here disrupted by brain injury, resulting in impaired conscious processing (Hillary
et al., 2015). Furthermore, these brain network signature of acute brain injury mechanisms was
confirmed by spatial homogeneity analysis (thresholding and Jaccard index), which indicated
higher spatial similarity of identified changes in voxel connection density between subjects with
same etiologies in comparison to the whole patient group. However, despite higher intra-group
similarity, these changes seemed more spatially scatted in the TBI patients group in comparison
to anoxic patients, which is in accordance with the heterogeneity of brain lesion found in this
group of patients. Finally, it is worth noting, that we specifically observed in the traumatic brain
injury group, that the loss long-range connection density of positive correlations (hypo-CDP)
between the PMC and the mPFC, was balanced with a spatially overlapping increase of negative
coactivation (hyper-CDN). The total amount of the later was associated to patient recovery and
could depict maladaptive brain plasticity processes. We hypothesize that this potentially
compensatory increase of negative connection density may indicate some aberrant inhibitory
processes or competitive mechanisms of information processing (Fox et al., 2009, 2012; Gee et
al., 2011; Gopinath et al., 2015; Liu et al., 2015), resulting in the breakdown of more efficient
network organization (i.e. PMC hypo-CDP). This is further supported by the unfavorable

96
outcome of our patients with a higher number of overlapping PMC voxels with decreased
positive connections but yet increased negative connections with mPFC. Interestingly, the same
hyper-CDP and hyper-CDN patterns in the control pathways were not associated with the
outcome in TBI patients. This result indicates that despite of the more global pattern of these
changes, the increase of negative connection density seems maladaptive only when present in
regions critical to conscious processing.
There are several limitations in this study. First the number of patients is relatively small
and our results need to be validated in larger cohorts. Second, we performed a study of density
of connections between each PMC voxel and all of the mPFC voxels, aiming to explore in
detail, the topology and the functional characteristics of the connections established from PMC
which was assumed homogeneous. Therefore, future studies should also address the functional
segregation and heterogeneity within mPFC in this setting. In future studies, brain damage in
the form of lesions in traumatic brain injury should be assessed in the pre-processing step, as
though not properly treated lesions can potentially give rise to artificially induced connectivity.
In summary, a complex pattern of decreased and increased connections was observed, and the
topography of these changes, seemed to be in agreement with the hypothesis of network
imbalance between internal/external processing systems, within PMC during acquired disorders
of consciousness. We report a significant link between the PMC (ventral parts of both the PCC
and PreCu) and the mPFC functional connectivity and patient recovery. Actually, the number
of PMC voxels with hypo-CDP showed a significant negative association with the CRSR score
and a “negative” predictive value in relation to good outcome assessed 3 months after the coma
onset, notwithstanding etiology. Additionally, traumatic brain injury specifically appeared to
be associated with a greater prevalence of hyperconnected positively and negatively correlated
voxels, and the total amount of latter, was inversely associated with patient neurological
outcome. This point might reflect a maladaptive plasticity mechanism through a resilient
functional network and an inefficient redistribution of remaining resources and pave the way
for innovative prognosis and therapeutics methods in this challenging setting.

97
4.2 Topological reorganization of high-order resting state networks in coma
4.2.1 Scientific justification
Brain network graphs have small-world characteristics representing functionally
associated clusters with high density of local connections (modules; i.e. resting-state networks)
and few long-range connections between segregated areas supported by the integrative
properties of highly connected hub nodes (Bullmore & Sporns, 2009; van den Heuvel & Sporns,
2013). In fact, connectionist theories of consciousness suggest that the brain complexity,
reflected in the balance between the local (i.e. segregation) and global (i.e. integration)
information processing, (i.e. hubs), may be crucial to generate and maintain conscious
experience (Dehaene & Changeux, 2011; Tononi et al., 2016). Nevertheless, there have only
been a few graph theoretical studies in patients with DOC (rs-fMRI - Achard et al., 2012; Crone
et al., 2014; Liu et al., 2014; Liu et al. 2017), (EEG - Beudel, et al., 2014; Chennu et al., 2014,
2017), (DTI – Weng et al., 2017), and none of them have fully explored the potential
contribution of such mathematical methods to specifically address the relationship between
coma and the whole set of complex topological disturbances (see Table 2.1.1, Table 2.2.1. and
Table 6.2.1 for review).
To our knowledge, the study of Achard and colleagues (2012) has been the first and only rs-
fMRI study to investigate the global and local network topology in the acute-stage DOC
patients. In this study, the authors have shown conserved global network properties, but a severe
reorganization of high degree or highly efficient “hub” nodes in patient group.
4.2.2 Objectives and hypotheses
We aimed to characterize during this extreme condition of acquired consciousness abolition
(i.e. coma), brain’s residual ability to segregate and integrate information at a threefold level:
(i) a whole-brain analysis, aiming to identify global neural correlates of coma (ii) a network
level build upon multiple RSNs analysis, to enable the characterization of brain injury impact
over predefined RSNs, knowns to be involved in self-related processing and potentially critical
for consciousness emergence (Demertzi et al., 2014, 2015; Di Perri et al., 2016; Heine et al.,

98
2012; Kirsch et al., 2017; Ovadia-Caro et al., 2012; Qin et al., 2015; Roquet et al., 2016; Sair
et al., 2017): the dorsal default mode network (dDMN), ventral default mode network (vDMN),
salience network (SAL), posterior salience network (P.SAL), right executive control network
(RECN) and the left executive control network (LECN).; (iii) and at a nodal level, with a special
focus on network hubs reorganization (Achard et al., 2012).
In line with network-level theoretical frameworks (Dehaene & Changeux, 2011; Dehaene and
Naccache, 2001; Tononi & Koch, 2008; Tononi et al. 2016), we hypothesize that the complete
loss of consciousness that is observed during coma is related to the massive breakdown of whole
brain functional connectivity. Despite the behavioral homogeneity which is associated to coma
state, and underpinning patient’s considerable neurological outcome heterogeneity, we expect
to identify among patients a large repertoire of local and global information processing
impairments, spanning from well-preserved to almost completely dissolute (i.e. randomized)
networks, and generating less efficient and costlier functional brain configurations than small-
word arrangement (Fornito et al., 2015; Stam, 2014). At a nodal level, we speculate to identify
a significant functional impairment in highly connected hubs (van den Heuvel & Sporns, 2013)
which have been described as involved in brain metastable dynamic (Leech & Sharp, 2014) and
conscious processing (Hannawi et al., 2015). Finally, we assume that the reorganization in coma
patients’ brain network topology will be associated with lower resilience to targeted attack on
network hubs.
4.2.3 Methods
4.2.3.1 Participants We compared rs-fMRI data of 25 patients with anoxic brain injury, who met the clinical
definition of coma (Glasgow Coma Scale score (53) at the admission to hospital < 8, with motor
responses < 6; Mean=51y; STD=18y; age range=18-80y; 12M) to 25 age-matched healthy
controls (Mean= 44y; STD=20y; age range=22-74y; 10M). Standardized clinical examination
was performed on the day of the scanning using the Glasgow Coma Scale and the Full Outline
of Unresponsiveness (Wijdicks et al., 2005).

99
4.2.3.2 Data preprocessing Functional data were preprocessed using Statistical Parametric Mapping (version SPM 12;
http://www.fil.ion.ucl.ac.uk/spm/). The fMRI images were realigned (motion corrected), slice-
time corrected, coregistered to each subject’s T1-weighted image and normalized to standard
stereotaxic anatomical Montreal Neurological Institute (MNI) space. The images were not
smoothed in order to minimize the spillage of the signal of the neighboring ROIs.
T1-weighted images were segmented to compute grey matter, white matter and cerebro-spinal
fluid images. Rs-fMRI data was further analyzed using the CONN toolbox (v.16a;
http://www.nitrc.org/projects/conn) (Whitfield-Gabrieli & Nieto-Castanon, 2012). In order to
reduce the motion effects on our data, we only included subjects characterized by motion
parameters smaller than 3 mm translation and 3° rotation. We have also performed ART outlier
detection & scrubbing, as an additional preprocessing step to identify rapid scan-wise
movement (global-signal scan-to-scan Z-value = 3, and a composite subject-motion signal mm-
value = 0.5mm). In addition, using the independent sample t-test we found no significant
differences between the patient (M = 0.130; SD = 0.10) and the control group (M = 0.132; SD
= 0.06) in estimated composite movement parameters (t(24) = -0.076, p = .94).
We originally included 28 patients, from which three patients were excluded, one due to
excessive movement (≥3 mm) and two due to preprocessing failure (ex. normalization failure).
Non-neuronal sources of noise were estimated and removed using the CompCor method
(Behzadi et al., 2007) integrated in the CONN toolbox. Principal components of the signals
from the white matter and the CSF voxels (using normalized T1 segmented masks), alongside
the motion parameters (estimated during realignment) and between-scan motion outliers (ART
toolbox), were removed with regression. Finally, a temporal band-pass filter was applied to the
residual blood oxygen level–dependent (BOLD) time course in order to obtain a low-frequency
range of 0.01 to 0.1 Hz.
4.2.3.3 Network construction To perform our graph theoretical analysis, we needed to construct a graph for the resting-state
sessions of each of our subjects. Within this framework a brain graph consists of set of nodes
that is brain regions, and edges represented by pairwise relationships between these nodes.
Brain nodes were defined using a functional atlas representing temporally coherent functional
networks generated using resting-state independent component analysis in an independent
study with healthy controls (Shirer et al., 2012). We have used the expanded “Willard” atlas
100
(Richiardi et al., 2015) with more grey matter coverage but significantly overlapping with the
original functional atlas published in the article of Shirer and colleagues (2012). The final nodes
included in our analysis were 6 mm radius spheres defined around the center of mass
coordinates of original “Willard” atlas regions. This was done in order to ensure the same
number of voxels within each of the nodes, as this was not the case with the original functional
atlas.
We have specifically studied six networks, given their consistent replication in other studies
and established importance in relation to disorders of consciousness. These networks consisted
of 82 nodes in total, reflecting the - dorsal default mode network (dDMN; 21 nodes), ventral
default mode network (vDMN; 13 nodes), salience network (SAL; 12 nodes), posterior salience
network (P.SAL; 13 nodes); right executive control network (RECN; 13 nodes) and the left
executive control network (LECN; 10 nodes). To facilitate the presentation of results, the MNI
center-mass coordinates of each of these nodes were used to identify the corresponding
anatomical regions of the AAL atlas (Tzourio-Mazoyer et al., 2002). These were further used
in the visualization (BrainNet; http://www.nitrc.org/projects/bnv/) (Xia, Wang, & He, 2013)
and interpretation of our results. The full detailed list of brain nodes used in our study can be
found in Supp. Table 6.3.2.
Graph edges were constructed by computing Pearson correlation coefficients between the
average BOLD signal of all the nodes of these predefined functional networks. This resulted in
82x82 connectivity matrix for each of the subjects in each of the groups.
4.2.3.4 Graph theory analysis
4.2.3.4.1 Threshold selection Thresholding is necessary to reduce the influence of weak and potentially spurious connections
that could significantly influence the network topology. Importantly, to keep the graph fully
connected, we extracted the minimum spanning tree (MST) for each subject, based on the
correlation matrix with absolute weights. The remaining values of the correlation matrices were
thresholded using subject-dependent connection density thresholds to obtain the same number
of edges for each subject thus allowing us to compare groups with each other. Thus, the
remaining top 5-50% of the strongest (absolute) connections, with an increment of 5%, were
added to the MST from the MST-extracted connectivity matrix resulting in 10 binary undirected
adjacency matrices per subject in each group.

101
4.2.3.4.2 Randomness Lower levels of overall functional connectivity have been associated with higher degree of
randomness in the individual proportionally thresholded (i.e. connection density) brain graphs.
Edges with low functional strength have a higher probability of being spurious and often lead
to differences in clustering and global efficiency not necessarily reflecting real changes in
network organization but artificially induced differences due to low overall functional
connectivity (van den Heuvel et al., 2017). In our study, the results of global metrics (global
efficiency and clustering) across multiple thresholds, with the initial group of patients (N=25),
indicated whole brain network randomization in coma patients compared to controls (Supp.
Figure 6.3.6 - subpanels A and B). Nonetheless, the global metric results seemed highly variable
within the group of patients. This “randomness” of network topology was further explored using
the hub disruption index (HDI) (Achard et al., 2012) calculated using the global efficiency (GE-
HDI) estimated for each node individually (Supp. Figure 6.3.6 - subpanel D; Supp. Figure 6.3.7).
The GE-HDI enabled the characterization of three sub-group of patients (Supp. Figure 6.3.6 -
subpanel D), with one group showing significant global network reorganization indicative of a
randomization process (HDI < -0.8). The same sub-group of patients showed increased global
efficiency suggesting subtle randomization (Supp. Figure 6.3.6 subpanel C). These results were
supported with low values of functional connectivity in “random patients”, who had lower
density (<10%) of strong functional connections (Pearson’s r>.2; Supp. Table 6.3.3), not
sufficient to comparatively explore the network topology between groups (i.e. random
configuration). Therefore, to allow meaningful interpretation of patients’ global and local
network topology that is not related to randomness but to node related topological changes, we
decided to calculate the graph measures excluding patients (N=9) showing evidence of
randomization (HDI< -0.8 and/or low functional connectivity (density <10%); Supp. Table
6.3.3), leaving a total of 16 patients for further analysis. The boxplot of pairwise functional
connections (Pearson’s r) in remaining patients (in comparison to controls) can be seen in Supp.
Figure 6.3.8.
4.2.3.4.3 Network metrics The network analysis was done in R (v.3.3.2; The R Project for Statistical Computing;
http://www.R-project.org/) using the Brainwaver and iGraph package freely downloadable at

102
http://cran.r-project.org. The more detailed description of the applied graph metrics is provided
in Chapter I of this thesis.
Following global metrics were calculated: clustering and global efficiency. The clustering
(global average local efficiency – see description below) is a topological measure of segregated
information transfer. The global efficiency (GE) is a metric for efficiency of integrative
information transfer across the network. This measure is inversely related to the characteristic
path length (average shortest path between nodes) but is adapted to fragmented that is
disconnected graphs.
To explore the local/nodal network metrics we employed the degree and the local efficiency.
Each of these measures describe different aspects of topological node centrality permitting the
identification of nodes that have the highest influence on network-wide processes. The degree
represents the number of links connected to the node, assuming that nodes with many
connections have a higher influence on the network in comparison to low-degree nodes. The
local efficiency measures the integration capacity between immediate neighbors of a given
node. This metric also reflects the network resilience by indicating how efficiently neighbors
of a given node communicate when this node is disrupted.
4.2.3.4.4 Network reorganization mechanism We introduce a novel methodological approach which we labeled as the edge probability map.
This measures presents the difference between groups in connections between specific nodes
in a given network. Individual subject correlation matrices were thresholded using the
connection density threshold to obtain binary undirected graphs. The individual connection
density matrices were then summed for the patient and the control group separately, in order to
obtain the number of subjects that had a significant connection between a given pair of nodes.
These values were then normalized to a percentage of subjects having a specific connection
within this network and subtracted between groups to obtain the difference in the percentage of
subjects having a connection between particular nodes. This was done to identify specific
disconnections driving the increase or decrease of node degree in the patient group.
To detect network reorganization in comatose patients we have also computed the hub
disruption index (HDI) for nodal measures (Achard et al., 2012). To calculate HDI for a given
metric, for example the degree, we subtract the healthy group mean degree from the degree of
the corresponding node in an individual subject, and plot this individual difference against the
healthy group mean. The slope of a straight line fitted to a given plot is referred to as hub

103
disruption index. A negative HDI close to -1, indicates a severe network reorganization,
meaning that nodes with highest degree (i.e. hubness) in controls show greatest reduction in
patients, whereas the nodes with lowest nodal degree in controls show the greatest increase in
patients.
4.2.3.4.5 Network resilience to random failure and targeted attack To assess the resilience of the brain network we simulated the attacks on the network by
removing nodes (and its connections) in rank order of decreasing degree (targeted attack) or in
random order (random failure), repeating the process until the percentage of deleted nodes was
100%. After each deletion, we re-estimated the clustering and the global efficiency in order to
explore the global impact of the simulated lesion on the brain network.
4.2.3.5 Statistical analysis Global and nodal statistics (and functional connectivity) were compared between groups with
t-tests or permutation (100.000 iterations) using the package lmPerm implemented in R (v.3.3.2;
The R Project for Statistical Computing; http://www.R-project.org/). To control the multiple
comparisons for each nodal metric, the significance level of p-values was adjusted to 1/N
(p=.012), where N represent the number of nodes included in the analysis. The results were
visualized with the BrainNet Viewer (Xia et al., 2013).
4.2.4 Results
4.2.4.1 Global network topology In comparison to controls, patients showed a decrease in clustering across multiple thresholds,
as seen in Figure 4.2.1. (at cost 15%, permutation test p<.0001). However, there were no
statistically significant difference in the global efficiency between the two groups (permutation
test p=.198). These results seem to imply a loss of balance between segregation and integrative
properties of the brain network and may reflect loss of specialized information processing and
dedifferentiation within high-order resting state network included in our analysis.

104
Figure 4.2.1.Global topology in controls and patients. A) Global efficiency (GE) in controls and patients in comparison to regular and random networks, at multiple connection density thresholds (5-50%, increment 5%). B) Clustering in controls and patients in comparison to regular and random networks, at multiple connection density thresholds (5-50%, increment 5%).
4.2.4.2 Disruption of hub rank order This hub disruption index summarizes the pattern of network reorganization, in subtracting the
healthy group mean value from the value of the corresponding node in coma patients, and
plotting this individual difference against the healthy group mean. The slope of a straight line
fitted to a given plot is referred to as hub disruption index (Achard et al., 2012). A negative
HDI close to -1, indicates a severe network reorganization, meaning that nodes with highest
nodal efficiency (i.e. hubness) in controls show greatest reduction in patients, whereas the nodes
with lowest nodal efficiency in controls show the greatest increase in patients. The hub
disruption index calculated with the global (nodal) efficiency (permutation p<.0001) and local
efficiency (permutation p<.001) implied significant brain network reorganization within the

105
patient group (Figure 4.2.2). Further, HDI calculated using the degree implied the same
significant brain network reorganization within the patient group in comparison to control group
(Figure 3A), and we found evidence of a critical reorganization of high degree nodes (i.e. hubs).
Namely, cortical regions that were hubs of healthy brain networks seemed to become non-hubs
of comatose brain networks and vice versa. However, there seemed to be significant
heterogeneity within the coma patient group (Figure 4.2.3. - subpanel B), with some individuals
showing severe reorganization at global level, while others having similar values to healthy
subjects.
Figure 4.2.2. Brain node reorganization - the difference between groups in the HDI of global (nodal) efficiency and local efficiency. Boxplots represent medians with interquartile range and whiskers signify minimum and maximum values (excluding outliers); ** p< .001, *** p<.0001

106
Figure 4.2.3. Local network topology. A) Hub disruption of functional networks in comatose patients. The mean degree of each node in the healthy control group (x axis) is plotted against the difference between the groups in mean degree of each node (y axis). Normal hub nodes with high degree in the healthy group have a reduction in degree in the comatose group (i.e. dDMN.Cingulum_Post_L_R), whereas the healthy non-hub nodes have an increase of degree in patients (i.e. dDMN.Cingulum_Ant_L_2). B) Hub disruption index for each of the subjects in the control and the patient group. The HDI calculated using the degree is significantly different between the groups. The boxplot represents medians with interquartile range and whiskers signify minimum and maximum values (*** p< .0001). C) Brain representation of nodes that demonstrated significant between-group difference in nodal degree; P>C – significantly higher in patients; P<C –significantly lower in patients.
4.2.4.3 Local network topology
4.2.4.3.1 Node degree In accordance to hub disruption index estimated using the degree (Figure 4.2.3 – subpanel A),
Figure 4.2.3 (subpanel C) shows multiple regions that significantly differ between the patients
and the control group at nodal level (15% threshold; see Supp. Figure 6.3.9. for other thresholds).

107
Overall, we can see a major disruption in brain node centrality in the patient group reflected in
a combination of decrease and increase of node degree, suggesting specific regional changes in
brain network organization as seen in the HDI results. The decrease of nodal degree
encompassed the posterior cingulate gyrus (dDMN), the right middle frontal gyrus (vDMN)
and the left crus (I and II) of cerebellar hemisphere (RECN). In contrast, the increase of nodal
degree was shown in the anterior cingulate gyrus (dDMN), the left posterior thalamus (P.SAL)
and a sub-region of the left crus I of cerebellar hemisphere (P.SAL).
4.2.4.3.2 Edge probability map To identify specific disconnections driving the increase or decrease of node degree in the patient
group we calculated the edge probability map (Figure 4.2.4 – subpanel A). This measures
presents the difference in the percentage of coma patients and healthy subjects having a specific
between-node pairwise connection in a given network (Figure 4.2.4 - subpanel B).

108
Figure 4.2.4. A) The analysis pipeline for the edge probability map. Individual thresholded binarized adjacency matrices were summed in each subject group in order to obtain the proportion of subjects with a specific connection between a given pair of nodes. These values were then subtracted between groups in order to obtain the difference in the percentage of subjects having a particular pairwise node connection. B) Edge probability map. X and Y axes present the nodes in a given network and the color scale reflects the difference between the percentage of patient and healthy control subjects having a particular pairwise connection. The blue color (negative values) reflects a lower percentage of patients than healthy subjects with a specific connection, while the red color shows the opposite. The map was thresholded to reflect at least 33% of more/less patients having a given between-node connection in comparison to controls.

109
The posterior cingulate cortex (dDMN) seemed primarily disconnected to other regions from
the predefined dDMN network, such as different sub-regions of the frontal and anterior
cingulate cortex, with the most prominent disconnections with the superior medial frontal
cortex and the precuneus. In addition, the posterior cingulate showed inter-network
disconnections, such as lower connectivity with the left angular gyrus and the inferior parietal
cortex, originally integrated in the LECN. Further, vDMN’s right middle frontal gyrus (vDMN)
was primarily disconnected to the sub-areas of the right precuneus and superior frontal cortex,
implying mostly intra-hemispheric disruption in connectivity. Interestingly, all of these changes
reflected some local but mostly long-range disconnections between posterior parietal and
frontal regions. The sub-regions of the RECN’s crus of the cerebellar area showed intra-network
disconnections, with most other RECN regions, prominently the right medial orbitofrontal
cortex, angular gyrus, inferior parietal lobule and other sub-regions of the cerebellum crus.
Increases in between-node connections found in the patient group were predominantly
characterized by wide-spread mostly weak (in small percentage of patients) augmentation in
connections, as present for the left posterior thalamus (P.SAL) and the cerebellum crus I
(LECN). An increase in degree was more visible for dDMN’s anterior cingulate cortex, with its
two sub-regions showing different profiles of increase in connectivity – the left sub-portion
with the left supplementary motor area (SAL), and the more medial sub-region with the left
middle frontal gyrus (LECN) and the supramarginal gyrus (P.SAL).
4.2.4.4 Resilience To assess brain network’s robustness after acute brain injury, we explored both the local
efficiency (i.e. measure the integration capacity between immediate neighbors of a given node)
across the whole set of high-order resting state network included in our analysis, and the impact
of simulated random/targeted networks attacks, aiming to have additional insights on the
topological role played by brain hubs within the rearranged residual brain networks.
4.2.4.4.1 Local efficiency The local efficiency indicates how efficiently neighbors of a given node communicate when
this node is disrupted. Figure 4.2.5. shows a dramatic decrease in local efficiency, in wide range
of nodes in patients, supporting the results of reduction in global clustering. This decrease was
primarily seen in the precuneus, posterior cingulate, angular gyrus, cerebellum crus and the

110
frontal mid regions. Interestingly, these regions showed mutual disconnections (Figure 4.2.4 –
subpanel B) probably underlying the lower clustering and resilience seen at global level.
Figure 4.2.5. Brain regions with a significantly lower local efficiency in patients in comparison to controls. The regions with lower local efficiency are predominantly localized in the posterior regions of the brain in coma patients.
4.2.4.4.2 Node attack To further assess the resilience of the brain network in coma patients we simulated the attacks
on the network by removing nodes (and its connections) in rank order of decreasing degree
(targeted attack) or in random order (random failure).
Figure 4.2.6. shows the clustering as a function of results of targeted node attack (subpanel A)
or random failure (subpanel C). For example, under targeted attack after removal of 25% of
nodes, the clustering decreased by 44% (median values) in controls and 64% in patients
(permutation p<.000), indicating reduced resilience in individuals in coma. Further, we can
observe that under random failure, there wasn’t a large difference in resilience between the
control and the patient group, with a decrease in clustering by 27% and 29% from the baseline,
in the control and the patient group, respectively (permutation p=.007).
In contrary to these results, the global efficiency showed similar decrease in both groups (Figure
4.2.6), under targeted attack (subpanel B) and random failure (subpanel D). In other words, after
targeted removal of 25% of the nodes, the GE was reduced by 57% and 54% (p=.54), while
under random failure the global efficiency was decreased by 45% and 44% (p=.145), in controls
and patients, respectively.

111
Figure 4.2.6. Network resilience. Network resilience to targeted attack (A and B) and random failure (C and D) in controls and patients. The curves represent the clustering or global efficiency (y axis) as a function of number of nodes attacked (x axis). Under targeted attack, the clustering decreased more rapidly in patients in comparison to controls, indicating reduced resilience in individuals in coma. The global efficiency declined in a similar way after sequential removal of high-degree nodes in both groups.

112
4.2.5 Discussion Our findings significantly contribute to the growing evidence of the involvement of specific
high-order RSNs networks, and their critical regions, in the mechanisms during abolition of
consciousness. We observed among comatose patients a large repertoire of information
processing disturbances, at several levels: (i) whole brain impairments, encompassing gradual
disruption in topological clustering with the most severe changes implying a loss of functional
degeneracy (ii) significant disruption of hubs rank order across local networks metrics,
suggesting a critical reorganization of high degree nodes, with cortical regions that were hubs
of healthy brain networks becoming non-hubs of comatose brain networks and vice versa, (iii)
regularly observed specific coma-related within and between high-order RSN disconnections,
encompassing both losses and increases of long-range connections between connector hubs,
that might be related to functional dedifferentiation and adaptive compensation processes,
respectively (Fornito et al., 2015), (iv) a reduction in network resilience in coma patients as
simulated damage to reorganized high-degree nodes resulted in rapid network fragmentation.
The graph theoretical analysis of rs-fMRI data in the patient group, implied less efficient local
information integration and functional ‘closeness’ between neighboring nodes across the entire
high-order RSN connectome. It must be stressed that reduced clustering and modularity were
shown in previous studies on chronic DOC patients (Chennu et al., 2014; Crone et al., 2014),
but have not been yet reported in the pathological setting of acute brain injured patients. In
contrary to current results, a previous rs-fMRI study did not find significant changes in the
global measure of functional connectivity or network topology in the acute stage of brain
injured patients (Achard et al., 2012). This discrepancy may be explained by the differences in
patient’s neurological severity, brain injury etiologies, and network definitions, because we
deliberately focused on nodes integrated in high-order RSNs considered to be implicated in
consciousness-related processes (Giacino et al., 2014). The preservation of global efficiency in
coma patients may be due to the homeostatic conservation of this topological property even
under severe clinical conditions such as anoxic brain injury (Achard et al., 2012). However, in
our case, it could be indicative of random distribution of information that is nor specialized nor
integrative due to impairment in local specialized neural processing, present in our coma
patients. Altogether, these results suggest a loss of small-world organization in patients, which
normally ensures a balance between specialized/segregated and long-range integrated
information processing (Achard, Salvador, Whitcher, Sucklig, & Bullmore, 2006; Bullmore &
Sporns, 2012). These results support the hypothesis that conscious processing depends on brain

113
complexity, implying a fine-tuned balance between these two global topological properties
(Casali et al., 2013; Chennu et al., 2017; Tononi & Koch, 2008, 2015).
At the nodal level, we found strong evidence of node centrality disruption in non-random
comatose patients in comparison to the control group. The most significant decrease in
centrality (i.e. degree and local efficiency) was found in the posterior cingulate of the dDMN,
left cerebellum crus of RECN and frontal mid region of the vDMN network. Interestingly, the
changes in nodal degree reflected some local but mostly long-range disconnections between
posterior parietal and frontal hub regions, some of them related to changes in inter-modular
connectivity (i.e. connector hub) as shown for the dorsal posterior cingulate of the dDMN.
Previous functional connectivity studies in DOC patients, have suggested significant changes
along high-order midline posterior parietal (encompassing the precuneus and the posterior
cingulate cortex) and frontal regions in this setting (Achard et al., 2012; Chennu et al., 2017;
Crone et al., 2014; Hannawi et al., 2015; Silva et al., 2015). In the current study, the most
dramatic changes were reflected in the decrease in local efficiency in the midline posterior
parietal cortex, related to a diminished integration between neighboring nodes, and
consequently lower resiliency and efficiency in parallel information transfer of the network. It
must be stressed that a multimodal function, underpinned by a ‘rich club organization’ of the
posterior parietal cortex has been recently suggested (Alstott et al., 2009; van den Heuvel &
Sporns, 2011; Wang et al., 2014), and its role in human attentional focus and ‘tuning’ of whole-
brain metastability (Leech & Sharp, 2014), made of this brain region a strong candidate of the
‘minimally sufficient and jointly necessary’ (Crick & Koch, 2003) hubs that could constitute
the neural correlate of consciousness. Our data fit well in current theoretical frameworks of
conscious processing including the Global Neuronal Workspace (GNW), model according to
which conscious access occurs when initially segregated specialized information processing
(i.e. clustering) is made globally available to multiple brain systems through a network of
neurons with long-range axons situated along the frontal and parietal brain regions (Dehaene &
Changeux, 2011).
Otherwise, we found robust evidence of non-hub sub-regions of the RECN’s cerebellum crus
intra-network disconnections. We hypothesize that this circuit-selective significant reduction
of cerebellum centrality could be linked to diaschisis phenomena caused by a reduced excitatory
drive from the damaged cortex, to which cerebellum is densely connected (Herculano-Houzel,
2012) and could represent in the context of global brain severe injury, a potential useful
biomarker of diffuse cortico-cortical and cortico-thalamic widespread functional disruption.
From a cognitive point of view, this massive cerebellar disconnection seems in line with recent

114
studies which highlighted the cognitive role of this brain structure in consciousness related
processes as attention, working memory and self-reference tasks (Buckner, 2013; Sokolov,
Miall, & Ivry, 2017).
We concomitantly observed increases in between-node connections in the patient group,
primarily characterized by wide-spread mostly weak augmentation in connections. Further
analysis indicated that the regions with increased degree in patients tended to be the least central
nodes in the healthy controls, implying potential compensatory brain plastic processes, reflected
through reallocation of critical residual neural resources to otherwise not so central nodes (Di
Perri et al. 2014; Hillary et al., 2015; Liu et al., 2017). Brain regions depicting this pathological
pattern were mainly located within the salience network, which is known to be implicated in
homeostatic/visceral perception (Uddin, 2014) and seems to be responsible of the critical switch
between DMN and ECN throughout higher order-cognitive processes (Bonnelle et al., 2012;
Menon, 2015). The functional significance of this pathological increase of connectivity remains
an important topic for further investigation (Di Perri et al., 2016; Hillary et al., 2015).
Finally, we found evidence of decreased resilience in anoxic comatose patient’s brain
connectome reflected in a rapid deterioration of global clustering across high-order RSNs
caused by a simulated high-degree node “lesioning”. Nevertheless, the global efficiency of
comatose patient’s brain networks proved to be as resilient as those in healthy control
individuals, during random and targeted deletion of nodes. Altogether, these results might imply
that the coma patient’s hub node reorganization may have prevented the loss of global
integrative properties but did in fact lead to dedifferentiated non-specialized functional
processing related to lower networks resilience and potential diffusion of network failure. In
fact, strong local inter-connectivity within the modules (i.e. RSNs) is known to be closely tied
to functional degeneracy which reflects the brain’s capacity for resilience and recovery after
injury, and seems supported by high-degree nodes embedded locally (provincial hubs) and
bridge nodes serving to connect otherwise segregated processes (connector hubs), facilitating
the recruitment of alternative subsystems (Fornito et al., 2015).
This study has several limitations. A recent publication (van den Heuvel et al., 2017) has
implied some short-comings in applying proportional thresholding in patient-control
comparison studies in which groups show differences in overall strength of functional
connectivity. We have taken some measures of precaution in order to diminish this difference
between our groups, however, comatose patients usually have lower global functional
connectivity in contrary to healthy controls, which could induce or artificially inflate the
between-group topological differences. Thus, further studies should explore different methods

115
of edge selection, such as weighted thresholding or the unique inclusion of statistically
significant links in network construction. Different functional atlases could be used to explore
the brain topology in coma patients and it would be interesting to see if differently constructed
brain networks result in contrasting or comparable results with a similar clinical message. Our
team is currently testing different approaches of network construction in order to define a graph-
based method which could be applied to coma patients without dramatic exclusion of subjects.
Additionally, further research needs to include more patients with accurate long-term
longitudinal follow-up, encompassing repeated behavioral and fMRI assessment because
topological organization could significantly change over the course of time (Castellanos et al.,
2011; Nakamura, Hillary, & Biswal, 2009). Comatose patients with different etiologies, such
as traumatic brain injury, should be also studied aiming to identify potential etiology-related
pathology mechanisms.
116
4.3 The PMC-mPFC structure-function association in coma – an exploratory study
4.3.1 Scientific justification
A growing body of literature exists on the severe impairment in resting-state functional
connectivity and white and gray matter structural damage within the midline cortical regions,
primarily integrated in the default-mode network (DMN), in DOC patient (Table 2.2.1).
However, most of these studies have been conducted independently, without direct
investigation of the structure-function relationship in chronic DOC or acute stage coma patients
(Table 2.3.1). It is important to note, that the microstructural integrity of the white matter
connections between the posteromedial and medial prefrontal regions has been related to level
of functional connectivity between these two regions in healthy subjects (van den Heuvel et al.,
2008; Wang et al., 2014). Further, an association between the loss of structural integrity in the
DMN key nodes including their white matter connections, and the corresponding functional
connectivity, has been has been found in cognitively impaired TBI patients (Bonnelle et al.,
2011; Palacios et al., 2013; Sharp et al., 2011) and older healthy subjects (Vidal-Piñeiro et al.,
2014). A recent study has indeed demonstrated a significant structure-function correlation in
chronic DOC patients, with an increase in global structural damage (i.e. FA in whole brain
white matter) related to a reduction in effective connectivity (Bodart et al., 2017). Nevertheless,
the structural-functional connectivity relationship has not yet been demonstrated in the brain-
injured population in the acute stage of coma.
The present study is a preliminary exploratory study. The previous couple of years spent in
analyzing functional connectivity data have resulted in multiple questions regarding the
relationship between structural damage and functional dysfunctions in coma patients. This
project was executed in the end of my third year, and is not as elaborated as the previous two
ones due to time constraints. Nevertheless, the preliminary results presented in this thesis have
led to other projects which are currently being executed by our team.

117
4.3.2 Objectives and hypotheses
The main objective of this study was to investigate the structural integrity, and the structure-
function relationship of the PMC (posteromedial) and mPFC (medial prefrontal cortex) sub-
regions and their corresponding white matter connections. We expected to find significant
structural injury paralleled with a loss of functional connectivity in all comatose patients,
irrespective of etiology. However, we hypothesized that the anoxic brain injury patients would
primarily show cortical gray matter damage, while TBI patients would mostly exhibit a loss of
white matter microstructure within the tract connecting the PMC and mPFC sub-regions.
4.3.3 Methods
4.3.3.1 Participants From the total number (N = 35) of recruited anoxic BI patients, 6 patients were excluded from
this study, 1 due to excessive movement (≥3 mm), 3 due to preprocessing failure (e.g.
normalization failure due to ventricular enlargement) and 2 because of low quality (i.e.
artefacts) of the acquired images. From the total TBI comatose patients (N=20), 6 patients were
excluded, 2 due to excessive movement and 4 due to severe focal brain damage mostly localized
in the frontal lobe and thus significantly overlapping with our regions of interest.
Therefore, the final group of patients comprised 29 anoxic (Mean= 51y; STD= 18y; age range=
18-81y) BI injury, and 14 TBI (Mean= 43y; STD= 19y; age range= 18-76y) comatose patients.
Thirty four age-matched healthy controls were also included in the analysis (Mean= 50y; STD=
20y; age range= 22-74y).
4.3.3.2 ROI selection Our cortical gray matter ROIs were selected using the “Willard” functional atlas (Richiardi et
al., 2015). This atlas has more gray matter (GM) coverage but significantly overlaps with the
original functional atlas published in the article of Shirer and colleagues (2012). More
specifically, we chose the three sub-regions of the PMC, and 11 sub-regions of the frontal cortex
(i.e. mPFC and anterior cingulate) integrated in the dDMN network, as these were the regions
that were most consistently shown to be altered in our comatose patients (and DOC patients in

118
other studies). The analysis was done using each of these sub-regions separately, and using the
total mean values, averaged separately for the PMC and the mPFC region.
The white matter ROI was taken from the atlas published by Figley and colleagues (2015),
which is based on an fMRI guided DTI tractography between PMC and mPFC nodes of the
dDMN network integrated in the functional atlas published by Shirer and colleagues (2012).
Their analysis resulted in a group probability map, more conservative than the raw connection
counts, because it reflected the requirement of at least 25% of all subjects having overlapping
streamlines (between these two nodes) that are in exactly the same spatial location (in order to
eliminate biologically spurious or unlikely tracts). We avoided additional conservative
thresholding, due to the inclusion of acquired brain injury patients in which spatial
normalization is not always as successful as in healthy controls. The original WM ROI was
separated into left and right ROIs, to compare the groups in total and lateralized WM changes.
As it may be seen in Figure 1, the WM tract largely overlaps with the cingulum bundle, so for
now on, we will refer to this ROI as the cingulum.
Figure 4.3.4.3.1. Gray matter and white matter ROIs included in our analysis. The sub-regions are delineated using different colors without any specific significance attached to color nuances.
4.3.3.3 Image processing
4.3.3.3.1 Structural MRI Gray matter morphometry
Morphometry is the study of the size and the shape of the brain, and is based on standard MRI
sequences, such as T1-weighted images (Greve, 2011). There are several metrics that one can

119
use to test a morphometry-related hypothesis such as gray matter volume, white matter volume
or cortical thickness (Greve, 2011). We will specifically focus on voxel-based morphometry
(VBM), which enables the investigation of voxel-wise differences in the local grey matter
volume/topography without priori information about the location of these possible differences
(Good et al., 2001).
Image processing was performed using FSL v5 (www.fmrib.ox.ac.uk/fsl/) and an in-house
developed software in Matlab (version 6.5, The MathWorks), with procedures similar to those
described previously (Cherubini, Péran, Caltagirone, Sabatini, & Spalletta, 2009; Péran et al.,
2009, 2010).
Voxel-based morphometry was performed using the implemented FSL tool FSL-VBM v1.1
(Douaud et al., 2007), an optimized VBM protocol (Good et al., 2001). Briefly, all the T1
images where first brain extracted then segmented into images of gray matter (GM), white
matter (WM), and cerebro-spinal fluid (CSF). GM images where then non-linearly registered
(Andersson, Jenkinson, & Smith, 2007) to the gray matter ICBM-152 template, concatenated
and averaged. The resulting image was then flipped along the x-axis and both images where
averaged again creating the first GM template. Second, GM images of all participants where
non-linearly registered to this study specific template, and using the same final steps, a second
"non-linear" GM template was generated. This "non-linear" template was finally used to
register all the GM images. Then, the registered images of all subjects were multiplied by the
Jacobian of the warp field in order to introduce a compensation (or "modulation") correction
for local expansion or contraction, due to the non-linear component of the spatial
transformation. The corrected registered images were then concatenated and smoothed by a
Gaussian kernel (sigma = 4mm) to reduce registration imperfections and increase the signal-to-
noise ratio. Thus, gray density (GD) images were calculated for each participant.
Diffusion tensor imaging
The preprocessing of the diffusion tensor images was accomplished with FSL implemented tool
FDT (FMRIB's Diffusion Toolbox; https://fsl.fmrib.ox.ac.uk/fsl/fslwiki/FDT). The diffusion
tensor images were first corrected for distortions caused by eddy currents using the b = 0 volume
as reference. A diffusion tensor model was fit at each voxel and two diffusion parameters were
extracted, fractional anisotropy (FA) and mean diffusivity (MD), to build two parametric maps.
The FA maps were then registered to brain-extracted whole-brain volumes from T1-weighted
images using a full affine (correlation ratio cost function) alignment with nearest-neighbor

120
resampling. The calculated transformation matrix was then applied to the MD maps with
identical resampling options. The final results were obtained in calculating the average FA and
MD values in the GM and WM regions of interest, described in the previous section.
4.3.3.3.2 Resting-state functional MRI As in previous studies, functional data were preprocessed using Statistical Parametric Mapping
(version SPM 12; http://www.fil.ion.ucl.ac.uk/spm/). The fMRI images were realigned (motion
corrected), slice-time corrected, coregistered to each subject’s T1-weighted image and
normalized to standard stereotaxic anatomical Montreal Neurological Institute (MNI) space
(ref). The images were not smoothed in order to minimize the spillage of the signal of the
neighboring ROIs. T1-weighted images were segmented to compute gray matter, white matter
and cerebro-spinal fluid images.
Rs-fMRI data was further analyzed using the CONN toolbox (v.16a;
http://www.nitrc.org/projects/conn; Whitfield-Gabrieli & Nieto-Castanon, 2012). In order to
reduce the motion effects on our data, we only included subjects characterized by motion
parameters smaller than 3 mm translation and 3° rotation. We have also performed ART outlier
detection & scrubbing, as an additional preprocessing step to identify rapid scan-wise
movement (global-signal scan-to-scan Z-value=5, and a composite subject-motion signal mm-
value = 0.9mm). Non-neuronal sources of noise were estimated and removed using the
CompCor method (Behzadi et al., 2007) integrated in the CONN toolbox. Principal components
of the signals from the white matter and the CSF voxels (using normalized T1 segmented
masks), alongside the motion parameters (estimated during realignment) and between-scan
motion outliers (ART toolbox), were removed with regression. Finally, a temporal band-pass
filter was applied to the residual blood oxygen level–dependent (BOLD) time course in order
to obtain a low-frequency range of 0.01 to 0.1 Hz.
4.3.3.4 Statistical analysis The Mann-Whitney U test was conducted to investigate the differences in functional
connectivity (i.e. Pearson’s r) and structural integrity (i.e. VBM - gray matter density, MD, FA)
between the coma patient group and the healthy control group. The same test was used to
compare the two etiology groups – the anoxic BI and TBI patient sub-groups.

121
Spearman’s correlation analysis was performed to explore the link between the structural
integrity and functional connectivity in the total patient group, and two separate etiology
groups. All of the above mentioned analyses were performed using the IBM SPSS (IBM SPSS
Statistics for Windows, Version 20.0. Armonk, NY: IBM Corp.) statistical package.
4.3.4 Results
4.3.4.1 Structural damage and etiology-related differences in patients
Regional results
The mean diffusivity of the cingulum was significantly higher in the patient group in
comparison to the control group (U = 455, p = .005; Figure 4.3.4.3.2).
Further analysis showed that this increase of diffusivity was more present in the TBI group in
comparison to the control (U= 64, p< .0001) and anoxic BI (U= 116, p= .024) subjects.
Moreover, the loss of structural integrity, primarily seen in TBI patients, seemed to be
lateralized with more damage in the right cingulum, indicated by an increase of MD and
decrease of FA in this white matter tract (Figure 4.3.4.3.3.). The anoxic patient group showed a
significant increase in gray matter VBM values in the PMC region, in comparison to controls
(U= 315, p= .014) and traumatic BI patients (U= 120, p= .031) (Figure 4.3.4.3.2).
Figure 4.3.4.3.2. Group differences in structural metrics of averaged ROIs. The red line presents the mean values of a given metric. The * indicates p<.05, ** p<.01, *** p<.005, **** p<.001. The MD values were multiplied by 10.000 for visualization purposes.

122
Figure 4.3.4.3.3. Group differences in DTI metrics of the left and right cingulum. The red line presents the mean values of a given metric. The * indicates p<.05, ** p<.01, *** p<.005, **** p<.001. The MD values were multiplied by 10.000 for visualization purposes.
Sub-regional results
The apparent increase in the PMC grey matter density seen in anoxic BI in comparison to
controls and TBI patients, was principally located within the PMC 01 and PMC 02 sub-regions.
The remaining sub-region of the PMC exhibited an increase in FA only in anoxic patients
(Figure 4.3.4.3.4.).
Elevated FA and diminished MD were also shown in several sub-regions of the mPFC in both
anoxic and TBI patient groups (Figure 4.3.4.3.4.). However, the increase of the VBM values
seemed to be specific to the posteromedial cortex in anoxic brain injury.

123
Figure 4.3.4.3.4. Group differences in structural metrics of PMC and mPFC sub-regions. The red line presents the mean values of a given metric. The * indicates p<.05, ** p<.01, *** p<.005. The brain image illustrates the anatomical location of center-coordinate spheres of ROIs presented in boxplots. The MD values were multiplied by 10.000 for visualization purposes.
4.3.4.2 Functional disconnections in the patient group Figure 4.3.4.3.5. shows the group comparison in mean PMC-mPFC functional connectivity. The
FC strength was significantly lower in all patients (U= 89, p< .0001), and in the anoxic (U= 29,
p< .0001) and TBI (U= 60, p< .0001) patient group, separately. These results are compatible
with the findings from earlier studies presented in this thesis.
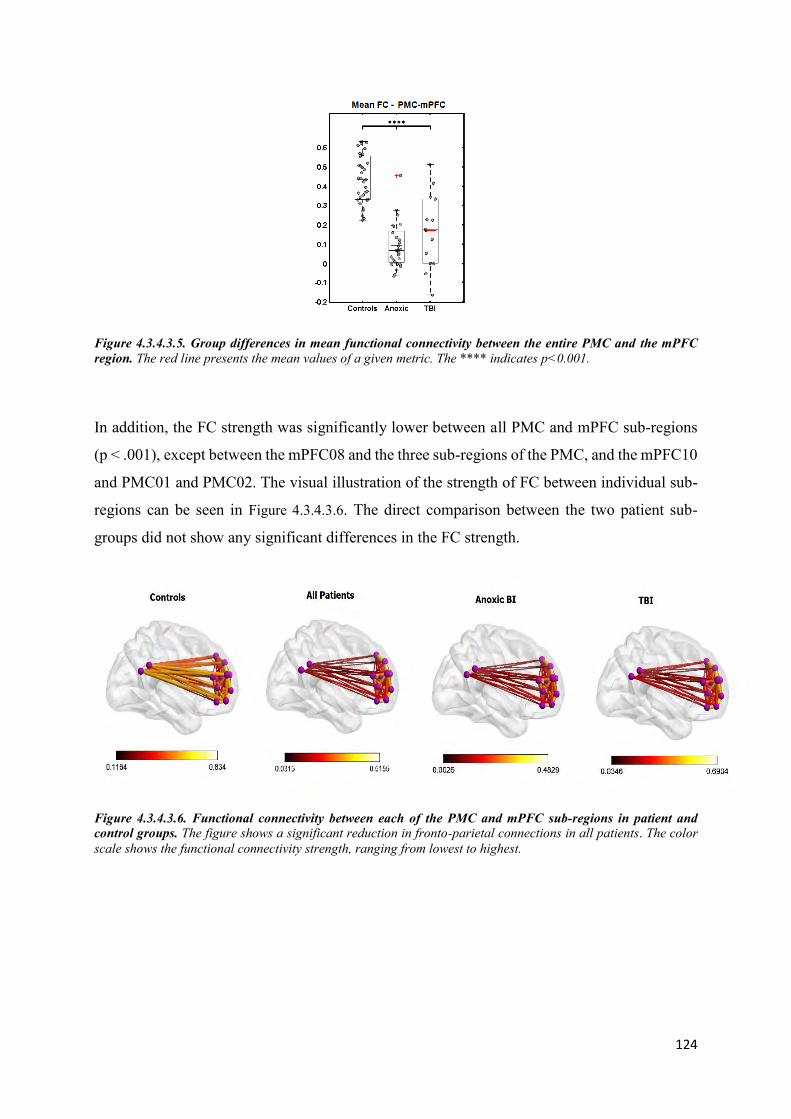
124
Figure 4.3.4.3.5. Group differences in mean functional connectivity between the entire PMC and the mPFC region. The red line presents the mean values of a given metric. The **** indicates p<0.001.
In addition, the FC strength was significantly lower between all PMC and mPFC sub-regions
(p < .001), except between the mPFC08 and the three sub-regions of the PMC, and the mPFC10
and PMC01 and PMC02. The visual illustration of the strength of FC between individual sub-
regions can be seen in Figure 4.3.4.3.6. The direct comparison between the two patient sub-
groups did not show any significant differences in the FC strength.
Figure 4.3.4.3.6. Functional connectivity between each of the PMC and mPFC sub-regions in patient and control groups. The figure shows a significant reduction in fronto-parietal connections in all patients. The color scale shows the functional connectivity strength, ranging from lowest to highest.

125
4.3.4.3 Structure-function association in the patient group The structure-function relationship was investigated using the average values of the entire ROIs
in order to ensure the readability of the results.
In the group with all patients (Figure 4.3.4.3.7.), there was a significant positive correlation
between the MD of the PMC (r= .433, p= .004) and mPFC (r= .315, p= .040), and the PMC-
mPFC functional connectivity. A negative association was indicated between the average
posteromedial VBM value and the PMC-mPFC functional connectivity (r= -.352, p= .021). We
did not find a significant relationship between the antero-posterior FC and the MD (r= .215, p=
.167), FA (r= -.023, p= .884) or VBM values (r= -.180, p= .247) of the cingulum.
There was a significant relationship between the mean diffusivity of the right cingulum and the
functional connectivity (r=.367, p=.015), however, the visual inspection of results (Figure
4.3.4.3.7., panel D), indicated that these findings were probably influenced by notable inter-
individual variability and outliers. This claim was supported by the lack of significant
associations between the MD of the cingulum and the mPFC-PMC FC in the etiology sub-
groups.
In the anoxic BI group, a significant negative association was found for the VBM values of the
PMC (r= -.504, p= .005) and the mPFC-PMC FC. Our findings also indicated a positive
association between the MD of the entire PMC (r= .521, p= .004), mPFC (r= .404, p= .030),
and the antero-posterior functional connectivity.
There were no significant structure-functional associations in the TBI group, which could be
due to small number of patients with traumatic brain injury (N= 14).

126
Figure 4.3.4.3.7. Structure-function association in anoxic and traumatic brain injury comatose patients. The figure presents the mean diffusivity (A) of the PMC and the mPFC (B), the VBM values of the PMC (C) and the MD of the right cingulum (D), plotted against the average PMC-mPFC functional connectivity. The MD values were multiplied by 10.000 for visualization purposes.
4.3.5 Discussion
4.3.5.1.1 Structural injury and etiology-related pathological mechanisms
In this study, we provide evidence for structural damage in acute stage comatose patients,
located in the white matter tract connecting the posteromedial cortex (PMC) and the medial
prefrontal cortex, mainly overlapping with the cingulum bundle. An increase in mean
diffusivity of the cingulum was present in all patients, and could be indicative of early stage
WM inflammation (Alexander et al., 2007). However, an augmentation in MD was significantly
more pronounced in traumatic in comparison to anoxic brain injury (Newcombe et al., 2010;
Van der Eerden et al., 2014), and it was paralleled with a reduction in fractional anisotropy,
suggesting extensive demyelination and widespread axonal loss. Damage to WM integrity is
very common in TBI, due to diffuse axonal injury effects on long-distance WM tracts, such as

127
the cingulum bundle and the corpus callosum (Bonnelle et al., 2011; Palacios et al., 2013; Sharp
et al., 2014).
Moreover, the right portion of the cingulum bundle seemed significantly more damaged,
suggesting lateralization. This is contrary to some previous studies with DOC patients,
indicating left-lateralized grey and white matter atrophy, with higher disruption associated with
longer time spent in DOC and discriminative between MCS- and MCS + (Bruno et al., 2011c;
Guldenmund et al., 2016; van der Eerden et al., 2014).
In opposed to TBI patients, the anoxic BI group showed predominantly cortical damage (Van
der Eerden et al., 2014), as suggested by higher values of VBM in the posteromedial cortex,
usually interpreted as an augmentation in gray matter density. However, this in fact may not be
indicative of an increase in gray matter volume but possibly of cortical laminar necrosis (i.e.
cell death involving cortical layers III and IV, visible in the acute stage, at around 2 weeks post
anoxia/ischemia) causing high-signal-intensity features on T1 images, thus resulting in higher
VBM values (Choi et al., 2010; Howard et al., 2012; Siskas, Lefkopoulos, Ioannidis, Charitandi,
Dimitriadis, 2003; Weiss et al., 2007). Further, our findings suggest that gray matter has greater
vulnerability to hypoxia when compared with white matter, particularly in brain regions
showing high basal metabolic levels, such as the posteromedial cortex (Howard et al., 2012;
Nolan et al., 2010). Also, posterior and anterior cerebral arteries intersect in the medial parietal
lobe thus rendering it particularly susceptible to hypoxic/anoxic ischemic injury.
In accordance, diffusion restriction abnormalities (Choi et al., 2010; Hirsch et al., 2014; Ryoo
et al., 2015; Youn et al., 2015) and loss of cortical thickness (Silva et al., 2017) in the medial
posterior cortex have been found in early stages in cardiac arrest comatose patients, with initial
cortical atrophy associated with poor outcome.
Studies with chronic DOC patients (i.e. on average >2y) with mixed etiologies, suggest
widespread decrease in gray matter density (assessed with VBM), in particular in the inferior
parietal lobe, including the bilateral PMC, the medial and superior frontal lobe and the cingulum
(Guldenmund et al., 2016; Juengling, Kassubek, Huppertz, Krause, & Els, 2005). Guldenmund
and colleagues (2016) found an association between structural damage and time spent in DOC,
and the extent of structural damage that was higher in non-traumatic UWS as compared to
MCS, especially in the PMC and ventromedial prefrontal cortex. Therefore, it would be
interesting to conduct a longitudinal VBM study with anoxic BI patients, to explore if this initial
apparent increase in gray matter density evolves and if these changes are linked to current or
future clinical and functional status. Follow-up studies with traumatic brain injury would be
equally interesting, as Wallerian degeneration can lead to late complications such as secondary

128
neuroinflammation and neurodegeneration distal to the initial focal injury (Sharp et al., 2014;
Warner et al., 2010).
In contrary to the changes seen in the posteromedial cortex, there seemed to be a complex
pattern of decrease/increase of all structural parameters in the medial prefrontal cortex, not
specifically discriminative between the two etiology groups. These results may be due to higher
heterogeneity in frontal structural damage in coma patients, especially in TBI subjects, and is
therefore difficult to interpret in the light of current results. Nevertheless, the most common
pattern of structural changes seemed to be a restriction in diffusion (increase in FA) which could
be a consequence of acute (ischemic, traumatic) lesions in our coma patients.
4.3.5.1.2 PMC-mPFC structure-function relationship
The functional connectivity was significantly lower for almost all pairwise links included in the
analysis, indicating a complete dissolution of PCC-mPFC FC, as frequently shown in disorders
of consciousness (Hannawi et al., 2015; Norton et al.; Koenig et al., 2014; Silva et al., 2015).
There results suggest that changes in PMC-mPFC function may be directly related to the
abolition of consciousness, while structural changes depend more on etiology that is differences
in pathology mechanisms associated with various brain injuries.
Our findings implied that a restriction in PMC and mPFC gray matter diffusivity and abnormal
PMC gray matter intensity interfere with efficient postero-anterior functional communication,
indicating that both structural and functional integrity need to be preserved for consciousness
to emerge. This is in accordance with studies showing correlation between mPFC-PMC
connectivity and GM integrity (Segall et al., 2012), with posterior midline GM atrophy
associated with reduced DMN functional connectivity (Vidal-Piñeiro et al., 2014).
Surprisingly, our findings did not imply codependence between the structural integrity of the
cingulum and resting-state FC, as usually shown in healthy subjects (Figley et al., 2015;
Greicius et al. 2009; van den Heuvel et al., 2009; Honey et al., 2009; Khalsa et al., 2014) and
patients with chronic DOC (Bodart et al., 2017).
However, our anoxic brain injury patients did not have extensive damage of the cingulum,
which could have been the underlying cause of the absence of a significant structure-function
relationship.
Further, previous studies have identified paralleled DMN structure-function disruption in
traumatic brain injury, also associated with worse cognitive functioning (Bonnelle et al., 2011;

129
Palacios et al., 2013; Sharp et al., 2014), which is in contrast to our findings. Nevertheless, it
must be noted that we did not include a large sample of traumatic brain injury patients in our
study, which may have led to insufficient power to detect small but important effects.
4.3.5.1.3 Conclusions To our knowledge, this is the first study to explore brain structure-function relationship in coma
patients using multimodal neuroimaging. Our findings implied a significant loss of structural
integrity in acute comatose patients, with primarily white matter injury (i.e. cingulum) in TBI,
and posteromedial gray matter damage in the anoxic BI group. A major reduction in the
functional connectivity between PMC and mPFC was shown for all patients, irrespective of
etiology. Furthermore, significant function-structure correlations found in comatose patients
suggested that both structural and functional integrity need to be preserved for consciousness
to emerge.
Given that we found a decrease in the WM mean diffusivity in all patients, further studies should
calculate the axial (AD) and radial (RD) diffusivity, in complement to MD, to explore potential
etiology differences in the pathological mechanisms related to structural damage
(demyelination – increase in RD vs. primary axonal damage – decrease in AD).
Future multimodal longitudinal studies with such an integrative approach should investigate the
evolution of the function-structure relationship and its relevance for long-term outcome
prediction. Further studies should conduct voxel-wise structural and functional analysis, as we
have shown some sub-regional differences within our functionally defined PMC and mPFC
ROIs. A recent meta-analysis showed that hub nodes of the structural (and functional)
connectome are much more likely to be pathologically lesioned by a wide-range of brain
disorders in comparison to non-hub regions (Crossley et al., 2014). Therefore, it would be
interesting to explore the relationship between densely functionally connected voxels
(identified in healthy subjects) and the corresponding gray matter volume (i.e. VBM). Also, the
WM microstructure should be investigated in more detail, with either voxel-wise or multiple-
ROI analysis along the antero-posterior tract in order to precisely locate the damage reflected
in our findings.
Finally, it would be of interest to include more regions from the dDMN and other resting-state
networks, such as the salience and executive control network, and their corresponding WM
connections, to investigate if these changes and their structure-functional association are
specific to or expand beyond the default mode network.

130
4.3.5.1.4 Limitations
This study has several limitations. We did not find significant structure-functional associations
when conducting separate analysis with TBI patients, which could be due to small number of
patients with traumatic brain injury (N=14) included in our study. The insufficient number of
patients was partially influenced by subject exclusion due to focal lesions overlapping with
regions of interest, and segmentation failure. The p-values were not corrected for multiple
comparisons, as this was a preliminary study conducted for exploratory purposes, however, all
p-values are fully reported and open to interpretation. Finally, more advanced analysis should
be done (e.g. regression analysis) to fully explore the causal relationship between the structure
and function.

131
5 Chapter V - General discussion and future perspectives
The overall findings of this thesis suggest a major disruption of functional connectivity and
significant topological reorganization in high-order resting state networks in the acute stage of
coma. Severe functional disconnections were particularly pronounced in the posteromedial
cortex, a functionally heterogeneous brain region, primarily associated with the default mode
network. More specifically, the ventral portions of the precuneus and the posterior cingulate
cortex were hypoconnected with other regions from the DMN (Study 2), most consistently with
the mPFC, irrespective of coma etiology (Study 1). In contrast, the dorsal PCC appeared to be
implicated in global brain dynamics, as suggested by a significant reduction in centrality and
inter-modular connectivity in this region (Study 2). These findings are in line with research
showing strong intra-modular coupling between the ventral PCC/PreCu and other DMN
regions, in opposed to a more transitional connectivity found in the dorsal PCC, serving to
integrate and coordinate the activity across multiple (resting-state) networks.
The functional organization in coma patients appeared to be dedifferentiated, as highlighted in
a complex pattern of decrease and increase of brain region connectivity and centrality pertaining
to high-level resting-state networks. The “hyper-connectivity/-centrality” (Study 1 and 2) could
be a consequence of compensatory brain plastic processes possibly reflecting resilient
connections engaging residual critical neural resources, otherwise normally distributed through
efficient brain network connections, here disrupted by brain injury, resulting in impaired
conscious processing.
The global “randomization” and the fronto-parietal disconnections, implied in this thesis (Study
2), suit connectionist theories of consciousness (presented in the introduction) which accentuate
the importance of complexity that is simultaneous differentiation and integration of brain
function in the emergence of consciousness.
Further, in the healthy brain long-range connections between segregated areas are supported by
the integrative properties of highly connected hub nodes, most commonly identified in the
posteromedial and prefrontal brain regions (in healthy subjects). These regions were
individually disrupted (i.e. structural damage) and mutually disconnected (i.e. functional
connectivity) in our coma patients. Interestingly, the long-range antero-posterior functional
disconnection was demonstrated in all of the studies in this thesis (and is compatible with

132
previous research), irrespective of the applied methodology. These findings are very
encouraging given that the reproducibility of results, despite differences between
methodological approaches, is the first step towards the development of clinically applicable
diagnostic/prognostic markers.
In fact, higher functional connectivity between the ventral PCC and PreCu and the medial
frontal regions was significantly related to better neurological recovery, registered 90 days after
the initial inclusion of patients, aiming towards potential clinical applicability of neuroimaging
in prognosis.
Furthermore, the long-range PMC-mPFC functional disconnection was coupled with
significant structural damage in the corresponding gray matter and white matter connections
(Study 3), implying that damaged structural integrity is linked to disruption in brain function.
Nevertheless, the directionality of this relationship will have to be investigated in further
studies, in order to determine if structural brain injury directly leads to functional
disconnections. In addition, this analysis should be extended to voxel-wise analysis, necessary
to fully explore the structural/functional differentiation of brain damage association with DOC.
Future studies should also explore if the structural and functional disruption found in these
metabolically expensive and topologically central regions (i.e. PMC) is related to greater
vulnerability, or symptomatology which arises once the damage propagates to these highly
connected hub nodes. Nonetheless, the identification of either of these mechanisms (i.e.
vulnerability and symptomatology) could lead to network-based treatments which aim to
restore normal wide-brain functioning through remediation of specific brain hubs.
Finally, it is important to note that a better understanding of etiology differences may prove to
be essential in early prediction and understanding of patient’s outcomes, as we have shown
some significant functional and structural differences between traumatic and anoxic brain
injury. This was reflected in a higher prevalence of hyperconnected voxels and white matter
structural damage in TBI in opposed to more notable functional disconnection and
posteromedial gray matter injury in anoxic BI.
The combination of behavioral clinical assessment with complementary measures derived from
brain structure (i.e. DWI/DTI; gray matter volume), brain metabolism (i.e. PET; markers of
neuroinflamation) and functional connectivity (i.e. fMRI, EEG), may further increase the
accuracy of prognosis prediction in the acute stage. Also, multimodal studies in a research
setting could help us better understand the interaction between brain changes observed on
different levels, and establish if one modality could be used as a proxy for another in patients
who are incompatible for some type of neuroimaging due to a critical clinical state, extensive

133
brain damage or metallic implants. In fact, our team is currently working on a multimodal
neuroimaging protocol which will hopefully lead to new insights regarding consciousness
abolition and recovery.
However, the multimodal approach leads to an ever increasing volume and complexity of
acquired data, imposing new challenges associated with “big data”.
The graph theoretical methodology is well suited for analyzing and integrating results in this
context, although, there are still some methodological barriers that need to be overcome in order
to fully exploit the possibilities of this approach. For example, traumatic brain injury is
associated with heterogeneous brain damage which interferes with node definition, which needs
to be exact for each of the subjects included in the graph analysis. Thus, the selection of nodes
of interest is not straightforward in TBI, especially when there is a significant spatial overlap
with a focal lesion. This was one of the main reasons why we did not include this sub-population
of coma patients in our second study. Furthermore, it would be interesting to do the analysis
using weighted correlation matrices, as both weak and strong functional connections can give
valuable insight into the pathological mechanisms in coma. Also, graph metrics could be
calculated separately for positive and negative functional connections, in order to specifically
explore the inter-network anticorrelations, which are particularly interesting in the context of
RSNs and disorders of consciousness. The continuing collaboration with the “graph theory”
team in Grenoble will surely lead to fruitful research and some more interesting results.
Future research should be longitudinal, with repeated MRI scanning, during the acute stage of
coma and recovery, in order pinpoint the brain mechanisms related to emergence of conscious
awareness. This was initially planned for the original study protocol, however, this idea couldn’t
be executed to high mortality rate of patients and logistical difficulties associated with
prolonged care for patients with disorders of consciousness.
In fact, one of the most important lessons this thesis project has taught me is how to balance the
methodological rigor and the clinical practicability, keeping in mind the best interest of patients
and yet trying to find the right research approach to deliver reliable and timely results.
Finally, the behavioral assessment (CRS-R) of neurological outcome should be repeated
multiple times within a short time interval, as the validity of testing results significantly impacts
our ability to find reliable neuroimaging biomarkers. Even though standardized behavioral
testing is considered today as the gold-standard for the diagnosis of disorders of consciousness,
it poses many limits (as discussed in the introduction), and should be combined with brain
imaging data in order to more reliably probe the residual capacity for conscious processing.

134
Diagnostic and prognostic errors carry particular moral risks in the case of disorders of
consciousness and can have important implications for medical decision-making, such as the
choice of therapy, concern for family members and the decision to withhold/withdraw life-
sustaining treatment.
The main contribution of this thesis in the context of previous research is evidence for: a) a
complex pattern of functional disconnection within the PMC (hypo- vs. hyper-connectivity;
correlation vs. anticorrelation); ii) significant reorganization in high-order resting-state
networks reflective of dedifferentiation and reduced brain complexity; iii) etiology-related
differences in functional/structural brain damage in the acute stage of coma; iv) significant
association between structural damage and functional disconnection; v) and predictive value of
PMC functional disconnections in relation to 3-month neurological outcome.
In conclusion, the analysis of resting-state functional connectivity and structural integrity in the
acute stage of coma implies significant heterogeneity in brain function and structure of coma
patients irrespectively of their apparent behavioral homogeneity. As such, these findings hold
significant promise towards development of neuroimaging markers for prognostication and
early identification of patients who would benefit from novel therapies (i.e. pharmacological,
brain stimulation) aiming to restore and promote adaptive cerebral plasticity leading to eventual
reemergence of consciousness and neurological recovery.

135
6 Appendices
6.1 Paper I

136

137

138

139

140

141

142

143

144

145
6.2 Appendices for Chapter I

146
Table 6.2.1. EEG studies with the graph theoretical approach
Author Modality Type of DOC
Etiology
Delay injury/imaging
Delay inclusion/outcome
Outcome assessment
Reported outcome
Findings
Coma Beudel et al. (2014)
19-channel EEG
56 coma 56 CA ≤ 5 days 6 months CPC 27 patients died (CPC=5); 19 normal (CPC=1), 8 mild (CPC=2), 1 modest (CPC=3), 1 severe (CPC=4) cerebral dysfunction.
Survivors showed significantly more nodes and connections, higher CPL, lower CC and SWI then non-survivors.
Chronic DOC
Chennu et al. (2014)
High-density resting-state EEG
13 UWS; 19 MCS
23 TBI; 9 anoxia
3 - 154 months
/ / Reduced CC, and PC (less hubs), increased CPL, and lacking long-distance connections, in the alpha band in DOC compared to healthy controls. Patients had higher CC and PC in delta and theta bands. More modular structure similarity between patients in delta and theta bands in opposed to the alpha band in controls. Metrics of alpha network efficiency correlated with the degree of behavioral awareness.
Chennu et al. (2017)
High-density EEG, PET
23 UWS; 17 MCS -; 49 MCS+; 11 EMCS; 4 LIS
51 TBI ; 53 Non-TBI;
9 - 7387 days
1 year GOS-E 39 positive outcome; 22 negative outcome
Positive outcome patients had diminished delta-band connectivity in central and parietal areas, and higher modularity and CC in delta networks.
CPC - Cerebral performance category; GOS-E – Glasgow Outcome Scale Extended; CA – cardiac arrest; CC – clustering coefficient; CPL – characteristic path length; PC – participation coefficient; LE – local efficiency; SWI – small-world index.

147
6.3 Appendices for Chapter IV
Figure 6.3.1. Individual traumatic brain injury patients’ connection density spatial maps. The spatial maps are presented separately for each patient. The changes in connection density are presented separately for hypo-CDP, hyper-CDP and hyper-CDN and the two anatomical PMC sub-regions – PreCu and PCC. The patients’ outcome is marked beneath the patients’ code – REC – Recovery, MCS – Minimally conscious state; VS/UWS – Vegetative state/Unresponsive wakefulness syndrome.

148
Figure 6.3.2. Individual anoxic brain injury patients’ connection density spatial maps. The spatial maps are presented separately for each patient. The changes in connection density are presented separately for hypo-CDP, hyper-CDP and hyper-CDN and the two anatomical PMC sub-regions – PreCu and PCC. The patients’ outcome is marked beneath the patients’ code – REC – Recovery, MCS – Minimally conscious state; VS/UWS – Vegetative state/Unresponsive wakefulness syndrome.

149
Figure 6.3.3. Differences in Calcarine-mPFC connection density changes between traumatic and anoxic brain injury. TBI patients showed significantly more Calcarine-mPFC hyper-CDP (sub-panel 2) and hyper-CDN voxels (sub-panel 4) in comparison with the anoxic BI patients. Boxplots represent medians with interquartile range and whiskers signify minimum and maximum values (excluding the outliers) (*p < .05, (**p < .005, ns: nonsignificant).
Figure 6.3.4. Connection density changes in the Calcarine-mPFC control pathway (threshold 33%). TBI patients show more widespread changes and a higher spatial congruity in hyper-CDN and hyper-CDP voxels in comparison to anoxic BI. Gradient bars (%) reflects the percentage of patients sharing the same voxel with a sig. Z-score (hyper CDP/CDN) at given anatomical location within the Calcarine. The minimum spatial homogeneity is set to at least 33% of patients in a given group.

150
Sensitivity Specificity Successfully classified
PPV NPV AUC 95% CI Std. error
80% 75% 77.8% 80% 75% 0.906 0.795-1.00 0.056
Figure 6.3.5. Logistic regression model. The graph presents true positive (sensitivity) on the vertical axis and true negative (1-specificity) on the horizontal axis. The area under the ROC curve (AUC) ranges from 0.5 to 1.00 with larger values indicative of a better fit. The area under the curve is 0.906 with 95% confidence interval (0.795-1.00). Also, the AUC is significantly different from 0.5 (50/50 chance) with p-value=0.000 suggesting that the logistic regression classifies the group significantly better than by chance. PPV – positive predictive value; NPV – negative predictive value; AUC – area under the curve; CI – confidence interval; Std. error – standard error.
Table 6.3.1. Individual patient results – the total number of hypo/hyper-CDP and hypo/hyper-CDN voxels for PMC (Panel A), PreCu (Panel B) and PCC (Panel B). The overlapping hypo-CDP and hyper-CDN voxels are presented only for PMC (Panel A). Number of voxels per region: PMC - 12862 voxels, PreCu - 11222 voxels, PCC - 1640 voxels. Abbreviations: TBI – traumatic brain injury, ANOXIC – anoxic brain injury; N – number of voxels with significant Z-score. REC – Recovery, MCS – Minimally conscious state; VS/UWS – Vegetative state/Unresponsive wakefulness syndrome.
A) Individual patient results - PMC results
Patient Etiology CRS-R score
Outcome Hypo-CDP voxels (N)
Hypo-CDN voxels (N)
Hyper-CDP voxels (N)
Hyper-CDN Voxels (N)
Hypo-CDP /Hyper-CDN overlap (N)
Patient 1 TBI 4 VS 504.00 6.00 1150.00 5716.00 489 Patient 2 TBI 9 VS 11.00 .00 2689.00 5620.00 11 Patient 3 TBI 20 REC 57.00 2.00 146.00 354.00 25 Patient 4 TBI 8 VS 530.00 7.00 413.00 2343.00 464 Patient 5 TBI 15 MCS 30.00 10.00 653.00 505.00 7 Patient 6 TBI 16 MCS 39.00 8.00 824.00 1052.00 20 Patient 7 TBI 8 VS 180.00 11.00 575.00 1843.00 65 Patient 8 TBI 22 REC 49.00 40.00 1508.00 958.00 29 Patient 9 TBI 7 VS 215.00 4.00 961.00 2212.00 182
Patient 10 TBI 14 MCS 76.00 28.00 3727.00 1980.00 66 Patient 11 TBI 6 VS 316.00 .00 414.00 1604.00 148 Patient 12 TBI 5 VS 632.00 5.00 360.00 4948.00 545

151
Patient 13 TBI 14 MCS 175.00 1.00 825.00 1221.00 17 Patient 14 TBI 23 REC 23.00 22.00 866.00 244.00 8 Patient 15 TBI 13 MCS 91.00 22.00 653.00 1507.00 12 Patient 16 Anoxic 6 VS 476.00 1.00 12.00 72.00 22 Patient 17 Anoxic 14 MCS 403.00 2.00 319.00 1184.00 190 Patient 18 Anoxic 18 MCS 13.00 24.00 1586.00 643.00 7 Patient 19 Anoxic 8 VS 273.00 3.00 106.00 159.00 40 Patient 20 Anoxic 7 VS 351.00 4.00 62.00 222.00 78 Patient 21 Anoxic 9 MCS 308.00 4.00 382.00 246.00 47 Patient 22 Anoxic 10 MCS 263.00 5.00 838.00 1917.00 133 Patient 23 Anoxic 6 VS 249.00 1.00 1305.00 2483.00 202 Patient 24 Anoxic 21 REC 5.00 45.00 1279.00 221.00 3 Patient 25 Anoxic 12 MCS 271.00 .00 111.00 437.00 52 Patient 26 Anoxic 9 VS 525.00 1.00 1.00 43.00 25 Patient 27 Anoxic 12 MCS 410.00 7.00 96.00 232.00 72
B) Individual patient results - Precuneus results Patient Etiology CRS-R
score Outcome Hypo-CDP
voxels (N) Hypo-CDN voxels (N)
Hyper-CDP voxels (N)
Hyper-CDN voxels (N)
Patient 1 TBI 4 VS 357.00 6.00 1040.00 4507.00 Patient 2 TBI 9 VS 9.00 .00 2460.00 4571.00 Patient 3 TBI 20 REC 42.00 1.00 127.00 244.00 Patient 4 TBI 8 VS 353.00 3.00 321.00 1816.00 Patient 5 TBI 15 MCS 24.00 9.00 625.00 415.00 Patient 6 TBI 16 MCS 38.00 4.00 764.00 901.00 Patient 7 TBI 8 VS 128.00 9.00 532.00 1268.00 Patient 8 TBI 22 REC 42.00 33.00 1447.00 801.00 Patient 9 TBI 7 VS 123.00 4.00 849.00 1523.00
Patient 10 TBI 14 MCS 50.00 22.00 3374.00 1514.00 Patient 11 TBI 6 VS 215.00 .00 393.00 993.00 Patient 12 TBI 5 VS 409.00 5.00 306.00 3949.00 Patient 13 TBI 14 MCS 110.00 1.00 763.00 908.00 Patient 14 TBI 23 REC 15.00 22.00 806.00 206.00 Patient 15 TBI 13 MCS 68.00 21.00 561.00 1206.00 Patient 16 Anoxic 6 VS 307.00 1.00 10.00 47.00 Patient 17 Anoxic 14 MCS 275.00 2.00 307.00 896.00 Patient 18 Anoxic 18 MCS 12.00 20.00 1396.00 553.00 Patient 19 Anoxic 8 VS 165.00 3.00 105.00 86.00 Patient 20 Anoxic 7 VS 228.00 4.00 56.00 99.00 Patient 21 Anoxic 9 MCS 201.00 4.00 374.00 150.00 Patient 22 Anoxic 10 MCS 185.00 5.00 799.00 1580.00 Patient 23 Anoxic 6 VS 152.00 1.00 1296.00 1821.00 Patient 24 Anoxic 21 REC 3.00 34.00 1182.00 189.00 Patient 25 Anoxic 12 MCS 194.00 .00 102.00 332.00 Patient 26 Anoxic 9 VS 342.00 1.00 1.00 20.00 Patient 27 Anoxic 12 MCS 278.00 7.00 91.00 193.00
C) Individual patient results - PCC results
Patient Etiology CRS-R score
Outcome Hypo-CDP voxels (N)
Hypo-CDN voxels (N)
Hyper-CDP voxels (N)
Hyper-CDN voxels (N)
Patient 1 TBI 4 VS 147.00 .00 110.00 1209.00

152
Patient 2 TBI 9 VS 2.00 .00 229.00 1049.00 Patient 3 TBI 20 REC 15.00 1.00 19.00 110.00 Patient 4 TBI 8 VS 177.00 4.00 92.00 527.00 Patient 5 TBI 15 MCS 6.00 1.00 28.00 90.00 Patient 6 TBI 16 MCS 1.00 4.00 60.00 151.00 Patient 7 TBI 8 VS 52.00 2.00 43.00 575.00 Patient 8 TBI 22 REC 7.00 7.00 61.00 157.00 Patient 9 TBI 7 VS 92.00 .00 112.00 689.00 Patient 10 TBI 14 MCS 26.00 6.00 353.00 466.00 Patient 11 TBI 6 VS 101.00 .00 21.00 611.00 Patient 12 TBI 5 VS 223.00 .00 54.00 999.00 Patient 13 TBI 14 MCS 65.00 .00 62.00 313.00 Patient 14 TBI 23 REC 8.00 .00 60.00 38.00 Patient 15 TBI 13 MCS 23.00 1.00 92.00 301.00 Patient 16 Anoxic 6 VS 169.00 .00 2.00 25.00 Patient 17 Anoxic 14 MCS 128.00 .00 12.00 288.00 Patient 18 Anoxic 18 MCS 1.00 4.00 190.00 90.00 Patient 19 Anoxic 8 VS 108.00 .00 1.00 73.00 Patient 20 Anoxic 7 VS 123.00 .00 6.00 123.00 Patient 21 Anoxic 9 MCS 107.00 .00 8.00 96.00 Patient 22 Anoxic 10 MCS 78.00 .00 39.00 337.00 Patient 23 Anoxic 6 VS 97.00 .00 9.00 662.00 Patient 24 Anoxic 21 REC 2.00 11.00 97.00 32.00 Patient 25 Anoxic 12 MCS 77.00 .00 9.00 105.00 Patient 26 Anoxic 9 VS 183.00 .00 .00 23.00 Patient 27 Anoxic 12 MCS 132.00 .00 5.00 39.00

153
Figure 6.3.6. Global topology in controls and patients – evidence of randomization. A) Global efficiency (GE) in controls and patients in comparison to regular and random networks, at multiple connection density thresholds (5-50%, increment 5%). B) Clustering in controls and patients in comparison to regular and random networks, at multiple connection density thresholds (5-50%, increment 5%). C) GE in controls and patients in comparison to random networks at the 15% connection density threshold. A sub-group of patients seems to have a GE more similar to random networks than to other subjects. D) Hub disruption index (HDI) calculated using GE (axis x) differentiates three sub-groups of patients (15% cost). Patients with a HDI GE smaller than -0.8 have also show a high GE (axis y) present in random networks.

154
Figure 6.3.7. Global efficiency (axis y) and HDI GE (axis x) at multiple thresholds (10-20%). Hub disruption index (HDI) calculated using GE (axis x) differentiates three sub-groups of patients at all thresholds. The sub-group of patients most similar to random networks has a HDI GE lower than ~-0.8, at all three connection density thresholds.

155
Figure 6.3.8. Functional connectivity (Pearson’s r) over all pairs of nodes, in controls and patients. Boxplots represent medians with interquartile range and whiskers signify minimum and maximum values (excluding outliers).
Table 6.3.2. MNI center-mass coordinates of each of the nodes used in the analysis. The AAL atlas was used to define the anatomical names of nodes.
MNI Coordinates RSN_region AAL_atlas_region -18 40 38 dDMN_1 Frontal_Sup_L 0 54 18 dDMN_2 Frontal_Sup_Medial_L_R -4 46 16 dDMN_3 Cingulum_Ant_L -6 52 32 dDMN_4 Frontal_Sup_Medial_L -2 42 4 dDMN_5 Cingulum_Ant_L_2 -6 60 2 dDMN_6 Frontal_Sup_Medial_L_2 2 46 -2 dDMN_7 Frontal_Med_Orb_R 0 36 16 dDMN_8 Cingulum_Ant_L_R -14 58 18 dDMN_9 Frontal_Sup_L_2 -4 40 12 dDMN_10 Cingulum_Ant_L_3 -2 54 -10 dDMN_11 Frontal_Med_Orb_L -48 -70 32 dDMN_12 Angular_L 18 36 46 dDMN_13 Frontal_Sup_R -2 -58 22 dDMN_14 PreCuneus_L_R 2 -60 32 dDMN_15 PreCu_L_R_2 -2 -46 30 dDMN_16 Cingulum_Post_L_R 0 -18 34 dDMN_17 Cingulum_Mid_L_R 50 -64 30 dDMN_18 Angular_R -2 -10 2 dDMN_19 Thalamus_L_R -24 -30 -14 dDMN_20 ParaHippocampal_L

156
26 -24 -18 dDMN_21 ParaHippocampal_R -14 -60 14 vDMN_1 Calcarine_L -26 8 52 vDMN_2 Frontal_Mid_L -30 -40 -16 vDMN_3 Fusiform_L -38 -82 30 vDMN_4 Occipital_Mid_L 12 -54 10 vDMN_5 Precuneus_R/Lingual_R 0 -50 52 vDMN_6 PreCuneus_L_R 8 -62 56 vDMN_7 PreCuneus_R -10 -68 54 vDMN_8 PreCuneus_L 2 -58 44 vDMN_9 PreCuneus_R_2 24 30 36 vDMN_10 Frontal_Mid_R 22 14 48 vDMN_11 Frontal_Mid_R_2 28 -36 -20 vDMN_12 Fusiform_R 42 -74 28 vDMN_13 Occipital_Mid_R 38 18 48 RECN_1 Frontal_Mid_R 44 28 28 RECN_2 Frontal_Inf_Tri_R 26 26 48 RECN_3 Frontal_Sup_R 34 30 40 RECN_4 Frontal_Mid_R_2 36 52 0 RECN_5 Frontal_Mid_Orb_R 48 -60 40 RECN_6 Angular_R 38 -62 52 RECN_7 Angular_R_2 48 -46 46 RECN_8 Parietal_Inf_R 4 36 44 RECN_9 Frontal_Sup_Medial_R -42 -68 -42 RECN_10 Cerebelum_Crus2_L -32 -74 -48 RECN_11 Cerebelum_Crus2_L_2 -30 -70 -34 RECN_12 Cerebelum_Crus1_L -14 -86 -32 RECN_13 Cerebelum_Crus2_L_3 -8 32 40 LECN_1 Frontal_Sup_Medial_L -42 18 42 LECN_2 Frontal_Mid_L -24 20 54 LECN_3 Frontal_Sup_L -32 28 44 LECN_4 Frontal_Mid_L_2 -42 44 -4 LECN_5 Frontal_Inf_Orb_L -44 -66 40 LECN_6 Angular_L -48 -52 48 LECN_7 Parietal_Inf_L -34 -70 48 LECN_8 Parietal Inf_L_2 -60 -44 -14 LECN_9 Temporal_Inf_L 34 -70 -44 LECN_10 Cerebelum_Crus2_R -32 44 20 SAL_1 Frontal_Mid_L -42 12 -4 SAL_2 Insula_L -8 10 62 SAL_3 Supp_Motor_Area_L -2 26 30 SAL_4 Cingulum_Ant_L -2 2 62 SAL_5 Supp_Motor_Area_L_2 -2 20 46 SAL_6 Supp_Motor_Area_L_3 -2 12 44 SAL_7 Cingulum_Mid_L 12 8 62 SAL_8 Supp_Motor_Area_R 26 44 26 SAL_9 Frontal_Mid_R 40 14 -2 SAL_10 Insula_R

157
-36 -56 -34 SAL_11 Cerebelum_Crus1_L 34 -60 -32 SAL_12 Cerebelum_Crus1_R -40 34 28 P.SAL_1 Frontal_Inf_Tri_L/Frontal_Mid_L -60 -34 36 P.SAL_2 SupraMarginal_L -58 -44 36 P.SAL_3 SupraMarginal_L_2 -8 -54 60 P.SAL_4 Precuneus_L 12 -30 44 P.SAL_5 Cingulum_Mid_R 26 -44 70 P.SAL_6 Postcentral_R 14 -54 66 P.SAL_7 Parietal_Sup_R 58 -30 34 P.SAL_8 SupraMarginal_R 58 -40 36 P.SAL_9 SupraMarginal_R_2 -14 -24 4 P.SAL_10 Thalamus_L_post -34 -44 -38 P.SAL_11 Cerebelum_Crus1_L -38 -16 -6 P.SAL_12 Insula_L_post 38 -8 -10 P.SAL_13 Insula_R_post
Table 6.3.3. Exclusion criteria. Nine patients were excluded due to HDI global efficiency < -0.8 or/and low functional connectivity. The functional connection density was calculated by setting a threshold of the correlation coefficients (Pearson’s r) > 0.2 and calculating the density of remaining connections within each of the individual matrices. All patients with a connection density <10% were excluded from further analysis.
Patients Functional_connection_density HDI_Global_efficiency Randomness Subject_001 0.08 -0.88 random Subject_002 0.10 -0.75 non-random Subject_003 0.35 -0.05 non-random Subject_004 0.11 -0.53 non-random Subject_005 0.12 -0.64 non-random Subject_006 0.09 -0.83 random Subject_007 .17 -0.57 non-random Subject_008 0.14 -0.63 non-random Subject_009 0.11 -0.56 non-random Subject_010 0.13 -0.82 random Subject_011 0.24 -0.88 random Subject_012 0.28 -0.56 non-random Subject_013 0.05 -0.85 random Subject_014 0.06 -0.96 random Subject_015 0.44 -0.55 non-random Subject_016 0.34 -0.07 non-random Subject_017 0.23 -0.03 non-random Subject_018 0.30 -0.22 non-random Subject_019 0.06 -0.91 random Subject_020 0.08 -0.95 random Subject_021 0.04 -0.86 random Subject_022 0.17 -0.46 non-random Subject_023 0.13 -0.65 non-random Subject_024 0.25 -0.20 non-random Subject_025 0.18 -0.01 non-random

158
Figure 6.3.9. Nodal topology in non-random patients at different connection density thresholds. The figures show nodal metric results found to be significantly different between patients and controls – degree and local efficiency. P>C – Values found to be significantly higher in patients in comparison to controls; P<C – values found to be significantly lower in patients versus controls.

159
7 References
Achard, S., Delon-Martin, C., Vértes, P. E., Renard, F., Schenck, M., Schneider, F., … Bullmore, E. T. (2012). Hubs of brain functional networks are radically reorganized in comatose patients. Proceedings of the National Academy of Sciences of the United States of America, 109(50), 20608–13. http://doi.org/10.1073/pnas.1208933109
Achard, S., Salvador, R., Whitcher, B., Sucklig, J., & Bullmore, E. (2006). A Resilient, Low-Frequency, Small-World Human Brain Functional Network with Highly Connected Association Cortical Hubs. Journal of Neuroscience, 26(1), 63–72. http://doi.org/10.1523/JNEUROSCI.3874-05.2006
Adams, J. H., Graham, D. I., & Jennett, B. (2000). The neuropathology of the vegetative state after an acute brain insult. Brain, 123, 1327–1338. http://doi.org/10.1093/brain/123.7.1327
Alexander, A. L., Lee, J. E., Lazar, M., & Field, A. S. (2007). Diffusion tensor imaging of the brain. Neurotherapeutics : The Journal of the American Society for Experimental NeuroTherapeutics, 4(3), 316–29. http://doi.org/10.1016/j.nurt.2007.05.011
Alexander-Bloch, A. F., Gogtay, N., Meunier, D., Birn, R., Clasen, L., Lalonde, F., … Bullmore, E. T. (2010). Disrupted Modularity and Local Connectivity of Brain Functional Networks in Childhood-Onset Schizophrenia. Frontiers in Systems Neuroscience, 4. http://doi.org/10.3389/fnsys.2010.00147
Alstott, J., Breakspear, M., Hagmann, P., Cammoun, L., & Sporns, O. (2009). Modeling the impact of lesions in the human brain. PLoS Computational Biology, 5(6). http://doi.org/10.1371/journal.pcbi.1000408
Amico, E., Marinazzo, D., Di Perri, C., Heine, L., Annen, J., Martial, C., … Goñi, J. (2017). Mapping the functional connectome traits of levels of consciousness. NeuroImage, 148(November 2016), 201–211. http://doi.org/10.1016/j.neuroimage.2017.01.020
Andersson, J. L. R., Jenkinson, M., & Smith, S. (2007). Non-linear registration, aka spatial normalisation. FMRIB Technial Report TR07JA2. Oxford Centre for Functional Magnetic Resonance Imaging of the Brain, Department of Clinical Neurology, Oxford University, Oxford, UK.
Andrews-Hanna, J. R., Reidler, J. S., Sepulcre, J., Poulin, R., & Buckner, R. L. (2010). Functional-Anatomic Fractionation of the Brain’s Default Network. Neuron, 65(4), 550–562. http://doi.org/10.1016/j.neuron.2010.02.005
Andrews-Hanna, J., Smallwood, J., & Spreng, R. (2014). The default network and self-generated thought: component processes, dynamic control, and clinical relevance. Ann N Y Acad Sci, 1316(1), 29–52. http://doi.org/10.1111/nyas.12360.The
Annen, J., Heine, L., Ziegler, E., Frasso, G., Bahri, M., Di Perri, C., … Laureys, S. (2016). Function–structure connectivity in patients with severe brain injury as measured by MRI-

160
DWI and FDG-PET. Human Brain Mapping, 37(11), 3707–3720. http://doi.org/10.1002/hbm.23269
Aston-Jones, G., Chen, S., Zhu, Y., & Oshinsky, M. L. (2001). A neural circuit for circadian regulation of arousal. Nature Neuroscience, 4(7), 732–738. http://doi.org/10.1038/89522
Baars, B. J. (1988). A cognitive theory of consciousness. Cambridge University Press, Cambridge, MA.
Balestrini, S., Francione, S., Mai, R., Castana, L., Casaceli, G., Marino, D., … Tassi, L. (2015). Multimodal responses induced by cortical stimulation of the parietal lobe: A stereo-electroencephalography study. Brain, 138(9), 2596–2607. http://doi.org/10.1093/brain/awv187
Barttfeld, P., Uhrig, L., Sitt, J. D., Sigman, M., Jarraya, B., & Dehaene, S. (2015). Signature of consciousness in the dynamics of resting-state brain activity. Proceedings of the National Academy of Sciences, 112(3), 887–892. http://doi.org/10.1073/pnas.1418031112
Bassett, D. S., & Bullmore, E. T. (2009). Human brain networks in health and disease. Current Opinion in Neurology, 22(4), 340–347. http://doi.org/10.1097/WCO.0b013e32832d93dd
Bassett, D. S., Nelson, B. G., Mueller, B. A., Camchong, J., & Lim, K. O. (2012). Altered resting state complexity in schizophrenia. NeuroImage, 59(3), 2196–2207. http://doi.org/10.1016/j.neuroimage.2011.10.002
Beckmann, C. F., DeLuca, M., Devlin, J. T., & Smith, S. M. (2005). Investigations into resting-state connectivity using independent component analysis. Philosophical Transactions of the Royal Society of London - Series B: Biological Sciences, 360(1457), 1001–1013. http://doi.org/10.1098/rstb.2005.1634
Behzadi, Y., Restom, K., Liau, J., & Liu, T. T. (2007). A component based noise correction method (CompCor) for BOLD and perfusion based fMRI. NeuroImage, 37(1), 90–101. http://doi.org/10.1016/j.neuroimage.2007.04.042
Beudel, M., Tjepkema-Cloostermans, M. C., Boersma, J. H., & van Putten, M. J. A. M. (2014). Small-world characteristics of EEG patterns in post-anoxic encephalopathy. Frontiers in Neurology, 5 JUN(June), 1–9. http://doi.org/10.3389/fneur.2014.00097
Bharath, R. D., Munivenkatappa, A., Gohel, S., Panda, R., Saini, J., Rajeswaran, J., … Biswal, B. B. (2015). Recovery of resting brain connectivity ensuing mild traumatic brain injury. Frontiers in Human Neuroscience, 9(September), 513. http://doi.org/10.3389/fnhum.2015.00513
Biswal, B., Yetkin, F. Z., Haughton, V. M., Hyde, J. S. (1995). Functional connectivity in the motor cortex of resting human brain using. Magn Reson Med, 34(9), 537–541. http://doi.org/10.1002/mrm.1910340409

161
Bodart, O., Amico, E., Gomez, F., Casali, A. G., Wannez, S., Heine, L., … Gosseries, O. (2017). Global structural integrity and effective connectivity in patients with disorders of consciousness. Brain Stimulation, 10(2), 6–13. http://doi.org/10.1016/j.brs.2017.11.006
Bodien, Y. G., & Giacino, J. T. (2016). Challenges and Pitfalls Associated with Diagnostic and Prognostic Applications of Functional Neuroimaging in Disorders of Consciousness. The Open Neuroimaging Journal, 10(Suppl-1, M2), 23–31. http://doi.org/10.2174/1874440001610010023
Bonnelle, V., Ham, T. E., Leech, R., Kinnunen, K. M., Mehta, M. A., Greenwood, R. J., & Sharp, D. J. (2012). Salience network integrity predicts default mode network function after traumatic brain injury. Proceedings of the National Academy of Sciences of the United States of America, 109(12), 4690–5. http://doi.org/10.1073/pnas.1113455109
Bonnelle, V., Leech, R., Kinnunen, K. M., Ham, T. E., Beckmann, C. F., De Boissezon, X., … Sharp, D. J. (2011). Default Mode Network Connectivity Predicts Sustained Attention Deficits after Traumatic Brain Injury. Journal of Neuroscience, 31(38), 13442–13451. http://doi.org/10.1523/JNEUROSCI.1163-11.2011
Bruno, M. A., Fernández-Espejo, D., Lehembre, R., Tshibanda, L., Vanhaudenhuyse, A., Gosseries, O., … Soddu, A. (2011c). Multimodal neuroimaging in patients with disorders of consciousness showing “functional hemispherectomy.” Progress in Brain Research, 193, 323–333. http://doi.org/10.1016/B978-0-444-53839-0.00021-1
Bruno, M. A., Ledoux, D., Lambermont, B., Damas, F., Schnakers, C., Vanhaudenhuyse, A., … Laureys, S. (2011b). Comparison of the full outline of unresponsiveness and Glasgow Liege Scale/Glasgow Coma Scale in an intensive care unit population. Neurocritical Care, 15(3), 447–453. http://doi.org/10.1007/s12028-011-9547-2
Bruno, M. A., Vanhaudenhuyse, A., Thibaut, A., Moonen, G., & Laureys, S. (2011a). From unresponsive wakefulness to minimally conscious PLUS and functional locked-in syndromes: Recent advances in our understanding of disorders of consciousness. Journal of Neurology, 258(7), 1373–1384. http://doi.org/10.1007/s00415-011-6114-x
Buckner, R. L. (2013). The cerebellum and cognitive function: 25 years of insight from anatomy and neuroimaging. Neuron. http://doi.org/10.1016/j.neuron.2013.10.044
Buckner, R. L., Andrews-Hanna, J. R., & Schacter, D. L. (2008). The brain’s default network: Anatomy, function, and relevance to disease. Annals of the New York Academy of Sciences, 1124, 1–38. http://doi.org/10.1196/annals.1440.011
Bullmore, E. T., & Bassett, D. S. (2011). Brain Graphs: Graphical Models of the Human Brain Connectome. Annual Review of Clinical Psychology, 7(1), 113–140. http://doi.org/10.1146/annurev-clinpsy-040510-143934
Bullmore, E., & Sporns, O. (2009). Complex brain networks: graph theoretical analysis of structural and functional systems. Nature Publishing Group, 10(3), 186–198. http://doi.org/10.1038/nrn2575

162
Bullmore, E., & Sporns, O. (2012). The economy of brain network organization. Nature Reviews Neuroscience, 13(MAY), 336–349. http://doi.org/10.1038/nrn3214
Bzdok, D., Heeger, A., Langner, R., Laird, A. R., Fox, P. T., Palomero-Gallagher, N., … Eickhoff, S. B. (2015). Subspecialization in the human posterior medial cortex. NeuroImage, 106, 55–71. http://doi.org/10.1016/j.neuroimage.2014.11.009
Calhoun, V. D., Lawrie, S. M., Mourao-Miranda, J., & Stephan, K. E. (2017). Prediction of Individual Differences from Neuroimaging Data. NeuroImage, 145, 135–136. http://doi.org/10.1016/j.neuroimage.2016.12.012
Casali, A. G., Gosseries, O., Rosanova, M., Boly, M., Sarasso, S., Casali, K. R., … Massimini, M. (2013). A Theoretically Based Index of Consciousness Independent of Sensory Processing and Behavior. Science Translational Medicine, 5(198), 198ra105-198ra105. http://doi.org/10.1126/scitranslmed.3006294
Casarotto, S., Comanducci, A., Rosanova, M., Sarasso, S., Fecchio, M., Napolitani, M., … Massimini, M. (2016). Stratification of unresponsive patients by an independently validated index of brain complexity. Annals of Neurology, 80(5), 718–729. http://doi.org/10.1002/ana.24779
Castellanos, N. P., Leyva, I., Buldú, J. M., Bajo, R., Paúl, N., Cuesta, P., … del-Pozo, F. (2011). Principles of recovery from traumatic brain injury: Reorganization of functional networks. NeuroImage, 55(3), 1189–1199. http://doi.org/10.1016/j.neuroimage.2010.12.046
Cauda, F., Geminiani, G., D’Agata, F., Sacco, K., Duca, S., Bagshaw, A. P., & Cavanna, A. E. (2010). Functional connectivity of the posteromedial cortex. PLoS ONE, 5(9), 1–11. http://doi.org/10.1371/journal.pone.0013107
Cauda, F., Micon, B. M., Sacco, K., Duca, S., D’Agata, F., Geminiani, G., & Canavero, S. (2009). Disrupted intrinsic functional connectivity in the vegetative state. Journal of Neurology, Neurosurgery, and Psychiatry, 80(4), 429–431. http://doi.org/10.1136/jnnp.2007.142349
Cavaliere, C., Aiello, M., Di Perri, C., Amico, E., Martial, C., Thibaut, A., … Soddu, A. (2016). Functional Connectivity Substrates for tDCS Response in Minimally Conscious State Patients. Frontiers in Cellular Neuroscience, 10. http://doi.org/10.3389/fncel.2016.00257
Cavaliere, C., Aiello, M., Di Perri, C., Fernandez-Espejo, D., Owen, A. M., & Soddu, A. (2015). Diffusion tensor imaging and white matter abnormalities in patients with disorders of consciousness. Frontiers in Human Neuroscience, 8(January), 6–12. http://doi.org/10.3389/fnhum.2014.01028
Cavanna, A. E., & Nani, A. (2014). Consciousness: Theories in neuroscience and philosophy of mind. Springer-Verlag Berlin Heidelberg. http://doi.org/10.1007/978-3-662-44088-9
Cavanna, A. E., & Trimble, M. R. (2006). The precuneus: A review of its functional anatomy and behavioural correlates. Brain, 129(3), 564–583. http://doi.org/10.1093/brain/awl004

163
Cha, J., Jo, H. J., Gibson, W. S., & Lee, J.-M. (2017). Functional organization of the human posterior cingulate cortex, revealed by multiple connectivity-based parcellation methods. Human Brain Mapping, 38(6), 2808–2818. http://doi.org/10.1002/hbm.23570
Chai, X. J., Castañán, A. N., Öngür, D., & Whitfield-Gabrieli, S. (2012). Anticorrelations in resting state networks without global signal regression. NeuroImage, 59(2), 1420–1428. http://doi.org/10.1016/j.neuroimage.2011.08.048
Chai, X. J., Ofen, N., Gabrieli, J. D. E., & Whitfield-Gabrieli, S. (2014). Selective Development of Anticorrelated Networks in the Intrinsic Functional Organization of the Human Brain. Journal of Cognitive Neuroscience, 26(3), 501–513. http://doi.org/10.1162/jocn_a_00517
Chang, C., & Glover, G. H. (2009). Effects of model-based physiological noise correction on default mode network anti-correlations and correlations. NeuroImage, 47(4), 1448–1459. http://doi.org/10.1016/j.neuroimage.2009.05.012
Chang, C., & Glover, G. H. (2010). Time-frequency dynamics of resting-state brain connectivity measured with fMRI. NeuroImage, 50(1), 81–98. http://doi.org/10.1016/j.neuroimage.2009.12.011
Chaudhary, U., Xia, B., Silvoni, S., Cohen, L. G., & Birbaumer, N. (2017). Brain–Computer Interface–Based Communication in the Completely Locked-In State. PLoS Biology, 15(1), 1–25. http://doi.org/10.1371/journal.pbio.1002593
Chen, J. E., Glover, G. H., Greicius, M. D., & Chang, C. (2017). Dissociated patterns of anti-correlations with dorsal and ventral default-mode networks at rest. Human Brain Mapping, 38(5), 2454–2465. http://doi.org/10.1002/hbm.23532
Chennu, S., Annen, J., Wannez, S., Thibaut, A., Chatelle, C., Cassol, H., … Laureys, S. (2017). Brain networks predict metabolism, diagnosis and prognosis at the bedside in disorders of consciousness. Brain, 140(8), 2120–2132. http://doi.org/10.1093/brain/awx163
Chennu, S., Finoia, P., Kamau, E., Allanson, J., Williams, G. B., Monti, M. M., … Bekinschtein, T. A. (2014). Spectral Signatures of Reorganised Brain Networks in Disorders of Consciousness. PLoS Computational Biology, 10(10). http://doi.org/10.1371/journal.pcbi.1003887
Cherubini, A., Péran, P., Caltagirone, C., Sabatini, U., & Spalletta, G. (2009). Aging of subcortical nuclei: Microstructural, mineralization and atrophy modifications measured in vivo using MRI. NeuroImage, 48(1), 29–36. http://doi.org/10.1016/j.neuroimage.2009.06.035
Choi, S. P., Park, K. N., Park, H. K., Kim, J. Y., Youn, C. S., Ahn, K. J., & Yim, H. W. (2010). Diffusion-weighted magnetic resonance imaging for predicting the clinical outcome of comatose survivors after cardiac arrest: a cohort study. Critical Care (London, England), 14(1), R17. http://doi.org/10.1186/cc8874
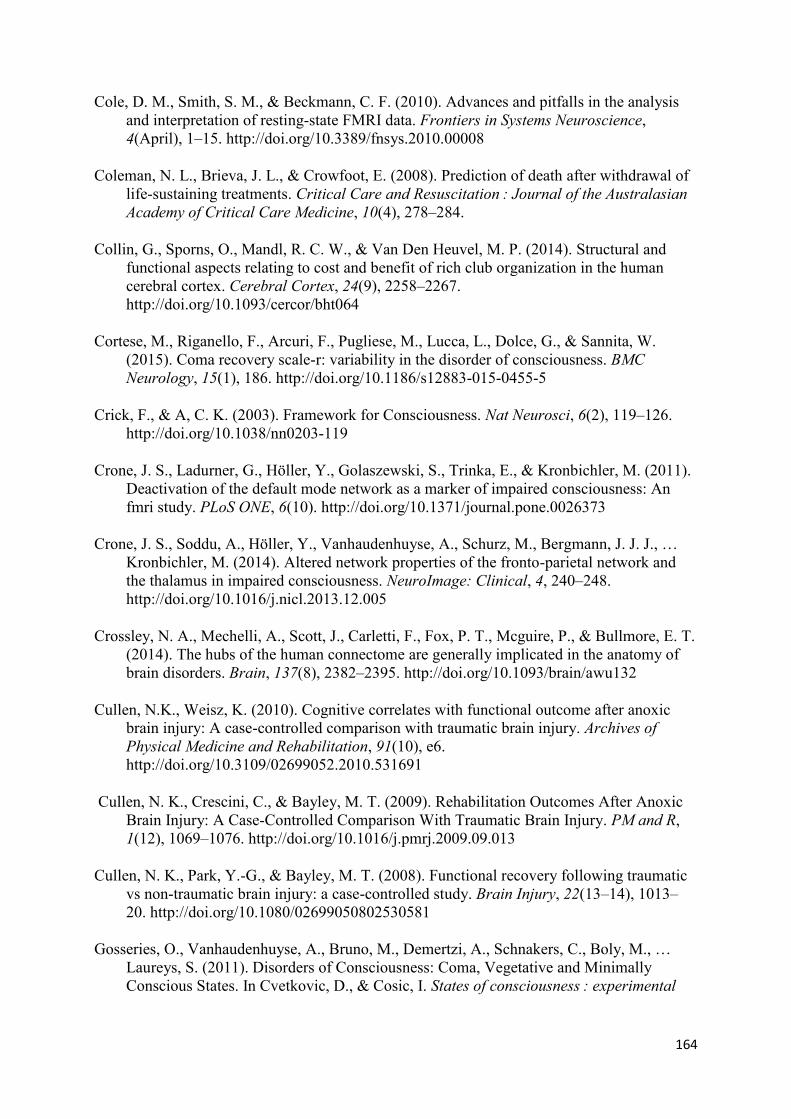
164
Cole, D. M., Smith, S. M., & Beckmann, C. F. (2010). Advances and pitfalls in the analysis and interpretation of resting-state FMRI data. Frontiers in Systems Neuroscience, 4(April), 1–15. http://doi.org/10.3389/fnsys.2010.00008
Coleman, N. L., Brieva, J. L., & Crowfoot, E. (2008). Prediction of death after withdrawal of life-sustaining treatments. Critical Care and Resuscitation : Journal of the Australasian Academy of Critical Care Medicine, 10(4), 278–284.
Collin, G., Sporns, O., Mandl, R. C. W., & Van Den Heuvel, M. P. (2014). Structural and functional aspects relating to cost and benefit of rich club organization in the human cerebral cortex. Cerebral Cortex, 24(9), 2258–2267. http://doi.org/10.1093/cercor/bht064
Cortese, M., Riganello, F., Arcuri, F., Pugliese, M., Lucca, L., Dolce, G., & Sannita, W. (2015). Coma recovery scale-r: variability in the disorder of consciousness. BMC Neurology, 15(1), 186. http://doi.org/10.1186/s12883-015-0455-5
Crick, F., & A, C. K. (2003). Framework for Consciousness. Nat Neurosci, 6(2), 119–126. http://doi.org/10.1038/nn0203-119
Crone, J. S., Ladurner, G., Höller, Y., Golaszewski, S., Trinka, E., & Kronbichler, M. (2011). Deactivation of the default mode network as a marker of impaired consciousness: An fmri study. PLoS ONE, 6(10). http://doi.org/10.1371/journal.pone.0026373
Crone, J. S., Soddu, A., Höller, Y., Vanhaudenhuyse, A., Schurz, M., Bergmann, J. J. J., … Kronbichler, M. (2014). Altered network properties of the fronto-parietal network and the thalamus in impaired consciousness. NeuroImage: Clinical, 4, 240–248. http://doi.org/10.1016/j.nicl.2013.12.005
Crossley, N. A., Mechelli, A., Scott, J., Carletti, F., Fox, P. T., Mcguire, P., & Bullmore, E. T. (2014). The hubs of the human connectome are generally implicated in the anatomy of brain disorders. Brain, 137(8), 2382–2395. http://doi.org/10.1093/brain/awu132
Cullen, N.K., Weisz, K. (2010). Cognitive correlates with functional outcome after anoxic brain injury: A case-controlled comparison with traumatic brain injury. Archives of Physical Medicine and Rehabilitation, 91(10), e6. http://doi.org/10.3109/02699052.2010.531691
Cullen, N. K., Crescini, C., & Bayley, M. T. (2009). Rehabilitation Outcomes After Anoxic Brain Injury: A Case-Controlled Comparison With Traumatic Brain Injury. PM and R, 1(12), 1069–1076. http://doi.org/10.1016/j.pmrj.2009.09.013
Cullen, N. K., Park, Y.-G., & Bayley, M. T. (2008). Functional recovery following traumatic vs non-traumatic brain injury: a case-controlled study. Brain Injury, 22(13–14), 1013–20. http://doi.org/10.1080/02699050802530581
Gosseries, O., Vanhaudenhuyse, A., Bruno, M., Demertzi, A., Schnakers, C., Boly, M., … Laureys, S. (2011). Disorders of Consciousness: Coma, Vegetative and Minimally Conscious States. In Cvetkovic, D., & Cosic, I. States of consciousness : experimental

165
insights into meditation, waking, sleep, and dreams. Frontiers collection, http://doi.org/10.1007/978-3-642-18047-7
Damoiseaux, J. S., Rombouts, S. A. R. B., Barkhof, F., Scheltens, P., Stam, C. J., Smith, S. M., & Beckmann, C. F. (2006). Consistent resting-state networks across healthy subjects. Proceedings of the National Academy of Sciences, 103(37), 13848–13853. http://doi.org/10.1073/pnas.0601417103
Dehaene, S., & Changeux, J. P. (2011). Experimental and Theoretical Approaches to Conscious Processing. Neuron, 70(2), 200–227. http://doi.org/10.1016/j.neuron.2011.03.018
Dehaene, S., & Naccache, L. (2001). Towards a cognitive neuroscience of consciousness: Basic evidence and a workspace framework. Cognition. http://doi.org/10.1016/S0010-0277(00)00123-2
Dehaene, S., Changeux, J. P., & Naccache, L. (2011). The global neuronal workspace model of conscious access: From neuronal architectures to clinical applications. Research and Perspectives in Neurosciences, 18, 55–84. http://doi.org/10.1007/978-3-642-18015-6_4
Demertzi, A., Antonopoulos, G., Heine, L., Voss, H. U., Crone, J. S., De Los Angeles, C., … Laureys, S. (2015). Intrinsic functional connectivity differentiates minimally conscious from unresponsive patients. Brain, 138(9), 2619–2631. http://doi.org/10.1093/brain/awv169
Demertzi, A., Gomez, F., Crone, J. S., Vanhaudenhuyse, A., Tshibanda, L., Noirhomme, Q., … Soddu, A. (2014). Multiple fMRI system-level baseline connectivity is disrupted in patients with consciousness alterations. Cortex, 52(1), 35–46. http://doi.org/10.1016/j.cortex.2013.11.005
Demertzi, A., Sitt, J. D., Sarasso, S., & Pinxten, W. (2017). Measuring states of pathological (un)consciousness: research dimensions, clinical applications, and ethics. Neuroscience of Consciousness, 3(1). http://doi.org/10.1093/nc/nix010
Demertzi, A., Soddu, A., & Laureys, S. (2013). Consciousness supporting networks. Current Opinion in Neurobiology, 23, 239–244. http://doi.org/10.1016/j.conb.2012.12.003
Di Perri, C., Bahri, M. A., Amico, E., Thibaut, A., Heine, L., Antonopoulos, G., … Laureys, S. (2016). Neural correlates of consciousness in patients who have emerged from a minimally conscious state: A cross-sectional multimodal imaging study. The Lancet Neurology, 15(8), 830–842. http://doi.org/10.1016/S1474-4422(16)00111-3
Di Perri, C., Heine, L., Amico, E., Soddu, A., Laureys, S., & Demertzi, A. (2014). Technology-based assessment in patients with disorders of consciousness. Annali dell’Istituto Superiore Di Sanita, 50(3), 209–220. http://doi.org/10.4415/ANN_14_03_03
Dinkel, J., Drier, A., Khalilzadeh, O., Perlbarg, V., Czernecki, V., Gupta, R., … Stevens, R. D. (2014). Long-Term White Matter Changes after Severe Traumatic Brain Injury: A 5-

166
Year Prospective Cohort. AJNR: American Journal of Neuroradiology, 35(1), 23–29. http://doi.org/10.3174/ajnr.A3616
Douaud, G., Smith, S., Jenkinson, M., Behrens, T., Johansen-Berg, H., Vickers, J., … James, A. (2007). Anatomically related grey and white matter abnormalities in adolescent-onset schizophrenia. Brain, 130(9), 2375–2386. http://doi.org/10.1093/brain/awm184
Dubois, J., & Adolphs, R. (2016). Building a Science of Individual Differences from fMRI. Trends in Cognitive Sciences, 20(6), 425–443. http://doi.org/10.1016/j.tics.2016.03.014
Estraneo, A., Moretta, P., Loreto, V., Lanzillo, B., Santoro, L., & Trojano, L. (2010). Late recovery after traumatic, anoxic, or hemorrhagic long-lasting vegetative state. Neurology, 75(3), 239–245. http://doi.org/10.1212/WNL.0b013e3181e8e8cc
Fallani, F. D. V., Richiardi, J., Chavez, M., & Achard, S. (2014). Graph analysis of functional brain networks: practical issues in translational neuroscience. Phil Trans Royal Society B: Biological Sciences, 369(1653). http://doi.org/10.1098/rstb.2013.0521
Faugeras, F., Rohaut, B., Valente, M., Sitt, J., Demeret, S., & Bolgert, F. (2017). Survival and consciousness recovery are better in the minimally conscious state than in the vegetative state. Brain Injury, 0(0), 1–6. http://doi.org/10.1080/02699052.2017.1364421
Feldman, H., Yeatman, J., Lee, E., Barde, L., & Gaman-Bean, S. (2010). Diffusion Tensor Imaging: A review for Pediatric Researchers and Clinicians. J Dev Behav Pediatr, 31(4), 346–356. http://doi.org/10.1097/DBP.0b013e3181dcaa8b.Diffusion
Fernández-Espejo, D., Soddu, A., Cruse, D., Palacios, E. M., Junque, C., Vanhaudenhuyse, A., … Owen, A. M. (2012). A role for the default mode network in the bases of disorders of consciousness. Annals of Neurology, 72(3), 335–343. http://doi.org/10.1002/ana.23635
Figley, T. D., Bhullar, N., Courtney, S. M., & Figley, C. R. (2015). Probabilistic atlases of default mode, executive control and salience network white matter tracts: an fMRI-guided diffusion tensor imaging and tractography study. Frontiers in Human Neuroscience, 9(November), 1–20. http://doi.org/10.3389/fnhum.2015.00585
Fornito, A., Zalesky, A., & Breakspear, M. (2013). Graph analysis of the human connectome: Promise, progress, and pitfalls. NeuroImage, 80, 426–444. http://doi.org/10.1016/j.neuroimage.2013.04.087
Fornito, A., Zalesky, A., & Breakspear, M. (2015). The connectomics of brain disorders. Nature Reviews Neuroscience, 16(3), 159–172. http://doi.org/10.1038/nrn3901
Fornito, A., Zalesky, A., & Bullmore, E. (2016). Fundamentals of brain network analysis. Fundamentals of Brain Network Analysis. Retrieved from http://ovidsp.ovid.com/ovidweb.cgi?T=JS&PAGE=reference&D=psyc12&NEWS=N&AN=2016-10843-000
Fornito. (2010). Network scaling effects in graph analytic studies of human resting-state fMRI data. Frontiers in Systems Neuroscience. http://doi.org/10.3389/fnsys.2010.00022

167
Fox, K. C. R., Spreng, R. N., Ellamil, M., Andrews-Hanna, J. R., & Christoff, K. (2015). The wandering brain: Meta-analysis of functional neuroimaging studies of mind-wandering and related spontaneous thought processes. NeuroImage. http://doi.org/10.1016/j.neuroimage.2015.02.039
Fox, M. D., & Greicius, M. (2010). Clinical applications of resting state functional connectivity. Frontiers in Systems Neuroscience, 4(June), 19. http://doi.org/10.3389/fnsys.2010.00019
Fox, M. D., Zhang, D., Snyder, A. Z., & Raichle, M. E. (2009). The Global Signal and Observed Anticorrelated Resting State Brain Networks. Journal of Neurophysiology, 101(6), 3270–3283. http://doi.org/10.1152/jn.90777.2008
Fransson, P. (2005). Spontaneous low-frequency BOLD signal fluctuations: An fMRI investigation of the resting-state default mode of brain function hypothesis. Human Brain Mapping, 26(1), 15–29. http://doi.org/10.1002/hbm.20113
Galanaud, D., Perlbarg, V., Gupta, R., Stevens, R. D., Sanchez, P., Tollard, E., … Puybasset, L. (2012). Assessment of White Matter Injury and Outcome in Severe Brain Trauma. Anesthesiology, 117(6), 1300–1310. http://doi.org/10.1097/ALN.0b013e3182755558
Gee, D. G., Biswal, B. B., Kelly, C., Stark, D. E., Margulies, D. S., Shehzad, Z., … Xavier, F. (2011). Processing among the Cerebral Hemispheres, Neuroimage, 54(1), 517–527. http://doi.org/10.1016/j.neuroimage.2010.05.073.Low
Giacino, J. T., & Kalmar, K. (1997). The Vegetative and Minimally Conscious States: A Comparison of Clinical Features and Functional Outcome. Journal of Head Trauma Rehabilitation, 12(4), 36–51. http://doi.org/10.1097/00001199-199708000-00005
Giacino, J. T., Ashwal, S., Childs, N., Cranford, R., Jennett, B., & Katz, D. I. (2002). The minimally conscious state, Neurology, 58, 349-353.
Giacino, J. T., Fins, J. J., Laureys, S., & Schiff, N. D. (2014). Disorders of consciousness after acquired brain injury: the state of the science. Nature Reviews Neurology Neurology, 10(2), 99–114. http://doi.org/10.1038/nrneurol.2013.279
Giacino, J. T., Kalmar, K., & Whyte, J. (2004). The JFK Coma Recovery Scale-Revised: Measurement characteristics and diagnostic utility. Archives of Physical Medicine and Rehabilitation, 85(12), 2020–2029. http://doi.org/10.1016/j.apmr.2004.02.033
Good, C. D., Johnsrude, I. S., Ashburner, J., Henson, R. N., Friston, K. J., & Frackowiak, R. S. (2001). A voxel-based morphometric study of ageing in 465 normal adult human brains. NeuroImage, 14(1 Pt 1), 21–36. http://doi.org/10.1006/nimg.2001.0786
Gopinath, K., Krishnamurthy, V., Cabanban, R., & Crosson, B. A. (2015). Hubs of Anticorrelation in High-Resolution Resting-State Functional Connectivity Network Architecture. Brain Connectivity, 5(5), 267–275. http://doi.org/10.1089/brain.2014.0323
Gore, J. C. (2003). Principles and practice of functional MRI of the human brain. Journal of Clinical Investigation, 112(1), 4–9. http://doi.org/10.1172/JCI200319010.Conventional

168
Gosseries, O., Zasler, N. D., & Laureys, S. (2014). Recent advances in disorders of consciousness: Focus on the diagnosis. Brain Injury, 28(9), 1141–50. http://doi.org/10.3109/02699052.2014.920522
Greer, D., & Wu, O. (2017). Neuroimaging in Cardiac Arrest Prognostication. Seminars in Neurology, 37(1), 066–074. http://doi.org/10.1055/s-0036-1594253
Greicius, M. D., & Menon, V. (2004). Default-Mode Activity during a Passive Sensory Task: Uncoupled from Deactivation but Impacting Activation. Journal of Cognitive Neuroscience, 16(9), 1484–1492. http://doi.org/10.1162/0898929042568532
Greicius, M. D., Krasnow, B., Reiss, A. L., & Menon, V. (2003). Functional connectivity in the resting brain: a network analysis of the default mode hypothesis. Proceedings of the National Academy of Sciences, 100(1), 253–258. http://doi.org/10.1073/pnas.0135058100
Greicius, M. D., Supekar, K., Menon, V., & Dougherty, R. F. (2009). Resting-state functional connectivity reflects structural connectivity in the default mode network. Cerebral Cortex, 19(1), 72–78. http://doi.org/10.1093/cercor/bhn059
Greve, D. N. (2011). An Absolute Beginner’s Guide to Surface- and Voxel-based Morphometric Analysis. Proceedings of the International Society for Magnetic Resonance in Medicine, i, 1–7.
Guldenmund, P., Soddu, A., Baquero, K., Vanhaudenhuyse, A., Bruno, M.-A., Gosseries, O., & Laureys, S. (2016). Structural brain injury in patients with disorders of consciousness: A voxel-based morphometry study. Brain Injury, 30(3), 343–352. http://doi.org/10.3109/02699052.2015.1118765
Haenggi, M., Z’Graggen, W. J., & Wiest, R. (2014). Prognostic Markers for Coma and Disorders of Consciousness. Epileptologie, 31, 68–72.
Hagmann, P., Cammoun, L., Gigandet, X., Meuli, R., Honey, C. J., Van Wedeen, J., & Sporns, O. (2008). Mapping the structural core of human cerebral cortex. PLoS Biology, 6(7), 1479–1493. http://doi.org/10.1371/journal.pbio.0060159
Hagmann, P., Jonasson, L., Maeder, P., Thiran, J.-P., Wedeen, V. J., & Meuli, R. (2006). Understanding Diffusion MR Imaging Techniques: From Scalar Diffusion-weighted Imaging to Diffusion Tensor Imaging and Beyond. RadioGraphics, 26(suppl_1), S205–S223. http://doi.org/10.1148/rg.26si065510
Hannawi, Y., Lindquist, M. A., Caffo, B. S., Sair, H. I., & Stevens, R. D. (2015). Resting brain activity in disorders of consciousness: a systematic review and meta-analysis. Neurology, 84(12), 1272–1280. http://doi.org/10.1212/WNL.0000000000001404; 10.1212/WNL.0000000000001404
He, J. H., Cui, Y., Song, M., Yang, Y., Dang, Y. Y., Jiang, T. Z., & Xu, R. X. (2015). Decreased functional connectivity between the mediodorsal thalamus and default mode network in patients with disorders of consciousness. Acta Neurologica Scandinavica, 131(3), 145–151. http://doi.org/10.1111/ane.12299

169
He, J. H., Yang, Y., Zhang, Y., Qiu, S. Y., Zhou, Z. Y., Dang, Y. Y., … Xu, R. X. (2014). Hyperactive external awareness against hypoactive internal awareness in disorders of consciousness using resting-state functional MRI: Highlighting the involvement of visuo-motor modulation. NMR in Biomedicine, 27(8), 880–886. http://doi.org/10.1002/nbm.3130
Heine, L., Demertzi, A., Laureys, S., & Gosseries, O. (2015). Consciousness: And Disorders of Consciousness. In Brain Mapping: An Encyclopedic Reference (Vol. 3, pp. 1067–1073). http://doi.org/10.1016/B978-0-12-397025-1.00133-0
Heine, L., Soddu, A., Gómez, F., Vanhaudenhuyse, A., Tshibanda, L., Thonnard, M., … Demertzi, A. (2012). Resting state networks and consciousness Alterations of multiple resting state network connectivity in physiological, pharmacological, and pathological consciousness states. Frontiers in Psychology, 3(AUG), 1–12. http://doi.org/10.3389/fpsyg.2012.00295
Hellyer, P. J., Scott, G., Shanahan, M., Sharp, D. J., & Leech, R. (2015). Cognitive Flexibility through Metastable Neural Dynamics Is Disrupted by Damage to the Structural Connectome. Journal of Neuroscience, 35(24), 9050–9063. http://doi.org/10.1523/JNEUROSCI.4648-14.2015
Herbet, G., Lafargue, G., & Duffau, H. (2015). The dorsal cingulate cortex as a critical gateway in the network supporting conscious awareness. Brain, awv381. http://doi.org/10.1093/brain/awv381
Herbet, G., Lafargue, G., de Champfleur, N. M., Moritz-Gasser, S., le Bars, E., Bonnetblanc, F., & Duffau, H. (2014). Disrupting posterior cingulate connectivity disconnects consciousness from the external environment. Neuropsychologia, 56(1), 239–244. http://doi.org/10.1016/j.neuropsychologia.2014.01.020
Herculano-Houzel, S. (2012). The remarkable, yet not extraordinary, human brain as a scaled-up primate brain and its associated cost. Proceedings of the National Academy of Sciences, 109(Supplement_1), 10661–10668. http://doi.org/10.1073/pnas.1201895109
Hillary, F. G., Rajtmajer, S. M., Roman, C. A., Medaglia, J. D., Slocomb-Dluzen, J. E., Calhoun, V. D., … Wylie, G. R. (2014). The rich get richer: Brain injury elicits hyperconnectivity in core subnetworks. PLoS ONE, 9(8). http://doi.org/10.1371/journal.pone.0104021
Hillary, F. G., Roman, C. A., Venkatesan, U., Rajtmajer, S. M., Bajo, R., & Castellanos, N. D. (2015). Hyperconnectivity is a fundamental response to neurological disruption. Neuropsychology, 29(1), 59–75. http://doi.org/10.1037/neu0000110
Hirsch, K. G., Mlynash, M., Jansen, S., Persoon, S., Eyngorn, I., Krasnokutsky, M. V., … Fischbein, N. J. (2014). Prognostic Value of A Qualitative Brain MRI Scoring System After Cardiac Arrest. Journal of Neuroimaging, 25(3), 430–437. http://doi.org/10.1111/jon.12143

170
Hirschberg, R., & Giacino, J. T. (2011). The Vegetative and Minimally Conscious States: Diagnosis, Prognosis and Treatment. Neurologic Clinics, 29(4), 773–786. http://doi.org/10.1016/j.ncl.2011.07.009
Honey, C. J., Sporns, O., Cammoun, L., Gigandet, X., Thiran, J. P., Meuli, R., & Hagmann, P. (2009). Predicting human resting-state functional connectivity from structural connectivity. Proceedings of the National Academy of Sciences of the United States of America, 106(6), 2035–40. http://doi.org/10.1073/pnas.0811168106
Horn, A., Ostwald, D., Reisert, M., & Blankenburg, F. (2014). The structural-functional connectome and the default mode network of the human brain. NeuroImage, 102(P1), 142–151. http://doi.org/10.1016/j.neuroimage.2013.09.069
Horsting, M. W., Franken, M. D., Meulenbelt, J., van Klei, W. A., & de Lange, D. W. (2015). The etiology and outcome of non-traumatic coma in critical care: a systematic review. BMC Anesthesiology, 15(1), 65. http://doi.org/10.1186/s12871-015-0041-9
Howard, R. S., Holmes, P. A., Siddiqui, A., Treacher, D., Tsiropoulos, I., & Koutroumanidis, M. (2012). Hypoxic-ischaemic brain injury: Imaging and neurophysiology abnormalities related to outcome. QJM, 105(6), 551–561. http://doi.org/10.1093/qjmed/hcs016
Huang, Z., Dai, R., Wu, X., Yang, Z., Liu, D., Hu, J., … Northoff, G. (2014). The self and its resting state in consciousness: An investigation of the vegetative state. Human Brain Mapping, 35(5), 1997–2008. http://doi.org/10.1002/hbm.22308
Hudetz, A. G., Liu, X., & Pillay, S. (2015). Dynamic Repertoire of Intrinsic Brain States Is Reduced in Propofol-Induced Unconsciousness. Brain Connectivity, 5(1), 10–22. http://doi.org/10.1089/brain.2014.0230
Juengling, F. D., Kassubek, J., Huppertz, H.-J., Krause, T., & Els, T. (2005). Separating functional and structural damage in persistent vegetative state using combined voxel-based analysis of 3-D MRI and FDG-PET. Journal of the Neurological Sciences, 228(2), 179–184. http://doi.org/10.1016/j.jns.2004.11.052
Keller, C. J., Bickel, S., Honey, C. J., Groppe, D. M., Entz, L., Craddock, R. C., … Mehta, A. D. (2013). Neurophysiological Investigation of Spontaneous Correlated and Anticorrelated Fluctuations of the BOLD Signal. Journal of Neuroscience, 33(15), 6333–6342. http://doi.org/10.1523/JNEUROSCI.4837-12.2013
Khalsa, S., Mayhew, S. D., Chechlacz, M., Bagary, M., & Bagshaw, A. P. (2014). The structural and functional connectivity of the posterior cingulate cortex: Comparison between deterministic and probabilistic tractography for the investigation of structure-function relationships. NeuroImage, 102(P1), 118–127. http://doi.org/10.1016/j.neuroimage.2013.12.022
Kim, Y. W., Kim, H. S., An, Y.-S., & Im, S. H. (2010). Voxel-based statistical analysis of cerebral glucose metabolism in patients with permanent vegetative state after acquired brain injury. Chinese Medical Journal, 123(20), 2853–2857. http://doi.org/10.3760/cma.j.issn.0366-6999.2010.20.020

171
Kirsch, M., Guldenmund, P., Ali Bahri, M., Demertzi, A., Baquero, K., Heine, L., … Laureys, S. (2017). Sedation of Patients With Disorders of Consciousness During Neuroimaging: Effects on Resting State Functional Brain Connectivity. Anesthesia and Analgesia, 124(2), 588–598. http://doi.org/10.1213/ANE.0000000000001721
Koch, C., Massimini, M., Boly, M., & Tononi, G. (2016). Neural correlates of consciousness: progress and problems. Nature Reviews Neuroscience, 17(5), 307–321. http://doi.org/10.1038/nrn.2016.22
Koenig, M. A., Holt, J. L., Ernst, T., Buchthal, S. D., Nakagawa, K., Stenger, V. A., & Chang, L. (2014). MRI default mode network connectivity is associated with functional outcome after cardiopulmonary arrest. Neurocritical Care, 20(3), 348–57. http://doi.org/10.1007/s12028-014-9953-3
Kondziella, D., Fisher, P. M., Larsen, V. A., Hauerberg, J., Fabricius, M., Møller, K., & Knudsen, G. M. (2017). Functional MRI for Assessment of the Default Mode Network in Acute Brain Injury. Neurocritical Care, 1–6. http://doi.org/10.1007/s12028-017-0407-6
Laird, A. R., Fox, P. M., Eickhoff, S. B., Turner, J. A., Ray, K. L., McKay, D. R., … Fox, P. T. (2011). Behavioral Interpretations of Intrinsic Connectivity Networks. Journal of Cognitive Neuroscience, 23(12), 4022–4037. http://doi.org/10.1162/jocn_a_00077
Lant, N. D., Gonzalez-Lara, L. E., Owen, A. M., & Fernández-Espejo, D. (2016). Relationship between the anterior forebrain mesocircuit and the default mode network in the structural bases of disorders of consciousness. NeuroImage: Clinical, 10, 27–35. http://doi.org/10.1016/j.nicl.2015.11.004
Latora, V., & Marchiori, M. (2001). Efficient Behavior of Small World Networks. Physical Review Letters, 87, 198701. http://doi.org/10.1103/PhysRevLett.87.198701
Laureys, S. (2005). The neural correlate of (un) awareness: lessons from the vegetative state. Trends in Cognitive Sciences, 9(12), 556–559. http://doi.org/10.1016/j.tics.2005.10.010
Laureys, S., & Schiff, N. D. (2012). Coma and consciousness: Paradigms (re)framed by neuroimaging. NeuroImage, 61(2), 478–491. http://doi.org/10.1016/j.neuroimage.2011.12.041
Laureys, S., Celesia, G. G., Cohadon, F., Lavrijsen, J., León-carrión, J., Sannita, W. G., … Dolce, G. (2010). Unresponsive wakefulness syndrome : a new name for the vegetative state or apallic syndrome. BMC Medicine, 8(1), 68. http://doi.org/10.1186/1741-7015-8-68
Laureys, S., Faymonville, M. E., Luxen, A., Lamy, M., Franck, G., & Maquet, P. (2000). Restoration of thalamocortical connectivity after recovery from persistent vegetative state. Lancet, 355(9217), 1790–1791. http://doi.org/10.1016/S0140-6736(00)02271-6
Laureys, S., Owen, A. M., & Schiff, N. D. (2004). Brain function in coma, vegetative state, and related disorders. Lancet Neurology. http://doi.org/10.1016/S1474-4422(04)00852-X

172
Laureys, S., Majerus, S., & Moonen, G. (2002). Assessing consciousness in critically ill patients. In: Vincent, J.L. (ed), Yearbook of intensive care and emergency medicine. Springer.
Lee, M. H., Smyser, C. D., & Shimony, J. S. (2013). Resting-State fMRI: A Review of Methods and Clinical Applications. American Journal of Neuroradiology, 34(10), 1866–1872. http://doi.org/10.3174/ajnr.A3263
Leech, R., & Sharp, D. J. (2014). The role of the posterior cingulate cortex in cognition and disease. Brain, 137(1), 12–32. http://doi.org/10.1093/brain/awt162
Leech, R., Braga, R., & Sharp, D. J. (2012). Echoes of the brain within the posterior cingulate cortex. The Journal of Neuroscience : The Official Journal of the Society for Neuroscience, 32(1), 215–222. http://doi.org/10.1523/JNEUROSCI.3689-11.2012
Siskas, N., Lefkopoulos, A., Ioannidis, I., Charitandi, A., Dimitriadis, A.S. (2003). Cortical laminar necrosis in brain infarcts: serial MRI. Neuroradiology, 45(5), 283–8. http://doi.org/10.1007/s00234-002-0887-7
Lin, J. S. (2000). Brain structures and mechanisms involved in the control of cortical activation and wakefulness, with emphasis on the posterior hypothalamus and histaminergic neurons. Sleep Medicine Reviews. http://doi.org/10.1053/smrv.2000.0116
Liu, X., Li, J., Gao, J., Zhou, Z., Meng, F., Pan, G., & Luo, B. (2017). Association of medial prefrontal cortex connectivity with consciousness level and its outcome in patients with acquired brain injury. Journal of Clinical Neuroscience. http://doi.org/10.1016/j.jocn.2017.04.015
Liu, X., Ward, B. D., Binder, J. R., Li, S. J., & Hudetz, A. G. (2014). Scale-free functional connectivity of the brain is maintained in anesthetized healthy participants but not in patients with unresponsive wakefulness syndrome. PLoS ONE, 9(3). http://doi.org/10.1371/journal.pone.0092182
Liu, Y., Huang, L., Li, M., Zhou, Z., & Hu, D. (2015). Anticorrelated networks in resting-state fMRI-BOLD data. Bio-Medical Materials and Engineering, 26 Suppl 1, S1201-11. http://doi.org/10.3233/BME-151417
Liu, Y., Liang, M., Zhou, Y., He, Y., Hao, Y., Song, M., … Jiang, T. (2008). Disrupted small-world networks in schizophrenia. Brain, 131(4), 945–961. http://doi.org/10.1093/brain/awn018
Luauté, J., Maucort-Boulch, D., Tell, L., Quelard, F., Sarraf, T., Iwaz, J., … Fischer, C. (2010). Long-term outcomes of chronic minimally conscious and vegetative states. Neurology, 75(3), 246–252. http://doi.org/10.1212/WNL.0b013e3181e8e8df
Luauté, J., Morlet, D., & Mattout, J. (2015). BCI in patients with disorders of consciousness: Clinical perspectives. Annals of Physical and Rehabilitation Medicine, 58(1), 29–34. http://doi.org/10.1016/j.rehab.2014.09.015
173
Luyt, C.-E., Galanaud, D., Perlbarg, V., Vanhaudenhuyse, A., Stevens, R. D., Gupta, R., … Puybasset, L. (2012). Diffusion Tensor Imaging to Predict Long-term Outcome after Cardiac Arrest. Anesthesiology, 117(6), 1311–1321. http://doi.org/10.1097/ALN.0b013e318275148c
Malagurski, B., Péran, P., Sarton, B., Riu, B., Gonzalez, L., Vardon-Bounes, F., … Silva, S. (2017). Neural signature of coma revealed by posteromedial cortex connection density analysis. NeuroImage: Clinical, 15(February), 315–324. http://doi.org/10.1016/j.nicl.2017.03.017
Margulies, D. S., Vincent, J. L., Kelly, C., Lohmann, G., Uddin, L. Q., Biswal, B. B., … Petrides, M. (2009). Precuneus shares intrinsic functional architecture in humans and monkeys. Proceedings of the National Academy of Sciences of the United States of America, 106(47), 20069–20074. http://doi.org/10.1073/pnas.0905314106
Mazoyer, B., Zago, L., Mellet, E., Bricogne, S., Etard, O., Houdé, O., … Tzourio-Mazoyer, N. (2001). Cortical networks for working memory and executive functions sustain the conscious resting state in man. Brain Research Bulletin, 54(3), 287–298. http://doi.org/10.1016/S0361-9230(00)00437-8
Mckee, A. C., & Daneshvar, D. H. (2015). The neuropathology of traumatic brain injury. Handbook of Clinical Neurology, 127, 45–66. http://doi.org/10.1016/B978-0-444-52892-6.00004-0
Mechelli, A., Price, C. J., Friston, K. J., & Ashburner, J. (2005). Voxel-based morphometry of the human brain: methods and applications. Current Medical …, 1(2), 105–113. http://doi.org/10.2174/1573405054038726
Menon, V. (2015). Salience Network. Brain Mapping: An Encyclopedic Reference (Vol. 2). Elsevier Inc. http://doi.org/10.1016/B978-0-12-397025-1.00052-X
Menon, V., & Uddin, L. Q. (2010). Saliency, switching, attention and control: a network model of insula function. Brain Structure and Function, 1–13. http://doi.org/10.1007/s00429-010-0262-0
Meskaldji, D. E., Fischi-Gomez, E., Griffa, A., Hagmann, P., Morgenthaler, S., & Thiran, J. P. (2013). Comparing connectomes across subjects and populations at different scales. NeuroImage, 80, 416–425. http://doi.org/10.1016/j.neuroimage.2013.04.084
Monti, M. M., Vanhaudenhuyse, A., Coleman, M. R., Boly, M., Pickard, J. D., Tshibanda, L., … Laureys, S. (2010). Willful modulation of brain activity in disorders of consciousness. The New England Journal of Medicine, 362(7), 579–89. http://doi.org/10.1056/NEJMoa0905370
Mori, S., & Zhang, J. (2006). Principles of Diffusion Tensor Imaging and Its Applications to Basic Neuroscience Research. Neuron, 51(5), 527–539. http://doi.org/10.1016/j.neuron.2006.08.012
Murphy, K., Birn, R. M., Handwerker, D. A., Jones, T. B., & Bandettini, P. A. (2009). The impact of global signal regression on resting state correlations: Are anti-correlated

174
networks introduced? NeuroImage, 44(3), 893–905. http://doi.org/10.1016/j.neuroimage.2008.09.036
Nakamura, T., Hillary, F. G., & Biswal, B. B. (2009). Resting network plasticity following brain injury. PLoS ONE, 4(12). http://doi.org/10.1371/journal.pone.0008220
Newcombe, V. F. J., Williams, G. B., Scoffings, D., Cross, J., Carpenter, T. A., Pickard, J. D., & Menon, D. K. (2010). Aetiological differences in neuroanatomy of the vegetative state: insights from diffusion tensor imaging and functional implications. Journal of Neurology, Neurosurgery & Psychiatry, 81(5), 552–561. http://doi.org/10.1136/jnnp.2009.196246
Nolan, J. P., Neumar, R. W., Adrie, C., Aibiki, M., Berg, R. A., Bbttiger, B. W., … Hoek, T. Vanden. (2010). Post-cardiac arrest syndrome : Epidemiology , pathophysiology , treatment , and prognostication : A Scientific Statement from the International Liaison Committee on Resuscitation ; the American Heart Association Emergency Cardiovascular Care Committee ; t. International Emergency Nursing, 18(1), 8–28. http://doi.org/10.1016/j.ienj.2009.07.001
Norton, L., Hutchison, R. M., Young, G. B., Lee, D. H., Sharpe, M. D., & Mirsattari, S. M. (2012). Disruptions of functional connectivity in the default mode network of comatose patients. Neurology, 78(3), 175–181. http://doi.org/10.1212/WNL.0b013e31823fcd61
O’Donnell, L. J., & Westin, C. F. (2011). An introduction to diffusion tensor image analysis. Neurosurgery Clinics of North America, 22(2), 185–viii. http://doi.org/10.1016/j.nec.2010.12.004
Ogawa, S., Lee, T. M., Kay, A. R., & Tank, D. W. (1990). Brain magnetic resonance imaging with contrast dependent on blood oxygenation. Proceedings of the National Academy of Sciences of the United States of America, 87(24), 9868–72. http://doi.org/10.1073/pnas.87.24.9868
Orringer, D. A., Vago, D. R., & Golby, A. J. (2012). Clinical applications and future directions of functional MRI. Seminars in Neurology, 32(4), 466–475. http://doi.org/10.1055/s-0032-1331816
Ovadia-Caro, S., Nir, Y., Soddu, A., Ramot, M., Hesselmann, G., Vanhaudenhuyse, A., … Malach, R. (2012). Reduction in inter-hemispheric connectivity in disorders of consciousness. PLoS ONE, 7(5). http://doi.org/10.1371/journal.pone.0037238
Palacios, E. M., Sala-Llonch, R., Junque, C., Roig, T., Tormos, J. M., Bargallo, N., & Vendrell, P. (2013). Resting-state functional magnetic resonance imaging activity and connectivity and cognitive outcome in traumatic brain injury. JAMA Neurology, 70(7), 845–51. http://doi.org/10.1001/jamaneurol.2013.38
Parente, F., Frascarelli, M., Mirigliani, A., Di Fabio, F., Biondi, M., & Colosimo, A. (2017). Negative functional brain networks. Brain Imaging and Behavior. doi: 10.1007/s11682-017-9715-x. [Epub ahead of print]

175
Parvizi, J. (2003). Neuroanatomical correlates of brainstem coma. Brain, 126(7), 1524–1536. http://doi.org/10.1093/brain/awg166
Parvizi, J., Van Hoesen, G. W., Buckwalter, J., & Damasio, A. (2006). Neural connections of the posteromedial cortex in the macaque. Proceedings of the National Academy of Sciences of the United States of America, 103(5), 1563–8. http://doi.org/10.1073/pnas.0507729103
Péran, P., Cherubini, A., Assogna, F., Piras, F., Quattrocchi, C., Peppe, A., … Sabatini, U. (2010). Magnetic resonance imaging markers of Parkinson’s disease nigrostriatal signature. Brain, 133(11), 3423–3433. http://doi.org/10.1093/brain/awq212
Péran, P., Cherubini, A., Luccichenti, G., Hagberg, G., Démonet, J. F., Rascol, O., … Sabatini, U. (2009). Volume and iron content in basal ganglia and thalamus. Human Brain Mapping, 30(8), 2667–2675. http://doi.org/10.1002/hbm.20698
Perlbarg, V., Puybasset, L., Tollard, E., Lehéricy, S., Benali, H., & Galanaud, D. (2009). Relation between brain lesion location and clinical outcome in patients with severe traumatic brain injury: A diffusion tensor imaging study using voxel-based approaches. Human Brain Mapping, 30(12), 3924–3933. http://doi.org/10.1002/hbm.20817
Peterson, A., Cruse, D., Naci, L., Weijer, C., & Owen, A. M. (2015). Risk, diagnostic error, and the clinical science of consciousness. NeuroImage: Clinical. http://doi.org/10.1016/j.nicl.2015.02.008
Poldrack, R. A. (2007). Region of interest analysis for fMRI. Social Cognitive and Affective Neuroscience, 2(1), 67–70. http://doi.org/10.1093/scan/nsm006
Popa, D., Popescu, A. T., & Pare, D. (2009). Contrasting Activity Profile of Two Distributed Cortical Networks as a Function of Attentional Demands. Journal of Neuroscience, 29(4), 1191–1201. http://doi.org/10.1523/JNEUROSCI.4867-08.2009
Posner, J. B., Plum, F., & Saper, C. (2007). Plum and Posner’s Diagnosis of Estupor and Coma. Neurology (Vol. 1). http://doi.org/10.1002/1521-3773(20010316)40:6<9823::AID-ANIE9823>3.3.CO;2-C
Prim, R. C. (1957). Shortest Connection Networks And Some Generalizations. Bell System Technical Journal, 36(6), 1389–1401. http://doi.org/10.1002/j.1538-7305.1957.tb01515.x
Qin, P., Wu, X., Huang, Z., Duncan, N. W., Tang, W., Wolff, A., … Northoff, G. (2015). How are different neural networks related to consciousness? Annals of Neurology, 78(4), 594–605. http://doi.org/10.1002/ana.24479
Raichle, M. E. (2015). The Brain’s Default Mode Network. Annual Review of Neuroscience, 38(1), 433–447. http://doi.org/10.1146/annurev-neuro-071013-014030
Raichle, M. E., MacLeod, A. M., Snyder, A. Z., Powers, W. J., Gusnard, D. A., & Shulman, G. L. (2001). A default mode of brain function. Proceedings of the National Academy of

176
Sciences of the United States of America, 98(2), 676–82. http://doi.org/10.1073/pnas.98.2.676
Richiardi, J., Altmann, A., Milazzo, A.-C., Chang, C., Chakravarty, M. M., Banaschewski, T., … Jonas, R. (2015). BRAIN NETWORKS. Correlated gene expression supports synchronous activity in brain networks. Science (New York, N.Y.), 348(6240), 1241–1244. http://doi.org/10.1126/science.1255905
Roquet, D., Foucher, J. R., Froehlig, P., Renard, F., Pottecher, J., Besancenot, H., … Kremer, S. (2016). Resting-state networks distinguish locked-in from vegetative state patients. NeuroImage: Clinical, 12, 16–22. http://doi.org/10.1016/j.nicl.2016.06.003
Rosazza, C., & Minati, L. (2011). Resting-state brain networks: Literature review and clinical applications. Neurological Sciences, 32(5), 773–785. http://doi.org/10.1007/s10072-011-0636-y
Rosazza, C., Andronache, A., Sattin, D., Bruzzone, M. G., Marotta, G., Nigri, A., … Minati, L. (2016). Multimodal study of default-mode network integrity in disorders of consciousness. Annals of Neurology, 79(5), 841–853. http://doi.org/10.1002/ana.24634
Rubinov, M., & Sporns, O. (2010). Complex network measures of brain connectivity: Uses and interpretations. NeuroImage, 52(3), 1059–1069. http://doi.org/10.1016/j.neuroimage.2009.10.003
Ryoo, S. M., Jeon, S.-B., Sohn, C. H., Ahn, S., Han, C., Lee, B. K., … Kim, W. Y. (2015). Predicting Outcome With Diffusion-Weighted Imaging in Cardiac Arrest Patients Receiving Hypothermia Therapy. Critical Care Medicine, 43(11), 2370–2377. http://doi.org/10.1097/CCM.0000000000001263
Sair, H. I., Hannawi, Y., Li, S., Kornbluth, J., Demertzi, A., Di Perri, C., … Stevens, R. D. (2017). Early Functional Connectome Integrity and 1-Year Recovery in Comatose Survivors of Cardiac Arrest. Radiology, (October), 162161. doi:10.1148/radiol.2017162161. [Epub ahead of print]
Satoru Hayasaka; Paul J. Laurienti. (2011). Comparison of Characteristics between Region- and Voxel-Based Network Analyses in Resting-State fMRI Data. NeuroImage, 18(11), 499–508. http://doi.org/10.1016/j.str.2010.08.012.Structure
Schiff, N. D. (2010). Recovery of consciousness after brain injury: a mesocircuit hypothesis. Trends in Neurosciences, 33(1), 1-9. doi: 10.1016/j.tins.2009.11.002.
Schiff, N. D. (2008). Central thalamic contributions to arousal regulation and neurological disorders of consciousness. Ann N Y Acad Sci,1129, 105-18. doi: 10.1196/annals.1417.029.
Schiff, N. D., Giacino, J. T., Kalmar, K., Victor, J. D., Baker, K., Gerber, M., … Rezai, A. R. (2007). Behavioural improvements with thalamic stimulation after severe traumatic brain injury. Nature, 448(7153), 600–603. http://doi.org/10.1038/nature06041

177
Schnakers, C., Majerus, S., & Laureys, S. (2004). Diagnosis and investigation of altered states of consciousness. Reanimation, 13(5), 368–375. http://doi.org/10.1016/j.reaurg.2004.03.019
Schnakers, C., Majerus, S., Giacino, J., Vanhaudenhuyse, A., Bruno, M.-A. A., Boly, M., … Laureys, S. (2008). A French validation study of the Coma Recovery Scale-Revised (CRS-R). Brain Injury, 22(10), 786–792. http://doi.org/10.1080/02699050802403557
Schnakers, C., Vanhaudenhuyse, A., Giacino, J., Ventura, M., Boly, M., Majerus, S., … Laureys, S. (2009). Diagnostic accuracy of the vegetative and minimally conscious state: Clinical consensus versus standardized neurobehavioral assessment. BMC Neurology, 9(1), 35. http://doi.org/10.1186/1471-2377-9-35
Seel, R. T., Sherer, M., Whyte, J., Katz, D. I., Giacino, J. T., Rosenbaum, A. M., … Zasler, N. (2010). Assessment scales for disorders of consciousness: Evidence-based recommendations for clinical practice and research. In Archives of Physical Medicine and Rehabilitation, 91(12), 1795-813. doi: 10.1016/j.apmr.2010.07.218.
Seeley, W. W., Crawford, R. K., Zhou, J., Miller, B. L., & Greicius, M. D. (2009). Neurodegenerative Diseases Target Large-Scale Human Brain Networks. Neuron, 62(1), 42–52. http://doi.org/10.1016/j.neuron.2009.03.024
Segall, J. M., Allen, E. A., Jung, R. E., Erhardt, E. B., Arja, S. K., Kiehl, K., & Calhoun, V. D. (2012). Correspondence between structure and function in the human brain at rest. Frontiers in Neuroinformatics, 27, 6:10. doi: 10.3389/fninf.2012.00010.
Sharp, D. J., Beckmann, C. F., Greenwood, R., Kinnunen, K. M., Bonnelle, V., De Boissezon, X., … Leech, R. (2011). Default mode network functional and structural connectivity after traumatic brain injury. Brain, 134(8), 2233–2247. http://doi.org/10.1093/brain/awr175
Sharp, D. J., Scott, G., & Leech, R. (2014). Network dysfunction after traumatic brain injury. Nat Rev Neurol, 10(3), 156–166. http://doi.org/10.1038/nrneurol.2014.15
Shirer, W. R., Ryali, S., Rykhlevskaia, E., Menon, V., & Greicius, M. D. (2012). Decoding subject-driven cognitive states with whole-brain connectivity patterns. Cerebral Cortex, 22(1), 158–165. http://doi.org/10.1093/cercor/bhr099
Siclari, F., Baird, B., Perogamvros, L., Bernardi, G., LaRocque, J. J., Riedner, B., … Tononi, G. (2017). The neural correlates of dreaming. Nature Neuroscience, 20(6), 872–878. http://doi.org/10.1038/nn.4545
Sidaros, A., Engberg, A. W., Sidaros, K., Liptrot, M. G., Herning, M., Petersen, P., … Rostrup, E. (2008). Diffusion tensor imaging during recovery from severe traumatic brain injury and relation to clinical outcome: A longitudinal study. Brain, 131(2), 559–572. http://doi.org/10.1093/brain/awm294
Siero, J. C. W., Bhogal, A., & Jansma, J. M. (2013). Blood oxygenation level-dependent/functional magnetic resonance imaging: Underpinnings, practice, and perspectives. PET Clinics, 8(3), 329–344. http://doi.org/10.1016/j.cpet.2013.04.003

178
Silva, S., Alacoque, X., Fourcade, O., Samii, K., Marque, P., Woods, R., … Loubinoux, I. (2010). Wakefulness and loss of awareness: Brain and brainstem interaction in the vegetative state. Neurology, 74(4), 313–320. http://doi.org/10.1212/WNL.0b013e3181cbcd96
Silva, S., De Pasquale, F., Vuillaume, C., Riu, B., Loubinoux, I., Geeraerts, T., … Peran, P. (2015). Disruption of posteromedial large-scale neural communication predicts recovery from coma. Neurology, 85(23), 2036–2044. http://doi.org/10.1212/WNL.0000000000002196
Silva, S., Peran, P., Kerhuel, L., Malagurski, B., Chauveau, N., Bataille, B., … Puybasset, L. (2017). Brain Gray Matter MRI Morphometry for Neuroprognostication After Cardiac Arrest. Critical Care Medicine, 45(8), e763–e771. http://doi.org/10.1097/CCM.0000000000002379
Skudlarski, P., Jagannathan, K., Calhoun, V. D., Hampson, M., Skudlarska, B. A., & Pearlson, G. (2008). Measuring brain connectivity: Diffusion tensor imaging validates resting state temporal correlations. NeuroImage, 43(3), 554–561. http://doi.org/10.1016/j.neuroimage.2008.07.063
Smith, S. M., Fox, P. T., Miller, K. L., Glahn, D. C., Fox, P. M., Mackay, C. E., … Beckmann, C. F. (2009). Correspondence of the brain’s functional architecture during activation and rest. Proceedings of the National Academy of Sciences, 106(31), 13040–13045. http://doi.org/10.1073/pnas.0905267106
Soares, J. M., Marques, P., Alves, V., & Sousa, N. (2013). A hitchhiker’s guide to diffusion tensor imaging. Frontiers in Neuroscience, 12, 7:31. doi: 10.3389/fnins.2013.00031.
Soddu, A., Gómez, F., Heine, L., Di Perri, C., Bahri, M. A., Voss, H. U., … Laureys, S. (2016). Correlation between resting state fMRI total neuronal activity and PET metabolism in healthy controls and patients with disorders of consciousness. Brain and Behavior, 6(1), 1–15. http://doi.org/10.1002/brb3.424
Soddu, A., Vanhaudenhuyse, A., Demertzi, A., Bruno, M.-A., Tshibanda, L., Di, H., … Noirhomme, Q. (2011). Resting state activity in patients with disorders of consciousness. Functional Neurology, 26(1), 37–43.
Soddu, A., Vanhaudenhuyse, A., Bahri, M. A., Bruno, M. A., Boly, M., Demertzi, A., … Noirhomme, Q. (2012). Identifying the default-mode component in spatial IC analyses of patients with disorders of consciousness. Human Brain Mapping, 33(4), 778–796. http://doi.org/10.1002/hbm.21249
Sokolov, A. A., Miall, R. C., & Ivry, R. B. (2017). The Cerebellum: Adaptive Prediction for Movement and Cognition. Trends in Cognitive Sciences, 21(5), 313-332. doi: 10.1016/j.tics.2017.02.005.
Spreng, R. N., & Andrews-Hanna, J. R. (2015). The Default Network and Social Cognition. In Brain Mapping: An Encyclopedic Reference (pp. 165–169). http://doi.org/10.1016/B978-0-12-397025-1.00173-1

179
Stam, C. J. (2014). Modern network science of neurological disorders. Nature Reviews Neuroscience, 15(10), 683–695. http://doi.org/10.1038/nrn3801
Stanley, M. L., Moussa, M. N., Paolini, B. M., Lyday, R. G., Burdette, J. H., & Laurienti, P. J. (2013). Defining nodes in complex brain networks. Frontiers in Computational Neuroscience, 7(November), 169. http://doi.org/10.3389/fncom.2013.00169
Stevens, M. C., Lovejoy, D., Kim, J., Oakes, H., Kureshi, I., & Witt, S. T. (2012). Multiple resting state network functional connectivity abnormalities in mild traumatic brain injury. Brain Imaging and Behavior, 6(2), 293–318. http://doi.org/10.1007/s11682-012-9157-4
Stevens, R. D., & Hannawi, Y. (2016). Coma Prognostication: Looks That Count. Critical Care Medicine, 44(12), 2292–2293. http://doi.org/10.1097/CCM.0000000000002039
Tagliazucchi, E., Chialvo, D. R., Siniatchkin, M., Amico, E., Brichant, J.-F., Bonhomme, V., … Laureys, S. (2016). Large-scale signatures of unconsciousness are consistent with a departure from critical dynamics. Journal of The Royal Society Interface, 13(114), 20151027. http://doi.org/10.1098/rsif.2015.1027
Teasdale, G., & Jennett, B. (1974). ASSESSMENT OF COMA AND IMPAIRED CONSCIOUSNESS. A Practical Scale. The Lancet, 304(7872), 81–84. http://doi.org/10.1016/S0140-6736(74)91639-0
Teasdale, G., Maas, A., Lecky, F., Manley, G., Stocchetti, N., & Murray, G. (2014). The Glasgow Coma Scale at 40 years: Standing the test of time. The Lancet Neurology, 13(8), 844–854. http://doi.org/10.1016/S1474-4422(14)70120-6
The Multi-Society Task Force on PVS. (1994). Medical aspects of the persistent vegetative state. The New England Journal of Medicine, 330(21), 1499–1508. http://doi.org/10.1056/NEJM199405263302107
Thibaut, A., Bruno, M. A., Chatelle, C., Gosseries, O., Vanhaudenhuyse, A., Demertzi, A., … Laureys, S. (2012). Metabolic activity in external and internal awareness networks in severely brain-damaged patients. Journal of Rehabilitation Medicine, 44(6), 487–494. http://doi.org/10.2340/16501977-0940
Thibaut, A., Bruno, M.-A., Ledoux, D., Demertzi, A., & Laureys, S. (2014). tDCS in patients with disorders of consciousness: sham-controlled randomized double-blind study. Neurology, 82(13), 1112–1118. http://doi.org/10.1212/WNL.0000000000000260
Thibaut, A., Di Perri, C., Chatelle, C., Bruno, M. A., Bahri, M. A., Wannez, S., … Laureys, S. (2015). Clinical response to tDCS depends on residual brain metabolism and grey matter integrity in patients with minimally conscious state. Brain Stimulation, 8(6), 1116–1123. http://doi.org/10.1016/j.brs.2015.07.024
Thibaut, A., Wannez, S., Donneau, A. F., Chatelle, C., Gosseries, O., Bruno, M. A., & Laureys, S. (2017). Controlled clinical trial of repeated prefrontal tDCS in patients with chronic minimally conscious state. Brain Injury, 31(4), 466–474. http://doi.org/10.1080/02699052.2016.1274776

180
Toga, A. W., Thompson, P. M., Mori, S., Amunts, K., & Zilles, K. (2006). Towards multimodal atlases of the human brain. Nature Reviews Neuroscience, 7(12), 952–966. http://doi.org/10.1038/nrn2012
Tomaiuolo, F., Cecchetti, L., Gibson, R. M., Logi, F., Owen, A. M., Malasoma, F., … Ricciardi, E. (2016). Progression from Vegetative to Minimally Conscious State Is Associated with Changes in Brain Neural Response to Passive Tasks: A Longitudinal Single-Case Functional MRI Study. Journal of the International Neuropsychological Society, 22(6), 620-30. http://doi.org/10.1017/S1355617716000485
Tomasi, D., & Volkow, N. D. (2010). Functional connectivity density mapping. Proceedings of the National Academy of Sciences, 107(21), 9885–9890. http://doi.org/10.1073/pnas.1001414107
Tomasi, D., & Volkow, N. D. (2011). Functional connectivity hubs in the human brain. NeuroImage, 57(3), 908–917. http://doi.org/10.1016/j.neuroimage.2011.05.024
Tononi, G. (1998). Consciousness and Complexity. Science, 282(5395), 1846–1851. http://doi.org/10.1126/science.282.5395.1846
Tononi, G. (2004). An information integration theory of consciousness. BMC Neuroscience, 5(1), 42. http://doi.org/10.1186/1471-2202-5-42
Tononi, G., & Koch, C. (2008). The neural correlates of consciousness: An update. Annals of the New York Academy of Sciences, 1124, 239-61. doi: 10.1196/annals.1440.004.
Tononi, G., & Koch, C. (2015). Consciousness: here, there and everywhere? Philosophical Transactions of the Royal Society B: Biological Sciences, 370(1668), 20140167–20140167. http://doi.org/10.1098/rstb.2014.0167
Tononi, G., Boly, M., Massimini, M., & Koch, C. (2016). Integrated information theory: from consciousness to its physical substrate. Nature Reviews Neuroscience, 17(7), 450–461. http://doi.org/10.1038/nrn.2016.44
Tsai, Y. H., Yuan, R., Huang, Y. C., Yeh, M. Y., Lin, C. P., & Biswal, B. B. (2014). Disruption of brain connectivity in acute stroke patients with early impairment in consciousness. Frontiers in Psychology, 4(JAN), 1–10. http://doi.org/10.3389/fpsyg.2013.00956
Turgeon, A. F., Lauzier, F., Simard, J.-F., Scales, D. C., Burns, K. E. A., Moore, L., … Canadian Critical Care Trials Group. (2011). Mortality associated with withdrawal of life-sustaining therapy for patients with severe traumatic brain injury: a Canadian multicentre cohort study. CMAJ : Canadian Medical Association Journal = Journal de l’Association Medicale Canadienne, 183(14), 1581–8. http://doi.org/10.1503/cmaj.101786
Tzourio-Mazoyer, N., Landeau, B., Papathanassiou, D., Crivello, F., Etard, O., Delcroix, N., … Joliot, M. (2002). Automated anatomical labeling of activations in SPM using a macroscopic anatomical parcellation of the MNI MRI single-subject brain. NeuroImage, 15(1), 273–289. http://doi.org/10.1006/nimg.2001.0978

181
Uddin, L. Q. (2014). Salience processing and insular cortical function and dysfunction. Nature Reviews Neuroscience, 16(1), 55–61. http://doi.org/10.1038/nrn3857
Uddin, L. Q., Kelly, A. M. C., Biswal, B. B., Castellanos, F. X., & Milham, M. P. (2009). Functional Connectivity of Default Mode Network Components: Correlation, Anticorrelation, and Causality. Human Brain Mapping, 30(2), 625–637. http://doi.org/10.1002/hbm.20531
van den Heuvel, M. P., & Hulshoff Pol, H. E. (2010). Exploring the brain network: A review on resting-state fMRI functional connectivity. European Neuropsychopharmacology, 20(8), 519–534. http://doi.org/10.1016/j.euroneuro.2010.03.008
van den Heuvel, M. P., & Sporns, O. (2011). Rich-club organization of the human connectome. The Journal of Neuroscience, 31(44), 15775–15786. http://doi.org/10.1523/JNEUROSCI.3539-11.2011
van den Heuvel, M. P., & Sporns, O. (2013). Network hubs in the human brain. Trends in Cognitive Sciences, 17(12), 683–696. http://doi.org/10.1016/j.tics.2013.09.012
van den Heuvel, M. P., de Lange, S. C., Zalesky, A., Seguin, C., Yeo, B. T. T., & Schmidt, R. (2017). Proportional thresholding in resting-state fMRI functional connectivity networks and consequences for patient-control connectome studies: Issues and recommendations. NeuroImage, 152(December 2016), 437–449. http://doi.org/10.1016/j.neuroimage.2017.02.005
van den Heuvel, M. P., Mandl, R. C. W., Kahn, R. S., & Hulshoff Pol, H. E. (2009). Functionally linked resting-state networks reflect the underlying structural connectivity architecture of the human brain. Human Brain Mapping, 30(10), 3127–3141. http://doi.org/10.1002/hbm.20737
van den Heuvel, M., Mandl, R., Luigjes, J., & Hulshoff Pol, H. (2008). Microstructural Organization of the Cingulum Tract and the Level of Default Mode Functional Connectivity. Journal of Neuroscience, 28(43), 10844–10851. http://doi.org/10.1523/JNEUROSCI.2964-08.2008
van der Eerden, A. W., Khalilzadeh, O., Perlbarg, V., Dinkel, J., Sanchez, P., Vos, P. E., … Puybasset, L. (2014). White matter changes in comatose survivors of anoxic ischemic encephalopathy and traumatic brain injury: comparative diffusion-tensor imaging study. Radiology, 270(2), 506–16. http://doi.org/10.1148/radiol.13122720
Van Dijk, K. R. A., Hedden, T., Venkataraman, A., Evans, K. C., Lazar, S. W., & Buckner, R. L. (2010). Intrinsic Functional Connectivity As a Tool For Human Connectomics: Theory, Properties, and Optimization. Journal of Neurophysiology, 103(1), 297–321. http://doi.org/10.1152/jn.00783.2009
van Erp, W. S., Lavrijsen, J. C. M., Vos, P. E., Bor, H., Laureys, S., & Koopmans, R. T. C. M. (2015). The vegetative state: Prevalence, misdiagnosis, and treatment limitations. Journal of the American Medical Directors Association, 16(1), 85.e9-85.e14. http://doi.org/10.1016/j.jamda.2014.10.014

182
Van Oort, E. S. B., van Cappellen van Walsum, A. M., & Norris, D. G. (2014). An investigation into the functional and structural connectivity of the Default Mode Network. NeuroImage, 90, 381–389. http://doi.org/10.1016/j.neuroimage.2013.12.051
van Wijk, B. C. M., Stam, C. J., & Daffertshofer, A. (2010). Comparing brain networks of different size and connectivity density using graph theory. PLoS ONE, 5(10). http://doi.org/10.1371/journal.pone.0013701
Vanhaudenhuyse, A., Noirhomme, Q., Tshibanda, L. J. F., Bruno, M. A., Boveroux, P., Schnakers, C., … Boly, M. (2010). Default network connectivity reflects the level of consciousness in non-communicative brain-damaged patients. Brain, 133(1), 161–171. http://doi.org/10.1093/brain/awp313
Varotto, G., Fazio, P., Rossi Sebastiano, D., Avanzini, G., Franceschetti, S., & Panzica, F. (2012). Music and emotion: An EEG connectivity study in patients with disorders of consciousness. Proceedings of the Annual International Conference of the IEEE Engineering in Medicine and Biology Society, EMBS, 5206–5209. http://doi.org/10.1109/EMBC.2012.6347167
Vidal-Piñeiro, D., Valls-Pedret, C., Fernández-Cabello, S., Arenaza-Urquijo, E. M., Sala-Llonch, R., Solana, E., … Bartrés-Faz, D. (2014). Decreased Default Mode Network connectivity correlates with age-associated structural and cognitive changes. Frontiers in Aging Neuroscience, 6(September), 1–17. http://doi.org/10.3389/fnagi.2014.00256
Vogt, B. A., & Laureys, S. (2005). Posterior cingulate, precuneal and retrosplenial cortices: Cytology and components of the neural network correlates of consciousness. Progress in Brain Research, 150, 205-217. http://doi.org/10.1016/S0079-6123(05)50015-3
Vogt, B. A., Vogt, L., & Laureys, S. (2006). Cytology and functionally correlated circuits of human posterior cingulate areas. NeuroImage, 29(2), 452–466. http://doi.org/10.1016/j.neuroimage.2005.07.048
Voss, H. U., Ulu, A. M., Dyke, J. P., Watts, R., Kobylarz, E. J., Mccandliss, B. D., … Schiff, N. D. (2006). Possible axonal regrowth in late recovery from the minimally conscious state, 116(7), 2005–2011. http://doi.org/10.1172/JCI27021.Related
Wang, F., Di, H., Hu, X., Jing, S., Thibaut, A., Di Perri, C., … Laureys, S. (2015). Cerebral response to subject’s own name showed high prognostic value in traumatic vegetative state. BMC Medicine, 13(1), 83. http://doi.org/10.1186/s12916-015-0330-7
Wang, J. (2010). Graph-based network analysis of resting-state functional MRI. Frontiers in Systems Neuroscience, 4(June), 16. http://doi.org/10.3389/fnsys.2010.00016
Wang, Z., Dai, Z., Gong, G., Zhou, C., & He, Y. (2014). Understanding structural-functional relationships in the human brain: a large-scale network perspective. Neuroscientist, 21(3), 290–305. http://doi.org/10.1177/1073858414537560
Wannez, S., Heine, L., Thonnard, M., Gosseries, O., & Laureys, S. (2017). The repetition of behavioral assessments in diagnosis of disorders of consciousness. Annals of Neurology, 81(6), 883–889. http://doi.org/10.1002/ana.24962

183
Warner, M. A., Youn, T. S., Davis, T., Chandra, A., Marquez de la Plata, C., Moore, C., … Diaz-Arrastia, R. (2010). Regionally Selective Atrophy After Traumatic Axonal Injury. Archives of Neurology, 67(11). http://doi.org/10.1001/archneurol.2010.149
Watts, D., & Strogatz, S. (1998). Collective dynamics of “small-world” networks. Nature, 393(6684), 440–442. http://doi.org/10.1038/30918
Weijer, C., Bruni, T., Gofton, T., Young, G. B., Norton, L., Peterson, A., & Owen, A. M. (2016). Ethical considerations in functional magnetic resonance imaging research in acutely comatose patients. Brain, 139(1), 292–299. http://doi.org/10.1093/brain/awv272
Weiss, N., Galanaud, D., Carpentier, A., Naccache, L., & Puybasset, L. (2007). Clinical review : Prognostic value of magnetic resonance imaging in acute brain injury and coma, Crit Care, 11(5): 230. http://doi.org/10.1186/cc6107
Weissenbacher, A., Kasess, C., Gerstl, F., Lanzenberger, R., Moser, E., & Windischberger, C. (2009). Correlations and anticorrelations in resting-state functional connectivity MRI: A quantitative comparison of preprocessing strategies. NeuroImage, 47(4), 1408–1416. http://doi.org/10.1016/j.neuroimage.2009.05.005
Weng, L., Xie, Q., Zhao, L., Zhang, R., Ma, Q., Wang, J., … Huang, R. (2017). Abnormal structural connectivity between the basal ganglia, thalamus, and frontal cortex in patients with disorders of consciousness. Cortex, 90(March), 71–87. http://doi.org/10.1016/j.cortex.2017.02.011
Whitfield-Gabrieli, S., & Nieto-Castanon, A. (2012). Conn: A Functional Connectivity Toolbox for Correlated and Anticorrelated Brain Networks. Brain Connectivity, 2(3), 125–141. http://doi.org/10.1089/brain.2012.0073
Wijdicks, E. F. M. (2001). The diagnosis of brain death. New England Journal of Medicine, 344(16), 1215–1221. http://doi.org/10.1056/NEJM200104193441606
Wijdicks, E. F. M., Bamlet, W. R., Maramattom, B. V., Manno, E. M., & McClelland, R. L. (2005). Validation of a new coma scale: The FOUR score. Annals of Neurology, 58(4), 585–593. http://doi.org/10.1002/ana.20611
Wu, K., Taki, Y., Sato, K., Sassa, Y., Inoue, K., Goto, R., … Fukuda, H. (2011). The overlapping community structure of structural brain network in young healthy individuals. PLoS ONE, 6(5). http://doi.org/10.1371/journal.pone.0019608
Wu, X., Zou, Q., Hu, J., Tang, W., Mao, Y., Gao, L., … Yang, Y. (2015). Intrinsic Functional Connectivity Patterns Predict Consciousness Level and Recovery Outcome in Acquired Brain Injury. The Journal of Neuroscience : The Official Journal of the Society for Neuroscience, 35(37), 12932–46. http://doi.org/10.1523/JNEUROSCI.0415-15.2015
Wu, X., Zhang, J., Cui, Z., Tang, W., Shao, C., Hu, J., …, & He, Y. (2016). White matter deficits underlie the loss of consciousness level and predict recovery outcome in disorders of consciousness. https://arxiv.org/abs/1611.08310

184
Xia, M., Wang, J., & He, Y. (2013). BrainNet Viewer: A Network Visualization Tool for Human Brain Connectomics. PLoS ONE, 8(7). http://doi.org/10.1371/journal.pone.0068910
Yao, S., Song, J., Gao, L., Yan, Y., Huang, C., Ding, H., … Xu, G. (2015). Thalamocortical Sensorimotor Circuit Damage Associated with Disorders of Consciousness for Diffuse Axonal Injury Patients. Journal of the Neurological Sciences, 356(1–2), 168–174. http://doi.org/10.1016/j.jns.2015.06.044
Yeo, S. S., Chang, P. H., & Jang, S. H. (2013). The Ascending Reticular Activating System from Pontine Reticular Formation to the Thalamus in the Human Brain. Frontiers in Human Neuroscience, 7. http://doi.org/10.3389/fnhum.2013.00416
Youn, C. S., Park, K. N., Kim, J. Y., Callaway, C. W., Choi, S. P., Rittenberger, J. C., … Kim, Y. M. (2015). Repeated diffusion weighted imaging in comatose cardiac arrest patients with therapeutic hypothermia. Resuscitation, 96, 1–8. http://doi.org/10.1016/j.resuscitation.2015.06.029
Yu, C., Zhou, Y., Liu, Y., Jiang, T., Dong, H., Zhang, Y., & Walter, M. (2011). Functional segregation of the human cingulate cortex is confirmed by functional connectivity based neuroanatomical parcellation. NeuroImage, 54(4), 2571–2581. http://doi.org/10.1016/j.neuroimage.2010.11.018
Zalesky, A., Fornito, A., Harding, I. H., Cocchi, L., Yücel, M., Pantelis, C., & Bullmore, E. T. (2010). Whole-brain anatomical networks: Does the choice of nodes matter? NeuroImage, 50(3), 970–983. http://doi.org/10.1016/j.neuroimage.2009.12.027
Zhang, H., Dai, R., Qin, P., Tang, W., Hu, J., Weng, X., … Northoff, G. (2017). Posterior cingulate cross- hemispheric functional connectivity predicts the level of consciousness in traumatic brain injury. Scientific Reports, (February), 1–9. http://doi.org/10.1038/s41598-017-00392-5
Zhang, S., & Li, C.S. (2012). Functional connectivity mapping of the human precuneus by resting state fMRI. NeuroImage, 59(4), 3548–3562. http://doi.org/10.1016/j.neuroimage.2011.11.023.Functional
Zhang, S., Ide, J. S., & Li, C. S. R. (2012). Resting-state functional connectivity of the medial superior frontal cortex. Cerebral Cortex, 22(1), 99–111. http://doi.org/10.1093/cercor/bhr088
Zhang, Y., Fan, L., Zhang, Y., Wang, J., Zhu, M., Zhang, Y., … Jiang, T. (2014). Connectivity-based parcellation of the human posteromedial cortex. Cerebral Cortex, 24(3), 719–727. http://doi.org/10.1093/cercor/bhs353
Zheng, Z. S., Reggente, N., Lutkenhoff, E., Owen, A. M., & Monti, M. M. (2017). Disentangling disorders of consciousness: Insights from diffusion tensor imaging and machine learning. Human Brain Mapping, 38(1), 431–443. http://doi.org/10.1002/hbm.23370