Extracellular matrix signatures of human ... - DSpace@MIT
13
Extracellular matrix signatures of human primary metastatic colon cancers and their metastases to liver The MIT Faculty has made this article openly available. Please share how this access benefits you. Your story matters. Citation Naba, Alexandra, Karl R. Clauser, Charles A. Whittaker, Steven A. Carr, Kenneth K. Tanabe, and Richard O. Hynes. "Extracellular matrix signatures of human primary metastatic colon cancers and their metastases to liver." BMC Cancer 2014, 14:518 (18 July 2014). As Published http://dx.doi.org/10.1186/1471-2407-14-518 Publisher BioMed Central Ltd. Version Final published version Citable link http://hdl.handle.net/1721.1/88601 Terms of Use Creative Commons Attribution Detailed Terms http://creativecommons.org/licenses/by/4.0
-
Upload
khangminh22 -
Category
Documents
-
view
1 -
download
0
Transcript of Extracellular matrix signatures of human ... - DSpace@MIT

Extracellular matrix signatures of human primarymetastatic colon cancers and their metastases to liver
The MIT Faculty has made this article openly available. Please share how this access benefits you. Your story matters.
Citation Naba, Alexandra, Karl R. Clauser, Charles A. Whittaker, StevenA. Carr, Kenneth K. Tanabe, and Richard O. Hynes. "Extracellularmatrix signatures of human primary metastatic colon cancers andtheir metastases to liver." BMC Cancer 2014, 14:518 (18 July 2014).
As Published http://dx.doi.org/10.1186/1471-2407-14-518
Publisher BioMed Central Ltd.
Version Final published version
Citable link http://hdl.handle.net/1721.1/88601
Terms of Use Creative Commons Attribution
Detailed Terms http://creativecommons.org/licenses/by/4.0

RESEARCH ARTICLE Open Access
Extracellular matrix signatures of human primarymetastatic colon cancers and their metastases toliverAlexandra Naba1,2*, Karl R Clauser3, Charles A Whittaker4, Steven A Carr3, Kenneth K Tanabe5
and Richard O Hynes1,2*
Abstract
Background: Colorectal cancer is the third most frequently diagnosed cancer and the third cause of cancer deathsin the United States. Despite the fact that tumor cell-intrinsic mechanisms controlling colorectal carcinogenesis havebeen identified, novel prognostic and diagnostic tools as well as novel therapeutic strategies are still needed tomonitor and target colon cancer progression. We and others have previously shown, using mouse models, that theextracellular matrix (ECM), a major component of the tumor microenvironment, is an important contributor totumor progression. In order to identify candidate biomarkers, we sought to define ECM signatures of metastaticcolorectal cancers and their metastases to the liver.
Methods: We have used enrichment of extracellular matrix (ECM) from human patient samples and proteomics todefine the ECM composition of primary colon carcinomas and their metastases to liver in comparison with normalcolon and liver samples.
Results: We show that robust signatures of ECM proteins characteristic of each tissue, normal and malignant, canbe defined using relatively small samples from small numbers of patients. Comparisons with gene expression datafrom larger cohorts of patients confirm the association of subsets of the proteins identified by proteomic analysiswith tumor progression and metastasis.
Conclusions: The ECM protein signatures of metastatic primary colon carcinomas and metastases to liver definedin this study, offer promise for development of diagnostic and prognostic signatures of metastatic potentialof colon tumors. The ECM proteins defined here represent candidate serological or tissue biomarkers and potentialtargets for imaging of occult metastases and residual or recurrent tumors and conceivably for therapies.Furthermore, the methods described here can be applied to other tumor types and can be used to investigateother questions such as the role of ECM in resistance to therapy.
Keywords: Extracellular matrix, Proteomics, Colorectal cancer, Metastasis, Tumor microenvironment, Matrisome
BackgroundWith more than 140,000 new cases diagnosed in 2012,colorectal cancer is the third most commonly diagnosedcancer type in both men and women in the UnitedStates. Thanks to prevention and, particularly, early de-tection, there has been a steady decrease in the number
of deaths due to colorectal cancer over the last two de-cades. And yet, in 2012 it was estimated that colorectalcancer would claim the lives of 50,000 patients. Severalgenes have been directly implicated in the etiology of colo-rectal cancer and, despite the fact that tumor-intrinsicmolecular mechanisms controlling colorectal carcinogen-esis have been identified [1,2], novel prognostic and diag-nostic tools as well as novel therapeutic strategies are stillneeded to prevent colon cancer progression.Proteomics has become a method of choice to identify
cancer-related biomarkers [3]. Within the last five years,
* Correspondence: [email protected]; [email protected] H. Koch Institute for Integrative Cancer Research, MassachusettsInstitute of Technology, Cambridge, MA 02139, USA2Howard Hughes Medical Institute, Massachusetts Institute of Technology,02139 Cambridge, MA, USAFull list of author information is available at the end of the article
© 2014 Naba et al.; licensee BioMed Central Ltd. This is an Open Access article distributed under the terms of the CreativeCommons Attribution License (http://creativecommons.org/licenses/by/4.0), which permits unrestricted use, distribution, andreproduction in any medium, provided the original work is properly credited. The Creative Commons Public DomainDedication waiver (http://creativecommons.org/publicdomain/zero/1.0/) applies to the data made available in this article,unless otherwise stated.
Naba et al. BMC Cancer 2014, 14:518http://www.biomedcentral.com/1471-2407/14/518

over 35 studies published in peer-reviewed journal appliedglobal proteomics techniques to the study of colorectalsamples from patients (reviewed in [4,5]). These studiesrevealed a certain number of proteins (including extracel-lular matrix proteins, see Results and discussion section)up or down-regulated in cancer samples as compared withnormal samples, which represent potential biomarkers.However, as discussed in the review by De Wit and col-leagues, these studies have not yet been successfully trans-lated to the clinic [4].The extracellular matrix (ECM) is a complex meshwork
of cross-linked proteins providing architectural supportfor cells. In addition, ECM proteins bind and presentgrowth factors to cells, thus providing both biophysicaland biochemical cues that are major regulators of cellularbehavior [6,7]. The ECM is a major component of thetumor microenvironment and exerts many roles duringtumor progression: it supports proliferation and survivalof tumor cells; it contributes to the formation of thecancer stem cell niche and thus sustains primary tumorgrowth; it participates by its nature and/or architecture inthe formation of a pro-invasive environment; and, finally,it contributes to the invasion of distant sites by participat-ing in the formation of a microenvironment that willsupport tumor cell seeding and growth [8-10]. Classicalpathology has used excessive ECM deposition (desmopla-sia) as a marker of tumors with poor prognosis long be-fore the composition and the complexity of the ECM waseven uncovered. Recent studies have also suggested thatthe ECM can act as a barrier to drug delivery and can con-fer chemo-resistance to tumors [11,12]. The ECM thusappears of great interest for discovery of ways to predict,diagnose and cure cancer.In order to characterize the ECM composition of tu-
mors, we have developed a proteomics-based approachand have shown, using mouse models, that we can iden-tify 100–150 ECM proteins in any given tissue or tumorsample [13]. Using human melanoma and mammary car-cinoma xenograft models, we have demonstrated thattumors of different metastatic ability differ in both tumor-and stroma-derived ECM components [13,14]. Moreover,we showed that several tumor-derived ECM proteins,characteristic of highly metastatic tumors, play importantcausal roles in metastatic dissemination [14].Having developed these systematic methods, we now
wished to analyze the composition of the ECM of humanpatient samples. We report here the characterization ofthe ECM composition of metastatic colorectal cancersamples (both primary tumors and metastases to liver)and paired normal tissues (normal colon and liver tissue).We have been able to identify consistent changes in theECM of i) colon tumors as compared with normal colonECM; ii) primary tumors as compared with metastases de-rived from them. Based on these changes, we derived
ECM protein signatures of primary colon carcinoma andprimary colon tumor metastasis to liver. Comparisons ofthese signatures with available clinical gene expressionarray data show that subsets of these signatures correlatewell with tumor progression and metastasis. We believethat these data sets will lead to the identification of moreprecise predictive signatures and to the development ofassays, in particular serological measurements or immu-nohistochemical assays, which could be used by patholo-gists to improve cancer patient management and care.
MethodsPatient samplesFor each of the three patients included in this study, weobtained a set of three samples: normal colon, colontumor and its metastasis to liver. None of the patientshad received chemotherapy prior to surgery and samplecollection and were all diagnosed with stage IV meta-static colon cancer. When available, we obtained dupli-cate samples of some tissues. Samples were between25 mg and 85 mg. To obtain enough material tocharacterize the composition of the normal liver ECM,we generated two pools of samples from 4 and 5 healthypatients respectively (reaching a total of approximately450 mg per pool). Informed consent was obtained fromall of the patients and none of the specimens came fromminors. The anonymized specimens were obtained fromthe MGH tissue bank and were removed for medicalreasons unrelated to this project. The specimens wereanalyzed in accordance with a protocol approved by theMassachusetts General Hospital’s Institutional ReviewBoard (IRB).
Tissue preparation and ECM protein enrichmentThe tissue and tumor samples were homogenized with aBullet Blender (Next Advance, Averill Park, NY) accordingto the manufacturer’s instructions. Sequential extractionsof frozen samples of tumors were performed using theCNMCS compartmental protein extraction kit (Millipore,Billerica, MA) as previously described [13]. In brief, fro-zen samples were homogenized and extracted sequen-tially to remove preferentially (1) cytosolic proteins, (2)nuclear proteins, (3) membrane proteins, (4) cytoskel-etal proteins leaving a final insoluble fraction enrichedfor ECM proteins, although different tissues behavesomewhat differently in the ease of extraction so thatproteins sometimes appear in more than one fraction.The effectiveness of extraction of specific proteins wasmonitored by immunoblotting using the following anti-bodies: rabbit anti-collagen I, mouse anti-GAPDH andrabbit anti-histones (Millipore, Billerica, MA), the rabbitanti-actin antibody (serum 14–1) was generated in ourlaboratory.
Naba et al. BMC Cancer 2014, 14:518 Page 2 of 12http://www.biomedcentral.com/1471-2407/14/518

Protein digestion, peptide fractionation, and massspectrometryThe ECM-enriched samples were solubilized in urea,reduced, digested with PNGaseF, Lys-C, and trypsin aspreviously described [13]. The resulting peptides (~50μg) were separated into 11 fractions by off-gel electro-phoresis (OGE) according to isoelectric point over a pHrange of 3–10 [13]. Each OGE fraction was analyzed byLC-MS/MS with an LTQ Orbitrap XL mass spectrom-eter (Thermo Fisher Scientific, San Jose, CA). Massspectra were interpreted with Spectrum Mill. MS/MSspectra were searched against a UniProt database con-taining human (78,369 entries) sequences downloadedfrom the UniProt web site on June 30, 2010 with a set ofcommon laboratory contaminant proteins (73 entries)appended. Peptides identified with a false discoveryrate < 1.6% were assembled into identified proteins, andannotated as being ECM-derived or not as previouslydescribed [13]. Detailed information is provided asAdditional file 1: Supplementary Methods. The rawmass spectrometry data have been deposited in the pub-lic proteomics repository MassIVE (http://massive.ucsd.edu) using the identifier: MSV000078555. The datashould be accessible at ftp://MSV000078555:[email protected].
Gene Set enrichment analysisGene Set Enrichment Analysis was performed usingGSEA v2.0.12 (http://www.broadinstitute.org/gsea). Weidentified four clinical gene expression datasets whichreported measurements on both primary colon tumorsand metastases to liver. The sample type was used todefine phenotypic classes for comparison. Probe setswere collapsed to unique gene symbols. Gene sets corre-sponding to the proteins in our ECM signatures of pri-mary metastatic colon tumors (37 genes) or metastasesto liver (7 genes) were created and the distributions ofthe genes for each of these signatures against the rank-ordered metastasis vs. primary colon tumor comparisonswere characterized using GSEA with the default settings.A positive normalized enrichment score indicates en-richment in metastasis samples. A negative normalizedenrichment score indicates enrichment in primary colontumor samples. Each gene in the proteomics-derivedgene set is ordered by its position in the ranked list ofgenes from the dataset and is assigned a rank metricscore reflecting its position and the number of probes inthe expression dataset. The leading-edge subsets of genesare those genes that appear in the ranked list before (forpositive enrichment scores) or after (for negative enrich-ment scores) the point at which the running sum reachesits maximum deviation from zero. The leading-edge sub-set can thus be interpreted as the core that accounts forthe gene set’s enrichment signal. Note that the analysis
includes only those genes in the gene set that are also inthe expression dataset. The raw GSEA data may be down-loaded from: http://rowley.mit.edu/Hynes/Naba_GSEA_ColonCancer/.
Results and discussionProteomic analyses of ECM from normal tissues andtumors from colorectal patient samplesWe obtained from Massachusetts General Hospital’s tis-sue bank patient-matched metastatic colorectal cancersamples (primary tumor and paired metastases to liver)and normal colonic tissue from three patients. We alsoobtained normal liver tissue from healthy donors (seeMethods). ECM proteins were enriched from normaltissues or tumors using the subcellular fractionationprotocol previously described [13]. Figure 1A shows theefficiency of the sequential extraction protocol leading tosignificant enrichment of collagen I (other ECM proteinswere similarly retained in the final insoluble fraction;data not shown) and concomitant depletion of intracel-lular proteins (actin, GAPDH, histones) in the finalECM-enriched samples.The composition of the ECM-enriched fractions ob-
tained was subsequently characterized by mass spec-trometry. The complete proteomic data sets and thematrisome subsets (ECM and ECM-associated proteins)are presented in Additional files 2 and 3.
Evaluation of intra-patient reproducibilityTo evaluate the reproducibility of our approach, we con-ducted analyses on two distinct pieces from each tissueor tumor from patient 1 (Figure 1B-D). We observed goodoverlap between the ECM proteins detected in each of theduplicate samples analyzed. This was true not only for theduplicate normal colon samples analyzed (Figure 1B) butalso for the duplicate colon tumor samples (Figure 1C)and the duplicate metastasis samples (Figure 1D). We ob-served similar reproducibility for normal colon and colontumor samples from patient 2 (Additional file 4). Of note,we had observed similar results from normal murine lungand colon tissues [13]. These results argue against signifi-cant intra-tumoral heterogeneity detectable at this level ofanalysis; it appears that the sample size (25-85 mg of tis-sue) was sufficient to average out any spatial heterogeneityin the ECM. It is also worth noting that we detected moreECM proteins in the tumor samples (primary colon tumorand metastasis to liver) than in the normal colon samples,which may reflect the desmoplasia that often accompaniestumor progression.
Comparison of the ECM composition of tissues andtumors across different patientsWe next wanted to compare the ECM composition ofsamples (normal tissues or tumors) from different patients.
Naba et al. BMC Cancer 2014, 14:518 Page 3 of 12http://www.biomedcentral.com/1471-2407/14/518

Therefore, we extended our analyses to samples from twoadditional patients and compared the compositions ofthe ECM of normal colon (Figure 2A), primary colorec-tal tumor (Figure 2B), and metastases to liver (Figure 2C)with the data obtained for patient 1. When we com-pared the ECM composition of the normal colon sam-ples from three patients, we identified a set of 89 ECMproteins present in all three samples (Figure 2A). Inaddition we identified subsets of proteins present in twoout of three samples (representing 10% to 12% of theproteins) and, finally, about 12% of the ECM proteinsdetected were patient-specific. The comparison of three
primary metastatic colorectal tumor samples from threepatients revealed that, again, the majority of proteinsdetected were found in all three samples (122 proteins;Figure 2B). We also identified subsets of proteins presentin two out of three samples and finally, depending on thesample, 8% to 15% of the ECM proteins detected werepatient-specific. The inter-patient variability was greaterfor the metastasis samples (Figure 2C). Although we de-tected a set of 71 proteins common to all three metastasissamples analyzed, the number of ECM proteins detectedin the metastasis from patient 1 was twice the number de-tected in patient 2 and 1.5 times the number of proteins
Figure 1 ECM protein enrichment from tissues and tumors and reproducibility of the proteomic analysis. A. The ECM protein enrichmentand sequential extraction of intracellular components (steps 1 to 4) were monitored in each sample (normal colon, colon tumor, metastasis toliver and normal liver) by immunoblotting for collagen I (ECM marker), actin (cytoskeletal marker), GAPDH (cytosolic marker), and histones (nuclearmarker). The insoluble fraction remaining after serial extraction was enriched for ECM proteins and largely depleted for intracellular components.B-D. Intra-patient reproducibility was assessed by comparing the ECM compositions of two distinct pieces of the same normal colon (B), primarycolon tumor (C) or metastasis to liver (D) from patient 1. Venn diagrams show the intra-patient reproducibility in terms of matrisome proteins.
Naba et al. BMC Cancer 2014, 14:518 Page 4 of 12http://www.biomedcentral.com/1471-2407/14/518

Figure 2 (See legend on next page.)
Naba et al. BMC Cancer 2014, 14:518 Page 5 of 12http://www.biomedcentral.com/1471-2407/14/518

detected in patient 3. For each of the three tissue types an-alyzed, we observed a striking overlap, although it is worthnoting that the inter-patient overlap is notably greater fornormal colon samples than it is for colon tumor andmetastasis samples, which may reflect the heterogeneityamong tumor samples (primary tumors or metastases) ascompared with normal tissues (see Conclusions).Because of the very small amount of extracellular matrix
in the normal liver, we were not able to analyze reliablythe liver ECM from individual patient samples (on average50 – 75 mg). Instead, and because of the high inter-patient overlap observed with normal colon samples, wegenerated two pools of normal liver samples from healthydonors (pools were composed of 4 and 5 liver samples, re-spectively, and were approximately 450 mg each). ECMproteins could successfully be enriched from these pooledliver samples (Figure 1A). Moreover, this strategy allowedus to obtain enough ECM material to be analyzed by massspectrometry. We identified 115 and 174 ECM proteins ineach pool, and 105 of them were detected in both pools(Figure 2D).After evaluating the similarity among samples obtained
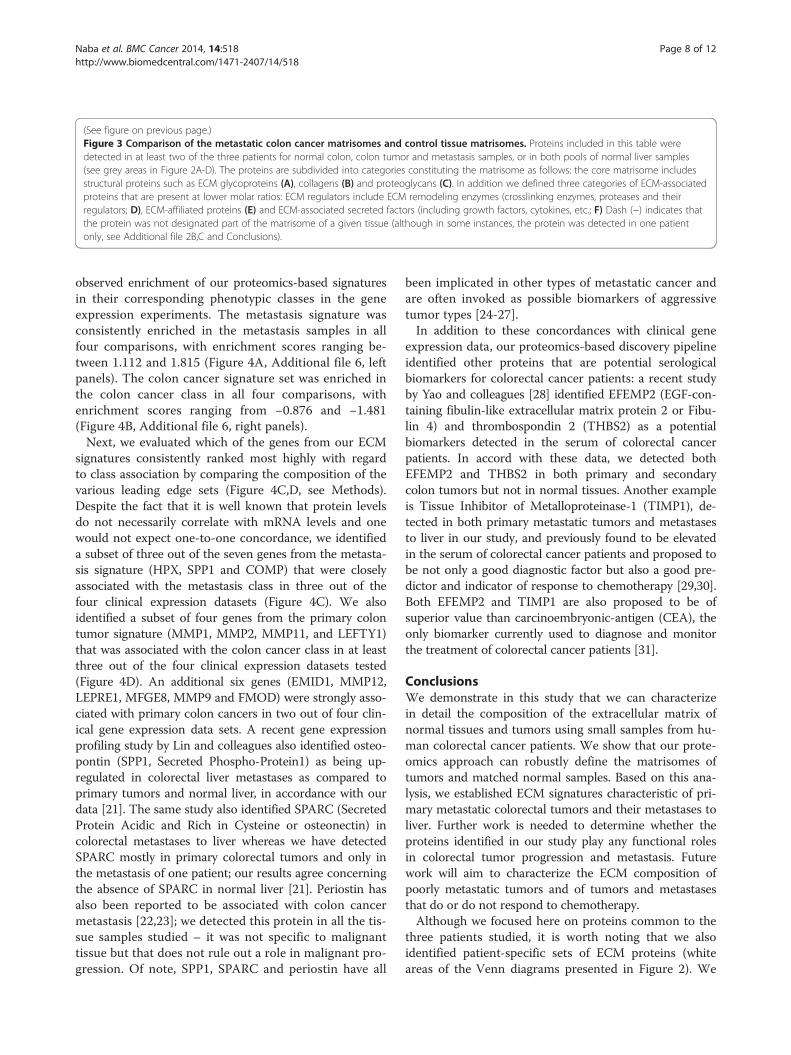
from different patients, we wanted to compare the ECMcompositions of normal tissues with those of primary andsecondary tumors. We therefore defined, for each tissueor tumor type, its “matrisome” as the ensemble of proteinsdetected in at least two of the three patients studied.According to this definition, the matrisome of normal hu-man colon comprises 122 proteins, the matrisome of pri-mary colon tumors 187 proteins and the matrisome ofmetastases 135 proteins (grey areas in Figure 2A-C). Todefine the normal liver matrisome, we took the intersec-tion (105 proteins) of the two pools analyzed (Figure 2D).We further subdivided each matrisome list into theprotein categories we previously defined [13,15]: ECMglycoproteins, collagens and proteoglycans for corematrisome proteins and ECM-affiliated proteins, ECMregulators and secreted factors for ECM-associated pro-teins (Figure 3) [13,15].
Definition of signatures of metastatic colorectal cancerand associated metastasis to liverThe comparison of the matrisome compositions ofnormal tissues (colon and liver) and colorectal tumors
(primary tumors and metastases) revealed that a largefraction of proteins (69) are ubiquitously expressed anddetected in all four tissue types (Figure 2E, Figure 3).We observed that half of the glycoproteins detected(Figure 3A) as well as most of the collagens (Figure 3B)and proteoglycans (Figure 3C) are common to the fourtissue types. Components associated with the extracellu-lar matrix, such as ECM regulators (that include ECMremodeling enzymes) or ECM-affiliated proteins andECM-associated secreted factors (growth factors, cyto-kines etc.) are present at lower abundance in the ECM-rich samples (Additional file 2B) and are, for the mostpart, restricted to certain tissues (Figure 3, Additionalfile 2B). This comparison also revealed that the ECMcomposition of metastases to liver resembles more theECM of primary colorectal tumors than that of normalliver. Importantly, we identified subsets of tumor-specificproteins: 37 proteins were characteristic of the colontumor matrisome, 7 proteins were characteristic of themetastasis matrisome and 23 proteins were characteristicof both primary tumors and metastases (Figure 2E,Figure 3, and Additional file 2C).
Gene Set enrichment analyses identify subsets ofECM-encoding genes strongly correlated with primarycolon tumors or their metastases to liverWe next sought to explore potential correlations be-tween our data and other clinical data sets. Accordingly,we used Gene Set Enrichment Analysis [16] to evaluatethe relationship between the proteomics-derived ECMsignatures for i) colon primary tumors and ii) metastases(Figure 2E, Figure 3; see Methods for further details)and microarray-based gene expression studies involvinglarge cohorts of patients. The four relevant clinical geneexpression data sets analyzed [17-20] represent a total of289 primary colon tumor samples and 120 metastasissamples (Additional file 5). Comparisons were set up be-tween colon tumor metastases to liver and primary tumorsamples; hence a positive enrichment score will indicateenrichment in metastasis samples and a negative enrich-ment score, enrichment in primary colon tumor samples(Figure 4A,B and Additional file 5). The distributions ofgenes in our two signatures within these comparisonswere characterized with GSEA and we consistently
(See figure on previous page.)Figure 2 Definition and comparison of the matrisomes of the metastatic colon cancer and control tissue. A-C. Venn diagrams show thenumbers of ECM proteins overlapping among the ECM-enriched fractions of the three patients’ normal colons (A), primary colon tumors (B) andmetastases to liver (C), respectively. For patients for whom we analyzed duplicate samples of the same tissue or tumor, we chose the sample withthe most abundant ECM protein content (see Additional file 2). We define the matrisome of a given tissue as the ensemble of proteins detectedin at least two out of the three patients (grey). D. Venn diagram shows the number of proteins overlapping between the ECM of two poolscomposed of 4 and 5 normal liver samples respectively. The normal liver matrisome is composed of 105 proteins (grey). E. Venn diagram showscomparisons among the metastatic colon cancer matrisomes (primary colon tumor and associated metastases to liver) and control tissuematrisomes (normal colon and normal liver). ECM signatures of primary metastatic colon tumors and associated metastases are listed (see alsoAdditional file 2C).
Naba et al. BMC Cancer 2014, 14:518 Page 6 of 12http://www.biomedcentral.com/1471-2407/14/518

Nor
mal
C
olon
Nor
mal
Li
ver
Col
on
Tum
orLi
ver
Met
.
COL10A1COL12A1COL14A1COL16A1COL18A1COL1A1COL1A2COL28A1COL3A1COL4A1COL4A2COL4A3COL5A1COL5A2COL6A1COL6A2COL6A3COL7A1COL15A1 - COL19A1 - COL25A1 - COL4A4 - COL4A6 - COL8A1 - COL8A2 - COL9A1 - COL9A3 - COL13A1 - - COL21A1 - - COL23A1 - - COL9A2 - - COL24A1 - - COL17A1 - - COL22A1 - - COL6A6 - - -
Nor
mal
C
olon
Nor
mal
Li
ver
Col
on
Tum
or
Live
rM
et.
DPTECM1EFEMP1ELNEMILIN1EMILIN2FBLN1FBLN2FBLN5FBN1FGAFGBFGGFN1LAMA4LAMA5LAMB1LAMB2LAMC1LTBP1MFAP4NID1POSTNTGFBITINAGL1TNCTNXBVTNNPNT -
THSD4 -
VWA1 -
IGFBP7 -
AEBP1 -
LAMB3 -
LAMC2 -
LTBP4 -
MFAP2 -
MFAP5 -
SRPX2 -
SRPX - -
LAMA2 - -
MATN2 - -
VWF - -
AGRN - -
EFEMP2 - -
HMCN1 - -
LTBP2 - -
MXRA5 - -
PXDN - -
THBS2 - -
EMILIN3 - - -
C15orf44 - - -
EMID1 - - -
FGL2 - - -
MFGE8 - - -
MMRN1 - - -
MMRN2 - - -
PAPLN - - -
SPARC - - -
SVEP1 - - -
COMP - - -
FNDC1 - - -
IGFALS - - -
SPP1 - - -
Nor
mal
C
olon
Nor
mal
Li
ver
Col
on
Tum
or
Live
rM
et.
ASPN
BGN
DCN
HSPG2
LUM
PRELP
PRG2
PRG3 -
VCAN -
OGN - -
PRG4 - -
FMOD - - -
Nor
mal
C
olon
Nor
mal
Li
ver
Col
on
Tum
orLi
ver
Met
.
ANXA1ANXA11ANXA2ANXA6LGALS1LGALS4ANXA4 - C1QC - LGALS3 - LGALS9 - - LMAN1 - - MUC2 - - GREM1 - - ANXA7 - - ANXA5 - - C1QA - - C1QB - - GPC4 - - MUC16 - - SFTPD - - SEMA3B - - - CLEC11A - - - CSPG4 - - - FCN1 - - - MUC13 - - - PLXDC2 - - - PLXNB2 - - - PLXND1 - - - C1QTNF5 - - - HPX - - -
Nor
mal
C
olon
Nor
mal
Li
ver
Col
on
Tum
orLi
ver
Met
.
A2MAMBPCTSBCTSGF9HRGPLGSERPINA1TGM2TIMP3ITIH1 - ADAMTSL4 - CTSD - ELANE - KNG1 - SERPING1 - F13A1 - ITIH2 - MMP19 - SERPINH1 - ITIH5 - - CTSH - - CTSS - - F12 - - SERPINC1 - - AGT - - CSTB - - ITIH4 - - F2 - - HTRA1 - - LOXL2 - - PLOD1 - - SERPINB1 - - SERPINE2 - - ST14 - - TIMP1 - - ADAMDEC1 - - - C17orf58 - - - CTSF - - - CTSL1 - - - CTSZ - - - F7 - - - ADAM10 - - - ADAM9 - - - ADAMTSL1 - - - LEPRE1 - - - LOXL1 - - - MMP1 - - - MMP11 - - - MMP12 - - - MMP2 - - - MMP9 - - - PLOD2 - - - PLOD3 - - - SERPINA3 - - - SERPINF1 - - - BMP1 - - -
Nor
mal
C
olon
Nor
mal
Li
ver
Col
on
Tum
orLi
ver
Met
.
S100A9 -
CXCL12 -
S100A4 - -
S100A6 - -
WNT2B - -
MST1 - -
ANGPTL6 - -
S100A8 - -
TCHH - -
HCFC1 - -
CBLN4 - - -
EGFL7 - - -
INHBE - - -
LEFTY1 - - -
MEGF8 - - -
S100A11 - - -
S100A14 - - -
S100A16 - - -
TGFB1 - - -
A B
C
F
D E
Figure 3 (See legend on next page.)
Naba et al. BMC Cancer 2014, 14:518 Page 7 of 12http://www.biomedcentral.com/1471-2407/14/518
observed enrichment of our proteomics-based signaturesin their corresponding phenotypic classes in the geneexpression experiments. The metastasis signature wasconsistently enriched in the metastasis samples in allfour comparisons, with enrichment scores ranging be-tween 1.112 and 1.815 (Figure 4A, Additional file 6, leftpanels). The colon cancer signature set was enriched inthe colon cancer class in all four comparisons, withenrichment scores ranging from −0.876 and −1.481(Figure 4B, Additional file 6, right panels).Next, we evaluated which of the genes from our ECM
signatures consistently ranked most highly with regardto class association by comparing the composition of thevarious leading edge sets (Figure 4C,D, see Methods).Despite the fact that it is well known that protein levelsdo not necessarily correlate with mRNA levels and onewould not expect one-to-one concordance, we identifieda subset of three out of the seven genes from the metasta-sis signature (HPX, SPP1 and COMP) that were closelyassociated with the metastasis class in three out of thefour clinical expression datasets (Figure 4C). We alsoidentified a subset of four genes from the primary colontumor signature (MMP1, MMP2, MMP11, and LEFTY1)that was associated with the colon cancer class in at leastthree out of the four clinical expression datasets tested(Figure 4D). An additional six genes (EMID1, MMP12,LEPRE1, MFGE8, MMP9 and FMOD) were strongly asso-ciated with primary colon cancers in two out of four clin-ical gene expression data sets. A recent gene expressionprofiling study by Lin and colleagues also identified osteo-pontin (SPP1, Secreted Phospho-Protein1) as being up-regulated in colorectal liver metastases as compared toprimary tumors and normal liver, in accordance with ourdata [21]. The same study also identified SPARC (SecretedProtein Acidic and Rich in Cysteine or osteonectin) incolorectal metastases to liver whereas we have detectedSPARC mostly in primary colorectal tumors and only inthe metastasis of one patient; our results agree concerningthe absence of SPARC in normal liver [21]. Periostin hasalso been reported to be associated with colon cancermetastasis [22,23]; we detected this protein in all the tis-sue samples studied – it was not specific to malignanttissue but that does not rule out a role in malignant pro-gression. Of note, SPP1, SPARC and periostin have all
been implicated in other types of metastatic cancer andare often invoked as possible biomarkers of aggressivetumor types [24-27].In addition to these concordances with clinical gene
expression data, our proteomics-based discovery pipelineidentified other proteins that are potential serologicalbiomarkers for colorectal cancer patients: a recent studyby Yao and colleagues [28] identified EFEMP2 (EGF-con-taining fibulin-like extracellular matrix protein 2 or Fibu-lin 4) and thrombospondin 2 (THBS2) as a potentialbiomarkers detected in the serum of colorectal cancerpatients. In accord with these data, we detected bothEFEMP2 and THBS2 in both primary and secondarycolon tumors but not in normal tissues. Another exampleis Tissue Inhibitor of Metalloproteinase-1 (TIMP1), de-tected in both primary metastatic tumors and metastasesto liver in our study, and previously found to be elevatedin the serum of colorectal cancer patients and proposed tobe not only a good diagnostic factor but also a good pre-dictor and indicator of response to chemotherapy [29,30].Both EFEMP2 and TIMP1 are also proposed to be ofsuperior value than carcinoembryonic-antigen (CEA), theonly biomarker currently used to diagnose and monitorthe treatment of colorectal cancer patients [31].
ConclusionsWe demonstrate in this study that we can characterizein detail the composition of the extracellular matrix ofnormal tissues and tumors using small samples from hu-man colorectal cancer patients. We show that our prote-omics approach can robustly define the matrisomes oftumors and matched normal samples. Based on this ana-lysis, we established ECM signatures characteristic of pri-mary metastatic colorectal tumors and their metastases toliver. Further work is needed to determine whether theproteins identified in our study play any functional rolesin colorectal tumor progression and metastasis. Futurework will aim to characterize the ECM composition ofpoorly metastatic tumors and of tumors and metastasesthat do or do not respond to chemotherapy.Although we focused here on proteins common to the
three patients studied, it is worth noting that we alsoidentified patient-specific sets of ECM proteins (whiteareas of the Venn diagrams presented in Figure 2). We
(See figure on previous page.)Figure 3 Comparison of the metastatic colon cancer matrisomes and control tissue matrisomes. Proteins included in this table weredetected in at least two of the three patients for normal colon, colon tumor and metastasis samples, or in both pools of normal liver samples(see grey areas in Figure 2A-D). The proteins are subdivided into categories constituting the matrisome as follows: the core matrisome includesstructural proteins such as ECM glycoproteins (A), collagens (B) and proteoglycans (C). In addition we defined three categories of ECM-associatedproteins that are present at lower molar ratios: ECM regulators include ECM remodeling enzymes (crosslinking enzymes, proteases and theirregulators; D), ECM-affiliated proteins (E) and ECM-associated secreted factors (including growth factors, cytokines, etc.; F) Dash (−) indicates thatthe protein was not designated part of the matrisome of a given tissue (although in some instances, the protein was detected in one patientonly, see Additional file 2B,C and Conclusions).
Naba et al. BMC Cancer 2014, 14:518 Page 8 of 12http://www.biomedcentral.com/1471-2407/14/518

Figure 4 (See legend on next page.)
Naba et al. BMC Cancer 2014, 14:518 Page 9 of 12http://www.biomedcentral.com/1471-2407/14/518

hypothesize that these may correlate with some propertyof the tumors (particular region sampled, stage, etc.) thatis beyond the scope of this study to determine due tothe small number of tumors examined. Nonetheless, onecan postulate that within the signatures defined here aresets of ECM proteins that could serve as novel bio-markers of metastatic potential in primary tumor biop-sies and could, furthermore, be used to detect smalldisseminated metastases that remain undetected bycurrent imaging methods. In order to test these postu-lates, one needs screening of larger cohorts of patientsfor presence or absence of these ECM proteins. Our ini-tial comparisons between the ECM protein signaturesand mRNA expression datasets support the correlationwith metastatic progression of some of the proteins de-fined – others may well correlate when examined at theprotein level (e.g., by immunohistochemistry of tumor tis-sue microarrays or by serological measurements). ECMproteins are particularly favorable candidate biomarkerssince they are abundant, are laid down in characteristicpatterns and are readily accessible. ECM protein levels mayindeed be more appropriate indicators of tumor propertiesthan mRNA levels since proteins are the operative mol-ecules in the tumor microenvironment and changesoccur at that level that are not reflected at the mRNAlevel because of post-transcriptional processes (transla-tion, stability etc.).Methods developed by others have already been used ef-
fectively to target tumor vascular-specific ECM proteins(splice variants of fibronectin or tenascin) for use in im-aging tumors and metastases in mouse models and pa-tients and also for targeting isotopes, drugs and cytokinesto tumors for therapeutic applications [32]. A recent studydemonstrated that administration of interleukin 12 coupledto an antibody directed against a tumor-specific splicedisoform of fibronectin (a major ECM protein) led to the re-gression of various tumors including subcutaneous CT26colon carcinoma tumors [33]. Such approaches could pro-vide sorely needed new strategies for the treatment andmanagement of metastatic colon cancers and we hope thatthe definition of larger numbers of ECM biomarkers willcontribute to improvements in colon cancer patients’ diag-nosis, prognosis, treatment and survival.
Availability of supporting dataIn addition to the supporting data included as additionalfiles, the raw GSEA data may be downloaded from:http://rowley.mit.edu/Hynes/Naba_GSEA_ColonCancer/.The raw mass spectrometry data accompanying this publi-cation have been deposited in the public proteomicsrepository MassIVE (http://massive.ucsd.edu) using theidentifier: MSV000078555. The data should be access-ible at ftp://MSV000078555:[email protected].
Additional files
Additional file 1: Supplementary Methods related to the Proteomicanalysis of ECM-enriched samples.
Additional file 2: A. Complete proteomics data set. Proteins aresorted by matrisome divisions (i.e. core matrisome, matrisomeassociated or other, column A), matrisome categories (column B) andoverall confidence score (column BS). B. Subset of extracellular matrixproteins detected in any samples. Data were extracted from Additionalfile 2A. C. Abundance of ECM proteins characteristic of metastatic colontumors, metastases or metastatic colon tumors and metastases (seeFigure 2E). Numbers represent the abundance of each protein andcorrespond to the sum of the abundance across the independentsamples for each protein (calculated from Additional file 2B, columns F,N and R for normal colon samples; columns V, AD and AL for colontumor samples; from columns AT, BB and BF for colon tumor metastasisto liver samples and columns BJ and BN for normal liver samples). Dash(−) indicates that the protein was detected in none of the independentsamples. White cells are indicative of proteins that were detected in onepatient only and thus do not qualify to be part of the matrisome of agiven tissue.
Additional file 3: Detailed list of all of the confidently identifiedpeptide spectrum matches (PSMs) from the LC-MS/MS runs of eachof the normal tissues and tumor samples analyzed. Due to its largesize, the excel file has been deposited in the public proteomicsrepository MassIVE and is accessible in the Results directory at ftp://[email protected]/.
Additional file 4: Intra-patient reproducibility (Patient 2). Venndiagrams represent the intra-patient reproducibility assessed by comparingthe ECM composition of two distinct pieces of the same colon tumor(A) or metastasis (B) from patient 2.
Additional file 5: A. List of publicly available clinical geneexpression datasets used for GSEA. B. Values indicate for each gene ofthe signatures its rank metric scores (used to build Figure 4C and D).
Additional file 6: GSEA Enrichment Plots. Enrichment plots generatedby comparing the metastasis ECM gene set (left panels) and the primarymetastatic colon cancer gene set (right panels) defined in this study withfour publicly available clinical gene expression data sets (see Additionalfile 5).
(See figure on previous page.)Figure 4 Gene Set Enrichment Analysis. Representative enrichment plot resulting from the comparison of the ECM proteomic signature ofmetastasis (A) or the ECM primary metastatic colon tumor signature (B) with the gene expression data set GSE49355 comprising 20 primarycolon adenocarcinoma samples and 19 paired liver metastasis samples. The position of the leading edge is highlighted and the direction of thecorrelation indicated. The positions of the ECM signature genes along the class comparison for each gene set are indicated by vertical lines.C - D. Heat map shows enrichment of the ECM metastasis signature in metastasis microarray samples (C) and of the ECM primary colon cancersignature in primary colon cancer microarray samples (D). Cells are colored according to the role of those genes in the enrichment based ontheir rank metric scores (Additional file 5B). Dark yellow cells indicate genes present in the leading edge of metastasis enrichment; dark blueindicates genes present in the leading edge of colon cancer enrichment; light blue indicates genes trending toward the colon cancer phenotypebut not part of the leading edge; light yellow indicates genes trending toward the liver metastasis phenotype but not part of the leading edge.Grey cells indicate genes for which the expression level was not determined.
Naba et al. BMC Cancer 2014, 14:518 Page 10 of 12http://www.biomedcentral.com/1471-2407/14/518

AbbreviationsECM: Extracellular matrix; LC-MS/MS: Liquid chromatography and tandemmass spectrometry; OGE: Off-gel electrophoresis.
Competing interestsThe authors declare that they have no competing interests.
Authors’ contributionsConception and design of the experiments: AN, KRC, SAC, KKT, ROH.Development of proteomics methodology: AN, KRC. Acquisition of data: AN,KRC. Analysis and interpretation of data: AN, KRC, CAW, ROH. Writing of themanuscript: AN, KRC, CAW, SAC, KKT, ROH. Study supervision: ROH. Allauthors have read and approved the submitted manuscript.
AcknowledgementsThe authors wish to thank Dr. Jie Wu from the Barbara K. OstromBioinformatics and Computing facility at the Swanson Biotechnology Centerfor assistance with Gene Set Enrichment Analyses, Dr. John Lamar for criticalreading of the manuscript and the members of the Hynes Lab for helpfuldiscussions.
Grant supportThis work was supported by grants from the National Cancer Institute –Tumor Microenvironment Network (U54 CA126515/CA163109), the BroadInstitute of MIT and Harvard, the Howard Hughes Medical Institute, of whichROH is an Investigator and in part by Support Grant to the Koch Institute(P30-CA14051 from the National Cancer Institute). AN was supported bypostdoctoral fellowships from the Howard Hughes Medical Institute and theLudwig Center for Cancer Research.
Author details1David H. Koch Institute for Integrative Cancer Research, MassachusettsInstitute of Technology, Cambridge, MA 02139, USA. 2Howard HughesMedical Institute, Massachusetts Institute of Technology, 02139 Cambridge,MA, USA. 3Proteomics Platform, Broad Institute of MIT and Harvard, 02142Cambridge, MA, USA. 4David H. Koch Institute for Integrative CancerResearch - Barbara K. Ostrom Bioinformatics and Computing facility at theSwanson Biotechnology Center, 02139 Cambridge, MA, USA. 5Division ofSurgical Oncology, Massachusetts General Hospital Cancer Center, Boston02114, MA, USA.
Received: 3 March 2014 Accepted: 30 June 2014Published: 18 July 2014
References1. Rustgi AK: The genetics of hereditary colon cancer. Genes Dev 2007,
21:2525–2538.2. Network CGA: Comprehensive molecular characterization of human
colon and rectal cancer. Nature 2012, 487:330–337.3. Hanash S, Taguchi A: The grand challenge to decipher the cancer
proteome. Nat Rev Cancer 2010, 10:652–660.4. De Wit M, Fijneman RJA, Verheul HMW, Meijer GA, Jimenez CR: Proteomics
in colorectal cancer translational research: biomarker discovery forclinical applications. Clin Biochem 2013, 46:466–479.
5. Luo Y, Wang L, Wang J: Developing proteomics-based biomarkers forcolorectal neoplasms for clinical practice: opportunities and challenges.Proteomics Clin Appl 2013, 7:30–41.
6. Hynes RO: The extracellular matrix: not just pretty fibrils. Science 2009,326:1216–1219.
7. Hynes RO, Naba A: Overview of the matrisome–an inventory ofextracellular matrix constituents and functions. Cold Spring Harb PerspectBiol 2012, 4:a004903.
8. Cretu A, Brooks PC: Impact of the non-cellular tumor microenvironmenton metastasis: potential therapeutic and imaging opportunities. J CellPhysiol 2007, 213:391–402.
9. Egeblad M, Nakasone ES, Werb Z: Tumors as organs: complex tissues thatinterface with the entire organism. Dev Cell 2010, 18:884–901.
10. Lu P, Weaver VM, Werb Z: The extracellular matrix: a dynamic niche incancer progression. J Cell Biol 2012, 196:395–406.
11. Jacobetz MA, Chan DS, Neesse A, Bapiro TE, Cook N, Frese KK, Feig C,Nakagawa T, Caldwell ME, Zecchini HI, Lolkema MP, Jiang P, Kultti A,
Thompson CB, Maneval DC, Jodrell DI, Frost GI, Shepard HM, Skepper JN,Tuveson DA: Hyaluronan impairs vascular function and drug delivery in amouse model of pancreatic cancer. Gut 2013, 62:112–120.
12. Chauhan VP, Stylianopoulos T, Boucher Y, Jain RK: Delivery of molecularand nanoscale medicine to tumors: transport barriers and strategies.Annu Rev Chem Biomol Eng 2011, 2:281–298.
13. Naba A, Clauser KR, Hoersch S, Liu H, Carr SA, Hynes RO: The matrisome:in silico definition and in vivo characterization by proteomics ofnormal and tumor extracellular matrices. Mol Cell Proteomics 2012,11:M111.014647.
14. Naba A, Clauser KR, Lamar JM, Carr SA, Hynes RO: Extracellular matrixsignatures of human mammary carcinoma identify novel metastasispromoters. eLife 2014, 3:e01308.
15. Naba A, Hoersch S, Hynes RO: Towards definition of an ECM parts list: anadvance on GO categories. Matrix Biol 2012, 31:371–372.
16. Subramanian A, Tamayo P, Mootha VK, Mukherjee S, Ebert BL, Gillette MA,Paulovich A, Pomeroy SL, Golub TR, Lander ES, Mesirov JP: Gene setenrichment analysis: a knowledge-based approach for interpretinggenome-wide expression profiles. Proc Natl Acad Sci U S A 2005,102:15545–15550.
17. Del Rio M, Mollevi C, Vezzio-Vie N, Bibeau F, Ychou M, Martineau P: Specificextracellular matrix remodeling signature of colon hepatic metastases.PLoS One 2013, 8:e74599.
18. Ki DH, Jeung H-C, Park CH, Kang SH, Lee GY, Lee WS, Kim NK, Chung HC,Rha SY: Whole genome analysis for liver metastasis gene signatures incolorectal cancer. Int J Cancer J Int Cancer 2007, 121:2005–2012.
19. Tsuji S, Midorikawa Y, Takahashi T, Yagi K, Takayama T, Yoshida K,Sugiyama Y, Aburatani H: Potential responders to FOLFOX therapyfor colorectal cancer by random forests analysis. Br J Cancer 2012,106:126–132.
20. Sheffer M, Bacolod MD, Zuk O, Giardina SF, Pincas H, Barany F, Paty PB,Gerald WL, Notterman DA, Domany E: Association of survival and diseaseprogression with chromosomal instability: a genomic exploration ofcolorectal cancer. Proc Natl Acad Sci U S A 2009, 106:7131–7136.
21. Lin AY, Chua M-S, Choi Y-L, Yeh W, Kim YH, Azzi R, Adams GA, Sainani K,van de Rijn M, So SK, Pollack JR: Comparative profiling of primarycolorectal carcinomas and liver metastases identifies LEF1 as aprognostic biomarker. PLoS One 2011, 6:e16636.
22. Ben Q-W, Zhao Z, Ge S-F, Zhou J, Yuan F, Yuan Y-Z: Circulating levels ofperiostin may help identify patients with more aggressive colorectalcancer. Int J Oncol 2009, 34:821–828.
23. Bao S, Ouyang G, Bai X, Huang Z, Ma C, Liu M, Shao R, Anderson RM,Rich JN, Wang X-F: Periostin potently promotes metastatic growth ofcolon cancer by augmenting cell survival via the Akt/PKB pathway.Cancer Cell 2004, 5:329–339.
24. Chlenski A, Cohn SL: Modulation of matrix remodeling by SPARC inneoplastic progression. Semin Cell Dev Biol 2010, 21:55–65.
25. Ahmed M, Behera R, Chakraborty G, Jain S, Kumar V, Sharma P, Bulbule A,Kale S, Kumar S, Mishra R, Raja R, Saraswati S, Kaur R, Soundararajan G,Kumar D, Thorat D, Sanyal M, Ramdasi A, Ghosh P, Kundu GC: Osteopontin:a potentially important therapeutic target in cancer. Expert Opin TherTargets 2011, 15:1113–1126.
26. Rangaswami H, Bulbule A, Kundu GC: Osteopontin: role in cell signalingand cancer progression. Trends Cell Biol 2006, 16:79–87.
27. Liu AY, Zheng H, Ouyang G: Periostin, a multifunctional matricellularprotein in inflammatory and tumor microenvironments. Matrix Biol J IntSoc Matrix Biol 2014.
28. Yao L, Lao W, Zhang Y, Tang X, Hu X, He C, Hu X, Xu LX: Identification ofEFEMP2 as a serum biomarker for the early detection of colorectalcancer with lectin affinity capture assisted secretome analysis ofcultured fresh tissues. J Proteome Res 2012, 11:3281–3294.
29. Holten-Andersen MN, Christensen IJ, Nielsen HJ, Stephens RW, Jensen V,Nielsen OH, Sørensen S, Overgaard J, Lilja H, Harris A, Murphy G, Brünner N:Total levels of tissue inhibitor of metalloproteinases 1 in plasma yieldhigh diagnostic sensitivity and specificity in patients with colon cancer.Clin Cancer Res 2002, 8:156–164.
30. Sørensen NM, Byström P, Christensen IJ, Berglund A, Nielsen HJ, Brünner N,Glimelius B: TIMP-1 is significantly associated with objective responseand survival in metastatic colorectal cancer patients receivingcombination of irinotecan, 5-fluorouracil, and folinic acid. Clin Cancer Res2007, 13:4117–4122.
Naba et al. BMC Cancer 2014, 14:518 Page 11 of 12http://www.biomedcentral.com/1471-2407/14/518

31. McPherson RA, Pincus MR: Henry’s Clinical Diagnosis and Management byLaboratory Methods. 22nd edition. Philadelphia, PA, U.S.A: Elsevier HealthSciences; 2011.
32. Pasche N, Neri D: Immunocytokines: a novel class of potent armedantibodies. Drug Discov Today 2012, 17:583–590.
33. Pasche N, Wulhfard S, Pretto F, Carugati E, Neri D: The antibody-baseddelivery of interleukin-12 to the tumor neovasculature eradicates murinemodels of cancer in combination with paclitaxel. Clin Cancer Res 2012,18:4092–4103.
doi:10.1186/1471-2407-14-518Cite this article as: Naba et al.: Extracellular matrix signatures of humanprimary metastatic colon cancers and their metastases to liver. BMCCancer 2014 14:518.
Submit your next manuscript to BioMed Centraland take full advantage of:
• Convenient online submission
• Thorough peer review
• No space constraints or color figure charges
• Immediate publication on acceptance
• Inclusion in PubMed, CAS, Scopus and Google Scholar
• Research which is freely available for redistribution
Submit your manuscript at www.biomedcentral.com/submit
Naba et al. BMC Cancer 2014, 14:518 Page 12 of 12http://www.biomedcentral.com/1471-2407/14/518