Early hypersynchrony in juvenile PINK1(-)/(-) motor cortex is rescued by antidromic stimulation
12
SYSTEMS NEUROSCIENCE ORIGINAL RESEARCH ARTICLE published: 21 May 2014 doi: 10.3389/fnsys.2014.00095 Early hypersynchrony in juvenile PINK1 - / - motor cortex is rescued by antidromic stimulation Romain Carron 1,2,3† , Anton Filipchuk 1,2,4† , Romain Nardou 5 , Abhinav Singh 6 , Francois J. Michel 1 , Mark D. Humphries 6 and Constance Hammond 1,2 * 1 Aix Marseille Université, Marseille, France 2 Institut National de la Recherche Médicale et de la Santé, INMED, UMR 901, Marseille, France 3 APHM, Hopital de la Timone, Service de Neurochirurgie Fonctionnelle et Stereotaxique, Marseille, France 4 Instituto de Neurociencias, CSIC and Universidad Miguel Hernández, San Juan de Alicante, Alicante, Spain 5 B&A Therapeutics, at INMED, Marseille, France 6 Faculty of Life Sciences, University of Manchester, Manchester, UK Edited by: Jose Bargas, Universidad Nacional Autónoma de México, Mexico Reviewed by: Gilad Silberberg, Nobel Institute for Neurophysiology, Karolinska Institute, Sweden Gordon William Arbuthnott, Okinawa Institute of Science and Technology, Japan *Correspondence: Constance Hammond, Institut National de la Recherche Médicale et de la Santé, INMED, UMR 901, 163 Route de Luminy, Boite Postale 13, 13273 Marseille, France e-mail: [email protected] † These authors have contributed equally to this work. In Parkinson’s disease (PD), cortical networks show enhanced synchronized activity but whether this precedes motor signs is unknown. We investigated this question in PINK1 - / - mice, a genetic rodent model of the PARK6 variant of familial PD which shows impaired spontaneous locomotion at 16 months. We used two-photon calcium imaging and whole-cell patch clamp in slices from juvenile (P14–P21) wild-type or PINK1 - / - mice. We designed a horizontal tilted cortico-subthalamic slice where the only connection between cortex and subthalamic nucleus (STN) is the hyperdirect cortico-subthalamic pathway. We report excessive correlation and synchronization in PINK1 - / - M1 cortical networks 15 months before motor impairment. The percentage of correlated pairs of neurons and their strength of correlation were higher in the PINK1 - / - M1 than in the wild type network and the synchronized network events involved a higher percentage of neurons. Both features were independent of thalamo-cortical pathways, insensitive to chronic levodopa treatment of pups, but totally reversed by antidromic invasion of M1 pyramidal neurons by axonal spikes evoked by high frequency stimulation (HFS) of the STN. Our study describes an early excess of synchronization in the PINK1 - / - cortex and suggests a potential role of antidromic activation of cortical interneurons in network desynchronization. Such backward effect on interneurons activity may be of importance for HFS-induced network desynchronization. Keywords: familial Parkinson, deep brain stimulation (DBS), synchronization, cortical network, antidromic activation INTRODUCTION Exaggerated resting-state synchronization of oscillatory activities in the sensorimotor cortex notably at β frequency (13–30 Hz) is positively correlated with Parkinson’s disease (PD) severity and attenuated together with motor symptoms by deep brain stimulation (DBS) of the subthalamic nucleus (STN-HFS; Brown and Marsden, 2001; Silberstein et al., 2005; Eusebio et al., 2012; Whitmer et al., 2012). These data were reproduced in the anes- thetized or freely moving rodent or primate models of PD (Goldberg et al., 2002; Sharott et al., 2005) validating the links between hypersynchronization and motor symptoms. Yet it is still not known whether cortical hypersynchronization is first observed when motor signs are already present or precedes them. We used the PINK1 - / - mice model of PD to determine whether juvenile (P14–P21) motor cortex networks are hyper- synchronized and typify the effect of parkinsonian treatments on this signature. The PINK1 - / - mice is a model of the autosomal recessive PARK6-linked Parkinsonism, an early-onset variant of familial PD caused by loss-of-function mutations in the mitochondrial protein PINK1 (Bentivoglio et al., 2001). PINK1 - / - mice show electrophysiological signs of dopaminergic dysfunction already at the age of 3–6 months and a reduction of locomotor activity 10 months later (Kitada et al., 2007; Dehorter et al., 2012). This model is therefore highly relevant for investi- gating the time course between hypersynchronization and motor signs. We focused our study on juvenile mice because the shift from immature to mature cortical activities occurs during the sec- ond post natal week (Allene et al., 2008; Dehorter et al., 2011) and thus constitutes the earliest possible stage at which dysfunction of M1 activities can occur. We used two-photon calcium imaging techniques to record the activity of large neuronal populations simultaneously in M1 and a horizontal tilted slice where the motor cortex M1 and the STN were connected via the hyperdirect cortico-STN pathway only. We report excessive correlation and synchronization in PINK1 - / - M1 cortical networks as early as 15 months before motor impairment. The percentage of correlated pairs of neurons and their strength of correlation were higher in the PINK1 - / - Frontiers in Systems Neuroscience www.frontiersin.org May 2014 | Volume 8 | Article 95 | 1
-
Upload
independent -
Category
Documents
-
view
1 -
download
0
Transcript of Early hypersynchrony in juvenile PINK1(-)/(-) motor cortex is rescued by antidromic stimulation

SYSTEMS NEUROSCIENCEORIGINAL RESEARCH ARTICLE
published: 21 May 2014doi: 10.3389/fnsys.2014.00095
Early hypersynchrony in juvenile PINK1−/− motor cortex isrescued by antidromic stimulationRomain Carron1,2,3†, Anton Filipchuk1,2,4†, Romain Nardou5, Abhinav Singh6, Francois J. Michel1,Mark D. Humphries6 and Constance Hammond1,2*1 Aix Marseille Université, Marseille, France2 Institut National de la Recherche Médicale et de la Santé, INMED, UMR 901, Marseille, France3 APHM, Hopital de la Timone, Service de Neurochirurgie Fonctionnelle et Stereotaxique, Marseille, France4 Instituto de Neurociencias, CSIC and Universidad Miguel Hernández, San Juan de Alicante, Alicante, Spain5 B&A Therapeutics, at INMED, Marseille, France6 Faculty of Life Sciences, University of Manchester, Manchester, UK
Edited by:Jose Bargas, Universidad NacionalAutónoma de México, Mexico
Reviewed by:Gilad Silberberg, Nobel Institute forNeurophysiology, KarolinskaInstitute, SwedenGordon William Arbuthnott,Okinawa Institute of Science andTechnology, Japan
*Correspondence:Constance Hammond, InstitutNational de la Recherche Médicaleet de la Santé, INMED, UMR 901,163 Route de Luminy, Boite Postale13, 13273 Marseille, Francee-mail:[email protected]†These authors have contributedequally to this work.
In Parkinson’s disease (PD), cortical networks show enhanced synchronized activitybut whether this precedes motor signs is unknown. We investigated this question inPINK1−/− mice, a genetic rodent model of the PARK6 variant of familial PD which showsimpaired spontaneous locomotion at 16 months. We used two-photon calcium imaging andwhole-cell patch clamp in slices from juvenile (P14–P21) wild-type or PINK1−/− mice. Wedesigned a horizontal tilted cortico-subthalamic slice where the only connection betweencortex and subthalamic nucleus (STN) is the hyperdirect cortico-subthalamic pathway.We report excessive correlation and synchronization in PINK1−/− M1 cortical networks15 months before motor impairment. The percentage of correlated pairs of neurons andtheir strength of correlation were higher in the PINK1−/− M1 than in the wild type networkand the synchronized network events involved a higher percentage of neurons. Bothfeatures were independent of thalamo-cortical pathways, insensitive to chronic levodopatreatment of pups, but totally reversed by antidromic invasion of M1 pyramidal neurons byaxonal spikes evoked by high frequency stimulation (HFS) of the STN. Our study describesan early excess of synchronization in the PINK1−/− cortex and suggests a potentialrole of antidromic activation of cortical interneurons in network desynchronization. Suchbackward effect on interneurons activity may be of importance for HFS-induced networkdesynchronization.
Keywords: familial Parkinson, deep brain stimulation (DBS), synchronization, cortical network, antidromicactivation
INTRODUCTIONExaggerated resting-state synchronization of oscillatory activitiesin the sensorimotor cortex notably at β frequency (13–30 Hz)is positively correlated with Parkinson’s disease (PD) severityand attenuated together with motor symptoms by deep brainstimulation (DBS) of the subthalamic nucleus (STN-HFS; Brownand Marsden, 2001; Silberstein et al., 2005; Eusebio et al., 2012;Whitmer et al., 2012). These data were reproduced in the anes-thetized or freely moving rodent or primate models of PD(Goldberg et al., 2002; Sharott et al., 2005) validating the linksbetween hypersynchronization and motor symptoms. Yet it isstill not known whether cortical hypersynchronization is firstobserved when motor signs are already present or precedes them.
We used the PINK1−/− mice model of PD to determinewhether juvenile (P14–P21) motor cortex networks are hyper-synchronized and typify the effect of parkinsonian treatmentson this signature. The PINK1−/− mice is a model of theautosomal recessive PARK6-linked Parkinsonism, an early-onsetvariant of familial PD caused by loss-of-function mutations
in the mitochondrial protein PINK1 (Bentivoglio et al., 2001).PINK1−/− mice show electrophysiological signs of dopaminergicdysfunction already at the age of 3–6 months and a reduction oflocomotor activity 10 months later (Kitada et al., 2007; Dehorteret al., 2012). This model is therefore highly relevant for investi-gating the time course between hypersynchronization and motorsigns. We focused our study on juvenile mice because the shiftfrom immature to mature cortical activities occurs during the sec-ond post natal week (Allene et al., 2008; Dehorter et al., 2011) andthus constitutes the earliest possible stage at which dysfunctionof M1 activities can occur. We used two-photon calcium imagingtechniques to record the activity of large neuronal populationssimultaneously in M1 and a horizontal tilted slice where themotor cortex M1 and the STN were connected via the hyperdirectcortico-STN pathway only.
We report excessive correlation and synchronization inPINK1−/− M1 cortical networks as early as 15 months beforemotor impairment. The percentage of correlated pairs of neuronsand their strength of correlation were higher in the PINK1−/−
Frontiers in Systems Neuroscience www.frontiersin.org May 2014 | Volume 8 | Article 95 | 1

Carron et al. Early hypersynchrony in PINK1−/− motor cortex
M1 than in the wild type network and synchronized networkevents involved a higher percentage of neurons. Both featureswere independent of thalamo-cortical pathways, insensitive tochronic levodopa treatment of pups, but totally reversed byhigh frequency stimulation of the STN (STN-HFS). HFS-evokedcortico-subthalamic spikes propagate antidromically and blockorthodromic spikes of M1 pyramidal neurons. They also activate,via axon collaterals, cortical GABAergic interneurons. This lastobservation points to the potential role of antidromically acti-vated cortical interneurons in network desynchronization.
MATERIALS AND METHODSSLICE PROCEDUREAll animal experiments were carried out in accordance withthe European Communities Council Directive of 24 November1986 (86/609/EEC). The experimental protocols were carried outin compliance with institutional ethical committee guidelinesfor animal research, and all efforts were made to minimizethe number of animals used and their suffering. We performedexperiments in postnatal (P14–P16) wildtype 129 SvEv (Janvier,France) or PINK1 KO 129 SvEv (Gispert et al., 2009) mice ofeither sex. We performed some of the electrophysiological exper-iments in (P14–P16) GAD67-green fluorescent protein-knock-in(GAD67-GFP-KI) mice (Tamamaki et al., 2003) to easily identifyand record cortical GABAergic interneurons. Mice were killedby decapitation under xylazine (Rompun 2%; used at 0.05%)and ketamine (Imalgene1000; used at 50 g/l; volume injected:0.2 ml/g) anesthesia. We kept brains in ice-cold oxygenated solu-tion containing (in mM): 110 choline, 2.5 KCl, 1.25 NaH2PO4,7 MgCl2, 0.5 CaCl2, 25 NaHCO3, 7 glucose. 400-µm-thickoblique horizontal slices were cut with a vibratome (VT1200Leica Microsystems Germany) with an angle of 32 ± 2 to obtainthe cortico-subthalamic slice. During the recovery period, sliceswere placed at room temperature (RT) with standard artificialcerebrospinal fluid (ACSF) saturated with 95% O2/5% CO2 andcontaining (in mM): 126 NaCl, 3.5 KCl, 1.2 NaH2PO4, 1.3 MgCl2,2 CaCl2, 25 NaHCO3, 11 glucose.
1,1′-DIOCTADECYL-3,3,3′,3′-TETRA-METHYLINDOCARBOCYAMINEPERCHLORATE (DiI) EXPERIMENTSMice (P14-P16) were anesthetized as above and intracar-dially perfused with 4% formaldehyde. We postfixed brainsby immersion for 2–4 weeks in the fixative solution con-taining 4% paraformaldehyde and performed 400 µm hor-izontal sections with an angle of 32 ± 2. We preparedslices for axon tracing experiments exactly as those usedfor imaging. We injected small amounts of 1,1′-Dioctadecyl-3,3,3′,3′-tetra-methylindocarbocyamine perchlorate (DiI) (Inter-chim, France) crystals diluted in ethanol in the M1 cortical region(Figures 1A1–2). Slices were incubated in the fixative solution at37C for 2–3 weeks, counterstained with Pitx2 antibody (Pitx2 isa homeodomain transcription factor expressed by STN neurons)(Capra Science, Sweden) (Martin et al., 2004), coverslipped andexamined with a confocal microscope (Olympus Fluoview-500).For Pitx2 immunocytochemistry we rinsed slices in PBS and incu-bated them for 1 h at RT in PBS/Triton 0.3%/goat normal serum5%. We then incubated them overnight at 4C with PBS/Triton
0.3%/goat normal serum 5% and pitx2 antibody (1:100) followedby Alexa 488 (1:200, Molecular Probes) in PBS triton for 1 h.
TWO PHOTON CALCIUM IMAGINGWe incubated cortico-subthalamic slices for 30 min in 2.5 ml ofoxygenated ACSF (35–37C) with 25 µl fura 2AM (1 mM, inDMSO + 0.8% pluronic acid; Molecular Probes). We performedimaging with a multibeam two-photon laser scanning system(Trimscope-LaVision Biotec) coupled to an Olympus microscopewith a high numerical aperture objective (20X, NA 0.95, Olym-pus). We acquired images of the scan field (444 µm × 336 µm)via a CCD camera (4 × 4 binning; La Vision Imager 3QE) witha time resolution of 137 ms (non-ratiometric 1000 images, laserat 780 nm) as previously described (Crépel et al., 2007; Dehorteret al., 2011). We previously estimated that around 10% of fura2-loaded cells were astrocytes (Dehorter et al., 2011). These fura2-loaded astrocytes are silent and are thus erroneously counted assilent neurons. This introduces a negligible error in the calcula-tion of the percentage of active neurons.
PATCH CLAMP RECORDINGS AND NEUROBIOTIN LABELING OFRECORDED CELLSCells were visualized with infrared-differential interferencecontrast optics (Axioskop2; Zeiss). We performed patch-clamprecordings in the whole cell configuration at 35–37C using theDigidata 1344A interface, the Multiclamp 700A amplifier andPClamp8 software (Axon Instruments, Foster City, CA, USA).For current-clamp recordings, patch electrodes (6–10 M)contained (in mM): 120 K-gluconate, 20 KCl, 10 HEPES,2 MgATP and 0.5 NaGTP, pH 7.2–7.4 (285–295 mOsm).Biocytin (Sigma-Aldrich; 5 mg/ml) was added in the pipettesolution and osmolarity corrected when necessary. To revealthe biocytin injected during whole-cell recordings of pyramidalneurons or interneurons, the recorded sections were fixed inparaformaldehyde (Antigenfix, 4%) for 48 h. They were rinsedin PBS and incubated for 1 h at RT in PBS/Triton 0.3%/goatnormal serum 5%. They were incubated overnight at 4C withPBS/Triton 0.3%/goat normal serum 5% and streptavidin Cy3(1:1000). They were rinsed in PBS 10 min 5 times, mountedin Eukitt (Electron Microscopy Sciences), and coverslipped.Dendritic fields were reconstructed using the Neurolucida system(MicroBrightField Inc., Colchester, VT, USA).
STIMULATIONAntidromic spikes were evoked in M1 cortical neurons usinga bipolar stimulating electrode (1 MΩ impedance, referenceTS33A10KT, WPI FL-USA) placed at the antero-lateral borderof the STN, close to the internal capsule fiber tract. Rectangularpulses of fixed duration (100 µs) and 20–50 µA amplitude weredelivered between the two poles of the electrode at a frequencyof 0.1–100 Hz STN (Grass stimulator). 100 Hz stimulations wereapplied over periods of several minutes.
CHRONIC LEVODOPA TREATMENTWe treated PINK1−/− pups over a 14 day period (from P1 to P14)with a daily injection of benserazide hydrochloride (DLserine 2-(2,3,4-trihydroxybenzyl)hydrazide hydrochloride, 10 mg/kg, i.p.),
Frontiers in Systems Neuroscience www.frontiersin.org May 2014 | Volume 8 | Article 95 | 2

Carron et al. Early hypersynchrony in PINK1−/− motor cortex
a DOPA decarboxylase inhibitor that does not cross the blood–brain barrier, 20 min delayed levodopa injection (10 mg/kg, i.p.).
DRUGSDrugs were prepared as concentrated stock solutions anddiluted in ACSF for bath application immediately prior touse. Gabazine, a selective GABAA receptor antagonist; (±)-2-amino-5-phosphonopentanoic acid (AP5, a selective NMDAreceptor antagonist), 6-cyano-7nitroquinoxaline 2, 3-dione(CNQX, an AMPA-KA receptors antagonist), DL-Serine 2-(2,3,4-trihydroxybenzyl)hydrazide hydrochloride (benserazide),an inhibitor of peripheral dopa decarboxylase and α-methyl-L-tyrosine (levodopa) were all purchased from Sigma Aldrich(France).
DATA ANALYSISFluorescent traces were analyzed with custom developed routinesin Matlab and calcium events identified using asymmetric leastsquares baseline and Schmitt trigger threshold. We took intoaccount only fields where more than 15% of fura2-loaded cellswere active to ensure sufficient numbers of active cells to detectnetwork-wide synchronization if present. We used 5% of baselinenoise as high threshold and 2% as low threshold. Onset andoffset identification allowed the generation of raster plots andthe estimation of the extent of cortical network correlation. Weapplied two main tests: pairwise and group tests. Throughout wedefine “co-active” as meaning those onset transients occurringsimultaneously within± 1 frame time window (411 ms).
Pairwise correlation test detected repeated co-activationbetween two cells (cell pairs continuously correlated). We esti-mated the degree of similarity of their spiking patterns using nor-malized Hamming similarity (Humphries, 2011). Each calciumtransient train was divided into discrete bins corresponding tothe time frame (137 ms) of recording. In each bin the number1 was given to the presence of any event onset, and the number0 for their absence. The resulting binary vector thus recorded thepattern of activity and inactivity of the neuron. For each pair ofbinary vectors the normalized Hamming similarity was the pro-portion of bins that differed between the two vectors, given the±1 frame time window. The parameter approached 1 as the vectorsbecame equal. In the graphic representation the lines connectingcorrelated cells have colors from red (high similarity of patterns,normalized Hamming similarity close to 1) to dark blue (low sim-ilarity of patterns, Hamming similarity close to 0 but never equalto 0, otherwise these cells could not be considered as correlated;see Figure 1A). To estimate the likelihood that the co-activationsmight be explained by chance we created random datasets for eachactive cell using inter-event interval reshuffling (Mao et al., 2001;Feldt et al., 2013). We generated 1000 random data sets for eachrecording session and computed the pairwise Hamming similarityfor all pairs in those data-sets, giving a distribution of 1000 ran-domized similarity scores for each pair of recorded neurons. Thethreshold for a significantly correlated pair of recorded neuronswas set to the 95th percentile of that distribution.
Separately we characterized the existence of neural ensem-bles, i.e., groups of neurons with consistently correlated activity.To do so, each recording was analyzed using the method in
FIGURE 1 | The cortico-subthalamic slice. (A) Four DiI injections in M1cortex in the slice (A1, transmission light photo and A2, fluorescent image,both just after the injection) and DiI-labeled cortical axons observed 15 dayslater in the internal capsule (IC) and STN (A3, confocal image superposingDiI labeling (red) and Pitx2 labeling (green)). Scale bars A1 and A2: 500 µm;A3: 150 µm. (B) Calcium dynamics from a sample of four neurons. Verticaldotted lines indicate some of the synchronous calcium transients. Totalduration = 137 s. (C) Percent of active cells from all imaged cells (left) andnumber of onsets of calcium transients from these active cells (right) inwild-type (wt) (n = 30) and PINK1−/− (n = 39) M1 imaged fields. In this andsubsequent figures, unless otherwise stated, the bottom and the top of theboxes are the first and third quartiles, the band inside is the median and thepoint is the mean, the ends of the whiskers are the minimum and themaximum of all the data.
Frontiers in Systems Neuroscience www.frontiersin.org May 2014 | Volume 8 | Article 95 | 3

Carron et al. Early hypersynchrony in PINK1−/− motor cortex
Humphries (2011), which we briefly describe here. A similaritymatrix was constructed using the computed Hamming similaritybetween each pair of retained neurons. Note that we do notset a threshold for correlation here, as we wish to retain allinformation about the correlation structure of the network. Thismatrix was then partitioned into groups using the communitydetection algorithm detailed in Humphries (2011), which self-determines the number and size of groups within the matrixthat maximizes the benefit function Qdata = [similarity withingroups] − [expected similarity within groups]. The resultingpartition thus corresponded to groups of neurons—ensembles—that were more similar in activity patterns than was expectedgiven the total similarity of each neuron’s activity to the wholedata-set. We then ran controls for checking if each clusteringwas significant compared to randomized data. For each recordingwe generated 20 randomized versions by shuffling each neuron’sinter-event intervals. We clustered each randomized version usingthe algorithm above, giving us 20 values of Qcontrol. These allowus to estimate whether or not the actual recording’s Qdata valueexceeded the 95% confidence level: thus a recording was deemedsignificant at this level if Qdata > max (Qcontrol).
The group event test identified incidences where a significantfraction of the network’s cells were active together. The minimalsize of these groups for each recording session was defined bythe corresponding simulated random sets: for each of the 1000random datasets we counted the number of co-active cells withineach time-window; this defined a distribution of expected countsof co-active cells due to random activity. The threshold forsignificant group co-activation was set at the 95th percentile ofthis distribution. Such clusters of correlated events were callednetwork events.
In our analyses, we did not take into account fields showinga clear rhythmic pattern reminiscent of the giant depolarizingpotentials (GDP) pattern (9% of the wild-type (wt) and 11%of all the PINK1−/− M1 recorded fields). This GDP-like pat-tern consisted of regularly-spaced network events occurring ata frequency of around 0.1–0.3 Hz in wt and PINK1−/− M1networks and was identical in wt and PINK1−/− M1 networks.We removed it because it represents the last step in the sequenceof immature network activities previously described in the cortex,hippocampus and striatum (Crépel et al., 2007; Allene et al., 2008;Dehorter et al., 2011).
STATISTICSAverage values are presented as means ± SEM and we per-formed statistical comparisons with Mann–Whitney rank sumtest (PrismeTM). We set the level of significance as (*) for P <
0.05; (**) for P < 0.01; (***) for P < 0.001.
RESULTSTHE CORTICOSUBTHALAMIC SLICE AND SPONTANEOUS CALCIUMTRANSIENTSThe 32 tilted horizontal slices contained portions of the M1cortical region and STN (Figure 1). We checked the presenceand functionality of M1 corticofugal axons to the STN withtwo methods. We visualized M1 corticofugal axons using theaxonal tracer DiI (Figures 1A1, 2), or tested their functionality
by stimulating the STN area and recording the responses (ortho-dromic or antidromic) in M1 pyramidal neurons (layers V/VI)(see Figure 5). For technical reasons, DiI and electrophysiologicalexperiments were conducted in different slices cut exactly thesame way. Fifteen days after DiI injection in the M1 region, labeledcorticofugal axons were seen running in numerous bundles radi-ally through the whole striatum, and in the internal capsule (n =22/22 slices). In the STN DiI labeling was seen around pitx2-positive somas (Figure 1A3). In PINK1−/− slices, stimulation ofthe rostral pole of the STN in control ACSF did not evoke EPSPsor orthodromic spikes in the recorded M1 pyramidal neurons(n = 5) whereas it clearly evoked antidromic spikes. We furtherassessed the antidromic functionality of the cortico-subthalamicconnection by recording antidromic spikes in M1 pyramidalneurons in the continuous presence of blockers of ionotropic glu-tamate receptors and their effect on the network (see Figure 5A).The above results showed that cortico-subthalamic axons arepresent and functional in the cortico-subthalamic slice.
Single neurons (projection neurons and interneurons) of thedeep layers (V/VI) of the M1 cortex in slices from aged-matchedwt or PINK1−/− mice generated spontaneous calcium transientsin control ACSF (Figure 1B). The voltage-sensitive sodium chan-nel blocker tetrodotoxin (TTX, 1 µM) or the calcium channelsblocker Cd2+ (200 µM) blocked all calcium transients (notshown) indicating that they resulted from the opening of voltage-gated calcium channels by sodium action potentials. On average,the ratio of active cells to the number of fura2-loaded cells wassimilar in wt (22 ± 5%, n = 709 out of 3085 neurons in 30 fields)as in PINK1−/− (22 ± 6%, n = 1034 out of 4763 neurons in 39)M1 networks (P = 0.4). Also, the average number of identifiedonsets of calcium transients per field (1000 images) was similarin wt (444 ± 222 per 137 s, n = 709 active neurons in 30 fields)as in PINK1−/− (406 ± 231 per 137 s, n = 1034 active neuronsin 39 fields) M1 active neurons (Figure 1C). To disambiguate ourterminology, we henceforth refer to the onsets of calcium tran-sients for individual neurons as “calcium transients”, reserving theterm “network events” for synchronized transient onsets at thenetwork-level.
PAIR-WISE CORRELATIONS AND SPONTANEOUS NETWORK EVENTSPINK1−/−M1 networks contained a significantly higher percent-age of correlated pairs of cells (14 ± 11%, n = 4873 neurons in40 fields) than wt M1 networks (8 ± 8%, n = 3541 neurons in 35fields) (P = 0.01). The strength of correlation, represented by thesimilarity of patterns of calcium transients between pairs of cells(1 means that patterns were totally similar and simultaneous), wasalso significantly higher in PINK1−/− than in wt M1 networks:0.44 ± 0.24 (n = 40 fields) vs. 0.26 ± 0.14 (n = 35 fields),respectively (P = 0.0005) (Figure 2A). In the majority of M1slices from wt (87%) and PINK1−/− (98%) mice we identifiedsynchronized network events characterized by statistically signifi-cant synchronous network-level activity (coactive within a 411 mstime window). Their time distribution had two main patterns:network events at very low frequency (0.007 Hz), which we namedsingle, and irregularly spaced network events synchronized at lowfrequency (0.03 Hz), which we named random (Figure 2B). Bothtypes of network events involved a significantly higher percentage
Frontiers in Systems Neuroscience www.frontiersin.org May 2014 | Volume 8 | Article 95 | 4

Carron et al. Early hypersynchrony in PINK1−/− motor cortex
FIGURE 2 | Spontaneous correlated calcium transients in M1 cortex:correlated cell pairs and network events. (A) Correlation maps offura2-loaded M1 cortical cells in four different fields, two from wt (left column)and two from PINK1−/− (right column) slices. Each black contour represents afura2-loaded silent cell and each black-filled contour represents a fura2-loadedactive cell. Lines link active cells with a statistically significant correlation (seeSection Materials and Methods). Line color is proportional to the value of thecorrelation (color scale from 0 to 1, right). In wt M1, 20 (top left) or 32 (bottomleft) calcium transients are correlated between some of the 30 or 33 activecells, respectively. In contrast in PINK1−/− M1, 115 (top right) and 98 (bottomright) calcium transients are correlated between most of the 35 or 34 activecells, respectively. (Middle column) Percentage of correlated cell pairscompared to all combinations of fura2-loaded cells (active and non-active)(top). Ratio of the correlated to the non-correlated calcium transients for eachactive cell pair (bottom). This indicates the similarity of firing between each
active cell pair. (B) Representative histograms (top traces, % active cells) andraster plots (bottom traces, number of active cells) of the populationdynamics after onset detection in four different M1 networks in slices fromP14–P16 wt (left column) and PINK1−/− (right column) mice. The proportionof fields with singly or randomly distributed network events was for wt:10–90%, n = 30; and for PINK1−/−: 20–80%, n = 39. Randomly distributednetwork events had a similar frequency in wt (0.034 ± 0.016 Hz, n = 27 fields)as in PINK1−/− (0.03 ± 0.02 Hz, n = 30 fields) M1 networks (P = 0.9). (C)Percentage of active cells involved in network events (% active cells/ networkevent) (left) and ratio of the percentage of active cells inside (peak) andoutside (basal) network events in wt (n = 30) and PINK1−/− (n = 39) M1 fieldsthat displayed single or random network events (right). (D) Percentage ofactive cells in wt M1 before (control) and during application of APV and CNQX(left) and percentage of active cells involved in network events before (intact)and after cutting (cut) the slices between cortex and thalamus.
Frontiers in Systems Neuroscience www.frontiersin.org May 2014 | Volume 8 | Article 95 | 5

Carron et al. Early hypersynchrony in PINK1−/− motor cortex
of active cells in PINK1−/− (45± 18%, n = 140 events in 39 fields)than in wt (38 ± 15%, n =123 events in 30 fields) M1 networks(P = 0.0004). Also, there was a significantly higher proportionof active cells involved in network events (signal) than in basalactivity (noise) in PINK1−/− (4.4 ± 3.0) than in wt (3.1 ± 2.6)M1 networks (P < 0.0001; Figure 2C). Therefore, the activity ismore concentrated in network events in PINK1−/− than in agematched wt M1 networks.
Antagonists of ionotropic glutamate receptors (CNQX-APV,10–40 µM) decreased by 50% the number of active M1 neurons(from 16 ± 6% to 8 ± 3%, n = 7, P = 0.012) and abolishedall network events (Figure 2D). Subsequent application of theGABAA antagonist gabazine (10 µM) totally abolished sponta-neous activity. In contrast, cutting the slices between thalamusand M1 networks to interrupt thalamo-cortical pathways slightlydecreased the percentage of spontaneously active cells (22 ± 5%in control and 17 ± 5% in cut slices, P = 0.03), but did not affectthe percentage of correlated pairs (8 ± 8% in control and 6 ±5% in cut slices, P = 0.64) and increased the percentage of cellsinvolved in network events (38± 15% in control and 41± 6% incut slices, P = 0.008) (n = 30 M1 fields and 120 events in controlslices and n = 8 M1 fields and 29 events in cut slices; Figure 2D).Therefore, pair-wise correlations and network events are drivenby local circuit synapses.
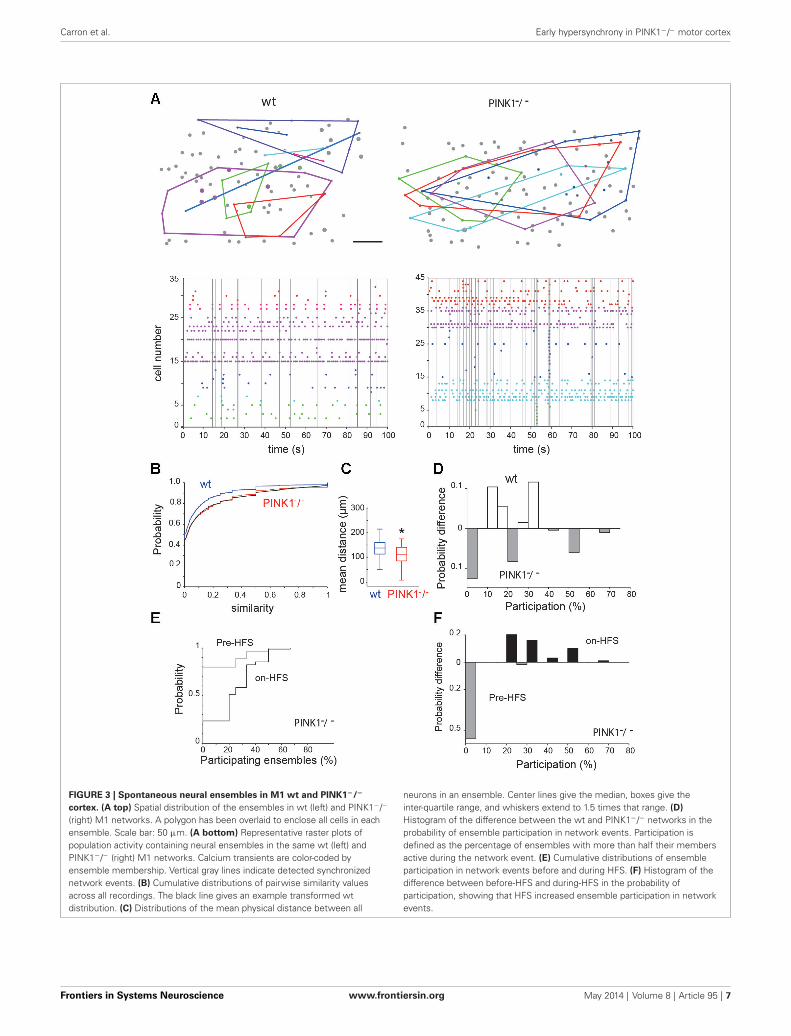
NEURAL ENSEMBLESThe shuffled controls showed that 28% (10/35) of wt and 30%(12/40) of PINK1−/− networks were organized into ensemblesof consistently co-active neurons (Figure 3A). We found nosignificant difference between the wt and PINK1−/− ensemblesfor average discreteness (Q values), average number of ensembles,or average number of neurons per ensemble (P > 0.05). However,the ensembles were more tightly grouped in PINK1−/− (107+/−3.8 µm, n = 40) than in wt (141+/− 8.4 µm, n = 38) (P = 0.008)networks (Figure 3C). Thus, despite the absence of detectabledifference in their functional structure (in their existence, num-ber, size or discreteness) neural ensembles of wt and PINK1−/−
M1 networks significantly differed in their physical structure. Thesmaller spatial extent of the ensembles may reflect an anatomicalchange in pyramidal cell connectivity in the PINK1−/− motorcortex (for example a higher probability of synaptic contactbetween neighbors).
Given the clear difference in significant pairwise correlationbetween wt and Pink1−/− networks (Figure 2A), this lack ofdifferences in ensemble structure was unexpected. To examinethis issue, we pooled all calculated Hamming similarity values(significant or not) across recordings to compare the global corre-lation statistics between wt and Pink1−/− M1 cortex. The result-ing distributions were very similar (Figure 3B) but translatedfrom each other, suggesting that hypersynchrony in Pink1−/−M1cortex was due to a uniformly-random increase in correlationcompared to the wt circuit. Consistent with this hypothesis, wefound that randomly increasing ∼10% of wt correlation val-ues by a randomly chosen value between 0.05 and 1 perfectlytransformed the wt distribution into the Pink1−/−distributionof correlations (black line in Figure 3B). We thus concluded thatthe difference of pair-wise correlation between wt and Pink1−/−
M1 cortex is not related to a difference of ensemble structure butresults from a uniformly-random increase in correlation.
To understand the relationship between the neural ensem-bles and network events, we then examined the participation ofensembles within those network events. Following Feldt et al.(2013), we counted an ensemble as participating if at least halfits members were active during the network event. We foundthat ensemble participation was very weak in both wt (11 +/−0.5%, n = 404 events) and PINK1−/− (11 +/− 0.6%, n = 497events) networks; median participation was 0% in both wt andPINK1−/− networks (Figure 3D). However, there was a clear dif-ference in the distributions of ensemble participation (P = 0.0017,two-sample Kolmogorov-Smirnov test): as Figure 3D shows,PINK1−/− networks had a higher probability either of no ensem-bles participating at all or of the majority of ensembles participat-ing in a network event. Thus, only in PINK1−/− networks couldnetwork events ever recruit the majority of neural ensembles.
CHRONIC LEVODOPA TREATMENTWe next tested whether chronic L-dopa treatment of PINK1−/−
pups would reverse the excess of synchronization of thePINK1−/− M1 network. A deficit of evoked dopaminergic trans-mission has been identified in the 3 months-old PINK1−/−
mouse (Kitada et al., 2007; 1058 /id) but when it begins duringdevelopment is still unknown. All the experiments were per-formed in PINK1−/− slices. L-dopa treatment from P1 to theday of recording (P14–P16) had no significant effect on anyof the characteristics of PINK1−/− M1 network activity (datanot shown). M1 networks from untreated or L-dopa-treatedPINK1−/− mice contained a similar percentage of correlatedpairs of cells (14 ± 11%, n = 4873 neurons in 40 fieldsvs. 17 ± 16%, n = 522 neurons in 19 fields) (P = 0.5).L-dopa treatment did not significantly change the percentageof PINK1−/− M1 fields showing network events (96% treatedvs. 98% untreated) and the pattern of these events (27% vs.20% single, 55% vs. 67% random). The mean frequency ofrandomly distributed network events was similar in untreated(4.3 ± 2.6 peaks per 137 s or 0.03 ± 0.02 Hz, n = 30 fields)as in L-dopa-treated (4.3 ± 3.0 peaks per 137 s or 0.03 ±0.02 Hz, n =12 fields) M1 fields (P = 0.9). Single or randomly-distributed network events involved a similar percentage ofactive cells in PINK1−/− M1 fields from untreated (45 ± 18%,n = 140 peaks in 39 fields) as from L-dopa-treated (50 ± 21%,n = 54 peaks in 18 fields) (P = 0.2) PINK1−/− mice. Also,the ratio between the percent of active cells involved in basalactivity (noise) to that involved in network events (signal) wassimilar without (0.30 ± 0.15, 140 events in 39 fields) as with(0.28 ± 0.14, n = 54 events in18 fields) (P = 0.4) L-dopatreatment.
CORTICAL DESYNCHRONIZATION DURING STN-HFSHFS of the antero-lateral pole of the STN (STN-HFS) significantlydecreased the percentage of M1 active cells to the number of M1fura2-loaded cells, from 100% before HFS to 67± 26% (P < 0.01paired t-test) and significantly increased the average number ofonsets of calcium transients per M1 active cell to 170± 90% (n =212 active cells in 9 fields, P < 0.05 paired t-test).
Frontiers in Systems Neuroscience www.frontiersin.org May 2014 | Volume 8 | Article 95 | 6
Carron et al. Early hypersynchrony in PINK1−/− motor cortex
FIGURE 3 | Spontaneous neural ensembles in M1 wt and PINK1−/−
cortex. (A top) Spatial distribution of the ensembles in wt (left) and PINK1−/−
(right) M1 networks. A polygon has been overlaid to enclose all cells in eachensemble. Scale bar: 50 µm. (A bottom) Representative raster plots ofpopulation activity containing neural ensembles in the same wt (left) andPINK1−/− (right) M1 networks. Calcium transients are color-coded byensemble membership. Vertical gray lines indicate detected synchronizednetwork events. (B) Cumulative distributions of pairwise similarity valuesacross all recordings. The black line gives an example transformed wtdistribution. (C) Distributions of the mean physical distance between all
neurons in an ensemble. Center lines give the median, boxes give theinter-quartile range, and whiskers extend to 1.5 times that range. (D)Histogram of the difference between the wt and PINK1−/− networks in theprobability of ensemble participation in network events. Participation isdefined as the percentage of ensembles with more than half their membersactive during the network event. (E) Cumulative distributions of ensembleparticipation in network events before and during HFS. (F) Histogram of thedifference between before-HFS and during-HFS in the probability ofparticipation, showing that HFS increased ensemble participation in networkevents.
Frontiers in Systems Neuroscience www.frontiersin.org May 2014 | Volume 8 | Article 95 | 7
Carron et al. Early hypersynchrony in PINK1−/− motor cortex
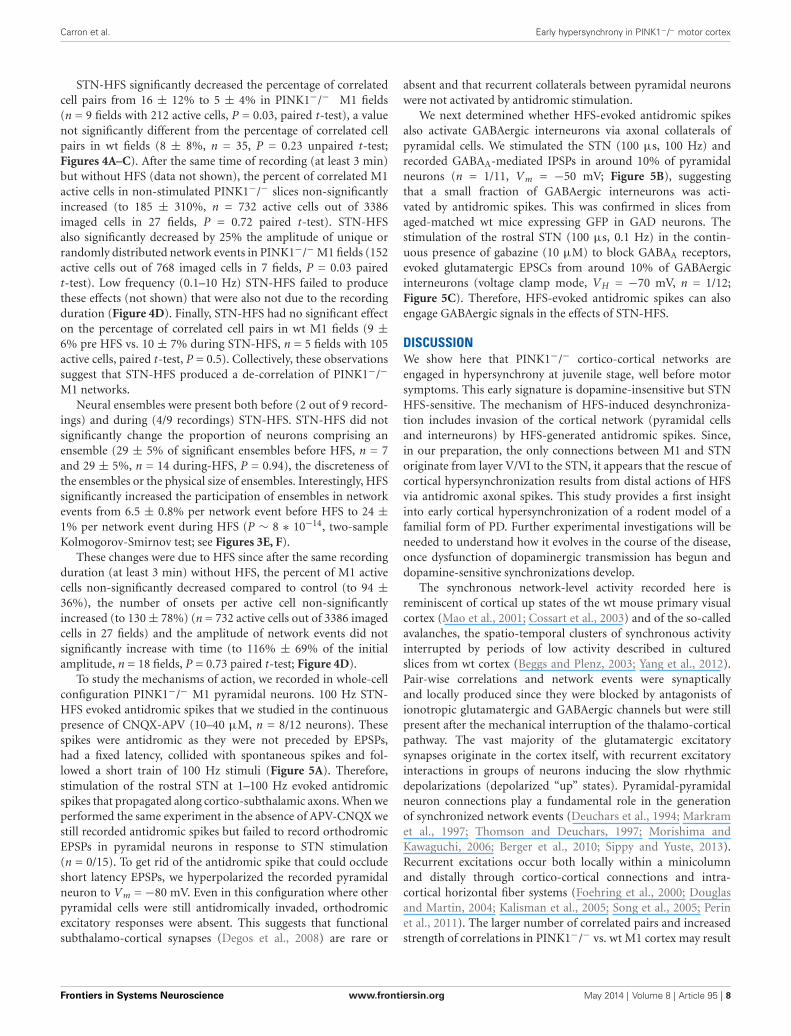
STN-HFS significantly decreased the percentage of correlatedcell pairs from 16 ± 12% to 5 ± 4% in PINK1−/− M1 fields(n = 9 fields with 212 active cells, P = 0.03, paired t-test), a valuenot significantly different from the percentage of correlated cellpairs in wt fields (8 ± 8%, n = 35, P = 0.23 unpaired t-test;Figures 4A–C). After the same time of recording (at least 3 min)but without HFS (data not shown), the percent of correlated M1active cells in non-stimulated PINK1−/− slices non-significantlyincreased (to 185 ± 310%, n = 732 active cells out of 3386imaged cells in 27 fields, P = 0.72 paired t-test). STN-HFSalso significantly decreased by 25% the amplitude of unique orrandomly distributed network events in PINK1−/−M1 fields (152active cells out of 768 imaged cells in 7 fields, P = 0.03 pairedt-test). Low frequency (0.1–10 Hz) STN-HFS failed to producethese effects (not shown) that were also not due to the recordingduration (Figure 4D). Finally, STN-HFS had no significant effecton the percentage of correlated cell pairs in wt M1 fields (9 ±6% pre HFS vs. 10 ± 7% during STN-HFS, n = 5 fields with 105active cells, paired t-test, P = 0.5). Collectively, these observationssuggest that STN-HFS produced a de-correlation of PINK1−/−
M1 networks.Neural ensembles were present both before (2 out of 9 record-
ings) and during (4/9 recordings) STN-HFS. STN-HFS did notsignificantly change the proportion of neurons comprising anensemble (29 ± 5% of significant ensembles before HFS, n = 7and 29 ± 5%, n = 14 during-HFS, P = 0.94), the discreteness ofthe ensembles or the physical size of ensembles. Interestingly, HFSsignificantly increased the participation of ensembles in networkevents from 6.5 ± 0.8% per network event before HFS to 24 ±1% per network event during HFS (P ∼ 8 ∗ 10−14, two-sampleKolmogorov-Smirnov test; see Figures 3E, F).
These changes were due to HFS since after the same recordingduration (at least 3 min) without HFS, the percent of M1 activecells non-significantly decreased compared to control (to 94 ±36%), the number of onsets per active cell non-significantlyincreased (to 130± 78%) (n = 732 active cells out of 3386 imagedcells in 27 fields) and the amplitude of network events did notsignificantly increase with time (to 116% ± 69% of the initialamplitude, n = 18 fields, P = 0.73 paired t-test; Figure 4D).
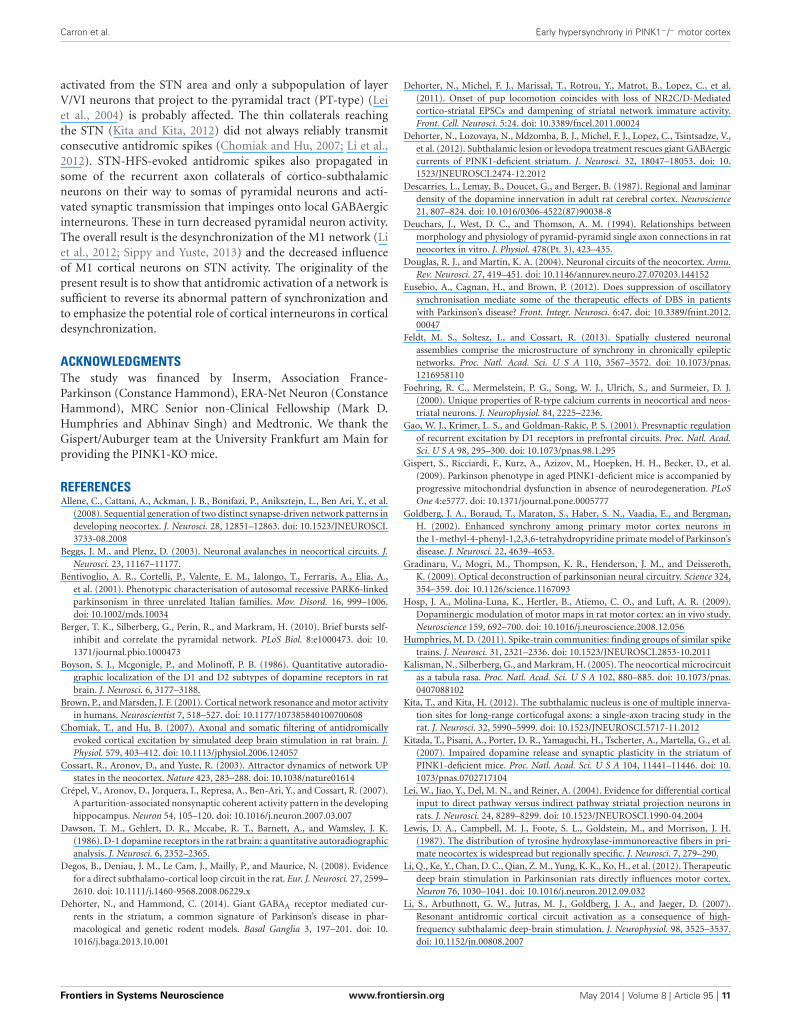
To study the mechanisms of action, we recorded in whole-cellconfiguration PINK1−/− M1 pyramidal neurons. 100 Hz STN-HFS evoked antidromic spikes that we studied in the continuouspresence of CNQX-APV (10–40 µM, n = 8/12 neurons). Thesespikes were antidromic as they were not preceded by EPSPs,had a fixed latency, collided with spontaneous spikes and fol-lowed a short train of 100 Hz stimuli (Figure 5A). Therefore,stimulation of the rostral STN at 1–100 Hz evoked antidromicspikes that propagated along cortico-subthalamic axons. When weperformed the same experiment in the absence of APV-CNQX westill recorded antidromic spikes but failed to record orthodromicEPSPs in pyramidal neurons in response to STN stimulation(n = 0/15). To get rid of the antidromic spike that could occludeshort latency EPSPs, we hyperpolarized the recorded pyramidalneuron to Vm = −80 mV. Even in this configuration where otherpyramidal cells were still antidromically invaded, orthodromicexcitatory responses were absent. This suggests that functionalsubthalamo-cortical synapses (Degos et al., 2008) are rare or
absent and that recurrent collaterals between pyramidal neuronswere not activated by antidromic stimulation.
We next determined whether HFS-evoked antidromic spikesalso activate GABAergic interneurons via axonal collaterals ofpyramidal cells. We stimulated the STN (100 µs, 100 Hz) andrecorded GABAA-mediated IPSPs in around 10% of pyramidalneurons (n = 1/11, Vm = −50 mV; Figure 5B), suggestingthat a small fraction of GABAergic interneurons was acti-vated by antidromic spikes. This was confirmed in slices fromaged-matched wt mice expressing GFP in GAD neurons. Thestimulation of the rostral STN (100 µs, 0.1 Hz) in the contin-uous presence of gabazine (10 µM) to block GABAA receptors,evoked glutamatergic EPSCs from around 10% of GABAergicinterneurons (voltage clamp mode, VH = −70 mV, n = 1/12;Figure 5C). Therefore, HFS-evoked antidromic spikes can alsoengage GABAergic signals in the effects of STN-HFS.
DISCUSSIONWe show here that PINK1−/− cortico-cortical networks areengaged in hypersynchrony at juvenile stage, well before motorsymptoms. This early signature is dopamine-insensitive but STNHFS-sensitive. The mechanism of HFS-induced desynchroniza-tion includes invasion of the cortical network (pyramidal cellsand interneurons) by HFS-generated antidromic spikes. Since,in our preparation, the only connections between M1 and STNoriginate from layer V/VI to the STN, it appears that the rescue ofcortical hypersynchronization results from distal actions of HFSvia antidromic axonal spikes. This study provides a first insightinto early cortical hypersynchronization of a rodent model of afamilial form of PD. Further experimental investigations will beneeded to understand how it evolves in the course of the disease,once dysfunction of dopaminergic transmission has begun anddopamine-sensitive synchronizations develop.
The synchronous network-level activity recorded here isreminiscent of cortical up states of the wt mouse primary visualcortex (Mao et al., 2001; Cossart et al., 2003) and of the so-calledavalanches, the spatio-temporal clusters of synchronous activityinterrupted by periods of low activity described in culturedslices from wt cortex (Beggs and Plenz, 2003; Yang et al., 2012).Pair-wise correlations and network events were synapticallyand locally produced since they were blocked by antagonists ofionotropic glutamatergic and GABAergic channels but were stillpresent after the mechanical interruption of the thalamo-corticalpathway. The vast majority of the glutamatergic excitatorysynapses originate in the cortex itself, with recurrent excitatoryinteractions in groups of neurons inducing the slow rhythmicdepolarizations (depolarized “up” states). Pyramidal-pyramidalneuron connections play a fundamental role in the generationof synchronized network events (Deuchars et al., 1994; Markramet al., 1997; Thomson and Deuchars, 1997; Morishima andKawaguchi, 2006; Berger et al., 2010; Sippy and Yuste, 2013).Recurrent excitations occur both locally within a minicolumnand distally through cortico-cortical connections and intra-cortical horizontal fiber systems (Foehring et al., 2000; Douglasand Martin, 2004; Kalisman et al., 2005; Song et al., 2005; Perinet al., 2011). The larger number of correlated pairs and increasedstrength of correlations in PINK1−/− vs. wt M1 cortex may result
Frontiers in Systems Neuroscience www.frontiersin.org May 2014 | Volume 8 | Article 95 | 8

Carron et al. Early hypersynchrony in PINK1−/− motor cortex
FIGURE 4 | M1 correlated cell pairs and network events during STN-HFS.(A, B) Example of two PINK1−/− M1 fields. Left are correlation maps of thefura2-loaded M1 cortical cells before (Pre-HFS) and during (on-HFS) STN-HFS;right are the corresponding histograms (top traces) and raster plots (bottomtraces) of the same population dynamics after onset detection before andduring STN-HFS (applied for at least 3 min). They display before HFS either asingle network event (A, Pre-HFS) or randomly distributed network events
(B, Pre-HFS) (total recording 137 s). (C) Percentage of correlated cell pairscompared to all combinations of fura2-loaded cells (active and non-active) inwt (n = 35) or PINK1−/− M1 (n = 9) fields before and during HFS as indicated.(D) From left to right, percentage of active cells, onsets per active cells,network event amplitude in M1 fields after 3 min HFS (black, n = 9 PINK1−/−
M1 fields) or after 3 min without HFS (gray, n = 27 PINK1−/− M1 fields),compared to the same items before HFS (normalized at 100%, dotted line).
Frontiers in Systems Neuroscience www.frontiersin.org May 2014 | Volume 8 | Article 95 | 9

Carron et al. Early hypersynchrony in PINK1−/− motor cortex
FIGURE 5 | Mechanisms of action of STN-HFS. (A) Antidromic activationof a PINK1−/− M1 pyramidal neuron in response to rostral STN stimulationin the continuous presence of APV (40 µM) and CNQX (10 µM). Schematicillustration of the stimulation and recording sites (top left). Fivesuperimposed traces and latency histogram (A1), collision test (A2) and100 Hz stimulation (A3), respectively showing the fixed latency of theantidromic spike, its collision (*) with a spontaneous spike and its ability tofollow a short train of HFS (V m = −60 mV, scale bars: 2 ms). (B) Whole cellrecording (B1) of a PINK1−/− pyramidal neuron in control ACSF (currentclamp mode, V m = −50 mV). Stars indicate the antidromic spikes and dotsbelow indicate the two hyperpolarizing responses recorded in response tosome of the stimuli (100 Hz). (B2) Biocytin-filled, whole-cell recorded M1pyramidal neurons of layers V-VI that responded to antidromic stimulation(scale bar 50 µm). (B3) Schematic illustration of two pyramidal neurons andone interneuron to show recording sites in B and C; Arrows indicate the
(Continued )
FIGURE 5 | Continueddirection of propagation of STN-HFS evoked antidromic spikes. (C) Wholecell recording of an inward glutamatergic current (C1) evoked by thestimulation of the rostral STN (100 µs, 0.1 Hz) in a cortical GAD-GFPinterneuron (C2, scale bar: 50 µm) (voltage clamp mode, V H = −70 mV, inthe continuous presence of gabazine 10 µM).
from (i) a difference of spontaneous activity in the network; or (ii)a change in the number and/or strength of synaptic connections(Mao et al., 2001). The former hypothesis can be ruled outbecause we did not identify any change of spontaneous activity(number of active cells or mean frequency of onsets). Whetherthe second hypothesis is valid remains to be determined and thismight be a difficult task because of the very low “hit rate” forrecording synaptically coupled layer V pyramidal cells in pairedrecordings (Markram et al., 1997). Indeed in spite of systematicrecordings in various experimental conditions to facilitate theoccurrence of EPSPs, we failed to evoke them by antidromicinvasion of pyramidal collaterals in PINK1−/− as in wt M1.
Several data led us to postulate that chronic L-dopa treatmentof PINK1−/− pups could reverse the excess of synchronization ofthe juvenile M1 network. The midbrain dopaminergic pathway ispresent early in development (Specht et al., 1981) and projects tosuperficial and deep layers of the M1 motor cortex (Descarrieset al., 1987; Lewis et al., 1987). Dopaminergic receptors of theD1 and D2 subtypes are present in rodent M1 (Boyson et al.,1986; Dawson et al., 1986), dopamine decreases the probabilityof glutamate release in layer V pyramidal neurons via presynapticD1 receptors (Gao et al., 2001) and dopaminergic signaling in M1is necessary for synaptic plasticity and motor skill learning (Hospet al., 2009; Molina-Luna et al., 2009).The lack of effect of L-dopatreatment that we found could result from an inadequate dose ofinjected L-dopa for an optimal spontaneous release of dopaminein the pup M1 cortical network (Stewart and Plenz, 2006, 2008)but the most likely hypothesis is that juvenile M1 hypersynchro-nization is independent of dopaminergic transmission. This isin agreement with our observation that the levodopa-sensitivesignature of dopaminergic dysfunction in the striatum, the giantGABAA currents, is not yet present in medium spiny neurons of2 month-old PINK1−/− mice (Dehorter and Hammond, 2014),suggesting that midbrain dopaminergic neurons do not yet dys-function at that stage.
Desynchronization by STN-HFS resulted from the backwardmodulation of the M1 cortical network activity by HFS-evokedaxonal spikes that antidromically propagate to a subpopulationof cortical neurons via the hyperdirect pathway (Li et al., 2007,2012). This is in keeping with studies in hemiparkinsonian ratssuggesting that HFS of the hyperdirect pathway is essential for theamelioration of PD motor symptoms (Gradinaru et al., 2009; Liet al., 2012). In our study it is unlikely that the effect of STN-HFS were mediated by orthodromic spikes in the subthalamo-cortical pathway which impinges upon layer III/IV neurons(Degos et al., 2008) because we did not record orthodromic monoor polysynaptic excitatory responses in layer V/VI pyramidalneurons. Cortico-striatal neurons whose axons do not projectto the pyramidal tract (IT-type) should not be antidromically
Frontiers in Systems Neuroscience www.frontiersin.org May 2014 | Volume 8 | Article 95 | 10
Carron et al. Early hypersynchrony in PINK1−/− motor cortex
activated from the STN area and only a subpopulation of layerV/VI neurons that project to the pyramidal tract (PT-type) (Leiet al., 2004) is probably affected. The thin collaterals reachingthe STN (Kita and Kita, 2012) did not always reliably transmitconsecutive antidromic spikes (Chomiak and Hu, 2007; Li et al.,2012). STN-HFS-evoked antidromic spikes also propagated insome of the recurrent axon collaterals of cortico-subthalamicneurons on their way to somas of pyramidal neurons and acti-vated synaptic transmission that impinges onto local GABAergicinterneurons. These in turn decreased pyramidal neuron activity.The overall result is the desynchronization of the M1 network (Liet al., 2012; Sippy and Yuste, 2013) and the decreased influenceof M1 cortical neurons on STN activity. The originality of thepresent result is to show that antidromic activation of a network issufficient to reverse its abnormal pattern of synchronization andto emphasize the potential role of cortical interneurons in corticaldesynchronization.
ACKNOWLEDGMENTSThe study was financed by Inserm, Association France-Parkinson (Constance Hammond), ERA-Net Neuron (ConstanceHammond), MRC Senior non-Clinical Fellowship (Mark D.Humphries and Abhinav Singh) and Medtronic. We thank theGispert/Auburger team at the University Frankfurt am Main forproviding the PINK1-KO mice.
REFERENCESAllene, C., Cattani, A., Ackman, J. B., Bonifazi, P., Aniksztejn, L., Ben Ari, Y., et al.
(2008). Sequential generation of two distinct synapse-driven network patterns indeveloping neocortex. J. Neurosci. 28, 12851–12863. doi: 10.1523/JNEUROSCI.3733-08.2008
Beggs, J. M., and Plenz, D. (2003). Neuronal avalanches in neocortical circuits. J.Neurosci. 23, 11167–11177.
Bentivoglio, A. R., Cortelli, P., Valente, E. M., Ialongo, T., Ferraris, A., Elia, A.,et al. (2001). Phenotypic characterisation of autosomal recessive PARK6-linkedparkinsonism in three unrelated Italian families. Mov. Disord. 16, 999–1006.doi: 10.1002/mds.10034
Berger, T. K., Silberberg, G., Perin, R., and Markram, H. (2010). Brief bursts self-inhibit and correlate the pyramidal network. PLoS Biol. 8:e1000473. doi: 10.1371/journal.pbio.1000473
Boyson, S. J., Mcgonigle, P., and Molinoff, P. B. (1986). Quantitative autoradio-graphic localization of the D1 and D2 subtypes of dopamine receptors in ratbrain. J. Neurosci. 6, 3177–3188.
Brown, P., and Marsden, J. F. (2001). Cortical network resonance and motor activityin humans. Neuroscientist 7, 518–527. doi: 10.1177/107385840100700608
Chomiak, T., and Hu, B. (2007). Axonal and somatic filtering of antidromicallyevoked cortical excitation by simulated deep brain stimulation in rat brain. J.Physiol. 579, 403–412. doi: 10.1113/jphysiol.2006.124057
Cossart, R., Aronov, D., and Yuste, R. (2003). Attractor dynamics of network UPstates in the neocortex. Nature 423, 283–288. doi: 10.1038/nature01614
Crépel, V., Aronov, D., Jorquera, I., Represa, A., Ben-Ari, Y., and Cossart, R. (2007).A parturition-associated nonsynaptic coherent activity pattern in the developinghippocampus. Neuron 54, 105–120. doi: 10.1016/j.neuron.2007.03.007
Dawson, T. M., Gehlert, D. R., Mccabe, R. T., Barnett, A., and Wamsley, J. K.(1986). D-1 dopamine receptors in the rat brain: a quantitative autoradiographicanalysis. J. Neurosci. 6, 2352–2365.
Degos, B., Deniau, J. M., Le Cam, J., Mailly, P., and Maurice, N. (2008). Evidencefor a direct subthalamo-cortical loop circuit in the rat. Eur. J. Neurosci. 27, 2599–2610. doi: 10.1111/j.1460-9568.2008.06229.x
Dehorter, N., and Hammond, C. (2014). Giant GABAA receptor mediated cur-rents in the striatum, a common signature of Parkinson’s disease in phar-macological and genetic rodent models. Basal Ganglia 3, 197–201. doi: 10.1016/j.baga.2013.10.001
Dehorter, N., Michel, F. J., Marissal, T., Rotrou, Y., Matrot, B., Lopez, C., et al.(2011). Onset of pup locomotion coincides with loss of NR2C/D-Mediatedcortico-striatal EPSCs and dampening of striatal network immature activity.Front. Cell. Neurosci. 5:24. doi: 10.3389/fncel.2011.00024
Dehorter, N., Lozovaya, N., Mdzomba, B. J., Michel, F. J., Lopez, C., Tsintsadze, V.,et al. (2012). Subthalamic lesion or levodopa treatment rescues giant GABAergiccurrents of PINK1-deficient striatum. J. Neurosci. 32, 18047–18053. doi: 10.1523/JNEUROSCI.2474-12.2012
Descarries, L., Lemay, B., Doucet, G., and Berger, B. (1987). Regional and laminardensity of the dopamine innervation in adult rat cerebral cortex. Neuroscience21, 807–824. doi: 10.1016/0306-4522(87)90038-8
Deuchars, J., West, D. C., and Thomson, A. M. (1994). Relationships betweenmorphology and physiology of pyramid-pyramid single axon connections in ratneocortex in vitro. J. Physiol. 478(Pt. 3), 423–435.
Douglas, R. J., and Martin, K. A. (2004). Neuronal circuits of the neocortex. Annu.Rev. Neurosci. 27, 419–451. doi: 10.1146/annurev.neuro.27.070203.144152
Eusebio, A., Cagnan, H., and Brown, P. (2012). Does suppression of oscillatorysynchronisation mediate some of the therapeutic effects of DBS in patientswith Parkinson’s disease? Front. Integr. Neurosci. 6:47. doi: 10.3389/fnint.2012.00047
Feldt, M. S., Soltesz, I., and Cossart, R. (2013). Spatially clustered neuronalassemblies comprise the microstructure of synchrony in chronically epilepticnetworks. Proc. Natl. Acad. Sci. U S A 110, 3567–3572. doi: 10.1073/pnas.1216958110
Foehring, R. C., Mermelstein, P. G., Song, W. J., Ulrich, S., and Surmeier, D. J.(2000). Unique properties of R-type calcium currents in neocortical and neos-triatal neurons. J. Neurophysiol. 84, 2225–2236.
Gao, W. J., Krimer, L. S., and Goldman-Rakic, P. S. (2001). Presynaptic regulationof recurrent excitation by D1 receptors in prefrontal circuits. Proc. Natl. Acad.Sci. U S A 98, 295–300. doi: 10.1073/pnas.98.1.295
Gispert, S., Ricciardi, F., Kurz, A., Azizov, M., Hoepken, H. H., Becker, D., et al.(2009). Parkinson phenotype in aged PINK1-deficient mice is accompanied byprogressive mitochondrial dysfunction in absence of neurodegeneration. PLoSOne 4:e5777. doi: 10.1371/journal.pone.0005777
Goldberg, J. A., Boraud, T., Maraton, S., Haber, S. N., Vaadia, E., and Bergman,H. (2002). Enhanced synchrony among primary motor cortex neurons inthe 1-methyl-4-phenyl-1,2,3,6-tetrahydropyridine primate model of Parkinson’sdisease. J. Neurosci. 22, 4639–4653.
Gradinaru, V., Mogri, M., Thompson, K. R., Henderson, J. M., and Deisseroth,K. (2009). Optical deconstruction of parkinsonian neural circuitry. Science 324,354–359. doi: 10.1126/science.1167093
Hosp, J. A., Molina-Luna, K., Hertler, B., Atiemo, C. O., and Luft, A. R. (2009).Dopaminergic modulation of motor maps in rat motor cortex: an in vivo study.Neuroscience 159, 692–700. doi: 10.1016/j.neuroscience.2008.12.056
Humphries, M. D. (2011). Spike-train communities: finding groups of similar spiketrains. J. Neurosci. 31, 2321–2336. doi: 10.1523/JNEUROSCI.2853-10.2011
Kalisman, N., Silberberg, G., and Markram, H. (2005). The neocortical microcircuitas a tabula rasa. Proc. Natl. Acad. Sci. U S A 102, 880–885. doi: 10.1073/pnas.0407088102
Kita, T., and Kita, H. (2012). The subthalamic nucleus is one of multiple innerva-tion sites for long-range corticofugal axons: a single-axon tracing study in therat. J. Neurosci. 32, 5990–5999. doi: 10.1523/JNEUROSCI.5717-11.2012
Kitada, T., Pisani, A., Porter, D. R., Yamaguchi, H., Tscherter, A., Martella, G., et al.(2007). Impaired dopamine release and synaptic plasticity in the striatum ofPINK1-deficient mice. Proc. Natl. Acad. Sci. U S A 104, 11441–11446. doi: 10.1073/pnas.0702717104
Lei, W., Jiao, Y., Del, M. N., and Reiner, A. (2004). Evidence for differential corticalinput to direct pathway versus indirect pathway striatal projection neurons inrats. J. Neurosci. 24, 8289–8299. doi: 10.1523/JNEUROSCI.1990-04.2004
Lewis, D. A., Campbell, M. J., Foote, S. L., Goldstein, M., and Morrison, J. H.(1987). The distribution of tyrosine hydroxylase-immunoreactive fibers in pri-mate neocortex is widespread but regionally specific. J. Neurosci. 7, 279–290.
Li, Q., Ke, Y., Chan, D. C., Qian, Z. M., Yung, K. K., Ko, H., et al. (2012). Therapeuticdeep brain stimulation in Parkinsonian rats directly influences motor cortex.Neuron 76, 1030–1041. doi: 10.1016/j.neuron.2012.09.032
Li, S., Arbuthnott, G. W., Jutras, M. J., Goldberg, J. A., and Jaeger, D. (2007).Resonant antidromic cortical circuit activation as a consequence of high-frequency subthalamic deep-brain stimulation. J. Neurophysiol. 98, 3525–3537.doi: 10.1152/jn.00808.2007
Frontiers in Systems Neuroscience www.frontiersin.org May 2014 | Volume 8 | Article 95 | 11

Carron et al. Early hypersynchrony in PINK1−/− motor cortex
Mao, B. Q., Hamzei-Sichani, F., Aronov, D., Froemke, R. C., and Yuste, R. (2001).Dynamics of spontaneous activity in neocortical slices. Neuron 32, 883–898.doi: 10.1016/S0896-6273(01)00518-9
Markram, H., Lubke, J., Frotscher, M., Roth, A., and Sakmann, B. (1997).Physiology and anatomy of synaptic connections between thick tuftedpyramidal neurones in the developing rat neocortex. J. Physiol. 500(Pt. 2),409–440.
Martin, D. M., Skidmore, J. M., Philips, S. T., Vieira, C., Gage, P. J., Condie, B. G.,et al. (2004). PITX2 is required for normal development of neurons in the mousesubthalamic nucleus and midbrain. Dev. Biol. 267, 93–108. doi: 10.1016/j.ydbio.2003.10.035
Molina-Luna, K., Pekanovic, A., Rohrich, S., Hertler, B., Schubring-Giese, M.,Rioult-Pedotti, M. S., et al. (2009). Dopamine in motor cortex is necessary forskill learning and synaptic plasticity. PLoS One 4:e7082. doi: 10.1371/journal.pone.0007082
Morishima, M., and Kawaguchi, Y. (2006). Recurrent connection patterns ofcorticostriatal pyramidal cells in frontal cortex. J. Neurosci. 26, 4394–4405.doi: 10.1523/JNEUROSCI.0252-06.2006
Perin, R., Berger, T. K., and Markram, H. (2011). A synaptic organizing principlefor cortical neuronal groups. Proc. Natl. Acad. Sci. U S A 108, 5419–5424. doi: 10.1073/pnas.1016051108
Sharott, A., Magill, P. J., Harnack, D., Kupsch, A., Meissner, W., and Brown,P. (2005). Dopamine depletion increases the power and coherence of beta-oscillations in the cerebral cortex and subthalamic nucleus of the awake rat. Eur.J. Neurosci. 21, 1413–1422. doi: 10.1111/j.1460-9568.2005.03973.x
Silberstein, P., Pogosyan, A., Kuhn, A. A., Hotton, G., Tisch, S., Kupsch, A., et al.(2005). Cortico-cortical coupling in Parkinson’s disease and its modulation bytherapy. Brain 128, 1277–1291. doi: 10.1093/brain/awh480
Sippy, T., and Yuste, R. (2013). Decorrelating action of inhibition in neocorti-cal networks. J. Neurosci. 33, 9813–9830. doi: 10.1523/JNEUROSCI.4579-12.2013
Song, S., Sjostrom, P. J., Reigl, M., Nelson, S., and Chklovskii, D. B. (2005). Highlynonrandom features of synaptic connectivity in local cortical circuits. PLoS Biol.3:e68. doi: 10.1371/journal.pbio.0030068
Specht, L. A., Pickel, V. M., Joh, T. H., and Reis, D. J. (1981). Fine structure ofthe nigrostriatal anlage in fetal rat brain by immunocytochemical localizationof tyrosine hydroxylase. Brain Res. 218, 49–65. doi: 10.1016/0006-8993(81)90988-4
Stewart, C. V., and Plenz, D. (2006). Inverted-U profile of dopamine-NMDA-mediated spontaneous avalanche recurrence in superficial layers of rat prefrontalcortex. J. Neurosci. 26, 8148–8159. doi: 10.1523/JNEUROSCI.0723-06.2006
Stewart, C. V., and Plenz, D. (2008). Homeostasis of neuronal avalanches duringpostnatal cortex development in vitro. J. Neurosci. Methods 169, 405–416.doi: 10.1016/j.jneumeth.2007.10.021
Tamamaki, N., Yanagawa, Y., Tomioka, R., Miyazaki, J., Obata, K., and Kaneko, T.(2003). Green fluorescent protein expression and colocalization with calretinin,parvalbumin and somatostatin in the GAD67-GFP knock-in mouse. J. Comp.Neurol. 467, 60–79. doi: 10.1002/cne.10905
Thomson, A. M., and Deuchars, J. (1997). Synaptic interactions in neocortical localcircuits: dual intracellular recordings in vitro. Cereb. Cortex 7, 510–522. doi: 10.1093/cercor/7.6.510
Whitmer, D., De Solages, C., Hill, B., Yu, H., Henderson, J. M., and Bronte-Stewart,H. (2012). High frequency deep brain stimulation attenuates subthalamic andcortical rhythms in Parkinson’s disease. Front. Hum. Neurosci. 6:155. doi: 10.3389/fnhum.2012.00155
Yang, X. L., Senthilkumar, D. V., and Kurths, J. (2012). Impact of connectiondelays on noise-induced spatiotemporal patterns in neuronal networks. Chaos22:043150. doi: 10.1063/1.4772999
Conflict of Interest Statement: Part of Constance Hammond team’s research isfunded by a donation from Medtronics to Institut national de la santé et de larecherche médicale (Inserm).
Received: 02 March 2014; accepted: 05 May 2014; published online: 21 May 2014.Citation: Carron R, Filipchuk A, Nardou R, Singh A, Michel FJ, Humphries MDand Hammond C (2014) Early hypersynchrony in juvenile PINK1−/− motor cortexis rescued by antidromic stimulation. Front. Syst. Neurosci. 8:95. doi: 10.3389/fnsys.2014.00095This article was submitted to the journal Frontiers in Systems Neuroscience.Copyright © 2014 Carron, Filipchuk, Nardou, Singh, Michel, Humphries andHammond. This is an open-access article distributed under the terms of the CreativeCommons Attribution License (CC BY). The use, distribution or reproduction in otherforums is permitted, provided the original author(s) or licensor are credited and thatthe original publication in this journal is cited, in accordance with accepted academicpractice. No use, distribution or reproduction is permitted which does not comply withthese terms.
Frontiers in Systems Neuroscience www.frontiersin.org May 2014 | Volume 8 | Article 95 | 12