Differential Thermogenic Response in Juvenile-Onset Type ...
232
William E. Oddou in Education AN ABSTRACT OF THE THESIS OF for the degree of Doctor of Philosophy presented on June 10, 1985 Title: Differential Thermogenic Response in Juvenile-Onset Type Obesity and Maturity-OnsetType Obesity Redacted for Privacy Abstract approved: Dckqata Campbell An increased metabolic efficiency may be a factor underlying the onset and maintenance of obesity. This study examined the Resting Metabolic Rate (RMR), the Thermic Effect of Food (TEF), the Thermic Effect of Exercise (TEE), and the Potentiation (P) of the TEF by Exercise in Juvenile-onset type obesity (JOTO), and Maturity-onset type obesity (MOTO). It was hypothesized that individuals categorized as JOTO would exhibit a greater metabolic efficiency and that this fact would necessitate a differential diagnosis and treatment schema. The RMR's of eight Juvenile-onset obese and eight Maturity-onset obese middle aged women were measured for five minutes every half hour for four hours under four conditions: 1) R-postabsorptive, 2) RF- postprandial, 3) RE-postabsorptive--exercised, and 4) RFE-postprandial-- exercised. Metabolic measurements were made via the technique of indirect open circuit calorimetry. The TEF (derived from integrating the total area under the 4 hour response curve) was 40.8 Kcal and 31.5 Kcal for the JOTO and MOTO subjects, respectively. The TEF after exercise amounted to 36 Kcal for the JOTO individuals and 34 Kcal for the MOTO individuals. These increases were significant (p<.001) compared to the baseline (R). The energy expenditure was not significantly elevated following the
-
Upload
khangminh22 -
Category
Documents
-
view
2 -
download
0
Transcript of Differential Thermogenic Response in Juvenile-Onset Type ...
William E. Oddou
in Education
AN ABSTRACT OF THE THESIS OF
for the degree of Doctor of Philosophy
presented on June 10, 1985
Title: Differential Thermogenic Response in Juvenile-Onset Type
Obesity and Maturity-OnsetType Obesity
Redacted for PrivacyAbstract approved:
Dckqata Campbell
An increased metabolic efficiency may be a factor underlying the
onset and maintenance of obesity. This study examined the Resting
Metabolic Rate (RMR), the Thermic Effect of Food (TEF), the Thermic
Effect of Exercise (TEE), and the Potentiation (P) of the TEF by
Exercise in Juvenile-onset type obesity (JOTO), and Maturity-onset type
obesity (MOTO). It was hypothesized that individuals categorized as
JOTO would exhibit a greater metabolic efficiency and that this fact
would necessitate a differential diagnosis and treatment schema.
The RMR's of eight Juvenile-onset obese and eight Maturity-onset
obese middle aged women were measured for five minutes every half hour
for four hours under four conditions: 1) R-postabsorptive, 2) RF-
postprandial, 3) RE-postabsorptive--exercised, and 4) RFE-postprandial--
exercised. Metabolic measurements were made via the technique of
indirect open circuit calorimetry.
The TEF (derived from integrating the total area under the 4 hour
response curve) was 40.8 Kcal and 31.5 Kcal for the JOTO and MOTO
subjects, respectively. The TEF after exercise amounted to 36 Kcal
for the JOTO individuals and 34 Kcal for the MOTO individuals. These
increases were significant (p<.001) compared to the baseline (R). The
energy expenditure was not significantly elevated following the
Exercise (RE) condition. JOTO individuals realized a 6.4 Kcal increase
while the energy expenditure increased by 4.7 Kcal for the MOTO
individuals.
These results suggest that the capacity for Juvenile-onset and
Maturity-onset obese women to respond to thermogenic stimulation is
essentially the same. No significant differences were apparent between
these groups on any of the measures of metabolic efficiency. This is
not to say, however, that metabolic efficiency is not an underlying
factor in the development and persistence of the obese state. Both
groups displayed a subnormal response to the food stimulus. Moreover,
exercise after eating failed to potentiate the TEF as it does in lean
individuals.
These blunted metabolic responses may constitute a partial
explanation for the etiology of obesity and may provide a rationale for
a more enlightened therapeutic approach. Possible mechanisms for this
blunted metabolic response might be a limited capacity to elevate
metabolic rate, a reduced sensitivity to the neural and hormonal
stimulation afforded by food and exercise, and a reduced rate of sub-
strate cycling.
DIFFERENTIAL THERMOGENIC RESPONSEIN
JUVENILE-ONSET TYPE OBESITYAND
MATURITY-ONSET TYPE OBESITY
by
William Eugene Oddou
A THESIS
submitted to
Oregon State University
in partial fulfillment ofthe requirements for the
degree of
Doctor of Philosophy
Completed June 10, 1985
Commencement June 1986

APPROVED:
Redacted for Privacy
Professor of Physical Educa on in charge of major
Redacted for Privacy
Chair6,4Department of Physical Education
Redacted for Privacy.Dean of School of Education
Redacted for Privacy
4Dean o aduate Sch
Date thesis is presented June 10, 1985
Typed by Rebecca Simpkins for William Eugene Oddou

TABLE OF CONTENTS
CHAPTER I
INTRODUCTION
Page
1
Need for the Study 1
Purpose of the Study 9
Hypotheses 9
Delimitations of the Study 10Limitations of the Study 10Summary 11
CHAPTER II 12
REVIEW OF LITERATURE 12
Thermogenesis and Energy Expenditure 12Basal Metabolic Rate 13Adaptations to Nutritional Status 18Thermic Effect of Food 25Exercise Thermogenesis 30Thermic Effect of Food plus Exercise 33Mediators and Mechanisms 36Mediators of Thermogenesis 36
Thyroid Hormones 37Catecholamines 40Insulin 43
Mechanisms of Thermogenesis 44Protein Synthesis 44Ion Transport 46Cellular Respiration 48Substrate Cycling 50
Summary 54
CHAPTER III 55
METHODS AND PROCEDURES 55
Subjects 55Procedures 58
Familiarization 58Body Composition 59Maximal Energy Expenditure 59Submaximal Energy Expenditure 61Caloric Requirements 63Resting Metabolic Rate 64
Experimental Treatments 65Adjustments 68Statistical Analysis 68Summary 77
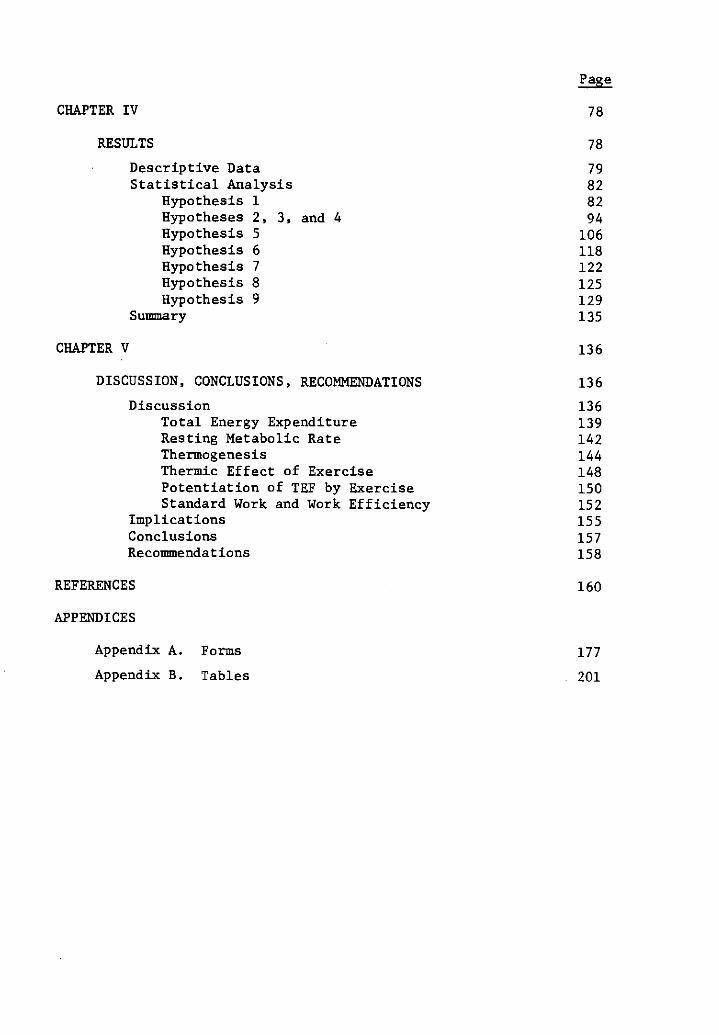
CHAPTER IV
Page
78
RESULTS 78
Descriptive Data 79
Statistical Analysis 82Hypothesis 1 82Hypotheses 2, 3, and 4 94Hypothesis 5 106Hypothesis 6 118Hypothesis 7 122Hypothesis 8 125Hypothesis 9 129
Summary 135
CHAPTER V 136
DISCUSSION, CONCLUSIONS, RECOMMENDATIONS 136
Discussion 136Total Energy Expenditure 139Resting Metabolic Rate 142Thermogenesis 144Thermic Effect of Exercise 148Potentiation of TEF by Exercise 150Standard Work and Work Efficiency 152
Implications 155Conclusions 157Recommendations 158
REFERENCES
APPENDICES
160
Appendix A. Forms 177
Appendix B. Tables 201
LIST OF FIGURES
Figure Page
1 A schematic of the total energy expenditure. 7
2 Work capacity test protocol. 60
3 The 2 x 4 x 8 factorial design with repeated measures. 69
4 2 x 4 factorial design with repeated measures. 72
5 The effect of thermogenic stimulation on oxygen 84consumption by group (MOTO and JOTO).
6 The effect of thermogenic stimulation on mean ±S.D. 85oxygen consumption (1/min).
7 The effect of thermogenic stimulation on energy 89expenditure (Kcal/min) by group (MOTO or JOTO).
8 The effect of thermogenic stimulation on mean ±S.D. 90energy expenditure (Kcal/min).
9 The effect of thermogenic stimulation on energy 92expenditure (Kcal/Kg(LBW)/HR) by group (MOTO andJOTO).
10 The effect of thermogenic stimulation on mean ±S.D. 93energy expenditure (Kcal/Kg(LBW)/HR).
11 The effect of thermogenic stimulation on respiratory 96exchange ratio (ft02//02) by group (MOTO and JOTO).
12 The effect of thermogenic stimulation on mean ±S.D. 97respiratory exchange ratio (VCO2 /V02).
13 Percent above baseline RMR (1/min) for each group. 100
14 Percent above baseline RMR (Kcal/min) for each group. 104
15 Percent above baseline RMR (Kcal/Kg(LBW)/Hr) for 107each group.
16 Energy expenditure (Kcal/min) prior to, during, and 119after exercise in the fasted and fed condition.
17 Energy cost (1/min) at rest, 0 watts, 50 watts, and 126100 watts by group.
Figure Page
18 Energy cost (ml/kg/min) at rest, 0 watts, 50 watts, 127and 100 watts by group.
19 Energy expenditure (Kcal /min) at rest, 0 watts, 50 128watts, and 100 watts by group.
20 Gross, net, and work efficiency (%) at 50 and 100watts by group.
131
21 Gross, net, and work efficiency at 50 and 100 watts 132of external work by group (* JOTO, MOTO)
22 A modification of Jequier's three component model of 137total energy expenditure.
LIST OF TABLES
Table Page
1 Preliminary subject recruitment. 56
2 Preliminary ANOVA table (3 factor). 71
3 Preliminary ANOVA table (2 factor). 74
4 Physical characteristics of the subjects by group. 80
5 Maximum oxygen consumption and energy expenditure by 81group.
6 Results of three-way analysis of variance with repeated 83measures on V02 (1/min).
7 Results of three-way analysis of variance with repeated 88measures on energy expenditure (Kcal/min).
8 Results of three-way analysis of variance with repeated 91measures on energy expenditure (Kcal /Kg(LBW) /Hr).
9 Results of three-way analysis of variance with repeated 95measures on respiratory exchange ratio.
10 Results of two-way analysis of variance with repeated 99measures on /02 (liters).
11 Results of two-way analysis of variance with repeated 102measures on energy expenditure (Kcal/min).
12 Results of two-way analysis of variance with repeated 105measures on energy expenditure (Kcal/Kg(LBW)/Hr).
13 Two-way analysis of variance with repeated measures 108on the average oxygen consumption over the four hourperiod on each treatment day.
14 Differences by group in the thermic effect of food 109(TEF) and exercise (TEE), and the potentiation of theTEF by exercise.
15 Two-way analysis of variance with repeated measures 110on the average energy expenditure (Kcal/min) over thefour hour period on each treatment day.

Table Page
16 Differences by group in the thermic effect of food(TEF) and exercise (TEE), and potentiation of the TEFby exercise.
111
17 Two-way analysis of variance with repeated measures 112
on the average energy expenditure (Kcal/Kg(1,810/Hr)over the four hour period on each treatment day.
18 Differences by group in the thermic effect of food 113(TEF), and exercise (TEE), and the potentiation ofthe TEF by exercise.
19 Differences by group and differences by groupscombined in the oxygen consumption, energy expenditure,and R.E.R. at a relative work load (50% V02) under twoconditions (fed and fasted).
117
20 Resting metabolic rate of the subjects by group. 120
21 One-way analysis of variance on resting metabolic rate 121(1/min) measured under similar conditions on fourseparate days.
22 Correlation matrix for resting metabolic rate determined 123under similar conditions on four separate days.
23 Energy expenditure at rest, 0 watts, 50 watts, and 124100 watts by group.
24 Difference in gross, net, and work efficiency between 130groups at two levels of work.
25 Total energy expenditure/calorie intake. 134
DIFFERENTIAL THERMOGENIC RESPONSEIN
JUVENILE-ONSET TYPE OBESITYAND
MATURITY-ONSET TYPE OBESITY
CHAPTER I
INTRODUCTION
The prevalence of obesity and its association with several serious
diseases makes it a fundamental problem in the health care community
(1,4,26,44,49,162,225,232). Obesity is thought to contribute either
primarily or secondarily to diabetes, coronary heart disease, hyper-
tension, hyperlipidemia, and orthopedic disabilities (3,4,49,232,236).
Treatment schema have included everything from complete or semi-
starvation to gastric reduction surgery but unfortunately the prognosis
for success is not good (2,19,49,170,241). It is estimated that the
incidence of relapse is between 70 and 95 percent (19,28,44,89,173).
These facts clearly demonstrate that obesity, as a condition, is poorly
understood.
Need for the Study
A need, therefore, exists to improve the understanding of the
factors leading to the development of obesity and those factors leading
to a more successful long-term maintenance of weight reduction (130).
Information is also needed regarding the physiological interactions
among various therapeutic modes used in the treatment of obesity and
the mechanisms underlying weight and body composition changes (46,70,
148,155,189). Other factors of concern are the relative influence of
morphology and age of onset of obesity on the development of, and
2
successful treatment of, the obese condition (11,22,27,121,122,213).
The mass of the adipose tissue depot is dependent on the size and
number of its fat cells. These cells are composed of approximately
90% triacyleglycerol with the balance comprised of proteinous material
(166). Bjorntorp and Sjostrom (23) comment that in certain types of
obesity the fat cell size is larger than normal. They also indicate
that the number of fat cells can be elevated above normal, especially
in severe obesity. Subgroups of obese individuals have been identified
based upon the characteristics of their adipose tissue cellularity.
Bjorntorp et al (22) used an arbitrary limit for fat cell number of
5 x 10¹⁰ as a dividing line. Those individuals with more than this
number of cells were categorized as hyperplastic obese. It has been
theorized that hyperplastic obesity has a strong genetic component to
its etiology. This is based upon the apparent negative correlation
between the age of onset of obesity and the number of fat cells (11).
Miller (170) suggested the term juvenile-onset type obesity (JOTO),
and used the term hyperplastic to characterize this type of obesity.
Strong familial evidence of hyperplastic obesity has been presented
as an argument for a genetic link (130,225).
Bjorntorp et al (25) and Sjostrom and Bjorntorp (215) state that
fat cell size is age-dependent, being higher in older individuals than
in younger. Bjorntorp et al (25) measured fat cell size at 0.80 micro-
grams in obese middle-aged women, whereas Sjostrom and Bjorntorp (215)
reported cell sizes of 0.41 micrograms in normal young women. Tropic
obesity is thus defined as an increased fat cell size with fat cell
number remaining essentially normal. Miller (170) noted that

3
hypertrophic obesity is more commonly associated with those individuals
who become obese in adulthood. Therefore, the phrase "maturity-onset
type obesity" (MOTO) is used to differentiate these individuals. It
is not known whether obese individuals categorized as "juvenile-onset"
or as "maturity-onset" require differential diagnosis and/or treatment
schema. It is known (22,25,27,121), however, that the normalization of
body fat in obese individuals with a large fat cell number often requires
that the fat cell size be reduced to a level below that of normal
individuals. Lepkovsky (159) reported that the size of the fat depot
might exert a regulatory effect on energy balance. It is suggested
that when fat cell size reaches a certain, yet undetermined level,
further weight reduction is extremely difficult (159,173). Bjorntorp
et al (27) indicate an extremely poor treatment prognosis in JOTO, and
they suggest that it may be worthwhile examining the differences in
metabolic efficiency in sub-type obesity for possible clues to the
etiology of the condition, and for insights into more successful plans
for treatment.
According to Bailey (15), obesity is the common manifestation of a
group of disorders in which surplus energy is stored as fat. The
condition of obesity results from a derangement in energy balance.
Simply stated, energy balance is the relationship between energy intake
and energy expenditure. A positive energy balance results in a deposi-
tion of fat; whereas a negative energy balance results primarily in fat
stores being utilized to meet the metabolic requirements of processes
such as maintenance, growth, activity, and thermoregulation. The First
4
Law of Thermodynamics leads to the conclusion that for adiposity to
increase, more calories must be assimilated than are needed to meet the
previously stated metabolic demands.
Although highly supportive of the Laws of Thermodynamics, Garrow
(89,90) takes some exception to the universally accepted energy
balance equation: change in energy stores = energy input - energy
output. He suggests that it is incorrect to assume if you alter two
components of the equation the third is unaffected. Miller and
Parsonage (173) also conclude that ample evidence shows that in calcu-
lating caloric balance care should be taken to account for the
influence of caloric intake on caloric output. They stated that it
seems apparent that the factorial method for calculating calorie
requirements by adding to the requirements for the basal metabolic
rate (BMP.) those for individual activities without taking into account
the thermic response to food, and more importantly the exercise induced
thermic response to food, needs revision. Several other important
researchers agree (132,139,172,207,238,261) that the normal increase in
metabolic rate associated with the thermic response to food and exercise
may be reduced in obesity. Differences in metabolic efficiency,
therefore, have been proposed as a possible mechanism for the etiology
and maintenance of obesity.
Over the past few decades, serious attempts have been made to
examine the physiological manifestations associated with thermogenesis
in the hope of explaining the apparent differences in food energy
requirements between individual human subjects. These differences can
not be explained by variations in physical activity. If fluctuations
5
in metabolic efficiency do occur, the dissipation or conservation of
heat would provide a logical and reasonable mechanism by which such a
variability might be brought about. Miller et al (172) surmised that
the primary mechanism for the regulation of energy balance was by
dietary induction of thermogenesis which is based upon the capacity to
increase heat production in response to the increased caloric intake
so that the total body energy stores remain unchanged. A defect in
thermogenesis may help to explain why some individuals tend to become
or remain obese while others do not.
Some factors that suggest the presence of physiological mechanisms
for the defense of body mass are (1) the failure of many obese
individuals to lose weight on very low calorie diets (170), (2) dis-
crepencies between predicted weight loss and actual weight loss (8,91,
155,126), and (3) the high relapse rate among reduced obese individuals
(225,232). Considerable evidence indicated that the caloric intake of
many obese individuals is no higher than the normal weight individual
(45,55,232). Also, the caloric intake of people of similar weight and
activity levels may vary considerably (8,162,199,214,233,241). These
factors force obesity researchers to acknowledge that the Laws of
Thermodynamics and energy balance may not apply to humans in a single,
uncomplicated way and may be insufficient to explain and treat obesity.
It is clear that a better understanding of the factors which cause some
individuals to waste their calories and others to hoard them in adipose
tissue stores is needed.
Thermogenesis is the dissipation or expenditure of energy in the
form of heat (118). There are many components of an individual's total
6
daily energy expenditure (Figure 1). These components include: (1)
basal metabolic rate (BMR), which is the rate of oxygen consumption at
rest under postabsorptive, thermoneutral conditions, needed to provide
the energy to drive basic life-supporting processes, (2) energy expended
in physical activity, (3) energy expanded in the digestion and metabo-
lism of food (the thermic effect of food), and (4) a variable component
of energy expenditure which changes in response to environmental
temperature and other external stimuli (shivering and non-shivering
thermogenesis).
Himms-Hagen (118) distinguishes between obligatory and facultative
components of energy expenditure. The former includes the BMR and the
thermic effect of food. The latter, termed facultative because its
magnitude is circumstantially dependent, includes those metabolic
changes which take place in response to the ambient temperature, physical
activity, and the organism's nutritional state. James and Trayhurn
(131) divide the total energy expenditure into the BMR, the cost of
physical activity, and "maintenance increments". These maintenance
increments include the thermic effect of food, adaptive responses to
the nutritional status, and metabolic adjustments to the environment
required to maintain body temperature. Garrow (90) divides the factors
determining energy expenditure into two broad categories, muscular
work and metabolic work. What these models share is the distinction
between a portion of the energy expenditure Which is essential to life,
and a portion which is variable and accommodating.
Recently, more attention in obesity research has been given to the
expenditure aspect of energy balance (46). Impaired thermogenesis

B.S.A. SEX AGE AMOUNT OF MISCELLANEOUSTHYROID HORMONE (FEVER, DRUGS, EMOTIONS)
BASAL METABOLIC RATEOR
RESTING METABOLIC RATE
PHYSICALACTIVITY
(TEE)
FOOD INTAKE(TEF)
ENVIRONMENTALTEMPERATURE
(NST -- ST)
TOTAL ENERGY EXPENDITURE
Figure 1. A schematic of the total energy expenditure.

8
(a defect in the capacity to dissipate energy and increase metabolic
rate in response to stimuli such as cold, heat, exercise, or certain
drugs and hormones) has been identified as a factor underlying the
development and persistence of obesity (15,91,131). In investigating
the differences among lean and obese individuals, researchers (131,139,
172,207,261) have tried to determine which components of the total
energy expenditure might be associated with the development of, or the
predisposition toward obesity. A difference among individuals in their
capacity to dissipate heat due to a variability in their metabolic
rate, either intrinsically (BMR) or in response to specific stimuli
such as changes in ambient temperature, the acute ingestion of food,
elevation or reduction of the nutritional status, muscular work,
certain hormones, or a combination of these factors, has been proposed
as a possible physiological basis for the etiology and maintenance of
obesity (15,91,131,139,172,180,207,235,261). Thus, impaired thermo-
genesis may be an important factor associated with obesity.
The research in the area of metabolic efficiency and impaired
thermogenesis is relatively new and therefore fairly incomplete.
Unsettled issues remain, including the differences in thermogenesis
in any of the sub-groups of human obesity. The possibility that
individuals categorized as JOTO may waste fewer calories as a result
of a diminished thermogenic response remains equivocal. If there is
a reduced energy expenditure under circumstances previously mentioned
(and assuming caloric consumption is identical in these groups of
individuals) any excess caloric intake would result in an increased
deposition of adipose tissue. This may account for the high failure
rate of certain individuals to conventional weight loss programs (130).

9
Purpose of the Study.
The purpose of this study was to investigate the metabolic
responses evoked by daily stimuli such as physical activity and food,
in order to determine if a differential thermogenic response exists in
sub-type obesity. The responses of individuals with Juvenile-onset
type obesity (JOTO) and those with Maturity-onset type obesity (MOTO)
were contrasted on a series of obligatory and facultative components
of energy expenditure. It is hypothesized that a primary metabolic
defect exists in subjects with familial obesity (JOTO), and that this
deviation from the average normal pattern of metabolism provides a
reasonable explanation as to the etiology of obesity.
Hypotheses
The following hypotheses were tested in this study:
1. Significant group by thermogenic stimuli by time interactions
exist among individuals categorized as JOTO or MOTO.
2. Differences in the thermic effect of food (TEF) exist among
individuals categorized as JOTO or MOTO.
3. Differences in the thermic effect of exercise (TEE) exist
among individuals categorized as JOTO or MOTO.
4. Differences in the exercise-induced thermic response to food
(potentiation of the TEF) exist among individuals categorized as JOTO
or MOTO.
5. The thermic effect to food and exercise is the same regardless
of the sequence in which they are presented.
10
6. Differences in the resting metabolic rate (RMR) exist among
individuals categorized as JOTO or MOTO.
7. Differences in the energy cost of standardized work exist among
individuals categorized as JOTO or MOTO.
8. Differences in the gross, net, and work efficiency exist among
individuals categorized as JOTO or MOTO.
9. Differences in the total energy expenditure (measured by
determining the calories required to maintain weight) exist among
individuals categorized as JOTO or MOTO.
Delimitations of the Study
This study was limited to 8 middle-aged females who were juvenile-
onset and 8 middle-aged females who were maturity-onset obese. They
were selected from a group of individuals who qualified for The Obesity
Research Project at Oregon State University. The subjects ranged in
age from 27 to 42 years. All were healthy, non-medicated, pre-
menopausal, non-smoking, moderately obese, middle-aged females.
Limitations of the Study
1. The lack of complete randomness because the subjects were
volunteers in the Obesity Research Program.
2. The small number of subjects investigated due to the exacting
nature of the methodological procedures.
3. The long list of pre-conditions for subject selection due to
their known effects upon the rate of metabolism.
4. Precise information could not be obtained regarding the sub-
ject's fat cell size and number. It remains only conjecture that the
11
group categorized as JOTO were hyperplastic obese while the group
categorized as MOTO were hypertrophies
Summary
Several metabolic abnormalities have been described in obese
persons, but little is known about the relative influence of morphology
and age of onset on the development of these changes. Leibel and
Hirsch (157) state unequivocally that small uncorrected, or unopposed,
variations in any of the obligatory or facultative components of energy
expenditure can, over time, result in large alterations in body compo-
sition. Therefore, the present study compared two groups of obese
middle-aged females; namely, juvenile-onset type obesity (JOTO) with
maturity-onset type obesity (MOTO) to determine if subtle differences
in metabolic efficiency between the groups exist. This knowledge may
help the clinician better understand the development of the obesity
condition, and lead to better treatment schema.

12
CHAPTER II
REVIEW OF LITERATURE
Thermogenesis and Energy Expenditure
Thermogenesis is defined as an increase in resting metabolic rate
in response to some stimulus such as food, exercise, cold, heat, or
stress; or as a result of the administration of certain drugs or
hormones. Leibel and Hirsch (157) point out that small uncorrected
or unopposed variations in any of these responses can, over time,
result in large alterations in body composition. Which aspects of the
total energy expenditure exhibit a reduced or impaired thermogenesis
is a matter of considerable debate. In part, the debate and the
discrepant findings in the research can be attributed to the difficulty
in assessing energy expenditure under a variety of conditions, and the
great variability among individuals with respect to both the caloric
intake required for weight maintenance and in the total daily caloric
expenditure (89,132). Because of this variability from person to person,
a sensible procedure for determining if the responses to certain
thermogenic stimuli are blunted or not is to test the same individuals
under a variety of conditions and compare their responses on a relative
rather than an absolute basis. This is not the usual practice in
metabolic research (89), however, since such an experimental procedure
is difficult and time consuming. Yet it may account for some of the
discrepancies and misunderstandings prevalent in the research.
Some of the unsettled issues regarding the bioenergetics of
obesity are whether the basal or resting metabolic rate, the thermic
effect of a meal, the energy expenditure during or after physical
13
activity, or the interaction of food and exercise differ among
individuals with juvenile-onset type obesity (JOTO) and those with
maturity-onset type obesity (MOTO). The possibility that SOTO
individuals may have a reduced thermogenic response to a variety of
stimuli remains equivocal (11,139,189). If there is a reduced energy
expenditure under these circumstances (and assuming caloric consumption
is similar in these groups of individuals) any excess caloric intake
would result in an increased deposition of adipose tissue. This
possibility may account for the dismal failure rate of these indivi-
duals to conventional weight loss programs (26,44,49,121,130,223,225).
Basal Metabolic Rate
The basal metabolic rate (BMR) consists of energy requiring
synthetic, osmotic, and mechanical processes. These processes include
(1) the energy needed to pump ions in order to maintain the proper
gradients across cell membranes, (2) the mechanical work involved in
the contraction of the heart and the work of the respiratory musculature,
and (3) the catabolism and synthesis of all tissues of the body (118).
Energy to drive these processes is derived from the oxidation of fat,
carbohydrate, and to a lesser extent, protein. A portion of the
energy liberated by the combustion of these fuels is conserved in the
form of ATP, which can later be hydrolyzed to provide the energy to
drive cellular processes. Only a portion of the free energy is
harnessed into usable chemical bonds which can later be transformed
to do cellular work. This is a result of the fact that biological
oxidations are not 100% efficient so that a portion of the free energy

14
derived from the metabolism of substrate is dissipated as heat (18,118,
182).
A number of investigators (20,57,68,123,141,245) have studied the
possible metabolic differences between lean and obese individuals,
They hypothesized that the obese expend less energy in basal processes
than their lean counterparts. This reduced basal energy expenditure
is only one factor favoring the defense of body mass. But, unfor-
tunately, this research is inconclusive because of problems in assessing
BMR.
There are at least two major problems in the study of basal
metabolism. The first problem is that the BMR is virtually nonexistent
because it is nearly impossible to measure (89). Accurate determination
of BMR requires the conditions of complete physical and mental rest,
which are hardly compatible with the laboratory setting. For this
reason, measurement of resting metabolic rate (RMR) is most often
performed. Under resting conditions the subject is in the fasted
state in a thermoneutral environment. The subject must be alert but
may be either reclining or lying down. Bailey et al (16) report a
cyclic variation of between 4-10% in the RMR independent of lying
supine or reclining, The stimulating effect of the experimental
conditions upon the metabolic rate is taken into account by differenti-
ating between basal and resting energy expenditure. It should also be
noted that Du Bois (70) defined the BMR as a single point, therefore
inferences beyond this point should not be made. Flatt (81) has noted
that the difference between the BMR and the RMR is approximately 20%,
15
The second problem is that differences in RMR may be due wholly,
or in part, to differences in the size of the individuals under study.
Therefore, RMR expressed as the absolute oxygen consumed or calories
expended per unit of time may be inappropriate to account for differences
in total body weight, body surface area, fat weight, or lean body
weight. Garrow (89,90) points out that the expression of metabolic
rate relative to body surface area is inappropriate. He states that
although surface area determines the rate of heat loss, the RMR is a
measure of heat production. Thus he concludes that the metabolic rate,
measured in a thermoneutral environment is not determined by the rate
of heat loss (89). To emphasize this point, the work of Leibel and
Hirsch (157) presented the relationship between RMR expressed in Kcal/
m2 and varying degrees of obesity. They reported no significant trend
between the degree of obesity and energy requirements of these indivi-
duals. Halliday (113) and Miller and Parsonage (173), however,
reported positive relationships between RMR and fat cell size, cell
number, and total fat mass in various groups of obese individuals.
Garrow (89) suggested that body weight is an adequate reference
for comparing most individuals. However, for the purpose of explain-
ing variations in metabolic rate among individuals of widely varying
sizes, lean body mass is the best determinant since it is the most
metabolically active component of the total body mass. Cunningham (56)
and Ljunggren (162) concluded that lean body mass (LBM) is the sole
predictor of RMR in obese individuals. But Bernstein et al (20)
reported significant multiple correlations for body fat on RMR. They
stated that enlarged fat cells have increased rates of lipolysis and
16
glucose utilization. In addition, their increased surface area might
require increased energy utilization. This Na+-K+ATPase activity is
required to maintain internal electrolyte balance, according to Bernstein
et al (20).
When RMR is expressed in absolute form, as oxygen consumed or
calories expended, several investigators (90,130,157,162), report that
the RMR of obese subjects is higher than that of lean subjects. When
expressed relative to total body weight, the obese may appear hypo-
metabolic. This might be attributed to their somewhat reduced lean
body mass in relationship to their total body weight rather than to a
metabolic conservation of energy (113). Keys et al (145) found that in
a group of subjects ranging in body weight from 76 to 152% of standard
weight the RMR per kilogram of actual body weight tended to decrease
as body weight increased. When corrected for differences in fat tissue
the RMR per kilogram of active tissue of the obese subjects was normal
or slightly elevated.
The significance of variability in RMR is still a matter of
controversy. According to Flatt (81), this variability may reflect
variations in muscle tone, changes in body composition, or the residual
influence of the previous day's dietary intake. While some investi-
gators (30,54,91,128,173) have dismissed the RMR as a possible source
of reduced thermogenesis, many others (36,68,123,245) have found that
the RMR is a good predictor of success in weight reduction. Ashwell
et al (11) and Miller and Parsonage (173) suggested that obese
individuals who tended to defend body mass while consuming small
17
amounts of food had lower RKR's than those not resistant to weight
loss.
James and Trayhurn (130) suggest that relative to the total energy
expenditure the RMR may be higher in the obese due to inadequate thermo-
genic stimulation in the other components of heat production. According
to Hoffmans et al (123), the mean values for RMR were 1550 Kcal /24 hours
in obese and 1421 Kcal /24 hours in a normal weight group. They reported
that the obese spend 68% of their day either sitting or sleeping.
Bradfield and Jourdan (36) measured the BMR and energy required for
weight maintenance in subjects confined to a metabolic ward. They
observed that the BMR accounted for 72% of the obese subject's total
energy expenditure but only 50% of the total energy expenditure of the
normal weighted controls. Using these data, James and Trayhurn (128)
subtracted 20% of the total energy expenditure for physical activity
for both the lean and obese subjects. The rationale for subtracting
equal amounts for the controls and obese subjects is that although
the obese may be less spontaneously active (89,232) than lean people
they expend more energy in weight dependent tasks. With physical
activity and basal metabolism deducted from the total energy expendi-
ture, James and Trayhurn observed that 30% and 8% of the total energy
output of the control and obese subjects, respectively, were unaccounted
for. These proportions of the total energy output represent the
"maintenance increments" in the metabolic rate or the capacity for
thermogenic adjustments to external stimuli. This suggests the obese
have a very small margin for adjustment or adaptation in thermogenesis
rather than any intrinsically depressed BMR. Such a small capacity
18
for thermogenic increments in the metabolic rate could contribute to
a reduced capacity to dispose of food energy, even in the presence
of a normal or elevated metabolic rate, suggest James and Trayhurn
(130).
Bailey (15) concluded that a substantial change in the BMR is not
apparent in obesity. However, he does suggest that any general reduc-
tion of energy expenditure might encourage the development of obesity.
Adaptations to Nutritional Status
Studies of basal metabolism and responses to a variety of thermo-
genic stimuli are easily confounded by alterations in the subject's
nutritional status and any manipulation of the dietary intake prior to
the study. Alteration of nutritional status and dietary intake exert
powerful influences upon all aspects of metabolism (5,7,39,125). In
fact, changes in RMR associated with changes in nutritional status are
thought to be a significant factor in the maintenance of energy
balance (15,30,37,42,98,189). Garrow (90) suggested that metabolic
adaptation to energy imbalances oppose or buffer large changes in body
weight in the normal individual. He hypothesized that a buffer control
system exists which tends to oppose weight changes when energy intake
is altered.
The work of Apfelbaum et al (7), Miller et al (172), Sims (214),
and other researchers (39,58,106,152) demonstrates that metabolic rate
is sensitive to both energy excesses and deficiencies. These responses
are considered longer term metabolic responses in contrast to the
acute change in metabolic rate which occurs in response to the ingestion
of a meal, although there is evidence for interactions among long-term
19
and acute changes in heat production (58,132,176).
Resting metabolic rate decreases during periods of underfeeding
or caloric restriction (5,7,43,123,222). For example, Apfelbaum et at
(5) found that the BMR declined about 0.9% per day over a fifteen day
period during which the subjects consumed 220 Kcal/day. In addition,
Bray (39) reported a 15% decline in energy expenditure following eight
days on a 450 Kcal diet. This decrease in metabolic rate occurs in
both normal and obese subjects and tends to be greater than can be
accounted for by the accompanying reduction in body weight. That is,
the change in metabolic rate is significant even when expressed relative
to body weight or lean body weight. Furthermore, the reduction in body
weight, when expressed as an energy deficit, does not adequately
account for the cumulative deficit in the caloric intake during the
period of caloric restriction. This implies that a depression of
thermogenesis or energy consuming processes accompanies the restriction
of caloric intake. To emphasize this point, the work of Dore (68)
reported a decline of 19.3% in the resting energy expenditure in a
group of obese individuals following a 30 kilogram weight loss. He
concluded that massive weight loss on very low energy intakes reduces
total energy expenditure.
Garrow (90) states that the adaptation of RMR to periods of
chronic caloric deficit is an obvious advantage in periods of famine
or deprivation. Such a depression of metabolic rate enhances the
chances of survival, since the body is more likely to resist debili-
tation due to starvation by conserving its energy stores.
20
In humans, refeeding after caloric restriction restores the RMR
towards the pre-restriction level (89,134,152), although it is reported
that this restoration may be incomplete (80,137,208). In addition,
Garrow (89) states that upon subsequent caloric restriction the meta-
bolic rate declines even more rapidly and at a rate proportional to the
severity of the restriction. This phenomenon might help to explain
the resistance to weight loss reported among some obese individuals
with long histories of previous dieting (173). Observations by
Thompson et al (232) support the notion that previous dieting is
inversely related to successful weight loss in obese subjects. The
apparent metabolic efficiency following caloric restriction has also
been associated with an increased efficiency of food utilization upon
refeeding (34). These facts clearly indicate that although weight can
be lost on very low calorie diets, weight maintenance is made
increasingly more difficult.
The reduction in basal thermogenesis is an important factor to
consider when reviewing reports of lower than normal resting metabolic
rates among obese and formerly obese individuals. The obese person
who has repeatedly restricted caloric intake or who is undergoing
weight reduction through very low calorie diets may indeed show a
depressed RMR. However, this abnormality may be independent of the
obesity. Instead, the depressed metabolic rates of some of these
obese and formerly obese (131,139,244) subjects might be largely
explained by their recent dietary history and not from the obese
condition per se. Therefore, stability of the dietary intake and
body weight at the time of metabolic testing seems to be a critical
experimental control.
21
In addition to the effects of caloric restriction upon the RMR
there is evidence that it also effects the total energy expenditure.
Apfelbaum et al (7), Buskirk et al (50) and Drenick and Dennin (69)
report a reduced resting energy expenditure and a reduction in the
energy cost of standardized work when subjects were in a fasted state.
The most marked decrement, from 2.8 to 2.2 Kcal/Kg/Hr, occurred in
walking. This diminution in energy expenditure was more than 30
percent and further calls into question the use of hypocaloric diets
in long-term weight loss programming.
Metabolic adaptations to overfeeding also occur. The failures of
overfed subjects to gain the thermodynamically predicted amount of
weight suggests the existence of a homeostatic mechanism by which
thermogenic output increases during periods of excessive caloric
intake (50,213,214). The term "luxusconsumption", meaning extravagant
consumption, was first used by Neuman (89). He observed an apparent
capacity to dispose of excess ingested calories and thus maintain a
fairly constant body weight despite a greatly increased caloric
intake. This adaptation to an increased nutritional status seems to
occur only after a period of overfeeding to exceed two weeks. It is
manifest by a decline in the rate of weight gain (34,58,98). Sims
(213,214) indicated that the experimental obese require more calories
to maintain weight than did a group of spontaneously obese individuals.
Miller at al (172) support these findings and also state that
increased caloric consumption does not necessarily result in weight
gain, particularly in lean individuals. This occurs because of an
increase in oxygen consumption at rest and during work, coincidental
22
with this period of overfeeding (172). This increase in energy
expenditure would minimize the gain in energy stores and partially
account for the excess calories not stored in the form of adipose
tissue. Apfelbaum et al (7) found that in subjects fed an excess of
1500 Kcal per day for 15 days (22,500 Kcal), the gain in adipose
tissue stores amounted to only 10,000 Kcal, leaving a total of 12,500
Kcal or 800 calories per day unaccounted for by any change in body
weight. The 24 hour energy expenditure of these subjects was 15%
greater after overfeeding and the BMA increased by 12.5% by the end of
the 15 days of overfeeding.
Glick et al (98) studied the metabolic responses of lean and obese
subjects. They concluded that dietary induced thermogenesis or luxus-
consumption is not a factor in regulating energy balance during short
term overfeeding but they did not discount the possibility that it
could figure in the long term regulation of energy balance. Thus, the
study indicated that there may be a certain threshold either in the
duration of overfeeding or the total caloric excess required before
adaptation would occur. According to Garrow (90), this delayed
onset makes sense because a metabolic adaptation to a few overfeedings
when food could be unavailable in the near future would be counter-
productive. Glick (99) appeared to agree with Garrow, with Katzoff
et al (142) and Welle et al (251) reported substantial increases
in energy expenditure as the result of acute dietary increases
especially to diets high in carbohydrate.
The influence of the nutritional composition of the diet during
periods of underfeeding and overfeeding has been investigated

23
previously. There appears to be a particular metabolic sensitivity to
the carbohydrate content of the diet. Jung et al (138) reported a
greater drop in metabolic rate when a hypocaloric diet contains little
or no carbohydrate. The increase in energy expenditure in animals fed
a hypercaloric high carbohydrate diet is greater than in animals
consuming a high protein diet (34,99,234,252). Welle et al (252)
cited the work of Goldman who found that when humans consumed either
excess fat or carbohydrate calories the ratio of weight gained to
the excess calories consumed was greater when excess fat was added to
the diet. In other words, the metabolic adaptation to overfeeding is
more prominent when the excess calories are consumed in the form of
carbohydrate. In addition, the subjects overfed fat required only
1800 Kcal/day to maintain a weight 20% above the prefeeding weight.
Those subjects consuming their calories in the form of carbohydrate
or a mixed nutritional composition required 2700 Kcal/day to maintain
their body weight at this higher level (252). Hurni et al (125),
however, reported no significant difference in the RMR of lean
individuals to a mixed diet (68 Kcal/hour) or a high-carbohydrate,
low-fat diet (66.5 Kcal/hour). These results indicate that the
composition of the diet had no influence on energy expenditure
measured over a 24 hour period. Miller, however, has stated repeatedly
that the BMR after overfeeding fat is essentially unchanged while it
was significantly elevated after excess carbohydrate was fed (170).
Miller et al (172) also noted that some subjects even lost weight
while consuming an excess of 8000-10,000 Kcal/week on a high carbo-
hydrate diet. Perhaps the discrepancy could be resolved if future

24
studies would examine the form in which the carbohydrate was adminis-
tered.
Miller (170) cautions that studies of the metabolic responses
to overfeeding have traditionally used initially lean individuals
and that the obese may not respond in the same way to caloric excesses.
James and Trayhurn (131) investigated the relationship between the
percentage of body fat and the magnitude of the thermogenic adaptation
in subjects consuming 150% of their normal intake. They observed that
the percentage increase in 24-hour energy expenditure was inversely
related to the subject's body fat. That is the initially fatter subjects
tended to demonstrate a smaller thermogenic adjustment. This suggests
that the thermogenic response may indeed be associated with a capacity
to preserve energy balance. Obesity may partially result from a
reduced adaptive thermogenic capacity (11,15,131,156,172,195,207,261).
Obese individuals reduced down below their usual weight, as the
result of dietary restriction, appear to gain weight more readily from
a given caloric excess than other obese individuals (211,244). A
smaller dietary induced thermogenic response is thought to be a factor
leading to this efficient weight gain. This points up the interaction
between the nutritional status and metabolic adaptation to over-
nutrition upon metabolic processes.
Knowledge about the subject's nutritional status prior to and
during the period of metabolic research is important. Not only are
there changes in basal or resting metabolism, but the responses to two
important thermogenic processes, the thermic effect of food, and the
energy expended in physical activity, are greatly influenced by
25
nutritional status. Therefore, nutritional status must come under
experimental control.
Thermic Effect of Food
The acute form of dietary induced thermogenesis (the thermic
effect of food) is the increment in the metabolic rate following eating.
This elevation in the metabolic rate is due to the obligatory utilization
of ATP in the metabolic handling of the ingested substrates; digestion,
intestinal absorption and the processes of transport, storage, and
elimination (81,118). The increased metabolic rate after the ingestion
of food is not solely due to digestive processes, since it is also
observed after the infusion of glucose and amino acid, as well (196).
The thermic response of food begins shortly after the ingestion
of the meal, peaks roughly two hours after eating, and then slowly
diminishes (132). The duration, magnitude, and time course of the
response are related to the caloric content and composition of the
meal. Miller et al (172) found that the magnitude of the thermic
effect of food was proportional to the caloric content of the meal
up to about 2000 calories. After this level, further increments in the
calorie content of the meal yielded relatively smaller increases in
the thermic effect. Considerable controversy exists regarding the
traditional concept that the thermic effect of a meal is positively
related to its protein content. Welle et al (250) found that protein
yielded a larger thermic effect than either fat or carbohydrate, but
Miller et al (172) refute this finding. Perhaps the discrepant
findings can be traced to methodological differences, especially

26
the duration of the postprandial measurement period. The larger thermic
effect of a protein meal is only apparent if the duration of the
metabolic determinations exceed three hours. Increase in metabolic
rate after the ingestion of glucose occurs much earlier and lasts
for a shorter time (251).
The contribution of postprandial thermogenesis to an individual's
total energy expenditure has been studied with attention to the
possibility that this aspect of energy expenditure may be a source of
reduced thermogenesis in the obese. Much of the research in this area
lacks adequate experimental control (91), First, the postprandial
metabolic rate, measured over a period of hours, must be compared to a
control condition in which metabolic measurements are made over the
same period of time, without the ingestion of food. This is necessary
in order to calculate the diurnal increase in metabolic rate which is
independent of eating, and to feret out the total increase in metabolic
rate which is due to postprandial thermogenesis (10,16). The assumption
that the RMR estimated from one baseline measurement would persist over
a period of hours cannot be made (16). Studies which fail to take this
into account may yield unreliable estimates of the thermic effect of
food.
The second limitation of certain studies on postprandial thermo-
genesis is that the postprandial measurement periods were not long
enough to control for variation among individuals in the time it takes
to achieve a peak increase in the postprandial metabolic rate.
Measurement of metabolic response for only one or two hours will yield
27
underestimates of the thermic effect of food in subjects who respond
more slowly to the meal. Methodological differences such as these,
as well as differences in the caloric content and composition of the
test meals may explain why some investigators have found a reduced
thermic response to food in the obese (132,133,141,191,207,212) while
others have not (37,224).
Strang and McCluggage (224) found that the total heat production
due to the thermic effect of a 610 Kcal mixed meal amounted to 51
calories for normal subjects, 58 calories for obese, and 67 calories
for underweight subjects. The magnitude of the response for the
underweight group was significantly greater than the other two groups.
However, the peak increase in metabolic rate after the meal occurred
much later in the obese group and their peak response was lower than
that of the underweight or normal weight subjects. One possible
explanation for these findings was the absolute caloric loading used
in the study. The thermogenic effects of a meal are directly propor-
tional to the relative caloric loadings (21).
A delayed increment in the postprandial metabolic rate may be a
physiological basis for a greater food intake and a longer feeding
time required before the obese feel satiated (191). Therefore, even
when overeating, an important factor in the development and maintenance
of obesity may be this underlying thermogenic defect related to the
threshold for satiety. Lepkovsky (159) supports this concept. He
writes there is evidence that the rise in metabolic rate after a meal
is related to a threshold for satiety, whereby the elevation in

28
metabolic rate is a signal to the hypothalmus which leads to the
cessation of eating.
The model of genetic obesity in rodents might shed some light on
this issue. Both hyperphagia and defective thermogenesis are found in
the genetically obese ob/ob mouse, but the hyperphagia is secondary
to inadequate heat production and indeed, the onset of obesity (235,237).
Similarly, overeating in humans might not be the result of gluttony
(172), but the consequence of a delayed and insufficient rise in the
postprandial metabolic rate. However, the role of the increased
metabolic rate or temperature in regulating hunger and satiety is not
entirely clear. The thermostatic theory does not completely explain
the regulation of hunger and satiety according to both Garrow (90)
and Stunkard (225).
While several investigators conclude that the overall postprandial
increment in metabolic rate is not a source of reduced thermogenesis
among the obese (37,261), others (131,132,139,207,212) report that
both obese and formerly obese subjects demonstrate a significantly
smaller thermic response to a test meal than do normal subjects. These
researchers propose that this blunted thermogenic response may indicate
a metabolic basis for obesity. They conclude that the reduced thermo-
genic response is not a consequence or characteristic of the obese
per se, since it is manifest in the post obese as well (21). Schwartz
et al (206), however, do not agree. They indicate that several meta-
bolic abnormalities, including a reduced thermic effect to a meal,
normalize upon weight reduction. This difference may be due to the
type of obese individual studied or the method(s) used to reduce excess
body fat.
29
It is unclear whether the reduced thermogenic response observed
in the obese is a result of the restriction of caloric intake utilized
to reduce their weight or whether it is related to an underlying
propensity to conserve calories. Apfelbaum (8) reported that following
a two week period of caloric restriction the postprandial increase in
metabolic rate (following the identical test meal) was significantly
diminished. This defective thermogenic response might be consequential
to the lowered nutritional status. In addition, this blunted thermic
effect of food would contribute to the depression in the 24-hour energy
expenditure which also occurred in response to the period of caloric
restriction.
Several studies (5,102,172) have shown that after a period of
overfeeding the thermic response to a standard meal is greatly
increased. This could account for the dissipation of some of the
excess calories during chronic overfeeding reported by Sims et al
(214). York (259) conducted a study with subjects divided into a high
(3500 Kcal/day), and a low (1435 Kcal/day) caloric intake group. The
thermic effect of food was much higher in the high energy intake
group. This suggests that there may be some interaction between the
previous day's intake or habitual daily intake and the acute response
to a single meal. Glick et al (98) suggest that dietary induced
thermogenesis might represent the summation of the thermic responses
to single meals during periods of high caloric intake. They surmised
that this was a primary mechanism by which body weight is regulated
in normal weight individuals.
30
Exercise Thermogenesis
As part of the process of muscular contraction, calcium is released
from intracellular stores leading to the activation of myosin ATPase.
Subsequently, conformational changes in the contractile elements of
the muscle fibers occur. In the process, ATP is hydrolyzed with a
portion of the free energy translated into mechanical work and the rest
dissipated as heat. As ATP is used to drive the contraction of muscle
during exercise the increased ADP supply accelerates mitochondrial
oxidation leading to an increased rate of substrate combustion (14,118,
182). Because of the calorigenic effect of exercise, both during the
actual activity and persisting several hours after vigorous exercise
(the post-exercise oxygen consumption) (1,64,188), thermogenesis
induced by physical activity is an important component of an individual's
total energy expenditure (67). For this reason, exercise is potentially
an important component of weight control regimens.
Comparing metabolic responses of lean and obese persons has been
an area of considerable interest (48,141,207,261). But as of yet,
no work has been undertaken comparing any of the sub-groups of human
obesity (26). Freedmen-Akabas et al (84) failed to show any sustained
increase in oxygen consumption following exercise in four groups of
normal individuals.
The portion of energy expended in physical activity is reduced
in the obese to the extent that the obese tend to be spontaneously
less active than lean individuals (48,225). However, the obese expend
more energy during a variety of tasks which involve the support or
31
movement of body weight such as walking, running, or climbing stairs
(2,30,63,106,115). This is logical because the heavier a person is the
more work it is to move their own body weight. This increased energy
expenditure is directly proportional to the excess weight carried
rather than the result of an alteration in cellular thermogenesis such
as a reduction in the efficiency of exercise (the coupling of work
accomplished to the energy expended) (50,253). Hanson et al (115)
showed that increased energy expenditure during treadmill walking was
similar when subjects either gained weight through overeating or carried
backpacks of equivalent weights. Apfelbaum (8), however, noted that
the increase in body weight (2.6%) alone after a 15 day period of
overfeeding did not adequately account for the observed increase in
oxygen consumption during walking and stair climbing. She proposed
that, indeed, a part or the increased energy expenditure represented
some form of thermogenic buffer against large changes in body weight.
An explanation for the discrepancy in these studies might be that the
subjects in Hanson's study that gained weight through overeating
consumed their excess calories in the form of fat, which is thought to
lead to smaller thermogenic adaptations than excess calories consumed
in the form of carbohydrate. Thus, overfeeding fat appears not to
augment the exercise metabolic rate and thereby activate a mechanism
for the disposal of some of the excess ingested calories.
Garrow (90) suggests that the "active" components of the total
energy output manifests the greatest response to overfeeding (as
opposed to the resting portion) and that "those who are both
gluttonous and slothful will show only moderate adaptation to
overnutrition while those who are gluttonous and active will adapt
32
more completely," in the sense of an increased energy output which
minimizes weight gain. In any event, the energy expended during weight
dependent exercise is not a source of reduced thermogenesis in the
obese.
Even in weight independent activity such as bicycling the energy
expended by the obese is higher when expressed both in absolute and
in relative forms (7,43,48,246). This increment in the energy cost
of cycling is thought to be related to the extra energy required to
move the greater mass of the obese subject's legs rather than to a
reduced efficiency of exercise (43,87). Thus the coupling of the
external work to metabolic activity appears to be similar for the obese
and the non-obese, and the extra energy expended by the obese is the
"hobbling" effect of their increased leg mass (61). Wasserman (246)
noted that the oxygen consumption during cycling against zero resistance
(unloaded) is significantly correlated to body weight. The difference
in the energy expended by lean and obese persons is most striking at
unloaded or light workloads (7). When pedalling against a high
resistance on the bicycle the extra mass of the obese individual's legs
could be advantageous: the weight of the leg, coupled with the force
of gravity, would assist in moving the pedals downwards. However,
when cycling against zero resistance at a fixed rate, in addition to
the hobbling effect of the extra leg weight, the obese person may also
need to work harder to resist the tendency for the pedalling rate to
increase (13,63).
An additional factor which might explain the higher energy cost
of cycling among the obese is the level of physical fitness. Astrand
33
et al (13) observed that the steady state oxygen consumption during
submaximal bicycle ergometry was lower among more aerobically fit
individuals. If the obese are less active than lean people, then one
might expect their level of aerobic fitness to be somewhat low. There-
fore, a lower level of fitness might partly account for the elevated
oxygen consumption of the obese during cycling (13).
Following caloric restriction and weight reduction the energy
expended in both weight bearing and weight independent exercise
decreases (2,5,63,246,253). An increase in the mechanical efficiency
during cycling at a given workload has been observed (246). The magni-
tude of the decrease in the exercise metabolic rate following caloric
restriction and weight loss appears to be greatest when pedalling
against zero resistance as the work intensity increases the difference
between the pre and post caloric restriction values diminishes somewhat
(7,246). This indicates that (1) the antithermogenic adaptations to
caloric restriction affect the metabolic responses to physical activity,
and (2) the "hobbling" effect is not due to an intrinsic defect in
the coupling of metabolism to external work since it appears to reverse
with weight loss. Exercise induced thermogenesis alone, independent
of dietary manipulation, does not seem to be a source of reduced
thermogenesis among the obese except insofar as they do not exercise
enough (2,30,40,63,74,225,232).
Thermic Effect of Food Plus Exercise
Several studies have found that there is an interaction between
the thermic effect of food and the energy expenditure during exercise
34
which may constitute another source of thermogenesis. Exercise after
a meal appears to potentiate the thermic effect of eating (41,58,141,
207,260) so that the combination of eating and exercise induces a
greater increase in the metabolic rate than the sum of the energy cost
of the exercise in the postabsorptive state and the thermic effect of
food (at rest), each measured separately. Miller and Mumford (171)
found that the thermic effect of a meal was augmented by light post-
prandial exercise by an amount roughly equivalent to twice the thermic
effect of the meal alone. The magnitude of this exercise-potentiated
thermogenesis was positively related to the caloric content of the
meal. Bray et al (43) found that the thermic effect of food was
roughly doubled by exercise but failed to show any relationship between
either the caloric content or composition of the test meal and the
magnitude of the potentiation. Swindells (228) did not observe any
potentiating effect of exercise on the thermic effect of food when the
caloric content of the meal was less than 1000 Kcal. These discrepant
findings may be related to differences in experimental methodologies,
such as the nature and duration of exercise and the duration and
frequency of the metabolic measurements. The subjects in these studies
were not obese.
In a study of the thermogenic responses of hyperplastic obese
women, Warnold et al (244) found that the postprandial oxygen consump-
tion was significantly higher than the fasting value at rest, but the
metabolic rate during moderate bicycle exercise was the same post-
prandially and postabsorptively. That is, in these women a thermic
effect of food was observed at rest but not during exercise. In a

35
comparative study of the potentiation of the thermic effect of food
by exercise in obese and lean subjects Zahorska-Markiewcz (261) found
that the metabolic rate, expressed relative to body surface area, was
lower for the obese at rest but higher during exercise. In addition,
the thermic effect of food, expressed as a percentage increase above
the postabsorptive RMR was similar for the obese and lean subjects.
However, exercise potentiated the thermic effect of food for the lean
subjects but not for the obese. In other words, for the obese group
the postabsorptive and postprandial exercise metabolic rate did not
differ significantly, while for the lean group the energy cost of the
exercise was much greater in the fed state than in the fasted state.
The increment in the energy expenditure exceeded the increase in the
metabolic rate due to the thermic effect at rest. The investigator
concluded that the failure of exercise to potentiate the thermic
response of food constituted a form of defective thermogenesis in the
obese subjects.
Segal and Gutin (207) reported that exercise potentiated the
thermic effect of food for the lean women but not for the obese subjects.
While performing a standardized work task at anaerobic threshold, the
thermic effect of food (TEF) was 2.5 times greater in the lean group
compared to only 1.1 times greater in the obese group. They concluded
"that this reduced response to the combined stimulus of food plus
exercise may constitute a subtle metabolic factor associated with the
etiology of obesity."
36
Mediators and Mechanisms
A number of mechanisms for thermogenesis have been theorized and a
few have been partially investigated. However, the understanding of
these processes and their exact role in body weight regulation is
limited. Investigation of the biochemical and cellular mechanisms
underlying various components of energy expenditure is important because
any deviation from the, normal level of energy expenditure may contribute
to the problem of obesity. Unfortunately, this work in vivo is diffi-
cult, and much of the work remains only speculative. Some of the
unresolved issues are the nature of the regulatory mechanisms for
thermogenesis, which tissues are involved, what is the capacity for
thermogenesis, and what is the significance of changes in these various
heat generating processes in relation to the total energy expenditure
of the individual. A more fundamental question deals with the mecha-
nisms of impaired thermogenesis in the various sub-groups of obese
individuals. It may be that a differential diagnosis and treatment
regimen is required based upon the potential differences in the
regulatory mechanisms and pathways for thermogenesis.
Mediators of Thermogenesis
The actions of two regulators of thermogenesis, thyroid hormones,
and the catecholamines have been investigated. They are thought to
play a critical role in various normal and abnormal thermogenic states.
Certain biochemical pathways of thermogenesis mediated by these hormones
are transmembrane sodium transport, protein synthesis, mitochondrial
respiration, and futile substrate cycling (12,118,181). A more complete

37
understanding of the normal and abnormal thermogenic responses to the
various stimuli, such as eating and exercising, requires a thorough
consideration of the underlying regulators and effecting pathways for
thermogenesis.
Thyroid Hormones
Throxine (T4) is synthesized in the thyroid gland. Sixty to
eighty percent of T4 is metabolized by tissues in the periphery.
Forty percent of the thyroxine is converted to triiodothyronine (T3)
and the rest is converted to reverse T3 (rT3) (164). T3 is more
biologically active than T4, and therefore has a more potent effect on
metabolism. The relative proportion of T3 and rT3 converted from T4
is considered a better indicator of thyroid status than the traditional
measurement of T4 (109,165). In various states of increased or decreased
thermogenesis, T4 may not change at all. However, the concentration of
T3 may be significantly increased during increased thermogenesis or
reduced during depressed thermogenesis. The concentration of rT3 may
be reduced during enhanced thermogenesis and increased during depressed
thermogenesis (107,109,136,138,165).
Evidence suggests that thyroid hormones regulate the obligatory
component of the total energy expenditure rather than the facultative
component. Changes in the BMR or the MR which are induced by changes
in thyroid function tend to be insidious, persistent, and pathological
(109,125). Considerable evidence also implicates the thyroid hormones
in acute and adaptive thermogenic responses (85,136,138,165,221). A
complex interaction between thyroid hormone and the catecholamines has
also been suggested (221).
38
Changes in the relative amounts of T3 and rT3 derived from T4
appear to mediate changes in the metabolic rate. During fasting and/or
severe carbohydrate restriction change in T4 is not associated with a
significant drop in metabolic rate. The conversion of T4 to T3 is
reduced (107,137) while the conversion of T4 to rT3 increases (107,136,
137). A single load of sucrose has been shown to increase the concen-
tration of T3 and reduce rT3 (210). Sharief (210) concluded that the
thermic response to a high carbohydrate load was mediated by changes in
the peripheral metabolism of T4. The effect of a single bout of
exercise is an increase in T3, decrease in rT3, and an increase in the
ratio of T3 to rT3 (28). The significant effects of a single load of
either carbohydrate or exercise on thyroid metabolism indicates that the
thyroid hormones may regulate acute changes in metabolic rate as well as
more long term changes.
The effects of exercise on thyroid hormone metabolism are not
totally understood. Trayhurn et al (237) reported an acute increase
in T3 in response to a single bout of exercise in rats, however another
study (192) showed minor or no effects of strenuous exercise on thyroid
hormone metabolism in humans. Trayhurn et al (237) reported that
chronic exercise training has an effect on thyroid metabolism similar
to caloric restriction (a decrease in the ratio of T3 to rT3). This
suggests that physical training may augment the peripheral sensitivity
of the tissues to the actions of T3. Some evidence (33) suggests that
exercise, in combination with caloric restriction, may counteract some
metabolic effects of dieting, such as the increase in rT3 and the drop
in T3.

39
Changes in the composition of the diet alter thyroid hormone
metabolism (137,138). A large increase in carbohydrate content led to
an increase in T3. A diet containing no carbohydrates, but enough
calories to maintain weight, led to an increase in rT3 and a decrease
in T3 (137). These are the same changes associated with fasting alone.
Evidence also suggests that during very low calorie dieting the
administering of small amounts of carbohydrates may prevent the reduc-
tion in T3. This would tend to minimize the reduction in metabolic
rate which is known to occur during periods of caloric restriction (21,
33,107). Jung et al (137) suggest that the amount of carbohydrate
required to prevent this change in the concentration of the thyroid
hormones depends on the carbohydrate intake prior to the restriction
period. With a very high sugar intake prior to the hypocaloric diet a
larger carbohydrate intake would be required to prevent the drop in T3.
SubjeCts already adapted to a lower carbohydrate intake could tolerate
a greater caloric restriction before a decrease in T3 would occur.
T3 increases and rT3 decreases in response to a hypercaloric mixed
diet (58). Danforth et al (58) stated that overfeeding when the excess
calories are consumed as fat does not alter thyroid hormone metabolism.
This lack of change is associated with little or no change in RMR or
the number of calories required for weight maintenance (69,138,252).
These findings suggest that the carbohydrate content of the diet may
regulate the dietary induced changes in thyroid hormone metabolism.
Some of the actions of T3 which influence the rate of metabolism
are: (1) stimulation of the degradation and mobilization of fat by
increasing lipolysis, (2) a biphasic effect upon protein metabolism
40
whereby a small amount leads to an increase in protein synthesis and a
reduction in nitrogen extraction while a large dose increases nitrogen
and protein loss, (3) another biphasic effect on glycogen metabolism
such that a small amount increases glycogen synthesis but a large dose
stimulates glycogenolysis, and (4) stimulation of transmembrane cation
transport (9,75,109,164,221).
Catecholamines
Metabolic rate, as well as most other physiological processes, are
influenced by the sympathetic nervous system (14). The catecholamines
are known to have an important role in regulation of body temperature
upon the exposure to cold. They are thought to mediate other thermo-
genic responses as well (152).
The catecholamines exert their influence upon metabolic and physio-
logic processes after they are released from either sympathetic nerve
endings or from the adrenal medulla. Epinephrine is synthesized and
stored in the adrenal medulla and is a circulating hormone (164).
Norepinephrine is synthesized and stored in vesicles of sympathetic
nerve endings (164). It is an adrenergic neurotransmitter which is
released from these endings in response to nerve stimulation. Norepi-
nephrine is thought to be a more powerful hormone than epinephrine
because it exerts its effects locally (164).
The catecholamines affect energy expenditure by transforming complex
fuels into usable substrates; mobilizing and delivery substrates to
support the metabolic requirements of the cells (152,176). A major
action of norepinephrine is the mobilization of free fatty acids and an
increase in the rate of lipolysis. The accelerated rate of cellular
41
metabolism induced by norepinephrine is associated with an elevated
oxygen uptake, heat production, and rate of substrate utilization (66,
142).
Sympathetic activity plays an important role in the thermogenic
and antithermogenic responses to environmental temperature, diet, and
physical activity. Several investigators (66,142,152) have shown that
fasting or severe caloric restriction significantly depresses sympa-
thetic nervous system activity. Since the catecholamines are involved
in substrate mobilization it was once thought that fasting would
increase sympathoadrenal activity in order to mobilize substrates from
storage. However, Landsberg and Young (152) found significantly
reduced rates of norepinephrine activity in fasted animals which
indicates diminished sympathetic activity. The investigators proposed
that the diminished metabolic rate associated with the fasted state
is a reflection of diminished sympathetic activity.
Jung et at (136,137) reported that plasma norepinephrine declined
by 40 percent in response to a 400 Kcal/day protein diet but not in
response to an isocaloric mixed diet. This suggests that the sympa-
thetic nervous system, like the thyroid axis, is sensitive to the
carbohydrate content of the diet. Upon refeeding subsequent to fasting,
norepinephrine turnover returns to normal (137). An increase in
norepinephrine activity upon overfeeding has been demonstrated although
it is possible that overeating a high fat diet yields a smaller change
in sympathetic activity than overeating carbohydrate (152,213).
Landsberg and Young (152) suggested norepinephrine is an important
mediator of postprandial thermogenesis. They observed substantial
42
increases in sympathetic activity in response to glucose feeding,
beginning 30 minutes postprandially and peaking one to two hours after
the meal. This increase in norepinephrine was associated with increases
in heart rate, pulse pressure, and oxygen consumption. The action of
norepinephrine in mediating the thermic effect of a meal is most
striking when the meal consists of carbohydrate. Welle et al (252)
found that plasma norepinephrine levels were unchanged after isocaloric
fat or protein intakes. The failure of norepinephrine to change in
response to the ingestion of fat or protein suggests that the sympathet-
ic nervous system does not regulate the thermic response to fat or
protein and that some other mechanism regulates the change in metabolic
rate in response to fat or protein.
Norepinephrine turnover rate also increases in response to a single
bout of exercise (14,190). Furthermore, exercise trained rats exhibit
a more pronounced norepinephrine induced increase in lipolysis than
sedentary animals. Peronnet et al (190) suggested that exercise training
may enhance the sensitivity to the lipolytic action of norepinephrine.
Changes in catecholamine and thyroid activity appear to mediate
the conservation or dissipation of energy in response to low or high
energy intakes. Sims (213) suggests that as a survival mechanism the
reduction in energy expenditure mediated by these hormones would spare
endogenous energy stores. Similarly, when excess calories in the form
of carbohydrate are taken, these hormones appear to regulate the dissi-
pation of some of the excess. Again, Sims (213) believes this is a
survival mechanism. It is advantageous for an animal to be able to
consume excessive calories with a reduced efficiency of weight gain if
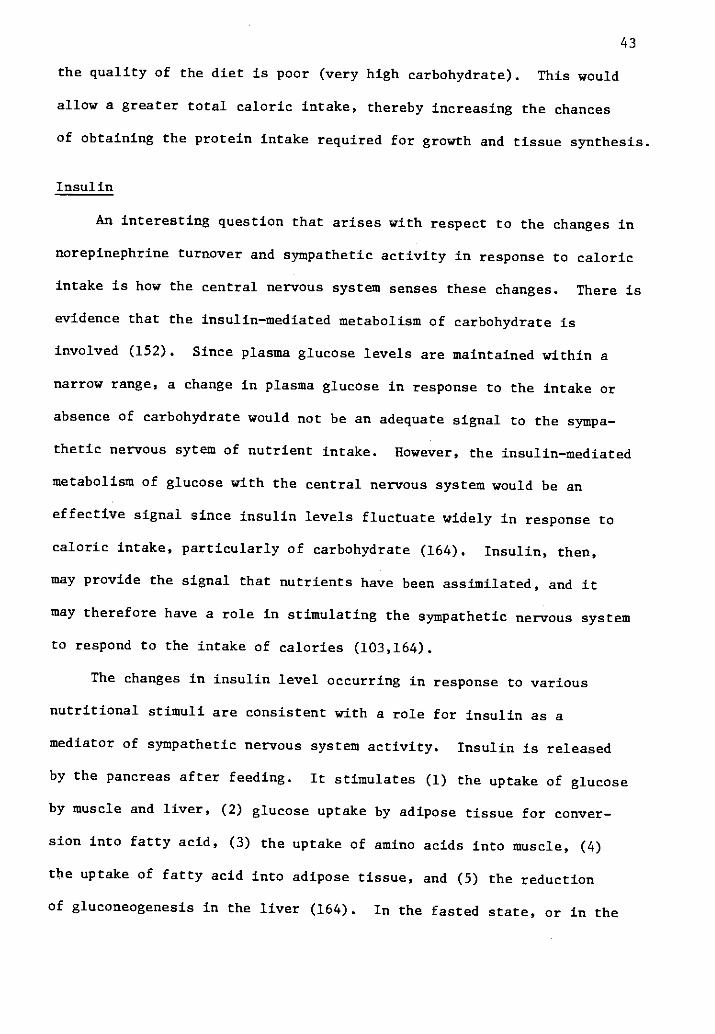
43
the quality of the diet is poor (very high carbohydrate). This would
allow a greater total caloric intake, thereby increasing the chances
of obtaining the protein intake required for growth and tissue synthesis.
Insulin
An interesting question that arises with respect to the changes in
norepinephrine turnover and sympathetic activity in response to caloric
intake is how the central nervous system senses these changes. There is
evidence that the insulin-mediated metabolism of carbohydrate is
involved (152). Since plasma glucose levels are maintained within a
narrow range, a change in plasma glucose in response to the intake or
absence of carbohydrate would not be an adequate signal to the sympa-
thetic nervous sytem of nutrient intake. However, the insulin-mediated
metabolism of glucose with the central nervous system would be an
effective signal since insulin levels fluctuate widely in response to
caloric intake, particularly of carbohydrate (164). Insulin, then,
may provide the signal that nutrients have been assimilated, and it
may therefore have a role in stimulating the sympathetic nervous system
to respond to the intake of calories (103,164).
The changes in insulin level occurring in response to various
nutritional stimuli are consistent with a role for insulin as a
mediator of sympathetic nervous system activity. Insulin is released
by the pancreas after feeding. It stimulates (1) the uptake of glucose
by muscle and liver, (2) glucose uptake by adipose tissue for conver-
sion into fatty acid, (3) the uptake of amino acids into muscle, (4)
the uptake of fatty acid into adipose tissue, and (5) the reduction
of gluconeogenesis in the liver (164). In the fasted state, or in the
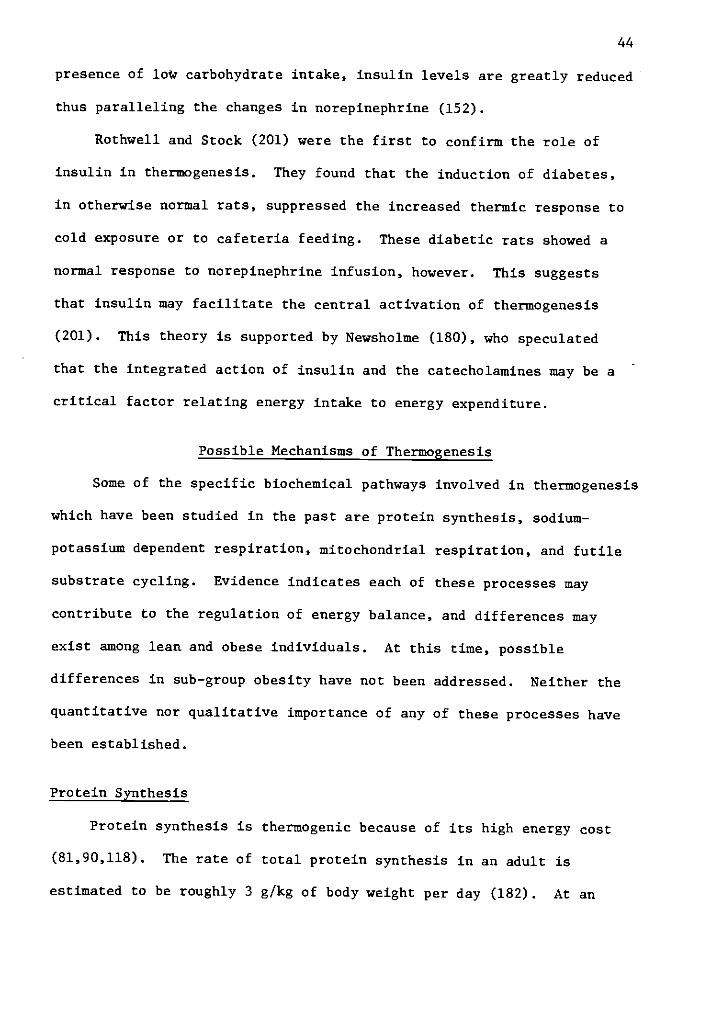
44
presence of loW carbohydrate intake, insulin levels are greatly reduced
thus paralleling the changes in norepinephrine (152).
Rothwell and Stock (201) were the first to confirm the role of
insulin in thermogenesis. They found that the induction of diabetes,
in otherwise normal rats, suppressed the increased thermic response to
cold exposure or to cafeteria feeding. These diabetic rats showed a
normal response to norepinephrine infusion, however. This suggests
that insulin may facilitate the central activation of thermogenesis
(201). This theory is supported by Newsholme (180), who speculated
that the integrated action of insulin and the catecholamines may be a
critical factor relating energy intake to energy expenditure.
Possible Mechanisms of Thermogenesis
Some of the specific biochemical pathways involved in thermogenesis
which have been studied in the past are protein synthesis, sodium-
potassium dependent respiration, mitochondrial respiration, and futile
substrate cycling. Evidence indicates each of these processes may
contribute to the regulation of energy balance, and differences may
exist among lean and obese individuals. At this time, possible
differences in sub-group obesity have not been addressed. Neither the
quantitative nor qualitative importance of any of these processes have
been established.
Protein Synthesis
Protein synthesis is thermogenic because of its high energy cost
(81,90,118). The rate of total protein synthesis in an adult is
estimated to be roughly 3 g/kg of body weight per day (182). At an
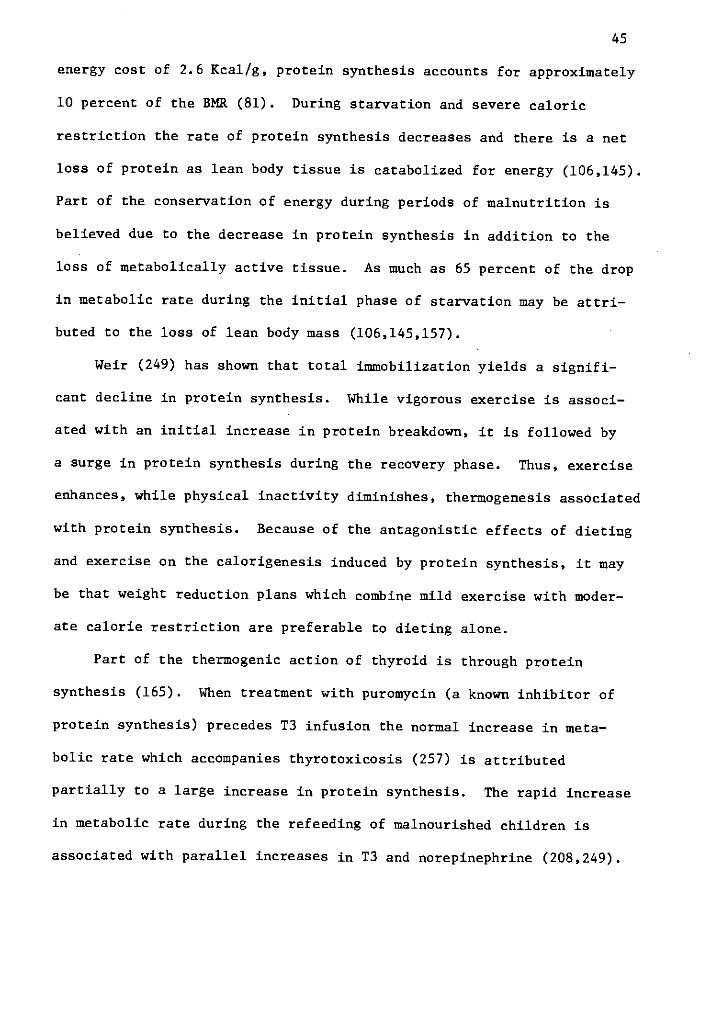
45
energy cost of 2.6 Kcal/g, protein synthesis accounts for approximately
10 percent of the BMR (81). During starvation and severe caloric
restriction the rate of protein synthesis decreases and there is a net
loss of protein as lean body tissue is catabolized for energy (106,145).
Part of the conservation of energy during periods of malnutrition is
believed due to the decrease in protein synthesis in addition to the
loss of metabolically active tissue. As much as 65 percent of the drop
in metabolic rate during the initial phase of starvation may be attri-
buted to the loss of lean body mass (106,145,157).
Weir (249) has shown that total immobilization yields a signifi-
cant decline in protein synthesis. While vigorous exercise is associ-
ated with an initial increase in protein breakdown, it is followed by
a surge in protein synthesis during the recovery phase. Thus, exercise
enhances, while physical inactivity diminishes, thermogenesis associated
with protein synthesis. Because of the antagonistic effects of dieting
and exercise on the calorigenesis induced by protein synthesis, it may
be that weight reduction plans which combine mild exercise with moder-
ate calorie restriction are preferable to dieting alone.
Part of the thermogenic action of thyroid is through protein
synthesis (165). When treatment with puromycin (a known inhibitor of
protein synthesis) precedes T3 infusion the normal increase in meta-
bolic rate which accompanies thyrotoxicosis (257) is attributed
partially to a large increase in protein synthesis. The rapid increase
in metabolic rate during the refeeding of malnourished children is
associated with parallel increases in T3 and norepinephrine (208,249).

46
According to Weir (249), this increase in metabolic rate is out of
proportion to the increase in body weight. He also suggests that the
recovery from malnutrition is more rapid in children who are given a
mild exercise program during the refeeding program.
Ion Transport
Another source of energy expenditure thought to be an important
component of cellular thermogenesis is the pumping of ions across cell
membranes. Sodium-potassium ATPase is the enzymatic expression of the
membrane-bound sodium pump whose functions are the extrusion of sodium
and the intrusion of potassium in cells. Maintenance of the internal
ionic concentration is critical to cellular function. In order to
maintain homeostatic concentrations both inside and outside the cell,
cells continuously expend energy derived from ATP. Thus, ATP is
required to pump these ions against electrochemical gradients in a
process of active transport. According to the Whittam concept, between
20-45 percent of the oxygen consumption in resting cells is required
for this active outward sodium transport (75,76). The utilization of
ATP in this process leads to an increased concentration of ADP, an
important regulator of the rate of mitochondrial oxidative activity
(9,118).
Both thyroid hormones and the catecholamines influence the activ-
ity and energy expenditure of the sodium-potassium pump (9,127). A
large portion of the calorigenesis induced by these hormones can be
explained by the stimulation of sodium-potassium pump activity. When
sodium-potassium ATPase activity is blocked, thyroid has a significantly
reduced effect on the tissue oxygen consumption (9,76,127). Likewise,

47
the increase in sodium-potassium ATPase activity in thyroid treated
tissues is proportional to the increase in tissue oxygen consumption
(182). As much as 60 percent of the increase in the metabolic rate
due to the administration of norepinephrine can be effectively inhibited
with the addition of ouabain (a specific inhibitor of the sodium
pump). Thus, norepinephrine-induced thermogenesis is partially
accounted for by an increase sodium-potassium ATPase activity. It is
also possible that norepinephrine induces an increase in the permeabil-
ity of the cell membrane leading to an increased passive flux of ions
which would create a need for increased pump activity. Further evi-
dence for the action of norepinephrine at the membrane is the cate-
cholimine induced changes in ATPase activity can be blocked by beta
adrenergic blocking agents (182).
Reduced sodium-potassium ATPase activity has been observed in
genetically obese mice. This may account for the defective thermo-
genesis in these animals and contribute to their conservation of
energy in the form of adipose tissue stores (234,235). Trayhurn at al
(237) also reported that the administration of T3 failed to increase
the enzyme in ob/ob mice while it significantly increased the pump
activity in normal mice.
De Luise et al (62) investigated the possibility that a reduction
in sodium pump activity is associated with human obesity. They found
a smaller number of pump sites, a lower level of sodium-potassium ATPase
and an increased concentration of sodium in the red blood cells of
obese humans. Exercise also may play a role in the treatment of obese

48
individuals with a reduced sodium pump dependent thermogenesis (147,
149,217). This would be done by augmenting the total caloric expendi-
ture, thereby compensating for the reduced thermogenesis, and perhaps
also affecting the sodium pumps in skeletal muscle through the ion
exchange which accompanies muscular contraction.
Bray et al (43) studied the hepatic sodium-potassium ATPase
activity in obese humans and found greater, rather than diminished,
activity of the enzyme compared to a group of lean controls. Mir et al
(174) also found increased sodium-potassium ATPase activity in the
obese and suggested the discrepancy may be due to differences in method-
ology. Obviously this is an area for further investigation.
Cellular Respiration
At one time it was thought that the frank uncoupling of respiration
in the mitochondria was the mechanism of thyroid of catecholamine
thermogenesis (75,76). It is possible that respiration and the electron
transport chain might proceed without the phosphorylation of ADP
resulting in an energy conservation. However, evidence suggests that
such uncoupling rarely occurs (9). But the activity of certain mito-
chondrial enzymes appears to loosen the tightness of respiratory control
in the mitochondrium, leading to the dissipation of energy. For
example, Newsholme (181) suggests that mitochondrial and cytoplasmic
glycerophosphate dehydrogenases are thought to play a role in thermo-
genesis through their influence on the efficiency of metabolic oxida-
tions. These two enzymes participate in the glycerophosphate cycle for
shuttling reduced equivalents into the mitochondria (155,182).
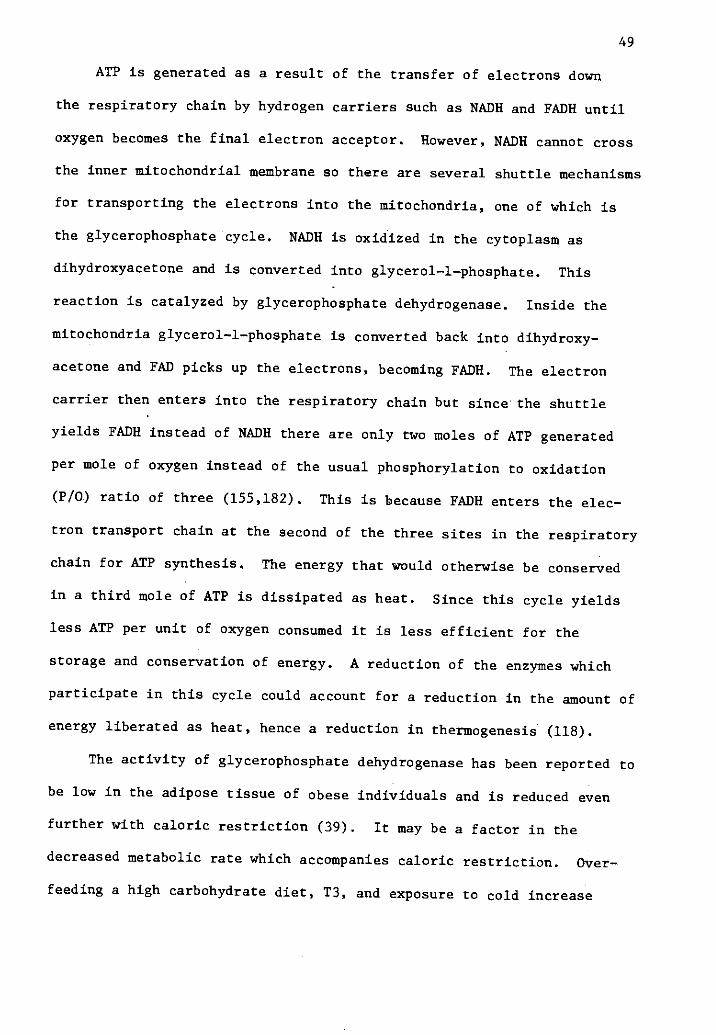
49
ATP is generated as a result of the transfer of electrons down
the respiratory chain by hydrogen carriers such as NADH and FADH until
oxygen becomes the final electron acceptor. However, NADH cannot cross
the inner mitochondrial membrane so there are several shuttle mechanisms
for transporting the electrons into the mitochondria, one of which is
the glycerophosphate cycle. NADH is oxidized in the cytoplasm as
dihydroxyacetone and is converted into glycerol-l-phosphate. This
reaction is catalyzed by glycerophosphate dehydrogenase. Inside the
mitochondria glycerol-l-phosphate is converted back into dihydroxy-
acetone and FAD picks up the electrons, becoming FADH. The electron
carrier then enters into the respiratory chain but since the shuttle
yields FADH instead of NADH there are only two moles of ATP generated
per mole of oxygen instead of the usual phosphorylation to oxidation
(P/O) ratio of three (155,182). This is because FADH enters the elec-
tron transport chain at the second of the three sites in the respiratory
chain for ATP synthesis, The energy that would otherwise be conserved
in a third mole of ATP is dissipated as heat. Since this cycle yields
less ATP per unit of oxygen consumed it is less efficient for the
storage and conservation of energy. A reduction of the enzymes which
participate in this cycle could account for a reduction in the amount of
energy liberated as heat, hence a reduction in thermogenesis (118).
The activity of glycerophosphate dehydrogenase has been reported to
be low in the adipose tissue of obese individuals and is reduced even
further with caloric restriction (39). It may be a factor in the
decreased metabolic rate which accompanies caloric restriction. Over-
feeding a high carbohydrate diet, T3, and exposure to cold increase
50
the activity of this enzyme (177,203,231).
The level and activity of glycerophosphate cycle enzymes are
influenced by exercise and exercise training. Winder and Holloszy
(257) compared the effects of T3 and endurance training on skeletal
muscle mitochondrial enzymes and found that both elicited an equal
increase in mitochondrial glycerophosphate dehydrogenase. The
authors suggested that exercise may enhance the cellular capacity for
thermogenesis. In a similar investigation, Davies et at (59) found
that exercise training increased the glycerophosphate content of
skeletal muscle. It is interesting to speculate about the chronic
effects of exercise training on the pathways of thermogenesis. The
possibility exists that exercise may play an important role in reversing
or compensating for the reduced thermogenic activity associated with
obesity. The influence of exercise on these pathways is explained by
the stimulation of the sympathetic nervous system by physical activity.
Substrate Cycling
Substrate, or "futile" cycling, is another process which dissipates
energy (180,181). Substrate cycles involve at least two different
non-equilibrium reactions. In one direction, the conversion of glucose-
6-phosphate to glucose (catalyzed by glucose-6-phosphatase) proceeds
spontaneously without the use of free energy. In the other direction,
when glucose is converted back to glucose-6-phosphate (catalyzed by
glucokinase) energy input is required for this reaction. A substrate
cycle exists when the pair of such enzymatic reactions is active in
both directions at once. Energy is dissipated when the ATP required
51
to drive the reaction in one direction is hydrolyzed, yet there is no
net change in the concentration of the metabolites since the reaction
is active in both directions at once. The result is a futile, energy
consuming cycle (182). The purpose of substrate cycling is thought to
involve the provision of precision in metabolic regulation (181).
There is evidence for the activity of one fatty acid cycle and
several substrate cycles in the metabolism of carbohydrate in human
tissues. Evidence for the existence of triglyceride-fatty acid sub-
strate cycle is that the net rate of fatty acid production from tri-
glyceride is lower than the rate of lipolysis, as indicated by the
rate of glycerol release (182). Therefore, some of the fatty acid is
reesterified to triglyceride (an ester is formed when some of this
fatty acid combines with coenzyme A). Glycerophosphate is oxidized
and combines with the fatty acid ester to reform triglyceride. No
useful work is done in this cycle and considerable energy is expended
since the conversion of ATP to ADP drives not only the process of
lipolysis but also the reesterification (81). When fatty acids are
cycled out of adipose tissue to the liver for reesterification and
transported back to the fat depot there is an additional energy cost
of the synthesis of lipoprotein carriers (58). This cycle is initiated
when certain hormones, such as norepinephrine or thyroid enhance the
rate of lipolysis by stimulating (through the membrane-bound adenylate
cyclase system) the lipase which catalyzes the hydrolysis of trigly-
ceride (118,155,182).
The term substrate cycling is used to describe the general traffic
of substrates in and out of storage. One of the roles of substrate
52
cycling is the distribution of fuels to the tissues of the body as they
are needed. The fatty acid cycle, provides a way of releasing free
fatty acids into the blood so that they can be taken up by the tissues
as they are needed and returning the excess as triglyceride to adipose
tissue for storage. Energy is expended in the processes of transport,
storage, and mobilization of metabolic fuels. The amount of energy
dissipated varies for different cycles (81). Dietary carbohydrate,
for example, when not oxidized directly can be converted to and stored
either as glycogen or as triglyceride. When glucose enters the lipo-
genic pathway for storage as fat it is estimated that 20% of the energy
is dissipated while only 5% is dissipated through storage as glycogen
(81).
The rate of substrate cycling is variable and is thought to increase,
under hormonal control, in anticipation of and recovery from, exercise
and after the ingestion of food (181). But whereas exercise stimulates
cycles related to the mobilization and utilization of substrates, eating
stimulates cycles involved in the uptake and storage of fuels. Norepi-
nephrine, T3, and glucocorticoids also stimulate the rate of cycling
(180,181).
The role of substrate cycling in regulating energy balance and
weight control has been given only limited consideration. Newsholme
(181) has hypothesized that obesity is associated with a reduction in
substrate cycling due to impairment of the hormonal and neural control
of these cycles. Newsholme and Leech (182) have proposed that a
contributing factor to the conservation of energy is the reduced
capacity of the catecholamines to increase the rate of substrate cycling.

53
A decreased sensitivity to the hormonal and nervous signals which
regulate the rate of various substrate cycles may be one mechanism
underlying impaired or reduced thermogenesis. Thus, the somewhat
smaller metabolic responses to T3 or to norephinephrine stimulation
might be attributed to the reduced effects of these stimuli on the
rate of substrate cycling.
James and Trayhurn (130) suggest that due to their high free fatty
acid levels under basal conditions the capacity for futile cycling is
enhanced in the obese. They also state that in response to a variety
of stimuli (food, exercise, or cold exposure) their capacity to incre-
ment the rate of such futile cycling is diminished. Naismith et at
(177) indicated that the storage of dietary carbohydrate as glycogen
is greater for the obese while lipogenesis is greater in the lean.
Furthermore, it was found that during long intervals between meals the
increase in non-esterfied fatty acids was much lower in the obese,
indicating less mobilization of fat out of storage. Since the conver-
sion of glucose to fat and the subsequent mobilization of fat out of
storage wastes more energy than the conversion and later utilization of
glycogen (81), this conversion of carbohydrate may be a source of
reduced thermogenesis in the obese (81,177,181). To date, however,
there is no experimental evidence on the contribution of futile cycling
to the positive energy balance associated with obesity. The quantita-
tive role of substrate cycling in human energy expenditure and meta-
bolic regulation is largely speculative because of the difficulty in
accurate measurement.
54
Summary
In summary, there are several known mechanisms of thermogenesis,
although the quantitative contribution of each to the total energy
expenditure remains poorly understood. The influence of dietary
excesses and deficiencies are well documented: caloric restriction
reduces thermogenesis, enabling the organism to conserve its energy
stores, while overnutrition favors the dissipation of energy. Many of
the acute and chronic physiologic effects of exercise suggest that
exercise has the potential to enhance the activity of thermogenic
pathways such as protein synthesis, mitochondrial respiration, substrate
cycling, and ion pumping. Thus, if defective thermogenesis underlies
obesity, treatment of the problem through dietary restriction alone
might only worsen the situation by further reducing thermogenic activity.
Therefore, an active program of exercise may be a crucial factor in the
treatment of obesity as a way of inducing energy imbalance while pre-
serving, and perhaps even enhancing, thermogenesis.

55
CHAPTER III
METHODS AND PROCEDURES
The primary purpose of this study was to determine if a differential
thermogenic response could be identified between two groups of obese
individuals. Any observable difference could help to answer some ques-
tions regarding the etiology of sub-group obesity and lead to better
diagnostic and treatment schema. The secondary purpose was to further
investigate the role of metabolic efficiency in the development
and persistence of Juvenile-onset and Maturity-onset obesity.
The Obesity Research Project from which this study emanated was
approved by the Human Subjects' Committee at Oregon State University
on October 29, 1984. Appendix A-1 reflects the Committee's formal
statement, amended as of April 30, 1985.
Subj ects
Volunteers for the initial subject pool were solicited from through
out the community by means of brochures, press releases, and personal
contacts. The Oregon State University Information Office was responsi-
ble for the contacts with newspapers and radio stations around the
state. As a result of their effort, articles appeared in five local
newspapers and public service announcements were aired over several
radio stations.
More than 200 women called in response to the information about
the research project. Initial screening was done by telephone, and
those individuals not meeting the criteria for subjects were rejected
at that time. Those who did meet the subject criteria were sent a

56
questionnaire (Appendix A-2) to complete and return for review. This
questionnaire asked for more detailed information regarding medical,
weight, and dieting history. Those people returning questionnaires
were categorized into the two subject groups, juvenile-onset obese,
and adult-onset obese based upon information provided in the pre-
screening instrument. Table 1 outlines the number of callers,
reasons for rejection, and the make-up of the final subject pool.
Table 1. Preliminary Subject Recruitment.
Callers 216
Rejected 142
Reasons for rejection:Weight too low/high 37
On medication 20
Distance too far to travel 19
Too old/young 17Postmenopausal/hysterectomy 17Too late 15Too much time/involvement 12
Too physically active 2
Weight not stable 1
Chronic disease 1
Smoker 1
People sent questionnaires 74
Questionnaires returned 41
Subject Pool:
Juvenile-onset type 18Adult-onset type 23
From the identified subject pool, ten matched pairs were selected.
The subjects were matched according to age and percent above "ideal"
body weight using the average weight for height presented in the Fogarty

57
Standards (44). Subsequently, one-way analysis of variances were
performed to examine matched groups by subjects and subjects within
groups variability. The results of these analyses indicated that the
groups were essentially equal on several important variables (age,
weight, body mass index, body surface area, and percent above ideal
weight). Homogeneity of variance was also indicated by the statistical
technique of Bartlett (see Appendix B, Table B-1).
The most important criteria for inclusion in the study was the
age-of-onset of obesity. Subjects with juvenile-onset type obesity
presented medical, school, or photographic documentation of overt
obesity prior to the age of 12 years (170,199,225). Subjects with
maturity-onset type obesity provided similar documentation showing
that their obesity developed after the age of sixteen years (170,225).
All subjects were middle-aged (29-42 years of age), pre-menopausal,
non-pregnant females with moderate to severe obesity (225). Weights
ranged between 140-214% of ideal body weight according to the Fogarty
Conference Standards (44). Other criteria for inclusion were that the
women (1) were free from any known metabolic or cardiovascular disease,
(2) had maintained a relatively stable body weight for three months
prior to the study, and (3) had no eating disorder. Women who had
gained or lost more than 2.25 Kg (5 pounds) over the prior three
months were not accepted, nor were women who reported erratic or
unusual eating habits such as fasting or fad dieting. Smokers were
also excluded from the study. The rationale for these rejection
criteria was the confounding influence weight change, erratic dietary
habits, certain drugs and hormones exert upon metabolic rate and
58
various thermogenic responses investigated in this study (5,10,21,35,
50,58,94,152,164,225).
All procedures and the risks and benefits of participation in
the study were explained to each subject (Appendix A-5). When all
questions were answered to the satisfaction of each subject, their
written consent for participation was obtained (Appendix A-6). In
addition, each subject obtained medical clearance from their personal
physician for participation in the Obesity Research Project (Appendix
A-4). The women were told they were free to withdraw from the study
at any time.
Procedures
The experimental procedures were conducted in the Human Performance
Laboratory within the Department of Physical Education at Oregon State
University.
Familiarization
Prior to the first day of testing the women went through an
extensive period of familiarization with all test equipment and pro-
cedures. They were introduced and given the opportunity to become
accustomed to bicycle ergometry and to graded treadmill walking. The
subjects also had the opportunity to breath through the mouth-piece
and breathing valve which was used in all metabolic determinations.
A complete practice trial followed approximately one week after the
initial familiarization phase.
59
To further enhance the precision of the various laboratory deter-
minations, the subjects were divided into five groups based upon
similarities in their menstrual cycle. Each group went through the
complete series of tests in the same order, and no more than four
subjects were evaluated in any one week. A sample schedule of events
can be examined in Appendix A-11.
Body Composition
Body density was estimated by the hydrostatic weighing procedure
outlined by McArdle et al (166). Residual lung volume was estimated
at 28% of the greatest of six repeat trials of forced vital capacity
(14,166). The percentage of body fat was estimated from a predictive
formula developed by Siri and Brozek (146,166). Lean body mass (LBM)
was then calculated in the following manner:
LBM = body weight - (body weight x percentage of body fat)
The test-retest reliability on the percentage of body fat determined
by the hydrostatic weighing procedure described above was acceptable
(r = 0.94). (Appendix B. Table B-10).
Maximal Energy Expenditure
A modified Balke (Figure 2) treadmill ergometer test (168) was
administered to each subject to derive a measure of her maximal oxygen
consumption and energy expenditure. All subjects walked at 3 m.p.h.
on the same calibrated Quinton motorized treadmill. The percent grade
was elevated by 5% every 3 minutes in the early stages, and by 2.5%
every 2 minutes in the later stages. Metabolic determinations were

Bicyclekgm/m
ErgomelerWalls
3000- -
1200--200 2750
1050 -175 2500--
2250
900-150 2000
1750
600-100 1500E
E- 1250C4
0> 1000300- 50
750
150- 25 500
250
Tteadmill (3 Mph)% Grade
1222.5
Rest 0 W 50 W 100 W Rec. Balke (modified) -4
20.0
17.5
15.0
12.5
10.0
7.5
5.0
2.5
0.0
111,11 11 11 11 I T I 1 I I IllilillIfifIT0 5 10 15 20 25 2 4 6 8
Time in Minutes10 12 14 16 18 20
Figure 2. Work capacity test protocol.

61
made each minute via open circuit spirometry. The subjects breathed
through a Daniels' Type low resistance two-way valve with the volume
of inspired air being measured by a Parkinson-Cowan CD-4 spirometer.
The expired air then passed through a 5 liter mixing chamber with a
sample being drawn off continuously at a rate of 1 liter per minute.
This sample then passed through a Beckman LB-2 infrared carbon dioxide
(CO2) analyzer and an Applied Electrochemistry S-3A oxygen (02)
analyzer. The gas analyzers were calibrated against gases of known
concentration before and after each test. Oxygen consumption (V02),
CO2 production (7CO2), and ventilation (7E), and the R.E.R. were
calculated immediately via an automated system (Rayfield Electronics,
Chicago, Il.). Standard end-points for the determination of 702 max
were applied (143,229). The test-retest reliability on the maximum
oxygen consumption expressed in liters/minute was acceptable at r = 0.95.
(Appendix B. Table B-9).
Submaximal Energy Expenditure
A multiple stage (Figure 2) submaximal energy expenditure test
was performed on an electrically braked Quinton bicycle ergometer. Seat
height was adjusted for each subject so that her knee was almost fully
extended when the pedal reached its lowest point. This seat height
was measured and recorded for subsequent reference.
The submaximal energy expenditure test consisted of the following
stages: (1) seated rest, (2) unloaded cycling at 60 RPM, (3) cycling
at 50 watts, and (4) cycling at 100 watts. Each stage was 5 minutes in
duration in order to allow adequate time for the subjects to achieve
62
steady state. For moderate exercise intensities, steady state is
achieved within two to three minutes (14). Metabolic measurements were
made during each minute of each stage by procedures previously
described.
The data obtained from these tests were used to compare the energy
expended by the subjects of each experimental group at seated rest,
during cycling against zero resistance, and at two submaximal workloads.
These data were used to derive estimates of the subject's gross, net,
and work efficiencies. These various measures of exercise efficiency
were assessed to determine whether the greater oxygen consumption
reported among obese subjects during weight supported exercise is
accounted for by a higher resting oxygen consumption, a higher energy
cost of moving the legs against zero resistance, or an intrinsic
difference in the coupling of metabolic energy expenditure to external
work. Any inherent differences in metabolic efficiency could be a
possible explanation for the relative ease of weight gain or difficulty
in weight loss which is often reported in the obese (173,199).
The gross efficiency is the ratio of the work accomplished to the
energy expended in performing the work and is calculated in the follow-
ing manner: Gross = W/E, where W is the external work, and E is the
energy expenditure during work (87). The net efficiency is the ratio
of the work accomplished to the energy expended with the resting energy
expenditure subtracted out: Net = W/E - er, where "er" is the energy
expenditure at seated rest upon the ergometer. For the work efficiency
the energy cost of pedalling against zero resistance is subtracted out:
Work = W/E - eu, where "eu" is the energy expended during unloaded
pedalling (87).

63
Caloric Requirements
The caloric requirement for weight maintenance was determined for
each subject. This was accomplished by feeding the subjects meals of
known composition and charting their weight over time. All meals were
prepared in the Metabolic Kitchen of the Department of Foods and Nutri-
tion. The diet consisted of real foods with the menu containing the
same foods each day throughout the three week period. A copy of the
menu appears in Appendix A-10a. The diet contained 14% calories as
protein, 26% as fat, and 60% carbohydrate; and met the RDA for all
nutrients. Caloric and nutrient content of the diet was determined
using the 1984 Ohio State Data Base. Foods were purchased in bulk
from constant sources, and all foods and ingredients were weighed to
0.1 gram.
The calories to maintain body weight were first estimated using
the method of Cunningham (55). In order to use this method, an esti-
mation of lean body mass was determined by densiometry prior to the
testing period. An estimate of the subject's activity level was
obtained using a three day activity record (Appendix A-9). Utilizing
the information from the activity records and the energy prediction
formula of Cunningham (55), the volume of 43 Kcals per kilogram of lean
body mass per day was used as the initial estimate of caloric need.
During the metabolic diet, subjects were weighed daily to 0.25 pounds.
Adjustments in food intake were made when a weight change of 0.5
pounds occurred consistently over a two day period. Appendix B, Table
B-4, presents a summary of the subjects weight from beginning to end
of the Metabolic Diet.
64
Although the caloric intake varied from subject to subject, the
composition of the meals were kept constant at 14% protein, 60% carbo-
hydrate, and 26% fat. Appendix A-10a presents a detailed description
of the meal plans used in this portion of the study.
Resting Metabolic Rate
The Resting Metabolic Rate was derived by averaging the results of
four separate trials. On all four trial days the subjects reported to
the Human Performance Laboratory at 6:30 a.m. following an overnight
fast. The subject's weight and dietary intake was stabilized by
procedures described above. Their exercise and work patterns were also
checked for consistency by means of a 24-hour Activity Record (Appendix
A-9).
Upon arrival, each subject was weighed and her blood pressure and
heart rate monitored. She then assumed a reclining position on a com-
fortable lounge chair for 30 minutes. After this stabilization period,
the resting metabolic rate was determined by the following procedure:
(1) the subject breathed through a Daniels' Type low resistance two-
way valve, (2) after a two minute adjustment period, the expired air
was collected for five minutes into a 120 liter meteorological balloon,
(3) a sample of the expired air was then drawn from the balloon at a
constant flow rate of one liter/minute, and was passed through a
Beckman LB-2 infrared carbon dioxide (CO2) analyzer and an Applied
Electrochemistry S-3A oxygen (02) analyzer, (4) ventilation was subse-
quently determined by evacuating the balloon through a Parkinson-Cowan
CD-4 spirometer by means of a vacuum pump to assure a constant flow

65
rate. The gas analyzers were calibrated against gases of known concen-
trations before and after each sample period.
The environmental conditions were maintained at thermoneutrality
(temperature = 68-72°F, and the relative humidity averaged 50%) as
suggested by Garrow (90). Subjects were also provided with individual
space heaters and blankets to assure their thermal comfort (178).
Appendix B, Table B -12, depicts the average morning temperature and
humidity for each test day.
Experimental Treatments
The order in which the four experimental treatments were adminis-
tered was randomized by a drawing of lots. The first treatment was
administered on Monday and consisted of the baseline determination of
Resting Metabolic Rate throughout the morning hours. The second
treatment was administered on either Tuesday or Wednesday, and consist-
ed of a standardized breakfast followed by a bout of exercise. The
resting metabolic rate was then followed for the remainder of the
morning. The third treatment was administered on Thursday, and con-
sisted of breakfast only, and subsequent determinations of the RMR.
Finally, the fourth treatment was administered either on Friday or
Saturday and it consisted of an exercise bout only and the four hour
follow-up. The six day test period was planned to coincide with the
follicular period of each subject's menstrual cycle. This was done to
minimize the effects of menstruation and reproductive hormones on the
resting metabolic rate and the subsequent thermogenic responses (109).
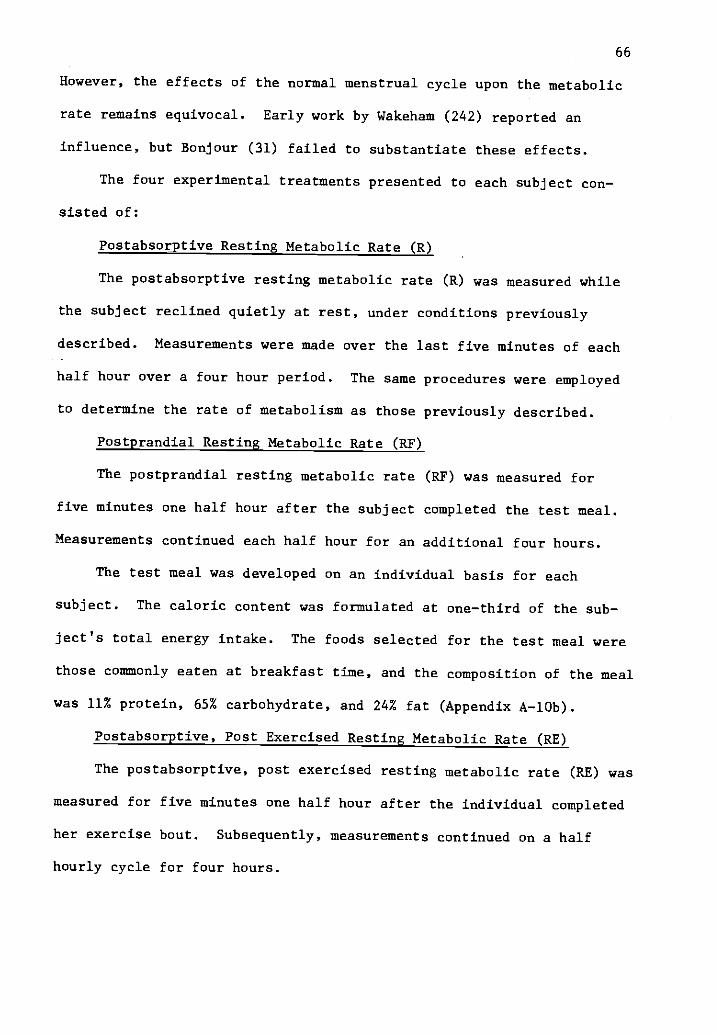
66
However, the effects of the normal menstrual cycle upon the metabolic
rate remains equivocal. Early work by Wakeham (242) reported an
influence, but Bonjour (31) failed to substantiate these effects.
The four experimental treatments presented to each subject con-
sisted of:
Postabsorptive Resting Metabolic Rate (R)
The postabsorptive resting metabolic rate (R) was measured while
the subject reclined quietly at rest, under conditions previously
described. Measurements were made over the last five minutes of each
half hour over a four hour period. The same procedures were employed
to determine the rate of metabolism as those previously described.
Postprandial Resting Metabolic Rate (RF)
The postprandial resting metabolic rate (RF) was measured for
five minutes one half hour after the subject completed the test meal.
Measurements continued each half hour for an additional four hours.
The test meal was developed on an individual basis for each
subject. The caloric content was formulated at one-third of the sub-
ject's total energy intake. The foods selected for the test meal were
those commonly eaten at breakfast time, and the composition of the meal
was 11% protein, 65% carbohydrate, and 24% fat (Appendix A-10b).
Postabsorptive, Post Exercised Resting Metabolic Rate (RE)
The postabsorptive, post exercised resting metabolic rate (RE) was
measured for five minutes one half hour after the individual completed
her exercise bout. Subsequently, measurements continued on a half
hourly cycle for four hours.

67
The exercise consisted of pedalling a calibrated Monarch bicycle
ergometer for 40 minutes at 50% of the subject's 0O2 max. The afore-
mentioned exercise intensity and duration was selected because it more
nearly simulates real-life exercise conditions (82).
Postprandial, Post Exercised Metabolic Rate (RFE)
The postprandial post exercised resting metabolic rate (RFE) was
measured for five minutes one half hour after the subject completed
her exercise session. This exercise period was preceded by the standard
breakfast described previously. Measurements of the RMR continued to
be taken for the last five minutes of each half hour for the next four
hours. (The four experimental treatments are depicted in table format
in Appendix A-7).
The metabolic measurements, 002, VCO2, and the respiratory exchange
ratio (R.E.R. = 9CO2/002) were obtained using the Haldane transformation
(166). Caloric expenditure was determined using the non-protein caloric
equivalent for 02 derived from the equation of Weir (249):
Kcal = [ (RER x 1.1) + 3.9 ] x 002
Both oxygen consumption and caloric expenditure were used for data
analysis. Values were expressed in gross form (liters of 02 or Kcal
per minute) and relative to body weight (Kg) and lean body weight (Kg/
LBM) per unit of time. Both oxygen consumption and caloric expenditure
are indicative of energy expenditure. However, the latter takes into
account variations in substrate utilization since its derivation
depends upon the RER which is 1.00 for the oxidation of carbohydrate
and approximately .70 for the oxidation of fat (166).
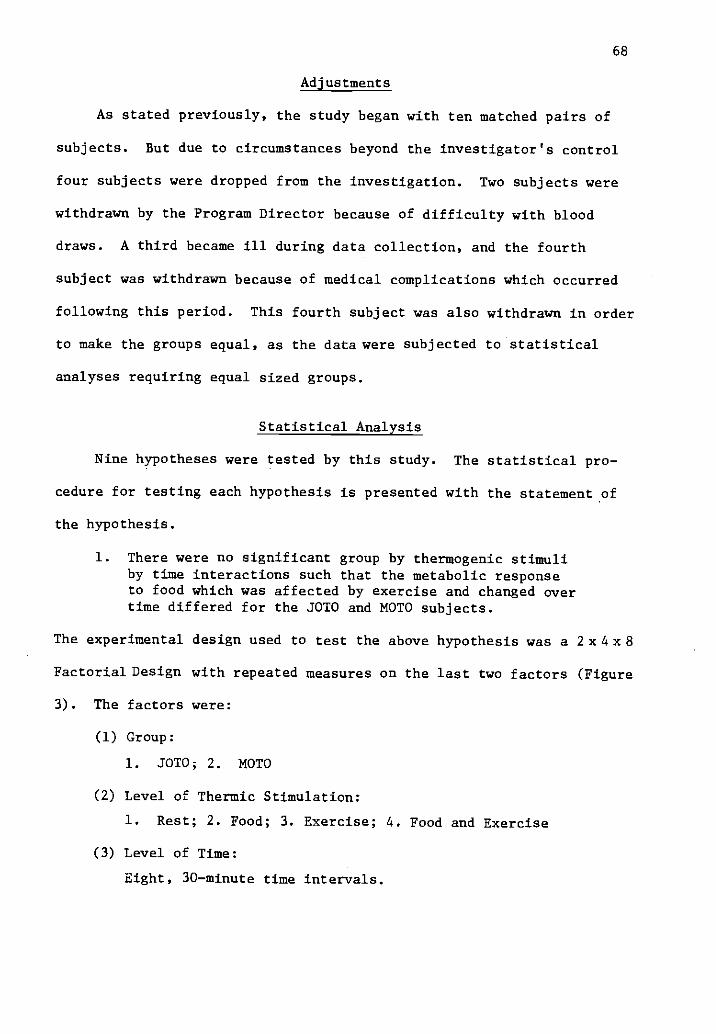
68
Adjustments
As stated previously, the study began with ten matched pairs of
subjects. But due to circumstances beyond the investigator's control
four subjects were dropped from the investigation. Two subjects were
withdrawn by the Program Director because of difficulty with blood
draws. A third became ill during data collection, and the fourth
subject was withdrawn because of medical complications which occurred
following this period. This fourth subject was also withdrawn in order
to make the groups equal, as the data were subjected to statistical
analyses requiring equal sized groups.
Statistical Analysis
Nine hypotheses were tested by this study. The statistical pro-
cedure for testing each hypothesis is presented with the statement of
the hypothesis.
1. There were no significant group by thermogenic stimuliby time interactions such that the metabolic responseto food which was affected by exercise and changed overtime differed for the JOTO and MOTO subjects.
The experimental design used to test the above hypothesis was a 2x 4 x 8
Factorial Design with repeated measures on the last two factors (Figure
3). The factors were:
(1) Group:
1. SOTO; 2. MOTO
(2) Level of Thermic Stimulation:
1. Rest; 2. Food; 3. Exercise; 4. Food and Exercise
(3) Level of Time:
Eight, 30-minute time intervals.

10
30
9020
16°0
69
41or 0fo 0
4:t.
A%
CI40'CZ" 0 *
S)
144.,,
4 Y10-e
tkeas-tes

70
Three-way analyses of variance with repeated measures were applied to
the 002 and KCAL data (Table 2 depicts the preliminary ANOVA Table).
Wherever appropriate post hoc comparisons among cell means were made.
The data were reported in absolute terms (Liters/minute, or calories/
min) and in relative terms (ml/Kg/min, Ml/KG-LBM/min, Kcal/Kg/min,
Kcal/Kg-LBM/min). Differences in the R.E.R. (VCO2/002) were also tested
by this model (209,258).
2. There was no significant difference in the Termic Effectof Food in JOTO vs. MOTO.
HO: pJ = pM
Hl: pJ # PM
3. There was no significant difference in the Thermic Effectof Exercise in JOTO vs. MOTO.
HO: pJ = pM
Hl: pJ # P14
4. There was no significant difference in the Exercise-InducedThermic Response to Food (Potentiation of the Thermic Effectof Food) in JOTO vs. MOTO.
HO: pJ = pM
Hl: pJ # pM
The experimental design used to study hypotheses 3, 4, and 5 was a 2 x 4
Factorial Design with repeated measures on the last factor (Figure 4).
The factors were:
(1) Group:
1. JOTO; 2. MOTO
(2) Level of Thermogenic Response:
1. Postabsorptive Metabolic Rate (R)2. Postprandial Metabolic Rate (RF)3. Postabsorptive Metabolic Rate Exercised (RE)4. Postprandial Metabolic Rate Exercised (RFE)
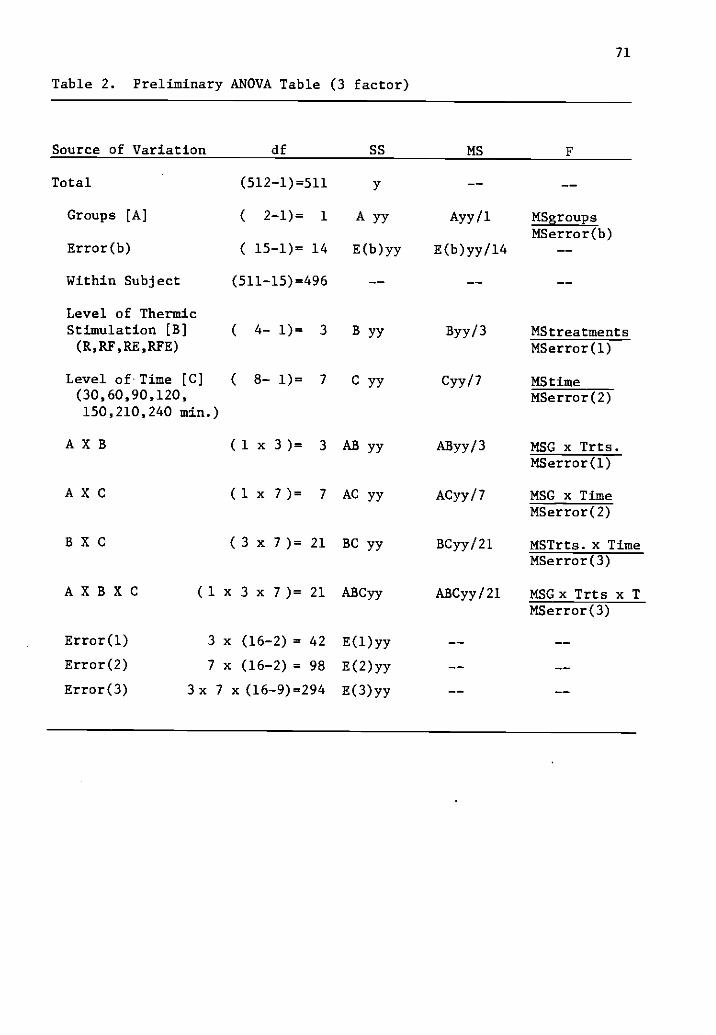
71
Table 2. Preliminary ANOVA Table (3 factor)
Source of Variation df SS MS F
Total (512-1)=511
Groups [A] ( 2-1)= 1 A yy Ayy/1 MSgroupsMSerror(b)
Error(b) ( 15-1)= 14 E(b)yy E(b)yy/14
Within Subject (511-15)=496
Level of ThermicStimulation [B] ( 4- 1)= 3 B yy Byy/3 MStreatments(R,RF,RE,RFE) MSerror(1)
Level of Time [C] ( 8- 1)= 7 C yy Cyy/7 MS time(30,60,90,120, MSerror(2)150,210,240 min.)
A X B ( 1 x 3 )= 3 AB yy AByy/3 MSG x Trts.MSerror(1)
A X C (1 x 7 )= 7 AC yy ACyy/7 MSG x TimeMSerror(2)
B X C ( 3 x 7 )= 21 BC yy BCyy/21 MSTrts. x TimeMSerror(3)
A X B X C (1 x 3 x 7 )= 21 ABCyy ABCyy/21 MSGx Trts x TMSerror(3)
Error(1) 3 x (16-2) = 42 E(1)yy
Error(2) 7 x (16-2) = 98 E(b)yy
Error(3) 3x 7 x(16-9)=294 E(3)yy
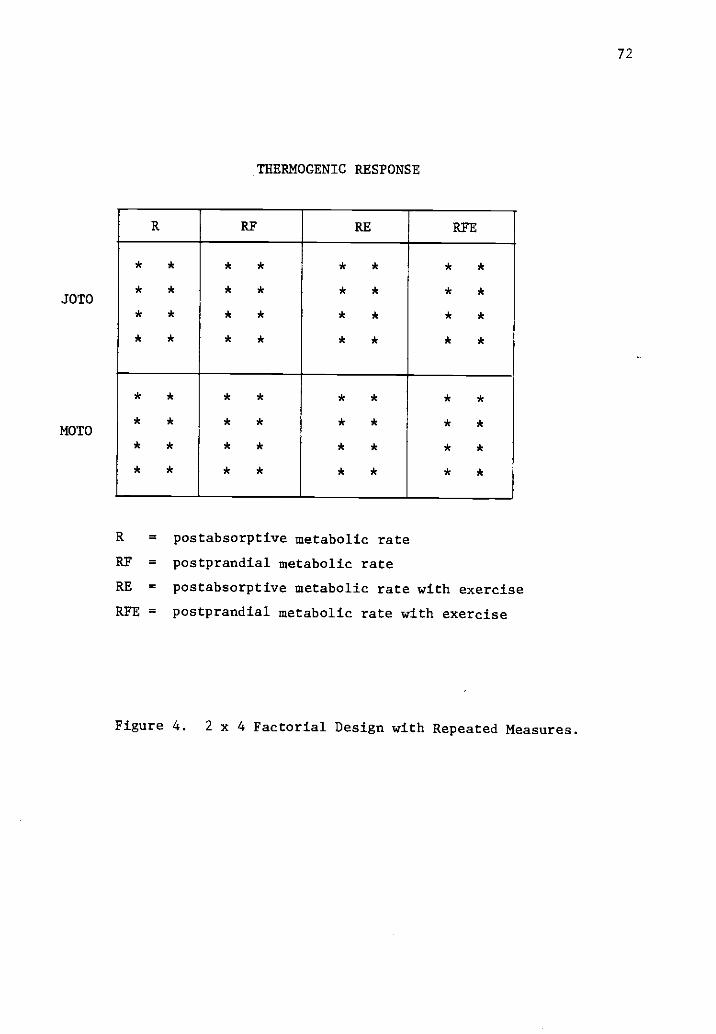
JOTO
MOTO
72
THERMOGENIC RESPONSE
R RF RE RFE
* * * * * * * *
* * * * * * * *
* * * * * * * *
* * * * * * * *
* * * * * * * *
* * * * * * * *
* * * * * * * *
* * * * * * * *
R =
RF =
RE =
postabsorptive metabolic rate
postprandial metabolic rate
postabsorptive metabolic rate with exercise
RFE = postprandial metabolic rate with exercise
Figure 4. 2 x 4 Factorial Design with Repeated Measures.
73
Two-way analyses of variance with repeated measures was applied to the
V02 and Kcal data. These data were obtained by integrating the area
beneath the four-hour response curve. Wherever appropriate, post hoc
comparisons among cell means were made. (Table 3 depicts the prelim-
inary ANOVA Table used in these analyses). The data were reported in
absolute and relative terms.
5. There was no significant difference in the caloricresponse to food and exercise when they were presentedin combination or when presented separately at differentoccasions [R - (F+E) = RF + RE].
The values for each subject for each treatment day were averaged
over the four hour period, and the following measures derived:
1. The increase in the Resting Metabolic Rate (RMR) due tothe Thermic Effect of Food, expressed as:
A. A percentage over the fasted RMR:
RF - R / R x 100
B. The absolute difference in the energy expenditureat rest in the fasted and fed states:
RF - R
2. The difference between the post-exercise metabolic rateunder food and no food conditions, expressed as:
A. The percentage above the fasted post-exercisemetabolic rate:
REF - RE / RE x 100
B. The absolute difference between the post-exercisemetabolic rate in the fasted and fed states:
RYE - RE
For these derived measures the Student's t test (219) was performed
using Group (JOTO vs. MOTO) as the independent variable. The derived
measures and the subsequent analyses were carried out on absolute
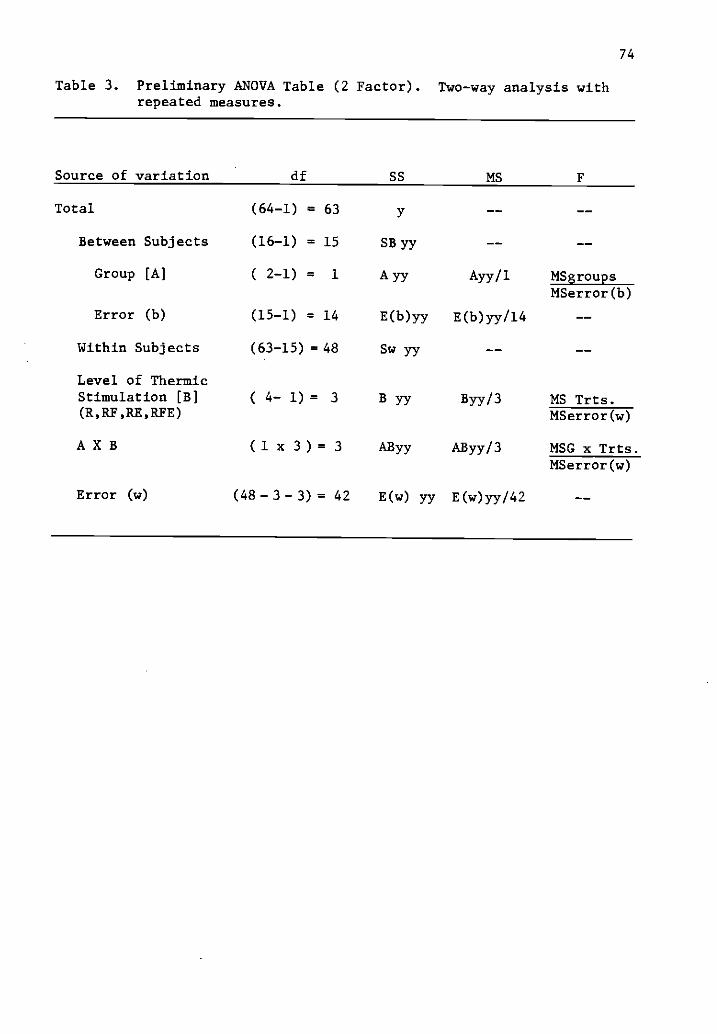
74
Table 3. Preliminary ANOVA Table (2 Factor).repeated measures.
Two-way analysis with
Source of variation df SS MS F
Total (64-1) = 63 y
Between Subjects (16-1) = 15 SB yy
Group [A] ( 2-1) = 1 A yy Ayy/1 MSgroupsMSerror(b)
Error (b) (15-1) = 14 E(b)yy E(b)yy/14
Within Subjects (63-15) = 48 Sw yy
Level of ThermicStimulation [B] ( 4- 1) = 3 B YY BYY/3 MS Trts.(R,RF,RE,RFE) MSerror(w)
A X B ( 1 x 3 ) = 3 AByy AByy/3 MSG x Trts.MSerror(w)
Error (w) (48- 3- 3) = 42 E(w) yy E(b)yy/42
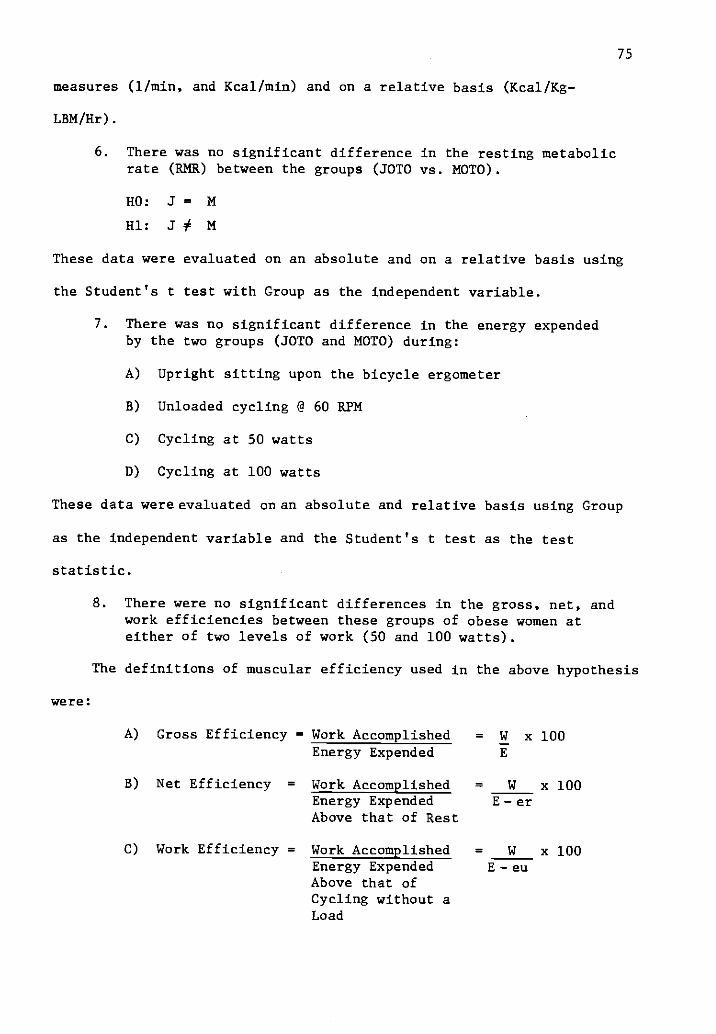
75
measures (1/min, and Kcal/min) and on a relative basis (Kcal/Kg-
LBM/Hr).
6. There was no significant difference in the resting metabolicrate (RMR) between the groups (JOTO vs. MOTO).
HO: J = M
Hl: J¢ M
These data were evaluated on an absolute and on a relative basis using
the Student's t test with Group as the independent variable.
7. There was no significant difference in the energy expendedby the two groups (JOTO and MOTO) during:
A) Upright sitting upon the bicycle ergometer
B) Unloaded cycling @ 60 RPM
C) Cycling at 50 watts
D) Cycling at 100 watts
These data were evaluated on an absolute and relative basis using Group
as the independent variable and the Student's t test as the test
statistic.
were:
8. There were no significant differences in the gross, net, andwork efficiencies between these groups of obese women ateither of two levels of work (50 and 100 watts).
The definitions of muscular efficiency used in the above hypothesis
A) Gross Efficiency = Work Accomplished = W x 100Energy Expended
B) Net Efficiency = Work Accomplished = W x 100Energy Expended E - er
Above that of Rest
C) Work Efficiency = Work Accomplished = W x 100Energy Expended E - eu
Above that ofCycling without aLoad

76
Two-way analyses of variance was applied to the Efficiency measures
(219). Post hoc comparisons were applied where appropriate.
9. There was no significant difference in the Total EnergyExpenditure/Calorie Intake between the two groups (JOTOvs. MOTO) or obese individuals.
HO: pJ = pM
Hl: p.1 # pM
These data were evaluted on an absolute and relative basis using Group
as the independent variable and the Student's t test as the test
statistic.
All other energy expenditure or metabolic efficiency data were
analyzed using the Student's t statistic with Group (JOTO vs. MOTO)
as the independent variable. Whenever appropriate, data were evaluated
in gross form but also relative to body weight (Kg) and lean body mass
(LBM). Differences between the two groups with respect to age, age
of onset of obesity, the average daily calories required to maintain
weight, and the various measures of body composition were also tested
for significance using unpaired t-tests. The .05 level of significance
was used for all statistical analyses. P values were reported to aid
in interpretation of statistical significance.
Statistical analyses were completed using The Number Cruncher
Statistical System, copyright 1984 by Jerry L. Hintze, Kaysville,
Utah. The Two and Three Factor Analyses of Variance with Repeated
Measures were performed using BMDP2V-Analysis of Variance and Co-
variance with Repeated Measures. BMDP Statistical Software, copyright
1982, from the University of California was available through the
Computer Center at Oregon State University.
77
Because of the small sample size in this study, the power of the
statistical tools utilized was reduced. Power is the probability of
rejecting the null hypothesis for a given significance criterion.
Assuming an effect size of .80, the power level of the statistical
tests performed was approximately .78 (184).
Summary
Eight subjects categorized as JOTO, and eight subjects categorized
as MOTO, were subjected to a number of stringent criterion measures of
the obligatory and the facultative components of the total energy
expenditure. It was hypothesized that group differences in metabolic
efficiency would be identified and that the results would indicate a
differential thermogenic response. Section IV presents a detailed
analysis of the results of these metabolic studies.
78
CHAPTER IV
RESULTS
The purpose of this study was to investigate the energy metabolism
of two distinct groups of obese individuals to establish if differences
in metabolic efficiency between the two groups could be identified.
Any failure in the regulation of the energy expenditure or deviation
from the normal pattern of metabolism at rest, during physical activity,
or in response to certain thermogenic stimuli could play an important
role in the development of obesity and in the persistence of the obese
condition.
An important requirement for this study was the proper identifi-
cation of the groups. These groups needed to represent two distinct
sub-types of obese individuals. The first group was composed of
Juvenile-onset type obesity or individuals who have been overfat from
early childhood. The prime cause of their obesity is suggested to be a
combination of genetic potential and a higher than required energy
intake. Ashwell (11) suggests that their adiposity was initially
due to hyperplasia of fat cells. But these cells are thought to
hypertrophy as well with an increase in body fat above 170% of ideal
body weight (11,204).
The second group of obese were Maturity-onset. Their obesity
developed after the age of sixteen and after they had reached their
mature stature. This type of obesity is associated with a greater
degree of hypertrophy. According to Ashwell (11), fat cell size
increases with the degree of obesity up to an average value of 1.0 pm.
79
After this, any further increase in body fat is attributed to an
increase in cell number (11,23,204).
It was the premise of this study that the etiology of Juvenile-
onset obesity is more metabolic in nature, and that Maturity-onset
obesity is more regulatory in nature (49,130). Therefore, one would
anticipate a greater metabolic efficiency in the subjects categorized
as JOTO.
Descriptive Data
The descriptive data for the Juvenile-onset and Maturity-onset
women are shown in Table 4. The mean age, weight, percent body fat,
fat weight, fat free weight, percent of ideal weight, and the body
mass index (BMI = w/h2) were similar in the two groups. The age-of-
onset of obesity was significantly (p < .001) lower in the Juvenile-
onset group. The Juvenile-onset obese women were significantly taller,
and this fact, in combination with a slightly greater weight, contributed
to a greater BSA (m2) in the Juvenile-onset group, as well. The
similarity which exists in regard to both the total body weight and the
lean body mass dispenses with the necessity to express subsequent
metabolic data in both absolute and relative form.
The maximum oxygen consumption and energy expenditure data appears
in Table 5. The tO2
max (the standard indicator of functional aerobic
fitness) was essentially equal in both groups of obese women. The
subjects in the JOTO group averaged 7.26 Mets, compared to 7.24 Mets
for the MOTO women. No matter what form of expression used, the
groups remained similar in both maximum oxygen consumption and maximum

80
Table 4. Physical characteristics of the subjects by group. Meanvalues 1.-S.D. are reported for each group.
JOTOn=8
MOTOn=8
t
statisticp value
Age 34.1 32.0 0.920 0.3734.4 4.8
Age of Onset 8.0 20.8 -8.912 <.0012.3 3.4
Height (cm) 168.9 159.3 4.924 <.0014.1 3.7
Weight (Kg) 99.4 95.6 0.620 0.54511.3 13.6
% Ideal Body Weight* 168.7 181.0 -1.092 0.29320.9 23.8
BMI (w/h2) 35.1 37.6 -1.109 0.2864.2 4.7
BSA (m2) 2.09 1.965 2.139 0.051.09 .13
% Body Fat 46.6 45.8 0.368 0.7184.6 3.8
Fat Weight (Kg) 46.7 44.1 0.585 0.5689.4 8.9
Fat Free Weight (Kg) 51.5 51.5 -0.028 0.9794.1 5.8
*Fogarty Conference Standards, 1977

81
Table 5. Maximum oxygen consumption and energy expenditure by group.Mean values ±S.D. are reported for each group.
JOTOn=8
MOTOn=8
t statistic(p value)
Maximum oxygen consumption
V02 liters/min. 2.53 2.43 0.752.234 .251 (.464)
V02 ml/kg/min. 25.41 25.36 0.0303.47 2.41 (.976)
V02 ml/kg(LBW)/min 47.97 47.37 0.2944.84 3.18 (.773)
METS 7.26 7.24 0.035.99 .70 (.972)
R.E.R. 1.13 1.14 -0.346.08 .05 (.735)
Maximum energy expenditure
Calories/minute 12.98 12.54 0.7031.24 1.28 (.494)
Kcal/kg/min. .132 .132 0.094.016 .013 (.926)
Kcal/kg(LBW)/min. .246 .244 0.244.024 .016 (.811)
82
energy expenditure (Table 5). This fact would effectively negate the
effect of aerobic fitness upon any subsequent measures of metabolic
efficiency (206).
Statistical Analysis
Hypothesis 1
Statistical analysis resulted in the acceptance of the first
null hypothesis.
There were no significant group by thermogenic stimuli bytime interactions such that the metabolic response to foodwhich was affected by exercise and changed over timediffered for the JOTO and MOTO subjects.
A three-way analysis of variance with repeated measures was used
to test this hypothesis. The results for oxygen consumption in liters
per minute can be observed in Table 6. There was a non-significant
group effect (F = .13, p = 0.720), meaning that the groups responded
similarly to each experimental treatment over time. The treatment
effect was significant (F = 75.00, p <0.001). The time effect was also
significant (F = 14.24, p <0.001), as was the treatment by time
interaction. The treatment by time by group interaction was non-
significant (F = 1.55, p = 0.061).
Significant treatment differences were evident at time 30 minutes
between R and R-F, R and R-F+E, R-E and R-F, and finally between
R-E and R-F+E. This pattern held true at time 60 minutes as well.
At time 90 minutes the only significant treatment differences were
between R and R-F, and between R and R-F+E. Finally, a significant
difference was obtained between R and R-F at 120 minutes using the
Post hoc test of Sheffe.

Table 6. Results of three-way analysismeasures on tO2 (1/min).
83
of variance with repeated
Source Sum of Squares df Mean Square F Prob
Mean 38.3431 1 38.3431 1975.14 .000Group [G] .0026 1 .0026 .13 .720Error .2718 14 .0194
Treatment [Trt] .0984 3 .0328 75.00 .000Trt x G .0016 3 .0005 1.23 .305Error .0186 42 .0004
Time [T] .0189 7 .0027 14.24 .000T x G .0009 7 .0001 .69 .684Error .0185 98 .0002
Trt x T .0231 21 .0011 7.89 .000Trt x T x G .0045 21 .0002 1.55 .061Error .0410 294 .0001
The repeated measures factors were:
Treatment [Trt]: R, Re, RF, R-F+ETime [T]: 8 half-hourly measurementsThe between subjects factor was group [G], JOTO or MOTO.

84
.325.
.300 RFERF
.275
.25030 80 90 120
TIME
.325. RFE
.300
.275
.250
MOTO
150 180 210 240
SOTO
-Cr
41110
30 60 90 120 150 180 210 240TIME
Figure 5. The effect of thermogenic stimulation on oxygenconsumption by group (MOTO and JOTO). R-RMR Baseline,RE-RMR after exercise, RF-RMR after feeding, RFE-RMRfood plus exercise.
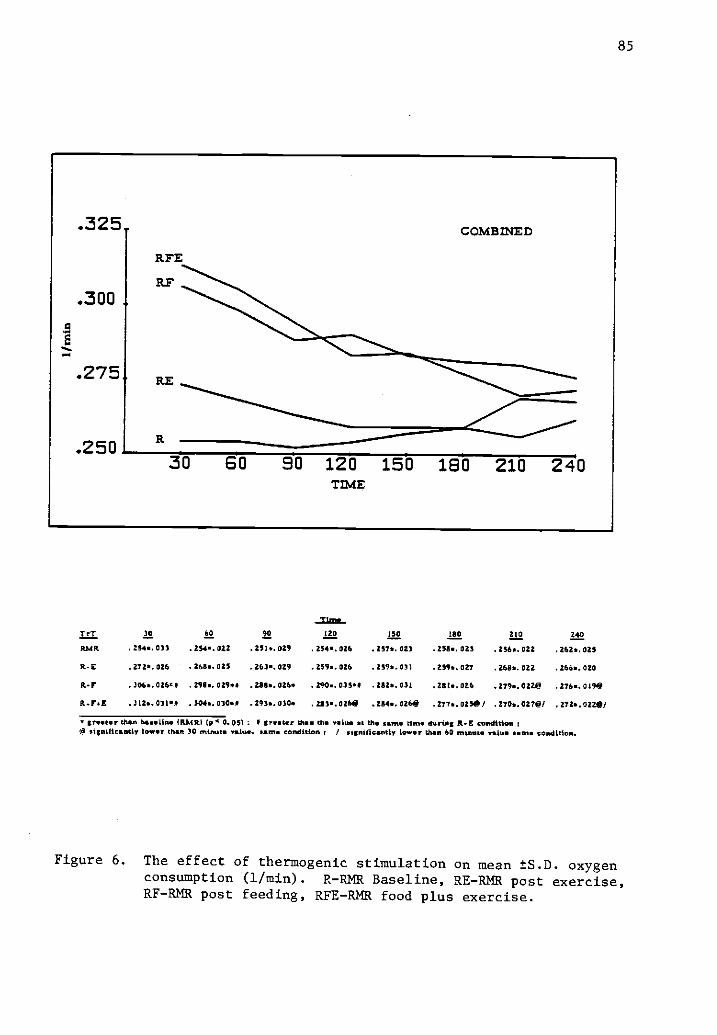
85
31=-T et 30 60 90 a 122 leo Al! zao
AMR . 254.. 031 . 284.. 022 . 251*. 029 . 254.. 026 . 257*. 023 . 258.. 023 . 256.. 022 . 262*. 025
li-E . 272*. 026 . 268.. 025 . 263.. 029 . 259*. 026 . 2596. 031 . 2596. 027 . 2611. 022 .266..020
Rd . 306*. 026. I . 298.. 029.4 .51/..026. . 200.. 033.4 . 282.. 031 . 28 . 026 . 279. 022e .276..019e
Et -IrsE .312..031.1 . 3046. 03000 . 293*. 030. . 283.. 02W . 254*. 026118 . 277*. 0250 / .270*. 027e/ . 272.. 0220/
greater than baseline (MARI (8 0. 05) : I trete r than the value at the same Um* during A- E conditionN significantly low., than 30 minute value. same condition t / significantly lower than 60 netnaut valise came condition.
Figure 6. The effect of thermogenic stimulation on mean ±S.D. oxygenconsumption (1/min). R-RMR Baseline, RE-RMR post exercise,RF-RMR post feeding, RFE-RMR food plus exercise.

86
The resting metabolic rate was significantly elevated after eating
the standard breakfast reaching its peak only 30 minutes after the meal.
The RMR remained elevated at 60, 90, 120, 150, and 180 minutes, as well.
Only minutes 210 and 240 were significantly lower when compared to the
peak period which occurred at 30 minutes under the fed condition (see
Figure 6). The RMR at the end of the experimental period under the fed
condition remained elevated above the baseline by 6.1%. Therefore, a
small under-estimation of the thermic effect of food occurred in the
present study.
Under the combined stimuli of feeding plus exercise, the RMR
reached a higher but non-significant peak at 30 minutes post-exercise.
The RMR declined rapidly after that. Times 120, 150, 180, 210, and
240 minutes declined significantly from the peak RMR which was recorded
at the 30 minute mark. The time effect was evident at minute 60, as
well, and did not dissipate until minute 180 (Figure 6).
In summary, the RMR baseline was fairly stable with few oscilla-
tions and a gradual diurnal rise of 3.1%. The metabolic rate four
hours post exercise was elevated over the baseline RMR, but at no time
was it significantly elevated. The RMR after the meal was significantly
elevated above the baseline RMR at 30, 60, 90, and 120 minutes. This
rate was also higher than after RMR-E at 30, 60, and 120 minutes. The
RMR after the combination of stimuli (feeding and exercising) was also
significantly higher than the baseline RMR at 30, 60, and 90 minutes.
This rate was elevated above the exercise only condition at 30 and
60 minutes. The RMR (fed and exercised) was not significantly higher
than the fed condition only, so it may be concluded that exercise at
87
this intensity after eating does not potentiate the thermic effect of
food.
Three-way analyses of variance with repeated measures were also
performed on the energy expenditure data in absolute terms (Kcal/minute)
and on a relative basis (Kcal/Kg(LBW)/hr.). The results of these
analyses can be reviewed in Tables 7 and 8, respectively. A detailed
study of these tables reveals observations similar to those already
presented. However, significant F-ratios were obtained for the Treat-
ment by Time by Group interaction in both analyses. Although this may
be true statistically, its importance from a physiological standpoint
is doubtful. Careful review of Figures 6, 8, and 10 indicate an
essential mirror-type resemblance in the response curves. The
occurrence of any interaction was the result of the similarities in
the response curves and their sensitivity to inter-individual variation
(oscillations), and any diurnal increase in RMR which might occur
throughout the morning hours.
Another factor which might contribute to the variation in the
energy expenditure expressed in (Kcal/min) or (Kcal/Kg(LBW)/hr.) is
the respiratory exchange ratio (tCO2//02). During steady state work
or at rest the R.E.R. is an indication of the fuel being metabolized.
An R.E.R. near .70 indicates that fat is the preferential fuel, whereas
an R.E.R. approaching 1.00 would indicate a shift to carbohydrate fuels.
The energy expenditure in Kcal/min per liter of oxygen consumed is
increased when carbohydrate is the predominate substrate.
The results of the three-way analysis of variance with repeated
measures on R E R can be found in Table 9. A non-significant group
effect (F = .11, p = 0.742) indicates that the groups responded
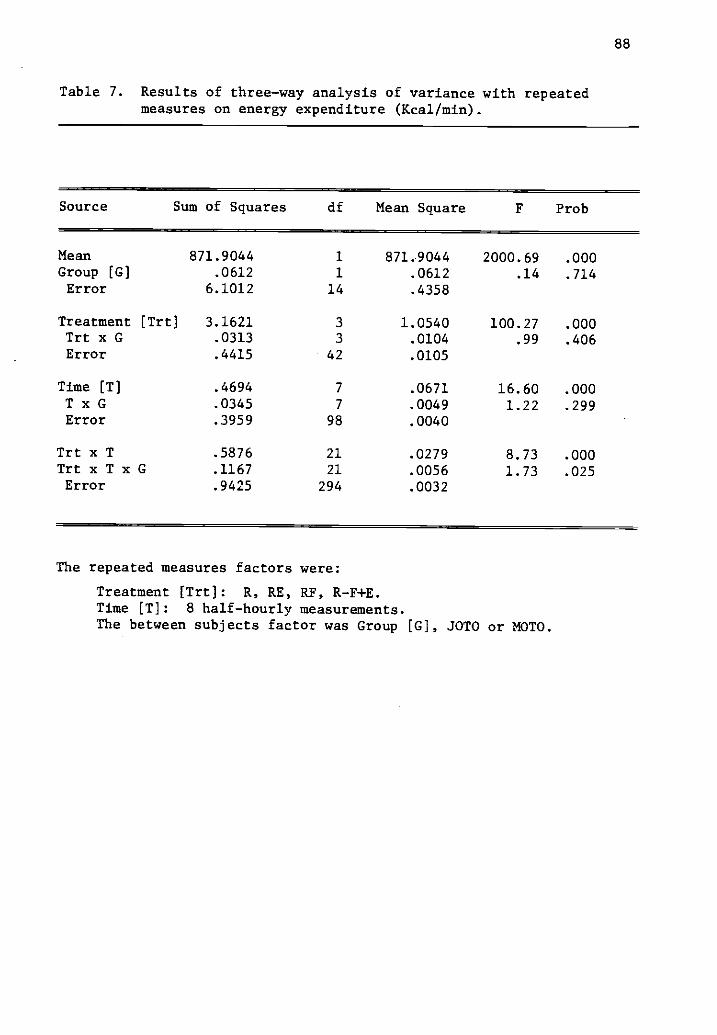
88
Table 7. Results of three-way analysis of variance with repeatedmeasures on energy expenditure (Kcal/min).
Source Sum of Squares df Mean Square F Prob
Mean 871.9044 1 871.9044 2000.69 .000Group [G] .0612 1 .0612 .14 .714Error 6.1012 14 .4358
Treatment [Trt] 3.1621 3 1.0540 100.27 .000Trt x G .0313 3 .0104 .99 .406Error .4415 42 .0105
Time [T] .4694 7 .0671 16.60 .000T x G .0345 7 .0049 1.22 .299Error .3959 98 .0040
Trt x T .5876 21 .0279 8.73 .000Trt x T x G .1167 21 .0056 1.73 .025Error .9425 294 .0032
The repeated measures factors were:
Treatment [Trt]: R, RE, RF, R-F+E.Time [T]: 8 half-hourly measurements.The between subjects factor was Group [G], JOTO or MOTO.

89
Figure 7. The effect of thermogenic stimulation on energy expenditure(Kcal/min) by group (MOTO or JOTO). R-RMR Baseline, RE-RMRafter exercise, RF-RMR after feeding, RFF-RMR food plusexercise.
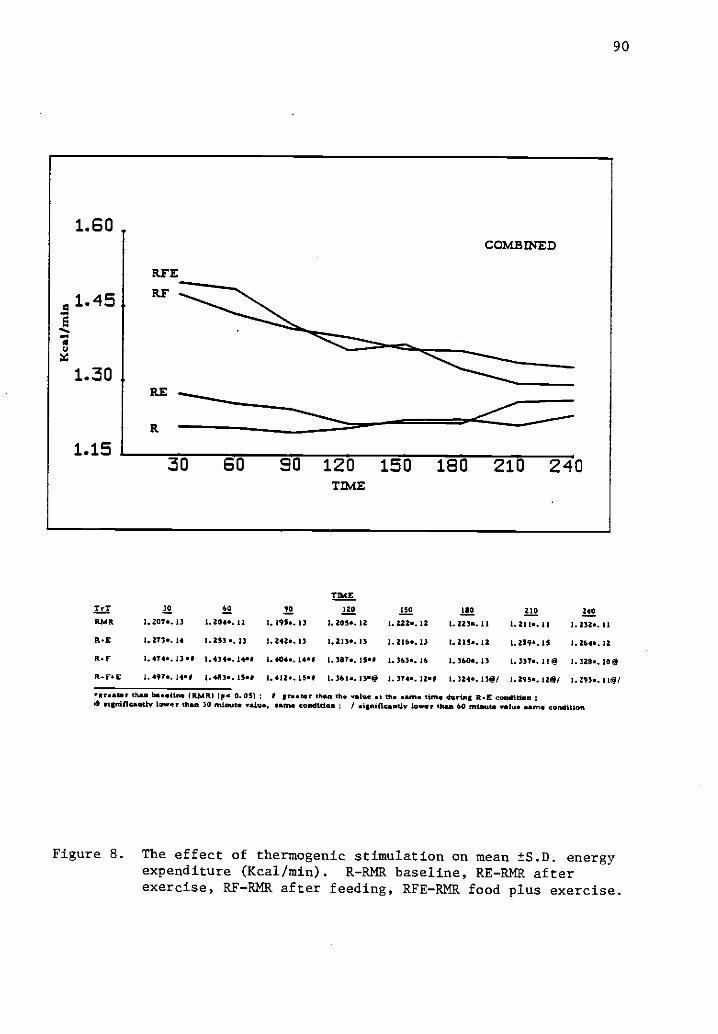
90
TIMETrT 30 60 90 120 MO 1110 210 240RPM 1.207*. 13 I. 20.0. 11 I. 195.. 13 1.203. 12 1.222..12 1.223.. 11 1.211.. 11 I. 232*. II
R.E I. 273*. 14 1.253.. 13 1. 242.. 13 1.213*. 13 1.2164.13 1.215.. 12 I. 259*. 15 1.264.. 12
R. I' 1.474..13 I. 434*. 1,90 I. 4044.1440 I. 3874.1519 1.363.. 16 I. 3604. 1) I.337*. 119 1.328.. 10
14.4"E 1.497., jog I. 4413*. 154 I. 412. 150 1.361..13.9 1.374.. 124 1. 3246. 139/ I. 215.. 129/ I. 293*. 119/
..... te than baseline (RP4R1 (pa 0.05) ; 5 tomtit t than the value 9 the same Wine daring Il-E condition0 tirdfIcantly lower than 30 minute value, mum condition ; / signifkaadv lower than 60 nitwit* video sante condition
Figure 8. The effect of thermogenic stimulation on mean ±S.D. energyexpenditure (Kcal/min). R-RMR baseline, RE-RMR afterexercise, RF-RMR after feeding, RFE-RMR food plus exercise.

91
Table 8. Results of three-way analysis of variance with repeatedmeasures on energy expenditure (Kcal /Kg(LBW) /Hr).
Source Sum of Squares df Mean Square F Prob
Mean 1153.5635 1 1153.5635 4264.53 .000Group [G] .0081 1 .0081 .03 .865Error 3.7870 14 .2705
Treatment [Trt] 4.1752 3 1.3917 116.98 .000Trt x G .0148 3 .0163 1.37 .266Error .4997 42 .0119
Time [T] .5821 7 .0831 15.62 .000T x G .0612 7 .0087 1.64 .133Error .5218 98 .0053
Trt x T .7515 21 .0358 8.72 .000TrtxTxG .1745 21 .0083 2.02 .006Error 1.2072 294 .0041
The repeated measures factors were:
Treatment [Trt]: R, RE, RF, R-F+ETime [T]: 8 half-hourly measurements.The between subjects factor was Group [G], JOTO or MOTO

92
1.90
1.70 RFE
MOT 0
RF
1.50RE
R
1.3030 60 90 120 150 180 210 240
TIME
1.90S OTO
RFE
1.70 RF
1.50RE
1.3030 60 90 120 150 180 210 240
Figure 9. The effect of thermogenic stimulation on energy expenditure(Kcal/Kg(LBW)/HR) by group (MOTO and JOTO). R-RMR baseline,RE-RMR after exercise, RF-RMR after feeding, RFE-RMR foodplus exercise.

93
1.90
:41.70
8
11.50
1.30
RFE
ELF
RE
-"qualms.-
COMBINED
30 80 90 120 150 180 210 240TIME
TIMETrT 30 CO 90 1E0 150 a M Z40
RMR 1. 385*. 12 I. 388*. 10 I. 374a. I I 1.3824. I2 I. 4066. 13 I. 409*. 12 1.393*. 08 1.622x, 08
R-E 1.463*. 12 1.14. 12 I. 4276. 1 1 1. 399 1 1 1. 399*. 12 1.398.. 1 1 1.4471. 1 1 1.454..''
lt-r I. tots.a Loso. Ian I. 608*. 14.1 I. 5956. 12 # 1. 5686. IMO 1.563.. 17P I. SSI6. 12@ L. 531*. 110
ft-[4E 1. 723.. 10.0 1.683e. 10*i I. MM. 1001 I. 566*. 1010 1. 583e. 11.5 1.516e. 120/ 1.4846. 139' I. 490..100/
greater than baseline (RMR) (p 0. 05) : 1 greater thee the value at the mine tinm during the R-E condition :0 Myriffeantly lower than 30 minute V11611, same condition / sienifiematly lower than 60 minute value came condition.
Figure 10. The effect of thermogenic stimulation on mean ±S.D.energy expenditure (Kcal/Kg(LBW)/HR). R-RMR Baseline,RE-RMR after exercise, RF-RMR after feeding, RFE-RMRfood plus exercise.
94
similarly under each condition. A highly significant Treatment effect
(F = 119.15, p <0.001) was also observed. The R.E.R. after the exercise
treatment was significantly lower than the values obtained under the
fed (R-F) and the fed and exercised (R-F+E) conditions. This was true
from minute 30 through minute 150. At minute 180 and 240 the baseline
(R) and the values after exercise alone (R-E) were significantly lower
than that after feeding (R-F). At minute 210, only R-E was lower
than the R-F condition.
Figures 11 and 12 present graphic representations of the R.E.R.
for each treatment across time. The R.E.R. after exercise is lower
than the baseline measurement indicating a shift to greater fat metab-
olism after exercise in a postabsorptive condition. The R.E.R. after
feeding was considerably elevated above the baseline measurements. This
was true for the measures after the food and exercise condition as well.
These differences reached statistical significance between the RE and
RF and RFE at most levels of time, as indicated in Figure 11.
It can be concluded that exercise and feeding markedly affect the
energy expenditure by shifting the proportion of substrate being
metabolized at any given time.
Hypotheses 2, 3, and 4
Statistical analysis resulted in the acceptance of the second,
third, and fourth null hypotheses.
There was no significant difference in the thermic effectof food in JOTO vs. MOTO.
There was no significant difference in the thermic effect ofexercise in JOTO vs. MOTO.
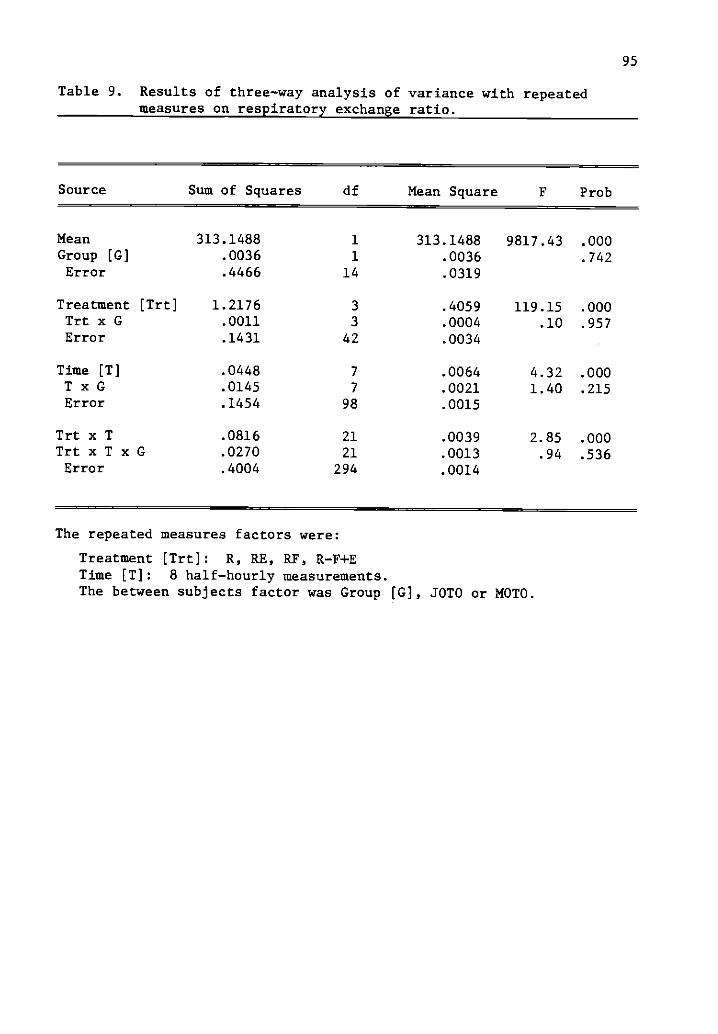
95
Table 9. Results of three-way analysis of variance with repeatedmeasures on respiratory exchange ratio.
Source Sum of Squares df Mean Square F Prob
Mean 313.1488 1 313.1488 9817.43 .000Group [G] .0036 1 .0036 .742Error .4466 14 .0319
Treatment [Trt] 1.2176 3 .4059 119.15 .000Trt x G .0011 3 .0004 .10 .957Error .1431 42 .0034
Time [T] .0448 7 .0064 4.32 .000T x G .0145 7 .0021 1.40 .215Error .1454 98 .0015
Trt x T .0816 21 .0039 2.85 .000TrtxTxG .0270 21 .0013 .94 .536Error .4004 294 .0014
The repeated measures factors were:
Treatment [Trt]: R, RE, RF,Time [T]: 8 half-hourly measurements.The between subjects factor was Group [G], SOTO or MOTO.

96
.900
.800a
.700
.600
.900
BOOaa
.700
.600
MOT 0
RFEEt
RE
30 SO 90 120 150 180 210 240TIME
RP
ATE
RE
SOTO
30 60 90 120 150 180 210 240TIME
Figure 11. The effect of thermogenic stimulation on respiratoryexchange ratio (7CO2/1702) by group (MOTO and JOTO).R-RER Baseline, RE-RER after exercise. RF-RER afterfeeding, RFE-RER food plus exercise.

97
.900
.800
.700
.600
RF COMBINED
R
RE
30 60 90 120 150 180 210 240TIME
lit 30 60 90 120 150 110 210 240
MAR . 790.. 07 . 71.8*. 04 . 7736.05 .7706.07 .7651.011 . 7566.04 . 7524,04 . 7421.04
It-E . 692.. 05 , 7011.05 .706.03 .7131.04 .7176.06 .7234.03 .701 *. 03 . 732*. 03
ft.? . 474.071 .1296.054 .5364.041 .037. 041 .11476.0411 . 8466.040 .8336.02 . 8296.0348
R-FE .131.048 .1266.038 . 432*. 048 .819.04 .8184.054 .8076.07 . 7776. 05 . 7736.04
groan t n, or less than the baseline (AMR) tip 0.05) 1 stoner than the valve at *erne tine during the P.1411E Candttlon.
Figure 12. The effect of thermogenic stimulation on mean ±S.D.respiratory exchange ratio (7CO2/1702). R-RER baseline,RE-RER after exercise, RF-RER after feeding, RFE-RERfood plus exercise.

98
There was no significant difference in the exercise-inducedthermic response to food (potentiation of the thermic effectof food by exercise) in JOTO vs. MOTO.
Two-way analysis of variance with repeated measures was used to
test these hypotheses. The dependent variables used in these analyses
were oxygen consumption (liters/min), and energy expenditure (Kcal/min)
and (Kcal/Kg(LBW)/Hr). These values were obtained by integrating the
total area under the response curve. In all cases, the results of
these analyses were similar.
Table 10 depicts the results of the statistical analysis using
oxygen consumption (liters) as the dependent variable. No group effect
could be identified (F = .13, p = 0.721). Therefore, the groups were
not different in regard to the TEF, TEE, or the exercise induced thermic
effect of food (potentiation).
A significant treatment effect (F = 69.36, p <0.001) was identi-
fied. Subsequent post hoc analyses revealed significant differences
between the baseline determination of RMR and those following both
feeding (RF) and feeding followed by exercise (RFE). These treatments
also resulted in significant elevations in metabolic rate above the
exercise treatment (RE) as well (Table 10).
Figure 13 displays the results in graphic form. The 40-minute
exercise bout elevated the metabolic rate for the entire post-exercise
period by 3.9% in the JOTO group and 2.5% in the MOTO group. These
increases were non-significant in relation to the baseline and could be
accounted for in part by the standard error of the measurement which
was estimated to be 2.2%. Feeding a standard breakfast accounted for a
14.4% increase in the Juvenile-onset subjects and a 10.3% increase in
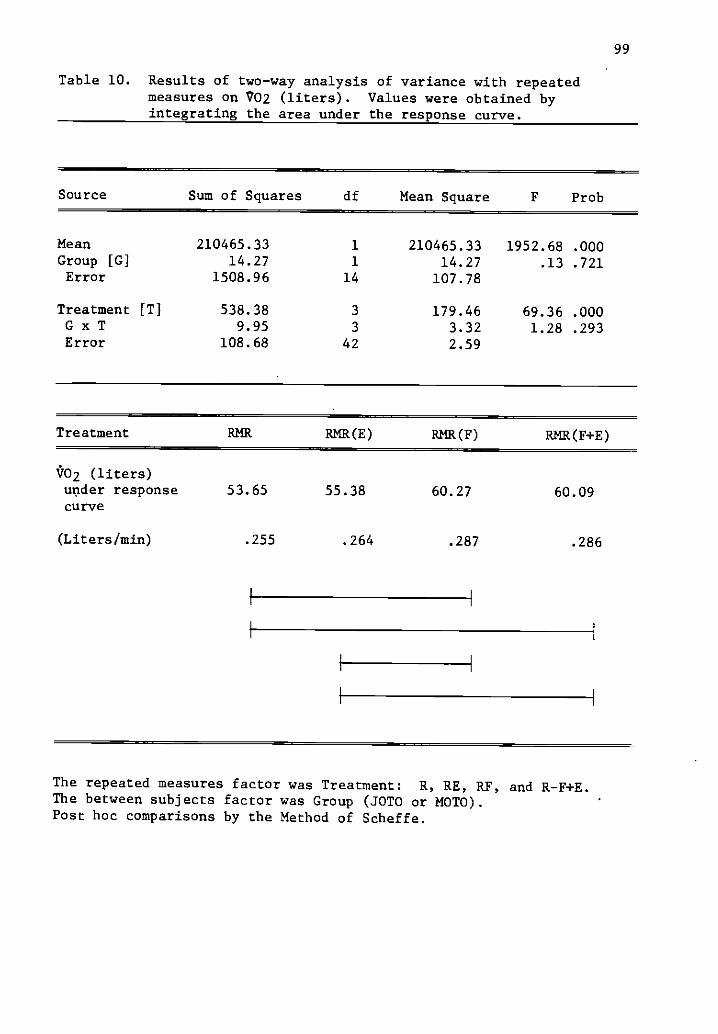
99
Table 10. Results of two-way analysis of variance with repeatedmeasures on V02 (liters). Values were obtained byintegrating the area under the response curve.
Source Sum of Squares df Mean Square F Prob
Mean 210465.33 1 210465.33 1952.68 .000Group [G] 14.27 1 14.27 .13 .721Error 1508.96 14 107.78
Treatment [T] 538.38 3 179.46 69.36 .000G x T 9.95 3 3.32 1.28 .293Error 108.68 42 2.59
Treatment RMR RMR(E) RMR(F) RMR(F+E)
V02 (liters)under responsecurve
53.65 55.38 60.27 60.09
(Liters/min) .255 .264 .287 .286
The repeated measures factor was Treatment: R, RE, RF, and R-F+E.The between subjects factor was Group (JOTO or MOTO).Post hoc comparisons by the Method of Scheffe.

25
20
15
10
5
100
MOTO JOTO MOTO JOTO MOTO
RMR--E R113--F RMR--F+E
Figure 13. Percent above baseline AMR (1/min) for each group.

101
the Maturity-onset subjects. These increases were not significantly
different from one another but were significantly elevated over both
the R and RE conditions. Finally, the resting metabolic rate following
a combination of feeding and exercising was up 12.8% for the SOTO
subjects and 11.2% for the MOTO subjects. These responses were signifi-
cantly higher than the baseline determination of RMR and also for the
determination of metabolic rate following exercise alone.
The reduced elevation in metabolic rate due to the combination of
stimuli can be partially explained by the time factor. The first
measurement of RMR came one-half hour after the exercise period, which
was one and one-half hours after the completion of the test meal.
From an earlier analysis, it was learned that the peak thermic effect
of food occurred rather rapidly after eating. Therefore, this peak
may have been missed because it may have occurred during the exercise
session itself.
In summary, exercise did not result in a significant elevation
in the post-exercise resting metabolic rate. Feeding, however, did
result in a significantly higher metabolic rate over the four hour
post-feeding period. The addition of exercise did not result in an
elevation in metabolic rate above the feeding condition alone.
Therefore, no potentiation effect was observed.
Table 11 presents the results of a similar analysis using
energy expenditure (Kcal/min) as the dependent variable. The results
were a non-significant group effect (F = .12, p = 0.734),
significant treatment effect (F = 93.06, p < 0.001), and no inter-
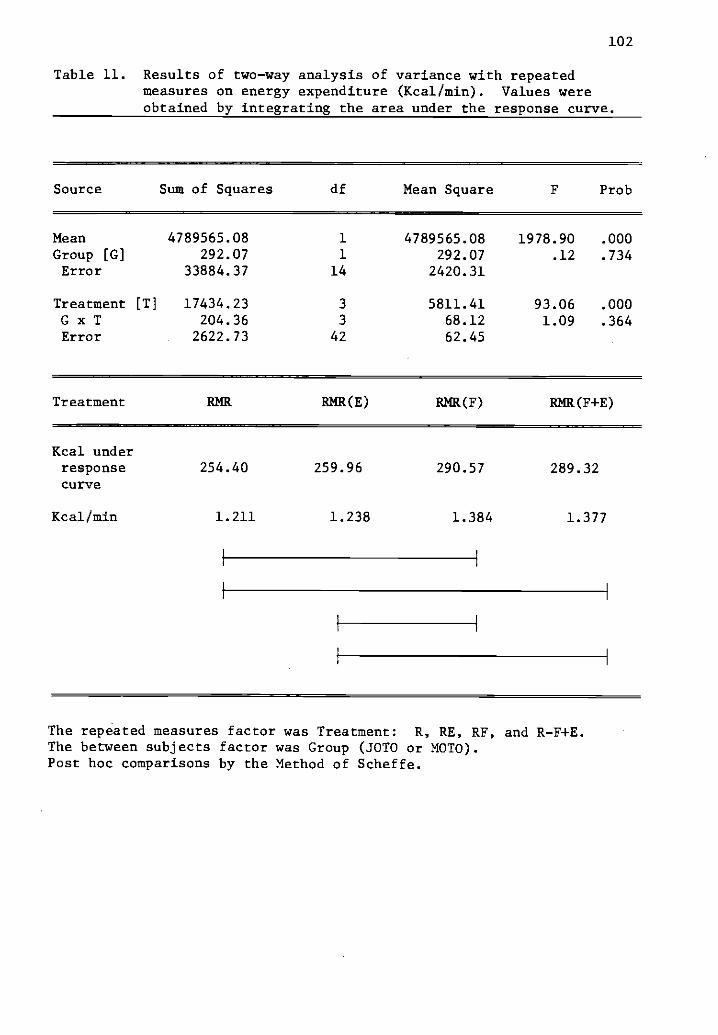
102
Table 11. Results of two-way analysis of variance with repeatedmeasures on energy expenditure (Kcal/min). Values wereobtained by integrating the area under the response curve.
Source Sum of Squares df Mean Square F Prob
Mean 4789565.08 1 4789565.08 1978.90 .000Group [0] 292.07 1 292.07 .12 .734Error 33884.37 14 2420.31
Treatment [T] 17434.23 3 5811.41 93.06 .000G x T 204.36 3 68.12 1.09 .364Error 2622.73 42 62.45
Treatment
Kcal underresponsecurve
Kcal/min
RMR RMR(E) RMR(F) RMR(F+E)
254.40
1.211
259.96
1.238
290.57 289.32
1.384 1.377
The repeated measures factor was Treatment: R, RE, RF, and R-F+E.The between subjects factor was Group (JOTO or MOTO).Post hoc comparisons by the Method of Scheffe.
103
action effect (F = 1.09, p = 0.364). Post hoc testing for the treatment
effect was identifcal to those previously presented.
In energy expenditure terms, exercise accounted for a rise of only
6.4 Kcal in the JOTO group and 4.7 Kcal in the MOTO group for the entire
post-exercise experimental period. In contrast, feeding resulted in an
increase in energy output of 40.8 Kcal in the JOTO and 31.5 Kcal in
the MOTO group. This amounted to 4.7% and 4.1% of the calories consumed
in the breakfast for the JOTO and MOTO groups, respectively.
Feeding followed by exercising, again raised the energy output
by 36 Kcal and 34 Kcal for the JOTO and MOTO groups, respectively.
In terms of a percentage of the calorie loadings, this accounted for
4.2% of the meal for the JOTO subjects and 4.3% for the MOTO subjects.
Caloric expenditure rose 2.5% and 1.9% above the baseline deter-
mination as the result of the exercise stimuli in the JOTO and MOTO
subjects, respectively. As the result of feeding, energy output
increased significantly for the JOTO subjects (16.1%), and the MOTO
subjects (12.4%) alike. The combination of breakfast followed by
exercise increased the metabolic rate (Kcal/min) by 14.1% in the
Juvenile-onset obese and by 13.4% in the Maturity-onset obese women.
This increase was also a significant finding. Figure 14 presents a
graphic representation of these data.
Similar findings were indicated when identical analyses were
completed using energy expenditure in Kcal/Kg(LBW)/Hr as the dependent
variable. Table 12 presents the results of these analyses. It can be
concluded that the form of expression of the resting metabolic rate
does not change the interpretation of the results. In absolute terms

25
20
104
co15
10
5
0JOTO MOTO JOTO MOTO JOTO MOTO
413--F RMR-F+E
Figure 14. Percent above baseline RMR (Kcal/min) for eachgroup.

105
Table 12. Results of two-way analysis of variance with repeatedmeasures on energy expenditure (Kcal/Kg(LBW)/Hr).
Source Sum of Squares df Mean Square F Prob
Mean 6334508.75 1 6334508.75 4185.73 .000Group [G] 61.39 1. 61.39 .04 .834Error 21187.01 14 1513.36
Treatment [T] 22868.51 3 7622.84 104.88 .000G x T 336.40 3 112.13 1.54 .217Error 3052.77 42 72.68
Treatment RMR RMR(E) RMR(F) RMR(F+E)
Kcal/Kg/LBW)under responsecurve
292.66 299.04 334.53 332.18
Kcal/Kg(LBW)/Hr 1.394 1.424 1.593 1.581
The repeated measures factor was Treatment: R, RE, RF, and R-F+E.The between subjects factor was Group (JOTO or MOTO).Post hoc comparisons by the Method of Scheffe.
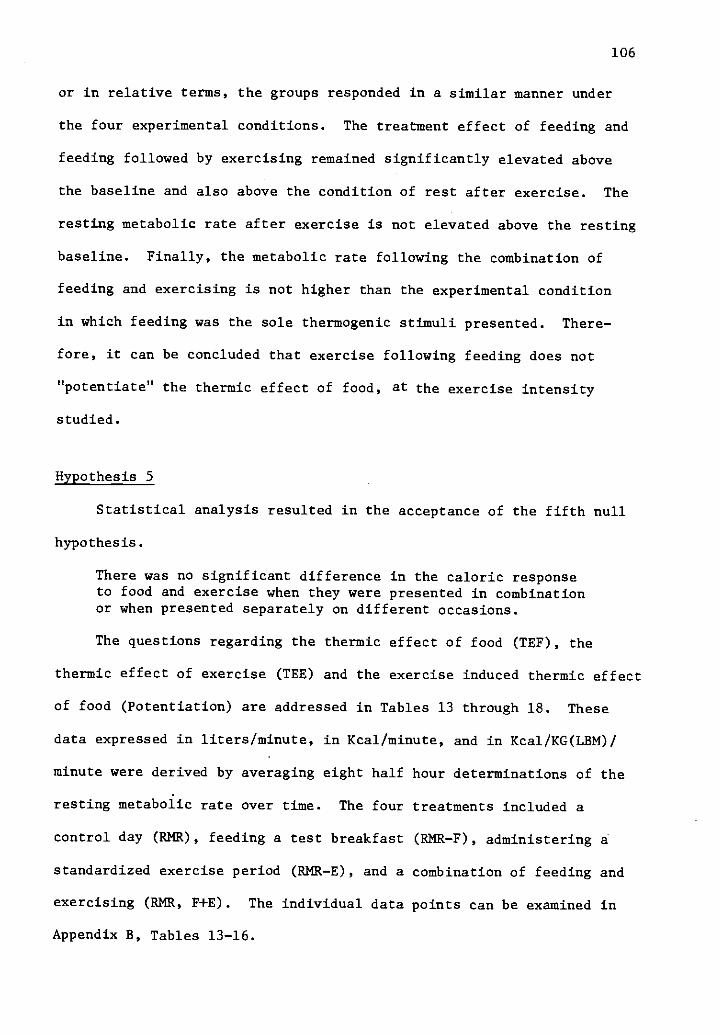
106
or in relative terms, the groups responded in a similar manner under
the four experimental conditions. The treatment effect of feeding and
feeding followed by exercising remained significantly elevated above
the baseline and also above the condition of rest after exercise. The
resting metabolic rate after exercise is not elevated above the resting
baseline. Finally, the metabolic rate following the combination of
feeding and exercising is not higher than the experimental condition
in which feeding was the sole thermogenic stimuli presented. There-
fore, it can be concluded that exercise following feeding does not
"potentiate" the thermic effect of food, at the exercise intensity
studied.
Hypothesis 5
Statistical analysis resulted in the acceptance of the fifth null
hypothesis.
There was no significant difference in the caloric responseto food and exercise when they were presented in combinationor when presented separately on different occasions.
The questions regarding the thermic effect of food (TEF), the
thermic effect of exercise (TEE) and the exercise induced thermic effect
of food (Potentiation) are addressed in Tables 13 through 18. These
data expressed in liters/minute, in Kcal/minute, and in Kcal/KG(LBM)/
minute were derived by averaging eight half hour determinations of the
resting metabolic rate over time. The four treatments included a
control day (RMR), feeding a test breakfast (RMR-F), administering a
standardized exercise period (RMR-E), and a combination of feeding and
exercising (RMR, F+E). The individual data points can be examined in
Appendix B, Tables 13-16.

25
ai 5
0
107
JOTO MOTO JOTO 10-0 JOTO MOTO
P143--E FN--F RMR--F+E
Figure 15. Percent above baseline RMR (Kcal/Kg(LBW)/Hr) for eachgroup.

108
Table 13. Two-way analysis of variance with repeated measures on theaverage oxygen consumption over the four hour period oneach treatment day. Post-hoc comparisons were performedusing Fisher's Least Significant Difference Test.
Source df Sum of Squares Mean Squares F Prob
A (Group) 1 .000248 .000248 .1 .68S (A) 14 .034065 .002433
B (Treatments) 3 .012063 .004021 77.51 <.001A x B 3 .000137 .000046 .88 .504Error 42 .002179 .000052Adj Tot 63 .048692 .000773
Treatment RMR RMR(E) RMR(F) RMR(F+E)
Mean 1/min .2557 .2645 .2867 .2871

109
Table 14. Differences by group in the thermic effect of food (TEF)and exercise (TEE), and the potentiation of the TEF byexercise. Values are mean tS.D. for each group.
JOTOn=8
MOTOn=8
t statistic(p value)
RMR (F) - RMR .0351 .0269 2.103(1/min) (.0078) (.0079) .054
RMR (F) - RMR /RMR x 100 13.76 10.52 2.067( 3.42) ( 2.83) .058
RMR (F+E) - RMR (E) .0233 .0218 .272(1/min) (.0093) (.0125) .789
RMR(F+E) - RMR(E)/RMR(E) x 100 8.96 8.44 .237
(%) (3.64) (4.95) .816
Potentiation
RKR(F+E) - RMR(F) -0.001 0.002 -.6241(1/min) (0.012) (.006) .543
RMR(F+E)-RMR(F)/RMR(F) x 100 -0.268 0.5825 -.518(%) (4.046) (2.279) .613
Total L02 over four hours -0.270 0.450 -.624(2.860) (1.573) .543
Total Kcal/four hours -1.302 2.168 -.624(13.770) (7.582) .542
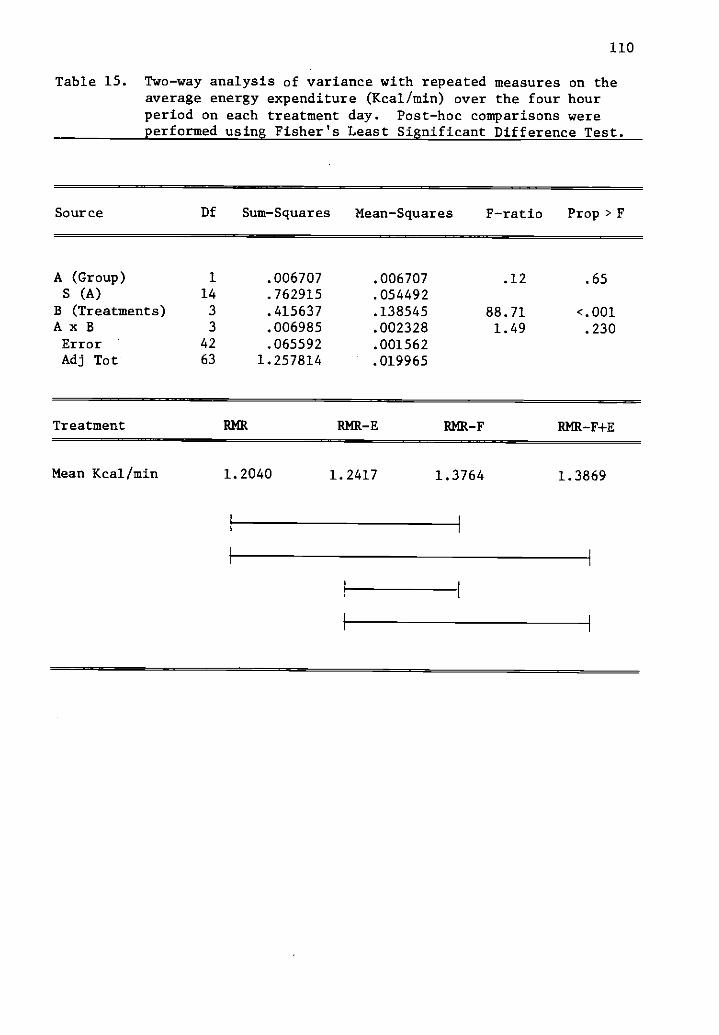
110
Table 15. Two-way analysis of variance with repeated measures on theaverage energy expenditure (Kcal/min) over the four hourperiod on each treatment day. Post-hoc comparisons wereperformed using Fisher's Least Significant Difference Test.
Source Df Sum-Squares Mean-Squares F-ratio Prop > F
A (Group) 1 .006707 .006707 .12 .65S (A) 14 .762915 .054492
B (Treatments) 3 .415637 .138545 88.71 <.001A x B 3 .006985 .002328 1.49 .230Error 42 .065592 .001562Adj Tot 63 1.257814 .019965
Treatment RMR AMR -E RMR-F RMR-F+E
Mean Kcal/min 1.2040 1.2417 1.3764 1.3869

111
Table 16. Differences by group in the thermic effect of food (TEF)and exercise (TEE), and potentiation of the TEF by exercise.Values are mean ±S.D. for each group.
JOTOn=8
MOTOn=8
t statistic(p value)
Thermic effect of food
RMR(F) - RMR .2003 .1543 2.201(Kcal/min) .0356 .0472 .0454
RMR(F) - RMR/RMR x 100 16.55 12.74 2.342(%) 3.12 3.37 .034
Kcal above Rest (TEF) 48.06 37.14 2.179(Kcal/four hour) 8.55 11.29 .047
Kcal in breakfast 857.7 783.0 1.88956.6 96.5 .080
% of the meal (TEF) 5.64 4.73 1.6011.11 1.15 .132
Potentiation
RMR(F+E) - RMR(E) .1446 .1276 .498(Kcal/min) .0507 .0613 .626
RMR(F+E)-RMR(E)/RMR(E) x 100 11.55 10.53 .4283(%) 4.322 4.187 .675
Kcal above RMR(E) 33.99 30.63 .4979(Kcal/four hour) 12.18 14.69 .626
% Kcal of meal 3.99 3.91 .10711.43 1.73 .916
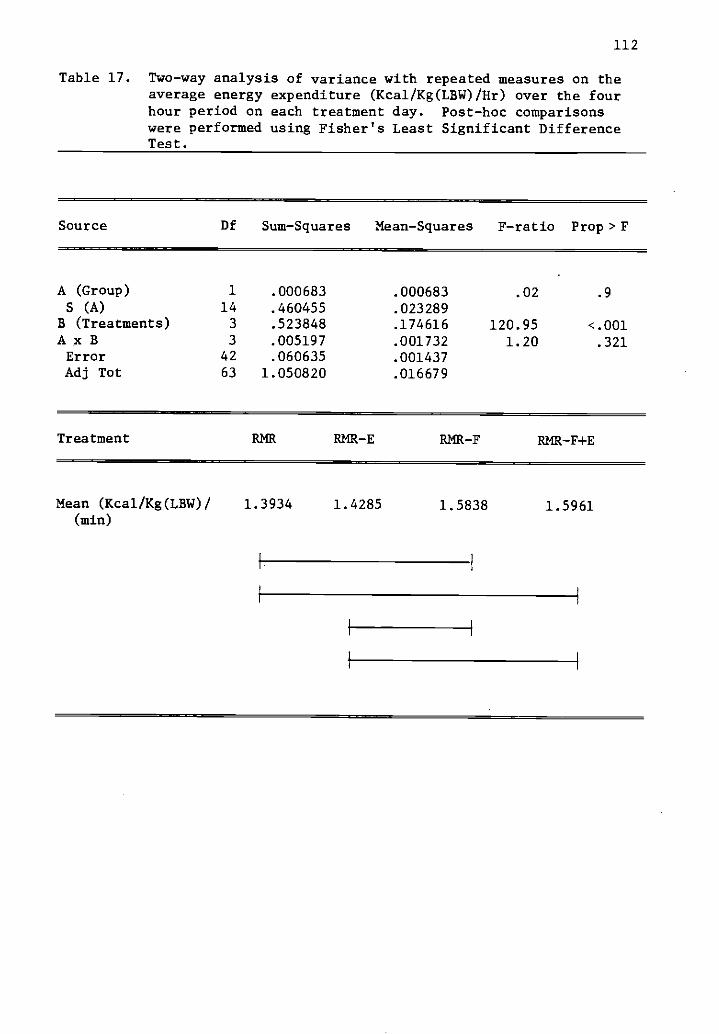
112
Table 17. Two-way analysis of variance with repeated measures on theaverage energy expenditure (Kcal/Kg(LBW)/Hr) over the fourhour period on each treatment day. Post-hoc comparisonswere performed using Fisher's Least Significant DifferenceTest.
Source Df Sum-Squares Mean-Squares F-ratio Prop > F
A (Group) 1 .000683 .000683 .02 .9
S (A) 14 .460455 .023289B (Treatments) 3 .523848 .174616 120.95 <.001A x B 3 .005197 .001732 1.20 .321Error 42 .060635 .001437Adj Tot 63 1.050820 .016679
Treatment RMR RMR-E RMR-F RMR -F+E
Mean (Kcal/Kg(LBW)/(min)
1.3934 1.4285 1.5838 1.5961

113
Table 18. Differences by group in the thermic effect of food (TEF),and exercise (TEE), and the potentiation of the TEF byexercise. Values are mean ±S.D. for each group.
JOTO
n=8MOTOn=8
t statistic(p value)
Thermic effect of food
RMR(F) - RMR .2224 .1830 1.631(Kcal/Kg(LBW)/Hr) .0493 .0472 .125
RMR(F) - RMR/RMR x 100 16.05 13.12 1.695(%) 3.51 3.42 .112
Kcal above rest (TEF) .889 .732 1.631(Kcal/Kg(LBW)/four hour) .197 .189 .125
Kcal in breakfast 16.27 15.19 3.285(Kcal/Kg/LBW) .643 .667 .005
% of the meal (TEF) 5.55 4.84 1.1641.17 1.28 .264
Potentiation
RMR(F+E) - RMR(E) .1594 .1514 .262(Kcal/Kg(LBW)/Hr) .0465 .0729 .797
RMR(F+E) - RMR(E)/RMR(E) x 100 11.41 10.69 .3063(%) 3.70 5.33 .764
RMR(F+E) - RMR(F) - .0287 .0066 -1.611(Kcal/Kg(LBW)/Hr) .0549 .0290 .130
RMR(F+E) - RMR(F)/RMR(F) x 100 -1.640 .400 -1.488(%) 3.410 1.850 .159
Kcal/Kg(LBW)/four hours - .277 .0265 -1.615.519 .116 .129
Total Kcal over four hours -5.754 1.493 -1.57611.54 5.992 .137
114
Table 13 depicts the results of a two-way analysis of variance with
repeated measures using two levels of group and four levels of treatment
as the independent variables (factors), and metabolic rate in liters
per minute as the dependent variable. The results indicate the absence
of any group effect (F = .10, p = 0.68), but a significant treatment
effect (F = 77.51, p < .001), and no interaction effect (F = .88, p =
0.504). The average resting metabolic rate over a four hour period
(RMR) was .256±.022 1/min. After the exercise bout, the resting
metabolic rate over the four hour post-exercise period averaged .265±
.027 1/min. Following feeding the metabolic rate increased significant-
ly to .287±.024 1/min and a similar increase was observed following the
combination of feeding and exercising (.287±.025 1/min). Post-hoc
comparisons of these means were made using Fisher's LSD Test. The
results are included in Table 13.
The increase in resting metabolic rate due to the introduction of
the food stimulus was .035 1/min or 13.7% for the Juvenile-onset group
and .027 1/min or 10.5% or the Maturity-onset group. These results
indicate a reduced (p .058) thermic effect of food in the Maturity-
onset group (Table 14). When the food stimulus was added to the
exercise stimulus the increase in the RMR amounted to .023 1/min or
8.9% for the JOTO subjects compared to .022 1/min or 8.5% for the MOTO
subjects. Both groups experienced a similar increase. The increase
in the RMR due to the combined stimulus of food and exercise over the
food stimulus alone (Potentiation) was negligible (Table 14).
When the dependent variable was expressed in Kcal/min (applying
the method of Weir) similar findings were obtained. Table 15 presents

115
the results of the two-way analysis of variance with repeated measures.
There was a non-significant group effect (F = .12, p = .65), but a very
significant treatment effect (F = 88.71, p <.001), without significant
interaction (F = 1.49, p = 0.230). These results were similar to
those discussed earlier.
Differences by group in the TEF, TEE, and the potentiation of the
TEF by exercise reported in Kcal/minute can be reviewed in Table 16.
The total caloric expenditure attributed to feeding averaged 48±8.5
Kcal in the Juvenile-onset group compared to 37.1±11.3 Kcal in the
Maturity-onset group. In absolute terms, the MOTO group exhibited
a significantly reduced TEF (p = .047). The TEF amounted to 5.64±1.1%
of the calories consumed in the breakfast for the JOTO individuals,
and 4.73±1.1% of the calories for the MOTO subjects. This difference
is considerable but not statistically significant (p = 0.132).
The potentiation question is addressed in Table 16. As concluded
previously, adding the exercise stimulus to the feeding stimulus is
quite similar to the feeding stimulus alone. The TEF above that
attributed to exercise alone was 33.9 (112.2) Kcal for the Juvenile-
onset group and 30.6 ( ±14.7) Kcal for the Maturity-onset group. This
amounted to 3.9% of the calories consumed in the test meal for the
subjects in both groups (Table 16).
The results of each treatment were expressed in Kcal/Kg(LBM)/Hr
and subjected to a similar set of analyses. Table 17 presents a
summary of the two-way analysis of variance with repeated measures
using two levels of group and four levels of treatment as the indepen-
dent variables. Again no group effect was identified but a highly
116
significant treatment effect did exist (F = 120.9, p< .001). The
results of Fisher's LSD Test indicated significant differences in RMR
due to food and the combination of eating and exercising. Exercise,
alone, at this intensity did not result in a significantly elevated post-
exercise metabolic rate.
The results of intra-group comparisons using Kcal/Kg(LBM)/Hr
as the dependent variable are reported in Table 18. On a relative
basis no significant differences could be identified. The TEF amounted
to 5.5 (±1.2%) of the test meal for the JOTO group, and 4.8 (±1.3%)
of the test meal for the MOTO group. Again the results indicate a
slightly depressed thermic response to food in the Maturity-onset obese
women. However, the thermic response to food and exercise combined
above that of food alone was slightly higher in the MOTO group (Table
18).
The results of statistical analyses to determine the effects of
eating upon the exercise energy expenditure can be reviewed in Table 19.
No significant group differences were evident in either the fasted or
fed condition, while exercising at a work load designed to elicit 50%
of the individuals' t02 max. For the groups combined, the average
oxygen consumption was 1.35 (±.181) 1/min in the fasted state and
increased only slightly to 1.37 (±.162) 1/min in the fed condition.
In energy expenditure terms (Kcal/min), the average caloric cost in the
fasted condition was 6.57 Kcal/min and increased significantly (p=.045)
to 6.73 Kcal/min in the fed state. This can be attributed to an
increase in the respiratory exchange ratio (R.E.R.) in the fed
condition which averaged .922 ( ±.026) as compared to only .893 (t.028)
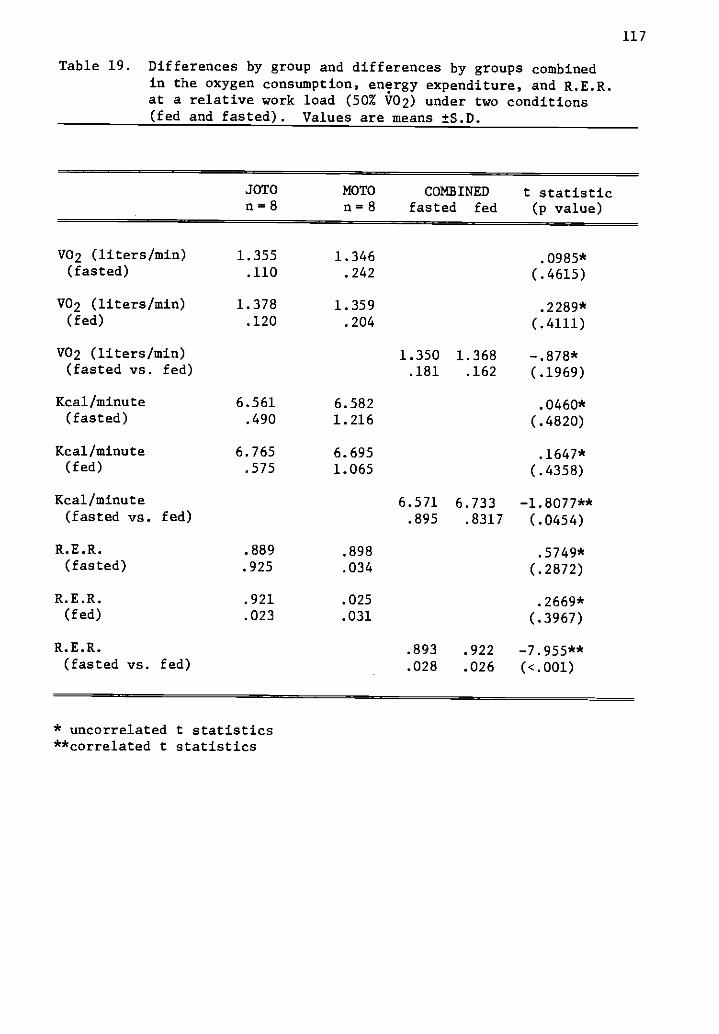
117
Table 19. Differences by group and differences by groups combinedin the oxygen consumption, energy expenditure, and R.E.R.at a relative work load (50% V02) under two conditions(fed and fasted). Values are means ±S.D.
JOTOn=8
MOTOn at 8
COMBINEDfasted fed
t statistic(p value)
V02 (liters/min) 1.355 1.346 .0985*(fasted) .110 .242 (.4615)
V02 (liters/min) 1.378 1.359 .2289*(fed) .120 .204 (.4111)
V02 (liters/min) 1.350 1.368 -.878*(fasted vs. fed) .181 .162 (.1969)
Kcal/minute 6.561 6.582 .0460*(fasted) .490 1.216 (.4820)
Kcal/minute 6.765 6.695 .1647*(fed) .575 1.065 (.4358)
Kcal/minute 6.571 6.733 -1.8077**(fasted vs. fed) .895 .8317 (.0454)
R.E.R. .889 .898 .5749*(fasted) .925 .034 (.2872)
R.E.R. .921 .025 .2669*(fed) .023 .031 (.3967)
R.E.R. .893 .922 -7.955**(fasted vs. fed) .028 .026 (<.001)
* uncorrelated t statistics**correlated t statistics
118
in the fasted state. This indicates a greater utilization of carbo-
hydrate fuels in the fed condition compared to the fasted condition.
Figure 16 presents a graphic representation of the energy expenditure
(Kcal/min) for each group in the fasted and fed condition.
Hypothesis 6
Statistical analysis resulted in the acceptance of the sixth null
hypothesis:
There was no significant difference in the resting metabolicrate (RMR) between the groups (JOTO vs. MOTO).
The resting metabolic rate data is summarized in Table 20, and
represents the mean of four separate determinations. Subjects in the
Juvenile-onset group averaged .256 (±.017) 1/minute compared to .251
(±.025) 1/minute for the Maturity-onset subjects. Whether expressed
in absolute terms (1/min or Kcal/min) or relative to body weight
(ml/kg/min or Kcal/kg(LBM)/min), there was no difference between the
groups in their maintenance oxygen requirements. The slight, but non-
significant difference in energy expenditure expressed in Kcal/min
can be attributed to a small difference in the respiratory exchange
ratio (R.E.R.) evident between the groups. The JOTO group averaged
.801 in contrast to .770 for the MOTO group. This would suggest a
slight shift toward increased fat metabolism at rest in individuals
with Maturity-onset type obesity. This accounts for the decreased
caloric expenditure per liter of oxygen consumed in the MOTO group.
Table 21 depicts the results of a one-way analysis of variance
on the resting metabolic rate (1/min) measured under similar conditions
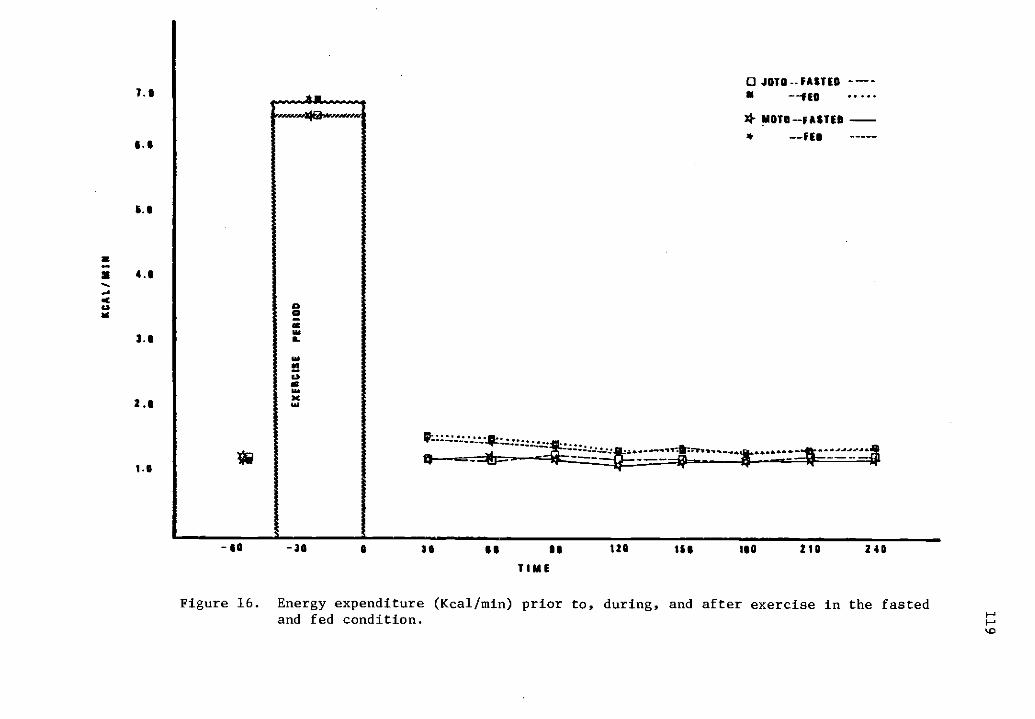
7.0
5.5
.1
3.11
2.5
1.0
JOTO FASTED ----11
* SIOTO-FASTED -* --TEO
SO -30 SS SG 120 155 ISO 210 240
TIME
Figure 16. Energy expenditure (Kcal/min) prior to, during, and after exercise in the fastedand fed condition.
1.0
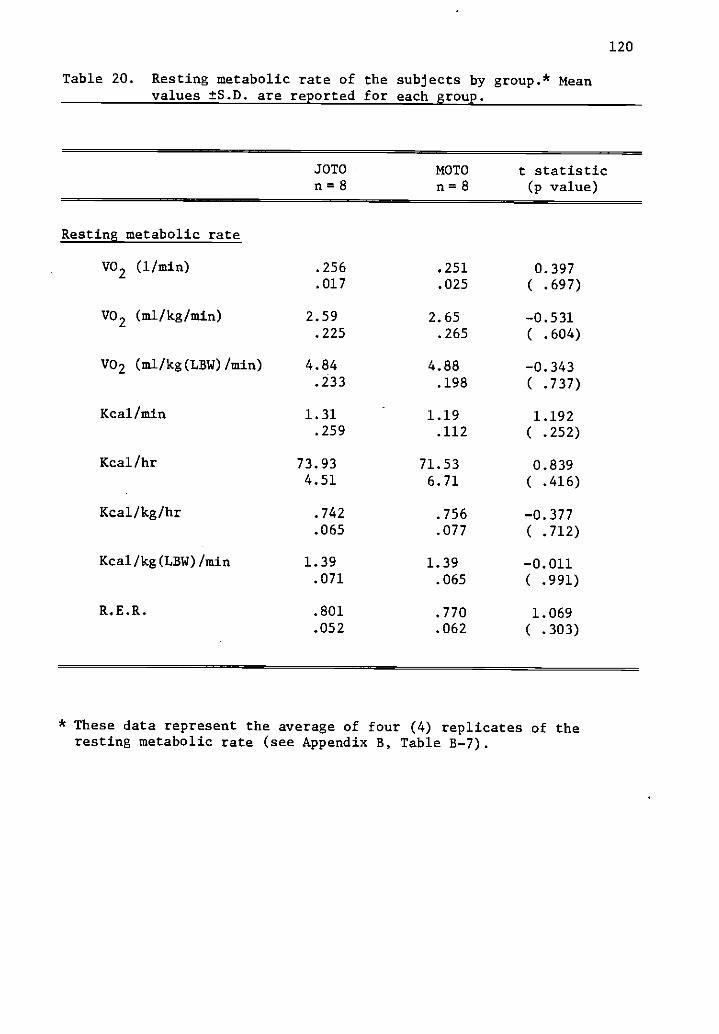
120
Table 20. Resting metabolic rate of the subjects by group.* Meanvalues ±S.D. are reported for each group.
JOTOn =8
MOTOn =8
t statistic(p value)
Resting metabolic rate
.256
.017.251.025
0.397( .697)
V02 (1/min)
V02 (ma/kg/min) 2.59 2.65 -0.531.225 .265 ( .604)
V02 (ml/kg(LBW)/min) 4.84 4.88 -0.343.233 .198 ( .737)
Kcal/min 1.31 1.19 1.192.259 .112 ( .252)
Kcal/hr 73.93 71.53 0.8394.51 6.71 ( .416)
Kcal/kg/hr .742 .756 -0.377.065 .077 ( .712)
Kcal/kg(LBW)/min 1.39 1.39 -0.011.071 .065 ( .991)
R.E.R. .801 .770 1.069.052 .062 ( .303)
* These data represent the average of four (4) replicates of theresting metabolic rate (see Appendix B, Table B -7).

121
Table 21. One-way analysis of variance on resting metabolic rate(1/min) measured under similar conditions on four separatedays.
Source df Sum-Squares Mean-square F ratio Prob
Among Groups 3 .000640 .0002133 0.41 0.747
Within Groups 60 .031244 .0005207
63 .031884Adj Total
Condition Day 1 Day 2 Day 3 Day 4
Ranked Means .2493 .2519 .2543 .2578(tS.D.)
S.E.E.
.0271 .0219 .0217 .0199
.0057
122
on four separate occasions. The results indicate no significant
(p = 0.747) day to day variation in RMR, and satisfied the investigator's
requirement for reliable measures. The standard error of the measure-
ment was estimated at .0057 liters which represents 2.25 percent of the
average resting rate. Correlational statistics (Table 22) indicated
that all measurements of the RMR were favorably related (p = .003).
The results of Step-Wise Multiple Regression indicate that the
LBM was the best predictor of the RMR (r2 = 0.79).
Hypothesis 7
Statistical analysis resulted in the acceptance of the seventh null
hypothesis:
There was no significant difference in the energy expended bythe two groups (JOTO vs. MOTO) during:
A. Upright sitting upon the bicycle ergometerB. Unloading cycling at 60 RPMC. Cycling at 50 wattsD. Cycling at 100 watts
The mean ( ±S.D.) energy expenditure at rest (seated upright on the
bicycle ergometer), 0 watts (unloaded cycling at 60 RPM), 50 watts,
and 100 watts is presented in Table 23. The results of a two-way
analysis of variance using group and condition (Rest. O. 50. and 100
watts) as the independent variables indicated no significant group
difference (p = 0.500). This was true regardless of the term used
to express the energy expenditure. The oxygen requirement for seated
rest equaled .300 (±.015) 1/min in the juvenile-onset group compared
to .291 (±.039) 1/min in the maturity-onset group. The energy cost
of moving the legs in the cycling motion against zero resistance was
.775 (±.125) 1/min for the JOTO woman and .756 (±.146) for the MOTO
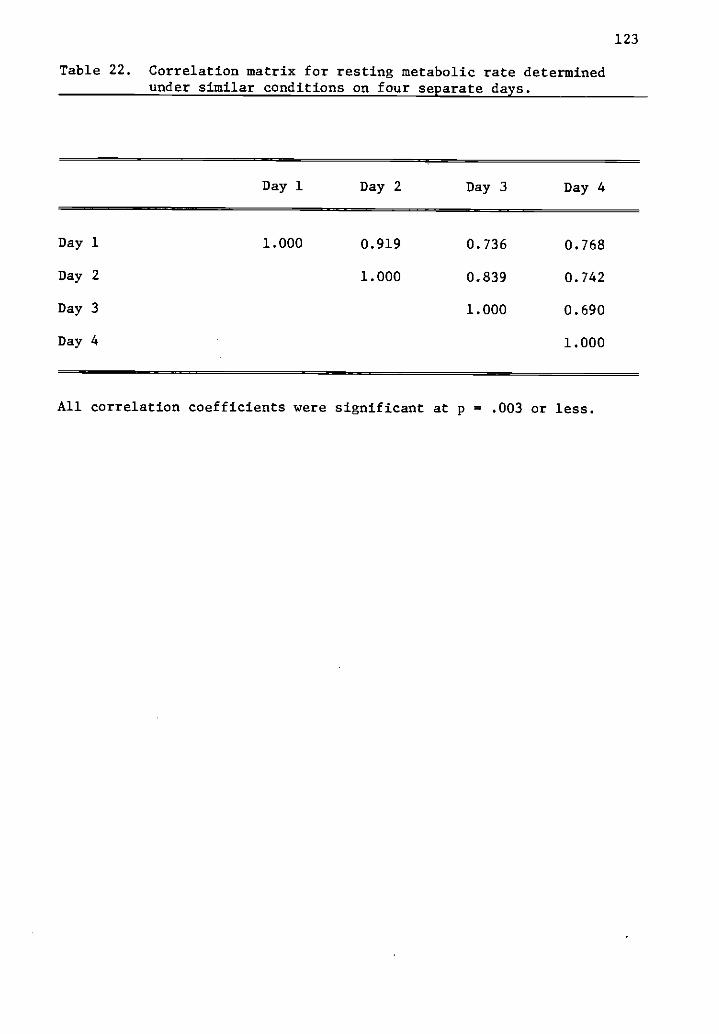
123
Table 22. Correlation matrix for resting metabolic rate determinedunder similar conditions on four separate days.
Day 1 Day 2 Day 3 Day 4
Day 1
Day 2
Day 3
Day 4
1.000 0.919
1.000
0.736
0.839
1.000
0.768
0.742
0.690
1.000
All correlation coefficients were significant at p = .003 or less.
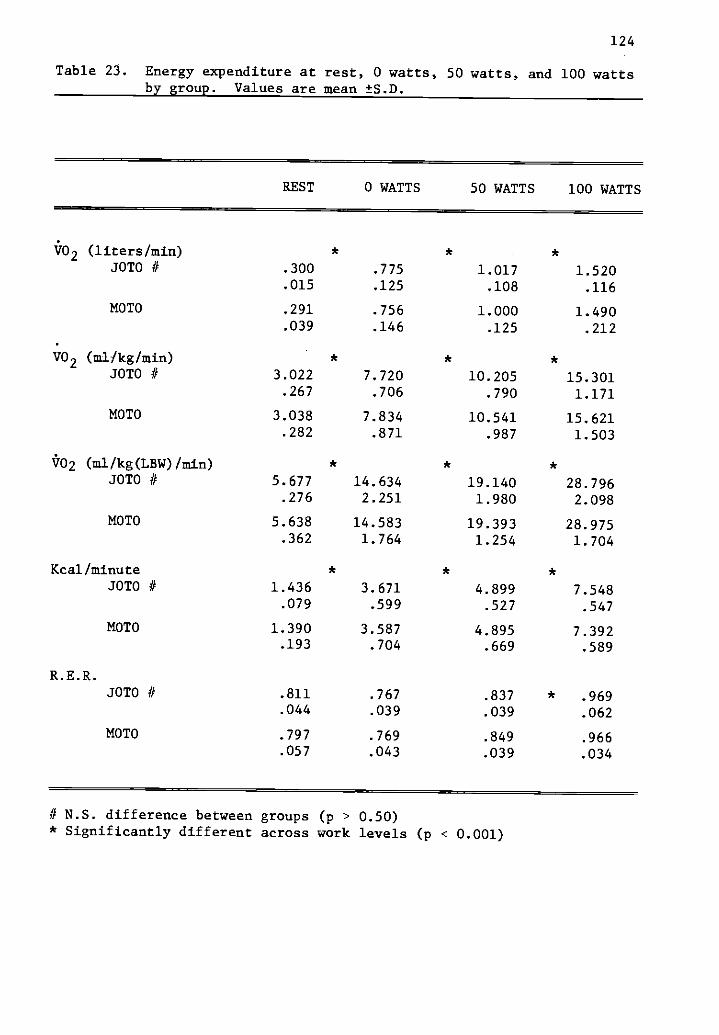
124
Table 23. Energy expenditure at rest, 0 watts, 50 watts, and 100 wattsby group. Values are mean ±S.D.
REST 0 WATTS 50 WATTS 100 WATTS
V02 (liters/min) * *
JOTO # .300 .775 1.017 1.520.015 .125 .108 .116
MOTO .291 .756 1.000 1.490.039 .146 .125 .212
V02 (ml/kg/min) * * *
JOTO // 3.022 7.720 10.205 15.301.267 .706 .790 1.171
MOTO 3.038 7.834 10.541 15.621.282 .871 .987 1.503
V02 (m//kg(LSW)/min) * * *JOTO if 5.677 14.634 19.140 28.796
.276 2.251 1.980 2.098
MOTO 5.638 14.583 19.393 28.975.362 1.764 1.254 1.704
Kcal/minute * * *
JOTO if 1.436 3.671 4.899 7.548.079 .599 .527 .547
MOTO 1.390 3.587 4.895 7.392.193 .704 .669 .589
R.E.R.JOTO if .811 .767 .837 * .969
.044 .039 .039 .062
MOTO .797 .769 .849 .966.057 .043 .039 .034
if N.S. difference between groups (p > 0.50)* Significantly different across work levels (p < 0.001)
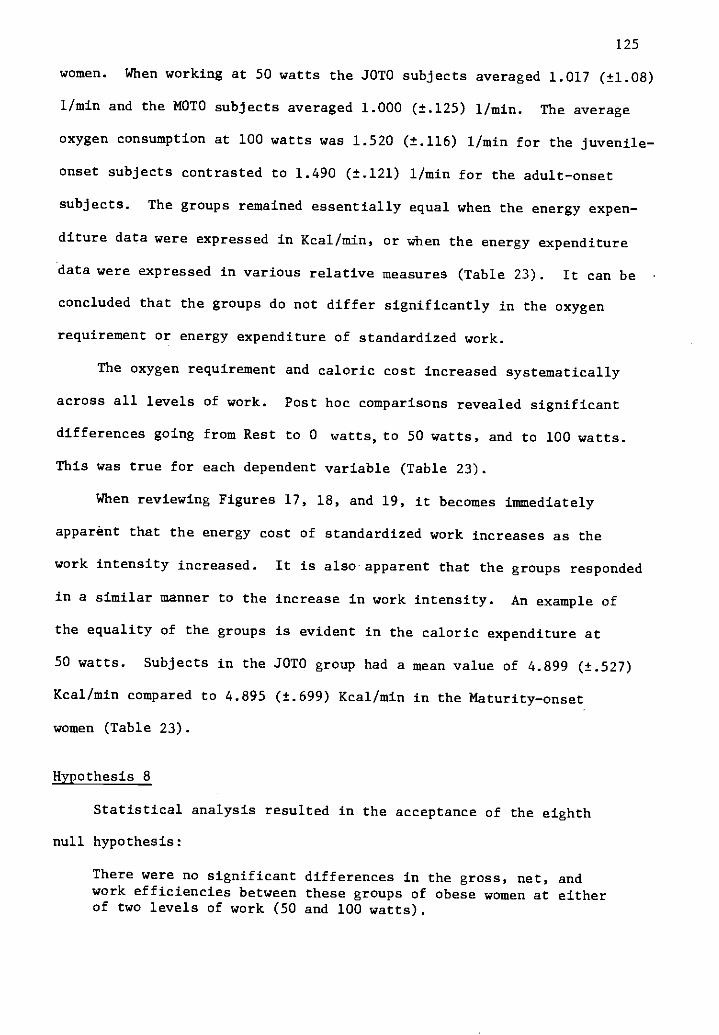
125
women. When working at 50 watts the JOTO subjects averaged 1.017 (±1.08)
1/min and the MOTO subjects averaged 1.000 (±.125) 1/min. The average
oxygen consumption at 100 watts was 1.520 (±.116) 1/min for the juvenile-
onset subjects contrasted to 1.490 (±.121) 1/min for the adult-onset
subjects. The groups remained essentially equal when the energy expen-
diture data were expressed in Kcal/min, or when the energy expenditure
data were expressed in various relative measures (Table 23). It can be
concluded that the groups do not differ significantly in the oxygen
requirement or energy expenditure of standardized work.
The oxygen requirement and caloric cost increased systematically
across all levels of work. Post hoc comparisons revealed significant
differences going from Rest to 0 watts, to 50 watts, and to 100 watts.
This was true for each dependent variable (Table 23).
When reviewing Figures 17, 18, and 19, it becomes immediately
apparent that the energy cost of standardized work increases as the
work intensity increased. It is also apparent that the groups responded
in a similar manner to the increase in work intensity. An example of
the equality of the groups is evident in the caloric expenditure at
50 watts. Subjects in the JOTO group had a mean value of 4.899 (±.527)
Kcal/min compared to 4.895 (±.699) Kcal/min in the Maturity-onset
women (Table 23).
Hypothesis 8
Statistical analysis resulted in the acceptance of the eighth
null hypothesis:
There were no significant differences in the gross, net, andwork efficiencies between these groups of obese women at eitherof two levels of work (50 and 100 watts).
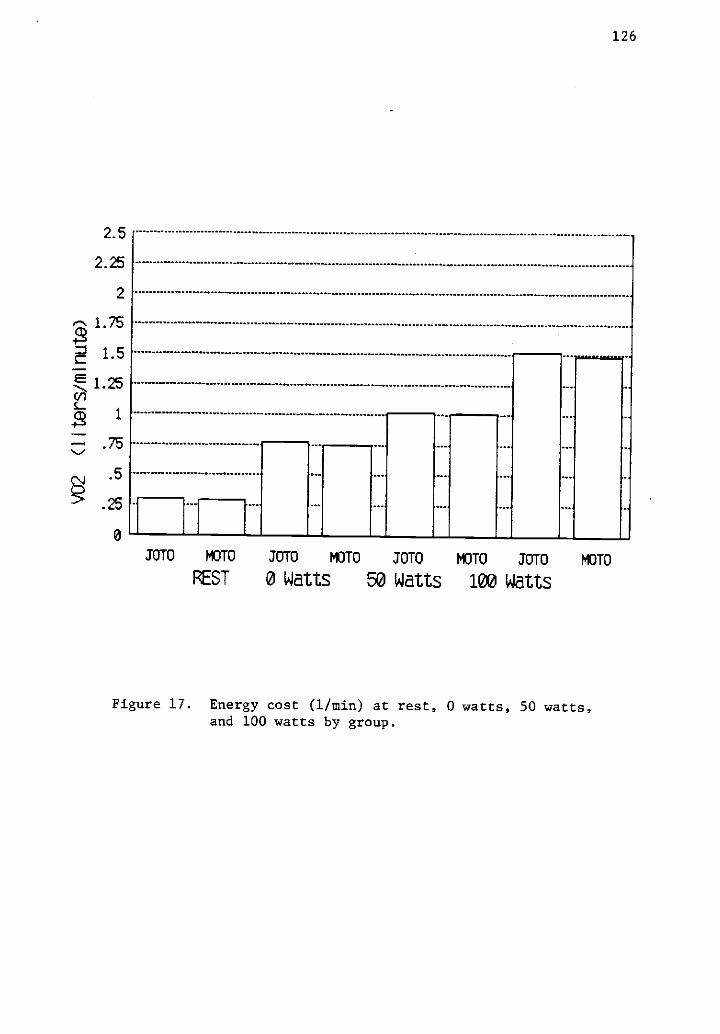
2.5
2.25
2
.5
126
JOTO MOTO 3010 MOTO JOTO ICTO JOTO 113TO
REST 0 Watts 50 Watts 100 Watts
Figure 17. Energy cost (1/min) at rest, 0 watts, 50 watts,and 100 watts by group.
20
18
2 16
8
3 4
2
127
JOTO MOTO JOTO MOTO JOTO MOTO JOTO MOTO
REST 0 Watts 50 Watts 100 Watts
Figure 18, Energy cost (ml/kg/min) at rest, 0 watts, 50 watts,and 100 watts by group,

10
9
8
7
6
5
4
3
2
1
128
JOTO MOTO JOTO MOTO 30T0 MOTO JOTO MOTO
REST 0 Watts 50 Watts 100 Watts
Figure 19. Energy expenditure (Kcal/min) at rest, 0 watts,50 watts, and 100 watts by group.
129
Table 24 depicts the difference in the gross, net, and work
efficiency between the groups while cycling at 50 and 100 watts on an
electrically braked bicycled ergometer. The gross, net, and work
efficiency was quite similar in both groups at either work load. No
significant group differences were identified by the two-way analysis
of variance model employed to study this question. Significant differ-
ences (p < .001) did exist, however, between the two levels of work in
all three measures of efficiency. The gross efficiency at 50 watts
of the groups combined was 14.82 (11.7)% and improved to 19.29 (t1.4)%
at 100 watts. The net efficiency (which corrects for the differences
between subjects in their resting caloric requirements) at 50 watts
averaged 20.89 (±2.7)% and increased to 23.79 (t1.8)% at the 100 watt
work load. Finally, the work efficiency (which accounts for the energy
cost of moving the legs with no resistance) at 50 watts averaged
57.63 (t7.7)% and declined to 36.95 (±2.6)% at the higher work load.
The exaggerated work efficiency at 50 watts was due in part to the
method of determination (Work E = W / E - er). The bulk of the energy
requirement of cycling at 50 watts involved simply moving the legs
in the cycling motion. Figures 20 and 21 present graphic representa-
tions of the efficiency question.
Hypothesis 9
Statistical analysis resulted in the acceptance of the ninth null
hypothesis:
There was no significant difference in the total energyexpenditure between the two groups (JOTO vs. MOTO) ofobese individuals.
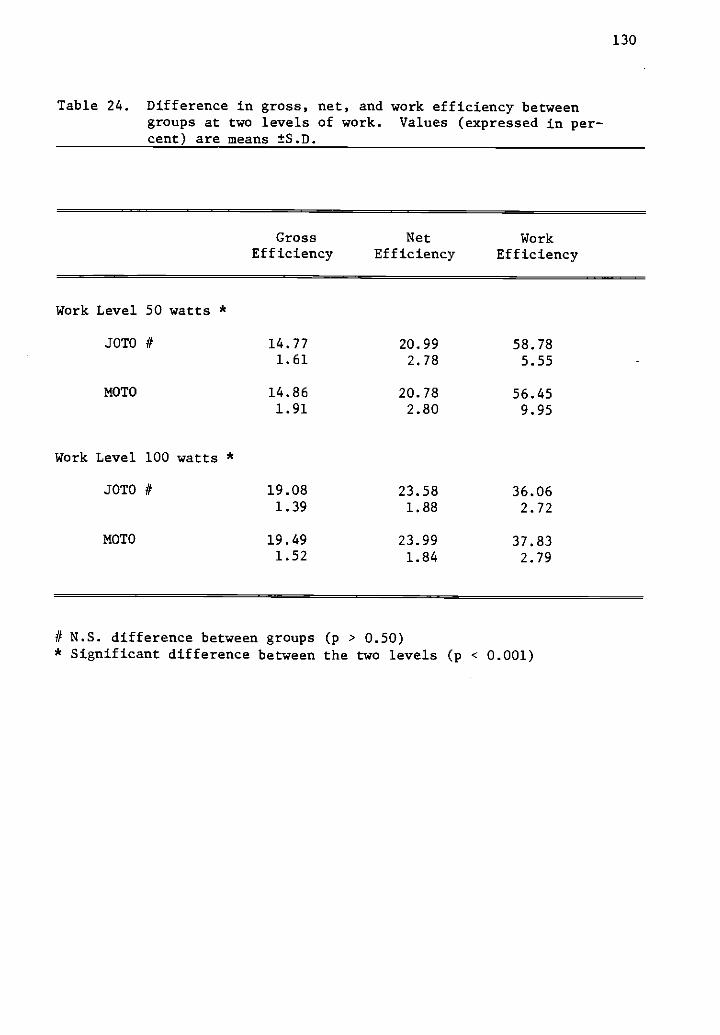
130
Table 24. Difference in gross, net, and work efficiency betweengroups at two levels of work. Values (expressed in per-cent) are means ±S.D.
Gross NetEfficiency Efficiency
WorkEfficiency
Work Level 50 watts *
JOTO # 14.77 20.99 58.781.61 2.78 5.55
MOTO 14.86 20.78 56.451.91 2.80 9.95
Work Level 100 watts *
JOTO # 19.08 23.58 36.061.39 1.88 2.72
MOTO 19.49 23.99 37.831.52 1.84 2.79
# N.S. difference between groups (p > 0.50)* Significant difference between the two levels (p < 0.001)
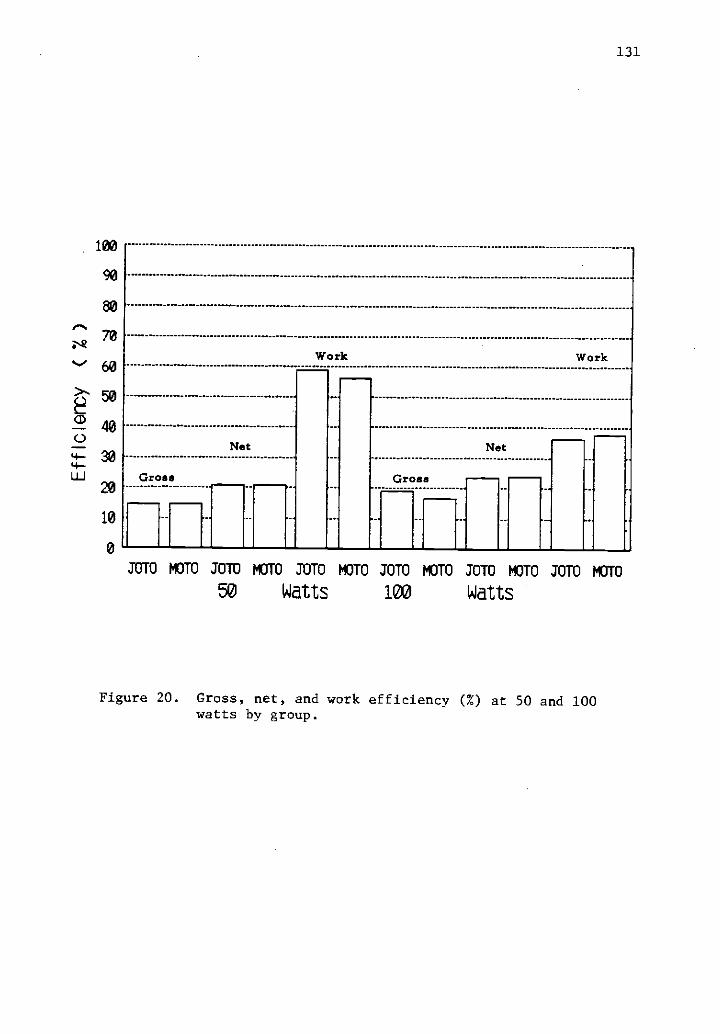
131
100
90
80F-,
es.2
70
60. 50
040
30
20
10
0
Gross
Net
Work
Gross
Net
Work
JUIU MOTO JOTO MOTO 30T13 MOTO JOTO MOTO JOTO MOTO JOTO mom
50 Watts 100 Watts
Figure 20. Gross, net, and work efficiency (%) at 50 and 100watts by group.

ca
WORK 1;1----
NET
GROSS
*--MOTO13---JOTO
60
WORK IN WATTS100
Figure 21. Gross, net, and work efficiency at 50 and 100 watts of externalwork by group (* JOTO, in MOTO)
N.)

133
The total energy expenditure was determined from the calories
required to maintain weight on the metabolic diet. The caloric require-
ment was 2512 (±182) for the JOTO group and 2323 ( :284) for the MOTO
group. The difference between the groups was not significant (p = 0.136).
When expressed relative to LBM, the average caloric intake was signifi-
cantly lower (p = 0.029) in the MOTO group. These individuals consumed
an average of 45.1 Kcal/Kg(LBM)/d in contrast to 47.6 Kcal/Kg(LBM)/d
in the Juvenile-onset group.
Although every effort was made to establish the caloric require-
ments for weight maintenance most individuals lost weight on the
metabolic diet (Appendix B, Table B-4). Individuals in the JOTO group
lost an average of 1.18 pounds, while members of the MOTO group lost
an average of 2.04 pounds. The difference of .847 pounds was equal
to a total caloric deficiency of 2964 calories for the period of
feeding, or 148 calories per day. When these calories were added to
the calories actually consumed by the subjects in the MOTO group, an
adjusted caloric intake was derived (Table 25). Statistical analysis
of these adjusted figures indicated similar caloric requirements for
the members of each group. More accurately, the calories required for
weight maintenance amounted to 47.66 ( ±1.97) Kcal/Kg(LBM)/d for the
subjects in the JOTO group compared to 47.99 (±2.23) Kcal/Kg(LBM)/d
for the Maturity-onset women.
The results of Step-Wise Multiple Regression indicated that LBM
was the best predictor of the calories per day required for weight
maintenance (r2 = 0.474). The total body weight, the thermic effect
of feeding, and the maximum oxygen consumption (1/min) added only

134
Table 25. Total energy expenditure/caloric intake. Derived from thecalories required to maintain weight on the metabolic diet.Mean values ±S.D. are reported for each group.
JOTOn=8
MOTOn=8
t statistic(p value)
Caloric intake
Kcal/day 2512.0 2323.0 1.582181.8 284.5 (.136)
Kcal/kg/d 25.45 24.49 0.7702.44 2.54 (.454)
Kcal/kg(LBW)/d 47.66 45.13 2.4281.97 2.18 (.029)*
Adjusted Caloric intake
Kcal/d 2512.0 2471.0 0.342181.8 284.5 (.737)
Kcal/kg/d 25.5 26.1 -0.4802.55 2.70 (.639)
Kcal/kg(LBW)/d 47.66 47.99 -0.3151.97 2.23 (.758)
*significant difference#see Appendix B, Table B-6.
135
slightly to the sequential R squared (r2 = 0.53). Significant simple
correlations were evident for LEM (r = 0.69, p = 0.003), for RMR
(r = 0.65, p = 0.006), and for BSA (m2) (r = 0.56, p = 0.025) using
total calories/day necessary for weight stability as the dependent
variable.
Summary
Statistical analyses resulted in the acceptance of all nine null
hypotheses. The premise that Juvenileonset type obese individuals
were more metabolic efficient than Maturityonset type obese individuals
could not be substantiated. Discussion of these results follow in the
next section.

136
CHAPTER V
DISCUSSION, CONCLUSIONS, AND RECOMMENDATIONS
Discussion
For the last several years, researchers have attempted to establish
whether obese individuals have a metabolic abnormality. Any deviation
from the average, normal rate of metabolism might account for the
development of their obesity and the difficulty they have in weight
reduction. Such a primary metabolic defect might evidence itself in
one or more of the components of the total energy expenditure. As a
means of clarification, Jequier (134) has proposed the use of a three-
component model of energy expenditure in humankind (Figure 22).
Careful study of these components and the factors affecting them have
answered many questions regarding the regulation of body weight. Still,
our knowledge is insufficient to explain why some people become fat,
and the exact etiology of their obesity.
Recently investigators have focused their attention on the role of
energy output in the regulation of energy balance. In so doing, it has
been helpful to call upon the insights inherent in Jequier's model
(Figure 22). Individuals or groups of individuals might differ in
their maintenance requirements for energy (BMR or RMR), their level of
physical activity, their thermogenic response to known stimuli, or
finally their ability to adapt their level of thermogenesis to meet
existing environmental conditions. Miller (170) suggested that thermo-
genesis (obligatory and adaptive) accounts for most of the variation

137
KCAL 24 HOUR ENERGY EXPENDITURE FACTORS AFFECTINGEACH COMPONENT
3500
3000
2500
2000
1500
1000
500
.Thermoregulatory Thermogenesis
- a A
- Obligatory Therrnogenesise
...-
...-Physical Activity
.....
No
a
BMR
yr
RMR
If
-4 TEE
Food IntakeComposition of DietIntake of Thermogenic
AgentsCold Exposure
"! Stress
Duration and Intensityof Physical Acitvity
LBMAgeSexThyroid Hormone StatusProtein Turnover RateSNS Activity
Figure 22. A modification of Jequier's three component model oftotal energy expenditure.

138
in energy expenditure between individuals. He concludes that obesity
is likely the result of some aberration in metabolic efficiency in
association with ample energy intake.
The purpose of this study was to determine if, and to what extent,
obese individuals of two distinct types exhibit a primary metabolic
defect. It was hypothesized that individuals of the Juvenile-onset
type with their associated hyperplasia would display a greater metabolic
efficiency. It has been stated previously that the early onset of
obesity has a metabolic derivation, whereas obesity occurring later in
life is predominately regulatory in nature. In part this study tested
those assumptions. The subjects were sixteen middle-aged obese
individuals of two types, Juvenile-onset, and Maturity-onset. They
were evaluated on a series of obligatory and facultative measures of
the total energy expenditure to determine if differences in metabolic
efficiency exist between the groups. Any observable difference would
suggest the necessity of, and advocacy for, a differential diagnostic
and treatment schema.
In particular this study examined differences in total energy
expenditure (24 Hr. E.E.), the resting metabolic rate (RMR), the
thermic effect of food (TEF), the thermic effect of exercise (TEE),
the potentiation of TEF by exercise, the energy cost of standard work,
and the gross, net, and work efficiency of standardized work in two
distinct groups of obese individuals.
139
Total Energy Expenditure
The total energy expenditure of the SOTO and MOTO individuals
over the 20 day feeding period was 2512 (±181) and 2471 (±284) calories/
day, respectively. Statistical analysis performed on the calories
required to maintain weight on the metabolic diet revealed that the
subjects in both groups had very similar energy requirements. There-
fore, it can be concluded that energy balance was attained on approxi-
mately 2500 Kcal/d for these moderately obese individuals. In order
to affect weight reduction, caloric intake would have to be reduced
below this level while keeping energy expenditure relatively constant.
Leibel and Hirsch (157) are proponents of the methodology used
in the present study to determine the long-term energy requirements of
human subjects. Studies by Ravussin et al (195) and Jequier and
Schutz (134) involve restricting the subjects in a respiratory chamber
and measuring energy expenditure continuously over a 24-hour period.
Other studies by Bernstein et al (20) and Warnold and others (244)
employed short term indirect calorimetric measures or less direct
measures, such as heart rate monitoring or activity records to predict
long-term requirements. The technique used in the present study
involved the careful monitoring of the caloric intake required to main-
tain weight on a "real" food diet. If done over a sufficient period
of time, this method provides a longer-term measure of the total energy
requirements at usual activity levels; without the need of a metabolic
chamber, or other high cost instrumentation. Leibel and Hirsch (157)
suggest that this is the most clinically relevant technique used to
estimate energy requirements. In particular, the technique reveals

140
an accurate estimation of the caloric needs of a wide range of indivi-
duals thus improving the sensitivity of dietary plans developed to
elicit weight gain or weight reduction.
As stated previously, the caloric requirements for sixteen indivi-
duals averaged approximately 2500 Kcal/day. This figure compares
favorably with those reported by Ravussin et al (195). They determined
the 24-hour energy expenditure of a similar group of obese women using
a respiratory chamber. Under these standardized living conditions, the
energy requirement was reported to be 2392 calories/day. Earlier
Curtis and Bradfield (57) studied a group of obese women in a free
living situation by means of indirect calorimetric measurements. They
determined that the caloric expenditure of these women was approximately
2484 Kcal/day. In a group of similar weight, but reduced obese, Leibel
and Hirsch (157) reported a diminished 24-hour energy requirement
equivalent to 2171 Kcal/day. Weight reduction was achieved on a 600
Kcal/day formula diet. This reinforces the findings of Bray (46) who
also reported a reduced 24-hour energy expenditure evoked by severe
dietary restriction.
Although many clinicians employ such practices because they lead to
rapid weight loss, the long-term prognosis for weight maintenance is
not good. Therefore, such practices should not be advocated in weight
loss regimens.
On a relative basis, it was determined that the JOTO and MOTO
individuals required 47.6 and 47.9 Kcal/Kg(LBW)/day, respectively.
Curtis and Bradfield (57) had earlier estimated that obese individuals
141
required 47 Kcal/Kg(LBW)/d and a method of Cunningham (55) predicts that
48 Kcal/Kg(LBW)/d are required for weight maintenance for obese
individuals. This is slightly less than the 50 Kcal/Kg(LBW)/d recom-
mended for normal weight individuals. This slightly greater caloric
requirement is necessary in order to meet the greater activity demands
in normal weight individuals according to Cunningham (55).
Leibel and Hirsch (57) have suggested that normal weight indivi-
duals require 36.4 (±0.8) Kcal/Kg/d. Their study revealed that
severely- obese (152 Kg) subjects could maintain body weight on 24.1
Kcal/Kg/d which compares favorably to the 25.7 Kcal/Kg/d in the present
study. Interestingly, Leibel and Hirsch (57) reported a diminished
calorie requirement on a per kilogram basis in reduced obese. In
this group, the energy needs were only 18.5 (±1.1) Kcal/Kg/d which again
reflects the body's adaptation to prolonged periods of underfeeding.
Differences in metabolic efficiency were not detected in indivi-
duals categorized as JOTO or MOTO. However, this study did support the
work of Curtis and Bradfield (57), Leibel and Hirsch (157), and Cunning-
ham (55). It clearly points out the need to derive an accurate esti-
mation of the LBM from which calorie needs can be derived. Applying the
prediction of 47-48 Kcal/Kg(LBW)/d, the clinician can accurately
establish the calories required for weight maintenance. Although the
obese individual is rarely concerned about weight maintenance , the
same procedure may be used to project the caloric deficit required to
elicit weight loss. This aspect of the study also emphasizes the
necessity to maintain the lean body compartment of the obese individual
during the period of weight reduction. This may be accomplished by
142
increasing physical activity. This would promote a greater caloric
deficit and an increased rate of fat loss, while maintaining the RMR
and the total energy expenditure necessary for continued weight loss
or a more successful maintenance of the reduced body weight.
Resting Metabolic Rate
It is a common practice to consider the total energy expenditure
as being made up of a number of components. The most significant
of which is the resting metabolic rate. According to Garrow (90),
the RMR is the most important item on the expenditure side of the energy
balance equation. The rationale for his statement is that the RMR is
a constant part of all energy expenditure. Garrow (90) also suggests
that for most individuals in Western societies, the RMR accounts for
75% of the TEE. In the present study, the RMR was approximately 71%
of the TEE. This was in good agreement with Hoffman's work (123).
He reported that 68% of the total energy expenditure was accounted
for by the RMR in a group of 16 obese women. Since the RMR accounts
for nearly three-fourths of the 24-hour energy requirements, it is the
best predictor of the rate of weight loss in times of forced or self-
imposed caloric restriction. Halliday et al (113) also pointed out
the paradox which confronts most dieters. They suggest that as weight
is lost (especially on very low calorie diets), metabolic rate decreases,
and thus it becomes more difficult for the reduced obese to achieve
further loss. Weight maintenance is also made exceedingly more diffi-
cult because of the decline in RMR and the re-establishment of "old"
eating habits. Successful weight reduction programs need to focus upon
the maintenance of RMR while concurrently eliciting a negative energy
143
balance. It is a yet untested hypothesis that exercise programming
might accomplish such a feat.
The current study suggests that the resting metabolic rate of
these two groups of obese individuals was essentially the same.
Therefore, the premise that individuals of the Juvenileonset type
would be more metabolically efficient, and that this would be reflected
in a lower RMR could not be substantiated by the data. When expressed
relative to lean body weight, the RMR of the subjects in the JOTO
group averaged 4.84 ( ±.23) ml/Kg(LBW)/min and those in the MOTO group
required 4.88 (±.20) ml/Kg(LBW)/min. In energy expenditure terms,
both groups expended 1.39 Kcal/Kg(LBW)/hr. in the resting state.
Durrant and Blaza (73) reported a similar value of 1.45 Kcal/Kg(LBW)/hr
in a group of mildly obese women. A value of 1.26 Kcal/Kg(LBW)/hr
was derived from the work of Felig et al (80). However, it is suggested
that these data were underestimates due in part to the way in which the
lean body mass was predicted. Hoffmans et al (123) estimated LBM by
densiometry as was done in the present study. They reported that the
RMR in obese individuals amounted to 1.37 Kcal/Kg(LBW)/hr which was
very similar to the 1.39 Kcal/Kg(LBW)/hr reported in this study.
In absolute terms, a higher RMR for obese individuals has been
reported by Sharif et al (210), Kaplin and Leveille (141), James et al
(128), Ravussin et al (195), Felig et al (80), and Hoffmans et al (123).
This finding is most assuredly the result of an increased LBM in the
obese. To emphasize this point Kaplin and Leveille (141), reported
that obese subjects had a 15% higher RMR than the lean controls. When
the resting rate was expressed in terms relative to LBM there was no
144
difference (1.45 Kcal /Kg(LBW) /hr for the lean and 1.44 Kcal /Kg(LBW) /hr
for the obese). However, the debate as to the best means of expression,
and its exact meaning, will undoubtedly continue for many years.
The findings of a higher than normal RMR in obese subjects when
expressed on an absolute basis does not rule out the possibility of
an increased metabolic efficiency in these individuals. An obvious
manifestation of metabolic efficiency is the reduced or sub-normal RMR
which occurs during weight reduction because of fasting or very low
calorie diets (46,50,106). If this were a permanent consequence of
such practices, a parallel reduction in food intake would be required
to re-establish energy balance. Otherwise physical activity could be
increased to counterbalance the fall in RMR. Such a theory remains
untested. However, a great deal of anecdotal information is available
regarding the success of such practices (19,232). Unfortunately,
the reduced energy requirements after weight reduction by conventional
methods increases the probability of weight gain subsequent to such
practices. This paradox partially explains the poor prognosis of many
popular weight loss systems and calls for a radically new approach to
weight loss. This approach will hopefully include moderate physical
activity as well as dietary modification.
Thermogenesis
The present study supports the concept of a reduced thermogenesis
in moderately obese women regardless of the age-of-onset. Thermogenesis
has been defined previously as heat production above that of rest
because of the introduction of some environmental stimulus. Miller
(170) and Jequier (132) suggest that thermogenesis accounts for most
145
of the variation in heat production between individuals. They agree
that adaptive thermogenesis is indicative of a homeostatic mechanism
for the regulation of body weight. An individual's ability to adapt
his level of thermogenesis to meet existing conditions partially
explains why some people can overeat without becoming fat while others
become fat without overeating.
Differences between lean and obese subjects in regard to the ther-
mic effect of food have been described by Pittet et at (191), Bessard
et al (21), Schwartz et al (206), and Kaplin and Leveille (141).
Recently, Shetty et al (212) reported a subnormal thermogenic response
to a glucose load in subjects with a family history of obesity. They
also reported a reduced TEF in the obese to a mixed dietary intake.
Fat and protein feedings do not lead to lower metabolic responses in
the obese, but Welle (252) suggested a greatly diminished TEF to fat
ingestion in both lean and obese individuals.
Previous studies have, however, given conflicting results regarding
the TEF in obesity. Bradfield and Jourdan (36), Strang and McClugage
(224), and Segal and Gutin (207) noted no differences in postprandial
increments in RMR between obese and non-obese subjects. These dis-
crepancies prevalent in the literature in regard to the TEF between
lean and obese may be due to (1) the length of the postprandial collec-
tion period, (2) the fat content of the test meal, or (3) the standard-
ization of the test load relative to individuals with large differences
in body weight. But the consensus of opinion is that a reduction
in the TEF in obese subjects constitutes a form of increased metabolic
efficiency (calorie storage per calorie ingested) that could contribute
to weight gain independent of increased caloric intake.

146
James and Trayhurn (131) investigated the thermogenic responses
of lean and obese subjects to norepinephrine infusion. They reported
that thermogenesis was significantly greater in those subjects or
normal weight. This indicates that the obese may have a reduced TEF
to a high carbohydrate meal due in part to an insensitivity to the
catecholimines. Jung et al (139) also investigated this issue. They
reported an increase of 21.2% in the RMR in lean subjects due to
norepinephrine infusion. But the obese subjects displayed a blunted
response of only 9.6% in the RMR over the same time period. Bessard
et al (21) and LeBlanc et al (153) reported a decrease in diurnal NE
excretion in the obese. They partially explained the lower thermogenic
response to feeding in obese subjects by this apparent diminished
action of the catecholamines. Additionally, Bessard et al (21) found
that these responses were unchanged after weight loss in the obese,
and suggested that the thermogenic defect may be a cause, rather than
a consequence, of obesity. In a recent study by Schwartz et al (206)
an argument was made against the role of the catecholimines as a
mediator of the TEF. They observed similar plasma NE concentrations
in response to feeding in obese and control subjects. Schwartz et al
(206) concluded that the reduced TEF observed in the obese, could not
be explained by a reduced SNS activity. It was suggested, however,
that the obese might display a NE resistance partially accounting for
the elevated levels in the plasma.
It is interesting to speculate that the pre-obese are quite
metabolically susceptible to weight gain. This is true because of an
inherently diminished TEF mediated in part by an insensitivity to the
147
catecholamines. The problem is further exacerbated by the typical
high fat diet common in Western societies. Again, Welle et at (251)
have reported a diminished catecholamine response and subsequently
reduced TEF due to the ingestion of food with a high fat content.
These subtle metabolic abnormalities make body weight regulation
increasingly difficult. Moreover, adaptive thermogenesis may be incon-
sequential under such dietary practices thus contributing to a positive
energy balance with the excess energy being stored as fat.
A reduced TEF in the obese was evident in the present study, but
no significant differences were present between the groups. Subse-
quent to the administration of the standard breakfast, the're was a
marked rise in metabolic rate. This increase reached a peak within 30
minutes and then slowly declined. The metabolic rate was significantly
higher than the baseline determination up to two hours post-feeding.
Additionally, the RMR remained elevated throughout the morning and was
6% above baseline at the end of the experimental period. This suggests
that the full TEF was underestimated in the present study. When the
total area under the response curve was calculated, the TEF resulted
in an increase in metabolic rate of 12 percent. In energy expenditure
terms, the TEF amounted to 40.8 Kcal and 31.5 Kcal in the JOTO and
MOTO subjects, respectively. Often these expenditures are reported
as a percentage of the calories ingested in the test meal. These
figures were 4.7% for the JOTO subjects and 4.1% for the MOTO subjects.
This compares favorably with the work of Pittet et al (191) who found
a 5% increment in obese and a 12% increment in a group of lean controls.
James and Trayhurn (131) reported that thermogenesis induced by glucose

148
ingestion was approximately 9% of the energy value of the load. Strang
and McCluggage (224) and Miller et al (172) reported that the normal
caloric response was 10% of the test meal. Therefore, the subjects
in this study did display a reduced thermic response to food. This 5%
deficit in obligatory thermogenesis would account for approximately
125 Kcal/d and could lead to difficulties maintaining energy balance.
It is of interest to speculate upon the role that exercise might play
in the improvement of energy balance in the obese. Certainly increased
physical activity could counteract this reduction in the thermic
response to feeding. Felig et al (80) implies that exercise might
improve the hormone response to feeding in obese individuals resulting
in a greater TEF, thus aiding weight reduction and a more successful
weight maintenance. This has been shown in animal models (96,97,235,
237), but its application to humans awaits empirical vertification.
Thermic Effect of Exercise
The EMR after exercise (thermic effect of exercise) was not signif-
icantly elevated in either experimental group under study. The total
increase in energy expenditure amounted to 6.4 Kcal and 4.7 Kcal in the
JOTO and MOTO groups, respectively. Therefore, it can be concluded
that while the thermic effect of exercise is apparent during the acti-
vity in question, there was no long-term residual effect of mild aerobic
exercise. This finding is in complete agreement with Freedman-Akabas
at al (84) who studied thermogenesis after exercise in normal weight
individuals. They reported no appreciable caloric loss beyond that
generated by the exercise period itself in either fit or unfit subjects.
149
However, it is possible that more prolonged or more intense exercise
could result in a sustained elevation in RMR as reported by Adams (1).
Passmore and Johnson (188), Miller and Parsonage (173), and deVries
and Gray (64) have reported such sustained increases in the post-
exercise oxygen consumption. Their exercise sessions were, for the
most part, considerably longer, and of greater intensity, than those
normally encountered in a typical exercise session used in exercise
programming.
The level of exercise administered in this study (40 minutes at
50%, V02 max) is consistent with that normally prescribed in weight-
control programs (82,83). Therefore, the claims of a residual effect
which would lead to an enhanced caloric expenditure for several hours
after exercise cannot be made.
The energy cost of physical activity was only slightly elevated
after eating. For the groups combined, the energy expenditure at a
constant work load was 6.57 (±.90) Kcal/min in the fasted condition
increasing to 6.73 (±.83) Kcal/min in the fed condition. This increase
was statistically significant even though it amounted to only a 2.4%
elevation in caloric expenditure. Furthermore, this increase could be
attributed to a shift in the preferential substrate being metabolized
during the exercise bout. In the fasted state, the RER was .89 with a
significant shift upward after eating to .92. This would indicate a
greater utilization of carbohydrate fuels in the fed condition, and
is consistent with the greater availability of carbohydrate fuel in the
fed condition.
150
Earlier, Apfelbaum et al (7.8) reported that the cost of walking,
stair climbing, and bicycling can vary from between 12 to 29% according
to the level of energy intake. They also reported a decline in the
energy cost of work of an equal magnitude (12-17%) in subjects on a
restricted diet. Whipp et al (253), Segal and Gutin (207), and Zahorska-
Markiewicz (261) have reported that feeding potentiated the energy cost
of physical work in lean individuals. They agreed that this response
was blunted in the obese. It is likely that feeding does potentiate
the TEE to a greater extent in the lean than in the obese. The signifi-
cance of this fact is unclear. It is doubtful that this slight increase
in the energy expenditure makes a significant contribution to energy
balance in man. But it is one more way in which increases in body weight
may be controlled in lean, physically active individuals.
Potentiation of TEF by Exercise
The combined stimulus of food followed by exercise did not result
in an enhanced thermogenesis. This so-called "Potentiation" of the
TEF by exercise has been reported elsewhere by Miller et al (172),
Apfelbaum et al (7), Segal and Gutin (207), Bradfield and others (35),
and Zahorska-Markiewicz (261). These studies revealed that lean
individuals exhibited a potentiation of the TEF by as much as 17%,
whereas obese individuals displayed little or no potentiation. The
only researchers who have failed to demonstrate this effect in lean
individuals were Swindells (228) and Sims (214). These discrepancies
might be due to differences in methodology, which abound in this
field of research.
151
In the current study, the energy expenditure measured for four
hours after feeding and exercising was compared to a baseline condi-
tion, a feeding-alone condition, and an exercise-only condition. The
RMR after the food plus exercise treatment was elevated by 14.1% and
13.4% in the SOTO and MOTO groups, respectively. On a percentage
basis, this was lower than for the feeding treatment alone. Under
that condition' energy output increased by 16.1% in the Juvenile-onset
obese compared to 12.4% in the Maturity-onset subjects. Therefore,
it can be concluded that exercise after eating did not potentiate
the TEF in these obese individuals.
These findings suggest that a significantly lower capacity for
thermogenesis manifests itself specifically in response to the combina-
tion of food and exercise, as was suggested by Segal and Gutin (207).
A difference in the capacity for substrate cycling has been used to help
explain this phenomenon. Newsholme (181) suggests that exercise and
eating stimulate substrate cycles separately, and that exercising after
a meal may increase the cycling rates even further. The cycles stimu-
lated by exercise and food are somewhat antagonistic; exercise increases
the rate of cycles in liver and adipose tissue which mobilize and
provide fuel for the working muscles while eating increases cycles
related to the assimilation and uptake of the nutrients by the tissues
for storage. The responses to food and to exercise are under neural
and hormonal control. Therefore, the combination of food plus exercise
might induce a kind of hormonal struggle with the conflicting signals
for substrate storage and mobilization creating an additional metabolic
challenge. The net result might be an amplification of the neural and

152
hormonal responses to the separate stimuli. In other words, under
the influence of the hormones which mediate the metabolic responses
to eating and to exercise, the combination of food plus exercise
might increase the cycling rate of glucose, fatty acids, and amino
acids in and out of storage to a larger extent than exercise alone or
eating alone.
There is evidence that the sensitivity to thermogenic hormones
(insulin, T3, norepinephrine) may be reduced in the obese yielding a
smaller metabolic response to a given increase in the concentration
or turnover rate of one or more of these hormones (45,107,137,206,251,
252). Thus, the failure of exercise to potentiate the thermic effect
of food in these obese individuals might be related to a reduced sensi-
tivity to the hormonal stimulation induced by the combination of food
and exercise. However, as was suggested by Salans and Wise (204) and
Newsholme and Leech (182), there is little evidence for the quantitative
role of substrate cycling in the metabolic responses to food and
exercise. The notion that a reduced rate of substrate cycling may
underlie the failure of exercise to potentiate the thermic response to
feeding in the obese is merely conjecture.
Standard Work and Work Efficiency
Functional responses during steady state exercise were evaluted
in Juvenile-onset and Maturity-onset obese subjects. This was done
in order to determine the physiologic cost of performing equivalent
external work loads of varying intensity on the bicycle ergometer. If
any one group of obese subjects could perform a set external work load

153
with less cost, it would lend support to an enhanced metabolic
efficiency in certain types of obesity.
However, the hypothesized difference between the groups could not
be substantiated. The observation that the 002 of standardized work
was considerably higher in these obese subjects is compatible with the
added work required to move legs of larger masses. This work could
not be measured by the ergometer, and should not be included in the
computation of work efficiency. When this correction was made, the
work efficiency of external work approximates 30% in normal weight
individuals (41). In this study, the work efficiency was 57% at 50
watts and 36% at 100 watts. These measures of efficiency were
approximately equal in both groups of obese subjects. Therefore,
work efficiency is not different and this suggests an equality of
metabolic coupling to external work in these subjects.
The exaggerated work efficiency evidenced in the current study was
the result of the method of determination. Work efficiency is deter-
minted by subtracting from the cost of a given amount of external work
(50 or 100 watts) the cost of moving the legs against zero load, the
so-called "0" watts. In the case of the obese subjects studied in the
present investigation, the cost of "0" watts was quite substantial.
Gaesser and Brooks reported that the oxygen cost of "0" work at 60 RPM
was .448 (±.019) 1/minute, or 2.13 (±0.11) Kcal/min. In the obese,
this task required .775 (±.125) 1/minute or 3.67 (±0.59) Kcal/min.
This fact served to inflate the measures of work efficiency to a greater
extent at 50 watts, but at 100 watts as well.

154
In more conventional terms, the net (muscular) efficiency of these
obese subjects was similar to values reported elsewhere. Gaesser and
Brooks (87) reported net efficiency of approximately 23% and Astrand
(13,14) suggested that net efficiency was 23.5% for bicycle ergometry.
In the current study, the average net efficiency was 20.8 (±2.8)% at
50 watts increasing to 23.7 (-11.8)% at 100 watts. The present study
demonstrates how the use of different definitions of efficiency yields
varied results and probably spurious conclusions about muscular
efficiency. However, such a theoretical approach can be justified for
comparative purposes.
Physical activity can be a major component of the overall energy
expenditure. However, most adult individuals in Western societies
exhibit a range of activity which represents only 15-20% of the total
energy expenditure (90). Moreover, most studies (48,232) have shown
no significant differences between the levels of physical activity
in sedentary lean and obese individuals. Garrow suggests that 75% of
the day is spent in resting conditions. Bloom and Eidex (30) state
that sleeping and sitting at rest take up approximately 70% of the TEE
in obese adults. In this study, it was estimated that 71% of the 24-
hour energy expenditure was taken up by these activities. The values
of increased physical activity in the obese seem obvious. An addition
of an hour walk per day would add approximately 300 calories to the TEE.
Given that calorie intake could be held constant, the increased energy
expenditure would contribute to a negative energy balance leading to
weight reduction and better long-term maintenance of body weight.
155
Implications
What are the implications of these findings? For individuals who
demonstrate a normal TEF or the normal potentiating effect of exercise
on the thermic response to food the extra calorigenesis induced by
engaging in moderate exercise after a meal might be recommended as a
long-term factor in weight control. For example, to obtain a maximal
calorigenic effect from the potentiation of the thermic effect of food
one might eat earlier in the day and plan to be more physically active
after each meal. It is hypothesized that eating frequent meals through-
out the day rather than one large meal at night, enables individuals to
consume more calories while maintaining energy balance (8,79,152,232).
One reason for this might be that more energy is dissipated through
the TEF and the potentiation of the TEF by exercise since this response
would be evoked more frequently throughout the day. This theory was
substantiated by Hill et al (120). They demonstrated that progressively
larger meals produce systematic increases in the thermic effect of the
meal. These increases were nonlinear, however, with a smaller increase
in the TEF in meals above 1000 calories. Therefore, greater calorie
"wastage" would occur consuming three meals of 800 calories each, rather
than one large meal of 2400 calories.
For individuals who do not demonstrate a normal TEF, or the incre-
mental response to the combination of food and exercise, the argument
for exercise as a central component of weight control regimens is even
stronger. In the presence of a reduced capacity for thermogenesis,
exercise definitely serves a compensatory function and might even have
a rehabilitative function. At the very least, exercise increases the
156
total energy output during the exercise session. Augmenting the energy
expenditure in this way is especially important for those with a reduced
capacity for thermogenesis as a way of compensating for the tendency
to conserve energy. Exercise is preferable to dietary restriction alone
as a way of inducing an imbalance between energy intake and energy
output because of the unfavorable effects of dieting on metabolic rate.
When exercise and moderate caloric restriction are used together in
weight reduction programs the exercise might counteract the reduction
in energy expenditure induced by dieting (33,119,206,222) by sparing
lean body tissue, stimulating protein synthesis, improving aerobic
function, increasing the activity of mitochondrial enzymes, and by
opposing the changes in peripheral thyroid hormone metabolism which
accompany caloric restriction.
It is even possible that exercise might reverse the thermogenic
defect. Some of the beneficial changes which accompany exercise
training suggest a potential for exercise to normalize impaired thermo
genesis. For example, exercise increases the sensitivity to insulin
and norepinephrine and is thought to augment the lipolytic actions of
T3 and norepinephrine (59,111,246,250,256). Newsholme (180) speculated
that exercise enhances substrate cycling, and Winder and Holloszy (257)
have observed that exercise increases the level of glycerophosphate
dehydrogenase and other mitochondrial enzymes. Each of these factors
is thought to play a role in cellular thermogenesis. Thus by enhancing
the activity of these thermogenic pathways, exercise training might
reverse impaired thermogenesis.

157
There is some evidence of an effect of exercise training on thermo-
genesis in animals. Gleeson et al (95,96,97) and Hill et al (119)
compared the TEF, at rest, and during exercise, in sedentary and
exercise-trained rats. Exercise training did not alter the RMR of the
animals, but the TEF was significantly greater in the trained animals.
They concluded that exercise training could augment the metabolic res-
ponses to the thermogenic stimuli of food and exercise, and suggested
that training might correct the reduced thermogenesis associated with
obesity. Both Hill et al (120) and Schwartz et al (206) found positive
correlations between maximum aerobic capacity and the TEF. This would
imply a relationship between improvements in fitness and in the thermic
effect to food and exercise. Such improvements would contribute to
an enhanced capacity for body weight regulation in those individuals
with an impaired adaptive thermogenesis.
An important topic for future study is the effect of exercise
programming on the thermogenic responses of those individuals identi-
fied as having a blunted capacity to respond to thermogenic stimuli.
If exercise does indeed lead to a normalization of inadequate thermo-
genesis then the role of exercise in the treatment of obesity is even
more critical.
Conclusions
The present work suggests that a differential thermogenic response
does not exist between Juvenile-onset and Maturity-onset obese women.
This study did, however, reveal that a diminished capacity for thermo-
genesis was present in these individuals when compared to normal,
158
standard individuals. These finding support the premise that a primary
metabolic defect is present in obese subjects With either familial or
spontaneous obesity. This investigation further suggests that differ-
ences in metabolic efficiency may underlie both types of obesity.
Thereby, the manifestation of obesity is reliant upon a certain genetic
predisposition in the presence of sufficient environmental factors.
If, indeed, a direct relationship can be established between
these thermogenic defects and metabolic efficiency in all types of
human subjects, then the procedures utilized in this study could be
useful for assessing the predisposition for the development of obesity,
and aid in its prevention.
Recommendations
The bioenergetics of obesity is a relatively new area of investi-
gation. Therefore, knowledge regarding the etiology and persistence
of obesity is still incomplete. Furthermore, the results of much of
the research dealing with obligatory and adaptive thermogenesis remains
equivocal. This is due to operational differences in methodology which
are prevalent in the research. Once these problems are overcome,
researchers can focus upon the real issues which are those dealing with
the mechanism(s) of action. This understanding will lead to better
diagnostic and treatment schema for the obese individual and in the
future to the prevention of the condition. To further enhance our
understanding of thermogenesis and its relationship to sub-type obesity,
research in the following areas is recommended:
1) Replicate this investigation with a larger sample, with less
age and body weight variance. Documentation of the age-of-onset of
159
obesity with increased vigilance.
2) Replicate this investigation using fat cell size and number as
a means of sub-classification (Hypertrophic vs. Hyperplastic), follow-
ing previously described criteria-fat cell number >5 x 10¹⁰, and fat
cell weight <0.8pg.
3) Replicate aspects of this study with individuals with varying
degrees of insulin resistance.
4) Develop a set of standardized procedures for subsequent investi-
gations in this field of research.
5) Investigate the effects of other known thermogenic stimuli
(caffeine, nicotine, norepinephrine, cold, stress) on the thermogenic
responses of hypometabolic and hypermetabolic individuals.
6) As a preventive health-fitness concept, these investigations
should be extended to the pre-obese. Studying pre-adolescents with a
family history of obesity could test the hypothesis that a blunted
thermogenesis is a cause rather than a consequence of obesity.
7) Study the effect of an exercise program on the thermogenic
responses of those individuals identified as having a blunted capacity
to respond to thermogenic stimuli.
160
REFERENCES
1. Adams, R.P. and B.G. Welch. Oxygen uptake, acid-base status, andperformance with varied inspired oxygen fractions. J. Appl. Physiol.49 (5): 863-868, 1980.
2. Allen, D.W., and B.M. Quigley. The role of physical activity in thecontrol of obesity. Med. J. Aust. 2:434-438, 1977.
3. Angel, A. Pathophysiologic changes in obesity. CMA Journal 119:1401-1406, 1978.
4. Angel, A., and D.A.K. Roncari. Medical complications of obesity.CMA Journal 119: 1408-1411, 1978.
5. Apfelbaum, M., J. Bostsarron, and D. Lacatis. Effect of caloricrestriction and excessive caloric intake on energy expenditure.Am. J. Clin. Nutr. 24:1405-1409, 1971.
6. Apfelbaum, M., A. Reinberg, R. Assan and D. Lacatis. Hormonal andmetabolic circadian rhythms before and during a low protein diet.Israel J. Med. Sci. 8:867-873, 1972.
7. Apfelbaum, M., L. Brigant and M. Joliff. Effects of severe dietrestriction on the oxygen consumption of obese women during exercise.Int. J. Obesity 1:387-393, 1977.
8. Apfelbaum, M. Adaptation to changes in caloric intake. Prog. Fd.Nutr. Sci. 2:543-559, 1978.
9. Asano, Y., U.A. Liberman and I.S. Edelman. Thyroid thermogenesis:relationships between Na+ dependent respiration and Na+-K+-adeno-sine triphosphatase activity in rat skeletal muscle. J. Clin.Invest. 57:368-379, 1976.
10. Aschoff, J., and H. Pohl. Rhythmic variations in energy metabolism.Fed. Proc. 29:1541-1551, 1970.
11. Ashwell, M.A., P. Priest, M. Bondoux and J.S. Garrow. Resistanceto slimming: adipose tissue cellularity studies. Proc. Nutr. Soc.34:85A, 1975.
12. Assimacorpoulos-Jeannet, F., and B. Jeanrenaud. The hormonal andmetabolic basis of experimental obesity. Clin. Endocr. Metab.5:337-365, 1976.
13. Astrand, I., P.O. Astrand, and A. Stunkard. Oxygen intake of obeseindividuals during work on a bicycle ergometer. Acta. Physio. Scand.50:294-299, 1969.
14. Astrand, P.O., and K. Rodahl. Textbook of Work Physiology. 2ndEdition. New York: McGraw-Hill, 1977. ::
15. Bailey, C.J. On the physiology and biochemistry of obesity. Sci.Prog. Oxf. 65:365-393, 1978.
16. Bailey, D., D. Harry, R.E. Johnson, and I. Kuppart. Oscillations inoxygen consumption of man at rest. Jour. Appl. Physiol. 34:467-470, 1973.
17. Baldwin, R.L.adipose tissue1970.
161
Metabolic functions affecting the contribution ofto total energy expenditure. Fed. Proc. 29:1277-1301,
18. and T.M. Carpenter. The Metabolism and Energyof Healthy Man During Rest. Washington D.C.,1910.
Benedict, F.C.,TransformationsCarnegie Inst.,
19. Bennett, W. and J. Gurin. The Dieter's Dilemma. New York. BasicBooks Inc., 1982.
20. Bernstein, R.S., J.C. Thornton, M.U. Yang, J. Yang, A.M. Redmond,R. Pierson, F.X. Pi-Sunyer, and T.B. Van Itallie. Prediction of theresting metabolic rate in obese patients. Am. J. Clin. Nutr.37:595-602, 1983.
21. Bessard, T., Y. Schutz, and E. Jequire. Energy expenditure andpostprandial thermogenesis in obese women before and after weightloss. Am. J. Clin. Nutr. 38:680-693, 1983.
22. Bjorntorp, P., A. Gustafson, and B. Persson. Adipose tissue fatcell size and number in relation to metabolism in endogenoushypertriglyceridemia. Acta. Med. Scan. 190:363-367, 1971.
23. Bjorntorp, P. and L. Sjostrom. Number and size of adipose tissuefat cells in relation to metabolism in human obesity. Metabolism.20:703-713, 1971.
24. Bjorntorp, P. and L. Sjostrom. The composition and metabolism invitro of adipose tissue fat cells of different sizes. Europ. J.Clin. Invest. 2:78-84, 1972.
25. Bjorntorp, P., A. Jonsson and P. Berchtold. Adipose tissuecellularity in maturity onset diabetes mellitus. Acta. Med. Scand.191:129-132, 1972.
26. Bjorntorp, P. Effects of age, sex, and clinical conditions onadipose tissue cellularity in man. Metabolism. 23:1091-11-1, 1974.
27. Bjorntorp, P., G. Carlgren, B. Isaksson, M. Krotkiewski, B. Larssonand L. Sjorstrom. Effect of an energy-reduced regimen in relationto adipose tissue cellularity in obese women. Am. J. Clin. Nutr.28:445-452, 1975.
28. Bjorntorp, P. Exercise in the treatment of obesity. Clin. inEndocrinology and Metab. 5:431-453, 1976.
29. Bjorntorp, P. Results of conservative therapy of obesity correla-tion with adipose tissue morphology. Am. J. Clin. Nutr. 33: 370-375, 1980.
30. Bloom, W.L. and M.F. Eidex. The comparison of energy expenditure inthe obese and lean. Metab. 16:685-692, 1972.
31. Bonjour, P.J., H.J. Welti, and E. Jequier. Calorimetric study ofthe thermoregulatory mechanisms at the onset of sweating during themenstrual cycle. J. Physiol. (Paris). 72:190-191, 1976.
32. Boothby, W.H. and J. Sandiford. Normal values for standard metabol-ism. Am. J. Physiol. 90:290-291, 1929.

162
33. Bosello, 0., F. Ferrari, J. Tonon, M. Cigolini, R. Micciolo andM. Renoffio. Serum thyroid hormone concentration during semi-starvation and physical exercise. Horm. Metab. Res. 13:651-652,1981.
34. Boyle, P.C., L.H. Storlien and R.E. Keesey. Increased efficiencyof food utilization following weight loss. Physio. and Behavior.21:261-264, 1978.
35. Bradfield, R.B., D.E. Curtis, and S. Margen. Effect of activity oncaoloric response of obese women. Am. J. Clin. Nutr. 21:1208-1210, 1968.
36. Bradfield, R.B. and M.H. Jourdan. Energy expenditure of obesewomen during weight loss. Am. J. Clin. Nutr. 25:971-975, 1972.
37. Bradfield, R.B. and M.H. Jourdan. Relative importance of specificdynamic action in weight-reduction diets. Lancet. ii:640-643,1973
38. Bray,,G.A. Calorigenic effect of growth hormone in obesity.J. Clin. Endocrinol. 29:119-125, 1969.
39. Bray, G.A. Effect of caloric restriction on energy expenditure inobese patients. Lancet. 2:397-398, 1969.
40. Bray, G.A. The myth of diet in the management of obesity. Am. J.Clin. Nutr. 23:1141-1147, 1970.
41. Bray, G.A., B.J. Whipp, and S.N. Koyal. The acute effects of foodintake on energy expenditure during cycle ergometry. Am. J. Clin.Nutr. 27:254-259, 1974.
42. Bray, G.A. and L.A. Campfield. Metabolic factors in the control ofenergy stores. Metab. Clin. Exp. 24:99-103, 1975.
43. Bray, G.A., B.J. Whipp, S.N. Koyal, and K. Wasserman. Somerespiratory and metabolic effects of exercise in moderately obesemen. Metabolism. 26:403-412, 1977.
44. Bray, G.A., ed. Obesity in America. Department of Health Educationand Welfare. N.I.H. Publication No. 80-359, 1980.
45. Bray, G.Aof weightuptake in
46. Bray, G.AExercise.
B.J. Whipp, S.N. Koyal, and A.L. Campfield. The effectgain on the norepinephrine induced stimulation of oxygennormal subjects. Am. J. Clin. Nutr. 34:633-635, 1981.
. The energetics of obesity. Med. Sci. Sports and15:32-40, 1983.
47. Brooke, G. and A. Ashworth. The influence of malnutrition on post-prandial metabolic rate and respiratory quotient. Br. J. Nutr.27:407-415, 1972.
48. Brownell, K.D., A.J. Stunkard, and J.M. Albaum. Evaluation andmodification of exercise patterns in the natural environment.Am. J. Psychiatry. 137:1540-1545, 1980.

163
49. Brownell, K.D. The psychology and physiology of obesity implica-tions for screening and treatment. J. Am. Dietetic Assoc. 84:406-413, 1984.
50. Buskirk, E.R., P.F. Iampietro, and B.E. Welch. Variations inresting metabolism with changes in food, exercise and climate.Metabolism Clin. Expt'l. 6:144-152, 1957.
51. Buskirk, E.R. and H. Taylor. Maximal oxygen intake and itsrelation to body composition, with special reference to chronicphysical activity and obesity. J. Appl. Physiol. 11:72-78, 1957
52. Cahill, G.F. Starvation in man Clinics in Endocr. and Metab.5:397-415, 1976.
53. Calloway, D.H., A.C.F. Odell, and S. Margen. Sweat and miscella-neous nitrogen losses in human balance studies. J. Nutrition.101:775-786, 1971.
54. Cunningham, J.J.metabolic rate in2374, 1980.
55. Cunningham, J.J.energy in adults.
56. Cunningham,The myth of1982.
57. Curtis, D.Eexpenditure1971.
A reanalysis of the factors influencing basalnormal adults. Am. J. Clin. Nutr. 33:2372-
An individualization of dietary requirements forJ. Am. Dietetic Assoc. 80:335-338, 1982.
J.J. Body composition and resting metabolic rate:feminine metabolism. Am. J. Clin. Nutr. 36:721-726,
. and R.B. Bradfield. Long-term energy intake andof obese housewives. Am. J. Clin. Nutr. 24:1410-1417,
58. Danforth, E., A.G. Burger, R.F. Goldman, and E.A.H. Sims. Thermo-genesis during weight gain. In G.A. Bray, (ed), Recent Advancesin Obesity Research II. London: Newman, 1978.
59. Davies, K.J., A.L. Packer, and G.A. Brooks. Mitochondrialbiogenesis and exercise. Med. Sci. Sports and Exercise. 13:118-127, 1981.
60. Davis, J.A., A.R. Tagliaferro, R. Kertzer, T. Garardo, J. Nichols,and J. Wheeler. Variations in dietary-induced thermogenesis andbody fatness with aerobic function. Eur. J. Appl. Physiol. 50:319-329, 1983.
61. Davis, J.A., B.J. Whipp, and K. Wasserman. The relation ofventilation to metabolic rate during moderate exercise in man.Eur. J. Appl. Physiol. 44:97-108, 1980.
62. DeLuise, M., G.L. Blackburn, and J.S. Flier. Reduced activity ofthe red cell sodium-potassium pump in human obesity. N. Engl. J.Med. 303:1017-1022, 1980.
63. Dempsey, J.A., W. Reddn, B. Balke, and J. Rankin. Work capacitydeterminants and physiologic cost of weight-supported work inobesity. J. Appl. Physiol. 21:1815-1820, 1966.

164
64. deVries, H. and D.E. Gray. After effects of exercise upon restingmetabolic rate. Research Quarterly. 34:314-321, 1963.
65. Dietrele, P., I. Bachl, G. Bachl, J. Henner, D. Frommeld, P. Minkus,C. Diterle, K.P. Hess, and F. Nassehinajad. Muscle metabolismduring exercise in diabetics and in obese in starvation. Horm.Metab. Res. 10:263-268, 1968.
66. Dimsdale, J.E. and J. Moss. Plasma catecholamines in stress andexercise. J.A.M.A. 243:340-342, 1980.
67. Dolgener, F. and C. Larsen. Effect of acute exercise on restingmetabolic rate in obese and non-obese females. Med. Sci. in SportEx. 16:161, 1984.
68. Dore, C., R. Hesp, D. Wilkins, and J.S. Garrow. Prediction ofenergy requirements of obese patients after massive weight loss.Hum. Nutr.: Clin. Nutr. 36C:41-48, 1983.
69. Drenick, E.J. and H.F. Dennin. Energy expenditure in fasting obesemen. J. Lab. Clin. Med. 81:421-430, 1973.
70. DuBois, E.F. Basal Metabolism in Health and Disease. Philadelphia,Lea and Febiger, 1936.
71. Durnin, J. and J. Wormersley. Body fat assessed from total bodydensity and its estimation from skinfold thicknesses. Br. J. Nutr.32:77-92, 1974.
72. Durnin, J.V.G.A. and R. Passmore. Energy, Work, and Leisure.London. Heinemann Ed. Books, 1967.
73. Durrant, M. and S. Blaza. The regulation of energy balance. In.M. Ashwell (Ed.) Biochemistry of Cellular Regulation Vol. II.Boca Raton, CRC Press Inc., 1980.
74. Durrant, M.L., J.P. Royston, and R. Wloch. Effect of exercise onenergy intake and eating patterns in lean and obese human. Physiol.and Behavior. 29:449-454, 1982.
75. Edelman, I.S. Thyroid thermogenesis. N. Engl. J. Med. 290:1303-1308, 1974.
76. Edelman, I.S. and F. Ismail-Beigi. Thyroid thermogenesis and activesodium transport. Rec. Prog. Hor. Res. 30:235-257, 1974.
77. Edwards, H.T., A. Thorndike, and D.B. Dill. The energy requirementin strenuous muscular exercise. N. Engl. J. Med. 213:532-535, 1935.
78. Epstein, L.H., R.R. Wing, and J.K. Thompson. The relationshipbetween exercise intensity, caloric intake and weight. Addict.Behay. 5:185-190, 1978.
79. Fabry, P., J. Fodor, Z. Hejl, T. Braun, and K. Zvolankova. Thefrequency of meals: its relationship to overweight. Lancet. ii:614-615, 1964.
165
80. Felig, P., J. Cunningham, M. Levitt, R. Hendler, and E. Nadel.Energy expenditure in obesity in fasting and postprandial state.Am. J. Physiol. 244:E45-E51, 1983.
81. Flatt, J.P. The biochemistry of energy expenditure. In G.A. Bray(ed), Recent Advances in Obesity Research II. London: Newman,1978.
82. Foss, M.L., R.M. Lampman, and D. Schteigart. Physical trainingprogram for rehabilitating extremely obese patients. Arch. Phys.Med. Rehabil. 57:425-429, 1976.
83. Foss, M.L., R.M. Lampman, and D. Schteingart. Extremely obesepatients: improvements in exercise tolerance with physical trainingand weight loss. Arch. Phys. Med. Rehabil. 61:119-124, 1980.
84. Freedman-Akabas, S., E. Holt,Lack of sustained increase inunfit subjects. Am. J. Clin.
85. Fregly, M.J., F.P. Field, M.JCatecholamine-thyroid hormoneFed. Proc. 38:2162-2169, 1979
H.R. Kissileff, and F.X. PiSunyer.VO9 following exercise fit andNutr. 41:545-549, 1985.
. Katovivich, and C.C. Barney.interaction in cold-acclimated rats.
86. Freyschuss, U. and A. Melcher. Exercise energy expenditure inextreme obesity: influence of ergometer type and weight loss.Scand. J. Clin. Lab. Invest. 38:753-759, 1978.
87. Gaesser, G.A. and G.A. Brooks. Muscular efficiency during steadyrate exercise. J. Appl. Physiol. 31:1132-1139, 1975.
88. Gale, C.C. Neuroendocrine aspects of thermogenesis. Ann. Rev.Physiol. 35:391-430, 1973.
89. Garrow, J.S. Energy Balance and Obesity in Man. Amsterdam:Elsevier-North Holland Pub. Co., 1978.
90. Garrow, J.S. The regulation of energy expenditure in man. RecentAdv. Obesity Research II. London: Newman, 1978.
91. Garrow, J.S. Thermogenesis and obesity in man. Recent Adv. ObesityResearch III. London: Libbey and Co., 1981.
92. Garrow, J.S., M. Durrant, S. Blaze, D. Wilkins, P. Royston, and S.Sunkin. The effect of meal frequency and protein concentration onthe composition of the weight lost by obese subjects. Br. J. Nutr.45:5-15, 1981.
93. Girardeir, L., J. Seydoux, and T. Clausen. Membrane potential ofbrown adipose tissue: a suggested mechanism for the regulation ofthermogenesis. J. General Physiol. 52:925-940, 1968.
94. Glass, A.R., K.D. Burman, W.T. Dahms, and T. Boehm. Endocrinefunction in human obesity. Metabolism. 30:89-104, 1981.
95. Gleeson, M., J.F. Brown, J.J. Waring, and M.J. Stock. The effectsof exercise and exercise training on dietary induced thermogenesisProc. Nutr. Soc. 38:8A, 1978.

166
96. Gleeson, M., J.F. Brown, J.J. Waring, and M.J. Stock. Thermogeniceffects of diet and exercise. Proc. Nutr. Soc. 39:82A, 1979.
97. Gleeson, M., J.F. Brown, and J.J. Waring. The effects of physicalexercise on metabolic rate and dietary-induced thermogenesis.Br. J. Nutr. 47:173-181, 1982.
98. Glick, Z., E. Shvartz, A. Magazanik, and M. Modan. Absence ofincreased thermogenesis during short-term overfeeding in normal andoverweight women. Am. J. Clin. Nutr. 30:1026-1035, 1977.
99. Glick, Z., R.J. Teague, and G.A. Bray. Brown adipose tissue:thermic response increased by a single low protein, high carbohy-drate meal. Science. 213:1125-1127, 1981.
100. Glickman, W., H.H. Mitchell, R.W. Keeton, and E.H. Lambert.Shivering and heat production in response to cold. J. Appl. Physiol.22:1-12, 1967.
101. Golay, A., Y. Schutz, H.U. Meyer, D. Thiebaud, B. Curchod, E. Maeder,J.P. Felber, and E. Jequier. Glucose induced thermogenesis innondiabetic and diabetic obese subjects. Diabetes. 31:1023-1028,1982.
102. Goldsmith, R., G.S. Riddell, and I.F. Russel. The energy cost of atask after the ingestion of protein, fat or carbohydrate. Proc.Nutr. Soc. 30:4A, 1971.
Goodhart, R.S. and M.E. Shils. Modern Nutrition in Health andDisease. Philadelphia: Lea and Febiger, 1978.
103.
104.
105.
106.
Gordon, E.S4:229-296,
Grande, F.21:305-314,
Grande, F.,rate in man12:230-238,
. Metabolic aspects of obesity. Adv. Metab. Disorders.1970.
Energetics and weight reduction. Am. J. Clin. Nutr.1968.
J.T. Anderson, and A. Keys. Changes of basal metabolicin semistarvation and refeeding. J. Appl. Physiol.1958.
107. Grant, A.M., 0.M. Edwards, A.N. Howard, G.S. Challand, E.P. Wright,and I.H. Mills. Thyroidal hormone metabolism in obesity duringsemi-starvation. Clin. Endocrin. 9:227-231, 1978.
108. Gulick, A. A study of weight regulation in the adult human bodyduring over-nutrition. Am. J. Physiol. 60:371-395, 1922.
109. Guyton, A.C. Textbook of Medical Physiology, 6th ed. Philadelphia:W.B. Saunders Co., 1981.
110. Hadjiolova, I., L. Mintcheva, S. Dunev, M. Daleva, S. Handjiev,and L. Balabanski. Physical working capacity in obese women afteran exercise programme for body weight reduction. Int. J. Obesity.6:405-410, 1981.
111. Hagberg, J.M., R.C. Hickson, J. McLane, A.A. Ehsani, and W.W. Winder.Disappearance of norepinephrine from the circulation followingstrenuous exercise. J. Appl. Physiol. 47:1311-1314, 1979.
167
112. Haggendal, J., L.H. Hartley, and B. Saltin. Aterial noradrenalineconcentration during exercise in relation to the relative worklevels. Scand. J. Clin. Lab. Invest. 26:337-342, 1970.
113. Halliday, D., R. Hesp, S.F. Stalley, P. Warwick, D.G. Altman, andJ.S. Garrow. Resting metabolic rate, weight, surface area and bodycomposition in obese women. Int. J. Obesity. 3:1-6, 1979.
114. Hansen, A.P. Serum growth hormone response to exercise in non-obeseand obese normal subjects. Scand. J. Clin. Lab. Invest. 31:175-83,1973.
115. Hanson, J.S. Exercise responses following production of experimen-tal obesity. J. Appl. Physiol. 35:587-591, 1973.
116. Hegsted, D.M. Energy needs and energy utilization. Nutr. Reviews32:33-37, 1974.
117. Herman, R.H., D. Zakim, and F.B. Stifel. Effect of diet on lipidmetabolism in experimental animals and man. Fed. Proc. 29:1302-1307, 1970.
118. Himms-Hagen, J. Cellular thermogenesis. Annu. Rev. Physiol. 38:315-351, 1976.
119. Hill, J.0., J.R. Davis, and A.R. Tagiaferro. Effects of diet andexercise training on thermogenesis in adult female rats. Physiol.and Behavior. 31:133-135, 1983.
120. Hill, J.0., S.B. Heymsfield, C. McMannus, and M. DiGirolamo. Mealsize and thermic response to food in male subjects as a function ofmaximal aerobic capacity. Metabolism. 33:743-749, 1984.
121. Hirsch, J. and B. Batchelor. Adipose tissue cellularity in humanobesity. Clin. Endocrin. Metab. 5:299-311, 1976.
122. Hirsch, J. and J.L. Kittle. Cellularity of obese and non-obesehuman adipose tissue. Fed. Proc. 29:1516-1522, 1970.
123. Hoffmans, M., W.A. Pfeifer, B.L. Gunddach, H.G.M. Nijrake, and J.Hautvast. Resting metabolic rate in obese and normal weight women.Int. J. Obesity. 3:111-118, 1979.
124. Horowitz, B.A. Metabolic aspects of thermogenesis: neural andhormonal control. Fed. Proc. 38:2147-2149, 1979.
125. Hurni, M., B. Burnand, P. Pittet, and E.J. Jequier. Metaboliceffects of a mixed and a high-carbohydrate low-fat diet in man,measured over 24 h in a respiratory chamber. Br. J. Nutr. 47:33-42, 1982.
126. Huttunen, P., J. Hirvonen, and V. Kinnula. The occurrence of brownadipose tissue in outdoor workers. Eur. J. Physiol. 46:339-345,1981.
127. Ismail-Beigi, F. and I.S. Edelman. Mechanisms of thyroid calori-genesis: the role of active sodium transport. Proc. Natl. Acad.Sci. 67:1071-1078, 1970.
168
128. James, W.P.T., H.L. Davies, J. Bailes, and M.J. Dauncey. Elevatedmetabolic rates in obesity. Lancet i:1122-1125, 1978.
129. James, W.P.T., M.J. Dauncey, R.T. Jung, P.S. Shetty, and P.Trayhurn. Comparison of genetic models of obesity in animals withobesity in man. In M. Festing (ed.), Animal Models of Obesity.New York: Oxford Press, 1979.
130. James, W.P.T. and P. Trayhurn.and genetic basis for obesity.
131. James, W.P.T. and P. Trayhurn.Med. Bulletin 37:43-48, 1981.
132. Jequier, E. Thermogenesis and human obesity: a review. In C.Bocalla (ed.) Nestle Research News 1982/83 Lausanne, Switzerland,Nestle Products Tech. Assist. Co. LTD., 1984.
133. Jequier, E., P. Pittet, and P.H. Gygax. Thermic effect of glucoseand thermal body insulation in lean and obese subjects: a colori-metric approach. Proc. Nutr. Soc. 37:45-54, 1978.
134. Jequier, E. and Y. Schutz. Long-term measurements of energyexpenditure in humans using a respiration chamber. Am. J. Clin.Nutr. 38:989-998, 1983.
135. Jordan, H.A., W.F. Weildand, S.P. Zeblely, E. Stellar, and A.J.Stunkard. The direct measurement of food intake in man: a methodfor the objective study of eating behavior. Psychosom. Med.28:836-841, 1966.
136. Jung, R.T., P.S. Shetty, M. Barrand, B.A. Callingham, and W.P.T.James. The role of catecholamines and thyroid hormones in themetabolic response to starvation. Proc. Nutr. Soc. 38:17A, 1978.
137. Jung, R.T., P.S. Shetty, and W.P.T. James. The effect of refeedingafter semistarvation on catecholamine and thyroid metabolism.Int. J. Obesity. 4:95-100, 1980.
138. Jung, R.T., P.S. Shetty, and W.P.T. James. Nutritional effects onthyroid and catecholamine metabolism. Clin. Sci. 58:183-191, 1980
139. Jung, R.T., P.S. Shetty, W.P.T. James, M.A. Barrand, and B.A.Callingham. Reduced thermogenesis in obesity. Nature 279:322-323, 1979.
140. Kalkhoff, R. and C.weight and muscular1239, 1971.
An integrated view of metabolicLancet ii:770-772, 1976.
Thermogenesis and obesity. Br.
141. Kaplin, M.L. and G.Anonobese women. Am.
Ferrou. Metabolic differences between over-overweight men. New Engl. J. Med. 284:1236-
. Leveille. Calorigenic response in obese andJ. Clin. Nutr. 29:1108-1113, 1976.
142. Katzoff, H. and E. Danforth. Norepinephrine sensitivity and energyexpenditure in response to overnutrition in lean and obese men.Clin. Res. 30:245A, 1982.
169
143. Keren, G., A. Magazanik, and Y. Epstein. A comparison of variousmethods for determination of V02 max. Eur. J. Appl. Physiol.45:117-124, 1980.
144. Kertzer, R., J.R. Davis, and A.R. Tagliaferro. The relationshipbetween VO
2max, resting metabolism and dietary-induced thermo-
genesis. Fed. Proc. 40:904-909, 1981.
145. Keys, A., H.L. Taylor, and F. Grande. Basal metabolism and age ofadult men. Metab. Clin. Exp. 22:579-565, 1973.
146. Keys, A. and J. Brozek. Body fat in adult man. Physiol. Rev.33:245-252, 1953.
147. Koivisto, V., R. Hendler, E. Nadel, and P. Felig. Influence ofphysical training on the fuel-hormone response to prolonged lowintensity exercise. Metabolism 31:192-197, 1982.
148. Kortkiewski, M., K. Mandroukas, L. Sjostrom, L. Sullivan, H.Wetterquivst, and P. Bjorntorp. Effects of long-term physicaltraining on body fat, metabolism, and blood pressure in obesity.Metabolism 28:650-658, 1979.
149. Kortkiewski, M., L. Toss, P. Bjorntorp, and G. Holm. The effectof very-low diet with and without chronic exercise on thyroid andsex hormones, plasma proteins, oxygen uptake, insulin, and c pep-tide concentration in obese women. Int. J. Obesity 5:293-297,1981.
150. Kukkonen, K., R. Raurammaa, O. Sitonen, and O. Hanninen. Physicaltraining of obese middle-aged persons. Annals Clin. Res. 14:Suppl. 34:80-85, 1982.
151. Lammert, O. and E.S. Hansen. Effects of excessive caloric intakeand caloric restriction on body weight and energy expenditure atrest and light exercise. Acta. Physiol. Scand. 114:135-141, 1982.
152. Landsberg, L., and J.B. Young. Fasting, feeding and regulationof the sympathetic nervous system. N. Engl. J. Med. 298:1295-1301, 1978.
153. LeBlanc, J., M. Boulay, S. Dulac, M. Jobin, and A. Labrie. Meta-bolic and cardiovascular responses to norepinephrine in trainedand nontrained human subjects. J. Appl. Physiol. 42:166-173, 1977.
154. LeBlanc, J., P. Mercier, and P. Samson. Diet-induced thermogenesiswith relation to training state in female subjects. Can. J.Physiol. Pharmacol. 62:334-337, 1984.
155. Lehninger, A.L. Biochemistry: The Molecular Basis of CellStructure and Function. New York: Worth Pub., 1979.
156. Leibel, R. Some aspects of energy metabolism relevant to obesity.In P.J. Garry (ed.), Human Nutrition Clinical and BiochemicalAspects. Washington, D.C., Am. Assoc. for Clin. Chem., 1981.
157. Leibel, R. and J. Hirsch. Diminished energy requirements inreduced-obese patients. Metabolism 33:164-170, 1984.

170
158. Leon, A.S., J. Conrad, D.B. Hunninghake, and R. Surface. Effectsof a vigorous walking program on body composition, and carbohydrateand lipid metabolism of obese young men. Am. J. Clin. Nutr. 32:1776-1787, 1979.
159. Lepkovsky, S. Newer concepts in the regulation of food intake.Am. J. Clin. Nutr. 26:271-278, 1973.
160. Leveille, G.A. Adipose tissue metabolism: influence of periodi-city of eating and diet composition. Fed. Proc. 29:1294-1282,1970
161. Lewis, S., W.L. Haskell, P. Wood, N. Manoogian, J.E. Bailey, andM. Pereira. Effects of physical activity on weight reduction inobese middle-aged women. Am. J. Nutr. 29:151-156, 1976.
162. Ljunggren, H., D. Ikkos, and R. Luft. Basal metabolism in womenwith obesity and anorexia nervosa. Br. J. Nutr. 15:21-32, 1961.
163. Mahalko, J.R. and L.K. Johnson. Accuracy of predictions of long-term energy needs. J. Am. Dietetic Assoc. 77:557-566, 1980.
164. Martin, C.R. Textbook of Endocrine Physiology. New York: OxfordUniversity Press, 1976.
165. Mason, J.W., L. Howard, T. Kotchen, F. Wherry, L.L. Pennington,and L.G. Jones. Plasma thyroid stimulating hormone response inanticipation of muscular-exercise in humans. J. Clin. Endocrinol.Metab. 37:403-406, 1973.
166. McArdle, W.D., F.I. Katch, and V.C. Katch. Exercise Physiology:Energy, Nutrition and Human Performance. Philadelphia: Lea andFebiger, 1981.
167. McKee, W.P., and R.E. Bolinger. Caloric expenditure of normal andobese subjects during standard work test. J. Appl. Physiol.15:197-200, 1960.
168. Mellerowicz, B. and V.N. Smodlaka. Ergometry: Basics of ExerciseTesting. Baltimore-Munich: Urban and Schwarzenberg, 1981.
169. Meneely, G.R. and N.L. Kaltreider. The volume of the lungdetermined by helium dilution: Description of the method andcomparison with other procedures. J. Clin. Invest. 28:129-139,1949
170. Miller, D.S. Energy balance and obesity. In P.B. Curtis-Prior(ed.), Biochemical Pharmacology of Obesity. London: Elsevier Sci.Publishers, 1983.
171. Miller, D.S. and P. Mumford. Obesity: physical activity andnutrition. Proc. Nutr. Soc. 25:100-107, 1966.
172. Miller, D.S., P. Mumford, and M.J. Stock. Gluttony II. Thermo-genesis in overeating man. Am. J. Clin. Nutr. 20:1223-1229, 1967.
173. Miller, D.S. and S. Parsonage. Resistance to Slimming: Adaptationor Illusion? Lancet i:773-779, 1975.

171
174. Mir, M.A., B.M. Charalambous, K. Morgan, and P.J. Evans.Erythrocyte sodium-potassium-ATPace and sodium transport inobesity. N. Engl. J. Med. 305:1263-1268, 1981.
175. Moore, J., J.N. Mehrishi, C. Verdoorn, and I.H. Mills. The roleof T3 and its receptor in efficient metabolizers receiving verylow-calorie diets. Int. J. Obesity 5:283-286, 1981.
176. Morgan, J.B., D.A. York, A. Wasilwska, and J. Portman. A study ofthe thermic response to a meal and to a sympathomimetic drug inrelation to energy balance in man. Br. J. Nutr. 47:21-32, 1982.
177. Naismith, M.D., M.D. Holdsworth, J.L. Bailey, and A.P. Flewitt.Carbohydrate conservation in the obese: a theory to explain theease of weight gain. Proc. Nutr. Soc. 40-51A, 1980.
178. Neilson, B. Metabolic reactions to changes in core and skintemperature in man. Acta. Physiol. Scand. 97:129-137, 1975.
179. Nestel, P. and B. Goldrick. Obesity: Changes in lipid metabolismand the role of insulin. Clin. in Endocrin. and Metab. 5:313-335, 1976.
180. Newsholme, E.A. A possible metabolic basis for the control ofbody weight. N. Engl. J. Med. 302:400-405, 1980.
181. Newsholme, E.A. Substrate cycles: their metabolic, energeticand thermic consequences in man. Biochem. Soc. Symp. 47:183-205,1979.
182. Newsholme, E.A. and A.R. Leech. Biochemistry for the MedicalSciences. Chichester: John Wiley and Sons, 1983.
183. Novack, R. Regulation of body temperature. Prog. Fd. Nutr. Sci.2:473-481, 1977.
184. Ostle, B. and R.W. Mensing. Statistics in Research, 3rd Ed.,Ames, Iowa State Univ. Press, 1975.
185. Palmblad, J., L. Levi, A. Burger, A. Melander, U. Westgren, andG. Skude. Effects of total energy withdraw on levels of growthhormone, thyrotropin, cortisol, adrenaline, noradrenaline, T4, T3,rT3 in healthy males. Acta. Med. Scand. 201:15-28, 1977.
186. Passmore, R. and F.J. Ritchie.J. Nutr. 11:79-85, 1957.The specific dynamic action of food
and the satiety mechanism. Br.
187. Passmore, R. and J.V.G.A. DurninLondon: Heinemann Books, 1967.
188. Passmore, R. and R.E. Johnson. Some metabolic changes followingprolonged moderate exercise. Metabolism 9(5):452-455, 1960.
189. Payne, P.R. and A.E. Dugdale. Mechanisms for the control of bodyweight. Lancet 1:583-587, 1977.
. Energy, Work and Leisure.
172
190. Peronnet, F., J. Cleroux, H. Perrault, D. Cousineau, J. Champlain,and R. Nadeau. Plasma norepinephrine response to exercise beforeand after training in humans. J. Appl. Physiol. 51:812-815, 1981.
191. Pittet, P., P. Chappuis, K. Acheson, F. DeTechtermann, and E.Jequier. Thermic effect of glucose in obese subjects studied bydirect and indirect calorimetry. Br. J. Nutr. 35:281-292, 1976.
192. Premachandra, B.N., W.W. Winder, R. Hickson, S. Lang, and J.O.Holloszy. Circulating reverse triiodothyronine in humans duringexercise. Bur. J. Appl. Physiol. 47:281-288, 1981.
193. Rabinowitz, D. Some endocrine and metabolic aspects of obesity.Ann. Rev. Med. 21:241-258, 1970.
194. Rahkila, P., J. Soimajarvi, E. Karvinen, and V. Vihko. Lipidmetabolism during exercise. Eur. J. Appl. Physiol. 44:245-254,1980.
195. Ravussin, E., B. Burnand, Y. Schutz, and E. Jequier. Twenty-fourhour energy expenditure and resting metabolic rate in obese,moderately obese, and control subjects. Am. J. Clin Nutr. 35:566-573, 1982.
196. Ravussin, E. and C. Bogardus. Thermogenic response to insulin andglucose infusions in man. Life Sciences 31:2011-2018, 1982.
197. Richard, D., A. Labrie, D. Lupien, A. Tremblay, and J. LeBlanc.Interactions between dietary obesity and exercise training oncarbohydrate metabolism. Int. J. Obesity 6:359-367, 1982.
198. Rochelle, R.H. and S.M. Horvath. Metabolic responses to food andacute cold stress. J. Appl. Physiol. 27:710-716, 1969.
199. Rodin, J. Current status of the internal-external hypothesis ofobesity. Am. Psychol. 36:361-372, 1981.
200. Rothwell, N.J. and M.J. Stock. A role for brown adipose tissue indiet-induced thermogenesis. Nature 281:31-35, 1979.
201. Rothwell, N.J. and M.J. Stock. A role for insulin in the diet-induced thermogenesis of cafeteria-fed rats. Metabolism 30:673-678, 1981.
202. Rothwell, N.J. and M.J. Stock. Diet-induced thermogenesis. Adv.Nutr. Research 5:201-220, 1983.
203. Rothwell, N.J. and M.J. Stock. Similarities between cold- anddiet-induced thermogenesis in the rat. Can. J. Physiol, Pharm.58:985-991, 1980.
204. Salans, L.B. and J.K. Wise. Metabolic studies of human obesity.Med. Clin. of North America 54:1533-1542, 1970.
205. Schutz, Y., T. Bessard, and E. Jequier. Diet-induced thermogenesismeasured over a whole day in obese and nonobese women. Am. J.Clin. Nutr. 40:542-552, 1984.

173
206. Schwartz, R.S., J.B. Halter, and E.L. Bierman. Reduced thermiceffect of feeding in obesity: role of norepinephrine. Metabolism32:114-117, 1983.
207. Segal, K.R. and B. Gutin. Thermic effects of food and exercise inlean and obese women. Metabolism 32:581-589, 1983.
208. Serog, P., M. Apfelbaum, N. Autissier, F. Baigts, and A. Ktorza.Effects of slimming and composition of diets on V02 and thyroidhormones in healthy subjects. Am. J. Clin. Nutr. 35:244-235,1982.
209. Shangold, M.M. Exercise and the adult female: hormonal andendocrine effects. In R.L. Terjung (ed.), Exercise and SportSciences Reviews, Vol. 12. Lexington, Collamore Press, 1984.
210. Sharief, N.N. and I. Macdonald. Differences in dietary-inducedthermogenesis with various carbohydrates in normal and overweightmen. Am. J. Clin. Nutr. 35:267-272, 1982.
211. Shetty, P.S., R.T. Jung, W.P.T. James, and M.A. Barrand. Post-prandial thermogenesis in obesity. Clin. Sci. 60:519-525, 1981.
212. Shetty, P.S., R.T. Jung, and W.P.T. James. Reduced dietary-induced thermogenesis in obese subjects before and after weightloss. Proc. Nutr. Soc. 38:87A, 1979.
213. Sims, E.A.H., E. Danforth, E.S. Horton, G.A. Bray, J.A. Glennon,and L.B. Salans. Endocrine and metabolic effects of experimentalobesity. Recent Prog. Hormone Res. 29:457-496, 1973.
214. Sims, E.A.H. Experimental obesity, dietary-induced thermogenesis,and their clinical implications; Clin. in Endocrin. and Metab.5:377-395, 1976.
215. Sjostrom, L. and P. Bjorntorp. Body composition and adipose tissuecellularity in human obesity. Acta. Med. Scand. 195:201-211,1974.
216. Sjostrom, L., P. Bjorntorp, and J. Vrana. Microscopic fat cellsize measurements on frozen-cut adipose tissue in comparison withautomatic determinations of osmium-fixed fat cells. J. LipidResearch 12:521-533, 1971.
217. Smith, T.J. and I.S. Edelman. The role of sodium transport inthyroid thermogenesis. Fed. Proc. 38:2150-2153, 1979.
218. Society of Acturaries (1959-1960). Build and Blood Pressure Study.Long Island, N.Y., Peter F. Mallon, Inc., 1959.
219. Sokal, R.R. and F.J. Rohlf. Biometry, 2nd Ed., New York, W.H.Freeman and Co., 1981.
220. Sterling, J.L. and M.J. Stock. Metabolic origins of thermogenesisinduced by diet. Nature 220:801-810, 1968.
221. Sterling, K. Thyroid hormone action at the cell level. N. Engl.J. Med. 300:173-177, 1979.

174
222. Stern, J.S., C. Schultz, P. Mole, H.R. Superko, and E. Bernauer.Effect of caloric restriction and exercise on basal metabolism andthyroid hormone. Alien. Nutr. Metab. 1:361-370, 1980.
223. Stern, J.S. Genetic influence in the development of obesity:focus on food intake. Int. J. Obesity 4:304-309, 1980.
224. Strang, I.M. and A.B. McCluggage. The specific dynamic action offood in abnormal states of nutrition. Am. J. Med. Sci. 182:49-70, 1931.
225. Stunkard, A.J. The current status of treatment for obeSity inadults. In A.J. Stunkard and E. Seller (eds.), Eating and ItsDisorders. New York: Raven Press, 1984.
226. Sukhatme, P.V. and S. Margen. Autoregulatory homeostatic natureof energy balance. Am. J. Clin. Nutr. 35:355-365, 1982.
227. Swan, H. Thermoregulation and Bioenergetics. New York: Elsevier,1974.
228. Swindells, Y.E. The influence of activity and size of meals oncaloric response in women. Br. J. Nutr. 27:65-70, 1972.
229. Taylor, H.L., E. Buskirk, and A. Henschell. Maximal oxygen intakeas an objective measure of cardio-respiratory performance.J. Appl. Physiol. 8:73-80, 1955.
230. Terjung, R.L. and C.M. Tipton. Plasma thyroxine and thyroid-stimulating hormone levels during submaximal exercise in humans.Am. J. Physiol.. 220:1840-1845, 1971.
231. Terjung, R.L. and W.W. Winder. Exercise and thyroid function.Med. Sci. Sports. 7:20-25, 1975.
232. Thompson, J.K., G.J. Jarvie, B.B. Lahey, and K.J. Curaton.Exercise and obesity: etiology, physiology, and intervention.Psych. Bull. 91:55-79, 1982.
233. Thomson, A.M., W.Z. Billewicz, and R. Passmore. The relationshipbetween calorie intake and body weight in man. Lancet 1:1027-1028, 1961.
234. Thurlby, P.L. and P. Trayhurn. The development of obesity inpreweaning ob/ob mice. Br. J. Nutr. 39:397-402, 1978.
235. Thurlby, P.L. and P. Trayhurn. The role of thermogenesis in thedevelopment of obesity in genetically obeses ob/ob mice. Br. J.Nutr. 42:377-385, 1979.
236. Toft, A.D., I.W. Campbell, and J. Seth. Diagnosis and Managementof Endocrine Diseases. London, Blackwell Scientific Pub., 1981.
237. Trayhurn, P., P.L. Thurlby, C.J.H. Woodward, and W.P.T. James.Thermoregulation in genetically obese rodents: the relationshipto metabolic efficiency. In M. Festing (ed.), Animal Models ofObesity. New York: Oxford University Press, 1979.
175
238. Trayhurn, P., P.L. Thurlby, and W.P.T. James. Thermogenic defectin pre-obese ob/ob mice. Nature 266:60-62, 1977.
239. Tzankoff, S.P. and A.H. Norris. Effect of muscle mass decrease onage-related BMR changes. J. Appl. Physiol. 43:1001-1006, 1977.
240. Tzankoff, S.P. and A.H. Norris. Longitudinal changes in basalmetabolism in man J. Appl. Physiol. 45:536-539, 1978.
241. Vanitallie, T.B., M. Yang, and S.A. Hashim. Dietary approaches toobesity: metabolic and appetitive considerations. In A. Howard(ed.), Recent Advances in Obesity Research I. London: NewmanPub., 1974.
242. Wakeham, G. Basal metabolism and the menstrual cycle. J. Biol.Chem. 56:555-561, 1923.
243. Wang, C.C. and S. Strouse. Studies on the metabolism of obesity.Arch. Int. Med. 34:573-583, 1924.
244. Warnold, I., G. Carlgren, and M. Krotkiewski. Energy expenditureand body composition during weight reduction in hyperplastic obesewomen. Am. J. Clin. Nutr. 31:750-763, 1978.
245. Warwick, M., and J.S. Garrow. The effect of addition of exerciseto a regime of dietary restriction on weight loss, nitrogen balance,resting metabolic rate and spontaneous physical activity in threeobese women in a metabolic ward. Int. J. Obesity 5:25-32, 1981.
246. Wasserman, K. and B.J. Whipp. Exercise physiology in health anddisease. Am. Rev. Resp. Dis. 112:219-245, 1975.
247. Webb, P. The measurement of energy exchange in man: an analysis.Am. J. Clin. Nutr. 33:1299-1310, 1980.
248. Wedgwood, R.J., D.E. Bass, J.A. Klimas, C.R. Kleeman, and M. Quinn.Relationship of body composition to basal metabolic rate in normalman. J. Appl. Physiol. 6:317-333, 1953.
249. Weir, J.B. DE V.
special reference1949.
250. Welle, S.L., andin obese women.
New methods for calculating metabolic rate withto protein metabolism. J. Physiol. 109:1-9,
R.G. Campbell. Normal thermic effect of glucoseAm. J. Clin. Nutr. 37:87-92, 1983.
251. Welle, S.L., U. Lilavivathana, and R.G. Campbell. Increased plasmanorepinephrine concentration and metabolic rates following glucoseingestion in man. Metabolism 29:806-809, 1980.
252. Welle, S.L., U. Lilavivathana, and R.G. Campbell. Thermic effectof feeding in man: increased plasma norepinephrine levels followinglucose but not protein or fat consumption. Metabolism 30:953-958, 1981.
253. Whipp, B.J., G.A. Bray, S.N. Koyal, and K. Wasserman. Exerciseenergentics and respiratory control in man following acute andchronic elevation of caloric intake. In. G.A. Bray (ed.), Obesityin Perspective, Volume 2, 1980.
176
254. Wilmore, J.H., P. Vodak, R. Parr, R. Girandola, and J. Billing.Further simplification of a method for determination of residuallung volume. Med. Sci. Sport and Exercise 12: 216-218, 1980.
255. Wiltshire, M.O.P. Some observations on basal metabolism inmenstruation. Lancet ii:388-390, 1921.
256. Winder, W.W., J.M. Hagberg, R.C. Hickson, A.A. Ehsani, and J.A.McLane. Time course of sympathoadrenal adaptation to enduranceexercise training in man. J. Appl. Physiol. 45:370-374, 1978.
257. Winder, W.W. and J.0. Holloszy. Response of mitochondria ofdifferent types of skeletal muscle to thyrotoxicosis. Am. J.Physiol. 232:180-184, 1977.
258. Winer, B.J. Statistical Principles in Experimental Design. 2ndEd. New York: McGraw-Hill, 1971.
259. York, D.A., J.B. Morgan, and T.G. Taylor. The relationship ofdietary induced thermogenesis to metabolic efficiency in man.Proc. Nutr. Soc. 39:57A, 1980.
260. Zahorska-Markiewicz, B. Effects of timing on energy expenditureduring rest and exercise in obese women. Nutr. Metab. 24 :238-
243, 1980.
261. Zahorska-Markiewicz, B. Thermic effect of food and exercise inobesity. Eur. J. Appl. Physiol. 44:231-235, 1980.

APPENDICES

177
APPENDIX A
FORMS
Appendices Content Page
A-1 Human Subjects Approval 178
A-2 Pre-participation Questionnaire 179
A-3 Activity History 183
A-4 Medical Referral Form 185
A-5 Subject Expectations 187
A-6 Subject Consent Form 190
A-7 Schedule of Treatments 193
A-8 Thermogenesis Worksheet 194
A-9 Activity Record 196
A-10 Nutritional Composition Meals 198
A-11 Schedule of Test Events 200
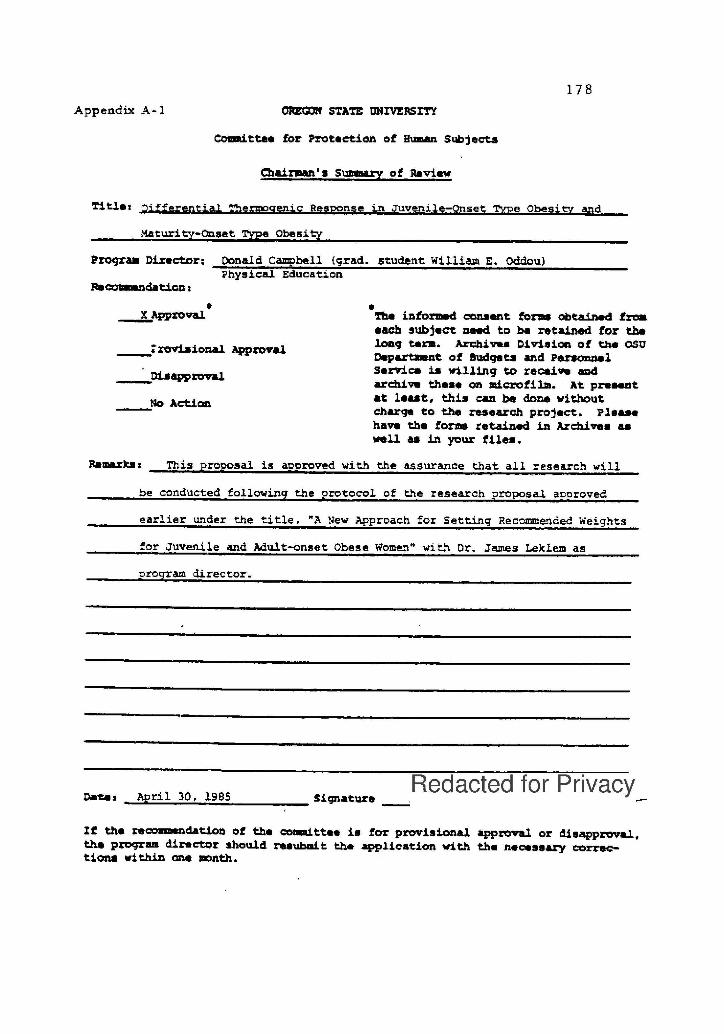
178Appendix A-1 OREGON STATE UNIVERSITY
Committee for Protection of Human Subjects
Chairman's Summary of Review
Title: Differential Thermocrenic Response in Juvenile -onset Type Obesity and
Maturity-Onset Type Obesity
Program Director: Donald Campbell (grad. student William E. Oddou)Physical Education
Recommendation;
SX Approval The informed consent forms obtained from
each subject need to be retained for the
:rovisional Approval long term. Archives Division of the OSUDepartment of Budgets and Personnel
Dis al Service is willing to receive andapprovarchive these on microfilm. At present
Action at least, this can be done withoutNocharge to the research project. Pleasehave the for retained in Archives aswell as in your files.
Remarks: This proposal is approved with the assurance that all research will
be conducted following the protocol of the research proposal approved
earlier under the title, "A New Approach for Setting Recommended Weights
for Juvenile and Adult-onset Obese Women" with Dr. James Leklem as
program director.
Dates April 30, 1985 SignatureRedacted for Privacy
If the recomendation of the committee is for provisional approval or disapproval,the program director should resubmit the application with the necessary correc-tions within one month.

Appendix A-2
Dr. LeklemDept. Foods & NutritionOregon State University
CONFIDENTIALNutrition Project
Age: Birth Date:
Predominant State of Residence:
Present Employment:
179
Code
City: No. of Years:
Race (circle one): a.b.
c.
d.
American IndianBlackCaucasianLatin American
Marital Status (circle one): a. singleb. married
-3E-** *** #414 ### ### ### ###
HEIGHT/WEIGHT: Height (feet and inches)
e. Asian
f. Other (specify)
c. divorced/separatedd. widowed
### -*if* *if* *## ###
Present Weight
Length of time you have maintained your present weight
What is the most you have ever weighed? What age?
How long did you maintain your heaviest weight?
What is the least you have weighed as an adult? What age?
How long did you maintain your lightest weight?
How many times have you lost more than 10 pounds of body weight?
List below your age, the means used to lost weight each time (e.g.dieting, illness--please specify, exercise program, diet pills, etc.),and how long you maintained the reduced weight.
How much How lost How long maintainedAge lost weight the lost weight
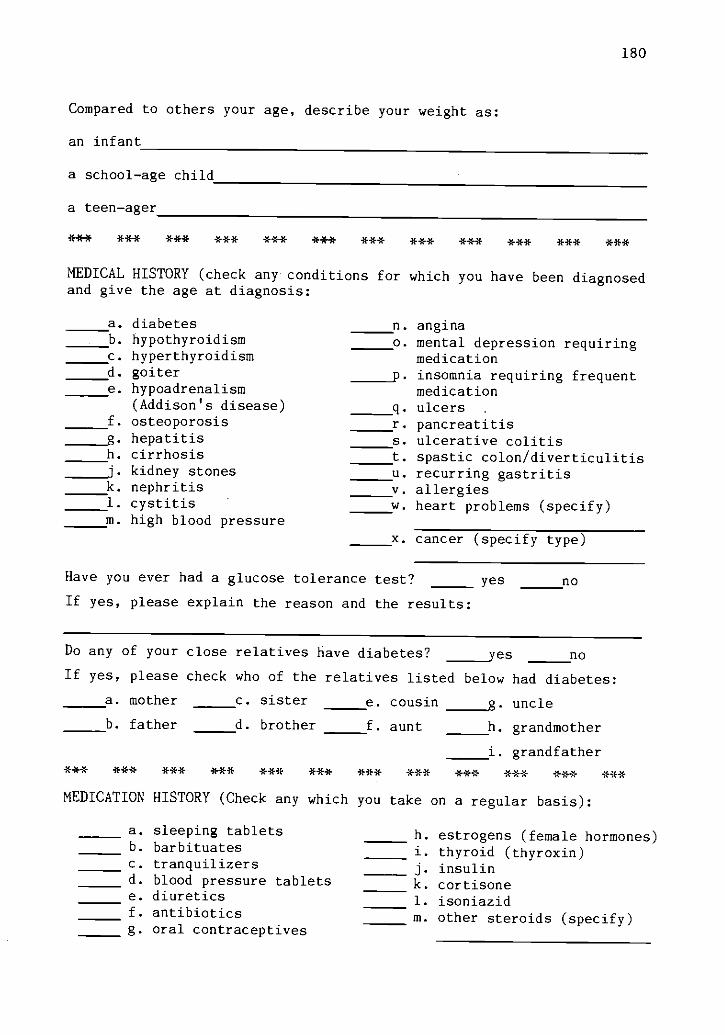
180
Compared to others your age, describe your weight as:
an infant
a school-age child
a teen-ager
*** *** *** *** *** *** *** *** *** *** *44*
MEDICAL HISTORY (check any conditions for which you have been diagnosedand give the age at diagnosis:
a. diabetes n. anginab. hypothyroidism o. mental depression requiringc. hyperthyroidism medicationd. goiter p. insomnia requiring frequente. hypoadrenalism medication
(Addison's disease) q. ulcers .
f. osteoporosis r. pancreatitis_____g. hepatitis s. ulcerative colitis
h. cirrhosis t. spastic colon/diverticulitisj. kidney stones u. recurring gastritisk. nephritis v. allergies1. cystitis w. heart problems (specify)m. high blood pressure
x. cancer (specify type)
Have you ever had a glucose tolerance test? yes no
If yes, please explain the reason and the results:
Do any of your close relatives have diabetes? yes no
If yes, please check who of the relatives listed below had diabetes:
a. mother c. sister e. cousin g. uncle
b. father d. brother f. aunt h. grandmother
i. grandfather*** *** *** *** *** *** *44* *41* *** *** *** *44*
MEDICATION HISTORY (Check any which you take on a regular basis):
a. sleeping tabletsb. barbituatesc. tranquilizersd. blood pressure tabletse. diureticsf. antibioticsg. oral contraceptives
h. estrogens (female hormones)i. thyroid (thyroxin)j. insulink. cortisone1. isoniazidm. other steroids (specify)
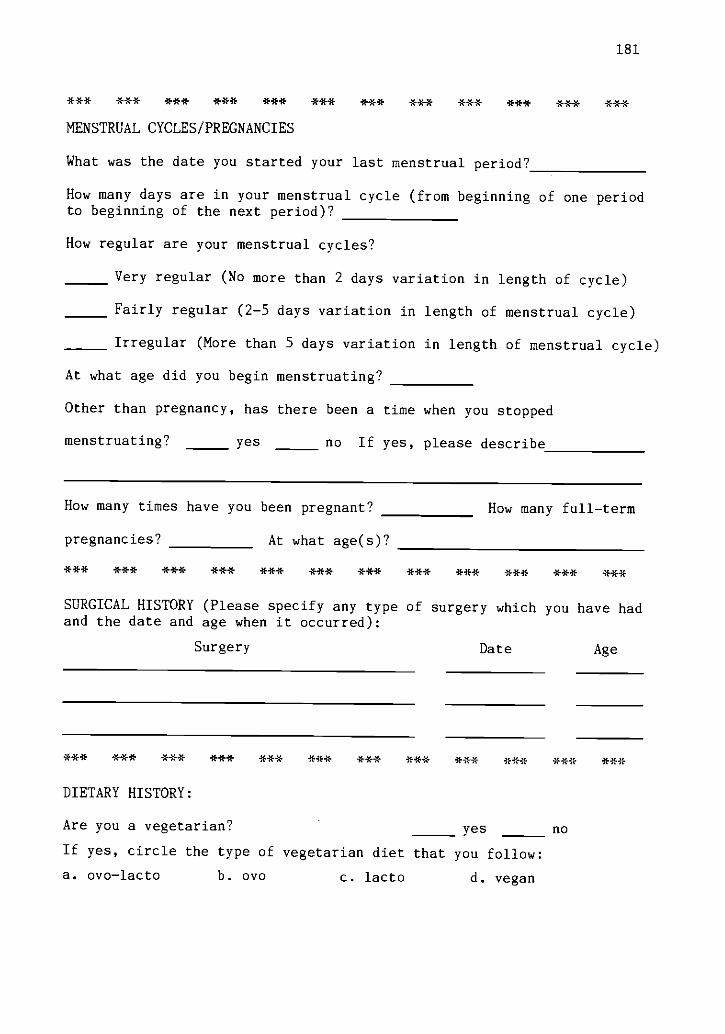
181
*** *** *** *** *** *** *** *** *** *** *** ***
MENSTRUAL CYCLES/PREGNANCIES
What was the date you started your last menstrual period?
How many days are in your menstrual cycle (from beginning of one periodto beginning of the next period)?
How regular are your menstrual cycles?
Very regular (No more than 2 days variation in length of cycle)
Fairly regular (2-5 days variation in length of menstrual cycle)
Irregular (More than 5 days variation in length of menstrual cycle)
At what age did you begin menstruating?
Other than pregnancy, has there been a time when you stopped
menstruating? yes no If yes, please describe
How many times have you been pregnant? How many full-term
pregnancies? At what age(s)?
*** *** *** *** *** *** *** *** *** *** *** ***
SURGICAL HISTORY (Please specify any type of surgery which you have hadand the date and age when it occurred):
Surgery Date Age
*** *** *** *** *** *41* *** *** * *** *** ***
DIETARY HISTORY:
Are you a vegetarian? yes
If yes, circle the type of vegetarian diet that you follow:
a. ovo-lacto b. ovo c. lacto d. vegan
no

Do you take vitamins? (Circle one)
a. yes, daily b. yes, frequently c. never
182
If yes, what type, amount and how long have you taken them?
Type Amount How long?
Type Amount How long?
Type Amount How long?
Are you presently taking vitamins? yes
If yes, what type, what amount and how often?
no
Please list all foods which you refuse to eat, cannot eat or prefer notto eat.
*** *** *** *** *** *** *** *** *** *** ***
EXERCISE LEVEL
Do you have a daily fitness program? yes no
Please describe:
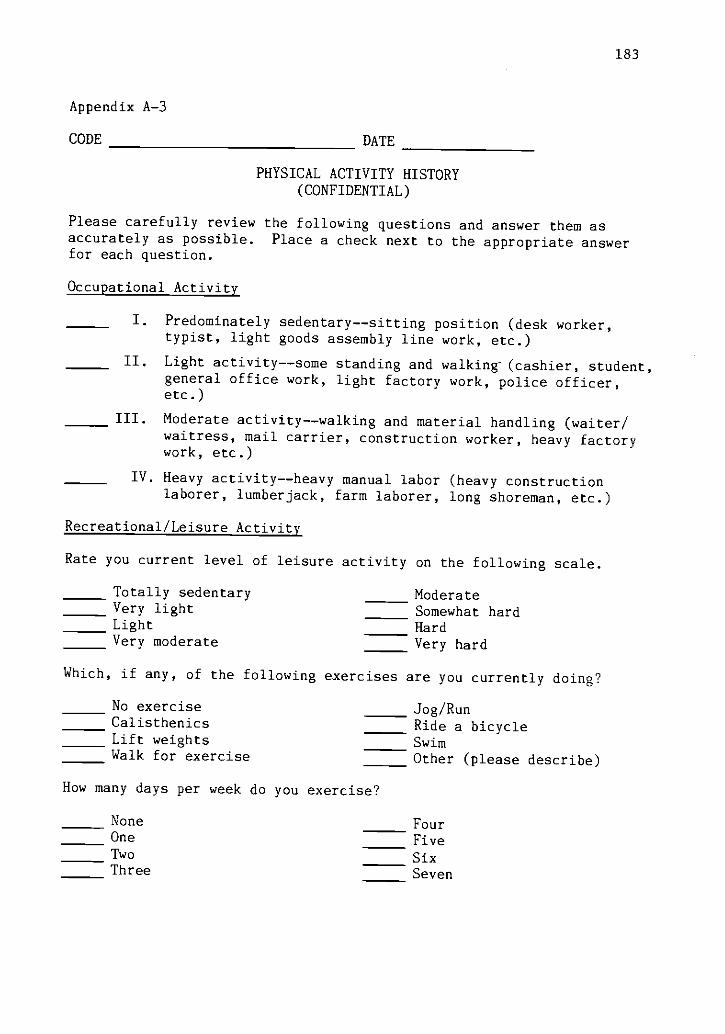
Appendix A-3
183
CODE DATE
PHYSICAL ACTIVITY HISTORY(CONFIDENTIAL)
Please carefully review the following questions and answer them asaccurately as possible. Place a check next to the appropriate answerfor each question.
Occupational Activity
I. Predominately sedentary--sitting position (desk worker,typist, light goods assembly line work, etc.)
II. Light activity--some standing and walking (cashier, student,general office work, light factory work, police officer,etc.)
III. Moderate activity--walking and material handling (waiter/waitress, mail carrier, construction worker, heavy factorywork, etc.)
IV. Heavy activity--heavy manual labor (heavy constructionlaborer, lumberjack, farm laborer, long shoreman, etc.)
Recreational/Leisure Activity
Rate you current level of leisure activity on the following scale.
Totally sedentaryVery lightLightVery moderate
ModerateSomewhat hardHardVery hard
Which, if any, of the following exercises are you currently doing?
No exerciseCalisthenicsLift weightsWalk for exercise
How many days per week do you exercise?
NoneOneTwoThree
Jog/RunRide a bicycleSwimOther (please describe)
FourFive
SixSeven

184
How much time do you spend on exercise each exercise day?
NoneLess than 15 minutes15-30 minutes30-45 minutes
45-60 minutes60-75 minutes75-90 minutesMore than 90 minutes
If you exercise, please rate the intensity of your exercise on thefollowing scale:
6
7 very, very light8
9 very light10
11 fairly light12
13 somewhat hard
14
15 hard16
17 very hard18
19 very, very hard20
How would you rate your current general state of physical fitness?
very, very good poorvery good very poorgood very, very poorneither good nor poor
How long have you maintained your current level of physical fitness?
< 6 months6 months 1 year1-2 years
2-3 years> 3 years
Briefly outline a normal week's activities: (Include both occupationaland recreational activities)
DAY ACTIVITY MINUTES ENGAGED IN ACTIVITY INTENSITY

185
Appendix A-4
MEDICAL REFERRAL FORM FOR PARTICIPATION IN THE OREGON STATE UNIVERSITYOBESITY PROGRAM.
AUTHORIZATION FOR GRADED EXERCISE TESTING AND EXERCISE PROGRAM
Your client applied for and has beenselected to participate in the O.S.U. Obesity Research Project. Thisprogram will be conducted over a 12 month period beginning in Novemberof 1984. Active participation in the program requires your medicalclearance. Please complete the following form and return it to theproject director. Thank you for your cooperation. You will be keptinformed throughout the course of the study regarding your client'sprogress.
Client Date:
Physical Examination
Height ft. in. Weight lb.
Blood Pressure Pulse
Laboratory (required) Normal AbnormalUrine-Glucose
[ [
Albumin[ [
Micro[ [
HGB[ [
HEMAT.[ [
Resting 12 Lead EKG[ [
Interpretation (enclose)
Findings
Are there any abnormalities of the following systems? Describe.
1. Eye [ ] [ ]
2. E. N. T. [ ] [
3. Head and Neck [ [ ]
4. Respiratory [ [ ]
5. Cardiovascular [ ] [ ]
6. Gastrointestinal [ [
7. Genitourinary [ ] [ ]
8. Metabolic/Endocrine [ ] [ ]
9. Neuropsychiatric [ ] [ ]

Have you any general comments?
Health Appraisal
Are you this person's regular physician? yes no
186
How would you rate this person's physical health?
Excellent Good Fair Poor
Does this person have any chronic long-term disability or significantfactors to consider? yes no
Specify:
Is the person listed capable of participating in a mild exercise program,as well as periodic laboratory evaluation?
yes no
Specify:
Signed: M.D.
Name of Physician
Address
Phone
Yours in Health
Bill OddouObesity Research ProjectDept. Physical EducationLangton HallOregon State UniversityCorvallis, OR 97331754-3718

Appendix A-5
SUBJECT EXPECTATIONS
187
Prior to beginning the study:
1. Complete health and physical activity forms.
2. Have a blood chemistry screen done through our lab. Our staff willdraw the blood sample and send it to Good Samaritan Hospital inCorvallis for analysis.
3. Have a resting 12-lead electrocardiogram (ECG) done in the HumanPerformance Lab. This requires only that the subject lie quietlywhile electrodes are attached and ECG monitored. The proceduretakes about 30 minutes.
4. Take the blood chemistry and 12-lead ECG information to personalphysician, have a routine physical exam, and obtain physician'spermission to perticipate. (We will pay for the routine physicalexams up to $35.)
5. Provide some evidence of age of onset of obesity -- medical orschool records, or photographs.
6. Keep a record of menstrual cycle for two months.
During the study:
1. Attend three (3) 1-hour exercise (walking) sessions per week for 12months with week long breaks at the end of fall, winter, spring, andsummer terms.
2. Attend a nutrition education class 4x/month during months 1-4, 2x/mo.during months 5-8, and lx/mo. during months 9-12.
3. Begin a walking routine the other 4 days of the week as physicalability improves due to training.
4. Keep records of food consumed and physical activity throughout thestudy. No mineral, vitamin, or other food supplements will beallowed during the study.
5. Consume a metabolic diet, eating all food in the metabolic kitchenin the Foods & Nutrition Dept. for 20-21 days at the beginning andagain at the end of the study, and for an 8-10 day period during the11 month testing period.
6. Participate in the following tests three (3) times during the study(1st, 5th, 11th months):
a) Three-hour glucose tolerance test This test involves comingto the nutrition lab early in the morning following a 12 hourovernight fast. A butterfly catheter will be inserted in an armvein and an initial blood sample drawn. The subject then con-sumes a glucose drink and blood samples will be drawn 30 minutes,1, 2, and 3 hours after the glucose load. Ten mls of blood will

188
be drawn each time. Subjects must remain in the lab sitting orlying quietly throughout the test.
b) Body composition determinations This involves skinfold mea-surements, girths, and body diameters as well as underwaterweighing. The procedures will require about 11 hours of thesubjects' time.
c) Pulmonary capacity and function -- These will be determinedusing standard procedures by breathing into a spirometer. Thistesting will be done during the same visit as the body compo-sition determinations.
d) Exercise'test to determine functional capacity -- The testinvolves riding a bicycle ergometer at 3 separate submaximalworkloads for 5 minutes at each workload. ECG and blood pressureis monitored each minute. Subjects will also be hooked up to amouthpiece and breathing valve so inspired and expired air canbe analyzed for oxygen, carbon dioxide, and total volume. Aftera 5 minute rest period, subjects will walk on a motor-driventreadmill at 3.0 mph at increasing grades until volitional fati-gue is reached or end-point criteria as defined by the AmericanCollege of Sports Medicine. ECG, blood pressure and ventilationwill also be monitored each minute during this phase of the test.
e) Energy metabolism tests -- Each subject will do all four testsdescribed below. Each test will involve 4-6 hours of thesubjects' time. They will arrive at the Human Performance Labearly in the morning and sit quietly for 30 minutes. Restingmetabolic rate (RMR) will be measured via the mouthpiece andbreathing valve for ten minutes. A butterfly catheter will thenbe inserted into an arm vein. Subject will sit quietly againfor 30-60 minutes until their RMR returns to the initial level.At that point subjects will do one of the following:
1) sit quietly for a 4-hour period with RMR measured via thebreathing valve for 10 minutes each half hour.
2) consume a 700 kcal meal then sit quietly for a 4-hour periodwith RMR measured for 10 minutes each half hour.
3) consume a 700 kcal meal, then ride a bicycle ergometer at50% of their V02 max for 40 minutes. For the following 4hours they will sit quietly having RMR measured for 10minutes each half hour.
4) no meal will be consumed but subjects will ride the bicycleergometer and then sit quietly having RMR measured all inthe same manner described in 3).
During tests 3) and 4), 20 mls of blood will be drawn throughthe butterfly catheter at 0, 20, 40, and 85 minutes. Duringthe time subjects sit quietly following a meal or bicycle ride,they will be able to listen to the radio or read a book ormagazine.

189
g) Blood lipid, iron, and B6 assessment -- During each of the three
test periods subjects will have 30 mis of blood drawn followingan overnight fast for analysis of blood lipids, iron and B6status.
h) Urine collections Subjects will collect 24hour specimensduring the metabolic diet periods and all test periods. Theywill bring urine to Milam Hall each morning and pick up newcollection bottles.
Qualified personnel will be conducting all of these tests. MedicalTechnologists will be involved in all blood drawing. People trained indoing graded exercise testing and CPR will conduct all the exercise andmetabolic tests. Emergency procedures will be rehearsed and instructionsposted at each testing site. Appropriate emergency facilities will benotified each time that testing is being conducted.
BENEFITS TO SUBJECTS
1. Extensive health, fitness, and metabolic evaluatio will be donethree times in a 12 month period. This king of evaluation wouldcost subjects well over $500 if done on their own just one time.
2. Reduction in health risk factors associated with obesity throughsupervised exercise and nutrition education program.
3. Opportunity through the education program to develop lifestylehabits that will minimize health risk factors and allow maintenanceof a recommended body weight over the long term.

Appendix A-6
Subject Consent Form
190
, give my consent to partici-
pate in this study. The study has been explained to me and all my
questions have been answered. I understand that I will be expected to
have a routine physical exam prior to beginning the study and have read
the description of this in my "Subject Expectations" paper. I under-
stand that I shall be expected to attend the exercise classes three
times a week throughout the study, and the nutrition education classes
on a weekly basis. I understand that I will be expected to keep records
of my food intake and physical activity throughout the study, to abstain
from taking any vitamin, mineral, or food supplements during the study,
to consume all my food in the metabolic kitchen during the three testing
periods, to do 24-hour urine collections during all testing periods, and
to participate in the tests outlined in my "Subject Expectations" paper
at months 1, 4, and 11. These tests include a glucose tolerance test,
body composition and pulmonary function tests, exercise test to deter-
mine functional capacity, four energy metabolism tests, blood lipid and
nutritional status tests. I also understand that I am expected to have
adipose tissue biopsies dones at two sites (abdominal and buttocks),
once at the beginning and again at the end of the study. I have read
the attached description of the adipose tissue biopsy procedure to be
used in this study. Any questions I have concerning this procedure have
been answered. This procedure will be carried out at the Corvallis
Clinic.

191
I understand the physical stress the exercise tests will place on
me. Any symptoms such as chest pain, excessive shortness of breath,
muscular cramps, etc. will be cause for discontinuing a test procedure.
I understand that I may terminate the test on request at any time.
There exists the possibility of certain changes occurring during an
exercise test. They include abnormal blood pressure, rapid or very slow
heart beat, and very rare instances of heart attack. Constant surveil-
lance by supervising personnel will help to anticipate such possibili-
ties, and tests can thus be terminated where warranted. Emergency
resuscitation equipment and personnel are on constant standby if
required to deal with an unusual situation that might occur.
I agree to allow blood to be drawn for the various tests as out-
lined in the "Subject Expectations" paper. I understand that there is
.a minimal risk of infection when blood is drawn, that sterile procedures
will be followed to minimize this risk, and that a trained medical
technologist will draw the blood samples. I understand there is a
minimal risk of infection associated with each of the incisions made
during the adipose tissue biopsy. I understand that sterile procedures
will be followed to minimize the risk and I agree to follow the instruc-
tions for care of the two incision sites. I further understand that a
local physician will be available should there be any problems following
this biopsy procedure.
I understand that I am free to withdraw from the study at any time.
I also understand that the investigators reserve the right to withdraw
me from this study at any time.
I am assured that all information concerning me will be kept

192
confidential. My name and address will not be on the medical question-
naire. All data will be coded and medical and exercise history forms
will be kept in one place under the supervision of the principal inves-
tigator.
Name Date
Witness Date
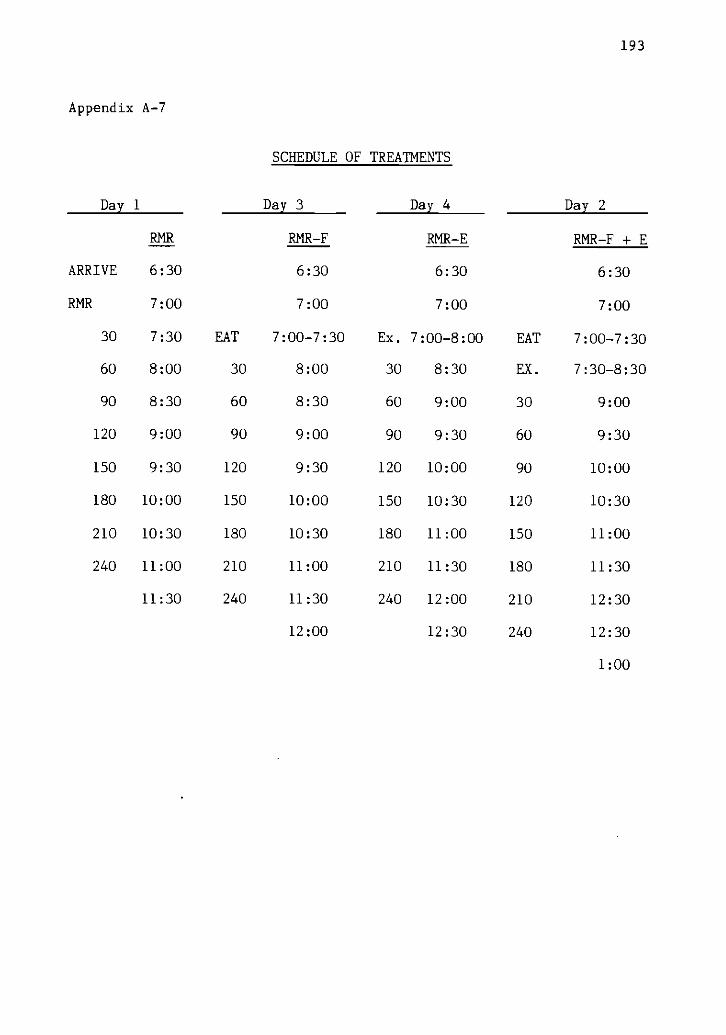
Appendix A-7
SCHEDULE OF TREATMENTS
193
Day 1 Day 3 Day 4 Day 2
ARRIVE
RMR
RMR RMR-F RMR-E RMR-F + E
6:30
7:00
6:30
7:00
6:30
7:00
6:30
7:00
30 7:30 EAT 7:00-7:30 Ex. 7:00-8:00 EAT 7:00-7:30
60 8:00 30 8:00 30 8:30 EX. 7:30-8:30
90 8:30 60 8:30 60 9:00 30 9:00
120 9:00 90 9:00 90 9:30 60 9:30
150 9:30 120 9:30 120 10:00 90 10:00
180 10:00 150 10:00 150 10:30 120 10:30
210 10:30 180 10:30 180 11:00 150 11:00
240 11:00 210 11:00 210 11:30 180 11:30
11:30 240 11:30 240 12:00 210 12:30
12:00 12:30 240 12:30
1:00

194
Appendix A-8
THERMOGENESIS WORKSHEET
NAME NUMBER WEIGHT LBS. KG.
DATE TREATMENT: RMR, RMR-F, RMR-E, RMR-F + E
TIME CONDITION MEASUREMENTS
6:30 arrival
6:45 Blood Pressure / mm/Hg
6:50-7:00 rmr Barometric Pressure mm/Hg
7:00
00
treatment
rmr
02 CO2 %
°CVe(final) Temp.Ve(initial). Temp. °C
Barometric Pressure mm/Hg02 CO2 %Ve(final) Temp. °CVe(initial) Temp. °C
+30 rmr Barometric Pressure mm/Hg02 CO2Ve(final) Temp. °CVe(initial) Temp. °C
+60 rmr Barometric Pressure mm/Hg02 CO2Ve(final) Temp. °CVe(initial) Temp. °C
+90 rmr Barometric Pressure mm/Hg02 CO2Ve(final) Temp. °CVe(initial) Temp. °C
+120 rmr Barometric Pressure mm/Hg02 CO2Ve(final) Temp. °CVe(initial) Temp. oc
+150 rmr Barometric Pressure mm/Hg02 CO2Ve(final) Temp. °CVe(initial) Temp. °C
+180 rmr Barometric Pressure mm/Hg02 CO2
.cVe(final) Temp.Ve(initial) Temp. °C

195
+210 rmr Barometric Pressure mm/Hg02 CO2 %
Ve(final) Temp. °C
Ve(initial Temp. °C
+240 rmr Barometric Pressure mm/Hg02 CO2Ve(final) Temp. °CVe(initial Temp. °C
Comments:
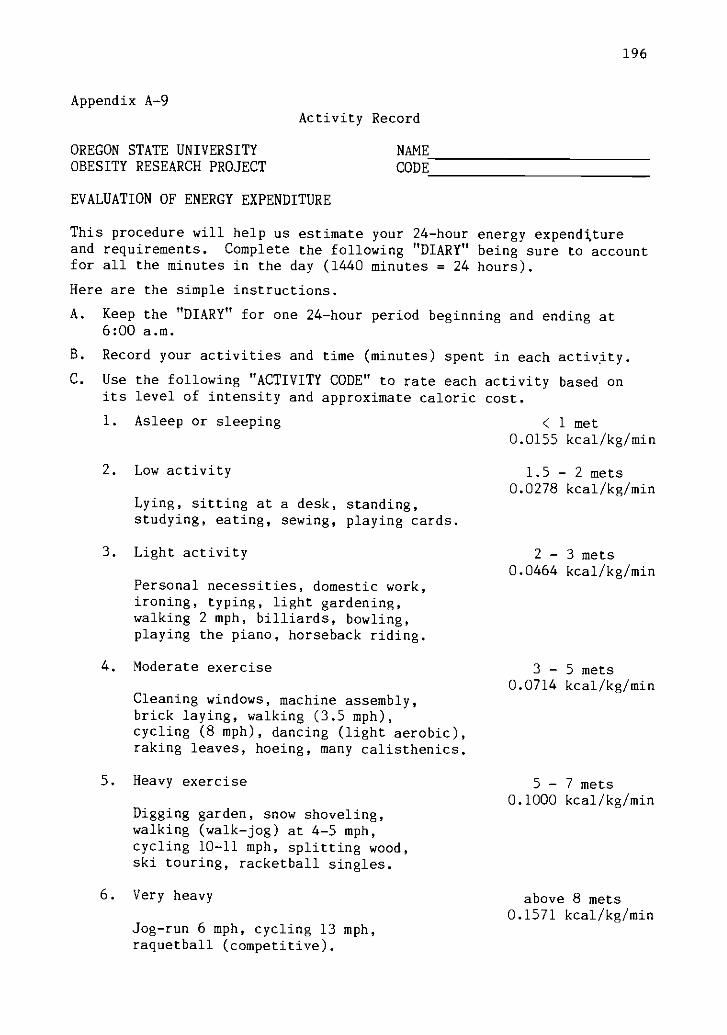
Appendix A-9Activity Record
OREGON STATE UNIVERSITYOBESITY RESEARCH PROJECT
EVALUATION OF ENERGY EXPENDITURE
NAMECODE
196
This procedure will help us estimate your 24-hour energy expendttureand requirements. Complete the following "DIARY" being sure to accountfor all the minutes in the day (1440 minutes = 24 hours).
Here are the simple instructions.
A. Keep the "DIARY" for one 24-hour period beginning and ending at6:00 a.m.
B. Record your activities and time (minutes) spent in each activity.
C. Use the following "ACTIVITY CODE" to rate each activity based onits level of intensity and approximate caloric cost.
1. Asleep or sleeping < 1 met0.0155 kcal/kg/min
2. Low activity
Lying, sitting at a desk, standing,studying, eating, sewing, playing cards.
3. Light activity
Personal necessities, domestic work,ironing, typing, light gardening,walking 2 mph, billiards, bowling,playing the piano, horseback riding.
4. Moderate exercise
Cleaning windows, machine assembly,brick laying, walking (3.5 mph),cycling (8 mph), dancing (light aerobic),raking leaves, hoeing, many calisthenics.
5. Heavy exercise
Digging garden, snow shoveling,walking (walk-jog) at 4-5 mph,cycling 10-11 mph, splitting wood,ski touring, racketball singles.
6. Very heavy
Jog-run 6 mph, cycling 13 mph,raquetball (competitive).
1.5 - 2 mets0.0278 kcal/kg/min
2 3 mets0.0464 kcal/kg/min
3 5 mets0.0714 kcal/kg/min
5 7 mets0.1000 kcal/kg/min
above 8 mets0.1571 kcal/kg/min
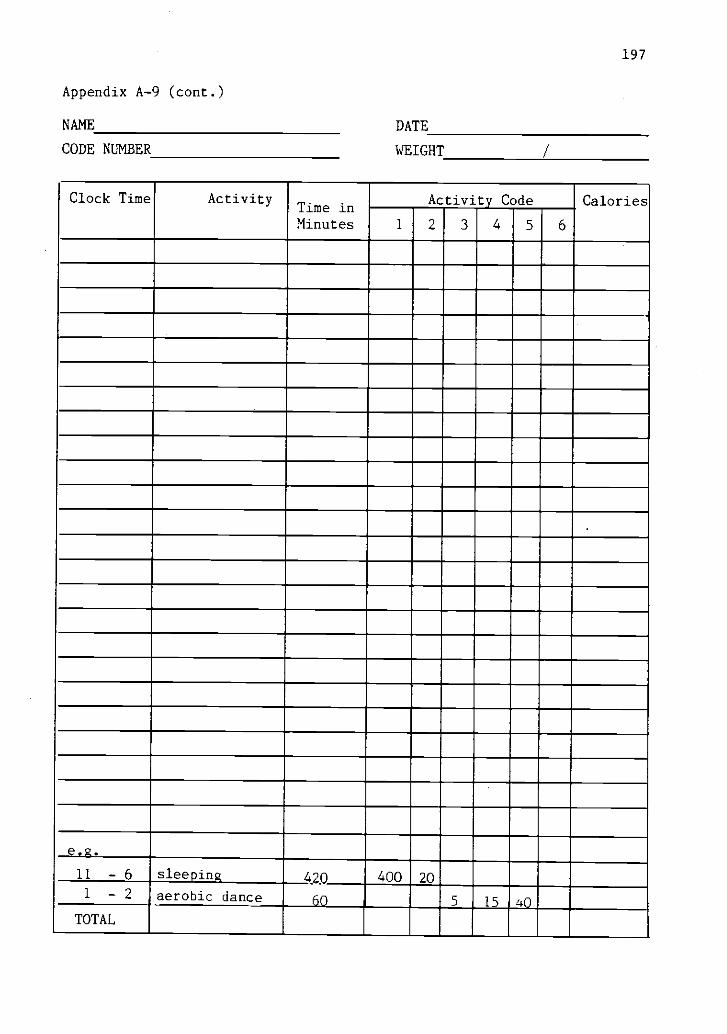
Appendix A-9 (cont.)
NAME
CODE NUMBER
197
DATE
WEIGHT
Clock Time ActivityTime inMinutes
Activity Code
1 2 3 4 5 6
Calories
e.g.
11 - 6
1 2
TOTAL
sleeping
aerobic dance420 400 20
60 5 15 40

198
Appendix A-10a. Composition of the Metabolic Diet.
METABOLIC DIET MENU
Breakfast
Wheat flake cereal 1-1/2 oz.*Raisins 1 oz.2% milk 8 oz.
OrAnge juice 8 oz.Plain muffin 2 (40 gm each)*Margarine 2 tsp.*
Lunch
Whole wheat breadCheddar cheeseDill pickleRaw carrot sticksCanned pears, light syrupApple juiceVanilla wafers
2 slices*1-1/2 oz.2 slices2-1/2 oz.1/2 cup8 oz.1 oz.*
Snack
Popcorn, plain 4 cups
Dinner
Brown rice 1 cup cooked*Turkey breast 2 oz.Corn 1/2 cupPeas 1/2 cup*Whole wheat bread 2 slices*Margarine 2 tsp.*Salad:Lettuce 1 cupRed cabbage 1/2 oz.
French dressing 1/2 oz.*Ice milk 1/2 cup*
Percent calories:
Protein 14%Fat 26%
Carbohydrate 60%
*Quantity of these foods adjusted to meet individual caloric require-ments.

199
Appendix A-10b. Composition of the Test Breakfast
THERMIC BREAKFAST MENU
Wheat flake cereal 1-1/2 oz.*
Raisins 1 oz.
2% Milk 8 oz.
Orange Juice 8 oz.
Plain Muffin 2 (40 gm each)*
Margarine 2 tsp.*
Whole Wheat Bread 1 slice*
Percent calories:
Protein 11%
Fat 23%
Carbohydrate 66%
* Quantity of these foods adjusted to meet individualcaloric requirements.
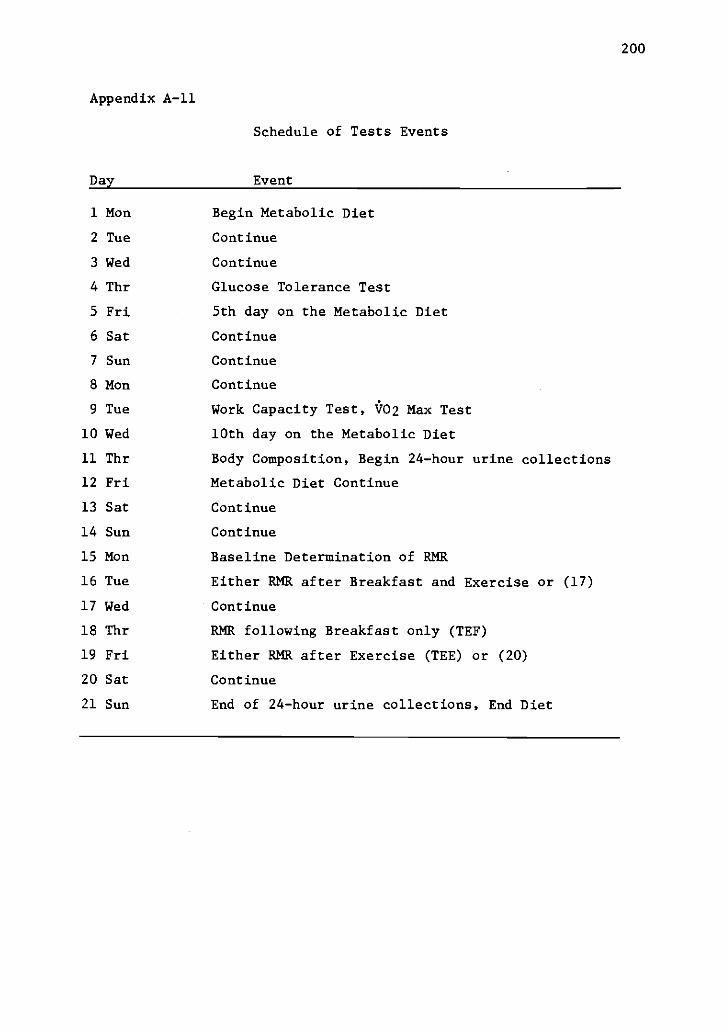
200
Appendix A-11
Schedule of Tests Events
Day Event
1 Mon Begin Metabolic Diet
2 Tue Continue
3 Wed Continue
4 Thr Glucose Tolerance Test
5 Fri 5th day on the Metabolic Diet
6 Sat Continue
7 Sun Continue
8 Mon Continue
9 Tue Work Capacity Test, V02 Max Test
10 Wed 10th day on the Metabolic Diet
11 Thr Body Composition, Begin 24-hour urine collections
12 Fri Metabolic Diet Continue
13 Sat Continue
14 Sun Continue
15 Mon Baseline Determination of RMR
16 Tue Either RMR after Breakfast and Exercise or (17)
17 Wed Continue
18 Thr RMR following Breakfast only (TEF)
19 Fri Either RMR after Exercise (TEE) or (20)
20 Sat Continue
21 Sun End of 24-hour urine collections, End Diet

Appendices
APPENDIX B
TABLES
Content
201
Page
B-1 Preliminary Descriptive Stats 202
B-2 Subject Description 203
B-3 Results of Activity Records 204
B-4 Weight Stability during Metabolic Diet 205
B-5 Calories Required to Maintain Weight 206
B-6 Kcal Required to Maintain Weight (Adjusted) 207
B-7 Results of Four RMR Determinations 208
B-8 RMR by Subject 209
B-9 Test-Retest on Max #02 210
8-10 Test-Retest on Percent Body Fat 211
B-11 Results of Thyroid Function Test 212
B -12 Average Temperature and Humidity at Test Time 213
B-13 Data by Subject Treatment (R) 214
B-14 Data by Subject Treatment (RF) 215
B-15 Data by Subject Treatment (RE) 216
B-16 Data by Subject Treatment (RFE) 217
B-17 Data by Subject Average #02 at Work. 218
B-18 Mean Data TEF and Potentiation (V02) 219
B-19 Mean Data TEF and Potentiation (Kcal) 220
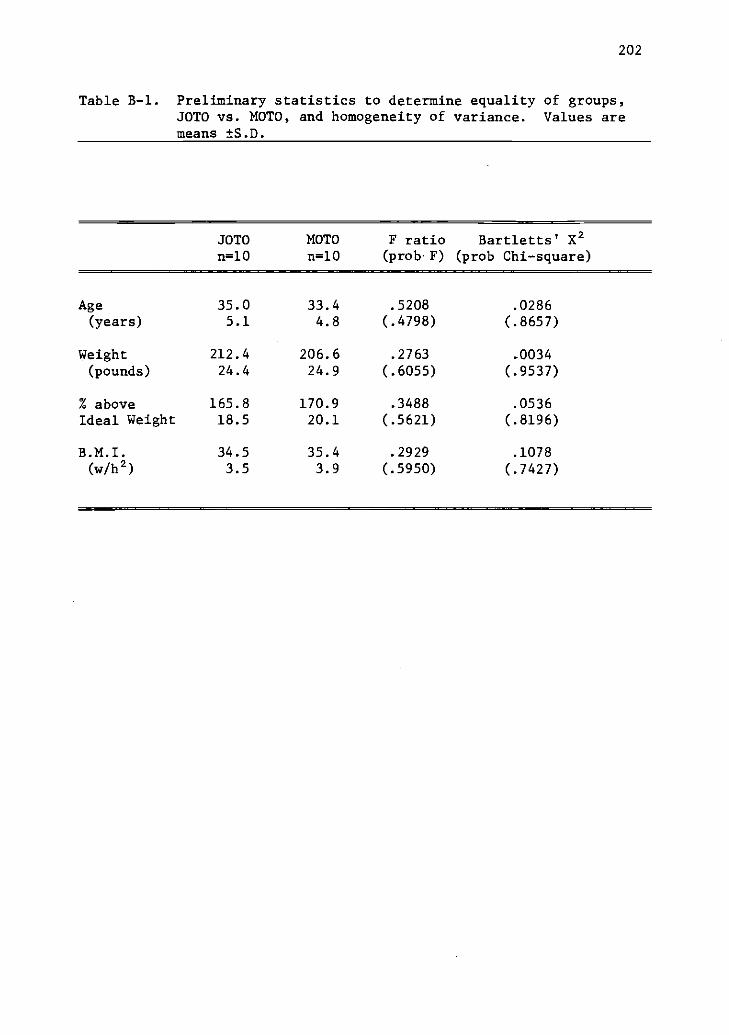
202
Table B-1. Preliminary statistics to determine equality of groups,JOTO vs. MOTO, and homogeneity of variance. Values aremeans ±S..
JOTOn=10
MOTOn=10
F ratio(prob F)
Bartletts' X2(prob Chi-square)
Age 35.0 33.4 .5208 .0286(years) 5.1 4.8 (.4798) (.8657)
Weight 212.4 206.6 .2763 .0034
(pounds) 24.4 24.9 (.6055) (.9537)
% above 165.8 170.9 .3488 .0536Ideal Weight 18.5 20.1 (.5621) (.8196)
B.M.I. 34.5 35.4 .2929 .1078(w/h2) 3.5 3.9 (.5950) (.7427)

Table B-2 SUBJECT DESCRIPTION
GROUP ID AGE AGE OF HEIGHT WEIGHT % IDEAL BMI BSA % BODY F. W. F. F. W.yrs Onset cm Kg Bdy. Wt. w/h2 m2 Fat Kg Kg
JOTOCB 31 6 169.5 112.6 187 39 2.20 50.0 56.3 56.3ME 32 8 161.9 107.2 196 41 2.08 52.3 56.1 51.2TF 34 9 171.5 99.9 164 34 2.12 45.6 45.5 54.4CG 39 6 167.0 81.2 140 30 1.92 38.4 31.2 50.0JL 30 8 170.8 107.9 180 37 2.18 49.1 52.9 54.9PM 29 11 166.4 88.3 155 32 1.97 44.6 39.4 48.9JM 37 11 175.9 91.4 144 30 2.08 42.6 38.9 52.4PW 41 5 168.3 107.3 184 38 2.16 50.1 53.7 53.5
Mean 34 8 168.9 99.5 168.8 35.1 2.09 46.6 46.8 51.5S. D. 4. 4 Z. 3 4. 1 11.3 20.9 4. 2 . 10 4. 6 9. 5 4. 1
MOTOJC 30 16 160.0 103.9 197 41 2.05 47.6 49.4 54.5DJ 32 19 160.0 113.2 214 43 2.12 47.4 53.6 59.5MJ 28 24 153.7 74.1 151 32 1.73 39.9 29.6 44.5KK 29 19 161.3 101.9 190 40 2.02 45.9 46.7 55.2SL 31 20 155.6 105.4 203 43 2.02 52.6 55.5 49.9JS 36 24 162.6 83.7 153 32 1.90 43.9 36.8 46.9HS 42 26 156.9 83.3 162 33 1.84 46.6 38.8 44.5BW 28 19 164.5 99.5 178 37 2.04 42.3 42.6 57.2
Mean 32.0 20.9 159.3 95.6 181 37.6 1.97 45.8 44.1 51.5S. D. 4. 8 3. 4 3. 6 13.6 23.8 4. 8 . 13 3. 8 8. 9 5.9
1)0
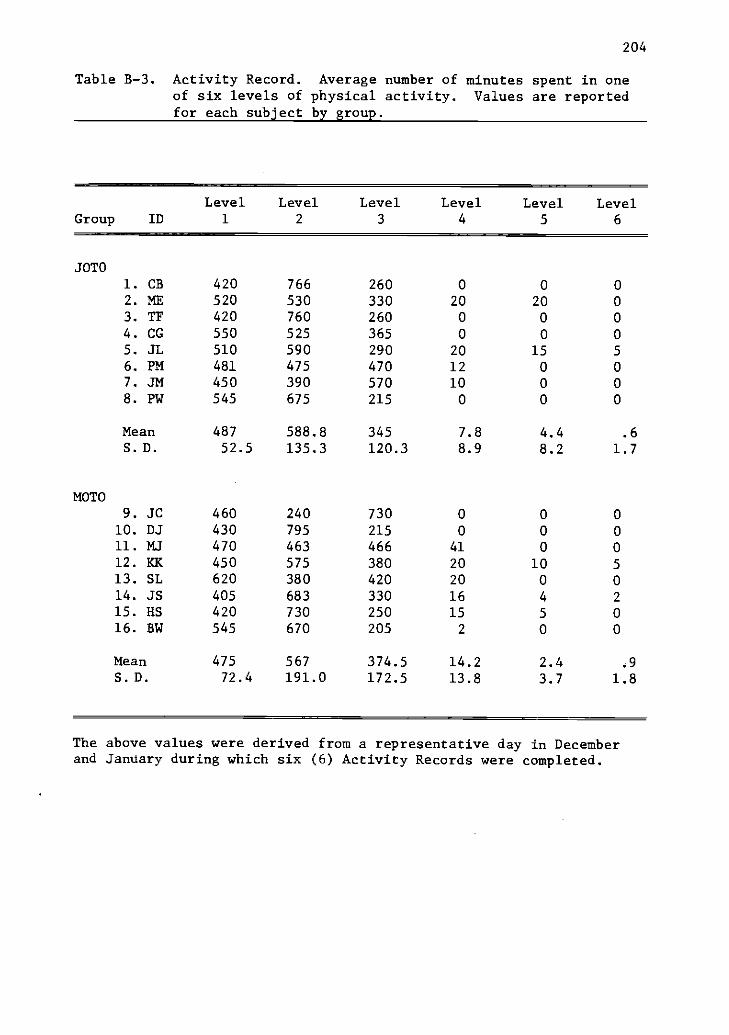
204
Table B-3. Activity Record. Average number of minutes spent in oneof six levels of physical activity. Values are reportedfor each subject by group.
Level Level Level Level Level LevelGroup ID 1 2 3 4 5 6
JOTOI. CB 420 766 260 0 0 0
2. ME 520 530 330 20 20 03. TF 420 760 260 0 0 0
4. CG 550 525 365 0 0 0
5. JL 510 590 290 20 15 5
6. PM 481 475 470 12 0 07. JM 450 390 570 10 0 0
8. PW 545 675 215 0 0 0
Mean 487 588.8 345 7.8 4.4 .6
S.D. 52.5 135.3 120.3 8.9 8.2 1.7
MOTO9. JC 460 240 730 0 0 0
10. DJ 430 795 215 0 0 011. MJ 470 463 466 41 0 0
12. KK 450 575 380 20 10 5
13. SL 620 380 420 20 0 014. JS 405 683 330 16 4 2
15. HS 420 730 250 15 5 0
16. BW 545 670 205 2 0 0
Mean 475 567 374.5 14.2 2.4 .9
S.D. 72.4 191.0 172.5 13.8 3.7 1.8
The above values were derived from a representative day in Decemberand January during which six (6) Activity Records were completed.

205
Table B-4. Weight stability throughout the period of metabolicdetermination. Weight in pounds is reported for eachsubject by group.
Group ID Beginning Weight Ending Weight A Weight
JOTO1. CB 249.50 247.25 -2.252. ME 241.00 240.00 -1.003. TF 220.50 221.25 +1.004. CG 182.25 180.75 -1.505. JL 239.00 238.00 -1.006. PM 194.00 190.25 -3.757. JM 202.25 203.75 +1.508. PW 238.00 235.75 -2.25
Mean 220.81 219.63 -1.18S.D. 25.09 25.08
MOTO
9. JC 232.00 228.00 -4.0010. DJ 251.75 249.75 -2.0011. MJ 165.75 165.25 -0.5012. KK 228.00 226.00 -2.0013. SL 235.00 232.00 -3.0014. JS 187.50 185.00 -2.5015. HS 186.00 184.25 -1.7516. BW 221.00 220.50 -0.50
Mean 213.38 211.34 -2.04S.D. 29.87 29.35
Overall Mean 217.09 215.48 -1.61S.D. 26.93 26.72
r.= 0.9985

206
Table B-5. Calories required to maintain weight by subject.
Group ID Kcal/day Kcal/kg/d Kcal/kg(LBW)/d
SOTO CB 2563 22.76 42.52ME 2432 22.69 47.56TF 2747 27.50 50.52CG 2392 29.46 47.84JL 2784 25.80 50.67PM 2240 25.37 45.84JM 2445 26.75 46.63PW 2495 23.27 46.70
Mean 2512.3 25.45 47.66S.D. 181.8 2.44 1.97
MOTOJC 2215 21.32 40.66DJ 2775 24.52 46.65MJ 2059 27.80 46.30KK 2454 24.08 44.49SL 2170 20.59 43.43JS 2174 25.97 46.30HS 2043 24.54 46.03BW 2697 27.10 47.21
Mean 2323.4 24.49 45.13S.D. 284.5 2.55 2.19

207
Table B-6. Adjusted calories required to maintain weight by group.*
Group ID Kcal/day Kcal/kg/d Kcal/kg(LBW)/d
JOTO CB 2563 22.76 42.52ME 2432 22.69 47.56TF 2747 27.50 50.52CG 2392 29.46 47.84JL 2784 25.80 50.67PM 2240 25.37 45.84JM 2445 26.75 46.63PW 2495 23.27 46.70
Mean 2512.3 25.45 47.66S.D. 181.8 2.44 1.97
MOTO JC 2363 22.74 43.37DJ 2923 25.83 49.11MJ 2207 29.80 49.40KK 2602 25.53 47.10JS 2322 27.74 49.48SL 2318 21.99 46.41HS 2191 26.32 49.29BW 2845 28.59 49.77
Mean 2471.4 26.07 47.99S.D. 284.5 2.70 2.23
*An average of 148 calories were added to all members of Group 2(MOTO) to account for the greater average weight loss while on themetabolic diet. On the average members of Group 2 (MOTO) lost 2.032pounds compared to 1.185 pounds lost per member of Group 1 (JOTO).The difference of .847 pounds is equal to a total caloric deficiencyof 2964 Kcal. This figure divided by the 20 days of feeding equalsthe 148 calories. Had the subjects in Group 2 received an averageof 148 Kcal/d more, their weight loss would have been approximatelythe same as the subjects in Group 1.

208
Table B-7. The results of four (4) determinations of resting meta-bolic rate conducted under similar conditions on four(4) separate days.
Group ID RMR(L/min)Day 1
RMR(L/min)Day 2
RMR(L/min)Day 3
RMR(L/min)Day 4
SOTOCB .260 .251 .265 .264ME .242 .245 .238 .259TF .269 .268 .271 .272CG .208 .234 .261 .263JL .288 .290 .291. .266PM .246 .238 .239 .240JM .220 .236 .257 .232PW .261 .266 .262 .276
MOTOJC .266 .253 .274 .283DJ .299 .291 .282 .291MJ .223 .229 .217 .252KK .240 .262 .261 .240JS .237 .233 .239 .241SL .234 .236 .232 .234HS .214 .220 .218 .230BW .282 .278 .263 .283
Mean .249 .252 .254 .258S.D. .027 .022 .019 .022
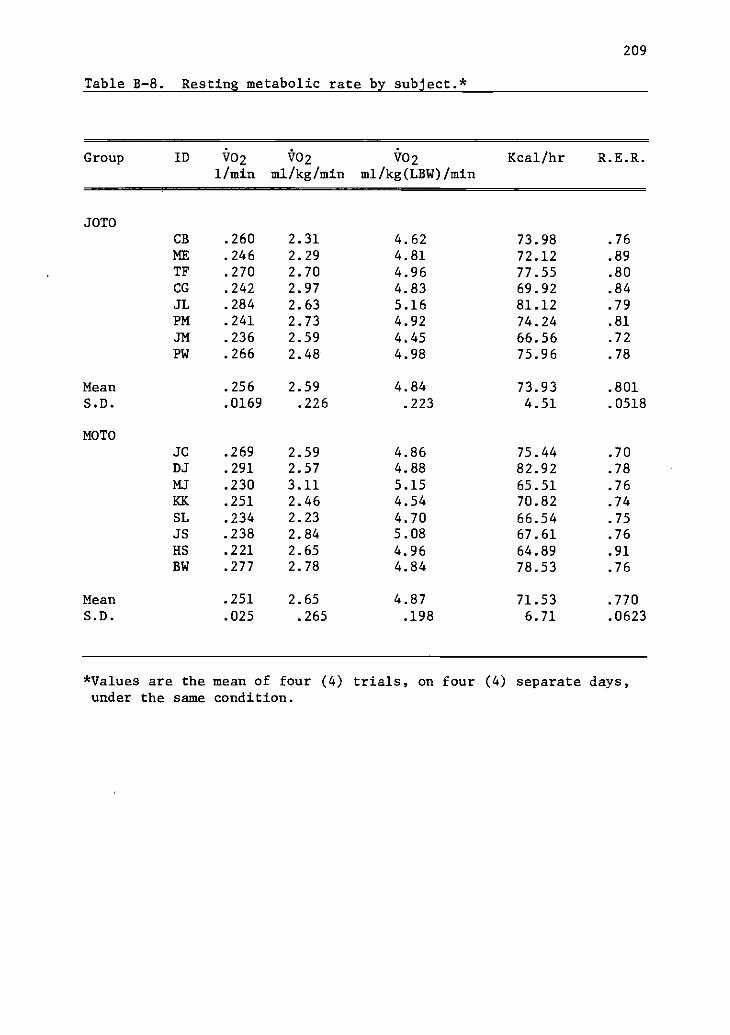
209
Table B-8. Resting metabolic rate by subject.*
Group ID t02 t02 i702
1/min ml/kg/min ml/kg(LBW)/minKcal/hr R.E.R.
JOTOCB .260 2.31 4.62 73.98 .76ME .246 2.29 4.81 72.12 .89TF .270 2.70 4.96 77.55 .80CG .242 2.97 4.83 69.92 .84
JL .284 2.63 5.16 81.12 .79
PM .241 2.73 4.92 74.24 .81
JM .236 2.59 4.45 66.56 .72
PW .266 2.48 4.98 75.96 .78
Mean .256 2.59 4.84 73.93 .801S.D. .0169 .226 .223 4.51 .0518
MOTOJC .269 2.59 4.86 75.44 .70DJ .291 2.57 4.88 82.92 .78
MJ .230 3.11 5.15 65.51 .76
KK .251 2.46 4.54 70.82 .74
SL .234 2.23 4.70 66.54 .75JS .238 2.84 5.08 67.61 .76
HS .221 2.65 4.96 64.89 .91
BW .277 2.78 4.84 78.53 .76
Mean .251 2.65 4.87 71.53 .770
S.D. .025 .265 .198 6.71 .0623
*Values are the mean of four (4) trials, on four (4) separate days,under the same condition.
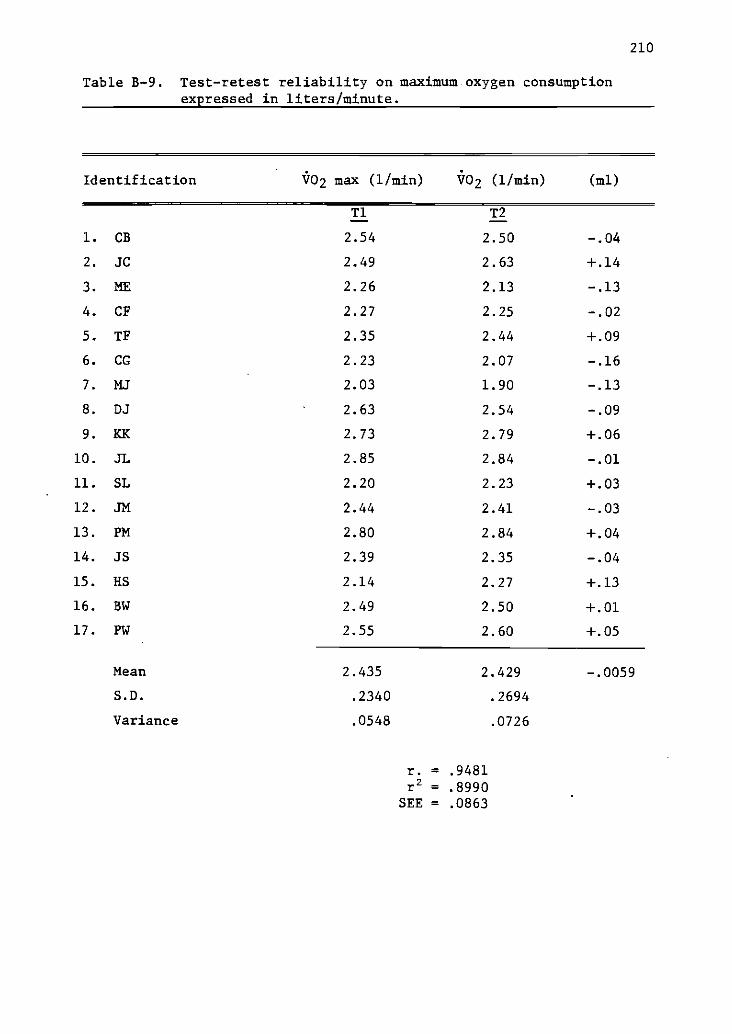
210
Table B-9. Test-retest reliability on maximum oxygen consumptionexpressed in liters/minute.
Identification V02 max (1/min) V02 (1/min) (ml)
Ti T2
1. CB 2.54 2.50 -.04
2. JC 2.49 2.63 +.14
3. ME 2.26 2.13 -.13
4. CF 2.27 2.25 -.02
5. TF 2.35 2.44 +.09
6. CG 2.23 2.07 -.16
7. MJ 2.03 1.90 -.13
8. DJ 2.63 2.54 -.09
9. KK 2.73 2.79 +.06
10. JL 2.85 2.84 -.01
11. SL 2.20 2.23 +.03
12. JM 2.44 2.41 -.03
13. PM 2.80 2.84 +.04
14. JS 2.39 2.35 -.04
15. HS 2.14 2.27 +.13
16. BW 2.49 2.50 +.01
17. PW 2.55 2.60 +.05
Mean 2.435 2.429 -.0059
S.D. .2340 .2694
Variance .0548 .0726
r. = .9481
r2 = .8990SEE = .0863

211
Table 8-10. Test-retest reliability on the percentage (%) of body fatdetermined by the hydrostatic method.
Identification % Body Fat % Body Fat A
T1 T2
1. CB 48.8 50.0 +1.2
2. JC 49.4 47.6 -1.8
3. ME 51.5 52.3 +0.8
4. CF 42.9 42.2 -0.7
5. TF 44.9 45.5 +0.6
6. CG 38.2 38.4 +0.2
7. MJ 41.9 39.9 -2.0
8. DJ 47.8 47.4 -0.4
9. KK 43.9 45.8 +1.9
10. JL 47.5 49.0 +1.5
11. JM 41.9 42.6 +0.7
12. SL 50.8 52.0 +1.2
13. PM 43.4 44.6 +1.2
14. JS 45.0 43.9 -1.1
15. HS 45.8 46.6 +0.8
16. BW 42.4 42.5 +0.1
17. MW 46.3 46.5 +0.2
18. PW 48.8 50.0 +1.2
Mean 45.51 45.93 +0.31S.D. 3.65 3.92
r. = .9440r2. = .891
rho = .9272

212
Table B-11. Thyroid Function Examination
Identification rT3-Uptake T4(mcg/ld) Free T4 Index
1. CB 38.6 6.9 2.66
2. NC 35.3 8.5 3.00
3. JC 37.9 8.5 3.22
4. ME 34.8 8.7 3.03
5. CF 35.9 9.2 3.30
6. TF 35.2 10.8 3.80
7. MJ 38.2 7.8 2.98
8. DJ 34.6 9.3 3.22
9. CG 37.3 7.4 2.76
10. JK 34.6 8.7 3.01
11. KK 38.0 7.4 2.81
12. SI 34.1 10.2 3.48
13. SL 34.1 8.2 2.80
14. JM 36.4 8.7 3.17
15. PM 36.4 9.4 3.42
16. JS 35.2 8.3 2.92
17. HS 35.0 8.2 2.87
18. MW 34.0 10.1 3.43
19. BW 36.7 9.2 3.38
20. PW 35.8 8.5 3.04
Normative Values 34-44 5.0-12.0 1.75-5.40
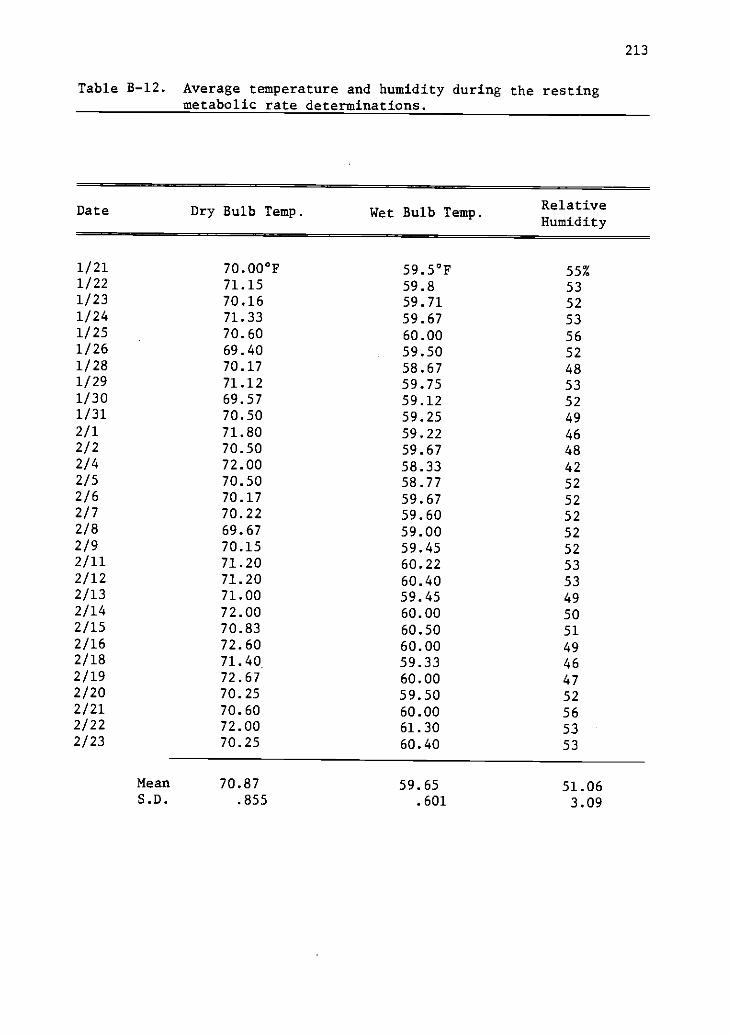
213
Table B-12. Average temperature and humidity during the restingmetabolic rate determinations.
Date Dry Bulb Temp. Wet Bulb Temp.RelativeHumidity
1/21 70.00°F 59.5°F 55%1/22 71.15 59.8 531/23 70.16 59.71 521/24 71.33 59.67 531/25 70.60 60.00 561/26 69.40 59.50 521/28 70.17 58.67 481/29 71.12 59.75 531/30 69.57 59.12 521/31 70.50 59.25 492/1 71.80 59.22 462/2 70.50 59.67 482/4 72.00 58.33 422/5 70.50 58.77 522/6 70.17 59.67 522/7 70.22 59.60 522/8 69.67 59.00 522/9 70.15 59.45 522/11 71.20 60.22 532/12 71.20 60.40 532/13 71.00 59.45 492/14 72.00 60.00 502/15 70.83 60.50 512/16 72.60 60.00 492/18 71.40 59.33 462/19 72.67 60.00 472/20 70.25 59.50 522/21 70.60 60.00 562/22 72.00 61.30 532/23 70.25 60.40 53
Mean 70.87 59.65 51.06S.D. .855 .601 3.09

Table B-13Data by Subject for each Treatment. Values are in liters/minute.
Group ID Treatment T1 T2 T3 T4 T5 T6 T7 T8 Mean VO230" 60" 90" 120" 150" 180" 210" 240"
JOTOCB R .271 . 253 . 254 . 237 .235 . 262 .267 .288 .258ME R .233 .235 .236 .237 .247 .246 .246 .246 .242TF R . 265 . 259 . 260 . 267 .260 . 275 .259 . 253 .263CC R . 221 . 241 .233 . 241 .239 . 242 . 265 . 248 . 241JL R . 308 .286 .298 . 291 . 303 .300 . 284 . 287 . 295PM R , 231 . 252 . 219 . 243 .269 . 255 . 225 . 246 .243JM R . 225 . 250 . 233 . 220 .225 . 228 . 245 . 249 .234PW R .263 . 256 . 276 . 269 .275 .277 . 268 . 289 .271
Mean .252 .254 . 251 . 251 .256 .261 . 257 . 263S. D. . 030 . 015 . 023 . 025 . 023 . 018 . 021 . 025
MOTO
J C R .265 .279 . 283 .271 .256 .249 . 283 .266 .269DJ R .315 .289 . 297 . 304 .296 .297 . 294 .313 . 300MJ R . 228 .219 . 236 . 246 . 245 237 .231 . 241 . 236KK R .231 .235 .254 .240 .261 .255 .258 .255 .249
S It . 294 .270 . 219 . 240 . 246 .246 .235 .242 . 249SL R . 221 . 219 . 212 .222 229 . 228 .228 . 237 . 225HS R . 225 .236 .230 .238 . 245 . 252 .236 . 234 . 237BW R . 272 .284 . 283 .291 . 276 . 280 .275 .298 . 282
Mean .256 .254 .252 .256 .257 .256 .255 .261S. D. . 035 . 029 . 032 . 028 . 021 . 023 . 025 . 029
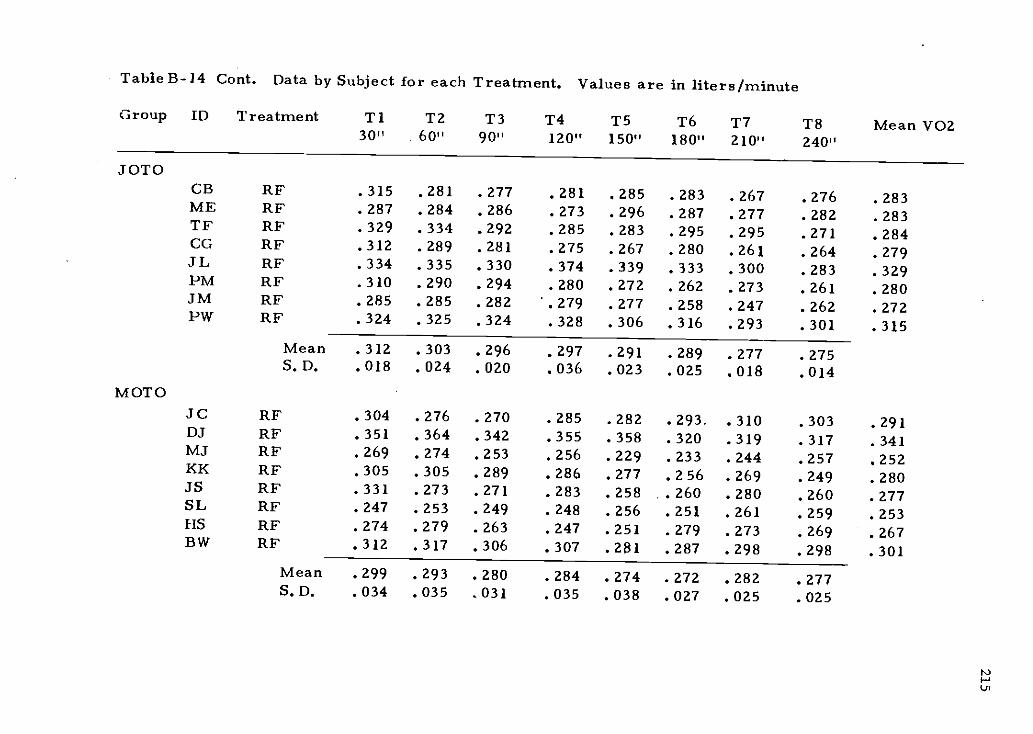
Table H-14 Cont. Data by Subject for each Treatment. Values are in liters/minute
Group ID Treatment T1 T2 T3 T4 T5 T6 T7 T8 Mean VOZ30" 60" 90" 120" 150" 180" 210" 240"
JOTOCB RF .315 . 281 .277 .281 . 285 .283 .267 .276 .283ME RF .287 .284 .286 .273 .296 .287 .277 .282 .283TF RF .329 .334 .292 .285 .283 .295 .295 .271 .284CC RE .312 .289 .281 .275 . 267 . 280 .261 .264 .279JL RF .334 .335 .330 .374 .339 .333 .300 .283 .329PM RF .310 .290 .294 .280 .272 .262 . 273 . 261 . 280JM RE' .285 . 285 .282 .279 .277 . 258 .247 .262 . 272PW RF .324 .325 .324 .328 .306 .316 .293 .301 .315
Mean .312 .303 .296 .297 .291 .289 .277 . 275S. D. . 018 . 024 . 020 036 023 025 018 . 014
MOTOJC RF .304 .276 .270 .285 .282 .293. .310 .303 .291DJ RF .351 .364 .342 .355 .358 .320 .319 .317 .341MJ RF .269 . 274 .253 .256 .229 . 233 .244 .257 .252KK RF . 305 . 305 . 289 . 286 . 277 . 256 . 269 . 249 . 280JS RF .331 .273 .271 .283 .258 .260 .280 .260 .277SL RF .247 . 253 .249 . 248 .256 .251 . 261 . 259 . 253HS RF .274 .279 .263 .247 .251 . 279 .273 .269 . 267BW RF .312 .317 .306 .307 . 281 .287 . 298 . 298 .301
Mean .299 . 293 . 280 . 284 . 274 . 272 282 .277S. D. .034 .035 .031 .035 .038 .027 .025 .025
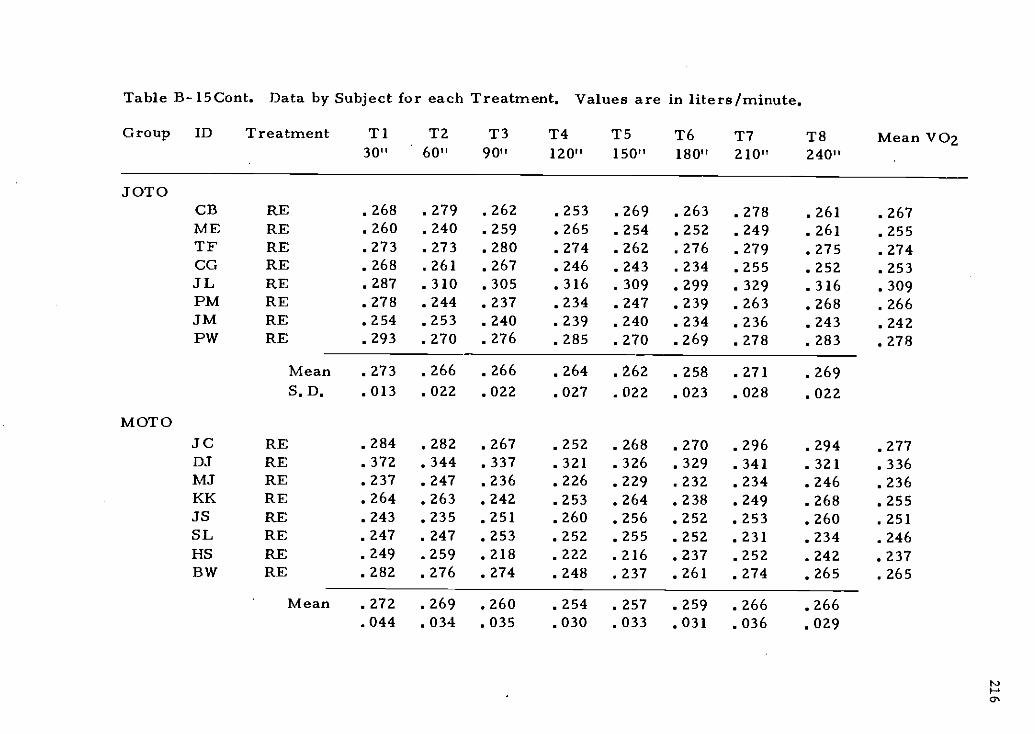
Table B-15Cont. Data by Subject for each Treatment. Values are in liters/minute.
Group ID Treatment T1 T2 T3 T4 T5 T6 T7 T8 Mean VOz30" 60" 90" 120" 150" 180" 210" 240"
JOTOCB RE . 268 . 279 . 262 .253 . 269 . 263 . 278 . 261 . 267ME RE . 260 . 240 . 259 . 265 . 254 . 252 . 249 . 261 .255TF RE . 273 . 273 . 280 . 274 . 262 . 276 . 279 . 275 . 274CG RE .268 .261 .267 .246 .243 .234 .255 .252 .253JL RE . 287 . 310 . 305 . 316 . 309 . 299 . 329 . 316 . 309PM RE . 278 . 244 . 237 . 234 . 247 . 239 . 263 . 268 . 266JM RE . 254 . 253 . 240 . 239 . 240 . 234 . 236 . 243 . 242PW RE . 293 . 270 .276 .285 . 270 . 269 . 278 . 283 . 278
Mean . 273 . 266 .266 . 264 . 262 . 258 . 271 . 269S. D. .013 .022 .022 .027 .022 .023 .028 .022
MOTOSC RE . 284 . 282 . 267 . 252 . 268 . 270 . 296 . 294 . 277DJ RE .372 .344 .337 .321 .326 .329 .341 .321 .336MJ RE . 237 . 247 . 236 . 226 . 229 . 232 . 234 . 246 . 236KK RE . 264 . 263 . 242 . 253 . 264 . 238 . 249 . 268 . 255JS RE . 243 . 235 . 251 . 260 . 256 . 252 . 253 . 260 . 251SL RE . 247 . 247 . 253 . 252 . 255 . 252 . 231 . 234 . 246HS RE .249 .259 .218 .222 .216 .237 .252 .242 .237I3W RE . 282 . 276 . 274 .248 . 237 . 261 . 274 . 265 . 265
Mean . 272 . 269 260 . 254 257 . 259 . 266 . 266.044 .034 .035 .030 .033 .031 .036 .029
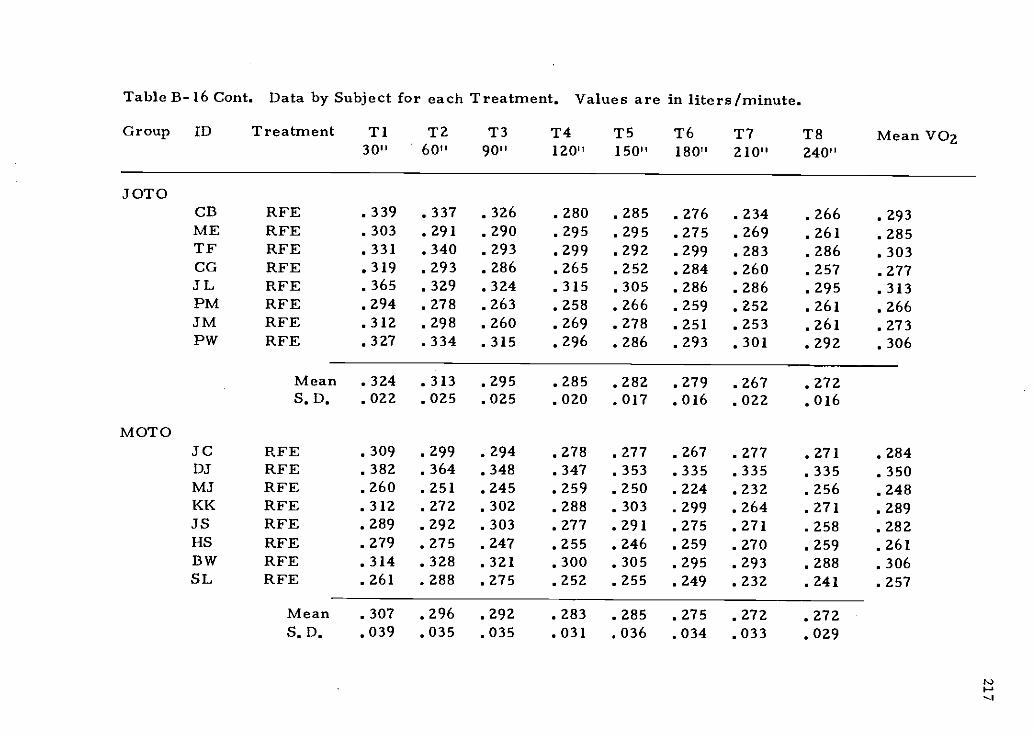
Table 13-16 Cont. Data by Subject for each Treatment. Values are in liters/minute.
Group ID Treatment T1 T2 T3 T4 T5 T6 T7 T8 Mean VO230" 60" 90" 120" 150" 180" 210" 240"
JOTOCB RFE .339 . 337 .326 .280 . 285 .276 . 234 .266 .293ME RFE .303 .291 .290 .295 .295 .275 .269 .261 .285TF RFE .331 .340 .293 .299 .292 .299 .283 .286 .303CG RFE .319 . 293 .286 .265 . 252 . 284 . 260 .257 . 277JL RFE . 365 .329 .324 . 315 . 305 . 286 . 286 . 295 .313PM RFE .294 .278 .263 .258 .266 .259 .252 .261 .266JM RFE . 312 . 298 .260 . 269 . 278 . 251 . 253 . 261 .273PW RFE .327 .334 .315 .296 .286 .293 .301 .292 .306
Mean . 324 . 313 . 295 . 285 282 . 279 . 267 272S.D. .022 .025 .025 .020 .017 .016 .022 .016
MOTOJ C RFE . 309 . 299 . 294 . 278 . 277 . 267 . 277 . 271 . 284DJ RFE .382 .364 .348 .347 .353 .335 .335 .335 .350MJ RFE . 260 . 251 . 245 . 259 . 250 . 224 . 232 . 256 . 248KK RFE . 312 . 272 . 302 . 288 . 303 . 299 . 264 . 271 . 289JS RFE . 289 . 292 . 303 . 277 . 291 . 275 . 271 . 258 . 282HS RFE . 279 . 275 . 247 . 255 . 246 . 259 . 270 . 259 . 261BW RFE . 314 . 328 . 321 . 300 . 305 . 295 . 293 . 288 . 306SL RFE . 261 . 288 . 275 . 252 . 255 . 249 . 232 . 241 . 257
Mean .307 .296 .292 .283 .285 .275 .272 .272S.D. .039 .035 .035 .031 .036 .034 .033 .029

218
Table B-17. Oxygen consumption, enemy expenditure, and R.E.R. at arelative work load (50% V02 max) under two conditions(fed,fasted). Values are means across the 40 minuteexercise period.
Group ID
V021/minfasted
V021/minfed
Kcal/min
fasted
Kcal/min
fed
R.E.R.
fasted
R.E.R.
fed
JOTOCB 1.344 1.431 6.554 6.985 .887 .893
ME 1.276 1.413 6.218 6.954 .885 .930TF 1.491 1.416 6.985 6.993 .888 .943CG 1.231 1.148 5.945 5.648 .911 .929JL 1.525 1.547 7.424 7.585 .881 .923PM 1.276 1.363 6.220 6.695 .887 .920JM 1.281 1.274 6.306 6.300 .930 .949PW 1.416 1.429 6.835 6.963 .843 .882
Mean 1.355 1.377 6.561 6.764 .889 .921S.D. .110 .120 .490 .575 .025 .023
MOTOJC 1.531 1.456 7.467 7.279 .889 .913DJ 1.653 1.683 8.207 8.386 .965 .983MJ 0.861 1.043 4.162 5.031 .848 .880KK 1.495 1.563 7.308 7.722 .897 .946JS 1.408 1.322 6.841 6.473 .872 .906SL 1.288 1.239 6.307 6.101 .908 .933HS 1.227 1.224 5.988 5.988 .898 .903BW 1.303 1.338 6.377 6.579 .903 .924
Mean 1.346 1.359 6.582 6.695 .898 .925S.D. .242 .204 1.216 1.065 .034 .031
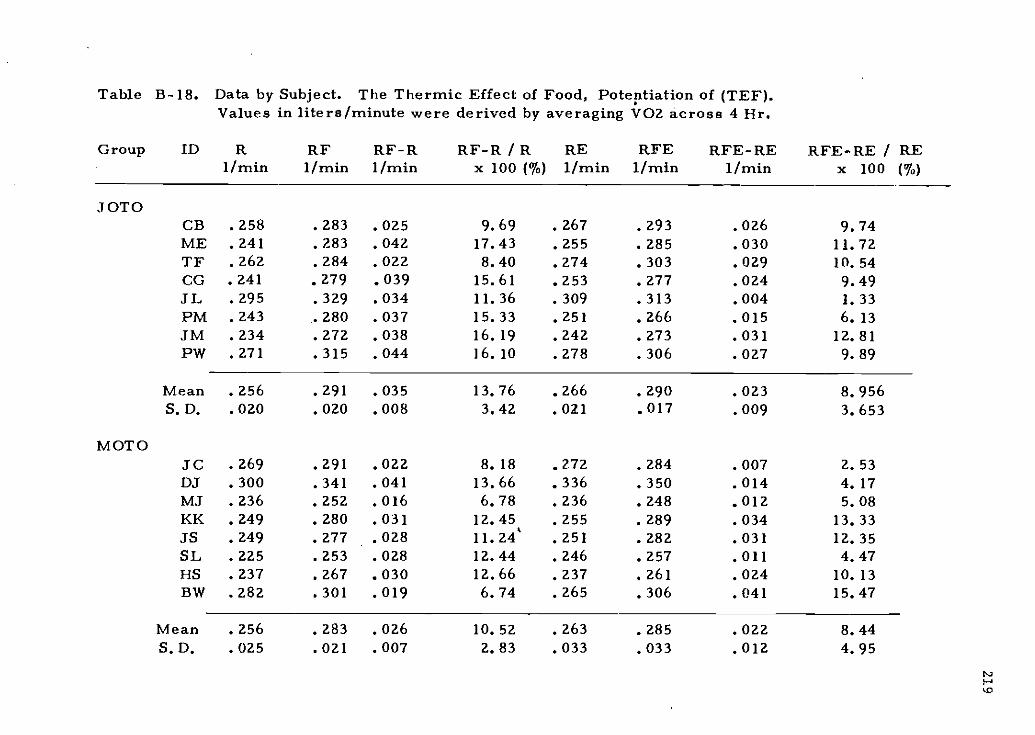
Table B-18.
Group ID
Data by Subject. The Thermic Effect of Food, Potentiation of (TEF).Values in liters/minute were derived by averaging VOZ across 4 Hr.
R RF RF-R R F-R / R. RE RFE RFE-RE1/min 1/min 1/min x 100 (%) 1/min 1/min 1/min
RFE-RE / REx 100 (%)
JOTOCB .258 .283 .025 9.69 .267 .293 .026 9.74ME . 241 . 283 . 042 17.43 . 255 . 285 . 030 11.72TF . 262 . 284 . 022 8.40 . 274 . 303 . 029 10.54CO . 241 . 279 . 039 15.61 .253 . 277 . 024 9.49JL . 295 . 329 . 034 11.36 . 309 . 313 . 004 1.33PM . 243 . 280 . 037 15.33 .251 . 266 . 015 6.13JM . 234 . 272 . 038 16.19 . 242 . 273 . 031 12.81PW .271 .315 .044 16.10 .278 .306 .027 9.89
Mean . 256 . 291 . 035 13.76 . 266 . 290 . 023 8.956S. D. . 020 . 020 . 008 3.42 . 021 017 . 009 3.653
MOTOJC .269 .291 .022 8.18 .2.72 .284 .007 2.53DJ . 300 . 341 . 041 13.66 . 336 . 350 . 014 4.17MJ .236 .252 .016 6.78 .236 .248 .012 5.08KK . 249 . 280 . 031 12.45 . 255 . 289 . 034 13.33JS . 249 . 277 . 028 11.24 . 251 . 282 . 031 12.35SL . 225 . 253 . 028 12.44 . 246 . 257 . 011 4.47HS . 237 . 267 . 030 12.66 . 237 . 261 . 024 10.13BW .282 .301 .019 6.74 .265 .306 .041 15.47
Mean . 256 . 283 . 026 10.52 . 263 . 285 . 022 8.44S. D. . 025 . 021 . 007 2.83 . 033 033 . 012 4.95
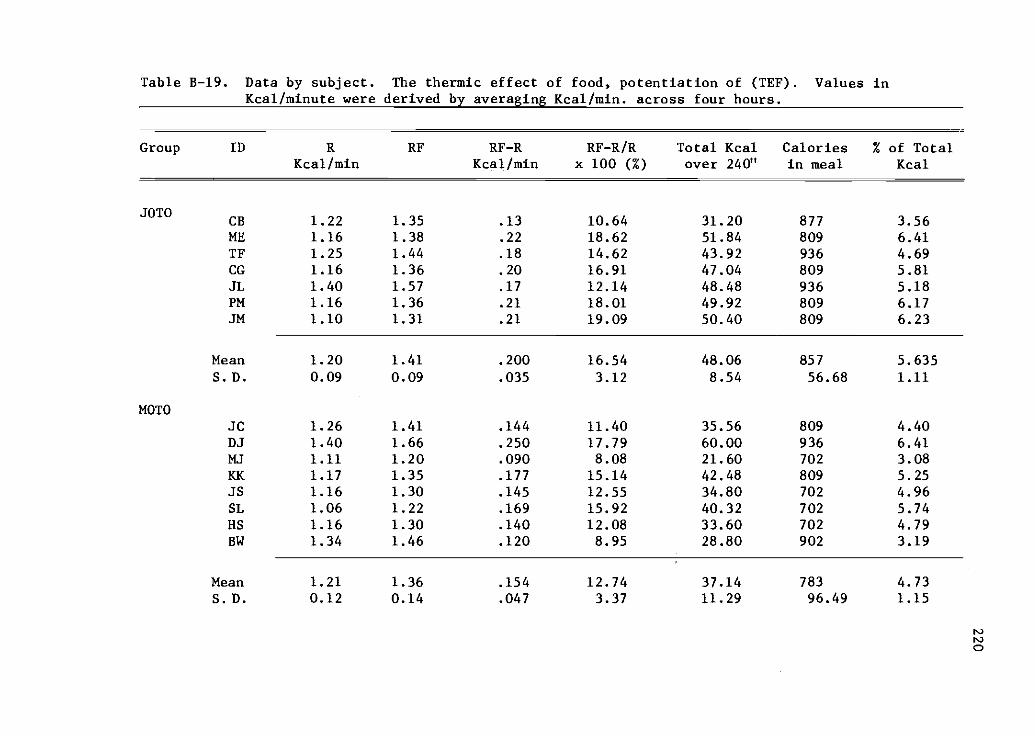
Table B-19. Data by subject. The thermic effect of food, potentiation of (TEF). Values inKcal/minute were derived by averaging Kcal/min. across four hours.
Group ID RE' RF-R RF-R/R Total Kcal Calories % of TotalKcal/min Kcal/min x 100 (%) over 240" in meal Kcal
JOTOCB 1.22 1.35 .13 10.64 31.20 877 3.56ME 1.16 1.38 .22 18.62 51.84 809 6.41TF 1.25 1.44 .18 14.62 43.92 936 4.69CG 1.16 1.36 .20 16.91 47.04 809 5.81JL 1.40 1.57 .17 12.14 48.48 936 5.18PM 1.16 1.36 .21 18.01 49.92 809 6.17JM 1.10 1.31 .21 19.09 50.40 809 6.23
Mean 1.20 1.41 .200 16.54 48.06 857 5.635S.D. 0.09 0.09 .035 3.12 8.54 56.68 1.11
MOTOJC 1.26 1.41 .144 11.40 35.56 809 4.40DJ 1.40 1.66 .250 17.79 60.00 936 6.41MJ 1.11 1.20 .090 8.08 21.60 702 3.08KK 1.17 1.35 .177 15.14 42.48 809 5.25JS 1.16 1.30 .145 12.55 34.80 702 4.96SL 1.06 1.22 .169 15.92 40.32 702 5.74HS 1.16 1.30 .140 12.08 33.60 702 4.79BW 1.34 1.46 .120 8.95 28.80 902 3.19
Mean 1.21 1.36 .154 12.74 37.14 783 4.73S. D. 0.12 0.14 .047 3.37 11.29 96.49 1.15
PO
0
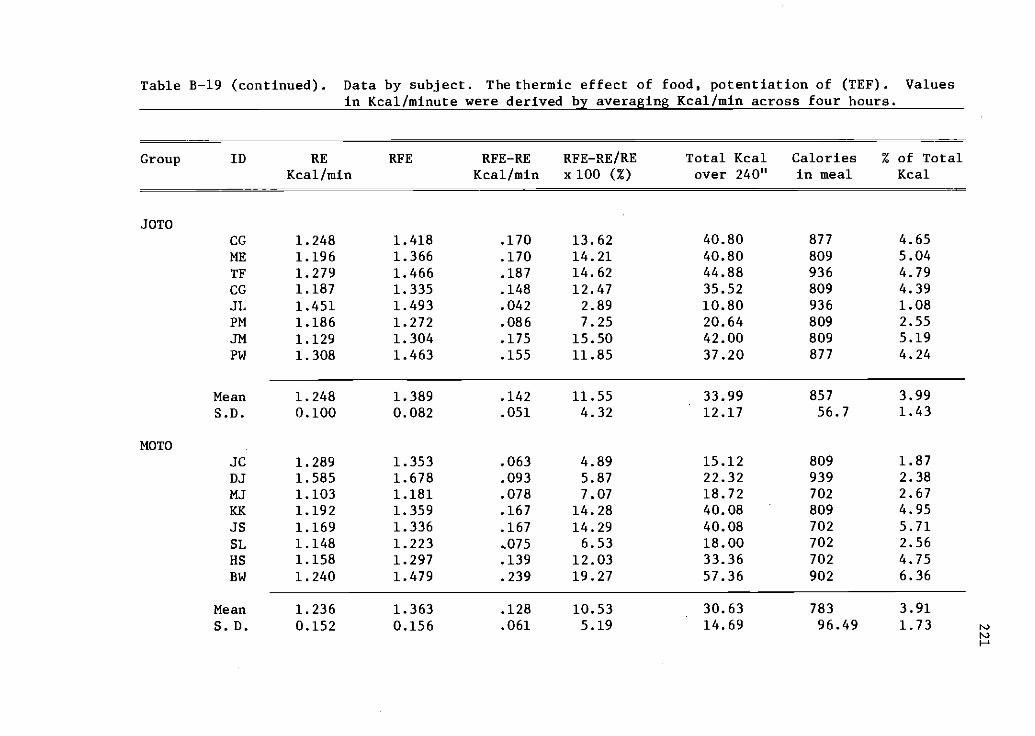
Table B-19 (continued). Data by subject. The thermic effect of food, potentiation of (TEF). Valuesin Kcal/minute were derived by averaging Kcal/min across four hours.
Group ID RE RFE RFE-RE RFE-RE/RE Total Kcal Calories % of TotalKcal/min Kcal/min x 100 (%) over 240" in meal Kcal
JOTOCG 1.248 1.418 .170 13.62 40.80 877 4.65
ME 1.196 1.366 .170 14.21 40.80 809 5.04
TF 1.279 1.466 .187 14.62 44.88 936 4.79CG 1.187 1.335 .148 12.47 35.52 809 4.39
JL 1.451 1.493 .042 2.89 10.80 936 1.08
PM 1.186 1.272 .086 7.25 20.64 809 2.55
JM 1.129 1.304 .175 15.50 42.00 809 5.19
PW 1.308 1.463 .155 11.85 37.20 877 4.24
Mean 1.248 1.389 .142 11.55 33.99 857 3.99
S.D. 0.100 0.082 .051 4.32 12.17 56.7 1.43
MOTOJC 1.289 1.353 .063 4.89 15.12 809 1.87
DJ 1.585 1.678 .093 5.87 22.32 939 2.38
MJ 1.103 1.181 .078 7.07 18.72 702 2.67
KK 1.192 1.359 .167 14.28 40.08 809 4.95
JS 1.169 1.336 .167 14.29 40.08 702 5.71
SL 1.148 1.223 .075 6.53 18.00 702 2.56
HS 1.158 1.297 .139 12.03 33.36 702 4.75
BW 1.240 1.479 .239 19.27 57.36 902 6.36
Mean 1.236 1.363 .128 10.53 30.63 783 3.91
S.D. 0.152 0.156 .061 5.19 14.69 96.49 1.73r...)
r,.)
r