
An expression signature of syndecan-1 (CD138), E-cadherin ...
Upload
independentCategory
view
0download
0
E-cadherin transcriptional downregulation by promotermethylation but not mutation is related to epithelial-to-mesenchymal transition in breast cancer cell lines
M Lombaerts1, T van Wezel1, K Philippo1, JWF Dierssen1, RME Zimmerman1, J Oosting1, R van Eijk1,PH Eilers2, B van de Water3, CJ Cornelisse1 and A-M Cleton-Jansen*,1
1Department of Pathology, Leiden University Medical Center, PO Box 9600, L1-Q, NL-2300 RC Leiden, The Netherlands; 2Medical Statistics, LeidenUniversity Medical Center, PO Box 9604, NL-2300 RC Leiden, The Netherlands; 3Division of Toxicology, Leiden/Amsterdam Center for Drug Research,Leiden University, PO Box 9502, NL-2300 RA Leiden, The Netherlands
Using genome-wide expression profiling of a panel of 27 human mammary cell lines with different mechanisms of E-cadherininactivation, we evaluated the relationship between E-cadherin status and gene expression levels. Expression profiles of cell lines withE-cadherin (CDH1) promoter methylation were significantly different from those with CDH1 expression or, surprisingly, those withCDH1 truncating mutations. Furthermore, we found no significant differentially expressed genes between cell lines with wild-type andmutated CDH1. The expression profile complied with the fibroblastic morphology of the cell lines with promoter methylation,suggestive of epithelial–mesenchymal transition (EMT). All other lines, also the cases with CDH1 mutations, had epithelial features.Three non-tumorigenic mammary cell lines derived from normal breast epithelium also showed CDH1 promoter methylation, afibroblastic phenotype and expression profile. We suggest that CDH1 promoter methylation, but not mutational inactivation, is partof an entire programme, resulting in EMT and increased invasiveness in breast cancer. The molecular events that are part of thisprogramme can be inferred from the differentially expressed genes and include genes from the TGFb pathway, transcription factorsinvolved in CDH1 regulation (i.e. ZFHX1B, SNAI2, but not SNAI1, TWIST), annexins, AP1/2 transcription factors and members ofthe actin and intermediate filament cytoskeleton organisation.British Journal of Cancer (2006) 94, 661–671. doi:10.1038/sj.bjc.6602996 www.bjcancer.comPublished online 21 February 2006& 2006 Cancer Research UK
Keywords: E-cadherin; epithelial–mesenchymal transition; promoter methylation; mammary cell lines; TFGb pathway
����������������������������������������������������
Decreased E-cadherin expression is associated with a moreaggressive behaviour of breast cancer (Siitonen et al, 1996). Thehomotypic cellular adhesion molecule E-cadherin is a trans-membrane glycoprotein important for the organisation ofepithelial structure (Takeichi, 1995; Huber et al, 1996; Yagi andTakeichi, 2000). E-cadherin can form homophilic interactions withE-cadherin molecules on neighbouring cells in a Ca2þ -dependentway and is the main component of adherens junctions. Byrecruitment of a- and b-catenin, the E-cadherin is anchored to theactin cytoskeleton.
Mutational inactivation of CDH1 has been found in 56% oflobular breast carcinomas (Berx et al, 1996) and 50% of diffusegastric carcinomas (Becker et al, 1994). In the first tumour type,this is accompanied by loss of the wild-type allele (Berx et al,1995). Complete loss of E-cadherin protein expression has beenfound in 84% of lobular breast carcinomas (De Leeuw et al, 1997).Loss of membranous E-cadherin expression results in a reductionof adhesion between epithelial tumour cells and explains the
characteristic diffuse growth pattern observed in these tumours(Berx et al, 1998). CDH1 mutations were also identified in lobularcarcinoma in situ, the putative precursor of invasive lobularcarcinoma (Vos et al, 1997). Thus, in addition to its role as aninvasion suppressor, E-cadherin also acts as a classical tumoursuppressor gene in pre-invasive lobular breast carcinoma. Besidesmutational inactivation of the E-cadherin gene, CDH1 may also betargeted by promoter hypermethylation (Graff et al, 1995; Gradyet al, 2000; Tamura et al, 2000), thereby inhibiting CDH1 geneexpression. Evidence is accumulating for a prominent role ofepithelial-to-mesenchymal transition (EMT) in tumour progres-sion (reviewed by Thiery, 2002). During early embryonic develop-ment, E-cadherin is a critical switch in EMT. Upon downregulationof E-cadherin, epithelial cells acquire a fibroblastic pheno-type, dissociate from the epithelium and migrate. This processis essential for gastrulation, neural crest formation, kidneydevelopment and so on (reviewed by Thiery, 2003). Severalproteins have been identified that downregulate E-cadherinexpression including SNAI1/SNAIL (Batlle et al, 2000; Cano et al,2000), ZFHX1B/SIP1 (Comijn et al, 2001), SNAI2/SLUG (Hajraet al, 2002; De Craene et al, 2005), TWIST1 (Yang et al, 2004)and DeltaEF1 (Eger et al, 2005). Altered expression of thesetranscription factors seems to be also associated with an altered
Revised 13 January 2006; accepted 18 January 2006; published online 21February 2006
*Correspondence: Dr A-M Cleton-Jansen;E-mail: [email protected]
British Journal of Cancer (2006) 94, 661 – 671
& 2006 Cancer Research UK All rights reserved 0007 – 0920/06 $30.00
www.bjcancer.com
Tra
nsl
ati
on
al
Th
era
peu
tics
overexpression of transcriptional repressors of E-cadherin intumour cells (Batlle et al, 2000; Cano et al, 2000; Comijn et al, 2001;Hajra et al, 2002; Yang et al, 2004; Eger et al, 2005). CDH1 geneexpression is upregulated by several factors, AML1, p300 andHNF3 (Liu et al, 2005). Also post-transcriptional regulation ofE-cadherin has been observed and recently ADAM10 wasidentified as the cleaving protease (Maretzky et al, 2005).
Given the relevance of E-cadherin in tumour development andprogression and the different mechanisms involved in its regulation,we set out to use a genome-wide expression analysis to identify genesor pathways in mammary epithelial cells that are either (in)directlyaffected by loss of E-cadherin function or are altogether associatedwith a (epi)genetic programme that determines the biological statusof cells: epithelial or mesenchymal. For this purpose, we performed agene expression profile study on 27 different breast mammary celllines with a known CDH1 mutation, promoter hypermethylation andexpression status. Remarkably, no significant differences in geneexpression were identified between breast cancer cell lines with wild-type E-cadherin without promoter methylation and those harbouringCDH1 truncating mutations. The results showed a marked differencein expression profile between cell lines with CDH1 promotermethylation compared to those with CDH1 mutational inactivation,especially for genes involved in EMT and part of the TGFb pathway.
MATERIALS AND METHODS
Cell lines
The 27 breast and four colon cancer cell lines used in this study arelisted in Table 1. MPE600 and SK-BR-5 were provided by Dr F
Waldman (California Pacific Medical Centre, San Francisco, CA,USA) and Dr E Stockert (Sloan-Kettering Institute for CancerResearch, New York, NY, USA), respectively. Dr SP Ethier donatedSUM44PE (Ethier et al, 1993) and SUM185PE (Forozan et al, 1999).OCUB-F was obtained from the Riken Gene Bank. Other cell lineswere obtained from the American Type Culture Collection. Wegenotyped all cell lines using the Powerplex 1.2 system (Promega,Leiden, The Netherlands) according to the manufacturer’sinstructions. All cell lines were grown in RPMI1640 mediumsupplemented with 5 mM glutamine and 10% heat-inactivated fetalcalf serum at 371C under 5% CO2 (culture media from GIBCOInvitrogen, Grand Island, NY, USA).
E-cadherin protein expression
Cells were grown until 80% confluence and lysed by adding 1 mlhot lysis solution (1% SDS, 10 mM Tris pH 7.4, 10 mM EDTA,supplemented with complete protease inhibitor (BoehringerMannheim)). Protein concentration was determined by the BioradDC Protein Assay (Biorad, Hercules, CA, USA). Western blots ofelectrophoretically separated proteins (Winter et al, 2003) fromwhole-cell lysates were probed with HECD-1 (Zymed Laboratories,San Francisco, CA, USA) antibodies to detect E-cadherin (diluted1 : 1000). Control blots were probed with anti-b-actin (1 : 500)(Sigma, St Louis, MO, USA). Anti-mouse IgG peroxidaseconjugates (Transduction Laboratories, Lexington, KY, USA) wereused as secondary antibodies, and the blots were developed for1 min using the enhanced chemiluminescent detection system(Amersham Int., Little Chalfont, UK). Exposure time was 1 min.Membranous E-cadherin expression was analysed using HECD-1
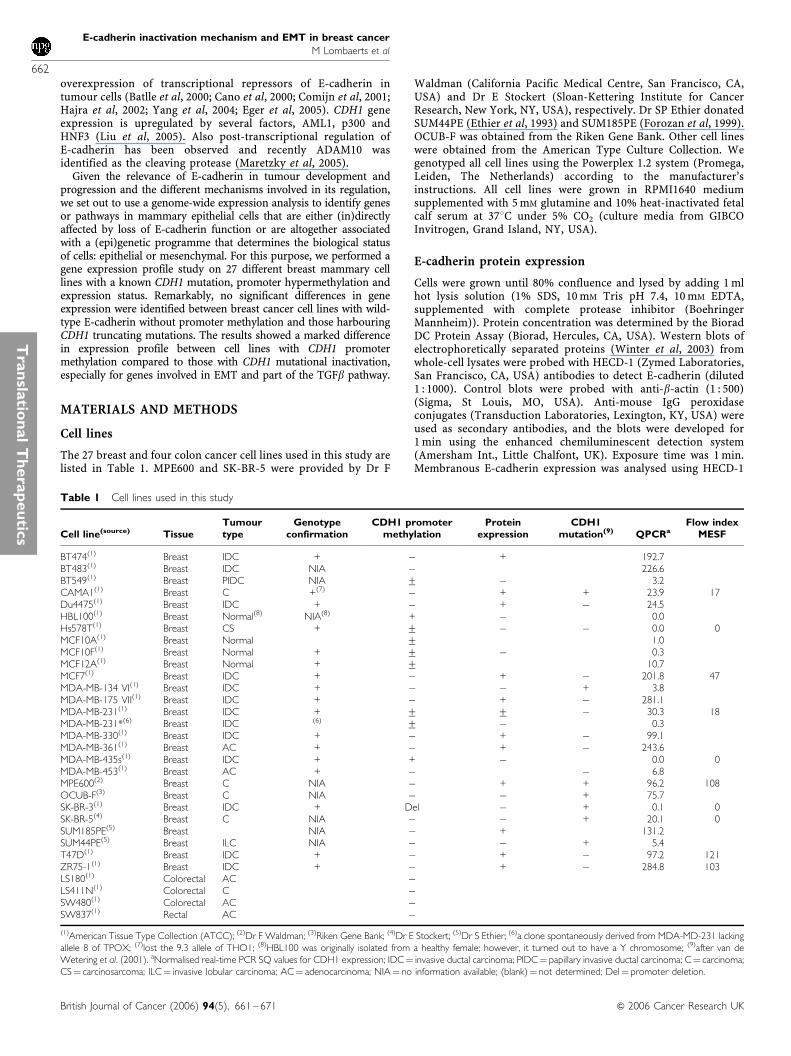
Table 1 Cell lines used in this study
Cell line(source) TissueTumourtype
Genotypeconfirmation
CDH1 promotermethylation
Proteinexpression
CDH1mutation(9) QPCRa
Flow indexMESF
BT474(1) Breast IDC + � + 192.7BT483(1) Breast IDC NIA � 226.6BT549(1) Breast PIDC NIA 7 � 3.2CAMA1(1) Breast C +(7) � + + 23.9 17Du4475(1) Breast IDC + � + � 24.5HBL100(1) Breast Normal(8) NIA(8) + � 0.0Hs578T(1) Breast CS + 7 � � 0.0 0MCF10A(1) Breast Normal 7 1.0MCF10F(1) Breast Normal + 7 � 0.3MCF12A(1) Breast Normal + 7 10.7MCF7(1) Breast IDC + � + � 201.8 47MDA-MB-134 VI(1) Breast IDC + � � + 3.8MDA-MB-175 VII(1) Breast IDC + � + � 281.1MDA-MB-231(1) Breast IDC + 7 7 � 30.3 18MDA-MB-231*(6) Breast IDC (6) 7 � 0.3MDA-MB-330(1) Breast IDC + � + � 99.1MDA-MB-361(1) Breast AC + � + � 243.6MDA-MB-435s(1) Breast IDC + + � 0.0 0MDA-MB-453(1) Breast AC + � � 6.8MPE600(2) Breast C NIA � + + 96.2 108OCUB-F(3) Breast C NIA � � + 75.7SK-BR-3(1) Breast IDC + Del � + 0.1 0SK-BR-5(4) Breast C NIA � � + 20.1 0SUM185PE(5) Breast NIA � + 131.2SUM44PE(5) Breast ILC NIA � � + 5.4T47D(1) Breast IDC + � + � 97.2 121ZR75-1(1) Breast IDC + � + � 284.8 103LS180(1) Colorectal AC �LS411N(1) Colorectal C �SW480(1) Colorectal AC �SW837(1) Rectal AC �(1)American Tissue Type Collection (ATCC); (2)Dr F Waldman; (3)Riken Gene Bank; (4)Dr E Stockert; (5)Dr S Ethier; (6)a clone spontaneously derived from MDA-MD-231 lackingallele 8 of TPOX; (7)lost the 9.3 allele of THO1; (8)HBL100 was originally isolated from a healthy female; however, it turned out to have a Y chromosome; (9)after van deWetering et al. (2001). aNormalised real-time PCR SQ values for CDH1 expression; IDC¼ invasive ductal carcinoma; PIDC¼ papillary invasive ductal carcinoma; C¼ carcinoma;CS¼ carcinosarcoma; ILC¼ invasive lobular carcinoma; AC¼ adenocarcinoma; NIA¼ no information available; (blank)¼ not determined; Del¼ promoter deletion.
E-cadherin inactivation mechanism and EMT in breast cancer
M Lombaerts et al
662
British Journal of Cancer (2006) 94(5), 661 – 671 & 2006 Cancer Research UK
Tra
nsla
tion
al
Th
era
peu
tics

by flow cytometry of viable cells as described previously (Corveret al, 1994). In brief, 1 mg of HECD1 was used to label the cells. Foreach sample, measurements from 20 000 single cells were collectedusing a standard FACSCaliburt flow cytometer (BD Biosciences,San Diego, CA, USA). Data were analysed using WinList 5.0software (Verity Software House Inc., Topsham, ME, USA).
Methylation-specific PCR
CDH1 promoter methylation was determined as described byHerman et al (1996). Modification of DNA before PCR was carriedout with the EZ Methylation Kitt (Zymo Research, Orange, CA,USA) according to the manufacturer’s instructions. Methylation-specific fragments were sequenced to determine methylation ofCpGs between the primer binding sites. As a control for efficientmodification, we used primers for fragments of CDH3 and TERF2,flanking CDH1, which do not contain CpGs and exclusivelyamplified modified DNA (primer sequences and PCR conditionsare available upon request).
RNA isolation
When cell cultures reached 70–80% confluence, RNA was isolatedusing TRIzol (Invitrogen Life Technologies Breda, The Nether-lands) and purified using Qiagen RNeasy mini kit columns (QiagenSciences, Germantown, MD, USA). Samples were DNase treatedusing the Qiagen RNase-free DNase kit (Qiagen). The isolation andpurification were carried out according to the manufacturer’sinstructions.
cDNA microarrays
cDNA clones were amplified to generate PCR products for thecDNA microarray from a sequence verified clone collection(Research Genetics, Invitrogen, Huntsville, AL, USA). Apart fromthese clones, cDNAs related to adhesion, cytoskeleton andcarcinogenesis were selected. These additional clones wereobtained from the Deutsches Krebsforschungszentrum (DeutschesRessourcenzentrum fur Genomforschung, Berlin, Germany) orcreated by performing an RT–PCR (reverse transcriptase) reactionon RNA from mammary cell lines. Subsequently, these PCRproducts were cloned using the TOPO TA cloning kit (Invitrogen,Carlsbad, CA, USA). All plasmid inserts were PCR amplified usingplasmid-specific primers.
Purified PCR products, in 3� SSC buffer, were spotted induplicate on MicroMax SuperChipt I slides (Perkin-Elmer LifeScience, Boston, MA, USA) at the Leiden Genome TechnologyCenter (http://www.lgtc.nl/) using the OmniGrid 100 robot(GeneMachines, San Carlos, CA, USA). In total, 9216 PCRproducts, including ‘landing marks’, consisting of biotin- andfluorescein-labelled PCR products to facilitate spot identification,were spotted in duplicate on each slide.
cDNA labelling and hybridisation
For cDNA labelling and signal amplification, we used the tyramidesignal amplification (TSA) kit (Perkin-Elmer Life Science, Boston,MA, USA) according to the manufacturer’s instructions withminor modification. A 1 mg portion of RNA was used to generatebiotin- or fluorescein-labelled cDNA. In general, cell line cDNAwas labelled with fluorescein (Cy3) whereas reference cDNA waslabelled with biotin (Cy5). This reference RNA consists of RNAisolated from several human tumour cell lines (HL-60, K562, NCI-H226, COLO205, SNB-19, LOX-IMVI, OVCAR-3, OVCAR-4, CAK-IPC-3, MCF7, Hs578 T, MCF10F, MCF12A, OUMS27 and SW1353),analogous to the panel described by Ross et al (2000). LabelledcDNA was purified on YM-30 Microcon columns (MilliporeCorporation, Bedford, MA, USA), dissolved in the hybridisation
buffer and applied to cDNA arrays. Slides were hybridisedovernight at 651C in Corning Hybridization Chambers (Corning,NY, USA). The TSA reaction and washing of the slides was carriedout using ThermoShandon Coverplates (http://www.thermo.com/).
Data analysis
Microarrays were scanned using the GeneTAC LSIV laser scanner(Genomic Solutions, Ann Arbor, MI, USA). Each slide was scannedat two different gain settings, namely, a low gain to avoid detectorsaturation by high-amplitude signals and high gain to improvesignal detection from weakly expressed genes. This approachprovides a larger dynamic range of signal detection. Fluorescentspots were detected and quantified using GenePix Pro 3.0 software(Axon Instruments Inc., Union City, CA, USA). An MS-Excelmacro was created for automated spot selection. This enablesexclusion of saturated spots and spots with a signal below thethreshold. The remaining spots were corrected for local back-ground noise. The intensity for both dyes of each spot wasnormalised to the median of all spots on the array. For each spot,the ratio of the sample to the reference was calculated. For spotsmeasured both at high gain and low gain, ratios were averaged.Finally, ratios were log 10-transformed.
Unsupervised cluster analysis (using the options ‘Completelinkage’ and ‘Correlation’) was made on log 10-transformed ratioswith Cluster 2.12 (Eisen et al, 1998) and visualised using Treeview1.6 (MB Eisen, http://rana.lbl.gov/index.htm). For the identifica-tion of differentially expressed genes, R version 1.9.0 (http://www.R-project.org/) (R Development Core Team, 2004) using theLimma (linear models for microarray data) package of Biocon-ductor (http://www.bioconductor.org/) was applied. Limma is amoderated T-statistic that detects differentially expressed genesbetween groups given the natural variance within these groups,corrected for false discovery rate due to multiple testing(Wettenhall and Smyth, 2004). Cluster analysis was made forgenes yielding a signal in at least 90% of the samples. Independenthybridisations including dye-swaps of the same sample generallyclustered together; therefore, we averaged experimental data forevery cell line. Furthermore, we averaged ratios of duplicate spotson the array to improve significance. Differentially expressed geneswere determined for cDNAs that gave a signal in at least 80% of thesamples.
To test reproducibility of hybridisation and data acquisition,duplicate or triplicate microarray hybridisations were performedfor 13 of the 31 cell lines, and seven dye-swap experiments. As theresults of the duplicate or triplicate array hybridisations of thesame cell line are highly similar, these are averaged as well asduplicate spots.
Real-time PCR
Quantitative real-time PCR (qPCR) was performed to verify resultsfound by the cDNA microarray analysis and examine theexpression profile of candidate genes (Table 4). Primerswere developed with the Beacon Designer 3 software (PremierBiosoft International, Palo Alto, CA, USA). Primer sequencesand PCR conditions are available upon request. Reactionswere performed using qPCR Corekits for SybrGreen or TAQmanprobes (Eurogentec, Seraing, Belgium). Cycle threshold (Ct)and starting quantities (SQ) were determined using the BioradiCycler software (Biorad, Hercules, CA, USA). Ct and SQvalues were normalised to the expression levels of three house-keeping genes, HNRPM, CPSF6 and TBP, selected from themicroarray results as being stably expressed (Van Wezel et al,2005), using the geNorm program (Vandesompele et al, 2002).Statistical analysis (ANOVA) was carried out using SPSS 10.0(SPSS Inc., Chicago, IL, USA).
E-cadherin inactivation mechanism and EMT in breast cancer
M Lombaerts et al
663
British Journal of Cancer (2006) 94(5), 661 – 671& 2006 Cancer Research UK
Tra
nsl
ati
on
al
Th
era
peu
tics
RESULTS
Cell line characterisation
All breast cell lines were genotyped to verify their identity. For 18cell lines, results could be verified by data available from the ATCC(http://www.atcc.org). Only for CAMA1, we were unable to identifythe 9.3 allele of THO1 on chromosome 11p15.5. Although for sixcell lines no genotypes of the loci tested with the Powerplex kitwere available, all had a unique profile. The MDA-MB-231* cellline is a derivative of MDA-MB-231 that spontaneously arose inour laboratory. Both genotypes are identical except the loss ofallele 8 of TPOX in MDA-MD-231*. Mutations in the DNAsequence of the CDH1 gene have been reported previously (van deWetering et al, 2001).
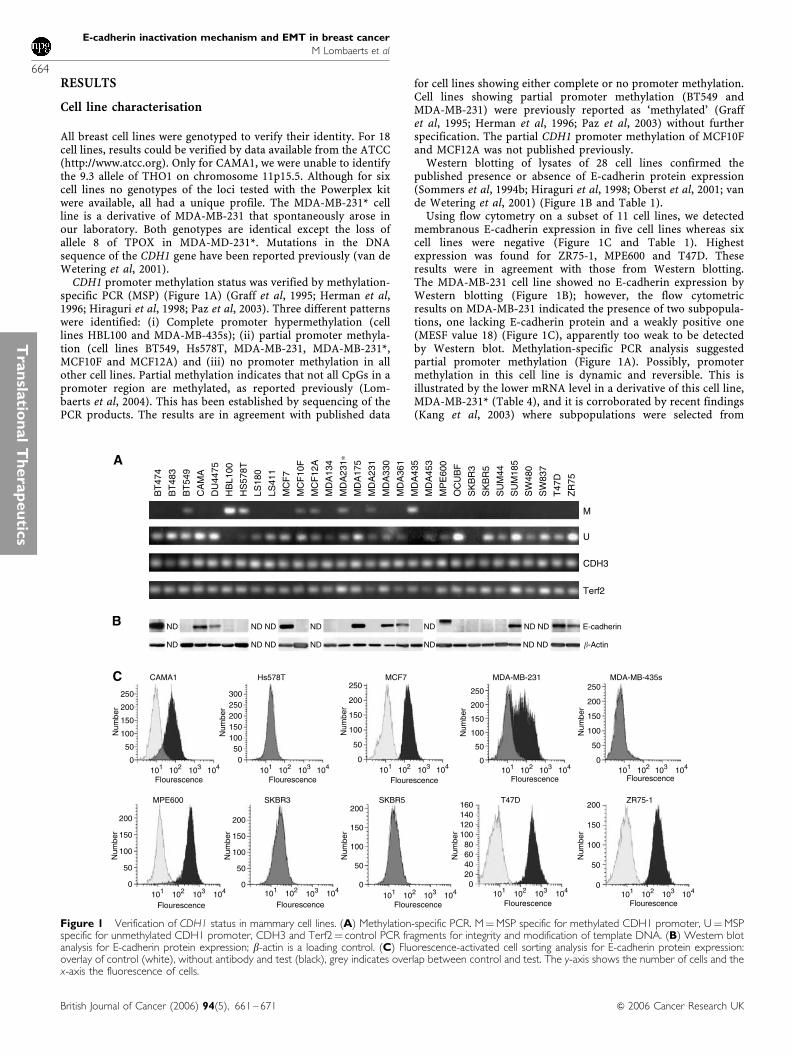
CDH1 promoter methylation status was verified by methylation-specific PCR (MSP) (Figure 1A) (Graff et al, 1995; Herman et al,1996; Hiraguri et al, 1998; Paz et al, 2003). Three different patternswere identified: (i) Complete promoter hypermethylation (celllines HBL100 and MDA-MB-435s); (ii) partial promoter methyla-tion (cell lines BT549, Hs578T, MDA-MB-231, MDA-MB-231*,MCF10F and MCF12A) and (iii) no promoter methylation in allother cell lines. Partial methylation indicates that not all CpGs in apromoter region are methylated, as reported previously (Lom-baerts et al, 2004). This has been established by sequencing of thePCR products. The results are in agreement with published data
for cell lines showing either complete or no promoter methylation.Cell lines showing partial promoter methylation (BT549 andMDA-MB-231) were previously reported as ‘methylated’ (Graffet al, 1995; Herman et al, 1996; Paz et al, 2003) without furtherspecification. The partial CDH1 promoter methylation of MCF10Fand MCF12A was not published previously.
Western blotting of lysates of 28 cell lines confirmed thepublished presence or absence of E-cadherin protein expression(Sommers et al, 1994b; Hiraguri et al, 1998; Oberst et al, 2001; vande Wetering et al, 2001) (Figure 1B and Table 1).
Using flow cytometry on a subset of 11 cell lines, we detectedmembranous E-cadherin expression in five cell lines whereas sixcell lines were negative (Figure 1C and Table 1). Highestexpression was found for ZR75-1, MPE600 and T47D. Theseresults were in agreement with those from Western blotting.The MDA-MB-231 cell line showed no E-cadherin expression byWestern blotting (Figure 1B); however, the flow cytometricresults on MDA-MB-231 indicated the presence of two subpopula-tions, one lacking E-cadherin protein and a weakly positive one(MESF value 18) (Figure 1C), apparently too weak to be detectedby Western blot. Methylation-specific PCR analysis suggestedpartial promoter methylation (Figure 1A). Possibly, promotermethylation in this cell line is dynamic and reversible. This isillustrated by the lower mRNA level in a derivative of this cell line,MDA-MB-231* (Table 4), and it is corroborated by recent findings(Kang et al, 2003) where subpopulations were selected from
ND ND ND
NDNDND
ND ND ND ND
ND NDND ND
E-cadherin
BT
474
BT
483
BT
549
CA
MA
DU
4475
HB
L100
HS
578T
LS18
0
LS41
1
MC
F7
MC
F10
F
MC
F12
A
MD
A13
4
MD
A23
1∗
MD
A23
1
MD
A33
0
MD
A36
1
MD
A43
5
MD
A45
3
MP
E60
0
MD
A17
5
OC
UB
F
SK
BR
3
SK
BR
5
SU
M44
SU
M18
5
SW
480
SW
837
T47
D
ZR
75
M
U
CDH3
Terf2
200
250
150
100
50
0
200
250
150
100
50
0
200
250
150
100
50
0
200
250
150
100
50
0
200
150
100
50
0
200
150
100
50
0
200
150
100
50
0
200
150
100
50
0
160140
100120
2040
8060
0
200250300
150100500
101 102 103 104
101 102 103 104101 102 103 104101 102 103 104 101 102 103 104 101 102 103 104
101 102 103 104 101 102 103 104 101 102 103 104 101 102 103 104
CAMA1 Hs578T MCF7 MDA-MB-231 MDA-MB-435s
MPE600 SKBR3 SKBR5 T47D ZR75-1
Num
ber
Num
ber
Num
ber
Num
ber
Num
ber
Num
ber
Num
ber
Num
ber
Num
ber
Num
ber
Flourescence Flourescence Flourescence
FlourescenceFlourescenceFlourescence
Flourescence Flourescence
FlourescenceFlourescence
�-Actin
A
B
C
Figure 1 Verification of CDH1 status in mammary cell lines. (A) Methylation-specific PCR. M¼MSP specific for methylated CDH1 promoter, U¼MSPspecific for unmethylated CDH1 promoter, CDH3 and Terf2¼ control PCR fragments for integrity and modification of template DNA. (B) Western blotanalysis for E-cadherin protein expression; b-actin is a loading control. (C) Fluorescence-activated cell sorting analysis for E-cadherin protein expression:overlay of control (white), without antibody and test (black), grey indicates overlap between control and test. The y-axis shows the number of cells and thex-axis the fluorescence of cells.
E-cadherin inactivation mechanism and EMT in breast cancer
M Lombaerts et al
664
British Journal of Cancer (2006) 94(5), 661 – 671 & 2006 Cancer Research UK
Tra
nsla
tion
al
Th
era
peu
tics

MDA-MB-231 cells with different metastatic propensities. Thisplasticity of the CDH1 promoter has been observed previously(Graff et al, 2000).
The results on methylation status were in agreement withthe protein expression data. Cell lines showing partial or completepromoter methylation lacked E-cadherin protein expression,with the exception of MDA-MB-231. Although the methylationprofile was similar to that of other cell lines showing partialmethylation (BT549, MCF10F and MCF12A), flow cytometryshowed weak membranous protein expression in a subpopulationof the cells. For SK-BR-3, we could not detect a fragment inthe MSP analysis. In order to verify the quality of DNAmodification, we performed a PCR on modified DNA with primersspecific for two fragments flanking CDH1. As PCR fragments wereobtained for both flanking genes, a homozygous deletion of theDNA containing the CDH1 promoter is likely. This result is indiscordance with the reported loss of only exons 2–12 (van deWetering et al, 2001).
Cluster analysis
Unsupervised cluster analysis of all cell lines identified two mainclusters (Figure 2). Cluster 1 contains cell lines with a fibroblasticmorphology, whereas the cluster 2 includes cell lines with a moreor less epithelial appearance (Figure 3). The ‘Fibroblastic’ clusterincludes two subclusters: 1A includes the breast cancer cell linesBT549, HBL100, Hs578T, MDA-MB-231, MDA-MB-231* andMDA-MB-435s, which all show CDH1 promoter methylationand are oestrogen receptor negative (ER�). Remarkably, cluster1B (‘Fibroblastic-Normal’) contains three cell lines derived
from normal breast tissue (MCF10A, MCF10F and MCF12A).Cluster 2, containing cell lines with an epithelial morphology,is divided into three subclusters. 2A (‘Epithelial-Ecad-expressing’)contains the cell lines BT483, BT474, MCF7, MDA-MB-175VII,MDA-MB-330, MDA-MB-361, MDA-MB-453, T47D andZR75-1, with wild type CDH1 and two cell lines with CDH1mutations, CAMA1 and MPE600. Cluster 2A includes eight ERþ
cell lines and two ER� cell lines. Interestingly, CAMA1 andMPE600 carry in-frame CDH1 exon deletions (van de Weteringet al, 2001) and show membrane-bound E-cadherin proteinexpression in our flow cytometry analysis (Figure 1C). Thus,all cell lines in this cluster express E-cadherin protein, butinterestingly, the size of the altered protein of MPE600 islarger than normal E-cadherin, suggesting a failure in the removalof the signal peptide. Cluster 2B (‘Epithelial-CDH1-mutated’)includes all breast cancer cell lines harbouring inactivatingCDH1 mutations (MDA-MB-134VI, SK-BR-3, SK-BR-5, SUM44PEand OCUB-F) and two cell lines with wild-type CDH1, SUM185PEand Du4475. 2B includes two ER� and one ERþ cell line. BothOcub-F and Du4475 grow in suspension, but no deviating growthpattern was observed for SUM185PE. Cluster 2C (‘Epithelial-Rectal’) contains cell lines derived from (colo-) rectal tumours(LS180, LS411N, SW480 and SW837). The separation of thecolorectal cell lines validates the resolving power of the microarraymethod.
Differentially expressed genes
To identify differentially expressed genes associated with differ-ences in E-cadherin expression, we first compared the seven breasttumour cell lines in the ‘Epithelial’ cluster with CDH1 mutationswith 12 harbouring wild-type CDH1 from the same cluster.Remarkably, we did not identify any significant differentiallyexpressed genes using the Limma package. As CAMA1 andMPE600 harbour a mutation in the CDH1 gene but still expressE-cadherin, we next removed CAMA1 and MPE600 from thisanalysis. Also, this comparison did not yield any differentiallyexpressed genes (data not shown).
Next, we compared the 18 breast tumour cell lines from the‘Epithelial’ cluster with those from the ‘Fibroblastic’ cluster. Weidentified 121 clones showing a highly significant difference inexpression (false discovery rate (FDR) o0.01), whereas anadditional 187 clones showed differential expression at a lowerlevel of significance (0.01pFDRo0.05). Twenty-eight genes wererepresented by two or more clones in this list. In total, weidentified 273 genes that were significantly up- or downregulatedin cell lines with a CDH1 promoter methylation vs cell lines
Epithelial Fibroblastic12
2B 2A
1B 1A
2C
Ecad-expressing
CDH1mutations
Rectal Normal Tumour
Figure 3 Morphology of representative cell lines in the different clusters. Cluster 1A is represented by MDA-MB-435, 1B by MCF10A, 2A by SKBR3, 2Bby MCF7 and 2C by SW480.
2B2A
2C
2 1
1B 1A
MC
F7
T47
DC
AM
A1
MD
A33
0
MD
A36
1
MD
A17
5
MD
A13
4D
U44
75
BT
474
SK
BR
5
SU
M18
5
SU
M44
OC
UB
F
BT
483
ZR
75M
DA
453
MP
E60
0
SK
BR
3
SW
837
SW
480
MC
F12
A
LS41
1LS
180
MC
F10
AM
CF
10F
HS
578T
BT
549
MD
A23
1
MD
A43
5H
BL1
00
MD
A23
1*
Figure 2 Hierarchical cluster analysis of cDNA microarray data for allcell lines reveals an ‘epithelial’ cluster (2) with wild-type CDH1 (2A),mutated CDH1 (2B) and colorectal cell lines (2C) and a ‘fibroblastic’ cluster(1), including tumour (1A) and ‘normal’ mammary cell lines (1B).
E-cadherin inactivation mechanism and EMT in breast cancer
M Lombaerts et al
665
British Journal of Cancer (2006) 94(5), 661 – 671& 2006 Cancer Research UK
Tra
nsl
ati
on
al
Th
era
peu
tics

without promoter methylation (FDRo0.05). Table 2 shows the top10 up- and downregulated genes based on the false discovery rate.Table 3 shows a subset of genes that are of particular interestbecause they are involved in the TGFb pathway, EMT control orcytoskeletal (re)organisation.
Real-time PCR
Quantitative PCR was performed to validate cDNA micro-array expression data for six differentially expressed genes(CTNNB1, CDH1, ELF3, FN1, FOSL1 and TGFB1; see Table 4).The correlation between results from the microarray and qPCRwas highly significant (Figure 4). The microarray expressiondata led us to hypothesise that breast cell lines with CDH1promoter methylation all have undergone EMT. To verify this, wealso performed qPCR for genes that are involved in the regulationof CDH1 expression (TWIST1, ZFHX1B, SNAI1 and SNAI2) or (amarker for) EMT (ILK, VIM and SERPINE1), but could not beevaluated on the array because of poor hybridisation results orabsence.
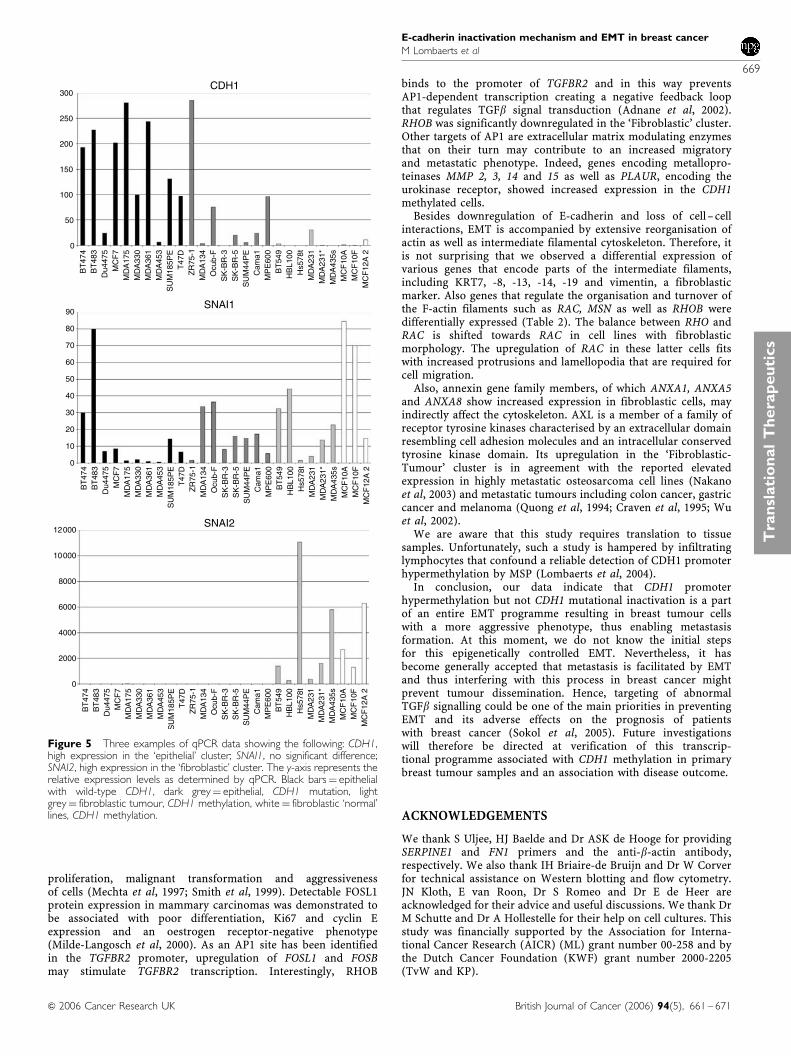
As determined by one-way ANOVA, the normalised startingquantity, a measure for the amount of mRNA in the sample,differed significantly between tumour cell lines with CDH1promoter methylation with a fibroblastic morphology (‘Fibroblas-tic-Tumour’ cluster) and epithelial breast cancer cell lines(‘Epithelial-Ecad-Expressing’ and ‘Epithelial-CDH1-Mutated’ clus-ters) for several genes (Table 4). CDH1 and ELF3 were expressed ata significantly higher level in cells with an epithelial morphology,whereas FN1, FOSL1, VIM, ZFHX1B, SNAI2, SERPINE1 and TFGB1showed a higher expression in fibroblastic breast tumour cells(Table 4 and Figure 5).
Cell lines in the ‘Epithelial-Ecad-Expressing’ subcluster showedconsiderable variation in CDH1 expression, with higher expressionlevels predominantly in the ERþ cell lines. Remarkably, thehighest levels of ELF3 expression were identified in both SK-BR-3and SK-BR-5 cell lines.
Several cell lines within the ‘Fibroblastic-Tumour’ subclustershow high expression of TWIST1, particularly BT549 and MDA-MB-435s, but for the whole group the results did not differsignificantly from those of the epithelial cluster. Of the ‘Epithelial’cluster, SUM44PE, which was originally derived from a lobular
carcinoma (Ethier et al, 1993; van de Wetering et al, 2001), showedthe highest expression. Remarkably, cell lines derived from normalbreast epithelial cells, MCF10A, MCF10F and MCF12A, showedvery high expression levels of FN1, SERPINE1, ZFHX1B, SNAI2,TGFB1, TWIST1 and VIM and low values for CDH1 and ELF3,which is comparable to expression data from cell lines in the‘Fibroblastic-Tumour’ subcluster.
DISCUSSION
Alterations in E-cadherin are an important event in carcinogenesis;however, there is controversy about the corollary of the typeof E-cadherin inactivation (mutation or promoter hypermethyla-tion) and the aggressiveness of tumour cells. In view of its functionin adhesion, it is considered as an invasion suppressor, whichis indeed corroborated by in vitro experiments (Vleminckxet al, 1991). Nevertheless, mutational inactivation is alreadyidentified in pre-invasive lobular carcinoma in situ (Vos et al,1997), thereby supporting a role in early carcinogenesis insteadof invasive capacity. In order to identify pathways that areaffected by E-cadherin inactivation, we performed a genome-wideexpression study on 27 human mammary cell lines, which arewell characterised on E-cadherin RNA and protein expressionstatus.
Cluster analysis of the microarray data identified twomain clusters that coincide with the epithelial and fibroblasticphenotype of the cells, respectively. Importantly, the ‘Fibroblastic’cluster included only cell lines with either partial or completeCDH1 promoter methylation. This contrasts with the ‘Epithelial’cluster that included cell lines with wild-type as well as celllines with mutant CDH1 status. Based on published data onin vitro invasion assays, cellular phenotype and gene expressionprofiles, Lacroix and Leclercq, (2004) classified breast cancercell lines into three groups: luminal epithelial, weakly luminalepithelial and ‘mesenchymal’ or ‘stromal’ like. In our analyses, allcell lines belonging to both the luminal and weakly epi-thelial luminal type group into the ‘Epithelial’ cluster. Theposition of colorectal tumour cell lines as ‘epithelial’ subclusterrather than forming an out-group suggests that the origin ofthese cells is subordinate to the phenotype (epithelial or
Table 2 Top 10 upregulated (41) and downregulated (o1) genes in the ‘Fibroblastic-Tumour’ cluster when compared with breast tumour cell lines inthe ‘Epithelial’ cluster
Symbol Name Locus ID Fold Change P-value Keyword
FOSL1 FOS-like antigen 1 8061 692 1.03E�07 Transcription factorGBE1 Glucan (1,4-alpha-) branching enzyme 1 2632 9.77 6.09E�07 Sucrose metabolismMMP15 Matrix metalloproteinase 15 4324 9.55 2.83E�06 Matrix degradationAMPD1 Adenosine monophosphate deaminase 1 270 7.94 3.27E�06 Purine metabolismCOL4A2 Collagen type IV alpha 2 1284 36.3 1.31E�05 MatrixACADL Acyl-coenzyme A dehydrogenase long chain 33 72.4 1.32E�05 Fatty acid metabolismPLAUR Plasminogen activator, urokinase receptor 5329 43.6 2.99E�05 Matrix degradationAXL AXL receptor tyrosine kinase 558 11.8 2.99E�05PHLDA1 Pleckstrin homology-like domain family A member 1 22822 13.2 3.56E�05ANXA5 Annexin A5 308 5.62 3.65E�05IGFBP2* Insulin-like growth factor binding protein 2 3485 0.00371 1.27E�05 IGFBPST14* Suppression of tumorigenicity 14 6768 0.0110 1.27E�05 Serine proteaseTFDP2 Transcription factor Dp-2 7029 0.0355 2.58E�05 Transcription factorXBP1 X-box binding protein 1 7494 0.0302 2.61E�05 Transcription factorKRT13 Keratin 13 3860 0.0195 3.65E�05 CytoskeletonKIAA0089 KIAA0089 23171 0.170 7.60E�05 unknownELF3 E74-like factor 3 1999 0.0263 1.20E�04 Transcription factorFXYD3 FXYD domain containing ion transport regulator 3 5349 0.0107 1.24E�04 Ion transportKRT14 Keratin 14 3861 0.0195 1.24E�04 CytoskeletonIL1RN Interleukin 1 receptor antagonist 3557 0.0933 1.24E�04
*Genes also identified by Lacroix and Leclerq.
E-cadherin inactivation mechanism and EMT in breast cancer
M Lombaerts et al
666
British Journal of Cancer (2006) 94(5), 661 – 671 & 2006 Cancer Research UK
Tra
nsla
tion
al
Th
era
peu
tics

Table 3 Selection of differentially expressed genes involved in TGFb, matrix remodelling and cytoskeleton
Symbol Name Locus ID Fold change P Up or down Group
VEGFC Vascular endothelial growth factor C 7424 30.9 2.42E�02 Up AngiogenesisPLOD2 Procollagen-lysine, 2-oxoglutarate 5-dioxygenase 2 5352 6.17 2.96E�02 Up AngiogenesisSTC1 Stanniocalcin 1 6781 12.0 2.35E�03 Up AngiogenesisSPARC Secreted protein, acidic, cysteine-rich 6678 28.2 2.57E�02 Up AP1 targetCSF1* Colony stimulating factor 1 1435 102 6.36E�05 Up CytokineITGB1 Integrin, beta 1 3688 5.13 2.03E�02 Up CytoskeletonRAC2 Ras-related C3 botulinum toxin substrate 2 5880 6.76 1.59E�02 Up CytoskeletonKRT7 Keratin 7 3855 0.0602 1.97E�02 Down CytoskeletonKRT8 Keratin 8 3856 0.0251 5.38E�04 Down CytoskeletonKRT19 Keratin 19 3880 0.00891 3.10E�04 Down CytoskeletonRHOB Ras homolog gene family, member B 388 0.0589 9.87E�03 Down CytoskeletonARHD Ras homolog gene family, member D 29984 0.0871 3.42E�02 Down CytoskeletonDSP* Desmoplakin 1832 0.0631 1.22E�03 Down Cytoskeleton/adhesionCAV1 Caveolin 1 857 126 3.65E�05 Up Cytoskeleton/adhesionCAV2 Caveolin 2 858 10.7 1.50E�03 Up Cytoskeleton/adhesionCD44 CD44 antigen 960 51.3 5.27E�05 Up Cytoskeleton/adhesionFN1 Fibronectin 1 2335 17.4 2.36E�03 Up Cytoskeleton/adhesionMSN Moesin 4478 115 1.26E�04 Up Cytoskeleton/adhesionS100A2 S100 calcium binding protein A2 6273 5.50 4.72E�02 Up Cytoskeleton/adhesionS100A3 S100 calcium binding protein A3 6274 7.41 1.08E�02 Up Cytoskeleton/adhesionCDH1* E-cadherin 999 0.0589 2.82E�02 Down Cytoskeleton/adhesionMAPK1 Mitogen-activated protein kinase 1 5594 54.9 1.69E�03 Up MAPKCOL5A1 Collagen type V alpha 1 1289 8.32 1.58E�02 Up MatrixCOL15A1 Collagen type XV alpha 1 1306 3.31 3.94E�02 Up MatrixBMP1 Bone morphogenetic protein 1 649 9.55 1.85E�02 Up Matrix degradationMMP2 Matrix metalloproteinase 2 4313 27.5 9.29E�03 Up Matrix degradationMMP3 Matrix metalloproteinase 3 4314 2.45 4.81E�02 Up Matrix degradationMMP14* Matrix metalloproteinase 14 4323 53.7 5.27E�05 Up Matrix degradationPLAU* Plasminogen activator, urokinase 5328 14.45 3.32E�03 Up Matrix degradationSERPINE1* Serine or cysteine proteinase inhibitor member 1 5054 19.1 1.44E�02 Up Matrix degradationSERPINE2 Serine or cysteine proteinase inhibitor member 2 5270 759 1.40E�04 Up Matrix degradationTPD52* Tumor protein D52 7163 0.25 1.86E�02 Down MorphogenesisANXA1 Annexin A1 301 6.31 3.82E�05 Up Phospho-lipid bindingANXA5 Annexin A5 244 5.75 3.66E�05 Up Phospho-lipid bindingANXA8 Annexin A8 244 3.09 3.24E�02 Up Phospho-lipid bindingTGFB1 Transforming growth factor beta 1 7040 11.8 3.76E�02 Up TGFbetaTGFB2 Transforming growth factor beta 2 7042 23.4 1.50E�03 Up TGFbetaTGFBR2 Transforming growth factor beta receptor II 7048 11.2 9.56E�04 Up TGFbetaFST Follistatin 10468 11.5 6.41E�04 Up TGFbetaFOSB FBJ murine osteosarcoma viral oncogene homolog B 2354 2.24 4.47E�02 Up Transcription factorTFAP2A Transcription factor AP-2 alpha 7020 0.224 2.29E�03 Down Transcription factorTFAP2C* Transcription factor AP-2 gamma 7022 0.144 3.58E�02 Down Transcription factorMDM2* Mouse double minute 2 homolog isoform 4193 0.380 5.59E�03 Down Ubiquitination
Up indicates upregulated in the ‘fibroblastic’ cell lines. *Genes also identified by Lacroix and Leclerq.
Table 4 Quantitative RT–PCR data
Symbol Name Locus ID Fold change P-value Up or down Keyword
CPSF6 Cleavage and polyadenylation specific factor 6 11052 0.98 7.15E�01 NS Housekeeping geneHNRPM Heterogeneous nuclear ribonucleoprotein M 4670 1.0 1.00E+00 NS Housekeeping geneTBP TATA box binding protein 6908 1.0 1.00E+00 NS Housekeeping geneCTNNB1 Catenin beta 1 1499 1.1 1.00E+00 NS Adhesion and transcription factorSNAI1 Snail homolog 1 6515 1.3 1.00E+00 NS Transcription repressorTWIST1 Twist homolog 1 7291 1.7 1.00E+00 NS Transcription repressorILK Integrin-linked kinase 3611 1.26 9.50E�02 NS TGFbetaTFGB1 Transforming growth factor beta 7040 2.0 1.50E�02 Up TGFbetaSERPINE1 Serine or cysteine proteinase inhibitor 5054 5.1 3.00E�03 Up Matrix degradationFN1 Fibronectin 1 2335 2.8 2.00E�03 Up Mesenchymal markerFOSL1 FOS-like antigen 1 8061 2.4 0.00E+00 Up Transcription factorSNAI2* Snail homolog 2, slug 6591 12 0.00E+00 Up Transcription repressorVIM* Vimentin 7431 12 0.00E+00 Up Mesenchymal markerZFHX1B Zinc finger homeobox 1b, sip1 9839 8.9 0.00E+00 Up Transcription repressorCDH1 E-cadherin 999 0.15 0.00E+00 Down Cytoskeleton/adhesionELF3 E74-like factor 3 1999 0.24 0.00E+00 Down Transcription factor
Up indicates upregulated in the ‘fibroblastic’ cell lines. NS¼ not significant. *Genes also identified by Lacroix and Leclerq.
E-cadherin inactivation mechanism and EMT in breast cancer
M Lombaerts et al
667
British Journal of Cancer (2006) 94(5), 661 – 671& 2006 Cancer Research UK
Tra
nsl
ati
on
al
Th
era
peu
tics

fibroblastic), underscoring the large phenotypic differencesinduced by EMT.
The fibroblastic phenotype of the cell lines in the latter cluster isstrongly indicative of EMT. This is also supported by the increasedinvasiveness of these cell lines (BT549, Hs578T, MDA-MB-231 andMDA-MB-435s) in vitro and their metastatic potential in mousemodels (Price et al, 1990; Thompson et al, 1992; Sommers et al,1994a). Lacroix and Leclercq (2004) identified 72 differentiallyexpressed genes between the (weakly) luminal epithelial andmesenchymal cell lines of which 15 genes (21%) coincide withdifferentially expressed genes in our ‘Epithelial’ vs ‘Fibroblastic’cluster and are indicated in Tables 2–4 with an asterisk. Thefinding that the three non-tumorigenic mammary cell lines derivedfrom normal epithelium form a cluster close to the fibroblastictumour cell lines is remarkable. However, given their fibroblasticmorphology and the CDH1 promoter methylation, this is notunexpected.
Our observation that EMT only occurs in breast cancer celllines with CDH1 promoter hypermethylation and not with aCDH1 mutational inactivation questions the presumed centralrole of E-cadherin loss as the initial or primary cause forEMT. This is furthermore illustrated by the surprising lack ofsignificantly differentially expressed genes when comparingcell lines with wild-type and mutant CDH1. It stronglysuggests that E-cadherin transcriptional inactivation is an epi-phenomenon and part of an entire programme, with much moresevere effects than loss of E-cadherin expression alone. The genesthat are involved in this programme can be inferred from thesignificantly differentially expressed genes when comparing‘Fibroblastic’ and ‘Epithelial’ cell lines. Two of the identifiedupregulated genes are upstream repressors of CDH1 transcription,thereby emphasising that E-cadherin itself is not the initiatingevent in this programme.
We identified 273 differentially expressed genes betweenbreast cancer cell lines in the ‘Epithelial’ vs the ‘Fibroblastic’cluster, underscoring that these two phenotypes are highlydifferent (Lacroix and Leclercq, 2004). We hypothesisethat mutational inactivation is selected for early in carcinogenesisand results in increased growth. In contrast, the transcriptionalinactivation by promoter methylation seems part of a largerprogramme directed towards EMT, thereby increasing invasiveand tumorigenic capacity or providing normal epithelial cellswith the propensity to divide infinitely in culture as can beinferred from cluster 1B. The TGFb pathway and furthermore
transcription factors that regulate E-cadherin (ZFHX1Band SNAI2), FOSL1 and other AP1/AP2 transcription factors,members of cytoskeleton organisation, IGFBPs, caveolaecomponents, annexins and the AXL receptor tyrosine kinase seempart of such a programme. Further below we will discuss how themajor groups of gene products that differentiate the ‘Fibroblastic’and ‘Epithelial’ breast tumour cell line fit in the this EMTparadigm.
The increased expression of several genes involved in the TGFbpathway in the ‘Fibroblastic’ cluster, that is, TGFb1, TGFb2 andtheir receptor TGFbR2, is in agreement with the important role ofthis pathway in the induction of EMT (Thiery, 2003 and referencestherein). Furthermore, one of the known downstream targets of theTGFb pathway is ZFHX1B/SIP1, which is a direct repressor ofCDH1 (Comijn et al, 2001). Another transcriptional repressor ofCDH1, SNAI2/SLUG, a downstream target of the cKIT pathway(Perez-Losada et al, 2002), is also significantly upregulated in the‘Fibroblastic’ cluster, suggesting that other pathways might also beinvolved in EMT-related E-cadherin downregulation. For twoother transcription factors that are well known to regulate E-cadherin expression in relation to EMT, TWIST (Yang et al, 2004)and SNAI1 (Cano et al, 2000), no significantly altered expressionwas observed in ‘Fibroblastic’ cells. Together, this suggests thatZFHX1B and SNAI2 are the predominant transcriptional regula-tors of CDH1 accounting for the EMT phenotype of breast tumourcell lines. Remarkably, TWIST upregulation was reported inlobular breast cancer as an alternative for inactivating mutationsof CDH1 (Yang et al, 2004) and, moreover, SUM44PE, the onlybreast cancer cell line of lobular origin in our panel, showed thehighest expression of TWIST. As TWIST is not significantlydifferentially expressed in the fibroblastic cell lines, we suggest thatits protein product has a direct effect on CDH1 and results in asimilar phenotype as CDH1 mutations, thereby contributing to thetypical phenotype of lobular breast cancer. The lack of upregula-tion of SNAI1 is unexpected, especially given the recentlyidentified role of this gene in breast cancer recurrence (Moodyet al, 2005).
FOSL1 (also called FRA1) and FOSB, albeit to a lesserextent, were significantly upregulated genes in cell lines withCDH1 promoter methylation. These FOS family membersform heterodimers with JUN family members (mainly, c-Jun,JunB and JunD) thereby forming the AP1 transcriptionfactor (Karin et al, 1997). Various studies have shown thatalterations of the composition of AP1 are related to changes in
CDH1
21
0
−2
−10 0.0 0.0
0.0
1.01.0
2.0
2.52.5
1.2
1.6
1.5 1.5
1.50.5 −0.5 −2.0
−3.0 −2.0 −1.0
−1.00.0 0.5
0.8
0.5 0.5
qPC
R lo
g(S
Q)
qPC
R lo
g(S
Q)
qPC
R lo
g(S
Q)
qPC
R lo
g(S
Q)
qPC
R lo
g(S
Q)
qPC
R lo
g(S
Q)
P=4.46 10−9 P=2.22 10−5 P=1.04 10−6
P=3.54 10−8P=9.54 10−7P=1.42 10−8
3
2
1
0
−1
Array log(ratio)
Array log(ratio)
Array log(ratio)
Array log(ratio)
Array log(ratio)
Array log(ratio)
FN1 FOSL1 TGFB14321
1
0
0−3 −2 −1 0−3 −2 −1
CTNNB1 ELF3
×
×
× ×
××
Figure 4 Correlation between cDNA microarray data and real-time qPCR for six genes.
E-cadherin inactivation mechanism and EMT in breast cancer
M Lombaerts et al
668
British Journal of Cancer (2006) 94(5), 661 – 671 & 2006 Cancer Research UK
Tra
nsla
tion
al
Th
era
peu
tics
proliferation, malignant transformation and aggressivenessof cells (Mechta et al, 1997; Smith et al, 1999). Detectable FOSL1protein expression in mammary carcinomas was demonstrated tobe associated with poor differentiation, Ki67 and cyclin Eexpression and an oestrogen receptor-negative phenotype(Milde-Langosch et al, 2000). As an AP1 site has been identifiedin the TGFBR2 promoter, upregulation of FOSL1 and FOSBmay stimulate TGFBR2 transcription. Interestingly, RHOB
binds to the promoter of TGFBR2 and in this way preventsAP1-dependent transcription creating a negative feedback loopthat regulates TGFb signal transduction (Adnane et al, 2002).RHOB was significantly downregulated in the ‘Fibroblastic’ cluster.Other targets of AP1 are extracellular matrix modulating enzymesthat on their turn may contribute to an increased migratoryand metastatic phenotype. Indeed, genes encoding metallopro-teinases MMP 2, 3, 14 and 15 as well as PLAUR, encoding theurokinase receptor, showed increased expression in the CDH1methylated cells.
Besides downregulation of E-cadherin and loss of cell– cellinteractions, EMT is accompanied by extensive reorganisation ofactin as well as intermediate filamental cytoskeleton. Therefore, itis not surprising that we observed a differential expression ofvarious genes that encode parts of the intermediate filaments,including KRT7, -8, -13, -14, -19 and vimentin, a fibroblasticmarker. Also genes that regulate the organisation and turnover ofthe F-actin filaments such as RAC, MSN as well as RHOB weredifferentially expressed (Table 2). The balance between RHO andRAC is shifted towards RAC in cell lines with fibroblasticmorphology. The upregulation of RAC in these latter cells fitswith increased protrusions and lamellopodia that are required forcell migration.
Also, annexin gene family members, of which ANXA1, ANXA5and ANXA8 show increased expression in fibroblastic cells, mayindirectly affect the cytoskeleton. AXL is a member of a family ofreceptor tyrosine kinases characterised by an extracellular domainresembling cell adhesion molecules and an intracellular conservedtyrosine kinase domain. Its upregulation in the ‘Fibroblastic-Tumour’ cluster is in agreement with the reported elevatedexpression in highly metastatic osteosarcoma cell lines (Nakanoet al, 2003) and metastatic tumours including colon cancer, gastriccancer and melanoma (Quong et al, 1994; Craven et al, 1995; Wuet al, 2002).
We are aware that this study requires translation to tissuesamples. Unfortunately, such a study is hampered by infiltratinglymphocytes that confound a reliable detection of CDH1 promoterhypermethylation by MSP (Lombaerts et al, 2004).
In conclusion, our data indicate that CDH1 promoterhypermethylation but not CDH1 mutational inactivation is a partof an entire EMT programme resulting in breast tumour cellswith a more aggressive phenotype, thus enabling metastasisformation. At this moment, we do not know the initial stepsfor this epigenetically controlled EMT. Nevertheless, it hasbecome generally accepted that metastasis is facilitated by EMTand thus interfering with this process in breast cancer mightprevent tumour dissemination. Hence, targeting of abnormalTGFb signalling could be one of the main priorities in preventingEMT and its adverse effects on the prognosis of patientswith breast cancer (Sokol et al, 2005). Future investigationswill therefore be directed at verification of this transcrip-tional programme associated with CDH1 methylation in primarybreast tumour samples and an association with disease outcome.
ACKNOWLEDGEMENTS
We thank S Uljee, HJ Baelde and Dr ASK de Hooge for providingSERPINE1 and FN1 primers and the anti-b-actin antibody,respectively. We also thank IH Briaire-de Bruijn and Dr W Corverfor technical assistance on Western blotting and flow cytometry.JN Kloth, E van Roon, Dr S Romeo and Dr E de Heer areacknowledged for their advice and useful discussions. We thank DrM Schutte and Dr A Hollestelle for their help on cell cultures. Thisstudy was financially supported by the Association for Interna-tional Cancer Research (AICR) (ML) grant number 00-258 and bythe Dutch Cancer Foundation (KWF) grant number 2000-2205(TvW and KP).
300
250
200
150
100
50
0
BT
474
BT
483
Du4
475
MC
F7
T47
DZ
R75
-1
Ocu
b-F
Cam
a1
MD
A17
5
MD
A13
4
MD
A23
1
MD
A43
5sM
DA
231*
MD
A33
0M
DA
361
MP
E60
0B
T54
9H
BL1
00H
s578
t
MD
A45
3S
UM
185P
E
SK
-BR
-3S
K-B
R-5
SU
M44
PE
MC
F10
AM
CF
10F
MC
F12
A 2
BT
474
BT
483
Du4
475
MC
F7
T47
DZ
R75
-1
Ocu
b-F
Cam
a1
MD
A17
5
MD
A13
4
MD
A23
1
MD
A43
5sM
DA
231*
MD
A33
0M
DA
361
MP
E60
0B
T54
9H
BL1
00H
s578
t
MD
A45
3S
UM
185P
E
SK
-BR
-3S
K-B
R-5
SU
M44
PE
MC
F10
AM
CF
10F
MC
F12
A 2
BT
474
BT
483
Du4
475
MC
F7
T47
DZ
R75
-1
Ocu
b-F
Cam
a1
MD
A17
5
MD
A13
4
MD
A23
1
MD
A43
5sM
DA
231*
MD
A33
0M
DA
361
MP
E60
0B
T54
9H
BL1
00H
s578
t
MD
A45
3S
UM
185P
E
SK
-BR
-3S
K-B
R-5
SU
M44
PE
MC
F10
AM
CF
10F
MC
F12
A 2
90
80
70
60
50
40
30
20
10
0
0
12000
10000
8000
6000
4000
2000
CDH1
SNAI1
SNAI2
Figure 5 Three examples of qPCR data showing the following: CDH1,high expression in the ‘epithelial’ cluster; SNAI1, no significant difference;SNAI2, high expression in the ‘fibroblastic’ cluster. The y-axis represents therelative expression levels as determined by qPCR. Black bars¼ epithelialwith wild-type CDH1, dark grey¼ epithelial, CDH1 mutation, lightgrey¼ fibroblastic tumour, CDH1 methylation, white¼ fibroblastic ‘normal’lines, CDH1 methylation.
E-cadherin inactivation mechanism and EMT in breast cancer
M Lombaerts et al
669
British Journal of Cancer (2006) 94(5), 661 – 671& 2006 Cancer Research UK
Tra
nsl
ati
on
al
Th
era
peu
tics
REFERENCES
Adnane J, Seijo E, Chen Z, Bizouarn F, Leal M, Sebti SM, Munoz-Antonia T(2002) RhoB, not RhoA, represses the transcription of the transforminggrowth factor beta type II receptor by a mechanism involving activatorprotein 1. J Biol Chem 277: 8500 – 8507
Batlle E, Sancho E, Franci C, Dominguez D, Monfar M, Baulida J,Garcia DH (2000) The transcription factor snail is a repressorof E-cadherin gene expression in epithelial tumour cells. Nat Cell Biol2: 84 – 89
Becker KF, Atkinson MJ, Reich U, Becker I, Nekarda H, Siewert JR, HoflerH (1994) E-cadherin gene mutations provide clues to diffuse type gastriccarcinomas. Cancer Res 54: 3845 – 3852
Berx G, Becker KF, Hofler H, van Roy F (1998) Mutations of the humanE-cadherin (CDH1) gene. Hum Mutat 12: 226 – 237
Berx G, Cleton-Jansen AM, Nollet F, De Leeuw WJ, Van de Vijver MJ,Cornelisse C, van Roy F (1995) E-cadherin is a tumour/invasionsuppressor gene mutated in human lobular breast cancers. EMBO J 14:6107 – 6115
Berx G, Cleton-Jansen AM, Strumane K, De Leeuw WJ, Nollet F, van Roy F,Cornelisse C (1996) E-cadherin is inactivated in a majority of invasivehuman lobular breast cancers by truncation mutations throughout itsextracellular domain. Oncogene 13: 1919 – 1925
Cano A, Perez-Moreno MA, Rodrigo I, Locascio A, Blanco MJ, del BarrioMG, Portillo F, Nieto MA (2000) The transcription factor snail controlsepithelial – mesenchymal transitions by repressing E-cadherin expres-sion. Nat Cell Biol 2: 76 – 83
Comijn J, Berx G, Vermassen P, Verschueren K, van Grunsven L, BruyneelE, Mareel M, Huylebroeck D, van Roy F (2001) The two-handed E boxbinding zinc finger protein SIP1 downregulates E-cadherin and inducesinvasion. Mol Cell 7: 1267 – 1278
Corver WE, Cornelisse CJ, Fleuren GJ (1994) Simultaneous measurement oftwo cellular antigens and DNA using fluorescein-isothiocyanate, R-phycoerythrin, and propidium iodide on a standard FACScan. Cytometry15: 117 – 128
Craven RJ, Xu LH, Weiner TM, Fridell YW, Dent GA, Srivastava S, VarnumB, Liu ET, Cance WG (1995) Receptor tyrosine kinases expressed inmetastatic colon cancer. Int J Cancer 60: 791 – 797
De Craene B, Gilbert B, Stove C, Bruyneel E, van Roy F, Berx G (2005)The transcription factor snail induces tumor cell invasion throughmodulation of the epithelial cell differentiation program. Cancer Res 65:6237 – 6244
De Leeuw WJ, Berx G, Vos CB, Peterse JL, Van de Vijver MJ, Litvinov S, vanRoy F, Cornelisse CJ, Cleton-Jansen AM (1997) Simultaneous loss of E-cadherin and catenins in invasive lobular breast cancer and lobularcarcinoma in situ. J Pathol 183: 404 – 411
Eger A, Aigner K, Sonderegger S, Dampier B, Oehler S, Schreiber M, Berx G,Cano A, Beug H, Foisner R (2005) DeltaEF1 is a transcriptional repressorof E-cadherin and regulates epithelial plasticity in breast cancer cells.Oncogene 24: 2375 – 2385
Eisen MB, Spellman PT, Brown PO, Botstein D (1998) Cluster analysis anddisplay of genome-wide expression patterns. Proc Natl Acad Sci USA 95:14863 – 14868
Ethier SP, Mahacek ML, Gullick WJ, Frank TS, Weber BL (1993)Differential isolation of normal luminal mammary epithelial cells andbreast cancer cells from primary and metastatic sites using selectivemedia. Cancer Res 53: 627 – 635
Forozan F, Veldman R, Ammerman CA, Parsa NZ, Kallioniemi A,Kallioniemi OP, Ethier SP (1999) Molecular cytogenetic analysis of 11new breast cancer cell lines. Br J Cancer 81: 1328 – 1334
Grady WM, Willis J, Guilford PJ, Dunbier AK, Toro TT, Lynch H, WiesnerG, Ferguson K, Eng C, Park JG, Kim SJ, Markowitz S (2000) Methylationof the CDH1 promoter as the second genetic hit in hereditary diffusegastric cancer. Nat Genet 26: 16 – 17
Graff JR, Gabrielson E, Fujii H, Baylin SB, Herman JG (2000) Methylationpatterns of the E-cadherin 50 CpG island are unstable and reflect thedynamic, heterogeneous loss of E-cadherin expression during metastaticprogression. J Biol Chem 275: 2727 – 2732
Graff JR, Herman JG, Lapidus RG, Chopra H, Xu R, Jarrard DF, Isaacs WB,Pitha PM, Davidson NE, Baylin SB (1995) E-cadherin expression issilenced by DNA hypermethylation in human breast and prostatecarcinomas. Cancer Res 55: 5195 – 5199
Hajra KM, Chen DY, Fearon ER (2002) The SLUG zinc-fingerprotein represses E-cadherin in breast cancer. Cancer Res 62:1613 – 1618
Herman JG, Graff JR, Myohanen S, Nelkin BD, Baylin SB (1996)Methylation-specific PCR: a novel PCR assay for methylation status ofCpG islands. Proc Natl Acad Sci USA 93: 9821 – 9826
Hiraguri S, Godfrey T, Nakamura H, Graff J, Collins C, Shayesteh L, DoggettN, Johnson K, Wheelock M, Herman J, Baylin S, Pinkel D, Gray J (1998)Mechanisms of inactivation of E-cadherin in breast cancer cell lines.Cancer Res 58: 1972 – 1977
Huber O, Korn R, McLaughlin J, Ohsugi M, Herrmann BG, Kemler R (1996)Nuclear localization of beta-catenin by interaction with transcriptionfactor LEF-1. Mech Dev 59: 3 – 10
Kang Y, Siegel PM, Shu W, Drobnjak M, Kakonen SM, Cordon-Cardo C,Guise TA, Massague J (2003) A multigenic program mediating breastcancer metastasis to bone. Cancer Cell 3: 537 – 549
Karin M, Liu Z, Zandi E (1997) AP-1 function and regulation. Curr OpinCell Biol 9: 240 – 246
Lacroix M, Leclercq G (2004) Relevance of breast cancer cell lines as modelsfor breast tumours: an update. Breast Cancer Res Treat 83: 249 – 289
Liu YN, Lee WW, Wang CY, Chao TH, Chen Y, Chen JH (2005) Regulatorymechanisms controlling human E-cadherin gene expression. Oncogene24: 8277 – 8290
Lombaerts M, Middeldorp JW, van der WE, Philippo K, van Wezel T, SmitVT, Cornelisse CJ, Cleton-Jansen AM (2004) Infiltrating leukocytesconfound the detection of E-cadherin promoter methylation in tumors.Biochem Biophys Res Commun 319: 697 – 704
Maretzky T, Reiss K, Ludwig A, Buchholz J, Scholz F, Proksch E, deStrooper B, Hartmann D, Saftig P (2005) ADAM10 mediates E-cadherinshedding and regulates epithelial cell – cell adhesion, migration, andbeta-catenin translocation. Proc Natl Acad Sci USA 102: 9182 – 9187
Mechta F, Lallemand D, Pfarr CM, Yaniv M (1997) Transformation by rasmodifies AP1 composition and activity. Oncogene 14: 837 – 847
Milde-Langosch K, Bamberger AM, Methner C, Rieck G, Loning T (2000)Expression of cell cycle-regulatory proteins rb, p16/MTS1, p27/KIP1,p21/WAF1, cyclin D1 and cyclin E in breast cancer: correlations withexpression of activating protein-1 family members. Int J Cancer 87: 468 –472
Moody SE, Perez D, Pan TC, Sarkisian CJ, Portocarrero CP, Sterner CJ,Notorfrancesco KL, Cardiff RD, Chodosh LA (2005) The transcriptionalrepressor Snail promotes mammary tumor recurrence. Cancer Cell 8:197 – 209
Nakano T, Tani M, Ishibashi Y, Kimura K, Park YB, Imaizumi N, Tsuda H,Aoyagi K, Sasaki H, Ohwada S, Yokota J (2003) Biological properties andgene expression associated with metastatic potential of humanosteosarcoma. Clin Exp Metast 20: 665 – 674
Oberst M, Anders J, Xie B, Singh B, Ossandon M, Johnson M, Dickson RB,Lin CY (2001) Matriptase and HAI-1 are expressed by normal andmalignant epithelial cells in vitro and in vivo. Am J Pathol 158: 1301 –1311
Paz MF, Fraga MF, Avila S, Guo M, Pollan M, Herman JG, Esteller M (2003)A systematic profile of DNA methylation in human cancer cell lines.Cancer Res 63: 1114 – 1121
Perez-Losada J, Sanchez-Martin M, Rodriguez-Garcia A, Sanchez ML, OrfaoA, Flores T, Sanchez-Garcia I (2002) Zinc-finger transcription factor Slugcontributes to the function of the stem cell factor c-kit signaling pathway.Blood 100: 1274 – 1286
Price JE, Polyzos A, Zhang RD, Daniels LM (1990) Tumorigenicity andmetastasis of human breast carcinoma cell lines in nude mice. Cancer Res50: 717 – 721
Quong RY, Bickford ST, Ing YL, Terman B, Herlyn M, Lassam NJ (1994)Protein kinases in normal and transformed melanocytes. Melanoma Res4: 313 – 319
R Development Core Team (2004) R Foundation for Statistical Computing.Vienna, Austria. ISBN 3-900051-00-3, URL http://www.R-project.org RefType: Generic
Ross DT, Scherf U, Eisen MB, Perou CM, Rees C, Spellman P, Iyer V, JeffreySS, Van de RM, Waltham M, Pergamenschikov A, Lee JC, Lashkari D,Shalon D, Myers TG, Weinstein JN, Botstein D, Brown PO (2000)Systematic variation in gene expression patterns in human cancer celllines. Nat Genet 24: 227 – 235
Siitonen SM, Kononen JT, Helin HJ, Rantala IS, Holli KA, Isola JJ (1996)Reduced E-cadherin expression is associated with invasiveness andunfavorable prognosis in breast cancer. Am J Clin Pathol 105: 394 – 402
Smith LM, Wise SC, Hendricks DT, Sabichi AL, Bos T, Reddy P, Brown PH,Birrer MJ (1999) cJun overexpression in MCF-7 breast cancer cells
E-cadherin inactivation mechanism and EMT in breast cancer
M Lombaerts et al
670
British Journal of Cancer (2006) 94(5), 661 – 671 & 2006 Cancer Research UK
Tra
nsla
tion
al
Th
era
peu
tics
produces a tumorigenic, invasive and hormone resistant phenotype.Oncogene 18: 6063 – 6070
Sokol JP, Neil JR, Schiemann BJ, Schiemann WP (2005) The use of cystatinC to inhibit epithelial – mesenchymal transition and morphologicaltransformation stimulated by transforming growth factor-beta. BreastCancer Res 7: R844 – R853
Sommers CL, Byers SW, Thompson EW, Torri JA, Gelmann EP (1994a)Differentiation state and invasiveness of human breast cancer cell lines.Breast Cancer Res Treat 31: 325 – 335
Sommers CL, Gelmann EP, Kemler R, Cowin P, Byers SW (1994b)Alterations in beta-catenin phosphorylation and plakoglobin expressionin human breast cancer cells. Cancer Res 54: 3544 – 3552
Takeichi M (1995) Morphogenetic roles of classic cadherins. Curr Opin CellBiol 7: 619 – 627
Tamura G, Yin J, Wang S, Fleisher AS, Zou T, Abraham JM, Kong D,Smolinski KN, Wilson KT, James SP, Silverberg SG, Nishizuka S,Terashima M, Motoyama T, Meltzer SJ (2000) E-cadherin gene promoterhypermethylation in primary human gastric carcinomas. J Natl CancerInst 92: 569 – 573
Thiery JP (2002) Epithelial – mesenchymal transitions in tumour progres-sion. Nat Rev Cancer 2: 442 – 454
Thiery JP (2003) Epithelial – mesenchymal transitions in development andpathologies. Curr Opin Cell Biol 15: 740 – 746
Thompson EW, Paik S, Brunner N, Sommers CL, Zugmaier G, Clarke R,Shima TB, Torri J, Donahue S, Lippman ME (1992) Association ofincreased basement membrane invasiveness with absence of estrogenreceptor and expression of vimentin in human breast cancer cell lines.J Cell Physiol 150: 534 – 544
van de Wetering M, Barker N, Harkes IC, van der HM, Dijk NJ, HollestelleA, Klijn JG, Clevers H, Schutte M (2001) Mutant E-cadherin breast cancercells do not display constitutive Wnt signaling. Cancer Res 61: 278 – 284
Vandesompele J, De Preter K, Pattyn F, Poppe B, Van Roy N, De Paepe A,Speleman F (2002) Accurate normalization of real-time quantitative RT –PCR data by geometric averaging of multiple internal control genes.Genome Biol 3: RESEARCH0034
van Wezel T, Lombaerts M, van Roon EH, Philippo K, Baelde HJ, Szuhai K,Cornelisse CJ, Cleton-Jansen AM (2005) Expression analysis of candidatebreast tumour suppressor genes on chromosome 16q. Breast Cancer Res7: R998 – R1004
Vleminckx K, Vakaet L, Mareel M, Fiers W, van Roy F (1991) Geneticmanipulation of E-cadherin expression by epithelial tumor cells revealsan invasion suppressor role. Cell 66: 107 – 119
Vos CB, Cleton-Jansen AM, Berx G, De Leeuw WJ, ter Haar NT, van Roy F,Cornelisse CJ, Peterse JL, Van de Vijver MJ (1997) E-cadherininactivation in lobular carcinoma in situ of the breast: an early eventin tumorigenesis. Br J Cancer 76: 1131 – 1133
Wettenhall JM, Smyth GK (2004) limmaGUI: a graphical user interface forlinear modeling of microarray data. Bioinformatics 20: 3705 – 3706
Winter MJ, Nagelkerken B, Mertens AE, Rees-Bakker HA, Briaire-de BruijnIH, Litvinov SV (2003) Expression of Ep-CAM shifts the state ofcadherin-mediated adhesions from strong to weak. Exp Cell Res 285: 50 –58
Wu CW, Li AF, Chi CW, Lai CH, Huang CL, Lo SS, Lui WY, Lin WC (2002)Clinical significance of AXL kinase family in gastric cancer. AnticancerRes 22: 1071 – 1078
Yagi T, Takeichi M (2000) Cadherin superfamily genes: functions,genomic organization, and neurologic diversity. Genes Dev 14:1169 – 1180
Yang J, Mani SA, Donaher JL, Ramaswamy S, Itzykson RA, Come C,Savagner P, Gitelman I, Richardson A, Weinberg RA (2004) Twist, amaster regulator of morphogenesis, plays an essential role in tumormetastasis. Cell 117: 927 – 939
E-cadherin inactivation mechanism and EMT in breast cancer
M Lombaerts et al
671
British Journal of Cancer (2006) 94(5), 661 – 671& 2006 Cancer Research UK
Tra
nsl
ati
on
al
Th
era
peu
tics
Copyright © 2022 FDOKUMEN