Toluene inhalation modulates dentate gyrus granule cell output in vivo
Upload
khangminh22Category
view
0download
0
TECHNISCHE UNIVERSITÄT MÜNCHEN
Lehrstuhl für Technische Chemie II
Investigation into the reaction of toluene methylation to p-xylene
over acidic zeolites
John Hyung-Joon Ahn
Vollständiger Abdruck der von der Fakultät für Chemie der Technischen Universität
München zur Erlangung des akademischen Grades eines
Doktor-Ingenieur (Dr.-Ing.)
genehmigten Dissertation.
Vorsitzende: Univ.-Prof. Dr. Moniek Tromp
Prüfer der Dissertation:
1. Univ. -Prof. Dr. Johannes A. Lercher
2. Univ. -Prof. Dr.-Ing. Hartmut Spliethoff
Die Dissertation wurde am 04.04.2013 bei der Technischen Universität München eingereicht
und durch die Fakultät für Chemie am 21.06.2013 angenommen.


“We imagine that when we are thrown out of our accustomed grooves that all is lost, but
it is only then that what is new and good begins. While there is life there is happiness.
There is much, so much before us. I say this to you.”
Pierre, War and Peace
Leo Tolstoy
(1828-1910)

“No, I don’t like work. I had rather laze about and think of all the fine things that can be
done. I don’t like work—no man does—but I like what is in the work, the chance to find
yourself. Your own reality—for yourself, not for others—what no other man can ever
know. They can only see the mere show, and never can tell what it really means.”
Heart of Darkness
Joseph Conrad
(1857-1924)

Acknowledgements
So finally, I see a light at the end of the tunnel. After all the thinking and sweating,
breaking and fixing, reading and writing, that were filled with many joys and pains,
satisfactions and disappointments, smiles and cusses in the midst of this ugly green-grey
building, during the early mornings and late nights, cold winter snowstorms and refreshing
summer thunderstorms (I found out that it is a bit less sunnier here in Germany than the
golden California), over many sunsets and sunrises, I have arrived, at last. From the beloved
and comfortable place of the sunshine State that I left behind to this strange and foreign place
that I came to take on the scientific challenges and to develop into whom I was born to
become... The journey of my life somehow led me into this unique and unusual path to TC II
(Lehrstuhl für Technische Chemie II) of TUM (Technische Universität München) and has
now come to an end; it is time again to continue onto another road, a new, unknown and an
exciting chapter of my life. For all these years that I spent in TC II of TUM, I am deeply
humbled and grateful for the people that enabled me to build and mature my character into
whom I am today. With that being said, I would like now to thank:
Johannes Lercher for giving me an once-in-a-lifetime opportunity to be part of this world-
class laboratory. He has provided me with scientific freedom and the almost unlimited
resources that I needed to excel on a challenging research project.
Andy Jentys for supervising this project and helping me to write more clearly than I was
able to.
Robin Kolvenbach for helpful technical discussions and support throughout the project. I
was able to learn many valuable things about diffusion from Robin, whom I would consider to
be one of the top experts in his field.
Oliver Gutiérrez for his friendship, encouragements, helpful technical and life discussions,
and all the times that were spent with and for me. It is hard to imagine what my life in
Germany and in TC II would have been like, without my fellow “American”. Also Minerva
and our Hilda (whom I befriended, I think and hope, since she was 6 days old) for extra joy
and friendship that they provided us with.
Anastasia Pashigreva, Bo Peng and Jeongnam Kim for their friendship, being my
travelling companions, giving me food, love, souvenirs and their time spent together. Without
these special friends, I would have found that my life in München much less fun.
My elite officemates: Monica Pop, Jennifer Hein, Stefanie Reiner, Robin Kolvenbach and
Stefan Schallmoser for precious times that we spent together inside 46 303. They were a
young, energetic and fun group of people, and we shared together (intentionally or
unintentionally) many of the joys, frustrations, sweet and bitter things of our everyday life
experiences in TC II. I felt privileged to be a member of this lively office and to share my
precious two or three years of life with them.
My diverse and interesting lunch-mates over the years (some of the vivid memories
written inside parenthesis): André Santos (always leftover food on the Mensa trays), Murat
Küçükdişli (I copied and pasted his name from the Facebook), André Van Veen (discussion
about how Europe is better than the second-class America), Erika Ember, Elena Wuttke (sorry
that Mensa food was so nasty-tasting), Francisco Gonzalez, Marie-Cruz Sanchez, for
interesting conversations and listening to my silly humors. It was good to have friends to eat
and enjoy with.
Some of the other kind and generous colleagues that I interacted with: Xuebing Li (found
me a nice place to live in Garching), Daniela Hartmann (picked me up from Neufahrn S-Bahn
station on my first arrival in Germany), Yongzhong Zhu and Michael Salzinger (gave me the
momentum to start with zeolite synthesis), Despina Tzoulaki (swapped our places in LSAC-
TC II of TUM), Sarah Maier, Sonja Wyrzgol, Baoxiang Peng, Hui Shi, Xianyong Sun
(helpful discussions in methylation chemistry), Linus Schulz (for the shooting, which evolved
somehow into a poking game because he always lost), Elizabeth Hanrieder (had a great
patience to talk in German with me), Sebastian Müller (allowed me to use his “state-of-the-
art” Berty reactor), Wenji Song, Maximilian Hahn (only one who spoke proper English in the
group) and Stanislav Kasakov.
Our talented and all-knowing secretaries and technicians: Helen Lemmermöhle, Stefanie
Maier, Karen Schulz, and Bettina Federmann for helping and supporting me with various
paper works (some unnecessary, but forced by law) in unserem full-of-bureaucracy
Deutschland over the years. Xaver Hecht for his demonstration of almost magical “Chuck-

Norris” like skills in the laboratories (he unfortunately could not cure cancer with his tears nor
could he cut scissors with papers) and Martin Neukamm for consistently providing me
wonderful zeolite images and their corresponding elemental compositions. These were the
people behind the scenes of our everyday life in TC II and they deserve big thanks from me.
The valuable mentors during my research career: Enrique Iglesia and Mirosław
Derewiński. My research career started under Enrique’s supervision and it was in his lab, that
I began to develop and mature into a scientist that I am today. I am proud to say that I was
part of LSAC laboratory and that he was my great mentor. He was also the one who has
recommended me to Johannes and I was able to begin my training at TC II in TUM as a result
(and also my short-lived career at Symyx). I began with zero zeolite synthesis and
modification background as I came to TC II and through Mirek’s boundless optimism and
countless encouragements, I was able to learn few things about zeolite synthesis and
ultimately, was able to succeed here. I am very grateful for the contribution of his wisdom and
philosophy into my life.
Finally my family for always supporting and loving me as who I am. Without them, I do
not know where I would be in my life. All in all, thanks.
John H. Ahn
March 2013
Abstract
The reaction of toluene methylation was investigated over acidic zeolites to better
understand limitations of this reaction and to improve the catalyst yield and selectivity
towards p-xylene. A significant fraction of methanol was utilized to form products other than
xylenes, e.g., light hydrocarbons, tri- and tetramethylbenzenes, during the reaction of toluene
methylation, because the aromatic products of toluene methylation were readily methylated
further inside the zeolite pores. The hierarchical materials derived from MFI (H-ZSM-5) by a
series of modifications, i.e., desilication, dealumination and chemical liquid deposition of
tetraethyl orthosilicate (TEOS) onto the zeolite surface, increased the toluene consumption
rate (per Brønsted acid site) and p-xylene selectivity simultaneously. The reaction rate
increased because desilication/dealumination decreased the diffusion length and consequently
increased the diffusivity of reactant and product molecules. The p-xylene selectivity increased
because deposition of TEOS increased the diffusivity of p-xylene, while it decreased for the
bulkier o- and m- xylene isomers. This differences in diffusivities of xylenes played more
significant role in determining p-xylene selectivity as the reactions became faster at higher
reaction temperatures.
Die zeolithkatalysierte Toluolmethylierungsreaktion wurde hinsichtlich der Verbesserung
der Ausbeute und der Selektivität untersucht und insbesonders die reaktionslimitierenden
Faktoren evaluiert. Es konnte gezeigt werden, dass ein signifikanter Anteil des Methanols in
Nebenprodukte, z.B. leichte Kohlenwasserstoffe, Tri- und Tetrabenzolisomere, umgesetzt
wurde, da die primären Produkte der Toluolmethylierung (Xylole) innerhalb der Pore weiter
methyliert wurden. Durch postsynthetische Modifizierung der zeolithischen Katalysatoren,
durch Desilizierung, Dealumierung und Abscheidung von Tetraethylorthosilikat auf der
äußeren Oberfläche, konnte eine Steigerung der Reaktionsrate (pro Brønsted Säurezentrum)
als auch der p-Xylol Selektivität erreicht werden. Die Steigerung der Reaktionsrate kann
hierbei auf die Verkürzung der Diffusionswege sowohl für die Reaktant, als auch für die
Produktmoleküle zurückgeführt werden. Die Erhöhung der p-Xylol Selektivität wurde durch
eine Optimierung der Transporteigenschaften durch die Oberflächenmodifizierung mit
Tetraethylorthosilikat hervorgerufen, wobei die Diffusivität von p-Xylol selektiv erhöht und
jene von o- und m-Xylol verringert wurde.
Table of Contents
Chapter 1:
Introduction..........................................................................................1
1.1. General Introduction.........................................................................2
1.2. Chemistry of toluene methylation.....................................................6
1.3. Catalysts............................................................................................8
1.3.1. Zeolite characterization.....................................................................................14
1.4. Motivation and scope of the thesis..................................................22
1.5. References.......................................................................................24
Chapter 2:
Methanol usage in toluene methylation with medium and large pore
zeolites.................................................................................................31
2.1. Introduction.....................................................................................32
2.2. Experimental...................................................................................33
2.2.1. Materials............................................................................................................33
2.2.2. Catalyst characterization...................................................................................34
2.2.3. Catalytic testing.................................................................................................35
2.3. Results.............................................................................................36
2.3.1. Catalyst characterization...................................................................................36
2.3.2. Methylation of toluene in medium and large pore zeolites...............................37
2.3.3. Methanol usage in methylation of toluene........................................................38
2.3.4. Reaction of toluene, p-xylene and 1,2,4-trimethylbezene with methanol.........40
2.3.5. Effect of residence time on methanol usage in toluene methylation................42
2.4. Discussion.......................................................................................43
2.4.1. Methanol usage in toluene methylation with large pore zeolites......................43
2.4.2. Methanol usage in toluene methylation with medium pore zeolites.................44
2.4.3. Effect of residence time on methanol utilization in toluene methylation.........49
2.5. Conclusions.....................................................................................51
2.6. Acknowledgments...........................................................................51
2.7. Supplementary material...................................................................52
2.8. References.......................................................................................59
Chapter 3:
Characterization and catalytic properties of hierarchical H-ZSM5 in
toluene methylation............................................................................63
3.1. Introduction.....................................................................................64
3.2. Experimental...................................................................................65
3.2.1. Materials............................................................................................................65
3.2.2. Catalyst characterization...................................................................................66
3.2.3. Catalytic testing.................................................................................................68
3.3. Results and discussion.....................................................................68
3.3.1. Chemical composition and structural characterization of hierarchical
materials............................................................................................................68
3.3.2. Acid site characterization of hierarchical materials..........................................71
3.3.3. Catalytic testing of toluene methylation over hierarchical materials................77
3.3.3.1. Influence of hierarchical pores and reaction temperature on methanol
usage......................................................................................................................80
3.3.3.2. Influence of hierarchical pores and reaction temperature on
selectivities............................................................................................................82
3.3.4. Impact of hierarchical materials on toluene methylation..................................85
3.4. Conclusions.....................................................................................87
3.5. Acknowledgments...........................................................................87
3.6. Supplementary material...................................................................88
3.7. References.....................................................................................103
Chapter 4:
Influence of the reaction temperature on p-xylene selectivity in
toluene methylation over medium pore-sized zeolites.....................107
4.1. Introduction...................................................................................108
4.2. Experimental.................................................................................109
4.2.1. Materials..........................................................................................................109
4.2.1. Catalyst characterization.................................................................................110
4.2.2. Catalytic testing...............................................................................................111
4.3. Results...........................................................................................112
4.3.1. Catalyst characterization.................................................................................112
4.3.2. Catalytic testing...............................................................................................117
4.4. Discussion.....................................................................................121
4.5. Conclusions...................................................................................127
4.6. Acknowledgments.........................................................................128
4.7. Supplementary material.................................................................128
4.8. References.....................................................................................135
Chapter 5:
Summary and concluding remarks..................................................138


Chapter 1: Introduction
1
Chapter 1
Introduction

Chapter 1: Introduction
2
1.1. Introduction
Aromatics are valuable raw materials for the chemical and petrochemical industries. The
global consumption of aromatic molecules is more than 85 million tons per year (as of 2006)
[1]. The primary sources of these compounds are produced from catalytic reforming or
thermal cracking of naphtha [2,3]. Among the aromatics, benzene, toluene and xylenes (BTX)
are the most important precursors for chemical commodities, e.g., for polyesters and
plasticizers. Some of the most relevant intermediates and products from BTX are shown in
Figure 1.1 [2].
Figure 1.1: Transformation of benzene, toluene and xylenes into various chemical commodities [2].
Chapter 1: Introduction
3
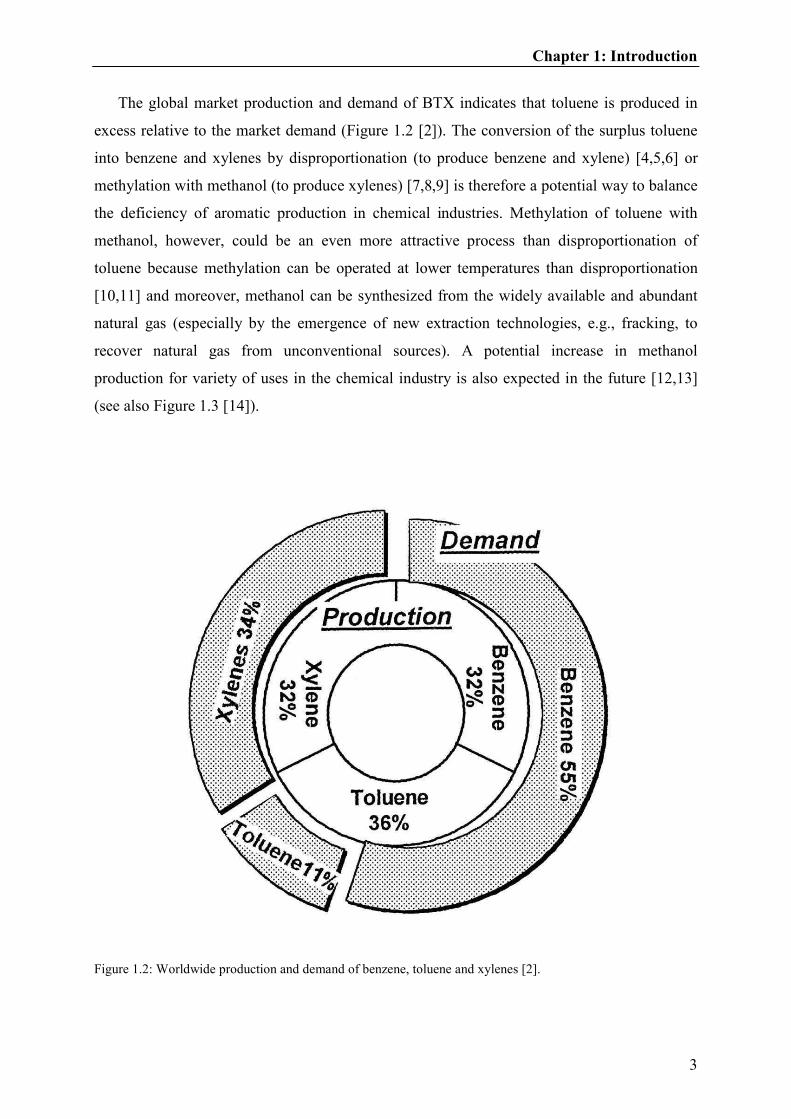
The global market production and demand of BTX indicates that toluene is produced in
excess relative to the market demand (Figure 1.2 [2]). The conversion of the surplus toluene
into benzene and xylenes by disproportionation (to produce benzene and xylene) [4,5,6] or
methylation with methanol (to produce xylenes) [7,8,9] is therefore a potential way to balance
the deficiency of aromatic production in chemical industries. Methylation of toluene with
methanol, however, could be an even more attractive process than disproportionation of
toluene because methylation can be operated at lower temperatures than disproportionation
[10,11] and moreover, methanol can be synthesized from the widely available and abundant
natural gas (especially by the emergence of new extraction technologies, e.g., fracking, to
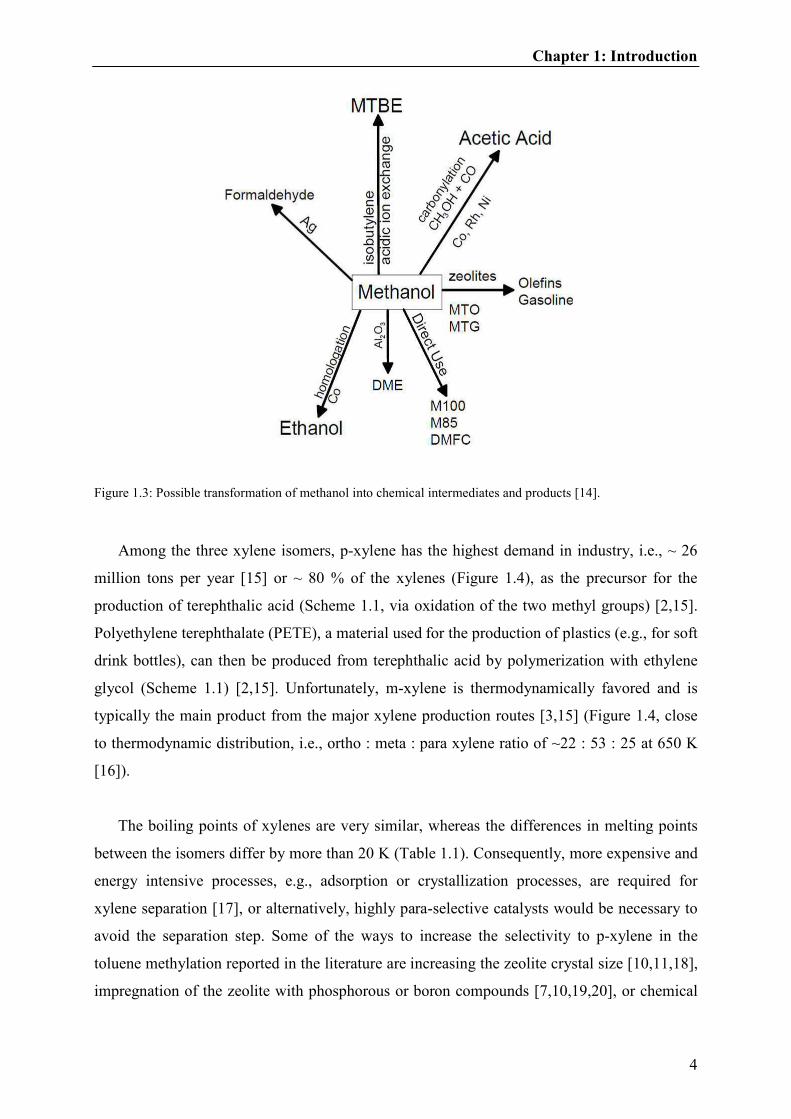
recover natural gas from unconventional sources). A potential increase in methanol
production for variety of uses in the chemical industry is also expected in the future [12,13]
(see also Figure 1.3 [14]).
Figure 1.2: Worldwide production and demand of benzene, toluene and xylenes [2].
Chapter 1: Introduction
4
Figure 1.3: Possible transformation of methanol into chemical intermediates and products [14].
Among the three xylene isomers, p-xylene has the highest demand in industry, i.e., ~ 26
million tons per year [15] or ~ 80 % of the xylenes (Figure 1.4), as the precursor for the
production of terephthalic acid (Scheme 1.1, via oxidation of the two methyl groups) [2,15].
Polyethylene terephthalate (PETE), a material used for the production of plastics (e.g., for soft
drink bottles), can then be produced from terephthalic acid by polymerization with ethylene
glycol (Scheme 1.1) [2,15]. Unfortunately, m-xylene is thermodynamically favored and is
typically the main product from the major xylene production routes [3,15] (Figure 1.4, close
to thermodynamic distribution, i.e., ortho : meta : para xylene ratio of ~22 : 53 : 25 at 650 K
[16]).
The boiling points of xylenes are very similar, whereas the differences in melting points
between the isomers differ by more than 20 K (Table 1.1). Consequently, more expensive and
energy intensive processes, e.g., adsorption or crystallization processes, are required for
xylene separation [17], or alternatively, highly para-selective catalysts would be necessary to
avoid the separation step. Some of the ways to increase the selectivity to p-xylene in the
toluene methylation reported in the literature are increasing the zeolite crystal size [10,11,18],
impregnation of the zeolite with phosphorous or boron compounds [7,10,19,20], or chemical

Chapter 1: Introduction
5
vapor (CVD) [21,22] or liquid deposition (CLD) [23,24,25] of tetra-alkyl orthosilicate onto
the zeolite surfaces.
Figure 1.4: Worldwide production and demand of p-, m- and o-xylenes [2].
Scheme 1.1: Production of polyethylene terephthalate (PETE) from p-xylene. Terephthalic acid is first
synthesized as an intermediate by oxidation of the methyl groups on a p-xylene and subsequently polymerized
with ethylene glycol to produce PETE.

Chapter 1: Introduction
6
Table 1.1: Boiling and melting points of o-, m- and p-xylenes [3].
Boiling point (K) Melting Point (K)
o-Xylene 417 248
m-Xylene 412 225
p-Xylene 411 286
1.2. Chemistry of toluene methylation
The most feasible mechanism for the methylation of toluene with methanol over acidic
zeolite is shown in Scheme 1.2. The methanol first forms a methylating species, either a
methoxy [26,27,28] or a protonated methanol [29,30,31] on the Brønsted acid site of a zeolite
(shown as methoxy for simplicity in Scheme 1.2). The nucleophilic toluene then reacts with
the methylating species on the surface via carbenium ion like transition state [32,33] and
forms an alkoxide intermediate [34,35]. After deprotonation, the product (xylene) leaves from
the surface, the Brønsted acid site is restored and the catalytic cycle is closed. A similar
methylation reaction mechanism applies to the methylation of other aromatics and alkenes,
e.g., of xylenes to trimethylbenzenes or of propene to butenes, which are also produced as
byproducts during the reaction of toluene methylation [36,37]. Note that the methanol can
readily form dimethyl ether (DME) by dehydration [38,39] under these conditions, which can
also methylate unsaturated aromatic and alkene molecules via similar mechanism [30,40,41].
The major difference between them is that a water and a methanol molecule is released when
methanol and DME is used as a methylating species, respectively.
Scheme 1.2: Toluene methylation with methanol with an acidic zeolite (shown as a small cluster) via carbenium
ion transition state and alkoxide intermediates. The methylating species are represented as methoxy species for
simplicity.

Chapter 1: Introduction
7
The goal of toluene methylation is to selectively generate xylenes and in particular, p-
xylene. The reaction pathways during toluene methylation are shown in Scheme 1.3. The
difficulty of achieving a high p-xylene selectivity arises from several major side reactions
during toluene methylation. The reactants can directly react via toluene disproportionation
(two molecules of toluene react to form a benzene and xylene) [4,5,6] or via methanol to
hydrocarbons reactions (leading to the formation of light hydrocarbons) [13,39]. When the
reactants, toluene and methanol, react together, o- and p-xylene are most likely formed as a
primary products [29,42,43], but they can readily isomerize in acidic zeolites and significantly
lower the selectivity of p-xylene. In addition, the aromatic products, e.g., xylenes, can be
further methylated to form tri- and tetra-methylbenzenes [7,11,44 ,45 ]. In medium pore
zeolites, these bulky multi-methylated aromatics cannot leave the zeolite pores and eventually
form lower-methylated aromatics, e.g., xylenes and tri-methylbenzenes, with light
hydrocarbons as byproducts (hydrocarbon pool cycle [11,13,46]). This lowers the efficiency
of methylation, i.e., methanol used to form xylenes, but increases the xylene selectivity within
aromatics in medium pore-sized zeolites [ 47 ]. It was also concluded that the light
hydrocarbons observed in the toluene methylation are most likely not generated from the
direct coupling of methanol and/or DME [48,49] nor from alkene methylation-cracking cycle
[50,51], but from further methylation and subsequent elimination of light hydrocarbons (and
less-methylated aromatic molecules, such as xylenes) [47].

Chapter 1: Introduction
8
Scheme 1.3: Reaction pathways during the reaction of toluene with methanol inside a medium pore-sized zeolite
[47]. The reaction of disproportionation, methanol to hydrocarbons, toluene methylation, isomerization, further
methylation and elimination as xylenes (light hydrocarbons as byproducts) are shown.
1.3. Catalysts
Alkylation is a reaction that involves transfer of an alkyl group from one molecule to
another. Methylation of toluene is a specific type of alkylation in which the methyl from
methanol or DME is a transferred. The alkylation reactions were initially carried out in the
industry with liquid acid catalyst, such as Friedel-Crafts catalysts (e.g., AlCl3) [52], sulfuric
and hydrofluoric acid [53]. Although these catalysts have been optimized and operated
efficiently to produce high quality products, most of them are toxic, volatile, corrosive,
difficult to separate after the reaction and are unable to be regenerated. The solid acids for
Chapter 1: Introduction
9
various alkylation processes, consequently, have been developed to replace the existing liquid
acid catalysts (e.g., alkylation of isobutane and butenes from using sulfuric or hydrofluoric
acid to trifluoromethanesulfonic acid (F3CSO3H) on a porous support [53]) and some of the
possible candidates for alkylation reaction (at least proven in the laboratory scale) were
polyoxometalates [54,55,56], perfluorosulfonic acid resins (Nafion) [57,58], sulfated zirconia
[59,60] and zeolites [59,61]. The synthetic zeolites in particular, have attracted much attention
in the industry since their discovery [62], because of their high surface area, the size of the
micropores (molecular dimension of the pores, i.e., shape selectivity) and the possibility of
modulating the electronic properties of the active sites [61].
As of 2001, ~ 1.6 million tons of synthetic zeolites are annually produced as laundry
detergents, catalysts and absorbents [63]. There are currently over 200 known structures
(2012) [64], but only about dozen are commercially used in the industry as listed in Table 1.2.
Note that each structure is labeled by three capital letters, e.g., FAU for faujasites or MOR for
mordenites, which represents the framework type code defined by the IUPAC (International
Union of Pure and Applied Chemistry) in 1978 [65]. The nomenclatures used in parenthesis
are the original names that were first given at the time of discovery, which typically used the
names of minerals (if the natural analogs exist), e.g., FER (ferrierite), letters of the Latin and
Greek alphabets, e.g., Zeolite Y, or the acronyms that indicate the names of industrial or
university laboratory with a consecutive numbering system e.g., ZSM-5 (Zeolite Socony
Mobil-five) [64,66].

Chapter 1: Introduction
10
Table 1.2: Zeolite used in commercial and emerging catalytic processes [63].
Structural type (zeolite or zeotype)
Catalytic process
FAU (Y) Catalytic cracking, Hydrocracking, Aromatic alkylation, NOx reduction, Acetylation
MOR (Mordenite) Light alkanes hydroisomerisation, Hydrocracking, Dewaxing, NOx reduction, Aromatic alkylation and transalkylation, Olefin oligomerization
MFI (ZSM-5, TS-1, Silicalite)
Dewaxing, Methanol to gasoline, Methanol to olefins and products, FCC additive, Hydrocracking, Olefin cracking and oligomerisation, Benzene alkylation, Xylene isomerization, Toluene disproportionation, Aromatization, NOx reduction, Oxidations, Hydration, Amination, Beckmann rearrangement, Cyclodimerisation
BEA (Beta) Benzene alkylation, Aliphatic alkylation, Acetylation, Baeyer-Villiger reaction, FCC additive, Etherification
LTL (KL) Alkane aromatization
MWW (MCM-22) Benzene alkylation
CHA (SAPO-34) Methanol to olefins
AEL (SAPO-11) Long chain alkane hydroisomerisation, Beckmann rearrangement
FER (Ferrierite) Olefin skeletal isomerization
ERI (Erionite) Selectoforming
RHO (Rho) Amination
TON (Theta-1, ZSM-22) Long chain alkane hydroisomerisation
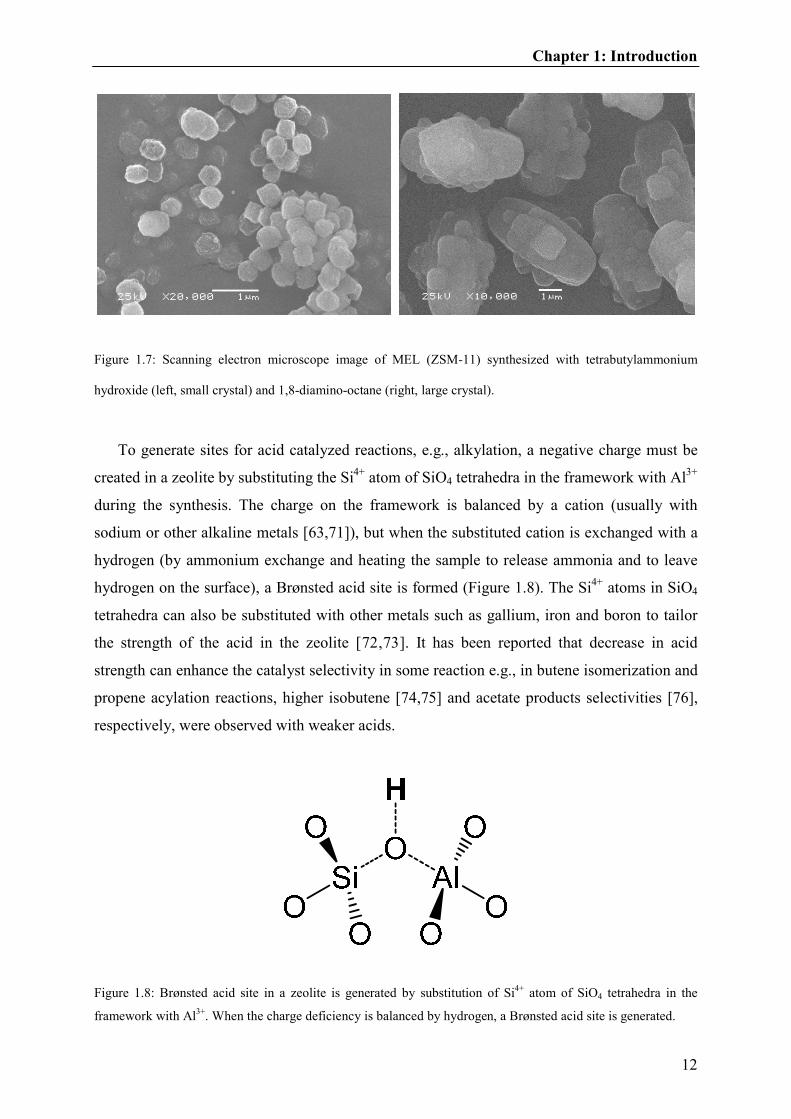
Zeolites are microporous crystalline structures composed of aluminosilicates. Most of the
zeolites frameworks are made from rings consisting of 8, 10 or 12 silicon (or aluminum) and
oxygen atoms with pore size of ~ 0.3 - 0.7 nm and are typically referred as small, medium or
large pore-sized zeolites, respectively (also as 8, 10 or 12 membered-ring (MR) zeolites). Few
frameworks, such as DON (UTD-1) [67], however, can be somewhat larger (14-MR zeolite
with pore opening of ~ 0.8 nm [64]). These materials can have variety of shapes, sizes and
frameworks depending on the synthesis conditions [68]. For example, TON (NU-10) has a
straight, 1-dimensional and nonintersecting channel systems (Figure 1.5) with long needle like
crystal structures and MFI (ZSM-5) has a 3-dimensional structure comprised of two types of
intersecting channels (one sinusoidal and the other straight) with cauliflower shaped crystals
(Figure 1.6). Furthermore, different crystal size with same framework can be synthesized by
changing the template, e.g., MEL (H-ZSM11) is also 3-dimensional structure comprised of
straight intersecting channels and synthesis with tetrabutylammonium hydroxide or 1,8-
diamino-octane as the organic templates results in small and large crystal zeolites,
respectively (Figure 1.7) [69,70]. It is also interesting to note that the same synthesis gel can
be used for both TON (H-NU10) and MEL (H-ZSM11, large crystal) synthesis, i.e., only by

Chapter 1: Introduction
11
changing the rotation condition of the autoclaves (60 rpm for TON and static for MEL
(synthesis), different framework zeolites are crystalized [70].
Figure 1.5: Zeolite framework of TON (NU-10) on the left [64] and a scanning electron microscope (SEM)
image on the right.
Figure 1.6: Zeolite framework of MFI (ZSM-5) on the left [64] and a scanning electron microscope (SEM)
image on the right.
Chapter 1: Introduction
12
Figure 1.7: Scanning electron microscope image of MEL (ZSM-11) synthesized with tetrabutylammonium
hydroxide (left, small crystal) and 1,8-diamino-octane (right, large crystal).
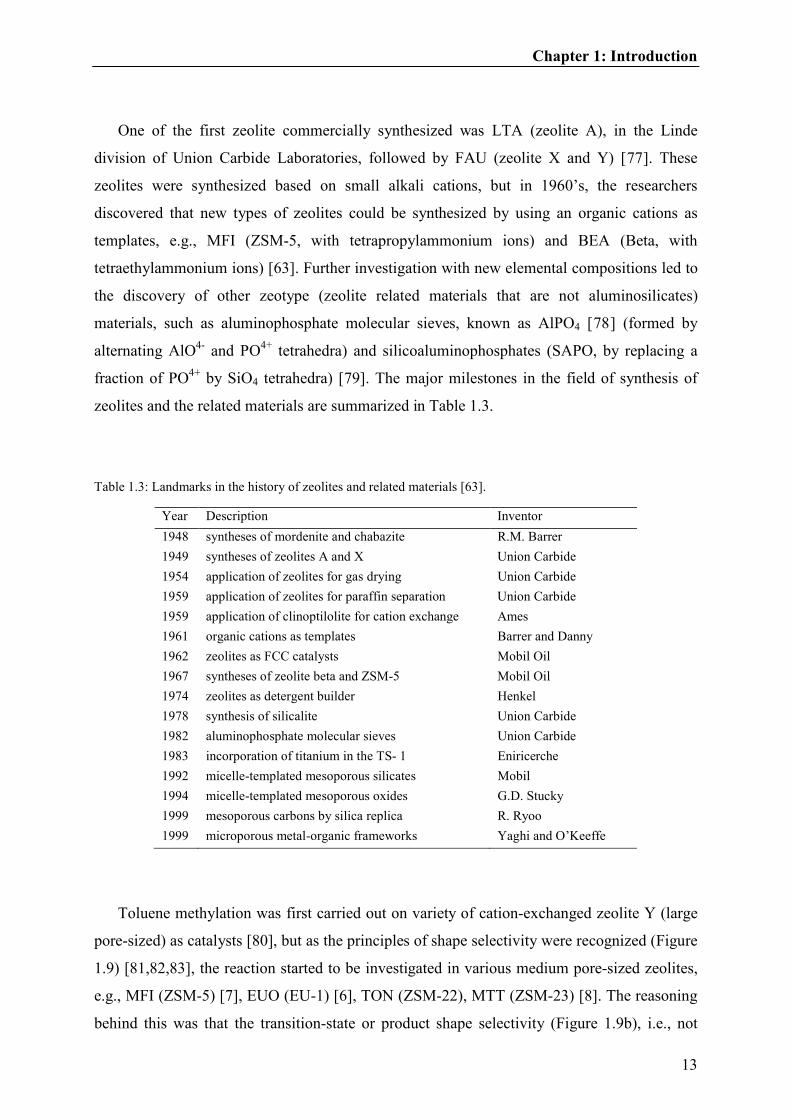
To generate sites for acid catalyzed reactions, e.g., alkylation, a negative charge must be
created in a zeolite by substituting the Si4+ atom of SiO4 tetrahedra in the framework with Al3+
during the synthesis. The charge on the framework is balanced by a cation (usually with
sodium or other alkaline metals [63,71]), but when the substituted cation is exchanged with a
hydrogen (by ammonium exchange and heating the sample to release ammonia and to leave
hydrogen on the surface), a Brønsted acid site is formed (Figure 1.8). The Si4+ atoms in SiO4
tetrahedra can also be substituted with other metals such as gallium, iron and boron to tailor
the strength of the acid in the zeolite [72,73]. It has been reported that decrease in acid
strength can enhance the catalyst selectivity in some reaction e.g., in butene isomerization and
propene acylation reactions, higher isobutene [74,75] and acetate products selectivities [76],
respectively, were observed with weaker acids.
Figure 1.8: Brønsted acid site in a zeolite is generated by substitution of Si4+ atom of SiO4 tetrahedra in the
framework with Al3+. When the charge deficiency is balanced by hydrogen, a Brønsted acid site is generated.
Chapter 1: Introduction
13
One of the first zeolite commercially synthesized was LTA (zeolite A), in the Linde
division of Union Carbide Laboratories, followed by FAU (zeolite X and Y) [77]. These
zeolites were synthesized based on small alkali cations, but in 1960’s, the researchers
discovered that new types of zeolites could be synthesized by using an organic cations as
templates, e.g., MFI (ZSM-5, with tetrapropylammonium ions) and BEA (Beta, with
tetraethylammonium ions) [63]. Further investigation with new elemental compositions led to
the discovery of other zeotype (zeolite related materials that are not aluminosilicates)
materials, such as aluminophosphate molecular sieves, known as AlPO4 [78] (formed by
alternating AlO4- and PO4+ tetrahedra) and silicoaluminophosphates (SAPO, by replacing a
fraction of PO4+ by SiO4 tetrahedra) [79]. The major milestones in the field of synthesis of
zeolites and the related materials are summarized in Table 1.3.
Table 1.3: Landmarks in the history of zeolites and related materials [63].
Year Description Inventor
1948 syntheses of mordenite and chabazite R.M. Barrer
1949 syntheses of zeolites A and X Union Carbide
1954 application of zeolites for gas drying Union Carbide
1959 application of zeolites for paraffin separation Union Carbide
1959 application of clinoptilolite for cation exchange Ames
1961 organic cations as templates Barrer and Danny
1962 zeolites as FCC catalysts Mobil Oil
1967 syntheses of zeolite beta and ZSM-5 Mobil Oil
1974 zeolites as detergent builder Henkel
1978 synthesis of silicalite Union Carbide
1982 aluminophosphate molecular sieves Union Carbide
1983 incorporation of titanium in the TS- 1 Eniricerche
1992 micelle-templated mesoporous silicates Mobil
1994 micelle-templated mesoporous oxides G.D. Stucky
1999 mesoporous carbons by silica replica R. Ryoo
1999 microporous metal-organic frameworks Yaghi and O’Keeffe
Toluene methylation was first carried out on variety of cation-exchanged zeolite Y (large
pore-sized) as catalysts [80], but as the principles of shape selectivity were recognized (Figure
1.9) [81,82,83], the reaction started to be investigated in various medium pore-sized zeolites,
e.g., MFI (ZSM-5) [7], EUO (EU-1) [6], TON (ZSM-22), MTT (ZSM-23) [8]. The reasoning
behind this was that the transition-state or product shape selectivity (Figure 1.9b), i.e., not
Chapter 1: Introduction
14
allowing the m- and o-xylenes to form or to leave because of larger kinetic diameter relative
to p-xylene, would hinder the formation of m- and o-xylenes and therefore increase selectivity
of p-xylene. The high selectivity of p-xylene (> 90 %), however, was only achieved after
modification of the medium pore-sized zeolites, e.g., by deposition of tetraethyl orthosilicate
(TEOS) on the zeolite surface [21,22] or by impregnation with a boron, phosphorous or
manganese [84,85,86].
Figure 1.9: Illustrations depicting the concepts of reactant (a), transition-state (b) and product (c) shape
selectivity [83].
1.3.1.Zeolite characterization
A variety of experimental techniques is available for characterization of zeolites and most
reported below are described in more details in literature, e.g., 77,87. Here, the theoretical
background of the methods that are used in this work will be discussed briefly.
• Atomic absorption spectroscopy (AAS)
The AAS was used to determine the elemental composition of the zeolites, e.g., silicon,
aluminum, iron and sodium. Typically, the solids are first dissolved with a boiling mixture of
hydrofluoric/nitro-hydrofluoric acid before they are vaporized and the absorbance measured
(the concentrations are then determined based on the Beer-Lambert Law). The molar ratio of
Chapter 1: Introduction
15
silicon and aluminum (or iron) indicates the acid concentration of a zeolite, i.e., the higher the
silicon content relative to the aluminum, the lower the acid concentration is.
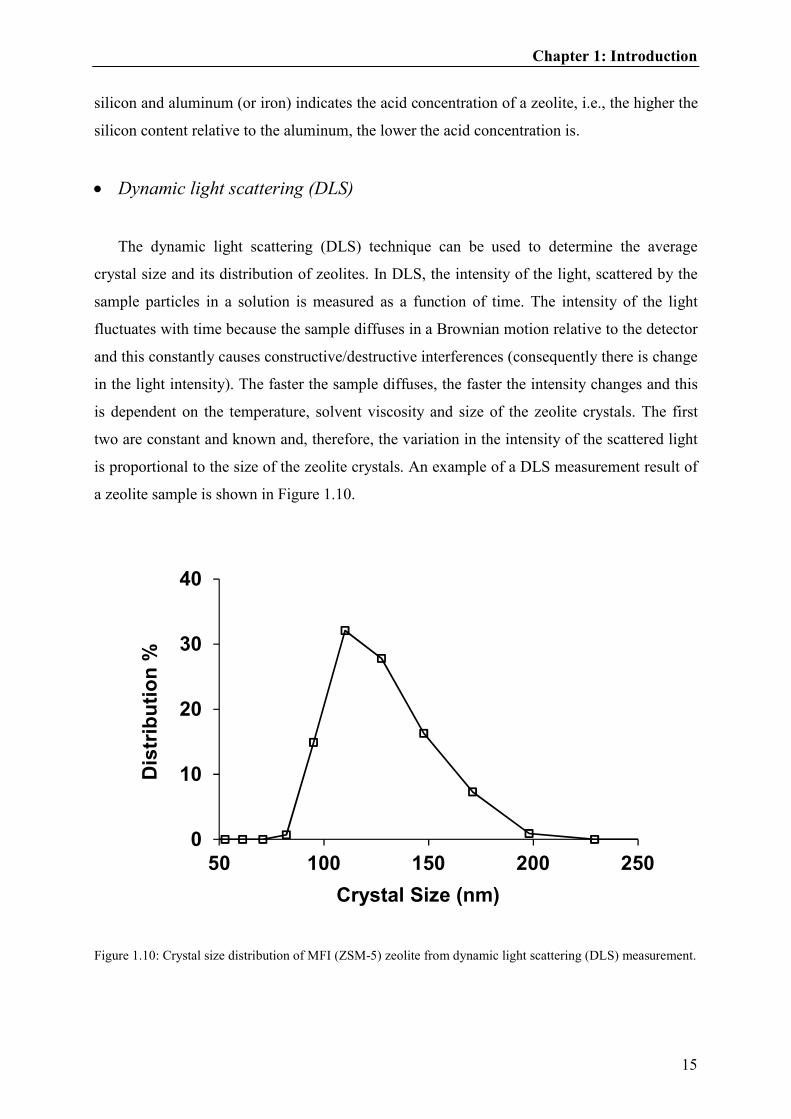
• Dynamic light scattering (DLS)
The dynamic light scattering (DLS) technique can be used to determine the average
crystal size and its distribution of zeolites. In DLS, the intensity of the light, scattered by the
sample particles in a solution is measured as a function of time. The intensity of the light
fluctuates with time because the sample diffuses in a Brownian motion relative to the detector
and this constantly causes constructive/destructive interferences (consequently there is change
in the light intensity). The faster the sample diffuses, the faster the intensity changes and this
is dependent on the temperature, solvent viscosity and size of the zeolite crystals. The first
two are constant and known and, therefore, the variation in the intensity of the scattered light
is proportional to the size of the zeolite crystals. An example of a DLS measurement result of
a zeolite sample is shown in Figure 1.10.
Figure 1.10: Crystal size distribution of MFI (ZSM-5) zeolite from dynamic light scattering (DLS) measurement.
0
10
20
30
40
50 100 150 200 250
Dis
trib
uti
on
%
Crystal Size (nm)
Chapter 1: Introduction
16
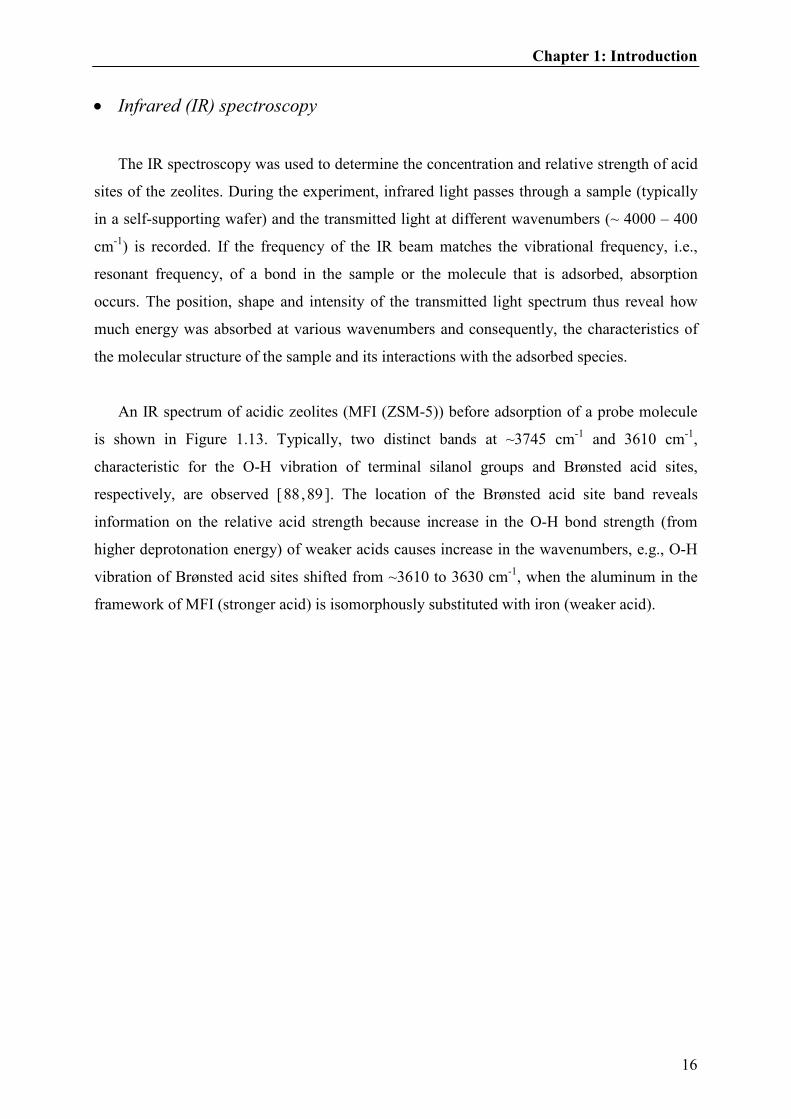
• Infrared (IR) spectroscopy
The IR spectroscopy was used to determine the concentration and relative strength of acid
sites of the zeolites. During the experiment, infrared light passes through a sample (typically
in a self-supporting wafer) and the transmitted light at different wavenumbers (~ 4000 – 400
cm-1) is recorded. If the frequency of the IR beam matches the vibrational frequency, i.e.,
resonant frequency, of a bond in the sample or the molecule that is adsorbed, absorption
occurs. The position, shape and intensity of the transmitted light spectrum thus reveal how
much energy was absorbed at various wavenumbers and consequently, the characteristics of
the molecular structure of the sample and its interactions with the adsorbed species.
An IR spectrum of acidic zeolites (MFI (ZSM-5)) before adsorption of a probe molecule
is shown in Figure 1.13. Typically, two distinct bands at ~3745 cm-1 and 3610 cm-1,
characteristic for the O-H vibration of terminal silanol groups and Brønsted acid sites,
respectively, are observed [88,89]. The location of the Brønsted acid site band reveals
information on the relative acid strength because increase in the O-H bond strength (from
higher deprotonation energy) of weaker acids causes increase in the wavenumbers, e.g., O-H
vibration of Brønsted acid sites shifted from ~3610 to 3630 cm-1, when the aluminum in the
framework of MFI (stronger acid) is isomorphously substituted with iron (weaker acid).

Chapter 1: Introduction
17
Figure 1.11: Infrared (IR) spectra of activated samples (MFI; heated to 723 K for 1 hour) measured at 423 K
under vacuum. The bands at 3745 cm-1 and 3610 cm-1 represents O-H vibration of the terminal silanol groups
and the Brønsted acid sites, respectively.
Variety of molecules, such as ammonia, carbon monoxide, benzene, pyridine and its
derivatives [90], are used in literature to probe the acid characteristics (concentration and
strength of Brønsted and Lewis acid sites) of a zeolite. Pyridine, in particular, was used as
probe molecules in this work to determine the total concentration of Brønsted and Lewis acid
sites and an IR spectrum of samples after adsorption of pyridine is shown in Figure 1.12. The
band at ~1545 cm-1 represents the ring deformation vibration of pyridinium ions formed on
Brønsted acid sites and the band at ~1450 cm-1 coordinately bonded pyridine molecules on
Lewis acid sites [91]. The total number of Brønsted and Lewis acid sites can thus be
determined by integrating the bands at ~ 1546 and 1455 cm-1, respectively [92].
34003500360037003800Wavenumber (cm-1)
Terminal
silanol
Brønsted
acid
H-Fe-ZSM5
H-ZSM5
No
rma
lize
d a
bs
orb
an
ce

Chapter 1: Introduction
18
Figure 1.12: Infrared (IR) spectra of MFI (H-ZSM-5) after adsorption of pyridine at 423 K, 0.01 kPa and
outgassing for 1 hour under vacuum (spectra of the activated sample subtracted). The bands at 1545 cm-1 and
1450 cm-1 represents Brønsted and Lewis acid site, respectively.
The concentration of Brønsted acid sites located in the pore mouth regions, which may be
of importance in shape selective reactions, can be determined by using 2-6-di-tert-butyl-
pyridine (2,6-DTBPy) as a probe molecule for medium pore-sized (10-MR, ~ 4 - 6 nm)
zeolites [93] because the kinetic diameter of 2,6-DTBPy (1.05 nm) is much larger than the
pores. Two major characteristic bands from the adsorption of 2,6-DTBPy are observed, i.e., at
3367 cm-1 (N-H+ stretching of protonated 2,6-DTBPy) and 1616 cm-1 (C=C bond in an
aromatic ring of adsorbed 2,6-DTBPy) [93], as shown in Figure 1.13 (with MFI (ZSM-5)).
The larger area of the bands at 3367 cm-1 and 1616 cm-1 of the desilicated (DS) material
indicates that the concentration of the Brønsted acid sites accessible by 2,6-DTBPy is higher
in DS sample than the parent ZSM-5. These areas can also be integrated to calculate the
number of Brønsted acid sites interacting with 2,6-DTBPy (sites located in the pore mouth
regions).
14001450150015501600
Wavenumber (cm-1)
Lewis
acidBrønsted
acid
No
rmali
zed
ab
so
rban
ce

Chapter 1: Introduction
19
Figure 1.13: The IR spectra of MFI samples after adsorption of 2,6-di-tert-butyl-pyridine (2,6-DTBPy, spectra of
activated samples are subtracted). The characteristic bands at 3367 cm-1 and 1616 cm-1 appear due to the 2,6-
DTBPy interaction with the zeolite.
• Nitrogen adsorption
The nitrogen (N2) physisorption was measured to determine the pore volumes (micro- and
meso-), pore size distributions, Brunauer-Emmett-Teller (BET) [94] and external surface
areas of the zeolites. The measurement is typically carried out by adsorbing-desorbing (by
equilibration) nitrogen over certain pressure ranges at liquid nitrogen temperature (77 K),
after the samples are outgassed. There are several methods to calculate the pores volumes and
external surface areas from the measurement and some of the common methods used in the
literature are t-plot [95,96] and αs-plot methods [97 ,98]. These methods are based on
empirical models, in which the volume of N2 adsorbed is plotted versus the statistical
thickness (t-plot) or an adsorption isotherm of an appropriate nonporous, reference material
(αs-plot). The pore size distributions can be evaluated by density functional theory (DFT;
based on principles of statistical mechanics) or Barrett, Joyner and Halenda (BJH; based on
1400180022002600300034003800
Wavenumber (cm-1)
No
rmali
zed
ab
so
rban
ce
ZSM-5-DS
ZSM-5
3367cm-1 1616cm-1
Chapter 1: Introduction
20
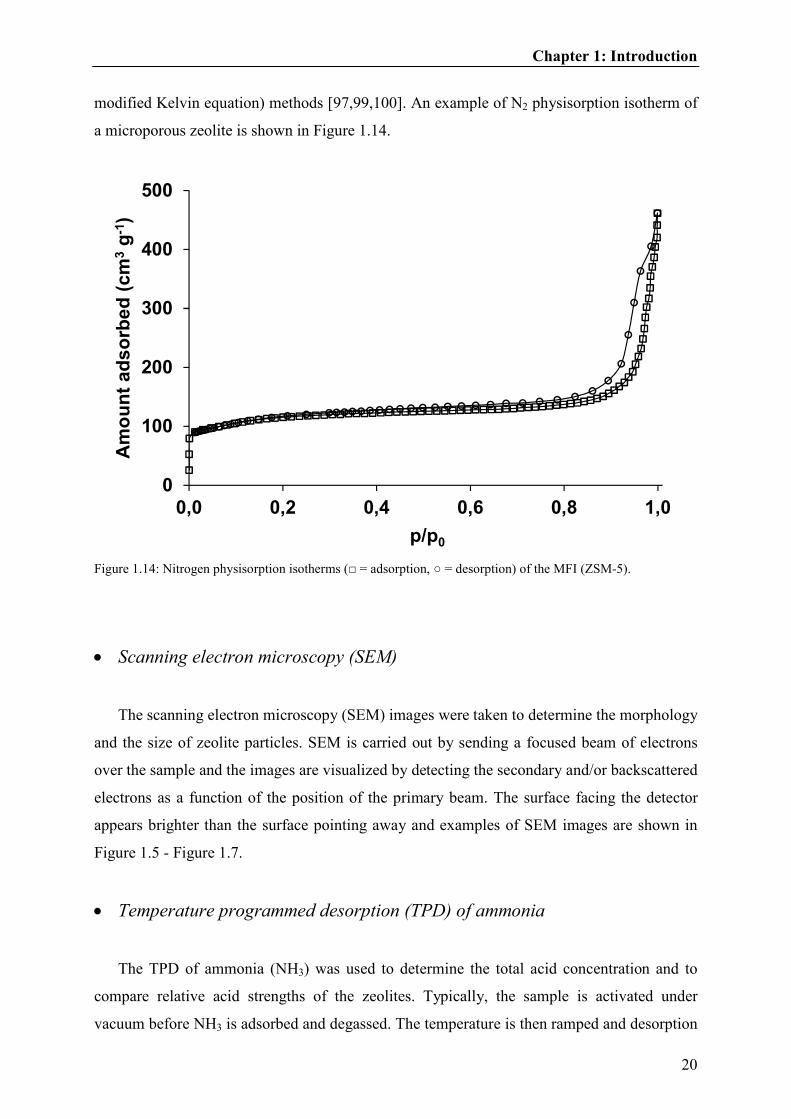
modified Kelvin equation) methods [97,99,100]. An example of N2 physisorption isotherm of
a microporous zeolite is shown in Figure 1.14.
Figure 1.14: Nitrogen physisorption isotherms (□ = adsorption, ○ = desorption) of the MFI (ZSM-5).
• Scanning electron microscopy (SEM)
The scanning electron microscopy (SEM) images were taken to determine the morphology
and the size of zeolite particles. SEM is carried out by sending a focused beam of electrons
over the sample and the images are visualized by detecting the secondary and/or backscattered
electrons as a function of the position of the primary beam. The surface facing the detector
appears brighter than the surface pointing away and examples of SEM images are shown in
Figure 1.5 - Figure 1.7.
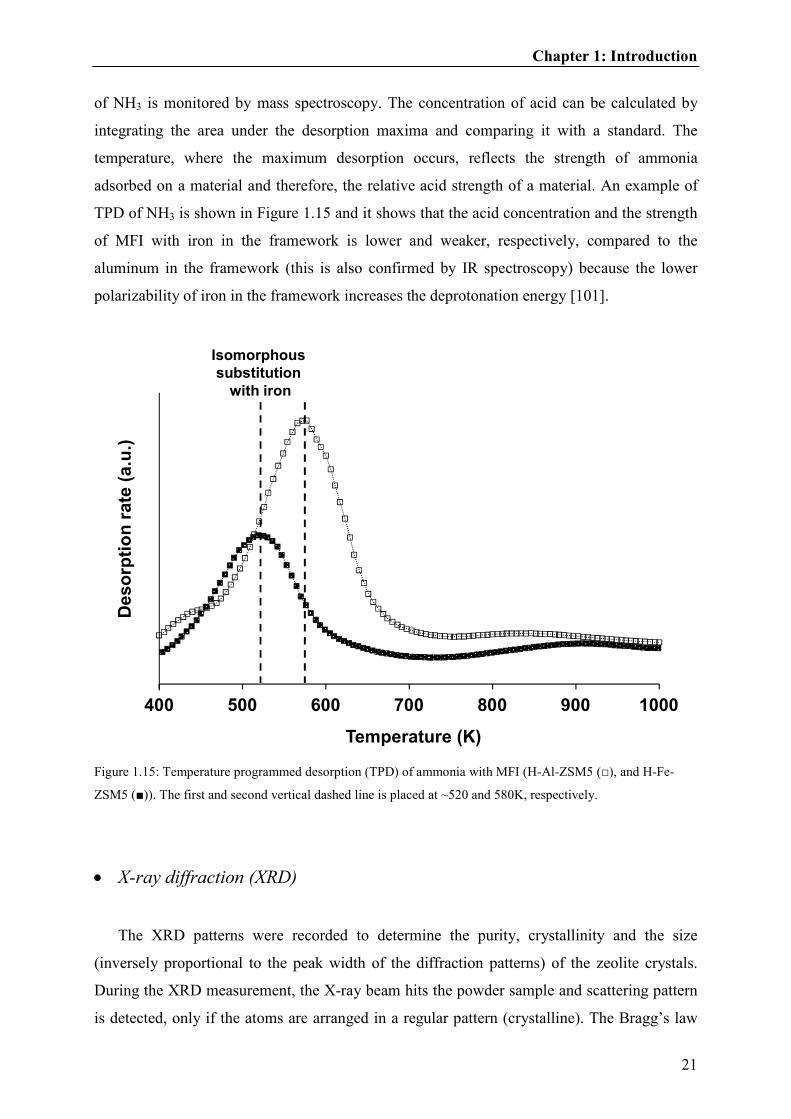
• Temperature programmed desorption (TPD) of ammonia
The TPD of ammonia (NH3) was used to determine the total acid concentration and to
compare relative acid strengths of the zeolites. Typically, the sample is activated under
vacuum before NH3 is adsorbed and degassed. The temperature is then ramped and desorption
0
100
200
300
400
500
0,0 0,2 0,4 0,6 0,8 1,0
Am
ou
nt
ad
so
rbe
d (
cm
3g
-1)
p/p0
Chapter 1: Introduction
21
of NH3 is monitored by mass spectroscopy. The concentration of acid can be calculated by
integrating the area under the desorption maxima and comparing it with a standard. The
temperature, where the maximum desorption occurs, reflects the strength of ammonia
adsorbed on a material and therefore, the relative acid strength of a material. An example of
TPD of NH3 is shown in Figure 1.15 and it shows that the acid concentration and the strength
of MFI with iron in the framework is lower and weaker, respectively, compared to the
aluminum in the framework (this is also confirmed by IR spectroscopy) because the lower
polarizability of iron in the framework increases the deprotonation energy [101].
Figure 1.15: Temperature programmed desorption (TPD) of ammonia with MFI (H-Al-ZSM5 (□), and H-Fe-
ZSM5 (■)). The first and second vertical dashed line is placed at ~520 and 580K, respectively.
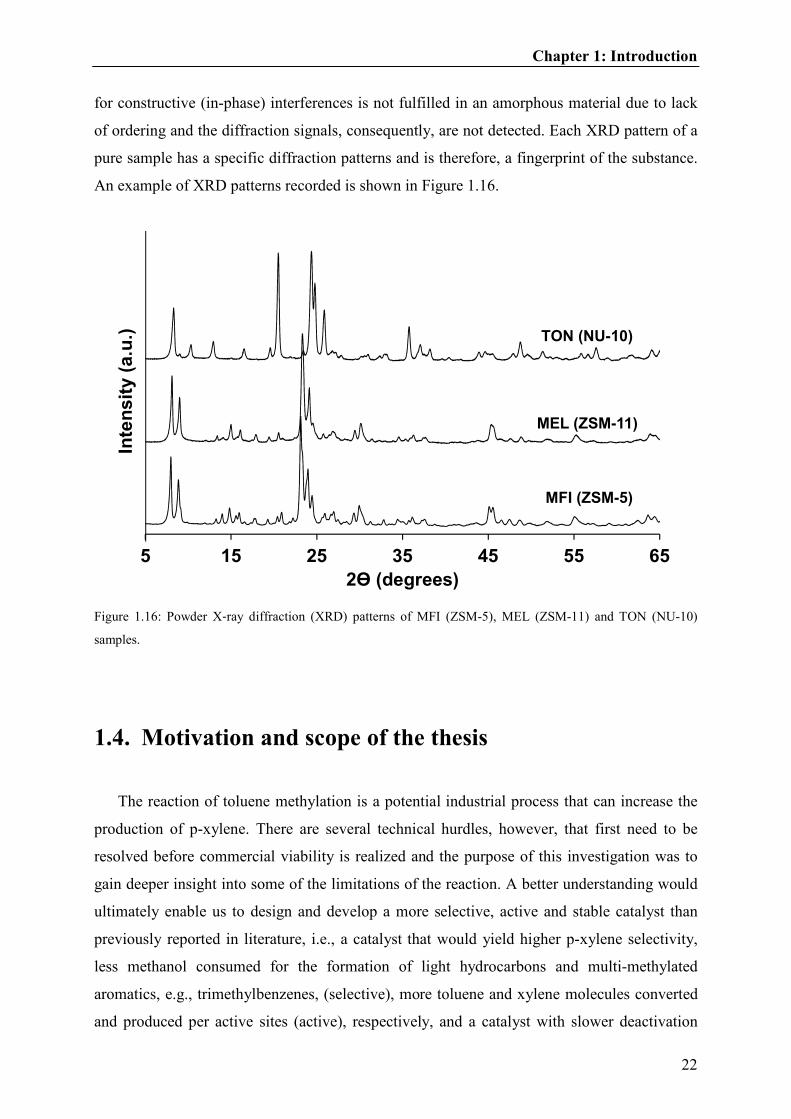
• X-ray diffraction (XRD)
The XRD patterns were recorded to determine the purity, crystallinity and the size
(inversely proportional to the peak width of the diffraction patterns) of the zeolite crystals.
During the XRD measurement, the X-ray beam hits the powder sample and scattering pattern
is detected, only if the atoms are arranged in a regular pattern (crystalline). The Bragg’s law
400 500 600 700 800 900 1000
Temperature (K)
De
so
rpti
on
ra
te (
a.u
.)
Isomorphous
substitution
with iron
Chapter 1: Introduction
22
for constructive (in-phase) interferences is not fulfilled in an amorphous material due to lack
of ordering and the diffraction signals, consequently, are not detected. Each XRD pattern of a
pure sample has a specific diffraction patterns and is therefore, a fingerprint of the substance.
An example of XRD patterns recorded is shown in Figure 1.16.
Figure 1.16: Powder X‐ray diffraction (XRD) patterns of MFI (ZSM-5), MEL (ZSM-11) and TON (NU-10)
samples.
1.4. Motivation and scope of the thesis
The reaction of toluene methylation is a potential industrial process that can increase the
production of p-xylene. There are several technical hurdles, however, that first need to be
resolved before commercial viability is realized and the purpose of this investigation was to
gain deeper insight into some of the limitations of the reaction. A better understanding would
ultimately enable us to design and develop a more selective, active and stable catalyst than
previously reported in literature, i.e., a catalyst that would yield higher p-xylene selectivity,
less methanol consumed for the formation of light hydrocarbons and multi-methylated
aromatics, e.g., trimethylbenzenes, (selective), more toluene and xylene molecules converted
and produced per active sites (active), respectively, and a catalyst with slower deactivation
5 15 25 35 45 55 65
Inte
ns
ity (
a.u
.)
2ϴ (degrees)
MEL (ZSM-11)
MFI (ZSM-5)
TON (NU-10)

Chapter 1: Introduction
23
and therefore longer lifetime (stable). In this work, we have focused in three different major
topics.
• Utilization of methanol in toluene methylation
One molecule of methanol reacts with one molecule of toluene to form one molecule of
xylene in toluene methylation, according to the stoichiometry. Despite of using an excess of
toluene relative to methanol by many research groups in the past [19,21,103,102], the reaction
is accompanied by many undesired side-products (i.e., non-xylenes), such as light
hydrocarbons [6,42,85,103] and multi-methylated aromatics, e.g., trimethyl- and tetramethyl-
benzenes [7,11,42,43]. Inefficient usage of methanol, i.e., methanol not being used to form
xylenes only, even in excess of toluene relative to methanol is one of the major drawbacks for
the process commercialization [15] and this issue has not been discussed in details so far in
the literature. In Chapter 2, the utilization of methanol in toluene methylation was investigated
therefore, using medium (H-ZSM-5 and H-ZSM-11) and large pore-sized (H-MOR and H-
BETA) zeolites. The results presented here highlight the significance of the hydrocarbon pool
cycle [104,105] and of the product shape selectivity [106,107], rather than the transition state
selectivity, and the challenges in an efficient usage of methanol in the toluene methylation
reaction.
• Hierarchical zeolites and the catalytic properties in toluene methylation
The hierarchical zeolites were first prepared from H-ZSM-5 by desilication and
subsequent dealumination. The first method generated mesopores within microporous crystals
and the latter removed significant amount of extra-framework aluminum species formed from
desilication procedure. These methods shorten the diffusion path length and thus increased the
transport rates of all molecules [108,109,110]. Consequently, the catalysts were generally
more active (relative to the parent materials) [111,112,113], albeit there was some loss in the
shape selective behavior (lower p-xylene selectivity [113]). These zeolites were further
modified by chemical liquid deposition of TEOS to compensate for the lower selectivity of p-
xylene. The TEOS deposition on a zeolite surface selectively reduced the number of
unselective Brønsted acid sites in the pore mouth region (because kinetic diameter of TEOS is
larger than the size of the H-ZSM-5 micropores) and partially blocked the pore openings
[21,22,25]. This modification method changed the transport properties of product molecules
Chapter 1: Introduction
24
to favor high p-xylene selectivity, i.e., the diffusivity of o- and m-xylene decreases, while the
p-xylene slightly increases [24]. In chapter 3, we combine these concepts of zeolite
modification to demonstrate that the toluene consumption rate (per Brønsted acid site) and p-
xylene selectivity can be enhanced simultaneously over these novel hierarchical zeolites.
Furthermore, all these catalysts are also extensively characterized by AAS, SEM, N2
adsorption and IR spectroscopy using pyridine and 2,6-di-tert-butyl-pyridine as probe
molecules to understand the consequence of these modifications on the catalytic activity and
p-xylene selectivity.
• Influence of the reaction temperature on p-xylene selectivity in toluene
methylation
There are three major reaction pathways for the formation of p-xylenes during toluene
methylation, i.e., methylation of toluene, isomerization of xylenes, further methylation and
subsequent elimination of less-methylated aromatic molecules as xylenes (and light
hydrocarbons) from multi-methylated aromatics [11,13,44,45]. In chapter 4, the influence of
these reactions on the selectivity of p-xylene during toluene methylation was investigated
with medium pore-sized zeolites at different reaction temperatures. Increase in the reaction
temperature consistently resulted in higher p-xylene selectivity because the differences in
diffusivities of xylenes i.e., between p-xylene and o-, m-xylenes [24], became dominant in
determining p-xylene selectivity from fast reactions. These results suggest that toluene
methylation to p-xylene reaction should be operated at relative high temperatures because it
enables both the formation rate of xylenes and the selectivity of p-xylene to increase
simultaneously.
1.5. References
[1] International Energy Agency, Energy Technology Perspectives, France, 2006.
[2] T. Tsai, S. Liu, I. Wang, Applied Catalysis A: General 181 (1999) 355-398.
[3] W. Vermeiren, J.P. Gilson. Topics in Catalysis 52 (2009) 1131-1161.
[4] W.W. Kaeding, C. Chu, L.B. Young, S.A. Butter, J. Catal. 69 (1981) 392-398.
[5] Y. Xiong, P.G. Rodewald, C.D. Chang, J. Am. Chem. Soc. 117 (1995) 9421-9431.

Chapter 1: Introduction
25
[6] G.N. Rao, R. Kumar, P. Ratnasamy, Appl. Catal. 49 (1989) 307-318.
[7] W.W. Kaeding, C. Chu, L.B. Young, B. Weinstein, S.A. Butter, J. Catal. 67 (1981)
159-174.
[8] R. Kumar, P. Ratnasamy, J. Catal. 116 (1989) 440-448.
[9] H. Nishi, K. Nowinska, J. B. Moffat, J. Catal. 116 (1989) 480-487.
[10] L.B. Young, S.A. Butter, W.W. Kaeding, J. Catal. 76 (1982) 418-432.
[11] O. Mikkelsen, P.O. Rønning, S. Kolboe, Micropor. Mesopor. Mater. 40 (2000) 95-
113.
[12] G.A. Olah, Angew. Chem. Int. Ed. 44 (2005) 2636-2639.
[13] U. Olsbye, S. Svelle, M. Bjørgen, P. Beato, T.V.W. Janssens, F. Joensen, S. Bordiga,
K.P. Lillerud, Angew. Chem. Int. Ed. 51 (2012) 2-24.
[14] P.L. Spath, D.C. Dayton, Preliminary Screening-Technical and Economic Assessment
of Synthesis Gas to Fuels and Chemicals with Emphasis on the Potential for Biomass-
Derived Syngas, National Renewable Energy Laboratory, USA, 2003.
[15] S. Kulprathipanja, Zeolites in Industrial Separation and Catalysis, Wiley-VCH,
Germany, 2010.
[16] R. D. Chirico, W.V. Steele, J. Chem. Eng. Data 42 (1997) 784-790.
[17] R.A. Meyers, Handbook of Petroleum Refining Processes, McGraw-Hill, USA, 2003.
[18] Y.S. Bhat, J. Das, K.V. Rao, A.B. Halgeri, 159 (1996) 368-374.
[19] J.P. Breen, R. Burch, M. Kulkarni, D. McLaughlin, P.J. Collier, S.E. Golunski, Appl.
Catal. A: General 316 (2007) 53-60.
[20] H. Vinek, G. Rumplmayr, J.A. Lercher, J. Catal. 115 (1989) 291-300.
[21] T. Hibino, M. Niwa, Y. Murakami, J. Catal. 128 (1991) 551-558.
[22] H.P. Röger, M. Krämer, K.P. Möller, C.T. O’Connor, Micropor. Mesopor. Mater. 21
(1998) 607-614.
[23] S. Zheng, H.R. Heydenrych, H.P. Röger, A. Jentys, J.A. Lercher, Top. Catal. 22
(2003) 101-106.
[24] S. Zheng, A. Jentys, J.A. Lercher, J. Catal. 241 (2006) 304-311.
[25] J. Čejka, N. Žilková, B. Wichterlová, G. Eder-Mirth, J.A. Lercher, Zeolites 17 (1996)
265-271.
[26] Y. Jiang, M. Hunger, W. Wang, J. Am. Chem. Soc. 128 (2006) 11679-11692.
[27] T.R. Forester, R.F. Howe, J. Am. Chem. Soc. 109 (1987) 5076-5082.
[28] J. Rakoczy, T. Romotowski, Zeolites, 13 (1993) 256-260.

Chapter 1: Introduction
26
[29] A.M. Vos, X. Rozanska, R.A. Schoonheydt, R.A. van Santen, F. Hutschka, J. Hafner,
J. Am. Chem. Soc. 123 (2001) 2799-2809.
[30] I.I. Ivanova, A. Corma, J. Phys. Chem. B 101 (1997) 547-551.
[31] G. Mirth, J.A. Lercher, J. Phys. Chem. 95 (1991) 3736-3740.
[32] M.V. Frash, V.B. Kazansky, A.M. Rigby, R.A. van Santen, J. Phys. Chem. B 102
(1998) 2232-2238.
[33] A.M. Rigby, G.J. Kramer, R.A. van Santen, J. Cat. 170 (1997) 1-10.
[34] J.F. Haw, B.R. Richardson, I.S. Oshiro, N.D. Lazo, J.A. Speed, J. Am. Chem. Soc. 111
(1989) 2052-2058.
[35] V. Kazansky, Acc. Chem. Res. 24 (1991) 379-383.
[36] S. Svelle, B. Arstad, S. Kolboe, O. Swang, J. Phys. Chem. B 107 (2003) 9281-9289.
[37] B. Arstad, S. Kolboe, O. Swang, J. Phys. Chem. B 106 (2002) 12722-12726.
[38] S.R. Blaszkowski R.A. van Santen, J. Am. Chem. Soc. 118 (1996) 5152-5153.
[39] C.D. Chang, Catal. Rev.-Sci. Eng. 25 (1983) 1-118.
[40] S. Svelle, S. Kolboe, O. Swang, U. Olsbye, J. Phys. Chem. B 109 (2005) 12874-
12878.
[41] T. Maihom, B. Boekfa, J. Sirijaraensre, T. Nanok, M. Probst, J. Limtrakul, J. Phys.
Chem. C 113 (2009) 6654-6662.
[42] P.B. Venuto, L.A. Hamilton, P.S. Landis, J.J. Wise, J. Catal. 4 (1966) 81-98.
[43] A.M. Vos, K.H.L. Nulens, F. De Proft, R.A. Schoonheydt, P. Geerlings, J. Phys.
Chem. B 106 (2002) 2026-2034.
[44] Z. Zhu, Q. Chen, Z. Xie, W. Yang, C. Li, Micropor. Mesopor. Mater. 88 (2006) 16-21.
[45] A.M. Prakash, S.V.V. Chilukuri, R.P. Bagwe, S. Ashtekar, D.K. Chakrabarty,
Micropor. Mater. 6 (1996) 89-97.
[46] D.M. McCann, D. Lesthaeghe, P.W. Kletnieks, D.R. Guenther, M.J. Hayman, V. Van
Speybroeck, M. Waroquier, J.F. Haw, Angew. Chem. Int. Ed. 47 (2008) 5179-5182.
[47] J. H. Ahn, R. Kolvenbach, S. S. Al-Khattaf, A. Jentys, J. A. Lercher, in preparation.
[48] W. Song, D.M. Marcus, H. Fu, J.O. Ehresmann, J.F. Haw J. Am. Chem. Soc. 124
(2002) 3844-3845.
[49] D. Lesthaeghe, V. Van Speybroeck, G.B. Marin, M. Waroquier, Ind. Eng. Chem. Res.
46 (2007) 8832-8838.
[50] M. Bjørgen, S. Svelle, F. Joensen, J. Nerlov, S. Kolboe, F. Bonino, L. Palumbo, S.
Bordiga, U. Olsbye, J. Catal. 249 (2007) 195-207.

Chapter 1: Introduction
27
[51] D.A. Simonetti, J.H. Ahn, E. Iglesia, J. Catal. 277 (2011) 173-195.
[52] R.H. Allen, L.D. Yats, J. Am. Chem. Soc. 83 (1961) 2799-2805.
[53] J. Weitkamp, Y. Traa, Catal. Today 49 (1999) 193-199.
[54] H. Nishi, K. Nowinska, J.B. Moffat, J. Catal. 116 (1989) 480-487.
[55] S. Kamiguchi, S. Nishida, H. Kurokawa, H. Miura, T. Chihara, J. Mol. Catal. A 226
(2005) 1-9.
[56] M.J. Janik, R.J. Davis, M. Neurock J. Catal 244 (2006) 65-77.
[57] G.A. Olah, D. Meidar,R. Malhotra, J.A. Olah, S.C.Naranc, J. Catal. 61 (1980) 96-102.
[58] P. Botella, A. Corma, J.M. López-Nieto, J. Catal. 185 (1999) 371-377.
[59] A. Corma, Chem. Rev. 95 (1995) 559-614.
[60] G.D. Yadav, J.J. Nair, Micropor. Mesopor. Mater. 33 (1999) 1-48.
[61] A. Corma, J. Catal. 216 (2003) 298-312.
[62] R.M. Barrer, D.W. Riley, J. Chem. Soc. (1948) 133-143.
[63] F. Di Renzo, F. Fajula, Stud. Surf. Sci. Catal. 157 (2005) 1-12.
[64] Database of Zeolite Structures (http://www.iza-structure.org/databases/).
[65] R.M. Barrer, Pure. Appl. Chem. 51 (1979) 1091-1100.
[66] Ullmann's Encyclopedia of Industrial Chemistry, Wiley-VCH, Germany, 2011.
[67] C.C. Freyhardt, M. Tsapatsis, R.F. Lobo, K.J. Balkus, M.E. Davis, Nature 381 (1996)
295-298.
[68] C.S. Cundy, P.A. Cox, Micropor. Mesopor. Mater. 82 (2005) 1-78.
[69] P. De Luca, F. Crea, R. Aiello, A. Fonseca, J.B. Nagy, Stud. Surf. Sci. Catal. 105
(1997) 325-332.
[70] M. Derewinski, M. Machowska, Stud. Surf. Sci. Catal. 154 (2004) 349-354.
[71] E.M. Flanigen, Stud. Surf. Sci. Catal. 137 (2001) 11-35.
[72] C.T.W. Chu, C.D. Chang, J. Phys. Chem. 89 (1985) 1569-1571.
[73] R. Szostak, Molecular Sieves: Principles of Synthesis and Identification, Thomson
Science, United Kingdom, 1998.
[74] P. Mériaudeau, V.A. Tuan, L.N. Hung, V.T. Nghiem, C. Naccache, J. Chem. Soc.,
Faraday Trans. 94 (1998) 467-471.
[75] R. Byggningsbacka, N. Kumar, L.E. Lindfors, Catal. Lett. 58 (1999) 231-234.
[76] O. Kresnawahjuesa, R.J. Gorte, D. White, J. Mol. Catal. A 212 (2004) 309-314.
[77] A.W. Chester, E.G. Derouane, Zeolite Characterization and Catalysis, Springer
Science, Germany, 2009.
Chapter 1: Introduction
28
[78] S.T. Wilson, B.M. Lok, C.A. Messina, T.R. Cannan, E.M. Flanigen, J. Am. Chem.
Soc. 104 (1982) 1146-1147.
[79] B.M. Lok, C.A. Messina, R.L. Patton, R.T. Gajek, T.R. Cannan, E.M. Flanigen, J. Am.
Chem. Soc. 106 (1984) 6092-6093.
[80] T.Yashima, H. Ahmad, K. Yamazaki, M. Katsuta, N. Hara, J. Catal. 16 (1970) 273-
280.
[81] P.B. Weisz, Pure Appl. Chem. 52 (1980) 2091-2103.
[82] S.M. Csicsery, Zeolites 4 (1984) 202-213.
[83] B. Smit, T.L.M. Maesen, Nature 451 (2008) 671-678.
[84] J. Breen, R. Burch, M. Kulkarni, P. Collier, S. Bolunski, J. Am. Chem. Soc. 127
(2005) 5020-5021.
[85] Y. Zhao, H. Wu, W. Tan, M. Zhang, M. Liu, C. Song, X. Wang, X. Guo, Catalysis
Today 156 (2010) 69-73.
[86] N.Y. Chen, W.W. Kaeding, F.G. Dwyer, J. Am. Chem. Soc. 101 (1979) 6783.
[87] J. W. Niemantsverdriet, Spectroscopy in Catalysis, Wiley-VCH, Germany, 2007.
[88] N. Tøpsoe, K. Pedersen, E.G. Derouane, J. Catal. 70 (1981) 41-52.
[89] P.A. Jacobs, R. Von Ballmoos, J. phys. Chem. 83 (1982) 3050-3052.
[90] J.A. Lercher, C. Gründling, G. Eder-Mirth, Catal. Today 27 (1996) 353-376.
[91] E.P. Parry, J. Catal. 2 (1963) 371-379.
[92] C.A. Emeis, J. Catal. 141 (1993) 347-354.
[93] A. Corma, V. Fornes, L. Forni, F. Marquez, J. Martinez-Triguero, D. Moscotti, J.
Catal. 179 (1998) 451-458.
[94] S. Brunauer, P. H. Emmett, E. Teller, J. Am. Chem. Soc. 60 (1938) 308-319.
[95] B.C. Lippens, B.G. Linsen, J.H. de Boer, J. Catal. 3 (1964) 32-37.
[96] G. Halsey, J. Chem. Phys. 16 (1948) 931-937.
[97] M. Kruk, M. Jaroniec, J. Choma, Carbon 36 (1998) 1447.
[98] S. J. Gregg, Adsorption Surface Area and Porosity, 2nd ed.; Academic Press Inc.: New
York, 1982.
[99] E.P. Barrett, L.G. Joyner, P.P. Halenda, J. Am. Chem. Soc. 73 (1951) 373-380.
[100] K. Sing, Colloids Surf., A 187-188 (2001) 3-9.
[101] A. Chatterjee, T. Iwasaki, T. Ebina, A. Miyamoto, Micropor. Mesopor. Mater. 21
(1998) 421-428.
[102] G. Mirth, J.A. Lercher, J. Catal 147 (1994) 199-206.

Chapter 1: Introduction
29
[103] R. Kumar, P. Ratnasamy, J. Catal 118 (1989) 68-78.
[104] U. Olsbye, M. Bjørgen, S. Svelle, K. Lillerud, S. Kolboe, Catal. Today 106 (2005)
108-111.
[105] D. Lesthaeghe, A. Horré, M. Waroquier, G.B. Marin, V. Van Speybroeck, Chem. Eur.
J. 15 (2009) 10803-10808.
[106] B. Smit, T.L.M. Maesen, Nature 451 (2008) 671-678.
[107] T.F. Degnan, J. Catal 216 (2003) 32-46.
[108] J.C. Groen, W. Zhu, S. Brouwer, S.J. Huynink, F. Kapteijn, J.A. Moulijn, J. Pérez-
Ramírez, J. Am. Chem 129 (2007) 355-360.
[109] F.C. Meunier, D. Verboekend, J.P. Gilson, J.C. Groen, J. Pérez-Ramírez, Micropor.
Mesopor. Mater. 148 (2012) 115-121.
[110] R. Kolvenbach, J. H. Ahn, S. S. Al-Khattaf, A. Jentys, J. A. Lercher, in preparation
[111] C.H. Christensen, K. Johannsen, E. Törnqvist, I. Schmidt, H. Topsøe, C.H.
Christensen, Cat. Today 128 (2007) 117-122.
[112] C.H. Christensen, K. Johannsen, I. Schmidt, C.H. Christensen, J. Am. Chem 125
(2003) 13370-13371.
[113] C. Fernandez, I. Stan, J.P. Gilson, K. Thomas, Aurélie Vicente, A. Bonila, J. Pérez-
Ramírez, Chem. Eur. J. 16 (2010) 6224-6233.

Chapter 1: Introduction
30

Chapter 2: Methanol usage
31
Chapter 2
Methanol usage in toluene methylation with
medium and large pore zeolites
The reaction of toluene methylation was investigated with four acidic zeolites of different pore
geometries, i.e., the medium pore zeolites H-ZSM5 and H-ZSM11 as well as the large pore
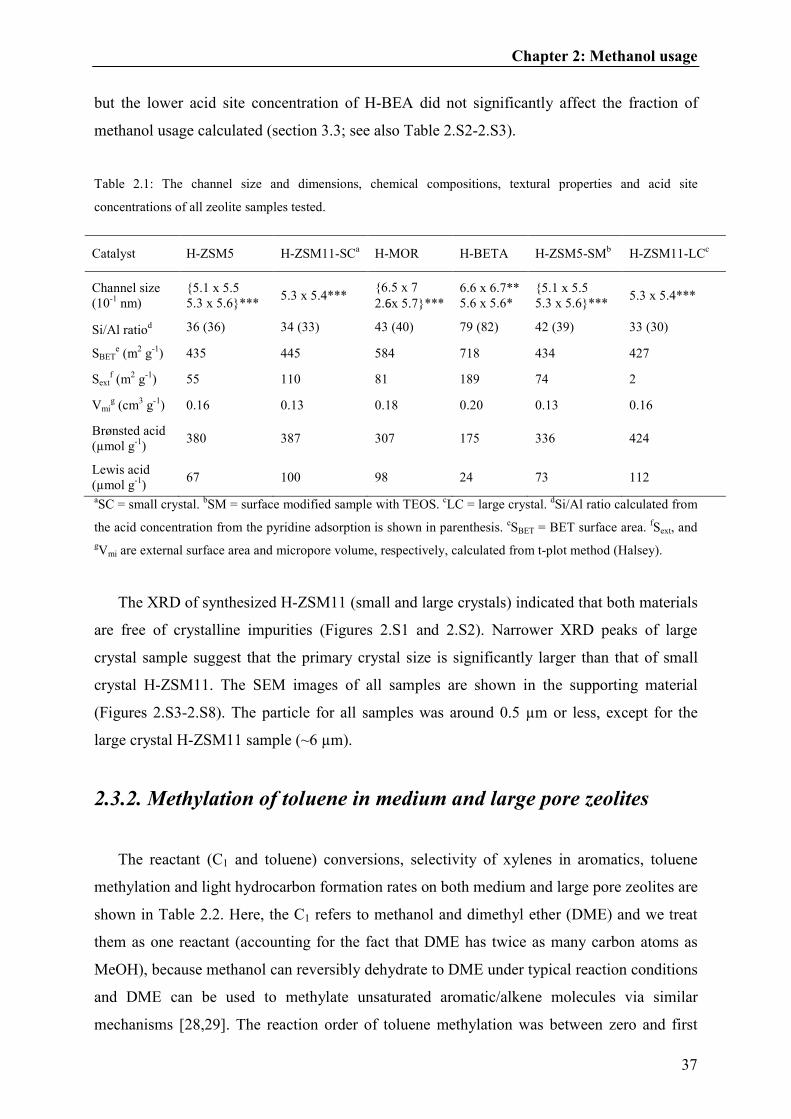
zeolites H-MOR and H-BEA. The methylation, methanol consumption, light hydrocarbon
formation and disproportionation rates for the reaction of toluene, p-xylene and 1,2,4-
trimethylbenezene with methanol were determined. The products of toluene methylation, e.g.,
xylenes and trimethylbenzenes, were readily methylated further in both medium and large
pore zeolites. Considerably higher fraction of methanol was used to form light hydrocarbons
with the medium pore zeolites than with large pore zeolites. This was related to the fact that
the dealkylation of light hydrocarbons from highly methylated aromatics became more
favorable relative to methylation at an earlier stage, i.e., after fewer methyl groups were
added to the aromatic ring. Increasing the effective residence time of bulky aromatic
molecules with medium pore zeolites, modified either by coating the surface with tetraethyl
orthosilicate or by increasing the intra-crystal pore length, converted a larger fraction of
methanol to light hydrocarbons via methylation and subsequent dealkylation of light
hydrocarbons.

Chapter 2: Methanol usage
32
2.1. Introduction
Benzene, toluene and xylenes, are important raw materials for variety of petrochemical
commodities [1,2,3]. The majority of these molecules are generated via catalytic reforming or
as byproducts of naphtha cracking [2,3]. Among the three, toluene is produced in excess
relative to the market demand [1] and methylation of toluene to xylenes would, therefore, be a
potential way to balance the deficiency of xylene production.
In toluene methylation, methanol (MeOH) reacts with a toluene to form a xylene (Scheme
2.1). Under typical reaction conditions, this reaction is accompanied by several side reactions
leading to light hydrocarbons (LH) [ 4 , 5 , 6 , 7 ] and further methylated aromatics, e.g.,
trimethylbenzene (TriMB) and tetramethylbenzene (TetraMB) [5,8,9,10]. Many research
groups have, thus, used an excess of toluene relative to methanol [6,11,12,13] to avoid
formation of these side products, albeit with the drawback of lower maximum toluene
conversions and relatively high selectivity to light hydrocarbons, nevertheless. Inefficient
methanol usage, even in excess of toluene relative to methanol is, thus, one of the major
drawbacks for the process commercialization [3] and has not been resolved.
Scheme 2.1: The reaction of toluene methylation with methanol. The formation of undesired side products
during the reaction such as light hydrocarbons and trimethylbenzenes are indicated by dashed arrows.
Chapter 2: Methanol usage
33
Thus, we selected four different acidic zeolites to gain insight into the methanol usage
during toluene methylation, i.e., H-ZSM5, H-ZSM11, H-MOR and H-BEA; the first two are
medium pore-sized zeolites (10-membered ring (MR)) and the latter two large pore-sized
zeolites (12-MR). The data here indicated that most of the methanol was used for methylation
of toluene and its aromatic products, e.g., xylenes and TriMBs, but the dealkylation of light
hydrocarbons from highly methylated aromatic molecules eventually became more favorable
relative to methylation because of product shape selectivity [14]. The multiple aromatic
methylation and the subsequent dealkylation is a well-discussed reaction pathway for the
formation of light hydrocarbons during methanol-to-hydrocarbons reactions [9,15,16,17]. The
formation of ethene as well as some propene [18] is likely to occur by side chain methylation
(via methylation of methyl group of an aromatic ring) or by a paring mechanism (via aromatic
ring contraction and expansion) [19,20]. In this work, we provide clear evidence that such a
reaction route also plays an important role in the methanol usage during the toluene
methylation reaction.
2.2. Experimental
2.2.1. Materials
The materials H-ZSM5 (Si/Al = 36), H-MOR (Si/Al = 45) and H-BEA (Si/Al = 75) were
provided by Süd-Chemie and H-ZSM11 was synthesized by using tetrabutylammonium
hydroxide (TBAOH; ≥99.0 %, 30-hydrate, Sigma Aldrich) and 1,8-diamino-octane (DAO; 98
%, Sigma Aldrich) as the organic templates for small (SC) and large crystal (LC) zeolites,
respectively [21,22]. Aluminum nitrate (≥98 %, nona-hydrate), fumed silica (Cab-O-sil M-5)
and sodium hydroxide (≥98 %) were used for SC H-ZSM11 synthesis and aluminum sulphate
(99.99 %), potassium hydroxide (99.99 %) and silica sol (Ludox AS-30) for LC H-ZSM11
synthesis (all purchased from Sigma Aldrich). The gel composition for SC H-ZSM11 was
9TBAOH: Al2O3: 90SiO2: 1065H2O: 6.5Na2O. The uniform mixture was aged overnight and
transferred into Teflon liners and sealed inside autoclaves. The crystallization time was 18
hours at 448 K under rotation (60 rpm). The gel composition for LC H-ZSM11 was 26DAO:
Al2O3: 90SiO2: 3580H2O: 12K2O. This mixture was aged for ~1 hour before it was transferred

Chapter 2: Methanol usage
34
into Teflon liners and sealed inside autoclaves. The crystallization time was 72 hours at 433 K
under static conditions.
After the desired crystallization time, the autoclaves were cooled under water, the solids
separated by centrifugation and washed three times with deionized water. The samples were
dried in an oven at 353 K, ground and treated at 823K (heating rate of 0.05 K s-1
) for 10 hours
in synthetic air (flowing at 1.67 cm3 s
-1; 20.5% O2 in N2, Westfalen) to remove the organic
templates.
After the template removal, ammonium ion exchange was carried out at 353 K under
stirring for 6 hours in a 0.2 M NH4Cl solution (30 cm3 per gram of zeolite). This procedure
was repeated three times. After the third ammonium exchange, the zeolites were separated by
centrifugation, washed, dried and treated in synthetic air (flowing at 1.67 cm3 s
-1) for 10 hours
(heating rate of 0.05 K s-1
) at 823 K to obtain the protonic form of the zeolite.
The surface modified (SM) sample of H-ZSM5 was prepared by heating 10 g of zeolite in
250 cm3 of hexane (>97 %, Sigma Aldrich) containing 1.5 cm
3 of tetraethyl orthosilicate
(TEOS; 4 weight% SiO2 relative to the zeolite; >99.0 %, Sigma Aldrich) at 353 K under
stirring for 1 hour [23]. Hexane was removed by a rotary evaporator under vacuum and the
sample was dried at 353 K and subsequently treated in a synthetic air (flowing at 1.67 cm3 s
-1)
at 353 K (0.083 K s-1
) for 2 hours, at 453 K (0.033 K s-1
) for 3 hours and finally at 823 K
(0.033 K s-1
) for 5 hours. This procedure was repeated three times before the material was
characterized and tested (total deposition amount of 12 wt % SiO2).
2.2.2. Catalyst characterization
The elemental composition of the zeolites was determined by atomic absorption
spectroscopy (AAS; Unicam M Series Flame-AAS equipped with an FS 95 auto-sampler and
a GF 95 graphite furnace) and the purity and crystallinity of the samples were examined by X-
ray diffraction (XRD; Philips X’Pert Pro system, λCuKα = 0.154056 nm, 40 kV/40 mA)
recorded between 2 θ angles of 5-70° (step size of 0.017° and a scan speed of 115 seconds per
step). Nitrogen physisorption measurements were carried out at 77 K on PMI automated
sorptometer after outgassing the samples under vacuum at 523 K for 2 hours. The BET
surface area [24] was calculated from the nitrogen adsorption data over a relative pressure
Chapter 2: Methanol usage
35
range from 0.01-0.1 p/p0. The pore volumes and external surface areas were evaluated by
using the t-plot method [25] according to Halsey [26]. The scanning electron microscopy
(SEM) images of all samples were recorded on a JEOL JSM 5900LV microscope operating at
25 kV. The characteristic diffusion time of medium pore zeolites were determined by
measuring o-xylene uptake rates by flowing 2.1 cm3 s
-1 of helium to a self-supporting wafer in
a cell (1.5 cm3), using infrared spectroscopy (Thermo Nicolet 6700 FT-IR spectrometer,
resolution of 4 cm-1
). The sample was activated at 523 K (heating rate of 0.17 K s-1
) under
flowing helium for 12 hours before switching to a second helium stream (2.1 cm3 s
-1) with
saturated o-xylene (0.05 kPa). The spectra were measured every 60s at 403 K and were
normalized to the integral of the overtone lattice band between 2105 and 1740 cm-1
of the
activated H-ZSM5 sample. The characteristic ring vibrations of o-xylene at 1496 and 1466
cm-1
[27 ] were integrated and normalized to the steady state integral to determine the
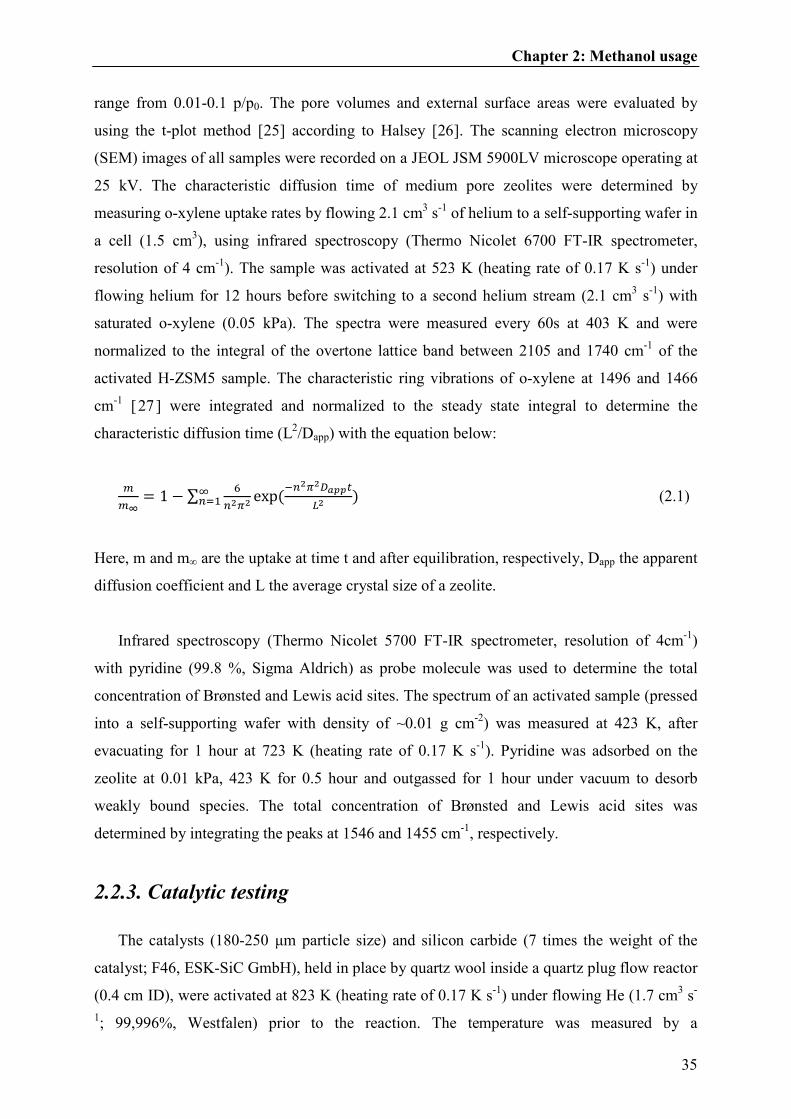
characteristic diffusion time (L2/Dapp) with the equation below:
�
��= 1 − ∑
�
�exp(
�������
����� ) (2.1)
Here, m and m∞ are the uptake at time t and after equilibration, respectively, Dapp the apparent
diffusion coefficient and L the average crystal size of a zeolite.
Infrared spectroscopy (Thermo Nicolet 5700 FT-IR spectrometer, resolution of 4cm-1
)
with pyridine (99.8 %, Sigma Aldrich) as probe molecule was used to determine the total
concentration of Brønsted and Lewis acid sites. The spectrum of an activated sample (pressed
into a self-supporting wafer with density of ~0.01 g cm-2
) was measured at 423 K, after
evacuating for 1 hour at 723 K (heating rate of 0.17 K s-1
). Pyridine was adsorbed on the
zeolite at 0.01 kPa, 423 K for 0.5 hour and outgassed for 1 hour under vacuum to desorb
weakly bound species. The total concentration of Brønsted and Lewis acid sites was
determined by integrating the peaks at 1546 and 1455 cm-1
, respectively.
2.2.3. Catalytic testing
The catalysts (180-250 µm particle size) and silicon carbide (7 times the weight of the
catalyst; F46, ESK-SiC GmbH), held in place by quartz wool inside a quartz plug flow reactor
(0.4 cm ID), were activated at 823 K (heating rate of 0.17 K s-1
) under flowing He (1.7 cm3 s
-
1; 99,996%, Westfalen) prior to the reaction. The temperature was measured by a
Chapter 2: Methanol usage
36
thermocouple in external contact to the reactor and was maintained constant by a stainless
steel furnace connected to a Eurotherm controller (Series 2416). The catalysts were tested at
673 K at 101 kPa by flowing premixed feed of toluene (>99.9 %, Sigma Aldrich) or p-xylene
(>99 %, Sigma Aldrich) or 1,2,4-trimethylbenzene (98 %, Sigma Aldrich) with methanol
(>99.8 %, Sigma Aldrich) into a vaporizer filled with silicon carbide. The total flow rate was
2.3 cm3 s
-1 and the aromatic to methanol molar ratio was 4 with paromatic = 1.2-6 kPa and
pmethanol = 0.3-1.5 kPa. The reactor effluent was sampled ~0.75 hour after the start of the
reactant flow into the reactor and was analyzed by on-line gas chromatography (Agilent
7820A) using a DB-WAX column (30 m x 0.32 mm x 0.5 µm) and a flame ionization
detector. The product selectivities did not change significantly with the reaction time (time-
on-stream behavior of a medium (H-ZSM5) and large (H-BEA) pore zeolites is summarized
in Table 2.S1).
The rates of methylation (toluene, p-xylene and 1,2,4-TriMB; based on consumption)
were calculated by multiplying the aromatic feed rate per gram of zeolite in the reactor (mol
g-1
s-1
) by the conversion of the reactant aromatic molecule (%; the isomers, e.g., o- and m-
xylene when p-xylene was co-fed with methanol, were treated as reactants) and dividing it by
the concentration of Brønsted acid sites (mol H+ g
-1), determined by the adsorption of
pyridine. The formation rates of light hydrocarbon were calculated by multiplying the rate of
total carbons in the feed per gram of zeolite in the reactor by the carbon selectivity of light
hydrocarbons formed and dividing it by the concentration of Brønsted acid sites.
2.3. Results
2.3.1. Catalyst characterization
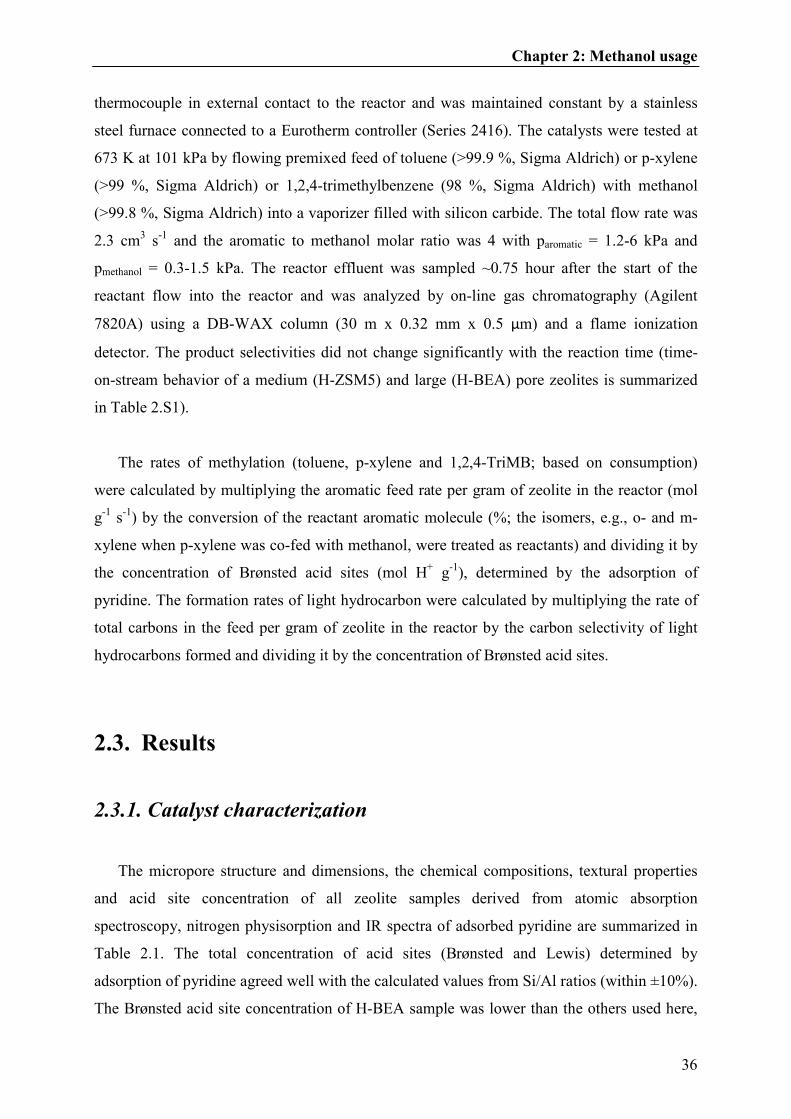
The micropore structure and dimensions, the chemical compositions, textural properties
and acid site concentration of all zeolite samples derived from atomic absorption
spectroscopy, nitrogen physisorption and IR spectra of adsorbed pyridine are summarized in
Table 2.1. The total concentration of acid sites (Brønsted and Lewis) determined by
adsorption of pyridine agreed well with the calculated values from Si/Al ratios (within ±10%).
The Brønsted acid site concentration of H-BEA sample was lower than the others used here,
Chapter 2: Methanol usage
37
but the lower acid site concentration of H-BEA did not significantly affect the fraction of
methanol usage calculated (section 3.3; see also Table 2.S2-2.S3).
Table 2.1: The channel size and dimensions, chemical compositions, textural properties and acid site
concentrations of all zeolite samples tested.
Catalyst H-ZSM5 H-ZSM11-SCa H-MOR H-BETA H-ZSM5-SM
b H-ZSM11-LC
c
Channel size
(10-1
nm)
{5.1 x 5.5
5.3 x 5.6}*** 5.3 x 5.4***
{6.5 x 7
2.6x 5.7}***
6.6 x 6.7**
5.6 x 5.6*
{5.1 x 5.5
5.3 x 5.6}*** 5.3 x 5.4***
Si/Al ratiod 36 (36) 34 (33) 43 (40) 79 (82) 42 (39) 33 (30)
SBETe (m
2 g
-1) 435 445 584 718 434 427
Sextf (m
2 g
-1) 55 110 81 189 74 2
Vmig (cm
3 g
-1) 0.16 0.13 0.18 0.20 0.13 0.16
Brønsted acid
(µmol g-1
) 380 387 307 175 336 424
Lewis acid
(µmol g-1
) 67 100 98 24 73 112
aSC = small crystal.
bSM = surface modified sample with TEOS.
cLC = large crystal.
dSi/Al ratio calculated from
the acid concentration from the pyridine adsorption is shown in parenthesis. eSBET = BET surface area.
fSext, and
gVmi are external surface area and micropore volume, respectively, calculated from t-plot method (Halsey).
The XRD of synthesized H-ZSM11 (small and large crystals) indicated that both materials
are free of crystalline impurities (Figures 2.S1 and 2.S2). Narrower XRD peaks of large
crystal sample suggest that the primary crystal size is significantly larger than that of small
crystal H-ZSM11. The SEM images of all samples are shown in the supporting material
(Figures 2.S3-2.S8). The particle for all samples was around 0.5 µm or less, except for the
large crystal H-ZSM11 sample (~6 µm).
2.3.2. Methylation of toluene in medium and large pore zeolites
The reactant (C1 and toluene) conversions, selectivity of xylenes in aromatics, toluene
methylation and light hydrocarbon formation rates on both medium and large pore zeolites are
shown in Table 2.2. Here, the C1 refers to methanol and dimethyl ether (DME) and we treat
them as one reactant (accounting for the fact that DME has twice as many carbon atoms as
MeOH), because methanol can reversibly dehydrate to DME under typical reaction conditions
and DME can be used to methylate unsaturated aromatic/alkene molecules via similar
mechanisms [28,29]. The reaction order of toluene methylation was between zero and first

Chapter 2: Methanol usage
38
with respect to methanol and first with respect to toluene under the reaction conditions used
(see Figure 2.S9-2.S10). Small crystal H-ZSM11 was used for all catalytic tests, unless
indicated otherwise and the catalyst amount was adjusted to keep the C1 conversion (the
limiting reactant) at a comparable range. The rate of toluene methylation was similar for all
zeolites, but the xylene selectivity was somewhat higher and the light hydrocarbon formation
rates significantly higher for the medium compared to the large pore zeolites.
Table 2.2: C1 and toluene conversion, xylene selectivity, toluene methylation and light hydrocarbon formation
ratesa with medium
b and large
c pore zeolites in toluene methylation
Catalyst H-ZSM5 H-ZSM11 H-MOR H-BETA
C1 conversiond (%) 55 64 55 53
Toluene conversion (%) 6.4 7.9 9.4 8.7
Xylenes in aromatics (%) 88 86 77 74
Toluene methylation ratese
[10-2
mol (mol H s)-1
] 16 17 15 15
Light hydrocarbon formation rates
[10-2
mol C (mol H s)-1
] 10 10 2.0 0.3
aReaction rates are measured at ptoluene = 6 kPa, pmethanol = 1.5 kPa, 673 K, 6-20 mg catalyst and 2.3cm
3s
-1 total
flow rate. bH-ZSM5 and H-ZSM11.
cH-MOR and H-BEA.
dC1 is methanol and DME (both are treated as the
same reactant because methanol can be transformed into DME during the reaction and DME can also be used for
methylation). eCalculated based on the toluene consumption.
2.3.3. Methanol usage in methylation of toluene
To better define methanol usage during the methylation of toluene, three different
fractional use of reactant (based on C1 usage) were calculated, i.e., MeOH for toluene
alkylation, MeOH for aromatics alkylation, MeOH for LH formation, and the definitions are
shown below:
Fraction of MeOH for toluene alkylation = ������� !��������"#$�%&'��(���
)�*+,��� !�()�*+,���-%×/)0)"#$ (2.2)
Fraction of MeOH for aromatics alkylation = �&12����3-%&�45)'-6&��*4,)'-…
)�*+,��� !�()�*+,���-%�89)"#$ (2.3)
Fraction of MeOH for LH formation = %&:-6&:;-<&:=-…
)�*+,��� !�()�*+,���-%�89)"#$ (2.4)
The subscripts “in” and “out” indicate the rate of reactant (toluene or methanol/DME) going
in and out of the reactor, respectively. Each term in the numerator of equations 3-4, as well as
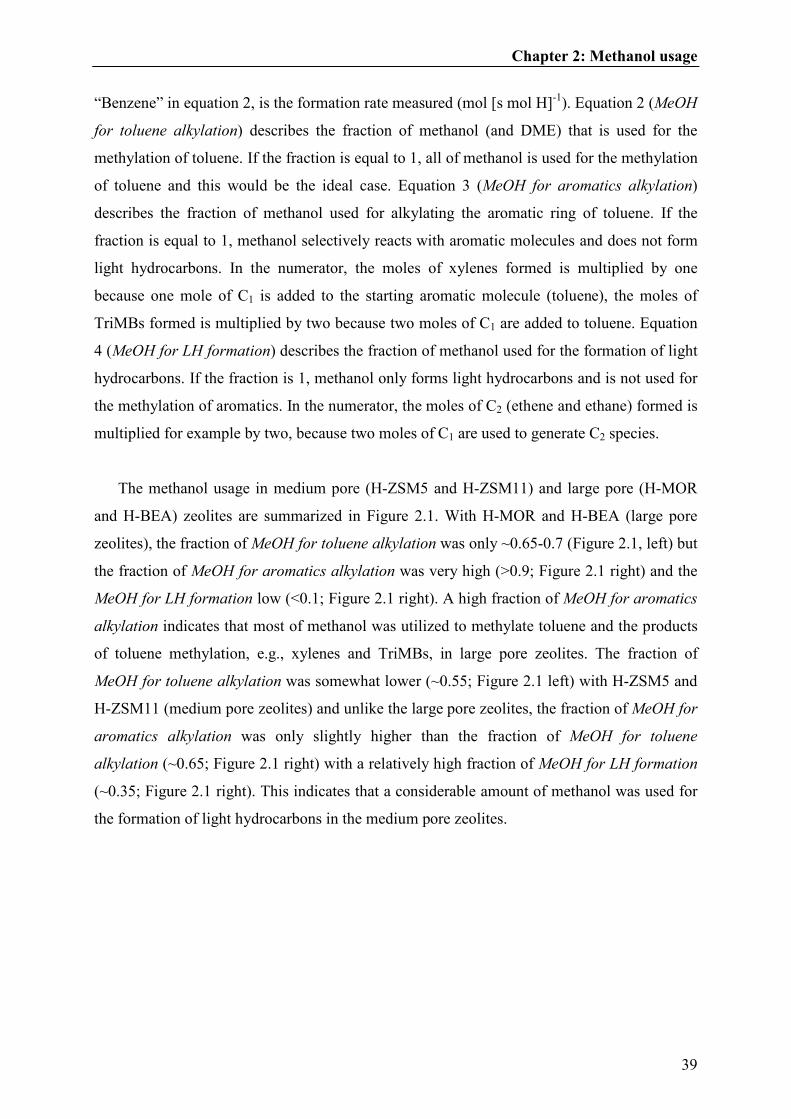
Chapter 2: Methanol usage
39
“Benzene” in equation 2, is the formation rate measured (mol [s mol H]-1
). Equation 2 (MeOH
for toluene alkylation) describes the fraction of methanol (and DME) that is used for the
methylation of toluene. If the fraction is equal to 1, all of methanol is used for the methylation
of toluene and this would be the ideal case. Equation 3 (MeOH for aromatics alkylation)
describes the fraction of methanol used for alkylating the aromatic ring of toluene. If the
fraction is equal to 1, methanol selectively reacts with aromatic molecules and does not form
light hydrocarbons. In the numerator, the moles of xylenes formed is multiplied by one
because one mole of C1 is added to the starting aromatic molecule (toluene), the moles of
TriMBs formed is multiplied by two because two moles of C1 are added to toluene. Equation
4 (MeOH for LH formation) describes the fraction of methanol used for the formation of light
hydrocarbons. If the fraction is 1, methanol only forms light hydrocarbons and is not used for
the methylation of aromatics. In the numerator, the moles of C2 (ethene and ethane) formed is
multiplied for example by two, because two moles of C1 are used to generate C2 species.
The methanol usage in medium pore (H-ZSM5 and H-ZSM11) and large pore (H-MOR
and H-BEA) zeolites are summarized in Figure 2.1. With H-MOR and H-BEA (large pore
zeolites), the fraction of MeOH for toluene alkylation was only ~0.65-0.7 (Figure 2.1, left) but
the fraction of MeOH for aromatics alkylation was very high (>0.9; Figure 2.1 right) and the
MeOH for LH formation low (<0.1; Figure 2.1 right). A high fraction of MeOH for aromatics
alkylation indicates that most of methanol was utilized to methylate toluene and the products
of toluene methylation, e.g., xylenes and TriMBs, in large pore zeolites. The fraction of
MeOH for toluene alkylation was somewhat lower (~0.55; Figure 2.1 left) with H-ZSM5 and
H-ZSM11 (medium pore zeolites) and unlike the large pore zeolites, the fraction of MeOH for
aromatics alkylation was only slightly higher than the fraction of MeOH for toluene
alkylation (~0.65; Figure 2.1 right) with a relatively high fraction of MeOH for LH formation
(~0.35; Figure 2.1 right). This indicates that a considerable amount of methanol was used for
the formation of light hydrocarbons in the medium pore zeolites.

Chapter 2: Methanol usage
40
Figure 2.1: Fraction of MeOH used for the methylation of toluene (MeOH for toluene alkylation; left, filled),
methylation of aromatics (MeOH for aromatics alkylation; right, empty) and formation of light hydrocarbons
(MeOH for LH formation; right, striped) calculated for both medium (H-ZSM5 and H-ZSM11) and large pore
zeolites (H-MOR and H-BEA) at ptoluene = 6 kPa, pmethanol = 1.5 kPa, 673 K, 6-20 mg catalyst, 2.3 cm3s
-1 total
flow rate, and C1 conversion = 53-64 %.
2.3.4. Reaction of toluene, p-xylene and 1,2,4-trimethylbezene with
methanol
The rate of methylation (measured at the same partial pressures and similar C1 conversion
levels) of toluene, p-xylene and 1,2,4-TriMB with large pore zeolites increased as the number
of methyl substitutions in the aromatic ring increased. This trend was especially pronounced
with H-BEA (Figure 2.2). An opposite trend was observed with medium pore zeolites (H-
ZSM5 and H-ZSM11). The rates of light hydrocarbon formation, as well as the methanol
usage towards light hydrocarbons (Fraction of MeOH for LH formation) in large pore zeolites
increased systematically with number of methyl substitutions (Figure 2.3 and Figure 2.4). The
same trends were observed with medium pore zeolites except that the light hydrocarbon
formation rate decreased, when the number of methyl groups increased from p-xylene to
1,2,4-TriMB (Figure 2.3).
0,0
0,2
0,4
0,6
0,8
1,0
H-ZSM5 H-ZSM11 H-MOR H-BEA
Fra
cti
on
of
MeO
Hu
sag
e1.0
0.8
0.6
0.4
0.2
0 0,0
0,2
0,4
0,6
0,8
1,0
H-ZSM5 H-ZSM11 H-MOR H-BEA
Fra
cti
on
of
Me
OH
usa
ge
1.0
0.8
0.6
0.4
0.2
0
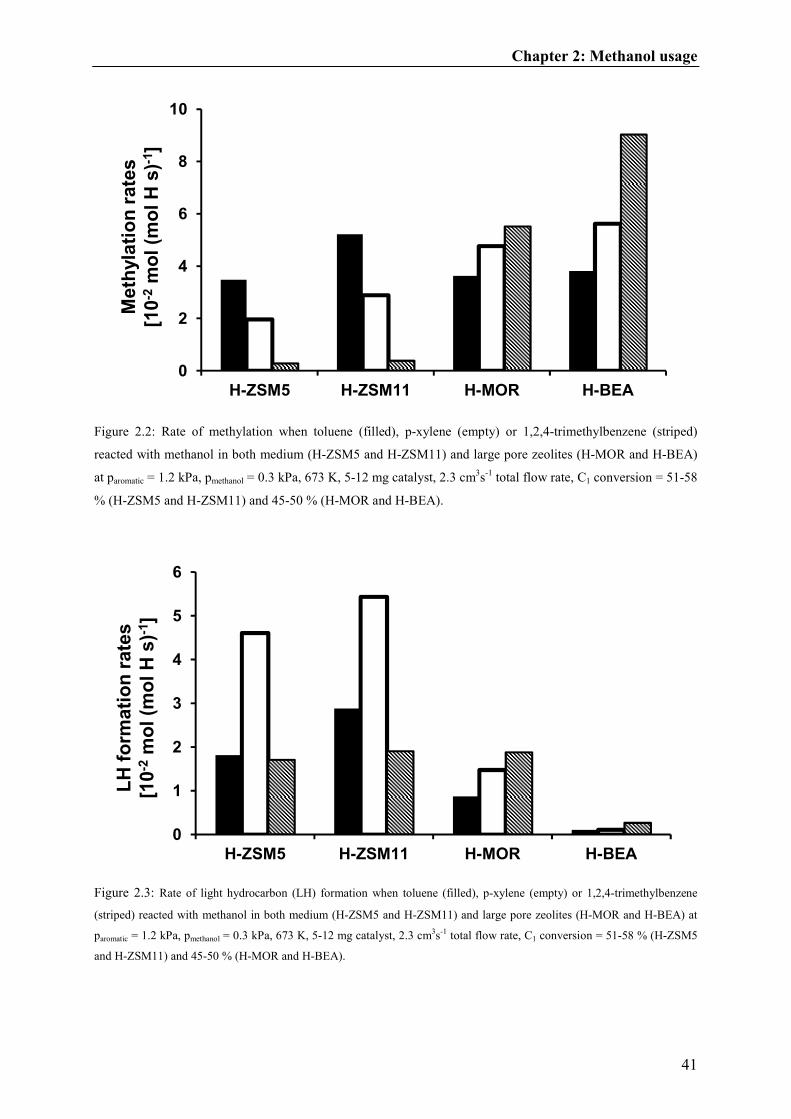
Chapter 2: Methanol usage
41
Figure 2.2: Rate of methylation when toluene (filled), p-xylene (empty) or 1,2,4-trimethylbenzene (striped)
reacted with methanol in both medium (H-ZSM5 and H-ZSM11) and large pore zeolites (H-MOR and H-BEA)
at paromatic = 1.2 kPa, pmethanol = 0.3 kPa, 673 K, 5-12 mg catalyst, 2.3 cm3s
-1 total flow rate, C1 conversion = 51-58
% (H-ZSM5 and H-ZSM11) and 45-50 % (H-MOR and H-BEA).
Figure 2.3: Rate of light hydrocarbon (LH) formation when toluene (filled), p-xylene (empty) or 1,2,4-trimethylbenzene
(striped) reacted with methanol in both medium (H-ZSM5 and H-ZSM11) and large pore zeolites (H-MOR and H-BEA) at
paromatic = 1.2 kPa, pmethanol = 0.3 kPa, 673 K, 5-12 mg catalyst, 2.3 cm3s-1 total flow rate, C1 conversion = 51-58 % (H-ZSM5
and H-ZSM11) and 45-50 % (H-MOR and H-BEA).
Meth
yla
tio
n r
ate
s
[10
-2m
ol(m
olH
s)-1
]
0
2
4
6
8
10
H-ZSM5 H-ZSM11 H-MOR H-BEA
LH
fo
rmati
on
rate
s
[10
-2m
ol(m
olH
s)-1
]
0
1
2
3
4
5
6
H-ZSM5 H-ZSM11 H-MOR H-BEA

Chapter 2: Methanol usage
42
Figure 2.4: Fraction of methanol used for the formation of light hydrocarbons (MeOH for LH formation) when
toluene (filled), p-xylene (empty) or 1,2,4-trimethylbenzene (striped) reacted with methanol in both medium (H-
ZSM5 and H-ZSM11) and large pore zeolites (H-MOR and H-BEA) at paromatic = 1.2 kPa, pmethanol = 0.3 kPa, 673
K, 5-12 mg catalyst, 2.3 cm3s
-1 total flow rate, C1 conversion = 51-58 % (H-ZSM5 and H-ZSM11) and 45-50 %
(H-MOR and H-BEA).
2.3.5. Effect of residence time on methanol usage in toluene
methylation
Two additional medium pore zeolites were used in order to investigate the relationship
between the residence time of bulky methylated aromatics and the methanol usage in toluene
methylation. One was prepared by coating the outer surface of H-ZSM5 with tetraethyl
orthosilicate. This method partially blocked access to the pore system and increased the
overall tortuosity [11, 30 , 31 ], thereby, increasing the effective residence time of bulky
aromatics molecules, such as o- and m-xylenes [31]. The second sample was a large crystal
H-ZSM11 zeolite (SEM image is shown in Figure 2.S7), for which the longer channel length
should increase the effective residence time of molecules inside the micropores. For both
modified samples, higher fraction of methanol was converted into light hydrocarbons and less
was utilized for the methylation of aromatic molecules (Figure 2.5).
MeO
Hfo
r L
H f
orm
ati
on
0,0
0,2
0,4
0,6
0,8
1,0
H-ZSM5 H-ZSM11 H-MOR H-BEA
1.0
0.8
0.6
0.4
0.2
0
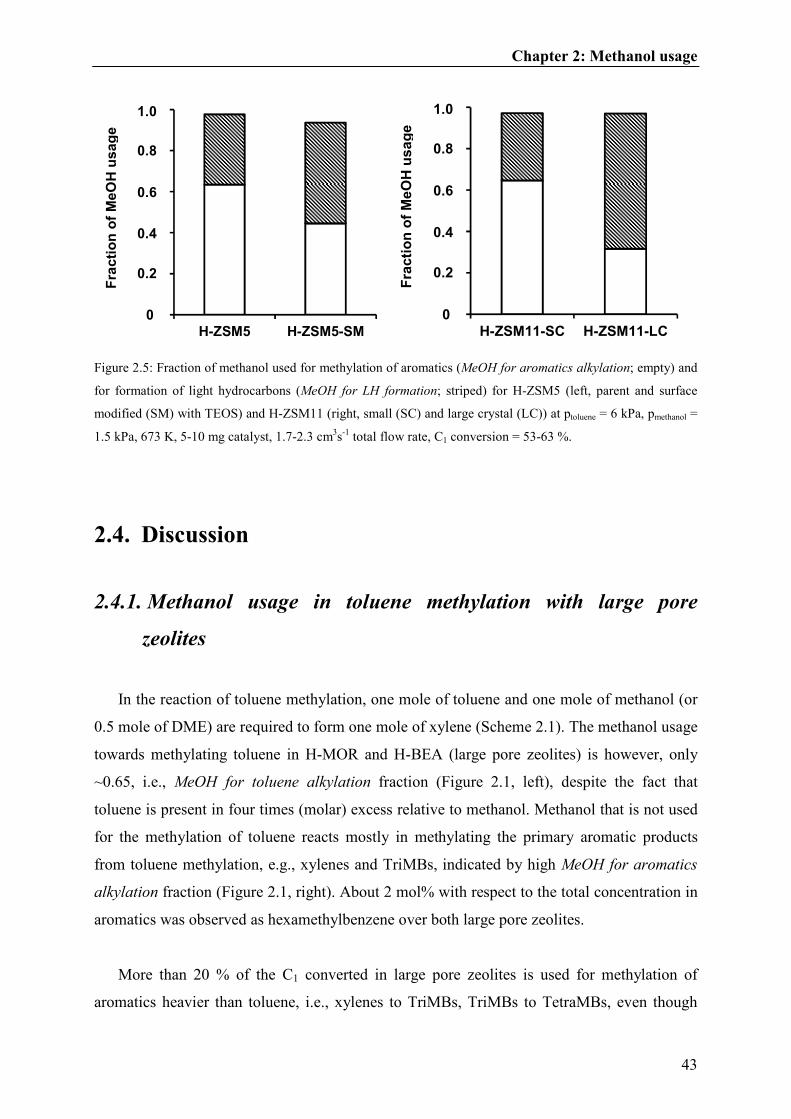
Chapter 2: Methanol usage
43
Figure 2.5: Fraction of methanol used for methylation of aromatics (MeOH for aromatics alkylation; empty) and
for formation of light hydrocarbons (MeOH for LH formation; striped) for H-ZSM5 (left, parent and surface
modified (SM) with TEOS) and H-ZSM11 (right, small (SC) and large crystal (LC)) at ptoluene = 6 kPa, pmethanol =
1.5 kPa, 673 K, 5-10 mg catalyst, 1.7-2.3 cm3s
-1 total flow rate, C1 conversion = 53-63 %.
2.4. Discussion
2.4.1. Methanol usage in toluene methylation with large pore
zeolites
In the reaction of toluene methylation, one mole of toluene and one mole of methanol (or
0.5 mole of DME) are required to form one mole of xylene (Scheme 2.1). The methanol usage
towards methylating toluene in H-MOR and H-BEA (large pore zeolites) is however, only
~0.65, i.e., MeOH for toluene alkylation fraction (Figure 2.1, left), despite the fact that
toluene is present in four times (molar) excess relative to methanol. Methanol that is not used
for the methylation of toluene reacts mostly in methylating the primary aromatic products
from toluene methylation, e.g., xylenes and TriMBs, indicated by high MeOH for aromatics
alkylation fraction (Figure 2.1, right). About 2 mol% with respect to the total concentration in
aromatics was observed as hexamethylbenzene over both large pore zeolites.
More than 20 % of the C1 converted in large pore zeolites is used for methylation of
aromatics heavier than toluene, i.e., xylenes to TriMBs, TriMBs to TetraMBs, even though
0,0
0,2
0,4
0,6
0,8
1,0
H-ZSM5 H-ZSM5-SM
Fra
cti
on
of
MeO
Hu
sag
e1.0
0.8
0.6
0.4
0.2
0 0,0
0,2
0,4
0,6
0,8
1,0
H-ZSM11-SC H-ZSM11-LC
Fra
cti
on
of
Me
OH
us
ag
e
1.0
0.8
0.6
0.4
0.2
0
Chapter 2: Methanol usage
44
the toluene concentration is >90 % of the aromatics in the gas phase. One of the reasons for
the secondary methylation is related to the fact that the activation energy for methylation
decreases with increasing methyl substitution of the aromatic ring, in the absence of steric
hindrances [32,33]. The methyl groups are electron donating and increasing the number of
methyl groups increases in the base strength of aromatic molecules. The rate of methylation
indeed increases as the number of methyl substitution increases from toluene to p-xylene to
1,2,4-TriMB (Figure 2.2) and this most likely contributes to further methylation of methylated
products from toluene, as well as lower xylene selectivity within aromatics (relative to
medium pore zeolites; Table 2.2).
2.4.2. Methanol usage in toluene methylation with medium pore
zeolites
The methanol usage towards toluene methylation is less efficient (~0.55; MeOH for
toluene alkylation fraction in Figure 2.1, left) with H-ZSM5 and H-ZSM11 (medium pore
zeolites) compared to the large pore zeolites, and a substantial fraction of methanol is
converted into the light hydrocarbons (Figure 2.1 right). This is unexpected at first, especially
because toluene is fed in a four times (molar) excess compared to methanol. Thus the
formation of light hydrocarbons from methanol [34,35] is expected to play a minor role
relative to the toluene methylation. Only a slight increase in MeOH for aromatics alkylation
from MeOH for toluene alkylation fractions are observed (~0.65 from 0.55, see Figure 2.1),
indicating that the bulky xylenes and TriMB is not methylated further or able to exit the
micropores very slowly due to the relatively large size of these molecules. Note that only a
very small amount of TetraMB (<2 mol %) and no penta- or hexamethylbenzenes were
detected in the gas phase.
The kinetic results for H-ZSM5 and H-ZSM11 (Figure 2.2) show that the methylation
rates of aromatics decrease, as the number of methyl substitutions increases, which is in
contrast to the theoretical simulations reported in ref. [16]. The calculations using a 46 T-atom
ZSM5 cluster, which accounts for the steric hindrances, indicates that the reaction rate
constants for methylation increases from toluene to p-xylene and 1,2,4-TriMB by an order of
magnitude at 673 K (the activation energy of methylation also decreased) [16]. Furthermore,
the intersection diameter of H-ZSM5 (~0.9 nm) is larger than the kinetic diameter of the

Chapter 2: Methanol usage
45
bulkiest TetraMB (0.86nm for 1,2,3,5-TetraMB [36]). Thus, the methylation rate of aromatics
in the medium pore zeolites probably does not decrease due to steric hindrances, at least for
the methylation reaction occurring on Brønsted acid sites located at the intersections with the
aromatic molecules tested here (1,2,4-TriMB methylates to TetraMB). The highly methylated
aromatic molecules most likely methylate further, but leaves the zeolite pores as less-
methylated aromatics, e.g., as xylenes and TriMBs, by splitting off light hydrocarbons (vide
infra).
The fraction of methanol used for the formation of light hydrocarbons increases as the
number of methyl groups increases in the aromatic ring (Figure 2.4). It is unlikely that the
majority of the light hydrocarbons is generated from the direct coupling of methanol and/or
DME because of high activation barriers [37,38] or from alkene methylation-cracking cycle
[39,40], because the aromatics concentration is much higher compared to that of alkenes
under the reaction conditions used (>50:1 in the gas phase). Therefore, we expect that most of
the light hydrocarbons are formed by the methylation of aromatics followed by ring
contraction-expansion (paring mechanism) or by side chain methylation with subsequent
cracking [19,20].
It is difficult to unequivocally conclude, however, that all of the light hydrocarbons are
generated via this route because alkene methylation has slightly lower energy of activation
relative to the aromatic methylation [29,41]. Moreover, 1,2,4-TriMB diffuse slower than p-
xylene to active sites in the micropores [31] and consequently, the local concentration ratio of
alkenes to aromatics inside the micropores with 1,2,4-TriMB as an aromatic feed relative to p-
xylene or toluene, may be higher during the reaction. Thus, the alkene methylation-cracking
cycle could play a more significant role for the formation of light hydrocarbons and increase
the MeOH for LH formation fraction (Figure 2.4), when 1,2,4-TriMB reacts with methanol
compared to the reaction with p-xylene. The diffusivities of toluene and p-xylene, however,
are similar [42,43], but a significant increase in the fraction of MeOH for LH formation is
observed from toluene to p-xylene, as the reactant in the feed (Figure 2.4). The steady
increase in methanol usage towards formation of light hydrocarbons with increasing methyl
substitution and the similar diffusivities of toluene and p-xylene, therefore, indicate that most
light hydrocarbons are generated from the highly methylated aromatics.

Chapter 2: Methanol usage
46
Figure 2.3 shows that the formation rate of light hydrocarbons increases significantly,
when p-xylene (instead of toluene) is co-fed with methanol, suggesting that the overall
generation of the light hydrocarbons is limited by the rate of sequential methylation of
aromatics. The computational results also show that the light hydrocarbon dealkylation step is
at least by an order of magnitude faster than the methylation step in MFI (H-ZSM5)
framework [16]. When 1,2,4-TriMB is used as an aromatic in the feed instead of p-xylene, the
light hydrocarbon formation rate decreases (Figure 2.3) most likely because the rate
coefficient of 1,2,4-TriMB methylation decreases slightly relative to p-xylene methylation
[16]. The intra-particle diffusion of bulkier TriMB to the active sites is also much slower than
for p-xylene and less aromatic molecules are, thus, available for methylation and subsequent
dealkylation of light hydrocarbons [31]. Methanol, nevertheless, is used more effectively for
the light hydrocarbon formation, when reacting with 1,2,4-TriMB (higher methylated
aromatics) compared to the less-methylated molecules such as p-xylene and toluene (Figure
2.4), because TriMB is closer to the point at which dealkylation is favored over methylation.
The methylation of the xylenes to TriMBs and TetraMBs continues in the zeolite pores,
but it cannot be stated at which point the dealkylation to light hydrocarbons becomes more
favorable, i.e., how many times toluene methylates, before the rate of dealkylation becomes
faster than that of methylation. We speculate that 1,2,3,5-TetraMB can be formed in medium
pore zeolites and methylated further at the geminal carbon position to 1,1,2,4,6-
pentamethylbenzene, because the corresponding pentamethyl-benzenium cation (Figure 2.6)
has been observed by NMR spectroscopy (formed most likely in the channel intersections)
when toluene reacts with methanol [ 44 ]. Note that it is possible for penta- and
hexamethylbenezene also to form inside the zeolite pores but these species were only
indirectly detected, i.e., by dissolving the used zeolite in HF [45].
Figure 2.6: 1,1,2,4,6-petamethylbenzenium cation.

Chapter 2: Methanol usage
47
The dealkylation reactions from highly methylated aromatic molecules increase the
selectivity of light hydrocarbon molecules (undesired byproducts) in toluene methylation. The
comparison of disproportionation and methylation rates for toluene, p-xylene or 1,2,4-TriMB
when co-fed with methanol, is shown in Table 2.3. The disproportionation rates are calculated
as the equations shown below:
Disproportionation rate of toluene = 2 x formation rate of benzene (2.5)
Disproportionation rate of p-xylene = 2 x formation rate of toluene (2.6)
Disproportionation rate of 1,2,4-TriMB = 2 x formation rate of all xylenes (2.7)
The contribution to the products from disproportionation (e.g., benzene from toluene),
increases, as the number of methyl groups in the aromatic ring increases (% reacted aromatic
consumed for disproportionation in Table 2.3). These products result either from the
disproportionation or demethylation or from a reaction involving the cleavage of a light
hydrocarbon from a highly methylated aromatic molecule.
Table 2.3: C1 conversion, methylation and disproportionation ratesa, percent of reacted aromatic molecule
consumed for disproportionation, and xylene isomer selectivity with H-ZSM5 and H-ZSM11.
Catalyst H-ZSM5 H-ZSM11
Aromatic molecule in feed Toluene p-xylene 1,2,4-TriMB Toluene p-xylene 1,2,4-
TriMB
C1 conversionb (%) 54 51 53 57 51 58
Methylation ratesc
[10-2
mol (mol H s)-1
] 35 22 3.7 52 33 4.9
Disproportionation ratesd
[10-2
mol (mol H s)-1
] 0 1.1 1.6 0 1.3 1.8
% reacted aromatic consumed
for disproportionation 0 4.8 31 0 3.7 26
% p-xylene within xylenes 59 93 54 55 92 47
% m-xylene within xylenes 23 6 36 27 7 41
% o-xylene within xylenes 18 1 10 18 1 12
aReaction measured at ptoluene = 1.2 kPa, pmethanol = 0.3 kPa, 673 K, 5-12 mg catalyst and 2.3 cm
3s
-1 total flow rate.
bC1 is methanol and DME.
cCalculated based on the consumption of aromatic reactant in the feed. The isomers
are treated also as a reactant. dCalculated as the equations 2.5-2.7.
Chapter 2: Methanol usage
48
Only a minor quantity of disproportionation products, i.e., benzene and toluene, relative to
methylation products are observed, when toluene or p-xylene reacts with methanol, but the
contribution of the disproportionation increases significantly for the reaction with 1,2,4-
TriMB, as indicated by a large decrease and a slight increase in the rates of methylation and
disproportionation, respectively, relative to the rates observed during toluene or p-xylene
conversions (Table 2.3). Note that the disproportionation should not be significant [46,47,48]
and de-methylation rates very slow compared to methylation rates [16,41] under the present
reaction conditions in medium pore zeolites.
This suggests that a considerable fraction of the “disproportionation” products is formed
from the dealkylation of light hydrocarbons from highly methylated aromatics. Some of these
less-methylated aromatic molecules are most likely generated as p/m-xylenes because ~90%
of xylenes from the reaction between methanol and 1,2,4-TriMB are observed as p/m-isomers
(Table 2.3). A drastic decrease in the methylation rate of 1,2,4-TriMB compared to toluene or
p-xylene in the feed may also indicate that TriMBs are formed as a major product in this
reaction pathway and decreases, consequently, the overall conversion of 1,2,4-TriMB. The
apparent rate of methylation, thus, decreases with increasing number of methyl groups on an
aromatic ring (from toluene to p-xylene to 1,2,4-TriMB; Table 2.3) because the aromatic
reactant, e.g., xylenes and especially TriMBs, are formed as a product after dealkylation of
light hydrocarbons from highly methylated aromatics. For example, the lower conversion of
1,2,4-TriMB and in consequence, lower methylation rates during the reaction of 1,2,4-TriMB
with methanol are observed compared to methylation with toluene, because the converted
1,2,4-TriMB in the feed forms the same reactant molecule again after aromatic methylation-
dealkylation cycle.
In addition, the primary products of higher methylated aromatic reactants (e.g., TetraMBs
from 1,2,4-TriMB) have higher probability to methylate further and dealkylate light
hydrocarbons, because their diffusion rate is slower than that of the primary products of lower
methylated aromatic reactants (e.g., xylenes from toluene). Note that only very small amounts
of TetraMB and no penta- or hexamethylbenzenes are able to exit through the zeolite pores.
Thus, the lower rate of methylation with an increase in number of methyl groups on the
aromatic ring is also observed, because the primary products of p-xylene methylation are
larger than the products of toluene methylation (likewise, the primary products of 1,2,4-
TriMB methylation than p-xylene methylation).
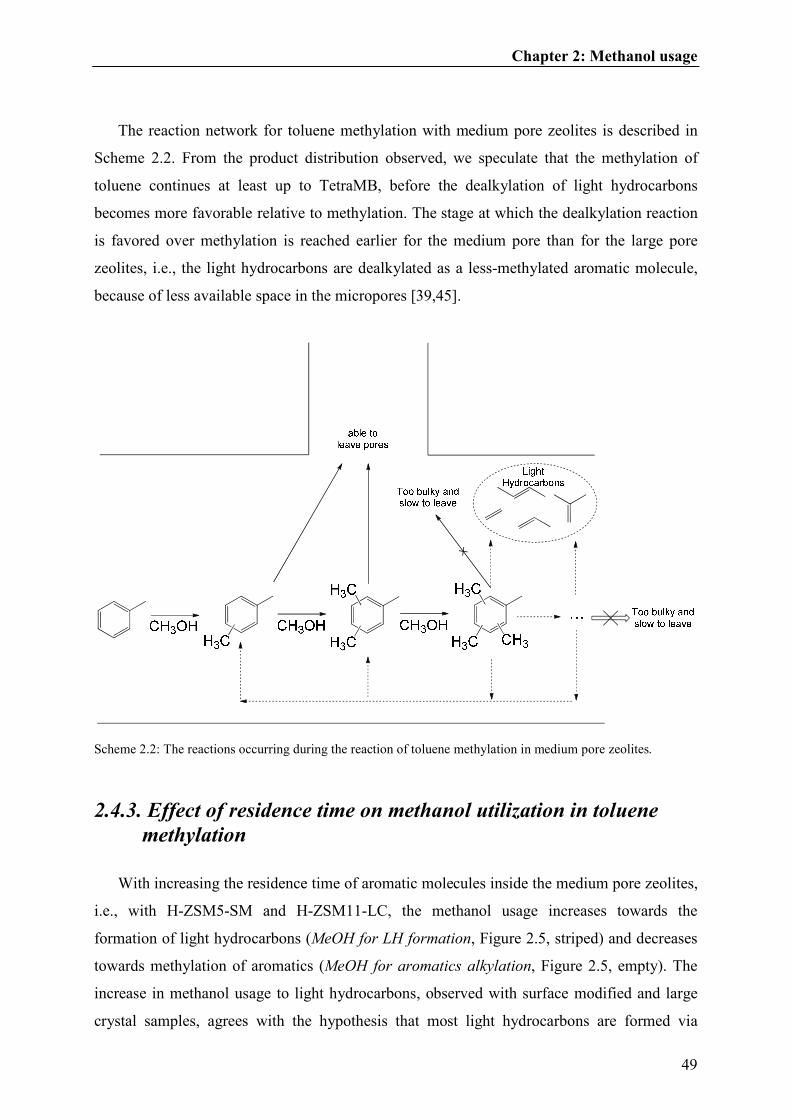
Chapter 2: Methanol usage
49
The reaction network for toluene methylation with medium pore zeolites is described in
Scheme 2.2. From the product distribution observed, we speculate that the methylation of
toluene continues at least up to TetraMB, before the dealkylation of light hydrocarbons
becomes more favorable relative to methylation. The stage at which the dealkylation reaction
is favored over methylation is reached earlier for the medium pore than for the large pore
zeolites, i.e., the light hydrocarbons are dealkylated as a less-methylated aromatic molecule,
because of less available space in the micropores [39,45].
Scheme 2.2: The reactions occurring during the reaction of toluene methylation in medium pore zeolites.
2.4.3. Effect of residence time on methanol utilization in toluene
methylation
With increasing the residence time of aromatic molecules inside the medium pore zeolites,
i.e., with H-ZSM5-SM and H-ZSM11-LC, the methanol usage increases towards the
formation of light hydrocarbons (MeOH for LH formation, Figure 2.5, striped) and decreases
towards methylation of aromatics (MeOH for aromatics alkylation, Figure 2.5, empty). The
increase in methanol usage to light hydrocarbons, observed with surface modified and large
crystal samples, agrees with the hypothesis that most light hydrocarbons are formed via
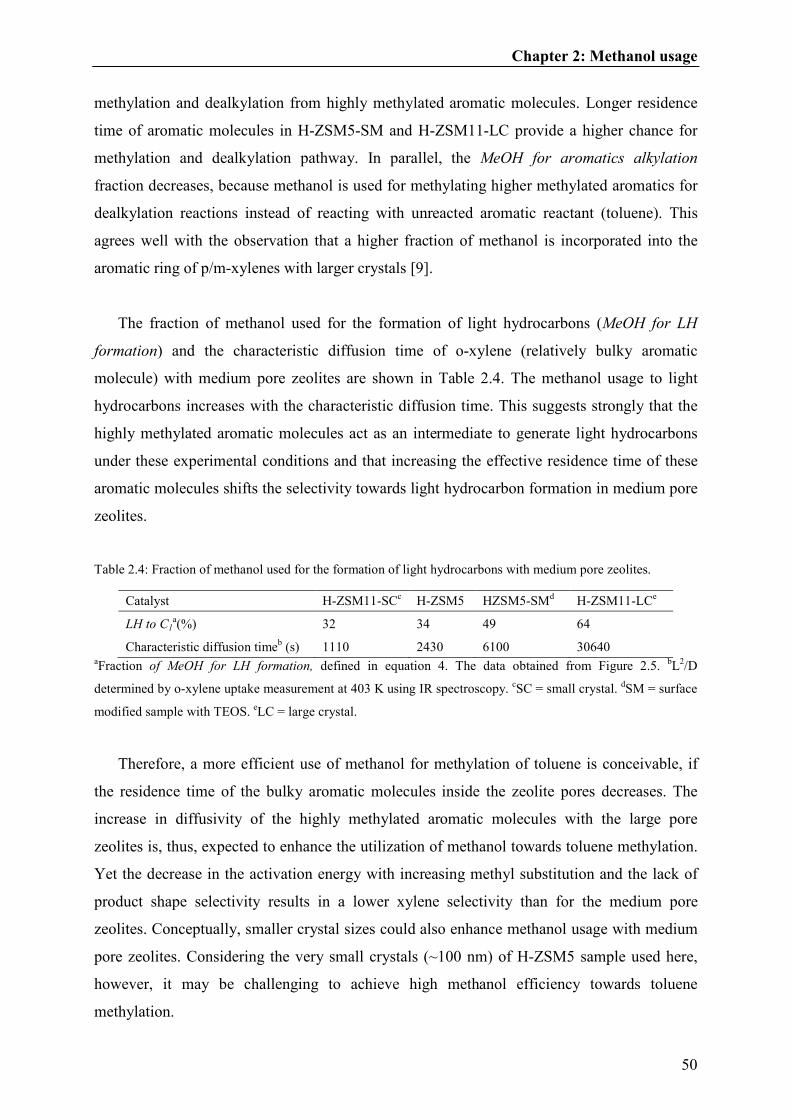
Chapter 2: Methanol usage
50
methylation and dealkylation from highly methylated aromatic molecules. Longer residence
time of aromatic molecules in H-ZSM5-SM and H-ZSM11-LC provide a higher chance for
methylation and dealkylation pathway. In parallel, the MeOH for aromatics alkylation
fraction decreases, because methanol is used for methylating higher methylated aromatics for
dealkylation reactions instead of reacting with unreacted aromatic reactant (toluene). This
agrees well with the observation that a higher fraction of methanol is incorporated into the
aromatic ring of p/m-xylenes with larger crystals [9].
The fraction of methanol used for the formation of light hydrocarbons (MeOH for LH
formation) and the characteristic diffusion time of o-xylene (relatively bulky aromatic
molecule) with medium pore zeolites are shown in Table 2.4. The methanol usage to light
hydrocarbons increases with the characteristic diffusion time. This suggests strongly that the
highly methylated aromatic molecules act as an intermediate to generate light hydrocarbons
under these experimental conditions and that increasing the effective residence time of these
aromatic molecules shifts the selectivity towards light hydrocarbon formation in medium pore
zeolites.
Table 2.4: Fraction of methanol used for the formation of light hydrocarbons with medium pore zeolites.
Catalyst H-ZSM11-SCc H-ZSM5 HZSM5-SM
d H-ZSM11-LC
e
LH to C1a(%) 32 34 49 64
Characteristic diffusion timeb (s) 1110 2430 6100 30640
aFraction of MeOH for LH formation, defined in equation 4. The data obtained from Figure 2.5.
bL
2/D
determined by o-xylene uptake measurement at 403 K using IR spectroscopy. cSC = small crystal.
dSM = surface
modified sample with TEOS. eLC = large crystal.
Therefore, a more efficient use of methanol for methylation of toluene is conceivable, if
the residence time of the bulky aromatic molecules inside the zeolite pores decreases. The
increase in diffusivity of the highly methylated aromatic molecules with the large pore
zeolites is, thus, expected to enhance the utilization of methanol towards toluene methylation.
Yet the decrease in the activation energy with increasing methyl substitution and the lack of
product shape selectivity results in a lower xylene selectivity than for the medium pore
zeolites. Conceptually, smaller crystal sizes could also enhance methanol usage with medium
pore zeolites. Considering the very small crystals (~100 nm) of H-ZSM5 sample used here,
however, it may be challenging to achieve high methanol efficiency towards toluene
methylation.

Chapter 2: Methanol usage
51
2.5. Conclusions
The present results show that significant fraction of C1 was utilized to form undesired
side-products, such as light hydrocarbons, tri- and tetramethylbenzenes, in toluene
methylation reaction. The analysis suggests that the products of toluene methylation, e.g.,
xylenes and trimethylbenzenes, are readily methylated further in the zeolite pores. These
highly methylated aromatic molecules eventually dealkylate light hydrocarbons. With
medium pore zeolites (H-ZSM5 and H-ZSM11), the rate of these dealkylation reactions
becomes kinetically competitive relative to methylation at an earlier stage, i.e., as less-
methylated aromatics compared to the large pore zeolites (H-MOR and H-BEA). This pores
size effect increases the xylene selectivity within aromatics and the methanol usage towards
undesired light hydrocarbons in medium pore zeolites. Likewise for large pore zeolites, the
lack of product shape selectivity decreases the selectivity of xylenes, but also the selectivity to
light hydrocarbons. Therefore, the inefficiency of methanol converted during toluene
methylation is caused by the further methylation of, e.g., xylenes and trimethylbenzenes
(aromatic products of toluene), and eventual dealkylation as light hydrocarbons from product
shape selectivity. Modest improvements are foreseen for catalytic materials with smaller
zeolite crystals.
2.6. Acknowledgments
The financial support from the King Fahd University of Petroleum and Minerals
(KFUPM) is acknowledged. Helpful technical discussions with André van Veen, Xianyong
Sun and Oliver Gutiérrez, as well as the N2 physisorption measurements by Xaver Hecht,
SEM images and AAS measurements by Martin Neukamm are also acknowledged.
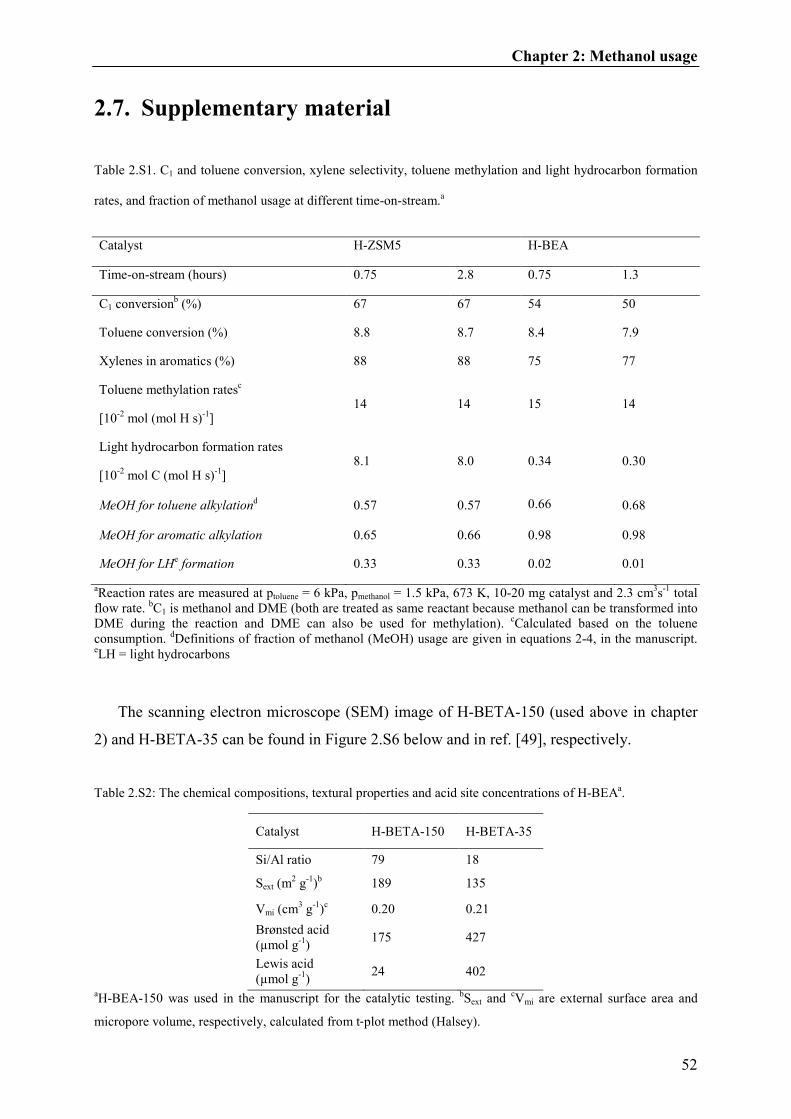
Chapter 2: Methanol usage
52
2.7. Supplementary material
Table 2.S1. C1 and toluene conversion, xylene selectivity, toluene methylation and light hydrocarbon formation
rates, and fraction of methanol usage at different time-on-stream.a
Catalyst H-ZSM5 H-BEA
Time-on-stream (hours) 0.75 2.8 0.75 1.3
C1 conversionb (%) 67 67 54 50
Toluene conversion (%) 8.8 8.7 8.4 7.9
Xylenes in aromatics (%) 88 88 75 77
Toluene methylation ratesc
[10-2
mol (mol H s)-1
] 14 14 15 14
Light hydrocarbon formation rates
[10-2
mol C (mol H s)-1
] 8.1 8.0 0.34 0.30
MeOH for toluene alkylationd 0.57 0.57 0.66 0.68
MeOH for aromatic alkylation 0.65 0.66 0.98 0.98
MeOH for LHe formation 0.33 0.33 0.02 0.01
aReaction rates are measured at ptoluene = 6 kPa, pmethanol = 1.5 kPa, 673 K, 10-20 mg catalyst and 2.3 cm
3s
-1 total
flow rate. bC1 is methanol and DME (both are treated as same reactant because methanol can be transformed into
DME during the reaction and DME can also be used for methylation). cCalculated based on the toluene
consumption. dDefinitions of fraction of methanol (MeOH) usage are given in equations 2-4, in the manuscript.
eLH = light hydrocarbons
The scanning electron microscope (SEM) image of H-BETA-150 (used above in chapter
2) and H-BETA-35 can be found in Figure 2.S6 below and in ref. [49], respectively.
Table 2.S2: The chemical compositions, textural properties and acid site concentrations of H-BEAa.
Catalyst H-BETA-150 H-BETA-35
Si/Al ratio 79 18
Sext (m2 g
-1)
b 189 135
Vmi (cm3 g
-1)
c 0.20 0.21
Brønsted acid
(µmol g-1
) 175 427
Lewis acid
(µmol g-1
) 24 402
aH-BEA-150 was used in the manuscript for the catalytic testing.
bSext and
cVmi are external surface area and
micropore volume, respectively, calculated from t‐plot method (Halsey).
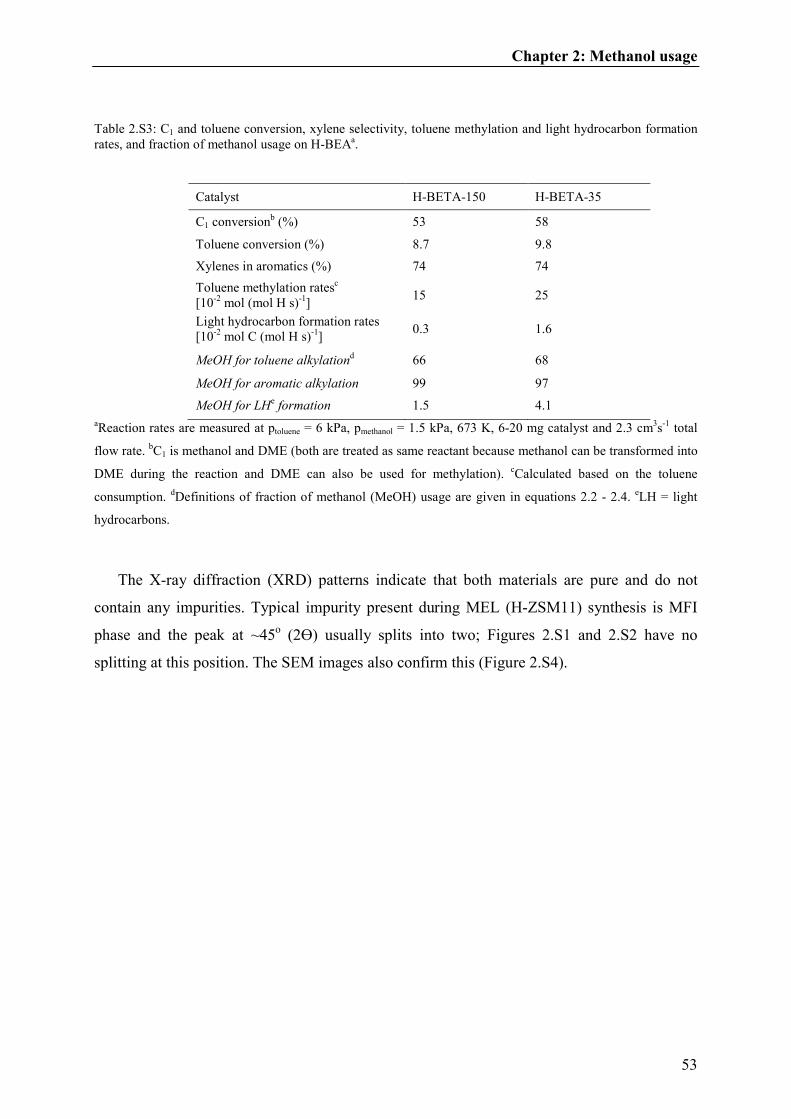
Chapter 2: Methanol usage
53
Table 2.S3: C1 and toluene conversion, xylene selectivity, toluene methylation and light hydrocarbon formation
rates, and fraction of methanol usage on H-BEAa.
Catalyst H-BETA-150 H-BETA-35
C1 conversionb (%) 53 58
Toluene conversion (%) 8.7 9.8
Xylenes in aromatics (%) 74 74
Toluene methylation ratesc
[10-2
mol (mol H s)-1
] 15 25
Light hydrocarbon formation rates
[10-2
mol C (mol H s)-1
] 0.3 1.6
MeOH for toluene alkylationd 66 68
MeOH for aromatic alkylation 99 97
MeOH for LHe formation 1.5 4.1
aReaction rates are measured at ptoluene = 6 kPa, pmethanol = 1.5 kPa, 673 K, 6-20 mg catalyst and 2.3 cm
3s
-1 total
flow rate. bC1 is methanol and DME (both are treated as same reactant because methanol can be transformed into
DME during the reaction and DME can also be used for methylation). cCalculated based on the toluene
consumption. dDefinitions of fraction of methanol (MeOH) usage are given in equations 2.2 - 2.4.
eLH = light
hydrocarbons.
The X-ray diffraction (XRD) patterns indicate that both materials are pure and do not
contain any impurities. Typical impurity present during MEL (H-ZSM11) synthesis is MFI
phase and the peak at ~45o (2Ɵ) usually splits into two; Figures 2.S1 and 2.S2 have no
splitting at this position. The SEM images also confirm this (Figure 2.S4).
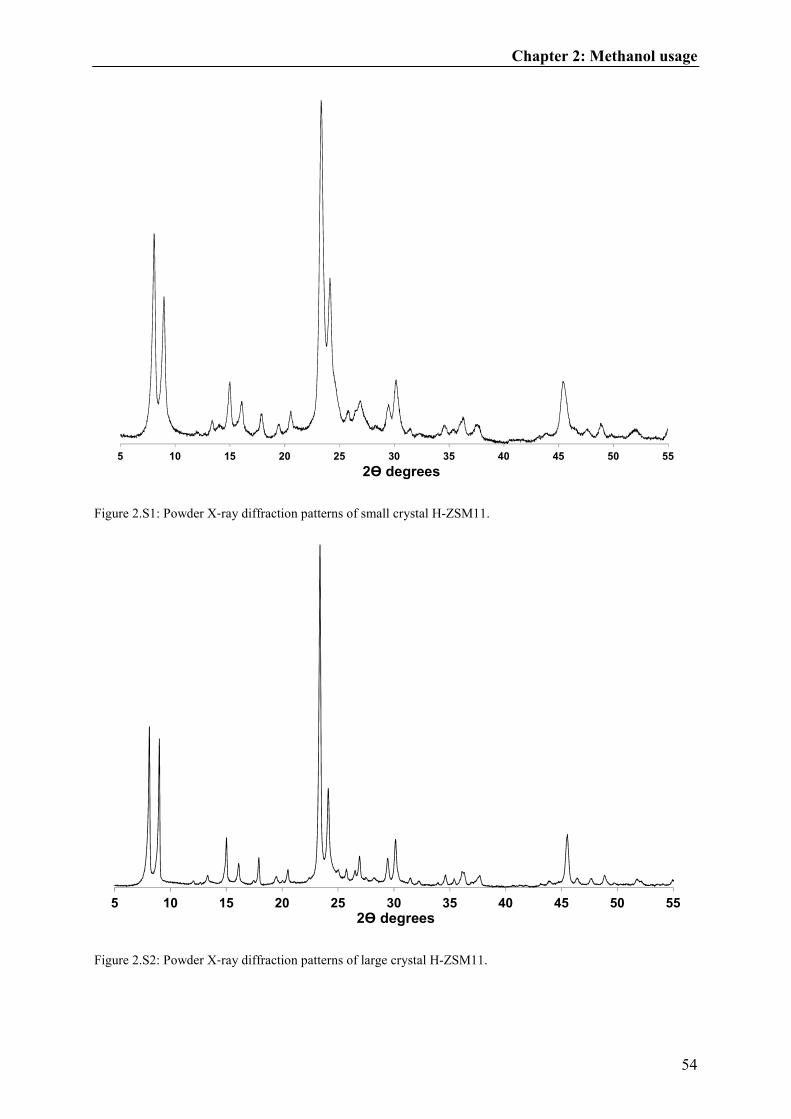
Chapter 2: Methanol usage
54
Figure 2.S1: Powder X‐ray diffraction patterns of small crystal H-ZSM11.
Figure 2.S2: Powder X‐ray diffraction patterns of large crystal H-ZSM11.
2Ɵ degrees5 10 15 20 25 30 35 40 45 50 55
2Ɵ degrees5 10 15 20 25 30 35 40 45 50 55
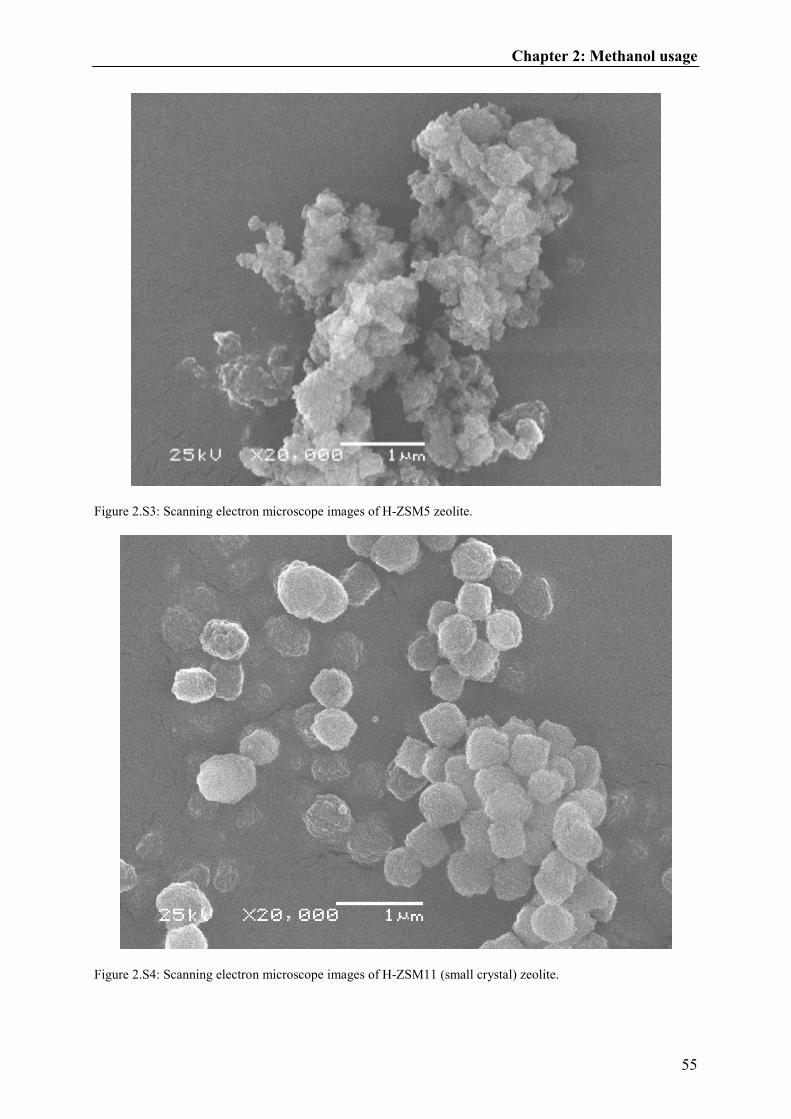
Chapter 2: Methanol usage
55
Figure 2.S3: Scanning electron microscope images of H-ZSM5 zeolite.
Figure 2.S4: Scanning electron microscope images of H-ZSM11 (small crystal) zeolite.
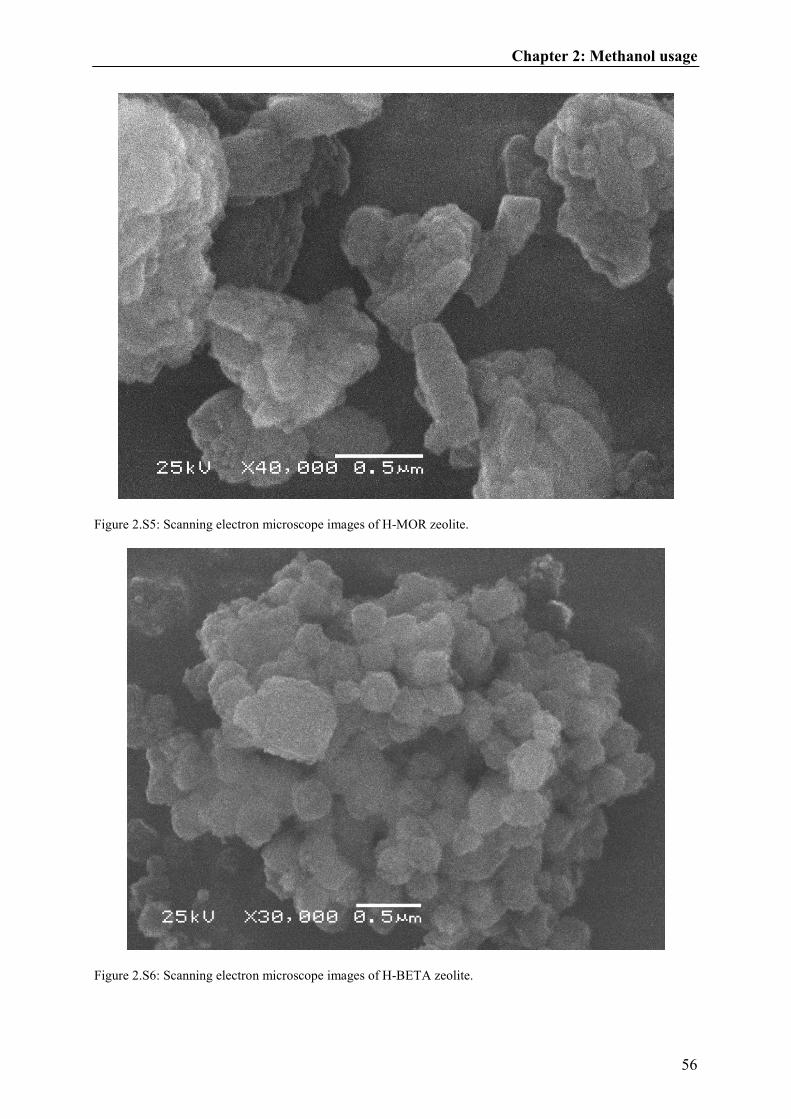
Chapter 2: Methanol usage
56
Figure 2.S5: Scanning electron microscope images of H-MOR zeolite.
Figure 2.S6: Scanning electron microscope images of H-BETA zeolite.
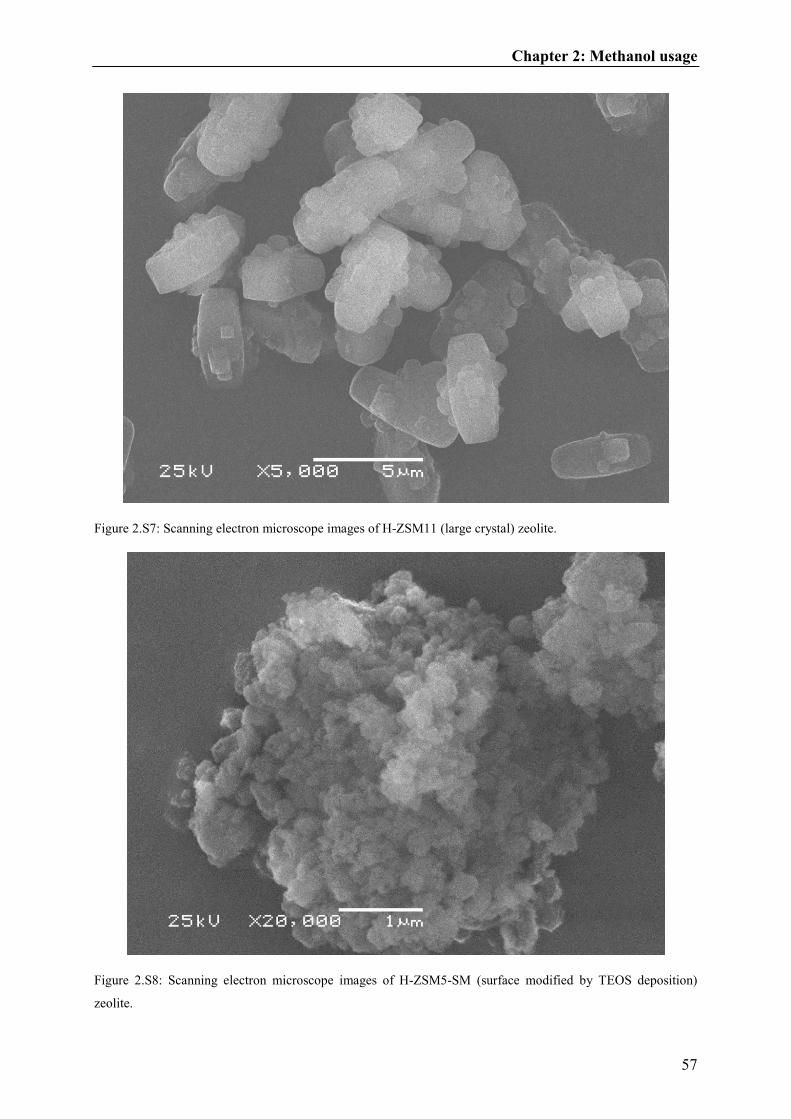
Chapter 2: Methanol usage
57
Figure 2.S7: Scanning electron microscope images of H-ZSM11 (large crystal) zeolite.
Figure 2.S8: Scanning electron microscope images of H-ZSM5-SM (surface modified by TEOS deposition)
zeolite.
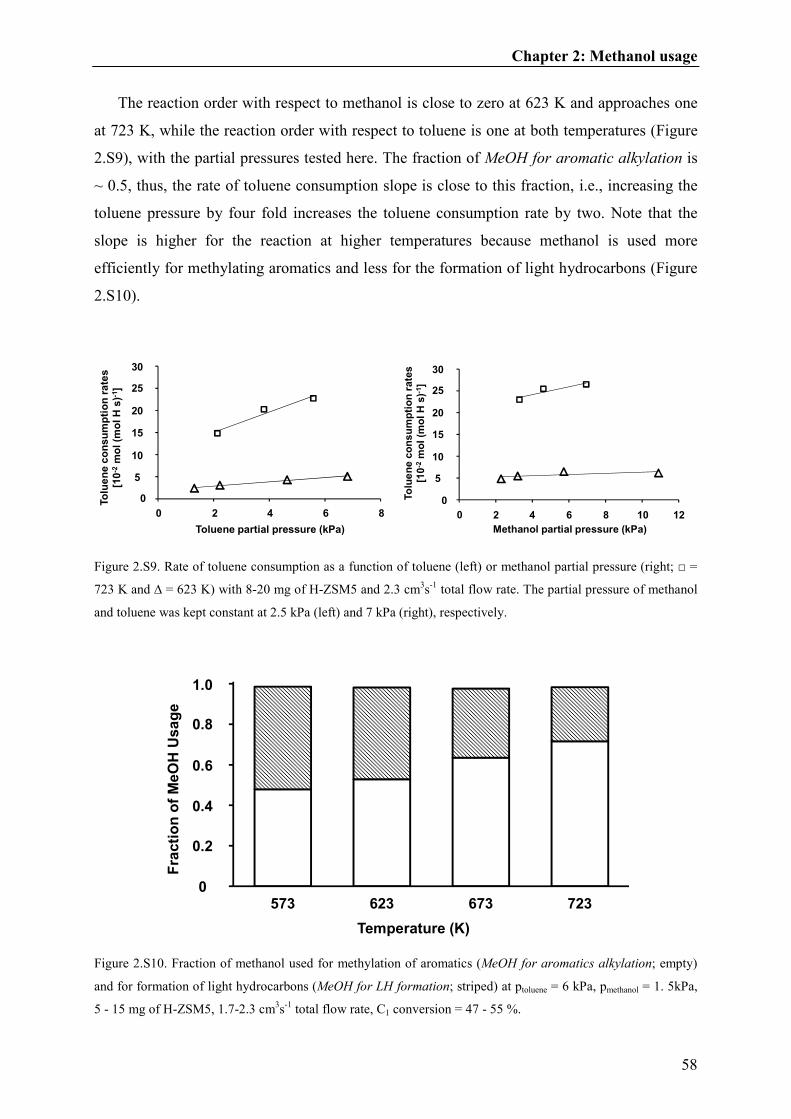
Chapter 2: Methanol usage
58
The reaction order with respect to methanol is close to zero at 623 K and approaches one
at 723 K, while the reaction order with respect to toluene is one at both temperatures (Figure
2.S9), with the partial pressures tested here. The fraction of MeOH for aromatic alkylation is
~ 0.5, thus, the rate of toluene consumption slope is close to this fraction, i.e., increasing the
toluene pressure by four fold increases the toluene consumption rate by two. Note that the
slope is higher for the reaction at higher temperatures because methanol is used more
efficiently for methylating aromatics and less for the formation of light hydrocarbons (Figure
2.S10).
Figure 2.S9. Rate of toluene consumption as a function of toluene (left) or methanol partial pressure (right; □ =
723 K and ∆ = 623 K) with 8-20 mg of H-ZSM5 and 2.3 cm3s
-1 total flow rate. The partial pressure of methanol
and toluene was kept constant at 2.5 kPa (left) and 7 kPa (right), respectively.
Figure 2.S10. Fraction of methanol used for methylation of aromatics (MeOH for aromatics alkylation; empty)
and for formation of light hydrocarbons (MeOH for LH formation; striped) at ptoluene = 6 kPa, pmethanol = 1. 5kPa,
5 - 15 mg of H-ZSM5, 1.7-2.3 cm3s
-1 total flow rate, C1 conversion = 47 - 55 %.
0,00
0,05
0,10
0,15
0,20
0,25
0,30
0,00 0,02 0,04 0,06 0,08
0
0 2 4 6 8
5
15
25
20
30
10
Toluene partial pressure (kPa)
To
lue
ne c
on
su
mp
tio
n r
ate
s
[10
-2m
ol(m
olH
s)-
1]
0,00
0,05
0,10
0,15
0,20
0,25
0,30
0,00 0,02 0,04 0,06 0,08 0,10 0,120
0 2 4 6 8 10 12
5
15
25
20
30
10
Methanol partial pressure (kPa)
To
lue
ne c
on
su
mp
tio
n r
ate
s
[10
-2m
ol(m
olH
s)-
1]
0,0
0,2
0,4
0,6
0,8
1,0
573 623 673 723
Fra
cti
on
of
Me
OH
Usa
ge
Temperature (K)
1.0
0.8
0.6
0.4
0.2
0
Chapter 2: Methanol usage
59
2.8. References
[1] T. Tsai, S. Liu, I. Wang, Applied Catalysis A: General 181 (1999) 355-398.
[2] W. Vermeiren, J.P. Gilson. Topics in Catalysis 52 (2009) 1131-1161.
[3] S. Kulprathipanja, Zeolites in Industrial Separation and Catalysis, Wiley-VCH,
Weinheim, 2010.
[4] Y. Zhao, H. Wu, W. Tan, M. Zhang, M. Liu, C. Song, X. Wang, X. Guo, Catalysis
Today 156 (2010) 69-73.
[5] Z. Zhu, Q. Chen, Z. Xie, W. Yang, C. Li, Micropor. Mesopor. Mater. 88 (2006) 16-21.
[6] R. Kumar, P. Ratnasamy, J. Catal 118 (1989) 68-78.
[7] G.N. Rao, R. Kumar, P. Ratnasamy, App. Catal. 49 (1989) 307-318.
[8] W.W. Kaeding, C. Chu, L.B. Young, B. Weinstein, S.A. Butter, J. Catal. 67 (1981)
159-174.
[9] O. Mikkelsen, P.O. Rønning, S. Kolboe, Micropor. Mesopor. Mater. 40 (2000) 95-
113.
[10] A.M. Prakash, S.V.V. Chilukuri, R.P. Bagwe, S. Ashtekar, D.K. Chakrabarty,
Micropor. Mater. 6 (1996) 89-97.
[11] T. Hibino, M. Niwa, Y. Murakami, J Catal. 128 (1991) 551-558.
[12] J.P. Breen, R. Burch, M. Kulkarni, D. McLaughlin, P.J. Collier, S.E. Golunski, Appl.
Catal. A: General 316 (2007) 53-60.
[13] G. Mirth, J.A. Lercher, J. Catal 147 (1994) 199-206.
[14] B. Smit, T.L.M. Maesen, Nature 451 (2008) 671-678.
[15] S. Svelle, F. Joensen, J. Nerlov, U. Olsbye, K. Lillerud, S. Kolboe, M. Bjørgen, J. Am.
Chem. Soc. 128 (2006) 14770-14771.
[16] D.M. McCann, D. Lesthaeghe, P.W. Kletnieks, D.R. Guenther, M.J. Hayman, V. Van
Speybroeck, M. Waroquier, J.F. Haw, Angew. Chem. Int. Ed. 47 (2008) 5179-5182.
[17] B. Arstad, S. Kolboe, J. Am Chem. Soc. 123 (2001) 8137-8138.
[18] M. Bjørgen, F. Joensen, K. Lillerud, U. Olsbye, S. Svelle, Catal. Today 142 (2009) 90-
97.
[19] U. Olsbye, M. Bjørgen, S. Svelle, K. Lillerud, S. Kolboe, Catal. Today 106 (2005)
108-111.
[20] D. Lesthaeghe, A. Horré, M. Waroquier, G.B. Marin, V. Van Speybroeck, Chem. Eur.
J. 15 (2009) 10803-10808.
Chapter 2: Methanol usage
60
[21] P. De Luca, F. Crea, R. Aiello, A. Fonseca, J.B. Nagy, Stud. Surf. Sci. Catal. 105
(1997) 325-332.
[22] M. Derewinski, M. Machowska, Stud. Surf. Sci. Catal. 154 (2004) 349-354.
[23] S. Zheng, H.R. Heydenrych, A. Jentys, J.A. Lercher J. Phys. Chem. B 106 (2002)
9552-9558.
[24] S. Brunauer, P. H. Emmett, E. Teller, J. Am. Chem. Soc. 1938, 60, 308-319.
[25] B.C. Lippens, B.G. Linsen, J.H. de Boer, J. Catal. 3 (1964) 32-37.
[26] G. Halsey, J. Chem. Phys. 16 (1948) 931-937.
[27] G. Mirth, J. Cejka, J.A. Lercher, J. Catal. 139 (1993) 24-33.
[28] I.I. Ivanova, A. Corma, J. Phys. Chem. B 101 (1997) 547-551.
[29] S. Svelle, S. Kolboe, O. Swang, U. Olsbye, J. Phys. Chem. B 109 (2005) 12874-
12878.
[30] H.P. Röger, M. Krämer, K.P. Möller, C.T. O’Connor, Micropor. Mesopor. Mater. 21
(1998) 607-614.
[31] S. Zheng, A. Jentys, J.A. Lercher, J. Catal. 241 (2006) 304-311.
[32] D. Lesthaeghe, B. De Sterck, V. Van Speybroeck, G.B. Marin, M. Waroquier, Angew.
Chem. Int. Ed. 46 (2007) 1311-1314.
[33] B. Arstad, S. Kolboe, O. Swang, J. Phys. Chem. B 106 (2002) 12722-12726.
[34] C.D. Chang, Catal . Rev. Sci. Eng. 25 (1983) 1-118.
[35] M. Stöcker, Micropor. Mesopor. Mater. 29 (1999) 3-48.
[36] H.P. Röger, K.P. Möller, C.T. O’Connor, Micro. Mater. 8 (1997) 151-157.
[37] W. Song, D.M. Marcus, H. Fu, J.O. Ehresmann, J.F. Haw J. Am. Chem. Soc. 124
(2002) 3844-3845.
[38] D. Lesthaeghe, V. Van Speybroeck, G.B. Marin, M. Waroquier, Ind. Eng. Chem. Res.
46 (2007) 8832-8838.
[39] M. Bjørgen, S. Svelle, F. Joensen, J. Nerlov, S. Kolboe, F. Bonino, L. Palumbo, S.
Bordiga, U. Olsbye, J. Catal. 249 (2007) 195-207.
[40] D.A. Simonetti, J.H. Ahn, E. Iglesia, J. Catal. 277 (2011) 173-195.
[41] D. Lesthaeghe, J. Van der Mynsbrugge, M. Vandichel, M. Waroquier, V. Van
Speybroeck, ChemCatChem 3 (2011) 208-212.
[42] R. Kolvenbach, J.H. Ahn, S.S. Al-Khattaf, A. Jentys, J.A. Lercher, in preparation.
[43] S.J. Reitmeier, O.C. Gobin, A. Jentys, J.A. Lercher, J. Phys. Chem. C 113 (2009),
15355-15363.
Chapter 2: Methanol usage
61
[44] T. Xu, D.H. Barich, P.W. Goguen, W. Song, Z. Wang, J.B. Nicholas, J.F. Haw, J. Am.
Chem. Soc. 120 (1998) 4025-4026.
[45] S. Svelle, U. Olsbye, F. Joensen, M. Bjørgen, J. Phys. Chem. C 111 (2007) 17981-
17984.
[46] W.W. Kaeding, C. Chu, L.B. Young, S.A. Butter, J. Catal. 69 (1981) 392-398.
[47] Fernandez, C.; Stan, I.; Gilson, J.; Thomas, K.; Vicente, A.; Bonilla, A.; Pérez-
Ramírez, J. Chem. Eur. J. 16 (2010) 6224-6233.
[48] Cheng, X.; Wang, X.; Long, H. Micropor. Mesopor. Mater. 119 (2009) 171-175.
[49] S.M. Maier, A. Jentys, J.A. Lercher, J. Phys. Chem. C 115 (2011) 8005-8013.

Chapter 2: Methanol usage
62

Chapter 3: Hierarchical Materials
63
Chapter 3
Characterization and catalytic impact of hierarchically structured H-ZSM5 for toluene
methylation
Hierarchical zeolites based on H-ZSM5 were designed, synthesized and characterized as
catalysts for highly active and shape selective methylation of toluene. Desilication, followed
by dealumination and chemical deposition of a mesoporous SiO2 overlayer were investigated
as rational pathways for modifying the mesoporosity, diffusion and acid site concentration of
the catalysts. Desilication and subsequent dealumination decreased the effective diffusion
length of zeolite crystals and increased the turnover rate of toluene, albeit with some loss in
p-xylene selectivity. Deposition of a mesoporous SiO2 overlayer decreased the toluene
turnover rate due to the longer residence time of large aromatic methylation products inside
the pores. This modification, however, significantly increased the p-xylene selectivity by
selectively enhancing the diffusivity of p-xylene, while decreasing it for o- and m-xylenes. The
design strategy allowed simultaneous increase of the toluene turnover rate and p-xylene
selectivity.
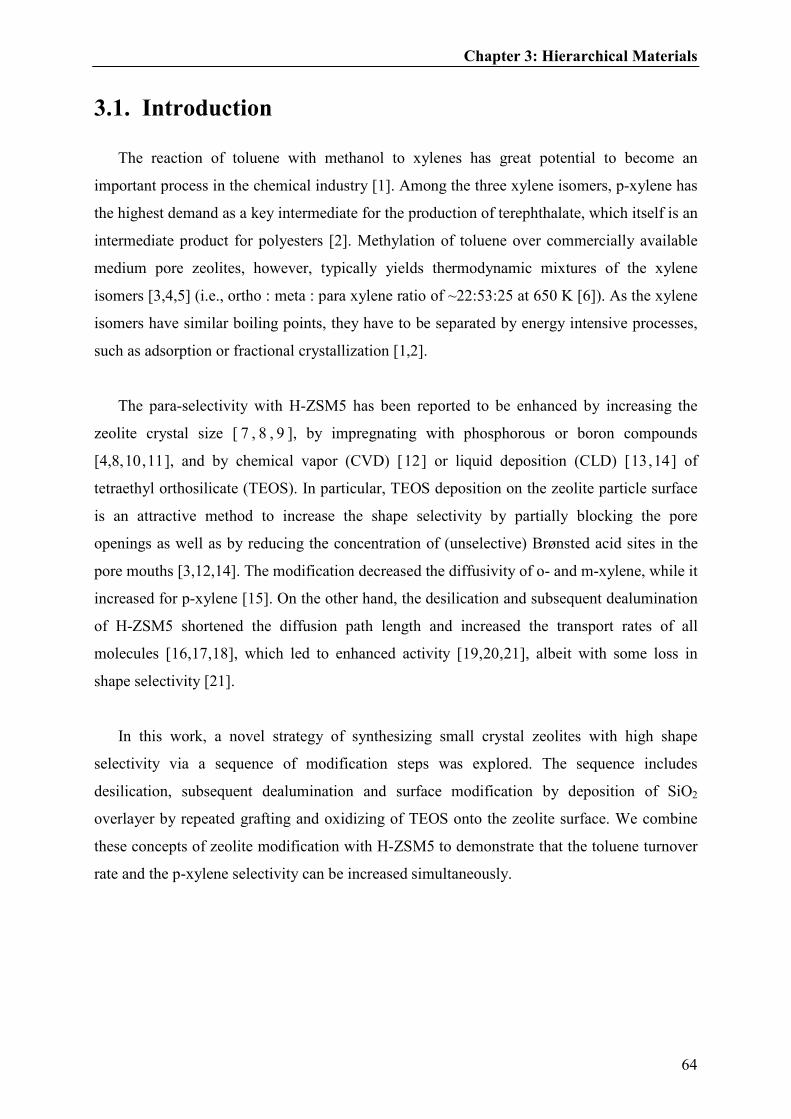
Chapter 3: Hierarchical Materials
64
3.1. Introduction
The reaction of toluene with methanol to xylenes has great potential to become an
important process in the chemical industry [1]. Among the three xylene isomers, p-xylene has
the highest demand as a key intermediate for the production of terephthalate, which itself is an
intermediate product for polyesters [2]. Methylation of toluene over commercially available
medium pore zeolites, however, typically yields thermodynamic mixtures of the xylene
isomers [3,4,5] (i.e., ortho : meta : para xylene ratio of ~22:53:25 at 650 K [6]). As the xylene
isomers have similar boiling points, they have to be separated by energy intensive processes,
such as adsorption or fractional crystallization [1,2].
The para-selectivity with H-ZSM5 has been reported to be enhanced by increasing the
zeolite crystal size [ 7 , 8 , 9 ], by impregnating with phosphorous or boron compounds
[4,8,10,11], and by chemical vapor (CVD) [12] or liquid deposition (CLD) [13,14] of
tetraethyl orthosilicate (TEOS). In particular, TEOS deposition on the zeolite particle surface
is an attractive method to increase the shape selectivity by partially blocking the pore
openings as well as by reducing the concentration of (unselective) Brønsted acid sites in the
pore mouths [3,12,14]. The modification decreased the diffusivity of o- and m-xylene, while it
increased for p-xylene [15]. On the other hand, the desilication and subsequent dealumination
of H-ZSM5 shortened the diffusion path length and increased the transport rates of all
molecules [16,17,18], which led to enhanced activity [19,20,21], albeit with some loss in
shape selectivity [21].
In this work, a novel strategy of synthesizing small crystal zeolites with high shape
selectivity via a sequence of modification steps was explored. The sequence includes
desilication, subsequent dealumination and surface modification by deposition of SiO2
overlayer by repeated grafting and oxidizing of TEOS onto the zeolite surface. We combine
these concepts of zeolite modification with H-ZSM5 to demonstrate that the toluene turnover
rate and the p-xylene selectivity can be increased simultaneously.

Chapter 3: Hierarchical Materials
65
3.2. Experimental
3.2.1. Materials
Zeolite H-ZSM5 (Si/Al = 36; Süd-Chemie) was used as parent material and five different
hierarchical samples were prepared by desilication (DS), subsequent dealumination (DS-DA)
and by surface modification (SM) by CLD of TEOS, as shown in Scheme 3.1.
Scheme 3.1: Hierarchical samples prepared from the parent H-ZSM5 zeolite. DS = desilicated H-ZSM5, DS-DA
= dealuminated DS sample, SM = surface modified sample by chemical liquid deposition of tetraethyl
orthosilicate (TEOS).
The desilicated DS sample was prepared by heating the parent H-ZSM5 in a 0.2 M NaOH
(>98 %, Sigma Aldrich) solution (30 cm3 per gram of zeolite) at 340 K under stirring for 0.75
hour [22]. The solution was transferred into vials and the solid phase was centrifuged at 4000
rpm for ~0.5 hours and washed with deionized water. The washing procedure was repeated
three times. The sodium form of the DS zeolite was exchanged into the ammonium form in
0.2 M NH4Cl (>99.5 %, Sigma Aldrich) solution (30 cm3 per gram of zeolite) at 353 K under
stirring for 6 hours. The solid was separated and the ion exchange with fresh 0.2 M NH4Cl
solution was repeated three times in total. After the third ammonium exchange, the zeolites
were separated by centrifugation, washed and dried (at 353 K) before the sample was treated
in a synthetic air (flowing at 1.7 cm3 s-1; 20.5 % O2 in N2, Westfalen) at 823 K (heating rate of
0.05 K s-1) for 10 hours to obtain protonic form of the zeolite.
H-ZSM5 DS DS-DA
DS-DA-SMDS-SMSM
Desilication Dealumination
0.2 M NaOH at
340 K, 0.75 h
1 M tartaric acid
at 333 K, 4 h
Surface ModificationTEOS (3 x 4 wt% of SiO2)
in hexane at 353 K, 1 h

Chapter 3: Hierarchical Materials
66
The desilicated-dealuminated DS-DA sample was prepared from the DS sample in a 1 M
2,3-dihydroxybutanedioic acid (L-tartaric acid; >99.5 %, Sigma Aldrich) solution (20 cm3 per
gram of zeolite) at 333 K under stirring for 4 hours [23]. This solution was separated, washed
and dried in an oven as described above, before the sample was treated in a synthetic air
(flowing at 1.7 cm3 s-1) at 823 K (0.05 K s-1) for 10 hours.
The surface modified SM samples were prepared by heating the parent H-ZSM5, the DS
or the DS-DA sample in hexane (25 cm3 per gram of zeolite; 97 %, Sigma Aldrich) with
TEOS (4 weight % SiO2 per gram of zeolite; >99.0 %, Sigma Aldrich) at 353 K under stirring
for 1 hour [13]. Hexane was removed with a rotary evaporator under vacuum and the
materials were dried at 353 K, before the treatment in a synthetic air (flowing at 1.7 cm3 s-1) at
353 K (0.083 K s-1) for 2 hours, 453 K (0.033 K s-1) for 3 hours and finally at 823 K (0.033 K
s-1) for 5 hours. This procedure was repeated three times for all samples (i.e., H-ZSM5, DS
and DS-DA) before the catalysts were characterized and tested (total deposition amount of 12
weight % of SiO2).
3.2.2. Catalyst characterization
The elemental composition of the materials was determined by atomic absorption
spectroscopy (AAS; Unicam M Series Flame-AAS equipped with an FS 95 auto-sampler and
a GF 95 graphite furnace). The powder X-ray diffraction (XRD; Philips X’Pert Pro system,
λCuKα = 0.154056 nm, 40kV/40mA) patterns were recorded between 2θ angles of 5-70° (step
size of 0.017° and a scan speed of 115 seconds per step). The signals between ~5-10o and 22-
25o after background correction was integrated and compared to the parent H-ZSM5 to
estimate the relative crystallinity of the hierarchical samples (see Table 3.S1). The crystal size
distribution was determined by dynamic light scattering (DLS) using a Malvern Zetasizer
Nano ZS system.
The nitrogen physisorption measurements were carried out at 77 K on PMI automated
sorptometer after outgassing the samples under vacuum at 523 K for 2 hours. The Brunauer-
Emmett-Teller isotherm [ 24 ] was used to calculate the apparent surface area from the
adsorption data over a relative pressure range from 0.01-0.1 p/po. The micro- and meso-pore
volumes were evaluated by using the αs comparative plot [25] with nonporous hydroxylated
silica [26] as the reference adsorbent. The macro-pore volume was calculated by subtracting
Chapter 3: Hierarchical Materials
67
micro- and meso-pore volumes from the total pore volume determined at p/po = 0.95. The
pore size distribution of the zeolites was evaluated by the DFT method (cylindrical pore,
NLDFT equilibrium model).
Infrared (IR) spectroscopy (Thermo Nicolet 5700 FT-IR spectrometer, resolution 4 cm-1)
with pyridine (99.8 %, Sigma Aldrich) and 2,6-di-tert-butyl-pyridine (2,6-DTBPy; >97 %,
Sigma Aldrich) as probe molecules was used to determine the total concentration of Brønsted
and Lewis acid sites as well as of Brønsted acid sites located in the pore mouth regions [27],
respectively. 2,6-DTBPy was used as a probe molecule to determine the concentration of
Brønsted acid sites located in the pore mouth regions because the kinetic diameter of 2,6-
DTBPy (1.05 nm) is much larger than the size of the H-ZSM5 micropores (0.51 x 0.55 and
0.53 x 0.56 nm [28]). All samples were pressed into self-supporting wafers (density ~0.01 g
cm-2) and activated under vacuum (<10-7 kPa) for 1 hour at 723 K (heating rate of 0.17 K s-1)
before the spectra of the activated samples were collected. The samples were then exposed to
pyridine or 2,6-DTBPy at 0.01 kPa and 423 K for 0.5 hour and outgassed for 1 hour under
vacuum to desorb weakly bound species. The bands at ~1545 cm-1 and ~1450 cm-1 in the IR
spectra of pyridine adsorbed were integrated to determine the total concentration of Brønsted
and Lewis acid sites, respectively. Pyridine adsorbed on Lewis acid sites resulted in two
bands, i.e., one centered at 1447±1 cm-1 and the other at 1455±1 cm-1, which were
deconvoluted with two Gaussian functions without baseline correction (R² values were larger
than 0.98 in all cases). This sample was subsequently heated to 723 K (0.17 K s-1) for 0.5 hour
in vacuum to determine the concentration of strong Brønsted and Lewis acid sites. In order to
calculate the concentration of Brønsted acid sites interacting with 2,6-DTBPy, the change of
3610 cm-1 area of the parent H-ZSM5 sample was correlated to the integrated area of the N-
H+ stretching band of protonated 2,6-DTBPy at 3367 cm-1 [27]. This ratio was used to relate
the area of the band at 3367 cm-1 to the concentration of Brønsted acid sites interacting with
2,6-DTBPy for the hierarchical samples. All spectra were collected at 423 K and normalized
to the overtone lattice vibration bands at 1990 and 1870 cm-1 for comparison of the IR spectra
of different samples. Note that the acid site concentrations were normalized to the weight of
zeolite and the materials with SiO2 overlayer deposited were multiplied by 1.12 (g of material
per g of zeolite) because the total SiO2 (TEOS) deposition amount was 12 weight % of the
zeolite.

Chapter 3: Hierarchical Materials
68
3.2.3. Catalytic testing
The catalyst samples (4-25 mg, 180-250 µm) diluted with silicon carbide (7 times the
weight of the catalyst; F46, ESK-SiC GmbH) were held in place by quartz wool inside a
quartz plug flow reactor (0.4 cm ID). All catalysts were treated at 823 K (0.17 K s-1) under
flowing helium (1.7 cm3 s-1; 99,996%, Westfalen) for 0.5 hour prior to the reaction. The
temperature was measured by a type K thermocouple in external contact to the reactor. It was
maintained constant by a stainless steel furnace controlled by an Eurotherm controller (Series
2416). The toluene methylation was carried out at temperatures between 548-723 K at
atmospheric pressure by flowing premixed toluene (> 99.9 %, Sigma Aldrich) and methanol
(MeOH; >99.8 %, Sigma Aldrich) feed (ptoluene = 6 kPa, pmethanol = 1.5 kPa) into a vaporizer
filled with silicon carbide. The total flow rate was varied between 1.2 and 2.3 cm3 s-1. The
reactor effluent was analyzed by on-line gas chromatography (Agilent 7820A) equipped with
a DB-WAX column (30 m x 0.32 mm x 0.5 µm) and a flame ionization detector. All the rates
were normalized by the total concentration of Brønsted acid sites determined by the
adsorption of pyridine.
3.3. Results and discussion
3.3.1. Chemical composition and structural characterization of
hierarchical materials
The chemical composition and the textural properties of the parent and hierarchical
materials are compiled in Table 3.1 [18]. The Si/Al ratios indicate that desilication selectively
removed Si, while the dealumination selectively removed Al from the zeolite. The surface
modification by TEOS led to the deposition of a SiO2 overlayer on the zeolite, increasing the
nominal Si/Al ratio.

Chapter 3: Hierarchical Materials
69
Table 3.1: Chemical composition and textural properties of the parent and hierarchical materials derived from H-
ZSM5.
Catalyst Si/Al ratio
SBETa
(m2 g-1 ) Sext
b (m2 g-1)
Vmic
(cm3 g-1) Vmeso
c (cm3 g-1)
Vmacroc
(cm3 g-1)
H-ZSM5 36 435 57 0.12 0.03 0.17 DS 27 482 96 0.12 0.05 0.23 DS-DA 39 484 99 0.12 0.05 0.24 SM 42 434 24 0.09 0.08 0.13 DS-SM 36 348 41 0.06 0.08 0.14 DS-DA-SM 47 435 84 0.08 0.06 0.20
aSBET = specific surface area analyzed according to Brunauer-Emmett-Teller, bSext = external surface area, cVmi,
Vmeso Vmacro correspond to the micro-, meso- and macro-pore volume of the zeolite.
The BET and external surface areas, as well as the meso- and macropore volumes
increased considerably after desilication, but only marginally after subsequent dealumination.
The increase in the pore volume with diameters of approximately 4-6 nm for the DS sample in
Figure 3.1 confirmed the generation of mesopores by desilication, while significant change in
the pore volumes after subsequent dealumination was not observed. The deposition of the
SiO2 overlayer decreased the micropore volume, but increased the mesopore volume with
pore diameters <2 nm (Table 3.1 and Figures 3.S1-3.S3).
Figure 3.1: Pore size distribution of the parent (H-ZSM5; □), desilicated (DS; ∆) and subsequently dealuminated
(DS-DA; ○) samples, analyzed by DFT method (cylindrical pore, NLDFT equilibrium model).
0
0,03
0,06
0,09
0,12
2 4 6 8 10 12
dV
(cm
3[n
m g
]-1)
Pore Size (nm)
0.12
0.09
0.06
0.03
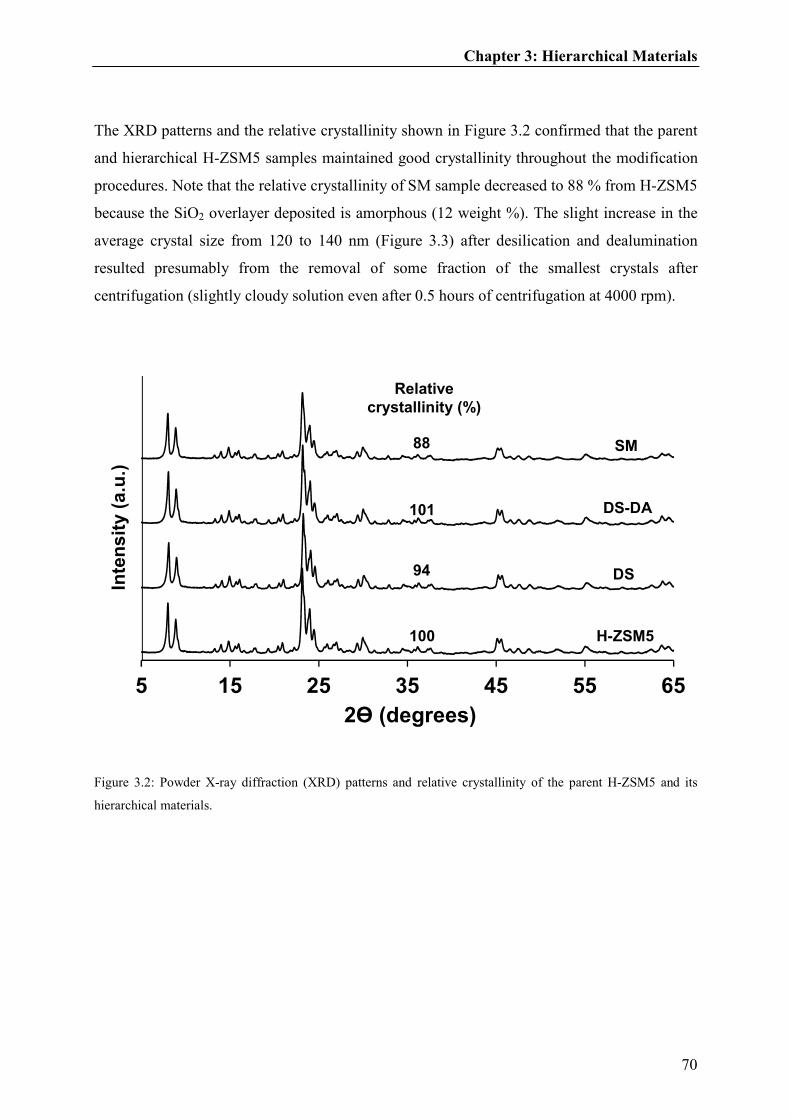
Chapter 3: Hierarchical Materials
70
The XRD patterns and the relative crystallinity shown in Figure 3.2 confirmed that the parent
and hierarchical H-ZSM5 samples maintained good crystallinity throughout the modification
procedures. Note that the relative crystallinity of SM sample decreased to 88 % from H-ZSM5
because the SiO2 overlayer deposited is amorphous (12 weight %). The slight increase in the
average crystal size from 120 to 140 nm (Figure 3.3) after desilication and dealumination
resulted presumably from the removal of some fraction of the smallest crystals after
centrifugation (slightly cloudy solution even after 0.5 hours of centrifugation at 4000 rpm).
Figure 3.2: Powder X-ray diffraction (XRD) patterns and relative crystallinity of the parent H-ZSM5 and its
hierarchical materials.
5 15 25 35 45 55 65
2ϴ (degrees)
H-ZSM5
DS
DS-DA
SM
Relative
crystallinity (%)
Inte
ns
ity (
a.u
.)
101
88
94
100

Chapter 3: Hierarchical Materials
71
Figure 3.3: Crystal size distribution of the parent (H-ZSM5; □), desilicated (DS; ∆) and subsequently
dealuminated (DS-DA; ○) samples measured by dynamic light scattering (DLS) method.
3.3.2. Acid site characterization of hierarchical materials
The stacked and superimposed IR spectra of activated samples are shown in Figure 3.4
and Figures 3.S4-3.S5 (see also Figure 3.S6). Two distinct bands were observed at 3745 cm-1
and 3610 cm-1, characteristic for the O-H vibration of terminal silanol groups and Brønsted
acid sites, respectively [29,30]. Desilication of the parent H-ZSM5 significantly increased the
external surface area (Table 3.1) and consequently the concentration of terminal silanols
(3745 cm-1) increased [30]. A band at ~3670 cm-1 appeared after desilication resulting from
the formation of extra-framework aluminum (EFAl) species [31] and decreased the broad
band centered ~3500 cm-1 [ 32 ], as a result of the removal of the silanol nest (see
superimposed spectra in Figure 3.S4, left) [33]. The decrease in intensity of the band at 3670
cm-1 showed that subsequent dealumination of the desilicated sample removed EFAl species
and the simultaneous re-appearance of a broad band centered at ~3500 cm-1 indicated that the
removal of aluminum atoms from the zeolite lattice led to formation of silanol nests (Figure
3.S4, left) [34]. Deposition of a mesoporous SiO2 overlayer decreased both the bands at 3745
cm-1 and 3610 cm-1 (terminal silanol groups and Brønsted acid sites), while the intensity of
0
10
20
30
40
50
50 100 150 200 250
Dis
trib
uti
on
%
Crystal Size (nm)
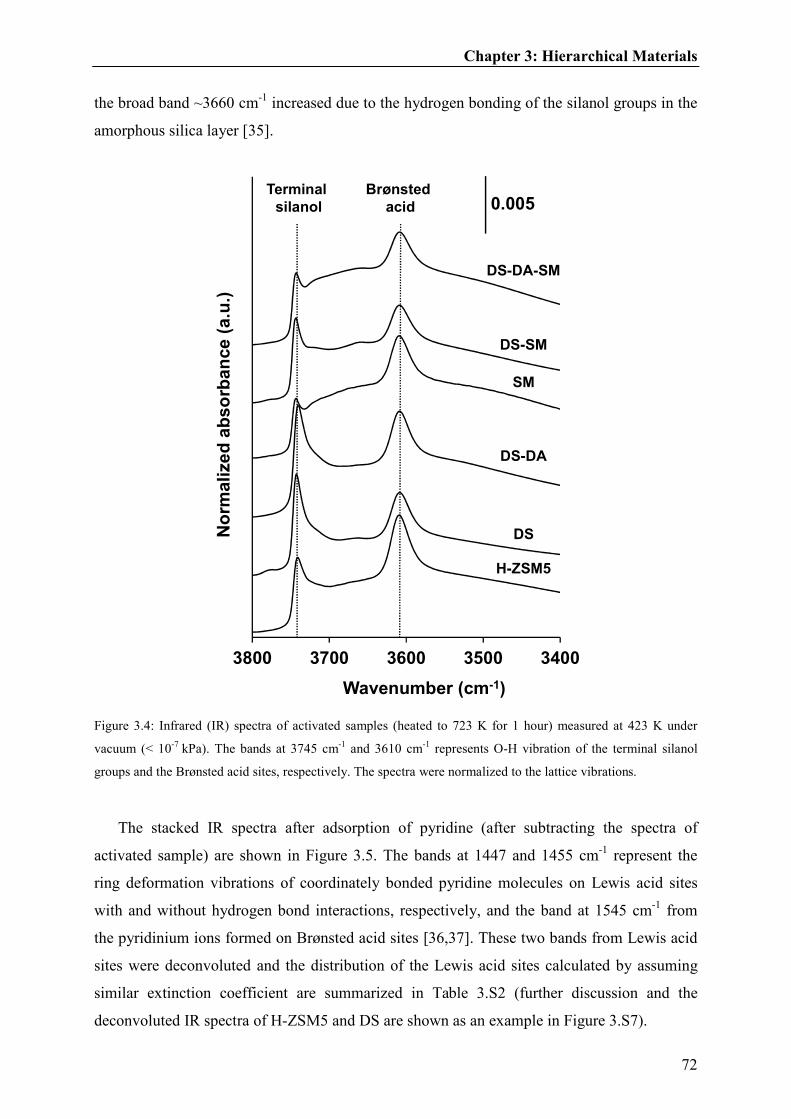
Chapter 3: Hierarchical Materials
72
the broad band ~3660 cm-1 increased due to the hydrogen bonding of the silanol groups in the
amorphous silica layer [35].
Figure 3.4: Infrared (IR) spectra of activated samples (heated to 723 K for 1 hour) measured at 423 K under
vacuum (< 10-7 kPa). The bands at 3745 cm-1 and 3610 cm-1 represents O-H vibration of the terminal silanol
groups and the Brønsted acid sites, respectively. The spectra were normalized to the lattice vibrations.
The stacked IR spectra after adsorption of pyridine (after subtracting the spectra of
activated sample) are shown in Figure 3.5. The bands at 1447 and 1455 cm-1 represent the
ring deformation vibrations of coordinately bonded pyridine molecules on Lewis acid sites
with and without hydrogen bond interactions, respectively, and the band at 1545 cm-1 from
the pyridinium ions formed on Brønsted acid sites [36,37]. These two bands from Lewis acid
sites were deconvoluted and the distribution of the Lewis acid sites calculated by assuming
similar extinction coefficient are summarized in Table 3.S2 (further discussion and the
deconvoluted IR spectra of H-ZSM5 and DS are shown as an example in Figure 3.S7).
34003500360037003800
Wavenumber (cm-1)
No
rmali
ze
d a
bso
rban
ce (
a.u
.)
DS-DA-SM
DS-SM
SM
DS-DA
DS
H-ZSM5
Terminal
silanol
Brønsted
acid 0.005

Chapter 3: Hierarchical Materials
73
Figure 3.5: IR spectra after adsorption of pyridine at 423 K, 0.01 kPa and outgassing for 1 hour under vacuum
(spectra of the activated sample subtracted). The bands at 1447 and 1455 cm-1 represent the coordinately bonded
pyridine molecules on Lewis acid sites with and without hydrogen bond interactions, respectively, and the band
at 1545 cm-1 the ring deformation vibrations of pyridinium ions formed on Brønsted acid sites.
The IR spectra of the samples after 2,6-DTBPy adsorption are shown in Figure 3.6. The
fraction of terminal silanol groups (3745 cm-1) and Brønsted acid sites (3610 cm-1) interacted
with 2,6-DTBPy, as shown by the decrease in the intensity of both bands. New bands
appeared at 3367 cm-1 and 1616 cm-1, which are assigned to the N-H+ and C=C stretching
vibrations of 2,6-DTBPyH+, respectively. The linear correlations between these vibrational
bands shown in Figure 3.S9 indicate that both bands can be used for quantification of these
acid sites probed. After desilication, the bands at 3367 cm-1 and 1616 cm-1 in Figure 3.6
increased compared to the parent H-ZSM5 because a significant concentration of mesopores
was formed (therefore increased the external surface area, Table 3.1) and a substantial fraction
1400150016001700
Wavenumber (cm-1)
DS-DA-SM
DS-SM
SM
DS-DA
DS
H-ZSM5
Lewis
acid
Brønsted
acidN
orm
ali
zed
ab
so
rba
nce (
a.u
.)
0.005
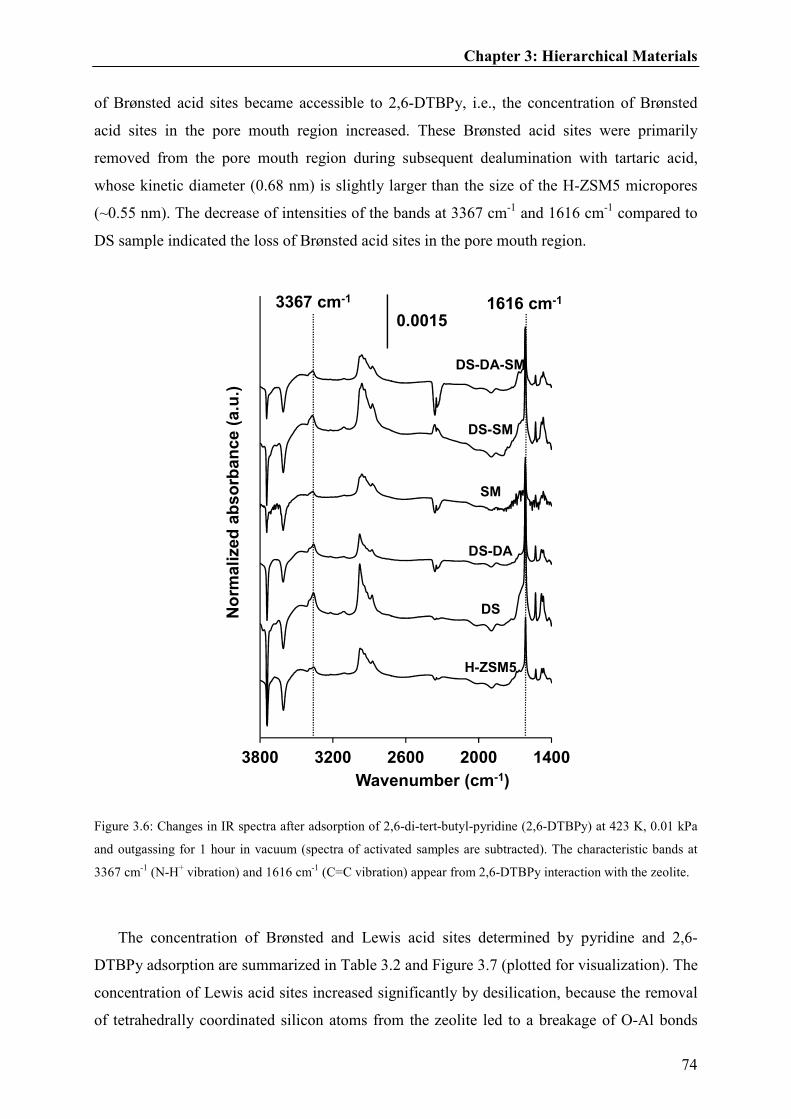
Chapter 3: Hierarchical Materials
74
of Brønsted acid sites became accessible to 2,6-DTBPy, i.e., the concentration of Brønsted
acid sites in the pore mouth region increased. These Brønsted acid sites were primarily
removed from the pore mouth region during subsequent dealumination with tartaric acid,
whose kinetic diameter (0.68 nm) is slightly larger than the size of the H-ZSM5 micropores
(~0.55 nm). The decrease of intensities of the bands at 3367 cm-1 and 1616 cm-1 compared to
DS sample indicated the loss of Brønsted acid sites in the pore mouth region.
Figure 3.6: Changes in IR spectra after adsorption of 2,6-di-tert-butyl-pyridine (2,6-DTBPy) at 423 K, 0.01 kPa
and outgassing for 1 hour in vacuum (spectra of activated samples are subtracted). The characteristic bands at
3367 cm-1 (N-H+ vibration) and 1616 cm-1 (C=C vibration) appear from 2,6-DTBPy interaction with the zeolite.
The concentration of Brønsted and Lewis acid sites determined by pyridine and 2,6-
DTBPy adsorption are summarized in Table 3.2 and Figure 3.7 (plotted for visualization). The
concentration of Lewis acid sites increased significantly by desilication, because the removal
of tetrahedrally coordinated silicon atoms from the zeolite led to a breakage of O-Al bonds
14002000260032003800
Wavenumber (cm-1)
No
rmali
zed
ab
so
rban
ce (
a.u
.)
DS-DA-SM
DS-SM
SM
DS-DA
DS
H-ZSM5
3367 cm-1 1616 cm-1
0.0015
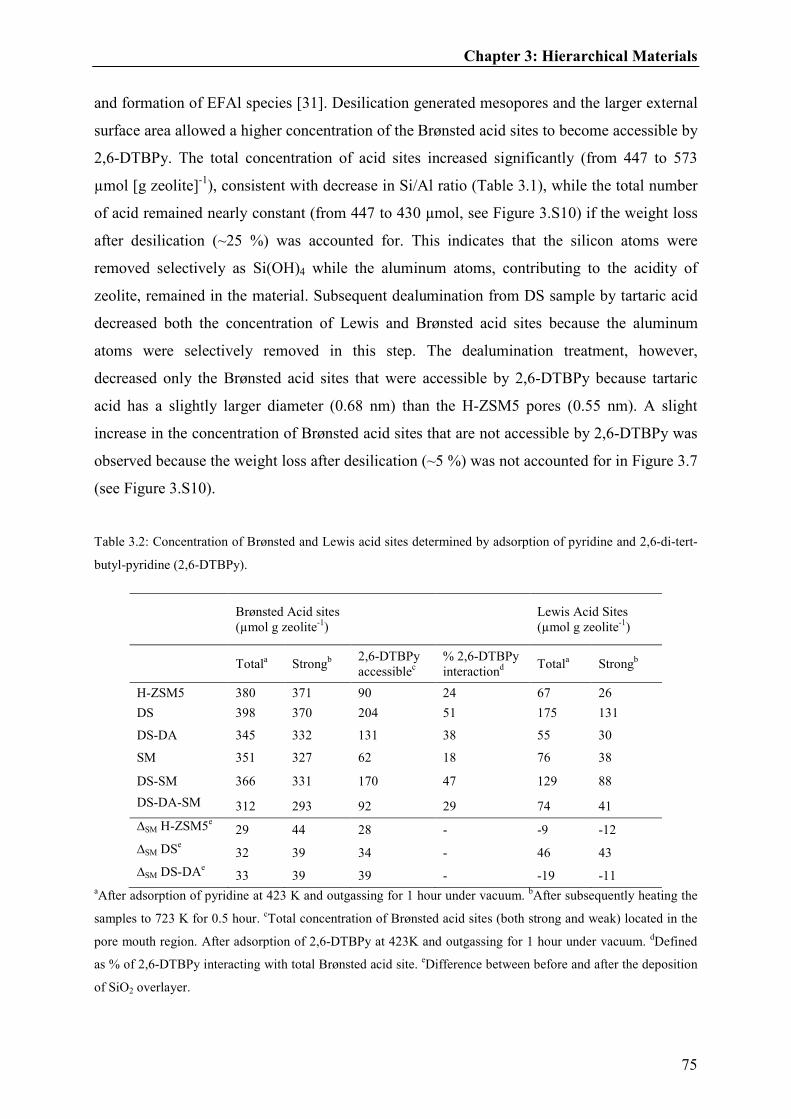
Chapter 3: Hierarchical Materials
75
and formation of EFAl species [31]. Desilication generated mesopores and the larger external
surface area allowed a higher concentration of the Brønsted acid sites to become accessible by
2,6-DTBPy. The total concentration of acid sites increased significantly (from 447 to 573
µmol [g zeolite]-1), consistent with decrease in Si/Al ratio (Table 3.1), while the total number
of acid remained nearly constant (from 447 to 430 µmol, see Figure 3.S10) if the weight loss
after desilication (~25 %) was accounted for. This indicates that the silicon atoms were
removed selectively as Si(OH)4 while the aluminum atoms, contributing to the acidity of
zeolite, remained in the material. Subsequent dealumination from DS sample by tartaric acid
decreased both the concentration of Lewis and Brønsted acid sites because the aluminum
atoms were selectively removed in this step. The dealumination treatment, however,
decreased only the Brønsted acid sites that were accessible by 2,6-DTBPy because tartaric
acid has a slightly larger diameter (0.68 nm) than the H-ZSM5 pores (0.55 nm). A slight
increase in the concentration of Brønsted acid sites that are not accessible by 2,6-DTBPy was
observed because the weight loss after desilication (~5 %) was not accounted for in Figure 3.7
(see Figure 3.S10).
Table 3.2: Concentration of Brønsted and Lewis acid sites determined by adsorption of pyridine and 2,6-di-tert-
butyl-pyridine (2,6-DTBPy).
Brønsted Acid sites (µmol g zeolite-1)
Lewis Acid Sites (µmol g zeolite-1)
Totala Strongb
2,6-DTBPy accessiblec
% 2,6-DTBPy interactiond
Totala Strongb
H-ZSM5 380 371 90 24 67 26
DS 398 370 204 51 175 131
DS-DA 345 332 131 38 55 30
SM 351 327 62 18 76 38
DS-SM 366 331 170 47 129 88
DS-DA-SM 312 293 92 29 74 41
∆SM H-ZSM5e 29 44 28 - -9 -12
∆SM DSe 32 39 34 - 46 43
∆SM DS-DAe 33 39 39 - -19 -11 aAfter adsorption of pyridine at 423 K and outgassing for 1 hour under vacuum. bAfter subsequently heating the
samples to 723 K for 0.5 hour. cTotal concentration of Brønsted acid sites (both strong and weak) located in the
pore mouth region. After adsorption of 2,6-DTBPy at 423K and outgassing for 1 hour under vacuum. dDefined
as % of 2,6-DTBPy interacting with total Brønsted acid site. eDifference between before and after the deposition
of SiO2 overlayer.
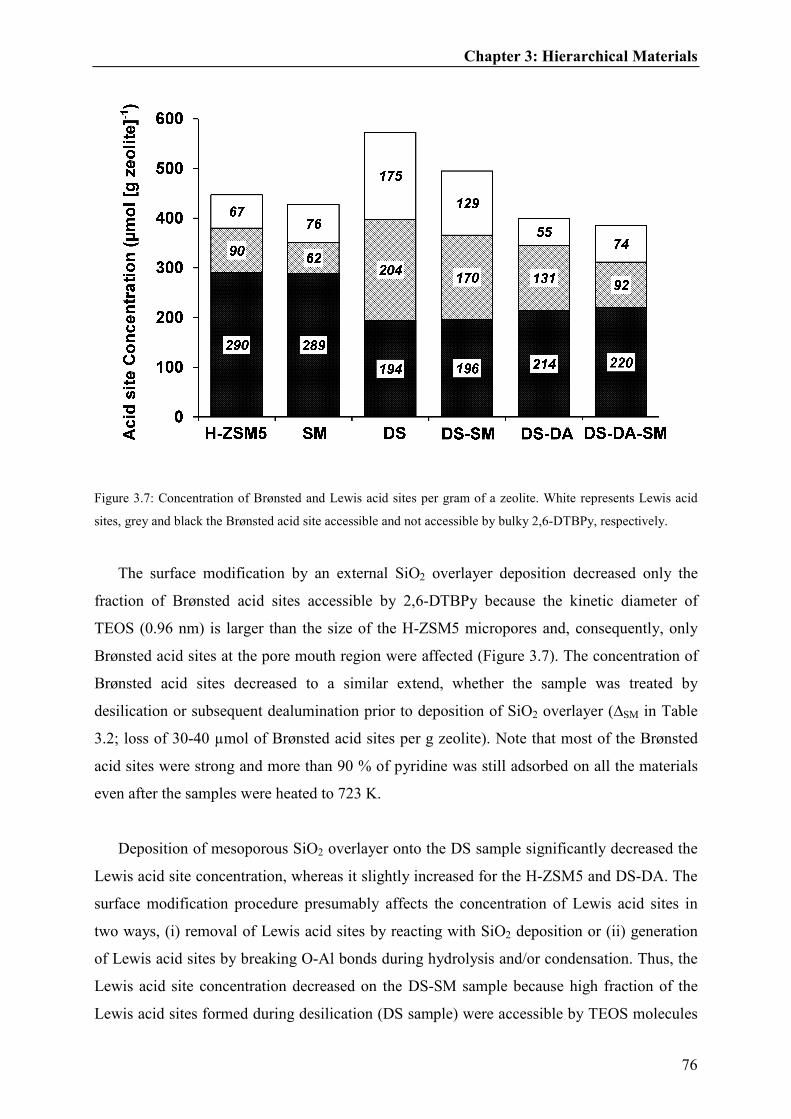
Chapter 3: Hierarchical Materials
76
Figure 3.7: Concentration of Brønsted and Lewis acid sites per gram of a zeolite. White represents Lewis acid
sites, grey and black the Brønsted acid site accessible and not accessible by bulky 2,6-DTBPy, respectively.
The surface modification by an external SiO2 overlayer deposition decreased only the
fraction of Brønsted acid sites accessible by 2,6-DTBPy because the kinetic diameter of
TEOS (0.96 nm) is larger than the size of the H-ZSM5 micropores and, consequently, only
Brønsted acid sites at the pore mouth region were affected (Figure 3.7). The concentration of
Brønsted acid sites decreased to a similar extend, whether the sample was treated by
desilication or subsequent dealumination prior to deposition of SiO2 overlayer (∆SM in Table
3.2; loss of 30-40 µmol of Brønsted acid sites per g zeolite). Note that most of the Brønsted
acid sites were strong and more than 90 % of pyridine was still adsorbed on all the materials
even after the samples were heated to 723 K.
Deposition of mesoporous SiO2 overlayer onto the DS sample significantly decreased the
Lewis acid site concentration, whereas it slightly increased for the H-ZSM5 and DS-DA. The
surface modification procedure presumably affects the concentration of Lewis acid sites in
two ways, (i) removal of Lewis acid sites by reacting with SiO2 deposition or (ii) generation
of Lewis acid sites by breaking O-Al bonds during hydrolysis and/or condensation. Thus, the
Lewis acid site concentration decreased on the DS-SM sample because high fraction of the
Lewis acid sites formed during desilication (DS sample) were accessible by TEOS molecules
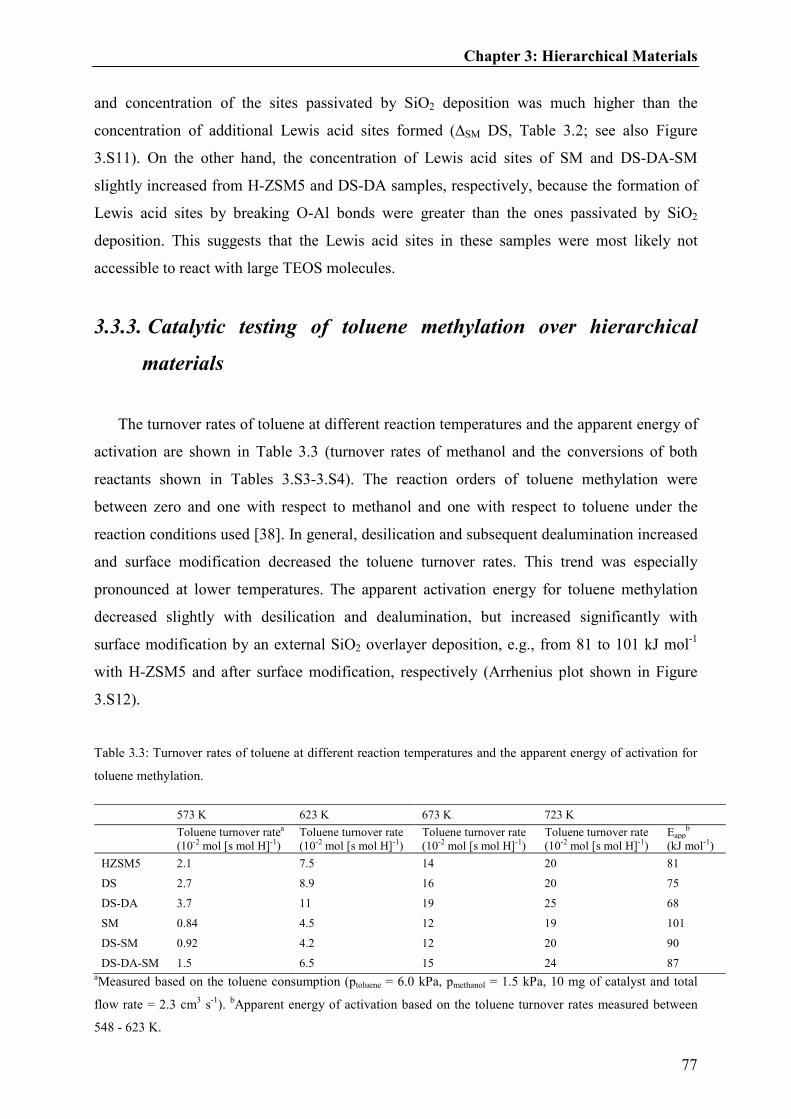
Chapter 3: Hierarchical Materials
77
and concentration of the sites passivated by SiO2 deposition was much higher than the
concentration of additional Lewis acid sites formed (∆SM DS, Table 3.2; see also Figure
3.S11). On the other hand, the concentration of Lewis acid sites of SM and DS-DA-SM
slightly increased from H-ZSM5 and DS-DA samples, respectively, because the formation of
Lewis acid sites by breaking O-Al bonds were greater than the ones passivated by SiO2
deposition. This suggests that the Lewis acid sites in these samples were most likely not
accessible to react with large TEOS molecules.
3.3.3. Catalytic testing of toluene methylation over hierarchical
materials
The turnover rates of toluene at different reaction temperatures and the apparent energy of
activation are shown in Table 3.3 (turnover rates of methanol and the conversions of both
reactants shown in Tables 3.S3-3.S4). The reaction orders of toluene methylation were
between zero and one with respect to methanol and one with respect to toluene under the
reaction conditions used [38]. In general, desilication and subsequent dealumination increased
and surface modification decreased the toluene turnover rates. This trend was especially
pronounced at lower temperatures. The apparent activation energy for toluene methylation
decreased slightly with desilication and dealumination, but increased significantly with
surface modification by an external SiO2 overlayer deposition, e.g., from 81 to 101 kJ mol-1
with H-ZSM5 and after surface modification, respectively (Arrhenius plot shown in Figure
3.S12).
Table 3.3: Turnover rates of toluene at different reaction temperatures and the apparent energy of activation for
toluene methylation.
573 K 623 K 673 K 723 K
Toluene turnover ratea Toluene turnover rate Toluene turnover rate Toluene turnover rate Eappb
(10-2 mol [s mol H]-1) (10-2 mol [s mol H]-1) (10-2 mol [s mol H]-1) (10-2 mol [s mol H]-1) (kJ mol-1)
HZSM5 2.1 7.5 14 20 81
DS 2.7 8.9 16 20 75
DS-DA 3.7 11 19 25 68
SM 0.84 4.5 12 19 101
DS-SM 0.92 4.2 12 20 90
DS-DA-SM 1.5 6.5 15 24 87 aMeasured based on the toluene consumption (ptoluene = 6.0 kPa, pmethanol = 1.5 kPa, 10 mg of catalyst and total
flow rate = 2.3 cm3 s-1). bApparent energy of activation based on the toluene turnover rates measured between
548 - 623 K.

Chapter 3: Hierarchical Materials
78
The reaction of toluene methylation is diffusion limited because the turnover rates were
affected by changes of mesoporosity/diffusivity in the catalyst (Table 3.3) and the estimated
values of Thiele modulus were somewhat larger than unity, i.e., ~2-6 at 723 K and 1-2 at 573
K (Table 3.S5; effectiveness factor also calculated) [39]. Consequently, an increase in toluene
turnover rates was observed from desilication and subsequent dealumination, because the
effective diffusion length (determined by assuming an unchanged diffusivity inside the
micropores) decreased by ~9 and 35 %, respectively [18]. After the surface modification by
SiO2 overlayer deposition, the diffusivity of large aromatic molecules decreased significantly
from partial blocking of the pore openings [15,18] and resulted presumably in higher relative
concentration of aromatic products, such as trimethylbenzenes (TriMBs), compared to the
reactant (toluene) in the zeolite pores. The surface coverage with these species over H-ZSM5
and SM samples during toluene methylation increased from ~20 to 40 % at 573 K,
respectively (see Figure 3.S13 [40]). This led to higher probability for the aromatic product
methylation relative to the toluene and, consequently, lowered the toluene turnover rates (vide
infra). In addition, the increase of aromatic products in the zeolite pores also led to a lower
fraction of methanol being adsorbed/activated for methylation and reduced the overall rate of
methylation. Note that the turnover rate increased significantly with the dealuminated sample
compared to the sample after desilication, despite of the unchanged mesopore volume (Table
3.1). This indicates that the EFAl species formed on the external surface after desilication
(Figure 3.7) block the micropore entrances and/or interact with the aromatic reactant and
product molecules [18].
The diffusional limitation of this reaction most likely results from the slow transport of the
large product molecules (e.g., m-xylene and TriMBs) out of the zeolite pores, rather than from
the transport of the reactant molecules (toluene) to the active sites, because diffusivities of the
methylated products inside the ZSM-5 pores were much lower compared to the reactant
molecules. For example, m-xylene diffuses at least two orders of magnitude slower than
toluene [18,41] and the difference should be even greater for larger products, such as TriMBs.
Toluene must replace large aromatic products on the activated methanol [42] during the
methylation and, thus, the turnover rates of toluene methylation are strongly influenced by
residence time (therefore the relative concentration) of the large aromatic product molecules
inside the zeolite pores under the steady state reaction conditions.

Chapter 3: Hierarchical Materials
79
The limitation from diffusion of large aromatic products suggests that the surface
concentration of reactants, i.e., toluene and methanol, and p-xylene (similar diffusivity
compared to toluene [41]), should be independent of the diffusion length during toluene
methylation over H-ZSM5. These species were nearly absent from the zeolite surface at
reaction temperatures, but was covered with large aromatics, e.g., m-xylene and TriMBs, at
much higher concentrations than that of the gas phase [43] (see section 3.3.2). In addition, the
measured surface coverage of large aromatic products was much higher than the predicted
coverage at equilibrium [40], also indicating that the reaction is limited by diffusion of these
molecules.
The relative concentration of large aromatic products of toluene (e.g., m-xylene and
TriMBs) compared to the reactant (toluene) should be higher for the samples with a longer
effective diffusion length, e.g., SM compared to H-ZSM5 or H-ZSM5 compared to DS-DA
sample. The apparent energy of activation shown in Table 3.3, thus, increased significantly
with surface modification and slightly decreased with desilication-dealumination, because the
average apparent activation energy of diffusion during the reaction (Ediff) presumably reflects
more of the larger product molecules over the zeolites with longer effective diffusion length,
i.e., the fraction of TriMBs used when defining the average Ediff, relative to xylenes, should be
higher with SM than with H-ZSM5 sample [40]. The Ediff increases as molecules become
larger [18,41] and the measured Eapp, thus, increases because Eapp in a diffusion limited
reaction is proportional to the activation energy of diffusion, i.e., ���� = ���� + ��� [44].
Note that the activation energy of reaction, Erxn, should be constant for all catalysts because
the framework is the same and the acid strength between the hierarchical samples is similar.
The significant presence of aromatic products from toluene methylation in the zeolite
pores [43] also leads to competitive methylation reactions, i.e., toluene methylation to xylene
and xylene (or TriMB) methylation to TriMB (or Tetramethylbenzene (TetraMB)). The latter
(xylene and TriMB) methylation reaction should be more significant for zeolites with longer
effective diffusion length because the relative concentration of larger aromatic products to
toluene is higher. The relative formation rate of xylenes to TriMBs, however, were not
affected significantly (Table 3.S6) by changing the effective diffusion length because of
product shape selectivity [38]. Note that the methylation of larger aromatic products is also
favored compared to toluene because the activation energy of methylation reactions decreases
with number of methyl substitutions (~ 10 kJ mol-1 between xylene and toluene methylation

Chapter 3: Hierarchical Materials
80
[45,46]). The reaction rates are proportional to exp(������∙� ) [47] and the differences in the rates
caused by lower activation energy should be more pronounced at lower reaction temperatures
(Table 3.3, see also section 3.3.3).
3.3.3.1. Influence of hierarchical pores and reaction temperature on
methanol usage
The methanol usage during toluene methylation, in particular, the fraction of methanol
used for formation of light hydrocarbons (LH), was determined previously by examining the
fraction of MeOH for LH formation [38]. The fraction was defined based on the formation or
consumption rates as follows:
Fraction of MeOH for LH formation = ��������� ��!�…#$%&�'()���(#$%&�'()�×+#�),-. (1)
Methanol and dimethyl ether (DME) were treated as one reactant (accounting for the
stoichiometry of ½ for DME), because methanol can dehydrate to DME during the reaction,
which could also methylate aromatic molecules via a similar mechanism [48,49]. The fraction
of MeOH for LH formation (Equation 1) describes how much methanol was used for the
formation of light hydrocarbons. A fraction of unity would indicate that methanol was used
only for formation of light hydrocarbons and none for the methylation of aromatics. A
fraction of zero, vice versa, would indicate that methanol was entirely used for the
methylation of aromatic molecules and none for the formation of light hydrocarbons.
The fractions of methanol used for the formation of light hydrocarbons over H-ZSM5 and
the hierarchical zeolites are summarized in Table 3.4. A higher methanol usage towards
formation of light hydrocarbons was observed with decreasing the reaction temperature, e.g.,
the fraction of MeOH for LH formation increased from 0.23 to 0.52, as the temperature
decreased from 723 to 573 K with H-ZSM5 (Table 3.4). Note that the products of toluene
methylation, e.g., xylenes and TriMBs, could methylate further and eventually dealkylate
light hydrocarbons from highly-methylated aromatics [50,51] from product shape selectivity,
i.e., highly-methylated aromatic molecules cannot exit the pores (Scheme 3.2) [38]. The
methylation of xylenes or TriMBs was favored relative to toluene methylation, because the
activation energy of toluene methylation was higher than that of xylenes or TriMBs and this
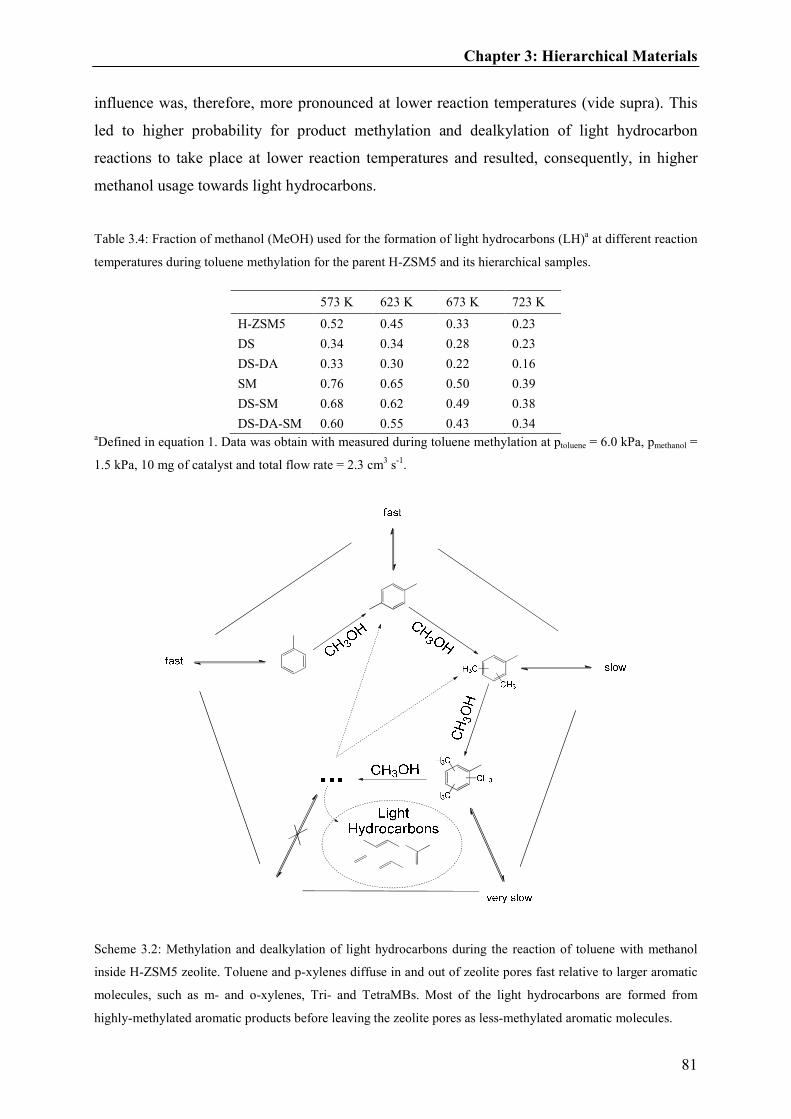
Chapter 3: Hierarchical Materials
81
influence was, therefore, more pronounced at lower reaction temperatures (vide supra). This
led to higher probability for product methylation and dealkylation of light hydrocarbon
reactions to take place at lower reaction temperatures and resulted, consequently, in higher
methanol usage towards light hydrocarbons.
Table 3.4: Fraction of methanol (MeOH) used for the formation of light hydrocarbons (LH)a at different reaction
temperatures during toluene methylation for the parent H-ZSM5 and its hierarchical samples.
573 K 623 K 673 K 723 K
H-ZSM5 0.52 0.45 0.33 0.23
DS 0.34 0.34 0.28 0.23
DS-DA 0.33 0.30 0.22 0.16
SM 0.76 0.65 0.50 0.39
DS-SM 0.68 0.62 0.49 0.38
DS-DA-SM 0.60 0.55 0.43 0.34 aDefined in equation 1. Data was obtain with measured during toluene methylation at ptoluene = 6.0 kPa, pmethanol =
1.5 kPa, 10 mg of catalyst and total flow rate = 2.3 cm3 s-1.
Scheme 3.2: Methylation and dealkylation of light hydrocarbons during the reaction of toluene with methanol
inside H-ZSM5 zeolite. Toluene and p-xylenes diffuse in and out of zeolite pores fast relative to larger aromatic
molecules, such as m- and o-xylenes, Tri- and TetraMBs. Most of the light hydrocarbons are formed from
highly-methylated aromatic products before leaving the zeolite pores as less-methylated aromatic molecules.
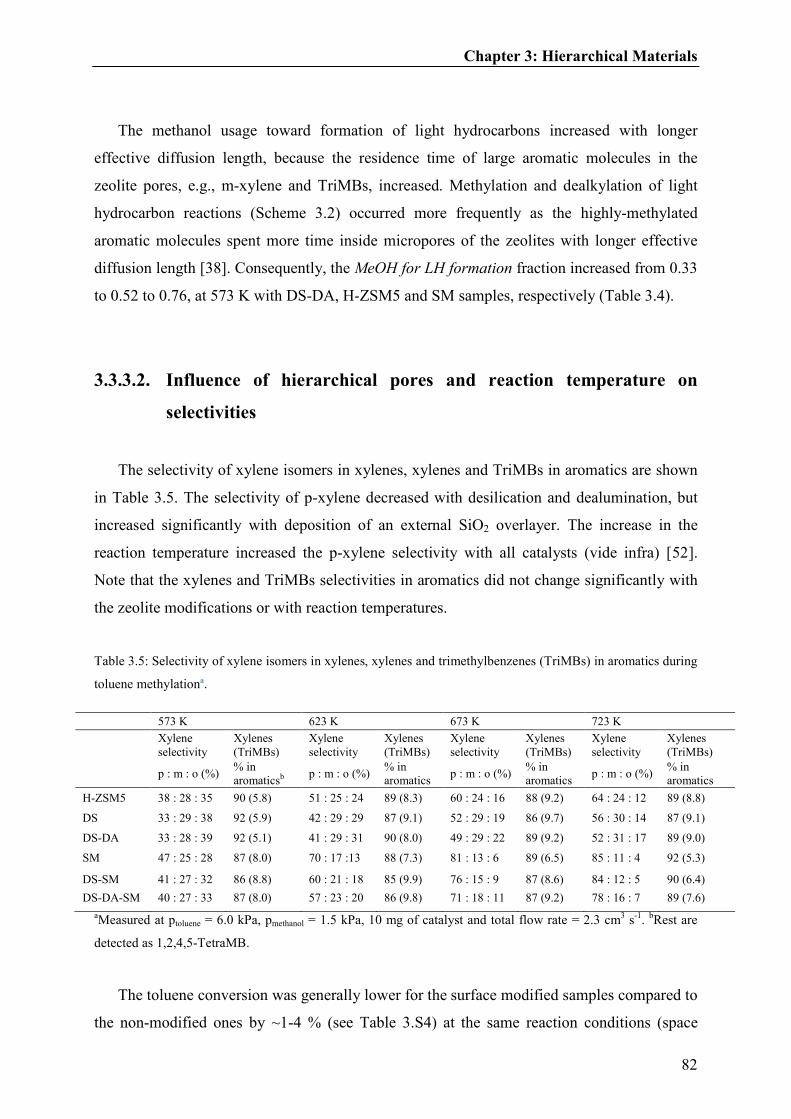
Chapter 3: Hierarchical Materials
82
The methanol usage toward formation of light hydrocarbons increased with longer
effective diffusion length, because the residence time of large aromatic molecules in the
zeolite pores, e.g., m-xylene and TriMBs, increased. Methylation and dealkylation of light
hydrocarbon reactions (Scheme 3.2) occurred more frequently as the highly-methylated
aromatic molecules spent more time inside micropores of the zeolites with longer effective
diffusion length [38]. Consequently, the MeOH for LH formation fraction increased from 0.33
to 0.52 to 0.76, at 573 K with DS-DA, H-ZSM5 and SM samples, respectively (Table 3.4).
3.3.3.2. Influence of hierarchical pores and reaction temperature on
selectivities
The selectivity of xylene isomers in xylenes, xylenes and TriMBs in aromatics are shown
in Table 3.5. The selectivity of p-xylene decreased with desilication and dealumination, but
increased significantly with deposition of an external SiO2 overlayer. The increase in the
reaction temperature increased the p-xylene selectivity with all catalysts (vide infra) [52].
Note that the xylenes and TriMBs selectivities in aromatics did not change significantly with
the zeolite modifications or with reaction temperatures.
Table 3.5: Selectivity of xylene isomers in xylenes, xylenes and trimethylbenzenes (TriMBs) in aromatics during
toluene methylationa.
573 K 623 K 673 K 723 K
Xylene selectivity
Xylenes (TriMBs)
Xylene selectivity
Xylenes (TriMBs)
Xylene selectivity
Xylenes (TriMBs)
Xylene selectivity
Xylenes (TriMBs)
p : m : o (%)
% in aromaticsb
p : m : o (%) % in aromatics
p : m : o (%) % in aromatics
p : m : o (%) % in aromatics
H-ZSM5 38 : 28 : 35 90 (5.8) 51 : 25 : 24 89 (8.3) 60 : 24 : 16 88 (9.2) 64 : 24 : 12 89 (8.8)
DS 33 : 29 : 38 92 (5.9) 42 : 29 : 29 87 (9.1) 52 : 29 : 19 86 (9.7) 56 : 30 : 14 87 (9.1)
DS-DA 33 : 28 : 39 92 (5.1) 41 : 29 : 31 90 (8.0) 49 : 29 : 22 89 (9.2) 52 : 31 : 17 89 (9.0)
SM 47 : 25 : 28 87 (8.0) 70 : 17 :13 88 (7.3) 81 : 13 : 6 89 (6.5) 85 : 11 : 4 92 (5.3)
DS-SM 41 : 27 : 32 86 (8.8) 60 : 21 : 18 85 (9.9) 76 : 15 : 9 87 (8.6) 84 : 12 : 5 90 (6.4)
DS-DA-SM 40 : 27 : 33 87 (8.0) 57 : 23 : 20 86 (9.8) 71 : 18 : 11 87 (9.2) 78 : 16 : 7 89 (7.6)
aMeasured at ptoluene = 6.0 kPa, pmethanol = 1.5 kPa, 10 mg of catalyst and total flow rate = 2.3 cm3 s-1. bRest are
detected as 1,2,4,5-TetraMB.
The toluene conversion was generally lower for the surface modified samples compared to
the non-modified ones by ~1-4 % (see Table 3.S4) at the same reaction conditions (space

Chapter 3: Hierarchical Materials
83
velocity, temperature and partial pressures), because the concentration of Brønsted acid sites
decreased after mesoporous SiO2 overlayer deposition (Table 3.2). The selectivity of p-xylene
decreased as the toluene conversion increased, but the selectivity to p-xylene was clearly
higher for the surface modified materials (SM, DS-SM and DS-DA-SM) at the same toluene
conversion level (Figure 3.8, at 723 K; p-xylene selectivity vs. C1 conversion shown in Figure
3.S14). Note that the p-xylene selectivity decreased faster at toluene conversion levels above
~15 % (compared to the lower toluene conversion levels) for H-ZSM5 sample (Figure 3.8,
empty square) because the methanol was nearly depleted at this point (conversion >90 %).
Under these conditions the isomerization became the dominant reaction and the p-xylene
selectivity started to approach the thermodynamic equilibrium. The disproportionation
reaction was slow in these reaction conditions, i.e., <1% of the toluene converted went
through disproportionation (not shown).
Figure 3.8: p-xylene selectivity vs. the conversion of toluene during toluene methylation, measured at 723 K
(ptoluene = 6.0 kPa, pmethanol = 1.5 kPa, 4-25 mg of catalyst, total flow rate = 1.2-2.3 cm3s-1, C1 (methanol and
DME) conversion = 40-99 %). The filled symbols represent surface modified samples (SM (■), DS-SM (▲) and
DS-DA-SM (●)) and unfilled the non-modified samples (parent H-ZSM5 (□), DS (∆) and DS-DA (○)).
It was previously reported that the concentration of Brønsted acid sites located in the pore
mouth region does not affect the p-xylene selectivity significantly [3,12,14]. This was
20
30
40
50
60
70
80
90
0 5 10 15 20Toluene conversion (%)
p-x
yle
ne s
ele
cti
vit
y (
%) DS-DA-SM
DS-SM
SM
DS-DA
DS
H-ZSM5
equilibrium
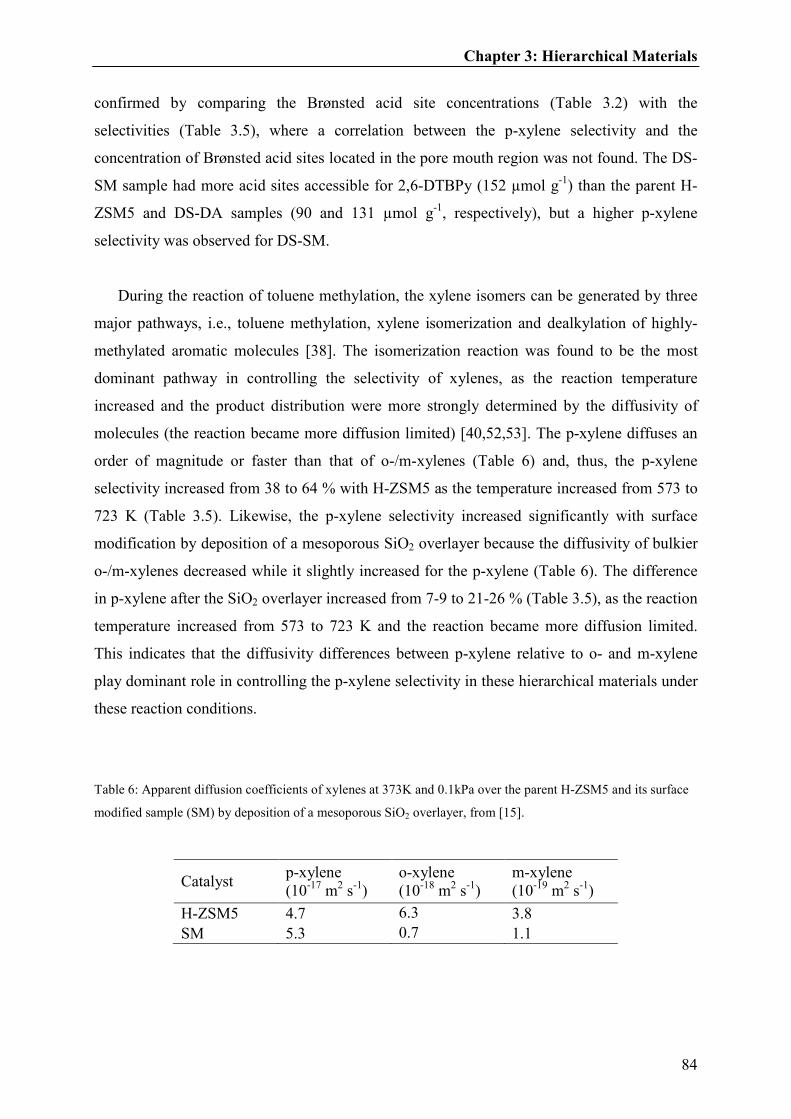
Chapter 3: Hierarchical Materials
84
confirmed by comparing the Brønsted acid site concentrations (Table 3.2) with the
selectivities (Table 3.5), where a correlation between the p-xylene selectivity and the
concentration of Brønsted acid sites located in the pore mouth region was not found. The DS-
SM sample had more acid sites accessible for 2,6-DTBPy (152 µmol g-1) than the parent H-
ZSM5 and DS-DA samples (90 and 131 µmol g-1, respectively), but a higher p-xylene
selectivity was observed for DS-SM.
During the reaction of toluene methylation, the xylene isomers can be generated by three
major pathways, i.e., toluene methylation, xylene isomerization and dealkylation of highly-
methylated aromatic molecules [38]. The isomerization reaction was found to be the most
dominant pathway in controlling the selectivity of xylenes, as the reaction temperature
increased and the product distribution were more strongly determined by the diffusivity of
molecules (the reaction became more diffusion limited) [40,52,53]. The p-xylene diffuses an
order of magnitude or faster than that of o-/m-xylenes (Table 6) and, thus, the p-xylene
selectivity increased from 38 to 64 % with H-ZSM5 as the temperature increased from 573 to
723 K (Table 3.5). Likewise, the p-xylene selectivity increased significantly with surface
modification by deposition of a mesoporous SiO2 overlayer because the diffusivity of bulkier
o-/m-xylenes decreased while it slightly increased for the p-xylene (Table 6). The difference
in p-xylene after the SiO2 overlayer increased from 7-9 to 21-26 % (Table 3.5), as the reaction
temperature increased from 573 to 723 K and the reaction became more diffusion limited.
This indicates that the diffusivity differences between p-xylene relative to o- and m-xylene
play dominant role in controlling the p-xylene selectivity in these hierarchical materials under
these reaction conditions.
Table 6: Apparent diffusion coefficients of xylenes at 373K and 0.1kPa over the parent H-ZSM5 and its surface
modified sample (SM) by deposition of a mesoporous SiO2 overlayer, from [15].
Catalyst p-xylene (10-17 m2 s-1)
o-xylene (10-18 m2 s-1)
m-xylene (10-19 m2 s-1)
H-ZSM5 4.7 6.3 3.8 SM 5.3 0.7 1.1
Chapter 3: Hierarchical Materials
85
3.3.4. Impact of hierarchical materials on toluene methylation
The p-xylene selectivity as a function of the toluene turnover rates of the parent and the
hierarchical materials at 723 K is shown in Figure 3.9 (similar figure as a function of gram of
zeolite shown in Figure 3.S15 [40]). Desilication and subsequent dealumination increased the
toluene turnover rate by ~2 and 25 %, respectively, but the surface modification by an
external SiO2 overlayer deposition on these materials decreased the rate by ~5 %. These
modification procedures led to higher (DS and DS-DA) and lower (deposition of SiO2
overlayer) toluene turnover rates by decreasing and increasing the concentration of highly
methylated aromatic products in the pores, respectively, i.e., the coverage of activated
methanol and the probability of toluene methylation relative to aromatic products increased
with desilication-dealumination and decreased with SiO2 overlayer. On the other hand,
desilication and subsequent dealumination decreased the p-xylene selectivity within xylenes
from ~65 to 55 and 50 % while the SiO2 overlayer increased p-xylene selectivity significantly
(from 50-65 to 75-85 %). Overall, the series of these zeolite modifications, i.e., desilication,
dealumination and deposition of mesoporous SiO2 overlayer, simultaneously enhanced the p-
xylene selectivity and toluene turnover rate. The decrease in p-xylene selectivity (negative)
and increase in toluene turnover rates (positive), to a different extent, from desilication-
dealumination was compensated (and forfeited) after deposition of SiO2 overlayer.

Chapter 3: Hierarchical Materials
86
Figure 3.9: Selectivity of p-xylene within xylenes vs. toluene turnover rate (left) or consumption rate (right)
during toluene methylation at 723 K (ptoluene = 6.0 kPa, pmethanol = 1.5 kPa, 10mg, total flow rate = 2.3 cm3s-1. The
filled symbols represent surface modified samples (SM (■), DS-SM (▲) and DS-DA-SM (●)) and unfilled the
non-modified samples (parent HZSM5 (□), DS (∆) and DS-DA (○)).
Modification of the zeolite porosity is an effective method for simultaneously increasing
both p-xylene selectivity and toluene turnover rates, however, only at relatively high reaction
temperatures (compare Figure 3.9, at 723 K and Figure 3.S16, at 573 K). Deposition of an
external SiO2 overlayer increased the effective diffusion length and, consequently, the
coverage of activated methanol decreased and the competitive reactions between methylation
of the aromatic products (e.g., xylene and TriMB) and the reactant (toluene) increased. Higher
reaction temperature decreased the effect of lower activation energies for the methylation of
xylene to TriMB (and TriMB to TetraMB) compared to the methylation of toluene (vide
supra). As a result, the difference in toluene turnover rates between the parent and the surface
modified samples decreased as the temperature increased, e.g., SM sample from H-ZSM5
decreased the rate from 2.3 to 0.8 (10-2 mol [s mol H]-1) at 573 K, but only from 20 to 19 at
723 K (Table 3.3). Therefore, a higher toluene turnover rate was observed for DS-DA-SM
sample compared to the parent H-ZSM5 at high reaction temperatures as a result of relatively
less-favored methylation of the aromatic products and higher coverage of activated methanol
from shorter effective diffusion length.
50
60
70
80
90
0,17 0,19 0,21 0,23 0,25
Toluene turnover rate (mol [sec mol H]-1)
p-x
yle
ne
se
lecti
vit
y (
%)
0.17 0.19 0.21 0.23 0.25
DS-DA-SM
DS-SMSM
DS-DA
DS
H-ZSM5

Chapter 3: Hierarchical Materials
87
3.4. Conclusions
Mesopores were generated in microporous H-ZSM5 by desilication with NaOH and
chemical liquid deposition (CLD) of tetraethyl orthosilicate (TEOS) onto the zeolite surfaces.
The Lewis and Brønsted acid site concentrations in the pore mouth region (accessible by 2,6-
di-tert-butyl-pyridine) increased substantially after desilication, but these sites were
effectively removed by subsequent dealumination with tartaric acid, without causing major
changes to the mesoporosity. The surface modification by deposition of a mesoporous SiO2
overlayer mainly decreased the concentration of Brønsted acid sites in the pore mouth region
and decreased the diffusivity of the bulkier o- and m- xylene isomers, while increasing for p-
xylene (desired product).
The toluene turnover rate and p-xylene selectivity increased simultaneously at relatively
high reaction temperatures (>673 K) with H-ZSM5 after desilication, dealumination and
subsequent SiO2 overlayer deposition via CLD of tetraethyl orthosilicate. The turnover rate of
toluene was strongly influenced by effective diffusion length because the reaction of toluene
methylation was diffusion limited by the transport of large aromatic products. The selectivity
of p-xylene among these hierarchical materials in these reaction conditions was
predominantly controlled by the diffusivity differences between p-xylene relative to o- and m-
xylenes and the Brønsted acid sites in the pore mouth region were determined to play only a
minor role.
3.5. Acknowledgments
The financial support from the King Fahd University of Petroleum and Minerals (KFUPM) is
acknowledged. Helpful technical discussions with Gary Haller, Jeongnam Kim, Mirek
Derewinski, Oliver Gutiérrez, Stefan Schallmoser and Xianyong Sun, as well as Carolina
Neudeck for dynamic light scattering experiments, Xaver Hecht for N2 physisorption
experiments and Martin Neukamm for AAS measurements are also acknowledged.

Chapter 3: Hierarchical Materials
88
3.6. Supplementary materials
Table 3.S1: Integrated area counts from powder X-ray diffraction pattern in Figure 2 of the manuscript.
5-10o 22-25o Total
Relative crystallinitya (%)
H-ZSM5 37484 28246 65730 100 DS 36261 25443 61704 94 DS-SM 40013 26524 66537 101 SM 22697 34848 57545 88
aDetermined by assuming that the parent H-ZSM5 has perfect crystallinity.
The pore distribution size of the parent (H-ZSM5), desilicated (DS) and subsequently
dealuminated (DS-DA) samples are compared to the corresponding surface modified (SM)
materials in Figures 3.S1-3.S3. The applicable diameter range with nitrogen adsorption
measurement was 1.8nm (cylindrical pore, NLDFT equilibrium model).
Figure 3.S1: Pore size distribution of the parent (H-ZSM5; □) and its surface modified sample by SiO2
deposition (SM; ■), analyzed by DFT method (cylindrical pore, NLDFT equilibrium model).
0
0,04
0,08
0,12
0,16
0,2
0,24
2 4 6 8 10 12
dV
(cm
3[n
m g
]-1)
Pore Size (nm)
0.24
0.20
0.16
0.12
0.08
0.04

Chapter 3: Hierarchical Materials
89
Figure 3.S2: Pore size distribution of the desilicated (DS; ∆) and its surface modified samples by SiO2 deposition
(DS-SM; ▲), analyzed by DFT method (cylindrical pore, NLDFT equilibrium model).
Figure 3.S3: Pore size distribution of the subsequent dealuminated (DS-DA; ○) and its surface modified samples
by SiO2 deposition (DS-DA-SM; ●), analyzed by DFT method (cylindrical pore, NLDFT equilibrium model).
0
0,04
0,08
0,12
0,16
0,2
0,24
2 4 6 8 10 12
dV
(cm
3[n
m g
]-1)
Pore Size (nm)
0.24
0.20
0.16
0.12
0.08
0.04
0
0,04
0,08
0,12
0,16
0,2
0,24
2 4 6 8 10 12
dV
(c
m3
[nm
g]-
1)
Pore Size (nm)
0.24
0.20
0.16
0.12
0.08
0.04

Chapter 3: Hierarchical Materials
90
Figure 3.S4: Superimposed infrared (IR) spectra of H-ZSM5, DS and DS-DA (left) and H-ZSM5 and SM (right)
measured at 423 K under vacuum (< 10-7 kPa) after activation at 723 K for 1 hour. The bands at 3745 cm-1 and
3610 cm-1 represents O-H vibration of the terminal silanol groups and the Brønsted acid sites, respectively. The
spectra were normalized to the lattice vibrations and were superimposed onto H-ZSM5 spectrum.
34003500360037003800
Wavenumber (cm-1)
No
rmali
zed
ab
so
rba
nc
e (
a.u
.)
DS-DA
DS
H-ZSM5
Terminal
silanol
Brønsted
acid
0.002
34003500360037003800
Wavenumber (cm-1)
0.003
No
rmali
zed
ab
so
rba
nc
e (
a.u
.)
Terminal
silanol
Brønsted
acid
SM
H-ZSM5

Chapter 3: Hierarchical Materials
91
Figure 3.S5: Superimposed infrared (IR) spectra of DS and DS-SM (left) and DS-DA and DS-DA-SM (right)
measured at 423 K under vacuum (< 10-7 kPa) after activation at 723 K for 1 hour. The bands at 3745 cm-1 and
3610 cm-1 represents O-H vibration of the terminal silanol groups and the Brønsted acid sites, respectively. The
spectra were normalized to the lattice vibrations and were superimposed onto DS or DS-DA spectrum.
34003500360037003800
Wavenumber (cm-1)
0.002
No
rmali
zed
ab
so
rban
ce (
a.u
.)Terminal
silanol
Brønsted
acid
DS-SM
DS
34003500360037003800
Wavenumber (cm-1)
0.002
No
rmali
zed
ab
so
rban
ce (
a.u
.)
Terminal
silanol
Brønsted
acid
DA-DS-SM
DS-DA

Chapter 3: Hierarchical Materials
92
Figure 3.S6: Infrared (IR) spectra of activated samples (heated to 723 K for 1 hour) after subtraction of the
spectra prior to the modification, i.e., DS = DS minus H-ZSM5, DS-DA = DS-DA minus DS, SM = SM minus
H-ZSM5, DS-SM = DS-SM minus DS and DS-DA-SM = DS-DA-SM minus DS-DA. All spectra were measured
at 423 K under vacuum (< 10-7 kPa) and normalized to the lattice vibrations. The bands at 3745 cm-1 and 3610
cm-1 represents O-H vibration of the terminal silanol groups and the Brønsted acid sites, respectively.
The distribution of the Lewis acid sites calculated by assuming similar extinction
coefficient is summarized in Table 3.S2 (deconvoluted IR spectra of H-ZSM5 and DS are
shown as an example in Figure 3.S7). The fraction of Lewis acid sites with hydrogen bond
interactions from Brønsted acid site (1447 cm-1) decreased significantly from 96 to 42% with
desilication because relative concentration of the Brønsted to Lewis acid sites decreased by
desilication (B/L; Table 3.S2). Consequently, there was less Brønsted acid sites available to
interact with coordinately bonded pyridine on the Lewis acids sites generated by desilication.
Subsequent dealumination removed more Lewis relative to Brønsted acid sites (Table 2) and
34003500360037003800
Wavenumber (cm-1)
No
rmali
zed
ab
so
rban
ce (
a.u
.)
DS-DA-SM
DS-SM
SM
DS-DA
DS
0.005
Terminal
silanol
Brønsted
acid

Chapter 3: Hierarchical Materials
93
the fraction of the band at ~1447 cm-1 increased from 42 to 72 %. Note that the Brønsted to
Lewis acid site ratio was slightly higher for the DS-DA sample compared to H-ZSM5 (6.3 to
5.7; Table 3.S2) but lower fraction of the band at ~1447 cm-1 was observed (71 vs. 96 % with
DS-DA and H-ZSM5, respectively). This suggests that the Lewis acid sites with a nearby
Brønsted acid site were selectively removed (or vice versa, Brønsted acid located near Lewis
acid sites were removed) by subsequent dealumination using tartaric acid.
Deposition of mesoporous SiO2 onto H-ZSM5 and DS-DA removed some Brønsted acids
but slightly increased Lewis acid sites (Table 2). This decreased the Brønsted to Lewis acid
site ratio and as a result, the fraction of Lewis acid sites with hydrogen bond interactions from
a Brønsted acid site (1447 cm-1) from 96 to 79 % and 71 to 62 % after depositing mesoporous
SiO2 overlayer on H-ZSM5 and DS-DA (Table 3.S2), respectively. In contrast, less Brønsted
relative to Lewis acid sites were removed with DS sample, i.e., the ratio of Brønsted to Lewis
acid sites increased with the DS sample, and, consequently, the fraction of band at 1447 cm-1
increased slightly after deposition of SiO2 overlayer from 42 to 44 % (Table 3.S2). Note that
decrease in the fraction of the band at 1447 cm-1 after heating the samples to 723 K was more
pronounced compared to 1455 cm-1, indicating that pyridine is less strongly bound to the sites
with hydrogen bond from a Brønsted acid site. A linear correlation between the fraction of
Lewis acid band at 1447 cm-1 and the fraction of Lewis acid sites remaining after heating to
723 K was observed (Figure 3.S8).
Table 3.S2: Distribution of Lewis acid sites determined from infrared spectral band deconvolution.
Totala Strongb
1455 cm-1 (%)c 1447 cm-1 (%)c 1455 cm-1 (%)c 1447 cm-1 (%)c B/Ld
H-ZSM5 4 96 39 61 5.7 DS 58 42 90 10 2.3 DS-DA 29 71 74 26 6.3 SM 21 79 78 22 4.6 DS-SM 56 44 91 9 2.8 DS-DA-SM 38 62 83 17 4.2 aAfter adsorption of pyridine at 423K and outgassing for 1 hour under vacuum. bAfter subsequently heating the
samples to 723 K for 0.5 hour. cSimilar molar extinction coefficients were assumed for bands at 1447 and 1455
cm-1, which represent the coordinately bonded pyridine molecules on Lewis acid sites with and without
hydrogen bond interactions from a Brønsted acid site, respectively. dB/L = Ratio of total Brønsted to Lewis acid
sites, from Table 2.
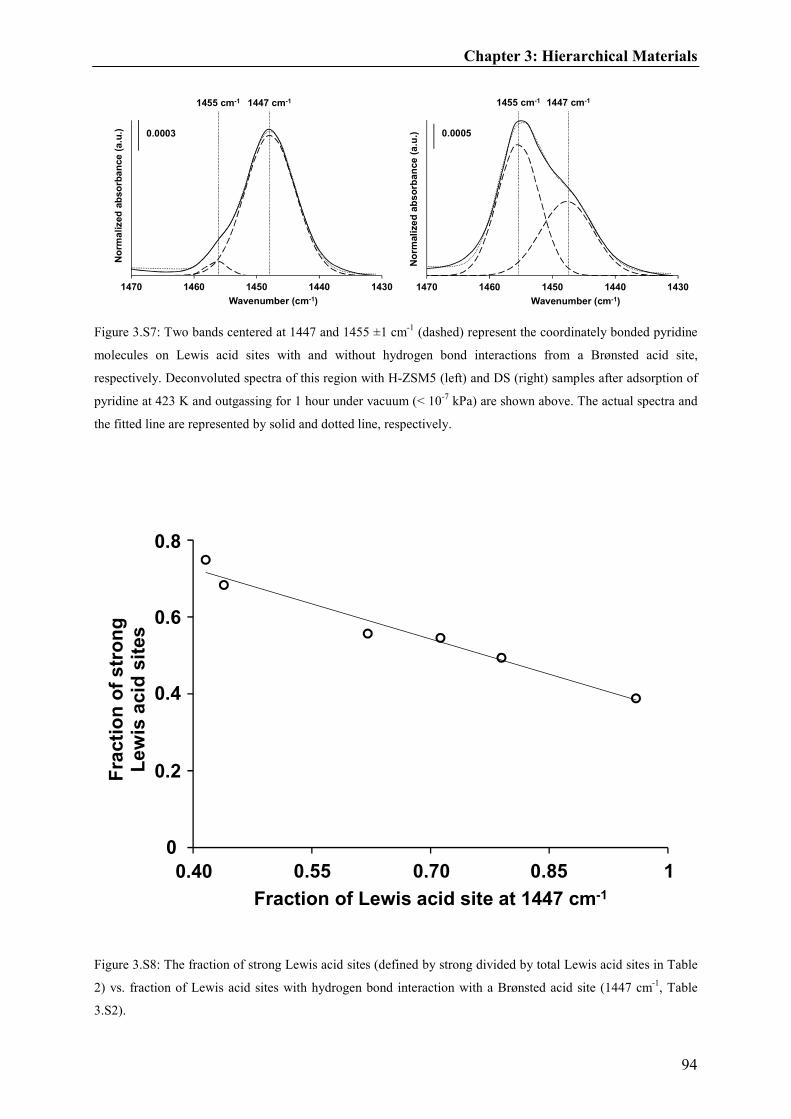
Chapter 3: Hierarchical Materials
94
Figure 3.S7: Two bands centered at 1447 and 1455 ±1 cm-1 (dashed) represent the coordinately bonded pyridine
molecules on Lewis acid sites with and without hydrogen bond interactions from a Brønsted acid site,
respectively. Deconvoluted spectra of this region with H-ZSM5 (left) and DS (right) samples after adsorption of
pyridine at 423 K and outgassing for 1 hour under vacuum (< 10-7 kPa) are shown above. The actual spectra and
the fitted line are represented by solid and dotted line, respectively.
Figure 3.S8: The fraction of strong Lewis acid sites (defined by strong divided by total Lewis acid sites in Table
2) vs. fraction of Lewis acid sites with hydrogen bond interaction with a Brønsted acid site (1447 cm-1, Table
3.S2).
14301440145014601470
Wavenumber (cm-1)
0.0003
No
rma
lized
ab
so
rba
nce
(a
.u.)
1447 cm-11455 cm-1
14301440145014601470
Wavenumber (cm-1)
0.0005
No
rmali
ze
d a
bs
orb
an
ce
(a
.u.)
1447 cm-11455 cm-1
0
20
40
60
80
40 55 70 85 100
Fra
cti
on
of
str
on
g
Le
wis
acid
sit
es
Fraction of Lewis acid site at 1447 cm-1
10.850.700.40 0.55
0.8
0.6
0.2
0.4

Chapter 3: Hierarchical Materials
95
Figure 3.S9: Area counts of the band at 1616 cm-1 (C=C vibration) vs. 3367 cm-1 (N-H+ vibration), after
adsorption of 2,6-di-tert-butyl-pyridine at 423 K, 0.01 kPa and outgassing for 1 hour in vacuum (< 10-7 kPa).
The synthesis batch loses ~ 25 and 5 % of mass during desilication and subsequent
dealumination procedure, respectively. The number (instead of concentration) of acid sites
normalized to the initial 1 gram of parent H-ZSM5 sample are calculated, therefore, to keep
track of the changes after each procedure more accurately. These numbers are determined as
follows:
H-ZSM5: [Acid site] x 1g material (2)
DS: [Acid site] x 1g material x 0.75 (3)
DS-DA: [Acid site] x 1g material x 0.75 x 0.95 (4)
SM: [Acid site] x 1g material (5)
DS-SM: [Acid site] x 1g material x 0.75 (6)
DS-DA-SM: [Acid site] x 1g material x 0.75 x 0.95 (7)
0
0,01
0,02
0,03
0,04
0 0,005 0,01 0,015 0,02 0,025
Peak a
rea o
f 1616 c
m-1
(a.u
.)
Peak area of 3370 cm-1 (a.u.)
0.0250.020.0150.010.005
0.01
0.02
0.03
0.04

Chapter 3: Hierarchical Materials
96
where [acid site] denotes the concentration of sites per gram of zeolite (reported in Table 3 of
the manuscript as µmol per gram of material). Figure 3.S10 shows the number of acid sites
normalized by initial 1 gram of the parent H-ZSM5.
Figure 3.S10: Number of Brønsted and Lewis acid sites calculated from 1 gram of H-ZSM5 as a starting
material. The material loses ~ 25 and 5 % of weight during desilication and subsequent dealumination,
respectively, and gains ~ 12 % of mass after TEOS deposition onto the surface. White represents Lewis acid
sites, grey and black the Brønsted acid site accessible and not accessible by bulky 2,6-DTBPy, respectively.

Chapter 3: Hierarchical Materials
97
Figure 3.S11: Change in Lewis acid concentration after deposition of SiO2 overlayer (from Table 2).
Table 3.S3: Turnover rates of C1 at different reaction temperatures during toluene methylation.
573 K 623 K 673 K 723 K
C1
a turnover rateb (10-2 mol [s mol H]-1)
C1 turnover rate (10-2 mol [s mol H]-1)
C1 turnover rate (10-2 mol [s mol H]-1)
C1 turnover rate (10-2 mol [s mol H]-1)
H-ZSM5 5.4 17 25 31
DS 4.5 16 27 32
DS-DA 6.1 18 29 35
SM 4.0 16 29 36
DS-SM 3.1 14 29 38
DS-DA-SM 4.5 18 32 42 aC1 = methanol and DME (both are treated as the same reactant because methanol can be transformed into DME
during the reaction and DME can also be used for methylation). bMeasured at ptoluene = 6.0 kPa, pmethanol = 1.5
kPa, 10 mg of catalyst and total flow rate = 2.3 cm3 s-1.
-50
-35
-20
-5
10
25
HZSM5 DS DS-DA
∆ L
ew
is A
cid
sit
e c
on
ce
ntr
ati
on
(µm
ol
[g z
eo
lite
]-1)
Removal of Lewis
acid sites during
TEOS deposition
Generation of Lewis acid
sites during
condensation/hydrolysis

Chapter 3: Hierarchical Materials
98
Table 3.S4: Conversion of reactants (C1 and toluene) at different reaction temperatures during toluene
methylation.
573 K 623 K 673 K 723 K C1
a Toluene C1 Toluene C1 Toluene C1 Toluene % conversionb % conversion % conversion % conversion H-ZSM5 15 1.4 45 4.8 68 8.7 84 13 DS 11 1.8 44 5.9 75 10 89 13 DS-DA 15 2.1 46 6.2 73 11 88 14 SM 8.5 0.4 39 2.4 65 6.2 82 10 DS-SM 5.5 0.5 31 2.3 67 6.4 88 11 DS-DA-SM 8.3 0.7 34 3.0 65 6.9 83 11
aC1 = methanol and DME. bMeasured at ptoluene = 6.0 kPa, pmethanol = 1.5 kPa, 10 mg of catalyst and total flow rate
= 2.3 cm3 s-1.
Figure 3.S12: Temperature dependence of toluene turnover rates between 548-623 K (ptoluene = 6.0 kPa, pmethanol =
1.5 kPa, 10 mg, total flow rate = 2.3 cm3s-1.The filled symbols represent surface modified samples (SM (■), DS-
SM (▲) and DS-DA-SM (●)) and unfilled the non-modified samples (parent HZSM5 (□), DS (∆) and DS-DA
(○)).
-6
-5
-4
-3
-2
1,6 1,65 1,7 1,75 1,8 1,85
Ln
(to
luen
e t
urn
ov
er
rate
)
1000/T (K-1)
1.81.751.71.651.6 1.85
DS-DA-SM
DS-SM
SM
DS-DA
DS
H-ZSM5
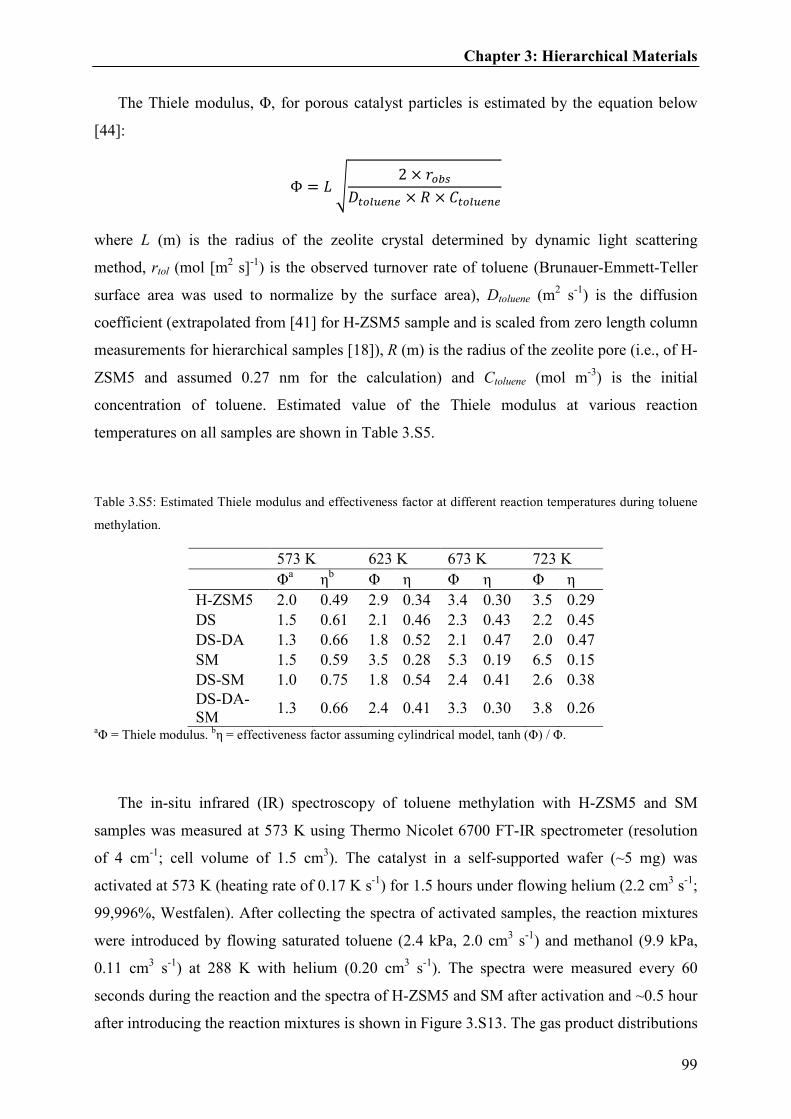
Chapter 3: Hierarchical Materials
99
The Thiele modulus, Φ, for porous catalyst particles is estimated by the equation below
[44]:
Φ = 01 2 × 3(456%()7$'$ × 8 × 9%()7$'$
where L (m) is the radius of the zeolite crystal determined by dynamic light scattering
method, rtol (mol [m2 s]-1) is the observed turnover rate of toluene (Brunauer-Emmett-Teller
surface area was used to normalize by the surface area), Dtoluene (m2 s-1) is the diffusion
coefficient (extrapolated from [41] for H-ZSM5 sample and is scaled from zero length column
measurements for hierarchical samples [18]), R (m) is the radius of the zeolite pore (i.e., of H-
ZSM5 and assumed 0.27 nm for the calculation) and Ctoluene (mol m-3) is the initial
concentration of toluene. Estimated value of the Thiele modulus at various reaction
temperatures on all samples are shown in Table 3.S5.
Table 3.S5: Estimated Thiele modulus and effectiveness factor at different reaction temperatures during toluene
methylation.
573 K 623 K 673 K 723 K
Φa ηb Φ η Φ η Φ η
H-ZSM5 2.0 0.49 2.9 0.34 3.4 0.30 3.5 0.29 DS 1.5 0.61 2.1 0.46 2.3 0.43 2.2 0.45 DS-DA 1.3 0.66 1.8 0.52 2.1 0.47 2.0 0.47 SM 1.5 0.59 3.5 0.28 5.3 0.19 6.5 0.15 DS-SM 1.0 0.75 1.8 0.54 2.4 0.41 2.6 0.38 DS-DA-SM
1.3 0.66 2.4 0.41 3.3 0.30 3.8 0.26 aΦ = Thiele modulus. bη = effectiveness factor assuming cylindrical model, tanh (Φ) / Φ.
The in-situ infrared (IR) spectroscopy of toluene methylation with H-ZSM5 and SM
samples was measured at 573 K using Thermo Nicolet 6700 FT-IR spectrometer (resolution
of 4 cm-1; cell volume of 1.5 cm3). The catalyst in a self-supported wafer (~5 mg) was
activated at 573 K (heating rate of 0.17 K s-1) for 1.5 hours under flowing helium (2.2 cm3 s-1;
99,996%, Westfalen). After collecting the spectra of activated samples, the reaction mixtures
were introduced by flowing saturated toluene (2.4 kPa, 2.0 cm3 s-1) and methanol (9.9 kPa,
0.11 cm3 s-1) at 288 K with helium (0.20 cm3 s-1). The spectra were measured every 60
seconds during the reaction and the spectra of H-ZSM5 and SM after activation and ~0.5 hour
after introducing the reaction mixtures is shown in Figure 3.S13. The gas product distributions

Chapter 3: Hierarchical Materials
100
and rates (all within factor of 2) trends were similar to the ones obtained from plug flow
reactor at similar conditions. The areas of the O-H vibration region of Brønsted acid (~3610
cm-1) in Figure 3.S13 were integrated to estimate the changes of surface coverage in the
zeolites. About 20 and 40 % of Brønsted acid sites interacted with H-ZSM5 and SM samples,
respectively (determined by change in the area counts of dashed from solid spectra in 3610
cm-1 region in Figure 3.S13).
Figure 3.S13: Infrared spectra before (solid) and during the reaction of toluene methylation (dashed, after ~0.5
hour) at 573 K with H-ZSM5 (top) and SM (bottom; surface modified sampled derived from H-ZSM5 by
depositing SiO2 overlayer from tetraethyl orthosilicate) samples. The areas of O-H vibration region
corresponding to Brønsted acid (~3610 cm-1) were integrated to estimate the surface coverage in the zeolites.
14002000260032003800
0.003
No
rmali
zed
ab
so
rban
ce (
a.u
.)
Wavenumber (cm-1)
H-ZSM5
SM

Chapter 3: Hierarchical Materials
101
Table 3.S6: Formation rate of xylenes and trimethylbenzenes (TriMBs) and the rate ratios at different reaction
temperatures.
573 K 623 K 673 K 723 K Formation ratesa
Xylenes (TriMBs)b
X:Tc Xylenes (TriMBs)
X:T Xylenes (TriMBs)
X:T Xylenes (TriMBs)
X:T
H-ZSM5 2.1 (0.13) 16 6.8 (0.64) 11 12 (1.3) 10 18 (1.8) 10 DS 2.5 (0.16) 16 7.8 (0.81) 10 14 (1.5) 9 18 (1.8) 10 DS-DA 3.4 (0.19) 18 9.8 (0.87) 11 17 (1.8) 10 23 (2.3) 10 SM 0.7 (0.06) 11 4.1 (0.34) 12 11 (0.78) 14 18 (1.0) 17 DS-SM 0.8 (0.08) 10 3.6 (0.42) 9 10 (1.0) 10 18 (1.3) 14 DS-DA-SM 1.3 (0.12) 11 5.6 (0.64) 9 13 (1.4) 9 21 (1.8) 12
aMeasured at ptoluene = 6.0 kPa, pmethanol = 1.5 kPa, 10 mg of catalyst and total flow rate = 2.3 cm3 s-1. The units of
the rates are reported as 10-2 mol [s mol H]-1. bValues inside the parenthesis are the TriMBs formation rates. bX:T
= ratio of xylene to TriMBs formation rates.
Figure 3.S14: p-xylene selectivity vs. the conversion of C1 (methanol and DME) during toluene methylation,
measured at 723 K (ptoluene = 6.0 kPa, pmethanol = 1.5 kPa, catalyst amount = 4-25 mg, total flow rate = 1.2-2.3
cm3s-1, toluene conversion = 5-16 %). The filled symbols represent surface modified samples (SM (■), DS-SM
(▲) and DS-DA-SM (●)) and unfilled the non-modified samples (parent H-ZSM5 (□), DS (∆) and DS-DA (○)).
20
30
40
50
60
70
80
90
40 50 60 70 80 90 100
C1 conversion (%)
p-x
yle
ne s
ele
cti
vit
y (
%)
equilibrium

Chapter 3: Hierarchical Materials
102
Figure 3.S15: Selectivity of p-xylene within xylenes vs. toluene consumption rate (per gram of zeolite) during
toluene methylation at 723 K (ptoluene = 6.0 kPa, pmethanol = 1.5 kPa, 10mg, total flow rate = 2.3 cm3s-1. The filled
symbols represent surface modified samples (SM (■), DS-SM (▲) and DS-DA-SM (●)) and unfilled the non-
modified samples (parent HZSM5 (□), DS (∆) and DS-DA (○)).
Figure 3.S16: Selectivity of p-xylene within xylenes vs. toluene turnover rate during toluene methylation at 573
K (ptoluene = 6.0 kPa, pmethanol = 1.5 kPa, 10mg, total flow rate = 2.3 cm3s-1. The filled symbols represent surface
modified samples (SM (■), DS-SM (▲) and DS-DA-SM (●)) and unfilled the non-modified samples (parent
HZSM5 (□), DS (∆) and DS-DA (○)).
50
60
70
80
90
65 70 75 80 85 90
p-x
yle
ne
se
lec
tivit
y
(%)
Toluene consumption rate (µmol [sec g zeolite]-1)
DS-DA-SM
DS-SMSM
DS-DA
DS
H-ZSM5
30
35
40
45
50
0,00 0,01 0,02 0,03 0,04
Toluene turnover rate (mol [sec mol H]-1)
p-x
yle
ne s
ele
cti
vit
y (
%)
0 0.01 0.02 0.03 0.04
DS-DA-SM
DS-SM
SM
DS-DADS
H-ZSM5

Chapter 3: Hierarchical Materials
103
3.7. References
[1] W. Vermeiren, J.P. Gilson. Topics in Catalysis 52 (2009) 1131-1161.
[2] T. Tsai, S. Liu, I. Wang, Applied Catalysis A: General 181 (1999) 355-398.
[3] T. Hibino, M. Niwa, Y. Murakami, J. Catal. 128 (1991) 551-558.
[4] W.W. Kaeding, C. Chu, L.B. Young, B. Weinstein, S.A. Butter, J. Catal. 67 (1981)
159-174.
[5] H. Vinek, J.A. Lercher, J. Mol. Catal., 64 (1991) 23-39.
[6] R. D. Chirico, W.V. Steele, J. Chem. Eng. Data 42 (1997) 784-790.
[7] Y.S. Bhat, J. Das, K.V. Rao, A.B. Halgeri, 159 (1996) 368-374.
[8] L.B. Young, S.A. Butter, W.W. Kaeding, J. Catal. 76 (1982) 418-432.
[9] O. Mikkelsen, P.O. Rønning, S. Kolboe, Micropor. Mesopor. Mater. 40 (2000) 95-
113.
[10] J.P. Breen, R. Burch, M. Kulkarni, D. McLaughlin, P.J. Collier, S.E. Golunski, Appl.
Catal. A: General 316 (2007) 53-60.
[11] H. Vinek, G. Rumplmayr, J.A. Lercher, J. Catal. 115 (1989) 291-300.
[12] H.P. Röger, M. Krämer, K.P. Möller, C.T. O’Connor, Micropor. Mesopor. Mater. 21
(1998) 607-614.
[13] S. Zheng, H.R. Heydenrych, H.P. Röger, A. Jentys, J.A. Lercher, Top. Catal. 22
(2003) 101-106.
[14] J. Čejka, N. Žilková, B. Wichterlová, G. Eder-Mirth, J.A. Lercher, Zeolites 17 (1996)
265-271.
[15] S. Zheng, A. Jentys, J.A. Lercher, J. Catal. 241 (2006) 304-311.
[16] J.C. Groen, W. Zhu, S. Brouwer, S.J. Huynink, F. Kapteijn, J.A. Moulijn, J. Pérez-
Ramírez, J. Am. Chem 129 (2007) 355-360.
[17] F.C. Meunier, D. Verboekend, J.P. Gilson, J.C. Groen, J. Pérez-Ramírez, Micropor.
Mesopor. Mater. 148 (2012) 115-121.
[18] R. Kolvenbach, J. H. Ahn, S. S. Al-Khattaf, A. Jentys, J. A. Lercher, in preparation.
[19] C.H. Christensen, K. Johannsen, E. Törnqvist, I. Schmidt, H. Topsøe, C.H.
Christensen, Cat. Today 128 (2007) 117-122.
[20] C.H. Christensen, K. Johannsen, I. Schmidt, C.H. Christensen, J. Am. Chem 125
(2003) 13370-13371.
[21] C. Fernandez, I. Stan, J.P. Gilson, K. Thomas, Aurélie Vicente, A. Bonila, J. Pérez-
Ramírez, Chem. Eur. J. 16 (2010) 6224-6233.
Chapter 3: Hierarchical Materials
104
[22] J.C. Groen, L.A.A. Peffer, J.A. Moulijn, J. Pérez-Ramírez, Colloids and Surfaces A:
Physicochem. Eng. Aspects 241 (2004) 53-58.
[23] J. Kim, M. Choi, R. Ryoo, J. Catal. 269 (2010) 219-228.
[24] S. Brunauer, P. H. Emmett, E. Teller, J. Am. Chem. Soc. 60 (1938) 308-319.
[25] M. Kruk, M. Jaroniec, J. Choma, Carbon 36 (1998) 1447.
[26] S. J. Gregg, Adsorption Surface Area and Porosity, 2nd ed.; Academic Press Inc.: New
York, 1982.
[27] A. Corma, V. Fornes, L. Forni, F. Marquez, J. Martinez-Triguero, D. Moscotti, J.
Catal. 179 (1998) 451-458.
[28] Database of Zeolite Structures (http://www.iza-structure.org/databases/).
[29] N. Tøpsoe, K. Pedersen, E.G. Derouane, J. Catal. 70 (1981) 41-52.
[30] G. Qin, L. Zheng, Y. Xie, C. Wu, J. Catal. 95 (1985) 609-612.
[31] G. Lietz, K.H. Schnabel, C. Peuker, T. Gross, W. Storek, J. Volter, J. Catal. 148
(1994) 562-568.
[32] K. Yamagishi, S. Namba, T. Yashima, J. Phys. Chem. 95 (1991) 872-877.
[33] M. Kustova, M.S. Holm, C.H. Christensen, Y. Pan, P. Beato, T.V.W. Janssens, F.
Joensen, J. Nerlov, Stud. Surf. Sci. Catal. 174A (2008) 117-122.
[34] D. Ma, F. Deng, R. Fu, X. Han, X. Bao, J. Phys. Chem. B 105 (2001) 1770-1779.
[35] R.A. Shaikh, S.G. Hegde, A.A. Behlekar, B.S. Rao, Catal. Today 49 (1999) 201-209.
[36] J.P. Marques, I. Gener, P. Ayrault, J.C. Bordado, J.M. Lopes, F. Ramôa Ribeiro, M.
Guisnet, Micropor. Mesopor. Mater. 60 (2003) 251-262.
[37] E.P. Parry, J. Catal. 2 (1963) 371-379.
[38] J.H. Ahn, R. Kolvenbach, S.S. Al-Khattaf, A. Jentys, J.A. Lercher, ACS Catal. 3
(2013) 817-825.
[39] P.B. Weisz, Science 178 (1973) 433-440.
[40] J. H. Ahn, R. Kolvenbach, S. S. Al-Khattaf, A. Jentys, J. A. Lercher, to be submitted.
[41] O.C. Gobin, S.J. Reitmeier, A. Jentys, J.A. Lercher, J. Phys. Chem. C 113 (2009)
20435-20444.
[42] G. Mirth, J.A. Lercher, J. Phys. Chem. 95 (1991) 3736-3740.
[43] G. Mirth, J.A. Lercher, J. Catal. 132 (1991) 244-252.
[44] I. Chorkendorff, J.W. Niemantsverdriet, Concepts of Modern Catalysis and Kinetics,
Wiley-VCH, Weinheim, Germany, 2003, p. 211-213.

Chapter 3: Hierarchical Materials
105
[45] D. Lesthaeghe, B. De Sterck, V. Van Speybroeck, G.B. Marin, M. Waroquier, Angew.
Chem. Int. Ed. 46 (2007) 1311-1314.
[46] D.M. McCann, D. Lesthaeghe, P.W. Kletnieks, D.R. Guenther, M.J. Hayman, V. Van
Speybroeck, M. Waroquier, J.F. Haw, Angew. Chem. Int. Ed. 47 (2008) 5179-5182.
[47] S. Arrhenius, Z. physik. Chem. 4 (1989) 226-248.
[48] S. Svelle, S. Kolboe, O. Swang, U. Olsbye, J. Phys. Chem. B 109 (2005) 12874-
12878.
[49] I.I. Ivanova, A. Corma, J. Phys. Chem. B 101 (1997) 547-551.
[50] Olsbye, U.; Bjørgen, M.; Svelle, S.; Lillerud, K.; Kolboe, S. Catal. Today 106 (2005)
108-111.
[51] Lesthaeghe, D.; Horré, A.; Waroquier, M.; Marin, G.B.; Van Speybroeck, V. Chem.
Eur. J. 15 (2009) 10803-10808.
[52] J. H. Ahn, R. Kolvenbach, S. S. Al-Khattaf, A. Jentys, J. A. Lercher, in preparation.
[53] G. Mirth, J.A. Lercher, J. Catal. 147 (1994) 199-206.

Chapter 3: Hierarchical Materials
106

Chapter 4: Selectivity of p-xylene
107
Chapter 4
Influence of the reaction temperature on p-
xylene selectivity in toluene methylation over
medium pore-sized zeolites
The influence of the reaction temperature on p-xylene selectivity in toluene methylation was
investigated over medium pore-sized zeolites with different frameworks (H-ZSM5, H-ZSM11
and H-NU10) as well as after structural modifications including deposition of tetraethyl
orthosilicate on the surface, isomorphous substitution of aluminum in the framework with
iron and the crystal size. An increase in the reaction temperature consistently resulted in a
higher p-xylene selectivity from all three major reaction pathways for the formation of p-
xylene during toluene methylation, i.e., methylation of toluene, isomerization of xylenes,
further methylation and subsequent formation of xylenes after eliminating light hydrocarbons
as byproducts. Among these reactions, the isomerization of xylenes influenced the xylene
selectivity most strongly at high temperatures and enabled the diffusivity differences between
xylene isomers to play a significant role in favoring high p-xylenes selectivity.

Chapter 4: Selectivity of p-xylene
108
4.1 Introduction
Xylenes are important chemical intermediates for the production of polyesters and
plasticizers [1,2]. The sources for the industrial production of xylenes are catalytic reforming
and thermal cracking of naphtha, but alternative routes include the reaction from toluene by
disproportionation and methylation [3]. The alkylation of toluene with methanol in particular,
is an attractive route to produce xylenes because toluene is produced in surplus relative to the
market demand [1, 4 ]. Furthermore, toluene methylation can be carried out at lower
temperatures than toluene disproportionation [5,6] and methanol, used for the alkylation,
should be widely available from the abundant resources of natural gas and potential increase
in production for variety of uses in the future [7,8].
Among the three xylene isomers, p-xylene is the most valuable intermediate in the
industry (~80 % of xylenes demand) for the production of terephthalate [1,4]. m-Xylene,
however, is the thermodynamically favored isomer (~50 % [9]) and is typically the main
product from various xylene production routes [3,5]. A catalyst with high para selectivity
would therefore be desirable to reduce the costs of the expensive and energy intensive
separation processes (e.g. crystallization or adsorption methods [1,3]) for the xylene isomers.
Impregnation with phosphorous or boron compounds [10,11], tetraethyl orthosilicate (TEOS)
deposition on the zeolite surface [12,13] or increasing the crystal size [5,6] are some of the
known procedures in the literature to enhance the p-xylene selectivity during toluene
methylation. Despite of a significant demand of p-xylene in the industry, detailed studies of
the reaction conditions (e.g., temperature and pressure) and the zeolite properties governing
diffusion on xylene selectivity were yet not reported in the literature.
Herein, we investigate the factors influencing the selectivity of p-xylene in toluene
methylation over various medium pore-sized zeolites at different reaction temperatures. Three
main reaction pathways for the formation of p-xylenes during toluene methylation were
studied: methylation of toluene, isomerization of xylenes, further methylation and subsequent
elimination of less-methylated aromatic molecules as xylenes (and light hydrocarbons) from
highly-methylated aromatics [6,8,14,15]. In all these pathways, an increase of the reaction
temperature consistently resulted in a higher p-xylene selectivity because the effect of
differences in diffusivities between p-xylene and o-, m-xylenes [ 16 ] became more
pronounced. This study demonstrates that high reaction temperatures are advantageous for the
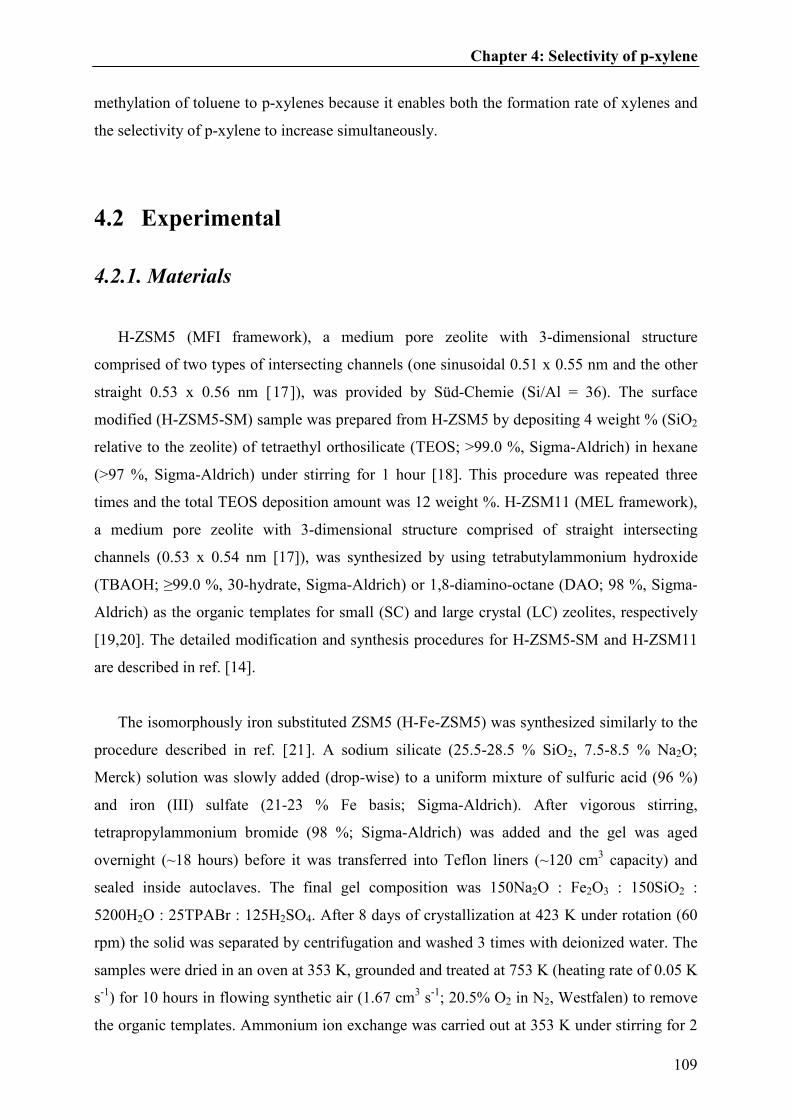
Chapter 4: Selectivity of p-xylene
109
methylation of toluene to p-xylenes because it enables both the formation rate of xylenes and
the selectivity of p-xylene to increase simultaneously.
4.2 Experimental
4.2.1. Materials
H-ZSM5 (MFI framework), a medium pore zeolite with 3-dimensional structure
comprised of two types of intersecting channels (one sinusoidal 0.51 x 0.55 nm and the other
straight 0.53 x 0.56 nm [17]), was provided by Süd-Chemie (Si/Al = 36). The surface
modified (H-ZSM5-SM) sample was prepared from H-ZSM5 by depositing 4 weight % (SiO2
relative to the zeolite) of tetraethyl orthosilicate (TEOS; >99.0 %, Sigma-Aldrich) in hexane
(>97 %, Sigma-Aldrich) under stirring for 1 hour [18]. This procedure was repeated three
times and the total TEOS deposition amount was 12 weight %. H-ZSM11 (MEL framework),
a medium pore zeolite with 3-dimensional structure comprised of straight intersecting
channels (0.53 x 0.54 nm [17]), was synthesized by using tetrabutylammonium hydroxide
(TBAOH; ≥99.0 %, 30-hydrate, Sigma-Aldrich) or 1,8-diamino-octane (DAO; 98 %, Sigma-
Aldrich) as the organic templates for small (SC) and large crystal (LC) zeolites, respectively
[19,20]. The detailed modification and synthesis procedures for H-ZSM5-SM and H-ZSM11
are described in ref. [14].
The isomorphously iron substituted ZSM5 (H-Fe-ZSM5) was synthesized similarly to the
procedure described in ref. [21]. A sodium silicate (25.5-28.5 % SiO2, 7.5-8.5 % Na2O;
Merck) solution was slowly added (drop-wise) to a uniform mixture of sulfuric acid (96 %)
and iron (III) sulfate (21-23 % Fe basis; Sigma-Aldrich). After vigorous stirring,
tetrapropylammonium bromide (98 %; Sigma-Aldrich) was added and the gel was aged
overnight (~18 hours) before it was transferred into Teflon liners (~120 cm3 capacity) and
sealed inside autoclaves. The final gel composition was 150Na2O : Fe2O3 : 150SiO2 :
5200H2O : 25TPABr : 125H2SO4. After 8 days of crystallization at 423 K under rotation (60
rpm) the solid was separated by centrifugation and washed 3 times with deionized water. The
samples were dried in an oven at 353 K, grounded and treated at 753 K (heating rate of 0.05 K
s-1
) for 10 hours in flowing synthetic air (1.67 cm3 s
-1; 20.5% O2 in N2, Westfalen) to remove
the organic templates. Ammonium ion exchange was carried out at 353 K under stirring for 2

Chapter 4: Selectivity of p-xylene
110
hours in a 1 M NH4NO3 solution (30 cm3 per gram of zeolite). This procedure was repeated
twice. After the second ammonium exchange, the zeolites were separated by centrifugation,
washed, dried and treated in synthetic air (flowing at 1.67 cm3 s
-1) for 10 hours (heating rate
of 0.083 K s-1
) at 753 K to obtain the protonic form of the zeolite.
H-NU10 (TON framework), a 1-dimensional zeolite with straight, nonintersecting
elliptical shaped channels of 0.46 x 0.57 nm [17], was synthesized from aluminum sulphate
(99.99 %, Sigma-Aldrich), potassium hydroxide (99.99 %, Sigma-Aldrich), silica sol (Ludox
AS-30, Sigma-Aldrich) and DAO as the organic template, with the gel composition of
26DAO : Al2O3 : 90SiO2 : 3580H2O : 12K2O [22]. The gel was aged ~1 hour before it was
transferred into Teflon liners and sealed inside autoclaves. Note that this procedure for the H-
NU10 synthesis was exactly the same as the large crystal H-ZSM11 synthesis, except for the
rotation of the autoclaves (60rpm; static during H-ZSM11-LC synthesis) [23]. After the 72
hours of crystallization at 433 K, the materials were separated, washed, dried and treated in
synthetic air (followed by ammonium exchange) as described above, except the treatment
temperature in synthetic air was 823 K, instead of 753 K.
4.2.2. Catalyst characterization
Atomic absorption spectroscopy (AAS; Unicam M Series Flame-AAS equipped with an
FS 95 auto-sampler and a GF 95 graphite furnace) was used to determine the elemental
composition of the zeolites. The purity and crystallinity of the samples were examined by X-
ray diffraction patterns (XRD; Philips X’Pert Pro system, λCuKα = 0.154056 nm, 40kV/40mA)
recorded between 2 θ angles of 5-70° (step size of 0.017° and a scan speed of 115 seconds per
step). The nitrogen physisorption experiments were carried out at 77 K on a PMI automated
sorptometer after outgassing the samples under vacuum at 523 K for 2 hours. The BET
surface area [24] was calculated from the adsorption data over a relative pressure range from
0.01-0.1, the pore volumes and external surface areas were evaluated by using the t-plot
method [25] according to Halsey [26]. The scanning electron microscopy (SEM) images of all
samples were recorded on a JEOL JSM 5900 LV microscope operating at 25 kV.
Diffuse Reflectance (DR) UV/Vis spectroscopy was used in order to check for the
presence of FexOy species in H-Fe-ZSM5 catalyst. The powdered zeolite was placed in a
sample cup of 10 mm diameter and 3 mm depth at ambient conditions and the UV/Vis spectra
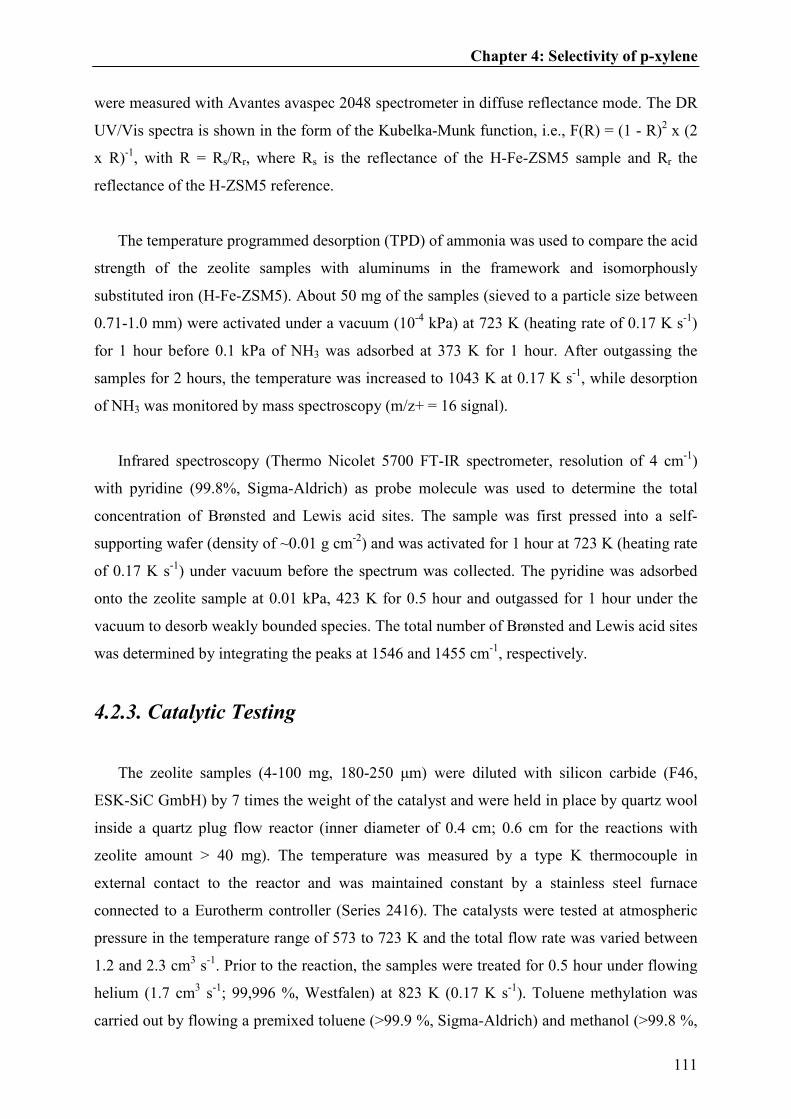
Chapter 4: Selectivity of p-xylene
111
were measured with Avantes avaspec 2048 spectrometer in diffuse reflectance mode. The DR
UV/Vis spectra is shown in the form of the Kubelka-Munk function, i.e., F(R) = (1 - R)2 x (2
x R)-1
, with R = Rs/Rr, where Rs is the reflectance of the H-Fe-ZSM5 sample and Rr the
reflectance of the H-ZSM5 reference.
The temperature programmed desorption (TPD) of ammonia was used to compare the acid
strength of the zeolite samples with aluminums in the framework and isomorphously
substituted iron (H-Fe-ZSM5). About 50 mg of the samples (sieved to a particle size between
0.71-1.0 mm) were activated under a vacuum (10-4
kPa) at 723 K (heating rate of 0.17 K s-1
)
for 1 hour before 0.1 kPa of NH3 was adsorbed at 373 K for 1 hour. After outgassing the
samples for 2 hours, the temperature was increased to 1043 K at 0.17 K s-1
, while desorption
of NH3 was monitored by mass spectroscopy (m/z+ = 16 signal).
Infrared spectroscopy (Thermo Nicolet 5700 FT-IR spectrometer, resolution of 4 cm-1
)
with pyridine (99.8%, Sigma-Aldrich) as probe molecule was used to determine the total
concentration of Brønsted and Lewis acid sites. The sample was first pressed into a self-
supporting wafer (density of ~0.01 g cm-2
) and was activated for 1 hour at 723 K (heating rate
of 0.17 K s-1
) under vacuum before the spectrum was collected. The pyridine was adsorbed
onto the zeolite sample at 0.01 kPa, 423 K for 0.5 hour and outgassed for 1 hour under the
vacuum to desorb weakly bounded species. The total number of Brønsted and Lewis acid sites
was determined by integrating the peaks at 1546 and 1455 cm-1
, respectively.
4.2.3. Catalytic Testing
The zeolite samples (4-100 mg, 180-250 µm) were diluted with silicon carbide (F46,
ESK-SiC GmbH) by 7 times the weight of the catalyst and were held in place by quartz wool
inside a quartz plug flow reactor (inner diameter of 0.4 cm; 0.6 cm for the reactions with
zeolite amount > 40 mg). The temperature was measured by a type K thermocouple in
external contact to the reactor and was maintained constant by a stainless steel furnace
connected to a Eurotherm controller (Series 2416). The catalysts were tested at atmospheric
pressure in the temperature range of 573 to 723 K and the total flow rate was varied between
1.2 and 2.3 cm3 s
-1. Prior to the reaction, the samples were treated for 0.5 hour under flowing
helium (1.7 cm3 s
-1; 99,996 %, Westfalen) at 823 K (0.17 K s
-1). Toluene methylation was
carried out by flowing a premixed toluene (>99.9 %, Sigma-Aldrich) and methanol (>99.8 %,
Chapter 4: Selectivity of p-xylene
112
Sigma-Aldrich) feed (ptoluene = 6 kPa, pmethanol = 1.5 kPa) into a vaporizer filled with silicon
carbide. The isomerization reactions were carried out in a similar way by flowing o-, m- or p-
xylene (all >99.0 %, Sigma-Aldrich) or a premixed feed of methanol and o- or m-xylene
(pxylene = 2.4 kPa, pmethanol = 0 or 0.6 kPa) with same total gas flow rate through the reactor
(1.2 and 2.3 cm3 s
-1). The subsequent methylation and elimination of aromatic product
molecules was tested by flowing premixed feed of 1,2,4-trimethylbenzene (1,2,4-TriMB;
98 %, Sigma-Aldrich) with methanol at p1,2,4-TriMB = 1.2 kPa, pmethanol = 0.3 kPa. The reactor
effluent was sampled 10 minutes after the start of the reactant flow into the reactor and was
analyzed by on-line gas chromatography (Agilent 7820A) equipped with a DB-WAX column
(30 m x 0.32 mm x 0.5 µm) and a flame ionization detector. All the rates were normalized by
the total concentration of the Brønsted acid sites determined by adsorption of pyridine. The C1
in the manuscript refers to methanol and dimethyl ether (DME) and they are treated as one
reactant (accounting for the stoichiometry of ½ for DME) because methanol can readily
dehydrate to form DME during the reaction and both molecules can methylate unsaturated
aromatic/alkene molecules via a similar mechanism [27,28].
4.3. Results
4.3.1.Catalyst characterization
The chemical composition and textural properties of all the samples from AAS and
nitrogen physisorption measurements are summarized in Table 4.1. Three different types of
medium pore-sized (10-membered ring) zeolites i.e., H-ZSM5 (MFI), H-ZSM11 (MEL) and
H-NU10 (TON), with similar Si/Al content (except for H-Fe-ZSM5) were used in this work.
The MFI sample with isomorphously substituted iron in the framework (H-Fe-ZSM5) was
synthesized with relatively low iron content, in order to avoid formation of FexOy clusters.
The bands observed at ~215 and 240 nm in the UV/Vis spectrum of H-Fe-ZSM5 in Figure 4.1
(taken after treatment in synthetic air at 753 K for 10 hours) confirmed that the iron was
incorporated as tetrahedral Fe3+
in the zeolite framework and the lack of broadening at λ >
300nm the absence (or only of a minor presence) of FexOy species [29,30].
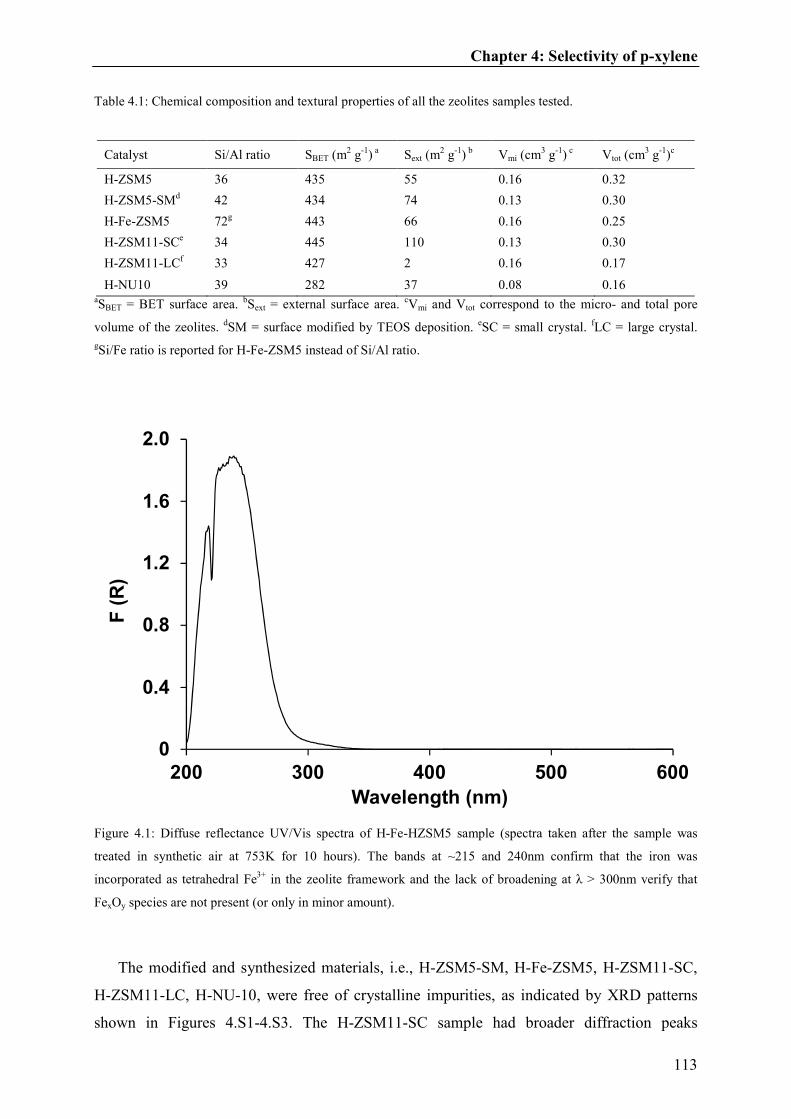
Chapter 4: Selectivity of p-xylene
113
Table 4.1: Chemical composition and textural properties of all the zeolites samples tested.
Catalyst Si/Al ratio SBET (m2 g
-1)
a Sext (m
2 g
-1)
b Vmi (cm
3 g
-1)
c Vtot (cm
3 g
-1)
c
H-ZSM5 36 435 55 0.16 0.32
H-ZSM5-SMd 42 434 74 0.13 0.30
H-Fe-ZSM5 72g 443 66 0.16 0.25
H-ZSM11-SCe 34 445 110 0.13 0.30
H-ZSM11-LCf 33 427 2 0.16 0.17
H-NU10 39 282 37 0.08 0.16 aSBET = BET surface area.
bSext = external surface area.
cVmi and Vtot correspond to the micro- and total pore
volume of the zeolites. dSM = surface modified by TEOS deposition.
eSC = small crystal.
fLC = large crystal.
gSi/Fe ratio is reported for H-Fe-ZSM5 instead of Si/Al ratio.
Figure 4.1: Diffuse reflectance UV/Vis spectra of H-Fe-HZSM5 sample (spectra taken after the sample was
treated in synthetic air at 753K for 10 hours). The bands at ~215 and 240nm confirm that the iron was
incorporated as tetrahedral Fe3+
in the zeolite framework and the lack of broadening at λ > 300nm verify that
FexOy species are not present (or only in minor amount).
The modified and synthesized materials, i.e., H-ZSM5-SM, H-Fe-ZSM5, H-ZSM11-SC,
H-ZSM11-LC, H-NU-10, were free of crystalline impurities, as indicated by XRD patterns
shown in Figures 4.S1-4.S3. The H-ZSM11-SC sample had broader diffraction peaks
0
0,4
0,8
1,2
1,6
2
200 300 400 500 600
F (
R)
Wavelength (nm)
1.6
1.2
0.8
0.4
2.0

Chapter 4: Selectivity of p-xylene
114
compared to the H-ZSM11-LC sample because the primary crystal size of H-ZSM11-SC is
significantly smaller. The SEM images of all samples are shown in Figures 4.S4-4.S9. The
particle sizes for all samples were about 0.5 µm or less except for the H-ZSM11-LC (~6 µm)
and H-NU10 (long needle like structure with length of ~1µm and width of ~0.1 µm).
The temperature programmed desorption of ammonia and the concentrations of total acid
sites calculated are shown in Figure 4.2 and Table 4.2, respectively. The temperature of the
maximum in the NH3 TPD traces reflects the activation energy of desorption and, thus, the
relative acid strength of the materials. For the zeolites with aluminum in the framework (all
except H-Fe-ZSM5), a desorption temperature of ~580 K was observed while the NH3
desorption peak for the zeolite with iron in the framework occurred at a lower temperature
(~520 K). This indicates that H-Fe-ZSM5 has weaker acid strength than the other zeolites
[31,32] because the iron in the framework increases the deprotonation energy from lower
polarizability [33].
Figure 4.2: Temperature programmed desorption (TPD) of ammonia with H-ZSM5 (□), H-ZSM5-SM (x), H-Fe-
ZSM5 (■), H-ZSM11-SC (∆), H-ZSM11-LC (◊) and H-NU10 (○). The first and second vertical dashed line is
placed at ~520 and 580 K, respectively.
400 500 600 700 800 900 1000
Temperature (K)
Des
orp
tio
n r
ate
(a
.u.)
Isomorphous
substitution
with iron

Chapter 4: Selectivity of p-xylene
115
Table 4.2: Total concentration of acid sites calculated from integrating the temperature programmed desorption
(TPD) peak of ammonia and comparing it to the standard zeolite material (H-ZSM5 from Süd-Chemie, 360
µmol of acid sites g-1
).
Catalyst Total Acid sites (µmol g-1
)
H-ZSM5 405
H-ZSM5-SM 326
H-Fe-ZSM5 240
H-ZSM11-SC 397
H-ZSM11-LC 413
H-NU-10 324
The O-H stretching vibrations in the IR spectra of the activated samples are shown in
Figure 4.3 (spectrum of H-ZSM11-LC is not shown because of low transmittance in this
region). The band at 3745 cm-1
, characteristic for the O-H vibration of terminal silanol groups
[34], was observed at the same wavenumbers on all samples. The band at ~3610 cm-1
,
characteristic for the O-H vibration of SiOHAl groups (Brønsted acid sites) [31,35], was
shifted to 3630 cm-1
for the iron containing sample because the acid strength of the SiOHFe
sites was weaker (i.e. the O-H bond has a higher deprotonation energy). The O-H band from
the Brønsted acid sites of H-NU10 sample, however, was shifted to lower wavenumbers
compared to other aluminum containing samples. This was not because of increase in the acid
strength (see TPD temperature in Figure 4.2), but most likely resulted from a weak
perturbation of the O-H group inside the relative smaller pores in H-NU10. Note that for H-
MOR, the O-H vibration of SiOHAl groups in the side pockets (8-membered ring) also had a
lower wavenumber than the ones in the 12-membered ring channels [36,37].

Chapter 4: Selectivity of p-xylene
116
Figure 4.3: Infrared (IR) spectra of the samples (after heating to 723K for 1 hour for activation) measured at 423
K under vacuum. The bands at 3745 and ~3630-3590 cm-1
(the dashed line at 3610 cm-1
) represent O-H vibration
of the terminal silanol groups and the Brønsted acid sites, respectively.
The concentrations of Brønsted and Lewis acid sites, determined by adsorption of
pyridine, are summarized in Table 3 (the IR spectra of samples after the adsorption of
pyridine are shown in Figure 4.S10-4.S11). H-ZSM5 (aluminum in the framework) retained
>95 % of pyridine adsorbed on the Brønsted acid sites after outgassing at 723 K, while the
isomorphously substituted iron sample retained only ~75 %, confirming that the acid strength
of H-Fe-ZSM5 was weaker than H-(Al)-ZSM5. The total concentrations of Brønsted acid
sites shown in Table 3 were used to normalize the rates.
34003500360037003800
Wavenumber (cm-1)
No
rmali
zed
ab
so
rban
ce
H-Fe-ZSM5
H-ZSM5-SM
H-ZSM5
H-ZSM11-SC
H-NU10
Terminal
silanolBrønsted
acid

Chapter 4: Selectivity of p-xylene
117
Table 3: Concentration of Brønsted and Lewis acid sites determined by adsorption of pyridine.
Catalyst Brønsted Acid sites
(µmol g-1
)
Lewis Acid Sites
(µmol g-1
)
Totala Strong
b Total Strong
H-ZSM5 380 371 67 26
H-ZSM5-SMc 313 292 68 34
H-Fe-ZSM5 162 122 42 27
H-ZSM11-SCd 387 357 100 78
H-ZSM11-LCe 393 342 104 76
H-NU10 331 288 48 36 aMeasured at 423 K, after outgassing for 1 hour under vacuum.
bMeasured at 423 K, after heating the samples to
723K for 0.5 hour. cSM = surface modified by TEOS deposition.
dSC = small crystal.
eLC = large crystal.
4.3.2. Catalytic testing
The xylenes are produced from three main reaction pathways during toluene methylation
(Scheme 4.1), i.e., methylation of toluene, isomerization of the xylene products and further
methylation and elimination of less-methylated aromatic molecules as xylenes and light
hydrocarbons from highly-methylated aromatics [14]. The disproportionation of toluene
(calculated based on the formation rate of benzene, not shown) was not considered in this
work because it was slow under these reaction conditions (e.g., less than 1% of the toluene
converted went through disproportionation during toluene methylation).

Chapter 4: Selectivity of p-xylene
118
Scheme 4.1: Three main reaction pathways of generating xylenes during the reaction of toluene with methanol
inside a medium pore-sized zeolite [14]. The solid, double half and dashed arrows represent toluene methylation,
xylene isomerization and further methylation and elimination as xylenes (light hydrocarbons as byproducts),
respectively.
The selectivity of xylenes and the toluene turnover rates from toluene methylation over
different (framework, surface modification, acid strength and crystal size) medium pore-sized
zeolites at similar C1 (methanol and DME) conversion levels from 573-723 K are shown in
Table 4.4 (conversions of C1 and toluene are reported in Table 4.S1). The selectivity of p-
xylene clearly increased over all medium pore zeolites (e.g., from 38 to 68 % with H-ZSM5)
with increasing the reaction temperature, whereas the selectivity to m- and o-xylene decreased
(e.g., from 28 to 20% for m-xylene and 35 to 12 % for o-xylene with H-ZSM5). H-Fe-ZSM5
had lower toluene turnover rates than H-ZSM5, because of the lower acid strength (e.g., from
0.30 to 0.10 mol [s mol H]-1
at 723 K). H-NU10 had the lowest activity compared to the other
zeolites (by an order of a magnitude), most likely because the relatively small and long 1-
dimensional channels significantly decreased the transport of reactants to the Brønsted acid
sites. Similarly, the toluene turnover rate of the large crystal H-ZSM11 decreased compared to
the small crystal H-ZSM11 (e.g., from 0.42 to 0.15 mol [s mol H]-1
at 723 K).
CH3OH
CH3OH
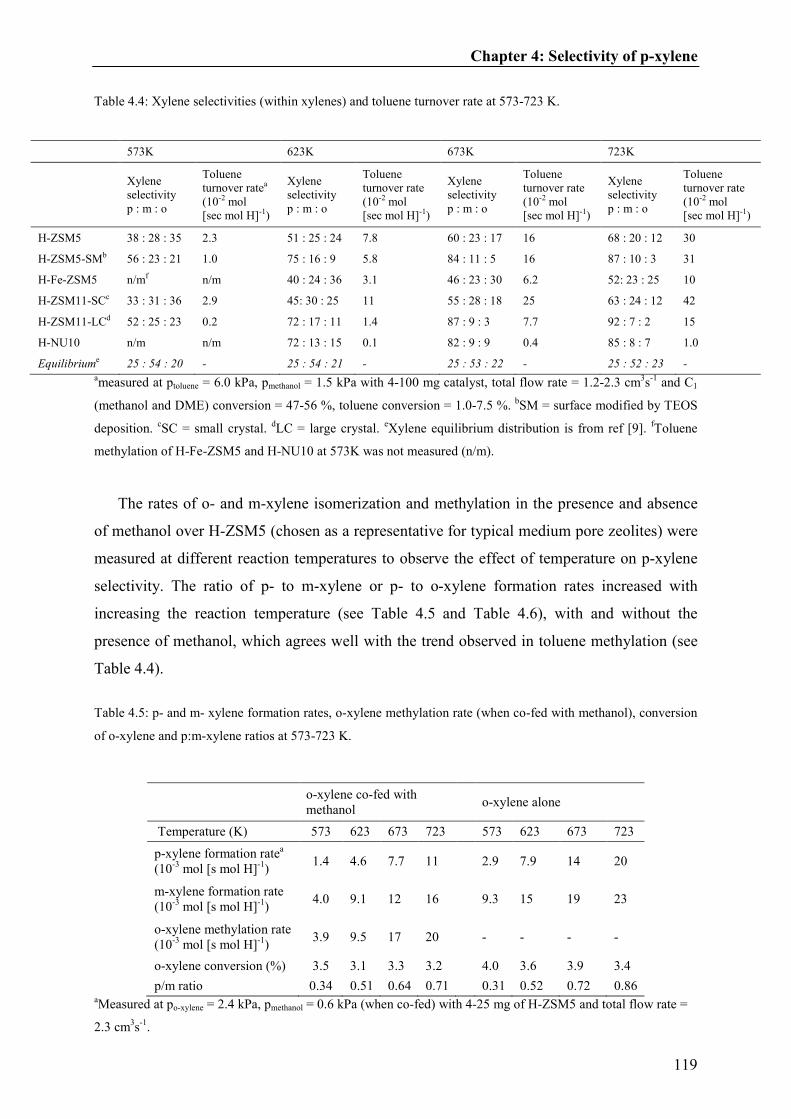
Chapter 4: Selectivity of p-xylene
119
Table 4.4: Xylene selectivities (within xylenes) and toluene turnover rate at 573-723 K.
573K 623K 673K 723K
Xylene
selectivity
p : m : o
Toluene
turnover ratea
(10-2 mol
[sec mol H]-1)
Xylene
selectivity
p : m : o
Toluene
turnover rate
(10-2 mol
[sec mol H]-1)
Xylene
selectivity
p : m : o
Toluene
turnover rate
(10-2 mol
[sec mol H]-1)
Xylene
selectivity
p : m : o
Toluene
turnover rate
(10-2 mol
[sec mol H]-1)
H-ZSM5 38 : 28 : 35 2.3 51 : 25 : 24 7.8 60 : 23 : 17 16 68 : 20 : 12 30
H-ZSM5-SMb 56 : 23 : 21 1.0 75 : 16 : 9 5.8 84 : 11 : 5 16 87 : 10 : 3 31
H-Fe-ZSM5 n/mf n/m 40 : 24 : 36 3.1 46 : 23 : 30 6.2 52: 23 : 25 10
H-ZSM11-SCc 33 : 31 : 36 2.9 45: 30 : 25 11 55 : 28 : 18 25 63 : 24 : 12 42
H-ZSM11-LCd 52 : 25 : 23 0.2 72 : 17 : 11 1.4 87 : 9 : 3 7.7 92 : 7 : 2 15
H-NU10 n/m n/m 72 : 13 : 15 0.1 82 : 9 : 9 0.4 85 : 8 : 7 1.0
Equilibriume 25 : 54 : 20 - 25 : 54 : 21 - 25 : 53 : 22 - 25 : 52 : 23 - ameasured at ptoluene = 6.0 kPa, pmethanol = 1.5 kPa with 4-100 mg catalyst, total flow rate = 1.2-2.3 cm
3s
-1 and C1
(methanol and DME) conversion = 47-56 %, toluene conversion = 1.0-7.5 %. bSM = surface modified by TEOS
deposition. cSC = small crystal.
dLC = large crystal.
eXylene equilibrium distribution is from ref [9].
fToluene
methylation of H-Fe-ZSM5 and H-NU10 at 573K was not measured (n/m).
The rates of o- and m-xylene isomerization and methylation in the presence and absence
of methanol over H-ZSM5 (chosen as a representative for typical medium pore zeolites) were
measured at different reaction temperatures to observe the effect of temperature on p-xylene
selectivity. The ratio of p- to m-xylene or p- to o-xylene formation rates increased with
increasing the reaction temperature (see Table 4.5 and Table 4.6), with and without the
presence of methanol, which agrees well with the trend observed in toluene methylation (see
Table 4.4).
Table 4.5: p- and m- xylene formation rates, o-xylene methylation rate (when co-fed with methanol), conversion
of o-xylene and p:m-xylene ratios at 573-723 K.
o-xylene co-fed with
methanol
o-xylene alone
Temperature (K) 573 623 673 723 573 623 673 723
p-xylene formation ratea
(10-3
mol [s mol H]-1
) 1.4 4.6 7.7 11 2.9 7.9 14 20
m-xylene formation rate
(10-3
mol [s mol H]-1
) 4.0 9.1 12 16 9.3 15 19 23
o-xylene methylation rate
(10-3
mol [s mol H]-1
) 3.9 9.5 17 20 - - - -
o-xylene conversion (%) 3.5 3.1 3.3 3.2 4.0 3.6 3.9 3.4
p/m ratio 0.34 0.51 0.64 0.71 0.31 0.52 0.72 0.86 aMeasured at po-xylene = 2.4 kPa, pmethanol = 0.6 kPa (when co-fed) with 4-25 mg of H-ZSM5 and total flow rate =
2.3 cm3s
-1.
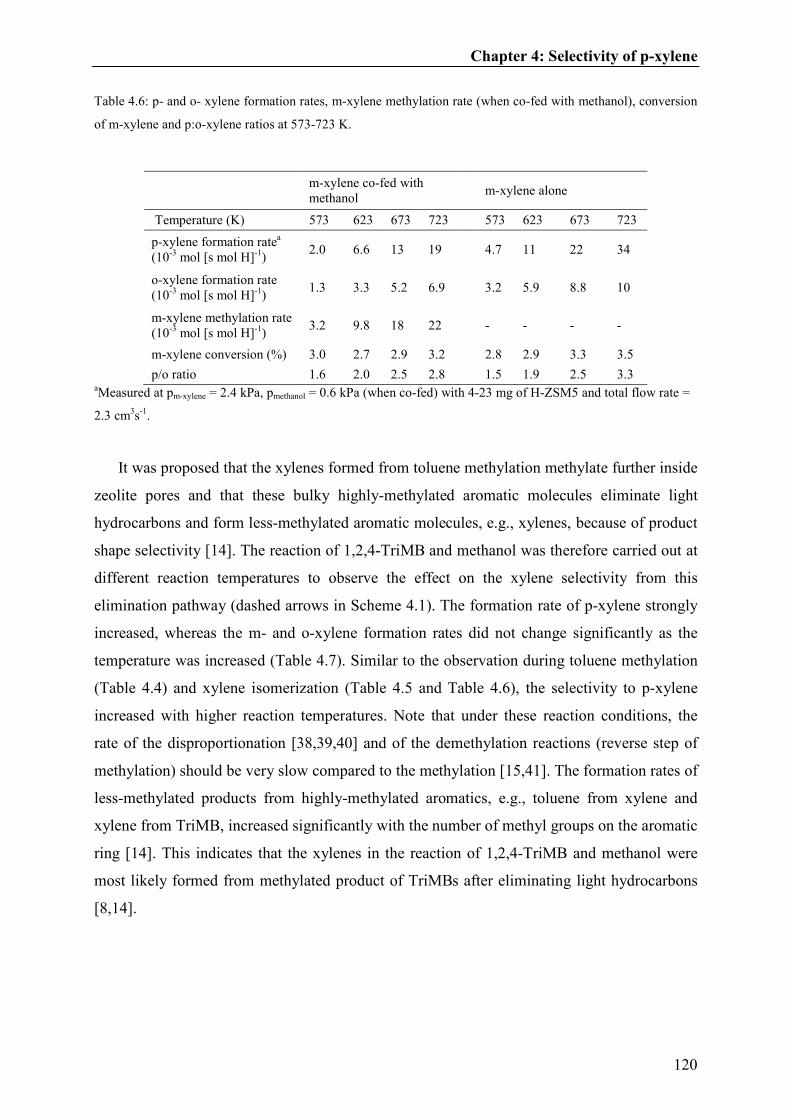
Chapter 4: Selectivity of p-xylene
120
Table 4.6: p- and o- xylene formation rates, m-xylene methylation rate (when co-fed with methanol), conversion
of m-xylene and p:o-xylene ratios at 573-723 K.
m-xylene co-fed with
methanol
m-xylene alone
Temperature (K) 573 623 673 723 573 623 673 723
p-xylene formation ratea
(10-3
mol [s mol H]-1
) 2.0 6.6 13 19 4.7 11 22 34
o-xylene formation rate
(10-3
mol [s mol H]-1
) 1.3 3.3 5.2 6.9 3.2 5.9 8.8 10
m-xylene methylation rate
(10-3
mol [s mol H]-1
) 3.2 9.8 18 22 - - - -
m-xylene conversion (%) 3.0 2.7 2.9 3.2 2.8 2.9 3.3 3.5
p/o ratio 1.6 2.0 2.5 2.8 1.5 1.9 2.5 3.3 aMeasured at pm-xylene = 2.4 kPa, pmethanol = 0.6 kPa (when co-fed) with 4-23 mg of H-ZSM5 and total flow rate =
2.3 cm3s
-1.
It was proposed that the xylenes formed from toluene methylation methylate further inside
zeolite pores and that these bulky highly-methylated aromatic molecules eliminate light
hydrocarbons and form less-methylated aromatic molecules, e.g., xylenes, because of product
shape selectivity [14]. The reaction of 1,2,4-TriMB and methanol was therefore carried out at
different reaction temperatures to observe the effect on the xylene selectivity from this
elimination pathway (dashed arrows in Scheme 4.1). The formation rate of p-xylene strongly
increased, whereas the m- and o-xylene formation rates did not change significantly as the
temperature was increased (Table 4.7). Similar to the observation during toluene methylation
(Table 4.4) and xylene isomerization (Table 4.5 and Table 4.6), the selectivity to p-xylene
increased with higher reaction temperatures. Note that under these reaction conditions, the
rate of the disproportionation [38,39,40] and of the demethylation reactions (reverse step of
methylation) should be very slow compared to the methylation [15,41]. The formation rates of
less-methylated products from highly-methylated aromatics, e.g., toluene from xylene and
xylene from TriMB, increased significantly with the number of methyl groups on the aromatic
ring [14]. This indicates that the xylenes in the reaction of 1,2,4-TriMB and methanol were
most likely formed from methylated product of TriMBs after eliminating light hydrocarbons
[8,14].
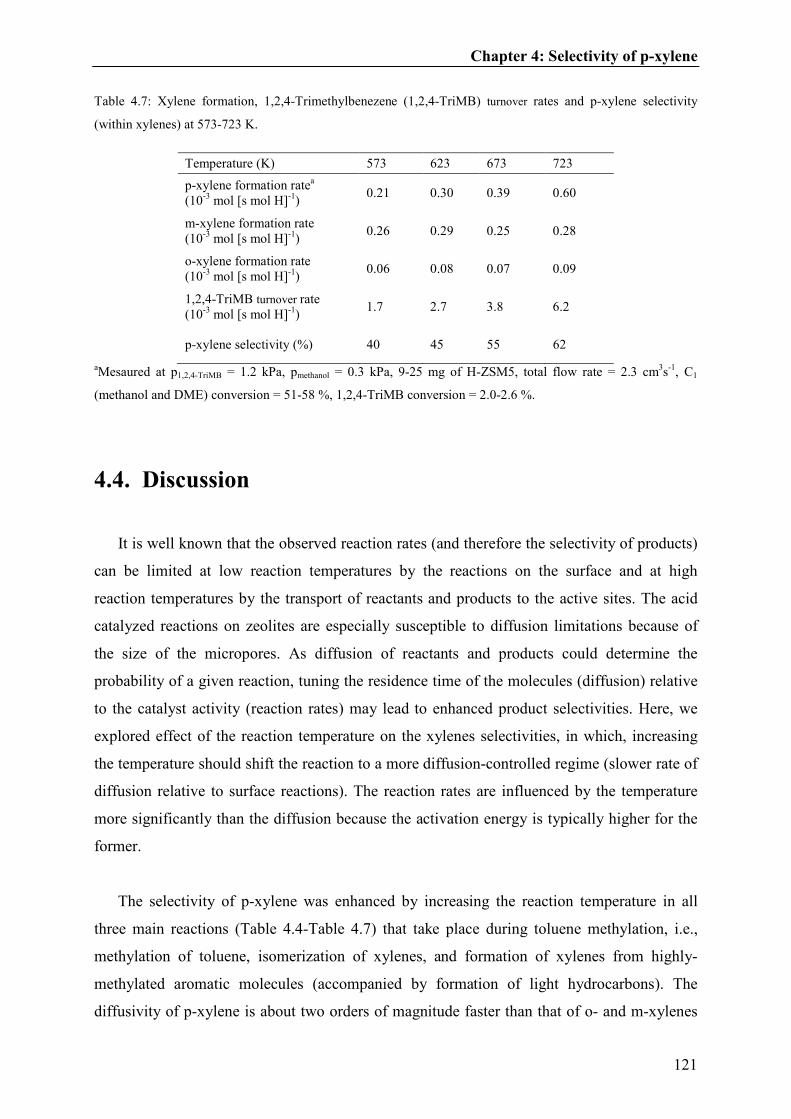
Chapter 4: Selectivity of p-xylene
121
Table 4.7: Xylene formation, 1,2,4-Trimethylbenezene (1,2,4-TriMB) turnover rates and p-xylene selectivity
(within xylenes) at 573-723 K.
Temperature (K) 573 623 673 723
p-xylene formation ratea
(10-3
mol [s mol H]-1
) 0.21 0.30 0.39 0.60
m-xylene formation rate
(10-3
mol [s mol H]-1
) 0.26 0.29 0.25 0.28
o-xylene formation rate
(10-3
mol [s mol H]-1
) 0.06 0.08 0.07 0.09
1,2,4-TriMB turnover rate
(10-3
mol [s mol H]-1
) 1.7 2.7 3.8 6.2
p-xylene selectivity (%) 40 45 55 62
aMesaured at p1,2,4-TriMB = 1.2 kPa, pmethanol = 0.3 kPa, 9-25 mg of H-ZSM5, total flow rate = 2.3 cm
3s
-1, C1
(methanol and DME) conversion = 51-58 %, 1,2,4-TriMB conversion = 2.0-2.6 %.
4.4. Discussion
It is well known that the observed reaction rates (and therefore the selectivity of products)
can be limited at low reaction temperatures by the reactions on the surface and at high
reaction temperatures by the transport of reactants and products to the active sites. The acid
catalyzed reactions on zeolites are especially susceptible to diffusion limitations because of
the size of the micropores. As diffusion of reactants and products could determine the
probability of a given reaction, tuning the residence time of the molecules (diffusion) relative
to the catalyst activity (reaction rates) may lead to enhanced product selectivities. Here, we
explored effect of the reaction temperature on the xylenes selectivities, in which, increasing
the temperature should shift the reaction to a more diffusion-controlled regime (slower rate of
diffusion relative to surface reactions). The reaction rates are influenced by the temperature
more significantly than the diffusion because the activation energy is typically higher for the
former.
The selectivity of p-xylene was enhanced by increasing the reaction temperature in all
three main reactions (Table 4.4-Table 4.7) that take place during toluene methylation, i.e.,
methylation of toluene, isomerization of xylenes, and formation of xylenes from highly-
methylated aromatic molecules (accompanied by formation of light hydrocarbons). The
diffusivity of p-xylene is about two orders of magnitude faster than that of o- and m-xylenes
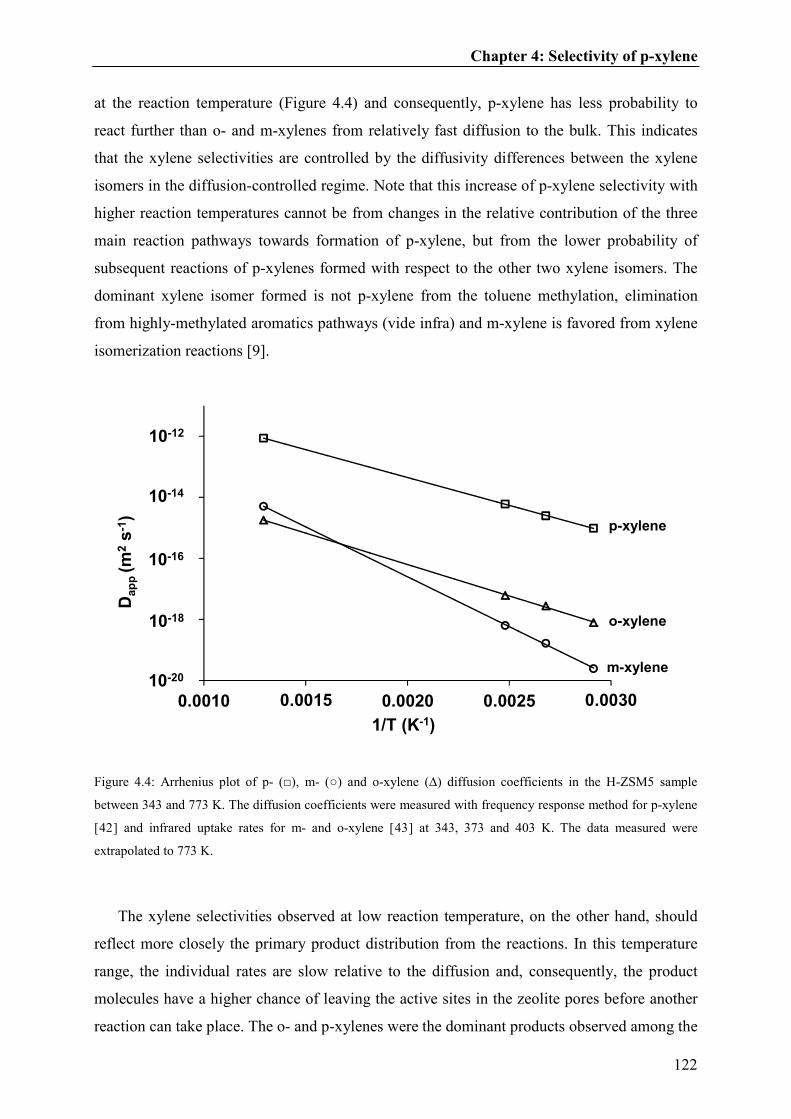
Chapter 4: Selectivity of p-xylene
122
at the reaction temperature (Figure 4.4) and consequently, p-xylene has less probability to
react further than o- and m-xylenes from relatively fast diffusion to the bulk. This indicates
that the xylene selectivities are controlled by the diffusivity differences between the xylene
isomers in the diffusion-controlled regime. Note that this increase of p-xylene selectivity with
higher reaction temperatures cannot be from changes in the relative contribution of the three
main reaction pathways towards formation of p-xylene, but from the lower probability of
subsequent reactions of p-xylenes formed with respect to the other two xylene isomers. The
dominant xylene isomer formed is not p-xylene from the toluene methylation, elimination
from highly-methylated aromatics pathways (vide infra) and m-xylene is favored from xylene
isomerization reactions [9].
Figure 4.4: Arrhenius plot of p- (□), m- (○) and o-xylene (∆) diffusion coefficients in the H-ZSM5 sample
between 343 and 773 K. The diffusion coefficients were measured with frequency response method for p-xylene
[42] and infrared uptake rates for m- and o-xylene [43] at 343, 373 and 403 K. The data measured were
extrapolated to 773 K.
The xylene selectivities observed at low reaction temperature, on the other hand, should
reflect more closely the primary product distribution from the reactions. In this temperature
range, the individual rates are slow relative to the diffusion and, consequently, the product
molecules have a higher chance of leaving the active sites in the zeolite pores before another
reaction can take place. The o- and p-xylenes were the dominant products observed among the
1E-20
1E-18
1E-16
1E-14
1E-12
0,001 0,0015 0,002 0,0025 0,003
Dap
p (m
2s
-1)
1/T (K-1)
0.0010 0.0015 0.0020 0.0025 0.0030
p-xylene
o-xylene
m-xylene
10-14
10-16
10-18
10-20
10-12

Chapter 4: Selectivity of p-xylene
123
xylenes at low temperatures during the reaction of toluene methylation (e.g., ~70 % at 573 K,
see Figure 4.5 left) because these isomers were the primary xylene products from toluene
methylation [44]. This observation is in accordance with the fact that the methyl addition is
favored at o- and p- positions because the methyl group on the aromatic ring of toluene is an
electron donating group (inductive effect) and the positive charge can be placed on the
position of a methyl group to form tertiary carbocations (Scheme 4.2).
Figure 4.5: Selectivity of xylene isomers within xylenes at 573-723 K with the parent H-ZSM5. The reaction on
the left with toluene and methanol (ptoluene = 6.0 kPa, pmethanol = 1.5 kPa, 4-10 mg, total flow rate = 1.2-2.3 cm3s
-1,
C1 conversion = 47-55 %, toluene conversion = 4.3-6.5%) and on the right with 1,2,4-TriMB and methanol
(p1,2,4-TriMB = 1.2 kPa, pmethanol = 0.3 kPa, 9-25mg, total flow rate = 2.3cm3s
-1, C1 (methanol and DME) conversion
= 51-58 %, 1,2,4-TriMB conversion = 2.0-2.6 %). Black, grey and white represents p-, m- and o-xylene
selectivities. Data from Table 4.4 and Table 4.7.
3851
60 66
28
25
2322
3524
17 12
0
20
40
60
80
100
573 623 673 723
xyle
ne
sele
cti
vit
y (
%)
Temperature (K)
Methylation of toluene
4047
5563
4943
3629
11 11 10 8
0
20
40
60
80
100
573 623 673 723
xyle
ne s
ele
cti
vit
y (
%)
Temperature (K)
Methylation of 1,2,4-TriMB
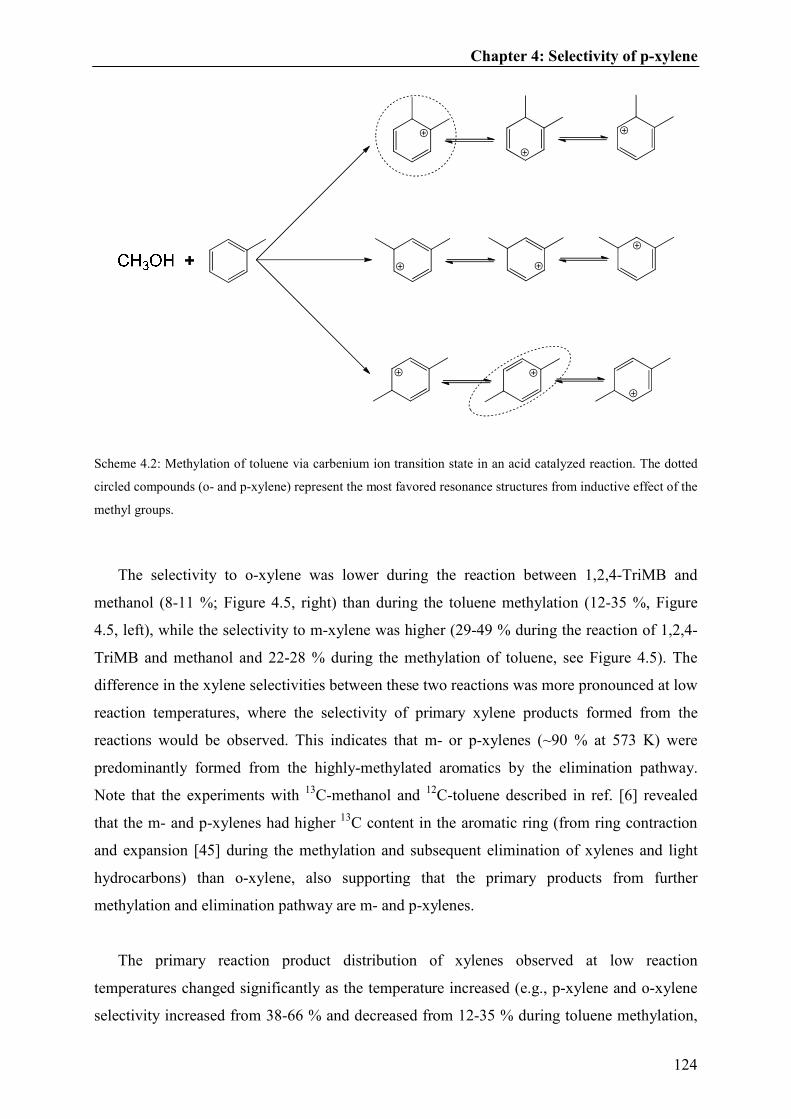
Chapter 4: Selectivity of p-xylene
124
Scheme 4.2: Methylation of toluene via carbenium ion transition state in an acid catalyzed reaction. The dotted
circled compounds (o- and p-xylene) represent the most favored resonance structures from inductive effect of the
methyl groups.
The selectivity to o-xylene was lower during the reaction between 1,2,4-TriMB and
methanol (8-11 %; Figure 4.5, right) than during the toluene methylation (12-35 %, Figure
4.5, left), while the selectivity to m-xylene was higher (29-49 % during the reaction of 1,2,4-
TriMB and methanol and 22-28 % during the methylation of toluene, see Figure 4.5). The
difference in the xylene selectivities between these two reactions was more pronounced at low
reaction temperatures, where the selectivity of primary xylene products formed from the
reactions would be observed. This indicates that m- or p-xylenes (~90 % at 573 K) were
predominantly formed from the highly-methylated aromatics by the elimination pathway.
Note that the experiments with 13
C-methanol and 12
C-toluene described in ref. [6] revealed
that the m- and p-xylenes had higher 13
C content in the aromatic ring (from ring contraction
and expansion [45] during the methylation and subsequent elimination of xylenes and light
hydrocarbons) than o-xylene, also supporting that the primary products from further
methylation and elimination pathway are m- and p-xylenes.
The primary reaction product distribution of xylenes observed at low reaction
temperatures changed significantly as the temperature increased (e.g., p-xylene and o-xylene
selectivity increased from 38-66 % and decreased from 12-35 % during toluene methylation,

Chapter 4: Selectivity of p-xylene
125
respectively, Figure 4.5). The reaction kinetics shifted to a more diffusion-controlled regime
as the surface reactions became faster relative to diffusion and the selectivity of xylenes
became controlled more strongly by the differences in diffusivity between xylene isomers.
The selectivity of p-xylene thus increased at high reaction temperatures because it diffuses
faster than o- and m-xylenes by about two orders of magnitude (Figure 4.4). In addition,
similar xylene selectivities are observed at high temperatures (see 723 K in Figure 4.5)
between the toluene methylation and the elimination from highly-methylated aromatic
reaction pathways, despite of the differences in the primary xylene products formed from
these two reactions. This suggests that xylene isomerization is probably the most important
reaction (among toluene methylation, xylene isomerization and xylene production from
highly-methylated aromatic molecules) for determining xylene selectivity at high reaction
temperatures.
The significance of isomerization on xylene selectivity was further examined by
comparing the reaction of o- or m-xylene individually and by co-feeding the xylene isomer
with methanol at different temperatures. Only isomerization reactions take place when o- or
m-xylene reacts over the catalyst, whereas both isomerization and methylation-elimination
reactions occur when xylene is introduced together with methanol in the feed (other reactions,
e.g., disproportionation, were not significant under these reaction conditions). The selectivity
to p-xylene increased (relative to o- or m-xylene) with increasing temperature for all reactions
with and without the presence of methanol, i.e., higher p-/m-xylene and p-/o-xylene ratios
were observed (Figure 4.6). At low reaction temperatures, the selectivity to p-xylene (relative
to o- or m-xylene) was higher when o- or m-xylene was co-fed with methanol than without
(e.g., at 573 K, the p:m and p:o ratios were 0.34 and 1.8 in the presence of methanol and 0.31
and 1.5 without methanol, respectively). This indicates that the methylation-elimination
pathway (co-fed with methanol) generated more p-xylene as primary products compared to
the isomerization reactions (vide supra). In contrast, a lower p-xylene selectivity was
observed at high reaction temperatures, when o- or m-xylene reacted with methanol in the
feed compared to the reaction without methanol (e.g., at 723 K, the p:m and p:o ratios were
0.69 and 2.8 in the presence of methanol and 0.86 and 3.3 without methanol, respectively).
The relatively low p-selectivity in the presence of methanol at high reaction temperatures can
be assigned to the decrease in the isomerization rates (Table 4.5 and Table 4.6), as some of o-
or m-xylene in the feed were consumed for methylation reactions. This indicates that fast
isomerization at higher reaction temperatures favors high p-xylene selectivity by shifting the

Chapter 4: Selectivity of p-xylene
126
reaction to a more diffusion-limited regime and consequently enables the diffusivity
differences in xylenes to become more important in determining the selectivity of xylenes.
Figure 4.6: Ratios of xylene isomers within xylenes at 573-723 K with H-ZSM5 (pxylene = 2.4 kPa, pmethanol = 0.6
kPa, 4-25 mg, total flow rate = 2.3 cm3s
-1) with o-xylene (left) and m-xylene (right) in the feed. The white
represents the xylene ratios when xylene was co-fed with methanol and the black without. o-Xylene conversion
= 2.7-4.0 %, m-xylene conversion = 1.6-3.5 % and C1 (methanol and DME) conversion = 47-54 % (when co-fed
with methanol). Data from Table 4.5 and Table 4.6.
The influence of xylene isomerization at high reaction temperatures on p-xylene
selectivity was additionally investigated by comparing the H-ZSM5 and its iron substituted
sample, H-Fe-ZSM5. The relative differences in diffusivity of the xylene isomers in these
samples are similar because both samples have the same zeolite structure (MFI) and
comparable crystal sizes (concluded from the SEM images in Figures 4.S4 and 4.S6, and
analyzing the width of X-ray diffraction peaks in Figure 4.S1). The only difference between
the two zeolites is the acid strength of the sites, which allows the direct assessment of the
influence of isomerization rates on p-xylene selectivity during toluene methylation. Table 4.8
shows that the reaction rates, in particular p-xylene isomerization, decreased significantly
over the iron containing zeolite (by about factor of 7) because of weaker acid strength of H-
Fe-ZSM5 compared to H-ZSM5. Slower isomerization rates decreased the influence of the
diffusivity differences of xylenes on p-xylene selectivity because the reaction became less
diffusion limited (more reaction controlled) and consequently, a decrease in the p-xylene
selectivity was observed, i.e., from 68 to 52 % with H-ZSM5 and H-Fe-ZSM5, respectively
(Table 4.8). Note that this was not because of higher Si/Al ratio of H-Fe-ZSM5. The H-ZSM5
0
0,2
0,4
0,6
0,8
1
573 623 673 723
p:m
-xyle
ne
ra
tio
Temperature (K)
0.8
0.6
0.4
0.2
Isomerization and
methylation of o-xylene
0
1
2
3
4
573 623 673 723
p:o
-xyle
ne r
ati
oTemperature (K)
Isomerization and
methylation of m-xylene
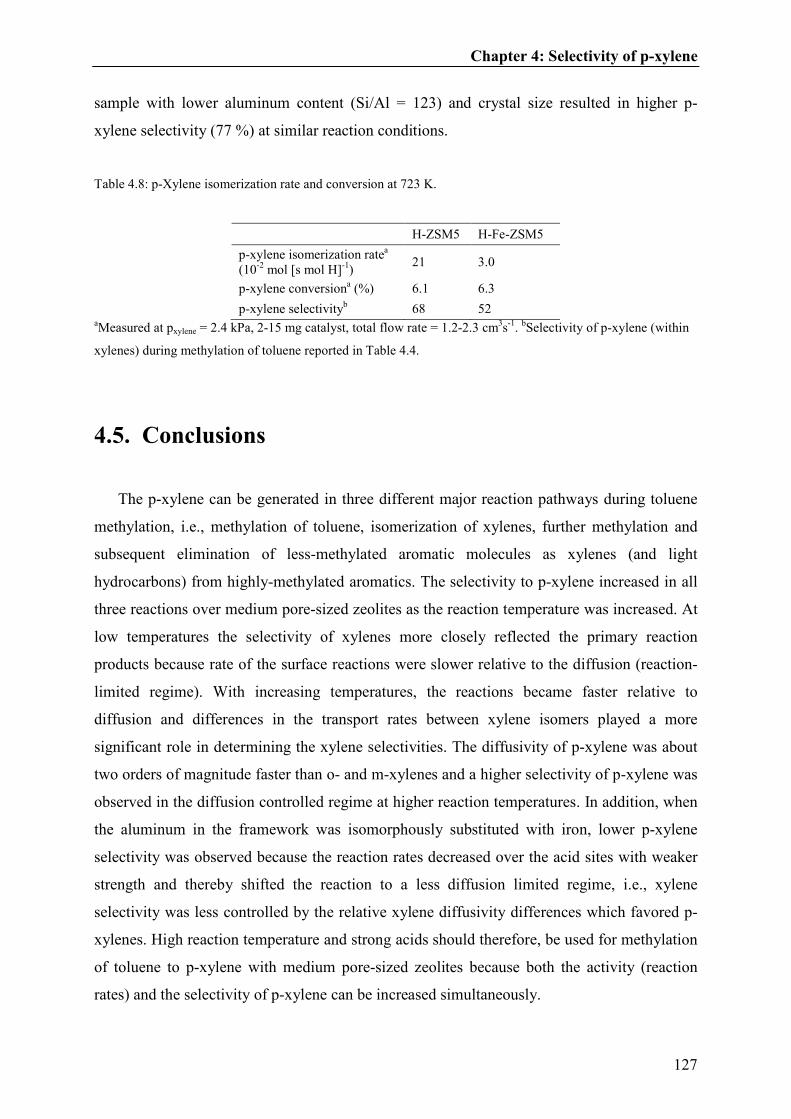
Chapter 4: Selectivity of p-xylene
127
sample with lower aluminum content (Si/Al = 123) and crystal size resulted in higher p-
xylene selectivity (77 %) at similar reaction conditions.
Table 4.8: p-Xylene isomerization rate and conversion at 723 K.
H-ZSM5 H-Fe-ZSM5
p-xylene isomerization ratea
(10-2
mol [s mol H]-1
) 21 3.0
p-xylene conversiona (%) 6.1 6.3
p-xylene selectivityb 68 52
aMeasured at pxylene = 2.4 kPa, 2-15 mg catalyst, total flow rate = 1.2-2.3 cm
3s
-1.
bSelectivity of p-xylene (within
xylenes) during methylation of toluene reported in Table 4.4.
4.5. Conclusions
The p-xylene can be generated in three different major reaction pathways during toluene
methylation, i.e., methylation of toluene, isomerization of xylenes, further methylation and
subsequent elimination of less-methylated aromatic molecules as xylenes (and light
hydrocarbons) from highly-methylated aromatics. The selectivity to p-xylene increased in all
three reactions over medium pore-sized zeolites as the reaction temperature was increased. At
low temperatures the selectivity of xylenes more closely reflected the primary reaction
products because rate of the surface reactions were slower relative to the diffusion (reaction-
limited regime). With increasing temperatures, the reactions became faster relative to
diffusion and differences in the transport rates between xylene isomers played a more
significant role in determining the xylene selectivities. The diffusivity of p-xylene was about
two orders of magnitude faster than o- and m-xylenes and a higher selectivity of p-xylene was
observed in the diffusion controlled regime at higher reaction temperatures. In addition, when
the aluminum in the framework was isomorphously substituted with iron, lower p-xylene
selectivity was observed because the reaction rates decreased over the acid sites with weaker
strength and thereby shifted the reaction to a less diffusion limited regime, i.e., xylene
selectivity was less controlled by the relative xylene diffusivity differences which favored p-
xylenes. High reaction temperature and strong acids should therefore, be used for methylation
of toluene to p-xylene with medium pore-sized zeolites because both the activity (reaction
rates) and the selectivity of p-xylene can be increased simultaneously.
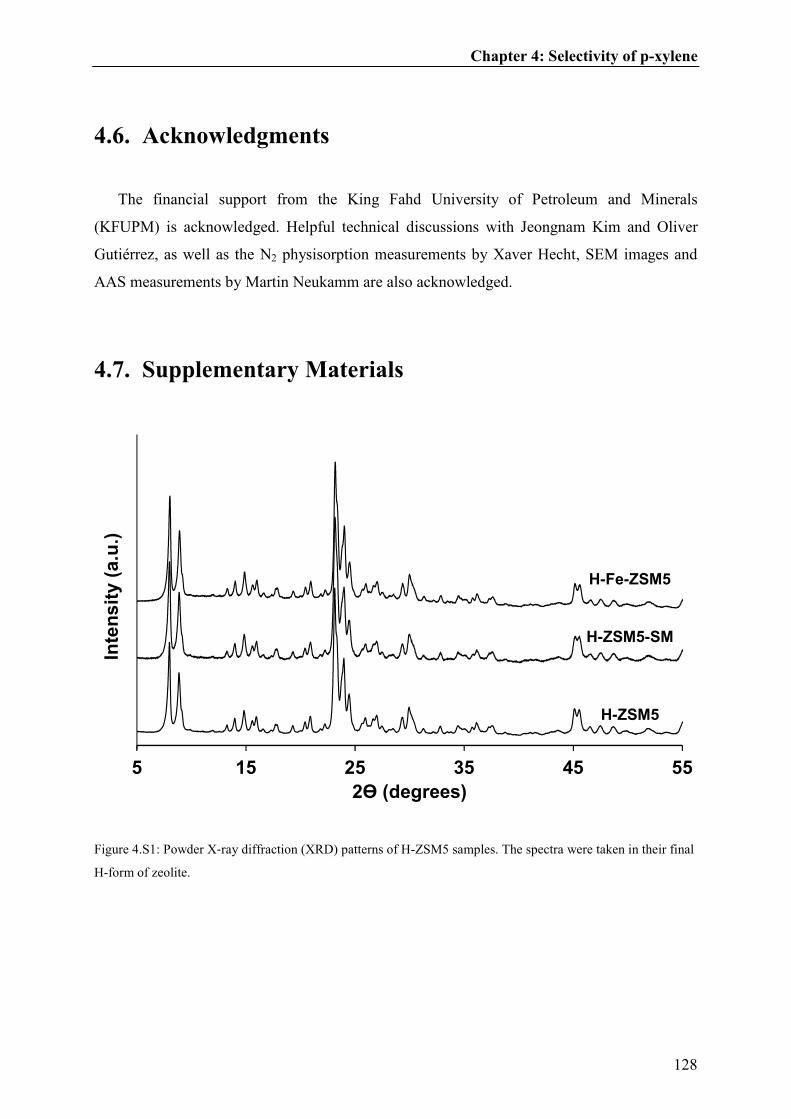
Chapter 4: Selectivity of p-xylene
128
4.6. Acknowledgments
The financial support from the King Fahd University of Petroleum and Minerals
(KFUPM) is acknowledged. Helpful technical discussions with Jeongnam Kim and Oliver
Gutiérrez, as well as the N2 physisorption measurements by Xaver Hecht, SEM images and
AAS measurements by Martin Neukamm are also acknowledged.
4.7. Supplementary Materials
Figure 4.S1: Powder X‐ray diffraction (XRD) patterns of H-ZSM5 samples. The spectra were taken in their final
H-form of zeolite.
5 15 25 35 45 55
2ϴ (degrees)
Inte
ns
ity (
a.u
.)
H-Fe-ZSM5
H-ZSM5-SM
H-ZSM5

Chapter 4: Selectivity of p-xylene
129
Figure 4.S2: Powder X‐ray diffraction (XRD) patterns of H-ZSM11 samples. The spectra were taken in their
final H-form of zeolite.
Figure 4.S3: Powder X‐ray diffraction (XRD) patterns of H-NU10 sample. The spectrum was taken in its final
H-form of zeolite.
5 15 25 35 45 55
2ϴ (degrees)
Inte
ns
ity (
a.u
.)
H-ZSM11-LC
H-ZSM11-SC
5 15 25 35 45 55
2ϴ (degrees)
Inte
nsit
y (
a.u
.)

Chapter 4: Selectivity of p-xylene
130
Figure 4.S4: Scanning electron microscope (SEM) image of H-ZSM5 sample.
Figure 4.S5: Scanning electron microscope (SEM) image of H-ZSM5-SM sample (H-ZSM5 surface modified by
tetraethyl orthosilicate (TEOS) deposition).
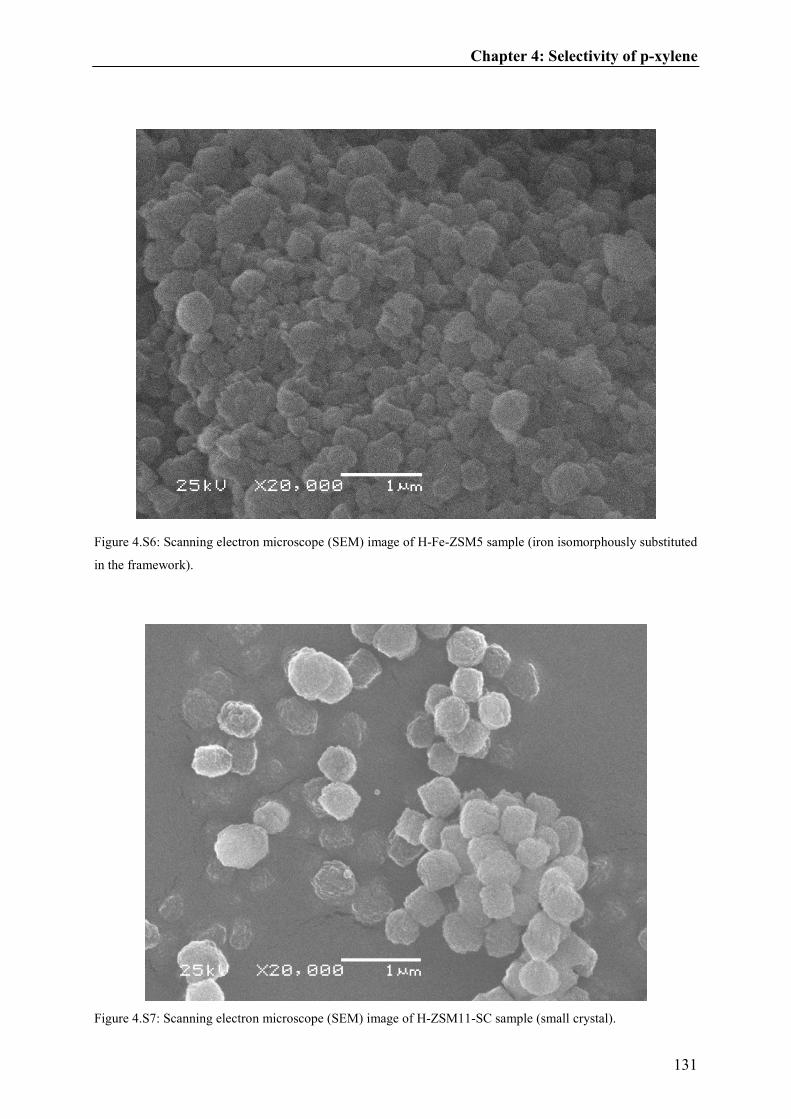
Chapter 4: Selectivity of p-xylene
131
Figure 4.S6: Scanning electron microscope (SEM) image of H-Fe-ZSM5 sample (iron isomorphously substituted
in the framework).
Figure 4.S7: Scanning electron microscope (SEM) image of H-ZSM11-SC sample (small crystal).

Chapter 4: Selectivity of p-xylene
132
Figure 4.S8: Scanning electron microscope (SEM) image of H-ZSM11-LC sample (large crystal).
Figure 4.S9: Scanning electron microscope (SEM) image of H-NU10 sample.

Chapter 4: Selectivity of p-xylene
133
Figure 4.S10: Infrared (IR) spectra of all samples after adsorption of pyridine at 423 K, 0.01 kPa and outgassing
for 1 hour under vacuum (spectra of the activated sample subtracted). The bands at 1545 cm-1
and ~1450 cm-1
represents Brønsted and Lewis acid site, respectively.
14001450150015501600
Wavenumber (cm-1)
No
rmali
zed
ab
so
rban
ce
H-Fe-ZSM5
H-ZSM5-SM
H-ZSM5
H-ZSM11-SC
H-NU10
Lewis
acid
Brønsted
acid
H-ZSM11-LC

Chapter 4: Selectivity of p-xylene
134
Figure 4.S11: Infrared (IR) spectra of H-ZSM5 and H-Fe-ZSM5 (iron isomorphously substituted in the
framework). The solid lines represent the spectra after adsorption of pyridine at 423 K, 0.01 kPa and outgassing
for 1 hour under vacuum. The dotted lines represent the spectra after additional outgassing at 723 K for 0.5 hour
under vacuum. The spectra of the activated samples were subtracted from the spectra shown above. The bands at
1545 cm-1
and ~1450 cm-1
represents Brønsted and Lewis acid site, respectively.
Table 4.S1: C1 (methanol and dimethyl ether) and toluene conversion at 573-723 K.
573K 623K 673K 723K
Conversiona C1 Toluene C1 Toluene C1 Toluene C1 Toluene
H-ZSM5 47 4.3 53 5.0 55 6.4 50 6.5
H-ZSM5-SMb 50 2.0 51 3.2 51 4.1 53 5.8
H-Fe-ZSM5 n/me n/m 52 4.8 54 4.9 52 5.2
H-ZSM11-SCc 50 6.3 53 6.5 51 7.1 52 7.5
H-ZSM11-LCd 52 1.1 51 2.0 56 3.4 53 5.1
H-NU10 n/m n/m 53 1.0 48 2.3 50 3.3 ameasured at ptoluene = 6.0 kPa, pmethanol = 1.5 kPa with 4-100 mg catalyst, total flow rate = 1.2-2.3 cm
3s
-1.
bSM =
surface modified by TEOS deposition. cSC = small crystal.
dLC = large crystal.
eToluene methylation of H-Fe-
ZSM5 and H-NU10 at 573K was not measured (n/m).
34003500360037003800
Wavenumber (cm-1)
No
rmali
zed
ab
so
rban
ce
H-Fe-ZSM5
H-ZSM5
14001450150015501600
Wavenumber (cm-1)
No
rmali
zed
ab
so
rban
ce
H-Fe-ZSM5
H-ZSM5
Lewis
acid
Brønsted
acid
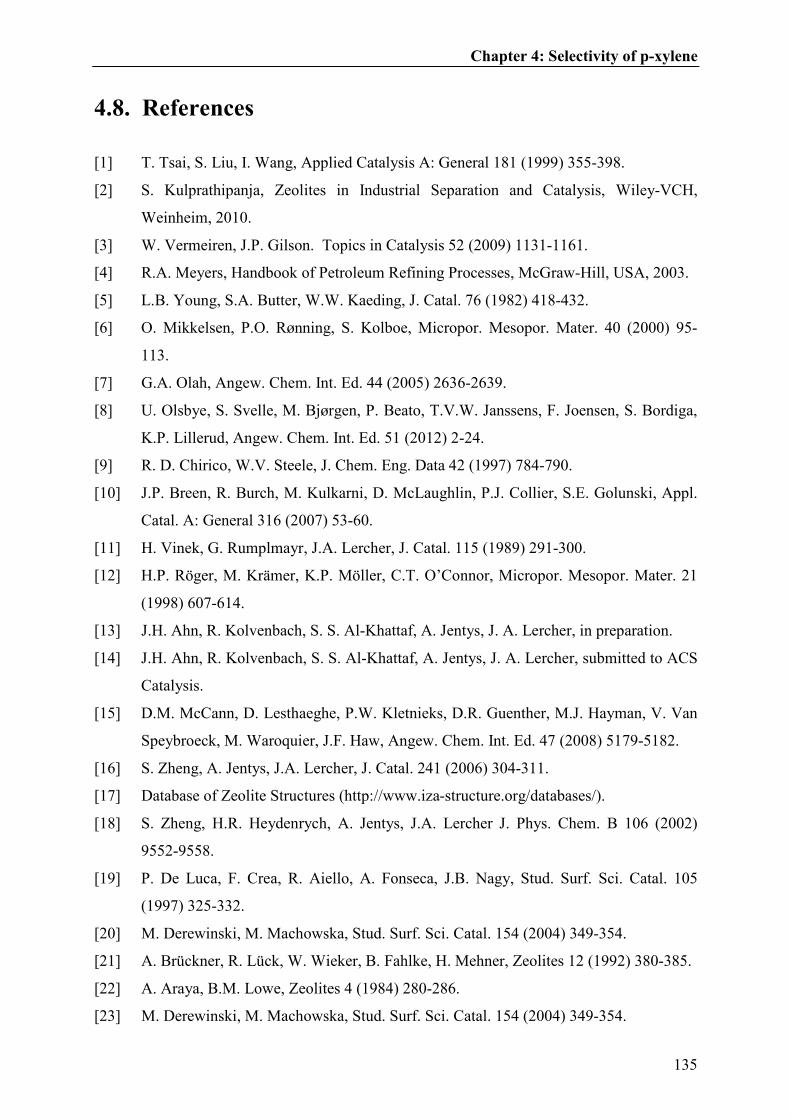
Chapter 4: Selectivity of p-xylene
135
4.8. References
[1] T. Tsai, S. Liu, I. Wang, Applied Catalysis A: General 181 (1999) 355-398.
[2] S. Kulprathipanja, Zeolites in Industrial Separation and Catalysis, Wiley-VCH,
Weinheim, 2010.
[3] W. Vermeiren, J.P. Gilson. Topics in Catalysis 52 (2009) 1131-1161.
[4] R.A. Meyers, Handbook of Petroleum Refining Processes, McGraw-Hill, USA, 2003.
[5] L.B. Young, S.A. Butter, W.W. Kaeding, J. Catal. 76 (1982) 418-432.
[6] O. Mikkelsen, P.O. Rønning, S. Kolboe, Micropor. Mesopor. Mater. 40 (2000) 95-
113.
[7] G.A. Olah, Angew. Chem. Int. Ed. 44 (2005) 2636-2639.
[8] U. Olsbye, S. Svelle, M. Bjørgen, P. Beato, T.V.W. Janssens, F. Joensen, S. Bordiga,
K.P. Lillerud, Angew. Chem. Int. Ed. 51 (2012) 2-24.
[9] R. D. Chirico, W.V. Steele, J. Chem. Eng. Data 42 (1997) 784-790.
[10] J.P. Breen, R. Burch, M. Kulkarni, D. McLaughlin, P.J. Collier, S.E. Golunski, Appl.
Catal. A: General 316 (2007) 53-60.
[11] H. Vinek, G. Rumplmayr, J.A. Lercher, J. Catal. 115 (1989) 291-300.
[12] H.P. Röger, M. Krämer, K.P. Möller, C.T. O’Connor, Micropor. Mesopor. Mater. 21
(1998) 607-614.
[13] J.H. Ahn, R. Kolvenbach, S. S. Al-Khattaf, A. Jentys, J. A. Lercher, in preparation.
[14] J.H. Ahn, R. Kolvenbach, S. S. Al-Khattaf, A. Jentys, J. A. Lercher, submitted to ACS
Catalysis.
[15] D.M. McCann, D. Lesthaeghe, P.W. Kletnieks, D.R. Guenther, M.J. Hayman, V. Van
Speybroeck, M. Waroquier, J.F. Haw, Angew. Chem. Int. Ed. 47 (2008) 5179-5182.
[16] S. Zheng, A. Jentys, J.A. Lercher, J. Catal. 241 (2006) 304-311.
[17] Database of Zeolite Structures (http://www.iza-structure.org/databases/).
[18] S. Zheng, H.R. Heydenrych, A. Jentys, J.A. Lercher J. Phys. Chem. B 106 (2002)
9552-9558.
[19] P. De Luca, F. Crea, R. Aiello, A. Fonseca, J.B. Nagy, Stud. Surf. Sci. Catal. 105
(1997) 325-332.
[20] M. Derewinski, M. Machowska, Stud. Surf. Sci. Catal. 154 (2004) 349-354.
[21] A. Brückner, R. Lück, W. Wieker, B. Fahlke, H. Mehner, Zeolites 12 (1992) 380-385.
[22] A. Araya, B.M. Lowe, Zeolites 4 (1984) 280-286.
[23] M. Derewinski, M. Machowska, Stud. Surf. Sci. Catal. 154 (2004) 349-354.
Chapter 4: Selectivity of p-xylene
136
[24] S. Brunauer, P. H. Emmett, E. Teller, J. Am. Chem. Soc. 60 (1938) 308-319.
[25] B.C. Lippens, B.G. Linsen, J.H. de Boer, J. Catal. 3 (1964) 32-37.
[26] G. Halsey, J. Chem. Phys. 16 (1948) 931-937.
[27] I.I. Ivanova, A. Corma, J. Phys. Chem. B 101 (1997) 547-551.
[28] S. Svelle, S. Kolboe, O. Swang, U. Olsbye, J. Phys. Chem. B 109 (2005) 12874-
12878.
[29] S. Bordiga, R. Buzzoni, F. Geobaldo, C. Lamberti, E. Giamello, A. Zecchnia, G.
Leofanti, G. Petrini, G. Tozzola, G. Vlaic, J. Catal. 158 (1996) 486-501.
[30] J. Pérez-Ramírez, J.C. Groen, A. Brückner, M.S. Kumar, U. Bentrup, M.N. Debbagh,
L.A. Villaescusa, J. Catal. 232 (2005) 318-334.
[31] C.T.W. Chu, C.D. Chang, J. Phys. Chem. 89 (1985) 1569-1571.
[32] P. Mériaudeau, V.A. Tuan, L.N. Hung, V.T. Nghiem, C. Naccache, J. Chem. Soc.,
Faraday Trans. 94 (1998) 467-471.
[33] A. Chatterjee, T. Iwasaki, T. Ebina, A. Miyamoto, Micropor. Mesopor. Mater. 21
(1998) 421-428.
[34] N. Tøpsoe, K. Pedersen, E.G. Derouane, J. Catal. 70 (1981) 41-52.
[35] P.A. Jacobs, R. Von Ballmoos, J. Phys. Chem. 83 (1982) 3050-3052.
[36] F. Eder, M. Stockenhuber, and J. A. Lercher, J. Phys. Chem. B 101 (1997) 5414-5419.
[37] V.L. Zbolobenko, M.A. Makarova, J. Dwyer, J. Phys. Chem. 97 (1993) 5962-5964.
[38] W.W. Kaeding, C. Chu, L.B. Young, S.A. Butter, J. Catal. 69 (1981) 392-398.
[39] C. Fernandez, I. Stan, J. Gilson, K. Thomas, A. Vicente, A. Bonilla, J. Pérez-Ramírez,
Chem. Eur. J. 16 (2010) 6224-6233.
[40] X. Cheng, X. Wang, H. Long, Micropor. Mesopor. Mater. 119 (2009) 171-175.
[41] D. Lesthaeghe, J. Van der Mynsbrugge, M. Vandichel, M. Waroquier, V. Van
Speybroeck, Angew. ChemCatChem 3 (2011) 208-212.
[42] O.C. Gobin, S.J. Reitmeier, A. Jentys, J.A. Lercher J. Phys. Chem. C 113 (2009)
20435-20444.
[43] R. Kolvenbach, J. H. Ahn, S. S. Al-Khattaf, A. Jentys, J. A. Lercher, in preparation.
[44] P.B. Venuto, L.A. Hamilton, P.S. Landis, J.J. Wise, J. Catal. 4 (1966) 81-98.
[45] U. Olsbye, M. Bjørgen, S. Svelle, K. Lillerud, S. Kolboe, Catal. Today 106 (2005)
108-111.

Chapter 4: Selectivity of p-xylene
137

Chapter 5: Summary and concluding remarks
138
Chapter 5
Summary and concluding remarks

Chapter 5: Summary and concluding remarks
139
Summary and concluding remarks
The reaction of toluene methylation has great potential to become a key process for
increasing the production of p-xylenes in chemical industries. The endeavor of our work
focused on investigating the technical challenges and improving the catalyst system by better
understanding various limitations of this reaction. Herein, the topics regarding the utilization
of methanol (Chapter 2), synthesis of hierarchical zeolites for simultaneous enhancement of
catalyst activity and p-xylene selectivity (Chapter 3), and the influence of the reaction
temperature on p-xylene selectivity (Chapter 4) during toluene methylation, were addressed in
detail.
A significant fraction of methanol (i.e., >30%) was utilized to form products other than
xylenes, e.g., light hydrocarbons, tri- and tetramethylbenzenes, during the toluene methylation
reaction. Despite of using an excess of toluene relative to methanol (i.e., 4:1 molar ratios), the
products of toluene methylation (e.g., xylenes and trimethylbenzenes) were readily
methylated further inside the zeolite pores because the rate of methylation increased as the
number of methyl substitution increased. These multi-methylated aromatic molecules
eventually eliminated light hydrocarbons as a consequence of product shape selectivity. We
therefore concluded from the work reported in chapter 2 that the inefficiency of methanol
usage during toluene methylation was a consequence of the further methylation of the
aromatic products of toluene, e.g., xylenes and trimethylbenzenes, and that the light
hydrocarbons were unavoidable side-products from product shape selectivity.
A series of hierarchical materials were derived from a microporous MFI (H-ZSM-5) by
desilication, dealumination and chemical liquid deposition of tetraethyl orthosilicate (TEOS)
onto the zeolite surface. For the first time in the literature, the work in chapter 3 demonstrated
that this sequence of zeolite modification can increase simultaneously the toluene
consumption rate (per Brønsted acid site) and p-xylene selectivity. We concluded here that the
consumption rate of toluene increased because the mesopores enhanced the diffusivity of the
reactant and product molecules by decreasing the diffusion length. We further concluded that
the increase in the selectivity of p-xylene within these hierarchical materials was not caused
by the removal of unselective Brønsted acid sites in the pore mouth region, but predominantly
by the diffusivity differences between p-xylene relative to o- and m-xylenes. TEOS deposition
on the zeolite surface therefore, increased the p-xylene selectivity because diffusivity of the
Chapter 5: Summary and concluding remarks
140
bulkier o- and m- xylene isomers decreased, while it increased for p-xylene (the desired
product).
The selectivity of p-xylene over medium pore-sized zeolites was further investigated in
chapter 4 by examining three different major reaction pathways for the formation of p-xylene
during toluene methylation, i.e., methylation of toluene, isomerization of xylenes, further
methylation and subsequent elimination of less-methylated aromatic molecules as xylenes
(and light hydrocarbons) from multi-methylated aromatics. In all these pathways, increasing
the reaction temperature consistently resulted in higher p-xylene selectivity because the
differences in diffusivities of xylenes i.e., between p-xylene and o-, m-xylenes, played more
significant role in determining selectivity of xylenes, as the reactions (most importantly
xylene isomerization) became faster at higher reaction temperature. We concluded, therefore,
that the reaction of toluene methylation to p-xylene over medium pore-sized zeolites should
be operated at high temperature because both the activity (reaction rates) and the selectivity of
p-xylene can be increased simultaneously.

Chapter 5: Summary and concluding remarks
141
Copyright © 2022 FDOKUMEN