A comparative study of toluene, toluene-d3 and p
25
1 Critical influences on the rate of intramolecular vibrational redistribution: A comparative study of toluene, toluene-d3 and p-fluorotoluene. Julia A. Davies 1 , Alistair M. Green, Adrian M. Gardner 2 , Carolyn D. Withers, Timothy G. Wright and Katharine L. Reid School of Chemistry, University of Nottingham, Nottingham NG7 2RD, United Kingdom Abstract The intramolecular vibrational redistribution (IVR) dynamics following the excitation of a mode in the first electronically excited states of toluene, toluene-d3 and p-fluorotoluene that has predominantly C-CH3 stretching character and an internal energy of ~1200 cm -1 have been compared using picosecond time-resolved photoelectron imaging spectroscopy as a probe. Temporal changes in the intensities of spectral features in each molecule have enabled IVR lifetimes of 12, 15 and 50 ps, respectively, to be determined. Our measurements show that doorway states are critical in mediating the IVR dynamics in toluene and toluene-d3, and we deduce that these doorway states, which are assigned in the course of this work, are also instrumental in reducing the IVR lifetimes of these molecules relative to p-fluorotoluene. 1. Introduction One of the goals in studies of intramolecular dynamics is to investigate the respective roles of (a) density of states and (b) the activation of particular degrees of freedom on the rate and mechanism of energy redistribution. For this reason, it is valuable to study closely-related systems that are prepared in comparable vibrational states, and/or with comparable excitation energy. Classic examples of this are the studies by Lehmann, Scoles and coworkers of molecules containing carbon triple bonds [1,2], and the studies of Parmenter and coworkers of small fluorobenzenes with and without attached methyl groups [3-5]. In recent work, we have studied intramolecular vibrational energy redistribution (IVR) in the first electronically excited states of toluene and p-fluorotoluene (pFT), and have published some selected results [6-8]. In the present work, we compare the dynamics that result subsequent to the preparation of one quantum in a near-isoenergetic (~1200 cm -1 ), predominantly C-CH3 stretching mode, in the S1 electronic states of toluene, toluene-d3 and pFT. An interesting feature of the chosen molecules is the degree of freedom associated with the methyl rotor. Evidence that torsional motion of the methyl group in substituted toluenes affects the IVR lifetime has been discussed in the literature by a number of authors [3,5-7,9-11]. A study by Perry et al. [12] has suggested that when excitation occurs in a vibrational mode associated with a center 1 Current address: Department of Chemistry, Imperial College London, Exhibition Road, London SW7 2AZ, UK 2 Current address: Department of Chemistry, Emory University, Atlanta, GA 30322, USA
-
Upload
khangminh22 -
Category
Documents
-
view
1 -
download
0
Transcript of A comparative study of toluene, toluene-d3 and p

1
Critical influences on the rate of intramolecular vibrational redistribution: A
comparative study of toluene, toluene-d3 and p-fluorotoluene.
Julia A. Davies1, Alistair M. Green, Adrian M. Gardner2, Carolyn D. Withers, Timothy G. Wright and
Katharine L. Reid
School of Chemistry, University of Nottingham, Nottingham NG7 2RD, United Kingdom
Abstract
The intramolecular vibrational redistribution (IVR) dynamics following the excitation of a mode in
the first electronically excited states of toluene, toluene-d3 and p-fluorotoluene that has
predominantly C-CH3 stretching character and an internal energy of ~1200 cm-1 have been
compared using picosecond time-resolved photoelectron imaging spectroscopy as a probe.
Temporal changes in the intensities of spectral features in each molecule have enabled IVR
lifetimes of 12, 15 and 50 ps, respectively, to be determined. Our measurements show that
doorway states are critical in mediating the IVR dynamics in toluene and toluene-d3, and we
deduce that these doorway states, which are assigned in the course of this work, are also
instrumental in reducing the IVR lifetimes of these molecules relative to p-fluorotoluene.
1. Introduction
One of the goals in studies of intramolecular dynamics is to investigate the respective roles of (a)
density of states and (b) the activation of particular degrees of freedom on the rate and
mechanism of energy redistribution. For this reason, it is valuable to study closely-related
systems that are prepared in comparable vibrational states, and/or with comparable excitation
energy. Classic examples of this are the studies by Lehmann, Scoles and coworkers of molecules
containing carbon triple bonds [1,2], and the studies of Parmenter and coworkers of small
fluorobenzenes with and without attached methyl groups [3-5]. In recent work, we have studied
intramolecular vibrational energy redistribution (IVR) in the first electronically excited states of
toluene and p-fluorotoluene (pFT), and have published some selected results [6-8]. In the
present work, we compare the dynamics that result subsequent to the preparation of one
quantum in a near-isoenergetic (~1200 cm-1), predominantly C-CH3 stretching mode, in the S1
electronic states of toluene, toluene-d3 and pFT.
An interesting feature of the chosen molecules is the degree of freedom associated with the methyl
rotor. Evidence that torsional motion of the methyl group in substituted toluenes affects the IVR
lifetime has been discussed in the literature by a number of authors [3,5-7,9-11]. A study by Perry et
al. [12] has suggested that when excitation occurs in a vibrational mode associated with a center
1 Current address: Department of Chemistry, Imperial College London, Exhibition Road, London SW7 2AZ, UK 2 Current address: Department of Chemistry, Emory University, Atlanta, GA 30322, USA

2
of flexibility (i.e. a bond about which internal rotation occurs), the IVR lifetime increases with
torsional barrier height. For toluene derivatives, the C-CH3 bond represents such a center, and a
motivation for our comparative study is to see if this relationship holds true. In Table I it can
be seen that the barrier heights (V6) in the first excited electronic state for toluene and toluene-d3
are very similar, but the barrier height for pFT is around 35% higher due to the influence of the
fluorine substituent [11,13-15]. Furthermore, it can be seen that the energies of the internal
rotation levels are comparable for toluene and pFT but, as expected, are significantly lower for
toluene-d3.
Moss and Parmenter have compared the IVR lifetimes following the preparation of a CF stretching
vibration at ~1230 cm-1 in the S1 excited states of pFT and pFT-d3 [5], and also of pFT and m-
fluorotoluene (mFT) [4]. In their work, it was found that the IVR lifetime of pFT-d3 was about a
factor of two shorter than that of pFT. However, the IVR lifetime of mFT was a factor of twelve
shorter than that of pFT. Moss and Parmenter rationalized this by postulating that the increased
interaction between the methyl rotor and the aromatic ring for the meta structure, consistent with
the fact that in S1 the torsional barrier in mFT is four times larger than that in pFT, serves to
promote IVR. However, this is inconsistent with the relationship proposed by Perry et al. [12].
Borst and Pratt [11] have suggested that the IVR dynamics are not controlled directly by barrier
height, but by the hyperconjugative interaction between the benzene ring and the methyl group,
which in turn influences the barrier height. The role of hyperconjugation in IVR has been
explored by a number of authors [16-19] and is expected to lead to an inhibition of IVR in pFT
relative to toluene, assuming an equivalent density of states.
The mode of interest in the present work is 𝜈13 according to Varsanyi [20]; this same mode is
labelled 𝜈8 in Ref. [21], and has recently been redesignated M6 in Ref. [22] as part of a
rationalization of the vibrations of monosubstituted benzenes. In the present work, we use one-
photon excitation from the vibrational origin in S0 to prepare one quantum in this mode in S1 in
each of toluene, toluene-d3 and pFT. The resulting dynamics are then probed through time-
resolved photoelectron spectroscopy. In common with some of our recent work, we use the slow
electron velocity map imaging (SEVI) method [6,7], which provides superior resolution to that
obtained in our earlier time-resolved studies [23,24]. The higher quality data allows quantum
beats and exponential decays associated with coupled vibrational states in S1 to be characterized.
Our results are also discussed in light of resonance-enhanced multiphoton ionization (REMPI) and
zero-electron-kinetic-energy (ZEKE) photoelectron spectra which have been measured with
nanosecond laser pulses [25-27].
2. Experiment

3
The picosecond laser system (Coherent), velocity-map imaging (VMI) photoelectron spectrometer,
experimental procedures and data analysis techniques used in the picosecond experiments have
been described elsewhere [6,7] and are not reproduced in detail here. Briefly, the two UV
outputs from the laser system have pulse durations of 1 ps and bandwidths of ~13 cm-1. The co-
propagating laser beams are focused into the VMI chamber using a 1.0 m focal length lens,
resulting in typical pump and probe pulse intensities of 5 x 10⁹ W/cm2 and 1 x 10¹¹ W/cm2
respectively. The wavelength of the pump beam is tuned to be resonant with the absorption
maximum at ~1192 cm-1 (toluene), ~1225 cm-1 (toluene-d3) and ~1195 cm-1 (pFT) above the S1
origin; the probe wavelength is chosen to access the cation internal states of interest. The
samples (toluene, toluene-d3 and pFT) are seeded in 3 bar He and expanded through a pulsed
nozzle (General Valve) operating at a repetition rate of 40 Hz. The supersonic expansion is
skimmed leading to a molecular beam with a rotational temperature of ~10 K. Inside the
spectrometer chamber, the laser beams are spatially and temporally overlapped with the pulsed
molecular beam; the typical operating pressure is 4 x 10⁻⁸ mbar. A delay stage enables the
selection of chosen time intervals between the pump excitation pulse and the probe ionization
pulse in order to monitor time-dependent behaviour. A three-element electrostatic lens focuses
the electrons onto a vacuum imaging detector (VID, Photek) to create a two-dimensional image,
which is captured using a CCD camera and recorded using IFS32 software (Photek). Using this
technique we are able to record photoelectron images as a function of both pump-probe time
delay and probe wavelength. These images are converted to give photoelectron spectra as
discussed in earlier work [6]. Photoelectron angular distributions were also obtained from the
images but they showed no significant changes with time delay and will not be discussed further.
The imaging detector is also operated in ion detection mode to measure mass-resolved REMPI
spectra via the S1 state of each molecule.
The nanosecond REMPI and ZEKE experiments, some of whose results are discussed in the
present work, are fully described in Refs. [25,26].
3. Results and Discussion
3.1 REMPI and photoelectron spectra
Figure 1 shows one-colour REMPI spectra measured via S1 in toluene, toluene-d3 and pFT using
picosecond laser pulses (bandwidth ~13 cm-1). In each case the peaks are assigned according to
Varsanyi notation [20]. The peak corresponding to excitation of the mode of interest (131 in
Varsanyi notation) appears at ~1192 cm-1 for toluene, at ~1225 cm-1 for toluene-d3 and at
~1195 cm-1 for pFT. The assignment of the peak in toluene-d3 contradicts previous work in the
literature [28,29] and has been established by reference to the time-resolved photoelectron
spectra measured in the present work in combination with supporting quantum chemistry
calculations. Figure 2 shows nanosecond REMPI spectra measured via S1 in the region of the
transition of interest in toluene, toluene-d3 and pFT. Also shown in each plot is the idealized

4
Gaussian spectral profile of the picosecond pump laser pulse, which indicates the spectral region
that is accessed in the time-resolved experiments. In the case of toluene, the nanosecond REMPI
spectrum reveals that three partially resolved peaks lie within the Gaussian profile; these are
centered at 1184, 1192 and 1197 cm-1 and will be denoted |1>, |2> and |3> respectively. For
toluene-d3 two close-lying peaks at 1222 and 1225 cm-1 lie within the Gaussian profile, with a less
intense peak at 1215 cm-1 at the edge of the profile.3 For pFT a peak at 1195 cm-1 dominates the
spectral region contained within the Gaussian profile, with additional minor peaks appearing at
1203 and 1208 cm-1.
Nanosecond ZEKE spectra have been recorded for toluene and pFT, and picosecond time-resolved
photoelectron spectra have been recorded for all three molecules. Before discussing these
results, we briefly outline the information they can provide. In the nanosecond experiments the
resolution of the excitation step is ~0.1 cm-1, enabling a narrow portion of each absorption profile
to be selectively excited. Although true eigenstate resolution (selection of all relevant quantum
numbers) is not achieved, for the purposes of this discussion we can assume that a stationary
“vibrational eigenstate” has been prepared. The wavefunction of the prepared state, which has
no time-dependence, is given by:
y = I = aIb b + aIdn dnn
å , (1)
where |I> denotes the vibrational eigenstate prepared, |b> denotes the zero-order bright state
(131 in this case) and nd is the set of dark zero-order states to which the bright state is coupled.
The coefficients aIγ express the relative contributions of the bright and dark states to the prepared
eigenstate. The photoelectron spectrum that results following the ionization of the prepared
wavefunction represented by Eq. (1) will be the photoelectron spectrum characteristic of |I>
which will consist of a superposition of the photoelectron spectra that are characteristic of the
contributing bright and dark states. If the bright state is not coupled to any dark states it will be
equivalent to a vibrational eigenstate, and so the photoelectron spectrum will simply reflect the
bright state in that case. For molecules such as toluene, photoelectron spectra generally show a
strong Δv = 0 peak, along with a series of weaker Δv ≠ 0 peaks. Thus, a photoelectron spectrum
characteristic of the 131 bright state is expected to show a strong peak corresponding to the 131
cation state. If, however, the bright state is strongly coupled to a single dark state (Fermi
resonance) then the characteristic photoelectron spectrum will contain two strong features
corresponding to Δv = 0 for each of the bright and dark states, along with weaker Δv ≠ 0 peaks
for both states. If the bright state is coupled to many dark states, designated “bath states”, then
a highly congested photoelectron spectrum is expected. In the case of toluene, the excitation of a
narrow spectral region centered on each of the REMPI peaks denoted |1>, |2> and |3> in Fig. 2a
3In the case of toluene-d3 the intensities of the peaks at 1222 and 1225 cm-1 are suppressed in the nanosecond REMPI
spectrum by a factor of ~4, as determined from the ratio of the peak intensities in the nanosecond and picosecond REMPI spectra. This suppression could conceivably be attributed to mode-specific internal conversion or intersystem crossing. We can estimate a lower limit of 3 ns for such non-adiabatic dynamics from our picosecond studies of all three molecules and therefore conclude that this relatively slow process can be neglected in the present IVR studies.

5
gives rise to the ZEKE spectra shown in Fig. 3a-c, respectively. Clear congestion can be seen in
all three cases, particularly for |1>; the assignment of the peaks that appear above the
congestion is discussed in Ref [25]. In Fig. 3d the ZEKE spectrum measured following excitation
of a narrow portion of the absorption profile in pFT is shown. The congestion observed in this
ZEKE spectrum is more prominent than that seen in previous work [27,30], as a consequence of
the adoption of different background subtraction procedures, but significant structure still
remains. For both toluene and pFT, nanosecond ZEKE spectra therefore provide evidence of IVR
following the excitation of the bright state, with the IVR being apparently more significant in the
case of toluene.
In the picosecond time-resolved experiments the ~13 cm-1 bandwidth of the excitation pulse
coherently excites vibrational features lying within a relatively broad spectral region in S1; see the
Gaussian profiles superimposed on the REMPI spectra in Fig. 2. A time-evolving wavepacket
(superposition of eigenstates) is prepared, which can be represented by:
,
( ) exp exp exp
n
I I II I Ib I Id n
I I I n
iE t iE t iE tt c I c a b c a d , (2)
where the cI coefficients weight the contribution of each eigenstate, |I>, in the prepared
superposition. In the limit where the bandwidth encompasses all dark states to which a single
bright state is coupled, the wavepacket at zero time will resemble the zero-order bright state:
y (0) = cI I =I
å b , (3)
whereas at later times it will resemble multiple zero-order states. The photoelectron spectrum
that results following the ionization of the wavepacket given in Eq. (2) will be time-dependent. At
time zero it is expected to be dominated by a Δv = 0 peak characteristic of the bright state, and
its structure is then expected to change with pump-probe time delay. If the bright state is
coupled to many dark states then its signature will become progressively weaker at long time
delays. If it is strongly coupled to a limited number of dark states then oscillations in the time-
dependent intensity (i.e., quantum beats) are expected, as observed in our earlier work [6-8].
Picosecond time-resolved photoelectron spectra, measured at selected time delays, are compared
in Figs. 4 and 5 for toluene and pFT, and in Fig. 6 for toluene and toluene–d3. These spectra were
measured using the SEVI technique described in Ref. [6], which enables us to optimize the
resolution in the photoelectron spectra. In Fig. 4a it can be seen that the toluene photoelectron
spectrum shows distinct changes in structure over only a few picoseconds, with the intensity of
the 131 cation peak at 1234 cm-1 gradually decreasing from 0 to 3 ps and then increasing from 3
to 5 ps. By contrast, the pFT photoelectron spectra shown in Fig. 4b remain very similar over the
same range of time delays. In Fig. 5 the photoelectron spectra measured at 0 ps and at 500 ps
are compared for toluene and pFT. Over this timescale the intensity in the sharp peaks is almost
entirely lost for toluene, leading to a relatively featureless spectrum at 500 ps. This indicates that
almost all of the population has been transferred from the bright state to a multitude (bath) of

6
weakly coupled dark states. In contrast, the sharp peaks in the pFT photoelectron spectrum only
decrease in intensity by approximately a factor of two, and the broad continuum below the sharp
peaks shows an increase in intensity, which indicates that only part of the bright state population
is redistributed (see Section 3.4). In Fig. 6 the early time behaviour of the toluene and toluene-
d3 photoelectron spectra are compared. The photoelectron spectrum measured at time zero for
toluene-d3 is strikingly similar to that recorded for toluene. Spectra at increasing time delays for
both molecules show significant changes in structure, with the 131 cation peaks initially
decreasing in intensity and then reappearing again at 6 ps for toluene and at 12 ps for toluene-d3.
As observed in our earlier work [7], this initial oscillation in intensity is characteristic of the
influence of strongly-coupled dark states [31] in the IVR dynamics. These states, known as
doorway states, mediate the coupling between the prepared bright state and a weakly-coupled
bath of dark states and have maximum population at intermediate stages of the IVR process.
To summarize, these preliminary observations suggest that in the case of toluene and toluene-d3
the IVR dynamics are dominated by a limited number of doorway states. In the case of pFT there
is no evidence for doorway states, and the weakly coupled states only remove part of the bright
state population. Thus it appears that the relatively well-structured ZEKE spectrum observed for
pFT results from this substantial remaining bright state population. In the following sections we
quantify and discuss the IVR dynamics further, including the likely coupling mechanisms giving
rise to the observed behaviour. We focus our discussion on anharmonic and torsion-vibration
coupling which are likely to be the dominant mechanisms at the temperatures and S1 internal
energies studied. We note that we see no evidence for vibronic coupling (loss of population from
S1)3 on the timescale of our experiments.
3.2 Time profiles
The time-dependent behaviour can be characterized by plotting the integrals of peaks in the
photoelectron spectra as a function of time delay. These peak integrals are determined by using
the trapezium rule across cation internal energy ranges that are specified in Table II. Examples of
these time profiles are shown in Figs. 7 to 10; the solid lines represent fits that are described
below. In Fig. 7 the peak integrals correspond to regions of photoelectron intensity encompassing
the 131 ion state in toluene, toluene-d3 and pFT. This ion state reflects the behaviour of the
initially prepared bright state in S1 because of the v = 0 propensity on ionization. In the present
work, the resolution is not sufficient to determine the intensity due to a single ion vibrational
state uniquely, and the spectra show an increasing contribution from the broad continuum
underneath the sharp peaks as the time delay increases. As a consequence, we refrain from
commenting on the absolute intensity values that are determined from the time profiles of the
peak integrals. Instead, we use the time profiles to determine IVR timescales (lifetimes and
oscillation periods), and we obtain quantitative information on individual ion peak intensities
directly from the picosecond photoelectron spectra. First we discuss each of Figs. 7-10 in turn.

7
In Fig. 7 it can be seen that the photoelectron intensity corresponding to the 131 ion state decays
over a 200 ps timescale for all three molecules, signifying the transfer of population away from
the bright state and into the bath states. However, differences in the time profiles for the three
molecules are clear, with oscillatory structure observed at early time delays for toluene and
toluene-d3 but not for pFT. As discussed above, these oscillations reflect the transfer of
population between the bright state and one or more doorway states.
In Fig. 8 we compare the toluene time profiles for peak integrals corresponding to three distinct
regions of photoelectron intensity, one of which (1200-1260 cm-1) reflects the behaviour of the
bright state and the other two of which (1260-1320 cm-1 and 1400-1530 cm-1) reflect the
behaviour of two doorway states. Strong oscillations are observed in all three cases, with the
photoelectron intensity maximized at 0 ps for the bright state region and minimized at 0 ps for
the doorway state regions. It is clear that the oscillation patterns are too complicated to describe
with a single cosine function. In Fig. 9 we compare the early time behavior of the toluene-d3
peak integrals that correspond to regions of photoelectron intensity reflecting bright (1160-
1350 cm-1) and doorway (1350-1450 cm-1) state behaviour. As noted in Section 3.1, the
oscillation period has roughly doubled on moving from toluene to toluene-d3. The plot in Fig. 9b
is approximately a mirror image of the plot shown in Fig. 9a, providing a particularly clear
signature of the transfer of population between the bright and dark states. In Fig. 10 we compare
the early time behaviour of peak integrals representing bright (1180-1275 cm-1) and dark (1370-
1550 cm-1) state behaviour for pFT. In this instance, the time profiles are devoid of any strong or
regular oscillatory components, and reflect the gradually increasing population of bath states with
time that is characteristic of statistical IVR.
Oscillation periods and decay times can be extracted from the data shown in Figs. 7-10 by fitting
the time-dependent peak intensities to the empirical equation
1 2
2 2 exp exp cos cos
C D
t t t tI t A B C D . (4)
This empirical equation is based on the physical situation in which a bright state is strongly
coupled to two doorway states and weakly coupled to a bath of other dark states; it contains the
same ingredients used in our earlier work [7] and yields the fits that are plotted as solid lines in
Figs. 7-10. Relating Eq. (4) to our earlier work reveals that the coefficients A, B, C and D are
collections of the coupling coefficients, aI, which were introduced in Eq. (1). Because the cosine
terms in Eq. 4 only appear when doorway states are involved in the dynamics, C and D can be set
to zero in the case of pFT. Table II lists the values of the parameters in Eq. (4) that are obtained
from the fits of the time profiles of selected regions of the photoelectron spectra for toluene,
toluene-d3 and pFT. The values obtained for the lifetimes 𝜏1 and 𝜏2 are discussed in Section 3.3
and the oscillation periods 𝜏𝐶 and 𝜏𝐷 are discussed in Section 3.5.

8
3.3 IVR lifetimes
The exponential decay time constants in Eq. (4) provide information on the overall IVR lifetime.
When oscillations are observed in the time profiles, as occurs for toluene and toluene-d3, two
lifetimes are deduced [see Eq. (4)] with the 𝜏1 value representing the overall exponential lifetime
and the 𝜏2 value indicating the decay time of the beating behaviour; in principle these two values
should be equal in most circumstances. Values for the IVR lifetimes have been determined from
the average of the 𝜏1 and 𝜏2 values given in Table II for each molecule, where available. However,
the poorly determined 𝜏1 value for the toluene-d3 doorway state region has been excluded from
this average because the uncertainty of ±15 ps is much larger than the uncertainties in the other
𝜏1 and 𝜏2 values determined for toluene-d3. This procedure leads to values of the IVR lifetime,
𝜏𝐼𝑉𝑅, of 12 ± 7 ps, 15 ± 4 ps and 50 ± 6 ps for toluene, toluene-d3 and pFT, respectively (see
Table II). In what follows we discuss these values by reference to the density of states in each
molecule, and to the barrier to internal rotation (see Table I). In particular, we seek to explain (i)
why the 𝜏𝐼𝑉𝑅 values are so similar for toluene and toluene-d3 and (ii) why the 𝜏𝐼𝑉𝑅 value for toluene
(and hence for toluene-d3) is so much shorter than that for pFT.
The overall density of states at the S1 bright state energy for the three molecules has been
estimated with a simple counting algorithm using the scaled harmonic vibrational frequencies
given in Ref. [26], and the calculated torsional energies listed in Table I. The vibrational
frequencies corresponding to the same modes in toluene and toluene-d3 are very similar in most
cases (Table III), however, the torsional energies are strongly affected by deuteration (Table I).
As a consequence, the average density of states in the region of the bright state energy is
approximately a factor of two greater for toluene-d3. Although toluene and pFT have the same
number of modes with frequencies below 1000 cm-1, nine of those modes have frequencies that
are more than 7% lower in pFT than in toluene. As a consequence, despite the similarity of the
torsional energies, the average density of states in pFT in the region of the bright state is
approximately a factor of two higher. Thus, pFT and toluene-d3 have similar average densities of
states at the bright state energy, whereas toluene has a significantly lower density of states. An
increased density of states at a given excitation energy might be expected to lead to a shorter
IVR lifetime. However, in the present work, similar 𝜏𝐼𝑉𝑅 values have been determined for toluene
and toluene-d3, with a much longer 𝜏𝐼𝑉𝑅 value determined for pFT, indicating poor correlation with
the density of states. The comparable IVR lifetimes for toluene and toluene-d3 can be rationalized
by noting that the additional states that contribute to the density of states for toluene-d3 at a
given excitation energy are caused by the availability of lower lying torsionally excited levels in
the deuterated molecule, which suggests that these torsionally excited levels do not play a key
role in the dynamics. This in turn would imply that in the case studied here torsion-vibration
interactions do not play a major role in the IVR dynamics in toluene or toluene-d3. However, we
cannot find a way to rationalize the relative IVR lifetimes in toluene and pFT on the basis of the
densities of states and conclude that the total average density of states is not a good predictor of
the relative IVR lifetimes at these excitation energies.

9
A substantial barrier to internal rotation is caused by an interaction of the ring with the methyl
group, which could be expected either to (a) facilitate IVR, as concluded by Moss and Parmenter
in their comparison of pFT and mFT [4], or (b) hinder IVR as concluded by Perry and coworkers
[12]. In the case of toluene and toluene-d3 the barriers are very similar, consistent with the
observation of a similar IVR lifetime in the two molecules. Although our observed relative IVR
lifetimes for toluene and pFT lend support to the Perry and coworkers hypothesis (see the barrier
heights listed in Table I) and are inconsistent with that of Moss and Parmenter, this assumes that
the same IVR mechanism operates in each molecule. The Borst and Pratt hyperconjugation
hypothesis [11], in which the motion of the methyl group modulates the structure of the ring thus
disrupting its conjugation, would also lead to a longer lifetime for pFT relative to toluene because
the fluorine atom acts to stabilize the hyperconjugated structure.
In general it is expected that IVR lifetimes decrease with excitation energy. In the case of pFT,
reference to our earlier work [7] shows that this is not always observed. In that work an IVR
lifetime of only 17 ps was measured at an excitation energy of 845 cm-1, compared with the
lifetime of 50 ps measured at an excitation energy of 1195 cm-1 in the present work. In Ref. [7]
doorway states were observed to mediate the IVR dynamics at 845 cm-1; their presence may
therefore be invoked to explain this observation. In corroboration of this, we have found in the
present work that shorter IVR lifetimes are determined for the molecules (toluene and toluene-d3)
in which doorway states are observed to operate than are determined for pFT in which no
doorway states contribute. Thus, in both the present work and the work presented in Ref. [7],
the availability of doorway states appears to serve to reduce the IVR lifetime. Our observations to
date are therefore consistent with the idea that the presence of doorway states is a critical
determinant of IVR lifetimes. The availability or otherwise of such doorway states is a
coincidental consequence of the presence of dark states that (i) have an S1 internal energy
approximately equal to that of the bright state, (ii) have the same overall symmetry as the bright
state, and (iii) are strongly coupled to the bright state. The presence of doorway states cannot be
predicted on the basis of arguments concerning the total density of states, the torsional barrier
height, or hyperconjugative interactions.
3.4 Comparison of IVR dynamics in toluene and p-fluorotoluene
As discussed in our earlier work on toluene and pFT [6,7], a molecular beam temperature of ~10
K is used in the picosecond time-resolved experiments. Owing to the different nuclear spin
symmetries of the torsional levels [13], the bright state prepared at time zero will contain roughly
equal populations of two incoherently prepared torsional components, characterized by values of
the internal rotation quantum number of m = 0 and m = 1, and there will be < 5 % population in
levels with m > 1. For each molecule, the various torsional components may exhibit different
dynamics if torsion-vibration coupling plays a significant role in the IVR process; this is because
symmetry selection rules dictate that different dark vibrational states will couple to each of the

10
torsional components of the bright state [32]. In contrast, in anharmonic coupling the torsional
quantum number is conserved and the same set of vibrational dark states can couple to all
torsional components of the bright state.
As discussed in Section 3.1, the time-resolved photoelectron spectra shown in Fig. 5 show that
almost all of the intensity of the sharp peaks observed at 0 ps is lost at 500 ps for toluene,
whereas only half of the intensity is lost for pFT at 500 ps. From this we conclude that half of the
bright state population is “trapped” in the case of pFT, which is consistent with an IVR pathway
existing for one of the initially prepared torsional components but not for the other. Such a
situation can only occur if torsion-vibration coupling mediates the IVR process. In the case of
toluene, the substantial decrease in bright state intensity indicates that both torsional
components undergo IVR. These interpretations are consistent with the ZEKE spectra shown in
Fig. 3. For pFT, the strong 131 ZEKE peak at 1230 cm-1 together with the congestion observed at
higher ion internal energies (see Fig. 3d) suggests that only part of the bright state population
undergoes IVR. In the case of toluene, the high degree of congestion visible in the ZEKE spectra
in Figs. 3a-c supports the conclusion that both prepared torsional components undergo IVR.
3.5 Comparison of IVR dynamics in toluene and toluene-d3
As discussed in Sections 3.1 and 3.2, the time evolution of the wavepackets in toluene and
toluene-d3 is analogous to some previous observations we have made [7], and is characteristic of
IVR that is facilitated by doorway states. The early time dynamics is dominated by the interaction
of the bright state with these doorway states and is relatively unaffected by other interactions
which will increasingly contribute at later times. In the present work, the doorway states for
toluene give rise to oscillations in the time profiles with periods of C = 6.5 ps and
D = 4.9 ps
which are consistent for all the ion energy ranges studied (see Table II). These oscillation periods
correlate with eigenstate energy separations of /C C
E 5.1 cm-1 and /D D
E 6.8 cm-1,
which are approximately consistent with the separations E23 = 5 cm-1 and E12 = 8 cm-1 between
the three peaks (|1> at 1184 cm-1, |2> at 1192 cm-1 and |3> at 1197 cm-1) in the nanosecond
REMPI spectrum (see Fig. 2a). This suggests that the S1 vibrational eigenstates responsible for
the three REMPI peaks contain contributions from the bright state and the coupled doorway
states. Therefore we conclude that two doorway states dominate in toluene.
For toluene-d3, oscillations with a period of C = 10.6 ps are observed in the time profiles which
are consistent for all the ion energy ranges studied (see Table II). This period corresponds to an
energy separation of /C C
E 3.1 cm-1, which is in excellent agreement with the spacing
between the peaks at 1222 and 1225 cm-1 present in the nanosecond REMPI spectrum in Fig. 2b.
The close-lying peak at 1215 cm-1 does not appear to be involved in the IVR dynamics, as
evidenced by the absence of oscillations with periods of either 5 or 3 ps that would be consistent
with peak separations of 7 and 10 cm-1 between the 1215 cm-1 peak and the peaks at 1222 and

11
1225 cm-1, respectively. The deduced values of 15.4 ps, 20.1 ps and 26.1 ps for D in the three
ion energy ranges studied (Table II) are not consistent within error bars. Although this might
suggest that the bright state couples to more than one doorway state, only one ion peak
characteristic of a doorway state appears in the time-resolved photoelectron spectra for toluene-
d3 (see below), indicating that a single doorway state is involved in the dynamics. The variation
in the deduced values for D can be explained, however, if the four observed oscillation periods
(C plus the three values found for
D ) are caused by energy differences between four or more
eigenstates,[33] each containing contributions from the bright state and a single doorway state,
as well as from multiple bath states.
In order to provide assignments for the doorway states in toluene and toluene-d3, we consider the
cation internal energies of peaks observed in the photoelectron spectra at times when the
contribution of the doorway states is maximized; t = 3 ps for toluene and t = 6 ps for toluene-d3.
In the case of toluene we find that two characteristic photoelectron peaks with cation internal
energies of 1290 and 1460 cm-1 appear at 3 ps (see Fig. 6a) and these can be attributed to the v
= 0 ionization of two doorway states; we label these states Doorway A and Doorway B. These
peaks can also be seen in the toluene ZEKE spectrum shown in Fig. 3b. In the case of toluene-d3,
a cation peak characteristic of a doorway state appears at an internal energy of 1391 cm-1, as
observed in the 6 ps spectrum in Fig. 6b. We label the equivalent S1 state Doorway C.
With this information we can begin a search for candidates for the doorway states that (i) have S1
energies close to that for the S1 131 bright state, (ii) have cation internal energies consistent with
the experimental observations, and (iii) fulfill the selection rules allowing coupling to one or more
of the torsional components of the 131 bright state. The procedure used for the doorway state
search is outlined in Ref. [7] and has been updated to make use of the selection rule for torsion-
vibrational coupling, m = ±3n (where n = 1, 2, …), discussed by Gascooke and Lawrance [32],
with the caveat that the total symmetry of the bright and doorway states in the G12 point group
must be the same. In order to perform such a search it is necessary to have a consistent set of
vibrational frequencies for S1 and the ion. For this purpose the calculated scaled harmonic values
listed in Table III were adopted; these values approximate the uncoupled anharmonic frequencies.
The TD-B3LYP/aVTZ method was used for the S1 calculation, with UB3LYP/aVTZ used for the
cation; in both cases a scaling factor of 0.97 was applied. The use of the scaled harmonic values
in S1 is consistent with a search for zero-order states that can couple to the bright state [7]. The
energies of the torsional levels, EF, were taken from the calculated values listed in Table I.
Because of incomplete available information, the energies of the torsional levels in the ion were
assumed to be the same as those in S1; for known cases this is a reasonable approximation [34].
Torsion-vibrational states were accepted as plausible doorway candidates if their S1 energy lay
within ±40 cm-1 of the relevant torsional component of the 131 bright state, and if their cation
energy lay within ±25 cm-1 of the energy of the photoelectron peaks deemed to be characteristic
of the ionization of a doorway state (see above). The wider energy window in S1 reflects the fact

12
that the calculated frequencies are less accurate for excited electronic states than for ion ground
states. The resulting candidates are listed in Table IV for toluene and in Table V for toluene-d3.
These Tables list the doorway state candidates first according to whether they are anharmonic or
torsion-vibration candidates, and then in order of increasing N, which represents the difference
in the number of vibrational quanta between the bright state and the candidate; the coupling
strength is expected to depend inversely on N. The value assigned for N is further increased if
a change in torsional state is also required, by assigning N = 1 for m = ±3 or ±6, N = 2 for
m = ±9 or ±12, …. In Tables IV and V we only list candidates with a total N 4.
Before discussing the candidates listed in Tables IV and V we consider the torsional level
dependence of the observed dynamics in toluene and toluene-d3. As discussed in Section 3.4, at
~10 K the prepared bright state in toluene contains two torsional components ( 10 a and 1 e ) with
almost equal population. In the case of toluene-d3, the lower energies of the torsional levels
mean that prior to excitation significant population (~12%) resides in the 2 e (ortho) state, in
addition to ~47% in the 10 a (para) state and 38% in the 1 e (ortho) state. Therefore in this case
IVR channels involving three torsional levels of the bright state need to be considered. In
principle, IVR dynamics can be associated with any or all of the torsional components prepared in
each molecule. In the data shown in Fig. 6 the intensity of the 131 ion peak, which directly
reflects the S1 bright state population, decreases by at least 75% between 0 and 3 ps for toluene
and between 0 and 6 ps for toluene-d3, where this change in intensity corresponds to the transfer
of vibrational population to the doorway states. Our results therefore suggest that more than one
torsional component of the bright state must be coupled to doorway states in toluene and in
toluene-d3. This in turn implies that either the same anharmonic coupling route exists for each
component, or coincidental torsion-vibration coupling routes exist for each component. This
observation will be used when discussing the plausibility of the candidates listed.
(a) Doorway A (toluene)
Possible candidates for Doorway A, which has an ion energy of 1290 cm-1, are given in the upper
part of Table IV. It can be seen that there are four states that (i) satisfy the selection rules for
coupling to one or both torsional components of the bright state, (ii) are energetically plausible
and (iii) give rise to N 4. Only one of these candidates, |1116b110b1>, satisfies the selection
rules for coupling to both |131, 10 a > and |131, 1 e > through anharmonicity. Two of the other
states (|31, 13 a > and |6a1, 112 a >) satisfy the selection rules for coupling to the m = 0
component only, through a torsion-vibration interaction. The final state, (|416b1, 7 e >) satisfies
the selection rules for coupling to the m = 1 component only, again through a torsion-vibration
interaction. Because an IVR route must be available to both torsional components (see discussion
above) the |1116b110b1> state is superficially the most likely, but we also allow for the possibility
that a combination of two torsion-vibration states, each giving an IVR route for one of the

13
torsional components of the bright state, could give rise to doorway A. The plausibility of the
candidate states can be tested by using the experimentally determined ion vibrational frequencies
presented in Ref. [26]. These frequencies, when combined with the calculated torsional energies,
enable the prediction of ion peak positions of 1295, 1258 and 1305 cm-1 for the |1116b110b1>,
|6a1, 112 a > and |416b1, 7 e > candidates, respectively. The observed ion peak at 1290 cm-1 lies
significantly closer to the predicted value for |1116b110b1> than the values for |6a1, 112 a > and
|416b1, 7 e >, and therefore the latter states can be dismissed on energetic grounds. An
experimentally based ion energy for the final possible candidate, |31, 13a>, is not available, but
this state could only contribute in coincidental combination with the |416b1, 7 e > state, which has
been discounted. Therefore we conclude that the |1116b110b1> state is the most likely candidate
for Doorway A.
(b) Doorway B (toluene)
There are seven candidates listed in the lower part of Table IV that could give rise to the ion peak
near 1460 cm-1. Three of these candidates (|112>, |6a14116b1> and |17a110b1151>) satisfy the
selection rules for coupling to both torsional components of the bright state through
anharmonicity. Two of the remaining states (|6a110a1, 26 a >, and |17b1151, 26 a >) satisfy the
selection rules for coupling to m = 0 only, through a torsion-vibration interaction. The |17b1,
10 e > state satisfies the selection rules for coupling to m = 1 only, through a torsion-vibration
interaction. The two components of the final state, |6a117b1, 23 a > and |6a117b1, 2 e >,
respectively satisfy the selection rules for coupling to the m = 0 and m = 1 components of the
bright state, but because they are separated by 25 cm-1 they cannot simultaneously lie within the
laser bandwidth on excitation.
Based on predicted coupling strength alone the |112> state (for which N = 3) is the most likely
candidate, and its calculated ion frequency is very close to the position of the observed ion peak
at 1460 cm-1. However, the calculated frequency of |112> in S1 is 30 cm-1 away from the
experimental energy of the bright state. Because experimental ion frequencies are not available
for modes ν11, ν10a and ν17b, the plausibility of most of these doorway state candidates cannot be
further assessed. The exceptions are |6a14116b1> and |17a110b1151>. The former has an
energy in the ion which, using experimentally derived vibrational frequencies [26], is predicted to
be 21 cm-1 lower than the observed peak at 1460 cm-1, whilst the latter has an energy in S1 which
is predicted on the basis of experimentally derived vibrational frequencies [21,26] to be 25 cm-1
lower than that of the bright state. These relatively large discrepancies do not lend support to
either of these candidates.
Instead, we consider the hypothesis that Doorway B is in fact related to Doorway A. Such a
relationship might be expected if Doorway A and Doorway B are part of a Fermi resonance. In
the S1 electronic state the |11> state that contributes to Doorway A is known to be in Fermi
resonance with |4116b1> [21]. Therefore it is expected that any state of the form |11Y1> will be

14
in Fermi resonance with |4116b1Y1>. In addition, the state |16b110b1> is known to be strongly
coupled to |6a1> (and weakly coupled to |16a2>) [6,26,32]; therefore any state of the form |
X116b110b1> will be in Fermi resonance with | X16a1>. Based on this, we could expect the
|1116b110b1> state to be strongly coupled to the states |116a1>, |4116b16a1> and |4116b210b1>,
forming states that can couple to both torsional components of the bright state. Because the two
Fermi resonances have been well-characterized, we know the energies of the relevant ion states;
these are listed in Table VI. Two of these zero order states have experimental ion energies that
lie within 11 cm-1 of a doorway state; these are |1116b110b1>, already found as the most
plausible candidate for Doorway A, and |4116b210b1> which has an ion energy of 1471 cm-1, close
to that required for Doorway B. It is interesting to note that the state |116a1> only requires N =
3 and might be expected to be a bright state. However, if this state were significantly populated
(either on excitation or through IVR) then an ion peak at 1263 cm-1 would be observed in
between the ion peaks at 1234 cm-1 and 1290 cm-1 which correspond to the bright state and
Doorway A respectively. No such peak is seen in the time-resolved spectra in Fig. 4(a). In
conclusion, we assign Doorway B to |4116b210b1> based on the evidence presented, although we
note that five vibrational quanta have to change in order for it to couple to the bright state.
Figure 11 illustrates the deduced tier structure for the coupled vibrational states and indicates
how the progression of the IVR process is reflected in the time-resolved photoelectron spectra.
(c) Doorway C (toluene-d3)
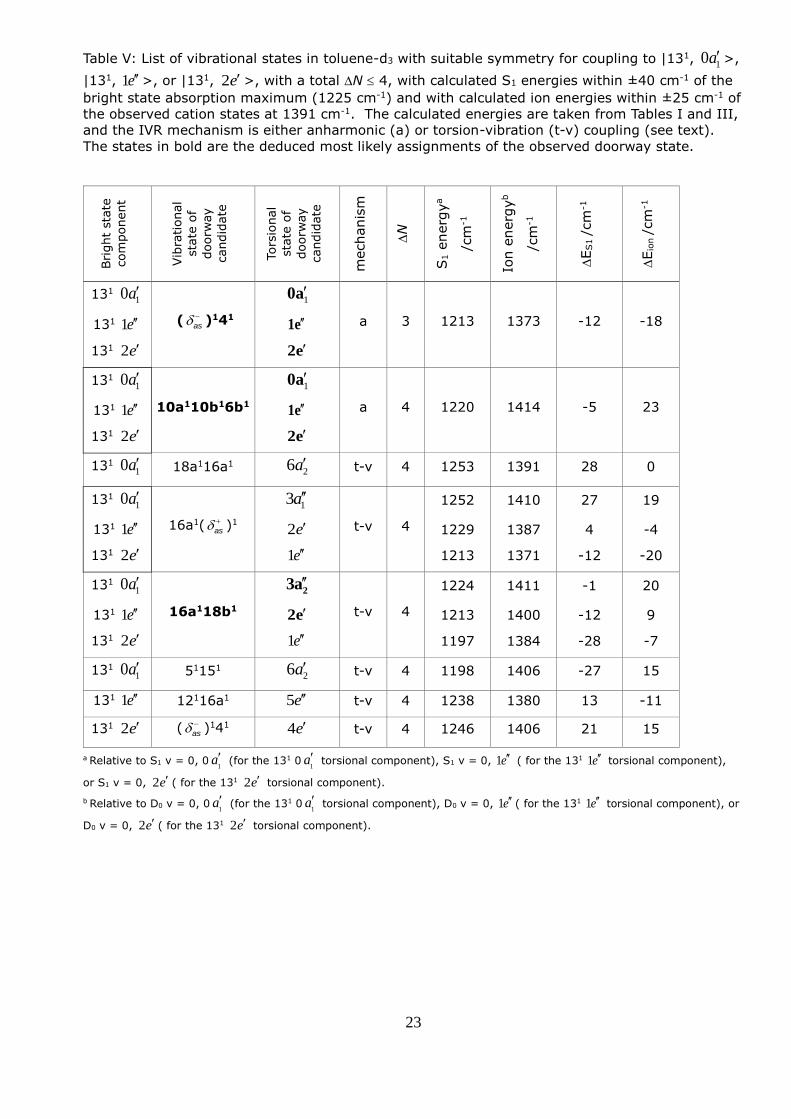
In the case of toluene-d3 (see Table V) there are eight plausible doorway state candidates. Of
these, the |( as )141> and |10b16b110a1> states satisfy the selection rules for anharmonic
coupling to the bright state and therefore provide an IVR route for all three torsional components
of the bright state. In addition, two torsional components of the |16a118b1> state provide an IVR
route for each of the m = 0 and m = 1 bright state components through a torsion-vibration
coupling mechanism. These are |16a118b1, 23 a >, which is coupled through m = ±3 to |131,
10 a >, and |16a118b1, 2 e > which is coupled through m = ±3 to |131, 1 e >. The separation of
11 cm-1 between these two components means that both can lie within the bandwidth on
excitation, lending plausibility to this assignment. Although the |16a1( as )1 13a> and |16a1( as )1
2 e > states also provide a route for each of the m = 0 and m = 1 bright state components, in
this case their separation (23 cm-1) means that they cannot both lie within the bandwidth. We
further note that combination bands involving the Fermi resonance between |11> and |4116b1>,
which were identified as doorway states for toluene, are out of range of the bright state in the
case of toluene-d3.
The |( as )141> state gives rise to the lowest N and seems on this basis to be the most likely
candidate. The experimental ion energy of 528 cm-1 for 41 given in Ref [26] is 8 cm-1 higher than
the calculated value, which brings the estimated ion energy for |( as )141> to within 12 cm-1 of the
observed ion peak energy. For the |10b16b110a1> state, an experimental ion energy value of 477

15
cm-1 for 6b1 [26] brings the estimated ion energy to within 8 cm-1 of the observed ion peak
energy. Either of these states is therefore possible and the anharmonic mechanism would be
consistent with the comparable IVR rates in toluene and toluene-d3 (see Section 3.3). However,
for toluene-d3 the torsion-vibration mechanism involving |16a118b1, 23 a > and |16a118b1, 2 e >
cannot be dismissed. The calculated ion energies of 1400 and 1411 cm-1 for these two
components are within 9 and 20 cm-1, respectively, of the observed peak in the photoelectron
spectrum. The experimental ion energy of 334 cm-1 for 16a1 [26] is 7 cm-1 lower than the
calculated value, which would bring the estimated ion energy closer to that of the observed peak.
Therefore we conclude that Doorway C could be assigned to |(as )141>, |10b16b110a1>, or the
combination of |16a118b1, 23 a > and |16a118b1, 2 e >.
(d) Summary
We thus deduce that two doorway states dominate the IVR dynamics in toluene, and that these
can be assigned to |1116b110b1> (Doorway A) and |4116b210b1> (Doorway B). These states
satisfy the selection rule for anharmonic coupling to both |131, 10 a > and |131, 1 e >. The
interaction of the bright state with the two doorway states gives rise to the two oscillation periods
C = 6.5 ps and
D = 4.9 ps observed in the time profiles shown in Fig. 8, and to the three peaks
observed in the REMPI spectrum in Fig. 2a. Ionization of Doorway A and Doorway B gives rise to
the peaks at 1290 and 1460 cm-1 respectively, as seen in the photoelectron spectrum measured
at 3 ps (see Fig. 6a). We thus deduce that the early time dynamics is dominated by anharmonic
coupling to two doorway states. However, torsion-vibration coupling is still expected to play a role
in the longer time dynamics as a consequence of indirect interactions involving bath states.
In the case of toluene-d3, one doorway state (Doorway C) drives the IVR dynamics. This state
could be assigned to |( as )141>, |10b16b110a1> or the combination of |16a118b1, 23 a > and
|16a118b1, 2 e >. In all three cases IVR from both the |131, 10 a > and |131, 1 e > components
could occur; in the former two cases IVR from the |131, 2e'> component could also occur. The
influence of Doorway C at early stages of the IVR process is manifested by strong oscillations in
the time profiles with a period of C = 10.6 ps (see Fig. 9), and is further supported by the
observation of two peaks at 1222 and 1225 cm-1 in the nanosecond REMPI spectrum in Fig. 2b.
Ionization of this Doorway C gives rise to the peak at 1391 cm-1 seen in the photoelectron
spectrum measured at 6 ps (see Fig. 6b).
4. Conclusions
We have examined the IVR dynamics that result following the preparation of the S1 131 vibrational
level in toluene, toluene-d3 and pFT, where mode 13 is predominantly a C-CH3 stretching motion
at ~1200 cm-1 in each molecule. Similar IVR lifetimes of 12 and 15 ps are observed for toluene

16
and toluene-d3, whereas the IVR lifetime for pFT is approximately four times longer. These
lifetimes are listed in Table VII, along with some comparators. In the measurements conducted
using chemical timing by Parmenter and coworkers [4,5] the sample was at room temperature;
this may explain the large discrepancies in the determined lifetimes (see Table VII). In our work,
the significantly shorter IVR lifetimes observed for toluene and toluene-d3 when compared with
pFT are attributed to the role played by doorway states, which are observed to mediate the IVR
process in the case of toluene and toluene-d3 but not in pFT. Tentative assignments for these
doorways states have been made in the course of this work. In contrast to the interpretations
given elsewhere [4,9], we find no consistent role for the methyl rotor in mediating the IVR
dynamics, and in fact in pFT, where torsion-vibration coupling is deduced to dominate the
dynamics, the IVR lifetime is relatively long. We conclude that, at these relatively low excitation
energies, IVR lifetimes are largely determined by details of the energy level structure and the
availability of doorway states.
Acknowledgements
We are grateful to Warren Lawrance for helpful discussions. This work was supported by EPSRC
grant EP/E046150.

17
References
[1] J.E. Gambogi, J.H. Timmermans, K.K. Lehmann, G. Scoles, J. Chem. Phys. 99 (1993)
9314.
[2] E.R.T. Kerstel, K.K. Lehmann, T.F. Mentel, B.H. Pate, G. Scoles, J. Phys. Chem. 95 (1991)
8282.
[3] C.S. Parmenter, B.M. Stone, J. Chem. Phys. 84 (1986) 4710.
[4] P.J. Timbers, C.S. Parmenter, D.B. Moss, J. Chem. Phys. 100 (1994) 1028.
[5] D.B. Moss, C.S. Parmenter, J. Chem. Phys. 98 (1993) 6897.
[6] J.A. Davies, A.M. Green, K.L. Reid, Phys. Chem. Chem. Phys. 12 (2010) 9872.
[7] J.A. Davies, K.L. Reid, J. Chem. Phys. 135 (2011) 124305.
[8] J.A. Davies, K.L. Reid, Phys. Rev. Lett. 109 (2012) 193004.
[9] D.B. Moss, C.S. Parmenter, G.E. Ewing, J. Chem. Phys. 86 (1987) 51.
[10] D.B. Moss, C.S. Parmenter, T.A. Peterson, C.J. Pursell, Z.Q. Zhao, Institute of Phys.
Conference Series (1992) 465.
[11] D.R. Borst, D.W. Pratt, J. Chem. Phys. 113 (2000) 3658.
[12] D.S. Perry, G.A. Bethardy, X.-L. Wang, Ber. Bunsenges. Phys. Chem. 99 (1995) 530.
[13] P.J. Breen, J.A. Warren, E.R. Bernstein, J.I. Seeman, J. Chem. Phys. 87 (1987) 1917.
[14] K. Okuyama, N. Mikami, M. Ito, J. Phys. Chem. 89 (1985) 5617.
[15] Z.Q. Zhao, C.S. Parmenter, D.B. Moss, A.J. Bradley, A.E.W. Knight, K.G. Owens, J. Chem.
Phys. 96 (1992) 6362.
[16] L.H. Spangler, Annual Rev. Phys. Chem. 48 (1997) 481.
[17] H. Nakai, M. Kawai, Chem. Phys. Lett. 307 (1999) 272.
[18] H. Nakai, M. Kawai, J. Chem. Phys. 113 (2000) 2168.
[19] B. Pradhan, B.P. Singh, C.K. Nadi, T. Chakraborty, T. Kundu, J. Chem. Phys. 122 (2005)
204323.
[20] G. Varsanyi, Assignments for Vibrational Spectra of Seven Hundred Benzene Derivatives,
Wiley, New York, 1974.
[21] C.G. Hickman, J.R. Gascooke, W.D. Lawrance, J. Chem. Phys. 104 (1996) 4887.
[22] A.M. Gardner, T.G. Wright, J. Chem. Phys. 135 (2011) 114305.
[23] P.T. Whiteside, A.K. King, J.A. Davies, K.L. Reid, M. Towrie, P. Matousek, J. Chem. Phys.
123 (2005) 204317.
[24] A.K. King, S.M. Bellm, C.J. Hammond, K.L. Reid, M. Towrie, P. Matousek, Molecular Phys.
103 (2005) 1821.
[25] A.M. Gardner, T.G. Wright, in preparation.
[26] A.M. Gardner, A.M. Green, V.M. Tame-Reyes, V.H.K. Wilton, T.G. Wright, J. Chem. Phys.
138 (2013) 134303.
[27] V.L. Ayles, C.J. Hammond, D.E. Bergeron, T.G. Wright, J. Chem. Phys. 126 (2006)
244304.
[28] W.J. Balfour, Y. Fried, Canadian J. Phys. 72 (1994) 1218.

18
[29] W.J. Balfour, R.S. Ram, Canadian J. Phys. 72 (1994) 1225.
[30] C.J. Hammond, V.L. Ayles, D.E. Bergeron, K.L. Reid, T.G. Wright, J. Chem. Phys. 125
(2006) 124308.
[31] P. Avouris, W.M. Gelbart, M.A. Elsayed, Chem. Rev. 77 (1977) 793.
[32] J.R. Gascooke, W.D. Lawrance, J. Chem. Phys. 138 (2013) 134302.
[33] P.M. Felker, A.H. Zewail, J. Chem. Phys. 82 (1985) 2961.
[34] K.T. Lu, G.C. Eiden, J.C. Weisshaar, J. Phys. Chem. 96 (1992) 9742.

19
Tables
Table I: Internal rotor barrier heights (V6) and energy levels in S1 taken from the specified
references, or calculated* and quoted to one decimal place.
Barrier
height
Toluene
energy/cm-1
Toluene-d3
energy/cm-1 pFT energy/cm-1
V6 26.4 [11] 24.5 [11] 33.7 [15]
Torsional
level calc*
exp
[11,13] calc* exp calc*
exp
[14,15]
0 1a 0 - 0 - 0 -
1e 5.3 5.2 2.7 - 4.9 4.9
2e 21.2 20.6 11.0 - 19.5 13.7
23a 41.0 41.0 18.5 - 35.5 -
13a 54.2 53.5 30.8 - 52.3 52.9
4e 84.6 84.2 43.8 - 78.1 74.3
5e 132.3 130.8 68.5 - 122.0 108.4
26a 190.4 - 98.6 - 175.7 -
16a 190.4 - 98.6 - 175.7 172.0
*The internal rotor energies are calculated from the internal rotor constant F, assuming that the energies are given by
Fm2. The internal rotor constants are: F = 5.29 cm-1 (toluene [11]), F = 2.74 cm-1 (toluene-d3 [11]), F = 4.88 cm-1 (pFT
[14,15]). The degeneracy of the 1
3 a and 2
3 a internal rotation states is lifted through interaction with the torsional
potential such that their energies are separated by half the torsional barrier height [11]. The degenerate2
6 a and 1
6 a
states lie above the barrier.

20
Table II: Parameters given by fitting the time profiles for chosen regions of the photoelectron
spectra to Eq. 4 (see text).
tol-h8 tol-d3 pFT
Bright Doorway Doorway Bright Doorway Bath Bright Dark
1200-
1260a
1260-
1320 a 1400-
1530a
1160-
1350a
1350-
1450a
1500-
1650a
1180-
1275a
1370-
1550a
A 51 4 55 3 116 4 207 6 107 3 141 4 16.4
0.3 12.0 0.2
B 32 5 b 10 6 106 13 30 3 -52 7 7.4 0.3 6.4 0.3
C 71 7 10 4 33 7 111 14 16 3 -26 7 - -
D b 12 4 17 6 44 12 -29 3 -28 3 - -
C
/ps 6.4 0.2 6.3 0.3 6.8 0.2 10.8 0.2 10.6 0.2 10.4 0.3 - -
D
/ps
b 4.9 0.2 4.9 0.3 20.1 2.1 15.4 0.6 26.1 3.2 - -
1
/ps 20 7 b 10 12 19 6 58 15 17 5 55 6 45 5
2
/ps 5 1 17 12 8 3 12 3 15 3 11 2 - -
IVR
c
/ps 12 7 15 4 50 6
a Region of ion internal energy in cm-1 over which the photoelectron intensity is integrated b Term makes a negligible contribution in this case c Taken from the average of the 𝜏1 and 𝜏2 values but omitting the value of 1 determined for the toluene-d3 doorway state
because of its large uncertainty. The average uncertainty is also given.

21
Table III: Calculated scaled harmonic frequencies for toluene and toluene-d3 taken from Ref
[26]. Only those modes whose S1 fundamental frequencies are 1192 cm-1 in toluene and/or
1225 cm-1 in toluene-d3 are included.
Modea Modeb Modec Symd toluene toluene-d3
S1e ionf S1
e ionf
M6 8 13
1A
1A
1184 1220 1210 1240
M7 9 9a 1142 1181 1143 1185
M8 10 18a 945 958 944 952
M9 11 12 960 979 962 974
M10 12 1 745 753 718 727
M11 13 6a 452 504 436 476
M12 14 17a 2A
2A
697 996 697 993
M13 15 10a 562 784 562 783
M14 16 16a 210 340 210 340
M15 20 5
2A
1B
797 1008 806 1008
M16 21 17b 695 919 675 952
M17 22 11 581 731 576 681
M18 23 4 437 564 417 520
M19 24 16b 312 374 308 366
M20 25 10b 146 147 138 139
S7 18 as 1345
967.0900000
00000
1439 1011 1039
S8 19 as 967 979 796 853
M26 33 3
1A
2B
1140 1258 1140 1259
M28 35 18b 1027 1052 995 1052
M29 37 6b 522 485 520 492
M30 38 15 329 336 293 299
S4 30 as
1427 1384 1030 1002
S5 36 as
927 944 765 777
a Notation for the vibrations of the aromatic ring from Ref. [22]. Notation for the methyl group vibrations from Ref. [32]..
b Notation used in Ref. [21]
c Notation used in Ref. [20]
d Irreducible representation using the G12 (C2v) point group.
e TD-B3LYP/aVTZ with a scaling factor of 0.97.
f UB3LYP/aVTZ with a scaling factor of 0.97.

22
Table IV: List of vibrational states in toluene with suitable symmetry for coupling to |131, 0 1a> or
|131, 1e>, with a total N 4, with calculated S1 energies within ±40 cm-1 of the bright state
absorption maximum (1192 cm-1) and with calculated ion energies within ±25 cm-1 of the
observed cation states at either 1290 cm-1 (top) or 1460 cm-1 (bottom). The calculated energies
are taken from Tables I and III, and the IVR mechanism is either anharmonic (a) or torsion-
vibration (t-v) coupling (see text). The level in bold is the deduced most likely assignment for
one of the observed doorway states.
Bri
ght
sta
te
com
ponent
Vib
rational
sta
te o
f
doorw
ay
candid
ate
Tors
ional
sta
te o
f
doorw
ay
candid
ate
mechanis
m
N
S1 e
nerg
ya
/cm
-1
Ion e
nerg
yb
/cm
-1
E
S1 /cm
-1
E
ion /cm
-1
131 0 1a 1116b110b1
10a
a 4 1203 1274 11 -16
131 1e 1e
131 0 1a 31 13a t-v 3 1194 1312 2 22
131 1e 416b1 7 e t-v 4 1213 1303 21 13
131 10 a 6a1 112 a t-v 4 1214 1266 22 -24
131 10 a 112
10 a a 3 1162 1462 -30 2
131 1e 1 e
131 10 a 6a14116b1
10 a a 4 1201 1442 9 -18
131 1e 1 e
131 10 a 17a110b1151
10 a a 4 1172 1479 -20 19
131 1e 1 e
131 10 a 6a110a1 26a t-v 4 1204 1478 12 18
131 10 a 17b1151 26a t-v 4 1214 1445 22 -15
131 10 a 6a117b1
23a t-v 4
1188 1464 -4 4
131 1e 2 e
1163 1439 -29 -21
131 1e 17b1 10 e t-v 4 1219 1443 27 -17
a Relative to S1 v = 0, 01a (for the 131 0
1a torsional component) or S1 v = 0, 1 e ( for the 131 1 e torsional component).
b Relative to D0 v = 0, 01a (for the 131 0
1a torsional component) or D0 v = 0, 1 e ( for the 131 1 e torsional component).
23
Table V: List of vibrational states in toluene-d3 with suitable symmetry for coupling to |131, 10 a >,
|131, 1 e >, or |131, 2 e >, with a total N 4, with calculated S1 energies within ±40 cm-1 of the
bright state absorption maximum (1225 cm-1) and with calculated ion energies within ±25 cm-1 of
the observed cation states at 1391 cm-1. The calculated energies are taken from Tables I and III,
and the IVR mechanism is either anharmonic (a) or torsion-vibration (t-v) coupling (see text).
The states in bold are the deduced most likely assignments of the observed doorway state.
Bri
ght
sta
te
com
ponent
Vib
rational
sta
te o
f
doorw
ay
candid
ate
Tors
ional
sta
te o
f
doorw
ay
candid
ate
mechanis
m
N
S1 e
nerg
ya
/cm
-1
Ion e
nerg
yb
/cm
-1
E
S1 /cm
-1
E
ion /cm
-1
131 10 a
(as )141
10a
a 3 1213 1373 -12 -18 131 1e 1e
131 2e 2e
131 10 a
10a110b16b1
10a
a 4 1220 1414 -5 23 131 1e 1e
131 2e 2e
131 10 a 18a116a1 26a t-v 4 1253 1391 28 0
131 10 a
16a1( as )1
13 a
t-v 4
1252 1410 27 19
131 1e 2 e 1229 1387 4 -4
131 2e 1 e 1213 1371 -12 -20
131 10 a
16a118b1
23a
t-v 4
1224 1411 -1 20
131 1e 2e 1213 1400 -12 9
131 2e 1e 1197 1384 -28 -7
131 10 a 51151 26a t-v 4 1198 1406 -27 15
131 1e 12116a1 5e
t-v 4 1238 1380 13 -11
131 2e ( as )141 4e
t-v 4 1246 1406 21 15
a Relative to S1 v = 0, 01a (for the 131 0
1a torsional component), S1 v = 0, 1 e ( for the 131 1 e torsional component),
or S1 v = 0, 2 e ( for the 131 2 e torsional component).
b Relative to D0 v = 0, 01a (for the 131 0
1a torsional component), D0 v = 0, 1 e ( for the 131 1 e torsional component), or
D0 v = 0, 2 e ( for the 131 2 e torsional component).

24
Table VI: Ion energies of the states expected to be strongly coupled to |1116b110b1> in the S1
electronic state of toluene. The states given in bold have experimental ion energies closest to the
peaks observed at 1290 and 1460 cm-1 in the photoelectron spectrum at 3 ps.
Zero order
state
Ion
energy*/
cm-1
(calculated
[26])
Ion energy/
cm-1
(experimental
[25,26])
|116a1> 1257 1263
|1116b110b1> 1274 1295
|4116b16a1> 1442 1439
|4116b210b1> 1459 1471
*Scaled Harmonic; see Table III
Table VII: Measured IVR lifetimes.
Excitation
energy
toluene a
toluene-d3 a
pFT pFT-d3 b
mFT c a b
~1200 cm-1 12 ps 15 ps 50 ps 15.2 ps 3.4 ps 1.2 ps
~2000 cm-1 - - - 3.4 ps 1.5 ps -
a. This work. b. D.B. Moss and C.S. Parmenter, J. Chem. Phys. 98, 6897 (1993). c. P.J. Timbers, C.S. Parmenter and D.B. Moss, J. Chem. Phys. 100, 1028 (1994).

25
Figures
1. Comparison of (1 + 1) picosecond REMPI spectra measured via the S1 excited state in (a)
toluene, (b) toluene-d3 and (c) pFT, with selected vibrational states labelled.
2. (1 + 1) nanosecond REMPI spectra measured in the vicinity of the 1
013 transition in S1 for
(a) toluene, (b) toluene-d3 and (c) pFT. In each plot, a Gaussian profile represents the
idealized spectral profile of the picosecond laser pulse and indicates the spectral region
excited in the time-resolved experiments.
3. Comparison of ZEKE spectra following excitation of a narrow portion of the S1 131
absorption profile. (a), (b) and (c) are measured following excitation at the centre of the
regions labelled (|1>, |2> and |3>, respectively, in the toluene absorption profile shown in
Fig. 2a. (d) is measured following excitation at the centre of the pFT absorption profile
shown in Fig. 2c (see text for details).
4. Comparison of picosecond time-resolved SEVI spectra at early time following preparation
of the 131 bright state in S1: (a) toluene, (b) pFT.
5. Comparison of SEVI spectra at time delays of 0 ps and 500 ps: (a) toluene, (b) pFT.
6. Comparison of time-resolved SEVI spectra illustrating recurrence behaviour: (a) toluene,
(b) toluene-d3.
7. Time profiles for a region of the photoelectron spectrum dominated by signal from the 131
cation state: (a) toluene, (b) toluene-d3 and (c) pFT (see text). The intensity scale is zero
at the point where it crosses the abscissa. The data points are indicated by solid circles;
the solid line results from fitting the data to Eq. (4).
8. Time profiles for toluene for selected regions of the photoelectron spectrum: (a) 1200-
1260 cm-1, (b) 1260-1320 cm-1 and (c) 1400-1530 cm-1 (see text). The intensity scale is
zero at the point where it crosses the abscissa. The data points are indicated by solid
circles; the solid line results from fitting the data to Eq. (4).
9. Time profiles for toluene-d3 for selected regions of the photoelectron spectrum: (a) 1160-
1350 cm-1 and (b) 1350-1450 cm-1 (see text). The intensity scale is zero at the point
where it crosses the abscissa. The data points are indicated by solid circles; the solid line
results from fitting the data to Eq. (4).
10. Time profiles for pFT for selected regions of the photoelectron spectrum: (a) 1180-1275
cm-1 and (b) 1370-1550 cm-1 (see text). The intensity scale is zero at the point where it
crosses the abscissa. The data points are indicated by solid circles; the solid line results
from fitting the data to Eq. (4).
11. Schematic diagram illustrating the proposed tier structure for the scenario discussed in
Section 3.5(b), which has been created following the assignment of the two doorway
states that operate in toluene. The upper section indicates how the hierarchy of the
coupled vibrational states is reflected in the time-resolved photoelectron spectra.