Generalized-Yvon-Born-Green Model of Toluene
18
Generalized-Yvon–Born–Green Model of Toluene a Christopher R. Ellis, Joseph F. Rudzinski, William G. Noid* Introduction Atomically detailed molecular dynamics (MD) simulations have contributed profound insight into the structure, thermodynamics, and dynamics of many condensed phase systems. [1,2] By propagating the motion of each atom within a system, these simulations provide exquisite resolution for studying molecular processes on microse- cond timescales and nanometer length scales, [3] of course, subject to the accuracy of an empirical force field for a given system. [4] Despite tremendous advances in computational hardware and software, though, atomically detailed MD simulations remain prohibitively expensive for effectively investigating processes that occur on significantly longer length and time scales. The computational expense of atomistic simulation methods has motivated the development of ‘‘coarse- grained’’ (CG) models that represent molecular systems in somewhat reduced detail by grouping atoms into bigger Full Paper W. G. Noid, C. R. Ellis, J. F. Rudzinski Department of Chemistry, The Pennsylvania State University, University Park, Pennsylvania 16802 E-mail: [email protected] a Christopher R. Ellis and Joseph F. Rudzinski contributed equally. Coarse-grained (CG) models provide a highly efficient computational means for investigating complex processes that evolve on large length-scales or long time-scales. The predictive capability of these models relies upon their ability to reproduce the relevant structural properties of accurate, though prohibitively expensive, atomistic models. The many-body potential of mean force (PMF) is the appropriate potential for a CG model that quantitatively reproduces the structure of an underlying atomistic model. Because this PMF cannot be readily calculated or simulated, several methods attempt to systematically approximate this PMF with relatively simple molecular mechanics potentials. Recently, we have proposed a gener- alized-Yvon–Born–Green (g-YBG) approach to determine approximate potentials for accurate CG models directly from structural information. In the present work, we demonstrate the mechanism by which the g-YBG approach employs simple structural information to charac- terize and approximate the many-body PMF. We then employ this approach to parameterize a three site CG model for liquid toluene. We demonstrate that this model accurately reproduces the structural properties of an all-atom model. Moreover, using this model system, we demonstrate the vari- ational nature of the method and investi- gate the sensitivity of the model to the CG mapping. Finally, we briefly investigate the transferability of the CG model to different temperatures. 478 Macromol. Theory Simul. 2011, 20, 478–495 ß 2011 WILEY-VCH Verlag GmbH & Co. KGaA, Weinheim wileyonlinelibrary.com DOI: 10.1002/mats.201100022
-
Upload
independent -
Category
Documents
-
view
0 -
download
0
Transcript of Generalized-Yvon-Born-Green Model of Toluene

Full Paper
478
Generalized-Yvon–Born–Green Modelof Toluenea
Christopher R. Ellis, Joseph F. Rudzinski, William G. Noid*
Coarse-grained (CG) models provide a highly efficient computational means for investigatingcomplex processes that evolve on large length-scales or long time-scales. The predictivecapability of these models relies upon their ability to reproduce the relevant structuralproperties of accurate, though prohibitively expensive, atomistic models. The many-bodypotential of mean force (PMF) is the appropriate potential for a CG model that quantitativelyreproduces the structure of an underlying atomistic model. Because this PMF cannot be readilycalculated or simulated, several methods attempt to systematically approximate this PMFwith relatively simple molecular mechanics potentials. Recently, we have proposed a gener-alized-Yvon–Born–Green (g-YBG) approach to determine approximate potentials for accurateCG models directly from structural information. In the present work, we demonstrate themechanism by which the g-YBG approach employs simple structural information to charac-terize and approximate the many-body PMF. We then employ this approach to parameterize athree site CG model for liquid toluene. Wedemonstrate that this model accuratelyreproduces the structural properties ofan all-atom model. Moreover, using thismodel system, we demonstrate the vari-ational nature of the method and investi-gate the sensitivity of the model to the CGmapping. Finally, we briefly investigatethe transferability of the CG model todifferent temperatures.
Introduction
Atomically detailed molecular dynamics (MD) simulations
have contributed profound insight into the structure,
thermodynamics, and dynamics ofmany condensed phase
systems.[1,2] By propagating the motion of each atom
W. G. Noid, C. R. Ellis, J. F. RudzinskiDepartment of Chemistry, The Pennsylvania State University,University Park, Pennsylvania 16802E-mail: [email protected]
a Christopher R. Ellis and Joseph F. Rudzinski contributed equally.
Macromol. Theory Simul. 2011, 20, 478–495
� 2011 WILEY-VCH Verlag GmbH & Co. KGaA, Weinheim wileyonline
within a system, these simulations provide exquisite
resolution for studying molecular processes on microse-
cond timescales and nanometer length scales,[3] of course,
subject to the accuracy of an empirical force field for a given
system.[4] Despite tremendous advances in computational
hardware and software, though, atomically detailed MD
simulations remain prohibitively expensive for effectively
investigating processes that occur on significantly longer
length and time scales.
The computational expense of atomistic simulation
methods has motivated the development of ‘‘coarse-
grained’’ (CG) models that represent molecular systems
in somewhat reduced detail by grouping atoms into bigger
library.com DOI: 10.1002/mats.201100022

Generalized-Yvon–Born–Green Model of Toluene
www.mts-journal.de
effective interaction sites.[5–9] The resulting CG models are
frequently expected to be three orders of magnitude more
efficient than atomically detailedmodels.[10,11] By focusing
on the essential details of a particular systemor process, CG
models also significantly simplify subsequent analysis.[12]
Consequently, CG models provide a powerful framework
forhypothesis-driven investigationsof specific interactions
for a given phenomena.[13–15] Moreover, CG models have
been particularly useful for investigating slow processes
involving complex industrial or biological polymers, e.g.,
the diffusion of gases and additives through polymeric
melts[16] or the association of viral capsid proteins.[17]
However, despite their computational efficiency, CG
models may be misleading if they have not been carefully
parameterized to reproduce the ‘‘correctphysics’’ governing
a specific process.[15,18,19] Consequently, a wide range of
approaches have been developed for ensuring consistency
between a CG model and either experimental data or
simulations of accurate high resolution models. These
approaches often focus on either thermodynamic or
structural properties. Klein and coworkers[20–26] and
Marrink and coworkers[27–33] have pioneered the parame-
trization of CG models that reproduce thermodynamic
properties such as partitioning, liquid density, surface
tension, or solvation free energies. In addition to accurately
modeling thermodynamic properties, these models have
demonstrated considerable transferability for modeling a
variety of molecular systems in a range of thermodynamic
conditions.[34–36] Although a recent study has extended the
MARTINI approach to accurately model the radius of
gyration of polystyrene,[37] CG models that have been
parametrized to reproduce thermodynamic propertiesmay
prove less successful for modeling the conformations and
interactions of proteins and other complex polymers.[24,29]
Alternatively, structure-motivated strategies parame-
terize CGmodels to quantitatively reproduce the structural
properties of a particular system. In this case, the
appropriate potential for the CG model is a many-body
potential of mean force (PMF),[38] i.e., a configuration-
dependent free energy,[39] that reflects both the configura-
tion distribution of the high resolution model and also the
mapping fromthehigh resolutionmodel to theCGmodel. A
model that employs the PMF as a conservative potential
will quantitatively reproduce (at the resolution of the CG
mapping) all of the structural properties of the atomistic
model.[40,41] However, the many-body PMF cannot be
effectively calculated, represented, or simulated.[42] Con-
sequently, structure-motivated methods often approxi-
mate the PMF with simpler molecular mechanics–style
interaction potentials.
The terms in the approximate potential are frequently
parameterized to reproduce a corresponding set of simpler
structural correlation functions. If the interactions in theCG
model are statistically independentoronlyweakly coupled,
www.MaterialsViews.com
Macromol. Theory Simul.
� 2011 WILEY-VCH Verlag Gmb
then direct Boltzmann inversion determines each term in
the potential immediately from the corresponding dis-
tribution function.[43–45] However, if the interactions in the
CGmodel aremore strongly coupled, then eachdistribution
function reflects not only the corresponding interaction
potential, but also the correlated forces from the surround-
ings. Peter and coworkers[46–48] have employed a systema-
tic procedure to directly subtract this environment
mediated contribution from the potential obtained from
direct Boltzmann inversion. In addition, iterative Boltz-
mann inversion[49–51] and several related approaches, such
as the inverse Monte Carlo method,[52–54] relative entropy
framework,[55–57] and molecular renormalization group
approach[58–60] iteratively refine the CG potential over
multiple simulations until it accurately reproduces target
distribution functions. These iterative approaches have
been related to a variety of elegant variational princi-
ples[53,55,61] and have also been extended for considering
density-dependent potentials.[62,63] In the case of pair
additivepotentials, it ispossible toprove that thepotentials
exist and are unique,[64–67] although the existence and
convergence properties of these iterative procedures have
not been clearly determined for more complex systems.[68]
Izvekov and Voth have proposed an alternative force-
based multiscale coarse-graining (MS-CG) method for
approximating the many-body PMF.[69–71] Rather than
attempting to reproduce a target set of distribution
functions, the MS-CG approach employs force correlation
functionsdetermined fromatomistic simulations toproject
the many-body mean force (MF) field (i.e., the force field
determined from the PMF) onto a ‘‘basis set’’ determined by
the form of the approximate CG potential.[40,72–76] These
force correlation functions correspond to inner products of
themean force with the vectors in the basis set. TheMS-CG
force field is constructed to reproduce each inner product
when evaluated using configurations sampled from the
original atomistic simulation. The resulting equations for
the force field can be interpreted as relations that balance
the approximate MS-CG force field and the exact many-
body MF along each basis vector.[77] The MS-CG metric
tensor decomposes these projections into contributions
from each interaction in the approximate CG poten-
tial.[72,73,77,78] By disentangling the direct and environ-
ment-mediated forces, the MS-CG method directly (i.e.,
noniteratively) determines a variationally optimal approx-
imation to the many-body PMF, according to a force-based
metric defined for the space of CG force fields.
Mullinax and Noid have demonstrated that the MS-CG
force correlation functions can be directly determined from
relatively simple structural correlation functions.[77–79] In
fact, the normal MS-CG equations for the approximate
potential are equivalent to a natural generalization of
the Yvon–Born–Green (YBG) integral equation theory.[80]
The conventional YBG equation can be interpreted as a
2011, 20, 478–495
H & Co. KGaA, Weinheim479
480
www.mts-journal.de
C. R. Ellis, J. F. Rudzinski, W. G. Noid
statement of mechanical equilibrium that decomposes
the average force on a pair of particles into a direct force
between the pair and a correlated force arising from the
surrounding environment. While the YBG theory has been
previously extended for molecules with pair additive
interactions,[81–86] the generalized-YBG (g-YBG) theory
provides the first extension of this force balance relation
for molecular mechanics force fields.[77,78] This g-YBG
theory recovers the MS-CG approximation to the many-
body PMF directly from structures, without recourse to
force information, and employs theMS-CGmetric tensor to
address the correlations between different interactions
thatareneglectedbystraightforwardBoltzmann inversion.
Consequently, the g-YBG theory provides a natural link for
investigating the relation between iterative structure-
motivated methods and the direct force-motivated MS-CG
method. More generally, this approach provides a natural
perspective for quantifying the significance of many-body
correlations in CG models.
The YBG equation, along with the Ornstein–Zernicke
equation, is considered to be one of the fundamental
relations for modeling and understanding simple
liquids.[80] However, in contrast to the Ornstein–Zernicke
theory, which has been extensively developed and applied
for more complex molecules and polymers,[87–90] the YBG
theory has seen relatively little development beyond the
context of simple monatomic fluids.[81–86] Consequently,
this framework also paves the way for analogous future
development and application of the YBG integral
equation theory for proteins, polymers, and other mole-
cules with significant internal flexibility. Furthermore, in
combination with a recently proposed extended ensemble
framework,[91] the g-YBG theory provides a rigorous
approach for elucidating and improving the approxima-
tions that are inherent to knowledge-based methods[92–94]
for determining CG potentials from experimentally deter-
mined structures.[95]
It should be noted that, because the PMF is defined for a
particular system in a particular thermodynamic state
point, CG potentials that have been optimized to reproduce
the structural properties of a particular system in a
particular thermodynamic state may not provide a
satisfactory description for any other system or any other
thermodynamic state. Many recent studies have investi-
gated the transferability of structure-motivated CGmodels
and some progress has been achieved.[62,63,91,96–105] Never-
theless, the transferabilityof suchmodels isunclearapriori.
Consequently, it is important to systematically and care-
fully characterize the transferabilityof structure-motivated
CG models, including those developed by the g-YBG
approach.
The present manuscript continues the development of
the g-YBG theory and also develops a structurally accurate
CG model for toluene, which is an important industrial
Macromol. Theory Simul.
� 2011 WILEY-VCH Verlag Gmb
solvent and closely related to the sidechain of polystyrene
and various amino acids. The remainder of the manuscript
is organized as follows: Section II reviews the g-YBG theory
with special emphasis on the relationship between force
and structural correlation functions. Section III provides
relevant details of the following numerical calculations.
Section IV clarifies the relationship between correlation
functions characterizing forces and structures and presents
anewCGmodel for toluene.Thestructuralpropertiesof this
model are carefully compared with the original atomistic
model.Additional calculations investigate thesensitivityof
these results to theCGmapping, the forcefieldbasis set, and
the temperature. Finally, Section V presents concluding
comments.
Theory
Consistent Coarse-Grained Models
Thepresentwork considers high and low resolutionmodels
of a molecular system. The high resolution model will be
referred to as the ‘‘atomistic’’ model and its constituents
will be referred toas ‘‘atoms.’’ The lowresolutionmodelwill
be referred to as the CG model and its constituents will
be referredtoas ‘‘sites.’’ Thepresent formalismappliesquite
generally for relating high and low resolution particle-
basedmodelswithout rigid restraints. For clarity, lowerand
upper case symbolswill beused fordescribing theatomistic
and CG models, respectively. The presentation follows the
development of Voth, Andersen, and coworkers[40,73] and
subsequently extended by Mullinax and Noid.[77,91]
Theconfigurationof theatomisticmodel isdefinedbythe
Cartesian coordinates, r, forn atoms that interact according
to a potential, u(r), which may be of arbitrary complexity.
The atomistic configuration distribution, pr(r), is given by
2011, 2
H & Co
prðrÞ/ exp�uðrÞkBT
� �(1)
The configuration of the CGmodel is similarly defined by
the Cartesian coordinates, R, for N sites that interact
according to a potential, U(R). The CG configuration
distribution, PR(R), is given by:
PRðRÞ/ exp�UðRÞkBT
� �(2)
A set of N mapping functions,
MðrÞ ¼ fM1ðrÞ; M2ðrÞ; . . . ; MNðrÞg, determine the Carte-
sian coordinates of each site as a linear combination of
coordinates for the atoms that are ‘‘involved’’ in the site:
MIðrÞ ¼Xi
cIiri (3)
0, 478–495
. KGaA, Weinheim www.MaterialsViews.com

Generalized-Yvon–Born–Green Model of Toluene
www.mts-journal.de
for I ¼ 1; . . . ;N and {cIi} is a set of constants that satisfy the
conditionP
i cIi ¼ 1. We will assume that each atom is
involved in at most one site, although this assumption can
be readily relaxed.[40]
The mapping,M, and the atomistic probability distribu-
tion, pr, determine the probability distribution, pR, for
sampling an atomistic configuration, r, thatmaps to a fixed
CG configuration, R:
www.M
pRðRÞ ¼ dðMðrÞ�RÞh i (4)
where the angular brackets denote a canonical average
according to pr(r) and dðMðrÞ�RÞ ¼Q
I dðMIðrÞ�RIÞ.Equation (4) provides a natural, although certainly not
unique, criteria for consistency[40] in configuration space
between the models: a CG model is ‘‘consistent’’ (in
configuration space) with a particular atomistic model if
the canonical configurational distribution for the CG
model, PR, is equal to the probability distribution implied
by the mapping and atomistic distribution, i.e.,
PRðRÞ ¼ pRðRÞ (5)
Equations (1), (2), and (5) imply that the appropriate
potential for a consistent CGmodel is uniquely determined,
to within an additive constant:
U0ðRÞ ¼ �kBT ln pRðRÞ þ const: (6)
0
The force field obtained from this potential, U (R),may be expressed as a conditioned canonical ensemble
average of the atomistic forces evaluated for the
atomistic configurations r that map to the given CG
configuration R:
F0I ðRÞ ¼ fIðrÞh iR (7)
where fI(r) is the net ‘‘atomistic force’’ on site I in
configuration r, and the subscripted angular brackets
denote the conditioned canonical ensemble average
aðrÞh iR¼aðrÞdðMðrÞ�RÞh idðMðrÞ�RÞh i (8)
0 0
Because FI is a mean force (MF), the potential, U , isreferred to as the potential of mean force (PMF).[38,40] The
PMF is not a conventional potential energy function, but
should more properly be considered a configuration-
dependent free energy that contains not only energetic,
but also entropic effects arising from the distribution of
configurations in Equation (4). The PMF is a many-body
potential since it is determined from a many-body
distribution function and, in general, it cannot be
readily decomposed into simpler independent factors.[39,42]
aterialsViews.com
Macromol. Theory Simul.
� 2011 WILEY-VCH Verlag Gmb
Consequently, CG methods typically approximate the
PMF with relatively simple molecular mechanics type
potentials.
Approximate Coarse-Grained Force Fields
For the following analysis, it is convenient to consider
anabstractvector spaceofCGforcefields.[40,77,79] Eachelement
in this space specifies a vector force on each site as a function
of the CG configuration, F ¼ fF1ðRÞ; F2ðRÞ; . . . ; FNðRÞg.An innerproduct� canbedefinedbetweenany twoelements,
F(1) and F(2), in this vector space:
2011, 2
H & Co
Fð1Þ � Fð2Þ ¼ 1
3N
XI
Fð1ÞI ðMðrÞÞ � Fð2ÞI ðMðrÞÞ
* +; (9)
and a corresponding norm, according to kFk ¼ ðF� FÞ1=2.We consider approximate potentials of a molecular
mechanics form:
UðRÞ ¼Xz
Xl
Uz cz Rf gl� �� �
; (10)
where z indicates a particular interaction (e.g., a dihedral
angle interaction) and Uz is the corresponding potential
(e.g., a dihedral angle potential) that is a function of a
single scalar variable,cz (e.g., a dihedral angle) thatmay be
expressed as a function of the Cartesian coordinates, {R}l,
for a set of sites, l (e.g., the four successively bonded sites
that form a dihedral angle).[73] Each term in Equation (10)
is expanded as a linear combination of basis functions, uzd,
with constant coefficients, fzd:
UzðxÞ ¼Xd
fzduzdðxÞ (11)
The force on site I may be expressed:
FIðRÞ ¼Xz
Xd
fzdGGI;zdðRÞ (12)
where
GGI;zdðRÞ ¼Xl
@czlðRÞ@RI
fzd czlðRÞ� �
(13)
czlðRÞ ¼ czðfRglÞ, and fzdðxÞ ¼ �duzdðxÞ=dx. The CG force
field defined by Equation (12) then identifies a particular
vector that can be re-expressed more simply:
F ¼XD
fDGGD (14)
where D is a ‘‘super index’’ that identifies a particular
combination zd.[73] Equation (14) explicitly expresses F as a
0, 478–495
. KGaA, Weinheim481

482
www.mts-journal.de
C. R. Ellis, J. F. Rudzinski, W. G. Noid
linear combination of a set of vectors fGGDg, each of which
has elements given by Equation (13). The set of vectors
included in Equation (14) defines an incomplete basis set
that spans a subspace of the force field vector space.[40] The
constants fD are both parameters for the CG potential and
also coefficients that identify a particular vector in this
subspace. The many-body MF defined in Equation (7) is an
element in the vector space of CG force fields, but it is not
necessarily in the subspace spanned by a given finite basis.
However, because the MF is a conditional average of the
atomistic force field, it follows that:
F0 � F ¼ 1
3N
XI
fIðrÞ � FIðMðrÞÞ* +
(15)
for any CG force field F.[40]
Multiscale Coarse-Graining Method
The MS-CG method[69,70] directly determines an approx-
imate potential by minimizing the force-matching[106,107]
functional, x2½F�:
x2½F� ¼ 1
3N
XI
jfIðrÞ�FIðMðrÞÞj2* +
(16)
2
As a consequence of Equation (15), x ½F� can be re-expressed:
x2½F� ¼ x2½F0� þ jjF0�Fjj2 (17)
where jjF0�Fjj2 � 0, with equality holding if and only if
F¼ F0. Since x2½F0� is fixed by the atomistic model and CG
mapping, jjF0�Fjj2 is minimized when x2½F� is minimized.
Consequently, if a complete basis set is employed, the MS-
CG variational principle quantitatively determines the MF
and the resulting CG model would quantitatively repro-
duce the many-body structural distribution defined by the
atomistic model and the mapping. More generally, given
an incomplete basis set that spans a subspace of force
fields, the MS-CG procedure determines the force field in
the subspace that is ‘‘closest’’ to the MF, according to the
norm defined above.[73] In this sense, the MS-CG method
determines the force field within the subspace that
provides the ‘‘optimal’’ approximation to the MF. Given
the basis set expansion for the approximate CG force field,
Equation (14), x2 becomes a quadratic function of the
coefficients, f � ffDg, and the MS-CG force field can be
determined as the solution to a simple linear least squares
problem:[73,76]
x2ðfÞ ¼ x2ð0Þ�2XD
bDfD þXD
XD0
fDGDD0fD0 (18)
Macromol. Theory Simul.
� 2011 WILEY-VCH Verlag Gmb
where
2011, 2
H & Co
bD ¼ 1
3N
XI
fIðrÞ � GGI;DðMðrÞÞ* +
(19)
GDD0 ¼ 1
3N
XI
GGI;DðMðrÞÞ � GGI;D0 ðMðrÞÞ* +
(20)
2
The coefficients minimizing x may be determined fromthe normal system of linear equations:[72]
XD0
GDD0fD0 ¼ bD (21)
for each D. Notice that bD reflects atomistic force
information, while GDD0 quantifies correlations between
different interactions inmapped configurations. According
to Equation (9), GDD0 may be interpreted as a metric tensor
corresponding to the inner product of basis vectors, i.e.,
GDD0 ¼ GGD � GGD0 . Similarly, from Equation (9 and 15), it
follows that bD is equal to the inner product of the exact
many-body MF and the basis vector GGD, i.e., bD ¼ GGD � F0.
Consequently, it follows that the normal equations for the
MS-CG approximate force field, F, can be expressed:
GGD � F ¼ GGD � F0 (22)
Equation (22) emphasizes that the normal MS-CG
equations determine the projection of the MF[108–110] onto
the subspace spanned by the incomplete basis set fGGDg byrequiring that the MS-CG force field and the MF have
the same inner product with each basis vector.[73,77]
Equation (19), (21), and (22) clarify the significance of
atomistic force information in theMS-CGmethod. The force
correlation functions, bD, provide a clever and compact
means for characterizing the many-body MF. However,
Equation (6and7) demonstrate that theMFcanbeobtained
directly from a configuration distribution function. This
suggests that the MS-CG optimal approximation to the
many-body PMF can be determined from appropriate
structural information. The following subsection applies
this line of reasoning.
Generalized Yvon–Born–Green Theory
To proceed further, it is convenient to reformulate the MS-
CG framework in terms of a ‘‘continuous basis.’’[77,78]
Starting from Equation (10), the force on site I can be re-
expressed
FIðRÞ ¼Xz
ZdxfzðxÞGGI;zðR; xÞ (23)
0, 478–495
. KGaA, Weinheim www.MaterialsViews.com

Generalized-Yvon–Born–Green Model of Toluene
www.mts-journal.de
where fzðxÞ ¼ �dUzðxÞ=dx is a force function, and
x2
bz
Gz
gzð
Xz0
www.M
GGI;zðR; xÞ ¼Xl
@czlðRÞ@RI
dðczlðRÞ�xÞ (24)
The MS-CG functional becomes
½ffzðxÞg� ¼ x2½f0g��2Xz
ZdxbzðxÞfzðxÞ
þXz
Xz0
Zdx
Zdx0fzðxÞGzz0 ðx; x0Þfz0 ðx0Þ
(25)
where
ðxÞ ¼ 1
3N
XI
fIðrÞ � GGI;zðMðrÞ; xÞ* +
(26)
z0 ðx; x0Þ ¼1
3N
XI
GGI;zðMðrÞ; xÞ � GGI;z0 ðMðrÞ; x0Þ* +
(27)
which, as before, can be interpreted as inner products of
the basis vector GGzðxÞ with the MF and with GGz0 ðx0Þ,respectively. The normal equations are then expressed
Xz0
Zdx0Gzz0 ðx; x0Þfz0 ðx0Þ ¼ bzðxÞ (28)
By employing Equation (6 and 7), performing integration
by parts, and keeping track of appropriate Jacobian
factors,[111–113]bzðxÞ ¼ GGzðxÞ � F0 canbeexpressed in terms
of structural correlation functions:
bzðxÞ ¼ kBTd
dxgzðxÞ�LzðxÞ
� �(29)
where
xÞ ¼ 1
3N
Xl
jrczlðMðrÞÞj2dðczlðMðrÞÞ�xÞ* +
(30)
LzðxÞ ¼1
3N
Xl
r2czlðMðrÞÞ dðczlðMðrÞÞ�xÞ* +
(31)
jrczlðRÞj2¼P
I ð@czlðRÞ=@RIÞ2, andr2czlðRÞ¼P
I @2czlðRÞ=
@R2I . The generalized-YBG (g-YBG) equation[77] then deter-
mines the MS-CG force field directly from structural
aterialsViews.com
Macromol. Theory Simul.
� 2011 WILEY-VCH Verlag Gmb
correlation functions:
2011, 2
H & Co
Zdx0Gzz0 ðx; x0Þfz0 ðx0Þ ¼ kBT
d
dxgzðxÞ�LzðxÞ
� �(32)
0
By decomposing the metric factor, Gzz0 ðx; x Þ ¼dzz0gzðxÞdðx�x0Þ þ Gzz0 ðx; x0Þ, Equation (32) separates thedirect and indirect contributions to bzðxÞ:
fzðxÞ þXz0
Zdx0g�1
z ðxÞGzz0 ðx; x0Þfz0 ðx0Þ
¼ kBTd
dxlngzðxÞ�g�1
z ðxÞLzðxÞ� � (33)
This result applies quite generally for any molecular
mechanics force field and, in particular, for polymermodels
with angle and torsion potentials.
When applied to simple liquids, Equation (33) reduces to
the YBG integral equation theory.[80] For a liquid of CG
sites interacting via simple pair potentials, UðRÞ ¼Pl U
ð2ÞðclðRÞÞ; l identifies a particular pair of sites {I, J};
and clðRÞ ¼ jRI�RJ j is the distance between the pair. Then
jrclðRÞj2 ¼ 2,r2clðRÞ ¼ 4=clðRÞ, and the components of
b(x) simplify to:
gðxÞ ¼ cx2gðxÞ (34)
LðxÞ ¼ 2cxgðxÞ (35)
in terms of c ¼ ð4p=3Þr, the density r ¼ N=V , and the
conventional radial distribution function (RDF), g(x).
Equation (29) becomes bðxÞ ¼ kBTcx2dgðxÞ=dx; or, in
terms of the pair potential of mean force,[80,114]
wðxÞ ¼ �kBT ln gðxÞ,
�w0ðxÞ ¼ bðxÞcx2gðxÞ (36)
In this case, Equation (33) may be re-expressed:
fðxÞ þZ
dx01
cx2gðxÞGðx; x0Þ fðx0Þ ¼ �w0ðxÞ (37)
which quite simply asserts that the mean force,�w0ðxÞ, ona given particle when there is a second particle a distance x
away has two contributions:[80,114] (i) the direct force, f(x),
from the second particle; and (ii) the correlated net force
from the environment, which is decomposed into con-
tributions from shells of particles at a distance x0 away
from the first particle. It should be noted that Gðx; x0Þincorporates the vectorial nature of this correlated force,
which, by symmetry, is aligned along the vector between
the first two particles.
0, 478–495
. KGaA, Weinheim483

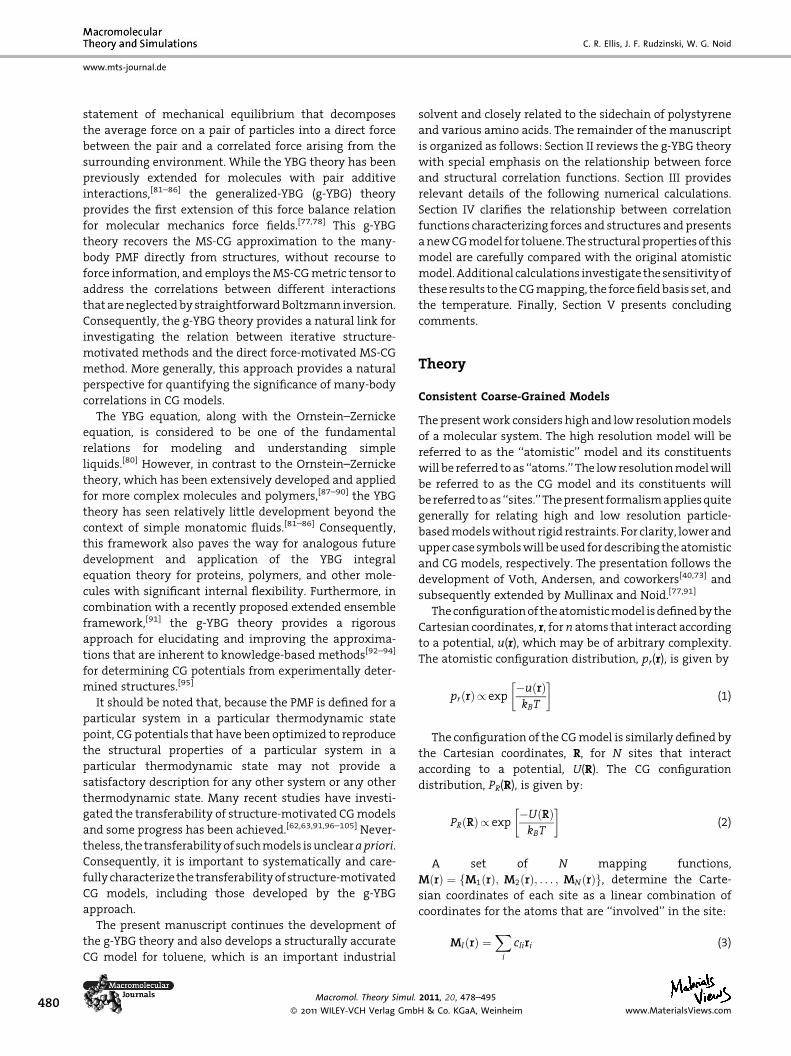
Figure 1. Representation of CG toluene molecules. (a) and(b) Present the methyl and COM mapping, respectively. (c) Pre-sents the molecular directors employed to characterize the pack-ing of molecules in the atomistic and CG models. These imageswere made with VMD.[127]
484
www.mts-journal.de
C. R. Ellis, J. F. Rudzinski, W. G. Noid
Methods
Simulation Details
All atomistic and CG simulations were performed with the
Gromacs 4.0.7 simulation suite.[115,116] The Gromacs sto-
chastic dynamics algorithm and Parrinello–Rahman baro-
stat[117] were employed to sample the constant NVT and
constant NPT ensembles, respectively. The Nose–Hoover
thermostat[118,119] and the Berendsen weak-coupling ther-
mostat and barostat[120] were employed in equilibration
stages. The interactions in the atomistic model were
determined from the OPLS-AA force field[121] and all bonds
wereflexible. Electrostatic interactionswere calculatedwith
the particle mesh Ewaldmethod[122] and periodic boundary
conditions[1]wereemployed inall simulations. Short-ranged
van der Waals interactions and also the real space
contribution to the electrostatic interactionswere truncated
at 1.4nm. A 1 fs integration time step was used in both
atomistic and CG MD simulations.
An atomistic model of 216 toluene molecules was
simulated in the canonical ensemble at 273, 298, and
373K. These canonical simulations were performed in a
volume corresponding to the equilibrium density of the
OPLS-AA toluene model at the given temperature and
atmospheric pressure. The starting configuration for each
canonical simulation was obtained by initially heating a
lattice of toluene molecules at constant volume to 1000K,
slowly cooling the system to the target temperature,
equilibrating the system volume at atmospheric pressure,
and finally sampling a configuration corresponding to the
average volume. The equilibrium densities of the OPLS-AA
model at 1 bar pressure and temperatures of 273, 298, and
378K were 889.3, 864.4, and 778.6 kg �m�3, respectively.
These densities agree quite accurately with the experi-
mental densities of 885.6, 862.3, and 790.1 kg �m�3
respectively.[123] The atomistic model was then simulated
for 22ns at each temperature. Configurations and forces
were sampled every 1 ps during the last 20ns of these
simulations. These configurations and forces weremapped
according to the CG representation of toluene and used to
evaluate the relevant force and structural correlation
functions. The atomistic simulations were extended an
additional 20ns to better sample orientational correlation
functions.
The calculated CG potentials were employed in simula-
tions sampling the canonical ensemble at 273, 298, and
398K. Each CG system was equilibrated for 2 ns in the
volume determined from corresponding atomistic simula-
tions, after which configurations were sampled in the
constant NVT ensemble every 1 ps. The resulting inter- and
intra-molecular correlation functions were compared with
those obtained by applying the CG mapping to configura-
tions sampled from atomistic simulations.
Macromol. Theory Simul.
� 2011 WILEY-VCH Verlag Gmb
CG Mapping
As shown in Figure 1, the present work considers two
different three site representations for toluene. Both
mappings employed three sites in order to capture the
planar geometry of toluene, which is expected to be
essential for characterizing and accurately reproducing
intermolecular packing and alignment. These sites were
associated with atomic groups based upon considerations
of molecular symmetry, shape, and size. Both mappings
employ two equivalent CB sites that represent single C
atoms, C3 and C5. The twomappings differ in the treatment
of the third distinct site, CF. The first mapping, which is
shown in Figure 1a and which will be referred to as the
methylmapping, defines themapped CF coordinates as the
Cartesian coordinates of the C7 atom. The secondmapping,
which is shown in Figure 1bandwhichwill be referred to as
the COM mapping, defines the mapped CF coordinates as
the center of mass for the group of atoms including C1, C7,
and the associatedhydrogenatoms.Although these twoCG
representationsareboth relativelyhigh resolution, theyare
consistent with several previous CG studies that employed
either three[28,37] or four sites[25] to model planar aromatic
groups.
Figure 1c also defines the two molecular directors that
will beemployed incharacterizing thealignmentof toluene
molecules in the atomistic and CG models. The first
molecular director, n1, is normal to the plane of the toluene
molecule. The secondmolecular director, n2, corresponds to
abisector of theCB�CF�CBbondangle and is definedas the
vectorpointing fromthemidpointof theCB�CBbondto the
CF site. These two directors approximately correspond to
the first and third principle axes defined by the molecular
inertia tensor.
Force Field Basis Set
These two different mappings determine two distinct
models and also distinctmany-body PMF. The force field for
each CG model was calculated by projecting the corre-
2011, 20, 478–495
H & Co. KGaA, Weinheim www.MaterialsViews.com

Generalized-Yvon–Born–Green Model of Toluene
www.mts-journal.de
spondingmany-bodyMF onto the force field basis set. Both
models employed the same basis set, whichwas defined by
the form of the approximate potential. In each case, the
approximate potential included intramolecular bond
stretch potentials between each pair of bonded sites and
also short-ranged nonbonded potentials between each pair
of sites in distinct molecules. These nonbonded pair
potentials were truncated at 1.4 nm. The CG potential did
not include explicit electrostatic interactions or angle-
dependent interactions, although they may be readily
treated in the present framework.[73,78,79] The majority of
the calculations reported below employed linear spline
functions, i.e., piecewise linear functions, to represent each
term in the potential. Grid spacings of 0.001 and 0.01nm
were employed for bond stretch and nonbonded pair
potentials, respectively.
In order to investigate the variational properties of the
method, the CG force fieldwas also calculated using amore
restricted ‘‘analytic’’ basis set. The calculations presented
below (row 2 of Figure 2 and column 2 of Figure 5) for the
restricted analytic basis set employed harmonic functions,
i.e., UzðxÞ ¼ fz1xþ fz2x2, to model each bond stretch and
Lennard–Jones-type 12–6 functions, i.e., UzðxÞ ¼ fz1=x6þ
fz2=x12, to model each nonbonded pair interaction, where
fz1 and fz2 may be either positive or negative.
0.36 0.37 0.38 0.39 0.4
-10000
-5000
0
5000
10000
b ζ(kJ m
ol-1
nm-2
)
Bond (CF-CB)
0.5
0
100
200
Pair (CF
0.36 0.37 0.38 0.39 0.4r (nm)
-3000
-1500
0
1500
3000
φ ζ(kJ m
ol-1
nm-1
)
0.5r (nm
0
10
20
a1
a2
Figure 2. Comparison of the force correlation function bzðxÞ (top psponding calculated force function fzðxÞ (bottom panels) for the CFinteraction (left panel) and the CF�CB nonbonded interaction (riconsidering the methyl mapping (Figure 1a). Solid black curves corlations employing forces according to the MS-CG method. Dashed gspond to calculations employing structures according to the g-YBG mealso present the bond stretch and nonbonded pair force functionsharmonic and Lennard–Jones basis functions, respectively, when usiblack) and structures (dotted gray).
www.MaterialsViews.com
Macromol. Theory Simul.
� 2011 WILEY-VCH Verlag Gmb
Force Field Calculation
For each force field basis set and eachmapping considered,
the parameters for theMS-CG force fieldwere calculated by
solving the associated set of normal equations given by
Equation (21). In each case, the matrix elements GDD0 were
calculated after mapping configurations sampled from
all-atom MD simulations. The vector bD was calculated
according to the MS-CG method by evaluating the force
correlation function in Equation (19). The vector bD was
also calculated from structural correlation functions
according to the g-YBG method using either Equation (29)
or a discretized version of this equation. The normal
equationswere solved via LU decomposition after applying
left preconditioning.[124] In the following calculations, the
normal equations were sufficiently well conditioned that
LU decomposition was quite stable. Singular value decom-
position may prove a useful alternative for systems that
leadto lesswell conditionednormalequations.Thestability
of these equations reflects several considerations including
the configurations sampled by the atomistic model, the CG
representation of those configurations, and the force field
basis set. These numerical issues have been briefly
addressed in previous studies of the MS-CG method[73,76]
and remain beyond the scope of the present study. The
calculated nonbonded force functions were smoothed by a
1
-CB)
1)
b1
b2
anels) and corre-�CB bond stretchght panel) whenrespond to calcu-ray curves corre-
thod. (a2) and (b2)calculated using
ng forces (dotted
2011, 20, 478–495
H & Co. KGaA, Weinhe
running average over three consecutive
grid points and then integrated to deter-
mine corresponding potentials.
Results and Discussion
Both the MS-CG and g-YBG approaches
determine a CG force field by projecting
the many-body MF onto an incomplete
basis set.[40,77] The MS-CG method
employs force correlation functions
sampled from atomistic simulations to
evaluate the inner product of theMFwith
each basis vector. In contrast, the g-YBG
method determines these same inner
products fromstructural correlation func-
tions. The present work employs the g-
YBG approach to develop a three site CG
model for toluene. Figure 2 and 3 demon-
strate the g-YBG procedure for determin-
ing the force field inner products.
Figure 4–6 assess the structural accuracy
of the resulting model at 298K and also
investigate the sensitivityof the results to
the mapping and the basis set. Figure 7
and8 investigate the transferabilityof the
model for simulations in the canonical
im485

0
40
80Bond (CF-CB)
0
1
Pair (CF-CB)
-1500
0
1500
kJ m
ol-1
nm-1
-5
0
5
0.37 0.38 0.39 0.4r (nm)
-3000
0
3000
kJ m
ol-1
nm-2
0.5 0.75 1 1.25r (nm)
-75
0
75
150
a1)
a2)
a3)
b1)
b2)
b3)
Figure 3. Analysis of bzðxÞ for the CF�CB bond stretch interaction (left panels) and the CF�CB pair nonbonded interaction (right panels)when considering the methyl mapping (Figure 1a). The top row presents the bond stretch distribution and nonbonded RDFs (solid black) andthe corresponding potential of mean force (dashed gray). The middle row presents the corresponding mean forces calculated by numericaldifferentiation (solid black) and also by Equation (36) in terms of the force correlation function, bzðxÞ (dashed gray). The middle row alsopresents the calculated force, fz, for each interaction (dashed–dotted black). The bottom row compares the contributions of kBTdgzðxÞ=dx(dashed gray) and �kBTLzðxÞ (dashed–dotted black) to the force correlation functions, bzðxÞ (solid black).
486
www.mts-journal.de
C. R. Ellis, J. F. Rudzinski, W. G. Noid
ensemble at 273 and 373K. With the exception of the
second row of Figure 2 and the second column of Figure 5,
which consider the reduced analytic basis set, all calcula-
tions employed linear spline basis functions with a grid
spacingof 0.001nmforbond stretchpotentials and0.01nm
for nonbonded pair potentials.
Accuracy of the g-YBG Approach for Calculating theMS-CG Potential
Figure 2 presents calculations of bz (top panels) and fz(bottom panels) for the intramolecular CF�CB bond stretch
interaction (left panels) and for the intermolecular CF�CB
interaction (right panels) when considering the methyl
mapping. Calculations employing forces are presented as
solid black curves, while calculations employing structures
are presented as dashed gray curves. To reduce statistical
noise inthefigure, theresults for thenonbonded interaction
have been smoothed by a running average over three
consecutive grid points. Nevertheless, despite the consider-
able noise in bz for the nonbonded interaction (Figure 2b1),
Macromol. Theory Simul.
� 2011 WILEY-VCH Verlag Gmb
it is clear that the g-YBG approach determines these force
correlation functions with essentially quantitative accu-
racy. Figure 2a2 and b2 demonstrate that, as a direct
consequence of accurately recovering bz, the g-YBG
approach also quantitatively recovers the MS-CG force
functions, fz. The two calculations for the CF�CB bond
interaction both obtain a linear restoring force and
quantitatively agree over the range of bond lengths that
are reasonably sampled (see Figure 3a1 below). The two
calculations also agree with near quantitative accuracy for
the CF�CB nonbonded force function. Statistical discre-
pancies in the calculations of bz result in small shifts
between the calculated force functions around r� 0.75nm.
Figure2a2andb2alsopresent the force functions thatare
calculated according to theMS-CG (dotted black) and g-YBG
(dottedgray) approacheswhenusing the restrictedanalytic
basis set, i.e., harmonic and Lennard–Jones basis functions
for the bond and nonbonded potentials, respectively.
Because the larger basis set determined a linear force
function for thebond stretch andbecause this interaction is
only weakly coupled to the nonbonded interactions, the
2011, 20, 478–495
H & Co. KGaA, Weinheim www.MaterialsViews.com

0.25 0.3 0.35 0.4R (nm)
0
50
100
P (R
)
methyl
0.25 0.3 0.35 0.4R (nm)
0
50
100
COM
30 45 60 75θ (deg)
0
0.1
0.2
0.3
0.4
0.5
P (θ
)
30 45 60 75θ (deg)
0
0.1
0.2
0.3
0.4
0.5
a1)
b1)
a2)
b2)
Figure 4. Comparison of the intramolecular distribution functions obtained from all-atom(solid black) and CG (dashed gray) simulations. Row a presents the CB�CB and CF�CB bondstretch distributions at smaller and larger R, respectively. Row b presents the CB�CF�CB andCB�CB�CF angle distributions at smaller and larger u, respectively. Columns 1 and 2 presentresults for the methyl and the COM mapping, respectively.
Generalized-Yvon–Born–Green Model of Toluene
www.mts-journal.de
calculationswith the twobasis sets agreequantitatively for
the bond force function. In contrast, by reducing the basis
set for the nonbonded pair interaction fromaflexible linear
spline to a Lennard–Jones function, the resulting non-
bonded force function changes significantly. The weakly
attractive double well that is present in the linear spline
calculation is replaced by a purely repulsive potential, as
might be expected on the basis of Weeks–Chandler–
Andersen theory.[125] As was the case for the linear spline
basis set, the g-YBG calculations accurately recover theMS-
CGforce functions for theanalyticbasis setover therangeof
distances that are accurately sampled in the atomistic
simulations.
In summary, Figure 2 clearly validates the g-YBG
approach as an accurate approach for determining the
MS-CG forcefielddirectly fromstructural information.[78,79]
Relating Force and Structural Correlation Functions
Figure3explicitly illustrates the relationshipbetween force
and structural correlation functions for the CF�CB bond
stretch (left panels) and the CF�CB nonbonded interaction
(right panels) when considering the methyl mapping. The
www.MaterialsViews.com
Macromol. Theory Simul. 2011, 20, 478–495
� 2011 WILEY-VCH Verlag GmbH & Co. KGaA, Weinheim
solid black curves in Figure 3a1 and
b1 present the bond stretch distri-
bution and RDF, respectively. The
dashed gray curves in Figure 3a1
and b1 present the potential of
mean force,wzðxÞ, that are obtainedby performing direct Boltzmann
inversion after normalizing the
corresponding distribution by the
appropriate Jacobian.[43] In each
case, wzðxÞ demonstrates attractive
wells (repulsivebarriers) atmaxima
(minima) in the corresponding dis-
tribution and diverges as the asso-
ciated probability distribution
vanishes.
Figure 3a2 and b2 compare, for
each interaction, two calculations
of the mean force function, �w0zðxÞ.
The solid black curve presents the
mean force calculated by numeri-
cally differentiating the corre-
sponding potential of mean force
from Figure 3a1 and b1. The dashed
gray curve presents the mean force
calculated by normalizing the force
correlation function, bzðxÞ, with the
corresponding probability distribu-
tion function according to
Equation (36). The two calculations
agree quantitatively and validate
the g-YBG identity for the MS-CG force correlation
functions. As expected, the mean force functions possess
the following properties: (i) they vanish at each local
maxima (and local minima) in the corresponding distribu-
tion function; (ii) they correspond to net forces driving each
interaction toward these maxima; (iii) they clearly reflect
the structurepresent in the force correlation functions from
Figure 2a1 and b1.
Figure 3a2 and b2 also compare these mean force
functions with the calculated g-YBG force functions that
provide the optimal approximation to the many-body
mean force (dashed–dotted black curves). As discussed
above and demonstrated by Equation (22), the calculated
force functions, fz, balance themean force along eachbasis
vector. In the caseof theCF�CBbond interaction, thespring
constants for the mean and direct forces differ by �12%,
which demonstrates that CG bonded potentials do couple
to other interactions. In the case of the intermolecular
CF�CB interaction, the direct force function deviates even
more dramatically from the mean force. In particular, the
hardwall and firstminima of themean force,which reflect
the initial rise and first maximum of the RDF, occur at
significantly shorter distances than the hard wall and the
487

0.5 10
0.5
1
1.5g
(r)
methyl
0.5 10
0.5
1
1.5
methyl - analytic
0.5 10
0.5
1
1.5COM
0.5 10
0.5
1
1.5
g (r
)
0.5 10
0.5
1
1.5
0.5 10
0.5
1
1.5
0.5 1r (nm)
0
0.5
1
1.5
g (r
)
0.5 1r (nm)
0
0.5
1
1.5
0.5 1r (nm)
0
0.5
1
1.5
2)aBC-BC a1)
c1) CF-CF
2)bBC-FC b1)
c2)
a3)
b3)
c3)
Figure 5. Comparison of site–site RDFs from all-atom (solid black) and CG (dashed gray) simulations at 298 K for the CB�CB, CF�CB, andCF�CF pairs in rows a, b, and c, respectively. Columns 1 and 3 present the results for the methyl and the COM mapping, respectively, whenusing the linear spline basis set. Column 2 presents the results for the methyl model when using the reduced analytic basis set. (b3) and (c3)also present atomistic RDFs for the methyl mapping as the dashed black curves.
488
www.mts-journal.de
C. R. Ellis, J. F. Rudzinski, W. G. Noid
first minima of the calculated direct force. Consequently,
while the mean force function indicates a net attraction
between the pair when they are separated by
0.4 nm� r� 0.5 nm, the calculated direct force function
is repulsive over this range. Similarly,while themean force
function indicates a net repulsion between the pair when
they are separated by r� 0.72 nm, at this distance the
calculated direct force function is attractive. These
differences between themean force and the corresponding
direct force reflect the correlated forces from the environ-
ment. In particular, preliminary calculations indicate that
these differences between the direct and mean force on
CF�CB pairs arise primarily from coupling to the CF�CB
bond stretch and, to a lesser extent, from coupling to the
CB�CB bond stretch and to nonbonded interactions. The
origin and physical significance of these correlations
require further study and may be considered in future
investigations.
Finally, Figure 3a3 and b3 decompose each force
correlation function bzðxÞ (from Figure 2a1 and b1)
according to Equation (29) into contributions from
kBTdgzðxÞ=dx (dashed gray) and from �kBTLzðxÞ (dashed–dotted black). Because the bond stretch distribution varies
Macromol. Theory Simul.
� 2011 WILEY-VCH Verlag Gmb
rapidly over a very narrow distance range, the derivative
term dominates bz for the bond stretch interaction. In
contrast, although the derivative term determines the fine
structure in the nonbonded force correlation function, both
terms make significant contributions.
In summary, Figure 3 demonstrates that the force
correlation function, bz, quantifies the mean net force
driving each interaction to a local equilibrium. This mean
force reflects both direct and environment-mediated
contributions, but can be quantitatively determined
directly from structural correlation functions.
Structural Accuracy of the g-YBG Model
Having demonstrated that the g-YBG approach quantita-
tively determines the MS-CG approximation to the many-
body PMF, Figures 4–6 assess the structural accuracy of two
distinct three site g-YBG models for toluene. In Figures 4
and 5, the left column presents results for the CG model
employing themethylmapping (shown in Figure 1a),while
the right column presents results for the CG model
employing the COM mapping (shown in Figure 1b). When
considering Figures 4–6, it should be noted that the
2011, 20, 478–495
H & Co. KGaA, Weinheim www.MaterialsViews.com

0
1
2
g CO
G(r
)
AA - methylAA - COMCG - methylCG - COM
0
0.5
1
<P2(c
osθ 1)>
0
0.5
<P2(c
osθ 2)>
0.5 1r (nm)
-0.5
0
<cos
θ 2>
a)
b)
c)
d)
Figure 6. Characterization of molecular packing observed in all-atom (solid curves) and CG(dashed curves) simulations of toluene when using the methyl (black curves) and COM (graycurves) mapping. (a) presents the RDFs for the molecular centers of geometry. (b) and(c) present the average of the second Legendre polynomial, P2ðcosuÞh i ¼ 3=2 cos2 uh i�1=2, forthe angles, u1 and u2, formed by the molecular directors n1 and n2, respectively, as a function ofintermolecular separation, r. (d) presents the average, cosu2h i, describing the alignment of thesecond molecular directors as a function of intermolecular separation. See Figure 1c for thedefinition of the molecular directors.
Generalized-Yvon–Born–Green Model of Toluene
www.mts-journal.de
differences in the atomistic distribution functions for the
two models reflect differences in the mapping applied to
the same set of atomically detailed configurations, while
the differences in the CG distribution functions reflect
differences in the configurations sampledwith twodistinct
CG potentials that approximate different PMFs.
Figure 4 compares the intramolecular bond stretch (top
panels) and angle distributions (bottom panels) for the
atomistic (solid black curves) and CG models (dashed gray
curves). The COMmapping moves the CF site nearer to the
aromatic ringandresults inanequilibriumgeometry that is
significantly closer to an equilateral triangle. The COM
mapping shortens the CF�CB bond by �0.06nm and also
generates a slightly narrower distribution for this bond
stretch. Figure4a1anda2demonstrate thatbothCGmodels
reproduce the corresponding bond stretch distributions
with quantitative accuracy. Figure 4b1 and b2demonstrate
that both CG models also reproduce the CB�CF�CB
angle distributionwith near quantitative accuracy, though
the distribution of CB�CB�CF angles is less sharply peaked
in the CG models than in the atomistic model. Although
both models reproduce the intramolecular toluene struc-
ture quite accurately, Figure 4 demonstrates that the COM
model gives a slightly more accurate description than the
methyl model.
www.MaterialsViews.com
Macromol. Theory Simul. 2011, 20, 478–495
� 2011 WILEY-VCH Verlag GmbH & Co. KGaA, Weinheim
Figure 5 compares the intermo-
lecular site–site RDFs of the OPLS-
AA (solid black curves) and CG
models (dashed gray curves) for
liquid toluene. Columns 1 and 3
present results for the methyl and
COM models, respectively, and
employ the linear spline basis set.
The atomistic CB�CB RDF (top row)
demonstrates relatively little struc-
ture, lacks a sharp first solvation
shell peak, and instead presents a
doublet-like split peak correspond-
ing to the two CB sites in each
molecule. The atomistic CF�CBRDF
(middle row) demonstrates consid-
erably more structure with signifi-
cant first and second peaks.
Figure 5b3 compares the atomistic
CF�CBRDF for themethyl andCOM
mappings as the dashed and solid
black curves, respectively. Because
the COM mapping moves the CF
site nearer to the aromatic ring and
farther from the molecular edge,
the corresponding CF�CB RDF
moves the first peak to larger
separation, shifts the second peak
to smaller separation, and demon-
strates slightly less structure relative to the CF�CB RDF for
the methyl mapping. The CF�CF RDF (bottom row)
continues the trend of increasing structure and also the
trend of increasing differences between the two atomistic
RDFs, as shown in Figure 5c3. Figure 5 demonstrates that
both CG models reproduce the atomistic site–site RDFs
quite accurately. With the exception of slight overstructur-
ing in the second solvation shell of CF�CF site pairs, the
methyl model nearly quantitatively reproduces the corre-
sponding atomistic RDFs. The COM model reproduces the
corresponding atomistic RDFs with slightly less accuracy,
but nevertheless clearly distinguishes between the ato-
mistic RDFs obtained for the two mappings. The quanti-
tative agreement between the atomistic and CG RDFs in
Figure 5 reflects the accuracy with which the (very weakly
attractive) calculated potentials reproduce the attractive
minima in the corresponding pair potentials of MF. (See
Figure 3b2.)
Finally, column 2 of Figure 5 compares the atomistic and
CG site–site RDFs for themethylmappingwhen employing
the reduced analytic basis set defined by harmonic bond
potentialsandLennard–Jones-type12–6nonbondedpoten-
tials. Comparison of the first and second columns reveals
that, for thegivenCGmapping, theCGforcefieldemploying
the reducedanalyticbasis set lessaccurately reproduces the
489

0.5 10
0.5
1
g (r
)
AA 273KAA 373KCG 273KCG 373K
0.5 10
0.5
1
1.5
g (r
)
0.5 1r (nm)
0
0.5
1
1.5
g (r
)
a) CB-CB
b) CF-CB
c) CF-CF
Figure 7. Characterization of the transferability of the CG toluene models. Figure 7compares site–site RDFs from all-atom (black curves) and CG (gray curves) simulationsat 273 K (dashed curves) and 373 K (solid curves) when employing the force fieldcalculated at 298 K for the methyl model (Figure 1a and left column in Figure 5) withthe linear spline basis set. (a–c) present RDFs for the CB�CB, CF�CB, and CF�CF sitepairs, respectively.
490
www.mts-journal.de
C. R. Ellis, J. F. Rudzinski, W. G. Noid
site–site RDFs determined by the atomistic models.
However, because the 12–6 potential quite accurately
captures the hard wall repulsion of the CG sites shown in
Figure 2b2, the corresponding 12–6 basis set also provides a
satisfactory representation of the atomistic RDFs. These
results further reinforce the conclusion that thehardwall of
the CG potential is most significant for reproducing
atomistic site–site RDFs, as would be expected from
Weeks–Chandler–Andersen theory.[125] Moreover, they
also demonstrate the variational nature of the g-YBG
calculations, i.e., for a given CG mapping, expanding the
force field basis set systematically improves the MS-CG
approximation to the many-body MF.[40,77]
Figure 6 compares the packing of toluene molecules in
the atomisticmodel (solid curves) and in the twoCGmodels
(dashed curves), corresponding to themethyl (black curves)
and COM (gray curves) mapping, as a function of the
distance between molecular centers of geometry. In
contrast to Figure 5, the two mappings of the atomistic
trajectory present almost identical results, but the results
for the two CG models differ significantly. Figure 6a
presents the intermolecular RDF between the centers of
geometry for toluenemolecules. Although Figure 5 demon-
strates that the site–site RDFs are slightly more structured
in the CGmodel, Figure 6a demonstrates thatmolecules are
Macromol. Theory Simul. 2011, 20, 478–495
� 2011 WILEY-VCH Verlag GmbH & Co. KGaA, Weinh
better packed into solvation shells in the
atomistic model. Nevertheless, the COM
and, to a lesser extent, also themethyl CG
model reproduces the intermolecular RDF
with reasonable accuracy.
Figure 6b presents the average of the
second Legendre polynomial describing
the alignment of toluenemolecules along
the first molecular director, n1, (shown in
Figure 1c) as a function of intermolecular
separation. Figure 6b demonstrates that,
in the atomistic model, the planes of
toluene molecules are almost perfectly
parallel at short distances. This alignment
rapidly decays to zero by the first solva-
tion shell and thendemonstrates a second
maxima near the minimum in the mole-
cular RDF at 0.8 nm. The COM model
nearly quantitatively reproduces this
alignment. Perhaps as a consequence of
the greater distance between the CF and
CB sites, though, the methyl model only
qualitatively reproduces the stacking of
toluene molecules at short distances.
Figure 6(c) presents the average of the
second Legendre polynomial describing
the alignment of toluenemolecules along
the second molecular director, n2, shown
in Figure 1c, as a function of intermole-
cular separation. In the atomisticmodel, toluenemolecules
demonstrate a slight tendency to be either aligned or anti-
aligned at very short separations. This alignment decays on
a slightly longer length scale than the alignment along n1.
The COM mapping, and to a lesser extent the methyl
mapping, qualitatively reproduce this alignment. Figure 6d
presents the average of the first Legendre polynomial
describing alignment along n2 as a function of intermole-
cular separation. Figure6ddemonstrates that, theatomistic
model has a very slight preference for toluenemolecules to
be anti-aligned rather than aligned along n2 at very short
separations.BothCGmodels reproduce thispreferencewith
reasonable accuracy.
In summary, Figure 4–6 demonstrate that both CG
models quite accurately reproduce the inter- and intra-
molecular structure of the OPLS-AA toluene model in the
canonical ensemble at 298Kandat adensity corresponding
to atmospheric pressure. Somewhat intriguingly, although
Figure 5 demonstrates that the methyl model reproduced
the atomistic site–site RDFswith greater accuracy than the
COM model, Figure 6 demonstrates that the COM model
reproduces thealignmentandpackingof toluenemolecules
more accurately.
The differences between the two CG models reflect the
subtle relationship between the CG mapping, the MF, the
eim www.MaterialsViews.com

0
1
2
g CO
G(r
)
AA 273KCG 273KAA 373KCG 373K
0
0.5
1
<P2(c
osθ 1)>
0
0.5
<P2(c
osθ 2)>
0.5 1r (nm)
-0.5
0
<cos
θ 2>
a)
b)
c)
d)
Figure 8. Further characterization of the transferability of the CG toluene models.Figure 8 compares the molecular packing observed in all-atom (black curves) and CG(gray curves) simulations at 273 K (dashed curves) and 373 K (solid curves) when employ-ing the force field calculated at 298 K for the methyl model (Figure 1a and left column inFigure 5) with the linear spline basis set. (a–d) present quantities corresponding toFigure 6a–d.
Generalized-Yvon–Born–Green Model of Toluene
www.mts-journal.de
force field basis set, and the structural accuracy of the CG
model.Afixedmapping (andagivenatomistic distribution)
completely determines theMF. For a givenMF, the accuracy
of the CG approximate force field depends upon the basis
set. Figure 5 demonstrates that, for a given MF, this
approximation (and, presumably, also the accuracy of the
resulting CG structure) can be systematically improved by
expanding the basis set. At the same time, Figure 6
demonstrates that, givenafixedbasis set, theaccuracywith
which the CG force field approximates the MF depends
subtly upon the mapping. In this case, the alignment and
packing of molecules in the atomistic model appear very
similar when viewed through the two different mappings.
However, given the same force field basis set, the aspects of
the MF that determine the packing and alignment of
toluene molecules are more accurately approximated by
the COM force field than by the methyl force field. This
relationship requires further investigation that may be
facilitated by considering the relative entropy formal-
ism.[55]
We note that DeVane et al.[25] have recently published a
four site CG model of toluene. This model placed CG sites
between atoms C1 and C7, between atoms C2 and C3,
between atoms C5 and C6, and on atom C4. DeVane et al.
parameterized attractive Lennard–Jones 9–6 potentials to
accurately reproduce experimental density, surface ten-
sion, and interfacial tension measurements. In contrast to
the present model, which slightly underestimates the
www.MaterialsViews.com
Macromol. Theory Simul. 2011, 20, 478–495
� 2011 WILEY-VCH Verlag GmbH & Co. KGaA, Weinhe
molecular packing of the OPLS-AAmodel,
the model of DeVane et al. appears to
slightly overestimate the atomistic pack-
ing reported by molecular RDFs.
Temperature Transferability of theg-YBG Model
Figure7and8assess the transferabilityof
the g-YBG toluene model that was para-
meterized at room temperature (i.e., at
298K) to temperatures slightly above the
freezing temperature (i.e., at 273K) and
slightly below the boiling temperature
(i.e., at 373K). In each case, the simula-
tions were performed in the canonical
ensemble in a volume corresponding to
the equilibrium density of the OPLS-AA
model at atmospheric pressure. Figure 7
and 8 only present results for the methyl
model, which more accurately repro-
duced site–site RDFs, but less accurately
reproduced molecular alignment and
packing. The trends for the COM model
are consistent with those shown below.
Figure 7 compares the site–site RDFs
calculated from simulations of the methyl model (gray
curves) with those obtained from atomistic simulations
(black curves) at 273 (dashed curves) and at 373K (solid
curves). As expected, simulations at decreasing tempera-
ture demonstrate more tightly packed structure, i.e., RDF
peaks increase inmagnitude and shift to shorter distances.
Simulations of the CG model, while employing the
potentials calculated for 298K, provide an increasingly
accurate description of atomistic site–site RDFs with
increasing temperature. At 373K, the CG simulations
reproduce the corresponding atomistic RDFs with essen-
tially quantitative accuracy. Even at 273K, though, the CG
model reproduces the atomistic RDFs quite accurately.
Figure 8 compares the alignment and packing of toluene
molecules in the atomistic and CG simulations at 273 and
373K for the methyl mapping. As shown in Figure 8a, the
molecularRDFs followthe trendsdemonstratedby thesite–
site RDFs in Figure 7. Although the CG molecular RDF
appears to demonstrate less temperature dependence than
the atomistic RDF, the agreement between the atomistic
and CG RDFs improves with increasing temperature.
Figure 8b–d characterize the alignment of toluene mole-
culesalong themoleculardirectors n1 and n2. Themolecular
alignment appears to be relatively temperature indepen-
dent in both the atomistic and CG models.
In summary, Figure 7 and 8demonstrate that the current
g-YBG models appear to provide a reasonably accurate
model ofmolecular structure in the constantNVTensemble
im491

492
www.mts-journal.de
C. R. Ellis, J. F. Rudzinski, W. G. Noid
over the range of temperatures for which toluene remains
liquid. It should be emphasized that this relatively high
degree of transferability was not ensured by the para-
meterization procedure for the CG model. In general,
despite considerable progress in this direction, current
structure-motivated CG models are not expected to
necessarily provide temperature transferability. The trans-
ferability of the present models may be a consequence of
the rigidity of toluene and the relatively high resolution
mappings employed.
Efficiency
In closing, we briefly comment upon the efficiency of the
present model. Although dramatic gains in computational
efficiency are a primary motivation for CG modeling, the
present study made no attempts to optimize the efficiency
of either theatomistic orCGmodels. The calculatedCG force
field, which was optimized to reproduce structure rather
than thermodynamic properties or efficiency, includes
relatively complicated tabulated potentials that are char-
acterized by a ‘‘hard’’ core excluded volume repulsion. The
form of these potentials may preclude larger time steps.
Moreover, the present work also employed a relatively fine
mapping that only reduced the number of particles in each
molecules from 7C and 8 H atoms to 3 CG sites. In contrast,
many CG models often employ ‘‘softer’’ Lennard–Jones
potentials that may be more efficient to evaluate and also
allow a larger integration time step. Furthermore, such
models also often benefit from applying more aggressive
CG mappings, although it should be noted that
recent thermodynamic-motivated approaches have
employed 3[28,37] or 4 sites[25] to accurately describe the
packing of small aromatic groups.
In order to quantify the efficiency of the presentmodel, it
is necessary to determine the physical relationship
between integration timesteps in the atomistic and CG
models. While it is difficult to directly relate timescales in
atomistic and CG simulations, one possible heuristic is to
scale time between the two models so as to match the
diffusion constant.[126] Based upon this perspective, the
efficiency of the present CG model may be estimated by
noting thatmoleculesdiffuse28.3and0.422nm/cpu-day in
the CG and atomistic simulations, respectively. Conse-
quently, according to this metric, the CG model provides a
67-fold gain in efficiency.
Summary and Conclusion
The present work continues the development of the g-YBG
framework and parameterizes a three site CG model for
simulating liquid toluene in the canonical ensemble at
Macromol. Theory Simul.
� 2011 WILEY-VCH Verlag Gmb
298K. Figure 2 demonstrates that the g-YBG calculations
accurately recover the MS-CG force field directly from
structural correlation functions, i.e., the g-YBG approach
minimizes a ‘‘force-matching’’ variational principle with-
out requiring explicit force information. Both the MS-CG
and g-YBG approach determine an ‘‘optimal approxima-
tion’’ to the many-body PMF by projecting the correspond-
ing many-body MF onto a set of basis vectors that
correspond to particular interactions in the CG potential.
While the MS-CG method determines these projections
from force correlation functions sampled in atomistic
simulations, Figure 3 demonstrates that these projections
are related to mean forces for the corresponding interac-
tions. These mean forces of a single variable can be
determined from corresponding simple structural correla-
tion functions, e.g., RDFs. The MS-CG metric tensor allows
one to decompose the mean force along a single degree of
freedom into a direct force and a correlated force from the
environment. Figure 3b explicitly demonstrates that the
surrounding environment makes important contributions
to the mean force for nonbonded interactions and, to a
lesser extent, also for bond stretch interactions. Preliminary
calculations indicate that the mean forces for nonbonded
interactions reflect very important contributions from
correlated bonded interactions and also contributions from
coupled nonbonded interactions.
Figure 4–6 investigate the structural accuracy of the
resulting three site toluenemodel andalso the sensitivityof
themodel to the CG representation and the force field basis
set. These calculations demonstrate that the CG model
provides a faithful description of the structure present in
the atomistic model, including the intramolecular
structure, the intermolecular site–site RDFs, and also
the molecular packing and alignment. Calculations were
performed with two different CG mappings that are
distinguished by the definition of the CF site. The methyl
mapping defined this site by the C atom of the methyl
substituent; the COMmapping defined the same site from
thecenterofmass for themethylgroupandtheneighboring
aromatic atom. Both representations led to reasonably
accuratedescriptions of theatomistic structure. Themethyl
model provides a better description of the intermolecular
site–site RDFs, while the COMmodel better reproduces the
molecular RDFs and the alignment of molecular axes.
The majority of calculations were performed with a
flexiblebasis set that representedeach termin thepotential
with linear spline functions. Calculations with reduced
basis sets (quadratic functions for bonded interactions and
Lennard–Jones-type functions for nonbonded interactions)
provided a less accurate representation of the atomistic
structure, thus demonstrating the variational nature of the
method. These calculations also demonstrated that the
site–site RDFs are more sensitive to the short-ranged
excluded volume contributions to the potential than to the
2011, 20, 478–495
H & Co. KGaA, Weinheim www.MaterialsViews.com

Generalized-Yvon–Born–Green Model of Toluene
www.mts-journal.de
weak longer-ranged attraction or to other fine structure in
the potentials, as would be expected according to Weeks–
Chandler–Andersen theory.
Figure 7 and 8 demonstrate that the current model
possesses reasonable temperature transferability for NVT
simulations in the liquid phase. In particular, temperature
dependent changes in the site–site RDFs are accurately
reproduced by the CG model over a range of 100K. The
present CG model is estimated to provide a 67-fold gain in
efficiency relative to the atomisticmodel, althoughwenote
that no efforts were attempted in the present work to
optimize the efficiency of either the atomistic or CGmodel.
In closing, we note that the present work demonstrates
that the g-YBG frameworknot only determines structurally
accurate CG models, but also provides insight into the
relationship between atomic structure and CG force fields.
Moreover, the present work suggests several directions for
future investigation. In particular, future work may
analyze the MS-CG metric tensor to further characterize
the coupling between different interactions and how these
couplings are determined by molecular structure. Addi-
tional work is clearly needed to better understand the
relationship between the CGmapping, force field basis set,
and structural accuracy. Finally, thiswork suggests that the
g-YBG formalism may prove useful for characterizing and
modeling complex molecular systems and polymers, in
analogy to the extensive development and contributions of
the Ornstein–Zernicke integral equation.
Acknowledgements: The present work has been financiallysupported by an NSF CAREER award (grant no. MCB 1053970)from the National Science Foundation and also by start-up fundsfrom the Pennsylvania State University. Numerical calculationswere performed using support and resources from ResearchComputing and Cyberinfrastructure, a unit of InformationTechnology Services at Penn State. Figure 1 and also the Tableof Contents graphicweremadewith VMD. VMD is developedwithNIH support by the Theoretical and Computational Biophysicsgroup at the Beckman Institute, University of Illinois at Urbana-Champaign. WGN thanks the organizers of the 2010 InternationalWorkshop on Novel Simulation Approaches to Soft Matter hostedby the Max Planck Institute for Complex Systems and gratefullyacknowledgesmany helpful and enjoyable conversationswith theparticipants and organizers during the meeting.
Received: February 23, 2011; Revised: May 3, 2011; Publishedonline: July 22, 2011; DOI: 10.1002/mats.201100022
Keywords: coarse-grained models; generalized-Yvon–Born–Green; structural correlations; toluene; transferability
[1] M. P. Allen, D. P. Tildesley, Computer Simulation of Liquids,Oxford Press, New York, USA 1987.
www.MaterialsViews.com
Macromol. Theory Simul.
� 2011 WILEY-VCH Verlag Gmb
[2] D. Frenkel, B. Smit, Understanding Molecular Simulation:From Algorithms to Applications, 2nd edition, AcademicPress, San Diego, CA, USA 2002.
[3] J. Gumbart, L. G. Trabuco, E. Schreiner, E. Villa, K. Schulten,Structure 2009, 17, 1453.
[4] R. B. Best, N.-V. Buchete, G. Hummer, Biophys. J. 2008, 395,L07.
[5] Coarse-Graining of Condensed Phase and Biomolecular Sys-tems (Ed., G. A. Voth), CRC Press, Boca Raton, FL, USA 2008.
[6] Partial special issue of J. Chem. Theory Comp. Volume 2,Issue (3), May 2006.
[7] Phys. Chem. Chem. Phys. Themed issue on coarse-grainedmodeling soft condensedmatter. Volume (11), Issue (12), 2009.
[8] Soft Matter themed issue on modeling soft matter.Volume 2, Issue (22), 2009.
[9] Faraday Discussions onmultiscale simulation of soft mattersystems Volume 144, 2010.
[10] C. Peter, K. Kremer, Soft Matter 2009, 5, 4357.[11] C. Peter, K. Kremer, Faraday Disc. 2010, 144, 9.[12] M. Levitt, A. Warshel, Nature 1975, 253, 694.[13] P. R. ten Wolde, D. Chandler, Proc. Natl. Acad. Sci. USA 2002,
99, 6539.[14] B. J. Reynwar, G. Illya, V. A. Harmandaris, M. M. Muller,
K. Kremer, M. Deserno, Nature 2007, 447, 461.[15] C. Clementi, Curr. Opin. Struc. Biol. 2008, 18, 10.[16] D. Fritz, C. R. Herbers, K. Kremer, N. F. A. van der Vegt, Soft
Matter 2009, 5, 4556.[17] M. Hagan, D. Chandler, Biophys. J. 2006, 91, 42.[18] A. T. Hagler, B. Honig, Proc. Natl. Acad. Sci. USA 1978, 75, 554.[19] G. S. Ayton, W. G. Noid, G. A. Voth, Curr. Opin. Struc. Biol.
2007, 17, 192.[20] J. C. Shelley, M. Y. Shelley, R. C. Reeder, S. Bandyopadhyay,
M. L. Klein, J. Phys. Chem. B 2001, 105, 4464.[21] S. O. Nielsen, C. F. Lopez, G. Srinivas, M. L. Klein, J. Chem. Phys.
2003, 119, 7043.[22] W. Shinoda, R. DeVane, M. L. Klein, Mol. Simul. 2007, 33, 27.[23] E. Khurana, R. H. DeVane, A. Kohlmeyer, M. L. Klein, Nano-
letters 2008, 8, 3626.[24] R. DeVane, W. Shinoda, P. B. Moore, M. L. Klein, J. Chem.
Theor. Comp. 2009, 5, 2115.[25] R. DeVane, M. L. Klein, C. C. Chiu, S. O. Nielsen, W. Shinoda,
P. B. Moore, J. Phys. Chem. B 2010, 114, 6386.[26] C. C. Chiu, R. DeVane, M. L. Klein, W. Shinoda, P. B. Moore,
S. O. Nielsen, J. Phys. Chem. B 2010, 114, 6394.[27] S. J. Marrink, A. H. de Vries, A. E. Mark, J. Phys. Chem. B 2004,
108, 750.[28] S. J. Marrink, H. J. Risselada, S. Yefimov, D. P. Tieleman, A. H.
de Vries, J. Phys. Chem. B 2007, 111, 7812.[29] L. Monticelli, S. K. Kandasamy, X. Periole, R. G. Larson, D. P.
Tieleman, S.-J. Marrink, J. Chem. Theor. Comp. 2008, 4, 819.[30] C. A. Lopez, A. J. Rzepiela, A. H. de Vries, L. Dijkhuizen,
P. H. Hunenberger, S. J. Marrink, J. Chem. Theor. Comp.2009, 5, 3195.
[31] L. Monticelli, E. Salonen, P. C. Ke, I. Vattulainen, Soft Matter2009, 5, 4433.
[32] X. Periole, M. Cavalli, S. J. Marrink, M. A. Ceruso, J. Chem.Theor. Comp. 2009, 5, 2531.
[33] H. Lee, A. H. de Vries, S. J. Marrink, R. W. Pastor, J. Phys.Chem. B 2009, 113, 13186.
[34] B. M. Mognetti, L. Yelash, P. Virnau, W. Paul, K. Binder,M. Muller, L. G. MacDowell, J. Chem. Phys. 2008, 128, 104501.
[35] B. M. Mognetti, P. Virnau, L. Yelash, W. Paul, K. Binder,M. Muller, L. G. MacDowell, J. Chem. Phys. 2009, 130, 044101.
[36] K. A.Maerzke, J. I. Siepmann, J. Phys. Chem. B 2011, 115, 3452.
2011, 20, 478–495
H & Co. KGaA, Weinheim493

494
www.mts-journal.de
C. R. Ellis, J. F. Rudzinski, W. G. Noid
[37] G. Rossi, L. Monticelli, S. R. Puisto, I. Vattulainen, T.Ala-Nissila, Soft Matter 2011, 7, 698.
[38] J. G. Kirkwood, J. Chem. Phys. 1935, 3, 300.[39] A. Liwo, S. Oldziej, M. R. Pincus, R. J. Wawak, S. Rackovsky,
H. A. Scheraga, J. Comp. Chem. 1997, 18, 849.[40] W. G. Noid, J.-W. Chu, G. S. Ayton, V. Krishna, S. Izvekov, G. A.
Voth, A. Das, H. C. Andersen, J. Chem. Phys. 2008, 128,244114.
[41] T. Murtola, A. Bunker, I. Vattulainen, M. Deserno,M. Karttunen, Phys. Chem. Chem. Phys. 2009, 11, 1869.
[42] A. Liwo, C. Czaplewski, J. Pillardy, H. A. Scheraga, J. Chem.Phys. 2001, 115, 2323.
[43] W. Tschop, K. Kremer, J. Batoulis, T. Burger, O. Hahn, ActaPolym. 1998, 49, 61.
[44] J. Baschnagel, K. Binder, P. Doruker, A. A. Gusev, O. Hahn,K. Kremer, W. L. Mattice, F. Muller-Plathe, M. Murat, W. Paul,S. Santos, U. W. Suter, V. Tries, Adv. Polym. Sci. 2000, 152, 41.
[45] V. A. Harmandaris, N. P. Adhikari, N. F. A. van der Vegt,K. Kremer, Macromolecules 2006, 39, 6708.
[46] A. Villa, C. Peter, N. F. A. van der Vegt, J. Chem. Theor. Comp.2010, 6, 2434.
[47] A. Villa, N. F. A. van der Vegt, C. Peter, Phys. Chem. Chem.Phys. 2009, 11, 2068.
[48] A. Villa, C. Peter, N. F. A. van der Vegt, Phys. Chem. Chem.Phys. 2009, 11, 2077.
[49] W. Schommers, Phys. Rev. A 1983, 28, 3599.[50] F. Muller-Plathe, ChemPhysChem 2002, 3, 754.[51] D. Reith, M. Putz, F. Muller-Plathe, J. Comp. Chem. 2003, 24,
1624.[52] A. P. Lyubartsev, A. Laaksonen, Phys. Rev. E 1995, 52, 3730.[53] A. P. Lyubartsev, A. Laaksonen, Phys. Rev. E 1997, 55, 5689.[54] A. Lyubartsev, A. Mirzoev, L. J. Chen, A. Laaksonen, Faraday
Disc. 2010, 144, 43.[55] M. S. Shell, J. Chem. Phys. 2008, 129, 144108.[56] A. Chaimovich, M. S. Shell, Phys. Rev. E 2010, 81.[57] A. Chaimovich, M. S. Shell, J. Chem. Phys. 2011, 134, 094112.[58] A. Savelyev, G. A. Papoian, J. Phys. Chem. B 2009, 113, 7785.[59] A. Savelyev, G. A. Papoian, Biophys. J. 2009, 96, 4044.[60] A. Savelyev, G. A. Papoian, Proc. Natl. Acad. Sci. USA 2010,
107, 20340.[61] T. Murtola, M. Karttunen, I. Vattulainen, J. Chem. Phys. 2009,
131, 055101.[62] E. C. Allen, G. C. Rutledge, J. Chem. Phys. 2009, 130, 034904.[63] E. C. Allen, G. C. Rutledge, J. Chem. Phys. 2009, 130, 204903.[64] R. L. Henderson, Phys. Lett. A 1974, 49, 197.[65] J. T. Chayes, L. Chayes, E. H. Lieb, Commun. Math. Phys. 1984,
93, 57.[66] J. T. Chayes, L. Chayes, J. Stat. Phys. 1984, 36, 471.[67] M. E. Johnson, T. Head-Gordon, A. A. Louis, J. Chem. Phys.
2007, 126, 144509.[68] G. Megariotis, A. Vyrkou, A. Leygue, D. N. Theodorou, Ind.
Eng. Chem. Res. 2011, 50, 546.[69] S. Izvekov, G. A. Voth, J. Phys. Chem. B 2005, 109, 2469.[70] S. Izvekov, G. A. Voth, J. Chem. Phys. 2005, 123, 134105.[71] S. Izvekov, P. W. Chung, B. M. Rice, J. Chem. Phys. 2010, 133,
064109.[72] W. G. Noid, J.-W. Chu, G. S. Ayton, G. A. Voth, J. Phys. Chem. B
2007, 111, 4116.[73] W. G. Noid, P. Liu, Y. T. Wang, J.-W. Chu, G. S. Ayton,
S. Izvekov, H. C. Andersen, G. A. Voth, J. Chem. Phys. 2008,128, 244115.
[74] L. Lu, G. A. Voth, J. Phys. Chem. B 2009, 113, 1501.[75] L. Larini, L. Y. Lu, G. A. Voth, J. Chem. Phys. 2010, 132, 164107.
Macromol. Theory Simul.
� 2011 WILEY-VCH Verlag Gmb
[76] L. Y. Lu, S. Izvekov, A. Das, H. C. Andersen, G. A. Voth, J. Chem.Theor. Comp. 2010, 6, 954.
[77] J. W. Mullinax, W. G. Noid, Phys. Rev. Lett. 2009, 103, 198104.[78] J. W. Mullinax, W. G. Noid, J. Phys. Chem. C 2010, 114,
5661.[79] J. W. Mullinax, W. G. Noid, J. Chem. Phys. 2010, 133, 124107.[80] J.-P. Hansen, I. R. McDonald, Theory of Simple Liquids, 2nd
edition, Academic Press, San Diego, CA, USA 1990.[81] S. G. Whittington, L. G. Dunfield, J. Phys. A: Math. Nucl. Gen.
1973, 6, 484.[82] K. E. Gubbins, Chem. Phys. Lett. 1980, 76, 329.[83] P. Attard, J. Chem. Phys. 1995, 102, 5411.[84] M. P. Taylor, J. E. G. Lipson, J. Chem. Phys. 1993, 100, 518.[85] M. P. Taylor, J. E. G. Lipson, J. Chem. Phys. 1995, 102,
2118.[86] M. P. Taylor, J. E. G. Lipson, J. Chem. Phys. 1995, 102, 6272.[87] H. C. Andersen, D. Chandler, J. Chem. Phys. 1972, 57, 1918.[88] H. C. Andersen, D. Chandler, J. Chem. Phys. 1972, 57, 1930.[89] K. S. Schweizer, J. G. Curro, Phys. Rev. Lett. 1987, 58, 246.[90] K. S. Schweizer, J. G. Curro, Adv. Chem. Phys. 1997, 93, 1.[91] J. W. Mullinax, W. G. Noid, J. Chem. Phys. 2009, 131, 104110.[92] S. Tanaka, H. A. Scheraga, Macromolecules 1976, 9, 945.[93] M. J. Sippl, Curr. Opin. Struc. Biol. 1995, 5, 229.[94] R. L. Jernigan, I. Bahar, Curr. Opin. Struc. Biol. 1996, 6,
195.[95] J. W. Mullinax, W. G. Noid, Proc. Natl. Acad. Sci. USA 2010,
107, 19867.[96] P. Liu, S. Izvekov, G. A. Voth, J. Phys. Chem. B 2007, 111, 11566.[97] Y. T. Wang, W. G. Noid, P. Liu, G. A. Voth, Phys. Chem. Chem.
Phys. 2009, 11, 2002.[98] J. Ghosh, R. Faller, Mol. Simul. 2007, 33, 759.[99] T. Vettorel, H. Meyer, J. Chem. Theor. Comp. 2006, 2, 616.[100] H.-J. Qian, P. Carbone, X. Chen, H. A. Karimi-Varzaneh, C. C.
Liew, F. Muller-Plathe, Macromolecules 2008, 41, 9919.[101] P. Carbone, H. A. K. Varzaneh, X. Chen, F. Muller-Plathe,
J. Chem. Phys. 2008, 128, 064904.[102] J. Fischer, D. Paschek, A. Gieger, G. Sadowski, J. Phys. Chem. B
2008, 112, 13561.[103] J. Silbermann, S. H. L. Klapp, M. Shoen, N. Channamsetty,
H. Block, K. E. Gubbins, J. Chem. Phys. 2006, 124, 074105.[104] V. Krishna, W. G. Noid, G. A. Voth, J. Chem. Phys. 2009, 131,
024103.[105] A. Das, H. C. Andersen, J. Chem. Phys. 2010, 132, 164106.[106] F. Ercolessi, J. B. Adams, Europhys. Lett. 1994, 26, 583.[107] S. Izvekov, M. Parrinello, C. J. Burnham, G. A. Voth, J. Chem.
Phys. 2004, 120, 10896.[108] A. J. Chorin, O. H. Hald, R. Kupferman, Proc. Natl. Acad. Sci.
USA 2000, 97, 2968.[109] A. J. Chorin, Multiscale Model. Simul. 2003, 1, 105.[110] A. J. Chorin, O. H. Hald, Stochastic Tools in Mathematics and
Science, Springer, New York, USA 2006.[111] M. J. Ruiz-Montero, D. Frenkel, J. J. Brey, Mol. Phys. 1997, 90,
925.[112] M. Sprik, G. Ciccotti, J. Chem. Phys. 1998, 109, 7737.[113] G. Ciccotti, R. Kapral, E. Vanden-Eijnden, ChemPhysChem
2005, 6, 1809.[114] T. L. Hill, Statistical Mechanics: Principles and Selected Appli-
cations, Dover reprint, New York 1987.[115] D. van der Spoel, E. Lindahl, B. Hess, G. Groenhof, A. E. Mark,
H. J. C. Berendsen, J. Comput. Chem. 2005, 26, 1701.[116] B. Hess, C. Kutzner, D. van der Spoel, E. Lindahl, J. Chem.
Theor. Comp. 2008, 4, 435.[117] M. Parrinello, A. Rahman, J. Chem. Phys. 1982, 76, 2662.
2011, 20, 478–495
H & Co. KGaA, Weinheim www.MaterialsViews.com

Generalized-Yvon–Born–Green Model of Toluene
www.mts-journal.de
[118] S. Nose, Mol. Phys. 1984, 52, 255.[119] W. G. Hoover, Phys. Rev. A 1985, 31, 1695.[120] H. J. C. Berendsen, J. P. M. Postma, W. F. van Gunsteren,
A. DiNola, J. R. Haak, J. Chem. Phys. 1984, 81, 3684.[121] W. L. Jorgensen, D. S. Maxwell, J. Tirado-Rives, J. Am. Chem.
Soc. 1996, 118, 11225.[122] T. Darden, D. York, L. Pedersen, J. Chem. Phys. 1993, 99, 8345.[123] H. Kashiwagi, T. Hashimoto, Y. Tanaka, H. Kubota, T. Makita,
Int. J. Thermophys. 1982, 3, 201.
www.MaterialsViews.com
Macromol. Theory Simul.
� 2011 WILEY-VCH Verlag Gmb
[124] W. H. Press, S. A. Teukolsky, W. T. Vetterling, B. P. Flannery,Numerical Recipes in FORTRAN: The Art of Scientific Comput-ing, Cambridge University Press, New York, USA 1992.
[125] H. C. Andersen, D. Chandler, J. D. Weeks, Adv. Chem. Phys.1976, 34, 105.
[126] D. Fritz, K. Koschke, V. A. Harmandaris, N. F. A. van der Vegt,K. Kremer, Phys. Chem. Chem. Phys. 2011, 13, 10412.
[127] W. Humphrey, A. Dalke, K. Schulten, J. Mol. Graph. 1996,14, 33.
2011, 20, 478–495
H & Co. KGaA, Weinheim495