Map Sheet 0637-D3 Arba Minch
137
Explanatory notes to the thematic geoscientific maps of Ethiopia at a scale of 1 : 50,000 Map Sheet 0637-D3 Arba Minch Kryštof Verner and Leta Megerssa (eds.) with co-authors Tomáš Hroch, David Buriánek, Karel Martínek, Jana Janderková, Jiří Šíma, Eva Kryštofová, Hadush Gebremariyam, Ezra Tadesse, Ferdawok Legesse, Ephrem Nisra, Befekadu Abateneh, Genet Assefa, Jan Valenta, Zoltán Pécskay, Petra Hejtmánková and Zuzana Krejčí Czech Geological Survey Geological Survey of Ethiopia 2018
-
Upload
khangminh22 -
Category
Documents
-
view
0 -
download
0
Transcript of Map Sheet 0637-D3 Arba Minch

Explanatory notes to the thematic geoscientific maps of Ethiopia at a scale of 1 : 50,000
Map Sheet 0637-D3 Arba Minch
Kryštof Verner and Leta Megerssa (eds.)
with co-authors
Tomáš Hroch, David Buriánek, Karel Martínek, Jana Janderková, Jiří Šíma,
Eva Kryštofová, Hadush Gebremariyam, Ezra Tadesse, Ferdawok Legesse,
Ephrem Nisra, Befekadu Abateneh, Genet Assefa, Jan Valenta,
Zoltán Pécskay, Petra Hejtmánková and Zuzana Krejčí
Czech Geological Survey
Geological Survey of Ethiopia
2018

© Kryštof Verner, Leta Megerssa, Tomáš Hroch, David Buriánek, Karel Martínek, Jana Janderková, Jiří Šíma, Eva Kryštofová, Hadush Gebremariyam, Ezra Tadesse, Ferdawok Legesse, Ephrem Nisra, Befekadu Abateneh, Genet Assefa, Jan Valenta, Zoltán Pécskay, Petra Hejtmánková and Zuzana Krejčí
ISBN 978-80-7075-948-6
Reviewed by Petr Hradecký (Czech Geological Survey, Prague, Czech Republic)and Ameha Atnafu Muluneh (Addis Ababa University, Ethiopia)

Compilation of the map as well as these explanatory notes were done by the team of geologists from the Czech Geological Survey (CGS), the Geological Survey of Ethiopia (GSE) and AQUATEST Ltd. within the framework of the Czech Official Development Assistance Program supported by the Czech Government through the Czech Development Agency. Thorough reviews by Petr Hradecký (CGS) and Ameha Atnafu Muluneh (Addis Ababa Univeristy) greatly improved this explanatory notes and are gratefully acknowledged. We would also like to thank our colleague Vladimír Žáček (CGS) for the constructive discussions. The comments and suggestions from the staff of GSE, in particular Bereket Fentaw (Hydrogeologist), Sisay Degu (Basic Geoscience mapping Directorate) and Samuel Hailu (Geologist) are also greatly appriciated. The SNNP Region President’s Office and SNNP Region Mines and Energy Agency are thanked for their welcoming and cooperative engagement. Due acknowledgment also goes to the Gamo Gofa Zone administration for issuing permissions and cooperation whenever needed. The administration of the Nech-Sar National Park is also greatly acknowledged for providing valuable information and access to the park. The Geology Department of Arba Minch University is thanked for the assistance during the field-work. This work also benefited from the support and facilitation by the management of the Geological Survey of Ethiopia, particularly Masresha G/Selassie (Director General), Hundie Melka (Deputy Director), Genet Asefa (acting head of the Geo-hazards Investigation Directorate), Almaz Mengiste (Secretary of Geo-hazards Investigation Directorate). We are also grateful to drivers from the Geological Survey of Ethiopia, namely Mekonen Hailu, Mulugeta Simegn, Getachew Tegene and Mulisa Legesse who were at the front of the demanding task of getting by, around the remote and rough terrain at different stages of the field work.
Finally, the team would like to acknowledge the untiring support of the local people who assisted the team by all means possible and facilitated the data collection and those who helped us in various ways.
Verner K., Megerssa L., Hroch T., Buriánek D., Martínek K., Janderková J., Šíma J., Kryštofová E., Gebremariam H., Tadesse E., Legesse F., Nisra E., Abateneh B., Assefa G., Valenta J., Pécskay Z., Hejtmánková P., Krejčí Z. (2018). Explanatory notes to the thematic geoscientific maps of Ethiopia at a scale of 1 : 50,000, Map Sheet 0637-D3 Arba Minch. 137 pages, 3 annexes, 4 maps. Czech Geological Survey, Prague; AQUATEST Ltd., Prague; Geological Survey of Ethiopia, Addis Ababa.
ACKNOWLEDGEMENT

apfu: Atoms per formula units CES: Code of Ethiopian Standard CGS: Czech Geological Survey CZDA: Czech Development Agency DEM: Digital Elevation Model EARS: East African Rift System EMA: Ethiopian Mapping Agency FAO: Food Aid Organization FDRE: Federal Democratic Republic of Ethiopia GPS: Global Positioning System GSE: Geological Survey of Ethiopia IUSS: International Union of Soil Sciences JICA: Japan International Cooperation Agency Ma: Million years MER: Main Ethiopian Rift MoWIE: Ministry of Water Resources, Irrigation and Energy MoWR: Ministry of Water Resources NMA: National Meteorological Agency of Ethiopia RSG: Reference Soil Group RVLB: Rift Valley Lakes Basin SNNP Region: South Nations, Nationalities and People Region of FDRE TDS: Total Dissolved Solid UNDP: United Nations Development Program WFB: World Food Program WRB: world Reference Base (for Soil Resources) WWDSE: Water Works Design and Supervision Enterprise
LIST OF ABBREVIATIONS
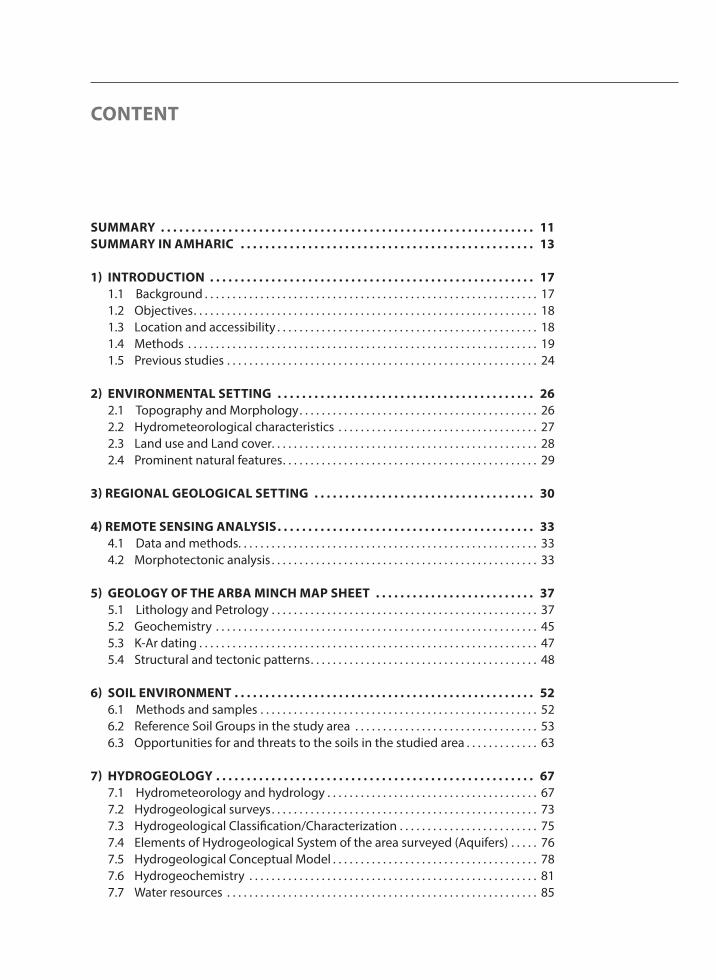
CONTENT
SUMMARY . . . . . . . . . . . . . . . . . . . . . . . . . . . . . . . . . . . . . . . . . . . . . . . . . . . . . . . . . . . . . 11SUMMARY IN AMHARIC . . . . . . . . . . . . . . . . . . . . . . . . . . . . . . . . . . . . . . . . . . . . . . . . 13
1) INTRODUCTION . . . . . . . . . . . . . . . . . . . . . . . . . . . . . . . . . . . . . . . . . . . . . . . . . . . . . 17.. 1.1 Background . . . . . . . . . . . . . . . . . . . . . . . . . . . . . . . . . . . . . . . . . . . . . . . . . . . . . . . . . . . . 17 1.2 Objectives. . . . . . . . . . . . . . . . . . . . . . . . . . . . . . . . . . . . . . . . . . . . . . . . . . . . . . . . . . . . . . 18 1.3 Location and accessibility . . . . . . . . . . . . . . . . . . . . . . . . . . . . . . . . . . . . . . . . . . . . . . . 18 1.4 Methods . . . . . . . . . . . . . . . . . . . . . . . . . . . . . . . . . . . . . . . . . . . . . . . . . . . . . . . . . . . . . . . 19 1.5 Previous studies . . . . . . . . . . . . . . . . . . . . . . . . . . . . . . . . . . . . . . . . . . . . . . . . . . . . . . . . 24 2) ENVIRONMENTAL SETTING . . . . . . . . . . . . . . . . . . . . . . . . . . . . . . . . . . . . . . . . . . 26 . 2.1 Topography and Morphology. . . . . . . . . . . . . . . . . . . . . . . . . . . . . . . . . . . . . . . . . . . 26 2.2 Hydrometeorological characteristics . . . . . . . . . . . . . . . . . . . . . . . . . . . . . . . . . . . . 27 2.3 Land use and Land cover. . . . . . . . . . . . . . . . . . . . . . . . . . . . . . . . . . . . . . . . . . . . . . . . 28 2.4 Prominent natural features. . . . . . . . . . . . . . . . . . . . . . . . . . . . . . . . . . . . . . . . . . . . . . 29
3) REGIONAL GEOLOGICAL SETTING . . . . . . . . . . . . . . . . . . . . . . . . . . . . . . . . . . . . 30 4) REMOTE SENSING ANALYSIS . . . . . . . . . . . . . . . . . . . . . . . . . . . . . . . . . . . . . . . . . . 33 . 4.1 Data and methods. . . . . . . . . . . . . . . . . . . . . . . . . . . . . . . . . . . . . . . . . . . . . . . . . . . . . . 33 4.2 Morphotectonic analysis . . . . . . . . . . . . . . . . . . . . . . . . . . . . . . . . . . . . . . . . . . . . . . . . 33 5) GEOLOGY OF THE ARBA MINCH MAP SHEET . . . . . . . . . . . . . . . . . . . . . . . . . . 37 . 5.1 Lithology and Petrology . . . . . . . . . . . . . . . . . . . . . . . . . . . . . . . . . . . . . . . . . . . . . . . . 37 5.2 Geochemistry . . . . . . . . . . . . . . . . . . . . . . . . . . . . . . . . . . . . . . . . . . . . . . . . . . . . . . . . . . 45 5.3 K-Ar dating . . . . . . . . . . . . . . . . . . . . . . . . . . . . . . . . . . . . . . . . . . . . . . . . . . . . . . . . . . . . . 47 5.4 Structural and tectonic patterns. . . . . . . . . . . . . . . . . . . . . . . . . . . . . . . . . . . . . . . . . 48 6) SOIL ENVIRONMENT . . . . . . . . . . . . . . . . . . . . . . . . . . . . . . . . . . . . . . . . . . . . . . . . . 52 . 6.1 Methods and samples . . . . . . . . . . . . . . . . . . . . . . . . . . . . . . . . . . . . . . . . . . . . . . . . . . 52 6.2 Reference Soil Groups in the study area . . . . . . . . . . . . . . . . . . . . . . . . . . . . . . . . . 53 6.3 Opportunities for and threats to the soils in the studied area . . . . . . . . . . . . . 63 7) HYDROGEOLOGY . . . . . . . . . . . . . . . . . . . . . . . . . . . . . . . . . . . . . . . . . . . . . . . . . . . . 67 . 7.1 Hydrometeorology and hydrology . . . . . . . . . . . . . . . . . . . . . . . . . . . . . . . . . . . . . . 67 7.2 Hydrogeological surveys. . . . . . . . . . . . . . . . . . . . . . . . . . . . . . . . . . . . . . . . . . . . . . . . 73 7.3 Hydrogeological Classification/Characterization . . . . . . . . . . . . . . . . . . . . . . . . . 75 7.4 Elements of Hydrogeological System of the area surveyed (Aquifers) . . . . . 76 7.5 Hydrogeological Conceptual Model . . . . . . . . . . . . . . . . . . . . . . . . . . . . . . . . . . . . . 78 7.6 Hydrogeochemistry . . . . . . . . . . . . . . . . . . . . . . . . . . . . . . . . . . . . . . . . . . . . . . . . . . . . 81 7.7 Water resources . . . . . . . . . . . . . . . . . . . . . . . . . . . . . . . . . . . . . . . . . . . . . . . . . . . . . . . . 85
VI M A P S H E E T 0 6 3 7 - D 3 A R B A M I N C H
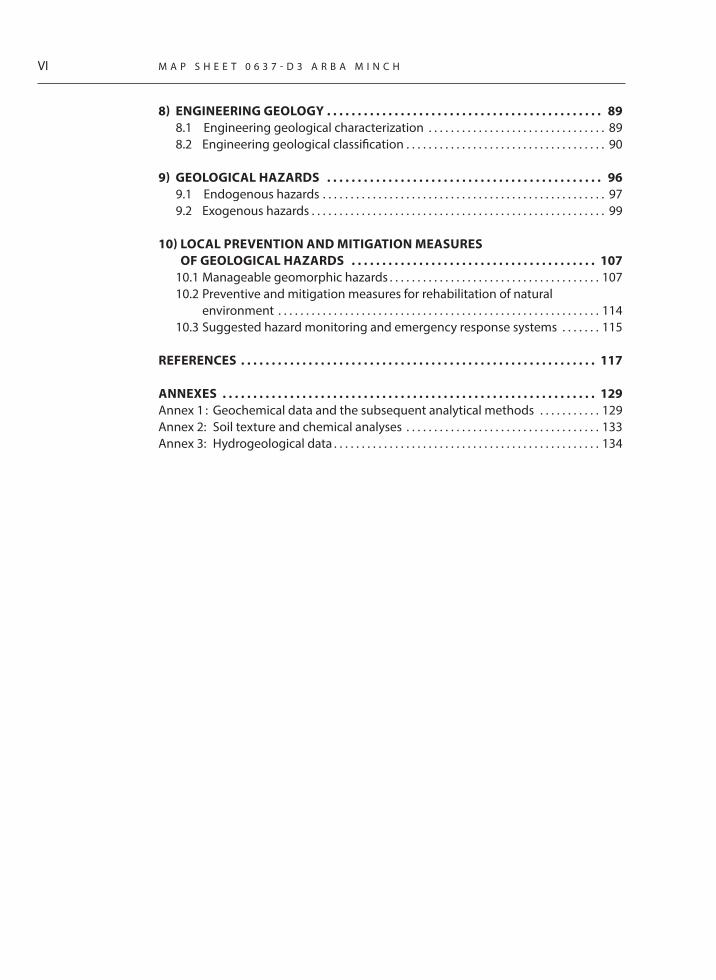
8) ENGINEERING GEOLOGY . . . . . . . . . . . . . . . . . . . . . . . . . . . . . . . . . . . . . . . . . . . . . 89 . 8.1 Engineering geological characterization . . . . . . . . . . . . . . . . . . . . . . . . . . . . . . . . 89 8.2 Engineering geological classification . . . . . . . . . . . . . . . . . . . . . . . . . . . . . . . . . . . . 90 9) GEOLOGICAL HAZARDS . . . . . . . . . . . . . . . . . . . . . . . . . . . . . . . . . . . . . . . . . . . . . 96.. 9.1 Endogenous hazards . . . . . . . . . . . . . . . . . . . . . . . . . . . . . . . . . . . . . . . . . . . . . . . . . . . 97 9.2 Exogenous hazards . . . . . . . . . . . . . . . . . . . . . . . . . . . . . . . . . . . . . . . . . . . . . . . . . . . . . 99
10) LOCAL PREVENTION AND MITIGATION MEASURES OF GEOLOGICAL HAZARDS . . . . . . . . . . . . . . . . . . . . . . . . . . . . . . . . . . . . . . . . 107
10.1 Manageable geomorphic hazards . . . . . . . . . . . . . . . . . . . . . . . . . . . . . . . . . . . . . . 107 10.2 Preventive and mitigation measures for rehabilitation of natural
environment . . . . . . . . . . . . . . . . . . . . . . . . . . . . . . . . . . . . . . . . . . . . . . . . . . . . . . . . . . 114 10.3 Suggested hazard monitoring and emergency response systems . . . . . . . 115
REFERENCES . . . . . . . . . . . . . . . . . . . . . . . . . . . . . . . . . . . . . . . . . . . . . . . . . . . . . . . . . . 117 ANNEXES . . . . . . . . . . . . . . . . . . . . . . . . . . . . . . . . . . . . . . . . . . . . . . . . . . . . . . . . . . . . . 129Annex 1 : Geochemical data and the subsequent analytical methods . . . . . . . . . . . 129Annex 2: Soil texture and chemical analyses . . . . . . . . . . . . . . . . . . . . . . . . . . . . . . . . . . . 133Annex 3: Hydrogeological data . . . . . . . . . . . . . . . . . . . . . . . . . . . . . . . . . . . . . . . . . . . . . . . . 134
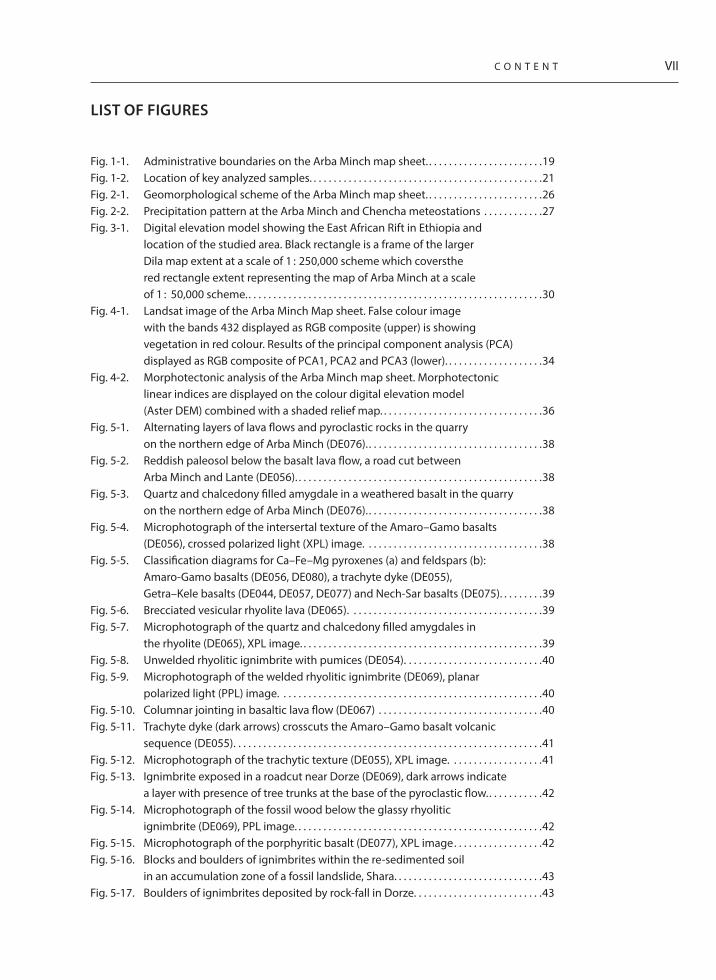
Fig. 1-1. Administrative boundaries on the Arba Minch map sheet.. . . . . . . . . . . . . . . . . . . . . . .19Fig. 1-2. Location of key analyzed samples. . . . . . . . . . . . . . . . . . . . . . . . . . . . . . . . . . . . . . . . . . . . . . .21Fig. 2-1. Geomorphological scheme of the Arba Minch map sheet. . . . . . . . . . . . . . . . . . . . . . . .26Fig. 2-2. Precipitation pattern at the Arba Minch and Chencha meteostations . . . . . . . . . . . .27Fig. 3-1. Digital elevation model showing the East African Rift in Ethiopia and
location of the studied area. Black rectangle is a frame of the larger Dila map extent at a scale of 1 : 250,000 scheme which coversthe red rectangle extent representing the map of Arba Minch at a scale of 1 : 50,000 scheme.. . . . . . . . . . . . . . . . . . . . . . . . . . . . . . . . . . . . . . . . . . . . . . . . . . . . . . . . . . .30
Fig. 4-1. Landsat image of the Arba Minch Map sheet. False colour image with the bands 432 displayed as RGB composite (upper) is showing vegetation in red colour. Results of the principal component analysis (PCA) displayed as RGB composite of PCA1, PCA2 and PCA3 (lower). . . . . . . . . . . . . . . . . . . .34
Fig. 4-2. Morphotectonic analysis of the Arba Minch map sheet. Morphotectonic linear indices are displayed on the colour digital elevation model (Aster DEM) combined with a shaded relief map. . . . . . . . . . . . . . . . . . . . . . . . . . . . . . . . .36
Fig. 5-1. Alternating layers of lava flows and pyroclastic rocks in the quarry on the northern edge of Arba Minch (DE076).. . . . . . . . . . . . . . . . . . . . . . . . . . . . . . . . . . .38Fig. 5-2. Reddish paleosol below the basalt lava flow, a road cut between Arba Minch and Lante (DE056). . . . . . . . . . . . . . . . . . . . . . . . . . . . . . . . . . . . . . . . . . . . . . . . . .38Fig. 5-3. Quartz and chalcedony filled amygdale in a weathered basalt in the quarry on the northern edge of Arba Minch (DE076).. . . . . . . . . . . . . . . . . . . . . . . . . . . . . . . . . . .38Fig. 5-4. Microphotograph of the intersertal texture of the Amaro–Gamo basalts (DE056), crossed polarized light (XPL) image. . . . . . . . . . . . . . . . . . . . . . . . . . . . . . . . . . . .38Fig. 5-5. Classification diagrams for Ca–Fe–Mg pyroxenes (a) and feldspars (b): Amaro-Gamo basalts (DE056, DE080), a trachyte dyke (DE055), Getra–Kele basalts (DE044, DE057, DE077) and Nech-Sar basalts (DE075). . . . . . . . .39Fig. 5-6. Brecciated vesicular rhyolite lava (DE065). . . . . . . . . . . . . . . . . . . . . . . . . . . . . . . . . . . . . . .39Fig. 5-7. Microphotograph of the quartz and chalcedony filled amygdales in the rhyolite (DE065), XPL image. . . . . . . . . . . . . . . . . . . . . . . . . . . . . . . . . . . . . . . . . . . . . . . . .39Fig. 5-8. Unwelded rhyolitic ignimbrite with pumices (DE054). . . . . . . . . . . . . . . . . . . . . . . . . . . .40Fig. 5-9. Microphotograph of the welded rhyolitic ignimbrite (DE069), planar polarized light (PPL) image. . . . . . . . . . . . . . . . . . . . . . . . . . . . . . . . . . . . . . . . . . . . . . . . . . . . .40Fig. 5-10. Columnar jointing in basaltic lava flow (DE067) . . . . . . . . . . . . . . . . . . . . . . . . . . . . . . . . .40Fig. 5-11. Trachyte dyke (dark arrows) crosscuts the Amaro–Gamo basalt volcanic sequence (DE055). . . . . . . . . . . . . . . . . . . . . . . . . . . . . . . . . . . . . . . . . . . . . . . . . . . . . . . . . . . . . .41Fig. 5-12. Microphotograph of the trachytic texture (DE055), XPL image. . . . . . . . . . . . . . . . . . .41Fig. 5-13. Ignimbrite exposed in a roadcut near Dorze (DE069), dark arrows indicate a layer with presence of tree trunks at the base of the pyroclastic flow.. . . . . . . . . . .42Fig. 5-14. Microphotograph of the fossil wood below the glassy rhyolitic ignimbrite (DE069), PPL image. . . . . . . . . . . . . . . . . . . . . . . . . . . . . . . . . . . . . . . . . . . . . . . . . .42Fig. 5-15. Microphotograph of the porphyritic basalt (DE077), XPL image. . . . . . . . . . . . . . . . . .42Fig. 5-16. Blocks and boulders of ignimbrites within the re-sedimented soil in an accumulation zone of a fossil landslide, Shara. . . . . . . . . . . . . . . . . . . . . . . . . . . . . .43Fig. 5-17. Boulders of ignimbrites deposited by rock-fall in Dorze. . . . . . . . . . . . . . . . . . . . . . . . . .43
C O N T E N T VII
LIST OF FIGURES

VIII M A P S H E E T 0 6 3 7 - D 3 A R B A M I N C H
Fig. 5-18. Clast-supported massive gravels deposited by hyperconcentrated flows, Lante. . . . . . . . . . . . . . . . . . . . . . . . . . . . . . . . . . . . . . . . . . . . . . . . . . . . . . . . . . . . . . . . . . . . . . . . . .44Fig. 5-19. Alternation of alluvial sandy soils and clast-supported gravel of alluvial sediments, west of Arba Minch . . . . . . . . . . . . . . . . . . . . . . . . . . . . . . . . . . . . . . .44Fig. 5-20. Small alluvial fan in the Kulfa River valley, northwest of Arba Minch. . . . . . . . . . . . . .45Fig. 5-21. In-channel gravel bars within a braided channel, north of Arba Minch.. . . . . . . . . . .45Fig. 5-22. Horizontally bedded sheet flood deposits (sandy soils and fine-grained sands) of an alluvial fan near Lante. . . . . . . . . . . . . . . . . . . . . . . . . . . . . . . . . . . . . . . . . . . . . .45Fig. 5-23. Ripple marks in a fine to medium-grained alluvial sand, Lante.. . . . . . . . . . . . . . . . . . .45Fig. 5-24. Chemical composition of volcanic rocks. . . . . . . . . . . . . . . . . . . . . . . . . . . . . . . . . . . . . . . . .46Fig. 5-25. Structural scheme of the Arba Minch map sheet showing a regional fabric pattern and mapped faults. . . . . . . . . . . . . . . . . . . . . . . . . . . . . . . . . . . . . . . . . . . . . . .49Fig. 5-26. Orientation diagrams of the primary structures in volcanic and volcano-sedimentary sequences . . . . . . . . . . . . . . . . . . . . . . . . . . . . . . . . . . . . . . . . . . .50Fig. 5-27. Orientation diagrams of faults and associated slickensides. . . . . . . . . . . . . . . . . . . . . .51Fig. 5-28. Regional NNE–SSW trending fault with a normal component of movement. A goat for the scale.. . . . . . . . . . . . . . . . . . . . . . . . . . . . . . . . . . . . . . . . . . . . . .51Fig. 5-29. Subvertical slickensides associated with WNW–ESE trending faults. . . . . . . . . . . . . . .51Fig. 6-1. The soil catena across the Rift Valley escarpment. . . . . . . . . . . . . . . . . . . . . . . . . . . . . . . .53Fig. 6-2. Different colours of Cambisols in the study area. . . . . . . . . . . . . . . . . . . . . . . . . . . . . . . . .54Fig. 6-3. Colluvial materials on the slopes of the Rift Valley escarpment (JJ09). . . . . . . . . . . . .58Fig. 6-4. A lithic discontinuity in the Regosol (Colluvic), soil profile JJ012 . . . . . . . . . . . . . . . . .58Fig. 6-5. Dystric Rhodic Nitisol at a typical highland location (alt. 2400m) (profile JJ003) and Rhodic Nitisol (Colluvic) with a colluvic material admixture in topsoil in an atypical location (alt. 1350 m) on the Sodo-Arba Minch road (profile JJ10).. . . . . . . . . . . . . . . . . . . . . . . . . . . . . . . . . . . . . . . . . . . . . . . . . . . . . . .59Fig. 6-6. Eutric Fluvisols with a well-expressed stratification developed from alluvial
sediments along the shores of the Lake Abaya in the profiles JJ007 (left) and JJ014 (right) . . . . . . . . . . . . . . . . . . . . . . . . . . . . . . . . . . . . . . . . . . . . . . . . . . . . . . . . . . . . . . .62Fig. 6-7. Soil texture distribution in the topsoil and subsoil in the soil of the study area . . . .65Fig. 6-8. Water erosion in Nitisols (Dorze; near the profile JJ003). . . . . . . . . . . . . . . . . . . . . . . . . .66Fig. 7-1. Hydrological scheme with location of the Arba Minch area . . . . . . . . . . . . . . . . . . . . . .67Fig. 7-2. Discharge diagram of the Kulfo River at the Arba Minch river gauge (MoWIE) . . . .68Fig. 7-3. Annual variability of the mean annual flow of the Kulfo River at the Arba Minch river gauge (MoWIE). . . . . . . . . . . . . . . . . . . . . . . . . . . . . . . . . . . . . . . . . . . . . . . . . . . . .69Fig. 7-4. Frequency of the yield of water points from porous aquifers of the Dila sheet . . . .77Fig. 7-5. Frequency of the yield of water points from fissured aquifers . . . . . . . . . . . . . . . . . . . .78Fig. 7-6. Conceptual hydrogeological model of the western plateau, escarpment and rift floor . . . . . . . . . . . . . . . . . . . . . . . . . . . . . . . . . . . . . . . . . . . . . . . . . . . . . . . . . . . . . . . . . . .79Fig. 7-7. Piper diagram for the classification of natural waters . . . . . . . . . . . . . . . . . . . . . . . . . . . .82Fig. 8-1. A slope cut in a residual (completely weathered) volcanic rock made for road work south of the study area where landslides are commonly encountered in improperly designed slope cuts (picture taken south of the Arba Minch map sheet near Gidole Town) . . . . . . . . . . . . . . . . . . . . . . . . . . . . . . . .91Fig. 8-2. Results of point load strength index tests of samples from various lithologic units in the Arba Minch area. . . . . . . . . . . . . . . . . . . . . . . . . . . . . . . . . . . . . . . . . .93Fig. 8-3. Results of laboratory physical tests of rocks from the major lithological units in the Arba Minch area. . . . . . . . . . . . . . . . . . . . . . . . . . . . . . . . . . . . . . . . . . . . . . . . . . . .93
C O N T E N T IX
Fig. 9-1. Scoria cone on the northern margin of Chamo Lake. . . . . . . . . . . . . . . . . . . . . . . . . . . . .98Fig. 9-2. The initial phase of bad land evolution with rill and gully erosion, west of Arba Minch. . . . . . . . . . . . . . . . . . . . . . . . . . . . . . . . . . . . . . . . . . . . . . . . . . . . . . . . . . . . . . . . 101Fig. 9-3. Surface erosion on deforested landscape formed by a weathered basalt, Shara Hill . . . . . . . . . . . . . . . . . . . . . . . . . . . . . . . . . . . . . . . . . . . . . . . . . . . . . . . . . . . . . . . . . . . . 101Fig. 9-4. Sinkholes in alluvial sediments, west to Arba Minch . . . . . . . . . . . . . . . . . . . . . . . . . . . 101Fig. 9-5. Lateral erosion of banks along a braided channel in an alluvial fan
near Lante . . . . . . . . . . . . . . . . . . . . . . . . . . . . . . . . . . . . . . . . . . . . . . . . . . . . . . . . . . . . . . . . . . . 101Fig. 9-6. Lateral erosion threatening bridge construction. . . . . . . . . . . . . . . . . . . . . . . . . . . . . . . 102Fig. 9-7. Flooded road in an alluvial fan near Lante. . . . . . . . . . . . . . . . . . . . . . . . . . . . . . . . . . . . . 102Fig. 9-8. Sketch of separation cell of current, forming behind the obstacle of a water stream (after Allen 1968). . . . . . . . . . . . . . . . . . . . . . . . . . . . . . . . . . . . . . . . . . . 102Fig. 9-9. Flooding of an alluvial plain near the Nech Sar National Park entrance, east to Arba Minch. . . . . . . . . . . . . . . . . . . . . . . . . . . . . . . . . . . . . . . . . . . . . . . . . . . . . . . . . . . 102Fig. 9-10. Active channel and abandoned channel on an alluvial fan north to Arba Minch . . . . . . . . . . . . . . . . . . . . . . . . . . . . . . . . . . . . . . . . . . . . . . . . . . . . . . . . . . . . . . . 103Fig. 9-11. Aggradation of sediment in an active channel of the Kulfo River, northern margin of Arba Minch . . . . . . . . . . . . . . . . . . . . . . . . . . . . . . . . . . . . . . . . . . . . . . . . . . . . . . . . 104Fig. 9-12. Accumulation of gravels on a farmland in the proximal part of an alluvial fan near Fara Gosa.. . . . . . . . . . . . . . . . . . . . . . . . . . . . . . . . . . . . . . . . . . . . . . . . . . . . . . . . . . . 104Fig. 9-13. Toppling of decomposed welded ignimbrites on the fault scarp near Shama Gede . . . . . . . . . . . . . . . . . . . . . . . . . . . . . . . . . . . . . . . . . . . . . . . . . . . . . . . . . . . . . . . . . 105Fig. 9-14. Hummocky topography of a landslide on the eastern slope of Shara Hill. . . . . . . 106Fig. 9-15. Cracks and subsidence of the reactivated part of a landslide on the southern slope of Shara Hill . . . . . . . . . . . . . . . . . . . . . . . . . . . . . . . . . . . . . . . . . . . 106Fig. 9-16. Rotational landslide in the Amaro River valley. . . . . . . . . . . . . . . . . . . . . . . . . . . . . . . . . 106Fig. 9-17. Rockslide in the fault scarp located southeast to Shama Gede.. . . . . . . . . . . . . . . . . 106Fig. 10-1. Gabion wall and the culvert . . . . . . . . . . . . . . . . . . . . . . . . . . . . . . . . . . . . . . . . . . . . . . . . . . 108Fig. 10-2. The lower end of the culvert. . . . . . . . . . . . . . . . . . . . . . . . . . . . . . . . . . . . . . . . . . . . . . . . . . 108Fig. 10-3. Lateral erosion of an unsupported slope of the river below a bridge . . . . . . . . . . . 108Fig. 10-4. Rest of the original bridge foundation and embankments caused by insufficient turbulent flow protection. . . . . . . . . . . . . . . . . . . . . . . . . . . . . . . . . . . . . . . . . 108Fig. 10-5. Situation of the road, culvert and water direction . . . . . . . . . . . . . . . . . . . . . . . . . . . . . 109Fig. 10-6. Lower end of the culvert to be sloped to avoid the turbulent flow of water. . . . . 109Fig. 10-7. Lateral erosion of an unsupported slope of the river below a bridge . . . . . . . . . . . 109Fig. 10-8. Rest of the original bridge foundation and embankments caused by insufficient turbulent flow protection. . . . . . . . . . . . . . . . . . . . . . . . . . . . . . . . . . . . . . 109Fig. 10-9. Situation of the bridge, unsupported slope and missing pillars protection . . . . . 110Fig. 10-10. Steel pillars protection . . . . . . . . . . . . . . . . . . . . . . . . . . . . . . . . . . . . . . . . . . . . . . . . . . . . . . . 110Fig. 10-11. Sketch showing problematic locations along the main road from Addis Ababa to Arba Minch . . . . . . . . . . . . . . . . . . . . . . . . . . . . . . . . . . . . . . . . . . . . . . . . . . 111Fig. 10-12. part A – Stable slope condition . . . . . . . . . . . . . . . . . . . . . . . . . . . . . . . . . . . . . . . . . . . . . . . 112Fig. 10-13. Protective wall is not filled by pieces of rocks. . . . . . . . . . . . . . . . . . . . . . . . . . . . . . . . . . 112Fig. 10-14. Part B – Slope cut across a tectonic line . . . . . . . . . . . . . . . . . . . . . . . . . . . . . . . . . . . . . . . 112Fig. 10-15. Non-functional culvert . . . . . . . . . . . . . . . . . . . . . . . . . . . . . . . . . . . . . . . . . . . . . . . . . . . . . . . 112Fig. 10-16. Unsupported higher part of the slope with blocks of rocks in a silty matrix . . . . . 113Fig. 10-17. Culvert is almost full of rock particles . . . . . . . . . . . . . . . . . . . . . . . . . . . . . . . . . . . . . . . . . 113Fig. 10-18. Inappropriate grading of material on the top of the road . . . . . . . . . . . . . . . . . . . . . . 113

X M A P S H E E T 0 6 3 7 - D 3 A R B A M I N C H
Fig. 10-19. Inappropriate slope of the road – blocks of rocks are unsupported. . . . . . . . . . . . . 113Fig. 10-20. Drainage along the road is deeply eroded . . . . . . . . . . . . . . . . . . . . . . . . . . . . . . . . . . . . 113Fig. 10-21. Well observed diversion of water along the road . . . . . . . . . . . . . . . . . . . . . . . . . . . . . . 113Fig. 10-22. Inappropriate material for road embankments . . . . . . . . . . . . . . . . . . . . . . . . . . . . . . . . 114Fig. 10-23. Inappropriate cutting slope . . . . . . . . . . . . . . . . . . . . . . . . . . . . . . . . . . . . . . . . . . . . . . . . . . 114
LIST OF TABLES
Tab. 1-1. Source of data used for the base map preparation . . . . . . . . . . . . . . . . . . . . . . . . . . . . . . .20Tab. 1-2. Summary of inventoried water points in the field. . . . . . . . . . . . . . . . . . . . . . . . . . . . . . . .22Tab. 2-1. Mean monthly precipitation at the Arba Minch (AM) and Chencha meteostations from 2005 to 2016 (JICA, 2012) . . . . . . . . . . . . . . . . . . . . . . . . . . . . . . . . . . .27Tab. 2-2. Precipitation variability (JICA, 2012) . . . . . . . . . . . . . . . . . . . . . . . . . . . . . . . . . . . . . . . . . . . . .28Tab. 5-1. K-Ar cooling age analytical results for tested samples . . . . . . . . . . . . . . . . . . . . . . . . . . . .47Tab. 6-1. Cambisols identified in the study area and selection of the diagnostic properties. . . . . . . . . . . . . . . . . . . . . . . . . . . . . . . . . . . . . . . . . . . . . . . . . . . . . . . . . . . . . . . . . . . . . .55Tab. 6-2. Selected chemical characteristics of Cambisols . . . . . . . . . . . . . . . . . . . . . . . . . . . . . . . . . .56Tab. 6-3. Soil particle distribution in the Regosol (Colluvic) with a lithic discontinuity at its base. . . . . . . . . . . . . . . . . . . . . . . . . . . . . . . . . . . . . . . . . . . . . . . . . . . . . . . . .58Tab. 6-4. The Munsell colour, diagnostic criteria and textural characteristics of Nitisols profiles . . . . . . . . . . . . . . . . . . . . . . . . . . . . . . . . . . . . . . . . . . . . . . . . . . . . . . . . . . . . . .60Tab. 6-5. Selected chemical characteristics of Nitisols.. . . . . . . . . . . . . . . . . . . . . . . . . . . . . . . . . . . . .60Tab. 6-6. The Munsell colour, textural characteristics and classification of Fluvisols . . . . . . . . .62Tab. 6-7. Selected chemical characteristics of the sampled Fluvisols . . . . . . . . . . . . . . . . . . . . . . .62Tab. 6-8. Major cultivated soils of the mapped area and their susceptibility to land degradation . . . . . . . . . . . . . . . . . . . . . . . . . . . . . . . . . . . . . . . . . . . . . . . . . . . . . . . . . . . .66Tab. 7-1. Runoff data from important rivers in the Arba Minch area (MoWIE). . . . . . . . . . . . . . .68Tab. 7-2. Baseflow data for the Arba Minch area . . . . . . . . . . . . . . . . . . . . . . . . . . . . . . . . . . . . . . . . . .70Tab. 7-3. Lake level stations at the Lake Abaya (Halcrow 2008) . . . . . . . . . . . . . . . . . . . . . . . . . . . .70Tab. 7-4. Basic characteristics of the lakes Abaya and Chamo (Halcrow 2008) . . . . . . . . . . . . . .70Tab. 7-5. Total surface water resources and total water resources (Halcrow, 2008) . . . . . . . . . .71Tab. 7-6. Impact of climate change on lake levels and the area (Halcrow 2008). . . . . . . . . . . . .72Tab. 7-7. Representative aquifer parameters (Halcrow, 2008) . . . . . . . . . . . . . . . . . . . . . . . . . . . . . .74Tab. 7-8. Description of individual aquifer units encountered in the basin (JICA 2012). . . . . .74Tab. 7-9. Parameters determined for aquifers within the Ethiopian Rift by JICA (2012). . . . . .74Tab. 7-10. Basic statistics of the yield of water points from porous aquifers in l/s . . . . . . . . . . . .77Tab. 7-11. Basic statistics of the yield of water points from fissured aquifers in l/s. . . . . . . . . . . .78Tab. 7-12. Groundwater chemistry compared to the drinking water standards and guidelines . . . . . . . . . . . . . . . . . . . . . . . . . . . . . . . . . . . . . . . . . . . . . . . . . . . . . . . . . . . . . . . . .84Tab. 7-13. Areal extents of aquifers in the Arba Minch map sheet. . . . . . . . . . . . . . . . . . . . . . . . . . .85Tab. 7-14. Assessment of water resources in the Arba Minch map sheet . . . . . . . . . . . . . . . . . . . .86Tab. 9-1. Characteristic hill slope hazards in the Arba Minch area . . . . . . . . . . . . . . . . . . . . . . . . 100

The Arba Minch map sheet is found covering an area that straddles the area between the western escarpment and the floor of the Main Ethiopian Rift in southern Ethiopia. The mapped area is comprised of lower Eocene to Pleistocene volcanics of episodic eruptions, which have a bimodal composition with alternating basic volcanic rocks and acidic pyroclastic rock intercalations. The geochemical signatures suggest a setting of intra-plate origin as expected, with possible fractionation in the case of acidic pyroclasts. Primary structures in the volcanic rocks have a subhorizontal to gently E or W dipping flow foliation. The main tectonic overprints are of a brittle origin in the form of extension joints and normal faults, which are quite consistent with the marginal older faults and fault escarps of the Main Ethiopian Rift. The faults have NNE–SSW trend with steep to moderately dipping slickensides towards ESE to NE. The geological map representing all identified lithological associations and structural relations is compiled at a scale of 1 : 50,000, which served as the base for subsequent thematic maps in the current study.
Soil type classification was compiled by integrating the geological map, field survey, satellite image interpretation and digital elevation models. Four soil catena units have been identified as reference groups: Cambisols, Nitisols-Acrisols, Regosols-Cambisols, and Fluvisols in the respective order from top of the escarpment to the rift floor. The soil classes have been identified based on chemical and physical properties, which are governed by relief, climate vegetation and landform.
Hydrogeological assessment has been made following the regional morphology, the local geological and water point’s inventory from around 280 points in the area. Surface hydrological characteristics and groundwater dynamics have been addressed to develop water resource assessment in the region. The total water resources in the area were assessed to correspond to 172 million m3/year. The quality of available water resources is also investigated, showing transitional calcium bicarbonate and basic sodium-bicarbonate hydrochemical composition. Distributions of the aquifers along with the hydrochemical compositions are combined in the compiled hydrogeological map at a scale of 1 : 50,000 of the Arba Minch map sheet in this study.
Engineering geological assessment of the area indicate regions of rock mass ranging in the strength classes of high (> 4 MPa), medium (2–4 MPa) and low (< 2 MPa). These correspond to the variation in lithological units, which on average show distinctly variable intact strength and variable susceptibility to weathering based on the field documentation and physiographic areal disposition. Prominent and sharp morphological regions stand out as generally resistant and stronger rock massunits, contrary to the rock mass units in subdued and smoothly undulating morphology. Genetic associations of the soil in the area are also distinguished into residual lateritic soil, colluvium slope wash deposits, alluvial cones, thin lacustrine deposits on the Lake Abaya shore and alluvial plains.
Exogenous and endogenous hazards in the area have been defined based on the existing studies and field documentation. In the case of endogenous hazards, seismicity has been found to be more critical as it has a higher probability of occurrence. Combined with low preparedness and poor legislation to enforce precautionary measures such as
SUMMARY

conservative construction design codes and inadequate to none emergency response systems and early warning systems the vulnerability is higher. Furthermore, extensive exogenous processes, which pose danger to everyday life, are extensively documented. Due to the morphological setup of the area, both aggradation and suffusion-related hydrological hazards appear to be overwhelming, affecting farmlands as well as infrastructure. All the potential risk areas suffering from such exogenous hazards are delineated in the hazard maps.
12 M A P S H E E T 0 6 3 7 - D 3 A R B A M I N C H
1
የአርባ ምንጭ ማፕ (0637-D3) 1 : 50,000 መስፈርት ሥነ-ምዴር ካርታ አጭር መግሇጫ
መግቢያ (Introduction)
ይህ ጥናት እና አባሪ 1፡50,000 መስፈርት ካርታዎች በቼክ ሪፑብሉክ የሌማት ትብብር ኤጄንሲ (CZDA) እና በኢትዮጵያ ፌዳራሊዊ ዱሞክራሲያዊ ሪፐብሉክ (ኢ.ፌ.ዱ.ሪ.) መካከሌ በተፈፀመ የመግባቢያ ሠነዴ ማዕቀፍ ፤ በዯቡብ ብሔር ብሔረሰቦች እና ህዝቦች ክሌሌ በተመረጡ አካባቢዎች ዝርዝር የሥነ-ምዴር ካርታ እና የተፈጥሮ አዯጋ ተጋሊጭነት እንዱሁም የከርሰ ምዴር ውሃ ሃብት አሇኝታ ግምገማ ሊይ የሚያተኩር ነው፡፡ በዚህም መሰረት ጥናቱ በቼክ ሪፐብሉክ ጂኦልጂካሌ ሠርቬይ (CGS) እና በኢትዮጵያ ጂኦልጂካሌ ሠርቬይ (GSE) በጋራ ከ2007 ዓ.ም. ጀምሮ እስከ 2010 ዓ.ም. የተካሄዯ ሲሆን ፤ በጥናቱ የተዲሰሱት አካባቢዎች በሲዲማ ዞን ሁሇት ስፍራዎች ማሇትም በሇኩ እና በመጆ (በአቅራቢያው በሚገኙ አዋሳኝ የኦሮሚያ ክሌሌ የቦረና ዞን ሰሜናዊ) አካባቢን ጨምሮ) ፤ በጌዱኦ ዞን በዱሊ አካባቢ (በአቅራቢያው በሚገኙ አዋሰኝ የኦሮሚያ ክሌሌ የጉጂ ዞን ሰሜናዊ አካባቢን ጨምሮ) ፤ እና በጋሞ ጎፋ ዞን የአርባ ምንጭ አካባቢን ያካተተ ነው፡፡
ጥናቱ በአራት የሥነ-ምዴር ጥናት ዘርፎች ሊይ በማትኮር የተካሄዯ ሲሆን አነዚህም የመሰረታዊ ዝርዝር የጂኦልጂ (የሥነ-ምዴር) ካርታ ዝግጅት በ1፡50.000 መስፈርት ፤ የአፈር ሽፋን ካርታ ዝግጅት በ1፡50.000 መስፈርት ፤ የኃይዴሮጂኦልጂ (የከርሰ-ምዴር ውሃ አሇኝታ) ካርታ ዝግጅት በ1፡50.000 መስፈርት እና የጂኦሃዛር (የሥነ-ምዴር አዯጋ ክስተት አመሊካች) ካርታ ዝግጅት በ1፡50.000 መስፈርት ናቸው፡፡ እነዚህን ተዛማጅ ጥናቶች ሇማከናወን በመስክ የአፈር፤የአሇት፤ የውሃ እንዱሁም ዝርዝር ቅኝትና የመስክ ሊይ ሌዩ ሌዩ ሣይንሳዊ ሌኬቶች የተዯረጉ ሲሆን፤ እነዚህ መረጃዎች በሳተሊይት ፎቶ እና የገጸ-ምዴር ዱጂታሌ ሞዳሌ በዘመናዊ ጂኦግራፊያዊ መረጃ አያያዝ (GIS) ታግዞ በማቀነባበር ካርታዎቹ ተዘጋጅተዋሌ፡፡ የዚህ ጥናት መሰረተ ሃሳብ በገፀ-መሬት እና በከርሰ-ምዴር አፈጣጠር መካከሌ ያሇውን ትስስር በሣይንሳዊ ትንታኔ በመታገዝ ሇሰው ሌጆች ጥቅም የሚሰጡ ጠጣርና ፈሳሽ የማዕዴን ሃብት ፤ እንዱሁም ሇተፈጥሮ አዯጋ ተጋሊጭነትና ሇአካባቢ ጥበቃ ወሳኝ የሆኑ መረጃዎች ማመንጨት ነው፡፡ ባጠቃሊይ የተጠኑት ስፍራዎች የመሬት አወቃቀር ከእሳተ ጎሞራ (volcanic rocks) ጋር በተያያዘ የተፈጠሩ አሇቶችና በከፍተኛ ሙቀትና ጭነት የተቀየሩ ሌውጥ አሇቶች (metamorphic rocks) የተመሰረተ ሲሆን ከአሇቶቹ በሊይ ሰፍረው የሚገኙት የቅርብ ጊዜ በዯሇሌ እና በናዲ የተከማቹ እንዱሁም ከበሰበሱ አሇቶች የተፈጠሩ የበሃ የአፈር አይነቶች በሁለም የተጠኑ ስፈራዎች ተዋቅረው የሚገኙባቸው ናቸው፡፡
አርባ ምንጭ ማፕ (Arba Minch map)
የጂኦልጂ ካርታ (የሥነ-ምዴር ካርታ) (Geology)
በአርባ ምንጭ አካባቢ የተዯረገው ጥናት 6° 00' እና 6° 15' ሰሜን ኬክሮስ እና 37° 30' እና 37° 45' ምስራቅ ኬንትሮስ (ዱሊ ማፕ ሺት) ወሰን ውስጥ የሚገኝና የታሊቁን የኢትዮጵ የስምጥ ሸሇቆ ምዕራባዊ አፋፍና ግርጌ አካቶ ይይዛሌ፡፡ በዚህ ስፍራ የሚገኘው ከርሰ-ምዴር ባጠቃሊይ በእሳተ ጎሞራ አማካኝነት በተፈጠሩ አሇቶች የተዋቀረ ሲሆን እነዚህም በይዘታቸው ሁሇት አይነት ማሇትም አሲዲዊ ይዘት ያሊቸውና ቤዚክ (ብረታማ ንጥረ ነገር አዘሌ) ይዘት ያሊቸው አሇቶች ናቸው፡፡ አሲዲማ ይዘት ያሊቸው አሇቶች አፈጣጠራቸው ሁሇት ሲሆን እነዚህም በእሳተ ጎሞራ ፍንዲታ ፍንጥርጣሪ የሚፈጠሩ እና በእሳተ ጎሞራ ቀሌጦ ከፈሰሰ አሇት የሚፈጠሩ ተብሇው ይከፈሊለ፡፡ በአርባ ምንጭ
SUMMARY IN AMHARIC

14 M A P S H E E T 0 6 3 7 - D 3 A R B A M I N C H
2
ማፕ ሺት ዉስጥ ያለ የአፈር ሽፋን እና የአሇት መዋቅር ከግንባታ ፤ ሌማት እና ተፈጥሮ አዯጋ ተጋሊጭነት አንፃር የተቃኙ ሲሆን በአሇቶቹ ባህያት ከተካሄደት የመስክ እና የናሙና ሌኬት በ “Point load strength” (ነጥብ ጭነት ጥንካሬ አሇካክ) - ከፍተኛ (> 4 MPa) ፤ መካከሇኛ (2–4 MPa) እና ዝቅተኛ (<2 MPa) ጥንካሬ ያሊቸው ናቸው፡፡ በአርባ ምንጭ ማፕ ውስጥ የሚገኙ የአሇትና የአፈር ሽፋኖች በስም ተሇይተው በካርታ የሰፈሩ ሲሆን እነዚህም በአፈጣጠራቸው እዴሜ ቅዯም ተከተሌ ፤ ከቀዯምት ወዯ ቀራቢው እንዯሚከተሇው ተዘርዝረዋሌ፡፡ የነዚህ አሇቶች እና አፈር ስርጭት በተያያዘው አባሪ ካርታ ሊይ የሰፈሩ ሲሆን በእንግሉዝኛ ቋንቋ ተገሌፀው ይገኛለ፡፡ የተዘረዘሩትን አሇቶች ሽፋን በካርታው ሊይ ሇመሇየት እንዱረዲ ከዝርዝሮቹ ፊት በቅንፍ የተመሇከቱትን ቁጥሮች በማየት ከካርታው ሊይ ማንበብ ያስችሊሌ፡፡
ከ56 እስከ 23 ሚሉዮን አመት በፊት ባሇው ዘመን የተፈጠሩ የእሳተ ጎሞራ አሇቶች (11) አማሮ ጋሞ ጥቁር ዴንጋይ (ብረት ነክ ንጥረ ነገር አዘሌ አሇት) ወይም እንግሉዚኛው አጠራር
Amaro–Gamo Basalt. (10) የኡጋዮ አሲዲማ አሇት ወይም በእንግሉዚኛው አጠራር Ugayo Rhyolite. (09) የሾላ እሳተ ጎሞራ ፍንጥቅጣቂ አሇት ወይም በእንግሉዚኛው አጠራር Shole Ignimbrite. (08) ጥቁር ዴንጋይ (ብረት ነክ ንጥረ ነገር አዘሌ አሇት) ወይም እንግሉዚኛ አጠራ Basalt.
ከ23 እስከ 5 ሚሉዮን አመት በፊት ባሇው ዘመን የተፈጠሩ የእሳተ ጎሞራ አሇቶች (07) ሚሞ የጥቁር ዴንጋይ ዘር (ብረት ነክ ንጥረ ነገር አዘሌ አሇት) ወይም በእንግሉዚኛው አጠራ
Mimo Trachyte. (06) ድርዜ እሳተ ጎሞራ ፍንጥቅጣቂ (ትፌ) አሇት ወይም በእንግሉዚኛው አጠራር Dorze
Ignimbrite.
ከ2 ሚሉዮን ዓመት ገዯማ በፊት የተፈጠሩ የእሳተ ጎሞራ አሇቶች (05) ነጭ-ሳር ጥቁር ዴንጋይ ዘር (ብረት ነክ ንጥረ ነገር አዘሌ አሇት) ወይም እንግሉዚኛ አጠራ
Nech Sar Basalt.
ከ2 ሚሉዮን ዓመት ወዱህ እስከ ቅዴመ ታሪክ ባሇው ዘመን የተፈጠሩ የገፀ-ምዴር አፈር ሽፋን (04) በናዲ የተከማቹ የአፈርና የአሇት ስብርባሪ ክምችት ወይም በእንግሉዚኛው አጠራር colluvium. (03) በናዲ እና በዯሇሌ የተፈጠሩ የአፈርና የአሇት ስብርባሪ ክምችት ወይም በእንግሉዚኛው አጠራር
Alluvium and colluvium. (02) የዯሇሌ አፈር ክምችት ወይም በእንግሉዚኛው አጠራር Alluvium. (01) የሐይቅ ዝቃጭ (ዯሇሌ) የአፈር ክምችት ወይም በእንግሉዚኛው አጠራር Lacustrine deposit. ከዚህም በተጨማሪ ሌዩ ሌዩ የሥነ-ምዴር መዋቅሮች (መስመሮች ወይም ስንጥቆች) በአካባቢው የተሇዩ ሲሆን ዋና ዋናዎቹ ከሰሜን-ምስራቅ ወዯ ዯቡብ-ምዕራብ የተሰዯሩ የመሬት ስንጥቅ ናቸው፡፡ ገፀ-ምዴር (Geomorphology)
የአርባ ምንጭ ማፕ ሺት የገፀ-ምዴር አቀማመጥ በታሊቁ የኢትዮጵያ እና ተዛማጅ የእሳተ ጎሞራ ተፅእኖ ያረፈበት ሲሆን፤ ምዕራባዊው ክፍሌ በስምጥ ሸሇቆው ዲርቻ የተፈጠረውን ዲገት የሚያካሌሌ ሲሆን መካከሇኛው ክፍሌ ዯግሞ የስምጥ ሸሇቆውን ግርጌ ይዞ ይገኛሌ፡፡ ግማሽ ያህሌ የአርባ ምንጭ ማፕ (መካከሇኛው ክፍሌ) በአባያ ሐይቅ የተያዘ ሲሆን ዯቡባዊው ክፍሌ ዯግሞ በነጭ-ሳር ብሔራዊ ፓርክ የተከሇሇ ነው፡፡ በአካባቢው የሚገኘው አውራ ጅረት የኩርፎ ወንዝ ሲሆን ከስምጥ ሸሇቆው አፋፍ ከፍታ ቦታዎች በመነሳት ወዯ አባያና ጫሞ ሐይቆች ይፈሳሌ፡፡ ፡፡ ባጠቃሇይ 3 ዋና ዋና መሌከአ ምዴራዊ አቀማመጥ ማሇትም በረጅም ዘመን የተፈጥሮ ሰፊ የመሸርሸር ክስተት የተፈጠረ

S U M M A R Y I N A M H A R I C 15
3
ዯሌዲሊ ንጣፍ ፤ ከስምጥ ሸሇቆ መፈጠር ጋር ተያይዞ በተፈጠረ የእሳተ ጎሞራና የሥነ-ምዴር ውቅር (ስንጥቅ) የተናጋ ምዴር እና በዯሇሌ የተሞሊ ገፀ-ምዴር ናቸው (Figure 2-1)::
የአፈር ሁኔታ (Pedology)
በአርባ ምንጭ ማፕ ሺት ውስጥ በአፈር ሳይንስ መርሆ የተሇዩት የአፈር አይነቶች ዋና ዋና ባህሪያት የሚከተለት ሲሆኑ በዚህ ሪፖርት ያሇውን አጭር መግሇጫ ከተዘጋጀው አባሪ የአፈር ስርጭት አመሌካች ካርታ ጋር ሇማናበብ ስማቸው በእንግሉዝኛ ቋንቋ ጭምር ተገሌጧሌ፡፡ በአጠቃሊይ በአርባ ምንጭ አካባቢ ያሇው የአፈር ዏይነት ሇከፍተኛ የዯን ሽፋን መሳሳት የተጋሇጠ ሲሆን በተሇይም ኒቲሶሌ የተባሇው የአፈር አይነት በአብዛኛው በሚገኝበት ተዲፋት መሌከአ-ምዴር ምክንያት ሇመሬት መንሸራተት እና ሽርሻሮ የተጋሇጠ ነው፡፡ ካምቢሶሌ (Cambisols) ፡ ሇእርሻ ተስማሚ የሆኑ የአፈር አይነቶች ሲሆኑ በአብዛኛው ሇእፅዋት አስፈሊጊ ንጥረ ነገር አሟሌተው የያዙ ናቸው፡፡ ነገር ግን ሇረጅም ጊዜ የውሃ እጥበት ሲጋሇጡ የንጥረ ነገር ይዘታቸውን የሚያጡ በመሆኑ ሇሽርሻሮና እጥበት እንዲይጋሇጡ በተሇይም በዝናባማ ወቅት በተክልችና ዛፎች ሽፋን የሚሹ ናቸው፡፡ በተጨማሪም የናይትሮጅን ንጥረ-ነገር ታክልባቸውና የተፈጥሮ ፍግ በመጠቀም እንዱሁም ተዲፋት መሬቶችን ባሇማረስ ምርታማነታቸውን ሇማስጠበቅ የሚቻሌ የአፈር አይነት ናቸው፡፡
ፍለቪሶሌ (Fluvisols) ፡ ታዲሽ የሆነ የንጥረ-ነገር አቅርቦት የሚያገኙ የአፈር አይነቶች ሲሆኑ እርጥበት በሚበዛባቸው ወይም በወንዞችና ውሃ አካሊት አቅራቢያ በስፋት የሚገኙ ሲሆኑ ሇአሲዲማነት የመጋሇጥ እዴሌ የሚስተዋሌባቸው የአፈር አይነቶች ናቸው፡፡ በመሆኑም በአቅራቢያቸው ባለ የውሃ አካሊት እንዲይጥሇቀሇቁ ጥንቃቄ የሚሹ የአፈር አይነቶች ናቸው፡፡
ለቪሶሌ (Luvisols) ፡ ሇእርሻ ተስማሚ የሆኑ የአፈር አይነቶች ሲሆኑ የተሸሇ የአየር እንቅስቃሴ በውስጣቸው የሚያስተናግደና በአብዛኛወ በንጥረ-ነገር ይዘት የዲበሩ ናቸው፡፡ በላሊ መሌኩ ባሊቸው የእርሻ ተስማሚነት ባህሪ ምክንያት ሇረጅም ዘመናት ሇእርሻ ተመረጭ በመሆናቸው በአብዛኛው አካባቢ የሊይኛው የአፈር ክፍሊቸው በመጥፋቱ የብስባሽ እና የናይትሮጂን እጥረት ያጠቃቸዋሌ፡፡ በተጨማሪም በተዲፋት መሬት ሊይ ሇከፋ ሽርሻሮ የተጋሇጡ የአፈር አይነት ናቸው፡፡
ኒቲሶሌ (Nitisols) ፡ ሇሌዩ ሌዩ የሰብሌ ምርቶች ተስማሚ የሆኑ የአፈር አይነቶች ሲሆኑ በተሇይም ሇቡና ተክሌ ተመራጭ የአፈር አይነት ናቸው፡፡ ሆኖም በውስጣቸው ባሇው የብረት ንጥረ ነገር ይዘት ባህሪ የተነሳ ፎስፌት የተባሇዉን ጠቃሚ ንጥረ ነገር ሇሰብሌ እንዲይውሌ አምቀው የመያዝ ባህሪ ያሊቸው በመሆኑ በየአመቱ በፎስፌት የበሇጸገ የማዲበሪያ ግብአት የሚፈሌጉ ናቸው፡፡ በተጨማሪም በአለሚኒየም ንጥረ-ነገር መብዛት በሚከሰት የተክልች መርዛማነት ተጽእኖ ሇመቀነስ የኖራ ግብአት የሚስፈሌጋቸው የአፈር አይነት ናቸው፡፡
የከርሰ-ምዴር ውሃ (Groundwater)
የከርሰ-ምዴር ውሃ አሇኝታ ከተሇየባቸው ውሃ አዘሌ አካሊት (aquifers) የመጀመሪውና በቀሊለ ጥቅም ሊይ ሉውሌ የሚችሇው ባሌተጠቀጠቁ የአሇትና የአፈር ውስጣዊ ክፍተቶች ሰርጎ የሚገኝ ውሃ ሲሆን በቀሊለ በሰው ኃይሌ ቁፋሮ ሉዯረስባቸው የሚችለ አሇኝታዎች ናቸው፡፡ በላሊ መሌኩ በጠጣር አሇቶች ስንጥቅ እና አሇቶች ውስጥ ባለ ክፍተቶች የተጠራቀሙ የከርሰ-ምዴር ውሃ ይዘቶች በሰፊው የሚገኙ ሲሆን በማሽን እገዛ በሚቆፈሩ ጥሌቅ ጉዴጓድች (100 ሜትር ወይም በሊይ) ውስጥ ፓምፖች በመግጠም ውሃውን ማውጣት የሚቻሌ አሇኝታ ሲሆን ከፍተኛ ወጪ የሚጠይቁ ናቸው፡፡ ባጠቃሊይ በአመት 172 ሚሉዮን ሜ.ኪዩብ የውሃ ሃብት ሇመጠቀም የሚያስችሌ

16 M A P S H E E T 0 6 3 7 - D 3 A R B A M I N C H
4
የከርሰ ምዴር ውሃ ሃብት ሉገኝ እንዯሚችሌ ተዯረገው ጥናት አመሊክቷሌ፡፡ በከርሰ-ምዴር ውሃ ካርታ ሊይ የሰፈሩ ዝርዝር የውሃ አሇኝታ ቋቶች፡-
ባሌተጠቀጠቁ የአሇት እና የአፈር ውስጥ ክፍተቶች በመካከሇኛ መጠን ነገር ግን በስፋት ስርገው የሚገኙ (Extensive and moderately productive or locally developed and highly productive porous aquifers).
በጠጣር አሇቶች ስንጥቅ መካከሌ በመካከሇኛ መጠን ነገር ግን በስፋት ስርገው የሚገኙ (Extensive and moderately productive fissured aquifer).
በአካባቢው የሚገኙት የውሃ ንጥረ ነገር ይዘት ከተወሰደት ናሙናዎች እንዯታየው በከፍተኛ ቦታዎች በአብዛኛው ካሌሲየም ባይካርቦኔት እና በዝቀተኛው የስምጥ ሸሇቆ አካባቢ ሶዴየም ባይካርቦኔት የከርሰ-ምዴር ውሃ የተፈጥሮ ኬሚካሊዊ ይዘት አይነት ያሳያሌ፡፡ በአብዛኛው የውሃ ተቋማት (በተሇይም በቅርብ ጥሌቀት በሚገኙ የከርሰ-ምዴር ውሃ አሇኝታዎች) ከእንስሳት በሚመነጩ የንፅህና ጉዴሇት ከፍተኛ የናይትሬት ብክሇት ተመሌክቷሌ፡፡
የተፈጥሮ አዯጋ (Geohazards)
ከተፈጥሮ አዯጋ ተጋሊጭነት አንፃር ገፀ-ምዴራዊ (ውጪያዊ) እና ከርሰ-ምዴራዊ (ውስጣዊ) ክስተቶች ጋር ተያይዘው የሚፈጠሩ ተሇይተው የተገሇፁ ሲሆን፤ በውጪያዊ የመሬት ሊይ ሂዯቶች የሚፈጠሩ የተፈጥሮ አዯጋ ስጋቶች በካርታ ሊይ ሰፍዋሌ፡፡ ከነዚህ የተፈጥሮ አዯጋዎች በተሇይም የርዕዯ-መሬት አዯጋ ከርሰ-ምዴራዊ ክስተት (ውስጣዊ) ሇስፍራው አሳሳቢ እና ዝግጁነት የሚያስፈሌገው ሲሆን ከውጫዊ የተፈጥሮ አዯጋዎች መካከሌ የዯሇሌና ሙሊትና የጎርፍ አዯጋዎች (aggradation, suffusion) በስምጥ ሸሇቆው አፋፍ ግርጌ በሚገኙ ሜዲማ የአባያ ሐይቅ ዲርቻዎች ጎሌተው የሚታዩ ሲሆን በተሇይም የእርሻ መሬትን እና መሰረተ ሌማትን ሇአዯጋ የሚያጋሌጡ ናቸው፡፡ በተጨማሪም የመሬት መንሸራተት እና የቋጥኝ ናዲ የስምጥ ሸሇቆውን አፋፍ አስታኮ የሚከሰቱ አዯጋዎች ናቸው (Geo-hazard map) ::

1.1 Background
A cooperation project on large-scale mapping and study of selected areas in Southern Nations, Nationalities and People’s Region (SNNPR) were conducted to identify and assess the geo-hazards risk vulnerability of the area surveyed. The project was implemented within the framework of the Memorandum of Understanding signed between the Czech Development Agency (CZDA) and the Federal Democratic Republic of Ethiopia (FDRE) for cooperation on priority issues.
The investigation and mapping within the project were carried out in four areas: Arba Minch, Leku, Dila and Mejo. The project is partly financially supported by the Czech Development Agency (CZDA) through the partner organization of the Czech Geological Survey (CGS) in response to the request for assistance raised by the Geological Survey of Ethiopia (GSE). In addition to the project outputs related to the areas investigated, the training and strengthening of the skills of the GSE professionals in geology, and the formulation of a representative methodology that can be used in other areas exposed to geo-hazards were realized as well.
The major objective of the project was to assess the vulnerability of local population, farmlands and the natural environment to geo-hazard phenomena. The current sharp increase in population and settlements and demands for farmland have merged with adverse competition in search for or the existence of available natural resources such as land for farming, groundwater, pastures, settlement areas and the likes resulting in increasing conflicts of interest. The extensive deforestation and endangering of indigenous vegetation due to the expansion of settlements and farmlands into outlying and empty areas is an example of such phenomena. Hence, the extension of agricultural land into often unsuitable areas is becoming a common practice, increasing the risk of susceptibility to various forms of geo-hazards. Without reasonable land management, it is inevitable that the land expansion will soon result in accelerated erosion, formation of deep erosion furrows, and the overall degradation of farmland leading to falling long-term viability and productivity. These processes can lead to the formation of the so-called “bad lands”, which are areas with no soil cover, without vegetation and with a high density of erosion furrows, which subsequently become unsuitable to keep the population in place if the area is not treated and managed appropriately.
On the other hand, due to the setting of natural environment where the great East African Rift Valley passes through the study area, serious threats are being noticed due to the occurence of ground fissures and subsidence, causing substantial loss of property and land as well as being a potential threat to the safety of inhabitants.
Comprehensive research and investigation of geology and lithology, including the analysis of possible geological hazards in the tectonically active areas are hence crucial for effective management and planning of development activities for sustainable agro-practice, improved quality and long-term protection of agricultural lands. The study also aids in directing and constraining the search for water resources and in the end to saving considerable financial costs associated with the remediation of negative phenomena
1) INTRODUCTION
18 M A P S H E E T 0 6 3 7 - D 3 A R B A M I N C H
arising from adverse geological processes. In connection with the current need for an analysis of possible geological hazards in vulnerable areas of southern Ethiopia, the GSE turned to the Czech Republic for assistance in improving the capacity of its professionals in the field of geological mapping, geological hazards risk assessment and hydrogeological investigation at a detailed scale of 1 : 50,000.
Geoinformation gathered at such level of detail as 1 : 50,000 scale is envisaged to be practical enough to be implemented and therefore to allow a sufficient assessment of geological hazards risk and hydrogeological characterization in the areas of strategic importance (e.g. current agglomerations, areas with rapidly growing population, areas susceptible to negative impacts of climate change, and areas with possible recent tectonic and seismic activity).
The GSE has chosen four areas exhibiting potential geological hazards to be defined, and to be comprehensively prioritized in terms of vulnerability to geo-hazards risk and suitability for agriculture from the geological point of view. These areas also exhibit variability in geological structure and lithology, and consequently the variability in potential geological hazards. On the basis of findings and practices of study in the selected areas, the GSE aims to develop practical methodologies in the form of a manual that will be crucial for subsequent similar tasks elsewhere in the country.
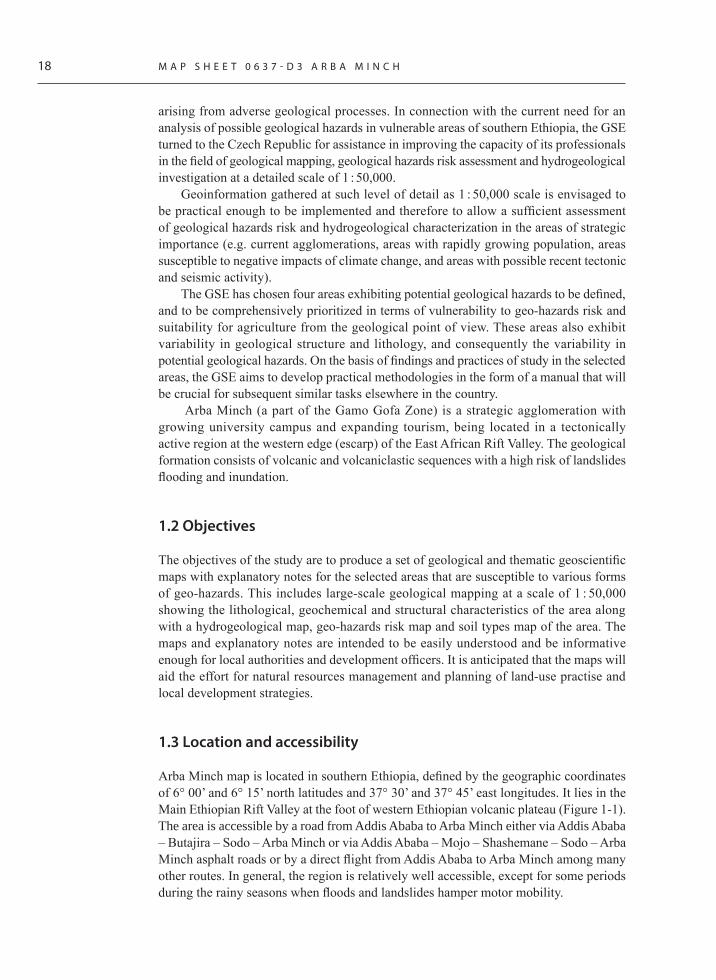
Arba Minch (a part of the Gamo Gofa Zone) is a strategic agglomeration with growing university campus and expanding tourism, being located in a tectonically active region at the western edge (escarp) of the East African Rift Valley. The geological formation consists of volcanic and volcaniclastic sequences with a high risk of landslides flooding and inundation.
1.2 Objectives
The objectives of the study are to produce a set of geological and thematic geoscientific maps with explanatory notes for the selected areas that are susceptible to various forms of geo-hazards. This includes large-scale geological mapping at a scale of 1 : 50,000 showing the lithological, geochemical and structural characteristics of the area along with a hydrogeological map, geo-hazards risk map and soil types map of the area. The maps and explanatory notes are intended to be easily understood and be informative enough for local authorities and development officers. It is anticipated that the maps will aid the effort for natural resources management and planning of land-use practise and local development strategies.
1.3 Location and accessibility
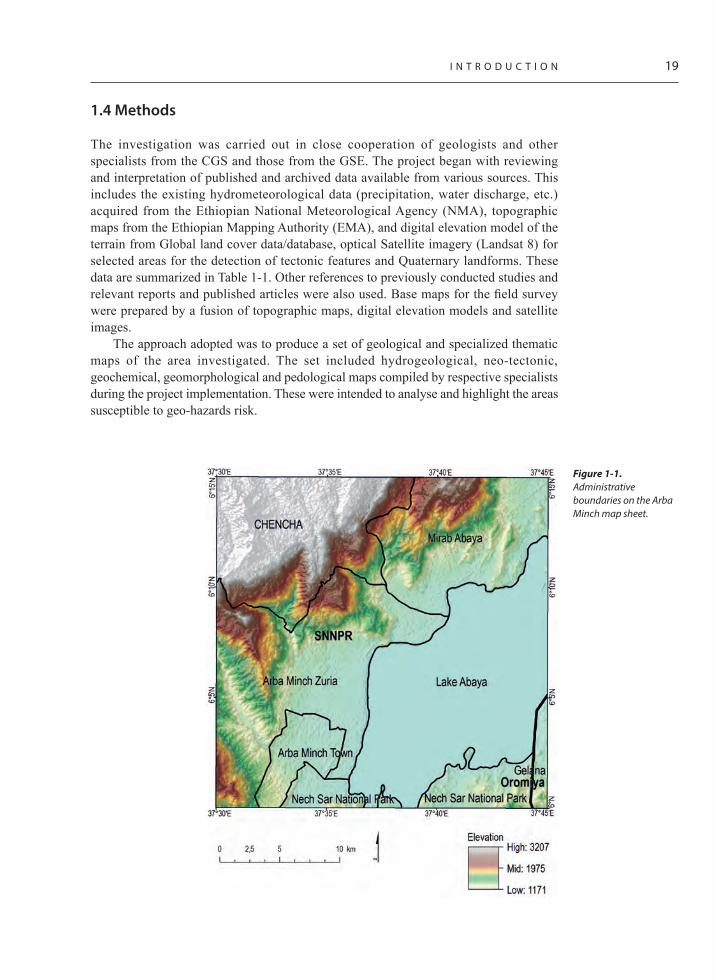
Arba Minch map is located in southern Ethiopia, defined by the geographic coordinates of 6° 00’ and 6° 15’ north latitudes and 37° 30’ and 37° 45’ east longitudes. It lies in the Main Ethiopian Rift Valley at the foot of western Ethiopian volcanic plateau (Figure 1-1). The area is accessible by a road from Addis Ababa to Arba Minch either via Addis Ababa – Butajira – Sodo – Arba Minch or via Addis Ababa – Mojo – Shashemane – Sodo – Arba Minch asphalt roads or by a direct flight from Addis Ababa to Arba Minch among many other routes. In general, the region is relatively well accessible, except for some periods during the rainy seasons when floods and landslides hamper motor mobility.
I N T R O D U C T I O N 19
1.4 Methods
The investigation was carried out in close cooperation of geologists and other specialists from the CGS and those from the GSE. The project began with reviewing and interpretation of published and archived data available from various sources. This includes the existing hydrometeorological data (precipitation, water discharge, etc.) acquired from the Ethiopian National Meteorological Agency (NMA), topographic maps from the Ethiopian Mapping Authority (EMA), and digital elevation model of the terrain from Global land cover data/database, optical Satellite imagery (Landsat 8) for selected areas for the detection of tectonic features and Quaternary landforms. These data are summarized in Table 1-1. Other references to previously conducted studies and relevant reports and published articles were also used. Base maps for the field survey were prepared by a fusion of topographic maps, digital elevation models and satellite images.
The approach adopted was to produce a set of geological and specialized thematic maps of the area investigated. The set included hydrogeological, neo-tectonic, geochemical, geomorphological and pedological maps compiled by respective specialists during the project implementation. These were intended to analyse and highlight the areas susceptible to geo-hazards risk.
Figure 1‑1. Administrative boundaries on the Arba Minch map sheet.

20 M A P S H E E T 0 6 3 7 - D 3 A R B A M I N C H
For the sake of keeping uniformity and coherence in the collection of field data by multidisciplinary experts at different time periods, a unified methodology based on CGS experience and previous mapping work conducted on regional scale in Ethiopia was established. In the field, an appropriate documentation and characterization of geological, hydrogeological and geo-hazards risk phenomena were all made. The characteristic rock, soil and water samples were collected at representative localities. Laboratory investigations and analyses of collected samples aimed to classify the local lithology and to describe and establish geochemical and hydrochemical characteristics of the surveyed areas. These were used as a basis for the geological interpretation of potential geo-hazards risk. Laboratory studies and analyses of the collected samples were carried out by various organizations and institutes. Physical properties were analysed in Ethiopia at the GSE Central Laboratory; geochemical analyses were made at ACME Labs in Canada, soil chemistry and microanalysis of polished sections were carried out at CGS Laboratories in Prague, and K-Ar dating was conducted at ATOMKI, Institute for Nuclear Research Laboratory, Debrecen (Hungary).
The following text provides an overview of the topics that were used to compile the final results/outputs based on an integrated analysis of the layers of geoscientific information in order to draw attention to the major geo-hazards risks and vulnerability of the study area to natural hazards. Selected field documentation points are shown in Figure 1-2.
Satellite data analysis
Interpretation of remote sensing data (Landsat images, Digital elevation models) was used to identify and delineate the extent of tectonic pattern and lines as well as to establish lithological boundaries followed by field reconnaissance and by a detailed survey later. Delineation of geomorphic features was also done using remote sensing data and interpretation of patterns in topographic maps combined with digital terrain models.
Geological mapping
Field work was carried out in order to compile the geological map of Arba Minch, which served as the basis for subsequent thematic mapping. Accordingly, sampling and field observations as well as the identification and brief characterization of geological units were undertaken in early stages of the project implementation. A tectonic pattern interpreted from the satellite images was compared and confronted with field observations, including the measurements of strike and inclination of geological units.
Table 1‑1 . Source of data used for the base map preparation
Dataset Source Resolution
Land use and land cover FAO 1 : 2 million scale
Soil map FAO 1 : 2 million scale
Dem USGS 30 m
Landsat images USGS 28 m
Topographic maps EMA 1 : 50,000 scale

I N T R O D U C T I O N 21
Geomorphological mapping
Geomorphological mapping appears to be one of the most effective tools or techniques to identify geo-hazards in the field. It was focused on the identification and recognition of fresh and recent characteristic landforms susceptible to geo-hazards and to assess the level of potential risk. It also helps to trace neotectonic phenomena.
Soil mapping
Examination and mapping of major soil types and their parameters were done by the combination of selective field sampling and fusion of geological map with land cover map. The obtained data were then compared to and confronted with the existing soil database of the country, which provides only regional distribution. Hence, in most cases, improvements in the available database have been made in terms of quality and detail. Soil sampling and site evaluation were performed by a CGS expert where the local GSE geologists working alongside were given the opportunity to learn the methodology in the field. Representative soil samples collected in the field were analysed in the Czech Republic.
Figure 1‑2. Location of key analyzed samples.

22 M A P S H E E T 0 6 3 7 - D 3 A R B A M I N C H
Hydrogeological Investigation
The potential role which the groundwater play in the occurrence or formation of geo-hazards was assessed by the hydrogeological characterization of lithological units, interpretation of tectonic pattern and analyses of samples collected at the existing water points. Local lithology, geological structure and tectonics were studied in order to find out the extent to which these phenomena may affect the quality of groundwater, and also if a reasonable water management can be established in selected areas. Hydrogeological mapping of the concerned areas was used to assess the vulnerability of the landscape to slope deformation, dangers of erosion and possible occurrence of flash floods.
Hydrogeological study of the Arba Minch area is based on the evaluation of data obtained from the existing reports and maps and also from observations in the field. No previous hydrogeological mapping or investigation at a scale of 1 : 50,000 were made, and the complete datasets needed for the geometric configuration or distribution of an aquifer is scarce or missing. Nevertheless, there exists the Dila map sheet at a scale of 1 : 250,000 compiled by Agezew et al. (2014) within which some scarce information is available.
The inventory of water points was based on a desk study, during which the relevant materials such as geological reports, drilling logs and maps and aerial photographs from the Regional Geological Department of GSE were acquired. Important data on climate and the distribution of hydrometeorological stations and topographic maps were acquired from various organizations and institutions. The desk study also included a preliminary interpretation of the obtained data and the compilation of terrain maps using satellite imagery, aerial photographs and digital elevation model (DEM) of the terrain with simplified geology.
During the field work, a total of 71 water points were identified and thoroughly inventoried, while 12 water samples were collected (Table 1-2). Measurement of electrical conductivity (EC) often showed very high values and occasionally above the scale of the instreument due to the high salinity of the water in the area. The static water level of open wells was measured using electrical sounding instruments wherever possible. Field data were processed and interpreted to construct the maps, while accompanying explanatory reports. The ArcGIS software was used to compile, store and process the geographic data and produce the relevant maps.
Table 1‑2 . Summary of inventoried water points in the field
Water point type Water points Samples
Borehole (BH) 7 3
Dug well (DW) 36 2
Spring (CS, SP) 26 5
Surface water (RW) 2 2
Total 71 12
K-Ar dating
For the determination of the age of ignimbrites, the K-Ar method was used during the analysis carried out at the Institute for Nuclear Research of the Hungarian Academy of Sciences in Debrecen. The basic principles of the conventional K-Ar dating and applied

I N T R O D U C T I O N 23
experimental techniques using the radioactive decay of the 40K isotope were described by Dalrymple and Lanphere (1969). Approximately 0.05 g of finely grounded samples were digested in acids (HF, HNO3) in teflon beakers and finally dissolved in 0.2 M HCl. Potassium was determined by flame photometry with a Na buffer and Li internal standard using Industrial M420 type flame photometer. Multiple runs of inter-laboratory standards (Asia1/95, LP-6, HD-B1, GL-0) indicated the accuracy and reproducibility of this method to be within 2%. Approximately 0.5 g of grounded samples were wrapped in aluminium foil and copper sieve preheated for about 24 h at 150-180 °C in vacuum. Argon was extracted under ultra-high vacuum conditions by RF induction heating and fusion of rock samples in Mo crucibles. The gas was purified by Ti sponge and SAES St 707 type getters in order to remove chemically active gas contaminants and some liquid nitrogen in a cold trap to remove condensable gases. The extraction line is directly linked to a mass spectrometer (90° magnetic sector type of 155 mm radius) used in static mode. Argon isotope ratios were measured by a 38Ar isotope dilution mass spectrometric method, previously calibrated with atmospheric argon and international rock standards. Experimental details of the K-Ar dating method were described in Balogh (1985). Age of the samples was calculated using the decay constants suggested by Steiger and Jäger (1977). Analytical error is given at 68% confidence level (1σ) using the equation of Cox and Dalrymple (1967).
Mineral chemistry
Chemical analyses of minerals were obtained using a Cameca SX-100 electron microprobe at the Joint Laboratory of the Department of Geological Sciences, Faculty of Science, Masaryk University in Brno and the Czech Geological Survey, Brno. The measurements were carried out in a wave-dispersion mode under the following conditions: acceleration voltage of 15 kV, beam diameter of 5 µm and probe current of 30 nA. The integration time was 20 s and the standards employed (Kα lines) were: augite (Si, Mg), orthoclase (K), jadeite (Na), chromite (Cr), almandine (Al), andradite (Fe, Ca), rhodonite (Mn) and TiO2 (Ti). Data were reduced on-line using the PAP routine procedure (Pouchou and Pichoir 1985). The empirical formulae of feldspars were recalculated to 8 oxygen atoms. The amphibole formulae were obtained on the basis of 23 oxygen atoms (Leake et al. 1997). The Fe2+/Fe3+ ratios in amphiboles were estimated assuming the cation sum of 13 without Ca, Na and K (13 eCNK). Pyroxenes are classified according to Morimoto et al. (1988); the formulae were obtained on the basis of 4 cations and the ferric iron estimated after Droop (1987).
Whole-rock geochemistry
About 4 kg samples were crushed (jaw crusher) and homogenized in an agate planetary ball mill for the whole-rock chemical analyses. Major and trace elements were determined at Acme Analytical Laboratories, Ltd., Vancouver, Canada. Major oxides were analyzed by the ICP-OES method. Loss on ignition (LOI) was calculated from the weight difference after the ignition at 1000 ºC. The rare earth and other trace elements were analysed by ICP-MS following LiBO2 fusion (analytic code: A4B4 – major oxides, Ba, Be, Co, Cr, Cs, Ga, Hf, Nb, Ni, Rb, Sc, Sr, Ta, Th, U, V, W, Y, Zr, REE; 1DX – Ag, As, Au, Bi, Cd, Cu, Hg, Mo, Ni, Pb, Sb, Se, Tl, Zn; 2ALeco – Ctot, Stot; for analytical details, reproducibility, and detection limits see http://acmelab.com). Geochemical data were handled and plotted using the GCDkit software package (Janoušek et al. 2006).
24 M A P S H E E T 0 6 3 7 - D 3 A R B A M I N C H
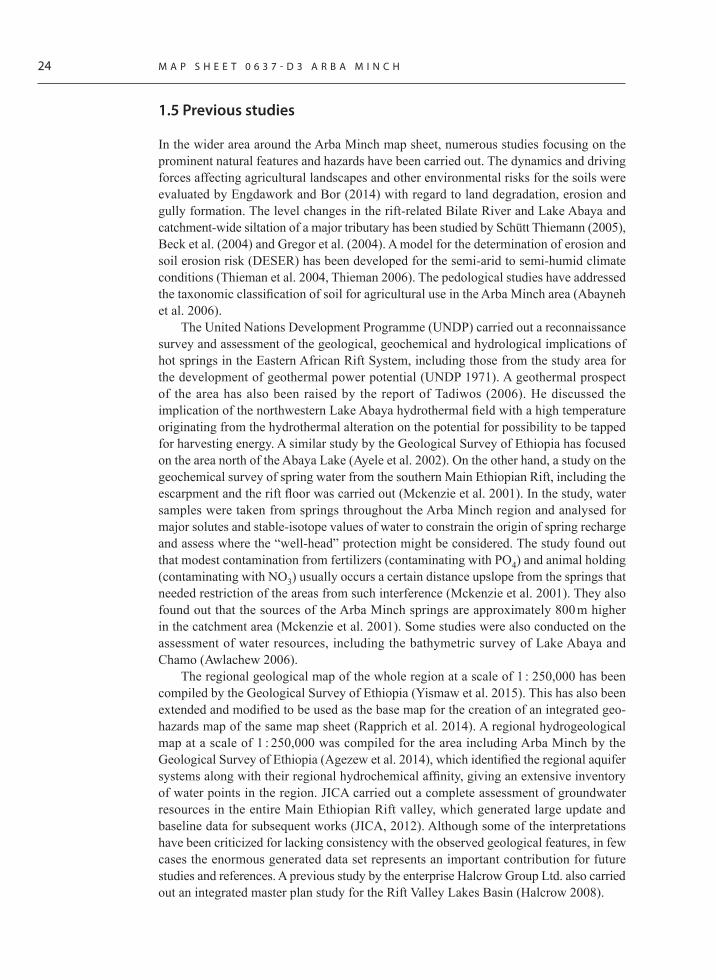
1.5 Previous studies
In the wider area around the Arba Minch map sheet, numerous studies focusing on the prominent natural features and hazards have been carried out. The dynamics and driving forces affecting agricultural landscapes and other environmental risks for the soils were evaluated by Engdawork and Bor (2014) with regard to land degradation, erosion and gully formation. The level changes in the rift-related Bilate River and Lake Abaya and catchment-wide siltation of a major tributary has been studied by Schütt Thiemann (2005), Beck et al. (2004) and Gregor et al. (2004). A model for the determination of erosion and soil erosion risk (DESER) has been developed for the semi-arid to semi-humid climate conditions (Thieman et al. 2004, Thieman 2006). The pedological studies have addressed the taxonomic classification of soil for agricultural use in the Arba Minch area (Abayneh et al. 2006).
The United Nations Development Programme (UNDP) carried out a reconnaissance survey and assessment of the geological, geochemical and hydrological implications of hot springs in the Eastern African Rift System, including those from the study area for the development of geothermal power potential (UNDP 1971). A geothermal prospect of the area has also been raised by the report of Tadiwos (2006). He discussed the implication of the northwestern Lake Abaya hydrothermal field with a high temperature originating from the hydrothermal alteration on the potential for possibility to be tapped for harvesting energy. A similar study by the Geological Survey of Ethiopia has focused on the area north of the Abaya Lake (Ayele et al. 2002). On the other hand, a study on the geochemical survey of spring water from the southern Main Ethiopian Rift, including the escarpment and the rift floor was carried out (Mckenzie et al. 2001). In the study, water samples were taken from springs throughout the Arba Minch region and analysed for major solutes and stable-isotope values of water to constrain the origin of spring recharge and assess where the “well-head” protection might be considered. The study found out that modest contamination from fertilizers (contaminating with PO4) and animal holding (contaminating with NO3) usually occurs a certain distance upslope from the springs that needed restriction of the areas from such interference (Mckenzie et al. 2001). They also found out that the sources of the Arba Minch springs are approximately 800 m higher in the catchment area (Mckenzie et al. 2001). Some studies were also conducted on the assessment of water resources, including the bathymetric survey of Lake Abaya and Chamo (Awlachew 2006).
The regional geological map of the whole region at a scale of 1 : 250,000 has been compiled by the Geological Survey of Ethiopia (Yismaw et al. 2015). This has also been extended and modified to be used as the base map for the creation of an integrated geo-hazards map of the same map sheet (Rapprich et al. 2014). A regional hydrogeological map at a scale of 1 : 250,000 was compiled for the area including Arba Minch by the Geological Survey of Ethiopia (Agezew et al. 2014), which identified the regional aquifer systems along with their regional hydrochemical affinity, giving an extensive inventory of water points in the region. JICA carried out a complete assessment of groundwater resources in the entire Main Ethiopian Rift valley, which generated large update and baseline data for subsequent works (JICA, 2012). Although some of the interpretations have been criticized for lacking consistency with the observed geological features, in few cases the enormous generated data set represents an important contribution for future studies and references. A previous study by the enterprise Halcrow Group Ltd. also carried out an integrated master plan study for the Rift Valley Lakes Basin (Halcrow 2008).

Geological mapping, mineral investigation and hydrogeological studies including drilling activities have been done in a certain part of the larger Dila map sheet starting from the early 60’s. As the map sheet falls in the southern part of the Main Ethiopian Rift, its relation with the Afar depression in terms of tectonic and structural setting have been studied by many researchers. Kazmin et al. (1980) studied the evolution of the northern part of the Main Ethiopian Rift and showed that the oldest volcanics of the area (the Oligocene-Lower Miocene Alaji basalts) predated the opening of the Ethiopian Rift System and the Afar depression. Chernet (2011) studied the northern part of Lake Abaya, and explained that the extensional axis of the MER became the locus of volcanic activity with bimodal basalt – rhyolite extrusion in the rift floor during Quaternary period. Moreover, Chernet (1998) also noted that the Wonji Fault Belt (WFB) stage of rifting can be correlated to the area north of Lake Abaya, hosting Quaternary central volcanic complexes, which straddle on the sequence of volcanic products and lacustrine deposits of Plio-Pleistocene age.
Bonini et al. (2005) outlined the evolution of the rift valley in between the Afar depression to the north and the Kenyan part of the rift in the south with several segments of the Main Ethiopian Rift. In the Arba Minch area, they highlight the evolution with the key area of the western rift margin (Chencha escarpment) and a part of the rift depression between the lakes Abaya and Chamo. They showed that incipient continental extension started to affect the southern Main Ethiopian Rift at around 20–21 Ma and that it also correlated to the roughly E-W extension phase of the rifting stage. A morphotectonic analysis of the southern Main Ethiopian Rift around Arba Minch (the Bridge of God area) was made by Boccaletti et al. (1998). They described the fault pattern and kinematics in the Arba Minch area and constrained the extension in E–W direction based on fault-slip data and large- and small-scale structural features (Boccaletti et al. 1998). Kogan et al. (2012) carried out the GPS survey to investigate the distribution of regional extension. This study has found out that the strain is accommodated only in the 10 kilometre wide zone along the western escarpment of the southern Main Ethiopian Rift. This is in contrast to the standard model where continental rifts become mid-ocean spreading canters through the strain localization according to Kogan et al. (2012).
The composition, extent and tectonic settings of Eocene and Oligocene to mid-Miocene volcanics of the southern Main Ethiopian Rift were further investigated by Woldegabriel et al. (1991). The geochemical characteristics of Quaternary volcanism and faulting in the Arba Minch region of southern Ethiopia were compared with the Wonji Fault Belt and the Silti-Debre Zeyit fault zones further north. The volcanics in Arba Minch were found to be significantly enriched by the most incompatible trace elements, suggesting differences in the contribution of mantle sources (Rooney 2010). The study of George et al. (2002) interpreted the volcanism in the southern Main Ethiopian Rift as the pre-rift stage corresponding to the Amaro and Gamo transitional tholeiites revealing the ages of 45–35 million years and the subsequent syn-rift stage corresponding to the Getra-Kele alkali basalts giving the ages between 19 and 11 Ma. Based on the trace element content and isotope ratios, they attributed the derivation of Amaro and Gamo basalts from the Kenyan plume rather than from the mantle plumes in the central or northern Ethiopian rift system. On the other hand, the Getra-Kele magmatism is interpreted as being the response to heating of carbonatitically metasomatised lithosphere by the Afar mantle (George et al. 2002).
I N T R O D U C T I O N 25
2.1 Topography and Morphology
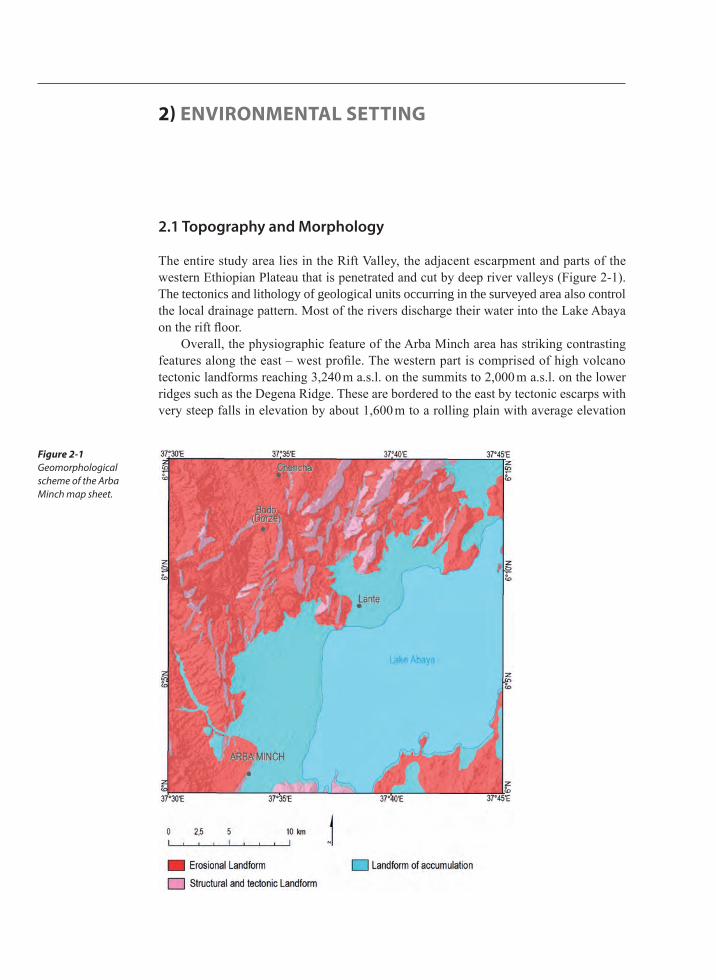
The entire study area lies in the Rift Valley, the adjacent escarpment and parts of the western Ethiopian Plateau that is penetrated and cut by deep river valleys (Figure 2-1). The tectonics and lithology of geological units occurring in the surveyed area also control the local drainage pattern. Most of the rivers discharge their water into the Lake Abaya on the rift floor.
Overall, the physiographic feature of the Arba Minch area has striking contrasting features along the east – west profile. The western part is comprised of high volcano tectonic landforms reaching 3,240 m a.s.l. on the summits to 2,000 m a.s.l. on the lower ridges such as the Degena Ridge. These are bordered to the east by tectonic escarps with very steep falls in elevation by about 1,600 m to a rolling plain with average elevation
2) ENVIRONMENTAL SETTING
Figure 2‑1 Geomorphological scheme of the Arba Minch map sheet.

of 1,400 m a.s.l. Such a sharp drop in altitude is obviously caused by normal dip-slip faulting typical of the Ethiopian main southern rift segment of the East African Rift Valley. These steep slopes are evidently a source of detrital material washed down during erosion processes, thus supplying local streams with loose sediment. Hence, the plains with a fl at to rolling plain slope are covered by the continuous supply of alluvium carried down by the numerous torrents from the tectonic ridges. Natural vegetation cover is rather sparse, forming small patches like thin forests that occur in the highlands, while the majority of the surveyed area is cultivated. Eucalyptus trees woodlots can be observed around farms.
2.2 Hydrometeorological characteristics
The area is climatically highly variable, being mainly characterized by the subtropical climatic zones (‘Weina Dega’) on the rift fl oor and temperate to humid (‘Dega’) on the escarpment and adjacent highlands. The highest ridges in the map (Chencha highlands) are characterized by sub-alpine (‘Wurch’) climatic zones.
Signifi cant variations in precipitation are recorded in apical parts of mountain ridges such as Chencha, attaining on average an altitude of 2,700 m a.s.l. with 1,390 mm of rainfall, whereas the precipitation fl uctuates around 780 mm in the low-lying plains with an average elevation of about 1,200 m a.s.l. around the city of Arba Minch. Concerning the rainfall, two seasons are recognized in the two climatic zones. Bimodal precipitation pattern occurs in the low-lying plains and unimodal rainfall with only one peak occurs in the highest rising part of the area (Assefa and Bork 2014). The bimodal rainy season lasts from March to June when the weather is rather unstable, being infl uenced by southeasterly blowing winds originating in the Indian Ocean and it is also affected by weak northeasterly winds bringing heavy rainfall to this area (Assefa and Bork 2014). Another short wet season starts in August and lasts until November with peak monthly precipitation of 92 mm in October. The two rainy seasons are separated by a distinct dry period. The unimodal rainfall takes place from April to October when moist winds from the Atlantic and Indian Oceans merge over the highlands. However, the season here is not as distinct as in the low-lying Arba Minch area. The precipitation patterns recorded at the Arba Minch and Chencha meteorological stations are shown in Figure 2-2 and summarized in Table 2-1 and Table 2-2.
Table 2‑1 . Mean monthly precipitation at the Arba Minch (AM) and Chencha meteostations from 2005 to 2016 (in mm; JICA, 2012)
Jan Feb Mar Apr May Jun Jul Aug Sep Oct Nov Dec
AM 26.4 31.0 46.6 147.8 135.5 58.7 48.2 57.7 81.9 119.8 60.8 31.6
Chencha 55.2 52.3 129 192 148 89 120 119 132 168 84.4 65.8
E N V I R O N M E N T A L S E T T I N G 27
22
2.2 Hydrometeorological characteristics
The area is climatically highly variable, being mainly characterized by the subtropical climatic zones (‘Weina Dega’) on the rift floor and temperate to humid (‘Dega’) on the escarpment and adjacent highlands. The highest ridges in the map (Chencha highlands) are characterized by sub-alpine (‘Wurch’) climatic zones.
Significant variations in precipitation are recorded in apical parts of mountain ridges such as Chencha, attaining on average an altitude of 2,700 m a.s.l. with 1,390 mm of rainfall, whereas the precipitation fluctuates around 780 mm in the low-lying plains with an average elevation of about 1,200 m a.s.l. around the city of Arba Minch. Concerning the rainfall, two seasons are recognized in the two climatic zones. Bimodal precipitation pattern occurs in the low-lying plains and unimodal rainfall with only one peak occurs in the highest rising part of the area (Assefa and Bork 2014). The bimodal rainy season lasts from March to June when the weather is rather unstable, being influenced by southeasterly blowing winds originating in the Indian Ocean and it is also affected by weak northeasterly winds bringing heavy rainfall to this area (Assefa and Bork 2014). Another short wet season starts in August and lasts until November with peak monthly precipitation of 92 mm in October. The two rainy seasons are separated by a distinct dry period. The unimodal rainfall takes place from April to October when moist winds from the Atlantic and Indian Oceans merge over the highlands. However, the season here is not as distinct as in the low-lying Arba Minch area. The precipitation patterns recorded at the Arba Minch and Chencha meteorological stations are shown in Figure 2-2 and summarized in Table 2-1 and Table 2-2.
Table 2-1. Mean monthly precipitation at the Arba Minch (AM) and Chencha meteostations from 2005 to 2016 (JICA, 2012)
Jan Feb Mar Apr May Jun Jul Aug Sep Oct Nov Dec AM 26.4 31.0 46.6 147.8 135.5 58.7 48.2 57.7 81.9 119.8 60.8 31.6
Chencha 55.2 52.3 129 192 148 89 120 119 132 168 84.4 65.8
Figure 2-2 Precipitation pattern at the Arba Minch and Chencha meteostations
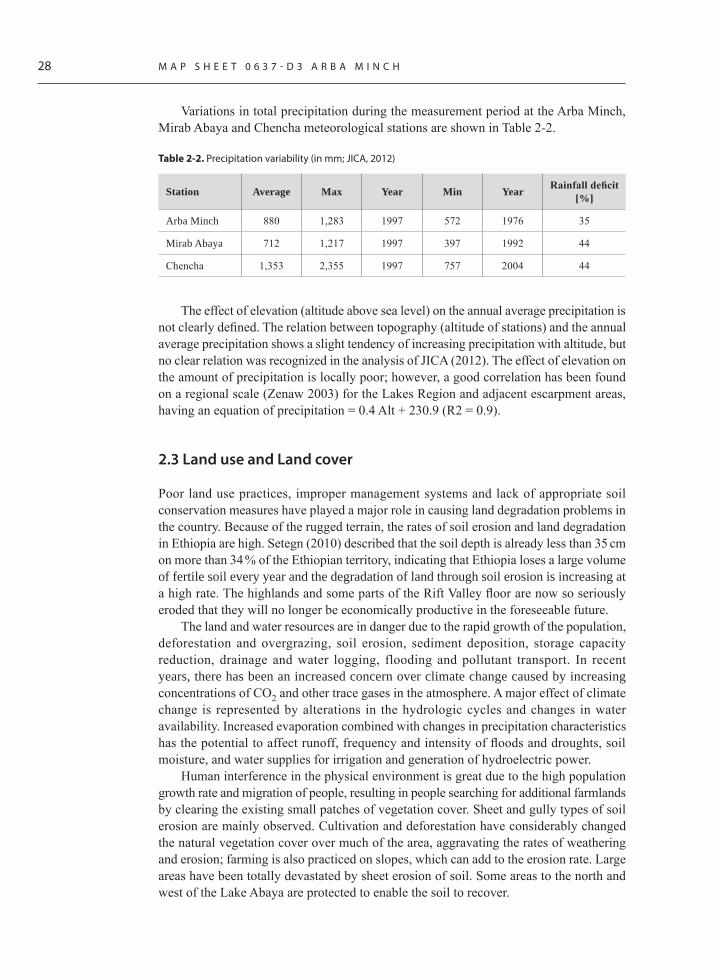
Variations in total precipitation during the measurement period at the Arba Minch, Mirab Abaya and Chencha meteorological stations are shown in Table 2-2.
Table 2-2. Precipitation variability (JICA, 2012)
Station Average Max Year Min Year Rainfall deficit [%] Arba Minch 880 1,283 1997 572 1976 35 Mirab Abaya 712 1,217 1997 397 1992 44 Chencha 1,353 2,355 1997 757 2004 44
The effect of elevation (altitude above sea level) on the annual average precipitation is not clearly defined. The relation between topography (altitude of stations) and the annual average precipitation
Figure 2‑2. Precipitation pattern at the Arba Minch and Chencha meteostations (in mm; JICA, 2012).
28 M A P S H E E T 0 6 3 7 - D 3 A R B A M I N C H
Variations in total precipitation during the measurement period at the Arba Minch, Mirab Abaya and Chencha meteorological stations are shown in Table 2-2.
Table 2‑2 . Precipitation variability (in mm; JICA, 2012)
Station Average Max Year Min Year Rainfall deficit [%]
Arba Minch 880 1,283 1997 572 1976 35
Mirab Abaya 712 1,217 1997 397 1992 44
Chencha 1,353 2,355 1997 757 2004 44
The effect of elevation (altitude above sea level) on the annual average precipitation is not clearly defined. The relation between topography (altitude of stations) and the annual average precipitation shows a slight tendency of increasing precipitation with altitude, but no clear relation was recognized in the analysis of JICA (2012). The effect of elevation on the amount of precipitation is locally poor; however, a good correlation has been found on a regional scale (Zenaw 2003) for the Lakes Region and adjacent escarpment areas, having an equation of precipitation = 0.4 Alt + 230.9 (R2 = 0.9).
2.3 Land use and Land cover
Poor land use practices, improper management systems and lack of appropriate soil conservation measures have played a major role in causing land degradation problems in the country. Because of the rugged terrain, the rates of soil erosion and land degradation in Ethiopia are high. Setegn (2010) described that the soil depth is already less than 35 cm on more than 34 % of the Ethiopian territory, indicating that Ethiopia loses a large volume of fertile soil every year and the degradation of land through soil erosion is increasing at a high rate. The highlands and some parts of the Rift Valley floor are now so seriously eroded that they will no longer be economically productive in the foreseeable future.
The land and water resources are in danger due to the rapid growth of the population, deforestation and overgrazing, soil erosion, sediment deposition, storage capacity reduction, drainage and water logging, flooding and pollutant transport. In recent years, there has been an increased concern over climate change caused by increasing concentrations of CO2 and other trace gases in the atmosphere. A major effect of climate change is represented by alterations in the hydrologic cycles and changes in water availability. Increased evaporation combined with changes in precipitation characteristics has the potential to affect runoff, frequency and intensity of floods and droughts, soil moisture, and water supplies for irrigation and generation of hydroelectric power.
Human interference in the physical environment is great due to the high population growth rate and migration of people, resulting in people searching for additional farmlands by clearing the existing small patches of vegetation cover. Sheet and gully types of soil erosion are mainly observed. Cultivation and deforestation have considerably changed the natural vegetation cover over much of the area, aggravating the rates of weathering and erosion; farming is also practiced on slopes, which can add to the erosion rate. Large areas have been totally devastated by sheet erosion of soil. Some areas to the north and west of the Lake Abaya are protected to enable the soil to recover.
E N V I R O N M E N T A L S E T T I N G 29
Land cover includes the cultivated land (large-scale farms and family farms with different intensity of cultivation), small vegetation (shrub lands and grassland, swamp), manmade features (urban or built-up areas), rocky outcrops, bare sand/soil, and water bodies. Land use information shows that only a part of the Arba Minch area is not cultivated. The floor of the Rift Valley is used for irrigation to cultivate different types of vegetation and fruit. This land use classified as “Intensive Annual Crop Production” describes the areas where annual crops (cereals, pulses, oilseeds and vegetables) are cultivated.
2.4 Prominent natural features
Several notable natural features can be observed in the Arba Minch area and its surroundings. For example, a few wetlands occur in low-lying parts of the Arba Minch map sheet. Moreover, spectacular landforms with structurally controlled and aligned cold springs exist between the Lake Abaya to the north and the Lake Chamo to the south. They emerge from the base of an escarpment on the western side of the Great Rift Valley and the name of the town of Arba Minch is derived from these springs meaning forty springs in the Amharic language. They are also a source of potable water for the region and serve as a tourist attraction.
One of the notable parks in the area is called Nech Sar (a total area of 514 km2), which northwestern part lies on the Arba Minch map sheet. It is a home of diverse flora, fauna and landforms. Generally, grasslands, woodlands, rivers, lakes, riverine forest and other forest cover including acacia trees and savannah can be found. Two Rift Valley lakes lie adjacent to or bordering the study area. The Lake Abaya which also hosts several small islands covers an area of about 1,140 km2, having a maximal depth of 24 m occupying the central and eastern sector of the Arba Minch map. The Chamo Lake is located south of the Arba Minch map separated from Lake Abaya by a narrow volcanic ridge called Bridge of God and resting at slightly lower elevation covering 316 km2 area with maximum of about 14 m depth.
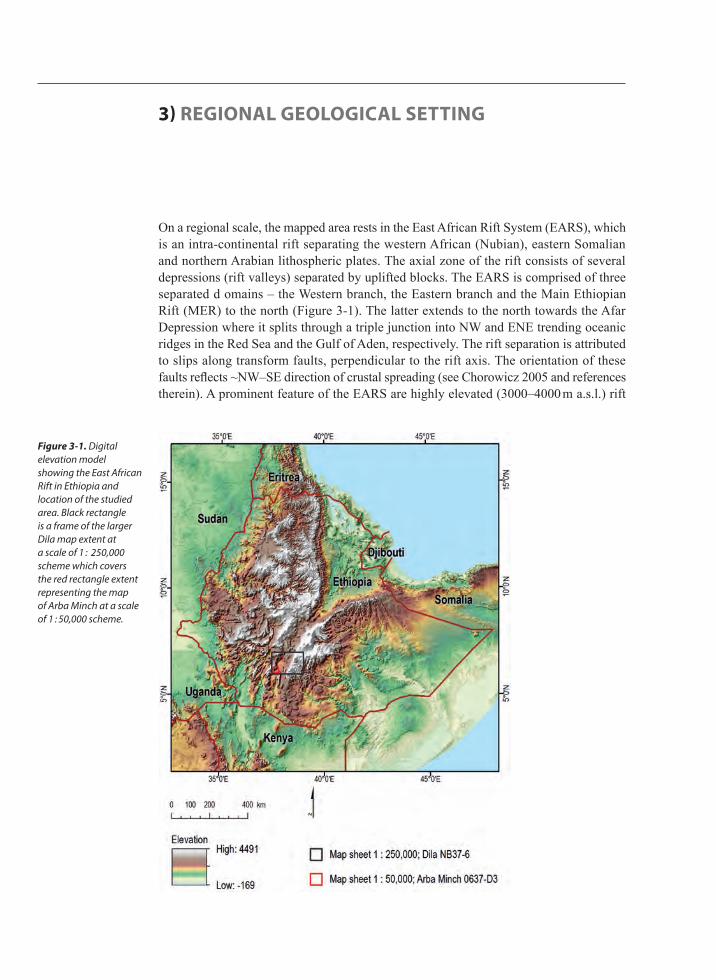
On a regional scale, the mapped area rests in the East African Rift System (EARS), which is an intra-continental rift separating the western African (Nubian), eastern Somalian and northern Arabian lithospheric plates. The axial zone of the rift consists of several depressions (rift valleys) separated by uplifted blocks. The EARS is comprised of three separated d omains – the Western branch, the Eastern branch and the Main Ethiopian Rift (MER) to the north (Figure 3-1). The latter extends to the north towards the Afar Depression where it splits through a triple junction into NW and ENE trending oceanic ridges in the Red Sea and the Gulf of Aden, respectively. The rift separation is attributed to slips along transform faults, perpendicular to the rift axis. The orientation of these faults reflects ~NW–SE direction of crustal spreading (see Chorowicz 2005 and references therein). A prominent feature of the EARS are highly elevated (3000–4000 m a.s.l.) rift
3) REGIONAL GEOLOGICAL SETTING
Figure 3‑1. Digital elevation model showing the East African Rift in Ethiopia and location of the studied area. Black rectangle is a frame of the larger Dila map extent at a scale of 1 : 250,000 scheme which covers the red rectangle extent representing the map of Arba Minch at a scale of 1 : 50,000 scheme.
shoulders and crustal domes, interpreted as being the result of uplift by mantle plume (e.g. Chorowicz 2005).
The MER is characterized by an active E–W oriented extensional movement between the African and Somalian plates with a rate of 5.2 + 0.9 mm/yr (Saria et al. 2014) to 7 mm/yr (Stamps et al. 2008). Three parts of the MER, which are distinct in age, strain accommodation, volcanism and orientation of faults have been recognized (e.g. Kazmin et al. 1980; Hayward and Ebinger 1996; Wolfenden et al. 2004).
The northern part of the MER is extending from the Afar Depression up to the Lake Koka region, which also forms the middle course of the Awash River. The main boundary faults in this region show an average N50° trend. This part of the MER was formed at around 10 to 11 Ma ago (Kazmin et al. 1980; Hayward and Ebinger 1996; Wolfenden et al. 2004). The central MER includes most of the Lakes Region and further southward up to the Lake Awasa area. Here, the major boundary faults exhibit roughly N30°–35° trend, and the age of faulting onset is estimated to have been around 8.3–9.7 Ma. The southern MER extends south of the Lake Awasa into a ca 300 km broad system of basins and ranges, referred to as the broadly rifted zone or the Gofa Basin (Davidson and Rex 1980; Ebinger et al. 2000). Faults in the southern MER show a dominant 0° to N20° trend and were active after ca 18 Ma (Woldegabriel et al. 1991; Ebinger et al. 1993).
These parts of the MER represent different stages of regional extension from early rifting in the southern MER to a more evolved crustal extension in the central and northern parts of the MER (Hayward and Ebinger 1996). The entire geodynamic evolution and tectonic pattern of the Main Ethiopian Rift has been summarized by Abbate et al. (2015). On the regional scale, the roughly ESE–WNW trending extension during the initial rifting has changed to the current ca ENE to WSW strike. A reactivation of earlier extensional faults resulting in left-lateral shearing following the change in orientation of regional stress field was observed at several localities across the MER.
The southern MER extends south of the Lake Awasa into the ~300 km wide system of basins and ranges also referred to as the broadly rifted zone or the Gofa basin and Range (Davidson and Rex 1980; Ebinger et al. 2000) that characterizes the overlapping area between the Ethiopian and Kenyan Rifts (Davidson and Rex 1980; Luelseged et al. 2017). Faults in the southern MER show a dominant N–S to N20°E trend and were well established after ~18 Ma (Zanettin and Petrucciani 1978; WoldeGabriel et al. 1991; Ebinger et al. 1993; Wolfenden et al. 2004). The southern segment is also the zone of overlap between northern extensions of the Kenyan Rift, which typically has N–S trending faults and the southern extension of the MER has NE trending faults. Around the Arba Minch area, the major structural control is represented by the Amaro oHrst, which bifurcates the rift into eastern and western grabens. The western graben is called Ganjuli, which is more conspicuous further south in Kenya and runs up all the way up to Chamo and Abiyata Lakes basin, while the eastern graben is called Galana Basin, including the area east of the Amaro Horst up to fault escarps of Dila.
In general, volcanism in the EARS is mainly concentrated in its northern part, which is interpreted as the result of the Afar mantle plume impact (e.g. Schilling et al. 1992). Characteristic volcanic rocks are represented by alkaline to hyperalkaline types developed from continental tholeiites through alkaline to transitional magmas (Mohr et al. 1972). A recent geophysical survey revealed that volcanic activity in the MER is concentrated in magmatic segments localized along the rift axis (e.g. Beutel et al. 2010; Keranen and Klemperer 2008). The ages of volcanic rocks largely differ within the entire EARS. The volcanic activity in the MER started at around 45 Ma followed by more
R E G I O N A L G E O L O G I C A L S E T T I N G 31

32 M A P S H E E T 0 6 3 7 - D 3 A R B A M I N C H
extensive eruptions of tholeiite to alkaline basalts between 31 and 28 Ma (Hofmann et al., 1997; Woldegabriel et al. 1991). A second volcanic event of intermediate and felsic compositions took place mainly between 17 and 11 Ma in the southern and central parts of the MER (Ebinger et al., 1993), and at around 12 Ma in its northern part (Wolfenden et al. 2004). Again, this was followed by a hiatus of basaltic eruptions with ages ranging from 11 to 8 Ma. This was followed by a period of drastically low volcanism, except for small eruptions of peralkaline pantelleritic ignimbrites intercalated with minor basaltic lava flows ca 7 Ma beyond the rift escarpment on the western plateau (Bonini et al. 2005).
By 1.8 Ma, volcanism and faulting were localized to the narrower magmatic segments within the rift (Keranen et al. 2004) with an oblique trend in the north–northeastern direction in contrast to the overall older northeastern trend of the rift. The segments are separated from one another by shorter intervals in a right-lateral en echelon pattern. Hence, the volcanisms that followed were of a bimodal composition between acidic and basic. This late activity started with the eruption of widespread Pleistocene ignimbrites (1.6–0.5 Ma) that, although younger, may be correlated to the Nazret unit that largely characterizes the northern MER (Bonini et al. 2005). The volcanic succession is closed by the Nech Sar olivine basalts (1.34–0.77 Ma; Ebinger et al. 1993), and by few pumiceous tuffs and obsidian flows overlying the Quaternary basalts in the Bridge of God area (Bonini et al. 2005).

Remote sensing techniques were used for a better understanding of lithologies on the Earth’s surface, geological structures as well as to provide an overview of the regional context of study areas. The area of the Arba Minch map sheet is extensively covered by vegetation, so that the spectral data from optical sensors (Landsat, Aster and QuickBird) provide mostly information on land use, but limited information on lithological variation. The main use of remote sensing data in this area has been the utilization of the digital elevation model (DEM) for the identification of geological structures using the morphotectonic analysis. Remotely sensed data (optical images, DEMs) were also used to identify and understand geomorphic processes and related potential natural hazards.
4.1 Data and methods
Remote sensing data used in this study comprise: satellite images Aster, Landsat 7 ETM+, Digital Globe and digital elevation model ASTER DEM. Landsat and ASTER images, and subsequently the Aster digital elevation model (Aster DEM) have a spatial resolution of 30 m, which is the best option for mapping at a scale of 1 : 50,000. These data are derived from the optical stereoscopic coverage of ASTER satellite images. DEMs provide the key data for understanding the main geomorphological and tectonic features of the area surveyed. Optical satellite imagery like Landsat and ASTER was also used to comprehend lithology and land cover of poorly accessible areas. However, its use for lithological/geological applications or considerations is restricted to the areas with no or poor vegetation (arid, semiarid, uplands). The Landsat satellite images were used to help to understand better the surface lithology. The area is largely covered by vegetation, so that even the images taken in dry season show lots of vegetation cover (Figure 4-1.) that makes the lithological interpretations difficult. The vegetation was obscured and possible lithologies in the areas with no or rare vegetation were improved using the Principal Component Analysis (PCA) (Figure 4-1 lower). Different colours may correspond to different minerals and rocks on the surface, but the interpretation is still difficult in the areas partly covered by vegetation. The comparison of interpretations using the Landsat Principal component analysis with those from the field observations and mapping show that the upper basalts appear mostly in yellow to orange to red-green colours, whereas ignimbrites correspond to the mostly dark violet colour shades, so that the distinction from the lower basalts (mostly bright violet colours) is not so good due to the vegetation cover. High-resolution satellite imagery Birds-Eye with a spatial resolution of up to 0.6–2.4 m was also used for selected areas, particularly those susceptible to landslides and other geo-hazards.
4.2 Morphotectonic analysis
Structural characteristics of an area can be revealed from remotely sensed data by the interpretation of linear features. It is the large synoptic view of satellite images that
4) REMOTE SENSING ANALYSIS

Figure 4‑1. Landsat image of the Arba Minch Map sheet. False colour image with the bands 432 displayed as RGB composite (upper) is showing vegetation in red colour. Results of the principal component analysis (PCA) displayed as RGB composite of PCA1, PCA2 and PCA3 (lower).
34 M A P S H E E T 0 6 3 7 - D 3 A R B A M I N C H

R E M O T E S E N S I N G A N A L Y S I S 35
allows the recognition of features that are difficult to follow and interpret during field campaigns. The shape of the features is determined by their dip angles. Except for the thrust, most faults are inclined steeply, forming straight lineaments relatively unaffected by topography. Cautions were made to avoid the misinterpretation of linear features from remote sensing data, which can also be mistaken for manmade features such as roads instead of faults lines, traces of dykes, a trace of dipping strata etc.
Accordingly, neo-tectonic faults were distinguished by (1) their morphology, forming asymmetric ridges with one side corresponding to breaks in slope or scarps, (2) the displacement of late Neogene lithological boundaries, structural or erosion surfaces, and (3) the occurrence of straight lines of several tens of kilometres in length (Saintot et al. 1999; Snyder et al. 2000; Jordan et al. 2005; Dhont and Chorowitz 2006). Satellite images and DEMs have been compared with geological maps in order to separate the scarps formed by fault planes (active) from those resulting from differential erosion of contrasting lithologies at contacts. The active fault scarps are elevated higher and are also longer than the scarps formed by lithological contacts.
The identification of kinematic indicators (whether it is strike-slip, normal or reverse fault) is made based on the following characteristic features: (1) Strike-slip faults have rectilinear traces and they locally bound push-up hills or extensional basins at step-over or bends of the fault trace. They can be associated with typical patterns such as tail-crack or horse-tail structures at fault terminations. (2) Reverse faults have sinuous traces and they are associated with half-cylindrical-shaped hills of the uplifted blocks due to drag folds deforming the (ancient) old planar erosion surface in the hanging wall. (3) Normal faults are recognized by the following geomorphic characters: (a) they generally have a widely arched trace, concave (mainly) or convex toward the footwall, in contrast to the strike-slip faults, whose trace is generally straighter; (b) they bound tilted plateaus (tilted blocks); (c) as is also the case for the strike-slip faults, they are not related to half-cylindrical-shaped hills corresponding to recent drag folds, which accompany active reverse faulting.
Mapping of the recent folds, the synclines forming lowlands filled with sediments, and the anticlines corresponding to the regularly-shaped elongated hills is also possible. It is important to point out that this approach provides information on the finite strain, but not on its detailed history. Faults usually develop in conjugate directions where one direction can be dominant. The recognition of conjugate fault systems allows an overall estimation of the maximum and minimum principal stress axes orientation. Faults represent local weaknesses in the Earth’s crust and become eroded easily so that they can form linear depressions often followed by streams, which are recognizable on digital terrain models and optical images. The higher water saturation of fault zones provides an excellent environment for plants that may grow along the fault line and enhance its discernment. However, as a rule, other geologically significant features such as truncations, displacements of lithological units, geophysical indices or direct field checking should support the statement that a linear feature in an image represents a real fault structure. Active faulting in an area may be beneficial to the recognition of faults as it may produce specific landforms like headless valleys, facetted spurs, shutter ridges, offset streams or sag ponds (Saintot et al. 1999; Snyder et al. 2000).
The morphotectonic analysis carried out within the Arba Minch map sheet revealed the prominent N–S and NNE–SSW to NE–SW trending linear structures, which are clearly expressed in the present-day morphology. Minor linear structures of NNW–SSE and E–W trends were also observed, particularly in the northern and western sectors of the map sheet. The ground-truth of morphotectonic linear structures achieved by field mapping

36 M A P S H E E T 0 6 3 7 - D 3 A R B A M I N C H
eliminated several lithological contact lines initially interpreted as structures. The results presented in Figure 4-2 show linear structural features, which are interpreted mainly as faults, fault zones and major fracture systems. Their prominent geomorphological expression points to their possible recent (Cenozoic) activity.
The comparison of results of the morphotectonic analysis with a geological map shows certain harmony of the major morphotectonic linear structural features with the faults verified and inferred by geological mapping. Correlation is quite high, although some linear structures or minor shear zones were not recognized or identified during the field mapping due to the poorly exposed terrain, so that they are not depicted on the geological map.
Figure 4‑2. Morphotectonic analysis of the Arba Minch map sheet. Morphotectonic linear indices are displayed on the colour digital elevation model (Aster DEM) combined with a shaded relief map.
5) GEOLOGY OF THE ARBA MINCH MAP SHEET
5.1 Lithology and Petrology
Volcanic activity in the southern MER is divided into three major episodes: (a) Eocene to Oligocene pre-rift volcanic activity (~45 to 27 Ma), Miocene syn-rift volcanic activity (~24 to 11 Ma) and Pleistocene post-rift volcanic activity. The pre-rift Amaro-Gamo sequence and related basic volcanites (Ebinger et al. 1993; George et al. 1998; George and Rogers 2002) have a minimum thickness of ~600 meters and are dominated by tholeiitic and transitional basalts. The associated Shole Ignimbrites also known as the Amaro Tuffs (JICA 2014; Ebinger et al., 1993; George et al., 1998) have a rhyolitic composition with a thickness of ~200 meters. The post-rift volcanic sequence represented by the Nech Sar Basalts (e.g. Levitte et al. 1974; Ebinger et al. 2000) was also described as the Bobem, Tosa Sucha or Arba Minch unit (Zanettin, 1978; George and Rogers, 1999; Rooney, 2010).
The pre-rift volcanic sequence comprises the following rock types on the Arba Minch map sheet: (a) Amygdaloidal basalt lavas and pyroclastic deposits (Amaro-Gamo Basalt) of Eocene age, mainly exposed at the lowest erosion base level on the map sheet around the Lake Abaya. This sequence was followed by a subsequent eruptive event, cropping out throughout the area surveyed, consisting mainly of (b) welded to unwelded Eocene to Lower Oligocene rhyolitic ignimbrites and minor pyroclastic deposits (Shole Ignimbrite) with (c) minor rhyolite lava flow and breccia called as the Ugayo rhyolite. The Shole ignimbrites are covered by (d) several massive basalt lava flows of Lower Oligocene age, cropping out mainly in the northeastern part of the Arba Minch map sheet.
The origin of the syn-rift volcanic sequence represented by minor deposition of the Dorze Ignimbrite (~30 meters in thickness) and the Mimo Trachyte lava flow (~10 meters in thickness), both revealing the Miocene age associated with the initial stage of the rift subsidence.
The Pleistocene post-rift volcanic deposits (Dino Formation) originated during the youngest volcanic event and are exposed in the lowest part of the rift structure in the southern sector of the map sheet. Representative rocks mainly include basaltic lava flows and erosional relics of several cinder cones.
Pre‑rift volcanic deposits
Eocene-Oligocene
11. Amaro–Gamo Basalts: basalts to trachybasalts with minor basaltic pyroclastic deposits are exposed mainly along the road cut close to the Lake Abaya and in the highland north of Arba Minch (the Dega Shara region). Amygdaloidal and partly also massive basalt lavas and pyroclastic deposits are the oldest rocks exposed in the area of the Arba Minch map sheet. Amygdaloidal, locally massive basalt lava flows crop out mainly in the middle to upper part of the basalt sequence, whereas the pyroclastic deposits
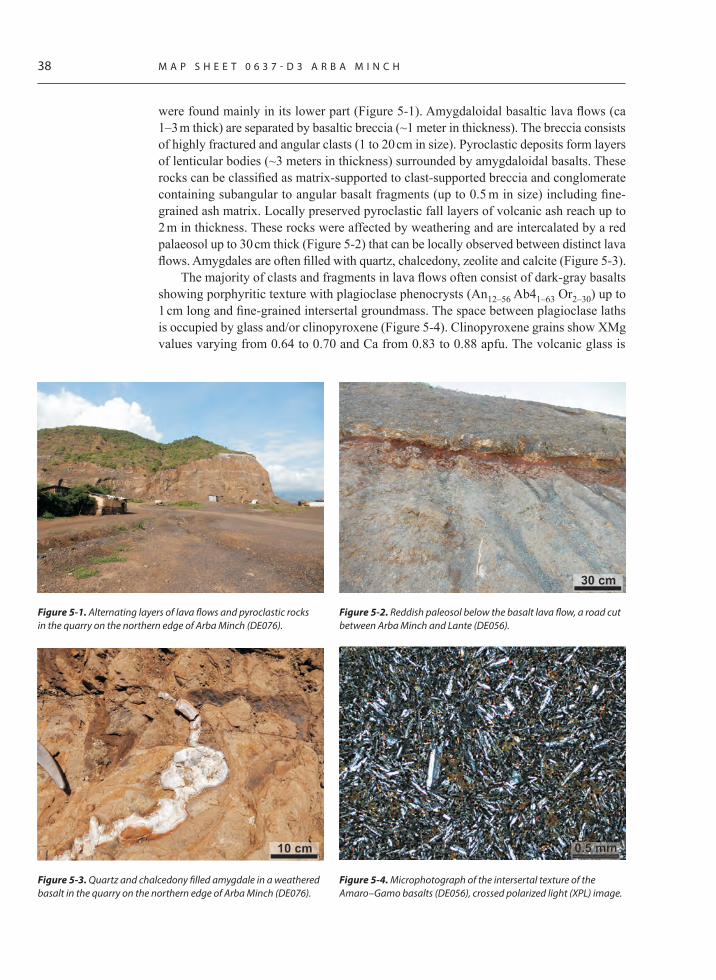
38 M A P S H E E T 0 6 3 7 - D 3 A R B A M I N C H
were found mainly in its lower part (Figure 5-1). Amygdaloidal basaltic lava flows (ca 1–3 m thick) are separated by basaltic breccia (~1 meter in thickness). The breccia consists of highly fractured and angular clasts (1 to 20 cm in size). Pyroclastic deposits form layers of lenticular bodies (~3 meters in thickness) surrounded by amygdaloidal basalts. These rocks can be classified as matrix-supported to clast-supported breccia and conglomerate containing subangular to angular basalt fragments (up to 0.5 m in size) including fine-grained ash matrix. Locally preserved pyroclastic fall layers of volcanic ash reach up to 2 m in thickness. These rocks were affected by weathering and are intercalated by a red palaeosol up to 30 cm thick (Figure 5-2) that can be locally observed between distinct lava flows. Amygdales are often filled with quartz, chalcedony, zeolite and calcite (Figure 5-3).
The majority of clasts and fragments in lava flows often consist of dark-gray basalts showing porphyritic texture with plagioclase phenocrysts (An12–56 Ab41–63 Or2–30) up to 1 cm long and fine-grained intersertal groundmass. The space between plagioclase laths is occupied by glass and/or clinopyroxene (Figure 5-4). Clinopyroxene grains show XMg values varying from 0.64 to 0.70 and Ca from 0.83 to 0.88 apfu. The volcanic glass is
Figure 5‑1. Alternating layers of lava flows and pyroclastic rocks in the quarry on the northern edge of Arba Minch (DE076).
Figure 5‑3. Quartz and chalcedony filled amygdale in a weathered basalt in the quarry on the northern edge of Arba Minch (DE076).
Figure 5‑2. Reddish paleosol below the basalt lava flow, a road cut between Arba Minch and Lante (DE056).
Figure 5‑4. Microphotograph of the intersertal texture of the Amaro–Gamo basalts (DE056), crossed polarized light (XPL) image.

affected by alterations and replaced by clay minerals and chlorite. The classification of basalts based on the type of pyroxene and feldspar is given in Figure 5-5.
10. Ugayo Rhyolite: rhyolite with subordinated ignimbrite is exposed in the northeastern edge of the Arba Minch map sheet (e.g. the Ugayo Hill at 1,342 m a.s.l.). Rhyolite lava flows and small domes are spatially related to a strongly welded crystal-rich ignimbrite, locally having fluidal texture and rheomorphic deformation. Brecciated lava prevails in outcrops and blocks (Figure 5-6). Angular clasts (up to 20 mm/cm in diameter) in this breccia have reddish to dark-red color shades, being vesicular and also containing fragments of a fine-grained rhyolite, locally with feldspar and/or quartz phenocrysts up to 1 mm in size. Fine-grained groundmass is rich in quartz, feldspar and opaque minerals. The groundmass is locally banded due to variations in grain size. Elongated quartz and chalcedony grains filling amygdales are present (Figure 5-7).
9. Shole Ignimbrite: rhyolitic ignimbrite and minor rhyolite is densely welded to non-welded rhyolitic ignimbrite and the pyroclastic fall deposits are exposed on steep slopes of an escarpment mainly in the northern and western part of the map sheet. This sequence
G E O L O G Y O F T H E A R B A M I N C H M A P S H E E T 39
Figure 5‑6. Brecciated vesicular rhyolite lava (DE065). Figure 5‑7. Microphotograph of the quartz and chalcedony filled amygdales in the rhyolite (DE065), XPL image.
Figure 5‑5. Classification diagrams for Ca–Fe–Mg pyroxenes (a) and feldspars (b): Amaro-Gamo basalts (DE056, DE080), a trachyte dyke (DE055), Getra–Kele basalts (DE044, DE057, DE077) and Nech-Sar basalts (DE075).

40 M A P S H E E T 0 6 3 7 - D 3 A R B A M I N C H
has a total thickness of ~50–200 m, consisting of several layers of ignimbrites with minor rhyolitic ash fall deposits and palaeosol horizons. The layers of fall deposits usually have a thickness of about 10–40 cm. Columnar jointing mainly occurs in moderately to densely welded facies of ignimbrites. Moderately to strongly welded ignimbrite displays a distinct lateral and vertical variation in the degree of welding and clasts abundance. The fine-grained, strongly welded, yellowish to reddish rhyolitic ignimbrite is abundant. The groundmass is fine-grained and contains flattened glass shards up to 1 mm in length (Figure 5-8). Crystal fragments comprise 1–32 vol. % of the ignimbrite and are dominated by subhedral to euhedral quartz, sanidine and plagioclase crystals. Clinopyroxene and magnetite are also present. Flattened fiamme with common eutaxitic structure and porphyritic texture of up to 6 cm in length was observed in the pyroclastic rocks. Yellowish moderately to slightly welded and relatively porous pumice flow deposits with prevailing ash matrix and pumice clasts of a few mm to cm large (Figure 5-9) occur in distant parts of pyroclastic flows. They are often spatially related to the well-sorted grayish-white to yellowish fall deposits.
Figure 5‑8. Unwelded rhyolitic ignimbrite with pumices (DE054).
Figure 5‑10. Columnar jointing in basaltic lava flow (DE067).
Figure 5‑9. Microphotograph of the welded rhyolitic ignimbrite (DE069), planar polarized light (PPL) image.
8. Basalt: massive basalt lavas (up to 400 m thick) are exposed mainly in the northeastern part of the Arba Minch map sheet around the town of Chencha. These basalts are massive, dark-colored rocks with well-developed columnar joints (Figure 5-10). The lava flows are locally intercalated with paleosoil horizons, fine basaltic scoria layers and epiclastic deposits up to 2 meters in thickness. The majority of basalts are massive, having aphyric or porphyritic texture with vesicles or amygdales up to 1 cm in size. These rocks are composed of plagioclase (40–55 vol. %) and clinopyroxene (38– 57 vol. %), usually with subordinate olivine and interstitial glass. Fine-grained groundmass is rich in plagioclase, clinopyroxene and volcanic glass. Plagioclase phenocrysts (An57-73

G E O L O G Y O F T H E A R B A M I N C H M A P S H E E T 41
Ab26-41 Or1-2) occur as subhedral short tabular laths of up to 1 mm in size. Clinopyroxene (diopside, XMg = 0.68 to 0.76 and Ca = 0.85 to 0.89 apfu) forms subhedral to anhedral crystals up to 0.5 mm in size. Olivine crystals have a subhedral shape up to 0.6 mm in size, often replaced by reddish-brown iddingsite. Alkali feldspar (An5-27 Ab55-63 Or10-40) is rare. Chlorite is partly replaced by volcanic glass or clinopyroxene. Brownish to reddish crusts are typical of partly weathered basalts.
Syn-rift volcanic deposits
Miocene
7. Mimo trachyte forms dykes as well as small lava flows exposed in a road cut between the towns of Arba Minch and Lante (DE055). Light-gray trachyte dykes (up to 2 meters in thickness) intruded the pre-rift Amaro-Gamo basalts (Figure 5-11). Trachyte is a fine-grained rock with aphanitic to porphyritic texture formed mainly by K-feldspar crystals (Ab9-10 Or90-91) with perthite (An1-2 Ab98-99). Feldspar laths show preferred orientation and the interstices in feldspar crystals are occupied by aegirine (XMg = 0.00 to 0.01 and Na = 0.80 to 0.82 apfu) or altered glass (Figure 5-12).
6. Dorze Ignimbrite represents densely welded rocks cropping out south of the village of Dorze. The predominant yellowish rhyolitic ignimbrite (~30 meters in thickness) reveals various content of clasts (Figure 5-13) and well-developed columnar jointing. Massive perlites to glassy ignimbrites with relics of petrified wood (Figure 5-14) are preserved along the weathered surface. In addition, a porous well-sorted pumice flow deposit with prevailing ash matrix and pumice clasts (mm to cm in size) occur mainly in the distant parts of pyroclastic flows.
Figure 5‑11. Trachyte dyke (dark arrows) crosscuts the Amaro–Gamo basalt volcanic sequence (DE055).
Figure 5‑12. Microphotograph of the trachytic texture (DE055), XPL image.

42 M A P S H E E T 0 6 3 7 - D 3 A R B A M I N C H
Figure 5‑13. Ignimbrite exposed in a roadcut near Dorze (DE069), dark arrows indicate a layer with presence of tree trunks at the base of the pyroclastic flow.
Post-rift volcanic deposits
Pleistocene
5. Nech-Sar Basalt: basaltic lava and pyroclastic deposits including several scoria cones are mainly exposed in the southern part of the map sheet, in the Nech Sar National Park between the lakes Abaya and Chamo. These basalts have a vesicular texture, also containing abundant volcanic bombs and lapilli. The basalts are fine-grained, having porphyritic plagioclase with abundant phenocrysts of clinopyroxene and/or olivine (Figure 5-15). Clinopyroxene corresponds to diopside with XMg = 0.66 to 0.81 and Ca = 0.86 to 0.93 apfu. The groundmass is predominantly formed by volcanic glass with plagioclase (An52-82 Ab18-45 Or1-3), pyroxene microphenocrysts and rare alkali feldspar laths (An9 Ab51 Or40). Within the basalt lava flows, several cm to m thick layers (unmapped) of acid volcanic ash newly dated at 2.34 Ma are locally present.
Figure 5‑14. Microphotograph of the fossil wood below the glassy rhyolitic ignimbrite (DE069), PPL image.
Figure 5‑15. Microphotograph of the porphyritic basalt (DE077), XPL image.

G E O L O G Y O F T H E A R B A M I N C H M A P S H E E T 43
Sedimentary deposits of Upper Pleistocene to Holocene
4. Colluvial sediments represent wide-spread gravitationally driven deposits occurring at the foot of escarpments by mass wasting processes (landslides, rock falls, debris flows). These deposits represent heterogeneous material in sediments of different grain sizes. Most voluminous deposits are as much as 10 meters thick, representing the accumulation zones of mostly fossil, deep-seated rockslides and landslides. They are characterized by matrix-supported, unsorted sediments with boulders up to several meters in diameter (Figure 5-16). The boulders are mostly welded ignimbrites, whereas basaltic rocks are rare. These sediments occur in areas including the southern and northeastern scarps of the Kaka Hill west of Arba Minch, slopes around Shama Gedel, Dorze and Chano Dorga in the central part of the map sheet and around Fara Gosa in the northern sector. Rock fall accumulations are commonly found in downthrown terraces (Figure 5-17). These deposits have a character of fallen down ignimbrite boulders of several meters in size. Locally, the colluvial sediments are represented by sandy to silty brownish or reddish soils with angular clasts of fresh to moderately weathered clasts of volcanic rocks up to 10 centimetres in size.
3. Colluvial to alluvial sediments are preserved in the most proximal parts of alluvial fans. Three main types of these deposits were identified: (a) debris flow deposits: massive unsorted matrix-supported gravel to boulder-rich sediments. The matrix consists of re-deposited silty clay, while the clasts are comprised of angular to sub-rounded cobbles and rarely also the boulders of volcanic rocks. (b) Hyper-concentrated flow deposits consist of clast-supported massive gravels (Figure 5-18), in which the clasts are of the same character as in the debris flow deposits, and the matrix is composed of fine- to coarse-grained sand. (c) Sheet-flood deposits are characterized by an alternation of sandy soils, coarse-grained sand and gravel, forming horizontally bedded layers and sheets of centimetres to a few decimetres thick. No sharp boundary is observed between the individual types of sediments.
Figure 5‑16. Blocks and boulders of ignimbrites within the re-sedimented soil in an accumulation zone of a fossil landslide, Shara.
Figure 5‑17. Boulders of ignimbrites deposited by rock-fall in Dorze.
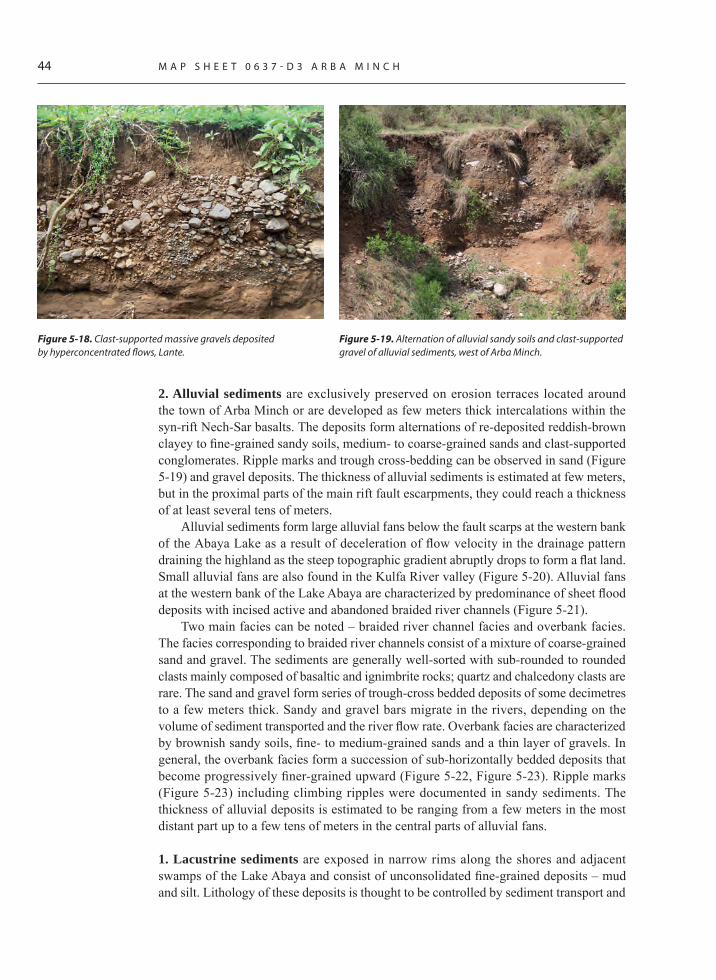
44 M A P S H E E T 0 6 3 7 - D 3 A R B A M I N C H
2. Alluvial sediments are exclusively preserved on erosion terraces located around the town of Arba Minch or are developed as few meters thick intercalations within the syn-rift Nech-Sar basalts. The deposits form alternations of re-deposited reddish-brown clayey to fine-grained sandy soils, medium- to coarse-grained sands and clast-supported conglomerates. Ripple marks and trough cross-bedding can be observed in sand (Figure 5-19) and gravel deposits. The thickness of alluvial sediments is estimated at few meters, but in the proximal parts of the main rift fault escarpments, they could reach a thickness of at least several tens of meters.
Alluvial sediments form large alluvial fans below the fault scarps at the western bank of the Abaya Lake as a result of deceleration of flow velocity in the drainage pattern draining the highland as the steep topographic gradient abruptly drops to form a flat land. Small alluvial fans are also found in the Kulfa River valley (Figure 5-20). Alluvial fans at the western bank of the Lake Abaya are characterized by predominance of sheet flood deposits with incised active and abandoned braided river channels (Figure 5-21).
Two main facies can be noted – braided river channel facies and overbank facies. The facies corresponding to braided river channels consist of a mixture of coarse-grained sand and gravel. The sediments are generally well-sorted with sub-rounded to rounded clasts mainly composed of basaltic and ignimbrite rocks; quartz and chalcedony clasts are rare. The sand and gravel form series of trough-cross bedded deposits of some decimetres to a few meters thick. Sandy and gravel bars migrate in the rivers, depending on the volume of sediment transported and the river flow rate. Overbank facies are characterized by brownish sandy soils, fine- to medium-grained sands and a thin layer of gravels. In general, the overbank facies form a succession of sub-horizontally bedded deposits that become progressively finer-grained upward (Figure 5-22, Figure 5-23). Ripple marks (Figure 5-23) including climbing ripples were documented in sandy sediments. The thickness of alluvial deposits is estimated to be ranging from a few meters in the most distant part up to a few tens of meters in the central parts of alluvial fans.
1. Lacustrine sediments are exposed in narrow rims along the shores and adjacent swamps of the Lake Abaya and consist of unconsolidated fine-grained deposits – mud and silt. Lithology of these deposits is thought to be controlled by sediment transport and
Figure 5‑18. Clast-supported massive gravels deposited by hyperconcentrated flows, Lante.
Figure 5‑19. Alternation of alluvial sandy soils and clast-supported gravel of alluvial sediments, west of Arba Minch.
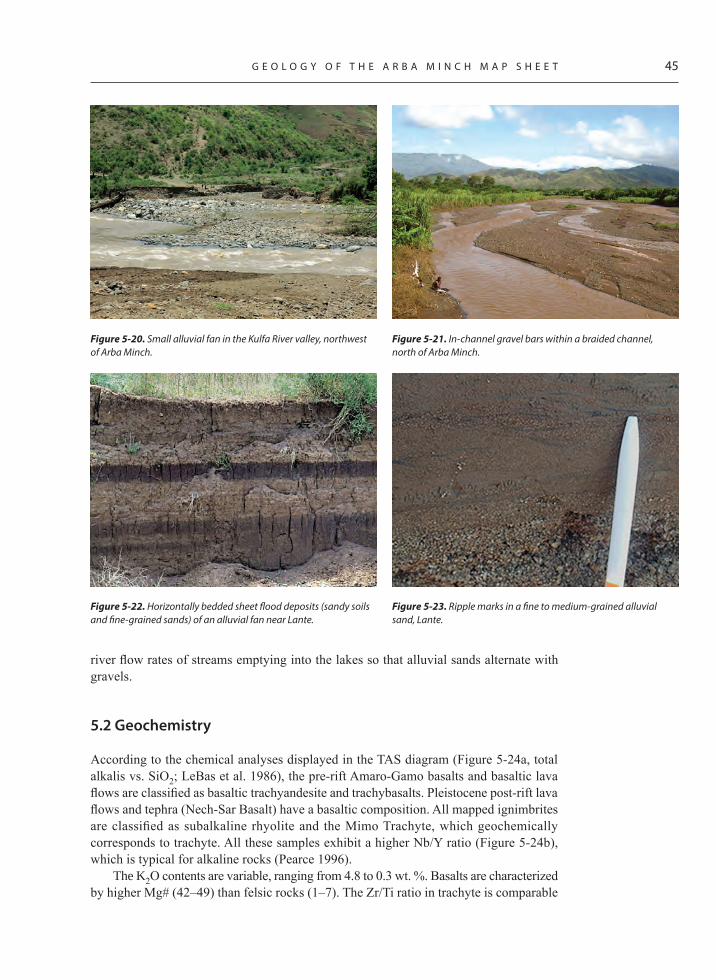
G E O L O G Y O F T H E A R B A M I N C H M A P S H E E T 45
river flow rates of streams emptying into the lakes so that alluvial sands alternate with gravels.
5.2 Geochemistry
According to the chemical analyses displayed in the TAS diagram (Figure 5-24a, total alkalis vs. SiO2; LeBas et al. 1986), the pre-rift Amaro-Gamo basalts and basaltic lava flows are classified as basaltic trachyandesite and trachybasalts. Pleistocene post-rift lava flows and tephra (Nech-Sar Basalt) have a basaltic composition. All mapped ignimbrites are classified as subalkaline rhyolite and the Mimo Trachyte, which geochemically corresponds to trachyte. All these samples exhibit a higher Nb/Y ratio (Figure 5-24b), which is typical for alkaline rocks (Pearce 1996).
The K2O contents are variable, ranging from 4.8 to 0.3 wt. %. Basalts are characterized by higher Mg# (42–49) than felsic rocks (1–7). The Zr/Ti ratio in trachyte is comparable
Figure 5‑20. Small alluvial fan in the Kulfa River valley, northwest of Arba Minch.
Figure 5‑22. Horizontally bedded sheet flood deposits (sandy soils and fine-grained sands) of an alluvial fan near Lante.
Figure 5‑21. In-channel gravel bars within a braided channel, north of Arba Minch.
Figure 5‑23. Ripple marks in a fine to medium-grained alluvial sand, Lante.
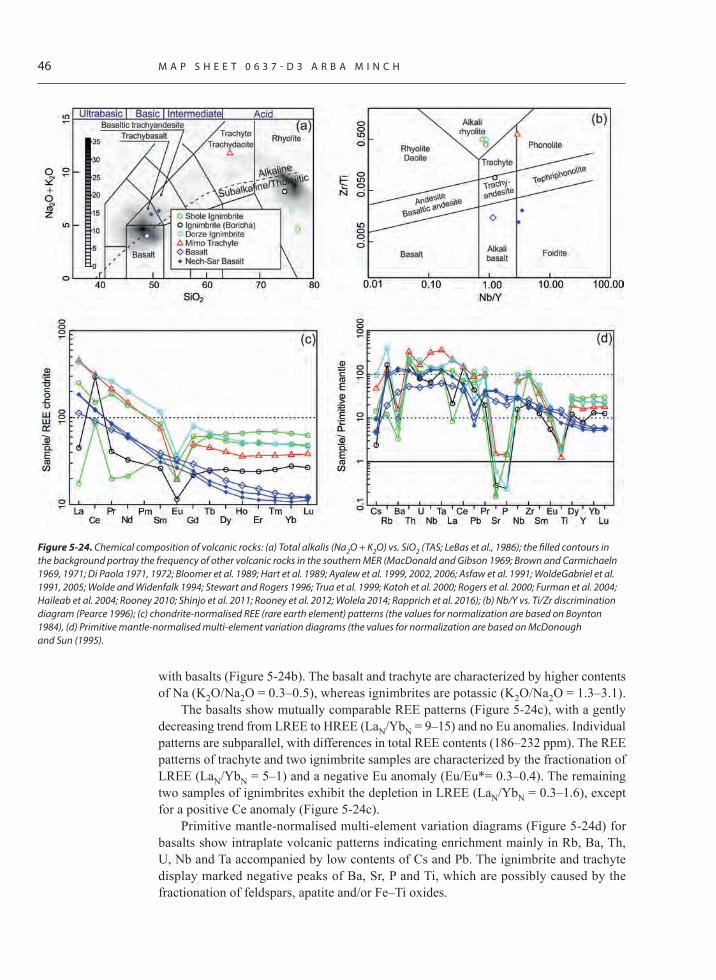
46 M A P S H E E T 0 6 3 7 - D 3 A R B A M I N C H
with basalts (Figure 5-24b). The basalt and trachyte are characterized by higher contents of Na (K2O/Na2O = 0.3–0.5), whereas ignimbrites are potassic (K2O/Na2O = 1.3–3.1).
The basalts show mutually comparable REE patterns (Figure 5-24c), with a gently decreasing trend from LREE to HREE (LaN/YbN = 9–15) and no Eu anomalies. Individual patterns are subparallel, with differences in total REE contents (186–232 ppm). The REE patterns of trachyte and two ignimbrite samples are characterized by the fractionation of LREE (LaN/YbN = 5–1) and a negative Eu anomaly (Eu/Eu*= 0.3–0.4). The remaining two samples of ignimbrites exhibit the depletion in LREE (LaN/YbN = 0.3–1.6), except for a positive Ce anomaly (Figure 5-24c).
Primitive mantle-normalised multi-element variation diagrams (Figure 5-24d) for basalts show intraplate volcanic patterns indicating enrichment mainly in Rb, Ba, Th, U, Nb and Ta accompanied by low contents of Cs and Pb. The ignimbrite and trachyte display marked negative peaks of Ba, Sr, P and Ti, which are possibly caused by the fractionation of feldspars, apatite and/or Fe–Ti oxides.
Figure 5‑24. Chemical composition of volcanic rocks: (a) Total alkalis (Na2O + K2O) vs. SiO2 (TAS; LeBas et al., 1986); the filled contours in the background portray the frequency of other volcanic rocks in the southern MER (MacDonald and Gibson 1969; Brown and Carmichaeln 1969, 1971; Di Paola 1971, 1972; Bloomer et al. 1989; Hart et al. 1989; Ayalew et al. 1999, 2002, 2006; Asfaw et al. 1991; WoldeGabriel et al. 1991, 2005; Wolde and Widenfalk 1994; Stewart and Rogers 1996; Trua et al. 1999; Katoh et al. 2000; Rogers et al. 2000; Furman et al. 2004; Haileab et al. 2004; Rooney 2010; Shinjo et al. 2011; Rooney et al. 2012; Wolela 2014; Rapprich et al. 2016); (b) Nb/Y vs. Ti/Zr discrimination diagram (Pearce 1996); (c) chondrite-normalised REE (rare earth element) patterns (the values for normalization are based on Boynton 1984), (d) Primitive mantle-normalised multi-element variation diagrams (the values for normalization are based on McDonough and Sun (1995).

G E O L O G Y O F T H E A R B A M I N C H M A P S H E E T 47
5.3 K-Ar dating
In order to determine the age of the fault activity, 8 samples of a volcanic sequence were selected for K-Ar dating at the Institute for Nuclear Research of the Hungarian Academy of Sciences in Debrecen. Locations of the samples and analytical results are shown in Table 5-1.
All samples were measured as whole-rock samples because of the very fine-grained texture of the samples. Generally, the samples enriched in pumices were selected from the ignimbrites, while care was taken during the preparation of the samples in order to avoid the presence of any xenocryst or xenoliths in the dated samples. Finally, the most suitable samples were selected among those enriched in volcanic glass the most and those not affected by post-magmatic activity.
Table 5‑1 . K-Ar cooling age analytical results for tested samples
No Sample Rock type Latitude Longitude K [%]
4°Ar rad[ccSTP/g]
4°Ar rad[%]
K/Ar age[Ma]
1 DE077 basalt 6.033857 37.53718 1.531 5.3190 × 10⁻⁸ 11.50 0.893 ± 0.10
2 EO53 basalt 6.042339 37.54079 1.433 6.4688 × 10⁻⁸ 2.50 1.16 ± 0.06
3 DE 219 acid ash 6.043457 37.54179 3.479 3.1612 × 10⁻⁷ 9 2.34 ± 0.35
4 TH615 trachyte 6.230248 37.56536 3.925 2.7885 × 10⁻⁶ 48.3 18.18 ± 0.66
5 DE069 ignimbrite 6.175495 37.57809 3.631 3.1658 × 10⁻⁶ 43.2 22.29 ± 0.63
6 EO52 basalt 6.001667 37.6279 0.643 6.7067 × 10⁻⁷ 23.50 26.63 ± 1.51
7 DE 067 basalt 6.126709 37.63336 0.668 7.1408 × 10⁻⁷ 43.1 27.29 ± 0.91
8 TH614B ignimbrite 6.180522 37.69872 4.157 6.1733 × 10⁻⁶ 92.5 37.80 ± 0.67
The newly obtained K-Ar ages fall into five distinct groups: 0.8–2.3 Ma, around 18 Ma, around 22 Ma, 26.6–27.3 Ma and around 37 Ma. These results are in complete accord with the overall stratigraphy, suggesting a sequence of voluminous eruptions of ignimbrites in the area. The oldest volcanisms dated as Eocene (37.8 Ma) probably coincide with the earliest pre-rifting sequence of volcanism in the region. The same has been noted from the yet unpublished dating of additional samples from the ignimbrites in the studied areas where no ages older than approximately 39 Ma were found. This oldest volcanism was followed by ca 10 million years of quiescence, ensuing as a basaltic eruption in the Lower Oligocene after the exhaustion of ignimbrite completely changed the composition, signifying the importance of bimodal volcanism common in the area.
This intermittent eruption of a bimodal composition took place again in the Upper Miocene (ca 22 Ma and ca 18 Ma) with yet another alternation in composition to ignimbrite and then trachyte, respectively. This was followed by the longest quiescence of volcanism, only to start similarly alternating eruptions of ignimbrite, firstly during the volcanism in Pleistocene, which was followed by the youngest basaltic eruptions in the area at around 1 Ma.
As noted earlier, the youngest ages for lavas found around Arba Minch range between 2 Ma and 0.9 Ma. On the basis of the analytical data determined in sample EO-53, it is
48 M A P S H E E T 0 6 3 7 - D 3 A R B A M I N C H
not possible to decide whether this K-Ar age reflects the real age of eruption or whether the radiometric age is simply slightly younger than the geological age. The latter might be the case because of potential loss in Ar caused by later eruption.
When taking into consideration that the sample DE-219 (K-Ar age; 2.34 ± 0.35 Ma) was also measured as the “whole-rock” sample, the age alternatively can be interpreted as a constraint on the timing of ash tuff eruption, suggesting that this volcanic activity took place also during the final stage of pyroclastic eruption. One may suppose that the scatter in whole-rock ages of ignimbrites/tuffs might reflect the incorporation of small amounts of excess 40Ar (e.g. the presence of xenocrysts) or some 40Ar loss due to the thermal effect caused by the subsequent event. However, it is evident that this acid ash tuff dated here into Pleistocene in terms of age, is apparently a part of this ignimbritic sequence and can be interpreted as contemporaneous volcanism. The stratigraphic record and the compositions of the dated samples also support this relationship.
K-Ar dating shows two distinct phases of basaltic eruptions (samples EO-52, EO-53) as well as three rhyolitic ignimbrite and acid ash eruptions with significant hiatus in between them. From the analytical data, a significant difference appears between the K content of the dated samples (0.643% and 1.433% for the samples EO-52 and EO-53, respectively), showing that the periods of voluminous outpouring of basalt were separated by protracted quiescent periods of no or limited volcanic activity. The magmatism from different periods also shows rather distinct characteristics in composition.
The whole-rock K-Ar ages obtained on sub-aerial basaltic lavas clearly show good consistency with the stratigraphy. From the consistency, it is concluded that the content of extraneous/excess argon in the basaltic magmas at the time of crystallization was low to negligible in the majority of cases. As a consequence, the analytical age can be considered as a geological age in such cases. From the limited radiometric age data available, it can be concluded that the emplacement of the rhyolitic ignimbrites was followed by alkali basalts, which formed the volcanic structure of a shield volcano and scoria cones.
5.4 Structural and tectonic patterns
The Arba Minch geological map at a scale of 1:50,000 lies at the western edge of the NNE–SSW trending southern domain of the Main Ethiopian Rift belonging to the East African Rift System (e.g. Hayward and Ebinger 1996; Bonini et al. 2005). This structure underwent a characteristic geodynamic evolution from an early continental extension (transtension), drifting toward the magma-dominated extension during a break-up due to the extension between the Nubian and Somalian plates (Agostini et al. 2011; Accocella 2010). The mapped area is built by: (a) pre-rift effusive rocks and volcaniclastic deposits consisting of three compositionally different rock sequences of Eocene to Oligocene ages such as the Amaro-Gamo Basalts, Shole Ignimbrites, basaltic lava flows and related acid pyroclastic deposits; (b) minor syn-rift volcanic deposits such as the Mimo Trachyte and the Dorze Ignimbrite of Miocene age. The pre- and syn-rift volcanic deposits are followed by (c) Pleistocene post-rift floor basaltic lava flows and related pyroclastic deposits (Dino Formation). A range of volcanic and volcano-sedimentary fabrics (flow foliation and bedding) and brittle rift-related structures (normal faults and extensional joints) were identified in the mapped area (Figure 5-25).

G E O L O G Y O F T H E A R B A M I N C H M A P S H E E T 49
Primary structures
The primary volcanic and volcano-sedimentary fabrics are defined by the planar preferred orientation of rock-forming minerals, micro-vesicles or micro-crystals and elongated mineral grains, lithic fragments or stretched and welded pumice fragments. The post-rift volcanic deposits show predominantly flat-lying bedding planes or flow foliations with weak orientational maxima reflecting ~SSW or ~E gently dipping planar fabrics (Figure 5-26a). Their origin is interpreted as corresponding to flow-stretching of viscous silicic lava or hot glass fragments during the flow.
Figure 5‑25. Structural scheme of the Arba Minch map sheet showing a regional fabric pattern and mapped faults.

50 M A P S H E E T 0 6 3 7 - D 3 A R B A M I N C H
The fabric pattern in pre- and syn-rift volcanic deposits exhibit a higher variability. The Amaro-Gamo basalts, basaltic lava flows (Figure 5-26b) and the Shole Ignimbrites show ~E or ~W gently dipping bedding or a flow foliation (Figure 5-26c) defined by the planar preferred orientation of rock-forming minerals or domains with variable amounts of micro-vesicles or micro-crystals. Slightly elongated mineral grains and lithic fragments or stretched and welded pumice fragments gently plunging to E or W were observed mainly in the Shole Ignimbrites (Figure 5-26c). These linear fabrics are interpreted to correspond to flow-stretching of viscous silicic lava or hot glass fragments during the flow of either coherent lava or clastic ignimbrites. A rare moderate to steeply dipping flow foliation probably reflects minor morphological inequalities in the basal parts of volcanic flows or their marginal parts. Contacts of individual volcanic flows and lithological boundaries are mostly sub-parallel to the flat-lying foliation or bedding planes in ignimbrites. In some places, the primary contacts were modified by normal faulting and/or exogenous processes. Minor Holocene pyroclastic deposits and lacustrine sediments exhibit scarce bedding mainly in the sub-horizontal position.
Brittle structures
Different types of brittle structures such as extensional joints, faults and fault zones mainly bearing normal kinematics were observed across the mapped area. The faults strongly affect the entire geological pattern, forming typical fault-dominated rift morphology. The prevailing faults are mostly parallel to the axis of the MER, forming prominent morphological features of the map sheet. These major faults dip steeply to ~ESE (Figure 5-27a and b), trending ~NNE–SSW (Figure 5-28). The fault planes are associated with fault lineation (slickensides) plunging steeply to moderately in ESE–NE directions, often bearing evidence of normal kinematics (Figure 5-29). Moreover, three subordinate sets of normal faults were identified within the area (Figure 5-27a and b): (a) steeply W to WSW dipping faults with steeply plunging lineations, which are ca 20o–30° oblique to the main fault system; (b) perpendicular, steeply to ~NNW dipping faults with ~NW plunging slickensides, and (c) moderately to steeply inclined faults trending ~WNW–ESE, which are perpendicular to the prevailing rift-parallel normal faults. The associated slickensides plunge predominantly to ~NNE or ~SSW, bearing evidence of normal kinematics. In
Figure 5‑26. Orientation diagrams of the primary structures in volcanic and volcano-sedimentary sequences: (a) – Bedding planes (poles) in ignimbrites and volcanoclastic rocks of the post-rift deposits; (b) – flow foliation in volcanic rocks (dots) in the pre-rift deposits and (c) – bedding planes (poles) in the Shole Ignimbrites and pyroclastic deposits. Equal projection to the lower hemisphere.

G E O L O G Y O F T H E A R B A M I N C H M A P S H E E T 51
addition, a right-lateral strike-slip component to the roughly WNW–ESE trending faults was also recognized at several sites within the surveyed area. The latter group of normal faults has not been observed yet in the post-rift volcanic deposits of Pleistocene age. The abundance of each set of normal faults is shown in Figure 5-27b.
Two distinct sets of extensional joints trending ~N(NNE)–S(SSW) and ~E(ESE)–W(WNW) with no evidence of movement were identified in all of the pre- to post-rift lithologies across the map sheet (Figure 5-27c). The frequency of extensional joints is shown in Figure 5-27d. Their orientation is largely consistent with the general fault pattern (compare the diagrams in Figure 5-27b and d).
Figure 5‑27. Orientation diagrams of faults and associated slickensides. (a) – Normal faults / fault zones in all volcanic sequences and associated slickensides. Post-rift deposits (red), pre- to syn-rift deposits (black); (b) – Frequency diagram showing the dip-direction of faults and fault zones in all units; (c) – Extensional joints in all lithologies (poles). Post-rift deposits (red), pre- to syn-rift deposits (black); (d) – Frequency diagram showing the dip-direction of extensional joints in all units. Equal projection to the lower hemisphere.
Figure 5‑28. Regional NNE–SSW trending fault with a normal component of movement. A goat for the scale.
Figure 5‑29. Subvertical slickensides associated with WNW–ESE trending faults. The buttom edge of the photo is 10 cm.
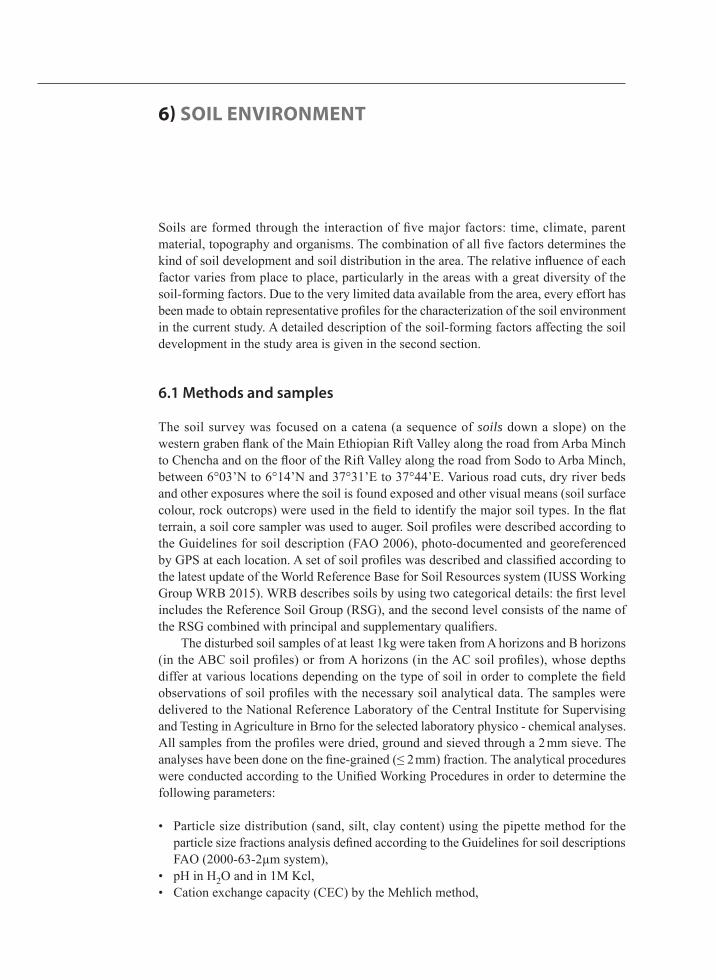
Soils are formed through the interaction of five major factors: time, climate, parent material, topography and organisms. The combination of all five factors determines the kind of soil development and soil distribution in the area. The relative influence of each factor varies from place to place, particularly in the areas with a great diversity of the soil-forming factors. Due to the very limited data available from the area, every effort has been made to obtain representative profiles for the characterization of the soil environment in the current study. A detailed description of the soil-forming factors affecting the soil development in the study area is given in the second section.
6.1 Methods and samples
The soil survey was focused on a catena (a sequence of soils down a slope) on the western graben flank of the Main Ethiopian Rift Valley along the road from Arba Minch to Chencha and on the floor of the Rift Valley along the road from Sodo to Arba Minch, between 6°03’N to 6°14’N and 37°31’E to 37°44’E. Various road cuts, dry river beds and other exposures where the soil is found exposed and other visual means (soil surface colour, rock outcrops) were used in the field to identify the major soil types. In the flat terrain, a soil core sampler was used to auger. Soil profiles were described according to the Guidelines for soil description (FAO 2006), photo-documented and georeferenced by GPS at each location. A set of soil profiles was described and classified according to the latest update of the World Reference Base for Soil Resources system (IUSS Working Group WRB 2015). WRB describes soils by using two categorical details: the first level includes the Reference Soil Group (RSG), and the second level consists of the name of the RSG combined with principal and supplementary qualifiers.
The disturbed soil samples of at least 1kg were taken from A horizons and B horizons (in the ABC soil profiles) or from A horizons (in the AC soil profiles), whose depths differ at various locations depending on the type of soil in order to complete the field observations of soil profiles with the necessary soil analytical data. The samples were delivered to the National Reference Laboratory of the Central Institute for Supervising and Testing in Agriculture in Brno for the selected laboratory physico - chemical analyses. All samples from the profiles were dried, ground and sieved through a 2 mm sieve. The analyses have been done on the fine-grained (≤ 2 mm) fraction. The analytical procedures were conducted according to the Unified Working Procedures in order to determine the following parameters:
• Particle size distribution (sand, silt, clay content) using the pipette method for the particle size fractions analysis defined according to the Guidelines for soil descriptions FAO (2000-63-2µm system),
• pH in H2O and in 1M Kcl, • Cation exchange capacity (CEC) by the Mehlich method,
6) SOIL ENVIRONMENT

S O I L E N V I R O N M E N T 53
• Sum of base cations and base saturation (BS), • Available nutrients P, K, Ca, Mg extracted by the Mehlich III method, • Soil carbonates determination by the gravimetric method.
Total organic carbon (TOC) was determined in the laboratories of the Czech Geological Survey using an infrared analyser.
A map of the spatial extent and distribution of the major Reference Soil Groups was constructed (Soil map). The final soil map is based on the most recent (available) geological map, results of the soil survey, aerial photos and topography. It can be said that if certain properties of soils from different parent materials under certain, climate, vegetative and topographic conditions are known, then the prediction of expected soil characteristics by looking only at the types of parent materials is possible (Gökbulak and Özcan 2008). If the bedrock is identical, then the most important soil-forming factor is the relief, particularly in the area with such a distinctively diversified topography, similarly to the mapped area. This presumption permits the basic prediction of the soil spatial distribution and construction of a soil map.
6.2 Reference Soil Groups in the study area
The soil cover of the area can be characterized in a simplified way by the following major Reference Soil Groups (RSG). The steep slopes with moderately weathered rocks in the uppermost part of the mapped area as well as the middle and lower slope positions of the Rift Valley escarpment are covered by Cambisols, the highland valleys and plateaus with
Figure 6‑1. The soil catena across the Rift Valley escarpment.

54 M A P S H E E T 0 6 3 7 - D 3 A R B A M I N C H
strongly weathered residual rocks cover Nitisols and Acrisols, the colluvial sediments on the slopes and lower foot of an escarpment are covered by Regosols and finally the flat valley floor is covered by Fluvisols developed from the alluvial and lacustrine deposits (Figure 6-1). The agriculture is concentrated in the highland area with the deeply weathered reddish soils and in the alluvial plain with the very young soils developed on the Quaternary, mostly Holocene, sediments.
Cambisols CM
Cambisols are the soils having at least the initial development of a cambic horizon. The cambic horizon is a subsurface horizon showing evidence of pedogenetic alteration that ranges from weak to relatively strong. The cambic horizon has lost at least half of the volume of the fine earth fraction. If the underlying layer has the same parent material, the cambic horizon usually shows higher oxide and/or clay contents than this underlying layer. The pedogenetic alteration of the cambic horizon can also be established by contrast with one of the overlying mineral horizons that are generally richer in organic matter and therefore have a darker and/or less intense colour shades. In this case, some well-developed soil structure is needed to prove pedogenetic alteration. The cambic horizon can be considered as the predecessor of many other diagnostic horizons, which have specific properties that are not recognized in the cambic horizon – such as illuvial or residual accumulations or the development of a specific soil structure (IUSS Working Group WRB 2015).
Cambisols cover slopes of the uppermost part of the mapped area as well as the slopes in the lower part between the highland plateaus and the foot of the escarpment. Generally, cambisols are not common in the sub-humid and humid tropics because of the faster rate of weathering and soil formation than in the temperate climate. However, in the areas with active erosion, they may occur in association with mature tropical soils and/or very young and weakly developed soils. Cambisols differ in the study area, particularly depending on the altitude and topographic position. The parent material is also of a great importance.
Figure 6‑2. Different colours of Cambisols in the study area. The dark brown coloured Haplic Cambisol (KE46) in the higher altitude (2773 m, left) and the red coloured Rhodic Cambisol (JJ01) in the middle part of the slope (2150 m, right).

S O I L E N V I R O N M E N T 55
The Cambisol profile shows some specific properties that are found in the uppermost locations of the study area. That indicates a presumable Andosol occurrence at high altitudes of the summit area, which were not included in the scope of the current study. The highest altitude represents the profile KE045, i.e. a very dark brownish black coloured soil (10YR 2/2 and 10YR 2/3), which results from the accumulation of organic matter (4.9 w.t. % in A horizon) with silt loamy texture and well-expressed granular structure in the surface horizon.
Cambisols in the middle and lower slope positions of the catena are more or less reddish coloured, corresponding to the Munsell colour hue redder than 7,5YR (Chromic qualifier) or even redder than 5YR (Rhodic qualifier) (Figure 6-2). The changes in colour and clay content between the overlying and underlying soil horizon belong to the crucial diagnostic properties of Cambisols, which are used during the field identification. Table 6-1 summarizes diagnostic data related to the Cambisol soil profiles in the study area.
Table 6‑1 . Cambisols identified in the study area and selection of the diagnostic properties
AltitudeM a.s.l. Profile Hor. Colour Clay
% Texture Soil type
2955 KE045Ah 10YR 2/2 12.18 silt loam Andic Cambisol
(Humic)Bw 10YR 2/3 11.78 silt loam
2773 KE046Ah 10YR 3/3 26.07 silt loam Haplic Cambisol
(Humic)Bw 10YR 3/4 27.26 silty clay loam
2522 KE039Ah 5YR 2/3 34.95 silty clay loam Chromic Cambisol
(Humic)Bw 5YR 2/4 40.15 silty clay
2150 JJ001Ah 2.5YR 4/3 54.36 silty clay Dystric Rhodic
CambisolBw 2.5YR 3/4 61.83 clay
1990 JJ004Ah 7.5YR 3/4 27.59 sandy clay loam Eutric Chromic
CambisolBw 5YR 3/4 35.33 clay loam
1660 JJ005 Ah 5YR 3/3 41.36 silty clay Eutric Chromic Cambisol (Colluvic)
Cambisols on the slopes developed from colluvial sediments in the lower part of the Rift Valley escarpment, containing an admixture of colluvic material (gravity deposits, heterogeneous mixture of material that has moved down the slope). The selected chemical properties of Cambisols that are essential for their agricultural use are summarized in Table 6-2.
The results of chemical analyses indicate that the Cambisols in the mapped area are mostly acidic soils, pH (H2O) ranges from very strong acidic values to moderately acidic.
The pH (H2O) values are higher than the values obtained using the KCl solution. The numerical difference in the values of pH measured by KCl and H2O and (delta pH) remains negative, which is an indication of the negatively charged clay surface. The comparison of KCl pH with H2O pH provides an assessment of the nature of the net

56 M A P S H E E T 0 6 3 7 - D 3 A R B A M I N C H
charge on the colloidal system. The pH (KCl) is lesser than pH (H2O) in the soils with net negative charge (the “normal” situation); the reverse is true in soils with net positive charge.
Cambisols have a high content of the total organic carbon (TOC) at altitudes exceeding 2,500 m a.s.l. TOC can be converted to the soil organic matter (SOM) by using a conversion factor of 1.724: SOM (%) = TOC (%) x 1.724. This conversion factor assumes that organic matter contains 58 % organic carbon (however, this can vary according to the type of organic matter, soil type and soil depth). The relationship between TOC and altitude has been investigated and positive correlations were reported (Sims and Nielsen, 1986). Altitude also influences TOC by controlling soil water balance, soil erosion and geologic deposition processes (Tan et al., 2004). The key drivers influencing the variability of soil organic carbon in the tropics are texture, climate, topography, and land use management. The relative importance of soil organic matter to provide certain functions in soils varies with texture and soil organic matter, generally being more critical in the soils with lower clay contents (Musinguzi et al. 2013).
The cation exchange capacity (CEC) is medium or high in most cases with the only exception of the profile JJ004 with low CEC. Generally, the soils with large amounts of high activity clays are not intensely weathered. High activity clays have a high CEC due to their large surface area. This means that these clays have a great capacity to retain and supply large quantities of nutrients. In contrast, low activity clays are more highly weathered. Thus, due to their lesser surface area, low activity clays have a lower capacity to retain and supply nutrients.
Soil chemistry is very complex - most nutrients exist in different chemical forms and not all forms are equally plant-available. The content of available nutrients considerably affects the soil pH and soil texture. A high content of Ca and Mg was determined in some Cambisols developed from basaltic rocks; the highest content was determined in
Table 6‑2 . Selected chemical characteristics of Cambisols
Sample DepthpH/H2O pH/KCl
Δ P K Ca Mg TOC* CEC CaCO3
cm pH mg/kg mg/kg mg/kg mg/kg % cmolc/kg %
JJ001A 10–20 4.70 4.10 –0.6 < 3.5 33 476 38 1.92 21.84 < 0.20
JJ001B 50–60 4.90 4.00 –0.9 < 3.5 < 20 232 12 0.74 18.49 < 0.20
JJ004A 20–30 5.40 4.30 –1.1 < 3.5 23 569 138 0.99 11.28 < 0.20
JJ004B 70–80 5.80 4.80 –1.0 < 3.5 < 20 653 78 0.63 9.46 < 0.20
JJ005A 10–20 5.40 4.00 –1.4 < 3.5 166 2212 1126 1.70 38.07 < 0.20
JJ005B 30–40 6.00 4.30 –1.7 < 3.5 97 3475 1361 0.74 37.49 < 0.20
KE039A 10–20 4.70 3.90 –0.8 < 3.5 88 728 53 2.99 34.29 < 0.20
KE039B 40–50 4.70 3.90 –0.8 < 3.5 74 375 62 2.61 22.42 < 0.20
KE045A 10–20 4.70 3.70 –1.0 < 3.5 56 1700 676 2.90 40.84 < 0.20
KE045B 40–50 5.00 3.70 –1.3 < 3.5 33 1119 292 1.96 37.86 < 0.20
KE046A 10–20 4.90 4.10 –0.8 < 3.5 119 1763 495 2.44 28.83 < 0.20
KE046B 40–50 5.00 4.10 –0.9 < 3.5 81 1572 415 2.19 21.26 < 0.20
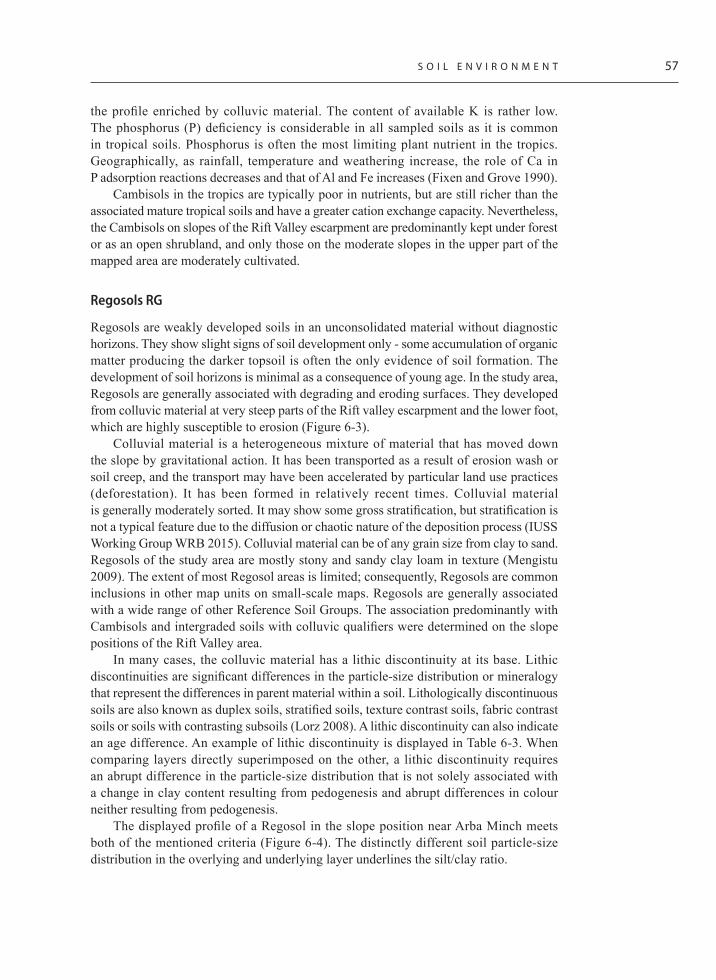
S O I L E N V I R O N M E N T 57
the profile enriched by colluvic material. The content of available K is rather low. The phosphorus (P) deficiency is considerable in all sampled soils as it is common in tropical soils. Phosphorus is often the most limiting plant nutrient in the tropics. Geographically, as rainfall, temperature and weathering increase, the role of Ca in P adsorption reactions decreases and that of Al and Fe increases (Fixen and Grove 1990).
Cambisols in the tropics are typically poor in nutrients, but are still richer than the associated mature tropical soils and have a greater cation exchange capacity. Nevertheless, the Cambisols on slopes of the Rift Valley escarpment are predominantly kept under forest or as an open shrubland, and only those on the moderate slopes in the upper part of the mapped area are moderately cultivated.
Regosols RG
Regosols are weakly developed soils in an unconsolidated material without diagnostic horizons. They show slight signs of soil development only - some accumulation of organic matter producing the darker topsoil is often the only evidence of soil formation. The development of soil horizons is minimal as a consequence of young age. In the study area, Regosols are generally associated with degrading and eroding surfaces. They developed from colluvic material at very steep parts of the Rift valley escarpment and the lower foot, which are highly susceptible to erosion (Figure 6-3).
Colluvial material is a heterogeneous mixture of material that has moved down the slope by gravitational action. It has been transported as a result of erosion wash or soil creep, and the transport may have been accelerated by particular land use practices (deforestation). It has been formed in relatively recent times. Colluvial material is generally moderately sorted. It may show some gross stratification, but stratification is not a typical feature due to the diffusion or chaotic nature of the deposition process (IUSS Working Group WRB 2015). Colluvial material can be of any grain size from clay to sand. Regosols of the study area are mostly stony and sandy clay loam in texture (Mengistu 2009). The extent of most Regosol areas is limited; consequently, Regosols are common inclusions in other map units on small-scale maps. Regosols are generally associated with a wide range of other Reference Soil Groups. The association predominantly with Cambisols and intergraded soils with colluvic qualifiers were determined on the slope positions of the Rift Valley area.
In many cases, the colluvic material has a lithic discontinuity at its base. Lithic discontinuities are significant differences in the particle-size distribution or mineralogy that represent the differences in parent material within a soil. Lithologically discontinuous soils are also known as duplex soils, stratified soils, texture contrast soils, fabric contrast soils or soils with contrasting subsoils (Lorz 2008). A lithic discontinuity can also indicate an age difference. An example of lithic discontinuity is displayed in Table 6-3. When comparing layers directly superimposed on the other, a lithic discontinuity requires an abrupt difference in the particle-size distribution that is not solely associated with a change in clay content resulting from pedogenesis and abrupt differences in colour neither resulting from pedogenesis.
The displayed profile of a Regosol in the slope position near Arba Minch meets both of the mentioned criteria (Figure 6-4). The distinctly different soil particle-size distribution in the overlying and underlying layer underlines the silt/clay ratio.
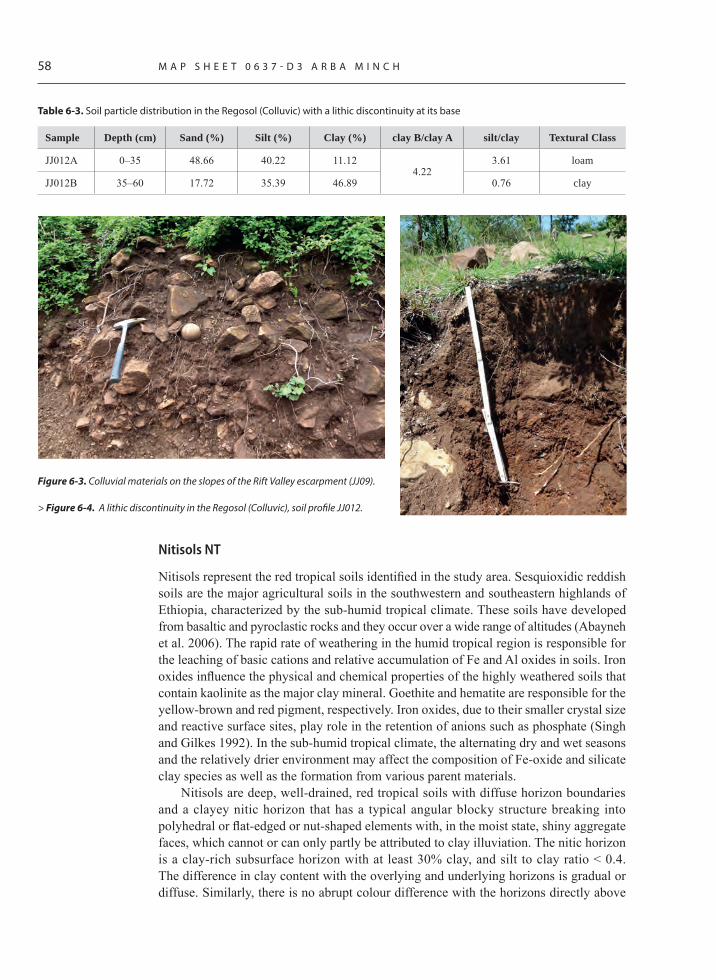
58 M A P S H E E T 0 6 3 7 - D 3 A R B A M I N C H
Nitisols NT
Nitisols represent the red tropical soils identified in the study area. Sesquioxidic reddish soils are the major agricultural soils in the southwestern and southeastern highlands of Ethiopia, characterized by the sub-humid tropical climate. These soils have developed from basaltic and pyroclastic rocks and they occur over a wide range of altitudes (Abayneh et al. 2006). The rapid rate of weathering in the humid tropical region is responsible for the leaching of basic cations and relative accumulation of Fe and Al oxides in soils. Iron oxides influence the physical and chemical properties of the highly weathered soils that contain kaolinite as the major clay mineral. Goethite and hematite are responsible for the yellow-brown and red pigment, respectively. Iron oxides, due to their smaller crystal size and reactive surface sites, play role in the retention of anions such as phosphate (Singh and Gilkes 1992). In the sub-humid tropical climate, the alternating dry and wet seasons and the relatively drier environment may affect the composition of Fe-oxide and silicate clay species as well as the formation from various parent materials.
Nitisols are deep, well-drained, red tropical soils with diffuse horizon boundaries and a clayey nitic horizon that has a typical angular blocky structure breaking into polyhedral or flat-edged or nut-shaped elements with, in the moist state, shiny aggregate faces, which cannot or can only partly be attributed to clay illuviation. The nitic horizon is a clay-rich subsurface horizon with at least 30% clay, and silt to clay ratio < 0.4. The difference in clay content with the overlying and underlying horizons is gradual or diffuse. Similarly, there is no abrupt colour difference with the horizons directly above
Figure 6‑3. Colluvial materials on the slopes of the Rift Valley escarpment (JJ09).
> Figure 6‑4. A lithic discontinuity in the Regosol (Colluvic), soil profile JJ012.
Table 6‑3 . Soil particle distribution in the Regosol (Colluvic) with a lithic discontinuity at its base
Sample Depth (cm) Sand (%) Silt (%) Clay (%) clay B/clay A silt/clay Textural Class
JJ012A 0–35 48.66 40.22 11.124.22
3.61 loam
JJ012B 35–60 17.72 35.39 46.89 0.76 clay

S O I L E N V I R O N M E N T 59
and below. The colours are of low values with hues often 2.5YR, moist, but sometimes redder or yellower. These soils are mostly derived from the basic parent rocks by strong weathering (IUSS Working Group WRB 2015). The exact origin of shiny faces of the polyhedral, flat-sided or nutty elements typical of the nitic horizon is still under debate. The development of these typical nitic properties, or the nitidization process, is assumed to be related to alternating micro-swelling and shrinking (Driessen et al. 2001). The soil moisture regime plays an important role because it influences the degree of swell–shrink behaviour, which will be strongest in a climate with contrasting wet and dry seasons. The contributing factors to Nitisol development are: (i) the presence of open 2/1 clays besides the dominant kaolinite, resulting in a relatively high water-dispersible clay content and high swell-shrink potential, (ii) seasonal cycles of wetting and drying, contributing to a strong blocky soil structure development, (iii) recurrent conditions of weak temporary hydromorphism, resulting in the redistribution of Fe-Mn oxides, and (iv) exceptional Fe oxide characteristics, particularly the extremely small particle size. Together with the presence of abundant clay coatings, these Fe oxide characteristics explain the shiny aspect of the ped face that is characteristic of nitic horizons (De Wispelaere 2015). The highly weathered mature red tropical soils predominantly cover the upper part of highlands, the highland valley areas with moderate slopes and the separating plateaus but were also found sporadically at the lower altitudes of the study area (Figure 6-5).
The described soil profiles have a clayey texture (but feel loamy), moderately developed A horizons with a granular structure and B horizons with a moderately to strongly developed subangular to angular blocky structure, which have common shiny soil aggregate faces typical for Nitisols. The shiny faces become more obvious with depth. Increasing amounts of the black nodules of Fe and Mn oxides were observed in the Bt horizon mostly in clusters. Soil profile JJ003 was classified as Dystric Rhodic Nitisol and soil profile JJ010 as Rhodic Nitisol (Colluvic). The Munsell colour, particle-size
Figure 6‑5. Dystric Rhodic Nitisol at a typical highland location (alt. 2400m) (profile JJ003) and Rhodic Nitisol (Colluvic) with a colluvic material admixture in topsoil in an atypical location (alt. 1350 m) on the Sodo-Arba Minch road (profile JJ10).
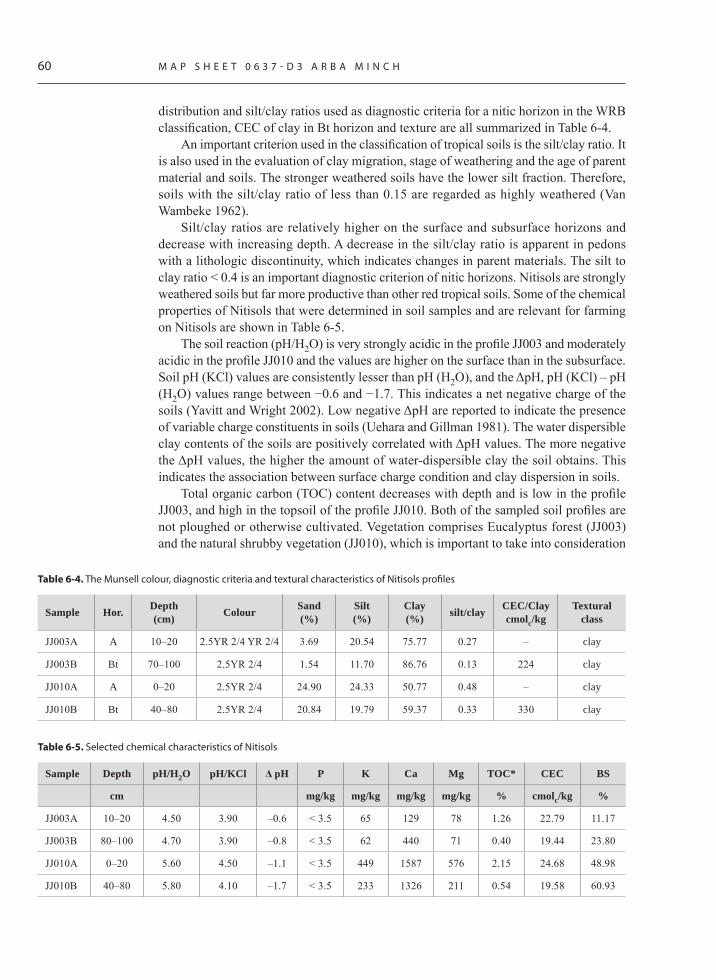
60 M A P S H E E T 0 6 3 7 - D 3 A R B A M I N C H
distribution and silt/clay ratios used as diagnostic criteria for a nitic horizon in the WRB classification, CEC of clay in Bt horizon and texture are all summarized in Table 6-4.
An important criterion used in the classification of tropical soils is the silt/clay ratio. It is also used in the evaluation of clay migration, stage of weathering and the age of parent material and soils. The stronger weathered soils have the lower silt fraction. Therefore, soils with the silt/clay ratio of less than 0.15 are regarded as highly weathered (Van Wambeke 1962).
Silt/clay ratios are relatively higher on the surface and subsurface horizons and decrease with increasing depth. A decrease in the silt/clay ratio is apparent in pedons with a lithologic discontinuity, which indicates changes in parent materials. The silt to clay ratio < 0.4 is an important diagnostic criterion of nitic horizons. Nitisols are strongly weathered soils but far more productive than other red tropical soils. Some of the chemical properties of Nitisols that were determined in soil samples and are relevant for farming on Nitisols are shown in Table 6-5.
The soil reaction (pH/H2O) is very strongly acidic in the profile JJ003 and moderately acidic in the profile JJ010 and the values are higher on the surface than in the subsurface. Soil pH (KCl) values are consistently lesser than pH (H2O), and the ΔpH, pH (KCl) – pH (H2O) values range between −0.6 and −1.7. This indicates a net negative charge of the soils (Yavitt and Wright 2002). Low negative ΔpH are reported to indicate the presence of variable charge constituents in soils (Uehara and Gillman 1981). The water dispersible clay contents of the soils are positively correlated with ΔpH values. The more negative the ΔpH values, the higher the amount of water-dispersible clay the soil obtains. This indicates the association between surface charge condition and clay dispersion in soils.
Total organic carbon (TOC) content decreases with depth and is low in the profile JJ003, and high in the topsoil of the profile JJ010. Both of the sampled soil profiles are not ploughed or otherwise cultivated. Vegetation comprises Eucalyptus forest (JJ003) and the natural shrubby vegetation (JJ010), which is important to take into consideration
Table 6‑4 . The Munsell colour, diagnostic criteria and textural characteristics of Nitisols profiles
Sample Hor. Depth(cm) Colour Sand
(%)Silt(%)
Clay(%) silt/clay CEC/Clay
cmolc/kgTextural
class
JJ003A A 10–20 2.5YR 2/4 YR 2/4 3.69 20.54 75.77 0.27 – clay
JJ003B Bt 70–100 2.5YR 2/4 1.54 11.70 86.76 0.13 224 clay
JJ010A A 0–20 2.5YR 2/4 24.90 24.33 50.77 0.48 – clay
JJ010B Bt 40–80 2.5YR 2/4 20.84 19.79 59.37 0.33 330 clay
Table 6‑5 . Selected chemical characteristics of Nitisols
Sample Depth pH/H2O pH/KCl Δ pH P K Ca Mg TOC* CEC BS
cm mg/kg mg/kg mg/kg mg/kg % cmolc/kg %
JJ003A 10–20 4.50 3.90 –0.6 < 3.5 65 129 78 1.26 22.79 11.17
JJ003B 80–100 4.70 3.90 –0.8 < 3.5 62 440 71 0.40 19.44 23.80
JJ010A 0–20 5.60 4.50 –1.1 < 3.5 449 1587 576 2.15 24.68 48.98
JJ010B 40–80 5.80 4.10 –1.7 < 3.5 233 1326 211 0.54 19.58 60.93

S O I L E N V I R O N M E N T 61
together with the considerable admixture of colluvic material in the profile JJ010. The clay mineralogy and content of Al and Fe (hydro-) oxides in tropical soils have had a significant influence on the stability of soil organic carbon (SOC) (Bech Bruun et al. 2010). The role of SOC is especially important in tropical farming systems, where the soil productivity often relies on limited external inputs, so that the maintenance of SOC reservoir plays a key role in the sustainable management of these soils. The cation exchange capacity (CEC) of the soils is medium high and surface horizons have a higher CEC than subsurface horizons. The soils of the humid tropics are characterized by a very low CEC and base status. The moderate to low CEC reflects the dominance of 1:1 lattice clays (either kaolinite and/or [meta-] halloysite). Base saturation is extremely low in the profile JJ003 in contrast to medium saturation in the profile JJ010. In the sub-humid tropical climate, it appears that the soils are relatively high in CEC and base saturation, while the difference in the rate of weathering and degree of leaching are the major factors. The content of available nutrients differs considerably between the two sampled profiles, and the content of available K, Ca and Mg ranges from low values in the profile JJ003 to satisfactory and high in the profile JJ010. Phosphorus is often the most limiting plant nutrient in the tropics. The highly weathered, iron-rich tropical soils tend to be deficient in plant-available phosphorus. The low pH together with high levels of iron and aluminium oxides tends to immobilize phosphorus onto soil particles, thus denying its availability to plants (Batjes 2011). The deep and porous solum and the stable soil structure of Nitisols permit deep rooting. Nitisols are widely used for food crop production on small farms. More than half of the area occupied by Nitisols worldwide is found in tropical Africa, and Ethiopia is one of the mainstays of these soils.
Fluvisols FL
Fluvisols represent genetically young soils with fluvic material without distinct horizon differentiation, except for the distinct topsoil horizon resulting from cultivation. Fluvic material refers to fluvial and lacustrine sediments that receive fresh detrital material or have received it in the past and still show stratification. Stratification may be reflected in different ways: variation in texture and/or content or nature of coarse fragments, different colours related to the source materials or alternating lighter and darker coloured soil layers, indicating an irregular decrease in soil organic carbon content with depth (IUSS Working Group WRB 2015). Fluvisols developed or derived from the recent alluvial and lacustrine deposits occupy the lowest part of selected area along the shores of the Lake Abaya. The Munsell colour, texture and classification are presented in Table 6-6 and their selected chemical characteristics in Table 6-7. Fluvic material is always associated with water bodies (e.g. rivers, lakes) and can therefore be distinguished from colluvial material (Figure 6-6).
The soil reaction (pH/H2O) is neutral to slightly alkaline. The pH (H2O) values are higher than those obtained using KCl solution. The numerical difference in the values of pH/KCl and pH/H2O (Δ pH) is negative, which is an indication of a negatively charged clay surface. Total organic carbon (TOC) is low, providing that the value of 2% of soil organic carbon is a useful guide for the level of soil organic carbon to maintain the soil properties in a functional form. The cation exchange capacity (CEC) is very high as well as the base saturation (BS). The high values of soil sorption characteristics correspond to the very high content of calcium and magnesium. On the other hand, the potassium content ranges from low to satisfactory, and the phosphorus content from very low to

62 M A P S H E E T 0 6 3 7 - D 3 A R B A M I N C H
low. However, the low phosphorus content is still higher than its content in other soils of the study area.
The Fluvisols of alluvial plain represent a very important part of agricultural land of the mapped area. The farming practices are dominantly represented by monocultures of cash crops (banana monoculture), mixed farming of banana with mango (poly-culture) and subsistence farming of maize, other cereals and cotton. The state farms consist of large complexes in this area.
Table 6‑6 . The Munsell colour, textural characteristics and classification of Fluvisols
Sample Depth (cm) Colour Sand (%) Silt (%) Clay (%) Texture RSG
JJ007 10–20 10YR 2/3 48.32 39.82 11.86 Loam Eutric Fluvisol
JJ011 10–20 10YR 2/3 6.66 55.92 37.42 Silty clay loam Eutric Fluvisol
JJ014 10–30 10YR 2/3 31.21 53.41 15.38 Silt loam Eutric Fluvisol
Table 6‑7 . Selected chemical characteristics of the sampled Fluvisols
Sample Depth pH/H2O
pH/KCl
Δ P K Ca Mg TOC CEC BS CaCO3
cm pH mg/kg mg/kg mg/kg mg/kg % cmolc/kg % %
JJ007 10–20 7.60 5.80 –1.8 < 3.5 78 7180 1092 0.36 41.42 100.00 0,60
JJ011 10–20 7.10 5.70 –1.4 21.1 253 6035 1184 0.68 44.92 96.15 0,20
JJ014 10–30 7.70 6.60 –1.1 7.8 170 6571 992 0.87 43.97 83.76 < 0,20
Figure 6‑6. Eutric Fluvisols with a well-expressed stratification developed from alluvial sediments along the shores of the Lake Abaya in the profiles JJ007 (left) and JJ014 (right).

S O I L E N V I R O N M E N T 63
Luvisols LV
Luvisols are moderately weathered soils and in the tropics they occur on relatively young surfaces. They are quite widespread in the mapped area, but they were not sampled within the described soil catena. Luvisols have a higher clay content in the subsoil than in the topsoil as a result of pedogenetic processes (especially clay migration) leading to an argic subsoil horizon. An argic horizon is a subsurface horizon with distinctly higher clay content than the overlying horizon. Textural differentiation is the main feature for the recognition of argic horizons. Luvisols have high-activity clays throughout the argic horizon and a high base saturation at the depth of 50–100 cm. Cation exchange capacity (CEC) equals to or more than 24 cmolc per kg clay throughout the argic horizon. The “illuvial” nature of the argic horizon may be established using a ×10 hand lens and/or using thin sections. (IUSS Working Group WRB 2015).
Luvisols are fertile soils and suitable for a wide range of agricultural uses if managed appropriately. They require erosion control measures on steep slopes.
Acrisols AC
Acrisols originate on old landscapes that have an undulating topography and a humid tropical climate. Acrisols have a higher clay content in the subsoil than in the topsoil as a result of pedogenetic processes (especially clay migration) leading to an argic subsoil horizon. The loss of iron oxides together with clay minerals may lead to a bleached eluviation horizon between the surface horizon and the argic subsurface horizon. Acrisols have low-activity clays in the argic horizon and a low base saturation at the depth of 50–100 cm. The occurrence of Acrisols is marginal in the mapped area and they were not described and sampled within the soil survey.
6.3 Opportunities for and threats to the soils in the studied area
This section highlights the strengths, weaknesses, opportunities for and threats to each of the main soil types found in the mapped area. The causative factors of soil threats in the tropics are deforestation for logging and fuel wood uses, deforestation for shifting cultivation, intensive agriculture, industrial activities, overgrazing, climatic, topographic and edaphic factors. It is more and more important that we understand the pressures that we are putting on soils and take steps to safe them for the future.
Cambisols
Strengths: Cambisols are among the higher quality agricultural soils in Africa as they are less depleted of nutrients than other tropical soils and have a sufficiently high nutrient-holding capacity to retain fertilisers.
Weaknesses: Strongly weathered Cambisols contain limited amounts of nutrients.
Opportunities: Depending on their depth, their water-holding capacity can be high in deeper profiles.
64 M A P S H E E T 0 6 3 7 - D 3 A R B A M I N C H
Threats: In hilly or mountainous areas, where Cambisols are the most frequent, care should be taken to prevent soil erosion when the surface is bare. Under such conditions, these soils are better kept under forest cover or perennial crops such as tea.
Regosols
Strengths: Most Regosols are well supplied with the nutrients as they occur in young weathering material.
Weaknesses: Water-holding capacity is often low and water stress of crops is common.
Opportunities: Shrub and tree cultivation is possible where climate allows. Otherwise, they are best left under natural vegetation.
Threats: A weakly developed soil formation makes these soils prone to erosion.
Nitisols
Strengths: Nitisols are suited for a wide range of crops. Many Nitisols are also used to grow coffee.
Weaknesses: In annual cropping, fertiliser application is necessary to make these soils productive. Due to the high amount of active iron, Nitisols suffer from phosphate-fixation. Retention rates of 80% or more are common.
Opportunities: Intensive liming can overcome the aluminium toxicity.
Threats: Soil erosion on steeper slopes.
Fluvisols
Strengths: Fluvisols, except for the very acid ones, are fertile because of the regular supply of nutrients. Riverine Fluvisols are highly suitable for wetland rice because of the close proximity to fresh water.
Weaknesses: Flood control or drainage may be needed due to the proximity of rivers. Low-lying back swamps, if not suitable for wetland rice, are best left under the natural vegetation; these areas may be used for extensive grazing when they are accessible.
Opportunities: High agricultural potential owing to good natural fertility.
Threats: Flooding and waterlogging; prone to urbanisation and sealing (Jones et al. 2013).
The surveyed area with its mountainous topography and steep slopes and tropical climate with heavy rains is susceptible to water erosion, the intense hill slope erosion in particular, resulting in the formation of rills and gullies. Erosion rates are very sensitive to soil texture and moisture, vegetation cover, land use, slope and climate as well as to soil conservation practices at the field level. Soils differ in their susceptibility to erosion based

S O I L E N V I R O N M E N T 65
on texture; a soil with a high content of silt and clay particles has a greater susceptibility to erosion than a sandy soil under the same conditions. The prevailing soil textures in the mapped area are shown in a ternary diagram in Figure 6-7.
Soil textural classes range between sandy clayey loam to clay in topsoil and clayey loam to clay in subsoil. Loamy soils with a medium to moderately fine texture and clayey soils with a fine texture are the most abundant in the area surveyed.
The susceptibility to land degradation differs within the major agricultural soils of the study area according to Stocking and Murnaghan (2000) (Table 6-8). Regosols are not included in the table because within the study area, they are generally associated with degrading and eroding surfaces in very steep parts of the Rift Valley escarpment, being prone to strong erosion at its foot. However, Regosols are mostly covered by natural shrubby vegetation and have no agricultural use except for very extensive grazing. The agricultural land use systems and forestland of Chencha and Arba Minch have undergone significant changes during the last century. Cultivated land increased, whereas the grasslands in the highlands were converted to a cultivated land. Similarly, there is a significantly decreasing trend in regional forest cover.
The most cited factors that cause deforestation in the study area are agricultural land expansion, fuel wood demand and settlement. Farmland scarcity has already caused farmers to cultivate marginal land areas and fragile ecosystems. This, coupled with deforestation and cattle grazing on the remaining forestland, resulted in a decline in soil fertility and an increase in soil erosion by water.
Nitisols present the predominantly cultivated Reference Soil Group in undulating parts of the mapped area, because of their high productivity among the soils of the humid tropics. However, they are prone to erosion on the slopes (Figure 6-8). The typical nitic properties, the high rainfall, the cultivation of most parts of the land and steep slopes, make this Nitisol region very sensitive not only to erosion, but also to landslides. Landslides are a significant problem for the local farmers. Therefore, it is important to look for reliable and sustainable measures to be adopted. Total reforestation with deep-rooted trees can possibly stabilize the slopes and reduce the landslide risk, although this is not a realistic measure due to the shortage of arable land in this highly populated area.
Figure 6‑7. Soil texture distribution in the topsoil and subsoil in the soil of the study area.
Soil texture distribution – topsoil Soil texture distribution – subsoil
58
Threats: Soil erosion on steeper slopes.
Fluvisols
Strengths: Fluvisols, except for the very acid ones, are fertile because of the regular supply of nutrients. Riverine Fluvisols are highly suitable for wetland rice because of the close proximity to fresh water.
Weaknesses: Flood control or drainage may be needed due to the proximity of rivers. Low-lying back swamps, if not suitable for wetland rice, are best left under the natural vegetation; these areas may be used for extensive grazing when they are accessible.
Opportunities: High agricultural potential owing to good natural fertility.
Threats: Flooding and waterlogging; prone to urbanisation and sealing (Jones et al. 2013).
The surveyed area with its mountainous topography and steep slopes and tropical climate with heavy rains is susceptible to water erosion, the intense hill slope erosion in particular, resulting in the formation of rills and gullies. Erosion rates are very sensitive to soil texture and moisture, vegetation cover, land use, slope and climate as well as to soil conservation practices at the field level. Soils differ in their susceptibility to erosion based on texture; a soil with a high content of silt and clay particles has a greater susceptibility to erosion than a sandy soil under the same conditions. The prevailing soil textures in the mapped area are shown in a ternary diagram in Figure 6-7.
Soil texture distribution – topsoil
Soil texture distribution – subsoil
Figure 6-7 Soil texture distribution in the topsoil and subsoil in the soil of the study area
Soil textural classes range between sandy clayey loam to clay in topsoil and clayey loam to clay in subsoil. Loamy soils with a medium to moderately fine texture and clayey soils with a fine texture are the most abundant in the area surveyed.
The susceptibility to land degradation differs within the major agricultural soils of the study area according to Stocking and Murnaghan (2000) (Table 6-8). Regosols are not included in the table because within the study area, they are generally associated with degrading and eroding surfaces in very steep parts of the Rift Valley escarpment, being prone to strong erosion at its foot. However, Regosols are mostly covered by natural shrubby vegetation and have no agricultural use except for

66 M A P S H E E T 0 6 3 7 - D 3 A R B A M I N C H
Agricultural practices in Ethiopia have long been accompanied by soil erosion. Farmers have been using diversified measures for soil and water conservation in several combinations. The indigenous and very old soil and water conservation technology in the area is based on stonewalled terraces. The main construction materials for terrace walls are stones of bedrock, which are abundant in the area. Farmers do not only construct terraces and plant trees on their fields; they also widely practice soil fertility improvement techniques. Among others, the most common practices to increase soil fertility include manuring, crop rotation, and cultivation of grass and trees along strips. These practices play vital roles in boosting macronutrients such as nitrogen, phosphorus and potassium into the soils of the area (Engdawork and Bork 2014). Terraces stand out as the most important measure for smallholder farming, coupled with manuring, crop rotation, fallowing and tree plantation in farm fields.
Table 6‑8 . Major cultivated soils of the mapped area and their susceptibility to land degradation
WRB RSG* Main Properties & Susceptibility to Land Degradation
Cambisols Soils with a higher base status than Luvisols, but otherwise similar limitations. They have a relatively good structure and chemical properties, and are not therefore greatly affected by degradation processes until these become large. Because of increasing clay with depth, they tend not to be greatly impacted by degradation. Cambisols have high
resilience to degradation and moderate sensitivity to yield decline.
Fluvisols Soils formed from unconsolidated water-borne materials. Highly variable, but much prized for intensive agriculture. Under most conditions, they have high resilience and low sensitivity. The big tropical exception is represented
by acid sulphate soils, which have massive chemical degradation impacts when drained for agriculture.
Nitisols One of the best and most fertile soils of the tropics. They can suffer from acidity and P-fixation, and when organic carbon decreases, they become very susceptible to erosion. But erosion has only a slight effect on crops.
Nitosols have moderate resilience and moderate to low sensitivity.
* Reference Soil Groups according to the World Reference Base for Soil Resources
Figure 6‑8. Water erosion in Nitisols (Dorze; near the profile JJ003).
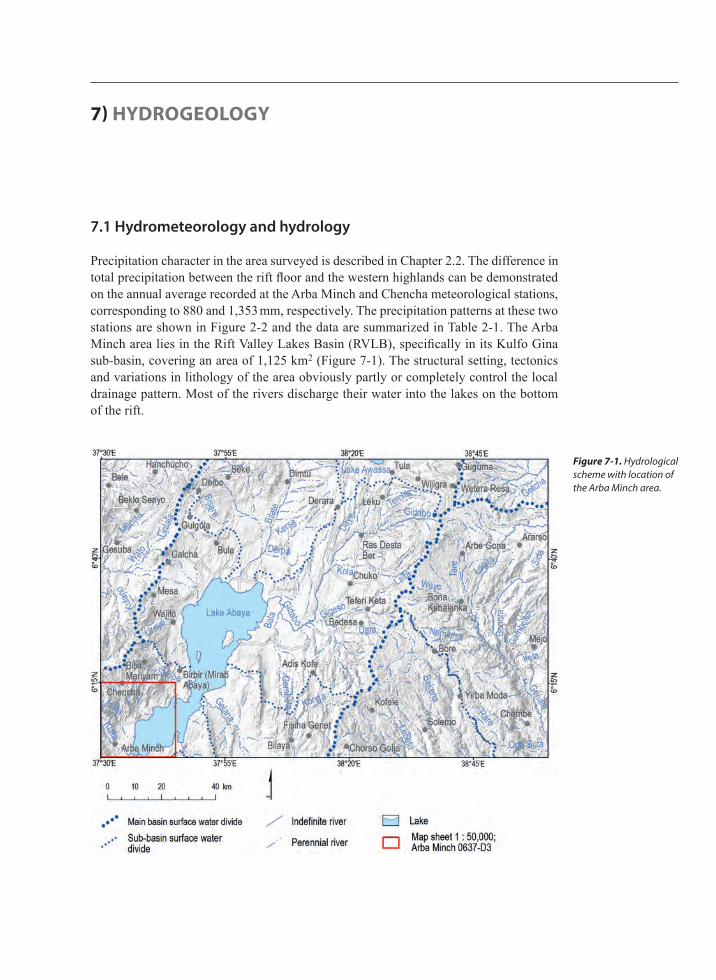
7.1 Hydrometeorology and hydrology
Precipitation character in the area surveyed is described in Chapter 2.2. The difference in total precipitation between the rift floor and the western highlands can be demonstrated on the annual average recorded at the Arba Minch and Chencha meteorological stations, corresponding to 880 and 1,353 mm, respectively. The precipitation patterns at these two stations are shown in Figure 2-2 and the data are summarized in Table 2-1. The Arba Minch area lies in the Rift Valley Lakes Basin (RVLB), specifically in its Kulfo Gina sub-basin, covering an area of 1,125 km2 (Figure 7-1). The structural setting, tectonics and variations in lithology of the area obviously partly or completely control the local drainage pattern. Most of the rivers discharge their water into the lakes on the bottom of the rift.
7) HYDROGEOLOGY
Figure 7‑1. Hydrological scheme with location of the Arba Minch area.

68 M A P S H E E T 0 6 3 7 - D 3 A R B A M I N C H
River discharge and base fl ow
There are three river gauging stations in the area surveyed (in the Kulfo Gina sub-basin), and three monitoring stations on the Lake Abaya (outside the map sheet) established by the Ministry of Water, Irrigation and Energy of the FDRE (MoWIE). The third gauging station is measuring and recording the discharge of springs at Arba Minch, but these measurements are problematic as the extraction of groundwater from the same springs for the town water supply affects the measurement (Table 7-1).
Runoff data records from river gauging stations show that the river discharge is directly proportional to the intensity of rainfall within the basin. There is a high discharge fl uctuation between the wet and dry seasons of the year. The fi rst high fl ow period is usually from April to May, the highest fl ow period lasts from June to October and the peak fl ow for the majority of rivers is usually recorded in August. The period from December to March is characterized by low fl ow when most of the smaller river beds are completely dry.
Table 7‑1 . Runoff data from important rivers in the Arba Minch area (MoWIE)
Map ID River Station
Mean fl ow
[m3/s]
Annual fl ow
[mm]
Annual precip.[mm]
Area [km2]
Specifi c runoff
[l/s.km2]Dominant aquifer
19 Kulfo Arba Minch 9.2 797.6 878 364 25.27 Volcanic/escarpment
20 Forty- Springs Arba Minch 0.152 NA 878 ND – 0 km2 ND Volcanic/escarpment
21 Harie Arba Minch 1.84 273.9 878 212 8.68 Volcanic/escarpment
Figure 7‑2. Discharge diagram of the Kulfo River at the Arba Minch river gauge (MoWIE).
The discharge data of the Kulfo River at the Arba Minch River gauge in the period from 1979 to 2008 recorded by the Ministry of Water, Irrigation and Energy of the FDRE (MoWIE) are given in Figure 7-2. The data show that the stream fl ow is relatively steady, but the total value of annual fl ow and particularly the maximum monthly discharge can vary considerably from year to year. The lowest daily discharge values occur in the period from November to April, but the river dried up in a period from November to January in the years 1987–1989. The highest daily discharge of 70.3 m3/s was recorded at the river

H Y D R O G E O L O G Y 69
gauge on October 26, 1997. The calculated mean annual discharge of 9.2 m3/s for the Arba Minch station represents a discharge generated mainly in the western escarpment where the Kulfo River originates, and where it receives a relatively large volume of atmospheric precipitation within the surveyed area.
Annual variability of the mean annual fl ow of the Kulfo River at the Arba Minch river gauge is shown in Figure 7-3.
The assessment of specifi c runoff based on the data from discharge measurements at gauging stations within the Arba Minch map sheet, while considering the altitude and lithology of the area, is as follows:• 10.0 l/s.km2 for the western highlands,• 16.0 l/s.km2 for the RVLB escarpment areas,• 4.0 l/s.km2 for the RVLB, excluding escarpment areas.
The basefl ow represents one of the most essential parameters and information on groundwater resources in the given basin. Some basefl ow methods for analyzing individual rainfall-runoff events were introduced by Bogena al. (2005), also taking into consideration the correlation analysis and daily river discharge in order to determine the appropriate basefl ow data.
The Kille’s method for the calculation of basefl ow was used in the study together with the separation of hydrographs where basefl ow data are derived from the discharge record of a stream by separating the basefl ow component from the total discharge. The Kille’s method was applied despite the fact that the data series are relatively short for using this method, time wise. Data on basefl ow determined by this procedure are shown in Table 7-2 together with basefl ow data assessed by the hydrograph separation method, which is another procedure used for the assessment of basefl ow. The basefl ow separation techniques use the time-series record of stream fl ow to derive the basefl ow signature. The common separation methods are either graphical, which focus on defi ning the points where basefl ow intersects the rising and falling limbs of the quick fl ow response, or involve fi ltering where data processing of the entire stream hydrograph derives a basefl ow component.
The graphical method was employed for the assessment of basefl ow in rivers of the surveyed area. The daily fl ow data were used to plot the basefl ow component of a fl ood hydrograph event, including the point where the basefl ow intersects the falling
Figure 7‑3. Annual variability of the mean annual fl ow of the Kulfo River at the Arba Minch river gauge (MoWIE).
62
Annual variability of the mean annual flow of the Kulfo River at the Arba Minch river gauge is shown in Figure 7-3.
Figure 7-3. Annual variability of the mean annual flow of the Kulfo River at the Arba Minch river gauge (MoWIE).
The assessment of specific runoff based on the data from discharge measurements at gauging stations within the Arba Minch map sheet, while considering the altitude and lithology of the area, is as follows:
10.0 l/s.km2 for the western highlands, 16.0 l/s.km2 for the RVLB escarpment areas, 4.0 l/s.km2 for the RVLB, excluding escarpment areas.
The baseflow represents one of the most essential parameters and information on groundwater resources in the given basin. Some baseflow methods for analyzing individual rainfall-runoff events were introduced by Bogena al. (2005), also taking into consideration the correlation analysis and daily river discharge in order to determine the appropriate baseflow data.
The Kille´s method for the calculation of baseflow was used in the study together with the separation of hydrographs where baseflow data are derived from the discharge record of a stream by separating the baseflow component from the total discharge. The Kille´s method was applied despite the fact that the data series are relatively short for using this method, time wise. Data on baseflow determined by this procedure are shown in Table 7-2 together with baseflow data assessed by the hydrograph separation method, which is another procedure used for the assessment of baseflow. The baseflow separation techniques use the time-series record of stream flow to derive the baseflow signature. The common separation methods are either graphical, which focus on defining the points where baseflow intersects the rising and falling limbs of the quick flow response, or involve filtering where data processing of the entire stream hydrograph derives a baseflow component.
The graphical method was employed for the assessment of baseflow in rivers of the surveyed area. The daily flow data were used to plot the baseflow component of a flood hydrograph event, including the point where the baseflow intersects the falling limb. Stream flow subsequent to this point was assumed to be entirely baseflow until the onset of the hydrographic response to the next significant rainfall event. These graphical approaches to partitioning baseflow vary in complexity (Linsley 1958).

70 M A P S H E E T 0 6 3 7 - D 3 A R B A M I N C H
limb. Stream flow subsequent to this point was assumed to be entirely baseflow until the onset of the hydrographic response to the next significant rainfall event. These graphical approaches to partitioning baseflow vary in complexity (Linsley 1958).
A comparison of the assessment of baseflow using the Kille’s method and hydrograph separation is shown in Table 7-2. The results show very small differences between the assessments of baseflow using either method.
The assessment of specific baseflow is based on the data from hydrograph separation and using the Kille’s method. The specific baseflow is assessed for the Arba Minch sheet based on the data from the river gauges shown in Table 7-1, being as follows:• 2.0 l/s.km2 for the western highlands,• 8.0 l/s.km2 for the RVLB escarpment areas,• 2.0 l/s.km2 for the RVLB, excluding escarpment areas.
Lakes
The Lake Abaya occupies a substantial part of the Arba Minch sheet. The Lake Chamo is located to the south of the area surveyed but is connected with the Lake Abaya through the Kulfo River. Monthly measurements of lake levels are conducted at the stations, whose list is given in Table 7-3. The basic descriptive data about the lakes are given in Table 7-4.
In general, a rehabilitation program is necessary to be implemented in order to minimize erosion and floods in the catchments. The basements of the lakes Awasa and Abaya require appropriate measures to be taken in order to protect soil and water, for
Table 7‑2 . Baseflow data for the Arba Minch area
Map ID River Area
[km2]
Specific runoff
[l/s.km2]
Kille method [m3/s]
Hydrograph separation
[m3/s]
Specific baseflow[l/s.km2]
Aquifer
19 Kulfo 364 25.27 4.81 5.34 13.2/14.7 Volcanic/escarpment
20 40 springs NA NA 0.152 (spring flow) Volcanic/escarpment
21 Harie 212 8.68 0.15 1.41 0.7/6.7 Volcanic/escarpment
Table 7‑3 . Lake level stations at the Lake Abaya (Halcrow 2008)
Map ID Site X UTM Y UTM Altitude [m a.s.l.] Start date End date
L1 Arba Minch (Lante Station) 345053 665614 1,178 Jul 1969 Apr 2006
L2 Arba Minch (Old Station) 348402 676662 1,184 Jan 1970 Oct 2005
L3 Gidicho Odola Island 383878 707540 1,184 Feb 1986 Dec 2001
Table 7‑4 . Basic characteristics of the lakes Abaya and Chamo (Halcrow 2008)
Lake Elevation [m a.s.l.]
Max. depth [m]
Mean depth [m]
Surface area [km2]
Storage volume [Mm3]
Level fluctuation [m]
Salinity [g/l]
Abaya 1,171 12 7 1121 9,818 Late/Recent 3.05 / 4.19 1.0
Chamo 1,107.25 14 12 335 4,100 4.05 1.5

H Y D R O G E O L O G Y 71
instance reforestation, construction of check dams at the mouths of gullies and terracing. This should be an effective and permanent solution to mitigate the problem of rising water levels in both lakes.
Water balance of the RVLB and irrigation potential
The Rift Valley floor is dominated by the lakes Abaya and Chamo with a basin area of 18,118 km2. Relatively large catchments of the River Bilate (5,900 km2) to the north, and the rivers Gidabo (3,447 km2) and Gelana (3,463 km2) to the east drain the western and eastern highlands. Their streams contribute significantly to the water level of the Lake Abaya. Rivers flowing from the western escarpment contribute less, although they bring a large amount of sediments, particularly to the Lake Abaya. The Abaya and Chamo lakes form a single basin because the two lakes are hydrologically interconnected through the River Kulfo, transferring water from the Lake Abaya into the Lake Chamo with a difference of 61 m in water levels of the two lakes. The river Kulfo and other streams like Sile and Sego, including an ephemeral stream, are flowing out from the Lake Abaya to the south and are emptying into the Lake Chamo. Halcrow (2008) noted that there is some flow from the Lake Chamo into the Segen River, towards the Lake Chew Bahir, when the lake levels are extremely high.
Currently, three large-scale irrigation schemes are planned by the Ministry of Water Resources, Energy and Irrigation for the rivers contributing to the Lake Abaya. On the Gelana River, there are plans for a net irrigation command area of 5,356 ha. The command area currently being considered for the River Gidabo covers a net area of 9,215 ha, and there are plans for a rehabilitation scheme for the existing state farms on the Lower Bilate River, providing a net area of 7,715 ha. The total surface water resources of the RVLB are estimated by Halcrow (2008) at just over 5,300 Mm3/year, calculated from total annual average river flow into the lake systems under ‘natural’ conditions – without human interventions as shown in Table 7-5. This amounts to a per capita water availability of 597 m3, which is well below the threshold of ‘water scarcity’ of 1,000 m3/capita/annum. This will decline to 232 m3/capita/annum by the end of 2034 because of the population growth – a situation of extreme water scarcity. The Gelana, Gidabo and Bilate river basins were studied from the point of view of irrigation in 2007 (Halcrow 2008).
Table 7‑5 . Total surface water resources and total water resources (Halcrow, 2008)
Lake system Total surface water resources [Mm3] Total water resources [%]
Ziway 0,755 14
Abijata 0,200 4
Langano 0,258 5
Shalla 0,340 6
Awasa 0,143 3
Abaya 2,512 47
Chamo 0,506 10
Chew Bahir 0,598 11
Total 5,312 –
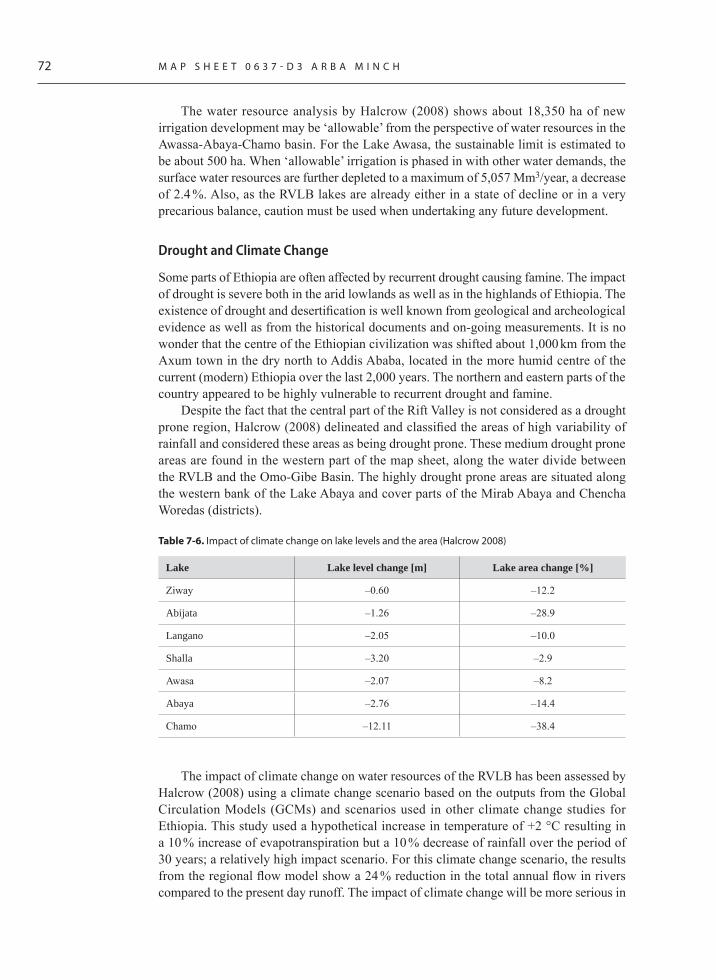
72 M A P S H E E T 0 6 3 7 - D 3 A R B A M I N C H
The water resource analysis by Halcrow (2008) shows about 18,350 ha of new irrigation development may be ‘allowable’ from the perspective of water resources in the Awassa-Abaya-Chamo basin. For the Lake Awasa, the sustainable limit is estimated to be about 500 ha. When ‘allowable’ irrigation is phased in with other water demands, the surface water resources are further depleted to a maximum of 5,057 Mm3/year, a decrease of 2.4 %. Also, as the RVLB lakes are already either in a state of decline or in a very precarious balance, caution must be used when undertaking any future development.
Drought and Climate Change
Some parts of Ethiopia are often affected by recurrent drought causing famine. The impact of drought is severe both in the arid lowlands as well as in the highlands of Ethiopia. The existence of drought and desertification is well known from geological and archeological evidence as well as from the historical documents and on-going measurements. It is no wonder that the centre of the Ethiopian civilization was shifted about 1,000 km from the Axum town in the dry north to Addis Ababa, located in the more humid centre of the current (modern) Ethiopia over the last 2,000 years. The northern and eastern parts of the country appeared to be highly vulnerable to recurrent drought and famine.
Despite the fact that the central part of the Rift Valley is not considered as a drought prone region, Halcrow (2008) delineated and classified the areas of high variability of rainfall and considered these areas as being drought prone. These medium drought prone areas are found in the western part of the map sheet, along the water divide between the RVLB and the Omo-Gibe Basin. The highly drought prone areas are situated along the western bank of the Lake Abaya and cover parts of the Mirab Abaya and Chencha Woredas (districts).
Table 7‑6 . Impact of climate change on lake levels and the area (Halcrow 2008)
Lake Lake level change [m] Lake area change [%]
Ziway –0.60 –12.2
Abijata –1.26 –28.9
Langano –2.05 –10.0
Shalla –3.20 –2.9
Awasa –2.07 –8.2
Abaya –2.76 –14.4
Chamo –12.11 –38.4
The impact of climate change on water resources of the RVLB has been assessed by Halcrow (2008) using a climate change scenario based on the outputs from the Global Circulation Models (GCMs) and scenarios used in other climate change studies for Ethiopia. This study used a hypothetical increase in temperature of +2 °C resulting in a 10 % increase of evapotranspiration but a 10 % decrease of rainfall over the period of 30 years; a relatively high impact scenario. For this climate change scenario, the results from the regional flow model show a 24 % reduction in the total annual flow in rivers compared to the present day runoff. The impact of climate change will be more serious in

H Y D R O G E O L O G Y 73
the lakes Ziway, Abijata and Langano, and the total average annual inflow into the Lake Ziway is predicted to decrease by between 19 % and 27 % due to decreasing inflows in the main rainy season (Table 7-6).
7.2 Hydrogeological surveys
Hydrogeology of the Arba Minch map sheet is compiled based on the assessment and interpretation of the data acquired from existing reports and maps and additional field documentation. There is no previous hydrogeological work at a scale of 1 : 50,000 and full datasets required for geometrical aquifer configuration are scarce; however, the sheet of Dila at a scale of 1 : 250,000 was compiled by Agezew et al. (2014). The hydrogeological system of the Arba Minch sheet is similar to those in the adjacent areas, in particular the highland area in the western sector of the map sheet, although some lithological units show different productivity characteristics or are completely missing. The hydrogeological map of Ethiopia at a scale of 1 : 2,000,000 was published by Chernet (1993). He classified the geological units of Ethiopia into four major groups, depending on the type of permeability and the extent of pertinent aquifer. The latest assessment of groundwater resources in the Lakes Region was done by Halcrow (2008) and by the Japanese International Cooperation Agency (JICA 2012). The Master Plan Study by Halcrow (2008) compiled studies of both the geology and hydrogeological conditions of the RVLB.
The borehole yield in l/s was assessed for various lithologies to be as follows:• Lacustrine sediments 4.03• Ignimbrite 2.81• Basalt 2.67• Volcanic sand 2.06• Pyroclastic and sedimentary rocks 1.5
The spring yield in l/s was assessed for various lithologies to be as follows:• Aglomerate 6.7• Basalt 4.46• Ignimbrite 17.17• Lake sediment 36.7• Rhyolite 22.5• River gravel 2.0• Scoria 13.25• Soil 4.5• Trachyte-rhyolite 1.5
Springs with records of both the yield and temperature were evaluated. The evaluation shows that most of the springs with high yields originate from thermal spring sources.
It can also be noted that the yields of thermal springs are highly variable (from 1.5 l/s up to 75 l/s). Representative aquifer parameters assessed by Halcrow (2008) are shown in Table 7-7.
For the purposes of the Master Plan, the adopted aquifer classification was broadly defined by the 1 : 2,000,000 Hydrogeological Map of Ethiopia (1988). The following
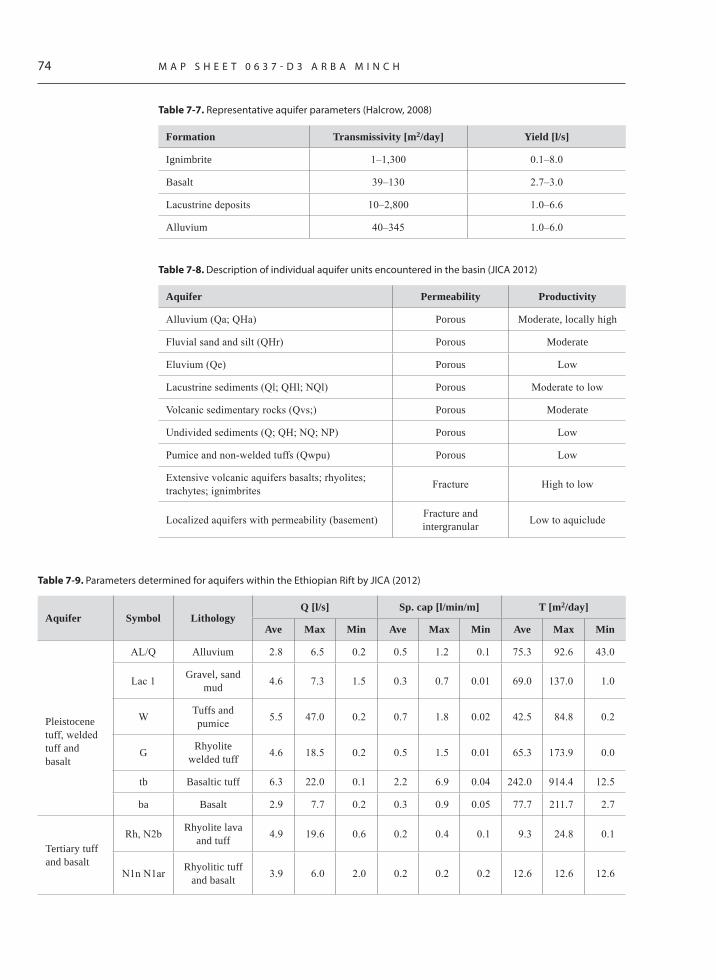
74 M A P S H E E T 0 6 3 7 - D 3 A R B A M I N C H
Table 7‑7 . Representative aquifer parameters (Halcrow, 2008)
Formation Transmissivity [m2/day] Yield [l/s]
Ignimbrite 1–1,300 0.1–8.0
Basalt 39–130 2.7–3.0
Lacustrine deposits 10–2,800 1.0–6.6
Alluvium 40–345 1.0–6.0
Table 7‑8 . Description of individual aquifer units encountered in the basin (JICA 2012)
Aquifer Permeability Productivity
Alluvium (Qa; QHa) Porous Moderate, locally high
Fluvial sand and silt (QHr) Porous Moderate
Eluvium (Qe) Porous Low
Lacustrine sediments (Ql; QHl; NQl) Porous Moderate to low
Volcanic sedimentary rocks (Qvs;) Porous Moderate
Undivided sediments (Q; QH; NQ; NP) Porous Low
Pumice and non-welded tuffs (Qwpu) Porous Low
Extensive volcanic aquifers basalts; rhyolites; trachytes; ignimbrites Fracture High to low
Localized aquifers with permeability (basement) Fracture and intergranular Low to aquiclude
Table 7‑9 . Parameters determined for aquifers within the Ethiopian Rift by JICA (2012)
Aquifer Symbol LithologyQ [l/s] Sp. cap [l/min/m] T [m2/day]
Ave Max Min Ave Max Min Ave Max Min
Pleistocene tuff, welded tuff and basalt
AL/Q Alluvium 2.8 6.5 0.2 0.5 1.2 0.1 75.3 92.6 43.0
Lac 1 Gravel, sand mud 4.6 7.3 1.5 0.3 0.7 0.01 69.0 137.0 1.0
W Tuffs and pumice 5.5 47.0 0.2 0.7 1.8 0.02 42.5 84.8 0.2
G Rhyolite welded tuff 4.6 18.5 0.2 0.5 1.5 0.01 65.3 173.9 0.0
tb Basaltic tuff 6.3 22.0 0.1 2.2 6.9 0.04 242.0 914.4 12.5
ba Basalt 2.9 7.7 0.2 0.3 0.9 0.05 77.7 211.7 2.7
Tertiary tuff and basalt
Rh, N2b Rhyolite lava and tuff 4.9 19.6 0.6 0.2 0.4 0.1 9.3 24.8 0.1
N1n N1ar Rhyolitic tuff and basalt 3.9 6.0 2.0 0.2 0.2 0.2 12.6 12.6 12.6
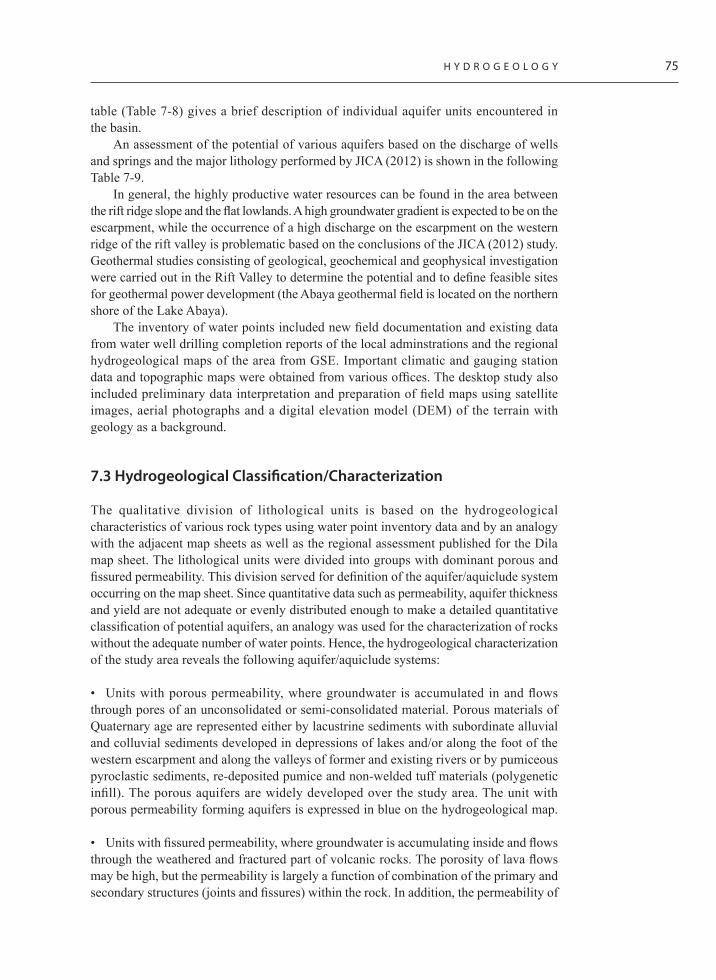
H Y D R O G E O L O G Y 75
table (Table 7-8) gives a brief description of individual aquifer units encountered in the basin.
An assessment of the potential of various aquifers based on the discharge of wells and springs and the major lithology performed by JICA (2012) is shown in the following Table 7-9.
In general, the highly productive water resources can be found in the area between the rift ridge slope and the flat lowlands. A high groundwater gradient is expected to be on the escarpment, while the occurrence of a high discharge on the escarpment on the western ridge of the rift valley is problematic based on the conclusions of the JICA (2012) study. Geothermal studies consisting of geological, geochemical and geophysical investigation were carried out in the Rift Valley to determine the potential and to define feasible sites for geothermal power development (the Abaya geothermal field is located on the northern shore of the Lake Abaya).
The inventory of water points included new field documentation and existing data from water well drilling completion reports of the local adminstrations and the regional hydrogeological maps of the area from GSE. Important climatic and gauging station data and topographic maps were obtained from various offices. The desktop study also included preliminary data interpretation and preparation of field maps using satellite images, aerial photographs and a digital elevation model (DEM) of the terrain with geology as a background.
7.3 Hydrogeological Classification/Characterization
The qualitative division of lithological units is based on the hydrogeological characteristics of various rock types using water point inventory data and by an analogy with the adjacent map sheets as well as the regional assessment published for the Dila map sheet. The lithological units were divided into groups with dominant porous and fissured permeability. This division served for definition of the aquifer/aquiclude system occurring on the map sheet. Since quantitative data such as permeability, aquifer thickness and yield are not adequate or evenly distributed enough to make a detailed quantitative classification of potential aquifers, an analogy was used for the characterization of rocks without the adequate number of water points. Hence, the hydrogeological characterization of the study area reveals the following aquifer/aquiclude systems:
• Units with porous permeability, where groundwater is accumulated in and flows through pores of an unconsolidated or semi-consolidated material. Porous materials of Quaternary age are represented either by lacustrine sediments with subordinate alluvial and colluvial sediments developed in depressions of lakes and/or along the foot of the western escarpment and along the valleys of former and existing rivers or by pumiceous pyroclastic sediments, re-deposited pumice and non-welded tuff materials (polygenetic infill). The porous aquifers are widely developed over the study area. The unit with porous permeability forming aquifers is expressed in blue on the hydrogeological map.
• Units with fissured permeability, where groundwater is accumulating inside and flows through the weathered and fractured part of volcanic rocks. The porosity of lava flows may be high, but the permeability is largely a function of combination of the primary and secondary structures (joints and fissures) within the rock. In addition, the permeability of

76 M A P S H E E T 0 6 3 7 - D 3 A R B A M I N C H
lava fl ows tends to decrease in geological time. The pyroclastic rocks between lava fl ows are generally porous but usually less permeable due to poor sorting during transport and deposition. They can be represented by an impermeable non-welded tuff in some parts of the volcanic sequence. Hence, extensive volcanic ash beds may form semi-horizontal barriers to the vertical water movement (infi ltration), resulting in the lower productivity of basaltic units occurring at a greater depth. They can have a confi ned or semi-confi ned character in some part of the aquifers. Layers of paleosoil of various thicknesses in between lava fl ows are less permeable and usually consist of clayey material on the one hand, whereas layers of fl uvial and lacustrine sediments and pumiceous pyroclastic materials between various lava fl ows can enhance the well yield on the other hand.
• Tertiary and Quaternary volcanic formations represented by basalts, rhyolite trachyte and ignimbrite form aquifers with good fi ssured porosity. The units with fi ssured permeability forming moderately productive aquifers are expressed on the hydrogeological map in green.
7.4 Elements of Hydrogeological System of the area surveyed (Aquifers)
Geological description and qualitative division of various geological units together with their topographic position in the surveyed area lead to a defi nition of elements of the hydrogeological system and its conceptual hydrogeological model. The system consists of a) a porous aquifer developed in lacustrine, alluvial and colluvial sediments and the volcano-sedimentary type of rocks of Quaternary age along the rivers, lakes, at the foot of the western escarpment and as an infi ll of depressions on the rift fl oor, and b) a fi ssured aquifer developed in Tertiary and Quaternary basalts, trachytes, ignimbrites and rhyolites in the highlands, escarpments and rift fl oor areas. The hydrogeological map shows aquifers defi ned based on the character of the groundwater fl ow (pores, fi ssures), the discharge of springs and the hydraulic characteristics of wells. The following aquifers and aquicludes were defi ned: extensive (145 km2) and moderately productive or locally developed and highly productive porous aquifers (T = 1.1–10 m2/d, q = 0.011–0.1 l/s.m, with spring discharge and well yield Q = 0.51–5 l/s). The aquifers consist of Quaternary alluvial and colluvial sediments, polygenetic infi lling of depressions and volcano-sedimentary rocks. The aquifers are depicted in light blue.
Extensive (400 km2) and moderately productive fi ssured aquifers (T = 1.1–10 m2/d, q = 0.011–0.1 l/s.m, with Q = 0.51–5 l/s). These aquifers consist of basalts of the rift fl oor, ignimbrite, rhyolite and trachyte of the highlands and escarpments. The aquifers are depicted in light green. The area of the Lake Abaya covering 220 km2 is not included in the description of aquifers.
Extensive and Moderately Productive Porous Aquifers
The porous aquifers altogether make up 145 km2, accounting for about 19 % of the area and consist of lacustrine sediments with subordinate alluvial, colluvial sediments, polygenetic infi lling of depressions and pumiceous pyroclastics of Quaternary age. These aquifers are shown in light blue.
Sedimentary and volcano-sedimentary rocks on the Arba Minch map sheet are characterized by a variable thickness and texture. The composition of sediments ranges

H Y D R O G E O L O G Y 77
from clay to sand and gravel, ash, tuff and diatomaceous materials. The dominant materials are silts interbedded with tuffs. Lacustrine deposits reach a signifi cant thickness, particularly around the Lake Abaya. Thick alluvial fans are developed at the foot of the western escarpment. This porous aquifer with moderate and locally high productivity is often developed in the RVLB. Flowing rivers and high runoff from the escarpment (alluvial fans along the western escarpment) lead to the deposition of transported material in large lakes on the rift fl oor. Such aquifer is a very good source of groundwater, depending on the thickness, sorting and recharge conditions. Aquifers in unconsolidated sediments are mainly recharged from direct infi ltration by percolating rain water but can be also recharged by bank infi ltration during the fl oods with high levels of water in river channels as well as high water levels in the Lake Abaya. Volcano-sedimentary rocks generally form volcaniclastic strata associated with volcanic eruptions, having the characteristics of sedimentary materials, often described as volcanic sand. These are dominated by clastic sediments (pumice) of volcanic origin mixed with alluvial and lacustrine deposits and tuff materials. Moderate yields of the local aquifer represent an important source and supply of water for the local population.
Sedimentary rocks are rather heterogenous, consisting of alternating coarse and fi ne deposits. The yield of boreholes drilled in the aquifer varies from 1 to 5 l/s. The average thickness of the aquifer is about 50 m, although it varies from 40 m to more than 200 m. The water points documented within the map sheet having variable yield are shown in Figure 7-4, and their general statistics are given in Table 7-10.
Extensive and Moderately Productive Fissured Aquifers
Fissured aquifers of moderate productivity make up 400 km2, accounting for 52 % of the area and mainly consist of basaltic rocks and tuffs if they are not mapped separately.
Figure 7‑4. Frequency of the yield of water points from porous aquifers of the Dila sheet.
70
Figure 7-4. Frequency of the yield of water points from porous aquifers of the Dila sheet
Extensive and Moderately Productive Fissured Aquifers
Fissured aquifers of moderate productivity make up 400 km2, accounting for 52 % of the area and mainly consist of basaltic rocks and tuffs if they are not mapped separately. These aquifers mostly occur on the rift floor but they are also present on the western escarpments, pediment slopes and the adjacent western highlands. Their age, tectonic and geomorphological settings dictate their hydrogeological characteristics. Fissure flow is dominant. Open faults and fault systems may also provide significant groundwater flow paths, which may allow the regional transfer of groundwater in places where they are extensive. The best example of the function of regional tectonic features is represented by the springs that emerge at the foot of the Arba Minch cliff, yielding several hundreds of litres per second. They can also be a source of hot springs. As there were only fewer water points documented within the map sheet from this aquifer, the yield of in this aquifer has been derived based on the additional waetr point inventories from the adjoiningDila map sheet area;which have continuity of similar lithology as shown in Figure 7-5 with the basic statistics (Table 7-11). Basalts usually form less viscous, thin lava flows and may be significantly affected by weathering, brecciation and may be interbedded with lacustrine or fluvial deposits. Groundwater flows through joints, fractures, scoria intercalations and scoriaceous horizons and interbedded sediments. The continuity of fractures in both horizontal and vertical directions gives the aquifers their hydraulic continuity within the adjacent units and aquifers.
Table 7-11. Basic statistics of the yield of water points from fissured aquifers in l/s
Number of water points
Max Min Median Average
190 70 0.035 3 4.67
Table 7‑10 . Basic statistics of the yield of water points from porous aquifers [l/s]
Number of data Max Min Median Average
90 75 0.029 2.5 4.61

78 M A P S H E E T 0 6 3 7 - D 3 A R B A M I N C H
These aquifers mostly occur on the rift floor but they are also present on the western escarpments, pediment slopes and the adjacent western highlands. Their age, tectonic and geomorphological settings dictate their hydrogeological characteristics. Fissure flow is dominant. Open faults and fault systems may also provide significant groundwater flow paths, which may allow the regional transfer of groundwater in places where they are extensive. The best example of the function of regional tectonic features is represented by the springs that emerge at the foot of the Arba Minch cliff, yielding several hundreds of litres per second. They can also be a source of hot springs. As there were only fewer water points documented within the map sheet from this aquifer, the yield of in this aquifer has been derived based on the additional waetr point inventories from the adjoiningDila map sheet area;which have continuity of similar lithology as shown in Figure 7-5 with the basic statistics (Table 7-11). Basalts usually form less viscous, thin lava flows and may be significantly affected by weathering, brecciation and may be interbedded with lacustrine or fluvial deposits. Groundwater flows through joints, fractures, scoria intercalations and scoriaceous horizons and interbedded sediments. The continuity of fractures in both horizontal and vertical directions gives the aquifers their hydraulic continuity within the adjacent units and aquifers.
Table 7‑11 . Basic statistics of the yield of water points from fissured aquifers [l/s]
Number of water points Max Min Median Average
190 70 0.035 3 4.67
Figure 7‑5. Frequency of the yield of water points from fissured aquifers.
7.5 Hydrogeological Conceptual Model
The general concept of rainwater infiltration and groundwater circulation in the Arba Minch map sheet takes into consideration the morphology of the area, specifically the relevant parts of the western highlands, escarpments and the rift floor. The western plateau is composed of faulted basalts and ignimbrites intercalated by volcaniclastic and sedimentary rocks. Outcrops on the gently undulating plain receiving adequate rainfall are exposed to moderate runoff, resulting in good infiltration. The rainwater percolates

H Y D R O G E O L O G Y 79
through the rock, and infiltration is particularly good in areas where the plateau is covered by thick eluvial deposits derived from the weathered bedrock. Aquifers outcropping in the plateau area also feed deeper fissured aquifers developed in the underlying volcanic rocks. Springs are abundant, but relatively small in mountain areas and represent shallow local groundwater flow. The springs at the foot of the escarpment show high discharge and represent deep local and regional groundwater flow. A group of “forty springs” at the foot of the escarpment in Arba Minch may serve as a typical example of large springs. The existence of deep regional groundwater flow is confirmed by the existence of hot springs and hot water along the Bilate River on the northern bank of the Lake Abaya. Groundwater from the escarpment area recharges the volcanic and sedimentary aquifers of the rift floor additionally to their direct recharge by precipitation. Groundwater from the western escarpment is drained by the Bilate River and by rivers on the western escarpment and by the Lake Abaya itself. A conceptual hydrogeological model of the western plateau, escarpment and rift floor and part of the eastern escarpment and plateau is shown in Figure 7-6.
Local ridges on the rift floor generate shallow local groundwater flow regime. This shallow as well as deep groundwater flow recharges the porous sediments along the lake shore. It is also possible that these sediments are recharged by water from lakes when their water level is higher than the groundwater level in the adjacent aquifers. Large alluvial fans on the western bank of the Lake Abaya are aquifers transferring groundwater directly into the lake. These fans are also a source of large amounts of sediment transported by local rivers that are emptying into the lake.
Figure 7‑6. Conceptual hydrogeological model of the western plateau, escarpment and rift floor.
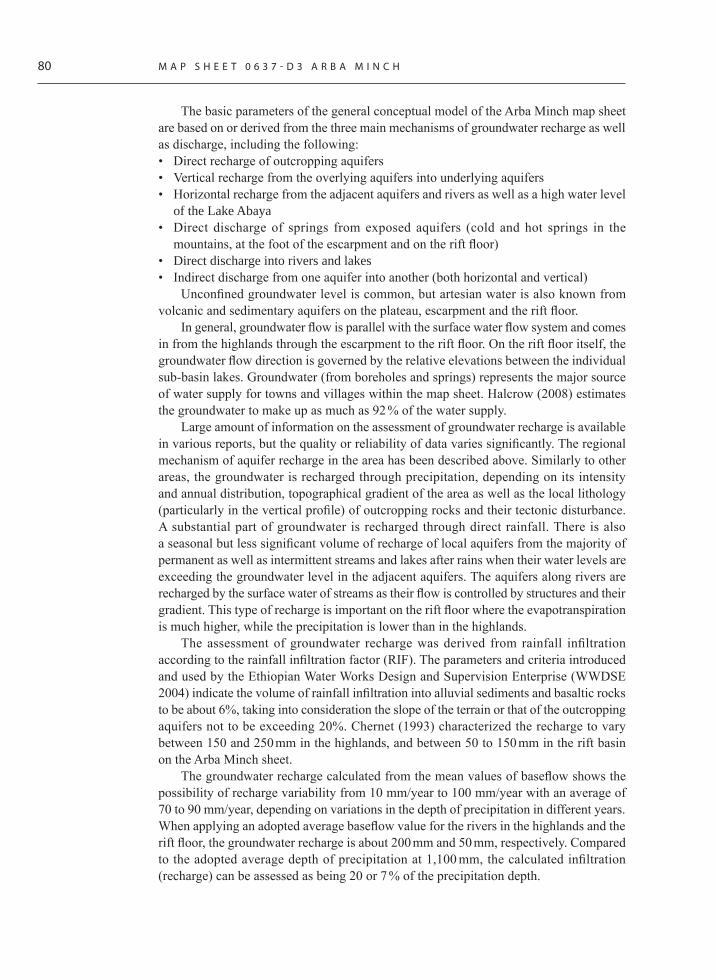
80 M A P S H E E T 0 6 3 7 - D 3 A R B A M I N C H
The basic parameters of the general conceptual model of the Arba Minch map sheet are based on or derived from the three main mechanisms of groundwater recharge as well as discharge, including the following:• Direct recharge of outcropping aquifers• Vertical recharge from the overlying aquifers into underlying aquifers• Horizontal recharge from the adjacent aquifers and rivers as well as a high water level
of the Lake Abaya • Direct discharge of springs from exposed aquifers (cold and hot springs in the
mountains, at the foot of the escarpment and on the rift floor) • Direct discharge into rivers and lakes • Indirect discharge from one aquifer into another (both horizontal and vertical)
Unconfined groundwater level is common, but artesian water is also known from volcanic and sedimentary aquifers on the plateau, escarpment and the rift floor.
In general, groundwater flow is parallel with the surface water flow system and comes in from the highlands through the escarpment to the rift floor. On the rift floor itself, the groundwater flow direction is governed by the relative elevations between the individual sub-basin lakes. Groundwater (from boreholes and springs) represents the major source of water supply for towns and villages within the map sheet. Halcrow (2008) estimates the groundwater to make up as much as 92 % of the water supply.
Large amount of information on the assessment of groundwater recharge is available in various reports, but the quality or reliability of data varies significantly. The regional mechanism of aquifer recharge in the area has been described above. Similarly to other areas, the groundwater is recharged through precipitation, depending on its intensity and annual distribution, topographical gradient of the area as well as the local lithology (particularly in the vertical profile) of outcropping rocks and their tectonic disturbance. A substantial part of groundwater is recharged through direct rainfall. There is also a seasonal but less significant volume of recharge of local aquifers from the majority of permanent as well as intermittent streams and lakes after rains when their water levels are exceeding the groundwater level in the adjacent aquifers. The aquifers along rivers are recharged by the surface water of streams as their flow is controlled by structures and their gradient. This type of recharge is important on the rift floor where the evapotranspiration is much higher, while the precipitation is lower than in the highlands.
The assessment of groundwater recharge was derived from rainfall infiltration according to the rainfall infiltration factor (RIF). The parameters and criteria introduced and used by the Ethiopian Water Works Design and Supervision Enterprise (WWDSE 2004) indicate the volume of rainfall infiltration into alluvial sediments and basaltic rocks to be about 6%, taking into consideration the slope of the terrain or that of the outcropping aquifers not to be exceeding 20%. Chernet (1993) characterized the recharge to vary between 150 and 250 mm in the highlands, and between 50 to 150 mm in the rift basin on the Arba Minch sheet.
The groundwater recharge calculated from the mean values of baseflow shows the possibility of recharge variability from 10 mm/year to 100 mm/year with an average of 70 to 90 mm/year, depending on variations in the depth of precipitation in different years. When applying an adopted average baseflow value for the rivers in the highlands and the rift floor, the groundwater recharge is about 200 mm and 50 mm, respectively. Compared to the adopted average depth of precipitation at 1,100 mm, the calculated infiltration (recharge) can be assessed as being 20 or 7 % of the precipitation depth.
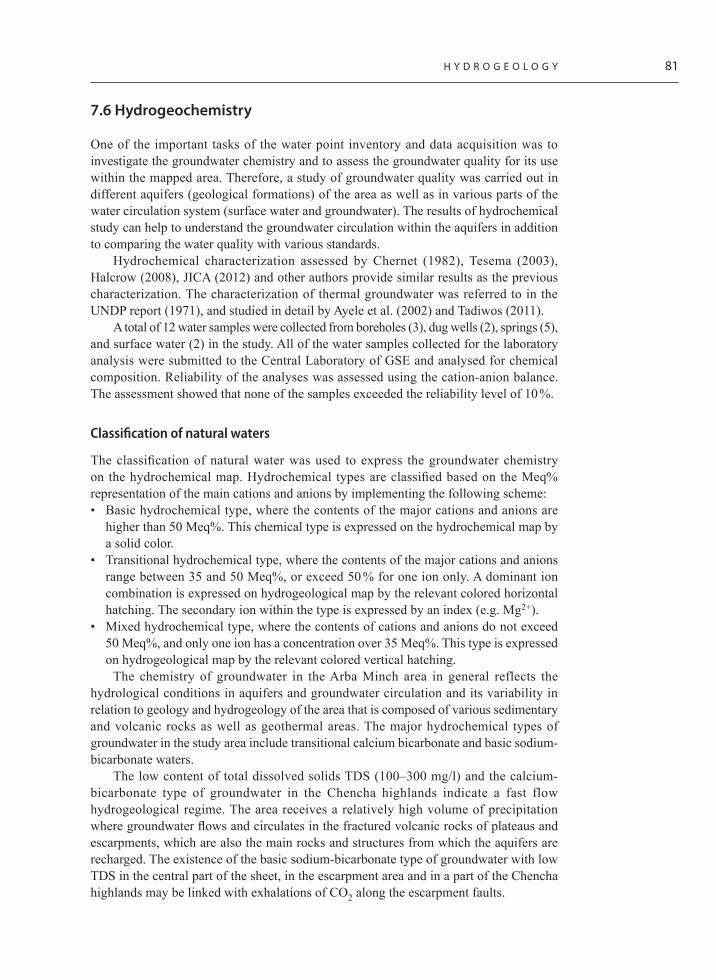
H Y D R O G E O L O G Y 81
7.6 Hydrogeochemistry
One of the important tasks of the water point inventory and data acquisition was to investigate the groundwater chemistry and to assess the groundwater quality for its use within the mapped area. Therefore, a study of groundwater quality was carried out in different aquifers (geological formations) of the area as well as in various parts of the water circulation system (surface water and groundwater). The results of hydrochemical study can help to understand the groundwater circulation within the aquifers in addition to comparing the water quality with various standards.
Hydrochemical characterization assessed by Chernet (1982), Tesema (2003), Halcrow (2008), JICA (2012) and other authors provide similar results as the previous characterization. The characterization of thermal groundwater was referred to in the UNDP report (1971), and studied in detail by Ayele et al. (2002) and Tadiwos (2011).
A total of 12 water samples were collected from boreholes (3), dug wells (2), springs (5), and surface water (2) in the study. All of the water samples collected for the laboratory analysis were submitted to the Central Laboratory of GSE and analysed for chemical composition. Reliability of the analyses was assessed using the cation-anion balance. The assessment showed that none of the samples exceeded the reliability level of 10 %.
Classification of natural waters
The classification of natural water was used to express the groundwater chemistry on the hydrochemical map. Hydrochemical types are classified based on the Meq% representation of the main cations and anions by implementing the following scheme: • Basic hydrochemical type, where the contents of the major cations and anions are
higher than 50 Meq%. This chemical type is expressed on the hydrochemical map by a solid color.
• Transitional hydrochemical type, where the contents of the major cations and anions range between 35 and 50 Meq%, or exceed 50 % for one ion only. A dominant ion combination is expressed on hydrogeological map by the relevant colored horizontal hatching. The secondary ion within the type is expressed by an index (e.g. Mg2+).
• Mixed hydrochemical type, where the contents of cations and anions do not exceed 50 Meq%, and only one ion has a concentration over 35 Meq%. This type is expressed on hydrogeological map by the relevant colored vertical hatching.
The chemistry of groundwater in the Arba Minch area in general reflects the hydrological conditions in aquifers and groundwater circulation and its variability in relation to geology and hydrogeology of the area that is composed of various sedimentary and volcanic rocks as well as geothermal areas. The major hydrochemical types of groundwater in the study area include transitional calcium bicarbonate and basic sodium-bicarbonate waters.
The low content of total dissolved solids TDS (100–300 mg/l) and the calcium-bicarbonate type of groundwater in the Chencha highlands indicate a fast flow hydrogeological regime. The area receives a relatively high volume of precipitation where groundwater flows and circulates in the fractured volcanic rocks of plateaus and escarpments, which are also the main rocks and structures from which the aquifers are recharged. The existence of the basic sodium-bicarbonate type of groundwater with low TDS in the central part of the sheet, in the escarpment area and in a part of the Chencha highlands may be linked with exhalations of CO2 along the escarpment faults.

82 M A P S H E E T 0 6 3 7 - D 3 A R B A M I N C H
The high content of total dissolved solids (exceeding 600 mg/l) and the transitional sodium-bicarbonate type of groundwater of the rift bottom generally reflect the impact of hot climate. Similarly, the groundwater circulation in porous sedimentary and volcaniclastic rocks shows higher solubility. Its contact with volcanic rocks in geothermal systems also reflects climatic conditions of a closed basin, in which the drainage is represented mainly by medium saline lakes (Lake Abaya 0.8 g/l).
The hydrochemistry of groundwater in the area is expressed on the hydrochemical map by the relevant coloured hatching (for transitional types). To facilitate the visualization of the classification of water types, the percentage of the major cations and anions of the analysed samples is plotted on the Piper diagram as shown in Figure 7-7.
The groundwater residence time along flow paths, time period of water-rock interaction, lithology, ion exchange and evaporation may play a significant role in the formation of groundwater chemistry. Major changes in the chemical composition of groundwater firstly occur in the soil zone. The second most important correlation of water chemistry with its rock environment is represented by its contact with hot rocks, including the groundwater enrichment by carbon dioxide. This mechanism is believed to form the sodium bicarbonate groundwater chemistry of the majority of groundwater on the rift valley bottom.
The relatively low content of total dissolved solids (TDS) and the uniform hydrochemistry and occurrence of calcium-bicarbonate and sodium-bicarbonate types of groundwater indicate a dynamic hydrogeological regime in the western highlands and in the escarpment area. The groundwater mostly infiltrates the aquifers in the highlands characterized by cold climate, receiving a large volume of rainfall that flows to the east to the drainage areas formed by rivers originating in highlands and then continues through the escarpment region in the Rift Valley and finally into the Lake Abaya. The groundwater flows through the lithologically homogeneous fissured aquifers developed in various Tertiary volcanic rocks in the highland and escarpment areas. Then, it flows into the lithologically heterogeneous fissured and mixed aquifers developed in various volcanic and volcaniclastic sedimentary rocks and unconsolidated Quaternary lacustrine sediments
Figure 7‑7. Piper diagram for the classification of natural waters.
75
80 60 40 20 20 40 60 80
20
40
60
80 80
60
40
20
20
40
60
80
20
40
60
80
Ca Na HCO3 Cl
Mg SO4
Legend:
Fissured aquiferPorous aquiferLakeRiver
Figure 7-7. Piper diagram for the classification of natural waters
The groundwater residence time along flow paths, time period of water-rock interaction, lithology, ion exchange and evaporation may play a significant role in the formation of groundwater chemistry. Major changes in the chemical composition of groundwater firstly occur in the soil zone. The second most important correlation of water chemistry with its rock environment is represented by its contact with hot rocks, including the groundwater enrichment by carbon dioxide. This mechanism is believed to form the sodium bicarbonate groundwater chemistry of the majority of groundwater on the rift valley bottom.
The relatively low content of total dissolved solids (TDS) and the uniform hydrochemistry and occurrence of calcium-bicarbonate and sodium-bicarbonate types of groundwater indicate a dynamic hydrogeological regime in the western highlands and in the escarpment area. The groundwater mostly infiltrates the aquifers in the highlands characterized by cold climate, receiving a large volume of rainfall that flows to the east to the drainage areas formed by rivers originating in highlands and then continues through the escarpment region in the Rift Valley and finally into the Lake Abaya. The groundwater flows through the lithologically homogeneous fissured aquifers developed in various Tertiary volcanic rocks in the highland and escarpment areas. Then, it flows into the lithologically heterogeneous fissured and mixed aquifers developed in various volcanic and volcaniclastic sedimentary rocks and unconsolidated Quaternary lacustrine sediments in the Rift Valley. Finally, the groundwater is drained into the Lake Abaya where it is mixed with lake water that is gradually evaporating. Successive development of TDS is abruptly changed when groundwater flow reaches the rift valley floor where the general trend in TDS as well as in groundwater hydrochemistry is strongly affected by the soluble material contained in variable volcano-sedimentary rock units of the rift valley floor. The content of groundwater TDS increases from 200–300 mg/l to more than 600 mg/l. This trend in TDS is shown by idealized iso-salinity lines on the hydrochemical map.
Surface water is characterized or represented by the samples taken from rivers and lakes in order to establish their hydrochemistry. A sample collected in the Humesa River is used to characterize the river water. The Humesa River originates in the highlands and flows through the escarpment area and its water is of the transient calcium-bicarbonate type with TDS at about 130 mg/l.
A sample from the Lake Abaya represents the chemistry of the main rift valley lakes. The composition of lake water reflects the chemistry of its water as such that it is influenced by the chemical composition of river water drained into the lake. The lake water chemistry is of the basic sodium-bicarbonate type, TDS are at about 850 mg/l for the Lake Abaya. The low TDS of the lake water show
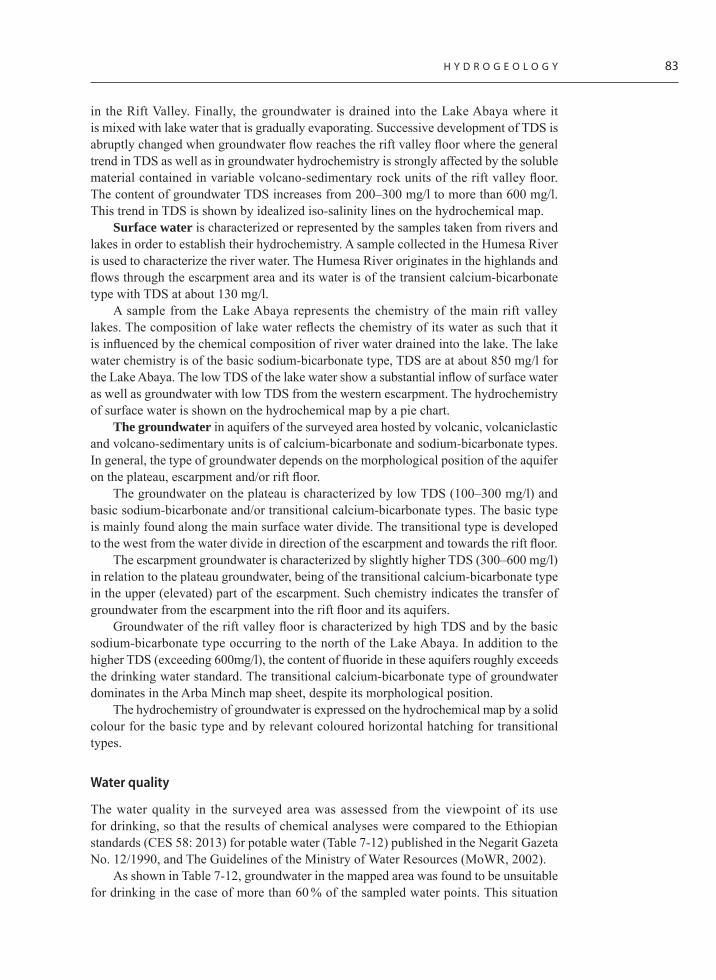
H Y D R O G E O L O G Y 83
in the Rift Valley. Finally, the groundwater is drained into the Lake Abaya where it is mixed with lake water that is gradually evaporating. Successive development of TDS is abruptly changed when groundwater flow reaches the rift valley floor where the general trend in TDS as well as in groundwater hydrochemistry is strongly affected by the soluble material contained in variable volcano-sedimentary rock units of the rift valley floor. The content of groundwater TDS increases from 200–300 mg/l to more than 600 mg/l. This trend in TDS is shown by idealized iso-salinity lines on the hydrochemical map.
Surface water is characterized or represented by the samples taken from rivers and lakes in order to establish their hydrochemistry. A sample collected in the Humesa River is used to characterize the river water. The Humesa River originates in the highlands and flows through the escarpment area and its water is of the transient calcium-bicarbonate type with TDS at about 130 mg/l.
A sample from the Lake Abaya represents the chemistry of the main rift valley lakes. The composition of lake water reflects the chemistry of its water as such that it is influenced by the chemical composition of river water drained into the lake. The lake water chemistry is of the basic sodium-bicarbonate type, TDS are at about 850 mg/l for the Lake Abaya. The low TDS of the lake water show a substantial inflow of surface water as well as groundwater with low TDS from the western escarpment. The hydrochemistry of surface water is shown on the hydrochemical map by a pie chart.
The groundwater in aquifers of the surveyed area hosted by volcanic, volcaniclastic and volcano-sedimentary units is of calcium-bicarbonate and sodium-bicarbonate types. In general, the type of groundwater depends on the morphological position of the aquifer on the plateau, escarpment and/or rift floor.
The groundwater on the plateau is characterized by low TDS (100–300 mg/l) and basic sodium-bicarbonate and/or transitional calcium-bicarbonate types. The basic type is mainly found along the main surface water divide. The transitional type is developed to the west from the water divide in direction of the escarpment and towards the rift floor.
The escarpment groundwater is characterized by slightly higher TDS (300–600 mg/l) in relation to the plateau groundwater, being of the transitional calcium-bicarbonate type in the upper (elevated) part of the escarpment. Such chemistry indicates the transfer of groundwater from the escarpment into the rift floor and its aquifers.
Groundwater of the rift valley floor is characterized by high TDS and by the basic sodium-bicarbonate type occurring to the north of the Lake Abaya. In addition to the higher TDS (exceeding 600mg/l), the content of fluoride in these aquifers roughly exceeds the drinking water standard. The transitional calcium-bicarbonate type of groundwater dominates in the Arba Minch map sheet, despite its morphological position.
The hydrochemistry of groundwater is expressed on the hydrochemical map by a solid colour for the basic type and by relevant coloured horizontal hatching for transitional types.
Water quality
The water quality in the surveyed area was assessed from the viewpoint of its use for drinking, so that the results of chemical analyses were compared to the Ethiopian standards (CES 58: 2013) for potable water (Table 7-12) published in the Negarit Gazeta No. 12/1990, and The Guidelines of the Ministry of Water Resources (MoWR, 2002).
As shown in Table 7-12, groundwater in the mapped area was found to be unsuitable for drinking in the case of more than 60 % of the sampled water points. This situation

84 M A P S H E E T 0 6 3 7 - D 3 A R B A M I N C H
reflects the fact that the majority of groundwater dissolves fluoride and other components from volcano-sedimentary and lacustrine sediments, being also in contact with the geothermal systems of the rift valley floor contributing to the higher mineralization of water. On the other hand, groundwater from the highlands and escarpment areas is suitable for drinking.
All parameters in the analysed groundwater samples, including TDS and fluoride contents, are below the maximum permissible levels (excluding 7.39 mg/l of fluorides in the Humesa River), so that the groundwater does not pose a threat when used for drinking. A particular interest was paid to the content of nitrates in groundwater. The content of nitrates is not related to the rock composition (type) but it reflects the pollution of groundwater by human and/or animal waste. The background content of nitrates in
Table 7‑12 . Groundwater chemistry compared to the drinking water standards and guidelines
CompoundRange
(min–max)[mg/l]
Ethiopian standards* (1) and MoWR** Guidelines (2) [mg/l]
Number of exceeding values
Highest desirable level
Maximum permissible level
Highest desirable level
Maximum permissible level
Na (1) NA – 200 – –
Na (2) 1.4–206 – 358 NA 0
Ca (1) 3.7–102 75 200 1 0
Cl (1) 0.9–60 200 250 0 0
Cl (2) 0.9–60 – 533 NA 0
HBO2 0.1–0.24 – 0.3 NA 0
(free) ammonia NA 0.05 0.1 NA NA
Fe (1) NA 0.1 1 NA NA
Fe (2) NA 0.4 NA NA
Mg (1) 1.4–296 50 150 0 1
Mn (1) NA 0.05 0.5 NA NA
Mn (2) NA – 0.5 NA NA
SO4 (1) 0.21–14.8 200 400 0 0
SO4 (2) 0.21–14.8 – 483 NA 0
TDS (1) 18–823 500 1500 3 0
pH (1) 5.14–8.12 7.0–8.5 6.5–9.2 4 1
pH (2) 5.14–8.12 – 6.5–8.5 NA 3
NO3 (1) 0.36–15.8 10 45 2 0
NO3 (2) 0.36–15.8 – 50 NA 0
F (1) 0.1–7.39 1 1.5 2 1
F (2) 0.1–7.39 – 3 NA 1
* CES 58: 2013, ** MoWR, 2002

H Y D R O G E O L O G Y 85
groundwater is about 5–10 mg/l, depending on the relevant land cover. In forest areas, it can be even higher because of the decomposition of various plants and other organic material. The nitrate content in the Arba Minch area varies from 0.0 mg/l to 15.8 mg/l, showing that aquifers are not polluted by human activity.
Agricultural standards for the quality of groundwater utilized for irrigation purposes are determined using the Sodium Adsorption Ratio (SAR), total dissolved solids (TDS), and the United States Salinity Criteria (USSC). The Sodium Adsorption Ratio (SAR) is applied to study the suitability of groundwater for irrigation purposes. The majority of water samples from the study area were found to be suitable for irrigation since they show the SAR value within the water quality class of excellent and/or good for agricultural purposes.
Industrial water criteria establish requirements of water quality to be used for different industrial processes that vary widely. Thus, the composition of water for high pressure boilers must meet extremely strict criteria, whereas water of a low quality can be used for cooling of condensers. There is a little threat of incrustation or corrosion when the local groundwater is transported in pipes for public water supply or for the delivery of water for industry or agriculture.
7.7 Water resources
Water resources in the area depend mainly on rainfall and other climatic conditions as well as on the hydrological, geological and topographical settings. The use of surface and groundwater, as a part of the integrated water resources and development program, must be dealt with respect to the public interest, addressing the acute problems of adequate and safe water supply schemes in the study area. In general, the ultimate source of all natural potable water is rain, but in an area where the atmospheric precipitation is scarce, some other ways should be suggested to meet the public demand. There are many meteorological stations operated by the National Meteorology Agency of Ethiopia in the surveyed area, and some of them with long-term measurements were selected to assess the rainfall intensity and precipitation depth. The long-term mean annual rainfall of the area has been assessed to be about 1,100 mm/year.
The areas of active aquifers that have the ability to store and provide water were selected and are depicted on the hydrogeological map. The active aquifers (see Table 7-13) of porous and fissured permeability cover an area of 765 km2.
The runoff characteristics vary widely because of the variability in climatic conditions and hydrogeological characteristics between different observation points. The value of specific surface runoff of 10 l/s.km2 and specific baseflow of 4 l/s.km2 were used for the further calculations of surface flow and baseflow determination in the areas consisting of
Table 7‑13 . Areal extents of aquifers in the Arba Minch map sheet
Aquifers Area [km2]
Porous aquifers 145
Fissured aquifers in volcanic rocks 400
Lake Abaya 220
Total of the area 765

86 M A P S H E E T 0 6 3 7 - D 3 A R B A M I N C H
Table 7‑14 . Assessment of water resources in the Arba Minch map sheet
Parameter Input Area [km2] Total resources Remark
Precipitation 1,000 mm 765 765 Million m3/year
Total water resources – map 10 l/s.km2 545 172 Million m3/year 22 % rainfall
Renewable groundwater resources in active aquifers 4 l/s.km2 545 69 Million m3/year 9 % rainfall
Static groundwater resources in fissured and mixed aquifers
5 % porosity100 m in thickness 400 2,000 Million m3 Not proved
Static groundwater resources in porous aquifers
15%100 m in thickness 145 2,175 Million m3 Not proved
active aquifers on the Arba Minch map sheet. The assessed water resources in the Arba Minch area are shown in Table 7-14.
Water resources in the area are huge but their future utilization within the closed Rift Valley Lakes Basin, covering more than 70 % of the Arba Minch area, depends on climate change, human demands for water and water resource management practices. Groundwater resources of the highlands representing the open hydrogeological system are more flexible in use.
THydrogeological system in the rift has been in equilibrium between inflow and outflow and evaporation from lakes. The development and implementation of new irrigation schemes and the use of more surface as well as groundwater will cause a significant annual average decrease in water level of the lakes, and also drying up the marshy areas in the centre of the Rift Valley.
Surface water resources development
Despite the fact that river gauge measurements show relatively moderate but consistent evapotranspiration when only 22 % of the total rainfall is drained as total runoff from the area, there exist sufficient water resources to be used for irrigation as well as for the drinking water supply for population of the studied area. The total water resources in the area were assessed to correspond to 172 million m3/year.
The surface water of the area should be primarily used for irrigation and also for small-scale electricity generation in the highlands and/or the escarpment area. However, the construction of dams would not be easy in the escarpment area. The irrigation plans and an assessment of potential and environmental impacts are discussed in detail by Halcrow (2008) for the Rift Valley Lakes Basin and by WWDSE (2003) for “Wabe Shebelle River Basin Integrated Master Water Plan Study Project” and by various other specific studies.
Groundwater resources development
The river gauge measurements show that nearly 22 % of precipitation is drained as total runoff from the area and about 9 % of precipitation infiltrates and appears as baseflow. There are good groundwater resources to be used for the supply of drinking water to people living within the area. There is also the potential to use groundwater of the area

H Y D R O G E O L O G Y 87
to support irrigation as well as the drinking water supply for people living outside of the mapped area. The total volume of renewable groundwater resources of active aquifers in the area has been assessed to be 69 Mm3/year.
The majority of people in the area live in small towns and villages, which are supplied with water from springs (Chencha highland, Arba Minch town), from drilled and dug wells (located along the foot of escarpments and the rift floor). Moreover, the water from drilled wells represents the safest water to drink, which should supply small towns as well as the rural population.
The data from regional and detailed surveys were evaluated in order to select appropriate areas and sites for drilling hydrogeological wells for water supply to the local population. The following criteria and lithologies were taken into account when selecting the most suitable areas and sites: • Basalts and ignimbrites contain groundwater, the quality of which mostly corresponds
to the standards for potable water.• The yields of wells penetrating basalts fluctuate between 2 and 10 l/s, and they are
sufficient for water supply for as many as 8 000 to 40 000 inhabitants, the consumption per person being 20 l/day.
The development and protection of water resources of the area and the environment as a whole have a principal importance for the development of the infrastructure with subsequent impacts on the eradication of poverty (development of irrigated agriculture, maintaining livestock during drought). Access to safe drinking water improves the health level of the population (statistics shows that 40 % of child death rates are related to diseases caused by insanitary water). Only about 15 % of the rural population have access to safe drinking water in the area, and about 70 % of infections are related to contaminated water resources. This is a serious problem for the creation of strong farm and pastoral as well as industrial communities capable of full-time engagement in working activity. It is therefore important to provide safe drinking water to communities. Protection of the environment, particularly prevention of soil erosion and degradation leading to food and water scarcity, is an important development aspect in the area. This aspect is based on the importance of water retention, which is of a primary importance with regard to the increase in population numbers connected with rising demands on soil use.
Another important task for the future development is the knowledge of groundwater resources of the area and monitoring of their fluctuations in groundwater levels and quality. Several monitoring wells were drilled by JICA (2012) in the aquifers for this purpose, but the results of monitoring are not available. It is recommended to drill additional monitoring wells next to the meteorological and river gauging stations and to carry out groundwater monitoring together with the measurements of weather phenomena. Selection of monitoring points for the observation of groundwater level (quantity) and quality fluctuations in lacustrine and volcanic aquifers should be discussed with the Woreda Water Offices.
The prospects for the development of mineral water resources in the area should be studied from the viewpoint of detailed chemical composition of groundwater in particular, while it is advisable to carry out a feasibility study to find out what sources of capital or funding can and should be used, and what return could be expected on the investment. The potential of hot water should be developed and exploited in small industry as well as for spa and recreation purposes.
The water potential of the area requires reliable and environmentally sound water management. Protection of water resources should be focused on better practices in

88 M A P S H E E T 0 6 3 7 - D 3 A R B A M I N C H
sanitation within small towns, villages and rural settlements. Most of the surface water and groundwater is fair in quality and can be used directly and/or after some treatment (chlorination) for drinking; agricultural and industrial purposes (see the section on hydrochemistry). The use of ponds for rain water harvesting is also common in some parts of the Arba Minch area, but this type of water resources can be very dangerous when used for human consumption. Indication of improper sanitation practices is reflected in the increase of nitrates from human and animal waste in the shallow groundwater that is used by dug wells. Water development practices should be based on the basic principles of protection as follows:• The source of groundwater should not be drilled directly in the center of a village or
town.• The final design of the well and distribution system should prevent direct percolation
of water from the surroundings of the well along its casing to the groundwater.• A well should be designed upstream from the groundwater flow direction in respect to
the existing and potential pollution sources (village area).• The required minimal protection zones should be respected by land use development
in the vicinity of wells.• Regular monitoring of water levels and quality should be performed.• There should be improvements in the general application of sanitation and waste
management practices.
8.1 Engineering geological characterization
The basic geotechnical characteristics of individual rock formations in the Arba Minch area are assessed and described in the following chapters and paragraphs. The major volcanic rock formations on the map sheet are used as a basis for characterizing each of the lithological groups and establishing qualitative groups with regard to their occurrence in the terrain, their geomorphic features and physical properties. This is because the engineering properties of soils and rocks influence the formation of large-scale morphological features apart from other external factors or endogenous and exogenous processes. A few examples of such relations exist and are worth mentioning. The Schmidt hammer rebound values, widely applied in the Polish Sudetes, were used in the surveyed area to reveal a strong correlation between weathered and less weathered or even fresh rocks and various elements of the relief (Day 1981; Aydin and Bsu et al. 2005; Placek and Migon 2007). This may indicate that either the frequent physical testing of rocks or general morphological features can be derived from one another, so that some engineering geological units can be identified and classified simply based on the morphology of the terrain or on observations in the field and the interpretation of landforms. The latter method was used in the current study, because the frequent testing of physical properties of rocks in the field was difficult due to the rugged terrain and a very limited accessibility and also due to a relatively short time for the testing of engineering properties of various units.
The sampling of rocks and observations and characterizations of outcrops were mostly carried out in the western sector of the Arba Minch map sheet, in particular due to a slightly better accessibility and also because the ridges and escarpments are found in this region. A few more ridges and hills are also found in the southern part of the map sheet. All the other areas are covered either by Quaternary alluvial and lacustrine deposits or the lake water with no reasonable shallower bedrock.
Variably weathered and tectonically disturbed volcanic rocks can be observed along the NW-SE running profile from the escarpment down to the rift floor. Step-like slopes are often formed mainly due to a sequence of normal faults. These often give rise to local pockets of colluvial deposits resting on variably thick lateritic residual soil layers underneath. The climatic conditions and parent rocks of basic volcanic nature favour the development of lateritic soils in most places. The most common and important rock types in the area are basalts and pyroclastic rocks. Ignimbrite forms a significant part of the pyroclastics with occasional intercalations of ash and tuffs. Basalts cover quite an extensive area on the western ridge and in the southeastern part of the map sheet. Widely spaced large joints and fractures in ignimbrites in most cases cause a rockfall of large blocks, while closely spaced fractures in basalts are the sites of extensive weathering and the subsequent development of deep-seated landslides as observed in several fossil landslides on the western and northwestern ridges.
8) ENGINEERING GEOLOGY

90 M A P S H E E T 0 6 3 7 - D 3 A R B A M I N C H
8.2 Engineering geological classification
The lithologies making up the Arba Minch area are re-classified into 3 engineering geological rock mass strength categories. These include high rock mass strength, medium rock mass strength and low rock mass strength units. On the other hand, the superficial younger Quaternary deposits are classified into 4 genetic soil units showing a closer similarity in geotechnical properties within these genetic classes. The genetic soil units include small patches of lacustrine sediments along some of the shorelines of the Lake Abaya, alluvial fans at the base of boundary faults and beyond the limits of Lake Abaya shores, weathering-derived colluvium deposits at the foot of the major escarpments (central part) and low undulating moderately flat ridge top lateritic soils resulting from intense weathering.
Genetic classification of soils
Lacustrine sediments Lacustrine soils form patches of land exposed as the lake retreated, which are in places where they had been covered by the Lake Abaya for a long period of time in the past. They are especially noticeable when forming a delta at knick points of tributaries emptying into the lake. In general, they are brownish to greyish coloured thinly laminated sediments comprised of clay and subordinate silt showing a low degree of consolidation. These are followed by densely packed sandy deposits underneath (Schütt et al. 2005).
Alluvial fans Most of the area stretching between the foot of the boundary fault escarpment and Lake Abaya shores is built of alluvial sediments of streams draining the surrounding ridges and emptying into the endorheic Abaya-Chamo lake system. With the two lakes having a difference of around 60 meters in elevation, there is only an occasional overflow from the Lake Abaya to the Lake Chamo during exceptional floods of the Kulfo River (Beck et al. 2004; Schütt et al. 2005). These are often accompanied by periodic debris avalanches as can be observed on the walls of a channel filled with sediments consisting of alternating gravels and fine-grained sediments as well as on the current debris filling of road cuts in the flat area surrounding the Lake Abaya. In many areas, the accumulated debris can be seen to rise above the local settlements. The yellowish colour of Lake Abaya sediments reflects the succession of sedimentary processes taking place in recent decades. These several exposures can be seen at road cuts and stream cut banks revealing the composition of debris deposits occurring in the area between the foot of escarps and the lake.
The alluvial fans are mostly comprised of various materials, depending on the local hydromorphic features. For example, the fan deposit is typically reddish to brownish in colour, sandy loam, without apparent bedding near the inflexion point of the Kurfo River changing its direction from NE (trend) to SW (trend) where only a small proportion of clay occurs, despite the most common soil composition elsewhere in the region (Beck et al. 2004, Schütt et al. 2005). In the upstream areas, boulder-rich granular compositions with moderate sand and silt contents in a stratified manner occur more often. On the seasonally marshy and water logged area such as the Airport, Silk Farm and Technology Campus of Arba Minch University, the soils contain a higher proportion of clay and silt along with some organic content, giving it a darker colour. An index test of in-situ consistency and compaction of soil using a penetrometer operated with steady hand pressure under field

E N G I N E E R I N G G E O L O G Y 91
moisture conditions gave a result of 250 – 300 KPa. Nevertheless, the plasticity obtained by the field test indicates a less plastic nature of the local soils.
Colluvial and gravity sedimentsDeposits associated with mass wasting in the form of mainly debris avalanches, purely gravity driven, are formed on the slopes of the western rift border area as well as in the volcanic ridges in the NW and W part. The soils are dominantly comprised of boulders and cobbles. The fragments of rock are detached, transported and accumulated at the foot of steep slopes such as fault escarps. The material composition is highly variable in the Arba Minch area where fine- and coarse-grained soils are found in the colluvium in variable proportions with respect to the boulder- and cobble-sized ones (poorly graded). Nonetheless, their occurrence on the naturally stable slopes is highly prone to subsequent instability if disturbed by adverse slope cuts or prolonged saturation.
A part of the Arba Minch town lies on an elevated terrace (Shecha), while the central part (Sikela) lies on a relatively lower-lying terrace, which rests on one of such colluvial deposits mentioned above. It is worth noting that the difference in elevation of these terraces in two parts of the city is due to a vertical displacement along a NW–SE trending normal fault scarp.
Regolith (wethered mantle)The volcanic rocks of a rift boundary escarpment are capped by variably thick lateritic weathered profiles. The main soil types in the area are Cambisols, Regosols, Nitisols, Fluvisols, Luvisols and Acrisols (see Chapter 6 of this report). These are mostly developed on basaltic bedrocks with a typical weathered reddish colour altered to the primarily sandy-clay material. Laterites are also developed on felsic rocks (pyroclastic tuff, ash and ignimbrites and rhyolitic lava) that are often altered to a material with greyish-yellow to reddish colour, fine-grained and of mostly plastic nature upon wetting (Figure 8-1). In the case of the reddish-brown lateritic soil, the underlying basalts are found in a highly weathered state and water seepages often issue from the soil contacts with the weathered parent rock on slope breaks. Laboratory analysis of the soil from the top of a ridge in the Chencha area gave 46% and 71% plastic and liquid limits respectively with 30% degree of swelling.
83
Colluvial and gravity sediments
Deposits associated with mass wasting in the form of mainly debris avalanches, purely gravity driven, are formed on the slopes of the western rift border area as well as in the volcanic ridges in the NW and W part. The soils are dominantly comprised of boulders and cobbles. The main depositional mechanism is gravitational where the fragments of rock are detached, transported and accumulated at the foot of steep slopes such as fault escarps. The material composition is highly variable in the Arba Minch area where fine- and coarse-grained soils are found in the colluvium in variable proportions with respect to the boulder- and cobble-sized ones (poorly graded). Nonetheless, their occurrence on the naturally stable slopes is highly prone to subsequent instability if disturbed by adverse slope cuts or prolonged saturation.
A part of the Arba Minch town lies on an elevated terrace (Shecha), while the central part (Sikela) lies on a relatively lower-lying terrace, which rests on one of such colluvial deposits mentioned above. It is worth noting that the difference in elevation of these terraces in two parts of the city is due to a vertical displacement along a NW–SE trending normal fault scarp.
Regolith
The volcanic rocks of a rift boundary escarpment are capped by variably thick lateritic weathered profiles. The main soil types in the area are Fluvisols, Leptosols, Cambisols, Acrisols and Alisols (see Chapter 6 of this report). These are mostly developed on basaltic bedrocks with a typical weathered reddish colour altered to the primarily sandy-clay material. Laterites are also developed on felsic rocks (pyroclastic tuff, ash and ignimbrites and rhyolitic lava) that are often altered to a material with greyish-yellow to reddish colour, fine-grained and of mostly plastic nature upon wetting (Figure 8-1). In the case of the reddish-brown lateritic soil, the underlying basalts are found in a highly weathered state and water seepages often issue from the soil contacts with the weathered parent rock on slope breaks. Laboratory analysis of the soil from the top of a ridge in the Chencha area gave 46% and 71% plastic and liquid limits respectively with 30% degree of swelling.
Figure 8-1 A slope cut in a residual (completely weathered) volcanic rock made for road work south of the study area where landslides are commonly encountered in improperly designed slope cuts (picture taken south of the Arba Minch map sheet near Gidole Town)
Engineering geological rock mass classification
The same geomorphic areas comprised of volcanic plateaus and escarpments in the area are classified into the lower, middle and higher rock mass strength units. The physical laboratory and field test values are given in Figure 8-2 and Figure 8-3.
Figure 8‑1. A slope cut in a residual (completely weathered) volcanic rock made for road work south of the study area where landslides are commonly encountered in improperly designed slope cuts (picture taken south of the Arba Minch map sheet near Gidole Town).
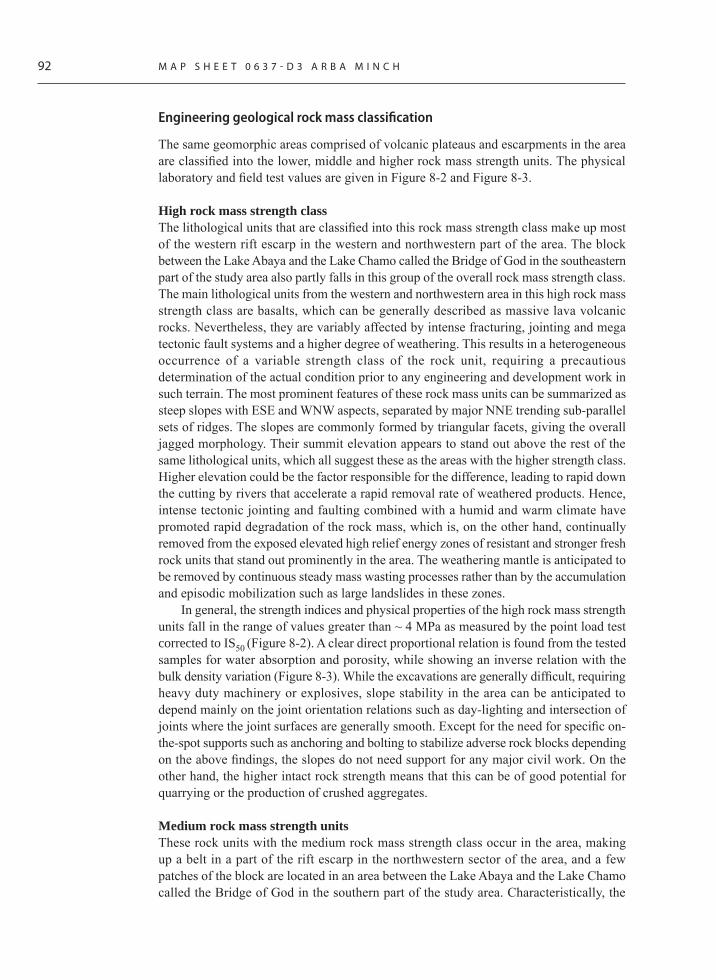
92 M A P S H E E T 0 6 3 7 - D 3 A R B A M I N C H
Engineering geological rock mass classification
The same geomorphic areas comprised of volcanic plateaus and escarpments in the area are classified into the lower, middle and higher rock mass strength units. The physical laboratory and field test values are given in Figure 8-2 and Figure 8-3.
High rock mass strength class The lithological units that are classified into this rock mass strength class make up most of the western rift escarp in the western and northwestern part of the area. The block between the Lake Abaya and the Lake Chamo called the Bridge of God in the southeastern part of the study area also partly falls in this group of the overall rock mass strength class. The main lithological units from the western and northwestern area in this high rock mass strength class are basalts, which can be generally described as massive lava volcanic rocks. Nevertheless, they are variably affected by intense fracturing, jointing and mega tectonic fault systems and a higher degree of weathering. This results in a heterogeneous occurrence of a variable strength class of the rock unit, requiring a precautious determination of the actual condition prior to any engineering and development work in such terrain. The most prominent features of these rock mass units can be summarized as steep slopes with ESE and WNW aspects, separated by major NNE trending sub-parallel sets of ridges. The slopes are commonly formed by triangular facets, giving the overall jagged morphology. Their summit elevation appears to stand out above the rest of the same lithological units, which all suggest these as the areas with the higher strength class. Higher elevation could be the factor responsible for the difference, leading to rapid down the cutting by rivers that accelerate a rapid removal rate of weathered products. Hence, intense tectonic jointing and faulting combined with a humid and warm climate have promoted rapid degradation of the rock mass, which is, on the other hand, continually removed from the exposed elevated high relief energy zones of resistant and stronger fresh rock units that stand out prominently in the area. The weathering mantle is anticipated to be removed by continuous steady mass wasting processes rather than by the accumulation and episodic mobilization such as large landslides in these zones.
In general, the strength indices and physical properties of the high rock mass strength units fall in the range of values greater than ~ 4 MPa as measured by the point load test corrected to IS50 (Figure 8-2). A clear direct proportional relation is found from the tested samples for water absorption and porosity, while showing an inverse relation with the bulk density variation (Figure 8-3). While the excavations are generally difficult, requiring heavy duty machinery or explosives, slope stability in the area can be anticipated to depend mainly on the joint orientation relations such as day-lighting and intersection of joints where the joint surfaces are generally smooth. Except for the need for specific on-the-spot supports such as anchoring and bolting to stabilize adverse rock blocks depending on the above findings, the slopes do not need support for any major civil work. On the other hand, the higher intact rock strength means that this can be of good potential for quarrying or the production of crushed aggregates.
Medium rock mass strength unitsThese rock units with the medium rock mass strength class occur in the area, making up a belt in a part of the rift escarp in the northwestern sector of the area, and a few patches of the block are located in an area between the Lake Abaya and the Lake Chamo called the Bridge of God in the southern part of the study area. Characteristically, the
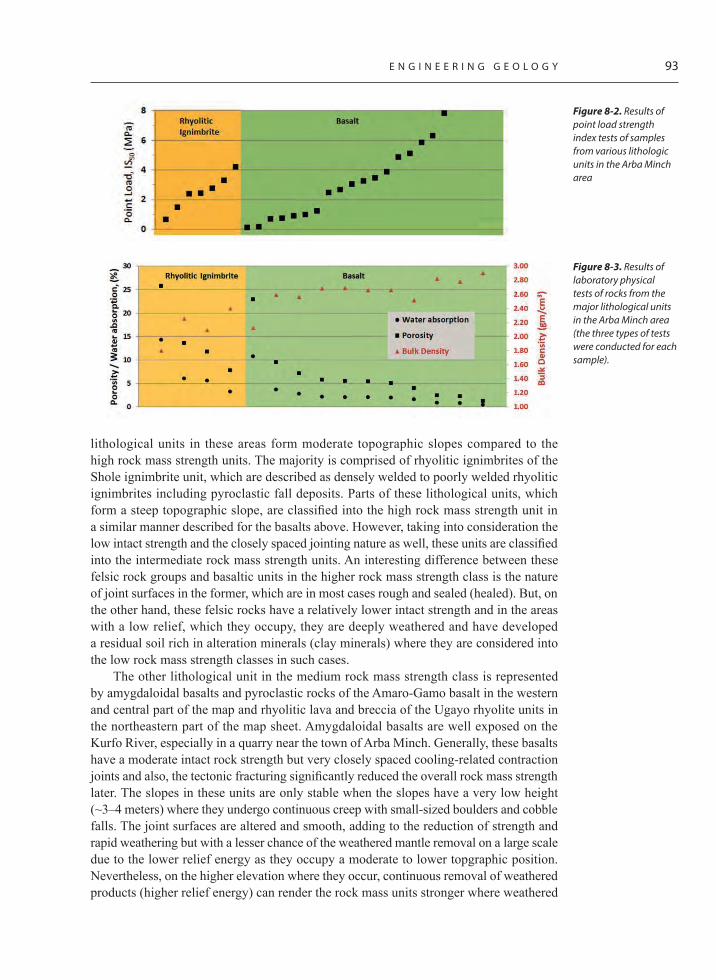
E N G I N E E R I N G G E O L O G Y 93
lithological units in these areas form moderate topographic slopes compared to the high rock mass strength units. The majority is comprised of rhyolitic ignimbrites of the Shole ignimbrite unit, which are described as densely welded to poorly welded rhyolitic ignimbrites including pyroclastic fall deposits. Parts of these lithological units, which form a steep topographic slope, are classified into the high rock mass strength unit in a similar manner described for the basalts above. However, taking into consideration the low intact strength and the closely spaced jointing nature as well, these units are classified into the intermediate rock mass strength units. An interesting difference between these felsic rock groups and basaltic units in the higher rock mass strength class is the nature of joint surfaces in the former, which are in most cases rough and sealed (healed). But, on the other hand, these felsic rocks have a relatively lower intact strength and in the areas with a low relief, which they occupy, they are deeply weathered and have developed a residual soil rich in alteration minerals (clay minerals) where they are considered into the low rock mass strength classes in such cases.
The other lithological unit in the medium rock mass strength class is represented by amygdaloidal basalts and pyroclastic rocks of the Amaro-Gamo basalt in the western and central part of the map and rhyolitic lava and breccia of the Ugayo rhyolite units in the northeastern part of the map sheet. Amygdaloidal basalts are well exposed on the Kurfo River, especially in a quarry near the town of Arba Minch. Generally, these basalts have a moderate intact rock strength but very closely spaced cooling-related contraction joints and also, the tectonic fracturing significantly reduced the overall rock mass strength later. The slopes in these units are only stable when the slopes have a very low height (~3–4 meters) where they undergo continuous creep with small-sized boulders and cobble falls. The joint surfaces are altered and smooth, adding to the reduction of strength and rapid weathering but with a lesser chance of the weathered mantle removal on a large scale due to the lower relief energy as they occupy a moderate to lower topgraphic position. Nevertheless, on the higher elevation where they occur, continuous removal of weathered products (higher relief energy) can render the rock mass units stronger where weathered
84
High rock mass strength class
The lithological units that are classified into this rock mass strength class make up the most of the western rift escarp in the western and northwestern part of the area. The block between the Lake Abaya and the Lake Chamo called the Bridge of God in the southeastern part of the study area also partly falls in this group of the overall rock mass strength class. The main lithological units from the western and northwestern area in this high rock mass strength class are basalts, which can be generally described as massive lava volcanic rocks. Nevertheless, they are variably affected by intense fracturing, jointing and mega tectonic fault systems and a higher degree of weathering. This results in a heterogeneous occurrence of a variable strength class of the rock unit, requiring a precautious determination of the actual condition prior to any engineering and development work in such terrain. The most prominent features of these rock mass units can be summarized as steep slopes with ESE and WNW aspects, separated by major NNE trending sub-parallel sets of ridges. The slopes are commonly formed by triangular facets, giving the overall jagged morphology. Their summit elevation appears to stand out above the rest of the same lithological units, which all suggest these as the areas with the higher strength class. Higher elevation could be the factor responsible for the difference, leading to rapid down the cutting by rivers that accelerate a rapid removal rate of weathered products. Hence, intense tectonic jointing and faulting combined with a humid and warm climate have promoted rapid degradation of the rock mass, which is, on the other hand, continually removed from the exposed elevated high relief energy zones of resistant and stronger fresh rock units that stand out prominently in the area. The weathering mantle is anticipated to be removed by continuous steady mass wasting processes rather than by the accumulation and episodic mobilization such as large landslides in these zones.
In general, the strength indices and physical properties of the high rock mass strength units fall in the range of values greater than ~ 4 MPa as measured by the point load test corrected to IS50 (Figure 8-2). A clear direct proportional relation is found from the tested samples for water absorption and porosity, while showing an inverse relation with the bulk density variation (Figure 8-3). While the excavations are generally difficult, requiring heavy duty machinery or explosives, slope stability in the area can be anticipated to depend mainly on the joint orientation relations such as day-lighting and intersection of joints where the joint surfaces are generally smooth. Except for the need for specific on-the-spot supports such as anchoring and bolting to stabilize adverse rock blocks depending on the above findings, the slopes do not need support for any major civil work. On the other hand, the higher intact rock strength means that this can be of good potential for quarrying or the production of crushed aggregates.
Figure 8-2 Results of point load strength index tests of samples from various lithologic units in the Arba Minch area (Bluish shade: low rock mass strength, Reddish shade: medium rock mass strength and Greenish shade: high rock mass strength)
85
Figure 8-3 Results of laboratory physical tests of rocks from the major lithological units in the Arba Minch area (Bluish shade: low rock mass strength, Reddish shade: medium rock mass strength and Greenish shade: high rock mass strength)
Medium rock mass strength units
These rock units with the medium rock mass strength class occur in the area, making up a belt in a part of the rift escarp in the northwestern sector of the area, and a few patches of the block are located in an area between the Lake Abaya and the Lake Chamo called the Bridge of God in the southern part of the study area. Characteristically, the lithological units in these areas form moderate topographic slopes compared to the high rock mass strength units. The majority is comprised of rhyolitic ignimbrites of the Shole ignimbrite unit, which are described as densely welded to poorly welded rhyolitic ignimbrites including pyroclastic fall deposits. Parts of these lithological units, which form a steep topographic slope, are classified into the high rock mass strength unit in a similar manner described for the basalts above. However, taking into consideration the low intact strength and the closely spaced jointing nature as well, these units are classified into the intermediate rock mass strength units. An interesting difference between these felsic rock groups and basaltic units in the higher rock mass strength class is the nature of joint surfaces in the former, which are in most cases rough and sealed (healed). But, on the other hand, these felsic rocks have a relatively lower intact strength and in the areas with a low relief, which they occupy, they are deeply weathered and have developed a residual soil rich in alteration minerals (clay minerals) where they are considered into the low rock mass strength classes in such cases.
The other lithological unit in the medium rock mass strength class is represented by amygdaloidal basalts and pyroclastic rocks of the Amaro-Gamo basalt in the western and central part of the map and rhyolitic lava and breccia of the Ugayo rhyolite units in the northeastern part of the map sheet. Amygdaloidal basalts are well exposed on the Kurfo River, especially in a quarry near the town of Arba Minch. Generally, these basalts have a moderate intact rock strength but very closely spaced cooling-related contraction joints and also, the tectonic fracturing significantly reduced the overall rock mass strength later. The slopes in these units are only stable when the slopes have a very low height (~ 3 – 4 meters) where they undergo continuous creep with small-sized boulders and cobble falls. The joint surfaces are altered and smooth, adding to the reduction of strength and rapid weathering but with a lesser chance of the weathered mantle removal on a large scale due to the lower relief energy as they occupy a moderate to lower topgraphic position. Nevertheless, on the higher elevation where they occur, continuous removal of weathered products (higher relief energy) can render the rock mass units stronger where weathered and weaker intact rocks continually give way to fresh, hard and less altered surfaces of the rock masses. The rhyolite lava and breccia cover small patches of the study area, occurring as domes and fissural flows along the faults of younger age. They generally have lower intact rock strength and are affected by intersecting joints, resulting in a potential
Figure 8‑2. Results of point load strength index tests of samples from various lithologic units in the Arba Minch area
Figure 8‑3. Results of laboratory physical tests of rocks from the major lithological units in the Arba Minch area (the three types of tests were conducted for each sample).

94 M A P S H E E T 0 6 3 7 - D 3 A R B A M I N C H
and weaker intact rocks continually give way to fresh, hard and less altered surfaces of the rock masses. The rhyolite lava and breccia cover small patches of the study area, occurring as domes and fissural flows along the faults of younger age. They generally have lower intact rock strength and are affected by intersecting joints, resulting in a potential for wedge rock mass failure depending on the slope cut and the orientation of joint sets. The joint surfaces are rough and straight with moderate spacing, which enhanced the rock mass strength on the other hand.
In general, the medium rock mass strength units exhibit a range of geotechnical properties, which imply different fates for excavability, slope stability and the use as a construction material. They generally have a relatively intermediate intact strength (~2 to 4 MPa) as measured by the point load test corrected to IS50 and also the moderate bulk density and lower water absorption and porosity (Figure 8-2 and Figure 8-3). The rhyolitic ignimbrites are noted to be the most problematic in terms of rockfall where they are often intercalated with thin soft pyroclastics and paleosoils, leading to wetting from the widely spaced mega sub-vertical joints in the competent solid ignimbrites of this rock unit above them. Extensive fallen blocks in the residential areas from recent geological times can be seen along most of the escarpments where these rocks occur. Perhaps, the recurrence of seismic activity could be associated with these fallen rocks; the activity cannot be confirmed but should be considered as the risk is higher. Hence, the presence of soft formations in any excavation is the reason for precaution measures that need to be considered for any infrastructure development in this terrain.
On the other hand, excavation work might still require pneumatic means with minimal explosive requirements for major civil works. In the case of no soft formation undercutting, the slope can be expected to perform well with no need for support but needs a geotechnical site condition assessment for the actual performance evaluation. The use of the medium strength rock mass units as a construction material is much limited due to their lower hardness, degradation potential and also because the interaction with a mixture of cement asphalt is uncertain. In contrast, amygdaloidal basalt requires quite extensive support in the case of deep excavation work to seal-off the joints by shotcrete and wire mesh along the slopes. Despite its potential use as a source of crushed aggregate, the additional effort of sorting is required to filter out the undesired weathered materials. Smaller domes and fissure flow rhyolites and rhyolite breccia are already proved to be a good source of masonry blocks, e.g. for cobble stone carving and dimension stones. But the quality of rocks needs to be evaluated before the utilization of all materials excavated. The occurrence of these small units, on the other hand, is an ideal condition as they are close to the residential areas and transport means by the main roads or sea (over the Lake Abaya).
Low rock mass strength unitsThe same lithological units occurring in the northwestern highland escarpment and southern blocks are partly classified into the low rock mass strength units based on the spatial associations of their characteristic morphological and physical properties. These include parts of massive basalts, trachyte units, rhyolitic ignimbrites and fall deposits of the Shole ignimbrites. The characteristic features include the visibly subdued topography (locally lower elevation) on a wider scale with a smooth and relatively flat gradient. Also, they occur in the areas where tectonic structures are densely located in the formations. Generally, these rock units are intensely weathered and have the hardness lower than 2 MPa. In some cases, unconsolidated pyroclastic deposits are found as thin layers and

E N G I N E E R I N G G E O L O G Y 95
anastomosing bands in the volcanic rocks of both rhyolitic and basaltic units where they form local patches of the weak rock mass strength among the high and medium rock mass strength categories.
The low rock mass strength units also have higher porosity and a water absorption capacity and lower bulk density (Figure 8-3). They are often associated with the developed residual soils, suggesting in-situ weathered parent rock materials. Their occurrence on a relatively flat and subdued topography in most cases means that although the units are potentially adverse in terms of their inherent properties, their spatial disposition is such that they are less likely to cause large-scale problems. However, the evaluation of the actual properties should always be performed for any infrastructure development on these units of rocks.
Generally, if the slopes are cut at a steeper angle and longer height, they should be supported and the role of groundwater should be a concern in terms of adverse geotechnical impacts. Their use as a construction material is limited to the use as a source of borrows material and as a source of selected infill to replace the expansive soil material excavated in other places for infrastructure construction. On the other hand, their potential for the development of deep-seated landslides is always of a great concern, especially when occurring on gently dipping terrace land forms where several fossil landslides have been delineated and the surroundings belonging to the low rock mass strength units.

The specific geological and climatic conditions of southern Ethiopia significantly affect the economic and socio-demographic development of this region. The geomorphological and geological character of the area creates favourable conditions for triggering geological processes that negatively influence human activities and the local environment. Surface erosion strongly affects soil quality and causes an overall degradation of farmland. Flooding and other alluvial processes in the western bank of the Lake Abaya threaten farmlands and the major access road to Arba Minch. Frequent slope deformations could be triggered or remobilized by extreme climatic events, earthquakes or inappropriate human intervention. Expansion of urbanization could lead to the loss of settlements and human beings in the areas exposed to or suffering from seismicity. The dangers associated with volcanic activity can neither be excluded. Hazardous phenomena were derived and evaluated from the synthesis of geological, geomorphological and remote-sensing data, and are also based on geological and geomorphological mapping in the field and the multi-disciplinary analysis of the achieved results. A range of factors such as geomorphological features (landform origin, slope deformations, impact of head-ward erosion) as well as the geological setting (lithology, degree and character of weathering, geotechnical and hydrogeological properties of rocks, data on historical earthquakes), and the age of volcanic rocks were taken into account and interpreted in order to identify and specify geological or natural hazards in general. The land-use and climate conditions were also considered.
The studied area morphologically belongs to the southern part of the MER. The area is drained into an endorheic depression of the Lake Abaya, representing the regional erosional base. The geomorphological character of the area is highly variable, generally being the result of a combination of volcanic and tectonic events as well as exogenous processes. The originally volcanic landforms of Pleistocene age in general were modified by tectonic processes. The tectonic vertical movements influenced the type of topography and hence the intensity of alluvial erosion and slope deformation processes.
Structural landforms consist of fault scarps and structural gently inclined structure slopes and terraces. Fault scarps are characterized by relatively steep and straight slopes, commonly with large downthrown blocks, slopes that are predisposed by the original trend of denuded fault plane occurring in the western highlands. The majority of fault scarps in the area are running north-south or north-east to south-west. These landforms are commonly affected by fossil landslides, rock-falls and surface erosion. Structural slopes and terraces are characterized by gently undulating to flat landforms affected by exogenous processes of low intensity. These landforms are copying the underlain gently inclined lava flows or more resistant ignimbrite strata.
Denudation landforms are represented by erosion slopes and erosion valleys that result from the prolonged effect of erosion processes on the exposed fresh or weathered rocks. Erosion slopes are widespread landforms with a different gradient formed by fluvial
9) GEOLOGICAL HAZARDS
G E O L O G I C A L H A Z A R D S 97
erosion. Erosion slopes give rise to scarps and V-shaped valleys, and frequently they are not exactly following or copying geological structures and tectonics.
Landforms of accumulation consist of alluvial plains, alluvial fans and infillings of endorheic depressions. Alluvial plains are formed only in the parts where fluvial systems show a lower gradient. Widespread alluvial fans were observed along the western bank of the Lake Abaya, representing landforms that are susceptible to floods, including the deposition of large volumes of material that may be exposed to lateral erosion.
9.1 Endogenous hazards
Seismic hazards in the study area are caused by extensional tectonics in the rift region. Continental rifts are characterized by a special type of seismicity - seismic swarms and volcanic earthquakes. Geothermal phenomena related to the volcanic activity and confined to rift regions are another typical feature that can be observed in the area surveyed. Several types of earthquakes are documented in the area, for instance shallow seismic swarms related to the magmatic activity and magma-derived fluid intrusions. The swarms consist of many thousands of weak to moderate earthquakes with magnitudes less than 5. The earthquakes accompanied by direct volcanic eruptions were observed and reported repeatedly in the past (Gouin 1979). Finally, the strong tectonic earthquakes are also recorded as being related to the displacements along active faults parallel with the rift valley. Historical earthquakes are poorly located and difficult to be assigned to known faults; their hypocentral depths and distribution remain unclear.
The oldest documented earthquake occurred in 1928 on the rift scarp west of the Lake Abaya, having a magnitude of 6, but its exact location is not known. Several smaller earthquakes with a magnitude below 5 were detected in 1972 east of the Arba Minch town (N 6.0°, E 37.7°), and then on June 30, 1974 to the northeast of the study area (N 6.3°, E 37.7°). Seismic swarms were recorded in March 1974 close to the Lake Abaya on the northern boundary of the study area (N 6.2°, E 37.7°). A catalogue of earthquakes of the United States Geological Survey (USGS) documents the earthquakes since 1973. However, there are no earthquakes reported in southern Ethiopia in the catalogue prior to 1983. The events reported in the catalogue include earthquakes in 1987 with a magnitude of 5.3 at the Lake Abaya, in 1999 with a magnitude of 4.7 west of the Arba Minch town, and in 2005 with a magnitude of 4.7 on the northern boundary of the area surveyed. Intense urban development has taken place in southern Ethiopia with evidently little attention paid to the high seismicity of the region endangering the population and infrastructure. The last strong earthquake occurred in 1906, when the population in the region was much sparser and the distribution of urban housing was sporadic. Anti-seismic measures have not been satisfactorily applied since. Anti-earthquake constructions were not made and the public was neither made aware of the potential danger, and the hazard maps were not compiled in order to implement an adequate emergency response strategy to confront strong earthquakes. A model or prototype of the local seismic network is being set up in cooperation with the Institute of Rock Structure and Mechanics of the Academy of Sciences of the Czech Republic in the southern part of Ethiopia to detect earthquake epicentres and to establish the zones of seismic hazards. The continued installation of monitoring facilities, including the specific analyses of seismic hazards in individual zones, are believed to increase the awareness
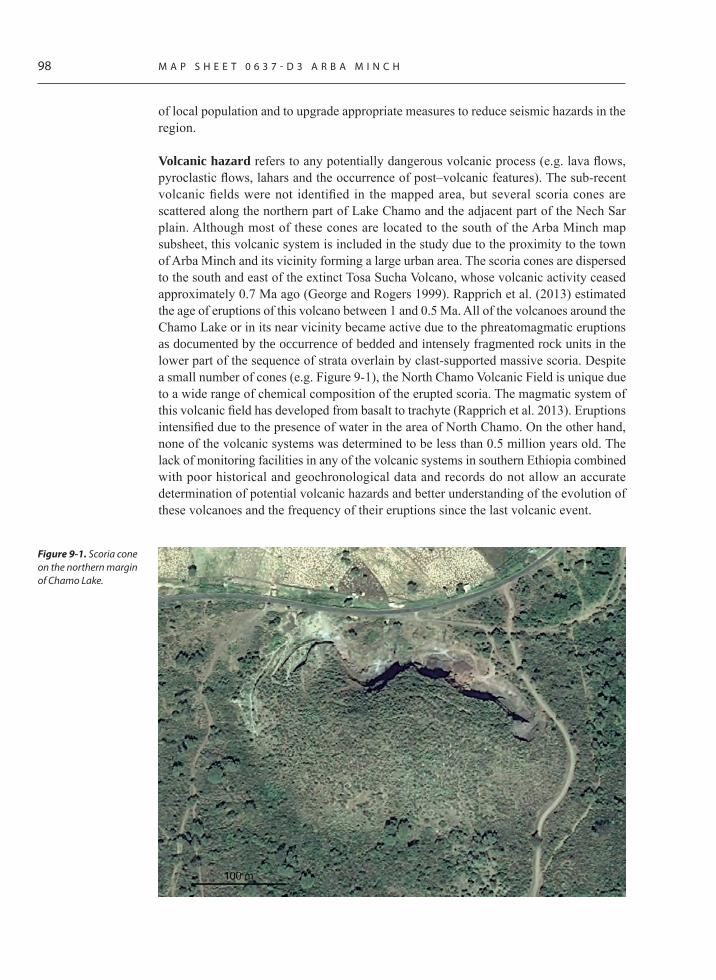
98 M A P S H E E T 0 6 3 7 - D 3 A R B A M I N C H
of local population and to upgrade appropriate measures to reduce seismic hazards in the region.
Volcanic hazard refers to any potentially dangerous volcanic process (e.g. lava flows, pyroclastic flows, lahars and the occurrence of post–volcanic features). The sub-recent volcanic fields were not identified in the mapped area, but several scoria cones are scattered along the northern part of Lake Chamo and the adjacent part of the Nech Sar plain. Although most of these cones are located to the south of the Arba Minch map subsheet, this volcanic system is included in the study due to the proximity to the town of Arba Minch and its vicinity forming a large urban area. The scoria cones are dispersed to the south and east of the extinct Tosa Sucha Volcano, whose volcanic activity ceased approximately 0.7 Ma ago (George and Rogers 1999). Rapprich et al. (2013) estimated the age of eruptions of this volcano between 1 and 0.5 Ma. All of the volcanoes around the Chamo Lake or in its near vicinity became active due to the phreatomagmatic eruptions as documented by the occurrence of bedded and intensely fragmented rock units in the lower part of the sequence of strata overlain by clast-supported massive scoria. Despite a small number of cones (e.g. Figure 9-1), the North Chamo Volcanic Field is unique due to a wide range of chemical composition of the erupted scoria. The magmatic system of this volcanic field has developed from basalt to trachyte (Rapprich et al. 2013). Eruptions intensified due to the presence of water in the area of North Chamo. On the other hand, none of the volcanic systems was determined to be less than 0.5 million years old. The lack of monitoring facilities in any of the volcanic systems in southern Ethiopia combined with poor historical and geochronological data and records do not allow an accurate determination of potential volcanic hazards and better understanding of the evolution of these volcanoes and the frequency of their eruptions since the last volcanic event.
Figure 9‑1. Scoria cone on the northern margin of Chamo Lake.

G E O L O G I C A L H A Z A R D S 99
9.2 Exogenous hazards
The landforms in the southern section of the rift were modelled by or resulted from the exogenous processes that also had an impact on the local population living in the area. These processes are connected with the recent evolution of the rift, mostly in a time span of 3 Ma (Bonini et al., 2005), during which the formation of fault scarps followed by the origin of depressions along the foot of escarpments took place; this also led to the deposition of material as a result of exogenous processes, the erosion in particular. The closed lake systems (endorheic) such as the Lake Abaya and the Lake Chamo were supplied with a huge volume of sediment transported by streams to the lakes, which resulted in water level rise and subsequent inundation of their shores. This has caused an escalation of infrastructure development costs on one hand and the reduction of farmland available for ever increasing population on the other hand. At the same time, there was an increasing threat of reactivation of large and small mass wasting processes in the western highlands in the form of landslides, debris avalanche and rockfalls (Table 9-1). Only some of these phenomena and features of a larger extent were identified and delineated but their origin and developments were not explained satisfactorily.
Alluvial hazards
Alluvial hazards are associated with dangerous exogenous processes such as the effects of rivers usually related to and triggered by heavy rains and consequent floods. The river banks, otherwise dry, are flooded during the rainy seasons and choked up by transported and deposited sediments. These processes often destroy farmland and houses close to streams and also damage the main highway running through the flood plain, thus temporarily blocking the traffic. However, no appropriate measures have been taken by local administrations so far to prevent such disasters to happen as they have a harmful effect on the local population, infrastructure and the environment. The deposition of large volumes of sediments in the Lake Abaya significantly raised the water level in the past 4 or 5 decades, forcing some facilities and built structures to be relocated.
In general, the flood plains and lower parts of active alluvial fans represent the most affected areas by floods. However, ephemeral streams must also be regarded as a potential risk of flooding, particularly during the rainy seasons. Frequent floods affect the lower parts of an alluvial fan of the Kulfo River, thus not allowing the access to the Nech-Sar National Park. Inundations on the Baso River alluvial fan around Lante affect large areas of farmland including the main access road, resulting in the loss of agriculture production and interrupted access to the Arba Minch town for a few days. Floods are usually accompanied by other dangerous alluvial processes like vertical (downward) surface erosion, lateral erosion, avulsion and accumulation and fluvial aggradation of material.
Alluvial downward erosion is one of the most common exogenous processes in the area affecting or modelling the landscape. A range of phenomena such as tectonics responsible for high gradient relief, climatic conditions with torrential rains producing rapid runoff, lithology with strongly weathered volcanic or volcaniclastic rocks and unconsolidated sediments promote favourable conditions for surface erosion (Figure 9-2). Intense deforestation and farming on steep slopes also largely accelerate the erosion that leads to decreasing the infiltration capacity of the ground and increasing runoff. The development of laminar flow, at the beginning without erosion, then turns into a turbulent

100 M A P S H E E T 0 6 3 7 - D 3 A R B A M I N C H
sheet flow increasing the erosion rate, resulting in the formation of erosion rills, gullies and V-shaped valleys (Figure 9-3).
In general, erosion is associated with slope deformations accompanied by mass movement and high sediment load in a drainage pattern. Fault scarps and adjacent structures and slopes covered with the products of weathering as well as the areas with unconsolidated sediments are affected the most by erosion. The area most affected by erosion lies in an erosion terrace and on erosion slopes west of the Arba Minch town, where loose alluvial gravel and sand sit on the moderately to strongly weathered basalts. The area is characterized by poor vegetation and is cut with numerous deeply incised erosion valleys. Some sub-surface erosion giving rise to small sinkholes of only decimetres in size was also observed in alluvial sandy soils (Figure 9-4). The gullying is perhaps an intermediate process in the course of the alluvial landform development where a once deposited mass is subjected to erosion and scouring as the water level and energy of the water in streams increase. Locally, the gullies are a few meters deep and their impact is important when considering the life expectancy of local people. The problem grows with the increasing distance from the foot of the escarpment towards the lakes shore.
Table 9‑1 . Characteristic hill slope hazards in the Arba Minch area
East [m]
North [m]
Elevation [m a. s. l.]
Degree of weathering* Characteristics
343476 685404 2274 Slightly weathered
Ridge forming, fine-grained basalt, strongly weathered, closely (<50 cm) to widely (2-3 m) spaced columnar jointed with a straight shape and smooth surface, having narrow holes filled with silty clay. Vulnerable to rockfalls.
438866 677338 1193 Slightly weathered
Road cut exposure, greenish grey, fine-grained, strong, slightly weathered trachyte-rhyolite. Joints closely spaced, straight, smooth surfaces with tight
holes. Contacts with strongly weathered basalt in oblate forms. Potential rockfall/rockslide into the main road from some
of the joints inclined to the road.
339397 669637 1371 Highly weathered
Hill side exposure in the northern part of Arba Minch. Dark coloured, very fine-grained, highly weathered basalt, almost completely changed to soils, strongly affected by micro-fractures and penetrative joint structures
and flow foliation. Joints are closely spaced (<1m), straight-curved & smooth with tight holes. Potential for downstream flooding due
to a long steep slope.
338663 671705 1553 Highly weathered
Hill side exposure in the northern part of Arba Minch. Dark coloured, very fine-grained, highly weathered basalt, almost completely changed to soils, strongly affected by micro-fractures and penetrative joint structures.
Joints are closely spaced (<1m), straight-curved & smooth with tight holes. Potential for downstream flooding due to a long steep slope.
342670 682786 2283 –
Road cut exposure. Dark brown coloured ignimbrite with glass-like obsidian and intercalated petrified/coal materials. Tectonically induced
joints are widely spaced (3-5m), straight and rough with some silty-clay soil filled with tight holes and bedding planes. The prevalence of rockfall hazard
potential due to dipping of the joints towards the road.
342888 683380 2384 Moderately weathered
Top of a ridge, Dorze Lodge. Fallen blocks of ignimbrite in Pleistocene. Densely populated area. Potential hazard site for the inhabitants due to
a soft formation having widely spaced sub-vertical joints in the ignimbrite rocks overlying the soft formation leading to the rockfall hazard.
* Degree of weathering according to the British Standards Institution (1981)

G E O L O G I C A L H A Z A R D S 101
Lateral Erosion of river banks is related to floods and high discharge, in general mainly on the banks of braided streams. Extensive lateral erosion has been documented along braided streams in alluvial fans on the western bank of the Lake Abaya. The presence of lateral and in-channel bars causes diversion of streams towards the channel banks (Figure 9-5). Sandy soils, loose sands and gravel forming the river banks represent an environment and material very susceptible to lateral erosion, particularly when the river discharge varies considerably (Figure 9-6). The obstacles in river beds like meandering or narrowing associated with building of bridges or other constructions aggravates the river channel by lateral erosion (Figure 9-7). The separation of stream flow behind the obstacles makes the water current whirling, thus boosting the lateral erosion (Figure 9-8).
Inundation affects the areas around river channels on the alluvial fans and shoreline around the Abaya Lake. The expansion of Lake Abaya affects the highly populated area, signaling a serious concern for inundation of the adjacent fertile and flat-lying farmland (Figure 9-9), which is the basic means of subsistence for local dwellers. During the second half of the 1970s, the water level in the Lake Abaya had a decreasing trend, but since 1987 the water level is seen to have constantly increased and the lake is expanding
Figure 9‑2. The initial phase of bad land evolution with rill and gully erosion, west of Arba Minch.
Figure 9‑4. Sinkholes in alluvial sediments, west to Arba Minch.
Figure 9‑3. Surface erosion on deforested landscape formed by a weathered basalt, Shara Hill.
Figure 9‑5. Lateral erosion of banks along a braided channel in an alluvial fan near Lante.

102 M A P S H E E T 0 6 3 7 - D 3 A R B A M I N C H
toward the western alluvial plain, threatening the farmlands and infrastructure. The lake level rise could be attributed to either tectonic or hydrologic effects. Tectonic processes and consequently the vertical movements strongly influence the topography of an area as well as the lake water level. Also, the extreme soil erosion caused by deforestation and expansion of farmland, could contribute to an increase in sediment deposition, leading to the siltation of lakes. The well-developed alluvial fans along the western bank as well as shifting of the Bilate River delta into the lake indicate a high sediment yield in tributaries of the Lake Abaya. According to Schütt et al. (2005), the depth of Lake Abaya is 26 meters at maximum, which makes the lake level very sensitive to a high sediment input.
Aggradation of sediments and avulsion amplify the negative impact of floods. Aggradation of sediments leads to the reduction of channel capacity, and the aggradation of material in the channel is associated with avulsion (a relatively rapid abandonment of river channel and the formation of a new channel take place). In general, avulsions occur as a result of channel slopes that are much less steeper than the slope that the river could flow through if it took a new course. The principal trigger factor of avulsion is the decrease in channel gradient, leading to the aggradation (accumulation) of sediments
Figure 9‑6. Lateral erosion threatening bridge construction.
Figure 9‑8. Sketch of separation cell of current, forming behind the obstacle of a water stream (after Allen 1968).
Figure 9‑7. Flooded road in an alluvial fan near Lante.
Figure 9‑9. Flooding of an alluvial plain near the Nech Sar National Park entrance, east to Arba Minch.
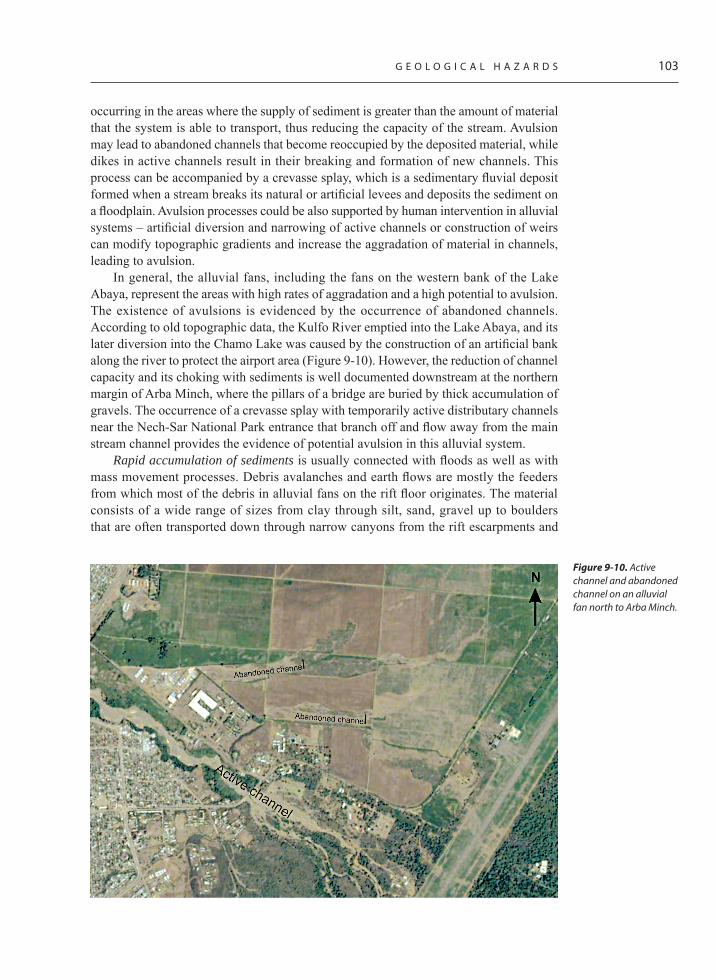
G E O L O G I C A L H A Z A R D S 103
occurring in the areas where the supply of sediment is greater than the amount of material that the system is able to transport, thus reducing the capacity of the stream. Avulsion may lead to abandoned channels that become reoccupied by the deposited material, while dikes in active channels result in their breaking and formation of new channels. This process can be accompanied by a crevasse splay, which is a sedimentary fluvial deposit formed when a stream breaks its natural or artificial levees and deposits the sediment on a floodplain. Avulsion processes could be also supported by human intervention in alluvial systems – artificial diversion and narrowing of active channels or construction of weirs can modify topographic gradients and increase the aggradation of material in channels, leading to avulsion.
In general, the alluvial fans, including the fans on the western bank of the Lake Abaya, represent the areas with high rates of aggradation and a high potential to avulsion. The existence of avulsions is evidenced by the occurrence of abandoned channels. According to old topographic data, the Kulfo River emptied into the Lake Abaya, and its later diversion into the Chamo Lake was caused by the construction of an artificial bank along the river to protect the airport area (Figure 9-10). However, the reduction of channel capacity and its choking with sediments is well documented downstream at the northern margin of Arba Minch, where the pillars of a bridge are buried by thick accumulation of gravels. The occurrence of a crevasse splay with temporarily active distributary channels near the Nech-Sar National Park entrance that branch off and flow away from the main stream channel provides the evidence of potential avulsion in this alluvial system.
Rapid accumulation of sediments is usually connected with floods as well as with mass movement processes. Debris avalanches and earth flows are mostly the feeders from which most of the debris in alluvial fans on the rift floor originates. The material consists of a wide range of sizes from clay through silt, sand, gravel up to boulders that are often transported down through narrow canyons from the rift escarpments and
Figure 9‑10. Active channel and abandoned channel on an alluvial fan north to Arba Minch.
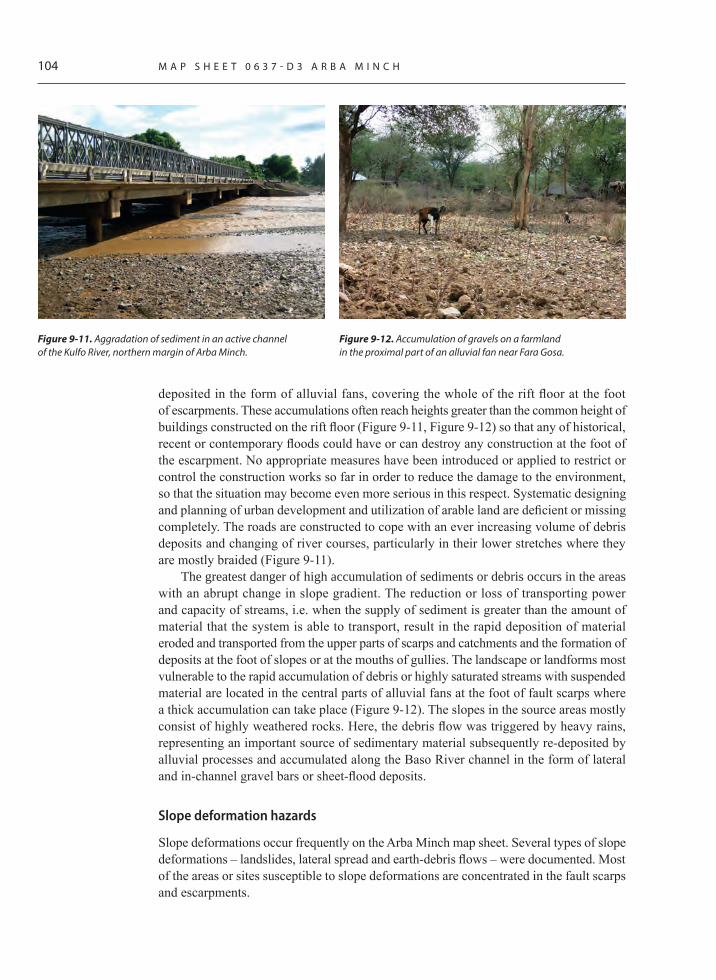
104 M A P S H E E T 0 6 3 7 - D 3 A R B A M I N C H
deposited in the form of alluvial fans, covering the whole of the rift floor at the foot of escarpments. These accumulations often reach heights greater than the common height of buildings constructed on the rift floor (Figure 9-11, Figure 9-12) so that any of historical, recent or contemporary floods could have or can destroy any construction at the foot of the escarpment. No appropriate measures have been introduced or applied to restrict or control the construction works so far in order to reduce the damage to the environment, so that the situation may become even more serious in this respect. Systematic designing and planning of urban development and utilization of arable land are deficient or missing completely. The roads are constructed to cope with an ever increasing volume of debris deposits and changing of river courses, particularly in their lower stretches where they are mostly braided (Figure 9-11).
The greatest danger of high accumulation of sediments or debris occurs in the areas with an abrupt change in slope gradient. The reduction or loss of transporting power and capacity of streams, i.e. when the supply of sediment is greater than the amount of material that the system is able to transport, result in the rapid deposition of material eroded and transported from the upper parts of scarps and catchments and the formation of deposits at the foot of slopes or at the mouths of gullies. The landscape or landforms most vulnerable to the rapid accumulation of debris or highly saturated streams with suspended material are located in the central parts of alluvial fans at the foot of fault scarps where a thick accumulation can take place (Figure 9-12). The slopes in the source areas mostly consist of highly weathered rocks. Here, the debris flow was triggered by heavy rains, representing an important source of sedimentary material subsequently re-deposited by alluvial processes and accumulated along the Baso River channel in the form of lateral and in-channel gravel bars or sheet-flood deposits.
Slope deformation hazards
Slope deformations occur frequently on the Arba Minch map sheet. Several types of slope deformations – landslides, lateral spread and earth-debris flows – were documented. Most of the areas or sites susceptible to slope deformations are concentrated in the fault scarps and escarpments.
Figure 9‑11. Aggradation of sediment in an active channel of the Kulfo River, northern margin of Arba Minch.
Figure 9‑12. Accumulation of gravels on a farmland in the proximal part of an alluvial fan near Fara Gosa.
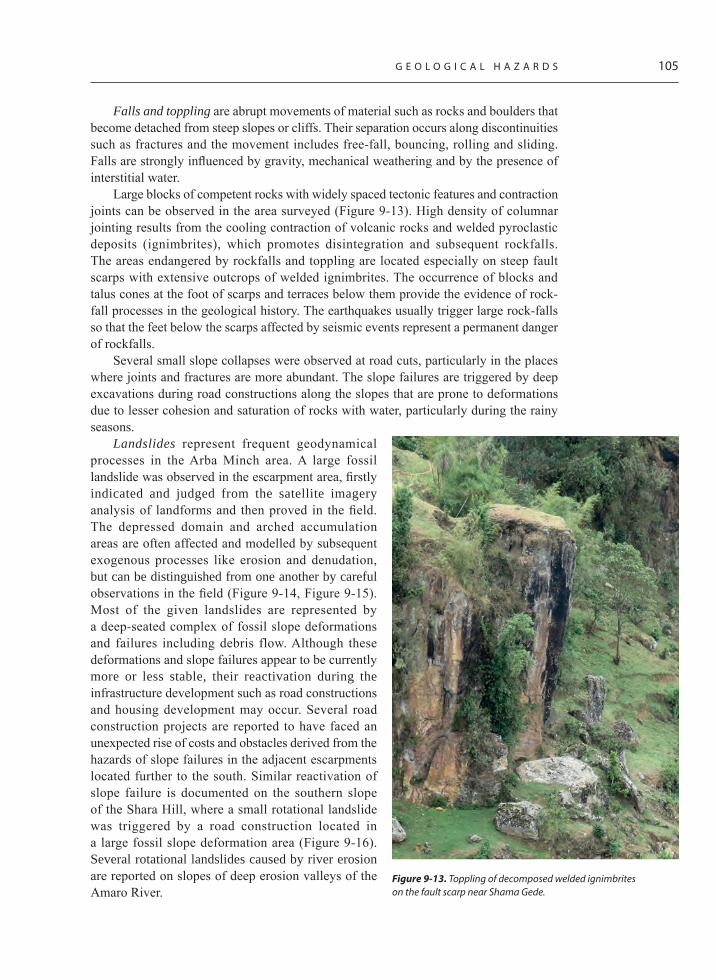
G E O L O G I C A L H A Z A R D S 105
Falls and toppling are abrupt movements of material such as rocks and boulders that become detached from steep slopes or cliffs. Their separation occurs along discontinuities such as fractures and the movement includes free-fall, bouncing, rolling and sliding. Falls are strongly influenced by gravity, mechanical weathering and by the presence of interstitial water.
Large blocks of competent rocks with widely spaced tectonic features and contraction joints can be observed in the area surveyed (Figure 9-13). High density of columnar jointing results from the cooling contraction of volcanic rocks and welded pyroclastic deposits (ignimbrites), which promotes disintegration and subsequent rockfalls. The areas endangered by rockfalls and toppling are located especially on steep fault scarps with extensive outcrops of welded ignimbrites. The occurrence of blocks and talus cones at the foot of scarps and terraces below them provide the evidence of rock-fall processes in the geological history. The earthquakes usually trigger large rock-falls so that the feet below the scarps affected by seismic events represent a permanent danger of rockfalls.
Several small slope collapses were observed at road cuts, particularly in the places where joints and fractures are more abundant. The slope failures are triggered by deep excavations during road constructions along the slopes that are prone to deformations due to lesser cohesion and saturation of rocks with water, particularly during the rainy seasons.
Landslides represent frequent geodynamical processes in the Arba Minch area. A large fossil landslide was observed in the escarpment area, firstly indicated and judged from the satellite imagery analysis of landforms and then proved in the field. The depressed domain and arched accumulation areas are often affected and modelled by subsequent exogenous processes like erosion and denudation, but can be distinguished from one another by careful observations in the field (Figure 9-14, Figure 9-15). Most of the given landslides are represented by a deep-seated complex of fossil slope deformations and failures including debris flow. Although these deformations and slope failures appear to be currently more or less stable, their reactivation during the infrastructure development such as road constructions and housing development may occur. Several road construction projects are reported to have faced an unexpected rise of costs and obstacles derived from the hazards of slope failures in the adjacent escarpments located further to the south. Similar reactivation of slope failure is documented on the southern slope of the Shara Hill, where a small rotational landslide was triggered by a road construction located in a large fossil slope deformation area (Figure 9-16). Several rotational landslides caused by river erosion are reported on slopes of deep erosion valleys of the Amaro River.
Figure 9‑13. Toppling of decomposed welded ignimbrites on the fault scarp near Shama Gede.

106 M A P S H E E T 0 6 3 7 - D 3 A R B A M I N C H
However, these landslides do not pose any danger to infrastructure or housing development. Rock slide areas were also identified around the Dorze and Shama Gede settlements. Collapsed blocks of rocks are spread over the two sites, being approximately a few hundreds of meters large (Figure 9-17). Ignimbrites exposed on the scarp show numerous randomly oriented fractures separating the blocks of a fresh rock. The initial stages of toppling can also be observed at this site.
Figure 9‑14. Hummocky topography of a landslide on the eastern slope of Shara Hill.
Figure 9‑16. Rotational landslide in the Amaro River valley.
Figure 9‑15. Cracks and subsidence of the reactivated part of a landslide on the southern slope of Shara Hill.
Figure 9‑17. Rockslide in the fault scarp located southeastto Shama Gede.

10) LOCAL PREVENTION AND MITIGATION MEASURES OF GEOLOGICAL HAZARDS
Geological hazards are the results of geodynamic processes taking place throughout the history of the Earth, so that the application of measures to prevent or mitigate geological dangers should take this fact into consideration. Two measures or strategies should be adopted in the Arba Minch area to cope with the above-mentioned issues. The first one is to reduce the geological hazards endangering the local population and infrastructure such as roads, farmlands and settlements nearby. This requires appropriate planning whenever possible to avoid any unnecessary relocation of the infrastructure (roads or settlements) or even a complete abandonment of the populated sites or the already built infrastructure. The second approach is to use mechanisms that control local geological processes and dangers. This actually involves the rehabilitation of highlands with minimum human intervention.
It should also be noted that apart from these preventive and mitigation strategies, it is vital to maintain an emergency preparedness and response plan based on the vulnerability of the area. This will ensure safeguarding the endangered population from imminent hazards if there are such phenomena identified. The Arba Minch area and the town itself situated in the active East African Rift, indeed need such preparedness (including the emergency response systems).
Some aspects of the encountered common problems caused by slope deformations and hydrologic processes and remedial measures taken thereof are discussed in the following paragraphs. These are followed by the recommended long-term preventive and rehabilitation strategies and then succeeded by suggestions for the monitoring and preparedness (including the emergency response systems) for various potential disasters anticipated from the geological setting of the area.
The construction of the main road from Addis Ababa to Arba Minch is commonly affected by a range of dangerous superficial processes briefly mentioned above. Obviously, there is a considerable movement of material (gravel and sand) and water (Figure 10-1). The culverts during the road construction are commonly built perpendicularly and not respecting the natural flow of water and their lower end is built of a vertical wall to prevent another stream to flow through (Figure 10-2). Two types of problems can be identified: (i) there is a gradual undermining of the road embankment construction caused by the lateral erosion of water when the direction of the water flow is changed or diverted, (ii) when the water flows through the culvert, it may be destroyed on its lower end due to an inappropriate shape where a turbulent water current occurs and thus accelerates the destruction of the culvert construction.
10.1 Manageable geomorphic hazardsRoad destruction on the alluvial fan on the western bank of the Abaya Lake
The system of alluvial fans on the western bank of the Lake Abaya is among those that are susceptible to natural hazards. The main road crossing the alluvial fans is frequently threatened by alluvial processes. Obviously, there is a considerable movement of

108 M A P S H E E T 0 6 3 7 - D 3 A R B A M I N C H
material (gravel and sand) and water accompanied by the lateral erosion and aggradation or alleviation, resulting in the increase of the land elevation due to the deposition of sediments. Several problems were identified in the road construction. The culverts in the road embankment are commonly built perpendicular to the road course, avoiding the natural flow of water (Figure 10-1) and their lower ends may be damaged due to a turbulent water current accelerating the destruction of the culvert construction (Figure 10-2).
The culverts in road embankments that do not comply with the natural flow of water and local topography in the area with alluvial fans on the streams may change their course resulting in erosion. That is why massive supporting walls were probably built along the road embankments to protect them against erosion (Figure 10-3, Figure 10-4). The most appropriate solution to eliminate lateral erosion and the subsequent road destruction is to obey the natural course of the water flow (leave it in the natural position). This would mean rebuilding the culverts so that they would be diagonal to the road course and would follow the course of the water flow (see Figure 10-5). This would not complicate the road construction; it suffices to lengthen the culvert a little. This operation would cost
Figure 10‑1. Gabion wall and the culvert. Figure 10‑2. The lower end of the culvert.
Figure 10‑3. Lateral erosion of an unsupported slope of the river below a bridge.
Figure 10‑4. Rest of the original bridge foundation and embankments caused by insufficient turbulent flow protection.
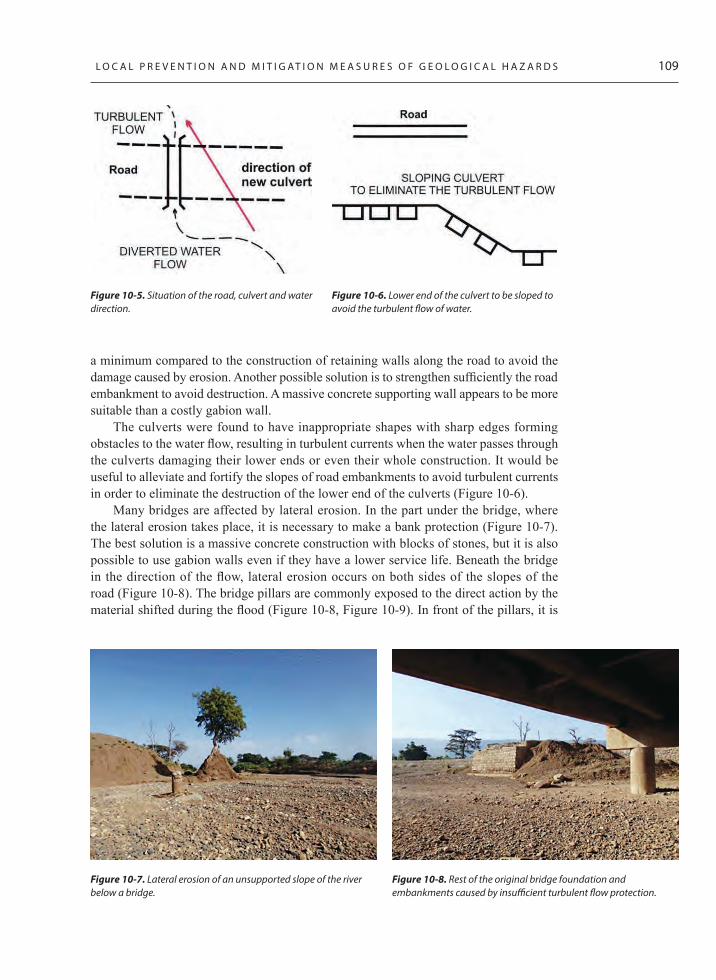
L O C A L P R E V E N T I O N A N D M I T I G A T I O N M E A S U R E S O F G E O L O G I C A L H A Z A R D S 109
a minimum compared to the construction of retaining walls along the road to avoid the damage caused by erosion. Another possible solution is to strengthen sufficiently the road embankment to avoid destruction. A massive concrete supporting wall appears to be more suitable than a costly gabion wall.
The culverts were found to have inappropriate shapes with sharp edges forming obstacles to the water flow, resulting in turbulent currents when the water passes through the culverts damaging their lower ends or even their whole construction. It would be useful to alleviate and fortify the slopes of road embankments to avoid turbulent currents in order to eliminate the destruction of the lower end of the culverts (Figure 10-6).
Many bridges are affected by lateral erosion. In the part under the bridge, where the lateral erosion takes place, it is necessary to make a bank protection (Figure 10-7). The best solution is a massive concrete construction with blocks of stones, but it is also possible to use gabion walls even if they have a lower service life. Beneath the bridge in the direction of the flow, lateral erosion occurs on both sides of the slopes of the road (Figure 10-8). The bridge pillars are commonly exposed to the direct action by the material shifted during the flood (Figure 10-8, Figure 10-9). In front of the pillars, it is
100
Figure 10-3 Lateral erosion of an unsupported slope of the river below a bridge
Figure 10-4 Rest of the original bridge foundation and embankments caused by insufficient turbulent flow protection
Figure 10-5 Situation of the road, culvert and water direction
Figure 10-6 Lower end of the culvert to be sloped to avoid the turbulent flow of water
Many bridges are affected by lateral erosion. In the part under the bridge, where the lateral erosion takes place, it is necessary to make a bank protection (Figure 10-7). The best solution is a massive concrete construction with blocks of stones, but it is also possible to use gabion walls even if they have a lower service life. Beneath the bridge in the direction of the flow, lateral erosion occurs on both sides of the slopes of the road (Figure 10-8). The bridge pillars are commonly exposed to the direct action by the material shifted during the flood (Figure 10-8, Figure 10-9). In front of the pillars, it is advisable to construct a protective structure (steel) in the opposite direction to prevent a possible damage to the bridge pillar in the event of a flood (Figure 10-10). It would be advisable to measure the aggradation of the material and periodically remove the material accumulated below from the channels. In the section above the bridge, it is necessary to remove potential obstacles (remnants of older construction, fallen trees etc.), because they change the flow of water into a turbulent flow and cause a water level increase.
Figure 10‑5. Situation of the road, culvert and water direction.
Figure 10‑7. Lateral erosion of an unsupported slope of the river below a bridge.
Figure 10‑6. Lower end of the culvert to be sloped to avoid the turbulent flow of water.
Figure 10‑8. Rest of the original bridge foundation and embankments caused by insufficient turbulent flow protection.

110 M A P S H E E T 0 6 3 7 - D 3 A R B A M I N C H
advisable to construct a protective structure (steel) in the opposite direction to prevent a possible damage to the bridge pillar in the event of a flood (Figure 10-10). It would be advisable to measure the aggradation of the material and periodically remove the material accumulated below from the channels. In the section above the bridge, it is necessary to remove potential obstacles (remnants of older construction, fallen trees etc.), because they change the flow of water into a turbulent flow and cause a water level increase.
Surface erosion on the western outskirts of the Arba Minch town
Surface erosion represents a serious problem for agriculture and urbanization, i.e. the population shift from rural to urban areas. The reforestation of the areas most susceptible to erosion is one of the options to reduce the negative impacts of erosion. Planting trees and diversified agriculture production can also help to slow down the erosion rates. Planting rows of trees, construction of small dams and polders in the drainage pattern are recommended to decelerate the runoff and to reduce the transport of sediment. Trees and deep-rooted bushes should also be planted on the boundaries of land plots to prevent soil erosion. In urban planning and during urbanization, it is necessary to obey natural processes, because erosion is a natural process that cannot be stopped. For example, the western outskirts of the Arba Minch town are affected by erosion, but it is assumed that this area will be used for housing development in the near future. A reasonable solution in this case is to set up a protective zone about 60 m broad along the edge of erosion valleys and gullies. No housing development should be allowed in this protective zone, which would avoid subsequent problems in the future.
Slope instability of a deep road cut on the main road to Addis Ababa
Slope instability is a very frequent phenomenon in the area. In many cases, slope failures, landslides or rockfalls are triggered by inappropriate human interventions such as a lack of sewerage or steep slope cuts in a weak and unstable material. A deep road cut on the main highway connecting Arba Minch with Addis Ababa may serve as an example of such intervention. The excavations varied by their engineering quality and were made in the rocks affected by tectonics to various extents. Culverts in the road embankment were constructed to drain water to the Lake Abaya.
101
Figure 10-7 Lateral erosion of an unsupported slope of the river below a bridge
Figure 10-8 Rest of the original bridge foundation and embankments caused by insufficient turbulent flow protection
Figure 10-9 Situation of the bridge, unsupported slope and missing pillars protection
Figure 10-10 Steel pillars protection
Surface erosion on the western outskirts of the Arba Minch town
Surface erosion represents a serious problem for agriculture and urbanization, i.e. the population shift from rural to urban areas. The reforestation of the areas most susceptible to erosion is one of the options to reduce the negative impacts of erosion. Planting trees and diversified agriculture production can also help to slow down the erosion rates. Planting rows of trees, construction of small dams and polders in the drainage pattern are recommended to decelerate the runoff and to reduce the transport of sediment. Trees and deep-rooted bushes should also be planted on the boundaries of land plots to prevent soil erosion. In urban planning and during urbanization, it is necessary to obey natural processes, because erosion is a natural process that cannot be stopped. For example, the western outskirts of the Arba Minch town are affected by erosion, but it is assumed that this area will be used for housing development in the near future. A reasonable solution in this case is to set up a protective zone about 60 m broad along the edge of erosion valleys and gullies. No housing development should be allowed in this protective zone, which would avoid subsequent problems in the future.
Slope instability of a deep road cut on the main road to Addis Ababa
Figure 10‑9. Situation of the bridge, unsupported slope and missing pillars protection.
Figure 10‑10. Steel pillars protection.

L O C A L P R E V E N T I O N A N D M I T I G A T I O N M E A S U R E S O F G E O L O G I C A L H A Z A R D S 111
A schematic drawing of the road cut is shown in Figure 10-11. In part A, the slope of the road cut is well designed due to the nature of the rock that is almost fresh. Benches in the slope are 1 m wide and 5 m high. The design appears to have been worked out very well judging from a minimum of debris left behind the adjacent protective wall (Figure 10-12, Figure 10-13). Part B is designed on the tectonically damaged rocks (Figure 10-14) but the cut does not reflect these geological conditions. Over time, debris falling behind the protective wall will fill the culvert below the road and create an obstacle to the runoff of water. It leads to an overflow on the road and destruction. The culvert is not fortified against the damage by erosion (Figure 10-15). The lifetime of the construction is thus considerably shorter and will incur a major cost to rebuild it.
Part C consists of fragments that are spilled over the protective wall and form a filling of about 80% of the culvert (Figure 10-17). It is a place based on a tectonically destroyed rock. The rock particles are moved into the space behind the protection wall filling the culvert. Part D is the most vulnerable part of the cutting and represents an example where the geological condition was not taken into account during the road construction. There are layers of deluvial deposits with blocks of approximately 0.3 to 0.7 m in size that float in the clay matrix located in the higher part of the slope (Figure 10-16). The described deluvial deposits are in an unstable position (Figure 10-15) and prone to fall, threatening the road. Part A is stable and no further action is needed. The slopes of Part B and Part C along the tectonic failure should be made at a more inclined gradient to create a stable slope. At the same time, it will be necessary to remove the deposit of rock fragments close to the culvert to make it functional. In Part D, it will be necessary to remove the unstable top part of the cutting (rock blocks in the fine-grained matrix). This will be difficult to implement because it is located at the top of the cutting. However, it will be necessary to carry out this action immediately; otherwise, there is the risk of a landslide on the road.
Construction of new roads in the zone
Several new roads were constructed from the main road to the villages around Arba Minch. These roads are built on sites with one machine only (excavator). The design is made on the site according to the local geological conditions without any site investigation. Local material is used. It is a short-term type of construction and will always need maintenance. With the right design, the service life can be extended to the maximum. The surface of the road is often made up of an inappropriate material (Figure 10-18). It is poorly graded (a uniform granular material) of about 63 mm fraction, which cannot be well compacted and is very quickly driven out of place. It would be advisable to use an open fraction, for
102
Slope instability is a very frequent phenomenon in the area. In many cases, slope failures, landslides or rockfalls are triggered by inappropriate human interventions such as a lack of sewerage or steep slope cuts in a weak and unstable material. A deep road cut on the main highway connecting Arba Minch with Addis Ababa may serve as an example of such intervention. The excavations varied by their engineering quality and were made in the rocks affected by tectonics to various extents. Culverts in the road embankment were constructed to drain water to the Lake Abaya.
A schematic drawing of the road cut is shown in Figure 10-11. In part A, the slope of the road cut is well designed due to the nature of the rock that is almost fresh. Benches in the slope are 1 m wide and 5 m high. The design appears to have been worked out very well judging from a minimum of debris left behind the adjacent protective wall (Figure 10-12, Figure 10-13). Part B is designed on the tectonically damaged rocks (Figure 10-14) but the cut does not reflect these geological conditions. Over time, debris falling behind the protective wall will fill the culvert below the road and create an obstacle to the runoff of water. It leads to an overflow on the road and destruction. The culvert is not fortified against the damage by erosion (Figure 10-15). The lifetime of the construction is thus considerably shorter and will incur a major cost to rebuild it.
Figure 10-11 Sketch showing problematic locations along the main road from Addis Ababa to Arba Minch
Part C consists of fragments that are spilled over the protective wall and form a filling of about 80% of the culvert (Figure 10-17). It is a place based on a tectonically destroyed rock. The rock particles are moved into the space behind the protection wall filling the culvert. Part D is the most vulnerable part of the cutting and represents an example where the geological condition was not taken into account during the road construction. There are layers of deluvial deposits with blocks of approximately 0.3 to 0.7 m in size that float in the clay matrix located in the higher part of the slope (Figure 10-16). The described deluvial deposits are in an unstable position (Figure 10-15) and prone to fall, threatening the road. Part A is stable and no further action is needed. The slopes of Part B and Part C along the tectonic failure should be made at a more inclined gradient to create a stable slope. At the same time, it will be necessary to remove the deposit of rock fragments close to the culvert to make it functional. In Part D, it will be necessary to remove the unstable top part of the cutting (rock blocks in the fine-grained matrix). This will be difficult to implement because it is located at the top of the cutting. However, it will be necessary to carry out this action immediately; otherwise, there is the risk of a landslide on the road.
Construction of new roads in the zone
Several new roads were constructed from the main road to the villages around Arba Minch. These roads are built on sites with one machine only (excavator). The design is made on the site according to the local geological conditions without any site investigation. Local material is used. It is a short-term type of construction and will always need maintenance. With the right design, the service life can be
Figure 10‑11. Sketch showing problematic locations along the main road from Addis Ababa to Arba Minch.

112 M A P S H E E T 0 6 3 7 - D 3 A R B A M I N C H
example, 0–63 mm, which is far more efficient. The slopes of the cuttings along the road do not respect the current geological structure and condition (Figure 10-19). In the case of rocky cuttings, steep slopes along the road can be used. In the case of contact with soil types, the slope of the cutting should be reduced to be stable in the long term. In the slopes, rock blocks frequently reside in a fine-grained matrix, which can subsequently fall down onto the road (Figure 10-23).
The biggest problem with the service lifetime of the road is the erosion by surface water during the rainy season. The drainage of the road must be done properly so that the water cannot erode the surface and the edges of the road. Transverse drainage is done by inclining into the trench along the road (Figure 10-20). The longitudinal trench is unpaved and there is instant erosion of the trench. The solution for the longitudinal trench is to create a pavement or at least fill the trench with boulders and stones in order to slow down the water flow and thereby reduce the drifting capacity of the water. The water from the longitudinal trench is either diverted out of the road (Figure 10-21), which is the best solution and is often correctly implemented in road construction. The second option is to transfer the water to the other side of the road using a culvert and then move the water to the natural slope.
Figure 10‑12. Part A – Stable slope condition.
Figure 10‑14. Part B – Slope cut across a tectonic line.
Figure 10‑13. Protective wall is not filled by pieces of rocks.
Figure 10‑15. Non–functional culvert.

L O C A L P R E V E N T I O N A N D M I T I G A T I O N M E A S U R E S O F G E O L O G I C A L H A Z A R D S 113
Figure 10‑16. Unsupported higher part of the slope with blocks of rocks in a silty matrix.
Figure 10‑18. Inappropriate grading of material on the top of the road.
Figure 10‑20. Drainage along the road is deeply eroded.
Figure 10‑17. Culvert is almost full of rock particles.
Figure 10‑19. Inappropriate slope of the road – blocks of rocks are unsupported.
Figure 10‑21. Well observed diversion of water along the road.

114 M A P S H E E T 0 6 3 7 - D 3 A R B A M I N C H
The culverts are not properly designed in most cases. The culverts are made perpendicular to the road and do not respect the natural flow direction of water. Water from trenches is forced to radically change the flow direction. This necessarily leads to an increase in the erosive power of the flow and thus the destruction of the road. The best solution is the construction of an oblique culvert, which is not structurally demanding, but is slightly longer than the perpendicular culvert. Compared to the additional costs in the case of a perpendicular culvert (strengthening of the passage against erosion), it is a minimum cost for more. If a perpendicular passage is used, it is necessary to create a fortified collector in front of the culvert (concrete construction) and at the same time also behind the culvert, in order to avoid back erosion of the road.
Along the road, an improper material of the embankment was often observed. It is a mixture of boulders and fine-grained materials (Figure 10-22). This mixture of differently grained materials is not compactable and will lead to additional settlement. If the embankment is not well compacted, it leads to the erosion of more susceptible embankments.
10.2 Preventive and mitigation measures for rehabilitation of natural environment
• Dangers that strongly affect the infrastructure development and land use in the studied area are tectonic, slope failures and alluvial processes. The greatest impact on land use is undoubtedly caused by the alluvial processes associated with high precipitation during the rainy season.
• The main prerequisite for eliminating the negative impact of natural hazards is to obey the natural processes that cause these dangers. It is important to note that any intervention in any natural system will induce an appropriate response often with adverse effects. Prior to each technical intervention into the development of the area, it is therefore important to carry out a study of potential impacts on both the planned project and the further decentralization of the concerned natural system.
• All structures closely associated with fluvial channels (buildings, bridges, culverts) must be designed to resist more than 100% of the maximum discharges. Simple
Figure 10‑22. Inappropriate material for road embankments. Figure 10‑23. Inappropriate cutting slope.

L O C A L P R E V E N T I O N A N D M I T I G A T I O N M E A S U R E S O F G E O L O G I C A L H A Z A R D S 115
reduction of the flow capacity with regard to its natural rate is only a short-term solution of the problem. Linear constructions (roads, power lines, etc.), culverts and bridges should obey the topography of the area so that they will not be a barrier to the natural runoff during high discharges and rainy seasons.
• It is necessary to permanently maintain the same stream channel capacity by cleaning and removing the deposited material, particularly in the vicinity of bridges or other constructions where the reduction of the channel capacity may cause damage to or even the destruction of the whole structure.
• Active alluvial fans represent areas of a high natural risk, especially in lower-lying regions, where the zones along active and abandoned channels can be affected by floods.
• Reforestation is the primary choice of a natural way to tackle the issue of areas susceptible to erosion. Planting rows of trees, construction of small dams and polders in the drainage pattern and gullies are recommended to decelerate the runoff and to reduce the transport of sediment.
• The sites affected by active and fossil slope failures represent the areas unsuitable for urban development. Also, it is advisable to avoid these places for road construction. In the case of any construction, it is suggested to carry out an engineering geological survey to check the slope stability and to ensure drawing the design and implementation of useful drainage.
10.3 Suggested hazard monitoring and emergency response systems
The majority of natural hazards are derived from the landforms or geomorphology of the area, so that detailed and high-resolution topographic data are necessary to be obtained to prevent the occurrence of natural hazards. The use of modern remote sensing methods (e.g. interferometry to measure small displacements) will allow identifying changes in the topography or morphology of the terrain that may indicate movements in fault zones and consequently even predict seismic hazards, which may result in mass movements such as landslides or slope failures, etc. High resolution topography using new remote sensing techniques will increase information on the terrain in order to better understand the processes taking place on the Earth’s surface and to delineate the areas susceptible to geological hazards such as alluvial plains or flat areas in general prone to severe floods, et cetera.
The elaboration of quantitative models of fluvial processes associated with rivers and streams, runoff models of basins and the optimization of water management should be a part of the long-term strategy. The installation of gauging stations with remote data transmission and the design of flood hazards early warning systems are vital steps for the management and protection from potential risks in the low-lying plains around the Arba Minch town.
To eliminate the risks from seismic and volcanic hazards, which are also eminent in the area, it is recommended to reinforce and strengthen the already installed seismic monitoring stations network to precisely locate earthquake epicentres, mitigate the risks and plan for any emergency.
For the assessment of volcanic hazards, it is necessary to have comprehensive information on the wider volcanic, geological and tectonic context of the area, including

116 M A P S H E E T 0 6 3 7 - D 3 A R B A M I N C H
the characteristics of individual volcanoes. The approach followed in the current study on geo-hazards phenomena and mapping of critical factors should be expanded to other areas. Age determinations provide fundamental information for the initial scoping assessment. Such age determinations may include historical information, stratigraphic relationships, radiometric dating and morphological considerations. In addition to the monitoring of seismic data, it is advisable to carry out a continuous monitoring campaign of accompanying volcanic phenomena such as fumaroles activity and the monitoring of changes in the physical and chemical properties of fumaroles and thermal waters. To eliminate the impact of volcano-seismic hazards, it is important to set up standards and strongly implement them in the construction of various civil infrastructure projects. In the zones with potential impacts of natural hazards, evacuation plans and evacuation paths should be identified in consultation with a multi-professional team composed of at least a law specialist, a medical team and geo-scientists to minimize the loss of human lives. Furthermore, extensive campaigns should be regularly held to increase the awareness of the wider public concerning the mechanisms and consequences of natural disasters to increase resilience in all aspects.

Abayneh, E., Zauyah S., Hanafi, M.M., Rosenani, A.B. (2006): Genesis and classification of sesquioxidic soils from volcanic rocks in sub-humid tropical highlands of Ethiopia. Geoderma 136, 682–695.
Abbate, E., Bruni, P., Sagri, M. (2015): Geology of Ethiopia: a review and geo-morphological perspectives. In Landscapes and Landforms of Ethiopia, Springer Netherlands, 33–64.
Acocella, V. (2010): Coupling volcanism and tectonics along divergent plate boundaries: Collapsed rifts from central Afar, Ethiopia. Geological Society of America Bulletin 9-10, 1717–1728.
Agezew, T., Regassa, T., Sima, J. (2014): Hydrogeological and hydrochemical maps of Dila NB 37-2. Explanatory notes. AQUATEST a.s., Prague. Czech Rep.
Agostini, A., Bonini, M., Corti, G., Sani, F., Mazzarini, F. (2011): Fault architecture in the Main Ethiopian Rift and comparison with experimental models: Implications for rift evolution and Nubia–Somalia kinematics. Earth and Planetary Science Letters, 301(3), 479–492.
Auxtero, E., Maderia, M., Sousa, E. (2003): Variable charge characteristics of selected Andisols from the Azores, Portugal. Catena 56 (1–3), 111–125.
Awlachew, S.B. (2006): Investigation of physical and bathymetric characteristics of Lakes Abaya and Chamo, Ethiopia, and their management implications. Lakes and Reservoirs: Research and Management, 11, 133–140.
Aydin, A., Basu, A. (2005): The Schmidt Hammer in rock material characterization. Engineering Geology. 81, 1–14.
Ayalew, D., Yirgu, G., Pik, R., (1999): Geochemical and isotopic (Sr, Nd and Pb) characteristics of volcanic rocks from southwestern Ethiopia. Journal of African Earth Sciences, 29(2), 381–391.
Ayalew, D. and Deniel, C., (2000): Origin by fractional crystallization of transitional basalt for the Asela-Ziway pantellerites. Crustal control in the genesis of Plio-Quaternary bimodal magmatism of the Main Ethiopian Rift (MER): geochemical and isotopic (Sr, Nd, Pb) evidence by Trua et al.(1999). Chemical Geology, 168(1-2), 1–3.
Ayele, A., Meseret, T., Solomon, K. (2002): Geothermal Resources exploration in the Abaya and Tulu Moye-Gedemsa geothermal prospects, Main Ethiopian Rift. Geolgical Survey of Ethiopia. Addis Ababa.
REFERENCES

118 M A P S H E E T 0 6 3 7 - D 3 A R B A M I N C H
Ayalew, D., Ebinger, C., Bourdon, E., Wolfenden, E., Yirgu, G. and Grassineau, N., (2006): Temporal compositional variation of syn-rift rhyolites along the western margin of the southern Red Sea and northern Main Ethiopian Rift. Geological Society, London, Special Publications, 259(1), 121–130.
Balogh, K. (1985): K/Ar dating of Neogene volcanic activity in Hungary: Experimental technique, experiences and methods of chronologic studies. ATOMKI Rep, D/1, 277–288.
Batjes, N.H. (2011): Global distribution of soil phosphorus retention potential. Wageningen, ISRIC World Soil Information (with dataset) ISRIC Report 6, 42 pp.
Beck, J., Busch, K., Eckhardt, E., Frayer, J., Hahl, R., Hundhausen, C., Reiche, S., Schwertfechter, C., Stumptner, A., Abebe, T., Amare, G., Ayalew, N., Bantie, W., Berhe, T., Kiros, N., Legesse, G., Muluneh, Z., Siynum, B., Tafere, M., Walelign, Z. (2004): Soil Erosion Risk and Water Balance of the Gina River Catchment – In: SCHÜTT (ed.): Watershed Management in the Abaya-Chamo Basin, South Ethiopia. Occasional Paper Geographie, 20, pp. 15–73. Berlin.
Bech Bruun, T., Elberling, B., Christensen, B.T. (2010): Liability of soil organic carbon in tropical soils with different clay minerals. Soil Biology & Biochemistry 42, 888–895.
Beutel, E., van Wijk, J., Ebinger, C., Keir, D., Agostini, A. (2010): Formation and stability of magmatic segments in the Main Ethiopian and Afar rifts. Earth and Planetary Science Letters 293 (3–4), 225–235.
Bloomer, S.H., Curtis, P.C., Karson, J.A., (1989): Geochemical variation of Quaternary basaltic volcanics in the Turkana Rift, northern Kenya. Journal of African Earth Sciences (and the Middle East), 8(2-4), 511–532.
Boccaletti, M., Bonini, M., Mazzuoli, R., Abebe, B., Piccardi, L., Tortorici, L. (1998): Quaternary oblique extensional tectonics in the Ethiopian Rift (Horn of Africa), Tectonophysics, Volume 287, Issues 1–4, 97–116.
Bogena, H., Kunkel, R., Schrobel, T., Schrey, H.P., Wendland, F. (2005): Distributed modeling of groundwater recharge at the macroscale. Ecological Modeling 187, 15–26.
Bonini, M., Corti, G., Innocenti, F., Manetti, P., Mazzarini, F., Abebe, T., Pecskay, Z. (2005): Evolution of the Main Ethiopian Rift in the frame of Afar and Kenya rifts propagation. Tectonics, 24, 1–21.
Boynton, W.V., (1984): Cosmochemistry of the rare earth elements: meteorite studies. In Developments in geochemistry. Vol. 2, pp. 63–114.
Brown, F.H. and Carmichael, I.S.E., (1969): Quaternary volcanoes of the Lake Rudolf region: 1. The basanite-tephrite series of the Korath Range. Lithos, 2(2), 239–260.
Brown, F.H. and Carmichael, I.S.E., (1971): Quaternary volcanoes of the Lake Rudolf region: II. The lavas of north island, south island and the Barrier. Lithos, 4(3), 305–323.

R E F E R E N C E S 119
British Standards Institution (1981): Code of Practice for site Investigations.
Brooks, N. (2005): Cultural responses to aridity in the Middle Holocene and increased social complexity, Quaternary International, Volume 151, Issues 1, 29–49.
Carrillo-Rivera, J.J., Cardona, A., Edmunds, W.M. (2002): Use of abstraction regime and knowledge of hydrogeological conditions to control high-fluoride concentration in abstracted groundwater: San Luis Potosı́ basin, Mexico, Journal of Hydrology, Volume 261, Issues 1–4, 24–47.
Central Statistics Authority (2012): Statistical abstract, Ethiopia.
CES 58 (2013): Compulsary Ethiopian Standar, Ethiopian Standard Agency.
Dalrymple, G.B., Lanphere, M.A. (1969): Potassium-Argon Dating. Principles, Techniques and Applications to Geochronology. W. H. Freeman and Co., San Francisco. 258 p.
Cox, A., Dalrymple, G.B. (1967): Statistical analysis of geomagnetic reversal data and the precision of potassium–argon dating. Journal of Geophysical Research, 72(10), 2603–2614.
Daniel, G. (1977): Aspects of Climate and Water budget in Ethiopia. Tech Monogr., Addis Ababa University Press, Addis Ababa.
Davidson, A., Rex, D.C. (1980): Age of volcanism and rifting in south-western Ethiopia, Nature, 283, 654–658.
Day, M. (1981): Rock hardness and landform development in the Gunong Mulu National Park, Sarawak, E. Malaysia. Earth Surface Processes and Landforms, 6, 165–172.
De Wispelaere, L., Marcelino, V., Regassa, A., De Grave, E., Dumon, M., Mees, F., Van Ranst, E. (2015): Revisiting nitic horizon properties of Nitisols in SW Ethiopia. Geoderma, 243–244, 69-79.
Di Paola, G.M., (1971): Geology of the Corbetti Caldera area (Main Ethiopian Rift Valley). Bulletin Volcanologique, 35(2), 497–506.
Di Paola, G.M., (1972): The Ethiopian Rift Valley (between 7 00′ and 8 40′ lat. north). Bulletin Volcanologique, 36(4), 517–560.
Dhont, D., Chorowicz, J. (2006): Review of the neotectonics of the Eastern Turkish-Armenian Plateau by geomorphic analysis of digital elevation model imagery. International Journal of Earth Sciences, 95, 34–49.
Driessen, P., J., Deckers, J, O., Spaargaren, F., Nachtergaele (2001): Lecture notes on the major soils of the world. World Soil Resources Reports No. 94. FAO, Rome.
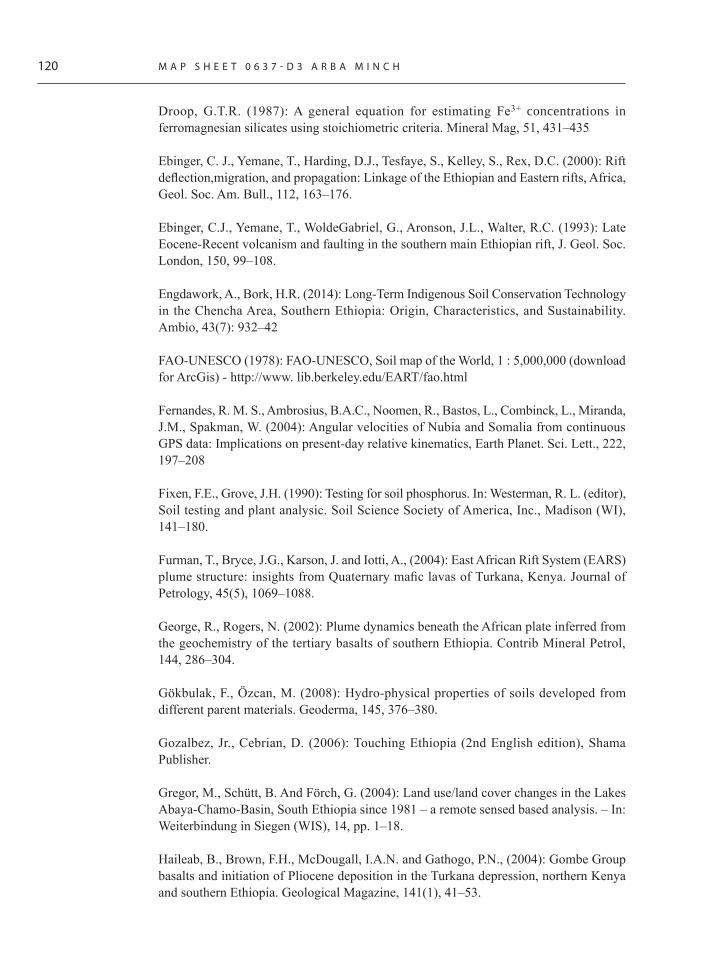
120 M A P S H E E T 0 6 3 7 - D 3 A R B A M I N C H
Droop, G.T.R. (1987): A general equation for estimating Fe3+ concentrations in ferromagnesian silicates using stoichiometric criteria. Mineral Mag, 51, 431–435
Ebinger, C. J., Yemane, T., Harding, D.J., Tesfaye, S., Kelley, S., Rex, D.C. (2000): Rift deflection,migration, and propagation: Linkage of the Ethiopian and Eastern rifts, Africa, Geol. Soc. Am. Bull., 112, 163–176.
Ebinger, C.J., Yemane, T., WoldeGabriel, G., Aronson, J.L., Walter, R.C. (1993): Late Eocene-Recent volcanism and faulting in the southern main Ethiopian rift, J. Geol. Soc. London, 150, 99–108.
Engdawork, A., Bork, H.R. (2014): Long-Term Indigenous Soil Conservation Technology in the Chencha Area, Southern Ethiopia: Origin, Characteristics, and Sustainability. Ambio, 43(7): 932–42
FAO-UNESCO (1978): FAO-UNESCO, Soil map of the World, 1 : 5,000,000 (download for ArcGis) - http://www. lib.berkeley.edu/EART/fao.html
Fernandes, R. M. S., Ambrosius, B.A.C., Noomen, R., Bastos, L., Combinck, L., Miranda, J.M., Spakman, W. (2004): Angular velocities of Nubia and Somalia from continuous GPS data: Implications on present-day relative kinematics, Earth Planet. Sci. Lett., 222, 197–208
Fixen, F.E., Grove, J.H. (1990): Testing for soil phosphorus. In: Westerman, R. L. (editor), Soil testing and plant analysic. Soil Science Society of America, Inc., Madison (WI), 141–180.
Furman, T., Bryce, J.G., Karson, J. and Iotti, A., (2004): East African Rift System (EARS) plume structure: insights from Quaternary mafic lavas of Turkana, Kenya. Journal of Petrology, 45(5), 1069–1088.
George, R., Rogers, N. (2002): Plume dynamics beneath the African plate inferred from the geochemistry of the tertiary basalts of southern Ethiopia. Contrib Mineral Petrol, 144, 286–304.
Gökbulak, F., Özcan, M. (2008): Hydro-physical properties of soils developed from different parent materials. Geoderma, 145, 376–380.
Gozalbez, Jr., Cebrian, D. (2006): Touching Ethiopia (2nd English edition), Shama Publisher.
Gregor, M., Schütt, B. And Förch, G. (2004): Land use/land cover changes in the Lakes Abaya-Chamo-Basin, South Ethiopia since 1981 – a remote sensed based analysis. – In: Weiterbindung in Siegen (WIS), 14, pp. 1–18.
Haileab, B., Brown, F.H., McDougall, I.A.N. and Gathogo, P.N., (2004): Gombe Group basalts and initiation of Pliocene deposition in the Turkana depression, northern Kenya and southern Ethiopia. Geological Magazine, 141(1), 41–53.
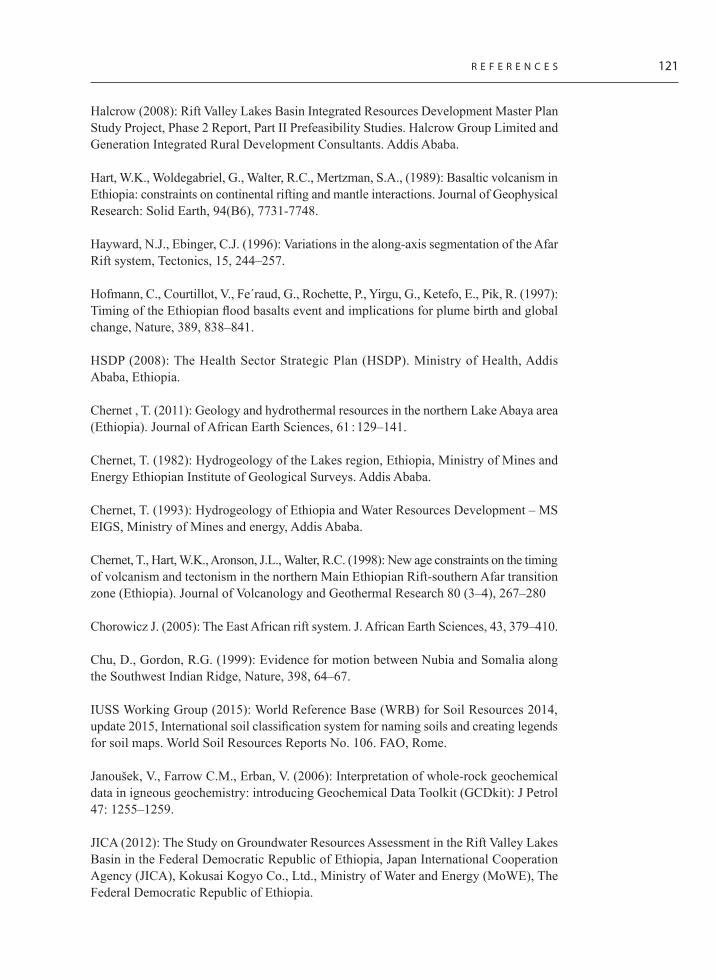
R E F E R E N C E S 121
Halcrow (2008): Rift Valley Lakes Basin Integrated Resources Development Master Plan Study Project, Phase 2 Report, Part II Prefeasibility Studies. Halcrow Group Limited and Generation Integrated Rural Development Consultants. Addis Ababa.
Hart, W.K., Woldegabriel, G., Walter, R.C., Mertzman, S.A., (1989): Basaltic volcanism in Ethiopia: constraints on continental rifting and mantle interactions. Journal of Geophysical Research: Solid Earth, 94(B6), 7731-7748.
Hayward, N.J., Ebinger, C.J. (1996): Variations in the along-axis segmentation of the Afar Rift system, Tectonics, 15, 244–257.
Hofmann, C., Courtillot, V., Fe´raud, G., Rochette, P., Yirgu, G., Ketefo, E., Pik, R. (1997): Timing of the Ethiopian flood basalts event and implications for plume birth and global change, Nature, 389, 838–841.
HSDP (2008): The Health Sector Strategic Plan (HSDP). Ministry of Health, Addis Ababa, Ethiopia.
Chernet , T. (2011): Geology and hydrothermal resources in the northern Lake Abaya area (Ethiopia). Journal of African Earth Sciences, 61 : 129–141.
Chernet, T. (1982): Hydrogeology of the Lakes region, Ethiopia, Ministry of Mines and Energy Ethiopian Institute of Geological Surveys. Addis Ababa.
Chernet, T. (1993): Hydrogeology of Ethiopia and Water Resources Development – MS EIGS, Ministry of Mines and energy, Addis Ababa.
Chernet, T., Hart, W.K., Aronson, J.L., Walter, R.C. (1998): New age constraints on the timing of volcanism and tectonism in the northern Main Ethiopian Rift-southern Afar transition zone (Ethiopia). Journal of Volcanology and Geothermal Research 80 (3–4), 267–280
Chorowicz J. (2005): The East African rift system. J. African Earth Sciences, 43, 379–410.
Chu, D., Gordon, R.G. (1999): Evidence for motion between Nubia and Somalia along the Southwest Indian Ridge, Nature, 398, 64–67.
IUSS Working Group (2015): World Reference Base (WRB) for Soil Resources 2014, update 2015, International soil classification system for naming soils and creating legends for soil maps. World Soil Resources Reports No. 106. FAO, Rome.
Janoušek, V., Farrow C.M., Erban, V. (2006): Interpretation of whole-rock geochemical data in igneous geochemistry: introducing Geochemical Data Toolkit (GCDkit): J Petrol 47: 1255–1259.
JICA (2012): The Study on Groundwater Resources Assessment in the Rift Valley Lakes Basin in the Federal Democratic Republic of Ethiopia, Japan International Cooperation Agency (JICA), Kokusai Kogyo Co., Ltd., Ministry of Water and Energy (MoWE), The Federal Democratic Republic of Ethiopia.

122 M A P S H E E T 0 6 3 7 - D 3 A R B A M I N C H
Jones, A., Breuning-Madsen, H., Brossard, M., Dampha, A., Deckers, J., Dewitte, O., Gallali, T., Hallett, S., Jones, R., Kilasara, M., Le Roux, P., Micheli, E., Montanarella, L., Spaargaren, O., Thiombiano, L., Van Ranst, E., Yemefack, M., Zougmore, R. (2013): Soil Atlas of Africa. European Commission, Publications Office of the European Union, Luxembourg. 176 pp.
Jordan, G., Meijninger, B.M.L., van Hinsbergen, D.J.J., Meulenkamp, J.E., van Dijk, P.M. (2005): Extraction of morphotectonic features from DEMs: Development and applications for study areas in Hungary and NW Greece, International Journal of Applied Earth Observation and Geoinformation, Volume 7, Issue 3, 163–182.
Katoh, S., Nagaoka, S., WoldeGabriel, G., Renne, P., Snow, M.G., Beyene, Y. and Suwa, G., (2000): Chronostratigraphy and correlation of the Plio-Pleistocene tephra layers of the Konso Formation, southern Main Ethiopian Rift, Ethiopia. Quaternary Science Reviews, 19(13), 1305–1317.
Kazmin, V. (1972): Geological Map of Ethiopia. Geological Survey of Ethiopia: Addis Ababa, Ethiopia.
Kazmin, V. (1975): Explanation of the geological map of Ethiopia. Bulletin number one. Geological Survey of Ethiopia, Addis Ababa.
Kazmin, V. (1980): Transform faults in the East African Rift system, Atti Convegni Lincei, 47, 65–73.
Keranen, K., Klemperer, S.L. (2008): Discontinuous and diachronous evolution of the Main Ethiopian Rift: implications for development of continental rifts. Earth and Planetary Science Letters 265 (1–2), 96–111.
Koeppen NMSA (1989): Climatic and Agroclimatic Resources of Ethiopia, NMSA.
Kogan, L., Fisseha, S., Bendick, R., Reilinger, R., McClusky, S., King, R. and Solomon, T. (2012), Lithospheric strength and strain localization in continental extension from observations of the East African Rift, J. Geophys. Res., 117, B03402, doi:10.1029/2011JB008516.
Lahmeyer International (2005): Genale-Dawa River Basin integrated resource develop-ment master plan study. Ministry of Water Resources.
Le Bas, M. J., Le Maitre, R. W., Streckeisen, A. and Zanettin, B. (1986): A chemical classi-fication of volcanic rocks based on the total alkali-silika diagram. J. Petrol., 27, 745–750.
Leake, B.E., Woolley, A.R., Arps C.E.S, Birch, W.D., Gilbert, M.C., Grice, J.D, Hawthorne F.C, Kato A, Kisch, H.J., Krivovichev, V.G., Linthout, K., Laird, J., Mandarino, J.A., Maresch, W.V., Nickel, E.H., Rock, N.M.S., Schumacher, J.C., Smith, D.C., Stephenson, N.C.N., Ungaretti, L., Whittaker, E.J.W., Youzhi, G. (1997): Nomenclature of amphiboles: report of the Subcommittee on Amphiboles of the International Mineralogical Association, Commission on New Minerals and Mineral Names, The Canadian Mineralogist, 35, 219–246

R E F E R E N C E S 123
Linsley, R.K., Kohler, M.A., Paulhus, J.L.H. (1958): Hydrology for Engineers. McGraw-Hill: New York.
Lorz, C. (2008): Lithological discontinuous soils – Archives for the Pedo – Geochemical Genesis of the Soil-Regolith-Complex, Z. Geomorph. N.F. 52, Suppl. 2, 119-132.
Luelseged, E., Daniel, A., Laó-Dávila, Mohamed, G.A., Estella, A. A., Stephen, S.G. (2017): Evolution of the broadly rifted zone in southern Ethiopia through gravitational collapse and extension of dynamic topography, Tectonophysics, Volume 699, Pages 213–226.
Macdonald, R. and Gibson, I.L., (1969): Pantelleritic obsidians from the volcano Chabbi (Ethiopia). Contributions to Mineralogy and Petrology, 24(3), 239–244.
McDonough, W.F. and Sun, S.S., (1995): The composition of the Earth. Chemical geology, 120(3-4), 223–253.
McKenzie, M.J., Siegel, D., Patterson, W., McKenzie, D.J. (2001): A geochemical survey of spring water from the main Ethiopian rift valley, southern Ethiopia: implication for well head protection. Hydrogeol J. 9, 265–272
Mohr, P.A. (1972): Regional Significance of Volcanic Geochemistry in the Afar Triple Junction, Ethiopia. Bull. Geol. Soc. Amer.,83, 213–221.
Morimoto, N., Fabries, J., Ferguson, A.K., Ginzburg, I.V., Ross, M., Seifert, F.A., Zussman, J., Aoki, K., Gottardi, G. (1988): Nomenclature of pyroxenes. Amer Miner 73, 1123–1133.
MoWR (2002): Negarit Gazeta No. 12/1990 and the Guidelines of Ministry of Water Resources.
MoWR (2005): Genale-Dawa and Wabe Shebelle River Basins integrated water Resources development. Master plan study, Ministry of Water Resourse, Addis Ababa, Ethiopia.
Musinguzi, P., Tenywa, J. S., Ebanyat, P., Tenywa, M. M., Mubiru, D. N., Basamba, T. A. Leip, A. (2013): Soil Organic Carbon Thresholds and Nitrogen Management in Tropical Agroecosystems: Concepts and Prospects. Journal of Sustainable Development; Vol. 6, No. 12, 31–43
NMA (2006): Annual Climatic Bulletin - Federal Democratic Republic of Ethiopia. Ministry of Water Resources, National Meteorological Agency (NMA), Climatolocical Service Team.
NMSA (1996): Assessment of Drought in Ethiopia, Meteorological Research Reports Series No. 2, Addis Ababa, Ethiopia.
Pearce, J.A., (1996): A user’s guide to basalt discrimination diagrams. Trace element geochemistry of volcanic rocks: applications for massive sulphide exploration. Geological Association of Canada, Short Course Notes, 12, 79–113.

124 M A P S H E E T 0 6 3 7 - D 3 A R B A M I N C H
Placek, A., Migoń P. (2007): Rock-landform relationships in the Sudetes in the light of rock strength assessment using the Schmidt hammer. Geomorphological Variations. Prague.
Pouchou, J.L., Pichoir F. (1985): “PAP” (φρZ) procedure for improved quantitative microanalysis. In: Armstrong. JT (ed) Microbeam Analysis. San Francisco Press, San. Francisco, pp 104–106.
Rapprich, V., Habtamu, E., Kycl, P., Hroch T., Verner K., Kopačková V., Mišurec, J., Šíma J., Málek, J., Malík, J., J., Tsigehana T., Yewubinesh B., Leta M., Ermiyas, F., Firdawok L., Ezra T., Habtamu, B., Alula, D., Tutan, N., Pecskay, Z., Freymuth, H. (2013): Explanation Booklet to the GEOLOGICAL Hazards and Engineering Geology Maps of Dila, NB 37-6. . Czech Geological Survey, Prague; AQUATES a.s., Prague; Geological Survey of Ethiopia, Addis Ababa.
Rapprich, V., Žáček, V., Verner, K., Erban, V., Goslar, T., Bekele, Y., Legesa, F., Hroch, T. and Hejtmánková, P., (2016): Wendo Koshe Pumice: The latest Holocene silicic explosive eruption product of the Corbetti volcanic system (southern Ethiopia). Journal of Volcanology and Geothermal Research, 310, 159–171.
Rogers, N., Macdonald, R., Fitton, J.G., George, R., Smith, M. and Barreiro, B., (2000): Two mantle plumes beneath the East African rift system: Sr, Nd and Pb isotope evidence from Kenya Rift basalts. Earth and Planetary Science Letters, 176(3), 387–400.
Rooney, T.O., Hart, W.K., Hall, C.M., Ayalew, D., Ghiorso, M.S., Hidalgo, P. and Yirgu, G., (2012): Peralkaline magma evolution and the tephra record in the Ethiopian Rift. Contributions to Mineralogy and Petrology, 164(3), 407–426.
Rooney, T.O. (2010): Geochemical evidence of lithospheric thinning in the southern Main Ethiopian Rift Lithos, 117, 33–48.
Saintot, A., Angelier, J., Chorowicz, J. (1999): Mechanical significance of structural patterns identified by remote sensing studies: a multiscale analysis of tectonic structures in Crimea. Tectonophysics 313, 187–218.
Setegn, S.G. (2010): Modeling Hydrological and Hydrodynamic Processes in Lake Tana Basin, Ethiopia, KTH. TRITA-LWR, PhD Thesis 1057.
Schilling, J.G., Kingsley, R.H., Hanan, B.B. McCully, B.L. (1992): Nd–Sr–Pb isotopic variations along the Gulf of Aden: evidence for Afar mantle plume–continental lithosphere interaction. Journal of Geophysical Research, 97, 10927–10966.
Shinjo, R., Chekol, T., Meshesha, D., Itaya, T. and Tatsumi, Y., (2011): Geochemistry and geochronology of the mafic lavas from the southeastern Ethiopian rift (the East African Rift System): assessment of models on magma sources, plume–lithosphere interaction and plume evolution. Contributions to Mineralogy and Petrology, 162(1), 209–230.
Schütt, B., Thiemann, S. (2005): Modern Lake Level Rise and Accelerated Fluviolacustine Sedimentation of Lake Abaya, South Ethiopia – In: Sustainable Management of Headwater

R E F E R E N C E S 125
Resources, United Nation University Series on Water Resources Management and Policy, 17, pp. 320 f., Tokyo.
Sims, Z.R., Nielsen, G.A. (1986): Organic carbon in Montana soils as related to clay content and climate. Soil Science Society of America Journal., 50, 1269–1271.
Singh, B., Gilkes, R.J. (1992): Properties and distribution of iron oxides and their association with minor elements in the soils of southwestern Australia. J. Soil Sci. 43, 77–98.
Snyder, N.P., Whipple, K.X., Tucker, G.E., Merritts, D.J. (2000): Landscape response to tectonic forcing: Digital elevation model analysis of stream profiles in the Mendocino triple junction region, northern California. Bull. Geol. Soc. Am., 112, 1250–1263.
Stamps, D., Calais, E., Saria, E., Hartnady, C.J.H., Nocquet, J., Ebinger, C.J., Fernandez, R. (2008): A kinematic model for the East African Rift. Geophys. Res. Lett., L05304.
Steiger, R.H., Jäger, E. (1977): Subcommission on geochronology: Convention on the use of decay constants in geo- and cosmochronology. Earth and Planetary Science Letters 36, 359–362.
Stewart, K. and Rogers, N., (1996): Mantle plume and lithosphere contributions to basalts from southern Ethiopia. Earth and Planetary Science Letters, 139(1-2), 195–211.
Stocking, M., Murnaghan, N. (2000): Handbook for the Field Assessment of Land Degradation. Earthscan, 169 pp.
Tan, Z.X., Lal R., Smeck N.E., Calhoun, F.G. (2004): Relationships between surface soil organic carbon pool and site variables. Geoderma., 121, 185–187
Tesema, Z., Dessie, T. (2003): Hydrology and Engineering Geology of Awasa Lake Cahtchment, Geological survey of Ethiopia.
Thiemann, S. (2006): Detection and Assessment of Erosion and Soil erosion Risk in the Watershed of the Bilate Rive – Southern Ethiopian rift Valley. PhD Thesis. Freie University Berlin, 186 pp.
Thiemann, S., Schütt, B. And Förch, G. (2004): Development and application of a Soil erosion risk model, the case of the Bilate River catchment area, south Ethiopia. – In: FWU Water Resources Publications, 2, pp. 46–52.
Tiessen, H., Cuevas, E., Chacon, P. (1994): The role of soil organic matter in sustaining soil fertility. Nature 371, 783–785.
Trua, T., Deniel, C. and Mazzuoli, R., (1999): Crustal control in the genesis of Plio-Quaternary bimodal magmatism of the Main Ethiopian Rift (MER): geochemical and isotopic (Sr, Nd, Pb) evidence. Chemical Geology, 155(3), 201–231.

126 M A P S H E E T 0 6 3 7 - D 3 A R B A M I N C H
Tsige, L., Abdelsalam, M.G. (2005): Neoproterozoic–Early Paleozoic gravitational tectonic collapse in the southern part of the Arabian-Nubian Shield: The Bulbul Belt of southern Ethiopia. Precambrian Res. 138 (3), 297–318.
Tsur, Y., Issar, A. (1989): The Buffer Role of Groundwater When Supply of Surface Water is Uncertain, Editor(s): E. Custodio, A. Gurguí, Developments in Water Science, Elsevier, Volume 39, 373–379.
Uehara, G. and Gillman, G.P. (1980): Charge characteristics of soils with variable and permanent charge minerals. Theory, Soil Science Society of America Journal, 44, 250–252.
UNDP (1971): Ethiopia: Investigation of Geothermal Resources for Power Development (ETH 26): Geology, Geochemistry and Hydrology of Hot Springs of the Eastern African Rift System in Ethiopia.
Van Wambeke, A. R. (1962): Criteria for classifying tropical soils by age. Journal of soil science, 13, 124–132.
WABCO (1990): Water Resources Development Master Plan for Ethiopia.
WHO (2006): World Health Statistics, http://www.who.int/countries/eth/eth/en/
Wolela, A., (2014): Volcanism, sedimentation, K/Ar and palynology studies, Yayu and Delbi-Moye Basins, Southwestern Plateau of Ethiopia. Journal of African Earth Sciences, 93, 1–13.
Wolde B., Widenfalk L., (1994): Petrochemical and geochemical constraints on Cenozoic magmatism in Ethiopia. Afr Geosci Rev 1:475–494.
WoldeGabriel, G. (1989): Geological map of Hagere Mariam in scale 1 : 250 000, MS GSE, Addis Ababa.
WoldeGabriel, G., Aronson, J. L., Walter, R.C. (1990): Geology, geochronology, and rift basin development in the central sector of the Main Ethiopian Rift, Geol. Soc. Am. Bull., 102, 439–458.
WoldeGabriel, G., Yemane, T., White, T., Asfaw, B., Suwa, G. (1991): Age of volcanism and fossils in the Burji-Soyoma area, Amaro Horst, southern Main Ethiopian Rift, J. Afr. Earth Sci., 13, 437–447.
WoldeGabriel, G., Hart, W.K., Katoh, S., Beyene, Y. and Suwa, G., (2005): Correlation of Plio–Pleistocene Tephra in Ethiopian and Kenyan rift basins: Temporal calibration of geological features and hominid fossil records. Journal of Volcanology and Geothermal Research, 147(1), 81–108.
Wolfenden, E., Ebinger, C., Yirgu, G., Deino, A., Ayalew, D. (2004): Evolution of the northern Main Ethiopian rift: Birth of a triple junction, Earth Planet. Sci. Lett., 224, 213–228.

R E F E R E N C E S 127
WWDSE (2004): Study and Design of Gelana, Gidabo and Bilate Irrigation Project, Water Works Design and Supervision Enterprise, Addis Ababa.
WWDST (2003): Wabe Shebelle River Basin Integrated Development Master Plan Study, MoWR, Addis Ababa.
Yavitt, J.B., Wright, S.J. (2002): Charge characteristics of soil in a lowland tropical moist forest in Panama in response to dry-season irrigation. Aust. J. Soil Res. 40 (2), 269–281.
Yismaw, A., Mitiku, B., G/Tsadik, T., Beyene, B., Dure, T., Edris, M., Burusa, G., Wenduante, M., Yehualashet, E., Abdulahid, T., Alemu T., Ashenafi S. (2015): geology, geochemistry and gravity survey of Dila map sheet, Memoir 37. Geological Survey of Ethiopia, Addis Ababa.
Zanettin, B., Petrucciani, C. (1978): The Evolution of the Chencha Escarpment and the Ganjuli Graben (Lake Abaya) in the Southern Ethiopian Rift. N. Jb. Geol. Paläont. Mh., 8, p. 473–490.


ANNEXES
Annex 1. Geochemical data and the subsequent analytical methods
Table 1 . Whole-rock compositions of volcanic rocks (oxide wt. % for major elements and ppm for trace elements)
Sample DE055 DE052 DE059 DE068 DE069 DE075 DE077 DE067
Rock Trachyte Ignimbrite Ignimbrite Ignimbrite Ignimbrite Basalt Basalt Basalt
wt. %
SiO2 63.64 73.59 74.15 78.09 70.52 50.08 48.88 48.16
Al2O3 16.75 11.14 13.40 12.04 11.37 18.05 17.91 14.26
Fe2O3 6.15 5.19 3.69 3.54 4.02 9.32 10.00 14.04
MgO 0.06 0.04 0.02 0.01 0.16 4.54 3.59 5.05
CaO 0.18 0.02 0.04 0.03 0.28 7.55 8.90 9.50
Na2O 8.70 3.24 1.92 0.13 1.47 4.09 3.90 3.10
K2O 2.95 4.82 2.54 0.25 4.51 2.14 2.03 0.83
TiO2 0.25 0.42 0.38 0.41 0.34 1.54 2.44 3.00
P2O5 0.03 < 0.01 0.03 0.03 < 0.01 0.54 0.63 0.41
MnO 0.14 0.15 < 0.01 0.01 0.07 0.17 0.16 0.21
Cr2O3 < 0.002 < 0.002 < 0.002 < 0.002 < 0.002 0.022 < 0.002 0.004
LOI 0.9 1.3 3.6 5.2 7.0 1.6 1.2 1.1
Sum 99.76 99.90 99.79 99.81 99.72 99.73 99.72 99.72
ppm
Mo 0.5 1.3 0.4 1.3 < 0.1 0.9 1.8 1.5
Cu 0.6 1.2 0.7 0.4 0.5 46.2 42.0 84.0
Pb 13.2 6.6 17.1 9.5 3.9 1.0 3.1 1.6
Zn 75 213 54 59 155 48 70 94
Ni 0.6 0.5 0.3 0.4 0.3 67.7 19.8 28.0
As 0.6 < 0.5 0.6 3.1 < 0.5 < 0.5 < 0.5 < 0.5
Cd < 0.1 0.2 < 0.1 < 0.1 0.1 < 0.1 < 0.1 < 0.1
Sb < 0.1 < 0.1 < 0.1 < 0.1 < 0.1 < 0.1 < 0.1 < 0.1
Bi < 0.1 < 0.1 < 0.1 < 0.1 < 0.1 < 0.1 < 0.1 < 0.1
Ag < 0.1 < 0.1 < 0.1 < 0.1 < 0.1 < 0.1 < 0.1 < 0.1
Au < 0.5 < 0.5 < 0.5 < 0.5 < 0.5 1.6 1.2 < 0.5
Hg < 0.01 < 0.01 < 0.01 < 0.01 < 0.01 < 0.01 < 0.01 < 0.01
Tl < 0.1 < 0.1 < 0.1 < 0.1 < 0.1 < 0.1 < 0.1 < 0.1
Se < 0.5 < 0.5 < 0.5 < 0.5 < 0.5 < 0.5 < 0.5 < 0.5

130 M A P S H E E T 0 6 3 7 - D 3 A R B A M I N C H
Table 2 . Trace element analyses of volcanic rocks (ppm)
Sample DE055 DE052 DE059 DE068 DE069 DE075 DE077 DE067
Ba 104 63 38 22 54 898 792 258
Sc 1 < 1 2 2 < 1 15 14 25
Be 6 2 6 2 10 2 2 2
Co 0.8 7.5 1.4 1.5 1.8 28.0 27.2 50.1
Cs 1.0 < 0.1 0.3 0.2 2.0 0.1 0.2 0.1
Ga 28.6 31.2 32.2 28.4 28.7 16.8 17.7 21.3
Hf 21.3 7.6 27.7 25.3 25.4 4.2 4.1 6.9
Nb 206.9 43.1 93.2 87.1 87.5 82.4 80.2 36.4
Rb 74.2 98.0 53.4 7.1 240.0 58.6 52.4 11.6
Sn 6 6 8 7 8 1 < 1 2
Sr 29.8 5.7 3.2 3.5 12.0 809.6 861.0 476.5
Ta 13.2 4.4 5.2 4.5 5.4 4.7 4.7 2.3
Th 26.2 14.4 20.4 14.0 17.7 9.9 9.4 4.2
U 3.3 1.6 2.1 2.1 4.2 1.6 1.9 1.0
V 11 < 8 < 8 < 8 < 8 147 245 296
W 4.4 34.8 5.3 7.4 7.9 8.5 6.9 17.3
Zr 962.0 228.6 1154.0 979.9 1014.9 187.8 176.6 270.6
Y 69.3 34.5 120.4 98.5 99.7 23.2 26.1 31.1
La 140.0 13.9 5.4 77.7 134.4 57.5 56.6 34.9
Ce 249.7 237.9 68.7 121.3 244.5 100.9 97.8 74.0
Pr 26.02 4.99 2.41 22.71 32.03 10.25 10.60 8.89
Nd 88.4 19.6 12.7 82.9 119.4 35.7 38.5 36.0
Sm 14.65 5.10 7.14 16.59 22.66 6.00 6.75 7.58
Eu 1.42 0.85 1.45 2.18 2.71 1.94 2.26 2.44
Gd 12.82 5.64 12.42 15.71 20.75 5.71 6.34 7.56
Tb 2.14 1.18 2.96 2.87 3.21 0.80 0.88 1.16
Dy 12.94 8.13 20.88 17.30 18.88 4.49 5.17 6.09
Ho 2.58 1.74 4.76 3.61 3.71 0.87 0.99 1.19
Er 7.68 5.04 14.48 10.87 10.58 2.38 2.79 3.19
Tm 1.19 0.82 2.23 1.61 1.61 0.36 0.39 0.44
Yb 7.84 5.80 13.75 10.40 10.22 2.25 2.48 2.63
Lu 1.23 0.86 2.02 1.55 1.50 0.36 0.39 0.39

A N N E X E S 131
Table 3 . Representative chemical composition of pyroxenes
Rock Basalt Basalt Basalt Basalt Basalt Basalt Basalt Basalt
Sample DE044 DE056 DE057 DE057 DE077 DE077 DE077 DE077
SiO2 49.32 48.10 50.94 50.82 47.98 48.68 48.24 47.93
TiO2 1.92 2.78 0.96 1.02 2.03 1.76 1.77 2.71
Al2O3 3.36 3.77 2.21 2.53 5.70 5.20 5.28 4.39
Cr2O3 0.03 0.02 0.02 0.01 0.15 0.33 0.37 0.01
Fe2O3 2.56 2.76 2.28 1.84 3.31 2.48 3.39 3.35
FeO 7.79 8.78 7.95 8.13 3.92 4.35 3.47 6.65
MnO 0.17 0.23 0.27 0.25 0.11 0.15 0.16 0.26
MgO 12.83 12.15 13.16 12.91 13.68 13.77 13.53 12.38
CaO 21.74 21.31 22.05 22.02 22.58 22.60 23.04 21.98
Na2O 0.41 0.43 0.40 0.44 0.39 0.38 0.43 0.56
K2O 0.04 0.02 0.00 0.02 0.01 0.00 0.01 0.01
Total 100.16 100.35 100.24 99.98 99.87 99.71 99.69 100.21
Si 1.851 1.814 1.906 1.906 1.784 1.811 1.797 1.799
Al 0.000 0.000 0.000 0.000 0.000 0.000 0.000 0.000
Fe2+ 0.244 0.277 0.249 0.255 0.122 0.135 0.108 0.209
Fe3+ 0.072 0.078 0.064 0.052 0.093 0.070 0.095 0.095
Cr 0.001 0.001 0.000 0.000 0.005 0.010 0.011 0.000
Ti 0.054 0.079 0.027 0.029 0.057 0.049 0.050 0.077
Mn 0.005 0.007 0.009 0.008 0.004 0.005 0.005 0.008
Mg 0.717 0.683 0.734 0.722 0.759 0.764 0.751 0.693
Ca 0.874 0.861 0.884 0.885 0.900 0.901 0.920 0.884
Na 0.030 0.031 0.029 0.032 0.028 0.028 0.031 0.041
K 0.002 0.001 0.000 0.001 0.000 0.000 0.001 0.001
TOTAL 4.000 4.000 4.000 4.000 4.000 4.000 4.000 4.000

132 M A P S H E E T 0 6 3 7 - D 3 A R B A M I N C H
Table 4 . Representative chemical composition of feldspars
Rock Basalt Basalt Basalt Basalt Basalt Basalt Basalt Basalt
Sample DE044 DE055 DE055 DE055 DE057 DE077 DE077 DE077
SiO2 61.74 65.37 64.82 68.48 65.92 47.46 47.91 52.44
P2O5 0.06 0.00 0.03 0.01 0.03 0.01 0.00 0.03
Al2O3 24.21 18.38 18.02 18.95 19.46 33.25 33.01 29.62
FeO 0.79 0.25 0.29 0.35 0.63 0.61 0.55 0.67
CaO 5.39 0.00 0.00 0.00 1.11 16.65 16.17 12.58
Na2O 6.87 0.99 1.10 11.56 6.03 1.95 2.27 4.05
K2O 1.68 15.44 15.23 0.33 6.69 0.09 0.13 0.40
BaO 0.10 0.00 0.01 0.00 0.02 0.00 0.01 0.03
SrO 0.11 0.00 0.00 0.00 0.00 0.16 0.12 0.09
Total 100.74 100.44 99.50 99.67 99.87 100.01 100.05 99.78
Si 2.721 2.996 2.999 3.000 2.948 2.175 2.193 2.381
Al 1.257 0.993 0.982 0.979 1.026 1.795 1.781 1.585
Fe3+ 0.029 0.010 0.011 0.013 0.023 0.023 0.021 0.025
T-site 4.007 3.998 3.992 3.992 3.998 3.994 3.995 3.991
K 0.094 0.903 0.899 0.018 0.382 0.005 0.008 0.023
Na 0.587 0.088 0.099 0.982 0.523 0.173 0.202 0.356
Ca 0.251 0.000 0.000 0.000 0.053 0.807 0.783 0.604
Ba 0.002 0.000 0.000 0.000 0.000 0.000 0.000 0.000
Sr 0.003 0.000 0.000 0.000 0.000 0.004 0.003 0.002
Σ Cat. 4.945 4.990 4.990 4.992 4.956 4.982 4.991 4.977
An 27 0 0 0 5 82 79 61
Ab 63 9 10 98 55 18 20 36
Or 10 91 90 2 40 1 1 2

A N N E X E S 133
Annex 2 . Soil textural and chemical analysesSa
mpl
eD
epth
Sand
Silt
Cla
ypH
/H2O
pH/K
Cl
PK
Ca
Mg
TOC
CE
CB
SC
aCO
3
cm%
%%
mg/
kgm
g/kg
mg/
kgm
g/kg
%cm
olc/k
g%
%
JJ00
1A10
–20
4.86
40.7
854
.36
4.70
4.10
< 3,
533
476
381.
9221
.84
25.4
0<
0.20
JJ00
1B50
–60
0.44
37.7
361
.83
4.90
4.00
< 3,
5<
2023
212
0.74
18.4
917
.23
< 0.
20
JJ00
3A10
–20
3.69
20.5
475
.77
4.50
3.90
< 3,
565
129
781.
2622
.79
11.1
7<
0.20
JJ00
3B80
–100
1.54
11.7
086
.76
4.70
3.90
< 3,
562
440
710.
4019
.44
23.8
0<
0.20
JJ00
4A20
– 3
053
.31
19.1
027
.59
5.40
4.30
< 3,
523
569
138
0.99
11.2
873
.75
< 0.
20
JJ00
4B70
–80
39.8
924
.78
35.3
35.
804.
80<
3,5
< 20
653
780.
639.
4689
.57
< 0.
20
JJ00
5A10
–20
17.7
140
.93
41.3
65.
404.
00<
3,5
166
2212
1126
1.70
38.0
766
.29
< 0.
20
JJ00
5B30
–40
15.3
836
.64
47.9
86.
004.
30<
3,5
9734
7513
610.
7437
.49
84.2
0<
0.20
JJ00
710
–20
48.3
239
.82
11.8
67.
605.
80<
3,5
7871
8010
920.
3641
.42
100.
000.
60
JJ01
0A0–
2024
.90
24.3
350
.77
5.60
4.50
< 3,
544
915
8757
62.
1524
.68
48.9
8<
0.20
JJ01
0B40
–80
20.8
419
.79
59.3
75.
804.
10<
3,5
233
1326
211
0.54
19.5
860
.93
< 0.
20
JJ01
110
–20
6.66
55.9
237
.42
7.10
5.70
21,1
253
6035
1184
0.68
44.9
296
.15
0.20
JJ01
2A10
–20
48.6
640
.22
11.1
27.
806.
50<
3,5
4285
5788
80.
4838
.80
100.
00<
0.20
JJ01
2B40
–60
17.7
235
.39
46.8
97.
007.
10<
3,5
6314
050
1545
0.64
60.2
899
.21
1.60
JJ01
410
–30
31.2
153
.41
15.3
87.
706.
607,
817
065
7199
20,
8743
.97
83.7
6<
0.20
KE0
39A
10–2
05.
6659
.39
34.9
54.
703.
90<
3,5
8872
853
2.99
34.2
99.
75<
0.20
KE0
39B
40–5
01.
0958
.76
40.1
54.
703.
90<
3,5
7437
562
2.61
22.4
20.
00<
0.20
KE0
45A
10–2
016
.88
70.9
412
.18
4.70
3.70
< 3,
556
1700
676
2.90
40.8
40.
00<
0.20
KE0
45B
40–5
020
.14
68.0
811
.78
5.00
3.70
< 3,
533
1119
292
1.96
37.8
60.
00<
0.20
KE0
46A
10–2
013
.61
60.3
226
.07
4.90
4.10
< 3,
511
917
6349
52.
4428
.83
7.52
< 0.
20
KE0
46B
40–5
014
.82
57.9
227
.26
5.00
4.10
< 3,
581
1572
415
2.19
21.2
60.
00<
0.20
TOC
– to
tal o
rgan
ic c
arbo
n, B
S –
base
satu
ratio
n, C
EC –
Cat
ion
exch
ange
cap
acity
Labo
rato
ry d
ata:
Nat
iona
l Ref
eren
ce L
abor
ator
y of
the
Cen
tral
Inst
itute
for
Supe
rvis
ing
and
Test
ing
in A
gric
ultu
re (B
rno,
Cze
ch R
epub
lic) a
nd la
bora
tori
es o
f the
Cze
ch
Geo
logi
cal S
urve
y (T
OC
ana
lyse
s).
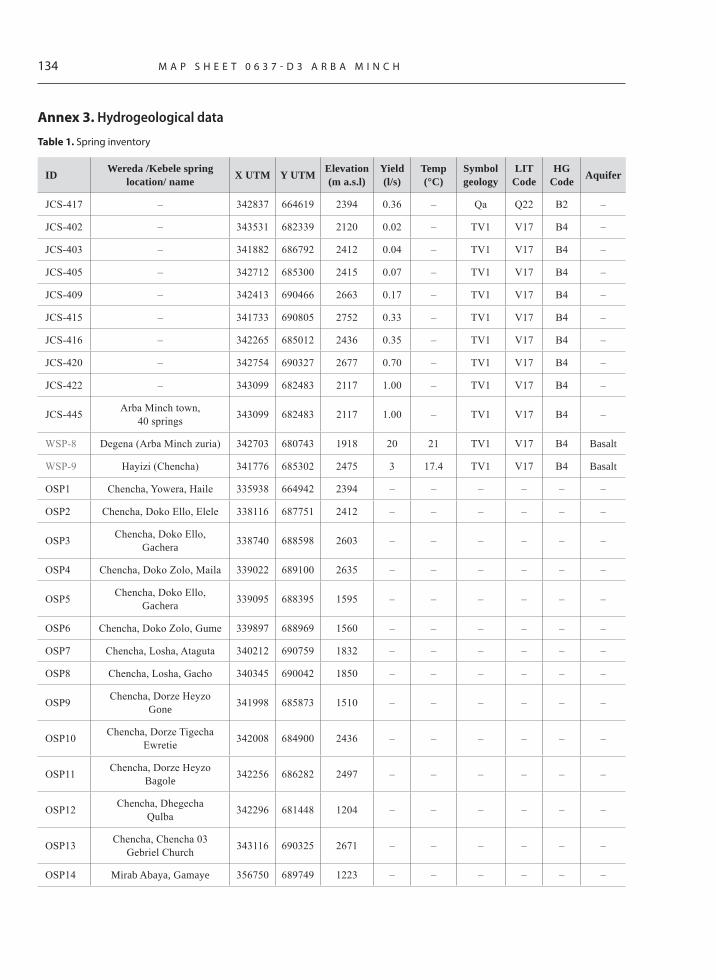
134 M A P S H E E T 0 6 3 7 - D 3 A R B A M I N C H
Annex 3 . Hydrogeological data
Table 1 . Spring inventory
ID Wereda /Kebele spring location/ name X UTM Y UTM Elevation
(m a.s.l)Yield (l/s)
Temp (°C)
Symbol geology
LIT Code
HG Code Aquifer
JCS-417 – 342837 664619 2394 0.36 – Qa Q22 B2 –
JCS-402 – 343531 682339 2120 0.02 – TV1 V17 B4 –
JCS-403 – 341882 686792 2412 0.04 – TV1 V17 B4 –
JCS-405 – 342712 685300 2415 0.07 – TV1 V17 B4 –
JCS-409 – 342413 690466 2663 0.17 – TV1 V17 B4 –
JCS-415 – 341733 690805 2752 0.33 – TV1 V17 B4 –
JCS-416 – 342265 685012 2436 0.35 – TV1 V17 B4 –
JCS-420 – 342754 690327 2677 0.70 – TV1 V17 B4 –
JCS-422 – 343099 682483 2117 1.00 – TV1 V17 B4 –
JCS-445 Arba Minch town,40 springs 343099 682483 2117 1.00 – TV1 V17 B4 –
WSP-8 Degena (Arba Minch zuria) 342703 680743 1918 20 21 TV1 V17 B4 Basalt
WSP-9 Hayizi (Chencha) 341776 685302 2475 3 17.4 TV1 V17 B4 Basalt
OSP1 Chencha, Yowera, Haile 335938 664942 2394 – – – – – –
OSP2 Chencha, Doko Ello, Elele 338116 687751 2412 – – – – – –
OSP3 Chencha, Doko Ello, Gachera 338740 688598 2603 – – – – – –
OSP4 Chencha, Doko Zolo, Maila 339022 689100 2635 – – – – – –
OSP5 Chencha, Doko Ello, Gachera 339095 688395 1595 – – – – – –
OSP6 Chencha, Doko Zolo, Gume 339897 688969 1560 – – – – – –
OSP7 Chencha, Losha, Ataguta 340212 690759 1832 – – – – – –
OSP8 Chencha, Losha, Gacho 340345 690042 1850 – – – – – –
OSP9 Chencha, Dorze HeyzoGone 341998 685873 1510 – – – – – –
OSP10 Chencha, Dorze TigechaEwretie 342008 684900 2436 – – – – – –
OSP11 Chencha, Dorze HeyzoBagole 342256 686282 2497 – – – – – –
OSP12 Chencha, DhegechaQulba 342296 681448 1204 – – – – – –
OSP13 Chencha, Chencha 03Gebriel Church 343116 690325 2671 – – – – – –
OSP14 Mirab Abaya, Gamaye 356750 689749 1223 – – – – – –

A N N E X E S 135
Table 2 . Borehole inventory
Site ID Locality X UTM Y UTM Elevation (m a.s.l) Depth Yield
JBH-7 Arba Minch * 340707 670049 – – 5.5
WBH 4 Lante, Arba Minch Zuria 350116 678301 – – –
JW-7 Arba Minch 341700 670517 – – –
OBH1 Arba Minch Zuria, KolasharaKolashara 341523 673385 2455 75 –
OBH2 Arbaminch Zuria Chano DorgaDorga 342714 676403 1199 70 –
OBH3 Mirab Abaya, UmolanteShiraro 351823 681377 1215 0 –
OBH4 Mirab Abaya, AnkoberAyelena 360900 690704 1223 0 –

136 M A P S H E E T 0 6 3 7 - D 3 A R B A M I N C H
Table 3 . Dug well inventory
Site ID Locality X UTM Y UTM Elevation (m a.s.l)
Depth (m)
Yield (l/s)
ODW1 Chencha, Dorze Holoo,Dode Ele. School 341378 687646 2412 9 0
ODW2 Arbaminch Zuria 344560 676080 1199 9,5 4,76
ODW5 Mirab Abaya 352000 680749 1199 0 0
ODW6 Mirab Abaya 355506 682413 1215 55 0
ODW7 Chencha, Chencha 02Chencha High school 342087 690306 2671 12 0
ODW8 Chencha, Chencha 02, Chencha 02 342194 690783 2007 0 0
ODW9 Chencha, Chencha 02, New Market 342428 690779 2712 0 0
ODW10 Arba Minch Zuria, Chano ChalabaSelam village 342780 674681 1199 17,2 0,83
ODW11 Arba Minch Zuria, Chano ChalabaAndinet village 342801 675129 1199 14,75 0,185
ODW12 Arba Minch Zuria, Chano Chalaba, Chalba 342887 674882 1199 17,5 0
ODW13 Chencha, Chencha 03,Tolola Elem. School 342891 688974 2635 0 0
ODW14 Arbaminch Zuria, Chano ChalabaMisirak village 343281 675450 1200 10,1 0,69
ODW15 Arbaminch Zuria, Chano DorgaChanodorga Ele sch 343398 676527 1198 0 0
ODW16 Arba Minch Zuria, Chano ChalabaAkoshafne 343652 673560 1199 0 0
ODW17 Arba Minch Zuria, Chano Chalaba, Chalba 343846 672278 1199 0 0
ODW18 Arba Minch Zuria, Chano MilleChano mille Market 343908 675664 1199 0 0
ODW19 Arba Minch Zuria, Chano MilleChano Mille 01 344186 675912 1199 14 0
ODW20 Arba Minch Zuria, Chano Mille, Mille 344206 674472 1199 0 0
ODW21 Arba Minch Zuria, Chano MilleChano mille 01 344207 675341 1199 7,5 3,24
ODW22 Arba Minch Zuria, Chano MilleChano Mille Elem School 344333 674503 1199 0 0
ODW23 Arba Minch Zuria, Chano MilleChanomille 03 344741 675427 1199 0 0
ODW24 Arba Minch Zuria, Chano Chalaba, Erze 345092 672126 1199 0 0
ODW25 Arba Minch Zuria, Lante, Mirab village 349850 678403 1189 0 0
ODW26 Arba Minch Zuria, Lante, Selamber 350189 678271 1200 0 0
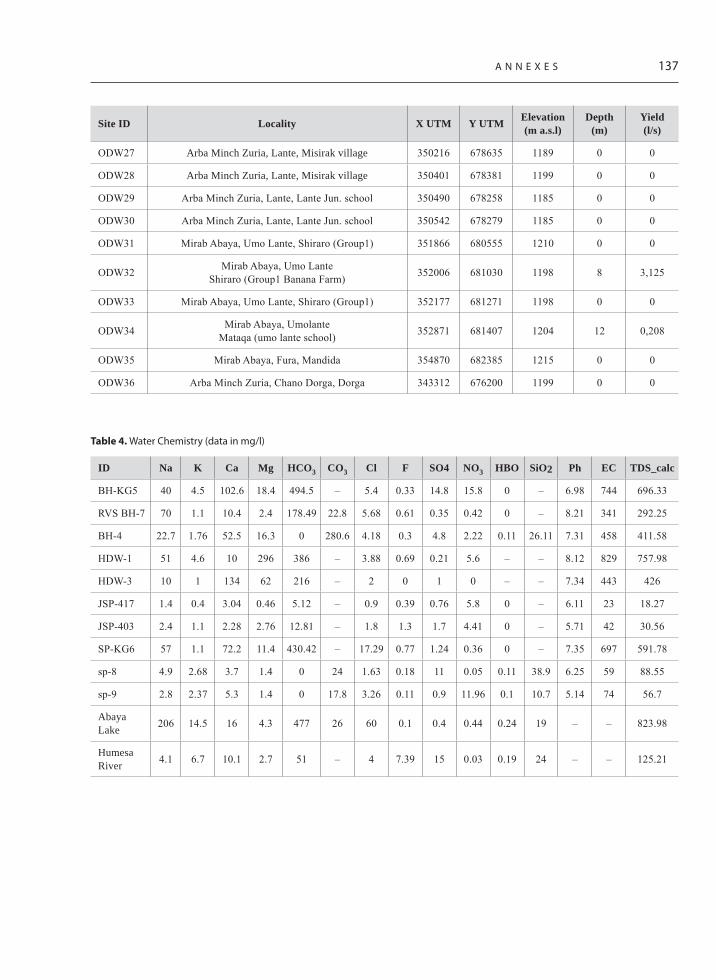
A N N E X E S 137
Site ID Locality X UTM Y UTM Elevation (m a.s.l)
Depth (m)
Yield (l/s)
ODW27 Arba Minch Zuria, Lante, Misirak village 350216 678635 1189 0 0
ODW28 Arba Minch Zuria, Lante, Misirak village 350401 678381 1199 0 0
ODW29 Arba Minch Zuria, Lante, Lante Jun. school 350490 678258 1185 0 0
ODW30 Arba Minch Zuria, Lante, Lante Jun. school 350542 678279 1185 0 0
ODW31 Mirab Abaya, Umo Lante, Shiraro (Group1) 351866 680555 1210 0 0
ODW32 Mirab Abaya, Umo LanteShiraro (Group1 Banana Farm) 352006 681030 1198 8 3,125
ODW33 Mirab Abaya, Umo Lante, Shiraro (Group1) 352177 681271 1198 0 0
ODW34 Mirab Abaya, UmolanteMataqa (umo lante school) 352871 681407 1204 12 0,208
ODW35 Mirab Abaya, Fura, Mandida 354870 682385 1215 0 0
ODW36 Arba Minch Zuria, Chano Dorga, Dorga 343312 676200 1199 0 0
Table 4 . Water Chemistry (data in mg/l)
ID Na K Ca Mg HCO3 CO3 Cl F SO4 NO3 HBO SiO2 Ph EC TDS_calc
BH-KG5 40 4.5 102.6 18.4 494.5 – 5.4 0.33 14.8 15.8 0 – 6.98 744 696.33
RVS BH-7 70 1.1 10.4 2.4 178.49 22.8 5.68 0.61 0.35 0.42 0 – 8.21 341 292.25
BH-4 22.7 1.76 52.5 16.3 0 280.6 4.18 0.3 4.8 2.22 0.11 26.11 7.31 458 411.58
HDW-1 51 4.6 10 296 386 – 3.88 0.69 0.21 5.6 – – 8.12 829 757.98
HDW-3 10 1 134 62 216 – 2 0 1 0 – – 7.34 443 426
JSP-417 1.4 0.4 3.04 0.46 5.12 – 0.9 0.39 0.76 5.8 0 – 6.11 23 18.27
JSP-403 2.4 1.1 2.28 2.76 12.81 – 1.8 1.3 1.7 4.41 0 – 5.71 42 30.56
SP-KG6 57 1.1 72.2 11.4 430.42 – 17.29 0.77 1.24 0.36 0 – 7.35 697 591.78
sp-8 4.9 2.68 3.7 1.4 0 24 1.63 0.18 11 0.05 0.11 38.9 6.25 59 88.55
sp-9 2.8 2.37 5.3 1.4 0 17.8 3.26 0.11 0.9 11.96 0.1 10.7 5.14 74 56.7
Abaya Lake 206 14.5 16 4.3 477 26 60 0.1 0.4 0.44 0.24 19 – – 823.98
Humesa River 4.1 6.7 10.1 2.7 51 – 4 7.39 15 0.03 0.19 24 – – 125.21


![[3H]4-(dimethylamino)-N-(4-(4-(2-methoxyphenyl)piperazin-1-yl) butyl)benzamide: A selective radioligand for dopamine D3 receptors. II. Quantitative analysis of dopamine D3 and D2 receptor](https://static.fdokumen.com/doc/165x107/6335c3b902a8c1a4ec01e90f/3h4-dimethylamino-n-4-4-2-methoxyphenylpiperazin-1-yl-butylbenzamide.jpg)