Tissue-specific dysregulation of DNA methylation in aging
25
Tissue-specific dysregulation of DNA methylation in aging Reid F. Thompson 1,4 , Gil Atzmon 2,6 , Ciprian Gheorghe 3 , Hong Qian Liang 2,6 , Christina Lowes 1 , John M. Greally 1,4,5,* , and Nir Barzilai 1,2,6,* 1 Department of Genetics (Computational Genetics), Albert Einstein College of Medicine, Bronx, NY 2 Department of Medicine (Endocrinology), Albert Einstein College of Medicine, Bronx, NY 3 Department of Obstetrics & Gynecology and Women’s Health, Albert Einstein College of Medicine, Bronx, NY 4 Department of Medicine (Hematology), Albert Einstein College of Medicine, Bronx, NY 5 Center for Epigenomics, Albert Einstein College of Medicine, Bronx, NY 6 Institute for Aging Research, Albert Einstein College of Medicine, Bronx, NY SUMMARY The normal aging process is a complex phenomenon associated with physiological alterations in the function of cells and organs over time. Although an attractive candidate for mediating transcriptional dysregulation, the contribution of epigenetic dysregulation to these progressive changes in cellular physiology remains unclear. In this study, we employed the genome-wide HELP assay to define patterns of cytosine methylation throughout the rat genome, and the LUMA assay to measure global levels of DNA methylation in the same samples. We studied both liver and visceral adipose tissue, and demonstrated significant differences in DNA methylation with age at >5% of sites analyzed. Furthermore, we showed that epigenetic dysregulation with age is a highly tissue-dependent phenomenon. The most distinctive loci were located at intergenic sequences and conserved non-coding elements, and not at promoters nor at CG-dinucleotide dense loci. Despite this, we found that there was a subset of genes at which cytosine methylation and gene expression changes were concordant. Finally, we demonstrated that changes in methylation occur consistently near genes that are involved in metabolism and metabolic regulation, implicating their potential role in the pathogenesis of age-related diseases. We conclude that different patterns of epigenetic dysregulation occur in each tissue over time and may cause some of the physiological changes associated with normal aging. Keywords aging; epigenetics; DNA methylation; tissue-specific; liver; visceral adiposity * Co-corresponding authors: John M. Greally MB PhD, Departments of Genetics (Computational Genetics) and Medicine (Hematology), Albert Einstein College of Medicine, 1301 Morris Park Avenue, Price 322, Bronx, NY 10461, USA, 718 678 1234 telephone, 718 678 1016 fax, [email protected], Nir Barzilai MD, Departments of Medicine (Endocrinology) and Genetics, Albert Einstein College of Medicine, 1300 Morris Park Avenue, Belfer 701 Bronx, NY 10461, USA, 718 430 3144 telephone, 718 430 8557 fax, [email protected]. AUTHOR CONTRIBUTIONS J.M.G. and N.B. designed the experiments, which were performed by R.F.T., G.A., C.G., H.L., and C.L., with data analysis by R.F.T. and interpretation by R.F.T., J.M.G., and N.B. The manuscript was authored by R.F.T., J.M.G., and N.B. with contributions from G.A. and C.G. NIH Public Access Author Manuscript Aging Cell. Author manuscript; available in PMC 2011 August 1. Published in final edited form as: Aging Cell. 2010 August ; 9(4): 506–518. doi:10.1111/j.1474-9726.2010.00577.x. NIH-PA Author Manuscript NIH-PA Author Manuscript NIH-PA Author Manuscript
Transcript of Tissue-specific dysregulation of DNA methylation in aging

Tissue-specific dysregulation of DNA methylation in aging
Reid F. Thompson1,4, Gil Atzmon2,6, Ciprian Gheorghe3, Hong Qian Liang2,6, ChristinaLowes1, John M. Greally1,4,5,*, and Nir Barzilai1,2,6,*
1Department of Genetics (Computational Genetics), Albert Einstein College of Medicine, Bronx,NY2Department of Medicine (Endocrinology), Albert Einstein College of Medicine, Bronx, NY3Department of Obstetrics & Gynecology and Women’s Health, Albert Einstein College ofMedicine, Bronx, NY4Department of Medicine (Hematology), Albert Einstein College of Medicine, Bronx, NY5Center for Epigenomics, Albert Einstein College of Medicine, Bronx, NY6Institute for Aging Research, Albert Einstein College of Medicine, Bronx, NY
SUMMARYThe normal aging process is a complex phenomenon associated with physiological alterations inthe function of cells and organs over time. Although an attractive candidate for mediatingtranscriptional dysregulation, the contribution of epigenetic dysregulation to these progressivechanges in cellular physiology remains unclear. In this study, we employed the genome-wideHELP assay to define patterns of cytosine methylation throughout the rat genome, and the LUMAassay to measure global levels of DNA methylation in the same samples. We studied both liverand visceral adipose tissue, and demonstrated significant differences in DNA methylation with ageat >5% of sites analyzed. Furthermore, we showed that epigenetic dysregulation with age is ahighly tissue-dependent phenomenon. The most distinctive loci were located at intergenicsequences and conserved non-coding elements, and not at promoters nor at CG-dinucleotide denseloci. Despite this, we found that there was a subset of genes at which cytosine methylation andgene expression changes were concordant. Finally, we demonstrated that changes in methylationoccur consistently near genes that are involved in metabolism and metabolic regulation,implicating their potential role in the pathogenesis of age-related diseases. We conclude thatdifferent patterns of epigenetic dysregulation occur in each tissue over time and may cause someof the physiological changes associated with normal aging.
Keywordsaging; epigenetics; DNA methylation; tissue-specific; liver; visceral adiposity
*Co-corresponding authors: John M. Greally MB PhD, Departments of Genetics (Computational Genetics) and Medicine(Hematology), Albert Einstein College of Medicine, 1301 Morris Park Avenue, Price 322, Bronx, NY 10461, USA, 718 678 1234telephone, 718 678 1016 fax, [email protected], Nir Barzilai MD, Departments of Medicine (Endocrinology) andGenetics, Albert Einstein College of Medicine, 1300 Morris Park Avenue, Belfer 701 Bronx, NY 10461, USA, 718 430 3144telephone, 718 430 8557 fax, [email protected] CONTRIBUTIONSJ.M.G. and N.B. designed the experiments, which were performed by R.F.T., G.A., C.G., H.L., and C.L., with data analysis by R.F.T.and interpretation by R.F.T., J.M.G., and N.B. The manuscript was authored by R.F.T., J.M.G., and N.B. with contributions from G.A.and C.G.
NIH Public AccessAuthor ManuscriptAging Cell. Author manuscript; available in PMC 2011 August 1.
Published in final edited form as:Aging Cell. 2010 August ; 9(4): 506–518. doi:10.1111/j.1474-9726.2010.00577.x.
NIH
-PA Author Manuscript
NIH
-PA Author Manuscript
NIH
-PA Author Manuscript

INTRODUCTIONAging is a complex phenomenon characterized by progressive loss of tissue homeostasiswith decline of normal cellular functions and capacity for replication (Van Zant & Liang2003; Chen 2004; Pelicci 2004; Sharpless & DePinho 2004; Campisi 2005). The liverexhibits age-dependent decay in overall structure, regenerative capacity, and function(Jackson et al. 1988; Schmucker 2005), while visceral fat depots expand with increasing ageand contribute to the pathogenesis of late-onset diseases such as diabetes, dyslipidemias, andcardiovascular disease (Hayashi et al. 2003; Nieves et al. 2003; Carr et al. 2004; Huffman &Barzilai 2009). On both a tissue-specific and whole-organism level, aging is associated withaccumulated genomic damage over time accompanied by progressive physiological decline(de Boer et al. 2002; Maslov & Vijg 2009).
Variation in an individual’s phenotypic age and lifespan is due in part to genetic influences(Gurland et al. 2004; Karasik et al. 2004; vB Hjelmborg et al. 2006), but epigenetics and theenvironment play major roles in determining physiological changes over a lifetime (Gartner1990; Kennedy 2006; Whitelaw & Whitelaw 2006; Ordovas & Shen 2008; Vogt et al.2008). Monozygotic twins show inherent epigenetic variability (Kaminsky et al. 2009) thatincreases with age (Fraga et al. 2005), a finding supported by longitudinal studies of DNAmethylation in single individuals (Bjornsson et al. 2008). In animals, DNA methylationdifferences are acquired in multiple tissues with age (Golbus et al. 1990; Ahuja et al. 1998;Peng et al. 2001; Kwabi-Addo et al. 2007). Moreover, epigenetic dysregulation occurs in alocus-specific manner, with some hepatic genes showing age-dependent DNAhypermethylation, and other loci exhibiting no changes with age (Akintola et al. 2008; Jianget al. 2008). It is now well-established that different tissues have specific patterns ofepigenetic regulation (Song et al. 2005; Eckhardt et al. 2006b; Khulan et al. 2006; Lister etal. 2008; Yagi et al. 2008; Song et al. 2009), and there is some evidence that there existgenes whose methylation patterns do not change with age in liver but exhibit significantdifferences in methylation with age in other cell types, raising the possibility of a tissue-specific effect of age on the epigenome (Akintola et al. 2008).
In this study, we applied an epigenome-wide approach (the HELP assay (Khulan et al.2006)) to interrogate DNA methylation patterns in aging F344*BN rats, and investigatedwhether significant changes in methylation status arise with increasing age. We used twotissues with distinct metabolic and cell growth characteristics (liver and visceral adiposetissue) to explore whether tissue-specific dysregulation of the epigenome occurs with age.We wanted to explore whether such changes were global and random, or whether certainloci emerged with specific patterns of hyper- or hypomethylation with age, and whether thepatterns observed were globally or locally concordant between tissues.
RESULTSTissue-Specific Differences in DNA Methylation with Age
We performed a genome-wide analysis of cytosine methylation at almost 40,000 uniquesites using the HELP assay (Khulan et al. 2006). We studied cytosine methylation in liverand adipose tissue isolated from young and old animals. Our interest in adipose tissue wasprompted by our recent demonstration that removal of an adipose fat pad in young animalsincreases their longevity by ~30%, suggesting that the biology of adipose tissue maybelinked to aging, and could be in part the the explanation of how caloric restriction extendslife (Muzumdar et al. 2008). Adipocytes have, however, a limited capacity to divide, so forcomparison we chose liver as being representative of a more actively-dividing tissue that hasbeen extensively studied for its changes with aging. We created four experimental groups:young liver (n=6), young adipose tissue (n=3), old liver (n=5), old adipose tissue (n=3). We
Thompson et al. Page 2
Aging Cell. Author manuscript; available in PMC 2011 August 1.
NIH
-PA Author Manuscript
NIH
-PA Author Manuscript
NIH
-PA Author Manuscript

confirmed overall experimental quality for each sample as described previously (Thompsonet al. 2008). To detect global patterns of epigenomic change occurring with age, wecompared one thousand randomly selected loci to generate a representative heatmap. Thisunsupervised clustering approach demonstrated that DNA methylation is globallycomparable across all samples and tissues (not shown). Tissue-specific differencesdistinguishing liver and adipose tissue were present at ~5.5% of loci overall (using aBonferroni correction for multiple testing with α=0.05).
Each of the first three figures presents the results and analysis in complementary ways, withheatmaps for visualizing patterns of global DNA methylation (Figure 1), volcano plots forvisualization of the statistical results (Figure 2) and the discordance from expected resultsdemonstrated by a significance analysis of microarrays (SAM) study (Figure 3). We usedthe top 5% of loci at which tissue-specific differences in cytosine methylation had beenidentified for a subsequent unsupervised clustering analysis, revealing not only the cleardifferences between liver and adipose tissue but also age-related changes that appear to bemore marked in liver than in fat (Figure 1A). As a complementary approach, we identifiedthe loci at which the most marked changes in methylation are occurring with age andperformed an unsupervised clustering analysis, again showing that the degree of differenceof cytosine methylation due to tissue type exceeds that due to aging (Figure 1B).
The distinct tissue-specific patterns observed using unsupervised clustering analysis ofHELP data prompted us to investigate age-related differences in fat and liver separately. InFigure 2 we show the fat and liver-specific distributions of age-related methylationdifferences, respectively, along with the degree of significance associated with each of thesechanges (volcano plots). At stringent thresholds determining the most widely divergent andhighly significant loci in each tissue, we find that liver has 50% more highly significant age-associated changes than visceral adipose tissue (378 compared with 240 sites, all of whichare combined and shown as a heatmap in Figure 1B). Moreover, the degree, extent, andsignificance of age-related differences in liver are all much greater than the differencesobserved in perinephric fat (Figure 2), demonstrating that age preferentially inducesepigenomic dysregulation in the liver with relatively fewer differences observed in adiposetissue. We confirmed these findings using the SAM approach (Tusher et al. 2001) (Figure3). We estimate that the top 378 differentially methylated sites in liver (δ=0.688) areassociated with a false discovery rate (FDR) less than 0.1%, indicating it is unlikely that anyof these changes occur by chance alone, whereas the differences observed in visceral fat(240 identified with δ=0.496) are not comparably robust (FDR of 46.1%). Interestingly, themajority of epigenetic dysregulation in the liver skewed towards age-dependenthypermethylation (Figures 1B, 2A, and 3A).
We then asked whether any of the liver-specific and fat-specific differentially methylatedloci were consistently dysregulated with age in both tissues. The large majority of changesappeared to be unique to each tissue (Figure 1B), with only five loci that were identified asdifferentially methylated in both tissues (Figure 2). However, contrary to any expectationthat these sites may change methylation status concordantly, four out of the five loci becomehypomethylated in fat but hypermethylated in the liver with increasing age (Figure 2, bluepoints). This observation is consistent with the overall tendency towards age-relatedhypermethylation in the liver (Figure 1B, 2A, and 3A).
Global Levels of DNA Methylation by Luminometric Methylation AssayUsing HELP, we demonstrated that liver exhibits global hypermethylation with age at theunique sequences interrogated using the microarray approach (Figure 2A), while adiposetissue shows no global tendency towards either hyper- or hypomethylation (Figure 2B). Totest whether these changes reflect those of the genome as a whole, we measured global
Thompson et al. Page 3
Aging Cell. Author manuscript; available in PMC 2011 August 1.
NIH
-PA Author Manuscript
NIH
-PA Author Manuscript
NIH
-PA Author Manuscript

levels of DNA methylation in both tissues from young (age 3.2 ± 0.2 months) and old (age18 months) F344*BN rats, a genetically homogeneous F1 hybrid strain, using theLuminometric Methylation Analysis (LUMA) assay (Karimi et al. 2006). As with HELP,this analysis revealed tissue-specific differences in methylation, with increased methylationin liver compared with visceral adipose tissue (p=0.09) (Figure 4). We estimated the percentof methylated HpaII sites by comparison of the data with corresponding MspI data, andfound that 58.7±1.4% and 48.0±7.3% (± SEM) of HpaII sites were methylated in liver andfat, respectively. No aging-related effect on global DNA methylation levels was shown inadipose tissue, but we observed a small degree of hypomethylation in liver with age(p=0.03) (Figure 4). As LUMA should be more influenced by methylation status atrepetitive elements than HELP (which predominantly samples unique sequences), thehypomethylation we observe is consistent with the demethylation and activation of specificrepetitive elements seen in other aging rodents and in humans (Barbot et al. 2002; Bollati etal. 2009). The LUMA data therefore indicate that cytosine methylation changes in agingliver occur distinctively in different genomic sequence contexts.
Genomic Distributions of Cytosine MethylationWe therefore tested how our cytosine methylation data from the HELP experimentsdistributed by annotated DNA sequence features, studying both liver and adipose tissue atyoung and old timepoints. The data were partitioned into five non-overlapping subsets: 1)consistently hypomethylated sites in all animals; 2) consistently hypermethylated sites; 3)loci with tissue-specific differences in methylation; 4) loci with age-associated differences inmethylation in liver; and 5) loci with age-associated differences in methylation in adiposetissue. The number of whole and partial sequence overlaps with CpG islands, CG clusters(Glass et al. 2007), conserved elements, repeat-masked sequences, gene bodies, andpromoters (defined as the proximal 10 kb sequence upstream of RefSeq transcription startsites) were measured for each of these sets of loci (Supp. Table 2). The probability thateach observed frequency could arise by random sampling of an equivalent number of locifrom the array was calculated using the tailed hypergeometric distribution function (Supp.Table 2) (Johnson et al. 1992).
First we investigated the consistent patterns of cytosine methylation in both liver andadipose tissue, focusing on sites that are hypo- or hypermethylated in all samples. Theepigenomic patterns we observed for these loci are concordant with prior expectations, withenrichment of hypomethylated sequences at CpG islands and CG clusters (Fig. 5A), a directagreement with the generally hypomethylated nature of these CG-dense elements (Bird et al.1985;Glass et al. 2007). Additionally, hypomethylated loci were enriched at promoters andconserved sequences, as well as in gene bodies (Fig. 5A). Repetitive elements by contrasttended to be hypermethylated (Supp. Table 2), as were intergenic sequences (Fig. 5A).Overall, these methylation patterns are typical of normal primary tissues from eutherianmammals.
We next investigated how these normal patterns of cytosine methylation differ betweentissues. When we studied ~1,000 of the loci most distinctively methylated between liver andadipose tissue, (p<0.0001 and |liver – adipose| > 1.5), we found them to be highly depletedat CpG islands, CG clusters, and to a lesser extent, promoters and conserved sequences, butmost strikingly enriched at gene bodies (Fig. 5A), which may be the consequence oftranscriptional differences in gene expression between the two tissues (Zilberman et al.2007;Ball et al. 2009).
Finally, we tested where age-related changes in methylation were occurring in each tissue.Overall, liver generated more significant data than adipose tissue, with a significantenrichment in dysregulated loci at intergenic and conserved sequences, and under-
Thompson et al. Page 4
Aging Cell. Author manuscript; available in PMC 2011 August 1.
NIH
-PA Author Manuscript
NIH
-PA Author Manuscript
NIH
-PA Author Manuscript

representation of dysregulated loci at promoters and CG-dense sequences (Fig. 5B).Similarly, conserved non-coding elements tend to be enriched among age-related differencesin methylation in both tissues (Fig. 5B). The cytosine methylation data from these analysesare provided as a UCSC genome browser track available as an open-access resource athttp://greallylab.aecom.yu.edu/ratAgeing/, and through the GEO database (accessionnumber GSE17332).
Quantitative Validation of DNA Methylation StatesWe confirmed our HELP results with a quantitative validation approach, bisulphiteMassArray (Ehrich et al. 2005), testing four loci representing pairs of constitutively-hypomethylated and constitutively-methylated sites identified by the HELP assay, and threeloci at which tissue-specific differences in methylation were observed, two of which werehypomethylated and one of which was hypermethylated in liver compared to adipose tissue.Supplementary Figure 1 shows the expected inverse correlation between methylation valuesdetermined independently for these loci by HELP and MassArray, confirming our ability todiscriminate methylation status in these samples, defining our hypermethylated category asgreater than approximately 60% methylation, and hypomethylation as lower values.
Transcriptional profiling reveals concordant changes in gene expression at epigenetically-dysregulated loci
Gene expression studies were performed in liver tissue using a long oligonucleotidemicroarray approach, identifying genes with robust differences in expression with age. Ourquestion was whether the epigenetic changes we observed, frequently located at non-promoter regions, were associated with changes in gene expression, implying a functionalconsequence to the underlying epigenetic dysregulation. We therefore compared loci withthe most robust changes in cytosine methylation to corresponding gene expressiondifferences with age. As demonstrated in Figure 6, a number of loci (31) exhibit robustchanges in both DNA methylation and gene expression. A detailed description of these locican be found in Table 1.
Molecular Interaction Network Analysis of Genes Associated with Age-Related EpigeneticDysregulation
Using Ingenuity Pathway Analysis (IPA) software (Redwood City, CA), we carried out anetwork analysis to investigate whether genes associated with age-related epigeneticdysregulation shared any common functional roles or relationships. We linked loci with age-associated dysregulation of cytosine methylation to RefSeq genes if they mapped within 10kb upstream of the transcription start site or anywhere within the body of the gene. Weperformed a filtered Ingenuity Pathway Analysis (IPA) on 102 genes (exclusivelyrepresenting changes identified in liver, p<0.0000001) from an input list of 65,000 genes(p<0.37842) which provided a dataset-specific context for the enrichment analysis. Twenty-seven of the 102 input genes were removed from consideration as IPA possessed insufficientinformation to include them in the network analysis. The remaining 75 genes (Supp. Table3) associated most strongly with a functional network relevant to metabolism (Figure 7).Among the nodes central to this network are Hnf4a and Leptin, the first being highlyimportant in liver development and function (Duncan et al. 1994;Odom et al. 2004;Rhee etal. 2006), and the second an important adipokine mediator between visceral fat and livermetabolism (Szanto & Kahn 2000;Fishman et al. 2007). IPA further revealed that these 75genes that have the most consistent epigenetic dysregulation with age are significantlyenriched for functions in lipid metabolism (p<0.0001) and metabolic disease (p<0.0001).
Thompson et al. Page 5
Aging Cell. Author manuscript; available in PMC 2011 August 1.
NIH
-PA Author Manuscript
NIH
-PA Author Manuscript
NIH
-PA Author Manuscript
DISCUSSIONWe investigated the effects of age on cytosine methylation throughout the genome using agenome-wide assay of a type not previously exploited in the study of aging metabolically-active tissues such as liver and visceral fat. This study represents one of the first suchgenome-wide studies of the aging epigenome, and is the first to demonstrate not onlygenome-wide but also locus-specific differences in cytosine methylation in both liver andadipose tissue. We find that normal aging in genetically identical rats exposed to the sameenvironment throughout life causes consistent tissue-specific dysregulation of cytosinemethylation, and that these changes skew globally towards hypermethylation of uniquesequences in the liver. This increased methylation is accompanied by hypomethylation at asmaller set of loci, and less pronounced effects in perinephric visceral fat. The epigenomicdysregulation appears to be non-random in terms of genomic sequence context,preferentially affecting specific loci and genomic compartments such as intergenic andconserved sequences. These epigenetic changes may be adaptive and secondary to otheralterations in cellular physiology, in which case they represent potential biomarkers of theaging process and indicators of the heterogeneity of the pathophysiology of aging betweentissues. However, as many of these changes occur in proximity to genes with well-established roles in metabolism and metabolic dysregulation, epigenomic dysregulation is aclear candidate for being a primary mediator of the pathogenesis of age-related metabolicdisease.
The extremely limited overlap that we observe between liver- and fat-specific epigeneticdysregulation is fundamentally due to the limited epigenetic variability observed in fat withage (Figures 3, 4), and results in an extremely small number of loci that are dysregulated inboth tissues with age. Identification of loci that are jointly dysregulated in different tissueswith age may suggest a common age-response mechanism operating in both tissues, but ourresults do little to shed light on such a mechanism with such a small number of loci involvedand the high false-positive rate in adipose tissue in the current study. Furthermore, thepreponderance of unique changes in each tissue suggests that a common mechanism mightexplain only a part of the story. Instead, we hypothesize that varying tissue environmentswith age, as well as varying mitotic activity and cellular susceptibilities to accumulateddamage, are the hallmarks of tissue-specific epigenomic dysregulation with age.
Why liver as opposed to fat should be subject to large epigenomic changes (Figures 3, 4) issomewhat counterintuitive, given that visceral fat is centrally involved in the pathogenesis ofage-related diseases (Muzumdar et al. 2008), and our prior expectation was that adiposetissue would have greater potential for epigenetic dysregulation due to the proximity of thenuclear DNA in adipocytes to free fatty acid flux and the accumulation of tissuemacrophages, a phenomenon typical of aging (Einstein et al. 2008). However, the tissue-specific epigenetic differences may be related to the distinct cell proliferation properties ofthe tissues, analogous to the distinct tissue-specific DNA mutational rates previouslyobserved in brain and small intestine (Busuttil et al. 2007). As liver is a relatively highlyproliferative tissue type (Duncan et al. 2009), it may be more susceptible than adipose tissueto the accumulation of mutations, not just those of DNA but also those of epigeneticorganization, or ‘epimutations’. DNA replication involves the propagation of cytosinemethylation patterns to daughter chromatids, with restoration of symmetrical methylationfrom an initially hemimethylated state by DNA methyltransferase 1 (DNMT1), thuspreserving the pattern of methylation present in the parental cell. However, DNMT1 hasmeasurable de novo methylation activity and an estimated error rate of 0.3–5% (Vilkaitis etal. 2005; Goyal et al. 2006), thus epimutations are likely to occur with each cell division. Aprior study has indicated that less mitotically-active cell types may be less prone to age-associated changes in cytosine methylation (Chu et al. 2007), results concordant with our
Thompson et al. Page 6
Aging Cell. Author manuscript; available in PMC 2011 August 1.
NIH
-PA Author Manuscript
NIH
-PA Author Manuscript
NIH
-PA Author Manuscript

data. The age-related epigenomic dysregulation that arises in a non-dividing cell type suchas mature adipocytes (Neese et al. 2002) is more likely to reflect changes that occur within asingle cell’s lifespan such as DNA repair-mediated loss of methylation (Barreto et al. 2007;Meulle et al. 2008).
While the locus-specific changes we observed are potentially valuable insights into thepathophysiology of aging, it is the striking tissue-specificity we observe that represents themost novel finding of our study. Because of these findings, we propose that epigenomicdysregulation in aging should be studied in a tissue-specific context, and that the lessonslearned from one tissue cannot necessarily be applied to other tissues. The failure of a large-scale, quantitative study of cytosine methylation to find changes in DNA methylation withage (Eckhardt et al. 2006a) may be due to their measurement of age-related differences asaverage values across the many loci and tissue types they studied, whereas our resultsindicate that a locus and cell type-specific approach to the same dataset may yield differentresults. The changes we observe in our study are unlikely to be due to a random pattern ofloss of epigenetic regulation, as might be concluded from a study of age effects on theepigenomes of twins (Fraga et al. 2005). Indeed, with an estimated false discovery rate ofabout 2.5% in liver and 21.3% in fat (δ=0.5), the epigenetic dysregulation we observe withage is likely due to reproducible, non-random biological differences.
The changes in methylation that we observed included but were not limited to promoter-proximal loci, making it difficult to predict whether these changes would have anyconsequences in terms of local transcription. We addressed this question by performing geneexpression microarray studies on young and old rat livers, demonstrating a subset of loci atwhich changes were concordant. The role of intergenic loci in transcriptional regulationremains difficult to assess, but our data indicate that at least some such loci are potentiallycis-reguatory and involved in cellular aging. Studies of the aging epigenome should nottherefore be limited to promoter regions but should include other genomic contexts also.
We have to consider the possibility that fat- and more notably liver-specific dysregulationcould be a product of a controlled tissue-specific response to accumulated stress with aging.This idea is supported by the results from our ontological and pathway analyses, whichshowed the enrichment of physiologically relevant loci in functional networks associatedwith metabolism and age-related diseases. The extremely limited overlap that we observebetween liver- and fat-specific epigenetic dysregulation (Figure 3) suggests that each tissueresponds differently to the damage and physiological insults that accumulate with age, withthe potential additional contribution of distinct cellular environments during the agingprocess. We hypothesize that a combination of differences in mitotic activity, tissueenvironments and cellular susceptibilities to accumulated damage, define the reasons for celltype-specific differences in epigenomic dysregulation with age.
While this study provides us with new insights into the contribution of epigeneticdysregulation in aging, many questions remain unanswered. In prioritizing future directions,it is clear that the study in isolation of one epigenetic regulatory mechanism such as cytosinemethylation is of less value than integrative studies of chromatin organization and geneexpression, with orthogonal, quantitative single-locus studies to validate results at individualloci. Our results highlight the importance of testing a range of tissues and taking intoaccount their replicative characteristics when assessing results. A focus on stem cells foranalysis has the potential for greater insights than using differentiated cells, but carries theinherent problem of limited cell numbers for these genome-wide assays.
We conclude that the epigenomic dysregulation associated with aging is non-random andhighly tissue-specific. Genome-wide assays focused on promoters or CG dinucleotide-dense
Thompson et al. Page 7
Aging Cell. Author manuscript; available in PMC 2011 August 1.
NIH
-PA Author Manuscript
NIH
-PA Author Manuscript
NIH
-PA Author Manuscript

regions would have failed to identify many of the changes we have found in this study,emphasizing the need for unbiased studies of the genome when exploring the role ofcytosine methylation and the many other regulators of the epigenome in aging. Morecomprehensive studies of the epigenome integrated with transcriptomic assays performed onindividual tissues has significant potential for identifying genes and pathways that are thetargets for modification with aging, and thus insights into this aspect of the pathophysiologyof aging in humans.
EXPERIMENTAL PROCEDURESAnimals
Young (3 months old, n=6) and old (18 months old, n=6) male Fischer 344/Brown NorwayF1 Hybrid (F33XBN) rats (Harlan Worldwide, Somerville, NJ) were housed in individualcages and were subjected to a standard light (6:00 a.m. to 6:00 p.m)-dark (6:00 p.m to 6:00a.m.) cycle. All rats were fed ad libitum using regular rat chow that consisted of 64%carbohydrate, 30% protein, and 6% fat with a physiological fuel value of 3.3 kcal/g chow.They were chronically catheterized 1 week before the study, recovered and were euthanizedrapidly (by pentobarbital sodium, 60 mg/kg body weight intravenously) when unstressedand conscious in order to avoid prolonged severe stress that might potentially affectepigenetic characteristics (Barzilai et al. 1998). The abdomen was quickly opened, andadipose and liver tissues were freeze-clamped in situ with aluminum tongs pre-cooled inliquid nitrogen (Rossetti & Giaccari 1990). The study protocol was reviewed and approvedby the Animal Care and Use Committee of the Albert Einstein College of Medicine.
HELP AssayHELP (HpaII tiny fragment Enrichment by Ligation-mediated PCR) assays were performedas described previously (Khulan et al. 2006). High molecular weight genomic DNA wasisolated from liver and perinephric fat tissues of young and old rats, digested to completionby HpaII and by MspI separately, and then amplified by ligation-mediated PCR (LM-PCR).Following PCR, the HpaII and MspI representations were labeled with differentfluorophores using random priming and were cohybridized on a customized genomicmicroarray representing HpaII/MspI fragments of 200–2,000 bp in unique sequence. Thismicroarray was designed specifically to target the 5’ regions of all known RefSeq genes inthe rat genome as well as imprinted regions and a number of gene bodies, until the numberof probes on the array was filled to the ~380,000 capacity.
HELP Microarray Data AnalysisMicroarray data were pre-processed and subject to quality control and quantilenormalization as previously described (Thompson et al. 2008). HpaII/MspI ratio values weresubsequently normalized by RMA (Irizarry et al. 2003) for each of four distinct subgroupsof rats/tissues: young liver, young fat, old liver, old fat (n=6, n=3, n=5, and n=3,respectively). This extra analytical step was used for inter-array normalization and to reducewithin-group variability, ensuring a more conservative approach to interpretation of ourdata. Changes in methylation state were defined using a HpaII/MspI ratio threshold of zero,where methylated loci and hypomethylated loci had ratio values less than zero and greaterthan zero, respectively.
MassArray ValidationTarget regions were amplified by PCR using the primers and cycling conditions described inSupplementary Table 1. Primers were selected with MethPrimer(http://www.urogene.org/methprimer/) using parameters as follows: 250–450 bp amplicon
Thompson et al. Page 8
Aging Cell. Author manuscript; available in PMC 2011 August 1.
NIH
-PA Author Manuscript
NIH
-PA Author Manuscript
NIH
-PA Author Manuscript

size, 56–60°C Tm, 24–30 bp length, and ≥1 CG in product. 50 µl PCR reactions werecarried out using the Roche FastStart High Fidelity Kit. In cases where products showedprimer-dimer or other contaminants, the bands of appropriate predicted size were excisedfrom 2% agarose gels, purified by the Qiagen Gel Extraction Kit, and eluted with 1X RocheFastStart High Fidelity Reaction Buffer (+MgCl2). All PCR products (5 µl) were aliquottedonto 384-well microtiter plates and were treated with 2 µl Shrimp Alkaline Phosphatase(SAP) mix for 20 minutes at 37°C to dephosphorylate unincorporated dNTPs. Microtiterplates were processed by the MassARRAY Matrix Liquid Handler. A 2 µl volume of eachSAP-treated sample was then heat-inactivated at 85°C for 5 minutes and subsequentlyincubated for 3 hours at 37°C with 5µl of Transcleave mix (T or C Cleavage Mix) forconcurrent in vitro transcription and base-specific cleavage. Samples were transferred ontothe spectroCHIP array by nanodispensation calibrated to ambient temperature and humidity,and analysis with the Sequenom MALDI-TOF MS Compact Unit following 4-pointcalibration with oligonucleotides of different mass provided in the Sequenom kit. Matchedpeak data were exported using EpiTYPER software and analyzed for quality and singlenucleotide polymorphisms according to analytical tools that we have developed (Thompsonet al. 2009).
Luminometric Methylation AssaysThis protocol was adapted from that previously described (Karimi et al. 2006). GenomicDNA (1 µg) was cleaved with HpaII + EcoRI or MspI + EcoRI (5 µl each enzyme) in twoseparate 200 µl reactions containing 20 µl NEB buffers 1 and 2, respectively. The reactionswere incubated at 37°C overnight, and purified by phenol-chloroform extraction andisopropanol precipitation, resuspended in 20 µl H2O. 20 µl of annealing buffer (20 mM Tris-acetate, 2 mM Mg-acetate pH 7.6) was added to the purified cleavage reactions, and sampleswere placed in a PSQ96™MA system (Biotage AB, Uppsala, Sweden). The instrument wasprogrammed to add dNTPs in twelve consecutive steps: 1) dTTP, 2) dGTP, 3) dATP, 4)dCTP, 5) dATP, 6) dCTP, 7) dTTP, 8) dGTP, 9) dTTP, 10) dGTP, 11) dATP, and 12)dCTP. Peak heights were calculated using the PSQ96™A software. The HpaII/EcoRI andMspI/EcoRI ratios were calculated for each respective reaction as follows:
Gene expression microarray assays and analysisTotal RNA isolated from livers of rats of 2 weeks and 10.5 months of age was isolated andpurified using Qiagen RNAEasy kit. The RNA was converted to cDNA and to dsDNA usingthe Superscript Double Stranded cDNA kit. These samples were labeled in our institutionalEpigenomics Shared Facility using the Roche-Nimblegen One Color DNA labeling kit andco-hybridised in pairs to a rat gene expression microarray (Roche-Nimblegen design 090901Rat HX12 expr HX12) which represents 26,419 genes with five long (60 nt)oligonucleotides per gene. The microarrays were scanned and analyzed using the NimblegenHybridization System. Genes showing robust differences in expression with age wereidentified following RMA normalization, and classified as those genes exhibiting a >2.5 SDincrease or decrease in age-related expression beyond the average difference observed withage. Integration of this dataset with the HELP microarray dataset was performed by agenome-wide mapping approach, wherein all methylation loci found between 50 kbupstream and 50 kb downstream of the gene body were linked to the containing gene.
Thompson et al. Page 9
Aging Cell. Author manuscript; available in PMC 2011 August 1.
NIH
-PA Author Manuscript
NIH
-PA Author Manuscript
NIH
-PA Author Manuscript

Ingenuity Pathway AnalysisThe most significantly differentially methylated loci were mapped to RefSeq gene identifiersby chromosomal position (i.e. within 10 kb upstream of the transcription start site, oroverlapping the gene body). The list of RefSeq identifiers was then uploaded to theIngenuity Pathway Analysis program (Redwood City, CA), enabling exploration of ontologyand molecular interaction networks. Each uploaded gene identifier was mapped to itscorresponding gene object (focus genes) in the Ingenuity Pathways Knowledge Base. Corenetworks were constructed for both direct and indirect interactions using default parameters,and the focus genes with the highest connectivity to other focus genes were selected as seedelements for network generation. New focus genes with high specific connectivity (i.e.overlap between the initialized network and gene’s immediate connections) were added tothe growing network until the network reached a default size of 35 nodes. Non-focus genes(i.e. those that were not among our differentially methylated input list) that contained amaximum number of links to the growing network were also incorporated.
The ranking score for each network was then computed by a right-tailed Fisher's exact testas the negative log of the probability that the number of focus genes in the network is notdue to random chance. Similarly, significances for functional enrichment of specific geneswere also determined by the right-tailed Fisher’s exact test, using all input genes as areference set.
Supplementary MaterialRefer to Web version on PubMed Central for supplementary material.
AcknowledgmentsThis work was supported by grants from the National Institutes of Health (AG21654 and AG18381 to N.B.,HG004401 and HD044078 to J.M.G.) and by the Core laboratories of the Albert Einstein Diabetes Research andTraining Center (DK 20541) and by Einstein’s Center for Epigenomics. The contributions of Dr. Shahina Maqbooland Gael Westby of the Einstein Epigenomics Shared Facility are gratefully acknowledged. R.F.T was supported bya NIA T32 training grant.
REFERENCESAhuja N, Li Q, Mohan AL, Baylin SB, Issa JP. Aging and DNA methylation in colorectal mucosa and
cancer. Cancer Res. 1998; 58:5489–5494. [PubMed: 9850084]Akintola AD, Crislip ZL, Catania JM, Chen G, Zimmer WE, Burghardt RC, Parrish AR. Promoter
methylation is associated with the age-dependent loss of N-cadherin in the rat kidney. Am J PhysiolRenal Physiol. 2008; 294:F170–F176. [PubMed: 17959753]
Ball MP, Li JB, Gao Y, Lee JH, LeProust EM, Park IH, Xie B, Daley GQ, Church GM. Targeted andgenome-scale strategies reveal gene-body methylation signatures in human cells. Nat Biotechnol.2009; 27:361–368. [PubMed: 19329998]
Barbot W, Dupressoir A, Lazar V, Heidmann T. Epigenetic regulation of an IAP retrotransposon in theaging mouse: progressive demethylation and de-silencing of the element by its repetitive induction.Nucleic Acids Res. 2002; 30:2365–2373. [PubMed: 12034823]
Barreto G, Schafer A, Marhold J, Stach D, Swaminathan SK, Handa V, Doderlein G, Maltry N, WuW, Lyko F, Niehrs C. Gadd45a promotes epigenetic gene activation by repair-mediated DNAdemethylation. Nature. 2007; 445:671–675. [PubMed: 17268471]
Barzilai N, Banerjee S, Hawkins M, Chen W, Rossetti L. Caloric restriction reverses hepatic insulinresistance in aging rats by decreasing visceral fat. J Clin Invest. 1998; 101:1353–1361. [PubMed:9525977]
Bird A, Taggart M, Frommer M, Miller OJ, Macleod D. A fraction of the mouse genome that isderived from islands of nonmethylated, CpG-rich DNA. Cell. 1985; 40:91–99. [PubMed: 2981636]
Thompson et al. Page 10
Aging Cell. Author manuscript; available in PMC 2011 August 1.
NIH
-PA Author Manuscript
NIH
-PA Author Manuscript
NIH
-PA Author Manuscript

Bjornsson HT, Sigurdsson MI, Fallin MD, Irizarry RA, Aspelund T, Cui H, Yu W, Rongione MA,Ekstrom TJ, Harris TB, Launer LJ, Eiriksdottir G, Leppert MF, Sapienza C, Gudnason V, FeinbergAP. Intra-individual change over time in DNA methylation with familial clustering. JAMA. 2008;299:2877–2883. [PubMed: 18577732]
Bollati V, Schwartz J, Wright R, Litonjua A, Tarantini L, Suh H, Sparrow D, Vokonas P, Baccarelli A.Decline in genomic DNA methylation through aging in a cohort of elderly subjects. Mech AgeingDev. 2009; 130:234–239. [PubMed: 19150625]
Busuttil RA, Garcia AM, Reddick RL, Dolle ME, Calder RB, Nelson JF, Vijg J. Intra-organ variationin age-related mutation accumulation in the mouse. PLoS One. 2007; 2:e876. [PubMed:17849005]
Campisi J. Senescent cells, tumor suppression, and organismal aging: good citizens, bad neighbors.Cell. 2005; 120:513–522. [PubMed: 15734683]
Carr DB, Utzschneider KM, Hull RL, Kodama K, Retzlaff BM, Brunzell JD, Shofer JB, Fish BE,Knopp RH, Kahn SE. Intra-abdominal fat is a major determinant of the National CholesterolEducation Program Adult Treatment Panel III criteria for the metabolic syndrome. Diabetes. 2004;53:2087–2094. [PubMed: 15277390]
Chen J. Senescence and functional failure in hematopoietic stem cells. Exp Hematol. 2004; 32:1025–1032. [PubMed: 15539079]
Chu MW, Siegmund KD, Eckstam CL, Kim JY, Yang AS, Kanel GC, Tavare S, Shibata D. Lack ofincreases in methylation at three CpG-rich genomic loci in nonmitotic adult tissues during aging.BMC Med Genet. 2007; 8:50. [PubMed: 17672908]
de Boer J, Andressoo JO, de Wit J, Huijmans J, Beems RB, van Steeg H, Weeda G, van der Horst GT,van Leeuwen W, Themmen AP, Meradji M, Hoeijmakers JH. Premature aging in mice deficient inDNA repair and transcription. Science. 2002; 296:1276–1279. [PubMed: 11950998]
Duncan AW, Dorrell C, Grompe M. Stem Cells and Liver Regeneration. Gastroenterology. 2009 Aug;137(2):466–481. [PubMed: 19470389]
Duncan SA, Manova K, Chen WS, Hoodless P, Weinstein DC, Bachvarova RF, Darnell JE Jr.Expression of transcription factor HNF-4 in the extraembryonic endoderm, gut, and nephrogenictissue of the developing mouse embryo: HNF-4 is a marker for primary endoderm in theimplanting blastocyst. Proc Natl Acad Sci U S A. 1994; 91:7598–7602. [PubMed: 8052626]
Eckhardt F, Lewin J, Cortese R, Rakyan VK, Attwood J, Burger M, Burton J, Cox TV, Davies R,Down TA, Haefliger C, Horton R, Howe K, Jackson DK, Kunde J, Koenig C, Liddle J, Niblett D,Otto T, Pettett R, Seemann S, Thompson C, West T, Rogers J, Olek A, Berlin K, Beck S. DNAmethylation profiling of human chromosomes 6, 20 and 22. Nat Genet. 2006; 38:1378–1385.[PubMed: 17072317]
Ehrich M, Nelson MR, Stanssens P, Zabeau M, Liloglou T, Xinarianos G, Cantor CR, Field JK, vanden Boom D. Quantitative high-throughput analysis of DNA methylation patterns by base-specificcleavage and mass spectrometry. Proc Natl Acad Sci U S A. 2005; 102:15785–15790. [PubMed:16243968]
Einstein FH, Fishman S, Bauman J, Thompson RF, Huffman DM, Atzmon G, Barzilai N, MuzumdarRH. Enhanced activation of a "nutrient-sensing" pathway with age contributes to insulinresistance. FASEB J. 2008; 22:3450–3457. [PubMed: 18566293]
Fishman S, Muzumdar RH, Atzmon G, Ma X, Yang X, Einstein FH, Barzilai N. Resistance to leptinaction is the major determinant of hepatic triglyceride accumulation in vivo. FASEB J. 2007;21:53–60. [PubMed: 17099068]
Fraga MF, Ballestar E, Paz MF, Ropero S, Setien F, Ballestar ML, Heine-Suner D, Cigudosa JC,Urioste M, Benitez J, Boix-Chornet M, Sanchez-Aguilera A, Ling C, Carlsson E, Poulsen P, VaagA, Stephan Z, Spector TD, Wu YZ, Plass C, Esteller M. Epigenetic differences arise during thelifetime of monozygotic twins. Proc Natl Acad Sci U S A. 2005; 102:10604–10609. [PubMed:16009939]
Gartner K. A third component causing random variability beside environment and genotype. A reasonfor the limited success of a 30 year long effort to standardize laboratory animals? Lab Anim. 1990;24:71–77. [PubMed: 2406501]
Thompson et al. Page 11
Aging Cell. Author manuscript; available in PMC 2011 August 1.
NIH
-PA Author Manuscript
NIH
-PA Author Manuscript
NIH
-PA Author Manuscript

Glass JL, Thompson RF, Khulan B, Figueroa ME, Olivier EN, Oakley EJ, Van Zant G, Bouhassira EE,Melnick A, Golden A, Fazzari MJ, Greally JM. CG dinucleotide clustering is a species-specificproperty of the genome. Nucleic Acids Res. 2007; 35:6798–6807. [PubMed: 17932072]
Golbus J, Palella TD, Richardson BC. Quantitative changes in T cell DNA methylation occur duringdifferentiation and ageing. Eur J Immunol. 1990; 20:1869–1872. [PubMed: 2209694]
Goyal R, Reinhardt R, Jeltsch A. Accuracy of DNA methylation pattern preservation by the Dnmt1methyltransferase. Nucleic Acids Res. 2006; 34:1182–1188. [PubMed: 16500889]
Gurland BJ, Page WF, Plassman BL. A twin study of the genetic contribution to age-related functionalimpairment. J Gerontol A Biol Sci Med Sci. 2004; 59:859–863. [PubMed: 15345739]
Hayashi T, Boyko EJ, Leonetti DL, McNeely MJ, Newell-Morris L, Kahn SE, Fujimoto WY. Visceraladiposity and the risk of impaired glucose tolerance: a prospective study among JapaneseAmericans. Diabetes Care. 2003; 26:650–655. [PubMed: 12610016]
Huffman DM, Barzilai N. Role of visceral adipose tissue in aging. Biochim Biophys Acta. 2009 Oct;1790(10):1117–1123. [PubMed: 19364483]
Irizarry RA, Hobbs B, Collin F, Beazer-Barclay YD, Antonellis KJ, Scherf U, Speed TP. Exploration,normalization, and summaries of high density oligonucleotide array probe level data. Biostatistics.2003; 4:249–264. [PubMed: 12925520]
Jackson RA, Hawa MI, Roshania RD, Sim BM, DiSilvio L, Jaspan JB. Influence of aging on hepaticand peripheral glucose metabolism in humans. Diabetes. 1988; 37:119–129. [PubMed: 3275553]
Jiang MH, Fei J, Lan MS, Lu ZP, Liu M, Fan WW, Gao X, Lu DR. Hypermethylation of hepatic Gckpromoter in ageing rats contributes to diabetogenic potential. Diabetologia. 2008; 51:1525–1533.[PubMed: 18496667]
Johnson, NL.; Kotz, S.; Kemp, AW. Univariate Discrete Distributions. New York: Wiley; 1992.Kaminsky ZA, Tang T, Wang SC, Ptak C, Oh GH, Wong AH, Feldcamp LA, Virtanen C, Halfvarson
J, Tysk C, McRae AF, Visscher PM, Montgomery GW, Gottesman, Martin NG, Petronis A. DNAmethylation profiles in monozygotic and dizygotic twins. Nat Genet. 2009; 41:240–245. [PubMed:19151718]
Karasik D, Hannan MT, Cupples LA, Felson DT, Kiel DP. Genetic contribution to biological aging:the Framingham Study. J Gerontol A Biol Sci Med Sci. 2004; 59:218–226. [PubMed: 15031305]
Karimi M, Johansson S, Stach D, Corcoran M, Grander D, Schalling M, Bakalkin G, Lyko F, LarssonC, Ekstrom TJ. LUMA (LUminometric Methylation Assay)--a high throughput method to theanalysis of genomic DNA methylation. Exp Cell Res. 2006; 312:1989–1995. [PubMed: 16624287]
Kennedy ET. Evidence for nutritional benefits in prolonging wellness. Am J Clin Nutr. 2006;83:410S–414S. [PubMed: 16470004]
Khulan B, Thompson RF, Ye K, Fazzari MJ, Suzuki M, Stasiek E, Figueroa ME, Glass JL, Chen Q,Montagna C, Hatchwell E, Selzer RR, Richmond TA, Green RD, Melnick A, Greally JM.Comparative isoschizomer profiling of cytosine methylation: the HELP assay. Genome Res. 2006;16:1046–1055. [PubMed: 16809668]
Kwabi-Addo B, Chung W, Shen L, Ittmann M, Wheeler T, Jelinek J, Issa JP. Age-related DNAmethylation changes in normal human prostate tissues. Clin Cancer Res. 2007; 13:3796–3802.[PubMed: 17606710]
Lister R, O'Malley RC, Tonti-Filippini J, Gregory BD, Berry CC, Millar AH, Ecker JR. Highlyintegrated single-base resolution maps of the epigenome in Arabidopsis. Cell. 2008; 133:523–536.[PubMed: 18423832]
Maslov AY, Vijg J. Genome instability, cancer and aging. Biochim Biophys Acta. 2009 Oct;1790(10):963–969. [PubMed: 19344750]
Meulle A, Salles B, Daviaud D, Valet P, Muller C. Positive regulation of DNA double strand breakrepair activity during differentiation of long life span cells: the example of adipogenesis. PLoSOne. 2008; 3:e3345. [PubMed: 18846213]
Muzumdar R, Allison DB, Huffman DM, Ma X, Atzmon G, Einstein FH, Fishman S, Poduval AD,McVei T, Keith SW, Barzilai N. Visceral adipose tissue modulates mammalian longevity. AgingCell. 2008; 7:438–440. [PubMed: 18363902]
Neese RA, Misell LM, Turner S, Chu A, Kim J, Cesar D, Hoh R, Antelo F, Strawford A, McCune JM,Christiansen M, Hellerstein MK. Measurement in vivo of proliferation rates of slow turnover cells
Thompson et al. Page 12
Aging Cell. Author manuscript; available in PMC 2011 August 1.
NIH
-PA Author Manuscript
NIH
-PA Author Manuscript
NIH
-PA Author Manuscript

by 2H2O labeling of the deoxyribose moiety of DNA. Proc Natl Acad Sci U S A. 2002; 99:15345–15350. [PubMed: 12424339]
Nieves DJ, Cnop M, Retzlaff B, Walden CE, Brunzell JD, Knopp RH, Kahn SE. The atherogeniclipoprotein profile associated with obesity and insulin resistance is largely attributable to intra-abdominal fat. Diabetes. 2003; 52:172–179. [PubMed: 12502509]
Odom DT, Zizlsperger N, Gordon DB, Bell GW, Rinaldi NJ, Murray HL, Volkert TL, Schreiber J,Rolfe PA, Gifford DK, Fraenkel E, Bell GI, Young RA. Control of pancreas and liver geneexpression by HNF transcription factors. Science. 2004; 303:1378–1381. [PubMed: 14988562]
Ordovas JM, Shen J. Gene-environment interactions and susceptibility to metabolic syndrome andother chronic diseases. J Periodontol. 2008; 79:1508–1513. [PubMed: 18673004]
Pelicci PG. Do tumor-suppressive mechanisms contribute to organism aging by inducing stem cellsenescence? J Clin Invest. 2004; 113:4–7. [PubMed: 14702099]
Peng H, Shen N, Qian L, Sun XL, Koduru P, Goodwin LO, Issa JP, Broome JD. Hypermethylation ofCpG islands in the mouse asparagine synthetase gene: relationship to asparaginase sensitivity inlymphoma cells. Partial methylation in normal cells. Br J Cancer. 2001; 85:930–935. [PubMed:11556848]
Rhee J, Ge H, Yang W, Fan M, Handschin C, Cooper M, Lin J, Li C, Spiegelman BM. Partnership ofPGC-1alpha and HNF4alpha in the regulation of lipoprotein metabolism. J Biol Chem. 2006;281:14683–14690. [PubMed: 16574644]
Rossetti L, Giaccari A. Relative contribution of glycogen synthesis and glycolysis to insulin-mediatedglucose uptake. A dose-response euglycemic clamp study in normal and diabetic rats. J ClinInvest. 1990; 85:1785–1792. [PubMed: 2189891]
Schmucker DL. Age-related changes in liver structure and function: Implications for disease? ExpGerontol. 2005; 40:650–659. [PubMed: 16102930]
Sharpless NE, DePinho RA. Telomeres, stem cells, senescence, and cancer. J Clin Invest. 2004;113:160–168. [PubMed: 14722605]
Song F, Mahmood S, Ghosh S, Liang P, Smiraglia DJ, Nagase H, Held WA. Tissue specificdifferentially methylated regions (TDMR): Changes in DNA methylation during development.Genomics. 2009; 93:130–139. [PubMed: 18952162]
Song F, Smith JF, Kimura MT, Morrow AD, Matsuyama T, Nagase H, Held WA. Association oftissue-specific differentially methylated regions (TDMs) with differential gene expression. ProcNatl Acad Sci U S A. 2005; 102:3336–3341. [PubMed: 15728362]
Szanto I, Kahn CR. Selective interaction between leptin and insulin signaling pathways in a hepaticcell line. Proc Natl Acad Sci U S A. 2000; 97:2355–2360. [PubMed: 10688912]
Thompson RF, Reimers M, Khulan B, Gissot M, Richmond TA, Chen Q, Zheng X, Kim K, GreallyJM. An analytical pipeline for genomic representations used for cytosine methylation studies.Bioinformatics. 2008; 24:1161–1167. [PubMed: 18353789]
Thompson RF, Suzuki M, Lau KW, Greally JM. A pipeline for the quantitative analysis of CGdinucleotide methylation using mass spectrometry. Bioinformatics. 2009 Sep 1; 25(17):2164–2170. [PubMed: 19561019]
Tusher VG, Tibshirani R, Chu G. Significance analysis of microarrays applied to the ionizing radiationresponse. Proc Natl Acad Sci U S A. 2001; 98:5116–5121. [PubMed: 11309499]
Van Zant G, Liang Y. The role of stem cells in aging. Exp Hematol. 2003; 31:659–672. [PubMed:12901970]
vB Hjelmborg J, Iachine I, Skytthe A, Vaupel JW, McGue M, Koskenvuo M, Kaprio J, Pedersen NL,Christensen K. Genetic influence on human lifespan and longevity. Hum Genet. 2006; 119:312–321. [PubMed: 16463022]
Vilkaitis G, Suetake I, Klimasauskas S, Tajima S. Processive methylation of hemimethylated CpGsites by mouse Dnmt1 DNA methyltransferase. J Biol Chem. 2005; 280:64–72. [PubMed:15509558]
Vogt G, Huber M, Thiemann M, van den Boogaart G, Schmitz OJ, Schubart CD. Production ofdifferent phenotypes from the same genotype in the same environment by developmentalvariation. J Exp Biol. 2008; 211:510–523. [PubMed: 18245627]
Thompson et al. Page 13
Aging Cell. Author manuscript; available in PMC 2011 August 1.
NIH
-PA Author Manuscript
NIH
-PA Author Manuscript
NIH
-PA Author Manuscript

Whitelaw NC, Whitelaw E. How lifetimes shape epigenotype within and across generations. Hum MolGenet. 2006; 15(Spec No 2):R131–R137. [PubMed: 16987876]
Yagi S, Hirabayashi K, Sato S, Li W, Takahashi Y, Hirakawa T, Wu G, Hattori N, Ohgane J, TanakaS, Liu XS, Shiota K. DNA methylation profile of tissue-dependent and differentially methylatedregions (T-DMRs) in mouse promoter regions demonstrating tissue-specific gene expression.Genome Res. 2008; 18:1969–1978. [PubMed: 18971312]
Zilberman D, Gehring M, Tran RK, Ballinger T, Henikoff S. Genome-wide analysis of Arabidopsisthaliana DNA methylation uncovers an interdependence between methylation and transcription.Nat Genet. 2007; 39:61–69. [PubMed: 17128275]
Thompson et al. Page 14
Aging Cell. Author manuscript; available in PMC 2011 August 1.
NIH
-PA Author Manuscript
NIH
-PA Author Manuscript
NIH
-PA Author Manuscript

Figure 1. Heatmap representation of global tissue-specific differences in DNA methylation inyoung and old animals(A) A heatmap of the top 5% of tissue-specific differences is shown, with each rowcorresponding to data from a single locus, and each column representing an organ sample(ADIPOSE and LIVER) obtained from a single rat (several young next to several old rats foreach tissue). The branching dendrogram at the top represents the result of unsupervisedclustering using these tissue-specific sites. Liver and adipose tissue show clear differences inmethylation, with hyper- and hypomethylation shown on a continuum from red to yellow,respectively. While the profile of older adipose tissue is relatively similar to young, cytosinemethylation in older liver tissue diverges more strongly from livers of young rats. (B) Thispanel shows a heatmap of the most significant age-related changes in DNA methylationidentified in either liver (378 loci shown below the horizontal dividing line) or adiposetissue (240 loci shown above the horizontal dividing line). The loci included in this heatmapare identical to those identified in Figure 2 (red and blue datapoints). It is apparent that thelarge majority of changes in cytosine methylation with age occur distinctly in either liver oradipose tissue, and rarely in both tissues concordantly.
Thompson et al. Page 15
Aging Cell. Author manuscript; available in PMC 2011 August 1.
NIH
-PA Author Manuscript
NIH
-PA Author Manuscript
NIH
-PA Author Manuscript
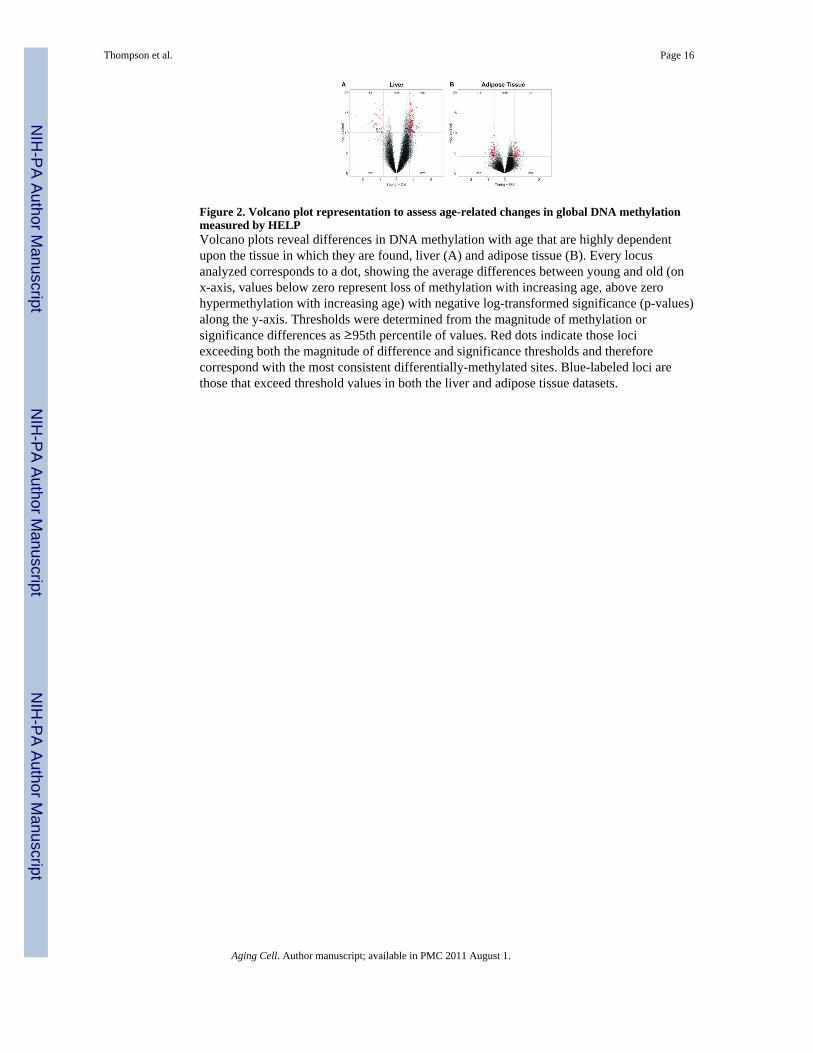
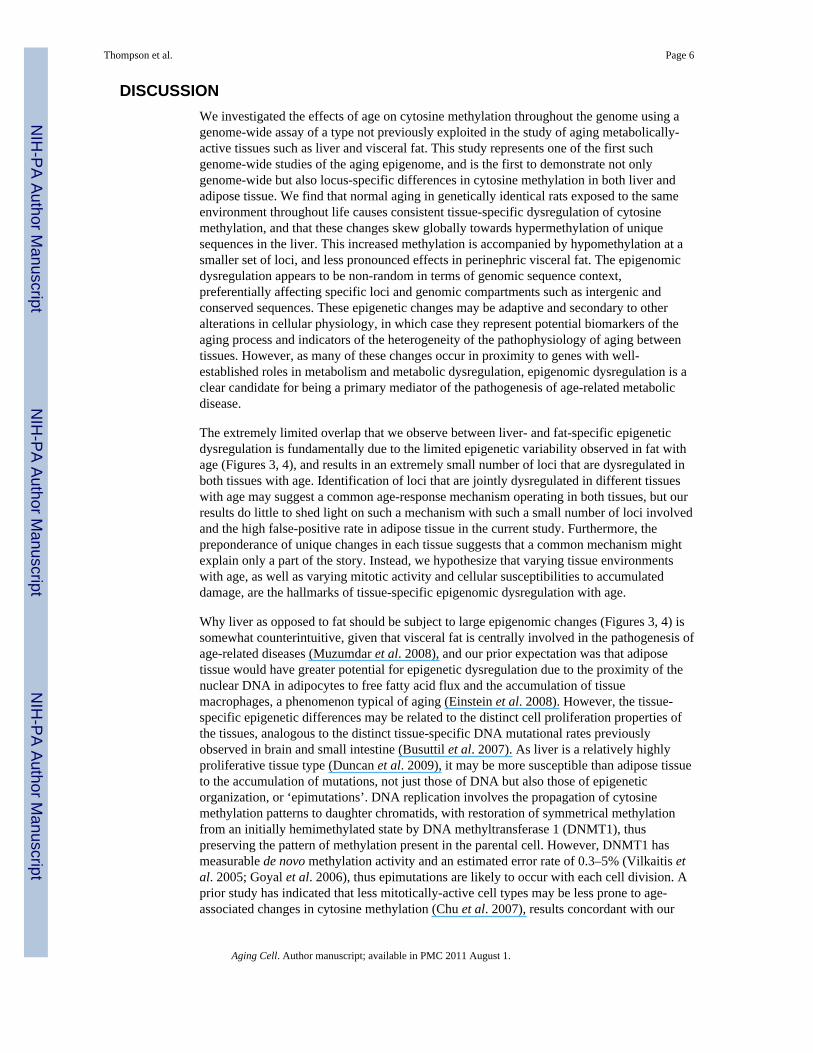
Figure 2. Volcano plot representation to assess age-related changes in global DNA methylationmeasured by HELPVolcano plots reveal differences in DNA methylation with age that are highly dependentupon the tissue in which they are found, liver (A) and adipose tissue (B). Every locusanalyzed corresponds to a dot, showing the average differences between young and old (onx-axis, values below zero represent loss of methylation with increasing age, above zerohypermethylation with increasing age) with negative log-transformed significance (p-values)along the y-axis. Thresholds were determined from the magnitude of methylation orsignificance differences as ≥95th percentile of values. Red dots indicate those lociexceeding both the magnitude of difference and significance thresholds and thereforecorrespond with the most consistent differentially-methylated sites. Blue-labeled loci arethose that exceed threshold values in both the liver and adipose tissue datasets.
Thompson et al. Page 16
Aging Cell. Author manuscript; available in PMC 2011 August 1.
NIH
-PA Author Manuscript
NIH
-PA Author Manuscript
NIH
-PA Author Manuscript

Figure 3. Significant age-related changes in DNA methylation in liver and adipose tissueSignificance analysis of microarrays (SAM) was performed for young and old rats in twodifferent tissues (liver and perinephric fat). (A) The panel shows a standard Q-Q plot withexpected T statistic along the x-axis and observed T-statistic along the y-axis. Values werecalculated using a two-class unpaired model comparing young and old liver data, with s0(~0.59) automatically generated. The solid diagonal line indicates a 45-degree line ofequivalent observed:expected ratios, and two dashed lines indicate thresholds of confidencecorresponding to δ=0.688. Green and red datapoints represent significant hyper- andhypomethylation, with age, respectively. Thus, SAM identifies a large number of highlysignificant changes in DNA methylation that occur in liver specifically (380 total loci withestimated false discovery rate (FDR)<0.1%). (B) As before, a Q-Q plot generated from acomparison of young and old adipose tissue (two-class unpaired T statistic, s0~0.22)demonstrates the extent to which differences in DNA methylation occur beyond what onewould expect to see by random chance alone (242 significant loci, δ=0.496). However, adirect comparison of both tissues demonstrates that the age-related changes observed in liverare much greater than those observed in perinephric fat, both in terms of their extent (380 inliver, with only 3 in fat, for δ=0.688 as shown in panel (A)) and significance (estimated FDRof 2.1% in liver compared to 46.1% in fat, for δ=0.496 as shown in panel (B)).
Thompson et al. Page 17
Aging Cell. Author manuscript; available in PMC 2011 August 1.
NIH
-PA Author Manuscript
NIH
-PA Author Manuscript
NIH
-PA Author Manuscript

Figure 4. LUMA as a technology to assess age-related changes in global DNA methylationDNA methylation was measured by the luminometric methylation assay (LUMA) in twotissues (Fat and Liver) from young and old rats. Each corresponding boxplot is arepresentation of the group-specific levels of methylation, shown along the y-axis (rangefrom 0 to 100 with 0 indicating complete methylation). Within each boxplot, the solid blackline indicates median methylation, with the upper and lower limits of each boxcorresponding to the 75% and 25% quantiles of the data. The bars associated with each boxrepresent the extremes of the data. The distributions of methylation levels in each tissuewere compared, demonstrating that liver tends to be more methylated than adipose tissueirrespective of age (p=0.09). Moreover, age-related differences were observed in liver, withrelative hypomethylation in older animals (p=0.03). Note that p-values were obtained bytwo-group unpaired t-test.
Thompson et al. Page 18
Aging Cell. Author manuscript; available in PMC 2011 August 1.
NIH
-PA Author Manuscript
NIH
-PA Author Manuscript
NIH
-PA Author Manuscript

Figure 5. Genomic distributions of DNA methylation in normal and aging tissuesHELP data were divided into five different subsets representing constitutivelyhypomethylated loci, constitutively hypermethylated loci, and tissue-specific differentially-methylated regions (DMR, Liver compared with Adipose) in panel (A), as well as age-related DMRs (Young compared with Old) specific to either liver or adipose tissue in panel(B). Overlap of these subsets with six different genomic features (gene bodies, promotersincluding 10 kb upstream of transcription start sites, intergenic regions, CpG islands, CGclusters, and conserved non-coding elements) was measured and is shown from left to rightin both panels. We also show genomic distributions for the whole microarray (All Loci, bothpanels), and are thus able to determine if a given subset of HELP data is enriched or
Thompson et al. Page 19
Aging Cell. Author manuscript; available in PMC 2011 August 1.
NIH
-PA Author Manuscript
NIH
-PA Author Manuscript
NIH
-PA Author Manuscript

depleted for any given genomic feature beyond what one might expect to see by randomchance. Many of the differences shown are associated with negligible probability that theymight occur with random sampling of the data (tailed hypergeometric distribution; *, **,***, and **** indicate P<1%, P<0.01%, P<0.00000001%, and P~0, respectively) (Supp.Table 2).
Thompson et al. Page 20
Aging Cell. Author manuscript; available in PMC 2011 August 1.
NIH
-PA Author Manuscript
NIH
-PA Author Manuscript
NIH
-PA Author Manuscript

Figure 6. Identification of loci at which cytosine methylation and gene expression are bothaltered with agingWe focused on the loci identified in Figure 2A, plotting HELP data along the x-axis andcorresponding gene expression data for these loci along the y-axis. A total of 378 loci withsignificant differences in cytosine methylation were analyzed, 347 of which were mapped toRefSeq genes, and 31 of which demonstrated a corresponding robust difference in geneexpression with age (> 2.5 SD from the mean of the overall distribution of gene expressiondata). Solid gray horizontal lines indicate the 2.5 SD cutoffs for these gene expression data,while solid gray vertical lines indicate the 95th percentile (approximately 2 SD) cutoffs forcytosine methylation data. Numerical labels appear in each of the four corners of the plot,corresponding to the number of datapoints meeting the defined criteria.
Thompson et al. Page 21
Aging Cell. Author manuscript; available in PMC 2011 August 1.
NIH
-PA Author Manuscript
NIH
-PA Author Manuscript
NIH
-PA Author Manuscript
Figure 7. Ingenuity Pathway Analysis (IPA) reveals that many of the most differentially-methylated genes form a molecular interaction network of particular relevance for metabolismRefSeq identifiers for 75 of the top 102 sites (filtered from an input list of 65,000, byp<0.0000001) that mapped to gene bodies and promoters were analyzed using the “CoreAnalysis” tool of IPA. This molecular interaction network was constructed with 35 nodes,19 of which were among the top differentially methylated sites (red nodes). In alphabeticalorder, this network consists of ABCG4, ABCG5, ABCG8, Abcg5/Abcg8, AGT, BACE2, β-estradiol, C1ORF109, CPA1, FBP1, FBP2, Fructose 1,6 Bisphosphatase, Fructose 2,6Bisphosphatase, GLE1, GMPPB, HBS1L, HNF4A, HSPH1, IKBKB, IP6K1, KRT10, LEP,LEPROT, NOXO1, NTHL1, NUDT1, PFKL, PROZ, RNMTL1, SERPINA10, SLC22A1,SLC22A3, SLC2A2, SLC38A4, XPA.
Thompson et al. Page 22
Aging Cell. Author manuscript; available in PMC 2011 August 1.
NIH
-PA Author Manuscript
NIH
-PA Author Manuscript
NIH
-PA Author Manuscript

NIH
-PA Author Manuscript
NIH
-PA Author Manuscript
NIH
-PA Author Manuscript
Thompson et al. Page 23
TAB
LE 1
Loci
at w
hich
cyt
osin
e m
ethy
latio
n an
d ge
ne e
xpre
ssio
n bo
th si
gnifi
cant
ly d
ysre
gula
ted
with
agi
ng.
AC
CE
SSIO
NN
UM
BE
RG
EN
EN
AM
E
GE
[log 2
(old
/you
ng)]
ME
TH
[log 2
(old
/yo
ung)
]
LO
CA
TIO
N[r
elat
ive
toT
SS]
DE
SCR
IPT
ION
NM
_012
493
Afp
−3.
5878
254 13
−1.8301945
Prom
oter
chlo
ride
intra
cellu
lar
chan
nel 6
NM
_012
493
Afp
−3.
5878
254 13
−1.2487887
Prom
oter
chlo
ride
intra
cellu
lar
chan
nel 6
NM
_031
511
Igf2
−3.
3338
100 79
−0.
8391
9697
925
kb
dow
nstre
amIn
sulin
-like
gro
wth
fact
orII
NM
_031
511
Igf2
−3.
3338
100 79
1.06
5765
2922
kb
dow
nstre
amIn
sulin
-like
gro
wth
fact
orII
NM
_012
488
A2m
−2.
9002
281 63
−1.
1201
1480
9Pr
omot
eral
pha-
2-m
acro
glob
ulin
prec
urso
r
NM
_001
013
083
Cpa
2
−2.
3129
951 92
−0.919576
17 k
bdo
wns
tream
carb
oxyp
eptid
ase
A2
XM
_001
064
308
LOC
6855
60
−1.
7613
548 36
−1.084331
49 k
bdo
wns
tream
sim
ilar t
om
onoa
cylg
lyce
rol O
-ac
yltra
nsfe
rase
2
NM
_001
024
369
Ypel
4
−1.
7382
221 66
1.36
5523
730
kb
dow
nstre
amyi
ppee
-like
4
XM
_001
080
259
E2f8
−1.
5854
266 39
1.42
1317
224
kb
dow
nstre
amE2
F tra
nscr
iptio
n fa
ctor
8
XM
_001
070
878
Stfa
2
−1.
4214
691 9
−0.824367
36 k
bdo
wns
tream
stef
in A
2
NM
_053
702
Ccn
a2
−1.
4193
500 43
−0.832823
8 kb
dow
nstre
amcy
clin
A2
NM
_001
008
804
Krt
10
−1.
3422
105 27
−0.876206
10 k
bdo
wns
tream
type
I ke
ratin
KA
10
NM
_001
012
167
Pld3
−1.
3017
941 88
−0.833135
29 k
b up
stre
amph
osph
olip
ase
D3
Aging Cell. Author manuscript; available in PMC 2011 August 1.

NIH
-PA Author Manuscript
NIH
-PA Author Manuscript
NIH
-PA Author Manuscript
Thompson et al. Page 24
AC
CE
SSIO
NN
UM
BE
RG
EN
EN
AM
E
GE
[log 2
(old
/you
ng)]
ME
TH
[log 2
(old
/yo
ung)
]
LO
CA
TIO
N[r
elat
ive
toT
SS]
DE
SCR
IPT
ION
NM
_133
547
Sult1
c2
3.33
9738
1 99−0.775869
38 k
b up
stre
amsu
lfotra
nsfe
rase
fam
ily,
cyto
solic
, 1c
NM
_053
288
Orm
12.
5637
637 72
0.83
0970
9G
ene
body
alph
a-1-
acid
glyc
opro
tein
NM
_053
288
Orm
12.
5637
637 72
0.92
4845
4G
ene
body
alph
a-1-
acid
glyc
opro
tein
NM
_177
426
Gst
m2
2.42
3050
1 841.
0789
278
Gen
e bo
dyG
luta
thio
ne-S
-tra
nsfe
rase
mu
type
2
NM
_134
350
Mx2
1.92
7683
5 46−0.833708
Gen
e bo
dym
yxov
irus r
esis
tanc
e 2
NM
_134
350
Mx2
1.92
7683
5 462.
2376
5327
kb
dow
nstre
amm
yxov
irus r
esis
tanc
e 2
NM
_001
042
619
Hsd
3b1.
8970
910 74
−0.78504
Gen
e bo
dy3
beta
-hyd
roxy
ster
oid
dehy
drog
enas
e
NM
_053
922
Acac
b1.
8731
377 25
−1.
3433
6516
4G
ene
body
acet
yl-C
oenz
yme
Aca
rbox
ylas
e 2
NM
_053
922
Acac
b1.
8731
377 25
−1.
2721
4291
1G
ene
body
acet
yl-C
oenz
yme
Aca
rbox
ylas
e 2
NM
_173
093
Cyp
2d13
1.84
2931
8 030.
7834
656
12 k
bdo
wns
tream
Cyt
ochr
ome
P450
,su
bfam
ily II
D3
NM
_130
414
Abcg
81.
8231
229 78
−1.23628
Gen
e bo
dyA
TP-b
indi
ng c
asse
ttesu
b-fa
mily
G, m
embe
r 8
NM
_130
414
Abcg
81.
8231
229 78
−1.0194304
Gen
e bo
dyA
TP-b
indi
ng c
asse
ttesu
b-fa
mily
G, m
embe
r 8
NM
_175
578
Rcan
21.
7824
881 35
0.98
0363
140
kb
dow
nstre
amre
gula
tor o
f cal
cine
urin
2
NM
_052
798
Zfp3
54a
1.73
3890
9 21−0.793965
45 k
b up
stre
amzi
nc fi
nger
pro
tein
354
A
NM
_031
721
Prss
111.
6127
511 68
−1.167703822
Gen
e bo
dypr
otea
se, s
erin
e, 1
1 (I
gfbi
ndin
g)
NM
_031
721
Prss
111.
6127
511 68
−0.97389659
Gen
e bo
dypr
otea
se, s
erin
e, 1
1 (I
gfbi
ndin
g)
NM
_031
721
Prss
111.
6127
511 68
−0.939681764
Gen
e bo
dypr
otea
se, s
erin
e, 1
1 (I
gfbi
ndin
g)
NM
_031
721
Prss
111.
6127
511 68
−0.796195907
Gen
e bo
dypr
otea
se, s
erin
e, 1
1 (I
gfbi
ndin
g)
Aging Cell. Author manuscript; available in PMC 2011 August 1.

NIH
-PA Author Manuscript
NIH
-PA Author Manuscript
NIH
-PA Author Manuscript
Thompson et al. Page 25
AC
CE
SSIO
NN
UM
BE
RG
EN
EN
AM
E
GE
[log 2
(old
/you
ng)]
ME
TH
[log 2
(old
/yo
ung)
]
LO
CA
TIO
N[r
elat
ive
toT
SS]
DE
SCR
IPT
ION
Posi
tive
valu
e:in
crea
sed
expr
essi
onle
vel i
nol
der
anim
al
Posi
tive
valu
e: le
ssm
ethy
late
din
old
eran
imal
TSS:
tran
scrip
tion
star
t site
.
GE:
gen
e ex
pres
sion
, mic
roar
ray
data
MET
H: m
ethy
latio
n, H
ELP
data
Aging Cell. Author manuscript; available in PMC 2011 August 1.