the effect of miR-140-5p dysregulation in the expression of ...
298
A study of the role of microRNAs in gastric cancer: the effect of miR-140-5p dysregulation in the expression of MDM2 in p53-dependent gastric cancer subtypes By Meng Xie Cardiff China Medical Research Collaborative School of Medicine, Cardiff University Cardiff May 2019 Thesis submitted to Cardiff University for the degree of Doctor of Medicine Word Count: 48226
-
Upload
khangminh22 -
Category
Documents
-
view
0 -
download
0
Transcript of the effect of miR-140-5p dysregulation in the expression of ...

A study of the role of microRNAs in gastric cancer: the effect of miR-140-5p dysregulation in
the expression of MDM2 in p53-dependent gastric cancer subtypes
By
Meng Xie
Cardiff China Medical Research Collaborative
School of Medicine, Cardiff University
Cardiff
May 2019
Thesis submitted to Cardiff University for the degree of Doctor of Medicine
Word Count: 48226

i
Thesis Summary
Gastric cancer is one of the leading causes of cancer-related death worldwide. Since
advanced gastric carcinoma often demonstrates marked architectural and cytological
heterogeneity, chemotherapy or targeted agents are seldom effective across all gastric cancer
patients. Therefore, there is an urgent need to develop effective biomarkers for identifying
patients with highly invasive disease and plan individual treatment decisions for each gastric
cancer patient.
In this study, in Silico data analysis from TCGA was employed to discover miRNAs which
had value in predicting patients’ outcome. Among them, miR-140-5p and -3p were chosen
to confirm their expression pattern in two independent cohorts with and without
neoadjuvant chemotherapy.
miR-140-5p, rather than miR-140-3p, was the dominant miRNA in both gastric tumours and
adjacent normal tissues. Reduced expression of miR-140-5p and -3p were found in most
gastric tumours compared to matched normal tissues without chemotherapy through online
data analysis and qPCR detection. Intestinal-type gastric cancer patients with lower
expression of miR-140-5p suffered worse survival. Gastric cancer patients treated with 5-
fluorouracil (5FU) based neoadjuvant treatment, both in online data and in independent
cohort examination, showed increased expression of miR-140-5p and -3p. Patients without
upregulation of neither miR-140-5p nor -3p exhibited the worst survival.
In this study, we explored a new potential target of miR-140-5p, mouse double minute 2
homolog (MDM2), which is the principle p53 antagonist in unstressed cells. We also provide
evidence, via several functional assays, that enforced miR-140-5p expression inhibits
malignant phenotypic characteristics, such as growth, spreading and attachment of gastric
cancer cells lines with wild-type p53. However enforced miR-140-5p expression increased
the 5FU resistance in these cells, probably due to upregulated p21 and a relatively low
proliferation rate. miR-140-5p expression may reflect the activity of p53-dependent
apoptosis when tumour cells are treated with 5FU. In this condition, elevated miR-140-5p
correlated with higher BAX expression and indicated a highly activated cell apoptosis
signaling. The results presented in this study collectively suggest that miR-140-5p and miR-
140-3p are involved in controlling the behavior of gastric cancer cells, but their subtype-

ii
specific expression pattern may reflect distinct cell conditions or responses. Several molecular
signaling pathways regulated by miR-140-5p or miR-140-3p that may be responsible for these
changes. This study found that the expression of miR-140-5p, in particular, could be used as
a biomarker for identification of gastric cancer patients with higher malignant potential and
for selection of gastric cancer patients who can benefit from the 5FU based treatment, and
also may be used for monitoring patients’ chemotherapy response.

iv
Contents
Thesis Summary........................................................................................................ i
Declaration ..............................................................................................................iii
Contents................................................................................................................... iv
List of Figures.......................................................................................................... x
List of Tables......................................................................................................... xiv
Acknowledgments ................................................................................................ xvii
Publications and presentations arising from this Thesis ........................................ 1
Glossary of Abbreviations........................................................................................ 2
Chapter 1. General Introduction ..........................................................................................5
1.1 Gastric cancer.....................................................................................................................6
1.1.1 Epidemiology ...............................................................................................................7
1.1.2 Risk factors and prevention .................................................................................... 13
1.1.3 Anatomy, Histophysiology and Function of the Stomach................................. 25
1.1.4 Classification of gastric cancer ............................................................................... 28
1.1.5 Pathology of gastric cancer..................................................................................... 43
1.1.6 Diagnosis and staging of gastric cancer ................................................................ 47
1.1.7 Treatment of gastric cancer .................................................................................... 51
1.1.8 Precision medicine for gastric cancer .................................................................... 61
1.2 microRNAs (miRNAs)................................................................................................. 72
1.2.1 Discovery of miRNAs............................................................................................. 73
1.2.2 miRNA Biosynthesis and Mechanisms of Action............................................... 75
1.2.3 miRNAs involved in gastric cancer progression .................................................. 78
1.2.4 Diagnostic potential of microRNAs in gastric cancer........................................ 79
1.2.5 Therapeutic potential of microRNAs in cancer .................................................. 81
1.3 miR-140-5p and miR-140-3p ....................................................................................... 83
1.4 Aims and objectives of this study ............................................................................. 90
Chapter 2. Materials and Methods................................................................................... 92
2.1 Clinical cohort study ..................................................................................................... 93
2.1.1 Gastric cancer cohort patient selection and tissue collection ............................ 93
2.1.2 Preparation of tissue samples................................................................................. 93

v
2.1.3 General compounds .................................................................................................94
2.1.4 General plastic consumables, hardware and software .........................................94
2.2 Cell lines ...........................................................................................................................94
2.3 Primers ..............................................................................................................................92
2.4 Antibodies ........................................................................................................................93
2.5 Mimics and inhibitors ..................................................................................................94
2.6 Preparation for standard reagents and solutions..................................................94
2.6.1 General laboratory used materials ..........................................................................94
2.6.2 Materials for cell culture use....................................................................................94
2.6.3 Materials for molecular biology ..............................................................................94
2.6.4 Materials for bacterial transformation....................................................................95
2.6.5 Materials for western blot ........................................................................................95
2.7 Cell culture, maintenance, and storage ...................................................................96
2.7.1 Growth media............................................................................................................96
2.7.2 Cell maintenance .......................................................................................................96
2.7.3 Trypsinisation of adherent cells and cell counting...............................................97
2.7.4 Frozen storage of cell stocks...................................................................................97
2.7.5 Resuscitation of cells ................................................................................................97
2.8 Methods for isolation and quantification of genetic material ..........................98
2.8.1 RNA Extraction ........................................................................................................98
2.8.2 Genomic DNA extraction .......................................................................................99
2.8.3 Spectrophotometric quantification of RNA and DNA......................................99
2.8.4 Reverse transcription (RT) of mRNA .................................................................100
2.8.5 General polymerase chain reaction (PCR)...........................................................101
2.8.6 Agarose gel electrophoresis and visualization.....................................................102
2.8.7 Real-time quantitative polymerase chain reaction (RT-qPCR) .........................102
2.8.8 miRNA reverse Transcription and real-time PCR .............................................104
2.9 Methods for protein extraction and detection.....................................................107
2.9.1 Protein extraction....................................................................................................107
2.9.2 Determination of protein concentration.............................................................107
2.9.3 SDS Polyacrylamide gel electrophoresis (SDS-PAGE) for protein separation108
2.9.4 Transfer of proteins to polyvinylidene fluoride membrane and membrane

vi
blocking ............................................................................................................................. 110
2.9.5 Immuno-blotting of proteins ............................................................................... 111
2.10 Methods for cell functional assays........................................................................ 111
2.10.1 Transfection of miRNA mimic/ inhibitor into Cell Lines............................. 111
2.10.2 Proliferation assay using thiazolyl blue tetrazolium bromide (MTT) ........... 112
2.10.3 Scratch assay for migration ................................................................................. 112
2.10.4 Transwell invasion assay ...................................................................................... 113
2.10.5 Flow cytometry cell cycle assay .......................................................................... 113
2.10.6 Cytotoxicity assays using MTT........................................................................... 115
2.11 Statistical analysis ...................................................................................................... 116
Chapter 3. The miRNAs Profiling of Gastric Cancer Progression ...................... 117
3.1 Chapter Introduction .................................................................................................. 118
3.2 Materials and methods .............................................................................................. 119
3.2.1 miRNA, mRNA expression profiles, and clinical information........................ 119
3.2.2 Differentially expressed miRNAs (DEMs) screening ....................................... 119
3.2.3 Prognosis-related DEMs determination ............................................................. 120
3.3 Results ............................................................................................................................ 120
3.3.1 Demographics study .............................................................................................. 120
3.3.2 Screening of DEMs ............................................................................................... 122
3.3.3 DEMs associated with Overall Survival of gastric cancer patients................. 126
3.4 Discussion ..................................................................................................................... 129
Chapter 4. Expression of miR-140-5p and miR-140-3p in Gastric cancer and Their
Clinical Relevance .................................................................................................................. 132
4.1 Chapter Introduction .................................................................................................. 133
4.2 Materials and methods .............................................................................................. 133
4.2.1 Tissue samples from two independent gastric cancer patients’ cohorts......... 133
4.2.2 RNA extraction and miR-140-5p/3p detection................................................. 134
4.2.3 Statistical analysis .................................................................................................... 134
4.3 Results ............................................................................................................................ 134
4.3.1 In Silico analysis of miR-140-5p expression in gastric cancer .......................... 134
4.3.2 Analysis of miR-140-5p/3p expression in an indication of gastric cancer

vii
progression from cohort without neoadjuvant chemotherapy ..................................149
4.3.3 Analysis of miR-140-5p/3p expression related to gastric cancer treatment from
cohort with neoadjuvant chemotherapy........................................................................156
4.4 Discussion......................................................................................................................161
Chapter 5 The Influence of miR-140-5p and -3p overexpression on the cellular
functions of human gastric cancer cell lines ..................................................................165
5.1 Chapter Introduction ..................................................................................................166
5.2 Materials and methods ...............................................................................................168
5.2.1 Cell lines....................................................................................................................168
5.2.2 Transfection of miR-140-5p and -3p mimics .....................................................169
5.2.3 RNA isolation, cDNA synthesis, RT-PCR, and qPCR......................................169
5.2.4 In vitro cell proliferation assay ................................................................................169
5.2.5 In vitro cell colony assay ..........................................................................................169
5.2.6 In vitro wound scratch assay ...................................................................................170
5.2.7 In vitro transwell migration assay ...........................................................................170
5.2.8 In vitro cell invasion assay .......................................................................................170
5.2.9 Cell cycle assays for flow cytometry.....................................................................170
5.2.10 Cell cytotoxic assays..............................................................................................171
5.3 Results.............................................................................................................................172
5.3.1 miR-140-5p, - 3p expression and the overexpression of miR-140-5p, -3p in gastric
cancer cell lines..................................................................................................................172
5.3.2 Effects of miR-140-5p and -3p on proliferation of gastric cancer cells ........173
5.3.3 Effect of miR-140-5p/3p on colony formation of gastric cancer cells .........175
5.3.4 Effect of miR-140-5p/3p on cell cycle of gastric cancer cells ........................176
5.3.5 Effect of miR-140-5p/3p on the migration of gastric cancer cells ................177
5.3.6 Effect of miR-140-5p and -3p on invasion of gastric cancer cell ...................181
5.3.7 Effect of miR-140-5p and -3p on chemotherapeutic drug-induced cell
proliferation inhibition of gastric cancer cells..............................................................182
5.4 Discussion......................................................................................................................184
Chapter 6. The Molecular Mechanism Underlying Deregulated miR-140-5p
Expression in Human Gastric cancer...............................................................................187
6.1 Introduction ...................................................................................................................188

viii
6.2 Materials and methods .............................................................................................. 189
6.2.1 Materials ................................................................................................................... 189
6.2.2 Online prediction of miR-140-5p targets. .......................................................... 189
6.2.3 Determining the expression of p53-related signaling molecules using PCR and
Western blot. ..................................................................................................................... 190
6.2.4 Statistical analysis .................................................................................................... 190
6.3 Results ............................................................................................................................ 190
6.3.1 Integrative analysis of miRNA and mRNA expression in intestinal versus diffuse
miR-140-5p downregulated gastric cancer. .................................................................. 190
6.3.2 Target prediction for miR-140-5p........................................................................ 195
6.3.3 Possible link between miR-140-5p and MDM2 in gastric cancer tumour tissues
............................................................................................................................................ 199
6.3.4 miR-140-5p and miR-140-3p overexpression and p53 signaling..................... 200
6.4 Discussion ..................................................................................................................... 203
Chapter 7. General Discussion........................................................................................ 207
7.1 Deregulated miR-140-5p expression in gastric cancer is associated with disease
progression in gastric cancer.......................................................................................... 211
7.2 Deregulated miR-140-5p expression in gastric cancer is associated with disease
progression in gastric cancer.......................................................................................... 215
7.3 Overexpression of miR-140-5p/3p inhibited malignant traits of gastric cancer
cells based on specific cell context ............................................................................... 216
7.4 Effective chemotherapy response is accompanied by enhanced expression of
miR-140-5p and -3p in gastric cancer........................................................................... 217
7.5 Reduced miR-140-5p/3p is associated with enhanced MDM2 signalling
through upregulation of its protein expression ........................................................ 218
7.6 Conclusion and perspectives.................................................................................... 219
References ................................................................................................................................ 221
Appendix ................................................................................................................................... 252
Appendix 1: Peking University Cancer Hospital Patients in Consent Information252
Appendix 2: General compounds used in this study and their sources. .................. 254
Appendix 3: General plastic consumables, hardware, and software used in this study
and their sources............................................................................................................... 256
ix
Appendix 4: Amplifluor™ Universal detection system using UniPrimer™. ..........257
Appendix 5: Amplification plot and standard curve produced using qPCR. ..........258
Appendix 6: Gastric Cancer Treatment Regimens.......................................................259
Appendix 7: Characteristics of miRNA datasets in human gastric cancer. .............264
Appendix 8: List of overlapping differentially expressed miRNAs in gastric cancer.267
Appendix 9: Differentially expressed miRNAs in TCGA based molecular classification
of gastric cancer................................................................................................................274
Appendix 10: Summary of miRNA target prediction tools.......................................275
Appendix 11: Overlapping results of targets prediction of miR-140-5p from online
tools. ...................................................................................................................................276

x
List of Figures
Figure 1.1: Estimated age-standardized incidence rates of gastric cancer................................ 7
Figure 1.2: Cancer age-standardized incidence and mortality rates of gastric cancer............. 8
Figure 1.3: Global incidence estimates of cardia and non-cardia gastric cancer by region.. 10
Figure 1.4: Cancers Ranked by Number of Deaths in Both Sexes.......................................... 11
Figure 1.5: Five-year survival rate by gastric cancer stage at diagnosis. .................................. 12
Figure 1.6.: Summary of risk factors and independent prognostic factors in clinical use.... 13
Figure 1.7: The induction of oxidative stress and its pathophysiological effects. ................. 14
Figure 1.8: Natural history of H. pylori infection........................................................................ 16
Figure 1.9: Multiple genetic and epigenetic alterations during gastric carcinogenesis and
lymphomagenesis and the incidence rates in different types of gastrictumours. .................. 17
Figure 1.10: Location of the stomach.......................................................................................... 25
Figure 1.11: The folds of the stomach wall (rugae) lining under the light microscope........ 26
Figure 1.12: Pathological types of early gastric cancer. ............................................................. 30
Figure 1.13: Schematic illustration of the modified Siewert’s classification. .......................... 32
Figure 1.14: Haematoxylin-eosin staining for Laurén classification of gastric cancer. ......... 34
Figure 1.15: Differences in clinical and histological characteristics among subtypes............ 39
Figure 1.16: Key features of gastric cancer molecular subtypes. As proposed by TCGA ... 40
Figure 1.17: Haematoxylin-eosin staining for Correa’s precancerous cascade in gastric cancer.
............................................................................................................................................................ 44
Figure 1.18: Designs of the Intergroup 0116 Trial and of the UK Medical Research Council’s

xi
MAGIC Trial. ...................................................................................................................................59
Figure 1.19: Timeline of selected major developments in gastric cancer (above arrow) and
related clinical trials (below arrow) in recent years. ....................................................................61
Figure 1.20: Dose-survival curves for both normal hematopoietic and transplanted
lymphoma colony forming units. ..................................................................................................64
Figure 1.21: Cell cycle effects of major classes of anti-cancer drugs. .....................................66
Figure 1.22: Noncoding RNA Regulatory Networks in Cancer ...............................................73
Figure 1.23: microRNA Biosynthesis............................................................................................75
Figure 1.24: Post-transcriptional modes of miRNA action. .....................................................77
Figure 1.25: miR-140 sequence in human and mouse................................................................84
Figure 2.1: The arrangement of paper, gel and nitrocellulose membrane. .......................... 110
Figure 2.2: In vitro Matrigel® invasion assay. .......................................................................... 113
Figure 2.3: Scattering system in FACS. ...................................................................................... 114
Figure 2.4: Relationship between the cell cycle and the DNA histogram. ........................... 115
Figure 3.1: Cluster analysis. ......................................................................................................... 122
Figure 3.2: Differences comparison based on miRNAs and Correlations........................... 124
Figure 3.3: Significantly deregulated miRNAs in student’s t-tests (P<0.00001). ............... 125
Figure 3.4: Stage-related miRNAs in student’s t-tests. ............................................................ 127
Figure 4.1: The miRNA-140-5p expression between NT and TP......................................... 135
Figure 4.2: miR-140-5p expression in gastric cancer. .............................................................. 137
Figure 4.3: Kaplan–Meier OS analysis for patients with miR-140-5p high or miR-140-5p low

xii
gastric cancer tissues. ....................................................................................................................138
Figure 4.4: Kaplan–Meier DFS analysis for patients with miR-140-5p high or miR-140-5p
low gastric cancer tissues..............................................................................................................139
Figure 4.5: Kaplan–Meier survival analysis for patients with different histological types and
different miR-140-5p expression. ...............................................................................................140
Figure 4.6: Kaplan–Meier OS analysis for patients with miR-140-5p high or miR-140-5p low
gastric cancer tissues (Beijing cohort).................................................................................153
Figure 4.7: Kaplan–Meier OS analysis for patients with various miR-140-5p/3p status in
gastric cancer tissues. ....................................................................................................................154
Figure 4.8: miR-140-5p and miR-140-3p and neoadjuvant treatment response of gastric
cancer. .............................................................................................................................................157
Figure 4.9: A Kaplan-Meier 5-year OS estimation in patients with different miR-140-5p/3p
status................................................................................................................................................158
Figure 4.10: miR-140-5p/3p status and OS in different subtypes of gastric cancer patients.
..........................................................................................................................................................159
Figure 5.1: miR-140-5p and -3p expression in gastric cancer cell lines and overexpression of
miR-140-5p and -3p respectively in AGS, NUGC4, MKN45, and HGC27. .......................172
Figure 5.2: Overexpression of miR-140-5p or 3p resulted in a significant reduction of
proliferation either in AGS or in NUGC4 cells, but no influence on the growth of neither
the HGC27 nor MKN45 cell line. ..............................................................................................174
Figure 5.3: Overexpression of miR-140-5p or 3p significantly decrease of colony formation
only in NUGC4 cell line...............................................................................................................175
Figure 5.4: Impact of upregulation of miR-140-5p/3p on cell cycle of gastric cancer cells.
..........................................................................................................................................................177

xiii
Figure 5.5: Effect of miR-140-5p and -3p on migration of gastric cancer cells. ................ 179
Figure 5.6: Effect of miR-140-5p and -3p overexpression on the migration of gastric cancer
cells using trans-well migration assay. ........................................................................................ 180
Figure 5.7: Impact of overexpression of miR-140-5p and -3p on invasive capacity of gastric
cancer cell lines.............................................................................................................................. 181
Figure 5.8: Impact of overexpression of miR-140-5p/3p on the drug-induced proliferation
inhibition of gastric cancer cell lines. ........................................................................................ 183
Figure 6.1: Heat Map of the top 50 features for miR-140-5p accumulating or decreasing
phenotypes. .................................................................................................................................... 194
Figure 6.2: The Gene Ontology (GO) category analysis of merged predicted targets of miR-
140-5p from in silico analysis, RNA seq and Protein array data............................................ 198
Figure 6.3: Correlation between miR-140-5p and MDM2 in gastric cancer (TCGA)........ 199
Figure 6.4: One-way ANOVA comparations of relative expression of MDM2, p53, and p21
in miR-140-5p and miR-140-3p overexpression gastric cancer cell lines. ............................ 200
Figure 6.5: The expression of MDM2, p53, and p21 in the miR-140-5p and miR-140-3p
overexpression gastric cancer cell lines...................................................................................... 201
Figure 6.6: Abated activation of MDM2/p53/BAX signaling in miR-140-5p overexpression
cells was determined using Western blot................................................................................... 202
Figure 6.7: 5FU induced miR-140-5p upregulation in cells with higher miR-140-5p before
treatment. ....................................................................................................................................... 203
Figure 7.1: The techniques used in this study........................................................................... 208

xiv
List of Tables
Table 1.1: The 5-year survival rates by stage for gastric cancer treated with surgery............ 13
Table 1.2: Laurén and WHO classification.................................................................................. 32
Table 1.3: Goseki classification. .................................................................................................... 36
Table 1.4: Ming classification......................................................................................................... 37
Table 1.5: The comparison between the intestinal and diffuse type of gastric cancer. ........ 45
Table 1.6: Pathologic stage............................................................................................................. 49
Table 1.7: Single-agent activity in advanced gastric cancer........................................................ 55
Table 1.8: Combination therapy for advanced gastric cancer. .................................................. 56
Table 1.9: Cell cycle effects of major classes of anti-cancer drugs.......................................... 65
Table 1.10: Nomenclature rules for miRNAs. ............................................................................ 74
Table 2.1: Cell Lines, Origin and Additional Information. ....................................................... 91
Table 2.2: Primers used in the current study to quantify gene expression ............................. 92
Table 2.3: Primary antibodies used in Western Blot. ................................................................. 93
Table 2.4.1: Reverse transcription PCR preparation 1.............................................................100
Table 2.4.2: Reverse transcription PCR preparation 2.............................................................100
Table 2.5: General PCR preparation ..........................................................................................101
Table 2.6: qPCR preparation .......................................................................................................104
Table 2.7.1: miRNA reverse transcription PCR preparation ..................................................104
Table 2.7.2: miRNA reverse transcription PCR preparation ..................................................105

xv
Table 2.7.3: miRNA reverse transcription PCR preparation.................................................. 105
Table 2.7.4: miRNA reverse transcription PCR preparation.................................................. 106
Table 2.8: qPCR preparation....................................................................................................... 106
Table 2.9: miRNA assay information......................................................................................... 106
Table 2.10: Preparation of diluted BSA Standards.................................................................. 107
Table 2.11: Protein size and gel percentage selection.............................................................. 109
Table 2.12: Components and volumes for a 10% resolving gel............................................. 109
Table 2.13: Components and volumes for a 5% stacking gel................................................. 109
Table 3.1: Patients’ demographics: ............................................................................................. 121
Table 3.2: Prognostic related miRNAs. ..................................................................................... 128
Table 3.3: Consistently deregulated miRNAs in three independent studies. ....................... 129
Table 4.1: miR-140 expression in gastric cancer cohort from TCGA. ................................. 136
Table 4.2: Cox regression analysis for comparison of gastric cancer patients OS.............. 141
Table 4.3: Cox regression analysis for comparison of gastric cancer patients DFS. .......... 142
Table 4.4: Relationship between miR-140-5p suppression and clinicopathological features in
gastric cancer patients. ................................................................................................................. 143
Table 4.5: Cox regression analysis for comparison of the intestinal type of gastric cancer
patients OS..................................................................................................................................... 144
Table 4.6: Cox regression analysis for comparison of the intestinal type of gastric cancer
patients DFS.................................................................................................................................. 145
Table 4.7: Cox regression analysis for comparison of diffuse type of gastric cancer patients
OS.................................................................................................................................................... 146

xvi
Table 4.8: Cox regression analysis for comparison of diffuse type of gastric cancer patients
DFS..................................................................................................................................................147
Table 4.9: Relationship between miR-140-5p suppression and clinicopathological features in
gastric cancer patients with intestinal type.................................................................................148
Table 4.10: Relationship between miR-140-5p suppression and clinicopathological features
in gastric cancer patients with diffuse type................................................................................149
Table 4.11: miR-140-5p expression in non-neoadjuvant chemotherapy cohort from Beijing
..........................................................................................................................................................151
Table 4.12: miR-140-3p expression in non-neoadjuvant chemotherapy cohort from Beijing
..........................................................................................................................................................152
Table 4.13: Cox regression analysis for comparison of OS in gastric cancer patients without
neoadjuvant chemotherapy. .........................................................................................................155
Table 4.14: Cox regression analysis for comparison of OS in gastric cancer patients with
neoadjuvant chemotherapy. .........................................................................................................160
Table 6.1: The top 20 signalling pathway in gastric cancer associated with miR-140-5p
upregulation in GSEA by KEGG...............................................................................................192
Table 6.2: The top 20 signalling pathway in gastric cancer associated with miR-140-5p
suppression in GESA by KEGG................................................................................................193
Table 6.3: Correlation between miR-140-5p/3p and MDM2 in gastric cancer (Beijing cohort).
Note: Cor = Correlation coefficient. N= Number of samples .............................................199

xvii
Acknowledgments
I am very grateful for the research scholarships from the Doctoral program of Cardiff
University and China Scholarships Council (No.201608060223). I would like to thank the
many people who contributed to the development and completion of this dissertation. My
supervisor, Dr. Alwyn Dart, who always gave me constant support and guidance. I would
also like to thank my panel members: Dr. Rachel Hargest who is one of the most well-
organized professors I have had; Dr. Yuxin Cui who brings clarity to even the most complex
topics, as well as being a most engaging presenter; Dr. You Zhou, who guided my early
bioinformatics analysis; and my friend, Dr. Jun Cai, with whom I shared many enjoyable,
thought-provoking lunches. Thank you all for your patient observations, suggestions, counsel
and, yes, criticisms regarding my often-incoherent ideas. Thanks to Professors Wen Guo
Jiang and Jiafu Ji without whom I could not have the chance to study at Cardiff University.
Individual thanks to current and past CCMRC members, each for his/her unique
contributions: Malamati, for her encouragement and for putting up with my anxiety; Fiona,
the lab mom; Juliet and Hayley for conversations about anything at all; Drs Lin Ye and Sioned
Owen for early discussions on the scientific method and reductionism; Dr. Andrew Sanders,
a fellow computer expert, Cathy for her indefatigable cheeriness and Channing, the most
easy-going guy on the planet; and Dr Tracey Martin, who always makes wonderful and
delicious cake. I thank you all for your camaraderie.
Finally, a lifetime of thanks to my family who have been the most supportive and proudest
family that I could have ever asked.

xviii
To Peng
the best thing that ever happened to me,
whose love, patience and unwavering support
has made every life challenge possible

1
Publications and presentations arising from this Thesis
Meng Xie, Rachel Hargest, Jiafu Ji, Wenguo Jiang and Alwyn Dart (2018). Relationship of
miR-140-5p expression and p53 function and contribution to prognosis prediction and
treatment decision of patients with gastric cancer. Journal of Clinical Oncology (published
conference abstract).
Meng Xie, Alwyn Dart Rachel Hargest, Jiafu Ji and Wenguo Jiang. MicroRNA Signature as a
Potential Biomarker for the Identification of Gastric Cancer Progression (submitted
conference abstract for International Gastric Cancer Conference 2017).

2
Glossary of Abbreviations
5′DFUR 5′-deoxy-5-fluorouridine 5FU 5-fluorouracilACRG the Asian Cancer Research GroupAGO argonaute proteins AJCC American Joint Committee on CancersAMAG autoimmune atrophic gastritis APC adenomatous polyposis coli ATM ataxia telangiectasia mutatedATR ataxia telangiectasia-mutated and RAD3-like proteinAUC area under the ROC curvesBCL-2 B cell leukaemia/lymphoma 2 BAX BCL2 associated X apoptosis regulator bp base pairBSS borate buffered salineCA72-4 carbohydrate antigen 72-4 CCND1 cyclin D1CDH1 epithelial cadherinCH2THF 5,10-methylenetetrahydrofolate CHK1 checkpoint kinase 1CHK2 cell cycle checkpoint kinase 2CI confidence intervalCIMP extreme high CpG island methylator phenotypeCIN chromosomal instabilityCOX-2 cyclooxygenase 2CSC cancer stem-like cells CT computerized tomographyCTNNA1 α-cateninCVID common variable immunodeficiencyDEM differentially expressed miRNAsDEPC diethyl pyrocarbonateDFS disease-free survival DHFU DihydrofluorouracilDMEM Dulbecco’s Modified Eagles’ MediumDMSO dimethyl sulfoxide dNTPs deoxynucleotide triphosphates DPD dihydropyrimidine dehydrogenasedTMP deoxythymidine monophosphate DSB double-strand breakDSS disease-specific survivalEBV Epstein–Barr virus

3
ECM extracellular matrixEGF epidermal growth factor EGJ esophagogastric junction EMAG environmental metaplastic atrophic gastritisEMT epithelial-to-mesenchymalES embryonic stem cells FAP familial adenomatous polyposisFAS Fas cell surface death receptorFBS foetal bovine serum FGF9 fibroblast growth factor 9 FIGC familial intestinal gastric cancer Gadd45 growth arrest and DNA damage-inducible 45GAPDH glyceraldehyde 3-phosphate dehydrogenaseGERD gastroesophageal reflux disease glm generalized linear modelGOF gain of function GS genome stable tumoursH. pylori Helicobacter pylori HDGC hereditary diffuse gastric cancerHER2 human epidermal growth factor receptor 2HNPCC hereditary non-polyposis colorectal cancerHR hazard ratio IL interleukinIM intestinal metaplasiaIR ionizing radiationJNK Jun-N-terminal Kinasekb kilo base pairsLFS Li-Fraumeni syndrome lm linear modellncRNAs long noncoding RNAs LS Lynch SyndromeMAGIC MRC Adjuvant Gastric Infusional ChemotherapyMALT mucosa-associated lymphoid tissueMDM2 mouse double minute 2 miRNAs microRNAsMMP matrix metalloproteinasemRNA messenger RNAMSI microsatellite unstable tumoursMSS microsatellite stableMTT 3-(4,5-dimethylthiazol-2-yl)-2,5-diphenyl tetrazolium bromideNACT Neoadjuvant chemotherapyNF-κb nuclear factor-kappa B

4
NSAID non-steroidal anti-inflammatory drugsNSCLC non-small cell lung cancernt nucleotideNT Solid Tissue NormalORR overall response rateOS overall survivalPBS phosphate Buffered Saline PD-1/L1 programmed cell death 1/ ligand 1PDX patient-derived tumour xenograftsPET positron emission tomography PFS progression-free survivalPI3K phosphoinositide-3-kinasPJS Peutz-Jeghers syndromePP2A phosphatase 2AqPCR real-time quantitative PCRRHOA ras homolog family member ARISC RNA-induced silencing complex RNAPII RNA polymerase IIROC receiver operating characteristic ROS reactive oxygen species rRNA ribosomal RNARunx1t1 runt-related transcription factor 1SD standard deviationsSEM standard errorSTAD Stomach adenocarcinomaTAK1 TGF-β activated kinaseTCGA The Cancer Genome AtlasTGF-β transforming growth factor betaTKIs tyrosine kinase inhibitors TLRs toll like receptors TNM tumour, node, metastasesTP Primary Solid TumorTP53INP1 tumour protein p53-induced nuclear protein 1tRNA transfer RNATS thymidylate synthase Tween 20 polyoxymethylene (20) sorbitan monolaurateUTR untranslated regionVEGFR2 vascular endothelial growth factor receptor-2 WHO World Health Organization

5
Chapter 1.
General Introduction
6
1.1 Gastric cancer
Gastric cancer is the fifth most common cancer worldwide and the third main cause of
cancer-related death, accounting for 6.8% of new cancer cases and 13.7% of the total cancer
deaths worldwide (Global cancer statistics from the World Health Organization (WHO) in
2012 (Ferlay et al. 2015). Whilst gastric cancer incidence and mortality decreased substantially
over the last decades in most countries worldwide, there are differences in the trends and
distribution in different areas (Ferro et al. 2014). As the early symptoms of gastric cancer are
similar to those of many other conditions, such as gastritis, gastric polyps or gastrointestinal
ulcers et al., early detection of gastric cancer mostly depends on opportunistic screening.
Nearly half of patients diagnosed with stages T2-T4a (T category defined in the 7th American
Joint Committee on Cancers (AJCC) TNM staging system as follows: T1a = mucosa, T1b =
submucosa, T2 = muscolaris propria, T3 = subserosa, T4a = perforates the serosa, T4b =
infiltration of adjacent structures (Marchet et al. 2011)) develop metastatic disease within two
years. Clinical outcomes are poor in metastatic disease, with median survival being around 1
year. For gastric cancer patients diagnosed at a surgically resectable stage, early radical
gastrectomy with draining lymph node dissection remains the cornerstone of therapy of
muscle-invasive disease. However, cancer-specific survival in patients with extra-gastric
extension or lymph node metastases after gastrectomy is relatively only around 25-48% (De
Angelis et al. 2014; Ferro et al. 2014; Van Cutsem et al. 2016). In the United Kingdom over
the last decade, gastric cancer incidence rates have decreased by more than a quarter while
six in ten (4457/6740) gastric cancer patients die from this disease each year (Cancer
Research UK 2016a). Approximately half of the world’s gastric cancer cases and deaths occur
in China, roughly 1364 deaths per day (Zong et al. 2016).
Current treatment options for gastric cancer include surgical intervention, chemotherapy,
and radiation therapy or a combination of these options. Surgery for gastric cancer although
technically challenging, is still considered the only curative treatment currently. Optimal
results are more likely to be achieved with the input of teams of experts from different
disciplines through careful tumour staging which is crucial to ensure that appropriate
interventions are selected (Coburn et al. 2018). Besides stage-based treatment determination,
increased attention has been paid to the molecular classification of gastric cancer. Several
histopathological characteristics have a significant prognostic impact on recurrence and

7
survival rates in gastric cancer and have shown great potential for improvement.
Conventional chemotherapy has been successful to some extent; the main drawbacks of
chemotherapy are its poor bioavailability, high-dose requirements, adverse side effects, low
therapeutic indices, development of multiple drug resistance, and non-specific targeting.
Targeted therapies, such as trastuzumab, an antibody against human epidermal growth factor
receptor 2 (HER2, also known as ERBB2), the vascular endothelial growth factor receptor-
2 (VEGFR-2) antibody ramucirumab, and programmed cell death 1 (PD-1)/ programmed
cell death ligand-1(PD-L1) antibody, also show promise. However, the remaining challenge
is to find sufficient molecular markers for therapy selection and monitoring.
1.1.1 Epidemiology
According to incidence estimated in the GLOBOCAN 2012 (Torre et al. 2015; Ferlay J 2013),
approximately 950 000 new cases are diagnosed annually, of whom 720 000 are expected to
die (Ferlay et al. 2015). In 2015 (Fitzmaurice et al. 2017), there were 1.3 million (1.2-1.4
million) incident cases of gastric cancer and 819 000 (95% uncertainty interval, UI: 795 000-
844 000) deaths worldwide (Figure 1.1).
Figure 1.1: Estimated age-standardized incidence rates of gastric cancer (ASR-World) in both sexes per 100,000, IARC GLOBOCAN 2012. Adapted from GLOBOCAN 2012. (Ferlay J 2013; Torre et al. 2015) The highest rates occur in Eastern Asia, South America, and Eastern Europe.
Despite the decline rate, the absolute number of new cases per year is increasing, mainly due
to aging in the world population. More than half of gastric cancer patients are over 60 years
old and the median age at diagnosis is 70 years (Karimi et al. 2014). Furthermore, the trend
toward declining incidence in young patients (younger than 50 years) has halted and replaced

8
by an upward trend in recent years (Correa 2011; Sonnenberg 2011). Gender, as well as age,
plays a crucial role in the incidence of gastric cancer. Age-standardized incidence rates are
about twice as high in men as in women, ranging from 3.3 in Western Africa to 35.4 in
Eastern Asia for men, and from 2.6 in Western Africa to 13.8 in Eastern Asia for women
(Figure 1.2).
Figure 1.2: Cancer age-standardized incidence and mortality rates of gastric cancerper 100,000 for in both sexes, GLOBOCAN 2012 estimates. Adapted from GLOBOCAN 2012(Torre et al. 2015; Ferlay J 2013).
Among males, incidence rates (cases/100,000) in Japan (Miyagi Prefecture, 66.7) and Korea
(64.6) are twice as high as the next highest rates in Iran (Golestan Province, 30.4). Among
females, incidence rates in Japan and Korea are 60% higher than the next highest rates in
Ecuador and Costa Rica. It was estimated that 1 in 27 men and 1 in 68 women develop
gastric cancer before age 79 years (Fitzmaurice et al. 2017). Moreover, globally, gastric cancer
incidence shows remarkable international variation and distinct characteristics by two major
9
topographical subsites, true gastric adenocarcinomas (non-cardia gastric cancers), of which
there were 691 000 new cases in 2012, and gastro-oesophageal-junction adenocarcinomas
(cardia gastric cancers), of which there were 260 000 new cases in that year(Colquhoun et al.
2015). As a result, the proportion of tumours located in the proximal two-thirds of the
stomach now accounts for more than 40 percent of gastric in some reports (Borch et al.
2000).
In Japan, the downward trend was particularly evident in young patients with non-cardia,
sporadic, intestinal type of gastric cancer (Kaneko and Yoshimura 2001; Bertuccio et al. 2009).
In China, the decline was less dramatic than other countries. Despite an overall decrease in
gastric cancer incidence, an increase of non-cardia gastric cancer has been observed in the
oldest and the youngest groups, and a less remarkable decline has been observed among
women than in men (Jemal et al. 2006; J. Zhang et al. 2018). In the United States, the
incidence rate for non-cardia gastric cancer declined among all race and age groups. People
aged 65-74 are most frequently diagnosed, and the average age at diagnosis is 69 (National
Cancer Institute 2018). About 6/10 patients diagnosed with gastric cancer each year are 65
or older. However, in younger and middle-aged Caucasians (25 to 39 years) the incidence
rate for non-cardia gastric cancer significantly increased between 1977 and 2007 (Camargo
et al. 2011; Colquhoun et al. 2015; Anderson et al. 2010). Figure 1.3 depicts the global
incidence rates of gastric cancer varied by gender; in particular, for cardiac gastric cancer,
rates in men were three times the rates in women (Colquhoun et al. 2015).
Histologically, gastric cancer was classified into intestinal and diffuse types by Laurén (Lauren
1965). These two biological entities are different with regard to epidemiology, aetiology,
pathogenesis, and behavior (see Chapter 1.15). The intestinal type is more common in males,
2:1 ratio worldwide. Diffuse-type cancers are equally distributed between males and females
(Jemal et al. 2011). There has been a worldwide decline in the incidence of the intestinal type
in recent decades, which parallels the overall decline in the incidence of gastric cancer. By
contrast, the decline in the diffuse type has been more gradual. Hence, the decrease in the
intestinal type cancers may partly contribute to the shift from intestinal to diffuse type of
gastric cancers (Borch et al. 2000; Kampschoer et al. 1989; Sidoni et al. 1989).

10
Figure 1.3: Global incidence estimates of cardia and non-cardia gastric cancer by region (A) and Estimated cardia and non-cardia gastric cancer age-standardized incidence rates (per 100 000) by region and sex (B). Source: Global patterns of cardia and non-cardia gastric cancer incidence in 2012 (Colquhoun et al. 2015).

11
Figure 1.4: Cancers Ranked by Number of Deaths in Both Sexes, Global, by Region, bySociodemographic Index (SDI), and in the 50 Most Populous Countries, 2015. The highest rates occur in Eastern Asia, South America, and Eastern Europe (Global Burden of Disease Cancer et al. 2017).

12
Mortality from gastric cancer has decreased in all countries over the last 50 years, for both
men and women, although the rate of decline differs by region (Figure 1.4) (Amiri et al. 2011).
The highest estimated mortality rates are in Eastern Asia (24 per 100,000 in men, 9.8 per
100,000 in women), the lowest in Northern America (2.8 and 1.5, respectively). High
mortality rates are also present in both sexes in Central and Eastern Europe and in Central
and South America (Figure 1.2). Despite the decline in mortality, the 5-year survival rate has
improved only by 11% (Figure 1.5) and is still poor in most countries (Collaborators 2016;
Danaei et al. 2005; Fontham 2009). Five-year survival rates are as high as 64.6 % in Japan
and 74.5% in South Korea (Matsuda et al. 2011). Well-developed, government-sponsored
screening programmes for gastric cancer by barium photofluorography or endoscopy are
available in these countries (Jung et al. 2017). The 5-year survival rate is 27.4% in China (M.
Li et al. 2017) and 20% in the United Kingdom (Cancer Research UK 2016b).
Figure 1.5: Five-year survival rate by gastric cancer stage at diagnosis. Source: Cancer of the Stomach. Surveillance Research Program, Cancer Control, and Population Sciences (National Cancer Institute 2017).
The comparisons of prognosis between women and men are controversial, and the
difference is more likely to be tumour stage- and age-dependent (Matsuzaka et al. 2016;
Maehara et al. 1992). Mortality rates for gastric cancer are highest in aged people (≥ 70 years)
(Liang et al. 2013). For all stages of gastric cancer, the relative 5-year survival is around 20%
(Table 1.1) (Cancer Research UK 2016b).

13
Table 1.1: The 5-year survival rates by stage for gastric cancer treated with surgery. Source: Stomach Cancer. Survival by stage (Cancer Research UK 2016b)
Stage1 5 year observed survivalStage IA 80%Stage IB 70%Stage IIA 60%Stage IIB 40%Stage IIIA 25%Stage IIIB 20%Stage IIIC 10%Stage IV 5%
1 TNM classification according to the 6th AJCC staging system.
1.1.2 Risk factors and prevention
A person’s risk of developing gastric cancer depends on multiple factors, including age,
genetics, and exposure to risk factors (including some potentially avoidable lifestyle factors)
(Figure 1.6). Gastric cancer represents a complex and heterogeneous disease. Studies of
migrant populations point to the importance of environmental factors in the aetiology of
this disease (McCredie et al. 1999).
Figure 1.6.: Summary of risk factors and independent prognostic factors in clinical use.ECOG: The Eastern Cooperative Oncology Group, the ECOG Scale of Performance Status is one such measurement. It describes a patient’s level of functioning in terms of their ability to care for themselves, daily activity, and physical ability (walking, working, etc.). WCC: the white blood cell count. Factorshighlighted in red font represent increased risk, factors highlighted in blue represent reduced risk.
Reactive oxygen species (ROS) is an essential factor in the pathogenesis of gastric cancer
(Bhattacharyya et al. 2014). Low and moderate amounts of ROS have beneficial effects on
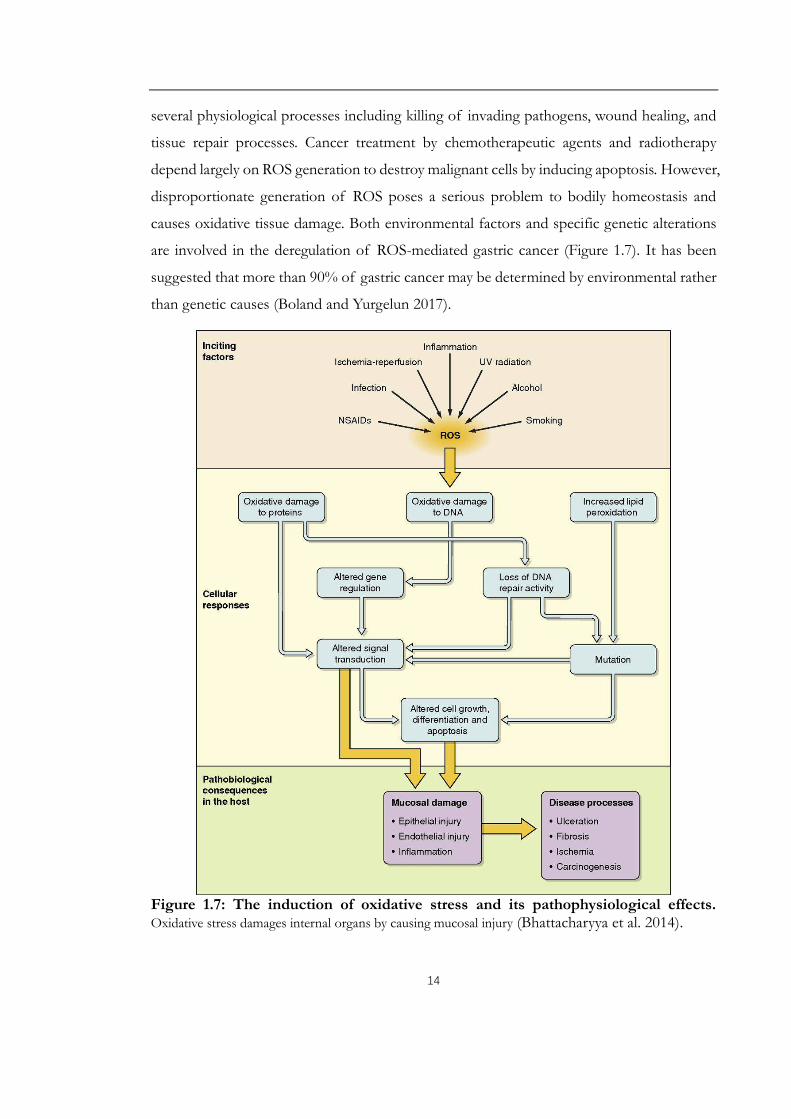
14
several physiological processes including killing of invading pathogens, wound healing, and
tissue repair processes. Cancer treatment by chemotherapeutic agents and radiotherapy
depend largely on ROS generation to destroy malignant cells by inducing apoptosis. However,
disproportionate generation of ROS poses a serious problem to bodily homeostasis and
causes oxidative tissue damage. Both environmental factors and specific genetic alterations
are involved in the deregulation of ROS-mediated gastric cancer (Figure 1.7). It has been
suggested that more than 90% of gastric cancer may be determined by environmental rather
than genetic causes (Boland and Yurgelun 2017).
Figure 1.7: The induction of oxidative stress and its pathophysiological effects.Oxidative stress damages internal organs by causing mucosal injury (Bhattacharyya et al. 2014).

15
1.1.2.1 Infectious and non- infectious environmental risk factors
Helicobacter pylori (H. pylori) is the most important etiologic factor for gastric cancer
and is established as a class I carcinogen by the International Agency for Research on gastric
cancer in 1994 (International Agency for Research on Cancer. 1994a; Fock et al. 2009). The
presence of geographic and familial clusters of gastric cancer presented a conundrum until
the most common cause of this disease—chronic infection by H. pylori—was discovered by
Marshall and Windsor (2005). It is estimated that 89% of non-cardia gastric cancers, which
accounts for 78% of gastric cancer cases, are attributed to H. pylori infection (International
Agency for Research on Cancer 1994b; De Martel et al. 2012). Non-cardia gastric cancer
with a high serum anti-H. pylori IgG titre was significantly correlated with younger (median
age, 55.0 years), a higher proportion of female (45.0%), non-smokers (58.9%) and diffuse-
type gastric cancer (Gong et al. 2018). H. pylori infection, which infects approximately 50%
of the world’s population, is a major factor in both the induction of atrophic gastritis and
histological progression to gastric cancer (Fox and Wang 2007). Despite the high infection
rate, most infected subjects develop no clinical symptoms or peptic ulceration and continue
their life with superficial chronic gastritis (Figure 1.8). Approximately 17% of infected
subjects will develop peptic ulcers, and 1% will progress to gastric cancer (Salih 2009). A
follow-up study of 1526 Japanese patients over a mean period of 7.8 years uncovered that
gastric cancer developed in 2.9% of patients infected with H pylori but in none of the
uninfected patients (Uemura et al. 2001; J. Kang et al. 2002).
H. pylori infection has been associated with an approximately six-fold increase in the risk of
distal gastric adenocarcinomas compared to the cardic tumours, including both the intestinal
and diffuse types. In terms of histology, H. pylori infection may be linked more closely with
intestinal-type gastric cancer because it was found in nearly 90% of the noncancerous gastric
mucosa in this setting, compared with less than one-third of the diffuse-type cancers
(Parsonnet et al. 1991). A modest increase in fasting plasma glucose levels was found to be a
risk factor for gastric cancer and that hyperglycaemia could be a possible cofactor increasing
the risk posed by H. pylori infection (Yamagata et al. 2005).

16
Figure 1.8: Natural history of H. pylori infection. The clinical course of H. pylori infection is highly variable depending on bacterial and host (genetic and immune) factors. Patients with increased acid secretion are more likely to have antral-predominant gastritis, which predisposes to duodenal ulcers. Patients with low acid secretion will more likely develop gastritis in the body of the stomach and are thus more likely to develop gastric ulcer, leading to gastric atrophy, intestinal metaplasia, dysplasia and, finally, in rare cases, gastric carcinoma. This sequence of events is more frequent in people of advanced age. Source: H. pylori infection and gastric cancer: state of the art (review) (Conteduca et al. 2013).
Long-term exposure to H. pylori promotes gastric carcinogenesis mainly through 2
mechanisms: Firstly, H. pylori could cause chronic gastric inflammation which may progress
to the precancerous changes of atrophic gastritis and intestinal metaplasia. The risk of gastric
cancer increases in relation to the severity and extent of those precancerous changes
(Naumann and Crabtree 2004); Secondly, chronic H. pylori infection can also contribute to
gastric mucosal genetic instability by reducing gastric acid secretion (hypochlorhydria), which
can promote the growth of gastric microbiome that processes dietary components into
carcinogens (Amieva and Peek 2016; Machado et al. 2009). This risk can be even higher in
patients with a higher intake of salted foods (Peleteiro et al. 2011).
People who have had mucosa-associated lymphoid tissue (MALT) lymphoma also have an
increased risk of getting adenocarcinoma of the stomach. This is probably because MALT
lymphoma of the stomach is caused by infection with H. pylori bacteria (Sakai et al. 2003)

17
(Figure 1.9). First-line eradication treatment of H. pylori relies on proton pump inhibitors
and the combination of two antibiotics such as amoxicillin, clarithromycin, or metronidazole.
If the first therapy fails, then the proposed second-line treatment is bismuth salts, proton
pump inhibitor, tetracycline, and metronidazole (Malfertheiner et al. 2007). H. pylori
eradication has been shown to yield 33%-47% reduction in gastric cancer incidence rate (Lee
et al. 2016; Pan et al. 2016; Ford et al. 2014). However, more recently it has been reported
that a considerable proportion of these individuals continue to progress to gastric cancer
even after the eradication of H. pylori, it is thought that long-term proton pump inhibitors
may have an impact on the development of gastric cancer as well (Cheung et al. 2018). The
number of gastric cancer cases that emerge after eradication has continued to increase.
Moreover, whether H. pylori eradication enables recovery from atrophy and intestinal
metaplasia, and eventually prevention for cancer development is not fully understood
(Poulsen et al. 2009; Uno et al. 2016; Song et al. 2017).
Figure 1.9: Multiple genetic and epigenetic alterations during gastric carcinogenesis and lymphomagenesis and the incidence rates in different types of gastrictumours. Source: H. pylori infection and gastric cancer: state of the art (review) (Conteduca et al. 2013).

18
Epstein–Barr virus (EBV) is a human herpes virus which latently infects B lymphocytes in
the majority of adults. The causal role of EBV in gastric carcinogenesis was suggested in
1994 (Imai et al. 1994). Nowadays, 10% of gastric carcinoma cases harbouring the clonal
EBV genome were thought to be Epstein–Barr virus (EBV)-associated throughout the world
(Nishikawa et al. 2017). The presence of EBV is observed in 7%–20% of gastric cancers,
being slightly more frequent in diffuse-type gastric cancers (Ushijima and Sasako 2004). The
highest EBV-positive rates were observed in the cardia and middle gastric cancer (Yamamoto
et al. 1994). The association between EBV and carcinogenesis varies from 4% in China, 7.7%
in France, 8.1% in Russia, 12.5% in Poland, to 17.9% in Germany (Takada 2000; Czopek et
al. 2003). Early studies also demonstrated that EBV infection was absent in preneoplastic
gastric lesions (intestinal metaplasia and dysplasia) but present in both intact stomach
carcinoma and gastric stump carcinoma suggesting that infection might be a late event in
gastric carcinogenesis (Zur Hausen et al. 2004). Intriguingly, EBV is more prevalent in gastric
remnant cancers (27.1%) than in an intact stomach. EBV has been shown to extend cell
generations of gastric epithelial cells in in vitro cell culture, but it cannot immortalize them
(Takada 2000). In addition, EBV in carcinoma biopsies indicates a monoclonal proliferation
of EBV-infected cells (Iizasa et al. 2012). However, the precise role of EBV in the
carcinogenic progress remains to be solved. Methylation of the tumour suppressor genes,
such as p16, p73, and RUNX3 is a key abnormality in EBV associated gastric cancer (Kang
et al. 2002; Nishikawa et al. 2017; Saito et al. 2013). Besides extreme DNA hypermethylation,
according to a novel classification system dividing gastric cancer established by The Cancer
Genome Atlas (TCGA), EBV associated gastric cancer are characterized by recurrent
PIK3CA mutations and amplification of JAK2, PD-L1, and PD-L2 (Cancer Genome Atlas
Research 2014). Mutation of p53 in gastric cancer was identified independently of EBV
infection (Szkaradkiewicz et al. 2006).
Increased age Two-thirds of people who have gastric cancer are over age 65. Especially for
intestinal-type gastric cancer, people aged 65-74 are the most frequently diagnosed
population (the diffuse type occurs in all age groups with equal gender distribution) (Williams
et al. 1988; Zali et al. 2011). Age was also found to be an independent prognostic factor in
gastric cancer (Ma et al. 2018). Age-dependent accumulation of DNA demethylation
preceding diploidy loss accounted for a significant subset of gastrointestinal cancers (Suzuki

19
et al. 2006).
Dietary factors including diets, foods, individual nutrients, methods of preparation, and
habits of consumption also have been proposed to protect against or increase the risk of
gastric carcinogenesis (Abnet et al. 2015). Healthy dietary habits, e.g. high intake of fresh
fruits and vegetables, Mediterranean diet, low-sodium diet, salt-preserved food, red and high
cured meat, sensible alcohol drinking, and maintaining a proper weight might be associated
with a decreased risk of gastric cancer. An evaluation of dose-response found similar levels
of association for fruits and vegetables: increase of 100 g of intake/day of fruit was
associated with a significant decrease in risk of gastric cancer (summary relative risk, 0.95),
and vegetables had a comparable, but not statistically significant association with reduced
risk (summary relative risk, 0.96) (Wang et al. 2014). In a large, prospective European study
of more than 450,000 people, those with higher fruit and vegetable intakes were less likely
to develop any gastric cancer (hazard ratio [HR], 0.77; P for trend=0.02) (Gonzalez et al.
2012). The associations were mainly significant for fresh fruit and diffuse-type gastric cancer
(HR, 0.59; P for trend=0.03), for citrus and gastric cardia cancers (HR, 0.61; P for
trend=0.01), and for smokers and persons residing in Northern European countries
(Gonzalez et al. 2012). In addition to the quantity, the variety of intake may be important. A
prospective analysis of a large European cohort containing 475 people who developed
gastric or esophageal cancer revealed that increasing variety of the types of fruits and
vegetables consumed, independent of total consumption, was inversely associated with the
risk of esophageal squamous cell carcinoma, particularly among smokers (Jeurnink et al.
2012). The mechanisms by which fruits and vegetables reduce cancer risk might involve their
ability to prevent the development of precancerous conditions, and probably, their high
levels of micronutrients (including b-carotene, vitamin C, vitamin E, folate and other
antioxidants), which can decrease DNA damage by scavenging for oxygen radicals (Nomura
et al. 2003; Abnet et al. 2015).
Smoking The causal relationship between tobacco smoking and gastric cancer had been
controversial until 2002 (IARC. IARC monographs. Tobacco smoking and tobacco smoke.
Lyon: IARC, 2002) (Gonzalez et al. 2003). The positive correlation between smoking and the
risk of gastric cancer was further highlighted by a meta-analysis recently (Ferro et al. 2018a).
Frequency, duration, and pack-years of smoking were independently associated with risk of

20
both gastric cardia adenocarcinoma and non-cardia adenocarcinoma (Steevens et al. 2010).
Compared with never smokers, the multivariable-adjusted incidence rate ratio for current
smokers was 1.60 for gastric cardia adenocarcinoma (Steevens et al. 2010). Targeting high-
risk smokers for serum pepsinogen screening was proposed to be a cost-effective strategy to
reduce intestinal-type non-cardia gastric adenocarcinoma mortality (Yeh et al. 2016).
Ethanol was thought to directly and dose-dependently impair the gastric mucosal barrier.
Both acidification of the mucosal cells and ethanol itself induce the release of inflammatory
and vasoactive substances. Inflammation and vasoconstriction lead to ischemia and mucosal
damage. However, an increased risk was only observed in case of patients with chronic
atrophic gastritis in Asian alcoholics, who are heterozygous for an inactive aldehyde
dehydrogenase (ALDH2) genotype, which has a strong impact on carcinogenic acetaldehyde
accumulation after drinking alcohol (Steevens et al. 2010; Testino 2011; Nemati et al. 2012;
Ishioka et al. 2018; Choi et al. 2018). In achlorhydric atrophic gastritis, bacterial overgrowth
results in the presence of glucose in the formation of minor concentrations of endogenous
ethanol and acetaldehyde in gastric juice. After administration of a small amount of alcohol,
intragastric acetaldehyde production increases 6.5-fold compared to healthy controls (Testino
2011). For frequent alcohol drinkers (3 or more drinks per week) in US Hispanics, the risk
may come from the risk of weight gain (32% vs 26%) (Cokkinides et al. 2012). Meta-analyses
of the association between alcohol drinking and gastric cancer additionally indicated that
individual participant data pooled analyses yielded more precise estimates for different levels
of exposure or cancer subtypes (Ferro et al. 2018b).
Obesity interacts with other mechanisms and results in earlier presentation or more
complicate disease. High overall obesity (body mass index (BMI)) (highest (≥35 kg/m2) vs.
reference (18.5-<25 kg/m2) increased the hazard ratio of gastric cardia adenocarcinoma to
3.67, 95% confidence interval, CI 2.00 to 6.71 (O'Doherty et al. 2012). Even in people having
no history of reflux, central obesity (large waist circumferences) increased the risk of acid
reflux and lengthening of the cardiac mucosa (Robertson et al. 2013; Derakhshan et al. 2015),
which was thought to be the cause of the rapid rise in gastroesophageal junction tumours
(Quante et al. 2013). Obesity may enhance immature myeloid cell trafficking and TH17
response which may result in accelerating H pylori-induced gastric carcinogenesis (Ericksen
et al. 2014). A retrospective analysis of 1.79 million men and women from Israel suggested

21
that adolescent obesity (the body mass index (BMI) ≥ 95th percentile of the baseline) is also
associated with an increased risk for non-cardiac gastric cancer (Levi et al. 2018). Leisure-
time physical activity has been proven to be associated with lower risk of gastric cardia cancer
(Moore et al. 2016; Keum et al. 2016). However, in patients undergoing curative gastric
cancer surgery, those who were overweight or mildly-to-moderately obese (BMI 23 to 30
kg/m2) preoperatively, had better overall survival (OS) and disease-specific survival (DSS)
than normal-weight patients (Lee et al. 2018). Therefore, it is suggested that
gastroenterologists are uniquely poised to participate in the multidisciplinary management
of obesity as physicians caring for people with obesity-related diseases, in addition to their
expertise in nutrition and endoscopic interventions (Camilleri et al. 2017).
Others A number of studies report that long-term use of non-steroidal anti-inflammatory
drugs (NSAID) such as aspirin is associated with a reduced risk of gastric cancer in a dose-
dependent manner. However, such an impact may be more predominantly in intestinal gastric
cancer (Lindblad et al. 2005; Wang et al. 2003; Dai and Wang 2006; Huang et al. 2017). The
presumed mechanism of chemoprevention is the inhibition of cyclooxygenase (COX)-2.
Aspirin exhibits an anti-cancerous effect through several inter-related mechanisms:
prostaglandin synthesis and catabolism in epithelial cells, inhibition of Wnt-β-catenin
signaling, inactivation of platelets, and the host immune response (Jackson et al. 2000).
Previous partial gastrectomy is also a risk factor for gastric cancer even many years later
(Offerhaus et al. 1988; Sitarz et al. 2012).
1.1.2.2 Genetic predisposition
Diet and infection with H. pylori are probably the prominent risk factors for gastric cancer,
however, familial aggregation in a variable but significant proportion of cases suggests the
importance of genetic predisposition (Caldas et al. 1999; Oliveira et al. 2015). About 10% of
gastric cancer cases show familial clustering (Guilford et al. 1998; Zanghieri et al. 1990; La
Vecchia et al. 1992). 1-3% of gastric cancers are linked to inherited gastric cancer
predisposition syndromes (Ang and Fock 2014). Earlier studies described a familial
component only for diffuse gastric carcinoma, designated hereditary diffuse gastric cancer
(HDGC) (Lehtola 1978). Germline mutations in the epithelial cadherin (CDH1) gene
associated HDGC is characterized by an increased risk for diffuse gastric cancer and lobular

22
breast cancer (Kaurah et al. 2007). Later research found that intestinal-type adenocarcinoma
is the main histological subtype of hereditary gastric cancers (Ang and Fock 2014). The
definition of family gastric cancer syndromes was extended to hereditary diffuse gastric
cancer, familial intestinal gastric cancer and gastric cancer in other familial cancer syndromes,
such as familial adenomatous polyposis (FAP) caused by defects in the adenomatous
polyposis coli (APC) gene, Lynch syndrome, an autosomal dominant disease caused by
germline mutations in DNA mismatch repair genes (mainly Hmsh2, Hmsh1, Hmsh6, Hpms1,
Hpms2) as well as mutations in the EPCAM gene, which inactivates MSH2 via promoter
hypermethylation (Galiatsatos et al. 2017). Li-Fraumeni syndrome (LFS) associated with
germline mutations in the TP53 gene, and Peutz-Jeghers syndrome caused by mutations in
STK11 (Van Lier et al. 2011) et al.
Other uncommon genetic reasons also include: polymorphisms in inflammatory genes (M.
Li et al. 2013; Wen et al. 2014), the variant genotype of folate intaking related enzymes
MTHFR (Larsson et al. 2006), hypertrophic gastropathy (including Ménétrier’s disease)
(Tersmette et al. 1990) and even rare inherited cancer syndromes, such as phosphatase and
tensin homolog (PTEN) hamartoma tumour (Cowden’s) syndrome (Ha et al. 2012). For
unknown reasons, people with type A blood have a higher risk of developing gastric cancer
(Aird et al. 1953).
1.1.2.3 Precursor lesions
Atrophic gastritis is characterized by the presence of metaplastic epithelial changes. There
are two main subtypes, autoimmune (AMAG) and environmental metaplastic atrophic
gastritis (EMAG). AMAG is associated with T-cell mediated destruction of the oxyntic
mucosa and production of autoantibodies directed against parietal cell antigens and intrinsic
factor, resulting in progressive atrophy of the glandular epithelium with loss of parietal and
chief cells (Nguyen et al. 2013). The loss of the normal exocrine glands of the gastric mucosa
causes hypochlorhydria and a resultant increase in gastric pH. Autoimmune gastritis is
increasingly recognized as a contributing aetiology, with or without the presence of H. pylori
(Coati et al. 2015). Populations with a high prevalence of atrophic gastritis have a high
prevalence of gastric cancer, and vice versa. Unlike AMAG, mucosal changes in patients with
EMAG affect both the body/fundus and the antrum in a multifocal distribution, but with

23
the heaviest involvement of the antrum and a relatively preserved gastric acid production.
Without the relative protective effect of the accompanying hypochlorhydria, EMAG patients
are more likely to develop gastric ulcer disease. It was estimated that atrophic gastritis and
other conditions that cause gastric atrophy are associated with an increased risk of both
cardia and non-cardia gastric adenocarcinomas, the magnitude of the risk ranges from 3 to
18 times greater than an age-matched population. The crude incidence for cancer was 1.7%
for atrophic gastritis during the observation period (Kato et al. 1992; Helicobacter and
Cancer Collaborative 2001; De Vries et al. 2008; Cheung 2017).
Metaplasia is thought to be involved in the pathogenesis of gastric cancer, particularly the
intestinal type. The estimated odds ratio of gastric cancer adjusted for age and sex, varied
from 17.1, for those with baseline diagnoses of superficial intestinal metaplasia (IM), to 29.3,
for those with deep IM or mild dysplasia or IM with glandular atrophy and neck hyperplasia,
to 104.2, for those with moderate or severe dysplasia, as compared with subjects with
superficial gastritis or chronic atrophic gastritis at baseline (You et al. 1999). Most patients
diagnosed with high-grade dysplasia of the gastric mucosa either already have or will soon
develop gastric cancer. In gastrectomy specimens for gastric cancer, 20-40% of patients have
associated dysplasia (Rugge et al. 1994). A report from Sweden which included 405,172
patients with gastric biopsy samples taken for a non-malignant indication between 1979 and
2011, found that the risk of gastric cancer was significantly increased in the presence of
intestinal metaplasia (hazard ratio [HR] 6.2, 95% CI 4.7-8.2) and dysplasia (HR 10.9, 95% CI
7.7-15.4). It was estimated that approximately 1 in 39 patients with intestinal metaplasia and
1 in 19 with dysplasia would develop gastric cancer within 20 years (Song et al. 2015).
Gastric polyps are typically found incidentally when upper gastrointestinal endoscopy is
performed for an unrelated indication; only rarely do they cause symptoms or other clinical
signs. Nevertheless, their discovery can be important since many polyps have malignant
potential (Rugge et al. 2016).
Gastric ulcer with benign morphology increased the risk of gastric cancer (incidence ratio
1.8), and this association probably reflects common risk factors (e.g., mainly H. pylori
infection) However, the risk were unchanged among patients with prepyloric ulcers, and
decreased among those with benign duodenal ulcers (incidence ratio 0.6) (Ihre et al. 1964;

24
Rollag and Jacobsen 1984; Hansson et al. 1996; Sogaard et al. 2016). A 3.4-year follow-up
study involving 1120 Japanese patients with peptic ulcer disease who had H. pylori eradication
therapy revealed that gastric cancer developed only in patients with a gastric ulcer but not
patients with duodenal ulcers. Patients who developed gastric cancer were significantly more
likely to have persistent H. pylori infection (hazard ratio 3.4). Another follow-up study from
the same group showed that, in patients with peptic ulcer disease, the risk of gastric cancer
was also significantly increased with a higher grade of baseline gastric mucosal atrophy, and
older age (Take et al. 2005; Take et al. 2007).
Besides the above factors, the interactions between host and environmental influences are
also worth attention. The best strategy to reduce the mortality for gastric cancer is to
schedule appropriate screening and surveillance programs. Currently, endoscopy is generally
considered to be the most sensitive and specific diagnostic screening method for gastric
cancer. However, mass screening for early detection of gastric cancer is expensive, and the
compliance of patients with endoscopy is poor, therefore, national screening programme are
only used in regions with high incidences, such as Japan, South Korea, and Singapore.
Endoscopic ultrasound is at present available in many centers and, although mainly used to
stage previously diagnosed tumours, it might be helpful in identifying early diffuse-type
gastric carcinoma lesions. Future studies of these and other methods of examining the
stomach in predisposed subjects are needed to draw conclusions on their use in diagnosing
early gastric lesions. For now, in the surveillance of those predisposed to gastric cancer
development, clinicians are urged to undertake detailed endoscopic mucosal examination
with multiple biopsies of even the subtlest of lesions. However, endoscopic surveillance
should be performed once or twice a year in patients who are at higher risk of gastric cancer
(history of gastric cancer in the family, inherited cancer syndromes) (Kim et al. 2016). Several
serum-based tumour markers including carbohydrate antigen (CA) 72-4, CA12-5 and
pepsinogenI/II have been widely used in clinical practice for gastric cancer,
carcinoembryonic antigen (CEA) and CA19-9 are the two most common markers for
following gastric cancer patients with known disease. However, insufficient sensitivity (20%-
30%) and specificity of these protein biomarkers limit their utility for early gastric cancer
detection. More prospective studies are needed to determine the use of other biomarkers in
the early detection of gastric cancer.

25
1.1.3 Anatomy, Histophysiology and Function of the Stomach
In humans, the stomach is a flattened J-shaped muscular organ located in the upper left part
of the abdomen. It extends from the left hypochondriac region into the epigastric region
obliquely, starting at the esophagogastric junction (EGJ) and leading to the duodenum via
the pylorus (Figure 1.10).
Figure 1.10: Location of the stomach. Source: Anatomy of Stomach, available at https://www. Earthslab.com/anatomy/stomach/
The stomach acts to blend ingested food with gastric secretions to create chyme, a semifluid
substance. The stomach controls the speed of delivery of chyme into the small intestine to
enable proper digestion and absorption. The gastric glands secret hydrochloric acid which
kills bacteria ingested in food. Citadel’s Intrinsic Factor within the gastric juice helps in the
absorption of vitamin B12 in the small intestine. Thus, the stomach is first and foremost a
principal site of digestion. It is the first site of protein break down by the stomach’s pepsin
enzyme. The capacity of the stomach is variable as the stomach is extremely distensible; At
birth the capacity is only 30 mL, at puberty the capacity is 1000 mL and in adults the capacity
is 1500 to 2000 mL. The stomach consists of various parts that serve distinct functions. For

26
the purposes of gross description, four main sections are identified in the stomach: cardia,
fundus, corpus (or body), and antrum (pylorus) (Figure 1.10). The superomedial margin is
termed the lesser curvature, and the inferolateral margin is termed the greater curvature.
Figure 1.11: The folds of the stomach wall (rugae) lining under the light microscope.A. Haematoxylin and eosin staining show the structure of the stomach lining under the light microscope. The numerous glands invaginate into the lamina propria. The mucosal layer appears with its columnar epithelial cells, narrow lamina propria, and pink-staining muscularis mucosa. The loose connective tissue of the submucosa contains some blood vessels. Adopted fromhttp://medcell.med.yale.edu/ histology/gi_tract_lab/stomach.php. B. A diagram of the layers of the stomach wall. Adopted from http://heritance.me/anatomy -of-stomach-wall.
The wall of the stomach has four layers (see Figure 1.11), similar to most of the alimentary
canal. From inside outwards, these are mucosa, submucosa, muscularis propria, and
subserosa (Mackintosh and Kreel 1977), but the muscularis and mucosa are modified for the
special roles of the stomach. Besides the usual circular and longitudinal layers of smooth
muscle, the muscularis external has an incomplete innermost layer of smooth muscle fibres
which run obliquely. This structure allows the stomach not only to mix, churn, and move

27
food along the tract, but also to pummel the food, physically breaking it down into smaller
fragments and passing it through to the small intestine (Maintenance of the body, Human
Anatomy and Physiology, Tenth Edition, Pearson). The mucosa is the most internal layer, it
is relatively thick (1.5-2 mm), soft, and velvety. It comprises a single layer of columnar
epithelium composed of mucous cells; they produce a cloudy, protective two-layer coat of
alkaline mucus in which the surface layer consists of viscous, insoluble mucus that traps a
layer of bicarbonate-rich fluid beneath it.
There are three types of glands in the stomach: glands in the cardiac region secrete mucous;
glands in the fundus and body include mucous neck cells, which secrete mucus,
parietal/oxyntic cells, which secrete hydrochloric acid and gastric intrinsic factor, and chief
cells, which secrete pepsinogen; glands in the pyloric region secrete mucus. Endocrine cells
in the pyloric mucosa produce the gastrin hormone which increases the secretion of gastric
juice. The oxyntic glands in the orad stomach make up 75% of the total number of glands.
The remaining 25% are pyloric glands in the antrum and pylorus.
To protect itself from chemical or physical trauma, the stomach mucosa produces a mucosal
barrier, by a thick coating of bicarbonate-rich mucus building up on the stomach wall. The
epithelial cells of the mucosa are joined together by tight junctions which prevent gastric
juice from leaking into underlying tissues layers. Additionally, the damaged epithelial mucosal
cells are shed and quickly replaced by division of undifferentiated stem cells that reside where
the gastric pits join the gastric glands. The surface epithelial mucous cells are completely
renewed every three to six days, but the more sheltered glandular cells deep within the gastric
glands have a longer lifespan. Anything that breaches the gel-like mucosal barrier causes
inflammation of the stomach wall, a condition called gastritis. Persistent damage to the
underlying tissues can promote peptic ulcers.
The next layer, the submucosa is where the nerve bundles locate. Moving outward there are
three layers of smooth muscle tissue that form the muscularis external which is responsible
for the movements of the stomach, from inner to outer, they are inner oblique layer, circular
muscle layer, and longitudinal layer. Finally, the outermost layer is the serosa which encloses
the stomach organ and is connected to the lining of the abdominal cavity.

28
Five arteries supply blood to the stomach. The left gastric artery arises directly from the
celiac axis and supplies the cardiac region. The right gastric artery (which supplies the lesser
curve) and the right gastroepiploic artery (which supplies the greater curve) arise from the
hepatic artery. The left gastroepiploic and the short gastric arteries arise from the splenic
artery and also supply the greater curvature. The sympathetic nerve supply to the stomach is
derived from the celiac plexus via nerves that follow the gastric and gastroepiploic arteries.
Branches also are received from the left and right phrenic nerves. The parasympathetic
supply is the vagus nerve via the main anterior and posterior trunks which lie adjacent to the
esophagogastric junction.
Recent studies have disproved the former view that lymphatic channels are present at all
levels of the lamina propria. By using careful ultrastructural techniques, lymphatics have been
demonstrated to be limited to the portion of the lamina propria immediately superficial to
the muscularis mucosae. From there, efferents penetrate the muscle and communicate with
larger lymphatic channels running in the submucosa. This arrangement implies that an early
gastric cancer may have lymphatic metastases, even though the primary tumour is entirely
superficial to the muscularis mucosae.
The lymphatic trunks of the stomach generally follow the main arteries and veins. Four areas
of drainage can be identified, each with its own group of nodes. The largest area comprises
the lower end of the oesophagus and most of the lesser curvature, which drains along the
left gastric artery to the left gastric nodes. From the immediate region of the pylorus, on the
lesser curvature, drainage is to the right gastric and hepatic nodes. The proximal portion of
the greater curvature drains to pancreatic splenic nodes in the hilum of the spleen, and the
distal portion of the greater curvature drains to the right gastroepiploic nodes in the greater
omentum and to pyloric nodes at the head of the pancreas. Efferents from all four groups
ultimately pass to celiac nodes around the main celiac axis (Human Anatomy and Physiology,
Tenth Edition, Pearson).
1.1.4 Classification of gastric cancer
Carcinomas of the stomach are morphologically heterogeneous. This heterogeneity is
reflected in the diversity of histopathological classifications available which are based on
different approaches, such as histological profile, degree of differentiation, pattern of growth,

29
and histogenesis. Several pathohistological classification systems proposed for the diagnosis
of gastric cancer based on macroscopic and/or microscopic feature. It is still controversial
as to which classification system imparts the most reliable information, and therefore, the
choice of system is varied in clinical routine. (Surgical Pathology criteria, Stanford Medicine,
Available at http://surgpathcriteria.stanford.edu/gitumours/ gastric-adenocarcinoma/).
Clinically, TNM (tumour, node, metastases) staging is far more important for prediction of
survival than any of these classifications.
1.1.4.1 Early and advanced gastric cancer
Early gastric cancer is defined as invasive cancer confined to mucosa and/or submucosa,
with or without lymph node metastases, irrespective of the tumour size (Hamilton R,
Aatonen LA. Tumours of Digestive System. Lyon: IARC; 2000:39-52). Most early gastric
carcinomas are small, measuring 2 to 5 cm in size, and often located at lesser curvature near
the angularis. Some early gastric carcinomas can be multifocal, often indicative of a worse
prognosis. 10% of early gastric cancer presents with lymph node metastases (Hu et al. 2012).
Early gastric carcinoma is divided into Type I for tumours with exophytic growth, Type II
with superficial growth, Type III with excavating growth, and Type IV for infiltrating growth
with lateral spreading (Figure 1.12) (Hu et al. 2012). Type II tumours are further divided into
IIa (elevated), IIb (flat) and IIc (depressed), as proposed by the Japanese Endoscopic Society
(Japanese Gastric Cancer 2011). A Paris classification has endorsed three gross patterns for
superficial neoplastic lesions in the gastrointestinal tract. Grossly and endoscopically,
tumours are classified as Type 0-I for polypoid growth (which is subcategorized to 0-Ip for
pedunculated growth and 0-Is for sessile growth), Type 0-II for nonpolypoid growth (which
is subcategorized into Type 0-IIa for slightly elevated growth, Type 0-IIb for flat growth, and
Type 0-IIc for slightly depressed growth), and Type 0-III for excavated growth.

30
Figure 1.12: Pathological types of early gastric cancer. A. Paris classification. B. Japanese classification.
Histologically, approximately 50-70% early gastric cancers are well differentiated, 10-30% are
poorly differentiated (Green and O'Toole 1982; Q. Huang et al. 2015). Tubular and papillary
architecture are the most common forms of well-differentiated early gastric cancer (Hu et al.
2012). The distinction between well-differentiated carcinoma and high-grade dysplasia or
carcinoma-in-situ can be challenging when only mucosal tissue is available for histologic
assessment (Hu et al. 2012). Intramucosal invasion may not be as easily confirmed as an
invasive carcinoma into submucosa where stromal desmoplasia is usually evident (Hu et al.
2012). The distinction between intramucosal carcinoma and carcinoma-in-situ or high-grade
dysplasia is important, as the intramucosal carcinoma of stomach, unlike the intramucosal
carcinoma in the colon, does metastasize (Hu et al. 2012). Generally, the useful histologic
features of intramucosal invasion are single tumour cell in the lamina propria and
significantly fused neoplastic glands of various sizes (Hu et al. 2012). Through adequate
tumour section and lymphadenectomy, the prognosis of early gastric carcinoma can reach
ever greater than 90% (Onodera et al. 2004; Suzuki et al. 2016).
Advanced gastric cancer, defined as carcinoma with muscularis propria invasion or beyond,
carries a much worse prognosis, with a 5 years survival rate at less than 60% (Hu et al. 2012).
Gastric cancer patients classified as stages II-IV (the 7th AJCC cancer staging system)
demonstrated high recurrence rates ranging from 25%-40% in an adjuvant setting, with
metastatic cases not amenable to re-resection (Cristescu et al. 2015). The distinction between
early and advanced gastric carcinoma before resection is clinically important because it helps
to decide if a neoadjuvant (pre-operative) therapy, which has shown to improve disease-free
survival (DFS) and OS, is warranted (Cunningham et al. 2006; Ychou et al. 2011). While the

31
macroscopic appearance is informative, the most accurate pre-operative staging information
is generally obtained with endoscopic ultrasonography (EUS) and computerised tomography
(CT) (Hwang et al. 2010).
1.1.4.2 Borrmann’s classification
The appearance of advanced gastric carcinomas can be exophytic, ulcerated, infiltrative or
combined (Hu et al. 2012). Endoscopic classification of advanced gastric cancer is well
known and was introduced by Borrmann in 1926 (Borrmann 1926) including 4 types: type I
for polypoid growth, type II for fungating growth, type III for ulcerating growth, and type
IV for diffusely infiltrating growth which is also referred to as linitis plastica-a signet ring cell
carcinoma involving most of gastric wall by infiltrating tumour cells. Histologically, advanced
gastric carcinoma often demonstrates marked architectural and cytological heterogeneity,
with several co-existing histologic growth patterns (Hu et al. 2012).
1.1.4.3 Cardia gastric cancer and Non-cardia gastric cancer
Anatomically, gastric cancers are classified into true gastric (non-cardia) and gastro-
oesophageal-junction cancers (cardia). Due to their differences in incidence, geographical
distribution, causes and clinical disease course, treatments for them also differ. The Siewert
classification (Figure 1.13) based on the epicentre location of tumour is widely used to
category the gastro-oesophageal-junction cancers into three types (Siewert and Stein 1998).
However, the biology difference between Siewert type II and type III gastric cancer is unclear.
The classification is also criticized by the non-specific definition of gastro-oesophageal-
junction adenocarcinoma (Demicco et al. 2011). TNM classification introduced a more
simplified categorization to aid correct anatomical classification, in which both the epicentre
and the tumour extension margin (within or beyond the gastro-oesophageal junction) are
included.

32
Figure 1.13: Schematic illustration of the modified Siewert’s classification. The distanceof the center of a tumour from anatomical cardia determines tumour type. Source: Oesophagogastric junction adenocarcinoma: which therapeutic approach (Mariette et al. 2011).
1.1.4.4 Laurén classification
Some national guidelines for the treatment of gastric cancer refer to the Laurén or the WHO
classifications regarding therapeutic decision-making (Okines et al. 2010), which underlines
the importance of a reliable classification system for gastric cancer. Currently, Laurén
(Lauren 1965) and WHO [FT Bosman, F Carneiro, RH Hruban, ND Thiese (Eds.), WHO
classification of tumours of the digestive system (4th ed.), IARC, Lyon (2010), pp. 44-58]
schemes are the most commonly used (Table 1.2).
Table 1.2: Laurén and WHO classification. Source: Pathohistological classification systems in gastric cancer: Diagnostic relevance and prognostic value (Berlth et al. 2014).
Laurén classification WHO classificationIntestinal type Papillary adenocarcinoma
Tubular adenocarcinomaMucinous adenocarcinoma
Diffuse type Signet-ring cell carcinoma and other poorly cohesive carcinomas
Indeterminate type Mixed carcinomaAdenosquamous Carcinoma

33
Squamous cell carcinomaHepatoid adenocarcinomaCarcinoma with lymphoid stromaChoriocarcinomaCarcinosarcomaParietal cell carcinomaMalignant rhabdoid tumourMucoepidermoid carcinomaPaneth cell carcinomaUndifferentiated carcinomaMixed adeno-neuroendocrine carcinomaEndodermal sinus tumourEmbryonal carcinomaPure gastric yolk sac tumourOncocytic adenocarcinoma
According to the Laurén classification, gastric carcinomas are separated into intestinal and
diffuse two main histological types presenting differences in not only in histomorphology
but also in clinical and epidemiological characteristics. Cohesiveness and glandular
differentiated malignant epithelial cells infiltrating the stroma characterize intestinal
carcinomas. Tumour cells may display varying degrees of nuclear atypia and may present
tubular, trabecular, papillary or tubular-papillary structures (Figure 1.14 A-C). According to
cellular and architectural criteria, gastric adenocarcinomas are classified as well, moderately
and poorly differentiated. A small percentage of adenocarcinomas are mixed, presenting
features of both types. Cytologically, cells are large and display cytoplasmic as well as nuclear
pleomorphism. In intestinal-type carcinoma, mitoses are frequently seen, as are
polymorphous inflammatory infiltrates.

34
Figure 1.14: Haematoxylin-eosin staining for Laurén classification of gastric cancer.A-C, Intestinal-type. Three different tumours are shown with the formation of irregular glands, tubules, and papillae. D, Mucinous adenocarcinoma, with small groups of tumour cells floating in pools of mucin. E, F, Diffuse type. Two different tumours are shown composed of non-cohesive individual cells infiltrating the stroma. Signet ring cell carcinoma (F) is formed by cells with abundant intracytoplasmic mucin and nuclei displaced to the periphery. This morphology is characteristic of this tumour type. Source: Gastric cancer: Overview, available from http://colombiamedica.univalle. Edu.co/index.php/comedica/article/view/1263/2150
In contrast, diffuse carcinomas are composed of discohesive cells that infiltrate the stroma
individually or in small groups (Figure 1.14 E-F). In some cases, the tumour may form solid
masses, but even in these cases the cells appear to be loose, with little cohesiveness and do
not form epithelial cords. Occasionally, tiny glandular lumens can be observed, formed by
cells that have no polarity and are surrounded by a diffuse infiltration of isolated tumour
cells. Infiltration of malignant cells with indistinct cytoplasm and pyknotic nuclei often

35
produces a connective tissue proliferation and a chronic, lymphocytic type of inflammation.
A variant of the diffuse histological type is the signet ring cell adenocarcinoma. By definition,
it must be predominantly composed (>50%) of signet ring cells. These cells are characterized
by abundant cytoplasmic mucin that displaces the nucleus to the periphery (Figure 1.14 F)
(Parsonnet et al. 1991).
Mucinous (colloid) adenocarcinomas may originate in adenocarcinomas of either intestinal
or diffuse types (Lauren 1965). They are rare histological subtype of undifferentiated gastric
carcinoma, accounting for approximately 2.6–6.6% of all gastric cancer cases (Kunisaki et al.
2006; Huszno et al. 2012). Mucinous gastric cancer exhibits a poorer prognosis compared to
non-mucinous gastric cancer, partly due to a more frequent incidence of advanced-stage
disease at diagnosis (Isobe et al. 2015). These tumours are composed of malignant epithelial
cells floating loose or in small groups in large mucinous areas (Figure 1.14 D). In some cases,
signet ring cells may be observed. By definition, the extracellular mucinous pools constitute
at least 50% of the tumour.
Despite its high clinical relevance, the prognosis value of Laurén’s classification remained
controversial (Goseki et al. 1992; Qiu et al. 2013). A recent systematic review and meta-
analysis which included 61,468 patients from 73 published studies, revealed that gastric
cancer patients with diffuse-type histology have a worse prognosis than those with intestinal
subgroup in all studies (HR 1.23; 95% CI, 1.17–1.29; P<0.0001). This applies to both loco-
regional confined (HR 1.21; 95% CI, 1.12–1.30; P<0.0001) and advanced disease (HR 1.25;
95% CI, 1.046–1.50; p=0.014), in both Asiatic (HR 1.2; 95% CI, 1.14–1.27; P<0.0001) and
Western patients (HR 1.3; 95% CI, 1.19–1.41; P<0.0001). Furthermore, both in those not
exposed (HR 1.15; 95% CI, 1.07–1.24; P<0.0001) or exposed (HR 1.27; 95% CI, 1.17–1.37;
P<0.0001) to (neo) adjuvant therapy. This provides important evidence for the use of
classification systems for stratification purposes in future clinical trials (Petrelli et al. 2017).
Similarly, a study enrolling 3071 patients evaluating the prognostic significance of Lauren’s
classification in gastric cancer also showed with intestinal-type gastric cancer (57.7%) had a
better 5-year OS than diffuse type (45.6%) and mixed type (43.4%, p < 0.001). Besides,
gastric cancer patients with intestinal type were older (p < 0.001), male predominant
(p < 0.001), smaller tumour size (p < 0.001), distal stomach predominant (p < 0.001),

36
relatively well differentiated (p < 0.001), less advanced Borrmann type (p < 0.001), less
scirrhous type stromal reaction(p < 0.001), less infiltrating type of Ming’s histology type
(refer to 1.1.4.6)(p < 0.001), less tumour invasion depth and less lymphovascular invasion
(p < 0.001). Lauren’s classification is an independent prognostic factor in gastric cancer
patients undergoing gastrectomy (Chen et al. 2016).
1.1.4.5 WHO classification
WHO classification includes not only adenocarcinoma of the stomach but also all other
types of gastric tumours of lower frequency (Table 1.2). The most common type of gastric
cancer is tubular adenocarcinoma, followed by papillary and mucinous types. Signet ring cell
carcinoma accounts for approximately 10% of gastric cancers and is defined by the presence
of signet ring cells in over 50% of the tumour. Patients with papillary adenocarcinoma,
mucinous adenocarcinoma were reported to experience unfavorable prognosis (Yasuda et al.
2000; Zheng et al. 2010; Kawamura et al. 2001). The Japanese classification system further
divides tubular adenocarcinoma into well-differentiated and moderately differentiated
adenocarcinoma (Japanese Gastric Cancer Association 2011).
1.1.4.6 Goseki classification (microscopic) and Ming classification (microscopic)
Prognostic-related but less common classification systems were demonstrated to correlate
with the pre-existing classification systems. Goseki et al. grading system (Goseki et al. 1992),
based on tubular differentiation and mucin secretion, was described to divide gastric cancer
into four groups, as presented in Table 1.3. Ming described the growth pattern of the lesion
and recognized two main growth patterns: the expanding growth pattern and the infiltrating
growth pattern (Table 1.4) (Ming 1977).
Table 1.3: Goseki classification. Source: Pathohistological classification systems in gastric cancer: Diagnostic relevance and prognostic value (Berlth et al. 2014).
Type Tubules Intracytoplasmic Mucin
I Well-differentiated Poor
II Well-differentiated Rich
III Poorly differentiated Poor
IV Poorly differentiated Rich

37
Table 1.4: Ming classification. Source: (Surgical Pathology criteria, Stanford Medicine. (Available athttp://surgpathcriteria.stanford.edu/gitumours/gastric-adenocarcinoma/).
In conclusion, the histotype-based classification system for gastric cancers demonstrated a
potential role as an effective tool for distinguishing patients in different clinical settings and
with distinct outcomes. However, due to the limited advantages of any one particular
classification, there’s no international consensus for research purposes. The difficulty of
assessing the prognosis of gastric cancer using histological methods is widely accepted and
this is also reflected in the essentially descriptive character of presently used classifications.
Several histotypes exhibited lower malignant potential have been identified, including
lymphocyte-rich cancer, muconodular cancer, very-well-differentiated tubular cancer with an
intestinal or gastric phenotype, and a low-grade subtype of diffuse desmoplastic cancer.
Other types of gastric cancer with poor outcome have also been identified from poorly
differentiated neuroendocrine carcinoma to anaplastic diffuse cancer or hepatoid,
chorioncarcinomatous and adenosquamous carcinoma. The different behaviour of these
histotypes led to a development of a histological grading system for prognostic evaluation,
in which low-grade or grade 1 (G1) was defined as muconodular, well-differentiated tubular,
diffuse desmoplastic and high lymphoid response (HLR); high-grade or grade 3 (G3) was
anaplastic and mucinous invasive and intermediate-grade or grade 2 (G2) was described as
ordinary cohesive, diffuse and mucinous cancers. This grading system was highly predictive
of patient outcome when applied to a large tumour series (Solcia et al. 2009; Chiaravalli et al.
2012). While for the evaluation of grade 2 ordinary cancers, which form a very large,
histologically heterogeneous group with a wide prognostic spectrum, carefully assessed stage,
other common histological parameters (invasive pattern, proliferative rate, structural or
cytological atypia, tumour cell phenotype) or a variety of promising molecular tools are
crucial for appropriate clinical decisions (Chiaravalli et al. 2012).
Type DescriptionExpanding type Infiltrating cohesive cell aggregates
Infiltrating typeDiffuse permeative infiltration by single noncohesive
cells or individual glandsUnclassified

38
1.1.4.7 Molecular classification
1.1.4.7.1 The classification system proposed by TCGA
The latest results from gastric cancer molecular subtype studies indicate that it might be
useful to integrate genomic and proteomic-based features of gastric cancer into the
classification systems to establish prognostic relevance (Berlth et al. 2014; Wong et al. 2014).
Several whole genome projects were carried out to develop a biologic classification scheme
helping guide patient therapy. TCGA research network published the results of full genomic
profiling of 295 primary gastric adenocarcinomas in 2014 (Cancer Genome Atlas Research
2014), which ushered in an era of precision medicine of gastric cancer with strong genetic–
clinical association.
Through complex statistical analyses, four tumour subgroups were identified: positive for
Epstein-Barr virus (EBV, 9%), microsatellite unstable tumours (MSI, 22%), genomically
stable tumours (GS, 20%), and chromosomally instability tumours (CIN, 50%). Correlation
with histological characteristics revealed enrichment of the diffuse subtype in the
genomically stable group (73%) (Figure 1.15). The frequency of chromosomally unstable
tumours was increased in gastro-oesophageal-junction adenocarcinomas, and most tumours
positive for Epstein-Barr virus were located in the fundus or body of the stomach. Finally,
tumours positive for this virus were mostly found in men (81%), but the predominance of
microsatellite unstable tumours slightly favored women (56%) (Figure 1.16).
EBV subtype Deregulated pathways and candidate drivers of each distinct classes of gastric
cancer were identified underlining the possibility of customized treatment and determination
of prognosis. EBV-positive tumours harbor a high CpG island methylator phenotype CIMP)
and exhibit a strong predilection for PIK3CA mutations and ARID1A mutations. All EBV-
positive tumours assayed displayed CDKN2A (p16INK4A) promoter hypermethylation but
lacked the MLH1 hypermethylation characteristic of (MSI-associated tumours in line with
previous studies (Bernal et al. 2012). EBV-positive tumours also show amplification of
immune stimuli related kinase JAK2, and immunosuppressant proteins: PD-L1 and PD-L2,
suggesting that PD-L1/2 antagonists and JAK2 inhibitors be tested in this subgroup (Cancer
Genome Atlas Research 2014).

39
Figure 1.15: Differences in clinical and histological characteristics among subtypes.A Flowchart outlines how tumours were classified into molecular subtypes. B, Epstein–Barr virus (EBV)-positive (red), microsatellite instability (MSI, blue), genomically stable (GS, green) and chromosomal instability (CIN, light purple) and ordered by mutation rate. The plot of patient age at initial diagnosis shows the median, 25th, and 75th percentile values (horizontal bar, bottom and top bounds of the box), and the highest and lowest values within 1.5 times the interquartile range (top and bottom whiskers, respectively). GE, gastroesophageal. Source: Comprehensive molecular characterization of gastric adenocarcinoma (Cancer Genome Atlas Research 2014).
MSI subtype tumours showed elevated mutation rates and hypermethylation (including
hypermethylation at the MLH1 promoter). Mutations in the top ten significantly mutated
genes, including TP53, KRAS, ARID1A, PIK3CA, ERBB3, PTEN, HLA-B, RNF43, B2M,
and NF1. B2M resulted in loss of expression of HLA class 1 complexes (Bernal et al. 2012),

40
suggesting an impair in reducing antigen presentation to the immune system (Cancer
Genome Atlas Research 2014).
Figure 1.16: Key features of gastric cancer molecular subtypes. As proposed by TCGA. This schematic lists some of the salient features associated with each of the four molecular subtypes of gastric cancer. Distribution of molecular subtypes in tumours obtained from distinct regions of the stomach is represented by inset charts. Epstein–Barr virus (EBV)-positive (red), microsatellite instability (MSI, blue), genomically stable (GS, green) and chromosomal instability (CIN, light purple) (Cancer Genome Atlas Research 2014).
CIN subtype Phosphorylation of EGFR (Py1068) was significantly elevated in the CIN
subtype, consistent with amplification of EGFR within that subtype. Elevated expression of
p53 was also consistent with frequent TP53 mutation and aneuploidy in the CIN subtype
(Cancer Genome Atlas Research 2014). Suppressed cytokines such as IL1B, IL2, IL3, IL21,
IL27, and INFG were found in CIN suggesting that high copy-number alteration may play
roles in cancer immunity by suppressing activation of immune cells (Sohn et al. 2017).
GS subtype CDH1 somatic mutations (37% of cases) and ras homolog family member A
(RHOA) mutations were almost exclusively enriched in the genome stable subtype. Analysis

41
of base changes’ patterns within gastric cancer revealed elevated rates of C to T transitions
at CpG dinucleotides and A to C transversions at the 3′ adenine of AA dinucleotides,
especially at AAG trinucleotides. In agreement with a prior study, the A to C transversions
were prominent in CIN, EBV and genome stable gastric cancers, not in MSI tumours (Dulak
et al. 2013).
The clinical utility of molecular classification has been reported recently. The EBV subtype
was associated with the best prognosis, for both DFS (P=0.006 by the log-rank test) and OS.
The genomically stable (GS) subtype was associated with the worst prognosis. Patients with
the MSI and CIN subtypes had a moderate prognosis. Patients with the CIN subtype
exhibited the greatest benefit from adjuvant chemotherapy (either single-agent 5-fluorouracil
(5FU) or a combination of 5FU and cisplatin/oxaliplatin, doxorubicin, or paclitaxel), as
evidenced by significantly increased DFS rates. The 3-year DFS rate was 58.7% for those
who received chemotherapy, compared with 33.5% for those who did not. The hazard ratio
(HR) for recurrence among those who received adjuvant chemotherapy was 0.39 (95% CI,
0.16–0.94, p=0.03). However, no benefit from adjuvant chemotherapy was observed among
patients with the GS subtype. Activated transcription regulator NUPR1 may be blamed for
chemoresistance (Vincent et al. 2012; Chowdhury et al. 2009). Patients with the MSI subtype
showed only moderate benefit from adjuvant chemotherapy. The benefit of adjuvant
chemotherapy could not be assessed for patients with the EBV subtype because all patients
received chemotherapy (Sohn et al. 2017).
1.1.4.7.2 The classification system proposed by ACRG
Similarly, the Asian Cancer Research Group (ACRG) (Cristescu et al. 2015) also proposed a
four-subgroup classification system associated with distinct genomic alterations, disease
progression, and prognosis across multiple gastric cancer cohorts, including microsatellite
stable with epithelial-to-mesenchymal transition features (MSS/EMT), MSS with mutant
type of TP53 (MSS/TP53+), and MSS with wild-type TP53 (MSS/TP53–).
MSI tumours (22.7%), with a parallel distribution ratio as the analysis from TCGA (22%),
were hyper-mutated intestinal-subtype tumours (>60%) predominantly occurring in the
antrum; diagnosed at clinical stage I/II (>50%). MSI tumours had the best prognosis; their

42
recurrence rate (22%) after surgical resection of primary GC was the lowest among all 4
subtypes.
MSS/EMT subtype The MSS/EMT (15.3%) and MSI distribution outliers exhibited a
mutually exclusive pattern. MSS/EMT subtype occurred at a significantly younger age than
did other subtypes. The majority (>80%) of the subjects in this subtype were diagnosed with
diffuse-type at stage III/IV. The MSS/EMT subtype also had the worst prognosis and the
highest recurrence rate (63%), with recurrences located mostly in the peritoneal cavity. CDH1
mutations were highly prevalent (37%) in the TCGA Genome Stable (GS) subtype but were
infrequent in the ACRG MSS/EMT subtype (2.8%).
For the remaining tumours, a two-gene (CDKN1A [also known as p21] and MDM2) p53-
activity signature was applied to reflect p53-activity. The signature shows a high score in
tumours with intact p53 activity (26.3%) and a low score in tumours with the p53 functional
loss (35.7%). Further analysis revealed a significant association between the p53 activity
signature and p53 mutation status. The MSS/p53− subtype showed the highest prevalence
of p53 mutations (60%), with recurrent focal amplifications in ERBB2, EGFR, Cyclin E1
(CCNE1), Cyclin D1 (CCND1), MDM2 and MYC and a corresponding increased mRNA
and protein levels of EGFR and ERBB2; By contrast the MSS/p53+ subtype showed a
relatively higher prevalence (compared to MSS/p53−) of mutations in APC, ARID1A,
KRAS, PIK3CA, and SMAD4. MSS/p53+tumours which were found to be correlated with
EBV infection and had the second-best prognosis, followed by MSS/p53-tumours. Whereas
the p53 signature is associated with survival in the MSS non-EMT subtype, neither p53
mutation status nor tumour proliferation signature alone significantly predicts survival. A
more recent project from Japan, employing ACRG classification to categorize patients with
gastric cancer using p53 tumour-specific single nucleotide mutation, found that the patients
were significantly younger in EMT. The undifferentiated type was significantly dominant in
MSI. There was no statistically significant difference in tumour depth, lymph node metastasis,
or tumour stage among the groups. Two-year cause-specific survival (CSS) rates were 95.5%
in MSI, 49.9% in EMT, 65.5% in p53+, and 78.5% in p53- (P=0.048). Although the follow-
up period was insufficient, CSS was worse in p53+ than in p53-tumours (Ahn et al. 2017).
These two newly classification system delineated the molecular signatures associated with
distinct clinical outcomes and potential therapeutic implications. Currently, the antitumour

43
efficacy of a molecularly targeted agent is tested in all gastric cancer types regardless of
molecular subtypes both in preclinical and clinical trials. Molecular screening and therapeutic
development according to gastric cancer molecular classifications may help to stratify
patients. (Cancer Genome Atlas Research 2014).
1.1.5 Pathology of gastric cancer
The morphological heterogeneity of gastric carcinomas is also reflected by the frequent
occurrence of two or more distinct components in individual cases (Caldas et al. 1999). The
classical classification system Laurén’s criteria, introduced in 1965, and remains currently
widely accepted and employed, since it constitutes a simple and robust classification
approach (Lauren 1965). As discussed in the previous section, intestinal and diffuse gastric
cancers exhibit a number of distinct clinical and molecular characteristics, including
histogenesis, cell differentiation, epidemiology, aetiology, carcinogenesis, biological
behaviours, and prognosis.
Carcinogenesis of intestinal gastric cancer
It is believed that a multistep cascade model for the development of intestinal-type gastric
adenocarcinoma consists of a sequential precancerous process of with the following well-
recognized steps progression from chronic superficial (non-atrophic) gastritis (chronic active
inflammation), to chronic atrophic gastritis (gland loss) to intestinal metaplasia, followed by
dysplasia and finally, gastric adenocarcinoma(Figure 1.17)(Lauren 1965; Correa 1992). It
is generally recognized that the process starts during childhood, triggered by the infection
with H. pylori, and advances slowly through the years, eventually leading in a few patients,
after several decades, to invasive carcinoma (Correa and Piazuelo 2011). This chronic
inflammation could induce higher levels of inducible nitric oxide synthase and spermine
oxidase, enzymes involved in nitrosative and oxidative stress that permanently alter the DNA
molecules of the gastric epithelial cells, such as p53 mutation and deficiency in mismatch
repair genes. Another hypothesis postulates that host innate immune response such as bone
marrow-derived cells contribute to the development of gastric cancer in the Helicobacter-
infected gastric mucosa. Experiments in mice reconstituted with labeled bone marrow and
infected with H. felis (the mouse-adapted Helicobacter species) demonstrated that bone
marrow-derived cells travel to, and engraft in, gastric mucosa with chronic inflammation and

44
progress to adenocarcinoma (Peek et al. 2010). At the same time, the host genetic
susceptibility cannot be ignored. Important advances include investigations of
polymorphisms in genes associated with the immune response to H. pylori infection, mainly
in IL-1B, IL1RN, TNF, and IL10. IL-1β is a proinflammatory cytokine and a potent inhibitor
of gastric acid secretion (El-Omar 2001). It has been hypothesized that profound
suppression of acid secretion promotes dissemination of H. pylori proximally to the corpus,
leading to a more extensive and severe gastritis that may favor the development of atrophy
and subsequently cancer (El-Omar 2001).
Figure 1.17: Haematoxylin-eosin staining for Correa’s precancerous cascade in gastric cancer. A,Normal gastric mucosa. B, Non-atrophic chronic gastritis. The abundant inflammatory infiltrates in lamina propria with well-preserved glands observed in the deeper half of the mucosa. C, Multifocal atrophic gastritis without intestinal metaplasia. Marked loss of glands, with a prominent inflammatory,infiltrate and proliferation of fibrous tissue in the lamina propria. D, Intestinal metaplasia, complete type. Goblet cells alternating with absorptive enterocytes that present well-developed brush border. E, Intestinal metaplasia, incomplete type. Goblet cells alternating with columnar cells that contain mucin droplets of variable sizes. F, Dysplasia. Epithelium with high-grade dysplasia (lower half of the photograph) occurring in a background of incomplete metaplasia (observed in the foveolar superficial epithelium). (H&E; original magnification: A-C x100; D-F x200). Source: Gastric Cancer: Overview, available from http://colombiamedica.univalle.edu.co/index.php/comedica/article/view/1263/2150
Carcinogenesis of diffuse gastric cancer

45
Diffuse-type adenocarcinomas do not show gender predominance, tend to develop in
younger subjects, have a poorer prognosis than the intestinal-type tumours, and are more
frequently located in the proximal stomach than in the distal stomach. Although
environmental factors seem to play a less important role than in the intestinal-type tumours,
H. pylori infection is also associated with the development of diffuse-type adenocarcinomas
(Gong et al. 2018; Kwak et al. 2014; Correa and Piazuelo 2012; Watanabe et al. 2012;
Tatemichi et al. 2008; Parsonnet et al. 1991; Marshall and Warren 1984). H. pylori-induced
inflammation activity has been shown to be well correlated with serum Hp-IgG or
pepsinogen II levels (Biasco et al. 1993; Plebani et al. 1996; Tu et al. 2014; Hsu et al. 1997;
Tatemichi et al. 2008). In a recent study, the proportion of diffuse-type gastric cancers
increased with higher Hp-IgG titre groups only among the non-smokers, and more patients
with intestinal-type gastric cancer had histories of smoking than those with diffuse-type
gastric cancer (Kwak et al. 2014). This could be partly explained by the hypothesis that
intestinal-type gastric cancer is more likely related to environmental factors than diffuse-type
gastric cancer (Chen et al. 2016). (Table 1.5)Table 1.5: The comparison between the intestinal and diffuse type of gastric cancer.Summarized from the review: Laurén classification and individualized chemotherapy in gastric cancer (Ma et al. 2016).
CharacteristicsLaurén classification type
Intestinal gastric cancer Diffuse gastric cancer
Clinical commonly in elderly male patients commonly in younger female patients
usually affects the gastric antrum usually affects the stomach body
exhibits a longer course and better prognosis
presents shorter duration and worse prognosis
Pathological with exitence of adhesion lacking adhesion and infiltrate the stroma as single cells or small subgroups, leading to a population of non-cohesive, scatteredtumour cells
arranged in tubular or glandular formations
Intracellular mucus may push the nucleus of the cell aside to form signet-ring cell carcinoma.
Associated with intestinal metaplasia without easily recognized precursor lesions
associated with lymphatic or vascular invasion
Peritoneal metastasis of diffuse gastric cancer

46
lesions are scattered in distant positions
Epidemiological more prevalent in high-risk areas more prevalent in low-risk areas
Etiology and Pathogenesis
associated with environmental factors
presents a genetic etiology
share common dietary and environmental risk factors
atrophic gastritis, intestinalmetaplasia
gastritis
involves DNA methylation (such as CDH1), histone modifications and chromosome recombination(Yamamoto et al. 2011)
Genetic factors CTNNB1 (the gene encoding β-catenin) mutation 17-27%
K-ras mutation 0-18% in both histological types
Amplifications of the ERBB2
p53 mutations (36-43%) p53 mutations (0-21%)
Somatic mutations of E-cadherin (in 33-50% sporadic diffuse-type gastric cancer)
Laurén’s classification has, nevertheless, several drawbacks. The first concerns the existence
of a fairly large group of tumours which do not fit within the two major types. This group
of “unclassified” or “indeterminate” gastric cancer includes undifferentiated (solid)
carcinomas, as well as carcinomas exhibiting a dual pattern of differentiation (mixed
intestinal and diffuse). The solid carcinomas display a clinicopathological profile similar to
that of glandular (intestinal) carcinomas, thus supporting the assumption that they could be
considered as a solid variant of intestinal carcinoma. Another drawback to Laurén’s
classification concerns the confusion linked to the term “intestinal”. This led to the proposal
of a modification of Laurén’s classification which recognizes four main types of gastric
cancer: glandular, isolated cell type, solid, and mixed carcinoma (Caldas et al. 1999). The
importance of distinguishing two main histopathological types of gastric cancer, one with a
diffuse component (isolated cell and mixed types) and one without a diffuse component
(glandular/intestinal and solid types), is highlighted by finding somatic E-cadherin mutations
exclusively in the first group (Muta et al. 1996; Tamura et al. 1996; Machado et al. 1999).

47
Features of gastric mucosa at the periphery of sporadic gastric carcinomas are in keeping
with these two histogenetic pathways. Chronic atrophic gastritis and intestinal metaplasia are
significantly more frequent at the periphery of glandular (intestinal) carcinomas and there is
a higher prevalence of foveolar hyperplasia at the mucosa overlying or at the periphery of
isolated cell type (diffuse) carcinomas (Carneiro et al. 1994).
Mixed stomach carcinomas, regardless of displaying a predominantly intestinal (glandular),
or a predominantly diffuse (isolated cell) pattern, do carry, in a multivariate analysis, a
significantly worse prognosis than the main types of Laurén’s classification (intestinal, diffuse
and unclassified/solid types) (Carneiro et al. 1995).
1.1.6 Diagnosis and staging of gastric cancer
Diagnosing gastric cancer in its early stages is a difficult task. Symptoms do not appear until
the lesion reaches late stages of development and are generally non-specific (Caldas et al.
1999). When the diagnosis of gastric carcinoma is established, it is at an incurable advanced
stage (stage III or IV) in over two-thirds of cases in non-endemic regions. In endemic regions
such as Japan, which use mass screening protocols, a higher rate of diagnosis of early-stage
gastric cancers has been observed for the past two decades (Yoshida and Saito 1996). Survival
after early gastric cancer is much better than advanced lesions, so identifying these lesions at
the earliest of stages is imperative for optimal survival. There are several conditions/lesions
of the stomach, such as chronic atrophic gastritis, intestinal metaplasia,
dysplasia/intraepithelial neoplasia, generally recognized as precancerous with varying
degrees of risk but, excluding dysplasia, routine interval surveillance examinations such as
endoscopy are not routinely performed in these conditions (The American Society for
Gastrointestinal Endoscopy 1988, Dinis-Ribeiro et al. 2012).
The most common symptoms at diagnosis of gastric cancer are anorexia, dyspepsia, weight
loss, and abdominal pain. Patients with tumours at the gastro-oesophageal junction or
proximal stomach may also present with dysphagia.
The diagnosis of gastric cancer relies on endoscopy and biopsy. For locally advanced gastric
cancer, EUS and CT of the chest and abdomen are currently the primary means of staging.
Laparoscopy is used to exclude small-volume peritoneal metastatic disease. A meta-analysis

48
showed that the sensitivity and specificity of EUS could discriminate between T1–T2
(superficial) and T3–T4 (advanced) gastric carcinomas, with a sensitivity of 86% (95% CI
81%-90%). The sensitivity values for diagnosis of superficial tumours (T1a vs T1b) and
lymph node status (positive vs negative) were 87% (81%-92%) and 83% (79%-87%),
respectively (Mocellin and Pasquali 2015).
EUS is useful in the preoperative diagnosis of T stage for selecting limited treatments, such
as laparoscopic proximal gastrectomy (LPG), which lacks the ability to palpate the tumour.
The tumour size may be underestimated if tumours are located in the upper third of the
stomach and are more histologically diffuse, scirrhous, with infiltrative growth, and more
frequent lymphatic and venous invasion. It is suggested that gastric cancer in the upper third
of the stomach with diffuse-type histology and >20 mm needs particular attention when
considering the application of LPG (Van Cutsem et al. 2016).
PET-CT (positron emission tomography [PET]) and MRI are not routinely used for staging
in gastric cancer, although growing evidence suggests that PET-CT could improve staging
through increased detection of involved lymph nodes and metastatic disease. These tests,
however, are not always informative, especially in patients with mucinous tumours, as they
might under stage the disease (Van Cutsem et al. 2016; Altini et al. 2015; Waddell et al. 2014).
A role for MRI also seems to be emerging, especially for the detection of peritoneal
metastases. Intraperitoneal metastases are common in people with gastric or gastro-
oesophageal-junction carcinomas and are difficult to diagnose with conventional imaging
methods.
Laparoscopic staging, with or without peritoneal lavage for malignant cells, remains
controversial, but expert groups recommend this approach in patients with potentially
curable gastric or gastro-oesophageal-junction carcinomas (Waddell et al. 2014; Van Cutsem
et al. 2008). Peritoneal lavage showing positive cytology, in the absence of macroscopic
peritoneal metastases, is associated with poor survival and is defined as metastatic disease
(Mezhir et al. 2011). Serosal infiltration is a strong indicator of peritoneal carcinomatosis,
which develops in up to 60% of patients with gastric cancer (Nakamura et al. 1992).
The staging system most often used for gastric cancer is the AJCC TNM system, which is

49
based on tumour size (T), number of lymph node involved (N), metastasis to distant sites
(M). TNM classification and the corresponding staging is crucial to ensure that appropriate
interventions are selected, and for monitoring outcomes. According to guidelines from the
American Cancer Society, pathologic stage (pStage, also called the surgical stage) is
determined by examining tissue removed during an operation. If surgery is not possible, the
cancer will be given a clinical stage (cStage) instead, which is based on the results of a physical
exam, biopsy, and imaging tests. The clinical stage will be used to help plan treatment, but it
may not predict the patient’s outlook as accurately as a pathologic stage, due to the difficulty
in accurately staging tumour thickness and nodal status.
Staging and TNM classification of gastric cancer according to the most recent American
Joint Committee on Cancer (AJCC) system 8th edition of the guidelines and staging manual
is listed in Table 1.6 (Gastric cancer Stages, available at https://www.cancer.org/
cancer/stomach-cancer/detection-diagnosis-staging/staging.html).
With the development of neoadjuvant chemotherapy in gastric cancer (see details below), a
new concept of post neoadjuvant pathological stage (ypTNM or ypStage) is introduced.
ypStage represents the combination of tumour status and its response to preoperative
therapy; pStage does not incorporate tumour treatment response. This new ypStage system
was created based on the National Cancer Database (NCDB), which included a relatively
small number of patients treated with preoperative therapy (<700) with a short median
follow-up (23 months); therefore, additional studies from more cancer centers that utilize
preoperative therapy are needed (Ikoma et al. 2018).
Table 1.6: Pathologic stage. It is determined by examining tissue removed during an operation. Source: Gastric cancer Stages, American Cancer Society, available at https://www.cancer.org /cancer/stomach-cancer/detection-diagnosis-staging/staging.html. The T categories are described in the table below, except for TX: the main tumour cannot be assessed due to lack of information. T0: No evidence of a primary tumour. The N categories are described in the table below, except for NX: Regional lymph nodes cannot be assessed due to lack of information. AJCC Stage Stage grouping Stage description
0 Tis N0 M0 There is high-grade dysplasia (very abnormal-looking cells) in the stomach lining OR there are cancer cells only in the top layer of cells of the mucosa (innermost layer of the stomach) and have not grown into deeper layers of tissue such as the lamina propria (Tis). This stage is also known as carcinoma in situ (Tis). It has not spread to nearby lymph nodes (N0) or distant sites (M0).
IA T1 N0 M0 The tumour has grown from the top layer of cells of the

50
mucosa into the next layers below such as the lamina propria, the muscularis mucosa, or submucosa (T1). It has not spread to nearby lymph nodes (N0) or to distant sites (M0).
IB T1 N1 M0 The cancer has grown from the top layer of cells of the mucosa into the next layers below such as the lamina propria, the muscularis mucosa, or submucosa (T1) AND it has spread to 1 to 2 nearby lymph nodes (N1). It has not spread to distant sites (M0).
T2 N0 M0 The cancer is growing into the muscularis propria layer (T2). It has not spread to nearby lymph nodes (N0) or to distant sites (M0).
IIA T1 N2 M0 The cancer has grown from the top layer of cells of the mucosa into the next layers below such as the lamina propria, the muscularis mucosa, or submucosa (T1) AND it has spread to 3 to 6 nearby lymph nodes (N2). It has not spread to distant sites (M0).
T2 N1 M0 The cancer is growing into the muscularis propria layer (T2) and it has spread to 1 to 2 nearby lymph nodes (N1) but not to distant sites (M0).
T3 N0 M0 The cancer is growing into the subserosa layer (T3). It has not spread to nearby lymph nodes (N0) or to distant sites (M0).
IIB T1 N3a M0 The cancer has grown from the top layer of cells of the mucosa into the next layers below such as the lamina propria, the muscularis mucosa, or submucosa (T1) and it has spread to 7 to 15 nearby lymph nodes (N3a). It has not spread to distant sites (M0).
T2 N2 M0 The cancer is growing into the muscularis propria layer (T2) and it has spread to 3 to 6 nearby lymph nodes (N2). It has not spread to distant sites (M0).
T3 N1 M0 The cancer is growing into the subserosa layer (T3) and it has spread to 1 to 2 nearby lymph nodes (N1) but not to distant sites (M0).
T4a N0 M0 The tumour has grown through the stomach wall into the serosa, but the cancer hasn’t grown into any of the nearby organs or structures (T4a). It has not spread to nearby lymph nodes (N0) or to distant sites (M0).
IIIA T2 N3a M0 The cancer is growing into the muscularis propria layer (T2) AND it has spread to 7 to 15 nearby lymph nodes (N3a). It has not spread to distant sites (M0).
T3 N2 M0 The cancer is growing into the subserosa layer (T3) and it has spread to 3 to 6 nearby lymph nodes (N2). It has not spread to distant sites (M0).
T4a N1 M0 The cancer has grown through the stomach wall into the serosa, but it has not grown into any of the nearby organs or structures (T4a). It has spread to 1 to 2 nearby lymph nodes (N1) but not to distant sites (M0).
T4a N2 M0 The cancer has grown through the stomach wall into the serosa, but it has not grown into any of the nearby organs or structures (T4a). It has spread to 3 to 6 nearby lymph

51
nodes (N1) but not to distant sites (M0).T4b N0 M0 The cancer has grown through the stomach wall and into
nearby organs or structures (T4b). It has not spread to nearby lymph nodes (N0) or to distant sites (M0).
IIIB T1 N3b M0 The cancer has grown from the top layer of cells of the mucosa into the next layers below such as the lamina propria, the muscularis mucosa, or submucosa (T1) and it has spread to 16 or more nearby lymph nodes (N3b). It has not spread to distant sites (M0).
T2 N3b M0 The cancer is growing into the muscularis propria layer (T2) and it has spread to 16 or more nearby lymph nodes (N3b). It has not spread to distant sites (M0).
T3 N3a M0 The cancer is growing into the subserosa layer (T3) and it has spread to 7 to 15 nearby lymph nodes (N3a). It has not spread to distant sites (M0).
T4a N3a M0 The cancer has grown through the stomach wall into the serosa, but it has not grown into any of the nearby organs or structures (T4a) and it has spread to 7 to 15 nearby lymph nodes (N3a). It has not spread to distant sites (M0).
T4b N1 M0 The cancer has grown through the stomach wall and into nearby organs or structures (T4b). It has spread to 1 to 2 nearby lymph nodes (N1) but not to distant sites (M0).
T4b N2 M0 The cancer has grown through the stomach wall and into nearby organs or structures (T4b). It has spread to 3 to 6 nearby lymph nodes (N1) but not to distant sites (M0).
IIIC T3 N3b M0 The cancer is growing into the subserosa layer (T3) and it has spread to 16 or more nearby lymph nodes (N3b). It has not spread to distant sites (M0).
T4a N3b M0 The cancer has grown through the stomach wall into the serosa, but it has not grown into any of the nearby organs or structures (T4a) and it has spread to 16 or more nearby lymph nodes (N3b). It has not spread to distant sites (M0).
T4b N3a M0 The cancer has grown through the stomach wall and into nearby organs or structures (T4b) and it has spread to 7 to 15 nearby lymph nodes (N3a). It has not spread to distant sites (M0).
T4b N3b M0 The cancer has grown through the stomach wall and into nearby organs or structures (T4b) and it has spread to 16 or more nearby lymph nodes (N3b). It has not spread to distant sites (M0).
IV Any T Any N M1 The cancer can grow into any layers (Any T) and might or might not have spread to nearby lymph nodes (Any N). It has spread to distant organs such as the liver, lungs, brain, or the peritoneum (the lining of the space around the digestive organs) (M1).
1.1.7 Treatment of gastric cancer
Treatment of gastric cancer depends on the TNM classification and staging which reflect
both the primary site of cancer started and its pattern of growth and metastasis. Despite

52
invading the wall of the stomach and nearby organs, the stomach has a very rich network of
lymph vessels and nodes, and the biological factors determine that gastric cancers spread
easily through the lymph vessels and nearby lymph nodes. As gastric cancer becomes more
advanced, it can travel through the bloodstream and metastasize to organs such as the liver,
lungs, and bones, which make it harder to treat.
1.1.7.1 Surgery
Adequate surgical resection is the only therapeutic option with an intention to cure for gastric
cancer (Ikoma et al. 2018). Endoscopic resection might be suitable as an alternative to surgery
for small well-differentiated early-stage tumours (T1a). The extent of surgery is determined
by tumour stage, diameter, location, and histological type. Adequate surgery in the stomach
is defined as complete resection of primary cancer with tumour-free surgical margins of at
least 4 cm and adequate lymphadenectomy (Van Cutsem et al. 2016). These requirements
correspond to total gastrectomy for gastric cancers with signet-ring cells (linitis plastica), and
those located in the upper third of the stomach or with atrophic gastritis. Cancer in the lower
two-thirds of the stomach can often be treated with subtotal gastrectomy. At least 16 lymph
nodes should be removed to enable adequate tumour staging and ensure optimum surgical
resection (Van Cutsem et al. 2016). Although there is no worldwide consensus on the degree
of lymphadenectomy, the D2 lymphadenectomy (perigastric [D1] plus coeliac artery and its
branches) is generally recommended if the associated postoperative morbidity and mortality
rates are acceptably low—for instance, in high-volume hospitals with experienced surgeons
(Songun et al. 2010; Van Cutsem et al. 2016). This approach, together with the improved
methods for staging, increased use of adjuvant and neoadjuvant therapies, and centralization
of surgery has contributed to improved cure rates in various registries and studies, from 30%
to up to 55% in the past decade.
Transabdominal total gastrectomy is the standard surgical approach to treat patients with
Siewert type II or III cancer of the gastro-oesophageal junction. This procedure is extended
with a transhiatal resection of the distal esophagus and lymphadenectomy of the lower
mediastinum and the abdominal D2 nodal compartment. A thoracoabdominal approach in
these patients can increase the risk of morbidity without improving survival and, therefore,
is not usually recommended to treat cardia (type II) or subcardia (type III) gastric cancers

53
(Van Cutsem et al. 2016; Sasako et al. 2006).
Early gastric cancer is limited to the mucosa or submucosa (pathologically staged as T1 or
lower), regardless of nodal status. Even in early gastric cancer, use of a multidisciplinary
approach to determine the best therapeutic strategy (i.e., endoscopic or surgical resection) is
mandatory because lymph-node metastases occur in up to 20% of patients and correlate well
with tumour penetration of the stomach wall and large tumour diameter (Dinis-Ribeiro et al.
2012; Wang et al. 2014).
Endoscopic versus surgical management of early gastric cancer has not been studied in
randomized clinical trials, but surgical resection is viewed as the gold standard and is
associated with 5-year recurrence-free survival of up to 98% (Youn et al. 2010). For mucosal
gastric carcinoma (T1a), endoscopic resection is deemed sufficient in all European guidelines
because the incidence of the lymph-node metastatic disease is very low. For patients with the
early disease but suspected or histologically proven lymph-node metastasis, endoscopic
resection should not be attempted, If the histopathological findings confirm a submucosal
carcinoma (T1b) after endoscopic resection, surgical resection that includes systematic
lymphadenectomy is recommended, because lymph-node involvement is seen in up to 20%
of these patients. Endoscopic resection of early gastric cancer should be done as a complete
en-bloc resection to allow full histological assessment of the lateral and basal margins (Van
Cutsem et al. 2008; Moehler et al. 2015). Patients who have endoscopic resection should be
monitored frequently by endoscopic surveillance.
Most patients with locally advanced gastric cancer, which invades the muscularis propria and
beyond (pathologically staged as T2 or higher), present with metastases in lymph nodes,
distant organs, or both. Locally advanced gastric cancer may need total resection of involved
structures. Prophylactic splenectomy is discouraged because it increases the risk of operative
morbidity and mortality without any survival benefit but might be necessary if the spleen or
its hilar lymph nodes are affected. Only patients without metastatic disease are potential
candidates for surgical management with curative intent, although selected patients with
peritoneal carcinomatosis or positive peritoneal cytology might benefit from aggressive
surgery in expert centers (Sano et al. 2004). Cytoreductive surgery with hyperthermic
intraperitoneal chemotherapy for prevention and treatment of peritoneal carcinomatosis

54
from gastric cancer was reported to be associated with improved OS at 1, 2, and 3 years, but
not at 5 years in a meta-analysis (Coccolini et al. 2014). However, better designed randomized
clinical trials with robust methods are needed to confirm the potential benefits of this
approach (Van Cutsem et al. 2016).
Minimally invasive surgery by laparoscopy has been gradually accepted in surgical oncology
over the past decade. Laparoscopic distal gastrectomy compared with open surgery was
associated with similar lymph-node dissection and long-term survival and with reduced
intraoperative blood loss, postoperative complications, analgesic consumption, and length of
hospital stay (Zeng et al. 2012). Well-designed randomized clinical trials with robust methods,
a precision evaluation of preoperative stage and a comprehensive understanding of the
biological behavior of gastric cancer may be required for better selection of adequate patients
who can benefit from laparoscopic gastrectomy.
1.1.7.2 Radiotherapy
Ionizing radiation (IR) introduces overwhelming genetic lesions in the DNA of irradiated
cells, causing cell death. Currently, adjuvant radio-chemotherapy is recommended in patients
with loco-regionally advanced carcinoma of the gastro-oesophageal junction (T2N1-3M0 or
T3N0-3M0) (Zeng et al. 2012). For patients with ≥Stage IB gastric cancer who have
undergone surgery without administration of preoperative chemotherapy (e.g. due to
understaging before the initial decision for upfront surgery), postoperative
chemoradiotherapy (CRT) or adjuvant chemotherapy is recommended (Smyth et al. 2016).
Although, radiotherapy is proven to be tolerated, improves the resectability of the tumour,
and does not increase the frequency of surgical complications. Off-target effects remain a
serious burden on patients receiving radiation therapy. The lungs are one of the most
sensitive organs to radiation, and chest radiation has a high chance of leading to radiation-
induced lung injury. For unresectable gastric cancer, radiotherapy is justified in cases with
anaemia, and/or in the cases with pyloric or cardiac obstruction (Sitarz et al. 2018). A recent
meta-analysis demonstrated that more than two-thirds of patients receiving palliative
radiotherapy would have a clinical benefit. Low biological equivalent dose (<39Gy regimens)
can be adequate for symptom palliation, such as diminishing bleeding and/or improving the
food passage. Toxicity rates appear acceptable for patients treated with palliative radiotherapy

55
alone. The optimal dose fractionation regimen for symptom palliation remains unclear. The
effect is usually short (3–6 months), but it is an easy therapeutic option. Prospective studies
to determine the effects of palliative gastric palliative radiotherapy on health-related quality
of life outcomes are still warranted (Tey et al. 2017).
1.1.7.3 Chemotherapy
No further treatment is usually needed after surgery for stage 0, or IA gastric cancer.
However, for management of locally advanced disease, especially for patients with T3, T4,
or node-positive tumours, adjuvant and neoadjuvant therapies are recommended. There is
improved DFS and OS in patients who have undergone adequate complete surgical resection
(R0) of locally advanced gastric cancer by eradicating microscopic disease locoregionally and
at a distance from the primary tumour (Lutz et al. 2012; Van Cutsem et al. 2011; Cunningham
et al. 2006).
Single-agent activity of many classical drugs was tested in advanced gastric cancer before the
1980s. Complete responses with single-agent therapy are uncommon, and partial responses
ranged from 10-20%, followed by a short time period to disease progression (Table 1.7).
Table 1.7: Single-agent activity in advanced gastric cancer. Agents that have obtained more than
10% response rate. Source: Chemotherapy for gastric cancer (Sastre et al. 2006).
Agents Response rate (%)Mitomycin C 30Doxorubicin 17Epirubicin 19Cisplatin 19BCNU 185FU 21
Etoposide (oral) 21Hydroxyurea 19
UFT 27Capecitabine 19
S-1 45Paclitaxel 17-23Docetaxel 17-29CPT-11 18

56
Chemotherapy regimens for gastric cancer have varied considerably since the 1980s. There
were no analyses supporting the regular use of adjuvant chemotherapy for gastric cancer
until 1993. Combination regimens of Platinum compounds, 5FU, taxanes or irinotecan were
developed to improve overall response rate and survival (Table 1.8).Table 1.8: Combination therapy for advanced gastric cancer. FAM fluorouracil-doxorubicin-mitomycin C, FAMTX methotrexate-leucovo-5FU-adriamycin, FEMTX adriamycin was substituted by its analogue 4-epi-doxorubicin, ELF 5FU-leucovorin -intravenous etoposide, modified-EFL oral etoposide, oral leucovorin and either 5FU continuous infusion or tegafur, ECF continuous 5FU infusion, cisplatin and epirubicin, PF cisplatin and 5FU, EAP cisplatin-etoposide-doxorubicin, FLEP 5FU modulated by folinic acid (FA)- epirubicin-cisplatin, ECC epirubicin-cisplatin-capecitabine, P-S-1 cisplatin- S-1 (oral fluoropyrimidine derivative analogue), MCF mitomycin C, cisplatin and fluorouracil, DP docetaxel-cisplatin, DCF docetaxel-cisplatin-5FU, EOF epirubicin-oxaliplatin-5FU, ECX epirubicin-cisplatin-capecitabine, EOX epirubicin-oxaliplatin-capecitabine
Response rate (%) Median survival (months)5FU-based combinations
FAM 30-42 6-9 FAMTX 33-63 6
ELF 53 11Modified-ELF 16-42 6-9.5
Cisplatin-5FU CI synergismPF 40 9-10
ECF 59-71 8.7P-5FU 48-h CI 50 9.3P-5FU 24-h CI 58 11
Cisplatin-based combinationsEAP 33-64 9FLEP 35 8
FLEP-type 39 11LV5FU2-P 27 13.3
Combinations including new drugsP-CPT11 41-58 9-12
LOHP-CPT11 50 8.5CPT11-bolus 5FU 22 7.6CPT11- 5FU CI 20 7
P-Xeloda 54.8 10.1ECC 59 9.6P-S-1 73-74 12
TPFU/LV 50 11-14DP 37-56 9-11
DCF 51 9.3
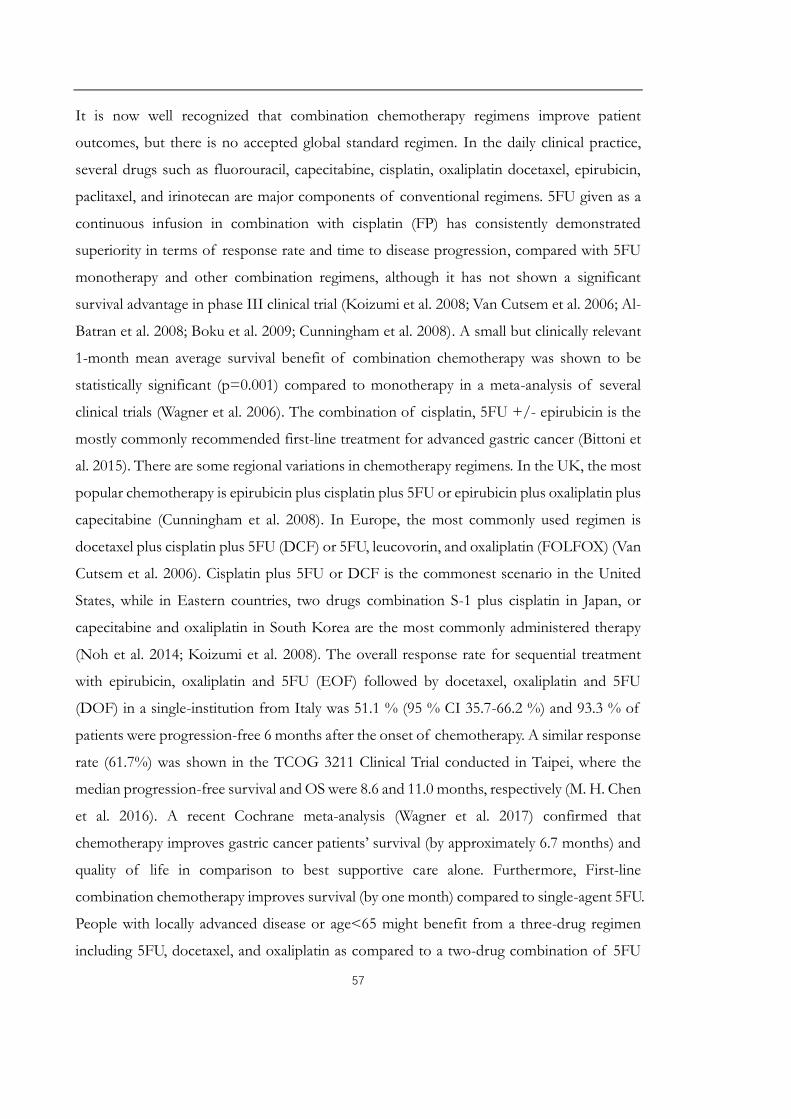
57
It is now well recognized that combination chemotherapy regimens improve patient
outcomes, but there is no accepted global standard regimen. In the daily clinical practice,
several drugs such as fluorouracil, capecitabine, cisplatin, oxaliplatin docetaxel, epirubicin,
paclitaxel, and irinotecan are major components of conventional regimens. 5FU given as a
continuous infusion in combination with cisplatin (FP) has consistently demonstrated
superiority in terms of response rate and time to disease progression, compared with 5FU
monotherapy and other combination regimens, although it has not shown a significant
survival advantage in phase III clinical trial (Koizumi et al. 2008; Van Cutsem et al. 2006; Al-
Batran et al. 2008; Boku et al. 2009; Cunningham et al. 2008). A small but clinically relevant
1-month mean average survival benefit of combination chemotherapy was shown to be
statistically significant (p=0.001) compared to monotherapy in a meta-analysis of several
clinical trials (Wagner et al. 2006). The combination of cisplatin, 5FU +/- epirubicin is the
mostly commonly recommended first-line treatment for advanced gastric cancer (Bittoni et
al. 2015). There are some regional variations in chemotherapy regimens. In the UK, the most
popular chemotherapy is epirubicin plus cisplatin plus 5FU or epirubicin plus oxaliplatin plus
capecitabine (Cunningham et al. 2008). In Europe, the most commonly used regimen is
docetaxel plus cisplatin plus 5FU (DCF) or 5FU, leucovorin, and oxaliplatin (FOLFOX) (Van
Cutsem et al. 2006). Cisplatin plus 5FU or DCF is the commonest scenario in the United
States, while in Eastern countries, two drugs combination S-1 plus cisplatin in Japan, or
capecitabine and oxaliplatin in South Korea are the most commonly administered therapy
(Noh et al. 2014; Koizumi et al. 2008). The overall response rate for sequential treatment
with epirubicin, oxaliplatin and 5FU (EOF) followed by docetaxel, oxaliplatin and 5FU
(DOF) in a single-institution from Italy was 51.1 % (95 % CI 35.7-66.2 %) and 93.3 % of
patients were progression-free 6 months after the onset of chemotherapy. A similar response
rate (61.7%) was shown in the TCOG 3211 Clinical Trial conducted in Taipei, where the
median progression-free survival and OS were 8.6 and 11.0 months, respectively (M. H. Chen
et al. 2016). A recent Cochrane meta-analysis (Wagner et al. 2017) confirmed that
chemotherapy improves gastric cancer patients’ survival (by approximately 6.7 months) and
quality of life in comparison to best supportive care alone. Furthermore, First-line
combination chemotherapy improves survival (by one month) compared to single-agent 5FU.
People with locally advanced disease or age<65 might benefit from a three-drug regimen
including 5FU, docetaxel, and oxaliplatin as compared to a two-drug combination of 5FU

58
and oxaliplatin. However, the OS benefit from treatment with adjuvant chemotherapy is
estimated to be approximately 4%, with the greatest benefit in patients with node-positive
disease. A meta-analysis (GASTRIC [Global Advanced/Adjuvant Stomach Tumour
Research International Collaboration] Group 2013) from Global Advanced/Adjuvant
Stomach Tumour Research International Collaboration in 2013 collected individual
treatment information from 4245 patients of 22 clinical trials and demonstrated the benefits
of the experimental treatments over their corresponding controls which hazard reductions
of 13% for OS (HR = 0.87, P < 0.0001,) and 21% for PFS (HR = 0.79, P < 0.0001,).
Although these overall relative risk reductions translate into only modest absolute
improvements in median OS and PFS, they nevertheless confirm the benefit of
chemotherapy for advanced gastric cancer and justify further efforts at improving current
regimens.
Given the relatively minor benefits of adjuvant chemotherapy seen in these early analyses,
the high rate of local relapse continued to stimulate interest in adjunctive treatment
modalities, resulting in two different but beneficial approaches. The first was postoperative
chemoradiotherapy, which was tested in a US Southwest Oncology Group/Intergroup study
(SWOG 9008/INT 0116, Figure 1.18A) (Macdonald et al. 2001), and the second was
perioperative chemotherapy, tested in a UK Medical Research Council (MRC) randomized
trial (the MRC Adjuvant Gastric Infusional Chemotherapy [MAGIC] trial, Figure 1.18B)
(Cunningham et al. 2006). These trials demonstrated clinically and statistically significant
survival benefits that have changed practice with two different treatment options in
resectable gastric cancer. As the patient populations studied were different, the results are
not directly comparable, but they do suggest treatment options for patients at different points
in their care.
Based on experience from adjuvant chemotherapy, most patients, currently receive
fluoropyrimidine- and platinum-based neoadjuvant therapy before initial surgery. This
approach is preferred especially for patients with a high likelihood of developing distant
metastases (i.e., those with bulky T3/T4tumours, visible perigastric nodes by preoperative
imaging studies, a linitis plastica appearance, or positive peritoneal cytology in the absence
of visible peritoneal disease). However, there are no randomized trials demonstrating better

59
outcomes from neoadjuvant therapy versus initial surgery followed by any form of adjuvant
therapy. Pragmatically there is a greater chance of delivering therapy in the preoperative
setting, and patients who are at high risk of developing distant metastases may be spared the
morbidity of unnecessary gastrectomy if evidence of distant metastases emerges after
chemotherapy. Currently, upfront surgery still remains an accepted approach, especially for
patients with clinically staged, non-bulky, T2 or T3 tumours with no visible perigastric nodes.
Clinical studies for choosing the best chemotherapy regimen are still ongoing (Cunningham
et al. 2006; Al-Batran et al. 2016; Xiong et al. 2014; Ronellenfitsch et al. 2013).
Figure 1.18: Designs of the Intergroup 0116 Trial and of the UK Medical Research Council’s MAGIC Trial. A. A trial of postoperative chemoradiotherapy in stage IB-IV gastric cancer. 5FU stands for fluorouracil; LV stands for leucovorin. B. A trial of perioperative chemotherapy in patients with operable gastric cancer. ECF= epirubicin/cisplatin/fluorouracil; Source: Therapeutic Options in Gastric Cancer (Jackson et al. 2007).
The outlook for patients with metastatic gastric cancer is very poor, with median survival
ranging from 4 months when treated only with best supportive care, to around 12 months
when treated with combination cytotoxic chemotherapy. The most frequently used standard
first-line chemotherapy regimen in metastatic gastric cancer is a combination of a

60
fluoropyrimidine with a platinum, although triple regimens including docetaxel might be
useful in otherwise healthy patients with a high tumour burden. Median survival does usually
not exceed 1 year. In patients with good performance status and organ function, second-line
treatment with agents that were not used in first-line treatments (i.e., taxanes or irinotecan)
can lead to slight survival benefits (Ford et al. 2014; Kang et al. 2012; Bolke et al. 2008; Van
Cutsem et al. 2006).
Generally, treatment regimens selection, dosing, administration, and the management of
related adverse events for gastric cancer can be a complex process that should be handled by
an experienced healthcare team. Clinicians must choose and verify treatment options based
on the individual patient. Drug dose modifications and supportive care interventions should
be administered accordingly. The cancer treatment regimens in Appendix 6 includes both
U.S. Food and Drug Administration-approved and unapproved indications/regimens. These
regimens are provided only to supplement the latest treatment strategies. The guidelines are
a work in progress that may be refined when new significant data becomes available.
1.1.7.4 Target therapy
The pivotal ToGA trial was the first randomized, prospective, multicentre phase 3 trial to
study the efficacy of targeted therapy with first line trastuzumab (a monoclonal antibody
against HER2) in patients with HER2-positive advanced gastric or gastro-oesophageal-
junction cancer (Bang et al. 2010). Up to 20% of gastric tumours overexpress the HER2
receptor, mostly because of HER2 amplification. 584 patients were enrolled and received
study treatment at least once. Median OS was 13.8 months (95% CI 12-16) in the
trastuzumab group, compared with 11.1 months in the chemotherapy group (10–13) (hazard
ratio 0·74; 95% CI 0·60-0·91; p=0·0046). The longest survival (median 16.0 months) was
seen in patients with high HER2 protein overexpression and HER2 amplification. On the
basis of this study, trastuzumab in combination with cisplatin and a fluoropyrimidine has
been approved for first-line treatment of advanced HER2-positive gastric and gastro-
oesophageal-junction adenocarcinomas (Van Cutsem et al. 2015; Jorgensen 2010).
Randomised trials have included assessments of antibodies against EGFR (Waddell et al.
2013; Lordick et al. 2013), and VEGFR2 (Wilke et al. 2014; Fuchs et al. 2014) in combination

61
with chemotherapy, but results have generally shown no or limited benefit, partly due to the
inappropriate selection of patients (Lordick et al. 2014; Tan et al. 2011). Several other
biological targeted agents are being, or have been, investigated. Hepatocyte growth factor
(HGF) and its receptor, the transmembrane tyrosine kinase cMET, as well as fibroblast
growth factor receptor (FGFR) are among the candidate targets for new agents in advanced
gastric cancer. Additionally, in view of the new data from the Cancer Genome Atlas research
network, PD-1 and PD-L1 may serve as emerging targets for treatment, and initial promising
results have been reported with pembrolizumab.
There is increasing recognition that for gastric cancer and other malignancies, that besides
the tumour stage, the intrinsic subtypes of GC, based on distinct patterns of expression,
may influence patient survival and response to chemotherapy. Distinct patterns of genomic
alteration or protein expression may provide clues for management and improvement of
patients’ clinical outcomes.
1.1.8 Precision medicine for gastric cancer
Identifying specific signaling pathways in individual patients might improve treatment
outcomes, for example, the use of anti-human epidermal growth factor receptor-2
monoclonal antibody, trastuzumab (Bang et al. 2010), anti-vascular endothelial growth factor
receptor-2 monoclonal antibody, ramucirumab (Fuchs et al. 2014), and has shifted the
previous histopathologic paradigm to incorporate new genetic and molecular features (Figure
1.19). However, equally importantly, tailoring individualized cytotoxic therapy for the
treatment of gastric cancer is warranted (Ma et al. 2016).
Figure 1.19: Timeline of selected major developments in gastric cancer (above arrow)

62
and related clinical trials (below arrow) in recent years. Source: Gastric Cancer in the Era of Precision Medicine. (Liu and Meltzer 2017)
1.1.8.1 Cytotoxic drugs sensitivity in gastric cancer according to Laurén
classification
Evidence of different response to treatment between gastric cancer subtypes has been
reported not only in patients with advanced disease but also in the adjuvant setting. In
particular, in an updated analysis of the INT-0116 study, evaluating post-operative chemo-
radiotherapy in patients with resected gastric cancer, it has been shown that the benefit of
adjuvant treatment is minimal in patients with diffuse histology while is significant in all the
other subsets (Smalley et al. 2012). Similar findings have been observed also in the ITACA-
S trial, a multicentre phase III trial comparing 5FU and leucovorin versus a sequential
regimen including irinotecan and 5FU followed by cisplatin and docetaxel in the adjuvant
treatment of resected gastric cancer patients. In a subgroups analysis of the trial, which could
not demonstrate any benefit for the intensive treatment versus the fluorouracil monotherapy,
the authors compared the outcome of patients according to disease histopathologic and
anatomic criteria-diffuse gastric cancer presented a worse outcome in terms of OS compared
to distal non-diffuse gastric cancer (HR=1.35; 95% CI 1.06–1.72, p=0.016) while no
significant difference in terms of prognosis was found between distal or proximal non-
diffuse gastric cancer. None of the three subtypes showed a benefit for the experimental arm
versus the 5FU arm.
It has been observed that the overall response rate to first-line chemotherapy (two drugs
fluoropyrimidine-based chemotherapy regimen or three drugs regimen as first-line
combination chemotherapy, including a platinum derivate, a fluoropyrimidine, and a third
drug) was 29.6%. The response rate for diffuse gastric cancer is about 20.4%, while in
patients with proximal non-diffuse gastric cancer or distal non-diffuse gastric cancer, the
response rate is higher, 46.1% and 34.3% respectively. Diffuse type gastric cancer patients
also presented a shorter PFS compared to other subgroups with a median PFS of 4.2 months
compared to 7.2 months for proximal non-diffuse gastric cancer patients and 5.9 months for
distal non-diffuse gastric cancer patients. These differences translated into statistically
significant differences in OS (Shah et al. 2011).

63
Interestingly, in these studies, gastroesophageal tumours, usually considered more aggressive
and presenting a worse prognosis compared to tumours arising from the rest of the stomach
(Kattan et al. 2003; Sakaguchi et al. 1998), had a greater benefit from the treatment. A subset
analysis of a phase II trial evaluating bevacizumab with a modified DCF regimen (docetaxel,
cisplatin, 5FU) in advanced gastric cancer patients diffused type of gastric cancer was shown
to have significantly worse PFS and OS compared to other subtypes. Diffuse tumours also
presented the worse response rate with 38% compared to 56% of distal/body diffuse gastric
cancer and 85% of proximal non-diffuse gastric cancer (Shah et al. 2011).
A subset analysis comparing the efficiency of trastuzumab in intestinal and diffuse type
gastric cancers showed that the addition of trastuzumab to chemotherapy showed that
diffuse type gastric cancer patients with 2% HER2 amplification had no effect on survival
with an HR for OS of 1.07 (0.56-2.05) versus an HR of 0.69 (0.54-0.88) for intestinal type
gastric cancer patients with 21.5% HER2 amplification (Bang et al. 2010; Tanner et al. 2005).
A multicentre study with more than 1000 HER2 negative gastric cancers undergoing
chemotherapy containing 2-3 drugs, sought to evaluate whether Laurén type influences the
efficacy of various chemotherapies and on patient OS. The ORR was found decreased when
tumours presenting a diffuse component. Anthracycline- or docetaxel-containing schedules
increased ORR only in the intestinal type. The diffuse type displayed increased mortality with
HR of 1.201 (95% CI, 1.054-1.368), Patients receiving chemotherapy with docetaxel had no
increase in OS for the subset having a diffuse component but exhibited increased OS in the
intestinal type: HR 0.65 (95% CI, 0.49-0.87). There was a similar significant difference for
the PFS analysis. These results further proved the clinical application utility of Laurén
classification in survival prediction and also to guide in chemotherapy selection (Jimenez
Fonseca et al. 2017).
1.1.8.2 Chemotherapy-associated genes in gastric cancer
Innate and acquired chemoresistance is multi-factorial and involves multiple key molecules
and accounts for the majority of relapse cases in cancer patients. Untailored treatment may
result in side effects and great economic burden without actual benefit.
Cell kinetic differences in normal and malignant tissues could significantly influence the

64
survival response of mammalian cells to most anti-tumour agents (Meyn et al. 1980). This
has been demonstrated by a quantitative assay for assessing the sensitivity of resting normal
bone marrow stem cells and rapidly dividing clonogenic AKR lymphoma cells to a variety
of cytotoxic agents. These agents are classified into 3 classes according to their activities
during certain phases of the cell cycle and on resting cells. For Class I agents there was no
difference in the toxicity exerted in rapidly proliferating or resting cells. Agents in this class
(e.g. X-irradiation) were said to be non-specific. In Class II the agents were more toxic to
proliferating cells than to the resting cells, with increasing doses killing a greater number of
cells until a plateau was reached, after which there was no further increase in cell kill. This
second class of agents is called phase-specific because proliferating cells were killed during a
specific part of the cell cycle. Resting (G0) cells do not appear to be affected by these agents
provided the exposure time is kept short (24 hours). For Class III agents, the survival curves
were exponential, but there was a great variance between the slopes. For equivalent doses,
some compounds exerted greater specificity against the tumour cells. These agents were
termed cycle specific, since although they damaged both proliferating and resting cells,
dividing cells were more sensitive than G0 cells and were killed throughout the cell cycle
(Figure 1.20).
Figure 1.20: Dose-survival curves for both normal hematopoietic and transplanted lymphoma colony forming units. Normal or tumour-bearing mice were given different doses of various agents and their femoral bone marrows were assayed 24 hours later for their content of colony-forming units. Source: The cell cycle and its significance for cancer treatment (Hill and Baserga 1975).
When mice were treated with short courses of phase-specific or cycle-specific agents there
was a much greater loss of malignant as opposed to normal stem cells. Subsequent studies

65
have confirmed that prolonged exposure to cycle specific agents resulted in an increased
sensitivity of normal stem cells, whereas tumour cells appeared less sensitive as treatment
continued. Similarly, if mice were treated after the previous injury to the marrow when
hematopoietic stem cells were proliferating to repair the damage, the specificity of these
agents for malignant cells was lost. Owing to these earlier studies relevant to the mode of
action, indications, and scheduling of cell cycle-specific and cell cycle-nonspecific drugs,
information on cell and population kinetics of cancer cells explain, in part, the limited
effectiveness of most available anticancer drugs. Also, the kinetic classification of antitumour
drugs is well-documented and aid the establishment of principles for agents’ administration
in clinical practice (Hill and Baserga 1975). Conventional chemotherapeutic agents are falling
into these two major classes (Table 1.9). A schematic summary of cell cycle kinetics is
presented in Figure 1.21.
Table 1.9: Cell cycle effects of major classes of anti-cancer drugs. Source: https://basicmedicalkey .com /cancer-chemotherapy/
Cell cycle-Specific (CSS) Agents Cell cycle-Nonspecific (CCNS) AgentsAntimetabolites (S phase) Alkylating agents
Capecitabine AltretamineCladribine BendamustineClofarabine (ara-C) BusulfanFludarabine Carmustine5FU ChlorambucilGemcitabine CyclophosphamideMethortrexate (MTX) DacarbazineNelarabine LomustinePralatrexate Mechlorethamine6-Thioguanine (6-TG) Melphalan
Topoisomerase II inhibitor (G1-S phase) TemzolomideEtoposide Thiotepa
Topoisomerase I inhibitor (G2-M phase) Antitumour antibioticsIrinotecan DactinomycinTopotecan Mitomycin
Taxanes (M phase) Platinum analoguesAlbumin-bound paclitaxel CarboplatinCabazitaxel CisplatinDocetaxel OxaliplatinPaclitaxel Anthracyclines
Vinca alkaloids (M phase) DaunorubicinVinblastine DoxorubicinVincristine Epirubin

66
Vinorelbine IdarubicinAntimicrotubule inhibitor (M phase) Mitoxantrone
IxabepiloneEribulinAntitumour antibiotics (G2-M phase)Bleomycin
Figure 1.21: The different phases of the cell cycle. The cell cycle includes four distinct phases: G1 (gap phase 1), S (DNA synthesis), G2 (gap phase 2), and M (mitosis). In the first phase (G1) the cell grows. When it has reached a certain size, it enters the phase of DNA-synthesis (S) where the chromosomes are duplicated. During the next phase (G2) the cell prepares itself for division. During mitosis (M) the chromosomes are separated and segregated to the daughter cells, which thereby get exactly the same chromosome set up. The cells are then back in G1 and the cell cycle is completed. G0 is the resting phase when the cell does not undergo division. Source: https://basicmedicalkey.com/cancer-chemotherapy/
5FU is a remarkable drug that has been available in the past half-century and has become
the mainstay of chemotherapy for gastrointestinal cancer. 5FU is an analogue of uracil with
a fluorine atom at the C-5 position in place of hydrogen (Wohlhueter et al. 1980). It rapidly
enters cells using the same facilitated transport mechanism as uracil. 5FU has converted
intracellularly to several active metabolites: fluorodeoxyuridine monophosphate (FdUMP),
fluorodeoxyuridine triphosphate (FdUTP) and fluorouridine triphosphate (FUTP). These
active metabolites disrupt RNA synthesis and the action of thymidylate synthase (TS). The
rate-limiting enzyme in 5FU catabolism is dihydropyrimidine dehydrogenase (DPD), which
converts 5FU to dihydrofluorouracil (DHFU). More than 80% of administered 5FU is
normally catabolized primarily in the liver, where DPD is abundantly expressed (Diasio and
Harris 1989). TS catalyzes the reductive methylation of deoxyuridine monophosphate

67
(dUMP) to deoxythymidine monophosphate (dTMP), with reduced 5,10-
methylenetetrahydrofolate (CH2THF) as the methyl donor. This reaction provides the sole
de novo source of thymidylate, which is necessary for DNA replication and repair. The 36-
kDa TS protein functions as a dimer, both subunits of which contain a nucleotide-binding
site and a binding site for CH2THF. The 5FU metabolite FdUMP binds to the nucleotide-
binding site of TS, forming a stable ternary complex with the enzyme and CH2THF, thereby
blocking binding of the normal substrate dUMP and inhibiting dTMP synthesis (Rennert
and Anker 1963; Sommer and Santi 1974). The exact molecular mechanisms that mediate
events downstream of TS inhibition have not been fully elucidated. Deoxynucleotide pool
imbalances (in particular, the dATP/dTTP ratio) are thought to severely disrupt DNA
synthesis and repair, resulting in lethal DNA damage (Yoshioka et al. 1987; Houghton et al.
1995). In addition, TS inhibition results in the accumulation of dUMP, which might
subsequently lead to increased levels of deoxyuridine triphosphate (dUTP). Both dUTP and
the 5FU metabolite FdUTP can be misincorporated into DNA. Repair of uracil and 5FU-
containing DNA by the nucleotide excision repair enzyme uracil-DNA-glycosylase (UDG)
is futile in the presence of high (F) dUTP/dTTP ratios and only results in further false-
nucleotide incorporation (Lindahl 1974). These futile cycles of misincorporation, excision,
and repair eventually lead to DNA strand breaks and cell death. DNA damage due to dUTP
misincorporation is highly dependent on the levels of the pyrophosphatase dUTPase, which
limits the intracellular accumulation of dUTP (Ladner 2001; Webley et al. 2000).
The 5FU metabolite FUTP is extensively incorporated into RNA, disrupting normal RNA
processing and function. Significant correlations between 5FU misincorporation into RNA
and loss of clonogenic potential have been shown in human colon and breast cancer cell
lines (Glazer and Lloyd 1982; Kufe and Major 1981). A number of in vitro studies indicated
that 5FU misincorporation can potentially disrupt many aspects of RNA processing, leading
to profound effects on cellular metabolism and viability.
To inhibit DPD-mediated degradation of 5FU. The UFT (uracil/Ftorafur) formulation uses
a 4:1 combination of uracil with the 5FU pro-drug Ftorafur, which improves 5FU
bioavailability by saturating DPD with its natural substrate (Adjei 1999). On this basis, further
optimization was made in a novel oral DPD inhibitory fluoropyrimidine S-1 containing
tegafur and two types of enzyme inhibitors, 5-chloro-2,4-dihydroxypyridine and potassium

68
oxonate in a molar ratio of 1:0.4:1 (Maehara 2003). Another approach has been to design
5FU pro-drugs that avoid DPD-mediated degradation in the liver. Capecitabine is an oral
fluoropyrimidine that is absorbed unchanged through the gastrointestinal wall and is
converted to 5′-deoxy-5-fluorouridine (5′DFUR) in the liver by the sequential action of
carboxylesterase and cytidine deaminase (Johnston and Kaye 2001). 5′DFUR is then
converted to 5FU by thymidine phosphorylase (TP) and/or uridine phosphorylase (Cao et
al. 2002; Miwa et al. 1998), both of which have been reported to be significantly more active
in tumour tissue than in normal tissue.
1.1.8.2.1 Metabolic related genes
Several studies have been set up to characterize the biological factors which correlate with
response to 5FU-based chemotherapy in order to define those patients who are most likely
to benefit of these drugs. Preclinical studies have demonstrated that TS expression is a key
determinant of 5FU sensitivity. Gene amplification of TS with consequent increases in TS
mRNA and protein has been observed in cell lines which are resistant to 5FU and
fluorodeoxyuridine (FUDR) (Copur et al. 1995; Cao et al. 2002). The TS gene promoter is
polymorphic and usually has either two (TSER*2) or three (TSER*3) 28-base-pair tandem-
repeat sequences (Horie et al. 1995). Preliminary studies indicate that TSER*3/TSER*3
homozygous patients are less likely to respond to 5FU-based chemotherapy than
TSER*2/TSER*2 homozygous and TSER*2/TSER*3 heterozygous patients (Pullarkat et
al. 2001; Marsh et al. 2001). Treatment with 5FU has been shown to acutely induce TS
expression in both cell lines and tumours (Swain et al. 1989; Chu et al. 1993). The thymidylate
synthase (TS) gene, which is induced at the G1–S transition in growth stimulated cells,
encodes an enzyme that is essential for DNA replication and cell survival. A study by
Kamoshida et al assessed the expression of TS, DPD, and TP levels in different tumour
types, including intestinal-type and diffuse-type gastric adenocarcinoma. The authors found
a high level of expression of TS, which may be associated with poor response to 5FU based
chemotherapy, in diffuse GC while TS was not overexpressed in intestinal type gastric cancer
(Kamoshida et al. 2005).
1.1.8.2.2 Cancer stem cells and epithelial-to-mesenchymal transition
The cancer stem cell theory postulates that cancers harbour a subset of cells which share

69
characteristics of normal stem cells, with a capacity for self-renewal and differentiation
(Rocco et al. 2012). Numerous studies have demonstrated that purported cancer stem-like
cells (CSC) are more resistant to chemotherapy than non-CSCs (Alison et al. 2012). Acquired
resistance is driven, in part, by intratumoural heterogeneity, that is, the phenotypic diversity
of cancer cells co-inhabiting a single tumour mass. This concept, taken together with the
identification of the EMT programme as a critical regulator of the CSC phenotype, offers
an opportunity to investigate the nature of intratumoural heterogeneity and a possible
mechanistic basis for anticancer drug resistance. Accumulating evidence has indicated that
conventional therapies often fail to eradicate carcinoma cells which have entered the CSC
state via activation of the EMT programme, thereby permitting CSC-mediated clinical
relapse (Shibue and Weinberg 2017). Diffuse gastric cancer was demonstrated to be enriched
in genome stable subtype in TCGA classification and in MSS-EMT subtype in ACRG
classification. Certain relevant genes correlated to the EMT process may contribute to drug
resistance in diffuse gastric cancers.
Two studies in Nature Genetics further confirmed a ranging mutation from 14.3%- 25.3%
of RHOA in diffuse gastric cancers (Kakiuchi et al. 2014; Kumar et al. 2016). Higher activity
of RhoA by its mutation in spheroids growth was proven in vitro and negatively correlated
with 5FU and cisplatin efficiency in vivo. Inhibition of RhoA could synergetically improve
tumour suppression with cisplatin by more than 70%.
BMI1, belonging to a polycomb group family, was found enriched in a CD44+ subgroup of
gastric cancer cells and was identified as a CSC biomarker in many malignancies. High BMI1
levels in gastric cancer cells increased resistance to 5FU, whereas BMI1 silencing enhanced
5FU antitumour activity (Xu et al. 2015).
1.1.8.2.3 Cell cycle-related genes
As mentioned above, slowly proliferating or quiescent cells are more resistant to DNA
damaging agent treatments such as 5FU acting in S phase of the cell cycle to cause DNA
damage. Cancer stem-like cells exhibit a low rate of division and proliferation in their niche
that helps them to avoid chemotherapy and radiation (Zou 2008). Usually, cells take a range
of actions to respond to the cytotoxic agents and involve a number of downstream sensors,
mediators, transducers and final effectors of the DNA damage response.

70
If a DNA lesion cannot be repaired quickly, apoptosis is initiated to eliminate the damaged
cell before it can undergo malignant transformation. p53 plays a crucial role in double-strand
break (DSB)-induced apoptosis. In response to DSBs, transcriptional activation of
proapoptotic factors such as Fas cell surface death receptor (FAS), B cell
leukaemia/lymphoma 2 (BCL2) associated X apoptosis regulator (BAX) and BCL2 binding
component 3 (BBC3, also known as PUMA), and is induced by ataxia telangiectasia mutated
(ATM)/ cell cycle checkpoint kinase 2 (CHK2) and ataxia telangiectasia-mutated and RAD3-
like protein (ATR)/ checkpoint kinase 1 (CHK1), phosphorylating and stabilizing p53.
CHK1 and CHK2 also stimulate the expression of E2F1 and p73 to support the action of
p53. This, in turn, transcribes BAX, PUMA, and phorbol-12-myristate-13-acetate-induced
protein 1 (Pmaip1, also known as NOXA).
In addition to cell apoptosis, p53 is also an important anticipator in the major pathway
controlling the DNA damage-induced G1/S-phase checkpoint and triggering G1-phase
arrest, i.e. the ATM/ATR-CHK2/CHK1-p53/MDM2-p21 pathway. DSBs and single-strand
breaks activate ATM/CHK2 and ATR/CHK1, which mediates MDM2 phosphorylation and
subsequent degradation through a self-catalytic mechanism, thereby stabilizing p53
expression and inducing p21 expression, which inhibits the activity of CCNE/CDK2 and
CCND/CDK4/6 complexes. This signalling cascade leads to cell-cycle arrest at G1 phase.
The cell-cycle arrest may also be induced via activation of CHK1/CHK2 and inactivation
of the CDC25A phosphatase. It consequently inhibits expression of the CCNE/CDK2 and
cyclin A/CDK2 complexes and delays the cell cycle at the G1/S transition (Kastenhuber and
Lowe 2017).
Thus, one important mechanism leading to chemoresistance is the dysfunction or loss of
p53-mediated apoptotic pathways typically triggered by DNA damage. For example, the loss
of the tumour suppressor protein p53 due to deregulated expression of its regulators
(MDM2 [de Rozieres et al. 2000]) leads to abnormal downstream targets such as p21, and
growth arrest and DNA damage-inducible 45 (Gadd45) (Brady et al. 2011).
As the most frequently mutated gene in human tumours (Kandoth et al. 2013), p53 mutations
were reported to induce resistance for a variety of standard chemotherapies in previous
studies. The primary alterations in p53 resulting from most tumour-associated mutations

71
could be only a single amino acid substitution in the 393-amino-acid protein, most of which
are within the central DNA-binding domain and can be any amino acid in this region. There
are a number of hotspots, including R175, G245, R248, R249, R273, and R282. Besides the
loss of tumour suppressor function and acquisition of the ability to suppress the function
of the remaining wild-type p53 allele via a dominant-negative mechanism, p53 mutations can
also demonstrate an abnormal gain of function (GOF) to facilitate oncogenesis, metastasis
and chemoresistance. This phenomenon has been widely demonstrated by many in vivo and
in vitro experiments. The most compelling evidence of mutant p53 (mutp53) GOF comes
from mice engineered to harbour tumour-associated hot spot p53 mutations. Knock-in mice
exhibited a broader tumour spectrum with a more invasive and metastatic phenotype than
p53–/– or p53+/– mice (Donehower 2014). Major mechanisms of mutp53-induced
chemoresistance include enhanced drug efflux and metabolism, promoting cell survival,
inhibiting apoptosis, upregulating DNA repair, suppressing autophagy, elevating
microenvironmental resistance and inducing a stem-like phenotype. However, mutp53 has
also been identified as a good predictor of chemoresistance in some clinical studies (Young
et al. 2008; Perrone et al. 2010; Kandoth et al. 2013; Yamasaki et al. 2010; Dawson et al.
2009).
The transcriptional activation function of p53 is fundamental for both cell cycle arrest and
apoptosis pathways. The p53 protein consists of two N-terminal transactivation domains
followed by a conserved proline-rich domain, a central DNA binding domain, and a C
terminus encoding its nuclear localization signals and an oligomerization domain needed for
transcriptional activity. p53 contains two distinct transcriptional activation domains
(comprising residues 1–40 and 40–83, respectively). Different p53 transcriptional activation
requirements, associated with different target gene expression programs, are important in the
settings of acute genotoxic stress and oncogenic stimuli. A functional assay using an allelic
series of p53 transactivation domain mutant knock-in mice suggested that p53 may trigger
multiple sub-programs which cooperate to promote tumour suppression, in response to
acute DNA damage or senescence, and by regulating actin dynamics or cell migration, and
DNA repair (Brady et al. 2011). p53 responses to acute DNA damage in primary cells rely
on an intact first transcriptional activation domain of p53 as the L25Q; W26S mutations
within this domain severely impair transactivation of most classical p53 targets including p21,

72
NOXA, and PUMA, and abrogate activity in both DNA damage-induced G1 arrest and
apoptosis(Brady et al. 2011). Consistent with the importance of p53-mediated transcription
in tumour suppression, the vast majority of tumour-derived p53 mutations occur in the
region encoding p53’s DNA binding domain. In normal cells, p53 protein is maintained at
low levels by a series of regulators including MDM2, which functions as a p53 ubiquitin
ligase to facilitate its degradation. DNA damage and replication stress produced by
deregulated oncogenes will activate p53 by promoting p53 phosphorylation, phosphorylation
or by inducing the ARF tumour suppressor to inhibit MDM2 (Xu and El-Gewely 2001).
Recently, advances in next-generation sequencing (NGS) technologies have defined the
genomic landscape of gastric cancer; studies of miRNAs and long noncoding RNAs
(lncRNAs), as well as novel preclinical models (such as patient-derived tumour xenografts
(PDX) and patient-derived organoids), have largely filled the gap between cancer genetics
and phenotype. These advances have made it possible to integrate traditional, genome-based
and phenotype-based diagnostic and therapeutic methods with application to individual
gastric cancer patients in the era of precision medicine (Liu and Meltzer 2017).
1.2 microRNAs (miRNAs)
MicroRNAs, a class of short RNAs; together with a variety of long ncRNAs (lncRNAs),
such as lincRNAs, antisense RNAs, pseudogenes, and circular RNAs (Figure 1.22) are
collectively known as the noncoding RNAs (ncRNAs). They constitute the majority of the
transcribed genome, of which only 1–2% code for proteins (Djebali et al. 2012; Carninci et
al. 2005), hinting that higher eukaryotes increased their complexity not by increasing the
number of genes but through more sophisticated regulation in which the ncRNAs are also
involved. Interest in this field has seen numerous studies delineating the coding-independent
functions of this novel class of RNAs, to decipher their roles and corresponding mechanism
in biological processes in different diseases, including in cancer development (Chan and Tay
2018).
miRNAs regulate post-transcriptional gene expression and may be exported from cells via
exosomes or in partnership with RNA-binding proteins. miRNAs in body fluids can act in a
hormone-like manner and play important roles in disease initiation and progression. Hence,

73
miRNAs are promising candidates for biomarkers (Pacholewska et al. 2017).
Figure 1.22: Noncoding RNA Regulatory Networks in Cancer. Noncoding RNAs (ncRNAs) constitute the majority of the human transcribed genome. The different subclasses of ncRNAs include microRNAs, a class of short ncRNAs; and a variety of long ncRNAs (lncRNAs), such as lincRNAs, antisense RNAs, pseudogenes, and circular RNAs (circRNA). Many studies have demonstrated the involvement of these ncRNAs in competitive regulatory interactions, known as competing endogenous RNA (ceRNA) networks, whereby lncRNAs can act as microRNA decoys to modulate gene expression. These interactions are often interconnected, thus aberrant expression of any network component could derail the complex regulatory circuitry, culminating in cancer development and progression. (Chan and Tay 2018).
1.2.1 Discovery of miRNAs
Six decades ago, Francis Crick proposed the 'central dogma', asserting that genetic
information travels from DNA through RNA towards protein synthesis (Crick 1970). Since
then RNAs have been mainly characterized as intermediaries in the process of protein
production, principally as temporary copies of genetic information (mRNA), components
of the ribosome (ribosomal RNAs [rRNAs]) or translators of codon sequence (tRNAs). For
many years, proteins represented the primary functional end product of genetic information,
though the genes that encode them account for less than 2% of the genome. Twenty years
ago, the first small temporal RNAs, lineage defective 4 (lin-4)4 and lethal 7 (let-7), were
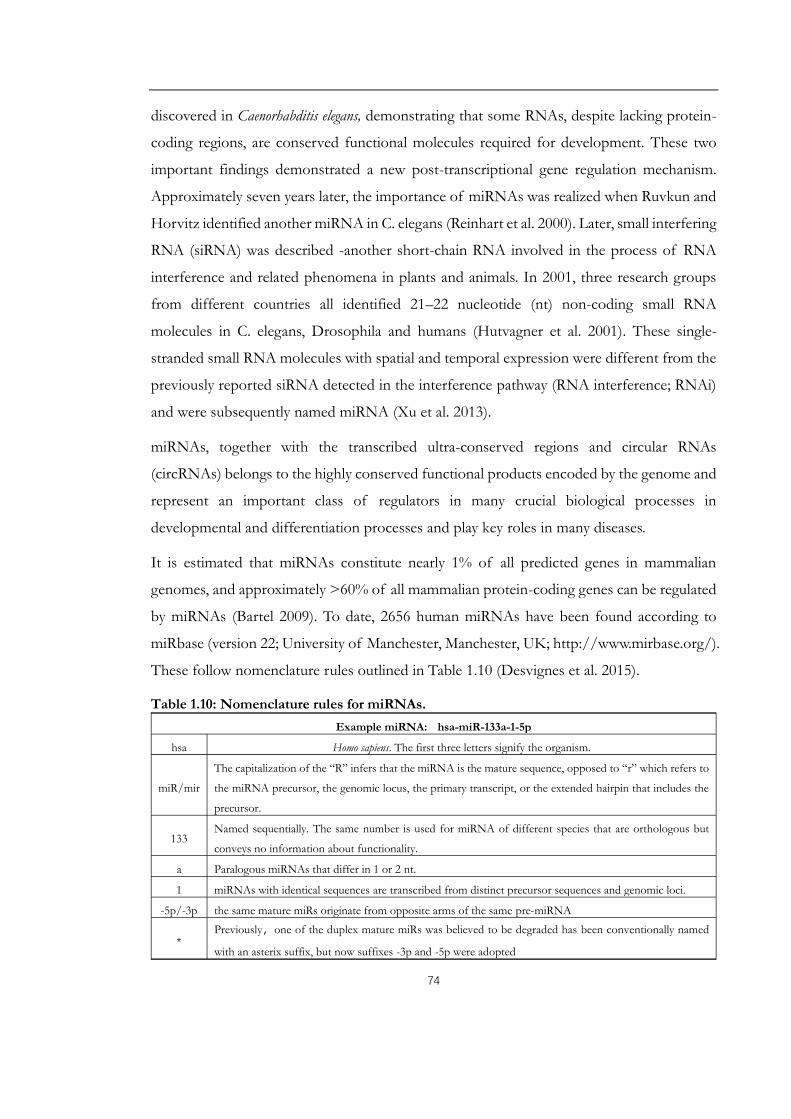
74
discovered in Caenorhabditis elegans, demonstrating that some RNAs, despite lacking protein-
coding regions, are conserved functional molecules required for development. These two
important findings demonstrated a new post-transcriptional gene regulation mechanism.
Approximately seven years later, the importance of miRNAs was realized when Ruvkun and
Horvitz identified another miRNA in C. elegans (Reinhart et al. 2000). Later, small interfering
RNA (siRNA) was described -another short-chain RNA involved in the process of RNA
interference and related phenomena in plants and animals. In 2001, three research groups
from different countries all identified 21–22 nucleotide (nt) non-coding small RNA
molecules in C. elegans, Drosophila and humans (Hutvagner et al. 2001). These single-
stranded small RNA molecules with spatial and temporal expression were different from the
previously reported siRNA detected in the interference pathway (RNA interference; RNAi)
and were subsequently named miRNA (Xu et al. 2013).
miRNAs, together with the transcribed ultra-conserved regions and circular RNAs
(circRNAs) belongs to the highly conserved functional products encoded by the genome and
represent an important class of regulators in many crucial biological processes in
developmental and differentiation processes and play key roles in many diseases.
It is estimated that miRNAs constitute nearly 1% of all predicted genes in mammalian
genomes, and approximately >60% of all mammalian protein-coding genes can be regulated
by miRNAs (Bartel 2009). To date, 2656 human miRNAs have been found according to
miRbase (version 22; University of Manchester, Manchester, UK; http://www.mirbase.org/).
These follow nomenclature rules outlined in Table 1.10 (Desvignes et al. 2015).
Table 1.10: Nomenclature rules for miRNAs.Example miRNA: hsa-miR-133a-1-5p
hsa Homo sapiens. The first three letters signify the organism.
miR/mir
The capitalization of the “R” infers that the miRNA is the mature sequence, opposed to “r” which refers to
the miRNA precursor, the genomic locus, the primary transcript, or the extended hairpin that includes the
precursor.
133Named sequentially. The same number is used for miRNA of different species that are orthologous but
conveys no information about functionality.
a Paralogous miRNAs that differ in 1 or 2 nt.
1 miRNAs with identical sequences are transcribed from distinct precursor sequences and genomic loci.
-5p/-3p the same mature miRs originate from opposite arms of the same pre-miRNA
*Previously,one of the duplex mature miRs was believed to be degraded has been conventionally named
with an asterix suffix, but now suffixes -3p and -5p were adopted

75
1.2.2 miRNA Biosynthesis and Mechanisms of Action
miRNA biogenesis consists of multiple steps of processing involving both nuclear and
cytoplasmic compartments (Figure 1.23). The canonical miRNA processing pathway starts
with encoding of primary miRNA transcript (pri-miRNA) from different regions of the
genome typically by RNA polymerase II (RNAPII). The majority of miRNA genes are
intergenic.
Figure 1.23: microRNA Biosynthesis. Source: Noncoding RNA: RNA Regulatory Networks in Cancer (Chan and Tay 2018).

76
However, about 20-40% of human miRNA genes originate in the introns of protein and
non-protein genes, or the exons of long protein-coding transcripts and are therefore
transcribed and regulated along with their host genes (Aravin et al. 2003; Ambros et al. 2003).
For miRNA genes organized in clusters, the pri-miRNA can be monocistronic or
polycistronic (Desvignes et al. 2015). Pri-miRNAs are subsequently cleaved by the
microprocessor complex DROSHA–DGCR8 resulting in a precursor hairpin. The pre-
miRNA is then exported from the nucleus by RAN: GTP: XPO5. Approximately 70 bp pre-
miRNA hairpin structures in the nucleus are subsequently exported to the cytoplasm by an
Exportin-5-mediated mechanism where they are further processed by the Dicer–TRBP
complex to form the mature 22 nt miRNA duplexes. In the cytoplasm, the miRNA duplex
is unwound, and the passenger strand is released and discarded. The mature single-stranded
miRNA is then incorporated into the miRNA-containing RNA-induced silencing complex
(miRISC) resulting in a precursor hairpin-the pre-miRNA, which is exported from the
nucleus by RAN: GTP: XPO5. Once in the cytoplasm, DICER1 ribonuclease, in complex
with one of the double-stranded RNA-binding proteins, TARBP2 or PRKRA (PACT),
cleaves the pre-miRNA hairpin to its mature double-stranded length of around 22
nucleotides. The RNA-induced silencing complex (RISC)-loading complex, comprising of
DICER1, TARBP2 (or PRKRA) and one of the Argonaute proteins (AGO1-4), loads the
functional strand of the mature miRNA into the RISC and the passenger strand is degraded.
DICER1 and TARBP2/PRKRA then dissociate leaving the mature RISC consisting of
AGO1-4 and miRNA. The miRNA then guides the RISC to silence target mRNAs through
mRNA cleavage, translational repression or deadenylation. (Figure 1.24). Special cases of
miRNA-like sequences from non-canonical biogenesis pathways including DROSHA-
independent miRNAs (e.g. miRtrons), Dicer-independent miRNAs (e.g. miR-451), and
pathways from other non-coding RNA genes (e.g. snoRNA or lncRNA) could be accepted
as miRNAs (Desvignes et al. 2015).

77
Figure 1.24: Post-transcriptional modes of miRNA action. miRNAs may promote degradation of mRNA via deadenylation and decapping or mRNA cleavage as well as repress translation of mRNAs by initiation or elongation block (Chan and Tay 2018).
miRNAs were primarily introduced to exert negative regulatory effects on genes via the
interaction between a miRNA-containing RISC complex and the 3’UTR of its target mRNA,
causing either mRNA cleavage, translational repression (initiation or elongation block) or
mRNA deadenylation followed by decapping and degradation of the mRNA. In addition to
3′UTR targeting, miRNAs were reported to be involved in gene activation which can also
enhance protein translation during amino acid starvation by targeting 5′UTR of mRNAs
encoding ribosomal proteins. As another nonclassical example, miR-483-5p, embedded
within the IGF2 gene, induces the transcription of its host gene by binding to the 5′UTR
region. Understanding of the mechanisms of action of miRNAs has significantly expanded
in the last few years, with discoveries demonstrating unexpected complexities of their
regulative manner, such as promoter binding, protein binding, or direct interaction with other
ncRNAs, or even relocalization in the nucleus. This localization supports the already proven
hypothesis that miRNAs can alternatively regulate transcriptional processes at a DNA level.
For example, human miR-373 binds to the E-cadherin (CDH1) promoter, thereby inducing

78
its expression (Ambros 2003). miRNAs have also been found to favour protein expression
(in addition to downregulating it) (Vasudevan et al. 2007). Finally, besides mRNAs, miRNAs
can target different types of ncRNAs, some of them being highly conserved among species
such as the ultra-conserved genes or poorly conserved such as the pseudogenes (Salmena et
al. 2011; Calin et al. 2007).
miRNAs also work as secreted molecules that trigger a receptor‐mediated response in a
different cell or tissue. They have the ability to be released into the extracellular environment
within exosomes (cell‐derived vesicles originated by the inward budding in the plasma
membrane generating multivesicular bodies) which are present in many and perhaps all
biological fluids. In this way, they can act as "hormones" (Cortez et al. 2011). Similarly,
exosomes have been shown to modulate tumour microenvironments by releasing miRNAs
in a coordinated manner. miR‐21 and miR‐29a can be transported through exosomes and
can act as direct agonists of Toll‐like receptors (TLRs). By binding as ligands to receptors
of the TLR family in immune cells, these miRNAs were shown to trigger a TLR‐mediated
prometastatic inflammatory response (such as secretion of interleukins) which could favour
tumour growth and metastasis (Lehmann et al. 2012; Fabbri et al. 2012). A better
understanding of the diversity of mechanism of miRNA’s action may provide solutions for
intervention in the future.
1.2.3 miRNAs involved in gastric cancer progression
The number of animal miRNAs gradually expanded during long-term evolution, their
expression pattern changed in various species, tissue or cell settings. Recent studies have
identified a number of miRNAs with aberrant expression in gastric cancer (Xie et al. 2018)
(Appendix 7). For example, the comparison of miRNAs deregulated in gastric cancer
revealed a significant increase of several tumour-associated miRNAs such as miR-21, -25
and -106a and miRNAs from the miR-17-92 cluster (Link et al. 2012). Eight miRNAs
(including miR-100, -143 and −145) were upregulated specifically in diffuse-type, while four
miRNAs (miR-202, -373, -494 and −498) in intestinal-type gastric cancer (Song et al. 2012).
Comparison between diffuse-type gastric cancers compared with intestinal-type gastric
cancers, uncovered largely downregulations of hsa-let7d*, hsa-miR-328, hsa-miR-32*, hsa-

79
miR-1227, hsa-miR-206, hsa-miR-1229, hsa-miR-595, and hsa-miR-631.
Some miRNAs are significantly enriched in clusters in discrete genomic regions. The
clustering patterns suggest that miRNAs in the same cluster might be transcribed in a
polycistronic manner, and miRNAs in the same cluster were hypothesized to regulate
functionally related genes. There is accumulating evidence suggesting that epigenetic and
genetic defects in noncoding RNAs play crucial roles in tumour initiation, progression,
invasion, and metastasis. For miRNAs, extensive studies explored their deregulation, function
and underlining mechanisms and correlated these with progression and prognosis of gastric
cancer, using miRNAs’ microarray and bioinformatics analysis together with in vitro or in vivo
experiments. Overexpressed oncogenic microRNAs that target tumour suppressor genes or
reduction of tumour suppressor miRNAs versus targeting oncogenes could synergistically
promote progression, resist apoptotic signals, and promote cell invasion and tumour
metastasis (Ueda et al. 2010; Song and Meltzer 2012). Among these high-throughput studies,
several clusters of miRNAs exhibited consistent deregulation, highlighting their significant
roles in fine tuning the transcriptome during distinct status setting or response to specific
stimuli promoting gastric cancer progression.
miRNAs are exported from cells both within and outside the exosomes (Iguchi et al. 2010).
Exosomes act as mediators of cell cell communication (Rani et al. 2011; Ahmed and Xiang
2011) and are carriers for functional miRNA delivery (M. Yang et al. 2011; Pegtel et al. 2010).
There is considerable interest in using exosomes in clinical applications as biomarkers and/or
as potential therapeutic tools (Bobrie et al. 2011; Zomer et al. 2010).
More recently, circular RNAs, characterized by the formation of a covalently closed
continuous RNA loop, are drawing renewed attention in cancer research. Moreover,
noncoding RNAs are stable in bodily fluids such as serum, plasma, gastric juice, and even in
exosomes, making them promising non- or less invasive gastric cancer biomarkers.
1.2.4 Diagnostic potential of microRNAs in gastric cancer
Over the past decade, the emergence of miRNA research has firmly established this
molecular family as a key component in cells. Expression levels of certain miRNAs are
altered in many diseases. Identification of tumour-specific genetic alterations in the miRNA

80
processing machinery, such as in the genes encoding TARBP2, AGO2, Dicer, and Exportin‐
5 (XPO5) provide strong evidence of deregulated miRNAs being relevant in cellular
transformation processes (Abelson et al. 2005). Exploiting their roles as potential biomarkers
to predict, diagnose or monitor disease including cancer has become a focus for researchers
around the globe. This is being driven by the importance of early cancer diagnosis and the
need to be able to distinguish between different forms of cancer. Alongside altered
expression under different disease states, miRNAs have other features that make them ideally
suited as biomarkers. miRNAs are present in biofluids including blood, urine, and saliva,
allowing relatively non-invasive sample collection. In addition to their accessibility, miRNAs
are highly stable in biofluids and in collected samples making miRNAs relatively easy to work
with and assay via a range of different methods.
Discovering miRNA expression patterns that are unique to a particular cancer is an
important first step in identifying biomarker signatures which will be effective in its detection.
A particular problem with cancer is the difficulty of determining whether the cancer is an
aggressive form that requires immediate treatment or low-grade cancer. In gastric cancer,
studies on miRNA profiling of cancer versus normal tissues showed significant changes and
defined commonly altered miRNAs. Profiling of miRNAs by various methods has allowed
for the identification of signatures associated with the diagnosis, staging, disease progression,
prognosis, and response to treatment of gastric cancer. For example, a five-microRNA
signature in plasma (consistently elevated miR-1, miR-20a, miR-27a, miR-34 and miR-423-
5p) was established by comparing 160 cancer-free controls, 124 patients with gastric non-
cardia adenocarcinoma (GNCA) and 36 patients diagnosed gastric cardia adenocarcinoma
(GCA). For GNCA, an area under the receiver operating characteristic (ROC) curves (AUCs)
ranged from 0.850 to 0.925 and 0.694 to 0.790 in the training and validation phases,
respectively (Abelson et al. 2005). Masahiro et al. reported that plasma miR-18a
concentrations were significantly higher in gastric cancer patients than in healthy controls.
Furthermore, plasma miR-18a levels were significantly reduced in postoperative samples
compared to in preoperative samples (Tsujiura et al. 2015). A similar study indicated that
plasma miRNA-199a-3p could be novel a potential diagnostic biomarker for early gastric
cancer (Li et al. 2013).

81
Significant analytical challenges using miRNAs in cancer and disease diagnostics remains,
such as identification of robust, reproducible and economic methods of detecting
expression of miRNAs, and selection of reference genes. There is no currently known
extracellular reference RNA for cell free miRNA analysis. Moreover, the assessment of
sample quantity and quality is more challenging for miRNAs than for message RNAs, for
which the sizes and relative abundance of ribosomal RNAs can be used to check RNA
integrity. In conclusion, validation of specific miRNA signatures as biomarkers could be a
critical milestone in diagnostics.
1.2.5 Therapeutic potential of microRNAs in cancer
By blocking the function of targeted mRNAs in specific cell types or microenvironment
conditions, miRNAs could represent a valid option for treating patients with certain cancers
in the future.
The advantages of using miRNAs (compared with other gene-silencing therapies) includes
the fact that it is an innate product and can be metabolised in human cells and likewise.
miRNAs can target multiple genes from the same pathway and therefore their action can
occur at multiple levels in the same pathway, thereby significantly reducing the development
of resistance. For example, miR-17-5p and miR-20, both of which have increased expression
in gastric cancer patients, have 2 anti-proliferative targets: p21 and TP53INP1 (Wang et al.
2013). Therefore, a personalized therapy based on the identification of patients with
upregulated miR-17-5p/miR-20a cluster expression and p21 and TP53INP1 protein
reduction in gastric cancer patients can be envisioned. These types of therapies are very
specific for patients having these molecular characteristics in the same cells. Patients with
high levels of miR-17-5p/miR-20a but normal levels of p21 and TP53INP1 or conversely
with normal levels of miRNAs but abnormal levels of these anti-proliferative tumour
suppressors should be excluded from clinical trials targeting miR-17-5p/ miR-20a. Strategies
for miRNA targeting are based on either restoring miRNA levels or blocking miRNA
function with oligonucleotide-based strategies. A targeted approach to replenish the
expression levels of particular miRNAs is restoring the level and function of one or a limited
number of miRNAs, usually located within a cluster (such as miR-15a and miR-16-1 at
13q14.3), either with miRNA mimics or with miRNAs encoded in expression vectors.

82
miRNA mimic molecules are double-stranded sequences with 100% similarity to the
endogenous miRNA, which can be delivered by nanoparticles and thereby are expressed in
the cells. This approach is particularly attractive because nanoparticles can be coated with
antibodies that recognize tumour-specific antigens, therefore allowing a tumour-specific
delivery of the miRNA of interest Recently, a clinical trial of MRX34 (Mirna Therapeutics,
TX, USA) constructed a miR-34 mimetic using nanoparticles coated with a neuroblastoma-
specific antidisialoganglioside GD2 antibody to restore miR-34 expression in cancer cells.
The agent was used to treat liver cancer and liver metastasis of other cancers in phase I
clinical trial. The therapy has proved to be effective in the inhibition of neuroblastoma
tumour growth in a murine orthotopic xenograft model (Tivnan et al. 2012). Moreover,
MRX34, a liposome-formulated mimic of the tumour suppressor miR-34, has been
developed in a clinical phase 1 trial for patients with advanced or metastatic liver cancer.
Preclinical studies have already shown that tail vein injection of MRX34 reduced tumour
growth and significantly enhanced survival with a favourable safety profile in orthotopic
mouse models of hepatocellular carcinoma (Bader 2012). In a pre-clinical study of non-small
cell lung cancer (NSCLC), MRX34 treatment significantly reduced the expression of the
checkpoint signal PD-L1 and increased infiltrating CD8+ cells in tumour tissues (Cortez et
al. 2016). However, the MRX34 clinical trial was stopped in 2016 since multiple serious
immune-related side effects were observed in patients. So, the safety of MRX34 still requires
further research (Beg et al. 2017).
Current strategies for inhibitory targeting of microRNAs are mainly based on antisense
oligonucleotides (so‐called anti‐miRNAs), comprised of locked nucleic acids (LNA) along
with tiny LNA anti-miRNA constructs, antagomirs, and miRNA sponges. Miravirsen
(SPC3649), an LNA against miR-122, is the first miRNA target therapy tested in a clinical
trial for the treatment of hepatitis C virus infection. This recently completed phase 2a trial
showed that SPC3649 exhibited robust antiviral activity in a dose-dependent manner
(Lindow and Kauppinen 2012). More impressively, 4 of 9 patients treated at the highest dose
(7 mg/kg) with SPC3649 reached undetectable levels of hepatitis C virus RNA (consequently
decreasing the possibility of developing hepatocellular carcinoma) (Janssen et al. 2013). The
effectiveness of antimiR‐122 treatment proved the plausibility of LNA-based therapeutics
and encourages the development of other specific miRNA-targeting therapeutic strategies
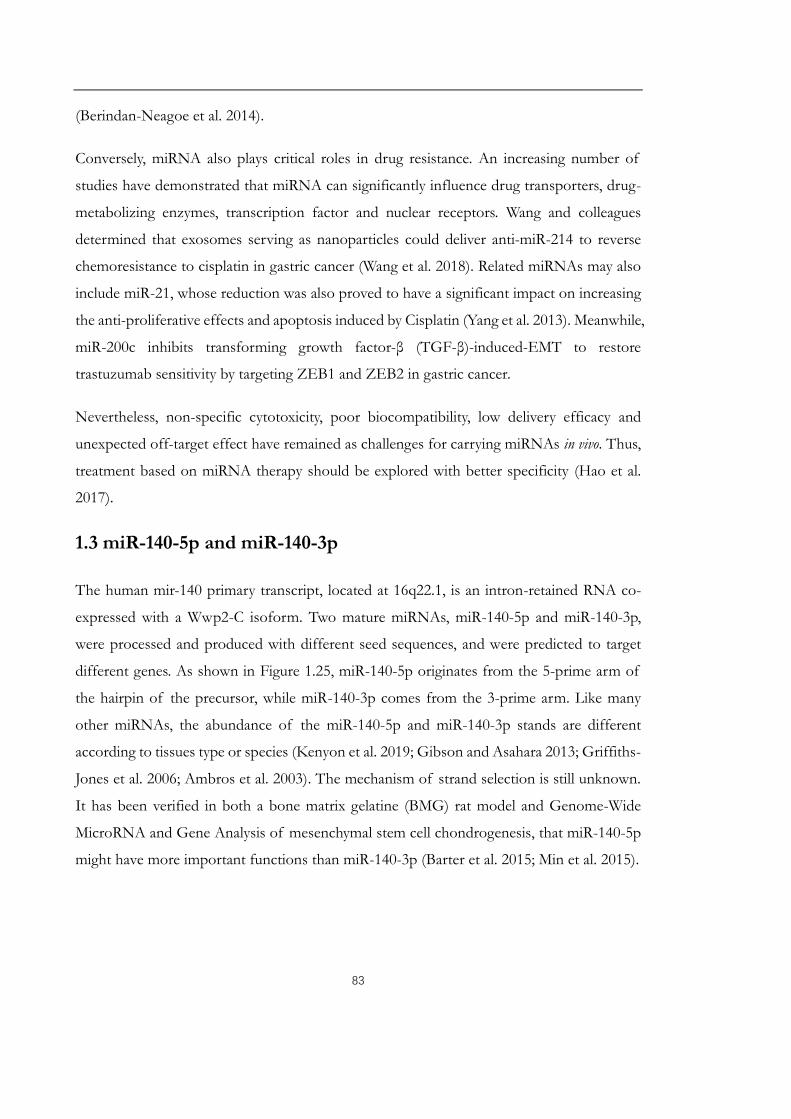
83
(Berindan-Neagoe et al. 2014).
Conversely, miRNA also plays critical roles in drug resistance. An increasing number of
studies have demonstrated that miRNA can significantly influence drug transporters, drug-
metabolizing enzymes, transcription factor and nuclear receptors. Wang and colleagues
determined that exosomes serving as nanoparticles could deliver anti-miR-214 to reverse
chemoresistance to cisplatin in gastric cancer (Wang et al. 2018). Related miRNAs may also
include miR-21, whose reduction was also proved to have a significant impact on increasing
the anti-proliferative effects and apoptosis induced by Cisplatin (Yang et al. 2013). Meanwhile,
miR-200c inhibits transforming growth factor-β (TGF-β)-induced-EMT to restore
trastuzumab sensitivity by targeting ZEB1 and ZEB2 in gastric cancer.
Nevertheless, non-specific cytotoxicity, poor biocompatibility, low delivery efficacy and
unexpected off-target effect have remained as challenges for carrying miRNAs in vivo. Thus,
treatment based on miRNA therapy should be explored with better specificity (Hao et al.
2017).
1.3 miR-140-5p and miR-140-3p
The human mir-140 primary transcript, located at 16q22.1, is an intron-retained RNA co-
expressed with a Wwp2-C isoform. Two mature miRNAs, miR-140-5p and miR-140-3p,
were processed and produced with different seed sequences, and were predicted to target
different genes. As shown in Figure 1.25, miR-140-5p originates from the 5-prime arm of
the hairpin of the precursor, while miR-140-3p comes from the 3-prime arm. Like many
other miRNAs, the abundance of the miR-140-5p and miR-140-3p stands are different
according to tissues type or species (Kenyon et al. 2019; Gibson and Asahara 2013; Griffiths-
Jones et al. 2006; Ambros et al. 2003). The mechanism of strand selection is still unknown.
It has been verified in both a bone matrix gelatine (BMG) rat model and Genome-Wide
MicroRNA and Gene Analysis of mesenchymal stem cell chondrogenesis, that miR-140-5p
might have more important functions than miR-140-3p (Barter et al. 2015; Min et al. 2015).
84
Figure 1.25: miR-140 sequence in human and mouse. A. In human, sequence of the miR-140 precursor (pre-miR-140) stem-loop located in intron 16 of the WWP2 gene. Seed sequence isrepresented in bold format. B. A schematic illustration demonstrating Wwp2 and pre-miR-140 loci are on mouse chromosome 8. Black boxes indicate exons of Wwp2, and the red box indicates the pre-miR-140 gene. (Adapted from previous publication (Inui et al. 2018; Tardif et al. 2013))
Previous reports have shown that miR-140-5p and miR-140-3p are almost exclusively
specific to chondrocytes and have been a focus of cartilage miRNA research to date. The
mir-140-deficient mice manifested a mild skeletal phenotype, with short stature and low body
weight, as well as craniofacial deformities characterized by a short snout and domed skull,
supporting the notion that mir-140 is a tissue-specific miRNA important in cartilage
development. Furthermore, mir-140-deficient mice showed age-related osteoarthritis (OA)-
like changes characterized by proteoglycan loss and fibrillation of articular cartilage. However,
transgenic mice overexpressing miR-140 in cartilage were resistant to antigen-induced
arthritis (Papaioannou et al. 2015; Araldi and Schipani 2010; Miyaki et al. 2010). Several
studies have also clarified that miR-140-5p exhibited the largest expression difference
between human articular chondrocytes and mesenchymal stem cells (Karlsen et al. 2014;
Miyaki et al. 2010; Miyaki et al. 2009). Gene Ontology (GO) analysis on the transcriptome
data with input lists of statistically significant up- or downregulated genes after either stable
miR-140-5p inhibition in differentiating mesenchymal stem cells or transient miR-140-5p
overexpression in dedifferentiating articular chondrocytes showed that miR-140-5p

85
negatively regulated genes involved in cytoskeleton remodelling and cell division, but
positively regulated genes related to extracellular regions and the extracellular matrix (Karlsen
et al. 2014). Additionally, miRNA-140-5p inhibits MSCs proliferation by targeting CXCL12
during TGF-β3-induced chondrogenic differentiation. TGF-β3 induced significant elevation
of miR-140-5p followed by markedly decreased CXCL12 inhibited mesenchymal stem cell’s
viability. It is worth noting that miR-140-5p was also significantly upregulated during cellular
senescence in mesenchymal stem cells (Yoo et al. 2014).
Furthermore, miR-140-5p is among the candidate miRNAs which can function in vivo to
suppress Fibroblast Growth Factor 9 (FGF9) as lung development progresses from
pseudoglandular to canalicular stages. Disruption of this progress or lack of epithelial Dicer1
increased FGF9 expression in pulmonary mesenchymal hyperplasia and a multicystic
architecture which is histologically and molecularly indistinguishable from Type I
Pleuropulmonary Blastoma (PPB) (Yin et al. 2015). In addition, downregulation of miR-140-
5p could have a role during pancreatic development. It may enhance OASIS expression and
activation in modulating extracellular matrix production, such as extracellular sulfated
proteoglycans, which regulate pancreatic endocrine differentiation during development by
inhibiting endocrine cell (β and α cell) development (Zertal-Zidani et al. 2007) and provide
help for the developing pancreas against physiological endoplasmic reticulum (ER) stress
(Vellanki et al. 2010). A similar phenomenon was shown in toxicity studies where OASIS
protects pancreatic β-cell lines and the C6 glioma line from tunicamycin and thapsigargin
(Vellanki et al. 2010) and protect astrocytes from kainic acid toxicity (Chihara et al. 2009),
which all are known to induce ER stress.
miR-140-3p demonstrates highest expression in human primary articular chondrocytes at
early passages compared with their dedifferentiated counterparts (Yan et al. 2011; Crowe et
al. 2016). miR-140-3p was also the most highly expressed microRNA in osteoarthritic
cartilage, playing a protective role against inflammation in chondrocytes (Crowe et al. 2016).
Corresponding targets of miR-140-3p included ADAMTS-5 and runt-related transcription
factor 2 (RUNX-2) (Le et al. 2013). Differential expression of miR-140-3p was found in
hematopoietic lineages and may be associated with platelet production and activation
(Collares et al. 2013).
86
Research on understanding inflammation has suggested that miR-140-5p and miR-140-3p
may play critical roles in the adaptive and innate immunity (O'Neill et al. 2011; Shimokawa
et al. 1998; Davidson-Moncada et al. 2010). They have also been reported as key components
in T cell differentiation, modulating the inflammatory response and activating toll-like
receptor pathways in macrophages (O'Neill et al. 2011; Shimokawa et al. 1998). Toll-like
receptors (TLRs) are pattern recognition receptors which regulate innate immunity and
defend against invading microorganisms (Sabroe et al. 2003). TLRs also mediate
autoimmunity. Upon stimulation, TLRs initiate downstream signalling pathways and lead to
the secretion of inflammatory chemokines and cytokines (Liu et al. 2014). miR-140-5p
downregulated TLR22 may be associated with or trigger a Th2 type immune response
(Valenzuela-Munoz et al. 2017). Lipopolysaccharides (LPS) treatment suppressed miR-140-
5p expression thus induced the high expression of TLR4 resulting in dramatically increasing
the number of the Th17 cells as well as the release of IL-6, IL-17 and IL-22 (Dileepan et al.
2016; Newcomb and Peebles 2013; Sethi et al. 2013; Kowalski et al. 2008). After an injury
such as radiation-treatment, miR-140-5p played a key role in maintaining this balance by
regulating macrophage polarization towards M1 macrophages, and antagonizing TGF-β1
activation, which promoted normal tissue repair and prevented the development of fibrosis.
In the absence of miR-140, M2 macrophages prevail and with constant wound healing of
lung tissue, scar tissue accumulated and contributed to the development of fibrosis (Duru et
al. 2016).
miR-140-3p negatively regulates nuclear factor-κB (NF-κB) inflammatory signaling by
regulating the expression of nuclear receptor coactivator 1 (NCOA1) and nuclear receptor-
interacting protein 1 (NRIP1), both of which are NF-κB co-activators (Takata et al. 2011).
NF-κB and AP-1 activated TNF-α which further augmented CD38 expression in human
airway smooth muscle (ASM) cells. CD38 is a cell-surface protein expressed in human ASM
cells, generating calcium-mobilizing second messenger molecules such as cyclic ADP-ribose,
contributing to airway hyper-responsiveness and the process of Asthma (Guedes et al. 2015).
Inflammation also plays a key role in coronary artery disease (CAD) and other manifestations
of atherosclerosis (Hansson 2005). To identify differentially regulated miRNAs in whole
blood in patients with coronary artery disease, a microarray study was conducted in 12

87
patients with CAD and 12 healthy control subjects. miR-140-3p, showed a rising trend,
accompanied by significantly reduced expression of target genes associated with
mitochondrial dysfunction and oxidative phosphorylation (Taurino et al. 2010). Upregulation
of miR-140-3p was also discovered in the coronary sinus blood of acute coronary syndrome
(ACS) patients, and this elevation was likely mainly derived from peripheral blood
mononuclear cells, including monocytes, circulating endothelial cells (CECs) and
lymphocytes (Li et al. 2017), which was, however, related to higher death rates in ACS of
CAD patients (Karakas et al. 2017). Ellagic acid and breviscapine inhibited cell apoptosis and
decreased fibrosis area and infarct area after acute myocardial infarction (AMI) by up-
regulating miR-140-3p and inhibiting MKK6 and subsequent TLR4 pathway (Wei et al. 2017).
In other respects, miR-140-5p was found to be upregulated in inhibition of biological
pathways associated with anabolic metabolisms, such as adipogenesis, cholesterol
biosynthesis, triacylglycerol synthesis, and insulin signaling (Craig et al. 2014). A marked
increase of circulating miR-140-5p was shown in morbidly obese patients; while surgery-
induced weight loss and food restriction led to a decrease of miR-140-5p (Gat-Yablonski et
al. 2013). Pioglitazone can decrease miR-140-5p expression and increase HDAC7 expression
in insulin resistance and adiposity patients (Liu et al. 2016).
Emerging evidence also revealed an altered expression of miR-140-5p and miR-140-3p in
different malignancies. Downregulation of miR-140-5p was reported in NSCLC, primary
breast cancer, colon cancer, hepatocellular carcinoma (HCC), osteosarcoma, chordomas and
lymphoma et al. Overexpression of miR-140-5p was reported to inhibit cell proliferation,
and cell cycle arrest in both colon cancer cell lines and a cancer stem cell line (Song et al.
2009). Mosakhani et al. (2012) found that upregulation of miR-140-5p was significantly
associated with poorer OS in metastatic colon cancer patients with wild-type KRAS/BRAF.
TGFβ signaling regulates tumour progression by a tumour cell-autonomous mechanism or
through a tumour–stroma interaction and has either a tumour-suppressing or tumour-
promoting function depending on cellular context (Ikushima and Miyazono 2010). miR-140-
5p could suppress the TGFβ pathway through targeting Smad3 (Butz et al. 2011; Pais et al.
2010). TGFβ receptor 1 (TGFBR1) and FGF9 are also direct targets for miR-140-5p.
Silencing TGFBR1 and FGF9 by small interfering RNA (siRNA) resembled the phenotype
resulting from the ectopic miR-140-5p expression, while overexpression of TGFBR1 and

88
FGF9 attenuated the effect of miR-140-5p on HCC growth and metastasis (H. Yang et al.
2013). An increasing body of evidence supports a stepwise model for the progression of
breast cancer from ductal carcinoma in situ (DCIS) to invasive ductal carcinoma (IDC).
Cancer stem cells (CSCs) are thought to be already programmed in pre-malignant DCIS
lesions and these tumour-initiating cells may determine the phenotype of DCIS. miRNA
profiling of normal mammary stem cells and cancer stem-like cells from DCIS tumours
revealed that miR-140-5p is significantly downregulated in cancer stem-like cells (basal-like
DCIS) compared with normal stem cells, linking miR-140 and dysregulated stem cell circuitry.
Targets of miR-140-5p, SOX9 and ALDH1, were the most significantly activated stem-cell
factors in DCIS stem-like cells (Li et al. 2014b; Wolfson et al. 2014; Yan et al. 2008). Targeted
therapies (tamoxifen) are only able to reduce DCIS risk in patients with oestrogen receptor
α (ERα)-positive disease (Li et al. 2014b). These may link to the restoration of miR-140-5p
after release from the suppression by ERα. Exosomal levels of miR-140-5p from stem cell
populations can be rescued by treatment with sulforaphane (Li et al. 2014b). In gastric cancer,
Cha et al. (2018) and Wu et al. (2019) have successively reported decreased miR-140-5p
expression in gastric cancer tissues, and its positive correlation with advanced stage and poor
clinical overcome. WNT1-mediated Wnt-β-catenin and THY1-mediated Notch signalling
pathway were identified to be responsible for lower miR-140-5p induced increased
proliferation, migration, invasion and impaired apoptosis of GC. Besides, Yu et al. (2019)
discussed miR-140-5p participated in regulation of NDRG3 and contributed to
5‑fluorouracil resistance in gastric cancer. However, it was reported that miR-140 exhibited
significantly higher expression levels in post-neoadjuvant chemotherapy specimens
compared with pre-neoadjuvant chemotherapy biopsies in breast cancer, and exhibited
significantly even higher expression levels in the ineffective group compared to the effective
group after neoadjuvant chemotherapy which indicated a poorer survival in breast cancer
patients (Chen et al. 2016). Retinoblastoma (Rb) depletion or inactivation in soft tissue
sarcoma cells exhibited slower proliferation and less efficient BrdU incorporation. However,
much higher spherogenic activity and aggressive behavior both in vitro and vivo. miR-140-5p
appeared to be positively controlled by Rb and to antagonize the effect of Rb depletion
through targeting IL-6 (Yoshida et al. 2017). The induction of IL-6 secretion and subsequent
autocrine/paracrine activation of STAT3 signalling supports the self-renewal activity of not
only cancer cells (Sansone et al. 2007; Korkaya et al. 2012; Marotta et al. 2011) but also

89
embryonic stem cells or induced pluripotent stem cells (Takahashi and Yamanaka 2016;
Brady et al. 2013). Furthermore, the promoting role of miR-140-5p to chemotherapy-
induced autophagy was determined by in osteosarcoma cells. miR-140-5p expression was
highly induced during chemotherapy of osteosarcoma cells, and this was accompanied by
up-regulated autophagy. The increased miR-140-5p expression levels up-regulated anticancer
drug-induced autophagy in osteosarcoma cells and ameliorated anticancer drug-induced cell
proliferation and decreased viability decrease (Wei et al. 2016).
Significant upregulation of miR-140-3p was found in metastatic nodal tissues compared to
nonmetastatic oral squamous cell carcinoma, and its expression had a strong negative
correlation with their DNA copy numbers and a negative correlation with their target genes.
Ingenuity Pathway Analysis on the expression of its target genes revealed a network
associated with cell cycle, connective tissue development, and cellular function and
maintenance. The central regulators in this pathway are p53, NF-κB, and HDAC1 (Serrano
et al. 2012). In line with this study, highly expressed miR-140-3p has been demonstrated to
control stemness of breast cancer cells as well. Contrary to the effect of the canonical hsa-
miR-140-3p, overexpression of the 5'isomiR-140-3p led to a decrease in cell viability. The
latter observation was supported by cell cycle analysis, where the 5'isomiR-140-3p but not
the hsa-miR-140-3p caused cell cycle arrest in G0/G1-phase. Additionally, 5'ismoiR-140-3p
overexpression was found to cause a decrease in cell migration (Salem et al. 2016). Up-
regulated miR-140-3p was shown in metastatic renal cell carcinoma comparing to localized
renal cell carcinoma (Zhu et al. 2016). Overexpression of miR-140-3p likewise correlated
with recurrence and tumour invasion in patients with spinal chordoma (Gulluoglu et al. 2016;
Zou et al. 2014). However, one controversial paper reported that increased expression of
miR-140-3p predicted improved breast cancer survival (Chang et al. 2016).

90
1.4 Aims and objectives of this study
The aims of the present study are:
1) To examine the expression of deregulated miRNAs and prognostic related miRNAs in
gastric cancer and their implication in the subtype classification of gastric cancer subtypes;
2) To select and clarify the role(s) of one or two miRNA(s) in gastric tissues and evaluate its
or their potential as clinically relevant prognostic biomarker(s).
3) To determine its or their impact on the functions of gastric cancer cells via an in vitro cell
model, which may contribute to its/their role(s) in the disease;
4) To discuss possible underlying molecular mechanism in its deregulation of gastric cancer.
Objective 1: Determination of miRNAs expression pattern in gastric cancer and their clinical
relevance. The expression analysis of miRNAs sequencing data from the TCGA cohort
(n=436) of gastric cancer tissue samples will be performed.
Objective 2: Expression of miR-140-5p and miR-140-3p will be determined using real-time
quantitative PCR in two independent gastric cancer patients’ cohorts with or without
neoadjuvant chemotherapy, respectively. The association with histopathological and clinical
characteristics will be evaluated accordingly. Additional analyses will be performed on
relevant public gene expression array data to further validate our findings.
Objective 3: Function of miR-140-5p and miR-140-3p on gastric cancer cells.
This will be achieved initially by studying the behavior, in particular proliferation, migration,
invasion and drug response of different gastric cell lines in response to transfection with
miRNA overexpression miRNA mimics or inhibitors.
Objective 4: Molecular mechanisms.
According to the Gene Set Enrichment Analysis (GSEA) analysis, a computational method
that determines whether an a priori defined set of transcriptome shows statistically
significant, concordant differences between two biological states (a specific miRNA

91
upregulation and suppression) from TCGA, combining with the clinical relevance analysis
and related cell behaviour alteration, cell cycle-related molecular mechanism will be
investigated by determining expression and activation of candidate molecules.

92
Chapter 2.
Materials and Methods

93
2.1 Clinical cohort study
2.1.1 Gastric cancer cohort patient selection and tissue collection
Pairs of primary human gastric cancer tissue and corresponding normal gastric tissue (>5
cm away from tumour margin) were collected from surgical specimens of informed,
consenting patients in 2 independent clinical cohorts. The first one included 70 gastric cancer
patients who did not receive any pre-treatment before surgery from the Beijing Cancer
Hospital from January 2004 to December 2010, and the second cohort contained 87 gastric
cancer patients (diagnosed and histologically confirmed with stage IIIA, IIIB, or IV [M0])
attending the Beijing Cancer Hospital neoadjuvant chemotherapy clinic trial from January
2002 to December 2006. This study was conducted according to the principles of the
Declaration of Helsinki and was approved by the Ethics Committee of The Beijing Cancer
Hospital. After gastrostomy, resected specimens were processed routinely for macroscopic
pathological assessment, then tissue samples sectioned at 20 µm thickness for RNA
extraction, reverse transcription and transcript expression analysis using quantitative
polymerase chain reaction (qPCR) were placed in labelled cryo vials, frozen in liquid nitrogen
and stored in the research laboratory at -80°C until required for processing and analysis. The
remaining surgical specimen was fixed in formalin for further wax blocking and section
examination; the subsequent report was obtained for data stratification. Gastric cancer stage
was classified according to the 2010 TNM classification recommended by the AJCC (7th
edition). Patient records were reviewed in the context of clinicopathological and follow-up
information. The median follow-up period was 21.7 months.
2.1.2 Preparation of tissue samples
Multiple sections of frozen tissue samples from the same patient sample biopsy were ground
using a Leica CM1900 Cryostat (Leica Biosystems, Newcastle Upon Tyne, UK). 100 mg of
homogenized sections were mixed thoroughly in 1 mL ice-cold TRI reagent (Sigma-Aldrich,
Poole, UK) using a handheld homogenizer (Cole Palmer, London, UK). RNA was
subsequently extracted according to the manufacturer's instructions. Following extraction,
RNA was resuspended in diethyl pyrocarbonate (DEPC) water and quantified using a
spectrophotometer (WPA UV 1101, Biotech, Cambridge, UK). Five micrograms of RNA
samples were prepared for miRNA assay analysis, the remaining samples were subsequently
94
standardized before undertaking the reverse transcription reaction using an iScript cDNA
synthesis kit (Bio-Rad Laboratories, Hemel Hemstead, UK) to generate cDNA.
2.1.3 General compounds
The general compounds used in this study and their sources are listed in Appendix 2.
2.1.4 General plastic consumables, hardware and software
The general plastic consumables, hardware, and software used in this study and their sources
are listed in Appendix 3.
2.2 Cell lines
Six gastric cancer cell lines and a pair of colon cancer cell lines were used for the study.
MKN7, MKN74, MKN45 and NUGC4 which have differing p53 status and established
from gastric carcinomas, were purchased from RIKEN BioResource Centre CELL BANK
(Ibaraki-ken, 305-0074 Japan); AGS and HGC27 were purchased from the American Type
Culture Collection (ATTC, Rockville, Maryland, USA). The HCT116 p53 Wild type cell line
and HCT116 p53 Knock-out cell line were provided by Professor M.C. Bibby (Cancer
Research Unit, University of Bradford, UK) and routinely maintained in our lab. All
information regarding these cell lines is listed in Table 2.1.

Table 2.1: Cell Lines, Origin and Additional Information. 1WT: Wild Type, 2stable: Microsatellite
Cell lines
Derived from
MorphologyCulture
Properties
Donor information Population Doubling
Time
Passage number
usedLauren
type Original Differentiation p53 Others age gender race
Gastric Cancer Cell Lines
AGS Primary cancer Intestinal Epithelial Poorly WT1 Stable2 Adherent 54 Female Caucasian 18-20 hrs. 10-18
NUGC4 Primary cancer Diffuse Signet ring cell Poorly WT Stable2 Adherent 35 Female Asian 2-3 days 2-5
MKN7Metastatic
site(lymph nodes)
Intestinal Tubular adenocarcinoma Well
Missensemutation
(278)
HER-2 positive Adherent 39 Male Asian 1 week 2-6
MKN74Metastatic
site(liver)
Intestinal Tubular adenocarcinoma Moderately
Missense mutation
(251)? Adherent 37 Male Asian 3 days 2-6
MKN45Metastatic
site(liver)
Diffuse Epithelial ?
p53 Missense mutation
(110)
CEA highly
producingAdherent 62 Female Asian 60 hrs. 2-5
HGC27Metastatic
site(lymph nodes)
? ? Undifferentiatedp53
frameshift(152)
Stable2 Adherent ? ? Caucasian 16-20 hrs. 18-23
Colon Cancer Cell LinesHCT116 p53 WT
Metastatic site ? Epithelial
WT Unstable(MSI-high), CEA highly
producing
Adherent
48 Male Caucasian
1-2 daysHCT116 p53 KO
Deleted of the exon2
91

92
2.3 Primers
Primers were designed or based on previous publications and blasted online
(https://blast.ncbi.nlm.nih.gov/Blast.cgi). Details for primers for conventional real-time
quantitative PCR (qPCR) are listed in table 2.2. An additional Z sequence, written in bold,
acts as a fluorescent tag in qPCR reactions and were synthesized by Sigma-Aldrich (Poole,
Dorset, UK). The stock primer solution was prepared according to the datasheet provided
and stored at -20˚C,the working solution was diluted either 1 in 10 or 1 in 100 (for the Z
sequence).
Table 2.2: Primers used in the current study to quantify gene expression
Gene Primer The sequence of Primer (5'->3')size (bp)
Tm (˚C)
CCND1 F1 AATGACCCCGCACGATTTC191 59
ZR1 ACTGAACCTGACCGTACATCAGGTTCAGGCCTTGCAC
F8 TGTGCTGCGAAGTGGAAACC405 61
R8 CCATTTGCAGCAGCTCCTCG
DNMT1 F1 CGTGGTGGTGGATGACAAG150 60
ZR1 ACTGAACCTGACCGTACAGGCTCCCCGTTGTAGGAGAT
F8 GTGGGGGACTGTGTCTCTGT676 59
R8 TGCTGCCTTTGATGTAGTCG
MDM2 F1 GTTATCTCAGTGCCTTTTGC101 58
ZR1 ACTGAACCTGACCGTACAAACAGACACATGTTCTACCC
F8 CCTTCGTGAGAATTGGCTTC462 57
R8 CATACTGGGCAGGGCTTATTC
p21 F1 CTGGAGACTCTCAGGGTCGAA66 60
ZR1 ACTGAACCTGACCGTACAGCGTTTGGAGTGGTAGAAATCT
F8 GCGATGGAACTTCGACTTTG352 58
R8 GGGCTTCCTCTTGGAGAAGAT
p53 F1 CTGTCATCTTCTGTCCCTTC172 60
ZR1 ACTGAACCTGATGGAATCAACCCACAGCTGCA
F8 AGACCCAGGTCCAGATGAAG484 59
R8 CACCACACTATGTCGAAAAGTGT
GAPDH
F1 AAGGTCATCCATGACAACTT87 55
ZR1 ACTGAACCTGACCGTACAGCCATCCACAGTCTTCTG
F8 GGCTGCTTTTAACTCTGGTA475 55
R8 GACTGTGGTCATGAGTCCTT

2.4 Antibodies
Primary antibodies used in this study are shown in Table 2.3
Table 2.3: Primary antibodies used in Western Blot. Secondary antibodies used were either horseradish peroxidase (HRP) conjugated anti-mouse (A9044) or anti-
rabbit (A0545) IgG antibodies from Sigma-Aldrich (Poole, Dorset, UK), in a dilution of 1 in 2000.
AntibodyThe molecularweight (kDa)
Target Species CompanyCatalognumber
Dilution
MDM2 90 Raised against amino acids 154-167 of MDM2 of human origin for detection of MDM2, MDM2 p60 cleavage product and p53-MDM2
complexes by WB
mouse monoclonal
Santa Cruz Biotechnology
Inc.sc-965
1 in1000
p53 53
Specifically recognizes the N-terminal epitope mapping between amino acid residues 11-25 of p53 of human origin, which could be
used for detection of wild-type and mutant p53 under denaturing and non-denaturing conditions of human origin by WB.
mouse monoclonal
Santa Cruz Biotechnology
sc-126 1 in 500
p21 21 Specific for an epitope mapping between amino acids 124-164 at the
C-terminus of p21 of human originmouse
monoclonalSanta Cruz
Biotechnologysc-
2716101 in 500
BAX 23 Amino acids 1-171 of Baxαrabbit
monoclonalSanta Cruz
Biotechnologysc-7480 1:500
GAPDH 37 GAPDH purified from rabbit muscle. recommended for detection of
GAPDH of human origin by WBMouse
monoclonalSanta Cruz
Biotechnology Incsc-
322331 in 2000
9 3

94
2.5 Mimics and inhibitors
The ready-to-use MISSION miRNAs (Sigma-Aldrich, Poole, Dorset, UK): hsa-miR-140-5p
(HMI0214), hsa-miR-140-3p (HMI0215) and the negative control mimic (HMC0003,
sequence from Caenorhabditis elegans with no homology to human gene sequences) mimics
were diluted in DEPC water to produce a stock concentration of 20 μM and used at a
working concentration of 20 nM. MISSION® Synthetic microRNA inhibitors: miR-140-5p
(HSTUD0214), hsa-miR-140-3p (HSTUD0215), and negative control inhibitor (cel-miR-
243-3p, NCSTUD002) were diluted in DEPC water to produce a stock concentration of 10
μM and used at a working concentration of 10 nM.
2.6 Preparation for standard reagents and solutions
2.6.1 General laboratory used materials
Phosphate buffered saline (PBS)
One PBS tablet (Sigma-Aldrich) was dissolved in 200 mL of purified water to make a working
concentration (containing 137 mM NaCl, 2.7 mM KCl, 10 mM Na2HPO4, 1.8 mM KH2PO4,
pH 7.20 - 7.60). This was then autoclaved and aliquoted accordingly.
2.6.2 Materials for cell culture use
0.25% Trypsin-EDTA
A 10X stock of Trypsin-EDTA (Sigma-Aldrich) was diluted to a 1X solution with PBS. This
was aliquoted and stored at -20℃ until use.
Antibiotics
Five millimolars of 100X antibiotics containing 10,000 U/mL penicillin, 10 mg/mL
streptomycin, 25 μg/mL amphotericin was added to 500 mL growth media to make a final
working concentration at 100 U/mL, 0.1 g/mL, streptomycin and 0.25 μg/mL amphotericin.
2.6.3 Materials for molecular biology
0.05% DEPC water (Diethyl pyrocarbonate)

95
A working solution of 0.05% DEPC water was prepared by dissolving 250 μL of DEPC was
added to 500 mL of distilled water, left for 24 hrs and then autoclaved.
2.6.4 Materials for bacterial transformation
LB broth
LB broth was made by dissolving 10 g tryptone, 10 g NaCl and 5 g yeast extract in 1 liter of
distilled water. After being adjusted pH to 7.0, the media was autoclaved prior to storage at
4°C until use. Appropriate antibiotics for colony selection were added prior to use.
LB Agar
LB agar was prepared by dissolving 10 g tryptone, 5 g yeast extract, 15 g agar and 10 g NaCl
in 1 liter of distilled water. The pH was adjusted to 7.0 and the media was autoclaved and
solid at room temperature. To prepare LB agar dishes, the agar was melted by heating in a
microwave to reach a liquid state. And when it cooled to approximately 65°C, the appropriate
antibiotic for colony selection was added, then poured into 10cm2 Petri dishes. Once
solidified, the plates were kept at 4°C until use.
2.6.5 Materials for western blot
Lysis buffer
The 100 mL lysis buffer containing NaCl 150 mM (0.87 g), TRIS base 50 mM (0.61 g), EGTA
5 mM (0.19 g), Triton X-100 1% (1 mL) was purchased from Melford Laboratories, UK. A
protease inhibitor cocktail tablet (Roche) was added and the solution was aliquoted and
stored at -20°C until use.
10% Ammonium Persulphate (APS)
One gram of APS (Melford Laboratories Ltd, UK) was dissolved in 10 mL of distilled water
and stored at 4°C until use for up to 2 weeks.
10% Sodium dodecyl sulfate (SDS)
Ten grams of SDS (Sigma-Aldrich) was dissolved in 100 mL of distilled water and was stored
at room temperature.

96
Running Buffer
One liter of 10X Tris-Glycine SDS buffer (Sigma-Aldrich) was added to 9 L of distilled water.
Transfer Buffer
One liter of 10X Tris-Glycine concentrate buffer (Sigma-Aldrich) was added to 7 L of
distilled water and 2 L of methanol (Fisher Chemical, Leicestershire).
0.01% TBS-Tween (TBS-T)
For the washing solution, 500 μL of Tween20 (Melford Laboratories Ltd, UK) was added to
500 mL of 1X TBS and mixed thoroughly.
Blocking buffer
Non-fat dried milk (Marvel) was dissolved in 1X TBS-T to a final concentration of 5%
(weight /volume) used for blocking membranes.
2.7 Cell culture, maintenance, and storage
2.7.1 Growth media
AGS, HGC27, HCT116 cell lines are cultured in Dulbecco’s Modified Eagle’s Medium
(Sigma-Aldrich, Dorset, UK), supplemented with 10% fetal calf serum (FCS) (Sigma-Aldrich,
Dorset, England, UK) and 1 × penicillin/streptomycin antibiotics (Sigma-Aldrich, Dorset,
UK). The other cell lines are maintained in RPMI-1640 Medium (Sigma-Aldrich, Dorset, UK)
and supplemented with FCS and antibiotics.
2.7.2 Cell maintenance
Cells were grown in culture flasks and incubated at 37˚C and 5% CO2 in a humidified
incubator. Cells were cultured in 6-well-plates, 25cm2 or 75cm2 tissue culture flasks
(Greiner Bio-One Ltd, Gloucestershire, UK) with loosely fitted caps. Mycoplasma
contamination in cell cultures was estimated using EZ-PCR Mycoplasma Test Kit (Biological
Industries, Israel). Cell medium was changed every 2-3 days and sub-cultured once they
reached a confluence of approximately 85-90%. All cell work was carried out aseptically,
using a Class II Laminar Flow Cabinet with sterile and autoclaved equipment and

97
consumables.
2.7.3 Trypsinisation of adherent cells and cell counting
Cell medium was aspirated, and the cells were briefly rinsed with sterile PBS before detaching
adherent cells. Depending on the amount and characteristics of cells were cultured, 0.5-2 ml
of Trypsin/EDTA (0.01% trypsin, 0.05% EDTA in borate buffered saline, BSS) was used
to detach adherent cells and they were incubated at 37˚C for 2-5 minutes. Once disassociated,
cells were collected in the appropriate medium containing FBS to stop the trypsinization
reaction and transferred to 20 ml universal containers (Greiner Bio-One Ltd, Gloucestershire,
UK) before being centrifuged at 1200 rpm for 5 minutes. The supernatant was then aspirated,
and the cell pellet was resuspended in an appropriate amount of medium. Cells were either
split and transferred to fresh tissue culture flasks for re-culturing or counted using Counter
II FL Automated Cell Counter (Thermo Fisher Scientific, Waltham, MA USA) and then
seeded at an appropriate concentration of cells for experimental requirements.
2.7.4 Frozen storage of cell stocks
Cells were trypsinized as previously described (section 2.7.3) and resuspended in medium
containing 10% Dimethyl sulphoxide (DMSO; Sigma-Aldrich, Dorset, UK) at a cell density
of about 106 cells/ml. The cell suspension was then divided into 1 mL aliquots and
transferred into cryo-vials (Grenier Bio-One, Germany) pre-labelled with cell names, date of
storing, owner’s name and was then wrapped in protective tissue paper or loaded into frozen
storage box containing isopropanol, before being stored at -80 ˚C or in liquid nitrogen tanks
for long-term preservation.
2.7.5 Resuscitation of cells
After being removed from frozen storage, cryo-vials were thawed immediately in a 37 ˚C
water bath. Once melting, cells are transferred into a universal container containing 9 mL of
normal culture medium and being centrifuged at 1000 rpm for 5 minutes. The supernatant
was then aspirated to remove the traces of DMSO from the cells. The cell pellet was
resuspended in 5 mL of the medium before being transferred to a fresh 25 cm2 tissue culture
flask left overnight in normal culture conditions. After 24 hours, the revived cells were
examined under the microscope to visually assess the viability of the adherent cells. The
medium was aspirated and replaced with fresh medium. The flask was returned to the

98
incubator and the previous standard subculture techniques were carried out when necessary.
2.8 Methods for isolation and quantification of genetic material
2.8.1 RNA Extraction
The TRI Reagent® (Sigma-Aldrich, Poole, Dorset, England, UK), containing phenol and
guanidine isothiocyanate which can break the protein-protein interactions and combine with
the inactivation of cellular nucleases, was employed for RNA extraction. According to the
manufacturer’s instructions, cell medium was replaced with TRIzol® Reagent (1 mL for 5-
10×105 cells). After addition of the reagent, this homogenate was passed several times
through pipetting to form a homogenous lysate and then transferred in a 1.5 mL Eppendorf.
Samples were left for 5 minutes at room temperature to ensure complete dissociation of
nucleoprotein complexes. This was followed by the addition of 100 μL of 1-Bromo-3-
chloropropane (Sigma-Aldrich, Poole, Dorset, England, UK), vigorous shaking for 15
seconds and incubation at room temperature for 15 min. The resulting homogenate was then
centrifuged at 12,000 x g for 15 minutes at 4 °C. Under these acidic conditions,
Centrifugation separates the homogenate into 3 phases: a pink organic phase (containing
protein), a white interphase (containing DNA), and a colourless upper aqueous phase
(containing RNA). This aqueous phase, which should constitute around 40-50% of the total
volume, was then carefully removed and transferred into a fresh tube, before adding 0.5 mL
of isopropanol (Sigma-Aldrich, Inc., Poole, Dorset, England, UK), and incubating for 10
minutes at room temperature. After centrifuging the samples at 12, 000 x g for 10 minutes at
4 ˚C, the RNA precipitate forms as a white pellet could be seen on the side and bottom of
the tube. The supernatant was then aspirated, and the RNA pellet was washed by vortexing
it with 1 mL of 75% ethanol (3:1 ratio of pure ethanol and diethylpyrocarbonate, DEPC,
water) and subsequently vortexing and centrifuging the samples at 7, 500 x g for 5 minutes
at 4 ˚C. After the ethanol was aspirated, the pellets were further air-dried at room temperature
for 5 mins to remove any remaining traces of ethanol. DEPC water was pre-warmed at 55
˚C in a Techne, Hybridiser HB-1D drying oven (Wolf Laboratories, York, UK), then dissolve
the RNA pellet in 20-50 μL (depending on pellet size) in pre-warmed DEPC water by
repeated pipetting for a short while.

99
2.8.2 Genomic DNA extraction
In order to assess the status of miR-140 in different cell lines used in this study, again, the
TRI-reagent was applied for this procedure. Cells were lysed and separated into three
different phases as elucidated previously. The aqueous RNA phase overlaying the DNA
interphase was carefully removed to improve the quality of the DNA isolated. The DNA
was precipitated from the interphase and organic phase by adding 0.3 mL of 100% ethanol
per 1 mL of TRI-Reagent used and mixing by inversion. The mix was allowed to stand for
2-3 minutes at room temperature before being centrifuged at 2, 000 x g for 5 minutes at 4
˚C. The supernatant was discarded, and the DNA pellet was washed twice in 1 mL of 0.1 M
trisodium citrate, 10% ethanol solution for every 1 mL of TRI-reagent used to remove
phenol from the DNA. During each wash, DNA pellet was allowed to stand for at least 30
minutes. With occasional mixing. Samples were centrifuged again at 2, 000 x g for 5 minutes
at 4 ˚C and the DNA pellet was resuspended in 1.5 mL of 75% ethanol per 1 mL of TRI-
reagent and left to stand for 20 minutes at room temperature. The DNA pellet was air-dried
for 5-10 minutes and dissolved by repeated slow pipetting with a micropipette in 8 mM
NaOH (0.1 mL to the DNA isolated from fully confluent 25 cm2 flask).
2.8.3 Spectrophotometric quantification of RNA and DNA
Once isolation was completed, the concentration and purity of the RNA and DNA were
measured by a NanoPhotometer (Implen, München, Germany). The absorbance measure
unit is the wavelength (λ) and some typical values are reported below:
λ = 230 nm: the wavelength of absorption of complex carbohydrates and phenols;
λ = 280 nm: the wavelength of absorption of proteins;
λ = 260 nm: the wavelength of absorption of nucleic acids;
λ = 320 nm: the wavelength of absorption of other contaminants.
Two μL sample was used to detect single-stranded RNA (μg/μL) at the wavelength of 260
nm, using DEPC water as a blank. The purity of RNA is evaluated by the ratio of the
readings at 260 nm and 280 nm (A260 / A280) and at 260 nm and 230 nm (A260 / A230).
The A260 / A280 ratio provides an estimate of the purity of RNA with respect to
contamination by protein and its value must be higher than 1.7. The A260 / A230 ratio
provides an estimate of the purity of RNA with respect to contamination by solvent (phenol,
salts) and its value must not be fewer than 2.2. Contaminations may decrease the efficiency

100
of the following reactions, mainly by the inhibition of the enzymes. DNA was also measured
using the NanoPhotometer, set to measure double-stranded DNA at 260 nm. After the
purification and quantification, the RNA samples are ready to be used immediately or they
can be stored at -80⁰C for later use.
2.8.4 Reverse transcription (RT) of mRNA
To measure genes expression at transcription level, 500 ng of RNA (cDNA synthesis, as
measured by real-time PCR, has a linear relationship to the input RNA across this range.)
was converted into complementary DNA (cDNA) using the GoScript™ Reverse
Transcription System (Promega Corporation, Madison, USA), following the protocol
outlined below.
The required volume of isolated RNA containing the desired quantity of RNA was made up
to 9 µL with PCR water in a thin walled 0.2 mL PCR tube. 1 µL of RT primer was added
and the resultant mixture was heated at 70°C for 5 minutes to denature the secondary
structure of RNA allowing more effective reverse transcription.
Table 2.4.1: Reverse transcription PCR preparation 1Component 1 reaction (μL)
RNA template (up to 2 µg) XRT primer 1.0RNAse/DNAse free water XFinal volume 5
Oligo-dT primers which bind to the polyA tail of messenger RNA were preferentially used
in this process. Following this incubation period, the PCR tube was immediately placed on
ice. The RT mix was made up using the following components:
Table 2.4.2: Reverse transcription PCR preparation 2Component 1 reaction (μL)
GoScript™ 5X Reaction Buffer 4.0MgCl2 (final concentration 25 mM) 2.0dNTP mix 10 mM 1.0RNAse/DNAse free water 7.0GoScript™ Reverse Transcriptase 1.0Final volume 15.0

101
10 µL of the above RT mix was added to each of the samples on ice. After briefly cortex
and a pulse spin, the resultant mixture was incubated at 25°C for 5 minutes, 42°C for 60
minutes and 75°C for 20 minutes. The cDNA was diluted in nuclease-free water in the ratio
1:8. cDNA Samples were added to PCR or qPCR amplification or stored at -20°C until use.
2.8.5 General polymerase chain reaction (PCR)
General PCR was performed using GoTaq Green Master Mix (Promega, Madison, USA) and
specific primers designed for the identification of the gene targets, which were synthesized
by Sigma (Sigma-Aldrich, Dorset, UK). Reactions for each sample were set up in 0.2 mL
PCR tube or a 96 well plate, as shown below:
Table 2.5: General PCR preparationComponent 1 reaction (μL)
2X GoTaq Green Master Mix 8.0Forward primer (10 pmol) 1.0Reverse primer (10 pmol) 1.0Nuclease-free water 5.0cDNA template 1.0Final volume 16.0
Once set up, the prepared reactions were briefly mixed and centrifuged. All reactions were
run alongside a negative control, which consisted of using nuclease-free water instead of the
cDNA template to ensure there was no contamination of the master mix. A loading control
probing for GAPDH expression was also run for each sample to confirm similar cDNA
quantities in each reaction prepared.
The PCR tubes or 96 well plates were placed in a 2720 Thermal Cycler (Applied Biosystems,
Paisley, UK). PCR conditions for MDM2 and GAPDH primers were optimized as:
Step 1 – Initial denaturation at 94 ˚C for 5 minutes
Followed by 25-42 cycles of:
Step 2 – Denaturing step at 94 ˚C for 30 seconds
Step 3 – Annealing step at 55 ˚C for 30 seconds

102
Step 4 – Extension step at 72 ˚C for 1.5 minutes
And finally:
Step 5 – Final extension at 72 ˚C for 10 minutes
2.8.6 Agarose gel electrophoresis and visualization
Samples were loaded onto 0.8% to 2.5% agarose gels (Melford Chemicals, Suffolk, UK),
depending on the predicted size of the DNA products. Weigh out the appropriate mass of
agarose into an Erlenmeyer flask, UK), and add the appropriate volume of 1X Tris-borate-
EDTA (TBE) buffer. Melt the agarose/buffer mixture by heating in a microwave, at 30 s
intervals, remove the flask and swirl the contents to mix well. Repeat until the agarose has
completely dissolved. SYBR Safe Gel Stain (Invitrogen, Paisley, UK) was then added at a
ratio of 1:10000. The agarose was left to cool slightly before being poured into the removable
gel tray and it was allowed to place an appropriate comb into the gel mold to create the wells.
Once set, the gel was submerged in 1X TBE buffer and the comb was removed. 10 µL of
the PCR samples were loaded in each well, alongside 5 µL of a 100 bp or 1 Kb DNA ladder
(Genscript, Piscataway, USA). Attach the leads of the gel box to the power supply, double
checking the cathode (black leads) should be closer the wells than the anode (red leads). The
samples were subjected to electrophoresis using a power pack (Gibco, Paisley, UK) at 100 V,
90 mA, 50 W for 30 minutes (or until the dye has migrated to an appropriate distance). Gels
were visualized and imaged using a U: Genius gel doc system (Syngene, Cambridge, UK).
2.8.7 Real-time quantitative polymerase chain reaction (RT-qPCR)
Quantitative PCR with a heat stable DNA polymerase could detect the products of the
reaction from the first cycle in which the amplified target becomes detectable (threshold
cycle, Ct) and thus generate a more accurate and reproducible result than the traditional end-
point PCR. The Ct value is inversely correlated with the starting amount of target genes. In
the current study, qPCR was performed using the Amplifluor ™ Universal Detection System
(Intergen®, New York, USA). This system is based on molecular energy transfer from an
excited fluorophore (fluorescein) to an acceptor moiety [4-(4’-dimethylaminophenylazo)
sulfonic acid (DABSYL)] that quenches the fluorescence emission. The fluorophore and
acceptor are tethered together via an oligonucleotide primer called UniPrimer™.
Amplifluor™ UniPrimer™ hairpin primers are designed in such a way that a fluorescent

103
signal is only generated when the primer is unfolded during its incorporation into an
amplification product.
Contained within the UniPrimer™ is a 3’-18 base oligonucleotides of tail called a Z sequence,
which acts as a universal PCR primer. The fluorophore and acceptor are located at the 5’ end.
In order to use the UniPrimer™, the Z sequence is added to the 5’ end of a target-specific
primer. The UniPrimer™ can then anneal to the Z’ sequence in an amplicon generated in
the initial cycles of the PCR reaction. As the UniPrimer™ is incorporated, the hairpin
becomes unfolded, quenching can no longer occur and then a fluorescence signal that
directly correlates to the amount of amplified DNA is produced. An illustration showing
how the Amplifluor™ Universal detection system using the UniPrimer™ detection system
works is shown in Appendix 4.
The components of each qPCR reaction are shown in Table. 2.6 Each sample was loaded
into a 96 well plate (Applied Biosystems™, Life Technologies Ltd, Paisley, UK), covered with
MicroAmp® Optical Adhesive film (ThermoFisher Scientific, Life Technologies Ltd, Paisley,
UK) and run alongside a podoplanin (PDPL) standard of a known transcript number
(ranging from 101 to 108). PDPL is a lymphangiogenesis marker, which acted as a reference
control gene to ensure any differences observed were not due to technical errors and allowed
normalization of results from different plates. GAPDH is an enzyme of ~37kDa that
catalyses the sixth step of glycolysis and thus serves to break down glucose for energy and
carbon molecules. Because the GAPDH gene is often stably and constitutively expressed at
a high level in most tissues and cells, it is considered a housekeeping gene and is commonly
used as a reference point for the analysis of expression levels of other genes. The 96 well
plate was placed in an iCycler Thermal Cycler which uses a light source to excite the
fluorescent molecules in the wells and an image intensifier and a 350,000-pixel charge-
coupled device (CCD) detector to image all 96 wells every second and detect fluorescent
light.
An example of the amplification plot and standard curve produced using qPCR is shown in
Appendix 5.
Each cDNA sample was diluted 1:8 with ddH2O. RT-qPCR performed using TaqMan®
Universal PCR Master Mix (Applied Biosystems, Paisley, UK) and Universal Primer

104
(Intergen®, New York, USA), with forward and fluorescent tagged reverse primers designed
for target gene amplification. Reactions for each sample were loaded in a 96 well plate with
triplicates, as shown in Table 2.6.
Table 2.6: qPCR preparationComponent 1 reaction (μL)
2X IQ Master Mix 5.0Forward primer (10 pmol) 0.3Reverse primer (1 pmol) 0.3Universal primer (10 pmol) 0.3cDNA template 1.0ddH2O 3.1Final volume 10.0
The plate was covered with optically clear Microseal® (BioRad Laboratories, California, USA)
and placed in a StepOnePlus™ Real-Time PCR System (Thermo Fisher Scientific, Waltham,
MA USA) at the following parameters: initial denaturation for 10 minutes at 95 ˚C; followed
by 85 cycles of denaturation at 95 ˚C for 10 seconds, annealing at 55 ˚C for 30 seconds and
elongation at 72°C for 10 seconds. Results were analyzed using ΔΔCT normalization to
the housekeeping gene, GAPDH.
2.8.8 miRNA reverse Transcription and real-time PCR
The reverse transcription for mature miRNA quantification was performed using TaqMan™
Advanced miRNA cDNA Synthesis Kit (Applied Biosystems, UK). Each reaction containing
5 ng RNA sample was set up in a 0.2 mL PCR tube (ABgene, Surrey, UK) and the
manufacturer’s protocol was adjusted as follow:
Perform the poly (A) tailing reaction, to modify mature miRNA by adding a 3’ adenosine
tail to the miRNA.
Table 2.7.1: miRNA reverse transcription PCR preparation Component 1 reaction (μL)
10X Poly (A) Buffer 0.5ATP 0.5Poly (A) Enzyme 0.3RNase-free water 1.7RNA sample (5 ng) 2.0Final volume 5.0

105
The reaction plate or tubes are placed into a 2720 Thermal Cycler (Applied Biosystems,
Paisley, UK), then incubate using the following settings and standard cycling: polyadenylation
at 37 ˚C for 45 minutes, 65 ˚C for 10 minutes and Hold at 4°C, then proceed to Ligation
Reaction, which allows the miRNA with poly(A) tail undergoes adaptor ligation at the 5’ end
and the adaptor could act as the forward-primer binding site for the following miR-Amp
reaction .
Table 2.7.2: miRNA reverse transcription PCR preparation.
Component 1 reaction (μL)5X DNA Ligase Buffer 3.050% PEG 8000 4.525X Ligation Adaptor 0.6RNA Ligase 1.5RNase-free water 0.4Poly(A) tailing reaction product. 5.0Final volume 15.0
Samples were incubated in a thermal cycler using the following settings and standard cycling:
ligation at 16 ˚C for 60 minutes, following setting up and mixing with the reverse
transcription (RT) reaction immediately as below:
Table 2.7.3: miRNA reverse transcription PCR preparationComponent 1 reaction (μL)
5X RT Buffer 6.0dNTP Mix (25 mM each) 1.220X Universal RT Primer 1.510X RT Enzyme Mix 3.0RNase-free water 3.3Adaptor ligation reaction product 15.0Final volume 30.0
The reaction plate or tubes are placed into a thermal cycler, then incubated using the
following settings and standard cycling: reverse transcription at 42 ˚C for 15 mins, stop
reaction at 85 ˚C for 5 minutes; In this step, a Universal RT primer binds to the 3’ poly(A)
tail and the miRNA is reverse transcribed. The resulting cDNA will be suitable for all
TaqMan® Advanced miRNA Assays. The last step is preparing the miR-Amp reaction to
improve detection of miRNA targets.

106
Table 2.7.4: miRNA reverse transcription PCR preparationComponent 1 reaction (μL)
2X miR-Amp Master Mix 25.020X miR-Amp Primer Mix 2.5RNase-free water 17.5RT reaction products 5.0Final volume 45.0
PCR amplification was performed following parameters: enzyme activation for 5 minutes at
95˚C; followed by 14 cycles of denature at 95 ˚C for 3 seconds, annealing and extending at
60°C for 30 seconds, finally stop the reaction at 99 ˚C for 10 minutes. The undiluted miR-
Amp reaction products were proceeded to performing the real-time PCR or stored at –20
˚C for up to 2 months.
Before performing real-time PCR, cDNA templates were diluted 1:10 with ddH2O. Each
reaction was performed as follows:
Table 2.8: qPCR preparationComponent 1 reaction (μL)
TaqMan® Fast Advanced Master Mix (2X) 10.0TaqMan® Advanced miRNA Assay (20X) 1.0RNase-free water 4.0Diluted cDNA template 5.0Final volume 20.0
The reaction plate was loaded in the StepOnePlus™ instrument (Thermo Fisher Scientific,
Waltham, MA USA), at the following conditions: enzyme activation at 95°C for 20 seconds,
following 40 cycles denature at 95 ˚C for 1 second and anneal/extend at 60°C for 20 seconds.
Results were transformed by 2-ΔΔCt, where: ΔCt = target gene Ct – housekeeping gene, Ct
ΔΔCT = ΔCt experimental group – ΔCt mean of the negative control group. Our
examination of hsa-miR-423-5p verified it was relatively consistent and moderately abundant
across stomach tissues and gastric cancer cell lines. Thus hsa-miR-423-5p was chosen as an
endogenous control for normalization.
Table 2.9: miRNA assay informationAssay name Target Sequence
hsa-miR-423-5p 5′-UGAGGGGCAGAGAGCGAGACUUU-3′

107
hsa-miR-140-5p 5′-CAGUGGUUUUACCCUAUGGUAG-3′hsa-miR-140-3p 5′-UACCACAGGGUAGAACCACGG-3′
2.9 Methods for protein extraction and detection
2.9.1 Protein extraction
Cells were seeded into 6-well-plates. Upon reaching sufficient confluency, cells were washed
with ice-cold PBS twice and scraped with 80 uL cell lysis buffer on ice. The cell suspension
was transferred to a 2 mL Eppendorf tube and followed by being placed on a Labinoco
rotating wheel (Wolf Laboratories, York, UK) for 1 hour rolling at 25 rpm. The lysates were
then centrifuged at maximum speed (15,000 x g) in a benchtop Eppendorf microcentrifuge
for 30 minutes at 4 ˚C. The supernatant was then transferred to a new 1.5 mL
microcentrifuge tube for determination of protein quantification.
2.9.2 Determination of protein concentration
For a typical protein assay, a chemical reagent is added to the protein sample, producing a
colour change in the sample solution. This colour change is quantitated with a
spectrophotometer or microplate reader and compared to a standard curve of known
concentrations of protein versus their absorbance after reaction with the reagent. The
amount of protein in the unknown sample is determined by interpolation, reading the
concentration of protein on the standard curve that corresponds to its absorbance.
2.9.2.1 Preparation of diluted albumin (BSA) standards
A standard curve was made by preparation of diluted bovine serum albumin (BSA) standards.
Dilute the contents of 1mL of 10 mg/mL BSA into several clean vials, as shown in Table
2.10.
Table 2.10: Preparation of diluted BSA Standards
VialVolume of Diluent
(µL)Volume and Source of
BSA (µL)Final BSA Concentration
(µg/mL)1 0 300 of Stock 10,0002 100 400 of Stock 8,0003 325 325 of Stock 50004 325 325 of Vial 2 40005 325 325 of Vial 3 2500

108
6 325 325 of Vial 4 20007 325 325 of Vial 6 10008 400 100 of Vial 5 5009 400 100 of Vial 7 20010 375 375 of Vial 9 10011 400 100 of Vial 10 25 12 400 0 Blank = 0
2.9.2.2 Preparation of the working reagent
The colorimetric Bio-Rad Detergent Compatible Protein Assay Kit was used to determine
protein concentration. These assay solutions include the Reagent A (alkaline copper tartrate
solution), Reagent S (surfactant solution), and Reagent B (Folin reagent). Prepare working
reagent by mixing 50 parts of Reagent A with 1 part of Reagent S (50:1, Reagent A: S).
The following formula was used to determine the total volume of Bio-Rad required: (#
standards + # unknowns) × (# replicates) × (25 µL per sample) = total volume working
reagent required
Five microliters of standards and unknown samples in triplicate were pipetted into 96-well -
plate. 25 µL of working reagent was added to each well and gently mixed. 200 µL of Reagent
B was subsequently added into each well. The samples were mixed thoroughly using a
microplate mixer and incubated at room temperature for 15 mins. Then the absorbance was
measured at 630 nm (available at 405-750 nm) using the ELx800 plate reading
spectrophotometer (Bio-Tek, WolfLaboratories, York, UK). After calculating the
concentration by comparing the reading to BSA standard curve, samples were diluted into
the same concentration (4 µg/µL) with lysis buffer, and aliquoted into several 0.5 mL
Eppendorf tubes. One of them was further mixed with 2X SDS Laemmli Buffer (Sigma-
Aldrich) at a ratio of 1:1. The samples were then denatured at 100 ˚C for 5 minutes and spun
down briefly before loading onto the SDS-PAGE gel. The remaining aliquots were stored at
-80°C for up to one month.
2.9.3 SDS Polyacrylamide gel electrophoresis (SDS-PAGE) for protein separation
The percentage of the gel used was dependent on the molecular weight (MW) of the desired
protein to be detected. As shown in Table 2.11.

109
Table 2.11: Protein size and gel percentage selectionProtein MW range (kDa) Recommended gel (%)
10-80 14%20-150 12%30-200 10%40-250 8% 60-300 6%
For a 10% resolving gel, Table 2.12 depicts the components and volumes used. For the 5%
stacking gel, Table 2.13 depicts the components and volumes used.
Table 2.12: Components and volumes for a 10% resolving gelSolution Component volume (mL)
H2O 5.930% acrylamide mix (Sigma-Aldrich, St Louis, USA)
5.0
1.5 M Tris-HCl (pH 8.8) 3.010% SDS 0.1510% Ammonium persulfate 0.15N, N, N′, N′-tetramethylelthylenediamine(TEMED, Sigma- Aldrich St Louis, USA)
0.006
Table 2.13: Components and volumes for a 5% stacking gelSolution Component volume (mL)
H2O 3.430% acrylamide mix (Sigma-Aldrich, St Louis, USA) 0.830.5 M Tris-HCl (pH 6.8) 0.6310% SDS 0.0510% Ammonium persulfate 0.05TEMED (Sigma- Aldrich St Louis, USA) 0.005
The resolving gel was added between two glass plates held in place by a loading cassette up
to 1.5 cm below the top edge of the plate. To produce a smooth level surface, the gel was
coved by water and allow to polymerize at room temperature. Once the resolving gel had set
totally, the overlaid water was poured out and the excess was removed by using a piece of
filter paper. The stacking gel was prepared according to Table 2.13 and added above the
resolving gel. A well-forming Teflon comb was then inserted, and the gel was allowed to
polymerize at room temperature. The cassette was then placed into a gel electrophoresis
apparatus filled with running buffer before removing the wells’ comb. 5 µL of a protein MW
marker (BLUeye Prestained Protein Ladder, 10-250 kDa, GeneDireX, Belgium) and 20 µg

110
pre-heated protein sample were loaded. The gel was run at a constant voltage of 80 V for
100 minutes (until the blue indicator strip reached the end).
2.9.4 Transfer of proteins to polyvinylidene fluoride membrane and membrane
blocking
Once the SDS-PAGE was completed, the protein samples were transferred to an
Immobilon® PVDF membrane (Merck Millipore, MA, USA) using a SemiDry system. A
piece of PVDF membrane cut to the same size as the resolving gel was activated in methanol
for 5 minutes. Simultaneously, six pieces of similarly sized filter papers were soaked in 1X
transfer buffer. Three of these sheets were placed one at a time onto the bottom graphite
base electrode of an SD20 SemiDry Maxi System blotting unit (SemiDry, Wolf Laboratories,
York, UK). The SDS-PAGE gel cassette was removed from the tank and the glass plates
gently pried using a scalpel and the resolving gel was carefully transferred on top of the
PVDF membrane, alongside the remaining three sheets of filter paper. Following removing
air bubbles between each layer by rolling a roller over the top filter paper, electroblotting was
carried out at a constant current of 500 mA (approximately 15 V) for 90-120 minutes. (Figure
2.1 from Nature Protocol Exchange: https:// www.nature.com/ protocol exchange/
protocols/ 2925)
Figure 2.1: The arrangement of paper, gel and nitrocellulose membrane. A. The membrane is oriented nearest to the positive electrode while the gel is situated towards the negative electrode. B. Representative diagrams of the transfer sandwitch setup for semi-dry transfer. The SDS-bound negatively charged proteins with thus migrate out of the gel and onto the membrane. Source: https://protocolexchange.researchsquare.com/article/nprot-2925/v1
Once the transfer was completed, membranes were transferred into a universal container and
incubated in 5% (w/v) blocking buffer (5 g of fat-free milk powder (Marvel) in 100 mL of

111
0.1% TBS-Tween) for at least one hour to ensure non-specific binding of the primary
antibody. The universals were kept on a rolling platform (Wolf Laboratories, York, UK).
2.9.5 Immuno-blotting of proteins
Primary antibodies were diluted in TBS-T according to Table 2.3. After the blocking, the
membrane was incubated with the primary antibody at 4°C overnight with constant rotation.
Membranes were then washed three times (5 minutes each) using 0.1% TBS-Tween with
constant rotation. The secondary antibody was chosen according to the source of the
primary antibody. 2.5 µL of HRP-conjugated secondary antibody was diluted 5 mL 0.1%
TBS-Tween. The membrane was then incubated in the secondary antibody for 1 hour at
room temperature with constant rotation.
Chemiluminescence was performed using a luminol/ peroxide based enhanced
chemiluminescence (ECL) reagent (SupersignalTM West Pico, Thermo Fisher Scientific,
Waltham, MA USA). The ECL reagent enables low picogram or high femtogram detection
of antigen by oxidizing luminol in the presence of HRP and peroxide. This reaction
produces a prolonged chemiluminescence that can be visualized on X-ray film or an imaging
system. According to the manufacturer's instruction, 100 µL of ECL reagent was required
to per cm2 of membrane area. After 5 minutes of incubation, the chemiluminescent signal
from the HRP-conjugated antibody was detected using G: Box (Syngene, Cambridge, UK),
composed of an illuminator and a camera connected to a computer. Briefly, the membrane
was placed on the black Chemiluminescence Exposure Screen. The imager calculates and
displays the exposure time with maximum dynamic range and minimum pixel saturation.
Images were captured and further analyzed by Image J software (National Institute of Health,
NY, USA, https://imagej.nih.gov/ij/, 1997-2016) for band quantification.
2.10 Methods for cell functional assays
2.10.1 Transfection of miRNA mimic/ inhibitor into Cell Lines
Following seeding of 3 x 10⁵ cells/well in 6-well-plate, cells were incubated until adherent.
20 pmol of MISSION miRNA-140-5p, miRNA-140-3p or Negative Control mimic (Sigma,
St. Louis, USA) was transfected the cell line using 7.5 μL Lipofectamine® 3000 reagent per
well with Opti-MEM, according to manufacturer’s instructions (Invitrogen, Thermo Fisher,

112
UK).
2.10.2 Proliferation assay using thiazolyl blue tetrazolium bromide (MTT)
Cell proliferation in response to treatment with miRNA mimics was measured using MTT
(Sigma-Aldrich, St. Louis, MO, USA) assay. The MTT assay involves the conversion of the
water-soluble MTT (3-(4, 5-dimethylthiazol-2-yl)-2, 5-diphenyltetrazolium bromide) to an
insoluble formazan. The formazan is then solubilized, and the concentration determined by
optical density at 570 nm. MTT solution was made by diluting 100 mg of MTT in 20 mL of
PBS and was filter sterilized through a 0.2 μm sterile filter (Sartorius AG, Göttingen,
Germany) to produce a working concentration of 5 mg/mL. Following 12 hours of
treatment of cells with mimics or inhibitors, cells were harvested, pelleted and resuspended.
Using 96-well-plate, 3000 cells in 100 μL of complete media were plated per well of six 96
well plates using at least six repeats for each cell line and a negative control. The plates were
incubated at 37 ˚C and 5% CO2 for a period of 12, 24, 36, 48 and 64 hours respectively. At
each time point, 10 μL of MTT solution was added directly to the well. Following a 4-hour
incubation period at 37˚C, the media was poured out gently and blotted the excess liquid
with a piece of tissue paper. To solubilize formazan crystals, lysis buffer was mixed by 10 g
SDS in 100 mL H2O with 83 μL of 37% HCl under the fume hood. 100 µL of the SDS-HCl
lysis solution was added to each well and mixed thoroughly using the pipette. Absorbance
was read at 570 nm (Bio-Rad 550 microplate reader; Bio-Rad Laboratories Inc., Hercules,
CA, USA).
2.10.3 Scratch assay for migration
Migration reflects cell motility in a 2D pattern such as a basal membrane, extracellular matrix
or on plastic plates. Via wound healing assay, the speed of wound closure and cell migration
can be quantified by taking snapshot pictures with a regular inverted microscope at several
time intervals.
Sufficient cells (1x10⁶/well) were seeded into a 6-well plate and allowed to adherent overnight
to form a confluent monolayer in the incubator. The scratch wound was made in a linear
fashion with a sharp sterile pipette tip and washed twice with PBS to remove floating cells.
The cells were re-cultured in 2 mL of new media and cell migratory behaviour was
documented every 1 hour using the EVOS® Cell Imaging time-lapse microscopy system

113
(Life Technologies, Paisley, UK). The size of the wounds was subsequently measured with
ImageJ software.
2.10.4 Transwell invasion assay
Invasive migration is a fundamental function underlying cellular processes such as
angiogenesis, immune response, metastasis, and invasion of cancer cells. Cell invasion assays
monitor cell movement penetrating a barrier which consists of basement membrane
components. Matrigel® (BD Biosciences, NJ USA) was used to mimic extracellular
matrices (Figure 2.2).
Figure 2.2: In vitro Matrigel® invasion assay. Cells seeded at the top chamber and chemoattractant or different cell line in the bottom chamber – outcome: number of cells migrated to the bottom chamber, compared to controls. Source: Adapted from http://cellomaticsbio.com/molecule-testing.php
2.10.5 Flow cytometry cell cycle assay
Flow cytometry was carried out for cell cycle analysis by quantitation of DNA content.
Propidium iodide (PI), one of the DNA-binding dyes, is used in this analysis. Cells must be
fixed or permeabilized to allow entry of the dye which is otherwise actively pumped out by
living cells. Alcohol is a dehydrating fixative which also permeabilizes. This will allow easy
access of the dye to the DNA and gives good profiles (low coefficient of variation, CV).
With fixed cells, samples may be accumulated, stained and analyzed at the conclusion of an
experiment. Alcohol-fixed cells are stable for several weeks at 4°C.

114
When the cells were grown to 80% confluent, cell medium and PBS used to wash cells were
collected in labeled 20 mL universal containers (Greiner Bio-One Ltd, Gloucestershire, UK);
Meanwhile, cells were trypsinized and plated in the incubator until disassociation. Then, cells
are harvested into universals using pre-collected cell medium and PBS to neutralize
trypsinization reaction. The suspension was centrifuged at 1500 × rpm for 5 minutes. The
cell pellet was fixed in 10 mL iced 70% ethanol. Samples were pipetted thoroughly to ensure
fixation of all cells and minimize clumping and stored at 4 ˚C for 30 min or until analysis.
Spin at 850 g in a centrifuge and spinning out of ethanol carefully to avoid cell loss when
discarding the supernatant. 50 µL of a 100 µg/ml sock of RNase was added to ensure only
DNA, not RNA, will be stained. 200 µL PI (from 50 µg/ml stock solution) was added before
cell cycle measurement. Flow cytometry analysis was performed on a Cyflow® flow
cytometer (Partec, New Jersey, USA). Data were analyzed using FCS Express 4 Flow
Research Edition (De Novo Software, California, USA).
Gating for live cells was carried out using forward scatter area (FCS-A) and side scatters area
(SSC-A). FCS-A measures the size whereas the SSC-A measures the cell granularity. Next
gating for single cells was performed using the FSC-A and forward scatter height (FSC-W)
to eliminate doublet cells (Figure 2.3) From this gate the cell cycle histogram was made using
fluorochrome channel PerCP-CY5-5-A against cell count. From here the percentage of cells
in G1, S and G2 phase could be calculated (Figure 2.4).
Figure 2.3: Scattering system in FACS. Forward and side scatter data can be used to classify samples by size (FSC) and by internal complexity (SSC). Source: Flowcytometrynet https://www.flowcytometry net.com/

115
Figure 2.4: Relationship between the cell cycle and the DNA histogram. Source: http:// flowbook.denovosoftware.com/ chapter-6-DNA-analysis
2.10.6 Cytotoxicity assays using MTT
To determine the effects of 5FU and cisplatin on cell proliferation, growth assay based on
the enzymatic reduction of the tetrazolium salt MTT by metabolically active cells. Cell
growth was determined as described previously, with a few modifications. Briefly, 104 cells
were seeded per well of 96-well plates, in 100 μL of steroid-stripped medium (without
additions). Cells were allowed to attach for 24 hrs, after which 8 wells were assayed
immediately to establish time 0 (t0). To the remaining wells, 100 μL of culture medium were
added either alone or supplemented with increasing concentrations of 5FU (ranging from
1.2 μM to 153.6 μM) or Cisplatin (0.78 μM to 100 μM); Cells were then incubated for 2 days
at 37 °C in the incubator. At the end of the incubations, 10 μL of 5 mg /mL MTT were
added to each well and cells were further incubated for 4 hr. at 37 ˚C. After carefully removing
the medium, 100 μL of the SDS-HCl lysis solution was added to each well and mixed
thoroughly using the pipette. Absorbance was read at 570 nm (Bio-Rad 550 microplate reader;
Bio-Rad Laboratories Inc., Hercules, CA, USA). Wells containing medium alone served as
blanks. The results were expressed as the mean ±standard error of the mean (SEM) of at
least 3 independent experiments, each with 6 replicate wells per cell line per cytotoxic
condition.

116
2.11 Statistical analysis
Transcript levels from qPCR experiments are reported as mean ± SEM unless otherwise
stated in results. Other data are presented as mean ± standard deviation (SD). The Mann-
Whitney test was used to analyze data where medians are presented, students t-test was used
to analyze data where means are presented. Each experiment was conducted at least 3 times
unless otherwise stated, and representative examples are shown. Unpaired t-tests and 2-way
ANOVA tests were used to statistically analyze differences between treated and control
groups. Differences from 3 independent repeats of an experiment were considered to be
statistically significant at p<0.05.

117
Chapter 3.
The miRNAs Profiling of Gastric
Cancer Progression

118
3.1 Chapter Introduction
Chapter 1 described the importance of miRNAs as critical regulators of global mRNA
expression in tumourigenesis and cancer progression. Recent miRNA expression profiling
studies suggested the clinical use of miRNAs as potential prognostic biomarkers in various
malignancies. Among 2588 identified human miRNAs, 352 have been shown to be either
increased or decreased in gastric cancer tissues compared with non-tumour adjacent mucosa,
with 120 miRNAs reported in 2 or more of the studies (Kuo et al. 2015; Shrestha et al. 2014).
Upregulation of miR-21, miR-25, miR-92, miR-223 and downregulation of miR-375 and
miR-148a were some of the most consistently altered microRNAs in gastric cancer despite
marked variability in study designs and specimen types (Shrestha et al. 2014).
Thus far, dysregulation of miRNAs in gastric cancer has been reported to be associated with
histology, Epstein-Barr virus infection, chemotherapy response, progression and metastasis
(Huang et al. 2015; Li et al. 2018; Kim et al. 2011; Treece et al. 2016; Katada et al. 2009).
A number of miRNAs were further proposed to be potential prognostic biomarkers for
gastric cancer patients, such as miR-1, miR-20b, miR-150, miR-214, miR-375, let-7g, miR-
125-5p, miR-146a, miR-218, miR-433, miR-451 and miR-200b/c (Katada et al. 2009).
Moreover, a seven-miRNA signature (miR-10b, miR-21, miR-223, miR-338, let-7a, miR-30a-
5p, and miR-126) has recently been identified as an independent predictor for relapse-free
survival among patients with gastric cancer (Li et al. 2010).
The possible drawback of these studies, however, is that a limited number of around 300
microRNAs have been chosen for the custom microarrays. This is merely 10% of the total
number of human microRNAs registered on miRbase. As well as limitations in the dynamic
range, sensitivity, and specificity of the microarray data themselves, different technological
detection platforms, small sample size, different sample origins, and various methods
employed for data processing and analysis may result in significant variations (Ding et al.
2017).
With the growing power and reducing cost of next-generation sequencing and
bioinformatics, the launch of TCGA, as well as other large-scale cancer genome projects,
have provided a comprehensive and multi-dimensional database of the key genomic and

119
epigenomic changes in cancer which are readily achieved and accessed. Bioinformatic
analysis of TCGA datasets has been shown to be an outstanding tool in identifying genetic
and epigenetic changes related to clinical outcomes.
The aim of this chapter was to identify potential therapeutic target miRNAs in gastric cancer.
In order to reduce the variables, the present study only investigated the expression RNA
sequencing data of gastric tissues. The miRNA dataset deposited by TCGA was used to
identify differentially expressed miRNAs (DEMs). Then prognosis related miRNAs were
selected according to both a generalized linear model (glm) and linear model (lm) analysis
and further confirmed via Kaplan-Meier method and log-rank test.
3.2 Materials and methods
3.2.1 miRNA, mRNA expression profiles, and clinical information
The Illumina HiSeq profile dataset of 1881 miRNA (436 tumour samples and 41 non-
tumour samples), mRNA expression (375 tumour samples and 32 non-tumour samples) and
corresponding clinical dataset from 443 cases were downloaded from the TCGA database
(https://portal.gdc.cancer.gov/projects/TCGA) up to June 2017. A customized R script to
match patients’ tumour and normal samples in the same case was applied to generate four
tabular data files (tumour and normal each for miRNA and mRNA expression profiles) for
gastric cancer patients.
3.2.2 Differentially expressed miRNAs (DEMs) screening
Only those mature miRNAs that had expression values in 90% of samples were further
evaluated. This led to a subsequent analysis of 377 mature miRNAs. The differentially
expressed miRNAs were screened out between patient and control samples applying linear
model fitting and eBays approach. Briefly, eBayes function uses linear fitting of individual
genes to build a hierarchical Bayes model, which estimates the probability of their differential
expressions. It uses data-defined global priors to shrink the sample variances toward a
common value and, therefore, enhance the statistical power and accuracy. Differential
expression analysis was performed by three approaches. At first, raw reads were analyzed
using R package DESeq2. In order to circumvent the multiple testing problems, which may
induce false-positive results, the Benjamin-Hochberg procedure was used to control the false

120
discovery rate (FDR) by adjusting the raw P-values (Benjamini et al. 1995). miRNAs with
Log2 fold change <-1 or >1 (P<0.05,after FDR adjusted) were considered as differentially
expressed miRNAs and were selected. Secondly, student’s test was performed to further
compare the difference of miRNAs expression by measuring RPKM (reads per kilobase of
exon model per million reads) between primary tumour samples (TP) and tissue normal
samples (NT) in both paired manner (41 TP vs 41 NT) and unpaired manner (436 TP vs 41
NT). The DEMs for further prognostic analysis were those in the overlap of the three groups.
3.2.3 Prognosis-related DEMs determination
Both a generalized linear model (glm) and linear model (lm) analysis were performed between
the miRNA HiSeq dataset and OS. The miRNAs with FDR less than 0.05 and those
possessing matching directionalities to survival in both the glm and lm analyses were
overlapped. Finally, the miRNAs with the lowest FDR values in both analyses were chosen
as miRNAs of interest. The Kaplan-Meier method and log-rank test were also applied to
further assess the clinical relevance of 16 miRNAs of interest. Comparisons between
patients with low and high miRNA expression were made by separating patients into low
and high expression group based on the median value of each miRNA’s expression. Survival
analysis was performed using GraphPad Prime v 6.0 (GraphPad Software, San Diego, CA).
Log-rank P<0.05 was considered statistically significant.
3.3 Results
3.3.1 Demographics study
A total of 443 gastric cancer patients were enrolled in this study. 41 had paired tissues
examined in TCGA, while 402 had only tumour samples available. The characteristics of the
subsets of 41 paired cancer tissues with adjacent normal mucosa or 402 cancer tissues
without matched normal mucosa are listed in Table 3.1. No significant differences were
observed between these two groups in the distribution of age (P=0.73, Fisher’s exact test)
and gender (P=0.1, Fisher’s exact test). TCGA is comprised of a multi-race population. More
than half of the samples obtained were White, 20% were Asian and the remainder were
Black or African and native Hawaiian or other Pacific Islanders (P=0.61, Fisher’s exact test).
All gastric cancer cases in this study were adenocarcinomas. However, the distribution of
tumour stage and the primary treatment response rate differed between the two groups. The

121
percentage of stage II patients in the paired and unpaired group are 46.34% and 27.61%,
respectively; In contrast, the stage III patients in the first and second group are 19.51% and
43.53%, respectively. Similarly, the percentage of patients presenting stable disease in paired
group is 29.27%, compared to 13.18% in the unpaired group. We thus further performed
three different algorithms including paired and unpaired analyses.Table 3.1: Patients’ demographics: characteristics of gastric cancer patient with paired tumour tissues and normal samples or with only tumour tissues. NA, not available. P values were calculated by Fisher’s exact test.
VariableGastric cancer patients
with paired tissues (n = 41), n (%)
Gastric cancer patients with only tumour tissue
(n = 402), n (%) P value
Gender 0.73Male 25 (60.98) 260 (64.68)
Female 16 (39.02) 142 (35.32)Age (years) 0.51
≥65 26 (63.41) 227 (56.47)<65 15 (36.59) 170 (42.29)
NA 5 (1.24)Race 0.61
Asian 10 (24.39) 79 (19.65)Black or African 1 (2.44) 12 (2.99)
White 22 (53.66) 255 (63.43)NA 8 (19.51) 56 (13.68)
H. pylori infection 0.20 Yes 1 (2.44) 19 (4.73)No 11 (26.83) 157 (39.05)NA 29 (70.73) 226 (56.22)
Histology 0.63Intestinal 15 (36.59) 176 (43.79)Diffuse 8 (19.51) 77(19.15)
NA 18 (43.90) 149 (39.07)TNM stage 0.01
I 9 (21.95) 50 (12.44)II 19 (46.34) 111 (27.61)III 8 (19.51) 175 (43.53)IV 4 (9.76) 40 (9.95)NA 1 (2.44) 26 (6.47)
Lymph-node status 0.36No metastasis 16 (39.02) 116 (28.86)
Metastasis 24 (58.54) 268 (66.67)NA 1 (2.44) 18 (4.47)
Primary therapy outcome 0.04Complete remission 20 (48.78) 221 (54.98)
Partial Remission 0 (0.0) 6 (1.49)Stable or progressive 12 (29.27) 53 (13.18)

122
NA 9 (21.95) 122 (30.35)Recurrence 0.10
Yes 5 (12.20) 107 (26.62)NO 26 (63.41) 234 (58.21)NA 10 (24.39) 61(15.17)
3.3.2 Screening of DEMs
We evaluated samples by cluster analysis and searched for miRNAs with altered expression
in primary tumour samples (TP) and tissue normal samples (NT) using different expression
analyses. At first, we conducted one-way hierarchical clustering analysis using Principal
Component Analysis to verify correct segregation of patients’ and control samples (Figure
3.1) and observed that libraries of three normal tissues clustered with tumour samples,
however, several tumour samples clustered with normal samples. The linear fitting model
assuming the common dispersion for all the miRNAs revealed that not only one cluster
distributed in either tumour samples or neighbouring normal tissues (Figure 3.2). Generally,
the miRNAs exhibited heterogeneous between tumours and normal tissues and harboured
homogeneity among tumours or normal tissues.
Figure 3.1: Cluster analysis. One-way hierarchical clustering using Principal Component Analysis (PCA) to verify the correct segregation of patients’ and control samples in the miRNA-Seq analysis. PCA summarizes the major variation that is contained in many dimensions into a reduced number of uncorrelated dimensions. Two principal components which identified those variables that express a large

123
amount of variation (25% and 18% respectively) were chosen to represent the difference between TP and NT. The plot on the first 2 principal components shows an interesting separation of the NT group along the first component. PC1 denotes principal component 1, PC2 denotes principal component 2.
Next, we employed three differential expression analyses with both raw data and normalized
data to identify miRNAs with altered expression between gastric cancer tissues and non-
cancerous tissues. We used the DESeq2 package which bases the estimation of the dispersion
on calculated mean-variance relationships in the dataset provided. It is thought to be a
powerful method for analysing RNA-Seq data (Bencurova et al. 2017). DESeq2 identified
288 differentially expressed miRNAs. Paired t-test and unpaired t-test identified 321 and 304
deregulated miRNAs respectively (Figure 3.3). The overlap analysis generated 207
differentially expressed miRNAs, among which 65 miRNAs were downregulated and 142
miRNAs were upregulated (Appendix 8). These candidate miRNAs are chosen to study
further.

124
Figure 3.2: Differences comparison based on miRNAs and Correlations. The differentially expressed miRNA pattern in paired tissue samples was further demonstrated in an eBayesbased linear model. The labels adjacent to the heatmap far right column and bottom row were used to denote a label for each sample. In this plot the distance between labels (samples) corresponded exactly to the colours of the dendrogram clusters. The darker the square was, the closer the compared samples were. Four TP patterns and three NT patterns were subgrouped according to their general distances for all miRNAs examined. .

Figure 3.3: Significantly deregulated miRNAs in student’s t-tests (P<<0.00001). A. Unpaired t-test analysis between 436 primary gastric cancer tissues and matched normal stomach tissues. B. Paired t-test analysis. Error bars represent standard error.
126

126
3.3.3 DEMs associated with Overall Survival of gastric cancer patients
Prediction of survival is one of the main functions of prognostic biomarkers. Both the glm
and lm function of R was applied to identify prognostically relevant miRNAs in gastric
cancer. In the glm analysis, the expression revealed 37 mature miRNAs were correlated with
gastric cancer patient’s survival (FDR<0.05). The lm analysis revealed 18 such miRNAs. The
directionality of the two lists of miRNAs was compared and overlapped to yield 16 common
miRNAs (Table 3.2). High expression of 10 miRNAs (hsa-mir-549a, hsa-mir-514a-1, hsa-
mir-21, hsa-mir-514a-3, hsa-mir-4326, hsa-mir-493, hsa-mir-34b, hsa-mir-1255a, hsa-mir-455
and hsa-mir-671) were correlated with poor prognosis. Six miRNAs (hsa-mir-140, hsa-mir-
328, hsa-mir-193a, hsa-mir-28, hsa-mir-129-2 and hsa-mir-5683) were positively associated
with better OS rate. Furthermore, we performed an unpaired t-test for each miRNA to
compare their expression in different stage tumours, and we found miR-21, miR-140, miR-
193a and miR-4326 showed significant correlation with gastric cancer progression (Figure
3.4).

127
Figure 3.4: Stage-related miRNAs in student’’s t-tests. Statistical analysis compared the miRNAs’ expression between stage I-II and stage III-IV, the results revealed miR-21 and miR-140 are both significantly and positively correlated with gastric cancer stage. Shown are representative results of unpaired t-test analysis. Error bars represent standard error. **** represent p<0.0001 and * represents p<0.05.

Table 3.2: Prognostic related miRNAs. Information on 16 miRNAs associated with OS of gastric cancer patients. Derived from the overlap result of glm analysis and lm analysis.
miRNAs Mean Log2 fold change Expression comparison P value Prognosis P valuehsa-mir-549a 2.297475 2.954531 6.19E-13 0.027
hsa-mir-514a-1 1.900981 2.093362 2.99E-06 0.007hsa-mir-21 974536.9 1.878363 8.95E-74 0.005
hsa-mir-514a-3 1.897514 1.752371 7.48E-05 0.023hsa-mir-4326 33.39163 1.278167 1.28E-07 0.007hsa-mir-493 49.48034 0.874156 3.09E-10 0.032hsa-mir-34b 3.388662 0.869264 0.000187 0.031
hsa-mir-1255a 1.896506 0.860887 0.005471 0.022hsa-mir-455 874.2628 0.779891 3.41E-05 0.007hsa-mir-671 24.5909 0.708348 1.21E-08 0.031hsa-mir-140 3622.466 -0.9567 4.58E-19 0.046hsa-mir-328 66.30372 -0.99735 2.41E-11 0.03hsa-mir-193a 624.3456 -1.14638 1.28E-19 0.044hsa-mir-28 21953.87 -1.17633 2.77E-23 0.021
hsa-mir-129-2 20.10709 -1.60691 7.94E-08 0.011hsa-mir-5683 16.02191 -2.88421 6.49E-19 0.028
129

129
3.4 Discussion
The data presented here, and previous literature have suggested miRNAs are deregulated in
gastric cancer and even indicate distant or progressive disease. In this study, comparisons
between gastric cancer samples and normal stomach tissues from TCGA dataset generated
207 differentially expressed miRNAs in line with the studies from Ding et al. (Ding et al.
2017) and Shrestha et al. (Shrestha et al. 2014). (Table 3.3).
Table 3.3: Consistently deregulated miRNAs in three independent studies. This table shows the 12 deregulated miRNAs which feature in all three studies. Dark grey= those miRNAs which were downregulated in at least two of three studies. Light grey= those miRNAs were upregulated in two of three studies. No colour= those miRNAs showed contrary expression patterns in the systematic review comparing to those in the other 2 studies. FC stands for fold change.
Current study Ding et al. Shrestha et al.miRNA log2 FC miRNA logFC hsa-miRNA Median FChsa-mir-490 -3.3 hsa-mir-490 -4.8 hsa-mir-133b -2.40hsa-mir-133b -2.8 hsa-mir-133b -3.4 hsa-mir-139 -1.84hsa-mir-139 -2.3 hsa-mir-139 -2.6 hsa-mir-490 -1.51hsa-mir-29c -1.8 hsa-mir-100 -1.5 hsa-mir-29c -1.32hsa-mir-100 -1.3 hsa-mir-29c -1.5 hsa-mir-188 -hsa-mir-200b 1.2 hsa-mir-19a 1.2 hsa-mir-135b 0.67hsa-mir-188 1.5 hsa-mir-335 1.2 hsa-mir-100 1.09hsa-mir-19a 1.6 hsa-mir-200b 1.5 hsa-mir-18a 1.18hsa-mir-335 1.6 hsa-mir-21 1.5 hsa-mir-200b 1.31hsa-mir-21 1.9 hsa-mir-188 1.6 hsa-mir-335 1.97hsa-mir-18a 2.1 hsa-mir-18a 1.8 hsa-mir-19a 2.00hsa-mir-135b 3.3 hsa-mir-135b 3.2 hsa-mir-21 2.02
We found that miR-490 was the most pronounced downregulated miRNAs followed by miR-
1/-133 family, miR-139 and miR-383. The miR-196 family and miR-21 were the most
commonly and significantly upregulated miRNAs in gastric cancer. miR-490 and miR-1/133
family were found to be involved in the multistage cascade of gastric carcinogenesis (Shen
et al. 2015). Upregulated miR-196a in gastric cancer promoted cell proliferation by
downregulating p27(kip1) (Sun et al. 2012). In addition, increased circulating miR-196a in
patient serum was associated with gastric cancer disease status and relapse (Tsai et al. 2012).
Co-activation of miR-196b and HOXA10 characterized a poor-prognosis subgroup of
patients with gastric cancer (Lim et al. 2013), in which miR-196b decreased levels of E-
cadherin, but drastically induced vimentin, MMP2, and MMP9, implying activation of EMT
(Liao et al. 2012). miR-21 has been identified as the best hit in a number of medium-scale

130
and high-scale profiling experiments designed for the detection of miRNAs dysregulated in
cancer (Chan et al. 2005). In a large-scale profiling of miRNA expression in 540 human
samples derived from 363 specimens representing six types of solid tumours and 177
respective normal control tissues, miR-21 was the only miRNA up-regulated in all types of
the analysed tumours, including breast, colon, lung, pancreas, prostate, and stomach(Volinia
et al. 2006). Generally, miR-21 expression levels are also very high in most cancer cell lines
of various origins, and in some lines, it accounts up for 15-25% of the cellular miRNA
content (Landgraf et al. 2007). Therefore, abundant miR-21 may be a general, albeit not
universal, feature of tumour cells.
Based on these deregulated miRNAs, we further explored which of them were significantly
correlated with patients’ survival. The analysis revealed 16 miRNAs among which miR-140-
5p, miR-328, miR-193a, miR-28 miR-129-2 and miR-5683 potentially acted as tumour
suppressors and were positively correlated with better survival. Although their
downregulation has been demonstrated in gastric cancer (Kim et al. 2011, Huo 2017), their
roles in disease progression and prognosis remained to be defined by more evidence from in
vitro and in vivo studies. Since miR-21 and miR-140 showed significant differences in
expression between early and advanced gastric cancer, and miR-21 has been widely examined
and demonstrated in various disease, including gastric cancer, we selected miR-140-5p for
further analysis. It is worth noting that though miR-140-5p was downregulated in tumour
tissues compared to normal samples, its downregulation correlated with gastric cancer
progression but only reached a boundary statistic value. However, a higher level of miR-140-
5p was more likely to appear in advanced gastric cancer tissues, reflecting its multiple
identities in gastric cancer progression. Moreover, Kim et al. demonstrated that higher miR-
140-5p in tumour samples from chemo-treated gastric cancer patients were correlated with
chemosensitivity (Kim et al. 2011). miR-140-5p is well established to have decreased
expression in many forms of cancer including; lung, breast, and colon et al. Most of the
functional pathways influenced by miR-140-5p have so far implicated it in tumour-
suppressing, these included SOX9 and ALDH1, which were significantly activated in CSCs.
miR-140-5p could also target IL-6, which activates STAT3 signalling supports the self-
renewal activity of cancer cells. The role of miR-140-5p in gastric cancer is yet to be
established. To define the role of miR-140-5p in gastric cancer, the next step is to perform
quantitive analysis of miR-140-5p expression level on independent human gastric cancer

131
cohort with a view to identifying whether miR-140-5p are deregulated in gastric cancer and
its correlation with clinicopathological features.

132
Chapter 4.
Expression of miR-140-5p and miR-
140-3p in Gastric cancer and Their
Clinical Relevance

133
4.1 Chapter Introduction
The human mir-140 primary transcript generates two mature miRNAs, miR-140-5p and
miR-140-3p. Initially reported in zebrafish, miR-140-5p and miR-140-3p are evolutionarily
conserved among vertebrates suggesting that these miRNAs occupy an important biological
role. Their expression in chondrocyte differentiation and cartilage tissue homeostasis is well
documented (Hong and Reddi 2013). Generally, the precursor microRNAs are designated
mir (lower case r) as in mir-140, whereas the mature microRNAs are designated miR (upper
case R). When relative expression levels are known the microRNA with low expression (i.e.,
the degraded strand) is designated by an asterisk, as in miR‐140*, which in this case is the
same as miR-140-3p. However, miR-140-5p and miR-140-3p like many other miRNAs, the
abundance of the -5p and -3p stands are different according to tissues type or species
(Ambros et al. 2003; Griffiths-Jones et al. 2006; Gibson and Asahara 2013; Kenyon et al.
2019). Although miR-140-5p and miR-140-3p have identical seed sequences, the roles of
miR-140-5p and miR-140-3p are complementary to one another in chondroplasia (Kenyon
et al. 2019; Tao et al. 2017), in the development of Rheumatoid Arthritis and other
autoimmune disease (Peng et al. 2016; Li et al. 2017) and in cancer progression as well
(Flamini et al. 2017; Kong et al. 2015; Li and He 2014). We thus tried to explore the
expression pattern of both miR-140-5p and miR-140-3p in the current study. It has been
reported that miR-140-5p and -3p appear to function as either tumour-suppressing or
tumour-promoting factors in cancer progression. It is clear that a large number of cellular
context-dependent factors contribute to the dynamic regulatory roles of miR-140-5p/3p.
Against this background, the rest part of this study aimed to examine the role of miR-140-
5p and 3p in gastric cancer. The first objective was set to determine their deregulation pattern
by comparing tumour samples and adjacent non-tumour tissues in an independent cohort.
In this chapter, we aimed to explore the expression and association of miR-140-5p and miR-
140-3p using in Silico analysis and qPCR detection in an independent cohort and to associate
such expression with the clinical pathological characteristics of gastric cancer patients.
4.2 Materials and methods
4.2.1 Tissue samples from two independent gastric cancer patients’ cohorts.
The collection of tissue samples has been described in Chapter 2. The first cohort (n=70),

134
composed of gastric cancer patients who did not receive any treatment before sample
collection, were used to compare miR-140-5p and -3p expression between stomach tumour
and non-tumour samples, and their association with disease progression such as tumour size,
metastasis status and patients’ OS. The second cohort was made of 87 patients who received
5FU based neoadjuvant chemotherapy, the comparison would be mainly between patients’
tumour samples with chemoresponse and those without response from chemotherapy.
4.2.2 RNA extraction and miR-140-5p/3p detection
RNA was extracted using TRI Reagent® See 2.8.1; The reverse transcription for mature
miRNA quantification was performed using TaqMan™ Advanced miRNA cDNA Synthesis
Kit and qPCR was performed using miR-140-5p and miR-140-3p assay with triplicate
reactions for each sample. miR-423-5p was used as the endogenous control. See 2.8.8.
4.2.3 Statistical analysis
Associations between miR-140-5p/3p expression and clinical characteristics were assessed
with either the Student’s t-test, One-way ANOVA or Mann-Whitney test. The predicted
probability of survival with gastric cancer was used as a surrogate marker to establish the
ROC curve. The Kaplan-Meier method and log-rank test were used for describing the
survival curve. The area under the curve (AUC) was used as an accuracy index for evaluating
the predictive performance of the selected miRNA signature. Univariate Cox regression
analysis was used to evaluate the hazard ratio (HR) of miRNA and clinical variables for
patient survival. Multivariate Cox regression analysis was conducted to test for independent
prognostic factors of OS, which was defined as the time from the operation date to the date
of death or final follow-up. Student’s t-test, One-way ANOVA or Mann-Whitney test were
performed using the statistical software Prism 6.0 (GraphPad Software, San Diego, CA
Software, La Jolla, CA), and all the other statistical tests were performed with SPSS version
23.0. Statistical significance was defined as p<0.05.
4.3 Results
4.3.1 In Silico analysis of miR-140-5p expression in gastric cancer
Using the normalized data from RNAseq in TCGA cohort (released June 2017), in which
only miR-140-5p was available, the expression of miR-140-5p in gastric cancer was first

135
evaluated by determining its levels based on the comparison between gastric cancer (n=435)
and the paired adjacent non-tumour gastric tissues (n=41). Clinical and pathological
information together with average miR-140-5p expression level is shown in Table 4.1.
Compared to adjacent normal tissues miR-140-5p reduced in gastric tumours (P=0.048)
(Table 4.1 and Figure 4.1).
Figure 4.1: The miRNA-140-5p expression between NT and TP. A. Paired analysis showed a significant decrease trend in primary tumour tissue compared to adjacent normal sample. B. Unpairedanalysis between gastric cancer and normal tissues showed a general decline of miR-140-5p in gastric cancer tissues as well.
Compared to diffuse type gastric cancers, a lower level of miR-140-5p was shown in intestinal
type gastric cancer tissue samples (P=0.11), and it could be even lower in poorer
differentiated intestinal gastric cancers (P=0.14) or gastric cancers with metastasis (P=0.03).
A relatively higher expression of miR-140-5p was observed in tumours from younger
patients (P=0.16), and higher miR-140-5p was correlated with advanced tumour stage in the
whole patient group and those with tumour metastases in the intestinal type of gastric cancer
(Table 4.1).

Table 4.1: miR-140 expression in gastric cancer cohort from TCGA.Whole (n=435) Intestinal type (n=186) Diffuse type (n=72)
N Mean ± SEM P value N Mean ± SEM P value N Mean ± SEM P value0.048 0.232 0.404
Tumour 435 865.5 ± 14.86 186 873.1 ± 28.41 72 965.2 ± 53.81Normal 41 962.5 ± 22.61 15 999.0 ± 112.8 3 1188 ± 49.56 Gender 0.701 0.401 0.784
Male 280 870.8 ± 23.83 124 890.3 ± 37.95 42 952.7 ± 65.63 Female 155 855.7 ± 30.87 62 839.5 ± 38.94 30 982.9 ± 92.03
Age 0.161 0.792 0.694≥65 247 839.4 ± 24.73 115 876.7 ± 38.78 28 992.1 ± 77.31<65 183 893.3 ± 29.53 68 860.9 ± 41.70 44 948.2 ± 73.61
Differentiation 0.163 0.135 0.751High-Moderate 107 794.8 ± 86.94 101 940.4 ± 45.24 2 1073 ± 206.8
Poor 280 887.8 ± 24.37 81 850.6 ± 35.74 70 977.3 ± 50.28 Histology 0.224
Intestinal 186 873.3 ± 28.41Diffuse 72 965.2 ± 53.81 0.106
Signet ring type 11 968.0 ± 78.44 0.984TNM staging 0.048 0.436 0.995
1-2 185 837.0 ± 24.81 70 847.7 ± 37.78 28 953.2 ± 84.65 3-4 223 914.3 ± 29.00 113 893.4 ± 39.62 40 952.5 ± 66.10
Node status 0.927 0.738 0.492Node negative 128 878.6 ± 36.31 49 892.4 ± 55.86 9 616.5 ± 25.55Node positive 288 874.8 ± 22.80 131 870.6 ± 33.90 33 657.5 ± 29.85
Metastasis 0.099 0.032 0.967Yes 30 981.7 ± 85.90 14 1086 ± 154.4 8 958.9 ± 142.1No 402 858.8 ± 19.30 172 856.0 ± 27.83 64 966.0 ± 58.23
Clinical outcomes 0.885 0.703 0.555Alive 264 863.2 ± 24.81 115 864.8 ± 38.11 44 990.8 ± 69.56Dead 171 868.8 ± 28.96 71 887.2 ± 41.95 28 925.1 ± 85.86
Primary therapy response 0.912 0.858 0.7839Complete/ Partial Remission 244 910.9 ± 26.33 105 908.7 ± 40.92 38 984.0 ± 67.37 Stable / Progressive Disease 89 905.3 ± 40.47 41 921.9 ± 54.68 22 950.0 ± 113.2
137

137
We then analyzed the association of miR-140-5p expression level with OS in gastric cancer
patients. Since adjacent normal samples’ transcriptional levels likely provided complementary
information on patient survival, the expression level changes of miRNAs between tumour
and paired nontumour samples may be more correlated with cancer relapse and survival than
absolute expression levels in tumour samples alone (Huang et al. 2016). Receiver operating
characteristic (ROC) curves were further employed to calculate the optimal cut-off value for
miR-140-5p in discriminating tumour tissues from non-tumour samples. The areas under the
curve (AUC) were 0.576 (95% confidence interval (CI): 0.484 to 0.668, p=0.108). According
to the analysis result, > 964.3 was set as cut off value for miR-140-5p overexpression, the
other way around was set as miR-140 low expression (Figure 4.2).
Figure 4.2: miR-140-5p expression in gastric cancer. A ROC curve of miR-140-5p as discriminators between gastric cancer and normal tissues. B.C.D. Comparisons of miR-140-5p expression in whole patients and patients’ different subtypes of gastric cancer.
Prognosis differed between patients with low miR-140-5p expression and those with high
miR-140-5p expression. Kaplan-Meier curve and log-rank analysis showed that low miR-
140-5p expression positively correlated with poor gastric cancer patients’ survival (OS: HR,

138
1.42; 95% CI, 1.01 to 1.91; P < 0.001 Figure 4.3 A; DFS: HR, 1.456; 95% CI, 0.9918 to 2.081;
P=0.056 Figure 4.4 A). This observation was also shown in the intestinal subtype of gastric
cancer (OS: HR, 1.70; 95% CI, 0.9958 to 2.901; P=0.121 Figure 4.3 B; DFS: HR, 1.418; 95%
CI, 0.8000 to 2.480; P=0.24 Figure 4.4 B), but not in those with diffuse subtype (Figure 4.3
C, 4.4 C).
Figure 4.3: Kaplan–Meier OS analysis for patients with miR-140-5p high or miR-140-5p low gastric cancer tissues. A. In the analysis included total patients, patients with high miR-140-5p expression (median survival 46.9 months) showed better OS versus low miR-140-5p expression in gastric cancer tissues (median survival 26.08 months). B. The analysis for patients with the intestinal type of gastric cancer showed a similar trend, a better clinical outcome for patients with higher miR-140-5p expression (median survival 58.23 months) compared to those with miR-140-5p lower expression (median survival 34.26 months). C. For patients with the diffuse type of gastric cancer, there is no significant difference between patients with higher miR-140-5p and those with lower miR-140-5p. Abbreviations:INT, intestinal type of gastric cancer; Diff, diffuse type of gastric cancer.
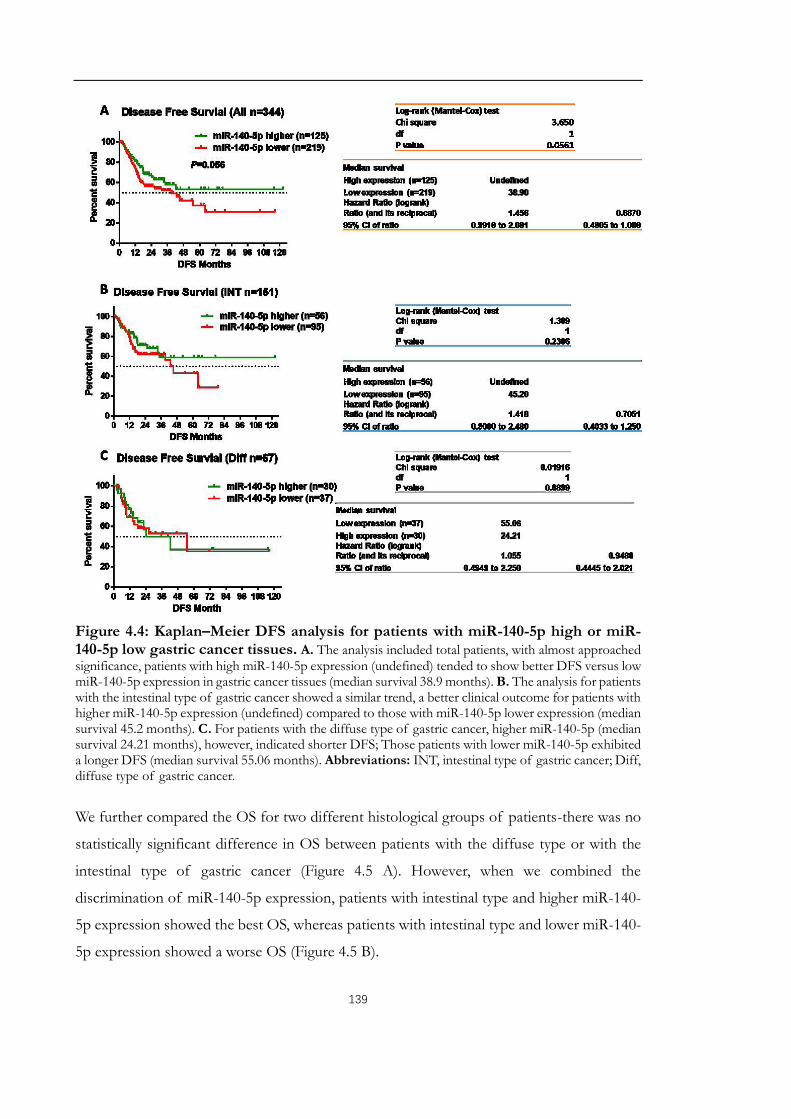
139
Figure 4.4: Kaplan–Meier DFS analysis for patients with miR-140-5p high or miR-140-5p low gastric cancer tissues. A. The analysis included total patients, with almost approached significance, patients with high miR-140-5p expression (undefined) tended to show better DFS versus low miR-140-5p expression in gastric cancer tissues (median survival 38.9 months). B. The analysis for patients with the intestinal type of gastric cancer showed a similar trend, a better clinical outcome for patients with higher miR-140-5p expression (undefined) compared to those with miR-140-5p lower expression (median survival 45.2 months). C. For patients with the diffuse type of gastric cancer, higher miR-140-5p (median survival 24.21 months), however, indicated shorter DFS; Those patients with lower miR-140-5p exhibited a longer DFS (median survival 55.06 months). Abbreviations: INT, intestinal type of gastric cancer; Diff, diffuse type of gastric cancer.
We further compared the OS for two different histological groups of patients-there was no
statistically significant difference in OS between patients with the diffuse type or with the
intestinal type of gastric cancer (Figure 4.5 A). However, when we combined the
discrimination of miR-140-5p expression, patients with intestinal type and higher miR-140-
5p expression showed the best OS, whereas patients with intestinal type and lower miR-140-
5p expression showed a worse OS (Figure 4.5 B).

140
Figure 4.5: Kaplan–Meier survival analysis for patients with different histological types and different miR-140-5p expression. A. The comparison between gastric cancer patients with intestinal subtype or with diffuse subtype showed no significant differences statistically. B. Although the comparison did not statistical significantly difference, gastric cancer patients with intestinal subtype and high miR-140-5p expression showed the best survival with undefined median survival. Individuals with diffuse type but high miR-140-5p expression showed a poor OS.

141
The multivariate Cox regression forward stepwise likelihood ratio (LR) analysis for the whole
patients showed TNM stage, age, tumour differentiation, miR-140-5p expression and
primary treatment response provided independent prognostic information (Table 4.2).
Table 4.2: Cox regression analysis for comparison of gastric cancer patients OS.Abbreviations: HR, hazard ratio; EGJ, esophagogastric junction.
ParametersUnivariate analysis Multi variate analysis
HR 95% CI P HR 95% CI P
Stage 0.01 0.02Stage I 0.23 0.08-0.64 0.01 0.24 0.08-0.69 0.01Stage II 0.36 0.17-0.76 0.01 0.34 0.15-0.74 0.01Stage III 0.60 0.33-1.11 0.10 0.47 0.24-0.91 0.03Stage IV reference
Age 0.09 0.01<65 0.68 0.43-1.07 0.54 0.34-0.85≥ 65 reference
Differentiation 0.06 0.01Well to moderate 0.66 0.41-1.02 0.49 0.30-0.81
Poor referencePrimary treatment <0.001 <0.001
Non-response 3.661 2.352-5.699 3.57 2.26-5.64Response reference
miR-140-5p 0.07 0.02High expression 0.65 0.41-1.03 0.58 0.31-0.83Low expression reference
Gender 0.52Male 1.16 0.74-1.83
Female referenceHistology 0.16
Intestinal type 0.44 0.19-1.03 0.06Diffuse type 0.49 0.20-1.20 0.12
Signet ring type referenceAnatomical site 0.64
EGJ 0.34 0.40-2.15 0.23Funds 0.64 0.23-1.53 0.28Body 0.88 0.44-1.71 0.68
Antrum reference

142
Higher TNM stage, older age, lower tumour differentiation grade and miR-140-5p low
expression were significantly associated with poorer OS, while patients with response to
primary chemotherapy treatment response were associated with better OS. In the DFS
analysis (Table 4.3), patients’ responses to primary chemotherapy treatment and miR-140-5p
status were both independent factors. Chi-square was used to further clarify the association
between miR-140-5p suppression and clinical, characteristics (Table 4.4). We found that
decreased miR-140-5p significantly correlated with tumour histology, and distant metastasis.
Table 4.3: Cox regression analysis for comparison of gastric cancer patients DFS.Abbreviations: HR, hazard ratio; EGJ, esophagogastric junction.
ParametersUnivariate analysis Multi variate analysis
HR 95% CI P HR 95% CI PPrimary treatment <0.001 <0.001
Non-response 6.83 4.17-11.12 7.23 4.39-11.91Response reference
miR-140-5p 0.26High expression 0.76 0.48-1.21 0.60 0.36-0.98 0.04 Low expression reference
Stage 0.09 0.51Stage I 0.29 0.11-0.78 0.01 0.53 0.18-1.46 0.21Stage II 0.54 0.26-1.13 0.10 0.80 0.36-1.78 0.59Stage III 0.59 0.31-1.12 0.11 0.66 0.34-1,28 0.22Stage IV reference reference
Age 0.53<65 1.16 0.73-1.82≥ 65 reference
Differentiation 0.67Well to moderate 0.91 0.57-1.43
Poor referenceGender 0.15 0.08
Male 1.44 0.88-2.35 1.57 0.93-2.62Female reference reference
Histology 0.18 0.15Intestinal type 0.47 0.19-1.18 0.11 0.72 0.27-1.92 0.56Diffuse type 0.63 0.24-1.67 0.35 1.21 0.43-3.40 0.72
Signet ring type reference referenceAnatomical site 0.30
EGJ 0.30 0.04-2.32 0.24Funds 0.74 0.32-1.67 0.46Body 1.10 0.58-2.10 0.77
Antrum reference

143
Table 4.4: Relationship between miR-140-5p suppression and clinicopathological features in gastric cancer patients.
miR-140-5p suppression Chi-square
Pa
Positive (%) Negative (%)Gender 0.64 0.52
Male 97(34.6) 183(65.4)Female 49(31.6) 106(68.4)
Age(years) 0.53 0.59≥65 79(32.0) 168(68.0)<65 63(34.4) 120(65.6)
Tumour location 1.45 0.15Cardia 30(28.0) 77(72.0)
Non-cardia 110(35.7) 198(64.3)Histology 4.57 0.03
Intestinal 62(33.33) 124(66.67)Diffuse 30(41.67) 42(58.33)
Signet ring type 7(63.6) 4(36.4)Differentiation 1.19 0.23
Well-moderate 51(30.7) 115(69.3)Poor 91(35.0) 169(65.0)
Depth of invasion 0.63 0.53T1-T2 34(29.8) 80(70.2)T3–T4 112(36.0) 199(64.0)
Lymph node involvement 0.57 0.57No 47(36.4) 82(63.6)Yes 97(33.6) 192(66.4)
Distant metastasis 1.945 0.05No 131(32.6) 271(67.4)Yes 15(50.0) 15(50.0)
TNM stage 0.70 0.87I 22(38.6) 35(61.4)II 42(32.8) 86(67.2)III 62(34.4) 118(65.6)IV 16(37.2) 27(62.8)
Primary treatment response 0.48 0.63Yes 92(37.7) 152(62.3)No 31(34.8) 58(65.2)
aChi -square test

144
We then performed Cox univariate and multivariate analyses in intestinal gastric cancer and
diffuse gastric cancer separately. Primary treatment response was a critical independent
protective factor in all groups. The results of intestinal-type gastric cancer patients’ group
revealed miR-140-5p expression was an independent prognosis factor in both OS analysis
and DFS analysis. Patients with tumour located in the body of the stomach were more likely
to have longer DFS survival than gastric cancer patients with tumour located at other sites
(Table 4.5 and 4.6). In the Chi-square analysis, miR-140-5p suppression showed a positive
trend in a relationship with lymph node involvement, distant metastasis, and tumour stage,
but it did not reach statistical significance.
Table 4.5: Cox regression analysis for comparison of the intestinal type of gastric cancer patients OS. Abbreviations: HR, hazard ratio; EGJ, esophagogastric junction.
ParametersUnivariate analysis Multi variate analysis
HR 95% CI P HR 95% CI PPrimary treatment <0.001 <0.001
Non-response 3.08 1.83-5.18 3.261 1.90-5.59Response reference
miR-140-5p 0.01High expression 0.52 0.30-0.88 0.57 0.33-0.99 0.05 Low expression reference
Stage 0.02 0.01Stage I 0.10 0.02-0.43 <0.001 0.08 0.02-0.35 <0.001Stage II 0.45 0.21-0.96 0.04 0.42 0.19-0.93 0.03Stage III 0.72 0.39-1.33 0.30 0.57 0.28-1.16 0.12Stage IV reference
Age 0.03 <0.001<65 0.55 0.32-0.93 0.39 0.22-0.68≥ 65 reference
Differentiation 0.61 0.01Well to moderate 0.61 0.38-0.98 0.51 0.31-0.87
Poor referenceGender 0.40
Male 0.81 0.50-1.32Female reference
Anatomical site 0.82EGJ 0.61 0.24-1.59 0.31
Funds 0.75 0.36-1.59 0.46Body 0.94 0.58-1.60 0.83
Antrum reference

145
Table 4.6: Cox regression analysis for comparison of the intestinal type of gastric cancer patients DFS. Abbreviations: HR, hazard ratio; EGJ, esophagogastric junction.
ParametersUnivariate analysis Multi variate analysis
HR 95% CI P HR 95% CI P
Primary treatment <0.001 <0.001Non-response 7.06 3.84-12.95 7.74 3.84-12.95
Response referencemiR-140-5p 0.15 0.03
High expression 0.66 0.37-1.17 0.52 0.29-0.93Low expression reference
Stage 0.09 0.44Stage I 0.17 0.05-0.61 <0.001 0.67 0.08-5.41 0.71Stage II 0.53 0.23-1.24 0.15 0.33 0.09-1.21 0.10Stage III 0.64 0.31-1.29 0.21 1.08 0.45-2.57 0.87Stage IV reference
Age 0.58<65 1.17 0.68-2.00≥ 65 reference
Differentiation 0.79Well to moderate 1.08 0.62-1.89
Poor referenceGender 0.70
Male 1.12 0.62-2.02Female reference
Anatomical site 0.41EGJ 0.69 0.28-1.70 0.42
Funds 0.85 0.39-1.82 0.67Body 0.51 0.27-1.00 0.05
Antrum reference

146
Male patients with diffuse-type gastric cancer had a shorter DFS and OS than female (Table
4.7 and 4.8). Additionally, the analysis also implied that diffuse type of gastric cancer patients
with a fundus tumour had a risk of death approximately twice higher compared to those
with tumours at other sites. Different from the intestinal type of gastric cancer, miR-140-5p
downregulation in the contingency analysis was positively correlated with local infiltration
depth of tumour; Similarly, low levels of miR-140-5p were seen in tumours depending on
their differentiation and in patients with older age but lacked statistical significance (Table
4.9 and 4.10).
Table 4.7: Cox regression analysis for comparison of diffuse type of gastric cancer patients OS. Abbreviations: HR, hazard ratio; EGJ, esophagogastric junction.
ParametersUnivariate analysis Multi variate analysis
HR 95% CI P HR 95% CI P
Primary treatment <0.001 <0.001Non-response 4.78 2.05-11.37 4.78 2.01-11.37
Response referencemiR-140-5p 0.93
High expression 0.97 0.44-2.11Low expression reference
Stage 0.11 0.26Stage I 0.31 0.07-1.39 0.13 0.53 0.11-2.55 0.43Stage II 0.19 0.05-0.73 0.02 0.27 0.07-1.03 0.06Stage III 0.40 0.13-1.24 0.11 0.39 0.13-1.23 0.11Stage IV reference
Age 0.42<65 0.72 0.33-1.59≥ 65 reference
Differentiation 0.27Well to moderate 3.20 0.47-25.18
Poor referenceGender 0.29
Male 2.05 0.89-4.76Female reference
Anatomical site 0.90EGJ 0.65 0.08-5.03 0.68
Funds 1.60 0.45-5.67 0.47Body 0.98 0.40-2.40 0.97
Antrum reference

147
Table 4.8: Cox regression analysis for comparison of diffuse type of gastric cancer patients DFS. Abbreviations: HR, hazard ratio; EGJ, esophagogastric junction.
ParametersUnivariate analysis Multi variate analysis
HR 95% CI P HR 95% CI P
Primary treatment <0.001 <0.001non-response 9.16 3.43-24.42 8.21 3.02-22.32
response referenceGender 0.03 0.05
male 2.74 1.08-6.98 2.68 1.02-7.04female reference
miR-140-5p 0.93high expression 1.04 0.47-2.32low expression reference
Stage 0.36 0.73Stage I 0.23 0.04-1.40 0.11 0.59 0.09-3.96 0.58.Stage II 0.35 0.09-1.41 0.14 0.57 0.13-2.44 0.45Stage III 0.49 0.13-1.78 0.28 0.46 0.12-1.78 0.26Stage IV reference
Age 0.91<65 0.95 0.39-2.30≥ 65 reference
Differentiation 0.54well to moderate 1.89 0.24-14.45
poor referenceAnatomical site 0.66
EGJ 0.77 0.10-6.09 0.81Funds 2.33 0.73-7.41 0.15Body 1.05 0.40-2.75 0.91
Antrum reference

148
Table 4.9: Relationship between miR-140-5p suppression and clinicopathological features in gastric cancer patients with intestinal type.
miR-140-5p suppression Chi-square
Pa
Positive (%) Negative (%)
Gender 0.54 0.58Male 43(34.6) 81(65.4)
Female 19(31.6) 43(68.4)Age(years) 0.42 0.67
≥65 39(32.0) 76(68.0)<65 21(34.4) 47(65.6)
Tumour location 0.53 0.59Cardia 12(28.0) 28(72.0)
Non-cardia 49(35.7) 93(64.3)Differentiation 0.22 0.82
High-moderate 34(30.7) 67(69.3)Poor 26(35.0) 55(65.0)
Depth of invasion 0.12 0.91T1-T2 17(29.8) 35(70.2)T3–T4 45(36.0) 89(64.0)
Lymph node involvement 1.14 0.25No 20(36.4) 30(63.6)Yes 41(33.6) 9166.4)
Distant metastasis 1.38 0.17No 55(32.6) 117(67.4)Yes 7(50.0) 7(50.0)
TNM stage 2.00 0.15b
I 12(38.6) 14(61.4)II 16(32.8) 28(67.2)III 25(34.4) 64(65.6)IV 8(37.2) 16(62.8)
Primary treatment response 0.12 0.90Yes 37(34.8) 68(65.2)No 14(37.7) 27(62.3)
aChi-square test. bChi-square test for trend

149
Table 4.10: Relationship between miR-140-5p suppression and clinicopathological features in gastric cancer patients with diffuse type.
miR-140-5p suppression Chi-square PaPositive (%) Negative
(%)Gender 0.73 0.47
Male 19(45.2) 23(54.8)Female 11(36.7) 19(63.3)
Age(years) 1.14 0.25≥65 14(50.0) 14(50.0)<65 16(36.4) 28(63.6)
Tumour location 0.35 0.72Cardia 4(36.4) 7(63.6)
Non-cardia 24(42.1) 33(57.9)Differentiation 0.81 0.23
High-moderate 1(50.0) 1(50.0)Poor 28(41.8) 39(58.2)
Depth of invasion 1.932 0.05T1-T2 4(22.2) 14(77.8)T3–T4 26(48.1) 28(51.9)
Lymph node involvement 0.19 0.85No 7(43.8) 9(56.2)Yes 23(41.1) 33(58.9)
Distant metastasis 0.51 0.61No 26(56.3) 38(43.7)Yes 4(50.0) 4(50.0)
TNM stage 0.9183 0.33b
I 2(28.6) 5(71.4)II 9(42.9) 12(57.1)III 15(44.1) 19(55.9)IV 4(57.1) 3(42.9)
Primary treatment response 0.83 0.41Yes 18(47.3) 20(52.7)No 8(36.4) 14(63.6)
aChi-square test. bChi-square test for trend
4.3.2 Analysis of miR-140-5p/3p expression in an indication of gastric cancer
progression from cohort without neoadjuvant chemotherapy
Further exploration was carried out on the involvement of miR-140-5p/3p in the disease
progression of gastric cancer in an independent cohort containing 70 patients who did not
receive any treatment before tissue collection. In line with the finding in TCGA analysis,
reduced expression of miR-140-5p was observed in tumour tissues compared with adjacent
non-tumour samples, especially in Borrmann I-II type of gastric cancer (Table 4.11). A
decreased miR-140-5p expression was seen in the relatively localized tumour (Borrmann I-

150
II) compared with diffuse tumour samples (Borrmann III-IV). Interestingly, higher miR-
140-5p expression was found in male patients with Borrmann I-II gastric cancer, but for the
Borrmann III-IV patients higher miR-140-5p are more likely happened in female patients. A
trend of reduced expression of miR-140-5p was prone in older patients. However, a relatively
lower expression of miR-140-5p was seen in the early stage of tumours compared with later
stage, which thought showed a reverse trend in Borrmann III-IV type patients, the result was
not statistically significant.
We also compared miR-140-3p expression in these gastric cancer patients. Comparing to
adjacent non-tumour samples, the level of miR-140-3p showed a decreased trend in paired
tumoural tissues and mainly occurred in Borrmann I-II patients. Although no significant
correlation was found between miR-140-3p expression and other clinical parameters, similar
to miR-140-5p, lower expression of miR-140-5p was more likely to be seen in the early stage
of tumours compared with later stage in Borrmann I-II patients, while the opposite in
Borrmann III-IV patients.
We further compared patients’ OS with different miR-140-5p expression level (Figure 4.6).
Patients with lower miR-140-5p in tumour samples compared to paired normal samples was
regarded as miR-140-5p low, whereas tumours harbouring a higher or equal level of miR-
140-5p was viewed as miR-140-5p high. A higher miR-140-5p was significantly correlated
with better OS for the total patients involved in the current study. Subgroup analysis revealed
that patients with Borrmann I-II are more likely to benefit from higher miR-140-5p
expression. On the contrary, higher miR-140-5p expression indicated an even worse
prognosis in gastric cancer patients with Borrmann III-IV subtypes. When both the
expression status of miR-140-5p and miR-140-3p was considered, patients with suppression
in both miR-140-5p and miR-140-3p showed the poorest survival (Figure 4.7A). The
combined analysis of miR-140-5p/3p expression level with tumour Borrmann classification
revealed that patients having Borrmann I-II type gastric cancer and having none or one of
the low expression of miR-140-5p/3p in the tumour samples had the best OS, however when
both miR-140-5p and miR-140-3p were downregulated in tumour tissues, patients would
suffer a worse prognosis regardless of their histological types (Figure 4.7 B).

Table 4.11: miR-140-5p expression in non-neoadjuvant chemotherapy cohort from Beijing
Whole (n=70) Borrmann I II (n=48) Borrmann III IV (n=22)
N Mean ±SEM P value N Mean ± SEM P value N Mean ±SEM P value<0.001 <0.001 0.26
Tumour tissue 70 1.73 ± 0.39 48 1.07 ± 0.19 22 3.18 ± 1.14Normal tissue 70 3.78 ± 0.44 48 3.42 ± 0.51 22 4.57 ± 0.86Gender 0.85 0.47 0.41
Male 53 1.69 ± 0.38 35 1.16 ± 0.24 18 2.73 ± 0.99 Female 17 1.87 ± 1.14 13 0.84 ± 0.32 4 5.18 ± 4.82
Age 0.11 0.40 0.22≥65 32 1.06 ± 0.26 23 0.90 ± 0.24 9 1.48 ± 0.69<65 38 2.30 ± 0.68 29 1.23 ± 0.30 9 4.35 ± 1.82
Differentiation 0.17 0.08 0.39High-Moderate 13 0.59 ± 0.33 9 1.23 ± 0.23 4 3.65 ± 1.36
Poor 57 1.95 ± 0.47 39 0.38 ± 0.19 18 1.08 ± 1.06Histology 0.01
Borrmann I-II 48 1.07 ±0.20Borrmann III-IV 22 3.18 ±1.14
TNM staging 0.36 0.62 0.321-2 18 1.12 ± 0.28 14 1.22 ± 0.33 4 0.75 ± 0.47 3-4 52 1.95 ± 0.52 34 1.01 ± 0.24 18 3.18 ± 1.36
153

Table 4.12: miR-140-3p expression in non-neoadjuvant chemotherapy cohort from Beijing
Whole (n=70) Borrmann I II (n=48) Borrmann III IV (n=22)
N Mean ±SEM P value N Mean ± SEM P value N Mean ±SEM P value0.09 0.08 0.66
Tumour tissue 70 0.12 ± 0.10 48 0.12 ± 0.01 22 0.12 ± 0.02Normal tissue 70 0.14 ± 0.08 48 0.14 ± 0.01 22 0.13 ± 0.01Gender 0.50 0.58 0.72
Male 53 0.12 ± 0.01 35 0.21 ± 0.02 18 0.12 ± 0.02Female 17 0.10 ± 0.02 13 0.10 ± 0.03 4 0.10 ± 0.06
Age 0.41 0.78 0.28≥65 38 0.11 ± 0.02 25 0.12 ± 0.02 13 0.15 ± 0.04<65 32 0.13 ± 0.02 23 0.11 ± 0.02 9 0.10 ± 0.02
Differentiation 0.88 0.70 0.75High-Moderate 13 0.12 ± 0.01 9 0.12 ± 0.02 4 0.12 ± 0.03
Poor 57 0.11 ± 0.03 39 0.10 ± 0.03 18 0.14 ± 0.04Histology 0.89
Borrmann I-II 48 0.12 ± 0.01Borrmann III-IV 22 0.12 ± 0.02
TNM staging 0.33 0.11 0.421-2 18 0.14 ± 0.02 14 0.15 ± 0.02 4 0.08 ± 0.04 3-4 52 0.11 ± 0.01 34 0.10 ± 0.02 18 0.13 ± 0.03
154

153
Figure 4.6: Kaplan–Meier OS analysis for patients with miR-140-5p high or miR-140-5p low gastric cancer tissues ((Beijing cohort)). A. The analysis included total patients showed a trend that patients with high miR-140-5p expression (median survival 42.87 months) are more likely to have better OS versus low miR-140-5p expression in gastric cancer tissues (median survival 33.17 months). B. The analysis for patients with relative local disease (Borrmann I-II) showed a similar trend as that in total population, a better clinical outcome for patients with higher miR-140-5p expression (undefined median survival) compared to those with miR-140-5p lower expression (median survival 35.37 months). C. For patients with more invasive gastric cancer, higher miR-140-5p (median survival 15.72 months), however, indicated shorter OS; Those patients with lower miR-140-5p exhibited a longer OS (median survival 18.5 months).

154
Figure 4.7: Kaplan–Meier OS analysis for patients with various miR-140-5p/3p status in gastric cancer tissues. A. The analysis included all the patients, patients with tumour harbouring both suppressing in miR-140-5p and -3p expression showed a trend to have a worse OS than patients with either miR-140-5p suppression or miR-140-3p or with no suppression of neither. B. Further analysis based on Borrmann classification showed that the OS significantly declined in the patients, whose tumours were localized but were suppressed in both miR-140-5p/3p. Abbreviations: BI-II O/N, one of none suppression of miR-140-5p/3p in Borrmann I-II type; BI-II BO, Borrmann I-II type with both suppressed miR-140-5p and miR-140-3p; BIII-IV O/N, one of none suppression of miR-140-5p/3p in Borrmann III-IV type; BIII-IV BO, Borrmann III-IV type with both suppressed miR-140-5p and miR-140-3p.

155
Table 4.13: Cox regression analysis for comparison of OS in gastric cancer patients without neoadjuvant chemotherapy. Abbreviations: HR, hazard ratio.
ParametersUnivariate analysis Multi variate analysis
HR 95% CI p HR 95% CI P
Stage 0.07 0.05Stage I-II 0.41 0.14-1.17 0.40 0.14-1.15
Stage III-IV referenceAge <0.001 0.01
<65 0.36 10.19-0.71 0.37 0.20-0.70
≥ 65 referenceHistology 0.01 0.01
Borrmann I-II 0.40 0.19-0.83 0.40 0.20-0.78Borrmann III-IV reference
R0 surgical margin 0.05 0.04No 2.33 0.99-5.45 2.30 1.03-5.11Yes reference
Vascular invasion 0.05 0.04No 0.43 0.19-1.00 0.45 0.21-0.98Yes reference
Low miR-140-5p/3p 0.10 0.08None or one 0.52 0.24-1.14 0.54 0.27-1.07
Both referenceGender 0.85
Male 1.09 0.46-2.58Female reference
Differentiation 0.82Well to moderate 1.15 0.43-2.84
Poor referenceAnatomical site
CardiaNon-cardia reference

156
4.3.3 Analysis of miR-140-5p/3p expression related to gastric cancer treatment from
cohort with neoadjuvant chemotherapy
A previous microarray-based study enrolling 87 patients diagnosed with metastatic gastric
cancer who received fluorouracil and cisplatin chemo treatment, revealed that higher
expression of miR-140-5p in pre-treated tumour samples was significantly correlated with a
delayed time to progression indicating chemotherapy-related survival benefits. However,
miR-140-5p was functionally validated to reduce cell proliferation through G1 and G2 phase
arrest mediated in part through the suppression of HDAC4 (Song et al. 2009) and be
important in contributing to chemoresistance to 5FU based chemotherapy in colorectal
cancer (Yang et al. 2017). Additionally, miR-140-5p was demonstrated to be overexpressed
in CD133+HiCD44+Hi colon cancer stem-like cells and, by reducing its expression, the
chemoresistance of CD133+HiCD44+Hi colon cancer stem-like cells to 5FU treatment can be
halted (Ju 2010). This led to a question of how miR-140-5p and miR-140-3p are involved in
the chemo response of gastric cancer patients. To answer this, an analysis of miR-140-5p/3p
expression in chemosensitive tumour tissues and chemoresistant tumour samples, as well as
their corresponding normal stomach tissues, was performed, using another gastric cancer
cohort in which tissues samples of patients were collected after 5FU based neoadjuvant
chemotherapy from Beijing Cancer Hospital. Neoadjuvant chemotherapy (NAC) is defined
as chemotherapy administered before locoregional treatment, such as surgery and/or
irradiation. It is well established that NAC plays an important role in downstaging tumours,
eliminating micrometastases, and relieving tumour-related symptoms in patients with locally
advanced gastric cancer (Yang et al. 2015). NAC increases the surgical resectability rate as
well as the quality of surgery if the gastric cancer cell is sensitive to chemotherapy (Chen et
al. 2018). As shown in Figure 4.8, among all subjects involved, 30 patients (37.04%) had
higher miR-140-5p and miR-140-3p (tumour versus adjacent non-tumour) expressions, and
46 patients had either increased miR-140-5p or increased miR-140-3p. Patients with a
pathological complete response or partial response exhibited a higher expression of either
miR-140-5p or miR-140-3p in the tumour samples. Patients with pathological complete
response or partial response showed a trend to have a better OS compared with patients with
stable or progressive disease (Figure 4.9 B HR=0.52, 95% CI: 0.30–0.89, P=0.116), however,
it is not an independent indicator for patients’ OS (Table 4.13). The Kaplan-Meier analysis,
however, demonstrated that patients with at least one alteration in miR-140-5p or miR-140-

157
3p could have a significantly increased OS (HR=0.56, 95% CI: 0.32-0.93, p=0.018).
Furthermore, the Cox analysis also indicated that higher expression of miR-140-5p or miR-
140-3p could be a potential independent prognostic factor although it only showed a
boundary statistically significance (Figure 4.9 A Table 4.13). Subgroup analysis revealed that
if pathological response was achieved, patients with either miR-140-5p or miR-140-3p
upregulation and those without alterations had similar survival (P=0.738). In contrast,
patients with residual disease (RD) would have worse OS if they did not have any alterations
in neither miR-140-5p nor miR-140-3p compared with patients having at least one alteration
in them (P < 0.05) (Figure 4.10).
Figure 4.8: miR-140-5p and miR-140-3p and neoadjuvant treatment response of gastric cancer. The levels of miR-140-5p and miR-140-3p were determined by qPCR in a cohort of gastric cancer patients receiving chemotherapy before surgery. Shown are miR-140-5p and miR-140-3p levels (mean ± standard deviation) and the comparisons of miR-140-5p or miR-140-3p in gastric tumoursof complete response, partial response, and non-response from the drug treatment via One-way ANOVA. ** represent P<0.01, * represents P<0.05.

158
Figure 4.9: A Kaplan-Meier 5-year OS estimation in patients with different miR-140-5p/3p status. The miRs’ expression level was determined according to ROC analysis. Tumours with higher miR-140-5p or miR-140-3p showed a trend to have a better prognosis in comparison with primary tumours without any alterations in neither miR-140-5p nor miR-140-3p (the relative expression was calculated using the expression of tumour sample divided by that of paired normal tissues). However, the difference was not statistically significant (P=0.18). B. Kaplan-Meier 5-year OS estimation in patients with different responses to chemotherapy. Neoadjuvant chemotherapy although not statistically significant, may increase long-term survival among patients who showed a complete or partial response (both are defined as a response according to a previous systematic review (Muhich and Boothroyd 1989)).
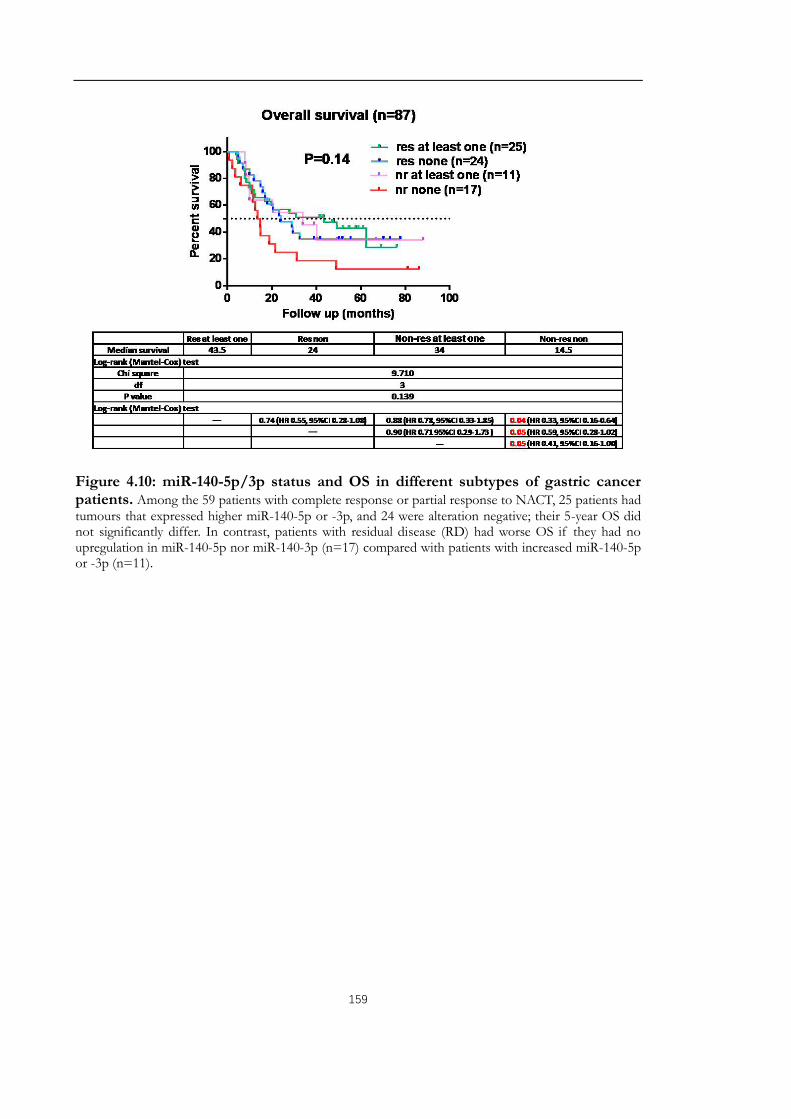
159
Figure 4.10: miR-140-5p/3p status and OS in different subtypes of gastric cancer patients. Among the 59 patients with complete response or partial response to NACT, 25 patients had tumours that expressed higher miR-140-5p or -3p, and 24 were alteration negative; their 5-year OS did not significantly differ. In contrast, patients with residual disease (RD) had worse OS if they had no upregulation in miR-140-5p nor miR-140-3p (n=17) compared with patients with increased miR-140-5p or -3p (n=11).

160
Table 4.14: Cox regression analysis for comparison of OS in gastric cancer patients with neoadjuvant chemotherapy. Abbreviations: HR, hazard ratio.
ParametersUnivariate analysis Multi variate analysis
HR 95% CI P HR 95% CI PT stage 0.01 0.01
T3 2.72 1.23-6.00 2.87 1.38-5.95T4 reference
N stage 0.18 0.08N0 2.27 0.70-23.82 2.64 0.89-3.89
N1-N3 referenceM stage 0.39
M0 1.66 0.52-5.26M1 reference
Response 0.63No 1.18 0.60-2.35Yes reference
Age 0.12 0.01<65 0.56 0.28-1.15 0.37 0.20-0.70
≥ 65 referenceGender 0.65
Male 0.85 0.41-1.73Female reference
Anatomical site 0.89Non-cardia 1.05 0.50-2.21
Cardia referenceHistology 0.01 0.01
Borrmann I-II 2.43 1.29-4.55 2.23 1.22-4.10Borrmann III-IV reference
R0 surgical margin <0.001 <0.001No 0.12 0.04-0.40 0.20 0.10-0.38Yes reference
Vascular invasion 0.11 0.04No 0.53 0.23-1.16 0.58 0.31-1.09Yes reference
Completed periods 0.26No 1.53 0.76-3.19Yes reference
Differentiation 0.24Well to moderate 0.61 0.27-1.39
Poor referenceHigher miR-140-5p/3p 0.09 0.07
None 1.89 0.91-3.93 1.68 0.96-2.93At least one reference

161
4.4 Discussion
The roles of miR-140-5p and -3p in maintenance of cartilage tissue, embryonic development,
regeneration and repair and in immune response and chronic inflammation have been
extensively demonstrated. miR-140-5p and 3p play roles of tumour suppression and have
attracted attention as both possible biomarkers and potential therapeutic targets in epithelial-
derived carcinoma such as lung cancer, breast cancer, colon cancer and ovarian cancer et al.,
as well as in other types of malignant tumour, like sarcomas, melanoma, lymphoma, and
leukemia. However, higher miR-140-5p expression was significantly associated with poorer
OS in anti-EGFR treated chemorefractory metastatic colorectal cancer patients with wild-
type KRAS and BRAF (Mosakhani et al. 2012). It was reported the miR-140-5p exhibited
significantly higher expression levels in post-neoadjuvant chemotherapy specimens
compared with pre-neoadjuvant chemotherapy biopsies in breast cancer and exhibited
significantly even higher expression levels in the ineffective group comparing to the effective
group after neoadjuvant chemotherapy which indicated a poorer survival in breast cancer
patients (Chen et al. 2016). Upregulation of miR-140-3p was found in metastasis nodal
tissues comparing to the nonmetastatic oral squamous cell carcinoma (Serrano et al. 2012).
Elevated miR-140-3p was also found in the milk of the milk stasis plus breast neoplasm
patients and contributed to breast carcinogenesis (Gu et al. 2014). Moreover, highly
expressed miR-140-3p was also shown to control stemness of breast cancer cells (Salem et
al. 2016). These suggest downregulation of miR-140-5p or-3p or their joint action underlines
tumour aggressiveness in a tissue, stage or cell context-dependent manner. To address the
specific roles of miR-140-5p and miR-140-3p in gastric cancer, the expression of miR-140-
5p in gastric cancer (The Cancer Genome Atlas, https://cancergenome.nih.gov/) was
initially analyzed. A slight decrease in miR-140-5p was observed in the whole population
(n=435). Interestingly, an ascending trend was noticed in intestinal type of gastric cancer,
especially patients with metastasis. In the survival analysis, patients with higher miR-140-5p
are more likely to experience longer DFS and OS, particularly in patients with intestinal type.
Although patients with intestinal gastric cancer were supposed to have a better survival than
those with diffuse type, we did not see that in the TCGA cohort. Moreover, when we
compared prognosis considering both their histological subtype and miR-140-5p status, the
log-rank analysis revealed that patients with intestinal subtype and higher miR-140-5p
expression had the best OS. On the contrary, patients with intestinal subtype but a

162
downregulated miR-140-5p had even worse OS compared to patients with the diffuse type
of gastric cancer. Cox analysis indicated lower miR-140-5p expression status together with
later stage, older age, worse differentiation and non-response from primary treatment were
independent OS risk factors for the whole cohort of gastric cancer patients and those with
intestinal-type gastric cancer patients, it’s worth nothing that miR-140-5p downregulation
was an independent risk factor for DFS of intestinal gastric cancer patients.
In this study, reduced expression of miR-140-5p and -3p was observed in gastric cancer
(n=70) compared with paired adjacent normal gastric tissues (n=70). Consistent with the
findings in the TCGA cohort, deregulated miR-140-5p also showed correlation with age,
tumour differentiation and tumour growth pattern. Borrmann classification instead of
Lauren classification was recorded for these patients, thus Borrmann type I and II tumours
were considered the localized type and Borrmann type III and IV were considered infiltrative
type in accordance with previous study (Saito et al. 2013). Subgroup analysis based on the
Borrmann classification indicated that, in line with the results we found in TCGA cohort,
poorer survival is more likely observed in patients with lower miR-140-5p expression,
especially in the localized type of gastric cancer. In the infiltrative type of gastric cancer,
conversely, lower miR-140-5p may suggest a better survival. The combined analysis of both
miR-140-5p and -3p expression and Borrmann’s classification indicated that localized type
of gastric cancer with none or only one deregulation of either miR-140-5p or miR-140-3p
suggested best survival benefit for gastric cancer patients. However, localized type of gastric
cancer with both deregulation of miR-140-5p and miR-140-3p expression manifested an OS
as poor as an infiltrative type of gastric cancer. Similar results were reported in astrocytoma
in which miR-140-5p was significantly lower in the diffuse astrocytoma’s tumour samples as
compared to the non-neoplastic brain tissues. However, during the spontaneously progress
from diffuse astrocytoma of World Health Organization (WHO) grade II to anaplastic
astrocytoma WHO grade III or secondary glioblastoma WHO grade IV, miR-140-5p,
alongside other 11 miRNAs, was elevated in a progressive manner. In addition, upregulation
of its median expression levels was also increased in secondary glioblastomas as compared
to low-grade gliomas (Malzkorn et al. 2010). Upregulation of miR-140-5p, along with
enriched genes in extracellular matrix (ECM)-receptor interaction, ribosome, and focal
adhesion pathways were thought to be important in recurrence of glioblastoma (Bo et al.
2015). Microarrays examination and OS analysis in metastatic colorectal cancer with a genetic

163
background of wild-type KRAS/BRAF also indicated that increased miR-140-5p
significantly correlated with poor OS (Mosakhani et al. 2012). In oestrogen-stimulated breast
cancer cells, miR-140 restoration reduced the CD44high/CD24low subpopulation frequency,
which is referred to the tumour-initiating cells. However, in the absence of oestrogens, miR-
140 overexpression had little to no impact on tumour-initiating cell frequency (Zhang et al.
2012). miR-140-5p expression was elevated in invasive ductal carcinomas (P=0.002), whereas
basal-like tumours had decreased expression of miR-140-5p compared to other tumours
(P=0.008). Lymph node-positive samples showed an approximately 13-fold increase in miR-
140-5p expression compared to lymph node-negative tissue (P=0.049) (Gullu et al. 2015).
Samples with no immunohistochemical staining for IGFBP5 showed increased miR-140-5p
expression (P=0.009) (Zhang et al. 2012). All of the above evidence again emphasized the
context-specific role of miR-140-5p.
Furthermore, we determined the pattern of miR-140-5p and -3p expression in this gastric
cancer patient cohort who received 5FU based NAC to evaluate their predictive roles in
chemoresponse. We found there was a significantly increased expression of miR-140-5p/3p
in malignant tumours compared with adjacent normal tissue, and even higher in responsive
tumour tissues. Survival analysis revealed that patients with no response from the NAC
treatment but armed with either higher miR-140-5p or miR-140-3p expression (compared to
paired normal tissues) could still have a chance for long-term survival.
Taken together, the results suggested that miR-140-5p and miR-140-3p may play specific or
even contrasting roles in gastric cancer with different biological background (intestinal vs.
diffuse, or Borrmann I-II (localized) vs. Borrmann III-IV (infiltrative)). Generally, miR-140-
5p and miR-140-3p played tumour suppressing roles in gastric cancer, and more advanced
tumours in the late stage (AJCC Stage III and Stage IV) had a decreased miR-140-5p/3p
expression in comparison with tumours at early stages of the disease (Stage I and Stage II).
Current cohort analysis also hinted a complementary function for this pair of miRNA
duplexes. However, further investigation should be performed to validate this finding in a
larger cohort with a well-documented histological description for subgroup analysis. Also,
since a big variance was seen in our q-PCR examination, an improvement should be made in
optimizing the endogenous reference and enhancing the accuracy for quantitative assessment.
Higher expression of miR-140 associated with 5FU chemoresistance was found in small cell
lung carcinoma cell lines (Polley et al. 2016), in osteosarcoma tumour xenografts, and in

164
CD133(+hi) CD44(+hi) colon cancer stem-like cells, probably due to slower proliferating
rate (Song et al. 2009). It was also suggested that increased miR-140-5p expression levels up-
regulated anticancer drug-induced autophagy in osteosarcoma cells and ameliorated the
anticancer drug-induced cell proliferation and viability decrease. Besides, miR-140-5p is
highly expressed in erlotinib-resistant cells (mesenchymal type A549) and is predicted to
target the TGFβ receptor and Smad2 (Wong and Wang 2015; Bryant et al. 2012). TGFβ may
act in a pro-tumourigenic, pro-EMT fashion in erlotinib-resistant cells, but may play an anti-
EMT and protective role in erlotinib-sensitive cells (epithelial type PC9) because inhibition
of TGFβ did not induce a complete EMT transition in these cells, indicating that the
perpetual activation of ERK and AKT signals from active EGFR signalling may rely on basal
activation from TGFβRII in order to persist (Krentz Gober et al. 2017). It was not surprising
that miR-140-5p, as one of the upstreamers of TGFβ, could play dual roles in the response
to cytotoxic stress. The gain of function of K-ras mutations, non-functional p53, as well as
deregulated TGFβ are well documented for their roles in the induction and potentiation of
tumourigenesis. The definite correlation between miR-140-5p and -3p and these factors
contributes to the tumourigenesis of gastric cancer warrant further investigation.
Taken together, these results show that the expression of miR-140-5p and -3p is reduced in
specific subtypes of gastric cancer. This is associated with the disease progression and poor
prognosis. Current findings from gastric cancer tissue samples led to a further investigation
for their functional roles in gastric cancer cells, which is supposed to help to elucidate how
and when miR-140-5p and -3p exert their protective roles on gastric cancer progression. This
subject is discussed in subsequent chapters.

165
Chapter 5
The Influence of miR-140-5p and -3p
overexpression on the cellular
functions of human gastric cancer cell
lines

166
5.1 Chapter Introduction
In the initial investigation, reduced expression of miR-140-5p and -3p was evident in
intestinal gastric cancer. The down-regulation of miR-140-5p and -3p may correlate with
progression of intestinal gastric cancer during the tumourigenesis, as such a trend was
observed in MKN7 with high differentiation, MKN74 with moderate differentiation and
AGS with low differentiation. Furthermore, intestinal-type gastric cancer patients with lower
expression of miR-140-5p exhibited a shorter OS, suggesting its implication in the prognosis
of the disease.
The most fundamental trait of cancer cells involves their ability to sustain chronic
proliferation, which is usually sustained by proliferative signaling conveyed in large part by
growth factors that bind cell-surface receptors, typically containing intracellular tyrosine
kinase domains. In normal cells, the activation of intracellular tyrosine kinase proceeds to
emit signals via branched intracellular signaling pathways that regulate progression through
the cell cycle as well as cell growth (increases in cell size) in a highly specific and localized
fashion properly. However, cancer cells acquire the capability to sustain proliferative signaling
in a number of alternative ways, mainly through gaining excessive growth advantages and
disruptions of negative-feedback mechanisms that attenuate cell proliferation (Hanahan and
Weinberg 2011).
The most virulent form of cancer is not only a disease of uncontrolled cell growth but also
a disease of uncontrolled cell migration. Metastasis, viewed as another hallmark of cancer,
involves the spread of cancer cells from the primary tumour to surrounding tissues and to
distant organs and the remains the leading cause of mortality among cancer patients (Labelle
and Hynes 2012; Seyfried and Huysentruyt 2013). Cancer cells must complete several
complex sequential steps to metastasize successfully, namely, detachment from the primary
tumour, intravasation into the vascular system (whether directly or via lymphatics and lymph
nodes), survival while in transit through the circulation, initial arrest, extravasation, initial
seeding, and survival and proliferation in the target tissue (Labelle and Hynes 2012). Tumour
cells that succeed in forming metastases may have acquired the necessary traits to complete
these steps while still in the primary tumour, either autonomously or as a result of changes
induced by inflammation, stromal cells or other environmental conditions (e.g., hypoxia,

167
mechanical forces) present in the primary tumour (Joyce and Pollard 2009).
Deregulated cell migration, along with proliferation, adhesion, and invasion, is an integrated
process that is essential for cancer metastasis. Migration takes place throughout embryonic
development and also participates in angiogenesis, immune responses, and wound repair
(Horwitz and Webb 2003). For example, chondroprogenitors present in the synovium may
facilitate their migration into the superficial zone of cartilage in response to articular surface
injury (Jayasuriya and Chen 2015). The classic model of cell migration on planar surfaces
describes various physicochemical events, including those initiated by a stimulus that activates
a set of signalling pathways leading to cell polarization and a rapid reorganization of actin
filaments and microtubules. Cells advance by protruding their membrane at their leading cell
border, which is followed by dynamic substrate adhesion via integrin adherence to the
substrate. Membrane retraction at the lagging cell edge finishes the cycle, which is then
repeated in rapid succession. The summation of this process results in cell migration. Cell
migration is indeed complex; it requires that events such as those described above, and other
allied functions be highly coordinated in time and space to keep the cell moving forward
(Morales 2007). Cell invasion, related to cell migration, is not only determined by the cell’s
ability to change and reorganize its cellular morphology, but also the potential to degrade the
extracellular matrix (ECM) (Justus et al. 2014). Scratch assays (or wounding assays), are
performed by creating a cell-free gap, or “scratch”, on a confluent cell monolayer upon which
cells at the edge of the opening move inward to close the scratch (Zaritsky et al. 2015). Cell
polarization is correlated with the direction of the maximal principal stress, maximum shear
stress drives cell polarity (He et al. 2015; Zaritsky et al. 2015).
Several studies have identified the roles of miR-140-5p and -3p in the regulation of cell
functions in various malignancies. Restoration of miR-140-5p induced p53 and p21
expression accompanied with G1 and G2 phase arrest in colon cancer, osteosarcoma (Song
et al. 2009), and pancreatic cancer (Liang et al. 2017). Ectopic overexpression of hsa-miR-
140-5p in colorectal cancer cell lines decreased Smad2 expression, leading to decreased
proliferation and cell invasion, and increased cell cycle arrest in vitro, and abolished tumour
formation and metastasis in vivo (Zhai et al. 2015). Moreover, lower miR-140-5p expression
correlated with increased expression of cyclin E which promoted cellular proliferation in
non-small cell lung cancer (Xie et al. 2018). E2 phosphorylated oestrogen receptor α (ERα)
could suppress miR-140-5p expression, which targets SOX2, leading to enhancement of

168
breast tumour-initiating cell survival (Vazquez-Martin et al. 2013). Gain-of-function
experiments in glioma revealed that miR-140-5p overexpression inhibited proliferation,
induced cell cycle arrest at the G0/G1 phase, and enhanced apoptosis (Cui et al. 2017). In
gastric cancer, miR-140-5p was reported to inhibit SOX4 directly, which might be one of its
mechanisms in suppressing gastric cancer cell proliferation (Zou and Xu 2016). In erlotinib
(an EGFR inhibitor) resistant non-small cell lung cancer cells miR-140-5p were highly
expressed and might associate with a mesenchymal-like phenotype (Krentz Gober et al. 2017).
Transient transfection of miR-140-3p inhibitors showed anti-proliferative effect on
chordoma cell lines U-CH1 (retain a wild-type allele of p53 gene, one allele of p53 had a
mutation-carrying a C > G substitution at nucleotide residue 412 within exon 4) (Jager et al.
2017; Kato et al. 2011) and U-CH2 (p53 proficient) (Li et al. 2011; Zhang et al. 2017), but
had no effect on MUG-Chor1 cell viability. Nevertheless, upregulation of miR-140-3p with
miR-140-3p mimics did not affect the cell proliferation or apoptosis (Gulluoglu et al. 2016).
Low expression of miR-140-5p or miR-140-3p was associated with enhanced colony
formation, invasion and xenograft formation in biliary tract cancer (Yu et al. 2016), basal-like
DCIS (Li et al. 2014a), poorly differentiated gastric cancer (Fang et al. 2017), oesophageal
squamous cell carcinoma (Zhang et al. 2018) and lung cancer (Kong et al. 2015).
Considering the paradoxical expression pattern and role in the regulation of the cellular
function of miR-140-5p and -3p in different tumour types, we aimed to decipher the
expression and function of miR-140-5p and -3p in gastric cancer cells with the different
molecular backgrounds. Gain/loss of function assays of miR-140-5p and -3p were employed
to compare differences in cell behaviors, including cell proliferation, cell cycle distribution,
migration, invasion, and drug-induced cell proliferation of four gastric cancer cell lines AGS,
NUGC4, MKN45, and HGC27.
5.2 Materials and methods
5.2.1 Cell lines
Intestinal gastric cancer cell lines AGS (wtp53), diffuse gastric cancer cell lines NUGC4
(wtp53), and MKN45 (mutp53) and HGC27 (mutp53) were used in this study. All these
cancer cell lines were cultured in DMEM medium with 10% FBS and antibiotics (Chapter
2.1).

169
5.2.2 Transfection of miR-140-5p and -3p mimics
Overexpression of miR-140-5p and -3p was conducted through chemical transfection of
miR-140-5p and -3p mimics with Lipofectamine 3000. Transfection efficiency was
confirmed by real-time PCR before cell function assays. All the experiments were performed
within 96 hours following transfection (Refer to chapter 2.1).
5.2.3 RNA isolation, cDNA synthesis, RT-PCR, and qPCR
RNA was extracted using a Tri Reagent kit (Sigma-Aldrich, Poole, Dorset, UK), miR-
transcription was then converted by the GoScriptTM Reverse Transcription System kit
separately (Refer to chapter 2.3).
5.2.4 In vitro cell proliferation assay
Twelve hours after transfection, cells from the six-well plate were trypsinised and counted as
described in chapter 2.10.2. Six replicates were set up for each cell lines with three different
transfection groups in one 96-well plate, Thus the cell pellet was resuspended at 1×10⁶ cells
/36 mL normal media and 100 µL of this suspension/well were seeded in six 96-well plates
(Greiner Bio-One Ltd., Gloucestershire, UK). Since serum present in the culture medium
can generate background, the outer wells empty were filled with 100 µL normal media but
no cells, following the same layout. The plates were incubated for 6h, 12h, 24h, 48h, 72h,
and 96h respectively. Following incubation, 10 µL of 5 mg/mL MTT solution was added to
each well for both experimental and control plates, which were then left in a normal
incubator for 4h. After the purple precipitate was visible, the medium was removed. The
remaining purple crystals were dissolved in 100 µL of acidified isopropanol and the
absorbance for each plate was read at 540 nm using an ELx800 plate reading
spectrophotometer (Bio-Tek, Wolf laboratories, York, UK). The blank plate’s absorbance
was subtracted from that of the plates which contained cells, to eliminate background
interference from the absorbance readings. Cell viability rate was calculated according to the
following formula: Cell viability (%) = A540 (sample)/A540 (control) × 100.
5.2.5 In vitro cell colony assay
Only a fraction of seeded cells retains the capacity to produce colonies (Franken et al. 2006).
Clonogenic assay or colony formation assay is an in vitro cell survival assay based on the
ability of a single cell to grow into a colony. A colony is defined to consist of at least 50 cells.

170
Single suspended cells were seeded in six-well plates at 300 cells per well. After one week,
the colonies were stained with 800 uL of 0.5% crystal violet for 10 min and washed with tap
water carefully. The number of colonies was counted under the microscope.
5.2.6 In vitro wound scratch assay
Cells were suspended and seeded into each well of a 6-well plate at a full confluence cell
density (1.2-2.0×10⁶). After the cells attached to the bottom and formed a monolayer, linear
wounds were scratched with a 10 uL pipette tip at the centre of the monolayer and the
detached cells were carefully washed off with PBS thrice. Afterward, 2 mL of DMEM
(Gibco BRL, USA) containing 2%FBS (Gibco BRL, USA) was added into each well, and the
wounds were photographed at 0 and every 2 hours for 24 hours using EVOS® Imaging
system and the wound closure area of each scratch wound was measured by Image J (National
Institutes of Health, NY, USA).
5.2.7 In vitro transwell migration assay
The chemo-stimuli induced migration assay was performed using Transwell chamber
(PIEP12R48, Millipore, UK). 2×10⁴ cells were seeded into Transwell inserts (pore size, 8μm)
in a 24-well plate. After 24-hour incubation, the cells that had migrated through and moved
onto the other side of the insert were fixed with 4% formaldehyde and stained with crystal
violet. Cells which had migrated were then counted under a microscope.
5.2.8 In vitro cell invasion assay
For invasion assay, the chamber was coated with Matrigel, and the following steps were
similar to migration assay. 2×10⁴ cells were seeded into Transwell inserts (pore size, 8μm).
After incubation, cells that had invaded through the Matrigel and migrated on to the other
side of the insert were fixed and stained with crystal violet, and then counted under a
microscope.
5.2.9 Cell cycle assays for flow cytometry
The analysed cells grown in the logarithmic phase were washed 2 X with PBS, then
trypsinised. Cells, cell medium and washed PBS were harvested together and spun at 850 g
for 5 minutes and then resuspended in 5 mL of ice cold 70% v/v Ethanol followed by being
left at 4°C. Following this, cells were again centrifuged using the same conditions and then

171
washed twice in PBS. 50 µL of a 100 µg/mL sock of RNase was added to each sample, 200
µL of 50 µg/mL propidium iodide (PI) was added to stain DNA content. Cells were then
incubated at room temperature in the dark for 15 minutes. Following this, samples were run
on the BD FACSCanto™ II flow cytometer (Becton, Dickinson and Company, UK.) using
the FL3 channel (575 nm).
5.2.10 Cell cytotoxic assays
Cells were replanted in 96-well plates at 5 ×10³ cells/well in hexad in 100 μL of medium.
After cell adherence, 5FU (ranging from 2 to 100 μM) was added and incubated for 48 h.
The following steps are similar to a proliferation assay. A complete medium control without
cells was used to determine background density of serum with drug solvent.

172
5.3 Results
5.3.1 miR-140-5p, - 3p expression and the overexpression of miR-140-5p, -3p in
gastric cancer cell lines
The expression of miR-140-5p and -3p has been detected in six gastric cancer cell lines
originated from human carcinoma including intestinal gastric cancer cell lines MKN7,
MKN74, and AGS; and diffuse gastric cancer cell lines NUGC4, MKN45, HGC27. Mature
miR-140-5p and -3p transcripts were determined using RT-PCR. Overall, miR-140-5p and -
3p showed almost equally distribution in all examined gastric cancer cell lines (Figure 5.1).
In the intestinal group, the degree of decline of miR-140-5p and -3p was related to the degree
of cells’ differentiation. Such a trend was not seen in the three diffuse gastric cancer-derived
cell lines. AGS, NUGC4, MKN45, and HGC27 were included in preliminary experiments
for transient overexpression of miR-140-5p or -3p. Initial tests showed that overexpression
of miR-140-5p and -3p was well established in all four of these cell lines by qPCR. (Figure
5.1).
Figure 5.1: miR-140-5p and -3p expression in gastric cancer cell lines and overexpression of miR-140-5p and -3p respectively in AGS, NUGC4, MKN45, and HGC27. (A) Expression of miR-140-5p and -3p in gastric cancer cell lines were examined using qPCR. Reagents used in miRNA reverse transcription step and in real-time PCR step were used as negative controls to exclude any contamination in the PCR reactions, and miR-423-5p was used as an internalcontrol according to the manual direction from TaqMan. (B) Expression of miR-140-5p and -3p in AGS, NUGC4, MKN45 and HGC27 gastric cancer cells transfected with miRNAs’ mimics were determined using RT-PCR.

173
5.3.2 Effects of miR-140-5p and -3p on proliferation of gastric cancer cells
Cancer is characterized by abnormal cellular proliferation. Combinations of defined growth-
promoting molecules under chemically defined conditions have revealed an important aspect
of the molecular events leading to cell proliferation. In particular, the availability of defined
mitogenic molecules has opened up the possibility of exploring the molecular and
physiological properties of the cellular receptors related to growth control, and the nature
of the intracellular signals (e.g. ion fluxes, cyclic nucleotides and cytoskeletal changes) capable
of eliciting or modulating a mitogenic response (Phillips 2015). Candidate drugs for solid
tumours are commonly evaluated predominantly by their ability to induce tumour shrinkage.
Progression in solid cancer is conventionally defined as an increase in tumour size, and, in a
superficial sense, the equating of therapeutic efficacy with tumour shrinkage is
understandable (Gandalovicova et al. 2017).
To evaluate the influence of miR-140-5p and -3p on proliferation of gastric cancer, we used
the MTT assay which examined NAD(P)H-dependent cellular oxidoreductase enzyme
activity to reflect the number of viable cells present. Overexpression of miR-140-5p or miR-
140-3p led to a distinct result in gastric cancer cell lines’ proliferation (Figure 5.2). For p53
wild-type gastric cancer cell lines AGS and NUGC4, overexpression of miR-140-5p/3p
resulted in a significant reduction of proliferation in both cell lines to varying degrees. In
AGS, the decrease started from 24 hours after miR-140-5p or miR-140-3p mimic transfection
and kept consistent to the end of the assay. For NUGC4, a marginal decrease was only
exhibited after two days following transfection compared to the mimic negative control (NC
mimic) with the difference statistically significant (Figure 5.2). In reverse, in HGC27 lines,
no significant difference in cell proliferation was found during 96 hours’ observation,
However, for MKN45 cell lines, a significant reduction of cells was only seen at 96 hours
(Figure 5.2).
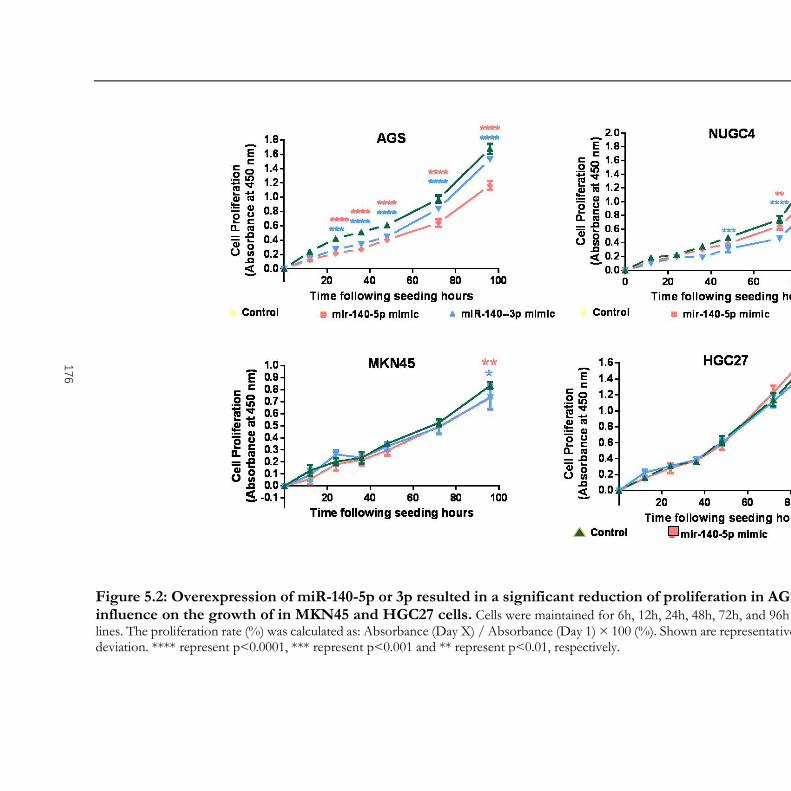
Figure 5.2: Overexpression of miR-140-5p or 3p resulted in a significant reduction of proliferation in AGS and NUGC4 cells, but little or noinfluence on the growth of in MKN45 and HGC27 cells. Cells were maintained for 6h, 12h, 24h, 48h, 72h, and 96h respectively. Sextuplet was set for each cell lines. The proliferation rate (%) was calculated as: Absorbance (Day X) / Absorbance (Day 1) × 100 (%). Shown are representative results n=3. Error bars represent standard deviation. **** represent p<0.0001, *** represent p<0.001 and ** represent p<0.01, respectively.
176

175
5.3.3 Effect of miR-140-5p/3p on colony formation of gastric cancer cells
The proliferation assay with MTT reflects cells’ metabolic state. Colony formation assay, on
the other hand, measures the ability to expand and form colonies at a low seeding density,
providing a fine visualization in terms of highlighting the pro-survival/pro-apoptosis balance
of given perturbations. Clonogenic potential does not necessarily parallel rapid growth, such
that prematurely senescent cells do not form colonies but are metabolically active. Since the
turnover time of transfected miRNA mimics was thought to be caused by cell division
instead of miRNA decay. After considering the possible dilution effect caused by cell division
(Jin et al. 2015), the results from the one-week colony formation assay indicated that over-
expression of miR-140-5p via mimics transfection significantly suppressed the potential of
cell colony formation in NUGC4 cells (doubling time, 2-3 days), but again did not show
significant impact on the colony formation on HGC27 and MKN45(Figure 5.3). However,
for the AGS cell lines, cells spread out in the dishes instead of forming any colonies.
Figure 5.3: Overexpression of miR-140-5p or 3p significantly decrease of colony formation only in NUGC4 cell line. Three hundred cells were maintained for 1 week. The colony formation rate (%) was calculated as: Colony number (miR-140-5p/miR-140-3p mimic) / Colony number
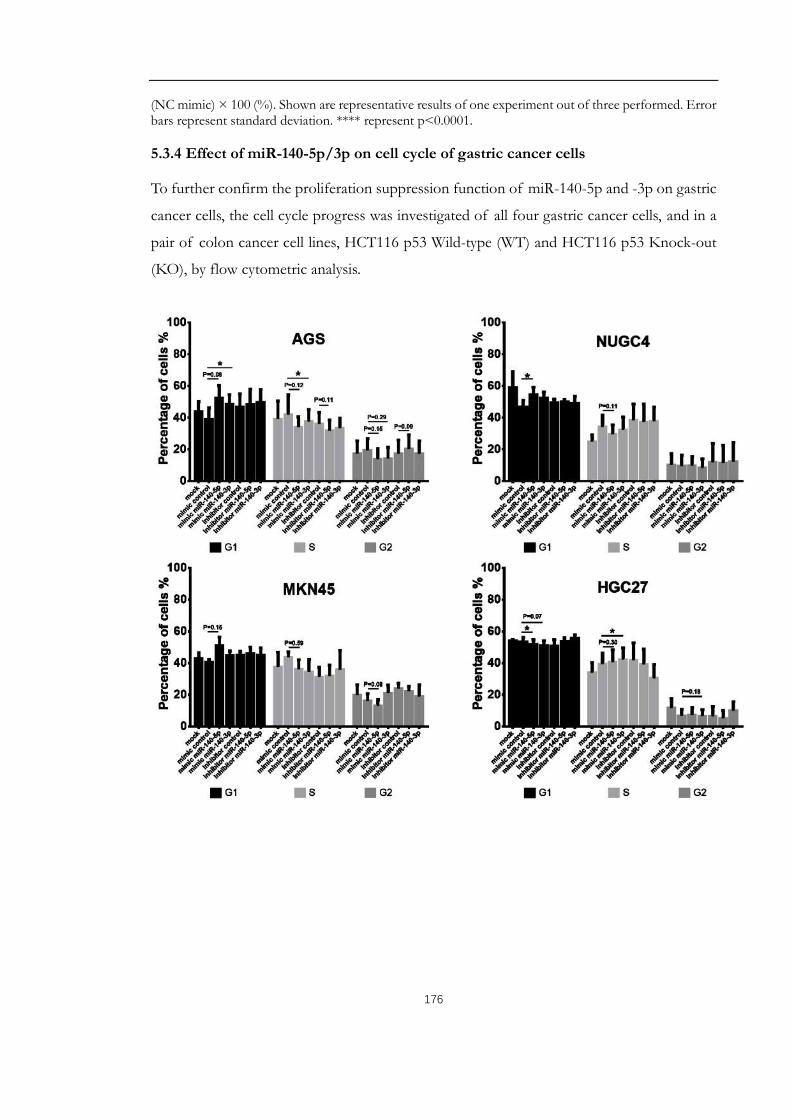
176
(NC mimic) × 100 (%). Shown are representative results of one experiment out of three performed. Error bars represent standard deviation. **** represent p<0.0001.
5.3.4 Effect of miR-140-5p/3p on cell cycle of gastric cancer cells
To further confirm the proliferation suppression function of miR-140-5p and -3p on gastric
cancer cells, the cell cycle progress was investigated of all four gastric cancer cells, and in a
pair of colon cancer cell lines, HCT116 p53 Wild-type (WT) and HCT116 p53 Knock-out
(KO), by flow cytometric analysis.

177
Figure 5.4: Flow cytometric analysis of cell cycle arrest after interfering miR-140-5p/3p expression in gastric and colon cancer cell lines. Mean percentage of cells ± SD were shown. With miR-140-5p overexpression, a slight but significant increase of G1 phase with or without marked decrease in S phase was seen in NUGC4 (p53 wt) and HCT116 (p53 wt) cell line, asimilar trend was also seen in AGS cell line (p53 wt) and in MKN45 cell line (p53 missense mutation). Reversely, a decrease of G1 phase but increased trend in S phase was seen in HGC27 cell line. No obvious change was seen in HCT (p53 KO) cell line. Only AGS cells showed increased G1 phase with miR-140-3p overexpression, which showed even more remarkable impact than miR-140-5p overexpression. Error bars represent standard deviation. * represent p<0.05, ** represent p<0.01.
As shown in Figure 5.4, In wt-p53 cancer cell lines transfected with negative control mimics,
around 40% of the cells were in the G0/G1 phase, and 55% and 15% of cells were in S
phase and G2/M phase, respectively. While, in cells transfected with miR-140-5p mimics,
there was a definite increase in the percentage of cells in G0/G1 phase (about 55%), as well
as a decrease in the percentage of cells in S phase (about 40%) and G2/M phase (5-10%). A
slight but significant G1/S arrest was also seen MKN45 cells harbouring functional mut-p53.
No change was seen in HCT116 KO cells, in HGC27 cells even a decrease in G0/G1 phase
was observed. These results imply that overexpression of miR-140-5p or miR-140-3p
induced cell cycle arrest at G1/S phase of gastric cancer cells might depend on cells’ status
and functions of p53.
5.3.5 Effect of miR-140-5p/3p on the migration of gastric cancer cells
During cancer metastasis, cancer cells migrate and spread to distant organs and form a new
mass. In the current study, both wound scratch and trans-well migration assays were
performed to assess the impact of overexpression of miR-140-5p or -3p on the motility of
gastric cancer cells. In the wound scratch assay, a cell-free area is created in a confluent
monolayer by physical exclusion. The exposure to the cell-free area induces the cells to

178
migrate into the gap (Rodriguez et al. 2005). A sequence of representative images from a
wound healing assay carried out on the confluent cells’ monolayer were captured for analysis.
As shown in Figure 5.5, during the 24-hour incubation, miR-140-5p overexpression in AGS
and NUGC4 cell lines reduced the cells’ migration in comparison with the control cells.
Although for AGS cells, significant reduction was seen nearly 12 hours after wounding, for
NUGC4 cells, a decreased trend showed at the very beginning of the migration assay. For
miR-140-3p overexpression, only NUGC4’s motility was weakened. Overexpression of
either miR-140-5p or miR-140-3p strengthened the migration of HGC27 cells. No
significant difference was found in the MKN45 cell lines.
This result was also in agreement with the other measurement of cell motility using the trans-
well migration assay. The ability of cell migration was determined by measuring the number
of cells which had migrated to the bottom of the insert from the upper culture chamber
over a period of 12 hours. The result showed that significantly decline in motility in AGS
and NUGC4 gastric cancer cells as a result of miR-140-5p overexpression. No significant
difference was found in the MKN45 cell lines. HGC27, in contrast, showed a higher motility
after miR-140-5p overexpression. For miR-140-3p mimic transfection, there was no
significant difference shown in all four gastric cancer cells. Furthermore, NUGC4 AND
MKN45 two diffuse type originated cell lines exhibited an impaired ability to initiate the
migration process. (P<0.01) (Figure 5.6).
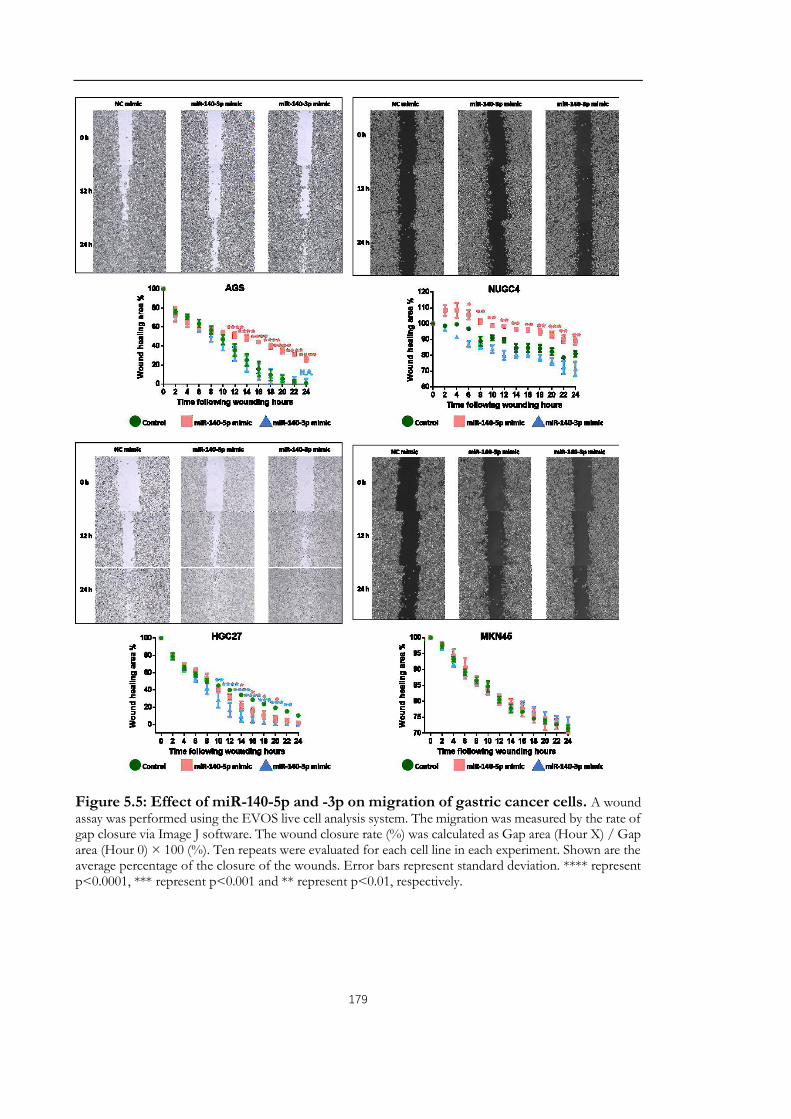
179
Figure 5.5: Effect of miR-140-5p and -3p on migration of gastric cancer cells. A wound assay was performed using the EVOS live cell analysis system. The migration was measured by the rate of gap closure via Image J software. The wound closure rate (%) was calculated as Gap area (Hour X) / Gap area (Hour 0) × 100 (%). Ten repeats were evaluated for each cell line in each experiment. Shown are the average percentage of the closure of the wounds. Error bars represent standard deviation. **** represent p<0.0001, *** represent p<0.001 and ** represent p<0.01, respectively.

180
Figure 5.6: Effect of miR-140-5p and -3p overexpression on the migration of gastric cancer cells using trans-well migration assay. Representative images of migrated cells are shown above the bar graph. **** represent p<0.0001, *** represent p<0.001 and ** represent p<0.01, respectively. N.A. stands for no significance. Error bars are the standard deviation.

181
5.3.6 Effect of miR-140-5p and -3p on invasion of gastric cancer cell
The gain of an invasive phenotype is the most important cancer feature and the one that
distinguishes malignant from benign tumours (Lazebnik 2010). In vitro, trans-well invasion
assay was undertaken to determine whether miR-140-5p/3p is involved in regulation of
invasiveness of gastric cancer cells. This assay is similar to the Trans-well migration but with
Matrigel coating in the insert. The invasive ability of cells was determined by measuring the
number of cells that attached to the matrix, invade into and through the matrix, and migrate
towards a chemoattractant. Figure 5.7 shows that AGS, NUGC4, and MKN45 with
upregulation of miR-140-5p or miR-140-3p showed significant impairment in their
invasiveness. Overexpression of miR-140-5p/3p, however, had no influence on the invasive
capacity of HGC27 cancer cells.
Figure 5.7: Impact of overexpression of miR-140-5p and -3p on invasive capacity of gastric cancer cell lines. Representative images of invade cells after staining and absorbance measured by dissolving the crystal violet stained invaded cells (bar graph). **** represent p<0.0001, *** represent p<0.001 and ** represent p<0.01, respectively. N.A. stands for no significance. Three experiments were performed. Error bars represent standard deviation.

182
5.3.7 Effect of miR-140-5p and -3p on chemotherapeutic drug-induced cell
proliferation inhibition of gastric cancer cells
As previously mentioned, higher miR-140-5p is associated with chemoresistance in patients
treated with 5FU based chemotherapy. To investigate the role of miR-140-5p and -3p in
anticancer drug-induced apoptosis/autophagy in gastric cancer cells, miRNA expression
levels were first analyzed by q-PCR in gastric cancer following treatment with 5FU. Elevated
miR-140-5p and -3p were demonstrated in AGS and NUGC4 following treatment with 5FU
(Figure 5.8). The cell viability of gastric cancer cells that had been treated with 5FU and
transfected with miR-140-5p/3p mimics or inhibitors, was determined using the MTT assay.
As shown in Figure 5.8, transfection with miR-140-5p mimic resulted in growing drug
resistance in NUGC4 cell line. Upregulation of IC50 with also shown in AGS and MKN45
transfected with miR-140-5p, but it did not reach the statistical significance. However,
upregulation of miR-140-5p increased chemosensitivity in the HGC27 cell line. In
accordance with these results, miR-140-5p inhibitor gave rise to a marked increase in
sensitivity after treatment with 5FU in the AGS and NUGC4 cell lines. As shown in Figure
5.8, miR-140-3p mimic transfection resulted in a dose-dependent amelioration of 5FU
induced cell proliferation inhibition in NUGC4 cell lines but had no impact on other three
cell lines. Accordingly, miR-140-3p inhibitor decreased chemoresistance in NUGC4 cell line,
but not other cells transfected with miR-140-3p inhibitors.

183
Figure 5.8: Impact of overexpression of miR-140-5p/3p on the drug-induced proliferation inhibition of gastric cancer cell lines. Cells were maintained for 48 hours with a series of gradient concentration 5FU, and the half maximal inhibitory concentration (IC50) for each cell line was determined by multi-proportion dilution method. Six wells were set for each cell lines. Non-linear regression with a sigmoidal fit model was used (GraphPad Prism). Shown are representative results of one experiment out of three being performed. Error bars represent standard deviation. **** represent p<0.0001, *** represent p<0.001 and ** represent p<0.01, respectively.

184
5.4 Discussion
This chapter has focused on the effect that the expression pattern of miR-140-5p and miR-
140-3p has on the phenotypic behaviour of gastric cancer cell lines by proliferation, cell cycle,
wound scratch, trans-well migration, invasion and apoptosis assays. Upregulated expression
of miR-140-5p indicates a favorable clinical prognosis in patients with the intestinal type of
gastric cancer. An in vitro assay also suggested the tumour suppressor role of miR-140-5p in
intestinal gastric cancer. These are in agreement with the results Fang et al. demonstrated
previously (Fang et al. 2017). However, since the current study employed a different method
for colony formation (without pre-coated plates by agarose) compare to the previous study,
the colony formation assay failed to reflect the miR-140-5p and -3p impacts on AGS cell line.
However, in the diffuse type of gastric cancer cell lines, we observed a negative regulating
role in cell’s aggressiveness played by miR-140-5p in NUGC4 cell line with wild-type of p53
and MKN45 cell lines with mutant but functional p53. Although not much significant results
were found in HGC27 cell line transfected with mimic-5p, a significant inhibition of invasion
was shown in all examined cell lines, suggesting a strong inhibitory role of miR-140-5p in
cells’ invasive ability, despite a slight facilitation of the migration of HGC27.
The effect of miR-140-3p on tumourigenesis has previously been only focused in NSCLC
and breast cancer. The inhibitory effect of miR-140-3p on cell growth and cell invasion has
been demonstrated in NSCLC by downregulating ATP8A1, which participates in the
transportation of exposure phosphatidyl-serine, which is a sign of early apoptosis back to
the inner layer, and in the formation of membrane ruffles regulating cell motility, via both in
vitro and in vivo assays (Dong et al. 2016). The shorter 3’UTR of its target genes, for example,
Ki-67, may play an important role in its function in cancer (Yan et al. 2018). Furthermore,
analysis of miRNA-seq data from breast cancer cell lines, identified six pairs of highly
expressed miRNAs and associated 5'isomiRs. Among them, hsa-miR-140-3p was of
particular interest because its 5'isomiR showed higher expression compared to the canonical
miRNA annotated in miRbase. It was found that both the hsa-miR-140-3p and 5’isomiR-
140-3p were higher in ER-negative (ER-) patients. Triple negative breast cancer patients
showed a trend towards better survival among patients with higher expression levels of both
hsa-miR-140-3p and 5’isomiR-140-3p. But it is the 5'isomiR-140-3p but not the hsa-miR-
140-3p caused cell cycle arrest in G0/G1-phase, and decreased cell migration. This suggested
the highly expressed 5'isomiR of hsa-miR-140-3p contributes to the tumour-suppressive

185
effects by reducing breast cancer proliferation and migration, and the endogenous canonical
hsa-miR-140-3p reflected the expression level of this isomiR (Salem et al. 2016). In the
current study, overexpression of miR-140-3p in gastric cancer cells had a similar
antiproliferative effect as miR-140-5p overexpression to AGS and NUGC4 cell lines, but no
influence on HGC27 and MKN45 cell lines. Also, miR-140-3p exerted an anti-invasive effect
on all the cell lines except HGC27 cells. It is noticeable that, both miR-140-5p and miR-140-
3p could target ADAMTS-5, one of the matrix‐degrading enzymes (Swingler et al. 2012).
To be mentioned, interfering expression of miR-140-5p/miR-140-3p with miRNA mimics
or inhibitor only showed marginal or no influence on cell cycle analysis assessed by flow
cytometry, which could be explained by two possibilities. First, although the proliferation
changed greatly by miR-140-5p overexpression based on our MTT assay, the MTT assay
measures metabolic activity (mainly succinate dehydrogenase) to reflect cell viability, which
could be affected by not cell cycle arrest, but cell senescence and cell apoptosis. Since both
miR-140-5p and miR-140-3p are involved in cartilage development and arthritis, the second
possibility is that miR-140-5p and miR-140-3p may exert complementary roles in a identical
cell signalling pathway, although target different genes.
In conclusion, the downregulation of miR-140-5p and miR-140-3p observed in human
gastric intestinal-type cancer suggests its tumour suppressor role in regulating the cellular
functions that are acquired by cancer cells during the disease progression, as reported in most
other tumours (Wang et al. 2017; Hu et al. 2016; Tan et al. 2011; Kawaguchi et al. 2017; Yan
et al. 2008). In contrast, miR-140-5p was upregulated in tumours compared to matched
normal tissue in pancreatic cancers, a high expression of miR-140-3p is also reported to be
associated with worse progression in clear cell renal cell carcinoma (Guan et al. 2018). These
in vitro assays demonstrated the complex roles that miR-140-5p and miR-140-3p do exert in
tumour development. In addition, the inhibitory role of miR-140-5p overexpression in the
cell cycle is possibly the underlying mechanism for chemoresistance, especially for cell cycle-
dependent anti-proliferative drug 5FU.
The combination of fluoropyrimidine and platinum is used worldwide for the treatment of
patients with advanced or metastatic gastric cancer in both the adjuvant and neoadjuvant
setting. Fluoropyrimidines, particularly 5FU, still represent the backbone of gastric cancer
chemotherapy, with response rates varying from 31% - 48%. Our results provide data that is

186
suggestive that this should be taken into account when selecting therapies in chemo-sensitive
patients. In order to further determine the role of miR-140-5p and miR-140-3p in gastric cancer,
the following chapter will focus on the mechanisms of their inhibitory effect on gastric cancer
cells.

187
Chapter 6.
The Molecular Mechanism
Underlying Deregulated miR-140-
5p Expression in Human Gastric
cancer

188
6.1 Introduction
The previous chapter has shown that upregulation of miR-140-5p may inhibit proliferation,
adhesion, invasion, and migration of AGS and NUGC4 gastric cancer cell lines but had little
or no inhibitory effect in MKN45 and HGC27. The diverse outcomes of miR-140-5p in vitro
assays of gastric cancer cell lines echoed its variable function in gastric cancer tumour tissue
analysis. Also, as discussed in Chapter 4, although-140-5p was generally accepted as a tumour
suppressor in the tumourigenesis of lung cancer, breast cancer, and colorectal cancer etc., a
pro-oncogenic role of miR-140-5p has also been implicated depending on different cell
context. Molecules and pathways involved in these different roles played by miR-140-5p in
gastric cancer are likely to be subspecies specific but are yet to be investigated. It has been
reported that loss of miR-140-5p led to an impairment of chondrocyte proliferation (Song
et al. 2009) via upregulation of SP1, a critical transcription factor in the inhibition of the cell
cycle via the activation of the p15INK4b and p21Waf1/Clip promoters in vitro (Yang et al.
2011). Tumour cells ectopically transfected with miR-140-5p showed upregulation of p53
and p21 expression accompanied with G1 and G2 phase arrest only in cell lines containing
wild-type of p53. Furthermore, miR-140-5p suppresses tumour cell migration and invasion
by targeting ADAM10-mediated Notch1 signalling pathway in hypopharyngeal squamous
cell carcinoma (Jing et al. 2016). Targets of miR-140-5p, SOX9 and ALDH1 were the most
significantly activated stem-cell factors in DCIS stem-like cells in breast cancer (Q. Li et al.
2014b; Wolfson et al. 2014; Yan et al. 2008). A decreased level of IGFBP-5, a miR-140-5p
target (Tardif et al. 2009), is related to disease recurrence in lung cancer (Shersher et al. 2011)
and to tamoxifen resistance in breast cancer. These may link to the restoration of miR-140-
5p after releasing from the suppression by ERα. Exosomal levels of miR-140-5p from stem
cell populations can be rescued by treatment with sulforaphane (Q. Li et al. 2014b). Moreover,
miR-140-5p appeared to be positively controlled by Rb and to antagonize the effect of Rb
depletion through targeting IL-6 (Yoshida et al. 2017). Rb depletion or inactivation in soft
tissue sarcoma cells exhibited slower proliferation and less efficient BrdU incorporation, but
much higher spherogenic activity and aggressive behavior both in vitro and in vivo. The
induction of IL-6 secretion and subsequent autocrine/paracrine activation of STAT3
signalling supports the self-renewal activity of not only cancer cells (Marotta et al. 2011;
Korkaya et al. 2012; Sansone et al. 2007), but also embryonic stem cells or induced
pluripotent stem cells (Brady et al. 2013; Takahashi and Yamanaka 2016). With regard to

189
miR-140-5p in gastric cancer progression, there are still relatively few studies available and
discrepancy was found between these studies. Plasma miR-140-5p was significantly higher in
gastric cancer patients than in healthy controls (Shin et al. 2015). Aberrantly downregulated
miR-140-5p in cancer tissue, compared with that in adjacent normal tissues, was determined
by both q-PCR and in situ hybridization (ISH) in tissue microarrays (Fang et al. 2017). ISH
analysis in 144 gastric cancer tissues revealed 32.6% of the GC tissues showed reduced
staining intensities of miR-140-5p. Zhai et al. demonstrated that overexpression of miR-140-
5p abolished tumour formation and metastasis in gastric cancer cells by directly targeting
YES proto-oncogene 1 (YES1) which upregulated Src signalling (Fang et al. 2017). Based on
these contrasting reports, the exact mechanism of action for miR-140-5p needs to be further
investigated. The aim of this chapter is to explore the pathways activated in miR-140-5p
deregulation in gastric cancer progression.
6.2 Materials and methods
6.2.1 Materials
The primers used in this chapter are shown in Table 2.4, including MDM2, p53, p21, PTEN,
and GAPDH. Details of antibodies for detection of MDM2, p53, p21, BAX, and GAPDH
are shown in Table 2.5.
6.2.2 Online prediction of miR-140-5p targets.
To identify functionally related pathways and genes that are associated with a miR-140-5p
based gastrin cancer phenotype, we associated miR-140-5p expression with transcriptome
for patients with accessible RNAseq information from TCGA and the Gene Set Enrichment
Analysis (GSEA). This database contains full access to the complete list of gene expression
values and was employed to cross-compare prior lists of differentially expressed genes
between gastric cancer patients with higher miRNA-140-5p expression (n=17) and lower
miRNA-expression (n=54). According to the indicated pathway, the direct targets of both
miR-140-3p and miR-140-5p have been investigated by using the bioinformatics approach
and in silico tools TargetScan, mirTarbase, and miRWalk. The literature review together with
the RNA-sequencing and protein array data from transfection with the biotinylated mimics
were obtained in a previous study carried out in the host lab (Flamini et al. 2018) and were
merged to specify targets of miR-140-5p.

190
6.2.3 Determining the expression of p53-related signaling molecules using PCR and
Western blot.
Since the cell cycle-related pathway was highlighted and MDM2 was indicated as a potential
target of miR-140-5p, the p53-related pathway was chosen for further analysis. Both RNA
and protein were extracted from gastric cancer cell lines transiently infected with miR-140-
5p or miR-140-3p mimic. The samples were analysed using either Western blot or PCR to
detect the expression level of these molecules. The methods used were as described in
section 2.4 and 2.5.
6.2.4 Statistical analysis
Correlation between miR-140-5p and -3p and other genes in gastric cancer tissue samples
was assessed using the Spearman correlation test via GraphPad Prime v 6.0 (GraphPad
Software, San Diego, CA).
6.3 Results
6.3.1 Integrative analysis of miRNA and mRNA expression in intestinal versus
diffuse miR-140-5p downregulated gastric cancer.
Gene enrichment analysis (GESA) of mRNA expression was obtained using the GAGE
package on KEGG pathways. High expression of miR-140-5p strongly indicated an
interaction between tumour cells and factors such as immune response, ECM biogenesis and
VEGF signaling pathway (Table 6.1). Pathways related to cell biological behaviours assumed
absolute superiority, which included autophagy and cell adhesion (Table 6.2). Genes with
reversed transcriptional trend in the phenotype with miR-140-5p suppression or not are
summarized in Figure 6.1. Given our in vitro cell model only showed the loss of miR-140-5p
in gastric cancer progression, we focused on the genes specifically activated during miR-140-
5p suppression in the analysis. The genes positively regulated in miR-140-5p suppression
phenotype included RTC, which E6 contributing to the immortalization epithelial cells
(Sherman et al. 2002), cell cycle regulator gene CTNN3 (Mizamtsidi et al. 2018), Cab39
regulating responses to metabolic stress and promoting survival, in part by activating AMP-
activated protein kinase (AMPK) and mTOR pathway(Shackelford and Shaw 2009), cell
adhesion-related BVES-AS1 (Xing et al. 2018) and ILK promoting cell survival in a p53-
dependent manner (Hausmann et al. 2015). KIF13B involved in aberrant cytokinesis (Wu et

191
al. 2013). The enhanced cell survival associating pathway was the most representative feature
in this phenotype.

Table 6.1: The top 20 signalling pathway in gastric cancer associated with miR-140-5p upregulation in GSEA by KEGG. ES denotes enrichment score, which reflects the degree to which a gene set is overrepresented at the top or bottom of a ranked list of genes. A positive ES indicates gene set enrichment at the top of the ranked list. NES denotes the normalized enrichment score. By normalizing the enrichment score, GSEA accounts for differences in gene set size and in correlations between gene sets and the expression dataset; therefore, the normalized enrichment scores (NES) can be used to compare analysis results across gene sets.
Pathway Name Size ES NES PPrimary immunodeficiency 35 0.62 1.60 0.07Glycosaminoglycan biosynthesis chondroitin sulfate 22 0.58 1.56 0.07Vegf signaling pathway 74 0.33 1.46 0.02Intestinal immune network for IgA production 43 0.56 1.45 0.16Ribosome 82 0.64 1.44 0.18Homologous recombination 28 0.51 1.43 0.14Complement and coagulation cascades 67 0.40 1.42 0.10PPAR signaling pathway 69 0.35 1.38 0.07Phenylalanine metabolism 17 0.44 1.36 0.11B cell receptor signaling pathway 74 0.38 1.33 0.17T cell receptor signaling pathway 107 0.35 1.29 0.18FC epsilon ri signaling pathway 78 0.30 1.26 0.16Alanine aspartate and glutamate metabolism 32 0.36 1.25 0.18Spliceosome 122 0.43 1.23 0.30Fc gamma r mediated phagocytosis 91 0.30 1.17 0.26Leukocyte transendothelial migration 116 0.28 1.16 0.25Chemokine signaling pathway 184 0.28 1.12 0.30DNA replication 36 0.44 1.11 0.41Cell adhesion molecules cams 128 0.31 1.11 0.34
192

Table 6.2: The top 20 signalling pathway in gastric cancer associated with miR-140-5p suppression in GESA by KEGG.
Pathway Name Size ES NES PArrhythmogenic right ventricular cardiomyopathy 74 -0.51 -1.70 0.02Regulation of autophagy 33 -0.43 -1.54 0.03Hypertrophic cardiomyopathy hcm 83 -0.46 -1.52 0.04Adherens junction 73 -0.40 -1.51 0.03Long term depression 68 -0.37 -1.42 0.06Dilated cardiomyopathy 90 -0.43 -1.39 0.11Nicotinate and nicotinamide metabolism 21 -0.43 -1.37 0.09Riboflavin metabolism 16 -0.47 -1.37 0.12Pantothenate and coa biosynthesis 16 -0.47 -1.35 0.14Oocyte meiosis 109 -0.34 -1.35 0.12Vascular smooth muscle contraction 114 -0.38 -1.32 0.18Vasopressin regulated water reabsorption 44 -0.37 -1.31 0.15Long term potentiation 69 -0.35 -1.30 0.13Phosphatidylinositol signalling system 76 -0.36 -1.30 0.15Erbb signalling pathway 87 -0.33 -1.27 0.16MAPK signalling pathway 263 -0.28 -1.26 0.11Focal adhesion 199 -0.33 -1.25 0.21Fatty acid metabolism 42 -0.42 -1.25 0.21Linoleic acid metabolism 26 -0.42 -1.22 0.21
193
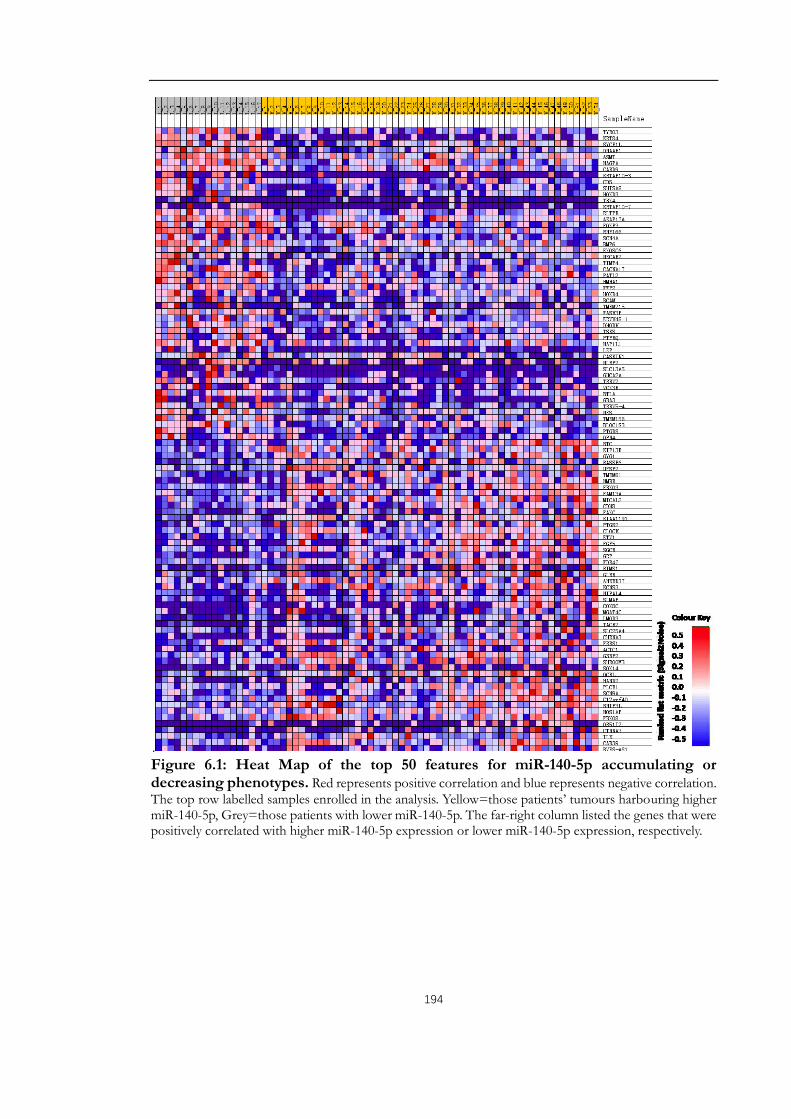
194
.Figure 6.1: Heat Map of the top 50 features for miR-140-5p accumulating or decreasing phenotypes. Red represents positive correlation and blue represents negative correlation. The top row labelled samples enrolled in the analysis. Yellow=those patients’ tumours harbouring higher miR-140-5p, Grey=those patients with lower miR-140-5p. The far-right column listed the genes that were positively correlated with higher miR-140-5p expression or lower miR-140-5p expression, respectively.

195
6.3.2 Target prediction for miR-140-5p
Identifying target mRNAs of miRNAs is an important step in elucidating the function of
miRNAs, yet this step has proven computationally difficult due to the complexity of the
miRNA–target interactions. Several target prediction programs have been developed, but the
overlap between sets of predicted target genes for a given miRNA by different programs is
unsatisifacted. Nevertheless, these target prediction programs are very useful to define
potential targets that can be validated experimentally. Rather than switching off their targets
completely, miRNAs fine-tune their expression thus playing an important role in tumour
formation, development, differentiation, metabolism, and disease progression. miRNAs are
incorporated into the RNA-induced silencing complex (RISC) and guide this complex to
specific mRNAs that contain miRNA target sites, which can fall into three categories. 5′-
Dominant canonical target sites show perfect complementarity to the seed sequence of the
miRNA (nucleotides 2–8) and extensive base pairing to the rest of the miRNA. 5′-dominant
seed only target sites are also perfectly complementary to the seed sequence but have a
limited base pairing with the rest of the miRNA. 3′-compensatory target sites do not have a
perfect match to the seed sequence but are compensated by extensive base pairing with the
3′-half of the miRNA. Target sites are usually in the 3′-UTR of mRNAs but there are
examples of target sites in other regions as well, and their flanking regions can also influence
interaction with miRNAs. Translation of mRNAs targeted by miRNAs is repressed and the
steady-state level of some but not all mRNA targets is also reduced.
The online prediction with different algorithms generated a list of more than 6000 potential
targets of miR-140-5p in total, among which 3593 were predicted by at least two algorithms.
However, the commonest predicted targets revealed by all the tools were only 13 (Appendix
11). And we further merged the online predicted genes with the altered transcriptomic and
proteomic data from a lung cancer cell line (A549) following the transfection of negative,
miR-140-5p and miR-140-3p miRNA mimics (Flamini et al. 2017).
The putative target genes were classified according to the Gene Ontology (GO) categories
(Figure. 6.2). Most of the targets were shown related to regulation of growth, cell cycle, cell
apoptosis and development. Given the results of our previous cell function assays and GSEA
analysis, MDM2, which was predicted by online prediction tools and suggested as a potential
target of miR-140-5p in the literature (Nicolas et al. 2008) was further chosen as the object

196
for further validation.
MDM2 was originally identified as one of three mdm genes whose expression is increased
more than 50-fold in the spontaneously transformed mouse BALB/c cell line and was later
proven to be the reason for the transformation (Fakharzadeh et al. 1991). Via binding to the
tumour suppressor p53, MDM2 inhibits p53 transactivation function by engaging its amino-
terminal transactivation domain via related N-terminal hydrophobic pockets (Momand et al.
1992; Laurie et al. 2006; Kussie et al. 1996). The wild type p53 is involved in the sensing of
cell stress and DNA damage, resulting in regulation of the cell cycle and apoptosis. An
interaction between the central acidic domain of MDM2 and the speci c DNA-binding
domain of p53 is essential for p53 ubiquitination via the RING domain of MDM2 and leads
to proteasomal degradation of p53; this keeps p53 levels and activity low in unstressed cells.
Mice which do not possess the mdm2 gene die before embryonic implantation due to
inappropriate apoptosis, with a total phenotypic rescue being possible through simultaneous
deletion of the p53 gene. Moreover, mice which express just 30% of the normal levels of
MDM2 exhibited decreased body weight and defects in haematopoiesis. These in vivo
experiments have provided compelling evidence towards the importance of the MDM2/p53
interaction. Of note, this interaction could be disrupted by multiple transcriptional
modification. Besides, MDM2 has also been shown to affect translation of p53, by
interacting directly with the mRNA encoding p53 itself and by targeting RPL26, which, upon
DNA damage, can associate with p53 mRNA and increased its protein expression (Manfredi
2010). The E3 ubiquitin ligase activity of MDM2 depends on an intact carboxy-terminal the
really interesting new gene (RING) finger domain. The p53-interaction domain is situated at
the amino terminus, which in turn binds to the amino transactivation domain of p53.
Although many short MDM2 proteins encoding just the carboxyl terminus of MDM2,
without the p53-binding domain, have been identified, in many cases, the frequency of
MDM2 deregulation is higher in tumours that retain wild-type p53 (Wade et al. 2013). The
p53 protein transcriptionally activates many genes, including the mdm2 gene. Therefore, p53
is regulated at protein level by MDM2, but once active, p53 activates the transcription of the
mdm2 gene, locking the proteins into a tight negative feedback loop and resulting in
oscillation of the cellular levels of the two proteins. Thus, MDM2 and p53 levels plays a crucial
role in regulating cell proliferation and apoptosis, loss of MDM2 leads to an active p53 which
may determine the vital status of the cell or embryo. Intriguingly, single-nucleotide

197
polymorphism (SNP) in the MDM2 promoter increased MDM2 expression and altered the
oscillation relationship. Similarly, point mutations in the two p53-binding sites of the Mdm2
promoter that were introduced into the endogenous Mdm2 locus resulted in increased response
to DNA damage, although p53 degradation kinetics in various tissues remained similar to the
wild-type control. This highlights the importance of understanding the distinct roles of MDM2
in different tissues (Karni-Schmidt et al. 2016). Apart from its involvement in p53-dependent
activities, MDM2 has p53-independent activities, including induction of stemness by
supporting polycomb repressor functions and K48-linked ubiquitination of the Notch
antagonist Numb (Todoric et al. 2017). A study of human sarcomas and bladder cancers
found tumours which overexpressed MDM2 and mutant p53 and the patients possessing
both of these abnormalities had a poorer prognosis than those with just one (Onel and
Cordon-Cardo 2004; Cordon-Cardo et al. 1994). Given its role as a negative regulator of p53,
as well as its overexpression in human tumours, the notion of Mdm2 as an oncogene is quite
reasonable. Nevertheless, as reviewed by Manfredi (2010), there is a growing body of
evidence to suggest that Mdm2 may also exert effects as a tumour suppressor in certain
experimental conditions. In gastric cancer, MDM2 promoter polymorphism is associated
with both an increased susceptibility to gastric carcinoma and poor prognosis (Ohmiya et al.
2006). Amplified MDM2 gene is associated with chromosomal instability (Lee et al. 2014).
The previous chapter has shown that miR-140-5p restoration resulted in inhibition of in
vitro cell cycle progress and proliferation of gastric cancer cells. Together with the role of
MDM2-p53 interaction in the regulation of cell cycle and apoptosis, we hypothesised that
one of the mechanisms by which miR-140-5p influence the growth rate of gastric cancer
cells is via the suppression of MDM2 and activation of p53.
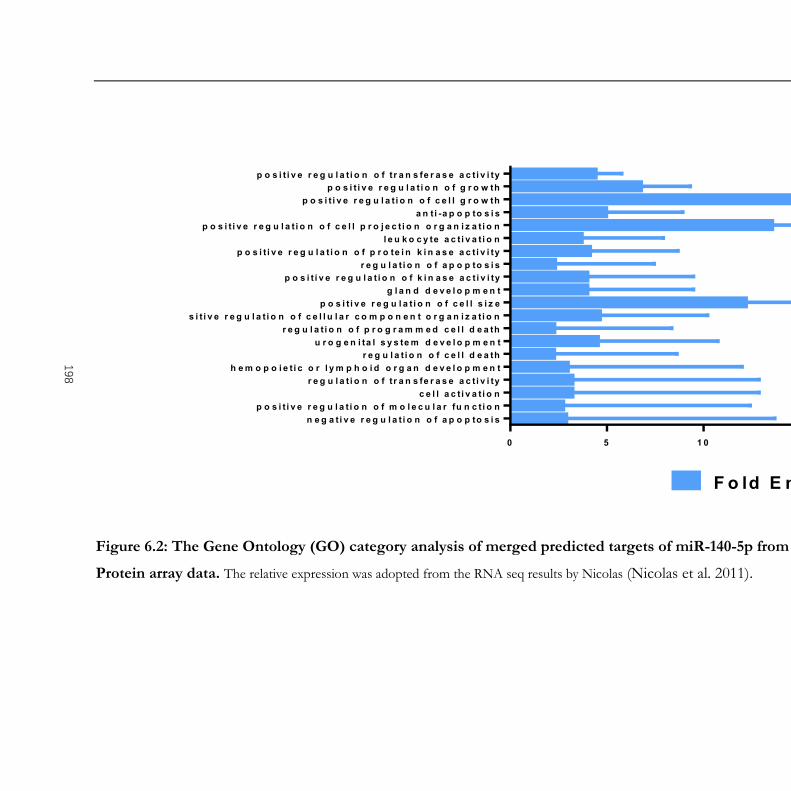
0 5 1 0 1 5 2 0
n e g a t i v e r e g u l a t i o n o f a p o p to s i sp o s i t i v e r e g u l a t i o n o f m o l e c u l a r fu n c t i o n
c e l l a c t i v a t i o nr e g u l a t i o n o f t r a n s fe r a s e a c t i v i ty
h e m o p o i e t i c o r l y m p h o i d o r g a n d e v e l o p m e n tr e g u l a t i o n o f c e l l d e a th
u r o g e n i ta l s y s te m d e v e l o p m e n tr e g u l a t i o n o f p r o g r a m m e d c e l l d e a th
p o s i t i v e r e g u l a t i o n o f c e l l u l a r c o m p o n e n t o r g a n i z a t i o np o s i t i v e r e g u l a t i o n o f c e l l s i z e
g l a n d d e v e l o p m e n tp o s i t i v e r e g u l a t i o n o f k i n a s e a c t i v i ty
r e g u l a t i o n o f a p o p to s i sp o s i t i v e r e g u l a t i o n o f p r o te i n k i n a s e a c t i v i ty
l e u k o c y te a c t i v a t i o np o s i t i v e r e g u l a t i o n o f c e l l p r o j e c t i o n o r g a n i z a t i o n
a n t i -a p o p to s i sp o s i t i v e r e g u l a t i o n o f c e l l g r o w th
p o s i t i v e r e g u l a t i o n o f g r o w thp o s i t i v e r e g u l a t i o n o f t r a n s fe r a s e a c t i v i ty
F o ld E n r ic h m e n t
Figure 6.2: The Gene Ontology (GO) category analysis of merged predicted targets of miR-140-5p from in silico analysis, RNA seq and
Protein array data. The relative expression was adopted from the RNA seq results by Nicolas (Nicolas et al. 2011).
198

199
6.3.3 Possible link between miR-140-5p and MDM2 in gastric cancer tumour tissues
The possible correlation between miR-140-5p and MDM2 was first evaluated in gastric
cancer patients’ transcriptome data from TGCA using the Spearman correlation test. A
significant negative correlation was seen between miR-140-5p and MDM2 (Figure 6.3).
0 1 0 0 0 0 2 0 0 0 0 3 0 0 0 00
5 0
1 0 0
1 5 0
m iR -1 4 0 -5 p
MD
M2
S p e a rm a n r = -0 .1 5 ( -0 .2 5 to -0 .0 5 )p < 0 .0 0
Figure 6.3: Correlation between miR-140-5p and MDM2 in gastric cancer (TCGA).
To validate this discovery, a similar correlation analysis was performed in the gastric cancer
patients’ cohort from Beijing Cancer Hospital. The negative correlations between miR-140-
5p and MDM2, and between miR-140-3p and MDM2 was also observed but did not reach
statistical significance. Interestingly, miR-140-5p and miR-140-3p showed significant co-
expression pattern in our analysis (Table 6.3).
Table 6.3: Correlation between miR-140-5p/3p and MDM2 in gastric cancer (Beijing cohort).Note: Cor = Correlation coefficient. N= Number of samples
mir-140-3p MDM2miR-140-5p Cor=0.54
P<0.00N=75
Cor=-0.11P=0.34N=76
miR-140-3p Cor=-0.14P=0.22N=81
P<0.01

200
6.3.4 miR-140-5p and miR-140-3p overexpression and p53 signaling
The negative correlation between miR-140-5p and MDM2 was observed in tumour tissue
analysis in both cohorts of gastric cancer. We then used qPCR and Western blots to address
whether the correlation is associated with deregulation of downstream genes and signaling
pathways.
The expression of MDM2, its direct target p53 and the downstream effector p21 were firstly
determined by qPCR in gastric cancer cell lines under normal conditions. The results showed
increased p21 expression at the transcriptional level. There was no significant difference at
the mRNA level in the expression of MDM2 or p53 in miR-140-5p overexpressed cells
compared with corresponding negative control. (Figure 6.4).
Figure 6.4: One-way ANOVA comparations of relative expression of MDM2, p53, and p21 in miR-140-5p and miR-140-3p overexpression gastric cancer cell lines. Shown are representative results n=3. Error bars represent standard deviation. ** represent p<0.01, respectively.
To detect whether miR-140-5p affects the expression of MDM2 at the protein level, we
examined the expression of MDM2 and its object of action using Western blot. A decreased
MDM2 expression was seen in miR-140-5p or -3p overexpressing cells compared to

201
corresponding transient transcription of the negative control. Conversely, the increased
protein level of p53 was seen in all examined gastric cancer cell lines following miR-140-5p
or -3p expression. In the examination of p21 expression, increased p21 was only seen in
AGS and NUGC4 cell lines which harbored wild-type p53, suggesting that miR-140-5p or
miR-140-3p may have a role in MDM2/p53/p21 signaling (Figure 6.5).
Figure 6.5: The expression of MDM2, p53, and p21 in the miR-140-5p and miR-140-
3p overexpression gastric cancer cell lines. Quantification of immunoblots was performed
using the ImageJ software, after densitometric analysis of the corresponding bands detected upon
revelation with a peroxidase-coupled secondary antibody.

202
MDM2, as a chief negative regulator of p53 (Bond et al. 2005), restrains p53 activity by firstly
binding and cutting off p53 from p53 target gene promoters (Momand et al. 1992). It
contains a RING domain with E3 ubiquitin ligase activity which can ubiquitinate p53,
resulting in p53 degradation through a negative feedback loop (Chen et al. 1995). Thus,
MDM2 can induce a rapid tumour growth by inhibiting p53 signaling pathways, which is in
agreement with our cell proliferation assay. However, the cytotoxic assay in our study
suggested an augmented cell resistance to 5FU treatment in gastric cancer cell lines with wild-
type p53. To clarify the role of p53 in drug-induced apoptosis, we explored the apoptosis-
related genes’ expression in NUGC4 and AGS cell lines. Western blots showed a relative
mildly reduced MDM2 in the miR-140-5p overexpressing cells after treating with 5FU.
Induced p53 was observed in all the cell lines with 5FU treatment, but comparison in
different transfection groups did not differ. However, the proapoptotic factor BAX showed
a slightly decrease in AGS miR-140-5p overexpressing cells and a significantly decline in
NUGC4 miR-140-5p overexpression cells. (Figure 6.6).
Figure 6.6: Abated activation of MDM2/p53/BAX signaling in miR-140-5p overexpression cells was determined using Western blot.
The inconsistency shown from the tissue sample analysis, where miR-140-5p upregulation
indicated a chemosensitive promoting role in NACT gastric cancer cohort, provoked further
analysis to compare the miR-140-5p expression status in negative control transfected cells
and in miR-140-5p mimic transfected cells after 5FU stimulating. The qPCR result
demonstrated that a high-level miR-140-5p showed a relatively slower and lesser upregulation
of miR-140-5p compared to the upregulated level of miR-140-5p in negative control
transfected cells, pre- and post-treated with 5FU (Figure 6.7).

203
Figure 6.7: 5FU induced miR-140-5p upregulation in cells with higher miR-140-5p before treatment. Results are triplicated analysis from two independent experiments.
6.4 Discussion
Generally, malignant cells acquire the ability to undergo de-regulated mitogenesis, to resist
proapoptotic insults, and to invade through tissue boundaries during progression. Several
aberrant cellular signalling pathways orchestrate these malignant traits in any particular type
of cancer tissues (Giancotti 2014). MDM2, as well as its homolog MDMX, is best
understood as a negative regulator of the p53 tumour suppressor to exert oncogenic activity,
although it has additional p53-independent roles (Karni-Schmidt et al. 2016). The p53
protein consists of two N-terminal transactivation domains followed by a conserved proline-
rich domain, a central DNA binding domain, and a C terminus encoding its nuclear
localization signals and an oligomerization domain needed for the transcriptional activity. In
normal and unstressed cells, p53 protein is maintained at low levels by a series of regulators
including MDM2 (Kubbutat et al. 1997; Haupt et al. 1997). However, p53 is stabilized in
response to various cellular stresses. For instance, DNA damage promotes p53
phosphorylation, blocking MDM2-mediated degradation (Shieh et al. 1997). Largely through
its function as a sequence-specific transcriptional factor, p53 regulates a plethora of genes
whose products mediate a variety of cellular pathways. The best-understood functions of
p53 focus on its ability to promote cell cycle arrest and apoptosis. Indeed, from the early
1990s, seminal studies showed that p53 is crucial for a reversible G1 phase checkpoint, which
is mediated, in part, by its ability to transcriptionally activate the p21 cyclin-dependent kinase
inhibitor gene. p53 can also promote apoptosis, relying on the induction of pro-apoptotic
BCL-2 family members whose action facilitates caspase activation and cell death. An ever-
growing body of work suggests that p53 also controls additional “non-canonical” programs

204
that contribute to its effects. As examples, p53 can modulate autophagy, alter metabolism,
repress pluripotency and cellular plasticity, and facilitate an iron-dependent form of cell
death known as ferroptosis. The p53 response is remarkably flexible and depends on the cell
type, its differentiation state, stress conditions, and collaborating environmental signals.
Approximately 30% of gastric cancers have been found to have p53 mutation or deletion.
MDM2 expression is positively regulated by p53 transactivation by a feedback loop.
Amplified MDM2 has been reported in more than 10% of gastric cancers.
Our initial analysis via GESA and online prediction tool to determine the cellular signaling
pathways that are altered in gastric cancer according to miR-140-5p status found an
enrichment of cell cycle pathway related transcriptome alteration, which was in line with the
omics-based findings in a previous study of miR-140-5p in lung cancer. Especially, MDM2
was suggested as a potential target of miR-140-5p.
In this study, we aimed to investigate changes in MDM2 and its downstream signalling in
gastric cancer cell lines with miR-140-5p overexpression. The co-expression analysis in the
TCGA cohort and the Beijing cohort of samples revealed a negative correlation between
miR-140-5p expression and MDM2 in both cohorts. It was initially indicated that
downregulation of miR-140-5p might contribute to disease progression of gastric cancer via
increasing MDM2 expression. We then showed that forced miR-140-5p expression by
transient transfection of mimic did not influence MDM2 expression at the transcriptional
level in gastric cancer cells, but we saw a significant reduction of MDM2 at translational
levels. Due to the possible limitation in recapitulating the actions of endogenous miRNAs
via transfection of miRNA mimic (Jin et al. 2015), whether miR-140-5p directly suppresses
MDM2 expression is yet to be elucidated. Meanwhile, p53 was upregulated, as was the p21,
but only in cells with an intact p53 function. This suggested that miR-140-5p was involved
in the transcriptional regulation of MDM2 via a direct or indirect way. Additionally, such a
regulation may lead to different cell response, at least partly depending on p53 status. For
example, miR-140-5p overexpression leading to a slight but significant cell cycle arrest in
both AGS and NUGC4 cell lines which harbour wild-type p53. Although both AGS and
NUGC4 are p53 functional cell lines, there is some difference in the cell functions and
protein alterations between these two cell lines after miR-140-5p transfection. This may be
explained by the fact that most miRNAs exert mild repression on many targets and act as
rheostats, fine-tuning the expression of hundreds of genes to reinforce cell fate decisions

205
brought about through other mechanisms (Vidigal and Ventura 2015); Secondly, there is an
emerging paradigm that miRNA can be not only cell-type or tissue-specific “signatures” for
certain normal or cancerous tissues, but also functional or inoperative to certain genes
depending on the molecular and cellular context (Zhang et al. 2015). For example, AGS is a
TGF-β/Smad/cMyc activated cell line other than NUGC4 cell line (Periasamy et al. 2014)
and TGF-β receptor I and SMAD3 were experimentally validated as miR-140-5p’s direct
targets (Pais et al. 2010; Zhang et al. 2015). Interestingly, accumulation of miR-140 could
also be transiently suppressed by TGF-β (Pais et al. 2010; Tardif et al. 2013).
We then focused on whether regulation of miR-140-5p on MDM2 still conserved during
cells’ response to 5FU, a cell-cycle-dependent cytotoxic drug. We found that 5FU treatment
resulted in lower MDM2 expression and upregulated p53. However, miR-140-5p upregulated
cells did not induce as much p53 accumulation as paired control cells without miR-140-5p
overexpression before drug treatment. Moreover, a decreased BAX was shown in cells with
upregulated miR-140-5p. Although current analysis supported MDM2 as a possible target of
miR-140-5p, this requires further work to determine the direct target site(s) and confirmed
with an intervention such as a dual-luciferase reporter gene system. A rescue analysis could
be considered in a miR-140-5p stably transfected cell model which could provide more
evidence about the interaction between miR-140-5p and MDM2 and its downstream
effectors. The correlation between miR-140-5p/3p expression and protein expression and
activation of MDM2/P53 in human gastric cancer tissues collecting before and after drug
treatment should be further examined using immunochemical or other techniques. Morover
qPCR analysis suggested that miR-140-5p did not increase after 5FU treatment in an already
higher miR-140-5p cell type. However, this was only implied in an in vitro cell model with a
transient transfection. Further evaluation in a stable transfection situation and in vivo mice
model should be investigated to evaluate this reaction following treatment with 5FU. In
addition, ectopic expression in the current study addressed the question of whether miR-
140-5p can exert a specific function on cell cycle-related genes, while loss-of-function studies
are still required to test whether it is also necessary for these functions.
During cytotoxic-induced cellular stress, p53-mediated processes can be antagonistic: cancer
cell growth in G1 phase may lead to an impairment of 5FU which exerts its anticancer
effects through inhibition of thymidylate synthase (TS) and incorporation of its

206
metabolites into RNA and DNA mainly in S (synthesis) phase (Focaccetti et al.
2015). Additionally p53 could also modulate autophagy which has the potential to
delay apoptosis (Thorburn et al. 2014), However, it was reported that in situations
where p53 failed to repress glycolysis, apoptosis would be favoured (Duan et al.
2015). Thus, the molecular interaction between distinct biochemical processes
controlled by p53, as well as its translocation sites (Park et al. 2016; S. Wang et al.
2017) might be explored to elicit different biological outcomes.
Taken together, our study provided evidence that miR-140-5p regulated the cell cycle through
an MDM2/p53 regulatory feedback loop, which may contribute to the promotion of cell
proliferation and anti-apoptosis, although further investigations remain necessary.

207
Chapter 7.
General Discussion

208
Extensive evidence has suggested that miRNAs are crucial regulators of gastric
carcinogenesis and progression via alteration of cell growth, cell cycles, apoptosis, and cell
migration. Several groups have analyzed the global miRNA content in gastric cancer with
the use of varying amounts of tumour samples, diverse reference samples as well as various
types of large-scale methods. Current progress in understanding the role of specific miRNAs
recognized as deregulated in gastric cancer cells has been reviewed (Pan et al. 2013; Liang et
al. 2017; Hao et al. 2017). The comprehensive multi-platform genomics data generated by
TCGA provides a large-scale miRNA profiling of gastric cancer for both tumour and
adjacent normal samples, and is the largest of its type worldwide (Chu et al. 2016). As shown
in the TCGA analysis, integrative miRNA expression analyses could be useful for the
identification of subclasses and subtype-specific drivers of expression changes of gastric
cancer (Cancer Genome Atlas Research 2014; Liu et al. 2018).
Figure 7.1: The techniques used in this study

209
In this study (Figure 7.1 Technical Route), we investigated the genome-wide miRNA
expression pattern in gastric cancer from TCGA database. Three analytical approaches
(linear model fitting, unpaired and paired t-test) were performed for analysis of differentially
expressed miRNAs in gastric cancer tissues and adjacent to tumour stomach samples.
Moreover, we conducted both the generalized linear model and the linear model in order to
discover potential gastric cancer biomarkers, not only to distinguish gastric cancer tissues
from normal stomach, but also to provide therapeutic or prognostic biomarkers. We
identified 16 potentially novel prognostic miRNA biomarkers of gastric cancer, out of which
ten were negatively correlated, and six were positively correlated with OS of gastric cancer
patients. Although their expression and role in gastric cancer need further experimental
investigation, computational analysis indicated that these miRNAs seemed to be potential
prognostic biomarkers for gastric cancer. miR-140 in particular, seemed to be interesting in
terms of its downregulation in tumour tissues compared to normal samples, but higher
expression in advanced gastric cancer tissues, reflecting its multiple identities in gastric cancer
progression. Very few studies have taken into account the different histological subtypes of
gastric cancer, miR-140-5p although generally accepted as a tumour suppressor in many
cancers, including non-small cell lung cancer (Wang et al. 2017; Tang et al. 2017; Flamini et
al. 2017; Zhang et al. 2016; Dong et al. 2016; Tan et al. 2011; Hu et al. 2016; Yuan et al. 2013),
primary breast cancer (Yan et al. 2008; Kawaguchi et al. 2017; Yan et al. 2018; Q. Li et al.
2014a; Wolfson et al. 2014; Gullu et al. 2015; Gernapudi et al. 2015), colorectal cancer (Song
et al. 2009; Zhai et al. 2015; J. Li et al. 2018; L. Yu et al. 2016; Piepoli et al. 2012) gastric
cancer (Fang et al. 2017), oesophageal cancer (Li et al. 2014), epithelial ovarian cancer (Su et
al. 2016; Lan et al. 2015; Iorio et al. 2007), basal cell carcinoma of the skin (Sand et al. 2012b),
cutaneous squamous cell carcinoma (Sand et al. 2012a), hepatocellular carcinoma (Yang et al.
2013) osteosarcoma (Song et al. 2009; Xiao et al. 2017; Wei et al. 2016; Gu et al. 2016),
gliomas (Malzkorn et al. 2010; Zhao et al. 2016), glioblastoma (Bo et al. 2015), and T-cell
acute lymphoblastic leukaemia (Correia et al. 2016). By targeting various targets, miR-140-5p
has shown to critically involved in tumour cell proliferation, apoptosis, vascularization,
migration, and invasion. These previously confirmed targets include HDAC4, Sp1, IGF1R,
MMD, TGFBR1, Smad2, Smad3, FGF9, BMP2, SOX2, SOX9, Slug, and ADAMTS5
(Summarized in Table 7.1).
However, miR-140-5p has also been implicated as having a possible oncogenic role in splenic
210
hemangiosarcoma (Grimes et al. 2016), chordomas (Bayrak et al. 2013), clear cell renal cell
carcinoma (Guan et al. 2018), and Hodgkin lymphoma (Khare et al. 2017). Moreover, its
upregulation was correlated with malignant progression of gliomas (Malzkorn et al. 2010),
disease recurrence in lung cancer (Shersher et al. 2011), and to chemoresistance in breast
cancer (Ahn et al. 2010; Chen et al. 2016). A miRNA profiling study on salivary gland
tumours showed that miR-140-5p was downregulated in tumour subtypes with low malignant
potential but showed an upregulation trend in histological subtypes with high malignant
potential (Bostjancic et al. 2017).
miR-140-5p/3p is encoded within intron 16 of Wwp2, an E3 ubiquitin ligase on
chromosome 16q22.1 (Inui et al. 2018). Extensive studies have demonstrated its role in
mediating embryonic development and regeneration, especially in cartilage development
(Miyaki et al. 2010; Araldi and Schipani 2010; Papaioannou et al. 2015; Mahboudi et al. 2018;
Plociennikowska et al. 2015), such as by targeting CXCL12 (Thorpe et al. 2010), IGF-I(Pando
et al. 2014), TLR-4 (Sun et al. 2017), and FGF9 (Yin et al. 2015). MiR-140-deficient mice
manifested a mild skeletal phenotype, with short stature and low body weight, as well as
craniofacial deformities characterized by a short snout and domed skull, supporting the
notion that miR-140 is a tissue-specific miRNA significant in chondrocyte development and
maintenance and ECM synthesis (Miyaki et al. 2010; Araldi and Schipani 2010; Papaioannou
et al. 2015; Papaioannou et al. 2013). miR-140-5p also play an important role in various
inflammatory diseases, such as osteoarthritis (Iliopoulos et al. 2008; Gabay and Clouse 2016),
asthma (Guedes et al. 2015), pulmonary arterial hypertension (Rothman et al. 2016) and
chronic inflammation induced oxidative stress injury such as coronary artery disease
(Marques et al. 2016) and type 2 diabetes (Ortega et al. 2014). In vivo studies of miR-140-
deficient mice showed age-related osteoarthritis-like changes characterized by proteoglycan
loss and fibrillation of articular cartilage, and by 12 months, miR-140-deficient mice showed
severe structural cartilage defects, while transgenic mice with overexpressed miR-140 in
cartilage were resistant to antigen-induced arthritis, which indicates suppression of miR-140
expression and plays an important role in diseases associated with cartilage destruction
(Miyaki et al. 2010). Targets of miR-140-5p, HDAC4, BMP2, SMAD3, IGFBP5, and Adamts-
5, were all responsible for enhanced cartilage destruction (Tardif et al. 2013; Clemmons et
al. 2002). In this present study, the role played by miR-140-5p/3p in gastric cancer was
examined.

211
7.1 Deregulated miRNAs in gastric cancer
With the latest released TCGA data, we utilized distinct analysing algorithms (DESeq2, glm
and lm) compared to existing research (Shrestha et al. 2014; Ding et al. 2017) and identified
a new group of DEMs and prognostic related DEMs in primary gastric cancer. In all 207
differentially expressed miRNAs were determined in this study, among which 65 miRNAs
were downregulated and 142 miRNAs were upregulated.
Almost simultaneously, Ding et al. (2017) explored dysregulated miRNAs in gastric cancer
by using the raw counts of miRNA expression data of 41 paired tumour and normal tissues
cancer from TCGA. miRNA expression was normalized by the R/Bioconductor package
edgeRv. Their results discovered 138 differentially expressed miRNAs (logFC > 1 or logFC
< −1, P < 0.05 after FDR adjustment). We compared results and found 100 miRNAs which
are consistently deregulated in both analyses (Appendix 8). There is no optimal pipeline for
the variety of different applications and analysis scenarios in which RNA-seq can be used.
Independent comparison studies have demonstrated that the choice of method (or even the
version of a software package) can markedly affect the outcome of the analysis and that no
single method is likely to perform favourably for all datasets. Repetition of important
analyses using more than one package should be considered to improve the reliability of
differential gene expression analysis (Conesa et al. 2016).
According to the system review by Shrestha et al. (2014) a total of 352 differentially expressed
microRNAs were reported in 14 miRNA expression profiling studies which compared
gastric cancer tissues with normal tissues. 120 microRNAs were reported in at least in two
studies, which is similar to the comparative analysis between Ding et al.’s (2017) work and
ours. Among the 120 differentially expressed miRNAs, 69 miRNAs had a consistent
direction of expression, in which 41 were reported to be upregulated and 28 down-regulated.
The review indicated that in the group of consistently reported miRNAs from 14 various
publications, miR-21 was reported upregulated in 10 studies followed by miR-25, miR-92,
and miR-223 upregulated in eight studies. miR-375 and miR-148a were found downregulated
in six and five studies, respectively, followed by miR-638 in four studies. Of note, miR-107
and miR-103 were reported in nine and eight studies, respectively, but their expression was
inconsistent (Shrestha et al. 2014). We further overlapped this vote ranking results with our
analysis and Ding et al.’s, and 18 and 17 consistently deregulated miRNAs were found

212
respectively (Appendix 8). 12 miRNAs were reported in all three analyses (Table 3.3). Among
these, downregulation of miRNA-100 and upregulation of miR-188 were demonstrated on
TCGA data, however, they represented a contrary tendency in the review analysis. The
unsatisfactory agreement between results obtained from different tools might be due to
different parameter settings, especially for genes that are expressed at low levels. As RNA-
seq has become the standard method for transcriptome analysis, but the technology and tools
are continuing to evolve. The heterogeneity of tumour characteristics between tumours is
equally deserving of attention.
Lymph node metastasis (LNM) is one of the most important risk factors of gastric cancer
recurrence after curative surgery. The 5-year survival rates of pathological N stages were as
follows: N0 (83.5%), N1 (57.8%), N2 (27.4%), and N3 (11.4%). As a result, pathological N
stage is one of the independent prognostic factors of gastric cancer (Fang et al. 2011).
Moreover, the occurrence of lymph node metastases after endoscopic submucosal dissection
(ESD) in patients with gastric cancer leads to a poor prognosis. Using logistic regression, Liu
et al. identified miR-100 and other 3 miRNAs (miR-27b, miR-128, and miR-214) which were
associated with LNM in GC patients. Expression of miR-27b, miR-128, miR-100, and miR-
214 were down-regulated in GC samples with LNM (Liu et al. 2017). Similarly, miRNA
microarray analyses were performed for 5 patients with LNM and 5 patients without LNM
and found that miR-188-5p as well as miR-451, miR-497, miR-1207-5p, miR-30a-5p, let-7e,
let-7g, let-7f, miR-96, and let-7a significantly dysregulated between patients with or without
LNM. However, further confirmation demonstrated that, with the exception of miR-1207-
5p, there was no significant correlation between lymph node metastasis and the expression
of other miRNAs (Huang et al. 2015).
In Yepes et al.’s (2016) study aimed to characterize miRNA expression profiles and identify
key miRNAs related to gastric carcinogenesis and histopathological traits, using co-
expression networks and supervised analysis, miR-100 together with miR-195, let-7c, miR-
140, miR-99a, and miR-125b, was determined to be highly correlated with the diffuse subtype.
Despite the evident morphological differences that allow classification of tissues into
intestinal and diffuse subtypes, the expression patterns that differentiate these subtypes are
subtle. This may become much clearer when the correlations between genes and progression
characteristics, such as TNM staging are analyzed.
213
Another aspect of this study on DEMs of TCGA gastric cancer subgroups (Appendix 9)
also as well demonstrated such variability. A large proportion of DEMs distributed across
four subtypes of gastric cancer (EBV, MSI, GS, and CIN). Some of them exhibited distinct
expression in specific subgroups. For example, EBV subgroup exhibited suppressed miR-
193a-5p downregulation and upregulated miR-181a-2-3p, miR-134-5p, miR-199b-5p miR-
199a-5p/3p and miR-217. Decreased miR-143-5p, miR-125b-5p, miR-26a-5p, miR-140-3p,
miR-30d-5p and increased miR-135b-5p were only characterized in the CIN subgroup. The
GS subgroup featured a lack of miR-582-3p, miR-10a-5p, but gain of let7f-5p, miR-361-3p,
let-7d-3p, miR-15b-3p, and miR-155-5p expressions. In the MSI group, non-downregulated
miRNA but unique upregulation of miR-16-5p, miR-29b-3p, miR-24-3p, miR-484, miR-128-
3p, let-7i-5p, miR-223-3p and miR-200b-5p were detected.
With regard to prognosis related miRNAs, except for miR-21, we discovered 15 more
miRNAs related to gastric cancer patients’ outcome based on current analysis methods.
Among 6 downregulated miRNAs, miR-5683 has been reported to be implicated in
maintaining the differentiated state of muscle cells (Doerrenberg et al. 2017) and was also
pinpointed to be one of down-regulated miRNAs in TCGA based gastric cancer analysis by
Huo (Doerrenberg et al. 2017). Down-regulated miR-28 in gastric cancer samples compared
with normal stomach tissue samples was also found by Kim et al. (Kim et al. 2011). A former
study defined that miR-28-5p and miR-28-3p had distinct effects on colorectal cancer cells
(Almeida et al. 2012). However, their roles in gastric cancer were not yet demonstrated. miR-
193a (Lujambio et al. 2007; Ando et al. 2009), and miR-129 are reported in methylation
associated gastric cancer, their low expression was associated with poor clinicopathological
features (Tsai et al. 2011), miR 34b was also distinguished as a methylation-associated
miRNA (Tsai et al. 2011), but in our study, it was upregulated and had a negative relationship
with gastric cancer outcomes. Upregulated miR-328 is widely underexpressed in many
cancers and contributes to tumour resistance to chemotherapy (Li et al. 2010). Macrophage-
derived reactive oxygen species play a role in suppressing miR-328 targeting CD44 in cancer
cells and promote redox adaptation (Ishimoto et al. 2014). High miR-140-5p levels have been
detected in the plasma of gastric cancer patients (Shin et al. 2015), whereas low miR-140-5p
level was found in cancerous tissues compared with that in adjacent gastric mucosa tissues
(Zou and Xu 2016). Lower expression of miRNA-140-5p is associated with decreased
chemosensitivity, but no significant change was found between tumour and non-tumour

214
tissue samples (Kim et al. 2011). A recent study also demonstrated that downregulated miR-
140-5p in gastric cancer was significantly correlated with reduced OS of these patients (Fang
et al. 2017).
Amongst the ten upregulated miRNAs, increased hsa-miR-671-5p in gastric cancer tissues
was found in a microarray-based analysis (Zhang et al. 2015), and miR 671 5p played as an
onco-miR in epithelioid sarcoma (Papp et al. 2014). However, decreased expression of miR-
671-5p was reported in invasive ductal carcinoma (IDC) compared to normal in
microdissected formalin-fixed, paraffin-embedded (FFPE) tissues (Tan et al. 2016). Hansen
et al. (2013) also reported that miR-671-directed cleavage of ciRS-7 results in prompt and
efficient repression of miR-7 targets and acted as a tumour suppressor in such cases. High
levels of miR-455-3p in gastric cancer tissues compared to their matching references has
been confirmed by qPCR (Su et al. 2012). Nonetheless, miR-455-5p was found to act as a
tumour suppressor in gastric cancer by down-regulating RAB18 (Liu et al. 2016). The role
of miR-1255a seems to be double-sided. It presented contrary expression trends in different
bladder cancer cell lines (Tatarano et al. 2011), and it was downregulated by Atorvastatin in
PC3 prostate cancer cells (Peng et al. 2013). As for miR-493, although Zhou et al. found that
expression levels of miR-493 were strongly down-regulated in gastric cancer, and its
downregulation was associated with clinical stage and the presence of LNM (Zhou et al.
2015). Tambe et al. (2016) demonstrated that high miR-493-3p levels were associated with
reduced survival of ovarian and breast cancer patients with aggressive tumours, especially in
the paclitaxel therapy arm. Upregulation of miR-4326 was also reported in Li et al.’s (2017)
study, and they further demonstrated miR-4326 might be associated with race, with a lower
level of miR-4326 more common in Asian patients. In metastatic renal cell carcinoma,
upregulated miR–4326, was among a group of miRNAs that could define patients not only
associated with short PFS and OS, but also with a poor response to tyrosine kinase inhibitors
(TKI) (Garcia-Donas et al. 2016). miR-514a was found to be an EMT-inducing miRNA in
gastric cancer (Yanaka et al. 2015). Upregulated miR-514a targeted the tumour suppressor
NF1 and modulated BRAFi sensitivity in melanoma (Stark et al. 2015). Conversely, miR-
514a-3p served as a tumour suppressor which could inhibit cell proliferation and EMT was
demonstrated in clear cell renal carcinoma (Ke et al. 2017) and human testicular germ cell
tumours (Ozata et al. 2017). Upregulation of miR-549 was associated with colorectal
carcinogenesis (Hamfjord et al. 2012) and oral cancer developed from oral leucoplakia (Zhu

215
et al. 2015) and may indicate tumours of glial origin if discovered in patients’ serum (Drusco
et al. 2018).
In the integrative analysis of prognostic related DEMs, it is inappropriate to interpret the
variation of a continuous variable in the same way as the variation of a binary variable.
Different modelling assumptions need to be taken into consideration. We applied the
framework introduced by Mo et al. (2013). Categorical observations are modelled as
multivariate binomial or multinomial random variables. Count data are modelled as
multivariate Poisson variables, and continuous measures such as miRNAs’ expression are
modelled as multivariate normal. Given the proper distributional assumptions for these
diverse types of bioinformatic variables, glm for a non-linear relationship for the distribution
of these variables and lm for the linear relationship were performed to identify those DEMs
representing distinct roles in gastric cancer patients’ survival. Like previous studies, increased
levels of miR-21 in both blood and tumour tissues indicate a significantly worse prognosis
in OS, as well as DFS, than those with decreased expression levels (Xu et al. 2012; Komatsu
et al. 2013).
Bioinformatic analysis of DEMs, potential and validated targets of miRNA and the
subsequent analysis of activation of downstream pathways clustered by target genes are
promising strategies for gaining insights into plausible biomarkers and key events involved
in cancer development and progression. However, both biological factors and analytical
factors could affect the actual performance of the DEMs analysis. In this study, we did not
set exclusion criteria so some tissues samples without completed data and cases of other
malignancies were enrolled. Therefore, it is essential to interrogate these candidate genes
subsequently with other pathological features and validate them systematically by PCR or
other independent experimental approaches before utilizing them as useful clinical
biomarkers.
7.2 Deregulated miR-140-5p expression in gastric cancer is associated with disease
progression in gastric cancer
To determine the role of miR-140-5p in gastric cancer, the expression of miR-140-5p was
conducted by detailed analysis from TCGA. The result showed a significantly reduced
expression of miR-140-5p in gastric cancers compared with adjacent non-tumour tissues,

216
especially in intestinal gastric cancer. This result was in line with the observations from a
qPCR examination conducted on paired gastric tumour tissue samples from the Beijing
cohort which presented a reduced expression of miR-140-5p in gastric cancers, particularly
the less infiltrative gross type (Borrmann I-II) of tumour samples with a predominantly
intestinal histological type (Chen et al. 2016). A decreased miR-140-5p expression was also
observed in relatively localized tumour (Borrmann I-II) compared with that in more
infiltrative tumour samples (Borrmann III-IV). Univariate and multivariate analysis have
suggested that miR-140-5p could serve as a prognostic biomarker in gastric cancer.
Decreased miR-140-5p and miR-140-3p expression in tumour tissues may be linked to a
shorter life expectancy for gastric cancer patients even those with earlier disease and/or lower
malignant potential subtypes.
In our further analysis of the role of miR-140-5p/3p in the cohort of gastric cancer tissue
samples having been treated with 5FU based NAC, it was demonstrated that reduced
expression of miR-140-5p/3p in treated tumour tissues compared with that in treated
normal tissues was associated with drug resistance of gastric cancer. Further analyses showed
that even in the no response group, gastric cancer patients with a higher level of miR-140-
5p in treated tumour samples could still have a relatively better OS. The findings of this study
have demonstrated that miR-140-5p/3p may act as tumour suppressor in intestinal gastric
cancer in comparison with diffuse type. This again highlights that miR-140-5p/3p plays
different roles in different malignancies which might be cancer specific and even cell specific.
Despite data indicating that miR-140-5p/3p can, in principle, control a wide variety of
biological processes, the physiological settings in which one or more processes predominate
are incompletely understood and deserve more systematic study. The exact molecular and
cellular events associated with the deregulated expression of miR-140-5p/3p in gastric
cancer are yet to be identified.
7.3 Overexpression of miR-140-5p/3p inhibited malignant traits of gastric cancer
cells based on specific cell context
To understand how altered expression of miR-140-5p/3p in gastric cancer is associated with
tumourigenesis, disease progression and prognosis, its impact on cellular function of gastric
cancer cells was examined in this study. Expression of miR-140-5p and -3p was determined
in six gastric cancer cell lines, as described in section 5.2.1. In the intestinal group of cancer

217
cell lines, decreased expression of miR-140-5p/3p was noted, which was in agreement with
the findings we had on cohort analysis. Overexpression of miR-140-5p or 3p in four cell
lines (AGS, NUGC4, MKN45 and HGC27) resulted in decreased proliferation and colony
formation only in cell lines harbouring wild-type p53: AGS and NUGC4. Cell cycle analysis
revealed an increased G1 phase but decreased S phase in AGS, NUGC4 and human
colorectal cancer cell lines with wild type p53 (HCT116 p53 wt), which suggests a G1/S cell
cycle arrest. Interestingly MKN45 with a missense mutation in p53 gene but was
demonstrated to have a functional p53 (Chen et al. 2016) also showed cell cycle arrest at the
G1/S as well. These observations were consistent with the results from a study on human
osteosarcoma and colon cancer cells (
Song et al. 2009).
Besides its inhibition role on cell growth, overexpression of miR-140-5p/3p had a
prohibiting impact on cell migration in AGS and NUGC4. However, an interesting finding
was seen in HGC27 cell lines, which reflected an oncomiR role of miR-140-5p in this specific
cell type. Notably, significantly restrained invasive ability was observed in all the examined
cell lines, considering the inconsistent role of miR-140-5p on cell motility, this may indicate
a profound part of miR-140-5p in curbing ECM degradation ability in gastric cancer cells. It
is interesting, but may not be surprising, that miR-140 is regarded as a cartilage-specific
miRNA. Knockout studies have revealed miR-140 to be an essential factor in osteoarthritis
development, as miR-140-/- mice showed osteoarthritis-like changes such as accelerated
proteoglycan loss and ECM degradation, while mice overexpressing miR-140 were protected
against degradation of proteoglycans and COL2 in a model of antigen-induced arthritis
(Miyaki et al. 2010). In the same study, the aggrecanase ADAMTS5 was shown to be a target
of miR-140, and it was suggested that this could explain the protective role of miR-140 in
ECM degradation.
7.4 Effective chemotherapy response is accompanied by enhanced expression of
miR-140-5p and -3p in gastric cancer
In the tissue analysis, elevated expression of miR-140-5p or miR-140-3p was detected in
tumours with complete or partial response to 5FU based NAC treatment compared to their
corresponding normal stomach tissues. The augmented expression of miR-140-5p or miR-

218
140-3p was associated with favourable prognosis even in the non-responsive patients.
However, in the gastric cancer cell models, a pre-overexpressed miR-140-5p induced
significant chemoresistance in NUGC4 and MKN45 cells, and an increased IC50 was shown
in AGS cells but did not reach a statistical significance. In the mechanism exploring analysis,
we found that a pre-upregulated miR-140-5p before drug treatment did not result in enough
p53 upregulation comparing to the control cells, which may partly explain the abatement in
cell apoptosis. Our results indicated a quantity dependent p53 induced apoptosis during
cytotoxic stress in gastric cancer cells. Further in vitro and in vivo apoptosis assay, as well as
corresponding mechanism examination, are required to elucidate this particular aspect, which
may provide a new potential strategy for the stratification of patients who can benefit from
specific drug treatment and also candidate targets to increase chemosensitivity.
7.5 Reduced miR-140-5p/3p is associated with enhanced MDM2 signalling through
upregulation of its protein expression
P53 is the most frequently mutated gene in human cancer (Kastenhuber and Lowe 2017).
Half of the gastric cancer patients were reported to show p53 somatic mutations. MDM2
functions as an oncogene mainly due to its major negative regulator role of p53. Studies have
repeated the central importance of MDM2 as a p53 regulator, demonstrating that very early
embryonic lethality of Mdm2-null mice was fully rescued in a p53-null background
(Fakharzadeh et al. 1991; Montes de Oca Luna et al. 1995; Jones et al. 1995). A recent study
investigating the role of MARCH7, a RING domain-containing ubiquitin E3 ligase, in
interacting and maintaining the stability of MDM2, also strengthened the concept that direct
or indirect MDM2 destabilization could enhance p53 accumulation and p21 induction in
normal cells and in DNA-damage treated cells (Zhao et al. 2018). In addition, MDM2 is
involved in a number of pathways that regulate cell proliferation and apoptosis, playing a
p53-independent role. MDM2. In a study of Cao et al. (2019), MDM2 was proven to promote
genome instability by ubiquitinating the transcription factor HBP1. Overexpression-induced
cell death following ionizing radiation could be abolished by overexpression of HBP1, which
delays DNA break repair and causes cell death in a p53-independent manner. However,
MDM2 has also been shown to regulate the expression of the anti-apoptotic protein XIAP
by binding to its mRNA that enhances XIAP translation, leading to the increased expression
of XIAP, which led to an MDM2-dependent prevention of cell death via caspase-mediated

219
apoptosis (Gu et al. 2009).
By using n gastric cancer cell lines, we showed that overexpression of miR-140-5p decreased
protein but not mRNA levels of MDM2. Corresponding changes of p53 and downstream
p21, if a functional p53 existed, were also seen in the miR-140-5p overexpression cell lines.
Upon being treated with 5FU, the miR-140-5p overexpressing cells presented a less enhanced
activation of p53, and lacked BAX, compared with cells transfected with negative control
mimics. Intriguingly, we also observed an increased apoptosis in HGC27 cell line with
nonsense mutation of p53, suggesting a MDM2-mediated apoptosis in a p53-independent
manner. Involvement of MDM2/p53 in the miR-140-5p and -3p overexpressing cells
resulted in cell cycle arrest and suppression of proliferation. Metastatic potential is yet to be
elucidated, for example via eliminating p53 by siRNA or CRISPR/Cas9 system. On the other
hand, targets of miR-140-5p participating migration should be investigated in a p53
dependent manner as well.
7.6 Conclusion and perspectives
In this study, reduced expression of miR-140-5p was observed in gastric cancer tissues and
was associated with advanced disease progression, those with distant metastases and poor
prognosis, especially in intestinal histological gastric cancer. In vitro function assays through
miR-140-5p and miR-140-3p overexpression demonstrated the inhibitory roles of miR-140-
5p and -3p in proliferation, migration and invasion of gastric cancer cells with wild-type p53.
However, its overexpression may cause an increased migration ability in HGC27 cells with
mutant p53. Although this association between mutant p53 and aggressive phenotype needs
further clarification, this suggests that miR-140-5p/3p exhibited a putative tumour
suppressor in some cases of gastric cancer. Elevated chemoresistance was also observed in
the miR-140-5p overexpressing gastric cancer cell lines with wild-type p53 and following
5FU treatment. Accordingly, miR-140-5p depletion by miR-140-5p inhibitor promoted
chemosensitivity. Further examination showed that pre upregulated miR-140-5p resulted in
a less effective activation in accelerating p53 and BAX expression. This study again
highlighted that miR-140-5p and -3p may have multiple cell identities based on cellular
context or specific molecular subgroups.
Questions raised by this study include;

220
1. Through what mechanism is miR-140 expression controlled in different types of gastric
cancer?
2. What is the functional significance of miR-140 in gastric cancer in vivo? Does miR-140
alter cancer cells phenotype? Does miR-140 play a role in communication between gastric
cancer cells and cells in their surrounding microenvironment, such as stromal cells or
immune cells?
3. If gastric cancer cells express miR-140 to protect against apoptosis, can this be reversed
by other drugs that are not cycle-dependent?
4. What is the association between different mutant p53 type and aggressive phenotype of
gastric cancer?
It is yet to be revealed if miR-140 or p53 alone are sufficient to influence cell fate in response
to chemotherapy. We have shown that miR-140-5p provides a mechanism through MDM2
which p53 can be manipulated; however, there are many other factors which influence p53
expression and function and need to be explored. We have identified constitutional MDM2
decreasing along with miR-140-5p upregulation in gastric cancer cells, the direct interacting
target site, or interacting approach and where this modulation occurs are yet unexplored.
Like many other potentially exciting therapies in cancer, the efficiency of therapy between
individuals differs for unexplained reasons and declines over time. The relevance of miRNA
functional heterogeneity and variants of its effector protein may help to understanding
differences in disease patterns between otherwise identical patients and even provide
potential therapeutic strategy or targets.

221
ReferencesABELSON, J. F. et al. 2005. Sequence variants in SLITRK1 are associated with Tourette's syndrome. Science, 310, 317-20.
ABNET, C. C. et al. 2015. Diet and upper gastrointestinal malignancies. Gastroenterology, 148, 1234-1243 e4.
ADJEI, A. A. 1999. A review of the pharmacology and clinical activity of new chemotherapy agents for the treatment of colorectal cancer. Br J Clin Pharmacol, 48, 265-77.
AHMED, K. A. and XIANG, J. 2011. Mechanisms of cellular communication through intercellular protein transfer. J Cell Mol Med, 15, 1458-73.
AHN, B. Y. et al. 2010. Genetic screen identifies insulin-like growth factor binding protein 5 as a modulator of tamoxifen resistance in breast cancer. Cancer Res, 70, 3013-9.
AHN, S. et al. 2017. High-throughput Protein and mRNA Expression-based Classification of Gastric Cancers Can Identify Clinically Distinct Subtypes, Concordant With Recent Molecular Classifications. Am J Surg Pathol, 41, 106-115.
AIRD, I. et al. 1953. A relationship between cancer of stomach and the ABO blood groups. Br Med J,1, 799-801.
AL-BATRAN, S. E. et al. 2008. Phase III trial in metastatic gastroesophageal adenocarcinoma with fluorouracil, leucovorin plus either oxaliplatin or cisplatin: a study of the Arbeitsgemeinschaft Internistische Onkologie. J Clin Oncol, 26, 1435-42.
AL-BATRAN, S. E. et al. 2016. Histopathological regression after neoadjuvant docetaxel, oxaliplatin,fluorouracil, and leucovorin versus epirubicin, cisplatin, and fluorouracil or capecitabine in patients with resectable gastric or gastro-oesophageal junction adenocarcinoma (FLOT4-AIO): results from the phase 2 part of a multicentre, open-label, randomised phase 2/3 trial. Lancet Oncol, 17, 1697-1708.
ALISON, M. R. et al. 2012. Cancer stem cells: in the line of fire. Cancer Treat Rev, 38, 589-98.
ALMEIDA, M. I. et al. 2012. Strand-specific miR-28-5p and miR-28-3p have distinct effects in colorectal cancer cells. Gastroenterology, 142, 886-896 e9.
ALTINI, C. et al. 2015. 18F-FDG PET/CT role in staging of gastric carcinomas: comparison with conventional contrast enhancement computed tomography. Medicine (Baltimore), 94, e864.
AMBROS, V. 2003. MicroRNA pathways in flies and worms: growth, death, fat, stress, and timing. Cell, 113, 673-6.
AMBROS, V. et al. 2003. A uniform system for microRNA annotation. RNA, 9, 277-9.
AMIEVA, M. and PEEK, R. M., JR. 2016. Pathobiology of Helicobacter pylori-Induced Gastric Cancer. Gastroenterology, 150, 64-78.
AMIRI, M. et al. 2011. The decline in stomach cancer mortality: exploration of future trends in seven European countries. Eur J Epidemiol, 26, 23-8.
ANDERSON, W. F. et al.. 2010. Age-specific trends in incidence of noncardia gastric cancer in US adults. JAMA, 303, 1723-8.
ANDO, T. et al. 2009. DNA methylation of microRNA genes in gastric mucosae of gastric cancer patients: its possible involvement in the formation of epigenetic field defect. Int J Cancer, 124, 2367-74.
ANG, T. L. and FOCK, K. M. 2014. Clinical epidemiology of gastric cancer. Singapore Med J, 55,621-8.

222
ARALDI, E. and SCHIPANI, E. 2010. MicroRNA-140 and the silencing of osteoarthritis. Genes Dev,24, 1075-80.
ARAVIN, A. A. et al. 2003. The small RNA profile during Drosophila melanogaster development. Dev Cell, 5, 337-50.
ASCHENBRENNER, L. et al. 2004. Uncoated endocytic vesicles require the unconventional myosin,Myo6, for rapid transport through actin barriers. Mol Biol Cell, 15, 2253-63.
BADER, A. G. 2012. miR-34 - a microRNA replacement therapy is headed to the clinic. Front Genet,3, 120.
BANG, Y. J. et al. 2010. Trastuzumab in combination with chemotherapy versus chemotherapy alone for treatment of HER2-positive advanced gastric or gastro-oesophageal junction cancer (ToGA): a phase 3, open-label, randomised controlled trial. Lancet, 376, 687-97.
BARTEL, D. P. 2009. MicroRNAs: target recognition and regulatory functions. Cell, 136, 215-33.
BARTER, M. J. et al. 2015. Genome-Wide MicroRNA and Gene Analysis of Mesenchymal Stem Cell Chondrogenesis Identifies an Essential Role and Multiple Targets for miR-140-5p. Stem Cells, 33,3266-80.
BAYRAK, O. F. et al. 2013. MicroRNA expression profiling reveals the potential function of microRNA-31 in chordomas. J Neurooncol, 115, 143-51.
BEG, M. S. et al. 2017. Phase I study of MRX34, a liposomal miR-34a mimic, administered twice weekly in patients with advanced solid tumours. Invest New Drugs, 35, 180-188.
BEIER, U. H. and GOROGH, T. 2005. Implications of galactocerebrosidase and galactosylcerebroside metabolism in cancer cells. Int J Cancer, 115, 6-10.
BENCUROVA, P. et al. 2017. MicroRNA and mesial temporal lobe epilepsy with hippocampal sclerosis: Whole miRNome profiling of human hippocampus. Epilepsia, 58, 1782-1793.
BENJAMINI, Y., HOCHBERG, Y. 1995. Controlling the false discovery rate: a practical and powerful approach to multiple testing. Journal of the Royal Statistical Society, Series B. 57 (1): 289–300.
BERINDAN-NEAGOE, I. et al. A. 2014. MicroRNAome genome: a treasure for cancer diagnosis and therapy. CA Cancer J Clin, 64, 311-36.
BERLTH, F. et al. 2014. Pathohistological classification systems in gastric cancer: diagnostic relevance and prognostic value. World J Gastroenterol, 20, 5679-84.
BERNAL, M. et al. 2012. Implication of the beta2-microglobulin gene in the generation of tumourescape phenotypes. Cancer Immunol Immunother, 61, 1359-71.
BERTUCCIO, P. et al. 2009. Recent patterns in gastric cancer: a global overview. Int J Cancer, 125,666-73.
BHATTACHARYYA, A. et al. 2014. Oxidative stress: an essential factor in the pathogenesis of gastrointestinal mucosal diseases. Physiol Rev, 94, 329-54.
BIASCO, G. et al. 1993. Serum pepsinogen I and II concentrations and IgG antibody to Helicobacter pylori in dyspeptic patients. J Clin Pathol, 46, 826-8.
BITTONI, A. et al. 2015. Three drugs vs two drugs first-line chemotherapy regimen in advanced gastric cancer patients: a retrospective analysis. Springerplus, 4, 743.
BO, L. J. et al. 2015. Bioinformatics analysis of miRNA expression profile between primary and recurrent glioblastoma. Eur Rev Med Pharmacol Sci, 19, 3579-86.
BOBRIE, A. et al. 2011. Exosome secretion: molecular mechanisms and roles in immune responses. Traffic, 12, 1659-68.

223
BOKU, N. et al. 2009. Fluorouracil versus combination of irinotecan plus cisplatin versus S-1 in metastatic gastric cancer: a randomised phase 3 study. Lancet Oncol, 10, 1063-9.
BOLAND, C. R. and YURGELUN, M. B. 2017. Historical Perspective on Familial Gastric Cancer. Cell Mol Gastroenterol Hepatol, 3, 192-200.
BOLKE, E. et al. 2008. Capecitabine and oxaliplatin for advanced esophagogastric cancer. N Engl J Med, 358, 1965; author reply 1965.
BOND, G. L. et al. 2005. MDM2 is a central node in the p53 pathway: 12 years and counting. Curr Cancer Drug Targets, 5, 3-8.
BORCH, K.,et al. 2000. Changing pattern of histological type, location, stage and outcome of surgical treatment of gastric carcinoma. Br J Surg, 87, 618-26.
BORRMANN, R. 1926 Geschwülste des Magens and Duodenums. In: Borchardt, H., Borrmann, R. and Christeller, E., Eds., Verdauungsschlauch: Erster Teil Rachenund Tonsillen, Speiserohre Magen und Darm, Bauchfell, Springer, Vienna, 812-1054.
BOSTJANCIC, E. et al. 2017. Expression, Mutation, and Amplification Status of EGFR and Its Correlation with Five miRNAs in Salivary Gland Tumours. Biomed Res Int, 2017, 9150402.
BRADY, C. A. et al. 2011. Distinct p53 transcriptional programs dictate acute DNA-damage responses and tumour suppression. Cell, 145, 571-83.
BRADY, J. J. et al. 2013. Early role for IL-6 signalling during generation of induced pluripotent stem cells revealed by heterokaryon RNA-Seq. Nat Cell Biol, 15, 1244-52.
BRYANT, J. L.,et al. 2012. A microRNA gene expression signature predicts response to erlotinib in epithelial cancer cell lines and targets EMT. Br J Cancer, 106, 148-56.
BUTZ, H. et al. 2011. MicroRNA profile indicates downregulation of the TGFbeta pathway in sporadic non-functioning pituitary adenomas. Pituitary, 14, 112-24.
CALDAS, C. et al. 1999. Familial gastric cancer: overview and guidelines for management. J Med Genet, 36, 873-80.
CALIN, G. A. et al. 2007. Ultraconserved regions encoding ncRNAs are altered in human leukemias and carcinomas. Cancer Cell, 12, 215-29.
CAMARGO, M. C. et al. 2011. Divergent trends for gastric cancer incidence by anatomical subsite in US adults. Gut, 60, 1644-9.
CAMILLERI, M. et al. 2017. Gastrointestinal Complications of Obesity. Gastroenterology, 152,1656-1670.
CANCER GENOME ATLAS RESEARCH, N. 2014. Comprehensive molecular characterization of gastric adenocarcinoma. Nature, 513, 202-9.
CANCER REARCH. 2016a. Stomach cancer mortality statistics. Available at: https://www.cancerresearchuk.org/health-professional/cancer-statistics/statistics-by-cancer-type/stomach-cancer/mortality [Accessed: 4 March 2018].
CANCER RESEARCH. 2016b. Survival by stage. Avilable at: http://about-cancer.cancerresearchuk.org/about-cancer/stomach-cancer/survival [Accessed 20 June 2019]
CAO, D. et al. 2002. Uridine phosphorylase (-/-) murine embryonic stem cells clarify the key role of this enzyme in the regulation of the pyrimidine salvage pathway and in the activation of fluoropyrimidines. Cancer Res, 62, 2313-7.
Cao Z. et al. 2019. MDM2 promotes genome instability by ubiquitinating the transcription factor HBP1. Oncogene. 38, 4835-4855
CARNEIRO, F. et al. 1994. T (Thomsen-Friedenreich) antigen and other simple mucin-type carbohydrate antigens in precursor lesions of gastric carcinoma. Histopathology, 24, 105-13.

224
CARNEIRO, F. et al. 1995. New elements for an updated classification of the carcinomas of the stomach. Pathol Res Pract, 191, 571-84.
CARNINCI, P. et al. 2005. The transcriptional landscape of the mammalian genome. Science, 309,1559-63.
CARVALHO, J. et al. 2012. Lack of microRNA-101 causes E-cadherin functional deregulation through EZH2 up-regulation in intestinal gastric cancer. J Pathol, 228, 31-44.
Cha Y. et al. 2018. MicroRNA-140-5p suppresses cell proliferation and invasion in gastric cancer by targeting WNT1 in the WNT/beta-catenin signaling pathway. Oncology letters. 16, 6369-6376.
CHAN, J. A. et al. S. 2005. MicroRNA-21 is an antiapoptotic factor in human glioblastoma cells. Cancer Res, 65, 6029-33.
CHAN, J. J. and TAY, Y. 2018. Noncoding RNA:RNA Regulatory Networks in Cancer. Int J Mol Sci,19.
CHANG, H. et al. 2015. Different microRNA expression levels in gastric cancer depending on Helicobacter pylori infection. Gut Liver, 9, 188-96.
CHANG, J. T. et al. 2016. Identification of MicroRNAs as Breast Cancer Prognosis Markers through the Cancer Genome Atlas. PLoS One, 11, e0168284.
CHEN, J. et al. 1995. Regulation of transcription functions of the p53 tumour suppressor by the mdm-2 oncogene. Mol Med, 1, 142-52.
CHEN, M. H. et al. 2016. A Phase II Study of Sequential Capecitabine Plus Oxaliplatin Followed by Docetaxel Plus Capecitabine in Patients With Unresectable Gastric Adenocarcinoma: The TCOG 3211 Clinical Trial. Medicine (Baltimore), 95, e2565.
CHEN, X. et al. 2016. The role of miRNAs in drug resistance and prognosis of breast cancer formalin-fixed paraffin-embedded tissues. Gene, 595, 221-226.
CHEN, Y. et al. 2018. Survival benefit of neoadjuvant chemotherapy for resectable breast cancer: A meta-analysis. Medicine (Baltimore), 97, e10634.
CHEN, Y. C. et al. 2016. Clinicopathological Variation of Lauren Classification in Gastric Cancer. Pathol Oncol Res, 22, 197-202.
CHEUNG, D. Y. 2017. Atrophic Gastritis Increases the Risk of Gastric Cancer in AsymptomaticPopulation in Korea. Gut Liver, 11, 575-576.
CHEUNG, K. S. et al. 2018. Long-term proton pump inhibitors and risk of gastric cancer development after treatment for Helicobacter pylori: a population-based study. Gut, 67, 28-35.
CHIARAVALLI, A. M. et al. 2012. Histotype-based prognostic classification of gastric cancer. World J Gastroenterol, 18, 896-904.
CHIHARA, K.,et al. 2009. Increased vulnerability of hippocampal pyramidal neurons to the toxicity of kainic acid in OASIS-deficient mice. J Neurochem, 110, 956-65.
CHOI, Y. J. et al. 2018. Correction: The relationship between drinking alcohol and esophageal, gastric or colorectal cancer: A nationwide population-based cohort study of South Korea. PLoS One, 13,e0197765.
CHOWDHURY, U. R. et al. 2009. Emerging role of nuclear protein 1 (NUPR1) in cancer biology. Cancer Metastasis Rev, 28, 225-32.
CHU, A. et al. 2016. Large-scale profiling of microRNAs for The Cancer Genome Atlas. Nucleic Acids Res, 44, e3.
CHU, E. et al. 1993. Regulation of thymidylate synthase in human colon cancer cells treated with 5-fluorouracil and interferon-gamma. Mol Pharmacol, 43, 527-33.

225
CLEMMONS, D. R. et al. 2002. Inhibition of insulin-like growth factor binding protein 5 proteolysis in articular cartilage and joint fluid results in enhanced concentrations of insulin-like growth factor 1 and is associated with improved osteoarthritis. Arthritis Rheum, 46, 694-703.
COATI, I. et al. 2015. Autoimmune gastritis: Pathologist's viewpoint. World J Gastroenterol, 21,12179-89.
COBURN, N. et al. 2018. Staging and surgical approaches in gastric cancer: A systematic review. Cancer Treat Rev, 63, 104-115.
COCCOLINI, F. et al. 2014. Intraperitoneal chemotherapy in advanced gastric cancer. Meta-analysis of randomized trials. Eur J Surg Oncol, 40, 12-26.
COKKINIDES, V. E. et al. 2012. Cancer-related risk factors and preventive measures in US Hispanics/Latinos. CA Cancer J Clin, 62, 353-63.
COLLABORATORS, G. B. D. R. F. 2016. Global, regional, and national comparative risk assessment of 79 behavioural, environmental and occupational, and metabolic risks or clusters of risks, 1990-2015: a systematic analysis for the Global Burden of Disease Study 2015. Lancet, 388, 1659-1724.
COLLARES, C. V. et al. 2013. Identifying common and specific microRNAs expressed in peripheral blood mononuclear cell of type 1, type 2, and gestational diabetes mellitus patients. BMC Res Notes,6, 491.
COLQUHOUN, A. et al. 2015. Global patterns of cardia and non-cardia gastric cancer incidence in 2012. Gut, 64, 1881-8.
CONESA, A. et al. 2016. A survey of best practices for RNA-seq data analysis. Genome Biol, 17, 13.
CONTEDUCA, V. et al. 2013. H. pylori infection and gastric cancer: state of the art (review). Int J Oncol, 42, 5-18.
COPUR, S. et al. 1995. Thymidylate synthase gene amplification in human colon cancer cell lines resistant to 5-fluorouracil. Biochem Pharmacol, 49, 1419-26.
CORDON-CARDO, C. et al. 1994. Molecular abnormalities of mdm2 and p53 genes in adult soft tissue sarcomas. Cancer Res, 54, 794-9.
CORREA, P. 1992. Human gastric carcinogenesis: a multistep and multifactorial process--First American Cancer Society Award Lecture on Cancer Epidemiology and Prevention. Cancer Res, 52,6735-40.
CORREA, P. 2011. Gastric cancer: two epidemics? Dig Dis Sci, 56, 1585-6; author reply 1586.
CORREA, P. and PIAZUELO, M. B. 2011. Helicobacter pylori Infection and Gastric Adenocarcinoma. US Gastroenterol Hepatol Rev, 7, 59-64.
CORREA, P. and PIAZUELO, M. B. 2012. The gastric precancerous cascade. J Dig Dis, 13, 2-9.
CORREIA, N. C. et al. 2016. microRNAs regulate TAL1 expression in T-cell acute lymphoblastic leukemia. Oncotarget, 7, 8268-81.
CORTEZ, M. A. et al. 2011. MicroRNAs in body fluids--the mix of hormones and biomarkers. Nat Rev Clin Oncol, 8, 467-77.
CORTEZ, M. A. et al. 2016. PDL1 Regulation by p53 via miR-34. J Natl Cancer Inst, 108.
CRAIG, P. M. et al. W. 2014. Profiling hepatic microRNAs in zebrafish: fluoxetine exposure mimics a fasting response that targets AMP-activated protein kinase (AMPK). PLoS One, 9, e95351.
CRICK, F. 1970. Central dogma of molecular biology. Nature, 227, 561-3.
CRISTESCU, R. et al. 2015. Molecular analysis of gastric cancer identifies subtypes associated with distinct clinical outcomes. Nat Med, 21, 449-56.
226
CROWE, N. et al. 2016. Detecting new microRNAs in human osteoarthritic chondrocytes identifies miR-3085 as a human, chondrocyte-selective, microRNA. Osteoarthritis Cartilage, 24, 534-43.
CUI, Y. et al. 2017. Long Noncoding RNA HOXA11-AS Functions as miRNA Sponge to Promote the Glioma Tumourigenesis Through Targeting miR-140-5p. DNA Cell Biol, 36, 822-828.
CUNNINGHAM, D. et al. 2006. Perioperative chemotherapy versus surgery alone for resectable gastroesophageal cancer. N Engl J Med, 355, 11-20.
CUNNINGHAM, D. et al. 2008. Capecitabine and oxaliplatin for advanced esophagogastric cancer. N Engl J Med, 358, 36-46.
CZOPEK, J. P. et al. 2003. EBV-positive gastric carcinomas in Poland. Pol J Pathol, 54, 123-8.
DAI, Y. and WANG, W. H. 2006. Non-steroidal anti-inflammatory drugs in prevention of gastric cancer. World J Gastroenterol, 12, 2884-9.
DANAEI, G. et al. 2005. Causes of cancer in the world: comparative risk assessment of nine behavioural and environmental risk factors. Lancet, 366, 1784-93.
DANN, C. E. et al. 2001. Insights into Wnt binding and signalling from the structures of two Frizzled cysteine-rich domains. Nature. 412, 86-90.
DAVIDSON-MONCADA, J.,et al. 2010. MicroRNAs of the immune system: roles in inflammation and cancer. Ann N Y Acad Sci, 1183, 183-94.
DAWSON, M. A. et al. 2009. Clinical and immunohistochemical features associated with a response to bortezomib in patients with multiple myeloma. Clin Cancer Res, 15, 714-22.
DE ANGELIS, R. et al. 2014. Cancer survival in Europe 1999-2007 by country and age: results of EUROCARE--5-a population-based study. Lancet Oncol, 15, 23-34.
DE MARTEL, C. et al. 2012. Global burden of cancers attributable to infections in 2008: a review and synthetic analysis. Lancet Oncol, 13, 607-15.
DE ROZIERES, S. et al. 2000. The loss of mdm2 induces p53-mediated apoptosis. Oncogene, 19,1691-7.
DE VRIES, A. C. et al. 2008. Gastric cancer risk in patients with premalignant gastric lesions: a nationwide cohort study in the Netherlands. Gastroenterology, 134, 945-52.
DEMICCO, E. G. et al. 2011. The dichotomy in carcinogenesis of the distal esophagus and esophagogastric junction: intestinal-type vs cardiac-type mucosa-associated adenocarcinoma. Mod Pathol, 24, 1177-90.
DERAKHSHAN, M. H. et al. 2015. In healthy volunteers, immunohistochemistry supports squamous to columnar metaplasia as mechanism of expansion of cardia, aggravated by central obesity. Gut, 64,1705-14.
DESVIGNES, T. et al. 2015. miRNA Nomenclature: A View Incorporating Genetic Origins,Biosynthetic Pathways, and Sequence Variants. Trends Genet, 31, 613-626.
DIASIO, R. B. and HARRIS, B. E. 1989. Clinical pharmacology of 5-fluorouracil. Clin Pharmacokinet, 16, 215-37.
DILEEPAN, M. et al. 2016. MicroRNA Mediated Chemokine Responses in Human Airway Smooth Muscle Cells. PLoS One, 11, e0150842.
DING, B. et al. 2017. A novel microRNA signature predicts survival in stomach adenocarcinoma. Oncotarget, 8, 28144-28153.
DING, L. et al. 2010. MiR-375 frequently downregulated in gastric cancer inhibits cell proliferation by targeting JAK2. Cell Res, 20, 784-93.

227
DINIS-RIBEIRO, M. et al. 2012. Management of precancerous conditions and lesions in the stomach (MAPS): guideline from the European Society of Gastrointestinal Endoscopy (ESGE), European Helicobacter Study Group (EHSG), European Society of Pathology (ESP), and the Sociedade Portuguesa de Endoscopia Digestiva (SPED). Endoscopy, 44, 74-94.
DJEBALI, S. et al. 2012. Landscape of transcription in human cells. Nature, 489, 101-8.
DOERRENBERG, M. et al. 2017. T-cell acute lymphoblastic leukemia in infants has distinct genetic and epigenetic features compared to childhood cases. Genes Chromosomes Cancer, 56, 159-167.
DONEHOWER, L. A. 2014. Insights into wild-type and mutant p53 functions provided by genetically engineered mice. Hum Mutat, 35, 715-27.
DONG, W. et al. 2016. MiR-140-3p suppressed cell growth and invasion by downregulating the expression of ATP8A1 in non-small cell lung cancer. Tumour Biol, 37, 2973-85.
DRUSCO A. et al. 2018. Circulating Micrornas Predict Survival of Patients with Tumours of Glial Origin. EBioMedicine, 30, 105-112.
DUAN, L. et al. 2015. p53-regulated autophagy is controlled by glycolysis and determines cell fate. Oncotarget, 6, 23135-56.
DULAK, A. M. et al. 2013. Exome and whole-genome sequencing of esophageal adenocarcinoma identifies recurrent driver events and mutational complexity. Nat Genet, 45, 478-86.
DURU, N. et al. 2016. Loss of miR-140 is a key risk factor for radiation-induced lung fibrosis through reprogramming fibroblasts and macrophages. Sci Rep, 6, 39572.
EL-OMAR, E. M. 2001. The importance of interleukin 1beta in Helicobacter pylori associated disease. Gut, 48, 743-7.
ERICKSEN, R. E. et al. 2014. Obesity accelerates Helicobacter felis-induced gastric carcinogenesis by enhancing immature myeloid cell trafficking and TH17 response. Gut, 63, 385-94.
FABBRI, M. et al. 2012. MicroRNAs bind to Toll-like receptors to induce prometastatic inflammatory response. Proc Natl Acad Sci U S A, 109, E2110-6.
Fakharzadeh, S. S. et al. 1991. Tumourigenic potential associated with enhanced expression of a gene that is amplified in a mouse tumour cell line. EMBO J, 10, 1565–1569.
FANG, W. L. et al. 2011. Comparison of the survival difference between AJCC 6th and 7th editions for gastric cancer patients. World J Surg, 35, 2723-9.
FANG, Z. et al. 2017. miR-140-5p suppresses the proliferation, migration and invasion of gastric cancer by regulating YES1. Mol Cancer, 16, 139.
FERLAY J, S. I. et al. 2013. GLOBOCAN 2012 v 1.0, Cancer incidence and mortality worldwide: IARC CancerBase No. 11 [Internet]. Lyon: International Agency for Research on Cancer; 2013]. Available from: http://globocan.iarc.fr. [Online]. 2018].
FERLAY, J. et al. 2015. Cancer incidence and mortality worldwide: sources, methods and major patterns in GLOBOCAN 2012. Int J Cancer, 136, E359-86.
FERRO, A. et al. 2018a. Tobacco smoking and gastric cancer: meta-analyses of published data versus pooled analyses of individual participant data (StoP Project). Eur J Cancer Prev, 27, 197-204.
FERRO, A. et al. 2018b. Alcohol intake and gastric cancer: Meta-analyses of published data versus individual participant data pooled analyses (StoP Project). Cancer Epidemiol, 54, 125-132.
FERRO, A. et al. 2014. Worldwide trends in gastric cancer mortality (1980-2011), with predictions to 2015, and incidence by subtype. Eur J Cancer, 50, 1330-44.
FLAMINI, V. et al. 2018. Distinct mechanisms by which two forms of miR-140 suppress the malignant properties of lung cancer cells. Oncotarget, 9, 36474-36491.

228
FLAMINI, V., et al 2017. Therapeutic Role of MiR-140-5p for the Treatment of Non-small Cell Lung Cancer. Anticancer Res, 37, 4319-4327.
FOCACCETTI, C. et al. 2015. Effects of 5-fluorouracil on morphology, cell cycle, proliferation,apoptosis, autophagy and ROS production in endothelial cells and cardiomyocytes. PLoS One, 10,e0115686.
FOCK, K. M. et al. 2009. Second Asia-Pacific Consensus Guidelines for Helicobacter pylori infection. J Gastroenterol Hepatol, 24, 1587-600.
FONTHAM, E. T. 2009. Infectious diseases and global cancer control. CA Cancer J Clin, 59, 5-7.
FORD, A. C. et al. 2014. Helicobacter pylori eradication therapy to prevent gastric cancer in healthy asymptomatic infected individuals: systematic review and meta-analysis of randomised controlled trials. BMJ, 348, g3174.
FORD, H. E. et al. 2014. Docetaxel versus active symptom control for refractory oesophagogastric adenocarcinoma (COUGAR-02): an open-label, phase 3 randomised controlled trial. Lancet Oncol,15, 78-86.
FOX, J. G. and WANG, T. C. 2007. Inflammation, atrophy, and gastric cancer. J Clin Invest, 117, 60-9.
FRANKEN, N. A. et al. 2006. Clonogenic assay of cells in vitro. Nat Protoc, 1, 2315-9.
FUCHS, C. S. et al. 2014. Ramucirumab monotherapy for previously treated advanced gastric or gastro-oesophageal junction adenocarcinoma (REGARD): an international, randomised, multicentre,placebo-controlled, phase 3 trial. Lancet, 383, 31-39.
GABAY, O. and CLOUSE, K. A. 2016. Epigenetics of cartilage diseases. Joint Bone Spine, 83, 491-4.
GALIATSATOS, P. et al. 2017. Low yield of gastroscopy in patients with Lynch syndrome. Turk J Gastroenterol, 28, 434-438.
GANDALOVICOVA, A. et al. 2017. Migrastatics-Anti-metastatic and Anti-invasion Drugs: Promises and Challenges. Trends Cancer, 3, 391-406.
GARCIA-DONAS, J. et al. 2016. Deep sequencing reveals microRNAs predictive of antiangiogenic drug response. JCI Insight, 1, e86051.
GAT-YABLONSKI, G. et al. 2013. Nutritional catch-up growth. World Rev Nutr Diet, 106, 83-9.
GERNAPUDI, R. et al. 2015. Targeting exosomes from preadipocytes inhibits preadipocyte to cancer stem cell signaling in early-stage breast cancer. Breast Cancer Res Treat, 150, 685-95.
GIANCOTTI, F. G. 2014. Deregulation of cell signaling in cancer. FEBS Lett, 588, 2558-70.
GIBSON, G. and ASAHARA, H. 2013. microRNAs and cartilage. J Orthop Res, 31, 1333-44.
GLAZER, R. I. and LLOYD, L. S. 1982. Association of cell lethality with incorporation of 5-fluorouracil and 5-fluorouridine into nuclear RNA in human colon carcinoma cells in culture. Mol Pharmacol, 21, 468-73.
GLOBAL BURDEN OF DISEASE CANCER COLLABORATION. 2017. Global, Regional, and National Cancer Incidence, Mortality, Years of Life Lost, Years Lived With Disability, and Disability-Adjusted Life-years for 32 Cancer Groups, 1990 to 2015: A Systematic Analysis for the Global Burden of Disease Study. JAMA Oncol, 3, 524-548.
GASTRIC (Global Advanced/Adjuvant Stomach Tumour Research International Collaboration) Group. 2013. Role of chemotherapy for advanced/recurrent gastric cancer: an individual-patient-data meta-analysis. Eur J Cancer, 49, 1565-77.
Goel, H.L. and Mercurio, A. M. 2013. VEGF targets the tumour cell. Nature reviews Cancer. 13, 871-882.

229
GONG, E. J. et al. 2018. Characteristics of non-cardia gastric cancer with a high serum anti-Helicobacter pylori IgG titer and its association with diffuse-type histology. PLoS One, 13, e0195264.
GONZALEZ, C. A. et al. 2012. Fruit and vegetable intake and the risk of gastric adenocarcinoma: a reanalysis of the European Prospective Investigation into Cancer and Nutrition (EPIC-EURGAST) study after a longer follow-up. Int J Cancer, 131, 2910-9.
GONZALEZ, C. A. et al. 2003. Smoking and the risk of gastric cancer in the European ProspectiveInvestigation Into Cancer and Nutrition (EPIC). Int J Cancer, 107, 629-34.
GOSEKI, N. et al. 1992. Differences in the mode of the extension of gastric cancer classified by histological type: new histological classification of gastric carcinoma. Gut, 33, 606-12.
GREEN, P. H. and O'TOOLE, K. M. 1982. Early gastric cancer. Ann Intern Med, 97, 272-3.
GRIFFITHS-JONES, S. et al. 2006. miRBase: microRNA sequences, targets and gene nomenclature. Nucleic Acids Res, 34, D140-4.
GRIMES, J. A. et al. 2016. A comparison of microRNA expression profiles from splenic hemangiosarcoma, splenic nodular hyperplasia, and normal spleens of dogs. BMC Vet Res, 12, 272.
Gu L. et al. 2009. Regulation of XIAP translation and induction by MDM2 following irradiation. Cancer cell. 15, 363-375.
GU, R. et al. 2016. Biological roles of microRNA-140 in tumour growth, migration, and metastasis of osteosarcoma in vivo and in vitro. Tumour Biol, 37, 353-60.
GU, Y. Q. et al. 2014. miRNA profiling reveals a potential role of milk stasis in breast carcinogenesis. Int J Mol Med, 33, 1243-9.
GUAN, L. et al. 2018. Biomarker identification in clear cell renal cell carcinoma based on miRNA-seq and digital gene expression-seq data. Gene, 647, 205-212.
GUEDES, A. G. et al. 2015. CD38 and airway hyper-responsiveness: studies on human airway smooth muscle cells and mouse models. Can J Physiol Pharmacol, 93, 145-53.
GUILFORD, P. et al. 1998. E-cadherin germline mutations in familial gastric cancer. Nature, 392,402-5.
GULLU, G. et al. 2015. Clinical significance of miR-140-5p and miR-193b expression in patients with breast cancer and relationship to IGFBP5. Genet Mol Biol, 38, 21-9.
GULLUOGLU, S. et al. 2016. The potential function of microRNA in chordomas. Gene, 585, 76-83.
HA, M. et al. 2012. A case of Cowden syndrome diagnosed from multiple gastric polyposis. World J Gastroenterol, 18, 861-4.
HAMFJORD, J. et al. 2012. Differential expression of miRNAs in colorectal cancer: comparison of paired tumour tissue and adjacent normal mucosa using high-throughput sequencing. PLoS One, 7,e34150.
HANAHAN, D. and WEINBERG, R. A. 2011. Hallmarks of cancer: the next generation. Cell, 144,646-74.
HANSEN, T. B. et al. 2013. Circular RNA and miR-7 in cancer. Cancer Res, 73, 5609-12.
HANSON, B. J. and HONG, W. 2003. Evidence for a role of SNX16 in regulating traffic between the early and later endosomal compartments. J Biol Chem, 278, 34617-30.
HANSSON, G. K. 2005. Inflammation, atherosclerosis, and coronary artery disease. N Engl J Med,352, 1685-95.
HANSSON, L. E. et al. 1996. The risk of stomach cancer in patients with gastric or duodenal ulcer disease. N Engl J Med, 335, 242-9.

230
HAO, N. B.et al. 2017. The role of miRNA and lncRNA in gastric cancer. Oncotarget, 8, 81572-81582.
HAUPT, Y. et al. 1997. Mdm2 promotes the rapid degradation of p53. Nature, 387, 296-9.
HAUSMANN, C. et al. 2015. ILKAP, ILK and PINCH1 control cell survival of p53-wildtype glioblastoma cells after irradiation. Oncotarget, 6, 34592-605.
HE, S. et al. 2015. Dissecting Collective Cell Behavior in Polarization and Alignment on Micropatterned Substrates. Biophys J, 109, 489-500.
HELICOBACTER and CANCER COLLABORATIVE, G. 2001. Gastric cancer and Helicobacter pylori: a combined analysis of 12 case control studies nested within prospective cohorts. Gut, 49, 347-53.
HILL, B. T. and BASERGA, R. 1975. The cell cycle and its significance for cancer treatment. Cancer Treat Rev, 2, 159-75.
HONG, E. and REDDI, A. H. 2013. Dedifferentiation and redifferentiation of articular chondrocytes from surface and middle zones: changes in microRNAs-221/-222, -140, and -143/145 expression. Tissue Eng Part A, 19, 1015-22.
HORIE, N. et al. 1995. Functional analysis and DNA polymorphism of the tandemly repeated sequences in the 5'-terminal regulatory region of the human gene for thymidylate synthase. Cell Struct Funct, 20, 191-7.
HORWITZ, R. and WEBB, D. 2003. Cell migration. Curr Biol, 13, R756-9.
HOUGHTON, J. A. et al. 1995. Ratio of 2'-deoxyadenosine-5'-triphosphate/thymidine-5'-triphosphate influences the commitment of human colon carcinoma cells to thymineless death. Clin Cancer Res, 1,723-30.
HSU, P. I. et al. 1997. Correlation of serum immunoglobulin G Helicobacter pylori antibody titers with histologic and endoscopic findings in patients with dyspepsia. J Clin Gastroenterol, 25, 587-91.
HU, B.et al. 2012. Gastric cancer: Classification, histology and application of molecular pathology. J Gastrointest Oncol, 3, 251-61.
HU, L. et al. 2016. Integrative microRNA and gene profiling data analysis reveals novel biomarkers and mechanisms for lung cancer. Oncotarget, 7, 8441-54.
HUANG, K. H.et al. 2015. The correlation between miRNA and lymph node metastasis in gastric cancer. Biomed Res Int, 2015, 543163.
HUANG, Q. et al. 2015. Differences in Clinicopathology of Early Gastric Carcinoma between Proximal and Distal Location in 438 Chinese Patients. Sci Rep, 5, 13439.
HUANG, X.et al. 2016. Transcriptional Profiles from Paired Normal Samples Offer Complementary Information on Cancer Patient Survival--Evidence from TCGA Pan-Cancer Data. Sci Rep, 6, 20567.
HUANG, X. Z. et al. 2017. Aspirin and non-steroidal anti-inflammatory drugs use reduce gastric cancer risk: A dose-response meta-analysis. Oncotarget, 8, 4781-4795.
HUO, Q. 2017. Analysis of expression profile of miRNA in stomach adenocarcinoma. J BUON, 22,1154-1159.
HUSZNO, J. et al. 2012. Mucin secretion activity of gastric cancer as a prognostic factor: a clinicopathological analysis. Contemp Oncol (Pozn), 16, 159-64.
HUTVAGNER, G. et al. 2001. A cellular function for the RNA-interference enzyme Dicer in the maturation of the let-7 small temporal RNA. Science, 293, 834-8.
HWANG, S. W.et al. 2010. Preoperative staging of gastric cancer by endoscopic ultrasonography and multidetector-row computed tomography. J Gastroenterol Hepatol, 25, 512-8.

231
INTERNATIONAL AGENCY FOR RESEARCH ON CANCER. 1994a. IARC working group on the evaluation of carcinogenic risks to humans: some industrial chemicals. Lyon, 15-22 February 1994. IARC Monogr Eval Carcinog Risks Hum, 60, 1-560.
INTERNATIONAL AGENCY FOR RESEARCH ON CANCER. 1994b. Schistosomes, liver flukes and Helicobacter pylori. IARC Working Group on the Evaluation of Carcinogenic Risks to Humans. Lyon, 7-14 June 1994. IARC Monogr Eval Carcinog Risks Hum, 61, 1-241.
IGUCHI, H. et al. 2010. Secretory microRNAs as a versatile communication tool. Commun Integr Biol, 3, 478-81.
IHRE, B. J. et al. 1964. Ulcer-Cancer of the Stomach. A Follow-up Study of 473 Cases of Gastric Ulcer. Gastroenterologia, 102, 78-91.
IIZASA, H. et al. 2012. Epstein-Barr Virus (EBV)-associated gastric carcinoma. Viruses, 4, 3420-39.
IKOMA, N. et al. 2018. Evaluation of the American Joint Committee on Cancer 8th edition staging system for gastric cancer patients after preoperative therapy. Gastric Cancer, 21, 74-83.
IKUSHIMA, H. and MIYAZONO, K. 2010. TGFbeta signalling: a complex web in cancer progression. Nat Rev Cancer, 10, 415-24.
ILIOPOULOS, D. et al. 2008. Integrative microRNA and proteomic approaches identify novel osteoarthritis genes and their collaborative metabolic and inflammatory networks. PLoS One, 3, e3740.
IMAI, S. et al. 1994. Gastric carcinoma: monoclonal epithelial malignant cells expressing Epstein-Barr virus latent infection protein. Proc Natl Acad Sci U S A, 91, 9131-5.
INSTITUTE, N. C. 2017. Survival by Stage, Cancer Stat Facts: Stomach Cancer [Online] [Online]. [Accessed 5th April 2018].
INSTITUTE, N. C. 2018. Cancer Stat Facts: Stomach Cancer [Online]. [Online]. Available: Available at: https://seer.cancer.gov/statfacts/html/stomach.html [Accessed 15 Augest 2018].
INUI, M. et al, H. 2018. Dissecting the roles of miR-140 and its host gene. Nat Cell Biol, 20, 516-518.
IORIO, M. V. et al. 2007. MicroRNA signatures in human ovarian cancer. Cancer Res, 67, 8699-707.
ISHIMOTO, T. et al. 2014. Macrophage-derived reactive oxygen species suppress miR-328 targeting CD44 in cancer cells and promote redox adaptation. Carcinogenesis, 35, 1003-11.
ISHIOKA, K. et al. 2018. Association between ALDH2 and ADH1B polymorphisms, alcohol drinking and gastric cancer: a replication and mediation analysis. Gastric Cancer, 21, 936-945.
ISOBE, T. et al. 2015. Characteristics and prognosis of mucinous gastric carcinoma. Mol Clin Oncol,3, 44-50.
JACKSON, C. et al. 2007. Therapeutic options in gastric cancer: neoadjuvant chemotherapy vs postoperative chemoradiotherapy. Oncology (Williston Park), 21, 1084-7; discussion 1090, 1096-8, 1101.
JACKSON, L. M. et al. 2000. Cyclooxygenase (COX) 1 and 2 in normal, inflamed, and ulcerated human gastric mucosa. Gut, 47, 762-70.
JAGER, D. et al. 2017. HOXA7, HOXA9, and HOXA10 are differentially expressed in clival and sacral chordomas. Sci Rep, 7, 2032.
JANSSEN, H. L. et al. 2013. Treatment of HCV infection by targeting microRNA. N Engl J Med, 368,1685-94.
JAPANESE GASTRIC CANCER Association. 2011. Japanese classification of gastric carcinoma: 3rd English edition. Gastric Cancer, 14, 101-12.
JAYASURIYA, C. T. and CHEN, Q. 2015. Potential benefits and limitations of utilizing chondroprogenitors in cell-based cartilage therapy. Connect Tissue Res, 56, 265-71.

232
JEMAL, A. et al. 2011. Global cancer statistics. CA Cancer J Clin, 61, 69-90.
JEMAL, A. et al. 2006. Cancer statistics, 2006. CA Cancer J Clin, 56, 106-30.
JEURNINK, S. M. et al. 2012. Variety in vegetable and fruit consumption and the risk of gastric and esophageal cancer in the European Prospective Investigation into Cancer and Nutrition. Int J Cancer,131, E963-73.
JIMENEZ FONSECA, P. et al. 2017. Lauren subtypes of advanced gastric cancer influence survival and response to chemotherapy: real-world data from the AGAMENON National Cancer Registry. Br J Cancer, 117, 775-782.
Jin H.Y. et al. 2015. Transfection of microRNA Mimics Should Be Used with Caution. Frontiers in genetics. 6, 340.
JING, P. et al. 2016. MicroR-140-5p suppresses tumour cell migration and invasion by targeting ADAM10-mediated Notch1 signaling pathway in hypopharyngeal squamous cell carcinoma. Exp Mol Pathol, 100, 132-8.
JOHNSTON, P. G. and KAYE, S. 2001. Capecitabine: a novel agent for the treatment of solid tumours. Anticancer Drugs, 12, 639-46.
JONES, S. N. et al. 1995. Rescue of embryonic lethality in Mdm2-deficient mice by absence of p53. Nature, 378, 206-8.
JORGENSEN, J. T. 2010. Targeted HER2 treatment in advanced gastric cancer. Oncology, 78, 26-33.
JOYCE, J. A. and POLLARD, J. W. 2009. Microenvironmental regulation of metastasis. Nat Rev Cancer, 9, 239-52.
JU, J. 2010. miRNAs as biomarkers in colorectal cancer diagnosis and prognosis. Bioanalysis, 2, 901-6.
JUNG, K. W. et al. 2017. Cancer Statistics in Korea: Incidence, Mortality, Survival, and Prevalence in 2014. Cancer Res Treat, 49, 292-305.
JUSTUS, C. R. et al. 2014. In vitro cell migration and invasion assays. J Vis Exp.
KAKIUCHI, M. et al. 2014. Recurrent gain-of-function mutations of RHOA in diffuse-type gastric carcinoma. Nat Genet, 46, 583-7.
KAMOSHIDA, S. et al. 2005. Immunohistochemical demonstration of fluoropyrimidine-metabolizing enzymes in various types of cancer. Oncol Rep, 14, 1223-30.
KAMPSCHOER, G. H. et al. 1989. Changing patterns in gastric adenocarcinoma. Br J Surg, 76, 914-6.
KANDOTH, C. et al. 2013. Mutational landscape and significance across 12 major cancer types. Nature, 502, 333-339.
KANEKO, S. and YOSHIMURA, T. 2001. Time trend analysis of gastric cancer incidence in Japan by histological types, 1975-1989. Br J Cancer, 84, 400-5.
KANG, G. H. et al. 2002. Epstein-barr virus-positive gastric carcinoma demonstrates frequent aberrant methylation of multiple genes and constitutes CpG island methylator phenotype-positive gastric carcinoma. Am J Pathol, 160, 787-94.
KANG, J. H. et al. 2012. Salvage chemotherapy for pretreated gastric cancer: a randomized phase III trial comparing chemotherapy plus best supportive care with best supportive care alone. J Clin Oncol,30, 1513-8.
KANG, J. Y. et al. 2002. Risk of gastric carcinoma in patients with atrophic gastritis and intestinal metaplasia. Gut, 51, 899.

233
KARAKAS, M. et al. 2017. Circulating microRNAs strongly predict cardiovascular death in patients with coronary artery disease-results from the large AtheroGene study. Eur Heart J, 38, 516-523.
KARIMI, P. et al. 2014. Gastric cancer: descriptive epidemiology, risk factors, screening, and prevention. Cancer Epidemiol Biomarkers Prev, 23, 700-13.
KARLSEN, T. A. et al. 2014. microRNA-140 targets RALA and regulates chondrogenic differentiation of human mesenchymal stem cells by translational enhancement of SOX9 and ACAN. Stem Cells Dev, 23, 290-304.
Karni-Schmidt O. et al. 2016. The Roles of MDM2 and MDMX in Cancer. Annual review of pathology. 11, 617-644
KASTENHUBER, E. R. and LOWE, S. W. 2017. Putting p53 in Context. Cell, 170, 1062-1078.
KATADA, T. et al. 2009. microRNA expression profile in undifferentiated gastric cancer. Int J Oncol,34, 537-42.
KATO, I. et al. 1992. Atrophic gastritis and stomach cancer risk: cross-sectional analyses. Jpn J Cancer Res, 83, 1041-6.
KATO, T. A. et al. 2011. In vitro characterization of cells derived from chordoma cell line U-CH1 following treatment with X-rays, heavy ions and chemotherapeutic drugs. Radiat Oncol, 6, 116.
KATTAN, M. W. et al. 2003. Postoperative nomogram for disease-specific survival after an R0 resection for gastric carcinoma. J Clin Oncol, 21, 3647-50.
KAURAH, P. et al. 2007. Founder and recurrent CDH1 mutations in families with hereditary diffuse gastric cancer. JAMA, 297, 2360-72.
KAWAGUCHI, T. et al. 2017. Overexpression of suppressive microRNAs, miR-30a and miR-200c are associated with improved survival of breast cancer patients. Sci Rep, 7, 15945.
KAWAMURA, H. et al. 2001. A clinicopathologic study of mucinous adenocarcinoma of the stomach. Gastric Cancer, 4, 83-6.
KE, X.et al. 2017. MiR-514a-3p inhibits cell proliferation and epithelial-mesenchymal transition by targeting EGFR in clear cell renal cell carcinoma. Am J Transl Res, 9, 5332-5346.
KENYON, J. D. et al. 2019. Analysis of -5p and -3p Strands of miR-145 and miR-140 During Mesenchymal Stem Cell Chondrogenic Differentiation. Tissue Eng Part A, 25, 80-90.
KEUM, N. et al. 2016. Association of Physical Activity by Type and Intensity With Digestive System Cancer Risk. JAMA Oncol, 2, 1146-53.
KHARE, D. et al. 2017. Plasma microRNA profiling: Exploring better biomarkers for lymphoma surveillance. PLoS One, 12, e0187722.
KIM, C. H. et al. 2011. miRNA signature associated with outcome of gastric cancer patients following chemotherapy. BMC Med Genomics, 4, 79.
KIM, G. H. et al. 2016. Screening and surveillance for gastric cancer in the United States: Is it needed? Gastrointest Endosc, 84, 18-28.
KOIZUMI, W. et al. 2008. S-1 plus cisplatin versus S-1 alone for first-line treatment of advanced gastric cancer (SPIRITS trial): a phase III trial. Lancet Oncol, 9, 215-21.
KOMATSU, S. et al. 2013. Prognostic impact of circulating miR-21 in the plasma of patients with gastric carcinoma. Anticancer Res, 33, 271-6.
KONG, X. M. et al. 2015. MicroRNA-140-3p inhibits proliferation, migration and invasion of lung cancer cells by targeting ATP6AP2. Int J Clin Exp Pathol, 8, 12845-52.
KORKAYA, H. et al. 2012. Activation of an IL6 inflammatory loop mediates trastuzumab resistance in HER2+ breast cancer by expanding the cancer stem cell population. Mol Cell, 47, 570-84.

234
KOWALSKI, M. L. et al. 2008. Increased responsiveness to toll-like receptor 4 stimulation in peripheral blood mononuclear cells from patients with recent onset rheumatoid arthritis. Mediators Inflamm, 2008, 132732.
KRENTZ GOBER, M. et al. 2017. A microRNA signature of response to erlotinib is descriptive of TGFbeta behaviour in NSCLC. Sci Rep, 7, 4202.
KUBBUTAT, M. H. et al. 1997. Regulation of p53 stability by Mdm2. Nature, 387, 299-303.
KUFE, D. W. and MAJOR, P. P. 1981. 5-Fluorouracil incorporation into human breast carcinoma RNA correlates with cytotoxicity. J Biol Chem, 256, 9802-5.
KUMAR, R. D. et al. 2016. Unsupervised detection of cancer driver mutations with parsimony-guided learning. Nat Genet, 48, 1288-94.
KUNISAKI, C.et al. 2006. Clinicopathologic characteristics and surgical outcomes of mucinous gastric carcinoma. Ann Surg Oncol, 13, 836-42.
KUO, W. T. et al. 2015. Bioinformatic Interrogation of 5p-arm and 3p-arm Specific miRNA Expression Using TCGA Datasets. J Clin Med, 4, 1798-814.
KUSSIE, P. H. et al. 1996. Structure of the MDM2 oncoprotein bound to the p53 tumour suppressor transactivation domain. Science, 274, 948-53.
KWAK, H. W. et al. 2014. Characteristics of gastric cancer according to Helicobacter pylori infection status. J Gastroenterol Hepatol, 29, 1671-7.
LA VECCHIA, C. et al. 1992. Family history and the risk of stomach and colorectal cancer. Cancer,70, 50-5.
LABELLE, M. and HYNES, R. O. 2012. The initial hours of metastasis: the importance of cooperative host-tumour cell interactions during hematogenous dissemination. Cancer Discov, 2, 1091-9.
LADNER, R. D. 2001. The role of dUTPase and uracil-DNA repair in cancer chemotherapy. Curr Protein Pept Sci, 2, 361-70.
LAN, H. et al. 2015. miR-140-5p inhibits ovarian cancer growth partially by repression of PDGFRA. Biomed Pharmacother, 75, 117-22.
LANDGRAF, P. et al. 2007. A mammalian microRNA expression atlas based on small RNA library sequencing. Cell, 129, 1401-14.
LARSSON, S. C. et al. 2006. Folate intake, MTHFR polymorphisms, and risk of esophageal, gastric,and pancreatic cancer: a meta-analysis. Gastroenterology, 131, 1271-83.
LAUREN, P. 1965. The Two Histological Main Types of Gastric Carcinoma: Diffuse and So-CalledIntestinal-Type Carcinoma. An Attempt at a Histo-Clinical Classification. Acta Pathol Microbiol Scand, 64, 31-49.
LAURIE, N. A. et al. 2006. Inactivation of the p53 pathway in retinoblastoma. Nature, 444, 61-6.
LAZEBNIK, Y. 2010. What are the hallmarks of cancer? Nat Rev Cancer, 10, 232-3.
LE, L. T. et al. 2013. Review: the role of microRNAs in osteoarthritis and chondrogenesis. Arthritis Rheum, 65, 1963-74.
LEE, J. H. et al. 2018. Body mass index and mortality in patients with gastric cancer: a large cohort study. Gastric Cancer, 21, 913-924.
LEE, Y. C. et al. 2016. Association Between Helicobacter pylori Eradication and Gastric Cancer Incidence: A Systematic Review and Meta-analysis. Gastroenterology, 150, 1113-1124 e5.
LEE, Y. S. et al. 2014. Genomic profile analysis of diffuse-type gastric cancers. Genome Biol, 15, R55.
LEHMANN, S. M. et al. 2012. An unconventional role for miRNA: let-7 activates Toll-like receptor 7 and causes neurodegeneration. Nat Neurosci, 15, 827-35.

235
LEHTOLA, J. 1978. Family study of gastric carcinoma; With special reference to histological types. Scand J Gastroenterol Suppl, 50, 3-54.
LEVI, Z. et al. 2018. Body mass index at adolescence and risk of noncardia gastric cancer in a cohort of 1.79 million men and women. Cancer, 124, 356-363.
LI, C. et al. 2013. MiRNA-199a-3p: A potential circulating diagnostic biomarker for early gastric cancer. J Surg Oncol, 108, 89-92.
LI, C. Y. et al. 2017. Identification and functional characterization of microRNAs reveal a potential role in gastric cancer progression. Clin Transl Oncol, 19, 162-172.
LI, H. et al. 2017. MiR-140-5p inhibits synovial fibroblasts proliferation and inflammatory cytokines secretion through targeting TLR4. Biomed Pharmacother, 96, 208-214.
LI, J. et al. 2018. MicroRNA-140 Inhibits the Epithelial-Mesenchymal Transition and Metastasis in Colorectal Cancer. Mol Ther Nucleic Acids, 10, 426-437.
LI, M. et al. 2013. Helicobacter pylori infection synergizes with three inflammation-related genetic variants in the GWASs to increase risk of gastric cancer in a Chinese population. PLoS One, 8, e74976.
LI, M. et al. 2017. Time trends of esophageal and gastric cancer mortality in China, 1991-2009: an age-period-cohort analysis. Sci Rep, 7, 6797.
LI, Q. et al. 2014a. Characterization of a stem-like subpopulation in basal-like ductal carcinoma in situ (DCIS) lesions. J Biol Chem, 289, 1303-12.
LI, Q. et al. 2014b. Downregulation of miR-140 promotes cancer stem cell formation in basal-like early stage breast cancer. Oncogene, 33, 2589-600.
LI, T. et al. 2018. Identification of hub genes with prognostic values in gastric cancer by bioinformatics analysis. World J Surg Oncol, 16, 114.
LI, W. and HE, F. 2014. Monocyte to macrophage differentiation-associated (MMD) targeted by miR-140-5p regulates tumour growth in non-small cell lung cancer. Biochem Biophys Res Commun, 450,844-50.
LI, W. et al. 2014. Down-regulation of miR-140 induces EMT and promotes invasion by targeting Slug in esophageal cancer. Cell Physiol Biochem, 34, 1466-76.
LI, W. Q. et al. 2010. Downregulation of ABCG2 expression in glioblastoma cancer stem cells with miRNA-328 may decrease their chemoresistance. Med Sci Monit, 16, HY27-30.
LI, X. et al. 2011a. Identification of new aberrantly expressed miRNAs in intestinal-type gastric cancer and its clinical significance. Oncol Rep, 26, 1431-9.
LI, X. et al. 2011b. miRNA-223 promotes gastric cancer invasion and metastasis by targeting tumoursuppressor EPB41L3. Mol Cancer Res, 9, 824-33.
LI, X. et al. 2010. Survival prediction of gastric cancer by a seven-microRNA signature. Gut, 59, 579-85.
LI, X. D. et al. 2017. Elevated plasma miRNA-122, -140-3p, -720, -2861, and -3149 during early period of acute coronary syndrome are derived from peripheral blood mononuclear cells. PLoS One,12, e0184256.
LI, Z. et al. 2011. Differential DNA damage responses in p53 proficient and deficient cells: cisplatin-induced nuclear import of XPA is independent of ATR checkpoint in p53-deficient lung cancer cells. Int J Biochem Mol Biol, 2, 138-145.
LIANG, L. et al. 2017. Identification of the key miRNAs associated with survival time in stomach adenocarcinoma. Oncol Lett, 14, 4563-4572.
LIANG, S. et al. 2017. The lncRNA XIST interacts with miR-140/miR-124/iASPP axis to promote pancreatic carcinoma growth. Oncotarget, 8, 113701-113718.

236
LIANG, Y. X. et al. 2013. Characteristics and prognosis of gastric cancer in patients aged >/= 70 years. World J Gastroenterol, 19, 6568-78.
LIAO, Y. L. et al. 2012. Transcriptional regulation of miR-196b by ETS2 in gastric cancer cells. Carcinogenesis, 33, 760-9.
LIM, J. Y. et al. 2013. Overexpression of miR-196b and HOXA10 characterize a poor-prognosis gastric cancer subtype. World J Gastroenterol, 19, 7078-88.
LINDAHL, T. 1974. An N-glycosidase from Escherichia coli that releases free uracil from DNA containing deaminated cytosine residues. Proc Natl Acad Sci U S A, 71, 3649-53.
LINDBLAD, M. et al. 2005. Nonsteroidal anti-inflammatory drugs and risk of esophageal and gastric cancer. Cancer Epidemiol Biomarkers Prev, 14, 444-50.
LINDOW, M. and KAUPPINEN, S. 2012. Discovering the first microRNA-targeted drug. J Cell Biol,199, 407-12.
LINK, A. et al. 2012. Macro-role of microRNA in gastric cancer. Dig Dis, 30, 255-67.
LIU, H. T. et al. 2017. Prognostic Value of microRNA Signature in Patients with Gastric Cancers. Sci Rep, 7, 42806.
LIU, H. Z. et al. 2016. Pioglitazone up-regulates long non-coding RNA MEG3 to protect endothelial progenitor cells via increasing HDAC7 expression in metabolic syndrome. Biomed Pharmacother, 78,101-109.
LIU, J. et al. 2018. Identification of key miRNAs and genes associated with stomach adenocarcinoma from The Cancer Genome Atlas database. FEBS Open Bio, 8, 279-294.
LIU, J. et al. 2016. MiR-455-5p acts as a novel tumour suppressor in gastric cancer by down-regulating RAB18. Gene, 592, 308-15.
LIU, T. et al. 2009. MicroRNA-27a functions as an oncogene in gastric adenocarcinoma by targeting prohibitin. Cancer Lett, 273, 233-42.
LIU, X. and MELTZER, S. J. 2017. Gastric Cancer in the Era of Precision Medicine. Cell Mol Gastroenterol Hepatol, 3, 348-358.
LIU, Y. et al. 2014. TLR2 and TLR4 in autoimmune diseases: a comprehensive review. Clin Rev Allergy Immunol, 47, 136-47.
LIU, Y. et al. 2013 MicroRNA-140 promotes adipocyte lineage commitment of C3H10T1/2 pluripotent stem cells via targeting osteopetrosis-associated transmembrane protein 1. The Journal of biological chemistry. 288, 8222-8230.
LORDICK, F. et al. 2014. Unmet needs and challenges in gastric cancer: the way forward. Cancer Treat Rev, 40, 692-700.
LORDICK, F. et al. 2013. Capecitabine and cisplatin with or without cetuximab for patients with previously untreated advanced gastric cancer (EXPAND): a randomised, open-label phase 3 trial. Lancet Oncol, 14, 490-9.
LUJAMBIO, A. et al. 2007. Genetic unmasking of an epigenetically silenced microRNA in human cancer cells. Cancer Res, 67, 1424-9.
LUO, H. et al. 2009. Down-regulated miR-9 and miR-433 in human gastric carcinoma. J Exp Clin Cancer Res, 28, 82.
LUTZ, M. P. et al. 2012. Highlights of the EORTC St. Gallen International Expert Consensus on the primary therapy of gastric, gastroesophageal and oesophageal cancer - differential treatment strategies for subtypes of early gastroesophageal cancer. Eur J Cancer, 48, 2941-53.
MA, J. et al. 2016. Lauren classification and individualized chemotherapy in gastric cancer. Oncol Lett, 11, 2959-2964.

237
MA, X. et al. 2018. Clinicopathological Characteristics and Prognoses of Elderly Gastric Cancer Patients after R0 Resection: A Multicenter Study in China. J Environ Pathol Toxicol Oncol, 37, 81-91.
MACDONALD, J. S. et al. 2001. Chemoradiotherapy after surgery compared with surgery alone for adenocarcinoma of the stomach or gastroesophageal junction. N Engl J Med, 345, 725-30.
MACHADO, A. M. et al. 2009. Helicobacter pylori infection induces genetic instability of nuclear and mitochondrial DNA in gastric cells. Clin Cancer Res, 15, 2995-3002.
MACHADO, J. C. et al. 1999. E-cadherin gene mutations provide a genetic basis for the phenotypic divergence of mixed gastric carcinomas. Lab Invest, 79, 459-65.
MACKINTOSH, C. E. and KREEL, L. 1977. Anatomy and radiology of the areae gastricae. Gut, 18,855-64.
MAEHARA, Y. 2003. S-1 in gastric cancer: a comprehensive review. Gastric Cancer, 6 Suppl 1, 2-8.
MAEHARA, Y. et al. 1992. Prognosis for surgically treated gastric cancer patients is poorer for women than men in all patients under age 50. Br J Cancer, 65, 417-20.
MAHBOUDI, H. et al. 2018. Enhanced chondrogenesis differentiation of human induced pluripotent stem cells by MicroRNA-140 and transforming growth factor beta 3 (TGFbeta3). Biologicals, 52, 30-36.
MALFERTHEINER, P. et al. 2007. Current concepts in the management of Helicobacter pylori infection: the Maastricht III Consensus Report. Gut, 56, 772-81.
MALZKORN, B. et al. 2010. Identification and functional characterization of microRNAs involved in the malignant progression of gliomas. Brain Pathol, 20, 539-50.
MARCHET, A. et al. 2011. Validation of the new AJCC TNM staging system for gastric cancer in a large cohort of patients (n = 2,155): focus on the T category. Eur J Surg Oncol, 37, 779-85.
MARIETTE, C. et al. 2011. Oesophagogastric junction adenocarcinoma: which therapeutic approach? Lancet Oncol, 12, 296-305.
Manfredi, J. J. et al. The Mdm2-p53 relationship evolves: Mdm2 swings both ways as an oncogene and a tumour suppressor. 2010. Genes & development, 24, 1580-1589
MAROTTA, L. L. et al. 2011. The JAK2/STAT3 signaling pathway is required for growth of CD44(+)CD24(-) stem cell-like breast cancer cells in human tumours. J Clin Invest, 121, 2723-35.
MARQUES, F. Z. et al. 2016. The transcardiac gradient of cardio-microRNAs in the failing heart. Eur J Heart Fail, 18, 1000-8.
MARSH, S. et al. 2001. Polymorphism in the thymidylate synthase promoter enhancer region in colorectal cancer. Int J Oncol, 19, 383-6.
MARSHALL, B. J. and WARREN, J. R. 1984. Unidentified curved bacilli in the stomach of patients with gastritis and peptic ulceration. Lancet, 1, 1311-5.
MARSHALL, B. J. and WINDSOR, H. M. 2005. The relation of Helicobacter pylori to gastric adenocarcinoma and lymphoma: pathophysiology, epidemiology, screening, clinical presentation,treatment, and prevention. Med Clin North Am, 89, 313-44, viii.
MATSUDA, T. et al. 2011. Population-based survival of cancer patients diagnosed between 1993 and 1999 in Japan: a chronological and international comparative study. Jpn J Clin Oncol, 41, 40-51.
MATSUZAKA, M. et al. 2016. High Mortality Rate of Stomach Cancer Caused Not by High Incidence but Delays in Diagnosis in Aomori Prefecture, Japan. Asian Pac J Cancer Prev, 17, 4723-4727.

238
MCCREDIE, M. et al. 1999. Cancer mortality in migrants from the British Isles and continental Europe to New South Wales, Australia, 1975-1995. Int J Cancer, 83, 179-85.
MENG Y. et al. 2017. MicroRNA-140-5p regulates osteosarcoma chemoresistance by targeting HMGN5 and autophagy. Scientific reports. 7, 416.
MEYN, R. E. et al. 1980. Cycle-dependent anticancer drug cytotoxicity in mammalian cells synchronized by centrifugal elutriation. J Natl Cancer Inst, 64, 1215-9.
MEZHIR, J. J et al. 2011. Positive peritoneal cytology in patients with gastric cancer: natural history and outcome of 291 patients. Indian J Surg Oncol, 2, 16-23.
MIN, Z. et al. 2015. MicroRNAs associated with osteoarthritis differently expressed in bone matrix gelatin (BMG) rat model. Int J Clin Exp Med, 8, 1009-17.
MING, S. C. 1977. Gastric carcinoma. A pathobiological classification. Cancer, 39, 2475-85.
MIWA, M. et al. 1998. Design of a novel oral fluoropyrimidine carbamate, capecitabine, which generates 5-fluorouracil selectively in tumours by enzymes concentrated in human liver and cancer tissue. Eur J Cancer, 34, 1274-81.
MIYAKI, S. et al. 2009. MicroRNA-140 is expressed in differentiated human articular chondrocytes and modulates interleukin-1 responses. Arthritis Rheum, 60, 2723-30.
MIYAKI, S. et al. 2010. MicroRNA-140 plays dual roles in both cartilage development and homeostasis. Genes Dev, 24, 1173-85.
MIZAMTSIDI, M. et al. 2018. Diagnosis, management, histology and genetics of sporadic primary hyperparathyroidism: old knowledge with new tricks. Endocr Connect, 7, R56-R68.
MO, Q. et al. 2013. Pattern discovery and cancer gene identification in integrated cancer genomic data. Proc Natl Acad Sci U S A, 110, 4245-50.
MOCELLIN, S. and PASQUALI, S. 2015. Diagnostic accuracy of endoscopic ultrasonography (EUS) for the preoperative locoregional staging of primary gastric cancer. Cochrane Database Syst Rev,CD009944.
MOEHLER, M. et al. 2015. International comparison of the German evidence-based S3-guidelines on the diagnosis and multimodal treatment of early and locally advanced gastric cancer, including adenocarcinoma of the lower esophagus. Gastric Cancer, 18, 550-63.
MOMAND, J. et al. 1992. The mdm-2 oncogene product forms a complex with the p53 protein and inhibits p53-mediated transactivation. Cell, 69, 1237-45.
MONTES DE OCA LUNA, R. et al. 1995. Rescue of early embryonic lethality in mdm2-deficient mice by deletion of p53. Nature, 378, 203-6.
MOORE, S. C. et al. 2016. Association of Leisure-Time Physical Activity With Risk of 26 Types of Cancer in 1.44 Million Adults. JAMA Intern Med, 176, 816-25.
MORALES, T. I. 2007. Chondrocyte moves: clever strategies? Osteoarthritis Cartilage, 15, 861-71.
MOSAKHANI, N. et al. 2012. MicroRNA profiling predicts survival in anti-EGFR treated chemorefractory metastatic colorectal cancer patients with wild-type KRAS and BRAF. Cancer Genet,205, 545-51.
MOTTET D. et al. 2009. HDAC4 represses p21(WAF1/Cip1) expression in human cancer cells through a Sp1-dependent, p53-independent mechanism. Oncogene.28, 243-256.
MUHICH, M. L. and BOOTHROYD, J. C. 1989. Synthesis of trypanosome hsp70 mRNA is resistant to disruption of trans-splicing by heat shock. J Biol Chem, 264, 7107-10.
MUTA, H. et al. 1996. E-cadherin gene mutations in signet ring cell carcinoma of the stomach. Jpn J Cancer Res, 87, 843-8.

239
NAKAMURA, K. et al. 1992. Pathology and prognosis of gastric carcinoma. Findings in 10,000 patients who underwent primary gastrectomy. Cancer, 70, 1030-7.
NAUMANN, M. and CRABTREE, J. E. 2004. Helicobacter pylori-induced epithelial cell signalling in gastric carcinogenesis. Trends Microbiol, 12, 29-36.
NEMATI, A. et al. 2012. Case-control study of dietary pattern and other risk factors for gastric cancer. Health Promot Perspect, 2, 20-7.
NEWCOMB, D. C. and PEEBLES, R. S., JR. 2013. Th17-mediated inflammation in asthma. Curr Opin Immunol, 25, 755-60.
NGUYEN, T. L. et al. 2013. Autoimmune gastritis mediated by CD4+ T cells promotes the development of gastric cancer. Cancer Res, 73, 2117-26.
NICOLAS, F. E. et al. 2008. Experimental identification of microRNA-140 targets by silencing and overexpressing miR-140. RNA, 14, 2513-20.
NICOLAS, F. E. et al. 2011. mRNA expression profiling reveals conserved and non-conserved miR-140 targets. RNA Biol, 8, 607-15.
NISHIKAWA, J. et al. 2017. The Role of Epigenetic Regulation in Epstein-Barr Virus-Associated Gastric Cancer. Int J Mol Sci, 18.
NOH, S. H. et al. 2014. Adjuvant capecitabine plus oxaliplatin for gastric cancer after D2 gastrectomy (CLASSIC): 5-year follow-up of an open-label, randomised phase 3 trial. Lancet Oncol, 15, 1389-96.
NOMURA, A. M. et al. 2003. Case-control study of diet and other risk factors for gastric cancer in Hawaii (United States). Cancer Causes Control, 14, 547-58.
NOONE AM, H. N. et al. 2017 SEER Cancer Statistics Review, 1975-2015 [Online]. National Cancer Institute. Bethesda, MD. Available: https://seer.cancer.gov/csr/1975_2015 [Accessed 5 May 2018].
O'DOHERTY, M. G. et al. 2012. A prospective cohort study of obesity and risk of oesophageal and gastric adenocarcinoma in the NIH-AARP Diet and Health Study. Gut, 61, 1261-8.
O'NEILL, L. A. et al. 2011. MicroRNAs: the fine-tuners of Toll-like receptor signalling. Nat Rev Immunol, 11, 163-75.
OFFERHAUS, G. J. et al. 1988. Mortality caused by stomach cancer after remote partial gastrectomy for benign conditions: 40 years of follow up of an Amsterdam cohort of 2633 postgastrectomy patients. Gut, 29, 1588-90.
OH, H. K. et al. 2011. Genomic loss of miR-486 regulates tumour progression and the OLFM4 antiapoptotic factor in gastric cancer. Clin Cancer Res, 17, 2657-67.
OHMIYA, N. et al. 2006. MDM2 promoter polymorphism is associated with both an increased susceptibility to gastric carcinoma and poor prognosis. J Clin Oncol, 24, 4434-40.
OKINES, A. et al. 2010. Gastric cancer: ESMO Clinical Practice Guidelines for diagnosis, treatment and follow-up. Ann Oncol, 21 Suppl 5, v50-4.
OLIVEIRA, C. et al. 2015. Familial gastric cancer: genetic susceptibility, pathology, and implications for management. Lancet Oncol, 16, e60-70.
ONEL, K. and CORDON-CARDO, C. 2004. MDM2 and prognosis. Mol Cancer Res, 2, 1-8.
ONODERA, H. et al. 2004. Surgical outcome of 483 patients with early gastric cancer: prognosis,postoperative morbidity and mortality, and gastric remnant cancer. Hepatogastroenterology, 51, 82-5.
ORTEGA, F. J. et al. 2014. Profiling of circulating microRNAs reveals common microRNAs linked to type 2 diabetes that change with insulin sensitization. Diabetes Care, 37, 1375-83.
OSAWA, S. et al. 2011. MicroRNA profiling of gastric cancer patients from formalin-fixed paraffin-embedded samples. Oncol Lett, 2, 613-619.

240
OZATA, D. M. et al. 2017. Loss of miR-514a-3p regulation of PEG3 activates the NF-kappa B pathway in human testicular germ cell tumours. Cell Death Dis, 8, e2759.
PACHOLEWSKA, A. et al. 2017. Differential Expression of Serum MicroRNAs Supports CD4(+) T Cell Differentiation into Th2/Th17 Cells in Severe Equine Asthma. Genes (Basel), 8.
PAIS, H. et al. 2010. Analyzing mRNA expression identifies Smad3 as a microRNA-140 target regulated only at protein level. RNA, 16, 489-94.
PAN, H. W. et al. 2013. MicroRNA dysregulation in gastric cancer. Curr Pharm Des, 19, 1273-84.
PAN, K. F. et al. 2016. A large randomised controlled intervention trial to prevent gastric cancer by eradication of Helicobacter pylori in Linqu County, China: baseline results and factors affecting the eradication. Gut, 65, 9-18.
PANDO, R. et al. 2014. A serum component mediates food restriction-induced growth attenuation. Endocrinology, 155, 932-40.
PAPAIOANNOU, G. et al. 2013. let-7 and miR-140 microRNAs coordinately regulate skeletal development. Proc Natl Acad Sci U S A, 110, E3291-300.
PAPAIOANNOU, G. et al. 2015. MicroRNA-140 Provides Robustness to the Regulation of Hypertrophic Chondrocyte Differentiation by the PTHrP-HDAC4 Pathway. J Bone Miner Res, 30,1044-52.
PAPP, G. et al. 2014. SMARCB1 expression in epithelioid sarcoma is regulated by miR-206, miR-381, and miR-671-5p on Both mRNA and protein levels. Genes Chromosomes Cancer, 53, 168-76.
PARK, J. H. et al. 2016. p53 as guardian of the mitochondrial genome. FEBS Lett, 590, 924-34.
PARSONNET, J. et al. 1991. Helicobacter pylori infection in intestinal- and diffuse-type gastric adenocarcinomas. J Natl Cancer Inst, 83, 640-3.
PEEK, R. M. et al. 2010. Role of innate immunity in Helicobacter pylori-induced gastric malignancy. Physiol Rev, 90, 831-58.
PEGTEL, D. M. et al. 2010. Functional delivery of viral miRNAs via exosomes. Proc Natl Acad Sci U S A, 107, 6328-33.
PELETEIRO, B. et al. 2011. Salt intake and gastric cancer risk according to Helicobacter pylori infection, smoking, tumour site and histological type. Br J Cancer, 104, 198-207.
PENG, J. S. et al. 2016. Amelioration of Experimental Autoimmune Arthritis Through Targeting of Synovial Fibroblasts by Intraarticular Delivery of MicroRNAs 140-3p and 140-5p. Arthritis Rheumatol, 68, 370-81.
PENG, X. et al. 2013. Inhibition of proliferation and induction of autophagy by atorvastatin in PC3 prostate cancer cells correlate with downregulation of Bcl2 and upregulation of miR-182 and p21. PLoS One, 8, e70442.
PERIASAMY, J. et al. 2014. Stratification and delineation of gastric cancer signaling by in vitro transcription factor activity profiling and integrative genomics. Cell Signal, 26, 880-94.
PERRONE, F. et al. 2010. TP53 mutations and pathologic complete response to neoadjuvant cisplatin and fluorouracil chemotherapy in resected oral cavity squamous cell carcinoma. J Clin Oncol, 28, 761-6.
PETERSON, S. M. et al. 2014. Common features of microRNA target prediction tools. Front Genet,5, 23.
PETRELLI, F. et al. 2017. Prognostic value of diffuse versus intestinal histotype in patients with gastric cancer: a systematic review and meta-analysis. J Gastrointest Oncol, 8, 148-163.
PETROCCA, F. et al. 2008. E2F1-regulated microRNAs impair TGFbeta-dependent cell-cycle arrest and apoptosis in gastric cancer. Cancer Cell, 13, 272-86.

241
PHILLIPS, B. 2015. Towards evidence based medicine for paediatricians. Arch Dis Child, 100, 713.
PIEPOLI, A. et al. 2012. Mirna expression profiles identify drivers in colorectal and pancreatic cancers. PLoS One, 7, e33663.
PLEBANI, M. et al. 1996. Helicobacter pylori serology in patients with chronic gastritis. Am J Gastroenterol, 91, 954-8.
PLOCIENNIKOWSKA, A. et al. 2015. Co-operation of TLR4 and raft proteins in LPS-induced pro-inflammatory signaling. Cell Mol Life Sci, 72, 557-581.
POLLEY, E. et al. 2016. Small Cell Lung Cancer Screen of Oncology Drugs, Investigational Agents,and Gene and microRNA Expression. J Natl Cancer Inst, 108.
POULSEN, A. H. et al. 2009. Proton pump inhibitors and risk of gastric cancer: a population-based cohort study. Br J Cancer, 100, 1503-7.
PULLARKAT, S. T. et al. 2001. Thymidylate synthase gene polymorphism determines response and toxicity of 5-FU chemotherapy. Pharmacogenomics J, 1, 65-70.
QIU, M. Z. et al. 2013. Clinicopathological characteristics and prognostic analysis of Lauren classification in gastric adenocarcinoma in China. J Transl Med, 11, 58.
QUANTE, M. et al. 2013. The rapid rise in gastroesophageal junction tumours: is inflammation of the gastric cardia the underwater iceberg? Gastroenterology, 145, 708-11.
RANI, S. et al. 2011. Isolation of exosomes for subsequent mRNA, MicroRNA, and protein profiling. Methods Mol Biol, 784, 181-95.
REINHART, B. J. et al. 2000. The 21-nucleotide let-7 RNA regulates developmental timing in Caenorhabditis elegans. Nature, 403, 901-6.
RENNERT, O. M. and ANKER, H. S. 1963. On the Incorporation of 5',5',5'-Trifluoroleucine into Proteins of E. Coli. Biochemistry, 2, 471-6.
ROBERTSON, E. V. et al. 2013. Central obesity in asymptomatic volunteers is associated with increased intrasphincteric acid reflux and lengthening of the cardiac mucosa. Gastroenterology, 145,730-9.
ROCCO, A. et al. 2012. Cancer stem cell hypothesis and gastric carcinogenesis: Experimental evidence and unsolved questions. World J Gastrointest Oncol, 4, 54-9.
RODRIGUEZ, L. G. et al. 2005. Wound-healing assay. Methods Mol Biol, 294, 23-9.
ROLLAG, A. and JACOBSEN, C. D. 1984. Gastric ulcer and risk of cancer. A five-year follow-up study. Acta Med Scand, 216, 105-9.
RONELLENFITSCH, U. et al. 2013. Perioperative chemo(radio)therapy versus primary surgery for resectable adenocarcinoma of the stomach, gastroesophageal junction, and lower esophagus. Cochrane Database Syst Rev, CD008107.
ROTHMAN, A. M. et al. 2016. MicroRNA-140-5p and SMURF1 regulate pulmonary arterial hypertension. J Clin Invest, 126, 2495-508.
RUGGE, M. et al. 1994. Gastric epithelial dysplasia in the natural history of gastric cancer: a multicenter prospective follow-up study. Interdisciplinary Group on Gastric Epithelial Dysplasia. Gastroenterology, 107, 1288-96.
RUGGE, M. et al. 2016. Chronicles of a cancer foretold: 35 years of gastric cancer risk assessment. Gut, 65, 721-5.
SABROE, I. et al. 2003. Toll-like receptors in health and disease: complex questions remain. J Immunol, 171, 1630-5.

242
SAITO, H. et al. 2013. Clinicopathologic characteristics and prognosis of advanced gastric cancer simulating early gastric cancer. Yonago Acta Med, 56, 73-8.
SAITO, M. et al. 2013. Role of DNA methylation in the development of Epstein-Barr virus-associated gastric carcinoma. J Med Virol, 85, 121-7.
SAKAGUCHI, T. et al. 1998. Characteristics and clinical outcome of proximal-third gastric cancer. J Am Coll Surg, 187, 352-7.
SAKAI, T. et al. 2003. Simultaneous early adenocarcinoma and mucosa-associated lymphoid tissue (MALT) lymphoma of the stomach associated with Helicobacter pylori infection. Gastric Cancer, 6,191-6.
SALEM, O. et al. 2016. The highly expressed 5'isomiR of hsa-miR-140-3p contributes to the tumour-suppressive effects of miR-140 by reducing breast cancer proliferation and migration. BMC Genomics,17, 566.
SALIH, B. A. 2009. Helicobacter pylori infection in developing countries: the burden for how long? Saudi J Gastroenterol, 15, 201-7.
SALMENA, L. et al. 2011. A ceRNA hypothesis: the Rosetta Stone of a hidden RNA language? Cell,146, 353-8.
SAND, M. et al. 2012a. Microarray analysis of microRNA expression in cutaneous squamous cell carcinoma. J Dermatol Sci, 68, 119-26.
SAND, M. et al. 2012b. Expression of microRNAs in basal cell carcinoma. Br J Dermatol, 167, 847-55.
SANO, T. et al. 2004. Gastric cancer surgery: morbidity and mortality results from a prospective randomized controlled trial comparing D2 and extended para-aortic lymphadenectomy--Japan Clinical Oncology Group study 9501. J Clin Oncol, 22, 2767-73.
SANSONE, P. et al. 2007. IL-6 triggers malignant features in mammospheres from human ductal breast carcinoma and normal mammary gland. J Clin Invest, 117, 3988-4002.
SASAKO, M. et al. 2006. Left thoracoabdominal approach versus abdominal-transhiatal approach for gastric cancer of the cardia or subcardia: a randomised controlled trial. Lancet Oncol, 7, 644-51.
SASTRE, J. et al. 2006. Chemotherapy for gastric cancer. World J Gastroenterol, 12, 204-13.
SERRANO, N. A. et al. 2012. Integrative analysis in oral squamous cell carcinoma reveals DNA copy number-associated miRNAs dysregulating target genes. Otolaryngol Head Neck Surg, 147, 501-8.
SETHI, A. et al. 2013. Role of miRNAs in CD4 T cell plasticity during inflammation and tolerance. Front Genet, 4, 8.
SEYFRIED, T. N. and HUYSENTRUYT, L. C. 2013. On the origin of cancer metastasis. Crit Rev Oncog, 18, 43-73.
SHACKELFORD, D. B. and SHAW, R. J. 2009. The LKB1-AMPK pathway: metabolism and growth control in tumour suppression. Nat Rev Cancer, 9, 563-75.
SHAH, M. A. et al. 2011. Phase II study of modified docetaxel, cisplatin, and fluorouracil with bevacizumab in patients with metastatic gastroesophageal adenocarcinoma. J Clin Oncol, 29, 868-74.
SHEN, J. et al. 2015. Epigenetic silencing of miR-490-3p reactivates the chromatin remodeler SMARCD1 to promote Helicobacter pylori-induced gastric carcinogenesis. Cancer Res, 75, 754-65.
SHERMAN, L. et al. 2002. Inhibition of serum- and calcium-induced terminal differentiation of human keratinocytes by HPV 16 E6: study of the association with p53 degradation, inhibition of p53 transactivation, and binding to E6BP. Virology, 292, 309-20.
SHERSHER, D. D. et al. 2011. Biomarkers of the insulin-like growth factor pathway predict progression and outcome in lung cancer. Ann Thorac Surg, 92, 1805-11; discussion 1811.

243
SHIBUE, T. and WEINBERG, R. A. 2017. EMT, CSCs, and drug resistance: the mechanistic link and clinical implications. Nat Rev Clin Oncol, 14, 611-629.
SHIEH, S. Y. et al. 1997. DNA damage-induced phosphorylation of p53 alleviates inhibition by MDM2. Cell, 91, 325-34.
SHIMOKAWA, T. et al. 1998. Hypocholesterolemic effects of the LDL receptor gene transcriptional upregulator CP-230821. J Biochem, 123, 596-601.
SHIN, V. Y. et al. 2015. A three-miRNA signature as promising non-invasive diagnostic marker for gastric cancer. Mol Cancer, 14, 202.
SHRESTHA, S. et al. 2014. A systematic review of microRNA expression profiling studies in human gastric cancer. Cancer Med, 3, 878-88.
SIDONI, A. et al. 1989. Changing patterns in gastric carcinoma. Tumouri, 75, 605-8.
SIEWERT, J. R. and STEIN, H. J. 1998. Classification of adenocarcinoma of the oesophagogastric junction. Br J Surg, 85, 1457-9.
SITARZ, R. et al. 2012. Gastroenterostoma after Billroth antrectomy as a premalignant condition. World J Gastroenterol, 18, 3201-6.
SITARZ, R. et al. 2018. Gastric cancer: epidemiology, prevention, classification, and treatment. Cancer Manag Res, 10, 239-248.
SMALLEY, S. R. et al. 2012. Updated analysis of SWOG-directed intergroup study 0116: a phase III trial of adjuvant radiochemotherapy versus observation after curative gastric cancer resection. J Clin Oncol, 30, 2327-33.
SMYTH, E. C. et al. 2016. Gastric cancer: ESMO Clinical Practice Guidelines for diagnosis, treatment and follow-up. Ann Oncol, 27, v38-v49.
SOGAARD, K. K. et al. 2016. Long-term risk of gastrointestinal cancers in persons with gastric or duodenal ulcers. Cancer Med, 5, 1341-51.
SOHN, B. H. et al. 2017. Clinical Significance of Four Molecular Subtypes of Gastric Cancer Identified by The Cancer Genome Atlas Project. Clin Cancer Res.
SOLCIA, E. et al. 2009. A combined histologic and molecular approach identifies three groups of gastric cancer with different prognosis. Virchows Arch, 455, 197-211.
SOMMER, H. and SANTI, D. V. 1974. Purification and amino acid analysis of an active site peptide from thymidylate synthetase containing covalently bound 5-fluoro-2'-deoxyuridylate and methylenetetrahydrofolate. Biochem Biophys Res Commun, 57, 689-95.
SONG, B. et al. 2009. Mechanism of chemoresistance mediated by miR-140 in human osteosarcoma and colon cancer cells. Oncogene, 28, 4065-74.
SONG, H. et al. 2015. Incidence of gastric cancer among patients with gastric precancerous lesions: observational cohort study in a low risk Western population. BMJ, 351, h3867.
SONG, J. H. et al. 2017. Risk Factors for Gastric Tumourigenesis in Underlying Gastric Mucosal Atrophy. Gut Liver, 11, 612-619.
SONG, J. H. and MELTZER, S. J. 2012. MicroRNAs in pathogenesis, diagnosis, and treatment of gastroesophageal cancers. Gastroenterology, 143, 35-47 e2.
SONG, M. Y. et al. 2012. Identification of serum microRNAs as novel non-invasive biomarkers for early detection of gastric cancer. PLoS One, 7, e33608.
SONGUN, I. et al. 2010. Surgical treatment of gastric cancer: 15-year follow-up results of the randomised nationwide Dutch D1D2 trial. Lancet Oncol, 11, 439-49.

244
SONNENBERG, A. 2011. Time trends of mortality from gastric cancer in Europe. Dig Dis Sci, 56,1112-8.
SPICER D. 2009. FGF9 on the move. Nature genetics. 41, 272-273.
STARK, M. S. et al. 2015. miR-514a regulates the tumour suppressor NF1 and modulates BRAFi sensitivity in melanoma. Oncotarget, 6, 17753-63.
STEEVENS, J. et al. 2010. Alcohol consumption, cigarette smoking and risk of subtypes of oesophageal and gastric cancer: a prospective cohort study. Gut, 59, 39-48.
SU, Y. et al. 2012. Aberrant expression of microRNAs in gastric cancer and biological significance of miR-574-3p. Int Immunopharmacol, 13, 468-75.
SU, Y. et al. 2016. MicroRNA-140-5p targets insulin like growth factor 2 mRNA binding protein 1 (IGF2BP1) to suppress cervical cancer growth and metastasis. Oncotarget, 7, 68397-68411.
SUN, D. G. et al. 2017. miR-140-5p-mediated regulation of the proliferation and differentiation of human dental pulp stem cells occurs through the lipopolysaccharide/toll-like receptor 4 signaling pathway. Eur J Oral Sci, 125, 419-425.
SUN, M. et al. 2012. MiR-196a is upregulated in gastric cancer and promotes cell proliferation by downregulating p27(kip1). Mol Cancer Ther, 11, 842-52.
SUN J, et al. 2016. miR1405p regulates angiogenesis following ischemic stroke by targeting VEGFA. Molecular medicine reports. 13, 4499-4505.
SUZUKI, H. et al. 2016. High rate of 5-year survival among patients with early gastric cancer undergoing curative endoscopic submucosal dissection. Gastric Cancer, 19, 198-205.
SUZUKI, K. et al. 2006. Global DNA demethylation in gastrointestinal cancer is age dependent and precedes genomic damage. Cancer Cell, 9, 199-207.
SWAIN, S. M. et al. 1989. Fluorouracil and high-dose leucovorin in previously treated patients with metastatic breast cancer. J Clin Oncol, 7, 890-9.
SWINGLER, T. E. et al. 2012. The expression and function of microRNAs in chondrogenesis and osteoarthritis. Arthritis Rheum, 64, 1909-19.
SZKARADKIEWICZ, A. et al. 2006. Epstein-Barr virus (EBV) infection and p53 protein expression in gastric carcinoma. Virus Res, 118, 115-9.
TAKADA, K. 2000. Epstein-Barr virus and gastric carcinoma. Mol Pathol, 53, 255-61.
TAKAHASHI, K. and YAMANAKA, S. 2016. A decade of transcription factor-mediated reprogramming to pluripotency. Nat Rev Mol Cell Biol, 17, 183-93.
TAKATA, A. et al. 2011. MicroRNA-22 and microRNA-140 suppress NF-kappaB activity by regulating the expression of NF-kappaB coactivators. Biochem Biophys Res Commun, 411, 826-31.
TAKE, S. et al. 2007. Baseline gastric mucosal atrophy is a risk factor associated with the development of gastric cancer after Helicobacter pylori eradication therapy in patients with peptic ulcer diseases. J Gastroenterol, 42 Suppl 17, 21-7.
TAKE, S. et al. 2005. The effect of eradicating helicobacter pylori on the development of gastric cancer in patients with peptic ulcer disease. Am J Gastroenterol, 100, 1037-42.
TAMBE, M. et al. 2016. Novel Mad2-targeting miR-493-3p controls mitotic fidelity and cancer cells' sensitivity to paclitaxel. Oncotarget, 7, 12267-85.
TAMURA, G. et al. 1996. Inactivation of the E-cadherin gene in primary gastric carcinomas and gastric carcinoma cell lines. Jpn J Cancer Res, 87, 1153-9.
TAN, I. B. et al. 2011. Intrinsic subtypes of gastric cancer, based on gene expression pattern, predict survival and respond differently to chemotherapy. Gastroenterology, 141, 476-85, 485 e1-11.

245
TAN, X. et al. 2016. miR-671-5p inhibits epithelial-to-mesenchymal transition by downregulating FOXM1 expression in breast cancer. Oncotarget, 7, 293-307.
TAN, X. et al. 2011. A 5-microRNA signature for lung squamous cell carcinoma diagnosis and hsa-miR-31 for prognosis. Clin Cancer Res, 17, 6802-11.
TANG, Y. et al. 2017. lncRNA XIST interacts with miR-140 to modulate lung cancer growth by targeting iASPP. Oncol Rep, 38, 941-948.
TANNER, M. et al. 2005. Amplification of HER-2 in gastric carcinoma: association with Topoisomerase IIalpha gene amplification, intestinal type, poor prognosis and sensitivity to trastuzumab. Ann Oncol, 16, 273-8.
TAO, S. C. et al. 2017. Exosomes derived from miR-140-5p-overexpressing human synovial mesenchymal stem cells enhance cartilage tissue regeneration and prevent osteoarthritis of the knee in a rat model. Theranostics, 7, 180-195.
TARDIF, G. et al. 2009. Regulation of the IGFBP-5 and MMP-13 genes by the microRNAs miR-140and miR-27a in human osteoarthritic chondrocytes. BMC Musculoskelet Disord, 10, 148.
TARDIF, G. et al. 2013. NFAT3 and TGF-beta/SMAD3 regulate the expression of miR-140 in osteoarthritis. Arthritis Res Ther, 15, R197.
TATARANO, S. et al. 2011. miR-218 on the genomic loss region of chromosome 4p15.31 functions as a tumour suppressor in bladder cancer. Int J Oncol, 39, 13-21.
TATEMICHI, M. et al. 2008. Different etiological role of Helicobacter pylori (Hp) infection in carcinogenesis between differentiated and undifferentiated gastric cancers: a nested case-control study using IgG titer against Hp surface antigen. Acta Oncol, 47, 360-5.
TAURINO, C. et al. 2010. Gene expression profiling in whole blood of patients with coronary artery disease. Clin Sci (Lond), 119, 335-43.
TCHERNITSA, O. et al. 2010. Systematic evaluation of the miRNA-ome and its downstream effects on mRNA expression identifies gastric cancer progression. J Pathol, 222, 310-9.
TERSMETTE, A. C. et al. 1990. Meta-analysis of the risk of gastric stump cancer: detection of high risk patient subsets for stomach cancer after remote partial gastrectomy for benign conditions. Cancer Res, 50, 6486-9.
TESTINO, G. 2011. The burden of cancer attributable to alcohol consumption. Maedica (Buchar), 6, 313-20.
TEY, J. et al. 2017. Palliative radiotherapy for gastric cancer: a systematic review and meta-analysis. Oncotarget, 8, 25797-25805.
The American Society for Gastrointestinal Endoscopy. 1988. The role of endoscopy in the surveillance of premalignant conditions of the upper gastrointestinal tract. Guidelines for clinical application. Gastrointest Endosc, 34, 18S-20S.
THORBURN, J. et al. 2014. Autophagy controls the kinetics and extent of mitochondrial apoptosis by regulating PUMA levels. Cell Rep, 7, 45-52.
THORPE, S. D. et al. 2010. The response of bone marrow-derived mesenchymal stem cells to dynamic compression following TGF-beta3 induced chondrogenic differentiation. Ann Biomed Eng, 38, 2896-909.
TIVNAN, A. et al. 2012. Inhibition of neuroblastoma tumour growth by targeted delivery of microRNA-34a using anti-disialoganglioside GD2 coated nanoparticles. PLoS One, 7, e38129.
TODORIC, J. et al. 2017. Stress-Activated NRF2-MDM2 Cascade Controls Neoplastic Progression in Pancreas. Cancer Cell, 32, 824-839 e8.
TORRE, L. A. et al. 2015. Global cancer statistics, 2012. CA Cancer J Clin, 65, 87-108.

246
TREECE, A. L. et al. 2016. Gastric adenocarcinoma microRNA profiles in fixed tissue and in plasma reveal cancer-associated and Epstein-Barr virus-related expression patterns. Lab Invest, 96, 661-71.
TSAI, K. W. et al. 2012. Aberrant expression of miR-196a in gastric cancers and correlation with recurrence. Genes Chromosomes Cancer, 51, 394-401.
TSAI, K. W. et al. 2011. Epigenetic regulation of miR-34b and miR-129 expression in gastric cancer. Int J Cancer, 129, 2600-10.
TSUJIURA, M. et al. 2015. Circulating miR-18a in plasma contributes to cancer detection and monitoring in patients with gastric cancer. Gastric Cancer, 18, 271-9.
TU, H. et al. 2014. Serum anti-Helicobacter pylori immunoglobulin G titer correlates with grade of histological gastritis, mucosal bacterial density, and levels of serum biomarkers. Scand J Gastroenterol, 49, 259-66.
UEDA, T. et al. 2010. Relation between microRNA expression and progression and prognosis of gastric cancer: a microRNA expression analysis. Lancet Oncol, 11, 136-46.
UEMURA, N. et al. 2001. Helicobacter pylori infection and the development of gastric cancer. N Engl J Med, 345, 784-9.
UNO, K. et al. 2016. Gastric cancer development after the successful eradication of Helicobacter pylori. World J Gastrointest Oncol, 8, 271-81.
USHIJIMA, T. and SASAKO, M. 2004. Focus on gastric cancer. Cancer Cell, 5, 121-5.
VALENZUELA-MUNOZ, V. et al. 2017. Modulation of Atlantic salmon miRNome response to sea louse infestation. Dev Comp Immunol, 76, 380-391.
VAN CUTSEM, E. et al. 2015. HER2 screening data from ToGA: targeting HER2 in gastric and gastroesophageal junction cancer. Gastric Cancer, 18, 476-84.
VAN CUTSEM, E. et al. 2011. The diagnosis and management of gastric cancer: expert discussion and recommendations from the 12th ESMO/World Congress on Gastrointestinal Cancer, Barcelona,2010. Ann Oncol, 22 Suppl 5, v1-9.
VAN CUTSEM, E. et al. 2006. Phase III study of docetaxel and cisplatin plus fluorouracil compared with cisplatin and fluorouracil as first-line therapy for advanced gastric cancer: a report of the V325 Study Group. J Clin Oncol, 24, 4991-7.
VAN CUTSEM, E. et al. 2016. Gastric cancer. Lancet, 388, 2654-2664.
VAN CUTSEM, E. et al. 2008. Expert opinion on management of gastric and gastro-oesophageal junction adenocarcinoma on behalf of the European Organisation for Research and Treatment of Cancer (EORTC)-gastrointestinal cancer group. Eur J Cancer, 44, 182-94.
VAN LIER, M. G. et al. 2011. High cancer risk and increased mortality in patients with Peutz-Jeghers syndrome. Gut, 60, 141-7.
VASUDEVAN, S. et al. 2007. Switching from repression to activation: microRNAs can up-regulate translation. Science, 318, 1931-4.
VAZQUEZ-MARTIN, A. et al. 2013. Reprogramming of non-genomic estrogen signaling by the stemness factor SOX2 enhances the tumour-initiating capacity of breast cancer cells. Cell Cycle, 12,3471-7.
VELLANKI, R. N. et al. 2010. OASIS/CREB3L1 induces expression of genes involved in extracellular matrix production but not classical endoplasmic reticulum stress response genes in pancreatic beta-cells. Endocrinology, 151, 4146-57.
VIDIGAL, J. A. and VENTURA, A. 2015. The biological functions of miRNAs: lessons from in vivostudies. Trends Cell Biol, 25, 137-47.

247
VINCENT, A. J. et al. 2012. Cytoplasmic translocation of p21 mediates NUPR1-induced chemoresistance: NUPR1 and p21 in chemoresistance. FEBS Lett, 586, 3429-34.
VOLINIA, S. et al. 2006. A microRNA expression signature of human solid tumours defines cancer gene targets. Proc Natl Acad Sci U S A, 103, 2257-61.
WADDELL, T. et al. 2013. Epirubicin, oxaliplatin, and capecitabine with or without panitumumab for patients with previously untreated advanced oesophagogastric cancer (REAL3): a randomised,open-label phase 3 trial. Lancet Oncol, 14, 481-9.
WADDELL, T. et al. 2014. Gastric cancer: ESMO-ESSO-ESTRO Clinical Practice Guidelines for diagnosis, treatment and follow-up. Radiother Oncol, 110, 189-94.
WADE, M. et al. 2013. MDM2, MDMX and p53 in oncogenesis and cancer therapy. Nat Rev Cancer,13, 83-96.
WAGNER, A. D. et al. 2006. Chemotherapy in advanced gastric cancer: a systematic review and meta-analysis based on aggregate data. J Clin Oncol, 24, 2903-9.
WAGNER, A. D. et al. 2017. Chemotherapy for advanced gastric cancer. Cochrane Database Syst Rev, 8, CD004064.
WANG, K. et al. 2017. Analysis of microRNA (miRNA) expression profiles reveals 11 key biomarkers associated with non-small cell lung cancer. World J Surg Oncol, 15, 175.
WANG, M. et al. 2013. miR-17-5p/20a are important markers for gastric cancer and murine double minute 2 participates in their functional regulation. Eur J Cancer, 49, 2010-21.
WANG, Q. et al. 2014. Consumption of fruit, but not vegetables, may reduce risk of gastric cancer: results from a meta-analysis of cohort studies. Eur J Cancer, 50, 1498-509.
WANG, S. et al. 2017. Overaccumulation of p53-mediated autophagy protects against betulinic acid-induced apoptotic cell death in colorectal cancer cells. Cell Death Dis, 8, e3087.
WANG, W. H. et al. 2003. Non-steroidal anti-inflammatory drug use and the risk of gastric cancer: a systematic review and meta-analysis. J Natl Cancer Inst, 95, 1784-91.
WANG, X. et al. 2018. Exosomes Serve as Nanoparticles to Deliver Anti-miR-214 to Reverse Chemoresistance to Cisplatin in Gastric Cancer. Mol Ther, 26, 774-783.
WANG, Y. Y. et al. 2013. Clinicopathologic significance of miR-10b expression in gastric carcinoma. Hum Pathol, 44, 1278-85.
WANG, Z. et al. 2014. Predictive factors for lymph node metastasis in early gastric cancer with signet ring cell histology and their impact on the surgical strategy: analysis of single institutional experience. J Surg Res, 191, 130-3.
WATANABE, M. et al. 2012. Development of gastric cancer in nonatrophic stomach with highly active inflammation identified by serum levels of pepsinogen and Helicobacter pylori antibody together with endoscopic rugal hyperplastic gastritis. Int J Cancer, 131, 2632-42.
WEBLEY, S. D. et al. 2000. Deoxyuridine triphosphatase (dUTPase) expression and sensitivity to the thymidylate synthase (TS) inhibitor ZD9331. Br J Cancer, 83, 792-9.
WEI, D. Z. et al. 2017. Ellagic acid promotes ventricular remodeling after acute myocardial infarction by up-regulating miR-140-3p. Biomed Pharmacother, 95, 983-989.
WEI, R. et al. 2016. miR-140-5p attenuates chemotherapeutic drug-induced cell death by regulating autophagy through inositol 1,4,5-trisphosphate kinase 2 (IP3k2) in human osteosarcoma cells. Biosci Rep, 36.
WEN, Y. Y. et al. 2014. Association of the IL-1B +3954 C/T polymorphism with the risk of gastric cancer in a population in Western China. Eur J Cancer Prev, 23, 35-42.

248
WILKE, H. et al. 2014. Ramucirumab plus paclitaxel versus placebo plus paclitaxel in patients with previously treated advanced gastric or gastro-oesophageal junction adenocarcinoma (RAINBOW): a double-blind, randomised phase 3 trial. Lancet Oncol, 15, 1224-35.
WILLIAMS, B. et al. 1988. Do young patients with dyspepsia need investigation? Lancet, 2, 1349-51.
WOHLHUETER, R. M. et al. 1980. Facilitated transport of uracil and 5-fluorouracil, and permeation of orotic acid into cultured mammalian cells. J Cell Physiol, 104, 309-19.
WOLFSON, B. et al. 2014. Roles of microRNA-140 in stem cell-associated early stage breast cancer. World J Stem Cells, 6, 591-7.
WONG, N. and WANG, X. 2015. miRDB: an online resource for microRNA target prediction and functional annotations. Nucleic Acids Res, 43, D146-52.
WONG, S. S. et al. 2014. Genomic landscape and genetic heterogeneity in gastric adenocarcinoma revealed by whole-genome sequencing. Nat Commun, 5, 5477.
Wu K. et al. 2019. MicroRNA-140-5p inhibits cell proliferation, migration and promotes cell apoptosis in gastric cancer through the negative regulation of THY1-mediated Notch signaling. Bioscience reports. 39.
WU, J. et al. 2013. Up-regulation of microRNA-1290 impairs cytokinesis and affects the reprogramming of colon cancer cells. Cancer Lett, 329, 155-63.
XIAO, Q. et al. 2017. Overexpression of miR-140 Inhibits Proliferation of Osteosarcoma Cells via Suppression of Histone Deacetylase 4. Oncol Res, 25, 267-275.
XIE, M. et al. 2018. MicroRNA-1 acts as a tumour suppressor microRNA by inhibiting angiogenesis-related growth factors in human gastric cancer. Gastric Cancer, 21, 41-54.
XIE, W. B. et al. 2018. MiR-140 Expression Regulates Cell Proliferation and Targets PD-L1 in NSCLC. Cell Physiol Biochem, 46, 654-663.
XING, Y. et al. 2018. Comprehensive analysis of differential expression profiles of mRNAs and lncRNAs and identification of a 14-lncRNA prognostic signature for patients with colon adenocarcinoma. Oncol Rep, 39, 2365-2375.
XIONG, B. H. et al. 2014. An updated meta-analysis of randomized controlled trial assessing the effect of neoadjuvant chemotherapy in advanced gastric cancer. Cancer Invest, 32, 272-84.
XU, H. and EL-GEWELY, M. R. 2001. P53-responsive genes and the potential for cancer diagnostics and therapeutics development. Biotechnol Annu Rev, 7, 131-64.
XU, X. et al. 2013. miRNA: The nemesis of gastric cancer (Review). Oncol Lett, 6, 631-641.
XU, Y. et al. 2012. miR-21 Is a Promising Novel Biomarker for Lymph Node Metastasis in Patients with Gastric Cancer. Gastroenterol Res Pract, 2012, 640168.
XU, Z. Y. et al. 2015. 5-Fluorouracil chemotherapy of gastric cancer generates residual cells with properties of cancer stem cells. Int J Biol Sci, 11, 284-94.
YAMAGATA, H. et al. 2005. Impact of fasting plasma glucose levels on gastric cancer incidence in a general Japanese population: the Hisayama study. Diabetes Care, 28, 789-94.
YAMAMOTO, E. et al. 2011. Role of DNA methylation in the development of diffuse-type gastric cancer. Digestion, 83, 241-9.
YAMAMOTO, N. et al. 1994. Epstein-Barr virus and gastric remnant cancer. Cancer, 74, 805-9.
YAMASAKI, M. et al. 2010. p53 genotype predicts response to chemotherapy in patients with squamous cell carcinoma of the esophagus. Ann Surg Oncol, 17, 634-42.
YAN, C. et al. 2011. MicroRNA regulation associated chondrogenesis of mouse MSCs grown on polyhydroxyalkanoates. Biomaterials, 32, 6435-44.

249
YAN, H. et al. 2018. Aberrant Ki-67 expression through 3'UTR alternative polyadenylation in breast cancers. FEBS Open Bio, 8, 332-338.
YAN, L. X. et al. 2008. MicroRNA miR-21 overexpression in human breast cancer is associated with advanced clinical stage, lymph node metastasis and patient poor prognosis. RNA, 14, 2348-60.
YANAKA, Y. et al. 2015. miR-544a induces epithelial-mesenchymal transition through the activation of WNT signaling pathway in gastric cancer. Carcinogenesis, 36, 1363-71.
YANG, H. et al. 2013. MicroRNA-140-5p suppresses tumour growth and metastasis by targeting transforming growth factor beta receptor 1 and fibroblast growth factor 9 in hepatocellular carcinoma. Hepatology, 58, 205-17.
YANG, J. et al. 2017. Expression analysis of microRNA as prognostic biomarkers in colorectal cancer. Oncotarget, 8, 52403-52412.
YANG, J. et al. 2011. MiR-140 is co-expressed with Wwp2-C transcript and activated by Sox9 to target Sp1 in maintaining the chondrocyte proliferation. FEBS Lett, 585, 2992-7.
YANG, M. et al. 2011. Microvesicles secreted by macrophages shuttle invasion-potentiating microRNAs into breast cancer cells. Mol Cancer, 10, 117.
YANG, S. M. et al. 2013. miR-21 confers cisplatin resistance in gastric cancer cells by regulating PTEN. Toxicology, 306, 162-8.
YANG, Y. et al. 2015. Perioperative chemotherapy more of a benefit for overall survival than adjuvant chemotherapy for operable gastric cancer: an updated Meta-analysis. Sci Rep, 5, 12850.
YAO, Y. et al. 2009. MicroRNA profiling of human gastric cancer. Mol Med Rep, 2, 963-70.
YASUDA, K. et al. 2000. Papillary adenocarcinoma of the stomach. Gastric Cancer, 3, 33-38.
YCHOU, M. et al. 2011. Perioperative chemotherapy compared with surgery alone for resectable gastroesophageal adenocarcinoma: an FNCLCC and FFCD multicenter phase III trial. J Clin Oncol,29, 1715-21.
YEH, J. M. et al. 2016. Gastric adenocarcinoma screening and prevention in the era of new biomarker and endoscopic technologies: a cost-effectiveness analysis. Gut, 65, 563-74.
YEPES, S. et al. 2016. Co-expressed miRNAs in gastric adenocarcinoma. Genomics, 108, 93-101.
YIN, Y. et al. 2015. Fibroblast Growth Factor 9 Regulation by MicroRNAs Controls Lung Development and Links DICER1 Loss to the Pathogenesis of Pleuropulmonary Blastoma. PLoS Genet,11, e1005242.
YOO, J. K. et al. 2014. Discovery and characterization of miRNA during cellular senescence in bone marrow-derived human mesenchymal stem cells. Exp Gerontol, 58, 139-45.
YOSHIDA, A. et al 2017. MicroRNA-140 mediates RB tumour suppressor function to control stem cell-like activity through interleukin-6. Oncotarget, 8, 13872-13885.
YOSHIDA, S. and SAITO, D. 1996. Gastric premalignancy and cancer screening in high-risk patients. Am J Gastroenterol, 91, 839-43.
YOSHIOKA, A. et al. 1987. Deoxyribonucleoside triphosphate imbalance. 5-Fluorodeoxyuridine-induced DNA double strand breaks in mouse FM3A cells and the mechanism of cell death. J Biol Chem, 262, 8235-41.
YOU, W. C. et al. 1999. Evolution of precancerous lesions in a rural Chinese population at high risk of gastric cancer. Int J Cancer, 83, 615-9.
YOUN, H. G. et al. 2010. Recurrence after curative resection of early gastric cancer. Ann Surg Oncol,17, 448-54.

250
YOUNG, K. H. et al. 2008. Structural profiles of TP53 gene mutations predict clinical outcome in diffuse large B-cell lymphoma: an international collaborative study. Blood, 112, 3088-98.
YU, J. et al. 2016. Septin 2 accelerates the progression of biliary tract cancer and is negatively regulated by mir-140-5p. Gene, 589, 20-26.
Yu J. et al. 2019. SNHG20/miR-140-5p/NDRG3 axis contributes to 5-fluorouracil resistance in gastric cancer. Oncology letters. 18,1337-1343.
YU, L. et al. 2016. microRNA -140-5p inhibits colorectal cancer invasion and metastasis by targeting ADAMTS5 and IGFBP5. Stem Cell Res Ther, 7, 180.
YUAN, Y. et al. 2013. miR-140 suppresses tumour growth and metastasis of non-small cell lung cancer by targeting insulin-like growth factor 1 receptor. PLoS One, 8, e73604.
ZALI, H. et al. 2011. Gastric cancer: prevention, risk factors and treatment. Gastroenterol Hepatol Bed Bench, 4, 175-85.
ZANGHIERI, G. et al. 1990. Familial occurrence of gastric cancer in the 2-year experience of a population-based registry. Cancer, 66, 2047-51.
ZARITSKY, A. et al. 2015. Seeds of Locally Aligned Motion and Stress Coordinate a Collective Cell Migration. Biophys J, 109, 2492-2500.
ZENG, Y. K. et al. 2012. Laparoscopy-assisted versus open distal gastrectomy for early gastric cancer: evidence from randomized and nonrandomized clinical trials. Ann Surg, 256, 39-52.
ZERTAL-ZIDANI, S. et al. 2007. Regulation of pancreatic endocrine cell differentiation by sulphated proteoglycans. Diabetologia, 50, 585-95.
ZHAI, H. et al. 2015. Inhibition of colorectal cancer stem cell survival and invasive potential by hsa-miR-140-5p mediated suppression of Smad2 and autophagy. Oncotarget, 6, 19735-46.
ZHANG, C. et al. 2017. Radioresistance of chordoma cells is associated with the ATM/ATR pathway,in which RAD51 serves as an important downstream effector. Exp Ther Med, 14, 2171-2179.
ZHANG, J. et al. 2018. The prognostic value of age in non-metastatic gastric cancer after gastrectomy: a retrospective study in the U.S. and China. J Cancer, 9, 1188-1199.
ZHANG, J. et al. 2015. Circulating MiR-16-5p and MiR-19b-3p as Two Novel Potential Biomarkers to Indicate Progression of Gastric Cancer. Theranostics, 5, 733-45.
ZHANG, K. et al. 2018. SNHG16/miR-140-5p axis promotes esophagus cancer cell proliferation,migration and EMT formation through regulating ZEB1. Oncotarget, 9, 1028-1040.
ZHANG, W. et al. 2015. MicroRNA-140-5p inhibits the progression of colorectal cancer by targeting VEGFA. Cell Physiol Biochem, 37, 1123-33.
ZHANG, X. et al. 2015. miR-140-5p regulates adipocyte differentiation by targeting transforming growth factor-beta signaling. Sci Rep, 5, 18118.
ZHANG, Y. et al. 2012. Estrogen receptor alpha signaling regulates breast tumour-initiating cells by down-regulating miR-140 which targets the transcription factor SOX2. J Biol Chem, 287, 41514-22.
ZHANG, Y. X. et al. 2016. Smad3-related miRNAs regulated oncogenic TRIB2 promoter activity to effectively suppress lung adenocarcinoma growth. Cell Death Dis, 7, e2528.
ZHAO, H. et al. 2016. The lncRNA H19 interacts with miR-140 to modulate glioma growth by targeting iASPP. Arch Biochem Biophys, 610, 1-7.
Zhao K, et al. 2018. Regulation of the Mdm2-p53 pathway by the ubiquitin E3 ligase MARCH7. EMBO reports. 19, 305-319.
ZHENG, H. C. et al. 2010. The pathobiological behaviors and prognosis associated with Japanese gastric adenocarcinomas of pure WHO histological subtypes. Histol Histopathol, 25, 445-52.

251
ZHOU, W. et al. 2015. MiR-493 suppresses the proliferation and invasion of gastric cancer cells by targeting RhoC. Iran J Basic Med Sci, 18, 1027-33.
ZHU, C. et al. 2014. A five-microRNA panel in plasma was identified as potential biomarker for early detection of gastric cancer. Br J Cancer, 110, 2291-9.
ZHU, G. et al. 2015. Identification of Gene and MicroRNA Signatures for Oral Cancer Developed from Oral Leukoplakia. Biomed Res Int, 2015, 841956.
ZHU, J. et al. 2016. Establishment of a miRNA-mRNA regulatory network in metastatic renal cell carcinoma and screening of potential therapeutic targets. Tumour Biol.
ZOMER, A. et al. 2010. Exosomes: Fit to deliver small RNA. Commun Integr Biol, 3, 447-50.
ZONG, L. et al. 2016. The challenge of screening for early gastric cancer in China. Lancet, 388, 2606.
ZOU, G. M. 2008. Cancer initiating cells or cancer stem cells in the gastrointestinal tract and liver. J Cell Physiol, 217, 598-604.
ZOU, J. and XU, Y. 2016. MicroRNA-140 Inhibits Cell Proliferation in Gastric Cancer Cell Line HGC-27 by Suppressing SOX4. Med Sci Monit, 22, 2243-52.
ZOU, M. X. et al. 2014. Identification of miR-140-3p as a marker associated with poor prognosis in spinal chordoma. Int J Clin Exp Pathol, 7, 4877-85.
ZUR HAUSEN, A. et al. 2004. Epstein-Barr virus in gastric carcinomas and gastric stump carcinomas: a late event in gastric carcinogenesis. J Clin Pathol, 57, 487-91.

252
Appendix
Appendix 1: Peking University Cancer Hospital Patients in Consent Information

253

254
Appendix 2: General compounds used in this study and their sources.
Material/Reagent SupplierAcetic acid Fisher Scientific, Leicestershire, UKAcrylamide mix (30%) Sigma-Aldrich, Poole, Dorset, UKAgarose Melford Laboratories Ltd, Suffolk, UKAmmonium Persulphate (APS) Sigma-Aldrich, Poole, Dorset, UK Ampicillin Sigma-Aldrich, Poole, Dorset, UKBio-Rad DC™ Protein Assay Bio-Rad Laboratories, Hercules, CA, USABovine serum albumin (BSA) Sigma-Aldrich, Poole, Dorset, UKCalcium chloride (CaCl2) Sigma-Aldrich, Poole, Dorset, UKChloroform Sigma-Aldrich, Poole, Dorset, UKCrystal violet Sigma-Aldrich, Poole, Dorset, UKDiethylpyrocarbonate (DEPC) Sigma-Aldrich, Poole, Dorset, UKDimethylsulphoxide (DMSO) Sigma-Aldrich, Poole, Dorset, UKDulbecco’s Modified Eagles’ Medium/Nutrient mixture F12
Sigma-Aldrich, Poole, Dorset, UK
Ethylenediaminetetraacetic acid (EDTA)
Duchefa Biochemie, Haarlem, Netherlands
Ethanol Fisher Scientific, Leicestershire, UK10% Fetal calf serum (FCS) PAA Laboratories, Coelbe, GermanyFormalin Sigma-Aldrich Ltd, Dorset, UKGoTaq® Green Master Mix PromegaG418Hydrochloric acid (HCl) Sigma-Aldrich, Poole, Dorset, UKIsopropyl alcohol/isopropanol/2-propanol
Sigma-Aldrich, Poole, Dorset, UK
Matrigel® BD Biosciences, Oxford, UKMethanol Fisher Scientific, Leicestershire, UKPenicillin Sigma-Aldrich, Poole, Dorset, UKPeroxidase-conjugated goat anti-rabbit IgG
Sigma-Aldrich, Poole, Dorset, UK
Peroxidase-conjugated rabbit anti-mouse IgG
Sigma-Aldrich, Poole, Dorset, UK
Phenylmethyl sulfonyl fluoride (PMSF)
Sigma-Aldrich, Poole, Dorset, UK
Precision qScript™ RT PCR kit Primerdesign Ltd, Southampton, UKREDTaq® ReadyMix™ PCR Reaction Mix
Sigma-Aldrich, Poole, Dorset, UK
RPMI-1640 Sigma-Aldrich, Poole, Dorset, UK

255
Serum bovine albumin Sigma-Aldrich, Poole, Dorset, UKSodium dodecyl sulphate (SDS) Melford Laboratories Ltd, Suffolk, UKStreptomycin Sigma-Aldrich, Poole, Dorset, UKSYBR®Safe DNA gel stain Life Technologies Ltd, Paisley, UKTetramethylelthylenediamine (TEMED)
Sigma-Aldrich, Poole, Dorset, UK
TRI Reagent Sigma-Aldrich, Poole, Dorset, UKTris-Cl Melford Laboratories Ltd, Suffolk, UKTriton X-100 Sigma-Aldrich, Poole, Dorset, UKTrypsin Sigma-Aldrich, Poole, Dorset, UKTween 20 Melford Laboratories Ltd, Suffolk, UK

256
Appendix 3: General plastic consumables, hardware, and software used in this
study and their sources
Hardware/Software Supplier0.2 μm filtration unit Sigma-Aldrich Co, Poole, Dorset, UK 25cm2 and 75cm2 culture flasks Cell Star, Germany Image J National Institute of HealthLecia DM IRB microscope Lecia GmbH, Bristol, UKR software http://www.r-project.org/GraphPad Prism 6.0 San Diego, CA Software, La Jolla, CASPSS version 23.0 IBM Corporation, Armonk, NY, USAMicrosoft Excel Microsoft In., Redmond, WA, USA Neubauer hemocytometer countingchamber
Reichert, Austria
Protein spectrophotometer BIO-TEK, Wolf Laboratories, York, UK RNA spectrophotometer BIO-TEK, Wolf Laboratories, York, UK UV light chamber Germix

257
Appendix 4: Amplifluor™ Universal detection system using UniPrimer™.
Source: The Scientist: https://www.the-scientist.com/.

258
Appendix 5: Amplification plot and standard curve produced using qPCR.
A. Amplification plot showing an exponential increase in transcript copy number with cycle
number B. Standard curve produced by plotting starting copy number against the cycle
threshold (Ct). Source: The Scientist: https://www.the-scientist.com/

259
Appendix 6: Gastric Cancer Treatment Regimens.
1Category 2A: Based upon lower-level evidence, there is uniform NCCN consensus that the intervention is appropriate. 2Category 1: Based upon the high-level evidence, there is uniform NCCN consensus that the intervention is appropriate. 3Category 2B: Based upon lower-level evidence, there is NCCN consensus that the intervention is appropriate. Source: Gastrointestinal cancer advisor available at https://www.cancertherapyadvisor.com/gastrointestinal-cancers/gastric-cancer-treatment-regimens/article/218159/.
Preoperative Chemoradiation (esophagogastric junction and gastric cardia)1
Note: All recommendations are Category 2A1 unless otherwise indicated.Preferred RegimensREGIMEN DOSINGPaclitaxel + carboplatin(Category 1)
Day 1: Paclitaxel 50mg/m2 IV + carboplatin AUC 2mg·min/mL IV. Repeat cycle weekly for 5 weeks.
Cisplatin + 5FU (Category 1) Days 1 and 29: Cisplatin 75–100mg/m2 IVDays 1–4 and 29–32: 5FU 750–1000mg/m2 continuous IV infusion over 24 hours daily.
OrDays 1–5: Cisplatin 15mg/m2 IV once daily + 5FU 800mg/m2continuous IV infusion over 24 hours daily.Repeat cycle every 21 days for 2 cycles.
Oxaliplatin + 5FU (Category 1) Day 1: Oxaliplatin 85mg/m2 + leucovorin 400mg/m2 + 5FU 400mg/m2IV push followed byDays 1–2: 5FU 800mg/m2 24-hour continuous infusion.Repeat cycle every 14 days for 3 cycles with radiation and 3 cycles after radiation.
Cisplatin + capecitabine Day 1: Cisplatin 30mg/m2 IVDays 1–5: Capecitabine 800mg/m2 orally twice daily.Repeat cycle weekly for 5 weeks.
Oxaliplatin + capecitabine Days 1, 15, and 29: Oxaliplatin 85mg/m2 IVDays 1–5: Capecitabine 625mg/m2 orally twice daily for 5 weeks.
Other RegimensPaclitaxel + 5FU (Category2B)
Day 1: Paclitaxel 45–50mg/m2 IV weeklyDays 1–5: 5FU 300mg/m2 IV continuous infusion.Repeat cycle weekly for 5 weeks.
Paclitaxel + capecitabine(Category 2B)
Day 1: Paclitaxel 45–50mg/m2 IVDays 1–5: Capecitabine 625-825mg/m2 orally twice daily.Repeat cycle weekly for 5 weeks.
Perioperative Chemotherapy (including esophagogastric junction)1
Epirubicin + cisplatin + 5FU(ECF) (Category 2B)
Day 1: Epirubicin 50mg/m2 IV bolus + cisplatin 60mg/m2
IVDays 1–21: 5FU 200mg/m2/day IV continuous infusion over 24 hours daily.Repeat cycle every 21 days for 3 cycles preoperatively and 3 cycles postoperatively.
ECF modification: epirubicin+ oxaliplatin + 5FU (Category2B)
Day 1: Epirubicin 50mg/m2 IV + oxaliplatin 130mg/m2 IVDays 1–21: 5FU 200mg/m2/day IV continuous infusion over 24 hours.Repeat cycle every 21 days for 3 cycles preoperatively and 3 cycles postoperatively

260
ECF modification: epirubicin+ cisplatin + capecitabine(Category 2B)
Day 1: Epirubicin 50mg/m2 IV + cisplatin 60mg/m2 IVDays 1–21: Capecitabine 625mg/m2 orally twice daily.Repeat cycle every 21 days for 3 cycles preoperatively and 3 cycles postoperatively.
ECF modification: epirubicin+ oxaliplatin + capecitabine(Category 2B)
Day 1: Epirubicin 50mg/m2 IV + oxaliplatin 130mg/m2 IVDays 1–21: Capecitabine 625mg/m2 orally twice daily.Repeat cycle every 21 days for 3 cycles preoperatively and 3 cycles postoperatively.
5FU + cisplatin (Category 1) Day 1: Cisplatin 75–80mg/m2 IVDays 1–5: 5FU 800mg/m2 IV continuous infusion over 24 hours daily.Repeat cycle every 28 days for 2–3 cycles preoperatively and 3–4 cycles postoperatively for a total of 6 cycles.
5FU + leucovorin + oxaliplatin Day 1: Oxaliplatin 85mg/m2 IV + leucovorin 400mg/m2 + 5FU 400mg/m2 IV push followed by:Days 1–2: 5FU 1200mg/m2 continuous IV daily over 24 hours.
OrDay 1: Oxaliplatin 85mg/m2 + leucovorin 200mg/m2 + 5FU 2600mg/m2 continuous IV infusion over 24 hours.Repeat cycle every 14 days.
Capecitabine + oxaliplatin Day 1: Oxaliplatin 130mg/m2 IVDays 1–14: Capecitabine 1000mg/m2 orally twice daily.Repeat cycle every 21 days.
Postoperative Chemoradiation (including esophagogastric junction)1
5FU + leucovorin (Category 1) Cycles 1, 3, and 4 (before and after radiation)Days 1–5: Leucovorin 20mg/m2 IV push + 5FU 425mg/m2/day IV pushRepeat cycle every 28 days.Cycle 2 (with radiation)Days 1–4 and 31–33: Leucovorin 20mg/m2 IV pushDays 1–4: 5FU 400mg/m2/day IV push.Repeat cycle every 35 days.The NCCN panel acknowledges that the Intergroup 0116 Trial formed the basis for postoperative adjuvant chemoradiation strategy. However, the panel does not recommend the above-specified doses or schedule of cytotoxic agents because of concerns regarding toxicity. The panel recommends one of the following modifications instead.
Capecitabine Days 1–14: Capecitabine 750–1000mg/m2 orally twice daily.Repeat cycle every 28 days; 1 cycle before and 2 cycles after chemoradiation.
5FU + leucovorin Days 1, 2, 15, and 16: Leucovorin 400mg/m2 IV followed by 5FU 400mg/m2 IV push and a 24-hour infusion of 5FU 1200mg/m2; 1 cycle before and 2 cycles after chemoradiation.Repeat cycle every 28 days.
5FU with radiation Days 1–5 OR Days 1–7: 5FU 200–250mg/m2 IV continuous infusion over 24 hours once daily; weekly for 5 weeks.
Capecitabine with radiation Days 1–5 OR Days 1–7: Capecitabine 625–825mg/m2
orally twice daily; weekly for 5 weeks.

261
Postoperative Chemotherapy (for patients who have undergone primary D2 lymph node dissection)
Capecitabine + oxaliplatin(Category 1)
Days 1–14: Capecitabine 1000mg/m2 orally twice dailyDay 1: Oxaliplatin 130mg/m2 IV.Repeat cycle every 21 days for 8 cycles.
Unresectable Locally Advanced, Recurrent or Metastatic Disease (where local therapy is not indicated)1
First-line TherapyTrastuzumab + chemotherapy(NOTE: for HER2-neuoverexpressingadenocarcinoma)
Day 1: Trastuzumab 8mg/kg IV loading dose (Cycle 1 only); followed bytrastuzumab 6mg/kg IV every 3 weeks, plus chemotherapy
OrDay 1 of Cycle 1: Trastuzumab 6mg/kg IV loading dose,then 4mg/kg IV every 14 days.Chemotherapy:Day 1: Cisplatin 80mg/m2 IV, plusDays 1–14: Capecitabine 1000mg/m2 orally twice daily. (Category 1)
OrDays 1–5: 5FU 800mg/m2 continuous IV infusion. (Category 2B)Repeat cycle every 21 days for 6 cycles.
Preferred RegimensFluoropyrimidine andcisplatin (5FU + cisplatin)(Category 1)
Day 1: Cisplatin 75−100mg/m2 IVDays 1–4: 5FU 750−1,000mg/m2 IV continuous infusion over 24 hours daily.
Fluoropyrimidine andcisplatin (5FU + cisplatin +leucovorin) (Category 1)
Day 1: Cisplatin 50mg/m2 IV + leucovorin 200mg/m2 IV + 5FU 2,000mg/m2 IV continuous infusion over 24 hours.Repeat cycle every 14 days.
Fluoropyrimidine andcisplatin (capecitabine +cisplatin) (Category 1)
Day 1: Cisplatin 80mg/m2 IVDay 1–14: Capecitabine 1000mg/m2 orally twice daily.Repeat cycle every 3 weeks.
Fluoropyrimidine andoxaliplatin (oxaliplatin +capecitabine)
Day 1: Oxaliplatin 130mg/m2 IVDays 1–14: Capecitabine 1000mg/m2 orally twice daily.Repeat cycle every 21 days.
Fluoropyrimidine andoxaliplatin (oxaliplatin +leucovorin + 5FU)
Day 1: Oxaliplatin 85mg/m2 IV + leucovorin 400mg/m2 IV + 5FU 400mg/m2 IVPDays 1−2: 5FU 1200mg/m2 IV continuous infusion over 24 hours daily.Repeat cycle every 14 days.
OrDay 1: Oxaliplatin 85mg/m2 IV + leucovorin 200mg/m2 IV + 5FU 2,600mg/m2 IV continuous infusion over 24 hours.Repeat cycle every 14 days.
Other RegimensModified DCF (docetaxel +cisplatin + leucovorin + 5FU)
Day 1: Docetaxel 40mg/m2 IV + leucovorin 400mg/m2 IV + 5FU 400mg/m2 IVDays 1−2: 5FU 1000mg/m2 IV continuous infusion over 24 hoursDay 3: Cisplatin 40mg/m2 IV.Repeat cycle every 14 days.

262
Modified DCF (docetaxel +oxaliplatin + 5FU)
Day 1: Docetaxel 50mg/m2 IV + oxaliplatin 85mg/m2 IVDays 1−2: 5FU 1,200mg/m2 IV continuous infusion over 24 hours.Repeat cycle every 14 days.
Modified DCF (docetaxel +carboplatin + 5FU) (Category2B)
Day 1: Docetaxel 75mg/m2 IVDay 2: Carboplatin AUC 6mg·min/mL IVDays 1–3: 5FU 1,200mg/m2 IV continuous infusion over 24 hours daily.Repeat cycle every 21 days.
ECF (Category 2B) Day 1: Epirubicin 50mg/m2 IV bolus + cisplatin 60mg/m2
IVDays 1–21: 5FU 200mg/m2 IV continuous infusion over 24 hours daily.Repeat cycle every 21 days.
ECF modifications (epirubicin+ oxaliplatin + 5FU) (Category2B)
Day 1: Epirubicin 50mg/m2 IV + oxaliplatin 130mg/m2 IVDays 1–21: 5FU 200mg/m2 IV continuous infusion over 24 hours.Repeat cycle every 21 days.
ECF modifications (epirubicin+ cisplatin + capecitabine)(Category 2B)
Day 1: Epirubicin 50mg/m2 IV + cisplatin 60mg/m2 IVDays 1–21: Capecitabine 625mg/m2 orally twice daily.Repeat cycle every 21 days.
ECF modifications (epirubicin+ oxaliplatin + capecitabine)(Category 2B)
Day 1: Epirubicin 50mg/m2 IV + oxaliplatin 130mg/m2 IVDays 1–21: Capecitabine 625mg/m2 IV orally twice daily.Repeat cycle every 21 days.
Fluorouracil and irinotecan(irinotecan + leucovorin +5FU)
Day 1: Irinotecan 180mg/m2 IV + leucovorin 400mg/m2 IV + 5FU 400mg/m2 IV push followed byDay 1−2: 5FU 1200mg/m2 IV continuous infusion over 24 hours daily.Repeat cycle every 14 days.
Paclitaxel + cisplatin orcarboplatin
Day 1: Paclitaxel 135–200mg/m2 IVDay 2: Cisplatin 75mg/m2 IV.Repeat cycle every 21 days.
OrDay 1: Paclitaxel 90mg/m2 IV + cisplatin 50mg/m2 IV.Repeat cycle every 14 days.
OrDay 1: Paclitaxel 200mg/m2 IV + carboplatin AUC 5mg·min/mL IV.Repeat cycle every 21 days.
Docetaxel + cisplatin Day 1: Docetaxel 70–85mg/m2 IV + cisplatin 70–75mg/m2
IV.Repeat cycle every 21 days.
Fluoropyridimine Day 1: Leucovorin 400mg/m2 IV + 5FU 400mg/m2 IV pushDays 1−2: 5FU 1200mg/m2 IV continuous infusion over 24 hours daily.Repeat cycle every 14 days.
OrDays 1–5: 5FU 800mg/m2 IV continuous infusion over 24 hours daily.Repeat cycle every 28 days.
OrDays 1–14: Capecitabine 1000–1250mg/m2 orally twice daily.Repeat cycle every 21 days.
Taxane Day 1: Docetaxel 75–100mg/m2 IV.Repeat cycle every 21 days.
Or

263
Day 1: Paclitaxel 135–250mg/m2 IV.Repeat cycle every 21 days.
OrDays 1, 8, 15 and 22: Paclitaxel 80mg/m2 IV once weekly.Repeat cycle every 28 days.
Second-line Therapy and Subsequent Therapy
Preferred RegimensRamucirumab (Category 12) Day 1: Ramucirumab 8mg/kg IV.
Repeat cycle every 14 days.Ramucirumab + paclitaxel(Category 1)
Day 1 and 15: Ramucirumab 8mg/kg IVDay 1, 8, and 15: Paclitaxel 80mg/m2.Repeat cycle every 28 days.
Docetaxel (Category 1) Day 1: Docetaxel 75–100mg/m2 IV.Repeat cycle every 21 days.
Paclitaxel (Category 1) Day 1: Paclitaxel 135–250mg/m2 IV.Repeat cycle every 21 days.
OrDay 1: Paclitaxel 80mg/m2 IV once weekly.Repeat cycle every 28 days.
OrDays 1, 8, and 15: Paclitaxel 80mg/m2 IV.Repeat cycle every 28 days.
Irinotecan (Category 1) Day 1: Irinotecan 250–350mg/m2 IV.Repeat cycle every 21 days.
OrDay 1: Irinotecan 150–180mg/m2 IV.Repeat cycle every 14 days.
OrDays 1 and 8: Irinotecan 125mg/m2 IV.Repeat cycle every 21 days.
5FU + irinotecan (if notpreviously used in first-linetherapy)
Day 1: Irinotecan 180mg/m2 IV + leucovorin 400mg/m2 IV + 5FU 400mg/m2 IV push followed byDay 1 and 2: 5FU 1200mg/m2 IV continuous infusion over 24 hours daily.Repeat cycle every 14 days.
Other RegimensIrinotecan + cisplatin Days 1 and 8: Irinotecan 65mg/m2 IV + cisplatin 25–
30mg/m2 IV.Repeat cycle every 21 days.
Docetaxel + irinotecan(Category 2B3)
Days 1 and 8: Docetaxel 35mg/m2 IV + irinotecan 50mg/m2 IV.Repeat cycle every 21 days.
Pembrolizumab (for second-line or subsequent therapy forMSI-H/dMMR tumours; forthird-line or subsequenttherapy for PD-L1-positiveadenocarcinoma)
Days 1: Pembrolizumab 200 mg IV.Repeat cycle every 21 days.

Appendix 7: Characteristics of miRNA datasets in human gastric cancer.
Modified from A systematic review of microRNA expression profiling studies in human gastric cancer(Shrestha et al. 2014). miRNAs over twofold
change provided 1 Formalin-fixed, paraffin-embedded tissues of H. pylori-positive (n=8) or H. pylori-negative (n=8) patients with an intestinal type of
gastric cancer. GNCA, gastric non-cardia adenocarcinoma; GCI, gastric cancer intestinal; GCD, gastric cancer diffused, NR, not reported.
Dataset Year Region Tumour type
No. of samples (cancer/normal)
Platform (manufacturer) Total miRNA
Differentially expressed miRNAsCriteria Up Down Total
Wang (Y. Y. Wang et al.
2013)
2013 China NR 17Tissue specimen
miRCURY LNA Array (v.16.0; Exiqon, Vedbaek, Denmark)
564 FC > 2, FC < 1.5 49 39 154
Katada (Katada et al. 2009)
2009 Japan GCD 84 (42/42) TaqMan PCR kit protocol on an Applied
Biosystems 7500 real-time PCR System
72 FC > 2, FC < 0.5 3 3 72
Hyun (Chang et al. 2015)
2015 Korea GCI 16 (8/8)1
Tissue specimenMicroarray (Agilent
Technologies, Palo Alto, CA,USA); TaqMan miRNA assays.
3523 FC > 2, P < 0.05 18 19 219
KAZUHIRO(Osawa et al.
2011)
2011 Japan NR 74 (37/37) Toray 3D-Gene® miRNA oligo chip (Toray Industries)
885 T/N ratio >1.40,<0.85, P < 0.05
30 11 41
Zhu (Zhu et al. 2014)
2014 China GNCA 80 (40/40) TaqMan low density array (TLDA) chips (V2.0; Applied Biosystems, Foster city, CA,
USA)
667 FC > 4 5 NR NR
278

Carvalho(Carvalho et al.
2012)
2012 Netherlands GCI 47 (37/10)Tissue specimen
miRNAChip_human_v2 (National DNA-Microarray
Facility, University of Aveiro,Portugal)
703 P < 0.05, FDR < +0.05
5 5 70
Kim (Kim et al. 2011)
2011 Korea GCI,GCD
124 (90/34)Tissue specimen
LMT miRNA microarray (Agilent technologies)
1667 P < 0.005 62 63 125
Li (X. Li et al. 2011a)
2011 China GCI 12 (6/6)Tissue specimen
miRCURY Array LNA microRNA Chip (v.14.0)
(Exiqon)
904 P < 0.01FC > 2
40 36 76
Li (X. Li et al. 2011b)
2011 China NR 20 (10/10)Tissue specimen
TaqMan Human miRNA Array v1.0 (Applied Biosystems)
365 P < 0.05 16 6 22
Oh (Oh et al. 2011)
2011 Singapore GCI,GCD
80 (40/40)Tissue specimen
Agilent Human miRNA Microarrays (V2, Agilent)
723 FDR < 0.01 40 40 146
Tchernitsa(Tchernitsa et
al. 2010)
2010 Germany GCI 12 (6/6)Tissue specimen
NCode TM MultiSpecies miRNA Microarray V1
(Invitrogen)
373 Significance of class comparison = 0.05
20 2 22
Ding (Ding et al. 2010)
2010 China GCI,GCD
12 (6/6)Tissue specimen
μParaflo microfluidic chip (LC Sciences)
NR P < 0.05 8 7 15
Tsukamoto 2010 Japan GCI,GCD
27 (22/5)Tissue specimen
G4470A Human MiRNA Microarray (Agilent
technologies)
470 P < 0.05 33 6 102
Ueda (Ueda et al. 2010)
2010 Japan GCI,GCD
353 (184/169)Tissue specimen
microRNA microarray chip (OSU_CCC version 3.0,
ArrayExpress)
326 P < 0.01 22 13 35
279

Yao (Yao et al. 2009)
2009 China NR 6 (3/3)Tissue specimen
miRCURY LNA microarray Array (v.11.0) (Exiqon)
847 FC > 2 59 46 326
Luo (Luo et al. 2009)
2009 China NR 27 (24/3)Tissue specimen
NR 328 P < 0.05 7 19 26
Liu (Liu et al. 2009)
2009 China NR 8 (4/4)Tissue specimen
microRNA Microarray (Packard Biochip Technologies
ScanArray Express microarray)
243 P < 0.05 4 5 9
Petrocca(Petrocca et al.
2008)
2008 Italy GCI 40 (20/20)Tissue specimen
second generation miRNA microarray chips (V2)
(Amersham BioScience Codelink)
250 Significance analysis of microarray (SAM)
14 5 19
Volinia (Volinia et al. 2006)
2006 USA NR 41 (20/21)Tissue specimen
miRNA microarray (Amersham BioScience Codelink)
190 FDR=0.06 22 6 28280

Appendix 8: List of overlapping differentially expressed miRNAs in gastric cancer.
MicroRNAs in blue denote the overlapped miRNAs in current and Bowen et al. ’s analysis (Conesa et al. 2016). * denotes that the microRNAs were reported in Sirjana et al.’s vote ranking review as well. ^ denotes deregulated miRNA in the same trend in both Ding et al.’s analysis (Ding et al. 2017)and Shrestha et al.’s (Shrestha et al. 2014). # denotes differentially expressed. miRNAs with an opposite change pattern between current analysis and Sirjana et al.’s.
DESeq2 et al. based analysis in the current study edgeRv based analysis in Bowen’s studymiRNA Base Mean log2 Fold Change P value miRNA logFC logCPM LR P value FDRhsa-mir-490* 96.4754 -3.3 4.38E-15 hsa-mir-490* -4.8051 5.883648 227.3672 2.24E-51 3.37E-49hsa-mir-133a-2 333.696 -3.2 1.53E-24 hsa-mir-1-2 -3.52462 8.462458 179.2811 6.96E-41 5.24E-39hsa-mir-133a-1 365.503 -3.1 1.70E-24 hsa-mir-133a-1 -3.47009 7.686724 189.3515 4.40E-43 4.98E-41hsa-mir-944 8.48945 -3 4.17E-15 hsa-mir-133b* -3.43591 4.882301 180.3691 4.03E-41 3.64E-39hsa-mir-1-1 261.397 -3 1.35E-22 hsa-mir-133a-2 -3.28029 2.878416 142.2048 8.77E-33 3.60E-31hsa-mir-1-2 277.487 -3 1.76E-22 hsa-mir-383 -2.58313 1.372154 65.92232 4.69E-16 1.18E-14hsa-mir-5683 16.0219 -2.9 5.11E-20 hsa-mir-139* -2.56445 6.924574 144.909 2.25E-33 1.02E-31hsa-mir-133b* 95.3475 -2.8 5.22E-19 hsa-mir-1-1 -2.5258 -0.29066 42.01943 9.04E-11 1.10E-09hsa-mir-383 4.61665 -2.5 1.67E-12 hsa-mir-204 -2.51743 3.768183 101.6399 6.66E-24 2.32E-22hsa-mir-205 779.212 -2.5 4.49E-05 hsa-mir-145 -2.43625 13.4502 68.19737 1.48E-16 4.18E-15hsa-mir-145 22605.5 -2.4 1.30E-29 hsa-mir-129-1 -2.37581 3.5062 86.67324 1.28E-20 4.13E-19hsa-mir-139* 253.038 -2.3 1.62E-42 hsa-mir-137 -2.17364 0.549852 39.20199 3.82E-10 4.11E-09hsa-mir-143 1118321 -2.1 1.41E-22 hsa-mir-187 -2.15428 3.835279 61.5645 4.28E-15 9.22E-14hsa-mir-551b 6.17111 -2 1.09E-16 hsa-mir-9-3 -2.10139 0.276495 41.2004 1.37E-10 1.55E-09hsa-mir-204 27.1713 -1.9 1.75E-10 hsa-mir-129-2 -2.0211 3.623788 64.84779 8.09E-16 1.92E-14hsa-mir-29c* 17565.9 -1.8 3.17E-23 hsa-mir-885 -1.99205 -0.00875 29.71627 5.00E-08 3.37E-07hsa-mir-1258 4.319 -1.7 6.25E-10 hsa-mir-486 -1.98119 7.630246 78.75621 7.03E-19 2.12E-17hsa-mir-6720 6.07512 -1.6 5.16E-12 hsa-mir-1258 -1.91162 1.044307 41.40072 1.24E-10 1.44E-09hsa-mir-129-1 17.087 -1.6 1.10E-08 hsa-mir-9-2 -1.86005 8.839239 58.76241 1.78E-14 3.66E-13hsa-mir-129-2 20.1071 -1.6 2.35E-08 hsa-mir-9-1 -1.84622 8.838711 57.91596 2.74E-14 5.38E-13hsa-mir-195 167.322 -1.6 1.23E-24 hsa-mir-143 -1.8152 19.02113 26.76652 2.30E-07 1.30E-06hsa-mir-486-2 236.69 -1.6 1.31E-15 hsa-mir-206 -1.79548 0.553828 28.00989 1.21E-07 7.18E-07hsa-mir-486-1 241.67 -1.6 1.94E-15 hsa-mir-605 -1.70801 -0.18536 24.60363 7.04E-07 3.42E-06hsa-mir-605 1.29341 -1.5 2.24E-11 hsa-mir-23c -1.65737 0.656976 33.62034 6.70E-09 5.41E-08
281

hsa-mir-202 2.27267 -1.5 5.92E-07 hsa-mir-30a -1.65228 14.39009 35.24595 2.91E-09 2.58E-08hsa-mir-365b 253.656 -1.5 3.01E-38 hsa-mir-144 -1.6373 7.165103 56.44918 5.77E-14 1.09E-12hsa-mir-365a 253.876 -1.5 3.12E-38 hsa-mir-363 -1.6186 3.370372 46.60951 8.66E-12 1.22E-10hsa-mir-203a 47749.9 -1.5 9.50E-10 hsa-mir-202 -1.60021 0.505004 26.81042 2.24E-07 1.28E-06hsa-mir-30a 75745.6 -1.5 5.11E-19 hsa-mir-149 -1.56676 4.789035 49.14688 2.37E-12 3.70E-11hsa-mir-149 75.7773 -1.4 9.85E-12 hsa-mir-99a -1.53989 9.092692 39.06369 4.10E-10 4.21E-09hsa-mir-187 44.3908 -1.3 0.00051 hsa-mir-100# -1.5395 12.16728 30.5749 3.21E-08 2.30E-07hsa-mir-218-2 65.653 -1.3 1.04E-12 hsa-mir-551b -1.50979 2.030806 29.24939 6.36E-08 4.17E-07hsa-mir-218-1 69.2889 -1.3 1.84E-12 hsa-mir-20b^ -1.4901 4.066006 39.32045 3.60E-10 3.96E-09hsa-mir-451a 1881.71 -1.3 6.28E-10 hsa-mir-365-1 -1.45572 4.578685 47.35135 5.93E-12 8.94E-11hsa-let-7c 9049.56 -1.3 3.37E-08 hsa-mir-29c* -1.45217 12.17281 31.27397 2.24E-08 1.63E-07hsa-mir-100# 20309.1 -1.3 4.07E-09 hsa-mir-218-2 -1.43116 5.544884 44.19166 2.98E-11 3.85E-10hsa-mir-378d-2 2.39748 -1.2 2.04E-08 hsa-mir-451 -1.41848 9.482372 31.30019 2.21E-08 1.63E-07hsa-mir-504 2.67883 -1.2 2.67E-06 hsa-mir-365-2 -1.4117 4.593021 44.94708 2.02E-11 2.69E-10hsa-mir-6511b-2 3.468 -1.2 9.24E-13 hsa-mir-195 -1.38402 6.196652 46.34211 9.93E-12 1.36E-10hsa-mir-144 428.623 -1.2 7.41E-08 hsa-let-7c -1.37102 11.10562 25.06968 5.53E-07 2.75E-06hsa-mir-28 21953.9 -1.2 9.13E-25 hsa-mir-378^ -1.3524 9.977656 33.84618 5.96E-09 4.90E-08hsa-mir-3199-2 2.55187 -1.1 2.09E-11 hsa-mir-378c -1.34841 3.995761 37.56583 8.84E-10 8.68E-09hsa-mir-4786 3.44811 -1.1 1.19E-07 hsa-mir-504 -1.34318 0.518477 21.00924 4.57E-06 1.93E-05hsa-mir-363 32.9539 -1.1 6.54E-07 hsa-mir-1247 -1.31901 4.444355 32.06739 1.49E-08 1.14E-07hsa-mir-378c 48.7569 -1.1 4.40E-14 hsa-mir-802 -1.30525 2.120566 8.819754 0.00298 0.006907hsa-mir-193a 624.346 -1.1 8.69E-21 hsa-mir-101-2 -1.238 5.831003 37.49146 9.18E-10 8.83E-09hsa-mir-125b-1 1025.14 -1.1 7.99E-09 hsa-mir-125b-1 -1.22699 9.332394 25.33243 4.83E-07 2.49E-06hsa-mir-125b-2 1076.54 -1.1 8.85E-09 hsa-mir-125b-2 -1.19928 4.172908 25.12644 5.37E-07 2.70E-06hsa-mir-125a 1597.74 -1.1 1.27E-20 hsa-mir-1262 -1.19894 0.628874 18.60011 1.61E-05 6.12E-05hsa-mir-378a 3824.24 -1.1 1.71E-15 hsa-mir-1224 -1.1755 4.110555 13.78066 0.000205 0.000611hsa-let-7e 4583.89 -1.1 5.29E-11 hsa-mir-28 -1.16295 12.74368 20.38194 6.34E-06 2.61E-05hsa-mir-23b 10354 -1.1 5.05E-20 hsa-mir-23b -1.14816 10.70065 23.39329 1.32E-06 6.22E-06hsa-mir-27b 13371.1 -1.1 4.86E-26 hsa-mir-218-1 -1.13081 0.310216 12.81953 0.000343 0.001hsa-mir-378d-1 1.80983 -1 6.40E-06 hsa-mir-125a -1.12163 8.957969 26.09095 3.26E-07 1.77E-06hsa-mir-1262 3.89914 -1 2.39E-09 hsa-mir-328 -1.08873 4.505851 25.32157 4.85E-07 2.49E-06hsa-mir-153-1 8.8946 -1 4.45E-05 hsa-mir-3678 -1.06929 -0.46024 9.381958 0.002191 0.005297
282

hsa-mir-326 hsa-mir-193ahsa-mir-328 23.785 -1 2.55E-09 hsa-mir-497 -1.06783 7.615196 26.51488 2.62E-07 1.46E-06hsa-mir-497 66.3037 -1 4.19E-12 hsa-mir-381 -1.05245 4.887338 25.87917 3.63E-07 1.96E-06hsa-mir-381 85.8655 -1 4.83E-12 hsa-mir-30c-2 -1.04833 5.898908 27.794 1.35E-07 7.92E-07hsa-mir-30c-2 193.556 -1 7.00E-14 hsa-mir-3199-2 -1.01405 9.079368 21.95033 2.80E-06 1.22E-05hsa-mir-99a 1442.18 -1 2.50E-20 hsa-mir-579 -1.01231 0.049924 11.01296 0.000905 0.00242hsa-mir-140 2829.08 -1 0.00011 hsa-mir-500b 1.003594 0.173085 10.04165 0.00153 0.003864hsa-mir-26a-1 3622.47 -1 3.36E-20 hsa-mir-1301 1.01082 2.853586 19.51406 9.99E-06 3.96E-05hsa-mir-26a-2 3747.54 -1 2.76E-25 hsa-mir-19b-1 1.013281 2.662935 19.28604 1.13E-05 4.42E-05hsa-mir-4640 3762.93 -1 1.58E-24 hsa-mir-3690 1.017658 2.760713 19.80815 8.56E-06 3.46E-05hsa-mir-3664 0.93441 1 0.00215 hsa-mir-33b 1.019013 -0.45859 7.58355 0.00589 0.012157hsa-mir-4709 1.78673 1 0.00128 hsa-mir-200c 1.06251 2.191573 17.20339 3.36E-05 0.000119hsa-mir-219b 1.82011 1 5.84E-05 hsa-mir-181b-2 1.123707 12.62303 13.92546 0.00019 0.000573hsa-mir-4660 1.88076 1 0.00011 hsa-mir-3682 1.131267 1.465516 18.29105 1.90E-05 7.08E-05hsa-mir-3117 2.13797 1 0.00031 hsa-mir-1304 1.133584 0.095028 13.76865 0.000207 0.000611hsa-mir-3922 2.54896 1 9.46E-05 hsa-mir-19a* 1.158205 0.530508 14.85341 0.000116 0.000378hsa-mir-550a-3 2.55428 1 0.00014 hsa-mir-4326 1.169756 4.440135 29.28147 6.26E-08 4.16E-07hsa-mir-616 5.6589 1 6.82E-07 hsa-mir-1537 1.178167 2.60476 22.28298 2.35E-06 1.03E-05hsa-mir-323b 11.9804 1 1.58E-05 hsa-mir-335* 1.196737 -0.57095 8.840801 0.002946 0.006863hsa-mir-421 12.6471 1 5.90E-05 hsa-mir-3127 1.200402 5.660871 34.92476 3.43E-09 2.98E-08hsa-mir-34c 12.839 1 1.97E-10 hsa-mir-222 1.205502 1.919227 25.61662 4.16E-07 2.19E-06hsa-mir-95 15.742 1 1.06E-08 hsa-mir-550a-1 1.229276 6.354788 34.67439 3.90E-09 3.32E-08hsa-mir-500b 26.4724 1 1.14E-06 hsa-mir-3677 1.230369 1.765377 24.84935 6.20E-07 3.05E-06hsa-mir-362 68.0902 1 2.29E-13 hsa-mir-3194 1.233403 2.618829 28.11401 1.14E-07 6.99E-07hsa-mir-222 68.414 1 9.27E-12 hsa-mir-940 1.245561 -0.22182 12.65948 0.000374 0.001069hsa-mir-106b* 386.191 1 3.26E-13 hsa-mir-142 1.252802 1.526729 23.16899 1.48E-06 6.69E-06hsa-mir-181a-1 2069.48 1 8.98E-22 hsa-mir-147b 1.26474 11.22242 21.86826 2.92E-06 1.25E-05hsa-mir-532 2251.98 1 4.21E-20 hsa-mir-556 1.268672 1.916673 17.66322 2.64E-05 9.53E-05hsa-mir-200c 4282.56 1 5.06E-16 hsa-mir-1228 1.284855 0.331394 16.9532 3.83E-05 0.000134hsa-mir-548k 33728.2 1 1.49E-09 hsa-mir-577 1.285879 0.054366 15.80262 7.03E-05 0.000237hsa-mir-3680-1 0.90486 1.1 0.00063 hsa-mir-639 1.286575 4.265989 23.98078 9.73E-07 4.63E-06hsa-mir-5703 0.94644 1.1 0.00098 hsa-mir-1266 1.309998 -0.29025 14.34584 0.000152 0.000477
283

hsa-mir-3691 1.13193 1.1 0.00064 hsa-mir-130b 1.31746 3.625128 30.40361 3.51E-08 2.44E-07hsa-mir-3942 1.38189 1.1 0.00063 hsa-mir-503 1.334593 4.434231 34.33792 4.63E-09 3.88E-08hsa-mir-4797 1.49245 1.1 0.00047 hsa-mir-3944 1.339988 2.37236 28.07584 1.17E-07 7.03E-07hsa-mir-559 1.49388 1.1 0.00031 hsa-mir-501 1.359005 -0.58497 12.04175 0.00052 0.001451hsa-mir-548o 1.52738 1.1 0.00133 hsa-mir-1292 1.364548 4.953196 42.87447 5.84E-11 7.33E-10hsa-mir-4766 1.54383 1.1 8.28E-05 hsa-mir-509-3 1.372709 -0.40602 14.58476 0.000134 0.000433hsa-mir-548s 1.56175 1.1 0.00028 hsa-mir-184 1.375675 -0.11822 12.50652 0.000406 0.001153hsa-mir-3194 1.57248 1.1 0.00061 hsa-mir-141 1.434392 3.704775 15.82452 6.95E-05 0.000236hsa-mir-3682 1.93347 1.1 0.00058 hsa-mir-182 1.461218 10.07376 27.45664 1.61E-07 9.31E-07hsa-mir-3652 3.23956 1.1 4.18E-07 hsa-mir-509-2 1.483654 12.73574 25.78177 3.82E-07 2.03E-06hsa-mir-5586 3.84742 1.1 7.63E-05 hsa-mir-935 1.484827 -0.22201 13.70959 0.000213 0.000626hsa-mir-940 7.84255 1.1 1.41E-09 hsa-mir-877 1.490044 1.558525 25.22209 5.11E-07 2.59E-06hsa-mir-550a-2 10.075 1.1 6.07E-08 hsa-mir-200b* 1.490746 1.090363 30.53817 3.27E-08 2.31E-07hsa-mir-3934 12.0803 1.1 1.35E-09 hsa-mir-301b 1.515505 10.36933 28.65058 8.67E-08 5.60E-07hsa-mir-320b-1 15.2677 1.1 1.73E-10 hsa-mir-21* 1.517523 0.565191 24.26225 8.41E-07 4.04E-06hsa-mir-4677 21.6989 1.1 2.45E-09 hsa-mir-429 1.524249 17.07657 28.22467 1.08E-07 6.78E-07hsa-mir-3677 25.4845 1.1 3.16E-18 hsa-mir-7-3 1.550224 8.159935 35.86425 2.12E-09 1.95E-08hsa-mir-320b-2 27.5123 1.1 2.80E-09 hsa-mir-937 1.551694 0.962984 28.57573 9.01E-08 5.74E-07hsa-mir-130b 35.5248 1.1 5.73E-10 hsa-mir-3651 1.566361 0.824561 28.12699 1.14E-07 6.99E-07hsa-mir-203b 113.421 1.1 8.95E-13 hsa-mir-146b 1.56792 0.552446 23.31423 1.38E-06 6.35E-06hsa-mir-223* 386.682 1.1 1.53E-05 hsa-mir-188* 1.571159 8.577653 50.55111 1.16E-12 1.94E-11hsa-mir-1307 1625.73 1.1 3.04E-08 hsa-mir-1254 1.584507 2.062049 41.67226 1.08E-10 1.28E-09hsa-mir-141 5186.86 1.1 1.10E-17 hsa-mir-551a 1.594923 -0.15366 21.86838 2.92E-06 1.25E-05hsa-mir-3684 5850.09 1.1 3.54E-09 hsa-mir-215^ 1.646534 -0.21254 18.34646 1.84E-05 6.94E-05hsa-mir-4645 1.04176 1.2 0.0001 hsa-mir-200a 1.685801 10.59604 23.36748 1.34E-06 6.24E-06hsa-mir-7854 1.11731 1.2 0.00019 hsa-mir-192^ 1.69807 10.43228 36.13127 1.84E-09 1.74E-08hsa-mir-1229 1.43001 1.2 8.95E-05 hsa-mir-105-2 1.719582 14.41716 22.35297 2.27E-06 1.01E-05hsa-mir-3150b 2.82291 1.2 8.75E-05 hsa-mir-96 1.771443 3.833691 19.13901 1.22E-05 4.74E-05hsa-mir-3200 7.16886 1.2 0.00023 hsa-mir-18a* 1.771828 3.458154 50.32947 1.30E-12 2.10E-11hsa-mir-217 12.7464 1.2 2.14E-06 hsa-mir-767 1.797128 4.26354 64.10104 1.18E-15 2.67E-14hsa-mir-708 186.445 1.2 2.66E-08 hsa-mir-3648 1.813376 3.790524 23.19221 1.47E-06 6.69E-06hsa-mir-181b-2 283.501 1.2 1.38E-11 hsa-mir-194-1 1.822511 1.564576 39.0819 4.06E-10 4.21E-09
284

hsa-mir-181b-1 443.857 1.2 2.41E-18 hsa-mir-194-2 1.827376 11.98643 31.70942 1.79E-08 1.35E-07hsa-mir-200b* 470.55 1.2 3.38E-19 hsa-mir-3662 1.858527 12.10746 32.49045 1.20E-08 9.33E-08hsa-mir-93* 6719.84 1.2 3.80E-12 hsa-mir-183 1.887278 -0.58133 20.02632 7.64E-06 3.11E-05hsa-mir-3174 20498.4 1.2 2.01E-16 hsa-mir-592 1.943658 11.47269 47.08264 6.81E-12 9.92E-11hsa-mir-4461 0.89233 1.3 0.00012 hsa-mir-1911 2.046905 1.778939 55.78928 8.07E-14 1.46E-12hsa-mir-643 2.3604 1.3 2.51E-05 hsa-mir-3176 2.127434 0.854113 20.84261 4.99E-06 2.09E-05hsa-mir-548v 2.94041 1.3 6.55E-08 hsa-mir-105-1 2.160355 -0.58701 26.15449 3.15E-07 1.74E-06hsa-mir-550a-1 5.93127 1.3 1.01E-06 hsa-mir-615 2.170972 3.821292 29.73005 4.97E-08 3.37E-07hsa-mir-3127 12.2797 1.3 1.27E-13 hsa-mir-3687 2.176016 1.402284 53.00359 3.33E-13 5.79E-12hsa-mir-1301 19.0495 1.3 1.56E-14 hsa-mir-509-1 2.324626 0.222873 38.23519 6.27E-10 6.30E-09hsa-mir-4326 33.1328 1.3 3.47E-17 hsa-mir-549 2.430465 -0.2549 32.75796 1.04E-08 8.28E-08hsa-mir-20a* 33.3916 1.3 3.99E-08 hsa-mir-135b* 2.68146 -0.48982 35.57181 2.46E-09 2.22E-08hsa-mir-210 1653.88 1.3 3.90E-14 hsa-mir-552 3.186272 4.944869 171.6598 3.21E-39 2.07E-37hsa-mir-500a 1838.62 1.3 1.85E-07 hsa-mir-196a-2 3.718047 4.015132 117.9429 1.78E-27 6.72E-26hsa-mir-17* 2145.32 1.3 1.85E-22 hsa-mir-548f-1 3.993711 2.400791 162.9158 2.61E-37 1.47E-35hsa-mir-194-1 5960.17 1.3 2.25E-19 hsa-mir-196b 4.040168 -0.00399 67.67345 1.93E-16 5.13E-15 hsa-mir-5698 23296.8 1.3 7.99E-11 hsa-mir-196a-1 4.826419 7.887649 348.1235 1.09E-77 2.45E-75hsa-mir-618 1.65549 1.4 1.37E-05 hsa-mir-1269 5.173649 6.457087 393.0208 1.82E-87 8.23E-85hsa-mir-7702 2.06486 1.4 1.99E-05 5.24766 4.896873 153.8731 2.47E-35 1.24E-33hsa-mir-4746 4.67635 1.4 5.00E-06hsa-mir-7-2 9.18916 1.4 4.83E-13hsa-mir-503 12.891 1.4 2.90E-09hsa-mir-200a 30.0206 1.4 7.63E-14hsa-mir-194-2 7398.47 1.4 5.51E-14hsa-mir-6783 26030.3 1.4 4.32E-12hsa-mir-1254-1 1.09785 1.5 1.45E-05hsa-mir-4449 1.54109 1.5 1.96E-06hsa-mir-3131 2.69368 1.5 4.91E-05hsa-mir-188* 8.22796 1.5 0.00012hsa-mir-3187 19.8367 1.5 1.06E-18hsa-mir-1292 1.3466 1.6 4.04E-05hsa-mir-1228 2.1785 1.6 4.04E-08
285
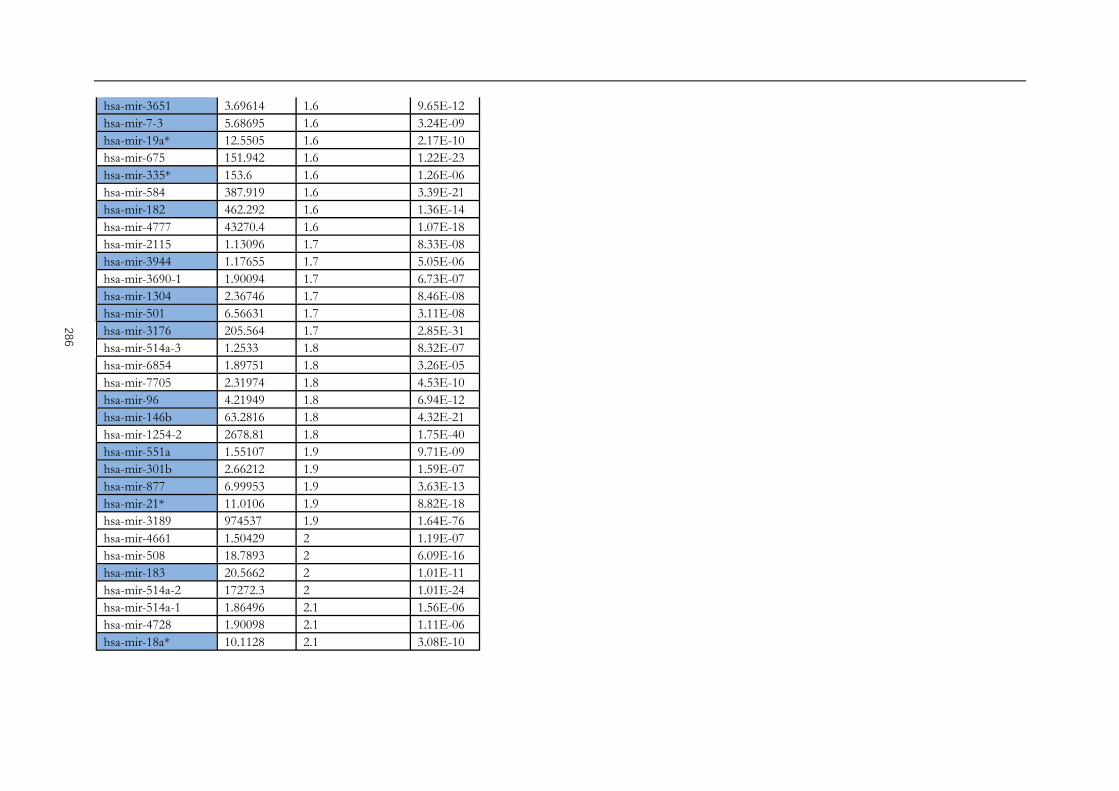
hsa-mir-3651 3.69614 1.6 9.65E-12hsa-mir-7-3 5.68695 1.6 3.24E-09hsa-mir-19a* 12.5505 1.6 2.17E-10hsa-mir-675 151.942 1.6 1.22E-23hsa-mir-335* 153.6 1.6 1.26E-06hsa-mir-584 387.919 1.6 3.39E-21hsa-mir-182 462.292 1.6 1.36E-14hsa-mir-4777 43270.4 1.6 1.07E-18hsa-mir-2115 1.13096 1.7 8.33E-08hsa-mir-3944 1.17655 1.7 5.05E-06hsa-mir-3690-1 1.90094 1.7 6.73E-07hsa-mir-1304 2.36746 1.7 8.46E-08hsa-mir-501 6.56631 1.7 3.11E-08hsa-mir-3176 205.564 1.7 2.85E-31hsa-mir-514a-3 1.2533 1.8 8.32E-07hsa-mir-6854 1.89751 1.8 3.26E-05hsa-mir-7705 2.31974 1.8 4.53E-10hsa-mir-96 4.21949 1.8 6.94E-12hsa-mir-146b 63.2816 1.8 4.32E-21hsa-mir-1254-2 2678.81 1.8 1.75E-40hsa-mir-551a 1.55107 1.9 9.71E-09hsa-mir-301b 2.66212 1.9 1.59E-07hsa-mir-877 6.99953 1.9 3.63E-13hsa-mir-21* 11.0106 1.9 8.82E-18hsa-mir-3189 974537 1.9 1.64E-76hsa-mir-4661 1.50429 2 1.19E-07hsa-mir-508 18.7893 2 6.09E-16hsa-mir-183 20.5662 2 1.01E-11hsa-mir-514a-2 17272.3 2 1.01E-24hsa-mir-514a-1 1.86496 2.1 1.56E-06hsa-mir-4728 1.90098 2.1 1.11E-06hsa-mir-18a* 10.1128 2.1 3.08E-10
286

hsa-mir-592 207.313 2.1 5.96E-26hsa-mir-509-1 20.7431 2.2 1.81E-17hsa-mir-615 3.36674 2.3 2.98E-08hsa-mir-184 13.2415 2.3 6.79E-16 hsa-mir-7974 9.13882 2.4 3.47E-08hsa-mir-937 2.95907 2.5 2.68E-11hsa-mir-483 11.4755 2.5 7.84E-20hsa-mir-4664 29.6098 2.5 2.88E-12hsa-mir-934 2.76805 2.6 5.11E-14hsa-mir-509-2 6.86696 2.6 5.89E-07hsa-mir-509-3 3.46509 2.7 1.71E-10hsa-mir-3662 3.79058 2.7 4.34E-11hsa-mir-935 2.85484 2.8 1.07E-13hsa-mir-549a 24.3065 2.9 1.47E-21hsa-mir-135b* 2.29748 3 9.07E-14hsa-mir-196b 214.13 3.3 1.01E-45hsa-mir-196a-1 1928.06 4.5 3.16E-52hsa-mir-196a-2 350.082 4.7 1.69E-67hsa-mir-105-1 392.763 4.7 1.51E-66hsa-mir-552 117.22 5.7 4.56E-24hsa-mir-1269a 189.267 5.8 2.60E-40hsa-mir-105-2 98.0023 5.9 2.86E-23hsa-mir-767 116.387 5.9 6.40E-26miRNA 144.592 5.9 9.33E-26
287

274
Appendix 9: Differentially expressed miRNAs in TCGA based molecular
classification of gastric cancer.

Appendix 10: Summary of miRNA target prediction tools.
Bold are tools used in the current study. Adopted from common features of microRNA target prediction tools by Peterson et al. (Peterson et al. 2014)
Method Type of Method Ref ResourceStark et. al Complementary (Stark et. al., 2003) http://www.russell.embl.de/miRNAsmiRanda Complementary (John et al., 2004) http://www.microrna.org
miRanda mirSVR Complementary (Enright et al., 2003) http://microrna.sanger.ac.ukmiRWalk - - http://www.umm.uni-heidelberg.de/apps/zmf/mirwalk/index.html
Target Scan Seed Complementary (Lewis et al., 2005) http://www.targetscan.orgDIANA Thermodynamics (Kirakidou et al., 2004) http://diana.cslab.ece.ntua.gr/PicTar Thermodynamics (Krek et al., 2005) http://pictar.mdc-berlin.de/
RNAHybrid Thermodynamics & Statistical model (Rehmsmeier et al., 2004) http://bibiserv.techfak.uni-bielefeld.de/rnahybridmiRGen++ Baynesian Inference (Huang et al., 2007b) http://www.psi.toronto.edu/genmir
MiTarget Support Vector Machine (Kim et al. 2006) http://cbit.snu.ac.kr/~miTargetMiRtaget2 Support Vector Machine (Wang and El Naqa, 2008) http://mirdb.orgTarBase Experimentally Validated Targets (Sethupathy et al., 2006) http://diana.cslab.ece.ntua.gr/tarbase/
MiRTarbase Experimentally validated (Chou CH et al., 2011) http://miRTarBase.mbc.nctu.edu.tw/
289

Appendix 11: Overlapping results of targets prediction of miR-140-5p from online tools.
Gene Description Validated evidence as miR-140-5p target
SNX16 Play a role in protein transportation from endosome to lysosome (Hanson and Hong 2003) Not available
GALC The enzyme responsible for the lysosomal catabolism of galactosyl ceramide (Beier and Gorogh 2005) Barter et al. (2015)
MYO6 Motor protein of the actin cytoskeleton (Aschenbrenner et al. 2004) Not available
VEGFA Angiogenesis and tumourigenesis (Goel et al. 2013) Zhang et al. (2015), Sun et al. (2016)
FZD6 Negative regulator of the canonical Wnt/beta-catenin signalling cascade, thereby inhibiting the processes that trigger the oncogenic transformation, cell proliferation, and inhibition of apoptosis. (Dann and Mercurio 2001)
Barter et al. (2015)
FGF9 An FGF family member possessing broad mitogenic and cell survival activities (Spicer 2009) Yang et al. (2013)
HMGN5 A nucleosomal binding and transcriptional activating protein Meng et al. (2017)
PRDM1 Transcription factor that mediates a transcriptional program in various innate and adaptive immune Not available
HDAC4 Chromatin remodelling and negative regulation of transcription by RNA polymerase II (Mottet 2009) Xiao et al. (2017), Papaioannou et al. (2015), Song et al. (2009)
STRADB A pseudokinase, induce cell cycle arrest but protect against apoptosis. Not available
OSTM1 Osteoclast differentiation and ion transmembrane transport Liu et al. (2013), Gernapudi et al. (2015)
MRPS10 Help in protein synthesis within the mitochondrion Not available
PHACTR2 Platelet activation, signalling and aggregation Not available
290