Head 140 — GOVERNMENT SECRETARIAT: FOOD AND ...
12
Head 140 — GOVERNMENT SECRETARIAT: FOOD AND HEALTH BUREAU (HEALTH BRANCH) Controlling officer: the Permanent Secretary for Food and Health (Health) will account for expenditure under this Head. Estimate 2019–20 .................................................................................................................................... $71,181.7m Establishment ceiling 2019–20 (notional annual mid-point salary value) representing an estimated 157 non-directorate posts as at 31 March 2019 rising by 27 posts to 184 posts as at 31 March 2020..... $129.4m In addition, there will be an estimated 12 directorate posts as at 31 March 2019 rising by one post to 13 posts as at 31 March 2020. Commitment balance.............................................................................................................................. $3,095.5m Controlling Officer’s Report Programmes Programme (1) Health Programme (2) Subvention: Hospital Authority Programme (3) Subvention: Prince Philip Dental Hospital These programmes contribute to Policy Area 15: Health (Secretary for Food and Health). Detail Programme (1): Health 2017–18 2018–19 2018–19 2019–20 (Actual) (Original) (Revised) (Estimate) Financial provision ($m) Government sector 449.8 734.6 700.1 907.4 (–4.7%) (+29.6%) (or +23.5% on 2018–19 Original) Subvented sector — — — 132.7 ————— ————— ————— ————————— Total 449.8 734.6 700.1 1,040.1 (–4.7%) (+48.6%) (or +41.6% on 2018–19 Original) Aim The aim is to formulate and oversee implementation of policies to protect and promote public health, to provide 2 comprehensive and lifelong holistic health care to each citizen, and to ensure that no one is prevented, through lack of means, from obtaining adequate medical treatment. Brief Description The Health Branch of the Food and Health Bureau formulates and co-ordinates policies and programmes to: 3 • protect and promote health; • prevent and treat illness and disease; and • minimise the impact of disability. Generally, the effectiveness of the work of the Branch is reflected in the extent to which the departments and 4 subvented organisations delivering medical and healthcare services achieve the objectives of this programme. The aim has been broadly achieved in 2018–19. 423
-
Upload
khangminh22 -
Category
Documents
-
view
0 -
download
0
Transcript of Head 140 — GOVERNMENT SECRETARIAT: FOOD AND ...

Head 140 — GOVERNMENT SECRETARIAT: FOOD AND HEALTH BUREAU (HEALTH BRANCH)
Controlling officer: the Permanent Secretary for Food and Health (Health) will account for expenditure under this Head.
Estimate 2019–20 .................................................................................................................................... $71,181.7m
Establishment ceiling 2019–20 (notional annual mid-point salary value) representing an estimated 157 non-directorate posts as at 31 March 2019 rising by 27 posts to 184 posts as at 31 March 2020 ..... $129.4m
In addition, there will be an estimated 12 directorate posts as at 31 March 2019 rising by one post to 13 posts as at 31 March 2020.
Commitment balance.............................................................................................................................. $3,095.5m
Controlling Officer’s Report
Programmes
Programme (1) Health Programme (2) Subvention: Hospital
Authority Programme (3) Subvention: Prince Philip
Dental Hospital
These programmes contribute to Policy Area 15: Health (Secretary for Food and Health).
Detail
Programme (1): Health
2017–18 2018–19 2018–19 2019–20 (Actual) (Original) (Revised) (Estimate)
Financial provision ($m)
Government sector 449.8 734.6 700.1 907.4 (–4.7%) (+29.6%)
(or +23.5% on 2018–19 Original) Subvented sector — — — 132.7
————— ————— ————— —————————
Total 449.8 734.6 700.1 1,040.1 (–4.7%) (+48.6%)
(or +41.6% on 2018–19 Original)
Aim
The aim is to formulate and oversee implementation of policies to protect and promote public health, to provide 2 comprehensive and lifelong holistic health care to each citizen, and to ensure that no one is prevented, through lack of means, from obtaining adequate medical treatment.
Brief Description
The Health Branch of the Food and Health Bureau formulates and co-ordinates policies and programmes to: 3
• protect and promote health;
• prevent and treat illness and disease; and
• minimise the impact of disability.
Generally, the effectiveness of the work of the Branch is reflected in the extent to which the departments and 4 subvented organisations delivering medical and healthcare services achieve the objectives of this programme. The aim has been broadly achieved in 2018–19.
423

Head 140 — GOVERNMENT SECRETARIAT: FOOD AND HEALTH BUREAU (HEALTH BRANCH)
Matters Requiring Special Attention in 2019–20
During 2019–20, the Branch will: 5
• develop a blueprint for the sustainable development of primary healthcare services and launch the first District Health Centre of Hong Kong in Kwai Tsing District;
• implement and provide funding for programmes under the Chinese Medicine Development Fund (CMDF) to support and promote the development of Chinese medicine (CM) in Hong Kong;
• launch the tender process for selecting a non-profit-making organisation as operator and complete the functional brief for the construction of the Chinese Medicine Hospital;
• service the Advisory Committee on Mental Health and pursue recommendations of the Mental Health Review Report;
• fully implement the Voluntary Health Insurance Scheme;
• oversee the implementation of the Pilot Accredited Registers Scheme for Healthcare Professions;
• prepare for the implementation of the new regulatory regime for private healthcare facilities and facilitate private hospital development;
• finalise legislative proposals for the regime on the regulation of medical devices;
• introduce legislative proposal for regulating health products for advanced therapies;
• finalise strategies for developing genomic medicine in Hong Kong, and prepare for the establishment of the Hong Kong Genome Institute to implement the Hong Kong Genome Project (HKGP);
• develop a comprehensive strategy on cancer prevention and care services;
• continue to oversee the smooth and timely implementation of capital works projects under the First Ten-year Hospital Development Plan (HDP), and the planning of those under the Second HDP;
• pursue the recommendations of the strategic review on healthcare manpower planning and professional development in consultation with stakeholders;
• continue to oversee the implementation of the strategy to prevent and control non-communicable diseases;
• continue to oversee the implementation of health promotion and preventive programmes;
• continue to oversee the implementation of the Elderly Health Care Voucher Scheme, the “Outreach Dental Care Programme for the Elderly” and the “Healthy Teeth Collaboration” programme;
• continue to oversee the development of the second stage of the Electronic Health Record Sharing System;
• continue efforts to promote breastfeeding and organ donation and to deter smoking;
• continue to manage the Health and Medical Research Fund (HMRF); and
• formulate and implement policy initiatives on the development of CM services as an integral part of the healthcare system in Hong Kong, including the provision of subsidised defined public outpatient CM services at the 18 district based CM clinics, and the further development of inpatient services with Integrated Chinese-Western Medicine treatment in Hospital Authority hospitals.
Programme (2): Subvention: Hospital Authority
2017–18 2018–19 2018–19 2019–20 (Actual) (Original) (Revised) (Estimate)
Financial provision ($m) 56,441.0 62,395.5 64,444.2 69,917.7 (+3.3%) (+8.5%)
(or +12.1% on 2018–19 Original)
Aim
The Hospital Authority advises the Government on the needs of the public for hospital services and resources 6 required to meet those needs, and provides adequate, efficient and effective public hospital services of the highest standard recognised internationally within the resources available.
424
Head 140 — GOVERNMENT SECRETARIAT: FOOD AND HEALTH BUREAU (HEALTH BRANCH)
Brief Description
The Branch subvents the Hospital Authority to provide public medical services. The Hospital Authority is a 7 statutory body established on 1 December 1990 under the Hospital Authority Ordinance (Cap. 113) to manage all public hospitals in Hong Kong. The Authority, with over 78 000 staff (full time equivalents), manages 43 public hospitals and institutions, 49 specialist outpatient clinics and 73 general outpatient clinics as at 31 December 2018.
The Hospital Authority manages and develops the public medical service system in ways which are conducive 8 to achieving the following objectives:
• to use hospital beds and clinics, staff, equipment and other resources efficiently to provide medical services of the highest standard within the resources available;
• to improve the efficiency of medical services by developing appropriate management structure, systems and performance measures;
• to attract, motivate and retain staff;
• to encourage public participation in the operation of the public medical service system; and
• to ensure accountability to the public for the management and control of the public medical service system.
The Hospital Authority generally achieved its performance targets in 2018–19. The volume of patient 9 care activities across the full range of services in 2018–19 is comparable to the level in 2017–18.
The key activity data in respect of the Hospital Authority are: 10
Targets
As at
31 March
As at 31 March
2019
As at 31 March
2020 2018
(Actual) (Revised
Estimate) (Target &
Plan)
Access to services inpatient services
no. of hospital beds general (acute and convalescent) ....................................................... 22 027 22 561 23 067 infirmary............................................................................................. 2 041 2 041 2 041 mentally ill ......................................................................................... 3 607 3 647 3 647 mentally handicapped ........................................................................ 680 680 680 ————— ————— ————— overall................................................................................................. 28 355 28 929 29 435
ambulatory and outreach services accident and emergency (A&E) services
percentage of A&E patients within target waiting time
triage I (critical cases – 0 minute) (%) ...................................... 100 100 100 triage II (emergency cases –
15 minutes) (%) ................................................................... 97 95 95 triage III (urgent cases – 30 minutes) (%) ................................ 76 90 90
specialist outpatient services median waiting time for first appointment at
specialist clinics first priority patients .................................................................. <1 week 2 weeks 2 weeks second priority patients ............................................................. 5 weeks 8 weeks 8 weeks
rehabilitation and geriatric services no. of community nurses .................................................................... 490 493 503 no. of geriatric day places .................................................................. 659 659 669
psychiatric services no. of community psychiatric nurses ................................................. 139 141 141 no. of psychiatric day places .............................................................. 889 889 889
425

Head 140 — GOVERNMENT SECRETARIAT: FOOD AND HEALTH BUREAU (HEALTH BRANCH)
Indicators
2018–19 2017–18
(Actual) (Revised
Estimate) 2019–20
(Estimate) Delivery of services inpatient services
no. of discharges and deaths general (acute and convalescent) ....................................................... 1 138 748 1 135 800 1 161 100 infirmary............................................................................................. 3 400 3 300 3 300 mentally ill ......................................................................................... 17 432 17 800 17 900 mentally handicapped ........................................................................ 629 630 630
————— ————— ————— overall................................................................................................. 1 160 209 1 157 530 1 182 930
no. of patient days general (acute and convalescent) ....................................................... 6 662 514 6 687 000 6 823 000 infirmary............................................................................................. 498 621 506 000 506 000 mentally ill ......................................................................................... 918 456 992 000 997 000 mentally handicapped ........................................................................ 191 510 201 000 201 000
————— ————— ————— overall................................................................................................. 8 271 101 8 386 000 8 527 000
bed occupancy rate (%) general (acute and convalescent) ....................................................... 93 93 93 infirmary............................................................................................. 89 89 89 mentally ill ......................................................................................... 70 70 70 mentally handicapped ........................................................................ 77 77 77
————— ————— ————— overall................................................................................................. 89 89 89
average length of stay (days)§ general (acute and convalescent) ....................................................... 5.9 5.9 5.9 infirmary............................................................................................. 139 139 139 mentally ill ......................................................................................... 55 55 55 mentally handicapped ........................................................................ 303 303 303
————— ————— ————— overall................................................................................................. 7.2 7.2 7.2
ambulatory and outreach services day inpatient services
no. of discharges and deaths .............................................................. 659 413 668 700 691 000 A&E services
no. of attendances ............................................................................... 2 189 040 2 192 000 2 198 000 no. of attendances per 1 000 population ............................................ 296 296 296 no. of first attendances for
triage I ....................................................................................... 22 144 22 100 22 100 triage II ...................................................................................... 52 111 52 100 52 100 triage III .................................................................................... 749 179 749 100 749 100
specialist outpatient services no. of specialist outpatient (clinical) new
attendances .................................................................................... 790 355 799 000 815 000 no. of specialist outpatient (clinical) follow-up
attendances .................................................................................... 6 926 315 6 950 000 7 004 000 ————— ————— ————— total no. of specialist outpatient (clinical)
attendances .................................................................................... 7 716 670 7 749 000 7 819 000 primary care services
no. of general outpatient attendances ................................................. 6 081 738 6 090 000 6 154 000 no. of family medicine specialist clinic
attendances .................................................................................... 311 626 311 600 317 600 ————— ————— ————— total no. of primary care attendances ................................................. 6 393 364 6 401 600 6 471 600
rehabilitation and palliative care services no. of rehabilitation day and palliative care day attendances .................................................................................... 98 104 99 900 103 100 no. of home visits by community nurses............................................ 877 610 876 000 892 000 no. of allied health (community) attendances .................................... 36 426 37 200 37 200 no. of allied health (outpatient) attendances ...................................... 2 745 545 2 772 000 2 793 000
426

Head 140 — GOVERNMENT SECRETARIAT: FOOD AND HEALTH BUREAU (HEALTH BRANCH)
2018–19 2017–18
(Actual) (Revised
Estimate) 2019–20
(Estimate)
geriatric services no. of outreach attendances ................................................................ 685 469 680 200 684 000 no. of geriatric elderly persons assessed for infirmary care service .................................................................... 1 766 1 860 1 860 no. of geriatric day attendances.......................................................... 148 258 148 200 150 700 no. of Visiting Medical Officer attendances ...................................... 110 805 111 000 111 000
psychiatric services no. of psychiatric outreach attendances ............................................. 292 121 299 900 308 100 no. of psychiatric day attendances ..................................................... 222 303 223 500 223 500 no. of psychogeriatric outreach attendances ...................................... 98 440 99 900 101 600
Quality of services
no. of hospital deaths per 1 000 populationΔ .............................................. 3 3 3 unplanned readmission rate within 28 days for general
inpatients (%) .......................................................................................... 10.6 10.6 10.6 Cost of services cost distribution
cost distribution by service types (%) inpatient .............................................................................................. 54.4 54.7 55.0 ambulatory and outreach .................................................................... 45.6 45.3 45.0
cost by service types per 1 000 population ($m) inpatient .............................................................................................. 4.5 4.9 5.2 ambulatory and outreach .................................................................... 3.8 4.0 4.2
cost of services for persons aged 65 or above share of cost of services (%) .............................................................. 48.5 49.9 50.1 cost of services per 1 000 population ($m) ........................................ 24.5 26.0 26.6
unit costs inpatient services
cost per inpatient discharged ($) general (acute and convalescent) .............................................. 26,110 28,450 29,740 infirmary ................................................................................... 239,970 254,540 261,840 mentally ill ................................................................................ 147,780 156,320 160,540 mentally handicapped ............................................................... 513,660 544,490 560,110
cost per patient day ($) general (acute and convalescent) .............................................. 4,950 5,370 5,630 infirmary ................................................................................... 1,640 1,710 1,760 mentally ill ................................................................................ 2,810 2,810 2,890 mentally handicapped ............................................................... 1,690 1,710 1,760
ambulatory and outreach services cost per A&E attendance ($) .............................................................. 1,390 1,490 1,530 cost per specialist outpatient attendance ($) ...................................... 1,230 1,310 1,350 cost per general outpatient attendance ($).......................................... 470 505 520 cost per family medicine specialist clinic
attendance ($) .............................................................................. 1,180 1,270 1,310 cost per outreach visit by community nurse ($) ................................. 575 620 640 cost per psychiatric outreach attendance ($) ...................................... 1,660 1,750 1,810 cost per geriatric day attendance ($) .................................................. 2,240 2,370 2,440
fee waivers¶ percentage of Comprehensive Social Security
Assistance (CSSA) fee waiver (%) ......................................................... 17.5 16.6 16.6 percentage of non-CSSA fee waiver (%)Φ ................................................. 12.8 16.6 18.1
Manpower (no. of full time equivalent staff as at 31 March)
Medical doctor ................................................................................................. 5 858 6 000 6 190
no. of specialists ........................................................................ 3 422 3 430 3 460 no. of trainees/non-specialists ................................................... 2 436 2 570 2 730
intern .................................................................................................. 470 496 494 dentist ................................................................................................. 8 8 11
medical total .............................................................................. 6 336 6 504 6 695
427

Head 140 — GOVERNMENT SECRETARIAT: FOOD AND HEALTH BUREAU (HEALTH BRANCH)
2018–19 2017–18
(Actual) (Revised
Estimate) 2019–20
(Estimate)
Nursing qualified staff ..................................................................................... 25 303 26 050 26 870 trainee ................................................................................................. 808 675 700
nursing total .............................................................................. 26 111 26 725 27 570 allied health ................................................................................................. 7 815 8 070 8 400 others ........................................................................................................... 36 664 38 130 39 760 ————— ————— —————
total ........................................................................................... 76 926 79 429 82 425
§ Derived by dividing the sum of length of stay of inpatients by the corresponding number of inpatients discharged and treated.
Δ Refers to the standardised hospital death rate covering inpatient and day inpatient deaths in Hospital Authority hospitals in a particular year. The standardised rate, as a standard statistical technique to facilitate comparison over years, is calculated by applying the Hospital Authority age-specific hospital death rate in that particular year to the “standard” population in mid-2001.
¶ Refers to the amount waived as percentage to total charge. Φ With effect from 15 July 2017, the medical fee waiver for public healthcare services has been extended to
cover Old Age Living Allowance (OALA) recipients meeting the eligibility criteria. In this regard, the percentage of non-CSSA fee waiver for 2017–18 Actual, 2018–19 Revised Estimate and 2019–20 Estimate includes fee waiver for OALA recipients of 6.6 per cent, 10.9 per cent and 12.4 per cent respectively.
Matters Requiring Special Attention in 2019–20
In 2019–20, the Hospital Authority will continue to meet the healthcare needs of the population within the policy 11 framework of the Government. The Government’s direction is for the Hospital Authority to focus on four priority areas: (a) acute and emergency care; (b) services for the low income group and the underprivileged; (c) illnesses that entail high cost, advanced technology and multi-disciplinary professional team work in their treatment; and (d) training of healthcare professionals.
The Hospital Authority will also: 12
• continue to introduce medical services in Tin Shui Wai Hospital, North Lantau Hospital and Hong Kong Children’s Hospital in phases. A total of around 500 hospital beds will be added across Hospital Authority’s hospital clusters to meet the service demand;
• continue to enhance palliative care consultative service, geriatric fragility fracture co-ordination services and restorative rehabilitative services for elderly patients;
• enhance the treatment and management of cancers, diabetes mellitus, renal diseases, stroke and cardiac diseases;
• augment the workforce by attracting and retaining staff through the Special Retired and Rehire Scheme, Limited Registration and various measures;
• continue to enhance access to accident and emergency, surgical, endoscopic, diagnostic imaging, specialist outpatient and general outpatient services as well as increase the number of operating theatre sessions and improve pharmacy services;
• enhance mental health services for patients with common mental disorder, children and adolescents with mental health needs as well as continue to strengthen the support for elderly patients with dementia; and
• continue to make use of investment returns generated from the $10 billion Public-Private Partnership (PPP) Endowment Fund allocated to the Hospital Authority to operate clinical PPP programmes.
Programme (3): Subvention: Prince Philip Dental Hospital
2017–18 2018–19 2018–19 2019–20 (Actual) (Original) (Revised) (Estimate)
Financial provision ($m) 170.1 212.1 217.2 223.9 (+2.4%) (+3.1%)
(or +5.6% on 2018–19 Original)
Aim
The aim is to provide facilities for the training of dentists and dental ancillary personnel. 13
428

Head 140 — GOVERNMENT SECRETARIAT: FOOD AND HEALTH BUREAU (HEALTH BRANCH)
Brief Description
The Branch subvents the Prince Philip Dental Hospital (PPDH). The PPDH is a statutory body established 14 in 1981 under the Prince Philip Dental Hospital Ordinance (Cap. 1081). It is a purpose-built teaching hospital to provide clinical training facilities for undergraduate and postgraduate students of the Faculty of Dentistry of the University of Hong Kong. It also runs courses for dental ancillary personnel at diploma level.
In the 2017/18 academic year, the PPDH generally achieved its overall performance targets in terms of the 15 number of students attending the undergraduate and postgraduate courses and the diploma courses.
The key performance measures are: 16
Indicators
Academic Year
2018/19 2017/18
(Actual) (Revised
Estimate) 2019/20
(Estimate) no. of training places
undergraduate .............................................................................................. 352 375 405 postgraduate# .............................................................................................. 75 81 80 student dental technician ............................................................................. 40 38 40 student dental surgery assistant ................................................................... 36 28 36 student dental hygienist ............................................................................... 52 59 64 student dental therapist ................................................................................ 10 10 10 ————— ————— ————— total .............................................................................................................. 565 591 635
capacity utilisation rate (%)Φ undergraduate .............................................................................................. 98 99 100 postgraduate ................................................................................................ 100 100 100 student dental technician ............................................................................. 100 95 100 student dental surgery assistant ................................................................... 100 78 97 student dental hygienist ............................................................................... 108˄ 102˄ 94 student dental therapist ................................................................................ 100 100 100
completion rate (%) undergraduate .............................................................................................. 100 100 100 postgraduate ................................................................................................ 100 100 100 student dental technician ............................................................................. 98 95 95 student dental surgery assistant ................................................................... 83 82 81 student dental hygienist ............................................................................... 92 85 84 student dental therapist ................................................................................ 100 100 100
# The indicators cover only research postgraduate programmes. Φ This refers to the number of students enrolled in courses as a percentage of the total number of training
places offered. ˄ The utilisation rates exceed 100 per cent because there were/are students retaking the course in 2017/18 and
2018/19 academic years.
Matters Requiring Special Attention in 2019–20
During 2019–20, PPDH will start improving its facilities having regard to the recommendations of consultancy 17 study and replacing old dental units by phases.
429

Head 140 — GOVERNMENT SECRETARIAT: FOOD AND HEALTH BUREAU (HEALTH BRANCH)
ANALYSIS OF FINANCIAL PROVISION
2017–18 2018–19 2018–19 2019–20 (Actual) (Original) (Revised) (Estimate) ($m) ($m) ($m) ($m) Programme
(1) Health ........................................................... 449.8 734.6 700.1 1,040.1
(2) Subvention: Hospital Authority ................... 56,441.0 62,395.5 64,444.2 69,917.7
(3) Subvention: Prince Philip Dental
Hospital ........................................................ 170.1 212.1 217.2 223.9
————— ————— ————— ———————— 57,060.9 63,342.2 65,361.5 71,181.7
(+3.2%) (+8.9%)
(or +12.4% on
2018–19 Original)
Analysis of Financial and Staffing Provision
Programme (1)
Provision for 2019–20 is $340.0 million (48.6%) higher than the revised estimate for 2018–19. This is mainly due to the increased cash flow requirement for the general non-recurrent items on CMDF, HMRF and HKGP as well as increased recurrent cost to support primary healthcare development and the HKGP. There will be an increase of 28 posts in 2019–20.
Programme (2)
Provision for 2019–20 is $5,473.5 million (8.5%) higher than the revised estimate for 2018–19. This is mainly due to the additional provision to the Hospital Authority for implementing various measures to meet the increasing demand for hospital services and to improve the quality of clinical care.
Programme (3)
Provision for 2019–20 is $6.7 million (3.1%) higher than the revised estimate for 2018–19. The increase is mainly due to the increased requirement in minor plant, equipment, maintenance, and improvement in 2019–20.
430

Head 140 — GOVERNMENT SECRETARIAT: FOOD AND HEALTH BUREAU (HEALTH BRANCH)
(No government staff under PROG 2-3)
PROG 1
(1.5%)
PROG 2
(98.2%)
PROG 3
(0.3%)
Allocation of provision
to programmes
(2019-20)
PROG 1
(197)
Staff by programme
(as at 31 March 2020)
122 121 121
169
197
0
50
100
150
200
250
2016 2017 2018 2019 2020
Num
ber
of
post
s
Year
Revised
Estimate
Estimate
Actual
Estimate
Changes in the size of the establishment
(as at 31 March)
431

Head 140 — GOVERNMENT SECRETARIAT: FOOD AND HEALTH BUREAU (HEALTH BRANCH)
Sub-
head
(Code)
Actual expenditure
2017–18
Approved estimate 2018–19
Revised estimate 2018–19
Estimate 2019–20
————— ————— ————— ————— $’000 $’000 $’000 $’000
Operating Account
Recurrent
000 Operational expenses .......................................... 55,993,650 62,149,505 64,188,815 69,610,419 ————— ————— ————— ————— Total, Recurrent ....................................... 55,993,650 62,149,505 64,188,815 69,610,419 ————— ————— ————— —————
Non-Recurrent
700 General non-recurrent ......................................... 184,921 250,000 230,000 420,000 ————— ————— ————— ————— Total, Non-Recurrent ............................... 184,921 250,000 230,000 420,000 ————— ————— ————— ————— Total, Operating Account ........................ 56,178,571 62,399,505 64,418,815 70,030,419
———————————————————
Capital Account
Subventions
85C Prince Philip Dental Hospital.............................. 576 535 535 637 899 Prince Philip Dental Hospital - minor plant,
vehicles, equipment, maintenance, and improvement (block vote) ..............................
8,125
17,439
17,439
22,162
979 Hospital Authority - equipment and information systems (block vote) .......................................
873,650
924,700
924,700
1,128,472
————— ————— ————— ————— Total, Subventions ................................... 882,351 942,674 942,674 1,151,271 ————— ————— ————— ————— Total, Capital Account ............................. 882,351 942,674 942,674 1,151,271
———————————————————
————— ————— ————— ————— Total Expenditure .................................... 57,060,922 63,342,179 65,361,489 71,181,690
————— ————— ————— —————
432
Head 140 — GOVERNMENT SECRETARIAT: FOOD AND HEALTH BUREAU (HEALTH BRANCH)
Details of Expenditure by Subhead
The estimate of the amount required in 2019–20 for the salaries and expenses of the Health Branch is $71,181,690,000. This represents an increase of $5,820,201,000 over the revised estimate for 2018–19 and $14,120,768,000 over the actual expenditure in 2017–18.
Operating Account
Recurrent
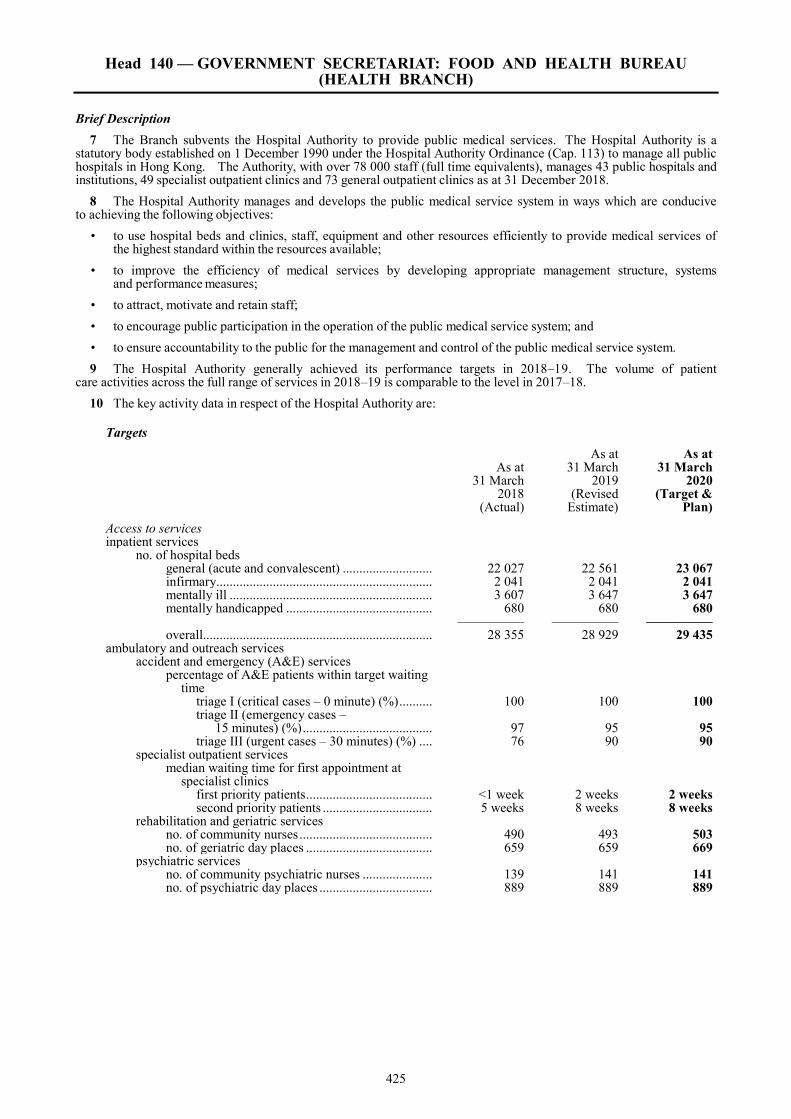
2 Provision of $69,610,419,000 under Subhead 000 Operational expenses is for the salaries, allowances and other operating expenses of the Health Branch.
3 The establishment as at 31 March 2019 will be 169 posts including one supernumerary post. It is expected that there will be an increase of 28 posts in 2019–20. Subject to certain conditions, the controlling officer may under delegated power create or delete non-directorate posts during 2019–20, but the notional annual mid-point salary value of all such posts must not exceed $129,417,000.
4 An analysis of the financial provision under Subhead 000 Operational expenses is as follows:
2017–18 (Actual) ($’000)
2018–19 (Original)
($’000)
2018–19 (Revised)
($’000)
2019–20 (Estimate)
($’000)
Personal Emoluments - Salaries ................................................................................... 98,387 126,780 116,395 153,320 - Allowances ............................................................................. 4,175 5,028 4,450 4,785 - Job-related allowances ........................................................... 1 2 2 2
Personnel Related Expenses - Mandatory Provident Fund
contribution .......................................................................... 208 197 295 317 - Civil Service Provident Fund
contribution .......................................................................... 4,823 10,736 7,642 13,309 Departmental Expenses
- General departmental expenses ............................................. 157,336 341,839 341,305 395,638 Subventions
- Hospital Authority ................................................................. 55,567,327 61,470,771 63,519,528 68,789,176 - Prince Philip Dental Hospital ................................................ 161,393 194,152 199,198 201,145 - Hong Kong Genome Institute ................................................ — — — 52,727
————— ————— ————— ————— 55,993,650 62,149,505 64,188,815 69,610,419
————— ————— ————— —————
Capital Account
Subventions
5 Provision of $22,162,000 under Subhead 899 Prince Philip Dental Hospital - minor plant, vehicles, equipment, maintenance, and improvement (block vote) is for the procurement of plant and equipment, maintenance, and minor improvement works costing over $200,000 but not exceeding $10 million for each project. The increase of $4,723,000 (27.1%) over the revised estimate for 2018–19 is mainly due to the increased requirement in 2019–20.
6 Provision of $1,128,472,000 under Subhead 979 Hospital Authority - equipment and information systems (block vote) is for the procurement of equipment items and computerisation projects costing over $200,000 each. The increase of $203,772,000 (22%) over the revised estimate for 2018–19 is mainly due to the increased cash flow requirements in 2019–20.
433

Head 140 — GOVERNMENT SECRETARIAT: FOOD AND HEALTH BUREAU (HEALTH BRANCH)
Commitments
Sub-
head
(Code)
Item
(Code) Ambit Approved
commitment
Accumulated expenditure
to 31.3.2018
Revised estimated
expenditure for 2018–19 Balance
————— ————— ————— ————— $’000 $’000 $’000 $’000
Operating Account
700 General non-recurrent
802 Chinese Medicine Development Fund ............... 500,000 — 25,000 475,000
803 Hong Kong Genome ProjectΩ ........................... 682,000 Ω — — 682,000
823 Health and Medical Research Fund ................... 2,915,000 772,688 205,000 1,937,312 ————— ————— ————— ————— 4,097,000 772,688 230,000 3,094,312 ————— ————— ————— —————
Capital Account
85C Prince Philip Dental Hospital
876 Replacement of air water separators of the Suction Pipe System at 3A and 3B clinics .............................................................
3,300 3,092 27 181
891 Replacement of lift nos. 1 to 5 and installation of ascending car over speed protection devices for lift nos. 1 to 6 .......................................................
5,500 4,000 508 992
————— ————— ————— ————— 8,800 7,092 535 1,173 ————— ————— ————— ————— Total ......................................................................................................................................... 4,105,800 779,780 230,535 3,095,485 ————— ————— ————— —————
Ω This is a new item, funding for which is sought in the context of the Appropriation Bill 2019.
434