Dynamics of the ssDNA Recognition by the RepA Hexameric Helicase of Plasmid RSF1010. Analyses Using...
39
Dynamics of the ssDNA Recognition by the RepA Hexameric Helicase of Plasmid RSF1010: Analyses Using Fluorescence Stopped-Flow Intensity and Anisotropy Methods ✩ Iraida E. Andreeva, Michal R. Szymanski, Maria J. Jezewska, Roberto Galletto, and Wlodzimierz Bujalowski * Department of Biochemistry and Molecular Biology, The University of Texas Medical Branch at Galveston, 301 University Boulevard, Galveston, TX 77555-1053, USA Department of Obstetrics and Gynecology, The University of Texas Medical Branch at Galveston, 301 University Boulevard, Galveston, TX 77555-1053, USA Sealy Center for Structural Biology and Sealy Center for Cancer Cell Biology, The University of Texas Medical Branch at Galveston, 301 University Boulevard, Galveston, TX 77555-1053, USA Abstract The kinetic mechanism of the single-stranded DNA (ssDNA) recognition by the RepA hexameric replicative helicase of the plasmid RSF1010 and the nature of formed intermediates, in the presence of the ATP nonhydrolyzable analog, β,γ-imidoadenosine-5′-triphosphate (AMP-PNP), have been examined, using the fluorescence intensity and anisotropy stopped-flow and analytical ultracentrifugation methods. Association of the RepA hexamer with the ssDNA oligomers that engage the total DNA-binding site and exclusively the strong DNA-binding subsite is a minimum four-step mechanism Extreme stability of the RepA hexamer precludes any disintegration of its structure, and the sequential character of the mechanism indicates that the enzyme exists in a predominantly single conformation prior to the association with the nucleic acid. Moreover, the hexameric helicase possesses a DNA-binding site located outside its cross channel. The reaction steps have dramatically different dynamics, with rate constants differing by 2–3 orders of magnitude. Such behavior indicates a very diverse nature of the observed transitions, which comprises binding steps and large conformational transitions of the helicase, including local opening of the hexameric structure. Steady-state fluorescence anisotropies of intermediates indicate that the entry of the DNA into the cross channel is initiated from the 5′ end of the bound nucleic acid. The global structure of the tertiary complex RepA–ssDNA–AMP–PNP is very different from the structure of the binary complex RepA–AMP-PNP, indicating that, in equilibrium, the RepA hexamer–ssDNA– AMP-PNP complex exists as a mixture of partially open states. ✩ This work was supported by National Institutes of Health Grants GM46679 and GM58565 (to W.B.). © 2009 Published by Elsevier Ltd. * Corresponding author. [email protected].. Present address: R. Galletto, Department of Biochemistry and Biophysics, Washington University, St. Louis, MO, USA. NIH Public Access Author Manuscript J Mol Biol. Author manuscript; available in PMC 2011 April 4. Published in final edited form as: J Mol Biol. 2009 May 15; 388(4): 751–775. doi:10.1016/j.jmb.2009.03.027. NIH-PA Author Manuscript NIH-PA Author Manuscript NIH-PA Author Manuscript
-
Upload
independent -
Category
Documents
-
view
2 -
download
0
Transcript of Dynamics of the ssDNA Recognition by the RepA Hexameric Helicase of Plasmid RSF1010. Analyses Using...

Dynamics of the ssDNA Recognition by the RepA HexamericHelicase of Plasmid RSF1010: Analyses Using FluorescenceStopped-Flow Intensity and Anisotropy Methods✩
Iraida E. Andreeva, Michal R. Szymanski, Maria J. Jezewska, Roberto Galletto, andWlodzimierz Bujalowski*Department of Biochemistry and Molecular Biology, The University of Texas Medical Branch atGalveston, 301 University Boulevard, Galveston, TX 77555-1053, USA
Department of Obstetrics and Gynecology, The University of Texas Medical Branch at Galveston,301 University Boulevard, Galveston, TX 77555-1053, USA
Sealy Center for Structural Biology and Sealy Center for Cancer Cell Biology, The University ofTexas Medical Branch at Galveston, 301 University Boulevard, Galveston, TX 77555-1053, USA
AbstractThe kinetic mechanism of the single-stranded DNA (ssDNA) recognition by the RepA hexamericreplicative helicase of the plasmid RSF1010 and the nature of formed intermediates, in thepresence of the ATP nonhydrolyzable analog, β,γ-imidoadenosine-5′-triphosphate (AMP-PNP),have been examined, using the fluorescence intensity and anisotropy stopped-flow and analyticalultracentrifugation methods. Association of the RepA hexamer with the ssDNA oligomers thatengage the total DNA-binding site and exclusively the strong DNA-binding subsite is a minimumfour-step mechanism
Extreme stability of the RepA hexamer precludes any disintegration of its structure, and thesequential character of the mechanism indicates that the enzyme exists in a predominantly singleconformation prior to the association with the nucleic acid. Moreover, the hexameric helicasepossesses a DNA-binding site located outside its cross channel. The reaction steps havedramatically different dynamics, with rate constants differing by 2–3 orders of magnitude. Suchbehavior indicates a very diverse nature of the observed transitions, which comprises binding stepsand large conformational transitions of the helicase, including local opening of the hexamericstructure. Steady-state fluorescence anisotropies of intermediates indicate that the entry of theDNA into the cross channel is initiated from the 5′ end of the bound nucleic acid. The globalstructure of the tertiary complex RepA–ssDNA–AMP–PNP is very different from the structure ofthe binary complex RepA–AMP-PNP, indicating that, in equilibrium, the RepA hexamer–ssDNA–AMP-PNP complex exists as a mixture of partially open states.
✩This work was supported by National Institutes of Health Grants GM46679 and GM58565 (to W.B.).© 2009 Published by Elsevier Ltd.*Corresponding author. [email protected] address: R. Galletto, Department of Biochemistry and Biophysics, Washington University, St. Louis, MO, USA.
NIH Public AccessAuthor ManuscriptJ Mol Biol. Author manuscript; available in PMC 2011 April 4.
Published in final edited form as:J Mol Biol. 2009 May 15; 388(4): 751–775. doi:10.1016/j.jmb.2009.03.027.
NIH
-PA Author Manuscript
NIH
-PA Author Manuscript
NIH
-PA Author Manuscript
Keywordshelicases; DNA replication; protein–ssDNA interactions; stopped-flow kinetics
IntroductionIn the course of major processes of DNA and RNA metabolism, such as replication,recombination, repair, and translation, the duplex regions of the nucleic acid are transientlyunwound, forming a metabolically active single-stranded DNA (ssDNA) intermediate.1-7
The unwinding reaction is catalyzed by a class of enzymes called helicases and is fueled bythe hydrolysis of nucleotide triphosphates. The RepA protein is a hexameric DNAreplicative helicase that is essential for replication of RSF1010 plasmid, a broad-hostnonconjugative plasmid that can confer bacterial resistance to sulfonamides andstreptomycin.8-11 What distinguishes the RepA protein from other hexameric helicases isthat its ringlike hexameric structure is extremely stable without any cofactors or specific saltin solution.8,9,12-14 The hexameric structure of the analogous Escherichia coli DnaBreplicative helicase is stabilized only by Mg2+ cations.15,16 However, several other well-known hexameric enzymes, such as bacteriophage T7, T4, or the E. coli transcriptiontermination factor Rho helicases, assemble into the hexamer at physiological concentrationsof the proteins, in the presence of nucleotide cofactors and/or the ssDNA.17-20
The RepA hexamer is the smallest known hexameric helicase with a molecular mass of ~180kDa.8-14 In the crystal structure, the diameter of a single RepA hexamer is ~115 Å, whilethe diameter of the central cross channel of the ringlike structure of the enzyme is only ~17Å.9 Nevertheless, analytical ultracentrifugation and dynamic light-scattering studies indicatethat the global structure of the RepA hexamer in solution is significantly different from itscrystal structure.21 The axial ratio of the protein, modeled as an ellipsoid of revolution, is~4.5 as compared to only ~2.4 for the crystal structure. The large axial ratio and theexperimentally determined partial specific volume strongly suggest that, in solution, thediameter of the cross channel of the hexamer is larger than ~17 Å seen in the crystal. Thesestudies also provided the first indication of a significant structural flexibility of the RepAhexamer. The enzyme exists in at least four global conformational states, modulated by thenumber of bound cofactors. Modulation of the global structure is separated into two phases,depending on the number of bound nucleotide cofactors. Nucleotide binding controls thehelicase–ssDNA interactions, through the changes of the enzyme structure and its ssDNAaffinity, prior to DNA binding.21
Interactions with the ssDNA conformation of the nucleic acid play a paramount role in theactivities of all helicases.1-7,12,16,21-27 Fluorescence energy transfer studies provide strongevidence that, in the complex with the ssDNA, the ssDNA passes through the central crosschannel of the RepA hexamer.28 Kinetic studies of the analogous DnaB helicase clearlyindicate that the DNA enters the cross channel of ~40 Å in diameter, through the localopening of the hexameric structure.29,30 However, the mechanism by which the nucleic acidenters the small cross channel of the extremely stable hexameric structure of the RepAhelicase has never been addressed. Dynamics, energetics, and the nature of the formedintermediates are unknown. The total site size of the enzyme–ssDNA complex, that is, thetotal number of occluded nucleotides by the RepA hexamer in the complex, is 19±1nucleotides, analogous to the site size of 20±3 nucleotides of the complex between muchlarger DnaB hexamer and the nucleic acid.12,16,24-27 Moreover, similar to the DnaBhelicase, the total ssDNA-binding site of the RepA hexamer is heterogeneous; that is, itcontains strong and weak DNA-binding subsites, sequentially placed within the total bindingsite (Fig. 1). A similar presence of the strong and weak DNA-binding subsites has been
Andreeva et al. Page 2
J Mol Biol. Author manuscript; available in PMC 2011 April 4.
NIH
-PA Author Manuscript
NIH
-PA Author Manuscript
NIH
-PA Author Manuscript
found for the monomeric E. coli PriA helicase, indicating that this is a general structure–function feature of the total DNA-binding site of the helicases.31-33 However, very little isknown about the role of the strong and weak DNA-binding subsites in the mechanism of theDNA entry into the cross channel of a hexameric helicase.
Functional and structural homology between the RepA hexamer and the DnaB helicasehexamer makes the RepA protein an excellent model for comparative studies of generalaspects of interactions between the hexameric replicative helicase and the DNA.8,9,12-14,21,28 The role of conformational changes of the protein accompanying theassociation with the ssDNA should be much more pronounced, due to the small size of thecross channel and the extreme stability of the RepA hexamer, than in the case of less stableenzymes. Moreover, quantitative kinetic mechanism of interactions with the ssDNA iscurrently known only for two hexameric helicases, making any mechanistic generalizationvery difficult.29,30,34 The paramount role of RepA helicase in the RSF1010 plasmidreplication indicates the presence of some specific mechanism of replicative helicaseactivities, which is not yet recognized. Furthermore, the fact that the RepA helicase plays anessential role in replication of the RSF1010 plasmid, which confers resistance to antibiotics,gives an opportunity to address the molecular aspects of such resistance.8-11,21,28
In this communication, we describe quantitative analyses of the kinetic mechanism of thessDNA entry into the cross channel of the RepA helicase. Extreme stability of the RepAhexamer precludes any disintegration of its structure prior to the association with the nucleicacid, and the enzyme exists in a single conformation preceding the association reaction.Moreover, the helicase possesses a DNA-binding site located outside its cross channel,which initially binds the DNA. The reaction steps comprise binding steps and largeconformational transitions of the enzyme, including local opening of the hexameric structurewith different thermodynamic characteristics. The entry of the nucleic acid into the crosschannel is initiated from the 5′ end of the bound DNA. Furthermore, in equilibrium, theRepA hexamer–ssDNA complex exists in a mixture of partially open states.
ResultsDynamics of the ssDNA binding to the total DNA-binding site of the RepA helicase
Because the total DNA-binding site of the RepA hexamer occludes 19±1 nucleotides, thehelicase binds only a single molecule of the ssDNA 20-mer and the oligomer encompassesthe entire total binding site of the enzyme.12 By the same token, only a single RepAhexamer binds to the ssDNA oligomers up to 37 nucleotides in length, engaging the entireDNA-binding site. To examine the mechanism of the DNA association with the total DNA-binding site of the RepA helicase, we selected a series of ssDNA oligomers, containing 20,25, and 30 nucleotides, which can accept only a single hexamer molecule (see below).Although binding of the ssDNA to the RepA helicase is not accompanied by any significantchange of the protein fluorescence, we previously found that association of the oligomers,labeled at the 5′ end with the fluorescent marker fluorescein, is accompanied by a largequenching of the emission intensity of the marker, providing an excellent signal to monitorthe complex kinetics of the helicase–ssDNA interactions.12 Because fluorescein isintroduced through the phosphoramidate chemistry (Materials and Methods), the markerconstitutes an additional residue in the selected nucleic acids. Therefore, the ssDNAoligomers are further referred as 21-, 26-, and 31-mers. Thermodynamic studies haveshowed that the presence of the marker does affect the energetics of the enzyme–ssDNAinteractions.12
All stopped-flow experiments discussed in this work have been performed under pseudo-first-order conditions with respect to the protein, by mixing the ssDNA oligomer with a
Andreeva et al. Page 3
J Mol Biol. Author manuscript; available in PMC 2011 April 4.
NIH
-PA Author Manuscript
NIH
-PA Author Manuscript
NIH
-PA Author Manuscript

large excess of the RepA helicase.29,30,35-38 The stopped-flow kinetic trace of the 5′-Fl-dT(pT)19 fluorescence, after mixing 5 × 10⁻⁹ M (oligomer) with 5 × 10⁻⁷ M RepA helicase(hexamer) (final concentrations) in buffer T5 (pH 7.6, 10 °C), containing 0.5 mM β,γ-imidoadenosine-5′-triphosphate (AMP-PNP), is shown in Fig. 2. The observed signal is thetotal fluorescence emission of the sample, which eliminates possible artifacts, resulting fromthe changes of the fluorescence anisotropy of the sample (Materials and Methods).37,38 Thecurve is shown in two time bases, 5 and 1500 s. The kinetic relaxation process is complex. Afast step is followed by a much slower intensity decay, as the system approachesequilibrium. The continuous line in Fig. 2 is a nonlinear least-squares fit of the experimentalcurve using a three-exponential function (Materials and Methods).29,30,35-38 As indicated bythe included deviations of the experimental curve from the fit, the three-exponential functionprovides an adequate description of the experimentally observed kinetics. However, thesame process monitored by the fluorescence anisotropy clearly indicates the presence of anadditional fast step (see below), although a higher number of exponents does notsignificantly improve the statistics of the total emission intensity fit (data not shown).Therefore, the association of the ssDNA 20-mer with the total DNA-binding site of theRepA helicase is a process, which includes at least four steps.29,30,35-40
The dependence of the reciprocal relaxation times, 1/τ1,1/τ2, and 1/τ3, characterizing theobserved kinetic steps, as a function of the total RepA concentration, [RepA]T, is shown inFig. 3a–c. The largest reciprocal relaxation time, 1/τ1, shows little dependence upon[RepA]T, indicating that it characterizes an intramolecular step.29,30,35-40 Moreover, the factthat anisotropy data provide strong evidence for the presence of an additional fast step, 1/τ1,characterizes an intramolecular transition (see below). A similar behavior is observed for 1/τ2, which has ~3 orders of magnitude lower values than 1/τ1, indicating a much slowertransition of the complex (Fig. 3b). Also, 1/τ3 does not show any pronounced dependenceupon [RepA]T (Fig. 3c). Thus, the simplest minimum mechanism that can account for theobserved dependence of the relaxation times upon the RepA concentration is a four-step,sequential binding process, in which the bimolecular association is followed by threeisomerization steps, as described in Eq. (1)
(1)
In the numerical analyses, to extract the rate constants from the relaxation time data in Fig.3a–c, we utilize the fact that the value of the overall binding constant, K21 = (3.1±0.4) × 106
M−1, has previously been independently obtained in the same solution conditions by theequilibrium fluorescence titration method.12 The overall binding constant K21 is related tothe partial equilibrium steps by Eq. (2), as
(2)
where the partial equilibrium constants for each step of the reaction, described in Eq. (1), areK1 = k1/k−1, K2 = k2/k−2, K3 = k3/k−3, and K4 = k4/k−4. Equation (2) reduces the number offitting parameters by 1 (see below).
The dependence of the individual amplitudes A1, A2, and A3 of all three observed relaxationprocesses upon the total concentration of RepA hexamer is shown in Fig. 3d. The individualamplitudes are normalized; that is, expressed as fractions of the total amplitude, Ai/∑Ai. At alow enzyme concentration, the contribution of amplitudes A1 and A3 of the fastest and
Andreeva et al. Page 4
J Mol Biol. Author manuscript; available in PMC 2011 April 4.
NIH
-PA Author Manuscript
NIH
-PA Author Manuscript
NIH
-PA Author Manuscript
slowest relaxation steps, respectively, dominates the total observed amplitude AT. Theamplitude A1 steadily increases with the increase of the protein concentration, while A3strongly decreases with the increase of [RepA]T. The values of the amplitude of the secondstep, A2, remains low and decreases with [RepA]T. Such behavior of the individualamplitudes is in complete agreement with the proposed kinetic mechanism [Eq. (1)] basedon the behavior of the relaxation times and anisotropy data (see below).29,30,35-39
Having determined individual amplitudes, one can address the molar fluorescence intensitiescharacterizing each intermediate of the reaction, using the matrix projection operatorapproach (Materials and Methods).29,30,35-39 In this case, we use the maximum fractionalquenching of the nucleic acid fluorescence, ΔFmax≈0.2, obtained in independent equilibriumtitrations.12,39 The values of ΔFmax can be analytically expressed as
(3)
where ΔF1, ΔF2, ΔF3, and ΔF4 are fractional fluorescence intensities of the correspondingintermediates in the association reaction of the 21-mer with the RepA hexamer, relative tothe fluorescence of the free nucleic acid, F0; that is, ΔFi =(Fi−F0)/F0. The value of F0 canbe taken as 1. Equation (3) furnishes an additional relationship among the fluorescenceparameters, with the value of ΔFmax playing the role of a scaling factor.29,30,35-39
The continuous lines in Fig. 3a–d are nonlinear least-squares fits of the experimentallydetermined relaxation times and fractional individual amplitudes of the reaction, defined inEq. (1), using a single set of binding and spectroscopic parameters and using the matrixprojection operator methods together with Eqs. (2) and (3) (Materials and Methods).29,30,35-39 First, the numerical analysis was performed by nonlinear least-squares fitting ofthe individual relaxation times and then simultaneous fitting of all three relaxation times.Subsequently, nonlinear least-squares fitting was performed with the individual amplitudes,using the rate constants obtained from the relaxation time analysis or allowing the rateconstants to float between +10% and −10% of the determined values. Finally, global fitting,with the simultaneous analysis of all relaxation times and individual amplitudes, refines theobtained parameters. Analogous stopped-flow and numerical analyses have been performedfor all examined ssDNA oligomers, 5′-Fl-dT(pT)19, 5′-Fl-dT(pT)24, and 5′-Fl-dT(pT)29,which engage the total DNA-binding site of the RepA helicase.12 The obtained partialequilibrium constants, rate constants, and spectroscopic parameters characterizing theintermediates of the reaction for all examined oligomers are included in Table 1.
The values of the partial equilibrium constant, K1, which describes the formation of the firstintermediate (H-ssDNA)1 in Eq. (1), changes from ~1.5 × 10⁵ M−1 for the 21-mer to ~5 ×10⁴ M−1 for the 31-mer. A statistical factor of the form N−n+1, where N is the length of theoligomer and n is the site size of the complex (in our case, n = 19 for the total DNA-bindingsite of the RepA hexamer), is expected for the large ligand binding to a homogeneousnucleic acid lattice.41-44 The data indicate that there is no statistical factor involved in theformation of the first intermediate for the 21-, 25-, and 31-mer. A similar lack of thestatistical effect in the RepA hexamer binding to the corresponding ssDNA oligomers hasbeen previously observed for the overall equilibrium constant, KN, in equilibrium studies12
(see Discussion). Nevertheless, the formation of the first intermediate has a predominantcontribution to the free energy of ssDNA binding. At 10 °C, the next three steps of thereaction increase the overall affinity. Moreover, the partial equilibrium constants have verysimilar values for all examined oligomers. The value of K2, which characterizes thetransition (H-ssDNA)1↔(H-ssDNA)2, is in the range of ~2.3–2.5. The values of K3, which
Andreeva et al. Page 5
J Mol Biol. Author manuscript; available in PMC 2011 April 4.
NIH
-PA Author Manuscript
NIH
-PA Author Manuscript
NIH
-PA Author Manuscript
describes the transition (H-ssDNA)2↔(H-ssDNA)3, is in the range of ~2.5–3.8, while thefinal step, (H-ssDNA)3↔(H-ssDNA)4, is described by the partial equilibrium constant, K4,with the values in the range of ~1.9–4.0 (Table 1). However, in spite of similar partialequilibrium constants, the dynamics of the second step, (H-ssDNA)1↔(H-ssDNA)2, of thereaction is very different from the dynamics of the remaining two steps. The values of theforward and backward rate constants, k2 and k−2, are ~3 orders of magnitude larger than thevalues of k3, k−3, k4,and k−4 (Table 1). These data provide the first indication that processesof a different nature are involved in the observed relaxation steps (see Discussion).
The difference between the first and the remaining intermediates is clearly seen in thecorresponding changes of the fluorescence emission of the nucleic acid, originating from thefluorescein marker located at the 5′ end of the examined ssDNA oligomers (Table 1). Theresults indicate that there is no fluorescence change, as compared to the free ssDNA, in thefirst binding step, that is, in the formation of (H-ssDNA)1, indicating that in the firstintermediate, the marker is in an environment similar to the bulk solution.45,46 This is verydifferent from the large fluorescence changes observed for the first intermediate in thecomplex formation between the E. coli DnaB hexamer and the etheno derivative of thessDNA 20-mer, dεA(pεA)19 (see Discussion).29 Nevertheless, the subsequentconformational transition, (H-ssDNA)1↔(H-ssDNA)2, induces significant quenching of thefluorescein emission. This is particularly pronounced for the two longer oligomers, 5′-Fl-dT(pT)24 and 5′-Fl-dT(pT)29,with F2 ≈0.2, as compared to the free nucleic acid, indicatingthat the marker is placed in a very different environment in (H-ssDNA)2 than in (H-ssDNA)1.45,46 Emission intensity of the marker is also quenched in the intermediates (H-ssDNA)3 and (H-ssDNA)4 for all examined ssDNAs, although to a lesser extent than in (H-ssDNA)2.
Dynamics of the ssDNA binding to the strong DNA-binding subsite of the RepA hexamerAs mentioned above, the total ssDNA-binding site of the RepA helicase is composed of twoDNA-binding subsites, differing by at least 2 orders of magnitude in their intrinsic affinitiesfor the nucleic acid.12 The strong DNA-binding subsite is located in the vicinity of the smalldomain of each protomer of the RepA hexamer (Fig. 1) and can accept the ssDNA fragmentup to 11 nucleotides.12 Therefore, the mechanism of the DNA binding to the RepA hexamerhas been addressed using a series of ssDNA oligomers, 5′-Fl-dT(pT)7,5′-Fl-dT(pT)8, and 5′-Fl-dT(pT)9, which exclusively bind to the strong subsite.12
The reciprocal relaxation times 1/τ1, 1/τ2, and 1/τ3 characterizing the observed kinetic stepsin the association reaction of the 10-mer, 5′-Fl-dT(pT)8, with the RepA hexamer, in bufferT5 (pH 7.6, 10 °C), containing 0.5 mM AMP-PNP, as a function of the total RepAconcentration, are shown in Fig. 4a–c. The values of the largest relaxation time, 1/τ1, aresignificantly larger than those observed for the 21-, 26-, and 31-mers, indicating that the firstrelaxation step is faster than the corresponding process observed for the oligomers that canengage the total DNA-binding site (see below). Moreover, 1/τ1 shows only a littledependence upon [RepA]T, an indication that it characterizes an intramolecular step (seeabove).29,30,35-40 As discussed above, the anisotropy data provide strong evidence of thepresence of an additional fast step, corroborating the conclusion that 1/τ1 characterizes anintramolecular transition. The behavior and the values of 1/τ2 and 1/τ3 are very similar to thebehavior and values of the corresponding parameters observed for the 21-, 26-, and 31-mers(Fig. 3a–c). Thus, the minimum mechanism of the 10-mer binding to the strong DNA-binding subsite of the RepA hexamer, which can account for all kinetic data, is a four-step,sequential binding process, as described in Eq. (1).
The dependence of the normalized individual amplitudes, A1, A2, and A3, of the observedrelaxation processes, in the binding of the 10-mer to the RepA hexamer, upon the total
Andreeva et al. Page 6
J Mol Biol. Author manuscript; available in PMC 2011 April 4.
NIH
-PA Author Manuscript
NIH
-PA Author Manuscript
NIH
-PA Author Manuscript
concentration of RepA hexamer concentration, is shown in Fig. 4d. The behavior of theamplitudes is different from the behavior observed in the case of the 21-mer (Fig. 3d),providing the first indication of different partial equilibria among the observedintermediates, as compared to the oligomer, which encompasses the total DNA-binding site.29,30,35-40 At low enzyme concentrations, only amplitude A3 of the slowest relaxation stephas a dominant contribution to the total observed amplitude, AT. The amplitude of the fastestobserved process, A1, has the lowest value of all observed amplitudes over the entire rangeof the examined protein concentrations and only gradually increases with increasing[RepA]T. On the other hand, the amplitude of the second step, A2, is much larger than thatobserved for the 21-mer (Fig. 3d) and, at high [RepA]T, dominates the total amplitude of thereaction. Nevertheless, the observed behavior of the individual amplitudes is in completeagreement with the proposed kinetic mechanism [Eq. (1)].29,30,35-39
The strategy of the numerical analysis of the data was the same as described above for the21-mer (see above). The continuous lines in Fig. 4a–d are nonlinear least-squares fits of theexperimentally determined relaxation times and normalized individual amplitudes of thereaction, defined in Eq. (1), using a single set of kinetic and spectroscopic parameters.Analogous stopped-flow and numerical analyses have been carried out for the 9- and the 11-mer, 5′-Fl-dT(pT)7 and 5′-Fl-dT(pT)9, which also exclusively engage in interactions with thestrong DNA-binding subsite of the RepA helicase.12 The obtained partial equilibriumconstants, rate constants, and spectroscopic parameters characterizing the intermediates ofthe reaction for all examined oligomers are included in Table 2.
Unlike the case of the 21-, 26-, and 31-mers, the values of the partial equilibrium constant,K1, which characterizes the formation of the first intermediate, (H-ssDNA)1, clearly increasewith the length of the oligomer from ~5 × 10⁴ to ~2 × 10⁵ M−1 obtained for the 9- and the11-mer, respectively. Thus, there is a statistical factor, N−n+1, involved in the formation ofthe first intermediate, where n = 8 for the strong DNA-binding subsite of the RepA hexamer(see above).41-44 Within experimental accuracy, the obtained statistical factor is similar tothe same factor determined in the equilibrium binding of the corresponding ssDNAoligomers to the RepA hexamer12 (see Discussion). Similar to the 21-, 26-, and 31-mers, theformation of the first intermediate has a predominant contribution to the free energy of thessDNA binding to the strong DNA-binding subsite. At 10 °C, the values of K2characterizing the transition (H-ssDNA)1↔(H-ssDNA)2 is in the range of ~0.7–1.4, that is,also similar to the values of the same parameter observed for the longer oligomers (Table 1).However, the values of K3, which characterizes the transition (H-ssDNA)2↔(H-ssDNA)3, isin the range of ~11.5–16. Thus, the formation of the intermediate (H-ssDNA)3 issignificantly more energetically favorable in the case of the oligomers that exclusively bindto the strong DNA-binding subsite than that observed for the oligomers that engage the totalDNA-binding site. On the other hand, the partial equilibrium constant, K4, is in the range of~0.8–1.7, which is lower than those observed for the 21-, 26-, and 31-mers (Tables 1 and 2)(see Discussion).
Similar to the oligomers that engage the total DNA-binding site, the dynamics of thetransition (H-ssDNA)1↔(H-ssDNA)2 is approximately 2–3 orders of magnitude faster thanthe dynamics of the remaining two steps of the reaction (Tables 2). As mentioned above,these data indicate that processes of different natures are involved in the observed relaxationsteps (see Discussion). Nevertheless, with the exception of the 11-mer, 5′-Fl-dT (pT)9, theforward and backward rate constants, k2 and k−2, are ~1 order of magnitude larger than thevalues of the same parameters obtained for the oligomers that engage the total DNA-bindingsite. Moreover, k2 and k−2 decrease with the length of the oligomer and, in the case of the11-mer, approach the values of the corresponding parameters observed for the 21-, 26-, and31-mers (Table 2). The forward rate constant, k3, characterizing the transition (H-
Andreeva et al. Page 7
J Mol Biol. Author manuscript; available in PMC 2011 April 4.
NIH
-PA Author Manuscript
NIH
-PA Author Manuscript
NIH
-PA Author Manuscript
ssDNA)2↔(H-ssDNA)3 is similar to the corresponding parameter observed for the 21-, 26-,and 31-mers. However, the values of the backward rate constant, k−3, are generally lowerthan the values of k−3 determined for the longer oligomers (see Discussion). In other words,it is more difficult for the shorter oligomers to return to the (H-ssDNA)2 intermediate, oncethey entered (H-ssDNA)3 than for the longer nucleic acids. In general, the dynamics of thetransition (H-ssDNA)3↔(H-ssDNA)4 is also different from the behavior of the longeroligomers (Tables 1 and 2). The forward rate constant, k4, is lower and the backward rateconstant, k−4, is higher for the oligomers that exclusively bind to the strong DNA-bindingsubsite than that for the oligomers that engage the total DNA-binding site.
Amplitude analysis indicates that the behavior of the fluorescence emission of thefluorescein marker is analogous, although not the same, to the behavior observed for thelonger oligomers (Tables 1 and 2). There is no fluorescence change, as compared to the freenucleic acid, in the binding step (Table 2). Thus, in the intermediate (H-ssDNA)1, themarker seems to be in an environment similar to the bulk solution, independent of the lengthof the bound ssDNA oligomer (Tables 1 and 2). The subsequent conformational transition(H-ssDNA)1↔(H-ssDNA)2 induces significant quenching of the fluorescein emission of thebound DNA. Nevertheless, there is no clear trend in the observed quenching of the emissionintensities with the changing length of the bound oligomer, as observed for the oligomersthat engage the total DNA-binding site (Table 1), with the highest quenching observed forthe 10-mer, 5′-Fl-dT(pT)8. With the exception of the 10-mer, transition to the intermediate(H-ssDNA)3 does not induce further changes in the emission intensity of the marker, whichremains similar to the emission observed for (H-ssDNA)2, while the transition to subsequentintermediate (H-ssDNA)4 is accompanied by significant additional quenching only in thecase of the 11-mer, 5′-Fl-dT(pT)9 (see Discussion).
Temperature effect on the ssDNA-binding dynamics to the total DNA-binding site and tothe strong DNA-binding subsite of the RepA hexamer
In order to further address the nature of different intermediates in the RepA hexamer bindingto the ssDNA, we examined the temperature effect on the dynamics of the reaction. Theexperiments have been performed using the ssDNA 21- and 31-mer, which engage the totalDNA-binding site in interactions, and with the 10- and 11-mer, which exclusively bind tothe strong DNA-binding subsite.12 The stopped-flow studies were carried out at twodifferent temperatures, analogously, as described above (data not shown). The obtainedkinetic and spectroscopic parameters for all examined complexes are included in Tables 1and 2. In general, the temperature increase from 10 to 20 °C does not affect the majorfeatures of the observed kinetic mechanism, which, at both temperatures, is the four-stepsequential process, described in Eq. (1). However, the effect of the temperature on internalequilibria differs among the reaction intermediates and is different for the total DNA-binding site, as compared to the strong DNA-binding subsite.
In the case of 21- and 31-mer, the partial equilibrium constant K1, characterizing the bindingstep RepA hexamer+ssDNA↔(H-ssDNA)1, is decreased, by a factor of ~2–3, with thetemperature increase. This step is too fast to address its dynamics in the stopped-flowexperiment. The partial equilibrium constant K2, characterizing the transition (H-ssDNA)1↔(H-ssDNA)2, is increased by a similar factor at a higher temperature, primarily due to theincreased forward rate constant, k2, while k−2 remains only slightly affected by temperature(Table 1). Analogously, the value of K3, which describes the transition (H-ssDNA)2↔(H-ssDNA)3, is higher at a higher temperature. However, this occurs primarily due to thedecrease of the backward rate constant, k−3, while k3 remains slightly affected. On the otherhand, the value of K4, characterizing the final transition (H-ssDNA)3↔(H-ssDNA)4,decreases with an increase in temperature, by a factor of ~2, mainly due to the decrease ofthe forward rate constant k4.
Andreeva et al. Page 8
J Mol Biol. Author manuscript; available in PMC 2011 April 4.
NIH
-PA Author Manuscript
NIH
-PA Author Manuscript
NIH
-PA Author Manuscript
In the case of the ssDNA oligomers that bind to the strong DNA-binding subsite of theRepA hexamer, both partial equilibrium constants K1 and K2, characterizing the binding stepRepA hexamer+ssDNA↔(H-ssDNA)1 and the transition (H-ssDNA)1↔(H-ssDNA)2,decrease at higher temperature. However, unlike the behavior of the 21- and 31-mer, there isa very strong effect of the temperature on both k2 and k−2, with k2 increasing by more than 1order of magnitude at the elevated temperature (Table 2). As a result, the transition (H-ssDNA)1↔(H-ssDNA)2 becomes ~1 order of magnitude faster for the 10- and 11-mer,which engage the strong DNA-binding subsite, than that observed for the ssDNA oligomersthat engage the total DNA-binding site (see Discussion). Instead of an increase, as observedfor the 21- and 31-mer, there is a decrease in the value of K3, with the temperature for the10- and 11-mer, due to the significant increase in the backward rate constant k−3.Nevertheless, similar to the 21- and 31-mer, the partial equilibrium constant K4 decreases athigher temperature, predominantly due to the increase in the backward rate constant k−4,while k4 remains only slightly affected by the temperature (Table 2).
The temperature dependence of the partial equilibrium constant Ki for each ith transition inthe process of the RepA hexamer binding to the ssDNA is described by van't Hoff'sequation47
(4)
where TR is the reference temperature, taken as the lowest experimentally studiedtemperature, that is, 10 °C, and ΔHi is the enthalpy change accompanying the ith transition.The obtained values of the thermodynamic function, ΔHi and ΔSi, characterizing the partialequilibria among the intermediates of the ssDNA binding to the total DNA-binding site andthe strong DNA-binding subsite of the RepA hexamer, for all examined oligomers, areincluded in Table 3. The errors in the determined parameters are inherently large.Nevertheless, the observed differences are larger than the errors and provide an importantinsight about the nature of the observed transitions.
The first step, that is, binding of the ssDNA to the total DNA-binding site and to the strongDNA-binding subsite, is characterized by negative enthalpy and entropy changes, suggestinga similar nature of both binding processes (see Discussion). In the next transition, (H-ssDNA)1↔(H-ssDNA)2, both ΔH2 and ΔS2 are positive, suggesting that a process of adifferent nature than the first binding step is observed in the interactions with the total DNA-binding site, as well as in interactions with the strong DNA-binding subsite (see Discussion).On the other hand, changes of the thermodynamic functions in the third transition, (H-ssDNA)2↔(H-ssDNA)3, differ for the association of the nucleic acid with the total bindingsite, as compared to the strong binding subsite (Table 3). The values of ΔH3 and ΔS3 arenegative for the 10- and 11-mer, while the corresponding parameters are positive for the 21-and 31-mer, suggesting that the nature of the transition is different for the total DNA-binding site, as compared to the strong binding subsite. In the final transition, (H-ssDNA)3↔(H-ssDNA)4, the values of ΔH4 and ΔS4 are negative for both the total bindingsite and the strong binding subsite, suggesting a similar process leading to the formation ofthe intermediate (H-ssDNA)4 (see Discussion).
The fractional distributions of the intermediates of the RepA hexamer binding to thessDNA
The fractional distributions of the ssDNA intermediates for the ssDNA oligomer, whichencompasses the total DNA-binding site of the RepA hexamer, at two different temperatures
Andreeva et al. Page 9
J Mol Biol. Author manuscript; available in PMC 2011 April 4.
NIH
-PA Author Manuscript
NIH
-PA Author Manuscript
NIH
-PA Author Manuscript
are shown in Fig. 5a and b. The plots are presented in semilogarithmic scale and weregenerated using the rate constants for the 21-mer (Table 1). The concentrations of theintermediates are normalized as molar fractions of the total concentration of the DNAoligomer. At the selected protein concentration, the nucleic acid is predominantly saturatedwith the enzyme. At 10 °C, the first intermediate, (H-ssDNA)1, significantly contributes tothe total population of the nucleic acid states over a large time span of the reaction.However, when the system reaches equilibrium, the (H-ssDNA)1 intermediate constitutesonly ~2% of the total DNA population. At 20 °C, the fractional contribution of (H-ssDNA)1strongly diminishes and becomes negligible at equilibrium (Fig. 5b). The fractionalcontribution of the second intermediate, (H-ssDNA)2, is much less dependent upon thetemperature than the first intermediate, and it has a significant contribution, ~53–60%, to thetotal population over the time course of the reaction. At equilibrium, (H-ssDNA)2constitutes ~8–11% of the total population of the nucleic acid (Fig. 5a and b). Both the thirdand the fourth intermediate, (H-ssDNA)3 and (H-ssDNA)4, dominate the population of thebound nucleic acid at equilibrium. However, their mutual proportions change withtemperature. At 10 °C, the fourth intermediate, (H-ssDNA)4, is in slight excess, while at thehigher temperature, the fractional contribution of (H-ssDNA)3 is significantly larger thanthat of (H-ssDNA)4 (Fig. 5b) (see Discussion).
The fractional distributions of the intermediates for the 11-mer, which exclusively binds tothe strong DNA-binding subsite, are shown in Fig. 5c and d, for the examined temperatures.The first intermediate, (H-ssDNA)1, has a larger contribution to the total population of thebound nucleic acid, at both 10 and 20 °C, than in the case of the 21-mer. Nevertheless, itsfractional contribution becomes very low, ~2%, at equilibrium. On the other hand, thesecond intermediate, (H-ssDNA)2, constitutes a much lower fraction of the total populationof the nucleic acid than in the case of the 21-mer. Moreover, it only has a 2–5% fractionalcontribution to the total nucleic acid population at equilibrium. Nevertheless, similar to the21-mer, the fractional contribution of (H-ssDNA)2 shows a modest dependence upon thetemperature. Similar to the 21-mer, both the third and the fourth intermediate, (H-ssDNA)3and (H-ssDNA)4, dominate the population of the bound nucleic acid at equilibrium.However, the third intermediate, (H-ssDNA)3, is at a significantly larger excess, ~50%, atboth examined temperatures than the final intermediate, (H-ssDNA)4, whose fractionalcontribution diminishes from ~31% to ~20% as the temperature increases (see Discussion).
Global conformation of the RepA hexamer–ssDNA complex in solution: Analyticalsedimentation velocity studies
The analytical sedimentation technique provides direct information about the hydrodynamicproperties of a macromolecule.15,21,48-53 In turn, the hydrodynamic properties reflect globalconformational states of the macromolecule in solution. We utilize the fact that thesedimentation coefficients of the ssDNA 21- and 11-mer, 5′-Fl-dT(pT)19 and 5′-Fl-dT(pT)9(~1.3 and ~1.5 S, respectively), which contain fluorescein at their 5′ ends, are much smallerthan the sedimentation coefficient of the binary complex RepA hexamer–AMP-PNP (~8.5S).21 Therefore, the sedimentation of the nucleic acid in the complex can be exclusivelymonitored at the fluorescein absorption band (495 nm), without any interference from thefree protein and nucleotide cofactor absorbance.15,16,27,31,54,55
Sedimentation velocity profiles of the ssDNA 11-mer, 5′-Fl-dT(pT)9, alone in buffer T5 (pH7.6, 10 °C), containing 0.5 mM AMP-PNP, are shown in Fig. 6a. The profiles have beenrecorded at a rotational speed of 35,000 rpm. The total nucleic acid concentration is 5 × 10⁻⁶
M (oligomer). It is evident that, in the applied rotational speed, the sedimentation boundaryof the nucleic acid moves very slowly from the meniscus. The situation is different in thepresence of the RepA hexamer. Sedimentation velocity profiles of the ssDNA 11-mer, 5′-Fl-dT(pT)9, in the presence of the RepA hexamer in buffer T5 (pH 7.6, 10 °C), containing 0.5
Andreeva et al. Page 10
J Mol Biol. Author manuscript; available in PMC 2011 April 4.
NIH
-PA Author Manuscript
NIH
-PA Author Manuscript
NIH
-PA Author Manuscript
mM AMP-PNP, are shown in Fig. 6b. Analogous sedimentation velocity profiles for the 21-mer, 5′-Fl-dT(pT)19, are shown in Fig. 6c. In both sets of experiments, the profiles havebeen recorded at the fluorescein absorption band (495 nm). The total DNA and proteinconcentrations are 5 × 10⁻⁶ M (oligomer) and 8 × 10⁻⁶ M (hexamer), respectively. At theselected RepA concentration, the enzyme completely saturates the ssDNA oligomers.12
Inspection of the profiles in Fig. 6b and c shows that there is an apparent single movingsedimentation boundary, indicating the presence of a single molecular species, for both the11- and 21-mer.15,16,27,31,54-56 Independent sedimentation equilibrium experiments confirmthe presence of a single species with molecular masses of 187,000 ± 9000 and 185,000 ±9000 Da, respectively (data not shown). To obtain the apparent average sedimentationcoefficient, s20,w, of both tertiary complexes, RepA–ssDNA–AMP-PNP, we analyzed thesedimentation velocity scans using the time-derivative approach, which provides s20,w =9.8±0.1 S and s20,w = 10.0± 0.1 S for the complex with the 11- and 21-mer, respectively.50,51 An example of the nonlinear least-squares fit for the RepA-5′-Fl-dT(pT)19 complex isshown in Fig. 6d.
In analogous solution conditions and in the presence of 0.5 mM AMP-PNP, the apparentaverage sedimentation coefficient (s20,w) of the binary complex RepA hexamer–AMP-PNPis 8.5±0.1 S; that is, the data show that the tertiary complex has a dramatically increasedsedimentation coefficient, as compared to the binary complex.21 The molecular masses ofthe 21-and 11-mer are ~6700 and ~3500 Da, respectively. Thus, the ssDNA oligomersconstitute ~3.5% and ~2% of the mass of the corresponding complex, respectively. Theobserved large increase of the apparent average sedimentation coefficient of the RepAhexamer in the tertiary complex with both ssDNA oligomers cannot be explained by theincreased molecular weight of both complexes. Moreover, the 21-mer, twice as large,induces a very similar increase of the sedimentation coefficient, as observed for the 11-mer(Fig. 6b and c). Because only a single molecular species is present in both samples (seeabove), the observed large increase in the apparent average sedimentation coefficient of thetertiary complex, with little dependence upon the length of the bound ssDNA oligomer, mustresult from the large global conformational changes of the RepA hexamer, when theenzyme–AMP-PNP complex is associated with the nucleic acid (see Discussion).
Stopped-flow, fluorescence anisotropy studies of the ssDNA binding to the total DNA-binding site of the RepA hexamer: Experiments with the ssDNA oligomers labeled at the 5′or 3′ end of the nucleic acid
In the kinetic experiments described above, the dynamics of the nucleic acid associationwith the RepA hexamer was followed by monitoring the total emission of the sample, F(t)(Materials and Methods). While fluorescence intensity provides information about thephysical environment surrounding the fluorophore, time dependence of the fluorescenceanisotropy, in stopped-flow experiments, provides information about the mobility of thefluorescing ligand, during the fluorescence lifetime of the individual intermediates.37,38,57
Moreover, anisotropy data may also add additional light on the mechanism of the reaction(see below).57 Because the lifetime of the fluorescein is ~4 ns, that is, it is orders ofmagnitude shorter than the lifetime of any intermediate formed in the kinetic reaction,stopped-flow fluorescence anisotropy studies provide the values of the steady-stateanisotropy of the nucleic acid molecule in each intermediate.
Unlike the total emission, stopped-flow kinetic traces, recorded using the fluorescenceanisotropy, are not a simple sum of exponential functions, even under pseudo-first-orderconditions.38,57 The time course of the fluorescence anisotropy of the sample is defined as
Andreeva et al. Page 11
J Mol Biol. Author manuscript; available in PMC 2011 April 4.
NIH
-PA Author Manuscript
NIH
-PA Author Manuscript
NIH
-PA Author Manuscript
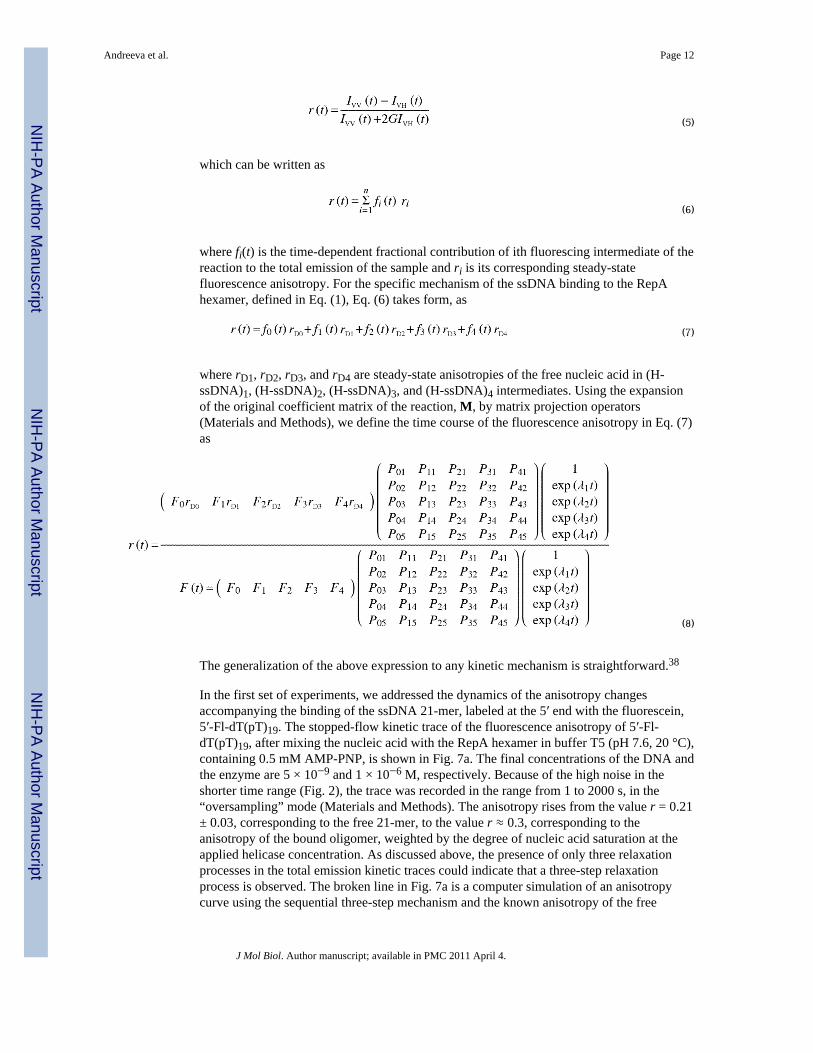
(5)
which can be written as
(6)
where fi(t) is the time-dependent fractional contribution of ith fluorescing intermediate of thereaction to the total emission of the sample and ri is its corresponding steady-statefluorescence anisotropy. For the specific mechanism of the ssDNA binding to the RepAhexamer, defined in Eq. (1), Eq. (6) takes form, as
(7)
where rD1, rD2, rD3, and rD4 are steady-state anisotropies of the free nucleic acid in (H-ssDNA)1, (H-ssDNA)2, (H-ssDNA)3, and (H-ssDNA)4 intermediates. Using the expansionof the original coefficient matrix of the reaction, M, by matrix projection operators(Materials and Methods), we define the time course of the fluorescence anisotropy in Eq. (7)as
(8)
The generalization of the above expression to any kinetic mechanism is straightforward.38
In the first set of experiments, we addressed the dynamics of the anisotropy changesaccompanying the binding of the ssDNA 21-mer, labeled at the 5′ end with the fluorescein,5′-Fl-dT(pT)19. The stopped-flow kinetic trace of the fluorescence anisotropy of 5′-Fl-dT(pT)19, after mixing the nucleic acid with the RepA hexamer in buffer T5 (pH 7.6, 20 °C),containing 0.5 mM AMP-PNP, is shown in Fig. 7a. The final concentrations of the DNA andthe enzyme are 5 × 10⁻⁹ and 1 × 10⁻⁶ M, respectively. Because of the high noise in theshorter time range (Fig. 2), the trace was recorded in the range from 1 to 2000 s, in the“oversampling” mode (Materials and Methods). The anisotropy rises from the value r = 0.21± 0.03, corresponding to the free 21-mer, to the value r ≈ 0.3, corresponding to theanisotropy of the bound oligomer, weighted by the degree of nucleic acid saturation at theapplied helicase concentration. As discussed above, the presence of only three relaxationprocesses in the total emission kinetic traces could indicate that a three-step relaxationprocess is observed. The broken line in Fig. 7a is a computer simulation of an anisotropycurve using the sequential three-step mechanism and the known anisotropy of the free
Andreeva et al. Page 12
J Mol Biol. Author manuscript; available in PMC 2011 April 4.
NIH
-PA Author Manuscript
NIH
-PA Author Manuscript
NIH
-PA Author Manuscript
nucleic acid. It is evident that the plot does not represent the observed experimental curve. Inorder to adequately represent the anisotropy data, one would have to assume a much highersteady-state anisotropy of the free 21-mer than experimentally determined.58 Rather, what isobserved is the presence of another fast step, which is not detectable in the total emissionexperiments, due to very low amplitude, with an intermediate characterized by a highsteady-state anisotropy. A nonlinear least-squares fit, using the four-step sequentialmechanism [Eq. (8)], provides an excellent description of the observed anisotropy kinetictrace, without introducing any physically unacceptable values of the steady-state anisotropyof any intermediates. Thus, the anisotropy data provide a strong indication that the kineticmechanism of the ssDNA binding to the total DNA-binding site is at least a four-stepmechanism, as defined in Eq. (1) (see Discussion).
The stopped-flow kinetic traces of the fluorescence anisotropy of 21-mer, 5′-Fl-dT(pT)19,after mixing the nucleic acid with the RepA hexamer at two different enzyme concentrationsin buffer T5 (pH 7.6, 20 °C), are shown in Fig. 7b. The final concentration of the DNA is 5× 10⁻⁹ M. The selected final concentrations of the enzyme are 7 × 10⁻⁷ and 1 × 10⁻⁶ M,respectively. The analysis of the experimental kinetic traces is greatly facilitated by the factthat F0, F1, F2, F3, and F4 and the rate constants for the reaction are known from the totalemission studies (see above). We also know the anisotropy of the free 21-mer, rD0 = 0.21 ±0.03. Thus, there are four parameters that must be determined, rD1, rD2, rD3, and rD4 [Eq.(7)]. The continuous lines in Fig. 7b are nonlinear least-squares fits of the experimentalfluorescence anisotropy curves, using Eq. (8), with anisotropies of the intermediates (H-ssDNA)1, (H-ssDNA)2, (H-ssDNA)3, and (H-ssDNA)4 as fitting parameters. Withinexperimental accuracy, the values of rD1, rD2, rD3, and rD4, obtained at different proteinconcentrations, are close, which is an expected result, as at any protein concentration, thesame intermediates, characterized by the same steady-state fluorescence anisotropies, areobserved. The obtained values of rD1, rD2, rD3, and rD4, averaged over applied proteinconcentrations, are as follows: rD1 = 0.40 ± 0.02, rD2 = 0.28 ± 0.02, rD3 = 0.28 ± 0.02, andrD4 = 0.35 ± 0.02. At 10 °C, the values of the corresponding parameters are as follows: rD1= 0.42 ± 0.02, rD2 = 0.33 ± 0.02, rD3 = 0.32 ± 0.02, and rD4 = 0.38 ± 0.02 (data not shown).These results indicate that the 5′ end of the nucleic acid becomes strongly immobilized inthe first intermediate, (H-ssDNA)1. In two subsequent intermediates, (H-ssDNA)2 and (H-ssDNA)3, the mobility of the 5′ end of the bound DNA decreases, while the 5′ end onceagain becomes strongly immobilized in the final intermediate, (H-ssDNA)4 (seeDiscussion).
Analogous stopped-flow fluorescence anisotropy experiments have been performed with thessDNA 21-mer labeled at the 3′ end with fluorescein. The kinetic trace of the fluorescenceanisotropy of the 21-mer, dT(pT)19-Fl-3′, after mixing the nucleic acid with the RepAhexamer, is shown in Fig. 8a. The final concentrations of the DNA and the enzyme are 5 ×10⁻⁹ and 1 × 10⁻⁶ M, respectively. The trace was recorded in the time range from 1 to 2000s (see above). The broken line in Fig. 8a is a computer simulation of anisotropy curve usingthe three-step mechanism and the known anisotropy of the free nucleic acid, 0.21 ± 0.03. Itis evident that the plot does not represent the observed experimental curve. As we discussedabove, in order to adequately represent the anisotropy data, we would have to assume thatthe steady-state fluorescence anisotropy of the free 21-mer is much higher thanexperimentally observed. In other words, anisotropy data indicate the presence of anotherfast step with an intermediate characterized by high fluorescence anisotropy, not detectablein the total emission studies (see above). The continuous line in Fig. 8a is a nonlinear least-squares fit, using the four-step sequential mechanism [Eq. (8)], which provides an adequatedescription of the observed anisotropy kinetic trace.
Andreeva et al. Page 13
J Mol Biol. Author manuscript; available in PMC 2011 April 4.
NIH
-PA Author Manuscript
NIH
-PA Author Manuscript
NIH
-PA Author Manuscript
The stopped-flow kinetic traces of the fluorescence anisotropy of dT(pT)19-Fl-3′, aftermixing the oligomer with the RepA hexamer, at three different enzyme concentrations, areshown in Fig. 8b. The selected final concentrations of the enzyme are 5 × 10⁻⁷, 7 × 10⁻⁷,and 1 × 10⁻⁶ M. To extract steady-state anisotropies of the reaction intermediates, weanalogously analyzed the experimental kinetic curves, as described above for 5′-Fl-dT(pT)19. In the case of dT(pT)19-Fl-3′, binding of the RepA hexamer is accompanied by asmall ~3–5% change of the nucleic acid fluorescence.12 Therefore, in the analysis of theexperimental kinetic traces in Fig. 8b, one can take that F0 = F1 = F2 = F3 = F4 = 1.Moreover, the rate constants are the same as those obtained for the oligomer labeled at the 5′end, 5′-Fl-dT(pT)19, in the total emission kinetic studies (Table 1). We also know theanisotropy of the free 21-mer, rD0 = 0.21 ± 0.03. Nevertheless, there are still four parametersthat must be determined, rD1, rD2, rD3, and rD4, that is, the specific steady-state anisotropiesof the intermediates (H-ssDNA)1, (H-ssDNA)2, (H-ssDNA)3, and (H-ssDNA)4. Thecontinuous lines in Fig. 8b are nonlinear least-squares fits of the kinetic anisotropy curves,using Eq. (8). The obtained values of rD1, rD2, rD3, and rD4, averaged over applied proteinconcentrations, are rD1 = 0.40 ± 0.02, rD2 = 0.35 ± 0.02, rD3 = 0.36 ± 0.02, and rD4 = 0.37 ±0.02. Thus, the behavior of the 3′ end of the nucleic acid in the association reaction with theRepA hexamer is different from that observed for the 5′ end. The 3′ end of dT(pT)19-Fl-3′becomes strongly immobilized in the first intermediate, (H-ssDNA)1, as observed for 5′-Fl-dT(pT)19. However, in the subsequent two intermediates, (H-ssDNA)2 and (H-ssDNA)3, themobility of the 3′ end is still strongly restricted, and it remains in the strongly immobilizedstate in the final intermediate, (H-ssDNA)4 (see Discussion).
DiscussionEnergetics and dynamics of interactions of the replicative hexameric helicase with thessDNA play a fundamental role in enzyme activities.1-7 This includes the specificrecognition of the ssDNA conformation of the replication origin, oriC, as well as themechanism of the free-energy transduction by the enzyme. The complexity of the system isreflected in the fact that, in the equilibrium complex, the ssDNA is bound to the total DNA-binding site, located inside the cross channel of the ringlike structure of the hexamer (Fig.1). Thus, the stability of the hexameric structure and the dynamics of the conformationalflexibility are inherently involved in the protein association with the nucleic acid. Moreover,although the total site size of the hexamer–ssDNA complex of the RepA helicase or the E.coli DnaB is ~20 nucleotides, the corresponding total DNA-binding site of both enzymes isheterogeneous and divided into strong and weak DNA-binding subsites, which encompass asimilar number of nucleotides, but differ by orders of magnitude in the affinities for thenucleic acid.12,26
Sequential, multiple-step kinetic mechanism of the ssDNA binding to the total DNA-binding site and to the strong DNA-binding subsite of the RepA helicase
In the presence of the ATP nonhydrolyzable analog AMP-PNP, binding of the ssDNAoligomers that encompass the total DNA-binding site and the ssDNA oligomers thatexclusively bind to the strong DNA-binding subsite occurs through the same four-stepsequential mechanism; that is, three isomerization processes follow the bimolecularassociation [Eq. (1)]. There are two important aspects of these data. First,the observedindependence of the mechanism upon the length of the ssDNA indicates that the observedintermediates of the reaction are generated by the response of the protein to the nucleic acidbinding; that is, they are the intrinsic property of the enzyme. Second, the RepA hexamer-ssDNA complex undergoes multiple conformational transitions, indicating that the complexexists in multiple conformational states (see below). The observed mechanism is morecomplex than that observed for the E. coli DnaB hexamer, which associates with the ssDNA
Andreeva et al. Page 14
J Mol Biol. Author manuscript; available in PMC 2011 April 4.
NIH
-PA Author Manuscript
NIH
-PA Author Manuscript
NIH
-PA Author Manuscript
through a three-step sequential process.29 The increased complexity of the dynamics of theassociation process most probably reflects the significantly more stable hexameric structureof the RepA helicase than the analogous hexameric structure of the DnaB protein (seebelow).8-14,21,28
Extreme stability of the RepA hexamer precludes any disintegration of the hexamer intomonomers or into lower oligomeric entities.8-14,21,28 On the other hand, the sequentialnature of the kinetic mechanism indicates that the enzyme predominantly exists in a singleconformational state prior to the nucleic acid binding.29,30,35-40 This is further confirmed bythe finding that the number of relaxation processes remains the same under pseudo-first-order conditions with respect to the nucleic acid concentration (data not shown).59 As wepreviously discussed, if the protein were in different conformations prior to the DNAassociation, then, under pseudo-first-order conditions with respect to the nucleic acid, thenumber of relaxation processes would be lower than that observed in the large excess of theprotein, a feature that is easy to detect in kinetic experiments.59 The sequential character ofthe mechanism may seem surprising, as our hydrodynamic studies, using analyticalultracentrifugation and dynamic light-scattering methods, showed that the RepA hexamerexists in multiple conformational states, generated by a specific and different number ofbound nucleotide cofactors, prior to the nucleic acid binding.21 However, the binding ofAMP-PNP to the six, initially independent, nucleotide-binding sites of the RepA hexamer ischaracterized by strong negative cooperativity.13,14 At the selected concentration of theAMP-PNP, 0.5 mM, only three nucleotide-binding sites are fully saturated with the cofactor,without engaging in cooperative interactions. In this binding state, the enzyme ispredominantly in a single conformation, in which it has an increased affinity for the ssDNA.21 Therefore, the kinetic results entirely corroborate the previous hydrodynamic data.
Association of the RepA hexamer with the ssDNA proceeds through steps characterizedby dramatically different dynamics
Intermediates in the RepA hexamer association with the ssDNA dramatically differ in thedynamics of their formation, both for the association with the total DNA-binding site and thestrong DNA-binding subsite (Tables 1 and 2). The first bimolecular step, RepA+ssDNA↔(H-ssDNA)1 [Eq. (1)], is beyond detection in the stopped-flow experiments. That wouldrequire that the reciprocal relaxation time characterizing this step is ≥ 1000 s, at the selectedprotein concentrations. Even if the association process was completely diffusion-controlled,the corresponding reciprocal relaxation time mainly reflects the backward rate constant,k−1.29,30,35-40 The smaller than diffusion-controlled forward rate constant, k1, would makethe reciprocal relaxation time even closer to k−1. Thus, the value of k−1 is at least 1000 s−1
for the binding to the total binding site and to the strong subsite. Such a fast first stepindicates that it involves the initial nucleic acid association with the outside surface of thehexamer, presumably on a single subunit and very fast, local structural rearrangements ofthe formed complex; that is, it does not involve large global conformational changes of theentire hexamer, analogously to the fast association reactions of the monomeric proteins withthe nucleic acid (see below).60
The second transition, (H-ssDNA)1↔(H-ssDNA)2, is ~3 orders of magnitude slower thanthe first step for both the total DNA-binding site and the strong DNA-binding subsite. Thedramatic drop in the rate of the reaction step indicates a dramatic change in the nature of theformed intermediate and strongly suggests that the dynamics of the (H-ssDNA)2 formationreflects the opening of the large hexameric structure of the RepA helicase. This conclusionis further supported by very different changes of enthalpy and entropy for the formation of(H-ssDNA)2, as compared to enthalpy of formation of (H-ssDNA)1 (see below). In the caseof the ssDNA oligomers that engage the total DNA-binding site, the values of the rateconstant, k2 ≈ 3 s−1, indicate that the opening occurs within ~300 ms. Notice that this
Andreeva et al. Page 15
J Mol Biol. Author manuscript; available in PMC 2011 April 4.
NIH
-PA Author Manuscript
NIH
-PA Author Manuscript
NIH
-PA Author Manuscript
transition is directly seen in the case of the extremely stable RepA hexamer but was notdetectable in the association with the nucleic acid of the analogous but less stable E. coliDnaB hexamer.29,30 Nevertheless, we could estimate the corresponding rate constant for theDnaB hexamer29 and obtained ~3.4 s−1. Thus, the dynamics of the opening of the hexamericstructure, when the enzyme associates with the ssDNA that encompasses the total DNA-binding site, seems to be very similar among the replicative hexameric helicases.
The values of the rate constants k2 and k−2 are higher by approximately a factor of 6 for theoligomers that exclusively bind to the strong DNA-binding site (Tables 1 and 2). Such adifference, which depends on the length of the bound DNA, points to a different engagementof the shorter oligomers in interactions with the protein both in (H-ssDNA)1 and (H-ssDNA)2 intermediates, which overlaps with the proposed process of the opening of thehexameric structure, (H-ssDNA)1↔(H-ssDNA)2 (see below). It also indicates that theintrinsic rate of the hexamer opening may be even faster than that observed for the longeroligomers and occurs within ~50 ms. The rates of the final two transitions, (H-ssDNA)2↔(H-ssDNA)3 and (H-ssDNA)3↔(H-ssDNA)4, are ~2–3 orders of magnitude slower than thetransition (H-ssDNA)1↔(H-ssDNA)2. Once again, the slow pace of the transitions indicatesthat they involve large conformational changes of the entire hexamer. On the other hand, thedifferent dynamics of both final steps, observed for the short versus long oligomers, pointsto a different engagement of the oligomers that encompass the total binding site and thestrong subsite, in interactions with the protein in intermediates (H-ssDNA)3 and (H-ssDNA)4. The shorter oligomers can enter the (H-ssDNA)3 intermediate as easily as thelonger nucleic acid. However, as we pointed out above, it is more difficult for the shorteroligomers to return to the (H-ssDNA)2 intermediate than for the longer oligomers. On theother hand, the higher rate constant k−4 for the shorter oligomers indicates that they canleave the (H-ssDNA)4 intermediate, back to the (H-ssDNA)3, easier than the oligomers thatcan engage the total DNA-binding site (see below).
In the ssDNA association with the RepA helicase, the binding steps are characterized bydifferent apparent enthalpy and entropy changes than the accompanying conformationalchanges of the hexamer
Temperature effect on the binding of the RepA hexamer to the ssDNA provides anadditional, strong indication of the different nature of the formed intermediates. The firstreaction step is characterized by the apparent negative enthalpy and entropy changes forboth oligomers that engage the total DNA-binding site and that exclusively bind to thestrong DNA-binding subsite (Table 3). In both cases, the first step, RepA+ssDNA↔(H-ssDNA)1, must include the fast association of the nucleic acid and the fast localrearrangement of the binding site (see above). Thus, the data show that the intrinsic DNA-binding process of the RepA hexamer, independent of the length of the nucleic acid,apparently is an enthalpy-driven process. The accompanying enthalpy changes aresignificantly larger than expected for a simple diffusion-controlled reaction, indicating thatthe observed first step indeed includes structural changes of the formed complex.40,61 Thefollowing transition, (H-ssDNA)1↔(H-ssDNA)2,is very different from the bimolecular stepand is characterized by apparent positive enthalpy and entropy changes, for both theoligomers that engage the total DNA-binding site and the oligomers that exclusively bind tothe strong DNA-binding subsite (Table 3).
As discussed above, dramatically slower dynamics of the second step for both sets ofssDNA oligomers, as compared to the bimolecular step, indicates that a globalconformational change of the RepA hexamer, that is, the opening of the hexameric structure,is dominating this transition (see above). The equally dramatic changes in the signs of thethermodynamic functions strongly support the conclusion that a process of a different naturedominates the step (H-ssDNA)1↔(H-ssDNA)2. Thus, the data indicate that the opening of
Andreeva et al. Page 16
J Mol Biol. Author manuscript; available in PMC 2011 April 4.
NIH
-PA Author Manuscript
NIH
-PA Author Manuscript
NIH
-PA Author Manuscript
the hexameric structure of the RepA helicase is an entropy-driven process strongly opposedby the enthalpy changes. Such thermodynamic characteristics of the hexameric structureenergetics can be understood if one takes into account the extreme stability of the RepAhexamer, which requires perfectly matching protein–protein interfaces, with multiple andenergetically favorable interactions. Breaking such intersubunit engagements must beenergetically unfavorable. Moreover, a large positive entropy change also suggests that thereorientation of subunits in the transition (H-ssDNA)1↔(H-ssDNA)2 is accompanied bylarge changes in the hydration of the hexamer. This conclusion corroborates our findingsthat global conformation changes of the RepA hexamer are accompanied by large changesof the degree of hydration, which contribute to changes in the partial specific volume of theenzyme.21
The next step, (H-ssDNA)2↔(H-ssDNA)3, is different for the ssDNA oligomers that engagethe total DNA-binding site, as compared to the oligomers that exclusively bind to the strongDNA-binding subsite. For the longer oligomers, the transition is accompanied by apparentpositive enthalpy and entropy changes, ΔH3 and ΔS3, while for the shorter oligomers, theprocess is characterized by apparent negative changes of the corresponding thermodynamicfunctions (Table 3). A plausible explanation of this difference is that, in the case of thessDNA oligomers that engage the total binding site, the entry of the nucleic acid into thecross channel requires further enlargement of the opening of the hexameric structure, whichis energetically unfavorable, without involving the changes in the state of the bound DNA.This conjecture is supported by the fluorescence anisotropy data on the entry of the 21-merinto the hexamer (see below). In the case of the shorter oligomers, the additional globalstructural changes are not necessary and the short DNA oligomer enters the cross channel,engaging one of the strong ssDNA-binding subsites.12 The DNA-binding process isintrinsically characterized by negative enthalpy and entropy changes, analogous to theformation of the initial intermediate, (H-ssDNA)1 (see above), resulting in the observedapparent negative enthalpy and entropy changes for the process (see above). The final step,(H-ssDNA)3↔(H-ssDNA)4, is similar for both sets of ssDNA oligomers and ischaracterized by apparent negative changes of ΔH4 and ΔS4 (Table 3). This step mustinclude the association of the longer oligomers with the total DNA-binding site, which ischaracterized by negative enthalpy and entropy changes, analogous to the formation of (H-ssDNA)1 and, at least, partial closing of the hexameric structure, which is also driven bynegative enthalpy change, as opposed to its opening (see above). In the case of the shorteroligomers that are already engaged in interactions with the strong DNA-binding subsite, thestep predominantly includes the enthalpy-driven partial closing of the hexameric structure,resulting in the observed apparent negative enthalpy and entropy changes (Table 3).
The RepA hexamer remains in the partially open state in the equilibrium tertiary complexRepA hexamer–ssDNA–AMP-PNP
The first indication that the equilibrium complex of the RepA hexamer with the ssDNA is amixture of different conformational states comes from the analysis of the fractionaldistributions of different intermediates of the reaction. The plots in Fig. 5, generated usingthe determined kinetic parameters, indicate that, at equilibrium, the population of the tertiarycomplex RepA hexamer–ssDNA–AMP-PNP is dominated by two intermediates, (H-ssDNA)3 and (H-ssDNA)4. This is true for the 21-mer, which encompasses the total DNA-binding site, and for the 11-mer, which exclusively engages the strong DNA-binding subsite.Recall that the kinetic and thermodynamic results discussed above strongly suggest that thelargest opening of the hexameric structure occurs in the intermediate (H-ssDNA)3, while (H-ssDNA)4 is either closed or in a partially open state, resembling the global structure of theRepA hexamer in the binary complex RepA–AMP-PNP. Therefore, the average globalconformation of the equilibrium tertiary complex should be different from the global
Andreeva et al. Page 17
J Mol Biol. Author manuscript; available in PMC 2011 April 4.
NIH
-PA Author Manuscript
NIH
-PA Author Manuscript
NIH
-PA Author Manuscript

conformation of the RepA hexamer in the binary complex. Analytical sedimentationvelocity data very strongly support this conclusion.
The apparent average sedimentation coefficients of both tertiary complexes with the ssDNA21-mer and 11-mer are dramatically larger than those determined for the RepA hexamer inthe binary complex, showing that the average global conformation of the RepA hexamer inthe equilibrium tertiary complex is indeed very different from its conformation in the binarycomplex. In the binary complex RepA hexamer–AMP-PNP and in the presence of 0.5 mMAMP-PNP, the apparent average sedimentation coefficient (s20,w) of the RepA hexamer is8.5±0.1 S, which indicates that the hexamer has an axial ratio (p) of ~1.9, when modeled asan oblate ellipsoid of revolution.21 The obtained values of the apparent averagesedimentation coefficients for tertiary complexes with the 21- and 11-mer are s20,w =10.0±0.1 S and s20,w = 9.8±0.1 S, respectively, indicating that the hexamer becomes muchmore spherical.21 This would be expected for the open intermediate, (H-ssDNA)3. In otherwords, a large population of the equilibrium tertiary complex of the RepA hexamer with thessDNA and the ATP nonhydrolyzable analog AMP-PNP exists in a conformational statewith an open hexameric structure. At present, we cannot exclusively address the globalconformation of the intermediate (H-ssDNA)4. However, the values of the apparent averagesedimentation coefficients of both examined tertiary complexes strongly suggest that thestructure of (H-ssDNA)4 is also more spherical than that in the binary complex and possiblyis in the partially open state.
The RepA hexamer possesses an outer DNA-binding site located outside the crosschannel of the ringlike hexameric structure
The plots of the fractional distributions of the reaction intermediates (Fig. 5) indicate that thefast-formed intermediate (H-ssDNA)1 sustains over a large time span of the associationprocess for the ssDNA oligomers that engage the total DNA-binding sites and the oligomersthat bind to the strong DNA-binding subsite. Moreover, the values of ΔH1 and ΔS1 indicatethat formation of (H-ssDNA)1 is not a simple diffusion-controlled process but involvesenergetically favorable conformational rearrangement of the complex. Furthermore, thefluorescence anisotropy data show that the nucleic acid is strongly immobilized in (H-ssDNA)1 (see below). Thus, the data strongly indicate that the RepA hexamer possesses aDNA-binding site located outside the cross channel of the hexamer, which forms the initialcomplex with the nucleic acid. The outside location of the site results in similar environmentaround the fluorescent marker, resulting in an unchanged value of the fluorescence emission(Tables 1 and 2). As pointed out above, this is different from the large fluorescence changesof the etheno derivative of the ssDNA 20-mer, dεA(pεA)19, observed for the firstintermediate in the association of the analogous E. coli DnaB hexamer with the ssDNA.29
First, the identified first step of the E. coli DnaB–ssDNA interactions includes the step thatwe were able to identify for the RepA hexamer as the transition (H-ssDNA)1↔(H-ssDNA)2.Second, the etheno derivative fluorescence monitors the structure of the entire bound ssDNAoligomer, while the fluorescein marker reports local environment of the part of the boundnucleic acid at its 5′ end.
Because the RepA hexamer is composed of six identical subunits, each subunit must possessan outer DNA-binding site. At first, this may seem odd with the fact that thermodynamicequilibrium studies have clearly shown that only a single molecule of the ssDNA 21-merbinds to the RepA hexamer.12 However, all transitions of the formed complex, subsequent tothe formation of the intermediate (H-ssDNA)1, are characterized by favorable changes of thefree energy of binding (Tables 1 and 2). As a result, the final equilibrium is strongly shiftedfrom the intermediate (H-ssDNA)1 toward the following intermediates. The plots in Fig. 5show that the intermediate (H-ssDNA)1 constitutes only a minute fraction, ~1–3%, of the
Andreeva et al. Page 18
J Mol Biol. Author manuscript; available in PMC 2011 April 4.
NIH
-PA Author Manuscript
NIH
-PA Author Manuscript
NIH
-PA Author Manuscript
equilibrium complex. Within experimental accuracy, such a small presence of the initialcomplex would not be detectable in standard equilibrium experiments.
A puzzling aspect of the association of the ssDNA oligomers that engage the total DNA-binding site of the RepA hexamer is the lack of the statistical effect, even in the formation ofthe initial complex (H-ssDNA)1 (Table 1). As pointed out above, such a statistical effect isexpected in the large protein binding to the homogeneous nucleic acid lattice.41-44 Thestatistical effect is clearly seen in the binding of the oligomers that engage the strong DNA-binding subsite (Table 2). Moreover, as expected, the statistical effect is entirely expressedin the formation of the first intermediate, (H-ssDNA)1. However, as discussed above, theformation of the intermediate (H-ssDNA)1 includes an additional rearrangement of theformed complex, which may depend upon the length of the associated nucleic acid. Recallthat while the binding to the strong DNA-binding subsite is base-independent, the binding ofthe oligomers that engage the total DNA-binding site is dependent upon the basecomposition of the nucleic acid; that is, it shows a significant preference for pyrimidineoligomers.12 Because the major part of the free energy of binding is generated in thebimolecular step (see above), the obtained results indicate that the outer DNA-binding siteof the RepA hexamer possesses an ability to discriminate between oligomers of differentbase compositions. In other words, the conformational rearrangement of the initial complexwith the longer ssDNA oligomers is different from the shorter oligomer and may mask theexpected statistical effect. Moreover, the notion that the base/sequence specificity for longoligomers is already in the outside binding site is further supported by the similarity in theenergetics of the next steps of the reaction for the longer and shorter ssDNA oligomers(Tables 1 and 2). If the base specificity were tested in the steps following the formation of(H-ssDNA)1, a significant difference in the energetics of some of these steps between thelong and short oligomers would be manifested and this has not been experimentallyobserved.
Steady-state fluorescence anisotropies of the reaction intermediates indicate a differentengagement of the 5′ and 3′ ends of the ssDNA oligomers during the course of theassociation reaction: Model for the RepA hexamer association with the ssDNA
The analysis of the stopped-flow kinetic data using fluorescence anisotropy providedinvaluable information about the mechanism of the examined reaction.38,57 This is due tothe fact that the anisotropy records formation of intermediates, which may not beaccompanied by detectable amplitudes in the fluorescence intensity measurements. Yet, theymay differ in their mobilities.57 In the case of the RepA hexamer–ssDNA association, itallowed us to formulate the correct kinetic mechanism of the observed association process.The difference in the steady-state anisotropies of the reaction intermediates, in the bindingof the RepA hexamer to the ssDNA oligomers, labeled at the 5′ or 3′ end of the nucleic acidsand encompassing the total DNA-binding site of the enzyme, is striking. The anisotropy ofthe first intermediate, (H-ssDNA)1, is rD1 = 0.40±0.02 for both 5′-Fl-dT(pT)19 and dT(pT)19-Fl-3′. Because the theoretically largest possible anisotropy value is 0.4, these dataindicate that in the first formed complex, the entire 21-mer is strongly immobilized,reinforcing the notion that (H-ssDNA)1 is not a simple collision complex, in spite of the factthat there is no fluorescence intensity change accompanying the formation of the firstintermediate (Table 1). However, in the next two intermediates, (H-ssDNA)2 and (H-ssDNA)3, the steady-state anisotropies of 5′-Fl-dT(pT)19 are rD2 = 0.28 ± 0.02 and rD3 =0.28±0.02, while the analogous values of the steady-state anisotropies are rD2=0.35±0.02and rD3 = 0.36±0.02 for dT(pT)19-Fl-3′. Therefore, in both intermediates (H-ssDNA)2 and(H-ssDNA)3, the 5′ end of the nucleic acid regains significant mobility, while the 3′ endremains strongly immobilized. Moreover, the fluorescence intensity of the marker at the 5′end is quenched, indicating an environment change around the 5′ end, while the analogous
Andreeva et al. Page 19
J Mol Biol. Author manuscript; available in PMC 2011 April 4.
NIH
-PA Author Manuscript
NIH
-PA Author Manuscript
NIH
-PA Author Manuscript
fluorescence intensity of the marker at the 3′ end is slightly affected. In the finalintermediate, (H-ssDNA)4, the anisotropies are rD4=0.35±0.02 and rD4 = 0.37±0.02, for the5′ and 3′ end, respectively, indicating that the entire nucleic acid is once again stronglyimmobilized.
The fluorescence anisotropy and hydrodynamic, kinetic, spectroscopic, and energeticanalyses discussed above provide a plausible model for the association of the RepA hexamerwith the ssDNA that encompasses the total DNA-binding site and the entry of the nucleicacid into the cross channel of the helicase. The model is depicted in Fig. 9. Association ofthe DNA with the outer DNA-binding site, on one of the hexamer subunits, leads to theformation of the initial complex, (H-ssDNA)1, in which the entire nucleic acid, that is, both5′ and 3′ ends, is strongly immobilized. The hexameric structure of the enzyme remainsclosed in this complex and the global structure of the enzyme is characterized by an axialratio of p~1.9.21 In the next intermediate, (H-ssDNA)2, the hexameric structure becomeslocally open and part of the bound nucleic acid, from its 5′ end, enters the cross channel. Theenvironment around the 5′ end changes as indicated by quenching of the fluorescein markeremission. Nevertheless, the DNA cannot yet engage the total DNA-binding site inside thecross channel. As a result, the 5′ end of the nucleic acid regains significant mobility. In thesame complex, the DNA fragment in the vicinity of the 3′ end stays bound to the outerDNA-binding site and is strongly immobilized. The environment around the 3′ end remainsunchanged, resulting in very little change in the intensity of the fluorescein marker emission.In the following intermediate, (H-ssDNA)3, the opening of the hexameric structure widenswithout significantly affecting the state of the bound DNA, with the mobility and theenvironment of the 5′ and 3′ ends remaining very similar to the their mobility in (H-ssDNA)2; that is, the 5′ end has significant mobility, while the 3′ end remains immobilized.The global structure of the open hexamer becomes much more spherical. In the finalintermediate, (H-ssDNA)4, the nucleic acid fully enters the cross channel and forms allcontacts with the total DNA-binding site inside the cross channel. The hexameric structurecloses over the bound DNA, although possibly, only partially.
Materials and MethodsReagents and buffers
All solutions were made with distilled and deionized >18 MΩ (Milli-Q Plus) water. Allchemicals were of reagent grade. Buffer T5 is 50 mM Tris adjusted to pH 7.6 with HCl at agiven temperature, 1 mM MgCl2, 10mM NaCl, and 10% glycerol. The temperature in thebuffer is indicated in the text.
RepA helicase of plasmid RSF1010Isolation and purification of the protein were performed, with slight modifications, aspreviously described.12-14 The protein was >99% pure as judged by SDS acrylamide gelelectrophoresis with Coomassie Brilliant Blue staining. The concentration of the protein wasspectrophotometrically determined using the extinction coefficient ε280=1.656 × 105 cm−1
M−1, obtained with approach based on Edelhoch's method.62,63
Nucleic acidsAll nucleic acids were purchased from Midland Certified Reagents (Midland, TX). ThessDNA oligomers with fluorescein at the 5′ end were synthesized using fluoresceinphosphoramidate. Labeling of the oligomers at the 3′ end with fluorescein was performed bysynthesizing the oligomer with a nucleotide residue with the amino group on a six-carbonlinker and, subsequently, modifying the amino group with fluorescein 5′-isothiocyanate(Midland, TX). The degree of labeling was determined by absorbance at 494 nm for
Andreeva et al. Page 20
J Mol Biol. Author manuscript; available in PMC 2011 April 4.
NIH
-PA Author Manuscript
NIH
-PA Author Manuscript
NIH
-PA Author Manuscript
fluorescein (pH 9) using the extinction coefficient, ε494=7.6 × 10⁴ M−1 cm−1 12,26,28,52,58
Concentrations of all ssDNA oligomers have been spectrophotometrically determined, aspreviously described by us.12,26,28,52,58
Analytical ultracentrifugation measurementsSedimentation velocity experiments were performed with an Optima XL-A analyticalultracentrifuge (Beckman Inc., Palo Alto, CA) using double-sector charcoal-filled 12-mmcenterpieces, as we previously described.10,12,15,27,33,34,52-54 Sedimentation velocity scanswere collected at the absorption band of the fluorescein marker at 495 nm. Time-derivativeanalysis of the scans was performed with the software supplied by the manufacturer. Thevalues of the apparent average sedimentation coefficients were corrected to s20,w for solventviscosity and temperature to standard conditions.48,49
Stopped-flow kineticsAll fluorescence stopped-flow kinetic experiments were performed using an SX.MV18stopped-flow instrument (Applied Photophysics Ltd. Leatherhead, UK). The reactions weremonitored using the total fluorescence of the fluorescein-labeled ssDNA oligomers withλex=475 nm, and the emission was observed through a GG500 cutoff filter (Schott,Pennsylvania), with the excitation monochromator slits at 1 mm (band pass ~4.5 nm). Thesample was excited with the vertically polarized light, and the time development of thefunction
(9)
was monitored, where IVV is the fluorescence intensity and the first and second subscriptsrefer to vertical (V) polarization of the excitation and vertical (V) or horizontal (H)polarization of the emitted light. The factor G = IHV/IHH corrects for the different sensitivityof the emission monochromator for vertically and horizontally polarized light.38 Theexperiments were performed in the oversampling mode, in which the instrument collects andaverages the multiple data points at the fastest instrumental rate for the selected timeinterval, achieving a higher signal-to-noise ratio. Usually, five to seven traces were collectedand averaged for each sample. The kinetic curves were fitted to extract relaxation times andamplitudes using nonlinear least-squares software provided by the manufacturer, with theexponential function defined as
(10)
where F(t) is the fluorescence intensity at time t, F(∞)is the fluorescence intensity at t=∞,Ai is the amplitude corresponding to the ith relaxation process, λi is the reciprocal relaxationtime characterizing the ith relaxation process, and n is number of relaxation processes. Allanalyses of the data were performed using Mathematica (Wolfram, Urbana, IL) andKaleidaGraph (Synergy Software, Pennsylvania).
Analysis of stopped-flow kinetic experimentsQuantitative examinations of both the relaxation times and the amplitudes of the observedkinetic processes have been performed using the matrix projection operator approach.22,23,29,30,33,36,37,39 The mechanism of the ssDNA (D) binding to the RepA hexamer (H)includes the bimolecular step, which is followed by three first-order conformationaltransitions as
Andreeva et al. Page 21
J Mol Biol. Author manuscript; available in PMC 2011 April 4.
NIH
-PA Author Manuscript
NIH
-PA Author Manuscript
NIH
-PA Author Manuscript
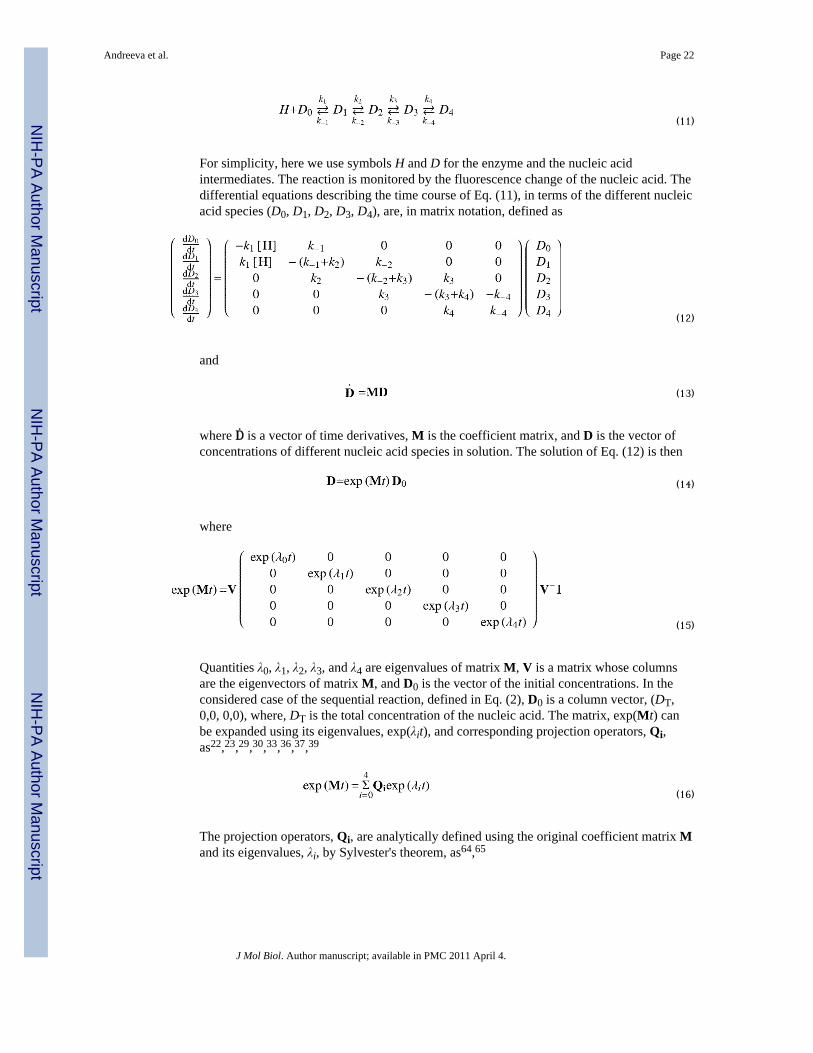
(11)
For simplicity, here we use symbols H and D for the enzyme and the nucleic acidintermediates. The reaction is monitored by the fluorescence change of the nucleic acid. Thedifferential equations describing the time course of Eq. (11), in terms of the different nucleicacid species (D0, D1, D2, D3, D4), are, in matrix notation, defined as
(12)
and
(13)
where Ḋ is a vector of time derivatives, M is the coefficient matrix, and D is the vector ofconcentrations of different nucleic acid species in solution. The solution of Eq. (12) is then
(14)
where
(15)
Quantities λ0, λ1, λ2, λ3, and λ4 are eigenvalues of matrix M, V is a matrix whose columnsare the eigenvectors of matrix M, and D0 is the vector of the initial concentrations. In theconsidered case of the sequential reaction, defined in Eq. (2), D0 is a column vector, (DT,0,0, 0,0), where, DT is the total concentration of the nucleic acid. The matrix, exp(Mt) canbe expanded using its eigenvalues, exp(λit), and corresponding projection operators, Qi,as22,23,29,30,33,36,37,39
(16)
The projection operators, Qi, are analytically defined using the original coefficient matrix Mand its eigenvalues, λi, by Sylvester's theorem, as64,65
Andreeva et al. Page 22
J Mol Biol. Author manuscript; available in PMC 2011 April 4.
NIH
-PA Author Manuscript
NIH
-PA Author Manuscript
NIH
-PA Author Manuscript

(17)
where n is the number of eigenvalues and I is the identity matrix of the same size as M. Inthe considered case, there are five eigenvalues, λ0, λ1, λ2, λ3,and λ4. One eigenvalue, λ0 = 0,results from the mass conservation in the reaction system at equilibrium. The solution for thesystem of Eq. (3) is then
(18)
The products QiD0 are column vectors, Pi, which are the projections of D0 on eacheigenvector of matrix M that is,
(19)
where Pij is the jth element of the projection of the vector of the initial concentrations of N0on the eigenvector corresponding to the ith eigenvalue of the matrix M.
There are five molar fluorescence intensities, F0, F1, F2, F3, and F4, characterizing D0, D1,D2, D3, and D4 states of the nucleic acid, free and in the complex with the RepA helicase.The fluorescence of the system at any time of the reaction, F(t), is defined as
(20)
Introducing Eq. (19) into Eq. (20) and rearranging provides
(21)
The four normal modes of reaction are characterized by the corresponding relaxation times,τ1 = −1/λ1, τ2 = −1/λ2, τ3 = −1/λ3, and τ4 = −1/λ4, and four amplitudes, A1, A2, A3, andA4.22,23,29,30,33,36,37,39 The individual amplitudes contain contributions from thefluorescence intensities characterizing all nucleic acid intermediates of the reaction. Theexperimental total amplitude, AT, is defined as
(22)
Andreeva et al. Page 23
J Mol Biol. Author manuscript; available in PMC 2011 April 4.
NIH
-PA Author Manuscript
NIH
-PA Author Manuscript
NIH
-PA Author Manuscript
where F(0) and F(∞) are the observed fluorescence intensities, F(t), of the system at t = 0and t = ∞, respectively. Introducing t = 0 for F(0) and t = ∞ for F(∞) into Eq. (22),subtracting, and rearranging, one obtains the total amplitude, AT, as
(23)
which is the sum of the individual amplitudes of all normal modes, that is, AT =A1+A2+A3+A4, where each of the individual amplitudes, A1, A2, A3, and A4, is a product ofthe row vector (F0, F1, F2, F3, F4), with the corresponding column in Eq. (23).22,23,29,30,33,36,37,39 The final vector multiplication in Eq. (23) returns the scalar value forthe total amplitude.
AcknowledgmentsWe wish to thank Gloria Drennan Bellard for her help in preparing the manuscript.
Abbreviations used
AMP-PNP β,γ-imidoadenosine-5′-triphosphate
ssDNA single-stranded DNA
References1. Enemark EJ, Joshua-Tor L. On helicases and other motor proteins. Curr. Opin. Struct. Biol. 2008;
18:243–257. [PubMed: 18329872]2. von Hippel PH, Delagoutte E. Helicase mechanisms and the coupling of helicases within
macromolecular machines. Part I: structures and properties of isolated helicases. Q. Rev. Biophys.2002; 35:431–478. [PubMed: 12621862]
3. von Hippel PH, Delagoutte E. Helicase mechanisms and the coupling of helicases withinmacromolecular machines. Part II: integration of helicases into cellular processes. Q. Rev. Biophys.2003; 36:1–69. [PubMed: 12643042]
4. Lohman TM, Bjornson KP. Mechanisms of helicase-catalyzed DNA unwinding. Annu. Rev.Biochem. 1996; 65:169–214. [PubMed: 8811178]
5. Baker TA, Funnell BE, Kornberg A. Helicase action of dnaB protein during replication from theEscherichia coli chromosomal origin in vitro. J. Biol. Chem. 1987; 262:6877–6885. [PubMed:3032979]
6. Heller RC, Marians KJ. Non-replicative helicases at the replication fork. DNA Repair. 2007; 6:945–952. [PubMed: 17382604]
7. LeBowitz JH, McMacken R. The Escherichia coli dnaB replication protein is a DNA helicase. J.Biol. Chem. 1986; 261:4738–4748. [PubMed: 3007474]
8. Scherzinger E, Ziegelin G, Barcena M, Carazo JM, Lurz R, Lanka E. The RepA protein of plasmidRSF1010 is a replicative DNA helicase. J. Biol. Chem. 1997; 2:30228–30236. [PubMed: 9374507]
9. Niedenzu T, Roleke D, Bains G, Scherzinger E, Saenger W. Crystal structure of the hexamericreplicative helicase RepA of plasmid RSF1010. J. Mol. Biol. 2001; 306:479–487. [PubMed:11178907]
10. De Gaaf J, Crossa JH, Heffron F, Falkow S. Replication of the nonconjugative plasmid RSF1010in Escherichia coli K-12. J. Bacteriol. 1978; 134:1117–1122. [PubMed: 350840]
Andreeva et al. Page 24
J Mol Biol. Author manuscript; available in PMC 2011 April 4.
NIH
-PA Author Manuscript
NIH
-PA Author Manuscript
NIH
-PA Author Manuscript
11. Guerry P, van Embden J, Falkow S. Molecular nature of two nonconjugative plasmids carryingdrug resistance genes. J. Bacteriol. 1974; 117:987–997. [PubMed: 4591964]
12. Jezewska MJ, Galletto R, Bujalowski W. Interactions of the RepA helicase hexamer of plasmidRSF1010 with the ssDNA. Quantitative analysis of stoichiometries, intrinsic affinities,cooperativities, and heterogeneity of the total ssDNA-binding site. J. Mol. Biol. 2004; 343:115–136. [PubMed: 15381424]
13. Jezewska MJ, Lucius AL, Bujalowski W. Binding of six nucleotide cofactors to the hexamerichelicase RepA protein of plasmid RSF1010. I. Direct evidence of cooperative interactions betweenthe nucleotide-binding sites of a hexameric helicase. Biochemistry. 2005; 44:3865–3876.[PubMed: 15751962]
14. Jezewska MJ, Lucius AL, Bujalowski W. Binding of six nucleotide cofactors to the hexamerichelicase RepA protein of plasmid RSF1010. II. Base specificity, nucleotide structure, magnesium,and salt effect on the cooperative binding of the cofactors. Biochemistry. 2005; 44:3877–3890.[PubMed: 15751963]
15. Bujalowski W, Klonowska MM, Jezewska MJ. Oligomeric structure of Escherichia coli primaryreplicative helicase DnaB protein. J. Biol. Chem. 1994; 269:31350–31358. [PubMed: 7989299]
16. Jezewska MJ, Kim U-S, Bujalowski W. Binding of Escherichia coli primary replicative helicaseDnaB protein to single-stranded DNA. Long-range allosteric conformational changes within theprotein hexamer. Biochemistry. 1996; 35:2129–2145. [PubMed: 8652555]
17. Dong F, Gogol EP, von Hippel PH. The phage T4-coded DNA replication helicase (gp41) forms ahexamer upon activation by nucleoside triphosphate. J. Biol. Chem. 1995; 270:7462–7473.[PubMed: 7706292]
18. Gogol EP, Seifried SE, von Hippel PH. Structure and assembly of the Escherichia colitranscription termination factor rho and its interactions with RNA. I. Cryoelectron microscopystudies. J. Mol. Biol. 1991; 221:1127–1138. [PubMed: 1719215]
19. Trakselis MA, McGeoch AT, Laskey RA, Bell SD. Organization of the archaeal MCM complex onDNA and implications for the helicase mechanisms. Nat. Struct. Mol. Biol. 2005; 12:756–762.[PubMed: 16116441]
20. Egelman EH, Yu X, Wild R, Hingorani MM, Patel SS. Bacteriophage T7 helicase/primase proteinsform rings around single-stranded DNA that suggest a general structure for hexameric helicases.Proc. Natl Acad. Sci. USA. 1995; 92:3869–3873.
21. Marcinowicz A, Jezewska MJ, Bujalowski W. Multiple global conformational states of thehexameric RepA helicase of plasmid RSF1010 with different ssDNA-binding capabilities areinduced by different numbers of bound nucleotides. Analytical ultracentrifugation and dynamiclight scattering studies. J. Mol. Biol. 2008; 375:386–408. [PubMed: 18022636]
22. Galletto R, Jezewska MJ, Bujalowski W. Unzipping mechanism of the double-stranded DNAunwinding by a hexameric helicase. I. Quantitative analysis of the rate of the dsDNA unwinding,processivity and kinetic step-size of the Escherichia coli DnaB helicase using rapid quench-flowmethod. J. Mol. Biol. 2004; 343:83–99. [PubMed: 15381422]
23. Galletto R, Jezewska MJ, Bujalowski W. Unzipping mechanism of the double-stranded DNAunwinding by a hexameric helicase. The effect of the 3′ arm and the stability of the dsDNA on theunwinding activity of the Escherichia coli DnaB helicase. J. Mol. Biol. 2004; 343:101–114.[PubMed: 15381423]
24. Jezewska MJ, Bujalowski W. A general method of analysis of ligand binding to competingmacromolecules using the spectroscopic signal originating from a reference macromolecule.Application to Escherichia coli replicative helicase DnaB protein–nucleic acid interactions.Biochemistry. 1996; 35:2117–2128. [PubMed: 8652554]
25. Jezewska MJ, Rajendran S, Bujalowski W. Strand specificity in the interactions of Escherichia coliprimary replicative helicase DnaB protein with replication fork. Biochemistry. 1997; 36:10320–10326. [PubMed: 9254631]
26. Jezewska MJ, Rajendran S, Bujalowski W. Functional and structural heterogeneity of the DNAbinding of the E. coli primary replicative helicase DnaB protein. J. Biol. Chem. 1998; 3:9058–9069. [PubMed: 9535894]
Andreeva et al. Page 25
J Mol Biol. Author manuscript; available in PMC 2011 April 4.
NIH
-PA Author Manuscript
NIH
-PA Author Manuscript
NIH
-PA Author Manuscript
27. Jezewska MJ, Rajendran S, Bujalowski W. Complex of Escherichia coli primary replicative heli-case DnaB protein with a replication fork. Recognition and structure. Biochemistry. 1998;37:3116–3136. [PubMed: 9485465]
28. Marcinowicz A, Jezewska MJ, Bujalowski PJ, Bujalowski W. The structure of the tertiary complexof the RepA hexameric helicase of plasmid RSF1010 with the ssDNA and nucleotide cofactors insolution. Biochemistry. 2007; 46:13279–13296. [PubMed: 17939681]
29. Bujalowski W, Jezewska MJ. Kinetic mechanism of the single-stranded DNA recognition byEscherichia coli replicative helicase DnaB protein. Application of the matrix projection operatortechnique to analyze stopped-flow kinetics. J. Mol. Biol. 2000; 295:831–852. [PubMed:10656794]
30. Rajendran S, Jezewska MJ, Bujalowski W. Multiple-step kinetic mechanism of DNA-independentATP binding and hydrolysis by Escherichia coli replicative helicase DnaB protein: quantitativeanalysis using the rapid quench-flow method. J. Mol. Biol. 2000; 303:773–795. [PubMed:11061975]
31. Jezewska MJ, Rajendran S, Bujalowski W. Escherichia coli helicase PriA protein-single strandedDNA complex. J. Biol. Chem. 2000; 5:865–873.
32. Jezewska MJ, Rajendran S, Bujalowski W. Interactions of Escherichia coli replicative helicasePriA protein with single-stranded DNA. Biochemistry. 2000; 39:10454–10467. [PubMed:10956036]
33. Galletto R, Jezewska MJ, Bujalowski W. Multi-step sequential mechanism of E. coli helicase PriAprotein–ssDNA interactions. Kinetics and energetics of the active ssDNA-searching site of theenzyme. Biochemistry. 2004; 43:11002–11016. [PubMed: 15323559]
34. Ahnert P, Picha KM, Patel SS. A ring-opening mechanism for DNA binding in the central channelof the T7 helicase-primase protein. EMBO J. 2000; 19:3418–3434. [PubMed: 10880454]
35. Bujalowski W, Jezewska MJ, Galletto R. Dynamics of gapped DNA recognition by humanpolymerase β. J. Biol. Chem. 2002; 7:20316–20327. [PubMed: 11912205]
36. Bujalowski W, Jezewska MJ. Kinetic mechanism of nucleotide cofactor binding to Escherichiacoli replicative helicase DnaB Protein. Stopped-flow kinetic studies using fluorescent, ribose-, andbase-modified nucleotide analog. Biochemistry. 2000; 39:2106–2122. [PubMed: 10684661]
37. Galletto R, Bujalowski W. The E. coli replication factor DnaC protein exists in two conformationswith different nucleotide binding capabilities. I. Determination of the binding mechanism usingATP and ADP fluorescent analogues. Biochemistry. 2002; 41:8907–8920. [PubMed: 12102633]
38. Galletto R, Bujalowski W. Kinetics of the E. coli replication factor DnaC protein-nucleotideinteractions. II. Fluorescence anisotropy and transient, dynamic quenching stopped-flow studies ofthe reaction intermediates. Biochemistry. 2002; 41:8921–8934. [PubMed: 12102634]
39. Bujalowski W. Thermodynamic and kinetic methods of analyses of protein–nucleic acidinteractions. From simpler to more complex systems. Chem. Rev. 2006; 106:556–606. [PubMed:16464018]
40. Hammes, GG.; Schimmel, PR. The Enzymes. Kinetics and Mechanism. Vol. II. Academic Press;New York, NY: 1970. p. 67-114.
41. Hill, TL. Cooperativity Theory in Biochemistry. Steady State and Equilibrium Systems. Springer-Verlag; New York, NY: 1985. p. 167-234.
42. Epstein IR. Cooperative and non-cooperative binding of large ligands to a finite one-dimensionallattice. A model for ligand–oligonucleotide interactions. Biophys. Chem. 1978; 8:327–339.[PubMed: 728537]
43. McGhee JD, von Hippel PH. Theoretical aspects of DNA–protein interactions: cooperative andnoncooperative binding of large ligands to a one-dimensional homogeneous lattice. J. Mol. Biol.1974; 86:469–489. [PubMed: 4416620]
44. Bujalowski W, Lohman TM, Anderson CF. On the cooperative binding of large ligands to a one-dimensional homogeneous lattice: the generalized three-state lattice model. Biopolymers. 1989;28:1637–1643. [PubMed: 2775853]
45. Fonseca MM, Scofano HM, Carvalho-Alves PC, Barrabin H, Mignaco JA. Conformationalchanges of the nucleotide site of the plasma membrane Ca2+-ATPase probed by fluorescencequenching. Biochemistry. 2002; 41:7483–7489. [PubMed: 12044182]
Andreeva et al. Page 26
J Mol Biol. Author manuscript; available in PMC 2011 April 4.
NIH
-PA Author Manuscript
NIH
-PA Author Manuscript
NIH
-PA Author Manuscript
46. Lakowicz, JR. Principles of Fluorescence Spectroscopy. 2nd edit.. Kluwer Academic; New York,NY: 1999. p. 185-233.
47. Connors, KA. Chemical Kinetics. The Study of Reaction Rates in Solution. VCH Publishers; NewYork, NY: 1990. p. 133-186.
48. Tanford, C. Physical Chemistry of Macromolecules. John Wiley & Sons, Inc.; New York, NY:1961. p. 364-390.
49. Cantor, RC.; Schimmel, PR. Biophysical Chemistry. Vol. II. W. H. Freeman; New York, NY:1980. p. 591-641.
50. Stafford W 3rd. Boundary analysis in sedimentation transport experiments: a procedure forobtaining sedimentation coefficient distributions using the time derivative of the concentrationprofile. Anal. Biochem. 1992; 203:295–301. [PubMed: 1416025]
51. Correia JJ, Chacko BM, Lam SS, Lin K. Sedimentation studies reveal a direct role ofphosphorylation in Smad3:Smad4 homo- and hetero-dimerization. Biochemistry. 2001; 40:1473–1482. [PubMed: 11170475]
52. Galletto R, Jezewska MJ, Bujalowski W. Interactions of the Escherichia coli DnaB helicasehexamer with the replication factor the DnaC protein. Effect of nucleotide cofactors and thessDNA on protein–protein interactions and the topology of the complex. J. Mol. Biol. 2003;329:441–465. [PubMed: 12767828]
53. Galletto R, Maillard R, Jezewska MJ, Bujalowski W. Global conformation of the Escherichia colireplication factor DnaC protein in absence and presence of nucleotide cofactors. Biochemistry.2004; 43:10988–11001. [PubMed: 15323558]
54. Lucius AL, Jezewska MJ, Bujalowski W. The Escherichia coli PriA helicase has two nucleotide-binding sites differing in their affinities for nucleotide cofactors. 1. Intrinsic affinities,cooperativities, and base specificity of nucleotide cofactor binding. Biochemistry. 2006; 45:7202–7216. [PubMed: 16752911]
55. Jezewska MJ, Rajendran S, Bujalowski W. Transition between different binding modes in rat DNApolymerase β–ssDNA complexes. J. Mol. Biol. 1998; 284:1113–1131. [PubMed: 9837730]
56. Otto R, Lillo MP, Beechem JM. Resolution of multi-phasic reactions by the combination offluorescence total-intensity and anisotropy stopped-flow kinetic experiments. Biophys. J. 1994;67:2511–2521. [PubMed: 7696490]
57. Jezewska MJ, Rajendran S, Bujalowska D, Bujalowski W. Does ssDNA pass through the innerchannel of the protein hexamer in the complex with the E. coli DnaB helicase? Fluorescenceenergy transfer studies. J. Biol. Chem. 1998; 3:10515–10529. [PubMed: 9553111]
58. Galletto R, Jezewska MJ, Bujalowski W. Kinetics of allosteric conformational transition of amacromolecule prior to ligand binding. Analysis of stopped-flow kinetic experiments. CellBiochem. Biophys. 2005; 42:121–144. [PubMed: 15858229]
59. Mulsch A, Colpan M, Wollny E, Gassen HG, Riesner D. Mechanism of the interactions betweenribosomal protein S1 and oligonucleotides. Nucleic Acids Res. 1981; 9:2367–2385. [PubMed:7019854]
60. Moore, JW.; Pearson, RG. Kinetics and Mechanism. J. Wiley & Sons; New York, NY: 1981. p.192-234.
61. Edelhoch H. Spectroscopic determination of tryptophan and tyrosine in proteins. Biochemistry.1967; 6:1948–1954. [PubMed: 6049437]
62. Gill SC, von Hippel PH. Calculation of protein extinction coefficients from amino acid sequencedata. Anal. Biochem. 1989; 182:319–326. [PubMed: 2610349]
63. Pilar, FL. Elementary Quantum Chemistry. McGraw-Hill; New York, NY: 1968.64. Fraser, RA.; Duncan, WJ.; Collar, AR. Elementary Matrices and Some Applications to Dynamics
and Differential Equations. Cambridge University Press; New York, NY: 1965. p. 57-96.
Andreeva et al. Page 27
J Mol Biol. Author manuscript; available in PMC 2011 April 4.
NIH
-PA Author Manuscript
NIH
-PA Author Manuscript
NIH
-PA Author Manuscript
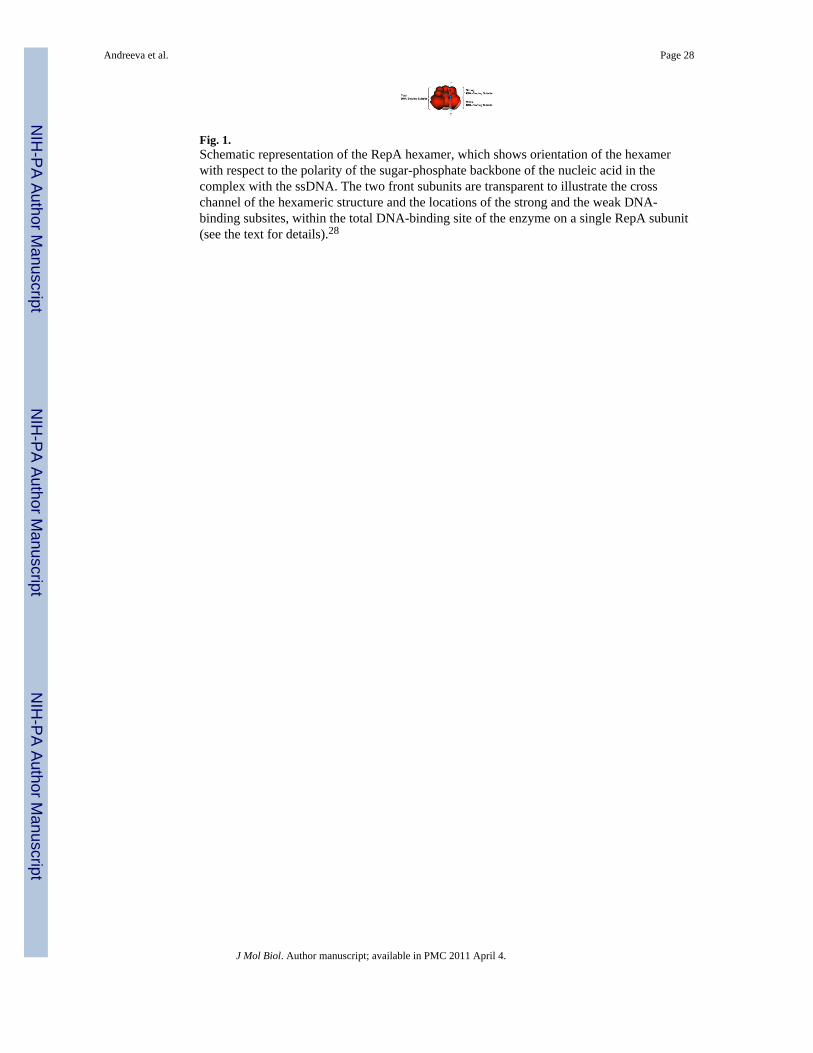
Fig. 1.Schematic representation of the RepA hexamer, which shows orientation of the hexamerwith respect to the polarity of the sugar-phosphate backbone of the nucleic acid in thecomplex with the ssDNA. The two front subunits are transparent to illustrate the crosschannel of the hexameric structure and the locations of the strong and the weak DNA-binding subsites, within the total DNA-binding site of the enzyme on a single RepA subunit(see the text for details).28
Andreeva et al. Page 28
J Mol Biol. Author manuscript; available in PMC 2011 April 4.
NIH
-PA Author Manuscript
NIH
-PA Author Manuscript
NIH
-PA Author Manuscript

Fig. 2.The fluorescence stopped-flow kinetic trace, recorded in two time bases, 5 and 1500 s, aftermixing the ssDNA 21-mer, 5′-Fl-dT(pT)19, with the RepA helicase in buffer T5 (pH 7.6, 10°C), containing 0.5 mM AMP-PNP (λex =475 nm, λ-em >500 nm). The final concentrationsof the 21-mer and the helicase are 5 × 10⁻⁹ M (oligomer) and 5 × 10⁻⁷ M (hexamer),respectively. The continuous line is the three-exponential, nonlinear least-squares fit of theexperimental curve using Eq. (10). The lower panel shows the deviations of theexperimental curve from the fit.
Andreeva et al. Page 29
J Mol Biol. Author manuscript; available in PMC 2011 April 4.
NIH
-PA Author Manuscript
NIH
-PA Author Manuscript
NIH
-PA Author Manuscript
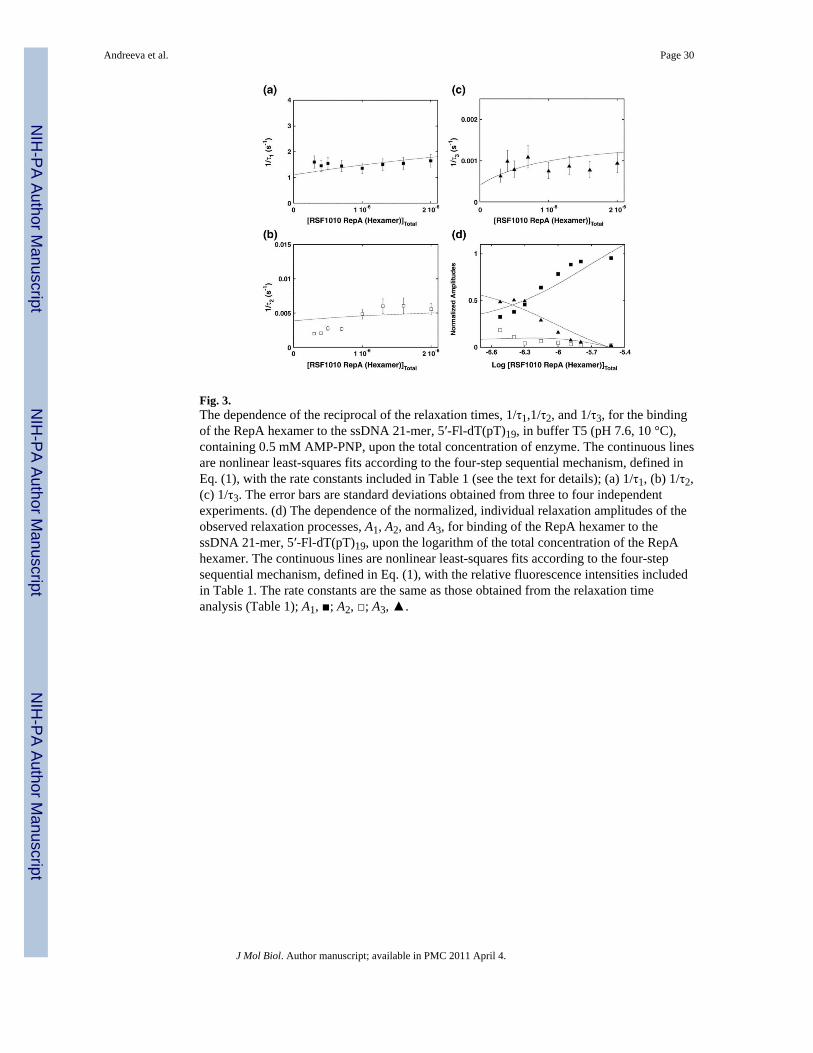
Fig. 3.The dependence of the reciprocal of the relaxation times, 1/τ1,1/τ2, and 1/τ3, for the bindingof the RepA hexamer to the ssDNA 21-mer, 5′-Fl-dT(pT)19, in buffer T5 (pH 7.6, 10 °C),containing 0.5 mM AMP-PNP, upon the total concentration of enzyme. The continuous linesare nonlinear least-squares fits according to the four-step sequential mechanism, defined inEq. (1), with the rate constants included in Table 1 (see the text for details); (a) 1/τ1, (b) 1/τ2,(c) 1/τ3. The error bars are standard deviations obtained from three to four independentexperiments. (d) The dependence of the normalized, individual relaxation amplitudes of theobserved relaxation processes, A1, A2, and A3, for binding of the RepA hexamer to thessDNA 21-mer, 5′-Fl-dT(pT)19, upon the logarithm of the total concentration of the RepAhexamer. The continuous lines are nonlinear least-squares fits according to the four-stepsequential mechanism, defined in Eq. (1), with the relative fluorescence intensities includedin Table 1. The rate constants are the same as those obtained from the relaxation timeanalysis (Table 1); A1, ■; A2, □; A3, ▲.
Andreeva et al. Page 30
J Mol Biol. Author manuscript; available in PMC 2011 April 4.
NIH
-PA Author Manuscript
NIH
-PA Author Manuscript
NIH
-PA Author Manuscript

Fig. 4.The dependence of the reciprocal of the relaxation times, 1/τ1, 1/τ2, and 1/τ3, for the bindingof the RepA hexamer to the ssDNA 10-mer, 5′-Fl-dT(pT)8, in buffer T5 (pH 7.6, 10 °C),containing 0.5 mM AMP-PNP, upon the total concentration of enzyme. The continuous linesare nonlinear least-squares fits according to the four-step sequential mechanism, defined inEq. (1), with the rate constants included in Table 2 (see the text for details); (a) 1/τ1, (b) 1/τ2,(c) 1/τ3. The error bars are standard deviations obtained from three to four independentexperiments. (d) The dependence of the normalized, individual relaxation amplitudes of thecorresponding relaxation processes, A1, A2, and A3, for binding of the RepA hexamer to thessDNA 10-mer, 5′-Fl-dT(pT)8, upon the logarithm of the total concentration of the RepAhexamer. The continuous lines are nonlinear least-squares fits according to the four-stepsequential mechanism, defined in Eq. (1), with the relative fluorescence intensities includedin Table 2. The rate constants are the same as those obtained from the relaxation timeanalysis (Table 2); A1, ■; A2, □; A3, ▲.
Andreeva et al. Page 31
J Mol Biol. Author manuscript; available in PMC 2011 April 4.
NIH
-PA Author Manuscript
NIH
-PA Author Manuscript
NIH
-PA Author Manuscript
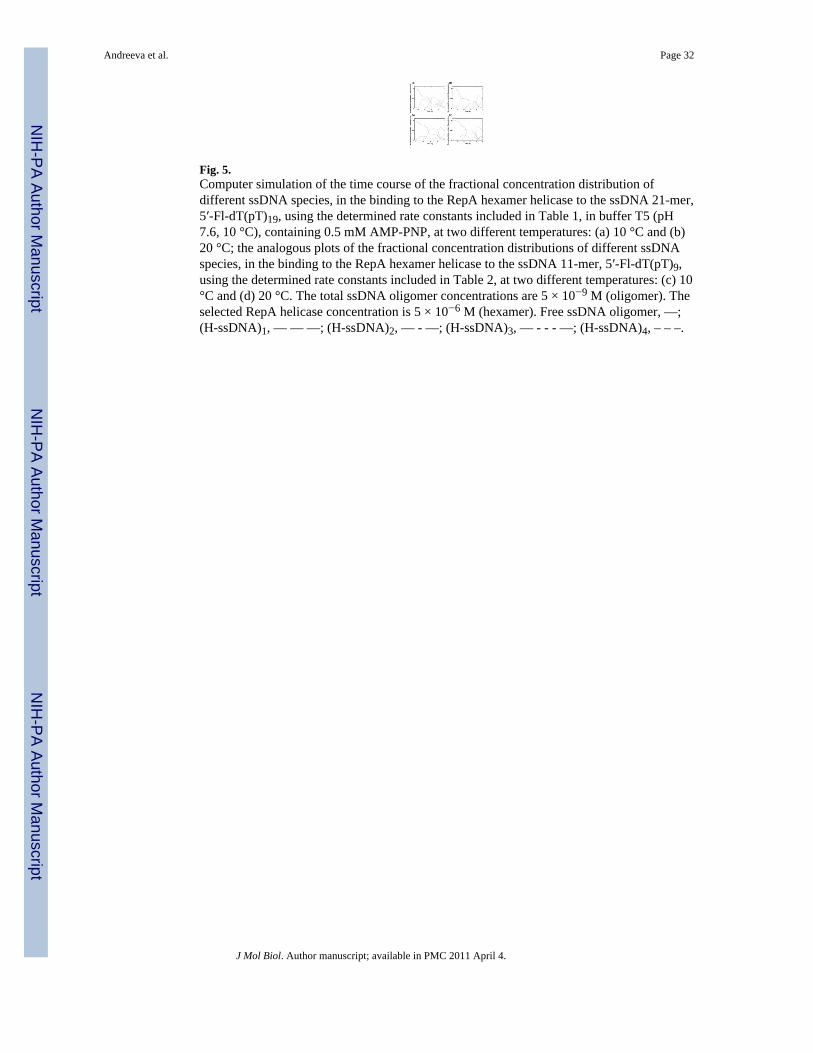
Fig. 5.Computer simulation of the time course of the fractional concentration distribution ofdifferent ssDNA species, in the binding to the RepA hexamer helicase to the ssDNA 21-mer,5′-Fl-dT(pT)19, using the determined rate constants included in Table 1, in buffer T5 (pH7.6, 10 °C), containing 0.5 mM AMP-PNP, at two different temperatures: (a) 10 °C and (b)20 °C; the analogous plots of the fractional concentration distributions of different ssDNAspecies, in the binding to the RepA hexamer helicase to the ssDNA 11-mer, 5′-Fl-dT(pT)9,using the determined rate constants included in Table 2, at two different temperatures: (c) 10°C and (d) 20 °C. The total ssDNA oligomer concentrations are 5 × 10⁻⁹ M (oligomer). Theselected RepA helicase concentration is 5 × 10⁻⁶ M (hexamer). Free ssDNA oligomer, —;(H-ssDNA)1, — — —; (H-ssDNA)2, — - —; (H-ssDNA)3, — - - - —; (H-ssDNA)4, – – –.
Andreeva et al. Page 32
J Mol Biol. Author manuscript; available in PMC 2011 April 4.
NIH
-PA Author Manuscript
NIH
-PA Author Manuscript
NIH
-PA Author Manuscript
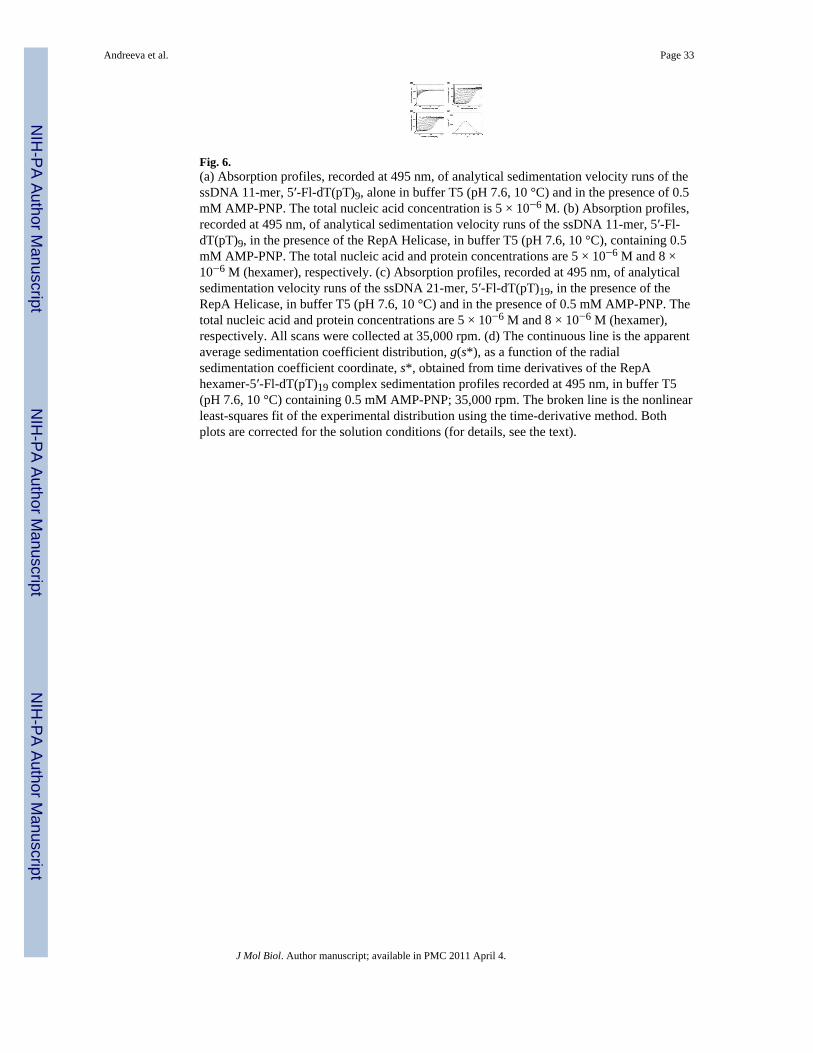
Fig. 6.(a) Absorption profiles, recorded at 495 nm, of analytical sedimentation velocity runs of thessDNA 11-mer, 5′-Fl-dT(pT)9, alone in buffer T5 (pH 7.6, 10 °C) and in the presence of 0.5mM AMP-PNP. The total nucleic acid concentration is 5 × 10⁻⁶ M. (b) Absorption profiles,recorded at 495 nm, of analytical sedimentation velocity runs of the ssDNA 11-mer, 5′-Fl-dT(pT)9, in the presence of the RepA Helicase, in buffer T5 (pH 7.6, 10 °C), containing 0.5mM AMP-PNP. The total nucleic acid and protein concentrations are 5 × 10⁻⁶ M and 8 ×10⁻⁶ M (hexamer), respectively. (c) Absorption profiles, recorded at 495 nm, of analyticalsedimentation velocity runs of the ssDNA 21-mer, 5′-Fl-dT(pT)19, in the presence of theRepA Helicase, in buffer T5 (pH 7.6, 10 °C) and in the presence of 0.5 mM AMP-PNP. Thetotal nucleic acid and protein concentrations are 5 × 10⁻⁶ M and 8 × 10⁻⁶ M (hexamer),respectively. All scans were collected at 35,000 rpm. (d) The continuous line is the apparentaverage sedimentation coefficient distribution, g(s*), as a function of the radialsedimentation coefficient coordinate, s*, obtained from time derivatives of the RepAhexamer-5′-Fl-dT(pT)19 complex sedimentation profiles recorded at 495 nm, in buffer T5(pH 7.6, 10 °C) containing 0.5 mM AMP-PNP; 35,000 rpm. The broken line is the nonlinearleast-squares fit of the experimental distribution using the time-derivative method. Bothplots are corrected for the solution conditions (for details, see the text).
Andreeva et al. Page 33
J Mol Biol. Author manuscript; available in PMC 2011 April 4.
NIH
-PA Author Manuscript
NIH
-PA Author Manuscript
NIH
-PA Author Manuscript
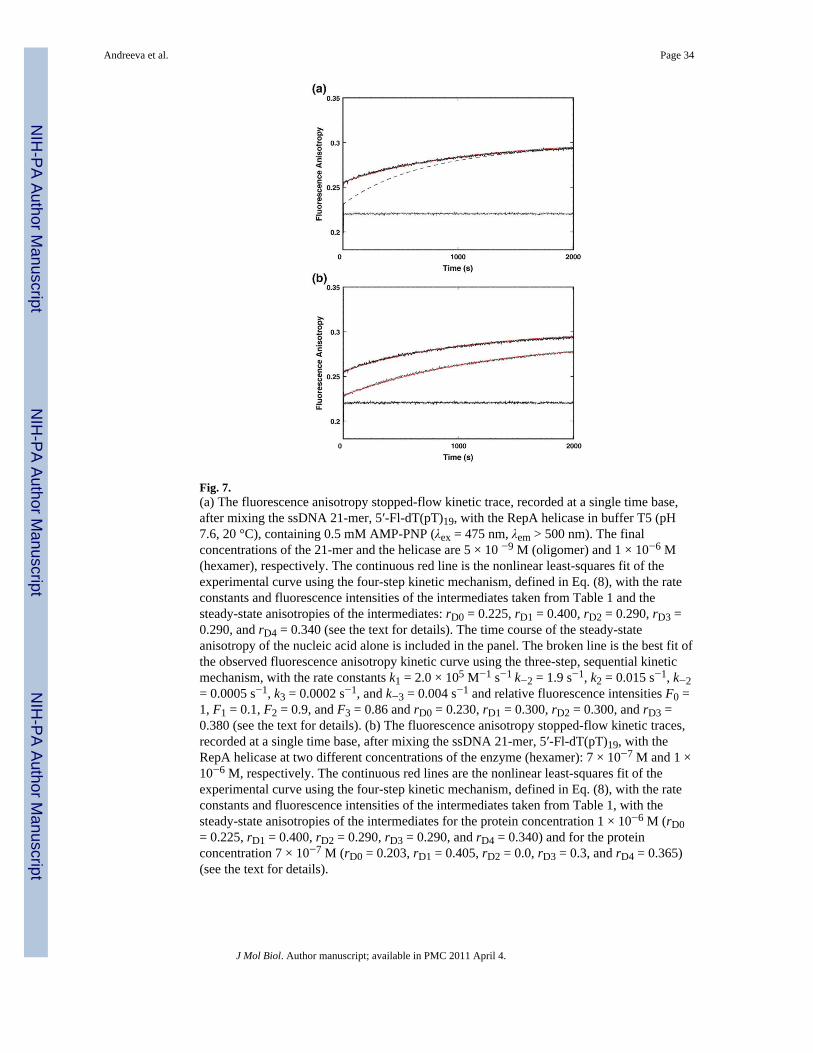
Fig. 7.(a) The fluorescence anisotropy stopped-flow kinetic trace, recorded at a single time base,after mixing the ssDNA 21-mer, 5′-Fl-dT(pT)19, with the RepA helicase in buffer T5 (pH7.6, 20 °C), containing 0.5 mM AMP-PNP (λex = 475 nm, λem > 500 nm). The finalconcentrations of the 21-mer and the helicase are 5 × 10 −9 M (oligomer) and 1 × 10⁻⁶ M(hexamer), respectively. The continuous red line is the nonlinear least-squares fit of theexperimental curve using the four-step kinetic mechanism, defined in Eq. (8), with the rateconstants and fluorescence intensities of the intermediates taken from Table 1 and thesteady-state anisotropies of the intermediates: rD0 = 0.225, rD1 = 0.400, rD2 = 0.290, rD3 =0.290, and rD4 = 0.340 (see the text for details). The time course of the steady-stateanisotropy of the nucleic acid alone is included in the panel. The broken line is the best fit ofthe observed fluorescence anisotropy kinetic curve using the three-step, sequential kineticmechanism, with the rate constants k1 = 2.0 × 10⁵ M−1 s−1 k−2 = 1.9 s−1, k2 = 0.015 s−1, k−2= 0.0005 s−1, k3 = 0.0002 s−1, and k−3 = 0.004 s−1 and relative fluorescence intensities F0 =1, F1 = 0.1, F2 = 0.9, and F3 = 0.86 and rD0 = 0.230, rD1 = 0.300, rD2 = 0.300, and rD3 =0.380 (see the text for details). (b) The fluorescence anisotropy stopped-flow kinetic traces,recorded at a single time base, after mixing the ssDNA 21-mer, 5′-Fl-dT(pT)19, with theRepA helicase at two different concentrations of the enzyme (hexamer): 7 × 10⁻⁷ M and 1 ×10⁻⁶ M, respectively. The continuous red lines are the nonlinear least-squares fit of theexperimental curve using the four-step kinetic mechanism, defined in Eq. (8), with the rateconstants and fluorescence intensities of the intermediates taken from Table 1, with thesteady-state anisotropies of the intermediates for the protein concentration 1 × 10⁻⁶ M (rD0= 0.225, rD1 = 0.400, rD2 = 0.290, rD3 = 0.290, and rD4 = 0.340) and for the proteinconcentration 7 × 10⁻⁷ M (rD0 = 0.203, rD1 = 0.405, rD2 = 0.0, rD3 = 0.3, and rD4 = 0.365)(see the text for details).
Andreeva et al. Page 34
J Mol Biol. Author manuscript; available in PMC 2011 April 4.
NIH
-PA Author Manuscript
NIH
-PA Author Manuscript
NIH
-PA Author Manuscript
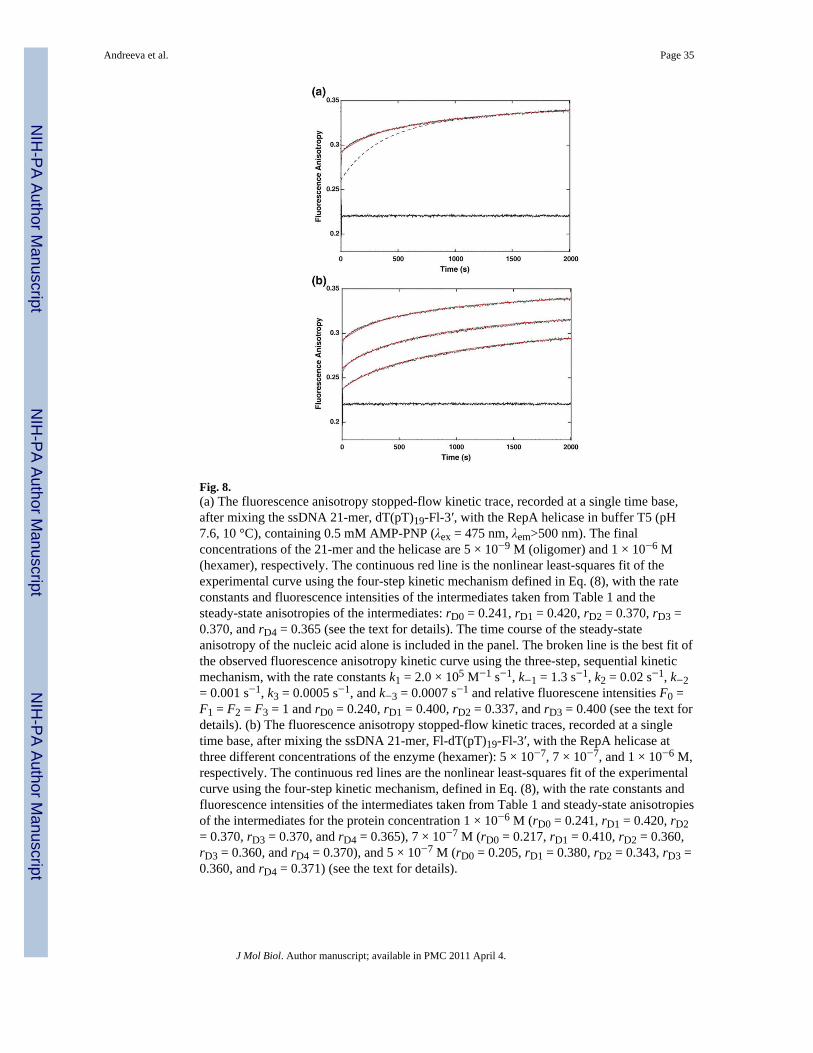
Fig. 8.(a) The fluorescence anisotropy stopped-flow kinetic trace, recorded at a single time base,after mixing the ssDNA 21-mer, dT(pT)19-Fl-3′, with the RepA helicase in buffer T5 (pH7.6, 10 °C), containing 0.5 mM AMP-PNP (λex = 475 nm, λem>500 nm). The finalconcentrations of the 21-mer and the helicase are 5 × 10⁻⁹ M (oligomer) and 1 × 10⁻⁶ M(hexamer), respectively. The continuous red line is the nonlinear least-squares fit of theexperimental curve using the four-step kinetic mechanism defined in Eq. (8), with the rateconstants and fluorescence intensities of the intermediates taken from Table 1 and thesteady-state anisotropies of the intermediates: rD0 = 0.241, rD1 = 0.420, rD2 = 0.370, rD3 =0.370, and rD4 = 0.365 (see the text for details). The time course of the steady-stateanisotropy of the nucleic acid alone is included in the panel. The broken line is the best fit ofthe observed fluorescence anisotropy kinetic curve using the three-step, sequential kineticmechanism, with the rate constants k1 = 2.0 × 10⁵ M−1 s−1, k−1 = 1.3 s−1, k2 = 0.02 s−1, k−2= 0.001 s−1, k3 = 0.0005 s−1, and k−3 = 0.0007 s−1 and relative fluorescene intensities F0 =F1 = F2 = F3 = 1 and rD0 = 0.240, rD1 = 0.400, rD2 = 0.337, and rD3 = 0.400 (see the text fordetails). (b) The fluorescence anisotropy stopped-flow kinetic traces, recorded at a singletime base, after mixing the ssDNA 21-mer, Fl-dT(pT)19-Fl-3′, with the RepA helicase atthree different concentrations of the enzyme (hexamer): 5 × 10⁻⁷, 7 × 10⁻⁷, and 1 × 10⁻⁶ M,respectively. The continuous red lines are the nonlinear least-squares fit of the experimentalcurve using the four-step kinetic mechanism, defined in Eq. (8), with the rate constants andfluorescence intensities of the intermediates taken from Table 1 and steady-state anisotropiesof the intermediates for the protein concentration 1 × 10⁻⁶ M (rD0 = 0.241, rD1 = 0.420, rD2= 0.370, rD3 = 0.370, and rD4 = 0.365), 7 × 10⁻⁷ M (rD0 = 0.217, rD1 = 0.410, rD2 = 0.360,rD3 = 0.360, and rD4 = 0.370), and 5 × 10⁻⁷ M (rD0 = 0.205, rD1 = 0.380, rD2 = 0.343, rD3 =0.360, and rD4 = 0.371) (see the text for details).
Andreeva et al. Page 35
J Mol Biol. Author manuscript; available in PMC 2011 April 4.
NIH
-PA Author Manuscript
NIH
-PA Author Manuscript
NIH
-PA Author Manuscript

Fig. 9.Schematic model for the binding of the ssDNA to the total DNA-binding site, the RepAhexamer. The DNA binds initially to the outer DNA-binding site of the helicase on one ofthe subunits, forming the initial complex, (H-ssDNA)1.In the intermediate (H-ssDNA)1,local conformational transition of the complex strongly immobilizes the entire nucleic acid.The hexameric structure of the enzyme remains closed. In the next intermediate, (H-ssDNA)2, the hexamer partially and locally opens and the part of the bound nucleic acid,from its 5′ end, enters the cross channel, although the DNA cannot yet engage the totalDNA-binding site inside the cross channel. The DNA fragment in the vicinity of the 3′ endstays bound to the outer DNA-binding site. In the following intermediate, (H-ssDNA)3, theopening of the hexameric structure widens without significantly affecting the state of thebound DNA, allowing the entire DNA to enter the cross channel. In the final intermediate,(H-ssDNA)4, the nucleic acid is completely in the cross channel and forms all contacts withthe total DNA-binding site located inside the cross channel. The hexameric structure closesover the bound DNA, although, possibly, only partially (see the text for details).
Andreeva et al. Page 36
J Mol Biol. Author manuscript; available in PMC 2011 April 4.
NIH
-PA Author Manuscript
NIH
-PA Author Manuscript
NIH
-PA Author Manuscript
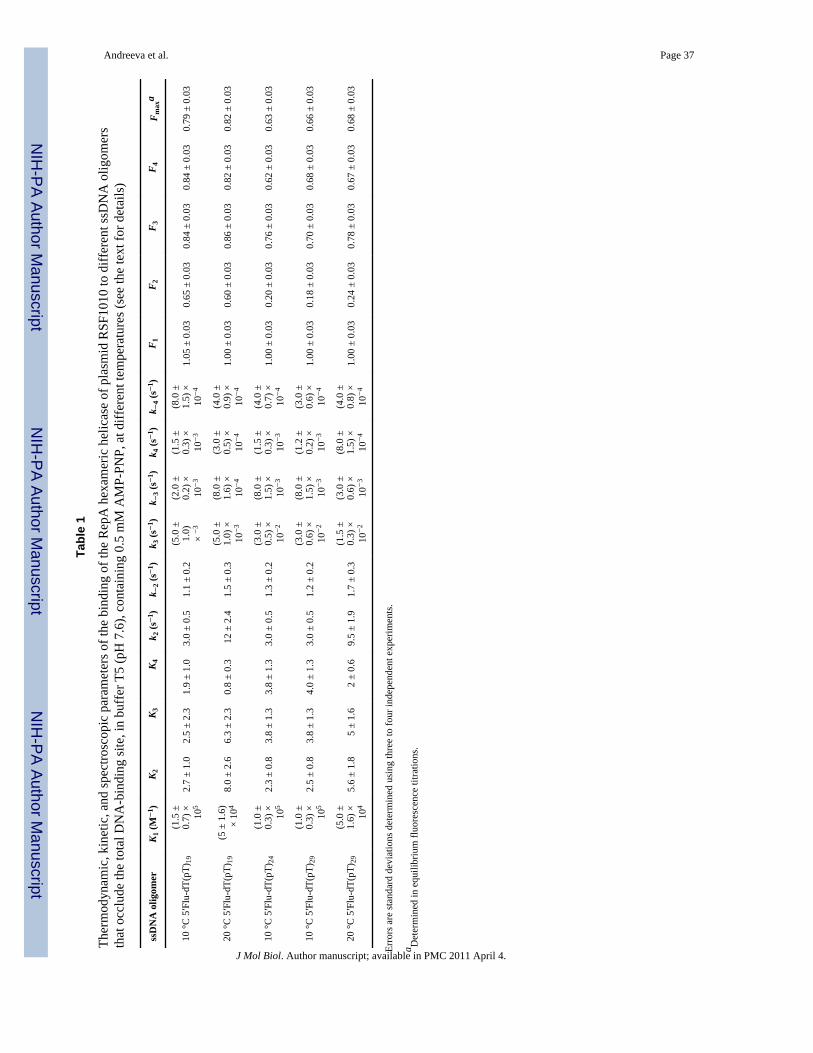
NIH
-PA Author Manuscript
NIH
-PA Author Manuscript
NIH
-PA Author Manuscript
Andreeva et al. Page 37
Tabl
e 1
Ther
mod
ynam
ic, k
inet
ic, a
nd sp
ectro
scop
ic p
aram
eter
s of t
he b
indi
ng o
f the
Rep
A h
exam
eric
hel
icas
e of
pla
smid
RSF
1010
to d
iffer
ent s
sDN
A o
ligom
ers
that
occ
lude
the
tota
l DN
A-b
indi
ng si
te, i
n bu
ffer
T5
(pH
7.6
), co
ntai
ning
0.5
mM
AM
P-PN
P, a
t diff
eren
t tem
pera
ture
s (se
e th
e te
xt fo
r det
ails
)
ssD
NA
olig
omer
K 1 (M
−1 )
K 2K 3
K 4k 2
(s−
1 )k −
2 (s−
1 )k 3
(s−
1 )k −
3 (s−
1 )k 4
(s−
1 )k −
4 (s−
1 )F 1
F 2F 3
F 4F m
axa
10 °C
5′F
lu-d
T(pT
) 19
(1.5
±0.
7) × 10
52.
7 ±
1.0
2.5
± 2.
31.
9 ±
1.0
3.0
± 0.
51.
1 ±
0.2
(5.0
±1.
0)×
−3
(2.0
±0.
2) ×
10−
3
(1.5
±0.
3) ×
10−
3
(8.0
±1.
5) ×
10−
41.
05 ±
0.0
30.
65 ±
0.0
30.
84 ±
0.0
30.
84 ±
0.0
30.
79 ±
0.0
3
20 °C
5′F
lu-d
T(pT
) 19
(5 ±
1.6
)×
104
8.0
± 2.
66.
3 ±
2.3
0.8
± 0.
312
± 2
.41.
5 ±
0.3
(5.0
±1.
0) ×
10−
3
(8.0
±1.
6) ×
10−
4
(3.0
±0.
5) ×
10−
4
(4.0
±0.
9) ×
10−
41.
00 ±
0.0
30.
60 ±
0.0
30.
86 ±
0.0
30.
82 ±
0.0
30.
82 ±
0.0
3
10 °C
5′F
lu-d
T(pT
) 24
(1.0
±0.
3) × 10
52.
3 ±
0.8
3.8
± 1.
33.
8 ±
1.3
3.0
± 0.
51.
3 ±
0.2
(3.0
±0.
5) ×
10−
2
(8.0
±1.
5) ×
10−
3
(1.5
±0.
3) ×
10−
3
(4.0
±0.
7) ×
10−
41.
00 ±
0.0
30.
20 ±
0.0
30.
76 ±
0.0
30.
62 ±
0.0
30.
63 ±
0.0
3
10 °C
5′F
lu-d
T(pT
) 29
(1.0
±0.
3) × 10
52.
5 ±
0.8
3.8
± 1.
34.
0 ±
1.3
3.0
± 0.
51.
2 ±
0.2
(3.0
±0.
6) ×
10−
2
(8.0
±1.
5) ×
10−
3
(1.2
±0.
2) ×
10−
3
(3.0
±0.
6) ×
10−
41.
00 ±
0.0
30.
18 ±
0.0
30.
70 ±
0.0
30.
68 ±
0.0
30.
66 ±
0.0
3
20 °C
5′F
lu-d
T(pT
) 29
(5.0
±1.
6) × 10
45.
6 ±
1.8
5 ±
1.6
2 ±
0.6
9.5
± 1.
91.
7 ±
0.3
(1.5
±0.
3) ×
10−
2
(3.0
±0.
6) ×
10−
3
(8.0
±1.
5) ×
10−
4
(4.0
±0.
8) ×
10−
41.
00 ±
0.0
30.
24 ±
0.0
30.
78 ±
0.0
30.
67 ±
0.0
30.
68 ±
0.0
3
Erro
rs a
re st
anda
rd d
evia
tions
det
erm
ined
usi
ng th
ree
to fo
ur in
depe
nden
t exp
erim
ents
.
a Det
erm
ined
in e
quili
briu
m fl
uore
scen
ce ti
tratio
ns.
J Mol Biol. Author manuscript; available in PMC 2011 April 4.
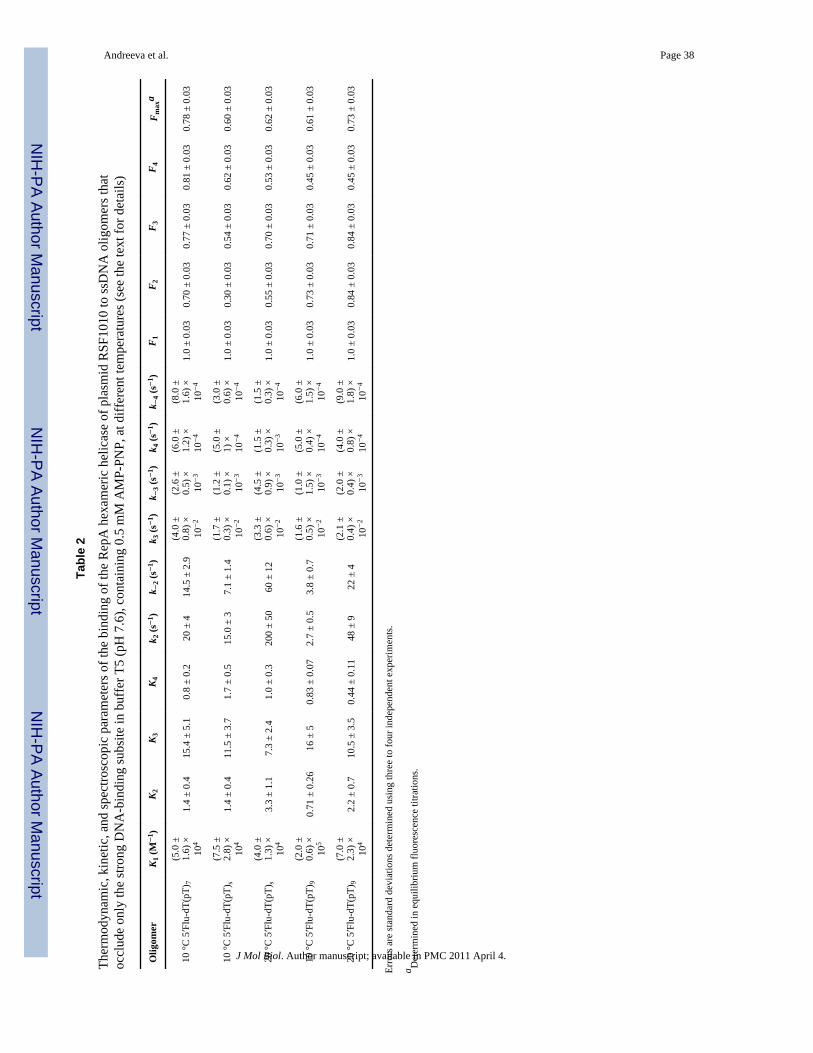
NIH
-PA Author Manuscript
NIH
-PA Author Manuscript
NIH
-PA Author Manuscript
Andreeva et al. Page 38
Tabl
e 2
Ther
mod
ynam
ic, k
inet
ic, a
nd sp
ectro
scop
ic p
aram
eter
s of t
he b
indi
ng o
f the
Rep
A h
exam
eric
hel
icas
e of
pla
smid
RSF
1010
to ss
DN
A o
ligom
ers t
hat
occl
ude
only
the
stro
ng D
NA
-bin
ding
subs
ite in
buf
fer T
5 (p
H 7
.6),
cont
aini
ng 0
.5 m
M A
MP-
PNP,
at d
iffer
ent t
empe
ratu
res (
see
the
text
for d
etai
ls)
Olig
omer
K 1 (M
−1 )
K 2K 3
K 4k 2
(s−
1 )k −
2 (s−
1 )k 3
(s−
1 )k −
3 (s−
1 )k 4
(s−
1 )k −
4 (s−
1 )F 1
F 2F 3
F 4F m
axa
10 °C
5′F
lu-d
T(pT
) 7(5
.0 ±
1.6)
×10
41.
4 ±
0.4
15.4
± 5
.10.
8 ±
0.2
20 ±
414
.5 ±
2.9
(4.0
±0.
8) ×
10−
2
(2.6
±0.
5) ×
10−
3
(6.0
±1.
2) ×
10−
4
(8.0
±1.
6) ×
10−
41.
0 ±
0.03
0.70
± 0
.03
0.77
± 0
.03
0.81
± 0
.03
0.78
± 0
.03
10 °C
5′F
lu-d
T(pT
) s(7
.5 ±
2.8)
×10
41.
4 ±
0.4
11.5
± 3
.71.
7 ±
0.5
15.0
± 3
7.1
± 1.
4(1
.7 ±
0.3)
×10
−2
(1.2
±0.
1) ×
10−
3
(5.0
±1)
×10
−4
(3.0
±0.
6) ×
10−
41.
0 ±
0.03
0.30
± 0
.03
0.54
± 0
.03
0.62
± 0
.03
0.60
± 0
.03
20 °C
5′F
lu-d
T(pT
) s(4
.0 ±
1.3)
×10
43.
3 ±
1.1
7.3
± 2.
41.
0 ±
0.3
200
± 50
60 ±
12
(3.3
±0.
6) ×
10−
2
(4.5
±0.
9) ×
10−
3
(1.5
±0.
3) ×
10−
3
(1.5
±0.
3) ×
10−
41.
0 ±
0.03
0.55
± 0
.03
0.70
± 0
.03
0.53
± 0
.03
0.62
± 0
.03
10 °C
5′F
lu-d
T(pT
) 9(2
.0 ±
0.6)
×10
50.
71 ±
0.2
616
± 5
0.83
± 0
.07
2.7
± 0.
53.
8 ±
0.7
(1.6
±0.
5) ×
10−
2
(1.0
±1.
5) ×
10−
3
(5.0
±0.
4) ×
10−
4
(6.0
±1.
5) ×
10−
41.
0 ±
0.03
0.73
± 0
.03
0.71
± 0
.03
0.45
± 0
.03
0.61
± 0
.03
20 °C
5′F
lu-d
T(pT
) 9(7
.0 ±
2.3)
×10
42.
2 ±
0.7
10.5
± 3
.50.
44 ±
0.1
148
± 9
22 ±
4(2
.1 ±
0.4)
×10
−2
(2.0
±0.
4) ×
10−
3
(4.0
±0.
8) ×
10−
4
(9.0
±1.
8) ×
10−
41.
0 ±
0.03
0.84
± 0
.03
0.84
± 0
.03
0.45
± 0
.03
0.73
± 0
.03
Erro
rs a
re st
anda
rd d
evia
tions
det
erm
ined
usi
ng th
ree
to fo
ur in
depe
nden
t exp
erim
ents
.
a Det
erm
ined
in e
quili
briu
m fl
uore
scen
ce ti
tratio
ns.
J Mol Biol. Author manuscript; available in PMC 2011 April 4.
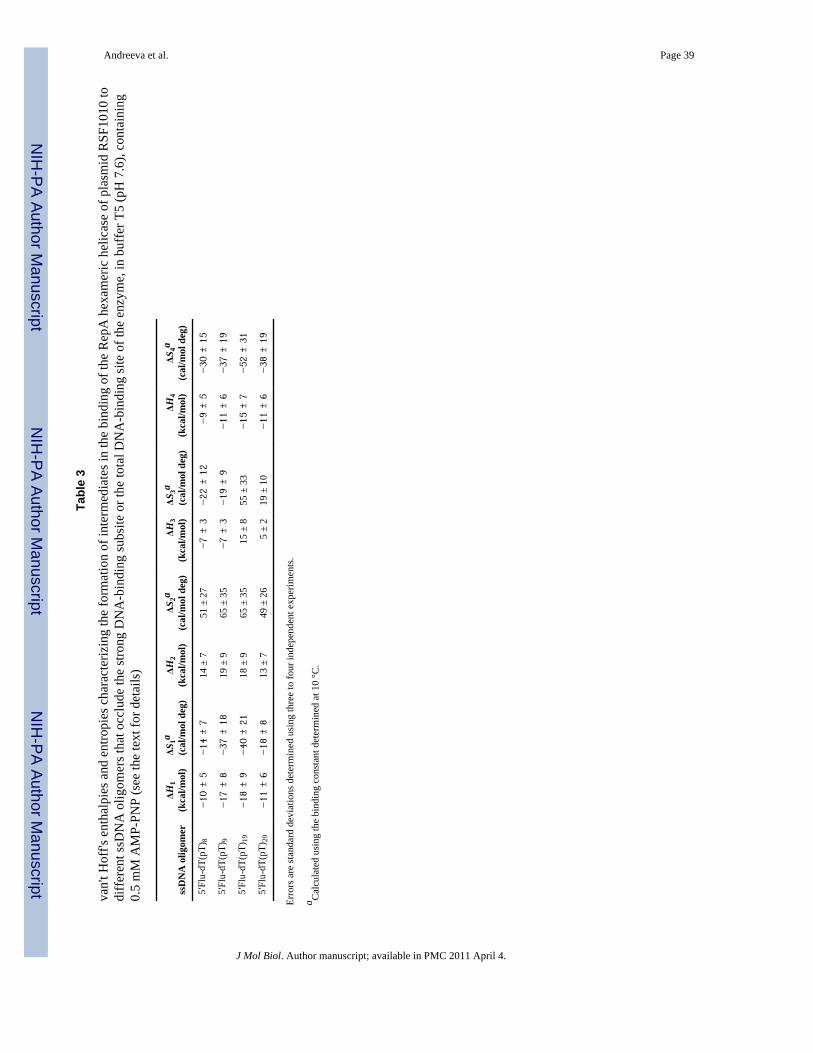
NIH
-PA Author Manuscript
NIH
-PA Author Manuscript
NIH
-PA Author Manuscript
Andreeva et al. Page 39
Tabl
e 3
van'
t Hof
f's e
ntha
lpie
s and
ent
ropi
es c
hara
cter
izin
g th
e fo
rmat
ion
of in
term
edia
tes i
n th
e bi
ndin
g of
the
Rep
A h
exam
eric
hel
icas
e of
pla
smid
RSF
1010
todi
ffer
ent s
sDN
A o
ligom
ers t
hat o
cclu
de th
e st
rong
DN
A-b
indi
ng su
bsite
or t
he to
tal D
NA
-bin
ding
site
of t
he e
nzym
e, in
buf
fer T
5 (p
H 7
.6),
cont
aini
ng0.
5 m
M A
MP-
PNP
(see
the
text
for d
etai
ls)
ssD
NA
olig
omer
ΔH1
(kca
l/mol
)ΔS
1a(c
al/m
ol d
eg)
ΔH2
(kca
l/mol
)ΔS
2a(c
al/m
ol d
eg)
ΔH3
(kca
l/mol
)ΔS
3a(c
al/m
ol d
eg)
ΔH4
(kca
l/mol
)ΔS
4a(c
al/m
ol d
eg)
5′Fl
u-dT
(pT)
8−10
± 5
−14
± 7
14 ±
751
± 2
7−7
± 3
−22
± 1
2−9
± 5
−30
± 1
5
5′Fl
u-dT
(pT)
9−17
± 8
−37
± 1
819
± 9
65 ±
35
−7
± 3
−19
± 9
−11
± 6
−37
± 1
9
5′Fl
u-dT
(pT)
19−18
± 9
−40
± 2
118
± 9
65 ±
35
15 ±
855
± 3
3−15
± 7
−52
± 3
1
5′Fl
u-dT
(pT)
29−11
± 6
−18
± 8
13 ±
749
± 2
65
± 2
19 ±
10
−11
± 6
−38
± 1
9
Erro
rs a
re st
anda
rd d
evia
tions
det
erm
ined
usi
ng th
ree
to fo
ur in
depe
nden
t exp
erim
ents
.
a Cal
cula
ted
usin
g th
e bi
ndin
g co
nsta
nt d
eter
min
ed a
t 10
°C.
J Mol Biol. Author manuscript; available in PMC 2011 April 4.