The ATPase cycle mechanism of the DEAD-box rRNA helicase, DbpA
24
The ATPase cycle mechanism of the DEAD-box rRNA helicase, DbpA Arnon Henn 1,* , Wenxiang Cao 1,* , David Hackney 2 , and Enrique M. De La Cruz 1,† 1Yale University, Department of Molecular Biophysics & Biochemistry, 260 Whitney Avenue, New Haven, CT 06520 2Carnegie Mellon University, Department of Biological Sciences, 4400 Fifth Avenue, Pittsburgh, PA 15213 Summary DEAD-box proteins are ATPase enzymes that destabilize and unwind duplex RNA. Quantitative knowledge of the ATPase cycle parameters is critical for developing models of helicase activity. However, limited information regarding the rate and equilibrium constants defining the ATPase cycle of RNA helicases is available, including the distribution and flux of populated biochemical intermediates, the catalytic step(s) that limits the enzymatic reaction cycle, and how ATP utilization and RNA interactions are linked. We present a quantitative kinetic and equilibrium characterization of the rRNA-activated ATPase cycle mechanism of DbpA, a DEAD-box rRNA helicase implicated in ribosome biogenesis. rRNA activates the ATPase activity of DbpA by promoting a conformational change after ATP binding that is associated with hydrolysis. Chemical cleavage of bound ATP is reversible and occurs via a gamma phosphate attack mechanism. ADP-P i and RNA binding display strong thermodynamic coupling, which causes DbpA-ADP-P i to bind rRNA with > 10-fold higher affinity than with bound ATP, ADP or in the absence of nucleotide. The rRNA-activated steady-state ATPase cycle of DbpA is limited both by ATP hydrolysis and P i release, which occur with comparable rates. Consequently, the predominantly populated biochemical states during steady-state cycling are the ATP- and ADP-P i -bound intermediates. Thermodynamic linkage analysis of the ATPase cycle transitions favors models in which rRNA duplex destabilization is linked to strong rRNA and nucleotide binding. The presented analysis of the DbpA ATPase cycle reaction mechanism provides a rigorous kinetic and thermodynamic foundation for developing testable hypotheses regarding the functions and molecular mechanisms of DEAD-box helicases. Keywords DEAD-box protein; RNA; helicase; ATPase; kinetics; nucleotide Introduction RNA helicases are ATPase enzymes that destabilize and unwind double-stranded RNA structures, refold RNA and disrupt RNA-protein complexes 1 - 4 . RNA helicases that belong to the superfamily II of molecular motor helicase enzymes known as DEAD- or the related † Address correspondence to Enrique M. De La Cruz, Yale University, Department of Molecular Biophysics & Biochemistry, P.O. Box 208114, New Haven, CT, 06520-8114. Tel. (203) 432-5424; Fax. (203) 432-1296; email: [email protected]. * These authors contributed equally to this work. Publisher's Disclaimer: This is a PDF file of an unedited manuscript that has been accepted for publication. As a service to our customers we are providing this early version of the manuscript. The manuscript will undergo copyediting, typesetting, and review of the resulting proof before it is published in its final citable form. Please note that during the production process errors may be discovered which could affect the content, and all legal disclaimers that apply to the journal pertain. NIH Public Access Author Manuscript J Mol Biol. Author manuscript; available in PMC 2009 March 14. Published in final edited form as: J Mol Biol. 2008 March 14; 377(1): 193–205. doi:10.1016/j.jmb.2007.12.046. NIH-PA Author Manuscript NIH-PA Author Manuscript NIH-PA Author Manuscript
Transcript of The ATPase cycle mechanism of the DEAD-box rRNA helicase, DbpA
The ATPase cycle mechanism of the DEAD-box rRNA helicase,DbpA
Arnon Henn1,*, Wenxiang Cao1,*, David Hackney2, and Enrique M. De La Cruz1,†
1Yale University, Department of Molecular Biophysics & Biochemistry, 260 Whitney Avenue, New Haven,CT 06520
2Carnegie Mellon University, Department of Biological Sciences, 4400 Fifth Avenue, Pittsburgh, PA 15213
SummaryDEAD-box proteins are ATPase enzymes that destabilize and unwind duplex RNA. Quantitativeknowledge of the ATPase cycle parameters is critical for developing models of helicase activity.However, limited information regarding the rate and equilibrium constants defining the ATPase cycleof RNA helicases is available, including the distribution and flux of populated biochemicalintermediates, the catalytic step(s) that limits the enzymatic reaction cycle, and how ATP utilizationand RNA interactions are linked. We present a quantitative kinetic and equilibrium characterizationof the rRNA-activated ATPase cycle mechanism of DbpA, a DEAD-box rRNA helicase implicatedin ribosome biogenesis. rRNA activates the ATPase activity of DbpA by promoting a conformationalchange after ATP binding that is associated with hydrolysis. Chemical cleavage of bound ATP isreversible and occurs via a gamma phosphate attack mechanism. ADP-Pi and RNA binding displaystrong thermodynamic coupling, which causes DbpA-ADP-Pi to bind rRNA with > 10-fold higheraffinity than with bound ATP, ADP or in the absence of nucleotide. The rRNA-activated steady-stateATPase cycle of DbpA is limited both by ATP hydrolysis and Pi release, which occur withcomparable rates. Consequently, the predominantly populated biochemical states during steady-statecycling are the ATP- and ADP-Pi-bound intermediates. Thermodynamic linkage analysis of theATPase cycle transitions favors models in which rRNA duplex destabilization is linked to strongrRNA and nucleotide binding. The presented analysis of the DbpA ATPase cycle reaction mechanismprovides a rigorous kinetic and thermodynamic foundation for developing testable hypothesesregarding the functions and molecular mechanisms of DEAD-box helicases.
KeywordsDEAD-box protein; RNA; helicase; ATPase; kinetics; nucleotide
IntroductionRNA helicases are ATPase enzymes that destabilize and unwind double-stranded RNAstructures, refold RNA and disrupt RNA-protein complexes1 - 4. RNA helicases that belongto the superfamily II of molecular motor helicase enzymes known as DEAD- or the related
†Address correspondence to Enrique M. De La Cruz, Yale University, Department of Molecular Biophysics & Biochemistry, P.O. Box208114, New Haven, CT, 06520-8114. Tel. (203) 432-5424; Fax. (203) 432-1296; email: [email protected].*These authors contributed equally to this work.Publisher's Disclaimer: This is a PDF file of an unedited manuscript that has been accepted for publication. As a service to our customerswe are providing this early version of the manuscript. The manuscript will undergo copyediting, typesetting, and review of the resultingproof before it is published in its final citable form. Please note that during the production process errors may be discovered which couldaffect the content, and all legal disclaimers that apply to the journal pertain.
NIH Public AccessAuthor ManuscriptJ Mol Biol. Author manuscript; available in PMC 2009 March 14.
Published in final edited form as:J Mol Biol. 2008 March 14; 377(1): 193–205. doi:10.1016/j.jmb.2007.12.046.
NIH
-PA Author Manuscript
NIH
-PA Author Manuscript
NIH
-PA Author Manuscript

DExH/D-box proteins5, which are present in every organism from viruses to humans and playfundamental roles in viral transcription and replication, protein translation, proper pre-mRNAsplicing and editing, ribosome biogenesis, RNA export to the cytoplasm, and RNAdegradation6. Recent work has provided insight to the mechanism of DEAD-box helicasedestabilization and unwinding7 - 9, but the RNA-activated ATPase cycle and its linkage toduplex destabilization and unwinding has for the most part remained uncharacterized.
Detailed mechanistic studies of DEAD-box RNA helicases have been hindered by arequirement for additional regulatory subunits, leaky ATPase activity in the absence of RNA,and low RNA substrate specificity10. DbpA is non-processive ATP-dependent 7 helicase thatdestabilizes and unwinds short rRNA duplexes 11. DbpA is unique among the E. coli DEAD-box family in that its ATPase activity is specifically activated by the peptidyl-transferase center(PTC) of the 23S ribosomal RNA12, thus it provides a unique model system in which toexamine enzymatic activation by RNA. DbpA is not activated by 5S rRNA, 16S rRNA, tRNA,native 50S or native 70S ribosomes, but is activated by denatured 70S ribosomes13, favoringa physiological role in ribosome biogenesis and/or assembly.
It is well established that many classes of nucleic acid helicases couple the free energy fromcatalytic cycles of ATP binding, hydrolysis and product release to mechanical work in the formof nucleic acid duplex unwinding14; 15 and translocation16. However, limited information isavailable regarding the ATPase cycle of RNA helicases, including the rate and equilibriumconstants defining the enzymatic reaction cycle, the distribution and flux of populatedbiochemical intermediates, what catalytic step(s) limits catalytic cycling, and how ATPutilization and RNA interactions are linked17; 18. In particular, it is unclear how RNA bindingincreases the DEAD-box protein ATPase activity, which can be achieved by accelerating ATPbinding, hydrolysis, and/or product release.
We present in this study a quantitative kinetic and equilibrium characterization of the rRNA-activated ATPase cycle mechanism of DbpA. The experimental approach and analysisemployed allows us to define in quantitative terms a) the ATPase cycle reaction pathway, b)the distribution of populated biochemical intermediates, c) the free energy changes associatedwith individual ATPase cycle transitions, d) the biochemical reaction(s) that limit ATPutilization, e) the nucleotide and RNA binding linkage (i.e. how binding of one affects theother), and f) how the catalytic ATPase activity of DbpA is activated by rRNA. Quantitativeknowledge of the rRNA-dependent ATPase cycle of DbpA will serve as the basis fordeveloping mechanistic models of how ATP utilization is coupled to RNA helicase activity.Given the high homology among all identified prokaryotic and eukaryotic DEAD-boxhelicases, the detailed analysis of the DbpA ATPase cycle reaction mechanism provides arigorous kinetic and thermodynamic foundation from which testable hypotheses regarding thefunctions and molecular mechanisms of DEAD-box helicases can be developed.
ResultsSteady-state ATPase activity of DbpA
The ATPase activity of DbpA is accelerated >500-fold from <0.01 s-1 to ∼5 s-1 by PTC-RNAunder our experimental conditions (Figure 1). The Michaelis constant (Km) for ATP in thepresence of saturating PTC-RNA is 65 μM and the apparent Michaelis constant for 153-merPTC-RNA in the presence of saturating ATP is 1.0 nM (Table 1), comparable to publishedvalues measured under slightly different conditions12.
DbpA exists as a non-associating monomer in the absence19 and in the presence of PTC-RNA,during both equilibrium conditions19 and steady state ATP cycling12. We present evidencebelow that two distinct DbpA-ADP states exist when bound to PTC-RNA. Therefore, the
Henn et al. Page 2
J Mol Biol. Author manuscript; available in PMC 2009 March 14.
NIH
-PA Author Manuscript
NIH
-PA Author Manuscript
NIH
-PA Author Manuscript

minimum reaction scheme that accounts for ATPase activity (ATP binding, hydrolysis andproduct release) free in solution and when bound to RNA, assuming that product release issequential and Pi dissociation precedes ADP release, is defined by ten biochemical states,fifteen equilibrium, and thirty rate constants (Scheme 1). We use this reaction scheme as aframework for interpreting the transient kinetic experiments described in the followingsections. We have omitted the non-specific collision complexes20, which almost certainlyexist, because they were not characterized in this study. We provide in the Appendix the explicitsolution of the differential equations describing the formation and loss of the biochemicalintermediates depicted in Scheme 1, and the equations used to analyze the kinetics of ATPbinding, hydrolysis and product release measured in this study.
Nucleotide bindingThe fluorescent mant-analogs were used to measure ATP and ADP binding to DbpA andDbpA-PTC complex. Previous measurements demonstrate that even though the mantfluorophore slightly alters the kinetics and affinity of unlabelled nucleotides ∼2-fold21, mant-nucleotides can be used to reliably monitor DbpA-nucleotide binding.
Time courses of fluorescence change after mixing DbpA with mantATP (Figure 2B) ormantADP21 follow single exponentials with observed rate constants that depend linearly onthe [mant-nucleotide] (Figure 2C and 3B), consistent with simple one-step bindingmechanisms21, yielding association rate constants from the slopes (k+T = 1.4 μM-1 s-1 andk+D = 3.3 μM-1 s-1), dissociation rate constants from the intercepts (k-T = 101 s-1; k-D = 170s-1) and overall equilibrium binding affinities from the ratio of rate constants (KT = 72 μM andKD = 51 μM; Table 1). The mantADP affinity (KD) is comparable to published values measuredwith mantADP21 or radiolabelled ADP22. The DbpA-mantADP dissociation rate constant(k-D) measured directly by competition with unlabeled ADP is 130 s-1 (data not shownand21), comparable to the value obtained from the intercept of Figure 3B. The mantADPdissociation rate constant was unaffected by 100 mM Pi (data not shown), suggesting that theaffinity of Pi for DbpA-ADP is >100 mM.
Time courses of fluorescence change after mixing DbpA-PTC with mantATP or mantADP arebiphasic and follow double exponentials (Figure 2A, 2B, 3A), indicating that binding ismonitoring at least two biochemical transitions. We favor a sequential, two-step bindingmechanism (Scheme 1) over a parallel reaction pathway with binding to a mixed populationbecause the relative amplitudes of the two phases measured in association (Figure 3A) anddissociation (Figure 3D; described below) reactions differ23. Accordingly, the fast observedrate constants (kfast) are dominated by nucleotide binding and the slow observed rate constants(kslow) arise from an isomerization(s) subsequent to nucleotide binding. We assume that thetwo high fluorescence states have similar intensities, so the observed fluorescence reflects thesum of the concentrations of these two species. The experimentally observed rate constants areindependent of the relative intensities of these states, so the outcomes of the analysis presentedbelow are unaffected if this assumption does not apply. The 2′- and 3′-mant nucleotide isomersexist as an equilibrium mixture (60% 3′ isomer) that interconvert slowly with a half life of∼10 minutes at pH 7.5, 25 °C24. The two isomers may bind DbpA with different kinetics,yielding the biphasic time courses, so measurements were also done with 2′-deoxy isomerslabeled at the 3′ hydroxyl. The fluorescence changes associated with 2′-deoxymantATPbinding are considerably smaller than with mixed 2′- and 3′- labeled isomers (data not shown),but the time courses remain biphasic, require a sum of two exponentials to describe the data,and are qualitatively similar, as reported for Rep DNA helicase24.
The fast observed rate constant (kfast) values depend linearly on the [mant-nucleotide] (Figure2C and 3B). The fast phase is much more rapid than the slow phase in the case of mantATPbinding (i.e. kfast ≫ kslow; Figure 2). Under these conditions, kfast = k+RT[mantATP] + k-RT
Henn et al. Page 3
J Mol Biol. Author manuscript; available in PMC 2009 March 14.
NIH
-PA Author Manuscript
NIH
-PA Author Manuscript
NIH
-PA Author Manuscript

(Eq. 33 of Appendix), permitting the mantATP association rate constant (k+RT = 1.2 μM-1
s-1) and the dissociation rate constant (k-RT = 61 s-1) to be determined from the slope andintercept of the [mantATP]-dependence of kfast, respectively (Figure 2C), and the mantATPbinding affinity (KRT = 51 μM) from the ratio of the rate constants (Table 1).
The slow phase observed with mantATP represents the approach to steady state followinginitial binding and has contributions from ATP hydrolysis (k+RH), or more likely aconformational change preceding rapid ATP hydrolysis (these are kinetically equivalent), ATPresynthesis (k-RH), and Pi release (k-RPi). ADP release does not contribute the slow phase ofATP binding (Appendix) because it is more rapid than the preceding steps (discussed below).The limited [mantATP] range examined precludes reliable determination of the [mantATP]-dependence of the observed slow phase rate constant (kslow). However, kslow is predicted todepend hyperbolically on the [mantATP] (Eq. 34 of Appendix, discussed below) with amaximum observed rate constant at saturating [mantATP] that is equal to the sum of the ATPhydrolysis, ATP resynthesis and Pi release rate constants (k+RH + k-RH + k-RPi ∼11 s-1, Fig.2D). Measurements presented below with unmodified ATP (Figure 4B) confirm this prediction.
The kfast ≫ kslow condition is not fulfilled with mantADP binding to DbpA-RNA (Figure 3B).Consequently, the square root approximation25 cannot be applied, so unconstrained globalfitting of the [mantADP]-dependence of kfast and kslow (Figure 3B; Table 1) to the followingquadratic rate constant equation(s)23:
was used to determine the mantADP binding (k+1RD = 4.1 μM-1 s-1), dissociation (k-1RD = 137s-1), and isomerization (k+2RD = 32 s-1, k-2RD = 77 s-1) rate constants (Table 1). Thecorresponding mantADP binding (K1RD) and isomerization (K2RD) equilibrium constantscalculated from the ratios of the rate constants are 33 μM and 2.4, respectively (Table 1).
The rate and equilibrium constants determined from the association time courses predict thatthe time course of irreversible mantADP release from an equilibrated DbpA-RNA-mantADPcomplex will be biphasic with a fast observed rate constant (koff-fast) of ∼190 s-1 and a slowobserved rate constant (koff-slow) of 55 s-1 according to the following equation(s)23:
(Eq.2)
Experimental time courses of irreversible mantADP release are biphasic with observed rateconstants of 170 s-1 and 40 s-1 (Figure 3D), consistent with two high fluorescence DbpA-RNA-mantADP states (HRD and HRD’) that exist in a reversible equilibrium (Scheme 1) definedby the rate constants determined from the association kinetics (Table 1). Inclusion of up to 100mM Pi does not affect dissociation mantADP from DbpA-RNA (data not shown), suggestingthat the affinity of Pi binding to DbpA-ADP-RNA is > 100 mM.
The overall affinity for ADP binding to DbpA-PTC-RNA (KRD, overall), accounting for bothDbpA-RNA-ADP states, calculated using the following expression 23:
(Eq.3)
is 23 μM. The overall affinity estimated from the [ADP]-dependence of the total transientkinetic time courses amplitudes (Figure 3A) yields a comparable value of 38 μM (data notshown).
Henn et al. Page 4
J Mol Biol. Author manuscript; available in PMC 2009 March 14.
NIH
-PA Author Manuscript
NIH
-PA Author Manuscript
NIH
-PA Author Manuscript
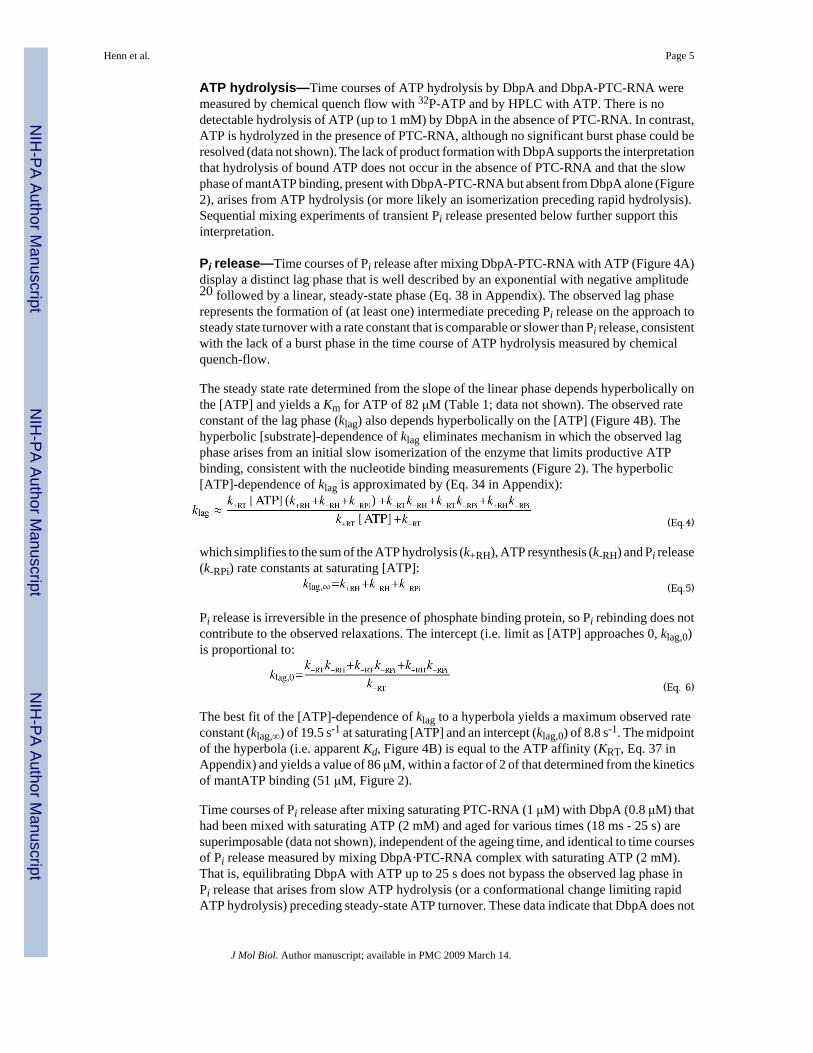
ATP hydrolysis—Time courses of ATP hydrolysis by DbpA and DbpA-PTC-RNA weremeasured by chemical quench flow with 32P-ATP and by HPLC with ATP. There is nodetectable hydrolysis of ATP (up to 1 mM) by DbpA in the absence of PTC-RNA. In contrast,ATP is hydrolyzed in the presence of PTC-RNA, although no significant burst phase could beresolved (data not shown). The lack of product formation with DbpA supports the interpretationthat hydrolysis of bound ATP does not occur in the absence of PTC-RNA and that the slowphase of mantATP binding, present with DbpA-PTC-RNA but absent from DbpA alone (Figure2), arises from ATP hydrolysis (or more likely an isomerization preceding rapid hydrolysis).Sequential mixing experiments of transient Pi release presented below further support thisinterpretation.
Pi release—Time courses of Pi release after mixing DbpA-PTC-RNA with ATP (Figure 4A)display a distinct lag phase that is well described by an exponential with negative amplitude20 followed by a linear, steady-state phase (Eq. 38 in Appendix). The observed lag phaserepresents the formation of (at least one) intermediate preceding Pi release on the approach tosteady state turnover with a rate constant that is comparable or slower than Pi release, consistentwith the lack of a burst phase in the time course of ATP hydrolysis measured by chemicalquench-flow.
The steady state rate determined from the slope of the linear phase depends hyperbolically onthe [ATP] and yields a Km for ATP of 82 μM (Table 1; data not shown). The observed rateconstant of the lag phase (klag) also depends hyperbolically on the [ATP] (Figure 4B). Thehyperbolic [substrate]-dependence of klag eliminates mechanism in which the observed lagphase arises from an initial slow isomerization of the enzyme that limits productive ATPbinding, consistent with the nucleotide binding measurements (Figure 2). The hyperbolic[ATP]-dependence of klag is approximated by (Eq. 34 in Appendix):
(Eq.4)
which simplifies to the sum of the ATP hydrolysis (k+RH), ATP resynthesis (k-RH) and Pi release(k-RPi) rate constants at saturating [ATP]:
(Eq.5)
Pi release is irreversible in the presence of phosphate binding protein, so Pi rebinding does notcontribute to the observed relaxations. The intercept (i.e. limit as [ATP] approaches 0, klag,0)is proportional to:
(Eq. 6)
The best fit of the [ATP]-dependence of klag to a hyperbola yields a maximum observed rateconstant (klag,∞) of 19.5 s-1 at saturating [ATP] and an intercept (klag,0) of 8.8 s-1. The midpointof the hyperbola (i.e. apparent Kd, Figure 4B) is equal to the ATP affinity (KRT, Eq. 37 inAppendix) and yields a value of 86 μM, within a factor of 2 of that determined from the kineticsof mantATP binding (51 μM, Figure 2).
Time courses of Pi release after mixing saturating PTC-RNA (1 μM) with DbpA (0.8 μM) thathad been mixed with saturating ATP (2 mM) and aged for various times (18 ms - 25 s) aresuperimposable (data not shown), independent of the ageing time, and identical to time coursesof Pi release measured by mixing DbpA·PTC-RNA complex with saturating ATP (2 mM).That is, equilibrating DbpA with ATP up to 25 s does not bypass the observed lag phase inPi release that arises from slow ATP hydrolysis (or a conformational change limiting rapidATP hydrolysis) preceding steady-state ATP turnover. These data indicate that DbpA does not
Henn et al. Page 5
J Mol Biol. Author manuscript; available in PMC 2009 March 14.
NIH
-PA Author Manuscript
NIH
-PA Author Manuscript
NIH
-PA Author Manuscript

hydrolyze bound ATP during the ageing time, either because it is very slow and/or theequilibrium constant for ATP hydrolysis favors ATP synthesis (KRH = k-RH/k+RH ≫ 1),consistent with the chemical quench flow measurements, and the conclusion that RNAactivates the DbpA ATPase cycle by promoting an isomerization that allows chemical cleavageof bound ATP.
Isotope Exchange—We used oxygen isotopic exchange26; 27 to determine the reversibilityof the ATP hydrolysis reaction (k-RH) in the presence of PTC-RNA. If hydrolysis occurswithout reversal (k-RH ≪ k-RPi) then one and only one water-derived oxygen will beincorporated into the released Pi. Reversible resynthesis of ATP from ADP and Pi before releaseof Pi, however, can result in the incorporation of additional oxygen atoms from water into Pi.The partition coefficient
(Eq. 7)
for the fraction of DbpA-RNA-ADP-Pi that partitions back to DbpA-RNA-ATP can becalculated from the extent of incorporation of these extra water oxygens into the Pi
28. For the∼50% enrichment of the water in 18O as used here, hydrolysis without reversal will incorporateone water-derived oxygen per Pi and will thus yield equal amounts of the species with 0 and1 18O per Pi and none of the species with 2, 3 or 4 oxygens per Pi (as indicated by the fit inFigure 5 at Pc = 0). The observation of a significant amount of the species with 2 18O per Piwith DbpA (Figure 5) indicates that reversal of hydrolysis does occur. A Pc value of 0.2 wasobtained as the best fit to a random mode28, which corresponds to a Pi release rate constant(k-RPi) that is ∼4 times faster than the ATP resynthesis rate constant (k-RH).
Knowledge of the Pc value, klag,∞ and klag,0 allow us to determine the values of the fundamentalrate constants defining ATP hydrolysis, ATP resynthesis and Pi release using Eqs. 6-8. ATPhydrolysis (k+RH) occurs at 11.9 s-1, ATP resynthesis (k-RH) occurs at 1.5 s-1 and Pi release(k-RPi) occurs at 6.1 s-1. The equilibrium constant for ATP hydrolysis determined from the ratioof the rate constants (KRH = k-RH/k+RH) is 0.13 (Table 1).
PTC-RNA binding—The affinity of nucleotide-free DbpA for 153mer PTC-RNA (KR inScheme, 1) determined by electrophoretic mobility shift assay under our conditions is 16 nM(Table 1, data not shown), comparable to published values measured under slightly differentbuffer conditions 22. The value of Km,RNA measured from [RNA]-dependent ATPase isdetermined by the Kd’s for RNA binding to DbpA intermediate states populated during ATPcycling (Appendix). Therefore, comparison of the Km,RNA value with the affinity of RNA inthe absence of nucleotide (KR) provides information regarding the RNA affinity of populatedcycling intermediates
If Km,RNA< KR, at least one nucleotide-bound intermediate that binds RNA more strongly thannucleotide-free DbpA must be populated during ATPase cycling. If Km,RNA> KR, at least onepopulated intermediate binds RNA more weakly than nucleotide-free DbpA. The PTC-RNAbinding affinity in the absence of nucleotide (16 nM) is larger than the Km,RNA value measuredduring steady-state cycling (1 nM), indicating that at least one nucleotide-bound intermediatestate(s) populated during steady-state cycling binds PTC-RNA with a higher affinity (< 16 nM)than nucleotide-free DbpA.
Knowledge of the affinities of nucleotide-free DbpA for PTC-RNA (KR) and nucleotide forDbpA (KT and KD) and DbpA-PTC-RNA (KRT and KRD) provides the information requiredto explain in thermodynamic terms how nucleotide bound to DbpA modulates the RNA bindingaffinity and vice-versa (i.e. how the two binding sites are linked/coupled). Detailed balanceallows the PTC-RNA affinity of DbpA with bound ATP to be calculated from KTR = KR
Henn et al. Page 6
J Mol Biol. Author manuscript; available in PMC 2009 March 14.
NIH
-PA Author Manuscript
NIH
-PA Author Manuscript
NIH
-PA Author Manuscript
KRT/KT (Scheme 1, Table 1). The affinities of DbpA with bound ADP (K1DR and K2DR) orADP-Pi (KPiR) for PTC-RNA can be determined in a similar manner (Table 1).
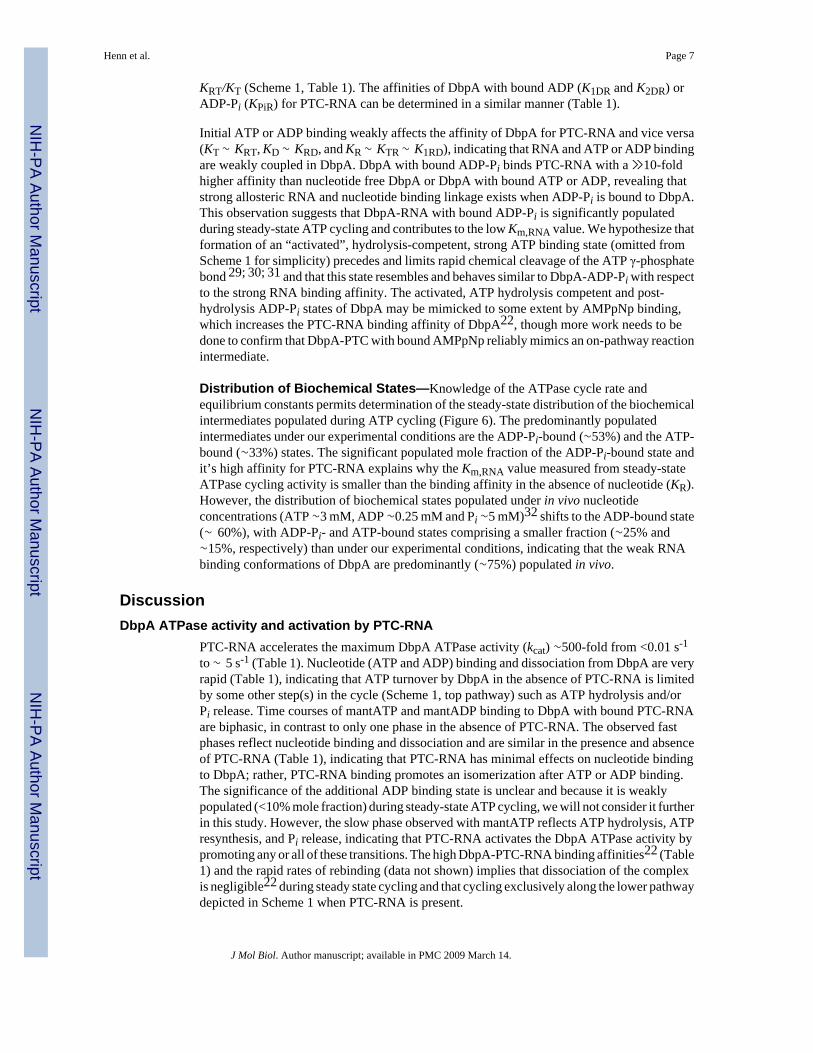
Initial ATP or ADP binding weakly affects the affinity of DbpA for PTC-RNA and vice versa(KT ∼ KRT, KD ∼ KRD, and KR ∼ KTR ∼ K1RD), indicating that RNA and ATP or ADP bindingare weakly coupled in DbpA. DbpA with bound ADP-Pi binds PTC-RNA with a ≫10-foldhigher affinity than nucleotide free DbpA or DbpA with bound ATP or ADP, revealing thatstrong allosteric RNA and nucleotide binding linkage exists when ADP-Pi is bound to DbpA.This observation suggests that DbpA-RNA with bound ADP-Pi is significantly populatedduring steady-state ATP cycling and contributes to the low Km,RNA value. We hypothesize thatformation of an “activated”, hydrolysis-competent, strong ATP binding state (omitted fromScheme 1 for simplicity) precedes and limits rapid chemical cleavage of the ATP γ-phosphatebond 29; 30; 31 and that this state resembles and behaves similar to DbpA-ADP-Pi with respectto the strong RNA binding affinity. The activated, ATP hydrolysis competent and post-hydrolysis ADP-Pi states of DbpA may be mimicked to some extent by AMPpNp binding,which increases the PTC-RNA binding affinity of DbpA22, though more work needs to bedone to confirm that DbpA-PTC with bound AMPpNp reliably mimics an on-pathway reactionintermediate.
Distribution of Biochemical States—Knowledge of the ATPase cycle rate andequilibrium constants permits determination of the steady-state distribution of the biochemicalintermediates populated during ATP cycling (Figure 6). The predominantly populatedintermediates under our experimental conditions are the ADP-Pi-bound (∼53%) and the ATP-bound (∼33%) states. The significant populated mole fraction of the ADP-Pi-bound state andit’s high affinity for PTC-RNA explains why the Km,RNA value measured from steady-stateATPase cycling activity is smaller than the binding affinity in the absence of nucleotide (KR).However, the distribution of biochemical states populated under in vivo nucleotideconcentrations (ATP ∼3 mM, ADP ∼0.25 mM and Pi ∼5 mM)32 shifts to the ADP-bound state(∼ 60%), with ADP-Pi- and ATP-bound states comprising a smaller fraction (∼25% and∼15%, respectively) than under our experimental conditions, indicating that the weak RNAbinding conformations of DbpA are predominantly (∼75%) populated in vivo.
DiscussionDbpA ATPase activity and activation by PTC-RNA
PTC-RNA accelerates the maximum DbpA ATPase activity (kcat) ∼500-fold from <0.01 s-1
to ∼ 5 s-1 (Table 1). Nucleotide (ATP and ADP) binding and dissociation from DbpA are veryrapid (Table 1), indicating that ATP turnover by DbpA in the absence of PTC-RNA is limitedby some other step(s) in the cycle (Scheme 1, top pathway) such as ATP hydrolysis and/orPi release. Time courses of mantATP and mantADP binding to DbpA with bound PTC-RNAare biphasic, in contrast to only one phase in the absence of PTC-RNA. The observed fastphases reflect nucleotide binding and dissociation and are similar in the presence and absenceof PTC-RNA (Table 1), indicating that PTC-RNA has minimal effects on nucleotide bindingto DbpA; rather, PTC-RNA binding promotes an isomerization after ATP or ADP binding.The significance of the additional ADP binding state is unclear and because it is weaklypopulated (<10% mole fraction) during steady-state ATP cycling, we will not consider it furtherin this study. However, the slow phase observed with mantATP reflects ATP hydrolysis, ATPresynthesis, and Pi release, indicating that PTC-RNA activates the DbpA ATPase activity bypromoting any or all of these transitions. The high DbpA-PTC-RNA binding affinities22 (Table1) and the rapid rates of rebinding (data not shown) implies that dissociation of the complexis negligible22 during steady state cycling and that cycling exclusively along the lower pathwaydepicted in Scheme 1 when PTC-RNA is present.
Henn et al. Page 7
J Mol Biol. Author manuscript; available in PMC 2009 March 14.
NIH
-PA Author Manuscript
NIH
-PA Author Manuscript
NIH
-PA Author Manuscript

PTC-RNA activates the steady-state ATPase activity of DbpA by shunting DbpA along adifferent ATP hydrolysis pathway (lower path in Scheme 1). In the absence of PTC-RNA,DbpA does not hydrolyze bound ATP to an appreciable extent, suggesting a slow, rate-limitingATP hydrolysis that is accelerated by PTC-RNA. Alternatively, ATP hydrolysis by DbpAcould be rapid, but the equilibrium largely favor the ATP state (i.e. ATP resynthesis is morerapid than hydrolysis and neither are rate limiting). Our data cannot distinguish between thesetwo possibilities. Nonetheless, the outcome is the same: DbpA without bound PTC-RNA bindsbut does not hydrolyze ATP. Because both DbpA and DbpA-PTC-RNA bind ATP, but nohydrolysis occurs without RNA, PTC-RNA binding must induce conformationalrearrangement of DbpA that allows ATP hydrolysis to occur. PTC-RNA may also modulatethe rate of Pi release from DbpA. However, PTC-RNA activation of DbpA ATPase activity isachieved by promoting ATP hydrolysis, which does not occur significantly in its absence.
The PTC-RNA activated steady-state ATPase cycle of DbpA is limited both by a step afterATP binding (interpreted as a step preceding rapid ATP hydrolysis) and Pi release, which occurwith comparable rates. ATP hydrolysis is readily reversible, but Pi release (∼6 s-1) occurs ∼4-fold more quickly than ATP resynthesis (∼1.5 s-1). Pi release can be considered to be essentiallyirreversible since rebinding is slow and overall binding weak (Table 1). Slow ATP hydrolysisand Pi release causes the ATP- and ADP-Pi-bound intermediates to be predominantly populatedduring steady-state ATP cycling under our conditions (2 mM ATP, <10 μM ADP). However,the distribution favors population of the ADP-bound states under physiological nucleotideconcentrations (∼3 mM ATP, ∼250 μM ADP).
The steady-state ATPase parameters (kcat, Km,ATP, and Km,RNA) are defined in terms ofindividual ATPase cycle rate constants according to the following expressions (Eqs. 25, 26and 55 of Appendix):
(Eq. 8)
The values of these parameters predicted from the experimentally determined rate andequilibrium constants are comparable to the experimentally determined values (kcat predicted∼4 s-1, observed ∼5 s-1; Km,ATP predicted ∼23 μM, observed ∼65 μM; and Km,RNA predicted∼5 nM, observed ∼1 nM; Table 1), indicating that the applied model and analysis are valid,and that the experimentally determined rate and equilibrium constants are consistent with theoverall steady-state ATPase cycling behavior of DbpA. When we account for the ADP (7 μM)present under our experimental conditions (Eq. 42 of Appendix), the predicted Km,ATP valueincreases slightly (∼27 μM; Table 1), while the kcat and Km,RNA are unaffected since they areindependent of [ADP]. Under physiological nucleotide conditions (3 mM ATP, 250 μM ADP;Figure 6), the apparent Km,ATP increases dramatically to 190 μM due to competition with ADP,accounting for the shift in the distribution of populated ATP- and ADP-bound states (Figure6).
Communication between RNA and nucleotide binding sitesPTC-RNA does not affect the affinity of DbpA for ATP or ADP, and as predicted fromthermodynamic linkage, neither ATP nor ADP binding significantly affects the affinity ofDbpA for PTC-RNA. That is, nucleotide (ATP and ADP) and PTC-RNA binding are weaklycoupled. This does not mean that there are no nucleotide- or RNA-dependent conformationalchanges in DbpA. However, if significant conformational rearrangement of DbpA is coupledto nucleotide or PTC-RNA binding alone, these do not affect binding of the other ligand. The
Henn et al. Page 8
J Mol Biol. Author manuscript; available in PMC 2009 March 14.
NIH
-PA Author Manuscript
NIH
-PA Author Manuscript
NIH
-PA Author Manuscript

structures of the DEAD-box protein, UAP56, with and without bound ADP33 are consistentwith small structural perturbations being coupled to nucleotide binding. There is no highresolution structure available of a DEAD-box protein with bound RNA and no bound adeninenucleotide. The weak coupling predicts that if the DbpA nucleotide binding site were perturbedby PTC-RNA binding, it would be in a way that does not affect initial ATP or ADP binding.
In contrast, strong thermodynamic coupling is displayed with ADP-Pi and RNA binding. DbpAwith bound ADP-Pi binds PTC-RNA with > 10-fold higher affinity than in the absence ofnucleotide, suggesting that DbpA undergoes significant conformational change when bothRNA and ADP-Pi are bound. The high-resolution crystal structure of the Vasa DEAD-boxprotein with bound RNA and AMPpNp shows a closure of the nucleotide-binding cleft34.Binding of AMPpNp may mimic an intermediate populated after initial ATP binding andpreceding Pi release, though the possibility that it represents an off-pathway intermediatecannot be eliminated. Therefore, it is likely that the conformational change that occurs afterinitial ATP binding to DbpA is a closure of the nucleotide-binding cleft separating the twoRecA domains that comprise the DbpA helicase core domain19; 35. Cleft closure wouldpromote non-covalent interactions between bound Mg2+ and ATP with the conserved helicasemotifs across the cleft of the DbpA core domain34, which would favor strong Mg2+ and ATPbinding and formation of the ATP hydrolysis competent, strong PTC-RNA bindingconformation (not shown in Scheme 1, discussed above). The hydrolysis-competent ATP statelikely binds PTC-RNA and nucleotide with high affinity as does the post-hydrolysis, ADP-Pi conformation (Scheme 1).
Our analysis confirms previous quantitative equilibrium binding measurements revealing theweak coupling between ADP and PTC-RNA binding22. Strong coupling between ATP andPTC- RNA binding to DbpA was concluded from the same study22. However, as clarified bythe authors, this conclusion was based on measurements done with AMPpNp, which bindsdifferently than ATP22. DbpA with bound AMPpNp may better represent a chemical statepopulated after initial ATP binding (an activated ATP state omitted from Scheme 1 forsimplicity, discussed below) and preceding product release.
ATPase cycle and free energy couplingUnwinding of duplex RNA by DbpA is coupled to ATP utilization2;19. The ATP-dependenceof efficient rRNA duplex unwinding by DbpA favors models in which destabilization andunwinding are coupled to one or more reaction steps along the DbpA ATPase cycle7; 11. Sincenucleotide binding has minimal effects on PTC-RNA binding affinity (i.e. ATP and ADPbinding processes are weakly coupled to PTC-RNA binding), it is very unlikely that largeconformational rearrangement or unwinding of RNA occurs during initial ATP and ADPbinding. On the other hand, the transiently populated DbpA-ADP-Pi state (and/or the strongATP binding, hydrolysis competent state discussed above) binds rRNA ≫15-fold morestrongly, indicating nucleotide-linked conformational rearrangement of the DbpA-PTC-RNAcomplex.
The free energy change associated with hydrolysis of ATP (ΔGo’ hydrolysis) in solution and atstandard state is ∼ -40 kJ mol-1 under our conditions36. In contrast, the total free energy change(ΔGo’ tot) associated with one catalytic turnover of ATP by DbpA-PTC-RNA, which reflectsthe sum of the free energy change for ATP hydrolysis (∼ -40 kJ mol-1) and the free energychange associated with work production37, is < -0.5 kJ mol-1 (ΔGo’tot = ΔGo’RT + ΔGo’RH -ΔGo’RPi -ΔGo’2RD - ΔGo 1RD
; Table 2), considerably less than the value of ΔGo’hydrolysis. Thedifference between ΔGo’hydrolysis and ΔGo’tot indicates that the hydrolysis free energy istransferred to and stored in the DbpA-PTC-RNA complex, suggesting that the final product isa high energy, DbpA-PTC-RNA complex in which the RNA is destabilized, unwound orunfolded and/or the DbpA is in a strained conformation. If the coupling efficiency is high and
Henn et al. Page 9
J Mol Biol. Author manuscript; available in PMC 2009 March 14.
NIH
-PA Author Manuscript
NIH
-PA Author Manuscript
NIH
-PA Author Manuscript

used to disrupt RNA secondary structure, a single consumed ATP molecule could destabilizea maximum of 4-5 duplex RNA base pairs38. The reported 10-mer rRNA duplex unwindingrate constant of DbpA is much slower39 (< 0.01 s-1) than ATP turnover. The large differencesuggests that futile (i.e. nonproductive) ATPase cycling occurs, presumably due to competitivereannealing of the partially unwound >4-5 base pair long segment.
We propose that the strong PTC-RNA binding transition is linked to rRNA duplexdestabilization. The slow hydrolysis rate (i.e. large activation energy) and large PTC-RNAbinding free energy change (Table 2) of this transition is consistent with significantconformational rearrangement of the DbpA-PTC-RNA complex. Consistent with the proposeddestabilization mechanism, the high-resolution structure of the DEAD-box RNA helicase,Vasa34, with bound ssRNA and AMPpNp undergoes a significant conformational change thatfavors closing of the nucleotide binding cleft and bending of ssRNA that precludes formationof Watson-Crick base pairing with a complementary strand. The observation that DbpA withbound AMPpNp strongly binds but does not unwind PTC-RNA duplexes7 seems at variancewith the proposed pathway. However, this observation can be accounted for if DbpA-AMPpNppopulated a strong RNA binding state that destabilized short rRNA duplexes but did notdissociate the destabilized strands.
Scheme 1 and the experimental rate and equilibrium constants (Table 1) are consistent withstrong PTC-RNA binding coinciding with an isomerization after ATP binding, interpreted asbeing a conformational change that precedes and limits ATP cleavage. Subsequent productrelease favors formation of the weak RNA binding conformation (Tables 1 and 2). Weak RNAbinding enables DbpA to transfer the unwound rRNA product to other factors (e.g. theribosomal proteins associated with the 50S subunit of the ribosome) and regenerate free DbpAcapable of initiating another round of catalysis.
Materials and MethodsReagents and Proteins
All chemicals and reagents were the highest purity commercially available. Millipore MlliQ®dispensed water that had been treated with DEPC for 8 hours and autoclaved was used in allprocedures. RNAse activity was undetectable in all reagents, buffers and protein preparations.ATP (99+% purity as assayed by HPLC, data not shown) was purchased from Roche MolecularBiochemicals (Indianapolis, IN) and ADP (Sigma A-5285, 99+% purity by HPLC, data notshown) was purchased from Sigma (St. Louis, MO). Nucleotide concentrations weredetermined by absorbance using ε 259 of 15,400 M-1 cm-1. The N-methylanthraniloyl (mant)derivatives of ADP, 2′-deoxyADP, ATP, and 2′-deoxyATP were synthesized23 andconcentrations determined using ε255 of 23,300 M-1 cm-1. A molar equivalent of MgCl2 wasadded to nucleotides immediately before use.
DbpA was overexpressed and purified as described 2; 21. The [DbpA] was determined byextinction coefficient method21; 40. MDCC (7-diethylamino-3-((((2- maleimidyl)ethyl)amino)carbonyl)coumarin)-labeled phosphate binding protein (PiBiP) was expressed, purifiedand labeled as described41.
RNA synthesisA DNA fragment of 153 bp containing a sequence from the E. coli 23S rRNA (2454-2606 nt)was cloned into an EcoRI and BamHI restriction site of (pTZ-18R). PTC-RNA was preparedby in-vitro transcription of BamHI digested pTZ-18R-PTC with T7 RNA polymerase.Transcripts were treated with DNase I, phenol extracted (pH 4.7), passed through a G-50 mini-spun column (Roche Molecular Biochemical) and precipitated in ethanol. [RNA] were
Henn et al. Page 10
J Mol Biol. Author manuscript; available in PMC 2009 March 14.
NIH
-PA Author Manuscript
NIH
-PA Author Manuscript
NIH
-PA Author Manuscript

calculated using ε 260 = 8600 M-1 cm-1 nucleotide-1. PTC-RNA was refolded12 in 50 mM K-HEPES (pH 7.5), 50 mM KCl, 5 mM MgCl2.
Steady state ATPase activityThe steady-state ATPase activity of DbpA (2-20 nM) was measured by absorbance (λ = 340nm) using the ATP regenerating, NADH coupled assay 12; 42at 25 (±0.1) °C in KMg75 buffer(75 mM KCl, 20 mM K-HEPES (pH 7.5), 5 mM MgCl2, 1 mM DTT) supplemented withsaturating (2 mM) ATP while varying the [PTC-RNA], or with saturating (120 nM) PTC-RNAand varying the [ATP]. The [RNA] or [ATP]-dependence of the steady state ATPase rate (Vin units of ATP sec-1 DbpA-1) was fitted to the quadratic form of the Briggs-Haldane equation:
(Eq. 9)
where ko is the ATPase rate of DbpA alone, kcat is the turnover rate at saturating [S], Km is theapparent Michaelis constant for substrate activation, [H]tot is the total [DbpA], and and[S]tot is the total [PTC-RNA] or [ATP]. This equation assumes a 1:1 binding stoichiometry,which has been confirmed for PTC-RNA-activated ATPase activity of DbpA12. The [ADP]under our conditions of 2 mM ATP is ∼7 μM 42.
Pre-steady state kinetic analysisAll transient kinetic fluorescence measurements were made in KMg75 buffer using an AppliedPhotophysics SX.18MV-R stopped-flow apparatus thermostatted at 25 ± 0.1 °C. Theconcentrations stated are final concentrations after mixing. Time courses were fitted to a sumof exponentials by nonlinear least squares fitting using Pro-K software provided with theinstrument. Uncertainties are reported as standard errors in the fits unless stated otherwise.
Mant-nucleotide binding kinetics were measured by energy transfer from DbpA tryptophans(λex = 280 nm) to bound mant-nucleotide (fluorescence monitored at 90° through a 400-nmlong-pass colored glass filter) under pseudo-first order conditions with [nucleotide] ≫ [DbpA]or [DbpA-RNA]21. Transient Pi release was measured using the fluorescently labeledmutant43 of PiBiP. Background Pi was removed from all solutions, syringes and the instrumentwith 7-methylguanosine (0.5-1 mM) and purine nucleoside phosphorylase (0.1 units mL-1).There was ∼5-fold enhancement in the fluorescence of MDCC-PiBiP with Pi binding (λex =436 nm, 460 nm long pass emission filter). The rate and equilibrium constants of Pi bindingto MDCC-PiBiP under experimental conditions comparable to those used in this study are k+= 117 μM-1 s-1, k- = 24 s-1, and Kd = 0.20 μM41.
Time courses of [α-32P]ATP hydrolysis were made at 25 °C in KMg75 buffer with a KINTEK(Austin, Texas) RQF-3 quench flow apparatus31. Experiments were done by mixing 23 μMDbpA or with 23 μM DbpA-PTC RNA 51mer with 20 μM ATP, ageing for various times thenquenching with 5 M formic acid. Samples were spotted (2 μL) on a Cellulose F TLC plates(Analtech, Newark, DE) and resolved in 0.6 M KH2PO4 pH 3.4 for 45 min. Plates were exposedto phosphor screen, read using Storm PhosphorImager®, Molecular Dynamic (GE Healthcare),and quantitated using ImageQuant software, Molecular Dynamic (GE Healthcare). Formationof ADP from the hydrolysis of ATP (1 mM) by DbpA was also measured by HPLC44.
Measurement of Oxygen Isotopic Exchange during ATP HydrolysisHydrolysis of ATP was performed in KMg75 buffer containing 49% [18O]-water supplementedwith 2 mM ATP, 4 mM phosphoenolpyruvate, and 100 units mL-1 pyruvate kinase to regenerate
Henn et al. Page 11
J Mol Biol. Author manuscript; available in PMC 2009 March 14.
NIH
-PA Author Manuscript
NIH
-PA Author Manuscript
NIH
-PA Author Manuscript

ATP. The reactions were quenched with acid and the Pi was isolated and analyzed for 18Ocontent27.
Kinetic modelingSimulations of reaction time courses and equilibrium distribution of biochemical states wereperformed with Tenua (provided by Dr. D. Wachsstock, available free athttp://www.geocities.com/tenua4java/), which is based on the kinetic simulation programKINSIM developed by Carl Frieden and colleagues45.
Supplementary MaterialRefer to Web version on PubMed Central for supplementary material.
AcknowledgementWe thank Dr. Eckhard Jankowsky (Case Western Reserve) for comments on the manuscript. This work is supportedby grants from the National Science Foundation (MCB-0546353), National Institutes of Health (GM071688), andAmerican Heart Association (0655849T) to E.M.D.L.C. W.C. is supported by American Heart Associationpostdoctoral fellowship award 0625997T.
References1. Cordin O, Banroques J, Tanner NK, Linder P. The DEAD-box protein family of RNA helicases. Gene
2006;367:17–37. [PubMed: 16337753]2. Henn A, Medalia O, Shi SP, Steinberg M, Franceschi F, Sagi I. Visualization of unwinding activity of
duplex RNA by DbpA, a DEAD box helicase, at single-molecule resolution by atomic forcemicroscopy. Proc Natl Acad Sci U S A 2001;98:5007–5012. [PubMed: 11296244]
3. Mohr S, Matsuura M, Perlman PS, Lambowitz AM. A DEAD-box protein alone promotes group IIintron splicing and reverse splicing by acting as an RNA chaperone. Proc Natl Acad Sci U S A2006;103:3569–74. [PubMed: 16505350]
4. Fairman ME, Maroney PA, Wang W, Bowers HA, Gollnick P, Nilsen TW, Jankowsky E. Proteindisplacement by DExH/D “RNA helicases” without duplex unwinding. Science 2004;304:730–4.[PubMed: 15118161]
5. Linder P, Lasko PF, Ashburner M, Leroy P, Nielsen PJ, Nishi K, Schnier J, Slonimski PP. Birth of theD-E-A-D box. Nature 1989;337:121–2. [PubMed: 2563148]
6. Rocak S, Linder P. DEAD-box proteins: the driving forces behind RNA metabolism. Nat Rev MolCell Biol 2004;5:232–41. [PubMed: 14991003]
7. Diges CM, Uhlenbeck OC. Escherichia coli DbpA is an RNA helicase that requires hairpin 92 of 23SrRNA. Embo J 2001;20:5503–12. [PubMed: 11574482]
8. Yang Q, Jankowsky E. The DEAD-box protein Ded1 unwinds RNA duplexes by a mode distinct fromtranslocating helicases. Nat Struct Mol Biol 2006;13:981–6. [PubMed: 17072313]
9. Tijerina P, Bhaskaran H, Russell R. Nonspecific binding to structured RNA and preferential unwindingof an exposed helix by the CYT-19 protein, a DEAD-box RNA chaperone. Proc Natl Acad Sci U S A2006;103:16698–703. [PubMed: 17075070]
10. Linder P. Dead-box proteins: a family affair-active and passive players in RNP-remodeling. NucleicAcids Res 2006;34:4168–80. [PubMed: 16936318]
11. Diges CM, Uhlenbeck OC. Escherichia coli DbpA is a 3′ -> 5′ RNA helicase. Biochemistry2005;44:7903–11. [PubMed: 15910005]
12. Tsu CA, Uhlenbeck OC. Kinetic analysis of the RNA-dependent adenosinetriphosphatase activity ofDbpA, an Escherichia coli DEAD protein specific for 23S ribosomal RNA. Biochemistry1998;37:16989–96. [PubMed: 9836593]
13. Fuller-Pace FV, Nicol SM, Reid AD, Lane DP. DbpA: a DEAD box protein specifically activated by23S rRNA. Embo J 1993;12:3619–26. [PubMed: 8253085]
Henn et al. Page 12
J Mol Biol. Author manuscript; available in PMC 2009 March 14.
NIH
-PA Author Manuscript
NIH
-PA Author Manuscript
NIH
-PA Author Manuscript

14. von Hippel PH, Delagoutte E. A general model for nucleic acid helicases and their “coupling” withinmacromolecular machines. Cell 2001;104:177–90. [PubMed: 11207360]
15. Lohman TM, Bjornson KP. Mechanisms of helicase-catalyzed DNA unwinding. Annu Rev Biochem1996;65:169–214. [PubMed: 8811178]
16. Tomko EJ, Fischer CJ, Niedziela-Majka A, Lohman TM. A nonuniform stepping mechanism for E.coli UvrD monomer translocation along single-stranded DNA. Mol Cell 2007;26:335–47. [PubMed:17499041]
17. Lorsch JR, Herschlag D. The DEAD box protein eIF4A. 1 A minimal kinetic and thermodynamicframework reveals coupled binding of RNA and nucleotide. Biochemistry 1998;37:2180–93.[PubMed: 9485364]
18. von Hippel PH, Delagoutte E. Macromolecular complexes that unwind nucleic acids. Bioessays2003;25:1168–77. [PubMed: 14635252]
19. Talavera MA, Matthews EE, Eliason WK, Sagi I, Wang J, Henn A, De La Cruz EM. Hydrodynamiccharacterization of the DEAD-box RNA helicase DbpA. J Mol Biol 2006;355:697–707. [PubMed:16325852]
20. Robblee JP, Cao W, Henn A, Hannemann DE, De La Cruz EM. Thermodynamics of nucleotidebinding to actomyosin V and VI: a positive heat capacity change accompanies strong ADP binding.Biochemistry 2005;44:10238–49. [PubMed: 16042401]
21. Talavera MA, De La Cruz EM. Equilibrium and kinetic analysis of nucleotide binding to the DEAD-box RNA helicase DbpA. Biochemistry 2005;44:959–70. [PubMed: 15654752]
22. Polach KJ, Uhlenbeck OC. Cooperative binding of ATP and RNA substrates to the DEAD/H proteinDbpA. Biochemistry 2002;41:3693–702. [PubMed: 11888286]
23. Hannemann DE, Cao W, Olivares AO, Robblee JP, De La Cruz EM. Magnesium, ADP, and actinbinding linkage of myosin V: evidence for multiple myosin V-ADP and actomyosin V-ADP states.Biochemistry 2005;44:8826–40. [PubMed: 15952789]
24. Moore KJ, Lohman TM. Kinetic mechanism of adenine nucleotide binding to and hydrolysis by theEscherichia coli Rep monomer. 1 Use of fluorescent nucleotide analogues. Biochemistry1994;33:14550–64. [PubMed: 7981217]
25. Johnson KA. Rapid kinetic analysis of mechanochemical adenosinetriphosphatases. MethodsEnzymol 1986;134:677–705. [PubMed: 2950300]
26. Hackney DD, Rosen G, Boyer PD. Subunit interaction during catalysis: alternating site cooperativityin photophosphorylation shown by substrate modulation of [18O]ATP species formation. Proc NatlAcad Sci U S A 1979;76:3646–50. [PubMed: 291029]
27. Olivares AO, Chang W, Mooseker MS, Hackney DD, De La Cruz EM. The tail domain of myosinVa modulates actin binding to one head. J Biol Chem 2006;281:31326–36. [PubMed: 16921171]
28. Hackney DD, Stempel KE, Boyer PD. Oxygen-18 probes of enzymic reactions of phosphatecompounds. Methods Enzymol 1980;64:60–83. [PubMed: 7374458]
29. Wong I, Lohman TM. A two-site mechanism for ATP hydrolysis by the asymmetric Rep dimer P2Sas revealed by site-specific inhibition with ADP-A1F4. Biochemistry 1997;36:3115–25. [PubMed:9115987]
30. Yengo CM, De la Cruz EM, Safer D, Ostap EM, Sweeney HL. Kinetic characterization of the weakbinding states of myosin V. Biochemistry 2002;41:8508–17. [PubMed: 12081502]
31. De La Cruz EM, Wells AL, Rosenfeld SS, Ostap EM, Sweeney HL. The kinetic mechanism of myosinV. Proc Natl Acad Sci U S A 1999;96:13726–31. [PubMed: 10570140]
32. John, L.; Ingraham, FCN. Escherichia Coli and Salmonella Typhimurium: Cellular and MolecularBiology. ASM Press; Washington, D.C.: 1987.
33. Shi H, Cordin O, Minder CM, Linder P, Xu RM. Crystal structure of the human ATP-dependentsplicing and export factor UAP56. Proc Natl Acad Sci U S A 2004;101:17628–33. [PubMed:15585580]
34. Sengoku T, Nureki O, Nakamura A, Kobayashi S, Yokoyama S. Structural basis for RNA unwindingby the DEAD-box protein Drosophila Vasa. Cell 2006;125:287–300. [PubMed: 16630817]
35. Henn A, Shi SP, Zarivach R, Ben-Zeev E, Sagi I. The RNA Helicase DbpA Exhibits a MarkedlyDifferent Conformation in the ADP-bound State When Compared with the ATP- or RNA-BoundStates. J Biol Chem 2002;277:46559–46565. [PubMed: 12324462]
Henn et al. Page 13
J Mol Biol. Author manuscript; available in PMC 2009 March 14.
NIH
-PA Author Manuscript
NIH
-PA Author Manuscript
NIH
-PA Author Manuscript

36. Phillips RC, George P, Rutman RJ. Thermodynamic data for the hydrolysis of adenosine triphosphateas a function of pH, Mg2+ ion concentration, and ionic strength. J Biol Chem 1969;244:3330–42.[PubMed: 5792663]
37. Jencks WP. The utilization of binding energy in coupled vectorial processes. Adv Enzymol RelatAreas Mol Biol 1980;51:75–106. [PubMed: 6255774]
38. Xia T, SantaLucia J Jr. Burkard ME, Kierzek R, Schroeder SJ, Jiao X, Cox C, Turner DH.Thermodynamic parameters for an expanded nearest-neighbor model for formation of RNA duplexeswith Watson-Crick base pairs. Biochemistry 1998;37:14719–35. [PubMed: 9778347]
39. Tsu CA, Kossen K, Uhlenbeck OC. The Escherichia coli DEAD protein DbpA recognizes a smallRNA hairpin in 23S rRNA. RNA 2001;7:702–9. [PubMed: 11350034]
40. Gill SC, von Hippel PH. Calculation of protein extinction coefficients from amino acid sequence data.Anal Biochem 1989;182:319–26. [PubMed: 2610349]
41. Henn A, De La Cruz EM. Vertebrate myosin VIIb is a high duty ratio motor adapted for generatingand maintaining tension. J Biol Chem 2005;280:39665–76. [PubMed: 16186105]
42. De La Cruz EM, Sweeney HL, Ostap EM. ADP inhibition of myosin V ATPase activity. Biophys J2000;79:1524–9. [PubMed: 10969013]
43. Brune M, Hunter JL, Corrie JE, Webb MR. Direct, real-time measurement of rapid inorganicphosphate release using a novel fluorescent probe and its application to actomyosin subfragment 1ATPase. Biochemistry 1994;33:8262–71. [PubMed: 8031761]
44. Samizo K, Ishikawa R, Nakamura A, Kohama K. A highly sensitive method for measurement ofmyosin ATPase activity by reversed-phase high-performance liquid chromatography. Anal Biochem2001;293:212–5. [PubMed: 11399034]
45. Barshop BA, Wrenn RF, Frieden C. Analysis of numerical methods for computer simulation of kineticprocesses: development of KINSIM--a flexible, portable system. Anal Biochem 1983;130:134–45.[PubMed: 6688159]
46. Gutfreund, H. Kinetics for the Life Sciences: Receptors,transmitters and catalysts. CambridgeUniversity Press; Cambridge: 1995.
Henn et al. Page 14
J Mol Biol. Author manuscript; available in PMC 2009 March 14.
NIH
-PA Author Manuscript
NIH
-PA Author Manuscript
NIH
-PA Author Manuscript

Figure 1. Steady state ATPase activity of DbpAA. PTC-RNA concentration-dependence of DbpA steady state turnover velocity at saturating(2 mM) ATP. B. ATP concentration-dependence of DbpA steady-state turnover velocity atsaturating (120 nM) PTC-RNA. The solid lines through the data points are the best fits to Eq.9. Uncertainty bars represent the standard errors from the fits. The steady-state ATPase rate ispresented as the number of ATP molecules hydrolyzed per DbpA per second.
Henn et al. Page 15
J Mol Biol. Author manuscript; available in PMC 2009 March 14.
NIH
-PA Author Manuscript
NIH
-PA Author Manuscript
NIH
-PA Author Manuscript

Figure 2. Kinetics of mantATP binding to DbpA and DbpA·PTC-RNAA. Time courses of mantATP binding assayed by resonance energy transfer from DbpAtryptophans to bound mantATP. The smooth lines through the data represent the best fits todouble exponentials. Final concentrations: 1 μM DbpA-PTC-RNA and (lower to upper) 30μM, 40 μM, 60 μM and 100 μM mantATP. B. Time course of 50 μM mantATP binding to 1μM DbpA (green) or 1 μM DbpA·PTC-RNA (blue). The solid lines are the best fits to single(DbpA) or double (DbpA-PTC) exponentials. C. [mantATP]-dependence of the fast observedrate constant of binding to DbpA ( ) or DbpA·PTC ( ). Solid lines are the fits to Eq. 33 ofAppendix.. D. [mantATP]-dependence of the slow observed rate constant for binding toDbpA·PTC-RNA ( ). The solid line represents the best fit to Eq. 34 of Supplementary Materialwith the apparent Kd constrained to 51 μM as predicted from the ratio of the rate constantsdetermined from data in Panel C. Uncertainty bars represent standard errors in the fits.
Henn et al. Page 16
J Mol Biol. Author manuscript; available in PMC 2009 March 14.
NIH
-PA Author Manuscript
NIH
-PA Author Manuscript
NIH
-PA Author Manuscript

Figure 3. Kinetics of mantADP binding to DbpA-PTC-RNAA. Time courses of mantADP binding assayed by resonance energy transfer from DbpAtryptophans to bound mantADP. The smooth lines through the data represent the best fits todouble exponentials. Final concentrations: 1 μM DbpA·PTC-RNA and (lower to upper) 10μM, 20 μM, 30 μM, 40 μM and 60 μM mantADP. B. [mantATP]-dependence of the observedrate constant binding to DbpA and DbpA·PTC (fast phase ( ) and slow phase ( ). Both solidlines are the fits to Eq. 2. C. The [mantADP]-dependence of the slow observed rate constantof binding mantADP to DbpA-PTC-RNA. Uncertainty bars represent standard errors in thefits. The solid line is the best fit to Eq. 2. D. Time course of mantADP dissociation from DbpA-PTC-RNA after mixing an equilibrated sample of 1 μM DbpA-PTC-RNA and 125 μMmantADP with 2 mM MgADP. The smooth lines are the best fits of the data to doubleexponentials with a fast observed rate constant of 169.8 (± 4.5) s-1 comprising 82% of theamplitude and a slow observed rate constant of 39.7 (± 2.7) s-1.
Henn et al. Page 17
J Mol Biol. Author manuscript; available in PMC 2009 March 14.
NIH
-PA Author Manuscript
NIH
-PA Author Manuscript
NIH
-PA Author Manuscript

Figure 4. Transient kinetics of Pi release from DbpA-PTC-RNAA. Time courses of transient Pi release after mixing 1 μM DbpA-PTC-RNA with excess ATPin the presence of 5 μM (final) MDCC-PiBiP. Solid lines are the best fits to Eq. 38 in Appendix.B. [ATP]-dependence of the observed rate constant that describe the lag phase component ofthe time courses. The solid line is the fit using Eq. 6.
Henn et al. Page 18
J Mol Biol. Author manuscript; available in PMC 2009 March 14.
NIH
-PA Author Manuscript
NIH
-PA Author Manuscript
NIH
-PA Author Manuscript

Figure 5. Distribution of 18O-labeled Pi species after hydrolysis of ATP by DbpA-PTC-RNA in49% 18O-waterInset-Distribution of 18O-2 and 18O-3 species. Note that only a trace of 18O-3 species due tonatural abundance will be detected if there was no exchange.
Henn et al. Page 19
J Mol Biol. Author manuscript; available in PMC 2009 March 14.
NIH
-PA Author Manuscript
NIH
-PA Author Manuscript
NIH
-PA Author Manuscript
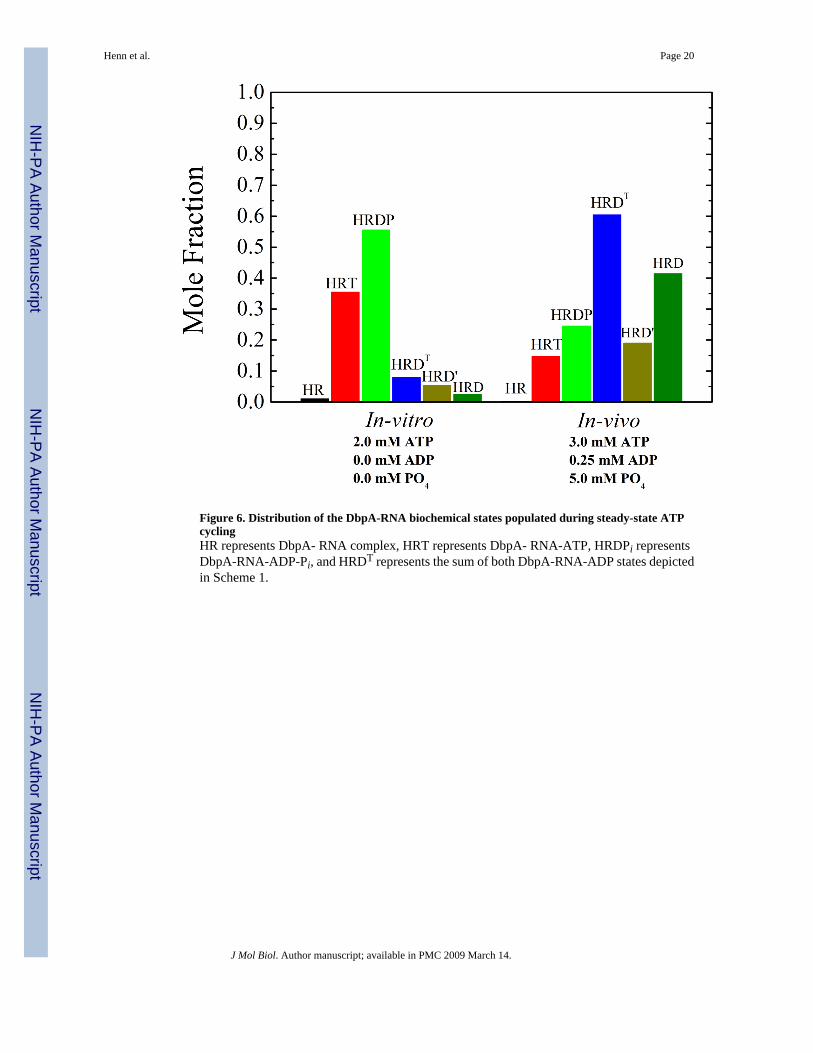
Figure 6. Distribution of the DbpA-RNA biochemical states populated during steady-state ATPcyclingHR represents DbpA- RNA complex, HRT represents DbpA- RNA-ATP, HRDPi representsDbpA-RNA-ADP-Pi, and HRDT represents the sum of both DbpA-RNA-ADP states depictedin Scheme 1.
Henn et al. Page 20
J Mol Biol. Author manuscript; available in PMC 2009 March 14.
NIH
-PA Author Manuscript
NIH
-PA Author Manuscript
NIH
-PA Author Manuscript

Scheme 1. The rRNA-activated DbpA ATPase cycleThe predominant cycling pathway at saturating rRNA is highlighted in green. Theintermediates populated in the absence of RNA are colored red.
Henn et al. Page 21
J Mol Biol. Author manuscript; available in PMC 2009 March 14.
NIH
-PA Author Manuscript
NIH
-PA Author Manuscript
NIH
-PA Author Manuscript

NIH
-PA Author Manuscript
NIH
-PA Author Manuscript
NIH
-PA Author Manuscript
Henn et al. Page 22
Table 1Rate and equilibriuma constants of the DbpA ATPase cycle. b
Steady-state parameterskcat (-PTC) < 0.01 s-1 (NADH assay, Figure 1A)kcat (+PTC) 5.3 (± 0.2) s-1 (NADH assay, Figure 1A)
5.2 (± 0.3) s-1 (NADH assay, Figure 1B)kcat (+PTC), predicted 4 s-1 (Equation 8)Km, ATP (+PTC) 65 (± 14) μM (NADH assay, Figure 1B)
82 (± 33) (PiBiP, Figure 4)Km, ATP (+PTC) predicted 23 μM (Equation 8)K m, PTC 1.0 (± 0.3) nM (NADH assay, Figure 1A)Km, PTC, predicted 5.2 nM (Equation 8)ATP bindingk +T 1.4 (± 0.2) μM-1 s-1 (mantATP; Figure 2C)k -T 101 (± 7) s-1 (mantATP; Figure 2C)K T 72 (± 11) μM (mantATP, ratio of rate constants)k +RT 1.2 (± 0.4) μM-1 s-1 (mantATP; Figure 2C)k -RT 61 (± 19) s-1 (mantATP; Figure 2C)K RT 51 (± 23) μM (mantATP ratio of rate constants)
86 (± 56) μM (ATP, PiBiP, K0.5 of lag, Figure 4B)Hydrolysis & Pi releaseK H ≫ 1 (PiBiP sequential mixing, quench flow)k+RH + k-RH + k-RPi 19.5 (± 4.1) s-1 (PiBiP; Figure 4B)
10.8 (± 3.6) s-1 (mantATP slow rate maximum; Figure 2D)Pc = k-RH/(k-RH + k-RPi) 0.2 (18O Exchange)k +RH 11.9 s-1 (18O Exchange & Pi release)k -RH 1.5 s-1 (18O Exchange & Pi release)K RH 0.13 (18O Exchange & Pi release)k -RPi 6.1 s-1 (PiBiP &18O Exchange; Figure 4B)k +RPi <0.06 mM-1 s-1 (calculated from KRPi and k-RPi)K RPi > 100 mM (effect of Pi on mantADP release)K Pi > 100 mM (effect of Pi on mantADP release)ADP bindingk +1D 3.3 (± 0.3) μM-1 s-1 (mantADP; Figure 4B)k -1D 170 (± 10) s-1 (mantADP; Figure 4B)
130 (± 2) s-1 (mantADP dissociation time course; Figure 4B)K 1D 51 (± 6) μM (mantADP ratio of rate constants Figure 4B)K 2D ≫1 (no slow phase in mantADP binding)k +1RD 4.1 (± 0.2) μM-1 s-1 (mantADP; Figure 4B)k -1RD 137 (± 20) s-1 (mantADP; Figure4B)K 1RD 33 (± 5) μM (mantADP ratio of rate constants; Figure 4B)k +2RD 32 (± 18) s-1 (mantADP; Figure 4C)k -2RD 77 (± 10) s-1 (mantADP; Figure 4C)K 2RD 2.4 (± 1.3) (mantADP; Figure 4C)K RD, overall 23 (± 4) μM (mantADP; Equation 3)RNA bindingcK R, overall 16 (± 2) nM (EMSA, data not shown)K TR, overall
d 11 nM (calculated from detailed balance)K PiR, overall
e ≪ 1.5 nM (estimated from detailed balance)K 2DR, overall
f ≪25 nM (estimated from detailed balance)K 1DR, overall
g 10 nM (calculated from detailed balance)
aKi defined as k-i/k+i
bConditions: 75 mM KCl, 20 mM K-HEPES (pH 7.5), 5 mM MgCl2, 1 mM DTT, 25 °C.
cKi represent dissociation equilibrium constants for overall PTC-RNA binding
dCalculated from KTR = KRT KR/KT
eCalculated from KPiR = KTR KRH/KH
fCalculated from K2DR = K1DR K2RD/K2D
J Mol Biol. Author manuscript; available in PMC 2009 March 14.

NIH
-PA Author Manuscript
NIH
-PA Author Manuscript
NIH
-PA Author Manuscript
Henn et al. Page 23
gCalculated from K1DR = K1RD KR/K1D
J Mol Biol. Author manuscript; available in PMC 2009 March 14.

NIH
-PA Author Manuscript
NIH
-PA Author Manuscript
NIH
-PA Author Manuscript
Henn et al. Page 24
Table 2Equilibrium constants and standard Gibbs free energy changes associated with DbpA, PTC-RNA (153 mer) andnucleotide association at 25 °C
Kd ΔGo’assoc (kJ mol-1)
K T 72 μM -23.6K RT 51 μM -24.5K H ≫ 1 ≫ 0K RH 0.13 -5.1K Pi > 100 mM < 5.7K RPi > 100 mM < 5.7K 2D ≫ 1 ≫ 0K 2RD 2.4 2.2K 1D 51 μM -24.5K 1RD 33 μM -25.6K R 16 nM -44.5K TR 11 nM -45.3K PiR ≪ 1.5 nM ≪ -50.4K 1DR 10 nM -45.6K 2DR ≪ 25 nM ≪ -43.4
K1DR = K1RD KR/K1D
KTR = KRT KR/KT
KPiR = KTR KRH/KH
K2DR = K1DR K2RD/K2D
J Mol Biol. Author manuscript; available in PMC 2009 March 14.