Large-Scale Analysis of Plasmid Relationships through Gene-Sharing Networks
34
and Evolution. All rights reserved. For permissions, please e-mail: [email protected] The Author 2011. Published by Oxford University Press on behalf of the Society for Molecular Biology Large scale analysis of plasmids relationships through gene sharing networks 1 Research article 2 Manu Tamminen 1 , Marko Virta 1 , Renato Fani 2 , Marco Fondi 2* 3 4 1 Department of Food and Environmental Sciences, P.O.Box 56, 00014 University of Helsinki, 5 Finland 6 7 2 Lab. of Microbial and Molecular Evolution, Dept. of Evolutionary Biology, Via Romana 17- 8 19, University of Florence, Italy 9 10 * Correspoding author: 11 Marco Fondi 12 Lab. of Microbial and Molecular Evolution, Dept. of Evolutionary Biology 13 Via Romana 17-19, University of Florence 14 Italy 15 E-mail [email protected] 16 Tel. +39 0552288248 17 Fax. +39 055 2288250 18 19 Running head: Analysis of plasmids through gene sharing networks 20 Keywords: horizontal gene transfer, antibiotic resistance, plasmid, network 21 22 23 MBE Advance Access published November 29, 2011 at Biblioteca di Scienze, Universit? degli studi di Firenze on January 11, 2012 http://mbe.oxfordjournals.org/ Downloaded from
-
Upload
independent -
Category
Documents
-
view
2 -
download
0
Transcript of Large-Scale Analysis of Plasmid Relationships through Gene-Sharing Networks

and Evolution. All rights reserved. For permissions, please e-mail: [email protected] The Author 2011. Published by Oxford University Press on behalf of the Society for Molecular Biology
Large scale analysis of plasmids relationships through gene sharing networks 1
Research article 2
Manu Tamminen1, Marko Virta1, Renato Fani2, Marco Fondi2* 3 4
1Department of Food and Environmental Sciences, P.O.Box 56, 00014 University of Helsinki, 5
Finland 6
7 2Lab. of Microbial and Molecular Evolution, Dept. of Evolutionary Biology, Via Romana 17-8
19, University of Florence, Italy 9
10
* Correspoding author: 11
Marco Fondi 12
Lab. of Microbial and Molecular Evolution, Dept. of Evolutionary Biology 13
Via Romana 17-19, University of Florence 14
Italy 15
E-mail [email protected] 16
Tel. +39 0552288248 17
Fax. +39 055 2288250 18
19
Running head: Analysis of plasmids through gene sharing networks 20
Keywords: horizontal gene transfer, antibiotic resistance, plasmid, network 21
22
23
MBE Advance Access published November 29, 2011 at B
iblioteca di Scienze, Universit? degli studi di Firenze on January 11, 2012
http://mbe.oxfordjournals.org/
Dow
nloaded from

Abstract 23
Plasmids are vessels of genetic exchange in microbial communities. They are known to 24
transfer between different host organisms and acquire diverse genetic elements from 25
chromosomes and/or other plasmids. Therefore, they constitute an important element in 26
microbial evolution by rapidly disseminating various genetic properties among different 27
communities. A paradigmatic example of this is the dissemination of antibiotic resistance 28
genes that has resulted in the emergence of multiresistant pathogenic bacterial strains. To 29
globally analyze the evolutionary dynamics of plasmids, we built a large graph in which 2343 30
plasmids (nodes) are connected according to the proteins shared by each other. The analysis 31
of this gene sharing network revealed an overall coherence between network clustering and 32
the phylogenetic classes of the corresponding micro-organisms, likely resulting from genetic 33
barriers to horizontal gene transfer between distant phylogenetic groups. Habitat was not a 34
crucial factor in clustering as plasmids from organisms inhabiting different environments 35
were often found embedded in the same cluster. Analyses of network metrics revealed a 36
statistically significant correlation between plasmid mobility and their centrality within the 37
network, providing support to the observation that mobile plasmids are particularly important 38
in spreading genes in microbial communities. Finally, our study reveals an extensive (and 39
previously undescribed) sharing of antibiotic resistance genes between Actinobacteria to 40
Gammaproteobacteria, suggesting that the former might represent an important reservoir of 41
antibiotic resistance genes for the latter. 42
43
at Biblioteca di Scienze, U
niversit? degli studi di Firenze on January 11, 2012http://m
be.oxfordjournals.org/D
ownloaded from

Introduction 43
Plasmids are paradigmatic examples of the network-like structure of microbial evolution 44
(Brilli et al. 2008). Indeed, they are among the most important players in the evolution of 45
prokaryotes because they can be transferred between microorganisms, thus representing 46
natural vectors for the transfer of genes and the functions they code for (Norman, Hansen, 47
Sorensen 2009). Accordingly, they often provide a basis for genomic rearrangements via 48
homologous recombination, facilitating the loss and/or acquisition of genes during these 49
events, which may eventually lead to horizontal gene transfer (HGT). As a consequence, 50
plasmids possess a mosaic structure with collections of functional genetic modules, each of 51
which likely possessing an independent phylogenetic history, organized into a stable and self-52
replicating entity (Osborn et al. 2000; Toussaint, Merlin 2002; Bosi, Fani, Fondi 2011). 53
Importantly, these functional blocks often embed genes that might have a great impact on the 54
metabolic functions of the host cell, providing additional traits that can be accumulated 55
without altering the gene content of the bacterial chromosome (Fondi et al. 2010). Plasmids 56
are actually involved in many accessorial functions and constitute, together with "not 57
essential" chromosomal regions, what is referred to as the "dispensable genome" in the 58
microbial pan-genome concept (Medini et al. 2005). This, in turn, can include genes for 59
ecologically important traits such as antibiotic resistance (Crosa, Luttropp, Falkow 1975), 60
pathogen virulence (Hacker, Kaper 2000), symbiotic nitrogen fixation (van Rhijn, 61
Vanderleyden 1995) and the production of allelopathic bacteriocins (Riley, Gordon 1999). 62
Among these processes, pathogenesis and antibiotic resistance are those that have been 63
primarily explored up to now. Indeed, it has been shown that the presence of plasmids can be 64
strictly linked to the emergence of a pathogenic lineages within a given taxonomic unit 65
(Reynaud et al. 2008; Le Roux et al. 2010). Parallely, in terms of antibiotic resistance, 66
plasmids serve a central role as the vehicles for resistance gene capture and their subsequent 67
spreading (Bennett 2008; Fondi, Fani 2010). Dissemination of these features represents one of 68
the most important effects of ‘bacterial sex’, from both an evolutionary and ecological 69
viewpoint (Kohiyama et al. 2003). In this context, plasmid mobility represents an essential 70
parameter of microorganisms’ fitness and it might also be a key element to an understanding 71
of the epidemiology of these plasmid-carried traits (Smillie et al. 2010). However, despite 72
their clear biological relevance, the pathways followed by plasmids during their evolutionary 73
history remain almost obscure. 74
at Biblioteca di Scienze, U
niversit? degli studi di Firenze on January 11, 2012http://m
be.oxfordjournals.org/D
ownloaded from

Nowadays the use of massive plasmid sequencing as a routine laboratory technique (Schluter 75
et al. 2008), together with the development of bioinformatics tools enabling the visualization 76
of sequence homology relationships through similarity networks (Vlasblom et al. 2006; Brilli 77
et al. 2008), can greatly speed up studies of gene mobility among plasmids. Furthermore, 78
thanks to the expansion of network oriented representation of sequences similarity 79
relationships (Lima-Mendez, Toussaint, Leplae 2007; Brilli et al. 2008; Dagan, Martin 2009; 80
Dagan et al. 2010; Fondi et al. 2010; Fondi, Fani 2010; Halary et al. 2010), graph theory 81
measures have been applied to better describe the gene(s) flow across the diverse microbial 82
communities, paving the way to large scale comparative analyses adopting bioinformatics 83
strategies. In more detail, by adopting a gene sharing network approach, Dagan et al. (Dagan, 84
Artzy-Randrup, Martin 2008) reported the construction and the analysis of graphs capturing 85
both vertical and lateral components of evolutionary history among 539,723 genes distributed 86
across 181 sequenced prokaryotic genomes. The same authors estimated that an impressive 87
amount (almost 80% on average) of the gene content of each analyzed genome was involved 88
in lateral gene transfer at some point in evolution. More recently, Halary et al. (Halary et al. 89
2010) applied mathematical studies of the centralities of a network embedding 119,381 90
homologous DNA families. They demonstrated that plasmids, and not viruses, are likely the 91
key vectors of genetic exchange between bacterial chromosomes. Moreover, results also 92
supported a disconnected yet highly structured network of genetic diversity, revealing the 93
existence of multiple “genetic worlds”. From the analysis of the same network, the same 94
authors also inferred that DNA pools mostly circulate between vehicles (i.e. plasmids, phages 95
and chromosomes) of the same type. Finally, (Lima-Mendez et al. 2008) represented 96
relationships across the phage population as a weighted graph where nodes represented 97
phages and edges represented phage–phage similarities in terms of gene content. Their 98
approach succeeded in capturing the pervasive mosaicism of phage genomes, indicating the 99
importance of horizontal gene exchange in their evolution and also proving to be a promising 100
tool for predicting lifestyles of individual phages from sequence data. 101
By applying a computational, network-oriented pipeline we have analyzed the evolutionary 102
relationships among 2343 microbial plasmids in order to explore the role of each of them 103
within the reticulate evolutionary dynamics of this class of mobile genetic elements. 104
Moreover, we focused the attention on the proteins involved in two main biological processes, 105
that is antibiotic resistance and pathogenesis, as well as on plasmid features that might be 106
involved in ruling the overall network of plasmids-mediated HGT (e.g. plasmid mobility). 107
at Biblioteca di Scienze, U
niversit? degli studi di Firenze on January 11, 2012http://m
be.oxfordjournals.org/D
ownloaded from

Data obtained provide interesting clues in gaining a systemic interpretation of the overall 108
behaviour of plasmids within bacterial evolution and in the spreading of some key biological 109
features such as antibiotic resistance and virulence. 110
Methods 111
Datasets assembly 112
All the available complete plasmid sequences (in GenBank format) were downloaded from 113
NCBI using EFetch interface (as on July the 24th 2010). Totally, 2343 plasmids (102772 114
ORFs) were retrieved and a complete table including all their main features (their size, 115
taxonomy, accession codes etc.) is available as Supplemental Information S1. Moreover, two 116
different subsets of sequences were created starting from the whole plasmid sequences 117
dataset. On one side, we created a set of plasmid-encoded proteins that were involved in the 118
process of antibiotic resistance. This was done using each of the retrieved sequences as seed 119
in BLAST (Altschul et al. 1997) search against the Antibiotic Resistance DataBase (ARDB) 120
(Liu, Pop 2009) using the following parameters: e-value 1e-20, minimum alignment length 50 121
amino acid (aa), that is a degree of amino acid sequence identity sufficiently high to retrieve 122
all the proteins that should perform a function related to antibiotic resistance (Friedberg 2006; 123
Fondi, Fani 2010). In this way, a set of 2678 sequences putatively associated to antibiotic 124
resistance (AR) were retrieved (See Supplemental Information S2 for the complete list of 125
accession codes of the proteins used in this work). These sequences belonged to 501 different 126
plasmids. 127
The same strategy with the same parameters, was applied when searching for virulence 128
related proteins (virulence factors, VF) within the whole plasmid sequence dataset. In this 129
case the probed database was the Virulence Factor DataBase (VFDB) (Chen et al. 2005; Yang 130
et al. 2008) and a set of 7840 sequences was retrieved from this BLAST search (belonging to 131
615 plasmids). Again, all the information about these sequences is available as Supplemental 132
Information S3. 133
Network construction 134
The network construction workflow described in this paragraph has been applied to each of 135
the three assembled datasets, i.e. the one embedding all retrieved plasmids sequences 136
(hereinafter referred to as “all sequences network”), the one embedding the antibiotic 137
resistance-related sequences (the “resistance network”) and the one embedding virulence 138
factor-related sequeces (the “virulence network”). 139
at Biblioteca di Scienze, U
niversit? degli studi di Firenze on January 11, 2012http://m
be.oxfordjournals.org/D
ownloaded from

In detail, each of the sequence dataset was used in an all against all BLAST probing 140
(Altschul et al. 1997) using the Murska parallel computing cluster (Center for Scientific 141
Computing, Espoo, Finland). The BLAST output was parsed to include matches from two 142
different identity thresholds (70% and 95%) by using ad hoc implemented Python scripts. 143
Two parsed files were obtained, one embedding those sequences sharing at least 70% 144
sequence identity and another one embedding sequences sharing at least 95% identity. 145
Similarly to (Dagan, Artzy-Randrup, Martin 2008) and, later, to (Halary et al. 2010), this 146
allows to interpret the resulting networks under a molecular clock–based assumption, i.e. 147
under the hypothesis that proteins with the highest percentages of identity were likely to be 148
more recently shared than the ones with less identity. In the present context, proteins with 149
95% identity were considered more recently shared than those with 70%. 150
Subsequently each of these parsed BLAST outputs was transformed into a gene sharing 151
network and visualized using Gephi visualization program (Bastian, Heymann, Jacomy 2009). 152
Accordingly, in this network, each node represents a single plasmid and two different 153
plasmids are linked on the basis of their shared protein content. In particular, sharing is 154
defined by a BLAST match between two reading frames longer than 300 bp and 95% or 70% 155
amino acid identity, respectively, therefore representing an absolute measure. To investigate 156
the dynamics of plasmids among bacterial cells, we applied a further filter to each of the 157
obtained graph, maintaining linked only those edges sharing at least five proteins and 158
discarded all the connections linking plasmids with a lower amount of shared proteins. 159
Similarly, to investigate the dynamics of individual genes or small gene clusters among the 160
plasmid population, we applied a filter to maintain only those edges that constitute sharing 161
less than 5 genes. Altogether, we obtained 8 different networks: (70% and 95% identity 162
values for all sequences with more or less than 5 gene transfers, and sequences related to AR 163
or VF). The Gephi-formatted network files are available as Supplemental Information S4. 164
Permutation tests 165
To evaluate the statistical significance of observed preferential gene flows (see below), we 166
randomly permuted 10000 times the phylogenetic affiliation of each node, while keeping 167
intact the original degree of each node within the network (randomization with node degree 168
conservation, see (Brohee et al. 2008)). A p-value was then obtained by counting the number 169
of times the randomly assembled networks returned a number of links greater (or lower) than 170
the observed one and dividing this number for the total amount of performed permutation 171
tests. 172
at Biblioteca di Scienze, U
niversit? degli studi di Firenze on January 11, 2012http://m
be.oxfordjournals.org/D
ownloaded from

Estimation of plasmid mobility 173
The presence of genes related to plasmid mobility were identified by BLAST analysis (with 174
the following parameters: e-value 1e-20, minimum alignment length 50 aa) of the plasmid-175
encoded amino acid sequences against a tra and mob gene dataset retrieved from ACLAME 176
database (http://aclame.ulb.ac.be/, (Leplae et al. 2004)). Since tra and mob genes are 177
generally associated with plasmid mobility and conjugation, we defined plasmid as mobile if 178
it contained one or more mob or tra genes [a similar approach was recently adopted by 179
(Smillie et al. 2010)]. 180
Network centralities, statistics and visualization 181
Network centrality values for network nodes were calculated using iGraph package in R 182
(Csardi 2006). Network clustering was estimated using the Louvain algorithm implemented in 183
Gephi (Blondel et al. 2008) by maximizing modularity and minimizing number of clusters. 184
All statistical tests to investigate the differences in degree and betweenness distributions and 185
GC% content were performed using the base statistics tools in R (R Development Core Team 186
2010; http://www.r-project.org/). Data plotting was performed using ggplot2 package of R 187
(Wickham 2009). All other statistical analyses were performed using in-house developed Perl 188
and Python scripts. Visualization of network clustering and gene sharing as an ideogram was 189
performed using Circos (Krzywinski et al. 2009). 190
Estimation of the phylogenetic distances of gene sharing 191
The 16S rRNA sequences for plasmid hosts were downloaded from Ribosomal Database 192
project (Cole et al. 2007; Cole et al. 2009). The 16S rRNA sequences were aligned using the 193
NAST aligner provided by Greengenes (DeSantis et al. 2006). The distance matrix of the 194
phylogenetic distances was calculated using Phylip (Felsestein 1989) 195
196
Estimation of phylogenetic coherence in major network clusters 197
The Conclustador algorithm (Leigh et al. 2011) was applied to analyze the congruence of 198
phylogenetic trees reconstructed from the sequences of the genes shared by plasmids 199
belonging to the same cluster in a network. Gene families responsible for the connections 200
among the different plasmids were extracted from the 70% and 95% networks and aligned 201
using Muscle software (Edgar 2004). Then, for each plasmid cluster, resulting multiple 202
sequence alignments were used as input for phylogenetic coherence analysis, adopting 203
at Biblioteca di Scienze, U
niversit? degli studi di Firenze on January 11, 2012http://m
be.oxfordjournals.org/D
ownloaded from
Conclustador (Leigh et al. 2011) algorithm. Finally, SplitsTree4 (Huson, Bryant 2006) was 204
used to visualise the phylogenetic information both in each single group identified by 205
Conclustador and in all the groups all at once (and, together, responsible for the plasmids 206
interconnections shown in the networks of Figure 1). In both cases, supernetworks were 207
inferred using data available from single gene phylogenetic analyses performed with RAxML 208
tool with 1000 bootstrap replications. 209
Since for Conclustador to work properly analyzed datasets should not be too fragmented, i.e. 210
about the 80% of the overall taxa dataset must be present in each multiple alignment, not all 211
the identified plasmids clusters could be reliably analyzed. Accordingly, only the major 212
clusters in the 70% and 95% networks were analyzed (namely clusters 961, 993, 1144 and 213
1238 for 70% network and 961, 993 and 1144 for 95% network). Interestingly, the 214
widespread fragmentation found for most of the clusters in the dataset might be due to a high 215
heterogeneity of the same clusters that, in turn, might mirror a high level of horizontal transfer 216
of their embedded genes. 217
218
Results and discussion 219
Gene sharing networks 220
Gene sharing between plasmids was visualized as a network where the plasmids are 221
represented as vertices (or nodes) and gene sharing as edges (or links). Altogether 8 networks 222
were constructed based on 70% and 95% identity between the amino acid sequences and 223
different edge criteria, such as the amount of genes shared (more than or less than 5), or 224
sharing antibiotic resistance or virulence genes (Supplemental Information S6). The identity-225
based criterion introduced for links setting allows interpreting the resulting networks under a 226
molecular clock–based assumption, i.e. under the hypothesis that sequences with the highest 227
percentages of identity (e.g. 95%) were likely to be more recently exchanged than the ones 228
with less identity (e.g. 70%) [see for example (Halary et al. 2010)]. Data for the networks 229
accounting for the sharing of 5 or more genes are reported in Figure 1a and b. Overall, the 230
plasmid network of all sequences at 70% identity (Figure 1b) threshold exhibits one major 231
connected component, some minor connected components and a large number of 232
disconnected plasmids (see below). The main connected component of the network of all 233
genes (the central one in Figure 1b) embeds plasmids mainly belonging to the Proteobacteria 234
phylum (particularly from Gamma, Alpha, and Beta subdivisions). Interestingly, this 235
component also contains plasmids from Actinobacteria. A similar trend is observed in the 236
at Biblioteca di Scienze, U
niversit? degli studi di Firenze on January 11, 2012http://m
be.oxfordjournals.org/D
ownloaded from

case of 95% identity threshold network (Figure 1a) although, as it might be expected, in this 237
case the main connected component of the network is smaller. The only phylogenetically 238
uniform major component is represented by plasmids from Borrelia burgdorferi 239
(Spirochaetes, yellow nodes of Figure 1a and b). 240
241
In order to investigate the relationships between the taxonomy of represented microorganisms 242
and the evolutionary interconnections of their plasmids, we performed network clustering 243
using the Louvain algorithm implemented in Gephi [see Methods, (Blondel et al. 2008)] and 244
compared the obtained plasmids groups with the phylogenetic and habitat affiliations of their 245
constituent cells. The network clusters embedding multiple phyla and/or habitats for the 70% 246
and 95% networks of all sequencesare presented in Figure 2. According to the network 247
clustering analysis, the network clusters more typically embed members from different 248
habitats than from different phylogenetic orders. Hence, it appears that phylogenetic distance 249
is a greater barrier to gene sharing than having a different habitat. This is likely due to limited 250
horizontal gene transfer across phylogenetic classes that could result from, for example, 251
restriction or incompatible replication systems [as reviewed in (Thomas, Nielsen 2005)]. 252
Moreover, these observations are consistent with findings from microbial ecology and 253
previous in silico analyses (Baquero, Martinez, Canton 2008; Fondi, Fani 2010) and suggest 254
that there is a (more or less) high degree of mixing of microbes between unrelated 255
environments. 256
257
Gene sharing across phylogenetic classes implies at least one past HGT event, and is therefore 258
simple to detect. However, HGT could also be commonplace within phylogenetic classes. To 259
investigate this, all the major network clusters (including those reported in Figure 2) were 260
analyzed using Conclustador package to infer phylogenetically congruent and incongruent 261
gene families. Overall, obtained data (provided as Supplemental Information S5) revealed a 262
high level of incongruence among the analyzed clusters. Indeed Conclustador identified 8, 4, 263
2 and 3 different groups within 961, 993, 1144 and 1238 major plasmids clusters, 264
respectively. Similarly, in the 95% network 6, 4 and 2 distinct phylogenetic groups for 961, 265
993 and 1144 were retrieved. The construction of phylogenetic networks of the sequences 266
embedded in the groups identified by Conclustador revealed, in most cases, high levels of 267
inter- species reticulation. Overall, these data suggest the presence of potential abundant HGT 268
at lower taxonomical levels than those reported in Figure 1 and 2. 269
270
at Biblioteca di Scienze, U
niversit? degli studi di Firenze on January 11, 2012http://m
be.oxfordjournals.org/D
ownloaded from

Furthermore, in order to shed some light on the putative functions encoded by the shared 271
genes, we performed a COG-based functional annotation of the sequences embedded in each 272
plasmid cluster. Data obtained (also reported in Supplemental material S5) revealed that most 273
of the sequences responsible of the plasmids interconnections encode for proteins involved in 274
DNA transposition and recombination. This is not surprising since these functions are 275
strongly linked to the process of HGT and, consequently, to plasmids. Nevertheless, as shown 276
in Supplemental material S5, other genes are shared among the different plasmids embedded 277
in the same cluster and, importantly, their encoded functions are not directly related to the 278
process of HGT itself. This suggests that other functions, probably related to more complex 279
phenotypes, are shared by the different plasmids, including for example genes involved in 280
transcription, inorganic ion transport and metabolism and cell motility (the three most 281
abundant functional categories of plasmids cluster 961, see Supplemental material S5). 282
283
To study the sharing of resistance and virulence genes, the same procedure of network 284
construction was applied to the antibiotic resistance and virulence factor sequence datasets. 285
Results of these analyses for networks of 70% identity criterion are shown in Supplemental 286
material S6. Overall, the topology of both networks appeared to be similar to 70% and 95% 287
networks of all sequences, although some differences can be identified. Indeed, concerning 288
the antibiotic resistance network, the Proteobacterial plasmids do not form a single 289
component, but two different major components can now be identified, one embedding 290
Gammaproteobacterial and Actinobacterial plasmids and the other one embedding Beta and 291
Alphaproteobacterial sequences. This suggests that plasmids belonging to these taxonomic 292
units are not preferential transfer partners of antibiotic resistance genes for 293
Gammaproteobacteria representatives. Conversely, in the virulence network, Proteobacterial 294
plasmids form the major connected component of the graph (Supplemental material S6), 295
revealing an intense sharing of virulence-related genes among microorganisms belonging to 296
this taxonomic unit. Although some remarkable exceptions of plasmids acting as bridges in 297
connecting otherwise separate groups do exist (see below), the other clusters of virulence 298
network are overall coherent with the phylogenetic class affiliation (although intense gene 299
sharing might be present within these groups of plasmids, as shown by previous phylogenetic 300
coherence analysis). 301
302
Network features and taxonomy 303
at Biblioteca di Scienze, U
niversit? degli studi di Firenze on January 11, 2012http://m
be.oxfordjournals.org/D
ownloaded from

In order to globally analyze the evolutionary relationships underlying the plasmid 304
populations, we applied graph theory measures to the gene sharing networks. In particular, the 305
networks were analyzed for node degree and betweenness. Degree is defined as the number of 306
connections a node has to other nodes. In the present context, a plasmid with a high degree is 307
a plasmid that shares a large number of genes with other plasmids. Betweenness is a centrality 308
measure that is defined as the frequency of a node to lie on the shortest path between two 309
other network nodes. In this context a plasmid with a high betweenness can transfer genes to 310
many other plasmid in the network with a low number of gene transfer events and, in other 311
words, can function as a bridge between otherwise disconnected regions of the network. 312
Accordingly, we computed centrality measures along the network, for all the classes of 313
prokaryotes present in the dataset. Results are provided in Figure 3, whose analysis revealed a 314
positive correlation between degree and betweenness that has also been observed by Halary et 315
al. 2010. However, in the network some nodes showed a much higher betweenness than most 316
nodes of the same degree (see below). Such outliers, characterized by a low degree but a high 317
betweenness, are especially important in any given network, as they can be seen as bridges 318
between smaller, more connected parts of the network (Halary et al. 2010). 319
Tables 1 and 2 report the highest degree and betweenness values, respectively, for individual 320
plasmids in the 70% and 95% identity networks of all sequences. The analysis of Table 1 321
reveals that all the plasmids possessing the highest values of degree belong to the Gamma 322
subdivision of Proteobacteria. This result can be easily explained by the oversampling of 323
plasmids from this class of bacteria. Indeed, the plasmids data used in this study is 324
unsystematically gathered from several unrelated sources and is highly biased toward human 325
pathogenic organisms (most of Gammaproteobacteria) (Wu et al. 2009). In this context, it is 326
likely that more detailed studies of individual environments would reveal several gene sharing 327
events between various phylogenetic groups that are not represented in the current data set. 328
Nevertheless, a detailed inspection of high-degree plasmids gave further support to previous 329
observations based on single plasmids sequence data. In fact, for example, plasmid pU302L 330
(see Table 1) from Salmonella enterica subsp. enterica serovar Typhimurium has already been 331
described for possessing a mosaic pattern of sequence homology with other plasmids (Chen et 332
al. 2007), suggesting, in turn, that this plasmid acquired resistance genes from a variety of 333
enteric bacteria (Chen et al. 2007). Notably, the fact that this plasmid is the best degree 334
scoring plasmid in the 95% network indicates that it acquired foreign genetic material from 335
very closely related microorganisms and/or very recently in time. Similarly, most of the other 336
at Biblioteca di Scienze, U
niversit? degli studi di Firenze on January 11, 2012http://m
be.oxfordjournals.org/D
ownloaded from

plasmids embedded in Table 1 possess a well documented history of HGT events [see for 337
example p1658/97 (Zienkiewicz et al. 2007; Yi et al. 2010) and pKF3-140 (Yi et al. 2010)]. 338
High betweenness nodes (plasmids) span over a larger taxonomic spectrum, suggesting that 339
this centrality measure is less affected by sampling biases. Indeed the plasmids with highest 340
betweenness values belong to diverse phylogenetic classes, including Bacilli, Lactobacilli and 341
Gamma, Beta, and Alphaproteobacterial representatives. As in the case of high degree 342
plasmids, mosaic-like structure of high-betweenness plasmids has been described before, for 343
example, of pCoo from Escherichia coli (Froehlich et al. 2005) and pGO1 from 344
Staphylococcus aureus (Caryl, O'Neill 2009). Hence, although the overall plasmids clustering 345
seems to agree with taxonomic classification of their source microorganisms, some plasmids 346
compact the overall network, residing in the path between plasmids that otherwise would 347
remain disconnected (Halary et al. 2010). Importantly, some of the plasmids that were found 348
to possess high degree/betweenness values (Table 1 and 2) were the same that were found to 349
be central in other gene sharing network analyses performed by Halary et al. (2010) (namely, 350
plasmids pOU7519, pU302L from Salmonella representatives, p1658/97, pIP1206 from 351
Escherichia coli, pKPN5 from Klebsiella pneumoniae, pVEF3 from Enterobacter faecium, 352
pSK41 from Staphylococcus aureus, pGdh442 from Lactococcus lactis and pTEF1 from 353
Enterococcus faecalis V583) thus confirming the key role of these DNA molecules in the 354
flow of genetic material among different microorganisms. In our opinion these plasmids 355
represent key players from an evolutionary viewpoint, contributing to the spreading of 356
potentially clinically relevant genetic determinants within the whole bacterial mobilome. 357
Several plasmids (1159 for the 70% identity network of all genes and 1369 for the 95% 358
identity network) in the data set shared less than five genes with any other plasmid and 359
therefore did not belong to any connected component. The taxonomic composition of this 360
disconnected component of the network is presented in Figure 4. Statistical randomization 361
testing (as described in Methods) was performed to evaluate the effect of sampling bias in the 362
frequency distribution. Most of the phylogenetic classes possessed between 2% and 5% of 363
disconnected plasmids, the only exception being represented by Gammaproteobacteria 364
(almost 15% of disconnected plasmids). For most classes the amount of disconnected 365
plasmids was higher than expected by random shuffling of the networks. 366
Dynamics of genes in the plasmid population 367
at Biblioteca di Scienze, U
niversit? degli studi di Firenze on January 11, 2012http://m
be.oxfordjournals.org/D
ownloaded from

In the previous sections we mainly analyzed networks in which two plasmids were connected 368
if they shared (at least) five genes, thus surely underestimating the real amount of gene 369
transfer events among plasmids. To go into greater details and to analyze the possible 370
dynamics of gene transfer among plasmids we built gene sharing networks taking into 371
account the sharing of single genes (up to four genes) among two given plasmids. Such 372
networks were constructed adopting the same computational strategy used for >= 5 networks 373
(see Methods) and, together with singlets taxonomical distribution and cross-taxa 374
interconnections, are reported in Supplemental Material S7. Overall, < 5 networks embedded 375
almost the same number of links (11458 and 5136 for 70% and 95% identity thresholds, 376
respectively) compared to >5 networks (12444 and 6777 for 70% and 95% identity 377
thresholds, respectively), suggesting the presence of an extensive amount of single gene (or of 378
relatively small gene sets) exchange among the different plasmids. 379
Louvain clustering of < 5 networks, although producing a large fraction of taxonomically 380
highly coherent groups, resulted in slightly more heterogeneous plasmid clustering compared 381
to the clustering obtained from >= 5 networks (Figure 2b and c). This suggests that when 382
considering the transfer single genes or groups of small genes, taxonomical barriers can be 383
bypassed more frequently than in the movement of larger sets of genes. In agreement with the 384
previous congruency analysis, a deeper analysis of the phylogenetic coherence (adopting the 385
coherence analysis pipeline described in Methods) of the gene families within the major 386
network clusters revealed a high amount of incongruency (data not shown). Hence, according 387
to the overall body of data presented here, it appears that the sharing of relatively small gene 388
sets is more abundant and spans over a larger phylogenetic distance than transfers of larger 389
sets of genes, although the great part of this genetic exchange still happens within the 390
boundaries of microbial phylogenetic classes. 391
392
Network comparison 393
To explore the differences among the networks, we computed Pearson product-moment 394
correlation coefficients between betweenness and degree values for each node (i.e. plasmid) 395
(Figure 5). Data obtained revealed a low positive correlation between betweenness and degree 396
in each of the networks, independently from the nucleic acid identity thresholds and/or the 397
functions shared among the different plasmids (virulence or antibiotic resistance genes). R2 398
values range between 0.25 and 0.36 for 70% networks and are slightly higher for 95% 399
at Biblioteca di Scienze, U
niversit? degli studi di Firenze on January 11, 2012http://m
be.oxfordjournals.org/D
ownloaded from

networks (ranging from 0.29 and 0.44). Accordingly, node degree does not explain all the 400
variation in node betweenness regardless the timing of the gene transfer(s) (70% vs. 95% 401
thresholds) and/or to the functions that are transferred (virulence vs. antibiotic resistance 402
determinants) – the values are most likely determined by the mobile nature of plasmids 403
themselves. 404
405
Analysis of mobilizable and conjugative plasmids 406
Conjugative plasmids have been defined as “vessels” of the communal gene pool (Norman, 407
Hansen, Sorensen 2009). Indeed, this class of plasmids possesses the ability to “visit” 408
different cells and, in principle, undergo genetic rearrangements (such as homologous 409
recombination) with other plasmids and/or other informative molecules (phage genomes and 410
chromosomes). For this reason, conjugative plasmids might be expected to possess a more 411
central position within the overall plasmid gene sharing network in respect to those that are 412
not mobilizable. To test this hypothesis all the tra- and mob-like sequences of the plasmids 413
were eliminated from the networks and the centrality measures of conjugative/mobilizable 414
plasmids were evaluated. Plasmid mobility was estimated by identifying the number of mob 415
and tra genes that they harbor (an approach similar to that adopted in (Smillie et al. 2010) and 416
described in Methods). The relationship existing between the mobility and the network 417
measures was investigated by studying the distribution of the centrality measures between the 418
mobile and non-mobile plasmids. The distributions of the centrality measures are presented in 419
Figure 6 and are significantly higher for mobilizable plasmids in the networks of all genes and 420
resistance genes (p-values according to Mann-Whitney tests are presented in Figure 6). 421
Therefore, the presence of mob or tra genes significantly promotes the gene sharing measures 422
in the networks of all genes and antibiotic resistance genes. This suggests that plasmid 423
mobility is an important mechanism in spreading various genetic traits within the plasmid 424
community, including antibiotic resistance genes. This fully agrees with the central role 425
inferred for conjugative plasmids in the context of bacterial evolution (Norman, Hansen, 426
Sorensen 2009) and gives further support to the idea that these particular plasmids act as 427
vessels of the communal gene pool. This also indicates that the high incidence of high degree 428
and betweenness values in certain phylogenetic classes (such as Gammaproteobacteria) does 429
not only result from their over-representation in current data set but are also affected by 430
genetic properties of their plasmids. 431
at Biblioteca di Scienze, U
niversit? degli studi di Firenze on January 11, 2012http://m
be.oxfordjournals.org/D
ownloaded from

Gene sharing over phylogenetic classes 432
The importance of plasmids within the complex microbial evolutionary network resides also 433
in the capability to connect microbes separated by a (more or less) long phylogenetic distance 434
and to overcome the various barriers to horizontal gene transfer (Thomas, Nielsen 2005). The 435
occurrence of gene sharing over phylogenetic classes was enumerated and visualized in 436
Figure 7. 437
Interestingly, some connections in the network span over very large phylogenetic distances. 438
For example we found connections linking Alphaproteobacteria and Cyanobacteria and in 439
particular plasmid pCC7120beta from Nostoc sp. PCC 7120 with plasmid pBBta01 from 440
Bradyrhizobium sp. BTAi1 and pCC7120gamma from Nostoc sp. PCC 7120 with plasmid 441
pNGR234b from Sinorhizobium fredii NGR234. These connections suggest the presence of 442
HGT among microorganisms inhabiting very different ecological niches (multiple and host 443
associated for Cyanobacteria and Alphaproteobacteria, respectively), involving genes linked 444
to important functions such as copper transport and transcriptional regulation, respectively. 445
Remarkably, also inter-kingdom transfers (involving chemotaxis related genes) were 446
observed: this is the case, for example, of connections linking plasmid pH308197_258 from 447
Bacillus cereus H3081.97 to plasmid pHmuk01 from Halomicrobium mukohataei DSM 448
12286. Also in this case, microorganisms belong to likely unrelated habitats (multiple and 449
specialized, respectively). 450
However, because the amount of inter-classes connections is likely strongly affected by 451
sampling biases, we performed statistical tests to investigate the significance of the observed 452
inter-class connections by performing random permutation of the original network, as 453
described in Methods. In the 70% identity network, inter-class links included connections 454
between more closely related microorganisms (e.g. connections between Alpha, Beta and 455
Gammaproteobacteria and between Bacilli and Lactobacilli) as well as connections between 456
more distantly related microorganisms (i.e. Actinobacteria and Betaproteobacteria, 457
Actinobacteria and Gammaproteobacteria, Alphaproteobacteria and Deinococci). However, 458
some closely related microorganisms possessed a lower amount of connections than expected 459
by chance (e.g. between Alphaproteobacteria and Gammaproteobacteria, p-value<1e-4), 460
possibly indicating a genetic incompability between these groups (Thomas, Nielsen 2005). As 461
it might be expected, when analyzing the 95% network, the number of observed connections 462
decreased and mainly closely related taxonomic groups were still interconnected (Bacilli-463
at Biblioteca di Scienze, U
niversit? degli studi di Firenze on January 11, 2012http://m
be.oxfordjournals.org/D
ownloaded from
Lactobacilli and Betaproteobacteria-Gammaproteobacteria (p-value<1e-4) among over-464
represented and Alphaproteobacteria-Gammaproteobacteria and Bacilli-Gammaproteobacteria 465
among under-represented (p-value<1e-4)). Notably, the connection between distantly related 466
Gammaproteobacteria and Actinobacteria also remained strong. 467
As noted in the case of gene transfers among phylogenetically incoherent groups (see 468
Supplemental Material S5), the majority of shared genes code for functions that are related to 469
the process of HGT itself and generally belong to L category in COG annotation (Figure 8). 470
Nevertheless, also other functions are exchanged as indicated by gene sharing (Figure 8), 471
underlining the key role of plasmids in spreading important biological traits throughout the 472
whole microbial world. 473
Gene transfer between Actinobacteridae and Gammaproteobacteria 474
According to the results presented in Figure 7, the gene sharing between Actinobacteria and 475
Gammaproteobacteria is spanning one of the longest phylogenetic distances within our 476
networks (Supplemental Information S8) and appears to be crucial in transferring antibiotic 477
resistance genes. Furthermore, most of the shared genes are (at least) 95% similar and 478
therefore, according to the molecular clock hypothesis, the transfer between these classes has 479
occurred recently. For this reason, we further analyzed this, apparently preferential, gene 480
flow. 481
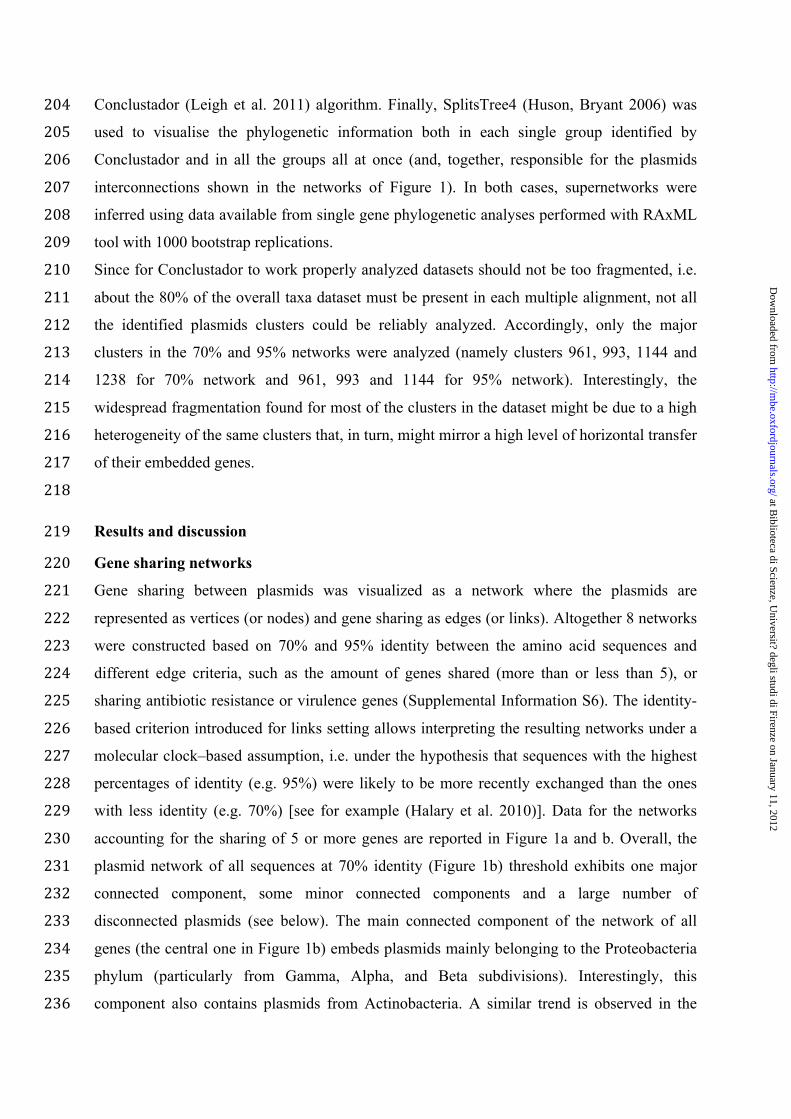
To better characterize the gene sharing between Actinobacteria and Gammaproteobacteria, we 482
selected representative plasmids with a high amount of shared genes between 483
Gammaproteobacteria and Actinobacteria and visualized them as circular ideogram with 484
resistance-, conjugation- and transposition-related genes and gene sharing events (Figure 9). 485
The analysis of Figure 9 revealed that the antibiotic resistance genes transfer between the 486
plasmids by transposition, as most of the links connecting Actinobacteria and 487
Gammaproteobacteria fall in plasmid regions embedding antibiotic resistance and/or 488
transposition-related genes. These results indicate the presence of a clinically-important gene 489
flow between representatives of these microbial groups, although not suggesting the possible 490
direction of these gene transfers (i.e. from Actinobacteria to Gammaproteobacteria or 491
viceversa). To shed some light on this point we investigated the composition of the involved 492
plasmids under the assumption that, if the HGT events are recent (as suggested by the high 493
amino acid identity) the transferred genes are expected to have a GC content closer to the 494
donor plasmids rather than to the recipient one (Karlin 2001). Hence, the GC content of the 495
at Biblioteca di Scienze, U
niversit? degli studi di Firenze on January 11, 2012http://m
be.oxfordjournals.org/D
ownloaded from

Actinobacterial and Gammaproteobacterial plasmids and genes was calculated and compared 496
(Supplemental Information S9). The Actinobacterial plasmid GC content (mean 0.56% from 7 497
plasmids) was significantly higher (p-value = 9.4e-3 according to a Mann-Whitney test) than 498
the Gammaproteobacterial GC content (mean 0.51% from 95 plasmids). Moreover, GC 499
contents were calculated for the individual transferred genes and compared to the plasmids. 500
According to Mann-Whitney test, the transferred genes have a significantly different GC 501
content from the Gammaproteobacterial plasmids (p =7.0e-15) but are not significantly 502
different from Actinobacterial plasmids (p = 0.42). Accordingly, the whole body of data 503
presented in this section suggests that the direction of gene transfer is very likely from 504
Actinobacteria to Gammaproteobacteria. This is consistent with the knowledge that some 505
Actinobacteria are natural producers of antibiotic compounds and, therefore, a potential 506
source of antibiotic resistance genes to human pathogens (Wright 2007; Miao, Davies 2010). 507
Conclusions 508
The use of gene sharing network as a tool to investigate microbial evolutionary relationships 509
is rapidly expanding, especially when studying non-tree like structures that sometimes can 510
arise in evolution (Dagan, Artzy-Randrup, Martin 2008; Halary et al. 2010). The power of 511
such approach is demonstrated here by revealing the relationships between biological 512
properties (e.g. plasmids mobility) and network properties (e.g. plasmid centrality) in the gene 513
sharing network. Moreover, the approach applied here also revealed an extensive antibiotic 514
resistance gene sharing between Actinobacterial and Gammaproteobacterial plasmids, 515
suggesting a potential source of antibiotic resistance genes that might have led to the recent 516
emergence of antibiotic multiresistance in pathogenic organisms. 517
The plasmid sequences analysed in this study were gathered in a non-systematic manner from 518
different sequencing projects; their sampling is therefore random and likely biased towards 519
human pathogenic organisms. The bioinformatic workflow described here would be best 520
suited for single genomic sequence data sets obtained from specifically selected 521
environments. We expect such data sets to become available as the DNA sequencing costs 522
decrease and genome sequencing from single cells becomes a routine approach 523
(Stepanauskas, Sieracki 2007; Rodrigue et al. 2009). The proposed approach could then be 524
used to investigate whether the functional categories of transferred genes would reflect the 525
different selective patterns present in the given environment(s). Therefore, obtaining single 526
at Biblioteca di Scienze, U
niversit? degli studi di Firenze on January 11, 2012http://m
be.oxfordjournals.org/D
ownloaded from

genome data sets from multiple different environments would permit evaluation and 527
comparison of gene sharing patterns in response to different environmental conditions. 528
529
530
Table 1 531
Individual plasmids with highest degree measures observed in the gene sharing networks of 532
all genes. 533
Accession Number Microorganism Plasmid name Degree
N. of tra/mob genes
Conjugative (c) or mobilizable (m)
70% Network
NC_010119 Salmonella enterica subsp. enterica serovar Choleraesuis pOU7519 268
17 c
NC_006856
Salmonella enterica subsp. enterica serovar Choleraesuis str. SC-B67 pSC138 254
17 c
NC_011964 Escherichia coli pAPEC-O103-ColBM 253 8 c NC_013951 Klebsiella pneumoniae pKF3-140 247 9 c NC_013728 Escherichia coli O26:H- pO26-CRL 243 21 c NC_010488 Escherichia coli SMS-3-5 pSMS35_130 242 13 c
NC_011092
Salmonella enterica subsp. enterica serovar Schwarzengrund str. CVM19633 pCVM19633_110 241
17 c
NC_006816 Salmonella enterica subsp. enterica serovar Typhimurium pU302L 240
17 c
NC_013122 Escherichia coli pEK499 231 15 c
NC_013437 Salmonella enterica subsp. enterica serovar Typhimurium pSLT-BT 225
4 c
95% Network
NC_006816 Salmonella enterica subsp. enterica serovar Typhimurium pU302S 192
16 c
NC_010488 Escherichia coli SMS-3-5 pSMS35_130 188 13 c
NC_006856
Salmonella enterica subsp. enterica serovar Choleraesuis str. SC-B67 pSC138 187
17 c
NC_013951 Klebsiella pneumoniae pKF3-140 186 9 c NC_011964 Escherichia coli pAPEC-O103-ColBM 184 8 c
NC_010119 Salmonella enterica subsp. enterica serovar Choleraesuis pOU7519 171
17
NC_013728 Escherichia coli O26:H- pO26-CRL 168 21 c NC_013122 Escherichia coli pEK499 166 15 c
at Biblioteca di Scienze, U
niversit? degli studi di Firenze on January 11, 2012http://m
be.oxfordjournals.org/D
ownloaded from

NC_011092
Salmonella enterica subsp. enterica serovar Schwarzengrund str. CVM19633 pCVM19633_110 165
17 c
NC_004998 Escherichia coli p1658/97 157 11 c 534
535
536
Table 2 537
Individual plasmids with highest betweenness measures observed in the gene sharing 538
networks of all genes. 539
Accession Number Microorganism Plasmid name Betweenness
N. of tra/mob genes
Conjugative (c) or mobilizable (m)
70% Network
NC_007635 Escherichia coli pCoo 8050 10 c/m
NC_006663 Staphylococcus epidermidis RP62A pSERP 6329
3 m
NC_007974 Cupriavidus metallidurans CH34 megaplasmid 6067
14 c
NC_011092
Salmonella enterica subsp. enterica serovar Schwarzengrund str. CVM19633 pCVM19633_110 5800
17 c
NC_010558 Escherichia coli 1520 pIP1206 5750 16 c
NC_009651
Klebsiella pneumoniae subsp. pneumoniae MGH 78578 pKPN5 5641
11
NC_011339 Bacillus cereus H3081.97 pH308197_258 5507 2 m NC_011655 Bacillus cereus AH187 pAH187_270 5330 7 c/m NC_012586 Rhizobium sp. NGR234 pNGR234b 5271 88 c NC_010980 Enterococcus faecium pVEF3 4700 4 m
95% Network
NC_011092
Salmonella enterica subsp. enterica serovar Schwarzengrund str. CVM19633 pCVM19633_110 38781
17 c
NC_005024 Staphylococcus aureus pSK41 29020 7 c NC_012547 Staphylococcus aureus pGO1 29020 9 c NC_010378 Escherichia coli pOLA52 21221 3 c
at Biblioteca di Scienze, U
niversit? degli studi di Firenze on January 11, 2012http://m
be.oxfordjournals.org/D
ownloaded from

NC_005054 Staphylococcus aureus pLW043 19209 6 c NC_009435 Lactococcus lactis pGdh442 18216 7 m
NC_004669 Enterococcus faecalis V583 pTEF1 15617
8
NC_008381 Rhizobium leguminosarum bv. viciae 3841 pRL10 15030
27 c
NC_013121 Escherichia coli pEK516 13724 11 c NC_005327 Escherichia coli pC15-1a 13073 9 c
NC_011996 Macrococcus caseolyticus JCSC5402 pMCCL2 12981
4 m
540
541
542
543
at Biblioteca di Scienze, U
niversit? degli studi di Firenze on January 11, 2012http://m
be.oxfordjournals.org/D
ownloaded from

Figure 1: 543
The gene sharing between plasmids presented as matrices (A) and networks (B) at both 70% 544
and 95% criteria. In network figures, plasmids are represented by the nodes (node size is 545
proportional to the plasmid size) and the shared genes by the links. At least five shared genes 546
are required to establish a link. 547
548
549
!"#$%&#'()*+,-# ./&#'()*+,-#
0"#$%&#'()*+,-# ./&#'()*+,-#
!1+*2341,)5'4#
!6784752,)2341,)5'4#
94::4752,)2341,)5'4#
041'66'#
;41,2341'66'#
<7'52184),)=#
0),4752,)2341,)5'4#
at Biblioteca di Scienze, U
niversit? degli studi di Firenze on January 11, 2012http://m
be.oxfordjournals.org/D
ownloaded from

549 Figure 2: 550
The major phylogenetic groups, their habitats and their clustering in A) the 70% and the 95% 551
networks for >= 5 networks and in 70% and the 95% networks for < 5 networks, B) and C), 552
respectively. The clusters that were subjected to Conclustador analysis have been indicated.In 553
D) the amount of inter- and intraphylum and inter- and intraclass clustering in the networks is 554
reported for both < 5 (low) and >= 5 (high) networks The clustering of the network has been 555
determined using the Louvain algorithm implemented in Gephi (see Methods). 556
557
558
!"# $"#
%"#
&'(')*#!+,-./+01/-23#!+4)/5,+6'-2,#!170,7-/6'/5,+6'-2,#$,+2112#$'6,7-/6'/5,+6'-2,#%0-//5,+6'-2,#8'2)/+/++2#8'16,7-/6'/5,+6'-2,#9,::,7-/6'/5,+6'-2,#;,1/5,+6'-2,#&,+6/5,+2112#
<#
<#<<#<<<#
M - Multiple habitats T - Terrestrial A - Aquatic H - Host-associated S - Specialized
M T A H M
T
M T
H M
S
*** M
A
H
M
A S H M
A * H M T
T
A H
M
M T A H M S T
* A
** A ** T
*** M
A
H
MA S H M
M T A H M
T H
M T
H M T
*** M
A
H
M
A S M
Cluster 993
Clus- ter 961
Cluster 1144
X9
coun
t
0
1000
2000
3000
4000
5000
6000
7000
0
1000
2000
3000
4000
5000
6000
7000
High
Inter−class Inter−habitat
Inter−class Intra−habitat
Intra−class Inter−habitat
Intra−class Intra−habitat
Low
Inter−class Inter−habitat
Inter−class Intra−habitat
Intra−class Inter−habitat
Intra−class Intra−habitat
70%95%
8"#
at Biblioteca di Scienze, U
niversit? degli studi di Firenze on January 11, 2012http://m
be.oxfordjournals.org/D
ownloaded from

558 Figure 3: 559
Dependency of plasmid betweenness from plasmid degree for different phylogenetic classes 560
according to Pearson’s product moment correlation coefficient. 561
562
563
Degree
Betweenness
0
1000
2000
3000
4000
02000400060008000100001200014000
0500010000150002000025000
0100020003000400050006000
0
10000
20000
30000
0
5000
10000
15000
050010001500200025003000
0
500
1000
1500
2000
70%
! !!!!!!!!!!!!!!!!!! !!! !!!!!
!!! !!!! !!!!!! !!!!!!!
!!!!!!
!
!
!!
!
!!!! !!!
!
!!!!!
!
!!!!!!!!!!
!
!
!
!!
!
!
!!!!!!!!
!
!
!!!!!!!!!!!!!!!!!!!!!!!!!!!!!!!!!!!!!!!!!!!!!!!
!!!!!!!!!! !!! !!
!!! ! !!!
!! !!!!
! !!!!!!!!!!!!! !!! !!!!!!!!
! !!! !!! !!! !
!
! !!!!! ! !!!!!
!!
! !!! !!!!! !! !!!! !!
!!
!!!!!
!!!!!!
!
!!!
!
!!!!!!!!! !!!!!!!!!!!!!!!!! !!!!!!!!! !! !!! !!! !
!
!!! !!!
! !!!!!!!!
!! !!!!
! !! !!!
!
!! !!! !!!
!!! !! !! ! !!!!!!!!! !!!!!!! !!!!!!
!!! ! !! !!!
!! !! !!!!!!!!! !! !! !!!!!!!! ! !!!! !!!!! !!! !!!!!!!! !!
!!
! !! !!! !!!!! !!!! !! !! !!
!
! !!! !! !!
!
! !!! !!! !!!!! ! !! !! !!!!!!! !! !! !!!!!!!!!! !!!!!!
!!!!! !!!! !! !!!!! !
!
!!!!!! !!! !!!!!!! !!!! !!
! !!!
!
!!!!!!
!
!!!! !!
!
!!
!
!!
!!!!!! ! !
!
!!!!!! ! !!!!!!!!!!!!!!!!!!!!!!!!!!!!!!!!!!!!!!!!!!!!!!! !!!!!!!!!!!!!!!!!! !!!!! ! ! !!! !! !! !!!! !!!! !!!
!!!!!!
!
!!
!
!!!!!!! !
!! !!!!!!!!!!
!
!!! !!!!!!!!!!!!!!
!
!
!! !!! ! !
!
!!!!!
!!!!!!!!!!!!!!!!
!!! !!!! !!!! !!!!!! !!! !!!! !
!!!!! !!! !!! !!!! !! ! !! !! !!!!!! !! !!!!!! ! !!!! ! ! !! !!!!! !! !!! !! ! !! !! !! !!! !!! !!!!!!!! !! !!! !!! !! !! ! !!! ! !! ! !!! !!!!!!!!!!!!!
!!!!
!!!! !!! ! !! !! !!! !! !!!
!!! !! ! !! !!!! !!!! ! !!!! !!
!! !! !!! !
!!!
!!! !
!
! !! ! !!! ! ! !!!! ! !! !! !!!!! !!
! ! !!!! ! ! ! !!
!
!!!!! !!
!!!!!!!!
!!
!!! !!! !! !! !!! !!! !!!!!!!!! !
! !!
! !!! ! !! !! !!
!!
!! !!!!!! ! !
!
!!! !!!! !
!
! !!!! ! !! !! !!!! !!! !
!!
!!!!! ! !
!!!!!
!
!!!! !!!!! !!
!!!!!! ! !! !!! !!!!!
! !!
!
!! !! !! !! !! !!! !!!!! !!
!! !!!! !! ! ! !!!!!
!
! ! !!! !! !!!!! !!! !!!!
!!! !!
!
!!!! !!!!! !! !!!!!!!! !!!!! !!!!! !! !!! !!!! ! !! !! !!!! !
!! !!!
!! !! ! !!
!!!
! !!!! !!! !! !!!! ! !!!!!!! !! !
! ! !! !!!! ! ! !!!! !! !! !! ! !!!! !!! !! !!! !! !! !!! !!! !!! ! !!!!!!!! ! ! !! !!! ! !!! !!! !! !!! ! !!!! ! !!!! !! ! !!!
!!!!!!! ! !!! ! !!! !!! ! !!! !
!
!!!!!!! !!! !!! !! ! !!
!
!!! ! !!!!!! ! !! !! !!!
!!!!! !!!!!!!!!!!!!!!
!! !!! !! ! !!!!!!! !!!!!!!!!! !!!!!!!
!!
!
!!!!!!!!!! !! !! !! !!! !!!! ! !!!!!! !!
!
!! !!! !!! !!! !! !!!!!!!!! !!!! !!!!! !!!! ! !! !!!!!!!!
!!!!!!!! !!!!!!!!!! !!!! !! ! !!
!!! !!! !!!!! !
!! !
!
!!!!!!!!
!
!!!
!
!!
! !!! !! !! !
!
!! !!!!! !!! !!!!!
!!!!
!! ! !! !!!
! !!!! !!!! !!! !!! !!! !!!!!!
!!!
!
!!!!! !! !!!
!
! !!!! !!!!! !!! !! !
!
! ! !! !! !!! !!!!
!
!!!! !!!
!
!! ! !! !!!!!!! !
!
!!! !!!! !!!!!! !!!!
!!! !!
! ! !!!
!
!
!
!!! !!! ! !!!! !!! !! !!!! !!!! !! !!! !! !!!! !! !!! !!! !!!!! !!!!!! !! !!! !!!!!!!
! !!!! !!! !!! !!! !!! ! !!
!! ! !
!
!!
!
!!
!
!
!
! !!
!!
!
!
!
!!!
!!
!
!
!!!!!!!!
0 50 100
150
200
250
95%
!!!!!!!!!!!!!!!!!!! !!!
!
!!
!
!!!!!! !!!!!!!!!!!!! !
!
!!!!!!!
!
!!!
!!!! !!! !!!!!!!!!!!!!!!!!!!!!! !!!!!!!!!!
!
!!!!!!!!!!!!!!!!!!!!!!!!!!!!!!!!!!!!!!!!!!!!!! !!!!!!!!!!!!!!!
!
!
!!!!!!!!!
!
!!!! !!!!!!!!!!!!!!!!!!!!!!!!! !!!!!!
!
!!!!!!!!!!!!!!!!
!!!
!
!
!!
!!!!!! !!!!!!!!!!!!!!!!!!!!!! !!!!!!!!!!!!!!!!!!!!!!!!!!!!!!!!!!!!!!! !!! !!! !
!
!!! !! !! !!!!!!!!!! !!!
!
!
!!!!!
!
!!!!!!! !!! !!!!!!!!!!!!!!!!
!!!!!! !!!!!!!!! !!
!!!!
!! !!! !!!!!!!! !! !!!!!!!!!!!!!!! !!!!!!!!!!!!!!!! !!
!
!
! !! !!!!!!!! !!!! !! !!!!
!
! !!!!
!!!
!
!!!! !!!! !!!! ! !!
!
! !!!! !!!
!
! !!!!!
!
!!!!!! !!!!!!
!
!!!!!!!! !! !!!!!! !!!!!!! !!!!!!!!!!!!!! !!! !!! !!!!!!!
!
!!!!!!
!
!! !!
!
!!!!!!!
!
!
! !! !!!! !!!!!!!!!!!!!!!!!!!!!!!!!!!!!!!!!!!!!!!!!!!!!!! !!!!!!!!!!!!!!!!!!!! !!! ! !!!! !! !!!!!! ! !!! !!!
!!!!!!!!!!
!!!!!!! !!!!!!!!!!!!
! !
!!! !!!!!!!!!!!!!!!
!
!!!!!!
!
!!!!!!!!!!!!!!!!!!!!!!!
!! !!!!!!!!!!!!!!
!
!!!!!!!
!!!!! ! !!!!! !!!! !!! !! !! !!!!!! !!!!!!!!! !!!!! !!!!
!!!! !! !!! !! ! ! ! !! !! !! ! !!! !
!
!!!!!!!! !!! !!! !!!!! !!! !!! !!!! !!!!!!!!!!!!!!
!!! !!!! !!!
!!! !! !!! !! !!!
!
!! !! ! !! !!!!!!!!!!!!! !!!
!!! !!! ! !!!
!!! !!
!!!! !!! ! !!!!! !!!!!!!!!! !!! ! !!!! !!! !!
!
!!!!!!
! !!!!!!!! !! !!! !!! !! !! !!!!!! !!!!!!!!! ! ! !!! !!! !!!!! !!! !!! !! ! !!! !! !!!!!!!!!
!
! !!!!! !! !! !!!!!! !!
! !!
!!!! ! !!!!!!!
!!
!! !!!!! !
!
!!!!!! ! !! !!!!
!!!!
! !! !!! !!!! !! !! !!! !!!!! ! !!!!
!!! !! ! ! !!!!!!
!! !!! !!!!!!! !!! !!! !!!! !!
!
!!!! !! !!!!! ! !!!!! !! !!!!!!!!!! !! !!! !!!! ! !! !! !!!! ! !! !!!
!! !! ! !!!!!
! !!!! !!! !! !!!! !!!!!!!! ! !!! ! !! !!!! !
!
!!!! !!!!!! ! !!!! !!! !!!
!! !! !!!!!!!! !!! !!
!!!!!!! !!!
! !!! !!!
! !!!!
!!!!! !!!! ! !!!!!!!!
!!
!!!!!!! !!
!
! !
!
!!
!
!!! !!! !!!!!!!!!!
!! !!!!!! !!
!
!!!! !!!!!!!!! !! ! !
!
!!!!! !!!!!!!!!!!!!!!
!!!!
! !! !!!!!!!!!!!!!!!!!!!
!!!
!!!
!
!
!
!!!!!!!!!!!!
!
!
!
!! !!
!!!! !
!!!!!!
!!
!!!
!!!
!!
!! !!!!
!!!!!!!!! !!!! !!!!! !!!! !!!!!!!!!!!
!!!!!!!!
!
!!!!!!!!! !!!! !! !!
! !!!!
!!!!!!!!!!!!!!!!
!!!!!!!! !!!!!!!!! !! !!!! !!!!!
!
!! !!!
!!!!!!!! ! !! !! !! !!!! !!!!!!!!!! !!
!!!!!! !!!!!
! !!!! !! !!! !! ! !!! ! !!!! !!! !! !!! ! !! !! !!! !!!!!
!!!! !!!!!!
!!!
!!!!!!! !!
!
!!
!!!! !!!!!! !!!
!
!!! !!
! !!
!!
!
!
!
!
!! ! !! ! !
!!
!!
!! !! !! !! !! !! !! !!! !! !!!! !!! !! !!! !!!!! !!!!!! !! ! !!!!!!!!!
! !!!! !!! !!!
!
!! !!! !
!!
!!
!
!
!
!
!
! !
!
!
!
!
!!!
!!
!
!
!
!
!
!!!
!
!
!!!!!!!!
0 50 100
150
Actinobacteria
Alphaproteobacteria
Bacilli
Betaproteobacteria
Gammaproteobacteria
Lactobacilli
Spirochaetes
Unassigned
r2 = 0.35 p-value < 2.2e-16
r2 = 0.40 p-value < 2.2e-16
r2 = 0.46 p-value < 2.2e-16
r2 = 0.52 p-value < 2.2e-16
r2 = 0.39 p-value < 2.2e-16
r2 = 0.28 p-value = 8.9e-16
r2 = 0.18 p-value = 6.6e-14
r2 = 0.35 p-value = 1.8e-6
r2 = 0.81 p-value < 2.2e-16
r2 = 0.17 p-value = 1.4e-10
r2 = 0.36 p-value < 2.2e-16
r2 = 0.67 p-value < 2.2e-16
r2 = 0.13 p-value < 2.2e-16
r2 = 0.33 p-value < 2.2e-16
r2 = 0.1 p-value = 8.2e-2
r2 = 0.41 p-value = 9.0e-8
at Biblioteca di Scienze, U
niversit? degli studi di Firenze on January 11, 2012http://m
be.oxfordjournals.org/D
ownloaded from

563 Figure 4: 564
The phylogenetic class distribution of the disconnected plasmids in the data set.A plus sign 565
(+) is used to mark the inter-class transfers that were more abundant than expected by random 566
assignment of the transfer events between plasmids (permutation test, p-value < 1e-4). A 567
minus sign (-) is used to mark the inter-class transfers that were less abundant than expected 568
by random assignment of the transfer events between plasmids (permutation test, p-value < 569
1e-4). 570
571
572
Percentage
AcaryochlorisActinobacteridae
AlphaproteobacteriaAquificales
ArchaeoglobiBacillalesBacteria
BacteroidiaBangiophyceae
BetaproteobacteriaChlamydiales
ChlorobiaChroococcales
ClostridiaCytophagia
DeferribacteralesDeinococci
DeltaproteobacteriaDikarya
EpsilonproteobacteriaErysipelotrichiFlavobacteria
FlorideophyceaeFusobacteriales
GammaproteobacteriaHalobacteria
HerpetosiphonalesLactobacillales
MethanobacteriaMethanococci
MethanomicrobiaMollicutes
MycetozoaNitrospirales
NostocalesOscillatoriales
PlanctomycetaciaSatellite Nucleic Acids
SchizopyrenidaSphingobacteria
SpirochaetalesStreptophytaThermococci
ThermomicrobialesThermoplasmata
ThermoproteiThermotogales
Unassigned
General
5% 10%
15%
Resistance
5% 10%
15%
Virulence
5% 10%
15%
Identity70%95%
!"
!"
!"!"
!"
!"
!"
!"
!"!"!"!"
!"!"
!"!"
!"
!"!"!"!"
!" !"!"
!"!"!"!"
!"
!"!"!"!"
!"!"
!"!"
!"
!"!"
!"!"
!"
!" !"!"
!"!"!"
!"
!"!"
!"
!"!"
!"!"
!"
!"!"
!"!"
at Biblioteca di Scienze, U
niversit? degli studi di Firenze on January 11, 2012http://m
be.oxfordjournals.org/D
ownloaded from

572 Figure 5. 573
Dependency of plasmid betweenness from plasmid degree for the major networks built in this 574
work according to Pearson’s product moment correlation coefficient. Networks of < 5 and >= 575
5 connections are indicated as Low and High, respectively. 576
577
578
Degree
Betweenness
0
1000
2000
3000
4000
5000
6000
0
500
1000
1500
2000
High
! !!!!!!!!!!!!!!!!! ! !! !!!!! !!!! !! !!!!
!!!! !! ! ! !
!
!!
!!
!! !! !! !!
!
!
!
! !!!!
!
!!!
!
! !!!
!
! !!
!
!!! !!!!
! !!! !!!!! !!
!
!
!
! !
!
!
! !
!
! !!!!! !!!!!!
!
! !!! !!!
! !
!!!!!!!
!
!!!!!
!
!
!
! !
!
!
!
!!
!
!!! !!
!
!
!
!! !!
!
! !!!!!
!
!!
!
!!
!!
!
!
!
!!
!
!!!
!
!
!
!! ! !
!
!!
!!!
!
!!!!!!! !!
!
!
!!
!!!
!
!
!!!!!!!!!! !!! !
!
!
!
!
!
!!!! ! !
!
!!!!!!!!!!!
!
!!
!
!
!!
!!!!!!!
!
!
!!!! ! ! !
!
!!!!!! !!!!
!
!
!
!
!!!
!!
!
!
!
!
!!!!!
!! !!! !
!
!!
!
!
! !!
!
! !!!
!!
!
!!
!
!
!
!
!
!
!!
!
!
!!
! !! !
!
!! !! !!
!
!
!
!
!
!
!
!
!
!! !!!
!
!
!
! !!!
!
!
!
!!
!
! !
!
!! !!!
!
! !!
!
!
!!!
!
!
!
!!!
!!
!! !
!
!!
!
!!!!!!!!
!
!! ! !!!!
!
!
!
!!!!!
!!!!!!! !!!!!
!
!
!!!! !! !!
!
!!!!
!
!
!
! !!!
!
!
!
!
!
!!!
!!
!
! !!! !
!
!
!!!!
!! !!
!
!
!
!! !!!!
!
!
!!
!
!
!!! !!! !
!
!
!
!
!
!
!
!!
!
!
! !!
!
!!!!! !!
!!! !! !!! !!!!!!!!
!!
!
!!! !
!
!
!!!!! !!!
!!! !
!
! !! !!!
!!
!
!
!
!
!
!!! !! !!! ! ! !
!
! ! !!!
!!!!! !!!!
!
!! !!!!
!
!!!!! !
!
!
!
!!!
!!!!
!
! !!
!
!! !!! !!! !!! !!! ! ! !!
!! !!! !!! !!
!
!
!!!
!!! !!!
!!
!! !!!
!
!!!! !!!!!!
!
! !!! !!! !!!!
!
!! !! !!! !! !!!! !! !
!
!! !!
!
!
!
!
!
!!!!! ! !!!
!!
!!!
!
! !
!
!
!!
!
!!
!!!
!
! ! !! !!!
!
!
! !
!!! !! !! ! !! !
!
!
!
!!! !!
!
!!!! !!
!
!!
!
!!!
! ! !!!!! !! ! !!!!!!!!! !!!!!! !!!!!!!!!!!!!!!!! !!! !! !! !!!!!!!!!!! !!!!!!!!!! !!!!!!!!!!!!!!!!!!!!!!! !!!!!!!!!!!!!!!!!!!!!!!!!!!!!!!!!!!!!!!!!!! !! !!!!!!!!
!! !!!!!!!!!!!!!! !! !!!! !!!!!!!!! !! !!
!
!!! !!! !! !! !!!!!!!
!
!
!
! !!!!!!!!!!!!
!!!! !!!!!!
!!
!
! !!!! !!!!
!!!!!!!!!
!
!!!!
!!!!!
!
!
!
!!
!
!
!
!
!
!
!! !
!
!! !!
!
! !!!
!
!!!
!
!
!
!!
!
!
!
! !!
!
!!!!
!
!
!
!!!!!!
!!!
!
!!
!!!!
!
!!!!! !
!
!
!
!!!!!!!
!
!!!!!
!!
!
!!!
!
!!!!!!! !!
!
!
!!!! !!!
!
!!!!
!
!
!
!
!
!!!!!!! !
!
! !
!
!
!
!
!!!!!
!
!!
!
!
!!!!!! !!
!
!! !!!
!
!
!
!!! !
!
!
!
!
! !
!
! !!
!!
!
!
!!!!!!
!
!
!
!!!
!
! !! !
!
!
!
!
!!!!!
!
!
!! ! !!
!
!
!
!!
!
!!!!!!!!!
!
! !!!
!!
!
!
!
!!!
!
! !! !! !!
!
!
!
!
! !
!
!
!
!!!!
!
!!!
!
!!!!! !!!!!!
!
!
! !
!
!!!!!!!!!!!!!
!!!!
!!!!
!
! !!
!!
!! !! !!!!
!
!
!
!
!
!!! !!! !
!
!
!! ! !!!!!! !!!! !
!
!!!
!! !
!
!!!!!
!
!!!!
!! !! !!!! !! !!!!!!!! !!!!!!
! !!!!
!!!!!
!
!!!!!!!!
!
!!! !!! !!! ! !!!! !! !!! !! !! !
!
!!
!!!
!!!! !!!
!
!
!!
!
!!!!! !! !!!
!
!
!
! !! ! !
!
!!!!! !!
!
!!!!! !!
!! !! !!!!!! !!! !!!!!!!! !! ! !! !!!! !!!!! ! !!!!!!!!! !!!!!!!!!!!!!!!!!!!!!!!!!!!!!!!!!!!!!!!!!!!!!!!!!!!!!!!!!!!!!!!!!!!!!!!!!!!!!!! !!!!!!!!!!!!!!!!!!!!!!!!!!!!!!!!!
50 100
150
Low
!!!! ! !! !!!! !!! !! !!! !!! !!! !!!!! !! ! !! !!! ! !!!
! !!! !!!! !! ! !! !!!!
! ! !!! !!! !!
!
!
!! !!! ! !!!
!
! !
!
! !!
!
!!
!! !!!!!! ! ! !!!
!
!
!! ! !
!
!!
!
!
!
! ! !!
!!
!
!
!!!
!!!!!
!!
!
!
!
!
! !
!
!!
!
!
!
!!!!
!
!!! ! !! !!!!
!
!!
!
!
!!
! !
!
!!
!!
!! !!!!
!
!! !
!
!
!
!
! !
!
!!
!
!! !!
!
!
!
!!
!!
!!!
!
!
!
!
!
!
!
!!!!
!
!!!!
!!
!
!
!! !!! !
!
!
!
!
! !
!
!
! !
!
! !
!
!
!
!
!
!
! !! !
!
!
!!!
!
!!!
!
!
!
!
!! !!!
!!
!!
!
!!! !
!
!!
!
!
!
!
!!! !
!
!
!
!!!!!!!!!
!
!!!! !
!
!
!
!
!
! !!! !
!!
!
!!!
!
!
!
!
!
!!
!
! !
!
!
!
!!
!!
!
!!
!
! !!! !!! !!!
!
!
!
!
!!
!
!! !
!!
!
!!
!
!!
!
!
!!
!!
!!
!
!
!
!
!
!
!!!!
!!
!!
!
!!!!
!
!
!
!
!
!
!
! !
!
!
!!
!
!
!
!
!
!
!
!
!
!!
!
!!!!!
!
!
! !!
!
!!
!!
!
!!! !
!
!
!! !!
!
!
!
!!
!
!
!!!!
!
!
!
!
!
!
!
!
!
!
!
!
!
!!
!
!
!
!!
!
!
!
!
!!
!
!
! !
!!
!
!
!! !
!
!!
!
!
!
!
!!!!!!!
!
!
!
!
!
! !
!
!
!
!
!
!
!
!
!!!
!
!
!
!
!
!
!
!
!
!!
!
!
!
!
!
!
!!!!!!!! !!!
!!
!
!
!!
!
!!
!
!
!
!
!
!
!
!!
!!
!!
!
!
!
!
!!
!
!!
!
!! !!
!
!
!
!
!
!
!
!!
!
!
!
!!
!
!
!
!
!!
!!
!!
!
!
!
!!
!
!
!
!
!!!
!
!
!
!
!!
!
!
!
!
!
!
!
!
!
!
!
!!
!
!
!
!
!
!
!! !!
!
!
!!!
!! !!
!!!!
!
!! !
!
!!
!
!!!!
!
!
!
!
!
!!! !
!
! !!
!
!
! !! !!
!
!
!
! !
!
!
!
!
!!
!!
!
!
!
!
!
!
!
!
!!! ! !!
!
!
!
!!
!!
!
! !!! !!! !! ! !
!!
!
!! !!
!
!!
!
!!!
!
!
!!
!
!
!
!
!
!
!!
!
! !! !!!
!
!!
!
!
!
!
!
!!
!
!!!!
!
! !!
!
!!! !!!!!! !
!
!!!!!
!
!! !
!
! !
!
!
!
!!
!!
!!!
!!!
!
!
!!! !!!!
!
!
!!!!
!
!!
!
! !
! !
!
!!
!
!!
!
!
!!
!
!!
!
!
!
! !
!
!
! !
!
!
!
!
!
! !
!
!
!
!
!
!!
!
!
!
!
!
! !!
!
!!
!
!
!
!
!
!!
!
!
!
!!
!
!!
!!!
!
!!
!
!
!
!
! ! !
!
!!
!
!
!!!!!
!
! !!!
! !!!!!! !!!!!!!! !! !!!!!!!! !! !!! !!!!!!!! !!! !! !! !!! !!!!! !!! !! !!!! !!!!! !!!!!!!!!!! !!!!!!! !!!!!!!!!!!!!!!!!!!!!!!!!!!!!!!!!!!! !!!!!!!!!! !!!!!!!!!!!!!! !!!!!!!!!!!!!!!!!! !!!!!!!!!!
!!! !!!!!! !!! !!! !!!!! !! !!! !! !!!! !!!!
!! !! !!! !!!! !! !
!
!!
!!
!
!!! !
! !!!
!
!
!!!!! !! !!!!!!!!!! !
!
! !!! !!!
!!!
!!
!
!!
!
!
!
!
!
!
! !
!
!!!!!!!!! !
!
!!! !!!!
!
!!
!
!!!!!
!
!
!! !!!
!
!
! !
!
!
!
!
!!!
!
! !!
!
!
!
!!!
!
!
!
!
!
!
!
! !
!
!!
!
!
!
!
! !
!
!!!
!
!
!!
!
!
!
! ! !!
!
!!!
!
!!!!
!
!!
!!
!
!
!!!!!!!!!!!
!
!
!
!
!
!
!
!
!
!!! !!!
!
! !
!!
!
!
!
!
!
!!!! !!!!! !!
!
!!!!
! !!
!!!
!
!!!!
!
!
!
!!
!
!
!!
!!!!!!!!!! !!
!
!
!
!
!
!!
!
!
! !!
!
!
!
!!!!!!
!
!
!
!
!!
!
!!!
!
!
!
!!
!!!!
!!!
!!
!
!
!
!
! !
!
!
!!
!
!
!
!
!
!
!
!
!!
!
!
!
!
!!!!
!
!
!
!
!!
!
!
!
!
!
!!!
!
!
!!
!
!! !
!
!!
!
!
!!!!!!!
!
!
!!
!
!
!
!
!
!!
!
!
!
!
!!
!
!!
!!! !
!
!
!
!
!
!
!
!!
!
!
!!
!
!
!
!
!
!
!
!
!
!
!!
!
!
!
!
!!
!
!
!
!
!
!
!
!! !!!!!!!!!! !!!!!
!
!
!
!
!
!!!
!
!
!!
!!
!
!
!
!
!
!!
!!!
!!
!
!
!
!
!
!!! ! !!!
!! !!! !
!!!!!! !!! !
!
!!!! !! !
!
!!!
!!
!!!!
! !! !!! !!!!!!!! !!!
!!!!! !
!
! !!
! !!!
!! !! ! !!!
!! !!!!
!
!
!
!
!!
!
!
!
!!
!
!
! !!
!
!!
!
!
!
!
!
!
!
!
!
!
!
!
!
!
!
!
!
!
!
!!!
!!
!
!!
!
!!!!!!!!! ! ! !!! ! !!! ! !!!!!!!!!!!! !!!!!!! ! !!!!!! !!!!!!!!!!! !!!!!!!!!! !!!!!!!!!!! !! !!!!!! !!!!!!!!!!!!!!!!!!!!!!!!!!!!!! !! !!!! !!!!!!!! !!!!!!!!!!!!!!!!!!!!!!!!!!!!!!!!!!!!!!!!!!!!!!!!!!
20 40 60 80 100
Resistance
!!!! !! ! !!! !! !!!! !!! !! ! !!! !! !! !!!!! !!! ! !!! !! !!!! !!!! !!
!
!!!! !!!!!
!!!
!
!!
!
!!
!
!
! !!!!
! !!!
!!
!
!
! ! !! !
!! !!
!
!! !!
! !!! !!! !!! !!
! !
!
!
!
!!!! !!!!! !!!!!!!!
!
! !!!!
!
!!!!!!!!!! !! !!! !!!! !!! !! !!!!! !!! !!! !
!! ! !!!! !!!!!
!
!!
!!
!!!! ! !!!!!
!!!! !
!
! !!! !!! ! !!!
!
!
!! !!!
!
!! !!! !!
!
!!!!
!
!!
!!!
!
!! !! !!!!!
!!! !!
!
!
!
! !! !!! ! !!!! !!
!
!
!
!! !! !! !!
! !!
! !!!!
!
!! !! !!!
! !! !!
!
!
!
!
!!! !! ! !! !
!!
!!
!
!!! !!!! ! !! !!!!!
!!! !!
!! ! ! !!! !!!!! ! !! !!!!! !!!! !! !!!!!!!!!!! !!!!! !!!!!!!!!!!!!!!!!!!!!
!!!!!! !!! !!!! ! !! !! ! !!! !! ! !!!!! !!!!!! !!!!! !!
!
!
!
!!!
! !!!!
!
!
!
!!
!
!!
!
!
!!
!
!
! !!
!
! !
!
!
! !!!
!
! !!!!! !
!
!!!
!
!
!!! !
!
! !
!
!
!
!!!! !!!!! !!!!!!!!
!
! !!!!
!
!!!!!!! ! !! !!!!!
! !!!!!!
!!!!!!
!
! ! !!! !!!!!
!
!
!
!
!!!
!!!! !!!
! !
!
!
!
!! !!!!
!
!
!
!
!! !!!
!
!! !! !!
!
!!
!!
!
!
!
!
!
!! !
!!
!
!
!! !
!
!
!
!!
! !!!! !!!
!
!
!
!
!! !!!!! !
!
! !!
!
!
!
!! !!
!
!!
!!
!
!!
!
!!!
!
! !
!
!
!!
!
!! !!!! !!
! !! !!
!
!!
!
!! !!!!! ! !! !!!!!!! !!!!! !!!!!!!!!!!!!!! !!!!!! !!!!!!!!!!!!!!!
20 40 60 80 100120
Virulence
!! ! !!!! ! ! !!!!!!
! !!! !!! !!!
!! !!! !! !!
!
! !! !!! !!!!! !!!
!!!!!!! ! !!! !! ! !!!
!!! !
!
! !!
!
! !!!!
!
! !!! !
!
! !!! ! ! !! !! ! !!! !!! !!!
! !!
!
! !! ! !!
! !!!!!!! !
!
!! !
!
!
!
!!!! ! !!
!
!
!! !! !!
!
!
!
!!!
!
! ! !!!!! !!!! !
!
!
!
! !!! !
!
! !!!
!
!!!!!
!
!!
! !!
!
!!! !! !
!
!
!!
!! !!!!!!!
!
!
!!!! !!
!
!
!
!! !!! !
!
!!!
! !!!
!
!!! !!!!
!
!
! ! !!!! !!!
!! !!! !! !!
!
!
!!
!!! !! !! ! !! !
!
! !!! !!! !! !! !!
!
!
!!!! !!!! !!!!!
! !!
!!
!
!!
!!! ! !!!!! !!!!!!!!!!!! !
!
!!!!!!!
! !
!
! !!!!
!
!! !! ! !!! !!
!!
!
!! !
!
!!!!!
!! !
!
!
!
!!
!
!!
!
!!!
! !
!!!
!!!
!
!!! !!!!!!! ! !!!! ! !!! ! !!! !! !!!! !!!!!! !!!!!!! ! !!!!!!!!! !!!!!!!!!!!!!!!! !!!!!!!!
!! !! !! !!!
!!
!
!!!! ! !! !!!! !! !! !!!!!!! !!!!!!! !!!!! ! !! !!! !!!
!!! !!! !
!
!!!!!
!!!! !! !!! !!!!!! !! !!!
!
!!! ! !!!!! !! !!!!
!
!
! ! !!
!!
!!!!!!! !!!!!! !! !!!!! ! !!
! ! !!!!! !!!
!! !! !! !!!!
!!! !!!
!!
!!! !!
!
! ! !!!! !! !
! !!!!! !!
!
!!! ! !!
!
!!!!! !!!!
! !!
!!!! ! !! !!!
!!!!! !!! !!
!!!!! !! !!!
!!!! !! !! !!!!!!!!!!
!
!
!!!!!!!!!!!! ! !!!!
!!!
!!!! !!
!!
! !! !! !!!!!!! !!! !! ! !!!!!!! ! !!!! ! !! !!!!!! !!!!!!!! ! !!!! !!!!!!!!!! !!!!! !!!!!!!!!!!!!!!!! !!!!! !!!!!! ! !!!!!
10 20 30 40 50 60 70
7095
r2 = 0.25 p-value < 2.2e-16
r2 = 0.44 p-value < 2.2e-16
r2 = 0.36 p-value < 2.2e-16
r2 = 0.31 p-value < 2.2e-16
r2 = 0.25 p-value < 2.2e-16
r2 = 0.32 p-value < 2.2e-16
r2 = 0.35 p-value < 2.2e-16
r2 = 0.30 p-value < 2.2e-16
at Biblioteca di Scienze, U
niversit? degli studi di Firenze on January 11, 2012http://m
be.oxfordjournals.org/D
ownloaded from

578 Figure 6. 579
The relationship between the network centrality measures and plasmid mobility. The mobile 580
plasmids are significantly more central in the networksof all and resistance genes, as indicated 581
by the p-values (calculated with Mann-Whitney tests) embedded in the figure. 582
583
584
Mobility
50
100
150
0
200
400
600
800
All sequences
!
!
!
!
!!
!
!
!!
!
!
!
!!
!
!
!!
!
!!
!!
!!!
!
!!
!!
!
!
!
!
!!
!
!
!
!
!!!
!
!
!
!
!
!
!
!
!
!
!!
!
!!
!
!
!
!
!
!
!
!
!
!
!
!
!
!!!
!
!
!
!
!
!
!
!
!
!
!
!
!
!
!
!
!
!
!
!
!!!!!
!
!
!!
!!
!
!!
!
!
!!
!
!!
!
!!
!!!
!
!
!!
!
!!
!
!!
!!
!
!!
!
!
!
!
!
!
!
!
!
!
!
!!
!!
!
!
!!
!
!
!
!
!
!
!!
!
!
!
!!
!
!
!
!
!
!
!
!
!!
!!
!
!
!
!
!
!
!
!
!
!
!
!
!
!
!
!
!
!
!
!
!!
!
!
!
!
!!
!
!
!
!!!!
!
!
!
!
!
!
!
!
!
!!!
!
!
!!
!
!!
!
!
!
!
!!
!
!!
!
!
!!
!
!!
!
!
!!
!!!
!!!!!
!
!!!
!!!!!
!
!
!
!
!
!
!
!
!
!
!
!!
!
!
!
!
!
!
!!
!!
!
!
!
!
!
!
!
!
!
!
!
!!
!
!!
!
!
!
!
!!!
!!
!
!
!
!
!
!
!
!!
!
!
!
!
!
!
!
!
!
!
!
!
!!!
!
!!!
!
!
!
!!
!
!!
!
!
!
!
!
!
!
!!
!!
!
!
!
!
!
!
!
!
!
!
!
!
!
!
!
!
!
!
!
!!!!
!
!
!
!
!
!
!
!!!!!!!!!!!
Mobile Non−mobile
Resistance
!!
!
!!
!!
!
!!
!!!
!
!
!!!
!
!
!
!!
!
!!!
!!
!
!
!
!
!
!
!!!!
!
!!
!!
!
!!
!!
!
!
!
!
Mobile Non−mobile
Virulence
!!!!!!
!!!!
!
!
!!!!
!
!!!
!
!!
!!
!
!
!!!!!!!
!!
!
!!
!
!
!
!!
!
!
!
!
!
!
!
!
!
!
!
!
!
!
!
!
!
!!
!
!
!
!!
!
!!!!!
!!
!
!
!!
!
!
!
!
!
!!!
!!
!!!!
!
!
!
!!!
!
!
!
!!
!
!!!
!
!!!!!!!!
!!!!!!!!!!!!!
!
!!!!!!
!
!!!
!
!!!!!
Mobile Non−mobile
Degree
Betweenness
Similarity70%95%
70% p-value 8.8e-16 95% p-value 4.8e-6
70% p-value 5.2e-3 95% p-value 1.7e-3
70% p-value 6.2e-1 95% p-value 2.1e-1
70% p-value 3.3e-19 95% p-value 1.5e-6
70% p-value 7.9e-3 95% p-value 4.9e-2
70% p-value 1.7e-1 95% p-value 2.9e-1
at Biblioteca di Scienze, U
niversit? degli studi di Firenze on January 11, 2012http://m
be.oxfordjournals.org/D
ownloaded from

584 Figure 7 585
The frequency of inter-class gene transfer events in the networks. A plus sign (+) is used to 586
mark the inter-class transfers that were more abundant than expected by random assignment 587
of the transfer events between plasmids (permutation test, p-value < 1e-4). A minus sign (-) is 588
used to mark the inter-class transfers that were less abundant than expected by random 589
assignment of the transfer events between plasmids (permutation test, p-value < 1e-4). 590
591
592
Acaryochloris−ChroococcalesActinobacteridae−AlphaproteobacteriaActinobacteridae−BetaproteobacteriaActinobacteridae−Deltaproteobacteria
Actinobacteridae−GammaproteobacteriaActinobacteridae−Halobacteria
Actinobacteridae−LactobacillalesActinobacteridae−NitrospiralesAlphaproteobacteria−Bacillales
Alphaproteobacteria−BetaproteobacteriaAlphaproteobacteria−Chroococcales
Alphaproteobacteria−DeinococciAlphaproteobacteria−Deltaproteobacteria
Alphaproteobacteria−GammaproteobacteriaAlphaproteobacteria−Nitrospirales
Alphaproteobacteria−NostocalesBacillales−Betaproteobacteria
Bacillales−ClostridiaBacillales−Deltaproteobacteria
Bacillales−GammaproteobacteriaBacillales−Halobacteria
Bacillales−LactobacillalesBacillales−Thermomicrobiales
Bacteria−GammaproteobacteriaBetaproteobacteria−Deinococci
Betaproteobacteria−DeltaproteobacteriaBetaproteobacteria−Gammaproteobacteria
Betaproteobacteria−NitrospiralesChroococcales−Gammaproteobacteria
Chroococcales−NostocalesDeinococci−Gammaproteobacteria
Deinococci−ThermomicrobialesDeltaproteobacteria−Gammaproteobacteria
Deltaproteobacteria−NitrospiralesGammaproteobacteria−Lactobacillales
Gammaproteobacteria−NitrospiralesNostocales−Thermomicrobiales
All sequences
0 100200300400500600
Resistance0 100200300400500600
Virulence
0 100200300400500600
Identity70%95%
Frequency
!"
!"
!"
!"!"!"!"
!"!" !"
!"
!"
!" !"
!"
!"!"
!"!"
!"
!" !"
!"
!"!"
!"
!"
!"
at Biblioteca di Scienze, U
niversit? degli studi di Firenze on January 11, 2012http://m
be.oxfordjournals.org/D
ownloaded from

592 Figure 8 593
COG functional annotation of the genes shared by the plasmids belonging to the different 594
taxonomical classes of the dataset. 595
596
597
Acaryochloris−ChroococcalesActinobacteridae−AlphaproteobacteriaActinobacteridae−BetaproteobacteriaActinobacteridae−Deltaproteobacteria
Actinobacteridae−GammaproteobacteriaActinobacteridae−Halobacteria
Actinobacteridae−LactobacillalesActinobacteridae−NitrospiralesAlphaproteobacteria−Bacillales
Alphaproteobacteria−BetaproteobacteriaAlphaproteobacteria−Chroococcales
Alphaproteobacteria−DeinococciAlphaproteobacteria−Deltaproteobacteria
Alphaproteobacteria−GammaproteobacteriaAlphaproteobacteria−Nitrospirales
Alphaproteobacteria−NostocalesBacillales−Betaproteobacteria
Bacillales−ClostridiaBacillales−Deltaproteobacteria
Bacillales−GammaproteobacteriaBacillales−Halobacteria
Bacillales−LactobacillalesBacillales−Thermomicrobiales
Bacteria−GammaproteobacteriaBetaproteobacteria−Deinococci
Betaproteobacteria−DeltaproteobacteriaBetaproteobacteria−Gammaproteobacteria
Betaproteobacteria−NitrospiralesChroococcales−Gammaproteobacteria
Chroococcales−NostocalesDeinococci−Gammaproteobacteria
Deinococci−ThermomicrobialesDeltaproteobacteria−Gammaproteobacteria
Deltaproteobacteria−NitrospiralesGammaproteobacteria−Lactobacillales
Gammaproteobacteria−NitrospiralesNostocales−Thermomicrobiales
Actinobacteridae−AlphaproteobacteriaActinobacteridae−Betaproteobacteria
Actinobacteridae−GammaproteobacteriaActinobacteridae−Lactobacillales
Alphaproteobacteria−BetaproteobacteriaAlphaproteobacteria−Gammaproteobacteria
Bacillales−GammaproteobacteriaBacillales−Lactobacillales
Betaproteobacteria−GammaproteobacteriaDeltaproteobacteria−Gammaproteobacteria
Gammaproteobacteria−Lactobacillales[C] Energy production and conversion
[D] Cell cycle control, cell division, chromosom
e partitioning
[E] Amino acid transport and m
etabolism
[F] Nucleotide transport and metabolism
[G] Carbohydrate transport and m
etabolism
[H] Coenzyme transport and m
etabolism
[I] Lipid transport and metabolism
[J] Translation, ribosomal structure and biogenesis
[K] Transcription
[L] Replication, recombination and repair
[M] Cell wall/m
embrane/envelope biogenesis
[N] Cell motility
[O] Posttranslational m
odification, protein turnover, chaperones
[P] Inorganic ion transport and metabolism
[Q] Secondary m
etabolites biosynthesis, transport and catabolism
[R] General function prediction only
[S] Function unknown
[T] Signal transduction mechanism
s
no functional class
70%95%
Frequency
0
100
200
300
400
at Biblioteca di Scienze, U
niversit? degli studi di Firenze on January 11, 2012http://m
be.oxfordjournals.org/D
ownloaded from
597 Figure 9 598
An ideogram of gene transfers between Actinobacterial plasmids (accession numbers 599
NC_004939, NC_004945 and NC_014167) and Gammaproteobacterial plasmids (accession 600
numbers NC_006816, NC_009141, NC_009651, NC_010488, NC_010886 and NC_011092). 601
Gene transfer events are marked using the curves in the middle of the ideogram. GC content 602
of the plasmids is plotted on the outer side of the plasmid molecules if it is above the average 603
of the GC content of the corresponding plasmid. Genes related to resistance, conjugation and 604
transposition are marked as lines on outer, middle and innermost rings, respectively, on the 605
inner side of the plasmid ring. 606
607
608
at Biblioteca di Scienze, U
niversit? degli studi di Firenze on January 11, 2012http://m
be.oxfordjournals.org/D
ownloaded from

Supplemental Information: 608
Supplemental Information S1: Detailed information for the complete sequence dataset used 609
in this work. 610
Supplemental Information S2: Complete antibiotic resistance related sequence dataset used 611
in this work. 612
Supplemental Information S3: Complete virulence factors related sequence dataset used in 613
this work. 614
Supplemental Information S4: The overall Gephi-formatted networks built in this work. 615
Supplemental Information S5: Phylogenetic coherence for 70% and 95% network clusters 616
and COG functional categories of genes shared within the major clusters. For each plasmids 617
cluster we report a) phylogenetic network built with Splitstree using as input all the different 618
ML phylogenetic trees obtained from the alignments of all the gene families shared by the 619
different plasmids included int the cluster, b) phylogenetic networks obtained using as input 620
the gene families belonging to coherent groups as assessed by Conclustador and c) the COG 621
functional annotation of the shared sequence 622
Supplemental Information S6: Networks built with antiobiotic resistance (A and B) and 623
virulence (C and D) related sequences at 70% and 95% identity thresholds 624
Supplemental Information S7: Networks built lowering the threshold of gene sharing to 625
between 1 and 5 genes at A) 70% and B) 95% identity thresholds. In C) and D) the 626
phylogenetic class distribution of the disconnected plasmids and their inter-taxa connections 627
are also reported. 628
Supplemental Information S8: Phylogenetic distances of gene sharing between 629
Actinobacterial and Gammaproteobacterial plasmids. 630
Supplemental Information S9: GC contents of Actinobacterial and Gammaproteobacterial 631
plasmids and the transferred genes. 632
633
Acknowledgements 634
at Biblioteca di Scienze, U
niversit? degli studi di Firenze on January 11, 2012http://m
be.oxfordjournals.org/D
ownloaded from

The study was financially supported by the Academy of Finland (grant number 129873) and 635
the Finnish Graduate School in Environmental Science and Technology (EnSTe). MF is 636
financed by a post-doctoral grant from “Fondazione Adriano Buzzati-Traverso”. The authors 637
would like to thank Kimmo Mattila for his kind assistance in parallel BLAST analyses. 638
639
References 640 641 Altschul, SF, TL Madden, AA Schaffer, J Zhang, Z Zhang, W Miller, DJ Lipman. 1997. 642
Gapped BLAST and PSI-‐BLAST: a new generation of protein database search 643 programs. Nucleic Acids Res 25:3389-‐3402. 644
Baquero, F, JL Martinez, R Canton. 2008. Antibiotics and antibiotic resistance in water 645 environments. Curr Opin Biotechnol 19:260-‐265. 646
Bastian, M, S Heymann, M Jacomy. 2009. Gephi: An Open Source Software for Exploring 647 and Manipulating Networks. International AAAI Conference on Weblogs and 648 Social Media. 649
Bennett, PM. 2008. Plasmid encoded antibiotic resistance: acquisition and transfer of 650 antibiotic resistance genes in bacteria. Br J Pharmacol 153 Suppl 1:S347-‐357. 651
Blondel, VD, J Guillaume, R Lambiotte, E Lefebvre. 2008. Fast unfolding of communites in 652 large networks. Journal of Statistical Mechanics: Theory and Experiment P10008. 653
Bosi, E, R Fani, M Fondi. 2011. The mosaicism of plasmids revealed by atypical genes 654 detection and analysis. BMC Genomics 12:403. 655
Brilli, M, A Mengoni, M Fondi, M Bazzicalupo, P Lio, R Fani. 2008. Analysis of plasmid 656 genes by phylogenetic profiling and visualization of homology relationships using 657 Blast2Network. BMC Bioinformatics 9:551. 658
Brohee, S, K Faust, G Lima-‐Mendez, G Vanderstocken, J van Helden. 2008. Network 659 Analysis Tools: from biological networks to clusters and pathways. Nat Protoc 660 3:1616-‐1629. 661
Caryl, JA, AJ O'Neill. 2009. Complete nucleotide sequence of pGO1, the prototype 662 conjugative plasmid from the Staphylococci. Plasmid 62:35-‐38. 663
Chen, CY, GW Nace, B Solow, P Fratamico. 2007. Complete nucleotide sequences of 84.5-‐ 664 and 3.2-‐kb plasmids in the multi-‐antibiotic resistant Salmonella enterica serovar 665 Typhimurium U302 strain G8430. Plasmid 57:29-‐43. 666
Chen, L, J Yang, J Yu, Z Yao, L Sun, Y Shen, Q Jin. 2005. VFDB: a reference database for 667 bacterial virulence factors. Nucleic Acids Res 33:D325-‐328. 668
Cole, JR, B Chai, RJ Farris, Q Wang, AS Kulam-‐Syed-‐Mohideen, DM McGarrell, AM 669 Bandela, E Cardenas, GM Garrity, JM Tiedje. 2007. The ribosomal database project 670 (RDP-‐II): introducing myRDP space and quality controlled public data. Nucleic 671 Acids Res 35:D169-‐172. 672
Cole, JR, Q Wang, E Cardenas, et al. 2009. The Ribosomal Database Project: improved 673 alignments and new tools for rRNA analysis. Nucleic Acids Res 37:D141-‐145. 674
Crosa, JH, LK Luttropp, S Falkow. 1975. Nature of R-‐factor replication in the presence of 675 chloramphenicol. Proc Natl Acad Sci U S A 72:654-‐658. 676
Csardi, GN, T. 2006. The igraph software package for complex network research. 677 InterJournal Complex Systems. 678
at Biblioteca di Scienze, U
niversit? degli studi di Firenze on January 11, 2012http://m
be.oxfordjournals.org/D
ownloaded from

Dagan, T, Y Artzy-‐Randrup, W Martin. 2008. Modular networks and cumulative impact of 679 lateral transfer in prokaryote genome evolution. Proc Natl Acad Sci U S A 680 105:10039-‐10044. 681
Dagan, T, W Martin. 2009. Getting a better picture of microbial evolution en route to a 682 network of genomes. Philos Trans R Soc Lond B Biol Sci 364:2187-‐2196. 683
Dagan, T, M Roettger, D Bryant, W Martin. 2010. Genome networks root the tree of life 684 between prokaryotic domains. Genome Biol Evol 2:379-‐392. 685
DeSantis, TZ, Jr., P Hugenholtz, K Keller, EL Brodie, N Larsen, YM Piceno, R Phan, GL 686 Andersen. 2006. NAST: a multiple sequence alignment server for comparative 687 analysis of 16S rRNA genes. Nucleic Acids Res 34:W394-‐399. 688
Edgar, RC. 2004. MUSCLE: a multiple sequence alignment method with reduced time and 689 space complexity. BMC Bioinformatics 5:113. 690
Felsestein, J. 1989. PHYLIP -‐ Phylogenetic inference package (Version 3.2). Cladistics 691 Cladistics 5: 164-‐166. :3. 692
Fondi, M, G Bacci, M Brilli, MC Papaleo, A Mengoni, M Vaneechoutte, L Dijkshoorn, R 693 Fani. 2010. Exploring the evolutionary dynamics of plasmids: the Acinetobacter 694 pan-‐plasmidome. BMC Evol Biol 10:59. 695
Fondi, M, R Fani. 2010. The horizontal flow of the plasmid resistome: clues from inter-‐696 generic similarity networks. Environ Microbiol. 697
Friedberg, I. 2006. Automated protein function prediction-‐-‐the genomic challenge. Brief 698 Bioinform 7:225-‐242. 699
Froehlich, B, J Parkhill, M Sanders, MA Quail, JR Scott. 2005. The pCoo plasmid of 700 enterotoxigenic Escherichia coli is a mosaic cointegrate. J Bacteriol 187:6509-‐701 6516. 702
Hacker, J, JB Kaper. 2000. Pathogenicity islands and the evolution of microbes. Annu Rev 703 Microbiol 54:641-‐679. 704
Halary, S, JW Leigh, B Cheaib, P Lopez, E Bapteste. 2010. Network analyses structure 705 genetic diversity in independent genetic worlds. Proc Natl Acad Sci U S A 706 107:127-‐132. 707
Huson, DH, D Bryant. 2006. Application of phylogenetic networks in evolutionary 708 studies. Mol Biol Evol 23:254-‐267. 709
Karlin, S. 2001. Detecting anomalous gene clusters and pathogenicity islands in diverse 710 bacterial genomes. Trends Microbiol 9:335-‐343. 711
Kohiyama, M, S Hiraga, I Matic, M Radman. 2003. Bacterial sex: playing voyeurs 50 years 712 later. Science 301:802-‐803. 713
Krzywinski, M, J Schein, I Birol, J Connors, R Gascoyne, D Horsman, SJ Jones, MA Marra. 714 2009. Circos: an information aesthetic for comparative genomics. Genome Res 715 19:1639-‐1645. 716
Le Roux, F, Y Labreuche, BM Davis, N Iqbal, S Mangenot, C Goarant, D Mazel, MK Waldor. 717 2010. Virulence of an emerging pathogenic lineage of Vibrio nigripulchritudo is 718 dependent on two plasmids. Environ Microbiol. 719
Leigh, JW, K Schliep, P Lopez, E Bapteste. 2011. Let Them Fall Where They May: 720 Congruence Analysis in Massive, Phylogenetically Messy Datasets. Mol Biol Evol. 721
Leplae, R, A Hebrant, SJ Wodak, A Toussaint. 2004. ACLAME: a CLAssification of Mobile 722 genetic Elements. Nucleic Acids Res 32:D45-‐49. 723
Lima-‐Mendez, G, A Toussaint, R Leplae. 2007. Analysis of the phage sequence space: the 724 benefit of structured information. Virology 365:241-‐249. 725
at Biblioteca di Scienze, U
niversit? degli studi di Firenze on January 11, 2012http://m
be.oxfordjournals.org/D
ownloaded from

Lima-‐Mendez, G, J Van Helden, A Toussaint, R Leplae. 2008. Reticulate representation of 726 evolutionary and functional relationships between phage genomes. Mol Biol Evol 727 25:762-‐777. 728
Liu, B, M Pop. 2009. ARDB-‐-‐Antibiotic Resistance Genes Database. Nucleic Acids Res 729 37:D443-‐447. 730
Medini, D, C Donati, H Tettelin, V Masignani, R Rappuoli. 2005. The microbial pan-‐731 genome. Curr Opin Genet Dev 15:589-‐594. 732
Miao, V, J Davies. 2010. Actinobacteria: the good, the bad, and the ugly. Antonie Van 733 Leeuwenhoek 98:143-‐150. 734
Norman, A, LH Hansen, SJ Sorensen. 2009. Conjugative plasmids: vessels of the 735 communal gene pool. Philos Trans R Soc Lond B Biol Sci 364:2275-‐2289. 736
Osborn, AM, FM da Silva Tatley, LM Steyn, RW Pickup, JR Saunders. 2000. Mosaic 737 plasmids and mosaic replicons: evolutionary lessons from the analysis of genetic 738 diversity in IncFII-‐related replicons. Microbiology 146 ( Pt 9):2267-‐2275. 739
R Development Core Team. 2010. R: A Language and Environment for Statistical 740 Computing. 741
Reynaud, Y, D Saulnier, D Mazel, C Goarant, F Le Roux. 2008. Correlation between 742 detection of a plasmid and high-‐level virulence of Vibrio nigripulchritudo, a 743 pathogen of the shrimp Litopenaeus stylirostris. Appl Environ Microbiol 744 74:3038-‐3047. 745
Riley, MA, DM Gordon. 1999. The ecological role of bacteriocins in bacterial competition. 746 Trends Microbiol 7:129-‐133. 747
Rodrigue, S, RR Malmstrom, AM Berlin, BW Birren, MR Henn, SW Chisholm. 2009. Whole 748 genome amplification and de novo assembly of single bacterial cells. PLoS One 749 4:e6864. 750
Schluter, A, L Krause, R Szczepanowski, A Goesmann, A Puhler. 2008. Genetic diversity 751 and composition of a plasmid metagenome from a wastewater treatment plant. J 752 Biotechnol 136:65-‐76. 753
Smillie, C, MP Garcillan-‐Barcia, MV Francia, EP Rocha, F de la Cruz. 2010. Mobility of 754 plasmids. Microbiol Mol Biol Rev 74:434-‐452. 755
Stepanauskas, R, ME Sieracki. 2007. Matching phylogeny and metabolism in the 756 uncultured marine bacteria, one cell at a time. Proc Natl Acad Sci U S A 104:9052-‐757 9057. 758
Thomas, CM, KM Nielsen. 2005. Mechanisms of, and barriers to, horizontal gene transfer 759 between bacteria. Nat Rev Microbiol 3:711-‐721. 760
Toussaint, A, C Merlin. 2002. Mobile elements as a combination of functional modules. 761 Plasmid 47:26-‐35. 762
van Rhijn, P, J Vanderleyden. 1995. The Rhizobium-‐plant symbiosis. Microbiol Rev 763 59:124-‐142. 764
Vlasblom, J, S Wu, S Pu, M Superina, G Liu, C Orsi, SJ Wodak. 2006. GenePro: a Cytoscape 765 plug-‐in for advanced visualization and analysis of interaction networks. 766 Bioinformatics 22:2178-‐2179. 767
Wickham, H. 2009. ggplot2: elegant graphics for data analysis. New York: Springer. 768 Wright, GD. 2007. The antibiotic resistome: the nexus of chemical and genetic diversity. 769
Nat Rev Microbiol 5:175-‐186. 770 Wu, D, P Hugenholtz, K Mavromatis, et al. 2009. A phylogeny-‐driven genomic 771
encyclopaedia of Bacteria and Archaea. Nature 462:1056-‐1060. 772 Yang, J, L Chen, L Sun, J Yu, Q Jin. 2008. VFDB 2008 release: an enhanced web-‐based 773
resource for comparative pathogenomics. Nucleic Acids Res 36:D539-‐542. 774
at Biblioteca di Scienze, U
niversit? degli studi di Firenze on January 11, 2012http://m
be.oxfordjournals.org/D
ownloaded from
Yi, H, Y Xi, J Liu, et al. 2010. Sequence analysis of pKF3-‐70 in Klebsiella pneumoniae: 775 probable origin from R100-‐like plasmid of Escherichia coli. PLoS One 5:e8601. 776
Zienkiewicz, M, I Kern-‐Zdanowicz, M Golebiewski, J Zylinska, P Mieczkowski, M 777 Gniadkowski, J Bardowski, P Ceglowski. 2007. Mosaic structure of p1658/97, a 778 125-‐kilobase plasmid harboring an active amplicon with the extended-‐spectrum 779 beta-‐lactamase gene blaSHV-‐5. Antimicrob Agents Chemother 51:1164-‐1171. 780
781 782
at Biblioteca di Scienze, U
niversit? degli studi di Firenze on January 11, 2012http://m
be.oxfordjournals.org/D
ownloaded from