Effective and robust plasmid topology analysis and the ...
10
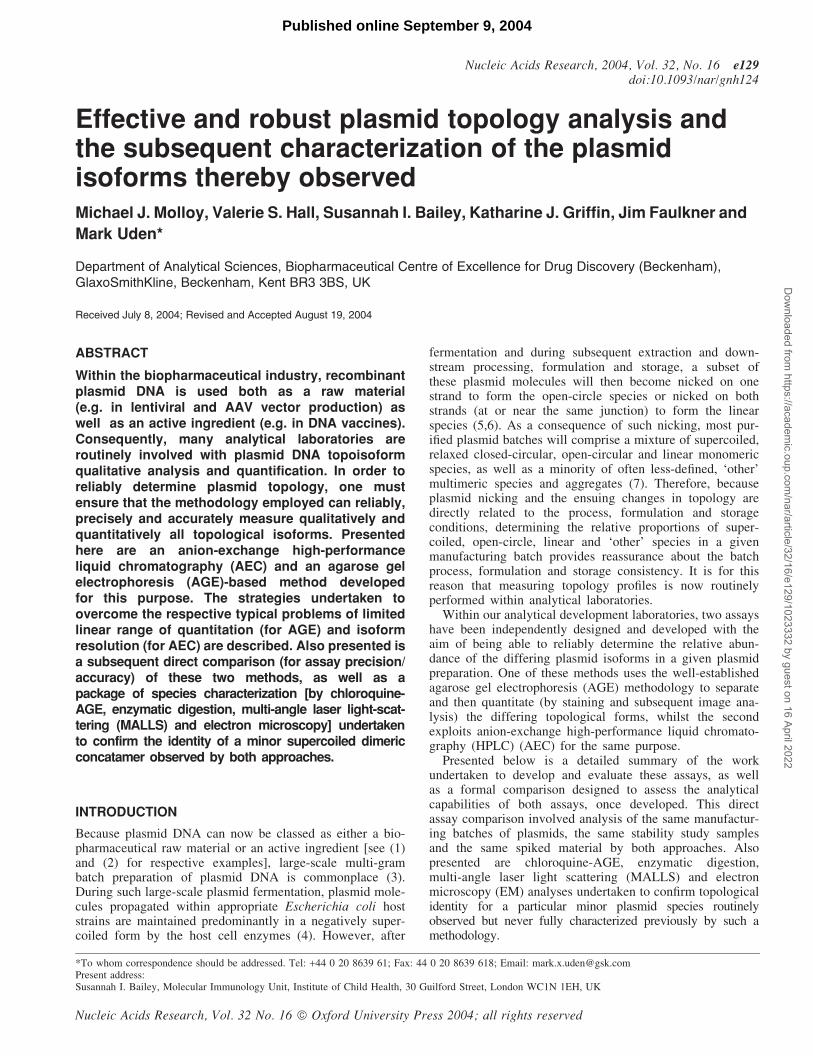
Effective and robust plasmid topology analysis and the subsequent characterization of the plasmid isoforms thereby observed Michael J. Molloy, Valerie S. Hall, Susannah I. Bailey, Katharine J. Griffin, Jim Faulkner and Mark Uden* Department of Analytical Sciences, Biopharmaceutical Centre of Excellence for Drug Discovery (Beckenham), GlaxoSmithKline, Beckenham, Kent BR3 3BS, UK Received July 8, 2004; Revised and Accepted August 19, 2004 ABSTRACT Within the biopharmaceutical industry, recombinant plasmid DNA is used both as a raw material (e.g. in lentiviral and AAV vector production) as well as an active ingredient (e.g. in DNA vaccines). Consequently, many analytical laboratories are routinely involved with plasmid DNA topoisoform qualitative analysis and quantification. In order to reliably determine plasmid topology, one must ensure that the methodology employed can reliably, precisely and accurately measure qualitatively and quantitatively all topological isoforms. Presented here are an anion-exchange high-performance liquid chromatography (AEC) and an agarose gel electrophoresis (AGE)-based method developed for this purpose. The strategies undertaken to overcome the respective typical problems of limited linear range of quantitation (for AGE) and isoform resolution (for AEC) are described. Also presented is a subsequent direct comparison (for assay precision/ accuracy) of these two methods, as well as a package of species characterization [by chloroquine- AGE, enzymatic digestion, multi-angle laser light-scat- tering (MALLS) and electron microscopy] undertaken to confirm the identity of a minor supercoiled dimeric concatamer observed by both approaches. INTRODUCTION Because plasmid DNA can now be classed as either a bio- pharmaceutical raw material or an active ingredient [see (1) and (2) for respective examples], large-scale multi-gram batch preparation of plasmid DNA is commonplace (3). During such large-scale plasmid fermentation, plasmid mole- cules propagated within appropriate Escherichia coli host strains are maintained predominantly in a negatively super- coiled form by the host cell enzymes (4). However, after fermentation and during subsequent extraction and down- stream processing, formulation and storage, a subset of these plasmid molecules will then become nicked on one strand to form the open-circle species or nicked on both strands (at or near the same junction) to form the linear species (5,6). As a consequence of such nicking, most pur- ified plasmid batches will comprise a mixture of supercoiled, relaxed closed-circular, open-circular and linear monomeric species, as well as a minority of often less-defined, ‘other’ multimeric species and aggregates (7). Therefore, because plasmid nicking and the ensuing changes in topology are directly related to the process, formulation and storage conditions, determining the relative proportions of super- coiled, open-circle, linear and ‘other’ species in a given manufacturing batch provides reassurance about the batch process, formulation and storage consistency. It is for this reason that measuring topology profiles is now routinely performed within analytical laboratories. Within our analytical development laboratories, two assays have been independently designed and developed with the aim of being able to reliably determine the relative abun- dance of the differing plasmid isoforms in a given plasmid preparation. One of these methods uses the well-established agarose gel electrophoresis (AGE) methodology to separate and then quantitate (by staining and subsequent image ana- lysis) the differing topological forms, whilst the second exploits anion-exchange high-performance liquid chromato- graphy (HPLC) (AEC) for the same purpose. Presented below is a detailed summary of the work undertaken to develop and evaluate these assays, as well as a formal comparison designed to assess the analytical capabilities of both assays, once developed. This direct assay comparison involved analysis of the same manufactur- ing batches of plasmids, the same stability study samples and the same spiked material by both approaches. Also presented are chloroquine-AGE, enzymatic digestion, multi-angle laser light scattering (MALLS) and electron microscopy (EM) analyses undertaken to confirm topological identity for a particular minor plasmid species routinely observed but never fully characterized previously by such a methodology. *To whom correspondence should be addressed. Tel: +44 0 20 8639 61; Fax: 44 0 20 8639 618; Email: [email protected] Present address: Susannah I. Bailey, Molecular Immunology Unit, Institute of Child Health, 30 Guilford Street, London WC1N 1EH, UK Nucleic Acids Research, Vol. 32 No. 16 ª Oxford University Press 2004; all rights reserved Nucleic Acids Research, 2004, Vol. 32, No. 16 e129 doi:10.1093/nar/gnh124 Published online September 9, 2004 Downloaded from https://academic.oup.com/nar/article/32/16/e129/1023332 by guest on 16 April 2022
-
Upload
khangminh22 -
Category
Documents
-
view
0 -
download
0
Transcript of Effective and robust plasmid topology analysis and the ...
Effective and robust plasmid topology analysis andthe subsequent characterization of the plasmidisoforms thereby observedMichael J. Molloy, Valerie S. Hall, Susannah I. Bailey, Katharine J. Griffin, Jim Faulkner and
Mark Uden*
Department of Analytical Sciences, Biopharmaceutical Centre of Excellence for Drug Discovery (Beckenham),GlaxoSmithKline, Beckenham, Kent BR3 3BS, UK
Received July 8, 2004; Revised and Accepted August 19, 2004
ABSTRACT
Within the biopharmaceutical industry, recombinantplasmid DNA is used both as a raw material(e.g. in lentiviral and AAV vector production) aswell as an active ingredient (e.g. in DNA vaccines).Consequently, many analytical laboratories areroutinely involved with plasmid DNA topoisoformqualitative analysis and quantification. In order toreliably determine plasmid topology, one mustensure that the methodology employed can reliably,precisely and accurately measure qualitatively andquantitatively all topological isoforms. Presentedhere are an anion-exchange high-performanceliquid chromatography (AEC) and an agarose gelelectrophoresis (AGE)-based method developedfor this purpose. The strategies undertaken toovercome the respective typical problems of limitedlinear range of quantitation (for AGE) and isoformresolution (for AEC) are described. Also presented isa subsequent direct comparison (for assay precision/accuracy) of these two methods, as well as apackage of species characterization [by chloroquine-AGE, enzymatic digestion, multi-angle laser light-scat-tering (MALLS) and electron microscopy] undertakento confirm the identity of a minor supercoiled dimericconcatamer observed by both approaches.
INTRODUCTION
Because plasmid DNA can now be classed as either a bio-pharmaceutical raw material or an active ingredient [see (1)and (2) for respective examples], large-scale multi-grambatch preparation of plasmid DNA is commonplace (3).During such large-scale plasmid fermentation, plasmid mole-cules propagated within appropriate Escherichia coli hoststrains are maintained predominantly in a negatively super-coiled form by the host cell enzymes (4). However, after
fermentation and during subsequent extraction and down-stream processing, formulation and storage, a subset ofthese plasmid molecules will then become nicked on onestrand to form the open-circle species or nicked on bothstrands (at or near the same junction) to form the linearspecies (5,6). As a consequence of such nicking, most pur-ified plasmid batches will comprise a mixture of supercoiled,relaxed closed-circular, open-circular and linear monomericspecies, as well as a minority of often less-defined, ‘other’multimeric species and aggregates (7). Therefore, becauseplasmid nicking and the ensuing changes in topology aredirectly related to the process, formulation and storageconditions, determining the relative proportions of super-coiled, open-circle, linear and ‘other’ species in a givenmanufacturing batch provides reassurance about the batchprocess, formulation and storage consistency. It is for thisreason that measuring topology profiles is now routinelyperformed within analytical laboratories.
Within our analytical development laboratories, two assayshave been independently designed and developed with theaim of being able to reliably determine the relative abun-dance of the differing plasmid isoforms in a given plasmidpreparation. One of these methods uses the well-establishedagarose gel electrophoresis (AGE) methodology to separateand then quantitate (by staining and subsequent image ana-lysis) the differing topological forms, whilst the secondexploits anion-exchange high-performance liquid chromato-graphy (HPLC) (AEC) for the same purpose.
Presented below is a detailed summary of the workundertaken to develop and evaluate these assays, as wellas a formal comparison designed to assess the analyticalcapabilities of both assays, once developed. This directassay comparison involved analysis of the same manufactur-ing batches of plasmids, the same stability study samplesand the same spiked material by both approaches. Alsopresented are chloroquine-AGE, enzymatic digestion,multi-angle laser light scattering (MALLS) and electronmicroscopy (EM) analyses undertaken to confirm topologicalidentity for a particular minor plasmid species routinelyobserved but never fully characterized previously by such amethodology.
*To whom correspondence should be addressed. Tel: +44 0 20 8639 61; Fax: 44 0 20 8639 618; Email: [email protected] address:Susannah I. Bailey, Molecular Immunology Unit, Institute of Child Health, 30 Guilford Street, London WC1N 1EH, UK
Nucleic Acids Research, Vol. 32 No. 16 ª Oxford University Press 2004; all rights reserved
Nucleic Acids Research, 2004, Vol. 32, No. 16 e129doi:10.1093/nar/gnh124
Published online September 9, 2004D
ownloaded from
https://academic.oup.com
/nar/article/32/16/e129/1023332 by guest on 16 April 2022

MATERIALS AND METHODS
Plasmid and plasmid manufacture
Plasmid extracts were prepared as described previously (3).The 6.5 kb ‘DNA vaccine’ plasmid analysed throughout thecourse of this study comprises a typical kanamcyin resistancecassette and pUC origin of replication plus a mammalianexpression cassette (pol II promoter/ORF/polyadenylation).Further details are available upon request.
Quantitative agarose electrophoresis
Horizontal gel electrophoresis was performed with 0.4 or 0.6%agarose gels prepared using 100 ml 1· TBE (Sigma–Aldrich,Poole, UK) and midigel apparatus (Owl, Portsmouth, NH)with 12-well combs. Electrophoresis was performed overnight(16–18 h) at 20 V. All staining was performed with 1·Sybr-Gold (Molecular Probes, Eugene, OR) made up infresh 1· TBE and for the lengths of time indicated. GelImage capture was by either a DOC-008 system (UVItecCambridge, UK) or a ProXpress Proteomic Gel ImagingSystem (PerkinElmer, Cambridge, UK). For gel image quanti-tation, the 16 bit depth images generated by the ProXpress wereanalysed using ImageQuant software version 5 (MolecularDynamics, SunnyVale, CA).
Anion-exchange high-performance liquidchromatography
All AEC analyses were performed on a Waters 2690 separa-tions module with a 2487 dual wavelength detector (Waters,Manchester, UK). Buffer A (borate buffer) was composed of25 mM boric acid (Sigma–Aldrich) adjusted to pH 9.0 with50% w/v sodium hydroxide (Sigma–Aldrich). Buffer B wascomposed of Buffer A with 1 M sodium chloride (Sigma–Aldrich). For all analyses, a 4.6 · 75 mm2 Toso-BiosepDNA-NPR anion exchange column (Anachem, Cambridge,UK) with a Machery–Nagel pre-column filter (Machery–Nagel, Oxford, UK) was used, and the column oven tempera-ture was set at 40�C. All plasmid DNA samples were preparedat 10 mg/ml in buffer A prior to 10 ml injections. The ultraviolet(UV) detection was at 260 nm with a flow rate of 1 ml/min andthe gradients used were as described in Figure 2. For resultanalysis, Atlas 2000 version 4.30 (Thermo LabSystems Inc.,Beverly, MA) was used.
Open-circle plasmid species generation
Open-circular topoisomers were prepared by incubatingsupercoiled plasmid DNA with the enzyme N.BstNB I (NewEngland Biolabs, Beverly, MA) at a concentration of 1 U/mg.The reaction was carried out in 1· N.BstNB I buffer (suppliedwith the enzyme) at 55�C for 1 h. The enzyme was inactivated bythe addition of EDTA (Sigma–Aldrich) to a final concentration of0.025 M, followed by incubation at 80�C for 20 min. Digestswere carried out such that the plasmid DNA in the final solutionwas at a concentration of 200 ng/ml. Successful digestion wasconfirmed by AGE.
Linear plasmid species generation
Linear plasmid preparations were generated by incubatingsupercoiled plasmid DNA with a single-cutting restrictionenzyme (HindIII, New England Biolabs) in the buffer recom-mended by the manufacturer. The concentration of enzyme
used was in excess of that suggested as necessary by themanufacturer. The reactions were incubated at 37�C for 2h. The DNA was cleaned up by extraction with buffer-saturated phenol (Sigma–Aldrich) followed by extractionwith phenol:chloroform:isoamyl alcohol (25:24:1) and thenwith chloroform (Sigma–Aldrich). Precipitation of the DNAwas carried out by the addition of 0.1 volumes of 3 M sodiumacetate and 2 volumes of ice-cold absolute ethanol (Sigma–Aldrich). After 20 min at �70�C, the DNA was pelleted bycentrifugation. The pellet was washed with 70% ethanol andthen re-suspended in water to give a final plasmid DNA con-centration of 200 ng/ml, as confirmed by the absorbance at260 nm. Successful linearization of the plasmid was confirmedby AGE.
Sample preparation for assay comparison
For the direct AEC and AGE comparative analysis, all sampleswere prepared at a concentration of 10 mg/ml in 25 mM boratebuffer, pH 9.0 (AEC buffer A), so as to be compatible withboth analytical approaches.
Fraction D topology analysis by T7 exonuclease enzymedigestion
To further characterize a particular plasmid species (fractionD) observed by both the AEC and AGE methodologies, thespecificity of the T7 exonuclease was exploited. For this work,1 mg of plasmid was incubated with T7 exonuclease (NewEngland Biolabs) for 1 h, using the manufacturer’s recom-mended conditions, prior to AGE-based separation andanalysis.
Fraction D analysis by chloroquine-AGE
A 25 · 20 cm2 0.6% agarose (1· TBE) gel containing5.0 mg/ml chloroquine (Sigma–Aldrich) was employed. The1· TBE running buffer also contained 5.0 mg/ml chloroquine,and electrophoresis was performed at 50 V for 48 h. Stainingwas carried out by soaking in 1· TBE containing 1· Sybr-Gold(Molecular Probes) for 24 h in the dark.
Fraction D analysis by MALLS
For all MALLS analyses, a Wyatt Dawn EOS detector (WyattTechnologies, Santa Barbara, CA) was connected in line toAEC (see above) and downstream of the UV detection.
RESULTS
Quantitative AGE assay development
The use of AGE for the separation of DNA topoisoformsinto discrete ‘bands’ has been considered routine for a numberof decades [see (8) for an example]. These bands arethen observed by gel staining with DNA intercalating agentssuch as ethidium bromide, prior to subsequent light excitationand film, video or digital image capture and analysis. How-ever, whilst this simple method is excellent for both separat-ing and distinguishing many plasmid species (supercoiled,relaxed, open-/closed-circular, linear, multimers and aggre-gates), it is far from ideal if information on the relativequantities of these differing species is then required. This isbecause the effective linear range of most, if not all, current
e129 Nucleic Acids Research, 2004, Vol. 32, No. 16 PAGE 2 OF 10
Dow
nloaded from https://academ
ic.oup.com/nar/article/32/16/e129/1023332 by guest on 16 April 2022

AGE gel staining and image capture methodologies is less thanone order of magnitude (9). Consequently, if qualitative andquantitative data are required by AGE-based methodologies, itis normal to examine extensive serial dilutions of a test sampleand then cross-reference this against an equally extensiveserial dilution of a standard [e.g. see (10,11)]. Because ofthis problem, many analytical laboratories have preferredAEC and capillary electrophoresis (CE) separation methodol-ogies for the analysis of a clinical grade plasmid material.However, the paradox of this preference is that these AECand CE methodologies have not been chosen for their plasmidspecies separation capabilities, which can sometimes beinferior to AGE, but rather for their superior assay sensitivityand linear ranges of quantitation (M. J. Molloy, unpublisheddata). For these reasons, it was therefore decided to undertakea critical re-evaluation and re-development of an in-houseAGE-based protocol in an attempt to improve assay sensitivityand linear range prior to the direct comparison with the AECassay.
The in-house AGE protocol chosen for such re-developmentoriginally involved overnight separation of plasmid species by0.6% AGE, subsequent staining with ethidium bromide, beforefinal image capture with a video documentation system.
The first modification to this assay involved a replacementof the ethidium bromide-staining regime with a Sybr-Goldstaining alternative. This unsymmetrical cyanine dye exhibits>1000-fold fluorescence enhancement upon binding nucleicacids and also has a high quantum yield upon such binding(12). Consequently, this switch to a staining reagent with suchproperties led to an immediate improvement in the assay bylowering the background noise and increasing the limit ofdetection. For comparison of typical images of an ethidiumbromide-stained sample and the Sybr-Gold-stained equivalentsee Figure 1A. This demonstrates that for plasmid prepara-tions containing low-level recombinants, the Sybr-Gold-staining methodology is preferable.
Subsequent to this change in the staining reagent, the secondassay modification involved an improvement to the quality ofthe gel image then captured. This was undertaken in the beliefthat the relatively low quantitation range observed withinAGE-based methods was primarily due to the relative low8 bit image depth (28 grey scales per pixel) (13) producedby the laboratory’s video documentation system. Conse-quently, by using, instead, a 16 bit (216 grey scales per pixel)peltier-cooled (and thus low noise) charge-coupled device(CCD) imaging system, an increase in assay linear rangewould be expected. However, even after this change andeven with careful image exposure trials, the assay linear rangedid not extend beyond 1–50 ng/band without the problem of asignificant signal ‘plateau’ (see Figure 1B). As a consequence,and because the 16 bit gel images contained more than theadequate theoretical image depth, it was concluded that theimage quality alone could not account for the low linear rangeof quantitation by the AGE-based methodology.
The third (and decisive) assay modification involved theSybr-Gold staining regime. The manufacturer’s recommendedstaining time for Sybr-Gold is 20–40 min (12). However, byextending the staining times to well beyond this recommenda-tion (up to a total of 24 h), it became apparent that a very goodlinear fit could be obtained to >300 ng/band loads and with noloss in sensitivity (see Figure 1C).
To conclude, as a consequence of changes to (i) the stainchosen, (ii) the image quality/depth and (iii) the staining time,the linear range of quantitation (per band) of an AGE-basedassay was improved from �5–50 to 0.5–300 ng. Consequently,all species in a 250 ng sample load could be reliably separatedand quantified down to a limit of �0.5 ng (0.2% total) and alimit of detection that is far less (0.1 ng or 0.04% total with agel image over-exposure; data not shown).
AEC assay development
AEC exploits the interaction between the negatively chargedphosphate groups on the plasmid DNA backbone and posi-tively charged groups on the resin stationary phase. The over-all interaction is thought not to be a distinct binding betweenspecific charges, but rather a local attraction generated byopposite charges in close proximity (14). Therefore, andusing a suitable salt gradient, this interaction is manipulatedfor effective resolution and quantitation of all differing topo-logical isoforms present within a sample. This is possiblebecause although the overall charge and molecular weightof differing topological species might be similar, these differ-ing isoforms will possess different conformations and thusdifferent local charge densities. Consequently, such specieswill possess differing column retention times in an increasingsalt gradient.
Generally, for AEC-based analysis of DNA, method devel-opment requires optimizing the key parameters on a case-by-case basis. To this end, several groups have evaluateddifferent anion exchange resins, mobile phase components,flow rate, pH, column temperature and gradient slopes (15–17).The initial in-house method adopted here utilized a 20 mMTris-based buffer (pH 9), a relatively shallow salt gradient(1% Buffer B/min), a non-porous resin and a thermostat-controlled Waters 2690 column oven which allows formobile phase pre-heating [so as to avoid unwanted compli-cations (18)]. However, because of the retention time driftand the subsequent isoform resolution issues with this initialmethod (data not shown), further development was needed.This development involved changing the buffer base (from20 mM Tris to 25 mM borate) and then subsequent re-optimization of the eluting salt gradient. The buffer waschanged for two reasons. First, at pH 9 a Tris-based bufferis close to the limit of its buffering capacity (pKa of Tris =8.06) and previous in-house work suggests that a pH of 9 isoptimal for plasmid isoform resolution (M. J. Molloy, unpub-lished data). Second, Tris buffers possess relatively high dpKa/dT values (�0.028/�C) when compared with borate (�0.008/�Cvalue) (19) and so may induce significant pH buffer changesin any temperature gradient between the 40�C and theambient buffer. After changing the buffer, re-optimizationof the elution gradient was then undertaken as outlined inFigure 2. The results suggest that a salt gradient with a slopeof 4% buffer B per minute was most suitable (with regard toresolution and peak tail factors) on our in-house AEC system.Consequently, for the analysis of the 6.5 kb plasmid used inthis AEC assay optimization, a 25 mM borate buffer and a4% gradient is optimal. For all subsequent AEC/AGE directassay comparison (as will now be described), this same 6.5 kbplasmid (or linear, nicked, spiked or degraded derivativesthereof) has been used on all occasions.
PAGE 3 OF 10 Nucleic Acids Research, 2004, Vol. 32, No. 16 e129
Dow
nloaded from https://academ
ic.oup.com/nar/article/32/16/e129/1023332 by guest on 16 April 2022

HPLC and Q-AGE direct comparison
After the completion of AGE and AEC assay development, adirect assay comparison was initiated. This comparisoninvolved a systematic analysis of the same samples by bothmethodologies, and the preparation of the samples chosen forthis analysis is described within Materials and Methods. Inbrief, this comparison was initially composed of two compo-nent parts. The first component involved analysis of purifiedplasmid or its temperature-degraded equivalent (stored at37�C for 18 days prior to re-freezing) in triplicate on threeseparate occasions by both methods. For the second compo-nent, an analysis of 18 stability study time-points by bothmethods was undertaken. As a consequence of this assay
comparison, a third component was then added. This involvedanalysis of equivalent amounts of near-pure supercoiled, linearand open-circle species by both methodologies.
The results of this work are outlined in Figures 3–5 anddemonstrate that both methodologies are acceptably precise(see RSD values, Figure 3D) and that both report broadlyequivalent results. However, also apparent is the fact thatboth qualitative and quantitative differences do exist betweenthe two assays. These differences will now be summarized.
Quantitative differences
The most notable quantitative difference between the twoassays relates to the levels of open-circular DNA reported.
Figure 1. Quantitative AGE assay development. (A) Ethidium bromide versus Sybr-Gold ‘Staining’. Aliquots of 200 ng of four plasmid batches known to containdiffering levels of recombinant plasmid were separated by AGE and then stained with 1· TBE containing either ethidium bromide (50 ng/ml) (left gel) or 1· Sybr-Gold (right gel) for 30 min prior to gel-image capture by Polaroid camera. Arrows indicate the position of low-level recombinants only clearly visible with Sybr-Gold staining. (B) Image analysis of a 1· Sybr-Gold stained gel using manufacture’s recommended staining times. Image capture by ProXpress. For this analysis, 1, 2and 5 ml volumes of MassRuler High Range DNA Ladder (MBI-Fermentas, Lithuania) were loaded in lanes 1, 2 and 3, respectively. Left panel, gel image with loadscorresponding to DNA quantities (per band) ranging from 1.6 to 10 ng (lane 1), 3.2 to 20 ng (lane 2) and 8 to 50 ng (lane 3). Middle panel, schematic ImageQuant(Molecular Dynamics, SunnyVale, CA) generated electropherogram traces of each lane. Right panel, scatter-plot with trend-line representation of area-under-curve signal (y-axis) against quantity (in nanograms) of DNA (x-axis) of the combined 1.6 ng through to 50 ng results. This plot highlights the significant signal‘plateau’ that develops above 50 ng loads (C) Extending assay linear range by increasing Sybr-Gold staining times. Triplicate 5ml (lanes 1, 3 and 5) and 30ml (lanes 2,4 and 6) MassRuler DNA ladder loads were separated by AGE. Subsequently, the gel was then dissected longitudinally into three parts and stained for 20 min (lanes 1and 2), 2 h (lanes 3 and 4) or 24 h (lanes 5 and 6). After such staining regimes, excess stain was removed by copious washing with water. Image analysis by ProXpressand scatter plot data representation was then undertaken as described above in (B). The 5 and 30 ml loads generate a collective DNA species quantitative range ofbetween 8 and 300 ng. The results of analysis reveal the R2 values obtained for the 20 min, 2 h and 24 h staining regimes are 0.910, 0.990 and 0.999, respectively.
e129 Nucleic Acids Research, 2004, Vol. 32, No. 16 PAGE 4 OF 10
Dow
nloaded from https://academ
ic.oup.com/nar/article/32/16/e129/1023332 by guest on 16 April 2022
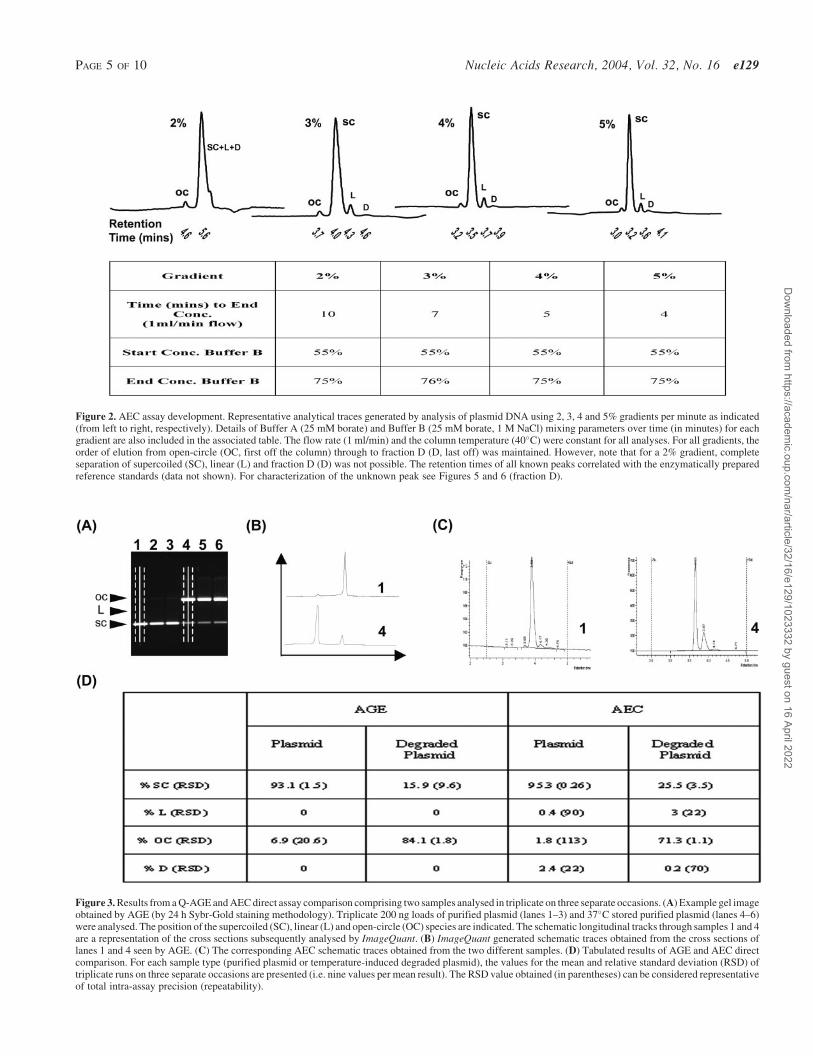
Figure 2. AEC assay development. Representative analytical traces generated by analysis of plasmid DNA using 2, 3, 4 and 5% gradients per minute as indicated(from left to right, respectively). Details of Buffer A (25 mM borate) and Buffer B (25 mM borate, 1 M NaCl) mixing parameters over time (in minutes) for eachgradient are also included in the associated table. The flow rate (1 ml/min) and the column temperature (40�C) were constant for all analyses. For all gradients, theorder of elution from open-circle (OC, first off the column) through to fraction D (D, last off) was maintained. However, note that for a 2% gradient, completeseparation of supercoiled (SC), linear (L) and fraction D (D) was not possible. The retention times of all known peaks correlated with the enzymatically preparedreference standards (data not shown). For characterization of the unknown peak see Figures 5 and 6 (fraction D).
Figure 3. Results from a Q-AGE and AEC direct assay comparison comprising two samples analysed in triplicate on three separate occasions. (A) Example gel imageobtained by AGE (by 24 h Sybr-Gold staining methodology). Triplicate 200 ng loads of purified plasmid (lanes 1–3) and 37�C stored purified plasmid (lanes 4–6)were analysed. The position of the supercoiled (SC), linear (L) and open-circle (OC) species are indicated. The schematic longitudinal tracks through samples 1 and 4are a representation of the cross sections subsequently analysed by ImageQuant. (B) ImageQuant generated schematic traces obtained from the cross sections oflanes 1 and 4 seen by AGE. (C) The corresponding AEC schematic traces obtained from the two different samples. (D) Tabulated results of AGE and AEC directcomparison. For each sample type (purified plasmid or temperature-induced degraded plasmid), the values for the mean and relative standard deviation (RSD) oftriplicate runs on three separate occasions are presented (i.e. nine values per mean result). The RSD value obtained (in parentheses) can be considered representativeof total intra-assay precision (repeatability).
PAGE 5 OF 10 Nucleic Acids Research, 2004, Vol. 32, No. 16 e129
Dow
nloaded from https://academ
ic.oup.com/nar/article/32/16/e129/1023332 by guest on 16 April 2022

It was noted both here and by previous work (data not shown),that the AEC assay reported lower levels relative to AGE.Indeed, it was because of such observations that the thirdcomponent part of the comparison was undertaken. In thissubsequent third investigation, identical aliquots of super-coiled plasmids were treated with (i) BSA (control), (ii) alinear generating restriction enzyme or (iii) a nicking(open-circle generating) enzyme. After these differing treat-ments, equal amounts of all three were analysed, withoutsubsequent purification steps. As a consequence of thiswork, and because without subsequent post-reaction purifica-tion and re-quantitation, equivalent loads of DNA should stillbe present, it was of interest to determine whether equivalenttotal sample load ‘area-under-the-curve’ values were seen forthe three differing preparations by both methodologies. Theresults of this work are represented in Figure 5A and demon-strate that whilst by Q-AGE equivalent amounts were present,by AEC, open-circle levels were reported on average at only54%—the values seen for the supercoiled or linear species.Therefore, and because subsequent nucleoside content analy-sis of the linear, open-circle and supercoiled preparations (by
enzymatic digestion and AEC analysis) suggested that therewas indeed equivalent levels of DNA in all three samples (datanot shown), it was concluded that open-circle levels are under-reported by the AEC approach. Finally, it was also noted thatbecause equivalent amounts of the three isoforms generateequivalent fluorescent signals by 24 h staining regimes, froma practical perspective, there appears to be little bias inSybr-Gold binding affinity for the differing plasmid topoiso-forms. However, further work is still required before this con-clusion can be extended and quoted for free-solution bindingstudies. This is because for ethidium bromide, an apparentsimilar lack of bias sometimes observed within gel-basedstaining regimes (20,21) is not replicated within classicfree-solution assays (22).
For further emphasis of the difference in open-circle-levelreporting by the two methods, an AEC ‘dedicated’ 10% linear/10% open-circle spiked supercoiled sample was then gener-ated prior to subsequent analysis by AGE. The results of thisanalysis (see Figure 5B) reveal this spiked sample to reportopen-circle content at 7.9 and 22% for AEC and AGEmethods, respectively. Additionally, the observation that for
Figure 4. A direct assay comparison: Stability study samples analysed by AGE- and HPLC-based methodologies. (A) Gel image of the �20, +4 or +37�C storedsamples separated by 0.6% AGE. Lane order: �70�C stored purified plasmid reference standard (ref), time zero (lane 0), 1 month time point (lane 1), 2 month timepoint (lane 2), 3 month time point (lane 3), 4 month time point (lane 4), 5 month time point (lane 5), 6 month time point (lane 6). The positions of the supercoiled (SC),linear (L) and open-circle species (OC) are indicated. (B) Line plot of stability study results as analysed by AGE methodology. Relative proportions of eachtopological sub-species (x-axis) over time (y-axis) are presented. Also included are numerical results at the final 6 month time point (in parentheses). (C) Line graphplot of stability study results as analysed by HPLC methodology. Relative proportion of each topological sub-species (x-axis) over time (y-axis) are presented. Alsoincluded are numerical results at the final 6 month time point (in parentheses).
e129 Nucleic Acids Research, 2004, Vol. 32, No. 16 PAGE 6 OF 10
Dow
nloaded from https://academ
ic.oup.com/nar/article/32/16/e129/1023332 by guest on 16 April 2022

all samples the supercoiled/linear signal ratio is equivalentwhen analysed by both assays (ongoing observation; datanot shown) further supports the conclusion that this is anopen-circle species-related issue.
Qualitative differences and fractionD characterization
The most striking qualitative difference between the twomethodsofplasmidanalysis is thatof theappearanceofadistinctpeak by AEC (termed fraction D) that was first observed duringthe AEC assay optimization (Figure 2). This species initiallyappeared to have no equivalent via the AGE assay. Therefore, inorder to investigate thisfractionfurther, itwascollected,purifiedby AEC and then re-analysed by AGE. This re-analysis revealedit to migrate at a position very close to the open-circle species(Figure 6A) and so initially suggested that it may be a form ofrelaxed-circular DNA that one can separate via charge–density/size (AEC) but not via shape/size (AGE) parameters. However,further work then revealed that this fraction could be separatedas a discrete and separate band by AGE, provided that a lowerpercentage (0.4%) gel was employed (Figure 6B). Further tothis, incubation of the purified fraction D with T7 exonuclease(specific for nicked DNA) (23) suggested this species was notnicked (Figure 6C). This was then verified by subsequent chlor-oquine gel analysis demonstrating fraction D to be supercoiled(Figure 6B). By such analysis, it was also noted that the super-coiled species observed are much larger than expected for a6.5 kb plasmid. As a consequence, and because this speciesalso co-migrates with a 13 kb supercoiled marker (Figure 6C),
it was proposed to be either a 13 kb dimeric concatamer or adouble 6.5 kb plasmid interwoven catenane. Therefore, and inorder toresolvethis,astep-wiseanalysisofa‘linearizing’enzymaticdigestion was undertaken. This digest analysis (see Figure 6E)revealed that a larger species co-migrating with the 13 kb linearDNA ladder is temporarily observed during digest progression.The appearance (and then the disappearance) of this speciesduring a linearizing restriction enzyme digest suggests thatthis fraction contains a 13 kb concatamer species containingtwo enzymatic sites, rather than an interwoven catenane of twoplasmidseachwithonesuchsite.SubsequentEManalysissuggeststhat all fractions contain the expected species (Figure 7A). Inaddition, relative size and weight analysis of these fractionsby MALLS confirmed fraction D to be nearly twice themolecular weight (see Figure 7B) of the other three fractions.
Finally, and with regard to the difficulties of fraction Dresolution by 0.6% AGE, further work revealed that this wasdue to a peculiarity of plasmid size. This was demonstratedby the analysis of smaller insert derivatives of the sameplasmid (Figure 6D) that revealed fraction D and open-circlespecies to be more readily resolved when smaller plasmidsare analysed. This open-circle/concatamer co-migrationunder certain conditions is also supported by previousobservations (24).
DISCUSSION
Whilst qualitative measurement of plasmid topology profilesis commonplace (particular by AGE), till date, little true
Figure 5. Analysis of different topological plasmid isoforms by AGE- and AEC-based methodologies. (A) Analysis of equivalent amounts of differing forms by bothmethodologies. One representative image of the triplicate AGE-based analyses undertaken is presented. The predominately linear (lane 1), open-circle (lane 2) andsupercoiled (lane 3) plasmid species isoforms were prepared as described in the text. AEC analysis was also undertaken in triplicate. Also presented are the tabulatedresults of the mean data values obtained by such analysis by both methods. These results are offered as both absolute raw assay data values and also signal strengthrelative (in %) to the predominantly supercoiled parental control. Results indicate that by AEC-based methodologies, the levels of the open-circle species observedare reduced. (B) Analysis of a linear/open-circle ‘spike’ preparation by both methodologies. Triplicate analyses of an AEC equated 10% linear/open-circle spikedplasmid (spiked according to a prior AEC-based abs260 quantification of starting material) was undertaken by both methods. A representative image generatedduring AGE analysis is shown. Also presented are the tabulated results of AGE- and AEC-based analysis. These results demonstrate that whilst open-circle levels inan AEC equated 10% spike preparation are recorded as �10% by subsequent analysis, such samples report much greater levels of open-circle by AGE.
PAGE 7 OF 10 Nucleic Acids Research, 2004, Vol. 32, No. 16 e129
Dow
nloaded from https://academ
ic.oup.com/nar/article/32/16/e129/1023332 by guest on 16 April 2022

consideration has been presented with regard to understandingtopology assays along the classic analytical guidelines centredon the limit of detection, limit of quantitation, linearity, pre-cision, accuracy, range and specificity. It is for such reasonsthat we undertook the assay development and evaluation workdescribed previously. Initially, three approaches (CE, AGEand AEC) were considered. However, due to the poor assayrobustness observed for our current in-house CE approach(data not shown), only the AGE and AEC methodologieswere considered suitable for further development.
For the AGE-based approach, assay development focussedon improving the assay linear range of quantitation because nosimple approach to overcome this assay limitation has beenreported previously. Consequently, the work presented heredescribing the use of 16 bit CCD imaging equipment, appro-priate dyes and unique, extended end-point staining protocolsis expected to be of benefit not only to AGE-based plasmidtopology assays but also to AGE-based quantitative analysis ofDNA in general. For example, because the assay linear range
extends from <0.5 ng to >300 ng (generating a 2�1 ng throughto 28 ng quantitation ‘window’), effective relative quantifica-tion of PCR amplicons should be more easily achieved. Thiswould, thereby, reduce laboratory demands on CE (25) and‘real-time’ PCR (26) analysis as it should allow effectiveAGE-based PCR amplicon quantitation and qualitative analy-sis without excessive serial dilution. Furthermore, with the useof wider gel combs [to prevent ‘smeary’ over-loading (data notshown)] plus longer, more concentrated staining regimes, it isexpected that this linear range could improve still further ifthe need arose.
For AEC-based topology analysis, the typical analyticalissues are not centred on the linear range of quantitationbut, instead, on the isoform specificity because without thecorrect separation methodology, the differing topologicalforms will often possess overlapping retention times. There-fore, and in an attempt to overcome this problem, we haveinvestigated the parameters involved with AEC topology assaydevelopment and have concluded that the gradient slope and
Figure 6. Fraction D analysis by AGE. (A) Separation of fraction D and open-circle species by both 0.6 and 0.4% AGE (left and right hand gel images, respectively).For 0.6% AGE, both the open-circle standard (lane 1) and parental purified plasmid (lane 2) were analysed. For 0.4% AGE, the AEC-collected fraction D (lane 1), theopen-circle standard (lane 2) and the parental purified plasmid (lane 3) were analysed. The arrow doublet indicates the positions of fraction D and open-circle speciesresolved during 0.4% AGE. Such resolution is not achieved during 0.6% AGE and the position of species co-migration is indicated by a single arrow. (B) Analysis bychloroquine gel. AEC-collected fraction D (lane 1), open-circle standard (lane 2) and purified plasmid (lane 3) were analysed by 1D chloroquine-AGE. Bracketsindicate the migration pattern and size of the differently linked sub-species existing in fraction D and the purified plasmid. As expected, the open-circle (nicked)derivative species migrates as a single, non-coiled species. Due to the low concentration of the fraction D collected by AEC combined with the reduced sensitivity ofchloroquine-AGE (M. Uden, unpublished data), the separated, differently linked forms observed are of low image intensity. (C) Fraction D resistance to T7exonuclease activity. A purified plasmid sample was incubated without (lane 2) or with (lane 3) T7 endonuclease prior to subsequent 0.4% AGE-based analysis. Thearrow indicates the position of the open-circle species selectively degraded by T7 exonuclease. Also included (lane 1) is a supercoiled DNA ladder (Sigma), withvisible markers (from top to bottom) of 16, 14, 12, 10, 8, 7, 6 and 5 kb. (D) Fraction D resolution by AGE in differently sized plasmids. Quadruplicate mini-preps of a5.0 kb plasmid, a 4.5 kb plasmid and a parental 6.5 kb plasmid were made and then analysed by 0.6% AGE. An arrow doublet indicates the positions of fraction D andopen-circle species in the 4.5 kb plasmid samples. These species are more readily resolved in the smaller 4.5 and 5.0 kb plasmids. A single arrow indicates the positionof the open-circle/fraction D co-migration observed in the 6.5 kb plasmid samples. (E) Restriction enzyme mediated linearization of the plasmid. Aliquots of 800 ngof the parental 6.5 kb plasmid were digested with a linearizing enzyme for 0, 1, 2, 4, 8, 16, 32, 64 and 128 min in lanes 3–11, respectively. Also included is a 1 kb linearDNA ladder (lane1: with visible markers, from bottom to top, of 3–12 kb) and a �70�C stored plasmid reference standard (lane 2). Indicated are the positions of thesupercoiled (SC) and linear (L) species. Note that general smearing is observed because of overloading (800 ng per lane). Such overloading is required so as to observethe faint linear species (indicated by an arrow) produced during the time-course and migrating as an estimated 13 kb species (if linear).
e129 Nucleic Acids Research, 2004, Vol. 32, No. 16 PAGE 8 OF 10
Dow
nloaded from https://academ
ic.oup.com/nar/article/32/16/e129/1023332 by guest on 16 April 2022

the buffer used are both critical factors. However, because ourin-house AEC assay remains bespoke for one particular plas-mid (data not shown), the AEC methodology presented cannotbe considered generic.
The subsequent direct comparison of the AEC and AGEassays developed revealed that both quantitative assays wereacceptably precise. However, due to the nature of topologyreporting (relative quantitation of all species within a singleload), many variables introduced between replicate analysis(e.g. from pipette errors) will be removed and, as such, goodprecision is expected (except where the assay noise becomes asignificant component of the signal). With respect to the assayaccuracy, it was still concluded that the open-circle species areunder-reported by AEC even though this is partly attributableto the fact that AEC resolves fraction D and the open-circleDNA as separate entities. This conclusion was made becauseof subsequent work (captured in Figure 5) which demonstratesa �50% under-reporting of open-circle species by AEC.Subsequent further investigation into the AEC methodsuggests that up to the point of column saturation, a proportion
of such species remain bound even during elution in high salt(data not shown). If such findings are reproducible, it shouldhelp explain this situation.
These observations, combined with the fact that the AGE-based approach is both generic and also readily capable ofresolving high molecular weight aggregates and permanentlydenatured plasmid (data not shown), suggest that the AGEapproach might be more suitable for most applications, pro-vided fraction D/open-circle co-migration is carefully consid-ered. Even so, and because in many ways AGE and AEC arecomplementary, it is likely that both will be employed forfuture in-house plasmid characterization. Consequently, weare continuing to develop the two methodologies furtherwith focus on the appropriate assay system suitability tests[peak-to-peak resolution factors, retention times, column effi-ciency (plate value) and peak tail factor] for AEC, and the useof suitably compliant imaging kit and secure data analysissoftware for the AGE approach.
With regard to characterization of fraction D, whilst thisspecies is often observed in plasmid preparations, it has rarely
Figure 7. Physical characterization of differing plasmid isoforms. (A) Analysis by EM. The four major fractions observed by AEC were collected separately (i.e.purified) and then analysed. Representative images for all four fractions are shown as indicated and correlate with previous work, suggesting that they represent (inorder of elution) open-circle (OC), supercoiled (SC), linear (L) and supercoiled dimer, respectively. Note that minor Adobe image contrast adjustments wereemployed to aid in visualization. (B) Analysis by MALLS. All fractions were analysed and the weight and size data (reported relative to the supercoiled fraction) arepresented. Results suggest fraction D to be nearly twice the molecular weight of the open-circle, supercoiled, linear fractions, thus being in agreement with fraction Dbeing a dimeric species.
PAGE 9 OF 10 Nucleic Acids Research, 2004, Vol. 32, No. 16 e129
Dow
nloaded from https://academ
ic.oup.com/nar/article/32/16/e129/1023332 by guest on 16 April 2022

been characterized further. As a consequence, and becauseminor levels of this species are observed within many plasmidsof differing ‘backbones’ (data not shown), it is hoped that suchcomplete characterization will be of interest to the fields ofboth pure and applied plasmid research.
In conclusion, a combination of effective assay develop-ment and the use of appropriate orthogonal and complemen-tary approaches as those described herein (AEC, AGE,chloroquin-AGE, MALLS, EM and enzyme digestion) shouldallow for near-complete resolution, qualitative measurementand quantification of all plasmid classes within any givenplasmid preparation. Thus, whilst the in-house batch-to-batch manufacturing topology profile consistency is both pre-ferable and expected, if variations do occur (e.g. duringchanges in fermentation, downstream processing, formulationor storage), these will be accurately, precisely and sensitivelydetected, and then quantified.
ACKNOWLEDGEMENTS
We gratefully acknowledge Professor Jack Griffith for theelectron microscopy work of Figure 7. We also thank allthose within both Process Development (PD) and ClinicallyActive Supplies (CAS) at Glaxosmithkline, Beckenham, forsupply of the plasmid material used throughout this work.
REFERENCES
1. Karolewski,B.A., Watson,D.J., Parente,M.K. and Wolfe,J.H. (2003)Comparison of transfection conditions for a lentivirus vector produced inlarge volumes. Hum. Gene Ther., 14, 1287–1296.
2. Restifo,N.P., Ying,H., Hwang,L. and Leitner,W.W. (2000) The promiseof nucleic acid vaccines. Gene Ther., 7, 89–92.
3. Eon-Duval,A., MacDuff,R.H., Fisher,C.A., Harris,M.J. and Brook,C.(2003) Removal of RNA impurities by tangential flow filtration inan RNase-free plasmid DNA purification process. Anal. Biochem., 316,66–73.
4. Drlica,K. (1992) Control of bacterial DNA supercoiling. Mol. Microbiol.,6, 425–433.
5. Evans,R.K., Xu,Z., Bohannon,K.E., Wang,B., Bruner,M.W. andVolkin,D.B. (2000) Evaluation of degradation pathways for plasmidDNA in pharmaceutical formulations via accelerated stability studies.J. Pharm. Sci., 89, 76–87.
6. Walther,W., Stein,U., Voss,C., Schmidt,T., Schleef,M. and Schlag,P.M.(2003) Stability analysis for long-term storage of naked DNA: impact onnonviral in vivo gene transfer. Anal. Biochem., 318, 230–235.
7. Levene,S.D., Donahue,C., Boles,T.C. and Cozzarelli,N.R. (1995)Analysis of the structure of dimeric DNA catenanes by electronmicroscopy. Biophys. J., 69, 1036–1045.
8. Keller,W. (1975) Determination of the number of superhelical turns insimian virus 40 DNA by gel electrophoresis. Proc. Natl Acad. Sci. USA,72, 4876–4880.
9. White,H.W. and Wu,M. (2001) Factors affecting quantitation of DNAbands in gels using a charge-coupled device imaging system.Electrophoresis, 22, 860–863.
10. Dukas,K., Sarfati,P., Vaysse,N. and Pradayrol,L. (1993) Quantitation ofchanges in the expression of multiple genes by simultaneous polymerasechain reaction. Anal. Biochem., 215, 66–72.
11. Gebhardt,A., Peters,A., Gerding,D. and Niendorf,A. (1994)Rapid quantitation of mRNA species in ethidium bromide-stainedgels of competitive RT–PCR products. J. Lipid Res., 35, 976–981.
12. Tuma,R.S., Beaudet,M.P., Jin,X., Jones,L.J., Cheung,C.Y., Yue,S. andSinger,V.L. (1999) Characterization of SYBR Gold nucleic acid gelstain: a dye optimized for use with 300-nm ultraviolet transilluminators.Anal. Biochem., 268, 278–288.
13. Sutherland,J.C., Monteleone,D.C., Trunk,J.G., Bennett,P.V. andSutherland,B.M. (2001) Quantifying DNA damage by gelelectrophoresis, electronic imaging and number-average length analysis.Electrophoresis, 22, 843–854.
14. Huber,C.G. (1998) Micropellicular stationary phases for high-performance liquid chromatography of double-stranded DNA.J. Chromatogr. A, 806, 3–30.
15. Colpan,M. and Riesner,D. (1984) High-performance liquidchromatography of high-molecular-weight nucleic acids on themacroporous ion exchanger, nucleogen. J. Chromatogr. A, 296,339–353.
16. Strege,M.A. and Lagu,A.L. (1991) Anion-exchange chromatography ofDNA restriction fragments. J. Chromatogr. A, 555, 109–124.
17. Yamakawa,H., Higashino,K. and Ohara,O. (1996) Sequence-dependentDNA separation by anion-exchange high-performance liquidchromatography. Anal. Biochem., 240, 242–250.
18. Rozing,G.P. and Goetz,H. (1989) Fast separation of biologicalmacromolecules on non-porous, microparticulate columns.J. Chromatogr. A, 476, 3–19.
19. Beynan,R.J. and Easterby,J.S. (1996) Buffer Solutions. BIOS ScientificPublishers, Oxford, UK.
20. Shubsda,M.F., Goodisma,J. and Dabrowiak,J.C. (1997) Quantitation ofethidium-stained closed circular DNA in agarose gels. J. Biochem.Biophys. Methods, 34, 73–79.
21. Topcu,Z. (2000) Densitometric quantification of DNA topoisomers inethidium brmoide-stained agaorse gels and chemiluminescence-detectedX ray films. Acta Biochim. Pol., 47, 835–839.
22. Bauer,W. and Vinograd,J. (1968) The interaction of closed circularDNA with intercalative dye. I. The superhelix of SV40 DNA in thepresence and absence of dye. J. Mol. Biol., 33, 141–171.
23. Kerr,C., Sadowski,P.D. (1972) Gene 6 exonuclease ofbacteriophage T7. II. Mechanism of the reaction. J. Biol. Chem., 247,311–318.
24. Tolmasky,M.E., Colloms,S., Blakely,G. and Sherratt,D.J. (2000)Stability by multimer resolution of pJHCMW1 is due to the Tn1331resolvase and not to the Escherichia coli Xer system. Microbiology, 146
(Pt 3), 581–589.25. Richards,M.P. and Poch,S.M. (2002) Quantitative analysis of gene
expression by reverse transcription polymerase chain reaction andcapillary electrophoresis with laser-induced fluorescence detection.Mol. Biotechnol., 21, 19–37.
26. Wilhelm,J. and Pingoud,A. (2003) Real-time polymerase chain reaction.Chembiochem, 4, 1120–1128.
e129 Nucleic Acids Research, 2004, Vol. 32, No. 16 PAGE 10 OF 10
Dow
nloaded from https://academ
ic.oup.com/nar/article/32/16/e129/1023332 by guest on 16 April 2022