DSV Panalpina A/S Investor presentation
52
DSV Panalpina A/S Investor presentation
-
Upload
khangminh22 -
Category
Documents
-
view
4 -
download
0
Transcript of DSV Panalpina A/S Investor presentation
DSV Panalpina A/S Investor presentation

2 | DSV Panalpina – H1 2021 results
Forward-looking statements
This announcement contains forward-looking statements that reflect DSV’s current expectations and views of future events. Some of these forward-looking statements can beidentified by terms and phrases such as “estimate,” “expect,” “target,” “plan,” “project,” “will” and similar expressions. These forward-looking statements include statements relatingto: the expected characteristics of the combined company; expected ownership of the combined company by Agility; expected financial results and characteristics of the combinedcompany; expected timing of the launch and closing of the proposed acquisition and satisfaction of conditions precedent, including regulatory conditions; and the expectedbenefits of the proposed acquisition, including related synergies. These forward-looking statements are subject to a number of risks and uncertainties, many of which are beyondour control, which could cause actual results to differ materially from such statements. These forward-looking statements are based on our beliefs, assumptions, and expectationsof future performance, considering the information currently available to us. These statements are only predictions based upon our current expectations and projections aboutfuture events. Risks and uncertainties include: the ability of DSV to integrate Agility GIL into DSV’s operations; the performance of the global economy; the capacity for growth ininternet and technology usage; the consolidation and convergence of the industry, its suppliers and its customers; the effect of changes in governmental regulations; disruptionfrom the proposed transaction making it more difficult to maintain relationships with customers, employees or suppliers; and the impact on the combined company (after givingeffect to the proposed acquisition) of any of the foregoing risks or forward-looking statements, as well as other risk factors listed from time to time in public disclosures.
The forward-looking statements should be read in conjunction with the other cautionary statements that are included elsewhere, including the risk factors included in any publicdisclosures of DSV or Agility. Any forward-looking statements made in this announcement are qualified in their entirety by these cautionary statements, and there can be noassurance that the actual results or developments anticipated by us will be realised or, even if substantially realised, that they will have the expected consequences to, or effectson, us or our business or operations. Except as required by law, we undertake no obligation to publicly update or revise any forward-looking statements, whether as a result ofnew information, future events or otherwise.
3 | DSV Panalpina – H1 2021 results
Completion of acquisition of Agility GIL
Content
Half-year 2021 results2 31 Appendix
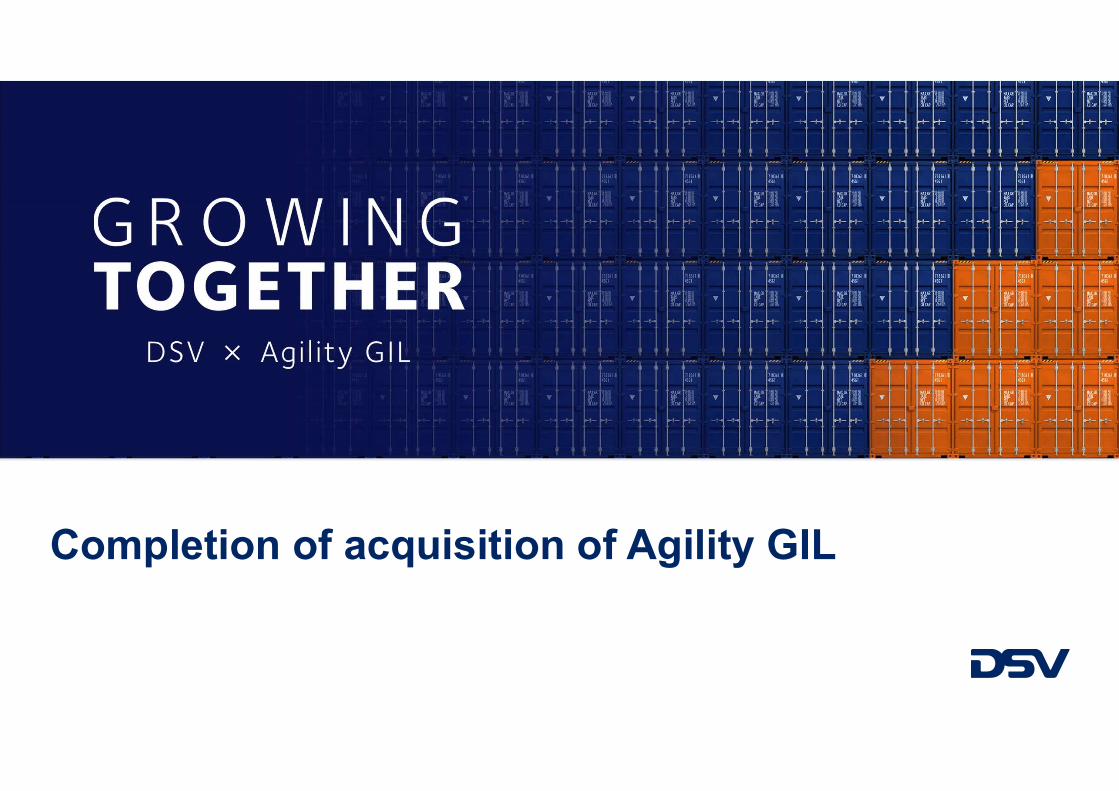
Completion of acquisition of Agility GIL
5 | DSV Panalpina – H1 2021 results
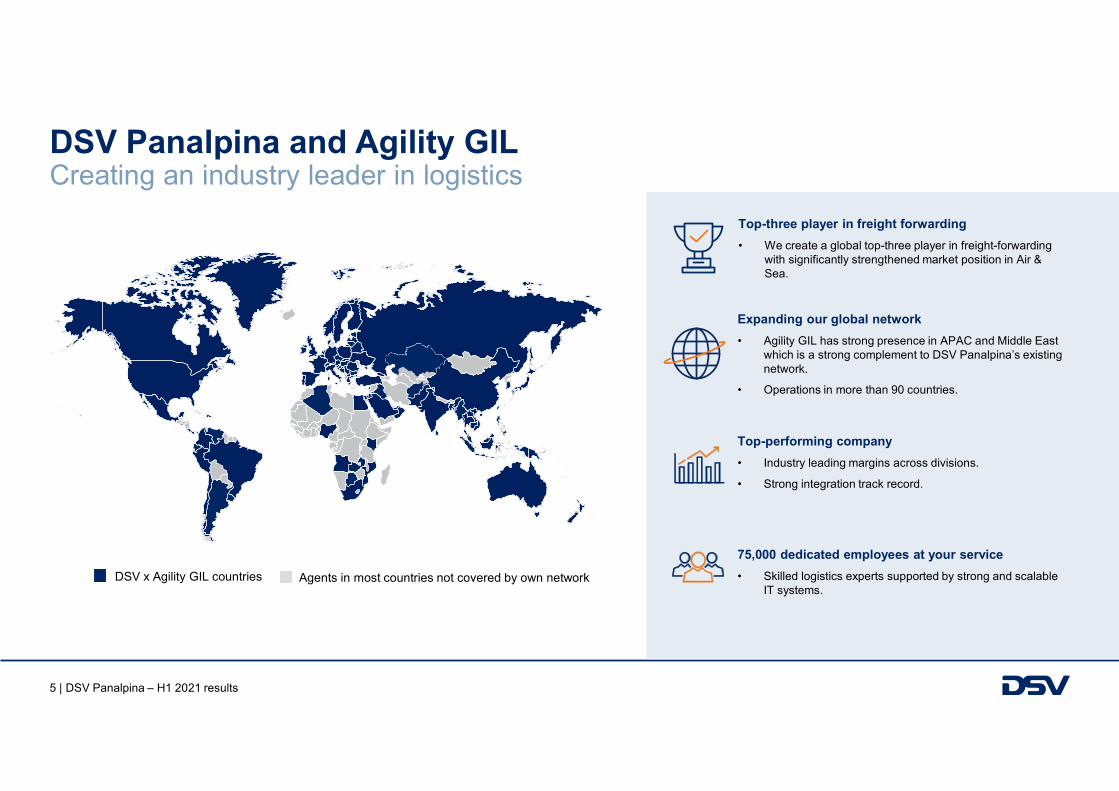
Agents in most countries not covered by own network
DSV Panalpina and Agility GIL Creating an industry leader in logistics
Expanding our global network
• Agility GIL has strong presence in APAC and Middle East which is a strong complement to DSV Panalpina’s existingnetwork.
• Operations in more than 90 countries.
75,000 dedicated employees at your service
• Skilled logistics experts supported by strong and scalable IT systems.
Top-three player in freight forwarding
• We create a global top-three player in freight-forwarding with significantly strengthened market position in Air & Sea.
Top-performing company
• Industry leading margins across divisions.
• Strong integration track record.
DSV x Agility GIL countries
6 | DSV Panalpina – H1 2021 results
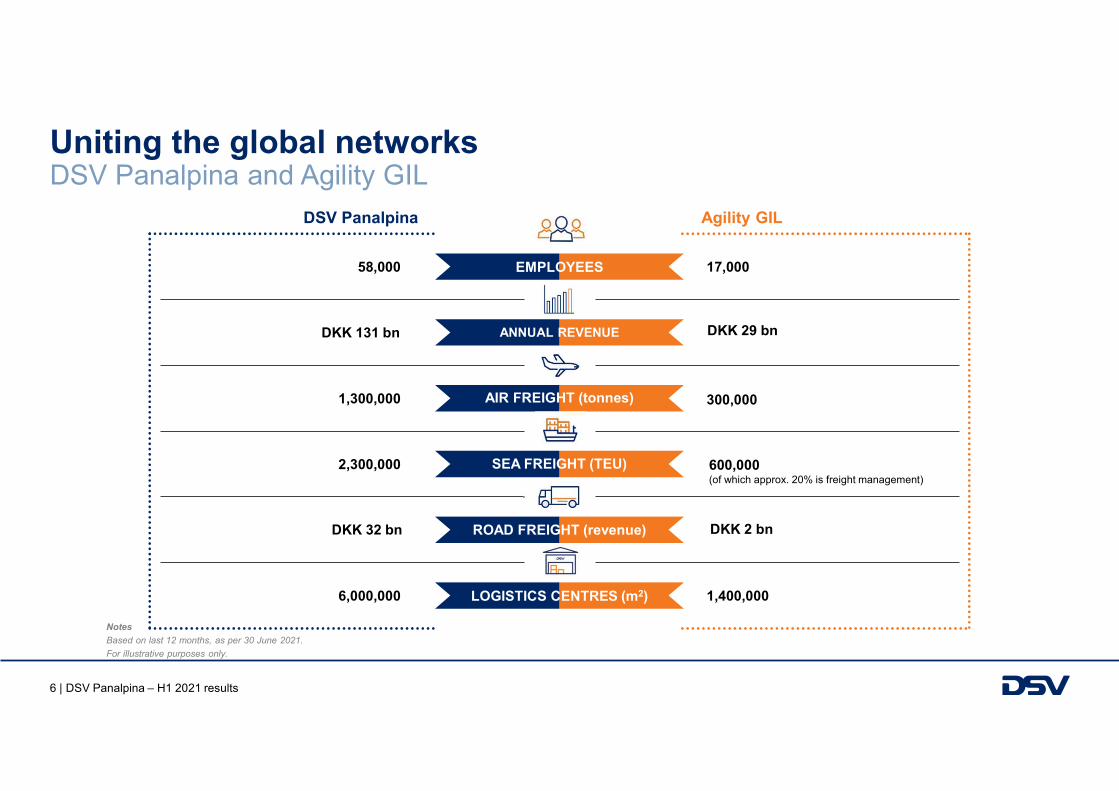
Uniting the global networks DSV Panalpina and Agility GIL
600,000(of which approx. 20% is freight management)
1,400,000
17,000
DKK 29 bn
300,000
Agility GIL
58,000
DKK 131 bn
1,300,000
2,300,000
6,000,000
DSV Panalpina
DKK 2 bnDKK 32 bn
SEA FREIGHT (TEU)
AIR FREIGHT (tonnes)
ANNUAL REVENUE
ROAD FREIGHT (revenue)
LOGISTICS CENTRES (m2)
EMPLOYEES
Notes
Based on last 12 months, as per 30 June 2021.
For illustrative purposes only.
7 | DSV Panalpina – H1 2021 results
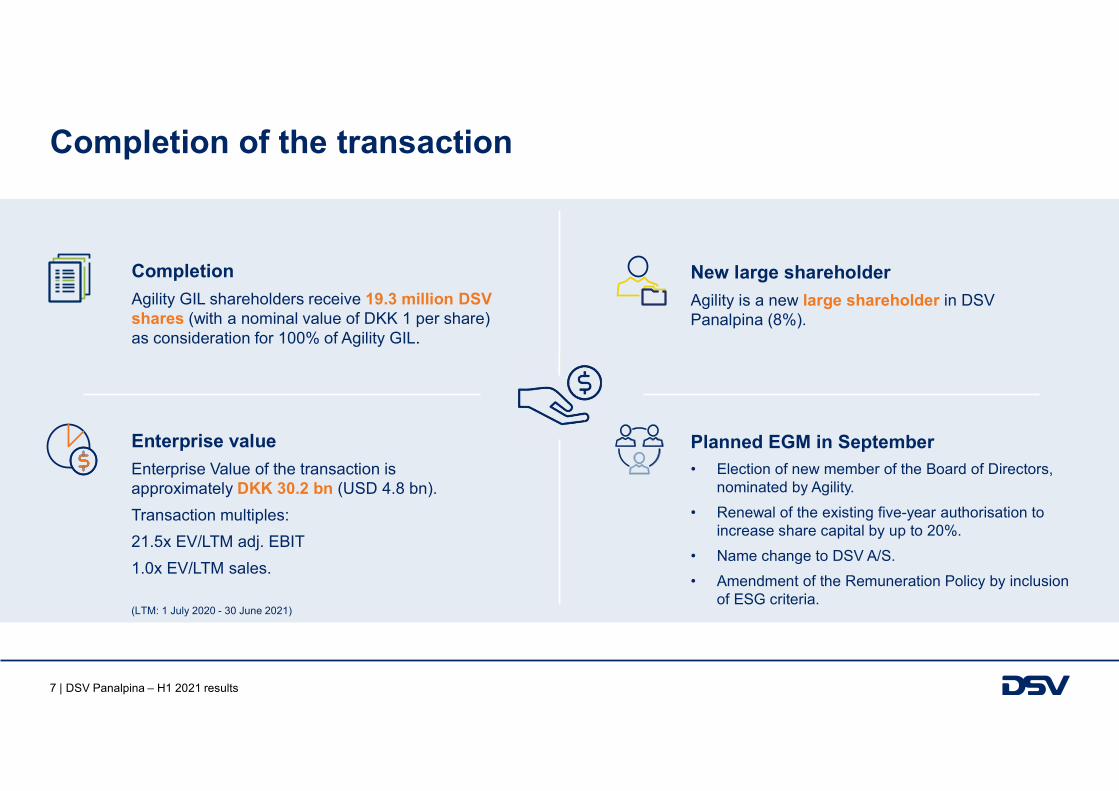
Completion of the transaction
Completion
Agility GIL shareholders receive 19.3 million DSV shares (with a nominal value of DKK 1 per share) as consideration for 100% of Agility GIL.
Enterprise value
Enterprise Value of the transaction is approximately DKK 30.2 bn (USD 4.8 bn).
Transaction multiples:
21.5x EV/LTM adj. EBIT
1.0x EV/LTM sales.
(LTM: 1 July 2020 - 30 June 2021)
New large shareholder
Agility is a new large shareholder in DSV Panalpina (8%).
Planned EGM in September• Election of new member of the Board of Directors,
nominated by Agility.
• Renewal of the existing five-year authorisation to increase share capital by up to 20%.
• Name change to DSV A/S.
• Amendment of the Remuneration Policy by inclusion of ESG criteria.

8 | DSV Panalpina – H1 2021 results
Expected EBIT before special items contribution
• Agility GIL will be included in the consolidated financial results of DSV Panalpina as from 16 August 2021.
• Once fully integrated, it is expected that Agility GIL will contribute approx. DKK 2,800 million to the combined EBIT before special items on an annual basis.
• Full-year effect expected from 2023 and includes synergies from the consolidation of operations, logistics facilities, administration and IT infrastructure.
• The transaction is expected to be EPS accretive (diluted and adjusted) by 2022.
Transaction and integration costs
• Expected transaction and integrations costs will be communicated in connection with the release of DSV Panalpina’s Q3 2021 interim financial report on 26 October 2021.
Expected EBIT contribution from Agility GIL
9 | DSV Panalpina – H1 2021 results
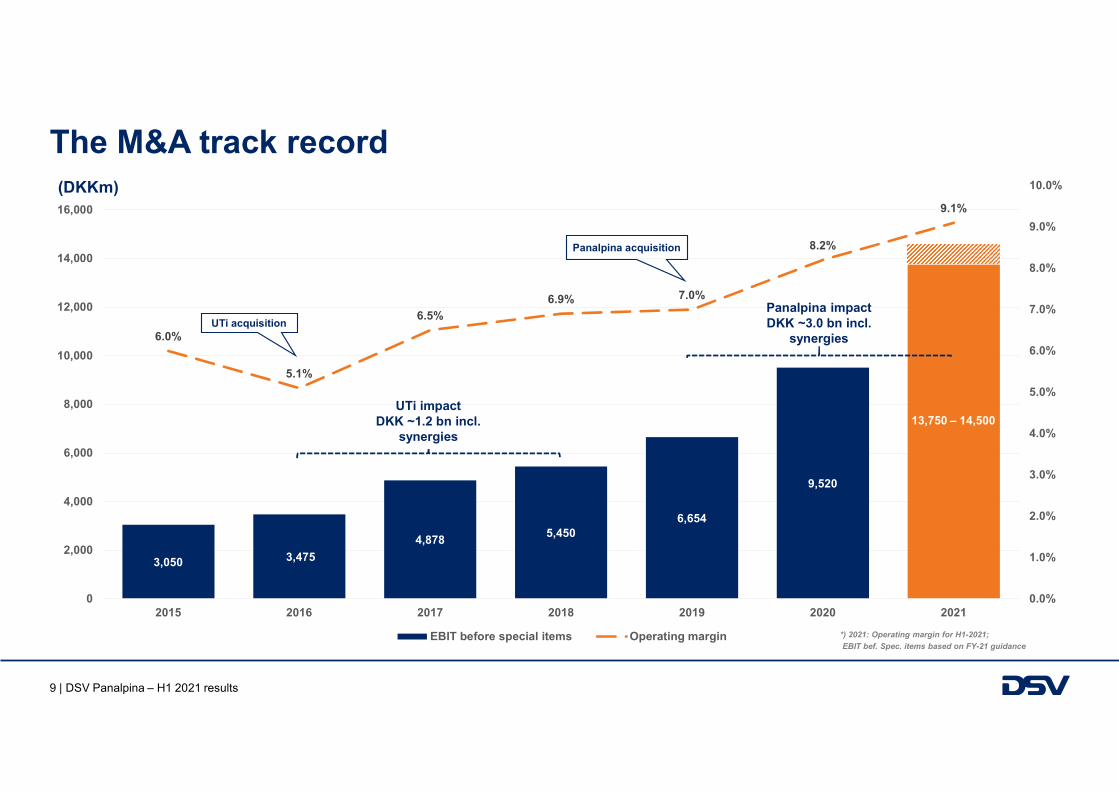
3,050 3,475
4,8785,450
6,654
9,520
6.0%
5.1%
6.5%
6.9% 7.0%
8.2%
9.1%
0.0%
1.0%
2.0%
3.0%
4.0%
5.0%
6.0%
7.0%
8.0%
9.0%
10.0%
0
2,000
4,000
6,000
8,000
10,000
12,000
14,000
16,000
2015 2016 2017 2018 2019 2020 2021
EBIT before special items Operating margin
UTi impact DKK ~1.2 bn incl.
synergies
The M&A track record
UTi acquisition
Panalpina acquisition
Panalpina impact DKK ~3.0 bn incl.
synergies
(DKKm)
*) 2021: Operating margin for H1-2021;
EBIT bef. Spec. items based on FY-21 guidance
13,750 – 14,500

10 | DSV Panalpina – H1 2021 results
Outlook for 2021 raised Main assumptions
(DKKm) Updated outlook 2021 Previous outlook 2021 Actual 2020
EBIT before special items 13,750-14,500 12,500-13,000 9,520
Effective tax rate 23.0% 23.0% 24.3%
Main assumptions
• Approximately DKK 750 million of the upgrade is related to Agility GIL, and the rest is related to the performance of the existing DSV business.
• The current situation in the transport markets with strong demand, tight capacity and high rates will most likely continue for the remainder of 2021.
• We expect yields in Air & Sea will decline compared to the levels reported for H1-21, but this is not expected to materialise until late in 2021.
• Currency exchange rates will remain at current level.

11 | DSV Panalpina – H1 2021 results
Next steps Expected timeline
27 April 2021
Announcement of agreement
16 August 2021
Closing
Integration commences
Filing to relevant authorities
Shareholder meeting Agility
H1-2021 interim financial report
Regulatory approvals
obtained and conditions
fulfilled
Extraordinary general meeting
Q3 2021 interim financial report
Update on expected timing of
synergies and integration costs
26 October 2021September 2021
12 | DSV Panalpina – H1 2021 results
HALF-YEAR 2021 RESULTS
13 | DSV Panalpina – H1 2021 results
Highlights H1 2021
*) Growth rates are in constant currencies.
• Strong financial results driven by all three divisions.• 2021 EBIT guidance upgraded after acquiring Agility GIL to DKK 13,750 – 14,500 million (previously DKK 12,5000 –
13,000 million).• New DKK 4,000 million share buyback programme initiated.
7,386
8,333
Q2-20 Q2-21
14,070
16,118
H1-20 H1-21
Gross profit (DKKm) EBIT before special items (DKKm)
2,613
3,571
Q2-20 Q2-21
4,179
6,638
H1-20 H1-21
+15.1%* +18.0%* +40.4%* +64.7%*
14 | DSV Panalpina – H1 2021 results
Air & Sea
11%
(DKKm) Q2 2021 Q2 2020 Growth* H1 2021 H1 2020 Growth**
Gross profit 2,897 3,015 (1.2)% 5,659 5,168 13.9%
Gross profit 2,245 1,648 41.7% 4,271 3,370 32.6%
Total gross profit 5,142 4,663 13.9% 9,930 8,538 21.3%
EBIT 2,843 2,112 39.5% 5,236 3,242 69.0%
*) Growth rates are in constant currencies and including M&A impact.
Operating margin Conversion ratio
45.3% 46.3% 44.0%50.0%
55.3%
Q2-20 Q3-20 Q4-20 Q1-21 Q2-21
11.0% 11.1%
9.0%
10.4% 11.0%
Q2-20 Q3-20 Q4-20 Q1-21 Q2-21
Management commentary
• Double-digit volume growth in Q2-21 and strong results in extraordinary market conditions.
• Global supply chains continue to be impacted by imbalances and capacity issues – we work hard to find the right solutions for our customers.
• Conversion ratio at all-time high reflecting the skills of our teams and scalability of the systems.
• Development in gross profit from air freight in Q2-21 must be seen in light of the surge in demand for high yielding air freight goods in Q2-20.

15 | DSV Panalpina – H1 2021 results
Air freight Q2 2021
*) Q4 2020 is the first quarter with full impact of the Panalpina acquisition on comparative figures.Air freight growth for the period Q3-20 to Q2-21 is adjusted for discontinued business (Airflo – perishables)
Volume growth air
DSV (including M&A)* 69% 9% (21%) (2%) 26%
Market estimate (25-30%) (14-17%) (8-10%) 5-7% 25-30%
Management commentary
• Acceleration of growth in Q2-21, both for the market and for DSV. Comparisons impacted by COVID-19 slow-down.
• With 26% volume growth in Q2-21 we are in line with the global market growth.
• Growth was driven by export from APAC and Americas, whereas EMEA exports were flat year on year.
• Yields continue to be impacted by market situation, but not to the same extent as 2020.
• Return of long-haul belly capacity will only happen gradually during 2022-24.
287 300 325 336 349
10,489
8,589
7,786 8,213 8,296
Q2-20 Q3-20 Q4-20 Q1-21 Q2-21
Tonnes, '000 Gross profit/tonne, DKK
16 | DSV Panalpina – H1 2021 results
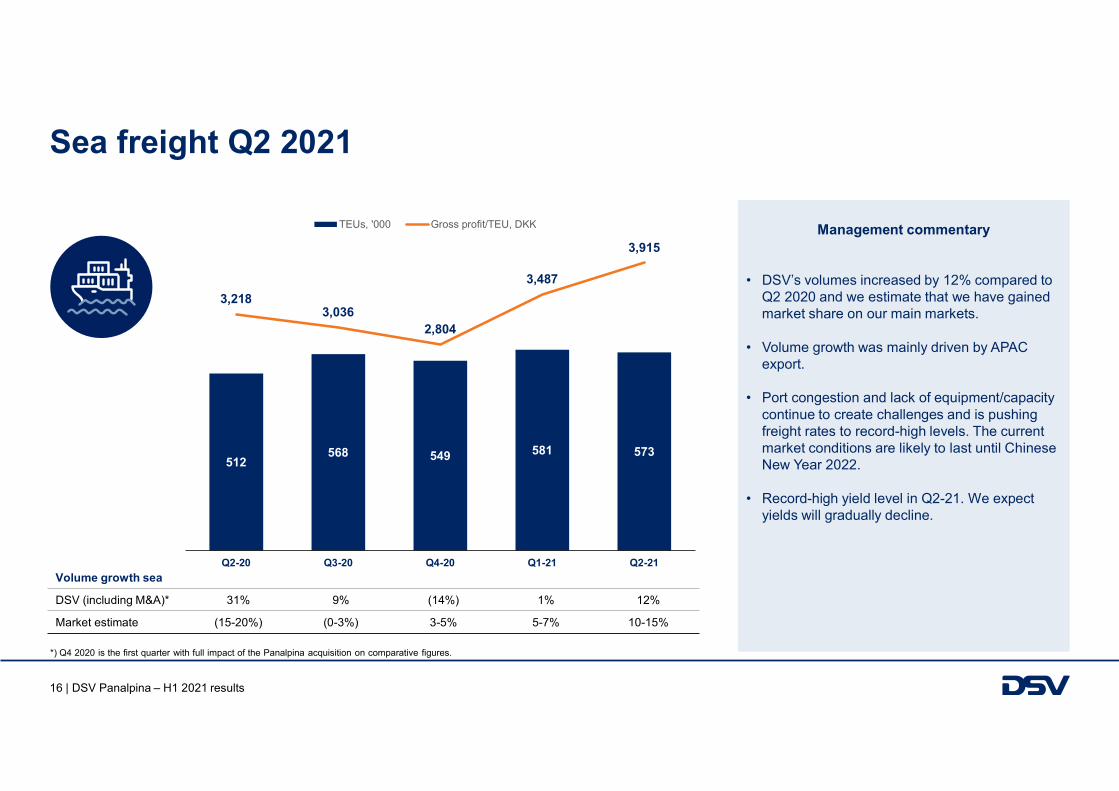
Volume growth sea
DSV (including M&A)* 31% 9% (14%) 1% 12%
Market estimate (15-20%) (0-3%) 3-5% 5-7% 10-15%
Sea freight Q2 2021
*) Q4 2020 is the first quarter with full impact of the Panalpina acquisition on comparative figures.
Management commentary
• DSV’s volumes increased by 12% compared to Q2 2020 and we estimate that we have gained market share on our main markets.
• Volume growth was mainly driven by APAC export.
• Port congestion and lack of equipment/capacity continue to create challenges and is pushing freight rates to record-high levels. The current market conditions are likely to last until Chinese New Year 2022.
• Record-high yield level in Q2-21. We expect yields will gradually decline.
512568 549 581 573
3,2183,036
2,804
3,487
3,915
Q2-20 Q3-20 Q4-20 Q1-21 Q2-21
TEUs, '000 Gross profit/TEU, DKK
17 | DSV Panalpina – H1 2021 results
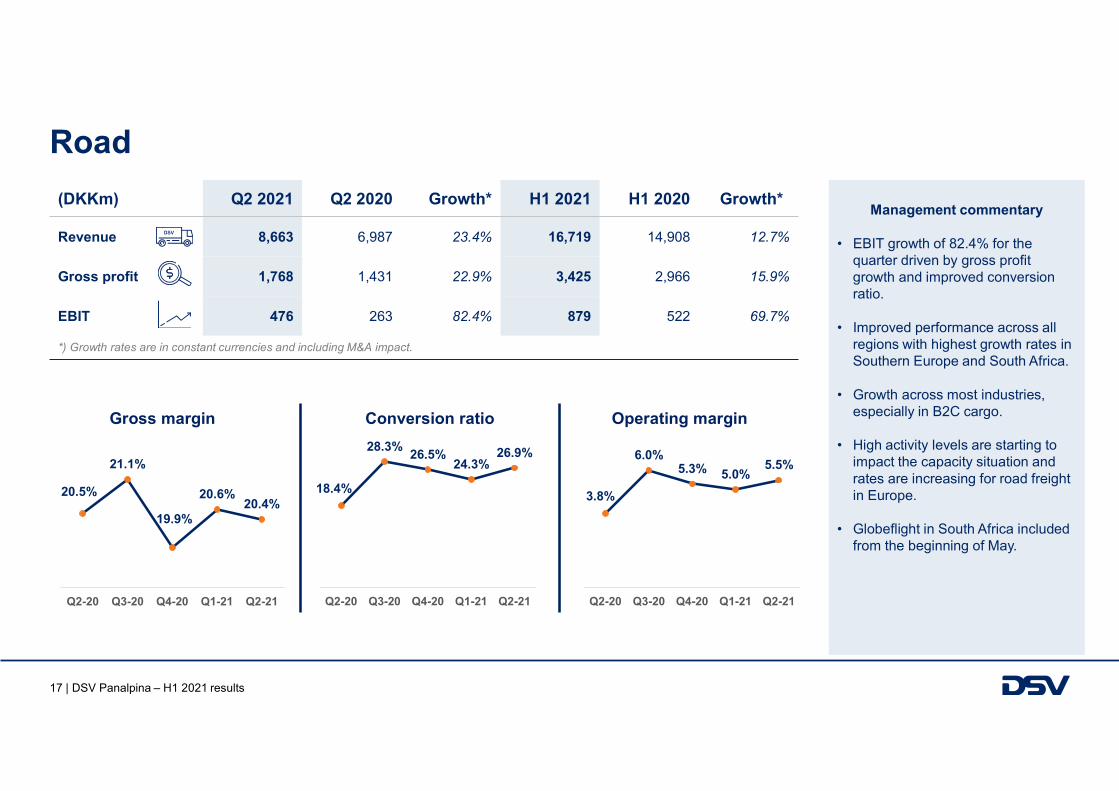
Road
11%
(DKKm) Q2 2021 Q2 2020 Growth* H1 2021 H1 2020 Growth**
Revenue 8,663 6,987 23.4% 16,719 14,908 12.7%
Gross profit 1,768 1,431 22.9% 3,425 2,966 15.9%
EBIT 476 263 82.4% 879 522 69.7%
*) Growth rates are in constant currencies and including M&A impact.
Gross margin Conversion ratio Operating margin
20.5%
21.1%
19.9%
20.6%20.4%
Q2-20 Q3-20 Q4-20 Q1-21 Q2-21
18.4%
28.3%26.5%
24.3%26.9%
Q2-20 Q3-20 Q4-20 Q1-21 Q2-21
3.8%
6.0%5.3% 5.0%
5.5%
Q2-20 Q3-20 Q4-20 Q1-21 Q2-21
Management commentary
• EBIT growth of 82.4% for the quarter driven by gross profit growth and improved conversion ratio.
• Improved performance across all regions with highest growth rates in Southern Europe and South Africa.
• Growth across most industries, especially in B2C cargo.
• High activity levels are starting to impact the capacity situation and rates are increasing for road freight in Europe.
• Globeflight in South Africa included from the beginning of May.

18 | DSV Panalpina – H1 2021 results
Solutions
(DKKm) Q2 2021 Q2 2020 Growth* H1 2021 H1 2020 Growth**
Revenue 3,997 3,256 23.5% 7,606 6,697 16.2%
Gross profit 1,377 1,271 8.6% 2,725 2,527 9.9%
EBIT 278 234 15.8% 541 393 37.0%
*) Growth rates are in constant currencies and including M&A impact.
39.0%38.8%
33.8%
37.4%
34.5%
Q2-20 Q3-20 Q4-20 Q1-21 Q2-21
18.4%23.8%
29.8%
19.5% 20.2%
Q2-20 Q3-20 Q4-20 Q1-21 Q2-21
7.2%9.2%
10.1%
7.3% 7.0%
Q2-20 Q3-20 Q4-20 Q1-21 Q2-21
Gross margin Conversion ratio Operating margin
Management commentary
• EBIT growth of 15.8% for Q2-21 driven by increase in gross profit growth and higher conversion ratio.
• Revenue growth driven by COVID-19 recovery and acquisition of Prime Cargo in January 2021.
• Gross margin for Q2-21 was negatively impacted by costs related to customer implementations.
• We see good momentum and growth across all industries.

19 | DSV Panalpina – H1 2021 results
P&L H1 2021(DKKm) Q2 2021 Q2 2020 Growth* H1 2021 H1 2020 Growth*
Headlines
Revenue 37,831 28,782 34.4% 71,447 56,091 31.5%
Gross profit 8,333 7,386 15.1% 16,118 14,070 18.0%
EBIT before special items 3,571 2,613 40.4% 6,638 4,179 64.7%
Profit for the period 2,527 1,390 4,856 1,721
P&L items
Cost base (staff, other ext., depreciations) 4,762 4,773 9,480 9,891
Special items, costs - 515 - 1,026
Financial items, FX adjustments 76 80 (82) 487
Financial items, other 177 142 356 332
KPIs
Gross margin (%) 22.0 25.7 22.6 25.1
Operating margin (%) 9.4 9.1 9.3 7.5
Conversion ratio (%) 42.9 35.4 41.2 29.7
Effective tax rate (%) 23.8 25.9 23.7 26.3
Employees 59,871 53,399
Diluted adjusted EPS 12 months 37.1 20.8 78.4%
*) Growth rates are in constant currencies.
Management commentary
• Revenue growth driven by higher activity and high freight rates.
• Strong growth in gross profit.
• Conversion ratio at record level, confirming the scalability of our systems and organisation.
• Financial costs and tax at expected level.
• Increase in number of employees is mainly related to blue-collar employees (+5,500 FTEs), due to general activity increase and M&A.
20 | DSV Panalpina – H1 2021 results
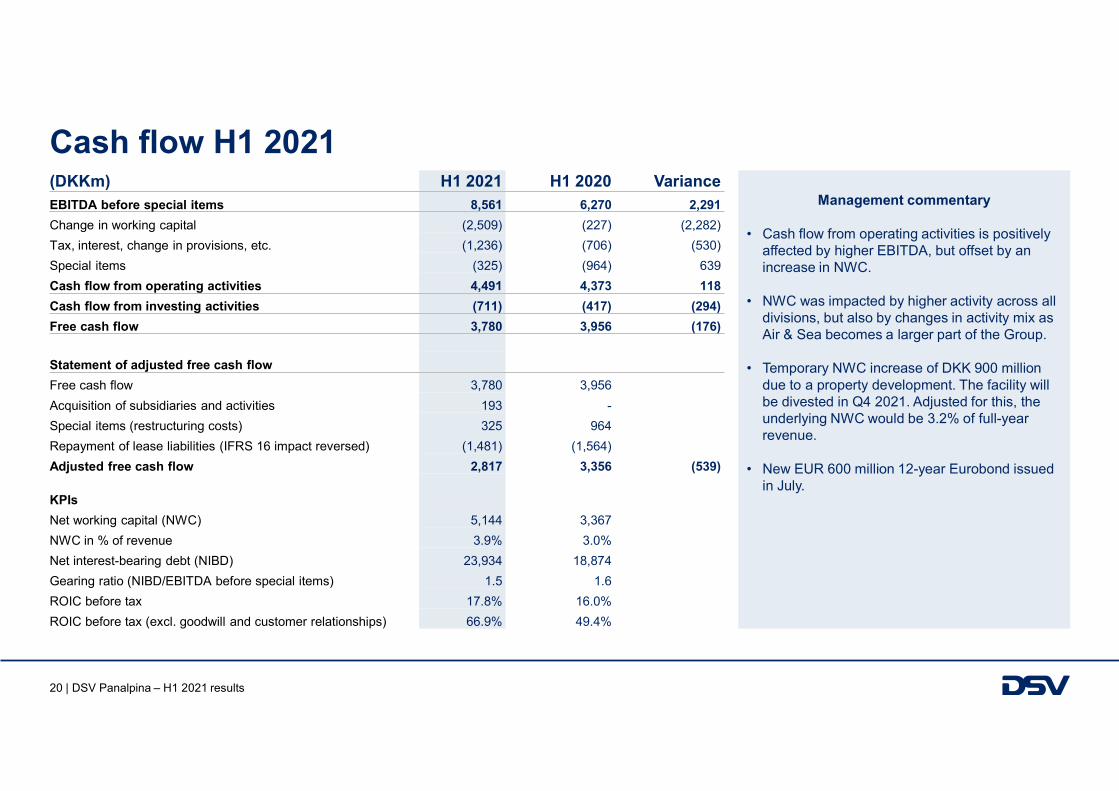
(DKKm) H1 2021 H1 2020 VarianceEBITDA before special items 8,561 6,270 2,291
Change in working capital (2,509) (227) (2,282)
Tax, interest, change in provisions, etc. (1,236) (706) (530)
Special items (325) (964) 639
Cash flow from operating activities 4,491 4,373 118
Cash flow from investing activities (711) (417) (294)
Free cash flow 3,780 3,956 (176)
Statement of adjusted free cash flow
Free cash flow 3,780 3,956
Acquisition of subsidiaries and activities 193 -
Special items (restructuring costs) 325 964
Repayment of lease liabilities (IFRS 16 impact reversed) (1,481) (1,564)
Adjusted free cash flow 2,817 3,356 (539)
KPIs
Net working capital (NWC) 5,144 3,367
NWC in % of revenue 3.9% 3.0%
Net interest-bearing debt (NIBD) 23,934 18,874
Gearing ratio (NIBD/EBITDA before special items) 1.5 1.6
ROIC before tax 17.8% 16.0%
ROIC before tax (excl. goodwill and customer relationships) 66.9% 49.4%
Cash flow H1 2021
Management commentary
• Cash flow from operating activities is positively affected by higher EBITDA, but offset by an increase in NWC.
• NWC was impacted by higher activity across all divisions, but also by changes in activity mix as Air & Sea becomes a larger part of the Group.
• Temporary NWC increase of DKK 900 million due to a property development. The facility will be divested in Q4 2021. Adjusted for this, the underlying NWC would be 3.2% of full-year revenue.
• New EUR 600 million 12-year Eurobond issued in July.
21 | DSV Panalpina – H1 2021 results
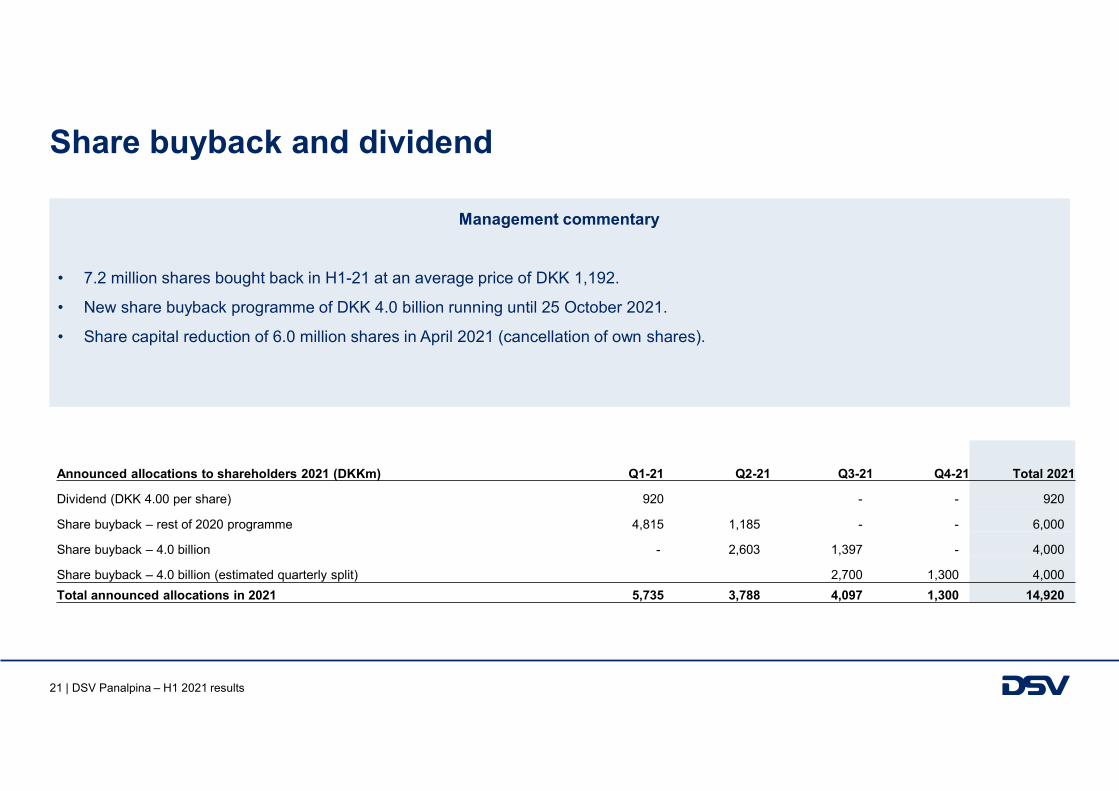
Share buyback and dividend
Announced allocations to shareholders 2021 (DKKm) Q1-21 Q2-21 Q3-21 Q4-21 Total 2021
Dividend (DKK 4.00 per share) 920 - - 920
Share buyback – rest of 2020 programme 4,815 1,185 - - 6,000
Share buyback – 4.0 billion - 2,603 1,397 - 4,000
Share buyback – 4.0 billion (estimated quarterly split) 2,700 1,300 4,000
Total announced allocations in 2021 5,735 3,788 4,097 1,300 14,920
Management commentary
• 7.2 million shares bought back in H1-21 at an average price of DKK 1,192.
• New share buyback programme of DKK 4.0 billion running until 25 October 2021.
• Share capital reduction of 6.0 million shares in April 2021 (cancellation of own shares).
22 | DSV Panalpina – H1 2021 results
Appendix
23 | DSV Panalpina – H1 2021 results
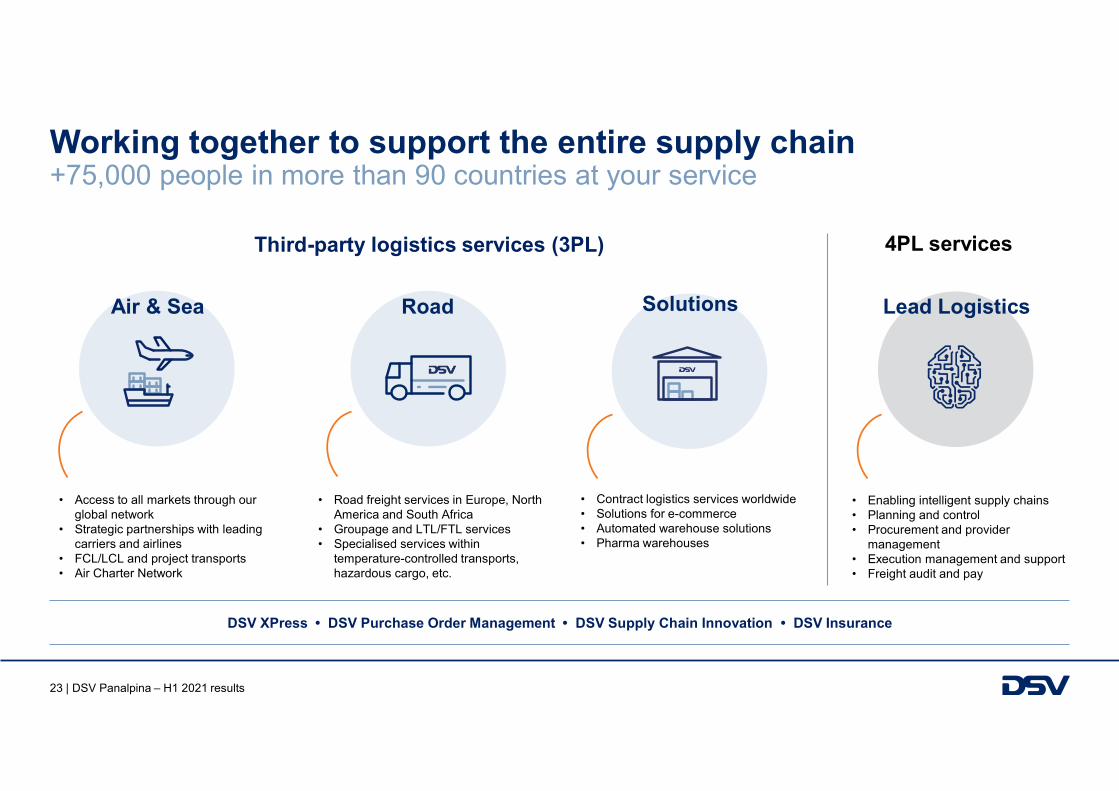
Working together to support the entire supply chain +75,000 people in more than 90 countries at your service
DSV XPress • DSV Purchase Order Management • DSV Supply Chain Innovation • DSV Insurance
Third-party logistics services (3PL) 4PL services
Lead Logistics
• Enabling intelligent supply chains• Planning and control• Procurement and provider
management• Execution management and support• Freight audit and pay
• Road freight services in Europe, North America and South Africa
• Groupage and LTL/FTL services• Specialised services within
temperature-controlled transports, hazardous cargo, etc.
Road
• Access to all markets through our global network
• Strategic partnerships with leading carriers and airlines
• FCL/LCL and project transports• Air Charter Network
Air & Sea
• Contract logistics services worldwide• Solutions for e-commerce• Automated warehouse solutions• Pharma warehouses
Solutions
24 | DSV Panalpina – H1 2021 results
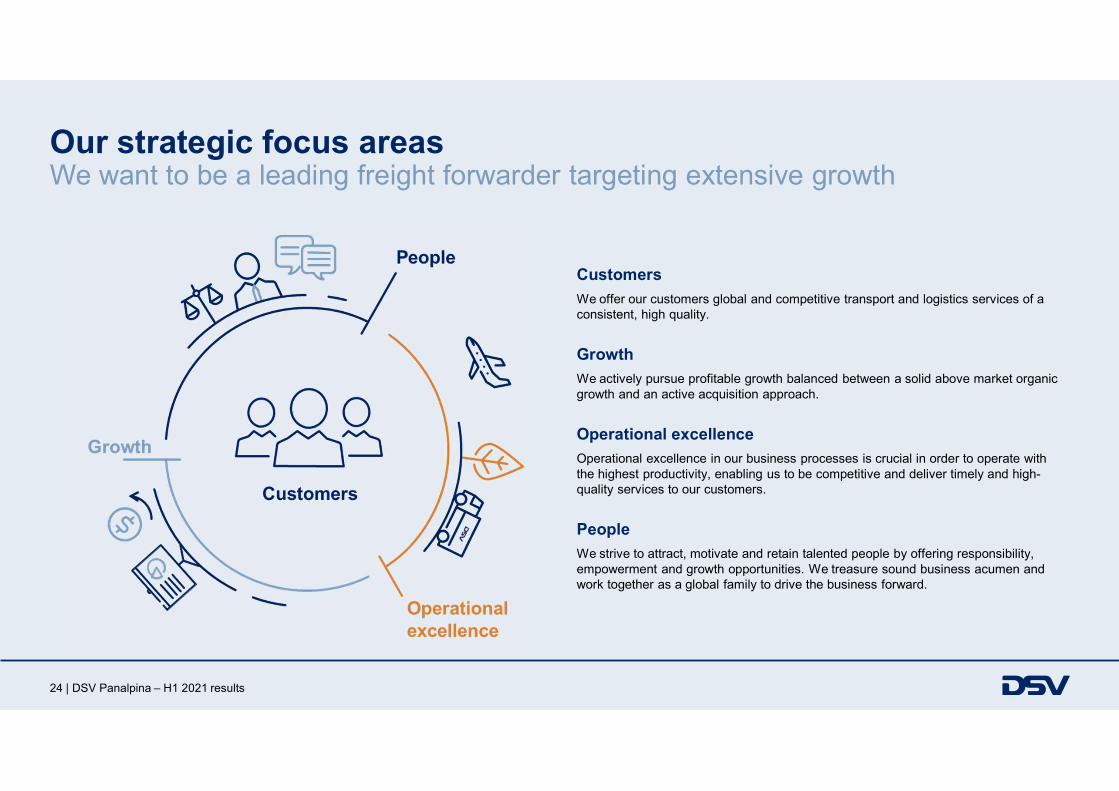
Our strategic focus areas We want to be a leading freight forwarder targeting extensive growth
Customers
We offer our customers global and competitive transport and logistics services of a consistent, high quality.
Growth
We actively pursue profitable growth balanced between a solid above market organic growth and an active acquisition approach.
Operational excellence
Operational excellence in our business processes is crucial in order to operate with the highest productivity, enabling us to be competitive and deliver timely and high-quality services to our customers.
People
We strive to attract, motivate and retain talented people by offering responsibility, empowerment and growth opportunities. We treasure sound business acumen and work together as a global family to drive the business forward.
25 | DSV Panalpina – H1 2021 results
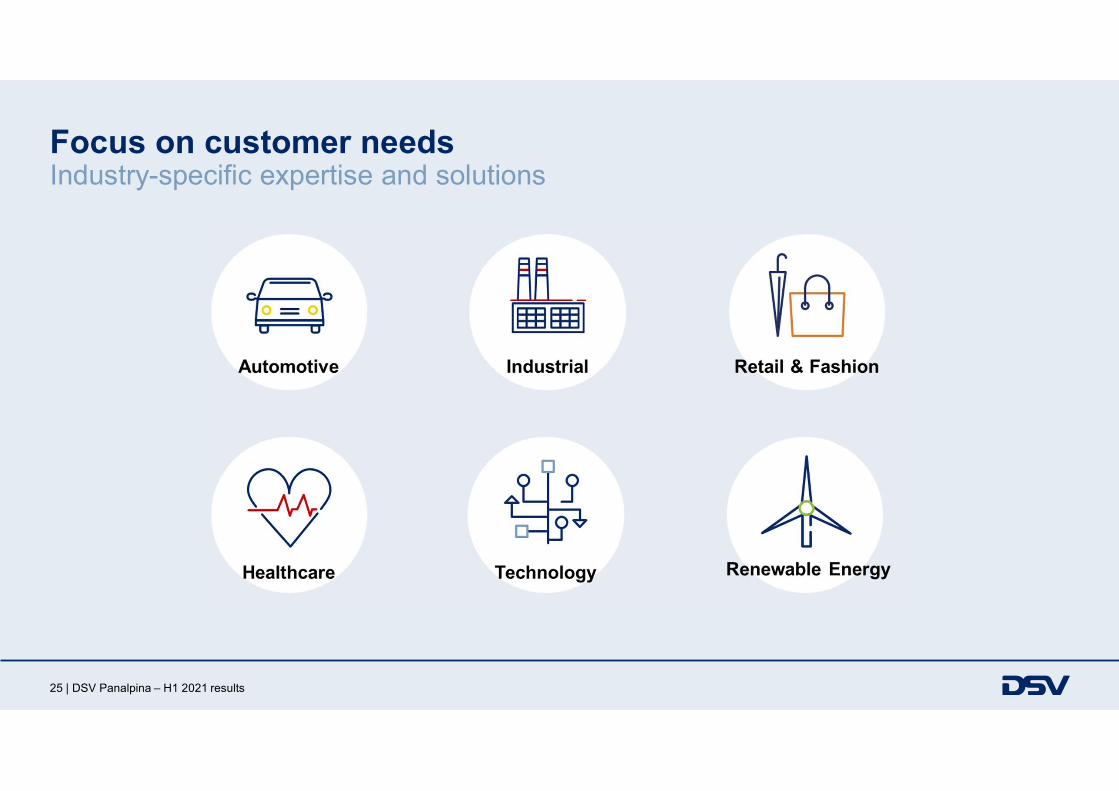
Focus on customer needs Industry-specific expertise and solutions
26 | DSV Panalpina – H1 2021 results
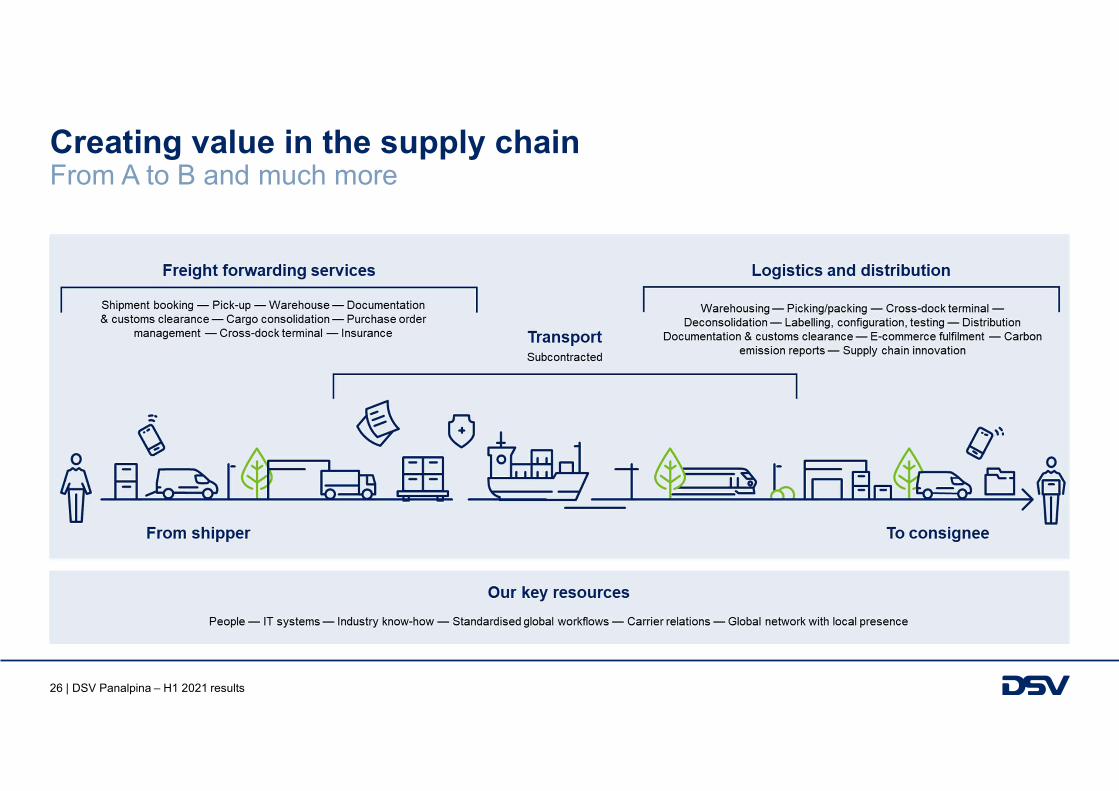
Creating value in the supply chain From A to B and much more
27 | DSV Panalpina – H1 2021 results
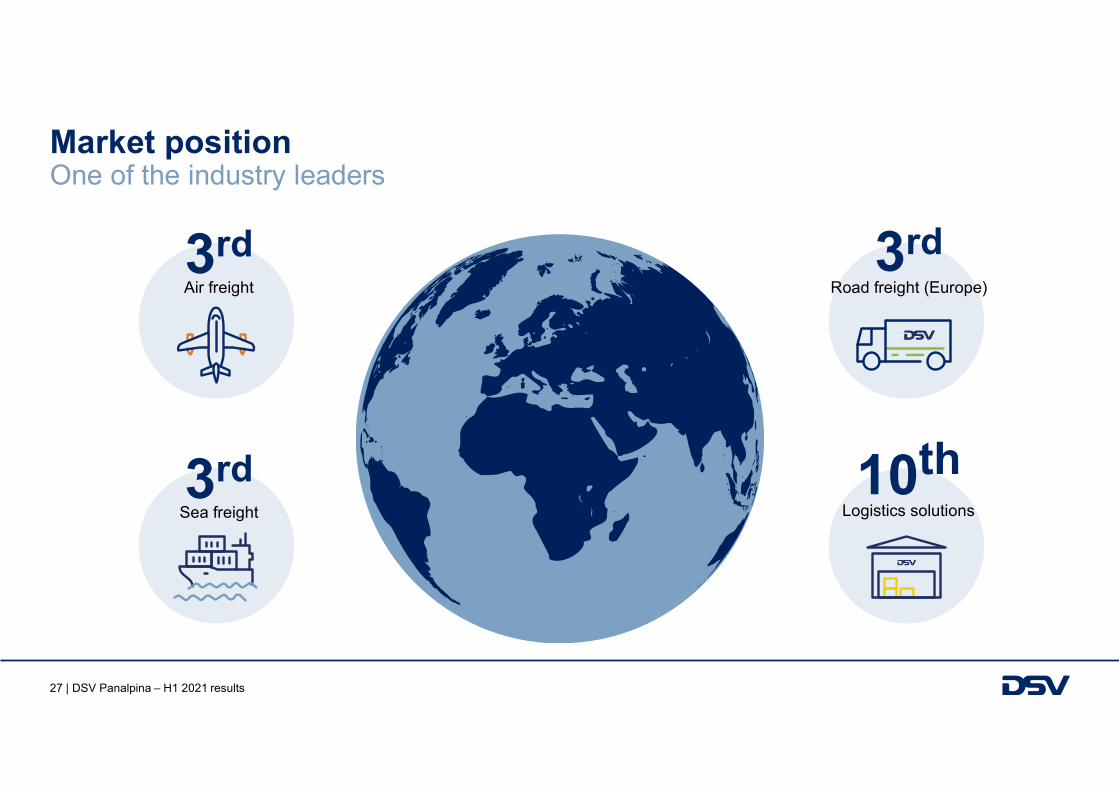
Market position One of the industry leaders
3rdAir freight
3rdSea freight
10thLogistics solutions
3rdRoad freight (Europe)

28 | DSV Panalpina – H1 2021 results
DSV trade lane exposure (excl. Agility GIL) Geographical volume exposure
Source: Container Trade StatisticsSource: Seabury
0%
4%
14%
28%
4%
5%
14%
6%
15%
8%
2%
4%
13%
10%
4%
11%
14%
3%
30%
10%
Misc.
Intra-Americas
Intra-EMEA
Intra-APAC
Americas - EMEA
EMEA - Americas
APAC - Americas
Americas - APAC
APAC - EMEA
EMEA - APAC
DSV Panalpina geographical exposure (2020)
Global market share geographical exposure (2020)
0%
7%
5%
20%
7%
8%
14%
8%
16%
15%
1%
9%
9%
5%
11%
13%
12%
6%
18%
16%
Misc.
Intra-Americas
Intra-EMEA
Intra-APAC
Americas - EMEA
EMEA - Americas
APAC - Americas
Americas - APAC
APAC - EMEA
EMEA - APAC
DSV Panalpina geographical exposure (2020)
Global market share geographical exposure (2020)
Air freight Sea freight
29 | DSV Panalpina – H1 2021 results
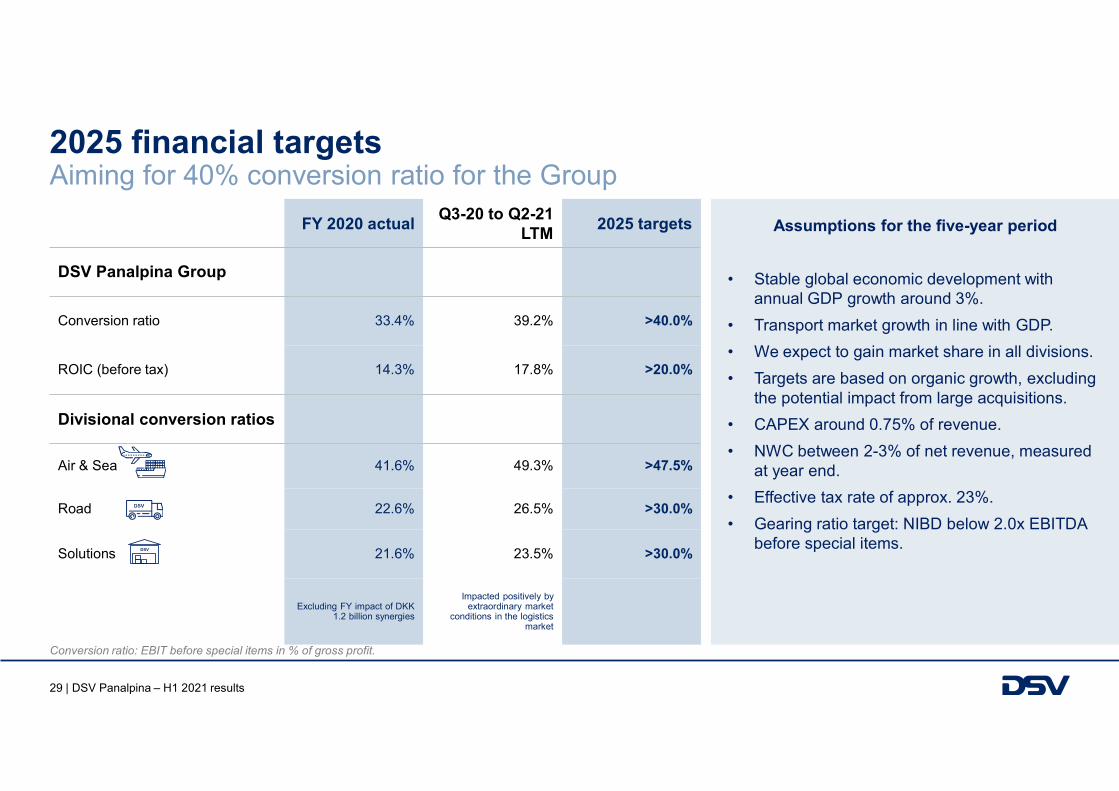
2025 financial targets
Assumptions for the five-year period
• Stable global economic development with annual GDP growth around 3%.
• Transport market growth in line with GDP.
• We expect to gain market share in all divisions.
• Targets are based on organic growth, excluding the potential impact from large acquisitions.
• CAPEX around 0.75% of revenue.
• NWC between 2-3% of net revenue, measured at year end.
• Effective tax rate of approx. 23%.
• Gearing ratio target: NIBD below 2.0x EBITDA before special items.
FY 2020 actualQ3-20 to Q2-21
LTM2025 targets
DSV Panalpina Group
Conversion ratio 33.4% 39.2% >40.0%
ROIC (before tax) 14.3% 17.8% >20.0%
Divisional conversion ratios
Air & Sea 41.6% 49.3% >47.5%
Road 22.6% 26.5% >30.0%
Solutions 21.6% 23.5% >30.0%
Excluding FY impact of DKK 1.2 billion synergies
Impacted positively by extraordinary market
conditions in the logistics market
Aiming for 40% conversion ratio for the Group
Conversion ratio: EBIT before special items in % of gross profit.

30 | DSV Panalpina – H1 2021 results
1 Consolidation of physical infrastructure –move towards multi-client facilities.
2 Consolidation of digital infrastructure – one Warehouse Management System.
3 Automation of warehousing operation and development of e-commerce capabilities.
Strategic focus areas
1 Market share gains. We aim to capitalise on the new, strong market position after the acquisition of Panalpina.
2 Scalability of IT infrastructure and further standardisation of workflows.
3 Further digital customer interaction –myDSV, real-time information, purchase order management.
Air & Sea
1 Further digital customer interaction –myDSV, real-time information, purchase order management, Quote Tool.
2 Implementation of Road Way Forward project.
3 Development of network and services.
Road Solutions
31 | DSV Panalpina – H1 2021 results
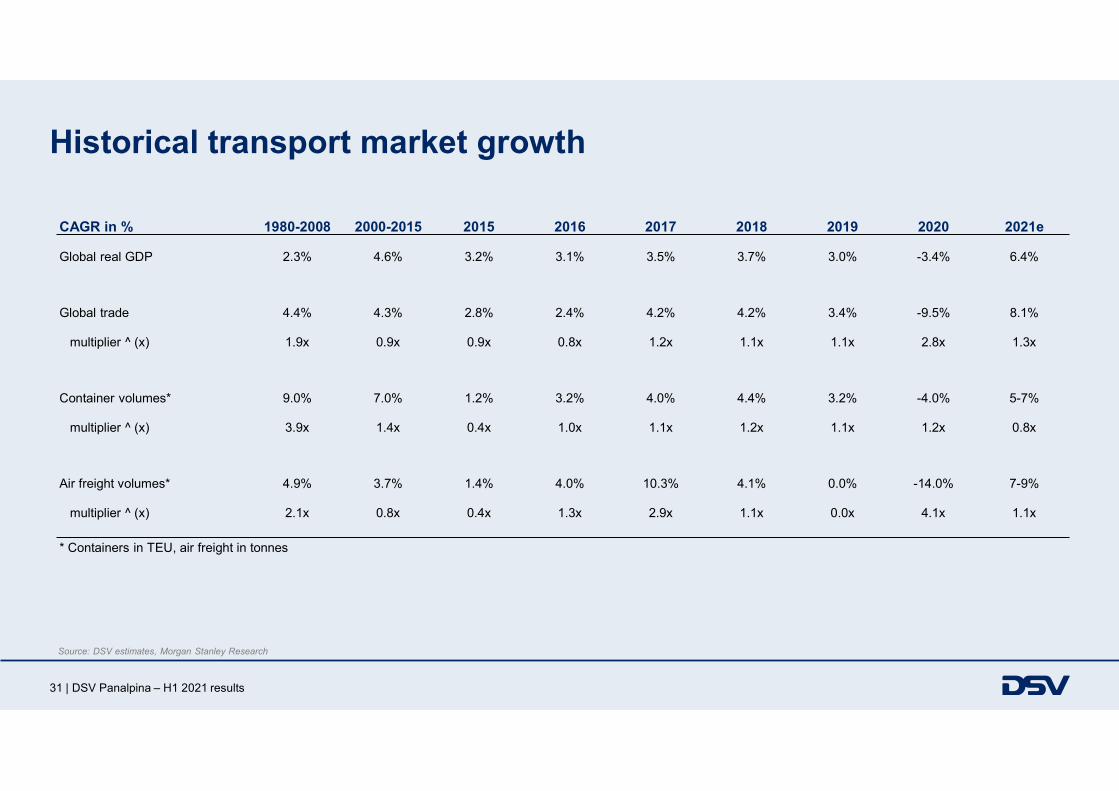
Historical transport market growth
CAGR in % 1980-2008 2000-2015 2015 2016 2017 2018 2019 2020 2021e
Global real GDP 2.3% 4.6% 3.2% 3.1% 3.5% 3.7% 3.0% -3.4% 6.4%
Global trade 4.4% 4.3% 2.8% 2.4% 4.2% 4.2% 3.4% -9.5% 8.1%
multiplier ^ (x) 1.9x 0.9x 0.9x 0.8x 1.2x 1.1x 1.1x 2.8x 1.3x
Container volumes* 9.0% 7.0% 1.2% 3.2% 4.0% 4.4% 3.2% -4.0% 5-7%
multiplier ^ (x) 3.9x 1.4x 0.4x 1.0x 1.1x 1.2x 1.1x 1.2x 0.8x
Air freight volumes* 4.9% 3.7% 1.4% 4.0% 10.3% 4.1% 0.0% -14.0% 7-9%
multiplier ^ (x) 2.1x 0.8x 0.4x 1.3x 2.9x 1.1x 0.0x 4.1x 1.1x
* Containers in TEU, air freight in tonnes
Source: DSV estimates, Morgan Stanley Research
32 | DSV Panalpina – H1 2021 results
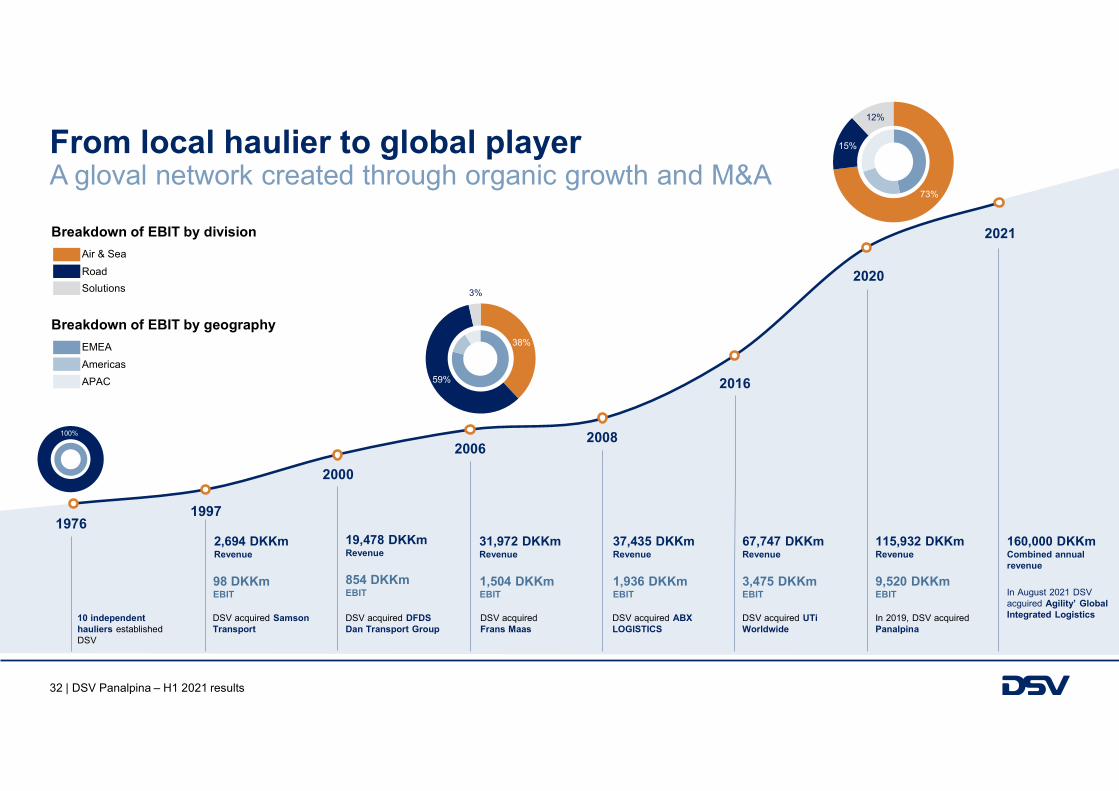
73%
15%
12%
1997
38%
59%
3%
100%
Breakdown of EBIT by division
Air & Sea
Road
Solutions
Breakdown of EBIT by geography
EMEA
Americas
APAC
DSV acquired Samson Transport
2,694 DKKmRevenue
98 DKKmEBIT
1976
10 independent hauliers establishedDSV
2000
DSV acquired DFDS Dan Transport Group
19,478 DKKmRevenue
854 DKKmEBIT
67,747 DKKmRevenue
2016
3,475 DKKmEBIT
DSV acquired UTi Worldwide
2008
37,435 DKKmRevenue
1,936 DKKmEBIT
DSV acquired ABX LOGISTICS
DSV acquired Frans Maas
2006
31,972 DKKmRevenue
1,504 DKKmEBIT
From local haulier to global player A gloval network created through organic growth and M&A
115,932 DKKmRevenue
In 2019, DSV acquiredPanalpina
2020
9,520 DKKmEBIT
2021
160,000 DKKmCombined annualrevenue
In August 2021 DSV acguired Agility’ Global Integrated Logistics
33 | DSV Panalpina – H1 2021 results
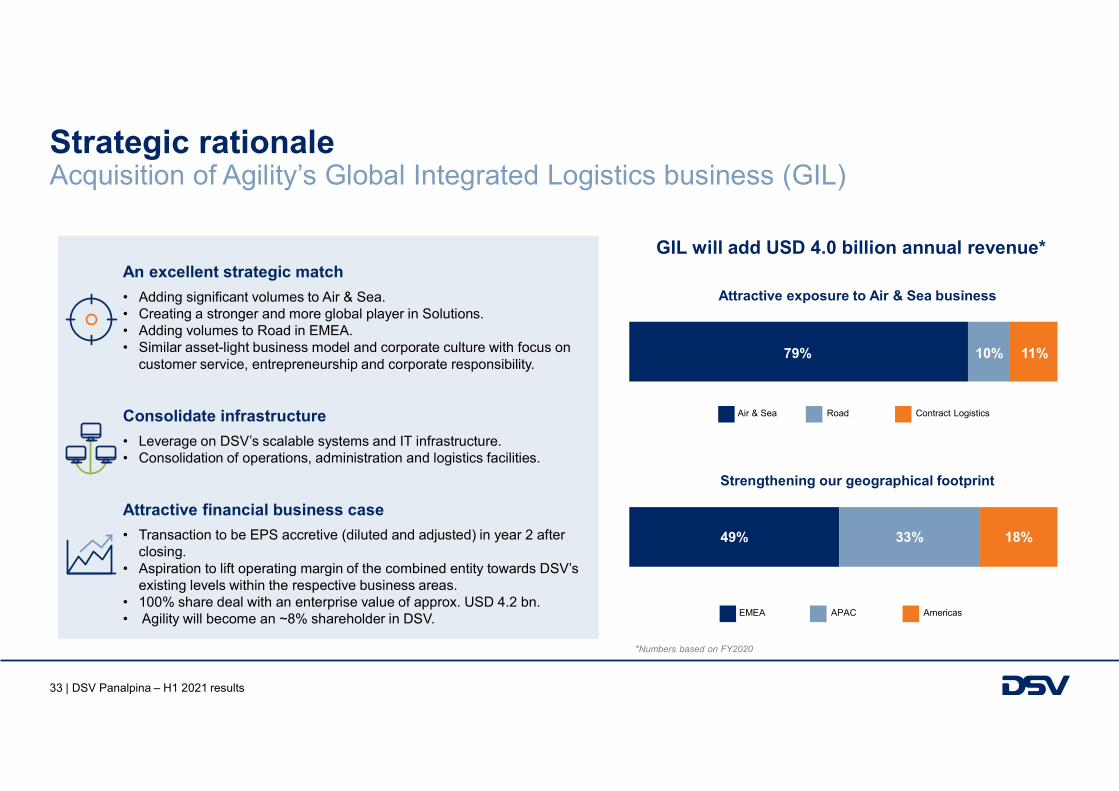
49% 33% 18%
An excellent strategic match
• Adding significant volumes to Air & Sea.• Creating a stronger and more global player in Solutions.• Adding volumes to Road in EMEA.• Similar asset-light business model and corporate culture with focus on
customer service, entrepreneurship and corporate responsibility.
Consolidate infrastructure
• Leverage on DSV’s scalable systems and IT infrastructure.• Consolidation of operations, administration and logistics facilities.
Attractive financial business case
• Transaction to be EPS accretive (diluted and adjusted) in year 2 after closing.
• Aspiration to lift operating margin of the combined entity towards DSV’s existing levels within the respective business areas.
• 100% share deal with an enterprise value of approx. USD 4.2 bn.• Agility will become an ~8% shareholder in DSV.
Strategic rationale Acquisition of Agility’s Global Integrated Logistics business (GIL)
Strengthening our geographical footprint
Attractive exposure to Air & Sea business
11%10%79%
EMEA APAC Americas
Air & Sea Road Contract Logistics
GIL will add USD 4.0 billion annual revenue*
*Numbers based on FY2020
34 | DSV Panalpina – H1 2021 results
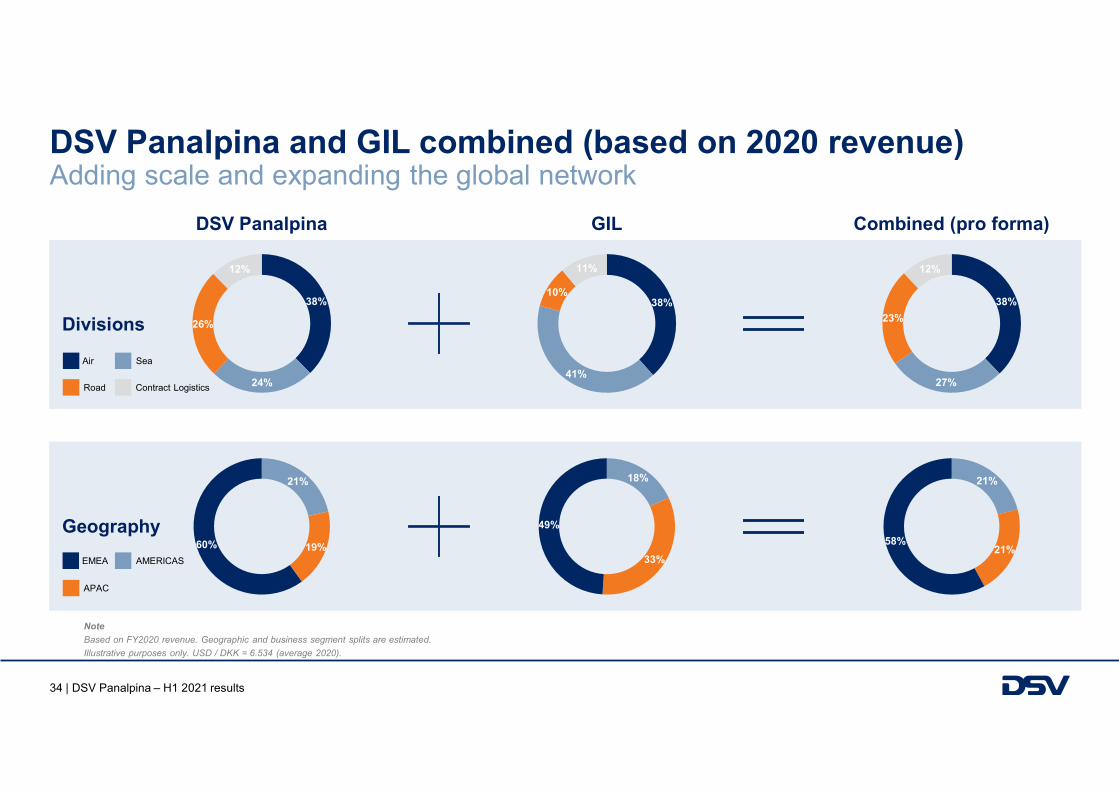
DSV Panalpina and GIL combined (based on 2020 revenue) Adding scale and expanding the global network
GILDSV Panalpina Combined (pro forma)
21%
19%60%
18%
33%
49%
21%
21%58%
Geography
EMEA AMERICAS
APAC
38%
24%
26%
12%
38%
41%
10%
11%
38%
27%
23%
12%
Divisions
Air Sea
Road Contract Logistics
Note
Based on FY2020 revenue. Geographic and business segment splits are estimated.
Illustrative purposes only. USD / DKK = 6.534 (average 2020).
35 | DSV Panalpina – H1 2021 results
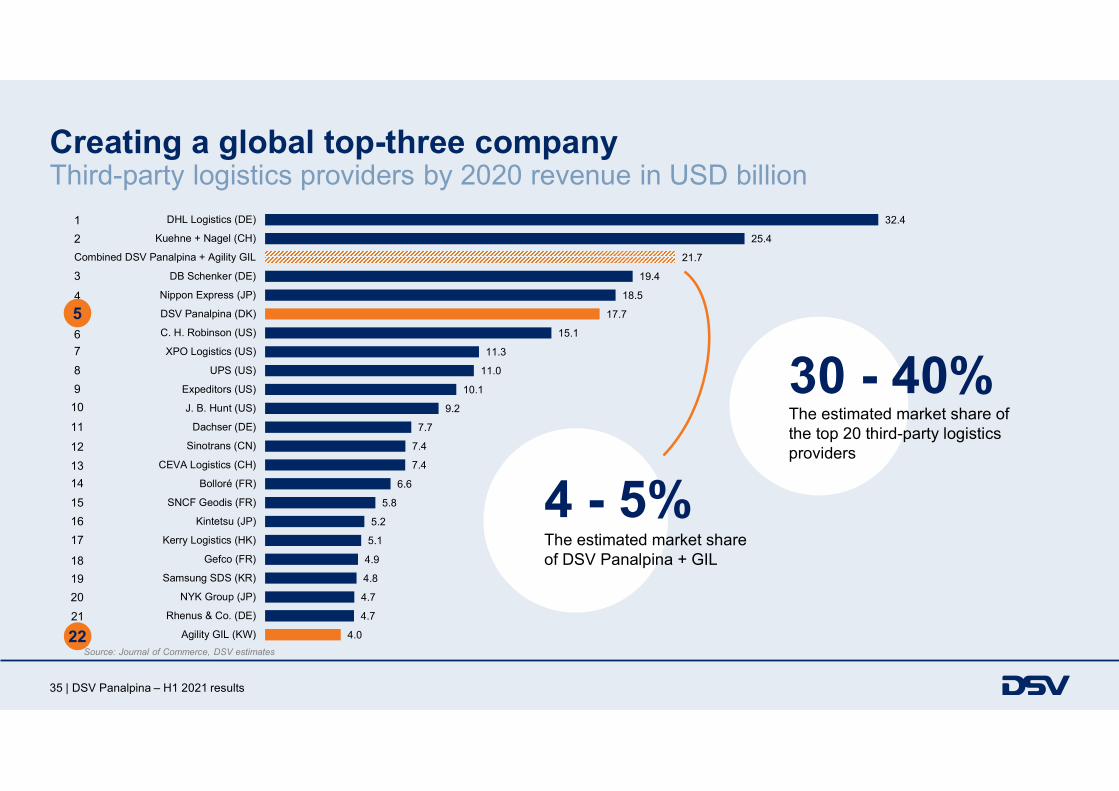
Creating a global top-three company Third-party logistics providers by 2020 revenue in USD billion
32.4
25.4
21.7
19.4
18.5
17.7
15.1
11.3
11.0
10.1
9.2
7.7
7.4
7.4
6.6
5.8
5.2
5.1
4.9
4.8
4.7
4.7
4.0
DHL Logistics (DE)
Kuehne + Nagel (CH)
Combined DSV Panalpina + Agility GIL
DB Schenker (DE)
Nippon Express (JP)
DSV Panalpina (DK)
C. H. Robinson (US)
XPO Logistics (US)
UPS (US)
Expeditors (US)
J. B. Hunt (US)
Dachser (DE)
Sinotrans (CN)
CEVA Logistics (CH)
Bolloré (FR)
SNCF Geodis (FR)
Kintetsu (JP)
Kerry Logistics (HK)
Gefco (FR)
Samsung SDS (KR)
NYK Group (JP)
Rhenus & Co. (DE)
Agility GIL (KW)
Source: Journal of Commerce, DSV estimates
The estimated market share of the top 20 third-party logistics providers
30 - 40%
The estimated market share of DSV Panalpina + GIL
4 - 5%
22
1
2
4
3
56
7
8
9
10
11
12
13
14
15
16
17
18
19
20
21
36 | DSV Panalpina – H1 2021 results
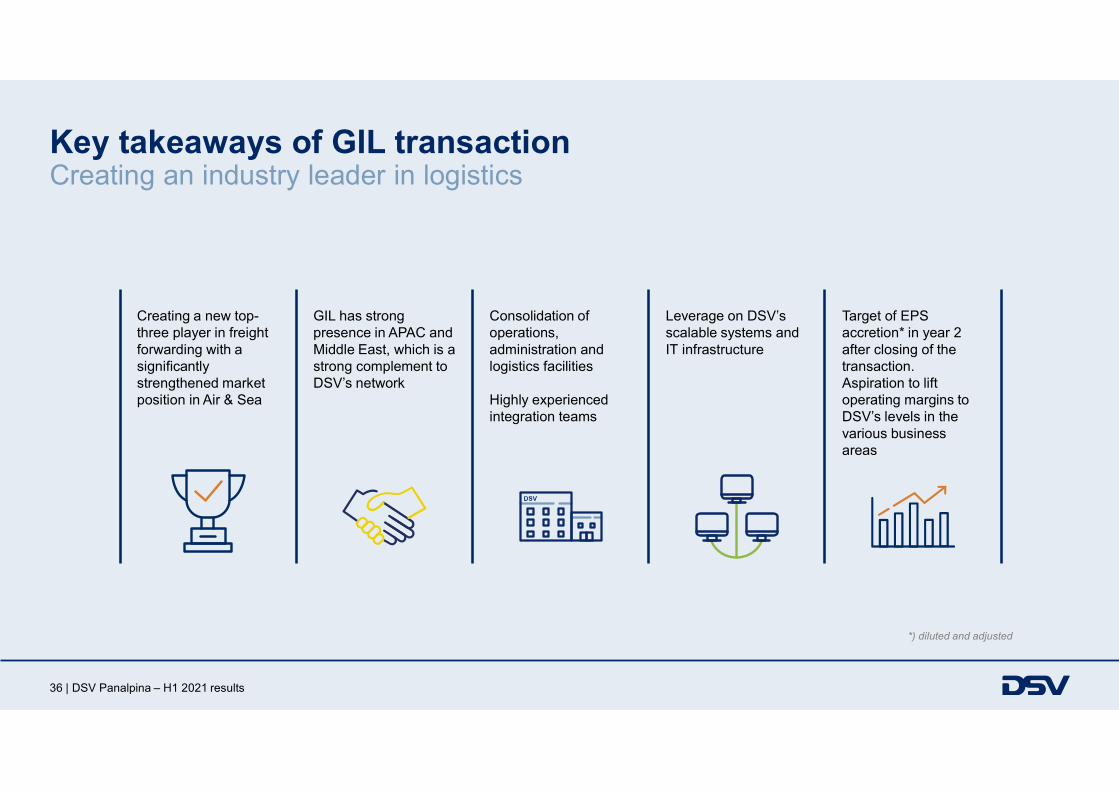
Key takeaways of GIL transaction Creating an industry leader in logistics
Creating a new top-three player in freight forwarding with a significantly strengthened market position in Air & Sea
GIL has strong presence in APAC and Middle East, which is a strong complement to DSV’s network
Consolidation of operations, administration and logistics facilities
Highly experienced integration teams
Leverage on DSV’s scalable systems and IT infrastructure
Target of EPS accretion* in year 2 after closing of the transaction. Aspiration to lift operating margins to DSV’s levels in the various business areas
*) diluted and adjusted
37 | DSV Panalpina – H1 2021 results
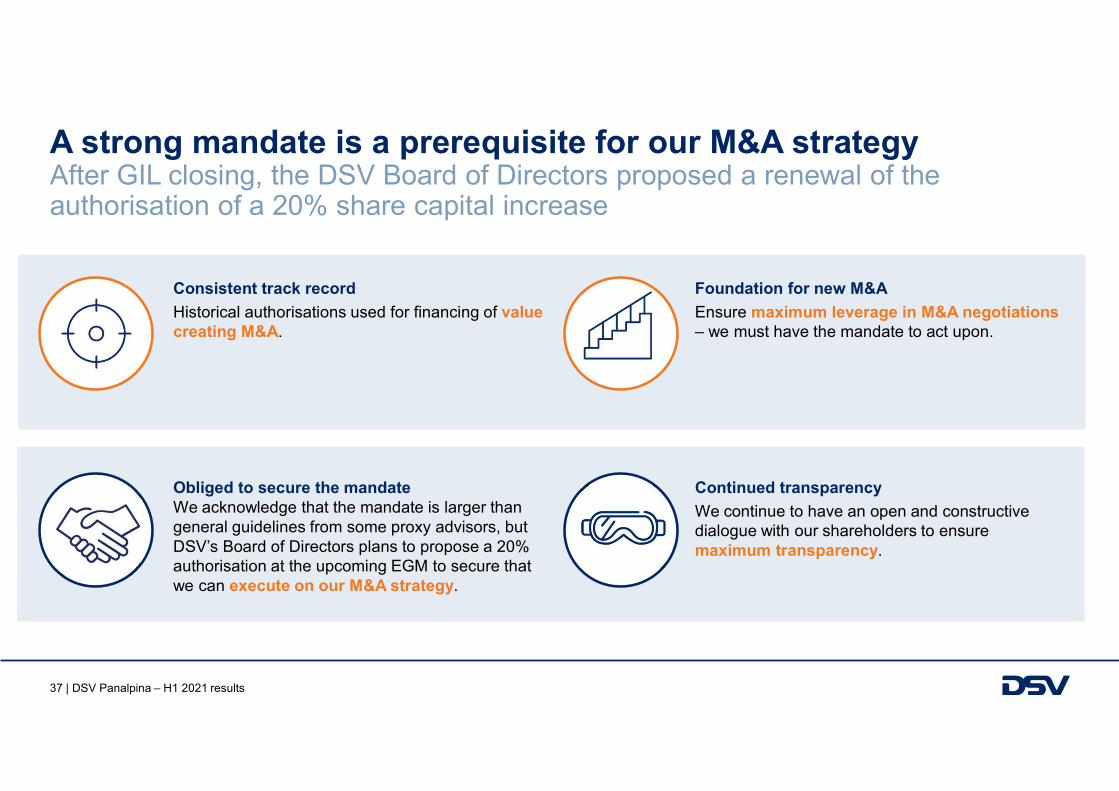
A strong mandate is a prerequisite for our M&A strategyAfter GIL closing, the DSV Board of Directors proposed a renewal of the authorisation of a 20% share capital increase
Consistent track record
Historical authorisations used for financing of value creating M&A.
Continued transparency
We continue to have an open and constructive dialogue with our shareholders to ensure maximum transparency.
Obliged to secure the mandateWe acknowledge that the mandate is larger than general guidelines from some proxy advisors, but DSV’s Board of Directors plans to propose a 20% authorisation at the upcoming EGM to secure that we can execute on our M&A strategy.
Foundation for new M&A
Ensure maximum leverage in M&A negotiations – we must have the mandate to act upon.
38 | DSV Panalpina – H1 2021 results
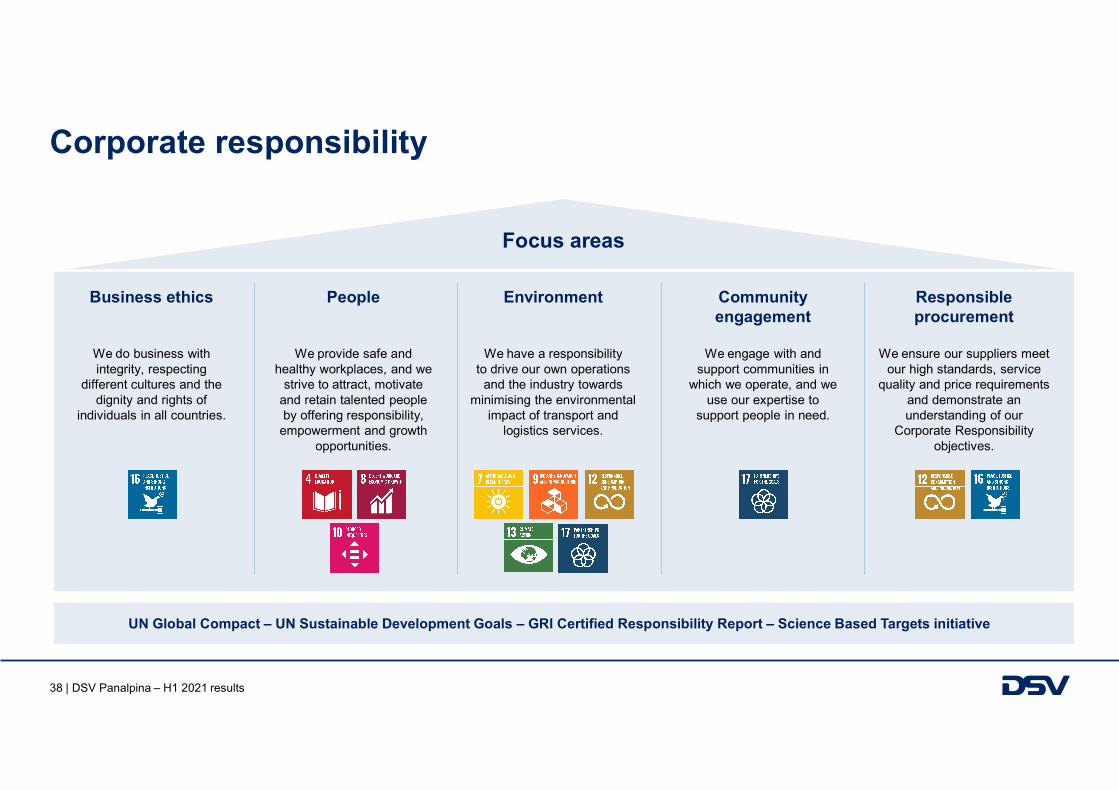
UN Global Compact – UN Sustainable Development Goals – GRI Certified Responsibility Report – Science Based Targets initiative
Corporate responsibility
Focus areas
Business ethics
We do business with integrity, respecting
different cultures and the dignity and rights of
individuals in all countries.
People
We provide safe and healthy workplaces, and we
strive to attract, motivate and retain talented people by offering responsibility,
empowerment and growth opportunities.
Environment
We have a responsibility to drive our own operations
and the industry towards minimising the environmental
impact of transport and logistics services.
Community engagement
We engage with and support communities in
which we operate, and we use our expertise to
support people in need.
Responsible procurement
We ensure our suppliers meet our high standards, service
quality and price requirements and demonstrate an understanding of our
Corporate Responsibility objectives.
39 | DSV Panalpina – H1 2021 results
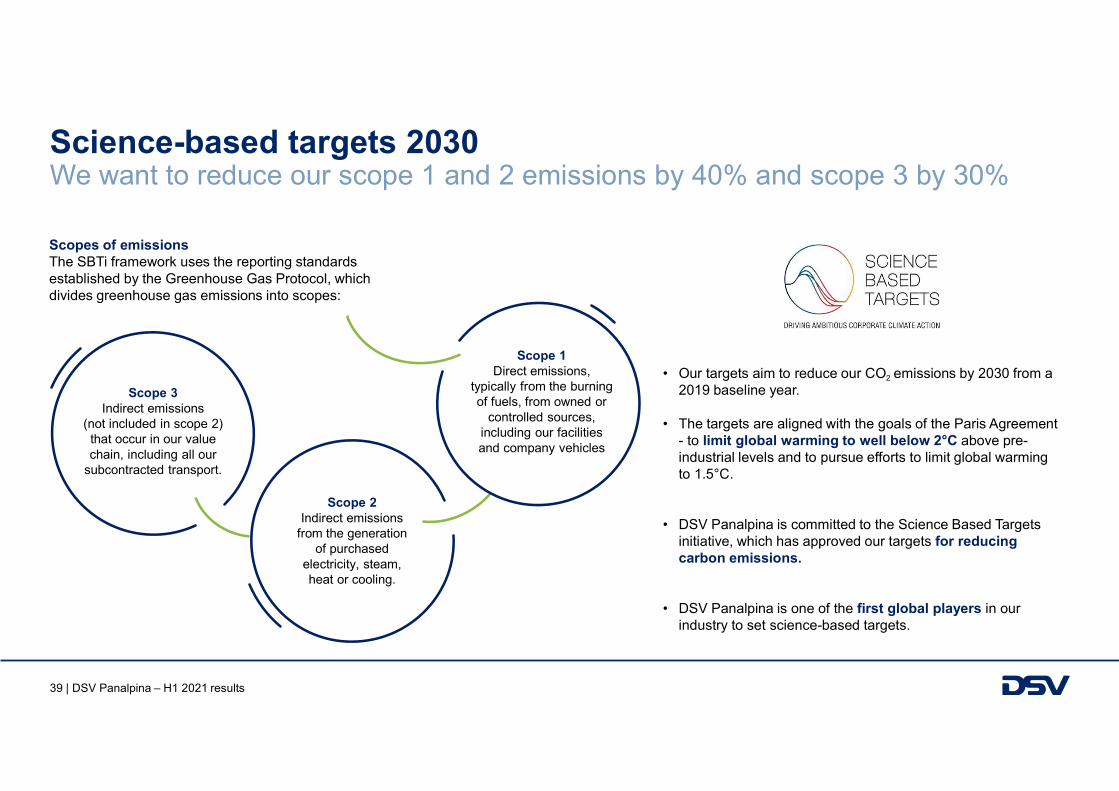
Science-based targets 2030We want to reduce our scope 1 and 2 emissions by 40% and scope 3 by 30%
• Our targets aim to reduce our CO2 emissions by 2030 from a 2019 baseline year.
• The targets are aligned with the goals of the Paris Agreement - to limit global warming to well below 2°C above pre-industrial levels and to pursue efforts to limit global warming to 1.5°C.
• DSV Panalpina is committed to the Science Based Targets initiative, which has approved our targets for reducing carbon emissions.
• DSV Panalpina is one of the first global players in our industry to set science-based targets.
Scopes of emissions The SBTi framework uses the reporting standards established by the Greenhouse Gas Protocol, which divides greenhouse gas emissions into scopes:
Scope 1 Direct emissions,
typically from the burning of fuels, from owned or
controlled sources, including our facilities and company vehicles
Scope 3 Indirect emissions
(not included in scope 2) that occur in our value chain, including all our
subcontracted transport.
Scope 2 Indirect emissions
from the generation of purchased
electricity, steam, heat or cooling.
40 | DSV Panalpina – H1 2021 results
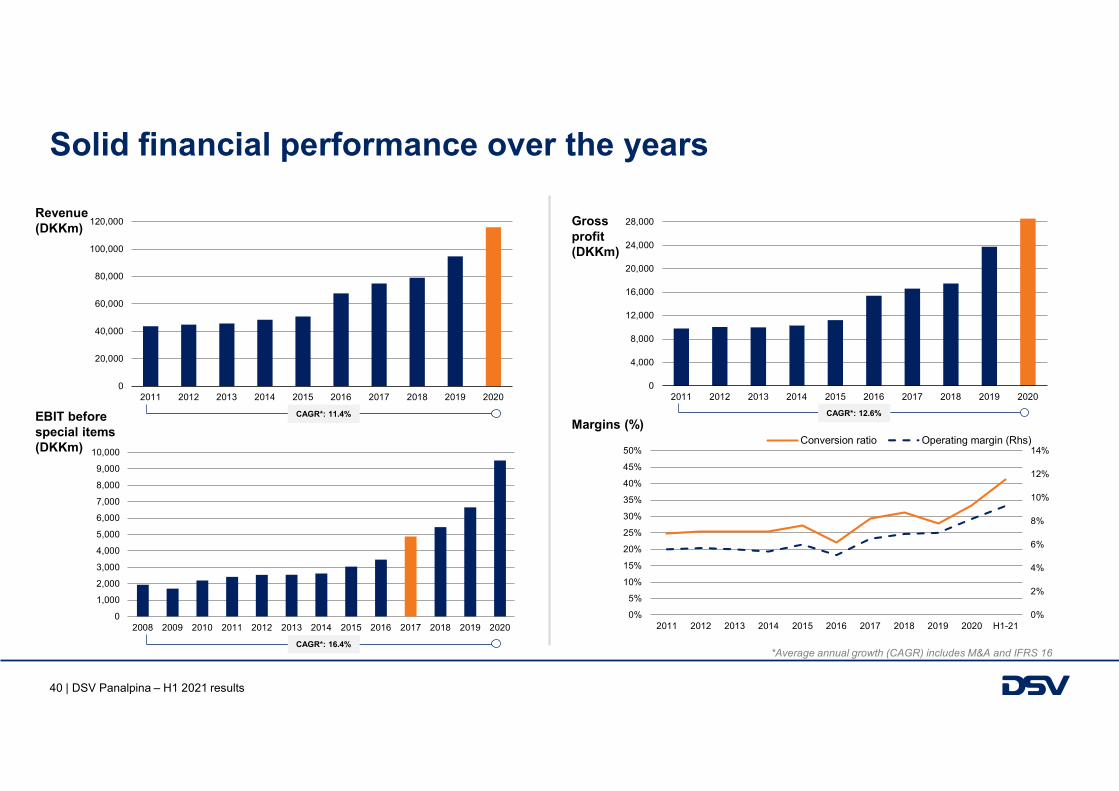
CAGR*: 12.6%
0
20,000
40,000
60,000
80,000
100,000
120,000
2011 2012 2013 2014 2015 2016 2017 2018 2019 2020
Solid financial performance over the years
0
1,000
2,000
3,000
4,000
5,000
6,000
7,000
8,000
9,000
10,000
2008 2009 2010 2011 2012 2013 2014 2015 2016 2017 2018 2019 2020
0
4,000
8,000
12,000
16,000
20,000
24,000
28,000
2011 2012 2013 2014 2015 2016 2017 2018 2019 2020
CAGR*: 11.4%
CAGR*: 16.4% *Average annual growth (CAGR) includes M&A and IFRS 16
Gross profit (DKKm)
Revenue(DKKm)
Margins (%)EBIT beforespecial items (DKKm)
0%
2%
4%
6%
8%
10%
12%
14%
0%
5%
10%
15%
20%
25%
30%
35%
40%
45%
50%
2011 2012 2013 2014 2015 2016 2017 2018 2019 2020 H1-21
Conversion ratio Operating margin (Rhs)
41 | DSV Panalpina – H1 2021 results
0%
5%
10%
15%
20%
25%
30%
2011 2012 2013 2014 2015 2016 2017 2018 2019 20200
10,000
20,000
30,000
40,000
50,000
60,000
70,000
2011 2012 2013 2014 2015 2016 2017 2018 2019 2020
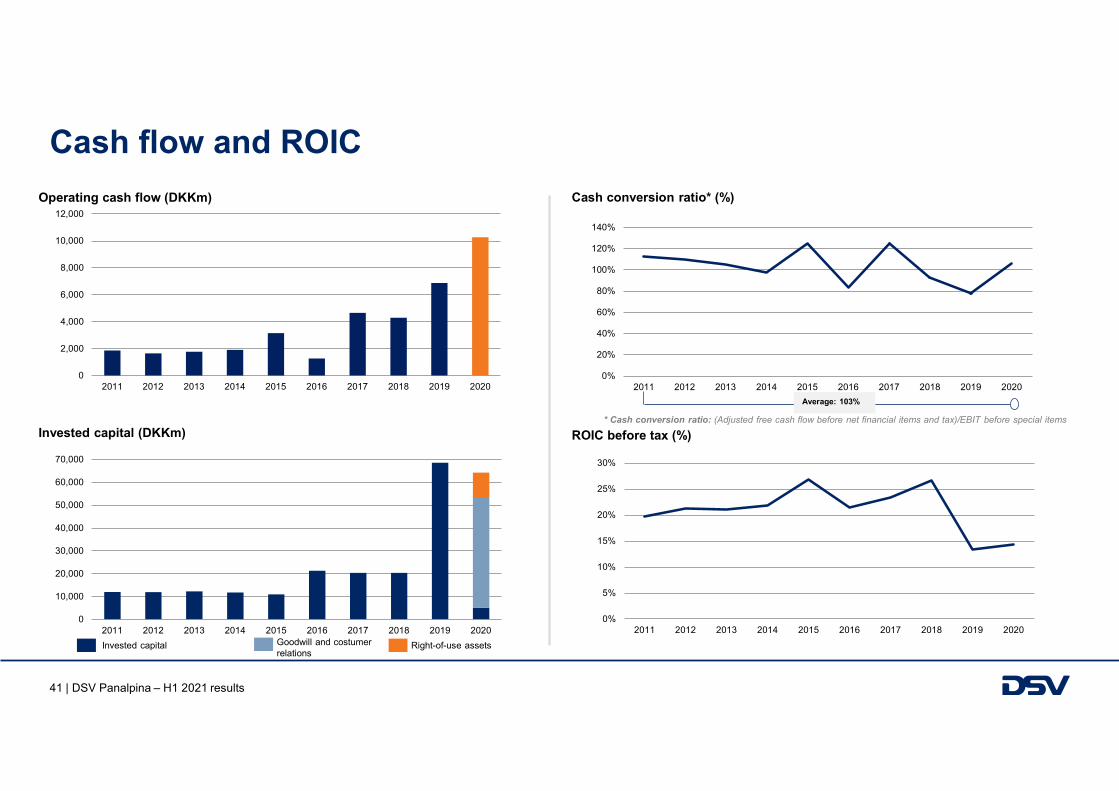
Cash flow and ROIC
0
2,000
4,000
6,000
8,000
10,000
12,000
2011 2012 2013 2014 2015 2016 2017 2018 2019 2020
* Cash conversion ratio: (Adjusted free cash flow before net financial items and tax)/EBIT before special items
0%
20%
40%
60%
80%
100%
120%
140%
2011 2012 2013 2014 2015 2016 2017 2018 2019 2020
Average: 103%
Operating cash flow (DKKm) Cash conversion ratio* (%)
Invested capital (DKKm)
Right-of-use assetsGoodwill and costumer relations
Invested capital
ROIC before tax (%)
42 | DSV Panalpina – H1 2021 results
0%
5%
10%
15%
20%
25%
30%
35%
40%
45%
0
800
1,600
2,400
3,200
4,000
4,800
5,600
6,400
7,200
8,000
2014 2015 2016 2017 2018 2019 2020
EBIT DKKm Conversion ratio (Rhs) Operating margin (Rhs)
0%
5%
10%
15%
20%
25%
0
200
400
600
800
1,000
1,200
1,400
2014 2015 2016 2017 2018 2019 2020
EBIT DKKm Conversion ratio (Rhs) Operating margin (Rhs)
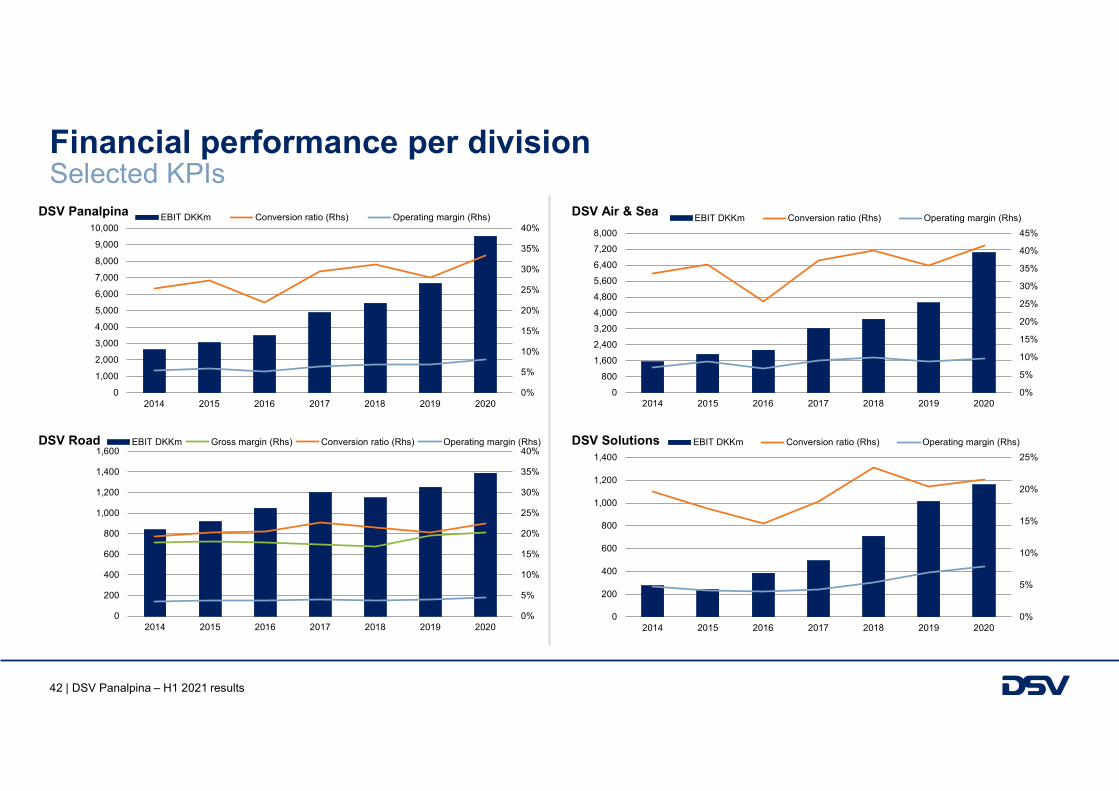
Financial performance per division Selected KPIs
DSV Air & SeaDSV Panalpina
DSV SolutionsDSV Road
0%
5%
10%
15%
20%
25%
30%
35%
40%
0
200
400
600
800
1,000
1,200
1,400
1,600
2014 2015 2016 2017 2018 2019 2020
EBIT DKKm Gross margin (Rhs) Conversion ratio (Rhs) Operating margin (Rhs)
0%
5%
10%
15%
20%
25%
30%
35%
40%
0
1,000
2,000
3,000
4,000
5,000
6,000
7,000
8,000
9,000
10,000
2014 2015 2016 2017 2018 2019 2020
EBIT DKKm Conversion ratio (Rhs) Operating margin (Rhs)
43 | DSV Panalpina – H1 2021 results
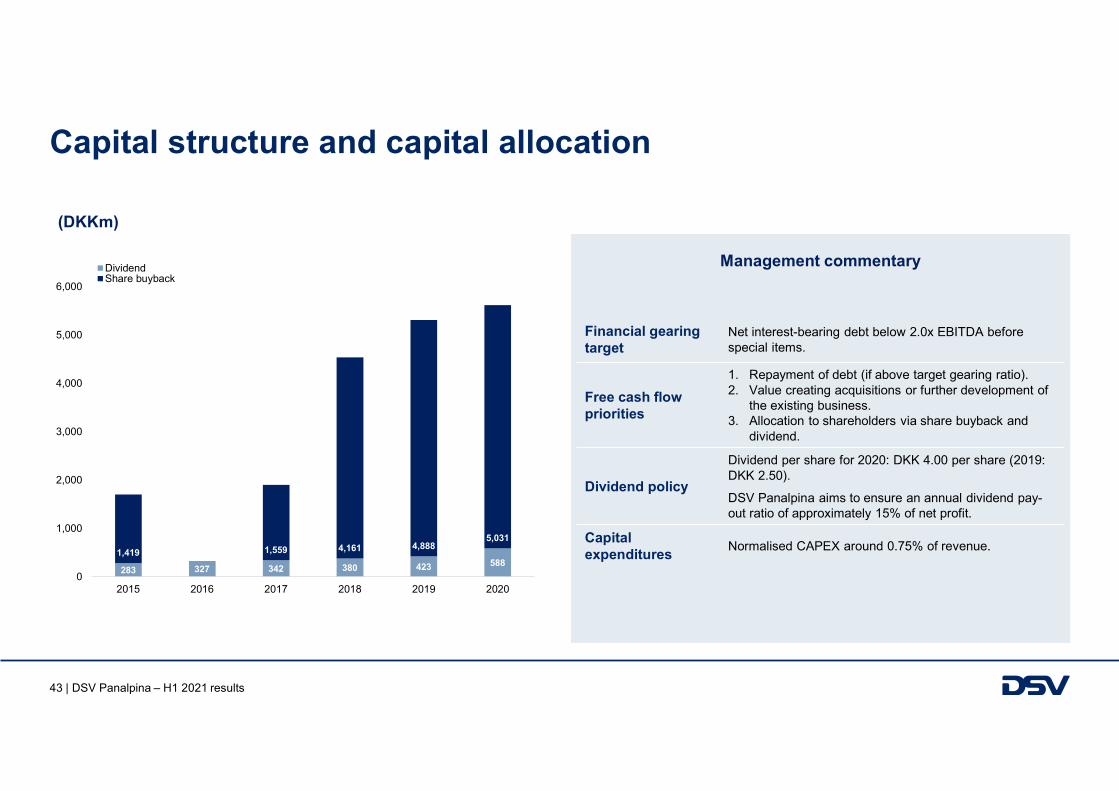
Capital structure and capital allocation
(DKKm)
Management commentary
283 327 342 380 423 5881,419 1,559 4,161 4,888
5,031
0
1,000
2,000
3,000
4,000
5,000
6,000
2015 2016 2017 2018 2019 2020
DividendShare buyback
Financial gearing target
Net interest-bearing debt below 2.0x EBITDA before special items.
Free cash flow priorities
1. Repayment of debt (if above target gearing ratio).2. Value creating acquisitions or further development of
the existing business.3. Allocation to shareholders via share buyback and
dividend.
Dividend policy
Dividend per share for 2020: DKK 4.00 per share (2019: DKK 2.50).
DSV Panalpina aims to ensure an annual dividend pay-out ratio of approximately 15% of net profit.
Capital expenditures
Normalised CAPEX around 0.75% of revenue.
44 | DSV Panalpina – H1 2021 results
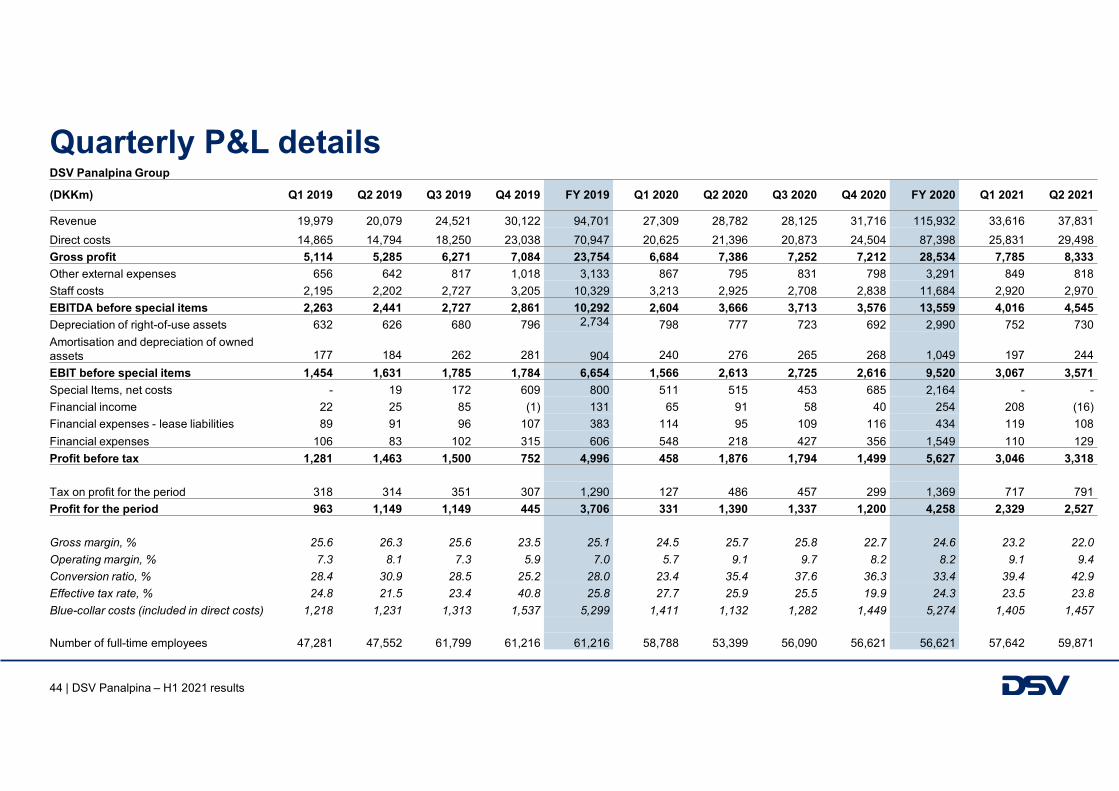
Quarterly P&L detailsDSV Panalpina Group
(DKKm) Q1 2019 Q2 2019 Q3 2019 Q4 2019 FY 2019 Q1 2020 Q2 2020 Q3 2020 Q4 2020 FY 2020 Q1 2021 Q2 2021
Revenue 19,979 20,079 24,521 30,122 94,701 27,309 28,782 28,125 31,716 115,932 33,616 37,831
Direct costs 14,865 14,794 18,250 23,038 70,947 20,625 21,396 20,873 24,504 87,398 25,831 29,498
Gross profit 5,114 5,285 6,271 7,084 23,754 6,684 7,386 7,252 7,212 28,534 7,785 8,333
Other external expenses 656 642 817 1,018 3,133 867 795 831 798 3,291 849 818
Staff costs 2,195 2,202 2,727 3,205 10,329 3,213 2,925 2,708 2,838 11,684 2,920 2,970
EBITDA before special items 2,263 2,441 2,727 2,861 10,292 2,604 3,666 3,713 3,576 13,559 4,016 4,545
Depreciation of right-of-use assets 632 626 680 796 2,734 798 777 723 692 2,990 752 730
Amortisation and depreciation of owned assets 177 184 262 281 904 240 276 265 268 1,049 197 244
EBIT before special items 1,454 1,631 1,785 1,784 6,654 1,566 2,613 2,725 2,616 9,520 3,067 3,571
Special Items, net costs - 19 172 609 800 511 515 453 685 2,164 - -
Financial income 22 25 85 (1) 131 65 91 58 40 254 208 (16)
Financial expenses - lease liabilities 89 91 96 107 383 114 95 109 116 434 119 108
Financial expenses 106 83 102 315 606 548 218 427 356 1,549 110 129
Profit before tax 1,281 1,463 1,500 752 4,996 458 1,876 1,794 1,499 5,627 3,046 3,318
Tax on profit for the period 318 314 351 307 1,290 127 486 457 299 1,369 717 791
Profit for the period 963 1,149 1,149 445 3,706 331 1,390 1,337 1,200 4,258 2,329 2,527
Gross margin, % 25.6 26.3 25.6 23.5 25.1 24.5 25.7 25.8 22.7 24.6 23.2 22.0
Operating margin, % 7.3 8.1 7.3 5.9 7.0 5.7 9.1 9.7 8.2 8.2 9.1 9.4
Conversion ratio, % 28.4 30.9 28.5 25.2 28.0 23.4 35.4 37.6 36.3 33.4 39.4 42.9
Effective tax rate, % 24.8 21.5 23.4 40.8 25.8 27.7 25.9 25.5 19.9 24.3 23.5 23.8
Blue-collar costs (included in direct costs) 1,218 1,231 1,313 1,537 5,299 1,411 1,132 1,282 1,449 5,274 1,405 1,457
Number of full-time employees 47,281 47,552 61,799 61,216 61,216 58,788 53,399 56,090 56,621 56,621 57,642 59,871

45 | DSV Panalpina – H1 2021 results
Quarterly P&L detailsAir & Sea
(DKKm) Q1 2019 Q2 2019 Q3 2019 Q4 2019 FY 2019 Q1 2020 Q2 2020 Q3 2020 Q4 2020 FY 2020 Q1 2021 Q2 2021
Divisional revenue 9,411 9,682 13,981 18,077 51,151 16,674 19,144 17,910 19,961 73,689 22,924 25,948Direct costs 6,987 7,153 10,538 13,956 38,634 12,799 14,481 13,607 15,893 56,780 18,136 20,806Gross profit 2,424 2,529 3,443 4,121 12,517 3,875 4,663 4,303 4,068 16,909 4,788 5,142Other external expenses 386 424 594 863 2,267 797 736 692 645 2,870 753 663Staff costs 943 935 1,442 1,773 5,093 1,679 1,530 1,394 1,445 6,048 1,445 1,435EBITDA before special items 1,095 1,170 1,407 1,485 5,157 1,399 2,397 2,217 1,978 7,991 2,590 3,044Depreciation of right-of-use assets 82 61 127 214 484 211 190 151 127 679 136 144Amortisation and depreciation of owned assets 15 16 60 76 167 58 95 72 61 286 61 57EBIT before special items 998 1,093 1,220 1,195 4,506 1,130 2,112 1,994 1,790 7,026 2,393 2,843
Gross margin, % 25.8 26.1 24.6 22.8 24.5 23.2 24.4 24.0 20,4 22.9 20.9 19.8Operating margin, % 10.6 11.3 8.7 6.6 8.8 6.8 11.0 11.1 9.0 9.5 10.4 11.0Conversion ratio, % 41.2 43.2 35.4 29.0 36.0 29.2 45.3 46.3 44.0 41.6 50.0 55.3
Number of full-time employees 12,072 12,103 22,824 21,516 21,516 20,610 18,723 18,067 18,008 18,008 17,999 18,067
AirRevenue, DKKm 4,598 4,564 7,352 10,620 27,134 9,530 12,057 10,296 12,873 44,756 12,975 14,197Gross profit, DKKm 1,230 1,224 1,827 2,313 6,594 2,153 3,015 2,578 2,529 10,275 2,762 2,897
Air freight, tonnes 170,103 170,301 288,793 442,069 1,071,266 359,975 287,452 300,147 324,831 1,272,405 336,307 349,210GP/tonne, DKK 7,231 7,187 6,326 5,226 6,155 5,981 10,489 8,589 7,786 8,075 8,213 8,296
SeaRevenue, DKKm 4,813 5,118 6,629 7,457 24,017 7,144 7,087 7,614 7,088 28,933 9.949 11,751Gross profit, DKKm 1,194 1,305 1,616 1,808 5,923 1,722 1,648 1,725 1,539 6,634 2,026 2,245
Sea freight, TEUs 359,925 391,333 520,048 635,820 1,907,126 575,814 512,138 568,130 548,820 2,204,902 581,019 573,385GP/TEU, DKK 3,317 3,335 3,107 2,846 3,106 2,991 3,218 3,036 2,804 3,009 3,487 3,915
46 | DSV Panalpina – H1 2021 results
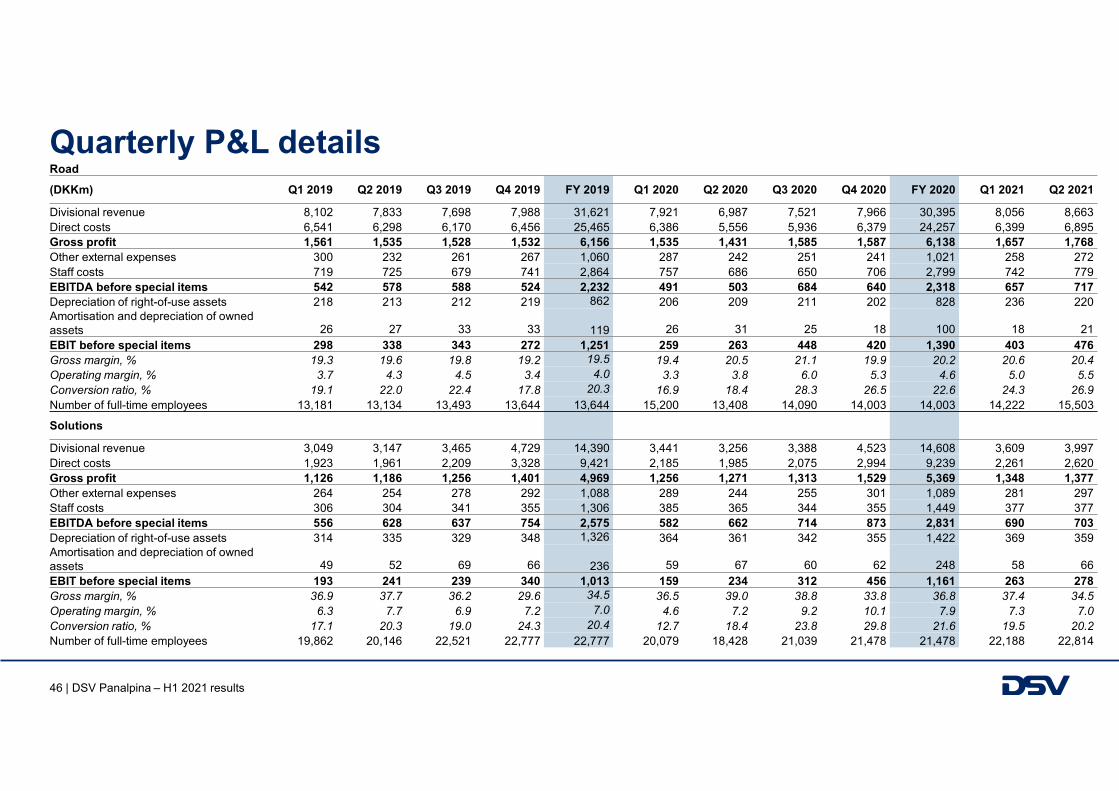
Quarterly P&L detailsRoad
(DKKm) Q1 2019 Q2 2019 Q3 2019 Q4 2019 FY 2019 Q1 2020 Q2 2020 Q3 2020 Q4 2020 FY 2020 Q1 2021 Q2 2021
Divisional revenue 8,102 7,833 7,698 7,988 31,621 7,921 6,987 7,521 7,966 30,395 8,056 8,663Direct costs 6,541 6,298 6,170 6,456 25,465 6,386 5,556 5,936 6,379 24,257 6,399 6,895Gross profit 1,561 1,535 1,528 1,532 6,156 1,535 1,431 1,585 1,587 6,138 1,657 1,768Other external expenses 300 232 261 267 1,060 287 242 251 241 1,021 258 272Staff costs 719 725 679 741 2,864 757 686 650 706 2,799 742 779EBITDA before special items 542 578 588 524 2,232 491 503 684 640 2,318 657 717Depreciation of right-of-use assets 218 213 212 219 862 206 209 211 202 828 236 220Amortisation and depreciation of owned assets 26 27 33 33 119 26 31 25 18 100 18 21EBIT before special items 298 338 343 272 1,251 259 263 448 420 1,390 403 476Gross margin, % 19.3 19.6 19.8 19.2 19.5 19.4 20.5 21.1 19.9 20.2 20.6 20.4Operating margin, % 3.7 4.3 4.5 3.4 4.0 3.3 3.8 6.0 5.3 4.6 5.0 5.5Conversion ratio, % 19.1 22.0 22.4 17.8 20.3 16.9 18.4 28.3 26.5 22.6 24.3 26.9Number of full-time employees 13,181 13,134 13,493 13,644 13,644 15,200 13,408 14,090 14,003 14,003 14,222 15,503
Solutions
Divisional revenue 3,049 3,147 3,465 4,729 14,390 3,441 3,256 3,388 4,523 14,608 3,609 3,997Direct costs 1,923 1,961 2,209 3,328 9,421 2,185 1,985 2,075 2,994 9,239 2,261 2,620Gross profit 1,126 1,186 1,256 1,401 4,969 1,256 1,271 1,313 1,529 5,369 1,348 1,377Other external expenses 264 254 278 292 1,088 289 244 255 301 1,089 281 297Staff costs 306 304 341 355 1,306 385 365 344 355 1,449 377 377EBITDA before special items 556 628 637 754 2,575 582 662 714 873 2,831 690 703Depreciation of right-of-use assets 314 335 329 348 1,326 364 361 342 355 1,422 369 359Amortisation and depreciation of owned assets 49 52 69 66 236 59 67 60 62 248 58 66EBIT before special items 193 241 239 340 1,013 159 234 312 456 1,161 263 278Gross margin, % 36.9 37.7 36.2 29.6 34.5 36.5 39.0 38.8 33.8 36.8 37.4 34.5Operating margin, % 6.3 7.7 6.9 7.2 7.0 4.6 7.2 9.2 10.1 7.9 7.3 7.0Conversion ratio, % 17.1 20.3 19.0 24.3 20.4 12.7 18.4 23.8 29.8 21.6 19.5 20.2Number of full-time employees 19,862 20,146 22,521 22,777 22,777 20,079 18,428 21,039 21,478 21,478 22,188 22,814
47 | DSV Panalpina – H1 2021 results
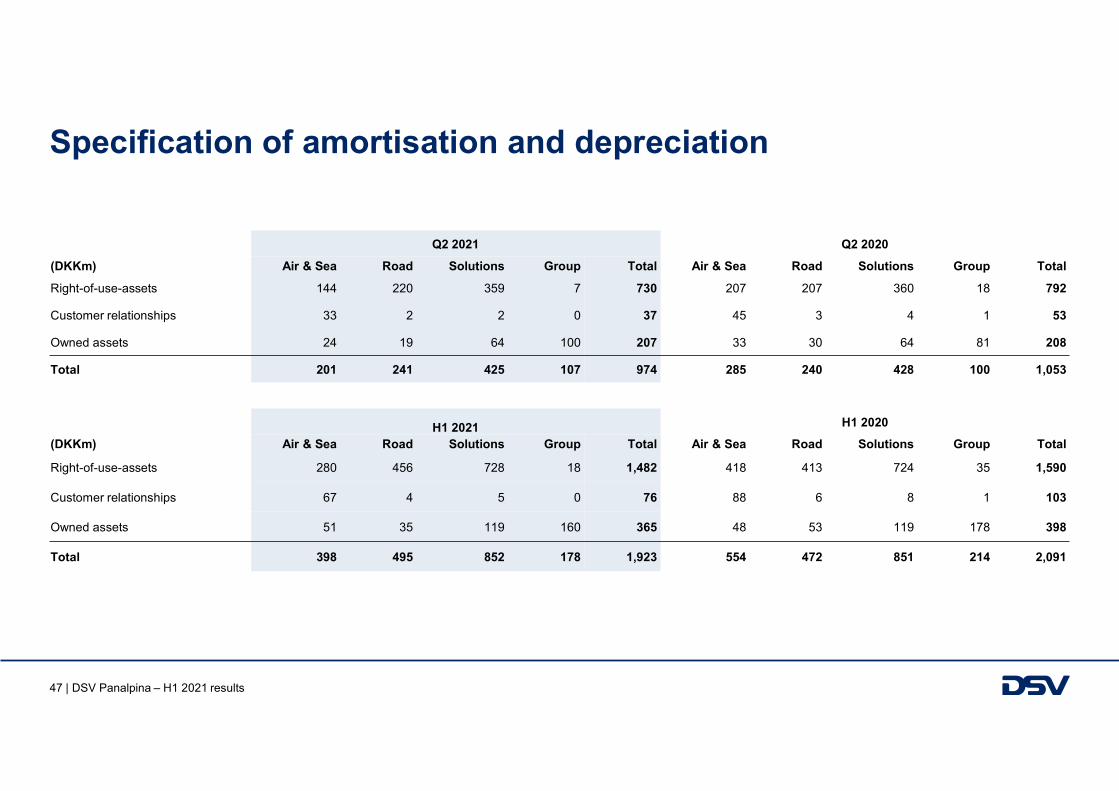
Specification of amortisation and depreciation
Q2 2021 Q2 2020
(DKKm) Air & Sea Road Solutions Group Total Air & Sea Road Solutions Group Total
Right-of-use-assets 144 220 359 7 730 207 207 360 18 792
Customer relationships 33 2 2 0 37 45 3 4 1 53
Owned assets 24 19 64 100 207 33 30 64 81 208
Total 201 241 425 107 974 285 240 428 100 1,053
H1 2021 H1 2020
(DKKm) Air & Sea Road Solutions Group Total Air & Sea Road Solutions Group Total
Right-of-use-assets 280 456 728 18 1,482 418 413 724 35 1,590
Customer relationships 67 4 5 0 76 88 6 8 1 103
Owned assets 51 35 119 160 365 48 53 119 178 398
Total 398 495 852 178 1,923 554 472 851 214 2,091
48 | DSV Panalpina – H1 2021 results
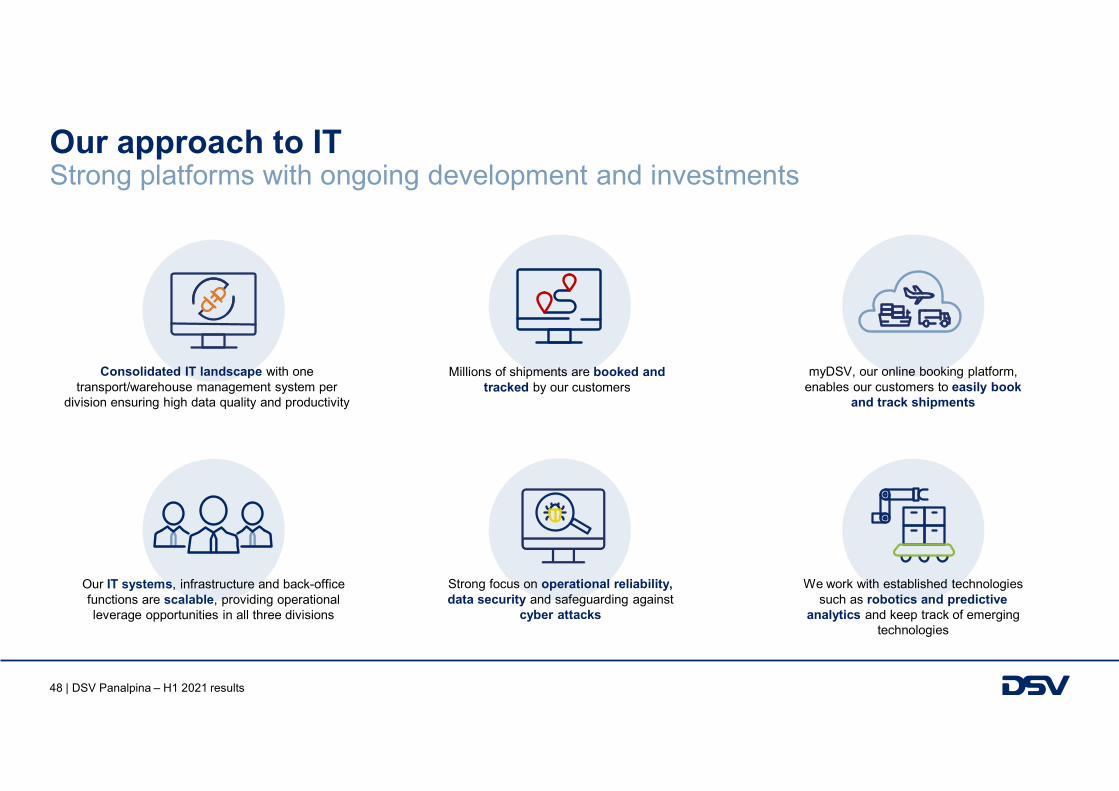
Our approach to IT
Millions of shipments are booked and tracked by our customers
Strong focus on operational reliability, data security and safeguarding against
cyber attacks
We work with established technologies such as robotics and predictive
analytics and keep track of emerging technologies
Strong platforms with ongoing development and investments
Consolidated IT landscape with one transport/warehouse management system per
division ensuring high data quality and productivity
Our IT systems, infrastructure and back-office functions are scalable, providing operational leverage opportunities in all three divisions
myDSV, our online booking platform, enables our customers to easily book
and track shipments
49 | DSV Panalpina – H1 2021 results
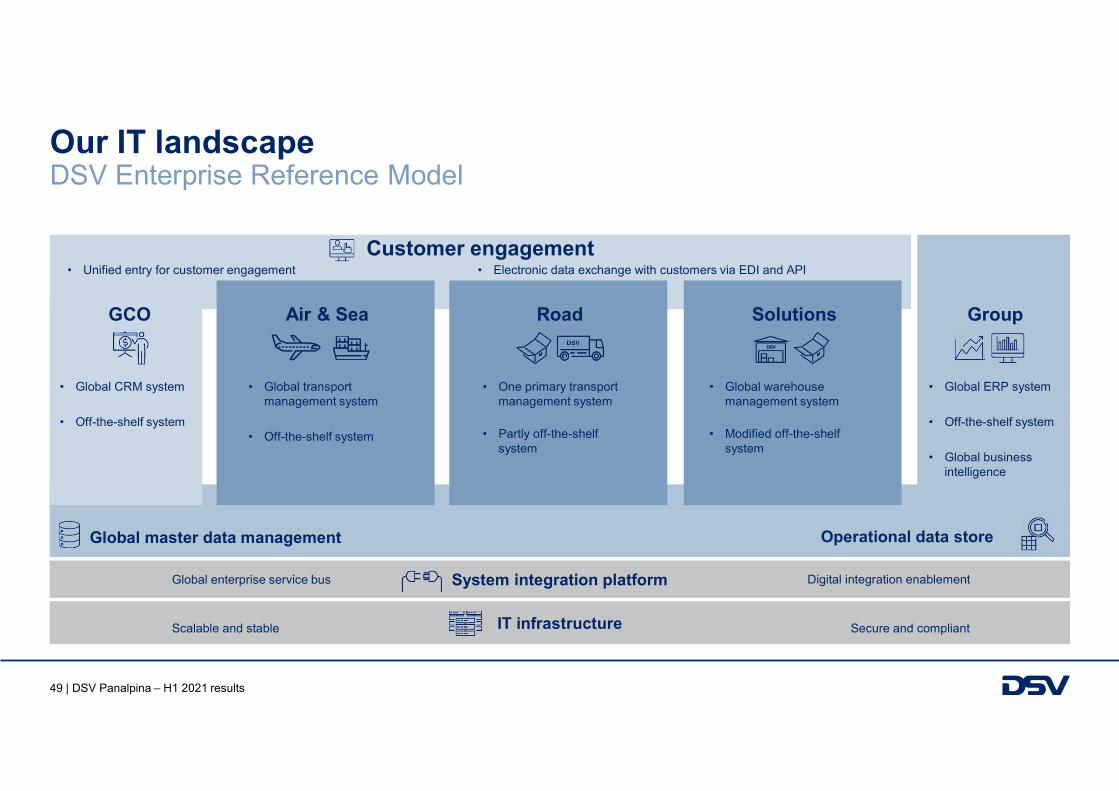
Our IT landscape DSV Enterprise Reference Model
Customer engagement
Air & Sea Road Solutions
System integration platform
• One primary transport management system
• Partly off-the-shelf system
GCO Group
• Unified entry for customer engagement • Electronic data exchange with customers via EDI and API
• Global CRM system
• Off-the-shelf system
• Global ERP system
• Off-the-shelf system
• Global business intelligence
IT infrastructure Secure and compliant
Global enterprise service bus Digital integration enablement
• Global transport management system
• Off-the-shelf system
• Global warehouse management system
• Modified off-the-shelf system
Scalable and stable
Operational data storeGlobal master data management
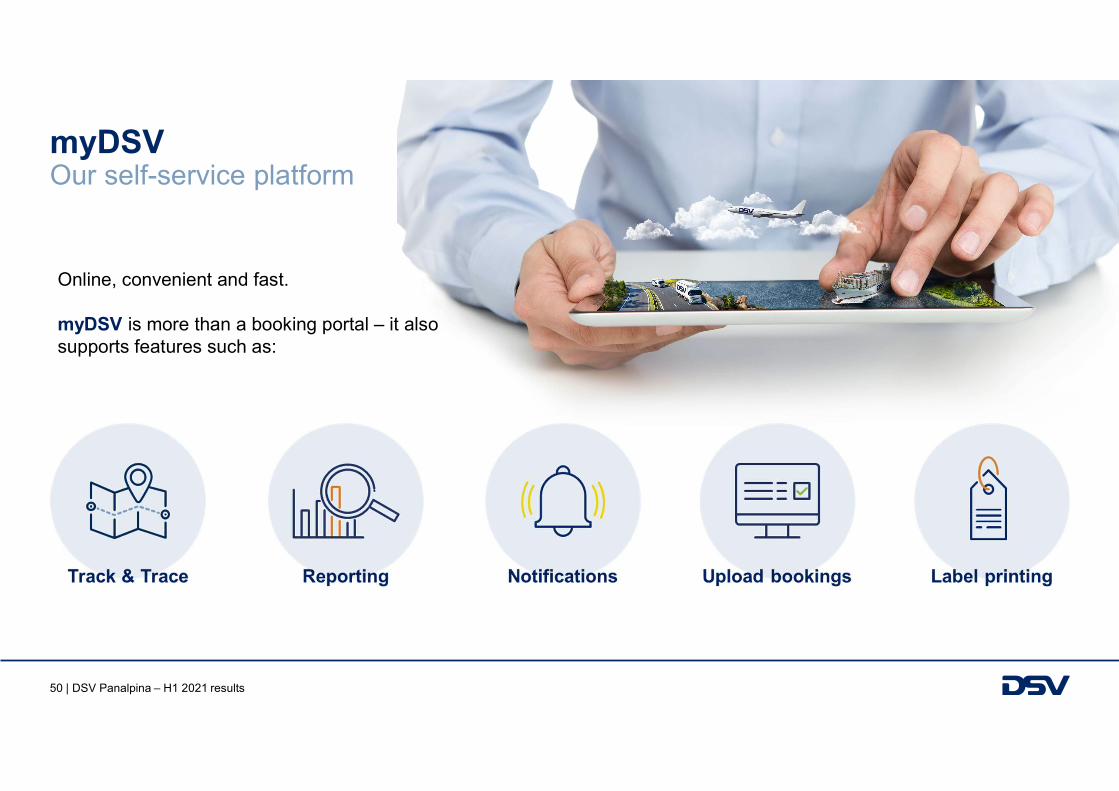
50 | DSV Panalpina – H1 2021 results
myDSVOur self-service platform
Online, convenient and fast.
myDSV is more than a booking portal – it also supports features such as:
51 | DSV Panalpina – H1 2021 results
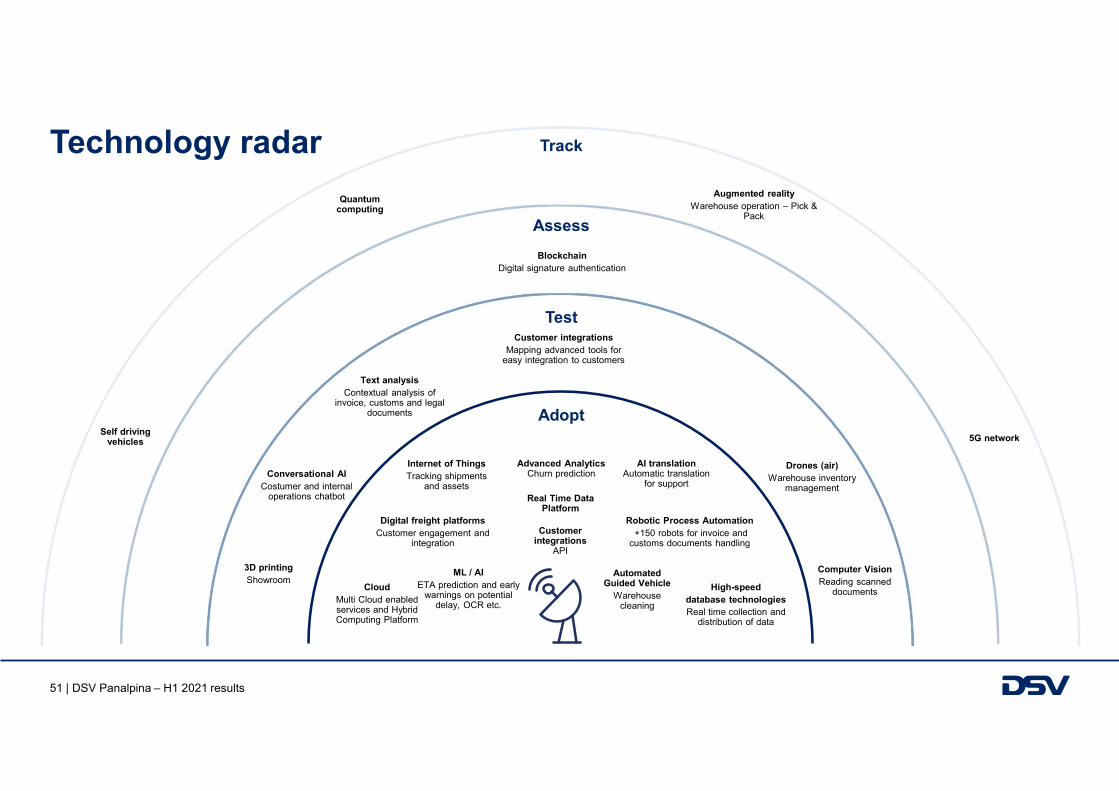
Technology radar
Test
Assess
Track
Adopt
Augmented realityWarehouse operation – Pick &
Pack
Self driving vehicles 5G network
Quantum computing
BlockchainDigital signature authentication
Drones (air)Warehouse inventory
management
ML / AIETA prediction and early
warnings on potential delay, OCR etc.
3D printingShowroom
Conversational AICostumer and internal
operations chatbot
Text analysisContextual analysis of
invoice, customs and legal documents
Computer VisionReading scanned
documents
Customer integrationsMapping advanced tools for
easy integration to customers
Robotic Process Automation+150 robots for invoice and
customs documents handling
High-speeddatabase technologiesReal time collection and
distribution of data
Internet of Things Tracking shipments
and assets
Digital freight platformsCustomer engagement and
integration
Automated Guided Vehicle
Warehouse cleaning
Advanced AnalyticsChurn prediction
Real Time Data Platform
AI translationAutomatic translation
for support
Customer integrations
API
CloudMulti Cloud enabled services and Hybrid Computing Platform
52 | DSV Panalpina – H1 2021 results
Investor contact information
Share information
Investor Relations contacts
DSV Panalpina A/S is listed on the Copenhagen stock exchange under the symbol ‘DSV’.For further company information, please visit: www.dsv.com
DSV Panalpina A/SHovedgaden 630, 2640 Hedehusene, Denmark [email protected]
Flemming Ole Nielsen +45 4320 3392 [email protected]
Mads Kristian Hofmeister +45 4320 3388 [email protected]
Daniela Veleva +45 4320 3387 [email protected]
Financial calendar 2021
26 Oct. 2021 Interim Financial Report, Third Quarter 2021