Doppler transient model based on Laplace wavelet and spectrum correlation assessment for locomotive...
21
Sensors 2013, 13, 15726-15746; doi:10.3390/s131115726 sensors ISSN 1424-8220 www.mdpi.com/journal/sensors Article A Doppler Transient Model Based on the Laplace Wavelet and Spectrum Correlation Assessment for Locomotive Bearing Fault Diagnosis Changqing Shen 1,2 , Fang Liu 1 , Dong Wang 2 , Ao Zhang 1 , Fanrang Kong 1, * and Peter W. Tse 2 1 Department of Precision Machinery and Precision Instrumentation, University of Science and Technology of China, Hefei 230026, China; E-Mails: [email protected] (C.S.); [email protected] (F.L.); [email protected] (A.Z.) 2 Department of Systems Engineering and Engineering Management, City University of Hong Kong, Hong Kong; E-Mails: [email protected] (D.W.); [email protected] (P.W.T.) * Author to whom correspondence should be addressed; E-Mail: [email protected]; Tel.: +86-551-6360-7074; Fax: +86-551-6360-6459. Received: 27 September 2013; in revised form: 3 November 2013 / Accepted: 11 November 2013 / Published: 18 November 2013 Abstract: The condition of locomotive bearings, which are essential components in trains, is crucial to train safety. The Doppler effect significantly distorts acoustic signals during high movement speeds, substantially increasing the difficulty of monitoring locomotive bearings online. In this study, a new Doppler transient model based on the acoustic theory and the Laplace wavelet is presented for the identification of fault-related impact intervals embedded in acoustic signals. An envelope spectrum correlation assessment is conducted between the transient model and the real fault signal in the frequency domain to optimize the model parameters. The proposed method can identify the parameters used for simulated transients (periods in simulated transients) from acoustic signals. Thus, localized bearing faults can be detected successfully based on identified parameters, particularly period intervals. The performance of the proposed method is tested on a simulated signal suffering from the Doppler effect. Besides, the proposed method is used to analyze real acoustic signals of locomotive bearings with inner race and outer race faults, respectively. The results confirm that the periods between the transients, which represent locomotive bearing fault characteristics, can be detected successfully. OPEN ACCESS
Transcript of Doppler transient model based on Laplace wavelet and spectrum correlation assessment for locomotive...

Sensors 2013, 13, 15726-15746; doi:10.3390/s131115726
sensors ISSN 1424-8220
www.mdpi.com/journal/sensors
Article
A Doppler Transient Model Based on the Laplace Wavelet
and Spectrum Correlation Assessment for Locomotive Bearing
Fault Diagnosis
Changqing Shen 1,2
, Fang Liu 1, Dong Wang
2, Ao Zhang
1, Fanrang Kong
1,* and Peter W. Tse
2
1 Department of Precision Machinery and Precision Instrumentation, University of Science and
Technology of China, Hefei 230026, China; E-Mails: [email protected] (C.S.);
[email protected] (F.L.); [email protected] (A.Z.) 2
Department of Systems Engineering and Engineering Management, City University of Hong Kong,
Hong Kong; E-Mails: [email protected] (D.W.);
[email protected] (P.W.T.)
* Author to whom correspondence should be addressed; E-Mail: [email protected];
Tel.: +86-551-6360-7074; Fax: +86-551-6360-6459.
Received: 27 September 2013; in revised form: 3 November 2013 / Accepted: 11 November 2013 /
Published: 18 November 2013
Abstract: The condition of locomotive bearings, which are essential components in trains,
is crucial to train safety. The Doppler effect significantly distorts acoustic signals during
high movement speeds, substantially increasing the difficulty of monitoring locomotive
bearings online. In this study, a new Doppler transient model based on the acoustic theory
and the Laplace wavelet is presented for the identification of fault-related impact intervals
embedded in acoustic signals. An envelope spectrum correlation assessment is conducted
between the transient model and the real fault signal in the frequency domain to optimize
the model parameters. The proposed method can identify the parameters used for simulated
transients (periods in simulated transients) from acoustic signals. Thus, localized bearing
faults can be detected successfully based on identified parameters, particularly period
intervals. The performance of the proposed method is tested on a simulated signal suffering
from the Doppler effect. Besides, the proposed method is used to analyze real acoustic
signals of locomotive bearings with inner race and outer race faults, respectively. The
results confirm that the periods between the transients, which represent locomotive bearing
fault characteristics, can be detected successfully.
OPEN ACCESS
Sensors 2013, 13 15727
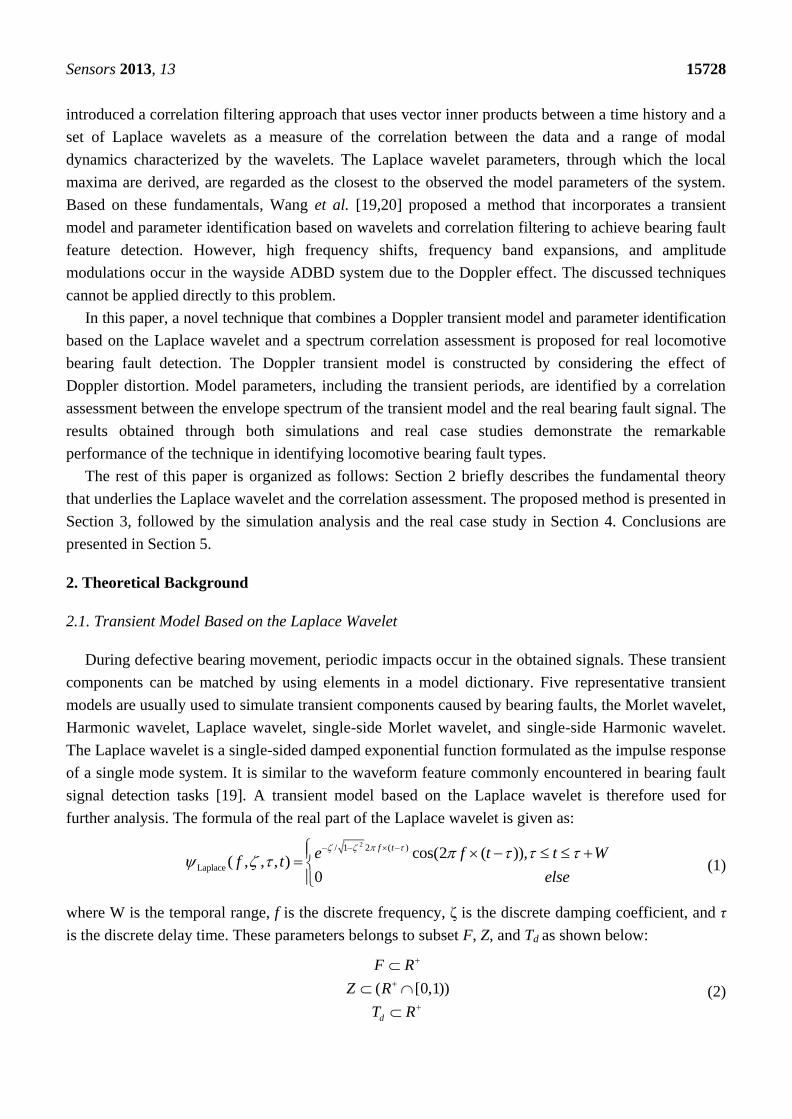
Keywords: Doppler transient model; locomotive bearings; spectrum correlation assessment;
Laplace wavelet; fault diagnosis
1. Introduction
Economic and social development in most countries has increased considerably the requirement for
transportation capability. Railway transportation has played an important role in this development due
to its strong transportation capability and high speeds. The continuous operation of trains is crucial in
ensuring fluid and efficient traffic circulation. However, failure of train components can result in
unexpected breakdowns, which can lead to serious traffic accidents. Hence, both the economy and
human safety are at risk if trains have faulty components. Locomotive bearings support the entire
weight of a train and they rotate at a high speed when the train is running. The health of these bearings
is crucial for the continuous and safe operation of the train. Therefore, the development of an effective
technique for monitoring locomotive bearings is profoundly significant [1].
A bearing usually consists of an inner race, an outer race, a cage, and a few rollers. Once one of
these components suffers from a local defect, approximately periodic impacts will be generated when
the defective surface comes into contact with the rollers [2]. These transient interaction components
therefore contain important information about the health status of the bearing. Extracting these
components is the most important task in bearing fault diagnosis based on signal processing [3].
The wayside acoustic defective bearing detector (ADBD) system [4] was developed in the 1980s to
identify bearing defects before the bearings are overheated. All the devices in this system are set on the
wayside, which makes the system more economical and feasible compared to an on-board monitoring
system [5]. Through the ADBD system, the health status of locomotive bearings can be detected in
passing vehicles. However, when the sound source is moving relative on the microphone, the Doppler
effect will occur in the recorded signals. The signals obtained by the ADBD system will suffer from
high frequency shift, frequency band expansion, and amplitude modulation [6], causing a significant
decline in the performance of the system, particularly when the vehicles pass at high speeds.
Various methods have been developed for bearing fault diagnosis when no relative movement is
observed between the bearing and the data acquisition system. Time-frequency analysis, which can
extract information from both the time and the frequency domains, was developed for non-stationary
signals. Several representative time-frequency distributions [7,8], such as the Wigner-Ville and the
Choi-Williams distributions, have proven their potential in bearing fault signal processing [9]. Wavelet
transforms were developed to decompose a temporal raw signal into different scales with varying
frequency bandwidths [10,11]. Thus, wavelet transforms can be used to enhance bearing fault-related
information for further processing [12,13]. The ensemble empirical mode decomposition (EEMD) is
an adaptive decomposition method that can decompose nonlinear and non-stationary signals into a set
of intrinsic mode functions (IMFs) according to its own natural oscillatory modes [14] and has been
widely applied in diagnosing bearing faults [15,16].
Matching pursuit is an adaptive approach that selects optimal atoms to approximate a signal through
iterations. It is effective for analyzing bearing fault transient signals [17]. Freudinger et al. [18]
Sensors 2013, 13 15728
introduced a correlation filtering approach that uses vector inner products between a time history and a
set of Laplace wavelets as a measure of the correlation between the data and a range of modal
dynamics characterized by the wavelets. The Laplace wavelet parameters, through which the local
maxima are derived, are regarded as the closest to the observed the model parameters of the system.
Based on these fundamentals, Wang et al. [19,20] proposed a method that incorporates a transient
model and parameter identification based on wavelets and correlation filtering to achieve bearing fault
feature detection. However, high frequency shifts, frequency band expansions, and amplitude
modulations occur in the wayside ADBD system due to the Doppler effect. The discussed techniques
cannot be applied directly to this problem.
In this paper, a novel technique that combines a Doppler transient model and parameter identification
based on the Laplace wavelet and a spectrum correlation assessment is proposed for real locomotive
bearing fault detection. The Doppler transient model is constructed by considering the effect of
Doppler distortion. Model parameters, including the transient periods, are identified by a correlation
assessment between the envelope spectrum of the transient model and the real bearing fault signal. The
results obtained through both simulations and real case studies demonstrate the remarkable
performance of the technique in identifying locomotive bearing fault types.
The rest of this paper is organized as follows: Section 2 briefly describes the fundamental theory
that underlies the Laplace wavelet and the correlation assessment. The proposed method is presented in
Section 3, followed by the simulation analysis and the real case study in Section 4. Conclusions are
presented in Section 5.
2. Theoretical Background
2.1. Transient Model Based on the Laplace Wavelet
During defective bearing movement, periodic impacts occur in the obtained signals. These transient
components can be matched by using elements in a model dictionary. Five representative transient
models are usually used to simulate transient components caused by bearing faults, the Morlet wavelet,
Harmonic wavelet, Laplace wavelet, single-side Morlet wavelet, and single-side Harmonic wavelet.
The Laplace wavelet is a single-sided damped exponential function formulated as the impulse response
of a single mode system. It is similar to the waveform feature commonly encountered in bearing fault
signal detection tasks [19]. A transient model based on the Laplace wavelet is therefore used for
further analysis. The formula of the real part of the Laplace wavelet is given as:
2/ 1 2 ( )
Laplace
cos(2 ( )),( , , , )
0
f te f t t W
f telse
(1)
where W is the temporal range, f is the discrete frequency, ζ is the discrete damping coefficient, and τ
is the discrete delay time. These parameters belongs to subset F, Z, and Td as shown below:
( [0,1))
d
F R
Z R
T R
(2)

Sensors 2013, 13 15729
A periodic multi-transient model based on the Laplace wavelet is constructed to simulate the
waveform characteristics by introducing parameter T:
Laplace ( , , , )m
t f t mT (3)
Figure 1 illustrates the single and periodic Laplace wavelet transient models, respectively.
Figure 1. (a) Single transient and (b) periodic Laplace wavelet transient model.
2.2. Correlation Analysis
In mathematics, the inner product serves as a powerful tool for evaluating the similarity of two time
series. Suppose that two time series x(n) and y(n) have the same length N. Then, the inner product
operation for the two finite length signals can be represented as [21]:
1
( ), ( ) ( ) ( )N
i
x n y n x i y i
(4)
The correlation coefficient , based on the inner product, can be used to assess the
degree of correlation between the two time series. Its formula is given by:
1( ), ( )
1 1
( ) ( )( ), ( )
( ), ( ) ( ), ( )( ) ( ) ( ) ( )
N
ix n n
N N
i i
x i ix n n
x n x n n nx i x i i i
(5)
In terms of the Cauchy-Schwarz inequality, the correlation coefficient is constrained to:
( ), ( )1 1x n n (6)
When the correlation coefficient is closer to 0, the linear dependence relationship between the two
signals is weaker.
0 0.02 0.04 0.06 0.08 0.1 0.12 0.14 0.16 0.18 0.2-1
-0.5
0
0.5
1
Time/s
Am
plit
ude
0 0.02 0.04 0.06 0.08 0.1 0.12 0.14 0.16 0.18 0.2-1
-0.5
0
0.5
1
Time/s
Am
plit
ude
(a)
(b)
Sensors 2013, 13 15730
3. Proposed Doppler Transient Model Based on Laplace Wavelet and Spectrum
Correlation Assessment
The conventional bearing fault detection methods have been developed for situations with no
relative movement between the signal acquisition system and the defective bearing, and thus the
acquired signal is not affected by the Doppler effect, however, locomotive bearing signals suffer from
high frequency shifts, frequency band expansions, and amplitude modulations due to the Doppler
effect. The fault-related impact intervals are not identical in this situation. Hence, the conventional
detection methods are not applicable in the diagnosis of real locomotive bearing faults. In this study, a
Doppler transient model based on the Laplace wavelet and a spectrum correlation assessment is
proposed to address the inability of traditional methods to handle Doppler-distorted acoustic signals in
real locomotive bearing fault detection. The correlation coefficient in the frequency domain does not
need to consider the transient model’s time delay in this method, reducing the computation time
required for parameter identification and thus improving the computational efficiency. A flowchart of
the proposed scheme is shown in Figure 2.
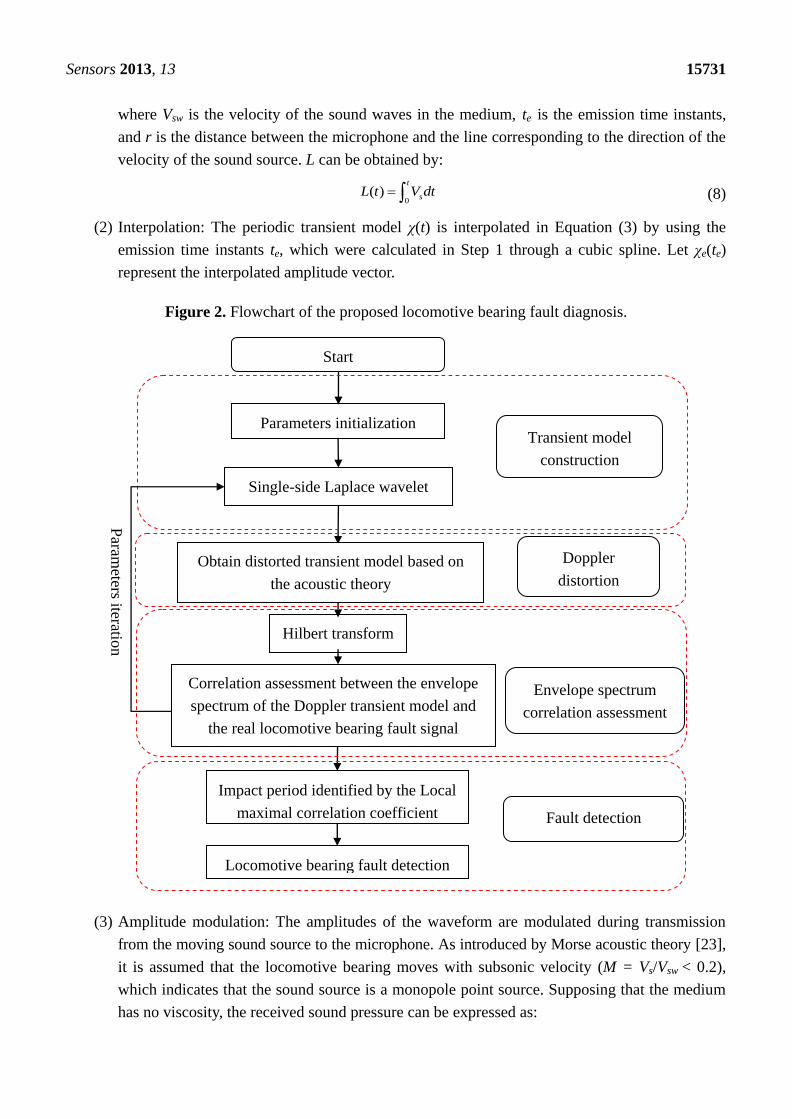
The proposed method follows the steps of transient model construction, Doppler distortion,
parameter identification through the assessment of the envelope spectrum correlation, and bearing fault
type identification through the recognized impact periods. Each step is discussed in detail in the
following subsections.
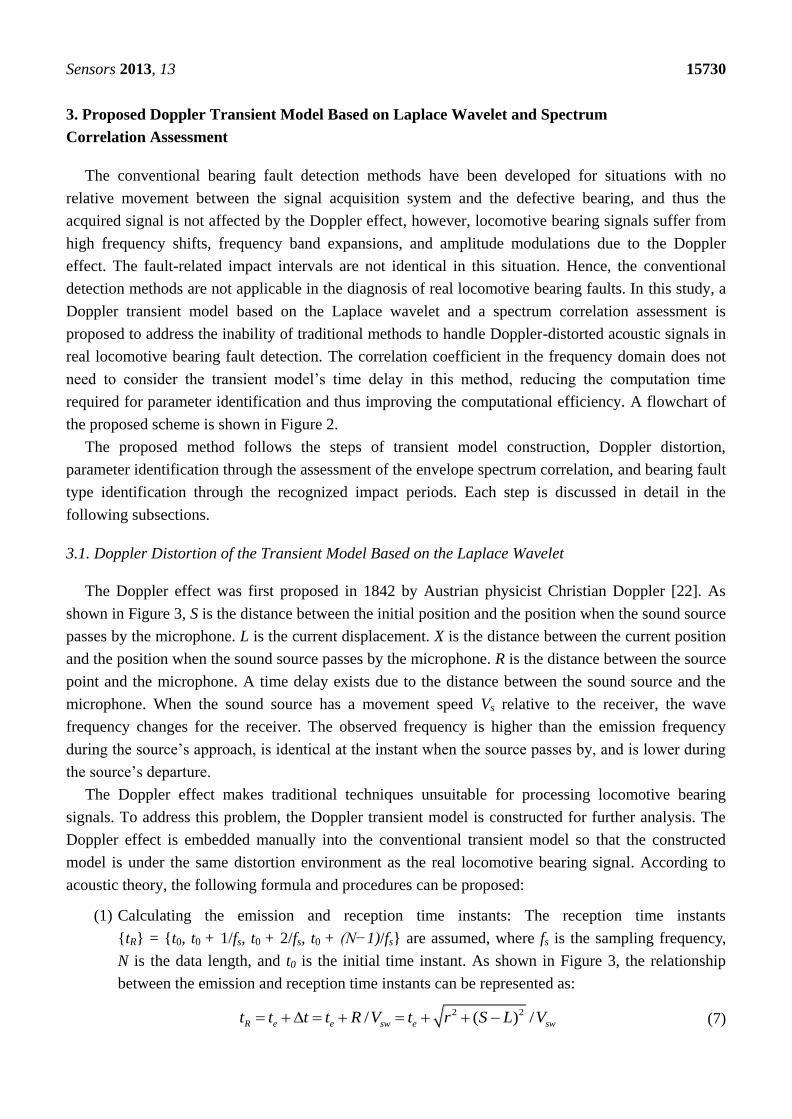
3.1. Doppler Distortion of the Transient Model Based on the Laplace Wavelet
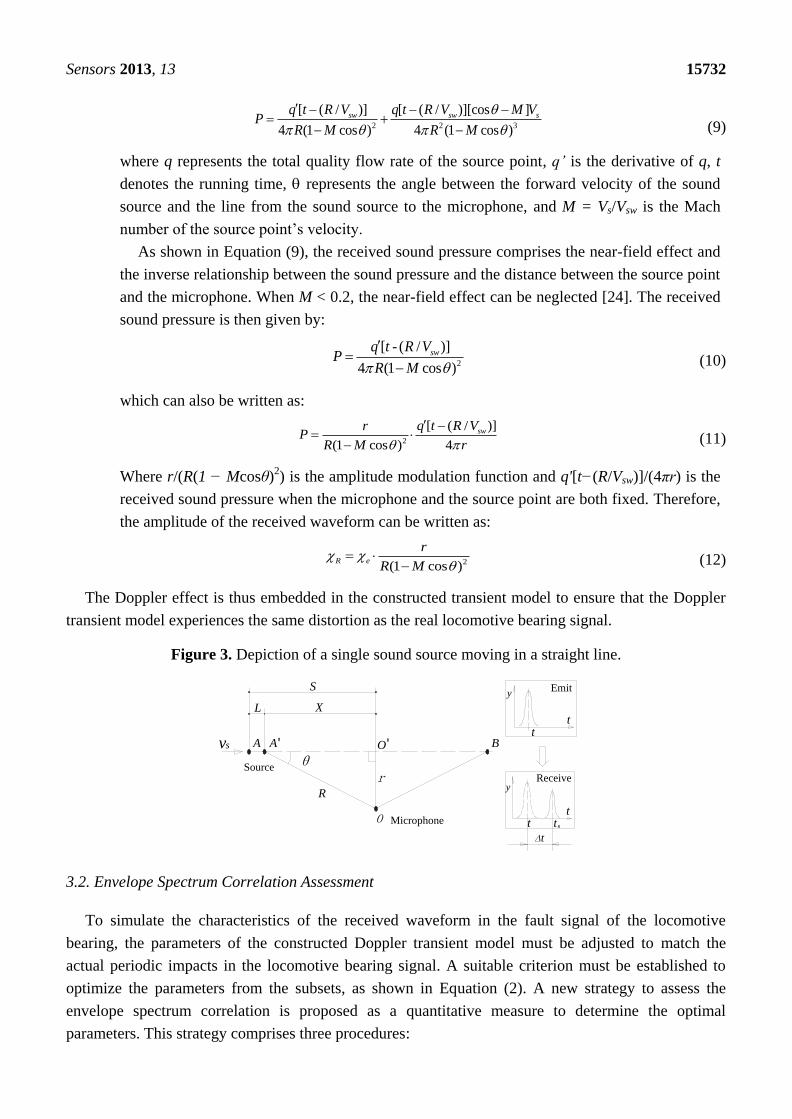
The Doppler effect was first proposed in 1842 by Austrian physicist Christian Doppler [22]. As
shown in Figure 3, S is the distance between the initial position and the position when the sound source
passes by the microphone. L is the current displacement. X is the distance between the current position
and the position when the sound source passes by the microphone. R is the distance between the source
point and the microphone. A time delay exists due to the distance between the sound source and the
microphone. When the sound source has a movement speed Vs relative to the receiver, the wave
frequency changes for the receiver. The observed frequency is higher than the emission frequency
during the source’s approach, is identical at the instant when the source passes by, and is lower during
the source’s departure.
The Doppler effect makes traditional techniques unsuitable for processing locomotive bearing
signals. To address this problem, the Doppler transient model is constructed for further analysis. The
Doppler effect is embedded manually into the conventional transient model so that the constructed
model is under the same distortion environment as the real locomotive bearing signal. According to
acoustic theory, the following formula and procedures can be proposed:
(1) Calculating the emission and reception time instants: The reception time instants
{tR} = {t0, t0 + 1/fs, t0 + 2/fs, t0 + (N−1)/fs} are assumed, where fs is the sampling frequency,
N is the data length, and t0 is the initial time instant. As shown in Figure 3, the relationship
between the emission and reception time instants can be represented as:
2 2/ ( ) /R e e sw e swt t t t R V t r S L V (7)
Sensors 2013, 13 15731
where Vsw is the velocity of the sound waves in the medium, te is the emission time instants,
and r is the distance between the microphone and the line corresponding to the direction of the
velocity of the sound source. L can be obtained by:
0( )
t
sL t V dt (8)
(2) Interpolation: The periodic transient model χ(t) is interpolated in Equation (3) by using the
emission time instants te, which were calculated in Step 1 through a cubic spline. Let χe(te)
represent the interpolated amplitude vector.
Figure 2. Flowchart of the proposed locomotive bearing fault diagnosis.
(3) Amplitude modulation: The amplitudes of the waveform are modulated during transmission
from the moving sound source to the microphone. As introduced by Morse acoustic theory [23],
it is assumed that the locomotive bearing moves with subsonic velocity (M = Vs/Vsw < 0.2),
which indicates that the sound source is a monopole point source. Supposing that the medium
has no viscosity, the received sound pressure can be expressed as:
Parameters initialization
Single-side Laplace wavelet
Hilbert transform
Impact period identified by the Local
maximal correlation coefficient
Transient model
construction
Doppler
distortion
Envelope spectrum
correlation assessment
Param
eters iteration
Locomotive bearing fault detection
Fault detection
Start
Correlation assessment between the envelope
spectrum of the Doppler transient model and
the real locomotive bearing fault signal
Obtain distorted transient model based on
the acoustic theory
Sensors 2013, 13 15732
2 2 3
[ ( / )] [ ( / )][cos ]
4 (1 cos ) 4 (1 cos )
sw sw sq t R V q t R V M VP
R M R M
(9)
where q represents the total quality flow rate of the source point, q’ is the derivative of q, t
denotes the running time, represents the angle between the forward velocity of the sound
source and the line from the sound source to the microphone, and M = Vs/Vsw is the Mach
number of the source point’s velocity.
As shown in Equation (9), the received sound pressure comprises the near-field effect and
the inverse relationship between the sound pressure and the distance between the source point
and the microphone. When M < 0.2, the near-field effect can be neglected [24]. The received
sound pressure is then given by:
2
[ - ( / )]
4 (1 cos )
swq t R VP
R M
(10)
which can also be written as:
2
[ ( / )]
(1 cos ) 4
swq t R VrP
R M r
(11)
Where r/(R(1 − Mcosθ)2) is the amplitude modulation function and q'[t−(R/Vsw)]/(4πr) is the
received sound pressure when the microphone and the source point are both fixed. Therefore,
the amplitude of the received waveform can be written as:
2(1 cos )R e
r
R M
(12)
The Doppler effect is thus embedded in the constructed transient model to ensure that the Doppler
transient model experiences the same distortion as the real locomotive bearing signal.
Figure 3. Depiction of a single sound source moving in a straight line.
Source
Microphone
R
r
t
y
t
t
y
t
X
Δt
L
θAA
O
O'
S
vs B
tR
Emit
Receive
'
3.2. Envelope Spectrum Correlation Assessment
To simulate the characteristics of the received waveform in the fault signal of the locomotive
bearing, the parameters of the constructed Doppler transient model must be adjusted to match the
actual periodic impacts in the locomotive bearing signal. A suitable criterion must be established to
optimize the parameters from the subsets, as shown in Equation (2). A new strategy to assess the
envelope spectrum correlation is proposed as a quantitative measure to determine the optimal
parameters. This strategy comprises three procedures:
Sensors 2013, 13 15733
(1) The Hilbert transforms of the periodic Doppler transient model and the real locomotive
bearing fault signal are obtained [25]:
1
1
R
R
A
A
tH t d
t
x tH x t d
t
(13)
where xA(t) is the real locomotive bearing fault signal, and the envelope signals are obtained
by calculating the modulus of the analytic signals:
*
*
R R R R
A A A A
E t A t t iH t
E t A x t x t iH x t
(14)
(2) Frequency spectrum analysis is performed by:
2
2
i ft
R R
i ft
A A
ES f E t e dt
ES f E t e dt
(15)
(3) The degree of correlation of the envelope spectrum is assessed by:
,
1
1 1
,
, ,R A
R A
ES f ES f
R R A A
N
R i A i
i
N N
R i R i A i A i
i i
ES f ES f
ES f ES f ES f ES f
ES f ES f
ES f ES f ES f ES f
(16)
3.3. Parameter Identification and Locomotive Bearing Fault Detection
The number and the diameter of the rolling elements in the locomotive bearings are represented by
Z and d, respectively. Dm is the pitch diameter, α denotes the contact angle of the bearing, and fn
denotes the rotational frequency. The ball pass frequency of the outer race (BPFO) can be obtained by:
ZfD
dBPFO
n
m
)cos1(2
1
(17)
If the surface of the outer race suffers a defect, then every time the rolling element passes through
the crack, periodic impulses will be created with interval t as:
BPFOt
1 (18)
Similarly, the ball pass frequency in the inner race (BPFI) is given by:
ZfD
dBPFI n
m
)cos1(2
1
(19)
Therefore, the inner race fault characteristic frequency is equivalent to BPFI. The optimal
parameters to obtain the local maximal envelope spectrum correlation coefficient are then identified, as
discussed in Section 3.2. The identified impact period in the Doppler transient model is the related
Sensors 2013, 13 15734
bearing fault impact interval. The fault type can be determined by referring to the calculated theoretical
fault-related impact intervals.
4. Simulation Validation of the Proposed Method
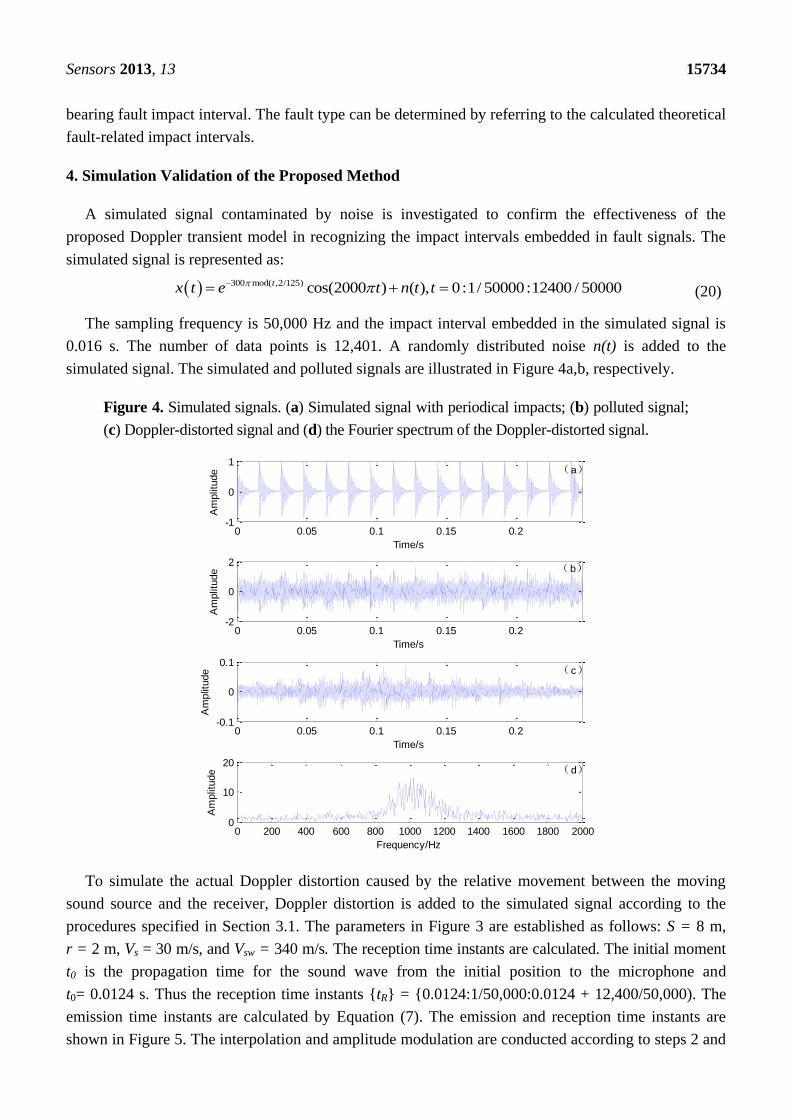
A simulated signal contaminated by noise is investigated to confirm the effectiveness of the
proposed Doppler transient model in recognizing the impact intervals embedded in fault signals. The
simulated signal is represented as:
300 mod( ,2/125) cos(2000 ) ( ), 0 :1/ 50000:12400 / 50000tx t e t n t t (20)
The sampling frequency is 50,000 Hz and the impact interval embedded in the simulated signal is
0.016 s. The number of data points is 12,401. A randomly distributed noise n(t) is added to the
simulated signal. The simulated and polluted signals are illustrated in Figure 4a,b, respectively.
Figure 4. Simulated signals. (a) Simulated signal with periodical impacts; (b) polluted signal;
(c) Doppler-distorted signal and (d) the Fourier spectrum of the Doppler-distorted signal.
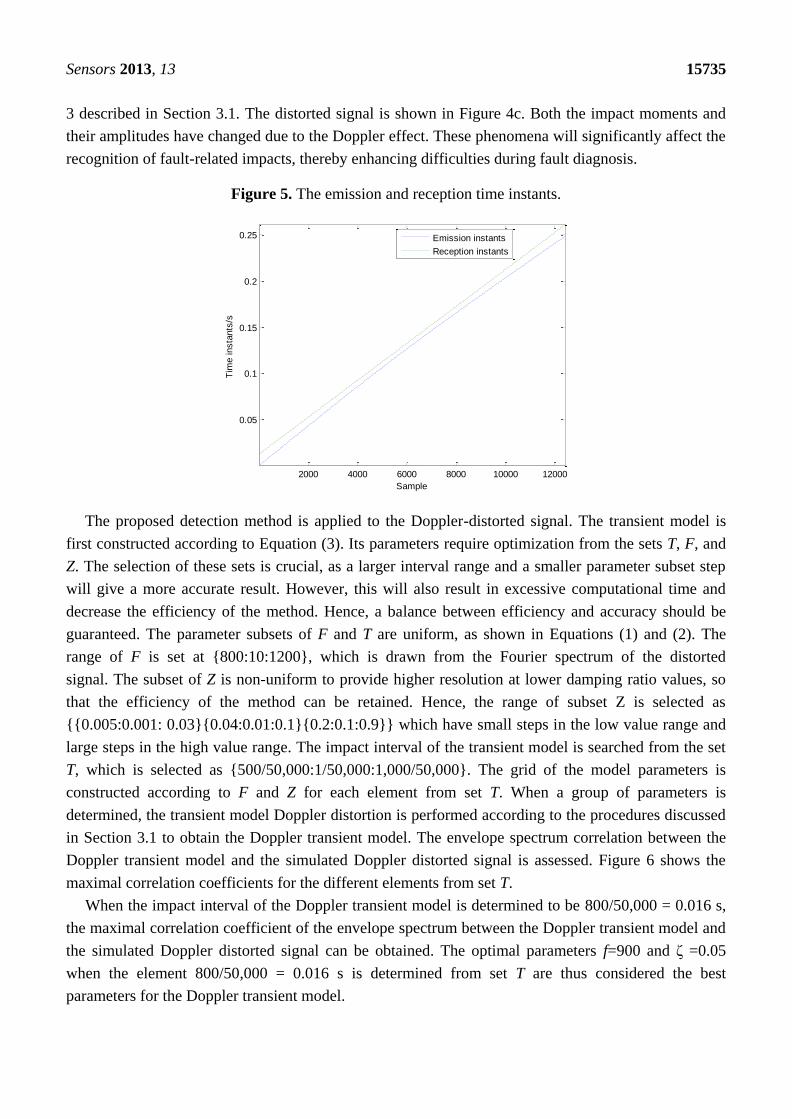
To simulate the actual Doppler distortion caused by the relative movement between the moving
sound source and the receiver, Doppler distortion is added to the simulated signal according to the
procedures specified in Section 3.1. The parameters in Figure 3 are established as follows: S = 8 m,
r = 2 m, Vs = 30 m/s, and Vsw = 340 m/s. The reception time instants are calculated. The initial moment
t0 is the propagation time for the sound wave from the initial position to the microphone and
t0= 0.0124 s. Thus the reception time instants {tR} = {0.0124:1/50,000:0.0124 + 12,400/50,000). The
emission time instants are calculated by Equation (7). The emission and reception time instants are
shown in Figure 5. The interpolation and amplitude modulation are conducted according to steps 2 and
0 0.05 0.1 0.15 0.2-1
0
1
Time/s
Am
plit
ude
0 0.05 0.1 0.15 0.2-2
0
2
Time/s
Am
plit
ude
0 0.05 0.1 0.15 0.2-0.1
0
0.1
Time/s
Am
plit
ude
0 200 400 600 800 1000 1200 1400 1600 1800 20000
10
20
Frequency/Hz
Am
plit
ude
(a)
(b)
(d)
(c)
Sensors 2013, 13 15735
3 described in Section 3.1. The distorted signal is shown in Figure 4c. Both the impact moments and
their amplitudes have changed due to the Doppler effect. These phenomena will significantly affect the
recognition of fault-related impacts, thereby enhancing difficulties during fault diagnosis.
Figure 5. The emission and reception time instants.
The proposed detection method is applied to the Doppler-distorted signal. The transient model is
first constructed according to Equation (3). Its parameters require optimization from the sets T, F, and
Z. The selection of these sets is crucial, as a larger interval range and a smaller parameter subset step
will give a more accurate result. However, this will also result in excessive computational time and
decrease the efficiency of the method. Hence, a balance between efficiency and accuracy should be
guaranteed. The parameter subsets of F and T are uniform, as shown in Equations (1) and (2). The
range of F is set at {800:10:1200}, which is drawn from the Fourier spectrum of the distorted
signal. The subset of Z is non-uniform to provide higher resolution at lower damping ratio values, so
that the efficiency of the method can be retained. Hence, the range of subset Z is selected as
{{0.005:0.001: 0.03}{0.04:0.01:0.1}{0.2:0.1:0.9}} which have small steps in the low value range and
large steps in the high value range. The impact interval of the transient model is searched from the set
T, which is selected as {500/50,000:1/50,000:1,000/50,000}. The grid of the model parameters is
constructed according to F and Z for each element from set T. When a group of parameters is
determined, the transient model Doppler distortion is performed according to the procedures discussed
in Section 3.1 to obtain the Doppler transient model. The envelope spectrum correlation between the
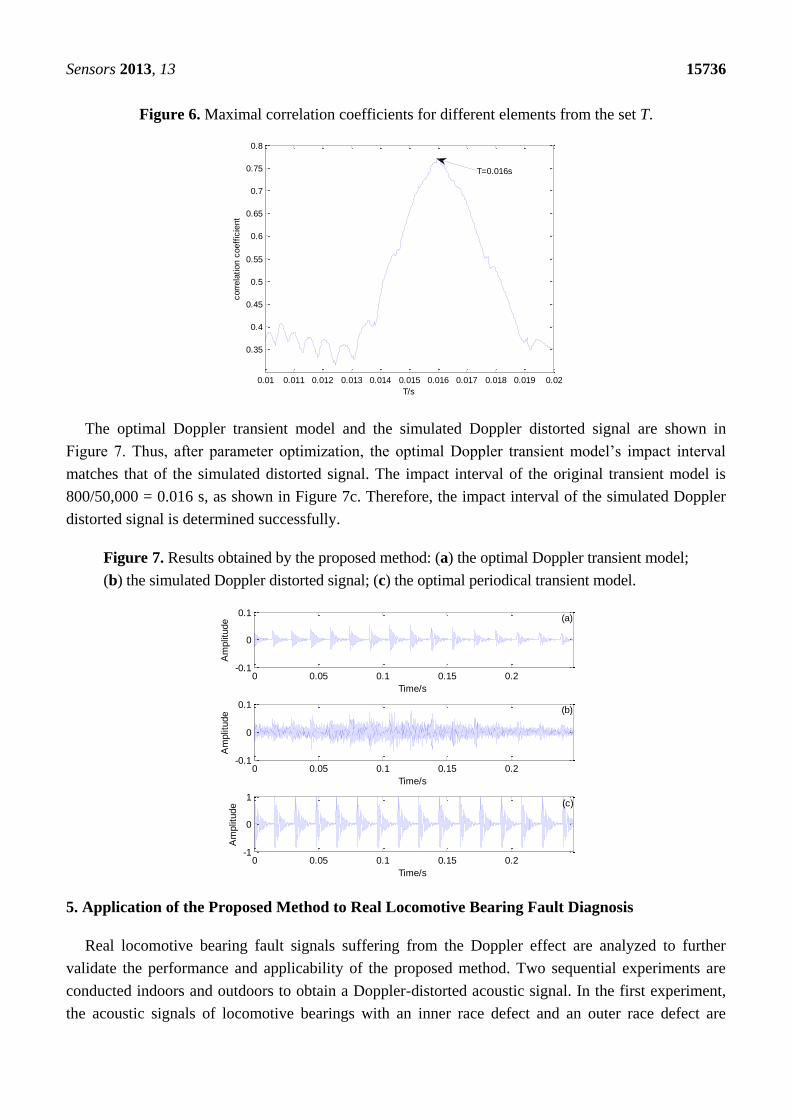
Doppler transient model and the simulated Doppler distorted signal is assessed. Figure 6 shows the
maximal correlation coefficients for the different elements from set T.
When the impact interval of the Doppler transient model is determined to be 800/50,000 = 0.016 s,
the maximal correlation coefficient of the envelope spectrum between the Doppler transient model and
the simulated Doppler distorted signal can be obtained. The optimal parameters f=900 and ζ =0.05
when the element 800/50,000 = 0.016 s is determined from set T are thus considered the best
parameters for the Doppler transient model.
2000 4000 6000 8000 10000 12000
0.05
0.1
0.15
0.2
0.25
Sample
Tim
e insta
nts
/s
Emission instants
Reception instants
Sensors 2013, 13 15736
Figure 6. Maximal correlation coefficients for different elements from the set T.
The optimal Doppler transient model and the simulated Doppler distorted signal are shown in
Figure 7. Thus, after parameter optimization, the optimal Doppler transient model’s impact interval
matches that of the simulated distorted signal. The impact interval of the original transient model is
800/50,000 = 0.016 s, as shown in Figure 7c. Therefore, the impact interval of the simulated Doppler
distorted signal is determined successfully.
Figure 7. Results obtained by the proposed method: (a) the optimal Doppler transient model;
(b) the simulated Doppler distorted signal; (c) the optimal periodical transient model.
5. Application of the Proposed Method to Real Locomotive Bearing Fault Diagnosis
Real locomotive bearing fault signals suffering from the Doppler effect are analyzed to further
validate the performance and applicability of the proposed method. Two sequential experiments are
conducted indoors and outdoors to obtain a Doppler-distorted acoustic signal. In the first experiment,
the acoustic signals of locomotive bearings with an inner race defect and an outer race defect are
0.01 0.011 0.012 0.013 0.014 0.015 0.016 0.017 0.018 0.019 0.02
0.35
0.4
0.45
0.5
0.55
0.6
0.65
0.7
0.75
0.8
T/s
corr
ela
tion c
oeff
icie
nt
T=0.016s
0 0.05 0.1 0.15 0.2-0.1
0
0.1
Time/s
Am
plit
ude
0 0.05 0.1 0.15 0.2-0.1
0
0.1
Time/s
Am
plit
ude
0 0.05 0.1 0.15 0.2-1
0
1
Time/s
Am
plit
ude
(a)
(b)
(c)
Sensors 2013, 13 15737
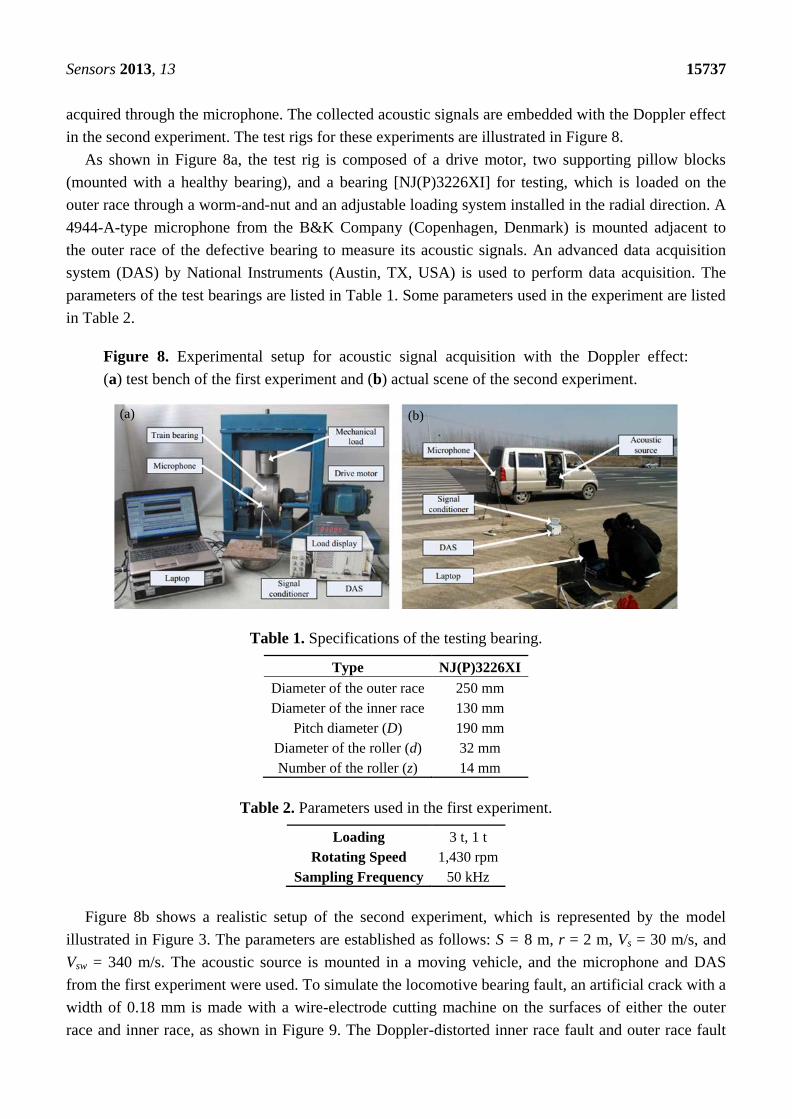
acquired through the microphone. The collected acoustic signals are embedded with the Doppler effect
in the second experiment. The test rigs for these experiments are illustrated in Figure 8.
As shown in Figure 8a, the test rig is composed of a drive motor, two supporting pillow blocks
(mounted with a healthy bearing), and a bearing [NJ(P)3226XI] for testing, which is loaded on the
outer race through a worm-and-nut and an adjustable loading system installed in the radial direction. A
4944-A-type microphone from the B&K Company (Copenhagen, Denmark) is mounted adjacent to
the outer race of the defective bearing to measure its acoustic signals. An advanced data acquisition
system (DAS) by National Instruments (Austin, TX, USA) is used to perform data acquisition. The
parameters of the test bearings are listed in Table 1. Some parameters used in the experiment are listed
in Table 2.
Figure 8. Experimental setup for acoustic signal acquisition with the Doppler effect:
(a) test bench of the first experiment and (b) actual scene of the second experiment.
(a) (b)
Table 1. Specifications of the testing bearing.
Type NJ(P)3226XI
Diameter of the outer race 250 mm
Diameter of the inner race 130 mm
Pitch diameter (D) 190 mm
Diameter of the roller (d) 32 mm
Number of the roller (z) 14 mm
Table 2. Parameters used in the first experiment.
Loading 3 t, 1 t
Rotating Speed 1,430 rpm
Sampling Frequency 50 kHz
Figure 8b shows a realistic setup of the second experiment, which is represented by the model
illustrated in Figure 3. The parameters are established as follows: S = 8 m, r = 2 m, Vs = 30 m/s, and
Vsw = 340 m/s. The acoustic source is mounted in a moving vehicle, and the microphone and DAS
from the first experiment were used. To simulate the locomotive bearing fault, an artificial crack with a
width of 0.18 mm is made with a wire-electrode cutting machine on the surfaces of either the outer
race and inner race, as shown in Figure 9. The Doppler-distorted inner race fault and outer race fault
Sensors 2013, 13 15738
signals are obtained in these experiments. The proposed method is then used to detect the fault-related
impact intervals.
Figure 9. Artificial defects on the (a) outer race and (b) on the inner race of the bearing.
(a) (b)
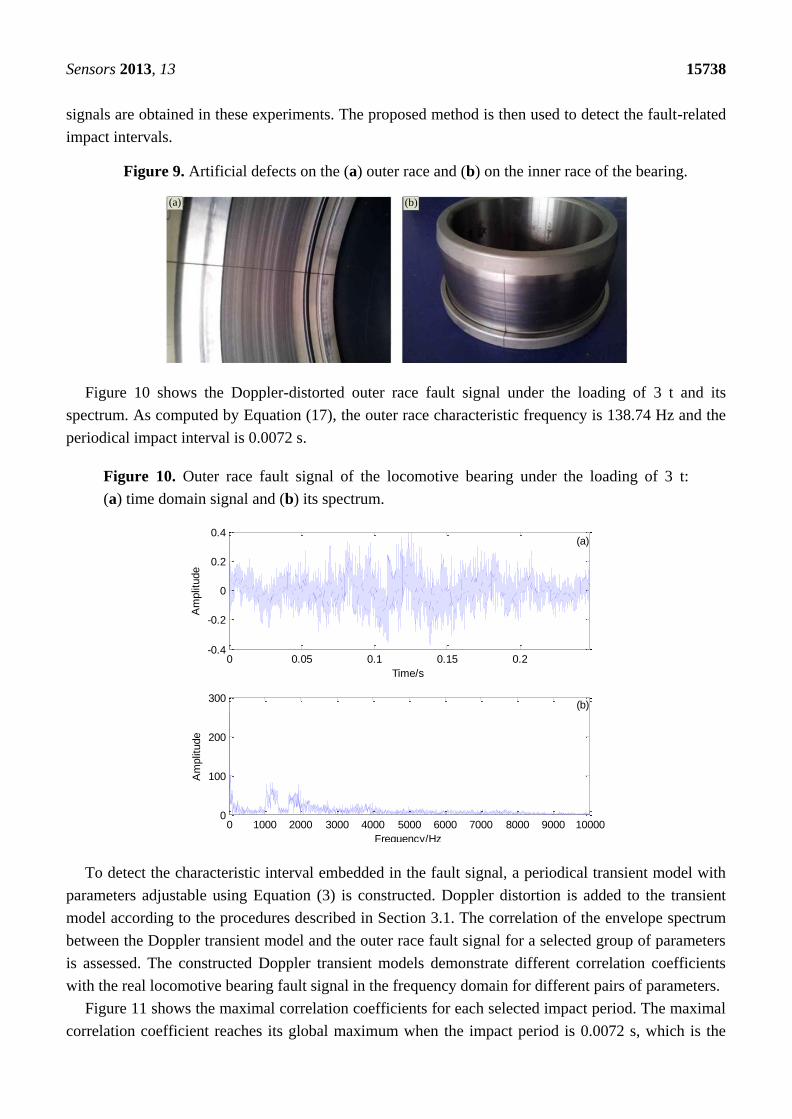
Figure 10 shows the Doppler-distorted outer race fault signal under the loading of 3 t and its
spectrum. As computed by Equation (17), the outer race characteristic frequency is 138.74 Hz and the
periodical impact interval is 0.0072 s.
Figure 10. Outer race fault signal of the locomotive bearing under the loading of 3 t:
(a) time domain signal and (b) its spectrum.
To detect the characteristic interval embedded in the fault signal, a periodical transient model with
parameters adjustable using Equation (3) is constructed. Doppler distortion is added to the transient
model according to the procedures described in Section 3.1. The correlation of the envelope spectrum
between the Doppler transient model and the outer race fault signal for a selected group of parameters
is assessed. The constructed Doppler transient models demonstrate different correlation coefficients
with the real locomotive bearing fault signal in the frequency domain for different pairs of parameters.
Figure 11 shows the maximal correlation coefficients for each selected impact period. The maximal
correlation coefficient reaches its global maximum when the impact period is 0.0072 s, which is the
0 0.05 0.1 0.15 0.2-0.4
-0.2
0
0.2
0.4
Time/s
Am
plit
ude
0 1000 2000 3000 4000 5000 6000 7000 8000 9000 100000
100
200
300
Frequency/Hz
Am
plit
ude
(a)
(b)
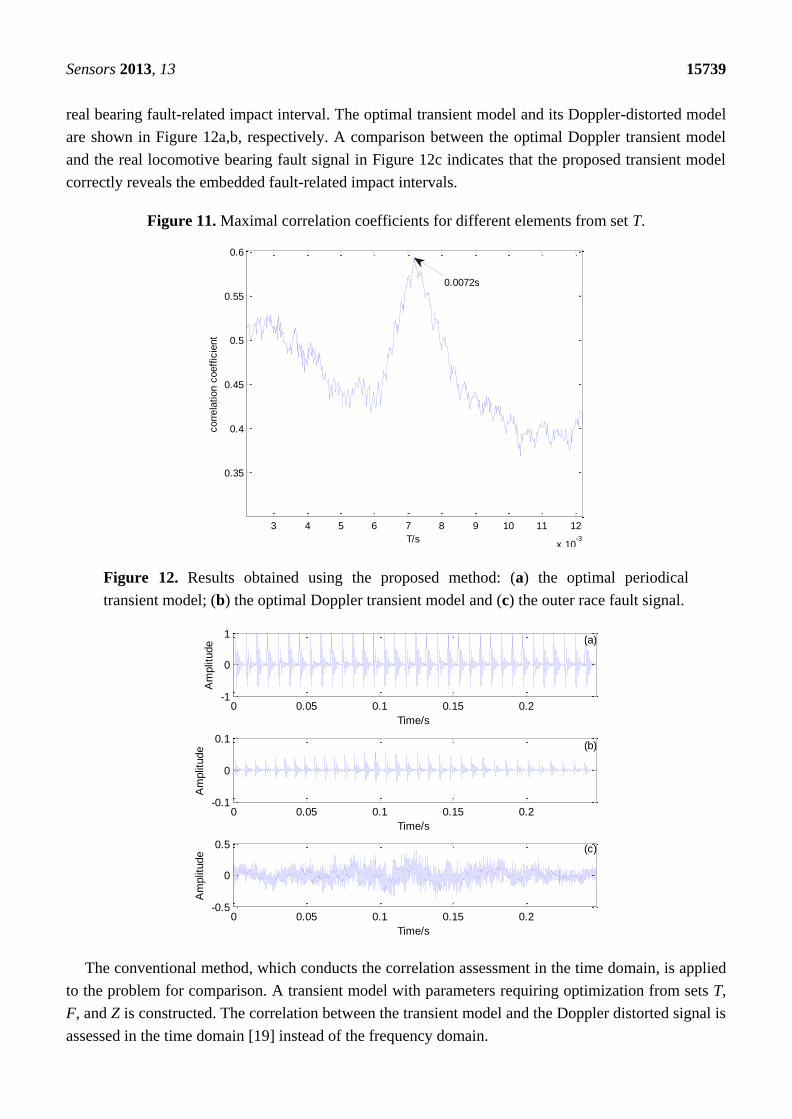
Sensors 2013, 13 15739
real bearing fault-related impact interval. The optimal transient model and its Doppler-distorted model
are shown in Figure 12a,b, respectively. A comparison between the optimal Doppler transient model
and the real locomotive bearing fault signal in Figure 12c indicates that the proposed transient model
correctly reveals the embedded fault-related impact intervals.
Figure 11. Maximal correlation coefficients for different elements from set T.
Figure 12. Results obtained using the proposed method: (a) the optimal periodical
transient model; (b) the optimal Doppler transient model and (c) the outer race fault signal.
The conventional method, which conducts the correlation assessment in the time domain, is applied
to the problem for comparison. A transient model with parameters requiring optimization from sets T,
F, and Z is constructed. The correlation between the transient model and the Doppler distorted signal is
assessed in the time domain [19] instead of the frequency domain.
3 4 5 6 7 8 9 10 11 12
x 10-3
0.35
0.4
0.45
0.5
0.55
0.6
T/s
corr
ela
tion c
oeff
icie
nt
0.0072s
0 0.05 0.1 0.15 0.2-0.1
0
0.1
Time/s
Am
plit
ude
0 0.05 0.1 0.15 0.2-0.5
0
0.5
Time/s
Am
plit
ude
0 0.05 0.1 0.15 0.2-1
0
1
Time/s
Am
plit
ude (a)
(b)
(c)
Sensors 2013, 13 15740
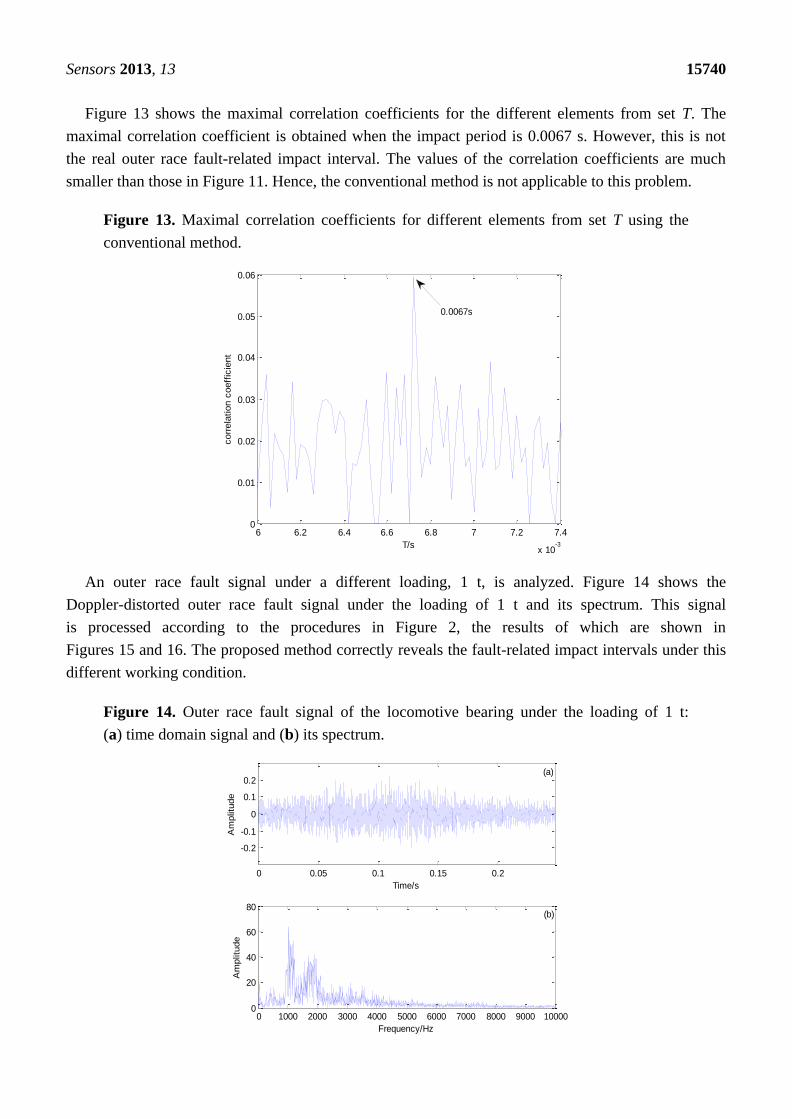
Figure 13 shows the maximal correlation coefficients for the different elements from set T. The
maximal correlation coefficient is obtained when the impact period is 0.0067 s. However, this is not
the real outer race fault-related impact interval. The values of the correlation coefficients are much
smaller than those in Figure 11. Hence, the conventional method is not applicable to this problem.
Figure 13. Maximal correlation coefficients for different elements from set T using the
conventional method.
An outer race fault signal under a different loading, 1 t, is analyzed. Figure 14 shows the
Doppler-distorted outer race fault signal under the loading of 1 t and its spectrum. This signal
is processed according to the procedures in Figure 2, the results of which are shown in
Figures 15 and 16. The proposed method correctly reveals the fault-related impact intervals under this
different working condition.
Figure 14. Outer race fault signal of the locomotive bearing under the loading of 1 t:
(a) time domain signal and (b) its spectrum.
6 6.2 6.4 6.6 6.8 7 7.2 7.4
x 10-3
0
0.01
0.02
0.03
0.04
0.05
0.06
T/s
corr
ela
tion c
oeff
icie
nt
0.0067s
0 0.05 0.1 0.15 0.2
-0.2
-0.1
0
0.1
0.2
Time/s
Am
plitu
de
0 1000 2000 3000 4000 5000 6000 7000 8000 9000 100000
20
40
60
80
Frequency/Hz
Am
plitu
de
(a)
(b)
Sensors 2013, 13 15741
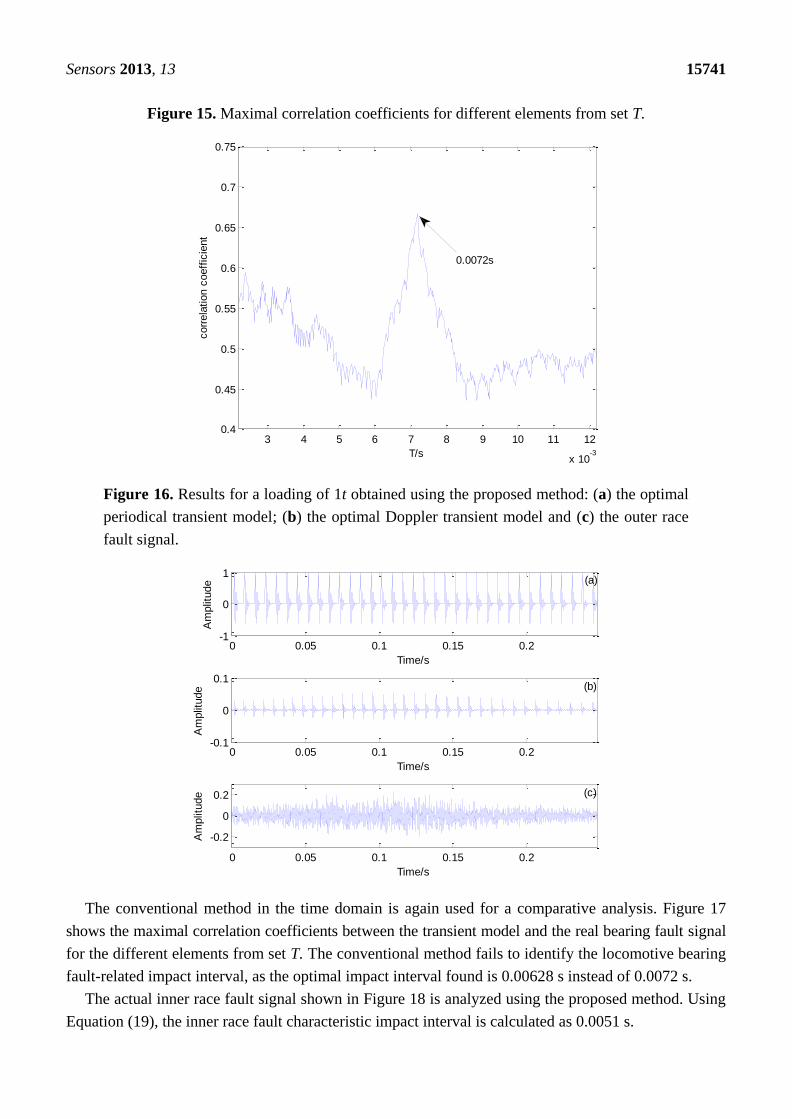
Figure 15. Maximal correlation coefficients for different elements from set T.
Figure 16. Results for a loading of 1t obtained using the proposed method: (a) the optimal
periodical transient model; (b) the optimal Doppler transient model and (c) the outer race
fault signal.
The conventional method in the time domain is again used for a comparative analysis. Figure 17
shows the maximal correlation coefficients between the transient model and the real bearing fault signal
for the different elements from set T. The conventional method fails to identify the locomotive bearing
fault-related impact interval, as the optimal impact interval found is 0.00628 s instead of 0.0072 s.
The actual inner race fault signal shown in Figure 18 is analyzed using the proposed method. Using
Equation (19), the inner race fault characteristic impact interval is calculated as 0.0051 s.
3 4 5 6 7 8 9 10 11 12
x 10-3
0.4
0.45
0.5
0.55
0.6
0.65
0.7
0.75
T/s
corr
ela
tion c
oeff
icie
nt
0.0072s
0 0.05 0.1 0.15 0.2-0.1
0
0.1
Time/s
Am
plit
ude
0 0.05 0.1 0.15 0.2
-0.2
0
0.2
Time/s
Am
plit
ude
0 0.05 0.1 0.15 0.2-1
0
1
Time/s
Am
plit
ude (a)
(b)
(c)

Sensors 2013, 13 15742
A transient model with optional parameters is established to recognize the locomotive bearing fault.
The Doppler distortion is added into the constructed model. The maximal correlation coefficients
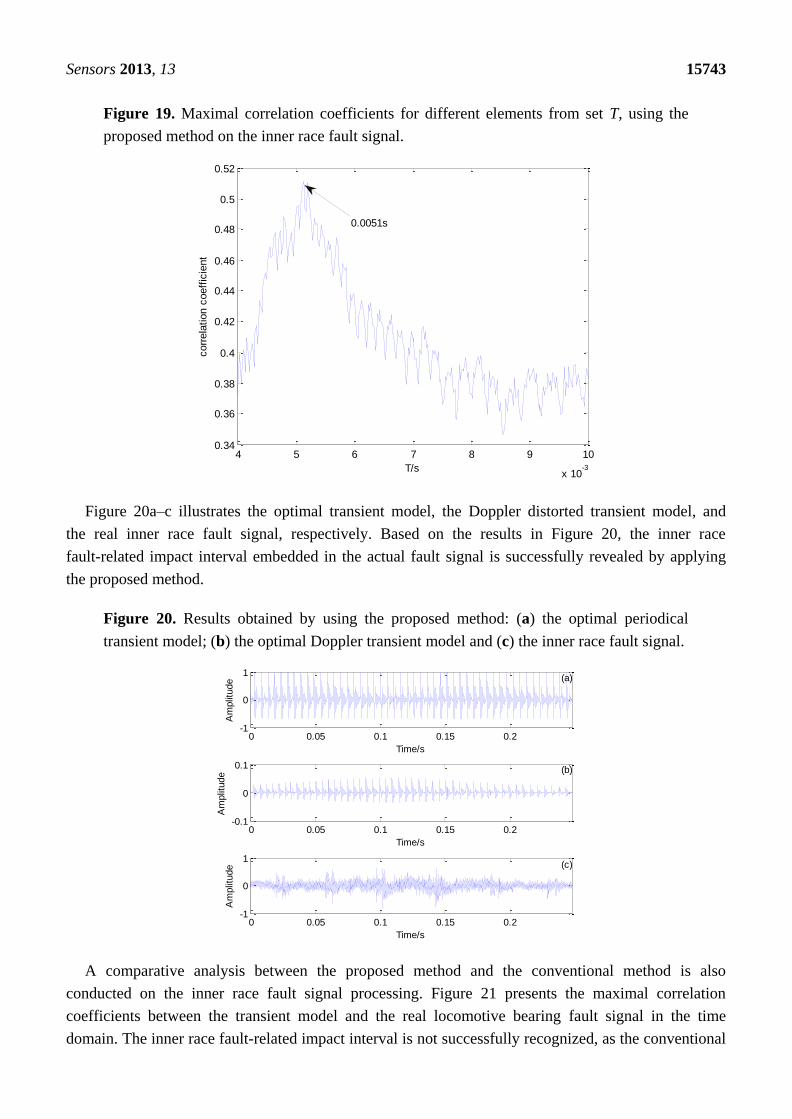
for every selected impact period after parameter optimization are shown in Figure 19. The global
maximal correlation coefficient is obtained when the impact period for the established transient model
is set as 0.0051 s.
Figure 17. Maximal correlation coefficients for different elements from set T, using the
conventional method and a loading of 1 t.
Figure 18. Inner race fault signal of the locomotive bearing: (a) time domain signal and
(b) its spectrum.
6 6.2 6.4 6.6 6.8 7 7.2 7.4
x 10-3
0
0.02
0.04
0.06
0.08
0.1
0.12
0.14
0.16
T/s
corr
ela
tion c
oeff
icie
nt
0.00628s
0 0.05 0.1 0.15 0.2-1
-0.5
0
0.5
1
Time/s
Am
plit
ude
0 1000 2000 3000 4000 5000 6000 7000 8000 9000 100000
100
200
300
Frequency/Hz
Am
plit
ude
(a)
(b)
Sensors 2013, 13 15743
Figure 19. Maximal correlation coefficients for different elements from set T, using the
proposed method on the inner race fault signal.
Figure 20a–c illustrates the optimal transient model, the Doppler distorted transient model, and
the real inner race fault signal, respectively. Based on the results in Figure 20, the inner race
fault-related impact interval embedded in the actual fault signal is successfully revealed by applying
the proposed method.
Figure 20. Results obtained by using the proposed method: (a) the optimal periodical
transient model; (b) the optimal Doppler transient model and (c) the inner race fault signal.
A comparative analysis between the proposed method and the conventional method is also
conducted on the inner race fault signal processing. Figure 21 presents the maximal correlation
coefficients between the transient model and the real locomotive bearing fault signal in the time
domain. The inner race fault-related impact interval is not successfully recognized, as the conventional
4 5 6 7 8 9 10
x 10-3
0.34
0.36
0.38
0.4
0.42
0.44
0.46
0.48
0.5
0.52
T/s
corr
ela
tion c
oeff
icie
nt
0.0051s
0 0.05 0.1 0.15 0.2-0.1
0
0.1
Time/s
Am
plit
ude
0 0.05 0.1 0.15 0.2-1
0
1
Time/s
Am
plit
ude
0 0.05 0.1 0.15 0.2-1
0
1
Time/s
Am
plit
ude (a)
(b)
(c)

Sensors 2013, 13 15744
method incorrectly selects the impact period T = 0.00638 s. The performance and superiority of the
proposed method is therefore validated by these specific case studies and comparative analyses.
Figure 21. Maximal correlation coefficients for different elements from set T, using the
conventional method on the inner race fault signal.
6. Conclusions
In this study, a new Doppler transient model based on the Laplace wavelet and a spectrum
correlation assessment is proposed for diagnosing locomotive bearing faults. The proposed scheme
includes Laplace wavelet transient model construction, Doppler distortion, spectrum correlation
assessment, and parameter optimization. After implementing the proposed method, the fault-related
impact interval can be successfully determined using on the optimal Doppler transient model.
The Laplace wavelet is used as the impact base function due to its superior ability to match actual
bearing fault impulses. A periodical transient model based on the Laplace wavelet is constructed.
The parameters of the model require optimization to properly match the real locomotive bearing fault
impact interval.
Through acoustical theoretical analysis, a procedure for adding the Doppler effect to the constructed
periodical transient model is proposed to simulate the Doppler distortion experienced by real
locomotive bearing fault signals.
A new criterion is established to choose proper parameters during Doppler transient model
construction. Correlation analysis is conducted between the envelope spectrum of the established
Doppler transient model and the locomotive bearing fault signal. The parameters for obtaining the
maximal correlation coefficient are found to be the optimal parameters for the model. Hence, the impact
interval in the optimal Doppler transient model is recognized as the fault-related impact interval.
The results obtained by investigating both simulated signals and locomotive bearing fault signals
indicate that the proposed method exhibits satisfactory performance in analyzing Doppler-distorted
locomotive bearing acoustical fault signals. The proposed method could be developed further for use in
a wayside train condition monitoring system.
6 6.2 6.4 6.6 6.8 7 7.2 7.4
x 10-3
0
0.01
0.02
0.03
0.04
0.05
0.06
0.07
T/s
corr
ela
tion c
oeff
icie
nt
0.00638s
Sensors 2013, 13 15745
Acknowledgments
The work described in this paper was partly supported by the Natural Science Foundation of China
(Grant No. 51075379 and 51375322) and a grant from the Research Grants Council of the Hong Kong
Special Administrative Region, China (Project No. CityU 122011). The authors also would like to
appreciate the two anonymous reviewers for their constructive comments and suggestions.
Conflicts of Interest
The authors declare no conflict of interest.
References
1. Lei, Y.G.; He, Z.J.; Zi, Y.Y. EEMD method and WNN for fault diagnosis of locomotive roller
bearings. Expert Syst. Appl. 2011, 38, 7334–7341.
2. Shen, Z.J.; He, Z.J.; Chen, X.F.; Sun, C.; Liu, Z.W. A monotonic degradation assessment index of
rolling bearings using fuzzy support vector data description and running time. Sensors 2012, 12,
10109–10135.
3. Shen, C.Q.; He, Q.B.; Kong, F.R.; Tse, P.W. A fast and adaptive varying-scale morphological
analysis method for rolling element bearing fault diagnosis. Proc. Inst. Mech. Eng. Part C J. Eng.
Mech. Eng. Sci. 2013, 227, 1362–1370.
4. Choe, H.C.; Wan, Y.L.; Chan, A.K. Neural Pattern Identification of Railroad Wheel-Bearing
Faults from Audible Acoustic Signals: Comparison of FFT, CWT and DWT Features. In
Proceedings of International Society for Optics and Photonics, Orlando, FL, USA, 21 April 1997;
pp. 480–496.
5. Sneed, W.H.; Smith, R.L. On-Board Real-Time Bearing Defects Detection and Monitoring. In
Proceedings of the 1998 ASME/IEEE Joint Railroad Conference, Philadelphia, PA, USA,
16 April 1998; pp. 149–153.
6. Dybala, J.; Radkowski, S. Reduction of Doppler effect for the needs of wayside condition
monitoring system of railway vehicles. Mech. Syst. Signal Process. 2012, 38, 125–136.
7. Cohen, L. Time-frequency distributions-a review. Proc. IEEE 1989, 77, 941–981.
8. Wang, S.; Chen, X.; Cai, G.; Chen, B.; Li, X.; He, Z. Matching demodulation transform
and synchrosqueezing in time-frequency analysis. IEEE Trans. Signal Process. 2013,
doi:10.1109/TSP.2013.2276393.
9. Jardine, A.K.S.; Lin, D.M.; Banjevic, D. A review on machinery diagnostics and prognostics
implementing condition-based maintenance. Mech. Syst. Signal Process. 2006, 20, 1483–1510.
10. Miao, Q.; Tang, C.; Liang, W.; Michael, P. Health assessment of cooling fan bearings using
wavelet-based filtering. Sensors 2013, 13, 274–291.
11. Peng, Z.K.; Chu, F.L. Application of the wavelet transform in machine condition monitoring and
fault diagnostics: A review with bibliography. Mech. Syst. Signal Process. 2004, 18, 199–221.
12. Shen, C.Q.; Wang, D.; Kong, F.R.; Tse, P.W. Fault diagnosis of rotating machinery based on the
statistical parameters of wavelet packet paving and a generic support vector regressive classifier.
Measurement 2013, 46, 1551–1564.
Sensors 2013, 13 15746
13. Yan, R.; Gao, R.X.; Chen, X. Wavelets for fault diagnosis of rotary machines: A review with
applications. Signal Process. 2014, 96, 1–15.
14. Huang, N.E.; Shen, Z.; Long, S.R. The empirical mode decomposition and the Hilbert spectrum
for nonlinear and non-stationary time series analysis. Proc. R. Soc. A Math. Phys. Eng. Sci. 1998,
454, 903–995.
15. Rai, V.K.; Mohanty, A.R. Bearing fault diagnosis using FFT of intrinsic mode functions in
Hilbert-Huang transform. Mech. Syst. Signal Process. 2007, 21, 2607–2615.
16. Yan, R.Q.; Gao, R.X. Rotary machine health diagnosis based on empirical mode decomposition.
J. Vib. Acoust. Trans. ASME. 2008, 130, doi:10.1115/1.2827360.
17. Mallat, S.; Zhang, Z. Matching pursuit with time-frequency dictionary. IEEE Trans. Signal
Process. 1993, 41, 3397–3415.
18. Freudinger, L.C.; Lind, R.; Brenner, M.J. Correlation Filtering of Modal Dynamics Using the
Laplace Wavelt. In Proceedings of 16th International Modal Analysis Conference, Santa Barbara,
CA, USA, 2–5 February 1998; pp. 868–877.
19. Wang, S.B.; Huang, W.G.; Zhu, Z.K. Transient model and parameter identification based on
wavelet and correlation filtering for rotating machine fault diagnosis. Mech. Syst. Signal Process.
2011, 25, 1299–1320.
20. Wang, S.; Zhu, Z.K.; He, Y.; Huang, W. Adaptive parameter identification based on Morlet
wavelet and application in gearbox fault feature detection. EURASIP J. Adv. Signal Process.
2010, 2010, 842879.
21. Inner Product Space, Wikipedia. Available online: http://en.wikipedia.org/wiki/Inner_product_
space (accessed on 7 November 2013).
22. Doppler Effect, Wikipedia. Available online: http://en.wikipedia.org/wiki/Doppler_effect (accessed
on 25 July 2013).
23. Morse, P.M.; Ingard, K.U. Theoretical Acoustics (Section 2); Science Press: Beijing, China, 1986;
pp. 822–850.
24. Yang, D.G.; Zheng, S.F.; Luo, Y.G.; Lian, X.M.; Jiang, X.Y. Acoustic holography method for the
identification of moving sound source. Acta Acust. 2002, 4, 357–362.
25. Fan, X.F.; Liang, M.; Yeap, T.H.; Kind, B. A joint wavelet lifting and independent component
analysis approach to fault detection of rolling element bearings. Smart Mater. Struct. 2007, 16,
1973, doi:10.1088/0964-1726/16/5/056.
© 2013 by the authors; licensee MDPI, Basel, Switzerland. This article is an open access article
distributed under the terms and conditions of the Creative Commons Attribution license
(http://creativecommons.org/licenses/by/3.0/).