DIVERSITY OF SHRUB SPECIES IN A SEMIARID AREA OF CENTRAL MEXICO
13
DIVERSIDAD DE ESPECIES ARBUSTIVAS EN UNA ZONA SEMIÁRIDA DEL CENTRO DE MÉXICO DIVERSITY OF SHRUB SPECIES IN A SEMIARID AREA OF CENTRAL MEXICO Sandra M. Gelviz-Gelvez * ; Numa P. Pavón Hernández 1 Centro de Investigaciones Biológicas, Universidad Autónoma del Estado de Hidalgo. Carretera Pachuca-Tulancingo km 4.5, Mineral de la Reforma. C. P. 42184. Pachuca, Hgo. México. Correo-e: [email protected] Tel. (045) 771802419 ( * Autora para correspondencia). RESUMEN L a diversidad alfa (verdadera) y la diversidad beta (recambio y anidamiento) de especies arbus- tivas se evaluaron en la zona semiárida del estado de Hidalgo, México. El índice de valor de importancia de las especies se relacionó con variables edáficas y elementos climáticos. Se re- portan 46 especies arbustivas pertenecientes a 21 familias, entre las que sobresalen Asteraceae y Fabaceae. El mayor número de especies efectivas registradas en un sitio fue de 7.8 y el menor de 1.6. La diversidad beta fue alta (0.9), lo cual se explica principalmente por el recambio de especies entre sitios (0.87) y en menor medida por el anidamiento (0.38). Las variables ambientales que mejor explicaron la distribución de las especies fueron la precipitación, el porcentaje de arena, el pH y el nitrógeno. Los resultados coinciden con lo documentado en otras zonas semiáridas, donde la alta diversidad regional se debe a un alto recambio de especies generado por la heterogeneidad ambiental que se muestra como un mosaico de condiciones, tanto de los elementos climáticos como de las características edáficas. ABSTRACT T he alpha diversity (true diversity) and beta diversity (turnover and nestedness) of shrub spe- cies were evaluated in the semiarid area of Hidalgo, Mexico. The importance value index of species was related to soil variables and climatic factors. We found 46 species from 21 families. Asteraceae and Fabaceae were the most important. The greatest number of effective species recorded was 7.8 and the smaller was 1.6. Beta diversity was high (0.9), mainly due to the tur- nover component (0.87) and to a lesser extent due to nestedness (0.38). Precipitation, nitrogen, pH and percentage of sand were the most important variables to explain the species distribution. These results agree with those reported in other semiarid areas. High regional diversity is due to a high species turno- ver generated by environmental heterogeneity that is displayed as a mosaic of conditions, both climatic and soil characteristics. Recibido: 06 de agosto, 2012 Aceptado: 18 de julio, 2013 doi: 10.5154/r.rchscfa.2012.08.049 http://www.chapingo.mx/revistas PALABRAS CLAVE: Arbustos, diversidad verdadera, diversidad beta, matorral xerófilo, suelo. KEYWORDS: Shrubs, true diversity, beta diversity, xeric scrub, soil.
Transcript of DIVERSITY OF SHRUB SPECIES IN A SEMIARID AREA OF CENTRAL MEXICO
DIVERSIDAD DE ESPECIES ARBUSTIVAS EN UNA ZONA SEMIÁRIDA DEL CENTRO DE MÉXICO
DIVERSITY OF SHRUB SPECIES IN A SEMIARID AREA OF CENTRAL MEXICO
Sandra M. Gelviz-Gelvez*; Numa P. Pavón Hernández1Centro de Investigaciones Biológicas, Universidad Autónoma del Estado de Hidalgo. Carretera Pachuca-Tulancingo km 4.5, Mineral de la Reforma. C. P. 42184. Pachuca, Hgo. México. Correo-e: [email protected] Tel. (045) 771802419 (*Autora para correspondencia).
RESUMEN
La diversidad alfa (verdadera) y la diversidad beta (recambio y anidamiento) de especies arbus-tivas se evaluaron en la zona semiárida del estado de Hidalgo, México. El índice de valor de importancia de las especies se relacionó con variables edáficas y elementos climáticos. Se re-portan 46 especies arbustivas pertenecientes a 21 familias, entre las que sobresalen Asteraceae
y Fabaceae. El mayor número de especies efectivas registradas en un sitio fue de 7.8 y el menor de 1.6. La diversidad beta fue alta (0.9), lo cual se explica principalmente por el recambio de especies entre sitios (0.87) y en menor medida por el anidamiento (0.38). Las variables ambientales que mejor explicaron la distribución de las especies fueron la precipitación, el porcentaje de arena, el pH y el nitrógeno. Los resultados coinciden con lo documentado en otras zonas semiáridas, donde la alta diversidad regional se debe a un alto recambio de especies generado por la heterogeneidad ambiental que se muestra como un mosaico de condiciones, tanto de los elementos climáticos como de las características edáficas.
ABSTRACT
The alpha diversity (true diversity) and beta diversity (turnover and nestedness) of shrub spe-cies were evaluated in the semiarid area of Hidalgo, Mexico. The importance value index of species was related to soil variables and climatic factors. We found 46 species from 21 families. Asteraceae and Fabaceae were the most important. The greatest number of effective
species recorded was 7.8 and the smaller was 1.6. Beta diversity was high (0.9), mainly due to the tur-nover component (0.87) and to a lesser extent due to nestedness (0.38). Precipitation, nitrogen, pH and percentage of sand were the most important variables to explain the species distribution. These results agree with those reported in other semiarid areas. High regional diversity is due to a high species turno-ver generated by environmental heterogeneity that is displayed as a mosaic of conditions, both climatic and soil characteristics.
Recibido: 06 de agosto, 2012Aceptado: 18 de julio, 2013doi: 10.5154/r.rchscfa.2012.08.049http://www.chapingo.mx/revistas
PALABRAS CLAVE: Arbustos, diversidad verdadera, diversidad beta, matorral xerófilo, suelo.
KEYWORDS: Shrubs, true diversity, beta diversity, xeric scrub, soil.
Diversidad de especies... Gelviz-Gelvez & Pavón-Hernández
324
INTRODUCCIÓN
Las zonas áridas y semiáridas han sido consideradas por lo general como sitios estresantes, con suelos infértiles, don-de la escasez de agua es el factor limitante más importante, cuya disponibilidad es escasa e impredecible. Sin embargo, las zonas semiáridas intertropicales, debido a la variación orográfica, altitudinal, latitudinal y geológica, son altamente heterogéneas en cuanto a la distribución espacio-temporal de la precipitación, la temperatura y las características del suelo (Bhandari & Ficklin, 2009; Pausas & Austin, 2001). Esto ha incrementado la diversidad biológica a consecuencia de un alto reemplazo de especies entre sitios que mantienen condiciones ambientales distintas (Holzapfel, Tielbörger, Pa-rag, Kigel, & Sternberg, 2006; Ylva-Li, Gowda, Martensson, Sandberg, & Fransson, 2010). La heterogeneidad ambiental ha sido el factor más asociado con la diversidad beta, don-de la tolerancia de las especies a las diferentes condiciones ambientales establece los diversos patrones de distribución espacial (Balvanera, Lott, Segura, Siebe, & Islas, 2002). Por lo anterior, es importante evaluar la diversidad tanto a escala local (alfa) como regional (beta), considerando el recambio de especies y el anidamiento (Baselga, 2010). El recambio implica la sustitución de especies entre sitios como conse-cuencia de limitaciones ambientales principalmente, mien-tras que el anidamiento implica que sitios pobres en especies sean en realidad subconjuntos de sitios con mayor riqueza (Quian, Ricklefs, & White, 2005; Ulrich & Gotelli, 2007). Por otro lado, es importante que las comparaciones entre sitios concuerden con lo intuitivamente esperado, por lo que ac-tualmente se utiliza la diversidad verdadera que expresa la riqueza como el número efectivo de especies (Moreno, Ba-rragán, Pineda, & Pavón, 2011).
Los ambientes semiáridos de México tienen una alta rique-za florística que se estima en alrededor de 6,000 especies, lo que representa aproximadamente 27 % de la flora en el país (Challenger & Soberón, 2008; Sánchez-Colón, Flores-Martínez, Cruz-Leyva, & Velázquez, 2009). Esta alta rique-za podría explicarse en parte por diferencias marcadas en la variación espacial de elementos climáticos, y las propiedades físicoquímicas del suelo tales como la textura, la densidad, la porosidad y la disponibilidad de nutrientes (Perroni-Ven-tura, Montaña, & García-Oliva, 2006; Ugalde, Granados-Sánchez, & Sánchez-González, 2008). En la zona semiárida del estado de Hidalgo, los arbustos representan la forma de vida dominante; plantas con altura mínima de 1 m y una máxima de 4 m, con ramificaciones a no más de 5 cm del suelo (Montaño-Árias, García-Sánchez, Ochoa-de la Rosa, & Monroy-Ata, 2006). Los arbustos son importantes en estos ecosistemas porque cumplen con diversas funciones: ayudan en el establecimiento de otras especies vegetales actuando como nodrizas, generan islas de fertilidad, levantamiento hidráulico y tienen una alta influencia en los procesos edá-ficos (Gutiérrez & Squeo, 2004; Montaño-Árias et al., 2006). La dinámica de los ecosistemas semiáridos respecto de los cambios en las propiedades del suelo es lenta (10 a 50 años);
INTRODUCTION
Arid and semi-arid areas have usually been considered as stressful sites with infertile soils, where water scarcity is the most obvious limiting factor or its unpredictable availability. However, the intertropical semiarid areas, due to the oro-graphic, altitudinal, latitudinal and geology variation, are highly heterogeneous in terms of spatial-temporal distribu-tion of precipitation, temperature and soil characteristics (Bhandari & Ficklin, 2009; Pausas & Austin, 2001). This has increased the biological diversity as a result of high species turnover among sites that maintain different environmental conditions (Holzapfel, Tielbörger, Parag, Kigel, & Sternberg, 2006; Ylva-Li, Gowda, Martensson, Sandberg, & Fransson, 2010). Environmental heterogeneity has been the factor most associated with beta diversity where species tolerance to different environmental conditions set the various spa-tial patterns (Balvanera, Lott, Segura, Siebe, & Islas, 2002). Therefore, it is important to assess the diversity both locally (alpha) and regionally (beta), considering turnover and nest-edness (Baselga, 2010). Turnover involves the replacement of species among sites as a result of mainly environmental con-straints, while nestedness implies that species-poor sites are actually subsets of sites with greater wealth (Quian, Ricklefs, & White, 2005; Ulrich & Gotelli, 2007). Moreover, it is im-portant that comparisons among sites match the intuitively expected, so now we use true diversity expressing wealth as the effective number of species (Moreno, Barragán, Pineda, & Pavón, 2011).
The semiarid environments of Mexico have high floris-tic richness estimated at around 6,000 species , represent-ing approximately 27 % of the flora in the country (Chal-lenger & Soberón, 2008; Sánchez-Colón, Flores-Martínez, Cruz-Leyva, & Velázquez, 2009). This high richness could be explained, in part, by marked differences in the spatial variation of climatic factors and soil physicochemical prop-erties such as texture, density, porosity and nutrient avail-ability (Perroni-Ventura, Montaña, & García-Oliva, 2006; Ugalde, Granados-Sánchez, & Sánchez-González, 2008). In the semiarid area of Hidalgo, shrubs represent the dominant life form; plants with minimum height of 1 m and maxi-mum height of 4 m, with ramifications to no more than 5 cm from the soil. (Montaño-Árias, García-Sánchez, Ochoa-de la Rosa, & Monroy-Ata, 2006). Shrubs are important in these ecosystems because they fulfill several functions: assist in the establishment of other plant species acting as nurses, generate fertility islands, hydraulic lift and have a high influ-ence on soil processes (Gutiérrez & Squeo, 2004; Montaño-Árias et al., 2006). The dynamics of semiarid ecosystems with respect of the changes in soil properties is slow (10 to 50 years); however, soil fertility processes are generated un-der the canopy of some shrubs (Montaño-Árias et al., 2006).
Soil properties and plant diversity in semiarid environ-ments have been evaluated in a few studies (Alvaréz-Yépis, Martínez-Yrízar, Búrquez, & Lindquist, 2008; Balvanera et
Revista Chapingo Serie Ciencias Forestales y del AmbienteDiversidad de especies... Gelviz-Gelvez & Pavón-Hernández
325
sin embargo, debajo del dosel de algunos arbustos se generan procesos de fertilidad del suelo (Montaño-Árias et al., 2006).
Las propiedades del suelo y la diversidad de plantas en am-bientes semiáridos se han evaluado en pocos trabajos (Ál-varez-Yépis, Martínez-Yrízar, Búrquez, & Lindquist, 2008; Balvanera et al., 2002; Romero-López, León-de la Luz, Pérez-Navarro, & De la Cruz-Agüero, 2006). En este trabajo se ana-lizó la diversidad de especies arbustivas en la zona semiárida del centro de México, en el estado de Hidalgo. El objetivo fue estimar la diversidad alfa y beta de las especies arbustivas do-minantes en la zona. Para ello, se evaluaron: 1) los factores ambientales que explican las variaciones en la diversidad alfa, 2) la importancia del recambio de especies en la diversidad total y 3) el porcentaje de la variación en la composición de las especies explicado por la heterogeneidad ambiental.
MATERIALES Y MÉTODOS
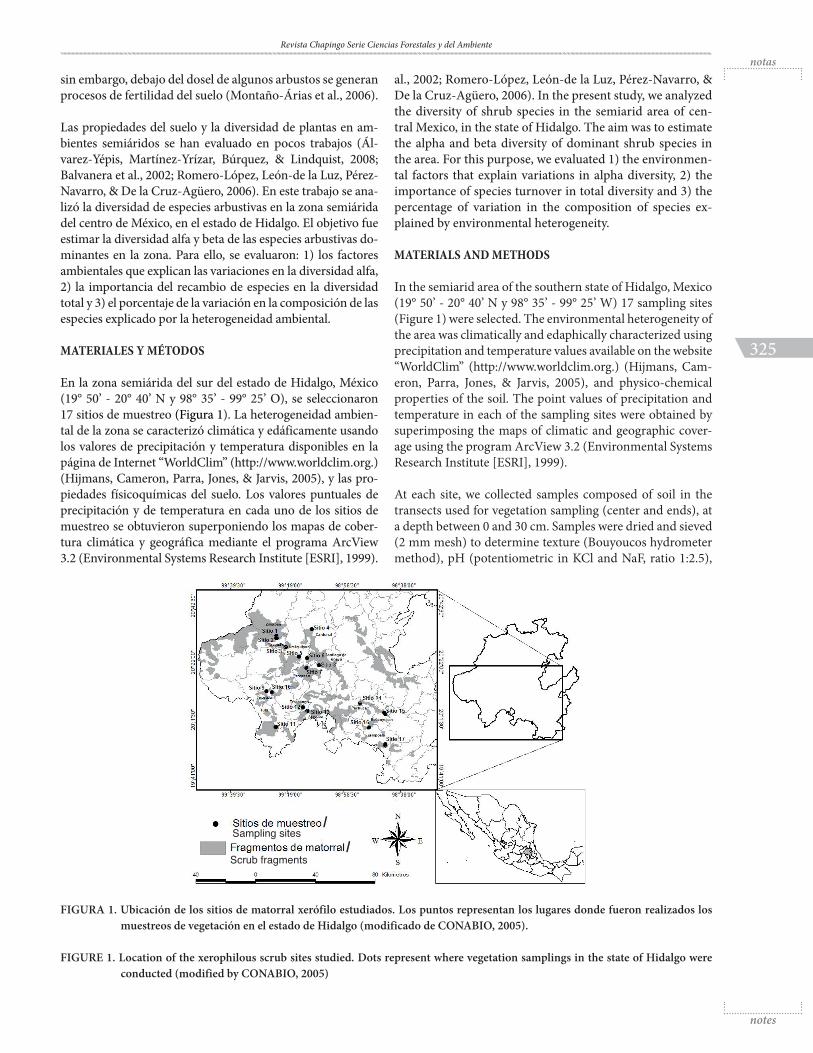
En la zona semiárida del sur del estado de Hidalgo, México (19° 50’ - 20° 40’ N y 98° 35’ - 99° 25’ O), se seleccionaron 17 sitios de muestreo (Figura 1). La heterogeneidad ambien-tal de la zona se caracterizó climática y edáficamente usando los valores de precipitación y temperatura disponibles en la página de Internet “WorldClim” (http://www.worldclim.org.) (Hijmans, Cameron, Parra, Jones, & Jarvis, 2005), y las pro-piedades físicoquímicas del suelo. Los valores puntuales de precipitación y de temperatura en cada uno de los sitios de muestreo se obtuvieron superponiendo los mapas de cober-tura climática y geográfica mediante el programa ArcView 3.2 (Environmental Systems Research Institute [ESRI], 1999).
FIGURA 1. Ubicación de los sitios de matorral xerófilo estudiados. Los puntos representan los lugares donde fueron realizados los muestreos de vegetación en el estado de Hidalgo (modificado de CONABIO, 2005).
FIGURE 1. Location of the xerophilous scrub sites studied. Dots represent where vegetation samplings in the state of Hidalgo were conducted (modified by CONABIO, 2005)
al., 2002; Romero-López, León-de la Luz, Pérez-Navarro, & De la Cruz-Agüero, 2006). In the present study, we analyzed the diversity of shrub species in the semiarid area of cen-tral Mexico, in the state of Hidalgo. The aim was to estimate the alpha and beta diversity of dominant shrub species in the area. For this purpose, we evaluated 1) the environmen-tal factors that explain variations in alpha diversity, 2) the importance of species turnover in total diversity and 3) the percentage of variation in the composition of species ex-plained by environmental heterogeneity.
MATERIALS AND METHODS
In the semiarid area of the southern state of Hidalgo, Mexico (19° 50’ - 20° 40’ N y 98° 35’ - 99° 25’ W) 17 sampling sites (Figure 1) were selected. The environmental heterogeneity of the area was climatically and edaphically characterized using precipitation and temperature values available on the website “WorldClim” (http://www.worldclim.org.) (Hijmans, Cam-eron, Parra, Jones, & Jarvis, 2005), and physico-chemical properties of the soil. The point values of precipitation and temperature in each of the sampling sites were obtained by superimposing the maps of climatic and geographic cover-age using the program ArcView 3.2 (Environmental Systems Research Institute [ESRI], 1999).
At each site, we collected samples composed of soil in the transects used for vegetation sampling (center and ends), at a depth between 0 and 30 cm. Samples were dried and sieved (2 mm mesh) to determine texture (Bouyoucos hydrometer method), pH (potentiometric in KCl and NaF, ratio 1:2.5),
//
Diversidad de especies... Gelviz-Gelvez & Pavón-Hernández
326
En cada sitio se recolectaron muestras compuestas de suelo en los transectos utilizados para el muestreo de la vegeta-ción (del centro y los extremos), a una profundidad entre 0 y 30 cm. Las muestras fueron secadas y tamizadas (malla de 2 mm) para determinar textura (método del hidrómetro de Bauyoucos), pH (potenciométrico en KCl y NaF, relación 1:2.5), materia orgánica (Walkley y Back), nitrógeno total (método calorimétrico), capacidad de campo, densidad (picnómetros), porosidad (relación entre densidad aparente y densidad real), punto de marchitez permanente y hume-dad aprovechable (Nanzyo, Dahlgren, & Shoji, 1993; Reyes-Jaramillo, 1996; Skopp, 2000).
El muestreo de la vegetación se realizó en los 17 sitios esta-bleciendo dos transectos de 5 x 50 m, divididos en cuadros de 5 x 5 m. Los transectos se ubicaron sobre laderas con aproximadamente 45° de pendiente con orientación este. Los arbustos presentes en cada cuadro fueron registrados y medidos (altura y cobertura). Además, el material vegetal se recolectó para su posterior determinación taxonómica. Los ejemplares se depositaron en el Herbario HGOM de la Uni-versidad Autónoma del Estado de Hidalgo y en el Herbario MEXU de la Universidad Nacional Autónoma de México.
El índice de valor de importancia (IVI) de las especies de cada sitio se calculó sumando la frecuencia, abundancia y cobertura relativa (Barajas, 2005). La diversidad alfa se es-timó mediante el análisis de diversidad verdadera (expo-nencial de Shannon, sensu Jost, 2006). El análisis se realizó con el paquete estadístico PAST (Hammer, Harper, & Ryan, 2001). El índice de Sorenson se determinó como medida de la diversidad beta siguiendo el criterio de Baselga (2010), con el fin de conocer el grado de diferenciación de la diver-sidad entre sitios. El análisis se hizo en el programa R (R Development Core Team, 2010). La relación entre la diver-sidad alfa y las variables ambientales se analizó mediante una regresión múltiple entre los valores de diversidad ver-dadera (variable dependiente) y las variables ambientales (variables independientes) (Cuadro 1). Se comprobó que la diversidad verdadera cumpliera con el supuesto de normali-dad (Shapiro-Wilks = 0.911, P = 0.106). En el modelo sólo se consideraron los factores significativos (P < 0.05).
El papel de la heterogeneidad ambiental en la distribución de las especies se exploró mediante un análisis de correspon-dencia canónica (ACC) (Álvarez-Yépis et al., 2008; Balvane-ra et al., 2002; Ter-Braak, 1986). El ACC es una técnica de ordenación donde la composición de especies está directa-mente relacionada con las variables ambientales (Sánchez-González & López-Mata, 2003). En el ACC, la dirección del máximo cambio de cada variable ambiental está representa-da por los vectores, y el gradiente ambiental por la extensión del vector en ambas direcciones asumiendo que las especies presentan una respuesta unimodal (Ter-Braak, 1986). El ACC permitió ordenar las especies a través del IVI de cada una de las mismas. La matriz original fue modificada me-diante la transformación de “Beals Smoothing” (McCune &
organic matter (Walkley and Back), total nitrogen (colori-metric method), field capacity, density (pyknometers), po-rosity (ratio between bulk density and true density), wilting point and available moisture (Nanzyo, Dahlgren, & Shoji, 1993; Reyes-Jaramillo, 1996; Skopp, 2000).
The vegetation sampling was conducted in 17 sites, estab-lishing two transects of 5 x 50 m, divided into squares of 5 x 5 m. Transects were located on hillsides with approximately 45° of slope with orientation east. Shrubs present in each square were recorded and measured (height and cover). Furthermore, the plant material was collected for later taxo-nomic analysis. The specimens were deposited in the Her-barium HGOM of the Universidad Autónoma del Estado de Hidalgo and in the Herbarium MEXU of the Universidad Nacional Autónoma de México.
The importance value index (IVI) of species at each site was calculated by adding the frequency, abundance and relative coverage (Barajas, 2005). Alpha diversity was estimated by analyzing the true diversity (Shannon exponential, sensu Jost, 2006). The analysis was performed using the statistical pack-age PAST (Hammer, Harper, & Ryan, 2001). The Sorenson index was determined as a measure of the beta diversity fol-lowing the criteria of Baselga (2010), in order to determine the degree of differentiation of diversity among sites. The analysis was done using the program R (R Development Core Team, 2010). The relationship between alpha diversity and environmental variables was analyzed using multiple regres-sion between true diversity values (dependent variable) and environmental variables (independent variables) (Table 1). It was found that true diversity fulfill the assumption of nor-mality (Shapiro-Wilks = 0.911, P = 0.106). Only the signifi-cant factors (P < 0.05) were considered in the model.
The role of environmental heterogeneity in the distribution of species was explored using a canonical correspondence analysis (CCA) (Álvarez-Yépis et al., 2008; Balvanera et al., 2002; Ter-Braak, 1986). The ACC is a management tech-nique where the species composition is directly related to the environmental variables (Sánchez-González & López-Mata, 2003). In the CCA, the direction of the maximum change of each environmental variable is represented by vectors, and the environmental gradient by the extension of the vector in both directions assuming that species have a unimodal response (Ter-Braak, 1986). The CCA allowed to sort the species through the IVI of each of them. The origi-nal matrix was modified by transforming “Beals Smooth-ing” (McCune & Mefford, 1995) due to the excess of zeros. A CCA was conducted considering all environmental vari-ables (Table 1); however, several overlapped given the collin-earity among them. Therefore, another CCA was conducted with environmental variables which showed no correlation with each other; total nitrogen, pH, precipitation and sand percentage. The results of CCA were plotted in a diagram “bi-plot” showing the environmental variables; reflect of the correlation of canonical axes and their contribution to
Revista Chapingo Serie Ciencias Forestales y del AmbienteDiversidad de especies... Gelviz-Gelvez & Pavón-Hernández
327
Mefford, 1995) debido al exceso de ceros. Se hizo un ACC considerando todas las variables ambientales (Cuadro 1); sin embargo, varias se sobreponían dada la colinealidad en-tre éstas. Por tanto, se realizó otro ACC con las variables ambientales que mostraron no estar correlacionadas entre sí: nitrógeno total, pH, precipitación y porcentaje de are-na. Los resultados del ACC se graficaron en un diagrama “bi-plot” que mostró las variables ambientales, reflejo de la correlación de los ejes canónicos y su contribución a la varianza total observada. La significancia de los ejes canó-nicos se determinó con una prueba de permutaciones de Monte Carlo con el paquete estadístico PC-Ord 5 (McCune & Mefford, 1995).
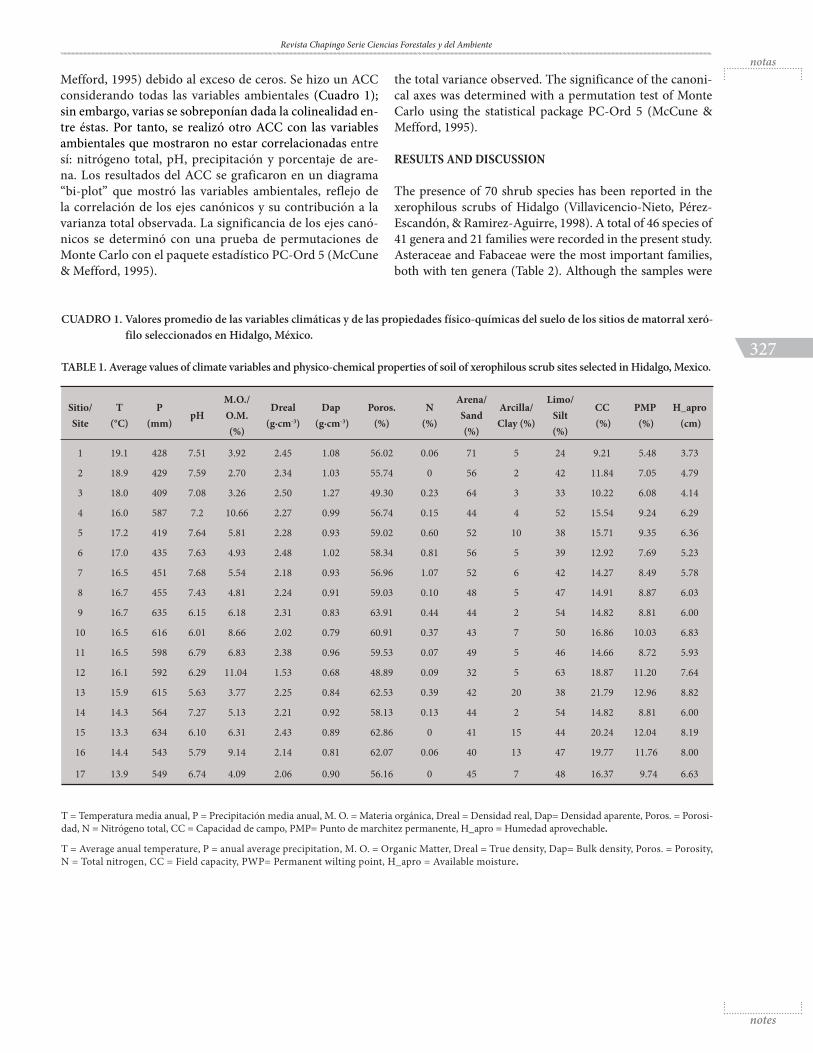
CUADRO 1. Valores promedio de las variables climáticas y de las propiedades físico-químicas del suelo de los sitios de matorral xeró-filo seleccionados en Hidalgo, México.
TABLE 1. Average values of climate variables and physico-chemical properties of soil of xerophilous scrub sites selected in Hidalgo, Mexico.
Sitio/Site
T (°C)
P (mm)
pHM.O./ O.M. (%)
Dreal (g·cm-3)
Dap (g·cm-3)
Poros. (%)
N (%)
Arena/ Sand (%)
Arcilla/ Clay (%)
Limo/ Silt (%)
CC (%)
PMP (%)
H_apro (cm)
1 19.1 428 7.51 3.92 2.45 1.08 56.02 0.06 71 5 24 9.21 5.48 3.73
2 18.9 429 7.59 2.70 2.34 1.03 55.74 0 56 2 42 11.84 7.05 4.79
3 18.0 409 7.08 3.26 2.50 1.27 49.30 0.23 64 3 33 10.22 6.08 4.14
4 16.0 587 7.2 10.66 2.27 0.99 56.74 0.15 44 4 52 15.54 9.24 6.29
5 17.2 419 7.64 5.81 2.28 0.93 59.02 0.60 52 10 38 15.71 9.35 6.36
6 17.0 435 7.63 4.93 2.48 1.02 58.34 0.81 56 5 39 12.92 7.69 5.23
7 16.5 451 7.68 5.54 2.18 0.93 56.96 1.07 52 6 42 14.27 8.49 5.78
8 16.7 455 7.43 4.81 2.24 0.91 59.03 0.10 48 5 47 14.91 8.87 6.03
9 16.7 635 6.15 6.18 2.31 0.83 63.91 0.44 44 2 54 14.82 8.81 6.00
10 16.5 616 6.01 8.66 2.02 0.79 60.91 0.37 43 7 50 16.86 10.03 6.83
11 16.5 598 6.79 6.83 2.38 0.96 59.53 0.07 49 5 46 14.66 8.72 5.93
12 16.1 592 6.29 11.04 1.53 0.68 48.89 0.09 32 5 63 18.87 11.20 7.64
13 15.9 615 5.63 3.77 2.25 0.84 62.53 0.39 42 20 38 21.79 12.96 8.82
14 14.3 564 7.27 5.13 2.21 0.92 58.13 0.13 44 2 54 14.82 8.81 6.00
15 13.3 634 6.10 6.31 2.43 0.89 62.86 0 41 15 44 20.24 12.04 8.19
16 14.4 543 5.79 9.14 2.14 0.81 62.07 0.06 40 13 47 19.77 11.76 8.00
17 13.9 549 6.74 4.09 2.06 0.90 56.16 0 45 7 48 16.37 9.74 6.63
T = Temperatura media anual, P = Precipitación media anual, M. O. = Materia orgánica, Dreal = Densidad real, Dap= Densidad aparente, Poros. = Porosi-dad, N = Nitrógeno total, CC = Capacidad de campo, PMP= Punto de marchitez permanente, H_apro = Humedad aprovechable.
T = Average anual temperature, P = anual average precipitation, M. O. = Organic Matter, Dreal = True density, Dap= Bulk density, Poros. = Porosity, N = Total nitrogen, CC = Field capacity, PWP= Permanent wilting point, H_apro = Available moisture.
the total variance observed. The significance of the canoni-cal axes was determined with a permutation test of Monte Carlo using the statistical package PC-Ord 5 (McCune & Mefford, 1995).
RESULTS AND DISCUSSION
The presence of 70 shrub species has been reported in the xerophilous scrubs of Hidalgo (Villavicencio-Nieto, Pérez-Escandón, & Ramirez-Aguirre, 1998). A total of 46 species of 41 genera and 21 families were recorded in the present study. Asteraceae and Fabaceae were the most important families, both with ten genera (Table 2). Although the samples were
Diversidad de especies... Gelviz-Gelvez & Pavón-Hernández
328
RESULTADOS Y DISCUSIÓN
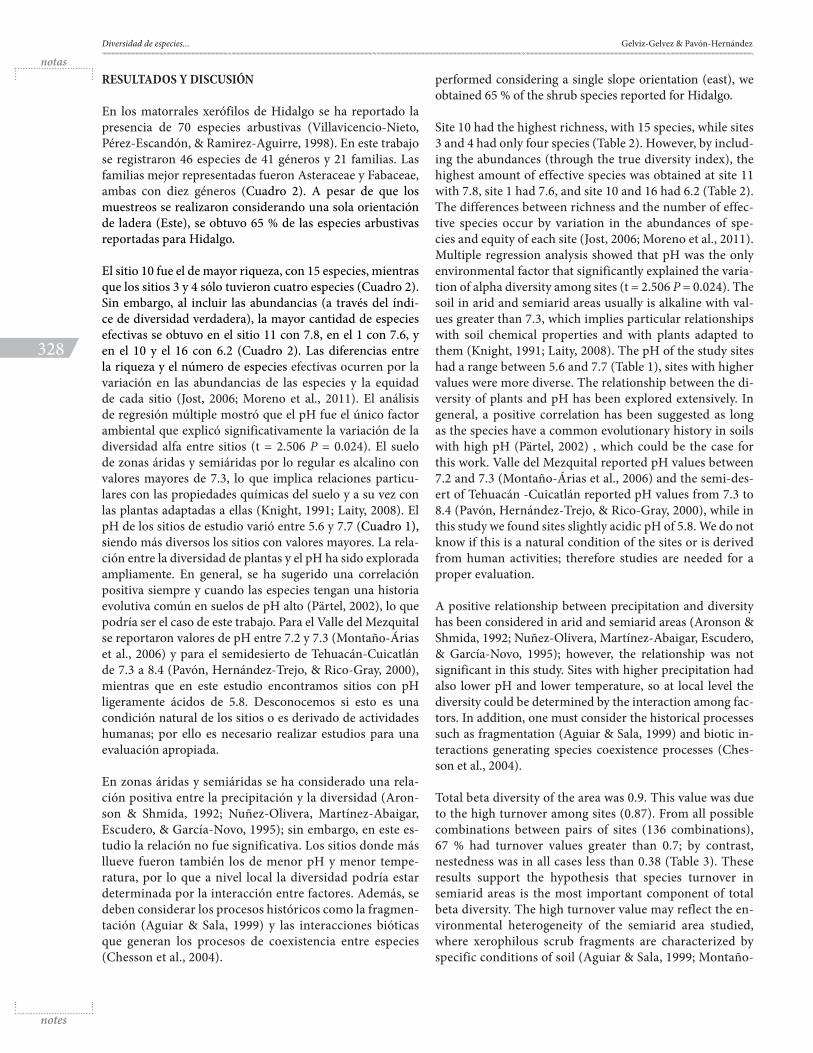
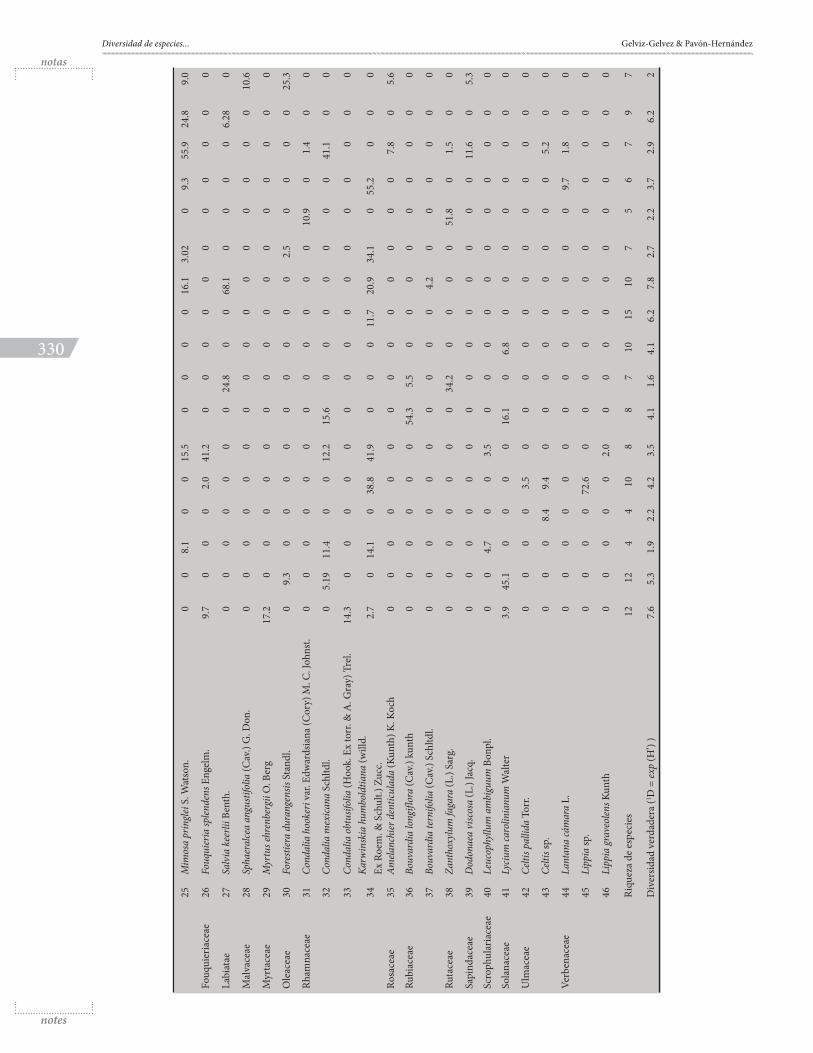
En los matorrales xerófilos de Hidalgo se ha reportado la presencia de 70 especies arbustivas (Villavicencio-Nieto, Pérez-Escandón, & Ramirez-Aguirre, 1998). En este trabajo se registraron 46 especies de 41 géneros y 21 familias. Las familias mejor representadas fueron Asteraceae y Fabaceae, ambas con diez géneros (Cuadro 2). A pesar de que los muestreos se realizaron considerando una sola orientación de ladera (Este), se obtuvo 65 % de las especies arbustivas reportadas para Hidalgo.
El sitio 10 fue el de mayor riqueza, con 15 especies, mientras que los sitios 3 y 4 sólo tuvieron cuatro especies (Cuadro 2). Sin embargo, al incluir las abundancias (a través del índi-ce de diversidad verdadera), la mayor cantidad de especies efectivas se obtuvo en el sitio 11 con 7.8, en el 1 con 7.6, y en el 10 y el 16 con 6.2 (Cuadro 2). Las diferencias entre la riqueza y el número de especies efectivas ocurren por la variación en las abundancias de las especies y la equidad de cada sitio (Jost, 2006; Moreno et al., 2011). El análisis de regresión múltiple mostró que el pH fue el único factor ambiental que explicó significativamente la variación de la diversidad alfa entre sitios (t = 2.506 P = 0.024). El suelo de zonas áridas y semiáridas por lo regular es alcalino con valores mayores de 7.3, lo que implica relaciones particu-lares con las propiedades químicas del suelo y a su vez con las plantas adaptadas a ellas (Knight, 1991; Laity, 2008). El pH de los sitios de estudio varió entre 5.6 y 7.7 (Cuadro 1), siendo más diversos los sitios con valores mayores. La rela-ción entre la diversidad de plantas y el pH ha sido explorada ampliamente. En general, se ha sugerido una correlación positiva siempre y cuando las especies tengan una historia evolutiva común en suelos de pH alto (Pärtel, 2002), lo que podría ser el caso de este trabajo. Para el Valle del Mezquital se reportaron valores de pH entre 7.2 y 7.3 (Montaño-Árias et al., 2006) y para el semidesierto de Tehuacán-Cuicatlán de 7.3 a 8.4 (Pavón, Hernández-Trejo, & Rico-Gray, 2000), mientras que en este estudio encontramos sitios con pH ligeramente ácidos de 5.8. Desconocemos si esto es una condición natural de los sitios o es derivado de actividades humanas; por ello es necesario realizar estudios para una evaluación apropiada.
En zonas áridas y semiáridas se ha considerado una rela-ción positiva entre la precipitación y la diversidad (Aron-son & Shmida, 1992; Nuñez-Olivera, Martínez-Abaigar, Escudero, & García-Novo, 1995); sin embargo, en este es-tudio la relación no fue significativa. Los sitios donde más llueve fueron también los de menor pH y menor tempe-ratura, por lo que a nivel local la diversidad podría estar determinada por la interacción entre factores. Además, se deben considerar los procesos históricos como la fragmen-tación (Aguiar & Sala, 1999) y las interacciones bióticas que generan los procesos de coexistencia entre especies (Chesson et al., 2004).
performed considering a single slope orientation (east), we obtained 65 % of the shrub species reported for Hidalgo.
Site 10 had the highest richness, with 15 species, while sites 3 and 4 had only four species (Table 2). However, by includ-ing the abundances (through the true diversity index), the highest amount of effective species was obtained at site 11 with 7.8, site 1 had 7.6, and site 10 and 16 had 6.2 (Table 2). The differences between richness and the number of effec-tive species occur by variation in the abundances of spe-cies and equity of each site (Jost, 2006; Moreno et al., 2011). Multiple regression analysis showed that pH was the only environmental factor that significantly explained the varia-tion of alpha diversity among sites (t = 2.506 P = 0.024). The soil in arid and semiarid areas usually is alkaline with val-ues greater than 7.3, which implies particular relationships with soil chemical properties and with plants adapted to them (Knight, 1991; Laity, 2008). The pH of the study sites had a range between 5.6 and 7.7 (Table 1), sites with higher values were more diverse. The relationship between the di-versity of plants and pH has been explored extensively. In general, a positive correlation has been suggested as long as the species have a common evolutionary history in soils with high pH (Pärtel, 2002) , which could be the case for this work. Valle del Mezquital reported pH values between 7.2 and 7.3 (Montaño-Árias et al., 2006) and the semi-des-ert of Tehuacán -Cuicatlán reported pH values from 7.3 to 8.4 (Pavón, Hernández-Trejo, & Rico-Gray, 2000), while in this study we found sites slightly acidic pH of 5.8. We do not know if this is a natural condition of the sites or is derived from human activities; therefore studies are needed for a proper evaluation.
A positive relationship between precipitation and diversity has been considered in arid and semiarid areas (Aronson & Shmida, 1992; Nuñez-Olivera, Martínez-Abaigar, Escudero, & García-Novo, 1995); however, the relationship was not significant in this study. Sites with higher precipitation had also lower pH and lower temperature, so at local level the diversity could be determined by the interaction among fac-tors. In addition, one must consider the historical processes such as fragmentation (Aguiar & Sala, 1999) and biotic in-teractions generating species coexistence processes (Ches-son et al., 2004).
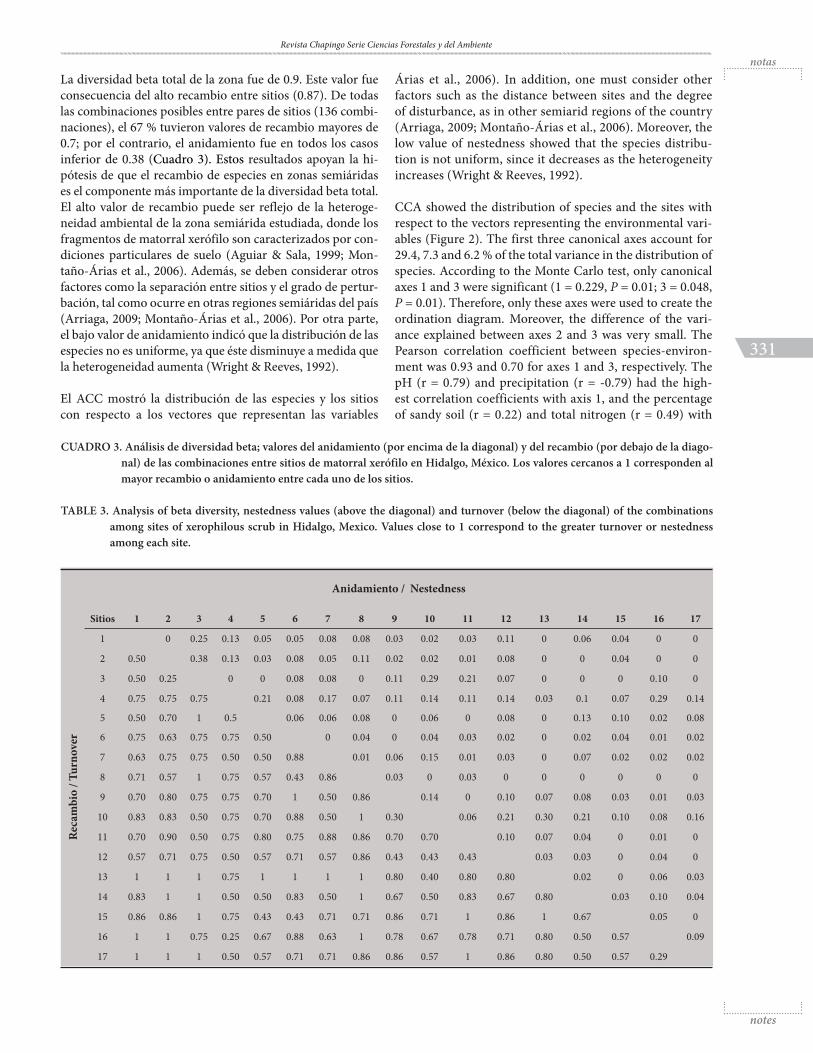
Total beta diversity of the area was 0.9. This value was due to the high turnover among sites (0.87). From all possible combinations between pairs of sites (136 combinations), 67 % had turnover values greater than 0.7; by contrast, nestedness was in all cases less than 0.38 (Table 3). These results support the hypothesis that species turnover in semiarid areas is the most important component of total beta diversity. The high turnover value may reflect the en-vironmental heterogeneity of the semiarid area studied, where xerophilous scrub fragments are characterized by specific conditions of soil (Aguiar & Sala, 1999; Montaño-
Revista Chapingo Serie Ciencias Forestales y del AmbienteDiversidad de especies... Gelviz-Gelvez & Pavón-Hernández
329
CU
AD
RO 2
. Índ
ice d
e val
or d
e im
port
anci
a pr
omed
io, p
or in
terv
alo
de p
reci
pita
ción
, de l
as es
peci
es a
rbus
tivas
dom
inan
tes p
or si
tio d
e la
zona
sem
iári
da d
e Hid
algo
, Méx
ico.
La
loca
lizac
ión
de lo
s siti
os se
mue
stra
en la
Fig
ura
1.
TABL
E 2.
Ave
rage
impo
rtan
ce v
alue
inde
x, p
er p
reci
pita
tion
inte
rval
, of t
he d
omin
ant s
hrub
spec
ies p
er si
te o
f the
sem
iari
d ar
ea o
f Hid
algo
, Mex
ico.
The
loca
tion
of t
he si
tes i
s sho
wn
in F
igur
e 1.
Fam
ilia
/ Fa
mily
Es
peci
e / S
peci
es
Si
tios d
e m
uest
reo
/ Sam
plin
g si
tes
12
34
56
78
910
11
12
13
1415
1617
Am
aran
tace
ae1
Iresin
e gla
udis
00
00
00
00
00
00
01.
80
00
2Ire
sine s
chaf
fner
i S. W
atso
n.0
00
00
00
00
00
00
10.4
12.9
00
Ast
erac
eae
3A
ster m
oran
ensis
Kun
th.
04.
150
02.
850
00
00
00
00
00
43.3
4Ag
erat
ina
espi
nosa
rum
(A. G
ray)
R. M
. Kin
g &
H. R
ob.
00
010
70
00
17.5
023
.40
00
00
016
.9
5Ba
ccha
ris s
orde
scen
s DC
.0
00
00
00
4.6
3.5
00
00
01.
40
0
6Fl
oure
nsia
resin
osa
(Bra
ndeg
ee) S
. F. B
lake
.65
.863
.455
.655
.60
00
0
0
00
00
08.
60
0
7G
ymno
sper
ma
glut
inos
a Le
ss.
00
10.1
00
00
15.9
122
00
00
00
00
8M
onta
noa
tom
ento
sa C
erv.
00
00
00
043
.625
.475
.20
0 2
.80
024
.90
9Pa
rthe
nium
inca
num
Kun
th.
5.4
63.1
42.7
02.
050
2.3
00
00
00
00
0
0
10Pe
rym
eniu
m b
upht
halm
oide
s DC
.0
00
00
00
00
00
00
00
67.3
0
11Tr
ixis
mex
icana
Moc
. Ex
Lex.
00
00
21.5
00
00
00
00
0
0
00
12Za
luza
nia
augu
sta (L
ag.)
Sch.
Bip.
029
.85.
90
00
2.7
013
.593
.150
.149
.20
27.3
40.9
2.06
0
Burs
erac
eae
13Bu
rser
a fa
garo
ides
(Kun
th) E
ngl.
00
010
.326
.616
.60
00
025
.90
09.
723
.80
0
Euph
orbi
acea
e14
Crot
on su
aveo
lens T
orr.
00
00
4.0
31.9
00
00
00
0
01.
40
0
15Cr
oton
cilia
togl
andu
lifer
Ort
.0
00
00
00
00
00
00
8.5
0
00
Faba
ceae
16Ac
acia
farn
esia
na W
all.
00
00
00
00
00
00
19.9
00
00
17Ac
acia
scha
ffner
i (S.
Wat
son)
F. J.
Her
m.
00
00
00
018
.20
00
8.68
0
4.2
0
00
18Br
ongn
iart
ia in
term
edia
Mor
ic. E
x se
r.0
00
00
00
00
06.
90
00
00
0
19C
haes
alpi
nia
hint
onii
00
00
00
6.8
00
0
00
00
00
0
20D
alea
bico
lor H
umb.
& B
onpl
. Ex
Will
d.0
02.
00
00
86.
339
.218
.20
4.4
00
3.7
0
23.9
0
21Ey
senh
ardt
ia p
olys
tach
ya (O
rteg
a) S
arg.
00
00
00
00
00
010
111
670
.99.
820
24.8
22Ey
senh
ardt
ia p
arvi
flora
Bra
ndeg
ee0
00
00
4.0
00
00
00
00
00
0
23H
avar
dia
elach
istop
hylla
(A. G
ray
ex s.
Wat
son)
L. R
ico.
00
00
03.
10
00
00
00
00
00
24M
imos
a sp
.0
02.
20
2.0
38.8
00
00
00
00
00
22.5
Diversidad de especies... Gelviz-Gelvez & Pavón-Hernández
330
25M
imos
a pr
ingl
ei S
. Wat
son.
00
8.1
00
15.5
00
00
16.1
3.02
09.
355
.924
.89.
0
Fouq
uier
iace
ae26
Fouq
uier
ia sp
lende
ns E
ngel
m.
9.7
00
02.
041
.20
00
00
00
00
00
Labi
atae
27Sa
lvia
kee
rlii B
enth
.0
00
00
00
24.8
00
68.1
00
00
6.28
0
Mal
vace
ae28
Spha
eral
cea
angu
stifo
lia (C
av.)
G. D
on.
00
00
00
00
00
00
00
00
10.6
Myr
tace
ae29
Myr
tus e
hren
berg
ii O
. Ber
g17
.20
00
00
00
00
00
00
00
0
Ole
acea
e30
Fore
stier
a du
rang
ensis
Sta
ndl.
09.
30
00
00
00
00
2.5
00
00
25.3
Rham
nace
ae31
Cond
alia
hoo
keri
var.
Edw
ards
iana
(Cor
y) M
. C. J
ohns
t.0
00
00
00
00
00
010
.90
1.4
00
32Co
ndal
ia m
exica
na S
chltd
l.0
5.19
11.4
00
12.2
15.6
00
00
00
041
.10
0
33Co
ndal
ia o
btus
ifolia
(Hoo
k. E
x to
rr. &
A. G
ray)
Tre
l.14
.30
00
00
00
00
00
00
00
0
34Ka
rwin
skia
hum
bold
tiana
(will
d.
Ex R
oem
. & S
chul
t.) Z
ucc.
2.7
014
.10
38.8
41.9
00
011
.720
.934
.10
55.2
00
0
Rosa
ceae
35Am
elanc
hier
den
ticul
ada
(Kun
th) K
. Koc
h0
00
00
00
00
00
00
07.
80
5.6
Rubi
acea
e36
Bouv
ardi
a lo
ngifl
ora
(Cav
.) ku
nth
00
00
00
54.3
5.5
00
00
00
00
0
37Bo
uvar
dia
tern
ifolia
(Cav
.) Sc
hltd
l.0
00
00
00
00
04.
20
00
00
0
Ruta
ceae
38Za
ntho
xylu
m fa
gara
(L.)
Sarg
.0
00
00
00
34.2
00
00
51.8
01.
50
0
Sapi
ndac
eae
39D
odon
aea
visc
osa
(L.)
Jacq
.0
00
00
00
00
00
00
011
.60
5.3
Scro
phul
aria
ceae
40Le
ucop
hyllu
m a
mbi
guum
Bon
pl.
00
4.7
00
3.5
00
00
00
00
00
0
Sola
nace
ae41
Lyciu
m ca
rolin
ianu
m W
alte
r3.
945
.10
00
016
.10
6.8
00
00
00
00
Ulm
acea
e42
Celti
s pal
lida
Torr
.0
00
03.
50
00
00
00
00
00
0
43Ce
ltis s
p.0
00
8.4
9.4
00
00
00
00
05.
20
0
Verb
enac
eae
44La
ntan
a cá
mar
a L.
00
00
00
00
00
00
09.
71.
80
0
45Li
ppia
sp.
00
00
72.6
00
00
00
00
00
00
46Li
ppia
gra
veol
ens K
unth
00
00
02.
00
00
00
00
00
00
Riqu
eza
de e
spec
ies
1212
44
108
87
1015
107
56
79
7
Div
ersid
ad v
erda
dera
(1 D =
exp
(H’)
)7.
65.
31.
92.
24.
23.
54.
11.
64.
16.
27.
82.
72.
23.
72.
96.
22
Revista Chapingo Serie Ciencias Forestales y del AmbienteDiversidad de especies... Gelviz-Gelvez & Pavón-Hernández
331
La diversidad beta total de la zona fue de 0.9. Este valor fue consecuencia del alto recambio entre sitios (0.87). De todas las combinaciones posibles entre pares de sitios (136 combi-naciones), el 67 % tuvieron valores de recambio mayores de 0.7; por el contrario, el anidamiento fue en todos los casos inferior de 0.38 (Cuadro 3). Estos resultados apoyan la hi-pótesis de que el recambio de especies en zonas semiáridas es el componente más importante de la diversidad beta total. El alto valor de recambio puede ser reflejo de la heteroge-neidad ambiental de la zona semiárida estudiada, donde los fragmentos de matorral xerófilo son caracterizados por con-diciones particulares de suelo (Aguiar & Sala, 1999; Mon-taño-Árias et al., 2006). Además, se deben considerar otros factores como la separación entre sitios y el grado de pertur-bación, tal como ocurre en otras regiones semiáridas del país (Arriaga, 2009; Montaño-Árias et al., 2006). Por otra parte, el bajo valor de anidamiento indicó que la distribución de las especies no es uniforme, ya que éste disminuye a medida que la heterogeneidad aumenta (Wright & Reeves, 1992).
El ACC mostró la distribución de las especies y los sitios con respecto a los vectores que representan las variables
CUADRO 3. Análisis de diversidad beta; valores del anidamiento (por encima de la diagonal) y del recambio (por debajo de la diago-nal) de las combinaciones entre sitios de matorral xerófilo en Hidalgo, México. Los valores cercanos a 1 corresponden al mayor recambio o anidamiento entre cada uno de los sitios.
TABLE 3. Analysis of beta diversity, nestedness values (above the diagonal) and turnover (below the diagonal) of the combinations among sites of xerophilous scrub in Hidalgo, Mexico. Values close to 1 correspond to the greater turnover or nestedness among each site.
Anidamiento / Nestedness
Rec
ambi
o / T
urno
ver
Sitios 1 2 3 4 5 6 7 8 9 10 11 12 13 14 15 16 17
1 0 0.25 0.13 0.05 0.05 0.08 0.08 0.03 0.02 0.03 0.11 0 0.06 0.04 0 0
2 0.50 0.38 0.13 0.03 0.08 0.05 0.11 0.02 0.02 0.01 0.08 0 0 0.04 0 0
3 0.50 0.25 0 0 0.08 0.08 0 0.11 0.29 0.21 0.07 0 0 0 0.10 0
4 0.75 0.75 0.75 0.21 0.08 0.17 0.07 0.11 0.14 0.11 0.14 0.03 0.1 0.07 0.29 0.14
5 0.50 0.70 1 0.5 0.06 0.06 0.08 0 0.06 0 0.08 0 0.13 0.10 0.02 0.08
6 0.75 0.63 0.75 0.75 0.50 0 0.04 0 0.04 0.03 0.02 0 0.02 0.04 0.01 0.02
7 0.63 0.75 0.75 0.50 0.50 0.88 0.01 0.06 0.15 0.01 0.03 0 0.07 0.02 0.02 0.02
8 0.71 0.57 1 0.75 0.57 0.43 0.86 0.03 0 0.03 0 0 0 0 0 0
9 0.70 0.80 0.75 0.75 0.70 1 0.50 0.86 0.14 0 0.10 0.07 0.08 0.03 0.01 0.03
10 0.83 0.83 0.50 0.75 0.70 0.88 0.50 1 0.30 0.06 0.21 0.30 0.21 0.10 0.08 0.16
11 0.70 0.90 0.50 0.75 0.80 0.75 0.88 0.86 0.70 0.70 0.10 0.07 0.04 0 0.01 0
12 0.57 0.71 0.75 0.50 0.57 0.71 0.57 0.86 0.43 0.43 0.43 0.03 0.03 0 0.04 0
13 1 1 1 0.75 1 1 1 1 0.80 0.40 0.80 0.80 0.02 0 0.06 0.03
14 0.83 1 1 0.50 0.50 0.83 0.50 1 0.67 0.50 0.83 0.67 0.80 0.03 0.10 0.04
15 0.86 0.86 1 0.75 0.43 0.43 0.71 0.71 0.86 0.71 1 0.86 1 0.67 0.05 0
16 1 1 0.75 0.25 0.67 0.88 0.63 1 0.78 0.67 0.78 0.71 0.80 0.50 0.57 0.09
17 1 1 1 0.50 0.57 0.71 0.71 0.86 0.86 0.57 1 0.86 0.80 0.50 0.57 0.29
Árias et al., 2006). In addition, one must consider other factors such as the distance between sites and the degree of disturbance, as in other semiarid regions of the country (Arriaga, 2009; Montaño-Árias et al., 2006). Moreover, the low value of nestedness showed that the species distribu-tion is not uniform, since it decreases as the heterogeneity increases (Wright & Reeves, 1992).
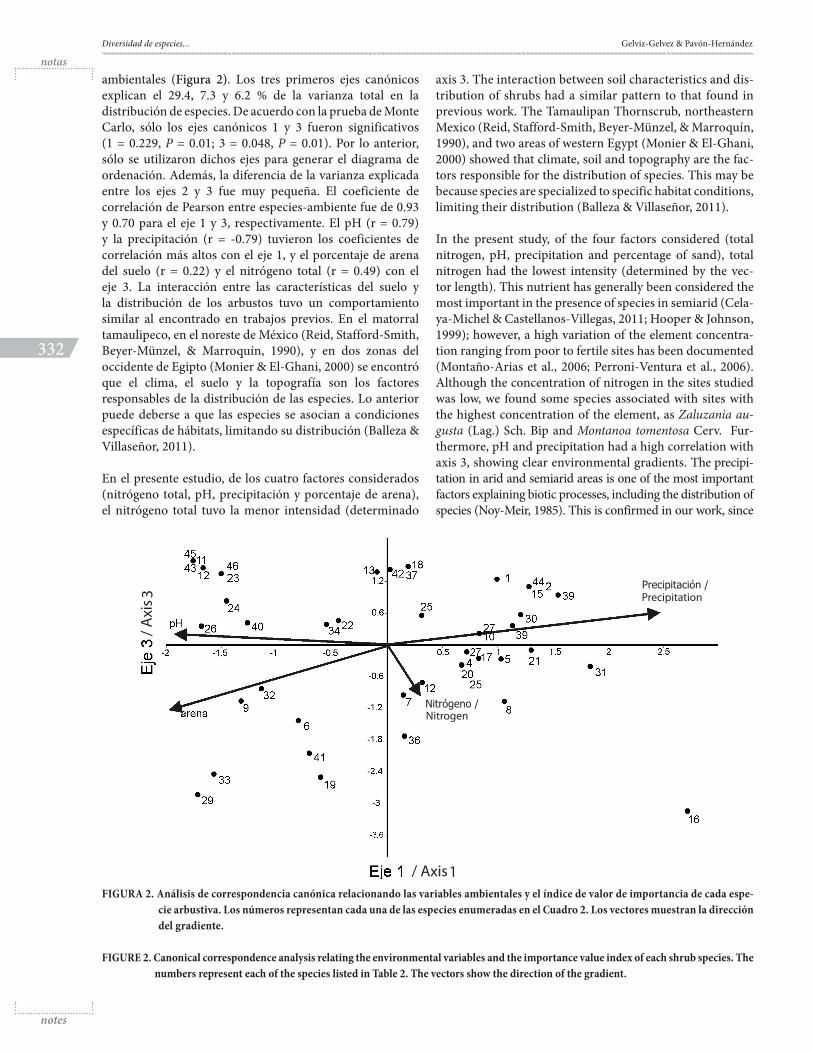
CCA showed the distribution of species and the sites with respect to the vectors representing the environmental vari-ables (Figure 2). The first three canonical axes account for 29.4, 7.3 and 6.2 % of the total variance in the distribution of species. According to the Monte Carlo test, only canonical axes 1 and 3 were significant (1 = 0.229, P = 0.01; 3 = 0.048, P = 0.01). Therefore, only these axes were used to create the ordination diagram. Moreover, the difference of the vari-ance explained between axes 2 and 3 was very small. The Pearson correlation coefficient between species-environ-ment was 0.93 and 0.70 for axes 1 and 3, respectively. The pH (r = 0.79) and precipitation (r = -0.79) had the high-est correlation coefficients with axis 1, and the percentage of sandy soil (r = 0.22) and total nitrogen (r = 0.49) with
Diversidad de especies... Gelviz-Gelvez & Pavón-Hernández
332
ambientales (Figura 2). Los tres primeros ejes canónicos explican el 29.4, 7.3 y 6.2 % de la varianza total en la distribución de especies. De acuerdo con la prueba de Monte Carlo, sólo los ejes canónicos 1 y 3 fueron significativos (1 = 0.229, P = 0.01; 3 = 0.048, P = 0.01). Por lo anterior, sólo se utilizaron dichos ejes para generar el diagrama de ordenación. Además, la diferencia de la varianza explicada entre los ejes 2 y 3 fue muy pequeña. El coeficiente de correlación de Pearson entre especies-ambiente fue de 0.93 y 0.70 para el eje 1 y 3, respectivamente. El pH (r = 0.79) y la precipitación (r = -0.79) tuvieron los coeficientes de correlación más altos con el eje 1, y el porcentaje de arena del suelo (r = 0.22) y el nitrógeno total (r = 0.49) con el eje 3. La interacción entre las características del suelo y la distribución de los arbustos tuvo un comportamiento similar al encontrado en trabajos previos. En el matorral tamaulipeco, en el noreste de México (Reid, Stafford-Smith, Beyer-Münzel, & Marroquín, 1990), y en dos zonas del occidente de Egipto (Monier & El-Ghani, 2000) se encontró que el clima, el suelo y la topografía son los factores responsables de la distribución de las especies. Lo anterior puede deberse a que las especies se asocian a condiciones específicas de hábitats, limitando su distribución (Balleza & Villaseñor, 2011).
En el presente estudio, de los cuatro factores considerados (nitrógeno total, pH, precipitación y porcentaje de arena), el nitrógeno total tuvo la menor intensidad (determinado
FIGURA 2. Análisis de correspondencia canónica relacionando las variables ambientales y el índice de valor de importancia de cada espe-cie arbustiva. Los números representan cada una de las especies enumeradas en el Cuadro 2. Los vectores muestran la dirección del gradiente.
FIGURE 2. Canonical correspondence analysis relating the environmental variables and the importance value index of each shrub species. The numbers represent each of the species listed in Table 2. The vectors show the direction of the gradient.
axis 3. The interaction between soil characteristics and dis-tribution of shrubs had a similar pattern to that found in previous work. The Tamaulipan Thornscrub, northeastern Mexico (Reid, Stafford-Smith, Beyer-Münzel, & Marroquín, 1990), and two areas of western Egypt (Monier & El-Ghani, 2000) showed that climate, soil and topography are the fac-tors responsible for the distribution of species. This may be because species are specialized to specific habitat conditions, limiting their distribution (Balleza & Villaseñor, 2011).
In the present study, of the four factors considered (total nitrogen, pH, precipitation and percentage of sand), total nitrogen had the lowest intensity (determined by the vec-tor length). This nutrient has generally been considered the most important in the presence of species in semiarid (Cela-ya-Michel & Castellanos-Villegas, 2011; Hooper & Johnson, 1999); however, a high variation of the element concentra-tion ranging from poor to fertile sites has been documented (Montaño-Arias et al., 2006; Perroni-Ventura et al., 2006). Although the concentration of nitrogen in the sites studied was low, we found some species associated with sites with the highest concentration of the element, as Zaluzania au-gusta (Lag.) Sch. Bip and Montanoa tomentosa Cerv. Fur-thermore, pH and precipitation had a high correlation with axis 3, showing clear environmental gradients. The precipi-tation in arid and semiarid areas is one of the most important factors explaining biotic processes, including the distribution of species (Noy-Meir, 1985). This is confirmed in our work, since
Precipitación /
Nitrógeno /
Revista Chapingo Serie Ciencias Forestales y del AmbienteDiversidad de especies... Gelviz-Gelvez & Pavón-Hernández
333
por la longitud del vector). Este nutriente, en general, se ha considerado el más importante en la presencia de especies en zonas semiáridas (Celaya-Michel & Castellanos-Villegas, 2011; Hooper & Johnson, 1999); sin embargo, en estas zonas se ha documentado una alta variación de la concentración del elemento que va desde sitios pobres hasta fértiles (Mon-taño-Árias et al., 2006; Perroni-Ventura et al., 2006). Aun-que la concentración de nitrógeno en los sitios estudiados fue baja, se encontraron algunas especies asociadas a sitios con mayor concentración del elemento, como Zaluzania au-gusta (Lag.) Sch. Bip y Montanoa tomentosa Cerv. Por otro lado, el pH y la precipitación tuvieron una alta correlación con el eje 3, mostrando claros gradientes ambientales. La precipitación en zonas áridas y semiáridas es uno de los fac-tores más importantes que explican los procesos bióticos, entre ellos la distribución de las especies (Noy-Meir, 1985). Esto se reafirma en nuestro trabajo, ya que las especies se distribuyen claramente en el gradiente de precipitación (Figura 2). La especie Condalia hookeri var. Edwardsiana (Cory) M. C. Johnst se encontró en los sitios con mayor pre-cipitación, mientras que Fouquieria splendens Engelm en los sitios más secos.
La textura es una propiedad del suelo correlacionada con otras propiedades tanto físicas como químicas. Así, el por-centaje de arena está relacionado con el punto de marchi-tamiento permanente, el contenido de materia orgánica, la porosidad, la capacidad de campo y la humedad aprovecha-ble. Por lo anterior, el porcentaje de arena se considera un buen indicador de la tolerancia de las especies a tales fac-tores. Los arbustos Parthenium incanum Kunth y Condalia mexicana Schltdl están relacionados con suelos de sitios con alto porcentaje de arena, mientras que Dodonaea visco-sa (L.) Jacq con los de menor porcentaje, siendo arcillosos. Algunas especies como Zaluzania augusta (Lag.) Sch. Bip y Karwinskia humboldtiana (willd. Ex Roem. & Schult.) Zucc se registraron en varios sitios, lo cual podría ser consecuen-cia de una mayor amplitud en la tolerancia a la variación ambiental tanto edáfica como climática, que les permite ser parte de una mayor cantidad de comunidades locales (Lei-bold & Geddes, 2005; Silvertown, 2004; Tokeshi, 1999). Esto también se ha señalado para las especies de Acacia distri-buidas en Turkana, Kenia, donde la amplia distribución se explica por la forma en que usan y comparten los recursos o cómo toleran las condiciones ambientales en una zona con alta heterogeneidad en la precipitación media anual, el suelo y el relieve (Patten & Ellis, 1995).
CONCLUSIONES
El recambio de especies es el factor principal que origina una alta diversidad de arbustos como consecuencia de la heterogeneidad ambiental de la zona semiárida estudiada. La variación en las características del suelo aunada a las di-ferencias en precipitación originan condiciones particulares para el establecimiento de las especies arbustivas. La hete-rogeneidad de la zona estuvo explicada principalmente por
species are clearly distributed in the precipitation gradient (Fig-ure 2). The species Condalia hookeri var. Edwardsiana (Cory) M. C. Johnst was found in sites with higher precipitation, while Fouquieria splendens Engelm in the driest places.
The texture is a soil property correlated with other physical and chemical properties. Thus, the sand percentage is related to the permanent wilting point, the organic matter content, porosity, field capacity and available moisture. Therefore, the percentage of sand is considered a good indicator of spe-cies tolerance to such factors. Parthenium incanum Kunth and Condalia mexicana Schltdl shrubs are related to site soils with high percentage of sand, while Dodonaea viscosa (L.) Jacq was recorded in sites with the lowest sand percent-age, being clay soil. Some species such as Zaluzania augusta (Lag.) Sch. Bip and Karwinskia humboldtiana (willd. Ex Roem. & Schult.) Zucc were recorded at several sites, which could be due to a greater range in tolerance to environmen-tal variation both soil and climate, allowing them to be part of a larger amount of local communities (Leibold & Geddes, 2005; Silvertown, 2004; Tokeshi, 1999). This has also been reported for Acacia species distributed in Turkana, Kenya, where the wide distribution is due to the way they use and share the resources or how they tolerate the environmental conditions in an area with high heterogeneity in average an-nual precipitation, soil and relief (Patten & Ellis, 1995).
CONCLUSIONS
Turnover is the main factor that causes a high diversity of shrubs as a result of environmental heterogeneity of the semi-arid area studied. The variation in soil characteristics coupled with differences in precipitation provoke particular condi-tions for the establishment of shrub species. The heterogene-ity of the area was mainly due to the pH, total nitrogen and soil sand percentage and distribution of precipitation.
ACKNOWLEDGEMENTS
The authors thank Felipe Barragán T. y Claudia Ballesteros for the comments on the manuscript. The author also thank Ernesto Lezama D., Pilar Saínos P., Cristian Omar A. and Enrique Cruz C. for their assistance in the field. To Ge-rardo Salazar, Verónica Juárez, Rafael Torres Colín, Manuel Ledesma y Miguel Ángel Villavicencio for their assistance in taxonomic determination. We thank the National Coun-cil of Science and Technology (CONACYT) for the doctoral scholarship (scholarship 228655) and the project FOMIX-CONACYT-98122 for funding to conduct the study.
End of English Version
Diversidad de especies... Gelviz-Gelvez & Pavón-Hernández
334
Celaya-Michel, H., & Castellanos-Villegas, E. (2011). Mineralización de nitrógeno en el suelo de zonas áridas y semiáridas. Terra Latinoamericana, 29, 343–356.
Challenger, A., & Soberón, J. (2008). Los ecosistemas terrestres de México. In J. Soberón, G. Halffter, & J. Llorente (Eds.), Capital natural de México, Vol. I: Conocimiento actual de la biodiversidad (pp. 88–105). México: Comisión Nacional para el Conocimiento y Uso de la Biodiversidad.
Chesson, P., Gebauer, R. L. E., Schwinning, S., Huntly, N., Wiegand, K., Ernest, M. S. K., & Weltzin, J. F. (2004). Resource pulses, species interactions, and diversity maintenance in arid and semi-arid environments. Oecologia, 141(2), 236–253. doi: 10.1007/s00442-004-1551-1
Environmental Systems Research Institute (ESRI). (1999). ArcView Gis 3.2. Nueva York, USA: Autor.
Gutiérrez, J. R., & Squeo. F. A. (2004). Importancia de los arbustos leñosos en ecosistemas semiáridos de Chile. Ecosistemas, 13, 36–45. Obtenido de http://www.redalyc.org/articulo.oa?id=54013107
Hammer, O., Harper, D. A. T., & Ryan, P. D. (2001). PAST version 2.07: Paleontological Stadistics Software Package for education and data analysis. Obtenido de http://folk.uio.no/ohammer/past/
Hijmans, R. J., Cameron, S. E., Parra, J. L., Jones, P. G., & Jarvis, A. (2005). Very high resolution interpolated climate surfaces for global land areas. International Journal of Climatology, 25, 1965–1978. doi: 10.1002/joc.1276
Holzapfel, C., Tielbörger, K., Parag, H. A., Kigel, J., & Sternberg, M. (2006). Annual plant-shrub interactions along an aridity gradient. Basic and Applied Ecology, 7, 268–279. doi: 10.1016/j.baae.2005.08.003
Hooper, D. U., & Johnson, L. (1999). Nitrogen limitation in dryland ecosystems: Responses to geographical and temporal variation in precipitation. Biogeohemistry, 46, 247–293. doi: 10.1007/bf01007582
Jost, L. (2006). Entropy and diversity. Oikos, 113, 363–375. doi: 10.1111/j.2006.0030-1299.14714.x
Knight, W. G. (1991). Chemistry of arid regions soils. In J. Skujins (Ed.), Semiarid lands and deserts: Soil resource and reclamation (pp. 111–171). New York, USA: Marcel Dekker.
Laity, J. (2008). Deserts and desert environments. New Jersey, USA: Wiley-Blackwell, Hoboken.
Leibold, M. A., & Geddes, P. (2005). El concepto de nicho en las metacomunidades. Ecologia Austral, 15, 117–129. Obtenido de http://www.scielo.org.ar/pdf/ecoaus/v15n2/v15n2a03.pdf
McCune, B., & Mefford, M. J. (1995). Pc-Ord, multivariate analysis of ecological data. Version 2.05. Oregon, USA: Gleneden Beach.
Monier, M., & El-Ghani, A. (2000). Floristic and environmental relations in two extreme desert zones of western Egypt. Global Ecology and Biogeography, 9, 499–516.
Montaño-Árias, N. M., García-Sánchez, R., Ochoa-de la Rosa, G., & Monroy-Ata, A. (2006). Relación entre la vegetación arbustiva, el mezquite y el suelo de un ecosistema semiárido en México. Terra Latinoamericana, 24, 193–205. Obtenido de http://www.redalyc.org/articulo.oa?id=57311108006
Moreno, C. E., Barragán, F., Pineda, E., & Pavón, N. (2011). Reanalizando la diversidad alfa: Alternativas para interpretar
el pH, el nitrógeno total y el porcentaje de arena del suelo, y por la distribución de la precipitación.
AGRADECIMIENTOS
Los autores agradecen a Felipe Barragán T. y Claudia Balles-teros por sus comentarios al manuscrito; a Ernesto Lezama D., Pilar Saínos P., Cristian Omar A. y Enrique Cruz C. por su ayuda en campo; a Gerardo Salazar, Verónica Juárez, Ra-fael Torres Colín, Manuel Ledesma y Miguel Ángel Villa-vicencio por su ayuda en la determinación taxonómica. Se agradece al Consejo Nacional de Ciencia y Tecnología (CO-NACYT) por la beca doctoral (becario 228655) y al proyecto FOMIX-CONACYT-98122 por el financiamiento para rea-lizar el estudio.
REFERENCIAS
Aguiar, M. R., & Sala, O. E. (1999). Patch structure, dynamic and implications for the functioning of arid ecosystems. Trends in Ecology and Evolution, 14, 273–277. Obtenido de http://en.agro.uba.ar/users/sala/pdfs/081-reprint.pdf
Álvarez-Yépis, J. C., Martínez-Yrízar, A., Búrquez, A., & Lindquist, C. (2008). Variation in vegetation structure and soil properties related tol and use history of old-growth and secondary tropical dry forest in northwestern Mexico. Forest Ecology and Management, 256, 355–366.
Aronson, J., & Shmida, A. (1992). Plant diversity along a Mediter-ranean-desert gradient and its correlation with interanual rainfall fluctuations. Journal of Arid Environments, 23, 235–247. Obtenido de http://bio.huji.ac.il/upload/E083-C%20%20Plant%20species%20diversity%20along%20a%20Mediter-ranean.pdf
Arriaga, L. (2009). Implicaciones del cambio de uso de suelo en la biodiversidad de los matorrales xerófilos: Un enfoque multiescalar. Investigación Ambiental, 1, 6–16.
Balleza, J., & Villaseñor, J. L. (2011). Contribución del estado de Zacatecas (México) a la conservación de la riqueza florística del desierto Chihuahuense. Acta Botánica Mexicana, 94, 61–89. Obtenido de http://www.redalyc.org/articulo.oa?id=57415694003
Balvanera, P., Lott, E., Segura, G., Siebe, C., & Islas, A. (2002). Patterns of β-diversity in a Mexican tropical dry forest. Journal of Vegetation Science, 13, 145-158. doi: 10.1111/j.1654-1103.2002.tb02034.x
Baselga, A. (2010). Partitioning the turnover and nestedness components of beta diversity. Global Ecology and Biogeography, 19, 134–143. doi: 10.1111/j.1466-8238.2009.00490.x
Barajas, G. C. I. (2005). Evaluación de la diversidad de la flora en el campus Juriquilla de la UNAM. Evaluación de la Biodiversidad, 1, 9–10. Obtenido de http://www.geociencias.unam.mx/~bole/eboletin/DiversidadUNAMjuriquilla.pdf
Bhandari, B., & Ficklin, R. L. (2009). Characterizing the variability of physical and chemical properties across the soil individuals mapped as amy silt loam soils in southeastern Arkansas. Journal of the Arkansas Academy of Science, 63, 34–43. Obtenido de http://libinfo.uark.edu/aas/issues/2009v63/v63a6.pdf
Revista Chapingo Serie Ciencias Forestales y del AmbienteDiversidad de especies... Gelviz-Gelvez & Pavón-Hernández
335
y comparar información sobre comunidades ecológicas. Revista Mexicana de Biodiversidad, 82, 1249–1261. Obtenido de http://www.revistas.unam.mx/index.php/bio/article/view/28802
Nanzyo, M., Dahlgren, R., & Shoji, S. (1993). Chemical characteristics of volcanic ash soils. In S. Shoji, & R. Dahlgren (Eds.), Volcanic ash soils genesis, properties and utilization (pp. 145–188). Amsterdam, Netherlands: Elsevier Science Publishers B. V.
Noy-Meir, I. (1985). Desert ecosystem structure and function. In M. Evenari, I. Noy-Meir, & D. W. Goodall (Eds.), Hot deserts and arid shrublands (pp. 93–101). Amsterdam, Netherlands: Elsevier.
Nuñez-Olivera, E., Martínez-Abaigar, J., Escudero, J. C., & García-Novo, F. (1995). A comparative study of Cistus ladanifer shrublands in Extremadura (CW Spain) on the basis of woody species composition and cover. Plant Ecology, 117(2), 123–132. doi: 10.1007/bf00045504
Pärtel, M. (2002). Local plant diversity patterns and evolutionary history at the regional scale. Ecology, 83, 2361–2366. Obtenido de http://nsmn1.uh.edu/dgraur/popbio/pH&EvolutionaryHistory.pdf
Patten, R. S., & Ellis, J. E. (1995). Patterns of species and community distributions related to environmental gradients in an arid tropical ecosystem. Journal of Vegetation Science, 117, 69–79. doi: 10.1007/bf00033260
Pausas, J. G., & Austin, M. P. (2001). Patterns of plant species richness in relation to different environments: an appraisal. Journal of Vegetation Science, 12, 153–166. Obtenido de http://www.uv.es/jgpausas/papers/PausasAustin01JVS12%282%29.pdf
Pavón, N. P., Hernández-Trejo, H., & Rico-Gray, V. (2000). Distribution of plant life forms along an altitudinal gradient in the semi-arid valley of Zapotitlán, México. Journal of Vegetation Science, 11, 39–42. Obtenido de http://www.planta.cn/forum/files_planta/distribution_of_plant_life_forms_along_an_altitudinal_gradient_in_the_semi_arid_valley_of_zapotitln_mexico__113.pdf
Perroni-Ventura, Y., Montaña, C., & García-Oliva, F. (2006). Relathionship between soil nutrient availability and plant species richness in a tropical semi-arid environment. Journal of Vegetation Science, 17, 719–728. doi: 10.1658/1100-9233 (2006) 17 [719: RBSNAA] 2.0.CO, 2
Quian, H., Ricklefs, R. E., & White, P. S. (2005). Beta diversity of angiosperms in temperate floras of eastern Asia and eastern North America. Ecology Letters, 8, 15–22. doi: 10.1111/j.1461-0248.2004.00682.x
R Development Core Team. (2010) R: A language and environment for statistical computing. Vienna, Austria: R Foundation for Statistical Computing. Obtenido de http:www.R-proyect.org
Reid, N., Stafford-Smith, D. M., Beyer-Münzel, P., & Marroquín, J. (1990). Floristic and structural variation in the Tamaulipan thornscrub northeastern México. Journal of Vegetation Science, 1, 529–538. doi: 10.2307/3235787
Reyes-Jaramillo. I. (1996). Fundamentos teórico-prácticos de temas selectos de la ciencia del suelo. Parte I. México: Universidad Autónoma Metropolitana.
Romero-López B. E., León-De la Luz, J., Pérez-Navarro, J. J., & De la Cruz- Agüero, G. (2006). Estructura y composición de la vegetación de la barra costera El Mogote, Baja California, México. Boletín de la Sociedad Botánica de México, 79, 21–32. Obtenido de http://www.redalyc.org/articulo.oa?id=57707903
Sánchez-Colón, S., Flores-Martínez, A., Cruz-Leyva, A. I., & Velázquez, A. (2009). Estado y transformación de los ecosistemas por causas humanas. In CONABIO (Ed.), Capital natural de México, Vol. II: Estado de conservación y tendencias de cambio (pp. 75–129). México, D. F.: CONABIO.
Sánchez-González, A., & López-Mata, L. 2003. Clasificación y ordenación de la vegetación del norte de la Sierra Nevada, a lo largo de un gradiente altitudinal. Anales del Instituto de Biología, Universidad Nacional Autónoma de México, Serie Botánica, 74, 47–71. Obtenido de http://www.uv.mx/personal/tcarmona/files/2010/08/Sanchez-y-Lopez-2003.pdf
Silvertown, J. (2004). Plant coexistence and the niche. Trends in Ecology and Evolution, 19, 605–611. Obtenido de http://www.open.ac.uk/science/biosci/personalpages/j.silvertown/pdfs/Silvertown%20Niche%20Review%202004.pdf
Skopp, J. M. (2000). Physical properties of primary particles. In M. Sumner (Ed.), Handbook of soil science (pp. 3–17). Florida, USA: CRC Press, Boca Ratón.
Ter-Braak, C. J. F. (1986). Canonical correspondence analysis: A new eigenvector technique for multivariate direct gradient analysis. Ecology, 67, 1167–1179. Obtenido de http://www.ohio.edu/plantbio/staff/mccarthy/multivariate/terBraak1986.pdf
Tokeshi, M. (1999). Species coexistence. Ecological and evolutionary perspectives. Oxford, UK: Blackwell Science.
Ugalde, A. J., Granados-Sánchez, D., & Sánchez-González, A. (2008). Sucesión en el matorral desértico de Larrea tridentata (DC.) conv. en la sierra de catorce, San Luis Potosí, México. Terra Latinoamericana, 26, 153–160.
Ulrich, W., & Gotelli, N.J. (2007). Null model analysis of species nestedness patterns. Ecology, 88, 1824–1831. Obtenido de http://www.uvm.edu/~ngotelli/manuscriptpdfs/UlrichE-cology.pdf
Villavicencio-Nieto, M. A., Pérez-Escandón, B. E., & Ramírez-Aguirre, A. (1998). Lista florística del estado de Hidalgo, recopilación bibliográfica. México: Universidad Autónoma del Estado de Hidalgo, Centro de Investigaciones Biológicas.
Wright, D. H., & Reeves, J. H. (1992). On the meaning and measurement of nestedness of species assemblages. Oecologia, 92, 416–428. doi: 10.1007/BF00317469
Ylva-Li, B., Gowda, J., Martensson, L., Sandberg, J., & Fransson, A. (2010). Plant species richness in a natural Argentinian matorral shrub-land correlates negatively with levels of plant phosphorus. Plant Soil, 345, 11–21. doi: 10.1007/s11104-010-0671-0