
Review Article: Build Up of Patches Caused by Rhizoctonia Solani
Antecedent Conditions Influence SoilRespiration Differences in Shrub
and Grass Patches
Jessica M. Cable,1* Kiona Ogle,2 Greg A. Barron-Gafford,3 Lisa P. Bentley,4
William L. Cable,5 Russell L. Scott,6 David G. Williams,7
and Travis E. Huxman8
1International Arctic Research Center, University of Alaska, Fairbanks, Alaska, USA; 2School of Life Sciences, Arizona State
University, Phoenix, Arizona, USA; 3B2 Earthscience, University of Arizona, Tucson, Arizona, USA; 4Department of Ecology &Evolutionary Biology, University of Arizona, Tucson, Arizona, USA; 5Geophysical Institute, University of Alaska, Fairbanks,
Alaska, USA; 6USDA-ARS, Tucson, Arizona, USA; 7Departments of Ecosystem Science and Management and Botany, University
of Wyoming, Laramie, Wyoming, USA; 8Ecology and Evolutionary Biology, University of California Irvine, Irvine, California,
USA
ABSTRACT
Quantifying the response of soil respiration to past
environmental conditions is critical for predicting
how future climate and vegetation change will
impact ecosystem carbon balance. Increased shrub
dominance in semiarid grasslands has potentially
large effects on soil carbon cycling. The goal of this
study was to characterize the effect of antecedent
moisture and temperature conditions on soil res-
piration in a grassland now dominated by shrubs.
Continuous measurements of soil respiration, soil
temperature, and soil moisture were made over the
entire summer of 2005 within distinct vegetation
microsites in this shrubland community—under
grasses, shrubs, and in open spaces. We analyzed
these data within a Bayesian framework that al-
lowed us to evaluate the time-scale over which
antecedent conditions influence soil respiration.
The addition of antecedent conditions explained an
additional 16% of the variation in soil respiration.
High soil moisture during the preceding month
increased respiration rates in both the grass and
shrub microsites. However, the time period over
which antecedent soil moisture influenced the
temperature sensitivity of soil respiration was
shorter in the shrub compared to the grass micro-
sites (1 vs. 2 weeks, respectively). The depth of
moisture was important; for example, for respira-
tion under shrubs, near-surface moisture was more
influential on the day of the respiration measure-
ment but subsurface moisture was more influential
on the antecedent time scale. Although more
mechanistic studies are required, this study is the
first to reveal that shrub encroachment changes the
time scales over which soil moisture and tempera-
ture affect soil respiration.
Key words: ecohydrology; lag effects; pulse re-
sponse; shrub encroachment; Sonoran desert;
temperature sensitivity.
Received 2 August 2012; accepted 15 April 2013;
published online 18 June 2013
Electronic supplementary material: The online version of this article
(doi:10.1007/s10021-013-9679-7) contains supplementary material,
which is available to authorized users.
Author Contributions: JMC conceived of the respiration portion of the
study, performed the research, analyzed the data, contributed the model,
and wrote the paper. KO contributed the model, helped with data anal-
ysis, and helped write the paper. BG and LPB helped write the paper.
WLC contributed to the research. RLS and DGW conceived of the study
and helped write the paper. TEH conceived of the study.
*Corresponding author; e-mail: [email protected]
Ecosystems (2013) 16: 1230–1247DOI: 10.1007/s10021-013-9679-7
� 2013 Springer Science+Business Media New York
1230
INTRODUCTION
The response of ecosystem processes to variation in
environmental conditions is important to under-
stand in light of recent and future changes in veg-
etation (Archer and others 2001) and climate
(Christensen and others 2007). Toward under-
standing the potential impacts of such changes, it is
important to quantify how the ecosystem process of
interest (for example, soil respiration) responds to
variation in antecedent conditions (for example,
past soil water and/or temperature). This study
explores how changes in vegetation associated with
recent shrub encroachment potentially impact soil
respiration and its relationship with antecedent
drivers in a semiarid shrubland community. Pre-
vious studies found that antecedent soil moisture is
critical for predicting soil respiration in semiarid
ecosystems (Sponseller 2007; Cable and others
2008; Casals and others 2009; Ma and others
2012). These studies, however, arbitrarily define
the antecedent conditions by choosing a fixed
integration period without considering any poten-
tial lag effects. We propose that the antecedent
conditions and their effects are more complex, and
simultaneous estimation of lag times, integration
periods, relative importance of past time periods,
and antecedent effects will improve our predictive
understanding of ecosystem processes such as soil
respiration.
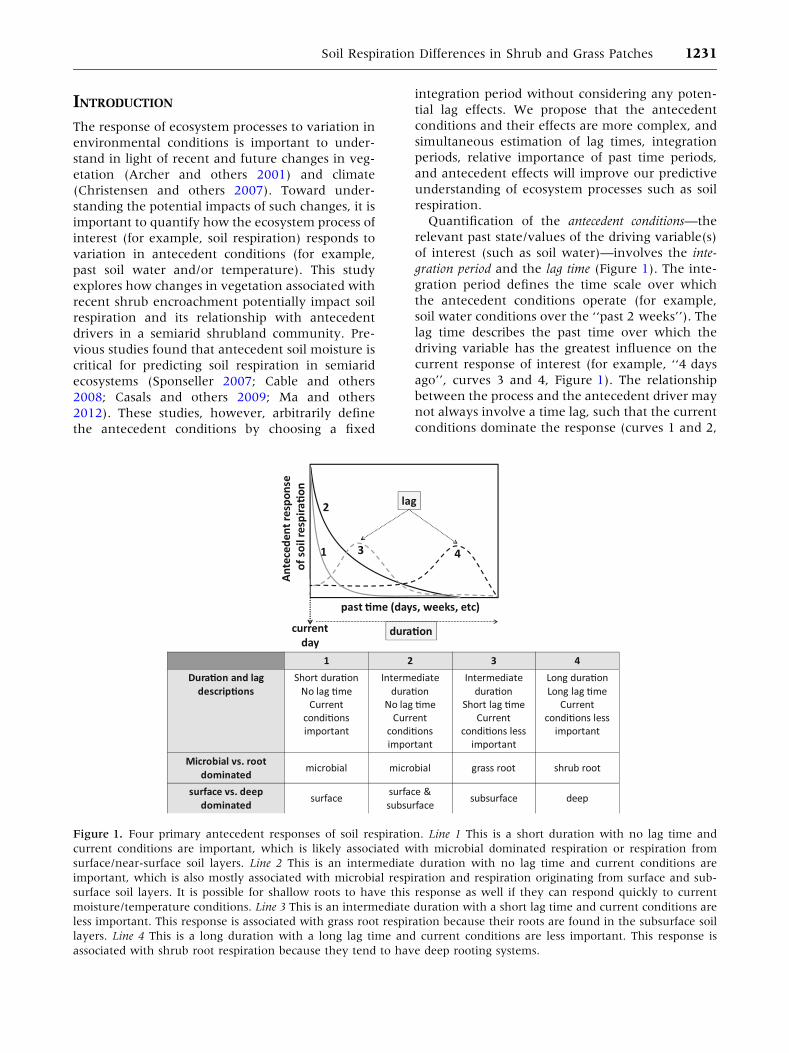
Quantification of the antecedent conditions—the
relevant past state/values of the driving variable(s)
of interest (such as soil water)—involves the inte-
gration period and the lag time (Figure 1). The inte-
gration period defines the time scale over which
the antecedent conditions operate (for example,
soil water conditions over the ‘‘past 2 weeks’’). The
lag time describes the past time over which the
driving variable has the greatest influence on the
current response of interest (for example, ‘‘4 days
ago’’, curves 3 and 4, Figure 1). The relationship
between the process and the antecedent driver may
not always involve a time lag, such that the current
conditions dominate the response (curves 1 and 2,
Figure 1. Four primary antecedent responses of soil respiration. Line 1 This is a short duration with no lag time and
current conditions are important, which is likely associated with microbial dominated respiration or respiration from
surface/near-surface soil layers. Line 2 This is an intermediate duration with no lag time and current conditions are
important, which is also mostly associated with microbial respiration and respiration originating from surface and sub-
surface soil layers. It is possible for shallow roots to have this response as well if they can respond quickly to current
moisture/temperature conditions. Line 3 This is an intermediate duration with a short lag time and current conditions are
less important. This response is associated with grass root respiration because their roots are found in the subsurface soil
layers. Line 4 This is a long duration with a long lag time and current conditions are less important. This response is
associated with shrub root respiration because they tend to have deep rooting systems.
Soil Respiration Differences in Shrub and Grass Patches 1231
Figure 1). The integration period and lag time
combine to describe the relative importance of past
conditions. The antecedent effect describes the direc-
tion and degree to which the antecedent conditions
impact the process of interest. If an antecedent ef-
fect does not exist, then the integration period and
lag time are irrelevant.
The response of soil respiration to antecedent
conditions should depend on the primary location
or depth in the soil where root or microbial activity
occurs. The environment of deeper soil layers is less
variable than surface layers; for example, it takes
longer for soil water to reach deeper layers, but the
water is retained longer (Schwinning and Ehle-
ringer 2001; Schenk and Jackson 2002b). The
temperature of deeper soil layers tends to be fairly
stable, with small diurnal and seasonal changes,
and cool relative to surface layers. In the surface
layers, availability of soil water is highly ephemeral
due to evaporation, and soil temperatures tend to
be more variable, with large daily and seasonal
cycles. Deeper soil layers are primarily occupied by
plant roots, and shallow surface layers are occupied
by both roots and non-rhizosphere associated mi-
crobes (Schenk and Jackson 2002a; Cable and
others 2009).
The relative dominance of roots versus microbes
could impact the antecedent response of soil res-
piration. In addition to being exposed to different
environments, roots and microbes tend to respond
differently to moisture and temperature, and they
have different life spans and acclimation times. The
long life span and acclimation time of roots (Palta
and Nobel 1989; Kubiske and others 1998; Pavon
and Briones 2000; Tang and others 2005; Zhang
and others 2009) may lead to a longer integration
time and lag period than the short-lived, rapidly
acclimating microbes (Luo and others 2001; Fierer
and Schimel 2003; Davidson and Janssens 2006;
Atkin and others 2008). Microbial respiration also
tends to be more moisture and temperature sensi-
tive than root respiration, with large and rapid re-
sponses of microbial respiration to water addition
and temperature increases (Qi and others 2002; Xu
and others 2004). Therefore, we hypothesize that
respiration from surface soil layers, particularly
those dominated by microbes, will have a short
integration period and no lag time, so current
conditions are more important than antecedent
conditions (curve 1, Figure 1). With increases in
microbial biomass and organic matter for microbial
consumption, we hypothesize a lengthening of the
integration period (curve 2, Figure 1). Further, we
hypothesize that respiration from deeper soil lay-
ers, which are dominated by roots, will have a long
integration period and a long lag time, with a rel-
atively low importance of environmental condi-
tions on the current day (curves 3 and 4, Figure 1).
Roots found closer to the surface should have a
shorter lag time and integration period (curve 3,
Figure 1) compared to deeper roots (curve 4, Fig-
ure 1).
The presence of different plant functional types
may affect the antecedent response of soil respira-
tion because of the impact on the depth distribu-
tion of soil activity. For example, relative to
neighboring grasses, woody plants or shrubs have
more belowground biomass (Cox and others 1986;
Schenk and Jackson 2002b), particularly in deeper
soil layers (Midwood and others 1998), and support
greater microbial biomass near the surface (Hibbard
and others 2001; McLain and Martens 2006;
Brantley and Young 2008; Cable and others 2009).
The soil temperature and moisture depth profiles
beneath shrubs also differ from those beneath
grasses, where the shrub canopies are more effec-
tive than grasses at shading the soil and intercept-
ing rainfall. Therefore, soil respiration under shrubs
likely originates from both surface and deeper soil
layers, and the microbes in the surface layers have
a larger organic matter pool to decompose. We
hypothesize that the antecedent response of respi-
ration under shrubs will be a qualitative mixture of
curves 2 and 4 (Figure 1). Soil respiration under
grasses likely originates more from the surface
layers where there is a small organic matter pool, so
we hypothesize that the antecedent response under
grasses will be a qualitative mixture of curves 1 and
3 (Figure 1).
MATERIALS AND METHODS
Field Study
The research site is a semiarid riparian shrubland
located on an old alluvial terrace of the San Pedro
River Basin in southeastern Arizona, near the town
of Sierra Vista (1200 m asl), where mean summer
temperature is 26�C and mean annual rainfall is
358 mm. Annual rainfall has a bimodal distribu-
tion, where 60% falls between June to September
(monsoon season) and the remainder falls between
December and March (Scott and others 2004). The
site is a medium-dense shrub-grass ecosystem with
a mix of velvet mesquite (Prosopis velutina) and
sacaton bunchgrass (Sporobolus wrightii) (Scott and
others 2006). The relative covers of each major
microsite type are: small to medium-sized (up to
1 m tall) mesquite (30%), large-sized (1–4.5 m tall)
mesquite (20%), sacaton bunchgrass (22%), open
1232 J. M. Cable and others
ground with litter (11%), open ground without
litter (11%), and other types of ground cover (5%).
From DOY 170 to 290 in 2005, continuous mea-
surements of soil respiration, soil moisture, and soil
temperature were made beneath two large-sized
mesquite (>3 m tall), two bunchgrasses, and in
two open spaces devoid of surface litter for a total of
six measurement locations.
Soil respiration collars (PVC, 25.4 cm diameter)
placed to 5 cm depth were installed in six locations
(two replicates each under grasses, in open space,
and under shrubs). Automated respiration mea-
surements were made using clear acrylic domes at-
tached to each collar. Opening and closing of the
domes over the collar were actuated using a pneu-
matic cylinder controlled by a datalogger (CR10X,
Campbell Scientific, Inc, Logan, UT). Each chamber
was fitted with 2.5 mm wide, 25 mm-long capillary
tubing vented to the atmosphere to relieve pressure
differentials (Hutchinson and Mosier 1981; David-
son and others 2002). A small 4.5-V microfan pro-
vided minor mixing of air within the chamber, and a
thermocouple was installed to measure chamber
temperature while the lid was closed. A 5-min
measurement procedure was triggered every
30 min for each collar. The procedure began with
the lid closing slowly, which created a closed loop
system wherein chamber air was circulated with a
pump, through a gas analyzer (LI-6262, CO2 and
H2O analyzer, LiCOR Inc., Lincoln, NE, USA). A low
flow rate (0.8 l min-1) was used to minimize dis-
turbance to the soil boundary layer. CO2 concen-
trations increased in the chamber over the 5-min
period, and the first 30 s (nonsteady-state period) of
data were discarded. Given the low flux rates in this
system, the build-up of CO2 in the chamber over this
period of time was always linear. The CO2 concen-
tration data were converted to flux density (FCO2;
lmol m-2 s-1) with the following equation:
FCO2 ¼dC
dt�
10 � V � Po � 1� Wo100
� �� �
R � S � T0 þ 273:15ð Þð Þ ;
where dC
dtis the slope of [CO2] with time (sec), V is
the chamber volume (cm3), Po is the initial pressure
(kPa), Wo is the initial water vapor mole fraction
(mmol mol-1), R is the universal gas constant, To is
the initial air temperature (�C), and S is the soil
surface area (cm2) (Pearcy and others 1990; LI-
COR 2010). Daily-integrated soil respiration was
computed by assuming that each flux measure-
ment was representative of its corresponding 30-
min period, and summing the 30-min fluxes over
each 24-h period.
Within 5 cm of each chamber, soil moisture
probes (% volume, ECH2O probes, Decagon De-
vices, Inc., Pullman, WA; probes were calibrated in
the lab for the soils at the field site) were installed
at two depths (1–4 and 6–16 cm), and soil ther-
mocouples were installed at 2.5 and 11 cm to re-
cord temperature (�C). Hereafter, we will refer to
the two depths as ‘‘surface’’ and ‘‘subsurface’’.
Precipitation data were collected with a tipping
bucket rain gauge (TE525, Texas Electronics), and
other basic meteorological data (air temperature,
relative humidity, PAR, and so on) were collected
on a nearby (<20 m away) eddy covariance tower
described elsewhere (Scott and others 2006).
DATA ANALYSIS
We took an approach similar to Cable and others
(2011) to analyze the daily integrated soil respira-
tion data, but the model herein explicitly quantifies
antecedent moisture and temperature and their
effects on the magnitude and the temperature
sensitivity of daily respiration. We apply the model
to learn how the antecedent conditions and their
effects differ between microsite types. We assumed
that roots of both functional types (grass and
shrub) can extend into open space soils. Thus, we
explicitly model soil respiration for each vegetated
microsite type, and we model soil respiration in the
open space as a mixture of the predicted respiration
dynamics in the grass and shrub microsites. This
approach serves to significantly reduce the number
of model parameters compared to an approach that
explicitly models the open space independent of
the vegetated microsites (we tried this parameter-
rich version, but the increase in model fit (R2) was
less than 1%). The mixture approach also allowed
us to quantify the relative importance of grasses
and shrubs for understanding soil respiration
responses on a landscape scale. We describe the
important elements of our model below; see Ta-
ble 1 for a list of the model parameters.
We defined the likelihood of the observed daily
soil respiration (Robs; mmol m-2 day-1) by assum-
ing that Robs is log-normally distributed such that
for day i (i = 1, 2,…,120) and collar c (c = 1, 2,…,6):
lnðRobsi;c Þ � Normal lLRi;c; r
2� �
ð1Þ
lLR is the mean (or predicted) log soil respiration
rate and r2 describes the observation variance. The
model for lLR is based on an Arrhenius-type
function described by Lloyd and Taylor (1994) as
modified in Cable and others (2011). Thus, for each
Soil Respiration Differences in Shrub and Grass Patches 1233
collar c associated with a vegetated microsite
(m = mesquite or grass):
lLRi;c ¼ ln Rbi;c
� �
þ Eoi;c1
298:15� Tom
� 1
ð�Ti;c þ 273:15Þ � Tom
� �ð2Þ
where Rb is the ‘‘base’’ respiration rate at 25�C,
Eo (Kelvin) is analogous to an energy of activa-
tion term, To (K) is a microsite-specific tempera-
ture sensitivity parameter, and T is the ‘‘average’’
soil temperature (�C) as described in equation (4).
As noted above, we assume that the respiration
response in the open space is a mixture of the
grass and mesquite respiration responses, such
that for each collar c associated with an open
microsite:
lLRi;c ¼ f � lLRi;c;grass þ ð1� f Þ � lLRi;c;mesquite ð3Þ
where f and (1-f) describe the relative contribution
of grass and mesquite, respectively, respiration to
open space respiration. The notation on the right,
lLRi;c;m for m = grass or mesquite, indicates that the
function in equation (2) is evaluated at the envi-
ronmental data associated with each open space
collar c, but the grass and mesquite respiration-
related terms (Rb, Eo, and To) are used in equation
(2).
In equation (2), lLR is described as a function of
soil temperature (T), and the slope (first derivative)
of this function reflects the sensitivity of R to
changes in T. The slope depends on Eo and To, and
we specifically focus on Eo as an index of the mi-
crosite-specific temperature sensitivity of R, where
larger values of Eo indicate greater sensitivity
(steeper slope). In equation (2), �T represents the
weighted average of T measured at two depths; the
weights p and (1-p) describe the relative impor-
tance of T measured at 2.5 and 11 cm, respectively,
and a value of p close to 1 indicates that soil res-
piration is more strongly coupled to surface com-
pared to subsurface temperature. Thus, for day i,
collar c, depth z (z = 1 for 2.5 cm, z = 2 for 11 cm),
and microsite m associated with c:
�Ti;c ¼ pm � Ti;c;z¼2:5 cm þ ð1� pmÞ � Ti;c;z¼11 cm ð4Þ
We allow p to vary by m (for m = grass, mesquite,
or open) because the microsites may differ in the
relative importance of each depth given potential
differences in the depth-distributions of roots and
microbes (Cable and others 2009). Note that p is an
estimated parameter, and the R data will inform the
relative importance of each depth.
We extend the original Lloyd and Taylor (1994)
function by modeling the base rate (Rb) and tem-
perature sensitivity (Eo) as a function of antecedent
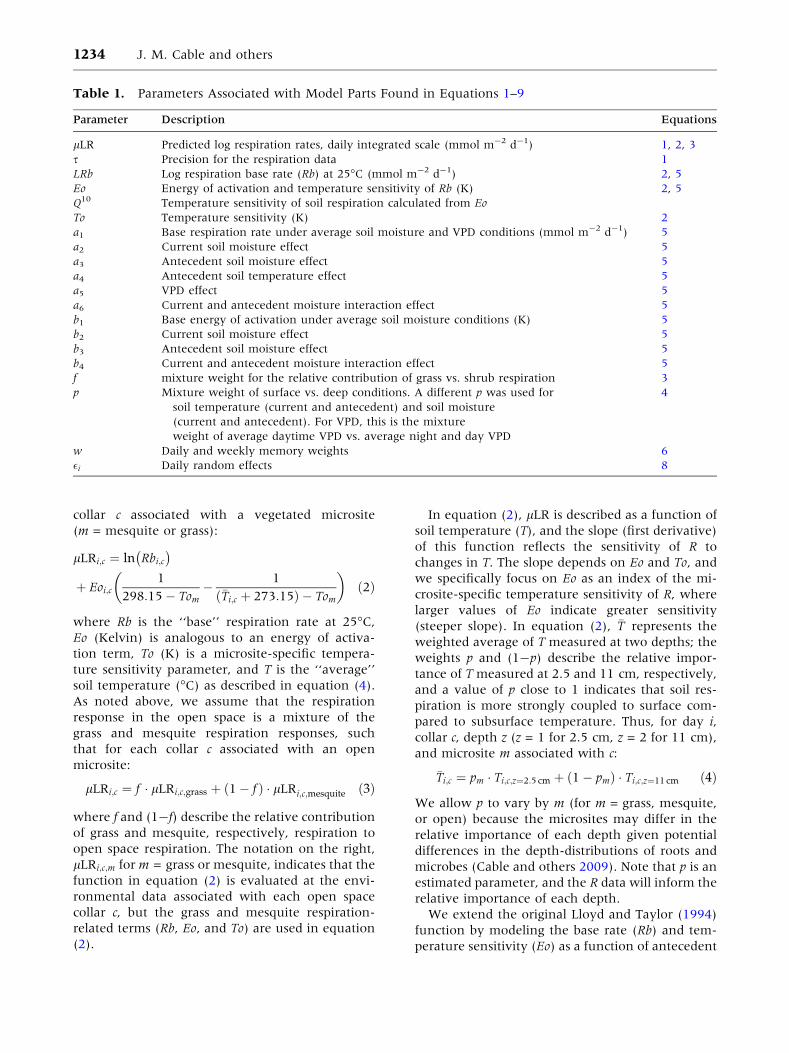
Table 1. Parameters Associated with Model Parts Found in Equations 1–9
Parameter Description Equations
lLR Predicted log respiration rates, daily integrated scale (mmol m-2 d-1) 1, 2, 3
s Precision for the respiration data 1
LRb Log respiration base rate (Rb) at 25�C (mmol m-2 d-1) 2, 5
Eo Energy of activation and temperature sensitivity of Rb (K) 2, 5
Q10 Temperature sensitivity of soil respiration calculated from Eo
To Temperature sensitivity (K) 2
a1 Base respiration rate under average soil moisture and VPD conditions (mmol m-2 d-1) 5
a2 Current soil moisture effect 5
a3 Antecedent soil moisture effect 5
a4 Antecedent soil temperature effect 5
a5 VPD effect 5
a6 Current and antecedent moisture interaction effect 5
b1 Base energy of activation under average soil moisture conditions (K) 5
b2 Current soil moisture effect 5
b3 Antecedent soil moisture effect 5
b4 Current and antecedent moisture interaction effect 5
f mixture weight for the relative contribution of grass vs. shrub respiration 3
p Mixture weight of surface vs. deep conditions. A different p was used for
soil temperature (current and antecedent) and soil moisture
(current and antecedent). For VPD, this is the mixture
weight of average daytime VPD vs. average night and day VPD
4
w Daily and weekly memory weights 6
�i Daily random effects 8
1234 J. M. Cable and others
and current soil water content (AntW and W,
respectively) and antecedent soil temperature
(AntT) (Cable and others 2008). We also include an
effect of vapor pressure deficit (VPD) on Rb to
implicitly account for potential aboveground con-
trols on R (Ekblad and others 2005; Carbone and
others 2008):
log Rbi;c
� �¼ a1m þ a2m �Wi;c þ a3m � AntWi;c
þ a4m � AntTi;c þ a5miþ a6m
� Wi;c � AntWi;c
� �
Eoi;c ¼ b1m þ b2m � AntTi;c þ b3mi; c þ b4m
� AntWi;c þ b5m � Wi;c � AntWi;c
� �
ð5Þ
The microsite-specific parameters a and b are
only allowed to differ between grass and mesquite.
Recall that open space is mixture of the two vege-
tated microsites such that equation (5) is evaluated
at the environmental conditions corresponding to
each open space collar, but the grass and shrub a
and b parameters are used according to equation
(3). The a1 and b1 parameters represent the mi-
crosite-specific base rate and temperature sensitiv-
ity, respectively, under average moisture,
antecedent moisture, antecedent temperature, and
VPD (Rb model only) conditions. That is, W, AntW,
AntT, and VPD are mean-centered, wherein the
mean for each variable, across all days and micro-
sites, was subtracted from each original observed
value. The parameters a2–a6 and b2–b5 describe the
main effects of the corresponding environmental
driver (that is, W, AntW, AntT, VPD), and a6 and b5
describe the current (W) and antecedent soil water
(AntW) interaction effects. Because Q10 values are
typically reported in the literature to describe the
temperature sensitivity of respiration, we calcu-
lated the Q10 to simplify comparisons with other
ecosystems, where:
Q10i;c¼ e
Eoi;c1
Ti;c�5�Tom� 1
Ti;cþ5�Tom
� �
ð6Þ
Similar to soil temperature, W, AntW, and AntT
represent weighted averages of soil moisture and
temperature at two depths (surface vs. subsurface),
and VPD is a weighted average of the maximum
daytime and daytime average VPD. For each vari-
able, there is a mixture weight (p) that describes
the importance of the surface conditions (or max-
imum VPD), and 1-p is the importance of the
subsurface layers (or average VPD). For each vari-
able, p varies by microsite (grass, shrub, or open),
and the mixture is computed analogous to equation
(4). We allow the open space to have independent
p’s (not a mixture of shrub and grass) because the
depth of roots and microbes may differ between
grass, mesquite, and open microsites, potentially
leading to a difference in the importance of the
depth of soil moisture and temperature.
We assumed that temperature operates and
affects respiration on a faster time scale (daily)
than soil water (weekly), and thus we computed
AntT over past days and AntW over past weeks.
For example, AntW is modeled as a weighted
average of past soil water conditions, such that the
antecedent conditions associated with day i, collar
c, microsite m, and depth z (that is, shallow vs.
subsurface) are:
AntWi;c;z ¼XN weeks
k¼1
wk;m � �Wi;k;c;z ð7Þ
We summed over the past N weeks, where k = 1 is
the ‘‘current’’ week, which goes from day i-6 to day
i; by trial and error, we set Nweeks = 10, which was
sufficiently long to capture the integration time and
lags associated with the different microsites. Because
we summed with respect to weeks, �Wi;k;c;z is the
weekly mean soil water averaged over days
i-7 k + 1 to i-7 k + 7. The importance of soil water
experienced different weeks into the past is given by
the weights, w. We assigned Dirichlet priors to the
microsite-specific vector of w’s to obey the con-
straints 0 £ wk,m £ 1 andPN weeks
k¼1 wk;m ¼ 1:AntTi,c,z is computed similarly to equation (7), except
we summed the product of daily weights and daily
temperature (Ti,c,z) from the current day to the
6 days ago (Ndays = 7). Following equation (4),
AntWi,c and AntTi,c in equation (5) are computed as
weighted averages of the surface (AntWi,c,1 and
AntTi,c,1) and subsurface (AntWi,c,2 and AntTi,c,2)
antecedent values.
The above equations essentially describe a multi-
level nonlinear regression model (for example,
Gelman and Hill 2006), which we implemented in
a Bayesian framework. Thus, we specified inde-
pendent and relatively noninformative (diffuse)
priors for all unknown parameters. Normal densi-
ties with large variances were used for a1–a6 and
b2–b5; a uniform distribution on the interval (0,1)
was used for f and the p’s associated with each
variable (W, AntW, T, AntT, VPD); wide uniform
densities were used for the standard deviation (r).
Lloyd and Taylor (1994) suggest that Eo and To are
relatively conserved across a variety of ecosystem
types. Thus, we used semi-informative normal
distribution priors for To and b1 (‘‘base’’ Eo) with
means given by the Lloyd and Taylor (1994) esti-
mates (227.13 and 308.56 K, respectively) and
Soil Respiration Differences in Shrub and Grass Patches 1235

relatively large variances (1,000) (Cable and others
2011). As required, we restricted To to occur be-
tween 0 and 285 K (285 K is slightly lower than
the minimum measured T).
We evaluated three additional versions of the
model, and we refer to the above model as the final
model. We compare this final model to: (1) a simple
model that does not include antecedent effects, and
the open microsite is assigned its own parameters;
(2) a random effects model that implements the same
assumptions as the simple model, but that incor-
porates day random effects; and (3) an antecedent
microsites model which is the same as the final
model, but this parameter-rich version allows for
the open microsite to have its own parameters such
that open space is not modeled as a mixture of the
vegetated microsites. Previous work found sub-
stantial temporal variation in respiration, even after
accounting for time varying environmental drivers
(Cable and others 2008); thus, comparison of the
simple model and the random effects model
quantifies the potential importance of residual
daily variation, and comparison of the final model
and the random effects model lends insight into
how much of the residual daily variation in R can
be attributed to antecedent effects. Comparison of
the final model and the antecedent microsites
model quantifies how well the mixing model ap-
proach works for describing respiration in open
spaces. For the simple and the day random effects
models, equation (5) becomes:
log Rbi;c
� �¼ a1m þ a2m �Wi;c þ a5m � VPDi
Eoi;c ¼ b1m þ b3mi; cð8Þ
For the random effects model, we also incorporated
day random effects (�) by modifying equation (2):
lLRi;c ¼ ln Rbi;c
� �
þ Eoi;c1
298:15� Tom
� 1
ðTi;c þ 273:15Þ � Tom
� �þ ei
ð9Þ
The �i are modeled as coming from a normal
distribution with mean zero and an unknown
variance term that is estimated. For the antecedent
microsites model, we do not employ equation (3);
we allow To and the a’s and b’s in equation (5) to
vary by all three microsites.
The seasonal dynamics of Rb and Q10 were pre-
dicted using the parameter estimates associated
with the final model and the daily environmental
data. That is, we computed Rb and Q10 based on
equations (2), (5), and (6) for each day i given the
posterior results for a and b, the predicted daily
VPD, and the predicted microsite-level daily means
for W, antW, and antT.
All models were programmed in the Bayesian
statistical software package WinBUGS (Spiegelhal-
ter and others 2002). For each model, we ran three
parallel Markov chain Monte Carlo (MCMC)
chains for approximately 10,000 iterations, and we
used the built-in Brooks–Gelman–Rubin (BGR)
diagnostic tool to evaluate convergence of the
chains to the posterior distribution (Brooks and
Gelman 1998; Gelman 2004b). We discarded the
first 4,000 burn-in samples, yielding an indepen-
dent sample of greater than 5,000 values for each
parameter from the joint posterior distribution (see
for example, Gelman 2004a, b; Gamerman and
Hedibert 2006). We present the posterior mean and
95% credible interval (95% CI, defined by the
2.5th and 97.5th percentiles of the posterior dis-
tribution) for each parameter of interest.
We compared models using two different ap-
proaches. First, the four models were compared by
using equation (2) to generate replicated data
associated with each observation of soil respiration
(Gelman 2004b), which produced predictive dis-
tributions for each respiration observation in the
dataset, for each model. A model that fits the data
perfectly would yield observed respiration data
versus predicted (replicated) data that fall exactly
along the 1:1 line. The R2 value from a regression of
the observed versus predicted data serves as an
informal index of model fit, but it does not account
for differences in model complexity between the
models. Thus, we also computed the posterior
predictive loss (D), which is the sum of a goodness
of fit term (G) plus a model complexity (penalty)
term (P) (Gelfand and Ghosh 1998). The model
with the lower D is preferred, which can be due to a
better model fit (low G value) and/or lower model
complexity (low P value).
RESULTS
Data Description
The summer rainy period (monsoon) of 2005
spanned DOY 200 to 255, and during this time,
VPD and air temperature declined (Figure 2).
During the onset of the monsoon, soil respiration
increased nearly 9-, 3-, and 2-fold for the shrub,
grass, and open microsites, respectively (Fig-
ure 3A). During this time, soil moisture content (%
v/v) also increased from zero to about 7, 10, and
17% in open, grass, and shrub microsites, respec-
tively (Figure 3D, E). In all three microsites, soil
temperature at both depths decreased by about
1236 J. M. Cable and others
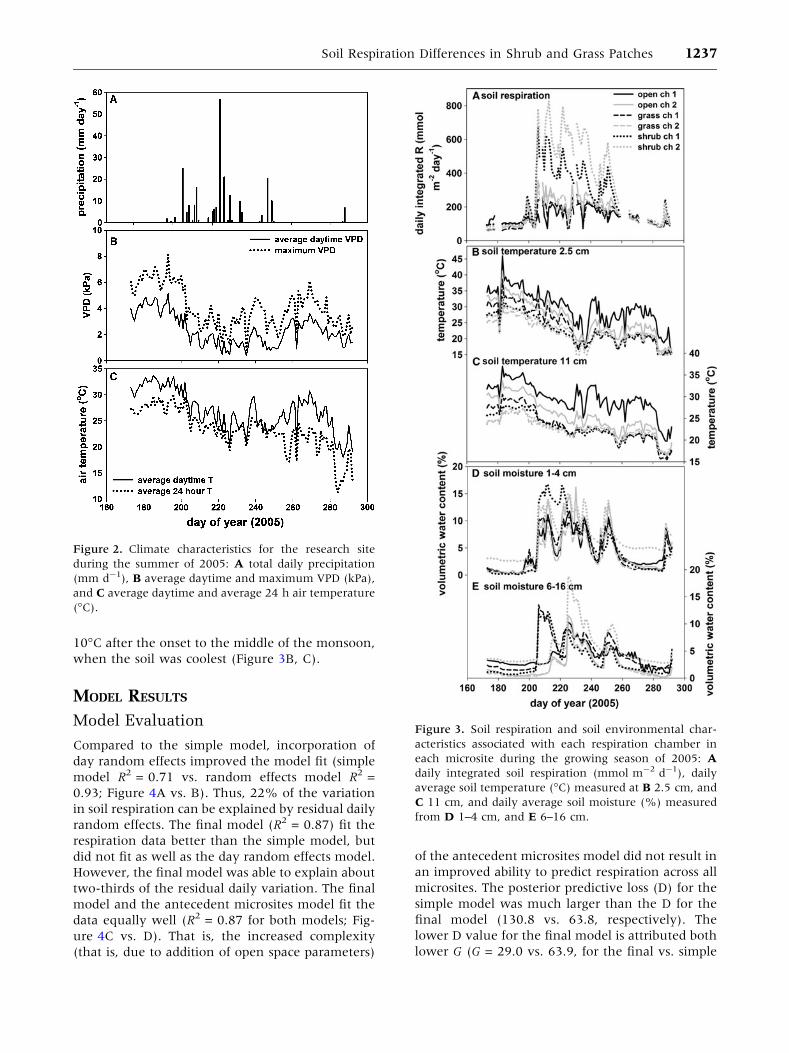
10�C after the onset to the middle of the monsoon,
when the soil was coolest (Figure 3B, C).
MODEL RESULTS
Model Evaluation
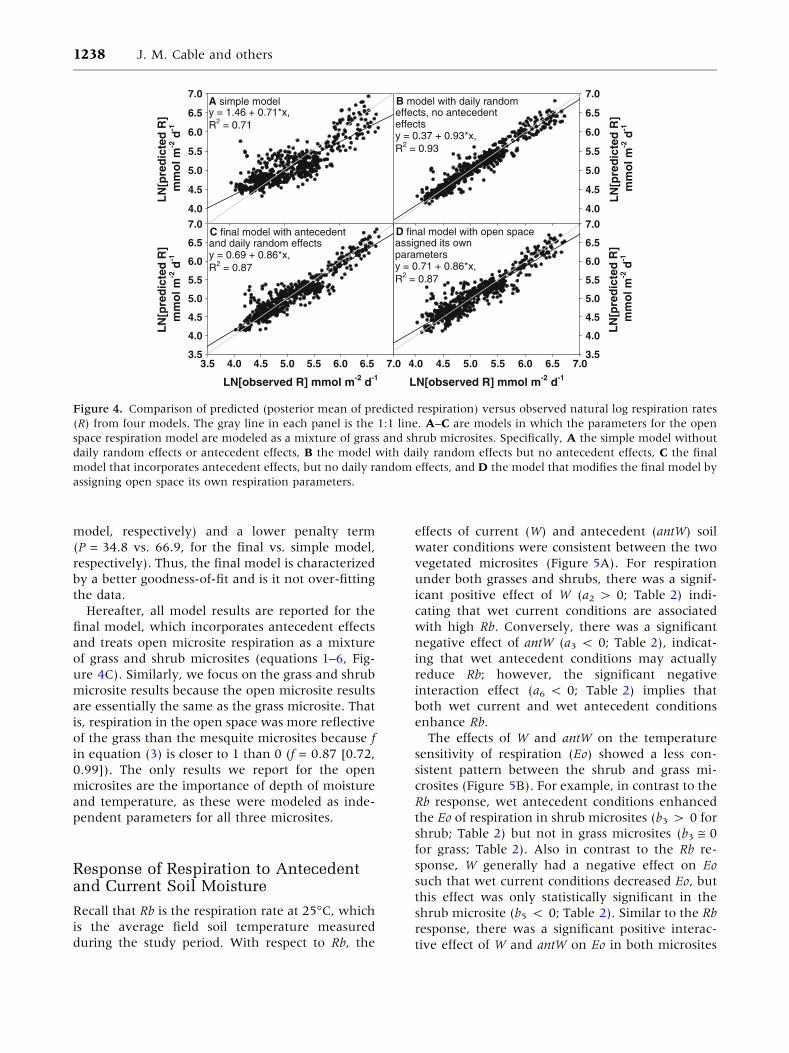
Compared to the simple model, incorporation of
day random effects improved the model fit (simple
model R2 = 0.71 vs. random effects model R2 =
0.93; Figure 4A vs. B). Thus, 22% of the variation
in soil respiration can be explained by residual daily
random effects. The final model (R2 = 0.87) fit the
respiration data better than the simple model, but
did not fit as well as the day random effects model.
However, the final model was able to explain about
two-thirds of the residual daily variation. The final
model and the antecedent microsites model fit the
data equally well (R2 = 0.87 for both models; Fig-
ure 4C vs. D). That is, the increased complexity
(that is, due to addition of open space parameters)
of the antecedent microsites model did not result in
an improved ability to predict respiration across all
microsites. The posterior predictive loss (D) for the
simple model was much larger than the D for the
final model (130.8 vs. 63.8, respectively). The
lower D value for the final model is attributed both
lower G (G = 29.0 vs. 63.9, for the final vs. simple
Figure 3. Soil respiration and soil environmental char-
acteristics associated with each respiration chamber in
each microsite during the growing season of 2005: A
daily integrated soil respiration (mmol m-2 d-1), daily
average soil temperature (�C) measured at B 2.5 cm, and
C 11 cm, and daily average soil moisture (%) measured
from D 1–4 cm, and E 6–16 cm.
Figure 2. Climate characteristics for the research site
during the summer of 2005: A total daily precipitation
(mm d-1), B average daytime and maximum VPD (kPa),
and C average daytime and average 24 h air temperature
(�C).
Soil Respiration Differences in Shrub and Grass Patches 1237
model, respectively) and a lower penalty term
(P = 34.8 vs. 66.9, for the final vs. simple model,
respectively). Thus, the final model is characterized
by a better goodness-of-fit and is it not over-fitting
the data.
Hereafter, all model results are reported for the
final model, which incorporates antecedent effects
and treats open microsite respiration as a mixture
of grass and shrub microsites (equations 1–6, Fig-
ure 4C). Similarly, we focus on the grass and shrub
microsite results because the open microsite results
are essentially the same as the grass microsite. That
is, respiration in the open space was more reflective
of the grass than the mesquite microsites because f
in equation (3) is closer to 1 than 0 (f = 0.87 [0.72,
0.99]). The only results we report for the open
microsites are the importance of depth of moisture
and temperature, as these were modeled as inde-
pendent parameters for all three microsites.
Response of Respiration to Antecedentand Current Soil Moisture
Recall that Rb is the respiration rate at 25�C, which
is the average field soil temperature measured
during the study period. With respect to Rb, the
effects of current (W) and antecedent (antW) soil
water conditions were consistent between the two
vegetated microsites (Figure 5A). For respiration
under both grasses and shrubs, there was a signif-
icant positive effect of W (a2 > 0; Table 2) indi-
cating that wet current conditions are associated
with high Rb. Conversely, there was a significant
negative effect of antW (a3 < 0; Table 2), indicat-
ing that wet antecedent conditions may actually
reduce Rb; however, the significant negative
interaction effect (a6 < 0; Table 2) implies that
both wet current and wet antecedent conditions
enhance Rb.
The effects of W and antW on the temperature
sensitivity of respiration (Eo) showed a less con-
sistent pattern between the shrub and grass mi-
crosites (Figure 5B). For example, in contrast to the
Rb response, wet antecedent conditions enhanced
the Eo of respiration in shrub microsites (b3 > 0 for
shrub; Table 2) but not in grass microsites (b3 @ 0
for grass; Table 2). Also in contrast to the Rb re-
sponse, W generally had a negative effect on Eo
such that wet current conditions decreased Eo, but
this effect was only statistically significant in the
shrub microsite (b5 < 0; Table 2). Similar to the Rb
response, there was a significant positive interac-
tive effect of W and antW on Eo in both microsites
C final model with antecedentand daily random effectsy = 0.69 + 0.86*x, R2 = 0.87
LN[observed R] mmol m-2 d-1
3.5 4.0 4.5 5.0 5.5 6.0 6.5 7.0
LN
[pre
dic
ted
R]
mm
ol m
-2 d
-1
3.5
4.0
4.5
5.0
5.5
6.0
6.5
7.0D final model with open space assigned its own parametersy = 0.71 + 0.86*x, R2 = 0.87
LN[observed R] mmol m-2 d-1
4.0 4.5 5.0 5.5 6.0 6.5 7.0
LN
[pre
dic
ted
R]
mm
ol m
-2 d
-1
3.5
4.0
4.5
5.0
5.5
6.0
6.5
7.0
B model with daily random effects, no antecedent effectsy = 0.37 + 0.93*x, R2 = 0.93
LN
[pre
dic
ted
R]
mm
ol m
-2 d
-1
4.0
4.5
5.0
5.5
6.0
6.5
7.0A simple modely = 1.46 + 0.71*x, R2 = 0.71
LN
[pre
dic
ted
R]
mm
ol m
-2 d
-1
4.0
4.5
5.0
5.5
6.0
6.5
7.0
Figure 4. Comparison of predicted (posterior mean of predicted respiration) versus observed natural log respiration rates
(R) from four models. The gray line in each panel is the 1:1 line. A–C are models in which the parameters for the open
space respiration model are modeled as a mixture of grass and shrub microsites. Specifically, A the simple model without
daily random effects or antecedent effects, B the model with daily random effects but no antecedent effects, C the final
model that incorporates antecedent effects, but no daily random effects, and D the model that modifies the final model by
assigning open space its own respiration parameters.
1238 J. M. Cable and others
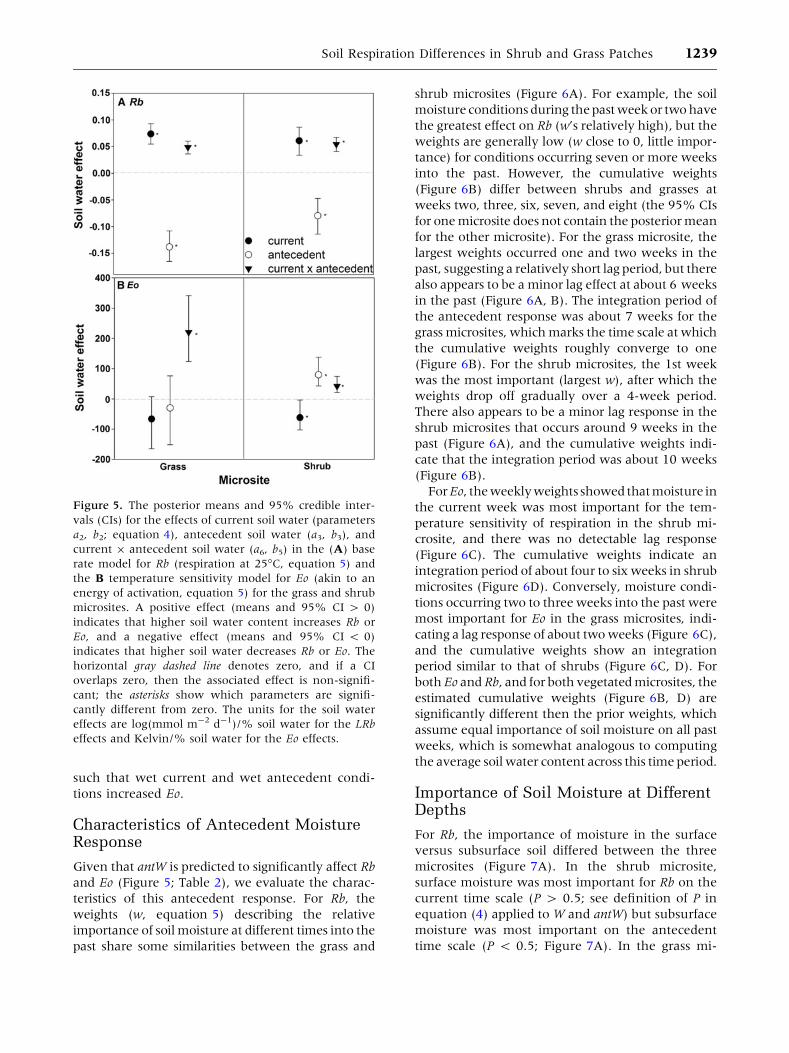
such that wet current and wet antecedent condi-
tions increased Eo.
Characteristics of Antecedent MoistureResponse
Given that antW is predicted to significantly affect Rb
and Eo (Figure 5; Table 2), we evaluate the charac-
teristics of this antecedent response. For Rb, the
weights (w, equation 5) describing the relative
importance of soil moisture at different times into the
past share some similarities between the grass and
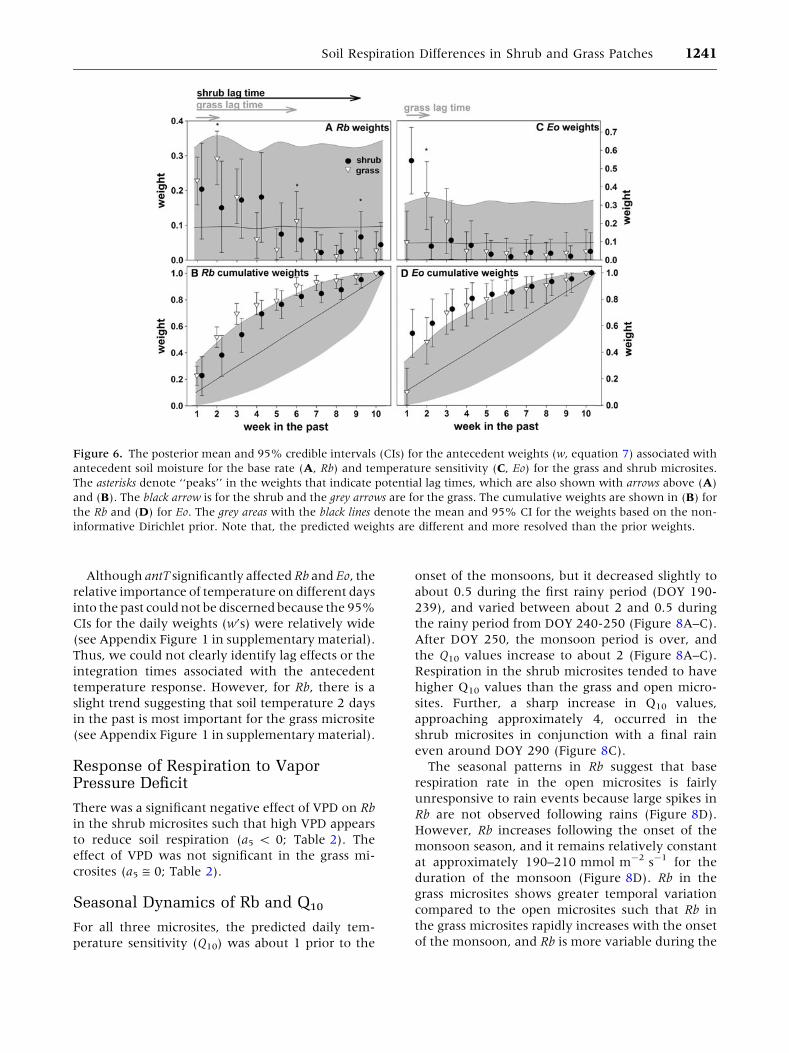
shrub microsites (Figure 6A). For example, the soil
moisture conditions during the past week or two have
the greatest effect on Rb (w’s relatively high), but the
weights are generally low (w close to 0, little impor-
tance) for conditions occurring seven or more weeks
into the past. However, the cumulative weights
(Figure 6B) differ between shrubs and grasses at
weeks two, three, six, seven, and eight (the 95% CIs
for one microsite does not contain the posterior mean
for the other microsite). For the grass microsite, the
largest weights occurred one and two weeks in the
past, suggesting a relatively short lag period, but there
also appears to be a minor lag effect at about 6 weeks
in the past (Figure 6A, B). The integration period of
the antecedent response was about 7 weeks for the
grass microsites, which marks the time scale at which
the cumulative weights roughly converge to one
(Figure 6B). For the shrub microsites, the 1st week
was the most important (largest w), after which the
weights drop off gradually over a 4-week period.
There also appears to be a minor lag response in the
shrub microsites that occurs around 9 weeks in the
past (Figure 6A), and the cumulative weights indi-
cate that the integration period was about 10 weeks
(Figure 6B).
For Eo, the weeklyweights showed thatmoisture in
the current week was most important for the tem-
perature sensitivity of respiration in the shrub mi-
crosite, and there was no detectable lag response
(Figure 6C). The cumulative weights indicate an
integration period of about four to six weeks in shrub
microsites (Figure 6D). Conversely, moisture condi-
tions occurring two to three weeks into the past were
most important for Eo in the grass microsites, indi-
cating a lag response of about two weeks (Figure 6C),
and the cumulative weights show an integration
period similar to that of shrubs (Figure 6C, D). For
both Eo and Rb, and for both vegetated microsites, the
estimated cumulative weights (Figure 6B, D) are
significantly different then the prior weights, which
assume equal importance of soil moisture on all past
weeks, which is somewhat analogous to computing
the average soil water content across this time period.
Importance of Soil Moisture at DifferentDepths
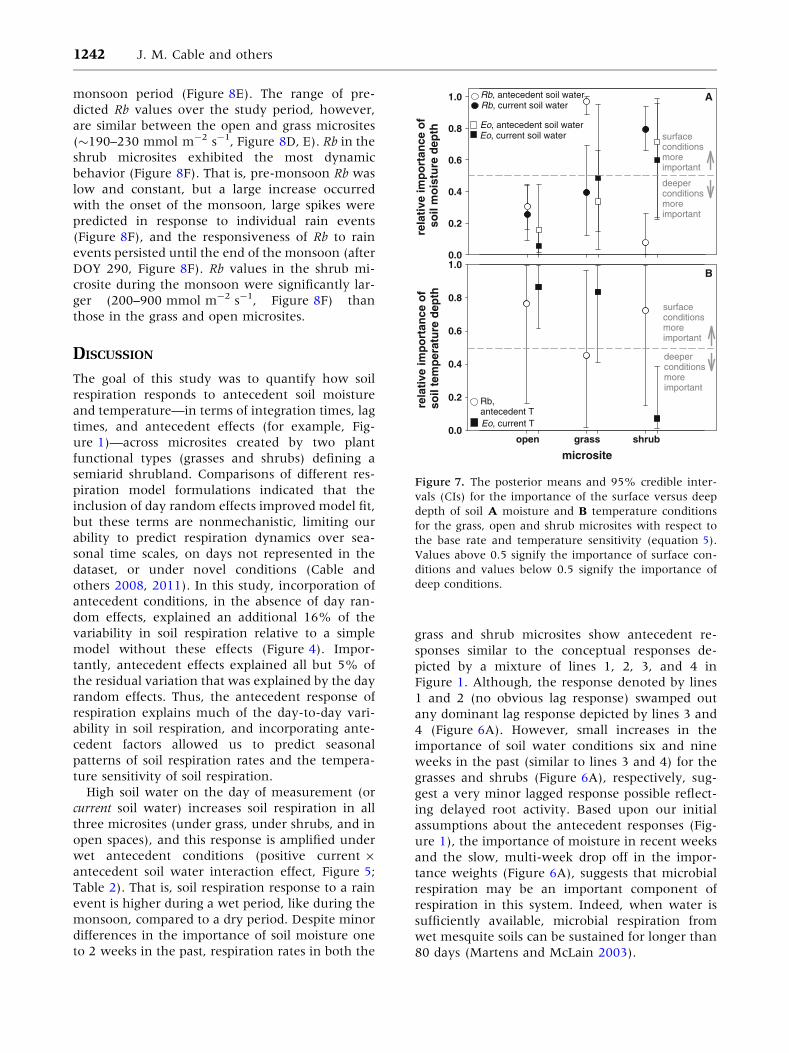
For Rb, the importance of moisture in the surface
versus subsurface soil differed between the three
microsites (Figure 7A). In the shrub microsite,
surface moisture was most important for Rb on the
current time scale (P > 0.5; see definition of P in
equation (4) applied to W and antW) but subsurface
moisture was most important on the antecedent
time scale (P < 0.5; Figure 7A). In the grass mi-
Figure 5. The posterior means and 95% credible inter-
vals (CIs) for the effects of current soil water (parameters
a2, b2; equation 4), antecedent soil water (a3, b3), and
current 9 antecedent soil water (a6, b5) in the (A) base
rate model for Rb (respiration at 25�C, equation 5) and
the B temperature sensitivity model for Eo (akin to an
energy of activation, equation 5) for the grass and shrub
microsites. A positive effect (means and 95% CI > 0)
indicates that higher soil water content increases Rb or
Eo, and a negative effect (means and 95% CI < 0)
indicates that higher soil water decreases Rb or Eo. The
horizontal gray dashed line denotes zero, and if a CI
overlaps zero, then the associated effect is non-signifi-
cant; the asterisks show which parameters are signifi-
cantly different from zero. The units for the soil water
effects are log(mmol m-2 d-1)/% soil water for the LRb
effects and Kelvin/% soil water for the Eo effects.
Soil Respiration Differences in Shrub and Grass Patches 1239
crosite, the importance of surface versus subsurface
depths for Rb was indistinguishable (wide 95% CI
for P that contained 0.5) on the current time scale,
but surface moisture was more important on the
antecedent time scale (P @ 1; Figure 7A). In the
open space, subsurface soil moisture was more
important than surface moisture on both time
scales (P < 0.5; Figure 7A).
For Eo, the importance of the two depths for each
time scale (current and antecedent) could not be
discerned (wide 95% CIs for P that contained 0.5)
for the grass and shrub microsites (Figure 7A).
Similar to Rb, Eo in the open microsite was more
sensitive to subsurface soil moisture on both time
scales (P < 0.5; Figure 7A).
Response of Respiration to AntecedentTemperature
For Rb, high antecedent soil temperature (antT) de-
creased respiration rates in the grass microsites
(a4 < 0), but increased respiration in the shrub mi-
crosites (a4 > 0; Table 2). The importance of surface
versus subsurface antT for Rbcouldnotbediscerned in
any microsite (wide 95% CIs for P that contained 0.5;
Figure 7B). High antT increased Eo in the shrub mi-
crosites (Table 2). On the current time scale, the
surface temperature was more important for Eo in the
grass and open microsites (P > 0.5; Figure 7B), and
the deep temperature was most important in the
shrub microsite (P < 0.5, Figure 7B).
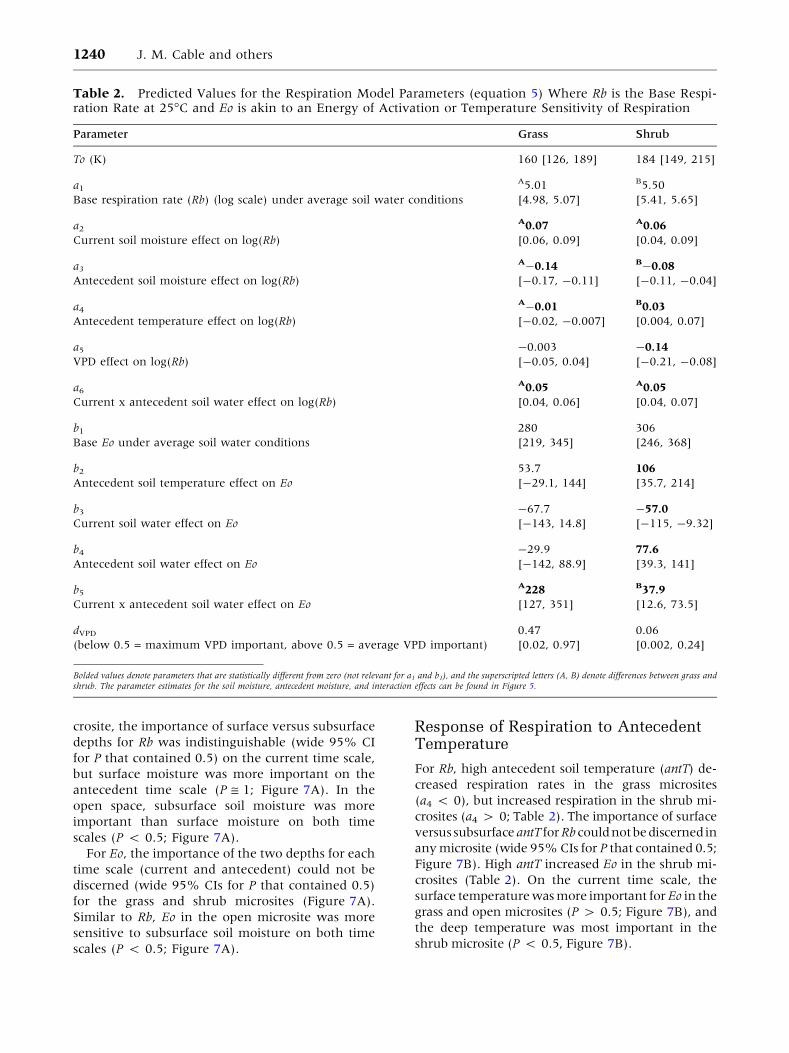
Table 2. Predicted Values for the Respiration Model Parameters (equation 5) Where Rb is the Base Respi-ration Rate at 25�C and Eo is akin to an Energy of Activation or Temperature Sensitivity of Respiration
Parameter Grass Shrub
To (K) 160 [126, 189] 184 [149, 215]
a1
Base respiration rate (Rb) (log scale) under average soil water conditions
A5.01
[4.98, 5.07]
B5.50
[5.41, 5.65]
a2
Current soil moisture effect on log(Rb)
A0.07
[0.06, 0.09]
A0.06
[0.04, 0.09]
a3
Antecedent soil moisture effect on log(Rb)
A-0.14
[-0.17, -0.11]
B-0.08
[-0.11, -0.04]
a4
Antecedent temperature effect on log(Rb)
A-0.01
[-0.02, -0.007]
B0.03
[0.004, 0.07]
a5
VPD effect on log(Rb)
-0.003
[-0.05, 0.04]
-0.14
[-0.21, -0.08]
a6
Current x antecedent soil water effect on log(Rb)
A0.05
[0.04, 0.06]
A0.05
[0.04, 0.07]
b1
Base Eo under average soil water conditions
280
[219, 345]
306
[246, 368]
b2
Antecedent soil temperature effect on Eo
53.7
[-29.1, 144]
106
[35.7, 214]
b3
Current soil water effect on Eo
-67.7
[-143, 14.8]
-57.0
[-115, -9.32]
b4
Antecedent soil water effect on Eo
-29.9
[-142, 88.9]
77.6
[39.3, 141]
b5
Current x antecedent soil water effect on Eo
A228
[127, 351]
B37.9
[12.6, 73.5]
dVPD
(below 0.5 = maximum VPD important, above 0.5 = average VPD important)
0.47
[0.02, 0.97]
0.06
[0.002, 0.24]
Bolded values denote parameters that are statistically different from zero (not relevant for a1 and b1), and the superscripted letters (A, B) denote differences between grass andshrub. The parameter estimates for the soil moisture, antecedent moisture, and interaction effects can be found in Figure 5.
1240 J. M. Cable and others
Although antT significantly affected Rb and Eo, the
relative importance of temperature on different days
into the past could not be discerned because the 95%
CIs for the daily weights (w’s) were relatively wide
(see Appendix Figure 1 in supplementary material).
Thus, we could not clearly identify lag effects or the
integration times associated with the antecedent
temperature response. However, for Rb, there is a
slight trend suggesting that soil temperature 2 days
in the past is most important for the grass microsite
(see Appendix Figure 1 in supplementary material).
Response of Respiration to VaporPressure Deficit
There was a significant negative effect of VPD on Rb
in the shrub microsites such that high VPD appears
to reduce soil respiration (a5 < 0; Table 2). The
effect of VPD was not significant in the grass mi-
crosites (a5 @ 0; Table 2).
Seasonal Dynamics of Rb and Q10
For all three microsites, the predicted daily tem-
perature sensitivity (Q10) was about 1 prior to the
onset of the monsoons, but it decreased slightly to
about 0.5 during the first rainy period (DOY 190-
239), and varied between about 2 and 0.5 during
the rainy period from DOY 240-250 (Figure 8A–C).
After DOY 250, the monsoon period is over, and
the Q10 values increase to about 2 (Figure 8A–C).
Respiration in the shrub microsites tended to have
higher Q10 values than the grass and open micro-
sites. Further, a sharp increase in Q10 values,
approaching approximately 4, occurred in the
shrub microsites in conjunction with a final rain
even around DOY 290 (Figure 8C).
The seasonal patterns in Rb suggest that base
respiration rate in the open microsites is fairly
unresponsive to rain events because large spikes in
Rb are not observed following rains (Figure 8D).
However, Rb increases following the onset of the
monsoon season, and it remains relatively constant
at approximately 190–210 mmol m-2 s-1 for the
duration of the monsoon (Figure 8D). Rb in the
grass microsites shows greater temporal variation
compared to the open microsites such that Rb in
the grass microsites rapidly increases with the onset
of the monsoon, and Rb is more variable during the
Figure 6. The posterior mean and 95% credible intervals (CIs) for the antecedent weights (w, equation 7) associated with
antecedent soil moisture for the base rate (A, Rb) and temperature sensitivity (C, Eo) for the grass and shrub microsites.
The asterisks denote ‘‘peaks’’ in the weights that indicate potential lag times, which are also shown with arrows above (A)
and (B). The black arrow is for the shrub and the grey arrows are for the grass. The cumulative weights are shown in (B) for
the Rb and (D) for Eo. The grey areas with the black lines denote the mean and 95% CI for the weights based on the non-
informative Dirichlet prior. Note that, the predicted weights are different and more resolved than the prior weights.
Soil Respiration Differences in Shrub and Grass Patches 1241
monsoon period (Figure 8E). The range of pre-
dicted Rb values over the study period, however,
are similar between the open and grass microsites
(�190–230 mmol m-2 s-1, Figure 8D, E). Rb in the
shrub microsites exhibited the most dynamic
behavior (Figure 8F). That is, pre-monsoon Rb was
low and constant, but a large increase occurred
with the onset of the monsoon, large spikes were
predicted in response to individual rain events
(Figure 8F), and the responsiveness of Rb to rain
events persisted until the end of the monsoon (after
DOY 290, Figure 8F). Rb values in the shrub mi-
crosite during the monsoon were significantly lar-
ger (200–900 mmol m-2 s-1, Figure 8F) than
those in the grass and open microsites.
DISCUSSION
The goal of this study was to quantify how soil
respiration responds to antecedent soil moisture
and temperature—in terms of integration times, lag
times, and antecedent effects (for example, Fig-
ure 1)—across microsites created by two plant
functional types (grasses and shrubs) defining a
semiarid shrubland. Comparisons of different res-
piration model formulations indicated that the
inclusion of day random effects improved model fit,
but these terms are nonmechanistic, limiting our
ability to predict respiration dynamics over sea-
sonal time scales, on days not represented in the
dataset, or under novel conditions (Cable and
others 2008, 2011). In this study, incorporation of
antecedent conditions, in the absence of day ran-
dom effects, explained an additional 16% of the
variability in soil respiration relative to a simple
model without these effects (Figure 4). Impor-
tantly, antecedent effects explained all but 5% of
the residual variation that was explained by the day
random effects. Thus, the antecedent response of
respiration explains much of the day-to-day vari-
ability in soil respiration, and incorporating ante-
cedent factors allowed us to predict seasonal
patterns of soil respiration rates and the tempera-
ture sensitivity of soil respiration.
High soil water on the day of measurement (or
current soil water) increases soil respiration in all
three microsites (under grass, under shrubs, and in
open spaces), and this response is amplified under
wet antecedent conditions (positive current 9
antecedent soil water interaction effect, Figure 5;
Table 2). That is, soil respiration response to a rain
event is higher during a wet period, like during the
monsoon, compared to a dry period. Despite minor
differences in the importance of soil moisture one
to 2 weeks in the past, respiration rates in both the
grass and shrub microsites show antecedent re-
sponses similar to the conceptual responses de-
picted by a mixture of lines 1, 2, 3, and 4 in
Figure 1. Although, the response denoted by lines
1 and 2 (no obvious lag response) swamped out
any dominant lag response depicted by lines 3 and
4 (Figure 6A). However, small increases in the
importance of soil water conditions six and nine
weeks in the past (similar to lines 3 and 4) for the
grasses and shrubs (Figure 6A), respectively, sug-
gest a very minor lagged response possible reflect-
ing delayed root activity. Based upon our initial
assumptions about the antecedent responses (Fig-
ure 1), the importance of moisture in recent weeks
and the slow, multi-week drop off in the impor-
tance weights (Figure 6A), suggests that microbial
respiration may be an important component of
respiration in this system. Indeed, when water is
sufficiently available, microbial respiration from
wet mesquite soils can be sustained for longer than
80 days (Martens and McLain 2003).
rela
tive
imp
ort
ance
of
soil
mo
istu
re d
epth
0.0
0.2
0.4
0.6
0.8
1.0
micrositeopen grass shrub
rela
tive
imp
ort
ance
of
soil
tem
per
atu
re d
epth
0.0
0.2
0.4
0.6
0.8
1.0
Rb,antecedent T
surface conditions moreimportant
deeper conditions more important
Eo, current T
Rb, current soil waterRb, antecedent soil water
Eo, current soil waterEo, antecedent soil water
surface conditions moreimportant
deeper conditions more important
B
A
Figure 7. The posterior means and 95% credible inter-
vals (CIs) for the importance of the surface versus deep
depth of soil A moisture and B temperature conditions
for the grass, open and shrub microsites with respect to
the base rate and temperature sensitivity (equation 5).
Values above 0.5 signify the importance of surface con-
ditions and values below 0.5 signify the importance of
deep conditions.
1242 J. M. Cable and others

With regard to the microbial response, despite
lower microbial biomass and substrate quality and
quantity under grasses (Cable and others 2009), the
antecedent responses of respiration rates in grass
and shrub microsites were similar (Figure 6). The
main differences were subtle, but the cumulative
weights diverge three weeks into the past such that
the integration period associated with antecedent
soil water was longer for shrubs than grasses (Fig-
ure 6B). This subtle difference may be due to the
higher nutrient quality and quantity under shrubs,
which could sustain microbial respiration for a
longer time. The similarity of the responses, how-
ever, may be related to the fact that the ratio of
microbial biomass to substrate availability is con-
served across these microsites (Cable and others
2009). Thus, the dry nature of the system might
make it such that, regardless of the substrate con-
ditions, respiration responds to water availability
on multiple time scales (for example, days to
weeks). Substrate limitation on microbial respira-
tion may only develop after very long periods of
sustained moisture availability (Martens and
McLain 2003; McLain and Martens 2006).
We also suggest that root respiration is not neg-
ligible at this site. For example, if microbial respi-
ration was the primary contributor to total soil
respiration, we would expect a greater importance
of surface compared to subsurface or deeper mois-
ture because microbes are concentrated very close
to the surface (0–5 cm) (Cable and others 2009).
Yet, subsurface moisture (6–16 cm), which coin-
cides with layers high in root biomass (Cable
unpublished data), was important for respiration
under shrubs on the antecedent time scale and was
always important in open spaces (which have low
microbial biomass) (Figure 7A). Lastly, the minor
importance of moisture 6 and 9 weeks in the past
for grass and shrub microsites, respectively (Fig-
ure 6A), is likely a root response.
Figure 8. Mean (solid black lines) and 95% credible intervals (dashed grey lines) for the predicted (A–C) daily temperature
sensitivities (Q10 values calculated from predicted Eo values) and (D–F) soil respiration rates at 25�C (Rb equation 2) for
soil respiration in (A, C) open space, (B, D) grass, and (C, F) shrub microsites.
Soil Respiration Differences in Shrub and Grass Patches 1243
Roots are generally characterized by long life
spans and acclimation times relative to microbes
(Palta and Nobel 1989; Kubiske and others 1998;
Pavon and Briones 2000; Tang and others 2005;
Zhang and others 2009). These differences between
roots and microbes suggest that roots likely have a
longer lag period compared to microbes (Luo and
others 2001; Fierer and Schimel 2003; Davidson
and Janssens 2006; Atkin and others 2008). Al-
though roots respond more slowly to moisture than
microbes, a lag of several weeks (as estimated here)
is likely long enough to elicit a root respiration
response (for example, Nobel 1997). However, the
lag time in this study is fairly muted, as indicated by
the slight increase in the importance weights on
days 6 and 9 for the grasses and shrubs, respectively
(Figure 6A). More detailed studies are required to
mechanistically tease-apart the contribution of
roots versus microbes to the antecedent soil respi-
ration response, and to explore the prevalence of
lagged responses of respiration to rain events.
The sensitivity of soil respiration to atmospheric
vapor pressure deficit (VPD) also suggests that root
respiration significantly contributed to soil respira-
tion, at least on the current time scale in the shrub
microsites. High maximum daily VPD was associ-
ated with reduced respiration rates (Table 2),
which suggests a potential link between respiration
and canopy photosynthesis. High VPD reduces
stomatal conductance and photosynthesis of the
shrubs and grasses as this site (Scott and others
2004), potentially reducing the amount of photo-
synthate allocated the roots and root exudation (for
example, Bowling and others 2002). Others
observed lags in soil respiration of up to several
days with changes in VPD (Bowling and others
2002), potentially resulting from lags in photo-
synthate transport time from leaves to roots.
However, we did not find a significant effect of
antecedent VPD.
We assumed the effects of antecedent soil tem-
perature would occur on the order of days rather
than weeks. High soil temperatures two to three
days in the past decreased respiration rates in the
grass microsites (Table 2). A decline in respiration
rates under high antecedent temperature has been
observed in other semiarid ecosystems (Cable and
others 2008), and we suspect this is related to low
substrate availability for microbial activity in the
grass microsites (Davidson and Janssens 2006).
Decreased sensitivity of respiration rates with
higher soil temperature can also be related to
acclimation processes (Davidson and Janssens
2006), but it is unclear why this would only occur
in the grass microsites.
Similar to respiration rates, the positive effect of
past and current soil moisture on the temperature
sensitivity of respiration was consistent across all
microsites (Figures 5B, 6C). Subsurface moisture
on both time scales influenced temperature sensi-
tivity of respiration in the open microsites, but in
the grass and shrub microsites the depth of soil
moisture was less important for temperature sen-
sitivity compared to its effect on respiration rates
(Figure 7A). Relative to grasses, shrubs shorten the
duration of the antecedent effect of soil moisture
on the temperature sensitivity of respiration by
1 week, wherein the most recent week is the most
important. For grasses, however, moisture two to
three weeks in the past was most important (Fig-
ure 6C, D).
Overall, it appears that the temperature sensi-
tivity of soil respiration under shrubs was more
coupled to recent rainfall events, but respiration
rates responded to moisture on a longer time scale
(Figure 6A vs. C). However, under grasses and in
open spaces, the temperature sensitivity and res-
piration rates responded to moisture on similar
time scales. Thus, our initial assumption that the
temperature sensitivity and base respiration rates
would have similar antecedent responses was
supported, but for only two of the microsites. These
findings further support the mechanism we pro-
pose herein, that microbes drive the temperature
sensitivity of respiration in this system. For exam-
ple, shrubs support a larger microbial biomass pool
and have highly decomposable litter (Cable and
others 2009), both of which are expected to en-
hance the temperature sensitivity of microbial
respiration (Davidson and Janssens 2006). The
difference in the response of the temperature sen-
sitivity versus the base respiration rates to ante-
cedent moisture may be significant for modeling
carbon dynamics, and requires that each compo-
nent of the respiration response be considered
separately. Lastly, we did not differentiate between
intrinsic versus apparent temperature sensitivity,
but the response of each sensitivity component to
moisture and temperature may differ (Davidson
and others 2012), particularly in extreme envi-
ronments, like deserts. Future work should focus
on differentiating between these two aspects of
temperature sensitivity.
Three primary patterns emerge from examining
the seasonal dynamics of respiration rates (Rb) and
the temperature sensitivity (presented as Q10 val-
ues) (Figure 8). The first is that the precipitation
pulse events affect the base respiration rates to a
greater extent than the temperature sensitivity in
the shrub microsites (Figure 8C, F). The base res-
1244 J. M. Cable and others
piration rates are very responsive to rain events,
but the temperature sensitivities show more grad-
ual changes over the summer (Figure 8C, F).
However, the opposite occurs in the grass and open
microsites, where the temperature sensitivity is
more responsive to the rain events but the base
respiration rates show more gradual trends over the
summer (Figure 8A, B, D, E). The second pattern is
that respiration rates in the shrub microsites are
more responsive to precipitation pulses compared
to the grass and open microsites. In fact, soil res-
piration rates in the open microsites are not
responsive to pulses. This supports our idea that
respiration in the open microsites is root domi-
nated, because root respiration is likely less im-
pacted by pulses of moisture and comparatively
more responsive to long periods of high soil mois-
ture (Milchunas and Lauenroth 2001). The third
pattern is that the shrubs support higher soil res-
piration rates and temperature sensitivities than
the grass and open microsites (Figure 8). This
behavior of soil respiration in shrub microsites
likely reflects the influence of higher microbial
biomass, substrate availability and quality, and
higher root biomass (Cable and others 2009). A
final observation is that the temperature sensitivi-
ties in the shrub microsites strongly increase in
response to a rain event occurring during the dry
post-monsoon period (after a long dry period,
around DOY 290, Figure 8C). Differences in the
pulse driven responses of the temperature sensi-
tivity and the respiration rates across microsites are
likely due to the differences in the primary controls
of each. Under optimal soil moisture and temper-
ature conditions, respiration rates are proportional
to carbon availability and the biomass of respiring
organisms. Controls on the temperature sensitivity
are more complex due to interacting processes re-
lated to enzyme kinetics (Davidson and Janssens
2006).
Grasses appear to have a greater effect on soil
respiration than their cover would suggest. We
hypothesized that respiration in open space would
be a mixture of grass and shrub root respiration
given the presence of roots from each vegetation
type, the absence of surface litter, and very low
microbial biomass in open spaces. Regardless of
time scale (current or antecedent), open space soil
respiration only responds to subsurface soil mois-
ture (Figure 7A), where roots tend to be located in
this system. We compared predictions from the
models where open space respiration is a mixture
of grass and shrub soil respiration, versus open
space receiving its own parameters that are esti-
mated independently from the grass and mesquite
microsites. The models predicted the respiration
rates equally well, indicating that the additional
complexity introduced by treating open space
independently does not improve our ability to
predict soil respiration in this microsite type (Fig-
ure 4C vs. D). Surprisingly, about 75% of the soil
respiration in open space appears to be derived
from grass roots. This is likely due to rooting
architecture of the shrubs and grasses at this site.
Due to the relatively shallow (�6.5 m depth) water
table, most mesquite roots extend to this water
source whereas the bunchgrasses cannot access the
water table given their shallower root systems
(maximum rooting depth �3 m) (Scott personal
communication). This results in bunchgrass roots
dominating inter-canopy near-surface soils and
apparently playing an important role in bare soil
respiration at this site.
CONCLUSIONS
In this semiarid riparian shrubland, we showed that
high soil moisture over the past month increases
the magnitude of soil respiration in shrub and grass
microsites. The integration time of the effect of
antecedent soil moisture on respiration rates at
25�C is longer than the effect on the temperature
sensitivity. Moreover, shrubs shorten the time
period over which antecedent soil moisture affects
the temperature sensitivity of respiration compared
to grasses. The relative response of roots versus
microbes cannot be wholly discerned, but the effect
of VPD and subsurface soil moisture on soil respi-
ration in shrub microsites suggests the importance
of roots, but the responsiveness of respiration rates
to rainfall suggests the importance of microbes.
Lastly, we show that open space devoid of litter is
dominated by grass root respiration, imparting a
larger effect of grasses on soil carbon flux than
previously thought. This study suggests that the
temporal scale of environmental variability is crit-
ical in understanding respiration dynamics in
shrublands. We provide a framework for quanti-
fying antecedent effects on respiration, which can
be applied to other ecophysiological processes, and
this study addresses the need to incorporate ante-
cedent effects of decomposition dynamics in
empirical models to better describe predictors of soil
respiration (Reichstein and others 2003).
ACKNOWLEDGMENTS
This study was supported by a DOE-NICCR Grant
awarded to K. Ogle, the field data collection was
supported by an NSF Grant (DEB-0414680) awar-
Soil Respiration Differences in Shrub and Grass Patches 1245
ded to T. Huxman and D. Williams, and J. Cable
was supported by an NSF OPP Grant #0852078.
REFERENCES
Archer S, Boutton TW, Hibbard KA. 2001. Trees in grasslands:
biogeochemical consequences of woody plant expansion. In:
Schulze ED, Heimann M, Harrison S, Holland E, Lloyd J,
Prentice IC, Schimel D, Eds. Global biogeochemical cycles in
the climate system. San Diego, CA: Academic Press. p 115–30.
Atkin OK, Atkinson LJ, Fisher RA, Campbell CD, Zaragoza-
Castells J, Pitchford JW, Woodward FI, Hurry V. 2008. Using
temperature-dependent changes in leaf scaling relationships
to quantitatively account for thermal acclimation of respira-
tion in a coupled global climate–vegetation model. Glob
Chang Biol 14:2709–26.
Bowling DR, McDowell NG, Bond BJ, Law BE, Ehleringer JR.
2002. C-13 content of ecosystem respiration is linked to pre-
cipitation and vapor pressure deficit. Oecologia 131:113–24.
Brantley ST, Young DR. 2008. Shifts in litter fall and dominant
nitrogen sources after expansion of shrub thickets. Oecologia
155:337–45.
Brooks SP, Gelman A. 1998. General methods for monitoring
convergence of iterative simulations. J Comput Graph Stat
7:434–55.
Cable JM, Ogle K, Williams DG, Weltzin JF, Huxman TE. 2008.
Soil texture drives responses of soil respiration to precipitation
pulses in the Sonoran desert: implications for climate change.
Ecosystems 11:961–79.
Cable JM, Ogle K, Tyler AP, Pavao-Zuckerman MA, Huxman TE.
2009. Woody plant encroachment impacts on soil carbon and
microbial processes: results from a hierarchical Bayesian
analysis of soil incubation data. Plant Soil 320:153–67.
Cable JM, Ogle K, Lucas RW, Huxman TE, Loik ME, Smith SD,
Tissue DT, Ewers BE, Pendall E, Welker JM, Charlet TN,
Cleary M, Griffith A, Nowak RS, Rogers M, Steltzer H, Sulli-
van PF, Van Gestel N. 2011. The temperature responses of soil
respiration in deserts: a seven desert synthesis. Biogeochem-
istry 103:71.
Carbone MS, Winston GC, Trumbore SE. 2008. Soil respiration
in perennial grass and shrub ecosystems: linking environ-
mental controls with plant and microbial sources on seasonal
and diel timescales. J Geophys Res: Biogeosci 113:G03024.
Casals P, Gimeno C, Carrara A, Lopez-Sangil L, Sanz MJ. 2009.
Soil CO2 efflux and extractable organic carbon fractions under
simulated precipitation events in a Mediterranean Dehesa.
Soil Biol Bioch 41:1915–22.
Christensen JH, Hewitson B, Busuioc A, Chen A, Gao X, Held I,
Jones R, Kwon W-T, Laprise R, Magana Rueda V, Mearns L,
Menendex CG, Raisanen J, Rinke A, Rupa Kumar K, Sarr A,
Whetton P (2007) Regional climate projections. In: Solomon
S, QD, Manning M, Chen Z, Marquis M, Averyt KB, Tignor M,
Miller HL (Ed) Climate change 2007: the physical science
basis. Contribution of Working Group I to the Fourth
Assessment Report of the Intergovernmental Panel on Climate
Change. Cambridge University Press, Cambridge, UK and New
York, NY, USA
Cox JR, Frasier GW, Renard KG. 1986. Biomass distribution at
grassland and shrubland sites. Rangelands 8:67–8.
Davidson EA, Janssens IA. 2006. Temperature sensitivity of soil
carbon decomposition and feedbacks to climate change. Nat-
ure 440:165–73.
Davidson EA, Savage K, Verchot LV, Navarro R. 2002. Mini-
mizing artifacts and biases in chamber-based measurements of
soil respiration. Agric For Meteorol 113:21–37.
Davidson EA, Samanta S, Caramori SS, Savage K. 2012. The
Dual Arrhenius and Michaelis–Menten kinetics model for
decomposition of soil organic matter at hourly to seasonal
time scales. Glob Chang Biol 18:371–84.
Ekblad A, Bostrom B, Holm A, Comstedt D. 2005. Forest soil
respiration rate and delta(13)C is regulated by recent above
ground weather conditions. Oecologia 143:136–42.
Fierer N, Schimel JP. 2003. A proposed mechanism for the pulse
in carbon dioxide production commonly observed following
the rapid rewetting of a dry soil. Soil Sci Soc Am J 67:798–805.
Gamerman D, Hedibert FL. 2006. Markov Chain Monte Carlo:
stochastic simulation for Bayesian inference. Boca Raton:
Chapman & Hall/CRC.
Gelfand AE, Ghosh SK. 1998. Model choice: a minimum pos-
terior predictive loss approach. Biometrika 85:1–11.
Gelman A. 2004a. Exploratory data analysis for complex models.
J Comput Graph Stat 13:755–79.
Gelman A. 2004b. Parameterization and Bayesian modeling. J
Am Stat Assoc 99:537–45.
Gelman A, Hill J. 2006. Data analysis using regression and
multilevel/hierarchical models. New York: Cambridge Uni-
versity Press.
Hibbard KA, Archer S, Schimel DS, Valentine DW. 2001. Bio-
geochemical changes accompanying woody plant encroach-
ment in a subtropical savanna. Ecology 82:1999–2011.
Hutchinson GL, Mosier AR. 1981. Improved soil cover method
for field measurement of nitrous-oxide fluxes. Soil Sci Soc Am
J 45:311–16.
Kubiske ME, Pregitzer KS, Zak DR, Mikan CJ. 1998. Growth and
C allocation of Populus tremuloides genotypes in response to
atmospheric CO2 and soil N availability. New Phytol 140:251–
60.
Lloyd J, Taylor JA. 1994. On the temperature-dependence of soil
respiration. Funct Ecol 8:315–23.
LI-COR. 2010. LI-8100 Manual
Luo YQ, Wan SQ, Hui DF, Wallace LL. 2001. Acclimatization of
soil respiration to warming in a tall grass prairie. Nature
413:622–5.
Ma SY, Baldocchi DD, Hatala JA, Detto M, Yuste JC. 2012. Are
rain-induced ecosystem respiration pulses enhanced by lega-
cies of antecedent photodegradation in semi-arid environ-
ments? Agric For Meteorol 154:203–13.
Martens DA, McLain JET. 2003. Vegetation community impacts
on soil carbon, nitrogen and trace gas fluxes. In: Proceedings,
first interagency conference on research in the watersheds,
Bensen, AZ.
McLain JET, Martens DA. 2006. Moisture controls on trace gas
fluxes in semiarid riparian soils. Soil Sci Soci Am J 70:367–77.
Midwood AJ, Boutton TW, Archer SR, Watts SE. 1998. Water
use by woody plants on contrasting soils in a savanna park-
land: assessment with delta H-2 and delta O-18. Plant Soil
205:13–24.
Milchunas DG, Lauenroth WK. 2001. Belowground primary
production by carbon isotope decay and longterm root bio-
mass dynamics. Ecosystems 4:139–50.
Nobel PS. 1997. Root distribution and seasonal production in the
northwestern Sonoran desert for a C-3 subshrub, a C-4
bunchgrass, and a CAM leaf succulent. Am J Bot 84:949–55.
1246 J. M. Cable and others
Palta JA, Nobel PS. 1989. Influences of water status, tempera-
ture, and root age on daily patterns of root respiration for 2
cactus species. Ann Bot-London 63:651–62.
Pavon NP, Briones O. 2000. Root distribution, standing crop
biomass and belowground productivity in a semidesert in
Mexico. Plant Ecol 146:131–6.
Pearcy RW, Ehleringer JR, Mooney HA, Rundel PW. 1990. Plant
physiological ecology: field methods and instrumentation.
London: Chapman and Hall.
Qi Y, Xu M, Wu JG. 2002. Temperature sensitivity of soil res-
piration and its effects on ecosystem carbon budget: nonlin-
earity begets surprises. Ecol Model 153:131–42.
Reichstein M, Rey A, Freibauer A, Tenhunen J, Valentini R,
Banza J, Casals P, Cheng YF, Grunzweig JM, Irvine J, Joffre R,
Law BE, Loustau D, Miglietta F, Oechel W, Ourcival JM,
Pereira JS, Peressotti A, Ponti F, Qi Y, Rambal S, Rayment M,
Romanya J, Rossi F, Tedeschi V, Tirone G, Xu M, Yakir D.
2003. Modeling temporal and large-scale spatial variability of
soil respiration from soil water availability, temperature and
vegetation productivity indices. Glob Biogeochem Cycles
17:1104.
Schenk HJ, Jackson RB. 2002a. The global biogeography of
roots. Ecol Monogr 72:311–28.
Schenk HJ, Jackson RB. 2002b. Rooting depths, lateral root
spreads and below-ground/above-ground allometries of plants
in water-limited ecosystems. J Ecol 90:480–94.
Schwinning S, Ehleringer JR. 2001. Water use trade-offs and
optimal adaptations to pulse-driven arid ecosystems. J Ecol
89:464–80.
Scott RL, Edwards EA, Shuttleworth WJ, Huxman TE, Watts C,
Goodrich DC. 2004. Interannual and seasonal variation in
fluxes of water and carbon dioxide from a riparian woodland
ecosystem. Agric For Meteorol 122:65–84.
Scott RL, Huxman TE, Williams DG, Goodrich DC. 2006. Eco-
hydrological impacts of woody-plant encroachment: seasonal
patterns of water and carbon dioxide exchange within a
semiarid riparian environment. Glob Chang Biol 12:311–24.
Spiegelhalter DJ, Best NG, Carlin BR, van der Linde A. 2002.
Bayesian measures of model complexity and fit. J R Stat Soc B
64:583–616.
Sponseller RA. 2007. Precipitation pulses and soil CO2 flux in a
Sonoran desert ecosystem. Glob Chang Biol 13:426–36.
Tang JW, Baldocchi DD, Xu L. 2005. Tree photosynthesis mod-
ulates soil respiration on a diurnal time scale. Glob Chang Biol
11:1298–304.
Xu LK, Baldocchi DD, Tang JW. 2004. How soil moisture, rain
pulses, and growth alter the response of ecosystem respiration
to temperature. Glob Biogeochem Cycles 18: GB4002.
Zhang ZS, Li XR, Liu LC, Jia RL, Zhang JG, Wang T. 2009. Dis-
tribution, biomass, and dynamics of roots in a revegetated
stand of Caragana korshinskii in the Tengger desert, north-
western China. J Plant Res 122:109–19.
Soil Respiration Differences in Shrub and Grass Patches 1247
Copyright © 2022 FDOKUMEN