Canada Mexico Trade
35
1 CanadaMexico Trade Relations Data Source: World Integrated Trade Solution (WITS), United Nations Commodity Trade Statistics Database (UN Comtrade): WITS-UN Comtrade. Retrieved and Presented by: Amr El-Alfy and Chiedza Sadomba Trade Ranking in 2012 1 • Canada’s imports from Mexico totalled: $25,523,293,000 • Canada’s exports to Mexico totalled: $5,392,936,000 • Mexico was Canada’s 3 rd largest import trading partner (Mexico was 4 th in 2002) • Mexico was Canada’s 5 th largest export trading partner (Mexico was 6 th in 2002) • Canada was Mexico’s 6th largest import trading partner • Canada was Mexico’s 2nd largest export trading partner Canada’s Exports and Imports with Mexico Source: WITSUN Comtrade, accessed November 20, 2013 (SITC Revision 1). 1 Based on total trade value in US dollars. Source: World Integrated Trade Solution (WITS), United Nations Commodity Trade Statistics Database (UN Comtrade), accessed October 14, 2013 and August 26, 2014 (HS 2002). 0 5,000,000 10,000,000 15,000,000 20,000,000 25,000,000 30,000,000 1962 1964 1966 1968 1970 1972 1974 1976 1978 1980 1982 1984 1986 1988 1990 1992 1994 1996 1998 2000 2002 2004 2006 2008 2010 2012 Trade Value in 1000 USD Year Gross imports from Mexico Gross exports to Mexico
Transcript of Canada Mexico Trade

1
Canada-‐Mexico Trade Relations Data Source: World Integrated Trade Solution (WITS), United Nations Commodity Trade Statistics Database (UN Comtrade): WITS-UN Comtrade. Retrieved and Presented by: Amr El-Alfy and Chiedza Sadomba
Trade Ranking in 20121 • Canada’s imports from Mexico totalled: $25,523,293,000 • Canada’s exports to Mexico totalled: $5,392,936,000 • Mexico was Canada’s 3rd largest import trading partner (Mexico was 4th in 2002) • Mexico was Canada’s 5th largest export trading partner (Mexico was 6th in 2002) • Canada was Mexico’s 6th largest import trading partner • Canada was Mexico’s 2nd largest export trading partner
Canada’s Exports and Imports with Mexico
Source: WITS-‐UN Comtrade, accessed November 20, 2013 (SITC Revision 1).
1 Based on total trade value in US dollars. Source: World Integrated Trade Solution (WITS), United Nations Commodity Trade Statistics Database (UN Comtrade), accessed October 14, 2013 and August 26, 2014 (HS 2002).
0
5,000,000
10,000,000
15,000,000
20,000,000
25,000,000
30,000,000
1962
1964
1966
1968
1970
1972
1974
1976
1978
1980
1982
1984
1986
1988
1990
1992
1994
1996
1998
2000
2002
2004
2006
2008
2010
2012
Trad
e Va
lue
in 1
000
USD
Year
Gross imports from Mexico Gross exports to Mexico

2
Canada’s Gross Imports from Mexico, 2012
Product Trade Value in 1000 USD Vehicles o/t railw/tramw roll-‐stock 7,200,509 Electrical mchy equip parts thereof 6,115,004 Nuclear reactors, boilers, mchy & m 3,712,393 Mineral fuels, oils & product of th 1,162,921 Furniture; bedding, mattress, matt 1,111,260 Optical, photo, cine, meas, checkin 870,690 Natural/cultured pearls, prec stone 674,349 Edible vegetables and certain roots 558,703 Edible fruit and nuts; peel of citr 435,893 Articles of iron or steel. 394,520 Ores, slag and ash. 291,343 Plastics and articles thereof. 225,235 Aircraft, spacecraft, and parts the 213,001 Art of apparel & clothing access, n 202,078 Rubber and articles thereof. 185,816 Miscellaneous articles of base meta 176,372 Toys, games & sports requisites; pa 146,259 Beverages, spirits and vinegar. 133,947 Art of apparel & clothing access, 115,833 Iron and steel. 109,702 Pharmaceutical products. 76,975 Ceramic products. 72,108 Paper & paperboard; art of paper pu 68,046 Organic chemicals. 66,032 Glass and glassware. 58,770 Printed books, newspapers, pictures 56,592 Inorgn chem; compds of prec mtl, r 55,926 Essential oils & resinoids; perf, 53,534 Tool, implement, cutlery, spoon & f 37,818 Coffee, tea, matï and spices. 33,669 Miscellaneous manufactured articles 33,102 Cocoa and cocoa preparations. 32,841 Railw/tramw locom, rolling-‐stock & 32,223 Miscellaneous chemical products. 31,433 Prep of vegetable, fruit, nuts or o 30,152 Explosives; pyrotechnic prod; match 29,564 Aluminium and articles thereof. 27,435 Salt; sulphur; earth & ston; plaste 27,059

3
Copper and articles thereof. 23,287 Miscellaneous edible preparations. 22,872 Articles of leather; saddlery/harne 22,828 Man-‐made filaments. 20,576 Ships, boats and floating structure 19,882 Art of stone, plaster, cement, asbe 19,483 Sugars and sugar confectionery. 19,043 Footwear, gaiters and the like; par 17,225 Wood and articles of wood; wood ch 16,929 Tanning/dyeing extract; tannins & 15,336 Carpets and other textile floor co 13,599 Animal/veg fats & oils & their clea 13,369 Residues & waste from the food indu 13,195 Prep.of cereal, flour, starch/milk; 13,156 Soap, organic surface-‐active agents 8,849 Fish & crustacean, mollusc & other 8,474 Oil seed, oleagi fruits; miscell gr 7,866 Musical instruments; parts and acce 6,638 Wool, fine/coarse animal hair, hors 5,380 Clocks and watches and parts thereo 5,362 Wadding, felt & nonwoven; yarns; tw 4,819 Live tree & other plant; bulb, root 4,789 Impregnated, coated, cover/laminate 4,610 Raw hides and skins (other than fu 3,855 Zinc and articles thereof. 3,707 Headgear and parts thereof. 3,357 Albuminoidal subs; modified starche 3,338 Man-‐made staple fibres. 1,787 Tin and articles thereof. 1,630 Fertilisers. 1,521 Special woven fab; tufted tex fab; 1,350 Tobacco and manufactured tobacco su 1,258 Works of art, collectors' pieces an 1,234 Prep of meat, fish or crustaceans, 1,193 Knitted or crocheted fabrics. 943 Cotton. 754 Prod.mill.indust; malt; starches; 494 Lac; gums, resins & other vegetable 398 Vegetable plaiting materials; veget 332 Manufactures of straw, esparto/othe 322 Cork and articles of cork. 182

4
Nickel and articles thereof. 181 Products of animal origin, nes or 139 Other base metals; cermets; article 97 Photographic or cinematographic goo 87 Furskins and artificial fur; manuf 83 Dairy prod; birds' eggs; natural ho 80 Umbrellas, walking-‐sticks, seat-‐sti 72 Arms and ammunition; parts and acc 67 Live animals 66 Prepr feathers & down; arti flower; 58 Cereals 30 Lead and articles thereof. 15 Other vegetable textile fibres; pap 6 Pulp of wood/of other fibrous cellu 1 Total Imports 25,195,308 Source: WITS-‐UN Comtrade, accessed December 29, 2013 (HS 2002).
Canada’s Gross Exports to Mexico, 2012 Product Trade Value in 1000 USD
Oil seed, oleagi fruits; miscell gr 965,254 Vehicles o/t railw/tramw roll-‐stock 725,798 Electrical mchy equip parts thereof 483,054 Nuclear reactors, boilers, mchy & m 423,796 Iron and steel. 348,900 Cereals 337,056 Aluminium and articles thereof. 252,958 Plastics and articles thereof. 218,682 Meat and edible meat offal 194,286 Aircraft, spacecraft, and parts the 160,178 Miscellaneous chemical products. 115,996 Pulp of wood/of other fibrous cellu 70,335 Paper & paperboard; art of paper pu 63,503 Optical, photo, cine, meas, checkin 58,775 Articles of iron or steel. 57,296 Furniture; bedding, mattress, matt 56,868 Pharmaceutical products. 56,239 Rubber and articles thereof. 54,691 Edible vegetables and certain roots 45,626 Natural/cultured pearls, prec stone 45,359 Mineral fuels, oils & product of th 41,449 Organic chemicals. 39,234

5
Ores, slag and ash. 37,438 Cocoa and cocoa preparations. 33,318 Prep of vegetable, fruit, nuts or o 32,237 Animal/veg fats & oils & their clea 31,145 Tool, implement, cutlery, spoon & f 30,118 Fertilisers. 29,119 Prep.of cereal, flour, starch/milk; 28,292 Miscellaneous articles of base meta 28,078 Salt; sulphur; earth & ston; plaste 26,138 Residues & waste from the food indu 25,615 Sugars and sugar confectionery. 21,887 Prod.mill.indust; malt; starches; 21,764 Essential oils & resinoids; perf, 18,490 Products of animal origin, nes or 16,018 Explosives; pyrotechnic prod; match 13,904 Miscellaneous edible preparations. 13,695 Wood and articles of wood; wood ch 12,407 Railw/tramw locom, rolling-‐stock & 12,321 Dairy prod; birds' eggs; natural ho 10,992 Special woven fab; tufted tex fab; 10,635 Impregnated, coated, cover/laminate 8,858 Man-‐made filaments. 7,193 Printed books, newspapers, pictures 6,353 Albuminoidal subs; modified starche 6,081 Toys, games & sports requisites; pa 5,592 Inorgn chem; compds of prec mtl, r 3,839 Other base metals; cermets; article 3,293 Art of apparel & clothing access, 2,141 Ships, boats and floating structure 2,076 Wadding, felt & nonwoven; yarns; tw 1,982 Tanning/dyeing extract; tannins & 1,830 Copper and articles thereof. 1,734 Soap, organic surface-‐active agents 1,663 Art of stone, plaster, cement, asbe 1,657 Articles of leather; saddlery/harne 1,268 Edible fruit and nuts; peel of citr 1,255 Glass and glassware. 1,232 Tobacco and manufactured tobacco su 1,017 Ceramic products. 1,007 Miscellaneous manufactured articles 880 Knitted or crocheted fabrics. 868

6
Raw hides and skins (other than fu 818 Live animals 716 Photographic or cinematographic goo 673 Art of apparel & clothing access, n 455 Coffee, tea, matï and spices. 346 Clocks and watches and parts thereo 295 Arms and ammunition; parts and acc 291 Lac; gums, resins & other vegetable 278 Man-‐made staple fibres. 270 Beverages, spirits and vinegar. 242 Cotton. 239 Fish & crustacean, mollusc & other 232 Nickel and articles thereof. 213 Zinc and articles thereof. 198 Other vegetable textile fibres; pap 160 Headgear and parts thereof. 141 Works of art, collectors' pieces an 138 Prepr feathers & down; arti flower; 90 Prep of meat, fish or crustaceans, 60 Musical instruments; parts and acce 57 Carpets and other textile floor co 31 Lead and articles thereof. 28 Footwear, gaiters and the like; par 25 Furskins and artificial fur; manuf 18 Tin and articles thereof. 7 Umbrellas, walking-‐sticks, seat-‐sti 3
Total Exports 5,336,788 Source: WITS-‐UN Comtrade, accessed December 29, 2013 (HS 2002).
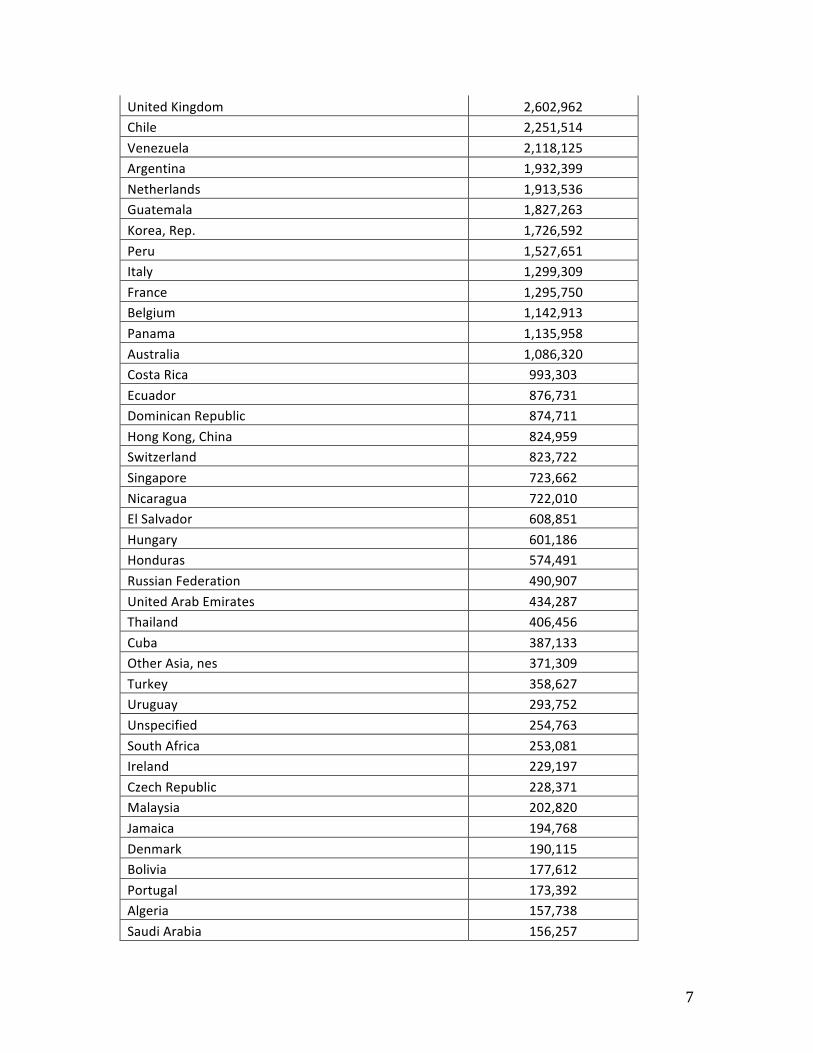
Mexico’s Export Trading Partners, 2012
Country Trade Value in 1000 USD United States 288,178,654 Canada 10,927,229 Spain 7,023,928 China 5,720,856 Brazil 5,657,554 Colombia 5,592,265 Germany 4,484,348 India 3,306,360 Japan 2,610,661
7
United Kingdom 2,602,962 Chile 2,251,514 Venezuela 2,118,125 Argentina 1,932,399 Netherlands 1,913,536 Guatemala 1,827,263 Korea, Rep. 1,726,592 Peru 1,527,651 Italy 1,299,309 France 1,295,750 Belgium 1,142,913 Panama 1,135,958 Australia 1,086,320 Costa Rica 993,303 Ecuador 876,731 Dominican Republic 874,711 Hong Kong, China 824,959 Switzerland 823,722 Singapore 723,662 Nicaragua 722,010 El Salvador 608,851 Hungary 601,186 Honduras 574,491 Russian Federation 490,907 United Arab Emirates 434,287 Thailand 406,456 Cuba 387,133 Other Asia, nes 371,309 Turkey 358,627 Uruguay 293,752 Unspecified 254,763 South Africa 253,081 Ireland 229,197 Czech Republic 228,371 Malaysia 202,820 Jamaica 194,768 Denmark 190,115 Bolivia 177,612 Portugal 173,392 Algeria 157,738 Saudi Arabia 156,257

8
Poland 154,148 Indonesia 146,405 Belize 129,623 Romania 124,288 Israel 115,724 Trinidad and Tobago 107,851 Paraguay 103,466 New Zealand 102,366 Finland 100,107 Sweden 92,825 Austria 88,780 Vietnam 84,243 Kuwait 83,928 Greece 71,356 Philippines 66,923 Norway 65,755 Qatar 64,923 Egypt, Arab Rep. 64,224 Iraq 59,142 Bahamas, The 58,156 Lithuania 53,842 Nigeria 48,733 Ukraine 46,208 Angola 44,922 Jordan 44,778 Haiti 44,703 Bulgaria 31,646 Libya 28,746 Bahrain 27,443 Slovak Republic 26,700 Barbados 26,151 Kazakhstan 25,696 Tunisia 25,371 Oman 24,222 Pakistan 22,732 Lebanon 18,014 Suriname 15,780 Luxembourg 15,278 Morocco 11,546 Guyana 11,290 Latvia 10,490

9
Zambia 10,163 Aruba 9,479 Estonia 8,745 Ghana 7,061 Cyprus 6,723 Slovenia 5,773 Iran, Islamic Rep. 5,689 Mongolia 4,947 Equatorial Guinea 4,931 Bermuda 4,897 Brunei 4,502 Papua New Guinea 4,022 Sri Lanka 3,955 Turkmenistan 3,873 Kenya 3,820 Togo 3,735 Uzbekistan 3,629 Azerbaijan 3,497 Gibraltar 2,915 Antigua and Barbuda 2,568 St. Lucia 2,418 Cameroon 2,412 Cote d'Ivoire 2,355 Bangladesh 2,168 Syrian Arab Republic 2,042 Dominica 2,022 Malta 1,904 Georgia 1,849 Myanmar 1,842 Belarus 1,796 Croatia 1,744 Korea, Dem. Rep. 1,685 Uganda 1,668 Cayman Islands 1,603 Guam 1,599 British Virgin Islands 1,579 Tanzania 1,444 Grenada 1,352 Turks and Caicos Isl. 1,320 Zimbabwe 1,163 Armenia 939

10
Bosnia and Herzegovina 919 Mozambique 902 St. Kitts and Nevis 879 Liberia 766 Yugoslavia 750 Fiji 731 Yemen 713 Albania 703 Iceland 698 Gabon 684 Macao 672 Congo, Rep. 659 Guinea 627 St. Vincent and the Grenadines 592 Eritrea 577 Senegal 539 Sudan 484 Namibia 459 Guinea-‐Bissau 441 Central African Republic 422 Swaziland 420 Afghanistan 401 Samoa 348 Lao PDR 302 Ethiopia(excludes Eritrea) 296 Macedonia, FYR 294 French Polynesia 291 Cambodia 236 Mauritius 219 Maldives 197 Micronesia, Fed. Sts. 184 Niger 173 New Caledonia 165 Sierra Leone 160 Mali 153 Nepal 146 Marshall Islands 139 Anguila 119 Kyrgyz Republic 111 Western Sahara 108 Mauritania 104

11
Burundi 92 Burkina Faso 87 Tajikistan 76 Occ.Pal.Terr 74 Moldova 70 Djibouti 67 Benin 66 Madagascar 60 Botswana 50 Bhutan 50 Andorra 36 San Marino 35 Congo, Dem. Rep. 33 Vanuatu 29 Wallis and Futura Isl. 27 Comoros 24 Solomon Islands 21 Fr. So. Ant. Tr 16 Montenegro 15 Christmas Island 10 Tonga 9 British Indian Ocean Ter. 7 Saint Pierre and Miquelon 6 Cocos (Keeling) Islands 3 Niue 3 Northern Mariana Islands 1 Malawi 1 Seychelles 0 Gambia, The 0 Total Exports 370,595,459 Source: WITS-‐UN Comtrade, accessed December 29, 2013 (HS 2002).
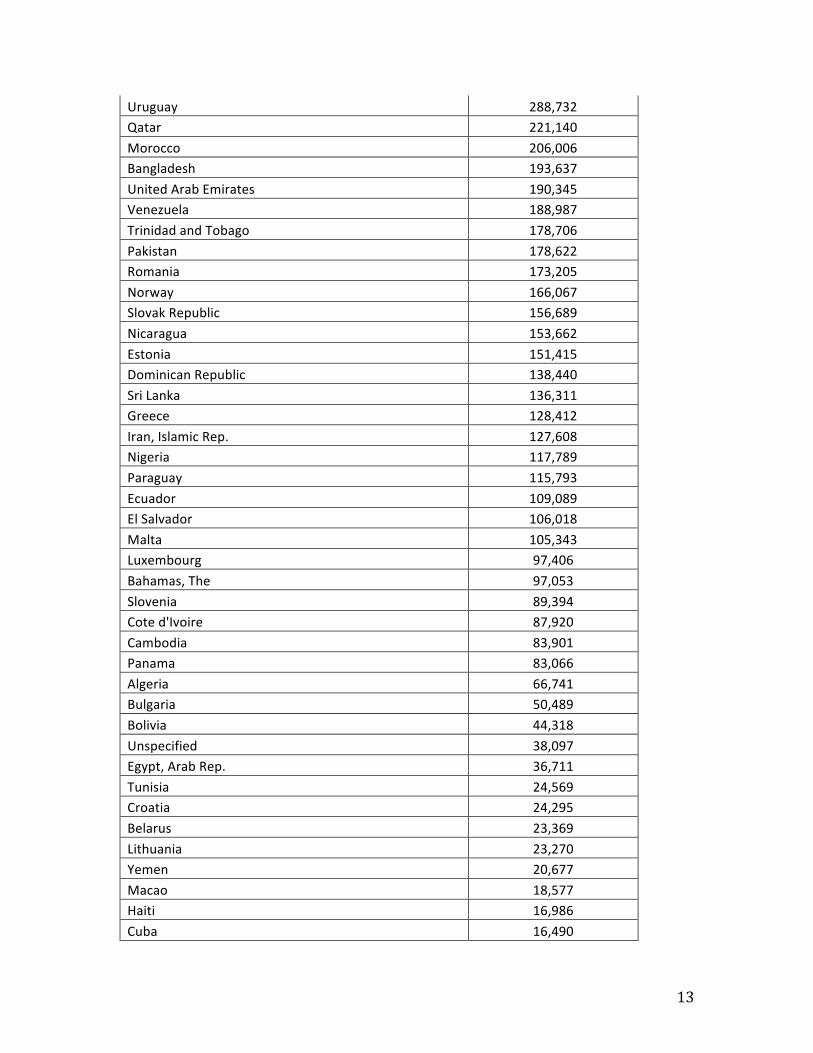
Mexico’s Import Trading Partners, 2012
Country Trade Value in 1000 USD United States 185,683,875 China 56,936,125 Japan 17,655,206 Germany 13,507,763 Korea, Rep. 13,340,966 Canada 9,889,853

12
Other Asia, nes 6,183,006 Italy 5,462,439 Malaysia 4,735,613 Brazil 4,494,509 Spain 4,081,099 Thailand 3,805,704 Netherlands 3,561,584 France 3,471,934 Costa Rica 3,259,369 India 2,950,912 United Kingdom 2,391,965 Switzerland 1,535,515 Chile 1,502,613 Philippines 1,389,075 Singapore 1,371,143 Sweden 1,299,168 Russian Federation 1,208,811 Indonesia 1,190,567 Vietnam 1,153,987 Ireland 1,010,600 Argentina 1,004,170 Belgium 984,205 Australia 934,458 Colombia 877,072 Austria 876,190 Israel 735,927 South Africa 706,579 Poland 677,480 Czech Republic 668,174 Saudi Arabia 667,353 Hungary 626,587 Guatemala 611,731 Denmark 465,797 Peru 439,973 Portugal 437,163 Turkey 426,413 Finland 423,044 Honduras 352,879 Hong Kong, China 338,755 New Zealand 335,043 Ukraine 298,779
13
Uruguay 288,732 Qatar 221,140 Morocco 206,006 Bangladesh 193,637 United Arab Emirates 190,345 Venezuela 188,987 Trinidad and Tobago 178,706 Pakistan 178,622 Romania 173,205 Norway 166,067 Slovak Republic 156,689 Nicaragua 153,662 Estonia 151,415 Dominican Republic 138,440 Sri Lanka 136,311 Greece 128,412 Iran, Islamic Rep. 127,608 Nigeria 117,789 Paraguay 115,793 Ecuador 109,089 El Salvador 106,018 Malta 105,343 Luxembourg 97,406 Bahamas, The 97,053 Slovenia 89,394 Cote d'Ivoire 87,920 Cambodia 83,901 Panama 83,066 Algeria 66,741 Bulgaria 50,489 Bolivia 44,318 Unspecified 38,097 Egypt, Arab Rep. 36,711 Tunisia 24,569 Croatia 24,295 Belarus 23,369 Lithuania 23,270 Yemen 20,677 Macao 18,577 Haiti 16,986 Cuba 16,490

14
Jordan 16,359 Oman 16,311 Latvia 15,323 Georgia 14,198 Bahrain 13,847 Marshall Islands 13,172 Sudan 12,662 Swaziland 10,987 Guyana 9,902 Korea, Dem. Rep. 9,098 Mauritius 7,735 Bosnia and Herzegovina 7,705 Kiribati 7,542 Madagascar 7,423 Namibia 6,711 Gabon 6,705 Vanuatu 6,556 Belize 6,260 Armenia 5,725 Aruba 4,884 Myanmar 4,728 Yugoslavia 4,453 Sierra Leone 4,329 Mongolia 3,959 Cameroon 3,944 Iceland 3,706 Mozambique 3,610 Cyprus 3,441 Malawi 3,389 Jamaica 3,252 Zimbabwe 3,038 Macedonia, FYR 2,642 Lesotho 2,380 St. Kitts and Nevis 2,377 Ethiopia(excludes Eritrea) 2,364 Senegal 2,358 Nepal 2,089 Syrian Arab Republic 1,893 British Virgin Islands 1,751 Micronesia, Fed. Sts. 1,710 Turkmenistan 1,693

15
Fiji 1,606 Kenya 1,520 Albania 1,316 Afghanistan 1,282 Ghana 1,132 Lebanon 1,108 Anguila 941 Kazakhstan 941 Maldives 823 Liberia 779 Moldova 733 Barbados 723 Lao PDR 673 Uganda 639 Equatorial Guinea 593 Somalia 593 Tanzania 567 San Marino 533 Congo, Rep. 475 Saint Helena 474 Seychelles 423 Sao Tome and Principe 343 Mauritania 328 East Timor 294 Kyrgyz Republic 286 Dominica 276 Pitcairn 261 Samoa 258 Gibraltar 229 Niger 202 Andorra 186 Iraq 181 Botswana 168 New Caledonia 161 Rwanda 161 Grenada 160 Mali 159 Congo, Dem. Rep. 157 Gambia, The 155 Palau 149 Tajikistan 146

16
Antigua and Barbuda 143 Papua New Guinea 135 St. Lucia 122 Benin 119 Uzbekistan 107 Falkland Island 95 Togo 93 Zambia 88 Angola 85 Bermuda 84 Chad 79 Libya 77 Turks and Caicos Isl. 75 Suriname 75 Montenegro 72 Kuwait 70 Burkina Faso 67 Holy See 64 Christmas Island 61 Montserrat 59 Eritrea 54 Central African Republic 52 British Indian Ocean Ter. 36 Tokelau 30 Comoros 29 Tuvalu 29 Cocos (Keeling) Islands 28 Solomon Islands 28 Guinea 26 St. Vincent and the Grenadines 26 Northern Mariana Islands 25 Nauru 23 Azerbaijan 21 Cayman Islands 21 Wallis and Futura Isl. 16 Guinea-‐Bissau 14 Niue 13 French Polynesia 13 Cape Verde 11 Bhutan 11 Brunei 9

17
Occ.Pal.Terr 8 Cook Islands 6 Burundi 4 Fr. So. Ant. Tr 2 Tonga 2 Norfolk Island 2 Guam 2 Western Sahara 1 Djibouti 1 Saint Pierre and Miquelon 1 Heard Island and McDonald Isla 0 Total Imports 370,723,173 Source: WITS-‐UN Comtrade, accessed December 29, 2013 (HS 2002).
18
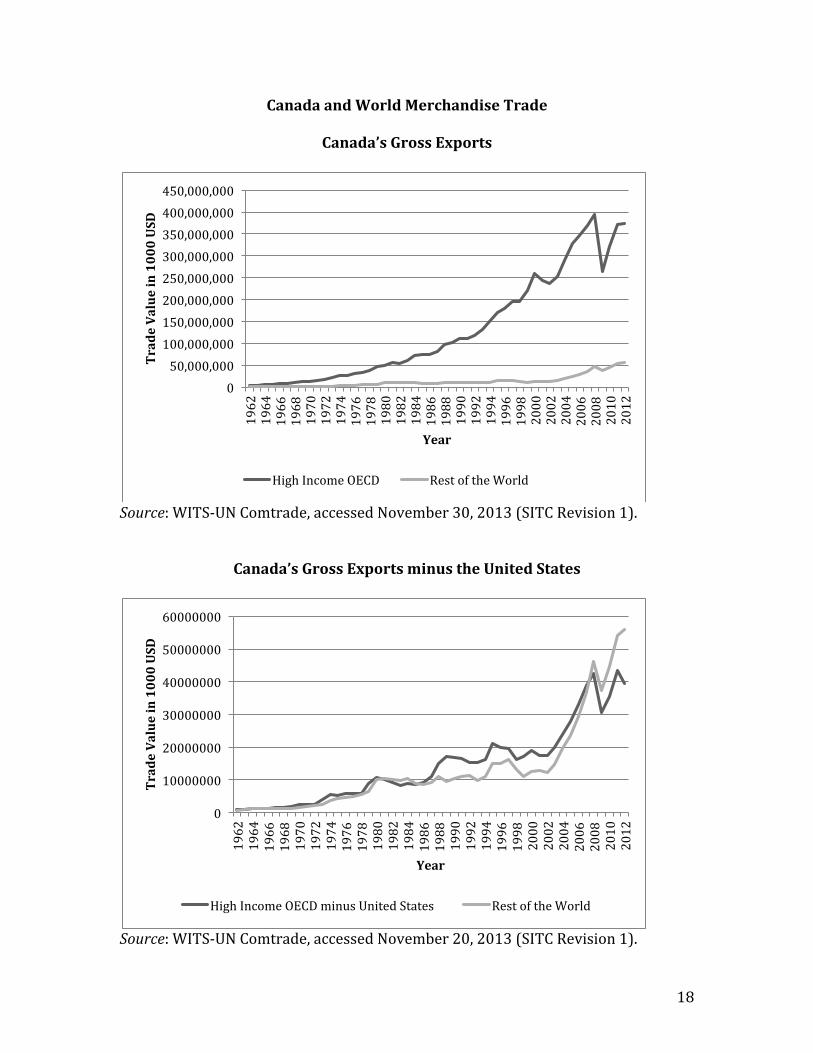
Canada and World Merchandise Trade
Canada’s Gross Exports
Source: WITS-‐UN Comtrade, accessed November 30, 2013 (SITC Revision 1).
Canada’s Gross Exports minus the United States
Source: WITS-‐UN Comtrade, accessed November 20, 2013 (SITC Revision 1).
0 50,000,000 100,000,000 150,000,000 200,000,000 250,000,000 300,000,000 350,000,000 400,000,000 450,000,000
1962
1964
1966
1968
1970
1972
1974
1976
1978
1980
1982
1984
1986
1988
1990
1992
1994
1996
1998
2000
2002
2004
2006
2008
2010
2012
Trade Value in 1000 USD
Year
High Income OECD Rest of the World
0
10000000
20000000
30000000
40000000
50000000
60000000
1962
1964
1966
1968
1970
1972
1974
1976
1978
1980
1982
1984
1986
1988
1990
1992
1994
1996
1998
2000
2002
2004
2006
2008
2010
2012
Trade Value in 1000 USD
Year
High Income OECD minus United States Rest of the World

19
Canada’s Gross Imports
Source: WITS-‐UN Comtrade, accessed November 20, 2013 (SITC Revision 1).
Canada’s Gross Imports minus the United States
Source: WITS-‐UN Comtrade, accessed November 20, 2013 (SITC Revision 1).
0
50,000,000
100,000,000
150,000,000
200,000,000
250,000,000
300,000,000
350,000,000
1962
1964
1966
1968
1970
1972
1974
1976
1978
1980
1982
1984
1986
1988
1990
1992
1994
1996
1998
2000
2002
2004
2006
2008
2010
2012
Total Value in 1000 USD
Year
High Income OECD Rest of the World
0
20000000
40000000
60000000
80000000
100000000
120000000
140000000
160000000
1962
1964
1966
1968
1970
1972
1974
1976
1978
1980
1982
1984
1986
1988
1990
1992
1994
1996
1998
2000
2002
2004
2006
2008
2010
2012
Total Value in 1000 USD
Year
High Income OECD minus United States Rest of the World

20
Canada’s Export Trading Partners, 2012
Country Trade Value in 1000 USD United States 337,829,640 China 19,363,968 United Kingdom 18,776,756 Japan 10,360,835 Mexico 5,392,936 Netherlands 4,544,161 Korea, Rep. 3,719,942 Germany 3,400,807 France 3,154,235 Brazil 2,580,227 Hong Kong, China 2,459,542 India 2,357,692 Norway 2,322,518 Belgium 2,307,764 Australia 2,040,239 Italy 1,709,299 Indonesia 1,681,590 Russian Federation 1,652,506 Other Asia, nes 1,466,151 United Arab Emirates 1,451,291 Saudi Arabia 1,369,282 Spain 920,092 Singapore 896,489 Switzerland 867,446 Turkey 850,435 Colombia 828,749 Chile 789,751 Malaysia 784,268 Venezuela 740,864 Thailand 716,511 South Africa 634,753 Peru 536,688 Bangladesh 525,481 Philippines 523,384 Bahamas, The 503,937 Finland 455,689 Sweden 447,568 Egypt, Arab Rep. 447,540 Poland 445,374 Cuba 422,266 Algeria 420,080

21
Iraq 395,344 New Zealand 385,304 Vietnam 370,104 Morocco 368,842 Denmark 333,445 Trinidad and Tobago 329,956 Nigeria 326,902 Sri Lanka 322,091 Ireland 317,270 Austria 316,837 Argentina 300,117 Pakistan 283,539 Israel 265,859 Ecuador 265,265 Ghana 215,667 Hungary 214,219 Qatar 201,225 Oman 185,614 Costa Rica 185,602 Luxembourg 175,161 Bulgaria 169,118 Libya 153,187 Ukraine 149,059 Tunisia 137,017 Jamaica 135,909 Dominican Republic 127,527 Portugal 124,422 Ethiopia(excludes Eritrea) 121,317 Czech Republic 116,985 Lebanon 116,649 Sudan 115,139 Jordan 114,823 Romania 114,113 Guatemala 113,795 Iran, Islamic Rep. 112,687 Angola 109,190 Kazakhstan 101,857 Greece 98,409 Kuwait 97,358 Kenya 95,635 Panama 90,746 Tanzania 80,536 Lithuania 78,294 Mongolia 71,990

22
Bahrain 69,518 Slovak Republic 69,101 Burkina Faso 66,691 Barbados 61,382 Malta 59,922 Slovenia 59,139 Latvia 54,754 Rwanda 51,113 Iceland 49,981 Turkmenistan 49,705 Nicaragua 45,774 Albania 44,617 Uruguay 42,395 Afghanistan 42,203 Azerbaijan 40,658 Cameroon 39,586 Mozambique 38,865 Honduras 38,678 Cote d'Ivoire 37,776 Senegal 37,352 Haiti 35,970 El Salvador 34,724 Bermuda 34,382 Bolivia 34,048 Zambia 33,150 Papua New Guinea 31,152 Gibraltar 28,587 Guinea 28,420 Guyana 26,776 Gabon 26,120 Togo 24,804 New Caledonia 23,141 Estonia 22,879 Congo, Dem. Rep. 22,687 Benin 21,818 Saint Pierre and Miquelon 20,744 Kyrgyz Republic 20,650 Suriname 20,581 Congo, Rep. 20,384 Madagascar 20,288 Mauritania 19,960 Georgia 19,960 Antigua and Barbuda 18,986 United States Minor Outlying I 17,575

23
Croatia 17,051 Paraguay 16,919 Mali 16,020 Liberia 14,060 Yemen 14,038 Armenia 13,614 Macedonia, FYR 12,298 Sierra Leone 11,418 Aruba 11,247 Greenland 10,889 Equatorial Guinea 10,882 Seychelles 10,579 Yugoslavia 10,553 Syrian Arab Republic 10,245 St. Lucia 10,062 Uganda 9,994 Namibia 9,826 Cyprus 9,582 Lao PDR 9,522 Cayman Islands 9,164 Fiji 8,525 French Polynesia 8,428 Belize 8,397 Antarctica 7,703 Macao 7,638 Cambodia 7,602 Zimbabwe 7,545 Uzbekistan 7,406 St. Vincent and the Grenadines 6,830 Niger 6,575 Nepal 6,564 Grenada 5,618 St. Kitts and Nevis 5,581 Dominica 5,400 Maldives 4,786 Mauritius 4,763 Chad 4,341 Brunei 4,306 Tajikistan 4,018 Malawi 3,947 Myanmar 3,088 Turks and Caicos Isl. 2,910 Belarus 2,817 Eritrea 2,589

24
Bosnia and Herzegovina 2,231 Botswana 2,065 Djibouti 1,974 Swaziland 1,938 British Virgin Islands 1,804 Korea, Dem. Rep. 1,758 Guam 1,626 Burundi 1,434 Vanuatu 1,208 Moldova 1,183 Lesotho 1,137 Montenegro 1,045 Gambia, The 966 American Samoa 954 Cape Verde 729 Anguila 640 Faeroe Islands 596 Comoros 474 Cook Islands 436 Montserrat 383 Somalia 344 Christmas Island 329 Solomon Islands 244 Cocos (Keeling) Islands 211 Central African Republic 194 Saint Helena 170 Sao Tome and Principe 163 Andorra 149 British Indian Ocean Ter. 131 Samoa 102 Fr. So. Ant. Tr 93 Guinea-‐Bissau 77 Pitcairn 68 Nauru 55 Tonga 54 Falkland Island 38 Heard Island and McDonald Isla 23 Bhutan 20 Niue 20 Kiribati 17 Norfolk Island 16 Wallis and Futura Isl. 13 East Timor 11 (blank)

25
Grand Total 453,212,327 Source: WITS-‐UN Comtrade, accessed October 10, 2013 (HS 2002).
Canada’s Import Trading Partners, 2012
Country Trade Value in 1000 USD United States 234,031,631 China 50,756,666 Mexico 25,523,293 Japan 15,042,352 Germany 14,309,799 United Kingdom 8,542,063 Korea, Rep. 6,380,322 Algeria 5,986,919 Italy 5,229,003 France 5,016,772 Other Asia, nes 4,588,741 Brazil 4,025,036 Iraq 4,006,809 Norway 3,750,856 Peru 3,686,962 Switzerland 3,576,965 Netherlands 3,550,042 Canada 3,364,684 Kazakhstan 3,076,300 India 2,858,769 Saudi Arabia 2,851,617 Thailand 2,635,274 Malaysia 2,228,187 Argentina 2,222,522 Sweden 2,093,359 Australia 2,079,885 Nigeria 2,008,009 Angola 1,930,849 Spain 1,750,328 Belgium 1,726,412 Chile 1,678,789 Vietnam 1,618,783 Turkey 1,480,411 Singapore 1,426,198 Austria 1,339,403 Indonesia 1,314,383 Ireland 1,273,264

26
Azerbaijan 1,232,943 Israel 1,145,600 Bangladesh 1,129,490 Russian Federation 1,108,965 Poland 1,094,816 Finland 1,048,119 Philippines 992,105 Denmark 951,110 South Africa 691,207 Colombia 665,041 Cambodia 598,632 Cuba 540,197 New Zealand 534,611 Egypt, Arab Rep. 515,561 Costa Rica 513,884 Guyana 454,420 Cote d'Ivoire 452,136 Equatorial Guinea 441,768 Hungary 422,123 Czech Republic 411,587 Guatemala 405,815 Nicaragua 399,984 Eritrea 373,055 Portugal 310,374 Slovak Republic 288,796 Dominican Republic 283,794 Hong Kong, China 280,062 Pakistan 277,929 Romania 273,803 Ecuador 261,950 Bolivia 250,787 Trinidad and Tobago 248,389 Venezuela 219,741 Honduras 218,835 United Arab Emirates 202,427 Bulgaria 200,528 Namibia 195,957 Sri Lanka 189,386 Lithuania 184,865 Qatar 172,725 Mongolia 166,629 Ukraine 164,770 Morocco 154,300 Greece 152,985

27
Luxembourg 147,371 Bahamas, The 146,698 Slovenia 143,376 Panama 122,095 Belarus 119,892 Suriname 115,655 Chad 115,320 Malawi 109,349 Sudan 106,421 Georgia 106,305 Jamaica 101,901 El Salvador 97,310 Madagascar 86,011 Armenia 80,033 Bahrain 78,738 Guinea 72,537 Uruguay 72,506 Iceland 55,765 Tunisia 51,176 Estonia 48,404 Iran, Islamic Rep. 40,018 Malta 35,648 Liberia 34,299 Croatia 32,806 Oman 30,722 Haiti 30,202 Jordan 21,835 Kenya 21,161 Lebanon 20,845 Ghana 20,345 Latvia 20,148 Kuwait 19,834 Ethiopia(excludes Eritrea) 17,733 Yugoslavia 14,046 Macao 13,508 Mauritius 13,083 Bosnia and Herzegovina 12,910 Nepal 12,304 Cameroon 11,086 Macedonia, FYR 10,027 Lao PDR 9,960 Paraguay 9,909 St. Kitts and Nevis 9,609 Barbados 9,552
28
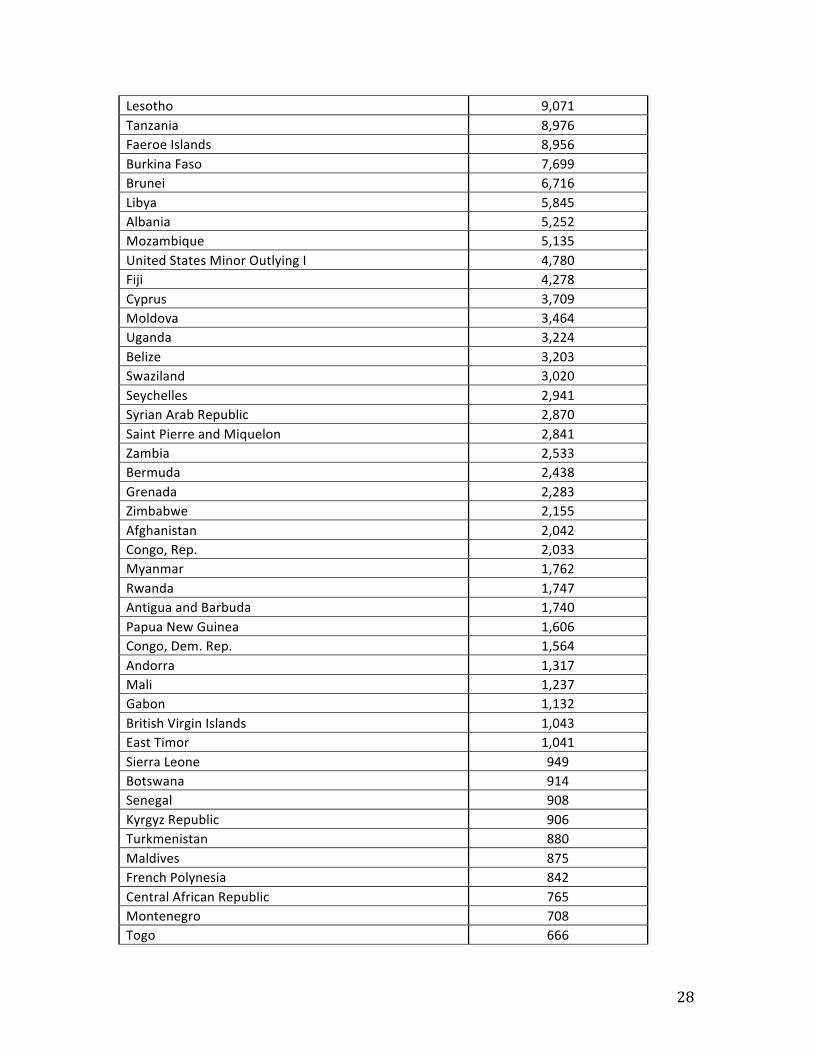
Lesotho 9,071 Tanzania 8,976 Faeroe Islands 8,956 Burkina Faso 7,699 Brunei 6,716 Libya 5,845 Albania 5,252 Mozambique 5,135 United States Minor Outlying I 4,780 Fiji 4,278 Cyprus 3,709 Moldova 3,464 Uganda 3,224 Belize 3,203 Swaziland 3,020 Seychelles 2,941 Syrian Arab Republic 2,870 Saint Pierre and Miquelon 2,841 Zambia 2,533 Bermuda 2,438 Grenada 2,283 Zimbabwe 2,155 Afghanistan 2,042 Congo, Rep. 2,033 Myanmar 1,762 Rwanda 1,747 Antigua and Barbuda 1,740 Papua New Guinea 1,606 Congo, Dem. Rep. 1,564 Andorra 1,317 Mali 1,237 Gabon 1,132 British Virgin Islands 1,043 East Timor 1,041 Sierra Leone 949 Botswana 914 Senegal 908 Kyrgyz Republic 906 Turkmenistan 880 Maldives 875 French Polynesia 842 Central African Republic 765 Montenegro 708 Togo 666

29
Uzbekistan 593 Norfolk Island 588 Falkland Island 580 American Samoa 547 Niger 476 Greenland 443 Comoros 416 Cayman Islands 414 Solomon Islands 381 New Caledonia 376 Burundi 367 Anguila 270 St. Lucia 267 Dominica 222 Montserrat 197 Mauritania 190 Turks and Caicos Isl. 186 Antarctica 183 St. Vincent and the Grenadines 170 Guam 143 Cocos (Keeling) Islands 140 Nauru 125 Yemen 122 Kiribati 114 Samoa 102 Korea, Dem. Rep. 88 Benin 86 Tajikistan 78 Vanuatu 70 Somalia 61 Gambia, The 56 Bhutan 53 Tonga 52 Christmas Island 48 Wallis and Futura Isl. 45 Cook Islands 44 Sao Tome and Principe 39 Saint Helena 39 Gibraltar 36 British Indian Ocean Ter. 26 Djibouti 26 Pitcairn 25 Cape Verde 16 Niue 15
30
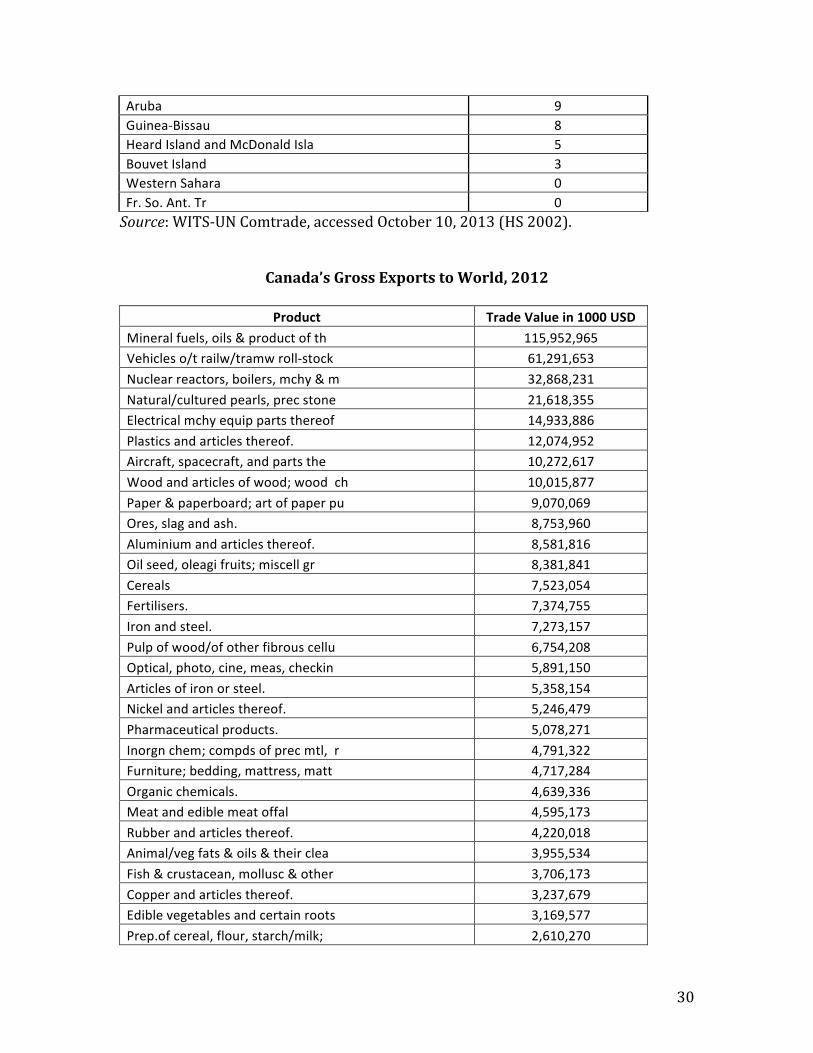
Aruba 9 Guinea-‐Bissau 8 Heard Island and McDonald Isla 5 Bouvet Island 3 Western Sahara 0 Fr. So. Ant. Tr 0 Source: WITS-‐UN Comtrade, accessed October 10, 2013 (HS 2002).
Canada’s Gross Exports to World, 2012
Product Trade Value in 1000 USD Mineral fuels, oils & product of th 115,952,965 Vehicles o/t railw/tramw roll-‐stock 61,291,653 Nuclear reactors, boilers, mchy & m 32,868,231 Natural/cultured pearls, prec stone 21,618,355 Electrical mchy equip parts thereof 14,933,886 Plastics and articles thereof. 12,074,952 Aircraft, spacecraft, and parts the 10,272,617 Wood and articles of wood; wood ch 10,015,877 Paper & paperboard; art of paper pu 9,070,069 Ores, slag and ash. 8,753,960 Aluminium and articles thereof. 8,581,816 Oil seed, oleagi fruits; miscell gr 8,381,841 Cereals 7,523,054 Fertilisers. 7,374,755 Iron and steel. 7,273,157 Pulp of wood/of other fibrous cellu 6,754,208 Optical, photo, cine, meas, checkin 5,891,150 Articles of iron or steel. 5,358,154 Nickel and articles thereof. 5,246,479 Pharmaceutical products. 5,078,271 Inorgn chem; compds of prec mtl, r 4,791,322 Furniture; bedding, mattress, matt 4,717,284 Organic chemicals. 4,639,336 Meat and edible meat offal 4,595,173 Rubber and articles thereof. 4,220,018 Animal/veg fats & oils & their clea 3,955,534 Fish & crustacean, mollusc & other 3,706,173 Copper and articles thereof. 3,237,679 Edible vegetables and certain roots 3,169,577 Prep.of cereal, flour, starch/milk; 2,610,270

31
Miscellaneous chemical products. 2,503,563 Residues & waste from the food indu 1,951,558 Essential oils & resinoids; perf, 1,652,237 Live animals 1,621,351 Miscellaneous edible preparations. 1,564,384 Salt; sulphur; earth & ston; plaste 1,436,810 Prep of vegetable, fruit, nuts or o 1,427,485 Miscellaneous articles of base meta 1,164,025 Zinc and articles thereof. 1,129,970 Cocoa and cocoa preparations. 1,058,890 Toys, games & sports requisites; pa 1,054,519 Art of stone, plaster, cement, asbe 1,012,877 Tanning/dyeing extract; tannins & 1,001,615 Beverages, spirits and vinegar. 987,493 Printed books, newspapers, pictures 983,551 Sugars and sugar confectionery. 919,407 Soap, organic surface-‐active agents 854,492 Prod.mill.indust; malt; starches; 835,403 Tool, implement, cutlery, spoon & f 812,728 Prep of meat, fish or crustaceans, 743,246 Furskins and artificial fur; manuf 707,483 Edible fruit and nuts; peel of citr 629,619 Lead and articles thereof. 604,408 Art of apparel & clothing access, n 565,801 Impregnated, coated, cover/laminate 556,151 Coffee, tea, matï and spices. 551,323 Man-‐made filaments. 542,753 Glass and glassware. 514,029 Ships, boats and floating structure 502,524 Art of apparel & clothing access, 478,057 Other base metals; cermets; article 469,468 Other made up textile articles; set 447,440 Railw/tramw locom, rolling-‐stock & 379,980 Dairy prod; birds' eggs; natural ho 325,209 Raw hides and skins (other than fu 315,861 Live tree & other plant; bulb, root 295,979 Arms and ammunition; parts and acc 251,646 Explosives; pyrotechnic prod; match 250,222 Footwear, gaiters and the like; par 242,869 Albuminoidal subs; modified starche 235,298 Articles of leather; saddlery/harne 230,726
32
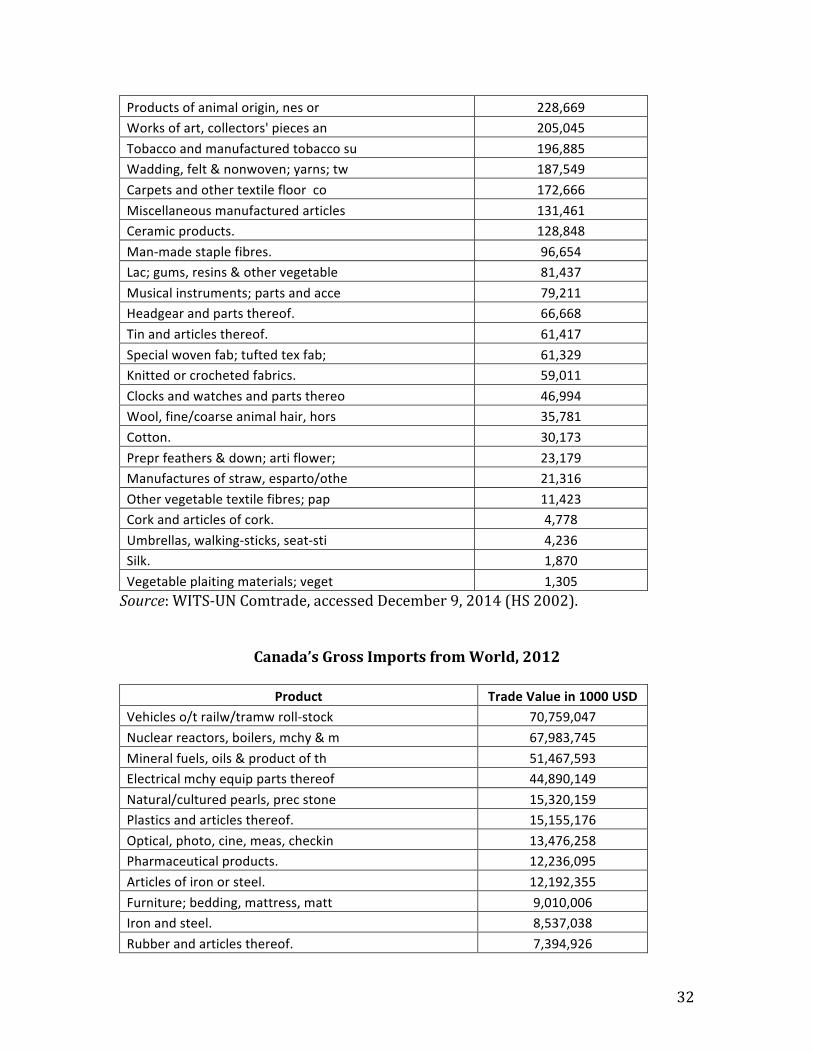
Products of animal origin, nes or 228,669 Works of art, collectors' pieces an 205,045 Tobacco and manufactured tobacco su 196,885 Wadding, felt & nonwoven; yarns; tw 187,549 Carpets and other textile floor co 172,666 Miscellaneous manufactured articles 131,461 Ceramic products. 128,848 Man-‐made staple fibres. 96,654 Lac; gums, resins & other vegetable 81,437 Musical instruments; parts and acce 79,211 Headgear and parts thereof. 66,668 Tin and articles thereof. 61,417 Special woven fab; tufted tex fab; 61,329 Knitted or crocheted fabrics. 59,011 Clocks and watches and parts thereo 46,994 Wool, fine/coarse animal hair, hors 35,781 Cotton. 30,173 Prepr feathers & down; arti flower; 23,179 Manufactures of straw, esparto/othe 21,316 Other vegetable textile fibres; pap 11,423 Cork and articles of cork. 4,778 Umbrellas, walking-‐sticks, seat-‐sti 4,236 Silk. 1,870 Vegetable plaiting materials; veget 1,305 Source: WITS-‐UN Comtrade, accessed December 9, 2014 (HS 2002).
Canada’s Gross Imports from World, 2012
Product Trade Value in 1000 USD Vehicles o/t railw/tramw roll-‐stock 70,759,047 Nuclear reactors, boilers, mchy & m 67,983,745 Mineral fuels, oils & product of th 51,467,593 Electrical mchy equip parts thereof 44,890,149 Natural/cultured pearls, prec stone 15,320,159 Plastics and articles thereof. 15,155,176 Optical, photo, cine, meas, checkin 13,476,258 Pharmaceutical products. 12,236,095 Articles of iron or steel. 12,192,355 Furniture; bedding, mattress, matt 9,010,006 Iron and steel. 8,537,038 Rubber and articles thereof. 7,394,926

33
Organic chemicals. 6,104,475 Paper & paperboard; art of paper pu 6,031,669 Aircraft, spacecraft, and parts the 5,647,872 Miscellaneous chemical products. 5,224,830 Beverages, spirits and vinegar. 4,971,320 Art of apparel & clothing access, 4,274,940 Edible fruit and nuts; peel of citr 4,272,958 Inorgn chem; compds of prec mtl, r 4,240,271 Art of apparel & clothing access, n 4,221,396 Toys, games & sports requisites; pa 4,206,918 Aluminium and articles thereof. 3,761,767 Ores, slag and ash. 3,730,636 Wood and articles of wood; wood ch 3,102,099 Printed books, newspapers, pictures 3,085,316 Essential oils & resinoids; perf, 2,951,249 Prep.of cereal, flour, starch/milk; 2,696,588 Miscellaneous articles of base meta 2,506,780 Edible vegetables and certain roots 2,492,834 Meat and edible meat offal 2,453,249 Glass and glassware. 2,393,175 Soap, organic surface-‐active agents 2,283,738 Tanning/dyeing extract; tannins & 2,276,526 Miscellaneous edible preparations. 2,268,876 Tool, implement, cutlery, spoon & f 2,265,192 Footwear, gaiters and the like; par 2,212,791 Prep of vegetable, fruit, nuts or o 2,194,301 Fish & crustacean, mollusc & other 1,893,134 Copper and articles thereof. 1,810,288 Coffee, tea, matï and spices. 1,737,250 Residues & waste from the food indu 1,711,255 Art of stone, plaster, cement, asbe 1,694,920 Articles of leather; saddlery/harne 1,502,240 Fertilisers. 1,398,290 Other made up textile articles; set 1,383,749 Prep of meat, fish or crustaceans, 1,372,058 Railw/tramw locom, rolling-‐stock & 1,300,504 Cocoa and cocoa preparations. 1,280,914 Sugars and sugar confectionery. 1,236,108 Animal/veg fats & oils & their clea 1,104,417 Ceramic products. 1,089,457 Albuminoidal subs; modified starche 909,782

34
Salt; sulphur; earth & ston; plaste 870,204 Carpets and other textile floor co 845,111 Oil seed, oleagi fruits; miscell gr 820,160 Ships, boats and floating structure 775,655 Miscellaneous manufactured articles 717,475 Cereals 690,083 Wadding, felt & nonwoven; yarns; tw 572,175 Man-‐made filaments. 560,796 Dairy prod; birds' eggs; natural ho 516,837 Arms and ammunition; parts and acc 501,838 Clocks and watches and parts thereo 459,363 Impregnated, coated, cover/laminate 448,622 Other base metals; cermets; article 441,204 Nickel and articles thereof. 408,911 Live tree & other plant; bulb, root 389,725 Man-‐made staple fibres. 380,631 Pulp of wood/of other fibrous cellu 325,572 Headgear and parts thereof. 305,384 Prod.mill.indust; malt; starches; 298,183 Musical instruments; parts and acce 251,727 Lac; gums, resins & other vegetable 246,999 Works of art, collectors' pieces an 239,475 Furskins and artificial fur; manuf 224,548 Knitted or crocheted fabrics. 210,646 Explosives; pyrotechnic prod; match 208,551 Live animals 185,059 Products of animal origin, nes or 158,749 Cotton. 158,712 Tobacco and manufactured tobacco su 154,134 Special woven fab; tufted tex fab; 125,533 Raw hides and skins (other than fu 100,526 Wool, fine/coarse animal hair, hors 95,273 Prepr feathers & down; arti flower; 91,381 Tin and articles thereof. 86,202 Umbrellas, walking-‐sticks, seat-‐sti 71,695 Zinc and articles thereof. 64,148 Manufactures of straw, esparto/othe 52,406 Cork and articles of cork. 33,220 Other vegetable textile fibres; pap 22,549 Lead and articles thereof. 17,757 Silk. 13,020

35
Vegetable plaiting materials; veget 10,313 Source: WITS-‐UN Comtrade, accessed December 9, 2014 (HS 2002).