Karst in Mariovo – extension, characteristics and importance
Upload
khangminh22Category
view
0download
0
minerals
Article
Distribution and Characteristics of NanotubularHalloysites in the Thach Khoan Area,Phu Tho, Vietnam
Bui Hoang Bac 1,2,* ID , Nguyen Tien Dung 1, Luong Quang Khang 1, Khuong The Hung 1,Nguyen Van Lam 1, Do Manh An 1, Phan Viet Son 1, Tran Thi Van Anh 1, Doan Van Chuong 3
and Bui Thanh Tinh 1
1 Faculty of Geosciences and Geoengineering, Hanoi University of Mining and Geology,Hanoi 100000, Vietnam; [email protected] (N.T.D.); [email protected] (L.Q.K.);[email protected] (K.T.H.); [email protected] (N.V.L.);[email protected] (D.M.A.); [email protected] (P.V.S.);[email protected] (T.T.V.A.); [email protected] (B.T.T.)
2 Center for Excellence in Analysis and Experiment, Hanoi University of Mining and Geology,Hanoi 100000, Vietnam
3 Beca Joint Stock Company, 25 Nguyen Khanh Toan, Cau Giay Street, Hanoi 100000, Vietnam;[email protected]
* Correspondence: [email protected]; Tel.: +84-0243-8384973
Received: 23 May 2018; Accepted: 25 June 2018; Published: 8 July 2018�����������������
Abstract: Two types of halloysite collected from the upper (UPS) and lower (LOS) zonesof a weathered pegmatite profile in the Thach Khoan area, Phu Tho were defined by X-raydiffraction (XRD), scanning electron microscopy (SEM), transmission electron microscopy (TEM),Fourier transform infrared spectroscopy (FT-IR), thermal analysis (TG and DTG), and N2
adsorption-desorption isotherms. XRD analysis showed that halloysite and kaolinite coexist insamples of size fractions <2 µm. Semi-quantitative analysis by XRD after formamide (FA) treatmentindicated that the halloysite contents are approximately 81% and 93% in UPS and LOS samples,respectively. The results of SEM and TEM analyses showed that while short halloysite type ismainly distributed in the upper zone, long halloysite type occurs primarily in the lower zone ofthe weathered pegmatite profile. The length of short halloysite ranging from 250 to 750 nm ismost popular, accounting for 47.2% of halloysites in the UPS sample. Meanwhile, long halloysiteswhich have the length of 750–1250 nm are dominant in the LOS sample with 69.9%. In addition,short halloysites with outer diameter of >100 nm constitute 79.1% of halloysites in the UPS samplewhile long halloysites with outer diameter of 50–100 nm make up 74.2% of halloysites in LOSsample. Specific surface areas are 15.7434 and 22.0211 m2/g and average pore sizes are 18.9837and 17.0281 nm for the UPS and LOS samples, respectively. The analysis implies that althoughforming under same natural geographical and climatic conditions, halloysites at different depths inthe weathered pegmatite profile may have different morphological and other properties.
Keywords: halloysite; kaolinite; nanotube; pegmatite; Phu Tho
1. Introduction
Halloysite was originally depicted as a 1:1 layered aluminosilicate mineral of the kaolin group byBerthier [1]. The chemical composition structure of halloysite is similar to that of minerals of the kaolingroup (kaolinite, nacrite and dickite minerals) but the unit layers of halloysite are isolated by a monolayer
Minerals 2018, 8, 290; doi:10.3390/min8070290 www.mdpi.com/journal/minerals
Minerals 2018, 8, 290 2 of 13
of water molecules [2–4]. Halloysite appears mainly in two different polymorphs: a chemical formulaAl2Si2O5 (OH)4·2H2O when fully hydrated and Al2Si2O5 (OH)4 when dehydrated [5].
Halloysite can been found in a variety of particle morphologies, such as short-tubular,large-tubular and spheroidal, and platy shapes [6]. However, nanotubular morphology is the mostcommon shape of halloysite. The tubular shape can be considered as rolled kaolin sheets with an innerdiameter of 1/30 nm, an outer diameter of 30/50 nm and a length of 100–2000 nm [7,8]. The interiorsurface of halloysite is composed of siloxane (Si–O–Si) groups, while the external is a gibbsite-likearray of aluminol (Al–OH) groups [9,10].
Halloysite deposits have been discovered and exploited in different countries such as NewZealand, United States, Australia, China, Brazil, and Turkey [11]. This mineral can be formed bothby weathering of igneous rocks and their hydrothermal alteration [12–19]. For instance, the MatauriBay (New Zealand) halloysite deposit was formed by hydrothermal alteration at low temperature ofrhyolite and dacite volcanic rocks [20]. The large mass of halloysite at the Dragon Mine (UT, USA)was formed by irregular replacement of Early Paleozoic dolomite rock in contact with hydrothermalfluids channeled along the Dragon Fissure Zone [21]. Halloysite at TePuke is a weathering product ofvolcanic rocks of rhyolite and andesite in the Bay of Plenty, New Zealand [22]. The above literatureand others have shown that halloysites from different areas also have different morphological andphysicochemical properties [7,23–25].
In the recent years, due to its superior properties such as tubular structure, non-toxicity, largesurface area, high mechanical strength, lower cost compared to nanotubular carbon, halloysite hasattracted considerable attention of scientists and many new possibilities of application [8,26–34].However, in many cases, differences in morphology, size, as well as other properties of halloysites mayhave certain impacts on their applicability in practice. For instance, Makaremi et al. [35] used twodifferent types of halloysite nanotubes to improve the properties of apple pectin bionanocompositesas potential films for food packaging applications. Results indicated that the short halloysites with50–3000 nm length and 50–200 nm outer diameter had better ability for the encapsulation of salicylicacid into their lumen, while the long halloysites with 200–30,000 nm length and 40–55 nm outerdiameter made the encapsulation process more difficult. Zheng and Ni [36] prepared an efficientflame-resistant composite using the pentaerythritol-loaded halloysites for the UV-curable epoxy resin.In this study, halloysites have length 300–1000 nm, outer diameter 50–70 nm and BET surface area36.40 m2/g. The obtained composite showed a low moisture absorption and a good stability of themechanical properties. Pasbakhsh et al. [37] have studies the properties of some halloysites in theworld, and have given orientations for their applications. For example, the long-tubular halloysitewith 200–5000 nm length and 40–55 nm outer diameter are very suitable for use both an additive and acarrier. The halloysite tubes showing a wide variation in size may be well suited as microfiber filler.Thus, it can be seen that studying the properties of halloysites from different deposits or even in adeposit is necessary before using them for different applications.
This study aims to study the distribution and characteristics two types of halloysite nanotubes froma weathered pegmatite profile in the Thach Khoan area, Phu Tho Province. Different characteristics ofthese halloysites were determined using X-ray diffraction (XRD), scanning electron microscopy–energydispersive X-ray spectroscopy (SEM-EDS), transmission electron microscopy (TEM), fourier transforminfrared spectroscopy (FT-IR), thermal analysis (TG and DTG), and N2 adsorption-desorptionisotherms. The results showed that halloysites from different depths of the weathered pegmatite in thestudy area have different morphological properties. This information is useful for the understandingof distribution and characteristics of halloysites in the deposit and helping for exploitation and usethese nanotubular minerals effectively.
Minerals 2018, 8, 290 3 of 13
2. Materials and Methods
2.1. General Geological Setting of Study Area
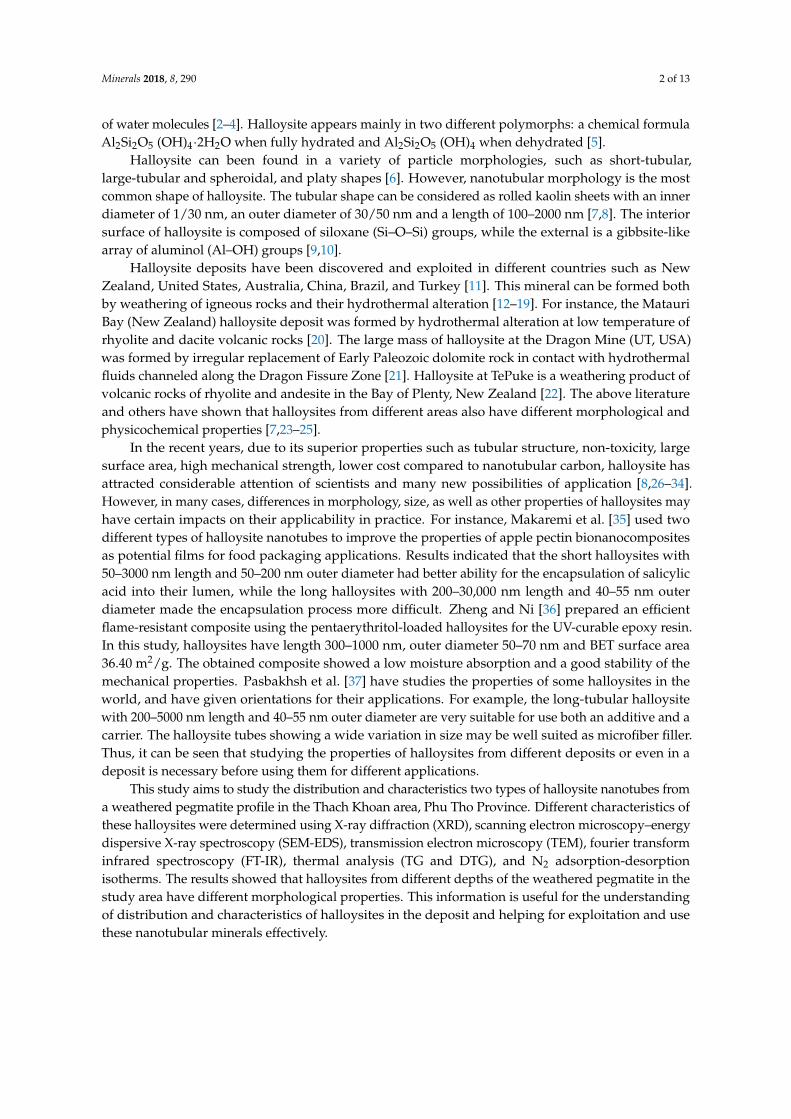
The study area has many pegmatite bodies with different sizes related to the Late Paleozoic TanPhuong granite Complex [38]. The surrounding rocks of pegmatite bodies are the metamorphic ThachKhoan formation of Proterozoic age (Figure 1). The composition of this formation consists mainly ofmica quartz schist, mica schist, staurolite-bearing quartz, disten, sillimanite, and garnet.
Minerals 2018, 8, x FOR PEER REVIEW 3 of 13
Thach Khoan formation of Proterozoic age (Figure 1). The composition of this formation consists mainly of mica quartz schist, mica schist, staurolite-bearing quartz, disten, sillimanite, and garnet.
Figure 1. Vietnam map and the site of the study area (A); geological legend (B) and geological map of the study area (C).
The pegmatite bodies have the strike of 60° N–80° W, dipping to the southwest with a slope of 50°–80°. They vary from several hundred up to thousands of meters in length and from tens to hundreds of meters wide. All pegmatite bodies have a similar weathering profile with an upper brown yellow zone (15–20 m), a middle pink zone (5–10 m) and a lower white, light orange zone (5–15 m).
2.2. Samples
A typical outcrop about 40 m high that has the GPS position of 21°11′31″ N and 105°15′07″ E, was prepared for sampling. For comparison purposes, two samples were collected separately. The first sample, called UPS sample, was taken in upper zone, and the second one, LOS sample, was from the lower zone of the weathered pegmatite profile. The samples were taken from the top down, perpendicular to the weathering layers. Separated samples were mixed homogeneously before using for further steps.
The bulk samples were first dissolved in deionized water by repeated ultrasonic vibration. A portion of the <2 µm clay sample fraction was obtained using the decantation method. The clay fractions were then freeze dried and examined by different analyses.
Figure 1. Vietnam map and the site of the study area (A); geological legend (B) and geological map ofthe study area (C).
The pegmatite bodies have the strike of 60◦ N–80◦ W, dipping to the southwest with a slopeof 50◦–80◦. They vary from several hundred up to thousands of meters in length and from tens tohundreds of meters wide. All pegmatite bodies have a similar weathering profile with an upper brownyellow zone (15–20 m), a middle pink zone (5–10 m) and a lower white, light orange zone (5–15 m).
2.2. Samples
A typical outcrop about 40 m high that has the GPS position of 21◦11′31′′ N and 105◦15′07′′ E,was prepared for sampling. For comparison purposes, two samples were collected separately. The firstsample, called UPS sample, was taken in upper zone, and the second one, LOS sample, was fromthe lower zone of the weathered pegmatite profile. The samples were taken from the top down,perpendicular to the weathering layers. Separated samples were mixed homogeneously before usingfor further steps.
The bulk samples were first dissolved in deionized water by repeated ultrasonic vibration.A portion of the <2 µm clay sample fraction was obtained using the decantation method. The clayfractions were then freeze dried and examined by different analyses.
Minerals 2018, 8, 290 4 of 13
2.3. Characterization
X-ray diffraction (XRD) patterns of the samples were collected by using a D8-Advance Brukerdiffraction (Bruker Corporation, Billerica, MA, USA) with radiation of CuKα (λ = 1.5406 nm) generatedat 40 kV and 40 mA. The data were archived in the Bragg angle (2θ) range of 3◦–70◦ with scanningspeed of 2◦ min−1. Minerals were defined by using the software of Evaluation 10.0 with database(PDF-2 2004) provided by the International Centre for Diffraction Data. Formamide (FA) treatmentwas used to estimate the content of halloysite and kaolinite in the samples [22].
The Fourier transform infrared (FT-IR) spectra for each sample were achieved in transmissionmode on pellets containing a pressed mixture of approximately 1.0 mg of the sample and 100 mg ofKBr. The IR spectra were recorded in the range from 4000 to 400 cm−1 with a resolution of 2 cm−1
(Shimadzu IR Prestige-21 spectro-meter instrument, Kyoto, Japan).Scanning electron microscope (SEM) coupled with energy dispersive X-ray spectroscopy (EDS)
(Quanta 450, FEI Company, Hillsboro, OR, USA) were initially used to analyze the morphology ofminerals and elements present in the samples. Transmission electron microscopy (TEM) images wereobtained by a JEM 1010 operated at an accelerating voltage of 200 kV. The samples were suspendedby using a drop-wise of ethanol and evaporated on 200 mesh copper grids covered with amorphousFormvar carbon.
Thermmogravimetric analyses (TG) were carried out on a SETERAM Instrument (Caluire-et-Cuire,France). Approximately 2–3 mg of the samples were heated from 50 to 1050 ◦C in a platinum cruciblewith a heating rate of 10 ◦C min−1, under an atmosphere of high purity N2.
The specific surface area of the samples was measured from N2 gas adsorption at 77 K by using aTriStar 3000 (Micromeritics Corp., Norcross, GA, USA). Surface areas were calculated from the linearpart of the (Brunauer-Emmett-Teller) BET plot. The N2 isotherms and the Barret-Joyner-Halenda (BJH)method were used to calculate pore size distributions of halloysites.
3. Results and Discussion
3.1. XRD Analysis
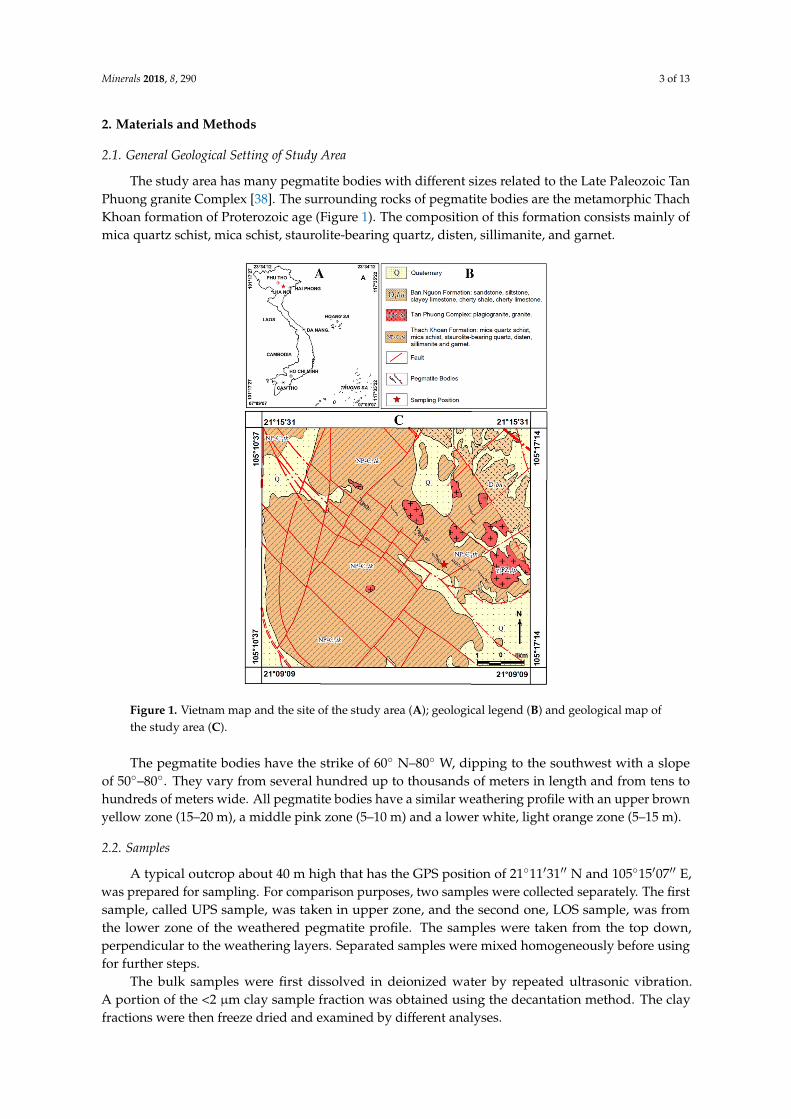
XRD patterns of the UPS and LOS samples with size fractions <2 µm in natural condition arepresented in Figure 2. The results indicated that minerals of kaolin group coexisted in the samples.The basal reflections of 10 Å halloysite were recorded at peaks of 10.0◦, 4.44◦, 3.36◦ and 2.56◦
(Al2Si2O5 (OH)4·2H2O, hexagonal structure, PDF No. 00-29-1489). The peaks at 7.38◦ and 3.60◦
refer to kaolinite (Al2Si2O5 (OH)4, with a triclinic structure, PDF No. 01-089-6538).
Minerals 2018, 8, x FOR PEER REVIEW 4 of 13
2.3. Characterization
X-ray diffraction (XRD) patterns of the samples were collected by using a D8-Advance Bruker diffraction (Bruker Corporation, Billerica, MA, USA) with radiation of CuKα (λ = 1.5406 nm) generated at 40 kV and 40 mA. The data were archived in the Bragg angle (2θ) range of 3°–70° with scanning speed of 2° min−1. Minerals were defined by using the software of Evaluation 10.0 with database (PDF-2 2004) provided by the International Centre for Diffraction Data. Formamide (FA) treatment was used to estimate the content of halloysite and kaolinite in the samples [22].
The Fourier transform infrared (FT-IR) spectra for each sample were achieved in transmission mode on pellets containing a pressed mixture of approximately 1.0 mg of the sample and 100 mg of KBr. The IR spectra were recorded in the range from 4000 to 400 cm−1 with a resolution of 2 cm−1 (Shimadzu IR Prestige-21 spectro-meter instrument, Kyoto, Japan).
Scanning electron microscope (SEM) coupled with energy dispersive X-ray spectroscopy (EDS) (Quanta 450, FEI Company, Hillsboro, OR, USA) were initially used to analyze the morphology of minerals and elements present in the samples. Transmission electron microscopy (TEM) images were obtained by a JEM 1010 operated at an accelerating voltage of 200 kV. The samples were suspended by using a drop-wise of ethanol and evaporated on 200 mesh copper grids covered with amorphous Formvar carbon.
Thermmogravimetric analyses (TG) were carried out on a SETERAM Instrument (Caluire-et-Cuire, France). Approximately 2–3 mg of the samples were heated from 50 to 1050 °C in a platinum crucible with a heating rate of 10 °C min−1, under an atmosphere of high purity N2.
The specific surface area of the samples was measured from N2 gas adsorption at 77 K by using a TriStar 3000 (Micromeritics Corp., Norcross, GA, USA). Surface areas were calculated from the linear part of the (Brunauer-Emmett-Teller) BET plot. The N2 isotherms and the Barret-Joyner-Halenda (BJH) method were used to calculate pore size distributions of halloysites.
3. Results and Discussion
3.1. XRD Analysis
XRD patterns of the UPS and LOS samples with size fractions <2 µm in natural condition are presented in Figure 2. The results indicated that minerals of kaolin group coexisted in the samples. The basal reflections of 10 Å halloysite were recorded at peaks of 10.0°, 4.44°, 3.36° and 2.56° (Al2Si2O5 (OH)4·2H2O, hexagonal structure, PDF No. 00-29-1489). The peaks at 7.38° and 3.60° refer to kaolinite (Al2Si2O5 (OH)4, with a triclinic structure, PDF No. 01-089-6538).
Figure 2. XRD results of the UPS and LOS samples. H—halloysite; K—kaolinite; Q—quartz. Figure 2. XRD results of the UPS and LOS samples. H—halloysite; K—kaolinite; Q—quartz.
Minerals 2018, 8, 290 5 of 13
For the measurement of the content of halloysite and kaolinite, the formamide (FA) treatmentwas applied to the samples following Churchman et al. [22]. The percentage of halloysite a in a samplewas defined by the equation:
a =I10
(I7 + I10)·100%, (1)
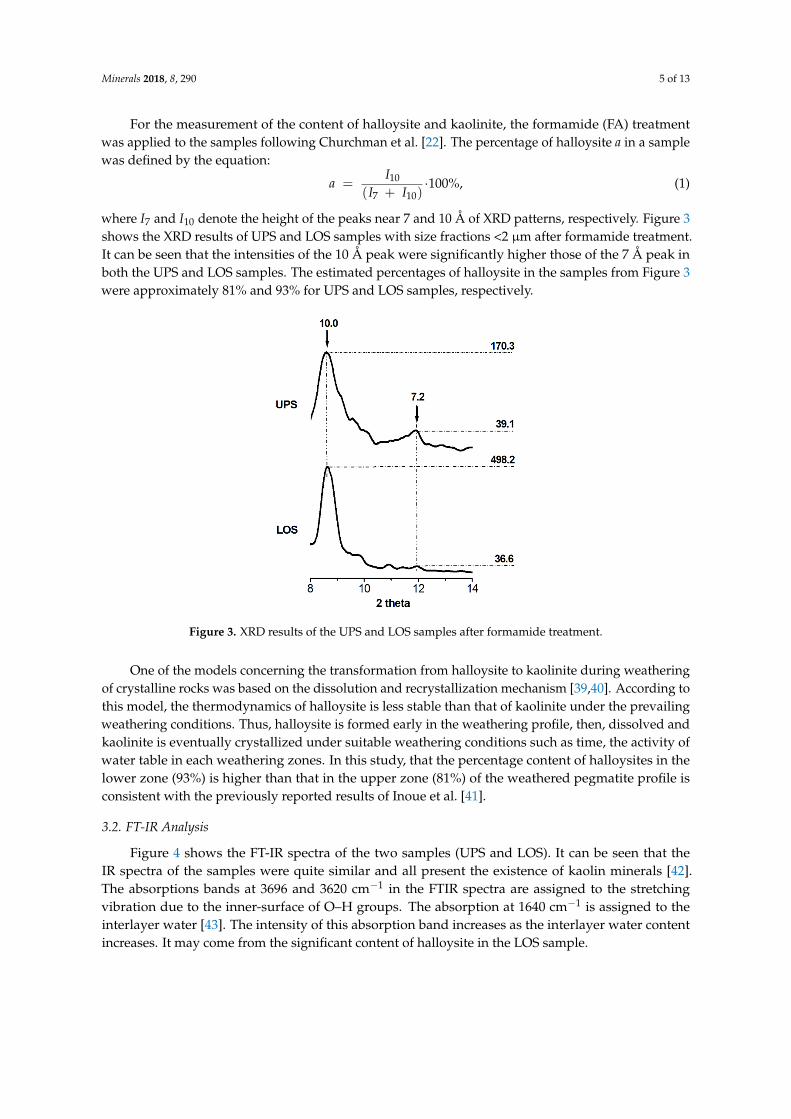
where I7 and I10 denote the height of the peaks near 7 and 10 Å of XRD patterns, respectively. Figure 3shows the XRD results of UPS and LOS samples with size fractions <2 µm after formamide treatment.It can be seen that the intensities of the 10 Å peak were significantly higher those of the 7 Å peak inboth the UPS and LOS samples. The estimated percentages of halloysite in the samples from Figure 3were approximately 81% and 93% for UPS and LOS samples, respectively.
Minerals 2018, 8, x FOR PEER REVIEW 5 of 13
For the measurement of the content of halloysite and kaolinite, the formamide (FA) treatment was applied to the samples following Churchman et al. [22]. The percentage of halloysite a in a sample was defined by the equation:
a = ( ) · 100%, (1)
where I7 and I10 denote the height of the peaks near 7 and 10 Å of XRD patterns, respectively. Figure 3 shows the XRD results of UPS and LOS samples with size fractions <2 µm after formamide treatment. It can be seen that the intensities of the 10 Å peak were significantly higher those of the 7 Å peak in both the UPS and LOS samples. The estimated percentages of halloysite in the samples from Figure 3 were approximately 81% and 93% for UPS and LOS samples, respectively.
Figure 3. XRD results of the UPS and LOS samples after formamide treatment.
One of the models concerning the transformation from halloysite to kaolinite during weathering of crystalline rocks was based on the dissolution and recrystallization mechanism [39,40]. According to this model, the thermodynamics of halloysite is less stable than that of kaolinite under the prevailing weathering conditions. Thus, halloysite is formed early in the weathering profile, then, dissolved and kaolinite is eventually crystallized under suitable weathering conditions such as time, the activity of water table in each weathering zones. In this study, that the percentage content of halloysites in the lower zone (93%) is higher than that in the upper zone (81%) of the weathered pegmatite profile is consistent with the previously reported results of Inoue et al. [41].
3.2. FT-IR Analysis
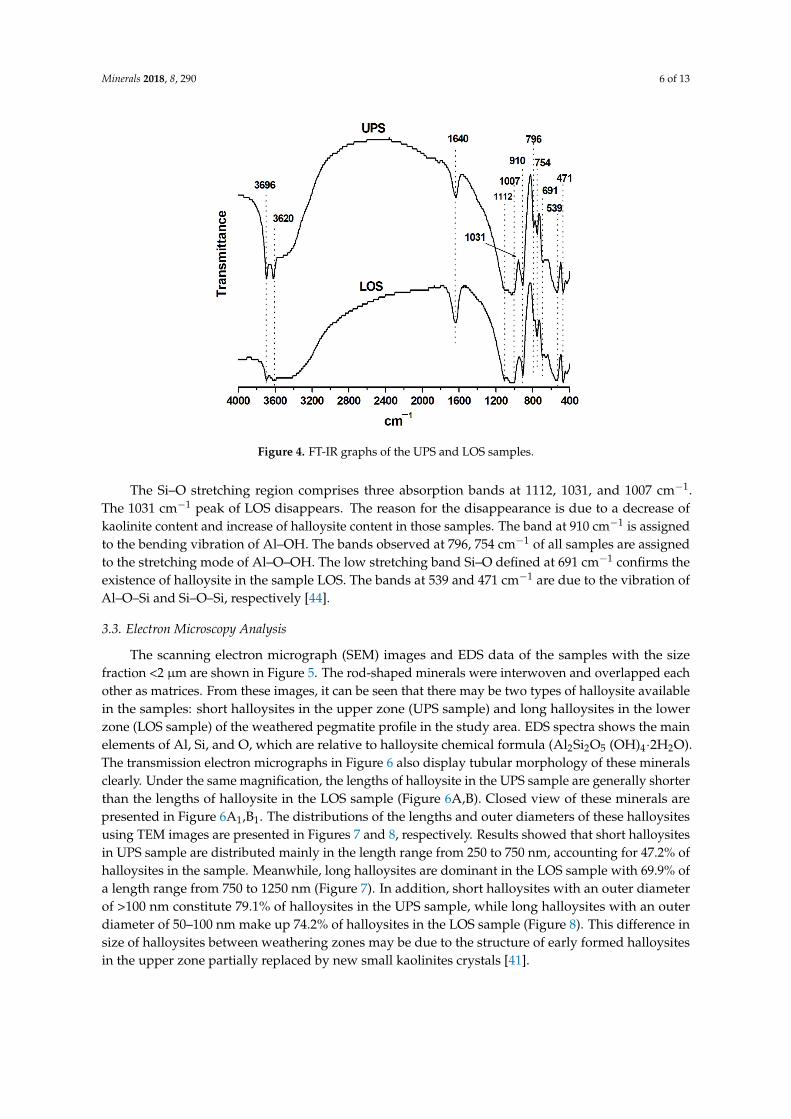
Figure 4 shows the FT-IR spectra of the two samples (UPS and LOS). It can be seen that the IR spectra of the samples were quite similar and all present the existence of kaolin minerals [42]. The absorptions bands at 3696 and 3620 cm−1 in the FTIR spectra are assigned to the stretching vibration due to the inner-surface of O-H groups. The absorption at 1640 cm−1 is assigned to the interlayer water [43]. The intensity of this absorption band increases as the interlayer water content increases. It may come from the significant content of halloysite in the LOS sample.
Figure 3. XRD results of the UPS and LOS samples after formamide treatment.
One of the models concerning the transformation from halloysite to kaolinite during weatheringof crystalline rocks was based on the dissolution and recrystallization mechanism [39,40]. According tothis model, the thermodynamics of halloysite is less stable than that of kaolinite under the prevailingweathering conditions. Thus, halloysite is formed early in the weathering profile, then, dissolved andkaolinite is eventually crystallized under suitable weathering conditions such as time, the activity ofwater table in each weathering zones. In this study, that the percentage content of halloysites in thelower zone (93%) is higher than that in the upper zone (81%) of the weathered pegmatite profile isconsistent with the previously reported results of Inoue et al. [41].
3.2. FT-IR Analysis
Figure 4 shows the FT-IR spectra of the two samples (UPS and LOS). It can be seen that theIR spectra of the samples were quite similar and all present the existence of kaolin minerals [42].The absorptions bands at 3696 and 3620 cm−1 in the FTIR spectra are assigned to the stretchingvibration due to the inner-surface of O–H groups. The absorption at 1640 cm−1 is assigned to theinterlayer water [43]. The intensity of this absorption band increases as the interlayer water contentincreases. It may come from the significant content of halloysite in the LOS sample.
Minerals 2018, 8, 290 6 of 13Minerals 2018, 8, x FOR PEER REVIEW 6 of 13
Figure 4. FT-IR graphs of the UPS and LOS samples.
The Si-O stretching region comprises three absorption bands at 1112, 1031, and 1007 cm−1. The 1031 cm−1 peak of LOS disappears. The reason for the disappearance is due to a decrease of kaolinite content and increase of halloysite content in those samples. The band at 910 cm−1 is assigned to the bending vibration of Al-OH. The bands observed at 796, 754 cm−1 of all samples are assigned to the stretching mode of Al-O-OH. The low stretching band Si-O defined at 691 cm−1 confirms the existence of halloysite in the sample LOS. The bands at 539 and 471 cm−1 are due to the vibration of Al-O-Si and Si-O-Si, respectively [44].
3.3. Electron Microscopy Analysis
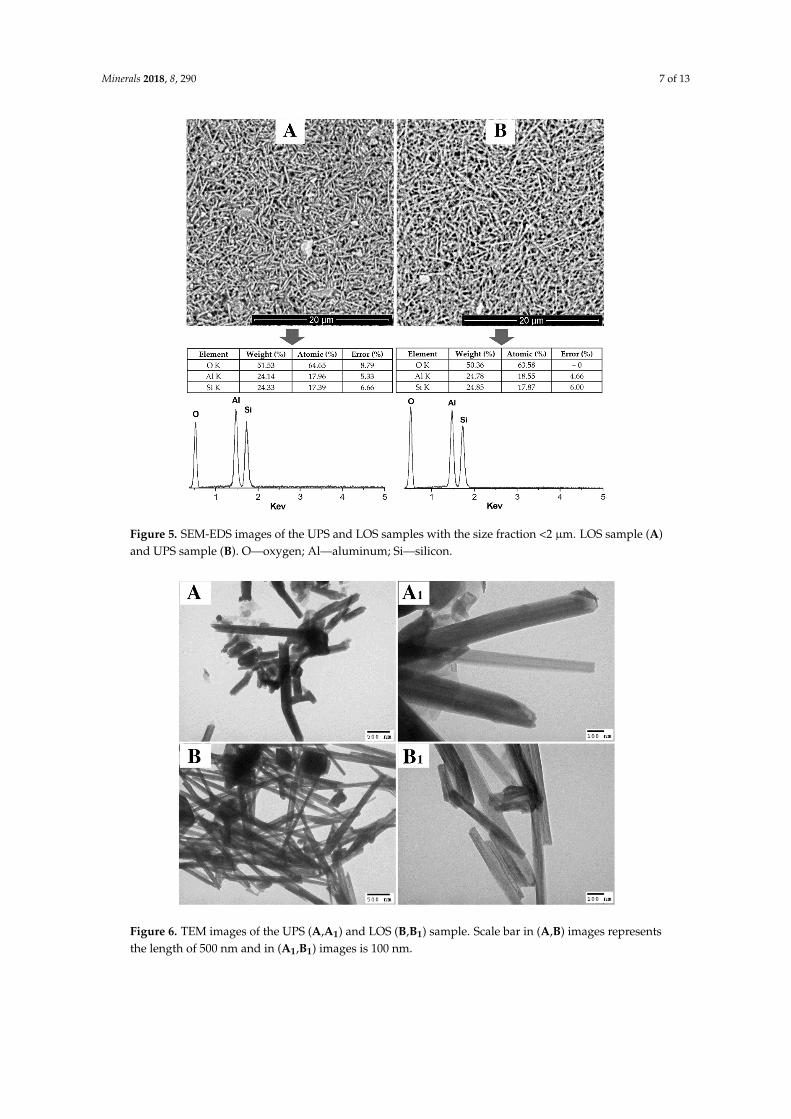
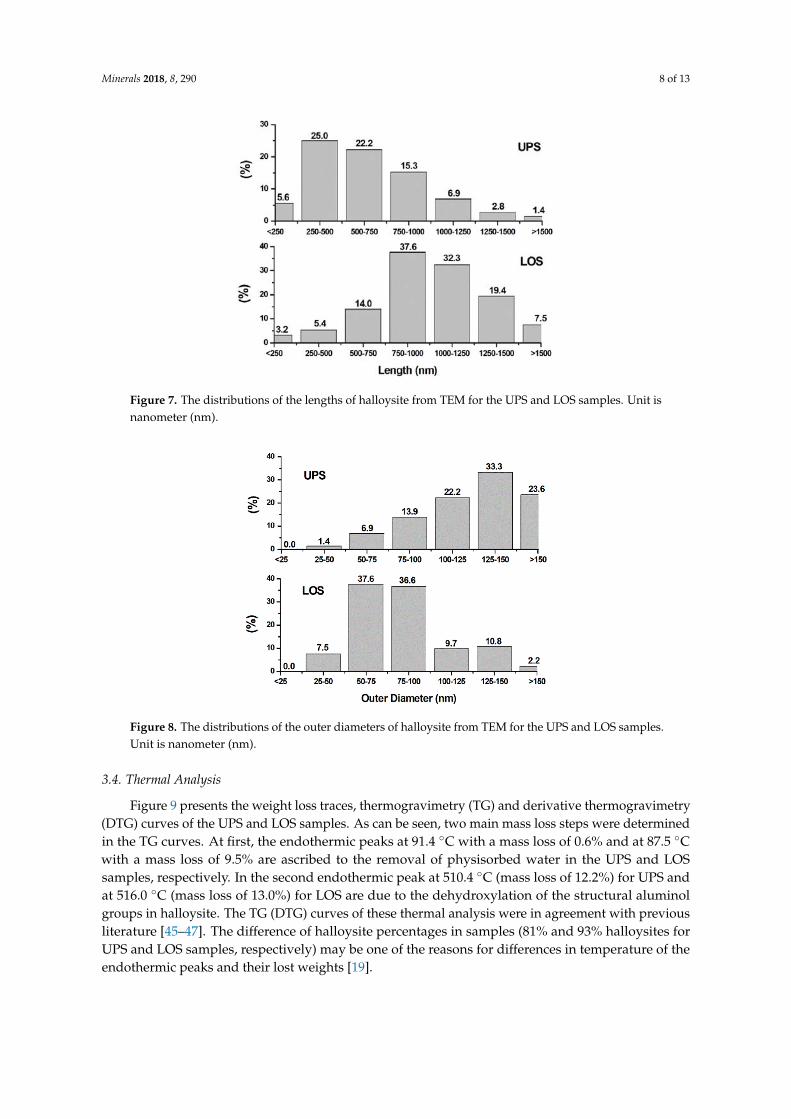
The scanning electron micrograph (SEM) images and EDS data of the samples with the size fraction <2 µm are shown in Figure 5. The rod-shaped minerals were interwoven and overlapped each other as matrices. From these images, it can be seen that there may be two types of halloysite available in the samples: short halloysites in the upper zone (UPS sample) and long halloysites in the lower zone (LOS sample) of the weathered pegmatite profile in the study area. EDS spectra shows the main elements of Al, Si, and O, which are relative to halloysite chemical formula (Al2Si2O5 (OH)4·2H2O). The transmission electron micrographs in Figure 6 also display tubular morphology of these minerals clearly. Under the same magnification, the lengths of halloysite in the UPS sample are generally shorter than the lengths of halloysite in the LOS sample (Figure 6A,B). Closed view of these minerals are presented in Figure 6A1,B1. The distributions of the lengths and outer diameters of these halloysites using TEM images are presented in Figures 7 and 8, respectively. Results showed that short halloysites in UPS sample are distributed mainly in the length range from 250 to 750 nm, accounting for 47.2% of halloysites in the sample. Meanwhile, long halloysites are dominant in the LOS sample with 69.9% of a length range from 750 to 1250 nm (Figure 7). In addition, short halloysites with an outer diameter of >100 nm constitute 79.1% of halloysites in the UPS sample, while long halloysites with an outer diameter of 50–100 nm make up 74.2% of halloysites in the LOS sample (Figure 8). This difference in size of halloysites between weathering zones may be due to the structure of early formed halloysites in the upper zone partially replaced by new small kaolinites crystals [41].
Figure 4. FT-IR graphs of the UPS and LOS samples.
The Si–O stretching region comprises three absorption bands at 1112, 1031, and 1007 cm−1.The 1031 cm−1 peak of LOS disappears. The reason for the disappearance is due to a decrease ofkaolinite content and increase of halloysite content in those samples. The band at 910 cm−1 is assignedto the bending vibration of Al–OH. The bands observed at 796, 754 cm−1 of all samples are assignedto the stretching mode of Al–O–OH. The low stretching band Si–O defined at 691 cm−1 confirms theexistence of halloysite in the sample LOS. The bands at 539 and 471 cm−1 are due to the vibration ofAl–O–Si and Si–O–Si, respectively [44].
3.3. Electron Microscopy Analysis
The scanning electron micrograph (SEM) images and EDS data of the samples with the sizefraction <2 µm are shown in Figure 5. The rod-shaped minerals were interwoven and overlapped eachother as matrices. From these images, it can be seen that there may be two types of halloysite availablein the samples: short halloysites in the upper zone (UPS sample) and long halloysites in the lowerzone (LOS sample) of the weathered pegmatite profile in the study area. EDS spectra shows the mainelements of Al, Si, and O, which are relative to halloysite chemical formula (Al2Si2O5 (OH)4·2H2O).The transmission electron micrographs in Figure 6 also display tubular morphology of these mineralsclearly. Under the same magnification, the lengths of halloysite in the UPS sample are generally shorterthan the lengths of halloysite in the LOS sample (Figure 6A,B). Closed view of these minerals arepresented in Figure 6A1,B1. The distributions of the lengths and outer diameters of these halloysitesusing TEM images are presented in Figures 7 and 8, respectively. Results showed that short halloysitesin UPS sample are distributed mainly in the length range from 250 to 750 nm, accounting for 47.2% ofhalloysites in the sample. Meanwhile, long halloysites are dominant in the LOS sample with 69.9% ofa length range from 750 to 1250 nm (Figure 7). In addition, short halloysites with an outer diameterof >100 nm constitute 79.1% of halloysites in the UPS sample, while long halloysites with an outerdiameter of 50–100 nm make up 74.2% of halloysites in the LOS sample (Figure 8). This difference insize of halloysites between weathering zones may be due to the structure of early formed halloysitesin the upper zone partially replaced by new small kaolinites crystals [41].
Minerals 2018, 8, 290 7 of 13Minerals 2018, 8, x FOR PEER REVIEW 7 of 13
Figure 5. SEM-EDS images of the UPS and LOS samples with the size fraction <2 µm. LOS sample (A) and UPS sample (B). O—oxygen; Al—aluminum; Si—silicon.
Figure 6. TEM images of the UPS (A,A1) and LOS (B,B1) sample. Scale bar in (A,B) images represents the length of 500 nm and in (A1,B1) images is 100 nm.
Figure 5. SEM-EDS images of the UPS and LOS samples with the size fraction <2 µm. LOS sample (A)and UPS sample (B). O—oxygen; Al—aluminum; Si—silicon.
Minerals 2018, 8, x FOR PEER REVIEW 7 of 13
Figure 5. SEM-EDS images of the UPS and LOS samples with the size fraction <2 µm. LOS sample (A) and UPS sample (B). O—oxygen; Al—aluminum; Si—silicon.
Figure 6. TEM images of the UPS (A,A1) and LOS (B,B1) sample. Scale bar in (A,B) images represents the length of 500 nm and in (A1,B1) images is 100 nm. Figure 6. TEM images of the UPS (A,A1) and LOS (B,B1) sample. Scale bar in (A,B) images represents
the length of 500 nm and in (A1,B1) images is 100 nm.
Minerals 2018, 8, 290 8 of 13Minerals 2018, 8, x FOR PEER REVIEW 8 of 13
Figure 7. The distributions of the lengths of halloysite from TEM for the UPS and LOS samples. Unit is nanometer (nm).
Figure 8. The distributions of the outer diameters of halloysite from TEM for the UPS and LOS samples. Unit is nanometer (nm).
3.4. Thermal Analysis
Figure 9 presents the weight loss traces, thermogravimetry (TG) and derivative thermogravimetry (DTG) curves of the UPS and LOS samples. As can be seen, two main mass loss steps were determined in the TG curves. At first, the endothermic peaks at 91.4 °C with a mass loss of 0.6% and at 87.5 °C with a mass loss of 9.5% are ascribed to the removal of physisorbed water in the UPS and LOS samples, respectively. In the second endothermic peak at 510.4 °C (mass loss of 12.2%) for UPS and at 516.0 °C (mass loss of 13.0%) for LOS are due to the dehydroxylation of the structural aluminol groups in halloysite. The TG (DTG) curves of these thermal analysis were in agreement with previous literature [45–47]. The difference of halloysite percentages in samples (81% and 93% halloysites for UPS and LOS samples, respectively) may be one of the reasons for differences in temperature of the endothermic peaks and their lost weights [19].
Figure 7. The distributions of the lengths of halloysite from TEM for the UPS and LOS samples. Unit isnanometer (nm).
Minerals 2018, 8, x FOR PEER REVIEW 8 of 13
Figure 7. The distributions of the lengths of halloysite from TEM for the UPS and LOS samples. Unit is nanometer (nm).
Figure 8. The distributions of the outer diameters of halloysite from TEM for the UPS and LOS samples. Unit is nanometer (nm).
3.4. Thermal Analysis
Figure 9 presents the weight loss traces, thermogravimetry (TG) and derivative thermogravimetry (DTG) curves of the UPS and LOS samples. As can be seen, two main mass loss steps were determined in the TG curves. At first, the endothermic peaks at 91.4 °C with a mass loss of 0.6% and at 87.5 °C with a mass loss of 9.5% are ascribed to the removal of physisorbed water in the UPS and LOS samples, respectively. In the second endothermic peak at 510.4 °C (mass loss of 12.2%) for UPS and at 516.0 °C (mass loss of 13.0%) for LOS are due to the dehydroxylation of the structural aluminol groups in halloysite. The TG (DTG) curves of these thermal analysis were in agreement with previous literature [45–47]. The difference of halloysite percentages in samples (81% and 93% halloysites for UPS and LOS samples, respectively) may be one of the reasons for differences in temperature of the endothermic peaks and their lost weights [19].
Figure 8. The distributions of the outer diameters of halloysite from TEM for the UPS and LOS samples.Unit is nanometer (nm).
3.4. Thermal Analysis
Figure 9 presents the weight loss traces, thermogravimetry (TG) and derivative thermogravimetry(DTG) curves of the UPS and LOS samples. As can be seen, two main mass loss steps were determinedin the TG curves. At first, the endothermic peaks at 91.4 ◦C with a mass loss of 0.6% and at 87.5 ◦Cwith a mass loss of 9.5% are ascribed to the removal of physisorbed water in the UPS and LOSsamples, respectively. In the second endothermic peak at 510.4 ◦C (mass loss of 12.2%) for UPS andat 516.0 ◦C (mass loss of 13.0%) for LOS are due to the dehydroxylation of the structural aluminolgroups in halloysite. The TG (DTG) curves of these thermal analysis were in agreement with previousliterature [45–47]. The difference of halloysite percentages in samples (81% and 93% halloysites forUPS and LOS samples, respectively) may be one of the reasons for differences in temperature of theendothermic peaks and their lost weights [19].
Minerals 2018, 8, 290 9 of 13
Minerals 2018, 8, x FOR PEER REVIEW 9 of 13
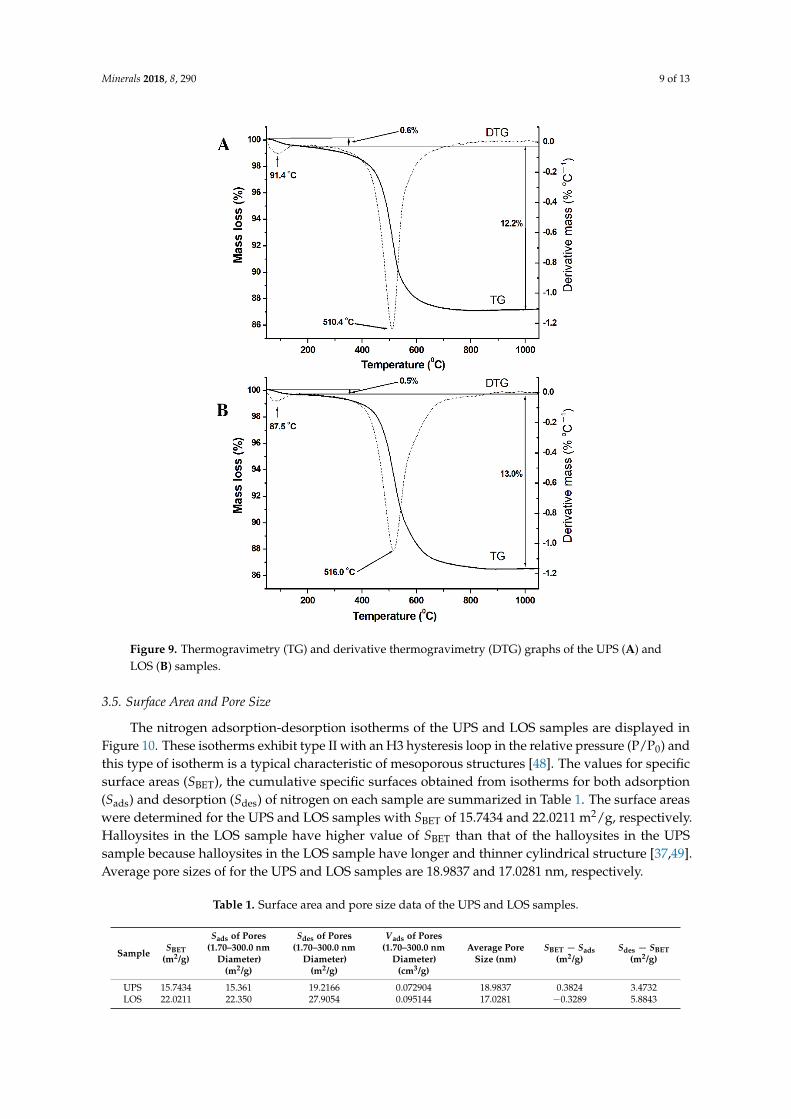
Figure 9. Thermogravimetry (TG) and derivative thermogravimetry (DTG) graphs of the UPS (A) and LOS (B) samples.
3.5. Surface Area and Pore Size
The nitrogen adsorption-desorption isotherms of the UPS and LOS samples are displayed in Figure 10. These isotherms exhibit type II with an H3 hysteresis loop in the relative pressure (P/P0) and this type of isotherm is a typical characteristic of mesoporous structures [48]. The values for specific surface areas (SBET), the cumulative specific surfaces obtained from isotherms for both adsorption (Sads) and desorption (Sdes) of nitrogen on each sample are summarized in Table 1. The surface areas were determined for the UPS and LOS samples with SBET of 15.7434 and 22.0211 m2/g, respectively. Halloysites in the LOS sample have higher value of SBET than that of the halloysites in the UPS sample because halloysites in the LOS sample have longer and thinner cylindrical structure [37,49]. Average pore sizes of for the UPS and LOS samples are 18.9837 and 17.0281 nm, respectively.
Table 1. Surface area and pore size data of the UPS and LOS samples.
Sample SBET
(m2/g)
Sads of Pores (1.70–300.0 nm
Diameter) (m2/g)
Sdes of Pores (1.70–300.0 nm
Diameter) (m2/g)
Vads of Pores (1.70–300.0 nm
Diameter) (cm3/g)
Average Pore Size (nm)
SBET − Sads
(m2/g)
Sdes − SBET
(m2/g)
UPS 15.7434 15.361 19.2166 0.072904 18.9837 0.3824 3.4732 LOS 22.0211 22.350 27.9054 0.095144 17.0281 −0.3289 5.8843
Figure 9. Thermogravimetry (TG) and derivative thermogravimetry (DTG) graphs of the UPS (A) andLOS (B) samples.
3.5. Surface Area and Pore Size
The nitrogen adsorption-desorption isotherms of the UPS and LOS samples are displayed inFigure 10. These isotherms exhibit type II with an H3 hysteresis loop in the relative pressure (P/P0) andthis type of isotherm is a typical characteristic of mesoporous structures [48]. The values for specificsurface areas (SBET), the cumulative specific surfaces obtained from isotherms for both adsorption(Sads) and desorption (Sdes) of nitrogen on each sample are summarized in Table 1. The surface areaswere determined for the UPS and LOS samples with SBET of 15.7434 and 22.0211 m2/g, respectively.Halloysites in the LOS sample have higher value of SBET than that of the halloysites in the UPSsample because halloysites in the LOS sample have longer and thinner cylindrical structure [37,49].Average pore sizes of for the UPS and LOS samples are 18.9837 and 17.0281 nm, respectively.
Table 1. Surface area and pore size data of the UPS and LOS samples.
Sample SBET(m2/g)
Sads of Pores(1.70–300.0 nm
Diameter)(m2/g)
Sdes of Pores(1.70–300.0 nm
Diameter)(m2/g)
Vads of Pores(1.70–300.0 nm
Diameter)(cm3/g)
Average PoreSize (nm)
SBET − Sads(m2/g)
Sdes − SBET(m2/g)
UPS 15.7434 15.361 19.2166 0.072904 18.9837 0.3824 3.4732LOS 22.0211 22.350 27.9054 0.095144 17.0281 −0.3289 5.8843
Minerals 2018, 8, 290 10 of 13Minerals 2018, 8, x FOR PEER REVIEW 10 of 13
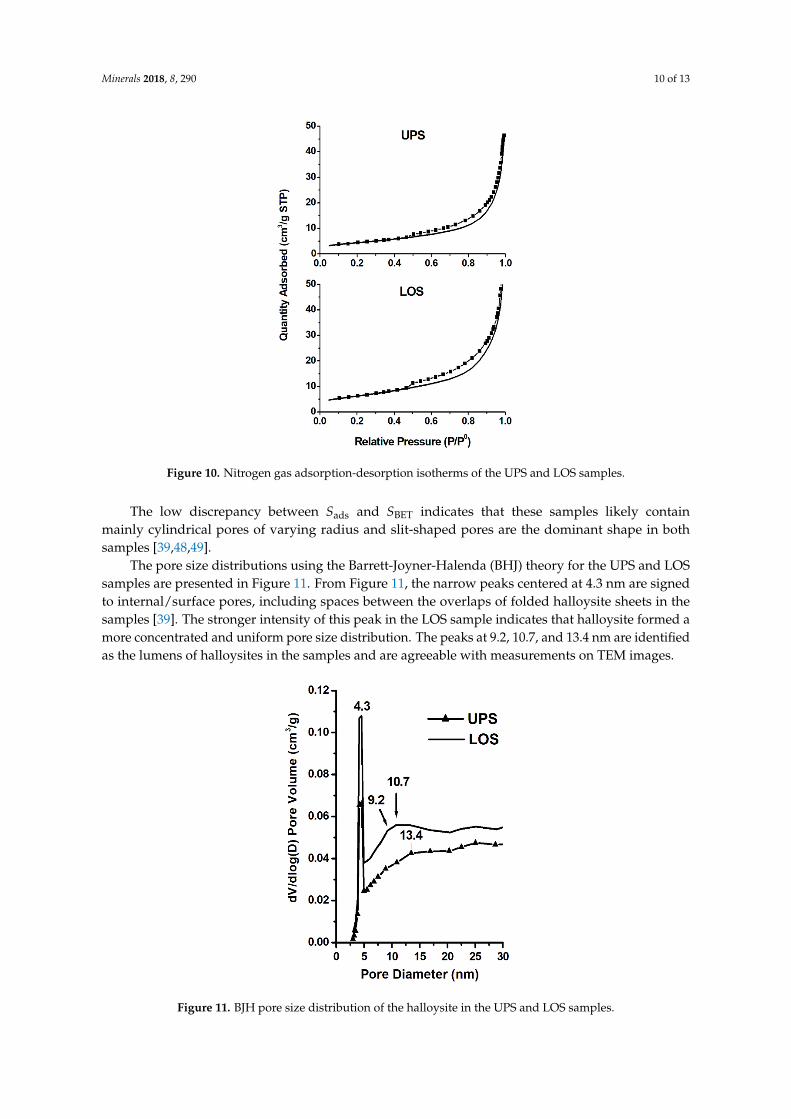
Figure 10. Nitrogen gas adsorption-desorption isotherms of the UPS and LOS samples.
The low discrepancy between Sads and SBET indicates that these samples likely contain mainly cylindrical pores of varying radius and slit-shaped pores are the dominant shape in both samples [39,48,49].
The pore size distributions using the Barrett-Joyner-Halenda (BHJ) theory for the UPS and LOS samples are presented in Figure 11. From Figure 11, the narrow peaks centered at 4.3 nm are signed to internal/surface pores, including spaces between the overlaps of folded halloysite sheets in the samples [39]. The stronger intensity of this peak in the LOS sample indicates that halloysite formed a more concentrated and uniform pore size distribution. The peaks at 9.2, 10.7, and 13.4 nm are identified as the lumens of halloysites in the samples and are agreeable with measurements on TEM images.
Figure 11. BJH pore size distribution of the halloysite in the UPS and LOS samples.
Figure 10. Nitrogen gas adsorption-desorption isotherms of the UPS and LOS samples.
The low discrepancy between Sads and SBET indicates that these samples likely containmainly cylindrical pores of varying radius and slit-shaped pores are the dominant shape in bothsamples [39,48,49].
The pore size distributions using the Barrett-Joyner-Halenda (BHJ) theory for the UPS and LOSsamples are presented in Figure 11. From Figure 11, the narrow peaks centered at 4.3 nm are signedto internal/surface pores, including spaces between the overlaps of folded halloysite sheets in thesamples [39]. The stronger intensity of this peak in the LOS sample indicates that halloysite formed amore concentrated and uniform pore size distribution. The peaks at 9.2, 10.7, and 13.4 nm are identifiedas the lumens of halloysites in the samples and are agreeable with measurements on TEM images.
Minerals 2018, 8, x FOR PEER REVIEW 10 of 13
Figure 10. Nitrogen gas adsorption-desorption isotherms of the UPS and LOS samples.
The low discrepancy between Sads and SBET indicates that these samples likely contain mainly cylindrical pores of varying radius and slit-shaped pores are the dominant shape in both samples [39,48,49].
The pore size distributions using the Barrett-Joyner-Halenda (BHJ) theory for the UPS and LOS samples are presented in Figure 11. From Figure 11, the narrow peaks centered at 4.3 nm are signed to internal/surface pores, including spaces between the overlaps of folded halloysite sheets in the samples [39]. The stronger intensity of this peak in the LOS sample indicates that halloysite formed a more concentrated and uniform pore size distribution. The peaks at 9.2, 10.7, and 13.4 nm are identified as the lumens of halloysites in the samples and are agreeable with measurements on TEM images.
Figure 11. BJH pore size distribution of the halloysite in the UPS and LOS samples. Figure 11. BJH pore size distribution of the halloysite in the UPS and LOS samples.
Minerals 2018, 8, 290 11 of 13
4. Conclusions
In conclusion, two main types of halloysite were formed in the weathered pegmatite profile inthe Thach Khoan area, Phu Tho, northern part of Vietnam. Analysis methods of XRD, SEM-EDS,TEM, FT-IR, TG and N2 adsorption-desorption isotherms were used to characterize these halloysites.The results showed that the short halloysite type is mainly distributed in the upper zone and longhalloysite type can be found in the lower zone of the weathered pegmatite profile. The short halloysiteshave the length ranging mainly from 250 to 750 nm, the outer diameter of >100 nm (79.1%), the specificsurface areas of 15.7434 m2/g and the average pore sizes of 18.9837 nm. Meanwhile, the length rangingmainly from 750 to 1250 nm (69.9%), the outer diameter of 50–100 nm (74.2%), the specific surface areasof 22.0211 m2/g, and the average pore sizes of 17.0281 nm are properties of the long halloysites. XRDafter formamide (FA) treatment indicated that the halloysite contents are approximately 81% and 93%for the upper zone and the lower zone of the weathered pegmatite profile, respectively. The resultsprovided useful information for the understanding of distribution and characteristics of differenthalloysites in the deposit and for exploiting and using these nanotubular minerals effectively.
Author Contributions: Conceptualization, B.H.B.; Formal analysis, K.T.H., D.M.A., T.T.V.A. and D.V.C.;Funding acquisition, B.H.B.; Investigation, K.T.H., T.T.V.A., D.V.C. and B.T.T.; Methodology, N.T.D., L.Q.K.and N.V.L.; Project administration, B.H.B.; Resources, N.T.D.; Validation, L.Q.K.; Visualization, D.M.A. and P.V.S.;Writing—review & editing, B.H.B.
Funding: This research was supported by the Ministry of Education and Training of Vietnam (MOET) under grantnumber B2017-MDA-17TĐ and by the Vietnam National Foundation for Science and Technology Development(NAFOSTED) under grant No. 105.99-2017.317.
Conflicts of Interest: The authors declare no conflicts of interest.
References
1. Berthier, P. Analyse de l’halloysite. Ann. Chim. Phys. 1826, 32, 332–335.2. Alexander, L.T.; Faust, G.T.; Hendricks, S.B.; Insley, H.; McMurdie, H.F. Relationship of the clay minerals
halloysite and endellite. Am. Mineral. 1943, 28, 1–18.3. Churchman, G.J.; Carr, R.M. Stability fields of hydration states of a halloysite. Am. Mineral. 1972, 57, 914–992.4. Churchman, G.J.; Carr, R.M. The definition and nomenclature of halloysites. Clays Clay Miner. 1975, 23,
382–388. [CrossRef]5. Joussein, E.; Petit, S.; Churchman, G.J.; Theng, B.K.G.; Righi, D.; Delvaux, B. Halloysite clay
minerals—A review. Clay Miner. 2005, 40, 383–426. [CrossRef]6. Wada, S.I.; Mizota, C. Iron-rich halloysite (10 Å) with crumpled lamellar morphology from Hokkaido, Japan.
Clays Clay Miner. 1982, 30, 315–317. [CrossRef]7. Guimaraes, L.; Enyashin, A.N.; Seifert, G.; Duarte, H.A. Structural, electronic, and mechanical properties of
single-walled halloysite nanotube models. J. Phys. Chem. C 2010, 114, 11358–11363. [CrossRef]8. Du, M.; Guo, B.; Jia, D. Newly emerging applications of halloysite nanotubes: A review. Polym. Int. 2010, 59,
574–582. [CrossRef]9. Bates, T.F.; Hildebrand, F.A.; Swineford, A. Morphology and structure of endellite and halloysite. Am. Miner.
1950, 35, 463–484.10. Chao, C.; Liu, J.; Wang, J.; Zhang, Y.; Zhang, B.; Zhang, Y.; Xiang, X.; Chen, R. Surface modification of
halloysite nanotubes with dopamine for enzyme immobilization. ACS Appl. Mater. Interfaces 2013, 5,10559–10564. [CrossRef] [PubMed]
11. Wilson, I.; Keeling, J. Global occurrence, geology and characteristics of tubular halloysite deposits. Clay Miner.2016, 51, 309–324. [CrossRef]
12. Adamo, P.; Violante, P.; Wilson, M.J. Tubular and spheroidal halloysite in pyroclastic deposits in the area ofthe Roccamonfina volcano (Southern Italy). Geoderma 2001, 99, 295–316. [CrossRef]
13. Singer, A.; Zarei, M.; Lange, F.M.; Stahr, K. Halloysite characteristics and formation in the northern GolanHeights. Geoderma 2004, 123, 279–295. [CrossRef]
14. Ece, Ö.I.; Schroeder, P.A. Clay mineralogy and chemistry of halloysite and alunite deposits in the Turpluarea, Balikesir, Turkey. Clays Clay Miner. 2007, 55, 18–35. [CrossRef]
Minerals 2018, 8, 290 12 of 13
15. Churchman, G.J.; Pontifex, I.R.; McClure, S.G. Factors influencing the formation and characteristics ofhalloysites or kaolinites in granitic and tuffaceous saprolites in Hong Kong. Clays Clay Miner. 2010, 58,220–237. [CrossRef]
16. García, F.J.; Sergio, G.R.; Andreas, K.; Armin, R. Study of natural halloysite from the Dragon Mine,Utah (USA). Z. Anorg. Allg. Chem. 2010, 635, 790–795. [CrossRef]
17. Bordeepong, S.; Bhongsuwan, D.; Pungrassam, T.; Bhongsuwan, T. Characterization of halloysite fromThung Yai district, Nakon Si Thammarat Province, in southern Thailand. Songklanakarin J. Sci. Technol. 2011,33, 599–607.
18. Saklar, S.; Agrili, H.; Zimitoglu, O.; Bas, ara, B.; Kaan, U. The characterisation studies of the northwestAnatolian halloysites/kaolinites. Miner. Res. Explor. Bull. 2012, 145, 48–61.
19. Ouyang, J.; Mu, D.; Zhang, Y.; Yang, H. Mineralogy and Physico-Chemical Data of Two Newly DiscoveredHalloysite in China and Their Contrasts with Some Typical Minerals. Minerals 2018, 8, 108. [CrossRef]
20. Brathwaite, R.L.; Christie, A.B.; Faure, K.; Townsend, M.G.; Terlesk, S. Origin of the Matauri Bay halloysitedeposit, Northland, New Zealand. Miner. Depos. 2012, 47, 897–910. [CrossRef]
21. Kildale, M.B.; Thomas, R.C. Geology of the halloysite deposit at the Dragon Mine. In Geology of the East TinticMountains and Ore Deposits of the Tintic Mining Districts; Guidebook to the Geology of Utah, 12; Cook, D.R.,Ed.; Utah Geological Society: Cedar City, UT, USA, 1957; pp. 94–96.
22. Churchman, G.J.; Theng, B.K.G. Interactions of halloysites with amides: Mineralogical factors affectingcomplex formation. Clay Miner. 1984, 19, 161–175. [CrossRef]
23. Keeling, J.L.; Pasbakhsh, P. Halloysite mineral nanotubes: Geology, properties and applied research. MESA J.2015, 77, 20–25.
24. Hillier, S.; Brydson, R.; Delbos, E.; Fraser, T.; Gray, N.; Pendlowski, H.; Phillips, I.; Robertson, J.; Wilson, I.Correlations among the mineralogical and physical properties of halloysite nanotubes (HNTS). Clay Miner.2016, 51, 325–350. [CrossRef]
25. Churchman, G.J.; Pasbakhsh, P.; Lowe, D.J.; Theng, B.K.G. Unique but diverse: Some observations on theformation, structure and morphology of halloysite. Clay Miner. 2016, 51, 395–416. [CrossRef]
26. Lvov, Y.; Abdullayev, E. Functional Polymer-Clay Nanotube Composites with Sustained Release of ChemicalAgents. Prog. Polym. Sci. 2013, 38, 1690–1719. [CrossRef]
27. Liu, M.; Jia, Z.; Jia, D.; Zhou, C. Recent advance in research on halloysite nanotubes-polymer nanocomposite.Prog. Polym. Sci. 2014, 39, 1498–1525. [CrossRef]
28. Kilislioglu, A.; Bilgin, B. Adsorption of uranium on halloysite. Radiochim. Acta 2002, 90, 155–160. [CrossRef]29. Yu, L.; Wang, H.; Zhang, Y.; Zhang, B.; Liu, J. Recent advances in halloysite nanotube derived composites for
water treatment. Environ. Sci. Nano 2016, 3, 28–44. [CrossRef]30. Ouyang, J.; Zhao, Z.; Zhang, Y.; Yang, H. Textual properties and catalytic performances of halloysite hybrid
CeO2-ZrO2 nanoparticles. J. Colloid Interface Sci. 2017, 505, 430–436. [CrossRef] [PubMed]31. Li, Z.; Liu, L.; González, A.J.; Wang, D. Bioinspired polydopamine-induced assembly of ultrafine Fe(OH)3
nanoparticles on halloysite toward highly efficient fire retardancy of epoxy resin via an action of interfacialcatalysis. Polym. Chem. 2017, 8, 3926–3936. [CrossRef]
32. Mo, J.; Ma, W.; Zhang, W.; Yuan, J. Structure and properties of carbon intercalated halloysite and itsorganosilicone hybrid film with low dielectric constant. Mater. Des. 2017, 128, 56–63. [CrossRef]
33. Cavallaro, G.; Danilushkina, A.A.; Evtugyn, V.G.; Lazzara, G.; Milioto, S.; Parisi, F.; Rozhina, E.V.;Fakhrullin, R.F. Halloysite nanotubes: Controlled access and release by smart gates. Nanomaterials 2017, 7,199. [CrossRef] [PubMed]
34. Yuan, P.; Tan, D.; Annabi-Bergaya, F. Properties and applications of halloysite nanotubes: Recent researchadvances and future prospects. Appl. Clay Sci. 2015, 112–113, 75–93. [CrossRef]
35. Makaremi, M.; Pasbakhsh, P.; Cavallaro, G.; Lazzara, G.; Aw, Y.K.; Lee, S.M.; Milioto, S. Effect of morphologyand size of halloysite nanotubes on functional pectin bionanocomposites for food packaging applications.ACS Appl. Mater. Interfaces 2017, 9, 17476–17488. [CrossRef] [PubMed]
36. Zheng, T.; Ni, X. Loading the polyol carbonization agent into clay nanotubes for the preparation ofenvironmentally stable UV-cured epoxy materials. J. Appl. Polym. Sci. 2017, 134, 45045. [CrossRef]
37. Pasbakhsh, P.; Churchman, G.J.; Keeling, J.L. Characterisation of properties of various halloysites relevant totheir use as nanotubes and microfibre fillers. Appl. Clay Sci. 2013, 74, 47–57. [CrossRef]
Minerals 2018, 8, 290 13 of 13
38. Nguyen, T.D.; Nguyen, P. Geological characteristics and quality of kaolin, feldspar in Thach Khoan area,Thanh Son, Phu Tho. J. Min. Geol. Sci. Technol. 2006, 15, 65–70. (In Vietnamese)
39. Fritz, B.; Clement, A.; Amal, Y.; Noguera, C. Simulation of the nucleation and growth of simple clay mineralsin weathering processes: The NANOKIN code. Geochim. Cosmochim. Acta 2009, 73, 1340–1358. [CrossRef]
40. Churchman, G.J.; Lowe, D.J. Alteration formation and occurrence of minerals in soils. In Handbook of SoilScience: Properties and Processes, 2nd ed.; Huang, P.M., Li, Y., Summer, M.E., Eds.; CRC Press: Boca Raton, FL,USA, 2012; Volume 1, pp. 20.1–20.72, ISBN 9781439803059.
41. Inoue, A.; Utada, M.; Hatta, T. Halloysite-to-kaolinite transformation by dissolution and recrystallizationduring weathering of crystalline rocks. Clay Miner. 2012, 47, 373–390. [CrossRef]
42. Bobos, I. Kaolinite to halloysite-7 Å transformation in the kaolin deposit of São Vicente de Pereira, Portugal.Clays Clay Miner. 2001, 49, 596–607. [CrossRef]
43. Frost, R.L.; Krist, J.; Horvath, E.; Kloprogge, J.T. Rehydration and phase changes of potassiumacetate-intercalated halloysite at 298K. J. Colloid Interface Sci. 2000, 226, 318–327. [CrossRef]
44. Li, Y.; Zhang, Y.; Zhang, Y.F.; Liu, M.; Zhang, F.; Wang, L. Thermal behavior analysis of halloysite selectedfrom Inner Mongolia Autonomous region in China. J. Ther. Anal. Calorim. 2017, 129, 1333–1339. [CrossRef]
45. Kang, H.; Liu, X.; Zhang, S.; Li, J. Functionalization of halloysite nanotubes (HNTs) via mussel-inspiredsurface modification and silane grafting for HNTs/soy protein isolate nanocomposite film preparation.RSC Adv. 2017, 7, 24140–24148. [CrossRef]
46. Tzounis, L.; Herlekar, S.; Tzounis, A.; Charisiou, N.D.; Goula, M.; Stamm, M. Halloysite NanotubesNoncovalently Functionalised with SDS Anionic Surfactant and PS-b-P4VP Block Copolymer for TheirEffective Dispersion in Polystyrene as UV-Blocking Nanocomposite Films. J. Nanomater. 2017, 2017, 1–11.[CrossRef] [PubMed]
47. Sun, P.; Liu, G.; Lv, D.; Dong, X.; Wub, J.; Wanga, D. Effective activation of halloysite nanotubes by piranhasolution for amine modification via silane coupling chemistry. RSC Adv. 2015, 5, 52916–52925. [CrossRef]
48. Lun, H.; Ouyang, J.; Yang, H. Natural halloysite nanotubes modified as an aspirin carrier. RSC Adv. 2014, 4,44197–44202. [CrossRef]
49. Churchman, G.J.; Davy, T.J.; Aylmore, L.A.G.; Gilkes, R.J.; Self, P.G. Characteristics of fine pores in somehalloysites. Clay Miner. 1995, 30, 89–98. [CrossRef]
© 2018 by the authors. Licensee MDPI, Basel, Switzerland. This article is an open accessarticle distributed under the terms and conditions of the Creative Commons Attribution(CC BY) license (http://creativecommons.org/licenses/by/4.0/).
Copyright © 2022 FDOKUMEN