Discovery of a Diatom That Oozes Oil
28
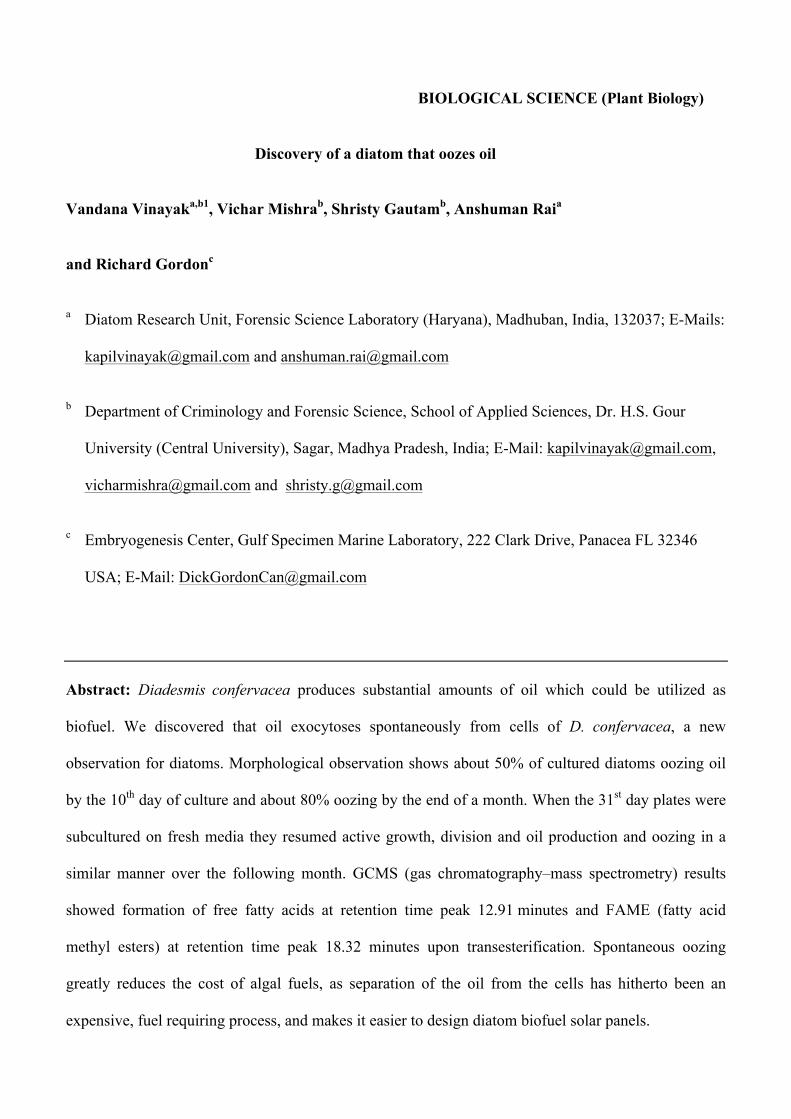
BIOLOGICAL SCIENCE (Plant Biology) Discovery of a diatom that oozes oil Vandana Vinayak a,b1 , Vichar Mishra b , Shristy Gautam b , Anshuman Rai a and Richard Gordon c a Diatom Research Unit, Forensic Science Laboratory (Haryana), Madhuban, India, 132037; E-Mails: [email protected] and [email protected] b Department of Criminology and Forensic Science, School of Applied Sciences, Dr. H.S. Gour University (Central University), Sagar, Madhya Pradesh, India; E-Mail: [email protected], [email protected] and [email protected] c Embryogenesis Center, Gulf Specimen Marine Laboratory, 222 Clark Drive, Panacea FL 32346 USA; E-Mail: [email protected] Abstract: Diadesmis confervacea produces substantial amounts of oil which could be utilized as biofuel. We discovered that oil exocytoses spontaneously from cells of D. confervacea, a new observation for diatoms. Morphological observation shows about 50% of cultured diatoms oozing oil by the 10 th day of culture and about 80% oozing by the end of a month. When the 31 st day plates were subcultured on fresh media they resumed active growth, division and oil production and oozing in a similar manner over the following month. GCMS (gas chromatography–mass spectrometry) results showed formation of free fatty acids at retention time peak 12.91 minutes and FAME (fatty acid methyl esters) at retention time peak 18.32 minutes upon transesterification. Spontaneous oozing greatly reduces the cost of algal fuels, as separation of the oil from the cells has hitherto been an expensive, fuel requiring process, and makes it easier to design diatom biofuel solar panels.
-
Upload
independent -
Category
Documents
-
view
0 -
download
0
Transcript of Discovery of a Diatom That Oozes Oil
BIOLOGICAL SCIENCE (Plant Biology)
Discovery of a diatom that oozes oil
Vandana Vinayaka,b1, Vichar Mishrab, Shristy Gautamb, Anshuman Raia
and Richard Gordonc
a Diatom Research Unit, Forensic Science Laboratory (Haryana), Madhuban, India, 132037; E-Mails:
[email protected] and [email protected]
b Department of Criminology and Forensic Science, School of Applied Sciences, Dr. H.S. Gour
University (Central University), Sagar, Madhya Pradesh, India; E-Mail: [email protected],
[email protected] and [email protected]
c Embryogenesis Center, Gulf Specimen Marine Laboratory, 222 Clark Drive, Panacea FL 32346
USA; E-Mail: [email protected]
Abstract: Diadesmis confervacea produces substantial amounts of oil which could be utilized as
biofuel. We discovered that oil exocytoses spontaneously from cells of D. confervacea, a new
observation for diatoms. Morphological observation shows about 50% of cultured diatoms oozing oil
by the 10th day of culture and about 80% oozing by the end of a month. When the 31st day plates were
subcultured on fresh media they resumed active growth, division and oil production and oozing in a
similar manner over the following month. GCMS (gas chromatography–mass spectrometry) results
showed formation of free fatty acids at retention time peak 12.91 minutes and FAME (fatty acid
methyl esters) at retention time peak 18.32 minutes upon transesterification. Spontaneous oozing
greatly reduces the cost of algal fuels, as separation of the oil from the cells has hitherto been an
expensive, fuel requiring process, and makes it easier to design diatom biofuel solar panels.
dickgordon
Text Box
Vinayak, V., R. Gordon, S. Gautam & A. Rai (2014). Discovery of a diatom that oozes oil. Advanced Science Letters 20(7-9, Special issue: National Conference on Nanotechnology and Renewable Energy, Jamia Millia Islamia, New Delhi, April 28-29, 2014), 1256-1267.

2
Keywords: diatom oil, lipids, diatom solar panels
Significant statement: Since diatoms have abundant oil but to extract oil from them is tedious and
cost effective process. Though the idea of increasing oil accumulation in diatoms by genetic
engineering is quite successful and achieved but if nature already has in its stock certain oil rich
diatoms which when cultured are loaded fully with oil acquiring the shape of whole cell, the need of
genetic engineering and its cost can be reduced. We have discovered a strain of diatom Diadesmis
confervacea which not only accumulates high amount of oil (14.6%) but also extracts oil naturally near
31st day of culturing in vivo when the cells attains maturity which is very significant in the area of
economical biofuel production.
\body
Footnote:
VV conducted, monitored and wrote the paper, SG collected the water sample, VM and SG did the
experimentation, AR analyzed the technical data. RG guided the whole experimentation, edited and
checked the ms.
1 Author to whom correspondence should be addressed; E-Mail: [email protected];
Tel.: +91-91-79-577953

3
1. Introduction
The global economy suffers due to the price hike in fuels time to time, which are obtained from natural
reservoirs. Diatom oil production is expected to be 7 to 200x per hectare compared to oilseed crops [1,
2, 3]. Diatoms play an important role in the ecological balance of earth because of their carbon dioxide
fixing ability and are responsible for “~20-25% of the world net primary production” [4] (cf.: [5, 6]).
When the silica shell is discounted, the dry weight of oil per dry weight of cell may exceed that of any
other organism [7]. Geologists suggest that fossil diatoms could be the source of much of the world’s
crude oil [8]. Mass culturing of diatoms for biofuel would not compete with food production [9] nor
contribute to net increase in atmospheric CO2. Diatoms include species able to survive in diverse
conditions [10, 11, 12] including high temperature [13, 14, 15, 16, 17].
It has been reported that when diatoms are put under stress conditions (low nutrients, high temperature,
low silica, high or low light, etc.) the concentration of oil increases [18]. This may be due to the shift
in lipid metabolism from synthesis of intracellular plasma membrane to storage lipid. Genetic
transformation of diatoms [19, 20, 21, 22, 23, 24, 25, 26, 27] or selective breeding [28] might someday
further increase oil production under broader conditions. In this paper we have sought diatoms with
high oil content in vivo under natural conditions and found one species that exhibits spontaneous
exudation of oil. All diatoms tested by us produced oil but the visible oil content seemed to be
maximum in Diadesmis confervacea, which was proved by transesterification. Diatoms with high lipid
content and naturally oozing would eliminate the expensive step in energy production of extracting oil
out of the diatoms [29]. They may prove to be key elements towards our goal of constructing biofuel
generating diatom solar panels [7].
The water body of Haryana, India that we selected, known as Sultanpur Lake, has slightly high pH
(7.88) and conductivity (0.42 S/m) during autumns compared to other seasons of the year. Commonly
occurring diatoms in Sultanpur Lake were Achnanthes, Cymbella, Cocconeis, Navicula, Gomphonema,

4
Nitzschia, Encyonema and Cyclotella. Besides these some rarely occurring diatoms were Diadesmis,
Reimeria, Sellaphora, Surirella, Luticola, Pinnularia, Melosira, Opephora, Synedra and Placoneis
(Plate 1). Pure diatom cultures of Diadesmis confervacea Kützing, Nitzschia palea (Kützing) W.
Smith, Cyclotella menenghiana Kützing, Pinnularia borelias (Ehrenberg) Rabenhorst, Placoneis
elginensis (Gregory) E.J. Cox and some new species of Nitzschia were obtained from this natural water
body. Among these pure diatom cultures of D. confervacea (Plate 2) was selected due to its maximum
oil content of 14.6% as compared, for example, to 5% in Nitzschia palea.
2. Results and discussions
In the present study about twelve pure cultures of diatom from fresh water bodies were obtained which
included Diadesmis confervacea Kützing, Nitzschia palea (Kützing) W. Smith, Cyclotella
menenghiana Kützing, Pinnularia borelias (Ehrenberg) Rabenhorst, Placoneis elginensis (Gregory)
E.J. Cox and some new species of Nitzschia. D. confervacea proved to have both high lipid content
and natural, spontaneous secretion of its oil. D. confervacea had the highest lipid content about 14.6%
as compared to Nitzschia 5% and thus was selected as the appropriate candidate for formation of
diatom solar panels. The in vivo growth of this diatom on modified f/2 media showed that 50% of the
cells oozed oil at 10th day of inoculation and 80% of the cells oozed oil spontaneously on 31st day of
inoculation. The axenic diatom culture was scraped from the culture media plate and transferred into
100 µl of freshly prepared chloroform: methanol (1:1) solution in a vial followed by transesterification
of oil in diatoms to fatty acids methyl esters and glycerol [30]. The TLC (thin layer chromatography)
chromatogram shows separation at different retention factors (Rf) which is defined as the distance
traveled by the compound divided by the distance traveled by the solvent. Rf for different components
was viz. cholesterol ester (Rf=0.88), triacyl glycerol (Rf=0.52), free fatty acids (Rf=0.45, 0.40 and
0.107), 1,3 diacyl glycerol (Rf=0.083), 1,2 diacyl glycerol (Rf=0.0357) and monoglycerols
(Rf=0.0238) for the transesterified sample in quadruplets (Figure 6). The GCMS results showed that
transesterification has resulted in formation of free fatty acids at retention time peak near C-12.91 and
5
some methyl esters (FAME) at retention time peak near C-18.32 (Figure 7 and Table 1), besides this
few other small peaks showing formation of esters and presence of fatty acids in a solvent mixture of
chloroform: methanol (1:1) were seen at retention time of approximately 30 minutes. One peculiarity
with D. confervacea is that the cells increased in size during the course of the experiment, rather than
decreased. This increase was not great in the valve to valve distance (Figure 2), suggesting that the size
increase is not due to an increased number of girdle bands. Rather, the tip to tip length of the valves
increased (Figure 3). Some diatom species do not show the usual decrease in size of the cell during cell
division [30].
It is worth considering some consistencies and inconsistencies in our data. The valves for which we
measured W and S to get their ratio have a larger value of W than that in Figure 5. Perhaps individual
cells teased out of these colonies are buckled [31] under tension and change shape.
The weight of transesterified lipid and average diatom cell count per 100 µl from 1st day to 31st day of
diatom D. confervacea was recorded which showed increase in FAME at 9th day and 24th day, however
oil oozed at around 31st day. The diatom count also raised significantly it being maximum between 13th
and 27th day thereafter growth retarded and oil started occupying whole volume of the diatom cell
(Figure 6). The oil in the diatoms expanded at the later stages and took the shape of the cell as a whole
(Plate 4 and 5). At 31st day onwards the oil started oozing from the diatom cells naturally without any
force, mechanical pressure or heat and was left with light brown chloroplast which again divided and
produced oil when fed with fresh nutrient media (Plate 6 & 7). Thus growth of diatoms especially D.
confervacea in in vivo conditions resulted in oozing of oil without cell lysis making it as good
candidate for construction of diatom solar panels.
The concept of milking oil from diatoms [7] can be achieved in a simple way: oozing of oil after one
month suggests that the nutrient medium is now deficient, perhaps providing the stress that increases

6
oil production without having to prepare media deficient in nitrates or silicates [18]. When supplied
with fresh nutrient media the diatom cells can ooze oil again.
Our results suggest that extraction of diatom oil using hydrocarbons [32, 33] or other means [34] is not
necessary, and that the oil comes out spontaneously from some diatoms without damage to the cells.
Furthermore, additional energy beyond that taken up by photosynthesis need not be supplied, nor is
genetic engineering [29, 35] necessary for oil exocytosis. Cultures that exuded their oil are capable of
doing it again, meeting a primary requirement for the potential success of diatom solar panels [7].
3. Methods
3.1 Taxonomy and Culturing
Diatom taxa were identified using various keys [36, 37, 38, 39, 40, 41, 42, 43, 44, 45, 46, 47, 48, 49,
50]. The water sample brought into the laboratory was studied first for its species richness and later on
was inoculated onto the prepared culture media. Each aliquot was cultured on f/2 solid agar
medium [51] with the following modifications: soil extract (5ml/liter), Na2SiO3.5H2O at a
concentration of 40 g/l (2ml/liter), with the final volume of medium made up to 1 liter by adding
autoclaved double distilled water. Brown diatom colonies appeared when grown at 18 ± 1°C under
18000 lux, light source: white/yellow light (25W tungsten bulb), light: dark conditions: 16 hrs/8 hrs.
The mixed colonies of cultured diatoms were then serial diluted to obtain axenic cultures. Possible
bacterial contamination, in case any remained, was treated with a mixture of Penicillin G (170 µg/l)
and Streptomycin (85 µg/l) in the ratio of 1:0.5 using a Metler Toledo AB 265-S/ FACT weighing
balance [52]. 100 µl of pure colonies of diatom culture at 6800cells/100µl were inoculated onto each
of 31 Petri plates of diameter 7.7 cm, labeled as 1st day to 31st day:
1. Each day the respective plate was observed for the presence and size of oil globules in the
diatom cells.

7
2. The exocytosis of oil from the diatom cells was also looked for on each day after their
inoculation.
3. The number of cells was counted on each day.
4. Each day the corresponding plate was also subjected to a transesterification process to estimate
the oil content [53].
5. Fatty acid methyl esters (FAME) were analyzed by GCMS and tested using TLC.
3.1.1 Morphological Study:
All the observations, length/breadth or diameters of individual oil droplets in duplicate were averaged
over usually five diatom cells in a single image recorded at 100X observation using a Leica DM 2500
compound microscope [54]fitted with Leica EC3 digital camera and using SEM Zess EVO MA
10(Plate 3) . Cells were observed in situ, on the medium in the Petri dishes, without the use of a cover
slip, which otherwise might mechanically cause oil expression [55]. The volumes of individual oil
droplets and whole diatom cells were determined by assessing the geometric shape of the cell or oil
globule [56]. Generally each oil globule had the projected shape of a circle or a capped rectangle. Clear
images with no overlapping of the filamentous diatom chains were selected for the measurement and
their sizes were measured using LAS EZ software [57].
The weight of the lipid content from 1st day till 31st day of inoculation was measured by the
transesterification process (Figure 1).
Figures 2 and 3 show that as the diatoms grow on the enriched medium their numbers not only
increase approximately exponentially but the cell size also increases. The oil content also peaks as the
culture matures. The diatom cells seem to finally exude oil when the cell size no longer increases in
size but the oil content inside the cell increases its volume until it finds no space inside and bursts open

8
the cell indicating there is a correlation between a morphological pattern of diatom growth and its oil
content. During the log or exponential phase during first 15-20 days of growth as shown in Figures 2
and 3, the lipid content took the shape of the cell, at least in girdle view (Plate 4 and 5). There were
small fluctuations in cell and lipid volume as all cells are not morphologically of the same size and
shape.
3.1.2 Volumetric Analysis:
A fixed volume (100 µl) of D. confervacea was inoculated onto each of 31 media Petri plates.
Colonies with maximum oil content were selected systematically, a form of taking the sample
maximum in statistics [58]. The following measurements were made for each selected cell in a colony:
L = length of cell along the axis of the colony = distance between valves of a cell
W = width of cell perpendicular to the axis of the colony
d = diameter of each spherical oil droplet in the cell
We calculated the oil droplet volume using the formula of Archimedes:
v = 43π d2
⎛⎝⎜
⎞⎠⎟3
For nonspherical oil droplets we approximated the shape as a cylinder with spherical caps and
measured:
l = longest straight side
w = shortest side (diameter of cylinder)
and estimated the volume as:

9
v = π w2
⎛⎝⎜
⎞⎠⎟2
l + 43π w
2⎛⎝⎜
⎞⎠⎟3
One parameter was not measured daily because of the orientation of the colonies:
S = maximum width of the valve
From the live cells in Plate 1 and 2 that are seen in valve view we estimate that W/S = 2.1 and that we
can approximate the valve surface area as an ellipse. This allows us to estimate the volume of the cell
as:
V = π W2
⎛⎝⎜
⎞⎠⎟S2
⎛⎝⎜
⎞⎠⎟ =
π4WS
or, approximatingW ≈ 2S :
V ≈ π8W 2
Figures 2 and 3 depict V and v and Figures 4 and 5 depict L and W versus each day, including standard
deviations. Plate 4 and 5 show the exocytosis pattern from diatom cells and their growth pattern over
one month duration. The average volume of oil droplets in the diatom cells was 35 µm3, initially, at the
time of inoculation. The diatoms started showing visible growth on the 4th day.
Figures 2-5 show large fluctuations that may be due to stochastic variations in the independent growth
in each Petri dish.
Plates 4 and 5 show exudation of oil from diatom cells on the 31st day, and the color change in
pigmentation is observed changing from golden brown to slightly pale. This is due to the exudation of
the oil content which when inside the cell pushes the chloroplast content together, which appears dark
golden brown; but once the oil exudates, the chloroplast spreads in the cell. After the 31st day D.

10
confervacea was subcultured on fresh culture media plates and after 14 days revived colonies were
obtained containing oil droplets as shown in Plate 6. The lipid content present within the revived
colonies of D. confervacea was stained by Sudan-IV dye [59] as shown in Plate 7.
Acknowledgments
We would also like to thank Karthick Balasubramanian and Kalina M. Manoylov who kindly assisted
with identification of Diadesmis confervacea, and we thank KMM for a critical reading of the
manuscript. We would also like to thank the Department of Biotechnology Government of India for
financial and laboratory support, and the Gulf Specimen Marine Laboratory and Birds Hill Provincial
Park for congenial natural environments for writing.
Conflicts of Interest
The authors declare no conflict of interest.
4. References:
1. Sheehan, J.; Dunahay, T.; Benemann, J.; Roessler, P. A Look Back at the U.S. Department of Energy’s Aquatic Species Program: Biodiesel from Algae. Close-Out Report [NREL/TP-580-24190]; National Renewable Energy Laboratory: Golden, Colorado, 1998; p.^pp.
. 2. Hu, Q.; Sommerfeld, M.; Jarvis, E.; Ghirardi, M.; Posewitz, M.; Seibert, M.; Darzins, A.
Microalgal triacylglycerols as feedstocks for biofuel production: perspectives and advances. Plant Journal 2008, 54, 621-639.
3. Demirbas, A. Progress and recent trends in biodiesel fuels. Energy Conv. Manag. 2009, 50, 14-34.
4. Werner, D. Introduction with a note on taxonomy. In The Biology of Diatoms; Werner, D., Ed. Blackwell Scientific Publications: Oxford, 1977; pp. 1-17.
5. Field, C.B.; Behrenfeld, M.J.; Randerson, J.T.; Falkowski, P. Primary production of the biosphere: Integrating terrestrial and oceanic components. Science 1998, 281, 237-240.
6. Tréguer, P.; Nelson, D.M.; Van Bennekom, A.J.; DeMaster, D.J.; Leynaert, A.; Quéguiner, B. The silica balance in the world ocean: a reestimate. Science 1995, 268, 375-379.
7. Ramachandra, T.V.; Mahapatra, D.M.; Karthick B.; Gordon, R. Milking diatoms for sustainable energy: biochemical engineering versus gasoline-secreting diatom solar panels. Industrial & Engineering Chemistry Research 2009, 48, 8769-8788.
8. Shukla, S.K.; Mohan, R. The contribution of diatoms to worldwide crude oil deposits. In The Science of Algal Fuels: Phycology, Geology, Biophotonics, Genomics and Nanotechnology; Gordon, R.; Seckbach, J., Eds.; Springer: Dordrecht, 2012; pp. 355-382.

11
9. Chisti, Y. Biodiesel from microalgae. Biotechnol. Adv. 2007, 25, 294-306. 10. Hobbs, W.O.; Wolfe, A.P.; Inskeep, W.P.; Amskold, L.; Konhauser, K.O. Epipelic diatoms
from an extreme acid environment: Beowulf Spring, Yellowstone National Park, USA. Nova Hedwigia 2009, 71-83.
11. Sterrenburg, F.A.S.; Gordon, R.; Tiffany, M.A.; Nagy, S.S. Diatoms: living in a constructal environment. In Algae and Cyanobacteria in Extreme Environments. Series: Cellular Origin, Life in Extreme Habitats and Astrobiology, Vol. 11; Seckbach, J., Ed. Springer: Dordrecht, The Netherlands, 2007; pp. 141-172.
12. DeNicola, D.M. A review of diatoms found in highly acidic environments. Hydrobiologia 2000, 433, 111-122.
13. Bryanskaya, A.V.; Namsaraev, Z.B.; Kalashnikova, O.M.; Barkhutova, D.D.; Namsaraev, B.B.; Gorlenko, V.M. Biogeochemical processes in algal-bacterial mats of the Urinskii alkaline hot spring. Microbiology 2006, 75, 611-620.
14. Fernandez-Turiel, J.L.; Garcia-Valles, M.; Gimeno-Torrente, D.; Saavedra-Alonso, J.; Martinez-Manent, S. The hot spring and geyser sinters of El Tatio, northern Chile. Sedimentary Geology 2005, 180, 125-147.
15. Tolomio, C.; Ceschi-Berrini, C.; Moschin, E.; Galzigna, L. Colonization by diatoms and antirheumatic activity of thermal mud. Cell Biochem Funct 1999, 17, 29-33.
16. Jones, B.; Renaut, R.W.; Rosen, M.R. Biogenicity of silica precipitation around geysers and hot spring vents, North Island, New Zealand. Journal of Sedimentary Research 1997, 67, 88-104.
17. Biebl, R.; Kusel-Fetzmann, E. Beobachtungen über das Vorkommen von Algen an Thermalstandorten auf Island [Observations on the occurrence of algae at thermal sites in Iceland]. Österr. Bot. Zeitschr. 1966, 113, 408-423.
18. Sharma, K.K.; Schuhmann, H.; Schenk, P.M. High lipid induction in microalgae for biodiesel production. Energies 2012, 5, 1532-1553.
19. Kroth, P.; León, R.; Gaván, A.; Fernández, E. Molecular biology and the biotechnological potential of diatoms. Advances in Experimental Medicine & Biology 2007, 616, 23-33.
20. Kroth, P.G. Genetic transformation: a tool to study protein targeting in diatoms. Methods Mol Biol 2007, 390, 257-268.
21. Dunahay, T.G.; Jarvis, E.E.; Roessler, P.G. Genetic transformation of the diatoms Cyclotella cryptica and Navicula saprophila. Journal of Phycology 1995, 31, 1004-1012.
22. Apt, K.E.; Kroth-Pancic, P.G.; Grossman, A.R. Stable nuclear transformation of the diatom Phaeodactylum tricornutum. Mol Gen Genet 1996, 252, 572-579.
23. Falciatore, A.; Casotti, R.; Leblanc, C.; Abrescia, C.; Bowler, C. Transformation of nonselectable reporter genes in marine diatoms. Mar. Biotechnol. 1999, 1, 239-251.
24. Zaslavskaia, L.A.; Lippmeier, J.C.; Kroth, P.G.; Grossman, A.R.; Apt, K.E. Transformation of the diatom Phaeodactylum tricornutum (Bacillariophyceae) with a variety of selectable marker and reporter genes. J. Phycol. 2000, 36, 379-386.
25. León, R.; Fernández, E. Nuclear transformation of eukaryotic microalgae: Historical overview, achievements and problems. Advances in Experimental Medicine & Biology 2007, 616, 1-11.
26. Miyagawa, A.; Okami, T.; Kira, N.; Yamaguchi, H.; Ohnishi, K.; Adachi, M. Research note: High efficiency transformation of the diatom Phaeodactylum tricornutum with a promoter from the diatom Cylindrotheca fusiformis. Phycological Research 2009, 57, 142-146.
27. Miyagawa-Yamaguchi, A.; Okami, T.; Kira, N.; Yamaguchi, H.; Ohnishi, K.; Adachi, M. Stable nuclear transformation of the diatom Chaetoceros sp. Phycological Research 2011, 59, 113-119.
28. Chepurnov, V.A.; Chaerle, P.; Mann, D.G. How to breed diatoms: examination of two species with contrasting reproductive biology. In The Science of Algal Fuels: Phycology, Geology, Biophotonics, Genomics and Nanotechnology; Gordon, R.; Seckbach, J., Eds.; Springer: Dordrecht, 2012; pp. 323-340.

12
29. Mercer, P.; Armenta, R.E. Developments in oil extraction from microalgae. Eur. J. Lipid Sci. Technol. 2011, 113, 539-547.
30. Rose, D.T.; Cox, E.J. Some diatom species do not show a gradual decrease in cell size as they reproduce. Fundam. Appl. Limnol. 2013, 182, 117-122.
31. Gordon, R.; Tiffany, M.A. Possible buckling phenomena in diatom morphogenesis. In The Diatom World; Seckbach, J.; Kociolek, J. P., Eds.; Springer: Dordrecht, The Netherlands, 2011; pp. 245-272.
32. Hejazi, M.A.; Wijffels, R.H. Milking of microalgae. Trends Biotechnol 2004, 22, 189-194. 33. Hejazi, M.A.; Holwerda, E.; Wijffels, R.H. Milking microalga Dunaliella salina for β-carotene
production in two-phase bioreactors. Biotechnology and Bioengineering 2004, 85, 475-481. 34. Zhang, F.; Cheng, L.H.; Xu, X.H.; Zhang, L.; Chen, H.L. Technologies of microalgal
harvesting and lipid extraction. Progress in Chemistry 2012, 24, 2062-2072. 35. Ribeiro, G.; Côrte-Real, M.; Johansson, B. Engineering of fatty acid production and secretion
in Saccharomyces cerevisiae. In FEBS Workshop Microbial Lipids: From Genomics to Lipidomics. Vienna, Austria; European Federation for the Science and Technology of Lipids: 2009; p. http://repositorium.sdum.uminho.pt/bitstream/1822/18577/18573/Poster%18520Gabriela%18520ASCB 2009.pdf.
36. du Buf, H.; Bayer, M.M. Automatic Diatom Identification; World Scientific: Singapore, 2002; p.^pp.
. 37. Pollanen, M.S. Forensic Diatomology and Drowning; Elsevier Science Health Science
Division: 1998; p.^pp. . 38. Round, F.E.; Crawford, R.M.; Mann, D.G. The Diatoms, Biology & Morphology of the Genera;
Cambridge University Press: Cambridge, 1990; p.^pp. . 39. Hustedt, F. Bacillariophyta (Diatomeae) [2nd, revised ed.]. Die Süsswasserflora Mitteleuropas
1930, 10, 1-466. 40. Hustedt, F. Die Kieselalgen Deutschlands, Osterreichs und der Schweiz, mit Berucksichtigung
der ubrigen Lander Europas sowie der angrenzenden Meeresgebiete. (To be cont'd.). In Rabenhorst S Kryptogamcn Flora 1930, 7-7, 785-920, 781-176, 177-320, 321-432, 433-576.
41. Hustedt, F., Die Kieselalgen Deutschlands, Österreich und der Schweiz, 3. Teil. In Akademische Verlagsgesellschaft: Leipzig, 1966.
42. Hustedt, F., Die Kieselalgen Deutschlands, Österreich und der Schweiz, 2. Teil. In Akademische Verlagsgesellschaft: Leipzig, 1959.
43. Patrick, R.; Reimer, C.W. The Diatoms of the United States, Exclusive of Alaska and Hawaii, Volume 1; Academy of Natural Sciences: Philadelphia, 1966; p.^pp.
. 44. Patrick, R.; Reimer, C.W. The Diatoms of The United States, Exclusive of Alaska and Hawaii;
Sutter House: Philadelphia, 1975; Vol. of Volume 2, Part 1, p.^pp. . 45. Krammer, K.; Lange-Bertalot, H. Bacillariophyceae. 1. Teil: Naviculaceae. In Süßwasserflora
von Mitteleuropa; Ett, J.; Gerloff, J.; Heymig, H.; Mollen-Haver, D., Eds.; Gustav Fischer: Stuttgart, 1986; Vol. 2/1, pp. 1-876.
46. Krammer, K.; Lange-Bertalot, H. Bacillariophyceae. 2. Teil: Bacillariaceae, Epithemiaceae, Surirellaceae. In Süßwasserflora von Mitteleuropa; Ett, J.; Gerloff, J.; Heymig, H.; Mollen-Haver, D., Eds.; G. Fisher: Stuttgart, 1988; Vol. 2/2, pp. 1-596.
47. Krammer, K.; Lange-Bertalot, H. Bacillariophyceae. 3. Teil: Centrales, Fragilariaceae, Eunotiaceae. In Süßwasserflora von Mitteleuropa; Ett, J.; Gerloff, J.; Heymig, H.; Mollen-Haver, D., Eds.; G. Fisher: Stuttgart, 1991; Vol. 2/3, pp. 1-576.
13
48. Krammer, K.; Lange-Bertalot, H. Bacillariophyceae. 4. Teil: Achnanthaceae. In Süßwasserflora von Mitteleuropa; Ett, J.; Gerloff, J.; Heymig, H.; Mollen-Haver, D., Eds.; G. Fisher: Stuttgart, 1991; Vol. 2/4, pp. 1-437.
49. Simonsen, R. Atlas and Catalogue of the Diatom Types of Friedrich Hustedt: Atlas, Plates 1-395, op 2-106; J. Cramer in der Gebruder Borntraeger Verlagsbuchhandlung: Stuttgart, 1987; Vol. 2, p.^pp.
. 50. Gandhi, H.P. Freshwater diatoms from Sagar in the Mysore State. J. Ind. Bot. Soc. 1959, 38,
305-331. 51. Guillard, R.R.; Ryther, J.H. Studies of marine planktonic diatoms .1. Cyclotella nana Hustedt,
and Detonula confervacea (Cleve) Gran. Canadian Journal of Microbiology 1962, 8, 229-239. 52. Mettler-Toledo AB265-S DualRange Analytical Balance. Available online:
http://in.mt.com/in/en/home/products/Laboratory_Weighing_Solutions/Analytical_Balances/Classic-Analytical/AB-S/AB265-S.html
53. Ryckebosch, E.; Muylaert, K.; Foubert, I. Optimization of an analytical procedure for extraction of lipids from microalgae. J. Am. Oil Chem. Soc. 2012, 89, 189-198.
54. Leica Microsystems Materials Analysis Microscope Leica DM2500 M. Available online: http://www.leica-microsystems.com/products/by-application/education/earth-material-science/detail/product/leica-dm2500-m/
55. Manoylov, K.M.; Beskok, A.; Gordon, R. Diatom cell survival after gentle mechanical release of stored lipids. 2013, in preparation.
56. Hillebrand, H.; Durselen, C.D.; Kirschtel, D.; Pollingher, U.; Zohary, T. Biovolume calculation for pelagic and benthic microalgae. Journal of Phycology 1999, 35, 403-424.
57. Leica Microsystems Imaging software for Windows Operating Systems for "EZ" documentation and annotation Leica LAS EZ. Available online: http://www.leica-microsystems.com/products/microscope-software/educational/details/product/leica-las-ez/
58. Wikipedia Sample maximum and minimum. Available online: http://en.wikipedia.org/wiki/Sample_maximum
59. Crawford, R.M. The protoplasmic ultrastructure of the vegetative cell of Melosira varians C.A. Agardh. J. Phycol. 1973, 9, 50-61.

14
5. Figure Legends:
Figure 1. Average volume V of diatom cells in µm3 and its standard error for samples of 5 Diadesmis
confervacea diatoms on a single plate, 2 plates per day, i.e., 10 cells measured per day. The day refers
to the end of each 24 hour period, i.e., plate’s labeled day 1 were measured 24 hours after inoculation.
The black bars show one standard error above the mean (top of blue bars).
Figure 2. Average volume v of oil per droplet in µm3 and its standard error for samples of Diadesmis
confervacea diatoms on a single plate, 2 plates per day. The day refers to the end of each 24 hour
period, i.e., plate’s labeled day 1 were measured 24 hours after inoculation. Five diatom oil droplets
were measured per plate, i.e., 10 oil droplets per day.
Figure 3. Average valve to valve length L of diatom cells in µm, measured along the axis of the
colony, and its standard error for samples of 5 Diadesmis confervacea diatoms on a single plate,
2 plates per day, i.e., 10 cells measured per day. The day refers to the end of each 24 hour period,
i.e., plate’s labeled day 1 were measured 24 hours after inoculation. The black bars show one
standard error above the mean (top of blue bars).
Figure 4. Average width W of diatom cells in µm, measured perpendicular to the axis of the
colony (i.e., length of the long axis of the valve), and its standard error for samples of Diadesmis
confervacea diatoms on a single plate, 2 plates per day, i.e., 10 cells measured per day. The day
refers to the end of each 24 hour period, i.e., plate’s labeled day 1 were measured 24 hours after
inoculation. The black bars show one standard error above the mean (top of blue bars).
Figure 5. Weight of transesterified lipid in micrograms (µg) and average diatom cell count per 100µl
from 1st day to 31st day of diatom Diadesmis confervacea. The day refers to the end of 24 hours, i.e.,
plate labeled day 1, were counted and transesterified 24 hours after inoculation. The red bars show
weight of transesterified lipid (µg) and green bars show average diatom cell count of Diadesmis
confervacea per 100 µl.

15
Figure 6: TLC of the oil extracted from Diadesmis confervacea (T) showing separation of cholesterol
ester (Rf= 0.88), free fatty acids (FFA) (Rf=0.45, 0.40 and 0.107), 1,3 diacyl glycerol (1,3 DAG)
(Rf=0.083), 1,2 diacyl glycerol (1,2 DAG) (Rf=0.0357) and monoglycerols (MG) (Rf=0.0238) with
standards- S1: Mustard oil, S2: Olive oil, S3: Cocconut oil, S4: Soyabean oil and S5: Codliver oil.
Figure 7 Chromatogram of oil extracted from Diadesmis confervacea analyzed in GCMS for first
(tR=Retention time) 19 minutes in which maximum free fatty acids and FAME were detected.
Plate 1. Microscope images of few diatoms containing lipid drops from the water sample of
Sultanpur Lake.
Plate 2. Microscope images of pure diatom cultures of Diadesmis confervacea (Ehrenberg)
Mereschkowsky.
Plate 3. SEM images of Diadesmis confervacea
Plate 4. Compound microscope images of Diadesmis confervacea diatoms showing the lipid
content growth pattern and exocytose of oil over one month. Each image is of a small sample
taken from the first culture media plate for that day (in duplicate). Lines are drawn by hand using
LAS EZ software [57] to indicate the measurements of oil droplets in the following manner:
Red lines indicate (------) Diameter of sphere = d
Pink line indicate (------) Diameter of cylinder = w
Blue line indicate (------) Length of cylinder = l
Plate 5. Compound microscope images of Diadesmis gallica diatoms and image is of a small sample
taken from second culture media plate for that day(in duplicate), with their whole diatom cell
measurement. Lines are drawn by hand to indicate the measurements in following manner:
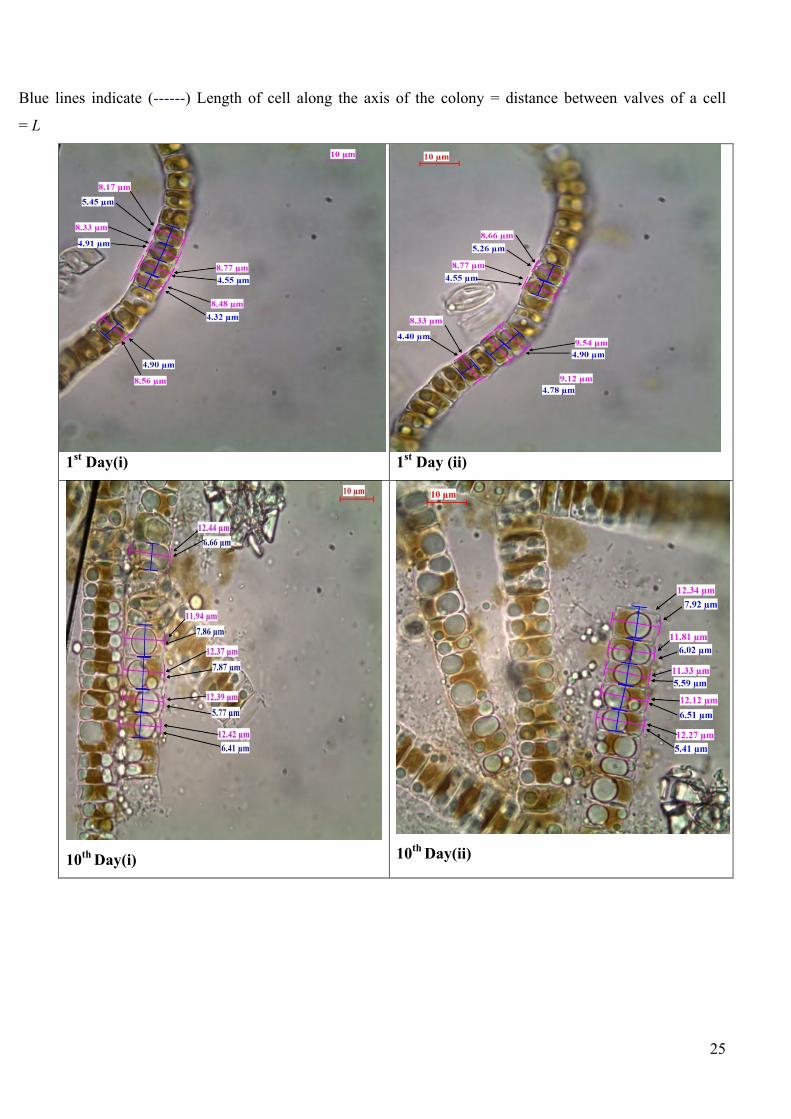
Pink lines indicate (------) Width of cell perpendicular to the axis of the colony = W
Blue lines indicate (------) Length of cell along the axis of the colony = distance between valves of a
cell = L
Plate 6. Microscope images of revived colony of diatom which was subculture after 31st day and
observed on 14th day.
Plate 7. Sudan IV staining of lipid droplets inside the diatom cell (Diadesmis confervacea) of
revived colonies.

16
Figure 1. Average volume V of diatom cells in µm3 and its standard error for samples of 5 Diadesmis
confervacea diatoms on a single plate, 2 plates per day, i.e., 10 cells measured per day. The day refers
to the end of each 24 hour period, i.e., plate’s labeled day 1 were measured 24 hours after inoculation.
The black bars show one standard error above the mean (top of blue bars).
Figure 2. Average volume v of oil per droplet in µm3 and its standard error for samples of Diadesmis
confervacea diatoms on a single plate, 2 plates per day. The day refers to the end of each 24 hour
period, i.e., plate’s labeled day 1 were measured 24 hours after inoculation. Five diatom oil droplets
were measured per plate, i.e., 10 oil droplets per day.

17
Figure 3. Average valve to valve length L of diatom cells in µm, measured along the axis of the
colony, and its standard error for samples of 5 Diadesmis confervacea diatoms on a single plate,
2 plates per day, i.e., 10 cells measured per day. The day refers to the end of each 24 hour period,
i.e., plate’s labeled day 1 were measured 24 hours after inoculation. The black bars show one
standard error above the mean (top of blue bars).
Figure 4. Average width W of diatom cells in µm, measured perpendicular to the axis of the
colony (i.e., length of the long axis of the valve), and its standard error for samples of Diadesmis
confervacea diatoms on a single plate, 2 plates per day, i.e., 10 cells measured per day. The day
refers to the end of each 24 hour period, i.e., plate’s labeled day 1 were measured 24 hours after
inoculation. The black bars show one standard error above the mean (top of blue bars).
18
Figure 5. Weight of transesterified lipid in micrograms (µg) and average diatom cell count per
100µl from 1st day to 31st day of diatom Diadesmis confervacea. The day refers to the end of 24
hours, i.e., plate labeled day 1, were counted and transesterified 24 hours after inoculation. The
red bars show weight of transesterified lipid (µg) and green bars show average diatom cell count
of Diadesmis confervacea per 100 µl.
Figure 6: TLC of the oil extracted from Diadesmis confervacea (T) showing separation of cholesterol
ester (Rf= 0.88), free fatty acids (FFA) (Rf=0.45, 0.40 and 0.107), 1,3 diacyl glycerol (1,3 DAG)
(Rf=0.083), 1,2 diacyl glycerol (1,2 DAG) (Rf=0.0357) and monoglycerols (MG) (Rf=0.0238) with
standards- S1: Mustard oil, S2: Olive oil, S3: Cocconut oil, S4: Soyabean oil and S5: Codliver oil.
Chlolesterol ester
Free fatty acids
1,3 DAG
1,2 DAG
MG
Figure 7 Chromatogram of oil extracted from Diadesmis confervacea analyzed in GCMS for first
(tR=Retention time) 19 minutes in which maximum free fatty acids and FAME were detected.

19
Plate 1. Microscope images of few diatoms containing lipid drops from the water sample of
Sultanpur Lake.

20
Image 1: Cyclotella meneghiniana Image 2: Nitzschia palea
Image 3: Pinnularia borealis Image 4: Diadesmis confervacea

21
Plate 2. Microscope images of pure diatom cultures of Diadesmis confervacea (Ehrenberg)
Mereschkowsky.
Image 1: Colony of Diadesmis confervacea (10x)
on solid agar culture medium plate.
Image 2: Pure culture of Diadesmis confervacea
(100x) and its filamentous form in girdle view.
Image 3: Solitary cells of Diadesmis confervacea
(100x) after teasing.
Image 4: Solitary cells of Diadesmis confervacea
(100x) after drying and mounting in DPX.

22
Plate 3. SEM images of Diadesmis confervacea
Plate 4. Compound microscope images of Diadesmis confervacea diatoms showing the lipid
content growth pattern and exocytose of oil over one month. Each image is of a small sample
23
taken from the first culture media plate for that day (in duplicate). Lines are drawn by hand using
LAS EZ software [57] to indicate the measurements of oil droplets in the following manner:
Red lines indicate (------) Diameter of sphere = d
Pink line indicate (------) Diameter of cylinder = w
Blue line indicate (------) Length of cylinder = l
1st Day(i) 1st Day (ii)
10th Day(i)
10th Day(ii)

24
29th Day(i)
29th Day(ii)
31st Day(i)
31st Day(ii)
Plate 5. Compound microscope images of Diadesmis gallica diatoms and image is of a small sample taken
from second culture media plate for that day(in duplicate), with their whole diatom cell measurement. Lines
are drawn by hand to indicate the measurements in following manner:
Pink lines indicate (------) Width of cell perpendicular to the axis of the colony = W
25
Blue lines indicate (------) Length of cell along the axis of the colony = distance between valves of a cell
= L
1st Day(i) 1st Day (ii)
10th Day(i)
10th Day(ii)

26
29th Day(i)
29th Day(ii)
31st Day(i)
31st Day(ii)
Plate 6. Microscope images of revived colony of diatom which was subculture after 31st day and
observed on 14th day.

27
Revived colony of diatom (Diadesmis
confervacea) of
Revived colony of diatom (Diadesmis
confervacea)
Plate 7. Sudan IV staining of lipid droplets inside the diatom cell (Diadesmis confervacea) of
revived colonies.
Revived colony of diatom (Diadesmis
confervacea) stained with Sudan IV.
Revived colony of diatom (Diadesmis
confervacea) stained with Sudan IV.

28
Table 1: GCMS results of the FAME of retention time peak at C-18.32.
Peak-18.32 Compound Name M.W. Formula
Cholest-5-ene,3-Bromo-,(3-Beta)- 448 C27H45Br Cholest-5-en-3-ol (3-Beta)-, Carbonochlo 448 C28H45O2Cl Cholest-5-on-3-ol (3-Beta)-,Acetate 526 C36H62O2 Cholesteryl Benzoate 428 C29H48O2 Cholesta-3,5-diene 490 C34H50O2 Cholesterol 368 C27H44 Cholesta-3,5-diene 386 C27H46O Cholest-5-en-3-ol (3-Beta)-Propanoate 368 C27H44 Cholestane-3,5-diol, diacetate (3-Beta), 5.A 442 C30H50O2 Cholest-5-en-3-ol (3-Beta)-, Tetradecanoa 488 C31H52O4 Cholesta-3,5-diene 596 C41H72O2 Cholest-5-en-3-ol (3-Beta)-,3-Phenyl-2-PR 368 C27H44 26,27-Dinorergost-5-en-3-ol, Benzoate, 516 C36H52O2 Cholesteryl Butyrate 476 C33H48O2 Cholesteryl Benzoate 456 C31H52O2 Cholestadiene 490 C34H50O2 Beta-Sitosterol Acetate 368 C27H44 Stigmastan-3-ol,5-Chloro-Acetate, (3.Beta) 456 C31H52O2 Methyl(25RS)-3.Beta-Acetoxy-5-Choleste 492 C31H53O2Cl