Discovery Driven Growth - HYPE Innovation
32
DISCOVERY DRIVEN GROWTH Lauren Salisbury November, 2015
-
Upload
khangminh22 -
Category
Documents
-
view
0 -
download
0
Transcript of Discovery Driven Growth - HYPE Innovation

DISCOVERY DRIVEN
GROWTH
Lauren Salisbury
November, 2015

MOMENTA PARTNERS
We accelerate time-to-value for industry leaders and startups in the Connected Industry space. We draw upon decades of experience to inspire and guide our client’s strategy, and help them execute via Acceleration, Executive Search and Venture Investments.
We provide hands-on advisors to help
accelerate your promise, partners,
pipeline and profit.
We identify, assess and
appoint outstanding and
impactful talent to help
you maintain a
competitive edge.
We invest and advise
to accelerate your
company’s growth;
opening doors,
validating your goals,
and improving how
stakeholders see
your company’s
potential.

DOES YOUR BUSINESS SAY THIS?….

BUT DOES IT ACTUALLY DO THIS?…

AND DO ‘WE’ DO THIS RESPONSE?

WE FOCUS ON TWO SIMPLE THINGS!
Be Credible
Be Relevant

• offers an non-conventional innovation approach to stimulate innovative growth options
HOW WILL DISCOVERY DRIVEN GROWTH ACHIEVE THIS?

• Project into the future fromthe past
• Anticipate major challenges
• Know your budget and time
• Holding managers to meetingthe numbers
• Recognize and embraceuncertainty
• Project only as far as issensible given knowledge
• Empower managers andpeople to take risk
• Accept failure and change
ITS UNCONVENTIONAL!

• offers an non-conventional innovation approach to stimulate innovative growth options
• mitigates risks by turning uncertainty into knowledge and ensuring you don’t let assumptions bias your decision making
• empowers a culture of innovation
• reinforces innovation as a credible and relevant part of your business with tangible impact on future growth
HOW WILL DISCOVERY DRIVEN GROWTH ACHIEVE THIS?
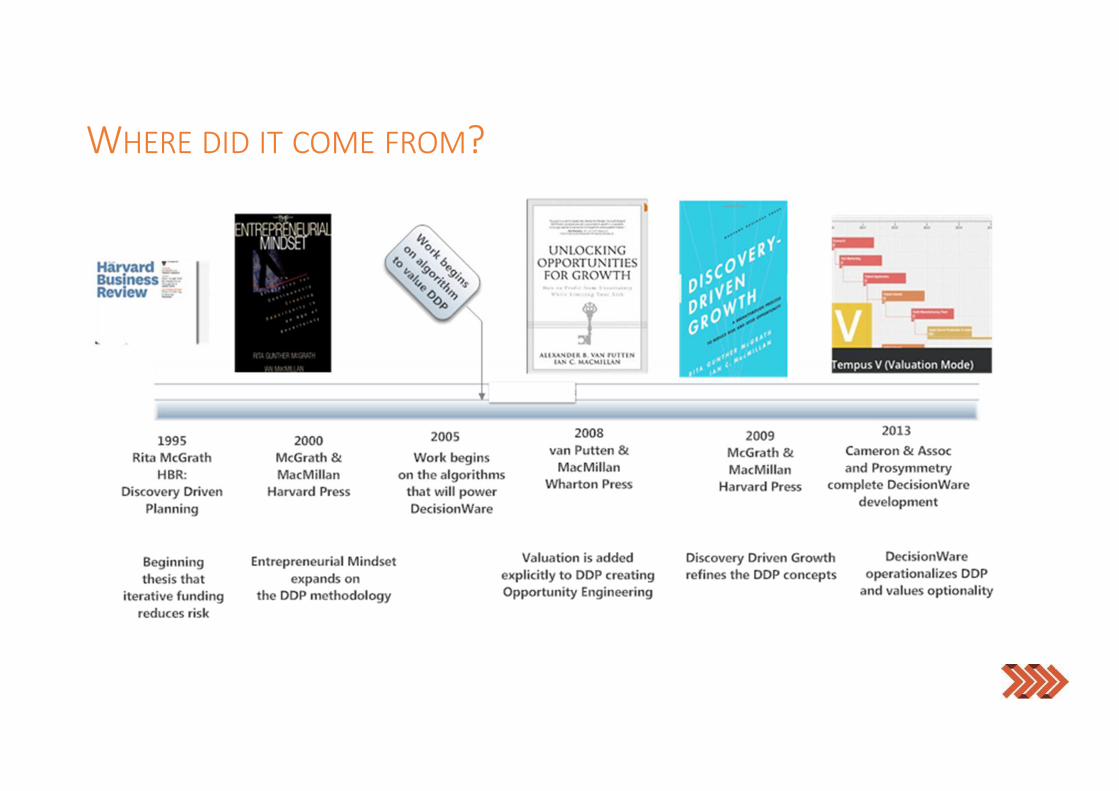
WHERE DID IT COME FROM?

HOW DOES IT WORK?
THREE SIMPLE STEPS…
3.
Checkpoint Plan
2.
Assumptions
1.
Framing

STEP ONE:
FRAMING THE OPPORTUNITY
DON’T MAKE IT COMPLEX!

STEP ONE:
FRAMING THE OPPORTUNITY
1. Look at business at maturity
2. Use a Reverse Income Statement
3. Start with Required Profits
required profits = necessary revenue – allowable costs
IS THE OPPORTUNITY BIG ENOUGH TO MATTER?
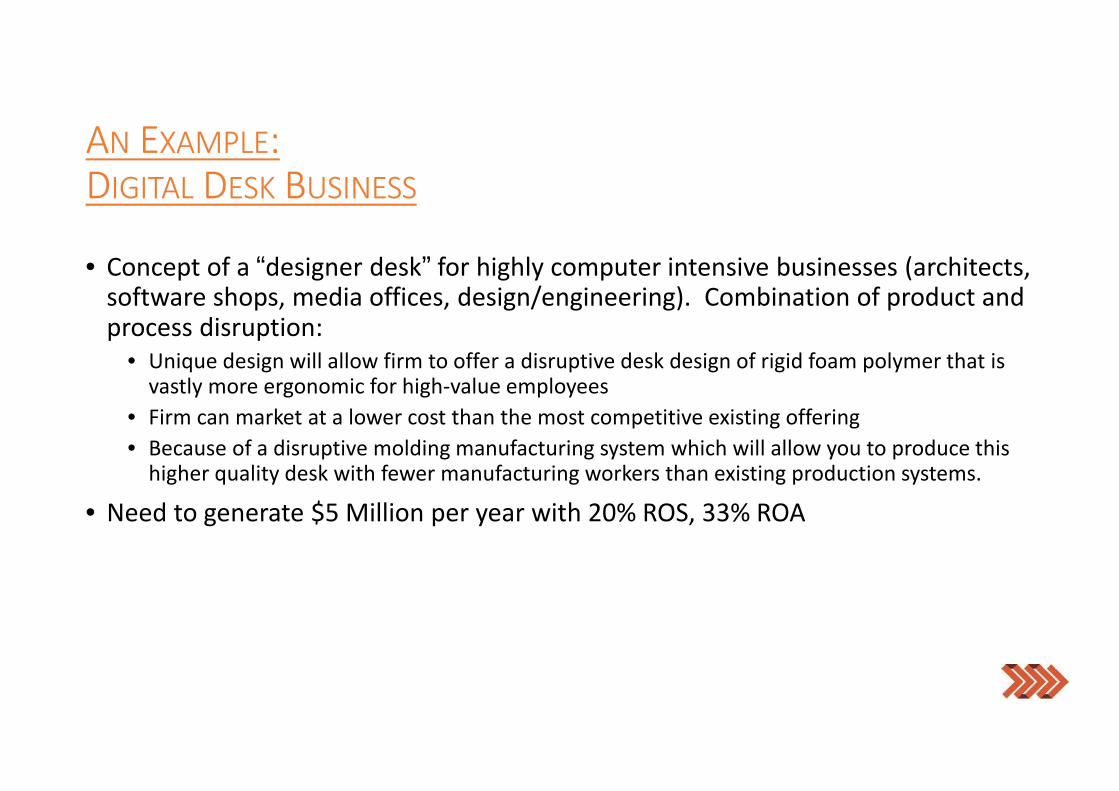
AN EXAMPLE:
DIGITAL DESK BUSINESS
• Concept of a “designer desk” for highly computer intensive businesses (architects, software shops, media offices, design/engineering). Combination of product and process disruption:
• Unique design will allow firm to offer a disruptive desk design of rigid foam polymer that is vastly more ergonomic for high-value employees
• Firm can market at a lower cost than the most competitive existing offering
• Because of a disruptive molding manufacturing system which will allow you to produce this higher quality desk with fewer manufacturing workers than existing production systems.
• Need to generate $5 Million per year with 20% ROS, 33% ROA

STEP ONE:
DIGITAL DESK REVERSE INCOME STATEMENT
REQUIRED PROFITS $5,000,000
REQUIRED ROS% 20.0%
NECESSARY SALES REVENUES $25,000,000
ALLOWABLE COSTS $20,000,000
WHOLESALE SELLING PRICE PER DESK $400.00
REQUIRED DESK SALES 62500
Desks per day (250 day year) 250

STEP TWO:
IDENTIFY YOUR ASSUMPTIONS
1. Layout the activities that will comprise the ventures allowable costs
2. Identify all of the underlying assumptions
3. Give assumptions a rangea. Expected Value
b. High
c. Low
4. Feedback to the Reverse Income Statement
CALL OUT ALL ASSUMPTIONS
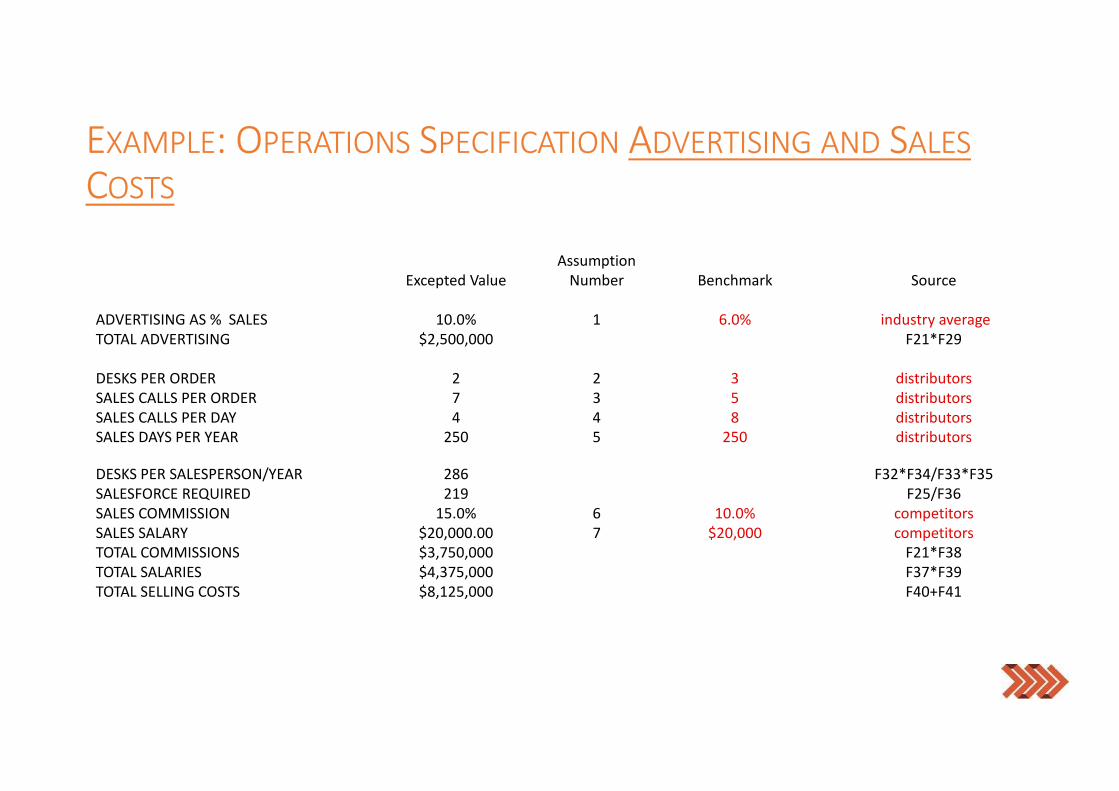
EXAMPLE: OPERATIONS SPECIFICATION ADVERTISING AND SALES
COSTS
Excepted Value
Assumption
Number Benchmark Source
ADVERTISING AS % SALES 10.0% 1 6.0% industry average
TOTAL ADVERTISING $2,500,000 F21*F29
DESKS PER ORDER 2 2 3 distributors
SALES CALLS PER ORDER 7 3 5 distributors
SALES CALLS PER DAY 4 4 8 distributors
SALES DAYS PER YEAR 250 5 250 distributors
DESKS PER SALESPERSON/YEAR 286 F32*F34/F33*F35
SALESFORCE REQUIRED 219 F25/F36
SALES COMMISSION 15.0% 6 10.0% competitors
SALES SALARY $20,000.00 7 $20,000 competitors
TOTAL COMMISSIONS $3,750,000 F21*F38
TOTAL SALARIES $4,375,000 F37*F39
TOTAL SELLING COSTS $8,125,000 F40+F41
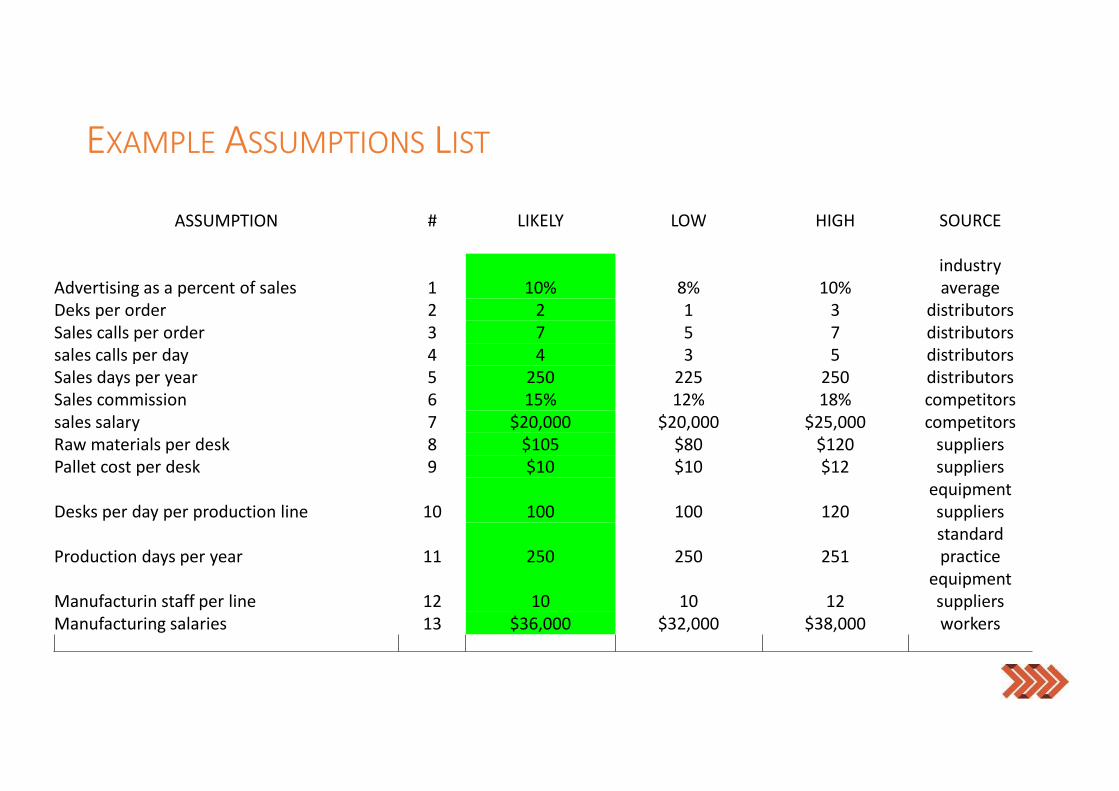
EXAMPLE ASSUMPTIONS LIST
ASSUMPTION # LIKELY LOW HIGH SOURCE
Advertising as a percent of sales 1 10% 8% 10%
industry
average
Deks per order 2 2 1 3 distributors
Sales calls per order 3 7 5 7 distributors
sales calls per day 4 4 3 5 distributors
Sales days per year 5 250 225 250 distributors
Sales commission 6 15% 12% 18% competitors
sales salary 7 $20,000 $20,000 $25,000 competitors
Raw materials per desk 8 $105 $80 $120 suppliers
Pallet cost per desk 9 $10 $10 $12 suppliers
Desks per day per production line 10 100 100 120
equipment
suppliers
Production days per year 11 250 250 251
standard
practice
Manufacturin staff per line 12 10 10 12
equipment
suppliers
Manufacturing salaries 13 $36,000 $32,000 $38,000 workers

THIS THEN FEEDBACKS TO RIS
REVENUES $25,000,000
ALLOWABLE COSTS $20,000,000
SELLING COSTS $8,125,000
ADVERTISING COSTS $2,500,000
MATERIALS COSTS $7,187,500
MANUFACTURING SALARIES $900,000
DELIVERY COSTS $171,360
DEPRECIATION CHARGES $625,000
MAXIMUM OTHER COST ALLOWED $491,140
Profit $5,491,140
ROS 22.0%
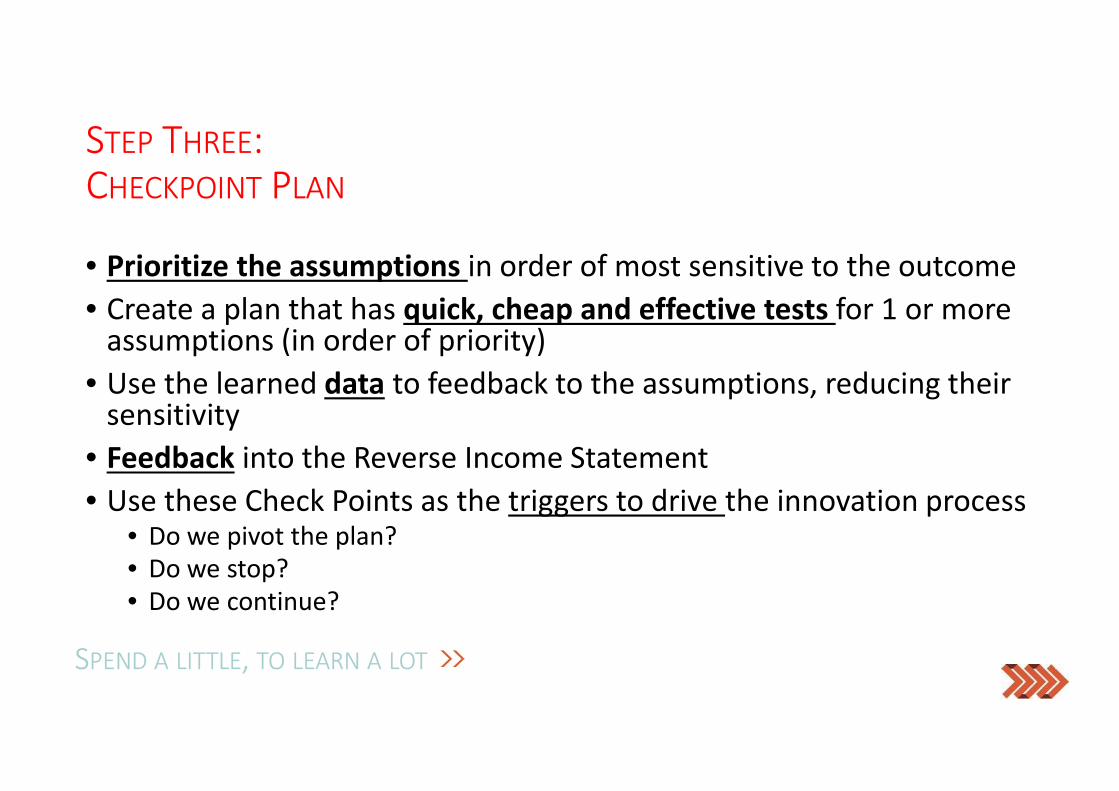
STEP THREE:
CHECKPOINT PLAN
• Prioritize the assumptions in order of most sensitive to the outcome
• Create a plan that has quick, cheap and effective tests for 1 or more assumptions (in order of priority)
• Use the learned data to feedback to the assumptions, reducing their sensitivity
• Feedback into the Reverse Income Statement
• Use these Check Points as the triggers to drive the innovation process• Do we pivot the plan?
• Do we stop?
• Do we continue?
SPEND A LITTLE, TO LEARN A LOT

WHAT IS THE MOST SENSITIVE ASSUMPTION
-70.0% -60.0% -50.0% -40.0% -30.0% -20.0% -10.0% 0.0% 10.0% 20.0% 30.0%
Deks per order
Raw materials per desk
sales calls per day
Sales commission
sales salary
Sales calls per order
Advertising as a percent of sales
Desks per day per production line
Sales days per year
Depreciation rate
Equipment cst per production line
Manufacturin staff per line
Pallet cost per desk
Manufacturing salaries
Delivery charge per delivery
Production days per year
Days Inventory
Days receivables
%Variance
Inpu
ts
Staircase Profit 1Illustrates Volatility: Shows contribution to upside and downside of output variable,
as input variables vary from their middle values to their max's and mins.
Downside Case
Upside Case
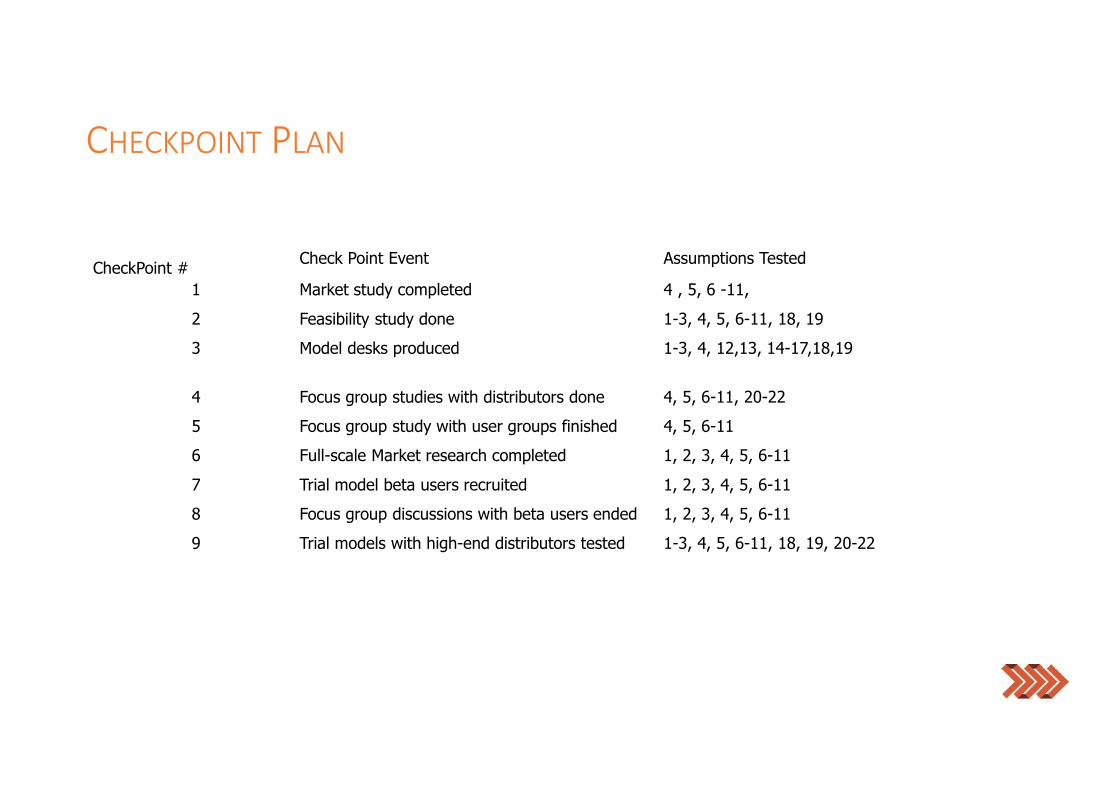
CHECKPOINT PLAN
Check Point Event Assumptions Tested CheckPoint #
1 Market study completed 4 , 5, 6 -11,
2 Feasibility study done 1-3, 4, 5, 6-11, 18, 19
3 Model desks produced 1-3, 4, 12,13, 14-17,18,19
4 Focus group studies with distributors done 4, 5, 6-11, 20-22
5 Focus group study with user groups finished 4, 5, 6-11
6 Full-scale Market research completed 1, 2, 3, 4, 5, 6-11
7 Trial model beta users recruited 1, 2, 3, 4, 5, 6-11
8 Focus group discussions with beta users ended 1, 2, 3, 4, 5, 6-11
9 Trial models with high-end distributors tested 1-3, 4, 5, 6-11, 18, 19, 20-22
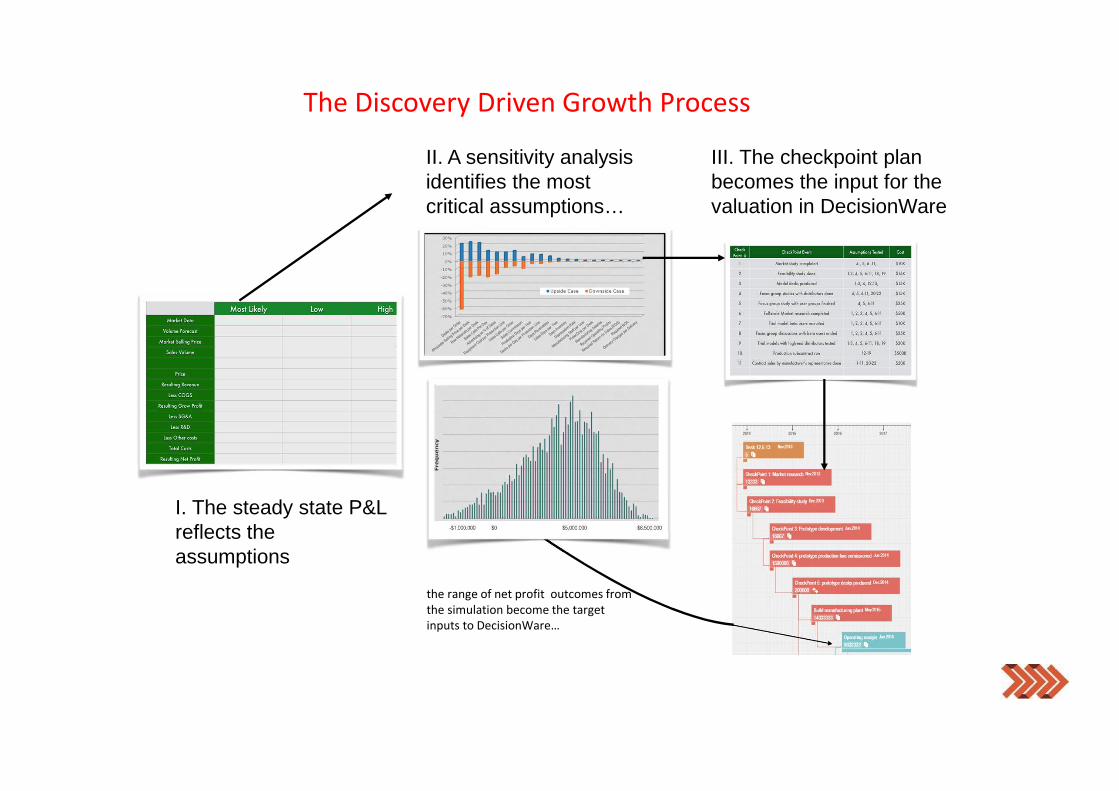
I. The steady state P&L reflects the assumptions
the range of net profit outcomes from
the simulation become the target
inputs to DecisionWare…
II. A sensitivity analysis identifies the most critical assumptions…
The Discovery Driven Growth Process
III. The checkpoint plan becomes the input for the valuation in DecisionWare

DISCOVERY DRIVEN GROWTH:
OPTIONS THINKING
• In conventional thinking we use NPV, it tell us…• we make the decision today;
• we will not learn anything new;
• we cannot modify the plan.
• Using DDG we have options thinking…• we should not decide today,
• we will learn, and we should be open to modifying the plan
• we largely eliminate the downside
• Allows up to capture the upside (with reduced risk)
Momenta Partners Intro.Confidential24

DIGITAL DESK EXAMPLE:
OPTIONS THINKING
Momenta Partners Intro.Confidential25
-70.0% -60.0% -50.0% -40.0% -30.0% -20.0% -10.0% 0.0% 10.0% 20.0% 30.0%
Deks per order
Raw materials per desk
sales calls per day
Sales commission
sales salary
Sales calls per order
Advertising as a percent of sales
Desks per day per production line
Sales days per year
Depreciation rate
Equipment cst per production line
Manufacturin staff per line
Pallet cost per desk
Manufacturing salaries
Delivery charge per delivery
Production days per year
Days Inventory
Days receivables
%Variance
Inpu
ts
Staircase Profit 1Illustrates Volatility: Shows contribution to upside and downside of output variable,
as input variables vary from their middle values to their max's and mins.
Downside Case
Upside Case
Eliminate the downside potential of -55% ROS Captures upside potential of 26% ROS

A REAL EXAMPLE
• Chemical company needs to decide whether to invest $18M into the core, or toward H2/H3 growth platform.
• Four H2/H3 platforms, for which there where four DDG plans created:• Reverse Income Statement
• Assumptions
• Checkpoint Plan
Momenta Partners Intro.Confidential26

THE OUTCOME:
ACCELERATING INVESTMENT OPTIONS
• At the start of the process, Platform One and Two looked to be the best investment option.
• After Four Months, and isolating the learnings, the investment was repositioned early.
Momenta Partners Intro.Confidential27
Core
Platform
P 1
P 2
P 3
P 4
t = 0
Platform
P 1
P 2
P 3
P 4
Core
t = 4 mos

REMEMBER STACEY?

LOOK AT HER NOW!
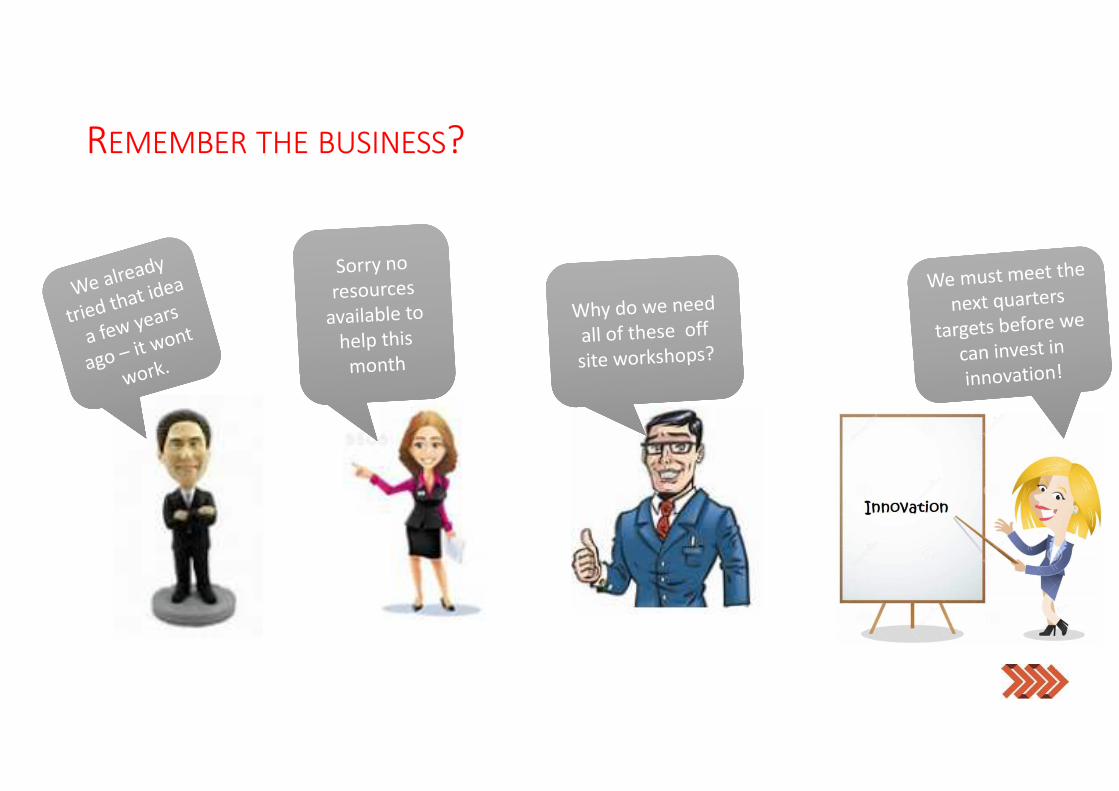
REMEMBER THE BUSINESS?

LOOK AT THEM NOW!