New advances on the Grothendieck's inequality problem for bilinear forms on JB*-triples
Upload
independentCategory
view
1download
0
Discovery of Novel Trichomonacidals Using LDA-Driven QSARModels and Bond-Based Bilinear Indices as Molecular Descriptors
Oscar M. Rivera-Borrotoa, b, Yovani Marrero-Poncea, c, d*, Alfredo Meneses-Marcela, e, Jose Antonio Escarioe**, AliciaGomez Barrioe, Vicente J. Aranf***, Miriam A. Martins Alhog, David Montero Pereirae, Juan Jose Nogale, FranciscoTorrensc, Froylan Ibarra-Velardeh, Yolanda Vera Montenegroh, Alma Huesca-Guillenh, Norma Riverah and ChristianVogeli
a Unit of Computer-Aided Molecular “Biosilico” Discovery and Bioinformatic Research (CAMD-BIR Unit), Faculty ofChemistry-Pharmacy, Central University of Las Villas, Santa Clara, 54830 Villa Clara, Cuba, E-mail: [email protected],[email protected], [email protected], Phone: 53-42-281192 [or 53-42-281473] (Cuba), 963543156 (Valencia),Fax: 53-42-281130 [or 53-42-281455] (Cuba), 963543156 (Valencia), URL: http://www.uv.es/yoma/
b Center of Studies on Bioinformatics (CEI), Faculty of Mathematics, Physics and Computer Science, Central University of LasVillas, Santa Clara, 54830 Villa Clara, Cuba
c Institut Universitari de Ciencia Molecular, Universitat de Valencia, Edifici d�Instituts de Paterna, P. O. Box 22085, E-46071Valencia, Spain
d Unidad de Investigacion de Diseno de Farmacos y Conectividad Molecular, Departamento de Qu�mica F�sica, Facultad deFarmacia, Universitat de Valencia, Spain
e Departamento de Parasitolog�a, Facultad de Farmacia, UCM, Pza. Ramon y Cajal s/n, 28040 Madrid, Spainf Instituto de Qu�mica Medica, CSIC, c/ Juan de la Cierva 3, 28006 Madrid, Spaing CIHIDECAR (CONICET), Dpto. de Qu�mica Organica, Facultad de Ciencias Exactas y Naturales, Universidad de Buenos Aires,
C1428EGA Buenos Aires, Argentinah Department of Parasitology, Faculty of Veterinarian Medicinal and Zootecnic, UNAM, Mexico, D. F. 04510, Mexicoi Universit�t Rostock, Institut f�r Chemie, Abteilung f�r Organische Chemie, Albert-Einstein-Straße 3a, 18059 Rostock, Germany
Keywords: Bond-based bilinear indices, LDA-based QSAR model, Lead generation,TOMOCOMD-CARDD software, Trichomonacidal
Received: December 19, 2006; Accepted: December 12, 2007
DOI: 10.1002/qsar.200610165
AbstractFew years ago, the World Health Organization estimated the number of adults withtrichomoniasis at 170 million worldwide, more than the combined numbers for gonorrhea,syphilis, and chlamydia. To combat this sexually transmitted disease, Metronidazole(MTZ) has emerged, since 1959, as a powerful drug for the systematic treatment ofinfected patients. However, increasing resistance to MTZ, adverse effects associated tohigh-dose MTZ therapies and very expensive conventional technologies related to thedevelopment of new trichomonacidals necessitate novel computational methods thatshorten the drug discovery pipeline. Therefore, bond-based bilinear indices, new 2-Dbond-based TOMOCOMD-CARDD Molecular Descriptors (MDs), and LinearDiscriminant Analysis (LDA) are combined to discover novel antitrichomonal agents.Generated models, using non-stochastic and stochastic indices, are able to classifycorrectly the 90.11% (93.75%) and the 87.92% (87.50%) of chemicals in the training(test) sets, respectively. In addition, they show large Matthews� correlation coefficients(C) of 0.80 (0.86) and 0.76 (0.71) for the training (test) sets, respectively. The result ofpredictions on the 10% full-out cross-validation test also evidences the quality of bothmodels. In order to test the models� predictive power, 12 compounds, already provedagainst Trichomonas vaginalis (Tv), are screened in a simulated virtual screeningexperiment. As a result, they correctly classified 9 out of 12 (75.00%) and 10 out of 12(83.33%) of the chemicals, respectively, which were the most important criteria to validatethe models. Finally, in order to prove the reach of TOMOCOMD-CARDD approach andto discover new trichomonacidals, these classification functions were applied to a set of
QSAR Comb. Sci. 28, 2009, No. 1, 9 – 26 � 2009 WILEY-VCH Verlag GmbH & Co. KGaA, Weinheim 9
* To whom correspondence should be addressed (contact for chem- and bioinformatics methods)** Contact for biological assays
*** Contact for chemical methods
Full Papers
eight chemicals which, in turn, were synthesized and tested toward in vitro activity againstTv. As a result, experimental observations confirm theoretical predictions to a greatextent, since it is gained a correct classification of 87.50% (7/8) of chemicals. Biologicaltests also show several candidates as antitrichomonals, since almost all the compounds[VAM2-(3 – 8)] exhibit pronounced cytocidal activities of 100% at the concentration of100 mg/mL and at 24 h (48 h) but VAM2 – 2: 99.37% (100%), and it is remarkable thatthese compounds do not show toxic activity in macrophage assays at this concentration.The Quantitative Structure – Activity Relationship (QSAR) models presented here couldsignificantly reduce the number of synthesized and tested compounds as well as could actas virtual shortcuts to new chemical entities with trichomonacidal activity.
1 Introduction
Trichomonas vaginalis (Tv) is a parasitic protozoan that isthe cause of trichomoniasis, a Sexually Transmitted Dis-ease (STD) of worldwide importance. Although Tv infec-tion is regarded primarily as a female disease, it also oc-curs in men [1]. Recent estimates have suggested that Tvinfections account for nearly one-third of the 15.4 millioncases of STDs in the United States [2]. In 1995, the WorldHealth Organization estimated the number of adults withtrichomoniasis at 170 million worldwide, more than thecombined numbers for gonorrhea, syphilis, and chlamydia[3].
Tricomonoasis encompasses symptoms such as severeinflammation [4 – 6]. The parasite is also known to be themain cause of vaginitis, cervicitis, and urethritis in women;it may also be responsible for prostatitis and other genito-urinary syndromes in men [7, 8]. Infections with this or-ganism have been linked to various additional pathologicalmanifestations including cervical neoplasia [9 – 12], atypi-cal pelvic inflammatory disease [13], tubal infertility [14],and so on [15 – 23]. Moreover, this infection can elevatethe risk of acquiring human immunodeficiency virus [19,20].
Until 1959, topical vaginal preparations availableagainst trichomoniasis provided some symptomatic reliefbut were ineffective as cures [24]. In 1959, a nitroimidazolederivative of a Streptomyces antibiotic, azomycin, wasfound to be highly effective in the systemic treatment oftrichomoniasis [25]. This derivative was 1-[2-hydroxyeth-yl]-2-methyl-5-nitroimidazole, commonly referred to asMetronidazole (MTZ).
MTZ enters the cell through diffusion [3] and is activat-ed in the hydrogenosomes of Tv [26]. Here, the nitrogroup of the drug is anaerobically reduced by pyruvate-ferredoxin oxidoreductase [22, 23, 26]. This results in cyto-toxic nitro radical-ion intermediates, which break theDNA strands [27, 28].
The recommended MTZ regimen results in cure rates ofapproximately 95% [29]. In fact, now, MTZ is the drugmost widely used in the treatment of anaerobic protozoanparasitic infections caused by Tv, Giardia duodenalis, andEntamoeba histolytica [25, 30 – 34]. However, resistance toMTZ has been demonstrated, both in field isolates of Tv
from patients refractory to treatment [35 – 39] and in labo-ratory-developed strains, obtained by exposing trichomo-nas to sublethal pressure of the drug either in vitro [40 –43] or in vivo [44, 45].
Although literature is replete with anecdotal reportsand larger patient series in which MTZ resistance seemsrelative and may be overcome with increasing doses of thedrug [46 – 56], high-dose therapy with MTZ, especiallywhen prolonged, is also associated with other importantcomplications including pancreatitis, neutropenia, and pe-ripheral neuropathy [57, 58].
In addition, in patients who do not respond to high-doseMTZ therapy, a variety of regimens have been evaluatedfor possible effectiveness, with rare or only occasional suc-cess. These include zinc sulfate, povidone-iodine douche,arsenicals, non-oxynol-9 cream, mebendazole, albenda-zole, furazolidone, and rifabutin [59 – 64]. Paromomycinwas previously reported to be useful in the management ofresistant trichomoniasis [65, 66]. However, local side ef-fects were considerable and can be quite severe [65, 66].
Currently, it is clear that new trichomonacidals areneeded to combat resistant Tv organisms and/or to palliateadverse effects observed in some patients toward high-dose MTZ treatments. However, the great cost associatedto the development of new compounds and the small eco-nomic size of the market for antiprotozoal drugs makesthis development slow [67, 68].
At present, many large pharmaceutical industries havereoriented their research strategies seeking to solve theproblem of generation/selection of Novel Chemical Enti-ties (NCEs), one of the major bottlenecks in the drug dis-covery pipeline. In fact, most integration projects cur-rently include efforts to integrate the data associatedwith NCE generation [69]. In this context, our researchgroup has recently introduced a novel scheme to performrational – in silico – molecular design (or selection/iden-tification of lead drug-like drug chemicals) and Quantita-tive Structure–Activity/Property Relationship (QSAR/QSPR) studies, known as TOMOCOMD-CARDD (ac-ronym of TOpological MOlecular COMputer Design-Computer Aided “Rational” Drug Design) [70]. Thismethod has been developed to generate 2-D (topologi-cal), 2.5 (3-D-chiral), and 3-D (topographical and geo-metrical) Molecular Descriptors (MDs) based on the ap-
10 � 2009 WILEY-VCH Verlag GmbH & Co. KGaA, Weinheim www.qcs.wiley-vch.de QSAR Comb. Sci. 28, 2009, No. 1, 9 – 26
Full Papers Oscar M. Rivera-Borroto et al.
plication of discrete mathematics and linear algebra tochemistry. This in silico method has been successfully ap-plied to the prediction of several physical, physicochemi-cal, chemical, and biological properties of organic com-pounds [71 – 90].
Recently, some authors have proposed new extended lo-cal (bond and bond-type) and total (whole) MDs, basedon the adjacency of edges and on quadratic, linear and bi-linear maps similar to those typically defined by mathema-ticians in linear algebra. These researchers also proposed anew matrix representation of the molecule, in the “sto-chastic” adjacency of edges as well as quadratic, linear andbilinear indices derived from it. Finally, the correlationability of the new descriptors has been tested in QSPR andQSAR studies [91 – 93].
The main objective of the present report is to use non-stochastic and stochastic bond-type bilinear indices to gen-erate predictive Linear Discriminant Analysis (LDA)-as-sisted QSAR models, enabling the selection of novel drug-like compounds with antitrichomonal activity. The in vitroevaluation of a new series of heterocyclic compounds, withantitrichomonal activity, is also presented.
2 Materials and Methods
2.1 Theoretical Support
The basis of the extension of bilinear indices, which will begiven here, is the edge-adjacency matrix considered andexplicitly defined in the chemical graph-theory literature[94, 95], and rediscovered by Estrada as an importantsource of new MDs [96 – 101]. In this section, we will firstdefine the nomenclature to be used in this study, then theatom-based molecular vector (�x) will be redefined forbond characterization, by using the same approach as pre-viously reported [91], and finally, some new definition ofbond-based non-stochastic and stochastic bilinear indices,with its peculiar mathematical properties, will be given.
2.1.1 Background in Edge-Adjacency Matrix and NewEdge-Relations: Stochastic Edge-Adjacency Matrix
Let G¼ (V, E) be a simple graph, with V¼ (v1, v2, ..., vn) andE¼ (e1, e2, ..., em) being the vertex- and edge-sets of G, re-spectively. Then G represents a molecular graph having nvertices and m edges (bonds). The edge-adjacency matrix Eof G (likewise called bond adjacency matrix, B) is a symmet-ric square matrix whose elements eij are 1 if and only if edgei is adjacent to edge j [98, 101, 102]. Two edges are adjacentif they are incident to a common vertex. This matrix corre-sponds to the vertex-adjacency matrix of the associated linegraph. Finally, the sum of the ith row (or column) of E isnamed the edge degree of bond i, d(ei) [96, 99, 100, 102].
By using the edge (bond)-adjacency relationships wecan find other new relation for a molecular graph that will
be introduced here. The kth stochastic edge-adjacency ma-trix, ESk can be obtained directly from Ek. Here, ESk¼[kesij] is a square matrix of order m (m¼number of bonds)and the elements kesij are defined as follow:
kesij ¼keij
kSUMðEkÞi¼
keij
kdðeÞið1Þ
where keij are the elements of the kth power of E and theSUM of the ith row of Ek is named the k-order edge de-gree of bond i, kd(ei). Notice that the matrix ESk, definedon Eq. 1, has the property that the sum of the elements ineach row is 1. Such an m�m matrix, with non-negative en-tries having this property, is called a “stochastic matrix”[103].
2.1.2 Chemical Information and Bond-Based MolecularVector
The atom-based molecular vector (�x) used to representsmall-to-medium size organic chemicals has been ex-plained in some detail elsewhere [74, 81, 84, 86, 104]. In away parallel to the development of �x, we present the exten-sion to the bond-based molecular vector (�w). The compo-nents (wi) of �w are numerical values, which represent a cer-tain standard bond property (bond label). Therefore, theseweights correspond to different bond properties for organ-ic molecules. Thus, a molecule having 5, 10, 15, ..., m bondscan be represented by means of vectors with 5, 10, 15, ...,m components, belonging to the spaces <5, <10, <15, ..., <m,respectively, where m is the dimension of the real set (<m).This approach allows encoding organic molecules, such as2-hydroxybut-2-enenitrile through the molecular vector�w¼ [wCsp3-Csp2, wCsp2¼Csp2, wCsp2-Osp3, wH-Osp3, wCsp2-Csp, wCsp�Nsp].This vector belongs to the product space <6.
These properties characterize each kind of bond (andbond-type) within the molecule. Diverse kinds of bondweights (wi) can be used to encode information related toeach bond in the molecule. These bond labels are chemi-cally meaningful numbers such as standard bond distances[68, 105 – 107] and standard bond dipoles [68, 105 – 107], oreven mathematical expressions involving atomic weightssuch as atomic log P [108], surface area contributions ofpolar atoms [109], atomic molar refractivities [110], atomichybrid polarizabilities [111], Gasteiger – Marsilli atomiccharges [112], atomic electronegativities in Pauling�s scale[113] and so on. Here we characterized each bond with thefollowing parameter:
w ¼ xi
diþ xj
djð2Þ
In this expression, xi can be any standard weight of theatom i bonded to atom j. The di is the vertex (atom) degreeof atom i. Thus, chemical information can be codified bymeans of two different molecular vectors, for instance, �w¼
QSAR Comb. Sci. 28, 2009, No. 1, 9 – 26 www.qcs.wiley-vch.de � 2009 WILEY-VCH Verlag GmbH & Co. KGaA, Weinheim 11
Discovery of Novel Trichomonacidals Using LDA-Driven QSAR Models and Bond-Based Bilinear Indices as ...
[w1, ..., wn] and �u¼ [u1, ..., un], �w= �u, which is possible ifdifferent weighting schemes are used.
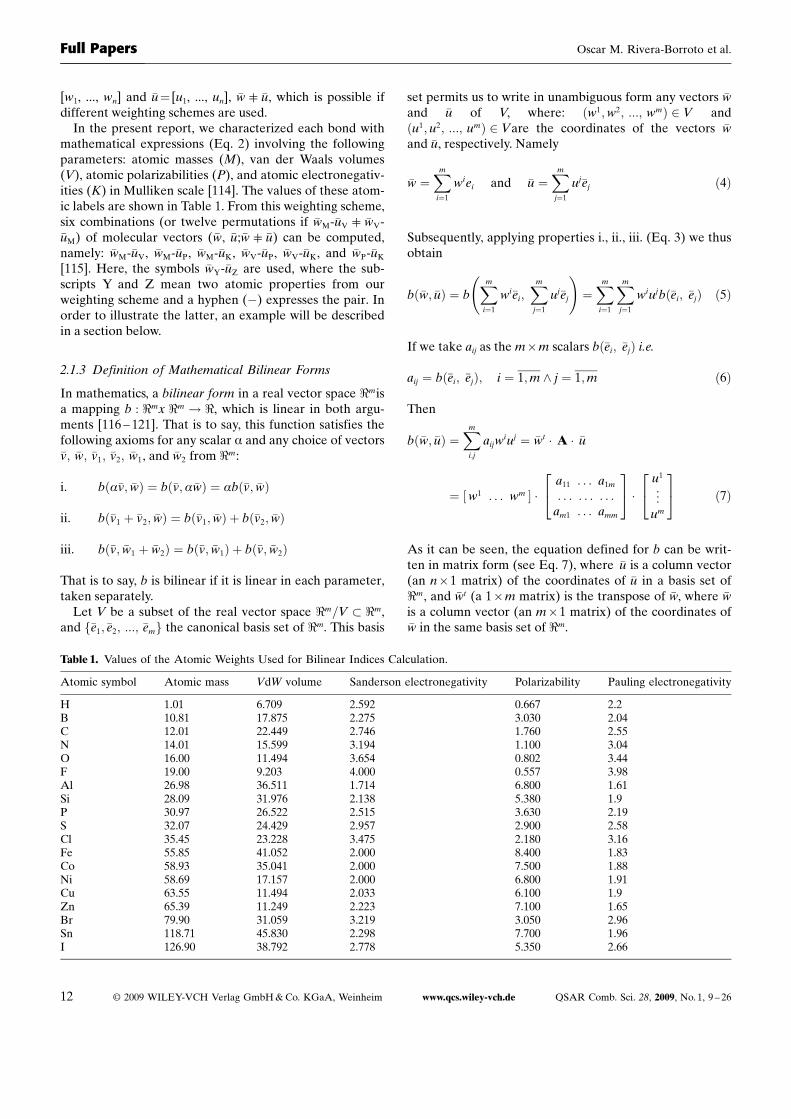
In the present report, we characterized each bond withmathematical expressions (Eq. 2) involving the followingparameters: atomic masses (M), van der Waals volumes(V), atomic polarizabilities (P), and atomic electronegativ-ities (K) in Mulliken scale [114]. The values of these atom-ic labels are shown in Table 1. From this weighting scheme,six combinations (or twelve permutations if �wM-�uV = �wV-�uM) of molecular vectors (�w, �u;�w= �u) can be computed,namely: �wM-�uV, �wM-�uP, �wM-�uK, �wV-�uP, �wV-�uK, and �wP-�uK
[115]. Here, the symbols �wY-�uZ are used, where the sub-scripts Y and Z mean two atomic properties from ourweighting scheme and a hyphen (�) expresses the pair. Inorder to illustrate the latter, an example will be describedin a section below.
2.1.3 Definition of Mathematical Bilinear Forms
In mathematics, a bilinear form in a real vector space <misa mapping b : <mx <m ! <, which is linear in both argu-ments [116 – 121]. That is to say, this function satisfies thefollowing axioms for any scalar a and any choice of vectors�v; �w; �v1; �v2; �w1, and �w2 from <m:
i. bða�v; �wÞ ¼ bð�v;a�wÞ ¼ abð�v; �wÞ
ii. bð�v1 þ �v2; �wÞ ¼ bð�v1; �wÞ þ bð�v2; �wÞ
iii. bð�v; �w1 þ �w2Þ ¼ bð�v; �w1Þ þ bð�v; �w2Þ
That is to say, b is bilinear if it is linear in each parameter,taken separately.
Let V be a subset of the real vector space <m=V � <m,and �e1;�e2; :::; �emf g the canonical basis set of <m. This basis
set permits us to write in unambiguous form any vectors �wand �u of V, where: ðw1;w2; :::; wmÞ 2 V andðu1; u2; :::; umÞ 2 Vare the coordinates of the vectors �wand �u, respectively. Namely
�w ¼Xm
i¼1
wiei and �u ¼Xm
j¼1
uj�ej ð4Þ
Subsequently, applying properties i., ii., iii. (Eq. 3) we thusobtain
bð�w; �uÞ ¼ bXm
i¼1
wi�ei;Xm
j¼1
uj�ej
!¼Xm
i¼1
Xm
j¼1
wiujbð�ei; �ejÞ ð5Þ
If we take aij as the m�m scalars bð�ei; �ejÞ i.e.
aij ¼ bð�ei; �ejÞ; i ¼ 1;m ^ j ¼ 1;m ð6Þ
Then
bð�w; �uÞ ¼Xm
i;j
aijwiuj ¼ �wt � A � �u
¼ w1 . . . wm½ � �a11 . . . a1m
. . . . . . . . .am1 . . . amm
24
35 �
u1
..
.
um
24
35 ð7Þ
As it can be seen, the equation defined for b can be writ-ten in matrix form (see Eq. 7), where �u is a column vector(an n�1 matrix) of the coordinates of �u in a basis set of<m, and �wt (a 1�m matrix) is the transpose of �w, where �wis a column vector (an m�1 matrix) of the coordinates of�w in the same basis set of <m.
12 � 2009 WILEY-VCH Verlag GmbH & Co. KGaA, Weinheim www.qcs.wiley-vch.de QSAR Comb. Sci. 28, 2009, No. 1, 9 – 26
Table 1. Values of the Atomic Weights Used for Bilinear Indices Calculation.
Atomic symbol Atomic mass VdW volume Sanderson electronegativity Polarizability Pauling electronegativity
H 1.01 6.709 2.592 0.667 2.2B 10.81 17.875 2.275 3.030 2.04C 12.01 22.449 2.746 1.760 2.55N 14.01 15.599 3.194 1.100 3.04O 16.00 11.494 3.654 0.802 3.44F 19.00 9.203 4.000 0.557 3.98Al 26.98 36.511 1.714 6.800 1.61Si 28.09 31.976 2.138 5.380 1.9P 30.97 26.522 2.515 3.630 2.19S 32.07 24.429 2.957 2.900 2.58Cl 35.45 23.228 3.475 2.180 3.16Fe 55.85 41.052 2.000 8.400 1.83Co 58.93 35.041 2.000 7.500 1.88Ni 58.69 17.157 2.000 6.800 1.91Cu 63.55 11.494 2.033 6.100 1.9Zn 65.39 11.249 2.223 7.100 1.65Br 79.90 31.059 3.219 3.050 2.96Sn 118.71 45.830 2.298 7.700 1.96I 126.90 38.792 2.778 5.350 2.66
Full Papers Oscar M. Rivera-Borroto et al.
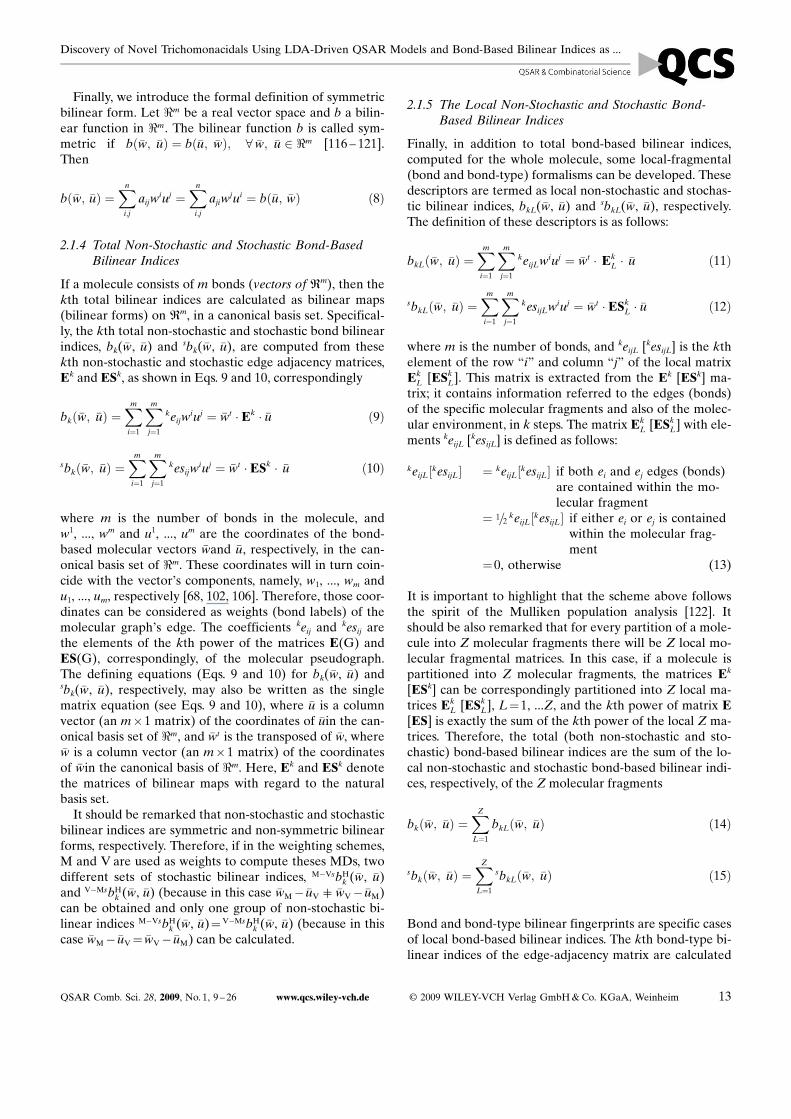
Finally, we introduce the formal definition of symmetricbilinear form. Let <m be a real vector space and b a bilin-ear function in <m. The bilinear function b is called sym-metric if bð�w; �uÞ ¼ bð�u; �wÞ; 8 �w; �u 2 <m [116 – 121].Then
bð�w; �uÞ ¼Xn
i;j
aijwiuj ¼
Xn
i;j
ajiwjui ¼ bð�u; �wÞ ð8Þ
2.1.4 Total Non-Stochastic and Stochastic Bond-BasedBilinear Indices
If a molecule consists of m bonds (vectors of Rm), then thekth total bilinear indices are calculated as bilinear maps(bilinear forms) on R
m, in a canonical basis set. Specifical-ly, the kth total non-stochastic and stochastic bond bilinearindices, bk(�w, �u) and sbk(�w, �u), are computed from thesekth non-stochastic and stochastic edge adjacency matrices,Ek and ESk, as shown in Eqs. 9 and 10, correspondingly
bkð�w; �uÞ ¼Xm
i¼1
Xm
j¼1
keijwiuj ¼ �wt � Ek � �u ð9Þ
sbkð�w; �uÞ ¼Xm
i¼1
Xm
j¼1
kesijwiuj ¼ �wt � ESk � �u ð10Þ
where m is the number of bonds in the molecule, andw1, ..., wm and u1, ..., um are the coordinates of the bond-based molecular vectors �wand �u, respectively, in the can-onical basis set of <m. These coordinates will in turn coin-cide with the vector�s components, namely, w1, ..., wm andu1, ..., um, respectively [68, 102, 106]. Therefore, those coor-dinates can be considered as weights (bond labels) of themolecular graph�s edge. The coefficients keij and kesij arethe elements of the kth power of the matrices E(G) andES(G), correspondingly, of the molecular pseudograph.The defining equations (Eqs. 9 and 10) for bk(�w, �u) andsbk(�w, �u), respectively, may also be written as the singlematrix equation (see Eqs. 9 and 10), where �u is a columnvector (an m�1 matrix) of the coordinates of �uin the can-onical basis set of <m, and �wt is the transposed of �w, where�w is a column vector (an m�1 matrix) of the coordinatesof �win the canonical basis of <m. Here, Ek and ESk denotethe matrices of bilinear maps with regard to the naturalbasis set.
It should be remarked that non-stochastic and stochasticbilinear indices are symmetric and non-symmetric bilinearforms, respectively. Therefore, if in the weighting schemes,M and V are used as weights to compute theses MDs, twodifferent sets of stochastic bilinear indices, M�VsbH
k (�w, �u)and V�MsbH
k (�w, �u) (because in this case �wM� �uV = �wV� �uM)can be obtained and only one group of non-stochastic bi-linear indices M�VsbH
k (�w, �u)¼V�MsbHk (�w, �u) (because in this
case �wM� �uV¼ �wV� �uM) can be calculated.
2.1.5 The Local Non-Stochastic and Stochastic Bond-Based Bilinear Indices
Finally, in addition to total bond-based bilinear indices,computed for the whole molecule, some local-fragmental(bond and bond-type) formalisms can be developed. Thesedescriptors are termed as local non-stochastic and stochas-tic bilinear indices, bkL(�w, �u) and sbkL(�w, �u), respectively.The definition of these descriptors is as follows:
bkLð�w; �uÞ ¼Xm
i¼1
Xm
j¼1
keijLwiuj ¼ �wt � EkL � �u ð11Þ
sbkLð�w; �uÞ ¼Xm
i¼1
Xm
j¼1
kesijLwiuj ¼ �wt � ESkL � �u ð12Þ
where m is the number of bonds, and keijL [kesijL] is the kthelement of the row “i” and column “j” of the local matrixEk
L [ESkL]. This matrix is extracted from the Ek [ESk] ma-
trix; it contains information referred to the edges (bonds)of the specific molecular fragments and also of the molec-ular environment, in k steps. The matrix Ek
L [ESkL] with ele-
ments keijL [kesijL] is defined as follows:
keijL½kesijL� ¼ keijL½kesijL� if both ei and ej edges (bonds)are contained within the mo-lecular fragment
¼ 1=2 keijL½kesijL� if either ei or ej is containedwithin the molecular frag-ment
¼0, otherwise (13)
It is important to highlight that the scheme above followsthe spirit of the Mulliken population analysis [122]. Itshould be also remarked that for every partition of a mole-cule into Z molecular fragments there will be Z local mo-lecular fragmental matrices. In this case, if a molecule ispartitioned into Z molecular fragments, the matrices Ek
[ESk] can be correspondingly partitioned into Z local ma-trices Ek
L [ESkL], L¼1, ...Z, and the kth power of matrix E
[ES] is exactly the sum of the kth power of the local Z ma-trices. Therefore, the total (both non-stochastic and sto-chastic) bond-based bilinear indices are the sum of the lo-cal non-stochastic and stochastic bond-based bilinear indi-ces, respectively, of the Z molecular fragments
bkð�w; �uÞ ¼XZ
L¼1
bkLð�w; �uÞ ð14Þ
sbkð�w; �uÞ ¼XZ
L¼1
sbkLð�w; �uÞ ð15Þ
Bond and bond-type bilinear fingerprints are specific casesof local bond-based bilinear indices. The kth bond-type bi-linear indices of the edge-adjacency matrix are calculated
QSAR Comb. Sci. 28, 2009, No. 1, 9 – 26 www.qcs.wiley-vch.de � 2009 WILEY-VCH Verlag GmbH & Co. KGaA, Weinheim 13
Discovery of Novel Trichomonacidals Using LDA-Driven QSAR Models and Bond-Based Bilinear Indices as ...
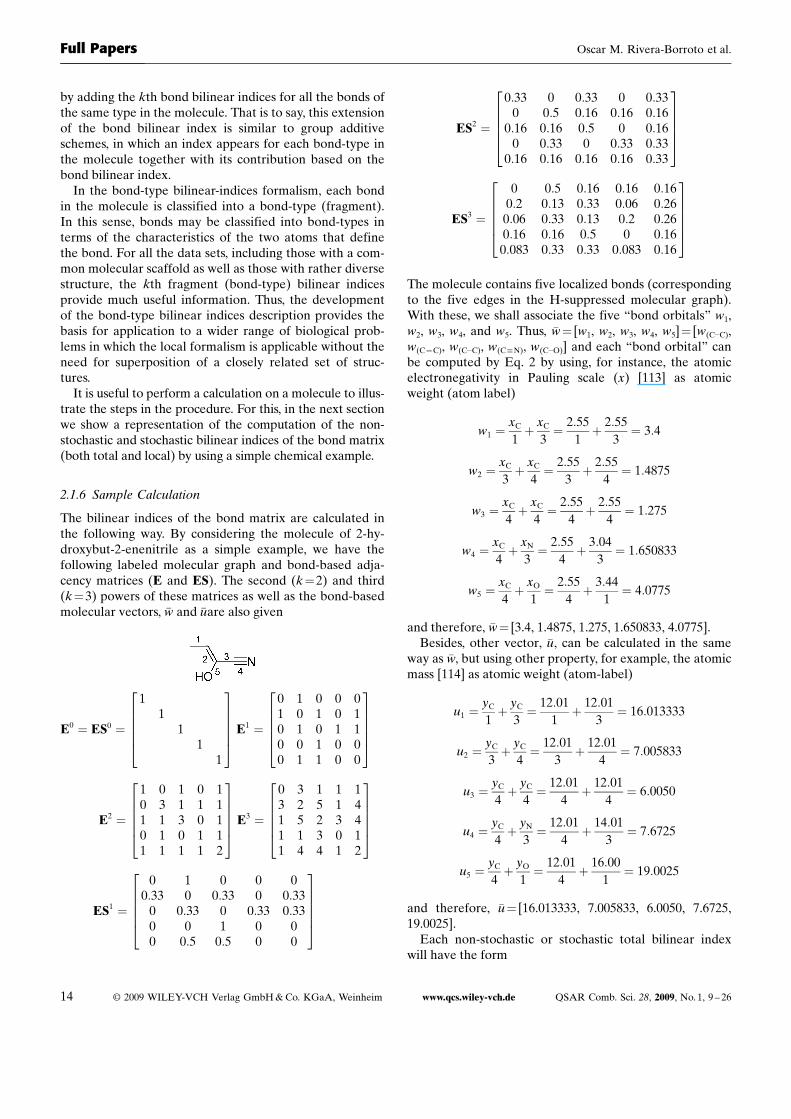
by adding the kth bond bilinear indices for all the bonds ofthe same type in the molecule. That is to say, this extensionof the bond bilinear index is similar to group additiveschemes, in which an index appears for each bond-type inthe molecule together with its contribution based on thebond bilinear index.
In the bond-type bilinear-indices formalism, each bondin the molecule is classified into a bond-type (fragment).In this sense, bonds may be classified into bond-types interms of the characteristics of the two atoms that definethe bond. For all the data sets, including those with a com-mon molecular scaffold as well as those with rather diversestructure, the kth fragment (bond-type) bilinear indicesprovide much useful information. Thus, the developmentof the bond-type bilinear indices description provides thebasis for application to a wider range of biological prob-lems in which the local formalism is applicable without theneed for superposition of a closely related set of struc-tures.
It is useful to perform a calculation on a molecule to illus-trate the steps in the procedure. For this, in the next sectionwe show a representation of the computation of the non-stochastic and stochastic bilinear indices of the bond matrix(both total and local) by using a simple chemical example.
2.1.6 Sample Calculation
The bilinear indices of the bond matrix are calculated inthe following way. By considering the molecule of 2-hy-droxybut-2-enenitrile as a simple example, we have thefollowing labeled molecular graph and bond-based adja-cency matrices (E and ES). The second (k¼2) and third(k¼3) powers of these matrices as well as the bond-basedmolecular vectors, �w and �uare also given
E0 ¼ ES0 ¼
11
11
1
266664
377775
E1 ¼
0 1 0 0 01 0 1 0 10 1 0 1 10 0 1 0 00 1 1 0 0
266664
377775
E2 ¼
1 0 1 0 10 3 1 1 11 1 3 0 10 1 0 1 11 1 1 1 2
266664
377775
E3 ¼
0 3 1 1 13 2 5 1 41 5 2 3 41 1 3 0 11 4 4 1 2
266664
377775
ES1 ¼
0 1 0 0 00:33 0 0:33 0 0:33
0 0:33 0 0:33 0:330 0 1 0 00 0:5 0:5 0 0
266664
377775
ES2 ¼
0:33 0 0:33 0 0:330 0:5 0:16 0:16 0:16
0:16 0:16 0:5 0 0:160 0:33 0 0:33 0:33
0:16 0:16 0:16 0:16 0:33
266664
377775
ES3 ¼
0 0:5 0:16 0:16 0:160:2 0:13 0:33 0:06 0:260:06 0:33 0:13 0:2 0:260:16 0:16 0:5 0 0:160:083 0:33 0:33 0:083 0:16
266664
377775
The molecule contains five localized bonds (correspondingto the five edges in the H-suppressed molecular graph).With these, we shall associate the five “bond orbitals” w1,w2, w3, w4, and w5. Thus, �w¼ [w1, w2, w3, w4, w5]¼ [w(C�C),w(C¼C), w(C�C), w(C�N), w(C�O)] and each “bond orbital” canbe computed by Eq. 2 by using, for instance, the atomicelectronegativity in Pauling scale (x) [113] as atomicweight (atom label)
w1 ¼xC
1þ xC
3¼ 2:55
1þ 2:55
3¼ 3:4
w2 ¼xC
3þ xC
4¼ 2:55
3þ 2:55
4¼ 1:4875
w3 ¼xC
4þ xC
4¼ 2:55
4þ 2:55
4¼ 1:275
w4 ¼xC
4þ xN
3¼ 2:55
4þ 3:04
3¼ 1:650833
w5 ¼xC
4þ xO
1¼ 2:55
4þ 3:44
1¼ 4:0775
and therefore, �w¼ [3.4, 1.4875, 1.275, 1.650833, 4.0775].Besides, other vector, �u, can be calculated in the same
way as �w, but using other property, for example, the atomicmass [114] as atomic weight (atom-label)
u1 ¼yC
1þ yC
3¼ 12:01
1þ 12:01
3¼ 16:013333
u2 ¼yC
3þ yC
4¼ 12:01
3þ 12:01
4¼ 7:005833
u3 ¼yC
4þ yC
4¼ 12:01
4þ 12:01
4¼ 6:0050
u4 ¼yC
4þ yN
3¼ 12:01
4þ 14:01
3¼ 7:6725
u5 ¼yC
4þ yO
1¼ 12:01
4þ 16:00
1¼ 19:0025
and therefore, �u¼ [16.013333, 7.005833, 6.0050, 7.6725,19.0025].
Each non-stochastic or stochastic total bilinear indexwill have the form
14 � 2009 WILEY-VCH Verlag GmbH & Co. KGaA, Weinheim www.qcs.wiley-vch.de QSAR Comb. Sci. 28, 2009, No. 1, 9 – 26
Full Papers Oscar M. Rivera-Borroto et al.
bk(�w; �u)¼þ ke11w1u1þ ke12w
1u2þ ke13w1u3þ ke14w
1u4
þ ke15w1u5þ ke21w
2u1þ ke22w2u2þ ke23w
2u3þ ke24w2u4
þ ke25w2u5þ ke31w
3u1þ ke32w3u2þ ke33w
3u3þ ke34w3u4
þ ke35w3u5þ ke41w
4u1þ ke42w4u2þ ke43w
4u3þ ke44w4u4
þ ke45w4u5þ ke51w
5u1þ ke52w5u2þ ke53w
5u3þ ke54w5u4
þ ke55w5u5¼
P5
i¼1
keiiwiui þ 2P5
ði;j¼1; i=jÞ
keijwiuj
sbk(�w; �u)¼þ kes11w1u1þ kes12w
1u2þ kes13w1u3þ kes14w
1u4
þ kes15w1u5þ kes21w
2u1þ kes22w2u2þ kes23w
2u3þ kes24w2u4
þ kes25w2u5þ kes31w
3u1þ kes32w3u2þ kes33w
3u3þ kes34w3u4
þ kes35w3u5þ kes41w
4u1þ kes42w4u2þ kes43w
4u3þ kes44w4u4
þ kes45w4u5þ kes51w
5u1þ kes52w5u2þ kes53w
5u3þ kes54w5u4
þ kes55w5u5¼P5
i¼1
keiiwiui þP5
ði;j¼1Þ
keijwiuj
The elements keii and kesii can be considered a measure ofthe attraction of a bond for an electron in the k step whilethe elements keij and kesij are the terms of interaction be-tween two bonds in the k step. In addition, keij¼ keji areequal by symmetry (non-oriented molecular graph). How-ever, kesij=
kesji. This is a logical result because the kth esij
elements are the transition probabilities with the “elec-trons” moving from bond i to j at the discrete time periodstk and they should be different in the two senses. This re-sult is in total agreement if the electronegativities of thetwo atom types in the bonds are taken into account.
In this way, Ek and ESk can be seen as graph – theoreti-cal electronic-structure models [123]. Actually, quantumchemistry starts from the fact that a molecule is made upof electrons and nuclei. The distinction here betweenbonded and non-bonded atoms is difficult to justify. Anytwo nuclei of a molecule interact directly and indirectlythrough the electrons present in the molecule. Only the in-tensity of this interaction varies on going from one pair ofnuclei to another. In this sense, the electron in an arbitrarybond i can move (step-by-step) to other bonds at differentdiscrete time periods tk (k¼0, 1, 2, 3, ..., n) through thechemical-bonding network. Therefore, the E1 and ES1 ma-trices consider the valence-bond electrons in one step andtheir power (k¼0, 1, 2, 3, ..., n) can be considered as an in-teracting – electron chemical – network model in k steps.This model can be seen as an intermediate between thequantitative quantum-mechanical Schrçdinger equationand classical chemical bonding ideas [123].
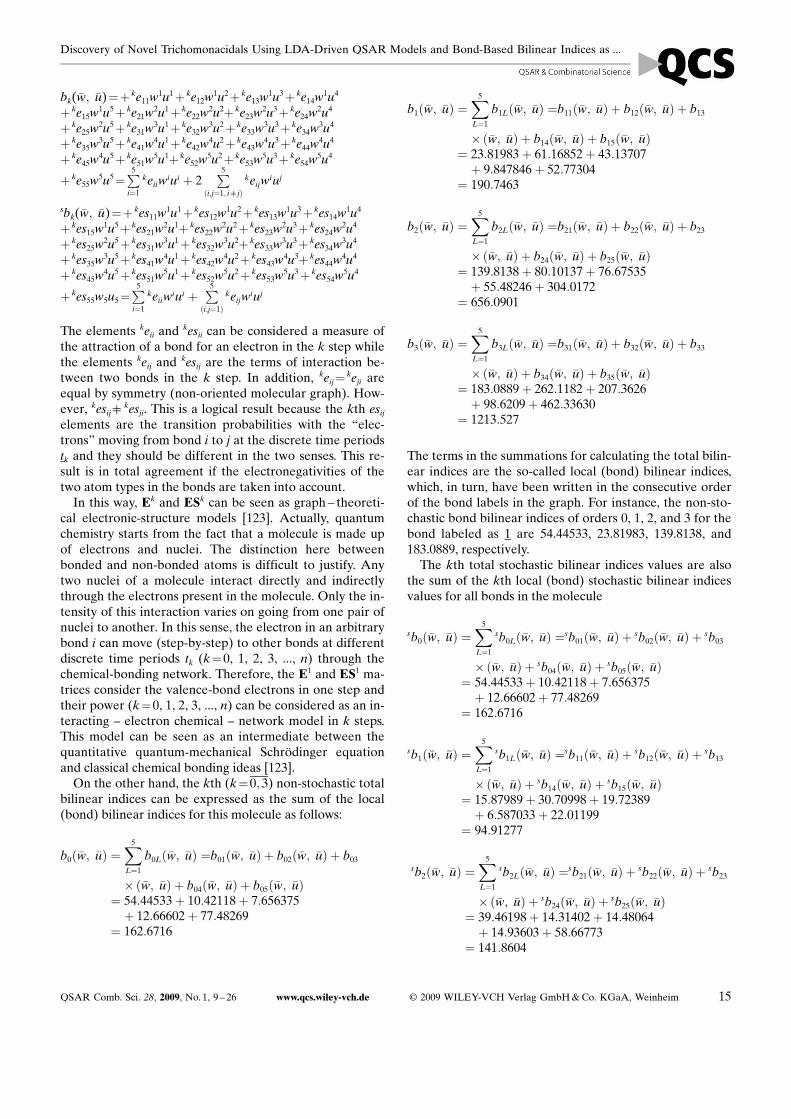
On the other hand, the kth (k¼0; 3) non-stochastic totalbilinear indices can be expressed as the sum of the local(bond) bilinear indices for this molecule as follows:
b0ð�w; �uÞ ¼X5
L¼1
b0Lð�w; �uÞ ¼b01ð�w; �uÞ þ b02ð�w; �uÞ þ b03
�ð�w; �uÞ þ b04ð�w; �uÞ þ b05ð�w; �uÞ¼ 54:44533þ 10:42118þ 7:656375þ 12:66602þ 77:48269
¼ 162:6716
b1ð�w; �uÞ ¼X5
L¼1
b1Lð�w; �uÞ ¼b11ð�w; �uÞ þ b12ð�w; �uÞ þ b13
�ð�w; �uÞ þ b14ð�w; �uÞ þ b15ð�w; �uÞ¼ 23:81983þ 61:16852þ 43:13707þ 9:847846þ 52:77304
¼ 190:7463
b2ð�w; �uÞ ¼X5
L¼1
b2Lð�w; �uÞ ¼b21ð�w; �uÞ þ b22ð�w; �uÞ þ b23
�ð�w; �uÞ þ b24ð�w; �uÞ þ b25ð�w; �uÞ¼ 139:8138þ 80:10137þ 76:67535þ 55:48246þ 304:0172
¼ 656:0901
b3ð�w; �uÞ ¼X5
L¼1
b3Lð�w; �uÞ ¼b31ð�w; �uÞ þ b32ð�w; �uÞ þ b33
�ð�w; �uÞ þ b34ð�w; �uÞ þ b35ð�w; �uÞ¼ 183:0889þ 262:1182þ 207:3626þ 98:6209þ 462:33630
¼ 1213:527
The terms in the summations for calculating the total bilin-ear indices are the so-called local (bond) bilinear indices,which, in turn, have been written in the consecutive orderof the bond labels in the graph. For instance, the non-sto-chastic bond bilinear indices of orders 0, 1, 2, and 3 for thebond labeled as 1 are 54.44533, 23.81983, 139.8138, and183.0889, respectively.
The kth total stochastic bilinear indices values are alsothe sum of the kth local (bond) stochastic bilinear indicesvalues for all bonds in the molecule
sb0ð�w; �uÞ ¼X5
L¼1
sb0Lð�w; �uÞ ¼sb01ð�w; �uÞ þ sb02ð�w; �uÞ þ sb03
�ð�w; �uÞ þ sb04ð�w; �uÞ þ sb05ð�w; �uÞ¼ 54:44533þ 10:42118þ 7:656375þ 12:66602þ 77:48269
¼ 162:6716
sb1ð�w; �uÞ ¼X5
L¼1
sb1Lð�w; �uÞ ¼sb11ð�w; �uÞ þ sb12ð�w; �uÞ þ sb13
�ð�w; �uÞ þ sb14ð�w; �uÞ þ sb15ð�w; �uÞ¼ 15:87989þ 30:70998þ 19:72389þ 6:587033þ 22:01199
¼ 94:91277
sb2ð�w; �uÞ ¼X5
L¼1
sb2Lð�w; �uÞ ¼sb21ð�w; �uÞ þ sb22ð�w; �uÞ þ sb23
�ð�w; �uÞ þ sb24ð�w; �uÞ þ sb25ð�w; �uÞ¼ 39:46198þ 14:31402þ 14:48064þ 14:93603þ 58:66773
¼ 141:8604
QSAR Comb. Sci. 28, 2009, No. 1, 9 – 26 www.qcs.wiley-vch.de � 2009 WILEY-VCH Verlag GmbH & Co. KGaA, Weinheim 15
Discovery of Novel Trichomonacidals Using LDA-Driven QSAR Models and Bond-Based Bilinear Indices as ...
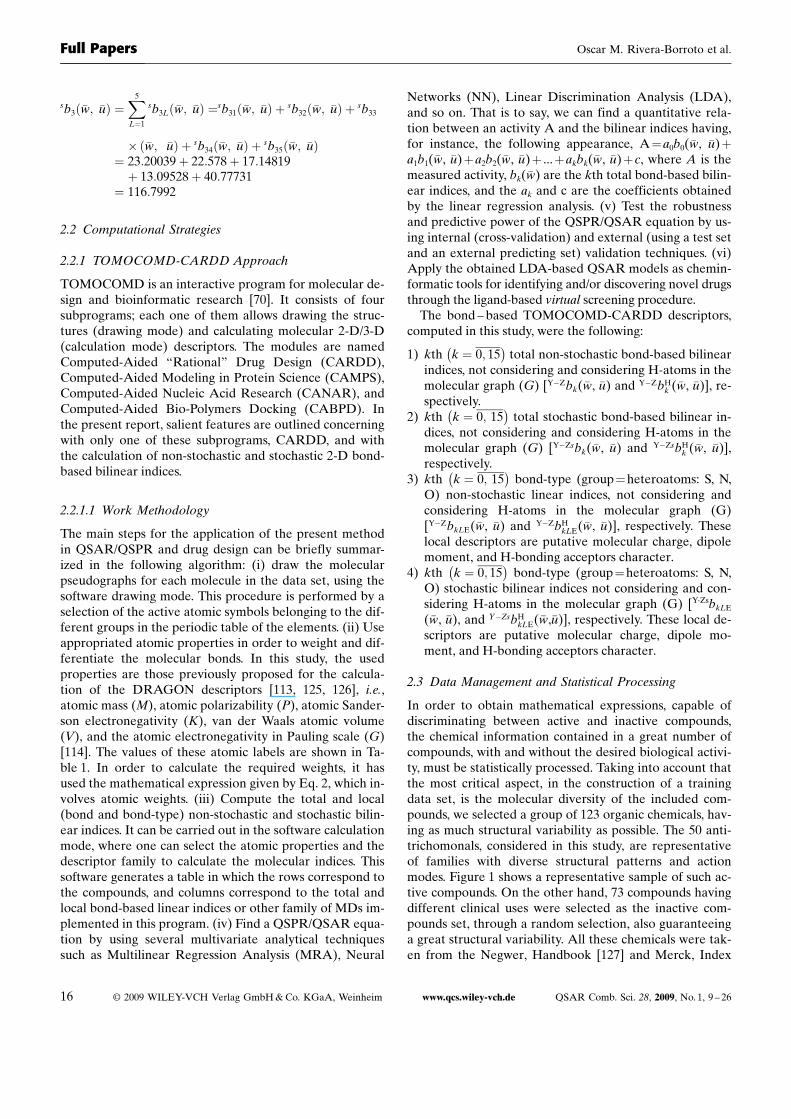
sb3ð�w; �uÞ ¼X5
L¼1
sb3Lð�w; �uÞ ¼sb31ð�w; �uÞ þ sb32ð�w; �uÞ þ sb33
�ð�w; �uÞ þ sb34ð�w; �uÞ þ sb35ð�w; �uÞ¼ 23:20039þ 22:578þ 17:14819þ 13:09528þ 40:77731
¼ 116:7992
2.2 Computational Strategies
2.2.1 TOMOCOMD-CARDD Approach
TOMOCOMD is an interactive program for molecular de-sign and bioinformatic research [70]. It consists of foursubprograms; each one of them allows drawing the struc-tures (drawing mode) and calculating molecular 2-D/3-D(calculation mode) descriptors. The modules are namedComputed-Aided “Rational” Drug Design (CARDD),Computed-Aided Modeling in Protein Science (CAMPS),Computed-Aided Nucleic Acid Research (CANAR), andComputed-Aided Bio-Polymers Docking (CABPD). Inthe present report, salient features are outlined concerningwith only one of these subprograms, CARDD, and withthe calculation of non-stochastic and stochastic 2-D bond-based bilinear indices.
2.2.1.1 Work Methodology
The main steps for the application of the present methodin QSAR/QSPR and drug design can be briefly summar-ized in the following algorithm: (i) draw the molecularpseudographs for each molecule in the data set, using thesoftware drawing mode. This procedure is performed by aselection of the active atomic symbols belonging to the dif-ferent groups in the periodic table of the elements. (ii) Useappropriated atomic properties in order to weight and dif-ferentiate the molecular bonds. In this study, the usedproperties are those previously proposed for the calcula-tion of the DRAGON descriptors [113, 125, 126], i.e.,atomic mass (M), atomic polarizability (P), atomic Sander-son electronegativity (K), van der Waals atomic volume(V), and the atomic electronegativity in Pauling scale (G)[114]. The values of these atomic labels are shown in Ta-ble 1. In order to calculate the required weights, it hasused the mathematical expression given by Eq. 2, which in-volves atomic weights. (iii) Compute the total and local(bond and bond-type) non-stochastic and stochastic bilin-ear indices. It can be carried out in the software calculationmode, where one can select the atomic properties and thedescriptor family to calculate the molecular indices. Thissoftware generates a table in which the rows correspond tothe compounds, and columns correspond to the total andlocal bond-based linear indices or other family of MDs im-plemented in this program. (iv) Find a QSPR/QSAR equa-tion by using several multivariate analytical techniquessuch as Multilinear Regression Analysis (MRA), Neural
Networks (NN), Linear Discrimination Analysis (LDA),and so on. That is to say, we can find a quantitative rela-tion between an activity A and the bilinear indices having,for instance, the following appearance, A¼a0b0(�w, �u)þa1b1(�w, �u)þa2b2(�w, �u)þ ...þakbk(�w, �u)þc, where A is themeasured activity, bk(�w) are the kth total bond-based bilin-ear indices, and the ak and c are the coefficients obtainedby the linear regression analysis. (v) Test the robustnessand predictive power of the QSPR/QSAR equation by us-ing internal (cross-validation) and external (using a test setand an external predicting set) validation techniques. (vi)Apply the obtained LDA-based QSAR models as chemin-formatic tools for identifying and/or discovering novel drugsthrough the ligand-based virtual screening procedure.
The bond – based TOMOCOMD-CARDD descriptors,computed in this study, were the following:
1) kth k ¼ 0; 15� �
total non-stochastic bond-based bilinearindices, not considering and considering H-atoms in themolecular graph (G) [Y�Zbk(�w, �u) and Y�ZbH
k (�w, �u)], re-spectively.
2) kth k ¼ 0; 15� �
total stochastic bond-based bilinear in-dices, not considering and considering H-atoms in themolecular graph (G) [Y�Zsbk(�w, �u) and Y�ZsbH
k (�w, �u)],respectively.
3) kth k ¼ 0; 15� �
bond-type (group¼heteroatoms: S, N,O) non-stochastic linear indices, not considering andconsidering H-atoms in the molecular graph (G)[Y�ZbkLE(�w, �u) and Y�ZbH
kLE(�w, �u)], respectively. Theselocal descriptors are putative molecular charge, dipolemoment, and H-bonding acceptors character.
4) kth k ¼ 0; 15� �
bond-type (group¼heteroatoms: S, N,O) stochastic bilinear indices not considering and con-sidering H-atoms in the molecular graph (G) [Y-ZsbkLE
(�w, �u), and Y�ZsbHkLE(�w,�u)], respectively. These local de-
scriptors are putative molecular charge, dipole mo-ment, and H-bonding acceptors character.
2.3 Data Management and Statistical Processing
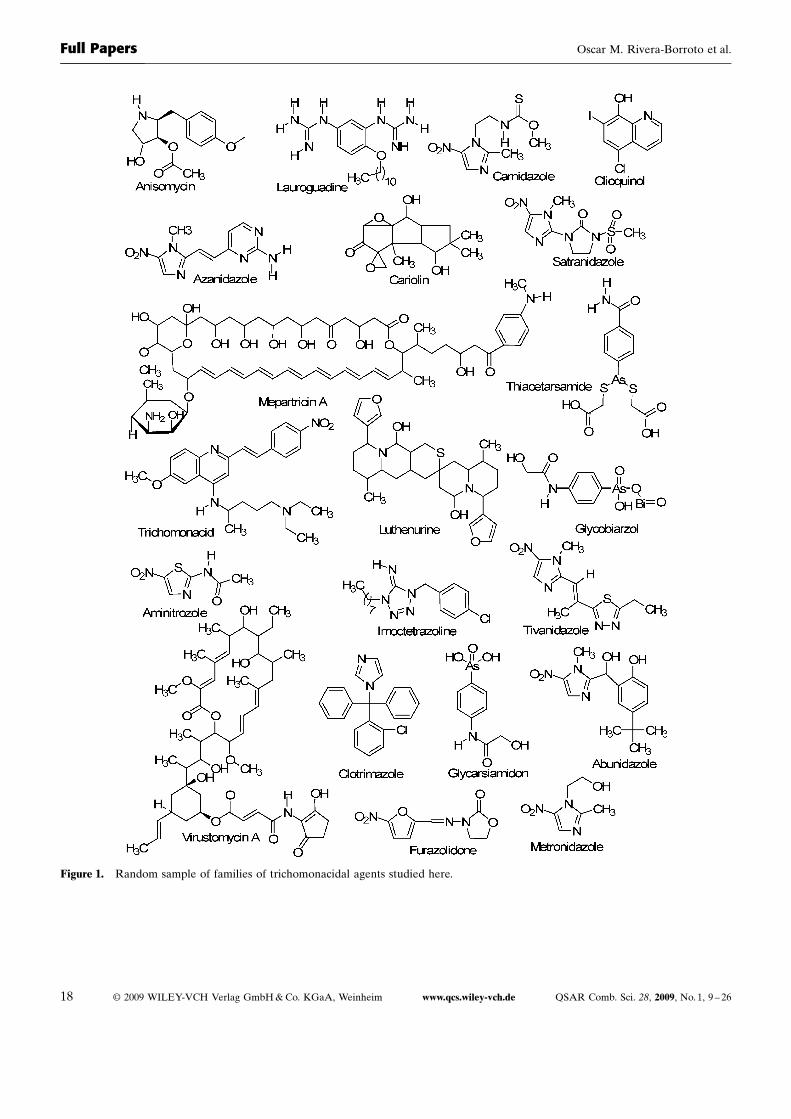
In order to obtain mathematical expressions, capable ofdiscriminating between active and inactive compounds,the chemical information contained in a great number ofcompounds, with and without the desired biological activi-ty, must be statistically processed. Taking into account thatthe most critical aspect, in the construction of a trainingdata set, is the molecular diversity of the included com-pounds, we selected a group of 123 organic chemicals, hav-ing as much structural variability as possible. The 50 anti-trichomonals, considered in this study, are representativeof families with diverse structural patterns and actionmodes. Figure 1 shows a representative sample of such ac-tive compounds. On the other hand, 73 compounds havingdifferent clinical uses were selected as the inactive com-pounds set, through a random selection, also guaranteeinga great structural variability. All these chemicals were tak-en from the Negwer, Handbook [127] and Merck, Index
16 � 2009 WILEY-VCH Verlag GmbH & Co. KGaA, Weinheim www.qcs.wiley-vch.de QSAR Comb. Sci. 28, 2009, No. 1, 9 – 26
Full Papers Oscar M. Rivera-Borroto et al.
[128], where their names, synonyms, and structural formu-las can be found. From these 123 chemicals 91 were chosenat random to form the training set, 40 of them being activeand 51 inactive ones. The remaining subseries, consistingof 10 trichomonacidals and 22 non-trichomonacidals, wereprepared as test sets for the external validation of themodels. The latter 32 chemicals were not used in the devel-opment of the classification models.
The discriminant functions were obtained by using LDA[129], as implemented in the STATISTICA program [130].The default parameters of this program were used in thedevelopment of the model. Forward stepwise was fixed asthe strategy for variable selection. The principle of maxi-mal parsimony (Occam�s razor) was taken into account asthe strategy for model selection. In its original form, Oc-cam�s razor states that “Numquam ponenda est pluritas sinnecesitate,” which can be translated as “Entities should notbe multiplied beyond necessity” [131]. In this case, simplic-ity is loosely equated with the number of parameters inthe model. If we understand the predictive error to be theerror rate for unseen examples, Occam�s razor can be stat-ed for the selection of QSAR/QSPR models as (“QSAR/QSPR Occam�s Razor”): given two QSAR/QSPR modelswith the same predictive error, the simplest one should bepreferred because simplicity is desirable in itself [131].Therefore, we select the model with the highest statisticalsignification, but having as few parameters (ak) as possible.
The quality of the models were determined by examin-ing Wilks� l parameter (U-statistic), square Mahalanobis�distance (D2), Fisher�s ratio (F), and the corresponding p-level [p(F)] as well as the percentage of good classificationin the training and test sets [129]. Models with a ratio be-tween the number of cases and variables in the equationlower than 5 were rejected.
The Wilks� l, for the overall discrimination, can takevalues in the range of 0 (perfect discrimination) to 1 (nodiscrimination). The D2 statistics indicates the separationof the respective groups, showing whether the model pos-sesses an appropriate discriminatory power to differentiatebetween the two respective groups.
The classification of cases was carried out by means ofthe posterior classification probabilities. Using the Maha-lanobis distances to do the classification, we can now de-rive the probabilities. The probability that a case belongsto a particular group is basically proportional to the Maha-lanobis distance from that group centroid (it is not exactlyproportional because we assume a multivariate normaldistribution around each centroid). Because the locationof each case is computed from the prior knowledge of thevalues for that case on the variables in the model, theseprobabilities are called posterior probabilities. In summa-ry, the posterior probability is the probability, based onour knowledge of the values of other variables, with whichthe respective case belongs to a particular group [130].
By using the models, any compound can be classified aseither active if DP%>0, being DP%¼ [P(active)�P(in-
active)]�100, or inactive, otherwise. P(active) and P(inac-tive) are the probabilities with which the equations classifya compound as active and inactive, respectively.
The statistical robustness and predictive power of theobtained model were assessed using a prediction (test) set[132]. In addition, a Leave-Many-Out (LMO) cross-valida-tion strategy was carried out. In this case, 10% of the dataset was used as group size, i.e., groups including 10% ofthe training data set were left out and predicted by themodel based on the remaining 90%. This process was car-ried out ten times on ten unique subsets. In this way, everyobservation was predicted once (in its group of left-out ob-servations). The overall mean for this process (10% fullleave-out cross-validation) was used as a good indicationof robustness, stability, and predictive power of the ob-tained models [132].
Finally, the calculation of percentages of global goodclassification (accuracy), sensibility, specificity (alsoknown as “hit rate”), false positive rate (also known as“false alarm rate”), and Matthews� correlation coefficient(C) in the training and test (predicting) sets permitted theassessment of the model [133].
2.4 Microscopic and Culture Techniques
The biological activity was tested on Tv JH31A #4 Ref.No. 30326 (ATCC, MD, USA), in modified Diamond me-dium, supplemented with equine serum and grown at 378(5% CO2). The compounds were added to the cultures atseveral concentrations (100, 10, and 1 mg/mL), after 6 h ofthe seeding (0 h). Viable protozoa were assessed at 24and 48 h after incubation at 378, by using the Neubauerchamber. MTZ (Sigma – Aldrich, SA, Spain) was used asa reference drug at concentrations of 2, 1, 0.5 mg/mL. Thecytocidal and cytostatic activities were determined, bythe calculation of percentages of cytocidal (%C) and cy-tostatic activities (%CA) in relation to controls, as previ-ously reported [134, 135].
3 Results and Discussion
3.1 Generation and Statistical Analysis of the LDA-Driven QSAR Models
In spite of the extensive number of statistical methods toobtain classification functions, we select LDA given thesimplicity of the method [129]. LDA in drug design hasbeen extensively reported by different authors [68, 73 – 75,79 – 87, 136, 137]. Therefore, LDA was also the techniqueused in the generation of discriminant functions in the cur-rent work. By means of the LDA technique implementedon the STATISTICA software [130], the following linearmodels were obtained, in which the total as well as localnon-stochastic and stochastic bond-based bilinear indiceswere used as independent variables
QSAR Comb. Sci. 28, 2009, No. 1, 9 – 26 www.qcs.wiley-vch.de � 2009 WILEY-VCH Verlag GmbH & Co. KGaA, Weinheim 17
Discovery of Novel Trichomonacidals Using LDA-Driven QSAR Models and Bond-Based Bilinear Indices as ...
18 � 2009 WILEY-VCH Verlag GmbH & Co. KGaA, Weinheim www.qcs.wiley-vch.de QSAR Comb. Sci. 28, 2009, No. 1, 9 – 26
Figure 1. Random sample of families of trichomonacidal agents studied here.
Full Papers Oscar M. Rivera-Borroto et al.
Clasif ¼ �3:32� 0:02MPbH1 ð�w; �uÞ þ 0:06MEbH
0 ð�w; �uÞþ0:12MEbH
1Lð�whal; �uhalÞ�0:12MEb1Lð�whal; �uhalÞ � 1:40�10�3MVb0ð�w; �uÞ � 7:59� 10�4 MVbH
0Lð�wE; �uEÞN ¼ 91 l ¼ 0:46 D2 ¼ 4:51 Fð6; 84Þ ¼ 15:90 p < 0:0001
ð16Þ
Clasif ¼ �5:27þ 0:23MPbH2Lð�wE; �uEÞ � 0:59MPbH
3Lð�wE; �uEÞþ0:13MEbH
1Lðð�wE; �uEÞ�0:21VPbH1Lð�whal; �uhalÞ
þ0:43VPbH4Lð�wE; �uEÞ � 0:02VPb3Lð�wE; �uEÞ
N ¼ 91 l ¼ 0:46 D2 ¼ 4:51 Fð6; 84Þ ¼ 15:90 p < 0:0001
ð17Þ
where N is the number of compounds, l is Wilks� statistics,D2 is the square of the Mahalanobis� distance, F is theFisher�s ratio, and p is the significance level.
As a result, model 16 was able to classify the 90.00%(36/40) of active and the 90.20% (46/51) of the inactivechemicals in the training set for a globally good classifica-tion of 90.11% (82/91). In addition, in the same learningseries, model 17 correctly classified the 87.50% (35/40) ofthe active and the 88.24% (45/51) of the inactive com-pounds by yielding an accuracy of 87.92% (80/91). Similar-ly, Eqs. 16 and 17 showed a 93.75% (30/32) and 87.50%
(28/32), respectively, of global predictability in the predic-tion series. Since 85.00% is considered as an acceptablethreshold limit for this kind of analysis, the former resultsvalidate, to some extent, the models for their use in the li-gand-based virtual screening procedure [138].
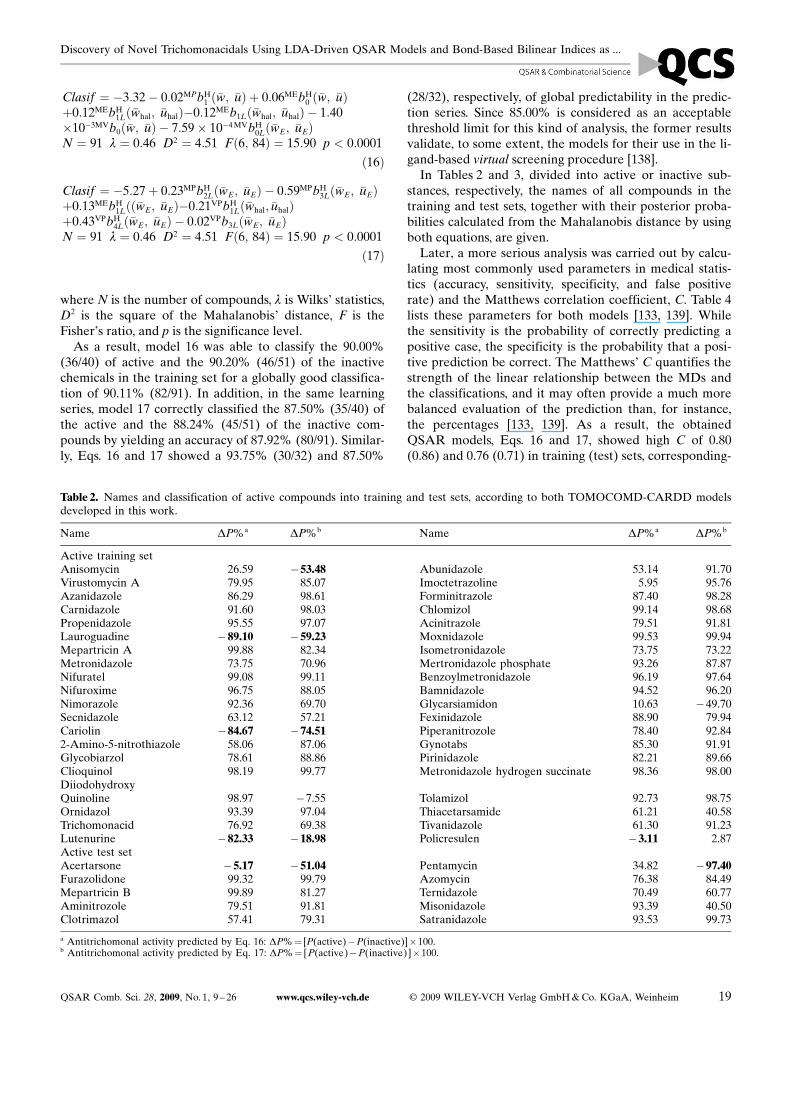
In Tables 2 and 3, divided into active or inactive sub-stances, respectively, the names of all compounds in thetraining and test sets, together with their posterior proba-bilities calculated from the Mahalanobis distance by usingboth equations, are given.
Later, a more serious analysis was carried out by calcu-lating most commonly used parameters in medical statis-tics (accuracy, sensitivity, specificity, and false positiverate) and the Matthews correlation coefficient, C. Table 4lists these parameters for both models [133, 139]. Whilethe sensitivity is the probability of correctly predicting apositive case, the specificity is the probability that a posi-tive prediction be correct. The Matthews� C quantifies thestrength of the linear relationship between the MDs andthe classifications, and it may often provide a much morebalanced evaluation of the prediction than, for instance,the percentages [133, 139]. As a result, the obtainedQSAR models, Eqs. 16 and 17, showed high C of 0.80(0.86) and 0.76 (0.71) in training (test) sets, corresponding-
QSAR Comb. Sci. 28, 2009, No. 1, 9 – 26 www.qcs.wiley-vch.de � 2009 WILEY-VCH Verlag GmbH & Co. KGaA, Weinheim 19
Table 2. Names and classification of active compounds into training and test sets, according to both TOMOCOMD-CARDD modelsdeveloped in this work.
Name DP%a DP%b Name DP%a DP%b
Active training setAnisomycin 26.59 �53.48 Abunidazole 53.14 91.70Virustomycin A 79.95 85.07 Imoctetrazoline 5.95 95.76Azanidazole 86.29 98.61 Forminitrazole 87.40 98.28Carnidazole 91.60 98.03 Chlomizol 99.14 98.68Propenidazole 95.55 97.07 Acinitrazole 79.51 91.81Lauroguadine �89.10 �59.23 Moxnidazole 99.53 99.94Mepartricin A 99.88 82.34 Isometronidazole 73.75 73.22Metronidazole 73.75 70.96 Mertronidazole phosphate 93.26 87.87Nifuratel 99.08 99.11 Benzoylmetronidazole 96.19 97.64Nifuroxime 96.75 88.05 Bamnidazole 94.52 96.20Nimorazole 92.36 69.70 Glycarsiamidon 10.63 �49.70Secnidazole 63.12 57.21 Fexinidazole 88.90 79.94Cariolin �84.67 �74.51 Piperanitrozole 78.40 92.842-Amino-5-nitrothiazole 58.06 87.06 Gynotabs 85.30 91.91Glycobiarzol 78.61 88.86 Pirinidazole 82.21 89.66Clioquinol 98.19 99.77 Metronidazole hydrogen succinate 98.36 98.00DiiodohydroxyQuinoline 98.97 �7.55 Tolamizol 92.73 98.75Ornidazol 93.39 97.04 Thiacetarsamide 61.21 40.58Trichomonacid 76.92 69.38 Tivanidazole 61.30 91.23Lutenurine �82.33 �18.98 Policresulen �3.11 2.87Active test setAcertarsone �5.17 �51.04 Pentamycin 34.82 �97.40Furazolidone 99.32 99.79 Azomycin 76.38 84.49Mepartricin B 99.89 81.27 Ternidazole 70.49 60.77Aminitrozole 79.51 91.81 Misonidazole 93.39 40.50Clotrimazol 57.41 79.31 Satranidazole 93.53 99.73
a Antitrichomonal activity predicted by Eq. 16: DP%¼ [P(active)�P(inactive)]�100.b Antitrichomonal activity predicted by Eq. 17: DP%¼ [P(active)�P(inactive)]�100.
Discovery of Novel Trichomonacidals Using LDA-Driven QSAR Models and Bond-Based Bilinear Indices as ...
ly, which proves the existence of a strong linear relation-ship, since a value of þ1 implies a total linear agreementbetween the variables under consideration.
3.1.1 Cross-Validation Methods as the Key for QSARModel Internal Validation
Validation is a crucial aspect of any QSAR modeling.Therefore, internal validation methods (e.g. cross-valida-tion) are considered, by many authors, as an indicator oreven as the ultimate proof of the stability and high-predic-tive power of a QSAR model. However, Golbraikh andTropsha demonstrated that high values of leave-one-outsquare correlation coefficient q2 appear to be a necessary,
but not a sufficient condition for the model to have a highpredictive power [140]. A more exhaustive cross-valida-tion method can be used, in which a fraction of the data(10 – 20%) is left out and predicted from a model based onthe remaining data. This process (LMO) is repeated untileach observation has been left out at least once [140, 141].
Following these statements, a leave-ten-fold full-out(LMO) cross-validation procedure was carried out here.For each group of observations (10% of the whole dataset, nine compounds) left out, a model was developedfrom the remaining 90% of the data (81 compounds). Thisprocedure was repeated ten times on ten unique subsets.The statistical results are depicted in Table 5. The overallmeans of correct classification in the training (test) set, for
20 � 2009 WILEY-VCH Verlag GmbH & Co. KGaA, Weinheim www.qcs.wiley-vch.de QSAR Comb. Sci. 28, 2009, No. 1, 9 – 26
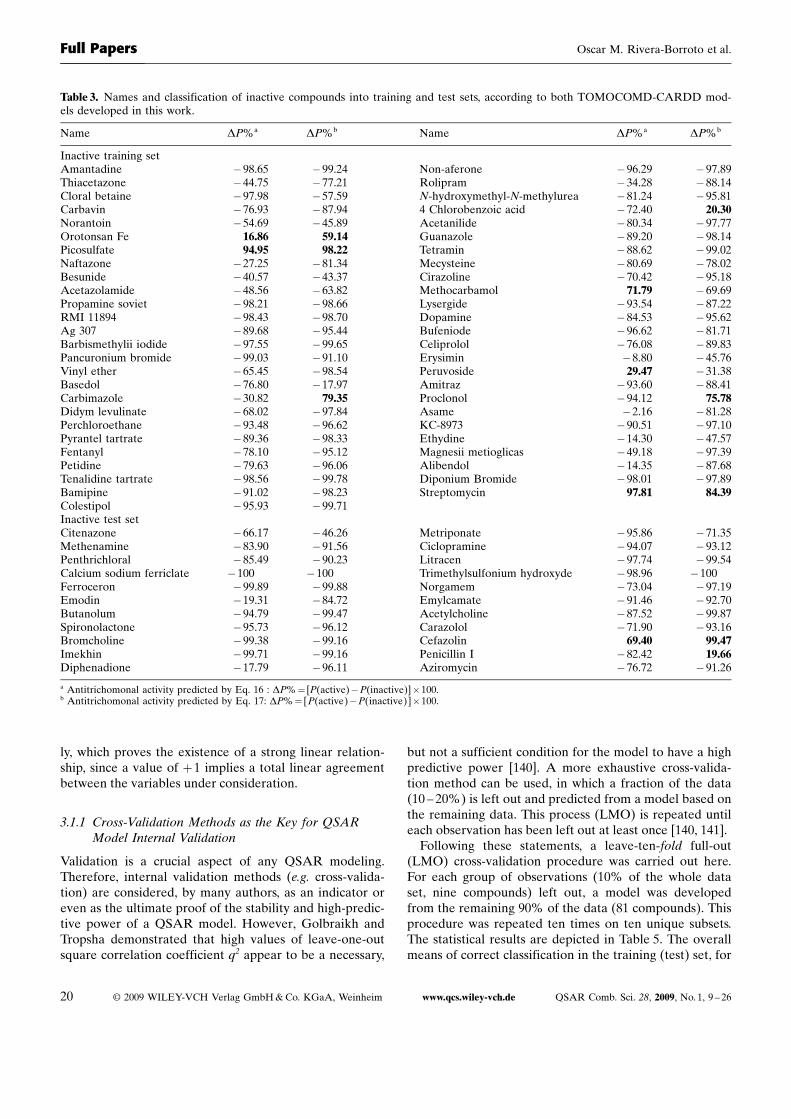
Table 3. Names and classification of inactive compounds into training and test sets, according to both TOMOCOMD-CARDD mod-els developed in this work.
Name DP%a DP%b Name DP%a DP%b
Inactive training setAmantadine �98.65 �99.24 Non-aferone �96.29 �97.89Thiacetazone �44.75 �77.21 Rolipram �34.28 �88.14Cloral betaine �97.98 �57.59 N-hydroxymethyl-N-methylurea �81.24 �95.81Carbavin �76.93 �87.94 4 Chlorobenzoic acid �72.40 20.30Norantoin �54.69 �45.89 Acetanilide �80.34 �97.77Orotonsan Fe 16.86 59.14 Guanazole �89.20 �98.14Picosulfate 94.95 98.22 Tetramin �88.62 �99.02Naftazone �27.25 �81.34 Mecysteine �80.69 �78.02Besunide �40.57 �43.37 Cirazoline �70.42 �95.18Acetazolamide �48.56 �63.82 Methocarbamol 71.79 �69.69Propamine soviet �98.21 �98.66 Lysergide �93.54 �87.22RMI 11894 �98.43 �98.70 Dopamine �84.53 �95.62Ag 307 �89.68 �95.44 Bufeniode �96.62 �81.71Barbismethylii iodide �97.55 �99.65 Celiprolol �76.08 �89.83Pancuronium bromide �99.03 �91.10 Erysimin �8.80 �45.76Vinyl ether �65.45 �98.54 Peruvoside 29.47 �31.38Basedol �76.80 �17.97 Amitraz �93.60 �88.41Carbimazole �30.82 79.35 Proclonol �94.12 75.78Didym levulinate �68.02 �97.84 Asame �2.16 �81.28Perchloroethane �93.48 �96.62 KC-8973 �90.51 �97.10Pyrantel tartrate �89.36 �98.33 Ethydine �14.30 �47.57Fentanyl �78.10 �95.12 Magnesii metioglicas �49.18 �97.39Petidine �79.63 �96.06 Alibendol �14.35 �87.68Tenalidine tartrate �98.56 �99.78 Diponium Bromide �98.01 �97.89Bamipine �91.02 �98.23 Streptomycin 97.81 84.39Colestipol �95.93 �99.71Inactive test setCitenazone �66.17 �46.26 Metriponate �95.86 �71.35Methenamine �83.90 �91.56 Ciclopramine �94.07 �93.12Penthrichloral �85.49 �90.23 Litracen �97.74 �99.54Calcium sodium ferriclate �100 �100 Trimethylsulfonium hydroxyde �98.96 �100Ferroceron �99.89 �99.88 Norgamem �73.04 �97.19Emodin �19.31 �84.72 Emylcamate �91.46 �92.70Butanolum �94.79 �99.47 Acetylcholine �87.52 �99.87Spironolactone �95.73 �96.12 Carazolol �71.90 �93.16Bromcholine �99.38 �99.16 Cefazolin 69.40 99.47Imekhin �99.71 �99.16 Penicillin I �82.42 19.66Diphenadione �17.79 �96.11 Aziromycin �76.72 �91.26
a Antitrichomonal activity predicted by Eq. 16 : DP%¼ [P(active)�P(inactive)]�100.b Antitrichomonal activity predicted by Eq. 17: DP%¼ [P(active)�P(inactive)]�100.
Full Papers Oscar M. Rivera-Borroto et al.
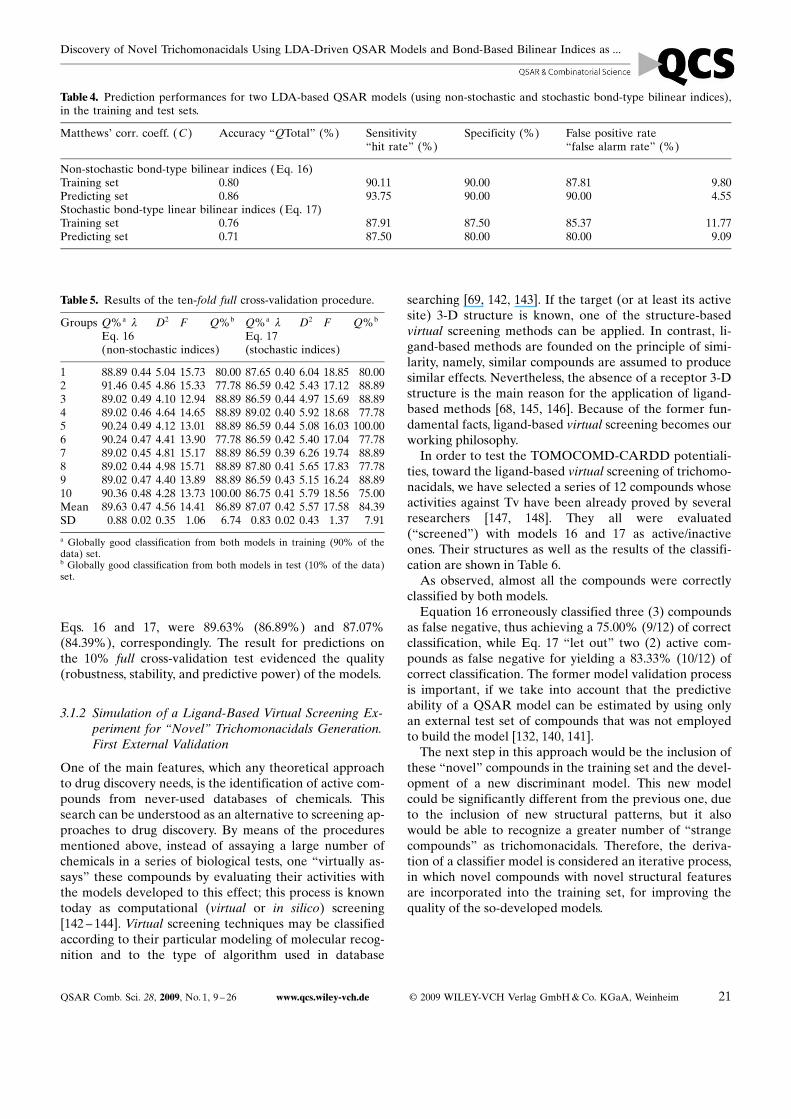
Eqs. 16 and 17, were 89.63% (86.89%) and 87.07%(84.39%), correspondingly. The result for predictions onthe 10% full cross-validation test evidenced the quality(robustness, stability, and predictive power) of the models.
3.1.2 Simulation of a Ligand-Based Virtual Screening Ex-periment for “Novel” Trichomonacidals Generation.First External Validation
One of the main features, which any theoretical approachto drug discovery needs, is the identification of active com-pounds from never-used databases of chemicals. Thissearch can be understood as an alternative to screening ap-proaches to drug discovery. By means of the proceduresmentioned above, instead of assaying a large number ofchemicals in a series of biological tests, one “virtually as-says” these compounds by evaluating their activities withthe models developed to this effect; this process is knowntoday as computational (virtual or in silico) screening[142 – 144]. Virtual screening techniques may be classifiedaccording to their particular modeling of molecular recog-nition and to the type of algorithm used in database
searching [69, 142, 143]. If the target (or at least its activesite) 3-D structure is known, one of the structure-basedvirtual screening methods can be applied. In contrast, li-gand-based methods are founded on the principle of simi-larity, namely, similar compounds are assumed to producesimilar effects. Nevertheless, the absence of a receptor 3-Dstructure is the main reason for the application of ligand-based methods [68, 145, 146]. Because of the former fun-damental facts, ligand-based virtual screening becomes ourworking philosophy.
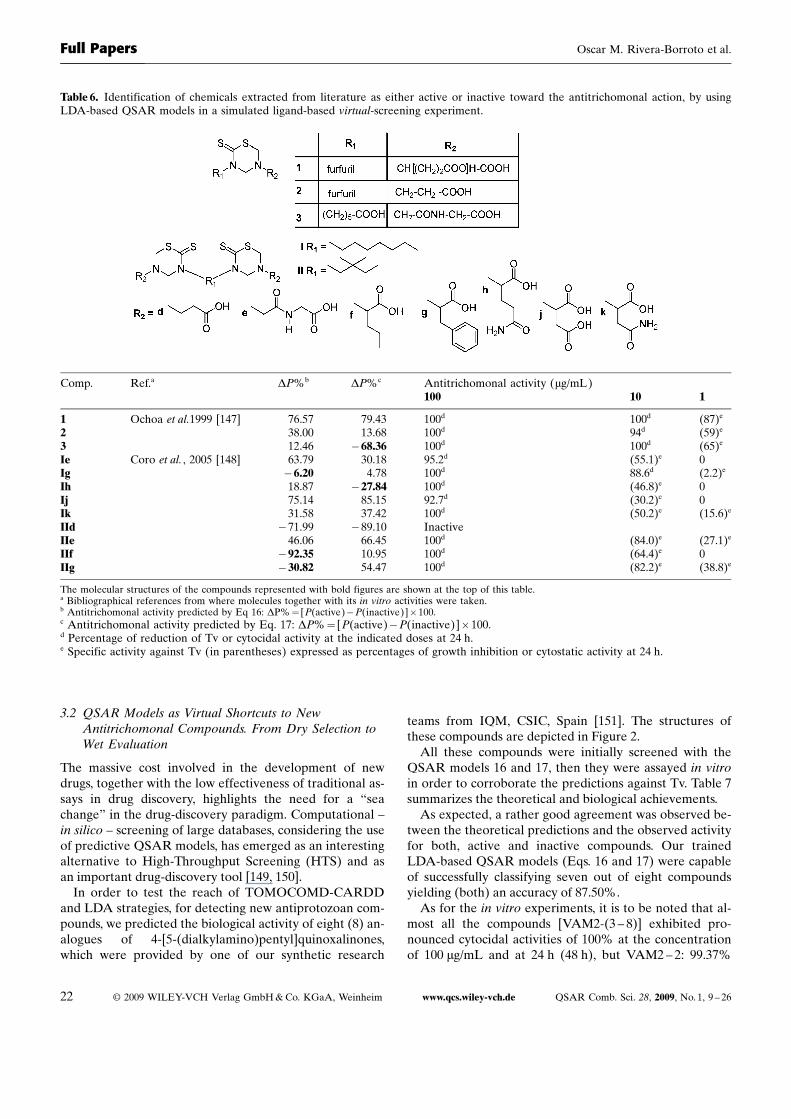
In order to test the TOMOCOMD-CARDD potentiali-ties, toward the ligand-based virtual screening of trichomo-nacidals, we have selected a series of 12 compounds whoseactivities against Tv have been already proved by severalresearchers [147, 148]. They all were evaluated(“screened”) with models 16 and 17 as active/inactiveones. Their structures as well as the results of the classifi-cation are shown in Table 6.
As observed, almost all the compounds were correctlyclassified by both models.
Equation 16 erroneously classified three (3) compoundsas false negative, thus achieving a 75.00% (9/12) of correctclassification, while Eq. 17 “let out” two (2) active com-pounds as false negative for yielding a 83.33% (10/12) ofcorrect classification. The former model validation processis important, if we take into account that the predictiveability of a QSAR model can be estimated by using onlyan external test set of compounds that was not employedto build the model [132, 140, 141].
The next step in this approach would be the inclusion ofthese “novel” compounds in the training set and the devel-opment of a new discriminant model. This new modelcould be significantly different from the previous one, dueto the inclusion of new structural patterns, but it alsowould be able to recognize a greater number of “strangecompounds” as trichomonacidals. Therefore, the deriva-tion of a classifier model is considered an iterative process,in which novel compounds with novel structural featuresare incorporated into the training set, for improving thequality of the so-developed models.
QSAR Comb. Sci. 28, 2009, No. 1, 9 – 26 www.qcs.wiley-vch.de � 2009 WILEY-VCH Verlag GmbH & Co. KGaA, Weinheim 21
Table 5. Results of the ten-fold full cross-validation procedure.
Groups Q%a l D2 F Q%b Q%a l D2 F Q%b
Eq. 16(non-stochastic indices)
Eq. 17(stochastic indices)
1 88.89 0.44 5.04 15.73 80.00 87.65 0.40 6.04 18.85 80.002 91.46 0.45 4.86 15.33 77.78 86.59 0.42 5.43 17.12 88.893 89.02 0.49 4.10 12.94 88.89 86.59 0.44 4.97 15.69 88.894 89.02 0.46 4.64 14.65 88.89 89.02 0.40 5.92 18.68 77.785 90.24 0.49 4.12 13.01 88.89 86.59 0.44 5.08 16.03 100.006 90.24 0.47 4.41 13.90 77.78 86.59 0.42 5.40 17.04 77.787 89.02 0.45 4.81 15.17 88.89 86.59 0.39 6.26 19.74 88.898 89.02 0.44 4.98 15.71 88.89 87.80 0.41 5.65 17.83 77.789 89.02 0.47 4.40 13.89 88.89 86.59 0.43 5.15 16.24 88.8910 90.36 0.48 4.28 13.73 100.00 86.75 0.41 5.79 18.56 75.00Mean 89.63 0.47 4.56 14.41 86.89 87.07 0.42 5.57 17.58 84.39SD 0.88 0.02 0.35 1.06 6.74 0.83 0.02 0.43 1.37 7.91
a Globally good classification from both models in training (90% of thedata) set.b Globally good classification from both models in test (10% of the data)set.
Table 4. Prediction performances for two LDA-based QSAR models (using non-stochastic and stochastic bond-type bilinear indices),in the training and test sets.
Matthews� corr. coeff. (C) Accuracy “QTotal” (%) Sensitivity“hit rate” (%)
Specificity (%) False positive rate“false alarm rate” (%)
Non-stochastic bond-type bilinear indices (Eq. 16)Training set 0.80 90.11 90.00 87.81 9.80Predicting set 0.86 93.75 90.00 90.00 4.55Stochastic bond-type linear bilinear indices (Eq. 17)Training set 0.76 87.91 87.50 85.37 11.77Predicting set 0.71 87.50 80.00 80.00 9.09
Discovery of Novel Trichomonacidals Using LDA-Driven QSAR Models and Bond-Based Bilinear Indices as ...
3.2 QSAR Models as Virtual Shortcuts to NewAntitrichomonal Compounds. From Dry Selection toWet Evaluation
The massive cost involved in the development of newdrugs, together with the low effectiveness of traditional as-says in drug discovery, highlights the need for a “seachange” in the drug-discovery paradigm. Computational –in silico – screening of large databases, considering the useof predictive QSAR models, has emerged as an interestingalternative to High-Throughput Screening (HTS) and asan important drug-discovery tool [149, 150].
In order to test the reach of TOMOCOMD-CARDDand LDA strategies, for detecting new antiprotozoan com-pounds, we predicted the biological activity of eight (8) an-alogues of 4-[5-(dialkylamino)pentyl]quinoxalinones,which were provided by one of our synthetic research
teams from IQM, CSIC, Spain [151]. The structures ofthese compounds are depicted in Figure 2.
All these compounds were initially screened with theQSAR models 16 and 17, then they were assayed in vitroin order to corroborate the predictions against Tv. Table 7summarizes the theoretical and biological achievements.
As expected, a rather good agreement was observed be-tween the theoretical predictions and the observed activityfor both, active and inactive compounds. Our trainedLDA-based QSAR models (Eqs. 16 and 17) were capableof successfully classifying seven out of eight compoundsyielding (both) an accuracy of 87.50%.
As for the in vitro experiments, it is to be noted that al-most all the compounds [VAM2-(3 – 8)] exhibited pro-nounced cytocidal activities of 100% at the concentrationof 100 mg/mL and at 24 h (48 h), but VAM2 – 2: 99.37%
22 � 2009 WILEY-VCH Verlag GmbH & Co. KGaA, Weinheim www.qcs.wiley-vch.de QSAR Comb. Sci. 28, 2009, No. 1, 9 – 26
Table 6. Identification of chemicals extracted from literature as either active or inactive toward the antitrichomonal action, by usingLDA-based QSAR models in a simulated ligand-based virtual-screening experiment.
Comp. Ref.a DP%b DP%c Antitrichomonal activity (mg/mL)100 10 1
1 Ochoa et al.1999 [147] 76.57 79.43 100d 100d (87)e
2 38.00 13.68 100d 94d (59)e
3 12.46 �68.36 100d 100d (65)e
Ie Coro et al. , 2005 [148] 63.79 30.18 95.2d (55.1)e 0Ig �6.20 4.78 100d 88.6d (2.2)e
Ih 18.87 �27.84 100d (46.8)e 0Ij 75.14 85.15 92.7d (30.2)e 0Ik 31.58 37.42 100d (50.2)e (15.6)e
IId �71.99 �89.10 InactiveIIe 46.06 66.45 100d (84.0)e (27.1)e
IIf �92.35 10.95 100d (64.4)e 0IIg �30.82 54.47 100d (82.2)e (38.8)e
The molecular structures of the compounds represented with bold figures are shown at the top of this table.a Bibliographical references from where molecules together with its in vitro activities were taken.b Antitrichomonal activity predicted by Eq 16: DP%¼ [P(active)�P(inactive)]�100.c Antitrichomonal activity predicted by Eq. 17: DP%¼ [P(active)�P(inactive)]�100.d Percentage of reduction of Tv or cytocidal activity at the indicated doses at 24 h.e Specific activity against Tv (in parentheses) expressed as percentages of growth inhibition or cytostatic activity at 24 h.
Full Papers Oscar M. Rivera-Borroto et al.
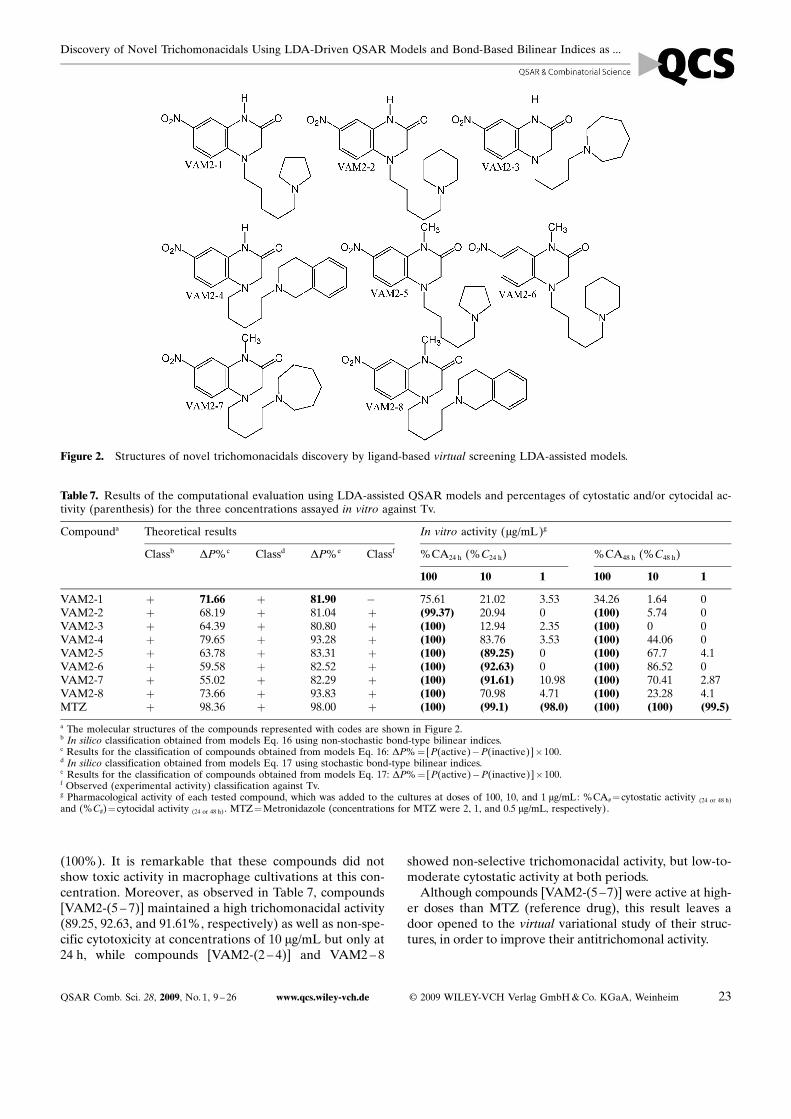
(100%). It is remarkable that these compounds did notshow toxic activity in macrophage cultivations at this con-centration. Moreover, as observed in Table 7, compounds[VAM2-(5 – 7)] maintained a high trichomonacidal activity(89.25, 92.63, and 91.61%, respectively) as well as non-spe-cific cytotoxicity at concentrations of 10 mg/mL but only at24 h, while compounds [VAM2-(2 – 4)] and VAM2 – 8
showed non-selective trichomonacidal activity, but low-to-moderate cytostatic activity at both periods.
Although compounds [VAM2-(5 –7)] were active at high-er doses than MTZ (reference drug), this result leaves adoor opened to the virtual variational study of their struc-tures, in order to improve their antitrichomonal activity.
QSAR Comb. Sci. 28, 2009, No. 1, 9 – 26 www.qcs.wiley-vch.de � 2009 WILEY-VCH Verlag GmbH & Co. KGaA, Weinheim 23
Figure 2. Structures of novel trichomonacidals discovery by ligand-based virtual screening LDA-assisted models.
Table 7. Results of the computational evaluation using LDA-assisted QSAR models and percentages of cytostatic and/or cytocidal ac-tivity (parenthesis) for the three concentrations assayed in vitro against Tv.
Compounda Theoretical results In vitro activity (mg/mL)g
Classb DP%c Classd DP%e Classf %CA24 h (%C24 h) %CA48 h (%C48 h)
100 10 1 100 10 1
VAM2-1 þ 71.66 þ 81.90 � 75.61 21.02 3.53 34.26 1.64 0VAM2-2 þ 68.19 þ 81.04 þ (99.37) 20.94 0 (100) 5.74 0VAM2-3 þ 64.39 þ 80.80 þ (100) 12.94 2.35 (100) 0 0VAM2-4 þ 79.65 þ 93.28 þ (100) 83.76 3.53 (100) 44.06 0VAM2-5 þ 63.78 þ 83.31 þ (100) (89.25) 0 (100) 67.7 4.1VAM2-6 þ 59.58 þ 82.52 þ (100) (92.63) 0 (100) 86.52 0VAM2-7 þ 55.02 þ 82.29 þ (100) (91.61) 10.98 (100) 70.41 2.87VAM2-8 þ 73.66 þ 93.83 þ (100) 70.98 4.71 (100) 23.28 4.1MTZ þ 98.36 þ 98.00 þ (100) (99.1) (98.0) (100) (100) (99.5)
a The molecular structures of the compounds represented with codes are shown in Figure 2.b In silico classification obtained from models Eq. 16 using non-stochastic bond-type bilinear indices.c Results for the classification of compounds obtained from models Eq. 16: DP%¼ [P(active)�P(inactive)]�100.d In silico classification obtained from models Eq. 17 using stochastic bond-type bilinear indices.e Results for the classification of compounds obtained from models Eq. 17: DP%¼ [P(active)�P(inactive)]�100.f Observed (experimental activity) classification against Tv.g Pharmacological activity of each tested compound, which was added to the cultures at doses of 100, 10, and 1 mg/mL: %CA#¼cytostatic activity (24 or 48 h)
and (%C#)¼cytocidal activity (24 or 48 h). MTZ¼Metronidazole (concentrations for MTZ were 2, 1, and 0.5 mg/mL, respectively).
Discovery of Novel Trichomonacidals Using LDA-Driven QSAR Models and Bond-Based Bilinear Indices as ...
4 Concluding Remarks
Once more, QSAR studies arise as an efficient alternativeto time-consuming and costly conventional HTS, in vitroor/and in vivo techniques. Particularly, there were demon-strated the possibilities of TOMOCOMD-CARDD�s MDsand LDA, for generating simple and robust models, capa-ble not only of identifying well-known and established tri-chomonacidals, but also of discovering new candidates.The latter is important, not only because it was possible todescribe such a complex biological phenomenon by a fewvariables, but also by the attempt to provide, at least, apartial solution to the generation of adequate drugs, com-peting with MTZ in the treatment of trichomoniasis, soneeded nowadays.
Acknowledgement
Yovani Marrero-Ponce (M.-P. Y.) acknowledges the Valen-cia University for kind hospitality during the second se-mester of 2007 M.-P. Y. thanks are given to the GeneralitatValenciana (Spain) for partial financial support as well asthe program “Estades Temporals per an InvestigadorsConvidats” for a fellowship to work at Valencia University(2006 – 2007). Some authors� thanks support from SpanishMEC (Project Reference: SAF2006 – 04698). Finally, F. T.thanks support from Spanish MEC (Project No.CTQ2004-07768-C02-01/BQU and CCT005-07-00365)and. EU (Program Feder). We are also indebted to thejournal Editor Professor Dr. Gisbert Schneider for hiskind attention. Finally, but not less, M-P, Y thanks are giv-en to the projects entitle “Strengthening postgraduate edu-cation and research in Pharmaceutical Sciences”. Thisproject is funded by the Flemish Interuniversity Council(VLIR) of Belgium.
References
[1] D. Petrin, K. Delgaty, R. Bhatt, G. Garber, Clin. Micro-biol. Rev. 1998, 11, 300 – 317.
[2] W. J. Cates, Sex. Transm. Dis. 1999, 26, S2 – S7.[3] World-Health-Organization, Global program on AIDS, An
overview of selected curable sexually transmitted diseases,World Health Organization, Geneva, Switzerland, 1995.
[4] M. T. Brown, Practitioner 1972, 209, 639 – 644.[5] R. D. Catterall, Med. Clin. North Am. 1972, 56, 1203 –
1209.[6] A. R. Wisdom,E. M. C. Dunlop, Br. J. Vener. Dis. 1965, 41,
90 – 96.[7] S. Garc�a,D. A. Bruckner, Diagnostic Medical Parasitology,
American Society for Microbiology, Washington (DC)1993, pp. 84 – 91.
[8] M. F. Rein, Trichomoniasis, R. Goldsmith, D. Heyneman(Eds.), Santafe de Bogota 1995.
[9] I. T. Gram, M. Macaluso, J. Churchill, H. Stalsberg, CancerCauses Control 1992, 3, 231 – 236.
[10] Z. F. Zhang,C. B. Begg, Int. J. Epidemiol. 1994, 23, 682 –690.
[11] M. Viikki, E. Pukkala, P. Nieminen,M. Hakama, Acta On-col. 2000, 39, 71 – 75.
[12] B. M. Kharsany, A. A. Hoosen, J. Moodley, J. Bagaratee,E. Gouws, Genitourin. Med. 1993, 69, 357 – 360.
[13] W. Cates, M. R. Joesoef, M. B. Goldman, Am. J. Obstet.Gynecol. 1993, 169, 341 – 346.
[14] F. Grodstein, M. B. Goldman, D. W. Cramer, Am. J. Epide-miol. 1993, 137, 577 – 584.
[15] D. E. Soper, R. C. Bump,W. G. Hurt, Am. J. Obstet. Gyne-col. 1990, 163, 1016 – 1023.
[16] M. F. Cotch, Program and abstracts of the 30th Inter-science Conference on Antimicrobial Agents and Chemo-therapy, Abs. 681, Vaginal infections and prematurity studygroup. Carriage of Trichomonas vaginalis (Tv) is associatedwith adverse pregnancy outcome, Washington DC 1990.
[17] H. Minkoff, A. N. Grunebaum, R. H. Schwarz, J. Feldman,M. Cummings, W. Crombleholme, L. Clark, G. Pringle,W. M. McCormack, Am. J. Obstet. Gynecol. 1984, 150,965 – 972.
[18] K. B. Fowler, R. F. Pass, J. Infect. Dis. 1991, 164, 259 – 264.[19] M. Laga, A. Manoka, M. Kivuvu, B. Malele, M. Tuliza, N.
Nzila, J. Goeman, F. Behets, V. Batter, M. Alary, W. L.Heyward, R. W. Ryder, P. Piot, AIDS 1993, 7, 95 – 102.
[20] F. Sorvillo, P. Kerndt, Lancet. 1998, 351, 213 – 214.[21] B. M. Honigberg, V. M. King, J. Parasitol. 1964, 50, 345 –
364.[22] M. M�ller, Symp. Soc. Gen. Microbiol. 1980, 30, 127 – 142.[23] M. M�ller, Acta Univ. Carol. Biol. 1987, 30, 249 – 260.[24] J. G. Lossick, H. L. Kent, Am. J. Obstet. Gynecol. 1991,
165, 1217 – 1222.[25] C. Cosar, L. Julou, Ann. Inst. Pasteur 1959, 96, 238 – 241.[26] N. Yarlett, N. C. Yarlett, D. Lloyd, Biochem. Pharmacol.
1986, 35, 1703 – 1708.[27] J. H. Tocher, D. I. Edwards, Biochem. Pharmacol. 1994, 48,
1089 – 1094.[28] M. H. Nielsen, Acta Pathol. Microbiol. Scand B 1976, 84,
93 – 100.[29] Centers for Disease Control and Prevention, Sexually
transmitted diseases treatment guidelines, Morb. Mortal.Wkly. Rep. 1993, 42 70.
[30] A. Garcia-Leverde, L. de Bonila, Am. J. Trop. Med. Hyg.1975, 24, 781 – 783.
[31] S. J. Powell, L. Macleod, A. J. Wilmot, R. Elsdon-Dew,Lancet. 1966, ii, 1329 – 1331.
[32] J. Scheider, Bull. Soc. Pathol. Exot. 1961, 54, 84 – 93.[33] S. M. Townson, P. F. L. Boreham, P. Upcroft, J. A. Upcroft,
Acta Trop. 1994, 56, 173 – 194.[34] R. Knight, J. Antimicrob. Chemother. 1980, 6, 577 – 593.[35] J. Kulda, M. Vojtechovska, J. Tachezy, P. Demes, E. Kunzo-
va, Br. J. Vener. Dis. 1982, 58, 394 – 399.[36] J. G. Lossick, M. M�ller, T. E. Gorrell, J. Infect. Dis. 1986,
153, 948 – 955.[37] J. G. Meingassner, J. Thurner, Antimicrob. Agents Chemo-
ther. 1979, 15, 254 – 257.[38] T. Meri, T. S. Jokiranta, L. Suhonen, S. Meri, J. Clin. Mi-
crobiol. 2000, 38, 763 – 767.[39] M. M�ller, J. G. Meingassner, W. A. Miller,W. J. Ledger,
Am. J. Obstet. Gynecol. 1980, 138, 808 – 812.[40] D. M. Brown, J. A. Upcroft, H. N. Dodd, N. Chen, P. Up-
croft, Mol. Biochem. Parasitol. 1999, 98, 203 – 214.[41] J. Kulda, J. Cerkasov, P. Demes, A. Cerkasovova, Exp. Par-
asitol. 1984, 57, 93 – 103.
24 � 2009 WILEY-VCH Verlag GmbH & Co. KGaA, Weinheim www.qcs.wiley-vch.de QSAR Comb. Sci. 28, 2009, No. 1, 9 – 26
Full Papers Oscar M. Rivera-Borroto et al.
[42] J. Kulda, J. Tachezy, A. Cerkasovova, J. Eukaryot. Micro-biol. 1993, 40, 262 – 269.
[43] �u ¼Pm
j�1uj�ejJ. Tachezy, J. Kulda, E. Tomkova, Parasitology
1993, 106, 31 – 37.[44] I. de Carneri, G. Achilli, G. Monti, F. Trane, Lancet 1969,
2, 1308 – 1309.[45] J. G. Meingassner, H. Mieth, R. Czok, D. G. Lindmark, M.
M�ller, Antimicrob. Agents Chemother. 1978, 13, 1 – 3.[46] J. Kulda, Int. J. Parasitol. 1999, 29, 199 – 212.[47] H. Gillette, G. P. Schmid, D. Moswe, XIIIth Meeting of the
International Society of Sexually Transmitted Disease Re-search, Metronidazole-resistant Trichomonas vaginalis, acase series, Denver, July 11 – 14 1999.
[48] J. G. Lossick, H. L. Kent, Am. J. Obstet. Gynecol. 1991,165, 1217 – 1222.
[49] B. C.-O. C. Group, Int. J. STD AIDS 1992, 3, 24 – 27.[50] M. Dan, J. D. Sobel, Infect. Dis. Obstet. Gynecol. 1996, 4,
77 – 84.[51] I. H. Ahmed-Jushuf, A. E. Murray, J. McKeown, Genitour-
in. Med. 1988, 64, 25 – 29.[52] J. H. I. Grossman, R. P. Galask, Obstet. Gynecol. 1990, 76,
521 – 522.[53] D. A. Lewis, L. Habgood, R. White, K. F. Barker, S. M.
Murphy, Int. J. STD AIDS 1997, 8, 780 – 784.[54] J. G. Lossick, H. L. Kent, Am. J. Obstet. Gynecol. 1991,
165, 1217 – 1222.[55] J. G. Lossick, M. Muller, T. E. Gorrell, J. Infect. Dis. 1986,
153, 948 – 955.[56] M. P. Dombrowski, R. J. Sokol, W. J. Brown, R. A. Brons-
teen, Obstet. Gynecol. 1987, 69, 524 – 525.[57] G. Saurina, W. M. McCormack, D. Landman, XIIIth Meet-
ing of the International Society of Sexually TransmittedDisease Research, A study of the prevalence of resistanttrichomoniasis and response to treatment in Brooklyn, NYDenver, July 11 – 14 1999.
[58] M. Dan, J. D. Sobel, Infect. Dis. Obstet. Gynecol. 1996, 4,77 – 84.
[59] E. M. Narcisi, W. E. Secor, Antimicrob. Agents Chemother.1996, 40, 1121 – 1125.
[60] E. T. Houang, Z. Ahmet, A. G. Lawrence, Sex. Transm.Dis. 1997, 24, 116 – 119.
[61] R. S. Pattman, M. S. Sprott, A. M. Kerns, M. Earnshaw,Genitourin. Med. 1989, 65, 274 – 275.
[62] C. A. Wong, P. D. Wilson, T. A. Chew, Aust. NZ J. Obstet.Gynaecol. 1990, 30, 169 – 171.
[63] C. H. I. Livengood, J. G. Lossick, Obstet. Gynecol. 1991,78, 954 – 956.
[64] P. G. Watson, R. S. Pattman, Int. J. STD AIDS 1996, 7,296 – 297.
[65] P. Nyirjesy, J. D. Sobel, M. V. Weitz, Clin. Infect. Dis. 1998,26, 986 – 988.
[66] P. Nyirjesy, M. V. Weitz, S. P. Gelone,T. Fekete, Lancet1995, 346, 1110.
[67] E. Estrada, A. Pena, Bioorg. Med. Chem. 2000, 8, 2755 –2770.
[68] E. Estrada, E. Uriarte, A. Montero, M. Teijeira, L. Santa-na, E. De Clercq, J. Med. Chem. 2000, 43, 1975 – 1985.
[69] R. K. Scott, Informatics integration: The bedrock of NCEselection. Biosilico 2003, 1, 14 – 17.
[70] Y. Marrero-Ponce,V. Romero, TOMOCOMD (TOpologi-cal MOlecular COMputer Design) for Windows, 1.0, 2002,TOMOCOMD software, Central University of Las Villas.,version 1.0 is a preliminary experimental version; in futurea professional version will be obtained upon request to Yo-
vani Marrero Ponce, [email protected] or [email protected] (for more details see www.uv.es/yoma).
[71] Y. Marrero-Ponce, Molecules 2003, 8, 687 – 726.[72] Y. Marrero-Ponce, J. Chem. Inf. Comput. Sci. 2004, 44,
2010 – 26.[73] Y. Marrero-Ponce, Bioorg. Med. Chem. 2004, 12, 6351 –
6369.[74] Y. Marrero-Ponce, J. A. Castillo-Garit, F. Torrens, V. Ro-
mero-Zaldivar, E. Castro, Molecules 2004, 9, 1100 – 1123.[75] Y. Marrero-Ponce, H. G. D�az, V. Romero, F. Torrens,
E. A. Castro, Bioorg. Med. Chem. 2004, 12, 5331 – 5342.[76] J. A. Castillo-Garit, Y. Marrero-Ponce, F. Torrens, R. Ro-
tondo, J. Mol. Graphics. Model. 2006. 26, 32 – 47.[77] Y. Marrero-Ponce, J. A. Castillo-Garit, J. Comput. Aid.
Mol. Des. 2005, 19, 369 – 383.[78] Y. Marrero-Ponce, M. A. Cabrera, V. Romero, E. Ofori,
L. A. Montero, Int. J. Mol. Sci. 2003, 4, 512 – 36.[79] Y. Marrero-Ponce, M. A. Cabrera, V. Romero, D. H. Gon-
zalez, F. Torrens, J. Pharm. Pharmaceut. Sci. 2004, 7, 186 –199.
[80] Y. Marrero-Ponce, M. A. Cabrera, V. Romero-Zaldivar, M.Bermejo, D. Siverio, F. Torrens, Internet Electron. J. Mol.Des. 2005, 4 124 – 150.
[81] Y. Marrero-Ponce, J. A. Castillo-Garit, E. Olazabal, H. S.Serrano, A. Morales, N. Castanedo, F. Ibarra-Velarde, A.Huesca-Guillen, A. M. Sanchez, F. Torrens, E. A. Castro,Bioorg. Med. Chem. 2005, 13, 1005 – 1020.
[82] Y. Marrero-Ponce, J. A. Castillo-Garit, E. Olazabal, H. S.Serrano, A. Morales, N. Castanedo, F. Ibarra-Velarde, A.Huesca-Guillen, E. Jorge, A. del Valle, F. Torrens,E. A.Castro, J. Comput. Aid. Mol. Des. 2004, 18, 615 – 34.
[83] Y. Marrero-Ponce, A. Huesca-Guillen, F. Ibarra-Velarde, J.Mol. Struct. (Theochem.) 2005, 717, 67 – 79.
[84] Y. Marrero-Ponce, A. Montero-Torres, C. R. Zaldivar,M. I. Veitia, M. M. Perez, R. N. Sanchez, Bioorg. Med.Chem. 2005, 13, 1293 – 1304.
[85] Y. Marrero-Ponce, R. Medina-Marrero, F. Torrens, Y. Mar-tinez, V. Romero-Zaldivar, E. A. Castro, Bioorg. Med.Chem. 2005, 13, 2881 – 99.
[86] Y. Marrero-Ponce, R. Medina-Marrero, Y. Martinez, F.Torrens, V. Romero-Zaldivar, E. A. Castro, J. Mol. Model.2006, 12, 255 – 271.
[87] Y. Marrero-Ponce, D. Nodarse, H. D. Gonzalez, R. Ramosde Armas, V. Romero-Zaldivar, F. Torrens, E. Castro, Int.J. Mol. Sci. 2004, 5, 276 – 293.
[88] Y. Marrero-Ponce, J. A. Castillo-Garit, D. Nodarse, Bioorg.Med. Chem. 2005, 13, 3397.
[89] Y. Marrero-Ponce, R. Medina, E. A. Castro, R. de Armas,H. Gonzalez, V. Romero, F. Torrens, Molecules 2004, 9,1124 – 1147.
[90] Y. Marrero-Ponce, R. Medina-Marrero, J. A. Castillo-Garit,V. Romero-Zaldivar, F. Torrens, E. A. Castro, Bioorg.Med. Chem. 2005, 13, 3003 – 3015.
[91] Y. Marrero-Ponce, F. Torrens, Y. J. Alvarado, R. Roton-do,V. Romero-Zaldivar, J. Comp.-Aid. Mol. Des. 2006, 20,685 – 701.
[92] Y. Marrero-Ponce, M. T. H. Khan, G. M. Casanola-Martin,A. Ather, K. M. Khan, F. Torrens, R. Rotondo, J. Comput.Aid. Mol. Design. 2007, 21, 167 – 188.
[93] G. M. Casanola-Martin, M. T. H. Khan, Y. Marrero-Ponce,A. Ather, S. Sultan, F. Torrens, R. Rotondo, Bioorg. Med.Chem. 2007, 15, 1483 – 1503.
[94] D. H. Rouvray (Ed.), Chemical Applications of GraphTheory, Academic Press, London 1976, pp. 180 – 181.
QSAR Comb. Sci. 28, 2009, No. 1, 9 – 26 www.qcs.wiley-vch.de � 2009 WILEY-VCH Verlag GmbH & Co. KGaA, Weinheim 25
Discovery of Novel Trichomonacidals Using LDA-Driven QSAR Models and Bond-Based Bilinear Indices as ...
[95] N. Trinajstic (Ed.), Chemical Graph Theory, CRC Press,Boca Raton, FL 1992.
[96] E. Estrada, J. Chem. Inf. Comput. Sci. 1995, 35, 31 – 33.[97] E. Estrada, A. Ramirez, J. Chem. Inf. Comput. Sci. 1996,
36, 837 – 43.[98] E. Estrada, J. Chem. Inf. Comput. Sci. 1996, 36, 844 – 49.[99] E. Estrada, N. Guevara, I. Gutman, J. Chem. Inf. Comput.
Sci. 1998, 38, 428 – 31.[100] E. Estrada, J. Chem. Inf. Comput. Sci. 1999, 39, 1042 – 48.[101] E. Estrada, E. Molina, J. Mol. Graph. Model. 2001, 20,
54 – 64.[102] R. Todeschini, V. Consonni, Handbook of Molecular De-
scriptors, Weinheim, Wiley-VCH, Germany 2000, pp. 668.[103] C. H. Edwards, D. E. Penney, Elementary Linear Algebra,
Prentice-Hall, Englewood Cliffs, New Jersey, USA 1988.[104] Y. Marrero Ponce, J. Chem. Inf. Comput. Sci. 2004, 44,
2010 – 2026.[105] E. Estrada, S. Vilar, E. Uriarte,Y. Gutierrez, J. Chem. Inf.
Comput. Sci. 2002, 42, 1194 – 203.[106] E. Estrada, A. Pena, R. Garcia-Domenech, J. Comput.
Aid. Mol. Des. 1998, 12, 583 – 595.[107] V. M. Potapov, Stereochemistry, Mir, Moscow 1978.[108] R. Wang, Y. Gao, L. Lai, Perspect. Drug Disc. Des. 2000,
19, 47 – 66.[109] P. Ertl, B. Rohde, P. Selzer, J. Med. Chem. 2000, 43, 3714 –
7.[110] A. K. Ghose, G. M. Crippen, J. Chem. Inf. Comput. Sci.
1987, 27, 21 – 35.[111] K. J. Miller, J. Am. Chem. Soc. 1990, 112, 8533 – 8542.[112] J. Gasteiger,M. Marsili, Tetrahedron Lett. 1978, 19, 3181 –
3184.[113] L. Pauling, The Nature of Chemical Bond, Cornell Univer-
sity Press, Ithaca (New York) 1939, pp. 2 – 60.[114] L. B. Kier, L. H. Hall, Molecular Connectivity in Struc-
ture – Activity Analysis, Research Studies Press, Letch-worth, UK 1986, pp. 262.
[115] P. G. Hoel, Introduccion a la Estadistica Matematica, Edito-rial Pueblo y Educacion, La Habana 1978, pp. 18 – 22.
[116] K. F. Riley, M. P. Hobson, S. J. Vence, Mathematical Meth-ods for Physics and Engineering, Cambridge UniversityPress, Cambridge, 1998, pp. 228 – 236.
[117] E. Hernandez, Algebra y Geometr�a, Universidad Autono-ma de Madrid, Madrid 1987, pp. 521 – 544.
[118] J. de Burgos-Roman, Algebra y Geometr�a Cartes�ana,McGraw-Hill Interamericana de Espana, Espana 2000,pp. 208 – 246.
[119] J. de Burgos-Roman, Curso de Algebra y Geometr�a,Alambra Longman, Ed., Madrid 1994, pp. 638 – 684.
[120] G. Werner, Linear Algebra, Springer-Verlag, New York1981, pp. 261 – 288.
[121] P. D. Walker, P. G. Mezey, J. Am. Chem. Soc. 1993, 115,12423.
[122] D. J. Klein, Internet Electron. J. Mol. Des. 2003, 2, 814 –834.
[123] J. H. Van Vleck, A. Sherman, Rev. Mod. Phys. 1935, 7,167 – 228.
[124] R. Todeschini, V. Consonni, M. Pavan, Dragon Software,version 2.1. 2002.
[125] R. Todeschini, P. Gramatica, Perspect. Drug Disc. Des.1998, 9 – 11, 355 – 380.
[126] V. Consonni, R. Todeschini, M. Pavan, J. Chem. Inf. Com-put. Sci. 2002, 42, 682 – 92.
[127] M. Negwer, Organic-Chemical Drugs and their Synonyms,Akademie-Verlag, Berlin 1987.
[128] S. Budavari, M. O�Neil, Ann Smith, P. Heckelman, J.Obenchain. The Merck Index on CD-ROM, Chapman andHall and Merck & Co., Inc. 1999.
[129] H. van de Waterbeemd, (Ed.), Chemometric Methods inMolecular Des., VCH Publishers, Weinheim 1995, pp. 265 –288.
[130] STATISTICA (data analysis software system) vs 6.0, Stat-Soft, Inc. www.statsoft.com. 2001.
[131] E. Estrada, G. Patlewicz, Croat. Chim. Acta 2004, 77, 203 –211.
[132] S. Wold, L. Erikson, in: Chemometric Methods in Molecu-lar Des., H. van de Waterbeemd (Ed.), VCH Publishers,New York 1995, pp. 309 – 318.
[133] P. Baldi, S. Brunak, Y. Chauvin, C. A. Andersen, H. Niel-sen, Assessing the Accuracy of Prediction Algorithms forClassification: an Overview. Bioinformatics 2000, 16, 412 –424.
[134] V. V. Kouznetsov, C. J. Rivero, P. C. Ochoa, E. Stashenko,J. R. Mart�nez, P. D. Montero, R. J. J. Nogal, P. C. Fernan-dez, S. S. Muelas, B. A. Gomez, A. Bahsas, L. Amaro, J.Arch. Pharm. 2005, 1, 338.
[135] V. V. Kouznetsov, M. L. Y. Vargas, B. Tibaduiza, C. Ochoa,P. D. Montero, R. J. J. Nogal, C. Fernandez, S. Muelas, A.Gomez, A. Bahsas, J. Amaro-Luis, J. Arch. Pharm. 2004,337, 127 – 132.
[136] J. Galvez, R. Garcia-Domenech, J. V. de Julian-Ortiz, R.Soler, J. Chem. Inf. Comput. Sci. 1995, 35, 272 – 284.
[137] R. A. Cercos-del-Pozo, F. Perez-Gimenez, M. T. Salabert-Salvador, F. J. Garcia-March, J. Chem. Inf. Comput. Sci.2000, 40, 178 – 184.
[138] J. Galvez, R. Garc�a, M. T. Salabert, R. Soler, J. Chem. Inf.Comput. Sci. 1994, 34, 520 – 525.
[139] R. A. Johnson, D. W. Wichern, Applied Multivariate Statis-tical Analysis, Prentice-Hall, New Jersey 1988.
[140] A. Golbraikh,A. Tropsha, J. Mol. Graph. Model. 2002, 20,269 – 276.
[141] K. Rose, L. H. Hall, L. B. Kier, J. Chem. Inf. Comput. Sci.2002, 42, 651 – 666.
[142] J. Xu, A. Hagler, Molecules 2002, 7, 566 – 700.[143] M. H. J. Seifert, K. Wolf, D. Vitt, Virtual High-Throughput
in silico Screening. Biosilico 2003, 1, 143 – 149.[144] C. Watson, Predictive in silico Models in Drug Discovery.
Biosilico 2003, 1, 83 – 84.[145] J. W. Mc Farland, D. J. Gans, (Ed.), Chemometric Methods
in Molecular Des., VCH Publishers, New York 1995,pp. 295 – 307.
[146] E. Estrada, E. Uriarte, Curr. Med. Chem. 2001, 8, 1573 –1588.
[147] A. Ochoa, E. Perez, R. Perez, M. Suarez, E. Ochoa, H.Rodr�guez, A. Gomez, S. Muelas, R. J. J. Nogal, R. A. Mar-t�nez, Arzneim. Forsch./Drug Res. 1999, 49, 764 – 769.
[148] J. Coro, R. Perez, H. Rodr�guez, M. Suarez, M. C. Vega,M. Rolon, D. Montero, J. J. Nogal, A. Gomez, Bioorg.Med. Chem. 2005, 13, 3413 – 3421.
[149] M. Lajiness, Molecular similarity-based methods for select-ing compounds for screening in: D. H.Rouvray (Ed.),Computacional Chemical Graph Theory, Nova Science,New York 1990, pp. 299 – 316.
[150] W. P. Walters, M. T. Stahl, M. A. Murcko, Drug Discov. To-day 1998, 3, 160 – 178.
[151] Y. Marrero-Ponce, M. A. Martins Alho, V. Aran, J. A. Es-cario, R. Grac�a S�nchez, J. J. Nogal-Ruiz, A. Meneses-Marcel, N. Rivera, J. Med. Chem., in progress.
26 � 2009 WILEY-VCH Verlag GmbH & Co. KGaA, Weinheim www.qcs.wiley-vch.de QSAR Comb. Sci. 28, 2009, No. 1, 9 – 26
Full Papers Oscar M. Rivera-Borroto et al.
Copyright © 2022 FDOKUMEN


![Descriptors for Sponge Gourd [Luffa cylindrica (L.) Roem.]](https://static.fdokumen.com/doc/165x107/63187e763394f2252e02b92e/descriptors-for-sponge-gourd-luffa-cylindrica-l-roem.jpg)