
Flexible 3D pharmacophores as descriptors of dynamic biological space
12
Flexible 3D pharmacophores as descriptors of dynamic biological space James H. Nettles a, * , Jeremy L. Jenkins a , Chris Williams b , Alex M. Clark b , Andreas Bender a , Zhan Deng a , John W. Davies a , Meir Glick a a Lead Discovery Informatics, Lead Discovery Center, Novartis Institutes for BioMedical Research Inc., 250 Massachusetts Ave., Cambridge, MA 02139, United States b Chemical Computing Group Inc., 1010 Sherbrooke Street West, Suite 910 Montreal, Quebec H3A 2R7, Canada Accepted 26 February 2007 Available online 1 March 2007 Abstract Development of a pharmacophore hypothesis related to small-molecule activity is pivotal to chemical optimization of a series, since it defines features beneficial or detrimental to activity. Although crystal structures may provide detailed 3D interaction information for one molecule with its receptor, docking a different ligand to that model often leads to unreliable results due to protein flexibility. Graham Richards’ lab was one of the first groups to utilize ‘‘fuzzy’’ pattern recognition algorithms taken from the field of image processing to solve problems in protein modeling. Thus, descriptor ‘‘fuzziness’’ was partly able to emulate conformational flexibility of the target while simultaneously enhancing the speed of the search. In this work, we extend these developments to a ligand-based method for describing and aligning molecules in flexible chemical space termed FEature POint PharmacophoreS (FEPOPS), which allows exploration of dynamic biological space. We develop a novel, combinatorial algorithm for molecular comparisons and evaluate it using the WOMBAT dataset. The new approach shows superior retrospective virtual screening performance than earlier shape-based or charge-based algorithms. Additionally, we use target prediction to evaluate how FEPOPS alignments match the molecules biological activity by identifying the atoms and features that make the key contributions to overall chemical similarity. Overall, we find that FEPOPS are sufficiently fuzzy and flexible to find not only new ligand scaffolds, but also challenging molecules that occupy different conformational states of dynamic biological space as from induced fits. # 2007 Elsevier Inc. All rights reserved. Keywords: Pharmacophore; FEPOPS; Virtual screening; 3D descriptors; Chemical space; Biological space 1. Introduction Scientific information has dramatically expanded during the past decade. Researchers have sequenced the human genome [1] accessed expression information on a chip [2] and garnered structural insight from complex biomolecular machines like G- protein coupled receptors [3] and structural proteins [4,5]. Advances in robotics, computational hardware and software allow production of staggering numbers of complex new chemical entities and biological readouts of their effects. For drug discovery, these are steps in the right direction, but effectively utilizing this glut of information still has not reached its potential [6]. Thinking of connecting complex signaling and metabolic networks, predicting three-dimensional structures of receptors or addressing conformational flexibility of biological macromolecules in the presence of different ligands may suffice to illustrate challenges still ahead. The development of enhanced tools, which allow researchers to effectively analyze trends in this multifarious environment, has necessarily become its own important arena for study. A novel feature of Graham Richards’ research was the utilization of algorithms from the field of signal and image processing to enhance in silico drug discovery. He explored these methods’ ability to scale back non-essential information and reveal the underlying patterns in complex molecular data sets as they do for other physical phenomenon. In 2002, a multi- scale approach was first successfully implemented to identify binding sites on the surface of proteins [7] and to dock flexible molecules [8]. In the multi-scale approach used, a hierarchy of models was generated using a k-means clustering algorithm for the potential ligand, which was represented by a growing number of feature points. These works demonstrated that www.elsevier.com/locate/JMGM Journal of Molecular Graphics and Modelling 26 (2007) 622–633 * Corresponding author. Tel.: +1 617 871 3904. E-mail address: [email protected] (J.H. Nettles). 1093-3263/$ – see front matter # 2007 Elsevier Inc. All rights reserved. doi:10.1016/j.jmgm.2007.02.005
-
Upload
independent -
Category
Documents
-
view
2 -
download
0
Transcript of Flexible 3D pharmacophores as descriptors of dynamic biological space

Flexible 3D pharmacophores as descriptors of dynamic biological space
James H. Nettles a,*, Jeremy L. Jenkins a, Chris Williams b, Alex M. Clark b,Andreas Bender a, Zhan Deng a, John W. Davies a, Meir Glick a
a Lead Discovery Informatics, Lead Discovery Center, Novartis Institutes for BioMedical Research Inc.,
250 Massachusetts Ave., Cambridge, MA 02139, United Statesb Chemical Computing Group Inc., 1010 Sherbrooke Street West, Suite 910 Montreal, Quebec H3A 2R7, Canada
Accepted 26 February 2007
Available online 1 March 2007
www.elsevier.com/locate/JMGM
Journal of Molecular Graphics and Modelling 26 (2007) 622–633
Abstract
Development of a pharmacophore hypothesis related to small-molecule activity is pivotal to chemical optimization of a series, since it defines
features beneficial or detrimental to activity. Although crystal structures may provide detailed 3D interaction information for one molecule with its
receptor, docking a different ligand to that model often leads to unreliable results due to protein flexibility. Graham Richards’ lab was one of the first
groups to utilize ‘‘fuzzy’’ pattern recognition algorithms taken from the field of image processing to solve problems in protein modeling. Thus,
descriptor ‘‘fuzziness’’ was partly able to emulate conformational flexibility of the target while simultaneously enhancing the speed of the search.
In this work, we extend these developments to a ligand-based method for describing and aligning molecules in flexible chemical space termed
FEature POint PharmacophoreS (FEPOPS), which allows exploration of dynamic biological space. We develop a novel, combinatorial algorithm
for molecular comparisons and evaluate it using the WOMBAT dataset. The new approach shows superior retrospective virtual screening
performance than earlier shape-based or charge-based algorithms. Additionally, we use target prediction to evaluate how FEPOPS alignments
match the molecules biological activity by identifying the atoms and features that make the key contributions to overall chemical similarity.
Overall, we find that FEPOPS are sufficiently fuzzy and flexible to find not only new ligand scaffolds, but also challenging molecules that occupy
different conformational states of dynamic biological space as from induced fits.
# 2007 Elsevier Inc. All rights reserved.
Keywords: Pharmacophore; FEPOPS; Virtual screening; 3D descriptors; Chemical space; Biological space
1. Introduction
Scientific information has dramatically expanded during the
past decade. Researchers have sequenced the human genome
[1] accessed expression information on a chip [2] and garnered
structural insight from complex biomolecular machines like G-
protein coupled receptors [3] and structural proteins [4,5].
Advances in robotics, computational hardware and software
allow production of staggering numbers of complex new
chemical entities and biological readouts of their effects. For
drug discovery, these are steps in the right direction, but
effectively utilizing this glut of information still has not reached
its potential [6]. Thinking of connecting complex signaling and
metabolic networks, predicting three-dimensional structures of
* Corresponding author. Tel.: +1 617 871 3904.
E-mail address: [email protected] (J.H. Nettles).
1093-3263/$ – see front matter # 2007 Elsevier Inc. All rights reserved.
doi:10.1016/j.jmgm.2007.02.005
receptors or addressing conformational flexibility of biological
macromolecules in the presence of different ligands may suffice
to illustrate challenges still ahead. The development of
enhanced tools, which allow researchers to effectively analyze
trends in this multifarious environment, has necessarily become
its own important arena for study.
A novel feature of Graham Richards’ research was the
utilization of algorithms from the field of signal and image
processing to enhance in silico drug discovery. He explored
these methods’ ability to scale back non-essential information
and reveal the underlying patterns in complex molecular data
sets as they do for other physical phenomenon. In 2002, a multi-
scale approach was first successfully implemented to identify
binding sites on the surface of proteins [7] and to dock flexible
molecules [8]. In the multi-scale approach used, a hierarchy of
models was generated using a k-means clustering algorithm for
the potential ligand, which was represented by a growing
number of feature points. These works demonstrated that

J.H. Nettles et al. / Journal of Molecular Graphics and Modelling 26 (2007) 622–633 623
docking flexible molecules using a four-point representation
was sufficient enough to closely reproduce the binding mode of
the ligands tested. These encouraging results are weighted
against the observations that many docking algorithms perform
well for some systems while very poorly for others [9]. The
performance of standard docking may be increased through
statistical training using multiple receptor complexes, however,
these methods are limited to cases with appropriate structural
data [10]. From another perspective, chemical similarity has
been shown to strongly correlate with biological function.
However, 2D descriptors are inherently limited to a chemical
space close to the reference molecule [11,12]. We became
interested in exploring 3D ligand-based methods as an adjunct
to both 2D and receptor based methods. The underlying idea is
that specific parts of a small molecule’s flexible chemical space
inherently complement aspects of the receptor’s biological
space they affect. It follows that those elements which correlate
in chemical activity space likely result from receptor specific
features. Those correlating features may be extracted as
descriptors of biology that may be used with or without explicit
structural constraints.
A ligand-based reincarnation of the multi-scale approach
was developed at Novartis as the FEature POint Pharmaco-
phoreS (FEPOPS) algorithm [13]. FEPOPS derives a ‘‘fuzzy’’
molecular representation for a compound and encodes
pharmacophoric properties on the feature points. This
information is used for 3D similarity searching to identify
novel scaffold classes (‘‘scaffold hops’’) where the similarity
between query molecule and each database compound is
calculated using Pearson’s correlation between the feature
descriptors [14]. FEPOPS was also recently employed for target
identification [15] and is now used routinely for virtual
screening in project work. This paper communicates recent
modifications to the FEPOPS algorithm that produce improve-
ments over the original version and allow for a more detailed
analysis of individual feature contribution toward enhancing or
limiting similarity.
Encoding a molecular structure for 3D similarity calcula-
tions is a non-trivial problem [11] which is, at the same time,
quite subjective—what properties of the molecule should be the
features of focus? Following the choice of descriptors for the
molecular properties is the question of how to ‘‘align’’ two or
more different molecules for comparison. This becomes
increasingly challenging as structural similarities between
the molecular pairs decreases. In the cases presented here only
two ‘‘extreme’’ possibilities shall be discussed: aligning
molecules by the shape(s) that can be attained, and aligning
molecules by the charges presented to the environment.
Intuitively, shape is a very logical descriptor to relate a
ligand to its binding site. Early suggestions from the Richards’
lab regarding shape as a descriptor [16], found functional
expressions in new algorithms, such as Rapid Overlay of
Chemical Structures (ROCS), that efficiently perform shape
alignment of molecules by employing Gaussian functions
which enable analytical calculation of gradients. ROCS shapes
provide excellent alignments in many situations and have been
effectively used for virtual screening [17]. While additional
information about interaction types such as charge can be
included, problems like matching of sub-shapes or aligning
non-shape-based features (polar/non-polar, H-bond doner/
acceptor, etc.. . .) represent challenges for whole-shape match-
ing algorithms such as this one.
A contrasting procedure of charge-based alignment of
molecular features was chosen for the original FEPOPS method
[13]. FEPOPS does not generate an explicit shape descriptor.
Instead, the distances between the four or more feature points of
a given molecule can provide a pseudo shape. To simplify
processing, the original algorithm used relative electrostatics to
determine the order of feature points and pair-wise Pearson
correlations between those features to compute similarity. The
features were first enumerated for the most negative charge
(feature point 1), followed by the next most negative charge
(feature point 2), with increasing numbers representing more
electropositive centers. This algorithm has worked remarkably
well in both retrospective enrichment studies and prospective
drug discovery for finding actives in new regions of chemical
space. However, biases were observed in cases where
substitution of strongly charged groups (that were not part of
the pharmacophore) caused the numbering of the feature points
to be swapped on otherwise similar molecules. In those cases, it
would be advantageous to have an alternative way to
automatically align and match feature points.
Following the observations above, we hypothesised that both
shape as well as atomic (or feature point) properties should be
included in the alignment ‘‘objective function’’. Using the
existing feature point distances of the four-point irregular
tetrahedron allowed us to capture the overall shape of most
molecules to a satisfying degree, while alleviating the
computational expense of computing an explicit shape
descriptor. To eliminate our reliance on a single descriptor,
as in the earlier version, we can now employ all seven FEPOPS
descriptors for comparing molecules. Included are the distances
in space between feature centroids, the atomic log P, hydrogen
bond donor and hydrogen bond acceptor properties, atom
electronegativity as well as formal negative and positive
charges of the atoms (where hydrogen bond donor and acceptor
properties as well as formal charges are integer properties,
while the rest are represented as real values). To optimize the
similarity calculation of structures, while at the same time
producing a sensible alignment of molecules, we now perform
combinatorial evaluation of the feature space representations of
molecules. To further the interpretation of the algorithm results,
we now provide output of the 3D coordinates of the FEPOPS
conformers for visualization and color coded 2D schemes of the
chemical structures. By understanding the mechanism involved
in a scaffold hop we can glean information about the biological
environment. Further details of the methods and results are
presented in the following sections.
Overall, we show that using multiple descriptors and
combinatorial alignment improves active recall. We are also
able to use the FEPOPS color coding to identify bioisosteres or
functionally equivalent groups between compounds. These can
guide further compound optimization and provide clues as to
what the binding mode of small molecules will be. By mapping

J.H. Nettles et al. / Journal of Molecular Graphics and Modelling 26 (2007) 622–633624
the pharmacophoric features to atomic cluster centroids rather
than explicit atoms, and by including tautomeric/conforma-
tional flexibility for each molecule the resultant alignments
accurately highlight similarity between structures that would
not be found with 2D methods. Likewise, use of this tool may
assist elucidation of underlying dynamic properties of flexible
binding sites that are not obvious from static structural models.
Given the importance of probing biological functions with
small molecules, we are confident that the development of this
work can guide our future understanding of interactions
between chemical and biological worlds.
2. Methods
These methods describe two variations of the FEPOPS
algorithm used to generate 3D descriptors of small molecules
and one new algorithm for alignment and comparison of those
descriptors. The new version of FEPOPS code (FEPOPS-II),
still under development, is a JAVA application integrating
conformation generation, clustering, and descriptor assign-
ment, into a single, portable executable. FEPOPS-II has an
Scheme 1. The generation o
additional feature for accepting pools of conformers from
external applications as inputs for clustering. This allows the
user to choose a favorite external conformation generation
method, yet use FEPOPS to scale down the flexible chemical
space. Additionally, a new algorithm for combinatorial
alignment (CombiAlign) is presented that can be used as a
post-processor with output from either of the FEPOPS
programs.
2.1. FEPOPS-I
FEPOPS descriptors were calculated using the method
previously described by Jenkins et al. [13]. The core application
was written in C and linking between external modules was
scripted through the Pipeline Pilot interface environment [18].
The workflow of the algorithm is illustrated in Scheme 1.
Molecules were first preprocessed by: (a) enumerating
tautomers and generating their 3D conformations, followed
by limited minimization with the Clean forcefield in Pipeline
Pilot, (b) assigning protonation states at pH 7.4, (c) calculating
Gasteiger–Marsili partial charges [19] and atomic log P values
f FEPOPS descriptors.

J.H. Nettles et al. / Journal of Molecular Graphics and Modelling 26 (2007) 622–633 625
using X log P [20]. An ensemble of multiple conformers for
each molecule was generated by systematic variation of
rotatable bonds at a fixed angle increment as described
previously. Ligand atoms were then grouped into four k-means
clusters [21] based on their spatial coordinates, and a geometric
centroid was defined for each cluster. Each centroid was
transformed to a ‘‘feature point’’ through association with five
different types of pharmacophoric features: the sum of partial
charges within this cluster, sum of atomic log P values,
presence of hydrogen bond donors and acceptors, and distances
to other centroids. In order to make the computation amenable
to large databases, we used k-medoids clustering to further
group and select a small number (typically k = 7) of explicit and
diverse FEPOPS conformers. The programs Partitioning
Around Medoids (PAM) and Clustering of LARge Application
(CLARA) in the R package were used to perform the k-mediods
clustering calculation [22]. The selected medoid FEPOPS
features were stored in a lookup table. The FEPOPS similarity
between two molecules is defined as the best Pearson’s
correlation coefficient between their aligned FEPOPS con-
formers [14].
2.2. FEPOPS-II
To more efficiently test some of the variables used by the
FEPOPS-I program, new code has been produced to increase
flexibility and portability. Using the same references as
FEPOPS-I, computations of charge, log P, handling of internal
or externally generated conformers, annotation, clustering and
output formatting can now be performed with a single JAVA
executable. This allows robust, coarsegrained linking of the
FEPOPS computational core to various front and back end
interfaces.
2.3. CombiAlign—FEPOPS combinatorial alignment
The original FEPOPS-I alignment mechanism relied
upon charge distribution, rather than shape or geometry
during the similarity calculations. The most negatively
charged centroid was defined as feature point 1, whereas the
most positively charged centroid was defined as feature point 4
(assuming initial selection of four k-means clusters) Here we
introduce the concept of combinatorial alignment. To align two
objects of four feature points it is sufficient to fix one of them
and explore the combinations without repetition of the other
one. Since the order of the feature points matters and each
feature point can be chosen only once, then the number of
permutations is given by Eq. (1), where n is the number of
feature points from which we can choose and r is the number to
be chosen.
n!
ðn� rÞ! (1)
Since n = r = 4 (meaning number of chosen feature points is
equal to number of feature points to choose from) then the
formula becomes
n!
ðn� rÞ! ¼n!
0!¼ n! ¼ 4! ¼ 24 (2)
One of the advantages of the FEPOPS algorithm is its
simplicity. Since it uses only a small number of feature points
(typically four) to describe a compound there is no need to
further reduce the size of the problem and all the putative
alignments can be compared in an exhaustive manner. The
alignment with the highest Pearson’s correlation value is
presumed to be the proper one.
A powerful analytical advantage of this method was that the
individual descriptors associated with each feature points could
be included or excluded from the similarity calculation
allowing for testing of single, or combined descriptor effects.
For example, performing the above alignment using only the
distance descriptors provides a rough ‘‘shape only’’ fitting of
the molecules.
2.4. Database
The World of Molecular Bioactivity Database (WOMBAT)
[23] (WOMBAT 2005 Sunset Molecular Systems; http://
sunsetmolecular.com/products/?id=4 (accessed on October
2006)) was used in this work. WOMBAT 2005.1 contains
117,007 compounds with 104,230 unique SMILES, which
target 1021 unique proteins published in 4773 articles in
medicinal chemistry journals between 1975 and 2004. Initially,
only compounds with activity (IC50/EC50/Ki/Kb/Kd/MIC/
ED50) < 30 mm were selected because this cutoff ensures
reasonable potency while not resulting in a substantial loss of
target information. Secondarily, these were filtered to just those
compounds having IC50 < 30 mm. Thus, two sets having
109,457/47,505 compounds with 964/544 biological targets
were employed during this study. 3D descriptors were
computed using the FEPOPS-1 method as described previously
[15].
2.5. Virtual screening for activity using nevirapine probe
Early studies employing scaled molecular representations
for virtual screening, systematically compared feature
points to a receptor derived grid to perform docking [7,8].
To relate FEPOPS ligand-based method of virtual screening to
these previous works, the same molecular probe (HIV-1
reverse transcriptase (HIV-1 RT) inhibitor—nevirapine) was
used.
2.5.1. 3D enrichment
The FEPOPS-I application generated 3D descriptors for the
47,505 compound, WOMBAT, test database as described
above. A Pipeline Pilot protocol was built to perform Pearson’s
correlation for assignment of similarity. A custom pilot script
component was written to execute ‘‘CombiAlign’’ as described
in Section 2.3. The FEPOPS representations of nevirapine were
extracted and the pairwise Pearson’s correlations were
calculated with respect to the remaining members of the

J.H. Nettles et al. / Journal of Molecular Graphics and Modelling 26 (2007) 622–633626
database. These calculations were performed in three ways: (1)
the original method based upon charge alignment, (2)
CombiAlign using all chemical descriptors and (3) CombiAlign
using only distance descriptors (pseudo shape). For each
method, compounds were sorted by maximal correlation and
enrichments for ability to predict HIV-1 RT activity were
plotted for presentation in Section 3.
2.5.2. 2D enrichment
The identical data set used for Section 2.5.1 was also
processed for 2D similarity. SMILES from WOMBAT were
read into Pipeline Pilot and both MDL public keys [24] and
Extended Connectivity Fingerprint (ECFP_6) [18] descriptors
were generated for all 47,505 compounds as described
previously [15]. Using nevaripine as the reference molecule,
Tanimoto similarity distance was computed for the remainder
of the data. For each method, compounds were sorted by
decreasing similarity and enrichment was calculated as in
Section 2.5.1.
2.6. Analysis of ligand binding to cAMP-dependent protein
kinase (PKA)
2.6.1. Preparation of conformer/tautomers
SMILES representation of tested compounds were read into
Pipeline Pilot 5.0. Molecules were standardized for charge, and
ionized at pH 7.4. Up to five tautomers were generated and
enumerated for each molecule. Results were output to an SD
formatted file for conformer generation.
The SD file was read into MOE 2006 [25] using the ‘‘Import
Conformers’’ function with no input filters. Up to 250
conformers were generated for each tautomer using the
following settings—Stochastic Search Strain Limit, 7; Super-
pose RMSD Test, 0.75; Refinement Conformation Limit, 300;
Stochastic Search Failure Limit, 30; Stochastic Search Iteration
Limit, 500; Energy Minimization Iteration Limit, 200; Energy
Minimization Gradient Test, 0.1. No external constraints were
applied to the force field potential. The MMFF 94� force field
was employed with bonded and van der Waals terms enabled.
MMFF charges were assigned, but electrostatic energies were
specifically not included for energy calculations during
conformer generation to broaden the resulting conformational
pool [26]. Explicit hydrogens were retained using a custom
script. Coordinates and annotation information were output to
mol2 files as input for FEPOPS-II.
2.6.2. k-Means, k-medoids clustering and descriptor
assignment
The mol2 file with MOE conformers was provided as input
to the JAVA executable of FEPOPS-II. The executable
partitioned ligand atoms into four k-mean clusters based upon
their spatial coordinates. Centroids were defined from the
atoms of each cluster. Partial charges of the atoms belonging to
each cluster were summed and along with log P, hydrogen bond
donors and acceptors were encoded into the centroids to create
‘‘feature points’’. The distances between feature points were
recorded after sorting on the basis of quadrupole directionality
to complete the FEPOPS descriptor.
Feature points clustering through k-medoids was performed
to find a smaller number of representative conformers. Up to
seven conformations for each of five tautomers were retained
making a maximum of 35 different 3D structures possible for
each unique 2D chemical entry. The full FEPOPS descriptor
was used for medoid selection.
FEPOPS-II generation of descriptors and clustering of
conformers for an average flexible molecule takes less than
0.6 s running under Linux on a 3.40 GHz Xeon server with 2GB
physical memory. A test set of 253 drug-like molecules having
15,271 conformations was processed into FEPOPS conformers
in 143 s including writing to disk.
2.6.3. Pearson’s correlation and assignment of similarity
FEPOPS representations of ATP and balanol analogs were
input to compute similarity indices for various alignments. As
in Section 2.5, similarity was computed in three ways using: (1)
the original method based upon charge alignment, (2)
CombiAlign using all chemical descriptors and (3) CombiAlign
using only distance descriptors (pseudo shape). In addition to
similarity mapping based upon flexible models of the ATP
probe, fitting was performed using the X-ray derived
conformation of the bound ligand as rigid input.
2.6.4. Mapping of PKA site interactions
The 3D coordinates of PKA complexed with ligands ATP
(1ATP) and balanol (1BAL) were downloaded from the RCSB
PDB. To overlay binding sites, backbone atoms of residues
Val15–Trp196 (728 atoms) were aligned using the ‘‘Match’’
function in Sybyl 7.1 with an RMSD of 0.92 A. The Ligand
Interaction Diagram (LID) feature in MOE 2006 was employed
to look ‘‘under the hood’’ of the protein binding sites and
produce a 2D scheme optimally representing the 3D ligand’s
interactions.
3. Results and discussion
Earlier studies employed scaled molecular representations
to perform docking by systematically comparing feature points
to a receptor derived grid [7,8]. Recognizing those successes
fitting the HIV-1 reverse transcriptase (HIV-1 RT) inhibitor,
nevirapine, to its receptor we chose to use this probe for an early
test of FEPOPS for ligand-based virtual screening.
In ligand-based virtual screening, a researcher uses a
molecule with known activity against a target of interest to
locate ‘‘similar’’ molecules within a large data set (such as a
company’s compound collection). Typically, the entire data-
base would be sorted by descending similarity and an
‘‘enrichment’’ factor determined from the percentage of all
actives shifted to the top of the dataset relative to random
distribution. Prospectively, such procedures may be used to
cherry pick small subsets of molecules for experimental assay
rather than screening an entire compound library.
Fig. 1 illustrates the comparative results of the three 3D
method variations employed (1) the shape descriptor alone for

Fig. 1. Active recall using nevirapine probe and different alignment methods.
Relative performance of three versions of FEPOPS and two 2D methods for
selecting known HIV-RT actives from a background of over 47,000 other drug-
like molecules using a single probe is shown. At the level of 10% sampled,
shape matching to nevirapine (Scheme 2) was slightly better than random for
separating actives and inactives. Charge based alignment performed better than
shape for this molecular system. However, the combinatorial alignment method
using both, charge and shape, as well as other descriptors out-performed both of
the single descriptor 3D methods. The combinatorial 3D method also out
performed the MDL keys and almost equaled ECFP enrichment for this system.
Importantly, the compounds predicted by the 2D and 3D methods are not
identical. It is also worth noting that this difficult dataset included a high
percentage of structurally diverse actives which bind at the nucleotide site in
addition to nevirapine’s allosteric site. Non-competitive binders were not
distinguished here, lowering apparent performance for all methods.
J.H. Nettles et al. / Journal of Molecular Graphics and Modelling 26 (2007) 622–633 627
alignment and scoring, (2) charge based alignment and full
descriptor scoring and (3) CombiAlign using all descriptors for
alignment and scoring. Nevirapine (Scheme 2) was used as a
single probe to rank molecules for HIV-1 RT activity within the
47,505 compound data set as described in Section 2.
Performance, in this experiment, is judged as the relative
ability to predict active compounds in the top 10% of the ranked
dataset. It can be seen that the shape method registered the
worst performance of the three for this system. The
combinatorial method, using all six descriptors, resulted in
about 30% increased enrichment relative to the charge based
alignment. A closer comparison of the charge and combinator-
ial results are shown in Fig. 2. Importantly, more compounds
with diverse chemical scaffolds were located in the first 300
Scheme 2. HIV-1 reverse transcriptase inhibitor—nevirapine.
molecules ranked for similarity and a representative set is
shown. Discovering hits which break from the tricyclic core of
the original molecule would be important to chemical teams
developing new drugs. The poor performance using only shape
for a small, relatively rigid molecule like nevirapine should not
be a surprise. One can imagine that many small molecules
could fit such a shape signature and that the placement of polar
functional groups on that shape would be needed for biological
recognition.
Consistent with previous findings for target fishing [15],
both of the 2D methods shown in Fig. 1 produced better initial
enrichments than the charge based version of FEPOPS.
However, the combinatorial 3D method retrieves more actives
than the MDL keys and shows performance near ECFP, while
predicting different compounds than the 2D method. We view
the 2D and 3D methods as complementary rather than
competitive.
Given the rigidity of nevirapine as a chemical probe, we also
explored the new alignment methods using more flexible probes
such as ATP. A previous study in our lab, using FEPOPS-I for
target identification, predicted a close 3D FEPOPS relationship
between the structurally different PKA binders ATP and
balanol (Scheme 3) [15]. In this study, we sought to compare
the FEPOPS-II 3D conformer outputs relative to crystal-
lographic complexes and to analyze differences in structural
overlaps due to the choice of alignment. For this exercise,
conformations of ATP and balanol analogs were generated
within MOE 2006 and FEPOPS clustering was used to
compress the chemical space of ATP as described in Section 2.
Fig. 3 illustrates how the seven FEPOPS conformers compare
to the 50 input conformers generated by MOE. Both charge
based and combinatorial methods yielded high scoring
(Pearson’s value >0.94) alignments between the molecular
pairs for all active analogs tested. The use of combinatorial
alignment resulted in a higher score (Pearson’s value = 0.97)
and found a closely overlapping conformation with <0.9 A
RMSD between the aligned feature points as depicted in
Fig. 4a. Importantly, this alignment (illustrated with color
coding in Scheme 3 and Fig. 4c and d) was consistent with the
orientation of the two ligands in the PKA binding site as
determined experimentally [27,28]. However, ligands extracted
from the superimposed protein structures do not show the same
level of overlap as our ligand based search. What is the source
of the discrepancy? Fig. 4c and d shows 2D representations of
PKA site interactions from crystallographic complexes of the
two drugs. The coloring scheme highlights ligand atom sets that
were defined by FEPOPS k-means clustering. Same colored
atom groups are predicted to be bioisosteric replacements.
Accordingly, the A and B rings of balanol fill the subsites
associated with ATP’s adenine and ribose, respectively. The
oxygen-rich rings C and D of balanol bridge similar interaction
as ATP’s triphosphate tail. 3D analysis of the same two sites
reveals significant induced fit between these two ligands. The
amide nitrogen of residue Ser 53 on the glycine rich loop moves
nearly 3 A to maintain contact between atoms of feature point 1
(red) in the different complexes. In fact, the centroids of feature
point 1 for the two ligands in the aligned binding sites are over

Fig. 2. Analysis of combinatorial vs. charge alignment for recall of HIV-RT actives. For each method, Pearson’s correlations were used as similarity scores to rank
each database compound relative to the nevirapine (Scheme 2) probe. The shape of the plot illustrates a significant improvement of early active recall for
combinatorial alignment (Combi Rank). Importantly, the chemical representations show that a structural variety of ‘‘hits’’ were retrieved in the first 300 predicted
molecules using the combinatorial method. Multiple representatives of new chemical classes were selected, so biological follow-up could inherently contain structure
activity relationships that would be fed back into evolving pharmacophore models.
J.H. Nettles et al. / Journal of Molecular Graphics and Modelling 26 (2007) 622–633628
5 A apart. Although, our flexible alignment reveals that ATP
and balanol do have conformations which present similar
features in space, their rigid biological space does not seem to
match. For example, the bound conformation of ATP is
significantly affected by the presence of manganese ions, not
included in our search. Thus, in our flexible alignments, the best
overlay of the two molecules most closely matches the bound
conformation of balanol. (Carbons of the FEPOPS conformer
of balanol overlay on the bound conformer with an
RMSD < 1.5 A.) Would FEPOPS find a match if we
constrained the ATP probe to its conformation found in the
Scheme 3. ATP and balanol, a competitive inhibitor for select kinases. Color
coding illustrates k-mean atomic clusters defining individual ‘‘feature points’’.
X-ray structure? The answer is yes. The top scoring tautomer/
conformer aligns with a Pearson’s value of 0.976—higher than
when using the flexible conformers. We see this as the basis for
the success this method has achieved in internal project work.
The pharmacophores are sufficiently flexible to match multiple
states of dynamic biological sites. Of particular interest for this
example is that the best alignment coming from the
combinatorial method with all descriptors is identical to that
obtained using only distances that model shape. Charge, though
certainly important for PKA biological activity, was not
necessary for correct alignment in this limited case. However,
Fig. 3. Scaling down the conformational space of ATP by k-medoids clustering
of the feature points. The full conformational set generated for a given molecule
is reduced to a user defined number of ‘‘FEPOP conformers’’ through cluster
based selection of distributed feature points. The default number of medoids
employed in this study was k = 7.

Fig. 4. Location of chemical feature points in biological space. (a) The best scoring flexible alignment conformer of balanol (yellow carbons) to ATP. Color coded
feature point centroids are presented as small spheres (balanol’s larger) with the central pairs almost superimposed. (b) The same ligands extracted from aligned
protein structures used in c and d illustrate significant induced fit. (c and d) The crystallographic coordinates for each molecule (1ATP, 1bx6) bound to cyclin
dependent protein kinase (PKA) are use to plot the local environment surrounding each molecule. Although large rearrangement occurs due to protein flexibility and
dynamics, the ligands’ feature atoms mapped to be in common appear in similar biological environments. FEPOPS flexible alignment and fitting of these dissimilar
molecules provides a chemical space solution to help understand bioisosteric relations that are acceptable in the dynamic biological receptor. Ligand interaction
diagrams and alignments were generated in MOE 2006.
J.H. Nettles et al. / Journal of Molecular Graphics and Modelling 26 (2007) 622–633 629
the advantage of using the combinatorial alignment method is
that all the descriptors may be used automatically for similarity
selection rather than choosing a single descriptor a priori. This
distinction is most likely responsible for combinatorial proving
more effective than either charge or shape alignment in
retrieving the HIV-RT actives from a background containing
similarly shaped molecules.
We have previously explored chemical similarity searching
in biologically annotated databases as a means to predict
biological targets for compounds [15,29]. In a majority of cases
when using a 2D topological descriptor, the nearest neighbor to
the probe molecule will have the same biological target. In fact,
by using Extended Connectivity Fingerprints (ECFP_6), we
found that 100,839 of WOMBAT compounds (out of 109,457 in
total) had the same target as their nearest neighbor in the
database (92%), while 8.618 (8%) had nearest neighbors with
different targets. The high success rate appears to be due in part
to the presence of congeneric series in the database. We
observed that the similarity of the chemical probe to the
database compounds needed to be above a certain Tanimoto
threshold (0.8 for MDL and 0.4 for ECFP_6) for the 2D
descriptors to accurately predict the target. The FEPOPS 3D
method continued to correctly predict target similarity for
chemical pairs with 2D similarity below those thresholds [15].
In the present study, we specifically selected probes that
would make difficult test cases for 2D topological similarity
methods due to their low 2D similarity to other members of the
same target class. We used FEPOPS 3D descriptors to search
WOMBAT to predict protein targets for compounds with
known mechanisms of action. For those that were correct, we
analyzed the features required for scaffold hops.
From the set of 8,618 WOMBAT compounds for which 2D
target predictions were incorrect, we selected the 177
compounds with the lowest Tanimoto similarity to any other
database compound. For these 177 compounds, the average
Tanimoto similarity of the WOMBAT nearest neighbor was
0.283 (with ECFP_6). As described above and elsewhere, this
similarity level is well below that at which ECFP can be used
reliably for target prediction [15]. FEPOPS descriptions of
these 177 compounds were then used to search the entire
WOMBAT 2005 database (�130 K compounds) to see if the
nearest neighbors retained the correct target as the probe
molecules. We found that FEPOPS could pinpoint the correct
targets (or a close homologue) for 21 compounds (12% hit rate).
A selection of these is shown in Fig. 5. The probe molecule and
the database molecule that FEPOPS identified as the closest
match are displayed (Fig. 5, left). The FEPOPS structural
alignment of the probe and hit is reflected in the color-coded
atoms and bonds. The 2D nearest neighbor with an incorrect
target prediction is shown. FEPOPS similarity is measured by
taking the highest Pearson’s correlation between FEPOPS
descriptors for all probe and 3D hit conformations. In the
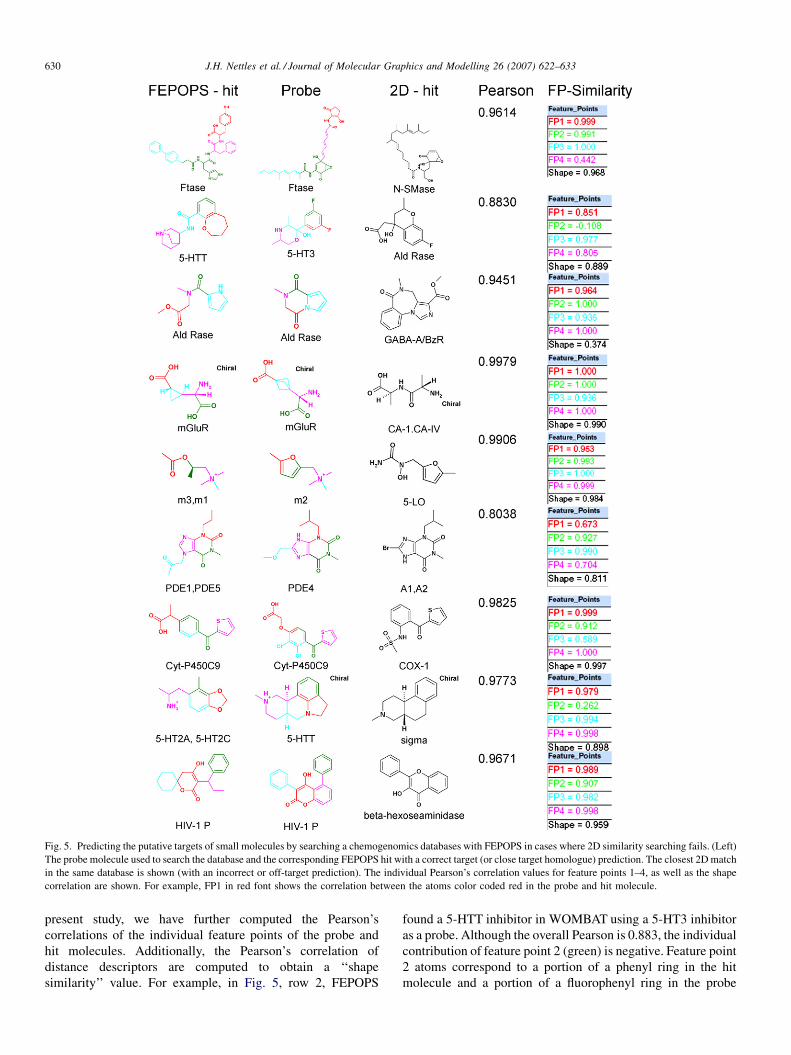
Fig. 5. Predicting the putative targets of small molecules by searching a chemogenomics databases with FEPOPS in cases where 2D similarity searching fails. (Left)
The probe molecule used to search the database and the corresponding FEPOPS hit with a correct target (or close target homologue) prediction. The closest 2D match
in the same database is shown (with an incorrect or off-target prediction). The individual Pearson’s correlation values for feature points 1–4, as well as the shape
correlation are shown. For example, FP1 in red font shows the correlation between the atoms color coded red in the probe and hit molecule.
J.H. Nettles et al. / Journal of Molecular Graphics and Modelling 26 (2007) 622–633630
present study, we have further computed the Pearson’s
correlations of the individual feature points of the probe and
hit molecules. Additionally, the Pearson’s correlation of
distance descriptors are computed to obtain a ‘‘shape
similarity’’ value. For example, in Fig. 5, row 2, FEPOPS
found a 5-HTT inhibitor in WOMBAT using a 5-HT3 inhibitor
as a probe. Although the overall Pearson is 0.883, the individual
contribution of feature point 2 (green) is negative. Feature point
2 atoms correspond to a portion of a phenyl ring in the hit
molecule and a portion of a fluorophenyl ring in the probe

J.H. Nettles et al. / Journal of Molecular Graphics and Modelling 26 (2007) 622–633 631
molecule. The sum of the Gasteiger charges of the atoms
contributing to feature point 2 is quite different due to the
presence of the fluorine atom. However, the remaining feature
points and overall shape are similar enough to provide good
overall FEPOPS similarity. The low score for feature point 2
carries us to a point in chemical space where there is some
adaptability in the biological space. This also brings up the idea
that partial alignment where some fractional number of feature
points (example three out of four) could be used to exclude
undesirable matches. As a second example, row #3 contains an
aldose reductase inhibitor match. Although the overall shape is
quite different (Shape Pearson = 0.374), feature points 1–4 are
highly similar. In other words, poor matches in shape or
individual feature point correlations can be compensated for, if
the remaining descriptors are highly similar.
Numerous other methods exist for calculation of 3D
similarity/superposition and/or pharmacopore elucidation and
are reviewed elsewhere [30,31]. FEPOPS incorporates similar
concepts in a way that lends itself to processing of large
datasets—analogous to high throughput screening (HTS). Any
true 3D method has to address the issue of conformational
flexibility. For FEPOPS, conformations may be either
generated internally using fast torsional rotations with bump
checking, or conformations may be derived from some external
method. The unique feature of FEPOPS is that two layers of
clustering are applied to reduce dimensionality of the 3D
chemical data. Rather than using atomic alignments of two or
more compound’s to develop a pharmacophoric feature
hypothesis, as in Catalyst or DISCO [32–34], FEature POint
PharmacophoreS are simply chemical features mapped to k-
means centroids from the atoms that define them. This reduces
every conformation of every molecule to the same number of
spacially separated pharmacopore points. The next level of k-
mediod clustering reduces the broad conformational space to k
conformers representing, spacially diverse chemical feature
space. Therefore, each molecule’s potential pharmacophores
are predefined and written to a lookup table as shown in Scheme
1. No user curation of the pharmacophores is performed, nor is
training based upon activity data. This simplification step is
very fast. As reported in methods, reducing pre-computed
conformers to FEPOPS descriptors and storing them takes less
than 0.6 s per molecule. Generating internal conformations and
clustering on that same data still adds less than 1 s per molecule.
Having the same number of descriptors for each molecule
allows rapid computation of a Pearson’s correlation score. A
new probe molecule may be tested against the precomputed
descriptors of a 1 million compound library in less than 2 h
using the combinatorial alignment algorithm described here.
Although the current method has no automated way to evaluate
the aligned pharmacophoric feature with respect to activity data
as do Catalyst, DISCO, or the newer Phase [35], it is under
development.
In this study, the compounds were prioritized by a
decreasing Pearson’s correlation value where all the descriptors
had the same weight. We believe it will be of value to assign
different statistical weights to each of the features depending
upon the nature of the dataset and the biological target at hand.
Work is currently underway to train statistical models on
aligned 3D features of bioactive molecular sets to extract
weights for pharmacophore elucidation. A powerful aspect of
feature points is that the user can increase the number to
enhance the ‘‘shape’’ information. Using weights and/or partial
shapes by only requiring subsets of features to align may be
particularly useful for selecting between the binding and
activating portions of antagonist and agonist or for modeling
dynamic sites that bind molecule with non-traditional
pharmacophores [36].
4. Conclusions
Graham Richards’ early work significantly inspired modern
research into chemical and biological similarity. Of particular
importance to our lab is the use of clustering techniques and
statistical analysis based on chemical descriptors to scale down
the noise in large HTS datasets and to pull out the true signal
[37]. Much excellent research has been done using 2D chemical
similarity [11,12,38,39] and more 3D methods are emerging
[13,40–45]. In this work, we show how clustering algorithms
may be directly applied to 3D chemical structure and used to
relate biological function. Our FEPOPS method reduces a small
molecule’s large, diverse, flexible, chemical space to a small
number of feature clusters that may be rapidly compared with
those of other molecules to predict functional similarity. We
have shown that both shape and charge features can have
significant influence on this predictivity, but a priori
determination of important features is not obvious. To
systematically explore these relations we have presented a
new combinatorial alignment algorithm that considers multiple
molecular feature descriptors during alignment and scoring. We
have also developed a new 3D analysis environment where
these overlapped chemical structures may be evaluated for
patterns related to their biological activity. Further evaluation of
these flexible pharmacophores over large well annotated data
sets may afford addition insight into chemical function within
dynamic biological environments.
Acknowledgements
We thank Alain Deschenes of Chemical Computing Group
for additional scripting assistance. J.N. and A.B. thank the
Education Office of NIBR for postdoctorate fellowship support.
References
[1] J.C. Venter, M.D. Adams, E.W. Myers, P.W. Li, R.J. Mural, G.G. Sutton,
H.O. Smith, M. Yandell, C.A. Evans, R.A. Holt, J.D. Gocayne, P.
Amanatides, R.M. Ballew, D.H. Huson, J.R. Wortman, Q. Zhang, C.D.
Kodira, X.H. Zheng, L. Chen, M. Skupski, G. Subramanian, P.D. Thomas,
J. Zhang, G.L. Gabor Miklos, C. Nelson, S. Broder, A.G. Clark, J. Nadeau,
V.A. McKusick, N. Zinder, A.J. Levine, R.J. Roberts, M. Simon, C.
Slayman, M. Hunkapiller, R. Bolanos, A. Delcher, I. Dew, D. Fasulo,
M. Flanigan, L. Florea, A. Halpern, S. Hannenhalli, S. Kravitz, S. Levy, C.
Mobarry, K. Reinert, K. Remington, J. Abu-Threideh, E. Beasley, K.
Biddick, V. Bonazzi, R. Brandon, M. Cargill, I. Chandramouliswaran, R.
Charlab, K. Chaturvedi, Z. Deng, V. Di Francesco, P. Dunn, K. Eilbeck, C.
Evangelista, A.E. Gabrielian, W. Gan, W. Ge, F. Gong, Z. Gu, P. Guan, T.J.

J.H. Nettles et al. / Journal of Molecular Graphics and Modelling 26 (2007) 622–633632
Heiman, M.E. Higgins, R.R. Ji, Z. Ke, K.A. Ketchum, Z. Lai, Y. Lei, Z. Li,
J. Li, Y. Liang, X. Lin, F. Lu, G.V. Merkulov, N. Milshina, H.M. Moore,
A.K. Naik, V.A. Narayan, B. Neelam, D. Nusskern, D.B. Rusch, S.
Salzberg, W. Shao, B. Shue, J. Sun, Z. Wang, A. Wang, X. Wang, J.
Wang, M. Wei, R. Wides, C. Xiao, C. Yan, A. Yao, J. Ye, M. Zhan, W.
Zhang, H. Zhang, Q. Zhao, L. Zheng, F. Zhong, W. Zhong, S. Zhu, S.
Zhao, D. Gilbert, S. Baumhueter, G. Spier, C. Carter, A. Cravchik, T.
Woodage, F. Ali, H. An, A. Awe, D. Baldwin, H. Baden, M. Barnstead, I.
Barrow, K. Beeson, D. Busam, A. Carver, A. Center, M.L. Cheng, L.
Curry, S. Danaher, L. Davenport, R. Desilets, S. Dietz, K. Dodson, L.
Doup, S. Ferriera, N. Garg, A. Gluecksmann, B. Hart, J. Haynes, C.
Haynes, C. Heiner, S. Hladun, D. Hostin, J. Houck, T. Howland, C.
Ibegwam, J. Johnson, F. Kalush, L. Kline, S. Koduru, A. Love, F. Mann, D.
May, S. McCawley, T. McIntosh, I. McMullen, M. Moy, L. Moy, B.
Murphy, K. Nelson, C. Pfannkoch, E. Pratts, V. Puri, H. Qureshi, M.
Reardon, R. Rodriguez, Y.H. Rogers, D. Romblad, B. Ruhfel, R. Scott, C.
Sitter, M. Smallwood, E. Stewart, R. Strong, E. Suh, R. Thomas, N.N.
Tint, S. Tse, C. Vech, G. Wang, J. Wetter, S. Williams, M. Williams, S.
Windsor, E. Winn-Deen, K. Wolfe, J. Zaveri, K. Zaveri, J.F. Abril, R.
Guigo, M.J. Campbell, K.V. Sjolander, B. Karlak, A. Kejariwal, H. Mi, B.
Lazareva, T. Hatton, A. Narechania, K. Diemer, A. Muruganujan, N. Guo,
S. Sato, V. Bafna, S. Istrail, R. Lippert, R. Schwartz, B. Walenz, S.
Yooseph, D. Allen, A. Basu, J. Baxendale, L. Blick, M. Caminha, J.
Carnes-Stine, P. Caulk, Y.H. Chiang, M. Coyne, C. Dahlke, A. Mays, M.
Dombroski, M. Donnelly, D. Ely, S. Esparham, C. Fosler, H. Gire, S.
Glanowski, K. Glasser, A. Glodek, M. Gorokhov, K. Graham, B. Grop-
man, M. Harris, J. Heil, S. Henderson, J. Hoover, D. Jennings, C. Jordan, J.
Jordan, J. Kasha, L. Kagan, C. Kraft, A. Levitsky, M. Lewis, X. Liu, J.
Lopez, D. Ma, W. Majoros, J. McDaniel, S. Murphy, M. Newman, T.
Nguyen, N. Nguyen, M. Nodell, S. Pan, J. Peck, M. Peterson, W. Rowe, R.
Sanders, J. Scott, M. Simpson, T. Smith, A. Sprague, T. Stockwell, R.
Turner, E. Venter, M. Wang, M. Wen, D. Wu, M. Wu, A. Xia, A. Zandieh,
X. Zhu, The sequence of the human genome, Science 291 (5507) (2001)
1304–1351.
[2] J.L. DeRisi, V.R. Iyer, P.O. Brown, Exploring the metabolic and genetic
control of gene expression on a genomic scale 10.1126/science.
278.5338.680, Science 278 (5338) (1997) 680–686.
[3] K. Palczewski, T. Kumasaka, T. Hori, C.A. Behnke, H. Motoshima, B.A.
Fox, I. Le Trong, D.C. Teller, T. Okada, R.E. Stenkamp, M. Yamamoto, M.
Miyano, Crystal structure of rhodops: A G protein-coupled receptor,
Science 289 (5480) (2000) 739–745.
[4] E. Nogales, S.G. Wolf, K.H. Downing, Structure of the alpha beta tubulin
dimer by electron crystallography, Nature 391 (6663) (1998) 199–203.
[5] S. Westermann, H.W. Wang, A. Avila-Sakar, D.G. Drubin, E. Nogales, G.
Barnes, The Dam1 kinetochore ring complex moves processively on
depolymerizing microtubule ends, Nature 440 (7083) (2006) 565–569.
[6] J.A. DiMasi, R.W. Hansen, H.G. Grabowski, The price of innovation: new
estimates of drug development costs, J. Health Econ. 22 (2) (2003) 151–
185.
[7] M. Glick, D.D. Robinson, G.H. Grant, W.G. Richards, Identification of
ligand binding sites on proteins using a multi-scale approach, J. Am.
Chem. Soc. 124 (10) (2002) 2337–2344.
[8] M. Glick, G.H. Grant, W.G. Richards, Docking of flexible molecules using
multiscale ligand representations, J. Med. Chem. 45 (21) (2002) 4639–
4646.
[9] G.L. Warren, C.W. Andrews, A.M. Capelli, B. Clarke, J. LaLonde, M.H.
Lambert, M. Lindvall, N. Nevins, S.F. Semus, S. Senger, G. Tedesco, I.D.
Wall, J.M. Woolven, C.E. Peishoff, M.S. Head, A critical assessment of
docking programs and scoring functions, J. Med. Chem. 49 (20) (2006)
5912–5931.
[10] Z. Deng, C. Chuaqui, J. Singh, Structural interaction fingerprint (SIFt): a
novel method for analyzing three-dimensional protein–ligand binding
interactions, J. Med. Chem. 47 (2) (2004) 337–344.
[11] A. Bender, R.C. Glen, Molecular similarity: a key technique in molecular
informatics, Org. Biomol. Chem. 2 (22) (2004) 3204–3218.
[12] Y.C. Martin, J.L. Kofron, L.M. Traphagen, Do structurally similar
molecules have similar biological activity? J. Med. Chem. 45 (19)
(2002) 4350–4358.
[13] J.L. Jenkins, M. Glick, J.W. Davies, A 3D similarity method for scaffold
hopping from known drugs or natural ligands to new chemotypes, J. Med.
Chem. 47 (25) (2004) 6144–6159.
[14] K. Pearson, Mathematical contributions to the theory of evolution. III.
Regression, heredity, and panmixia, Philos. Trans. R. Soc. Lond. A Math.
Phys. Eng. Sci. 187 (1896) 253–318.
[15] J.H. Nettles, J.L. Jenkins, A. Bender, Z. Deng, J.W. Davies, M. Glick,
Bridging chemical and biological space: ‘‘target fishing’’ using 2D and 3D
molecular descriptors, J. Med. Chem. 49 (2006) 6802–6810.
[16] A.Y. Meyer, W.G. Richards, Similarity of molecular shape, J. Comput.
Aided Mol. Des. 5 (5) (1991) 427–439.
[17] T.S. Rush 3rd, J.A. Grant, L. Mosyak, A. Nicholls, A shape-based 3D
scaffold hopping method and its application to a bacterial protein–protein
interaction, J. Med. Chem. 48 (5) (2005) 1489–1495.
[18] Pipeline Pilot, SciTegic, San Diego, CA, 2005.
[19] J. Gasteiger, M. Marsili, Iterative partial equalization of orbital electro-
negativity—a rapid access to atomic charges, Tetrahedron 36 (22) (1980)
3219–3228.
[20] R. Wang, Y. Fu, L. Lai, A new atom-additive method for calculating
partition coefficients, J. Chem. Inf. Model. 37 (3) (1997) 615–621.
[21] T. Hastie, R. Tibishirani, J. Friedman, The Elements of Statistical
Learning, Springer, New York, 2001.
[22] R.D.C. Team, R: A Language and Environment for Statistical
Computing, R Foundation for Statistical Computing, Vienna, Austria,
2003.
[23] M. Olah, M. Mracec, L. Ostopovici, R. Rad, A. Bora, N. Hadaruga, I.
Olah, M. Banda, Z. Simon, M. Mracec, T.I. Oprea, WOMBAT: World of
Molecular Bioactivity, in: T. Oprea (Ed.), Chemoinformatics in Drug
Discovery, Wiley-VHC, New York, 2004, pp. 223–239.
[24] MDL Public Keys, Elsevier MDL Inc., San Ramon, CA, 2001.
[25] Molecular Operating Environment (MOE), Computational Computing
Group, Montreal, Canada, 2006.
[26] A. Lakdawala, M. Wang, N. Nevins, D.C. Liotta, D. Rusinska-Roszak, M.
Lozynski, J.P. Snyder, Calculated conformer energies for organic mole-
cules with multiple polar functionalities are method dependent: Taxol
(case study), BMC Chem. Biol. 1 (1) (2001) 2.
[27] N. Narayana, T.C. Diller, K. Koide, M.E. Bunnage, K.C. Nicolaou, L.L.
Brunton, N.H. Xuong, L.F. Ten Eyck, S.S. Taylor, Crystal structure of the
potent natural product inhibitor balanol in complex with the catalytic
subunit of cAMP-dependent protein kinase, Biochemistry 38 (8) (1999)
2367–2376.
[28] J.H. Zheng, E.A. Trafny, D.R. Knighton, N.H. Xuong, S.S. Taylor, L.F.
Teneyck, J.M. Sowadski, 2.0 A refined crystal-structure of the catalytic
subunit of cAMP-dependent protein-kinase complexed with Mg ATP and
a peptide inhibitor, Acta Crystallogr. D Biol. Crystallogr. 49 (1993) 362–
365.
[29] Nidhi, M. Glick, J.W. Davies, J.L. Jenkins, Prediction of biological
targets for compounds using multiple-category Bayesian models
trained on chemogenomics databases, J. Chem. Inf. Model. 46 (3)
(2006) 1124–1133.
[30] O.F. Guner, Pharmacophore Perception, Development and Use in Drug
Design, International University Line, La Jolla, 2000.
[31] C. Lemmen, T. Lengauer, Computational methods for the structural
alignment of molecules, J. Comput. Aided Mol. Des. 14 (3) (2000)
215–232.
[32] O.O. Clement, A.T. Mehl, HipHop: pharmacophores based on multiple
common-feature alignments, in: O.F. Guner (Ed.), Pharmacophore Per-
ception, Development and Use in Drug Design, International University
Line, La Jolla, 2000, pp. 69–84.
[33] Y.C.D. Martin, What We Did Right and What We Missed, in: O.F. Guner
(Ed.), Pharmacophore Perception, Development and Use in Drug Design,
International University Line, La Jolla, 2000, pp. 51–68.
[34] Y. Patel, V.J. Gillet, G. Bravi, A.R. Leach, A comparison of the pharma-
cophore identification programs: Catalyst, DISCO and GASP, J. Comput.
Aided Mol. Des. 16 (8/9) (2002) 653–681.
[35] S.L. Dixon, A.M. Smondyrev, E.H. Knoll, S.N. Rao, D.E. Shaw, R.A.
Friesner, PHASE: a new engine for pharmacophore perception, 3D QSAR
model development, and 3D database screening. 1. Methodology and

J.H. Nettles et al. / Journal of Molecular Graphics and Modelling 26 (2007) 622–633 633
preliminary results, J. Comput. Aided Mol. Des. 20 (10–11) (2006)
647–671.
[36] J.H. Nettles, H. Li, B. Cornett, J.M. Krahn, J.P. Snyder, K.H. Downing,
The binding mode of epothilone A on alpha, beta-tubulin by electron
crystallography, Science 305 (5685) (2004) 866–869.
[37] M. Glick, J.L. Jenkins, J.H. Nettles, H. Hitchings, J.W. Davies, Enrichment
of high-throughput screening data with increasing levels of noise using
support vector machines, recursive partitioning, and laplacian-modified
naive bayesian classifiers, J. Chem. Inf. Model. 46 (1) (2006) 193–200.
[38] J. Hert, P. Willett, D.J. Wilton, P. Acklin, K. Azzaoui, E. Jacoby, A.
Schuffenhauer, Comparison of topological descriptors for similarity-
based virtual screening using multiple bioactive reference structures,
Org. Biomol. Chem. 2 (22) (2004) 3256–3266.
[39] J. Hert, P. Willett, D.J. Wilton, P. Acklin, K. Azzaoui, E. Jacoby, A.
Schuffenhauer, Comparison of fingerprint-based methods for virtual
screening using multiple bioactive reference structures, J. Chem. Inf.
Comput. Sci. 44 (3) (2004) 1177–1185.
[40] C. Lemmen, T. Lengauer, G. Klebe, FLEXS: a method for fast flexible
ligand superposition, J. Med. Chem. 41 (23) (1998) 4502–4520.
[41] G. Schneider, W. Neidhart, T. Giller, G. Schmid, Scaffold-hopping by
topological pharmacophore search: a contribution to virtual screening,
Angew. Chem. Int. Ed. Engl. 38 (19) (1999) 2894–2896.
[42] A.N. Jain, Morphological similarity: a 3D molecular similarity method
correlated with protein–ligand recognition, J. Comput. Aided Mol. Des. 14
(2) (2000) 199–213.
[43] R.D. Cramer, R.J. Jilek, K.M. Andrews, dbtop: Topomer similarity
searching of conventional structure databases, J. Mol. Graph. Modell.
20 (6) (2002) 447–462.
[44] A. Nicholls, N.E. MacCuish, J.D. MacCuish, Variable selection and model
validation of 2D and 3D molecular descriptors, J. Comput. Aided Mol.
Des. 18 (7–9) (2004) 451–474.
[45] G. Wolber, T. Langer, LigandScout: 3D pharmacophores derived from
protein-bound ligands and their use as virtual screening filters, J. Chem.
Inf. Model. 45 (1) (2005) 160–169.


![Descriptors for Sponge Gourd [Luffa cylindrica (L.) Roem.]](https://static.fdokumen.com/doc/165x107/63187e763394f2252e02b92e/descriptors-for-sponge-gourd-luffa-cylindrica-l-roem.jpg)

