Directional asymmetry of neurons in cortical areas MT and MST projecting to the NOT-DTN in macaques
11
Directional Asymmetry of Neurons in Cortical Areas MT and MST Projecting to the NOT-DTN in Macaques K.-P. HOFFMANN, F. BREMMER, A. THIELE, AND C. DISTLER Allgemeine Zoologie and Neurobiologie, Ruhr-Universita ¨t Bochum, D-44780 Bochum, Germany Received 14 June 2001; accepted in final form 1 November 2001 Hoffmann, K.-P., F. Bremmer, A. Thiele, and C. Distler. Direc- tional asymmetry of neurons in cortical areas MT and MST projecting to the NOT-DTN in macaques. J Neurophysiol 87: 2113–2123, 2002; 10.1152/jn.00488.2001. The cortical projection to the subcortical pathway underlying the optokinetic reflex was studied using anti- dromic electrical stimulation in the midbrain structures nucleus of the optic tract and dorsal terminal nucleus of the accessory optic system (NOT-DTN) while simultaneously recording from cortical neurons in the superior temporal sulcus (STS) of macaque monkeys. Projection neurons were found in all subregions of the middle temporal area (MT) as well as in the medial superior temporal area (MST). Anti- dromic latencies ranged from 0.9 to 6 ms with a median of 1.8 ms. There was a strong bias in the population of cortical neurons project- ing to the NOT-DTN for ipsiversive stimulus movement (towards the recording side), whereas in the population of cortical neurons not projecting to the NOT-DTN a more or less equal distribution of stimulus directions was evident. Our data indicate that there is no special area in the posterior STS coding for ipsiversive horizontal stimulus movement. Instead, a specific selection of cortical neurons from areas MT and MST forms the projection to the NOT-DTN and as a subpopulation has the same directional bias as their subcortical target neurons. These findings are discussed in relation to the func- tional grouping of cortical output as an organizational principle for specific motor responses. INTRODUCTION The important role of midbrain nuclei and extrastriate visual areas of the monkey cortex for the control of slow eye move- ments is well established. A unique possibility to study how evolutionary newer areas of the neocortex are linked with the older structures in the midbrain and pretectum to control visuo- motor behavior is provided by the optokinetic reflex and its underlying neuronal pathways. This basic behavior is present in all seeing animals, and its neuronal realization is remarkably constant across all vertebrates studied. In primates electrical stimulation as well as inactivation studies have shown unequiv- ocally that the middle temporal area (MT) and the medial superior temporal area (MST) in the superior temporal sulcus (STS) of the cortex as well as the nucleus of the optic tract and the dorsal terminal nucleus of the accessory optic system (NOT-DTN) in the midbrain are involved in the generation of slow eye movements during optokinetic nystagmus (OKN) and smooth pursuit (Du ¨rsteler and Wurtz 1988; Yakushin et al. 2000). However, it has been a paradox so far why lesions of various cortical areas lead to severe direction selective deficits in slow eye movements, and the question about the neuronal basis of this so-called directional asymmetry of the smooth pursuit and optokinetic system has intrigued neuroscientists for some time (e.g., Barton et al. 1996; Braddick 1996; Du ¨rsteler and Wurtz 1988; Heide et al. 1996; Lynch and McLaren 1983; Morrow and Sharpe 1993, 1995; Ter Braak and Van Vliet 1963; Thur- ston et al. 1988; Tusa et al. 1989; Wood et al. 1973; Zee et al. 1987). In normal cats, monkeys, and humans, monocularly as well as binocularly elicited slow eye movements are largely equivalent during clockwise and counterclockwise stimulation (symmetrical OKN). Unilateral cortical lesions lead to an im- paired reaction during stimulation towards the lesioned side, whereas slow eye movements towards the intact side are nor- mal. This finding is not readily explained by the loss of a certain visual cortical area coding for this direction of move- ment because there is no clear evidence that cortical areas like MT and MST (Albright 1989; Bremmer et al. 1997b; Erickson and Thier 1991; Komatsu and Wurtz 1988), LIP (Bremmer et al. 1997a), or the pursuit area in the frontal eye field (FEF) (Gottlieb et al. 1994) have a strong bias for a particular direc- tion of stimulus or pursuit movement. Nevertheless, electrical stimulation of MT/MST during ongoing pursuit frequently increased eye velocity when the eye moved towards and de- creased eye velocity when it moved away from the stimulated hemisphere (Komatsu and Wurtz 1989). These authors hypoth- esize that the directional bias for pursuit originates in the visual signal conveyed to the pursuit system. Consequently, lesions of the midbrain NOT-DTN in mon- keys receiving input from cortical areas MT and MST lead to deficits in the slow phase of OKN during visual stimulation towards the lesioned side (Cohen et al. 1990; Ilg et al. 1993; Kato et al. 1986; Yakushin et al. 2000). This result can easily be deduced from the loss of direction-selective neurons in the NOT-DTN strongly biased towards ipsiversive stimulus move- ment (Hoffmann et al. 1988; Mustari and Fuchs 1990). The NOT-DTN has been recognized as the key sensorimotor inter- face in the pathway underlying the optokinetic reflex not only in monkeys but in all mammals investigated so far (for review see Simpson et al. 1988; Wallman 1993; wallaby: Hoffmann et al. 1995; opossum: Volchan et al. 1989). Recently, the NOT has also been identified in the human brain by microstimulation Address for reprint requests: K.-P. Hoffmann, Allgemeine Zoologie and Neu- robiologie, Ruhr-Universita ¨t Bochum, Postfach 102148, ND 7/31, D-44780 Bo- chum, Germany (E-mail: [email protected]). The costs of publication of this article were defrayed in part by the payment of page charges. The article must therefore be hereby marked ‘‘advertisement’’ in accordance with 18 U.S.C. Section 1734 solely to indicate this fact. J Neurophysiol 87: 2113–2123, 2002; 10.1152/jn.00488.2001. 2113 0022-3077/02 $5.00 Copyright © 2002 The American Physiological Society www.jn.org
-
Upload
ruhr-uni-bochum -
Category
Documents
-
view
2 -
download
0
Transcript of Directional asymmetry of neurons in cortical areas MT and MST projecting to the NOT-DTN in macaques

Directional Asymmetry of Neurons in Cortical Areas MT and MSTProjecting to the NOT-DTN in Macaques
K.-P. HOFFMANN, F. BREMMER, A. THIELE, AND C. DISTLERAllgemeine Zoologie and Neurobiologie, Ruhr-Universitat Bochum, D-44780 Bochum, Germany
Received 14 June 2001; accepted in final form 1 November 2001
Hoffmann, K.-P., F. Bremmer, A. Thiele, and C. Distler. Direc-tional asymmetry of neurons in cortical areas MT and MST projectingto the NOT-DTN in macaques. J Neurophysiol 87: 2113–2123, 2002;10.1152/jn.00488.2001. The cortical projection to the subcorticalpathway underlying the optokinetic reflex was studied using anti-dromic electrical stimulation in the midbrain structures nucleus of theoptic tract and dorsal terminal nucleus of the accessory optic system(NOT-DTN) while simultaneously recording from cortical neurons inthe superior temporal sulcus (STS) of macaque monkeys. Projectionneurons were found in all subregions of the middle temporal area(MT) as well as in the medial superior temporal area (MST). Anti-dromic latencies ranged from 0.9 to 6 ms with a median of 1.8 ms.There was a strong bias in the population of cortical neurons project-ing to the NOT-DTN for ipsiversive stimulus movement (towards therecording side), whereas in the population of cortical neurons notprojecting to the NOT-DTN a more or less equal distribution ofstimulus directions was evident. Our data indicate that there is nospecial area in the posterior STS coding for ipsiversive horizontalstimulus movement. Instead, a specific selection of cortical neuronsfrom areas MT and MST forms the projection to the NOT-DTN andas a subpopulation has the same directional bias as their subcorticaltarget neurons. These findings are discussed in relation to the func-tional grouping of cortical output as an organizational principle forspecific motor responses.
I N T R O D U C T I O N
The important role of midbrain nuclei and extrastriate visualareas of the monkey cortex for the control of slow eye move-ments is well established. A unique possibility to study howevolutionary newer areas of the neocortex are linked with theolder structures in the midbrain and pretectum to control visuo-motor behavior is provided by the optokinetic reflex and itsunderlying neuronal pathways. This basic behavior is presentin all seeing animals, and its neuronal realization is remarkablyconstant across all vertebrates studied. In primates electricalstimulation as well as inactivation studies have shown unequiv-ocally that the middle temporal area (MT) and the medialsuperior temporal area (MST) in the superior temporal sulcus(STS) of the cortex as well as the nucleus of the optic tract andthe dorsal terminal nucleus of the accessory optic system(NOT-DTN) in the midbrain are involved in the generation ofslow eye movements during optokinetic nystagmus (OKN) andsmooth pursuit (Dursteler and Wurtz 1988; Yakushin et al.2000).
However, it has been a paradox so far why lesions of variouscortical areas lead to severe direction selective deficits in sloweye movements, and the question about the neuronal basis ofthis so-called directional asymmetry of the smooth pursuit andoptokinetic system has intrigued neuroscientists for some time(e.g., Barton et al. 1996; Braddick 1996; Dursteler and Wurtz1988; Heide et al. 1996; Lynch and McLaren 1983; Morrowand Sharpe 1993, 1995; Ter Braak and Van Vliet 1963; Thur-ston et al. 1988; Tusa et al. 1989; Wood et al. 1973; Zee et al.1987). In normal cats, monkeys, and humans, monocularly aswell as binocularly elicited slow eye movements are largelyequivalent during clockwise and counterclockwise stimulation(symmetrical OKN). Unilateral cortical lesions lead to an im-paired reaction during stimulation towards the lesioned side,whereas slow eye movements towards the intact side are nor-mal. This finding is not readily explained by the loss of acertain visual cortical area coding for this direction of move-ment because there is no clear evidence that cortical areas likeMT and MST (Albright 1989; Bremmer et al. 1997b; Ericksonand Thier 1991; Komatsu and Wurtz 1988), LIP (Bremmer etal. 1997a), or the pursuit area in the frontal eye field (FEF)(Gottlieb et al. 1994) have a strong bias for a particular direc-tion of stimulus or pursuit movement. Nevertheless, electricalstimulation of MT/MST during ongoing pursuit frequentlyincreased eye velocity when the eye moved towards and de-creased eye velocity when it moved away from the stimulatedhemisphere (Komatsu and Wurtz 1989). These authors hypoth-esize that the directional bias for pursuit originates in the visualsignal conveyed to the pursuit system.
Consequently, lesions of the midbrain NOT-DTN in mon-keys receiving input from cortical areas MT and MST lead todeficits in the slow phase of OKN during visual stimulationtowards the lesioned side (Cohen et al. 1990; Ilg et al. 1993;Kato et al. 1986; Yakushin et al. 2000). This result can easilybe deduced from the loss of direction-selective neurons in theNOT-DTN strongly biased towards ipsiversive stimulus move-ment (Hoffmann et al. 1988; Mustari and Fuchs 1990). TheNOT-DTN has been recognized as the key sensorimotor inter-face in the pathway underlying the optokinetic reflex not onlyin monkeys but in all mammals investigated so far (for reviewsee Simpson et al. 1988; Wallman 1993; wallaby: Hoffmann etal. 1995; opossum: Volchan et al. 1989). Recently, the NOThas also been identified in the human brain by microstimulation
Address for reprint requests: K.-P. Hoffmann, Allgemeine Zoologie and Neu-robiologie, Ruhr-Universitat Bochum, Postfach 102148, ND 7/31, D-44780 Bo-chum, Germany (E-mail: [email protected]).
The costs of publication of this article were defrayed in part by the paymentof page charges. The article must therefore be hereby marked ‘‘advertisement’’in accordance with 18 U.S.C. Section 1734 solely to indicate this fact.
J Neurophysiol87: 2113–2123, 2002; 10.1152/jn.00488.2001.
21130022-3077/02 $5.00 Copyright © 2002 The American Physiological Societywww.jn.org

(Taylor et al. 2000). It relays visual information from the retinaand, at least in some species from cortical areas, to the inferiorolive, the nucleus praepositus hypoglossi, the nucleus reticu-laris tegmenti pontis, and the dorsolateral pontine nucleus.Projections of these structures, directly and via the flocculus ofthe cerebellum to the vestibular nuclei, close the loop foreliciting slow eye movements (Buettner-Ennever et al. 1996;Mustari et al. 1994; Simpson et al. 1988). The key feature ofretinal slip neurons in the NOT-DTN projecting to these struc-tures is their direction-selective response to ipsiversive stimu-lus movement; i.e., neurons in the left NOT-DTN are activatedduring horizontal stimulus movement to the left, and neuronsin the right NOT-DTN are activated during stimulus movementto the right. In addition, in the NOT-DTN of cats and monkeys,all neurons are activated binocularly, i.e., each eye activatesneurons in the left as well as in the right NOT-DTN. Thisconnectivity leads to the symmetrical optokinetic response alsowith monocular stimulation. Other mammals have less binoc-ular neurons depending on the laterality of the position of theireyes in the head and lack of a fovea (Tauber and Atkin 1968).It is always the contralateral eye that has the stronger orsometimes even exclusive input to one NOT-DTN. With thisconnectivity, i.e., right eye only to left NOT-DTN, whichcodes leftward movement and vice versa, the monocular opto-kinetic response becomes asymmetric.
How can we relate the deficits observed after unilateralcortical lesions to this scheme? Using orthodromic electricalstimulation as well as neuroanatomical tracing techniques, werecently reported that the main cortical projection to the NOT-DTN originates from area MT and MST (Distler and Hoffmann2001; Hoffmann et al. 1991). Preliminary data showed thatcortical neurons projecting to the NOT-DTN as a populationhave a bias for ipsiversive stimulus direction and are binocu-larly activated (Hoffmann et al. 1992; Ilg and Hoffmann 1993).It has, however, been questioned whether the database waslarge enough to make such claim (Sommer and Wurtz 2000).By a case-by-case analysis we confirm that the great majorityof cortical neurons projecting to the NOT-DTN prefer stimulusmovements in the ipsiversive direction, thus matching thedirection preference of their target neurons as well as the biasof the impairment after unilateral cortical lesions. Neitherdirect neighbors that do not project to the NOT-DTN nor theoverall population of MT neurons show such a common direc-tion preference. It will be argued that the directionally biasedreduction in slow eye velocity after unilateral cortical lesionscan be explained by the loss of a specific subpopulation ofcortical neurons that relayed to the NOT-DTN strong directionselective activity when the eye lagged behind the stimulusvelocity during movements towards the lesioned hemisphere.The remaining retinal input to the NOT-DTN is not sufficientto maintain high gain eye velocities towards the decorticatedside.
M E T H O D S
Subjects
All experiments had been approved by the local ethics committeeand were carried out in accordance with the European CommunitiesCouncil Directive of 24 November 1986 (86 609 EEC) and NationalInstitutes of Health guidelines for care and use of animals for exper-imental procedures. The data for the present investigation were accu-
mulated over the last 10 yr in 12 hemispheres of adult macaquemonkeys of both sexes, 6 Macaca mulatta and 4 M. fascicularis, someof which prior to this terminal experiment were involved in otherstudies. Brain tissue from these animals served for anatomical studies(Distler and Hoffmann 2001; Telkes et al. 2000).
Surgery and recordings
After initial anesthesia with ketamine hydrochloride (10 mg/kg im),an intravenous catheter was placed, and the animals were intubatedthrough the mouth. Following additional local anesthesia with bupi-vacainhydrochloride 0.5% (Bupivacain) or prilocainhydrochloride0.5% (Xylonest), the animals were placed into a stereotactic appara-tus. During surgery they received additional doses of pentobarbital asneeded. After completion of all surgical procedures, the animals wereparalyzed with pancuronium chloride (Alloferin). During the wholesession the animals were artificially ventilated with nitrous oxide:oxygen as 3:1 containing 0.3–1% halothane. Heart rate, SPO2, bloodpressure, body temperature, and endtidal CO2 were monitored andkept at physiological levels. The skin overlying the skull was cut, andcraniotomies were performed according to stereotaxic coordinates toallow access to the midbrain and pretectum (Snider and Lee 1961;Szabo and Cowan 1984) and according to nuclear magnetic resonance(NMR) scans of the animals’ heads for access to the STS. Corneaewere protected with contact lenses that were chosen with a refrac-trometer (Rodenstock) to focus the animals’ eyes at the distance of thetangent screen used for visual stimulation.
Visual stimulation
Visual stimulation consisted of large area random dot patternsprojected onto a tangent screen in front of the animal. These patternscould be moved on a linear or a circular path at variable stimulusvelocities via a galvanometer-driven double-mirror system (Hoffmannand Distler 1989). In some of the experiments, random dot patterns orsinewave gratings were created on a computer and presented on amonitor in front of the animal. In addition, neurons’ responses tosmall single dots were tested.
Electrical stimulation
The NOT-DTN was localized electrophysiologically according toits position just anterior and lateral to the foveal representation in thesuperior colliculus (SC) and by its characteristic preference for ipsi-versive stimulus movement (Hoffmann et al. 1988). The microelec-trode was then left in place to be used later as a stimulating electrode.In histological reconstructions all but one stimulation sites wereverified in the NOT-DTN. Thus in these experiments terminals orfibers from cortical neurons were stimulated inside the NOT-DTN.One stimulation site was in the anterior pretectum. Data from thisexperiment are not included in this study. Single pulses 100 �s widewere applied through the NOT-DTN recording-stimulating electrodeat stimulus strength settings varying from 10 �A to 1.0 mA. Actualmeasurements of the peak currents in 100-�s-wide pulses revealedonly about one-half of the amplitudes compared with the settings onthe WPI constant current isolation unit. These corrected values aregiven in the results of this paper. The antidromic nature of the elicitedspikes was assessed, first, by the very constant latencies and shapes ofthe action potentials and, second, by a collision test where spontane-ous spikes are used to trigger the electrical stimulation at variousdelays. If the delay is equal or shorter than the latency of the anti-dromically elicited spike, this spike will be abolished because ofcollision of the spontaneous and the electrically elicited action poten-tial traveling along the same axon in opposite directions.
Data analysis
In all quantitatively tested cells the preferred direction was deter-mined using the weighted average of individual bins of the response
2114 K.-P. HOFFMANN, F. BREMMER, A. THIELE, AND C. DISTLER
J Neurophysiol • VOL 87 • APRIL 2002 • www.jn.org

histogram representing different stimulus directions. As tuning width(TW), we considered the interval comprising one-half of the responsearound the preferred direction. Because the response was not alwayssymmetrical around the preferred direction, we determined indepen-dently the intervals comprising 25% of the overall response strengthto the left and to the right of the preferred direction. A directionaltuning index (TI) was calculated as TI � 1 � (TW/360 � TW). Sharptuning is indicated by values close to 1.0, and broadly tuned cells arecharacterized by values close to 0.
Anatomical reconstructions
The histological procedures followed the protocol published previ-ously (Distler and Hoffmann 2001). For verification of the stimulationsites 50-�m-thick frozen sections of the midbrains were cut eithercoronally (8 cases), parasagitally (1 case), or perpendicularly to thelayers of the SC (1 case). At least two alternating series were cut: onefor Kluver-Barrera and one for Nissl stain. The cortical hemisphereswere cut at 50-�m thickness on a freezing microtome in the parasag-ittal (6 cases) or the frontal plane (6 cases). Five alternate series werecut and used for visualization of retrogradely labeled cells (1 case),Nissl stain, neutral red stain, Kluver-Barrera stain, for myeloarchitec-ture (Gallyas 1979; as modified by Hess and Merker 1983), and forSMI-32 immunohistochemistry (Hof and Morrison 1995) and Wis-teria floribunda agglutinin histochemistry (Bruckner et al. 1994).Cortical penetration tracks were reconstructed from serial sectionswith the aid of the penetration scheme and marking lesions made atcertain recording sites. Along these penetration tracks the recordingsites of NOT-DTN projecting neurons and of neurons not projectingto the NOT-DTN were marked according to microlesions and thedepth reading of the microdrive during the experiment. Two-dimen-sional reconstructions of the cortex were made by bending wires alonglayer IV of enlarged drawings of Nissl-stained sections of the entirehemisphere spaced at 2-mm interval for each hemisphere. After indi-cating landmarks as lip and fundus of sulcus on these wires, they weresoldered together appropriately to form three-dimensional models.These models were then unfolded to form two-dimensional maps ofthe cortical hemisphere (Van Essen and Maunsell 1980). The recon-structed recording sites and myeloarchitectonic borders were thentransferred on these maps. The area-specific myeloarchitecture asdescribed in the literature was used to distinguish extrastriate areasV2, V3, V4, V4t, MT, the densely myelinated zone of MST, FST, andLIPv (summarized in Distler et al. 1993). Myeloarchitectonic borderswere verified with the material stained for SMI-32 and Wisteriafloribunda agglutinin (Cusick et al. 1995; Hof and Morrison 1995).
R E S U L T S
For this study, a total of 2,139 cortical neurons was recordedfrom 12 cortical hemispheres of macaques and tested withelectrical stimulation in the NOT-DTN ipsilateral to the re-corded hemisphere. Of these, 1,957 cells were recorded inareas of the STS, and 182 cells were tested in other regions.Altogether 247 neurons could be antidromically activated fromthe NOT-DTN, thus comprising 11.5% of our tested sample ofcortical neurons (Table 1).
Recording sites
All but 13 antidromic cells were found in the STS. Therecording sites of these NOT-DTN projecting neurons as wellas recording sites of neurons not projecting to the NOT-DTNare summarized in the two-dimensional maps of the STS of 11of the 12 hemispheres in Fig. 1, A–K. In this figure, recordingsites of NOT-DTN projecting cells are indicated by red dots;those of nonantidromically activated cells are shown by opensymbols. The areal borders of V4t, MT, the densely myelinatedzone of MST (DMZ), and in some cases of the visual area inthe fundus of the STS (FST) are shown by broken lines. Tofacilitate comparison, all maps are shown as left hemispheres.It is clear from Fig. 1 that the bulk of our data comes from areaMT (1,717 tested neurons, 221 of these, corresponding to12.9%, could be driven by antidromic stimulation). Less datastem from area MST and the surrounding cortex [240 neuronstested, 14 antidromic neurons (6.2%)]. Even though we did notcover the whole extent of MT in single experiments, taking allexperiments together neurons projecting to the NOT-DTNwere found in all subregions of MT. This finding is furtheremphasized by the summary of recording sites of antidromi-cally identified projection neurons shown in Fig. 1L. For thissummary we superimposed the maps of all hemispheres andmarked the recording sites of NOT-DTN projecting neurons.The dashed lines indicate the approximate common outlines ofareas MT and MST in all these hemispheres. Even thoughsome parts of MT may have been sampled more closely thanothers, the present data, together with recent anatomical results(Distler and Hoffmann 2001), suggest that the NOT-DTN is
TABLE 1. Summary of the data base
CaseCells TestedSTS (Other)
NOT AntidromicSTS (Other)
NOTOrthodromic
PD Qualitative PD Quantitative
Non Anti Non Anti
Case 1 49 (67) 20 (6) 1 29 3 10 8Case 2, left 101 (22) 19 (0) 5 40 4 8 4Case 2, right 105 (17) 11 (1) 3 34 4 1 4Case 3, right 67 (1) 17 (0) 18 9 11 2Case 3, left 227 (0) 41 (0) 5 72 9 52 24Case 4 236 (14) 29 (0) 9 119 19 8 8Case 5 66 (0) 17 (0) 3 42 11 5 4Case 6 262 (0) 23 (0) 5 55 8 45 15Case 7 209 (32) 23 (2) 11 22 12 27 17Case 8 197 (0) 8 (0) 2 23 2 25 1Case 9 215 (0) 10 (0) 3 108 5 25 1Case 10 223 (29) 16 (4) 10 92 9 23 4Summary 1,957 (182) 234 (13) 57 654 95 240 92
Table 1 summarizes the number of cells tested with electrical stimulation, antidromically identified cells, cells orthodromically activated, and the number ofcells in which the directional preference (PD) was determined qualitatively or quantitatively. Numbers in parentheses indicate the number of neurons tested andof antidromic neurons found outside the STS. STS, superior temporal sulcus; NOT, nucleus of the optic tract; anti, antidromically activated from the NOT–dorsalterminal nucleus; non, non-projecting cells.
2115CHARACTERIZATION OF THE CORTICAL PROJECTION TO NOT-DTN
J Neurophysiol • VOL 87 • APRIL 2002 • www.jn.org

evenly connected with all subregions of MT. Thus there is nosubregion of MT (central or peripheral field; horizontal streak)specialized for transmitting information about horizontal stim-ulus movement to the subcortical optokinetic system.
Antidromic latencies
All stimulation sites were inside the NOT-DTN as ascer-tained by the characteristic direction specificity of neuronsrecorded with the same electrode before used for stimulationand verified by anatomical reconstructions. The latencies ofantidromic action potentials were determined for 211 of the234 STS cells. They ranged from 0.9 to 6 ms with most cellshaving latencies between 1 and 2.6 ms (MT: 2.12 � 1.08 ms,
mean � SD, n � 200, MST: 2.24 � 1.25 ms, n � 11). Becausethe latencies of MT and MST cells did not differ, data werepooled. The median of the latency distribution was 1.8 ms (Fig.2A). Assuming a conduction distance D between MT and theNOT-DTN of 20–25 mm (see DISCUSSION), the conductionvelocity V � D/Latency � U (U is utilization time, 0.2 ms)(Lemon 1984) falls in a range of 4–30 m/s (median 16 m/s).For 102 neurons the threshold for antidromic activation wasdetermined. Thresholds ranged from 18 �A up to 0.5 mA with90% of the neurons having thresholds below 250 �A. Themedian of this distribution was 130 �A. There was a slightcorrelation between threshold and latency of antidromic actionpotentials (r � 0.2368, P � 0.0145) with some neurons withhigher thresholds also having longer latencies (Fig. 2B). This
FIG. 1. Flat maps of the posterior part of the superiortemporal sulcus (STS) of 11 of the 12 experimental hemi-spheres. All maps are shown as left hemispheres, i.e., anterioris to the left, posterior is to the right. The thick solid linesindicate the outline of the sulcus; the thick broken linesindicate the fundus of the sulcus. Thin broken lines outlinethe areal borders of area V4t, the middle temporal area (MT),the visual area in the fundus of the STS (FST), and thedensely myelinated zone of the medial superior temporal area(MST) (DMZ) as determined on the basis of myeloarchitec-ture. Maps in A, B, G, H, J, and K are derived from frontalsections; maps in C, D, E, F, and I are derived from sagittalsections. Red symbols mark recording sites of antidromicallyidentified projection neurons; open symbols indicate record-ing sites of neurons not projecting to the NOT-DTN. In somemaps, marking lesions are indicated by triangles. L shows asuperposition of all maps. Here only the recording sites ofantidromically identified projection neurons are shown (reddots), the thin broken lines indicate the approximate averageareal outlines of MT and MST. Scale bars indicate 5 mm.
2116 K.-P. HOFFMANN, F. BREMMER, A. THIELE, AND C. DISTLER
J Neurophysiol • VOL 87 • APRIL 2002 • www.jn.org

suggests that thin fibers with slower conduction velocity andtherefore longer latencies can be electrically stimulated only athigher thresholds and that thicker fibers were not regularlystimulated by the spread of current from supramaximal stim-ulation strengths.
To determine to which degree the unavoidable spread ofcurrent during electrical stimulation to neighboring structures,i.e., the SC, the pulvinar, or other pretectal nuclei may haveinfluenced our data, in Fig. 3 we analyzed the thresholds (Fig.3A) and the antidromic latencies (Fig. 3B) with respect to thestimulation sites. The anterior-posterior position of the stimu-lation sites was determined by the distance between stimulationsite and the posterior edge of the pretectal olivary nucleus, theposition of which was set as anterior 1.0 (Snider and Lee1961). The mediolateral position had very little variability. Wedid not find any influence of the position of the stimulationelectrode in the NOT-DTN on the thresholds (correlation co-efficient, r � 0.03) and resulting antidromic latencies (corre-
lation coefficient r � 0.03) measured for corticofugal fibers,indicating that even if we involved neighboring structures byour current spread, it did not systematically influence ourresults.
Orthodromic latencies
In most experiments we also identified few neurons (2.91% ofthe STS neurons tested with electrical stimulation) that wereorthodromically activated by stimulation of the NOT-DTN. Ofthese neurons 52 were located in area MT, and 5 were located inarea MST. Most latencies ranged from 2 to 8 ms (MT: 3.5 � 3.2ms, n � 43, median � 2.7 ms; MST: 3.76 � 1.67 ms, n � 5,median � 3 ms). The median of the overall distribution oforthodromic latencies shown in Fig. 4 is 2.75 ms. Again, the datawere pooled in Fig. 4 because there was no significant differencebetween MT and MST cells (Mann-Whitney U test, P � 0.1).Furthermore, 4 cells were recorded with orthodromic latencies
FIG. 1. (continued)
2117CHARACTERIZATION OF THE CORTICAL PROJECTION TO NOT-DTN
J Neurophysiol • VOL 87 • APRIL 2002 • www.jn.org

ranging from 20 to 40 ms. The orthodromically activated neuronsdid not show a common direction preference; some of them werenon–direction selective. Otherwise they seemed indistinguishablefrom the antidromic or not activated cells.
Directional preference
A preferred direction could be determined quantitatively for332 and qualitatively for additional 749 cortical neurons. Mostantidromically identified NOT-DTN projecting neurons pre-ferred ipsiversive stimulus movements thus corresponding tothe preferred direction of their target neurons in the NOT-DTN. Much less often did NOT-DTN projecting neurons pre-fer contraversive stimulus movement. By contrast, corticalneurons not projecting to the NOT-DTN did not have a bias foripsiversive movement as a population. Figure 5 shows thequantitative and qualitative data of all cells separately for 9 ofthe 10 animals. The data from the 10th animal are omittedbecause the preferred direction could be tested only in 3antidromic neurons (case 8 in Table 1). Cells were groupedaccording to their preferred direction in upward (90 � 22.5°),
downward (270 � 22.5°), ipsiversive (180 � 67.5°), andcontraversive (0 � 67.5°) sectors. We chose this unequal widthof the sectors (vertical 45°, horizontal 135°) because our mainemphasis was on the ipsi-contra bias. Plus/minus 22.5° fromvertical was considered to be within the error range of direc-tional estimates, and neurons in this range were thus counted aseither up or down preferring but were not included in theipsi-contra count. All other neurons were classified as eitheripsi- or contraversive preferring. The left row of data plotsshows the preferred directions of antidromically driven cells;the right row shows the neurons not driven antidromically. Thedirection of the arrows indicates the preferred direction (ipsi,contra, up, down); the length of the arrows mirrors the numberof cells preferring this direction. The preferred direction withthe maximal cell count was set 100%, and the number of cellspreferring other directions was normalized to the direction withthe maximal count. The numbers indicate the total number ofcells included in the individual plots. All data are shown as ifderived from the left hemisphere to facilitate comparison.
The ratio between antidromic cells with ipsiversive preferreddirection and contraversive preferred direction is �5:1. Fornonantidromical cells it is 1:0.9. This difference between thepreferred directions of antidromically identified projection neu-rons and not antidromically identified neurons is highly signif-
FIG. 2. A: frequency distribution of latencies of action potentials of STSneurons elicited by antidromic electrical stimulation in the ipsilateral nucleusof the optic tract and dorsal terminal nucleus (NOT-DTN). Most latencies liebetween 1 and 2 ms, with a median of 1.8 ms. Ordinate: number of cells;abscissa: antidromic latencies in ms. B: relationship of antidromic latencies(abscissa, ms) and thresholds of excitability (ordinate, �A). There is slightcorrelation of the 2 parameters indicating that at least some of the fibers withlonger latencies have higher thresholds.
FIG. 3. Influence of the position of the stimulation site within the NOT-DTN given in anterior-posterior coordinates (ordinate; mm) on the thresholdsof excitability (A) and the antidromic latencies (B). There is no significantcorrelation between these parameters.
2118 K.-P. HOFFMANN, F. BREMMER, A. THIELE, AND C. DISTLER
J Neurophysiol • VOL 87 • APRIL 2002 • www.jn.org

icant (�2 test, P � 0.0001) not only on the population level butalso in all but one individual cases [�2 test, P � 0.05 to P �0.0001; in one case the difference was not significant (ipsi:contra � 13:9 neurons)].
There is a clear bias for horizontal stimulus movement also inthe group of neurons not projecting to the NOT-DTN, however,not a bias for either ipsi- or contraversive preferring. In part this isdue to the unequal sector size used for this analysis (see above). Inaddition, not antidromic neurons were often sampled near anti-dromic neurons to specifically compare the properties for pyra-midal neurons from layer V. Neighboring neurons in MT oftenshare a preference for the same or the opposite movement direc-tion (Albright 1984; Lagae et al. 1993; Malonek et al. 1994).Further qualitative tests of the direction preference in some of theexperiments revealed a similar bias.
When the preferred direction was not absolutely clear-cutalong the horizontal axis with qualitative testing or in a quan-titative test where only horizontal movement was presented,the preferred direction and tuning width was measured quan-titatively using the circular stimulation or a bar grating movingin eight different directions (see METHODS). The polar plots inFig. 6 show the preferred direction and tuning index of thesedifficult to judge qualitatively neurons projecting to the NOT-DTN (n � 56; top plot) and of neurons not projecting to theNOT-DTN (n � 176; bottom plot) from the same experiments.By this selection of neurons that are not unequivocally direc-tion selective during horizontal stimulation for analysis, moreneurons show upward or downward preferred directions than inthe total population. The position of the dots within the sectorsindicates the preferred direction of the cells; their distance fromthe origin of the circle indicates their tuning index. Sharplytuned cells are characterized by tuning indexes close to 1 (outercircle). Data from MT and MST were pooled because nodifference was obvious. Also, there was no significant differ-ence in the tuning index of NOT-DTN projecting and non-projecting cortical neurons. The preferred directions of the twopopulations, however, were significantly different from eachother (�2 test, P � 0.01). Whereas in these quantitativelyanalyzed populations the preferred directions of the non-projecting population were not statistically different from auniform distribution (�2 test, P � 0.1), the NOT-DTN project-ing population again shows a clear bias for ipsiversive pre-
ferred directions and was significantly different from an equaldistribution (�2 test, P � 0.0023). Note that the directionalpreference of most neurons included in this latter analysis wasless clear-cut and could not unequivocally be determined byqualitative testing. This may explain the somewhat lower butstill highly significant ipsi:contra bias in this subpopulationof cells (3:1 as compared with the �5:1 in the total popula-tion; see above). To unequivocally prove the ipsiversive biasin preferred directions also for this NOT-DTN population,we performed descriptive circular statistics (Rayleigh-test)(Batschelet 1981). The mean direction vector (normalizedlength 0.207) was significantly one-sided to 173° with 180°being horizontally ipsiversive (P � 0.01). In the non-projectingpopulation the directions were random, and the mean directionvector length (0.075 at 154°) was not significantly skewed(P � 0.1). A quantitative comparison of the NOT-DTN pro-
FIG. 4. Frequency distribution of the shortest orthodromic latencies mea-sured at STS neurons after electrical stimulation in the NOT-DTN. The medianof the distribution is 2.75 ms. Abscissa: orthodromic latency in ms; ordinate:number of cells.
FIG. 5. Preferred directions of stimulus movement of antidromically iden-tified projection neurons (left row) and of neurons not projecting to theNOT-DTN (right row) of 9 of the 10 animals used in this study. For thiscase-by-case analysis, both qualitative and quantitative data were included.Again, data were treated as if all were derived from the left hemisphere. Cellswere grouped in ipsiversive (112.5–247.5°), i.e., to the left; contraversive(292.5–67.5°), i.e., to the right; and vertical (90 � 22.5° and 270 � 22.5°). Thenumbers next to each plot indicate the number of neurons included. For furtherexplanations, see text.
2119CHARACTERIZATION OF THE CORTICAL PROJECTION TO NOT-DTN
J Neurophysiol • VOL 87 • APRIL 2002 • www.jn.org
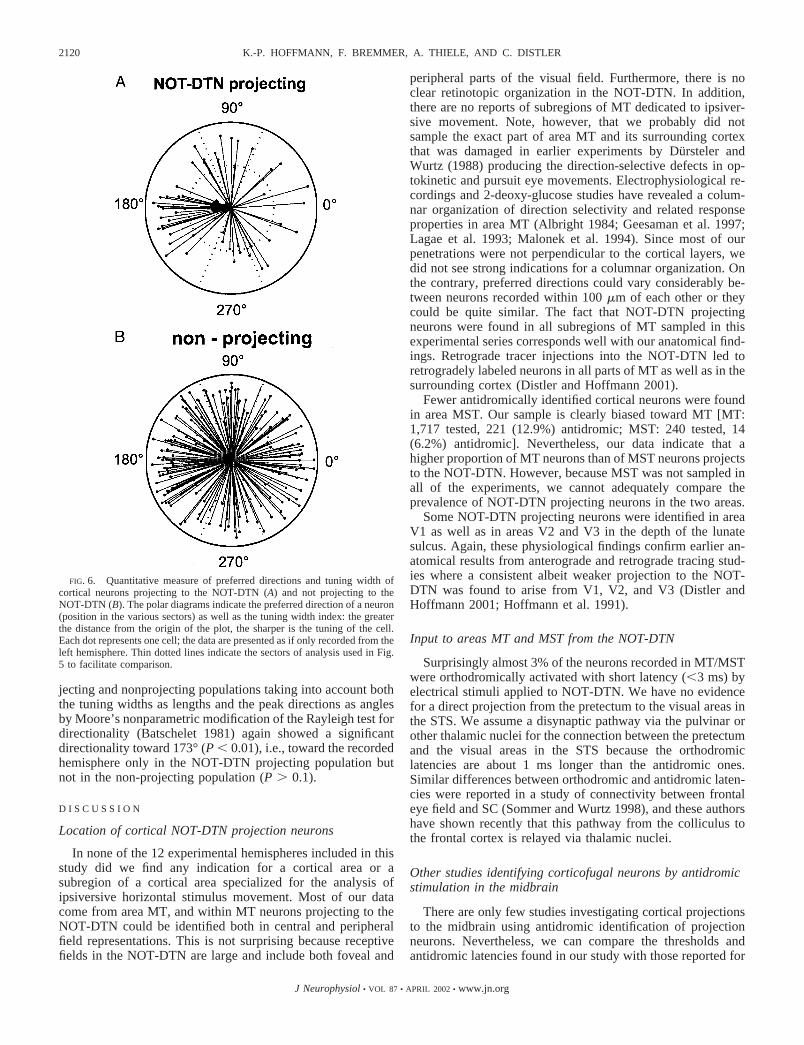
jecting and nonprojecting populations taking into account boththe tuning widths as lengths and the peak directions as anglesby Moore’s nonparametric modification of the Rayleigh test fordirectionality (Batschelet 1981) again showed a significantdirectionality toward 173° (P � 0.01), i.e., toward the recordedhemisphere only in the NOT-DTN projecting population butnot in the non-projecting population (P � 0.1).
D I S C U S S I O N
Location of cortical NOT-DTN projection neurons
In none of the 12 experimental hemispheres included in thisstudy did we find any indication for a cortical area or asubregion of a cortical area specialized for the analysis ofipsiversive horizontal stimulus movement. Most of our datacome from area MT, and within MT neurons projecting to theNOT-DTN could be identified both in central and peripheralfield representations. This is not surprising because receptivefields in the NOT-DTN are large and include both foveal and
peripheral parts of the visual field. Furthermore, there is noclear retinotopic organization in the NOT-DTN. In addition,there are no reports of subregions of MT dedicated to ipsiver-sive movement. Note, however, that we probably did notsample the exact part of area MT and its surrounding cortexthat was damaged in earlier experiments by Dursteler andWurtz (1988) producing the direction-selective defects in op-tokinetic and pursuit eye movements. Electrophysiological re-cordings and 2-deoxy-glucose studies have revealed a colum-nar organization of direction selectivity and related responseproperties in area MT (Albright 1984; Geesaman et al. 1997;Lagae et al. 1993; Malonek et al. 1994). Since most of ourpenetrations were not perpendicular to the cortical layers, wedid not see strong indications for a columnar organization. Onthe contrary, preferred directions could vary considerably be-tween neurons recorded within 100 �m of each other or theycould be quite similar. The fact that NOT-DTN projectingneurons were found in all subregions of MT sampled in thisexperimental series corresponds well with our anatomical find-ings. Retrograde tracer injections into the NOT-DTN led toretrogradely labeled neurons in all parts of MT as well as in thesurrounding cortex (Distler and Hoffmann 2001).
Fewer antidromically identified cortical neurons were foundin area MST. Our sample is clearly biased toward MT [MT:1,717 tested, 221 (12.9%) antidromic; MST: 240 tested, 14(6.2%) antidromic]. Nevertheless, our data indicate that ahigher proportion of MT neurons than of MST neurons projectsto the NOT-DTN. However, because MST was not sampled inall of the experiments, we cannot adequately compare theprevalence of NOT-DTN projecting neurons in the two areas.
Some NOT-DTN projecting neurons were identified in areaV1 as well as in areas V2 and V3 in the depth of the lunatesulcus. Again, these physiological findings confirm earlier an-atomical results from anterograde and retrograde tracing stud-ies where a consistent albeit weaker projection to the NOT-DTN was found to arise from V1, V2, and V3 (Distler andHoffmann 2001; Hoffmann et al. 1991).
Input to areas MT and MST from the NOT-DTN
Surprisingly almost 3% of the neurons recorded in MT/MSTwere orthodromically activated with short latency (�3 ms) byelectrical stimuli applied to NOT-DTN. We have no evidencefor a direct projection from the pretectum to the visual areas inthe STS. We assume a disynaptic pathway via the pulvinar orother thalamic nuclei for the connection between the pretectumand the visual areas in the STS because the orthodromiclatencies are about 1 ms longer than the antidromic ones.Similar differences between orthodromic and antidromic laten-cies were reported in a study of connectivity between frontaleye field and SC (Sommer and Wurtz 1998), and these authorshave shown recently that this pathway from the colliculus tothe frontal cortex is relayed via thalamic nuclei.
Other studies identifying corticofugal neurons by antidromicstimulation in the midbrain
There are only few studies investigating cortical projectionsto the midbrain using antidromic identification of projectionneurons. Nevertheless, we can compare the thresholds andantidromic latencies found in our study with those reported for
FIG. 6. Quantitative measure of preferred directions and tuning width ofcortical neurons projecting to the NOT-DTN (A) and not projecting to theNOT-DTN (B). The polar diagrams indicate the preferred direction of a neuron(position in the various sectors) as well as the tuning width index: the greaterthe distance from the origin of the plot, the sharper is the tuning of the cell.Each dot represents one cell; the data are presented as if only recorded from theleft hemisphere. Thin dotted lines indicate the sectors of analysis used in Fig.5 to facilitate comparison.
2120 K.-P. HOFFMANN, F. BREMMER, A. THIELE, AND C. DISTLER
J Neurophysiol • VOL 87 • APRIL 2002 • www.jn.org

cortical neurons in the FEF and the lateral intraparietal area(LIP) that project to the SC (Pare and Wurtz 1997; Sommerand Wurtz 2000). Due to the close neighborhood of LIP andMT and, therefore the similar cortex-midbrain conduction dis-tances, the LIP data are directly comparable to our study: thelatency range for LIP-SC neurons was 0.8–11 ms (Pare andWurtz 1997), for our MT-NOT/DTN neurons it was 0.9–6 ms.Also the thresholds for eliciting antidromic action potentialswere similar for both neuronal populations [LIP-SC: mean196–304 �A (Pare and Wurtz 1997), MT-NOT-DTN: 228 �A,this study]. When comparing our MT-NOT/DTN latencieswith the FEF-colliculus data from Sommer and Wurtz (1998),one has to take into account the greater distance between FEFand SC (�40 mm) (Segraves and Goldberg 1987) than be-tween MT and NOT-DTN (�20–25 mm reconstructed fromNMR images of the brains of our monkeys and from Fig. 6 ofa study by Tusa and Ungerleider (1988). We therefore calcu-lated the conduction velocity to be 4–30 m/s (median 16 m/s)from MT to NOT-DTN, which is slower than the conductionvelocity from FEF to the colliculus with 7–34 m/s (Segravesand Goldberg 1987) or �10 to �80 m/s (Sommer and Wurtz2000). These values confirm that the corticopretectal neuronsin MT have thinner axons and probably smaller somata thanthe corticotectal neurons in FEF (Fries 1984) but are similar tothe corticotectal neurons from LIP. This leads, however, to theastonishing fact that the latencies from cortex to the midbrainare rather similar irrespective of the output area and conductiondistance.
So far no other study has investigated the projection fromarea MT and MST to other nuclei in the midbrain by anti-dromic stimulation. We are in the process of completing asimilar study to the present one with antidromic stimulation inthe dorsolateral pontine nucleus while recording in MT andMST. In this cortico-pontine population we did find a uniformdistribution of the preferred directions contrasting our presentresult for the NOT-DTN projecting population (Hoffmann etal. 2000).
Segraves and Goldberg (1987) reported in their study ofneurons in the FEF antidromically identified from the SC thatpurely saccade related signals are overrepresented and purelyvisual-related signals are underrepresented in this projection.Sommer and Wurtz (2000) also examined the composition andtopographical organization of signals flowing from the FEF tothe SC by recording a larger sample of FEF neurons that wereantidromically activated from rostral or caudal SC. Their firstand most general result was that, in a sample of 88 corticotectalneurons, the types of signals relayed from FEF to SC werehighly diverse, reflecting the general population of signalswithin FEF rather than any specific subset of signals. Theyconclude that the FEF most likely influences the activity of SCneurons continuously from the start of fixation, through visualanalysis and cognitive manipulations, until a saccade is gener-ated and fixation begins anew. Furthermore, the projectionfrom FEF to SC is highly topographically organized in terms offunction at both its source and its termination.
Pare and Wurtz (1997) investigated the connection betweenthe posterior parietal cortex (PPC) and the SC by antidromi-cally activating neurons within the LIP area with single-pulsestimulation delivered to the intermediate layers of the SC andfound that the neuronal signal sent by LIP to the SC carriesboth visual and saccade-related information. Antidromically
identified neurons in LIP resemble SC buildup neurons in thatthey are also active during the delay period in a visual and amemory-guided saccade task. Taken together, the authors con-clude that properties of these antidromically identified neuronsin LIP are consistent with the characteristics of most neurons inLIP and therefore form no subpopulation.
Our present data indicate that the information transmittedfrom the motion-sensitive areas MT and MST to the NOT-DTN is highly nonuniform concerning the preferred directionof motion. A subpopulation mostly preferring ipsiversivemovement projects to the NOT-DTN. This finding based on alarge population of neurons (247 antidromically identified cellsin 12 cases) is highly significant, and doubts on the validity ofour previously published results (Ilg and Hoffmann 1993) bySommer and Wurtz (2000) can definitely be rejected. Thus itseems that the various corticofugal systems differ not only intheir overall quality of information but also in the selectivity ofinformation from within an area they transmit to subcorticalcenters like the SC or the NOT-DTN.
What leads to the ipsiversive bias in the cortical projectionto the NOT-DTN?
Is our result an artifact of selectively stimulating subpopu-lations of terminals or corticofugal fibers from MT and MST inthe NOT-DTN? The assertion is made that stimulating at thephysiologically identified site of the putative postsynaptic neu-rons of corticofugal fibers gives us the least possibility ofartifacts from stimulating fibers of passage or nearby structuresas well. The possibility always remains that many more corti-cal fibers project to the NOT-DTN that our stimulating elec-trodes did not reach, but we have no arguments against theassumption that they should have the same asymmetric direc-tion selectivity distribution. In fact all actual stimulation sitesdistributed over the entire NOT-DTN gave rise to an asym-metric direction selectivity distribution (Fig. 5). In all but onecase these asymmetries were statistically significant.
A more likely explanation is a selective selection of corticalinput by the postsynaptic NOT-DTN neurons. If the Hebbianrule that only synapses between neuronal elements firing in acorrelated manner are being consolidated during developmentapplies also for the cortico-subcortical projection from areaMT to the ipsilateral NOT-DTN, one can postulate that onlyneurons that share the same direction selectivity will be con-nected. The probability of occurrence of action potentials inclose temporal correlation should be higher in groups of neu-rons coding for the same stimulus, i.e., the same direction ofstimulus movement, than in neurons reacting to different stim-uli, i.e., different directions of stimulus movement (Hoffmann1987). Recent data from wallabys in which the anlage of theeye had been rotated at a very early stage in developmentunequivocally indicate that the direction selectivity in theNOT-DTN depends on direction-selective influences from theretina (Hoffmann et al. 1995). Under the presumption of theHebbian rule, one can assume that, after the direction selectiv-ity in the NOT-DTN has been predetermined by the retinalinput early during development, the direction-selective NOT-DTN neurons will then consolidate only terminals from corti-cal axons that code for the same direction.
2121CHARACTERIZATION OF THE CORTICAL PROJECTION TO NOT-DTN
J Neurophysiol • VOL 87 • APRIL 2002 • www.jn.org

Functional considerations
In normal cats, monkeys, and humans, monocularly as wellas binocularly elicited slow eye movements are largely equiv-alent during clockwise and counterclockwise stimulation (sym-metrical OKN). Unilateral cortical lesions lead to an impairedreaction during stimulation toward the lesioned side, whereasslow eye movements toward the intact side are normal. Thisfinding can now readily be explained by the loss of a specificpopulation of neurons in the visual cortical areas MT and MSTcoding for this direction of movement and providing the inputto the NOT-DTN. In line with this hypothesis are the resultsfrom electrical stimulation of MT/MST during ongoing pur-suit. This manipulation increased eye velocity when the eyemoved towards (ipsiversive) and decreased eye velocity whenit moved away from the stimulated hemisphere (Komatsu andWurtz 1989). These authors hypothesize that the directionalbias for pursuit originates in the visual signal conveyed to thepursuit system. The present study shows that the NOT-DTNreceives such a visual signal and, to our knowledge, is the onlystructure receiving such a biased visual signal from MT andMST.
In monkeys as well as in humans with early onset esotropia,pursuit with monocular viewing was much stronger for nasal-ward motion than for temporalward motion, especially fortargets presented in the nasal visual field (Kiorpes et al. 1996).Single-unit recordings made from the same monkeys revealedthat MT neurons were rarely driven binocularly, but otherwisehad normal direction-selective response properties. Most im-portantly their direction preferences were uniformly distrib-uted. These authors conclude that the pursuit defect in thesemonkeys is not due to altered cortical visual motion processingand suggest that the asymmetry in pursuit may be a conse-quence of imbalances in the two eyes’ inputs to the “down-stream” areas responsible for the initiation of pursuit. Wesuggest that one of these downstream areas is the NOT-DTN.Because, if in strabismic primates the cortical influence on theNOT-DTN preferring ipsiversive stimulus motion is muchstronger from the contralateral eye than from the ipsilateraleye, the right eye then would automatically have a high gainthrough the left NOT-DTN during stimulus movement to theleft (nasalward) but not in the opposite direction (temporal-ward). The opposite directions would hold true for the left eye.
In summary, the cortical projection to the NOT-DTN seemsnot only to be involved in optokinetic eye movements but alsoin pursuit and also may play a role in the initiation and supportof the short-latency ocular following response. Consequently,lesions of one hemisphere or the ipsilateral NOT-DTN shouldlead to the same asymmetric deficits also in these oculomotorfunctions (Inoue et al. 2000; Yakushin et al. 2000).
We thank E. Brockmann, H. Korbmacher, S. Kramer, G. Reuter, and G.Tinney for expert technical assistance. Dr. U. Ilg participated in some of theexperiments.
This work was supported by the Deutsche Forschungsgemeinschaft, Sonder-forschungsbereich 509, and a Lise Meitner stipend to C. Distler.
REFERENCES
ALBRIGHT TD. Direction and orientation selectivity of neurons in visual areaMT of the macaque. J Neurophysiol 52: 1106–1130, 1984.
ALBRIGHT TD. Centrifugal directional bias in the middle temporal visual area(MT) of the macaque. Vis Neurosci 2: 177–188, 1989.
BARTON JJS, SHARPE JA, AND RAYMOND JE. Directional defects in pursuit andmotion perception in humans with unilateral cerebral lesions. Brain 119:1535–1550, 1996.
BATSCHELET E. Circular Statistics in Biology. Mathematics in Biology. NewYork: Academic, 1981.
BRADDICK O. Where is the naso-temporal asymmetry? Motion processing.Curr Biol 6: 250–253, 1996.
BREMMER F, DISTLER C, AND HOFFMANN K-P. Eye position effects in monkeycortex. II. Pursuit- and fixation related activity in posterior parietal areas LIPand 7a. J Neurophysiol 77: 962–977, 1997a.
BREMMER F, ILG UI, THIELE A, DISTLER C, AND HOFFMANN K-P. Eye positioneffects in monkey cortex. I. Visual and pursuit related activity in extrastriateareas MT and MST. J Neurophysiol 77: 944–961, 1997b.
BRUCKNER G, SEEGER G, BRAUER K, HARTIG W, KACZA J, AND BIGL V.Cortical areas are revealed by distribution patterns of proteoglycan compo-nents and parvalbumin in the Mongolian gerbil and rat. Brain Res 658:67–86, 1994.
BUETTNER-ENNEVER JA, COHEN B, HORN AK, AND REISINE IL. Efferent path-ways of the nucleus of the optic tract in monkey and their role in eyemovements. J Comp Neurol 373: 90–107, 1996.
COHEN B, SCHIFF D, AND BUETTNER-ENNEVER J. Contribution of the nucleus ofthe optic tract to optokinetic nystagmus and optokinetic afternystagmus inthe monkey: clinical implications. In: Vision and the Brain, edited by CohenB and Bodis-Wollner I. New York: Brain Research, 1990, p. 233–255.
CUSICK CG, SELTZER B, COLA M, AND GRIGGS E. Chemoarchitectonics andcorticocortical terminations within the superior temporal sulcus of the rhesusmonkey: evidence for subdivisions of superior temporal polysensory cortex.J Comp Neurol 360: 513–535, 1995.
DISTLER C, BOUSSAOUD D, DESIMONE R, AND UNGERLEIDER LG. Corticalconnections of inferior temporal area TEO in macaque monkeys. J CompNeurol 334: 125–150, 1993.
DISTLER C AND HOFFMANN K-P. Cortical input to the nucleus of the optic tractand dorsal terminal nucleus (NOT-DTN) in macaques: a retrograde tracingstudy. Cereb Cortex 11: 572–580, 2001.
DURSTELER MR AND WURTZ RH. Pursuit and optokinetic deficits followingchemical lesions of cortical areas MT and MST. J Neurophysiol 60: 940–965, 1988.
ERICKSON RG AND THIER P. A neuronal correlate of spatial stability duringperiods of self-induced visual motion. Exp Brain Res 86: 608 – 616,1991.
FRIES W. Cortical projections to the superior colliculus in the macaque mon-key: a retrograde study using horseradish peroxidase. J Comp Neurol 230:55–76, 1984.
GALLYAS F. Silver staining of myelin by means of physical development.Neurol Res 1: 203–209, 1979.
GEESAMAN BJ, BORN RT, ANDERSEN RA, AND TOOTELL RB. Maps of complexmotion selectivity in the superior temporal sulcus of the alert macaquemonkey: a double-label 2-deoxyglucose study. Cereb Cortex 7: 749–757,1997.
GOTTLIEB JP, MACAVOY MG, AND BRUCE CJJ. Neural responses related tosmooth-pursuit eye movements and their correspondence with electricallyelicited smooth eye movements in the primate frontal eye field. J Neuro-physiol 72: 1634–1653, 1994
HEIDE W, KURZIDIM K, AND KOMPF D. Deficits of smooth pursuit eye move-ments after frontal and parietal lesions. Brain 119: 1951–1969, 1996.
HESS DT AND MERKER BH. Technical modifications of Gallyas’ silver stain formyelin. J Neurosci Methods 8: 95–97, 1983.
HOF PR AND MORRISON JH. Neurofilament protein defines regional patterns ofcortical organization in the macaque monkey visual system: a quantitativeimmunohistochemical analysis. J Comp Neurol 352: 161–186, 1995.
HOFFMANN K-P. Influence of visual experience on ontogeny of optokineticreflex in mammals. In: Imprinting and Cortical Plasticity, edited by Raus-cher JP and Marler P. New York: Wiley, 1987, p. 267–286.
HOFFMANN K-P AND DISTLER C. Quantitative analysis of visual receptive fieldsof neurons in the nucleus of the optic tract and dorsal terminal nucleus of theaccessory optic tract in macaque monkeys. J Neurophysiol 62: 416–428,1989.
HOFFMANN K-P, DISTLER C, AND BREMMER F. Different cortical output foroptokinetic and smooth pursuit eye movements in macaques. Eur J Neurosci12, Suppl 11: 286, 2000.
HOFFMANN K-P, DISTLER C, AND ERICKSON R. Functional projections fromstriate cortex and superior temporal sulcus to the nucleus of the optic tract(NOT) and dorsal terminal nucleus of the accessory optic tract (DTN) ofmacaque monkeys. J Comp Neurol 313: 707–724, 1991.
2122 K.-P. HOFFMANN, F. BREMMER, A. THIELE, AND C. DISTLER
J Neurophysiol • VOL 87 • APRIL 2002 • www.jn.org

HOFFMANN K-P, DISTLER C, ERICKSON R, AND MADER W. Physiological andanatomical identification of the nucleus of the optic tract and dorsal terminalnucleus of the accessory optic tract in monkeys. Exp Brain Res 69: 635–644,1988.
HOFFMANN K-P, DISTLER C, AND ILG U. Cortical contributions to ipsilateralfield representation and direction selectivity in the macaque monkey’snucleus of the optic tract and dorsal terminal nucleus. J Comp Neurol 321:150–162, 1992.
HOFFMANN K-P, DISTLER C, MARK RF, MAROTTE LR, HENRY GH, AND IBBOT-SON MR. Neural and behavioral effects of early eye rotation on the optoki-netic system in the wallaby Macropus eugenii. J Neurophysiol 73: 727–735,1995.
ILG UJ, BREMMER F, AND HOFFMANN K-P. Optokinetic and pursuit system: acase report. Behav Brain Res 57: 21–29, 1993.
ILG UJ AND HOFFMANN K-P. Functional grouping of the cortico-pretectalprojection. J Neurophysiol 70: 867–869, 1993.
INOUE Y, TAKEMURA A, KAWANO K, AND MUSTARI MJ. Role of the pretectalnucleus of the optic tract in short-latency ocular following responses inmonkeys. Exp Brain Res 131: 269–281, 2000.
KATO I, HARADA K, HASEGAWA T, IGARASHI T, KOIKE Y, AND KAWASAKI T.Role of the nucleus of the optic tract in monkeys in relation to optokineticnystagmus. Brain Res 364: 12–22, 1986.
KIORPES L, WALTON PJ, O’KEEFE LP, MOVSHON JA, AND LISBERGER SG.Effects of early onset artificial strabismus on pursuit eye movements and onneuronal responses in area MT of macaque monkeys. J Neurosci 16:6537–6553, 1996.
KOMATSU H AND WURTZ RH. Relation of cortical areas MT and MST to pursuiteye movements. I. Localization and visual properties of neurons. J Neuro-physiol 60: 580–603, 1988.
KOMATSU H AND WURTZ RH. Modulation of pursuit eye movements bystimulation of cortical areas MT and MST. J Neurophysiol 62: 31–47, 1989.
LAGAE L, RAIGUEL S, AND ORBAN GA. Speed and direction selectivity ofmacaque middle temporal neurons. J Neurophysiol 69: 19–39, 1993.
LEMON R. Methods for neuronal recording in conscious animals. In: IBROHandbook Series: Methods in the Neurosciences. New York: Wiley, 1984,vol. 4, p. 96–103.
LYNCH JC AND MCLAREN JW. Optokinetic nystagmus deficits following pari-eto-occipital cortex lesions in monkeys. Exp Brain Res 49: 125–130, 1983.
MALONEK D, TOOTELL RB, AND GRINVALD A. Optical imaging reveals thefunctional architecture of neurons processing shape and motion in owlmonkey area MT. Proc R Soc Lond B Biol Sci 258: 109–119, 1994.
MORROW MJ AND SHARPE JA. Retinotopic and directional deficits of smoothpursuit initiation after posterior cerebral hemispheric lesions. Neurology 43:595–603, 1993.
MORROW MJ AND SHARPE JA. Deficits of smooth-pursuit eye movement afterunilateral frontal lobe lesions. Ann Neurol 37: 443–451, 1995.
MUSTARI MJ AND FUCHS AF. Discharge patterns of neurons in the pretectalnucleus of the optic tract (NOT) in the behaving primate. J Neurophysiol 64:77–90, 1990.
MUSTARI MJ, FUCHS AF, KANEKO CRS, AND ROBINSON FR. Anatomicalconnections of the primate pretectal nucleus of the optic tract. J CompNeurol 349: 111–128, 1994.
PARE M AND WURTZ RH. Monkey posterior parietal cortex neurons antidromi-cally activated from superior colliculus. J Neurophysiol 78: 3493–3497,1997.
SEGRAVES MA AND GOLDBERG ME. Functional properties of corticotectalneurons in the monkey’s frontal eye field. J Neurophysiol 58: 1387–1419,1987.
SIMPSON JI, GIOLLI RA, AND BLANKS RHI. The pretectal nuclear complex andaccessory optic system. In: Neuroanatomy of the Oculomotor System, editedby Buettner-Ennever JA. Amsterdam: Elsevier, 1988, p. 335–364.
SNIDER RS AND LEE JC. A Stereotaxic Atlas of the Monkey Brain. Chicago, IL:The University of Chicago Press, 1961.
SOMMER MA AND WURTZ RH. Frontal eye field neurons orthodromicallyactivated from the superior colliculus. J Neurophysiol 80: 3331–3333, 1998.
SOMMER MA AND WURTZ RH. Composition and topographical organization ofsignals sent from the frontal eye field to the superior colliculus. J Neuro-physiol 83: 1979–2001, 2000.
SZABO J AND COWAN WM. A stereotaxic atlas of the brain of the cynomolgusmonkey (Macaca fascicularis). J Comp Neurol 222: 265–300, 1984.
TAUBER ES AND ATKIN A. Optomotor responses to monocular stimulation:relation to visual system organization. Science 160: 1365–1367, 1968.
TAYLOR RB, WENNBERG RA, LOZANO AM, AND SHARPE JA. Central nystagmusinduced by deep-brain stimulation for epilepsy. Epilepsia 41: 1637–1641,2000.
TELKES I, DISTLER C, AND HOFFMANN K-P. Retinal ganglion cells projecting tothe nucleus of the optic tract and dorsal terminal nucleus of the accessoryoptic system in macaque monkeys. Eur J Neurosci 12: 2367–2375, 2000.
TER BRAAK JWG AND VAN VLIET AGM. Subcortical optokinetic nystagmus inthe monkey. Psychatr Neurol Neurochir 66: 277–283, 1963.
THURSTON SE, LEIGH RJ, CRAWFORD T, THOMPSON A, AND KENNARD C. Twodistinct deficits of visual tracking caused by unilateral lesions of cerebralcortex in humans. Ann Neurol 23: 266–273, 1988.
TUSA RJ, DEMER JL, AND HERDMAN SJ. Cortical areas involved in OKN andVOR in cats: cortical lesions. J Neurosci 9: 1163–1178, 1989.
TUSA RJ AND UNGERLEIDER LG. Fiber pathways of cortical areas mediatingsmooth pursuit eye movements in monkeys. Ann Neurol 23: 174–183, 1988.
VAN ESSEN DC AND MAUNSELL JHR. Two-dimensional maps of the cerebralcortex. J Comp Neurol 191: 255–281, 1980.
VOLCHAN E, ROCHA-MIRANDA CE, PICANCO-DINIZ CW, ZINSMEISSER B, BER-NARDES RF, AND FRANCA JG. Visual response properties of pretectal units in thenucleus of the optic tract of the opossum. Exp Brain Res 78: 380–386, 1989.
WALLMAN J. Subcortical optokinetic mechanisms. Rev Oculomot Res 5: 321–342, 1993.
WOOD CC, SPEAR PD, AND BRAUN JJ. Direction-specific deficits in horizontaloptokinetic nystagmus following removal of visual cortex in the cat. BrainRes 60: 231–237, 1973.
YAKUSHIN SB, GIZZI M, REISINE R, RAPHAN T, BUTTNER-ENNEVER J, AND
COHEN B. Functions of the nucleus of the optic tract (NOT). II. Control ofocular pursuit. Exp Brain Res 131: 433–447, 2000.
ZEE DS, TUSA RJ, HERDMAN SJ, BUTLER PH, AND GUCER G. Effects ofoccipital lobectomy upon eye movements in primate. J Neurophysiol 58:883–907, 1987.
2123CHARACTERIZATION OF THE CORTICAL PROJECTION TO NOT-DTN
J Neurophysiol • VOL 87 • APRIL 2002 • www.jn.org