
Treatment of experimental periodontal disease by photodynamic therapy in immunosuppressed rats
Upload
georgetownCategory
view
0download
0
382
q 2002 American Society for Photobiology 0031-8655/02 $5.0010.00
Photochemistry and Photobiology, 2002, 75(4): 382–391
Direct Near-infrared Luminescence Detection of Singlet OxygenGenerated by Photodynamic Therapy in Cells In Vitro and Tissues InVivo¶
Mark Niedre1, Michael S. Patterson2 and Brian C. Wilson*1
1Department of Medical Biophysics, Ontario Cancer Institute/University of Toronto, Toronto, Canada and2Hamilton Regional Cancer Center/McMaster University, Hamilton, Canada
Received 26 June 2001; accepted 9 January 2002
ABSTRACT
Singlet oxygen (1O2) is believed to be the major cytotoxicagent involved in photodynamic therapy (PDT). Mea-surement of 1O2 near-infrared (NIR) luminescence at1270 nm in biological environments is confounded by thestrongly reduced 1O2 lifetime and probably has neverbeen achieved. We present evidence that this is now pos-sible, using a new NIR-sensitive photomultiplier tube.Time-resolved 1O2 luminescence measurements weremade in various solutions of aluminum tetrasulphonatedphthalocyanine (AlS4Pc) and Photofrin. Measurementswere also performed on suspensions of leukemia cells in-cubated with AlS4Pc, and a true intracellular componentof the 1O2 signal was clearly identified. Time-resolvedanalysis showed a strongly reduced 1O2 lifetime and anincreased photosensitizer triplet-state lifetime in the in-tracellular component. In vivo measurements were per-formed on normal skin and liver of Wistar rats sensitizedwith 50 mg/kg AlS4Pc. In each case, a small but statisti-cally significant spectral peak was observed at 1270 nm.The 1O2 lifetime based on photon count rate measure-ments at 1270 nm was 0.03–0.18 ms, consistent with pub-lished upper limits. We believe that these are the firstdirect observations of PDT-generated intracellular and invivo 1O2. The detector technology provides a new tool forPDT research and possibly clinical use.
INTRODUCTION
Photodynamic Therapy (PDT) is a minimally invasive treat-ment modality for cancer and other conditions (1,2). The
¶Posted on the web site on January 28, 2002.*To whom correspondence should be addressed at: Department of
Medical Biophysics, Ontario Cancer Institute, 610 University Av-enue, Toronto, ON M5G 2M9, Canada. e-mail: [email protected]
Abbreviations: AlS4Pc, tetrasulfonated aluminum phthalocyanine;BSA, bovine serum albumin; D2O, deuterium oxide; FWHM, fullwidth at half maximum; HSA, human serum albumin; MCS, mul-tichannel scaler; NaN3, sodium azide; NIR, near infrared; 1O2,singlet oxygen; OD, optical density; OPO, optical parametric os-cillator; PDT, photodynamic therapy; PMT, photomultiplier tube;PS, photosensitizer.
therapy utilizes a photosensitizing drug, usually administeredsystemically or topically, which may be preferentially local-ized in, for example, solid tumors. The photosensitizer isthen irradiated with a light source tuned to a wavelength tomatch the absorption spectrum of the drug. The subsequentphotochemical reaction results in oxygen-mediated destruc-tion or modification of the target tissue.
The main cytotoxic agent in PDT is widely believed (3)to be singlet oxygen [1O2 (1Dg)], a highly reactive oxygenspecies that oxidizes biological substrates. Critical sites ofaction for 1O2 in PDT include mitochondria, DNA and lipidmembranes (4,5). Sustained exposure of the treated tissue to1O2 results in breakdown of cellular microstructures and celldeath.
1O2 is produced by the following Type-II photochemicalpathway (6):
S 1 hn → S (1a)0 0 1
S → T (1b)1 1
3 1T 1 O → S 1 O (1c)1 2 0 2
where S0, S1 and T1 are the photosensitizer ground state, firstexcited singlet state and first excited triplet state, respective-ly and 3O2 and 1O2 are the ground-state triplet and excitedsinglet states of oxygen, respectively. Once produced, a mol-ecule of 1O2 can undergo nonradiative decay, oxidize sur-rounding biomolecules or undergo radiative decay at around1270 nm. The time-resolved measurement of this near-infra-red (NIR) emission is a commonly used method for deter-mining 1O2 lifetimes and quantum yields in solution (7).
Measurement of the NIR luminescence during PDT treat-ment is potentially of value as a direct dosimetry metric (8),so that the ability to detect 1O2 luminescence in true biolog-ical environments has been attempted previously. Several in-vestigators have reported positive results from cells in sus-pension (9,10) or red cell ghosts (11). However, these haveeither required the use of deuterium oxide (D2O) to increasethe lifetime of 1O2 and eliminate absorption of the 1270 nmluminescence by H2O or did not adequately distinguish be-tween intracellular and extracellular 1O2. Hence, the resultsdo not reflect optical and photophysical conditions presentin vitro or in vivo and so should not be interpreted as suc-cessful 1O2 measurements in biological environments.
Photochemistry and Photobiology, 2002, 75(4) 383
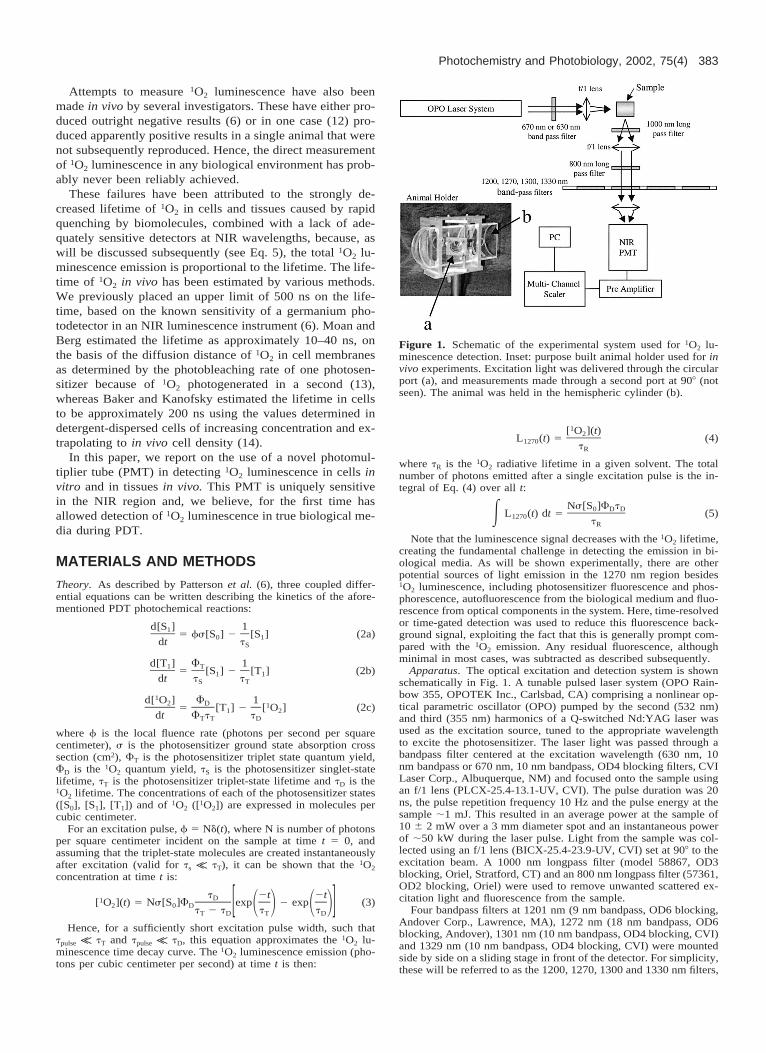
Figure 1. Schematic of the experimental system used for 1O2 lu-minescence detection. Inset: purpose built animal holder used for invivo experiments. Excitation light was delivered through the circularport (a), and measurements made through a second port at 908 (notseen). The animal was held in the hemispheric cylinder (b).
Attempts to measure 1O2 luminescence have also beenmade in vivo by several investigators. These have either pro-duced outright negative results (6) or in one case (12) pro-duced apparently positive results in a single animal that werenot subsequently reproduced. Hence, the direct measurementof 1O2 luminescence in any biological environment has prob-ably never been reliably achieved.
These failures have been attributed to the strongly de-creased lifetime of 1O2 in cells and tissues caused by rapidquenching by biomolecules, combined with a lack of ade-quately sensitive detectors at NIR wavelengths, because, aswill be discussed subsequently (see Eq. 5), the total 1O2 lu-minescence emission is proportional to the lifetime. The life-time of 1O2 in vivo has been estimated by various methods.We previously placed an upper limit of 500 ns on the life-time, based on the known sensitivity of a germanium pho-todetector in an NIR luminescence instrument (6). Moan andBerg estimated the lifetime as approximately 10–40 ns, onthe basis of the diffusion distance of 1O2 in cell membranesas determined by the photobleaching rate of one photosen-sitizer because of 1O2 photogenerated in a second (13),whereas Baker and Kanofsky estimated the lifetime in cellsto be approximately 200 ns using the values determined indetergent-dispersed cells of increasing concentration and ex-trapolating to in vivo cell density (14).
In this paper, we report on the use of a novel photomul-tiplier tube (PMT) in detecting 1O2 luminescence in cells invitro and in tissues in vivo. This PMT is uniquely sensitivein the NIR region and, we believe, for the first time hasallowed detection of 1O2 luminescence in true biological me-dia during PDT.
MATERIALS AND METHODS
Theory. As described by Patterson et al. (6), three coupled differ-ential equations can be written describing the kinetics of the afore-mentioned PDT photochemical reactions:
d[S ] 11 5 fs[S ] 2 [S ] (2a)0 1dt tS
d[T ] F 11 T5 [S ] 2 [T ] (2b)1 1dt t tS T
1d[ O ] F 12 D 15 [T ] 2 [ O ] (2c)1 2dt F t tT T D
where f is the local fluence rate (photons per second per squarecentimeter), s is the photosensitizer ground state absorption crosssection (cm2), FT is the photosensitizer triplet state quantum yield,FD is the 1O2 quantum yield, tS is the photosensitizer singlet-statelifetime, tT is the photosensitizer triplet-state lifetime and tD is the1O2 lifetime. The concentrations of each of the photosensitizer states([S0], [S1], [T1]) and of 1O2 ([1O2]) are expressed in molecules percubic centimeter.
For an excitation pulse, f 5 Nd(t), where N is number of photonsper square centimeter incident on the sample at time t 5 0, andassuming that the triplet-state molecules are created instantaneouslyafter excitation (valid for ts K tT), it can be shown that the 1O2
concentration at time t is:
t 2t 2tD1[ O ](t) 5 Ns[S ]F exp 2 exp (3)2 0 D 1 2 1 2[ ]t 2 t t tT D T D
Hence, for a sufficiently short excitation pulse width, such thattpulse K tT and tpulse K tD, this equation approximates the 1O2 lu-minescence time decay curve. The 1O2 luminescence emission (pho-tons per cubic centimeter per second) at time t is then:
1[ O ](t)2L (t) 5 (4)1270 tR
where tR is the 1O2 radiative lifetime in a given solvent. The totalnumber of photons emitted after a single excitation pulse is the in-tegral of Eq. (4) over all t:
Ns[S ]F t0 D DL (t) dt 5 (5)E 1270 tR
Note that the luminescence signal decreases with the 1O2 lifetime,creating the fundamental challenge in detecting the emission in bi-ological media. As will be shown experimentally, there are otherpotential sources of light emission in the 1270 nm region besides1O2 luminescence, including photosensitizer fluorescence and phos-phorescence, autofluorescence from the biological medium and fluo-rescence from optical components in the system. Here, time-resolvedor time-gated detection was used to reduce this fluorescence back-ground signal, exploiting the fact that this is generally prompt com-pared with the 1O2 emission. Any residual fluorescence, althoughminimal in most cases, was subtracted as described subsequently.
Apparatus. The optical excitation and detection system is shownschematically in Fig. 1. A tunable pulsed laser system (OPO Rain-bow 355, OPOTEK Inc., Carlsbad, CA) comprising a nonlinear op-tical parametric oscillator (OPO) pumped by the second (532 nm)and third (355 nm) harmonics of a Q-switched Nd:YAG laser wasused as the excitation source, tuned to the appropriate wavelengthto excite the photosensitizer. The laser light was passed through abandpass filter centered at the excitation wavelength (630 nm, 10nm bandpass or 670 nm, 10 nm bandpass, OD4 blocking filters, CVILaser Corp., Albuquerque, NM) and focused onto the sample usingan f/1 lens (PLCX-25.4-13.1-UV, CVI). The pulse duration was 20ns, the pulse repetition frequency 10 Hz and the pulse energy at thesample ;1 mJ. This resulted in an average power at the sample of10 6 2 mW over a 3 mm diameter spot and an instantaneous powerof ;50 kW during the laser pulse. Light from the sample was col-lected using an f/1 lens (BICX-25.4-23.9-UV, CVI) set at 908 to theexcitation beam. A 1000 nm longpass filter (model 58867, OD3blocking, Oriel, Stratford, CT) and an 800 nm longpass filter (57361,OD2 blocking, Oriel) were used to remove unwanted scattered ex-citation light and fluorescence from the sample.
Four bandpass filters at 1201 nm (9 nm bandpass, OD6 blocking,Andover Corp., Lawrence, MA), 1272 nm (18 nm bandpass, OD6blocking, Andover), 1301 nm (10 nm bandpass, OD4 blocking, CVI)and 1329 nm (10 nm bandpass, OD4 blocking, CVI) were mountedside by side on a sliding stage in front of the detector. For simplicity,these will be referred to as the 1200, 1270, 1300 and 1330 nm filters,
384 Mark Niedre et al.
respectively. The 1270 nm filter corresponds to the peak of the 1O2
luminescence spectrum, whereas the 1300 nm filter is off peak butstill within the 1O2 emission band (;15% of peak). The 1200 nmand 1330 nm filters, which lie outside the 1O2 band, were used todetermine the background fluorescence. The latter also served tocheck for a potential water-absorption artifact (see subsequent dis-cussion). For some later experiments, two additional filters at 1250nm (10 nm bandpass, OD4 blocking, CVI) and 1285 nm (10 nmbandpass, OD4 blocking, CVI) were added to provide further spec-tral resolution. The overall numerical aperture of the detection sys-tem was approximately 1.
The detector was a liquid nitrogen–cooled PMT (model R5509–42, Hamamatsu Corp., Bridgewater, NJ). This has a uniquely broadspectral response from 300 to 1400 nm and therefore enabled ex-tremely sensitive detection in the 1200–1330 nm range. Its rapidtemporal response (3 ns) allowed photon counting of the 1O2 lumi-nescence. The operating voltage was set at 21500 V, at which thedark current was ,1 nA, resulting in negligible dark counts. ThePMT output was amplified and converted to a voltage pulse usinga high-speed current preamplifier (model SR445, Stanford ResearchSystems, Sunnyvale, CA). A multichannel scaler (MCS; modelSR430, Stanford) connected to a personal computer was used fortime-resolved single photon counting, with a typical temporal reso-lution of 80 ns. For some experiments, a dual-channel photon coun-ter (SR-400, Stanford) was used instead of the MCS to give thetime-integrated luminescence signal.
The PMT has a quantum efficiency of 0.9% at 1270 nm and, whenoperated in photon-counting mode, approximately 2 3 104 darkcounts per second. For a continuous source, the minimum detectablesignal (SNR 5 1) with a 1 s integration time is therefore 2.5 3 10215
W. This is approximately an order of magnitude lower than thesignal detectable with a liquid nitrogen–cooled germanium detector(6) under comparable conditions. It is primarily this improvement insensitivity that has enabled the successful detection of 1O2 lumines-cence from photodynamic sensitizers in cells and tissues, as reportedsubsequently.
Data collection. At each of the NIR detection wavelengths thesignal was summed over many laser pulses (at 10 Hz), typically600–2400, giving data collection times of 60–240 s per wavelength.Measurements were made in either ‘‘time-integrated’’ or ‘‘time-re-solved’’ mode. In the former, the delayed luminescence in the timeinterval .5 ms in solution and .10 ms in vivo after the laser pulsewas summed, thereby removing the fast fluorescence component.This yielded the time-integrated spectrum of the light emitted fromthe sample. Because the absolute luminescence intensities variedfrom sample to sample (particularly in vivo), each spectrum wascorrected for the system response at each wavelength and normal-ized to the signal at 1200 nm. The mean spectrum for each controlsolution, cell suspension or tissue without photosensitizer was thensubtracted from that of the corresponding photosensitized sample.
For time-resolved measurements, the complete time curve wasmeasured at 1270 nm, and the background (i.e. the time curve froma control sample at 1270 nm) was subtracted from it. Equation (6),a simplified version of Eq. (3), was then chi squared–fitted to thedata using commercial software (mmnlfit.m, Matlab 5, The Math-works Inc., Natick, MA), with tT, tD and A (5 Ns[S0]FD) as freeparameters.
t 2t 2tD1[ O ] 5 A exp 2 exp (6)2 1 2 1 2[ ](t 2 t ) t tT D T D
Experiments in solution. Solutions of photosensitizer were mea-sured in quartz cuvettes (1 3 1 3 4 cm), firstly for 2.5 mM tetra-sulfonated aluminum phthalocyanine (AlS4Pc; Porphyrin Products,UT) in methanol and water, and Photofrin (QLT Phototherapeutics,Vancouver, BC, Canada) in methanol to confirm that the lifetimeswere in agreement with literature values. Subsequently, all solutionstudies were done with 6 mM AlS4Pc. The biophysical complexitywas then increased by adding bovine serum albumin (BSA; SigmaChemical Co., St. Louis, MO) in water up to a molar ratio of [BSA]/[AlS4Pc] 5 400, to provide a protein-rich environment to bind thephotosensitizer and possibly quench 1O2.
In order to confirm that the 1270 nm signal was due to 1O2, aknown 1O2 quencher (15), sodium azide (NaN3; Sigma), was addedto AlS4Pc in water up to a concentration of 2 M. As a final check
that the background corrected signal was caused only by 1O2 lumi-nescence, a solution of PS and BSA ([BSA]/[AlS4Pc] 5 200) wasprepared. NaN3 was then added to the solution so that the finalconcentration of NaN3 in the cuvette was 0.5 M, and the full timesignal was measured. Because the NaN3 completely quenches the1O2 luminescence but has little effect on the photosensitizer tripletstate, the intent was to rule out the (unlikely) possibility that thetriplet-state phosphorescence has a spectral peak in the 1270 nmregion and so could be mistaken for the 1O2 signal, for which thekinetics would be similar. The rationale was that the NaN3 wouldcompletely quench the 1O2 luminescence but not affect any photo-sensitizer (PS) triplet-state phosphorescence.
Experiments in cell suspensions. AML5 or P388 leukemia cellswere grown to confluence in suspension (in a-mem or RPMI media,respectively, with 10% fetal bovine serum (GIBCO, Life Technol-ogies Inc., Rockville, MD) and incubated with 3 or 6 mM AlS4Pcfor 24 h. Immediately before measurements, the cells were spun at5000 rpm for 5 min, resuspended in fresh medium, agitated for 10min, spun a second time and resuspended in fresh media, in orderto minimize the residual photosensitizer in the media. It should benoted that a large amount of the original PS used for incubation waswashed out during this step. The suspension was then rapidly trans-ferred to the measurement cuvette at a concentration of 50 3 106
cells per milliliter. This will be referred to as the ‘washed’ cellsuspension.
Two checks were made to discriminate between AlS4Pc in thecells and photosensitizer that may have leaked from the washed cellsinto the media before or during the luminescence measurements(typically ,30 min). Firstly, the washed suspension was spun downimmediately after the luminescence measurement, and cells that hadnot been incubated with AlS4Pc were added to the supernatant atthe same concentration and a second scan performed. This procedurere-created the same light scattering conditions in the sample. Thedifference between these two sets of scans then represented the frac-tion of the 1O2 signal originating from the cells in the washed sus-pension. Secondly, NaN3 was added to the washed cell suspensionafter the initial scan so that the final concentration of NaN3 in thecuvette was 0.5 M. The suspension was then rescanned immediatelyat 1270 nm only (completed within 2 min). Assuming that this timedelay was not sufficient to allow significant NaN3 diffusion into thecells but was long enough to completely quench the 1O2 in the me-dia, this determined the fraction of 1O2 signal originating from thecells only. Subsequent scans were performed 7 and 15 min later tolook for loss of signal as the NaN3 diffused into the cells.
For each set of cell suspension experiments, time-resolved scanswere also performed on control, unincubated cells to determine thebackground signal at each wavelength. In all cases, experimentswere repeated in triplicate.
Experiments in vivo. The feasibility of 1O2 luminescence detec-tion from photosensitizer in tissue in vivo was investigated in a smallnumber of Wistar rats (Charles River Laboratories Inc., Wilmington,MA). Four rats were injected i.p. with 50 mg/kg AlS4Pc, and fourwere uninjected controls. One of each was used in each experimentalrun to minimize the effect of any changes in instrument response.At 24 h after injection, the animals were anesthetized by i.p. injec-tion of 4.8 mg Xylazine (Bayer Inc., Toronto, ON, Canada) and 30mg Ketalean (MTC Pharmaceuticals, Cambridge, ON, Canada). Insix animals (three drugged, three control) the skin was irradiated,for which the abdomen was shaved and depilated (Nair, Carter-Hor-ner Inc., Mississauga, ON, Canada). For the final two of these, mea-surements were taken also with the two additional filter wavelengths(1250 and 1285 nm). In the remaining two animals the liver wasirradiated, for which an upper abdominal incision was made to ex-pose the liver surface, as described by Patterson et al. (16).
For the measurements the animals were placed in a purpose-builtholder (see Fig. 1, insert). The laser beam (3 mm diameter) wasdirected at 458 to the tissue surface and the signal measured at 908to the incident beam. Measurements were repeated at two to fourdifferent points on each tissue. Immediately after completing themeasurements, the animals were euthanized by intracardiac injectionof T-61 (Hoechst Roussel Vet, Whitby, SK, Canada). Liver and skinsamples outside the treated regions were removed for spectrofluor-imetric determination of the photosensitizer concentration using apreviously established protocol (17).

Photochemistry and Photobiology, 2002, 75(4) 385
Figure 2. 1O2 luminescence from simple solutions of AlS4Pc andPhotofrin in solution. A: Time-integrated spectra (.5 ms) for 2.5mM AlS4Pc in methanol, 2.5 mM AlS4Pc in H2O and 2.5 mM Pho-tofrin in methanol; errors are smaller than the symbol sizes. B: Time-integrated spectra (.5ms) for 2.5 mM AlS4Pc in H2O with additionalmeasurements made at 1250 and 1285 nm; errors are smaller thanthe symbol sizes. C: Time-resolved measurements at 1270 nm for2.5 mM AlS4Pc in methanol, 2.5 mM AlS4Pc in H2O and 2.5 mMPhotofrin in methanol, showing the best fits of Eq. (6).
RESULTS
Experiments in solution
Figure 2a shows the time-integrated spectra for AlS4Pc andPhotofrin in solution. Figure 2b shows the spectra measuredfor AlS4Pc in water with the two additional filters added. Ineach case, a peak was found at 1270 nm, consistent with 1O2
luminescence. Figure 2c shows the 1270 nm time-resolved
curves, together with the best fits of Eq. (6) to the data. Thederived photosensitizer triplet and 1O2 lifetimes are listed inTable 1, together with the values reported by Patterson etal. (6), obtained by frequency-domain 1O2 luminescencespectroscopy, and Krasnovsky (18), obtained by time-re-solved 1O2 luminescence measurements. Our values gener-ally agree well with the published data, indicating that thetime-resolved system performed correctly and supporting theinterpretation of the 1270 nm signal as caused by 1O2 lu-minescence.
The 1O2 detection limit was estimated using Eq. (5) forthe case of AlS4Pc in water. The irradiation volume wastaken as a cylinder of length 1 cm and diameter 3 mm. For2.5 mM AlS4Pc solutions the optical density was 0.11, sothat the volume was irradiated approximately uniformlythroughout. The total number of photosensitizer moleculesin this volume was ; 1014, which is much less than Nma 51.1 3 1016, where N is the number of photons per pulse andma (5 0.25 cm21) is the photosensitizer absorption coefficientat the irradiation wavelength, measured on a spectrometer(model UV160V, Shimadzu, Kyoto, Japan). Hence, all pho-tosensitizer molecules are excited during one 20 ns pulse,whereas the probability of more than one excitation cycleper molecule is low because the triplet-state yield is sub-stantial and tT k 20 ns. The 1O2 quantum yield, FD, wastaken as 0.38 (19), and its radiative lifetime in water, tR, wastaken as 5.55 ms (20). This yields ;2 3 107 molecules of1O2 that underwent radiative decay. The total number of pho-tons counted at 1270 nm (background subtracted) over 1200laser pulses was 16.0 6 0.1 103, so that each count corre-sponded, on average, to 1.3 6 0.1 3 103 1O2 molecules un-dergoing luminescence decay. Hence, for a minimum signalof 25 counts (SNR 5:1), the limiting detection sensitivity was;3 3 104 molecules. This is of the same order of magnitudeas an estimate based on the geometrical efficiency of thedetector system (;1%), the PMT quantum efficiency at 1270nm (;1%), the transmission of 1270 nm photons throughabout 4 mm of water (;30%) and the optical components(;20%) and the projection of the 1 cm long irradiation vol-ume onto the 3 mm wide photocathode (;30% overlap). Forthese values, 2 3 107 luminescence photons generated wouldyield ;40 counts.
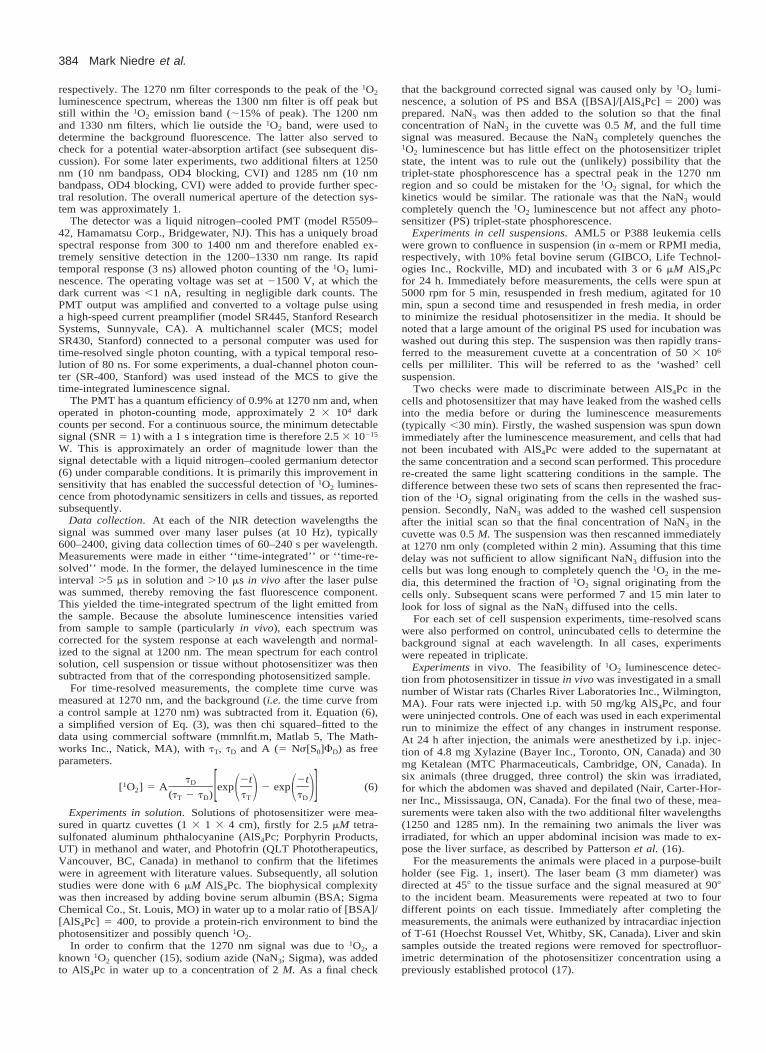
Figure 3 summarizes the time-resolved measurementswhen NaN3 was added in increasing concentration to AlS4Pcin water. For [NaN3] . 50 mM, the signal was detectablebut too noisy to analyze. It was observed that tD decreasedrapidly at first and then more slowly, whereas tT appearedto decrease slightly. The strong reduction in tD observed isconsistent with quenching of 1O2, and tD follows a Stern–Volmer quenching relationship. Figure 3b shows a linear re-lationship between the inverse lifetime and the concentrationof NaN3 as expected. The dashed line shows a quenchingconstant of kq 5 (4.4 6 2.0) 3 108 s21 M21 for 1O2. This isconsistent with the quenching constant of 5.76 3 108 s21
M21 for eosin Y and 5.83 3 108 s21 M21 for Rose Bengalmeasured by Hall and Chignell (15). In addition, the PStriplet state appeared to be quenched slowly with a quench-ing constant, kq, of 1.3 3 107 s21 M21. Slow quenching ofthe PS triplet state by NaN3 as a secondary effect has beenobserved previously (15), although a literature search failedto reveal rate constants for comparison.
386 Mark Niedre et al.
Table 1. Photosensitizer triplet state (tT) and 1O2 (tD) lifetimes (microseconds) for photosensitizers in solution, compared with publisheddata
Photosensitizerand solvent
Fits to Eq. 6
tT tD
Published values
tT tD
AlS4Pc in waterAlS4Pc in methanolPhotofrin in methanol
2.4 6 0.30.7 6 0.20.4 6 0.2
3.0 6 0.310.2 6 0.510.6 6 0.5
2.4 6 0.5*0.3 6 0.2*0.3 6 0.2*
3.0†8.5 6 0.5*9.0 6 0.5*
*Patterson et al. (6).†Krasnovsky et al. (18).
Figure 3. 1O2 luminescence for solutions of 6 mM AlS4Pc in waterwith increasing NaN3 concentration. A: Time-resolved measure-ments at 1270 nm, showing the best fits (.5 ms) to 0, 2.5, 12.5 and100 mM NaN3 concentrations. B: 1/tT and 1/tD vs NaN3 concentra-tion. The error bars correspond to variations in the fitted valuesbetween repeated experiments (N 5 3). The dotted lines show thefits to Stern–Volmer relationships (for 1O2, kq 5 4.4 3 108 M21 s21
and for the PS triplet state kq 5 1.3 3 107 M21 s21).
Figure 4. 1O2 luminescence for solutions of 6 mM AlS4Pc in waterwith increasing BSA:AlS4Pc molar ratio. A: Time-resolved mea-surements at 1270 nm showing the best fits (.5 ms) to 0:1, 1:3, 2:3 and 100:1 molar ratios. B: tT and tD vs molar ratio. The error barscorrespond to variations in the fitted values between repeated ex-periments (N 5 3).
Figure 4 shows the results of adding BSA. For [BSA]/[AlS4Pc] 5 400, tT increased from 2.4 6 0.3 to 20 6 2 ms.Similar increases in triplet-state lifetime have been reportedpreviously and attributed to binding to albumin and conse-quent shielding of the triplet state from diffusion of oxygenmolecules: for example, Foley et al. (21) reported an in-
crease in tT in aqueous phosphate buffered saline solutionsof sulphonated aluminum phthalocyanine bound to humanserum albumin (HSA) and Aveline et al. (22) reported thattT increased when HSA was added to aqueous solutions ofbenzoporphyrin derivative (BPD-MA). Over the same BSAconcentration range, our measured value of tD decreasedfrom 3.0 6 0.3 to 0.8 6 0.2 ms, presumably because of 1O2
quenching. A literature search failed to reveal another reportof this effect, but the decrease in tD seems plausible on thebasis of the known effects of quenching by proteins in bio-
Photochemistry and Photobiology, 2002, 75(4) 387
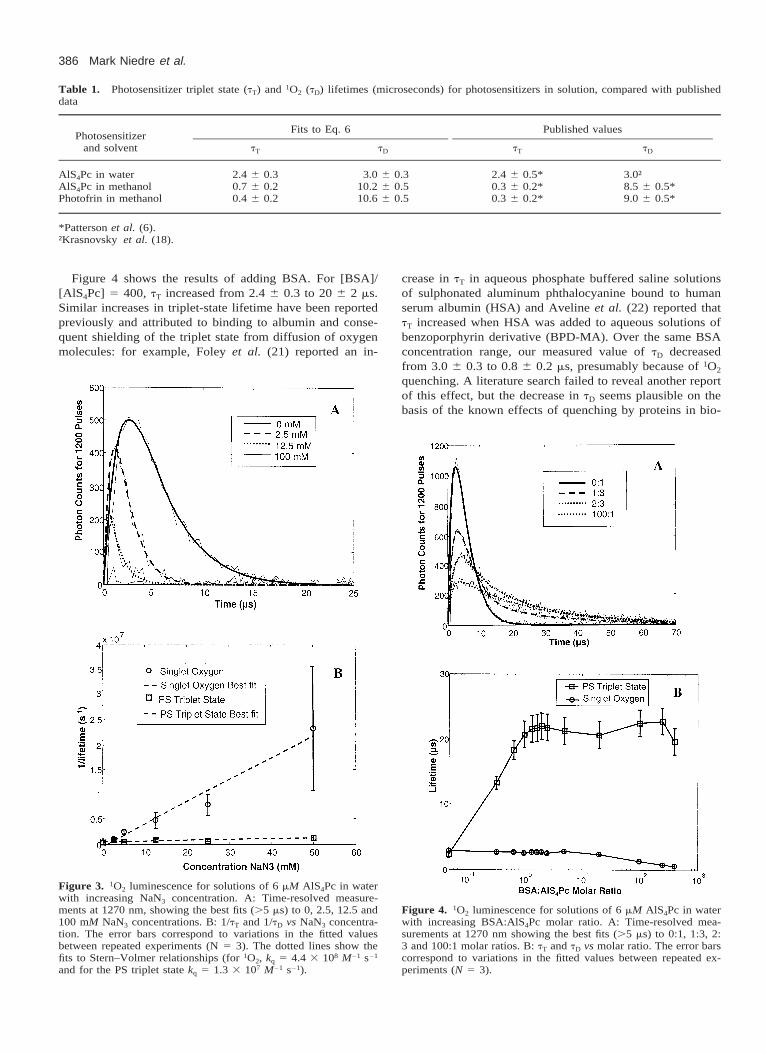
Figure 5. 1O2 luminescence from suspensions of AML5 murine leu-kemia cells. A: Time-integrated spectra (.5 ms) for (washed) sus-pensions incubated for 24 h with 6 or 3 mM AlS4Pc. The error barscorrespond to variations observed in repeated experiments. B: Time-resolved measurements at 1270 nm for (washed) suspension of in-cubated cells (6 mM AlS4Pc) and for the supernatant from this sus-pension with unincubated cells resuspended in it. The best-fit curvesshown are for tT1 5 3.2 6 0.5 ms, tD1 5 3.2 6 0.5 ms, tT2 5 19 63 ms and tD2 5 0.6 6 0.4 ms (incubated cells), and tT 5 3.2 6 0.2ms and tD 5 3.3 6 0.2 ms (supernatant 1 unincubated cells).
logical media. For [BSA]:[AlS4Pc] ratios between 1:3 and 1:1, a three-parameter fit to Eq. (6) yielded poor results (av-erage x2 5 18.9 per degree of freedom). A six-parameter fit(A1, tD1, tT1 and A2, tD2, tT2), assuming two components withdifferent lifetimes, gave (x2 5 2.8 per degree of freedom)tD1 5 3.1 6 0.5 ms, tT1 5 2.4 6 0.5 ms and tD2 5 3.1 6 0.5ms, tT2 5 20 6 4 ms. The value of A1 decreased monotoni-cally with increasing BSA concentration, whereas A2 in-creased. For [BSA]:[AlS4Pc] 5 1:3 and 1:1, A1/A2 was 0.96 0.1 and 0.10 6 0.05, respectively. The lifetimes shown inFig. 4b are the weighted averages of the two components:(A1·t1 1 A2·t2)/(A1 1 A2).
Finally, when NaN3 was added to solutions of BSA andPS, no signal was observed at 1270 nm after backgroundsubtraction (data not shown). We interpret this to mean thatthe long-lifetime signal was only caused by 1O2 lumines-cence and not by possible PS triplet-state phosphorescence.
Cell suspension experiments
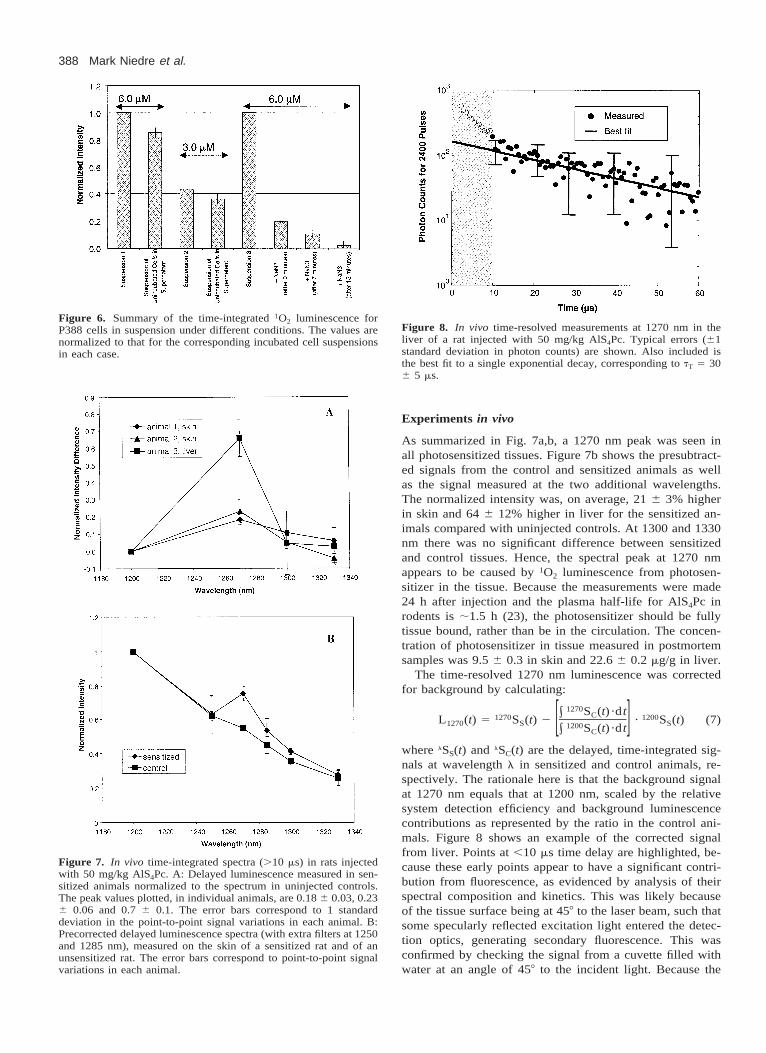
A statistically significant spectral peak was observed at 1270nm in cell suspensions, as shown in Fig. 5a. However, de-spite repeat washing of the cells before these measurements,a small quantity of photosensitizer was always found in themedia by the time the luminescence measurements werecompleted. Comparing the luminescence intensity from thesupernatant only (measured after the initial scan) with thatfrom media containing known photosensitizer concentra-tions, this was approximately 0.25 mM for cells incubatedwith 6 mM AlS4Pc. Hence, the signal from cell suspensionsrepresents 1O2 luminescence from both the cells and the me-dia.
Figure 5b shows the 1270 nm time-resolved curve for anAML5 cell suspension incubated with 6 mM AlS4Pc, as wellas that for the supernatant with the same concentration ofunincubated cells resuspended in it. For the former, a two-component (six-parameter) fit gave tT1 5 3.2 6 0.5 ms, tD1
5 3.2 6 0.5 ms and tT2 5 19 6 3 ms, tD2 5 0.6 6 0.4 ms,with a significantly lower x2 (2.3 per degree of freedom or1.4 with outliers removed) than a one-component fit (x2 5316 or 16.6 per degree of freedom). For the resuspension ofunincubated cells a single component fitted well (x2 5 3.5or 1.5 per degree of freedom), giving tT 5 3.3 6 0.2 ms, tD
5 3.3 6 0.2 ms, comparable to the values for AlS4Pc addedto media (2.7 6 0.5 and 2.7 6 0.5 ms, respectively) and tothe second component in the cell suspension.
In order to determine the fraction of signal originatingfrom intracellular photosensitizer, further experiments wereperformed on P388 cell suspensions incubated with 3 or 6mM AlS4Pc. In the washed suspension, the 1270 nm signal,after background subtraction, was 2.3 6 0.3 times higherwith a photosensitizer concentration of 6 mM than with 3mM. When the supernatant was removed after spinning downthe cells and unincubated cells added to it, the 1270 nmsignal after background correction was reduced by 15 6 2%and 16 6 2% for 5 and 2.5 mg/mL AlS4Pc, respectively.(The time from the last wash to completing the first set ofscans was ;30 min and between the start of the first andsecond measurements was ;40 min.) We interpret this tomean that only ;15% of the 1O2 luminescence from theincubated washed cell suspension originated from the cells
and 85% from trace photosensitizer in the media. It shouldbe noted that spinning the cells to obtain the supernatantprobably caused additional photosensitizer leakage from thecells, so that the 15% is a lower limit for the true intracel-lular fraction of the signal.
In the second determination of the intracellular fraction,the signal dropped to 19 6 3% immediately after addingNaN3 to the washed cell suspension. After 7 and 15 min, thevalue decreased further to 10 6 3% and 2 6 3%, respec-tively. In comparison, the 1270 nm luminescence signal fellto approximately 1% of the original value in a solution of2.5 mM AlS4Pc in cell-free media immediately upon additionof the same concentration of NaN3, showing that the timerequired for complete mixing of the NaN3 was negligible.We interpret these results to mean that 19 6 3% of the signalfrom the washed cell suspension was intracellular and thatsome time was required for the NaN3 to diffuse into the cellsand quench this remaining signal. The values for the intra-cellular fraction of the signal were therefore in good agree-ment between the two independent methods. Figure 6 sum-marizes these findings.
388 Mark Niedre et al.
Figure 6. Summary of the time-integrated 1O2 luminescence forP388 cells in suspension under different conditions. The values arenormalized to that for the corresponding incubated cell suspensionsin each case.
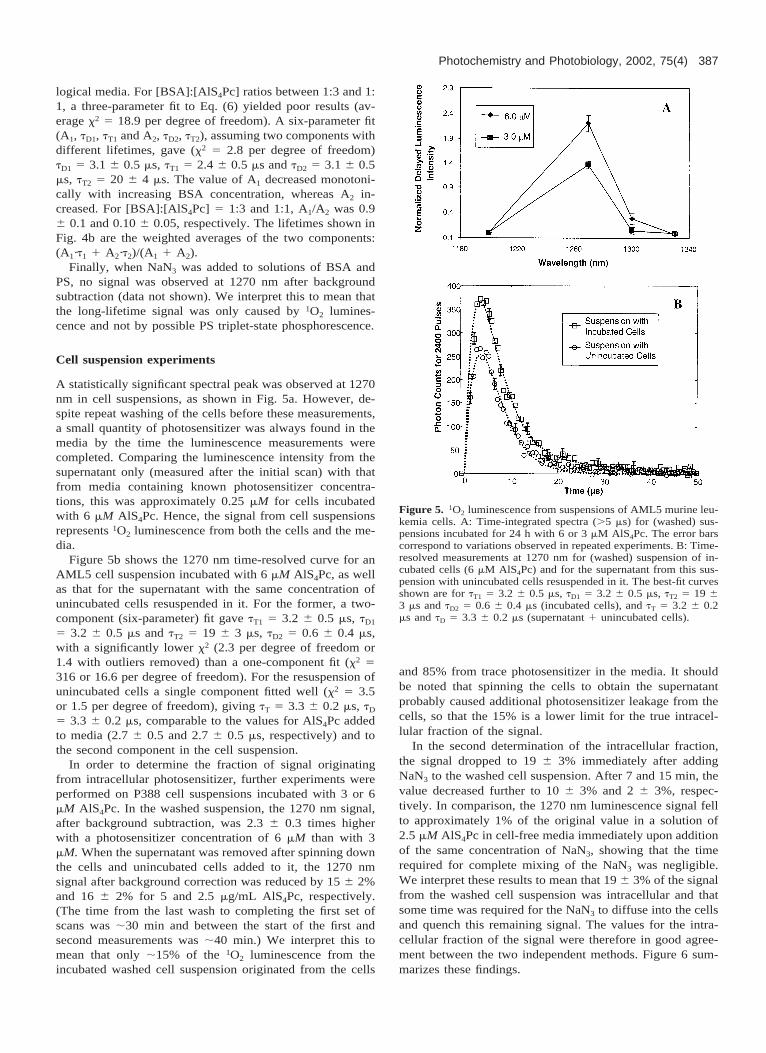
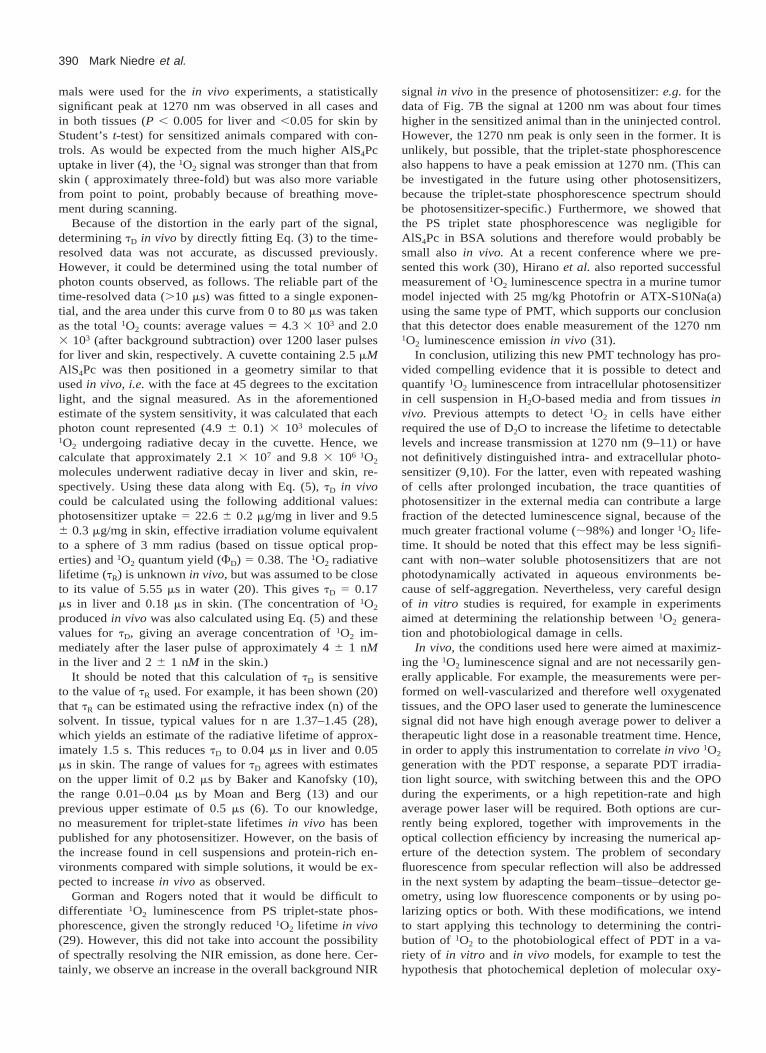
Figure 8. In vivo time-resolved measurements at 1270 nm in theliver of a rat injected with 50 mg/kg AlS4Pc. Typical errors (61standard deviation in photon counts) are shown. Also included isthe best fit to a single exponential decay, corresponding to tT 5 306 5 ms.
Figure 7. In vivo time-integrated spectra (.10 ms) in rats injectedwith 50 mg/kg AlS4Pc. A: Delayed luminescence measured in sen-sitized animals normalized to the spectrum in uninjected controls.The peak values plotted, in individual animals, are 0.18 6 0.03, 0.236 0.06 and 0.7 6 0.1. The error bars correspond to 1 standarddeviation in the point-to-point signal variations in each animal. B:Precorrected delayed luminescence spectra (with extra filters at 1250and 1285 nm), measured on the skin of a sensitized rat and of anunsensitized rat. The error bars correspond to point-to-point signalvariations in each animal.
Experiments in vivo
As summarized in Fig. 7a,b, a 1270 nm peak was seen inall photosensitized tissues. Figure 7b shows the presubtract-ed signals from the control and sensitized animals as wellas the signal measured at the two additional wavelengths.The normalized intensity was, on average, 21 6 3% higherin skin and 64 6 12% higher in liver for the sensitized an-imals compared with uninjected controls. At 1300 and 1330nm there was no significant difference between sensitizedand control tissues. Hence, the spectral peak at 1270 nmappears to be caused by 1O2 luminescence from photosen-sitizer in the tissue. Because the measurements were made24 h after injection and the plasma half-life for AlS4Pc inrodents is ;1.5 h (23), the photosensitizer should be fullytissue bound, rather than be in the circulation. The concen-tration of photosensitizer in tissue measured in postmortemsamples was 9.5 6 0.3 in skin and 22.6 6 0.2 mg/g in liver.
The time-resolved 1270 nm luminescence was correctedfor background by calculating:
1270# S (t) ·d tC1270 1200L (t) 5 S (t) 2 · S (t) (7)1270 S S1200[ ]# S (t) ·d tC
where lSS(t) and lSC(t) are the delayed, time-integrated sig-nals at wavelength l in sensitized and control animals, re-spectively. The rationale here is that the background signalat 1270 nm equals that at 1200 nm, scaled by the relativesystem detection efficiency and background luminescencecontributions as represented by the ratio in the control ani-mals. Figure 8 shows an example of the corrected signalfrom liver. Points at ,10 ms time delay are highlighted, be-cause these early points appear to have a significant contri-bution from fluorescence, as evidenced by analysis of theirspectral composition and kinetics. This was likely becauseof the tissue surface being at 458 to the laser beam, such thatsome specularly reflected excitation light entered the detec-tion optics, generating secondary fluorescence. This wasconfirmed by checking the signal from a cuvette filled withwater at an angle of 458 to the incident light. Because the

Photochemistry and Photobiology, 2002, 75(4) 389
Table 2. Summary of AlS4Pc triplet state (tT) and 1O2 (tD) life-times (microseconds) obtained in solution, cell suspensions and invivo
Medium tT tD
H2O 2.4 6 0.3 3.0 6 0.3MeOH 0.7 6 0.3 10.2 6 0.5
H2O 1 BSA (.2:1 molar ratio)Component 1Component 2
2.4 6 0.520 6 4
3.1 6 0.53.1 6 0.5
Cell suspensionComponent 1Component 2
3.2 6 0.519 6 3
3.2 6 0.50.6 6 0.4
Resuspension of supernatantwith unincubated cells
3.2 6 0.2 3.3 6 0.2
In vivo (liver)In vivo (skin)
30 6 526 6 5
0.03–0.170.04–0.18
initial rising part of the time-resolved curves was thus ob-scured, Eq. (6) could not be fitted reliably. Instead, a singleexponential decay was fitted to the data above 10 ms, givinga time constant of 30 6 5 ms. This can be attributed to thePS triplet state (i.e. tT 5 30 6 5 ms), because it is knownthat tT k tD in vivo. Similarly, a PS triplet-state lifetime of26 6 5 ms was measured in the skin.
Table 2 summarizes the various AlS4Pc triplet state and1O2 lifetimes obtained in these experiments in solution, cellsand tissue.
DISCUSSION
As in our earlier attempt to measure 1O2 luminescence invitro and in vivo (6), the luminescence spectrum was sam-pled here using discrete bandpass filters rather than a mono-chromator, in order to achieve the highest possible signal-tonoise-ratio. Although this limited the spectral information,the 1O2 luminescence signal should be unambiguous, be-cause it comprises a single peak at around 1270 nm with afull width at half maximum (FWHM) of ;30 nm (24) thatis adequately sampled by the 3 filters at 1200, 1270 and 1300nm. The 1200 nm and 1300 nm filters also allow subtractionof the background tissue and photosensitizer fluorescence.The 1250 nm and 1285 nm filters were added in later ex-periments to provide further spectral confirmation of the1270 nm peak. The agreement in simple solutions betweenour measured photosensitizer triplet state and 1O2 lifetimesand the published values, and the observed spectral peak at1270 nm, support the interpretation of the signal as 1O2 lu-minescence, as does the elimination of the 1270 nm signalby NaN3.
The extra filter was added at 1330 nm to cross-check fora possible differential light absorption artifact in vivo thatcould arise as follows. Water has a local absorption maxi-mum at 1190 nm and a minimum at around 1270 nm (25).Hence, if the PDT treatment caused an increase in tissuehydration, this could give rise to an artifactual increase inthe 1270 nm signal relative to the 1200 nm signal. However,because the water absorption increases from 1300 to 1330nm, such altered hydration would also produce a signal at1330 nm that is less than that at 1300 nm. This was not
observed (Fig. 7), so that we conclude that this hydrationartifact does not occur and that the 1270 nm peak seen invivo is the true 1O2 luminescence.
In simple solutions, it was observed that the PS tripletstate lifetime was longer in water than in methanol. Thiseffect has been observed previously (12) and has been attri-buted to higher solubility of oxygen in methanol than inwater.
As BSA was added to solutions of AlS4Pc in water, tT
increased from 2.4 6 0.3 ms in the self-aggregated, unboundstate (with no BSA) to 20 6 2 ms for the likely completelybound state ([BSA]/[AlS4Pc] $ 2). For molar ratios between1:3 and 1:1, curve fitting indicated two distinct sets of ki-netics, corresponding approximately to unbound and boundvalues for tT. As the concentration of BSA increased, thesignal from the bound (long tT) and unbound (short tT) frac-tions monotonically increased and decreased, respectively.Hence, the measurement system appears to be sensitiveenough to distinguish between two components in a samplewith different photophysical kinetics that are at least quali-tatively indicative of the microenvironment. Ideally, thiswould be verified by independently measuring tT using apulsed transient absorption spectroscopy system such as thatused by Aveline et al. (22). We are currently planning toadd this capability to our experimental system.
In the cell suspension experiments, it was critical to dem-onstrate that the observed 1O2 luminescence originated fromintracellular photosensitizer in the cells, not in the media.This has been a potential artifact in other published studiesin vitro that have reported positive results (9,10). The factthat only some 15–19% of the signal appeared to come fromthe cells, even using a long photosensitizer incubation time(to allow intracellular binding) and measuring as soon aspossible after multiple washing, reinforces this point. Theinterpretation of this fraction as truly intracellular in originis supported by the consistency between the resuspensionexperiments and the change in signal upon adding NaN3 toquench the 1O2 in the media. The kinetics of the 1O2 lumi-nescence also supports this conclusion. Thus, in resuspen-sion of the supernatant with unincubated cells, tT and tD
were the same as for solutions of AlS4Pc in media alone,but both were substantially different in the incubated cellsuspensions. Specifically in the latter, there appeared to betwo distinct sets of kinetics. One set (tT1 5 3.2 6 0.5 ms,tD1 5 3.2 6 0.5 ms) was comparable to AlS4Pc in media,whereas the other was significantly different, with increasedtriplet lifetime (tT2 5 19 6 3 ms) consistent with proteinbinding in the cellular environment and decreased 1O2 life-time (tD2 5 0.6 6 0.4 ms) consistent with increased quench-ing of 1O2. Other authors have reported similar results ofincreased tT in cells (22,26,27). For example, Aveline et al.(22) showed that, for benzoporphyrin derivative in pellets ofP388D1 and NBT-II cells, tT increased to approximately 23ms (again, tT in solution was lower but was not explicitlystated), whereas Truscott et al. (26) obtained a value of 7.7ms using transient absorption spectroscopy in fibroblast sus-pensions incubated with hematoporphyrin derivative com-pared with 2.4 ms in water (6). Again, an experiment toindependently measure tT would be valuable to verify theseresults.
Although we recognize that only a small number of ani-
390 Mark Niedre et al.
mals were used for the in vivo experiments, a statisticallysignificant peak at 1270 nm was observed in all cases andin both tissues (P , 0.005 for liver and ,0.05 for skin byStudent’s t-test) for sensitized animals compared with con-trols. As would be expected from the much higher AlS4Pcuptake in liver (4), the 1O2 signal was stronger than that fromskin ( approximately three-fold) but was also more variablefrom point to point, probably because of breathing move-ment during scanning.
Because of the distortion in the early part of the signal,determining tD in vivo by directly fitting Eq. (3) to the time-resolved data was not accurate, as discussed previously.However, it could be determined using the total number ofphoton counts observed, as follows. The reliable part of thetime-resolved data (.10 ms) was fitted to a single exponen-tial, and the area under this curve from 0 to 80 ms was takenas the total 1O2 counts: average values 5 4.3 3 103 and 2.03 103 (after background subtraction) over 1200 laser pulsesfor liver and skin, respectively. A cuvette containing 2.5 mMAlS4Pc was then positioned in a geometry similar to thatused in vivo, i.e. with the face at 45 degrees to the excitationlight, and the signal measured. As in the aforementionedestimate of the system sensitivity, it was calculated that eachphoton count represented (4.9 6 0.1) 3 103 molecules of1O2 undergoing radiative decay in the cuvette. Hence, wecalculate that approximately 2.1 3 107 and 9.8 3 106 1O2
molecules underwent radiative decay in liver and skin, re-spectively. Using these data along with Eq. (5), tD in vivocould be calculated using the following additional values:photosensitizer uptake 5 22.6 6 0.2 mg/mg in liver and 9.56 0.3 mg/mg in skin, effective irradiation volume equivalentto a sphere of 3 mm radius (based on tissue optical prop-erties) and 1O2 quantum yield (FD) 5 0.38. The 1O2 radiativelifetime (tR) is unknown in vivo, but was assumed to be closeto its value of 5.55 ms in water (20). This gives tD 5 0.17ms in liver and 0.18 ms in skin. (The concentration of 1O2
produced in vivo was also calculated using Eq. (5) and thesevalues for tD, giving an average concentration of 1O2 im-mediately after the laser pulse of approximately 4 6 1 nMin the liver and 2 6 1 nM in the skin.)
It should be noted that this calculation of tD is sensitiveto the value of tR used. For example, it has been shown (20)that tR can be estimated using the refractive index (n) of thesolvent. In tissue, typical values for n are 1.37–1.45 (28),which yields an estimate of the radiative lifetime of approx-imately 1.5 s. This reduces tD to 0.04 ms in liver and 0.05ms in skin. The range of values for tD agrees with estimateson the upper limit of 0.2 ms by Baker and Kanofsky (10),the range 0.01–0.04 ms by Moan and Berg (13) and ourprevious upper estimate of 0.5 ms (6). To our knowledge,no measurement for triplet-state lifetimes in vivo has beenpublished for any photosensitizer. However, on the basis ofthe increase found in cell suspensions and protein-rich en-vironments compared with simple solutions, it would be ex-pected to increase in vivo as observed.
Gorman and Rogers noted that it would be difficult todifferentiate 1O2 luminescence from PS triplet-state phos-phorescence, given the strongly reduced 1O2 lifetime in vivo(29). However, this did not take into account the possibilityof spectrally resolving the NIR emission, as done here. Cer-tainly, we observe an increase in the overall background NIR
signal in vivo in the presence of photosensitizer: e.g. for thedata of Fig. 7B the signal at 1200 nm was about four timeshigher in the sensitized animal than in the uninjected control.However, the 1270 nm peak is only seen in the former. It isunlikely, but possible, that the triplet-state phosphorescencealso happens to have a peak emission at 1270 nm. (This canbe investigated in the future using other photosensitizers,because the triplet-state phosphorescence spectrum shouldbe photosensitizer-specific.) Furthermore, we showed thatthe PS triplet state phosphorescence was negligible forAlS4Pc in BSA solutions and therefore would probably besmall also in vivo. At a recent conference where we pre-sented this work (30), Hirano et al. also reported successfulmeasurement of 1O2 luminescence spectra in a murine tumormodel injected with 25 mg/kg Photofrin or ATX-S10Na(a)using the same type of PMT, which supports our conclusionthat this detector does enable measurement of the 1270 nm1O2 luminescence emission in vivo (31).
In conclusion, utilizing this new PMT technology has pro-vided compelling evidence that it is possible to detect andquantify 1O2 luminescence from intracellular photosensitizerin cell suspension in H2O-based media and from tissues invivo. Previous attempts to detect 1O2 in cells have eitherrequired the use of D2O to increase the lifetime to detectablelevels and increase transmission at 1270 nm (9–11) or havenot definitively distinguished intra- and extracellular photo-sensitizer (9,10). For the latter, even with repeated washingof cells after prolonged incubation, the trace quantities ofphotosensitizer in the external media can contribute a largefraction of the detected luminescence signal, because of themuch greater fractional volume (;98%) and longer 1O2 life-time. It should be noted that this effect may be less signifi-cant with non–water soluble photosensitizers that are notphotodynamically activated in aqueous environments be-cause of self-aggregation. Nevertheless, very careful designof in vitro studies is required, for example in experimentsaimed at determining the relationship between 1O2 genera-tion and photobiological damage in cells.
In vivo, the conditions used here were aimed at maximiz-ing the 1O2 luminescence signal and are not necessarily gen-erally applicable. For example, the measurements were per-formed on well-vascularized and therefore well oxygenatedtissues, and the OPO laser used to generate the luminescencesignal did not have high enough average power to deliver atherapeutic light dose in a reasonable treatment time. Hence,in order to apply this instrumentation to correlate in vivo 1O2
generation with the PDT response, a separate PDT irradia-tion light source, with switching between this and the OPOduring the experiments, or a high repetition-rate and highaverage power laser will be required. Both options are cur-rently being explored, together with improvements in theoptical collection efficiency by increasing the numerical ap-erture of the detection system. The problem of secondaryfluorescence from specular reflection will also be addressedin the next system by adapting the beam–tissue–detector ge-ometry, using low fluorescence components or by using po-larizing optics or both. With these modifications, we intendto start applying this technology to determining the contri-bution of 1O2 to the photobiological effect of PDT in a va-riety of in vitro and in vivo models, for example to test thehypothesis that photochemical depletion of molecular oxy-

Photochemistry and Photobiology, 2002, 75(4) 391
gen in tissue at high fluence rates is responsible for reducedphotodynamic efficacy because of decreased 1O2 generation(32). At the same time, we will evaluate the utility of 1O2
luminescence monitoring as a PDT dosimetry tool in com-parison with other direct and indirect dosimetry methods (8).If these studies are encouraging, we then intend to developthis system for clinical use during PDT treatments.
Acknowledgements This work was supported by the Canadian Can-cer Society under a grant from the National Cancer Institute of Can-ada. The authors wish to thank Hamamatsu Corp., Japan, and inparticular Dr. Ken Kaufmann, Hamamatsu, NJ, for providing thePMT system. Dr. Richard Hill, OCI, provided the AML5 cell lineand QLT Phototherapeutics, Vancouver, BC, Canada, kindly sup-plied Photofrin. The assistance of Kathryn Adams, Kristen Camp-bell, Jason Forbes, Dr. Brian McIlroy, Andrea Molckovsky, PoupakPournazari and Dr. Robert Weersink in performing these experi-ments is also gratefully acknowledged.
REFERENCES1. Fisher, A. M. R., A. L. Murphree and C. J. Gomer (1995) Clin-
ical and preclinical photodynamic therapy. Lasers Surg. Med.17, 2–31.
2. Stewart, F., P. Baas and W. Star (1998) What does photody-namic therapy have to offer radiation oncologists (or their can-cer patients)? Radiother. Oncol. 48, 233–248.
3. Weishaupt, K. R., C. J. Gomer and T. J. Dougherty (1976) Iden-tification of singlet oxygen as the cytotoxic agent in photo-in-activation of a murine tumor. Cancer Res. 36, 2326–2329.
4. Henderson, B. W. and T. J. Dougherty (1992) How does pho-todynamic therapy work? Photochem. Photobiol. 55, 145–157.
5. Epe, B., M. Pflaum and S. Boiteux (1993) DNA damage in-duced by photosensitizers in cellular and cell-free systems. Mu-tat. Res. 299, 135–145.
6. Patterson, M. S., S. J. Madsen and B. C. Wilson (1990) Exper-imental tests of singlet oxygen luminescence monitoring in vivoduring photodynamic therapy. J. Photochem. Photobiol. B5, 69–84.
7. Krasnovsky, A. A. (1998) Singlet molecular oxygen in photo-biochemical systems: IR phosphorescence studies. Membr. Cell.Biol. 12, 665–690.
8. Wilson, B. C., M. S. Patterson and L. Lilge (1997) Implicit andexplicit dosimetry in photodynamic therapy: a new paradigm.Lasers Med. Sci. 12, 182–199.
9. Baker, A. and J. R. Kanofsky (1991) Direct observation of sin-glet oxygen phosphorescence at 1270 nm from L1210 leukemiacells exposed to polyporphyrin and light. Arch. Biochem. Bio-phys. 186, 70–75.
10. Baker, A. and J. R. Kanofsky (1993) Time-resolved studies ofsinglet-oxygen emission from L1210 leukemia cells labeledwith 5-(N-hexadecanoyl) amino eosin: a comparison with a one-dimensional model of singlet-oxygen diffusion and quenching.Photochem. Photobiol. 57, 720–727.
11. Oelckers, S., T. Ziegler, I. Michler and B. Roder (1999) Time-resolved detection of singlet oxygen luminescence in red-cellghost suspensions: concerning a signal component that can beattributed to 1O2 luminescence from the inside of a native mem-brane. J. Photochem. Photobiol. B53, 121–127.
12. Parker, J. G. (1987) Optical monitoring of singlet oxygen duringphotodynamic treatment of tumors. IEEE Circ. Devices Mag.January, 10–21.
13. Moan, J. and K. Berg (1991) The photodegradation of porphy-rins in cell can be used to estimate the lifetime of singlet oxy-gen. Photochem. Photobiol. 53, 549–553.
14. Baker, A. and J. R. Kanofsky (1992) Quenching of singlet ox-ygen by biomolecules from L1210 leukemia cells. Photochem.Photobiol. 55, 523–528.
15. Hall, R. D. and C. F. Chignell (1987) Steady-state near-infrared
detection of singlet molecular oxygen: a Stern–Volmer quench-ing experiment with sodium azide. Photochem. Photobiol. 45,459–464.
16. Patterson, M. S., B. C. Wilson and R. Graff (1990) In vivo testsof the concept of photodynamic threshold dose in normal ratliver photosensitized by aluminum chlorosulphonated phthalo-cyanine. Photochem. Photobiol. 51, 343–349.
17. Lilge, L., C. O’Carroll and B. C. Wilson (1997) A solubilizationtechnique for photosensitizer quantification in ex vivo tissuesamples. J. Photochem. Photobiol. B39, 229–235.
18. Krasnovsky Jr., A. A. (1981) Quantum yield of photosensitizedluminescence and radiative lifetime of singlet (1Dg) molecularoxygen in solution. Chem. Phys. Lett. 81, 443–445.
19. Fernandez, J. M., M. D. Bilgin and L. I. Grossweiner (1997)Singlet oxygen generation by photodynamic agents. J. Photo-chem. Photobiol. B37, 131–140.
20. Poulsen, T. D., P. R. Ogilby and K. V. Mikkelsen (1998) Sol-vent effects on the O2(a1Dg)-O2(X3Sg
2) radiative transition: com-ments regarding charge-transfer interactions. J. Phys. Chem. A.102, 9829–9832.
21. Foley, M. S. C., A. Beeby, A. W. Parker, S. M. Bishop and D.Phillips (1997) Excited triplet state photophysics of the sulpho-nated aluminium phthalocyanines bound to human serum al-bumin. J. Photochem. Photobiol. B33, 10–17.
22. Aveline, B. M., T. Hasan and R. W. Redmond (1995) The ef-fects of aggregation, protein binding and cellular incorporationon the photophysical properties of benzoporphyrin derivativemonoacid ring A (BPD-MA). J. Photochem. Photobiol. B30,161–169.
23. Peng, Q., J. Moan, M. Kongshaug, J. F. Evensen, H. Anholtand C. Rimington (1991) Sensitizer for the photodynamic ther-apy of cancer: a comparison of the tissue distribution of Pho-tofrin II and aluminum phthalocyanine tetrasulfonated in nudemice bearing a human malignant tumor. Int. J. Cancer 48, 258–264.
24. Wessels, J. M. and M. A. J. Rodgers (1995) Detection of theO2(1Dg) → O2(3S2
g) transition in aqueous environments: a Fou-rier-transform near infrared luminescence study. J. Phys. Chem.99, 15725–15727.
25. Driscoll, W. and W. Vaughan (1978) Handbook of Optics, Op-tical Society of America. McGraw-Hill Book Company, NewYork.
26. Truscott, T. G., A. J. McLean, A. M. R. Phillips and W. S.Foulds (1988) Detection of heamatoporphyrin derivative andhaematorporphyrin excited states in cell environments. CancerLett. 41, 31–35.
27. Firey, P. A., T. W. Jones, G. Jori and M. A. J. Rodgers (1988)Photoexcitation of zinc phthalocyanine in mouse myeloma cells:the observation of triplet states but not of singlet oxygen. Pho-tochem. Photobiol. 48, 357–360.
28. Bolin, F. P., L. E. Preuss, R. C. Taylor and R. J. Ference (1989)Refractive index of some mammalian tissues using a fiber opticcladding method. Appl. Opt. 28, 2297–2303.
29. Gorman, A. A. and M. A. J. Rogers (1992) Current perspectivesof singlet oxygen detection in biological environments. J. Pho-tochem. Photobiol. B14, 159–176.
30. Wilson, B. C., M. Niedre and M. S. Patterson (2001) Detectionof PDT-generated singlet oxygen in vitro and in vivo by near-infrared luminesecence. IPA 8th World Congress of Photody-namic Medicine, Vancouver, BC, Canada. [Abstract]
31. Hirano, T., E. Kohno and T. O. Yoshida (2001) Detection of1.27 mm emission from singlet oxygen in photodynamic thera-py. IPA 8th World Congress of Photodynamic Medicine, Van-couver, BC, Canada. [Abstract]
32. Robinson, D. J., R. S. de Bruijn, N. van der Veen, M. R. String-er, S. B. Brown and W. M. Star (1998) Fluorescence photo-bleaching of ALA-induced protoporphyrin IX during photody-namic therapy of normal hairless mouse skin: the effect of lightdose and fluence rate and the resulting biological effect. Pho-tochem. Photobiol. 67, 140–149.
Copyright © 2022 FDOKUMEN