Luminescence dating of Middle Stone Age Deposits at Die Kelders
29
James K. Feathers & Daniel A. Bush Department of Anthropology, University of Washington, Box 353100, Seattle, WA, 98195-3100, U.S.A. E-mail: [email protected] [email protected] Received 18 May 1998 Revision received 22 March 1999 and accepted 7 June 1999 Keywords: luminescence dating, Die Kelders, Middle Stone Age, aeolian sediments, South Africa. Luminescence dating of Middle Stone Age Deposits at Die Kelders Luminescence dating of sediments has not been used extensively for dating Middle Stone Age deposits in South Africa, despite its potential for contributing to a poorly dated record. Such deposits at Die Kelders cave, on the southern South African coast, consist of narrow bands of occupation debris separated by thicker layers of aeolian sands containing much less evidence of occupation. Homo- geneous, aeolian sediments are usually considered ideal for lumines- cence dating. Here we report luminescence analyses of five samples from these sands that demonstrate sufficient bleaching prior to burial to validate dating and that yield ages of about 60–70 ka, in agreement with other evidence from sedimentology, archaeology and electron spin resonance. Lack of significant differences in the ages suggests the deposits accumulated fairly rapidly during the early part of the Last Glaciation. 2000 Academic Press Journal of Human Evolution (2000) 38, 91–119 Article No. jhev.1999.0351 Available online at http://www.idealibrary.com on Introduction Dating Middle Stone Age (MSA) deposits in southern Africa has long been problem- atic because much of the MSA is older than the practical limits of radiocarbon. Reliance has necessarily been placed on less accepted techniques. Among these, luminescence dating of sediments seems a suitable choice. Its dating range encompasses the MSA and it can date directly any depositional events that can be associated with exposure to sufficient sunlight. Yet, luminescence has so far been sparingly used for the MSA (Brooks et al., 1995; Feathers, 1997; Gru ¨n et al., 1996). Part of the problem is that much of the known MSA record is contained in rock- shelters and caves, complex sediment traps likely to provide less than ideal dating targets in terms of assessing radioactivity and of assuring sufficient bleaching in antiquity (e.g., Roberts et al., 1998). Die Kelders Cave, on the southern South African coast, seems exceptional in this regard. The MSA deposits consist of a series of thin ‘‘occupation horizons’’ rich in arte- facts, macrofauna and organic material, separated by thicker ‘‘non-occupation hori- zons’’ of rather homogeneous quartzose sand (Avery et al., 1997; Grine et al., 1991; Marean et al., this volume; Tankard & Schweitzer, 1974). The latter do contain some localized concentrations of bone and organic material but are largely free of occupational debris that could complicate radioactivity assessment. Moreover, the well-sorted sands of the non-occupation horizons are best interpreted from textural evidence as aeolian deposits, believed derived from ancient dunes on the now- submerged continental shelf (Tankard & Schweitzer, 1976). Homogeneous aeolian deposits are generally considered the best candidates for successful luminescence dating. Since the non-occupation layers neatly divide a series of more intense occu- pations, they provide an opportunity for a stratigraphic series of dates that bracket the occupational events of interest. There are some possible complications. One is contamination by poorly bleached 0047–2484/00/010091+29$35.00/0 2000 Academic Press
-
Upload
independent -
Category
Documents
-
view
1 -
download
0
Transcript of Luminescence dating of Middle Stone Age Deposits at Die Kelders

James K. Feathers &Daniel A. BushDepartment of Anthropology,University of Washington,Box 353100, Seattle, WA,98195-3100, U.S.A. E-mail:[email protected]@u.washington.edu
Received 18 May 1998Revision received 22 March1999 and accepted 7 June1999
Keywords: luminescencedating, Die Kelders, MiddleStone Age, aeoliansediments, South Africa.
Luminescence dating of Middle Stone AgeDeposits at Die Kelders
Luminescence dating of sediments has not been used extensively fordating Middle Stone Age deposits in South Africa, despite itspotential for contributing to a poorly dated record. Such deposits atDie Kelders cave, on the southern South African coast, consist ofnarrow bands of occupation debris separated by thicker layers ofaeolian sands containing much less evidence of occupation. Homo-geneous, aeolian sediments are usually considered ideal for lumines-cence dating. Here we report luminescence analyses of five samplesfrom these sands that demonstrate sufficient bleaching prior to burialto validate dating and that yield ages of about 60–70 ka, in agreementwith other evidence from sedimentology, archaeology and electronspin resonance. Lack of significant differences in the ages suggests thedeposits accumulated fairly rapidly during the early part of the LastGlaciation.
� 2000 Academic Press
Journal of Human Evolution (2000) 38, 91–119Article No. jhev.1999.0351Available online at http://www.idealibrary.com on
IntroductionDating Middle Stone Age (MSA) depositsin southern Africa has long been problem-atic because much of the MSA is older thanthe practical limits of radiocarbon. Reliancehas necessarily been placed on less acceptedtechniques. Among these, luminescencedating of sediments seems a suitable choice.Its dating range encompasses the MSA andit can date directly any depositional eventsthat can be associated with exposure tosufficient sunlight. Yet, luminescence has sofar been sparingly used for the MSA (Brookset al., 1995; Feathers, 1997; Grun et al.,1996). Part of the problem is that much ofthe known MSA record is contained in rock-shelters and caves, complex sediment trapslikely to provide less than ideal dating targetsin terms of assessing radioactivity and ofassuring sufficient bleaching in antiquity(e.g., Roberts et al., 1998).
Die Kelders Cave, on the southern SouthAfrican coast, seems exceptional in thisregard. The MSA deposits consist of a seriesof thin ‘‘occupation horizons’’ rich in arte-
0047–2484/00/010091+29$35.00/0
facts, macrofauna and organic material,separated by thicker ‘‘non-occupation hori-zons’’ of rather homogeneous quartzosesand (Avery et al., 1997; Grine et al., 1991;Marean et al., this volume; Tankard &Schweitzer, 1974). The latter do containsome localized concentrations of bone andorganic material but are largely free ofoccupational debris that could complicateradioactivity assessment. Moreover, thewell-sorted sands of the non-occupationhorizons are best interpreted from texturalevidence as aeolian deposits, believedderived from ancient dunes on the now-submerged continental shelf (Tankard &Schweitzer, 1976). Homogeneous aeoliandeposits are generally considered the bestcandidates for successful luminescencedating. Since the non-occupation layersneatly divide a series of more intense occu-pations, they provide an opportunity for astratigraphic series of dates that bracket theoccupational events of interest.
There are some possible complications.One is contamination by poorly bleached
� 2000 Academic Press
92 . . . .
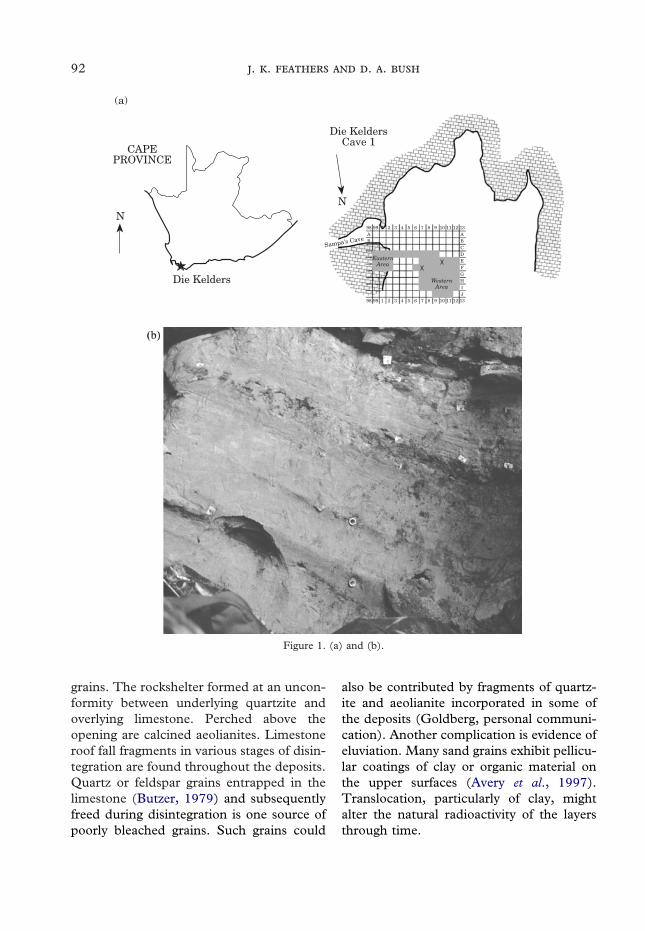
grains. The rockshelter formed at an uncon-formity between underlying quartzite andoverlying limestone. Perched above theopening are calcined aeolianites. Limestoneroof fall fragments in various stages of disin-tegration are found throughout the deposits.Quartz or feldspar grains entrapped in thelimestone (Butzer, 1979) and subsequentlyfreed during disintegration is one source ofpoorly bleached grains. Such grains could
also be contributed by fragments of quartz-ite and aeolianite incorporated in some ofthe deposits (Goldberg, personal communi-cation). Another complication is evidence ofeluviation. Many sand grains exhibit pellicu-lar coatings of clay or organic material onthe upper surfaces (Avery et al., 1997).Translocation, particularly of clay, mightalter the natural radioactivity of the layersthrough time.
98
Sampa's Cave
N
WesternArea
EasternArea
Die KeldersCave 1
99 1 2 3 4 5 6 7 8 9 10 11 12 13ABCDEFGHIJ
AB
98 99 1 2 3 4 5 6 7 8 9 10 11 12 13
CAPEPROVINCE
Die Kelders
N
(a)
Figure 1. (a) and (b).

93
Samples and procedures
Four samples were collected in a strati-graphic column in the eastern part of theexcavation from midpoints of layers 7, 9, 11and 13, youngest to oldest, separating MSAoccupation layers 6, 8, 10, and 12 (number-ing after Tankard & Schweitzer, 1974). Afifth sample was collected west of the othersfrom the upper part of the Layer 4/5 com-plex (Avery et al., 1997). Figure 1 shows thelocations. The samples were collected bydriving a metal pipe into cleaned profiles
and capping both ends. Small samplesfrom the intervening occupation layers werecollected for additional radioactivity assay.Sample locations were chosen far fromvisible roof fall.
Because of its abundance, quartz waschosen as the material for dating. A90–125 �m size fraction was prepared forluminescence analysis for all samples. Inaddition, a 4–11 �m multi-mineral fractionwas prepared for the samples from Layer 11and Layer 13. This not only provided anindependent assessment of the equivalent
Figure 1. (c).
Figure 1. Location of the luminescence samples. (a) Map showing the excavation units within Cave 1.Sample locations are marked with an ‘‘X’’. The samples from Layers 7, 9, 11, and 13 were drawn from thesouth face of excavation square F7. The samples from Layer 4/5 were drawn from the south face ofexcavation square E10. (b) Photo of the F7 profile, showing relatively sterile strata separated by dark, thinlayers of occupational debris. Samples were taken from midpoints of the sterile strata, from top to bottom,Layers 7, 9, 11 and 13. (c) Photo of the E10 profile showing the massive Layer 4/5. The circle near thetop of the photo is the end of the sample collection tube. (Photos by Barbara S. Hay.)
94 . . . .
dose, but also allowed evaluation of possiblecontamination from grains released fromroof fall. These should have a differentsize distribution than the aeolian sand andtherefore differentially affect the age fromthe two fractions. The 90–125 �m quartzfraction was isolated by sieving, treatmentwith HCl and H2O2, etching for 40 minwith 48% HF, and density separation fromminerals heavier than 2·66 specific gravityusing sodium polytungstate. The fine-grained fraction was isolated by settling inacetone after treatments with HCl andH2O2.
Thermoluminescence (TL), opticallystimulated luminescence (OSL) and infra-
red stimulated luminescence (IRSL) wereemployed for derivation of equivalent dose(DE). TL and OSL were measured from the90–125 �m quartz grains, IRSL from thefine-grains, the latter signal originating fromfeldspars. For TL, grains were dispersed onA1 planchets and normalized by weight. ForOSL, a monolayer of grains was secured onA1 discs by silicone spray. The fine grainsfor IRSL were settled onto A1 discs. Nor-malization for OSL and IRSL used 0·1 sshines. Normalization for TL used weight.TL measurements were from the so-calledslowly bleaching peak (SBP), which wasisolated by removing faster bleachingcomponents by exposure to 550 nm light,
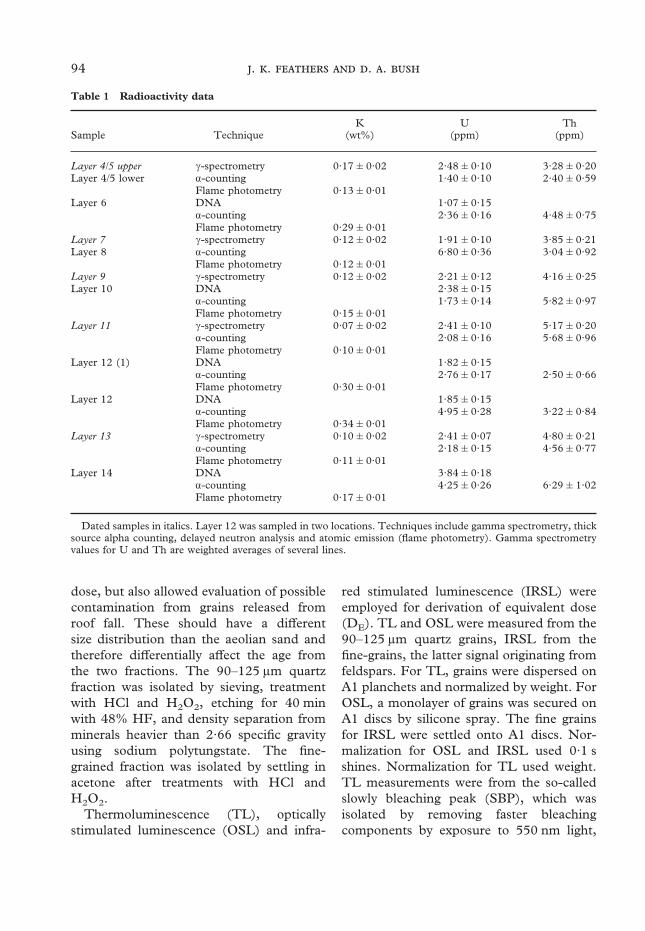
Table 1 Radioactivity data
Sample TechniqueK
(wt%)U
(ppm)Th
(ppm)
Layer 4/5 upper �-spectrometry 0·17�0·02 2·48�0·10 3·28�0·20Layer 4/5 lower �-counting 1·40�0·10 2·40�0·59
Flame photometry 0·13�0·01Layer 6 DNA 1·07�0·15
�-counting 2·36�0·16 4·48�0·75Flame photometry 0·29�0·01
Layer 7 �-spectrometry 0·12�0·02 1·91�0·10 3·85�0·21Layer 8 �-counting 6·80�0·36 3·04�0·92
Flame photometry 0·12�0·01Layer 9 �-spectrometry 0·12�0·02 2·21�0·12 4·16�0·25Layer 10 DNA 2·38�0·15
�-counting 1·73�0·14 5·82�0·97Flame photometry 0·15�0·01
Layer 11 �-spectrometry 0·07�0·02 2·41�0·10 5·17�0·20�-counting 2·08�0·16 5·68�0·96Flame photometry 0·10�0·01
Layer 12 (1) DNA 1·82�0·15�-counting 2·76�0·17 2·50�0·66Flame photometry 0·30�0·01
Layer 12 DNA 1·85�0·15�-counting 4·95�0·28 3·22�0·84Flame photometry 0·34�0·01
Layer 13 �-spectrometry 0·10�0·02 2·41�0·07 4·80�0·21�-counting 2·18�0·15 4·56�0·77Flame photometry 0·11�0·01
Layer 14 DNA 3·84�0·18�-counting 4·25�0·26 6·29�1·02Flame photometry 0·17�0·01
Dated samples in italics. Layer 12 was sampled in two locations. Techniques include gamma spectrometry, thicksource alpha counting, delayed neutron analysis and atomic emission (flame photometry). Gamma spectrometryvalues for U and Th are weighted averages of several lines.
95
following previously described procedures(Franklin & Hornyak, 1990; Feathers,1997). TL glow curves were obtained on aLittlemore glow oven in N2 atmosphereat 1�C/s. Luminescence was collected byan EMI 9635Q photomultiplier throughCorning 7-59 (blue) and Schott UG-11(ultraviolet) filters. OSL was measuredusing a halogen lamp source filtered to allowonly 500–540 nm light onto the sample andIRSL was measured using 880 nm lightemitting diodes, both on a Daybreak 1100automated system, using a 9235Q photo-multiplier with two Hoya U340 (ultraviolet)filters for OSL and two Schott BG39 (green-blue) filters for IRSL (Bortolot, 1997).Optical measurements were made at 100�Cto limit influence of low temperature traps.
Irradiations were by a 90Sr beta source,calibrated against 137Cs gamma sources,and a 241Am alpha source.
DE was determined using combined addi-tive dose and regeneration procedures.Regeneration followed exposures of 30 minfor OSL and IRSL and up to 22 hours forTL from a solar simulator (Applied PhysicsModel 9500). The ‘‘Australian slide’’ tech-nique (Huntley et al., 1993a), which con-trols for some of the problems in usingeither additive dose or regeneration alone(Prescott & Robertson, 1997), wasemployed in all cases. Both multi- andsingle-aliquot methods were employed forOSL, the single aliquot procedure followingDuller (1995) and using the luminescencecorrection method.
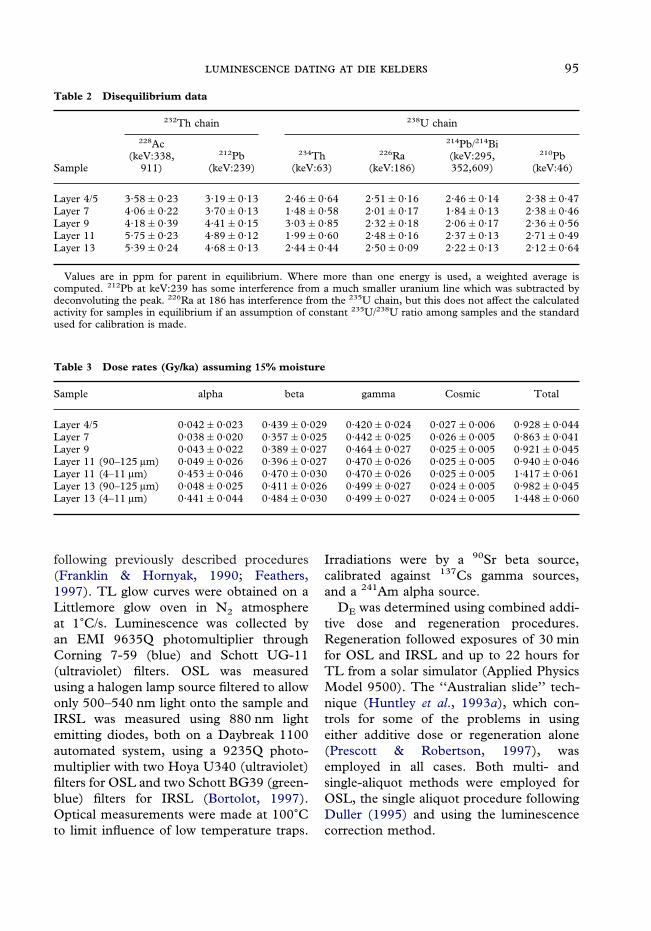
Table 2 Disequilibrium data
Sample
232Th chain 238U chain
228Ac(keV:338,
911)
212Pb(keV:239)
234Th(keV:63)
226Ra(keV:186)
214Pb/214Bi(keV:295,352,609)
210Pb(keV:46)
Layer 4/5 3·58�0·23 3·19�0·13 2·46�0·64 2·51�0·16 2·46�0·14 2·38�0·47Layer 7 4·06�0·22 3·70�0·13 1·48�0·58 2·01�0·17 1·84�0·13 2·38�0·46Layer 9 4·18�0·39 4·41�0·15 3·03�0·85 2·32�0·18 2·06�0·17 2·36�0·56Layer 11 5·75�0·23 4·89�0·12 1·99�0·60 2·48�0·16 2·37�0·13 2·71�0·49Layer 13 5·39�0·24 4·68�0·13 2·44�0·44 2·50�0·09 2·22�0·13 2·12�0·64
Values are in ppm for parent in equilibrium. Where more than one energy is used, a weighted average iscomputed. 212Pb at keV:239 has some interference from a much smaller uranium line which was subtracted bydeconvoluting the peak. 226Ra at 186 has interference from the 235U chain, but this does not affect the calculatedactivity for samples in equilibrium if an assumption of constant 235U/238U ratio among samples and the standardused for calibration is made.
Table 3 Dose rates (Gy/ka) assuming 15% moisture
Sample alpha beta gamma Cosmic Total
Layer 4/5 0·042�0·023 0·439�0·029 0·420�0·024 0·027�0·006 0·928�0·044Layer 7 0·038�0·020 0·357�0·025 0·442�0·025 0·026�0·005 0·863�0·041Layer 9 0·043�0·022 0·389�0·027 0·464�0·027 0·025�0·005 0·921�0·045Layer 11 (90–125 �m) 0·049�0·026 0·396�0·027 0·470�0·026 0·025�0·005 0·940�0·046Layer 11 (4–11 �m) 0·453�0·046 0·470�0·030 0·470�0·026 0·025�0·005 1·417�0·061Layer 13 (90–125 �m) 0·048�0·025 0·411�0·026 0·499�0·027 0·024�0·005 0·982�0·045Layer 13 (4–11 �m) 0·441�0·044 0·484�0·030 0·499�0·027 0·024�0·005 1·448�0·060
96 . . . .
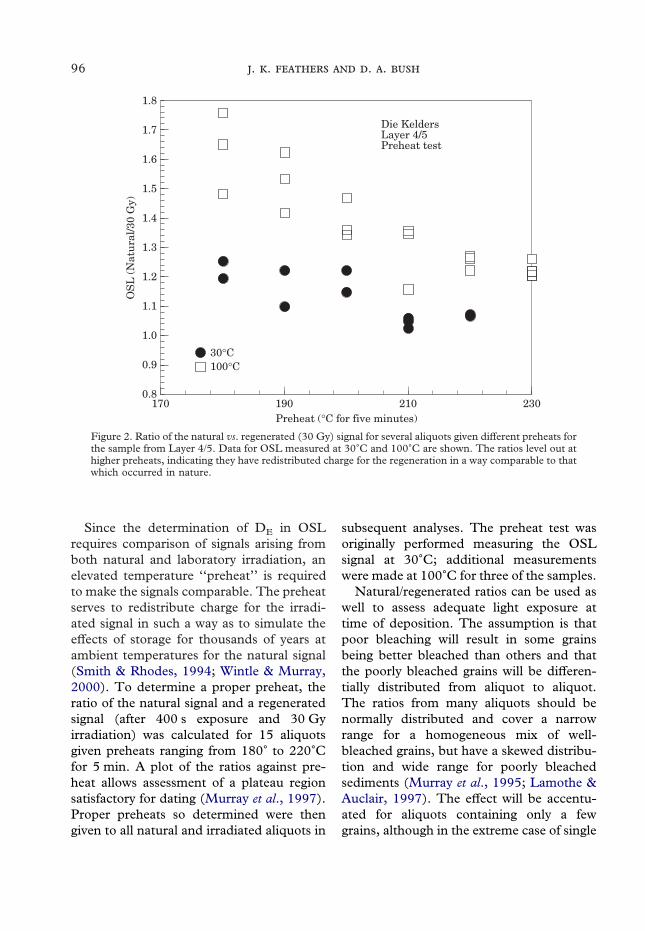
Since the determination of DE in OSLrequires comparison of signals arising fromboth natural and laboratory irradiation, anelevated temperature ‘‘preheat’’ is requiredto make the signals comparable. The preheatserves to redistribute charge for the irradi-ated signal in such a way as to simulate theeffects of storage for thousands of years atambient temperatures for the natural signal(Smith & Rhodes, 1994; Wintle & Murray,2000). To determine a proper preheat, theratio of the natural signal and a regeneratedsignal (after 400 s exposure and 30 Gyirradiation) was calculated for 15 aliquotsgiven preheats ranging from 180� to 220�Cfor 5 min. A plot of the ratios against pre-heat allows assessment of a plateau regionsatisfactory for dating (Murray et al., 1997).Proper preheats so determined were thengiven to all natural and irradiated aliquots in
subsequent analyses. The preheat test wasoriginally performed measuring the OSLsignal at 30�C; additional measurementswere made at 100�C for three of the samples.
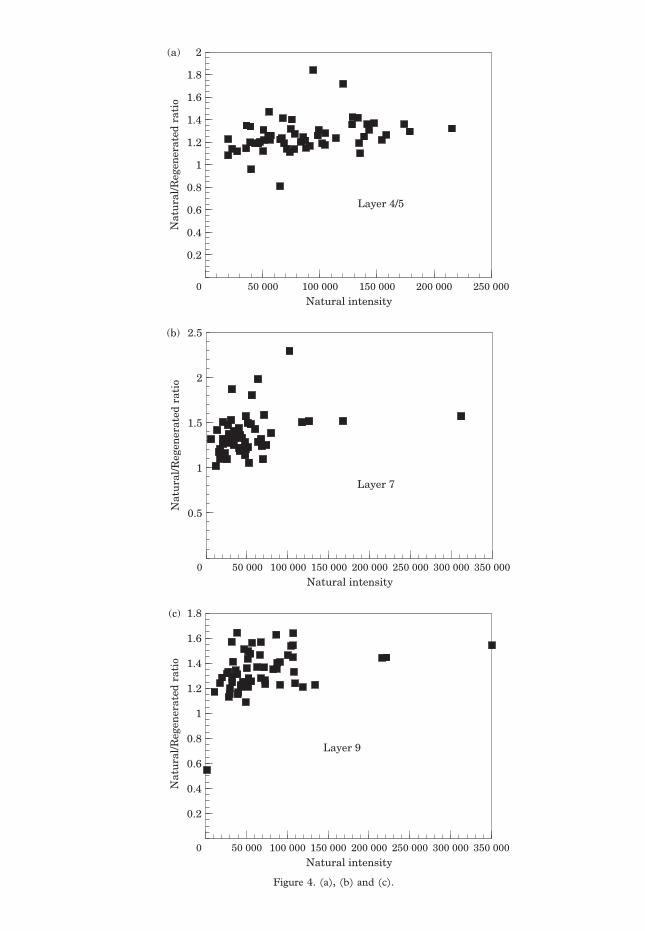
Natural/regenerated ratios can be used aswell to assess adequate light exposure attime of deposition. The assumption is thatpoor bleaching will result in some grainsbeing better bleached than others and thatthe poorly bleached grains will be differen-tially distributed from aliquot to aliquot.The ratios from many aliquots should benormally distributed and cover a narrowrange for a homogeneous mix of well-bleached grains, but have a skewed distribu-tion and wide range for poorly bleachedsediments (Murray et al., 1995; Lamothe &Auclair, 1997). The effect will be accentu-ated for aliquots containing only a fewgrains, although in the extreme case of single
0.8
Preheat (°C for five minutes)
OS
L (
Nat
ura
l/30
Gy)
230
Die KeldersLayer 4/5Preheat test
30°C100°C
190 210
1.8
1.0
1.2
1.4
1.6
170
0.9
1.1
1.3
1.5
1.7
Figure 2. Ratio of the natural vs. regenerated (30 Gy) signal for several aliquots given different preheats forthe sample from Layer 4/5. Data for OSL measured at 30�C and 100�C are shown. The ratios level out athigher preheats, indicating they have redistributed charge for the regeneration in a way comparable to thatwhich occurred in nature.

00.76
30
Ratio of N to 40 Gy
Nu
mbe
r of
ali
quot
s
0.59
Std. Dev = 0.23Mean = 1.37N = 55.00
0.25
0.25
Observed cum prob
Exp
ecte
d cu
m p
rob
0.50
0.75
20
10
1.00
0.50 0.75 1.000
Layer 4/5
0.94 1.11 1.29 1.46 1.64 1.81 1.99 2.16 2.34 2.51
(a)
00.76
30
Ratio of N to 40 Gy
Nu
mbe
r of
ali
quot
s
0.59
Std. Dev = 0.15Mean = 1.25N = 57.00
0.25
0.25
Observed cum prob
Exp
ecte
d cu
m p
rob
0.50
0.75
20
10
1.00
0.50 0.75 1.000
Layer 7
0.94 1.11 1.29 1.46 1.64 1.81 1.99 2.16 2.34 2.51
(b)
00.76
30
Ratio of N to 40 Gy
Nu
mbe
r of
ali
quot
s
0.59
Std. Dev = 0.14Mean = 1.35N = 55.00
0.25
0.25
Observed cum prob
Exp
ecte
d cu
m p
rob
0.50
0.75
20
10
1.00
0.50 0.75 1.000
Layer 9
0.94 1.11 1.29 1.46 1.64 1.81 1.99 2.16 2.34 2.51
(c)
Figure 3. (a), (b) and (c).

98 . . . .
grains, heterogeneity in the radioactivityenvironment will broaden the distribution.For this analysis 57 aliquots of about 100grains each were prepared for each sample.The natural and regenerated (after 400 sexposure and 40 Gy irradiation) signals weremeasured following a preheat as determined
above. The possibility that all grains werepoorly bleached, but uniformly so, can betested by comparing components of theluminescence signal that bleach at differentrates (for example, SBP versus OSL). Meas-uring the OSL of a modern surface sample,with a depositional history analogous to the
00.76
30
Ratio of N to 40 Gy
Nu
mbe
r of
ali
quot
s
0.59
Std. Dev = 0.33Mean = 1.33N = 57.00
0.25
0.25
Observed cum prob
Exp
ecte
d cu
m p
rob
0.50
0.75
20
10
1.00
0.50 0.75 1.000
Layer 11
0.94 1.11 1.29 1.46 1.64 1.81 1.99 2.16 2.34 2.51
(d)
00.76
30
Ratio of N to 40 Gy
Nu
mbe
r of
ali
quot
s
0.59
Std. Dev = 0.15Mean = 1.22N = 56.00
0.25
0.25
Observed cum prob
Exp
ecte
d cu
m p
rob
0.50
0.75
20
10
1.00
0.50 0.75 1.000
Layer 13
0.94 1.11 1.29 1.46 1.64 1.81 1.99 2.16 2.34 2.51
(e)
Figure 3. Histograms of ratios of natural vs. regenerated (40 Gy) signal, all given the same preheat, foreach sample. The insets plot the cumulative probability of the observed data (dots) against the expectedprobability of a normal distribution (solid line). Significant deviation from normality, not apparent here,would suggest non-uniform bleaching of grains.

99
ones of interest, is often recommended as afurther test of proper zeroing. However, thestratigraphy at Die Kelders is capped by aLater Stone Age shell midden and thusprovides no modern analog.
Radioactivity of the dated samples wasmeasured by high resolution gamma spec-trometry. The radioactivity of the interven-ing occupation layers was measured bythick-source alpha counting and delayedneutron analysis, the latter performed by theSaskatchewan Research Council. Two of thedated samples were also measured by thick-source alpha counting for comparison.Samples for thick-source alpha countingwere milled to flour consistency. Evidence ofdisequilibrium in the decay chains and thedistribution of radiaoctivity through the pro-file can provide information on possiblemovement of radionuclides through time.Moisture content was estimated from asample collected in an air-tight bag,although current moisture contents are notlikely to be representative of past conditions.This will be discussed further.
Dose rate
tj;3The radioactivity data are presented inTables 1 and 2. The gamma spectrometryresults (Table 2) show that for the datedsamples no statistically significant disequi-librium in the 238U chain is evident. Gammaspectrometry does not give as complete apicture for the 232Th chain, due to lack ofstrong emissions at the very top of the chain,although disequilibrium among 232Th,
228Rad and 228Ac is rare (Murray et al.,1987). Comparing emissions associatedwith 228Ac and 212Pb show the lower part ofthe chain in all samples close to equilibrium.The largest differences are with Layer 11and Layer 13. However, comparison of theweighted averages of gamma emissions withthe results from alpha counting (Table 1) forthese two samples suggests no significantdisequilibrium, in either chain. For doserate calculations, the weighted averages ofthe various gamma emissions were used(Table 1).
Comparison of alpha counts with 238Uconcentrations, determined from delayedneutron analysis, for the samples collectedfrom the occupation layers reveals that theU-series in these are not in equilibrium, theparent being depleted in most cases. Thismay reflect the presence of abundant bonein these layers. The overall radioactive com-position of these layers, however, is notsignificantly different than that of the non-occupation layers. Nor does there appear tobe any general trend vertically in the profilethat might suggest movement of radio-nuclides. This, coupled with the evidence ofonly localized disequilibrium, argues forlong-term stability in the overall radioactiveenvironment. The current dose rate is there-fore likely to be representative of the doserate since deposition. Dose rates (Table 3)were calculated following Nambi & Aitken(1986) giving allowance for beta and alphaattenuations (Aitken, 1985). The gammadose rates were calculated using gradientsbased on the nearness of the non-occupationlayers to the sample locations (after Aitken,1985, appendix H).
The cosmic dose rate is strongly influ-enced by the configuration of the cave aswell as the burial depth (2–3 m) of thesamples. The full cosmic flux impinges onthe surface of the cave through the caveopening, but from other directions it isattenuated by the thickness of the rock(about 5·5 m to the surface of the coastal
Table 4 Kolmogorov–Smirnov test for normality
Sample K–S z-score 2-tailed P
Layer 4/5 0·9639 0·3107Layer 7 0·8286 0·4984Layer 9 0·7081 0·6978Layer 11 0·8121 0·5246Layer 13 1·2531 0·0865
50 000
2
Natural intensity
Nat
ura
l/Reg
ener
ated
rat
io
0
Layer 4/5
100 000 150 000 200 000 250 000
0.2
1.2
1.4
1.6
0.4
0.6
0.8
1
1.8
(a)
50 000
2.5
Natural intensity
Nat
ura
l/Reg
ener
ated
rat
io
0.5
0
Layer 7
100 000 150 000 200 000 250 000 300 000 350 000
1
1.5
2
(b)
50 000
1.8
Natural intensity
Nat
ura
l/Reg
ener
ated
rat
io
0
Layer 9
100 000 150 000 200 000 250 000 300 000 350 000
0.2
1.2
1.4
1.6
0.4
0.6
0.8
1
(c)
Figure 4. (a), (b) and (c).
101
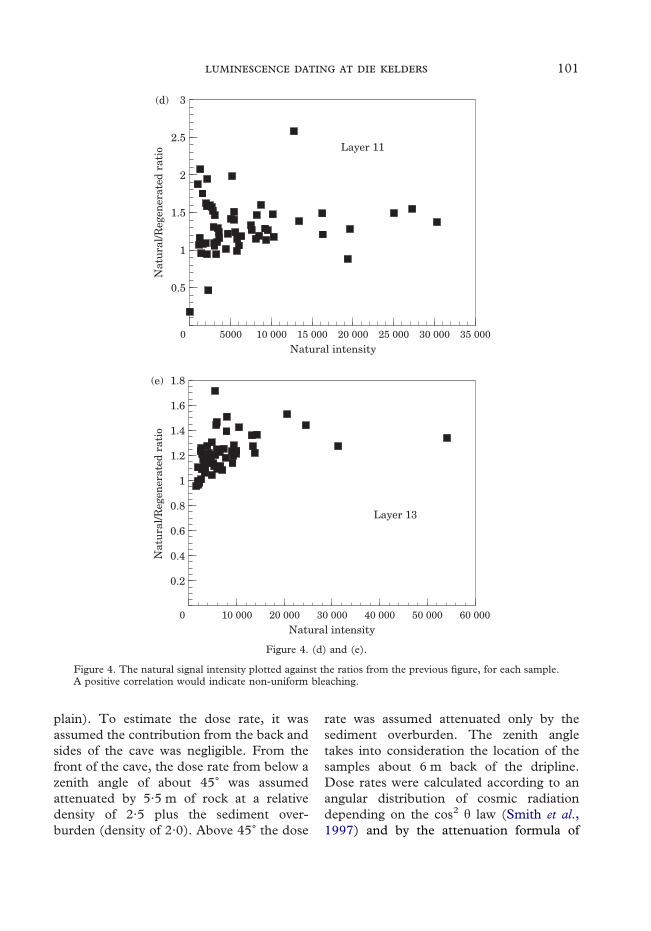
plain). To estimate the dose rate, it wasassumed the contribution from the back andsides of the cave was negligible. From thefront of the cave, the dose rate from below azenith angle of about 45� was assumedattenuated by 5·5 m of rock at a relativedensity of 2·5 plus the sediment over-burden (density of 2·0). Above 45� the dose
rate was assumed attenuated only by thesediment overburden. The zenith angletakes into consideration the location of thesamples about 6 m back of the dripline.Dose rates were calculated according to anangular distribution of cosmic radiationdepending on the cos2 � law (Smith et al.,1997) and by the attenuation formula of
5000
3
Natural intensity
Nat
ura
l/Reg
ener
ated
rat
io
0.5
0
Layer 11
10 000 15 000 20 000 25 000 30 000 35 000
1
1.5
2
2.5
(d)
1.8
Natural intensity
Nat
ura
l/Reg
ener
ated
rat
io
0.2
0
Layer 13
10 000 20 000 30 000 40 000 50 000 60 000
1.2
1.4
1.6
0.4
0.6
0.8
1
(e)
Figure 4. (d) and (e).
Figure 4. The natural signal intensity plotted against the ratios from the previous figure, for each sample.A positive correlation would indicate non-uniform bleaching.
102 . . . .
Prescott & Hutton (1988). Values are givenin Table 3.
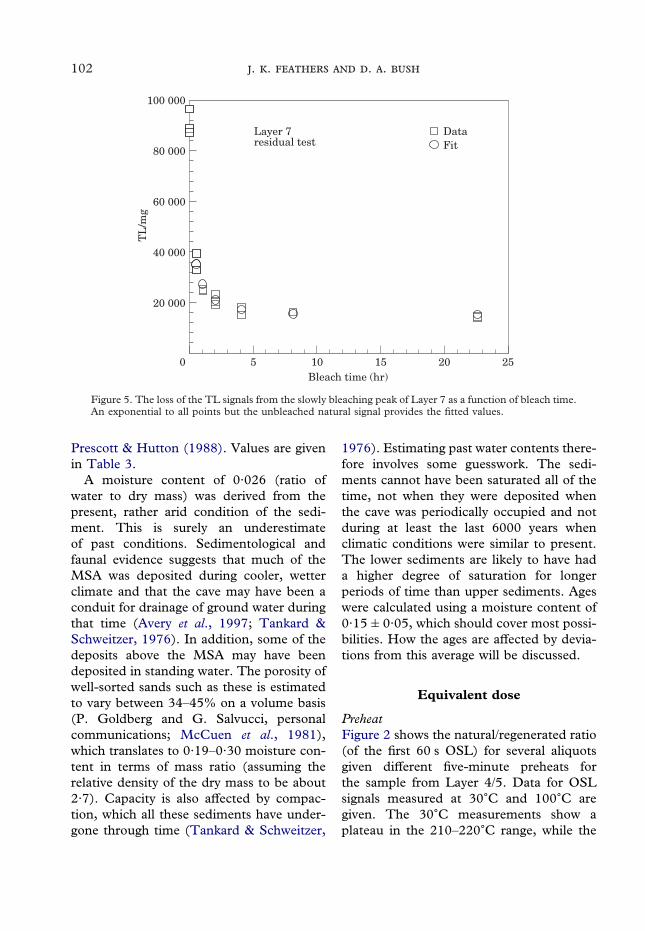
A moisture content of 0·026 (ratio ofwater to dry mass) was derived from thepresent, rather arid condition of the sedi-ment. This is surely an underestimateof past conditions. Sedimentological andfaunal evidence suggests that much of theMSA was deposited during cooler, wetterclimate and that the cave may have been aconduit for drainage of ground water duringthat time (Avery et al., 1997; Tankard &Schweitzer, 1976). In addition, some of thedeposits above the MSA may have beendeposited in standing water. The porosity ofwell-sorted sands such as these is estimatedto vary between 34–45% on a volume basis(P. Goldberg and G. Salvucci, personalcommunications; McCuen et al., 1981),which translates to 0·19–0·30 moisture con-tent in terms of mass ratio (assuming therelative density of the dry mass to be about2·7). Capacity is also affected by compac-tion, which all these sediments have under-gone through time (Tankard & Schweitzer,
1976). Estimating past water contents there-fore involves some guesswork. The sedi-ments cannot have been saturated all of thetime, not when they were deposited whenthe cave was periodically occupied and notduring at least the last 6000 years whenclimatic conditions were similar to present.The lower sediments are likely to have hada higher degree of saturation for longerperiods of time than upper sediments. Ageswere calculated using a moisture content of0·15�0·05, which should cover most possi-bilities. How the ages are affected by devia-tions from this average will be discussed.
Equivalent dose
PreheatFigure 2 shows the natural/regenerated ratio(of the first 60 s OSL) for several aliquotsgiven different five-minute preheats forthe sample from Layer 4/5. Data for OSLsignals measured at 30�C and 100�C aregiven. The 30�C measurements show aplateau in the 210–220�C range, while the
100 000
Bleach time (hr)
TL
/mg
0
Layer 7residual test
5 10 15 20 25
DataFit
20 000
40 000
60 000
80 000
Figure 5. The loss of the TL signals from the slowly bleaching peak of Layer 7 as a function of bleach time.An exponential to all points but the unbleached natural signal provides the fitted values.

103
100�C measurements show a slightly higherplateau at 220–230�C. Other samples showsimilar behavior with plateaus generally inthe 210–230�C range at both excitation tem-peratures. Both Layer 7 and Layer 11, forexample, showed plateaus covering thisrange at both temperatures. SubsequentOSL measurements were taken using pre-heats in this range. A similar test was con-ducted using IRSL for the Layer 11 sample.A nearly constant ratio from 180–220�C was
observed, similar to the plateau reported forfeldspars by Duller & Bøtter-Jensen (1993).The declining ratio with preheat evident inthe OSL of quartz can be explained byunrealized charge transfer in the irradiatedas opposed to the natural material. If a longtime period permits transfer from shallowtraps to the deep trap responsible for theOSL signal, at low preheats the transfer forthe laboratory irradiated material will not becompleted, making the regeneration signal
8000
Temperature (deg C)
TL
cou
nts
/mg
0 50
1000
100 150 200 250 300 350 400 450
2000
3000
4000
5000
6000
7000 Layer 7natural signal
no preheat210°C preheatpreheat + 550 nm
(a)
10 000
Temperature (deg C)
TL
cou
nts
/mg
0 50
1000
100 150 200 250 300 350 400 450
2000
3000
4000
5000
6000
7000
8000
9000Layer 7additive dose
Naturaln + 31 Gyn + 62 Gyn + 93 Gyn + 124 Gyn + 155 Gy
(b)
Figure 6 (a) and (b).
104 . . . .
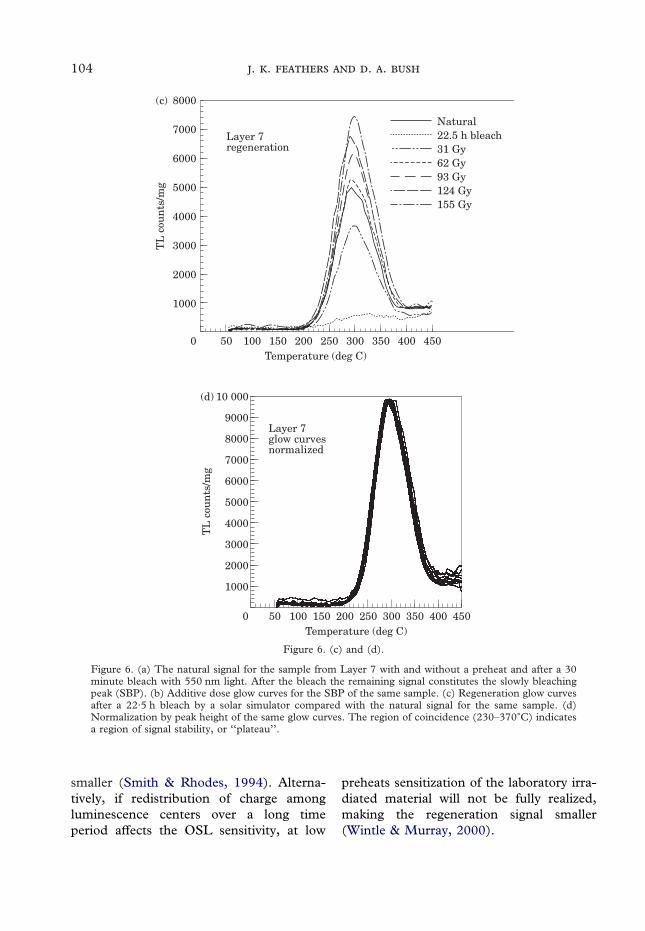
smaller (Smith & Rhodes, 1994). Alterna-tively, if redistribution of charge amongluminescence centers over a long timeperiod affects the OSL sensitivity, at low
preheats sensitization of the laboratory irra-diated material will not be fully realized,making the regeneration signal smaller(Wintle & Murray, 2000).
8000
Temperature (deg C)
TL
cou
nts
/mg
0 50
1000
100 150 200 250 300 350 400 450
2000
3000
4000
5000
6000
7000Layer 7regeneration
Natural22.5 h bleach31 Gy62 Gy93 Gy124 Gy155 Gy
(c)
10 000
Temperature (deg C)
TL
cou
nts
/mg
0 50
1000
100 150 200 250 300 350 400 450
2000
3000
4000
5000
6000
7000
8000
9000Layer 7glow curvesnormalized
(d)
Figure 6. (c) and (d).
Figure 6. (a) The natural signal for the sample from Layer 7 with and without a preheat and after a 30minute bleach with 550 nm light. After the bleach the remaining signal constitutes the slowly bleachingpeak (SBP). (b) Additive dose glow curves for the SBP of the same sample. (c) Regeneration glow curvesafter a 22·5 h bleach by a solar simulator compared with the natural signal for the same sample. (d)Normalization by peak height of the same glow curves. The region of coincidence (230–370�C) indicatesa region of signal stability, or ‘‘plateau’’.

105
BleachingLuminescence dating of sediments is validonly if the signal was fully reduced by sun-
light at the time of interest or, if a residualsignal remains, the residual is determinable.Figure 3 shows histograms of the natural/
180 000
Dose (Gy)
TL
cou
nts
/mg
0 20 40 160
Die KeldersLayer 4/5TL slide
RegenerationAdditive doseFit20 000
60 80 100 120 140
40 000
60 000
80 000
100 000
120 000
140 000
160 000
(a)
180 000
Dose (Gy)
TL
cou
nts
/mg
0 250
Die KeldersLayer 7TL slide
RegenerationAdditive doseFit20 000
50 100 150 200
40 000
60 000
80 000
100 000
120 000
140 000
160 000
(b)
Figure 7. (a) and (b).

106 . . . .
regenerated ratios (using the first 60 s of theOSL signal) for the 100-grain aliquots foreach sample. The insets show Q-Q (quan-
tile) plots comparing the observed data withthose expected in normal distributions.Despite a few outliers, with relatively large
180 000
Dose (Gy)
TL
cou
nts
/mg
0 250
Die KeldersLayer 9TL slide
RegenerationAdditive doseFit20 000
50 100 150 200
40 000
60 000
80 000
100 000
120 000
140 000
160 000
(c)
140 000
Dose (Gy)
TL
cou
nts
/mg
0 250
Die KeldersLayer 11TL slide
RegenerationAdditive doseFit20 000
50 100 150 200
40 000
60 000
80 000
100 000
120 000
(d)
Figure 7. (c) and (d).

107
natural signals suggestive of poor bleaching,the bulk of the aliquots cluster tightlyaround the modal value and form a nearnormal distribution. To test for normality, aKolmogorov–Smirnov one-sample test wasperformed. The K–S z score, a goodness offit statistic, and the two-tailed probabilityfor a normal distribution is given for eachsample in Table 4. At a 95% confidenceinterval, no sample deviates significantlyfrom normality. The distribution from Layer11 appears much broader than from theother samples, but still is normal. No otherevidence suggested this sample was less wellbleached than the others, although it diddiffer significantly from the others in lumi-nescence sensitivity, somewhat surprisinglygiven the presumed common source. This
may explain the different distribution. Atany rate, the broad and skewed distributionsreported in the literature for poorlybleached samples (Lamothe & Auclair,1997; Murray et al., 1995) are not evidentfor any of these samples. Nor is there anysignificant tendency for the brightest naturalsignals to correlate with the highest ratios, asmight be expected if high natural signalssignified poorly bleached grains (Li, 1994;Clarke, 1996). These data are displayed inFigure 4.
The conclusion drawn from these data isthat the samples were well bleached at thetime of deposition, as would be expected foraeolian deposits. The few poorly bleachedgrains, perhaps contributed by decayingroof fall, do not seem numerous enough to
140 000
Dose (Gy)
TL
cou
nts
/mg
0 250
Die KeldersLayer 13TL slide
RegenerationAdditive doseFit20 000
50 100 150
40 000
60 000
80 000
100 000
120 000
200
(e)
Figure 7. (e).
Figure 7. TL additive dose and regeneration growth curves for each sample, illustrating the ‘‘Australianslide’’ method (Huntley et al., 1983a). The additive dose points have been shifted horizontally by the sameamount to bring them into coincidence with the regenerative points. The fit to both sets of data after theshift are saturating exponentials with linear extensions. The amount of shift provides an estimate for theequivalent dose, which graphically is represented by the position on the dose axis of the lowest additivepoints (the natural signal). Because of sensitivity change, the shift for samples from Layers 9 and 11followed a scaling of the regeneration points.
108 . . . .
affect DE determinations significantly. Thepossibility remains that the grains werepoorly bleached, but uniformly so. Since theTL data is from a component that bleachesat a much slower rate than that of the OSL,this possibility can be eliminated if the DE
derived from TL matches that from OSL.This is indeed the case.
ThermoluminescenceThe slowly bleaching peak (SBP) in TL notonly is reduced at a slower rate, it alsocontains an unbleachable residual that mustbe determined. This was done by exposingdifferent aliquots of the natural material
for progressively longer times to the solarsimulator. The resulting loss of signal isshown for the sample from Layer 7 in Figure5. A saturating exponential was fitted to theinverse of these data and the inverse ofthe asymptote taken as the unbleachableresidual. The same was done for the othersamples.
The region of thermal stability used foranalysis was determined by normalizing bypeak height all glow curves (natural andirradiated) and determining the region ofcoincidence. A few curves were shiftedslightly horizontally to account for differ-ences in thermal lag. Figure 6(a) shows the
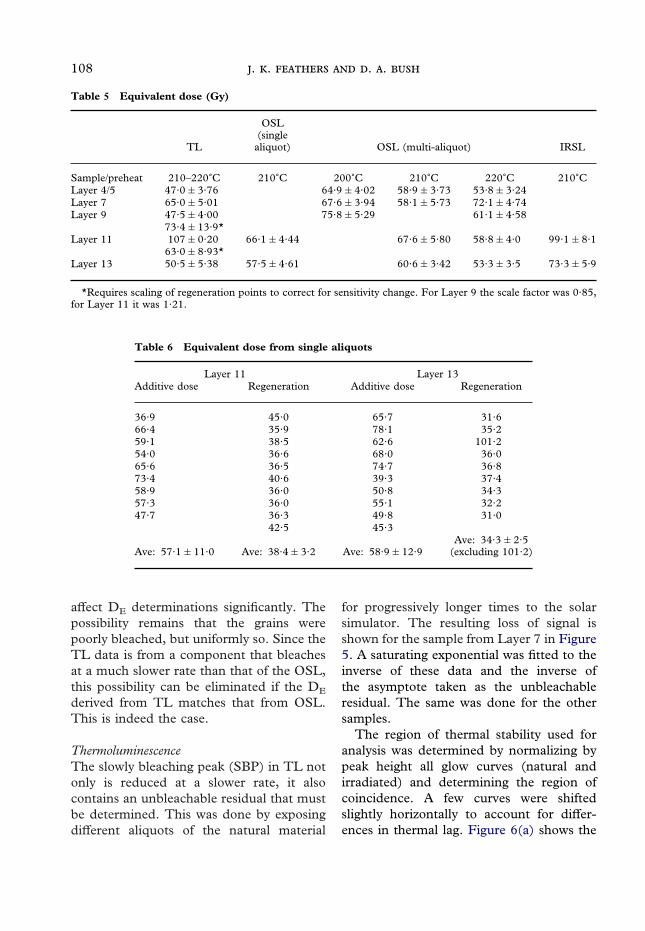
Table 5 Equivalent dose (Gy)
TL
OSL(singlealiquot) OSL (multi-aliquot) IRSL
Sample/preheat 210–220�C 210�C 200�C 210�C 220�C 210�CLayer 4/5 47·0�3·76 64·9�4·02 58·9�3·73 53·8�3·24Layer 7 65·0�5·01 67·6�3·94 58·1�5·73 72·1�4·74Layer 9 47·5�4·00 75·8�5·29 61·1�4·58
73·4�13·9*Layer 11 107�0·20 66·1�4·44 67·6�5·80 58·8�4·0 99·1�8·1
63·0�8·93*Layer 13 50·5�5·38 57·5�4·61 60·6�3·42 53·3�3·5 73·3�5·9
*Requires scaling of regeneration points to correct for sensitivity change. For Layer 9 the scale factor was 0·85,for Layer 11 it was 1·21.
Table 6 Equivalent dose from single aliquots
Layer 11 Layer 13Additive dose Regeneration Additive dose Regeneration
36·9 45·0 65·7 31·666·4 35·9 78·1 35·259·1 38·5 62·6 101·254·0 36·6 68·0 36·065·6 36·5 74·7 36·873·4 40·6 39·3 37·458·9 36·0 50·8 34·357·3 36·0 55·1 32·247·7 36·3 49·8 31·0
42·5 45·3
Ave: 57·1�11·0 Ave: 38·4�3·2 Ave: 58·9�12·9Ave: 34·3�2·5
(excluding 101·2)
109
0.5
Dose (Gy)
Nor
mal
ized
OS
L
0 250
Die KeldersLayer 11Single aliquot OSL slide
RegenerationAdditive doseFit
50 100 150 200
1
1.5
2
2.5
0.2
Dose (Gy)
Nor
mal
ized
OS
L
0 250
Die KeldersLayer 13Single aliquot OSL slide
RegenerationAdditive doseFit
50 100 150 200
0.4
0.6
0.8
2
1
1.2
1.4
1.6
1.8
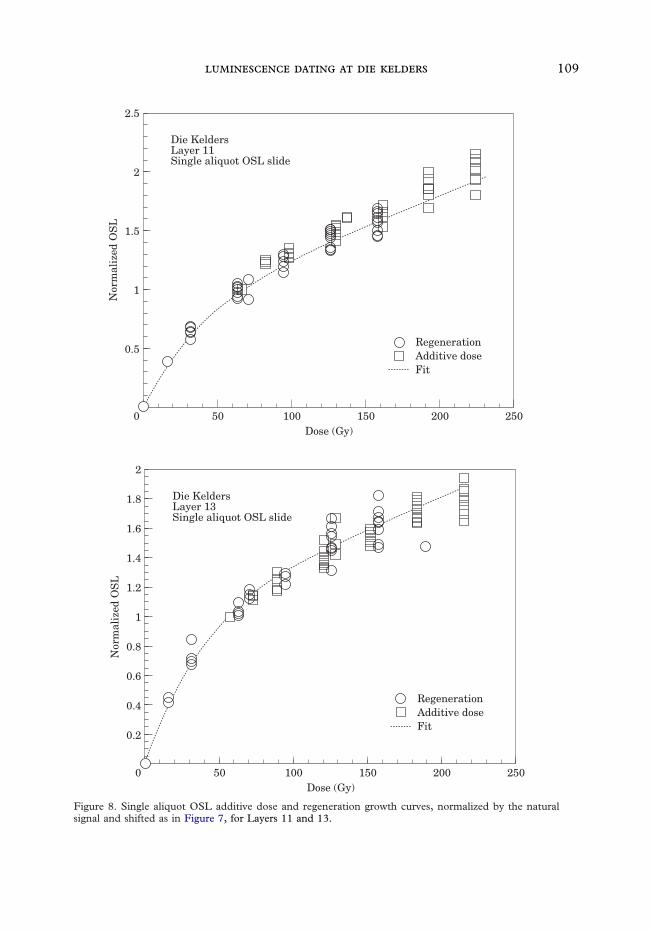
Figure 8. Single aliquot OSL additive dose and regeneration growth curves, normalized by the naturalsignal and shifted as in Figure 7, for Layers 11 and 13.
110 . . . .
natural signal for Layer 7, before and after apreheat, and after a 550 nm bleach to pro-duce the SBP. Figure 6(b) and (c) showadditive dose and regeneration SBP curvesfor the same sample. Figure 6(d) showsthese same curves normalized to peakheight. The stable region for this sample andthe others was about 230–370�C, whichincludes all but the high temperature tail ofthe SBP.
Figure 7 shows the additive dose andregeneration growth curves for each sampleafter the additive dose points have beenshifted horizontally to coincide with theregeneration points (the ‘‘Australian slide’’).The additive dose points for all curves butLayer 4/5 are nearly linear, which maybe surprising given the suspected age ofthese samples. Considering the regenerationcurve as well, however, clearly demonstratesthat this linearity occurs beyond a sublinearregion. The best fit to the combined curves,
shown in Figure 7, is a saturating exponen-tial with a linear extension, of the followingform (Huntley et al., 1993a:7):
I=yo{1�exp[�(D�Di)/Do]}+k(D�Di)
where I is the luminescence intensity, D isthe irradiation dose, yo is the saturationintensity, Di is the dose intercept, and Do
and k are constants.Horizontal shifting of the additive dose
curve to match the regeneration curve willonly succeed if no sensitivity change hasoccurred from optical zeroing. Sensitivitychange, if it is independent of dose, can becorrected with a multiplication, or scale fac-tor, although this is not always recom-mended if dose dependence cannot beshown (Prescott & Robertson, 1997). Fortwo of the samples (Layer 9 and Layer 11),best fits required scale changes (0·849 forLayer 9 and 1·21 for Layer 11). While the
20
10 000
Time (seconds)
OS
L c
oun
ts
0
10
Equ
ival
ent
dose
(G
y)
n + 154 Gyn + 92 Gyn + 31 GyNaturalBleach + 31 Gy
20
30
40
50
60
Layer 4/5OSL
40 60 80 100 120 140 160 180 200
20 000
30 000
40 000
50 000
60 000
0
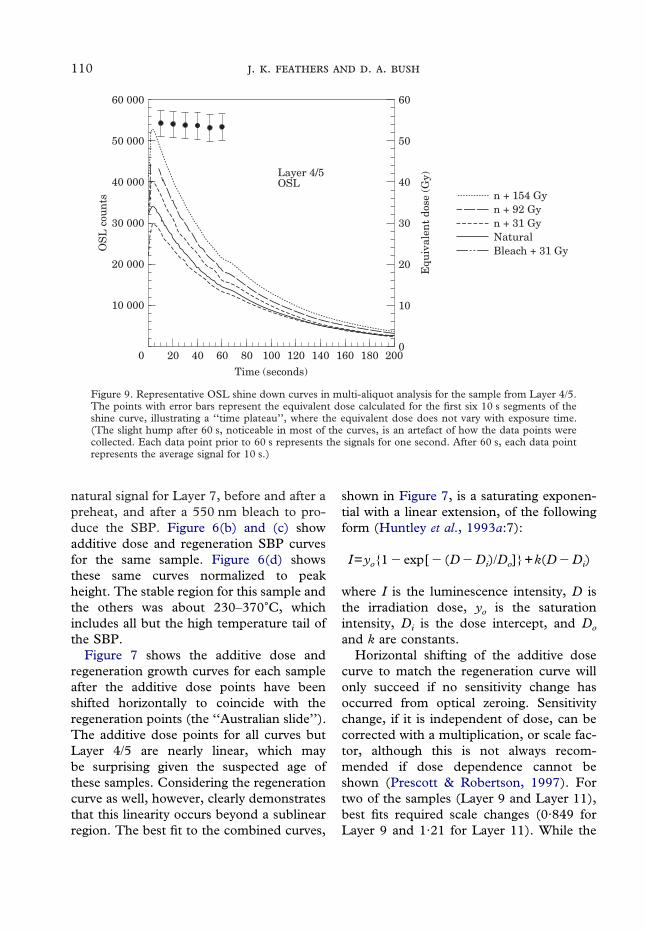
Figure 9. Representative OSL shine down curves in multi-aliquot analysis for the sample from Layer 4/5.The points with error bars represent the equivalent dose calculated for the first six 10 s segments of theshine curve, illustrating a ‘‘time plateau’’, where the equivalent dose does not vary with exposure time.(The slight hump after 60 s, noticeable in most of the curves, is an artefact of how the data points werecollected. Each data point prior to 60 s represents the signals for one second. After 60 s, each data pointrepresents the average signal for 10 s.)
111
legitimacy of correcting for the sensitivitychange remains uncertain, the DEs obtainedfor these two samples after the scalechange agree better with other data than if
no scale change had been made. The DEs,which correspond to the magnitude ofshift required to bring the curves intocoincidence, are given in Table 5.
Dose (Gy)
Nor
mal
ized
OS
L
0 250
Die KeldersLayer 4/5Multi-aliquot OSL slide
RegenerationAdditive doseFit
50 100 150 200
2
4
6
8
10
12
14(a)
Dose (Gy)
Nor
mal
ized
OS
L
0 250
Die KeldersLayer 7Multi-aliquot OSL slide
RegenerationAdditive doseFit
50 100 150 200
2
4
6
8
10
12
14(b)
Figure 10. (a) and (b).
112 . . . .
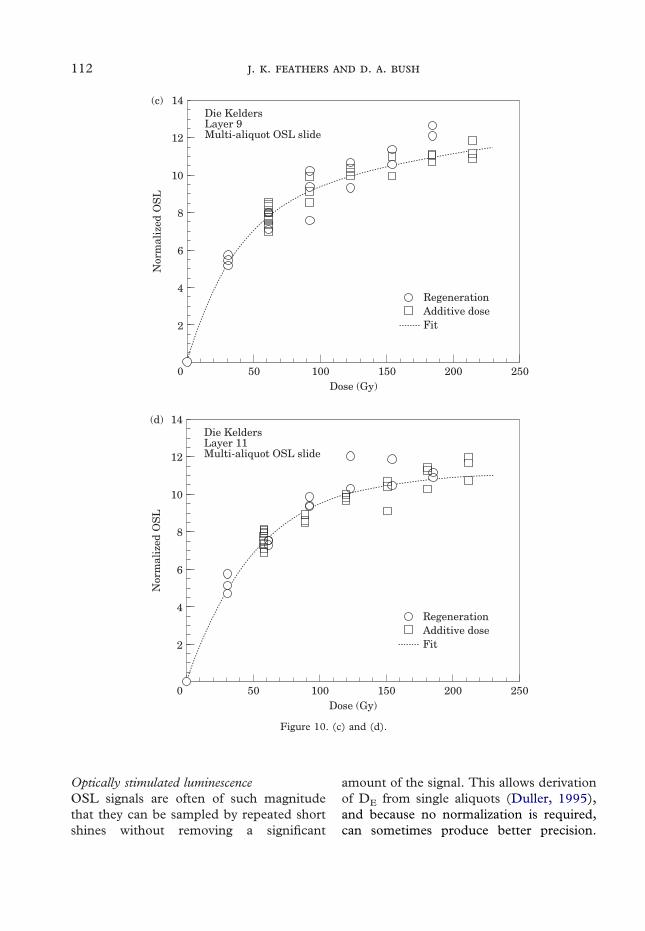
Optically stimulated luminescenceOSL signals are often of such magnitudethat they can be sampled by repeated shortshines without removing a significant
amount of the signal. This allows derivationof DE from single aliquots (Duller, 1995),and because no normalization is required,can sometimes produce better precision.
Dose (Gy)
Nor
mal
ized
OS
L
0 250
Die KeldersLayer 9Multi-aliquot OSL slide
RegenerationAdditive doseFit
50 100 150 200
2
4
6
8
10
12
14(c)
Dose (Gy)
Nor
mal
ized
OS
L
0 250
Die KeldersLayer 11Multi-aliquot OSL slide
RegenerationAdditive doseFit
50 100 150 200
2
4
6
8
10
12
14(d)
Figure 10. (c) and (d).

113
The procedure involves repeated dosingfollowed by short (0·1 s) shines to makeadditive dose or regenerated curves. Becauserepeated preheats are also necessary, thedata must be corrected for loss of signalby the preheats. This can be done byadjusting the luminescence signal by anexponential decay factor determined fromsuccessive preheats and shines but with-out irradiation on the same aliquot afterthe additive dose or regeneration procedureis completed (Murray et al., 1997). Duller(1994) cautioned that such procedurecan cause an underestimation of DE
for saturating curves. Varying the doseincrements on different single aliquot analy-ses can determine whether this problemis significant (Murray et al., 1997). Thiswas done and no difference in results wasobtained.
Twenty single aliquot analyses were per-formed for samples from Layer 11 andLayer 13, using a 210�C 5 min preheat and
0·1 s shines. Results are given in Table 6.The average DE measured by additive dosediffers from that by regeneration. The addi-tive dose DEs also have a much wider spreadof values, which can be attributed toextrapolation errors from the near linearityof the additive dose curves. A more accurateDE determination should be possible bycombining the two sets of measures. Thiswas done by normalizing each single ali-quot analysis by its natural signal and com-bining the data using the ‘‘Australian slide’’technique. This is illustrated in Figure 8 (afew aliquots with markedly different sensi-tivities than the others were omitted). Nosensitivity change between additive dose andregeneration is apparent. The DE for eachsample, taken from the horizontal shift, isgiven in Table 5. The results agreed withmulti-aliquot analyses (presented next) donewith a 210�C preheat and improved onprecision only slightly for Layer 11 and notat all for Layer 13. Only less time consuming
Dose (Gy)
Nor
mal
ized
OS
L
0 250
Die KeldersLayer 13OSL Multi-aliquot slide
RegenerationAdditive doseFit
50 100 150 200
2
4
6
8
10
12
14(e)
Figure 10. (e).
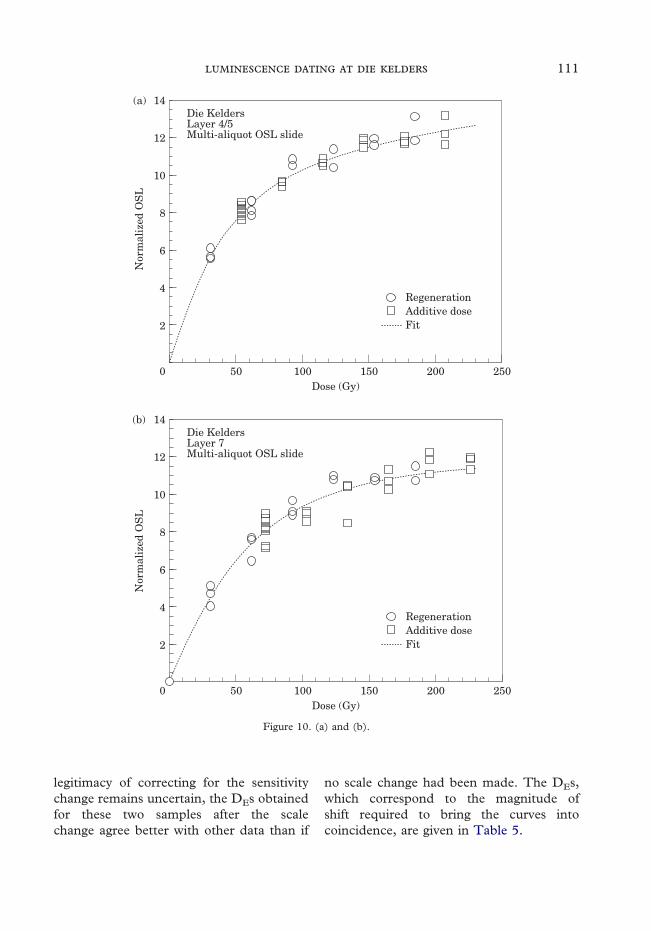
Figure 10. Multi-aliquot OSL additive dose and regeneration growth curves, shifted as in Figure 7, foreach sample.
114 . . . .
multi-aliquot analysis was performed for theother samples.
All multi-aliquots were normalized by a0·1 s shine prior to any measurements.Measurement involved 450 s shines. Onlythe first 58 s were used for analysis, andthe region from 350–390 s was used tosubtract background and more difficult tobleach components (Aitken & Xie, 1992).DEs were initially measured for successive10 s segments of the shine. For the first58 s there was no significant differenceamong the 10 s intervals, so the entiretime was integrated. Figure 9 shows someshine curves and the DEs determined foreach 10 s segment for the sample fromLayer 4/5, done with a 220�C 5 min pre-heat. DE was determined by the slidemethod, and these data for 220�C 5 minpreheats are presented for all samples inFigure 10. No scaling to correct forsensitivity changes was necessary, and thebest fits again were saturating exponentialswith linear extensions.
Analyses were repeated at different 5 minpreheats (from 200� to 220�C). Resultswhere no scaling was necessary are given inTable 5. For four of the samples the DE
decreases with increasing preheat. While alower DE is expected for 200�C given theresults of the preheat test, the continueddecline from 210� to 220�C, although notstatistically significant, was not expected atleast for some samples, such as Layer 11,where the preheat test showed a plateau inthis region. Collection of additional data forthe preheat test may possibly demonstratefiner scale differences between 210–220�C.The only exception to the downward trendis for the sample from Layer 7, where amuch higher DE was obtained with a 220�Cpreheat (again the preheat test showed aplateau from 210�–220�C). This analysiswas repeated and similar results obtained.We have no ready explanation for thisanomaly and consider the results using the210�C preheat to be more accurate. For the
other four samples we used the results fromthe 220�C preheat for age calculation.
A potential problem in using preheats forOSL is thermal transfer, where the preheattransfers electrons from thermally stable,light insensitive traps to the trap respon-sible for the OSL signal, and thereby artifi-cially increases the OSL signal. This wastested for two samples by the followingprocedure (Huntley et al., 1993b). Additivedose and regeneration curves were con-structed in the normal way except thatafter each irradiation (including the natu-ral) and prior to any preheat an 1800 sbleach by the solar simulator was applied.If the preheat transferred charge from alight insensitive trap filled by the irradiationto the OSL trap, then this should registeras the only OSL signal by this procedure.This can then be used to correct the OSLsignals obtained in the normal way. Forboth samples, the thermal transferred OSLsignal at all doses was less than 1% of thetotal OSL signal. A correction did notsignificantly affect the equivalent dose. Weconclude that thermal transfer is not aproblem for these samples. The differencein OSL signal before and after a preheatfor the other samples was similar to thetwo tested, so thermal transfer wasassumed not to be a problem for themeither. Use of the slide technique shouldalso minimize any problems with thermaltransfer (Rhodes & Bailey, 1997).
Infrared stimulated luminescenceIRSL, characteristic of feldspars, providesan independent determination of the DE ona different mineral with different lumines-cence characteristics. Since it was performedon fine grains, it also allows an independentdetermination on a different grain size.If grains released from disintegrating rooffall have any influence on the age determi-nation, one would not expect agreementin apparent ages from two different grainsizes.
115
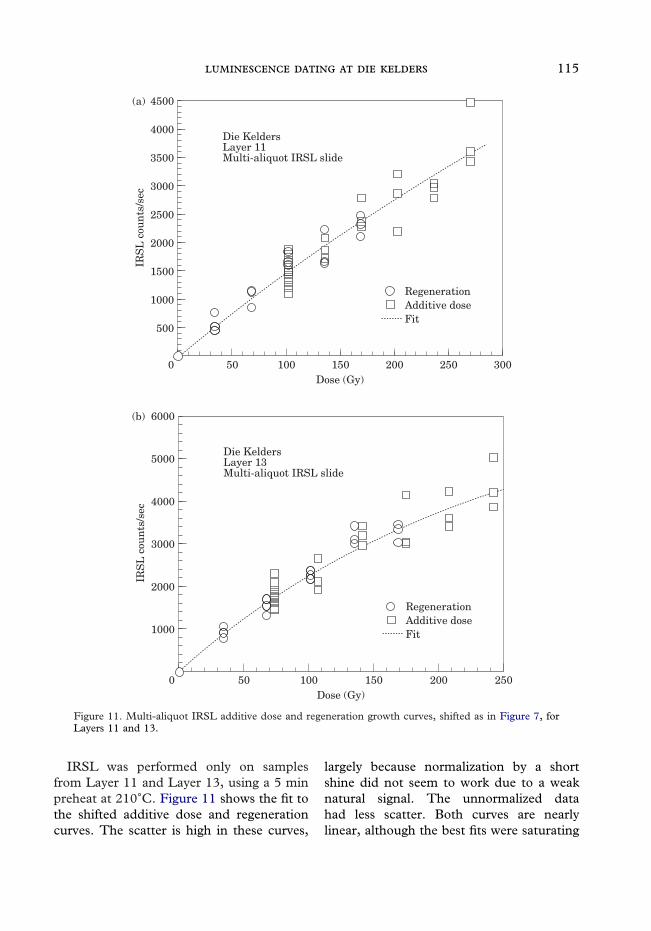
IRSL was performed only on samplesfrom Layer 11 and Layer 13, using a 5 minpreheat at 210�C. Figure 11 shows the fit tothe shifted additive dose and regenerationcurves. The scatter is high in these curves,
largely because normalization by a shortshine did not seem to work due to a weaknatural signal. The unnormalized datahad less scatter. Both curves are nearlylinear, although the best fits were saturating
Dose (Gy)
IRS
L c
oun
ts/s
ec
0 300
Die KeldersLayer 11Multi-aliquot IRSL slide
RegenerationAdditive doseFit
50 100 150 200
500
1000
1500
2000
2500
3000
4500
250
3500
4000
(a)
Dose (Gy)
IRS
L c
oun
ts/s
ec
0 250
Die KeldersLayer 13Multi-aliquot IRSL slide
RegenerationAdditive doseFit
50 100 150 200
1000
2000
3000
6000
4000
5000
(b)
Figure 11. Multi-aliquot IRSL additive dose and regeneration growth curves, shifted as in Figure 7, forLayers 11 and 13.

116 . . . .
exponentials. As expected, the feldspars,unlike the quartz, were far from saturation.Alpha efficiency was determined by con-structing an additive dose curve using alphairradiation and comparing it with the addi-tive dose using beta (Figure 12). The ratioof slopes produces the ‘‘b-value’’, which canbe related to alpha efficiency (Aitken, 1985;Lian et al., 1995). A b-value of 0·83–0·09was obtained. Only the data from Layer 13are shown. The data from Layer 11 had veryhigh scatter and produced an unreasonableb-value. It was therefore assumed that theb-value for Layer 11 was similar to that ofLayer 13.
The DEs from IRSL are given in Table 5.Feldspars are prone to anomalous fading.Time constraints prevented a direct assess-ment of any fading, but if the ages from theOSL and IRSL analyses agree, as they do(next section), this would be remarkablycoincidental if anomalous fading were asignificant factor.
Age calculationsTable 5 shows a near equivalence in DE forall samples whether determined by TL or
OSL (multi or single aliquot). The IRSLresults are different because of differentgrain size and therefore different dose rate.A fuller comparison is given in Table 7,which gives the tabulated ages. The multi-aliquot OSL ages are computed for differentmoisture contents, as will be discussedshortly. Single-aliquot OSL, TL and IRSLages are calculated assuming 15% moisturecontent. There is no significant disagree-ment between OSL (multi- or single-aliquot), TL or IRSL. The earlier evidenceon bleaching demonstrated little grain tograin difference in extent of bleaching, sug-gesting any contribution of poorly bleachedgrains from roof fall cannot be significant.The agreement of OSL with TL and IRSL,both of which have different bleachingcharacteristics than the OSL, affirms thisconclusion and also shows that the grains asa whole were not systematically under-bleached. Similar results from independentmethods suggest few other systematicproblems in DE determination.
Comparison among the samples showssimilar ages for all the samples but a clearstratigraphic inversion. The lower two
0
Dose (Gy)
IRS
L (
un
nor
mal
ized
)
–80 170
Layer 13alpha efficiency
BetaAlpha
–30 20 70 120
1000
2000
3000
6000
4000
5000
Figure 12. Additive dose curves using beta and alpha irradiation for the sample from Layer 13. The ratioof the slope of these two curves is equivalent to the b-value used to estimate alpha efficiency.

117
samples appear younger than highersamples, although only Layer 13 is signifi-cantly younger. Given the lack of evidencefor systematic error in the DE, the mostlikely source of error is in the dose rate,particularly in accounting for moisture con-tent. The lower samples, particularly thevery lowest, are likely to have been wetter forlonger periods of time. In Table 7, the agesare recalculated assuming different averagemoisture contents. If the higher sampleswere relatively dryer and the lower onewetter, the stratigraphic problems arereduced, although not eliminated.
The best conclusion from these data isthat the ages of all five samples are similarand that the differences reflect to somedegree uncertainties in the dose rate, par-ticularly in regard to moisture contents. Thismeans that the deposition of the MSA layersoccurred over a relatively short time, about60–70,000 years ago. This agrees in broadterms with the ESR dates, assuming theearly uptake model, reported in Avery et al.(1997). Sedimentary data suggest deposi-tion during a marine regression. The resultsreported here place this during the early partof the Late Glaciation as argued by Tankard& Schweitzer (1976) rather than during acold phase of the Late Interglaciation asargued by Hendey & Volman (1986).While a classic Howieson’s Poort assem-blage is not present at Die Kelders, thepresence of some backed pieces in theupper MSA deposits and the relatively high
frequency of cryptocrystalline silcretes insome occupation layers suggest a possiblehistoric affinity. The Howieson’s Poort isnot well-dated (Parkington, 1990), but evi-dence from Klasies River Mouth (Deaconet al., 1988; Grun et al., 1990) andBoomplaas Cave (Deacon, 1983) suggest anage of 60–70 ka, in agreement with the datesprovided here.
Summary
Five luminescence dates have been obtainedfrom MSA deposits at Die Kelders. Thedates are quite similar and average about60–70 ka, depending in part on assumptionsof past moisture content. They agree ingeneral with reported ESR dates. Thesamples appear to be well bleached, and DE
determined in varied ways produced similarresults. The radioactivity in the depositsappears to be generally uniform and showsno evidence of having changed in the past.The dates place the MSA occupations dur-ing the early part of the Last Glaciation, inagreement with sedimentary data. Theoccupations also appear to be congruent inage with Howieson’s Poort assemblageselsewhere in South Africa.
Acknowledgements
Collection of samples at Die Kelderswas made possible by a grant from theLouis S. B. Leakey Foundation. Laboratory
Table 7 Derived ages (ka) by technique
TL
OSL(singlealiquot) OSL (multi-aliquot) IRSL
Sample/moisture 15% 15% 10% 15% 20% 25% 15%Layer 4/5 50·7�4·7 55·0�4·3 58·0�4·5 61·0�4·6 63·9�4·8Layer 7 75·3�6·8 63·9�7·0 67·3�7·4 70·7�7·7 74·2�8·1Layer 9 79·7�15·6 63·0�5·7 66·4�5·9 69·7�6·2 73·1�6·5Layer 11 67·0�10 70·3�5·8 59·4�5·0 62·6�5·3 66·7�5·5 68·9�5·7 69·9�6·5Layer 13 51·4�6·0 58·6�5·4 51·5�4·2 54·3�4·4 57·0�4·5 59·8�4·7 50·6�4·6

118 . . . .
work was funded by the National ScienceFoundation grants SBR96-01302 andSBR97-05320 to Feathers. Kris Wilhelmsenassisted with sample preparation. The dis-cussion on moisture content benefited frominput by Paul Goldberg and G. Salvucci ofBoston University. Constructive criticismof an earlier version by three anonymousreviewers led to some additional datacollection and a much improved product.
References
Aitken, M. J. (1985). Thermoluminescence Dating.London: Academic Press.
Aitken, M. J. & Xie, J. (1992). Optical dating usinginfrared diodes: young samples. Quat. Sci. Rev. 11,147–152.
Avery, G., Cruz-Uribe, K., Goldberg, P., Grine, F. E.,Klein, R. G., Lenardi, M. J., Marean, C. W., Rink,W. J., Schwarcz, H. P., Thackeray, A. I. & Wilson,M. L. (1997). The 1992–1993 excavations at theDie Kelders Middle and Later Stone Age cave site,South Africa. J. Field Arch. 24, 263–291.
Bortolot, V. J. (1997). Improved OSL excitation withfiberoptics and focused lamps. Radiation Meas. 27,101–106.
Brooks, A. S., Cramer, J. S., Franklin, A. D., DeHeinzelin, J., Helgren, D. M., Hornyak, W. F.,Keating, J. M., Klein, R. G., Schwarcz, H., LeithSmith, J. N., Stewart, K., Todd, N., Verniers, J. &Yellen, J. (1995). Dating and context of three MiddleStone Age sites with bone points in the UpperSemliki Valley, Zaire. Science 268, 548–553.
Butzer, K. W. (1979). Preliminary notes on the geologyof Die Kelders Cave, Cape. Ann. S. Afr. Mus. 5,225–228.
Clarke, M. L. (1996). IRSL dating of sands: bleachingcharacteristics at deposition inferred from the use ofsingle aliquots. Radiation Meas. 26, 611–620.
Deacon, H. J. (1983). Late Quaternary Environmentand Cultural Relationships in the Southern Cape.Report to the Human Sciences Research Council,Department of Anthropology, University ofStellenbosch.
Deacon, H. J., Talma, A. S. & Vogel, J. C. (1988).Biological and cultural development of Pleistocenepeople in an Old World southern continent. In (J. R.Prescott, Ed.) Archaeometry: Australasian Studies1988, pp. S23–S31. Adelaide: The University ofAdelaide.
Duller, G. A. T. (1994). Luminescence dating ofsediments using single aliquots: new procedures.Quat. Sci. Rev. 13, 149–156.
Duller, G. A. T. (1995). Luminescence dating usingsingle aliquots: methods and applications. RadiationMeas. 24, 217–226.
Duller, G. A. T. & Bøtter-Jensen, L. (1993). Lumines-cence from potassium feldspars stimulated by infra-red and green light. Radiation Protection Dosimetry 47,683–688.
Feathers, J. K. (1997). Luminescence dating of sedi-ment samples from White Paintings Rockshelter,Botswana. Quat. Geochron. 16, 321–331.
Franklin, A. D. & Hornyak, W. F. (1990). Isolation ofthe rapidly bleaching peak in quartz TL glow curves.Ancient TL 8, 29–31.
Grine, F. E., Klein, R. G. & Volman, T. P. (1991).Dating archaeological and human fossils fromtheMiddle Stone Age levels of Die Kelders, SouthAfrica. J. hum. Evol. 21, 363–395.
Grun, R., Shackleton, N. J. & Deacon, H. J. (1990).Electron-spin-resonance dating of tooth enamelfrom Klasies River Mouth cave. Curr. Anthrop. 31,427–432.
Grun, R., Brink, J. S., Spooner, N. A., Taylor, L.,Stringer, C. B., Franciscus, R. G. & Murray, A. S.(1996). Direct dating of Florisbad hominid. Nature382, 500–501.
Hendey, Q. B. & Volman, T. P. (1986). Last inter-glacial sea levels and coastal caves in the CapeProvince, South Africa. Quat. Res. 25, 189–198.
Huntley, D. J., Hutton, J. T. & Prescott, J. R.(1993a). The stranded beach-dune sequence ofsouth-east South Australia: a test of thermolumines-cence dating, 0–800 ka. Quat. Sci. Rev. 12,1–20.
Huntley, D. J., Hutton, J. T. & Prescott, J. R. (1993b).Optical dating using inclusions within quartz grains.Geology 21, 1087–1090.
Lamothe, M. & Auclair, M. (1997). Assessing thedatability of young sediments by IRSL using anintrinsic laboratory protocol. Radiation Meas. 27,107–117.
Li, S.-H. (1994). Optical dating: insufficiently bleachedsediments. Radiation Meas. 23, 563–567.
Lian, O. B., Hu, J., Huntley, D. J. & Hicock, S. R.(1995). Optical dating studies of Quaternary organic-rich sediments from southwestern British Columbiaand northwestern Washington State. Can. J. EarthSci. 32, 1194–1207.
McCuen, R. H., Rawls, W. J. & Brakensiek, D. L.(1981). Statistical analysis of the Brooks-Corey andGreen-Ampt parameters across soil textures. WaterResources Research 17, 1005–1013.
Murray, A. S., Marten, R., Johnston, A. & Martin, P.(1987). Analysis for naturally occurring radio-nuclides at environmental concentrations by gammaspectrometry. J. Radioanal. Nucl. Chem. 115, 263–288.
Murray, A. S., Olley, J. M. & Caitcheon, G. G. (1995).Measurement of equivalent doses in quartz fromcontemporary water-lain sediments using opticallystimulated luminescence. Quat. Sci. Rev. 14, 365–371.
Murray, A. S., Roberts, R. G. & Wintle, A. G. (1997).Equivalent dose measurement using a single aliquotof quartz. Radiation Meas. 27, 171–184.
119
Nambi, K. S. V. & Aitken, M. J. (1986). Annual-doseconversion factors for TL and ESR dating. Archae-ometry 28, 202–205.
Parkington, J. (1990). A critique of the consensus viewon the age of Howieson’s Poort assemblages in SouthAfrica. In (P. Mellars, Ed.) The Emergence of ModernHumans, pp. 34–55. Edinburgh: Edinburgh Univer-sity Press.
Prescott, J. R. & Hutton, J. T. (1988). Cosmic ray andgamma ray dosimetry for TL and ESR. Nucl. TracksRadiation Meas. 14, 223–227.
Prescott, J. R. & Robertson, G. B. (1997). Sedimentdating by luminescence: a review. Radiation Meas.27, 893–922.
Rhodes, E. J. & Bailey, R. M. (1997). The effect ofthermal transfer on the zeroing of the luminescenceof quartz from recent glaciofluvial sediments. Quat.Sci. Rev. 16, 291–298.
Roberts, R., Bird, M., Olley, J., Galbraith, R., Lawson,E., Laslett, G., Yoshida, H., Jones, R., Fullagar, R.,Jacobsen, G. & Hua, Q. (1998). Optical and radio-
carbon dating at Jinmium rock shelter in northernAustralia. Nature 393, 358–362.
Smith, B. W. & Rhodes, E. J. (1994). Charge move-ments in quartz and their relevance to optical dating.Radiation Meas. 23, 329–333.
Smith, M. A., Prescott, J. R. & Head, M. J. (1997).Comparison of 14C and luminescence chronologiesat Puritjarra Rock Shelter, Central Australia. Quat.Geochron. 16, 299–320.
Tankard, A. J. & Schweitzer, F. R. (1974). The geologyof Die Kelders Cave and environs: a palaeoenviron-mental study. S. Afr. J. Sci. 70, 365–369.
Tankard, A. J. & Schweitzer, F. R. (1976). Texturalanalysis of cave sediments: Die Kelders, CapeProvince, South Africa. In (D. A. Davidson &M. L. Shackley, Eds) Geoarchaeology, pp. 289–316.London: Duckworth.
Wintle, A. G. & Murray, A. S. (2000). Towards thedevelopment of a preheat procedure for OSL datingof quartz. Radiation Meas. (in press).