Marine Predator Surveys in Glacier Bay National Park and Preserve

Quaternary Geochronology 18 (1999) 179—190
Luminescence dating of the last Weichselian Glacier advancein East Greenland
L. Hansen!,*, S. Funder!, A.S. Murray", V. Mejdahl"!Geological Museum, University of Copenhagen, DK-1350 Copenhagen K, Denmark
"The Nordic Laboratory for Luminescence Dating, Ris~ National Laboratory, DK-4000 Roskilde, Denmark1
Abstract
We have studied fluvial and deltaic sediments that accumulated at the margin of a fjord during the Flakkerhuk stade when the lastmajor glaciers advanced and retreated in the Scoresby Sund region, East Greenland. The sediments have been dated using theoptically stimulated luminescence of quartz and, as a control on the technique, those sediments deposited after deglaciation were alsodated using 14C. We conclude that the last glacier build-up began much earlier than previously suggested; our data indicate theexistence of a more or less stable ice cover for a period of c. 50 ka. This is consistent with the record of ice rafted detritus on thecontinental slope off the Scoresby Sund fjord complex, and suggests that the glacier had a polar regime with little surface melting orbasal slide. ( 1999 Elsevier Science Ltd. All rights reserved.
1. Introduction
The dating and understanding of the processes thatculminated in the last glacial maximum (LGM) at c.21—18 ka is important to our understanding of the inter-action between ice sheets and climate. On land theseevents are represented by moraines and other ice mar-ginal sediment accumulations. However, dating theseaccumulations has generally been difficult because sedi-ments in these turbulent environments have gone throughseveral cycles of reworking. There is thus little in situmaterial suitable for 14C dating, and luminescence tech-niques may be compromised by the periglacial environ-ment with short transport routes and turbid waters, whichallow only a limited chance for exposure to daylight.
This paper applies a combined approach to the datingof sedimentary successions on Jameson Land, EastGreenland (Fig. 1). In East Greenland, the LGM marksthe culmination of the last major resurgence, theFlakkerhuk stade. When the glacier advanced throughthe fjords it dammed shallow lake basins. We have
*Corresponding author. Email: [email protected] Nordic Laboratory for Luminescence Dating is a section of the
Department of Earth Sciences, Aarhus University, C.F. M+llers AlleDK-8000 As rhus C, Denmark.
dated the sediments that accumulated during dammingusing a combination of luminescence techniques onquartz (Q) and feldspar (F) grains from the same samples.As a control on the luminescence dates the results arecompared with 14C dates obtained from sediments de-posited in the Early Holocene. Because feldspar is lesssensitive to light than quartz the F/Q age ratio mayreflect the effect of differential bleaching and thus givesome indication of the depositional environment. Thesame approach was also applied to pre-Holocene sedi-ments deposited before the LGM and to sedimentsassigned to the Eemian from biostratigraphy. Unfortu-nately, material suitable for 14C dating was scarce in pre-Holocene sediments.
Our new results are compared both with revised datesfrom adjacent areas on Jameson Land (Lysa> and Land-vik, 1994; Tveranger et al., 1994), as well as the marinerecord from the shelf and slope of East Greenland (Namet al., 1995; Stein et al., 1996). An overview of previousfeldspar dates from the area was published by Mejdahland Funder (1994).
2. The Flakkerhuk stade and its setting
The Flakkerhuk stade marks the last major growth,culmination and initial decay of fjord glaciers in Scoresby
0277-3791/99/$ — see front matter ( 1999 Elsevier Science Ltd. All rights reserved.PII: S 0 2 7 7 - 3 7 9 1 ( 9 8 ) 0 0 0 5 1 - 1
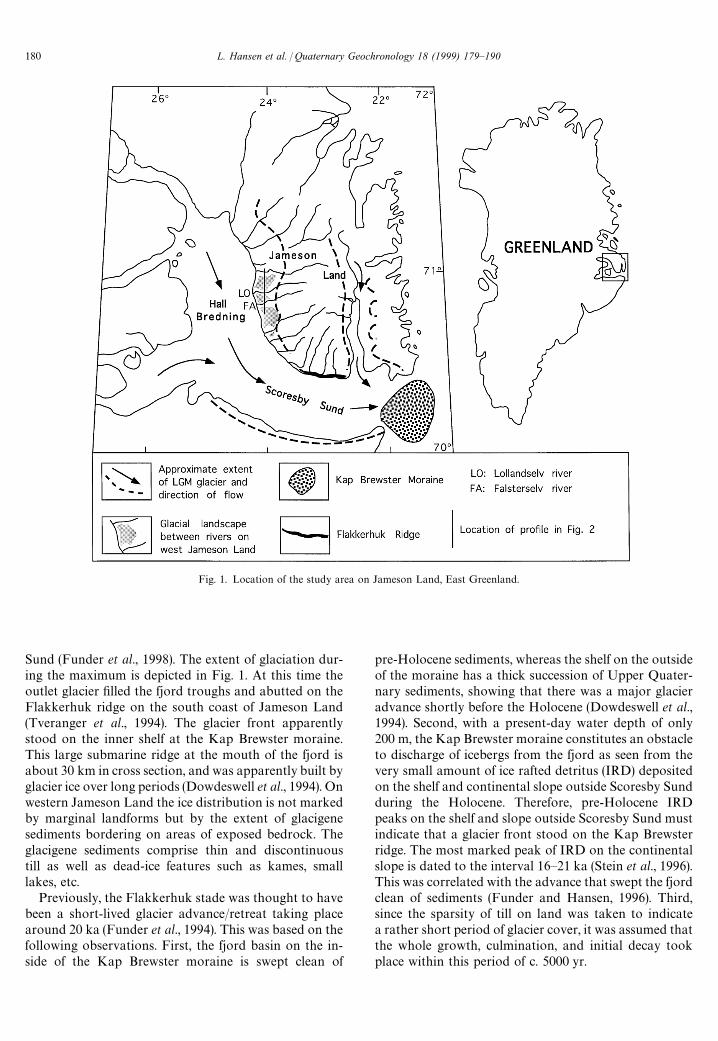
Fig. 1. Location of the study area on Jameson Land, East Greenland.
Sund (Funder et al., 1998). The extent of glaciation dur-ing the maximum is depicted in Fig. 1. At this time theoutlet glacier filled the fjord troughs and abutted on theFlakkerhuk ridge on the south coast of Jameson Land(Tveranger et al., 1994). The glacier front apparentlystood on the inner shelf at the Kap Brewster moraine.This large submarine ridge at the mouth of the fjord isabout 30 km in cross section, and was apparently built byglacier ice over long periods (Dowdeswell et al., 1994). Onwestern Jameson Land the ice distribution is not markedby marginal landforms but by the extent of glacigenesediments bordering on areas of exposed bedrock. Theglacigene sediments comprise thin and discontinuoustill as well as dead-ice features such as kames, smalllakes, etc.
Previously, the Flakkerhuk stade was thought to havebeen a short-lived glacier advance/retreat taking placearound 20 ka (Funder et al., 1994). This was based on thefollowing observations. First, the fjord basin on the in-side of the Kap Brewster moraine is swept clean of
pre-Holocene sediments, whereas the shelf on the outsideof the moraine has a thick succession of Upper Quater-nary sediments, showing that there was a major glacieradvance shortly before the Holocene (Dowdeswell et al.,1994). Second, with a present-day water depth of only200 m, the Kap Brewster moraine constitutes an obstacleto discharge of icebergs from the fjord as seen from thevery small amount of ice rafted detritus (IRD) depositedon the shelf and continental slope outside Scoresby Sundduring the Holocene. Therefore, pre-Holocene IRDpeaks on the shelf and slope outside Scoresby Sund mustindicate that a glacier front stood on the Kap Brewsterridge. The most marked peak of IRD on the continentalslope is dated to the interval 16—21 ka (Stein et al., 1996).This was correlated with the advance that swept the fjordclean of sediments (Funder and Hansen, 1996). Third,since the sparsity of till on land was taken to indicatea rather short period of glacier cover, it was assumed thatthe whole growth, culmination, and initial decay tookplace within this period of c. 5000 yr.
180 L. Hansen et al. / Quaternary Geochronology 18 (1999) 179—190

Fig. 2. Schematic north—south tending geological profile through west Jameson Land showing the youngest stratigraphic divisions of the LatePleistocene and representative sample locations.
3. Stratigraphy and sampling
Our work is based on several seasons of fieldwork onwestern Jameson Land, including sedimentological log-ging, mapping of depositional units, sampling of organicremains for palaeo-ecological information and for14C dating as well as collection of samples for luminescencedating. A summary description of the stratigraphy is givenhere, to provide a context for the sampling and dates.
The geomorphology of Jameson Land is characterisedby broad river valleys incised into thick successions ofPleistocene fluvial, marine and glacigenic sediments andHolocene delta terraces up to c. 80 m a.s.l. Earlier strati-graphic descriptions have been published by Ingolfssonet al. (1994) and more recently by Hansen et al. (1997).Both the stratigraphy and the configuration of the land-scape suggest that the present river valleys are relictfeatures that may have acted as sediment traps whenblocked by glacier ice in the nearby fjord. A schematicnorth—south trending profile crossing three river valleysof western Jameson Land is shown in Fig. 2. The areasbetween river valleys are composed of elevated erodedglacial landscapes c. 80—125 m a.s.l. with scattered boul-ders, kames, irregular small lakes and abandoned fluvialchannels. These relationships provide the basis of a chro-nostratigraphic framework for the Flakkerhuk stadesediments; we consider three depositional phases: (I)build-up, (II) culmination (LGM) and (III) decay.
3.1. The Weichselian: phase (I) build-up
Sedimentological investigations related to this phasewere concentrated in the Falsterselv river valley. Repre-
sentative logs from this area are shown in Fig. 3. Thesediments of Phase (I) are composed of a c. 15 m thicksuccession of cross-bedded and cross-laminated sandwith subordinate beds of laminated sand and mud. Cylin-drical or sheet like water escape structures are present.Organic remains in the sediments indicate interstadialconditions. Plant remains at site 638 are thermophilousand probably derived from the last interglacial period.Some successions are slightly upward fining. The lowerboundary, where exposed, is sharp or erosively overlyingolder deposits. Locally, the sediments pass into a diamic-ton (sites 700 and 551, Fig. 3). However, the upperboundary is often sharp and erosional. The ripplelaminated sand at site 541 is erosively overlain by west-erly inclined beds of sand and silt. Palaeocurrents aregenerally towards the west and south, sometimes evensoutheast. Similar, but less extensive beds were also re-corded in the same stratigraphic position north of theFalsterselv river in the central part of two rivervalleys (Fig. 2).
The cross-bedded and ripple laminated sands from theFalsterselv area are interpreted as fluvio-deltaic sedi-ments that were deposited in a shallow basin duringrising base level. The gradual change from fluvial sedi-ments into a diamicton of waterlain, probably gla-ciolacustrine, origin suggests that the rising base levelwas a result of glacier damming. This is supported by theapparent diversion of palaeocurrents along or even awayfrom the present coastline due to blocking of river outletsin the fjord. The transition from ripple laminatedbeds into delta foresets at site 541 is interpreted as aresult of continued deepening of the basin during baselevel rise. The sediments are probably composed of
L. Hansen et al. / Quaternary Geochronology 18 (1999) 179—190 181

Fig. 3. Correlation of selected sedimentological logs from the Falsterselv area with luminescence and 14C dates from these sites.
material derived from land and from proglacially up-thrusted marine or older Pleistocene sediments. This isalso suggested by the remains of thermophilous plants inthe upper part of site 638, which is glacially tectonised.Water escape structures may have been induced by gla-cier tectonic disturbances and a high rate of deposition.The advancing glacier margin may have been quite steepand the lack of extensive glacially derived outwash sheetsalso suggests that the advancing LGM glacier was cold.A suggested palaeoenvironmental reconstruction of theglacier damming is presented in Fig. 4.
Five samples for luminescence dating were collectedfrom cross-bedded and cross-laminated sands of phase (I)to date the time of glacier damming (Table 1). Onesample was collected near the Lollandselv River and onefrom an unnamed river further north (Fig. 2). Three sam-ples were collected near the Falsterselv River (Fig. 3).Three samples of plant remains from these deposits werealso taken for 14C dating (Fig. 3, Table 2).
3.2. The Weichselian: phase (II) culmination (LGM)
Diamictic beds less than 2 m thick overlie the beds ofphase (I) and are stratigraphically underlying terrace
sediments of the succeeding deglaciation (phase (III),see below). The diamictons are laterally of varyingcomposition and are often stratified. The beds arefound at varying altitudes, and are sometimes only sometens of centimetres thick and appear as a lag. The under-lying deposits of phase (I) were found to be gla-ciotectonized from W—NW up to 8 km from the presentcoast line.
The diamicton is interpreted as till and glacial sedi-ments that were redeposited and eroded during deglaci-ation. The glacier reached more than 8 km inland fromthe present coast line but no ridge or outwash marks itsmargin. The limit of glacial drift in the area is c. 15 kmfrom the coast and may represent the maximum exten-sion of glacier ice during LGM (Figs. 1 and 4). However,traces of the LGM glacier in the elevated glacial land-scapes are ill-defined.
3.3 The Holocene: phase (III) decay
The sediments of phase (III) consist of an upwardcoarsening succession of laminated mud, and westerlyinclined beds of sand and silt overlain by cross-beddedgravelly sand. The sediments are easily recognised from
182 L. Hansen et al. / Quaternary Geochronology 18 (1999) 179—190
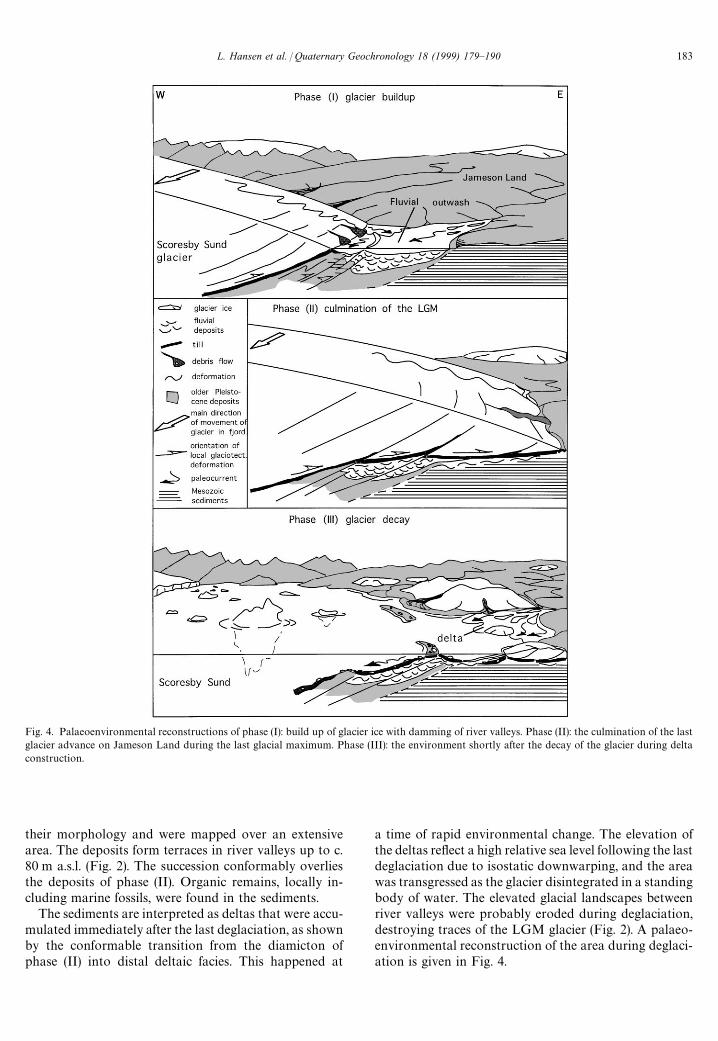
Fig. 4. Palaeoenvironmental reconstructions of phase (I): build up of glacier ice with damming of river valleys. Phase (II): the culmination of the lastglacier advance on Jameson Land during the last glacial maximum. Phase (III): the environment shortly after the decay of the glacier during deltaconstruction.
their morphology and were mapped over an extensivearea. The deposits form terraces in river valleys up to c.80 m a.s.l. (Fig. 2). The succession conformably overliesthe deposits of phase (II). Organic remains, locally in-cluding marine fossils, were found in the sediments.
The sediments are interpreted as deltas that were accu-mulated immediately after the last deglaciation, as shownby the conformable transition from the diamicton ofphase (II) into distal deltaic facies. This happened at
a time of rapid environmental change. The elevation ofthe deltas reflect a high relative sea level following the lastdeglaciation due to isostatic downwarping, and the areawas transgressed as the glacier disintegrated in a standingbody of water. The elevated glacial landscapes betweenriver valleys were probably eroded during deglaciation,destroying traces of the LGM glacier (Fig. 2). A palaeo-environmental reconstruction of the area during deglaci-ation is given in Fig. 4.
L. Hansen et al. / Quaternary Geochronology 18 (1999) 179—190 183

Table 1Luminescence dates
Sediment Deposits Elevation Water Mineral Dose rate D%
Age (ka) Stratigraphy Agesample site number (m a.s.l.) content % (Gyka~1) (Gy) Note 2 F/Q
R901011 Sandy delta foresets 55 30 Q 1.84 29.0 (2) 15.8$3.6 1.155 F 2.54 42.0 (2)
R901012 Sandy delta foresets 67 21 Q 2.32 18.7 (2) 8.1$1.1 1.855 F 3.30 46.8 (2)
R951002 Sandy delta foresets 74 29 Q 3.22 30.6 (6) 9.5$1.6 4.244 F 3.67 14.6 (3)
R951003 Sandy delta foresets 75 22 Q 2.50 24.6 (5) 9.8$1.2 1.8508 F 3.19 55.3 (4)
R951014 Sandy delta foresets 64 29 Q 2.73 53.8 (5) 17$3 2.3602b F 3.31 151 (5) (7.3$0.9,
note 1)R951015 Sandy delta foresets 63 24 Q 2.10 49.0 (1) 23$3 —
614 F 2.67R951019 Gravelly/sandy delta 60 16 Q 2.48 45.3 (3) 18.2$1.3 1.3
foresets, 635 F 3.08 70.0 (3)R951011 Gravelly delta plain 78 19 Q 2.65 43.6 (8) 16$3 1.1
660 F 3.55 62.1 (5)R951007 Sandy delta plain 75 23 Q 2.79 50.8 (4) 18.2$1.7 2.3
536a F 3.33 141 (4) (7.8$1.0note 1)
R951005 Sandy delta plain 65 16 Q 3.14 22.8 (4) 7.2$0.6 1.937 F 3.85 53.0 (1)
R951020 Fluvial sand 48 20 Q 2.29 141 (4) 62$7 0.78cross laminated, 638 F 3.44 166 (2)
R971001 Fluvial sand 45 19 Q 3.16 153 (4) 48$4 1.76cross bedded, 638 F 3.61 307 (3)
R971003 Fluvial sand 49 27 Q 2.78 196 (4) 70$7 0.82cross laminated, 541b F 3.28 189 (2)
R951006 Fluvial sand 35 16 Q 2.54 154 (4) 61$4 0.84cross bedded, 369 F 3.07 157 (3)
R951012 Fluvial sand 40 15 Q 2.41 169 (3) 70$8 0.8cross bedded, 662 F 3.07 172 (4)
R931020 Shallow marine sand 50 23 Q 2.22 242 (3) 109$10 1.2596 (Note 3) F 3.01 411 (2)
R931021 Shallow marine sand 49 22 Q 2.34 257 (3) 109$24 1.2295 (Note 3) F 3.07 413 (3)
R931016 Delta sediments 25 23 Q 3.29 204 (4) 62$5 1.39429 (Note 4a) F 4.00 346 (1)
R931032 Delta sediments 54 22 Q 2.45 173 (3) 71$5 1.48466 (Note 4b) F 3.63 379 (3)
Note 1: The two ages in parantheses were calculated from the dose distribution of Fig. 6, as described in the text.Note 2: The numbers given in parantheses after the average values of D
%show the number of independant estimates included in the average.
Note 3: These samples were collected on south Jameson Land and were originally published by Landvik et al. (1994).Note 4: Revised from (a) Lysa5 and Landvik (1994) and (b) Tveranger et al. (1994). The deposits, that are found in a similar stratigraphic position asphase (1) sediments, are here suggested as accumulated during glacier damming.
Wei
chse
lian
(not
e4)
Eem
ian
&&&
Wei
chse
lian
pha
se(I)&&
&&&&&&&&&
Holo
cene
phas
e(III
)&&&&&&&&&&&
A total of 10 samples for luminescence dating werecollected from sandy to gravelly delta foresets anddelta plain sediments to date the deglaciation and the ageof the marine limit. Two samples were collected fromnear the Lollandselv river, two from the Falsterselv river,and two from the unnamed river to the north. Fourfurther samples were collected to the south (not shown in
Fig. 2). As some plant remains were found in these sedi-ments, it was possible to use 14C as an independentcontrol on the luminescence dates (Table 2). The organicremains were found mainly in the finer grained deltasediments. Seven samples were taken from the Falsterselvarea and four samples to the north, near the unnamedriver (Fig. 2).
184 L. Hansen et al. / Quaternary Geochronology 18 (1999) 179—190
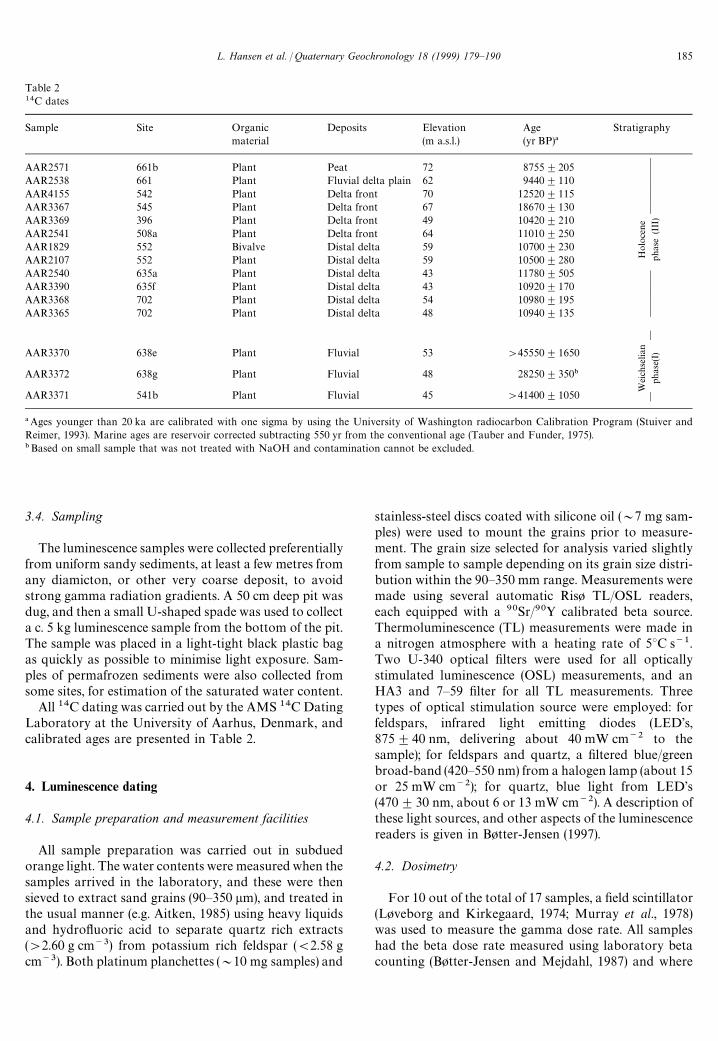
Table 214C dates
Sample Site Organic Deposits Elevation Age Stratigraphymaterial (m a.s.l.) (yr BP)!
AAR2571 661b Plant Peat 72 8755$205AAR2538 661 Plant Fluvial delta plain 62 9440$110AAR4155 542 Plant Delta front 70 12520$115AAR3367 545 Plant Delta front 67 18670$130AAR3369 396 Plant Delta front 49 10420$210AAR2541 508a Plant Delta front 64 11010$250AAR1829 552 Bivalve Distal delta 59 10700$230AAR2107 552 Plant Distal delta 59 10500$280AAR2540 635a Plant Distal delta 43 11780$505AAR3390 635f Plant Distal delta 43 10920$170AAR3368 702 Plant Distal delta 54 10980$195AAR3365 702 Plant Distal delta 48 10940$135
AAR3370 638e Plant Fluvial 53 '45550$1650
AAR3372 638g Plant Fluvial 48 28250$350"
AAR3371 541b Plant Fluvial 45 '41400$1050
!Ages younger than 20 ka are calibrated with one sigma by using the University of Washington radiocarbon Calibration Program (Stuiver andReimer, 1993). Marine ages are reservoir corrected subtracting 550 yr from the conventional age (Tauber and Funder, 1975)."Based on small sample that was not treated with NaOH and contamination cannot be excluded.
&
Wei
chse
lian
phas
e(I)
&&&&&&
Holo
cene
pha
se(III
)&&&&&&
3.4. Sampling
The luminescence samples were collected preferentiallyfrom uniform sandy sediments, at least a few metres fromany diamicton, or other very coarse deposit, to avoidstrong gamma radiation gradients. A 50 cm deep pit wasdug, and then a small U-shaped spade was used to collecta c. 5 kg luminescence sample from the bottom of the pit.The sample was placed in a light-tight black plastic bagas quickly as possible to minimise light exposure. Sam-ples of permafrozen sediments were also collected fromsome sites, for estimation of the saturated water content.
All 14C dating was carried out by the AMS 14C DatingLaboratory at the University of Aarhus, Denmark, andcalibrated ages are presented in Table 2.
4. Luminescence dating
4.1. Sample preparation and measurement facilities
All sample preparation was carried out in subduedorange light. The water contents were measured when thesamples arrived in the laboratory, and these were thensieved to extract sand grains (90—350 lm), and treated inthe usual manner (e.g. Aitken, 1985) using heavy liquidsand hydrofluoric acid to separate quartz rich extracts('2.60 g cm~3) from potassium rich feldspar ((2.58 gcm~3). Both platinum planchettes (&10 mg samples) and
stainless-steel discs coated with silicone oil (&7 mg sam-ples) were used to mount the grains prior to measure-ment. The grain size selected for analysis varied slightlyfrom sample to sample depending on its grain size distri-bution within the 90—350 mm range. Measurements weremade using several automatic Ris+ TL/OSL readers,each equipped with a 90Sr/90Y calibrated beta source.Thermoluminescence (TL) measurements were made ina nitrogen atmosphere with a heating rate of 5°C s~1.Two U-340 optical filters were used for all opticallystimulated luminescence (OSL) measurements, and anHA3 and 7—59 filter for all TL measurements. Threetypes of optical stimulation source were employed: forfeldspars, infrared light emitting diodes (LED’s,875$40 nm, delivering about 40 mW cm~2 to thesample); for feldspars and quartz, a filtered blue/greenbroad-band (420—550 nm) from a halogen lamp (about 15or 25 mW cm~2); for quartz, blue light from LED’s(470$30 nm, about 6 or 13 mW cm~2). A description ofthese light sources, and other aspects of the luminescencereaders is given in B+tter-Jensen (1997).
4.2. Dosimetry
For 10 out of the total of 17 samples, a field scintillator(L+veborg and Kirkegaard, 1974; Murray et al., 1978)was used to measure the gamma dose rate. All sampleshad the beta dose rate measured using laboratory betacounting (B+tter-Jensen and Mejdahl, 1987) and where
L. Hansen et al. / Quaternary Geochronology 18 (1999) 179—190 185

necessary this was also used to calculate the gammadose rate. The potassium content of feldspar extractswas also measured using beta counting (B+tter-Jensenand Mejdahl, 1985). An internal uranium and thoriumcontribution of 0.1 Gy ka~1 for quartz and 0.18 Gy ka~1
for feldspar was assumed (cf. dose rates of '1.84 (Q)and '2.36 (F) Gy ka~1). The Rb contribution to thedose rate was not explicitly taken into account. How-ever, this is considered negligible compared with othersources of uncertainty. Dose rates were calculatedusing an appropriate beta grain-attenuation factor(Mejdahl, 1979) and a water content correction factor(see below).
4.3. Water content
The samples were all collected during the arctic sum-mer, and so the measured water contents are taken asminima. Samples were also categorised into 3 groups,depending on texture, etc., and a saturated water content(when frozen) of 20, 25 and 30% assigned. The values arebased on porosity and on the permafrost samples, andshould only be regarded as indicative. Based on themodel of Hvidfeldt-Christiansen (1995) and Hvidfeldt-Christiansen et al. (1998), it was further assumed that thesamples were saturated (i.e. frozen) for 2/3 of the burialtime, and fully drained for the balance; the calculatedaverage values are given in Table 1. An uncertainty of 1/3of the possible range was assigned to each value. Theresulting quartz and feldspar dose rates are also shownin Table 1.
4.4. Equivalent dose (D%)
Equivalent doses were measured using both feldsparand quartz. Initial measurements were made using felds-par TL and OSL/IRSL (infrared stimulated lumines-cence). More recently single aliquot OSL techniques havebecome available for quartz which has allowed us to takeadvantage of the more reliable luminescence character-istics of this mineral.
Feldspar — Estimates of D%
have been obtained using3 protocols — the plateau TL method (Mejdahl, 1988);total bleach additive-dose both using infrared stimulatedluminescence (IRSL) and using blue-green broad-bandstimulated luminescence (OSL) with a preheat of 220°Cfor 40 s; and the Single Aliquot Regenerated and Addeddose (SARA) protocol (Mejdahl and B+tter-Jensen,1994), also using both IRSL and OSL. All added doseswere stored at 100°C for 14 d to minimise the effects ofanomalous fading (this is discussed further below). Aver-aging over the 10 samples for which paired TL and(OSL,IRSL) estimates exist, no systematic difference wasfound between the analyses (ratio TL/(OSL/IRSL)"1.12$0.15). Only the average values are presented inTable 1.
Quartz — The SARA protocol, using both blue LEDand blue/green broad-band stimulation, was employedfor some of the younger samples, using a preheat of220°C for 40 s. The Single Aliquot Regenerated doseprotocol [SAR, based on Murray and Roberts (1998) andMurray and Mejdahl (1998), and discussed in Wintle(1997)] was used for all samples, also with both types oflight source. This protocol has been shown to be insensi-tive to preheat conditions (Murray and Roberts, 1998;Murray and Mejdahl, 1998, Strickertsson and Murray,1998); a 280°C preheat for 10 s was routinely employed.For samples with larger values of D
%only SAR was used,
because this is better able to give useful estimates insamples approaching saturation. The use of this protocolis illustrated in Fig. 5, where the regenerated growthcurves for a single aliquot of each of a young and oldsample are shown, together with the natural signal. Alllight levels have been normalised to compensate for sen-sitivity changes with regeneration cycle, as discussed indetail by Murray and Roberts (1998), Murray and Mej-dahl (1998) and Strickertsson and Murray (1998). Theexperimental details are given in the figure caption, anda more detailed description of the technique is in prep-aration. When regenerating a single aliquot repeatedly,as is necessary to construct a growth curve, it is impor-tant to demonstrate that the cumulative effect of sensitiv-ity change over several dose/preheat/measurement cycleshas been satisfactorily corrected for. This was done ineach case by administering doses of increasing size up tothe maximum value, and then repeating the smallestregeneration dose at the end of the sequence. If thecorrection procedure has been successful, after nor-malisation the final regenerated measurement shouldoverlie the first regenerated measurement, as is shown inFig. 5. It should also be noted that the major source ofuncertainty in the values of D
%derived using this protocol
was inter-aliquot variability.Averaged over the 7 samples for which the two proto-
cols (SAR and SARA) were both applied (including 4 un-published values not otherwise relevant to this report),no significant difference was found between the pairedsets of estimates (SARA/SAR"0.97$0.07), and onlythe average values are given in Table 1. This agreement issimilar to that found by Murray and Mejdahl (1998)(using heated quartz), and Strickertsson and Murray(1998) (using Holocene sedimentary quartz).
The tabulated ages are based only on the quartz data,although the ratios of the feldspar to quartz ages aregiven in the final column in Table 1.
5. Discussion of dates
The ten luminescence dates based on quartz fromphase (III) sediments gave ages between 7.2 and 23 ka.Organic remains from the same sediments gave 10
186 L. Hansen et al. / Quaternary Geochronology 18 (1999) 179—190

Fig. 5. (a) A single aliquot of quartz (sample 951005) was preheated for10 s at 260°C, and then the OSL measured by stimulating for 100 s at125°C. A test dose was then given (5 Gy in this case, typically (20% ofthe natural dose), the sample heated at 5°C s~1 to 160°C, and the OSLmeasured again. The aliquot was then given the first (smallest) regen-eration dose of 5 Gy, and the measurement cycle repeated commencingwith the 260°C preheat. This regeneration cycle was repeated 4 timesmore, first with increasing regeneration doses up to 34 Gy, and finally(in the last cycle) with a regeneration dose identical to the first (smallest)regeneration dose of 5 Gy. The net OSL signal from the first 0.4 s ofstimulation was used in calculations. The closed circles are the OSLsignals from the regeneration doses (each normalised for sensitivitychanges by dividing by the OSL from the test doses). The final measure-ment is shown as an open triangle. The natural signal is shown asa horizontal dashed line. The data have been fitted with the sum ofa saturating exponential and a straight line, but since the natural dose isobtained from interpolation the result is insensitive to the model. (b)The same experimental sequence applied to sample R971003, but witha test dose of 10 Gy, and regeneration doses of between 24 and 730 Gy.
calibrated 14C dates in the range 12.5—9.4 ka with oneoutlier collected near the surface of a 70 m terrace giving18.7 ka. The youngest date of 9.4 ka was obtained fromfluvial sediments incised into the top of the delta; this isconsistent with the 14C date of 8.8 ka obtained from theoverlying peat which developed after delta formation(Table 2). The 14C dates show that the deltas mainlyaccumulated in the Early Holocene (12—10 ka), neglect-
ing the outlier of 18.7 ka. The average of the 10 lumines-cence dates is 14.3$1.7 ka (unweighted, because theindividual ages are clearly statistically different from eachother). This is only slightly older than the 14C mean of10.9$0.3 ka (n"10) for the primary deposits (i.e. omit-ting the 8.8 ka date), and consistent with the 14C averageif the 18.7 ka date is included (mean 11.6$0.7 ka). Weconclude that there is some evidence that quartz from thephase III sediments may not be completely bleached, butthat the average effect on the dates is slight. Because ofthe possibility of this incomplete bleaching, the indi-vidual uncertainties cannot be taken at face value, andthe unweighted average is considered the best lumines-cence estimate of the age of these deposits.
Five luminescence dates on quartz were obtained fromthe deposits of phase (I) ranging from 70 to 48 ka (Table1). The apparent stratigraphic inversion of the twoluminescence dates at site 638 is not statistically signifi-cant; the weighted average of the two dates is 51$3 ka.Three 14C dates (Table 2) were obtained from the samedepositional unit, two of which give non-finite ages over40 ka (Fig. 3). These dates were obtained from remains ofplants that may have lived in the catchment of the riveror in some cases be reworked as suggested from thepresence of thermophilous, probably interglacial, plantremains in one sample. At site 638 another sample gavea 14C date of c. 28 ka for brittle grass seeds. The seedsshould be well-suited to 14C dating, but unfortunatelythe sample was very small, consisting of c. 200 seeds andweighing 2 mg. It was too small for effective treatmentwith NaOH, and even a slight residual contamination,for instance by humic acids in the soil, could have offsetthe age. This 14C date, which is the only one obtainedfrom Jameson Land within the 20—30 ka range, is con-sidered to be of low reliability. The weighted average ofthe luminescence ages is 58$2 ka (n"5); the individualages range from 70$7 to 48$4 ka, and are not allconsistent with the average, indicating that they wereprobably deposited over a significant interval of time.
5.1. Comparison between quartz and feldspar dates
Quartz is known not to display anomalous fading, andit bleaches more readily in daylight than feldspar (God-frey-Smith et al., 1988; Wintle, 1997), although the lattereffect may be somewhat reduced by the filtering effect ofshallow turbid water. Thus, we consider the quartz datesto be inherently more reliable, and compare the feldspardates with them. In general the feldspar TL signal bleach-es more slowly in day light than the IRSL/OSL signal.However, the TL protocol used to derive feldspar equiva-lent doses (Mejdahl, 1988) is intended to take into ac-count explicitly the degree of bleaching, by searchingfor the ‘‘best’’ plateau as a function of glow curve temper-ature, for various bleaching times. The agreementbetween the OSL/IRSL feldspar data and those from TL
L. Hansen et al. / Quaternary Geochronology 18 (1999) 179—190 187
measurements confirms that, on average, the grossdifferences between TL and IRSL/OSL have been suc-cessfully removed by this TL protocol. The average feld-spar to quartz age ratio (F/Q) for nine of the ten EarlyHolocene phase (III) samples is 2.0$0.3 (Table 1); this issignificantly '1, and the largest individual value is 4.2.We interpret this as indicating that bleaching is incom-plete in these feldspar samples and, thus, may also beincomplete in the corresponding quartz, as was con-cluded from the 14C comparison. The poor bleaching ofthese delta sediments is consistent with deposition ata time of presumably rapid erosion and correspondinglyhigh concentrations of suspended sediment in melt water.
In contrast, the average F/Q value in phase (I) samplesis 1.0$0.2 (n"5), and if the single value '1 (R971001)is omitted, this ratio drops to 0.810$0.013. We interpretthis as suggesting that these samples are significantlybetter bleached than the younger group, and that anom-alous fading of feldspar may account for the values (1.Storage tests using these feldspar samples (IRSL after14 d at 100°C for '6 bleached and dosed aliquots,compared with the IRSL from aliquots bleached, dosedand measured immediately) gave 13$2% fading for fivephase (I) samples, and 18$5% for eight phase (III)samples. (It should be noted, however, that this degree offading was automatically corrected for by the measure-ment protocols, because the added doses were stored for14 d at 100°C prior to measurement. Thus, if the naturalfading discussed above exists, it must be in addition tothat measured during laboratory tests). Lamothe et al.(1994), in an IRSL study of single grains of feldspar fromlate glacial marine sands, also suggested that their under-estimates of age arose from anomalous fading, and theiroverestimates from incorporation of incompletelybleached older material in the deposit.
The sediments of phase (I) were not deposited duringa significant period of rapid climate change, as was thecase for phase (III), and it is reasonable to expect that theopportunity for bleaching of grains was better, on average.In any case, if these samples were incompletely bleached tothe same degree as those in the Holocene group, thesystematic error introduced would be only a few thousandyears, less than the typical age uncertainty in this group.
The two quartz samples assigned to the Eemian frombiostratigraphy, give, on average, a slight underestimateof the expected age (115—130 ka), although this is prob-ably not statistically significant for either sample individ-ually. The average F/Q ratio is 1.24, again suggesting thepossibility of some incomplete bleaching (Table 1). Boththese samples faded during laboratory tests (by 10 and11%, respectively).
5.2. Further tests on incomplete bleaching
We have tested the hypothesis of incomplete bleachingon two quartz samples which were confidently expected
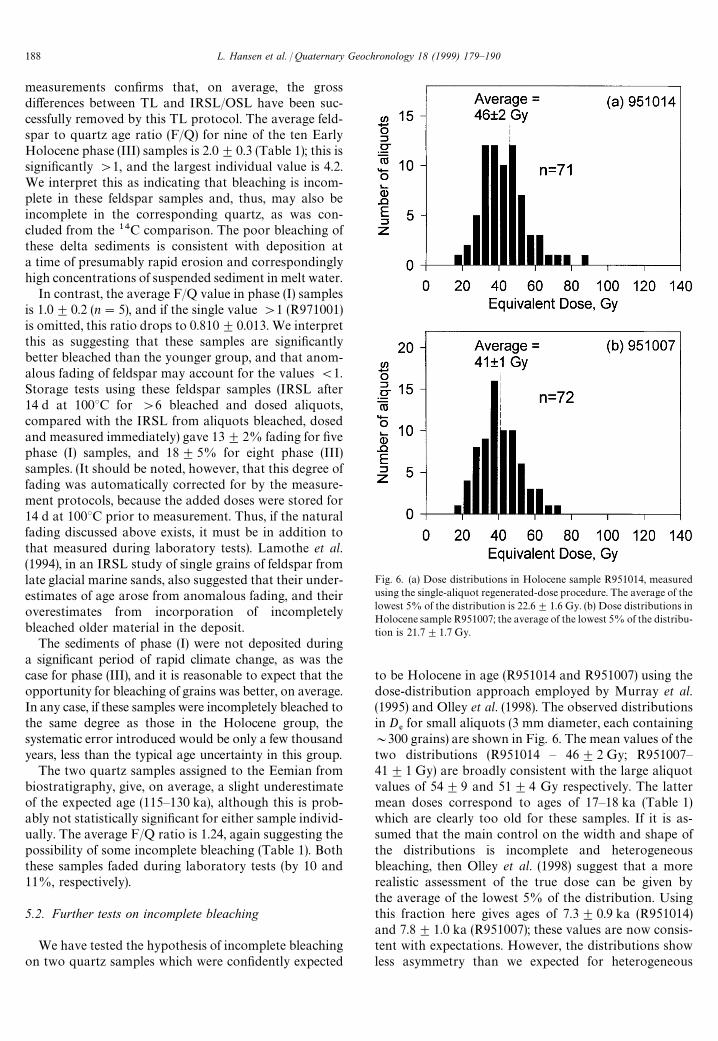
Fig. 6. (a) Dose distributions in Holocene sample R951014, measuredusing the single-aliquot regenerated-dose procedure. The average of thelowest 5% of the distribution is 22.6$1.6 Gy. (b) Dose distributions inHolocene sample R951007; the average of the lowest 5% of the distribu-tion is 21.7$1.7 Gy.
to be Holocene in age (R951014 and R951007) using thedose-distribution approach employed by Murray et al.(1995) and Olley et al. (1998). The observed distributionsin D
%for small aliquots (3 mm diameter, each containing
&300 grains) are shown in Fig. 6. The mean values of thetwo distributions (R951014 — 46$2 Gy; R951007—41$1 Gy) are broadly consistent with the large aliquotvalues of 54$9 and 51$4 Gy respectively. The lattermean doses correspond to ages of 17—18 ka (Table 1)which are clearly too old for these samples. If it is as-sumed that the main control on the width and shape ofthe distributions is incomplete and heterogeneousbleaching, then Olley et al. (1998) suggest that a morerealistic assessment of the true dose can be given bythe average of the lowest 5% of the distribution. Usingthis fraction here gives ages of 7.3$0.9 ka (R951014)and 7.8$1.0 ka (R951007); these values are now consis-tent with expectations. However, the distributions showless asymmetry than we expected for heterogeneous
188 L. Hansen et al. / Quaternary Geochronology 18 (1999) 179—190

bleaching. This may result from a more uniform grain-to-grain luminescence sensitivity than found by Olleyet al. (1998) and Murray and Roberts (1997). We considerthat these revised dates should be regarded as tentativeuntil the origins of the shape of the distributions arebetter understood.
In conclusion, five luminescence samples indicate thatthe glacier damming (phase (I)) occurred in all three riverbasins at c. 60 ka probably under conditions favourableto good bleaching. On the other hand, the decay of theglacier probably took place in a period of strong envir-onmental instability with poor bleaching conditions.Carbon-14 dates show that this happened in the EarlyHolocene, and the luminescence ages are only slightlyolder. Examination of the dose distributions in two sam-ples supported the hypothesis of incomplete bleaching.
6. Correlation with other areas
A significant implication of the new results is that thelast glacial resurgence in Scoresby Sund, the Flakkerhukstade, was not the short lasting (&5ka) glacier oscillationdescribed previously by Funder et al. (1994), but a longer50 ka period of stable ice cover marked by lacustrinesedimentation in ice dammed lakes rather than till andoutwash. In order to test the regionality of this conten-tion we have compared the record from western JamesonLand with that from sites previously investigated in thearea, and with marine geological studies on the continen-tal shelf and slope. At Jyllandselv, Langelandselv, andsites on the south coast of Jameson Land, sandy aquaticsediments underlie till of the Flakkerhuk stade (Landviket al., 1994; Lysa> and Landvik, 1994; Tveranger et al.,1994). In spite of the lack of fossils, they were interpretedas marine because of their aggradational nature, whichwas interpreted as reflecting a rise in relative sea level.Their age was provisionally estimated from their strati-graphic position between the Jyllandselv stade (&MIS5b) and the glacigene sediments of the Flakkerhuk stade;this interpretation was supported by luminescence dates.This applies to units 8 and 9, at Jyllandselv (Lysa> andLandvik, 1994), unit G at Langelandselv (Landvik et al.,1994), and unit E at Kap Stewart and possibly alsoHesteelv (Tveranger et al., 1994). However, as discussedabove aggradation can also result from base level riseduring damming and a correlation with the lacustrinephase (I) on western Jameson Land may be a more likelyalternative. In order to test this, two samples from south-ern Jameson Land have been redated using quartz(R931016 and R931032, Table 1). They were previouslydated using TL and OSL on alkali feldspars, and gave101 and 137 ka, respectively (Mejdahl and Funder, 1994).The corresponding quartz dates are 62$5 and71$5 ka. We conclude that the feldspar grains wereprobably incompletely bleached and the same may apply
to other sediments at this stratigraphic level which werepreviously dated using feldspar. The new dates supportcorrelation of these sediments with phase (I) sediments atFalsterselv.
On the continental slope outside the mouth ofScoresby Sund two coring transects have provided a re-cord of ice rafted detritus (IRD) and stable isotopes backto c. 300 ka (Nam et al., 1995; Stein et al., 1996). Therecords show a major increase in IRD at the MIS4/3boundary (c. 60 ka). This was followed by a period ofhigh IRD values, which culminated in the period fromc. 21 to c. 16 ka (Nam et al., 1995). One prerequisite forIRD from the Scoresby Sund drainage to reach thecontinental slope is that glacier fronts were located in anadvanced position on the inner shelf, i.e. that theScoresby Sund fjord basin was occupied by a glacier. Themarine geological results, therefore, support the conten-tion that the Flakkerhuk stade marked a long period ofrather stable glaciation with ice margins close to theirlast glacial maximum positions.
7. Conclusions
Luminescence dates on quartz from sediments from icedammed lakes which were formed during the last majorglacier build-up in Scoresby Sund are internally consis-tent. A comparison with feldspar dates may give anindication of the degree of bleaching, with F/Q age ratios'1 interpreted as reflecting incomplete bleaching priorto deposition. The quartz dates are also consistent witha sedimentological model of palaeoenvironment develop-ment leading to the culmination of glaciation during thelast ice age. The new results imply that the glacier build-up (phase I) was marked, not by deposition of till, but bythe formation of glacier dammed rivers and lakes indrowned valleys on Jameson Land which may have al-ready begun by c. 60 ka. The ice-dammed lakes wereoverridden by the ice margin, as seen from thin anddiscontinuous till and glacier-tectonics (phase II). It wasfollowed by a short culmination, at c. 20 ka. A compari-son with the previously published records from otherlocalities on Jameson Land suggests that the last glacialmaximum in East Greenland was a small expansion froma long lived, stable, polar glaciation that had alreadyreached close to maximum at c. 60 ka. This interpreta-tion is consistent with the IRD record from the continen-tal slope off Scoresby Sund. The sparsity of glacigenicsediments from this long lasting period of ice cover mustbe a consequence of the polar climate, which preventedsurface melting and basal sliding of the glacier.
Acknowledgements
The final draft of this manuscript was completed afterthe death of Vagn Mejdahl in August 1997. This work
L. Hansen et al. / Quaternary Geochronology 18 (1999) 179—190 189

was carried out within the projects ‘‘Arctic Termina-tions’’ and ‘‘CATLINA’’ which were financially sup-ported by the Danish Foundation of Natural Sciences(SNF). We want to thank Mads Terkelsen, Maria Hall-quist and Nicolaj Birkedahl for assistance during field-work.
References
Aitken, M. J. (1985). ¹hermoluminescence Dating. (359p). London: Aca-demic Press.
B+tter-Jensen, L. (1997). Luminescence techniques: instrumentationand methods. Radiation Measurements, 27, in press.
B+tter-Jensen, L., & Mejdahl, V. (1985). Determination of potassium infeldspars using a GM multicounter system. Nuclear ¹racks, 10,663—666.
B+tter-Jensen, L., & Mejdahl, V. (1987). Assessment of beta dose rateusing a GM multicounter system. Nuclear ¹racks and RadiationMeasurements, 14, 187—191.
Dowdeswell, J. A., Uenzelmann-Neben, G., Whittington, R. J.,& Marienfeld, P. (1994). The Late Quaternary sedimentary recordin Scoresby Sund, East Greenland. Boreas, 23, 294—310.
Funder, S., Hjort, C., & Landvik, J. Y. (1994). The last glacial cycles inEast Greenland, an overview. Boreas, 23, 283—293.
Funder, S., & Hansen, L. (1996). The Greenland ice sheet — a modelfor its culmination and decay during and after the last glacialmaximum. Bulletin of the Geological Society of Denmark, 42,137—152.
Funder, S., Hjort, C., Landvik, J. Y., Nam, S.-I., Reeh, N., & Stein, R.(1998). History of a stable ice margin — East Greenland duringthe Middle and Upper Pleistocene. Quaternary Science Reviews, 17,77—123.
Godfrey-Smith, D. I., Huntley, D. J., & Chen, W.-H. (1988). Opticaldating studies of quartz and feldspar sediment extracts. QuaternaryScience Reviews, 7, 373—380.
Hansen, L. A., Jensen, J. B., & Terkelsen, M. (1997). Review of Green-land activities, 1996. Geology of Greenland Survey Bulletin, 176,84—88.
Hvidfeldt-Christiansen, H. (1995). Nivation forms, processes and sedi-ments in recent and former Arctic areas. Unpublished PhD thesis,University of Copenhagen.
Hvidfeldt-Christiansen, H., Murray, A. S., Mejdahl, V., & Humlum, O.(1999). Luminescence dating of Holocene geomorphic activity onAmmassalik Island, SE Greenland. Quaternary Geochronology(Quaternary Science Reviews), 18, 191—205.
Ingolfsson, O., Lysa> , A., Funder, S., M+ller, P., & Bjorck, S. (1994). LateQuaternary glacial history of the central west coast of JamesonLand, East Greenland. Boreas, 23, 447—458.
Lamothe, M., Balsecu, S., & Auclair, M. (1994). Natural IRSL inten-sities and apparent luminescence ages of single feldspar grainsextracted from partially bleached sediments. Radiation Measure-ments, 23, 555—561.
Landvik, J. Y., Lysa> , A., Funder, S., & Kelley, M. (1994). The Eemianand Weichselian stratigraphy of the Langelandselv area, JamesonLand, East Greenland. Boreas, 23, 412—423.
Lysas , A., & Landvik, J.Y. (1994) The lower Jyllandselv succession:evidence for three Weichselian glacier advances over coastalJameson Land, East Greenland. Boreas, 23, 432—446.
L+veborg L., & Kirkegaard P. (1974). Response of 3@@]3@@ NaI(Tl)detectors to terrestrial gamma radiation. Nuclear Instruments andMethods, 121, 239—251.
Mejdahl, V. (1979). Thermoluminescence dating: beta-dose attenuationin quartz grains. Archaeometry, 21, 61—72.
Mejdahl, V. (1988). The plateau method for dating partially bleachedsediments by thermoluminescence. Quaternary Science Reviews, 7,347—348.
Mejdahl, V., & B+tter-Jensen L. (1994). Luminescence dating of archae-ological materials using a new technique based on single aliquotmeasurements. Quaternary Geochronology (Quaternary ScienceReviews), 13, 551—554.
Mejdahl, V., & Funder, S. (1994). Luminescence dating of Late Quater-nary sediments from East Greenland. Boreas, 23, 525-535.
Murray, A. S., Bowman S. G. E., & Aitken, M. J. (1978). Environmentalradiation studies relevant to thermoluminescence dating. In T. F.Gessell & W. M. Lowder (Eds.), Natural radiation environment vol.III’’. Conf-780422, US Department of Energy.
Murray, A. S., & Mejdahl, V. (1999). Comparison of regenerative-dosesingle-aliquot and multiple-aliquot (SARA) protocols using heatedquartz from archaeological sites. Quaternary Geochronology (Quat-ernary Science Reviews), 18, 223—229.
Murray, A. S., & Roberts, R. G. (1998). Measurement of equivalent dosein quartz using a regenerative-dose single-aliquot protocol. Radi-ation Measurements (in press).
Murray, A. S., & Roberts, R. G. (1997). Determining the burial time ofsingle grains of quartz using optically stimulated luminescence.Earth and Planetary Science ¸etters, 152, 163—180.
Murray, A. S., Olley, J. M., & Caitcheon, G. C. (1995). Measurements ofequivalent doses in quartz from contemporary waterlain sedimentsusing optically stimulated luminescence. Quaternary Geochronology(Quaternary Science Reviews), 14, 365—371.
Nam, S.-I., Stein, R., Grobe, H., & Hubberten, H. (1995). Late Quater-nary glacial/interglacial changes in sediment composition at theEast Greenland continental margin and their palaeoceanographicimplications. Marine Geology, 122, 243—262.
Olley, J. M., Caitcheon, G. C., & Murray, A. S. (1998). The distri-bution of apparent dose as determined by optically stimulatedluminescence in small aliquots of fluvial quartz: implications fordating young sediments. Quaternary Geochronology (QuaternaryScience Reviews), 17, 1033—1040.
Stein, R., Nam, S.-I., Grobe, H., & Hubberten, H. (1996). Late Quater-nary glacial history and short-term ice-rafted debris fluctuationsalong the East Greenland continental margin. In: J. T. Andrews, W.E. N. Austin, H. Bergstein & A. E. Jennings, (Eds.), ¸ate QuaternaryPalaeoceanographic of the North Atlantic Margins. Vol. 111, pp.135—151 Geological Society Special Publication.
Strickertsson, K. & Murray, A. S. (1998). Optically stimulated lumine-scence dates for Late Pleistocene and Holocene sedimentsfrom N+rre Lyngby, Northern Jutland, Denmark. QuaternaryGeochronology (Quaternary Science Reviews), 18, 169—178.
Stuiver, M., & Reimer, P. J. (1993). Radiocarbon calibration programrev. 3.0.3. Radiocarbon, 35, 215—230
Tauber, H., & Funder, S. (1975). 14C content of recent molluscs fromScoresby Sund, Central East Greenland. Rapport Gr~nlands Geo-logiske ºnders~gelse 75, 95—99.
Tveranger, J., Houmark-Nielsen, M., L+vberg, K., & Mangerud, J.(1994). Eemian-Weichselian stratigraphy of the Flakkerhuk ridge,southern Jameson Land, East Greenland. Boreas, 23, 359—384.
Wintle, A. G. (1997). Luminescence dating: laboratory procedures andprotocols. Radiation Measurements, 27, 769—817.
190 L. Hansen et al. / Quaternary Geochronology 18 (1999) 179—190
Copyright © 2022 FDOKUMEN