Lehigh Preserve Institutional Repository - Lehigh University
Upload
unitedstatesgeologicalsurveyCategory
view
0download
0
Marine Predator Surveys in Glacier Bay National Park and Preserve
Annual Report 2001
James L. Bodkin Kimberly A. Kloecker
Heather A. Coletti George G. Esslinger Daniel H. Monson
Brenda E. Ballachey
United States Geological Survey Biology Office
Alaska Science Center 1011 East Tudor Road
Anchorage, Alaska 99503

SUMMARY Since 1999, vessel based surveys to estimate species composition, distribution and relative abundance of marine birds and mammals have been conducted along coastal and pelagic (offshore) transects in Glacier Bay, Alaska. Surveys have been conducted during winter (November-March) and summer (June). This annual report presents the results of those surveys conducted in March and June of 2001. Following completion of surveys in 2002 we will provide a final report of the results of all surveys conducted between 1999 and 2002. Glacier Bay supports diverse and abundant assemblages of marine birds and mammals. In 2001 we identified 58 species of bird, 7 species of marine mammal, and 6 species of terrestrial mammal on transects sampled during winter and summer. Of course all species are not equally abundant. Among all taxa, in both seasons, sea ducks were the numerically dominant group. In their roles as consumers and because of their generally large size, marine mammals are also likely important in the consumption of energy produced in the Glacier Bay ecosystem. Most common and abundant marine birds and mammals can be placed in either a fish based (e.g. alcids and pinnipeds), or a benthic invertebrate (e.g. sea ducks and sea otters) based food web. Distinct differences in the species composition and abundance of marine birds were observed between winter and summer surveys. Winter marine bird assemblages were dominated numerically (> 11,000; 65% of all birds) by a relatively few species of sea ducks (scoters, goldeneye, Bufflehead, Harlequin and Long-tailed ducks). The sea ducks were distributed almost exclusively along near shore habitats. The prevalence of sea ducks during the March surveys indicates the importance of Glacier Bay as a wintering area for this poorly understood group of animals that occupy a high trophic position in a principally benthic invertebrate (mussel and clam) food web. Marine mammal assemblages were generally consistent between seasons, although Humpback and Killer whales were not observed in winter 2001. Summer marine bird assemblages remained numerically dominated by sea ducks, but species composition shifted between the goldeneye whose density was 44/m2 in winter to < 0.2/m2 in summer, to scoters, whose density was 29/m2 in winter to > 60/m2 in summer. Large increases in Black-legged kittiwake, murrelet (Marbled and Kittlitz’s) and Common merganser densities were detected during summer surveys. Seasonal differences in abundance of species likely reflected differences in life history attributes (e.g. reproductive biology, foraging ecology) among species. Because of differences observed in species composition between the winter and summer, it is apparent that a single annual survey cannot accurately describe the populations of marine birds and mammals that occur in Glacier Bay. Preliminary analysis further suggests that interpretations of data resulting from this type of survey may depend to a large extent on the individual species. Because species exhibit differences in behavior, morphology, coloration, and distribution, accuracy and precision of abundance estimates likely vary among species. Confidence in survey results should be evaluated in
ii

consideration of life history and detection probabilities at the species level. However, survey results likely provide reasonable estimates of species composition and relative abundance, as well as accurate abundance estimates for those species whose detection closely approximates one.
iii
SUMMARY ...................................................................................................................... II
INTRODUCTION............................................................................................................. 1 MARINE VERTEBRATE PREDATORS.................................................................................. 2
Seabirds....................................................................................................................... 2 Waterfowl.................................................................................................................... 2 Marine Mammals ........................................................................................................ 2
METHODS ........................................................................................................................ 6
RESULTS ........................................................................................................................ 11 COUNTS ......................................................................................................................... 16
Seabirds..................................................................................................................... 16 Waterfowl.................................................................................................................. 17 Shorebirds and other birds ....................................................................................... 17 Marine Mammals ...................................................................................................... 17
DENSITIES...................................................................................................................... 17 Seabirds..................................................................................................................... 17 Waterfowl.................................................................................................................. 18 Shorebirds and Other Birds ...................................................................................... 18 Marine Mammals ...................................................................................................... 18
DISTRIBUTIONS .............................................................................................................. 18 Seabirds..................................................................................................................... 18 Waterfowl.................................................................................................................. 19 Other Birds................................................................................................................ 19 Marine Mammals ...................................................................................................... 20
DISCUSSION .................................................................................................................. 34
ACKNOWLEDGEMENTS ........................................................................................... 36
REFERENCES................................................................................................................ 37
GUIDES USED IN THE IDENTIFICATION OF MARINE BIRDS................................................ 40
APPENDICES................................................................................................................. 41
APPENDIX 1 SPECIES CODES ......................................................................................... 42 APPENDIX 2 TRANSECT LOG .......................................................................................... 45 APPENDIX 3 OTHER CODES............................................................................................ 46
iv

Introduction Glacier Bay National Park provides habitat for a diverse group of marine vertebrate predators, including many species of birds, mammals, and fish. Several of these predators are endangered, threatened, or declining in all or a portion of their range, while others are stable or increasing. Some species are present throughout the year, while others are present only in the summer or winter. Although productivity, distribution, local abundance, long-term population trends, and annual variation of many marine vertebrate predators are likely to change, no comprehensive monitoring plan exists in Glacier Bay. Although scientists are studying individual species or groups of marine birds and mammals, no effort has been conducted to specifically monitor abundance and species composition of the group of marine birds and mammals that occur in Glacier Bay. The USGS, with the cooperation of Glacier Bay National Park, has undertaken a multi-year study: The Spatial Distribution of Small Schooling Fish and Associated Predators in Glacier Bay, Alaska, and Their Relationship to Oceanographic and Bathymetric Parameters (Taggart et al. 1999). This study takes a multi-species approach to understanding the trophic relationships between small schooling fish (SSF) and an array of marine vertebrate predators while simultaneously examining possible underlying oceanographic and bathymetric parameters. Some aspects of the study have been completed while others are ongoing. This annual report summarizes the marine vertebrate predator (non-fish) survey work performed in 2001. Following completion of surveys planned for 2002, a comprehensive analysis of the four years of predator surveys will be undertaken. The final report will include temporal patterns and variation in species composition and abundance of all common marine birds and mammals in Glacier Bay with recommendations for establishing long-term inventory and monitoring programs for these important marine predators. Managers need to differentiate between natural fluctuations in marine predator populations and anthropogenically-induced changes. Without an understanding of the species composition, abundance, and population trends it will be difficult for managers to determine when change occurs. It will be even more difficult to understand why or how population change occurs. Initially, these surveys of birds and mammals will provide an understanding of the seasonal and annual variation in population estimates and will provide estimates of our power to detect future change. Eventually, these surveys of top-level marine predators, in conjunction with surveys of their prey, will provide a foundation for understanding ecological relations between predators and their prey, and how these relations affect change in the marine bird and mammal populations in Glacier Bay. Because many of the marine birds and mammals occupy different trophic levels, or food webs, contrasts in trends of taxa with similar and different trophic positions will be useful in discriminating among potential causes of change. And finally, long-term time series of these type of data, and contrasts of similar data from other regions will provide a previously unavailable view of how these species change on regional and global scales.
1

Marine Vertebrate Predators
Seabirds Glacier Bay annually hosts large numbers of seabirds, including several species experiencing severe population declines and/or reproductive failures elsewhere. The three most prominent are Marbled and Kittlitz’s Murrelets, both rare and potentially threatened species, and Black-legged Kittiwakes. The former two species are currently experiencing population declines in part or all of their ranges, while throughout its range the Black-legged Kittiwake has had an increase in colony reproductive failures since the 1970's (Piatt and Andeson. 1996). Glacier Bay is believed to host the world's single largest breeding population of Kittlitz's murrelets – fully one quarter of the entire species – in addition to one of the world's highest concentrations of Marbled murrelets. Other seabirds also found at moderate to high densities in the bay include Pigeon Guillemots, Glaucous-winged Gulls, and Arctic Terns. Threats to seabirds include: oil pollution, nest disturbance, predators such as foxes and rats, human competition for food resources, changing food resources, and entrapment in fishing gear and trash.
Waterfowl Southeast Alaska is an important over wintering area for many species of sea ducks and provides habitat for waterfowl during migrations on both the south- and northbound journeys. More than 25 species of waterfowl, including 10 sea duck species, have been observed in Glacier Bay during the March and June predator surveys. Several species make up a large proportion of the bird biomass in Glacier Bay. Scoters, goldeneyes, mergansers, Mallards, Harlequin ducks, Long-tailed ducks, and Buffleheads have been counted in large numbers. Sea ducks are the most poorly understood group of all the waterfowl. Information about their basic natural history is often unavailable. The Sea Duck Joint Venture, an alliance between federal, state, and international wildlife management agencies, has listed as high priority information on the population size and trends as well as the linkage of breeding, molting, and wintering areas for scoters, Long-tailed ducks, Barrow’s goldeneye; and medium priority for Harlequin ducks, Buffleheads, mergansers, and Common goldeneye (SDJV 2001). Waterfowl vary in their feeding habits. Se ducks generally forage on benthic mollusks (mussels and clams), crustaceans, and other invertebrates, while other waterfowl feed on aquatic vegetation, and some eat fish. Often food and habitat requirements vary between wintering and breeding grounds. Distribution of wintering grounds are often restricted by the narrow requirements of the birds, leading to dense aggregations in some areas (USFWS 1999). Threats to waterfowl include: habitat loss, degradation, and contamination, predator populations, catastrophic events at wintering grounds, and harvest.
Marine Mammals Humpback whales (Megaptera novaeangliae) in Glacier Bay feed primarily on small schooling fish (Krieger 1987; Krieger et al. 1984). This pattern differs from other nearby areas where euphausiids make up the bulk of the whales’ diet (Krieger et al. 1984; Krieger et al. 1986). Humpback whales are mainly found in Glacier Bay during the
2

summer months, and are part of a much larger feeding aggregation of more than 400 whales in southeastern Alaska (Baker & Straley 1988). In 1973 Humpback whales were federally listed as Endangered with passage of the U.S. Endangered Species Act (ESA). Studies of whale prey, underwater acoustics, and whale numbers were undertaken from 1981 to 1984 in and near Glacier Bay (Baker 1985; Krieger et al. 1984; Krieger et al. 1986). These studies were initiated in response to reported declines in whale numbers in Glacier Bay and conflicting hypotheses as to the cause for this shift in distribution. In 1985 the NPS began a monitoring program in the Glacier Bay/Icy Strait area (Gabriele 1993; Straley 1994), and each year between May and September whales have been photographically identified to estimate numbers and monitor distribution. The numbers of whales using the Bay during the summer months are highly variable between years, and whales monitored in the Park have experienced high variability in reproductive success. The standard deviation of humpback whale reproductive success is three times higher for the Glacier Bay/Icy Strait area than a comparable population in Massachusetts Bay (Clapham & Mayo 1987). This variance appears to be related to the movement of whales into Glacier Bay. Humpback whales in Glacier Bay feed primarily on small schooling fish, as previously mentioned. One hypothesis is that the highly variable temporal and spatial availability of their prey may be driving the high variability of whale reproductive success seen in the Glacier Bay/Icy Strait area. The relationship between whale numbers and small schooling fish has been noted by NMFS in two biological opinions regarding NPS data; in both 1984 and 1993 NMFS identified the need for and recommended research to investigate the relationship of small schooling fish with humpback whales. Humpback whales require a high density of small schooling fish aggregations for successful foraging, and have high prey-density thresholds compared to other vertebrate predators (Piatt & Methven 1992a). Fluctuations in density of available prey thus have a strong influence on whale distribution and patterns of seasonal abundance (Piatt et al. 1992a). Harbor seal (Phoca vitulina) populations from south-central Alaska to the west have declined by up to 86% (Pitcher 1990), and Steller sea lion (Eumetopias jubatus) populations have also declined precipitously from the eastern Aleutian Islands to the central Gulf of Alaska since the early 1980's (Braham et al. 1977; Merrick et al. 1987). In contrast, seal and sea lion numbers in southeastern Alaska appear stable (Hoover-Miller 1994; Loughlin 1992), although data from some areas are not considered adequate for long-term trend analysis. In 1990, the Steller sea lion was declared federally Threatened under the ESA, and, due to continued declines, NMFS has recently listed the central and western Alaska populations as Endangered. Glacier Bay contains one of the largest documented breeding groups of harbor seals remaining in Alaska (Hoover-Miller 1994; Mathews 1992). Based on two Park-wide surveys in 1992 and 1994, harbor seal numbers appear to be stable (Mathews pers. comm.). Annual Park-wide surveys of harbor seals and sea lions are essential for monitoring trends in abundance and distribution, yet standardized monitoring for harbor seals was not started until 1992 (Mathews 1992). Other than opportunistic counts, sea lions in Glacier Bay were first monitored in 1994. Standardized monitoring is necessary for detecting changes in pinniped numbers in Glacier Bay, should they occur, and for comparative studies with declining populations elsewhere in Alaska.
3

Harbor porpoises (Phocoena phocoena) inhabit coastal waters where they are found in bays, estuaries, and tidal channels the North Atlantic and North Pacific (Calambokidis & Steiger 1982). Because harbor porpoise occur predominantly in inshore waters, they are particularly susceptible to entanglement in commercial and subsistence net fisheries. Populations in the Baltic Sea have undergone drastic reductions since the 1940's, and numbers in the Northwest Atlantic have declined. Although little is known of the status of this small cetacean in Pacific waters, historical records indicate that they were once numerous off the coast of Washington state, where they are now rare (Taylor & Dawson 1984); (Taylor & Dawson 1980). Reasons for the declines are unknown, but three areas of concern are: 1) pollution, particularly PCB's; 2) disturbance due to increased motorized vessel traffic; and 3) mortality from entanglement in fish nets (Taylor et al. 1980; Taylor et al. 1984). Harbor porpoises are found in near-shore waters throughout Alaska, where "... their population status is unknown, but believed to be at low levels and stable or declining in some areas (e.g. Prince William Sound)" (Dahlheim et al. 1992). In 1991, the National Marine Mammal Laboratory began a three-year study to obtain minimum population estimates of harbor porpoise in Alaska. Porpoise distribution was combined across southeastern Alaska, with an estimate of 1,910 animals (95% CI : 955 - 3,820) for the three 1991 surveys (April/May, July, and September). Glacier Bay was one of six harbor porpoise concentrations observed in southeastern Alaska, and was the only one with high densities during each of the three counts (Dahlheim et al. 1992). Taylor, (1984), also documented the occurrence of harbor porpoise in various parts of Glacier Bay throughout the year. In Sitakaday Narrows alone, one of the areas of the Park most heavily used by vessels, porpoise densities were estimated to be one to six animals per square km, depending on the season. Following translocations to the outer coast of Southeast Alaska in 1965, sea otters (Enhydra lutris) have been expanding their range and increasing in abundance. Since 1995, the number of sea otters in Glacier Bay proper has increased from around 5 to more than 1500 (Bodkin et al. 2002). Between 1993 and 1997 sea otters were apparently only occasional visitors to Glacier Bay, but in 1998 long-term residence was established as indicated by the presence of adult females and their dependent pups. Sea otter distribution is limited to the Lower Bay, south of Sandy Cove, and is not continuous within that area. Concentrations occur in the vicinity of Sita Reef and Boulder Island and between Pt. Carolus and Rush Pt. on the west side of the Bay. Sea otters occupy a position near the apex of the nearshore coastal marine ecosystem and are widely recognized for the role they play in structuring benthic communities (Simenstead et al. 1978, Estes and Duggin 1995). Most of the work on sea otter ecology has occurred on rocky reef habitats, and the role of sea otters in soft-sediment communities is less well understood. The diet of sea otters during 2001 in Glacier Bay based on visual observations of prey during 456 successful foraging dives. In Glacier Bay, diet consisted of 62% clam, 15% mussel, 9% crab, 7% unidentified, 4% urchins, and 4% other (Bodkin et al. 2002). Most prey recovered by sea otters are commercially, socially, or ecologically important species, and include butter and littleneck clams, blue mussels, green urchins and Dungeness crabs.
4

Sea otters are now well established in limited areas of the lower portions of Glacier Bay. It is likely that distribution and numbers of sea otters will continue to increase in Glacier Bay in the near future. Glacier Bay supports large and diverse populations of clams that are largely unexploited by sea otters at present. It is predictable that the density and sizes of clam populations will decline in response to otter predation. This will result in fewer opportunities for human harvest, but will also trigger ecosystem level changes, as prey for other predators, such as octopus, sea stars, fishes, birds and mammals are modified. Sea otters will also modify benthic habitats through excavation of sediments required to extract burrowing infauna such as clams. Effects of sediment disturbance by foraging sea otters are not understood. Glacier Bay also supports large populations of other preferred sea otter prey, such as king, Tanner, and Dungeness crabs and green sea urchins that are commercially, culturally, or ecologically important. As the colonization of Park waters by sea otters continues, it is also likely that dramatic changes will occur in the species composition, abundance, and size class distribution of many components of the nearshore marine ecosystem. Many of the changes will occur as a direct result of predation by sea otters. Others will result from indirect or cascading effects of sea otter foraging, such as increased kelp production and modified prey availability for other nearshore predators. Without recognizing and quantifying the extent of change initiated by the colonization of Glacier Bay by sea otters, management of nearshore resources will be severely constrained for many decades.
5

Methods In 1999 a series of transects was mapped out that covered the coastline of Glacier Bay and sampled the coastal and pelagic waters (Figures 1 - 3). This set of transects was surveyed in June 1999, 2000, and 2001. A subset of transects was surveyed in November 1999, March 2000, and March 2001. Transects are surveyed only if the sea state, light, and glare result in viewer conditions of fair or better. Figure 4 provides examples of survey conditions. Three research vessels were used as survey platforms during 2001. In March and June, the R/V Lutris II and the R/V Alaskan Gyre were used. The R/V Capelin was used only for the June work. As in previous surveys, transect widths varied by boat. Due to lower viewing angles, transects surveyed from the Lutris II or Capelin were 200 m wide, while those surveyed from the higher Alaskan Gyre were 300 m wide. The Lutris II and the Alaskan Gyre have been used for predator surveys since their inception in 1999. This was the first year that the Capelin was used, however it will probably be used more often in future surveys. It needs to be noted that the Alaskan Gyre was named the Tamnik when the first surveys were performed. In order to keep the electronic data uniform, the name Tamnik is still used in the “BoatName” column in the database. Surveys were conducted according to standard protocols (Irons et al. 1988, Gould, and Forsell 1989, Irons et in 2001). In summary, 2 observers, one on each side of the vessel, scan for birds and mammals 300 m ahead of the boat and 150 m to the side (200 m and 100 m for the Lutris II and Capelin). Usually the right side observer is also the boat driver. No one is ever an observer and data recorder at the same time. Survey personnel rotate through left and right observer and data recorder positions on the vessel they’re on each day. Within one survey, personnel rotate among the different vessels used. As animals are observed, identifications are verified using 10 x binoculars as needed, counts are made and the information is called out to a data recorder. Data entry procedures are described below. Information given to the data recorder is: species to lowest possible taxa, count, activity, and comments. Activity options are as follows: fly, fly with fish, water, water with fish, feed, land, and a note is made in the comment field if the animal is on ice or other flotsam. Other comments include: notes on breeding or juvenile plumage, if young or pups are included in the count, riptides, other vessels encountered on the transect, etc. Occasionally, the survey needs to be interrupted to verify an identification, to let a larger vessel cross the transect, or a segment of the transect that runs through a narrow passage is being covered again. In these and similar incidences, the data recorder can push the “Off-Tx” key. Any records collected during this period are now flagged as being off transect and are not included in data summaries and analyses. The “Off-Tx” key can also be used to record sightings that are visible but clearly outside the bounds of the survey area.
6

Figure 1. Map of Glacier Bay National Park depicting the full set of transects to be covered during marine predator surveys. Zoomed-in views can be seen in Figure 2.
7
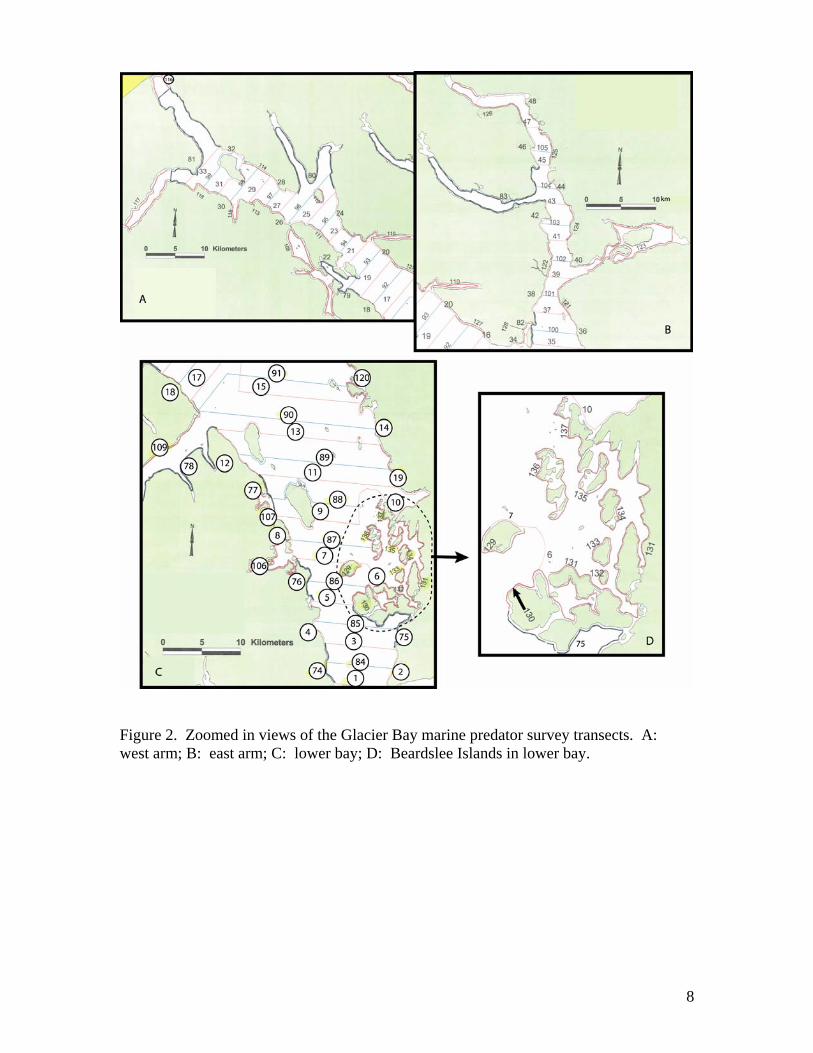
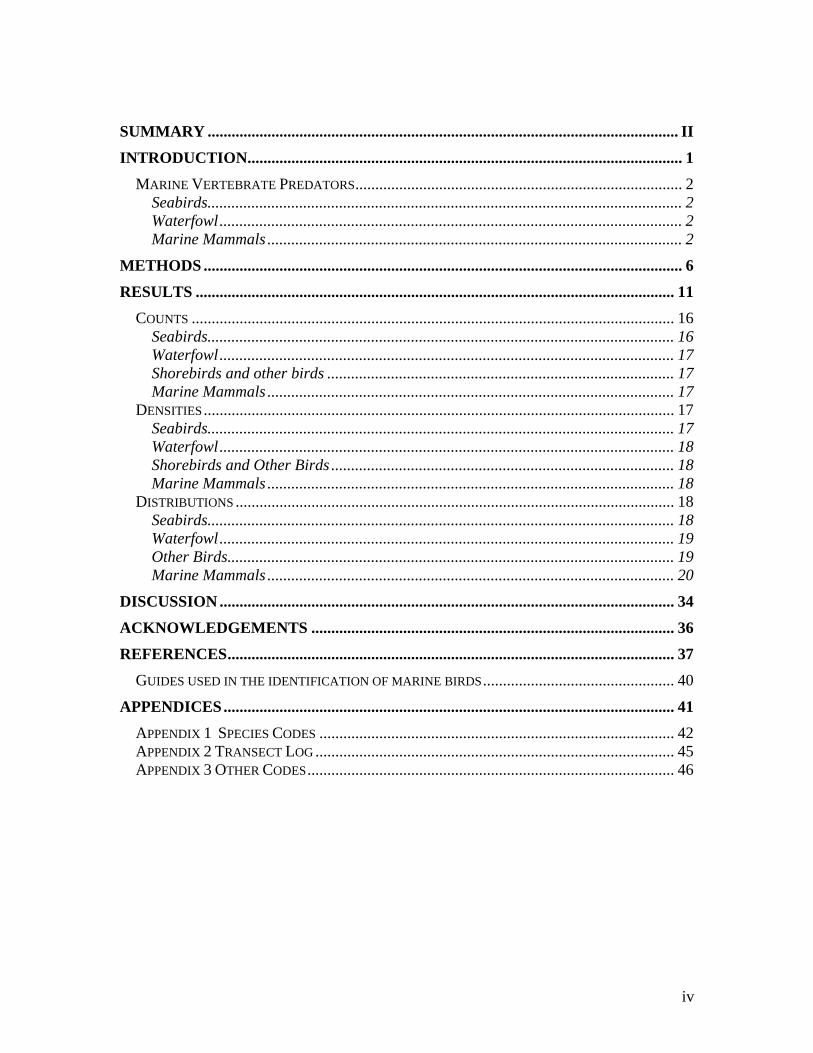
Figure 2. Zoomed in views of the Glacier Bay marine predator survey transects. A: west arm; B: east arm; C: lower bay; D: Beardslee Islands in lower bay.
8

Figure 3. Map showing the subset of Glacier Bay marine predator survey transects that is covered during the spring survey. Figures 1 and 2 show the entire set of transects. Note that transects 2, 75, 106, and X are not part of the systematically selected subset of transects, but are still surveyed. Tx 106 is surveyed because it is an area of biological interest, while the others are surveyed because they are convenient. A DOS-based, real-time, GPS-integrated software program (dLOG, Glenn Ford, Environmental Consulting, Inc.) is used for data recording during surveys. This program plots the ship’s actual trackline and allows data entry where each entered record is linked with the GPS input. If no user entries are being made, the program still collects a GPS record at a predetermined time interval (10-15 seconds in these surveys). Laptop computers are connected to the vessel’s power supply and GPS (PLGR, Rockwell precision lightweight GPS receiver). DLOG allows the keys to be programmed as “Hot Keys”. Pushing 1 hotkey results in the entry of a 4-letter species code or the activity.
9

Data fields can also be filled by typing the complete code or activity, thus non-common species may be entered. The alphabet and punctuation keys are labeled with codes for the more commonly observed species and the function keys are labeled as the activity codes and the “Off-Tx” code. The numeric keys are used as themselves. At the start of each transect, data fields are entered that are repeated with each user or GPS entered record. Such fields are: transect width, survey trip id, left and right observer initials, left and right observation conditions, and sea conditions. GPS entered records include lat, long, bottom depth, distance from shore, time, and date as well as the repeated fields. User entered records include species, species count, activity, and comments as well as the repeated fields. Because this report provides interim information only for the surveys conducted in 2001 we only provide descriptive analyses. For each species, or taxa, we provide the total number of individuals observed and their densities during March and June 2001 surveys, in tabular format. For species or taxa, whose total number comprises approximately 5% or more of the total number of bird or mammal observed, we provide maps indicating distribution and abundance. In cases where a species or taxa is abundant in only one season, we provide distribution and abundance maps only for that season. Densities for each species or group are calculated by summing the number of individuals observed within transects and dividing by the total area surveyed.
Figure 4. Pictures showing a variety of survey conditions. A: Excellent (slightly worse adjacent to shore); B: Poor (no surveys work performed); C: Excellent; D: Very Good (but glare creates temporary blind spots); E: Good; F: Excellent (but shorebirds can be cryptic and difficult to spot).
10

Results Approximately 101.7 km2 of transects were surveyed in March, while 288.9 km2 were surveyed in June 2001. The entire winter subset was surveyed in March, while 134/136 transects of the complete set were surveyed in June (Figure 5, Table 1). Transect 117 is usually skipped due to the presence of pupping harbor seals, while Tx 21 was skipped due to an oversight. In March, a total of 17, 274 birds and 381 marine and terrestrial mammals were counted. In June, 44,422 birds and 811 mammals were counted. Fifty-seven different avian species, 7 marine mammal species, and 6 terrestrial species were observed (Table 2). Several of these had not been observed during previous surveys.
Figure 5. Actual survey tracks for March (A) and June (B) 2001. It is important to keep these tracks in mind when looking at the distribution maps (Figures 6-18).
11

Table 1. Transect numbers and predator survey dates. An “x” indicates a transect was sampled during the corresponding survey. Transects in gray comprise the winter subset. See Figures 1 & 2 for actual locations of the transects. Txt # Jun
99 Nov 99
Mar 00
Jun 00
Mar 01
Jun 01
1 x x x x x x 2 x x x x x 3 x x x 4 x x x x x x 5 x x x x x x 6 x x 7 x x x 8 x x x 9 x x x x x x
10 x x x 11 x x x 12 x x x x 13 x x x x x x 14 x x x x x x 15 x x x 16 x x 17 x x x x x x 18 x x x x x x 19 x x x 20 x x x 21 x x x x x 22 x x x 23 x x x 24 x x x x x 25 x x x x x x 26 x x x x x x 27 x x x 28 x x x 29 x x x x x x 30 x x x 31 x x x 32 x x x x x x 33 x x x x x x 34 x x x 35 x x x x x x 36 x x x 37 x x x 38 x x x x x x 39 x x x x x x 40 x x x x x x 41 x x x 42 x x x x x x 43 x x x x x x 44 x x x 45 x x x
Txt # Jun 99
Nov 99
Mar 00
Jun 00
Mar 01
Jun 01
46 x x x x x 47 x x x x x 48 x x x 49 x x x 51 x x x 52 x x x 53 x x x 54 x x x 55 x x x 56 x x x 57 x x x 58 x x x 59 x x x 60 x x x 61 x x x 62 x x 63 x x x 64 x x x 65 x x x 66 x x x 67 x x x 68 x x x 69 x x x 70 x x x 71 x x x 72 x x x 73 x x x 74 x x x x x 75 x x x x x 76 x x x 77 x x x x x x 78 x x x 79 x x x x x 80 x x x 81 x x x 82 x x x x x x 83 x x x x 84 x x x 85 x x x 86 x x x 87 x x x 88 x x x 89 x x x 90 x x x 91 x x x 92 x x x
12

Txt # Jun 99
Nov 99
Mar 00
Jun 00
Mar 01
Jun 01
93 x x x 94 x x x 95 x x x 96 x x x 97 x x x 98 x x x 99 x x x 100 x x x 101 x x x 102 x x x 103 x x x 104 x x x 105 x x x 106 x x x x x 107 x x x x x x 108 x x x 109 x x x 110 x x x x x x 111 x x x 112 x x x 113 x x x x x x 114 x x x x x x 115 x x x 116 x x x 117 118 x x x 119 x x x 120 x x x x x x 121 x x x 122 x x x 123 x x x x x x 124 x x x x x x 125 x x x 126 x x x x 127 x x x 128 x x 129 x x x 130 x x x x x x 131 x x x x x x 132 x x x x x 133 x x x x x x 134 x x x x x x 135 x x x x x x 136 x x x x x x 137 x x x x
Total 134 39 42 131 47 134
13
Table 2. Species observed during the 2001 predator surveys in GBNPP. Code is the abbreviation appearing in the raw data files. Name is the common name. Number counted, percentage of all birds (or % of marine mammals or % of other mammals), and density (#/km2) are given. Several subtotals are also presented to allow comparison with previous reports. No off-transect sightings are included in these numbers.
Code Name March #
March %
March Density June # June
% June
Density June:Mar #
June:Mar Density
COLO Common Loon (W) 15 0.09 0.15 45 0.10 0.16 3.00 1.06 PALO Pacific Loon (W) 15 0.09 0.15 45 0.10 0.16 3.00 1.06 RTLO Red-throated Loon (W) 0 0.00 0.00 21 0.05 0.07 . . YBLO Yellow-billed Loon (W) 1 0.01 0.01 3 0.01 0.01 3.00 1.06 UNLO Unidentified Loon (W) 9 0.05 0.09 50 0.11 0.17 5.56 1.96
All Loons 40 0.23 0.39 164 0.37 0.57 4.10 1.44 HOGR Horned Grebe (W) 154 0.89 1.51 0 0.00 0.00 0.00 0.00 RNGR Red-necked Grebe (W) 3 0.02 0.03 0 0.00 0.00 0.00 0.00 UNGR Unknown Grebe (W) 18 0.10 0.18 1 0.00 0.00 0.06 0.02 FTSP Fork-tailed Storm-Petrel (S) 3 0.02 0.03 3 0.01 0.01 1.00 0.35 PECO Pelagic Cormorant (S) 187 1.08 1.84 69 0.16 0.24 0.37 0.13 GBGH Great Blue Heron (B) 7 0.04 0.07 10 0.02 0.03 1.43 0.50 CAGO Canada Goose (W) 177 1.02 1.74 551 1.24 1.91 3.11 1.10 BRAN Brant (W) 0 0.00 0.00 4 0.01 0.01 . . MALL Mallard (W) 771 4.46 7.58 304 0.68 1.05 0.39 0.14 GADW Gadwall (W) 0 0.00 0.00 2 0.00 0.01 . . GWTE Green-winged Teal (W) 0 0.00 0.00 3 0.01 0.01 . . AMWI American Wigeon (W) 16 0.09 0.16 95 0.21 0.33 5.94 2.09 NOPI Northern Pintail (W) 2 0.01 0.02 0 0.00 0.00 0.00 0.00 NOSH Northern Shoveler (W) 0 0.00 0.00 2 0.00 0.01 . . GRSC Greater Scaup (W) 0 0.00 0.00 10 0.02 0.03 . . SCAU Unidentified Scaup (W) 145 0.84 1.43 30 0.07 0.10 0.21 0.07 BLSC Black Scoter (W) 204 1.18 2.01 10 0.02 0.03 0.05 0.02 SUSC Surf Scoter (W) 1706 9.88 16.78 6949 15.64 24.05 4.07 1.43
WWSC White-winged Scoter (W) 824 4.77 8.10 7132 16.06 24.69 8.66 3.05 UNSC Unidentified Scoter (W) 172 1.00 1.69 3350 7.54 11.60 19.48 6.85
All Scoter 2906 16.82 28.58 17441 39.26 60.37 6.00 2.11 HADU Harlequin Duck (W) 394 2.28 3.88 1281 2.88 4.43 3.25 1.14 OLDS Long-tailed Duck (W) 429 2.48 4.22 12 0.03 0.04 0.03 0.01 BAGO Barrow’s Goldeneye (W) 2706 15.67 26.62 39 0.09 0.13 0.01 0.01 COGO Common Goldeneye (W) 134 0.78 1.32 0 0.00 0.00 0.00 0.00 UNGO Unidentified Goldeneye (W) 1600 9.26 15.74 3 0.01 0.01 0.00 0.00
All Goldeneye 4440 25.70 43.67 42 0.09 0.15 0.01 0.00 BUFF Bufflehead (W) 594 3.44 5.84 0 0.00 0.00 0.00 0.00 RBME Red-breasted Merganser (W) 495 2.87 4.87 17 0.04 0.06 0.03 0.01 COME Common Merganser (W) 257 1.49 2.53 4192 9.44 14.51 16.31 5.74 UNME Unidentified Merganser (W) 289 1.67 2.84 4 0.01 0.01 0.01 0.00
All Merganser 1041 6.03 10.24 4213 9.48 14.58 4.05 1.42 UNDU Unidentified Duck (W) 34 0.20 0.33 13 0.03 0.04 0.38 0.13
All Ducks 10772 62.36 105.95 23448 52.78 81.17 2.18 0.77
14

Code Name March
# March
% March Density
June #
June %
June Density
June:Mar #
June:Mar Density
NOHA Northern Harrier (O) 1 0.01 0.01 0 0.00 0.00 0.00 0.00 BAEA Bald Eagle (O) 108 0.63 1.06 161 0.36 0.56 1.49 0.52 SEPL Semipalmated Plover (B) 0 0.00 0.00 3 0.01 0.01 . . BLOY Black Oystercatcher (B) 98 0.57 0.96 386 0.87 1.34 3.94 1.39 LEYE Lesser Yellowlegs (B) 0 0.00 0.00 1 0.00 0.00 . . SPSA Spotted Sandpiper (B) 0 0.00 0.00 1 0.00 0.00 . .
WHIM Whimbrel (B) 0 0.00 0.00 1 0.00 0.00 . . BLTU Black Turnstone (B) 85 0.49 0.84 0 0.00 0.00 0.00 0.00 UNSB Unidentified Shorebird (B) 15 0.09 0.15 6 0.01 0.02 0.40 0.14 PAJA Parasitic Jaeger (S) 0 0.00 0.00 1 0.00 0.00 . . BLKI Black-legged Kittiwake (S) 174 1.01 1.71 6027 13.57 20.86 34.64 12.19 BOGU Bonaparte’s Gull (S) 0 0.00 0.00 447 1.01 1.55 . . ROGU Ross’ Gull (S) 0 0.00 0.00 24 0.05 0.08 . . GWGU Glaucous-winged Gull (S) 1906 11.03 18.75 2214 4.98 7.66 1.16 0.41 HEGU Herring Gull (S) 21 0.12 0.21 114 0.26 0.39 5.43 1.91 MEGU Mew Gull (S) 572 3.31 5.63 955 2.15 3.31 1.67 0.59 UNGU Unidentified Gull (S) 419 2.43 4.12 456 1.03 1.58 1.09 0.38
All Gull 3092 17.90 30.41 10237 23.04 35.44 3.31 1.17 ARTE Arctic Tern (S) 0 0.00 0.00 952 2.14 3.30 . . COMU Common Murre (S) 33 0.19 0.32 142 0.32 0.49 4.30 1.51 UNMU Unidentified Murre (S) 0 0.00 0.00 1 0.00 0.00 . . PIGU Pigeon Guillemot (S) 876 5.07 8.62 1863 4.19 6.45 2.13 0.75 KIMU Kittlitz’s Murrelet (S) 41 0.24 0.40 548 1.23 1.90 13.37 4.70
MAMU Marbled Murrelet (S) 196 1.13 1.93 3312 7.46 11.46 16.90 5.95 BRMU Brachyramphus Murrelet (S) 276 1.60 2.71 1777 4.00 6.15 6.44 2.27
All Murrelet 513 2.97 5.05 5637 12.69 19.51 10.99 3.87 TUPU Tufted Puffin (S) 0 0.00 0.00 23 0.05 0.08 . .
All Alcid 1422 8.23 13.99 7666 17.26 26.54 5.39 1.90 RUHU Rufous Hummingbird (O) 0 0.00 0.00 1 0.00 0.00 . . BEKI Belted Kingfisher (O) 0 0.00 0.00 4 0.01 0.01 . .
BBMA Black-billed Magpie (O) 58 0.34 0.57 0 0.00 0.00 0.00 0.00 NOCR Northwestern Crow (O) 1018 5.89 10.01 687 1.55 2.38 0.67 0.24 CORA Common Raven (O) 16 0.09 0.16 14 0.03 0.05 0.88 0.31 BASW Barn Swallow (O) 0 0.00 0.00 21 0.05 0.07 . . VGSW Violet-green Swallow (O) 0 0.00 0.00 1 0.00 0.00 . . UNSW Unidentified Swallow (O) 0 0.00 0.00 13 0.03 0.04 . . AMRO American Robin (O) 0 0.00 0.00 16 0.04 0.06 . .
All Seabirds (S) 4704 27.23 46.27 18928 42.61 65.52 4.02 1.42 All Waterfowl (W) 11164 64.63 109.81 24168 54.41 83.66 2.16 0.76 All Shorebirds (B) 205 1.19 2.02 408 0.92 1.41 1.99 0.70 All Other Birds (O) 1201 6.95 11.81 918 2.07 3.18 0.76 0.27 All Birds 17274 100.00 169.90 44422 100.00 153.77 2.57 0.91
15
Code Name March #
March %
March Density
June #
June %
June Density
June: Mar #
June:Mar Density
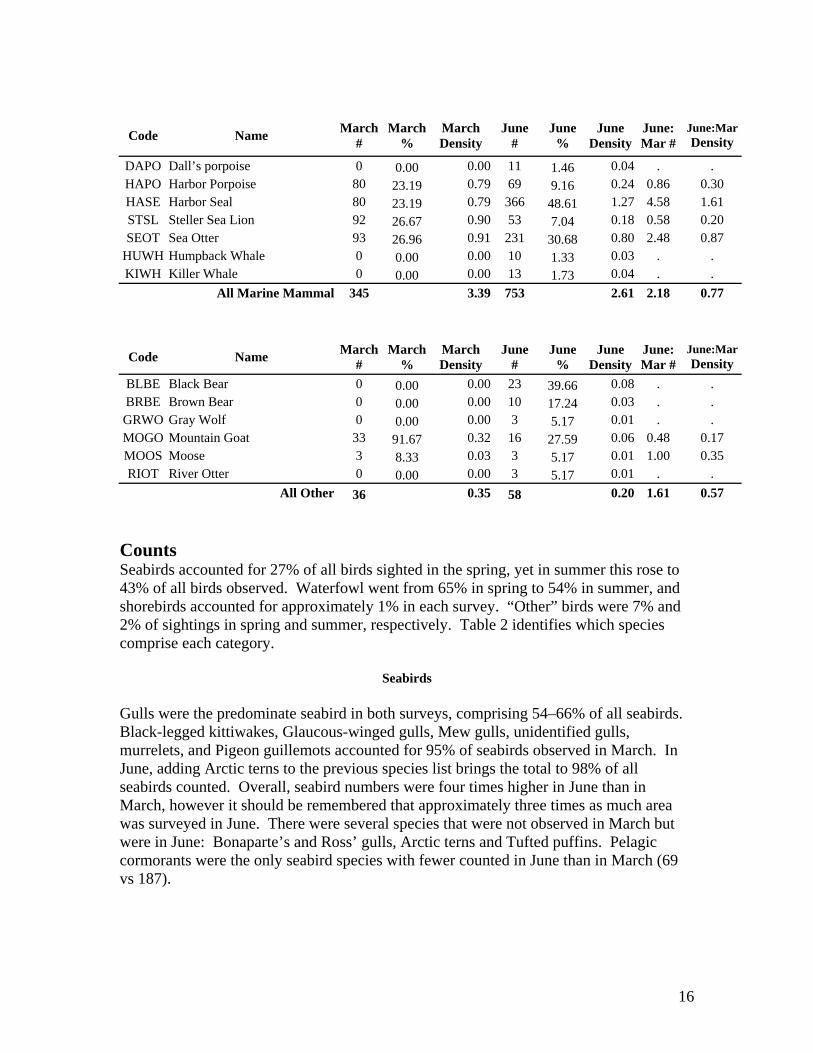
DAPO Dall’s porpoise 0 0.00 0.00 11 1.46 0.04 . . HAPO Harbor Porpoise 80 23.19 0.79 69 9.16 0.24 0.86 0.30 HASE Harbor Seal 80 23.19 0.79 366 48.61 1.27 4.58 1.61 STSL Steller Sea Lion 92 26.67 0.90 53 7.04 0.18 0.58 0.20 SEOT Sea Otter 93 26.96 0.91 231 30.68 0.80 2.48 0.87
HUWH Humpback Whale 0 0.00 0.00 10 1.33 0.03 . . KIWH Killer Whale 0 0.00 0.00 13 1.73 0.04 . .
All Marine Mammal 345 3.39 753 2.61 2.18 0.77
Code Name March #
March %
March Density
June #
June %
June Density
June: Mar #
June:Mar Density
BLBE Black Bear 0 0.00 0.00 23 39.66 0.08 . . BRBE Brown Bear 0 0.00 0.00 10 17.24 0.03 . . GRWO Gray Wolf 0 0.00 0.00 3 5.17 0.01 . . MOGO Mountain Goat 33 91.67 0.32 16 27.59 0.06 0.48 0.17 MOOS Moose 3 8.33 0.03 3 5.17 0.01 1.00 0.35 RIOT River Otter 0 0.00 0.00 3 5.17 0.01 . .
All Other 36 0.35 58 0.20 1.61 0.57 Counts Seabirds accounted for 27% of all birds sighted in the spring, yet in summer this rose to 43% of all birds observed. Waterfowl went from 65% in spring to 54% in summer, and shorebirds accounted for approximately 1% in each survey. “Other” birds were 7% and 2% of sightings in spring and summer, respectively. Table 2 identifies which species comprise each category.
Seabirds Gulls were the predominate seabird in both surveys, comprising 54–66% of all seabirds. Black-legged kittiwakes, Glaucous-winged gulls, Mew gulls, unidentified gulls, murrelets, and Pigeon guillemots accounted for 95% of seabirds observed in March. In June, adding Arctic terns to the previous species list brings the total to 98% of all seabirds counted. Overall, seabird numbers were four times higher in June than in March, however it should be remembered that approximately three times as much area was surveyed in June. There were several species that were not observed in March but were in June: Bonaparte’s and Ross’ gulls, Arctic terns and Tufted puffins. Pelagic cormorants were the only seabird species with fewer counted in June than in March (69 vs 187).
16
Waterfowl Among waterfowl, Barrow’s and Common goldeneye made up 40% of March numbers, but only 0.2% of June sightings. Scoters accounted for 26% and 72% of March and June numbers, respectively. In March, mergansers, Mallards, Harlequin ducks, Long-tailed ducks, and Buffleheads contributed 9.3, 6.9, 3.5, 3.8, and 5.3% of the waterfowl observed. In June, mergansers contributed 17.4% and Harlequin ducks 5.3%, while the other waterfowl numbers were negligible. Overall, waterfowl numbers were two times higher in June than in March, however it should be remembered that approximately three times as much area was surveyed in June. Also important to note is that some waterfowl numbers increased while others decreased. Canada goose, wigeon, scoter, Harlequin duck, merganser, and loon numbers increased from March to June; while Mallard, scaup, Long-tailed duck, goldeneye, and Bufflehead numbers decreased.
Shorebirds and other birds Black oystercatchers comprised 48% of the shorebirds seen in March and 95% of those seen in June. Black turnstones accounted for 42% of the March shorebirds but were absent in June. The “Other” bird category was dominated by crows, 85% of March and 75% of June sightings. Bald eagles accounted for 9 and 18% of the March and June other bird numbers.
Marine Mammals Marine mammal observations were fewer in March than in June. It is unknown whether this is due to the differential sampling effort or a reflection of true differences. Harbor porpoises, Harbor seals, Steller sea lions, and sea otters were seen in roughly equal numbers in March. In June, 4.5 times as many Harbor seals and 2.5 times as many sea otters were observed. Harbor porpoise and Steller sea lion observations dropped in June. Humpback and Killer (Orcinus orca) whales were sighted in June but not in March. Dall’s porpoise (Phocoenoides dalli) were also present in June, due to the addition of transects in Icy Straight. Densities Total seabird density in the spring was 46.3 birds per square kilometer (#/km2), yet in summer this rose to 65.5/km2. Waterfowl declined from 109.8/km2 in spring to 83.7/km2 in summer, and shorebird densities hovered between 1 and 2 birds/km2 in each survey. “Other” birds were 11.8/km27 and 3.2/km2 in spring and summer, respectively. Table 2 identifies which species comprise each category.
Seabirds Glaucous-winged gull densities were the highest of all the seabirds in March (18.8/km2), while Black-legged kittiwakes had the highest seabird densities in June (20.9/km2). Densities of Pelagic cormorants, Glaucous-winged gulls, Mew gulls, and Pigeon guillemots, dropped from March to June, while densities of most other species of seabirds
17

increased during the same period (Table 2). Murrelet density increased almost fourfold from March to June.
Waterfowl Barrow’s goldeneye densities were the highest of all birds in March (26.6/km2), while White-winged scoters had the highest densities in June (24.7/km2). Densities of most waterfowl species declined from March to June, although densities of scoters, Wigeon, and Common mergansers increased during the same period (Table 2). Common mergansers showed an almost six-fold increase in density from March to June, while Red-breasted mergansers declined from 4.87 to 0.06/km2, from March to June.
Shorebirds and Other Birds Black oystercatcher density increased approximately 30% from March to June. Black turnstones accounted for 42% of the March shorebirds but were completely absent in June. Other shorebirds were sighted in such low numbers that density will not be discussed. Bald eagle density declined approximately 50% and crow 75% from March to June.
Marine Mammals Marine mammal densities were lower in June than in March. Harbor porpoises, Harbor seals, Steller sea lions, and sea otters were seen in roughly equal densities in March. In June, however, densities were 1/3, 1/5, and 9/10 densities in March for Harbor porpoise, Steller sea lion, and sea otter, respectively. Harbor seal density was approximately 50% higher in June. Dall’s porpoise, Humpback and Killer whales were present in low densities in June, and not observed in March. Distributions Figures 6 - 18 show distributions of selected birds and mammals in Glacier Bay. The survey track line is also plotted to reference the actual area surveyed. A species cannot necessarily be considered absent from an area if that particular area was not covered during a survey.
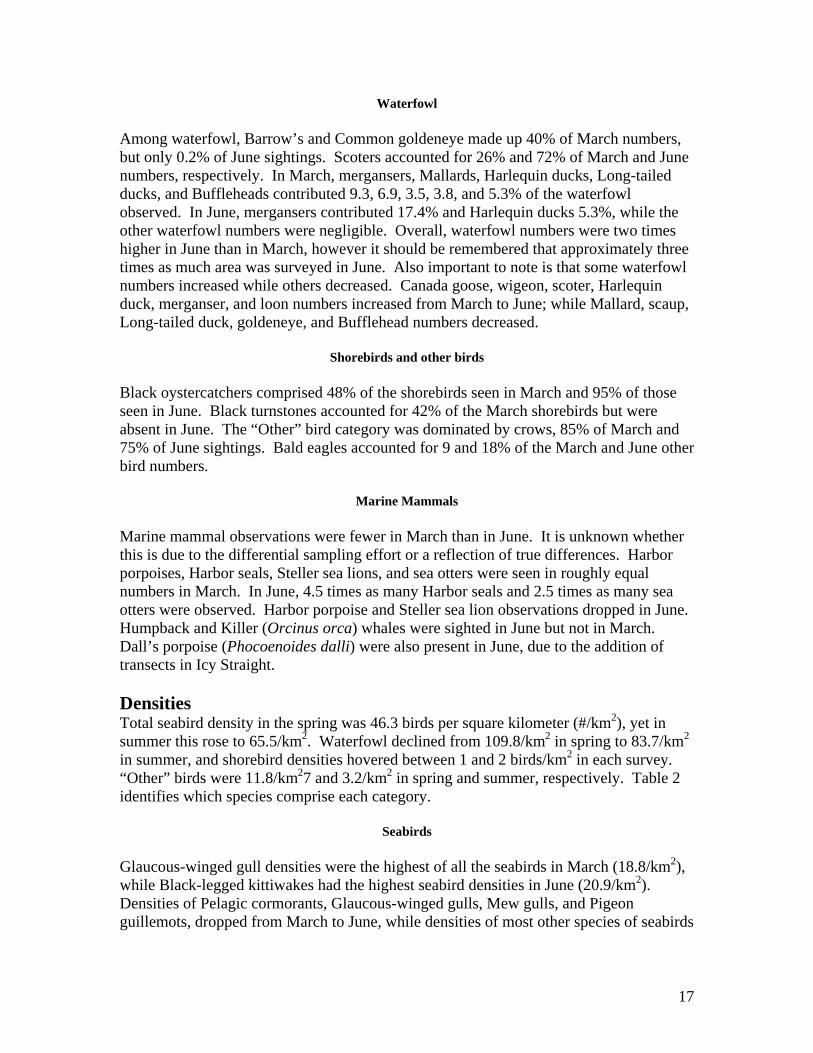
Seabirds In both the spring and summer surveys, Glaucous-winged gulls were present throughout the entire area surveyed (Figure 6). They were more concentrated in the sub-bays and inlets such as Berg, Fingers, Adams, and Wachusett as well as in the Beardslee Islands. There were scattered sightings along pelagic transects, though fewer as transects progressed up the arms. In March, Pigeon guillemots were concentrated in the Beardslee Islands, Berg and Fingers Bays, Hugh Miller complex, and the Sandy Cove area (Figure 7). There were few pelagic sightings. The June distribution was similar, except that there were many more guillemots in the upper bay. Murrelets were also found throughout the entire area surveyed, especially Fingers Bay, from Fingers eastward to the southern tip of Willoughby and further east to the Beardslee Islands, Sandy Cove, from
18

Seabree Island eastward to the shore north of Sandy Cove, and scattered up the East arm (Figure 8). They were observed on both coastal (nearshore) and pelagic (offshore) transects. In the summer survey they were more common on pelagic transects and up both arms than in March. Murrelets were also quite common in Icy Strait when that area was surveyed in June. Arctic terns, absent in March, were prevalent in the inlets off the upper arms (Tarr, queen, Rendu, Adams, Wachusett, and Muir) in June (Figure 9). Black-legged kittiwakes, found in Hugh Miller and Wachusett Inlet in March, were also common in those areas in June (Figure 10). In the summer they were also found at the ends of Tarr and Muir Inlets, out in Icy Strait, in the lower bay, and the lower parts of the east and west arms.
Waterfowl Waterfowl were found along coastal surveys in all suitable habitats. Mallards were concentrated in the Beardslee Islands, Berg and Fingers Bays, Sandy Cove and Adams Inlet in March (Figure 11). In June, they were found in Adams Inlet, the far ends of Geikie Inlet (including the end of Tyndall Cove), Scidmore Bay, and Wachusett Inlet. In March, scoters were found in the Beardslee Islands, Berg and Fingers Bays, along the shoreline north of Fingers to the Geikie entrance, Sandy Cove, Adams Inlet, and the Hugh Miller area (Figure 12). No scoters were seen in the upper west arm and only a few were seen in the upper east arm. In June, scoters were mostly in the upper east arm, Scidmore Bay, and the mainland shore north of Russell Island. Goldeneye sightings in March were similar to scoter sightings, with the addition of Wachusett Inlet, the mainland shore north of Russell Island, and the shoreline over the pass from north Scidmore Bay (Figure13). In June there were no goldeneye in the lower bay and very few elsewhere in the Park. In the spring, Adams Inlet was the location of most merganser sightings, although they were also observed in the same places as goldeneye (Figure 14). Distributions of mergansers did not change in the June survey, other than the addition of newly surveyed areas (Charpentier Inlet and Scidmore Bay). Overall, there seem to be more mergansers in the east arm than in the west. Harlequin ducks were concentrated in the Beardslee Islands, Sandy Cove and Leland Island in March, however they were mainly found in the upper arms in June (Figure 15). Long-tailed ducks were found in Adams Inlet and the Beardslee Islands in March and were almost absent in June (Figure 15). The few remaining were in the upper east arm. Buffleheads were found primarily in the Beardslee Islands in March and were not sighted at all in June (Figure 15).
Other Birds In the spring, Northern crows were observed in groups scattered along coastal lands of the lower bay, Hugh Miller complex, Adams, Wachusett, Seabree Island, and Sandy Cove (Figure 16). In June, the groups seem smaller and more scattered, covering almost the entire coastal area surveyed. Bald eagle distributions are similar to the crows, but without the large groups (Figure 17). Eagles were usually sighted singly, occasionally in pairs.
19

Marine Mammals Steller sea lions were seen in Adams Inlet, Sandy Cove, and Hugh Miller complex in March, while in June they were mainly observed around Flapjack Island and out in Icy Strait (Figure 18). Harbor seals were found in Adams Inlet and the Beardslee Islands in the spring, as well as Muir and Wachusett Inlets, and the west arm in the summer (Figure 18). Sea otters were observed around the Beardslee Islands, and from southern Willoughby Island eastward to Boulder Island in the spring survey (Figure 18). In the summer they were found in the same areas as well as from Pt. Carolus northward to Rush Point. In March, Harbor porpoises were observed between Adams and Wachusett Inlets (Figure 18). In June they were seen in that area, Sitakaday Narrows, and Icy Strait. There were no sightings of Humpback or Killer whales in March. In June, Humpback whales were observed in the waters north of Flapjack Island and Killer whales were observed near Adams Inlet and off Pt. Adolphs in Icy Strait (Figure 18).
20

Figure 6. Glaucous-winged gull sightings in March 2001 (A) and June 2001 (B). See Table 2 for the total number counted. Gray lines are the survey tracklines. See Figures 1-3 for transect numbers.
21
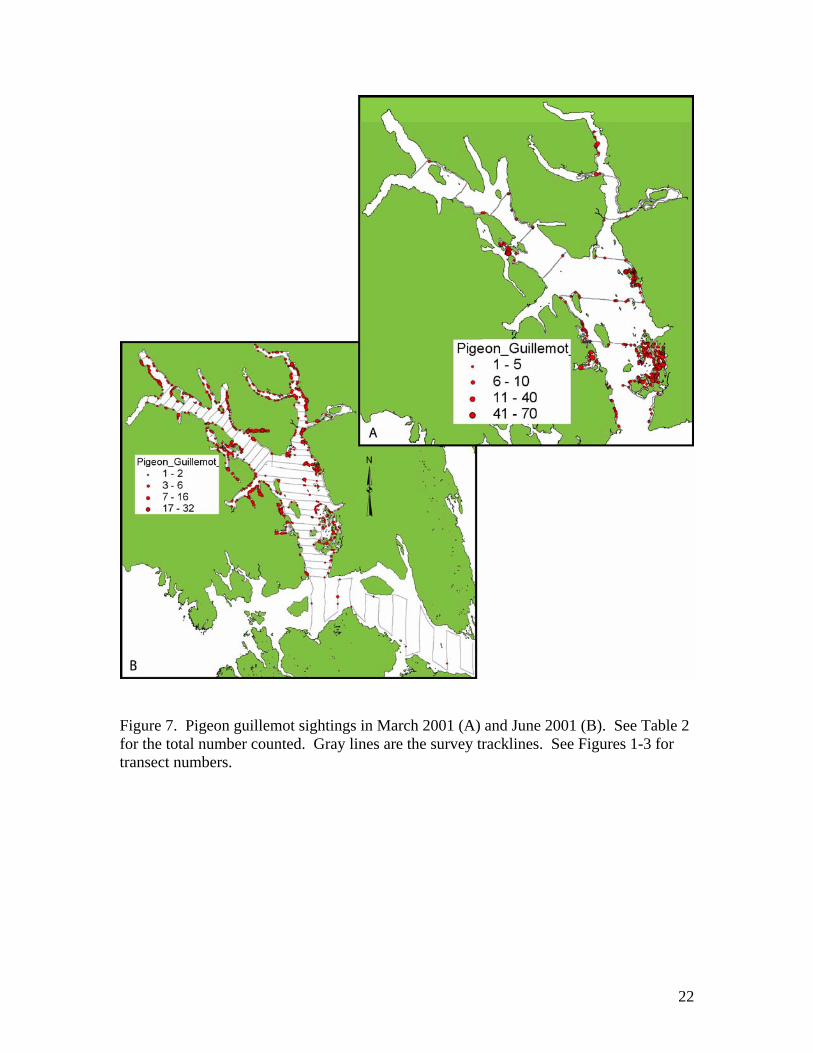
Figure 7. Pigeon guillemot sightings in March 2001 (A) and June 2001 (B). See Table 2 for the total number counted. Gray lines are the survey tracklines. See Figures 1-3 for transect numbers.
22

Figure 8. Kittlitz, marbled, and brachyramphous murrelet observations in March 2001 (A) and June 2001 (B). See Table 2 for the total number counted. Gray lines are the survey tracklines. See Figures 1-3 for transect numbers.
23
Figure 9. Arctic tern sightings in June 2001. See Table 2 for the total number counted. Gray lines are the survey tracklines. See Figures 1-3 for transect numbers.
24

Figure 10. Black-legged kittiwake observations in June 2001. See Table 2 for the total number counted. Gray lines are the survey tracklines. See Figures 1-3 for transect numbers.
25
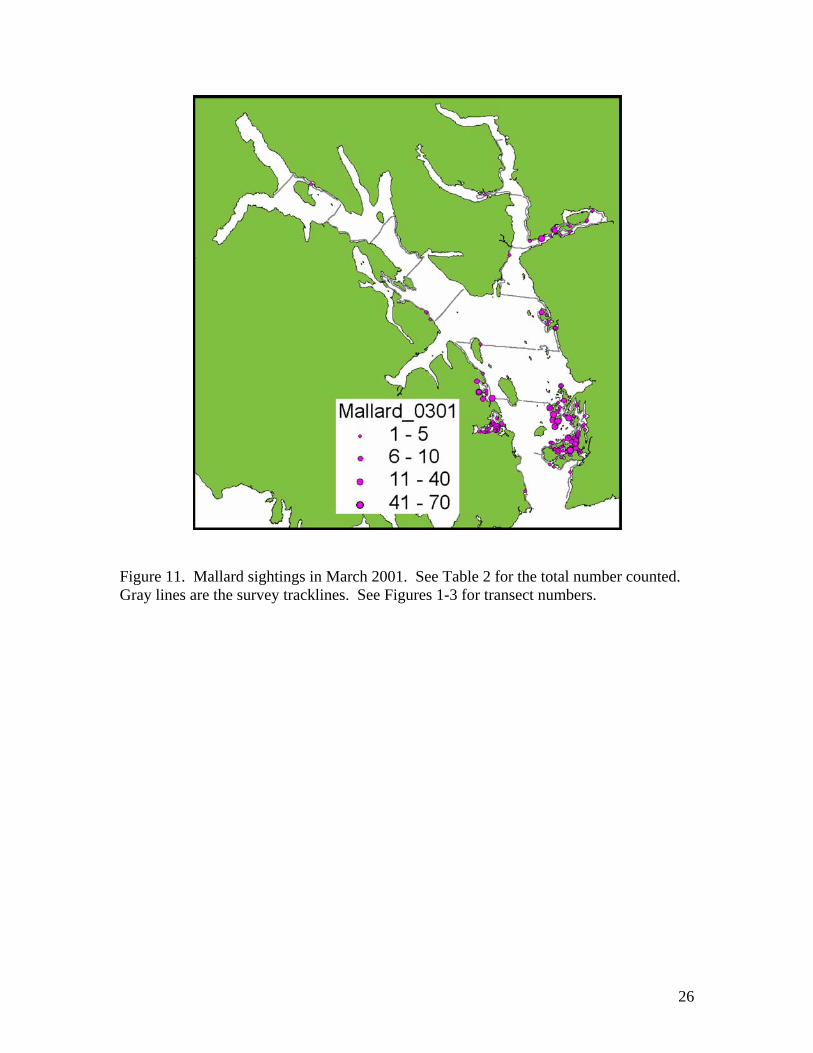
Figure 11. Mallard sightings in March 2001. See Table 2 for the total number counted. Gray lines are the survey tracklines. See Figures 1-3 for transect numbers.
26
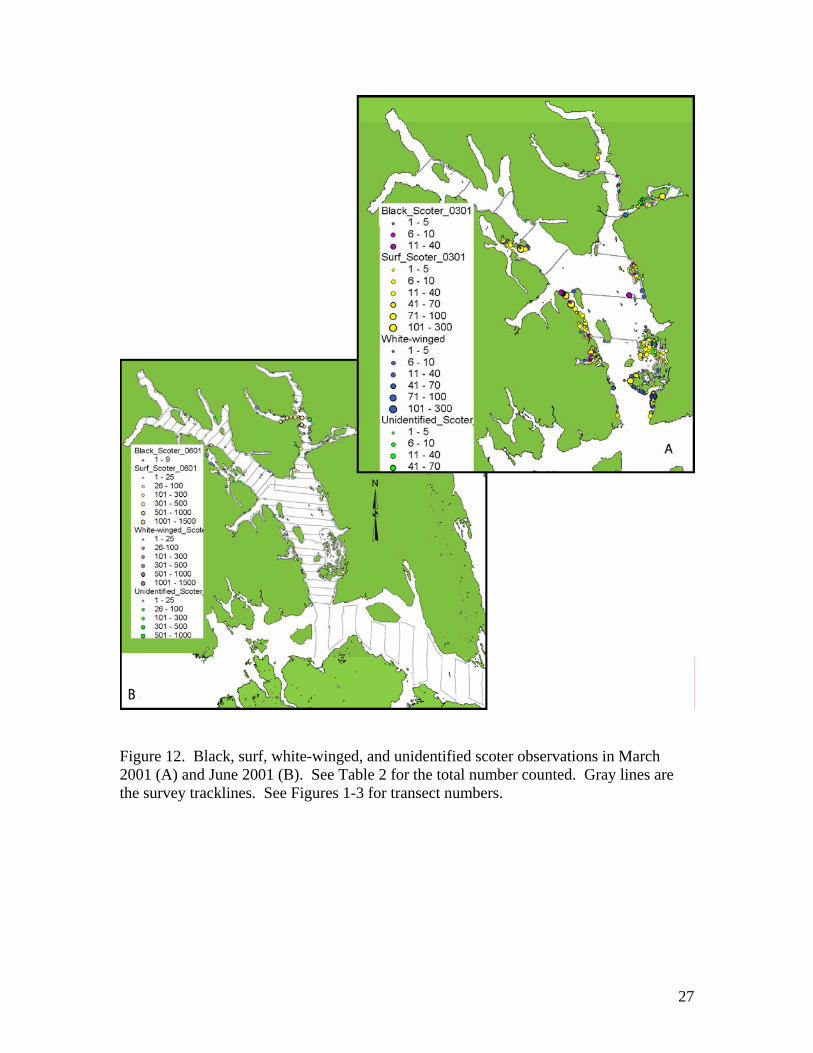
Figure 12. Black, surf, white-winged, and unidentified scoter observations in March 2001 (A) and June 2001 (B). See Table 2 for the total number counted. Gray lines are the survey tracklines. See Figures 1-3 for transect numbers.
27

Figure 13. Common, Barrow’s, and unidentified goldeneye observations in March 2001. See Table 2 for the total number counted. Gray lines are the survey tracklines. See Figures 1-3 for transect numbers.
28
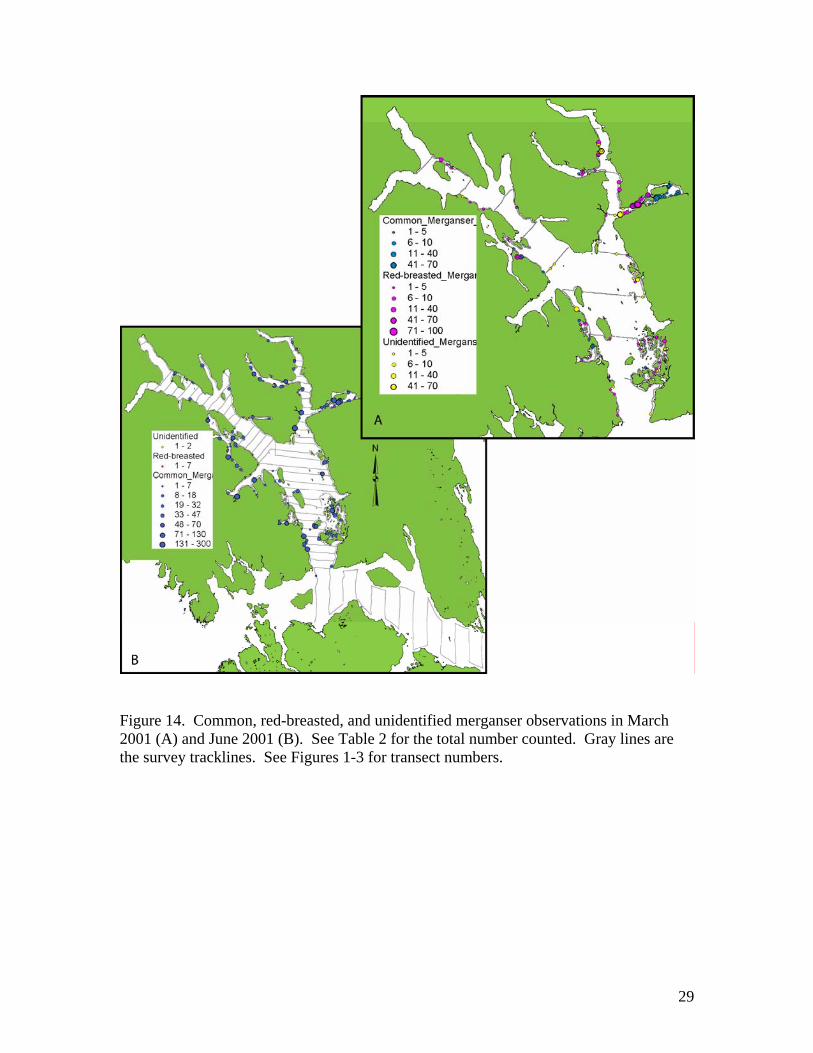
Figure 14. Common, red-breasted, and unidentified merganser observations in March 2001 (A) and June 2001 (B). See Table 2 for the total number counted. Gray lines are the survey tracklines. See Figures 1-3 for transect numbers.
29
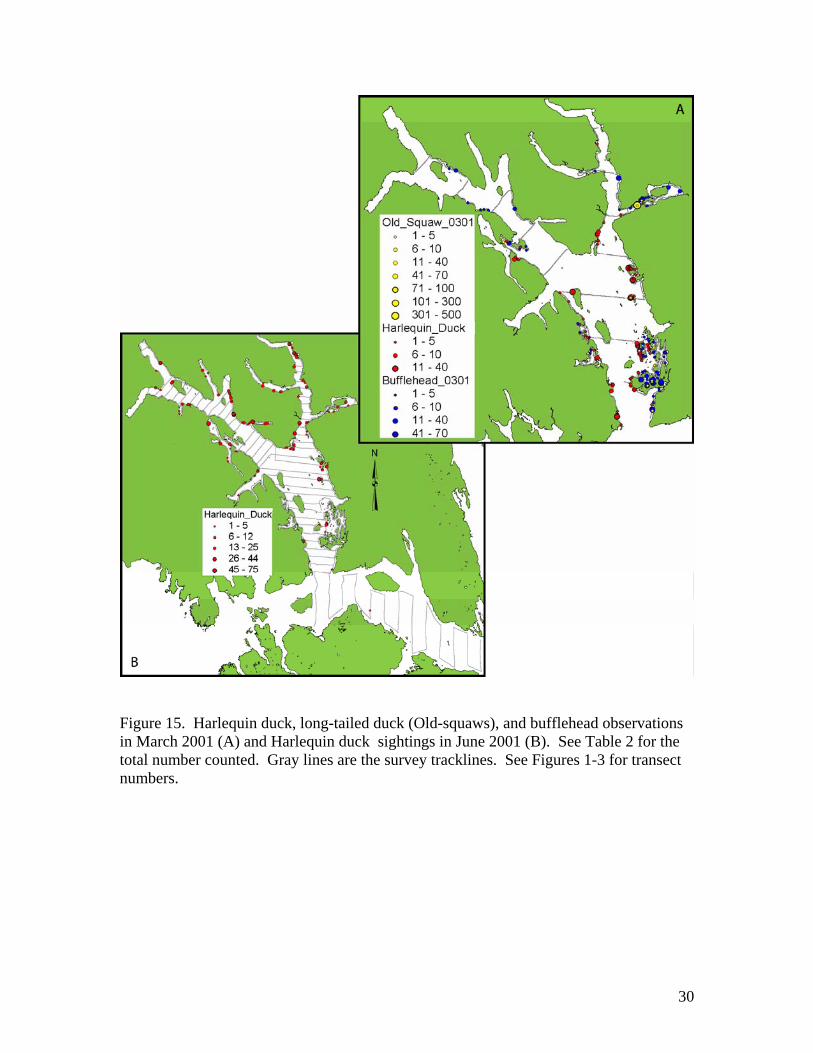
Figure 15. Harlequin duck, long-tailed duck (Old-squaws), and bufflehead observations in March 2001 (A) and Harlequin duck sightings in June 2001 (B). See Table 2 for the total number counted. Gray lines are the survey tracklines. See Figures 1-3 for transect numbers.
30

Figure 16. Northwestern crow sightings in March 2001. See Table 2 for the total number counted. Gray lines are the survey tracklines. See Figures 1-3 for transect numbers.
31
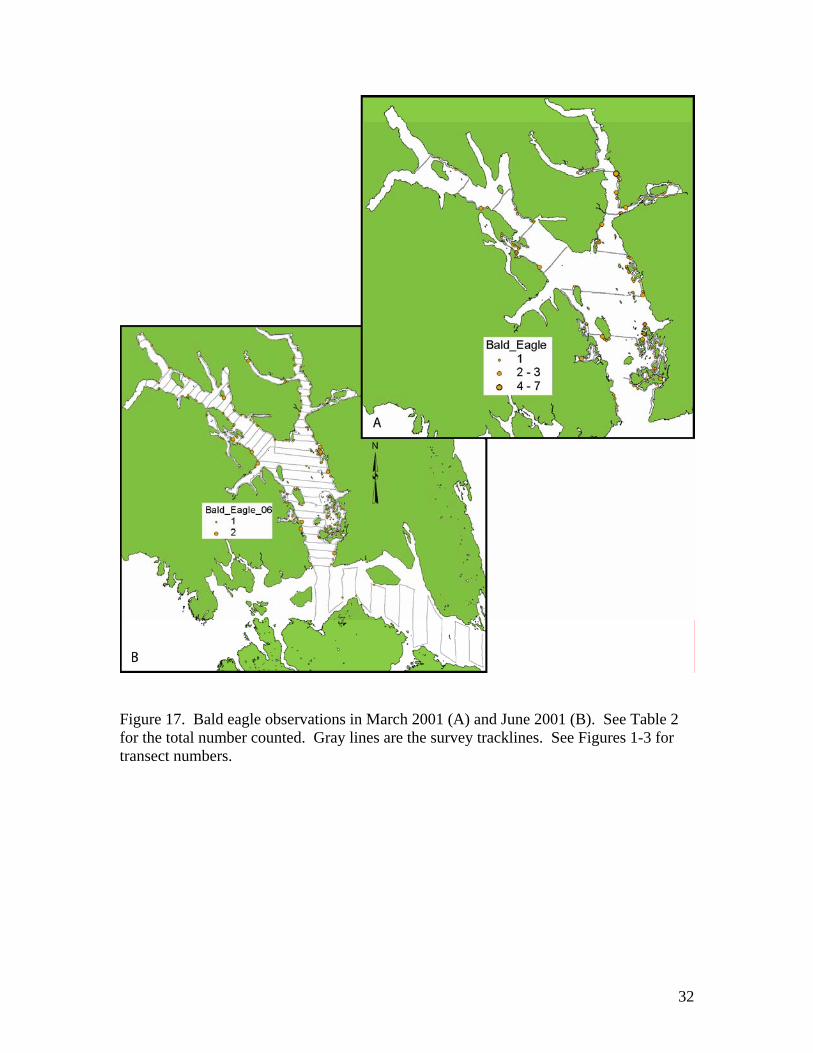
Figure 17. Bald eagle observations in March 2001 (A) and June 2001 (B). See Table 2 for the total number counted. Gray lines are the survey tracklines. See Figures 1-3 for transect numbers.
32
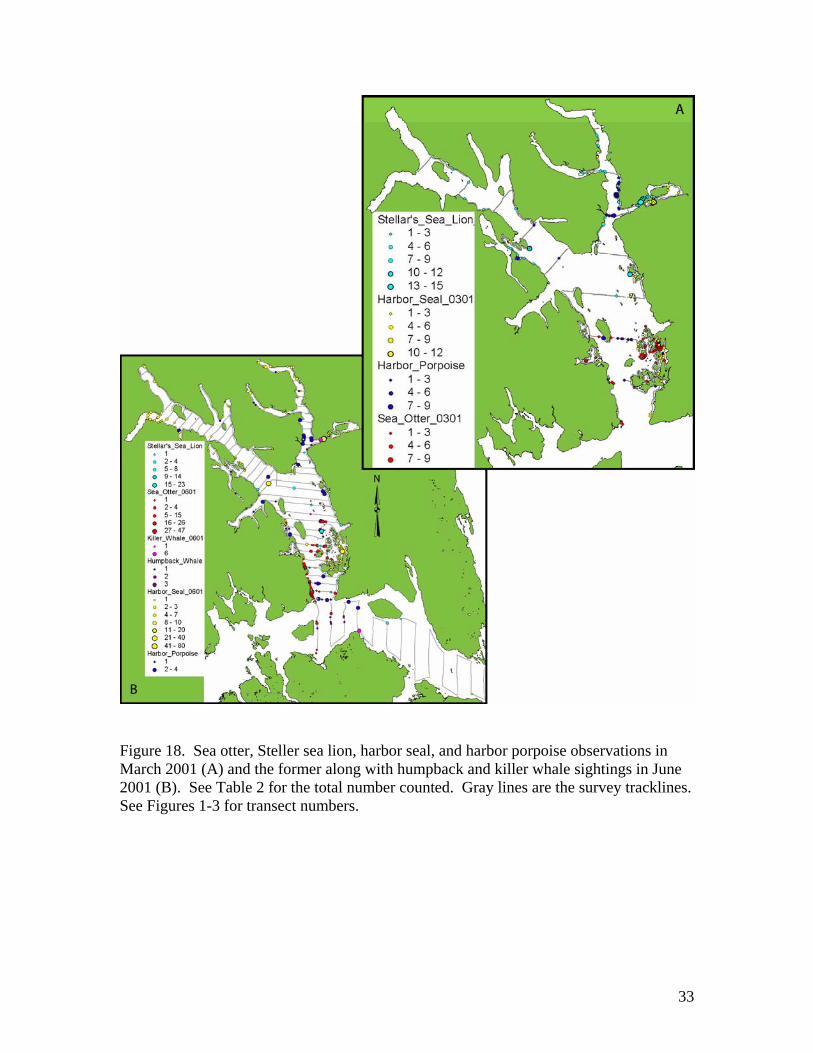
Figure 18. Sea otter, Steller sea lion, harbor seal, and harbor porpoise observations in March 2001 (A) and the former along with humpback and killer whale sightings in June 2001 (B). See Table 2 for the total number counted. Gray lines are the survey tracklines. See Figures 1-3 for transect numbers.
33

Discussion Since June 1999, scientists from the Alaska Science Center and GBNPP have completed six systematic, boat-based surveys of coastal and pelagic marine habitats in and adjacent to Glacier Bay. Surveys in1999 and 2000 were completed as part of a multi-disciplinary research program to investigate relations between physical and biological oceanography, forage fishes and marine bird and mammal predators (Taggart et al. 1999). Results of the 1999 and 2000 surveys are reported by Piatt et al. (2002). In 2001, using vessels and staff that participated in the 1999 and 2000 surveys, we repeated the predator surveys of Glacier Bay waters in March and June. In 2002 the surveys are being continued and a comprehensive analysis including all eight surveys, four in winter and 4 in summer, will be completed and submitted in 2003. This annual report presents the preliminary analysis of the 2001, March and June surveys. The purpose of these surveys, in addition to a component of the small schooling fish project (Taggart et al. 1999) is to provide a description of the species composition, distribution, and relative abundance of marine birds and mammals occurring in GBNPP. It is important to recognize the limitations of these types of surveys, as well as those attributes that render the results useful. Although a comprehensive treatment of the assumptions and interpretations of this type of survey can be expected in the 2003 final report, it is important to recognize the fundamental assumptions and inherent limitations of these surveys while interpreting the data presented in this report. First, transects surveyed during winter are a subset of the transects surveyed during summer, therefore contrasts of species composition, distribution and abundance, between winter and summer surveys needs to be within that group of transects during both periods. However, densities of species or taxonomic group (i.e. sea ducks) may be comparable between seasons and among years because differences in sample areas between surveys are accounted for. Second, differences in species composition and abundance may reflect changes in distribution, rather than population size. For example, goldeneye ducks comprise 26% of the total winter bird abundance in 2001, but less than 1% of summer bird abundance. This difference reflects predictable seasonal change in abundance reflected in the use of Glacier Bay as an over wintering area for these birds. Similar examples of seasonal variation in densities as a result of migratory behavior can be extended to other species that may spend winters (e.g. grebes, Bufflehead, and Mallards), or summers (e.g. Humpback whales and Arctic terns) in Glacier Bay. Other taxa may be present during both seasons but may be more abundant in either winter (e.g. Long-tailed ducks and Red-breasted mergansers), or summer (e.g. murrelets, Common mergansers, and Black-legged kittiwakes). Because most marine birds and mammals are highly mobile, apparent changes in abundance may actually reflect changes in distribution, to outside the study area, rather than change in abundance. Thirdly, the extent to which estimated densities reflect true densities, and thus can be used to estimate population
34

sizes within GBNPP, are unknown and likely vary among species. For example it may not be reasonable to assume that detection probability equals 1.0 (i.e. all members of that species are observed within the area sampled) for most species. For example, diving species are unavailable for detection while submerged, thus detection may be less than 1.0. Alternatively, species that flee in response to the survey vessel may either avoid detection (< 1.0), or be detected more than once (detection > 1.0). In addition, the detection bias for each species likely varies as a function of size (individual and group), behavior, and coloration. For example, whales are large and conspicuous, male goldeneye ducks are distinctively marked in high contrast black and white patterns that are easily detected, and scoters generally occur in large flocks, all attributes that facilitate detection. Alternatively, Harbor porpoise and most shorebirds are relatively small and inconspicuous, while Black oystercatchers often occur in rocky intertidal habitats that provide camouflage, and murrelets are small, mutely colored and generally occur in small numbers, all attributes that reduce detection. In order to compare survey results over time, without data to estimate detection, we must make the assumption that species-specific detection remains consistent over time. This may be a reasonable for some taxa, but not for others. For example, some birds (e.g. Northwestern crows, Bald eagles and Black-billed magpies) may be more easily detected during winter, when vegetation is at a minimum. Several attributes of these vessel-based surveys provide potentially unique and useful information. First, the surveys provide a measure of the species diversity, relative abundance and distribution of the marine bird and mammal communities that collectively occur in GBNPP, both migrants and residents, and within and across seasons. Because all marine birds and mammals are included, the survey results are capable of detecting changes in composition, distribution, and abundance of both common and rare species, both of which may be valuable in conservation and management policy and action. Secondly, because the surveys are taxonomically inclusive, including species that occupy a variety of trophic pathways and habitats, they may be particularly valuable in contributing to the process of identifying the causes of changes eventually observed within the marine bird and mammal communities. For example, increases in sea otter densities followed by declines in sea duck populations, may reflect a sea otter mediated reduction in those mussel and clam populations that previously supported high sea duck numbers. Data on sea duck abundance and their forage habits before and after sea otter colonization may provide an understanding of the processes responsible for population level changes among sea ducks. Similarly, declines in marine birds that occupy a forge fish based food web (e.g. alcids), may reflect changes in the species composition, distribution, or abundance of forage fishes. Thirdly, because these surveys are conducted at sea, where these birds and mammals forage, they can provide a useful adjunct to surveys conducted at haul-outs or colonies. At sea surveys, such as these may provide information on where the habitats and prey resources these birds and mammals require are located. Fourthly, despite the assumptions required in interpreting the results of these surveys, they have a historic precedence both in Glacier Bay (Piatt et al. 1991) and elsewhere in Alaska (Irons et al. 1988, Agler et al.1994, Agler et al. 1995). Because similar methods have been employed over time and in other areas, contrasts across these scales may be useful. And finally, because vessel based surveys are relatively
35
inexpensive, they may be sustainable over relatively long time scales and this may be one of the most desirable attributes when considering methods to monitor wildlife populations. The surveys we report on here provide a unique view into the species composition, distribution, and relative abundance of marine bird and mammal populations that occur during winter and summer in Glacier Bay. If conducted over time these survey results should provide reasonable measures of change in these variables. However it should be cautioned that the power to detect change in abundance over time likely would vary by species. Species that are common and uniformly distributed across transects (e.g. goldeneye) will display relatively low measures of variance, and thus relatively high power to detect change. Conversely, species that are rare or highly aggregated (e.g. shorebirds) will display relatively high measure of variance, and thus may demonstrate low power to detect change. Accurate abundance estimates are not required to monitor trends or proportional change in population size. However, if accurate estimates of abundance for a particular species are needed, or if estimating the magnitude of change is important, then it may be necessary to estimate detection for that species, or employ alternative survey methods. It is unlikely that these at sea vessel based surveys will provide the necessary accuracy and precision in abundance estimates for all species required for management or research purposes. For species where accurate data are required alternative survey methods may be more appropriate (e.g. haul out counts of pinnipeds, censuses of seabird colonies, or aerial survey for sea otters). For many other species (e.g. goldeneye, murrelets, and loons) alternative survey methods may not be readily available or applicable (i.e. brood counts). For many species it may be possible to test some of the assumptions regarding detection, thus improving the utility of the data generated through these at sea surveys of marine bird and mammals. ACKNOWLEDGEMENTS The Biology Office of the Alaska Science Center, USGS and Glacier Bay National Park and Preserve supported this work. We appreciate the participation and contributions to this work made by J. Degroot, J. De la Bruere, G. Drew, M. Kralovec, M. Moss, and A.Banks.
36

REFERENCES Agler, B.A., S.J. Kendall, P.E. Seiser, and D.B. Irons. 1994. Estimates of Marine Bird and Sea Otter Abundance in Lower Cook Inlet, Alaska during Summer 1993 and Winter 1994. Final Report: OCS Study, MMS 94-0063. Agler, B.A., S.J. Kendall, P.E. Seiser, and J. Lindall. 1995. Estimates of Marine Bird and Sea Otter Abundance in Southeast Alaska during Summer 1994. US Fish and Wildlife Service, Anchorage, Alaska Unpublished report. 48 pp. Baker, C.S. 1985. Population characteristics of humpback whales in Frederick Sound and Stephens Passage, southeastern Alaska: Survey 1, 1985. Unpublished report U.S. National Park Service, Glacier Bay National Park and Preserve. Baker, C.S. & J. Straley. 1988. Population characteristics of humpback whales in Glacier Bay and adjacent waters: summer 1988. Unpublished report U.S. National Park Service, Glacier Bay National Park and Preserve. Braham, H.W., R.D. Everitt & D.J. Rugh. 1977. Preliminary evidence of a northern sea lion (Eumetopias jubatus) population decline in the eastern Aleutian islands. National Marine Fisheries Service, Northwest and Alaska Fisheries Center. Bodkin, J.L. K.A. Kloecker, G.G. Esslinger, D.H. Monson, J.D. DeGroot and J. Doherty. 2002. Sea Otter Studies in Glacier Bay National Park and Preserve. Annual Report 2001. USGS Alaska Science Center, Anchorage AK. 68 pp. Calambokidis, J. & G.T. Steiger. 1982. Behavior of harbor porpoise in Glacier Bay, Alaska, with emphasis on marked individuals. Unpublished report Cascadia Research Collective. Clapham, P.J. & C.A. Mayo. 1987. Reproduction and recruitment of individually identified humpback whales (Megaptera novaeangliae) observed in Massachusetts Bay, 1979-1985. Canadian Journal of Zoology 65:2853-2863. Dahlheim, M., A. York, J. Waite & R. Towell. 1992. Abundance and distribution of harbor porpoise (Phocoena phocoena) in Southeast Alaska and Western Gulf of Alaska. Annual report U.S. National Marine Fisheries Service, National Marine Mammal Laboratory. Estes, J.A. and D.O. Duggins. 1995. Sea otters and kelp forests in Alaska: generality and variation in a community ecology paradigm. Ecological Monographs 65:75-100. Gabriele, C.M. 1993. Population characteristics of humpback whales (Megaptera novaeangliae) in Glacier Bay and adjacent waters: 1993. Unpublished report U.S. National Park Service, Glacier Bay National Park and Preserve.
37

Gould, P.J. & D.J. Forsell. 1989. Techniques for shipboard surveys of marine birds. Technical report U.S. Fish and Wildlife Service 25. Hoover-Miller, A. 1988. Steller sea lion. in Lentfer, J.W., ed. Selected marine mammals of Alaska: species accounts with research and management recommendations: Washington, D. C., U.S. Marine Mammal Commission. 159-193 pp.
Hoover-Miller, A. 1988. Harbor seal - Phoca vitulina. in Lentfer, J.W., ed. Selected marine mammals of Alaska: species accounts with research and management recommendations: Washington, D.C., Marine Mammal Commission. pp.125-157. Irons, D.B., D.R. Nysewander, and J.L. Trapp.1988 Prince William Sound waterbird distribution in relation to habitat type. US Fish and Wildlife Service, Anchorage, AK. Unpub. report. Irons, D.B., S.J. Kendall, W.P Erickson, L.L. McDonald, and B.K. Lance. 2001. Nine years after the Exxon Valdez oil spill. Condor. Krieger, K. 1987. Study of humpback whale prey in Glacier Bay. Proposal U.S. National Park Service. Krieger, K.J. 1990. Relationship between prey abundance and usage of Glacier Bay by humpback whales, in Second Glacier Bay Science Symposium, Glacier Bay National Park & Preserve, AK, U.S. National Park Service, p. 90-95. Krieger, K.J. & B.L. Wing. 1984. Hydroacoustic surveys and identification of humpback whale forage in Glacier Bay, Stephens Passage, and Frederick Sound, southeastern Alaska, summer 1983. NOAA Technical Memorandum U.S. National Marine Fisheries Service, Auke Bay Laboratory, Juneau NMFS F/N WC-66. Krieger, K.J. & F.L. Wing. 1986. Hydroacoustic monitoring of prey to determine humpback whale movements. National Oceanic and Atmospheric Administration and the National Marine Fisheries Service. Loughlin, T.R. 1992. Abundance and distribution of harbor seals (Phoca vitulina richardsi) in Bristol Bay, Prince William Sound, and Copper River Delta during 1991. U.S. National Marine Fisheries Service, National Marine Mammal Laboratory. Mathews, E.A. 1992. Harbor seal (Phoca vitulina) censuses in Glacier Bay National Park and Preserve: a comparison of land-based and aerial censusing. Final report, NMFS Contract NMFS, NMML and U.S. National Park Service, Glacier Bay National Park and Preserve. Merrick, R.L., T.R. Loughlin & D.G. Calkins. 1987. Decline in abundance of the northern sea lion, (Eumetopias jubatus), in Alaska, 1956-86. Fishery Bulletin 85:351-365.
38

Piatt, J.F. & P.J. Anderson. 1996. Response of Common Murres to the Exxon Valdez oil spill and long-term changes in the Gulf of Alaska marine ecosystem, in Exxon Valdez Oil Spill Symposium Proceedings. American Fisheries Society Symposium 18, Bethesda, Maryland, p. 720-737. Piatt, J.F., L. Climo, A. Springer & T. Duncan. 1991. Marine bird distribution in Glacier Bay National Park during the summer of 1991. Unpublished report U.S. Fish and Wildlife Service. Piatt, J.F. & D.A. Methven. 1992a. Threshold foraging behavior of baleen whales. Marine Ecology Progress Series 84:205-210. Piatt, J.F. & N.L. Naslund. 1995. Abundance, distribution and population status of marbled murrelets in Alaska. In: Ralph, C.J., Hunt Jr., G.L., Piatt, J.F., and Raphael, M. eds., Conservation assessment for the marbled murrelet. General Technical Report U.S. Forest Service PSW-GTR-152. Pitcher, K.W. 1990. Major decline in the number of harbor seals (Phoca vitulina) on Tugidak Island, Gulf of Alaska. Marine Mammal Science:121-134. Robards, M.D., G. Drew, S.J. Taggart, P.N. Hooge, J.F. Piatt, and J.L. Bodkin. 2002. Glacier Bay Ecological Studies: Small Schooling Fish Research DRAFT Final Report. USGS Alaska Science Center, Anchorage, Alaska. Simenstad, C.A., J.A. Estes, and K.W. Kenyon. 1978. Aleuts, sea otters, and alternate stable state communities. Science 200:403-411. Straley, J.M. 1994. Seasonal characteristics of humpback whales (Megaptera novaeangliae) in southeastern Alaska, University of Alaska Fairbanks, M.S. Thesis, 121 pp. SDVJ Joint Technical Team. 2001. Sea Duck Joint Venture, strategic plan 2001-2006. A North American Waterfowl Management Plan. USFWS, Anchorage, AK. Unpubl. Report. Taggart, S.J., P.N. Hooge, J.F. Piatt, J.L. Bodkin, P.R. Carlson and D.E. Lawson. 1999. The Spatial Distribution of Small Schooling Fishes and Associated Predators in Glacier Bay, Alaska, and Their Relationship to Oceanography and Bathymetry. Unpublished study plan. Alaska Science Center, USGS, Anchorage, Alaska. 31 pp. Taylor, B.L. & P.K. Dawson. 1980. A study concerning aspects of the natural history of harbor porpoise (Phocoena phocoena) in Glacier Bay National Monument. Proposal U.S. National Park Service, Anchorage Regional Office.
39

Taylor, B.L. & P.K. Dawson. 1984. Seasonal changes in density and behavior of harbor porpoise (Phocoena phocoena) affecting census methodology in Glacier Bay National Park, Alaska. Report International Whaling Commission 34. US Fish and Wildlife Service. 1999, Population status and trends of sea ducks in Alaska. USFWS, Anchorage AK, Unpubl. Report. Guides used in the identification of marine birds Harrison, P. 1985. Seabirds and identification guide. Houghton Mifflin Boston 448pp. National Geographic. 1987. Field guide to the birds of North America. National Geographic Society, Washington D.C.480 pp. Sibley, D.A. 2000. National Audobon Society The Sibley guide to birds. Alfred E. Knopf, Chanticleer Press, New York. 546 pp.
40

APPENDICES
41

Appendix 1 Species Codes Codes for species observed during predator surveys. Note that not all species have been observed in GBNPP. The list originated during pelagic surveys in Cook Inlet and has since been expanded to include species observed in GBNPP. GROUP ABBREVIATION SPECIES ALCID ANMU Ancient Murrelet ALCID BRMU Brachyramphus Murrelet ALCID CAAU Cassin's Auklet ALCID COMU Common Murre ALCID CRAU Crested Auklet ALCID HOPU Horned Puffin ALCID KIMU Kittlitz's Murrelet ALCID LEAU Least Auklet ALCID MAMU Marbled Murrelet ALCID PAAU Parakeet Auklet ALCID PIGU Pigeon Guillemot ALCID RHAU Rhinocerous Auklet ALCID TBMU Thick-billed Murre ALCID TUPU Tufted Puffin ALCID UNAC Unidentified Alcid ALCID UNAU Unidentified Auklet ALCID UNMU Unidentified Murre ALCID WHAU Whiskered Auklet CORMORANT BRAC Brant's Cormorant CORMORANT DCCO Double-crested CormorantCORMORANT PECO Pelagic Cormorant CORMORANT RFCO Red-faced Cormorant CORMORANT UNCO Unidentified Cormorant DUCK AMWI American Wigeon DUCK BAGO Barrow's Goldeneye DUCK BLSC Black Scoter DUCK BUFF Bufflehead DUCK COEI Common Eider DUCK COGO Common Goldeneye DUCK COME Common Merganser DUCK GADW Gadwall DUCK GRSC Greater Scaup DUCK GWTE Green-winged Teal DUCK HADU Harlequin Duck DUCK LESC Lesser Scaup DUCK MALL Mallard DUCK NOPI Northern Pintail DUCK NOSH Northern Shoveler DUCK OLDS Oldsquaw DUCK RBME Red-breasted Merganser DUCK SCAU Scaup
42
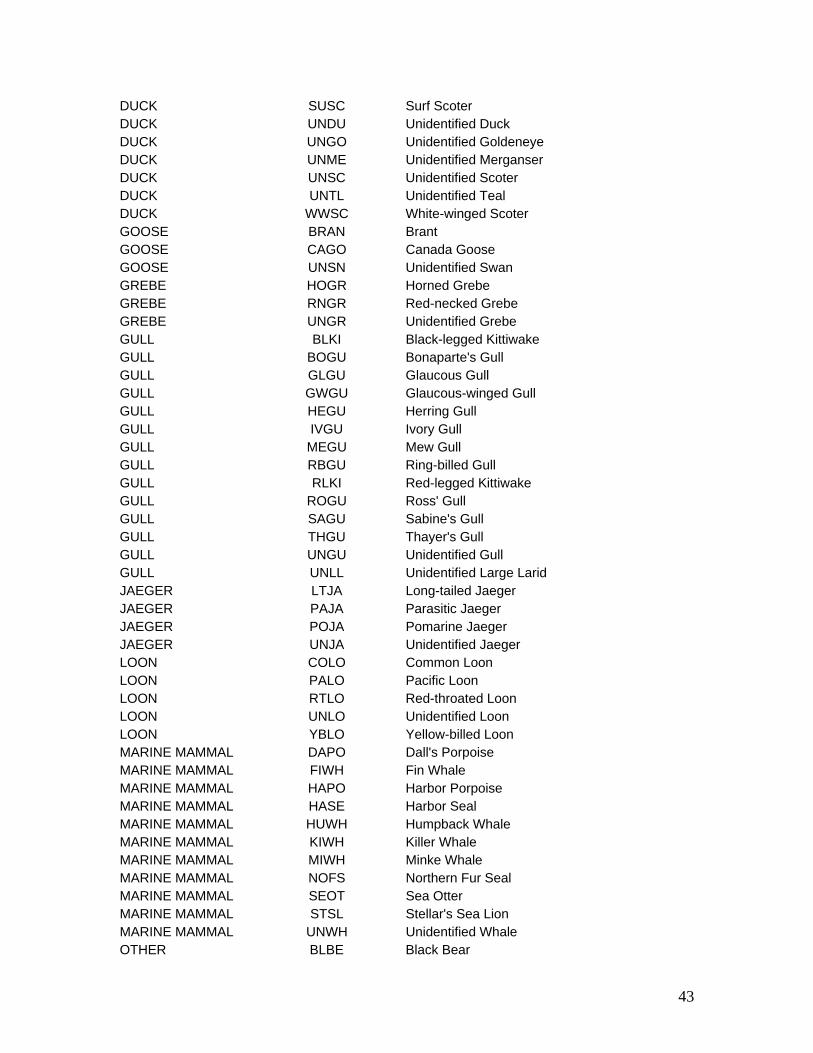
DUCK SUSC Surf Scoter DUCK UNDU Unidentified Duck DUCK UNGO Unidentified Goldeneye DUCK UNME Unidentified Merganser DUCK UNSC Unidentified Scoter DUCK UNTL Unidentified Teal DUCK WWSC White-winged Scoter GOOSE BRAN Brant GOOSE CAGO Canada Goose GOOSE UNSN Unidentified Swan GREBE HOGR Horned Grebe GREBE RNGR Red-necked Grebe GREBE UNGR Unidentified Grebe GULL BLKI Black-legged Kittiwake GULL BOGU Bonaparte's Gull GULL GLGU Glaucous Gull GULL GWGU Glaucous-winged Gull GULL HEGU Herring Gull GULL IVGU Ivory Gull GULL MEGU Mew Gull GULL RBGU Ring-billed Gull GULL RLKI Red-legged Kittiwake GULL ROGU Ross' Gull GULL SAGU Sabine's Gull GULL THGU Thayer's Gull GULL UNGU Unidentified Gull GULL UNLL Unidentified Large Larid JAEGER LTJA Long-tailed Jaeger JAEGER PAJA Parasitic Jaeger JAEGER POJA Pomarine Jaeger JAEGER UNJA Unidentified Jaeger LOON COLO Common Loon LOON PALO Pacific Loon LOON RTLO Red-throated Loon LOON UNLO Unidentified Loon LOON YBLO Yellow-billed Loon MARINE MAMMAL DAPO Dall's Porpoise MARINE MAMMAL FIWH Fin Whale MARINE MAMMAL HAPO Harbor Porpoise MARINE MAMMAL HASE Harbor Seal MARINE MAMMAL HUWH Humpback Whale MARINE MAMMAL KIWH Killer Whale MARINE MAMMAL MIWH Minke Whale MARINE MAMMAL NOFS Northern Fur Seal MARINE MAMMAL SEOT Sea Otter MARINE MAMMAL STSL Stellar's Sea Lion MARINE MAMMAL UNWH Unidentified Whale OTHER BLBE Black Bear
43

OTHER BRBE Brown Bear OTHER GRWO Grey Wolf OTHER MOGO Mountain Goat OTHER MOOS Moose OTHER RIOT River Otter PHALAROPE REPH Red Phalarope PHALAROPE RNPH Red-necked Phalarope PHALAROPE UNPH Unidentified Phalarope RAPTOR BAEA Bald Eagle RAPTOR GOEA Golden Eagle RAPTOR UNEA Unidentified Eagle RAPTOR UNRA Unidentified Raptor SHOREBIRD BLOY Black Oystercatcher SHOREBIRD BLTU Black Turnstone SHOREBIRD GBHE Great Blue Heron SHOREBIRD LEYE Lesser Yellowlegs SHOREBIRD SEPL Semipalmated Plover SHOREBIRD SPSA Spotted Sandpiper SHOREBIRD SURF Surfbird SHOREBIRD UNSB Unidentified Shorebird SHOREBIRD WHIM Whimbrel TERN ALTE Aleutian Tern TERN ARTE Arctic Tern TERN CATE Caspian Tern TERN UNTE Unidentified Tern TERRESTRIAL BIRD AMRO American Robin TERRESTRIAL BIRD BASW Barn Swallow TERRESTRIAL BIRD BBMA Black-billed Magpie TERRESTRIAL BIRD BEKI Belted Kingfisher TERRESTRIAL BIRD CLSW Cliff Swallow TERRESTRIAL BIRD CORA Common Raven TERRESTRIAL BIRD NOCR Northwestern Crow TERRESTRIAL BIRD RUHU Rufous Hummingbird TERRESTRIAL BIRD UNSW Unidentified Swallow TERRESTRIAL BIRD VGSW Violet-Green Swallow TERRESTRIAL BIRD WSOW Western Screech Owl TUBENOSE BFAL Black-footed Albatross TUBENOSE FTSP Fork-tailed Storm Petrel TUBENOSE LAAL Laysan Albatross TUBENOSE LESP Leach's Storm Petrel TUBENOSE MOPE Mottled Petrel TUBENOSE NOFU Northern Fulmar TUBENOSE SOSH Sooty Shearwater TUBENOSE STAL Short-tailed Albatross TUBENOSE STSH Short-tailed Shearwater TUBENOSE UNAL Unidentified Albatross TUBENOSE UNSH Unidentified Shearwater TUBENOSE UNSP Unidentified Storm Petrel
44

Appendix 2 Transect Log Example of a transect log sheet used during predator surveys. Transect Log GLBA Predator Surveys Page _____Survey Date: ________________________________________________ Name of Map File: ____________________________________________ Format for Naming .SRV output files: ___________________________ Trip ID: ____________________________________________________ Date Boat Name Transect # File Name Start Time Stop Time Proofed Comments
Please be accurate with times. Please cross-off comments if fixed during proofing.
45

Appendix 3 Other Codes Codes for observer and sea conditions. OBSERVER CONDITIONS
1 excellent 2 very good 3 good 4 fair 5 poor
SEA CONDITIONS
0 flat calm 1 rippled 2 up to 6 inch chop 3 up to 1 foot chop 4 1 - 2 foot chop 5 2 - 4 foot chop 6 4 - 6 foot chop 7 6 - 8 foot chop
46
Copyright © 2022 FDOKUMEN