
Organization and Evolution of the Biological Response to Singlet Oxygen Stress
18
Organization and Evolution of the Biological Response to Singlet Oxygen Stress Yann S. Dufour 1,2 , Robert Landick 1,3 and Timothy J. Donohue 1 ⁎ 1 Department of Bacteriology, University of Wisconsin- Madison, 1550 Linden Drive, Madison, WI 53706, USA 2 BACTER Institute, University of Wisconsin-Madison, Madison, WI 53706, USA 3 Department of Biochemistry, University of Wisconsin- Madison, 433 Babcock Drive, Madison, WI 53706, USA Received 15 June 2008; received in revised form 5 August 2008; accepted 7 August 2008 Available online 13 August 2008 The appearance of atmospheric oxygen from photosynthetic activity led to the evolution of aerobic respiration and responses to the resulting reactive oxygen species. In Rhodobacter sphaeroides, a photosynthetic α-proteobacter- ium, a transcriptional response to the reactive oxygen species singlet oxygen ( 1 O 2 ) is controlled by the group IV σ factor σ E and the anti-σ factor ChrR. In this study, we integrated various large datasets to identify genes within the 1 O 2 stress response that contain σ E -dependent promoters both within R. sphaeroides and across the bacterial phylogeny. Transcript pattern clustering and a σ E -binding sequence model were used to predict candidate promoters that respond to 1 O 2 stress in R. sphaeroides. These candidate promoters were experimentally validated to nine R. sphaeroides σ E -dependent promoters that control the transcription of 15 1 O 2 -activated genes. Knowledge of the R. sphaeroides response to 1 O 2 and its regulator σ E –ChrR was combined with large-scale phylogenetic and sequence analyses to predict the existence of a core set of approximately eight conserved σ E -dependent genes in α- proteobacteria and γ-proteobacteria. The bacteria predicted to contain this conserved response to 1 O 2 include photosynthetic species, as well as free- living and symbiotic/pathogenic nonphotosynthetic species. Our analysis also predicts that the response to 1 O 2 evolved within the time frame of the accumulation of atmospheric molecular oxygen on this planet. © 2008 Elsevier Ltd. All rights reserved. Edited by R. Ebright Keywords: singlet oxygen; reactive oxygen; species gene regulation; stress responses; sigma factors Introduction Genome sequences and genomewide datasets pro- vide a way to transfer accumulated knowledge from model systems to other organisms. For example, by merging high-throughput experimental technolo- gies with computational tools, one can predict con- servation of protein families, regulatory networks, and transcription factor binding sequences across prokaryotes and eukaryotes. 1,2 We analyze molecular aspects of the function, evo- lution, and phylogenetic conservation of prokaryotic transcriptional networks because of the large num- ber of bacterial genome sequences and the deep understanding of these organisms. Despite these advantages, the relatively high evolution rate of prokaryotes makes this task challenging. For exam- ple, because of potentially divergent evolutionary histories, the proper functional assignment within groups of homologous genes is difficult when genes are considered in isolation. 3 In addition, making inferences about prokaryotic regulatory networks or stress responses based solely on the presence of a transcription factor can be hazardous because DNA- binding proteins can represent interchangeable com- ponents in signal transduction pathways. 4 There- fore, it is critical to consider gene function in the context of regulation, interaction of gene products with other functions, the organism's metabolic life- style, and phylogenetic distances when constructing bacterial transcriptional network models. In this study, we analyze an important, yet incom- pletely characterized stress response to the reactive oxygen species singlet oxygen ( 1 O 2 ) in the facultative phototrophic bacterium Rhodobacter sphaeroides. This α-proteobacterium has been a model for the analysis of photosynthesis and other metabolic activities from a molecular, biochemical, and genomic perspective. 5 *Corresponding author. E-mail address: [email protected]. Abbreviations used: 1 O 2 , reactive oxygen species singlet oxygen; PSWM, position-specific weighted matrix; ChIP- chip, chromatin immunoprecipitation and microarray; Ba, billion years; EDTA, ethylenediaminetetraacetic acid. doi:10.1016/j.jmb.2008.08.017 J. Mol. Biol. (2008) 383, 713–730 Available online at www.sciencedirect.com 0022-2836/$ - see front matter © 2008 Elsevier Ltd. All rights reserved.
-
Upload
michiganstate -
Category
Documents
-
view
1 -
download
0
Transcript of Organization and Evolution of the Biological Response to Singlet Oxygen Stress

doi:10.1016/j.jmb.2008.08.017 J. Mol. Biol. (2008) 383, 713–730
Available online at www.sciencedirect.com
Organization and Evolution of the Biological Responseto Singlet Oxygen Stress
Yann S. Dufour1,2, Robert Landick1,3 and Timothy J. Donohue1⁎
1Department of Bacteriology,University of Wisconsin-Madison, 1550 Linden Drive,Madison, WI 53706, USA2BACTER Institute, Universityof Wisconsin-Madison,Madison, WI 53706, USA3Department of Biochemistry,University of Wisconsin-Madison, 433 Babcock Drive,Madison, WI 53706, USAReceived 15 June 2008;received in revised form5 August 2008;accepted 7 August 2008Available online13 August 2008
*Corresponding author. E-mail [email protected] used: 1O2, reactive o
oxygen; PSWM, position-specific wechip, chromatin immunoprecipitatiobillion years; EDTA, ethylenediamin
0022-2836/$ - see front matter © 2008 E
The appearance of atmospheric oxygen from photosynthetic activity led tothe evolution of aerobic respiration and responses to the resulting reactiveoxygen species. In Rhodobacter sphaeroides, a photosynthetic α-proteobacter-ium, a transcriptional response to the reactive oxygen species singlet oxygen(1O2) is controlled by the group IV σ factor σE and the anti-σ factor ChrR. Inthis study, we integrated various large datasets to identify genes within the1O2 stress response that contain σE-dependent promoters both within R.sphaeroides and across the bacterial phylogeny. Transcript pattern clusteringand a σE-binding sequence model were used to predict candidate promotersthat respond to 1O2 stress in R. sphaeroides. These candidate promoters wereexperimentally validated to nine R. sphaeroides σE-dependent promotersthat control the transcription of 15 1O2-activated genes. Knowledge of the R.sphaeroides response to 1O2 and its regulator σE–ChrR was combined withlarge-scale phylogenetic and sequence analyses to predict the existence of acore set of approximately eight conserved σE-dependent genes in α-proteobacteria and γ-proteobacteria. The bacteria predicted to contain thisconserved response to 1O2 include photosynthetic species, as well as free-living and symbiotic/pathogenic nonphotosynthetic species. Our analysisalso predicts that the response to 1O2 evolved within the time frame of theaccumulation of atmospheric molecular oxygen on this planet.
© 2008 Elsevier Ltd. All rights reserved.
Keywords: singlet oxygen; reactive oxygen; species gene regulation; stressresponses; sigma factors
Edited by R. EbrightIntroduction
Genome sequences and genomewide datasets pro-vide a way to transfer accumulated knowledge frommodel systems to other organisms. For example, bymerging high-throughput experimental technolo-gies with computational tools, one can predict con-servation of protein families, regulatory networks,and transcription factor binding sequences acrossprokaryotes and eukaryotes.1,2
We analyze molecular aspects of the function, evo-lution, and phylogenetic conservation of prokaryotictranscriptional networks because of the large num-ber of bacterial genome sequences and the deepunderstanding of these organisms. Despite these
ess:
xygen species singletighted matrix; ChIP-n and microarray; Ba,etetraacetic acid.
lsevier Ltd. All rights reserve
advantages, the relatively high evolution rate ofprokaryotes makes this task challenging. For exam-ple, because of potentially divergent evolutionaryhistories, the proper functional assignment withingroups of homologous genes is difficult when genesare considered in isolation.3 In addition, makinginferences about prokaryotic regulatory networks orstress responses based solely on the presence of atranscription factor can be hazardous because DNA-binding proteins can represent interchangeable com-ponents in signal transduction pathways.4 There-fore, it is critical to consider gene function in thecontext of regulation, interaction of gene productswith other functions, the organism's metabolic life-style, and phylogenetic distances when constructingbacterial transcriptional network models.In this study, we analyze an important, yet incom-
pletely characterized stress response to the reactiveoxygen species singlet oxygen (1O2) in the facultativephototrophic bacterium Rhodobacter sphaeroides. Thisα-proteobacterium has been a model for the analysisof photosynthesis and othermetabolic activities fromamolecular, biochemical, and genomic perspective.5
d.

714 Bacterial Singlet Oxygen Stress Response
Recently, a transcriptional response to 1O2 was dis-covered in this bacterium.6 In R. sphaeroides and otherphototrophs, 1O2 is a toxic reactive oxygen speciesgenerated by energy transfer from excited photosyn-thetic pigments to oxygen.7 1O2 can also be generatedin other ways by photosynthetic and nonphotosyn-thetic cells; its reactivitywith biomoleculesmakes 1O2lethal to prokaryotes and eukaryotes.8 Thus, manyorganisms should or are known to contain a systemused to sense the presence of 1O2 and to activatetarget genes needed tomount a stress response to thisreactive oxygen species.The R. sphaeroides transcriptional response to 1O2
is controlled by the group IV σ/anti-σ factor pairσE–ChrR.6 In this study, we used computational,experimental, and phylogenetic analyses to definemost, if not all, of the direct targets for σE. Ourresults predict that the transcriptional response to1O2, the master regulators of this response, andvarious members of the σE–ChrR regulon arefound in many other photosynthetic and nonpho-tosynthetic prokaryotes, suggesting that free-livingor pathogenic/symbiotic species also encounter1O2 in nature. Our findings provide new perspec-tives on the evolution, natural history, andbiological relevance of the transcriptional responseto 1O2.
Results
Identification of potential σE target genes
The R. sphaeroides rpoEchrR operon, which encodesσE and ChrR, contains a σE-dependent promoter, soits expression increases in ΔChrR cells (due to highσE activity).6,9 To identify potential members of theσE–ChrR regulon, we clustered transcript levelsfrom 67 publicly available R. sphaeroides global geneexpression datasets (Materials and Methods). ThePearson's correlation coefficient between the abun-dance of rpoE transcripts and that of chrR transcriptsacross this dataset was high (0.95) as expected, sincethese two genes are cotranscribed.6,9 In addition, thecorrelation coefficient between transcript levels forrpoE and another known σE target gene (rpoHII)
6
was 0.88, suggesting that clustering genes withexpression patterns that correlated with that of rpoE
Fig. 1. Expression profiles of σE–ChrR regulon members. Coof genes differentially expressed in response to increased σE acrepresent the relative abundance of transcripts in different cindicates low expression level, compared to the mean expresBrackets denote known or predicted transcriptional units.
could predict other potential members of the σE–ChrR regulon.To prevent spurious correlation, only genes that
showed a statistically significant differential expres-sion betweenΔChrR and wild-type cells (which havelow σE activity) were included in clustering analysis.RNA abundance levels from the resulting 110 geneswere clustered (Supplemental Fig. 1) in a hierarchicaltree based on the Pearson's correlation coefficient oftheir respective transcript patterns. In this tree, acluster of transcript patterns containing rpoE andsomeother knownσE target geneswas identified (Fig.1),6 indicating that this method successfully predictsother members of the σE–ChrR regulon. Likewise,genes that are likely to belong to the same transcrip-tion unit, based on computational predictions of R.sphaeroides operons,10,11 were present in the rpoE-containing transcript cluster, providing further con-fidence in the predictive nature of the output. ThisrpoE-containing cluster contains one gene that had notpreviously been identified as a potential σE target(RSP1852), suggesting the existence of additional yet-to-be-identified members of this regulon.If these operons were all directly transcribed by σE,
each one should contain a conserved promoter motif.To test whether DNA sequences upstream of theseclustered operons contain a common sequence ele-ment, we queried them for a conserved motif usingBioProspector.12 As predicted, a conserved motif wasfound upstream of all the potential operons containedwithin the rpoE-containing cluster. Thismotif containstwo high-information-content regions separated by avariable spacer sequence, which is typical of the −35and −10 regions recognized by group IV bacterial σfactors (Fig. 2a). Themotif also contains elements of anR. sphaeroides σE promoter derived from past muta-tional analysis.9 All but one of the known or predictedσE promoters have 13 bp between their putative −10and −35 elements; the exception (RSP1409) has a 14-bp spacer in its putative promoter.We recognize that clustering of global gene ex-
pression patterns would likely not identify operonscontaining multiple promoters if σE only makes asmall contribution to the total transcription, as istrue for the cycA gene.9 To search for additionalcandidate members of the σE–ChrR regulon, alibrary of putative R. sphaeroides promoters (Materi-als and Methods) was queried for sequences related
regulated genes identified from the hierarchical clusteringtivity (ΔchrR mutant) compared to wild-type cells. Colorsonditions. Red indicates high expression level and greension level. Genes are identified by their locus ID number.

Fig. 2. Sequence logos of thepredicted σE promoter motif in R.sphaeroides (a) and other bacteria (b).(a) The −35 and −10 motif logoswere derived by sequence alignmentof six σE-dependent promoters fromR. sphaeroides. The two conservedregions are separated by a spacer of13–14 bp. The information content(Iseq) of each motif is indicated. (b)The indicated −35 and −10 motifswere found upstream of the rpoEgene in 57 of the 73 selected micro-bial genomes. In both panels, thelogos were produced with WebLogo[http://weblogo.berkeley.edu/].
715Bacterial Singlet Oxygen Stress Response
to the conserved sequence motif. To perform thisquery, the conserved sequence motif was convertedinto a position-specific weighted matrix (PSWM)and used to score the promoter library based on thecontent information of the best match in each se-quence. To relax the stringency of the query, spacerlengths of 13 bp or 14 bp were allowed withoutpenalty, even though a spacing of 13 bp between the−35 region and the −10 region was more frequent
Table 1. Candidate and confirmed σE target operons and the
Gene ID Name ScoreNormalized
score −35
A. Putative promoters identified from the sequence analysis of a library of pRSP1087–1091 20.14 1.00 TGATCC
RSP0601 rpoHII 19.50 0.97 TGATCCRSP2143–2144 phrBcfaS 18.95 0.91 TGATCCRSP1092–1093 rpoEchrR 18.32 0.91 TGATCC
RSP1409 18.14 0.90 TCATCC★ RSP1852 18.06 0.90 TGATCT
RSP6076 17.89 0.89 TGATCTRSP3284 17.51 0.87 TGATCCRSP0296 cycA 16.83 0.84 TGATCCRSP4129 16.37 0.82 TGATCT
★ RSP6222 16.26 0.80 TGATCTRSP1207 hslO 16.15 0.80 CGATCC
★ RSP3336 15.66 0.78 AGATCTRSP1521 15.72 0.78 TGATCCRSP0357 15.72 0.78 TGATCC
B. Putative additional promoters identified within the regions significantly eRSP3832 19.49 0.97 TGATCARSP2324 16.80 0.85 TGATCCRSP2978 mrcA 16.54 0.84 AGATCCRSP1955 16.44 0.83 TGGTCCRSP1222 ham1 15.99 0.81 AGATCCRSP2047 15.87 0.80 GCATCCRSP3101 15.47 0.78 CGATCCRSP1612 14.79 0.74 CGATCARSP4003 dhaL 14.58 0.74 CGATCCRSP2401 13.67 0.69 TGGACCRSP2793 13.66 0.69 GGATTTRSP2940 12.38 0.63 CCATCARSP3007 11.05 0.56 CAATCT
Previously identified σE target operons/genes6,9 are shown in bold; stathis study. Promoters upstream of the remaining candidate genes/opwith reconstituted EσE in vitro.The normalized score is relative to the maximal score that can be obtacorrelation coefficient represents the Pearson's correlation coefficient opattern from the expression microarray dataset used in this study.
among operons with gene expression patterns thatclustered with the rpoEchrR operon (see above).Among the best 15 matches (Table 1), six wereknown σE target operons and one was a candidate σE
promoter upstream of a gene within the rpoE-con-taining cluster (RSP1852). On the other hand, none ofthe promoter regions for any of the other 110 diffe-rentially expressed genes analyzed above (Supple-mental Fig. 1) contained a match to the motif with a
ir putative promoters
Spacer −10Distance tostart codon
Correlationcoefficient
romoter regionsG ccttgggcgacag TCCGTAT −54 0.91G gacatgtgttttt TCCGTAG −66 0.88G ggaagcgggcccg CGCGTAA −49 0.85A gactggcccggcc GCCGTAA −130 1G ccggagccgccttc TGCGTAG −71 0.84G aaccgtcgcttaa CCCGTAT −103 0.93T caagtgagacccga TCCGTAA −43 NAG gaggtcgggcctc TCCGAAG −103 −0.30G gaacgcgcggccc GCAGTAG −88 −0.12G aaactaaagcttt GCCATAT −180 −0.22T catggggatatct CCCGTAG −72 NAG cccgcacggggtc GCCGTAT −110 0.58G acgtgaacaagat ACCGTAA −172 −0.25A gacctgatccggc GCCGGAT −140 −0.20A gctcgccgccatc GCCGTGA −183 0.63
nriched in the ChIP-chip experiment using anti-σE antibodiesG gggtgcgcgaccc TGCGTAA NA NAG gcgccgattgca ATCGTAG −434 0.03G gctgatcgtcggc GGCGTAT NA NAG gagcggtctcgcg TGCGTAG NA NAA gcaccggctggcc CGCGTAG NA NAG gttacctccttgc TGCGTAT +39 −0.05A ccttccatcatct TTCGTAT −68 −0.24G ctggcccgcag CCTGTAG NA NAA gatggtcttcagc TGGGTAT NA NAG gatgcgactctcc ACCGTAG −56 0.27G ccatggaaaacgag CGCGTAA NA NAG ccgggcggcggcat CCCGCAT NA NAC gaaggaatgttca GGCGTAT NA NA
rred genes were shown to be members of the σE–ChrR regulon inerons promoters failed to produce detectable levels of transcripts
ined from the constructed PSWM for the σE promoter motif. Thef each transcript level pattern relative to the rpoE transcript level

Fig. 3. In vitro transcription of target promoters usingreconstituted R. sphaeroides EσE. (a) Transcripts derivedfrom the known σE-dependent promoter RSP1092 (rpoE)and a promoter identified in this study (RSP1852) in thepresence of σE and ChrR. (b) Transcripts derived fromRSP6222 and RSP3336 as a function of increasing σE levels.The amount of σE used in (b) is indicated relative to theamount used in the reaction shown in (a).
716 Bacterial Singlet Oxygen Stress Response
score ≥75% of the maximum. Thus, it appears thatthe other differentially expressed operons (Supple-mental Fig. 1) are not likely to contain σE promoters.
Experimental analysis of candidate σE
target genes
To test these candidates (Table 1) for the presenceof a functional σE promoter, the regions spanningfrom −200 bp to +80 bp relative to the predicted
Fig. 4. Activity of σE-dependent promoters in R. sphaeroidesactivity (Miller units) in wild-type (gray), ΔchrR (black), andtriplicate, with bars representing standard deviations.
transcription initiation site were analyzed for func-tion in vitro and in vivo. Control experiments withknown σE target genes allowed us to assess therelative strength of these candidate promoters and toanalyze the ability of ChrR to inhibit their function.Whenmultiple-round transcription reactions were
performed usingR. sphaeroides core RNApolymerasereconstituted with recombinant σE, a product of thepredicted size was detected from the candidateRSP1852 promoter (Fig. 3a) at a level similar to thatobtained from the strong σE-dependent promoter(RSP1092) upstream of rpoE.6 As expected, additionof the anti-σ factor ChrR prevented the accumulationof the σE transcript from the known RSP1092 pro-moter and the candidate RSP1852 promoter (Fig. 3a).In contrast, the levels of transcript obtained from thecandidate RSP3336 and RSP6222 promoters werelower, and detection of these products required a σE
concentration that was 5- to 10-fold (250–500 nMrecombinant protein) in excess over R. sphaeroidescore RNA polymerase (50 nM; Fig. 3b). Controlexperiments indicate that similar increases in theconcentration of σE do not generate a higher amountof product from strong promoters such as RSP1092 inmultiple-round transcription assays under these con-ditions.13 Thus, DNA binding by EσE holoenzymemay be a limiting kinetic step for transcription at theRSP3336 andRSP6222 promoters.With RSP3336 andRSP6222, we were unable to show inhibition oftranscript formation by ChrR because the anti-σfactor could not be obtained at concentrations suffi-ciently high to inhibit all the σE in the assay.All other candidate promoters shown in Table 1
failed to produce a detectable transcript in vitro, re-gardless of the levels of σE added to core RNApolymerase (data not shown). Upon examination ofthe promoters tested, those active with σE in vitrocontain a GTA motif in their −10 region, whereas
. Promoter activity is reported as the level of β-galatosidaseΔrpoEchrR (white) cells. All assays were performed in
717Bacterial Singlet Oxygen Stress Response
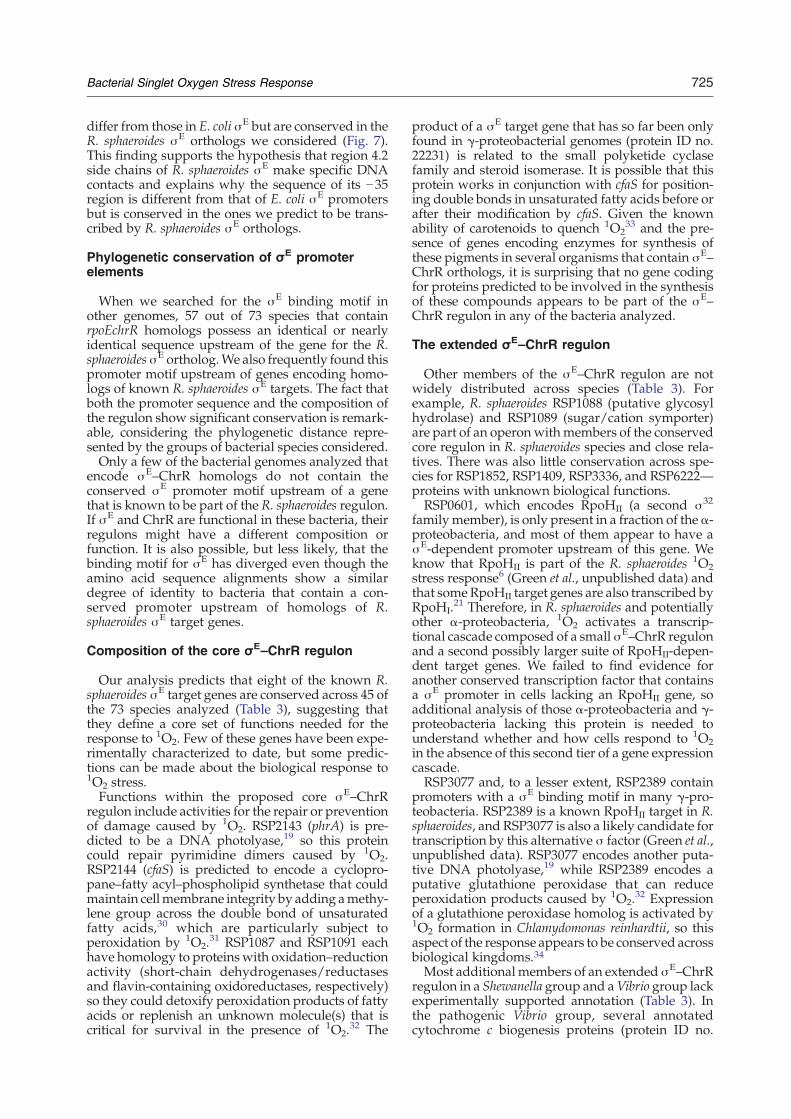
those that were inactive in this assay have one ormore substitutions in this motif. The RSP1207 pro-moter, which was also not transcribed by σE in vitro,contains a GTA motif in its putative −10 region butcontains a substitution in the first Tof the −35 regionthat it is conserved in all the active promoters. Thus,it appears that specific bases at these positions of the−10 and −35 elements are critical for σE-dependenttranscription.We also fused these and other candidate promoter
sequences to apromoterlessβ-galactosidase gene onalow-copy plasmid to test for activity in vivo. Theactivity of these reporter genes was tested in wild-type R. sphaeroides cells (low σE activity),ΔChrR cells(high σE activity), and cells lacking the rpoEchrRoperon (no σE activity). Consistent with the results ofin vitro transcription assays, we observed high re-porter gene activity in ΔChrR cells from known σE
target genes (RSP601, RSP1091, RSP1092, RSP1409,and RSP2143) and RSP1852, while activities fromboth RSP6222 and RSP3666 were lower (Fig. 4). Alldetectable activities of each of these promoters werelost inΔσE cells, suggesting that function under theseconditions required a functional rpoE gene. For un-known reasons, the activity of the RSP6222 promoteris reproducibly higher than that of RSP3666 in vivoeven though they generated comparable levels oftranscript under the conditionsused in vitro.Whenwetested each of the remaining candidate genes in Table1 for activity in vivo or in vitro (RSP6076, RSP4129,RSP3284, RSP1207, RSP1521, and RSP0357), therewas no evidence for the presence of a σE-dependentpromoter in either assay (data not shown).In sum, the combination of clustering analysis, pro-
moter motif predictions, and functional assaysallowed us to identify additional members of theσE–ChrR regulon. If these operons constitute theentire regulon (see below), then the number of genesdirectly transcribed by σE is relatively small (9 ope-
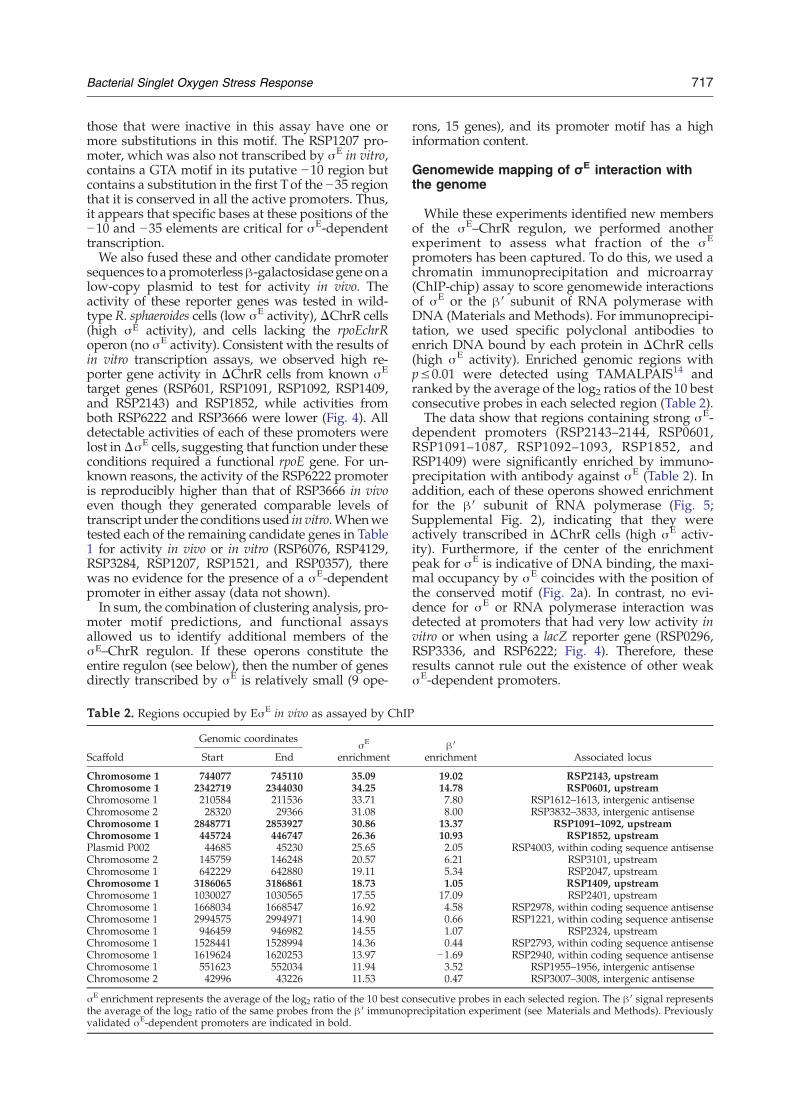
Table 2. Regions occupied by EσE in vivo as assayed by ChIP
Scaffold
Genomic coordinatesσE
enrichmentStart End
Chromosome 1 744077 745110 35.09Chromosome 1 2342719 2344030 34.25Chromosome 1 210584 211536 33.71Chromosome 2 28320 29366 31.08Chromosome 1 2848771 2853927 30.86Chromosome 1 445724 446747 26.36Plasmid P002 44685 45230 25.65Chromosome 2 145759 146248 20.57Chromosome 1 642229 642880 19.11Chromosome 1 3186065 3186861 18.73Chromosome 1 1030027 1030565 17.55Chromosome 1 1668034 1668547 16.92Chromosome 1 2994575 2994971 14.90Chromosome 1 946459 946982 14.55Chromosome 1 1528441 1528994 14.36Chromosome 1 1619624 1620253 13.97Chromosome 1 551623 552034 11.94Chromosome 2 42996 43226 11.53
σE enrichment represents the average of the log2 ratio of the 10 best cothe average of the log2 ratio of the same probes from the β′ immunopvalidated σE-dependent promoters are indicated in bold.
rons, 15 genes), and its promoter motif has a highinformation content.
Genomewide mapping of σE interaction withthe genome
While these experiments identified new membersof the σE–ChrR regulon, we performed anotherexperiment to assess what fraction of the σE
promoters has been captured. To do this, we used achromatin immunoprecipitation and microarray(ChIP-chip) assay to score genomewide interactionsof σE or the β′ subunit of RNA polymerase withDNA (Materials and Methods). For immunoprecipi-tation, we used specific polyclonal antibodies toenrich DNA bound by each protein in ΔChrR cells(high σE activity). Enriched genomic regions withp≤0.01 were detected using TAMALPAIS14 andranked by the average of the log2 ratios of the 10 bestconsecutive probes in each selected region (Table 2).The data show that regions containing strong σE-
dependent promoters (RSP2143–2144, RSP0601,RSP1091–1087, RSP1092–1093, RSP1852, andRSP1409) were significantly enriched by immuno-precipitation with antibody against σE (Table 2). Inaddition, each of these operons showed enrichmentfor the β′ subunit of RNA polymerase (Fig. 5;Supplemental Fig. 2), indicating that they wereactively transcribed in ΔChrR cells (high σE activ-ity). Furthermore, if the center of the enrichmentpeak for σE is indicative of DNA binding, the maxi-mal occupancy by σE coincides with the position ofthe conserved motif (Fig. 2a). In contrast, no evi-dence for σE or RNA polymerase interaction wasdetected at promoters that had very low activity invitro or when using a lacZ reporter gene (RSP0296,RSP3336, and RSP6222; Fig. 4). Therefore, theseresults cannot rule out the existence of other weakσE-dependent promoters.
β′enrichment Associated locus
19.02 RSP2143, upstream14.78 RSP0601, upstream7.80 RSP1612–1613, intergenic antisense8.00 RSP3832–3833, intergenic antisense13.37 RSP1091–1092, upstream10.93 RSP1852, upstream2.05 RSP4003, within coding sequence antisense6.21 RSP3101, upstream5.34 RSP2047, upstream1.05 RSP1409, upstream17.09 RSP2401, upstream4.58 RSP2978, within coding sequence antisense0.66 RSP1221, within coding sequence antisense1.07 RSP2324, upstream0.44 RSP2793, within coding sequence antisense
−1.69 RSP2940, within coding sequence antisense3.52 RSP1955–1956, intergenic antisense0.47 RSP3007–3008, intergenic antisense
nsecutive probes in each selected region. The β′ signal representsrecipitation experiment (see Materials and Methods). Previously

Fig. 5. Localization of σE-dependent promoters by ChIP-chip. Shown are three representative genomic regions enriched by the immunoprecipitation of DNA fragments usinganti-σE antibodies (red) or anti-β′ antibodies to assess RNA polymerase occupancy (blue). The data plot the log2 of the ratio of the immunoprecipitated sample to the controlsample as a function of probe location along the R. sphaeroides genome (coordinates are indicated in base pairs). Regions significantly enriched by anti-σE immunoprecipitation(p≤0.01) are indicated by red blocks. The locations of the annotated open reading frames are indicated by black blocks (read forward or reverse if above or below the baseline,respectively). The positions and orientations of the known or predicted σE promoter are indicated by a green arrow. The data were plotted using SignalMap™ v1.9 (NimbleGenSystems).
718BacterialS
ingletOxygen
Stress
Response

719Bacterial Singlet Oxygen Stress Response
This experiment identified 13 other regions en-riched for σE that were not among candidates fromthe clustering or motif-scanning datasets. However,most of these σE occupancy sites are within proteincoding sequences or large intergenic regions (Table 2;Supplemental Fig. 2), which were not part of theprevious searches.Whenweused the conservedmotif(Fig. 2a) to predict the location and orientation ofputative σE-dependent promoters in these regions(Table 1), several have a relatively good match, butmost are oriented in the opposite direction of thenearby open reading frame (Supplemental Fig. 2). Inaddition, with the exception of RSP1612 (Fig. 5),RSP3832, and RSP2401 (Supplemental Fig. 2), there isno evidence for RNA polymerase occupancy (activetranscription) beyond these putative σE binding sites.Finally, the global gene expression dataset indicatesthat none of the open reading frames neighboringthese 13 other regions of σE occupancy showedincreased expression levels when σE activity washigh. Thus, at this point, we lack evidence supportingthe hypothesis that these other σE occupancy sites arefunctionalσE-dependent promoters in vivo. However,we cannot exclude the existence of additional σE-dependent promoters directing the transcription ofsmall nonannotated open reading frames or smallRNA. Alternatively, those apparently nontranscribedregions that are enriched for EσE may representpoised RNApolymerase complexes in promoters thatrequire different environmental conditions or addi-tional proteins to be actively transcribed. If any ofthese regions contains functional σE promoters,further efforts will be needed to assay their activityor to elucidate the function of any product. In sum,when the results of ChIP-chip assays are combinedwith other experimental and computationalapproaches, we conclude that we have identified thevast majority of the protein coding genes directly andactively transcribed by R. sphaeroides σE.
Phylogenetic analysis of σE–ChrR across thebacterial kingdom
Based on what we learned about the R. sphaeroidesσE–ChrR regulon and its promoters, we tested forthe presence of this response across the bacterialkingdom. To do this, we analyzed the genomes of 84bacteria that contain a gene encoding a group IValternative σ factor adjacent to one coding for a ChrRhomolog.15 We limited our analysis to 73 bacteriawith almost complete genome sequences, since wewanted to probe for both σE–ChrR (regulators of the1O2 stress response) and members of the σE–ChrRregulon. These 73 σE–ChrR homologs were distrib-uted almost evenly between α-proteobacteria and γ-proteobacteria, with only one encoded by a β-pro-teobacterium (Acidovorax anenae subsp. citrulli) or aδ-proteobacterium (Myxococcus xanthus).To test for lateral transfer of theσE–ChrR structural
genes, we constructed a species tree based on theamino acid sequence of RuvB, RpoD, and GyrB.These proteins were selected to construct the speciesphylogeny because their genes are found in single
copy in the selected bacteria and they are thought tobe subject to lateral gene transfer only rarely. Thephylogenetic trees constructed with each proteinwere in agreement, supporting the assumption thatno lateral gene transfer occurred. Consequently, weconcatenated the RuvB, RpoD, and GyrB proteinsequences to build a species phylogenetic tree.Individual phylogenetic trees constructed for σE
and ChrR also suggested their coinheritance, so theiramino acid sequences were concatenated to build aσE–ChrR phylogenetic tree.By comparing the two phylogenetic trees (Fig. 6),
it appears that the σE–ChrR tree generally mirrorsthe species tree. The only exceptions are as follows:Pseudomonas syringae species and Oceanospirillum sp.MED 92, members of the γ-proteobacteria, containσE–ChrR proteins that appear more related to thosefound in α-proteobacteria. In addition, the σE–ChrRproteins of δ-proteobacteria and β-proteobacteriacluster with those found in the α-proteobacteria,suggesting lateral transfer of these genes into thesespecies. Taken together, this analysis suggests thatthe σE–ChrR pair evolved before the branching ofthe α-proteobacteria and γ-proteobacteria, a pointthat will be revisited in the Discussion.
Characterizing the putative σE–ChrR regulonacross species
To predict common or divergent aspects of thisnetwork across these bacteria, we also analyzed these73 genomes for possible orthologs of genes within theR. sphaeroides σE–ChrR regulon and genes predictedto contain σE promoters. Some of these 73 genomeswere not completely assembled, so not all potentialσE
target genes might be captured in other bacteria. Weused a two-step process to predict members of thisregulon in these bacteria based on theR. sphaeroidesσE
promoter motif and the known target genes.The first step was to identify candidate promoters
in these 73 genomes. This prediction was based onamino acid conservation across the 73 R. sphaeroidesσE homologs. Because residues of Escherichia coli σE
thatmake contact with the −35 promoter element areknown16, we can predict residues of the 73 R.sphaeroides σE homologs that are involved in the−35 promoter element recognition. Based on theconservation of these residues among the 73 R.sphaeroides σE homologs, we propose that thesequence of the −35 promoter element recognizedby these proteins is conserved. While informationabout interactions between domains 2.3–2.4 and the−10 promoter element is not available for group IV σfactors, alignments of the 73 homologs reveal a highdegree of amino acid sequence conservation in thisregion (Fig. 7). These facts supported a hypothesisstating that the DNA motif recognized by these σfactors would be sufficiently conserved so that the R.sphaeroides σE promoter motif could be used to queryfor potential target genes in the 73 bacterial genomesthat contain σE–ChrR homologs.To test this hypothesis, we performed a de novo
search for the R. sphaeroides σE promoter motif

Fig.
6(legend
onnext
page)
720 Bacterial Singlet Oxygen Stress Response

Fig. 7. Alignments of the amino acid sequences of σE homologs. Alignment of the regions 2.3–2.4 and 4.2 of σE
homologs from a set of representative species containing σE–ChrR proteins. The histogram below the alignmentrepresents the relative conservation score for each position based on alignment of all 73 σE homologs considered in thisstudy. Arrows indicate residues predicted to contact DNA in the −35 region of the promoter based on alignment with E.coli σE.16 Sequences are identified by their locus ID.
721Bacterial Singlet Oxygen Stress Response
upstream of rpoEchrR in other bacteria. This queryidentified a sequence upstream of the putative σE
structural gene in 57 of these 73 microbes that isalmost identicalwith that of theR. sphaeroidesσEmotif(Fig. 2b). This finding is not surprising, since genes forgroup IV σ factors are often positively autoregu-lated.17 Whenwe constructed a new PSWMusing theputative promoter sequences upstream of these 57rpoEchrR operons, this phylogenetically determinedPSWMwas almost identical with that of the R. sphae-roides σE motif. We then used the phylogeneticallydeterminedσE PSWMto score all upstream regions inthese 73 genomes to identify candidate members ofthe σE–ChrR regulons. The threshold used to score apositive match was intentionally set relatively low toincrease the sensitivity of the analysis, resulting in anincreased number of possible false positives. How-ever, these presumed false-positive matches are notconserved across the phylogeny.Subsequently, we asked whether groups of ortho-
logous genes (constructed using OrthoMCL; Materi-als andMethods) were consistently associatedwith apredicted σE promoter. When orthologs were iden-tified downstream of a candidate σE promoter, theywere scored to reflect their potential membership inthe σE–ChrR regulon (Materials and Methods). Toaccount for the existence of σE-dependent operons,genes likely to be cotranscribed with one containinga match to the σE promoter motif were consideredpositive. After each protein coding sequence hadbeen scored, ortholog group-specific values werecalculated and ranked by summing individualvalues within each group.After the groups of orthologous proteins had been
ranked, the dataset was split to include proteinsfound in α-proteobacteria or γ-proteobacteria (Fig.
Fig. 6. Phylogeny of the σE–ChrR pair. Phylogenetic tree coand ChrR (a) or RuvB, RpoD, and GyrB (b) using Bayesian inblue for γ-proteobacteria and salmon for α-proteobacteriprobabilities. Branches of the tree for closely related species w
8a and b; data derived from one δ-proteobacteriumand one β-proteobacterium were removed, sincethey did not exhibit any informative pattern). Thisanalysis showed that the σE (protein ID 21307) andChrR (protein ID 20362) homologs ranked highest inboth α-proteobacteria and γ-proteobacteria as ex-pected, since their expression should be positivelyautoregulated (see above). The remaining highlyranked groups from both α-proteobacteria and γ-proteobacteria contain orthologs of knownmembersof the R. sphaeroides σE–ChrR regulon (RSP1087;protein ID no. 20348; RSP1088, protein ID no. 21508;RSP1090, protein ID no. 20013; RSP1091, protein IDno. 21520; RSP2143, protein ID no. 21876; RSP2144,protein ID no. 254; Table 3). The presence of a σE
promoter motif upstream of these genes supportstheir assignment to a core set of genes for this regulonand the hypothesis that some part of the biologicalresponse controlled by σE and ChrR is conserved inα-proteobacteria and γ-proteobacteria. Unfortu-nately, the biological functions of most of thoseconserved proteins are unknown. Only RSP2143 andRSP2144 have been annotated (DNA photolyase andcyclopropane fatty acid synthase, respectively) in R.sphaeroides,18–20 providing some clues as to theresponse of these bacteria to the signal that increasesσE activity (see the Discussion).Other ortholog groups appear to be specific to the
α-proteobacteria or the γ-proteobacteria. For exam-ple, RSP0601 (rpoHII, protein ID no. 20947), whichencodes a secondmember of the σ32 family, is part ofthe R. sphaeroides σE–ChrR regulon,6,21 so it is notsurprising to find rpoHII orthologs that appear tocontain a σE promoter in α-proteobacteria such asRoseovarius sp. 217, Hyphomonas neptunium ATCC15444, Oceanicaulis alexandrii HTCC2633, Jannaschia
nstructed with the concatenated amino acid sequence of σE
ference. Proteobacteria classes are indicated by color (palea). Numbers on branches indicate Bayesian posteriorere collapsed for clarity.

Fig. 8. Potential σE target genes across selected bacteria. (a) Groups of orthologous genes (columns) that contain theputative σE binding motif in their promoter regions across the indicated α-proteobacteria. (b) Same as in (a), but for theindicated γ-proteobacteria. A gray box means that the organism does not possess a homolog for the corresponding group;black means that it possesses a homolog for the group but no conserved σE binding motif was found in its promoterregion; yellow means that a σE binding motif was found in the promoter region for the homologous gene. Shades ofyellow represent the degree to which the gene is connected to the σE binding motif (see the text). A description and anannotation of these orthologs are presented in Table 3 and Supplemental Table 2.
722 Bacterial Singlet Oxygen Stress Response

Table 3. Functional annotation of selected groups of homologous genes across the species considered in this study
Ortho ID Rsph locus Rsph gene name Annotation
The conserved core σE–ChrR regulon254 RSP2144 cfaS Cyclopropane–fatty acyl–phospholipid synthase20013 RSP1090 Uncharacterized conserved protein20348 RSP1087 Putative short-chain dehydrogenase/reductase20362 RSP1093 chrR Anti-σ factor, anti-RpoE21307 RSP1092 rpoE Alternative σ factor, group IV21508 RSP1088 Uncharacterized protein21520 RSP1091 Putative protein binding nicotinamide adenine
dinucleotide/flavin adenine dinucleotide21876 RSP2143 phrB Deoxyribodipyrimidine photolyase
The extended σE–ChrR regulonIn R. sphaeroides2073 RSP1089 Putative Na+/melibiose symporter19916 RSP1409 Protein containing fasciclin-like repeats20947 RSP0601 rpoHII Alternative σ factor from the σ32 family21322 RSP1852 Uncharacterized conserved protein21508 RSP1088 Uncharacterized protein21842 RSP0296 cycA Cytochrome c222229 RSP3336 ABC transporter, inner membrane subunit22678 RSP6222 Uncharacterized protein
In Shewanella or Vibrio species71 RSP2389 Putative glutathione peroxidase127 RSP2633 ccmF Cytochrome c maturation protein157 RSP1805 ccmG Thiol-disulfide isomerase and thioredoxins791 Uncharacterized protein884 Putative sodium/glutamate symporter2176 Uncharacterized conserved protein19769 RSP3077 Putative deoxyribodipyrimidine photolyase20054 RSP1803 ccmC ABC heme exporter, inner membrane subunit20172 Putative acyl-CoA dehydrogenases21430 Putative nucleoside diphosphate sugar epimerase21552 Uncharacterized conserved protein22038 RSP2945 ccmE Cytochrome-c-type biogenesis protein22231 Putative small polyketide cyclase or steroid isomerase23701 Adenosylmethionine-8-amino-7-oxononanoate
aminotransferase23867 RSP3424 Putative dehydrogenase
The corresponding R. sphaeroides locus ID and gene names are indicated when existing in the respective groups.
723Bacterial Singlet Oxygen Stress Response
sp. CCS1, Loktanella vestfoldensis SKA53, Maricaulismaris MCS10, and Silicibacter pomeroyi DSS3. How-ever, other α-proteobacteria contain an rpoHII genethat lacks elements related to the conserved σE pro-moter motif even though this sequence is presentupstream of other predicted core members of thisregulon. In addition, the predicted σE–ChrR reg-ulons in these α-proteobacteria do not appear to beextended to compensate for the loss of any RpoHIItarget gene, raising questions about the existence of asecond tier of 1O2-responsive genes in these speciesand the exact role of RpoHII in bacteria containingthis gene product (see the Discussion).In the γ-proteobacteria that contain rpoEchrR
operons, no rpoHII orthologs were found. On theother hand, the motif search revealed that a putativepolyketide cyclase (protein ID no. 22231 in Fig. 8b)specific for the γ-proteobacteria often possesses a σE
bindingmotif in its promoter region. In addition, thisgene is generally found in the genomic neighbor-hood of orthologs of the R. sphaeroides σE-regulatedgenes in these γ-proteobacteria†.In addition, several species of α-proteobacteria
and γ-proteobacteria do not have the conserved σE
†http://img.jgi.doe.gov/
binding motif associated with any of the predictedconserved regulon members. To test the hypothesisthat the σE promoter motif evolved into a differentsequence, we queried the promoter regions ofpossible regulon members in each species individu-ally for a conserved sequence that related to a σfactor binding site. This approach failed to yield anyconserved motif with high information content, so itis possible that σE is not functional or that both theσE binding motif and the regulon composition havediverged in these bacteria. However, no evidence forsuch divergence was evident in sequence alignmentsof their σE homologs in regions 2.3–2.4 and 4.2.In summary, this analysis uncovered a set of
genes that potentially constitute the core of a σE-dependent biological response to 1O2 that could beconserved across distantly related bacterial species.The implications of this finding are presented inthe Discussion.
Discussion
As oxygen appeared in the biosphere, cells evolvedthrough aerobic respiration and signal transductionpathways to respond to the toxic byproducts ofreactive oxygen species. In R. sphaeroides, the reactive

724 Bacterial Singlet Oxygen Stress Response
oxygen species 1O2 increases the activity of thealternative σ factor σE by somehow inactivating itsanti-σ factor ChrR.6,13,15 Although 1O2 can killcells,8,22 the process by which they respond to andrepair the damage from this compound is unknown.To understand how bacteria react to 1O2, we soughtto define the entire R. sphaeroides σE–ChrR regulonand to investigate the conservation of target genesin other cells containing these proteins. Our resultspredict that R. sphaeroides σE directly transcribesnine operons (15 genes), a small regulon sizecompared to other characterized group IV alter-native σ factors (Table 4).2,23–25 It also appears that acore set of putative σE target genes is conserved inmany α-proteobacteria and γ-proteobacteria.Finally, the ecology of the organisms predicted tomount a σE-dependent response to 1O2 is diverse,reinforcing the notion that there are differentsources of this reactive oxygen species in α-proteobacteria and γ-proteobacteria.
Predicted σE binding site
We identified R. sphaeroides σE-dependent promo-ters using a combination of transcription profiling,bioinformatic analysis, and ChIP-chip assays. Ourresults suggest that we have found most, if not all,proteins members of the R. sphaeroides σE–ChrRregulon. However, we cannot exclude the existenceof other promoters with activities or features similarto those of RSP0296, RSP6222, and RSP3336, and thefunction of the putative promoters that are notassociated with open reading frames still needs to beinvestigated. Experimental testing of several candi-date promoters that contained a sequence deviatingonly by one base from the predicted R. sphaeroides σE
consensus failed to give activity in vitro and in vivo, orto show occupancy by EσE in ChIP-chip analysis.The other genes that show significant correlation
with known σE targets by expression clustering donot contain sequences related to the σE promotermotif. We know that 1O2 activates a gene expressioncascade; a known σE target gene is one encoding the
Table 4. Evidence used to define the members of the R. sphae
Gene locus Name Annotation
RSP1092 rpoE Group IV σ factorRSP1093 chrR Anti-σ factorRSP1091 Putative dehydrogenaseRSP1090RSP1089RSP1088RSP1087 Putative short-chain alcohol dehydrogenaseRSP2143 phrB Deoxyribodipyrimidine photolyaseRSP2144 cfaS Cyclopropane fatty acyl phospholipid synthaseRSP1852RSP0601 rpoHII σ32 family σ factorRSP1409RSP0296 cycA Cytochrome c2RSP3336RSP6222
Genes are grouped by predicted transcriptional units.
alternative σ factor RpoHII.6 We propose that someor all of the genes in this other cluster that do notcontain a σE promoter are targets for RpoHII (Greenet al., unpublished data). If this is the case, therewould be a large number of additional operonsactivated in the presence of 1O2.The motif defined by nine confirmed R. sphaeroides
σE promoters (TGATCC-[15,16]-CCGTA) agreeswith the results of past mutational analysis9 andwith the prediction made from a smaller datasetderived from analyzing the effect of blue light onglobal transcript levels.26 The previous mutationalstudy found some single-base substitutions in thenonconserved region downstream of the −10 regionthat significantly increased its activity. The test pro-moter for this mutational study contains a subopti-mal −10 sequence, so it is possible that sequences inthis regionmay facilitate promotermelting byRNAPholoenzyme to initiate transcription.The high sequence conservation of the R. sphaer-
oides σE promoter (21.5 bit) is consistent with othercharacterized group IV σ factor motifs,2,16,27, sincetheir information content can be higher than those ofother members of the σ70 superfamily.28,29 Group IVσ factors have not been reported to function inconjunction with DNA-binding activators, so theirhigher information content may reflect a largedependence on DNA sequence elements to ensurebinding specificity. Our analysis of R. sphaeroides σE,together with other analyses of group IV σ factors,supports the value of using sequencemotifmodels topredict promoter elements.2,23–25By analyzing how region 4 of the group IV E. coli σ
factor σE binds the −35 region, it has been predictedthat other group IV σ factors contain a critical AACmotif in this promoter element.16 However, the pre-dicted R. sphaeroides σE −35 region contains an ATCmotif, suggesting that the DNA geometry created bythe AA/TT tract in the E. coli σE–DNA complexmight not be present in the cognate R. sphaeroides σE
promoters. If we infer the residues that contact theATC motif in the R. sphaeroides σE −35 motif byamino acid sequence alignment with E. coli σE, they
roides σE–ChrR regulon
Sequencemotif
Expressioncorrelation ChIP-chip
In vitroactivity
In vivo reporteractivity
+ + + ++ +++
+ + + ++ ++++++
+ + + ++ +++
+ + + ++ +++ + + ++ +++ + + + +++ − − + ++ − − + ++ − − + +
725Bacterial Singlet Oxygen Stress Response
differ from those in E. coli σE but are conserved in theR. sphaeroides σE orthologs we considered (Fig. 7).This finding supports the hypothesis that region 4.2side chains of R. sphaeroides σE make specific DNAcontacts and explains why the sequence of its −35region is different from that of E. coli σE promotersbut is conserved in the ones we predict to be trans-cribed by R. sphaeroides σE orthologs.
Phylogenetic conservation of σE promoterelements
When we searched for the σE binding motif inother genomes, 57 out of 73 species that containrpoEchrR homologs possess an identical or nearlyidentical sequence upstream of the gene for the R.sphaeroidesσE ortholog.We also frequently found thispromoter motif upstream of genes encoding homo-logs of known R. sphaeroides σE targets. The fact thatboth the promoter sequence and the composition ofthe regulon show significant conservation is remark-able, considering the phylogenetic distance repre-sented by the groups of bacterial species considered.Only a few of the bacterial genomes analyzed that
encode σE–ChrR homologs do not contain theconserved σE promoter motif upstream of a genethat is known to be part of the R. sphaeroides regulon.If σE and ChrR are functional in these bacteria, theirregulons might have a different composition orfunction. It is also possible, but less likely, that thebinding motif for σE has diverged even though theamino acid sequence alignments show a similardegree of identity to bacteria that contain a con-served promoter upstream of homologs of R.sphaeroides σE target genes.
Composition of the core σE–ChrR regulon
Our analysis predicts that eight of the known R.sphaeroides σE target genes are conserved across 45 ofthe 73 species analyzed (Table 3), suggesting thatthey define a core set of functions needed for theresponse to 1O2. Few of these genes have been expe-rimentally characterized to date, but some predic-tions can be made about the biological response to1O2 stress.Functions within the proposed core σE–ChrR
regulon include activities for the repair or preventionof damage caused by 1O2. RSP2143 (phrA) is pre-dicted to be a DNA photolyase,19 so this proteincould repair pyrimidine dimers caused by 1O2.RSP2144 (cfaS) is predicted to encode a cyclopro-pane–fatty acyl–phospholipid synthetase that couldmaintain cellmembrane integrity by adding amethy-lene group across the double bond of unsaturatedfatty acids,30 which are particularly subject toperoxidation by 1O2.
31 RSP1087 and RSP1091 eachhave homology to proteins with oxidation–reductionactivity (short-chain dehydrogenases/reductasesand flavin-containing oxidoreductases, respectively)so they could detoxify peroxidation products of fattyacids or replenish an unknown molecule(s) that iscritical for survival in the presence of 1O2.
32 The
product of a σE target gene that has so far been onlyfound in γ-proteobacterial genomes (protein ID no.22231) is related to the small polyketide cyclasefamily and steroid isomerase. It is possible that thisprotein works in conjunction with cfaS for position-ing double bonds in unsaturated fatty acids before orafter their modification by cfaS. Given the knownability of carotenoids to quench 1O2
33 and the pre-sence of genes encoding enzymes for synthesis ofthese pigments in several organisms that contain σE–ChrR orthologs, it is surprising that no gene codingfor proteins predicted to be involved in the synthesisof these compounds appears to be part of the σE–ChrR regulon in any of the bacteria analyzed.
The extended σE–ChrR regulon
Other members of the σE–ChrR regulon are notwidely distributed across species (Table 3). Forexample, R. sphaeroides RSP1088 (putative glycosylhydrolase) and RSP1089 (sugar/cation symporter)are part of an operonwithmembers of the conservedcore regulon in R. sphaeroides species and close rela-tives. There was also little conservation across spe-cies for RSP1852, RSP1409, RSP3336, and RSP6222—proteins with unknown biological functions.RSP0601, which encodes RpoHII (a second σ32
familymember), is only present in a fraction of the α-proteobacteria, and most of them appear to have aσE-dependent promoter upstream of this gene. Weknow that RpoHII is part of the R. sphaeroides 1O2stress response6 (Green et al., unpublished data) andthat someRpoHII target genes are also transcribed byRpoHI.
21 Therefore, in R. sphaeroides and potentiallyother α-proteobacteria, 1O2 activates a transcrip-tional cascade composed of a smallσE–ChrR regulonand a second possibly larger suite of RpoHII-depen-dent target genes. We failed to find evidence foranother conserved transcription factor that containsa σE promoter in cells lacking an RpoHII gene, soadditional analysis of those α-proteobacteria and γ-proteobacteria lacking this protein is needed tounderstand whether and how cells respond to 1O2in the absence of this second tier of a gene expressioncascade.RSP3077 and, to a lesser extent, RSP2389 contain
promoters with a σE binding motif in many γ-pro-teobacteria. RSP2389 is a known RpoHII target in R.sphaeroides, and RSP3077 is also a likely candidate fortranscription by this alternative σ factor (Green et al.,unpublished data). RSP3077 encodes another puta-tive DNA photolyase,19 while RSP2389 encodes aputative glutathione peroxidase that can reduceperoxidation products caused by 1O2.
32 Expressionof a glutathione peroxidase homolog is activated by1O2 formation in Chlamydomonas reinhardtii, so thisaspect of the response appears to be conserved acrossbiological kingdoms.34Most additional members of an extended σE–ChrR
regulon in a Shewanella group and aVibrio group lackexperimentally supported annotation (Table 3). Inthe pathogenic Vibrio group, several annotatedcytochrome c biogenesis proteins (protein ID no.

726 Bacterial Singlet Oxygen Stress Response
22038, cytochrome c biogenesis protein E; protein IDno. 127, cytochrome c maturation protein F; proteinID no. 20054, ABC heme exporter inner membranesubunit) are predicted to be part of the σE–ChrRregulon. Tetrapyrroles are a potential source of 1O2,and heme-containing proteins are damaged by thisreactive oxygen species, so placement of cyto-chrome c biogenesis operons in this stress responsemight help replenish the pool of these proteins insome species. In this regard, we note that transcrip-tion profiling experiments in Vibrio fischeri indicatethat the transcript levels for our predicted σE
targets correlate with the rpoEchrR homolog tran-scripts (Y. Wang and E. G. Ruby, personal commu-nication, 2008).
Sources of 1O2 in various bacteria
Our analysis predicts that the core σE–ChrRregulon is present in diverse bacteria found invarious environments. One major source of 1O2 forR. sphaeroides is via light energy transfer fromphotosynthetic pigments to molecular oxygen.35
Thus, it is not surprising to find σE–ChrR, membersof the R. sphaeroides σE regulon, and conservedpromoters in other photosynthetic bacteria. How-ever, among photosynthetic α-proteobacteria, Rho-dopseudomonas palustris and Rhodospirillum rubrumcontain σE–ChrR, but we could not define theirregulon because we could not detect the conservedσE promoter sequence.Only a few bacteria containing σE–ChrR are
photosynthetic, so nonphotosynthetic bacteria arelikely to encounter this reactive oxygen species innature. Of those containing the σE–ChrR regulon,the bacteria most similar to R. sphaeroides include thephylogenetically close members of the Roseobacterclade (Jannaschia, Silicabacter, Roseobacter, Loktanella,Oceanicola, and Roseovarius). Most Roseobacter spe-cies synthesize photosynthetic pigments in thepresence of oxygen,36 so there is relevance of a 1O2stress response to these bacteria. On the other hand,Silicibacter is not photosynthetic, but its closeassociation with photosynthetic dinoflagellates37
may expose it to 1O2 in nature.The symbiotic nitrogen fixers Rhizobium and
Bradyrhizobium possess rpoEchrR, but only Rhizobiumleguminosarum bv. viciae 3841 appears to contain theconserved core σE–ChrR regulon. Thus, it is notclear whether these organisms are exposed to 1O2 orwhether they sense a different signal such as anotherreactive oxygen or nitrogen species. In this regard,nitric oxide and reactive oxygen species are animportant part of the plant defense system,38,39 sosymbiotic bacteria may mount a transcriptionalresponse to those signals. Additional support for arole of σE–ChrR in a symbiotic/pathogenic lifestyleis indicated by the existence of a core σE–ChrRregulon among the Vibrionaceae clade. These γ-proteobacteria are nonphotosynthetic and notreported to live in proximity to known sources of1O2. On the other hand, most of them are eitherpathogenic or symbiotic,40 so their ability to sense or
respond to the host immune systemmay be essentialfor their lifestyle.The Shewanella clade also shows a strong conserva-
tion of the σE–ChrR regulon. In nature, these bacteriasynthesize a large amount of cytochromes to reduce avariety of metals.41 The hemes of these cytochromesare a potential source of 1O2, so this might explainwhy they contain the regulators and coremembers ofthe R. sphaeroides σE–ChrR regulon. However, theShewanella ChrR homologs possess an additionalcysteine residue in the N-terminal region thatcoordinates one of the zinc ions in the R. sphaeroidesanti-σ factor (Supplemental Fig. 3). It has beenproposed that 1O2 reacts with the N-terminal zincsite to initiate a conformational change that releasesσE so it can bind RNA polymerase and activate geneexpression.15 Thus, amino acid changes in the ChrRproteins of the Shewanella clade might allow it tosense a different signal. If this is the case, the signalmight still produce similar damage to biomolecules,since their predicted core regulon members are verysimilar to those in other organisms we considered.
Evolution of σE–ChrR and the appearanceof oxygen in the biosphere
Phylogenetic analysis suggests that the origin ofthe σE–ChrR proteins cannot be placed much laterthan the evolutionary divergence of the α-proteo-bacteria and γ-proteobacteria, which is estimated tobe between 2.51 and 2.36 billion years (Ba) ago.42,43
For comparison, the divergence of the cyanobacteriagroup, which is proposed to be the first microbe toperform oxygenic photosynthesis, is estimated to bebetween 2.65 Ba and 2.55 Ba,42,43 at about the timewhen signs of molecular oxygen appeared in theEarth's atmosphere (between 2.6 Ba and 2.3 Ba).44,45
For anoxygenic photosynthetic organisms, such asthe ancestor of R. sphaeroides, solar energy capture inthe presence of newly formed atmospheric oxygen islikely to have generated 1O2 for the first time.35 Thus,our phylogenetic predictions trace the history of σE–ChrR to a time coinciding with the appearance ofoxygen in the biosphere. Indeed, if σE–ChrR and theresponse to 1O2 did not appear until after the evo-lution of oxygenic photosynthesis, it explains whyorthologs of these proteins are not found incyanobacteria containing other group IV σ factors.46
Thus, it would appear that cyanobacteria, otherproteobacteria, and eukaryotes, which all respond tothe toxic effects of 1O2, use similar proteins to protectthemselves and repair damage from this reactiveoxygen species, but have evolved different networkarchitectures to mount a transcriptional response tothis signal.In summary, our results demonstrate the utility of
using genomic, computational, and experimentaltools to dissect the evolutionary history of importantsignal transduction pathways and to predict pro-moter architecture and target genes for members ofthe group IV family of σ factors across widely di-vergent bacterial species. We have identified most—or possibly all—protein members of the R.
727Bacterial Singlet Oxygen Stress Response
sphaeroides σE–ChrR regulon, providing informationneeded to begin a comprehensive and mechanisticview of how cells respond to 1O2. However, thepossible existence and potential function of smallfunctional RNAs or nonannotated peptides amonggenes directly transcribed by σE remain to be inves-tigated. Our analysis also predicts that σE–ChrRevolved at or near the time when oxygen appearedon the planet and that the response to 1O2 wasconserved across many bacterial species that werepresent before this change in the atmosphere alteredlife on Earth. However, the incomplete distributionof σE–ChrR among α-proteobacteria and γ-proteo-bacteria and their absence in δ-proteobacteria β-proteobacteria, and ε-proteobacteria that have beensequenced to date leave open questions regardingthe modalities of its acquisition or loss through thespecies lineages. Future analysis of the conservationand functions of the σE–ChrR regulon may helpform hypotheses about the evolutionary history ofthis system. For example, other bacteria that dealwith 1O2 stress may have placed members of the R.sphaeroides σE–ChrR regulon under the control of adifferent regulator. Finally, our findings support thehypothesis that the role of σE–ChrR as masterregulator of 1O2 stress is relevant to photosyntheticbacteria, as well as to nonphotosynthetic free-livingor symbiotic/pathogenic microbes.
Materials and Methods
Media, strains, plasmids, and molecular manipulation
E. coli strains were grown in Luria–Bertani medium47 at37 °C andR. sphaeroides strains in Sistrom's succinate-basedmedium48 at 30 °C. E. coli DH5α was used as a plasmidcarrier, and E. coli S17-1 was used as a donor for conju-gation of plasmids into R. sphaeroides. The media weresupplemented with ampicillin (100 μg/ml) or kanamycin(25 μg/ml) when required. Unless noted below, allreagents were used in accordance with the manufacturer'sspecifications.Plasmids used are listed in Supplemetal Table 1 (Supple-
mentary Materials). Plasmids not reported previously6,9
were constructed by amplifying the relevant regions fromR. sphaeroides 2.4.1 genomic DNA using oligonucleotideprimers containing an upstream KpnI restriction site and adownstream StuI restriction site. The amplified DNAfragments were digested with both KpnI and StuI beforebeing ligated in KpnI-StuI-digested pRKK96,49 to obtainthe in vitro transcription template, and in KpnI-StuI-digested pRKK200,50 to create a promoter fusion to alacZ reporter gene.
Microarray expression data
To identify genes that are coexpressed with knownmembers of the σE–ChrR regulon, R. sphaeroides gene ex-pression datasets were collected from the Gene ExpressionOmnibus database‡ as of May 2005. The dataset contains
‡http://www.ncbi.nlm.nih.gov/projects/geo/query/acc.cgi%3Facc%3DGPL162
RNA abundance measurements from 67 GeneChip Cus-tom Express microarrays (Affymetrix, Santa Clara, CA51)obtained from wild-type or mutant strains grown in asuccinate-based minimal medium under different condi-tions (GSM1670, GSM1671, GSM1672, GSM1673,GSM2416, GSM2417, GSM2418, GSM2419, GSM2420,GSM2421, GSM2422, GSM2423, GSM2424, GSM2425,GSM2426, GSM2427, GSM2429, GSM2430, GSM2450,GSM25295, GSM25296, GSM25297, GSM25298,GSM25299, GSM25300, GSM25301, GSM25302,GSM25303, GSM26242, GSM26243, GSM26244,GSM26245, GSM26260, GSM26262, GSM26263,GSM26265, GSM26266, GSM27348, GSM27349,GSM27350, GSM27351, GSM27352, GSM27353,GSM3030, GSM3031, GSM3032, GSM3258, GSM3260,GSM3262, GSM3272, GSM3273, GSM3274, GSM38774,GSM38775, GSM38776, GSM38777, GSM38778,GSM38779, GSM38780, GSM38781, GSM38782,GSM38783, GSM38810, GSM40560, GSM8107, GSM8108,and GSM8109).6,26,51–53 RNA levels in all datasets werenormalized using the RobustMultichip Averagemethod 54
to log2 scale.
Clustering genes by expression patterns andmotif discovery
RNA species with abundance levels that showed a two-fold or more difference and a significant difference at FDR0.1, using the software EBarrays,55 in expression levelbetween wild-type cells and those that have increased σE
activity (ΔchrR cells) were selected (∼100 loci) to limitspurious correlation in the clustering steps. Hierarchicalclusters were constructed with the R statistical softwareenvironment§ using (1−Pearson's correlation coefficient)/2 as the distance between expression patterns and the‘complete’method for cluster linkage. The BioProspector12
algorithm was used to search for a conserved bipartitemotif within 300 bp upstream of the predicted translationstarting site in sets of candidate promoter sequences. Theparameterswere set to search for two blocks of 6 bp and fora gap between 13 bp and 16 bp.
Determining promoter activity
In vivopromoter activitieswere determined bymeasuringβ-galactosidase activity in cells containing lacZ operonfusions harbored on a low-copy plasmid.50 β-Galactosidaseactivity (U/ml) was calculated as follows: (A420×1000)/[cellculture volume in assay (ml)×culture optical density(OD600)×time (min)].56 Culture optical density and absorp-tion at 420 nm were measured with a BioSpec 1601spectrophotometer (Schimatzu, Columbia, MD). All dataare reported from cultures performed in triplicate.In vitro transcription assays were performed using
plasmid templates in which a test promoter was cloned inpRKK96.49 Standard assay conditions mixed recombinantHis6-σ
E (50 nM)13 with R. sphaeroides core RNA poly-merase (50 nM) for 30 min at 30 °C in transcription buffer(40 mM Tris–HCl pH 7.9, 200 mM KCl, 10 mM Mgacetate, 1 mM DTT, and 62.5 mg/ml acetylated bovineserum albumin). Next, template DNA was added andincubated for 30 min before transcription was initiated byaddition of nucleotide triphosphates.9 Samples wereincubated for 20 min before RNA products were analyzedon 6% (wt/vol) denaturing PAGE, and products were
§http://www.R-project.org

728 Bacterial Singlet Oxygen Stress Response
visualized on a phosphorimager (Molecular Dynamics,Sunnyvale, CA).
‖http://img.jgi.doe.gov
ChIP-chip hybridization
Our protocol was adapted from Lee et al.57 R. sphaeroidesΔchrR cells (increased σE activity) were grown by bub-bling 500 ml of cell culture with 1% CO2, 30% O2, and 69%N2. At midexponential phase (∼2×10⁸ colony-formingunits/ml), formaldehyde and sodium phosphate wereadded to a final concentration of 1% and 10 mM, res-pectively. This mixture was incubated at 30 °C for 4 minbefore glycine was added to 100 mM, and the solution wasplaced on ice for 30 min with gentle agitation to quenchexcess formaldehyde. Cells were centrifuged at 3000g,washed twice with chilled phosphate-buffered saline, cen-trifuged, and flash-frozen at −80 °C. About 2×10¹⁰ cellswere suspended in 0.5 ml of 100mMTris (pH 8.0), 300mMNaCl, 2% Triton X-100, and 1 mM phenylmethylsulfonylfluoride, and sonicated eight times for 20 s with a BransonSonifier (Branson Ultrasonics Corp., Danbury, CT) set tolevel 6 and 50% output using a 3-mm microtip. A mixtureof micrococcal nuclease (50 U) and RNase A (0.5 μg) in200 μMCaCl2, 1.2 mMKCl, 6 mM sucrose, and 10 μMDTTwas added; the mixture was incubated for 1 h at 4 °C; andthen nuclease activity was inhibited by addition of 10 mMethylenediaminetetraacetic acid (EDTA). Cell debris wasremoved by centrifugation for 10 min at 12,000g, and analiquot was removed to analyze DNA fragmentation byagarose gel eletrophoresis (desired size of ∼200–1000 bpwith enrichment for ∼500-bp molecules).The resulting supernatant was incubated with gentle
mixing with 20 μl of Staphylococcus aureus protein ASepharose beads (Sigma-Aldrich, St. Louis, MO) for 3 h at4 °C as pretreatment to remove potential nonspecificbinding to the beads. After the beads had been removedby centrifugation (5 min at 3000g), one-tenth of the samplewas removed and used as non-antibody-treated control.Two microliters of the anti-R. sphaeroides σE rabbit poly-clonal antibody serum was added, and the mixture wasincubated overnight at 4 °Cwith gentlemixing before beingincubated with protein A Sepharose beads (30 μl) for 2 h at4 °C. The beads were recovered by centrifugation; washedonce (4 °C) with 250 mM LiCl, 100 mM Tris (pH 8.0), and2% Triton X-100; washed twicewith 600mMNaCl, 100mMTris (pH 8.0), and 2% Triton X-100; washed twice with300 mMNaCl, 100 mM Tris (pH 8.0), and 2% Triton X-100;and washed twice with TE buffer (10 mM Tris pH 8.0 and1 mM EDTA). Protein–DNA complexes were eluted fromthe beads by incubating at 65 °C for 30 min in 50 mM Tris(pH 8.0), 10 nMEDTA, and 1% sodium dodecyl sulfate. Thebeads were removed by centrifugation, and protein–DNAcross-linking was reversed by incubating the samples for12 h at 65 °C. DNAwas purified using the QIAquick PCRPurification Kit (QIAGEN, Inc., Valencia, CA).The DNA was amplified via ligation-mediated PCR.57
DNA fragments were treated with T4 DNA polymerase,purified by phenol extraction and ethanol precipitation(adding 20 μg of glycogen), and ligated via T4 DNA ligaseto 4 μM annealed oligonucleotide linkers (oJW102: GCG-GTGACCCGGGAGATCTGAATTC; oJW103: GAATTCA-GATC) at 16 °C overnight. DNAwas ethanol-precipitatedbefore amplification (22 cycles; annealing temperature of60 °C) with Taq DNA polymerase (New England Biolabs)and 1 μMoJW102 linker (50-μl reaction). The amplificationreaction was repeated using 15 μl of the first amplificationreaction product as template. After the products had beenpurified using a QIAquick Kit (QIAGEN), triplicates of
control and sample DNA (concentrated to ∼250 ng/μl)were pooled to obtain ∼4-μg quantities and hybridized toa custom-made NimbleGen microarray (NimbleGenSystems, Madison, WI). For each antibody, triplicatemicroarrays were analyzed.The custom-made NimbleGen microarray used for
ChIP-chip analysis was designed to tile the R. sphaeroides2.4.1 genome (two chromosomes and five plasmids) withoverlapping isothermal probes that ranged from 35 to 65bases, with an average spacing of 12 bp. The probes on thearray alternate between coding and noncoding DNAsequences. The list of probe features contained in thisarray is available upon request from the authors.
ChIP-chip data analysis
For analysis of each ChIP-chip microarray, quantilenormalization was used to obtain the same empiricaldistribution across the Cy3 and Cy5 channels and acrossarrays (limma package in the R environment) to correct fordye intensity bias and to minimize microarray-to-micro-array absolute intensity variations.58 The log2 of the ratioof experimental signals (Cy3) to control signals (Cy5) wascalculated. The data from the biological replicates wereaveraged for visualizations in SignalMap 1.9 software(NimbleGen Systems). Regions of the genome enriched foroccupancy by σE were identified using TAMALPAIS atp≤0.01 for a threshold set at the 98th percentile of the log2ratio for each chip.14 Only enriched regions that weresignificant in all three replicates were considered. Thepeaks were ranked by order of intensities calculated fromthe average of the 10 highest consecutive probe signals foreach peak.
Phylogenetic analyses
All genomic DNA sequences were obtained from theIntegrated Microbial Genomes system‖59 on January 10,2007. Groups of orthologous genes were determined usingthe OrthoMCL software set to the default parameters.60The protein sequences of orthologous gene products werealigned with CLUSTALW with the default parameters.61
Phylogenetic trees were constructed from the proteinsequence alignments with the MrBayes 3.1.2 software62
over 4×10⁶ generations (first 25% as burn-in) using theGeneral Time-Reversible model including an estimatedproportion of invariable sites and a γ-shaped distributionof rate variation across sites.A test promoter library for each bacterium was
constructed by extracting 300 bp upstream of each proteincoding sequence. Each test promoter sequence wasscanned for its best match to the defined PSWM accordingto its information content (Iseq):
Iseq ¼X
i
X
b
fb;ilog2fb;ipb
where i is the position in the matrix, b is one of the fourbases, fb,i is the observed frequency of each base at thatposition, pb is the background frequency of each base in thetarget genome (pA+pT=0.31 and pG+pC=0.69 for R.sphaeroides). The motif was defined by two matrices (6 bpfor the −35 region and 4 bp for the −10 region). Alternativespacer lengths of 15–17 bp were considered withoutpenalties. Promoter sequences containing a match of at

729Bacterial Singlet Oxygen Stress Response
least 0.75 times themaximal information content that couldbe obtained from the PSWMwere considered positive (andassigned a value of 1.0). Genes directly downstream andtranscribed in the same direction of genes with a positivepromoter were assigned a score of 0.8. The next genedownstream was assigned a score of 0.6 and so on, untileither the end of a potential operon was reached (fivegenes) or another gene transcribed in the opposite wasfound. The score for the each group of orthologous geneproducts was calculated by summing individual genescores.
Acknowledgements
We thank R. Alexandridis for help with the geneexpression analysis, R. Greenwell for help with invitro transcription assays, J. Rowland for help withthe ChIP assay, Y. Wang and E. Ruby for sharinggene expression data for V. fischeri, and J. Vierstraand A. Shade for discussion. This work was sup-ported by the National Institutes of General MedicalSciences (GM075273) and the Basic Energy Sciencesprogram of the Department of Energy (DE-FG02-05ER15653). Yann Dufour was supported by BAC-TER, a computational biology training programfunded by the Advanced Scientific ComputingResearch program of the Department of Energy(ER63232-1018220-0007203).
Supplementary Data
Supplementary data associated with this articlecan be found, in the online version, at doi:10.1016/j.jmb.2008.08.017
References
1. Kotelnikova, E. A., Makeev, V. J. & Gelfand, M. S.(2005). Evolution of transcription factor DNA bindingsites. Gene, 347, 255–263.
2. Rhodius, V. A., Suh, W. C., Nonaka, G., West, J. &Gross, C. A. (2006). Conserved and variable functionsof the sigmaE stress response in related genomes. PLoSBiol. 4, e2.
3. Koonin, E. V. (2005). Orthologs, paralogs, and evolu-tionary genomics. Annu. Rev. Genet. 39, 309–338.
4. Madan Babu, M., Teichmann, S. A. & Aravind, L.(2006). Evolutionarydynamics of prokaryotic transcrip-tional regulatory networks. J. Mol. Biol. 358, 614–633.
5. Mackenzie, C., Eraso, J. M., Choudhary, M., Roh, J. H.,Zeng, X., Bruscella, P. et al. (2007). Postgenomicadventures with Rhodobacter sphaeroides. Annu. Rev.Microbiol. 61, 283–307.
6. Anthony, J. R., Warczak, K. L. & Donohue, T. J. (2005).A transcriptional response to singlet oxygen, a toxicbyproduct of photosynthesis. Proc. Natl Acad. Sci.USA, 102, 6502–6507.
7. Rinalducci, S., Pedersen, J. Z. & Zolla, L. (2004).Formation of radicals from singlet oxygen producedduring photoinhibition of isolated light-harvestingproteins of photosystem II. Biochim. Biophys. Acta,1608, 63–73.
8. Davies, M. J. (2005). The oxidative environment andprotein damage. Biochim. Biophys. Acta Proteins Pro-teomics, 1703, 93–109.
9. Newman, J. D., Falkowski, M. J., Schilke, B. A.,Anthony, L. C. & Donohue, T. J. (1999). TheRhodobacter sphaeroides ECF sigma factor, sigma(E),and the target promoters cycA P3 and rpoE P. J. Mol.Biol. 294, 307–320.
10. Bockhorst, J., Qiu, Y., Glasner, J., Liu, M., Blattner, F. &Craven, M. (2003). Predicting bacterial transcriptionunits using sequence and expression data. Bioinfor-matics, 19, i34–i43.
11. Price, M. N., Huang, K. H., Alm, E. J. & Arkin, A. P.(2005). A novel method for accurate operon predic-tions in all sequenced prokaryotes. Nucleic Acids Res.33, 880–892.
12. Liu, X., Brutlag, D. L. & Liu, J. S. (2001). BioProspector:discovering conserved DNA motifs in upstreamregulatory regions of co-expressed genes. Pac. Symp.Biocomput. 6, 127–138.
13. Anthony, J. R., Newman, J. D. & Donohue, T. J. (2004).Interactions between the Rhodobacter sphaeroides ECFsigma factor, sigma(E), and its anti-sigma factor,ChrR. J. Mol. Biol. 341, 345–360.
14. Bieda, M., Xu, X., Singer, M. A., Green, R. & Farnham,P. J. (2006). Unbiased location analysis of E2F1-binding sites suggests a widespread role for E2F1 inthe human genome. Genome Res. 16, 595–605.
15. Campbell, E. A., Greenwell, R., Anthony, J. R., Wang,S., Lim, L., Das, K. et al. (2007). A conserved structuralmodule regulates transcriptional responses to diversestress signals in bacteria. Mol. Cell, 27, 793–805.
16. Lane, W. J. & Darst, S. A. (2006). The structural basisfor promoter −35 element recognition by the group IVsigma factors. PLoS Biol. 4, e269.
17. Helmann, J. D. (2002). The extracytoplasmic function(ECF) sigma factors. Adv. Microb. Physiol. 46, 47–110.
18. Cronan, J. E., Jr. (2002). Phospholipid modifications inbacteria. Curr. Opin. Microbiol. 5, 202–205.
19. Hendrischk, A. K., Braatsch, S., Glaeser, J. & Klug, G.(2007). The phrA gene of Rhodobacter sphaeroides en-codes a photolyase and is regulated by singlet oxygenand peroxide in a sigma(E)-dependent manner.Micro-biology, 153, 1842–1851.
20. Sancar, A. (2004). Photolyase and cryptochrome blue-light photoreceptors. Adv. Protein Chem. 69, 73–100.
21. Green, H. A. & Donohue, T. J. (2006). Activity of Rhodo-bacter sphaeroides RpoHII, a second member of the heatshock sigma factor family. J. Bacteriol. 188, 5712–5721.
22. Sies, H. (1993). Damage to plasmid DNA by singletoxygen and its protection. Mutat. Res. 299, 183–191.
23. Cao, M., Kobel, P. A., Morshedi, M. M., Wu, M. F.,Paddon, C. & Helmann, J. D. (2002). Defining theBacillus subtilis sigma(W) regulon: a comparative ana-lysis of promoter consensus search, run-off transcrip-tion/macroarray analysis (ROMA), and transcriptionalprofiling approaches. J. Mol. Biol. 316, 443–457.
24. Manganelli, R., Voskuil, M. I., Schoolnik, G. K. & Smith,I. (2001). The Mycobacterium tuberculosis ECF sigmafactor sigmaE: role in global gene expression andsurvival in macrophages. Mol. Microbiol. 41, 423–437.
25. Paget, M. S., Molle, V., Cohen, G., Aharonowitz, Y. &Buttner, M. J. (2001). Defining the disulphide stressresponse in Streptomyces coelicolor A3(2): identificationof the sigmaR regulon. Mol. Microbiol. 42, 1007–1020.
26. Braatsch, S., Moskvin, O. V., Klug, G. & Gomelsky, M.(2004). Responses of the Rhodobacter sphaeroides tran-scriptome to blue light under semiaerobic conditions.J. Bacteriol. 186, 7726–7735.

730 Bacterial Singlet Oxygen Stress Response
27. Alvarez-Martinez, C. E., Lourenco, R. F., Baldini, R. L.,Laub, M. T. & Gomes, S. L. (2007). The ECF sigmafactor sigma(T) is involved in osmotic and oxidativestress responses in Caulobacter crescentus. Mol. Micro-biol. 66, 1240–1255.
28. Shultzaberger, R. K., Chen, Z., Lewis, K. A. &Schneider, T. D. (2007). Anatomy of Escherichia colisigma70 promoters. Nucleic Acids Res. 35, 771–788.
29. Weindl, J., Hanus, P., Dawy, Z., Zech, J., Hagenauer, J.& Mueller, J. C. (2007). Modeling DNA-binding ofEscherichia coli sigma70 exhibits a characteristic energylandscape around strong promoters.Nucleic Acids Res.35, 7003–7010.
30. Wang, A. Y., Grogan, D. W. & Cronan, J. E., Jr. (1992).Cyclopropane fatty acid synthase of Escherichia coli:deduced amino acid sequence, purification, and stu-dies of the enzyme active site. Biochemistry, 31,11020–11028.
31. Heath, R. L. & Packer, L. (1968). Photoperoxidation inisolated chloroplasts: I. Kinetics and stoichiometry offatty acid peroxidation. Arch. Biochem. Biophys. 125,189.
32. Hayes, J. D. & McLellan, L. I. (1999). Glutathione andglutathione-dependent enzymes represent a co-ordi-nately regulated defence against oxidative stress. FreeRadical Res. 31, 273–300.
33. Edge, R., McGarvey, D. J. & Truscott, T. G. (1997). Thecarotenoids as anti-oxidants—a review. J. Photochem.Photobiol. B, 41, 189–200.
34. Ledford, H. K., Chin, B. L. & Niyogi, K. K. (2007).Acclimation to singlet oxygen stress in Chlamydomonasreinhardtii. Eukaryotic Cell, 6, 919–930.
35. Krieger-Liszkay, A. (2005). Singlet oxygen productionin photosynthesis. J. Exp. Bot. 56, 337–346.
36. Wagner-Dobler, I. & Biebl, H. (2006). Environmentalbiology of the marine Roseobacter lineage. Annu. Rev.Microbiol. 60, 255–280.
37. Miller, T. R. & Belas, R. (2004). Dimethylsulfoniopro-pionate metabolism by Pfiesteria-associated Roseobac-ter spp. Appl. Environ. Microbiol. 70, 3383–3391.
38. Wojtaszek, P. (1997). Oxidative burst: an early plantresponse to pathogen infection. Biochem. J. 322, 681–692.
39. Bolwell, G. P. (1999). Role of active oxygen species andNO in plant defence responses. Curr. Opin. Plant Biol.2, 287–294.
40. Thompson, F. L., Iida, T. & Swings, J. (2004).Biodiversity of vibrios.Microbiol.Mol. Biol. Rev. 68, 403.
41. Heidelberg, J. F., Paulsen, I. T., Nelson, K. E., Gaidos,E. J., Nelson, W. C., Read, T. D. et al. (2002). Genomesequence of the dissimilatory metal ion-reducingbacterium Shewanella oneidensis. Nat. Biotechnol. 20,1118–1123.
42. Battistuzzi, F. U., Feijao, A. & Hedges, S. B. (2004). Agenomic timescale of prokaryote evolution: insightsinto the origin of methanogenesis, phototrophy, andthe colonization of land. BMC Evol. Biol. 4.
43. Sheridan, P. P., Freeman, K. H. & Brenchley, J. E.(2003). Estimated minimal divergence times of themajor bacterial and archaeal phyla. Geomicrobiol. J. 20,1–14.
44. Bekker, A., Holland, H. D., Wang, P. L., Rumble, D.,III, Stein, H. J., Hannah, J. L. et al. (2004). Dating therise of atmospheric oxygen. Nature, 427, 117–120.
45. Wille, M., Kramers, J. D., Nagler, T. F., Beukes, N. J.,Schroder, S., Meisel, T. et al. (2007). Evidence for agradual rise of oxygen between 2.6 and 2.5 Ga fromMo isotopes and Re-PGE signatures in shales.Geochim. Cosmochim. Acta, 71, 2417–2435.
46. Gruber, T. M. & Gross, C. A. (2003). Multiple sigmasubunits and the partitioning of bacterial transcriptionspace. Annu. Rev. Microbiol. 57, 441–466.
47. Sambrook, J., Fritsch, E. F. & Maniatis, T. (1989).Molecular Cloning: A Laboratory Manual, 2nd edit. ColdSpring Harbor Laboratory, Cold Spring Harbor, NY;three volumes.
48. Sistrom, W. R. (1960). A requirement for sodium in thegrowth of Rhodopseudomonas spheroides. J. Gen. Micro-biol. 22, 778–785.
49. Karls, R. K., Wolf, J. R. & Donohue, T. J. (1999).Activation of the cycA P2 promoter for the Rhodobactersphaeroides cytochrome c2 gene by the photosynthesisresponse regulator. Mol. Microbiol. 34, 822–835.
50. Flory, J. E. & Donohue, T. J. (1997). Transcriptionalcontrol of several aerobically induced cytochromestructural genes in Rhodobacter sphaeroides. Microbiol-ogy, 143, 3101–3110.
51. Pappas, C. T., Sram, J., Moskvin, O. V., Ivanov, P. S.,Mackenzie, R. C., Choudhary, M. et al. (2004).Construction and validation of the Rhodobactersphaeroides 2.4.1 DNA microarray: transcriptomeflexibility at diverse growth modes. J. Bacteriol. 186,4748–4758.
52. Moskvin, O. V., Gomelsky, L. & Gomelsky, M. (2005).Transcriptome analysis of the Rhodobacter sphaeroidesPpsR regulon: PpsR as a master regulator of photo-system development. J. Bacteriol. 187, 2148–2156.
53. Tavano, C. L., Podevels, A. M. & Donohue, T. J. (2005).Identification of genes required for recycling reducingpower during photosynthetic growth. J. Bacteriol. 187,5249–5258.
54. Irizarry, R. A., Hobbs, B., Collin, F., Beazer-Barclay,Y. D., Antonellis, K. J., Scherf, U. & Speed, T. P.(2003). Exploration, normalization, and summariesof high density oligonucleotide array probe leveldata. Biostatistics, 4, 249–264.
55. Kendziorski, C. M., Newton, M. A., Lan, H. & Gould,M. N. (2003). On parametric empirical Bayes methodsfor comparing multiple groups using replicated geneexpression profiles. Stat. Med. 22, 3899–3914.
56. Zhang, X. & Bremer, H. (1995). Control of theEscherichia coli rrnB P1 promoter strength by ppGpp.J. Biol. Chem. 270, 11181–11189.
57. Lee, T. I., Johnstone, S. E. & Young, R. A. (2006).Chromatin immunoprecipitation and microarray-based analysis of protein location. Nat. Protoc. 1,729–748.
58. Bolstad, B. M., Irizarry, R. A., Astrand, M. & Speed,T. P. (2003). A comparison of normalization methodsfor high density oligonucleotide array data based onvariance and bias. Bioinformatics, 19, 185–193.
59. Markowitz, V. M., Szeto, E., Palaniappan, K., Grech-kin, Y., Chu, K., Chen, I. M. et al. (2008). The integratedmicrobial genomes (IMG) system in 2007: data contentand analysis tool extensions. Nucleic Acids Res. 36,D528–D533.
60. Li, L., Stoeckert, C. J., Jr. & Roos, D. S. (2003).OrthoMCL: identification of ortholog groups foreukaryotic genomes. Genome Res. 13, 2178–2189.
61. Thompson, J. D., Higgins, D. G. & Gibson, T. J. (1994).CLUSTAL W: improving the sensitivity of progres-sive multiple sequence alignment through sequenceweighting, position-specific gap penalties and weightmatrix choice. Nucleic Acids Res. 22, 4673–4680.
62. Ronquist, F. & Huelsenbeck, J. P. (2003). MrBayes 3:Bayesian phylogenetic inference under mixed models.Bioinformatics, 19, 1572–1574.


![Cholesterol Hydroperoxides Generate Singlet Molecular Oxygen [O 2 ( 1 Δ g )]: Near-IR Emission, 18 O-Labeled Hydroperoxides, and Mass Spectrometry](https://static.fdokumen.com/doc/165x107/63335dc0ce61be0ae50e9c78/cholesterol-hydroperoxides-generate-singlet-molecular-oxygen-o-2-1-d-g-near-ir.jpg)