Theoretical analysis of a novel, portable, CPC-based solar thermal collector for methanol reforming
Upload
khangminh22Category
view
0download
0
Direct Methanol Fuel Cell systems in portable electronics
A metrics-based conceptualization approach
Bas FLIPSEN


i
Direct Methanol Fuel Cell systems in portable electronics
A metrics-based conceptualization approach
Proefschrift
ter verkrijging van de graad van doctor
aan de Technische Universiteit Delft,
op gezag van de Rector Magnificus prof.ir. K.C.A.M. Luyben,
voorzitter van het College voor Promoties,
in het openbaar te verdedigen op dinsdag 14 december 2010 om 15:00 uur
door
Sebastiaan Frederik Johan FLIPSEN
ingenieur Luchtvaart en Ruimtevaart
ingenieur Advanced Industrial Design Engineering
geboren te Vlierden.

ii
Dit proefschrift is goedgekeurd door de promotoren:
Prof.dr.ir. J.C. Brezet
Prof.dr. C. Spitas
Copromotor: Dr. J.S.M. Vergeest
Samenstelling promotiecommissie:
Rector Magnificus voorzitter
Prof.dr.ir. J.C. Brezet Technische Universiteit Delft, promotor
Prof.dr. C. Spitas Technische Universiteit Delft, promotor
Dr. J.S.M. Vergeest Technische Universiteit Delft, copromotor
Prof.dr.ir. Geraedts Technische Universiteit Delft
Prof.dr. A.H.M.E. Reinders Technische Universiteit Delft, Universiteit Twente
Prof.dr.ir. A. van Keulen Technische Universiteit Delft
Dr. P. Li The University of Arizona, Tucson
Direct Methanol Fuel Cell systems in portable electronics
A metrics-based conceptualization approach
Bas Flipsen
Thesis Delft University of Technology, Delft, the Netherlands
Product Engineering research group, publication nr. 2
ISBN 978-90-5155-069-6
Cover design by René Smeets, Gerard Nijenhuis and Bas Flipsen
Layout by René Smeets KineticVision
Printed by VSSD in Delft (the Netherlands)
Distributed by Product Engineering
T: +31-15-2789398
Copyright © 2010 by Bas Flipsen. All rights reserved. No part of this publication may be
reproduced, stored in a retrieval system, or transmitted, in any form or by any means,
electronic, mechanical, photocopying, recording, or otherwise, without the prior written
permission of the author.
iii
Contents
Contents ..............................................................................................iii
Summary .............................................................................................. v
Samenvatting....................................................................................... ix
Symbols, acronyms and definitions ...................................................xiii
1. Introduction......................................................................................1 1.1 Problem definition .......................................................................2 1.2 Goal of the thesis.........................................................................3 1.3 Research methodology & structure of the thesis...........................3
2. Alternative power sources in context.................................................7 2.1 Fields of application.....................................................................7 2.2 Power and energy systems compared .........................................14 2.3 Conclusions...............................................................................27
3. Power source design and selection in practice, state of the art ........29 3.1 Approach...................................................................................30 3.2 Tools and Methods in the Field ..................................................31 3.3 Case study review......................................................................39 3.4 Conclusions...............................................................................45
4. Research Questions.........................................................................49 4.1 Answers to the initial research question.....................................49 4.2 Redefined problem definition .....................................................51 4.3 Main research questions............................................................52 4.4 Methodology ..............................................................................53
5. From batteries to DMFC power systems...........................................55 5.1 Introduction to batteries ............................................................55 5.2 DMFC explained ........................................................................61 5.3 Comparison...............................................................................66 5.4 Discussion.................................................................................84 5.5 Conclusions...............................................................................87
6. The user and their choice for a power source...................................91 6.1 Approach...................................................................................92 6.2 User acceptance and their differentiating properties...................94
iv
6.3 Results...................................................................................... 97 6.4 Discussion .............................................................................. 100 6.5 Conclusions ............................................................................ 104
7. Introduction to different orders of modeling..................................107 7.1 Orders of modeling .................................................................. 108 7.2 Differentiating properties......................................................... 112 7.3 Conclusions ............................................................................ 117
8. First order model: a heuristic approach to modeling a DMFC power
source ..........................................................................................119 8.1 Case study of a MP3 player...................................................... 120 8.2 Design of the DMFC hybrid system.......................................... 128 8.3 Design of the ‘scaled’ DMFC hybrid system.............................. 138 8.4 Discussion of the design, redesign and the model .................... 148 8.5 Modified heuristic models for a DMFC hybrid power system..... 153 8.6 Evaluation of the newly developed model ................................. 156 8.7 Conclusions ............................................................................ 159
9. Second order model: database-driven metrics-based design............161 9.1 “Automated design” approach.................................................. 162 9.2 Presentation of the optimization algorithm............................... 169 9.3 Component selection: MP3 player ............................................ 174 9.4 First test run: initial algorithm ................................................ 180 9.5 Second test run: improved algorithm ....................................... 187 9.6 Third test run: applying the evolutionary algorithm ................. 190 9.7 Discussion on the results ........................................................ 196 9.8 Conclusions ............................................................................ 201 9.9 Recommendations ................................................................... 203
10. Conclusions.................................................................................205 10.1 Answer to the main question ................................................... 205 10.2 Scientific and technological relevance ...................................... 213 10.3 Generalization of the models.................................................... 215 10.4 Recommendations for future research ..................................... 216
References.........................................................................................221
A Modeling of the open cell Voltage for a DMFC.................................231
B Mathematica files..........................................................................237 B.1 Initial algorithm....................................................................... 237 B.2 Evolutionary algorithm ............................................................ 248 B.3 Input tables (dbase) ................................................................. 254
Acknowledgements...........................................................................259
Curriculum Vitae ...............................................................................261

v
Summary
It is impossible to imagine life today without portable electronics like the
laptop computer, PDA, tablet pc’s and cell phone. All these products are
equipped with batteries which grant them grid independence and all-round
portability. The numbers are huge, for instance in 2009 more than 180
million smart phones have been sold, and this will be more than 400 million
by 2014. Connectivity to the internet and more functionality make these
devices long for longer run times and higher power use. At the moment
intensively used smartphones have to be recharged quite often, and an
alternative power system could be a solution to increase the time in between
recharges. This thesis concerns about such an alternative and studies the
techno-economical feasibility of Direct Methanol Fuel Cell (DMFC) systems
applied in portable electronic devices. To test the feasibility different
mathematical models are developed, which can be used during the
conceptual phase of the design phase. Instead of a conventional qualitative
approach, a quantitative comparison and selection is pursued, which may
count as ground-braking in this domain.
Based on an explorative research, data for different alternative power
systems in the application field of portable electronic devices are identified.
This data is then used to compare different power sources and energy
carriers with each other on three basic properties: power, energy and costs.
The DMFC is pinpointed as a power system which could outperform the
lithium-ion battery. Potentially, this system can store two to seven times the
amount of energy contained in current lithium-ion rechargeable batteries. To
test the feasibility of DFMC systems in portable applications a literature
research is conducted into available tools and methods. During the
conceptualization phase of the design process different tools are found which
can be used to simply identify the opportunity of different power systems.
Other more enumerative tools can be used during later phases of the design

vi
process, like embodiment and engineering where specification of the device
is already laid out. Tools which could identify a power system but which can
also used for designing a power system during the specification and
conceptualization phase are not found.
To research this lack of design tools during conceptualization the main
research question (RQ) is defined. The RQ deals with the feasibility of DMFC
systems for portable electronics and how to identify the opportunities of
DMFC systems in early phases of the design process. Differentiating
properties between DMFCs and rechargeable batteries are researched via a
techno-economical comparison and a research into the willingness of the
user to buy a fuel-cell powered cell-phone and laptop computer. In
comparison with the lithium-ion battery, a DMFC is an energy dense system,
especially applicable in low-power/long endurance applications like smoke
detectors. Based on a simple zero-order model the DMFC could be a factor
two to three smaller and six times more lightweight in this application field.
In the application fields as the laptop computer and cell-phone the DMFC
should be extended with an extra intermediate accumulator, leading to a so-
called DMFC-hybrid system, or in short the ‘DMFC system’. The zero-order
model used to identify the application field is based on basic energy and
power densities of three parts of the DMFC system, the fuel cell stack, the
bill of products and fuel tank. To increase accuracy a first-order
mathematical model is proposed. The model is constructed by designing a
DMFC system for a flash-drive MP3 player, the Samsung YP-Z5F. This model
breaks the DMFC system into five parts, the three presented earlier, plus the
empty space and the intermediate accumulator. The coefficients, efficiencies
and constants derived during this research by design project are based on
heuristic data from literature and prototype designs. To test the model, two
commercially available DMFC systems (the SFC Jenny and SFJ Efoy 2200)
are evaluated. Results from this validation show that the first-order model
estimates the volume of the five parts correctly, but approximations are
presented over a wide-range of well to not-so good system designs. Well-
engineered systems, like the Jenny, are positioned in the optimal estimate
zone, and conventionally designed systems (the Efoy) find itself in the middle
of the estimates. This type of models is well useable for the product designer
when a low amount of data is available, and can be designated as rules-of-

vii
thumb. Still, it is advised to test more commercially available DMFC systems
to fine-tune the constants, coefficients and efficiencies.
To research the design and specifications of the DFMC system more in depth
a second-order model is proposed. The model consists of an algorithm which
(i) selects and designs components, (ii) optimizes the selected component-set
to a minimizing objective function, and (iii) visualizes the results in a 3D
design. To test the algorithm a program is written in Mathematica which
evaluates multiple structural variants of the selected components.
Component selection is based on the objective function taking volume,
weight and costs into account. Once a fitting component-set has been
chosen, the algorithm places the components in 3D space and optimizes the
space for minimized volume. Two algorithms have been applied to optimize
for volume: the Random Walk (RW) method and an Evolutionary Algorithm
(EA), which guides the solution to a local minimum. The RW method is very
enumerative and converging to an optimum takes up a long time (more than
8 hours). The evolutionary approach reached convergence within a low
amount of calculations and time (15-30 minutes), and with better
performance. It converges to a lower value of the objective function, and
being quicker it is more useable for testing the feasibility of a DMFC system
applied in a certain application. The algorithm is tested on the previously
described MP3 player, and convergence was reached with a minimal value of
the boundary volume twice as large as the benchmarked battery. The DMFC
system is thus twice as large as the benchmarked lithium-ion battery. The
results also show that weight is less of an issue, because weight has halved
compared to the benchmark. The sales price is difficult to estimate because
not all necessary data is available. Based on the preliminary results the price
will be at least twice as high as the benchmarked battery, making this fuel
cell system not feasible within this application. Improvements in fuel cell
efficiency and a higher concentration of methanol could result in a feasible
solution. The specification of the DMFC system equals that of the
benchmarked battery; however the economical feasibility is still an issue. It
can be expected that the consumer is willing to pay more for improvement in
comfort, as can be seen in the transition from NiMH batteries to the Li-ion
battery. Improvement in weight probably is not enough.

viii
It is recommended to test the algorithm even further by evaluating a wide
range of applications. The database of components should therefore be
updated and extended with more commercially available components. The
initial pricing for the DMFC system is very high, but also the running costs
of methanol are high. This could be of subordinate concern when comfort is
improved, e.g. by increasing run time.
The first order model uses a minimal amount of input data and is therefore
an interesting tool for concept developers. The second order model can be
used to fine-tune the first order model.
Although this thesis is a small step in quantitative testing the feasibility of
concepts, it can be a significant stepping stone for industrial design
engineers. Making use of the strength of computers is finally within the
reach of the concept designer. We only have to grab it.
ix
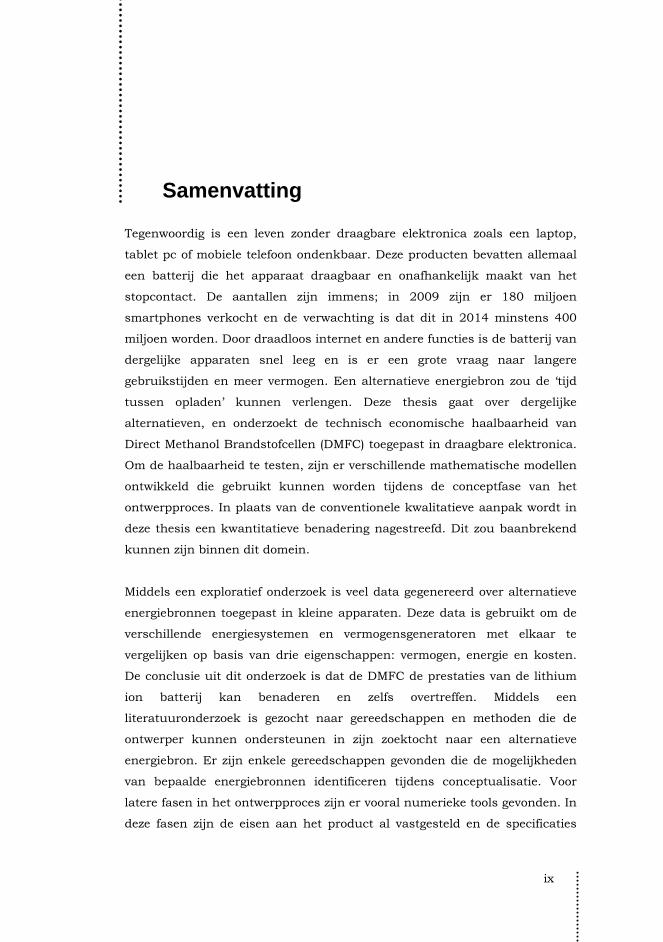
Samenvatting
Tegenwoordig is een leven zonder draagbare elektronica zoals een laptop,
tablet pc of mobiele telefoon ondenkbaar. Deze producten bevatten allemaal
een batterij die het apparaat draagbaar en onafhankelijk maakt van het
stopcontact. De aantallen zijn immens; in 2009 zijn er 180 miljoen
smartphones verkocht en de verwachting is dat dit in 2014 minstens 400
miljoen worden. Door draadloos internet en andere functies is de batterij van
dergelijke apparaten snel leeg en is er een grote vraag naar langere
gebruikstijden en meer vermogen. Een alternatieve energiebron zou de ‘tijd
tussen opladen’ kunnen verlengen. Deze thesis gaat over dergelijke
alternatieven, en onderzoekt de technisch economische haalbaarheid van
Direct Methanol Brandstofcellen (DMFC) toegepast in draagbare elektronica.
Om de haalbaarheid te testen, zijn er verschillende mathematische modellen
ontwikkeld die gebruikt kunnen worden tijdens de conceptfase van het
ontwerpproces. In plaats van de conventionele kwalitatieve aanpak wordt in
deze thesis een kwantitatieve benadering nagestreefd. Dit zou baanbrekend
kunnen zijn binnen dit domein.
Middels een exploratief onderzoek is veel data gegenereerd over alternatieve
energiebronnen toegepast in kleine apparaten. Deze data is gebruikt om de
verschillende energiesystemen en vermogensgeneratoren met elkaar te
vergelijken op basis van drie eigenschappen: vermogen, energie en kosten.
De conclusie uit dit onderzoek is dat de DMFC de prestaties van de lithium
ion batterij kan benaderen en zelfs overtreffen. Middels een
literatuuronderzoek is gezocht naar gereedschappen en methoden die de
ontwerper kunnen ondersteunen in zijn zoektocht naar een alternatieve
energiebron. Er zijn enkele gereedschappen gevonden die de mogelijkheden
van bepaalde energiebronnen identificeren tijdens conceptualisatie. Voor
latere fasen in het ontwerpproces zijn er vooral numerieke tools gevonden. In
deze fasen zijn de eisen aan het product al vastgesteld en de specificaties
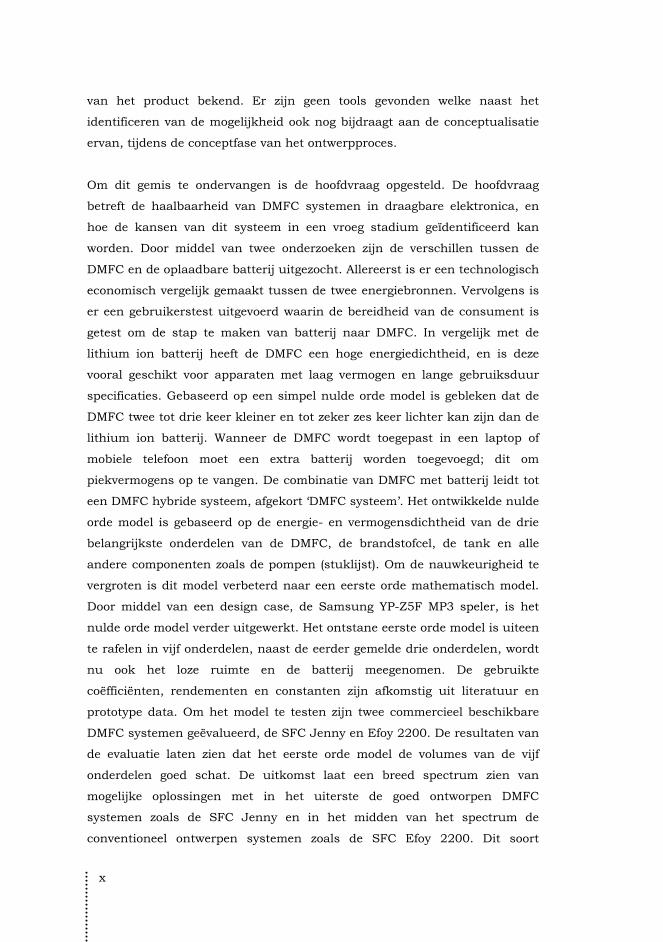
x
van het product bekend. Er zijn geen tools gevonden welke naast het
identificeren van de mogelijkheid ook nog bijdraagt aan de conceptualisatie
ervan, tijdens de conceptfase van het ontwerpproces.
Om dit gemis te ondervangen is de hoofdvraag opgesteld. De hoofdvraag
betreft de haalbaarheid van DMFC systemen in draagbare elektronica, en
hoe de kansen van dit systeem in een vroeg stadium geïdentificeerd kan
worden. Door middel van twee onderzoeken zijn de verschillen tussen de
DMFC en de oplaadbare batterij uitgezocht. Allereerst is er een technologisch
economisch vergelijk gemaakt tussen de twee energiebronnen. Vervolgens is
er een gebruikerstest uitgevoerd waarin de bereidheid van de consument is
getest om de stap te maken van batterij naar DMFC. In vergelijk met de
lithium ion batterij heeft de DMFC een hoge energiedichtheid, en is deze
vooral geschikt voor apparaten met laag vermogen en lange gebruiksduur
specificaties. Gebaseerd op een simpel nulde orde model is gebleken dat de
DMFC twee tot drie keer kleiner en tot zeker zes keer lichter kan zijn dan de
lithium ion batterij. Wanneer de DMFC wordt toegepast in een laptop of
mobiele telefoon moet een extra batterij worden toegevoegd; dit om
piekvermogens op te vangen. De combinatie van DMFC met batterij leidt tot
een DMFC hybride systeem, afgekort ‘DMFC systeem’. Het ontwikkelde nulde
orde model is gebaseerd op de energie- en vermogensdichtheid van de drie
belangrijkste onderdelen van de DMFC, de brandstofcel, de tank en alle
andere componenten zoals de pompen (stuklijst). Om de nauwkeurigheid te
vergroten is dit model verbeterd naar een eerste orde mathematisch model.
Door middel van een design case, de Samsung YP-Z5F MP3 speler, is het
nulde orde model verder uitgewerkt. Het ontstane eerste orde model is uiteen
te rafelen in vijf onderdelen, naast de eerder gemelde drie onderdelen, wordt
nu ook het loze ruimte en de batterij meegenomen. De gebruikte
coëfficiënten, rendementen en constanten zijn afkomstig uit literatuur en
prototype data. Om het model te testen zijn twee commercieel beschikbare
DMFC systemen geëvalueerd, de SFC Jenny en Efoy 2200. De resultaten van
de evaluatie laten zien dat het eerste orde model de volumes van de vijf
onderdelen goed schat. De uitkomst laat een breed spectrum zien van
mogelijke oplossingen met in het uiterste de goed ontworpen DMFC
systemen zoals de SFC Jenny en in het midden van het spectrum de
conventioneel ontwerpen systemen zoals de SFC Efoy 2200. Dit soort

xi
modellen, ook wel vuistregels genoemd, zijn erg bruikbaar voor de
industrieel ontwerper tijdens de conceptfase waarin weinig data (specs)
beschikbaar is. Toch is het te adviseren om het model te fine-tunen door het
model met meer commercieel beschikbare DMFC system te evalueren.
Om de specificaties van een DMFC systeem beter te kunnen ontwerpen is
het tweede orde model ontwikkeld. Dit model bestaat uit een model dat (i)
componenten uit een database selecteert of ontwerpt, (ii) de geselecteerde
componentenset optimaliseert naar de te minimaliseren doelfunctie, en (iii)
het resultaat visualiseert in een 3D ontwerp. Om het tweede orde model te
testen is er een programma geschreven in Mathematica die gebruikt maakt
van een optimalisatiealgoritme. Dit programma evalueert meerdere
structurele varianten uit een geselecteerde componentenset. De
componentselectie is gebaseerd op een doelfunctie, die rekening houdt met
het volume, het gewicht en de prijs van de componentenset. Wanneer er een
geschikte componentenset is gekozen plaatst het algoritme de componenten
ten opzichte van elkaar in een 3D ruimte. Het algoritme minimaliseert
vervolgens het productvolume door de plaatsing van de componenten te
variëren. Twee algoritmes zijn toegepast: de Random Walk (RW) methode en
een Evolutionair Algoritme (EA), welke de oplossing meer naar een lokaal
minimum richt. De RW methode is erg rekenintensief en convergeert pas na
veel berekeningen en tijd (8 uur) naar een minimaal volume. De EA echter
convergeert sneller (15-30 minuten) en zelfs naar een lagere waarde van het
volume. Het algoritme is getest op het ontwerp van een DMFC systeem voor
de eerder gebruikte casestudie, de MP3 speler. Het algoritme convergeert
naar een twee keer zo groot systeem vergeleken met de uitgangssituatie, de
lithium ion batterij. De resultaten laten ook zien dat het systeem twee maal
lichter is dan de batterij. Gewicht zal dan ook geen opstakel vormen voor de
haalbaarheid van het systeem. De prijs van het systeem is moeilijk in te
schatten daar niet alle data beschikbaar is. Gebaseerd op initiële
schattingen zal de prijs twee maal hoger zijn dan de uitgangssituatie. De
haalbaarheid van dit systeem komt hiermee dus in het geding. Verbeteringen
in het brandstofcelrendement en hogere concentraties methanol zullen
bijdragen aan een haalbaar systeem. Bij vergelijkbare energie en
vermogensspecificaties van de batterij, zal het DMFC systeem twee maal
groter en twee maal duurder worden. Uit vergelijkbare transities van de
NiMH batterij naar de Li-ion batterij is gebleken dat de consument wel

xii
bereidt is meer te betalen voor verbeterde prestaties, maar of een
gewichtswinst alleen genoeg is valt te betwijfelen.
Het wordt aanbevolen om het algoritme te testen in een breder
toepassingsgebied. De componentendatabase zou hierbij aangevuld moeten
worden met nieuwe commerciële componenten en regelmatig hernieuwd
moeten worden. De initiële prijs van het brandstofcelsysteem is hoog en de
kosten tijdens gebruik zijn door de prijs van methanol ook hoog. Dit kan,
zoals al eerder is gemeld, van ondergeschikt belang zijn als meer comfort
wordt geboden door bijvoorbeeld een langere gebruikstijd. Het eerste orde
model maakt gebruik van een minimale hoeveelheid inputdata, en is daarom
een interessante tool voor tijdens de conceptontwikkeling. Met behulp van
het tweede orde model kan het eerste orde model verbeterd worden.
Hoewel dit proefschrift een kleine stap is in het kwantitatief testen van
concepten, kan het een belangrijke opstap zijn voor industrieel ontwerpers.
De kracht van computers is eindelijk binnen het bereik van de
conceptontwerper en we hoeven deze kans alleen maar aan te grijpen.

xiii
Symbols, acronyms and definitions
Symbol Definition Dimensions
A Surface area mm2
Acell Active surface area mm2
c Cost €
C Capacity of an accumulator Wh
C Charge or discharge rate A Ah-1, C
ces Empty space coefficient -
cfp Flat pack coefficient -
cm can Canisters’ weight coefficient -
cv can Canisters’ volume coefficient -
cmeoh Methanol to total fuel fraction -
D Design Vector -
E Amount of electric energy Wh
E0 Standard cell potential V
Eday Energy needed for a single day Wh
F Faradays constant C mol-1
F(D) Objective function -
fsp Self Pumping Frequency Hz
g(D) Design constraint -
h Height mm
h(D) Behavioral constraint -
i Current density mA cm2
I Current A
ic Cross-over current density mA cm2
j(D) Discrete value constraint -
l Length mm
m Mass kg
M Molar mass kg mol-1

xiv
m Mass-transfer overvoltage constant mV
M(D) Dimensionless optimization metric -
ma Platinum loading on the anode mg cm-2
m Mass flow g min-1
maccu Accumulator mass kg
mc Platinum loading on the cathode mg cm-2
mfc Fuel cell mass kg
mfc Fuel cell mass kg
mfc-system Fuel cell system mass
mtotal Total mass kg
N Methanol concentration mol L-1
n Mass-transfer overvoltage constant cm2 mA-1
ne Amount of electrons per mole mol-1
P Power W
Pmean Mean power W
Ppeak Peak power W
px Specific power of component x W kg-1
(pρ)x Power density of component x W L-1
Qmax Maximum flow rate mL s-1
R Molar gas constant J K-1 mol-1
rau Auxiliary power to net power ratio -
rcloud Cloud vector consisting or only translation
vectors
-
rr Rotation vector -
rt Neighboring desing vector -
rt Translation vector -
SCE Specific Cost per unit of energy or power € Wh-1
SCP Specific Cost per unit of power € W-1
SPR Self pumping ratio min-1
T Temperature K
ttank Thickness of the tank mm
ux Specific energy of component x Wh kg-1
(uρ)x Energy density of component x Wh L-1
V Volume flow ml min-1
xv
V Volume mm3, L
Vaccu Accumulator volume mm3, L
Vbop BOP volume mm3, L
Vcell Working Cell Voltage V
Vempty Empty space volume mm3, L
Vfc Fuel cell volume mm3, L
VOC Open Cell Voltage V
Vtotal Total volume mm3, L
w Width mm
x Amount of moles used/produced in reaction -
z Number of electrons -
α Radius factor -
αa Charge transfer coefficient at the anode -
αc Charge transfer coefficient at the cathode -
Δgf Molar Gibbs free energy kJ mol-1
Δhf Lower heating value MJ kg-1 MJ kg-
1
Δtcycle Single cycle runtime s
Δtrun Runtime on one charge s
ΔVact Activation losses V
ΔVmass Mass transport losses V
ΔVx-over Cross-over losses V
ΔVΩ Ohmic losses V
ηbop BOP efficiency %
ηDC/DC DC to DC convertor efficiency %
ηfc Fuel cell efficiency %
ηsys System efficiency %
θ Angle of rotation vector -
λ Preference factor -
λstoch Stochiometric ratio at the anode or cathode -
ρ Density kg L-1
xvi
AC Alternating Current
AFC Alkaline Fuel Cell
BIOS Basic Input/Output System
BOP Bill Of Products
CAD Computer Aided Design
CES Cambridge Engineering Selector
CFRP Carbon Fiber Reinforced Plastics
CPU Central Processor Unit
DC Direct Current
DG Distributed Generation
DLC Double Layer Capacitor
DMFC Direct Methanol Fuel Cell
DOD Depth Of Discharge
DOF Degrees Of Freedom
DSM Design Structure Matrix
DVD Digital Video Disk
EA Evolutionary Algorithm
EDLC Electric/Electrochemical Double Layer Capacitor
EHD Electro HydroDynamic
EM Electro Magnetic
EMT Environmental Monitor Test bed
FC Fuel Cell
FEM Finite Element Method
GA Genetic Algorithm
GDL Gas Diffusion Layer
GPS Global Positioning System
HHV Higher Heating Value
xvii
HOGA Hybrid Optimization by Genetic Algorithms
HOMER Hybrid Optimization Model for Electric
Renewables
HS High Strength (steel)
HSDPA High Speed Downlink Packet Access
HT High Tenacity
IC Integrate Circuit
ICE Internal Combustion Engine
JPL Jet Propulsion Lab
LCC Life Cycle Costs
LCD Liquid Crystal Display
LED Light Emitting Diode
LHV Lower Heating Value
Li-ion Lithium ion
Li-poly Lithium polymer
LPG Liquefied Petroleum Gas
MCFC Molten Carbonate Fuel Cell
MEA Membrane Electrode Assembly
MEMS Micro Electro Mechanical Systems
MP3 MPEG layer 3
MPEG Moving Picture Experts Group
MS Microsoft
MTI Mechanical Technology, Incorporated
NASA National Aeronautics and Space Administration
NiCD Nickel Cadmium
NiMH Nickel Metal Hydride
NiTi Nickel Titanium
NPC Net Present Cost
xviii
OLED Organic Light Emitting Display
PAFC Phosphoric Acid Fuel Cell
Pb Lead
PC Personal Computer
PCB Printed Circuit Board
PDA Personal Digital Assistant
PEFC Polymer Exchange Membrane Fuel Cell
PEM FC Polymer Exchange Membrane Fuel Cell
POWER Power Optimization for Wireless Energy
Requirement
PV PhotoVoltaic
RF Radio Frequency
RQ Research Question
RTG Radioisotope Thermoelectric Generator
RW Random Walk
SPR Self Pumping Ratio
SFC Smart Fuel Cell
SOC State Of Charge
SOFC Solid Oxide Fuel Cell
SPR Self Pumping Ratio
TE Thermo Electric
TU Delft University of Technology Delft
VOC Open Cell Voltage
WiFi Wireless Fidelity
WIMS-ERC Wireless Integrated Microsystems Engineering
Research Center
WMA Windows Media Audio
xix
Power system A combination of a power source with an energy container
Power source Electric power generator
Energy Electric energy contained
Cell Electrochemical unit
Battery A device that converts the chemical energy contained in
its active materials directly into energy by means of an
electrochemical oxidation-reduction (redox) reaction. A
battery refers to one or more cells connected in series or
parallel.

xx
1
1 Introduction
The past 10 years more portable electronics have entered our lives. All these
electronic devices are powered by a battery and mainly the rechargeable
Lithium Ion battery. In 2009 more than 180 million smart phones have been
sold and this will be more than 400 million in 2014 [1]. Connectivity to the
internet makes these devices long for longer run times and higher power use
[2-4]. At the moment intensively used smart phones have to be recharged
quite often, and alternative power systems could be a solution to increasing
the run time.
This Chapter is an introduction to the research executed over the past 6
years and years before. During my professional career before the academic
career at TU Delft, I have been working on alternative power systems and the
application of it in portable products. At TNO industrial Technology we have
developed product concepts using a range of power systems, from wind-up
‘electric’ toothbrushes [5] to fuel cells in portable electronics [6, 7], where we
were in search for application fields for fuel cells [8] to finding applications
for butane/propane canisters [9]. In that period I noticed a need from the
product designer (mainly academia) for knowledge-based design, indication
the direction of the design process, making us of mathematical modeling
during early phases of the design process. This thesis is about this early
modeling, making use of mathematical calculations (with and without
computers) in early phases of the design process, applied in the field of
alternative power systems.
The problem and the goal of the research are defined and Section 1.1 and
1.2. The Chapter finishes with the structure of the thesis, which can be used
as the story line for this thesis, Section 1.3.
2
1.1 Problem definition In the design and engineering of risky and expensive products, like aircraft,
the principle of ‘first time right’ is one of the key factors in surviving the
competition. Predicting the feasibility of these products are thus of great
importance during every phase of the design process. For every design phase,
different tools as structural analysis, design for performance and costs are
the main drivers. Analytical tools and heuristic models are developed and
used to predict the performance, physical properties and life-cycle costing as
good as possible [10]. For less expensive products, the designer has to revert
to more trial-and-error methods and reading up on literature. Time, and
thus costs, is limiting the designer into getting in the deep of new
technologies. For the consumer industry alternative power systems are thus
less visible and designers are not known with the state-of-the-art
developments in the field.
Successful compact design of a portable electronic product depends on
proper selection of components and a sound matching of the power system.
A large part of the product is defined during early phases in the design
process, during which issues are addressed and important choices are made.
During these phases the product design engineer wants to size the
application and has to make important and sometimes irreversible choices,
which in a later stage are difficult and often costly to alter (principle of
Pareto). On the other hand the selection of the power system often takes
place late in the design process [11]. Generally the designer takes this
component of the shelf when the application is already designed or even
prototyped. “Power supplies are thus frequently an afterthought” [12]. Tools
and methods to make select a power system in early phases of the design
process are limited available. Because of the time-constraints, low visibility
of alternatives, and the lack of knowledge the designer looks merely at
primary or secondary batteries. Thus opportunities for short-term but
especially long-term developments in portable electronics are in that way
overlooked. The availability of analytical tools to support the designer in
making this choice is not available.
3
1.2 Goal of the thesis Three problems have been addressed in the previous section, (i) a problem
initiated by the growth of power-hungry electronic devices longing for longer
run times, (ii) the visibility of alternative power systems when designing
portable electronic products, and (iii) the limited availability of tools and
methods to make a selection of the power system or even design a power
system during the preliminary design phases.
In this thesis the field of alternative power systems is explored in search for
the existing alternatives for the rechargeable battery (mainly lithium-ion)
used in portable electronics. This thesis is thus started with an initial
research question:
“Which power systems can compete with the commonly used rechargeable
lithium based battery in the application field of portable electronic devices,
and how can a systematic approach help product designers select power
systems during the preliminary design phase?”
After definition of the context in Chapter 2 and analyzing the state of the art
tools and methods in Chapter 3, the initial question as described above will
be answered in Chapter 4. In the same chapter the main research question
is defined which is as follows:
“Are direct methanol fuel cell systems feasible for portable electronics and
can we identify the opportunities of DMFC systems in early phases of the
design process?”
The main question and its accompanying sub-questions will be answered in
the following Chapters 5 to 10.
1.3 Research methodology & structure of the thesis
To answer the initial research question this thesis will first explore the field
of alternative power systems. A large amount of data about alternative power
systems is acquired during my professional career, and is completed with an

4
exploratory research, described in Part I of this thesis. Part I is about the
context in which the research is conducted. First the application field for
batteries and its alternatives is defined in Chapter 2.1. This chapter will
define the bandwidth in which this research is conducted. Second a
quantitative performance data, physical data and cost data has been
gathered about different power systems which are presented in Chapter 2.2.
The field of power systems can be divided into two parts, the power
generators and the energy carriers. Two power systems (defined as a
combination of a power generator and energy carrier) are indicated as
potentially runner-ups for the commonly used lithium based rechargeable
batteries.
Because the interest is not only on alternative power systems but also on
selection and using mathematical modeling during conceptual design phase,
a literature review has been made on the tools and methods for selecting or
reviewing power systems. In Chapter 3 the design process is elaborated on,
and different tools and methods are pinpointed which can be used during
different phases of the design process.
In Chapter 4 the initial research question will be answered and the research
is more focused on the Direct Methanol Fuel Cell (DMFC) power system in
Part II of the thesis. In Chapter 5 a technological comparison is made of the
DMFC power system and the rechargeable battery, in search for
differentiating properties. Because one of the goals is a systematic approach
towards selecting/designing power systems, the focus in this chapter is on
using metrics for design and evaluation of power systems. In consumer
electronics it is not only about technology, but the user is also involved by
researching their preferences when buying a portable electronic device
(Chapter 6). This chapter results in quantitative data about the preference of
the user, making it possible to use this data for the selection phase of the
design process.
Data acquired during Part II is used in Part III where metric-based selection,
design and concept evaluation is researched. Four orders of modeling are
introduced in Chapter 7 as the basis for the rest of this thesis. Three orders
(zero, first and second-order modeling) are evaluated by means of Design
5
Research. A case-study from literature is used evaluating the zero-order
model and produce the first-order model (Chapter 8). This order of modeling
makes use of simple equations to test the feasibility of DMFC power systems
on three basic properties: volume, weight and costs. To improve accuracy of
the model a second-order model is proposed making use of the computer as
a generator and evaluator of multiple design architectures, or structural
variants (Chapter 9). The second-order of modeling is used as the stepping
stone for the third-order model, not evaluated within this thesis. The thesis
will finish with a concluding chapter where the research question is
evaluated, answered and, when needed, discussed.
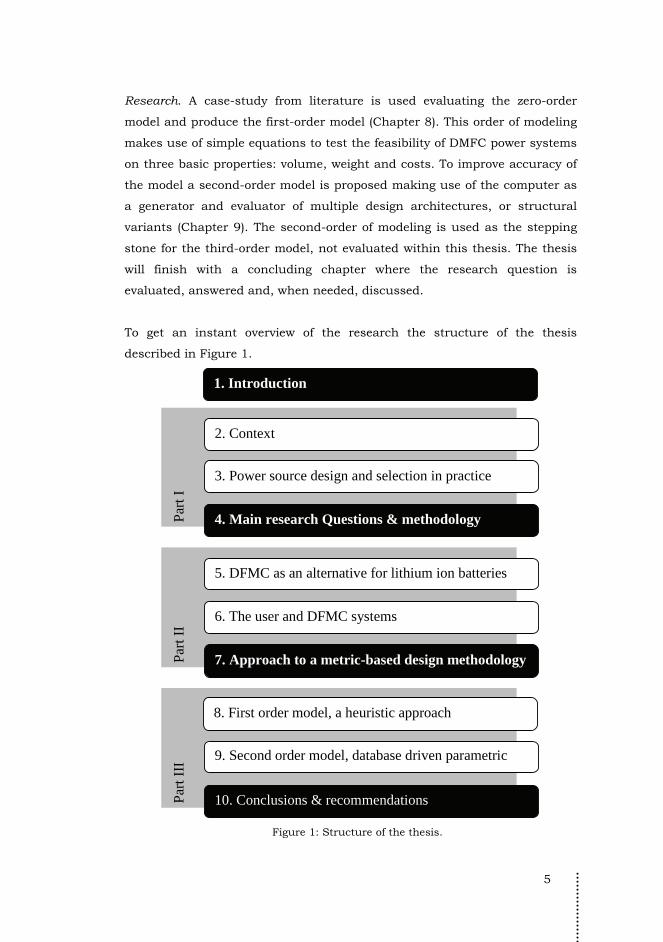
To get an instant overview of the research the structure of the thesis
described in Figure 1.
Par
t I
Par
t III
P
art I
I
2. Context
3. Power source design and selection in practice
4. Main research Questions & methodology
5. DFMC as an alternative for lithium ion batteries
6. The user and DFMC systems
7. Approach to a metric-based design methodology
8. First order model, a heuristic approach
9. Second order model, database driven parametric d i
10. Conclusions & recommendations
1. Introduction
Figure 1: Structure of the thesis.

6
7
2 Alternative power sources in context1
Two of the problems stated in the introduction were growth of electronic
devices which are more power hungry, now and in the near future, and the
low visibility of alternative power systems. To make alternative power
sources more comparable to each other an overview is made of alternatives
to the rechargeable batteries, Section 2.2. This comparison is based on basic
metrics as power, energy, price, weight and volume and has been executed
in the end of 2004.
Before this overview is presented, Section 2.1 gives the definition of “portable
electronic devices”, and thus the limits of the search field in Section 2.2.
Section 2.3 will draw the conclusions about the application field for different
power sources and the feasibility of some power sources in the field of
portable electronic devices. The chapter will finish with Section 2.3 giving an
overview of definitions used in this thesis.
2.1 Fields of application
2.1.1 What are portable electronic devices?
For the research described in this thesis the focus will be on “portable
electronic devices”. We limit the search field physically to products “which
can be carried with one arm for a longer period of time and which are not
voluminous”. Furthermore these devices “should be powered by batteries or
would potentially be interesting to power without electric cords (electronics)”.
1 Parts of this chapter are presented at the International Power Sources Symposium
(2004) and published in the Journal of Power Sources (2006), “Power Sources Compared: the ultimate truth?”162(2).
8
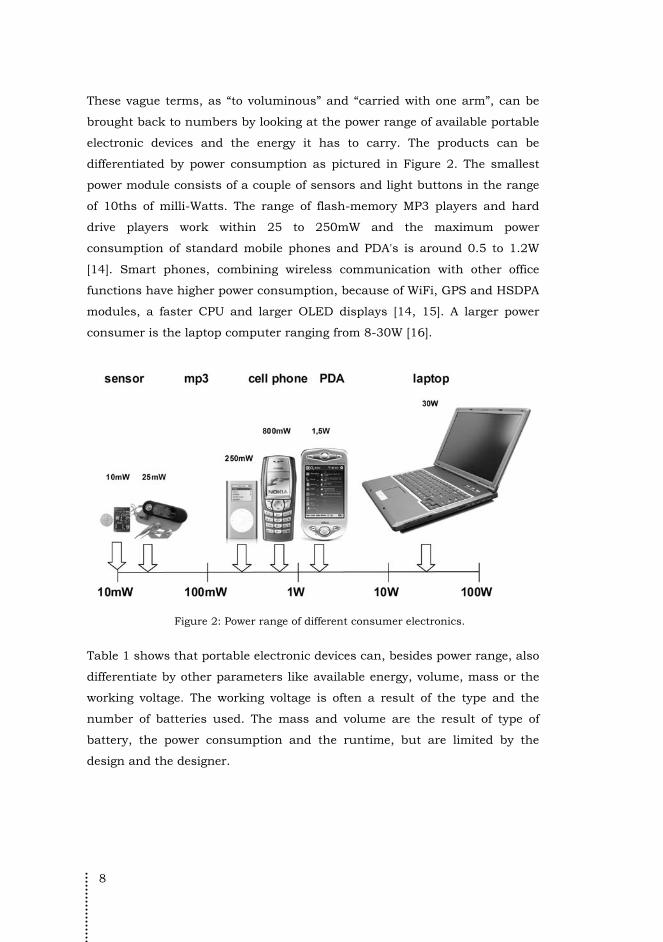
These vague terms, as “to voluminous” and “carried with one arm”, can be
brought back to numbers by looking at the power range of available portable
electronic devices and the energy it has to carry. The products can be
differentiated by power consumption as pictured in Figure 2. The smallest
power module consists of a couple of sensors and light buttons in the range
of 10ths of milli-Watts. The range of flash-memory MP3 players and hard
drive players work within 25 to 250mW and the maximum power
consumption of standard mobile phones and PDA's is around 0.5 to 1.2W
[14]. Smart phones, combining wireless communication with other office
functions have higher power consumption, because of WiFi, GPS and HSDPA
modules, a faster CPU and larger OLED displays [14, 15]. A larger power
consumer is the laptop computer ranging from 8-30W [16].
Figure 2: Power range of different consumer electronics.
Table 1 shows that portable electronic devices can, besides power range, also
differentiate by other parameters like available energy, volume, mass or the
working voltage. The working voltage is often a result of the type and the
number of batteries used. The mass and volume are the result of type of
battery, the power consumption and the runtime, but are limited by the
design and the designer.

9
Table 1: Overview of different consumer products and the differentiating metrics of the battery.
Batt type P (W)
E (Wh)
V (mm3)
m (g)
V (V)
Sensors button 0.010 0.15 700 2.2 1.5–15
Flashdrive MP3 AA 0.025 1.1 5,000 11 1.5
Harddrive MP3 li-ion/poly 0.250 2.9 6,600 13 7.2
Mobile phone li-ion/poly 0.800 3 30,000 50 2.4-7.2
PDA li-ion/poly 1.50 3 11,000 26 3-6
Portable DVD players
li-ion/poly 9–20 50 375,000 - 7.4-12
Laptop computers li-ion/poly 10–30 50 250,000 400 4-14.4
Electric bike Pb/NiMH 500 192-360 - 1500 24-36
In this thesis a distinction is made in product groups by dividing them to
power and capacity. Four groups can be defined by different power range:
1. Micro power: 0.01 to 0.1 W
2. Low power: 0.1 to 10 W
3. Medium power 10 to 100 W
4. High power: 100-1000 W
The same thing can be done with capacity, which can be divided as:
1. Low capacity: 0.1 to 1 Wh,
2. Medium capacity: 1-10Wh,
3. High capacity: 10-100 Wh
4. Ultra high capacity: 100-1000Wh systems.
If power and capacity is combined Table 2 can be made. To prove the
combinations are genuine and other combinations are either rare or not
existing in any product group, a product group was searched for, for every
power-capacity combination. The table shows that most products stay within
a bandwidth of power-capacity and less extremes can be found. The
extremes are found in products with low power and high endurance
applications like the ad-hoc sensor for data-networking and measuring
buoys. The measuring buoy works at powers in the range of 1W and have to
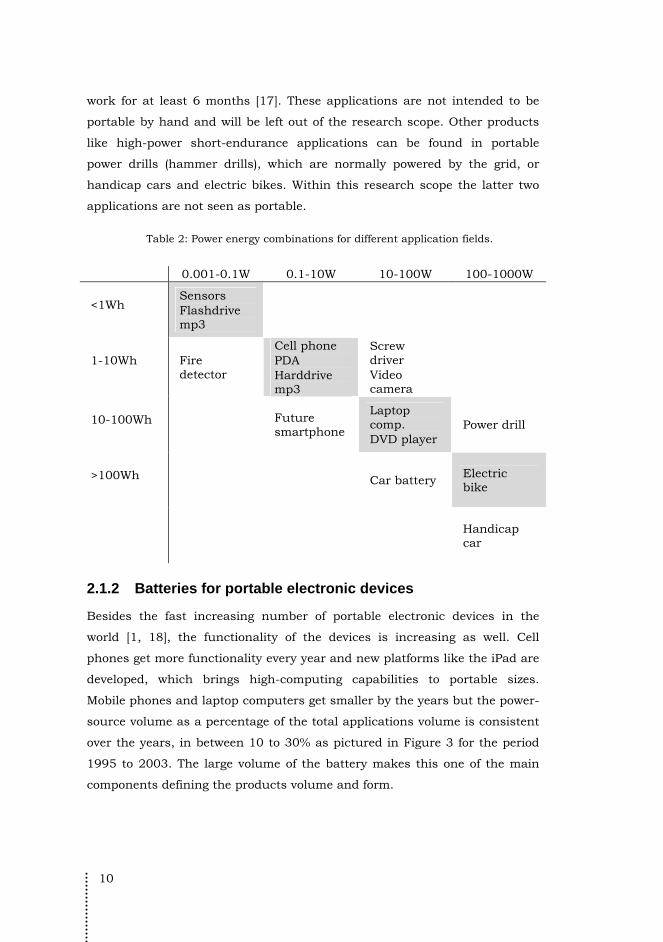
10
work for at least 6 months [17]. These applications are not intended to be
portable by hand and will be left out of the research scope. Other products
like high-power short-endurance applications can be found in portable
power drills (hammer drills), which are normally powered by the grid, or
handicap cars and electric bikes. Within this research scope the latter two
applications are not seen as portable.
Table 2: Power energy combinations for different application fields.
0.001-0.1W 0.1-10W 10-100W 100-1000W <1Wh
Sensors Flashdrive mp3
1-10Wh Fire
detector
Cell phone PDA Harddrive mp3
Screw driver Video camera
10-100Wh
Future smartphone
Laptop comp. DVD player
Power drill
>100Wh Car battery
Electric bike
Handicap car
2.1.2 Batteries for portable electronic devices
Besides the fast increasing number of portable electronic devices in the
world [1, 18], the functionality of the devices is increasing as well. Cell
phones get more functionality every year and new platforms like the iPad are
developed, which brings high-computing capabilities to portable sizes.
Mobile phones and laptop computers get smaller by the years but the power-
source volume as a percentage of the total applications volume is consistent
over the years, in between 10 to 30% as pictured in Figure 3 for the period
1995 to 2003. The large volume of the battery makes this one of the main
components defining the products volume and form.
11
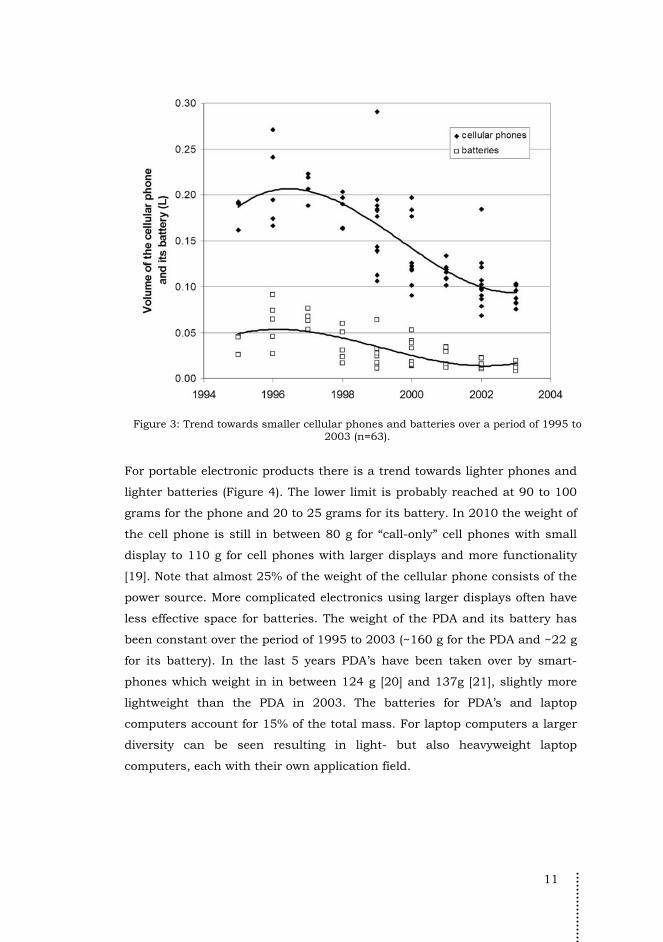
Figure 3: Trend towards smaller cellular phones and batteries over a period of 1995 to 2003 (n=63).
For portable electronic products there is a trend towards lighter phones and
lighter batteries (Figure 4). The lower limit is probably reached at 90 to 100
grams for the phone and 20 to 25 grams for its battery. In 2010 the weight of
the cell phone is still in between 80 g for “call-only” cell phones with small
display to 110 g for cell phones with larger displays and more functionality
[19]. Note that almost 25% of the weight of the cellular phone consists of the
power source. More complicated electronics using larger displays often have
less effective space for batteries. The weight of the PDA and its battery has
been constant over the period of 1995 to 2003 (~160 g for the PDA and ~22 g
for its battery). In the last 5 years PDA’s have been taken over by smart-
phones which weight in in between 124 g [20] and 137g [21], slightly more
lightweight than the PDA in 2003. The batteries for PDA’s and laptop
computers account for 15% of the total mass. For laptop computers a larger
diversity can be seen resulting in light- but also heavyweight laptop
computers, each with their own application field.

12
Figure 4: Trend towards lighter cellular phones and batteries over a period of 1995 to
2003 (n=63).
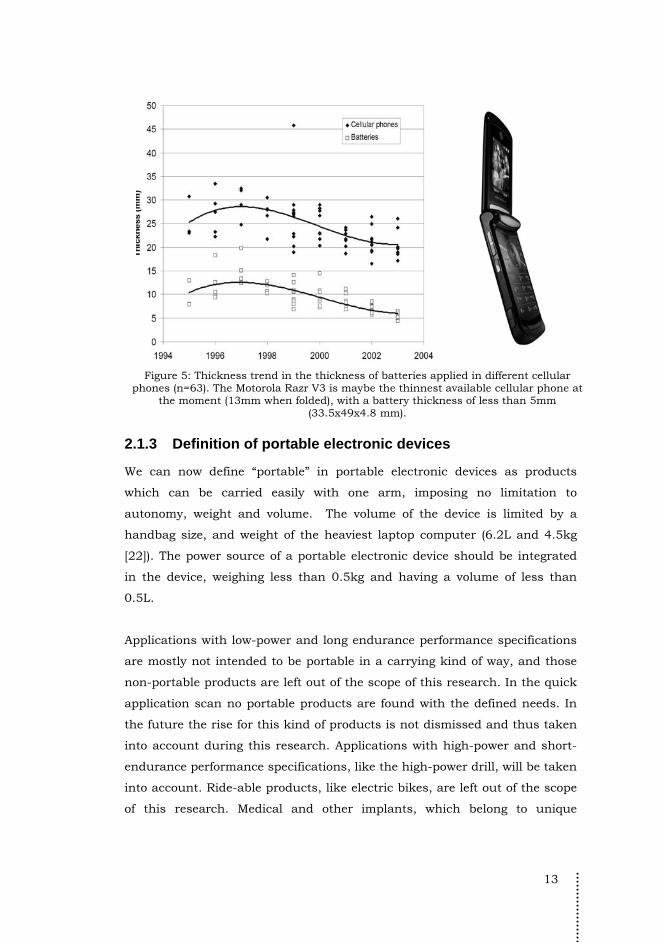
Another important trend in battery design is the trend for thinner batteries.
Thinner batteries mean thinner products. You can see this trend especially
in batteries for low power applications like mobile phones (Figure 5) with a
thickness of less than 5mm in 2003. The thickness of PDA batteries hasn’t
changed meaningfully in between 1995 and 2003, with a median of ~10mm
(n=58). Based on the current thickness of smart phones the current batteries
used in these devices are even thinner than 10mm [20, 21]. Laptop
computers have a median thickness of ~20mm (n=103). Generally the laptop
computer uses cylindrical batteries compared which are, because of their
construction, more energy dense than the flat batteries used in lower-power
applications like cell phones and smart phones.
13
Figure 5: Thickness trend in the thickness of batteries applied in different cellular
phones (n=63). The Motorola Razr V3 is maybe the thinnest available cellular phone at the moment (13mm when folded), with a battery thickness of less than 5mm
(33.5x49x4.8 mm).
2.1.3 Definition of portable electronic devices
We can now define “portable” in portable electronic devices as products
which can be carried easily with one arm, imposing no limitation to
autonomy, weight and volume. The volume of the device is limited by a
handbag size, and weight of the heaviest laptop computer (6.2L and 4.5kg
[22]). The power source of a portable electronic device should be integrated
in the device, weighing less than 0.5kg and having a volume of less than
0.5L.
Applications with low-power and long endurance performance specifications
are mostly not intended to be portable in a carrying kind of way, and those
non-portable products are left out of the scope of this research. In the quick
application scan no portable products are found with the defined needs. In
the future the rise for this kind of products is not dismissed and thus taken
into account during this research. Applications with high-power and short-
endurance performance specifications, like the high-power drill, will be taken
into account. Ride-able products, like electric bikes, are left out of the scope
of this research. Medical and other implants, which belong to unique
14
contexts and pose special constraints, do not belong to the considered group
and are not considered in this study.
2.2 Power and energy systems compared Alternatives to the lithium based battery can be found in several research
projects discussing the possibilities of (alternative) power sources on a
theoretical basis [23-26]. Although these research projects give an excellent
theoretical overview, our concern is directed towards more practical values.
Within the literature reviewed we have not found studies describing
applicable data on power sources, and a literature study has been executed
to compare the different power generating and energy containing systems
with each other.
This section gives an introduction in a large number of alternative power
sources and energy systems. Practical data of all these power sources and
energy systems are accumulated from literature, specification sheets and
internet sources. All data is brought back to its basic normalized parameters
for prize, power and energy contained.
2.2.1 Approach
A desk search has been executed to acquire power source specifics. We
defined the following specifics to be of importance for power sources: power
output, voltage, dimensions, weight, conversion efficiency (mechanical to
electric) and retail price per item. For energy systems the defined specifics
are nominal voltage, ampere-hour capacity, dimensions, weight and retail
price per item.
Data is gathered in five ways. At first an internet search has been carried out
to find price, power and energy specifics for different commercially available
energy systems. More specific data was found in the second search field:
specification sheets from manufacturers manufacturing power-generators or
storage devices. Third search field: storage devices, especially batteries used
in cellular phones and laptop computers, were measured by students at
Delft University of Technology [22, 27]. The energy specifics for these
batteries were looked after on the battery itself or via specification sheets on
the internet. Fourth field of research consisted of acquiring data from
15
scientific papers. A number of case studies [28-30] describe power specifics
of for instance fuel cells. When no data was available from literature it was
generated by means of calculations based on theory and practical conversion
efficiencies. The potential energy available for e.g. fuels are calculated based
on the lower heating value and literature-based conversion efficiencies. Note
that his research has been conducted in 2004. Data is not updated, unless
mentioned otherwise.
To compare the power sources to each other general parameters are used
like the power and energy density (p and u) and the specific power and
energy (pρ and uρ). Also two new parameters are defined to give more insight
in the cost-price for a power source or energy storage device2, namely the
Specific Cost (SC) of power and energy:
retailP
ouput
cSC
P= (1)
retailE
cSC
E= (2)
Batteries on the one hand are both a power generator and energy containing
system, but for most alternative systems the power and energy demand is
separated in a module which produces power and a module containing
energy. To make a fare comparison these two parts have been separated in
the comparison and in Section 2.2.2 power sources are compared and in
Section 2.2.3 energy storage systems. The combination of a power source
with a energy container defines a power system for a portable electronic
device. Batteries are not taken into account as a power source but are
compared as an energy container.
2.2.2 Power sources compared
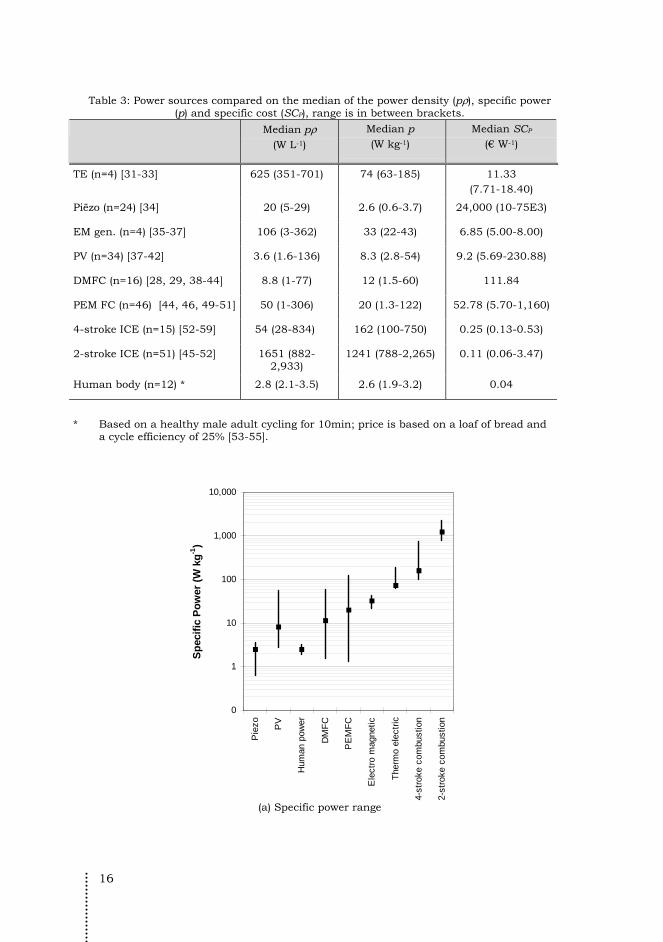
In Table 3 an overview is given of the median of the power density, specific
power and specific cost. All data is based on the power module itself without
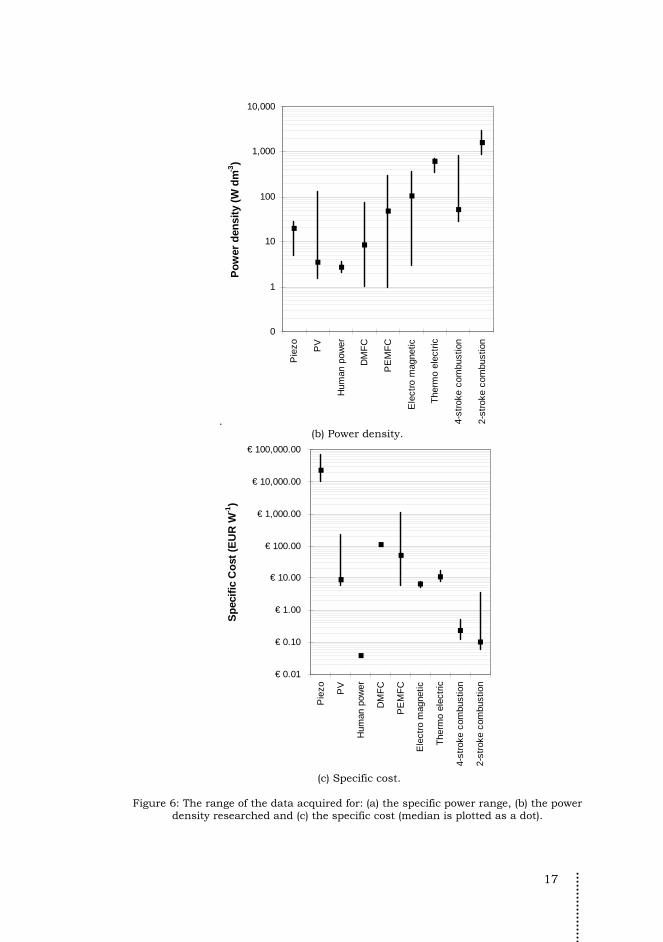
taking auxiliary systems into account. Figures 6 and 7 show the results of
specific power, power density and specific cost in a graphical form.
2 The SCE is based on the initial price and not life cycle costs.
16
Table 3: Power sources compared on the median of the power density (pρ), specific power (p) and specific cost (SCP), range is in between brackets.
Median pρ
(W L-1)
Median p (W kg-1)
Median SCP
(€ W-1)
TE (n=4) [31-33] 625 (351-701) 74 (63-185) 11.33 (7.71-18.40)
Piëzo (n=24) [34] 20 (5-29) 2.6 (0.6-3.7) 24,000 (10-75E3)
EM gen. (n=4) [35-37] 106 (3-362) 33 (22-43) 6.85 (5.00-8.00)
PV (n=34) [37-42] 3.6 (1.6-136) 8.3 (2.8-54) 9.2 (5.69-230.88)
DMFC (n=16) [28, 29, 38-44] 8.8 (1-77) 12 (1.5-60) 111.84
PEM FC (n=46) [44, 46, 49-51] 50 (1-306) 20 (1.3-122) 52.78 (5.70-1,160)
4-stroke ICE (n=15) [52-59] 54 (28-834) 162 (100-750) 0.25 (0.13-0.53)
2-stroke ICE (n=51) [45-52] 1651 (882-2,933)
1241 (788-2,265) 0.11 (0.06-3.47)
Human body (n=12) * 2.8 (2.1-3.5) 2.6 (1.9-3.2) 0.04
* Based on a healthy male adult cycling for 10min; price is based on a loaf of bread and
a cycle efficiency of 25% [53-55].
0
1
10
100
1,000
10,000
Pie
zo PV
Hum
an p
ower
DM
FC
PE
MF
C
Ele
ctro
mag
netic
The
rmo
elec
tric
4-st
roke
com
bust
ion
2-st
roke
com
bust
ion
Sp
ecif
ic P
ow
er (
W k
g-1
)
(a) Specific power range
17
.
0
1
10
100
1,000
10,000
Pie
zo PV
Hum
an p
ower
DM
FC
PE
MF
C
Ele
ctro
mag
netic
The
rmo
elec
tric
4-st
roke
com
bust
ion
2-st
roke
com
bust
ion
Po
wer
den
sity
(W
dm
-3)
(b) Power density.
€ 0.01
€ 0.10
€ 1.00
€ 10.00
€ 100.00
€ 1,000.00
€ 10,000.00
€ 100,000.00
Pie
zo PV
Hum
an p
ower
DM
FC
PE
MF
C
Ele
ctro
mag
netic
The
rmo
elec
tric
4-st
roke
com
bust
ion
2-st
roke
com
bust
ion
Sp
ecif
ic C
ost
(E
UR
W-1
)
(c) Specific cost.
Figure 6: The range of the data acquired for: (a) the specific power range, (b) the power
density researched and (c) the specific cost (median is plotted as a dot).
18
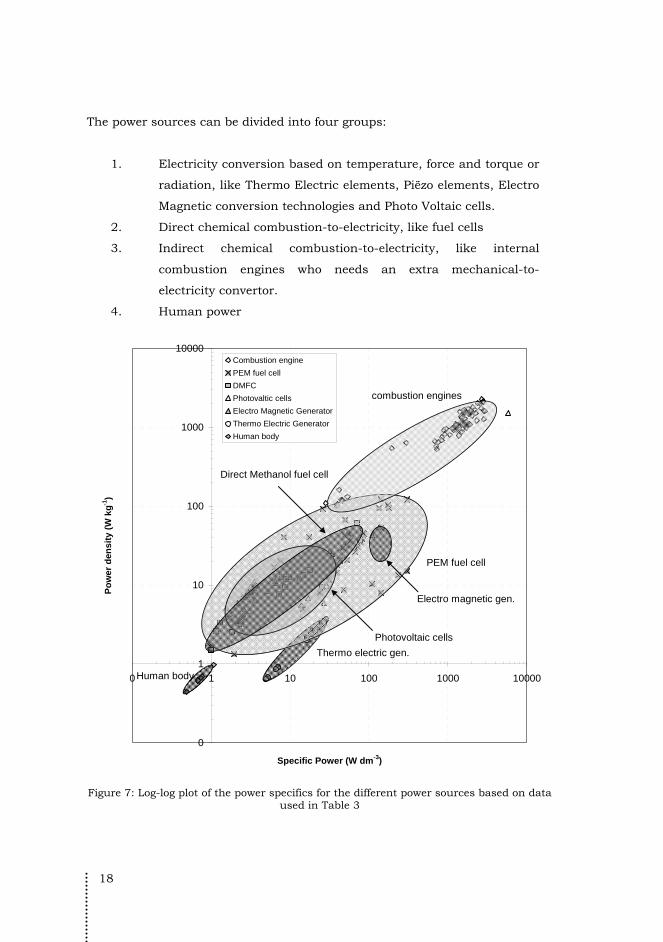
The power sources can be divided into four groups:
1. Electricity conversion based on temperature, force and torque or
radiation, like Thermo Electric elements, Piëzo elements, Electro
Magnetic conversion technologies and Photo Voltaic cells.
2. Direct chemical combustion-to-electricity, like fuel cells
3. Indirect chemical combustion-to-electricity, like internal
combustion engines who needs an extra mechanical-to-
electricity convertor.
4. Human power
0
1
10
100
1000
10000
0 1 10 100 1000 10000
Specific Power (W dm-3)
Po
wer
den
sit
y (
W k
g-1
)
Combustion engine
PEM fuel cell
DMFC
Photovaltic cells
Electro Magnetic Generator
Thermo Electric Generator
Human body
combustion engines
PEM fuel cell
Direct Methanol fuel cell
Electro magnetic gen.
Photovoltaic cells
Thermo electric gen.
Human body
Figure 7: Log-log plot of the power specifics for the different power sources based on data
used in Table 3
19
Figure 7 shows all power sources found plotted in a graphical form. The
figure shows a log-log plot of the specific power versus the power density of
all power sources. Batteries are not included because these products are
besides a power source also a energy storage device, and could best be
compared with power sources combined with energy storage means (like
fuels).
The internal combustion engines deliver the most power per unit of mass
and per unit of volume and are the most cost effective power source. The
data is mainly based on Internal Combustion Engines (ICE) found in RF-
controlled planes. The electro-magnetic generators and thermo-electric
elements are also very small and lightweight power generators, and also very
cost effective. The direct chemical combustion to electricity generators, the
Direct Methanol and PEM fuel cells deliver a fairly good amount of power per
unit volume and weight, but are very costly at the moment.
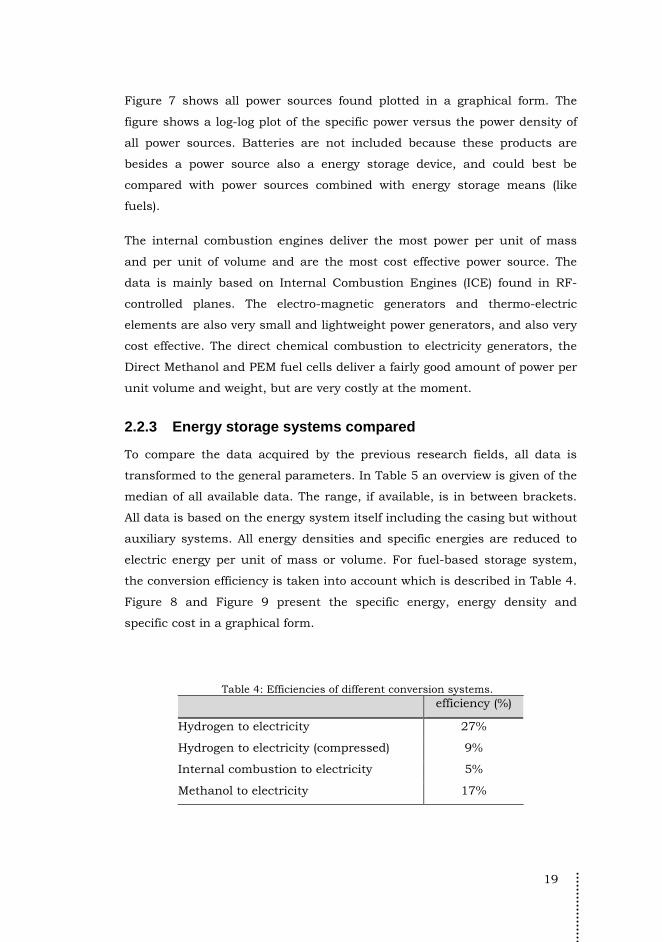
2.2.3 Energy storage systems compared
To compare the data acquired by the previous research fields, all data is
transformed to the general parameters. In Table 5 an overview is given of the
median of all available data. The range, if available, is in between brackets.
All data is based on the energy system itself including the casing but without
auxiliary systems. All energy densities and specific energies are reduced to
electric energy per unit of mass or volume. For fuel-based storage system,
the conversion efficiency is taken into account which is described in Table 4.
Figure 8 and Figure 9 present the specific energy, energy density and
specific cost in a graphical form.
Table 4: Efficiencies of different conversion systems.
efficiency (%)
Hydrogen to electricity 27%
Hydrogen to electricity (compressed) 9%
Internal combustion to electricity 5%
Methanol to electricity 17%
20
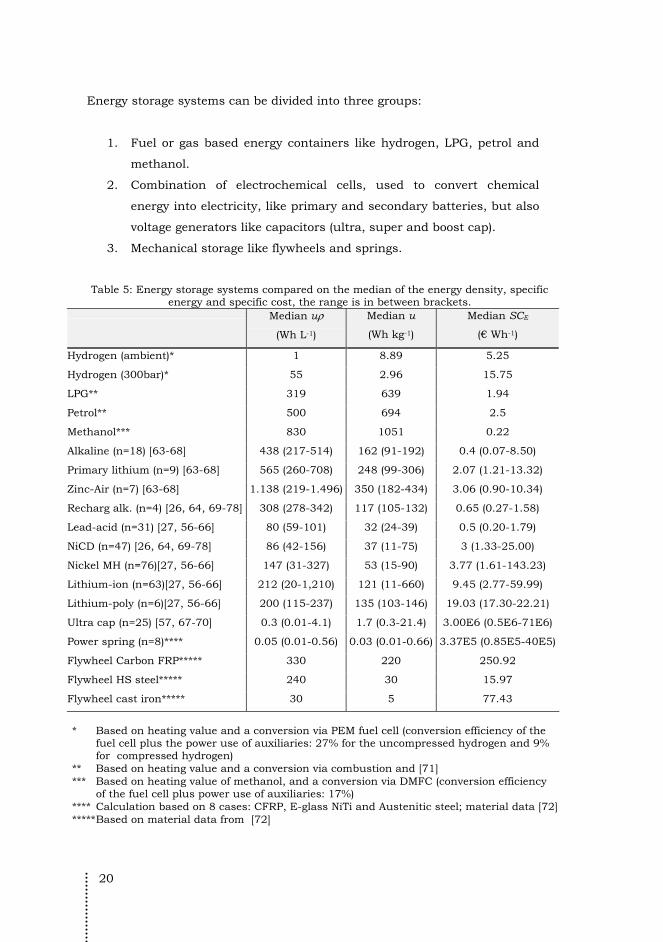
Energy storage systems can be divided into three groups:
1. Fuel or gas based energy containers like hydrogen, LPG, petrol and
methanol.
2. Combination of electrochemical cells, used to convert chemical
energy into electricity, like primary and secondary batteries, but also
voltage generators like capacitors (ultra, super and boost cap).
3. Mechanical storage like flywheels and springs.
Table 5: Energy storage systems compared on the median of the energy density, specific energy and specific cost, the range is in between brackets.
Median uρ
(Wh L-1)
Median u
(Wh kg-1)
Median SCE
(€ Wh-1)
Hydrogen (ambient)* 1 8.89 5.25
Hydrogen (300bar)* 55 2.96 15.75
LPG** 319 639 1.94
Petrol** 500 694 2.5
Methanol*** 830 1051 0.22
Alkaline (n=18) [63-68] 438 (217-514) 162 (91-192) 0.4 (0.07-8.50)
Primary lithium (n=9) [63-68] 565 (260-708) 248 (99-306) 2.07 (1.21-13.32)
Zinc-Air (n=7) [63-68] 1.138 (219-1.496) 350 (182-434) 3.06 (0.90-10.34)
Recharg alk. (n=4) [26, 64, 69-78] 308 (278-342) 117 (105-132) 0.65 (0.27-1.58)
Lead-acid (n=31) [27, 56-66] 80 (59-101) 32 (24-39) 0.5 (0.20-1.79)
NiCD (n=47) [26, 64, 69-78] 86 (42-156) 37 (11-75) 3 (1.33-25.00)
Nickel MH (n=76)[27, 56-66] 147 (31-327) 53 (15-90) 3.77 (1.61-143.23)
Lithium-ion (n=63)[27, 56-66] 212 (20-1,210) 121 (11-660) 9.45 (2.77-59.99)
Lithium-poly (n=6)[27, 56-66] 200 (115-237) 135 (103-146) 19.03 (17.30-22.21)
Ultra cap (n=25) [57, 67-70] 0.3 (0.01-4.1) 1.7 (0.3-21.4) 3.00E6 (0.5E6-71E6)
Power spring (n=8)**** 0.05 (0.01-0.56) 0.03 (0.01-0.66) 3.37E5 (0.85E5-40E5)
Flywheel Carbon FRP***** 330 220 250.92
Flywheel HS steel***** 240 30 15.97
Flywheel cast iron***** 30 5 77.43
* Based on heating value and a conversion via PEM fuel cell (conversion efficiency of the
fuel cell plus the power use of auxiliaries: 27% for the uncompressed hydrogen and 9% for compressed hydrogen)
** Based on heating value and a conversion via combustion and [71] *** Based on heating value of methanol, and a conversion via DMFC (conversion efficiency
of the fuel cell plus power use of auxiliaries: 17%) **** Calculation based on 8 cases: CFRP, E-glass NiTi and Austenitic steel; material data [72] ***** Based on material data from [72]
21
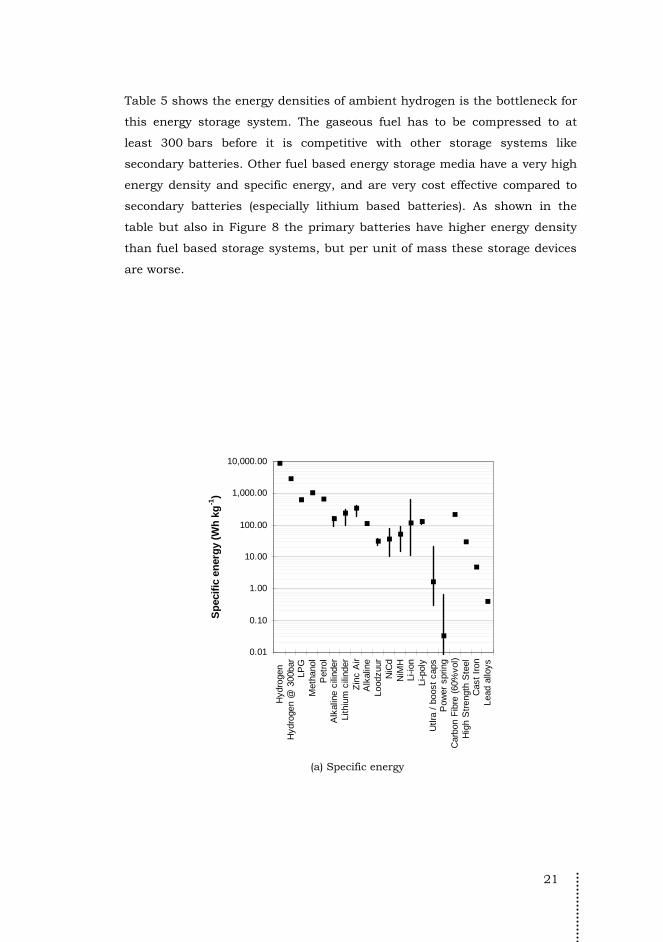
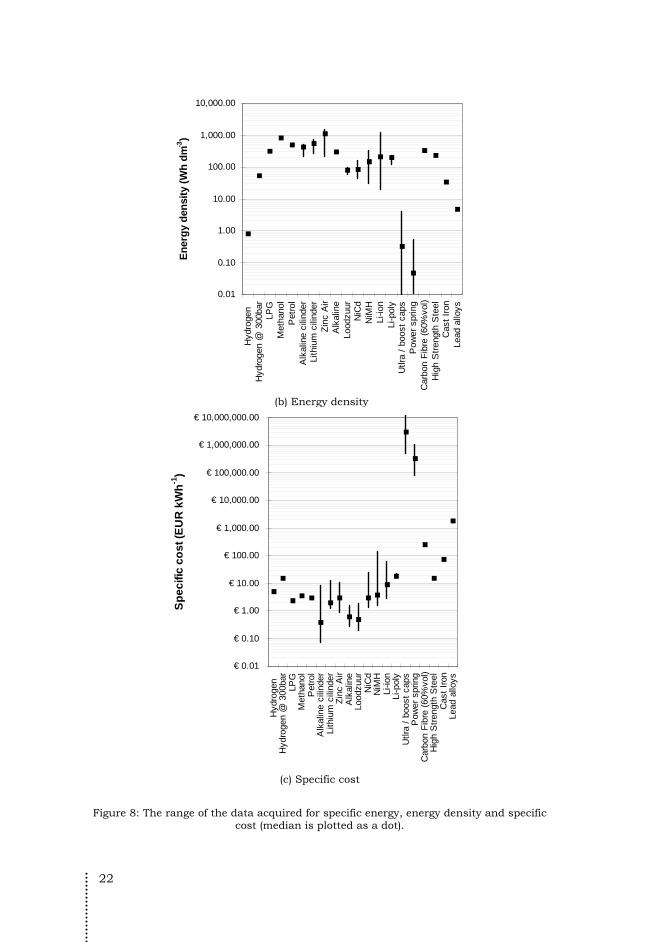
Table 5 shows the energy densities of ambient hydrogen is the bottleneck for
this energy storage system. The gaseous fuel has to be compressed to at
least 300 bars before it is competitive with other storage systems like
secondary batteries. Other fuel based energy storage media have a very high
energy density and specific energy, and are very cost effective compared to
secondary batteries (especially lithium based batteries). As shown in the
table but also in Figure 8 the primary batteries have higher energy density
than fuel based storage systems, but per unit of mass these storage devices
are worse.
0.01
0.10
1.00
10.00
100.00
1,000.00
10,000.00
Hyd
roge
n
Hyd
roge
n @
300
bar
LPG
Met
hano
lP
etro
lA
lkal
ine
cilin
der
Lith
ium
cili
nder
Zin
c A
irA
lkal
ine
Lood
zuur
NiC
dN
iMH
Li-io
nLi
-pol
yU
tlra
/ bo
ost
caps
Pow
er s
prin
gC
arbo
n F
ibre
(60
%vo
l)H
igh
Str
engt
h S
teel
Cas
t Ir
onLe
ad a
lloys
Sp
ecif
ic e
ner
gy
(Wh
kg
-1)
(a) Specific energy
22
0.01
0.10
1.00
10.00
100.00
1,000.00
10,000.00
Hyd
roge
n
Hyd
roge
n @
300
bar
LPG
Met
hano
lP
etro
lA
lkal
ine
cilin
der
Lith
ium
cili
nder
Zin
c A
irA
lkal
ine
Lood
zuur
NiC
dN
iMH
Li-io
nLi
-pol
yU
tlra
/ bo
ost
caps
Pow
er s
prin
gC
arbo
n F
ibre
(60
%vo
l)H
igh
Str
engt
h S
teel
Cas
t Ir
onLe
ad a
lloys
En
erg
y d
ensi
ty (
Wh
dm
-3)
(b) Energy density
€ 0.01
€ 0.10
€ 1.00
€ 10.00
€ 100.00
€ 1,000.00
€ 10,000.00
€ 100,000.00
€ 1,000,000.00
€ 10,000,000.00
Hyd
roge
n
Hyd
roge
n @
300
bar
LPG
Met
hano
lP
etro
lA
lkal
ine
cilin
der
Lith
ium
cili
nder
Zin
c A
irA
lkal
ine
Lood
zuur
NiC
dN
iMH
Li-io
nLi
-pol
yU
tlra
/ bo
ost
caps
Pow
er s
prin
gC
arbo
n F
ibre
(60
%vo
l)H
igh
Str
engt
h S
teel
Cas
t Ir
onLe
ad a
lloys
Sp
ec
ific
co
st
(EU
R k
Wh
-1)
(c) Specific cost
Figure 8: The range of the data acquired for specific energy, energy density and specific cost (median is plotted as a dot).
23
0
0
1
10
100
1,000
10,000
100,000
0.0001 0.001 0.01 0.1 1 10 100 1000 10000
Electric Power (W)
Pri
ce
(EU
R W
-1)
PEM fuel celltwo-stroke combustion enginefour-stroke combustion engineDMFCPhotovaltaic cellsElectro magnetic dynamoPiezo generatorThermo Electric generatorHuman power engine
Piezo gen.
Two-stroke CE
Four-stroke CE
PEM fuel cell
DMFC
PV cells
DynamoTE gen.
Human power
€1
€10
€100
€1.000
€10.000
€0,10
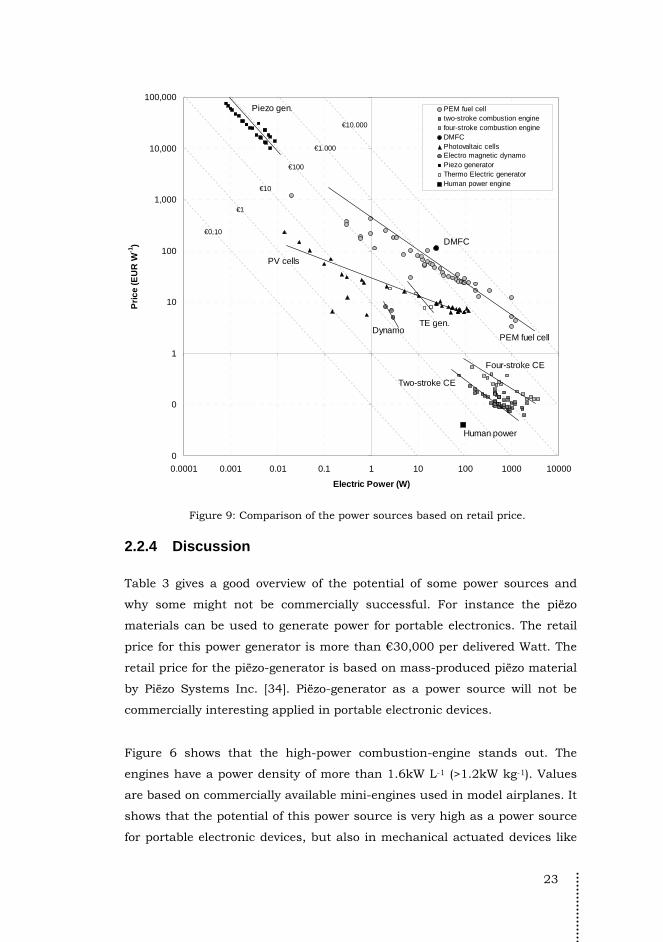
Figure 9: Comparison of the power sources based on retail price.
2.2.4 Discussion
Table 3 gives a good overview of the potential of some power sources and
why some might not be commercially successful. For instance the piëzo
materials can be used to generate power for portable electronics. The retail
price for this power generator is more than €30,000 per delivered Watt. The
retail price for the piëzo-generator is based on mass-produced piëzo material
by Piëzo Systems Inc. [34]. Piëzo-generator as a power source will not be
commercially interesting applied in portable electronic devices.
Figure 6 shows that the high-power combustion-engine stands out. The
engines have a power density of more than 1.6kW L-1 (>1.2kW kg-1). Values
are based on commercially available mini-engines used in model airplanes. It
shows that the potential of this power source is very high as a power source
for portable electronic devices, but also in mechanical actuated devices like
24
high-power drills. They seem to be very promising as an alternative power
source for portable applications. Why is this power source not applied more
often in portable electronic products? Reasons are its high noise output,
vibration, the toxic exhaust fumes and instability of electrical power from the
system. The engine is a spinning mass at high angular velocities and is
subject to angular velocity variation when load changes [25]. Besides output
the engine needs an air intake as well as cooling. The smallest existing
combustion engine is the Cox Tee Dee .010 two-stroke engine has a
mechanical power output of 15W at a speed of 32,000rpm, encapsulated in a
volume of 37.5x38x7mm3 and weighing only 14grams [45]. This production
engine is still to large to be placed in for instance a laptop computer. MEMS
and nanotechnology could lead the way to miniaturizing the engines more so
it could be installed in portable electronics [47]. The high noise output can
be decreased by muffler systems. The implication of miniaturization on noise
output is unknown at the moment.
The next interesting power source is the Polymer Exchange Membrane fuel
cell (PEM FC), fueled by hydrogen, and its more inefficient sister, the Direct
Methanol Fuel Cell (DMFC). A major problem in this area is the storage of
hydrogen. New developments could improve the total energy density of a
PEM power system but do not seem to be commercially available in the
upcoming years. The DMFC doesn’t have this problem. Methanol is easy to
refill when power is needed. The DMFC systems of today are fueled with a
3%wt methanol water mixture. Improvements are reported already by
Toshiba and MTI fuel cells which claim to have boosted the concentration up
to 100%. This means a higher energy density of the total system and a
smaller tank needed. This makes DMFC systems more interesting for
applying in portable electronics. The technology is still in its research phase
and industrial application still seems to be a long way.
When looking at costs the most cost effective power source is the human
body when cycling (Figure 7). The human body is only generating mechanical
output which has to be converted to electricity. Dynamos, thermo-electric
elements and piëzo generators are good conversion technologies. The
dynamo is a very cost-effective power converter. On the other hand PV cells
and thermo-electric generators are very cost-effective when compared to fuel
25
cells. This is probably because more effort in the past years is applied on
this field. For instance PV cells are under investigation since 1950 at the Bell
labs for use in space applications. At the moment large factories have been
build by Siemens, Shell and BP to mass-produce the cells on the roll. PEM
fuel cells on the contrary are under research since 1960 at General Electric
for the use in the NASA Gemini project. They got industrial attention since
the 1980’s by the car companies. Micro Direct Methanol fuel-cells were first
presented by Robert Hockaday in the beginning of the 1990’s [73]. A lot of
work is done since to decrease the price of fuel cells by lowering the amount
of platinum needed for the membrane and making it mass-produceable.
Tsuchiya and Kobayashi [74] analyzed the mass-production cost structure of
PEM fuel cells for automobiles (50 kW) by a learning-curve model. A
moderate scenario shows that production cost will decrease from €1.46 per
Watt for the production of 40 cars to about €0.14 per Watt in 2010 for the
production of 50,000 cars (a cut down of a factor 10 over ten years). This
price is in the same order as that for commercially available micro-
combustion engines. If these numbers are applicable to low-power fuel cells
in the range of 10 mW to 100 W has to be seen.
For DMFC systems the costs of materials used for fabricating are very high
(especially the high cost of platinum electro catalysts). According to [75] the
production costs for a direct methanol fuel cell could be $5 per generated
Watt, for a 20W and 60Wh power system. In 2004 the Smart Fuel Cell SFC-
A25 cost around €112 per generated Watt, but in 2010 the prices dropped to
€53 per generated Watt [76] for the next generation DMFC systems from
Smart Fuel Cell, the EFOY 2200 (90W) system.
Hydrogen seems to be a good option to be the next energy carrier for a wide
range of applications (Figure 8). The storage of hydrogen in small volume is
still a big issue researched on. Compression or other ways to decrease
volume of hydrogen is necessary. Problem with compression is the high
pressures needed ranging from 250 bars to 600 bars. These high
compression rates call for a high tension casing like steel or fibers.
Alternatives like nanotubes and liquefied hydrogen at low temperatures still
seems to very far away especially when applying it to consumer electronics.
26
Other carbon-hydrogen liquids like methanol are less energy dense but are
more practical in use. In combination with a fuel cell these energy carriers
are a great opportunity for powering portable electronic devices.
Petrol and other carbon-hydrogen liquids are able to carry lots of energy per
unit of volume and mass when using combustion-engine technology to
convert from fuel-to-mechanical-to-electricity. When carbon-hydrogen
liquids are directly converted to electricity, for instance by means of a DMFC,
the energy characteristics seems to improve because overall system
efficiency of the DMFC is higher than the combustion engine generator. In
comparison with the lithium-ion battery the methanol fuel-cell combination
could improve energy densities up to a magnitude of 3, and specific energies
up to 7.
The next interesting energy storage system is the Zinc-Air battery. This
system is a battery which, like fuel cells, needs air on the cathode side. A
proven technology used for instance in hearing aids, and lately also as a
back-up charger for cellular phones and PDA’s [77]. Problem with this
battery type is the single use only, but it can still compete with hydrogen or
methanol as an energy carrier, without the advantage of quick refill.
Rechargeable batteries have improved very fast the last decades. Large
improvement steps have been made from the first Nickel-Cadmium (NiCd)
cell to the energy dense lithium ion battery (li-ion). As can be seen in Figure
8 (a) and (b) the lithium-ion battery has a high energy density and specific
energy, but is very costly when compared to other battery systems, Figure 8
(c). Apparently the price of the battery is of subordinate concern to the
improvement in convenience and decrease of volume and mass.
Within the group of mechanical storage devices the flywheel and especially
the Carbon Fiber Resin Polymer has high potential energy specifics.
Unfortunately the price is still very high and can only decrease when the
price of carbon fibers decreases. The price now is based only on mean
material price for CFRP filled with 60%vol HT-carbon which is in between
€188 and €314 per kg [72]. Because the energy stored in flywheels is related
linear with mass and to the square of the angular velocity, smaller flywheels
can only store significant energy when rotation speeds are high. The
rotational speed is limited by the strength and density of the material. High

27
rotation speeds introduce gyroscopic forces complicating movement of the
total system. Implementing two contra-rotating flywheels will annul the total
angular momentum, but introduces significant design problems, like a-
synchronic acceleration [25]. Flywheels created from High Tension steel
seems to be a cheaper alternative but cannot compete with the energy
density of rechargeable batteries in general.
The worst energy storage system presented in the previous figures is
capacitors. Their energy storage specifics are both very low in comparison
with batteries, and their retail price is too high to be of interest as the
primary energy storage medium. On the other hand capacitors are not made
for energy storage but to boost power output. They are well-known for their
high pulsed power output, for the use in hybrid systems like in electric
buses but also to increase run-time of portable electronics [78]. They are
potentially interesting as an intermediate power source generating high
instant power for hybrid energy systems.
2.3 Conclusions This chapters’ goal was to compare and pinpoint the power systems which
can compete with lithium based rechargeable batteries in the field of
portable electronic devices. We have defined portable electronic devices in
the first section as ‘devices using electric energy, with an integrated power
source and carriable in once bag’. The size of the device has been limited to a
large laptop computer size (<6.2L) and weight (<4.5kg). Devices which are
implantable and applications, mainly in the field of low power, which are not
intended to be carried around are left out of the scope of this research. This
does not mean all low-power long-endurance applications are out of the loop.
At the moment no products satisfying this definition have been found, but in
the future the rise for these kinds of products are not dismissed and thus
taken into account during this research.
From the previous desk search it can be concluded that we can pinpoint two
power source-fuel combinations which can compete with the lithium based
rechargeable battery: (i) the high power-dense combustion engine in
combination with the high energy-dense carbon fuels as petrol, and (ii) fuel
28
cells chemically burning high-energy dense (carbon) hydrogen-based fuels
direct to electricity.
Besides the high power density and energy density of internal combustion
engine systems, the system is very cost-effective. Problem with the internal
combustion engine is its high noise and toxics output. Internal-combustion
power sources are thus of interest for outside applications where noise is
less of an issue than the lack of electric grid. To produce electricity the
internal combustion engine has to be coupled with a generator, making the
overall efficiency lower. Applications using the direct mechanical output of
the engine are of more interest. Feasible applications can be found in
construction work environments, like for high-power rotary-hammer drills.
The second interesting power-source is the fuel cell. Polymer exchange
membrane fuel cells make use of hydrogen as its fuel. Hydrogen is mass-
wise a very energy-dense fuel, but very poor volume-wise (specific energy). To
decrease volume hydrogen has to be compressed at high rates up to 600bars,
making this fuel less interesting for portable and small applications. When
combining the fuel cell with the more convenient and still high energy dense
methanol fuel, a possible successor to the lithium ion battery can be defined.
Because of the high energy-dense fuel, this power system could be a factor 7
smaller than currently lithium-ion batteries. Note that the fuel-cell and
auxiliaries are not taken in to account in this factor. It still has to be seen in
which cases the total system will be smaller than the lithium-ion battery.
The overviews given by Figure 6 to 9 compare the different power sources
and the energy carriers with each other. These figures are only indicative,
and only present the power generator and energy carrier on its own. It is still
not feasible to compare a power system, a combination of power generator
with an energy carrier, to the rechargeable battery. This is because with
most alternatives, especially the fuel-cells and internal combustion engine
systems, are a combination of a power source with a certain fuel. To make
alternative power systems more visible to the designer, new models have to
be developed, in which a specific power source energy combination (power
system) is compared with rechargeable batteries.
29
3 Power source design and selection in practice, state of the art3
In Chapter 2 the potential competitors for lithium-based rechargeable
batteries have been defined. The second part of the initial research question
is about how the designer can select or design a power system during the
preliminary design phase. This chapter will be about answering this question.
According to [80] a design of an industrial product is defined by four pieces
of information: (i) the dimensions of the parts and the product, (ii) the
production technology used to produce the parts, (iii) the materials used in
the parts, and (iv) the way the parts are put together. Portable products not
only consist of mechanical parts and components but more and more of
electronics and control engineering. A fifth piece should be added to the
previous list which involves the design of the software. Based on the results
from Chapter 2 the fuel cell system is indicated as a potential successor to
the lithium-ion battery powering portable electronic devices. The fuel-cell
system is besides an industrial product consisting of several components
placed in space, also a mechatronic product where software and power
management have great influence on the design of the system. The design of
a fuel cell system which is engineered by engineering designers in which
“form follows function” is generally the case. In this thesis the design of
software and power management is not taken into account and the focus is
on mechanical design.
To produce the correct drawings for fabricating the product the product
designer has to analyze and define the problem. The goal of the product or
3 Parts of this chapter are presented at the Knowledge Foundations’ Small Fuel Cells
2009 conference in Orlando FL (2009): “Selection of power sources for portable applications”.
30
the function it has to fulfill is thought through, he has to draw multiple
solutions to the problem, think and rethink the solutions and even do
calculations for testing of the feasibility or optimizing the system. The
thinking process and methods used during the design process are well
described in design handbooks as [81] and discussed in literature [82, 83].
In general the systematic design approach is described by (i) laying out a
specification, followed by (ii) exploration and evaluation of potential useful
concepts. Based on this evaluation (iii) the most promising concepts are
elaborated by producing potentially embodiments, which are evaluated and
(iv) the most promising embodiment is elaborated further to produce the
final detailed design.
The choice for an alternative power source, like the fuel cell system, can be
part of the strategy chosen by the company based on e.g. environmental
issues. When this is the cases the realized product will be equipped with this
alternative power source because it was one of the goals of the project. In
most cases the designer is not directed towards one solution and he/she is
open for alternatives to the commonly used battery. The designer has to
evaluate, compare and choose for a battery or, if visible, an alternative power
source during the design process. To do this he can make use of tools and
methods to make the optimal choice.
3.1 Approach This chapter reviews tools and methods for choosing or designing power
sources applied in portable electronic devices. The goal of this chapter
consists of two parts: first is to identify available tools and methods, and
detect when those tools are applied during the design process. Second we
want to know how real-life designers evaluate different optional power source
concepts when designing a product.
A literature review is conducted in Section 3.2, where specific tools and
methods for choosing or designing power sources are searched for. This
review is conducted by desk searching for tools on the internet and scientific
literature found on Scopus and ScienceDirect [84, 85].

31
Section 3.3 reviews case-studies, subdivided in three case-studies from
literature and two interviews with experts. The case-studies and expert
interviews are conducted to explore the mere pragmatic design approach
when designing power sources. Three case-studies from literature are
reviewed and a life case-study is evaluated by interviewing two experts in the
field. The interviews are held with a questionnaire a leading. The questions
asked were subdivided into a general introduction in which the research was
explained, followed by the design process the interviewed goes through when
designing an application powered by a portable power source. The design
freedom is discussed and in which phase of the developing process the main
focus is, when designing the power source. After designing the designer has
to make choices, how the design engineer makes these choices is questioned
in the part about decision making. The questionnaire is ended with examples
from practice.
Two of the case studies focus their attention to designing direct methanol
fuel cells, but the other two also evaluate other alternative power sources
during the design process. This chapter will end with conclusions in Section
3.4.
3.2 Tools and Methods in the Field A literature review is done on tools and methods in which different power
and energy sources are compared, selected or even designed. Four different
search and selection type of tools can be distinguished in literature, which
will be explained more in detail in the remainder of this section:
• Power source comparison charts (Section 3.2.1), which can be used
to identify power-source opportunities for different power sources.
• Power source selection for a specific application (Section 3.2.2),
especially interesting for the designer, designing portable electronics
with specific performance characteristics.
• Power source design tools (Section 3.2.3), which help the designer in
dimensioning the power source.
• Optimization tools (Section 3.2.4), where all possible configurations
of power-sources and energy-containers are evaluated and optimized
for single or multi objectives.
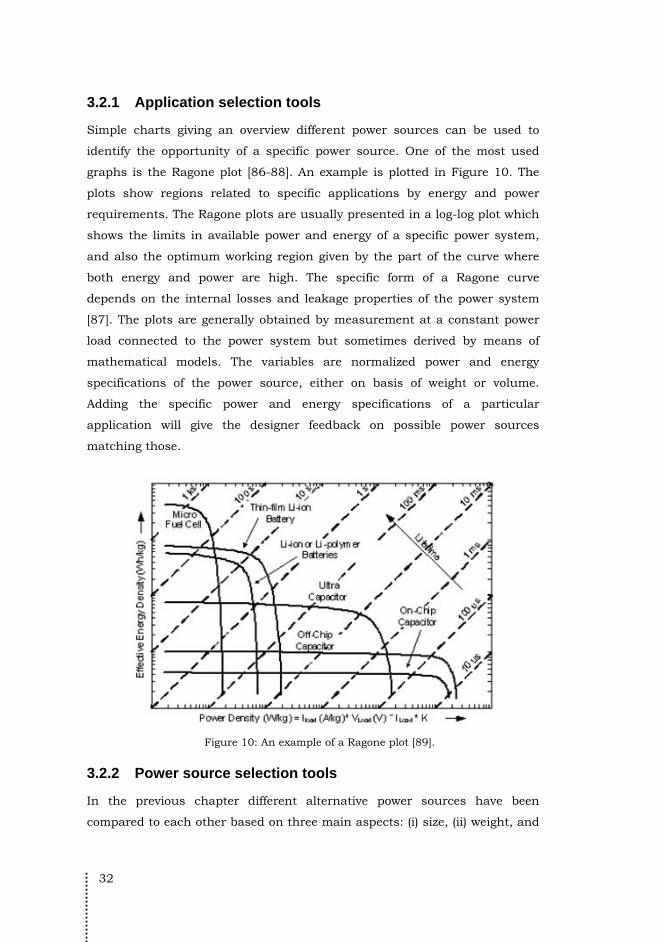
32
3.2.1 Application selection tools
Simple charts giving an overview different power sources can be used to
identify the opportunity of a specific power source. One of the most used
graphs is the Ragone plot [86-88]. An example is plotted in Figure 10. The
plots show regions related to specific applications by energy and power
requirements. The Ragone plots are usually presented in a log-log plot which
shows the limits in available power and energy of a specific power system,
and also the optimum working region given by the part of the curve where
both energy and power are high. The specific form of a Ragone curve
depends on the internal losses and leakage properties of the power system
[87]. The plots are generally obtained by measurement at a constant power
load connected to the power system but sometimes derived by means of
mathematical models. The variables are normalized power and energy
specifications of the power source, either on basis of weight or volume.
Adding the specific power and energy specifications of a particular
application will give the designer feedback on possible power sources
matching those.
Figure 10: An example of a Ragone plot [89].
3.2.2 Power source selection tools
In the previous chapter different alternative power sources have been
compared to each other based on three main aspects: (i) size, (ii) weight, and
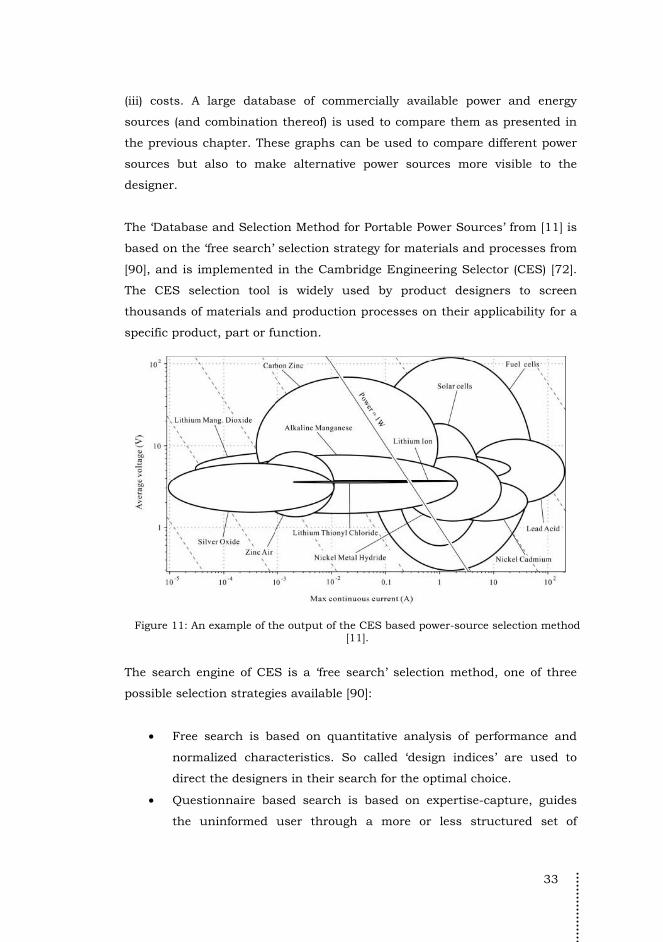
33
(iii) costs. A large database of commercially available power and energy
sources (and combination thereof) is used to compare them as presented in
the previous chapter. These graphs can be used to compare different power
sources but also to make alternative power sources more visible to the
designer.
The ‘Database and Selection Method for Portable Power Sources’ from [11] is
based on the ‘free search’ selection strategy for materials and processes from
[90], and is implemented in the Cambridge Engineering Selector (CES) [72].
The CES selection tool is widely used by product designers to screen
thousands of materials and production processes on their applicability for a
specific product, part or function.
Figure 11: An example of the output of the CES based power-source selection method [11].
The search engine of CES is a ‘free search’ selection method, one of three
possible selection strategies available [90]:
• Free search is based on quantitative analysis of performance and
normalized characteristics. So called ‘design indices’ are used to
direct the designers in their search for the optimal choice.
• Questionnaire based search is based on expertise-capture, guides
the uninformed user through a more or less structured set of
34
decisions, using built in expertise to compensate for the lack of it in
the user.
• Inductive reasoning and analogy search is based on a library of
previously solved problems or ‘cases’. An analysis of its features, a
solution and an assessment of the degree of success of this solution
is given, guiding product designers in product development or
improvement.
The power-source selector is mainly based on basic characteristics as mass
m, volume V, and cost c of existing components. In Figure 11 an example is
given of the output of the power-source selection-method. Besides size and
mass, a selection can be made manually based on performance parameters,
like average voltage and shelf life, and derived properties like energy per unit
of cost and energy density. This tool is interesting for exploring optional
power sources when conceptualizing a new or existing product. It makes
alternative power sources also visible to the user, besides optional primary
or secondary batteries.
In [91] van Gennip developed the PowerQuest, a database driven
power/energy source selection tool for designers during the concept phase.
The focus in 2006 was merely on photovoltaic cells, and it was intended to
be extended with other alternative power sources. The input for this online
tool consists of mean power draw (in Watts), a simple usage profile during
the day, the irradiation, and more specifications, like working voltage, when
known. This tool is used during the initial conceptualization phase of the
design process. It tries to give the user feedback on the possible match,
energy-wise, between the photovoltaic cell and the application the user
wants to evaluate, and returns with the design consequences when using a
photovoltaic cell, for instance the physical needed sun-irradiated surface
area.
3.2.3 Designing alternative power sources
A third problem designers have to cope with is the dimensions of a new
power source. Especially component volume and size is of great importance
when giving form to an application. For primary batteries a limited number

35
of standard forms exist, making the choice more easy when designing. When
the lithium-ion rechargeable battery was introduced the form was not
standardized. Cell phones and other flat electronic devices directed the form
from cylindrical to a thin flat prismatic form, the cheaper pouch cell or even
to the less energy-dense flexible cell. In general the battery is available in
prismatic form. A simple approach to dimensioning a battery during the
concept phase is by taking only three main constraints into account: (i)
energy it has to contain (Wh), (ii) charge and discharge currents (C), and (iii)
cycle life of the battery.
The procedure can be almost as easy as dividing the energy the application
needs with the energy-density of the specific battery (Wh L-1). The knowledge
to make the choice can be derived from an expert, a handbook or
specification sheets from battery manufacturers. This procedure is well
implemented in the CES based power-source selection-tool described in
previous sections.
Giving form to multi-component power sources, like fuel-cell hybrids and
other hybrid power-sources, is not as easy as giving form to stand alone
batteries. When minimizing size, mass or costs in hybrid power source
design one specific optimization tool is of interest, namely ‘Power
Optimization for Wireless Energy Requirement’ (POWER), developed at the
University of Michigan’s Wireless Integrated Microsystems Engineering
Research Center (WIMS-ERC), described in [92]. Factors influencing
selection of the power supply can be summarized as follows [12]:
• Electro chemistry: cell potential, discharge/charge profile, capacity
and lifetime;
• Geometry: surface area, volume and mass;
• Environment: temperature, pressure and exposure.
To overcome some of the limitations of electro chemistry, size, and shape,
often two or more power supplies are used within the same system. Typically
a hybrid power supply combines a high-power dense element, with a high
energy dense element. Different studies have shown that improved
performance is possible with hybrid supplies [93].

36
In [92] the systematic method is described for the selection and design of a
power systems for a WIMS Environmental Monitor Test bed (EMT). The
method focuses on selecting and designing power supplies for
microelectronic devices which are prescribed after design is nearly complete.
The methodology constraints are operating temperature, energy/power
density, and energy/power density. Further requirements/constraints on
rechargeability, mass, volume and lifetime are allowed in selecting the
appropriate battery electro chemistries or configurations like parallel, series
and combinations thereof. The algorithm separately evaluates results of
three strategies (approaches) to system design, specifying either:
• A single aggregate power profile,
• A power system designed to satisfy several power ranges (from
micro-, milli-, and Watts), or
• A power system designed to be housed within specified spaces
within the application, with device constraints on volume and
surface area.
The algorithm is implemented in MATLAB code and presented in [102, 104].
The batteries used in the application are selected from a database
comprising a large amount of commercially available primary and secondary
batteries. The algorithm described in the papers has the following stepwise
outline:
• A time segmented power profile of the system and its components is
introduced. Due to the impracticality of mapping small fluctuations,
data is coarsened before inputted into POWER;
• The energy, weighted power, energy density and weighted power
density of the device power-system are calculated4;
• The system is broken up in sub devices classified in power range
(from micro- to milli-Watts);
• A restriction of electro chemistry based on environmental
constraints is executed;
• For all devices in the system the voltage and current are computed.
4 The nominal voltage of the cell is the operating or rated voltage of the cell specified
by the manufacturer
37
• Capacity fade is estimated based on discharge current and cycle
number, using expressions from literature;
• Based on conditional statements, like the maximum number of
batteries used, the total number of batteries required to fulfill the
power profile is calculated; cells can be placed in combinations in
series and/or parallel according to energy, voltage and current
factors;
• Selection and ranking is done based on mass requirements, energy
density and battery lifetime;
• Results are compared on mass, volume surface area and the number
of cells in the configuration;
• Additionally the costs can be entered as a constraint.
The methodology focuses on micro-power system combining single primary
and secondary batteries. The application field is implantable electronics
where volume and weight of the power source is of great importance.
3.2.4 Optimization tools
In the paper written by [94] hybrid power systems, combining larger power
systems with energy storage systems, are optimized for element sizing. The
optimizing is based on costs and not on size. So-called ‘energy-hubs’ are
introduced, an optimal hub layout of a power system described as in Figure
12. Converters link inputs and outputs through coupling factors which can
be considered to be the converter’s steady-state energy efficiency. In general
a “system approach” is applied, and the costs of the system is optimized
based on normalized investment cost per hub element, e.g. a wind generator
costs approximately $2 per Watt, and normalized input data, e.g. from
available wind power.
Other optimization tools use dynamic models to optimize hybrid electric
energy generators with mostly two objectives in mind, namely the efficiency
of the system and the unmet load. These optimization tools are focused on
the total Net Present Cost (NPC) throughout the lifespan for both off-grid and
grid-connected power systems for remote, stand-alone, and distributed
generation (DG) applications. Enumerative methods like HOMER [95]
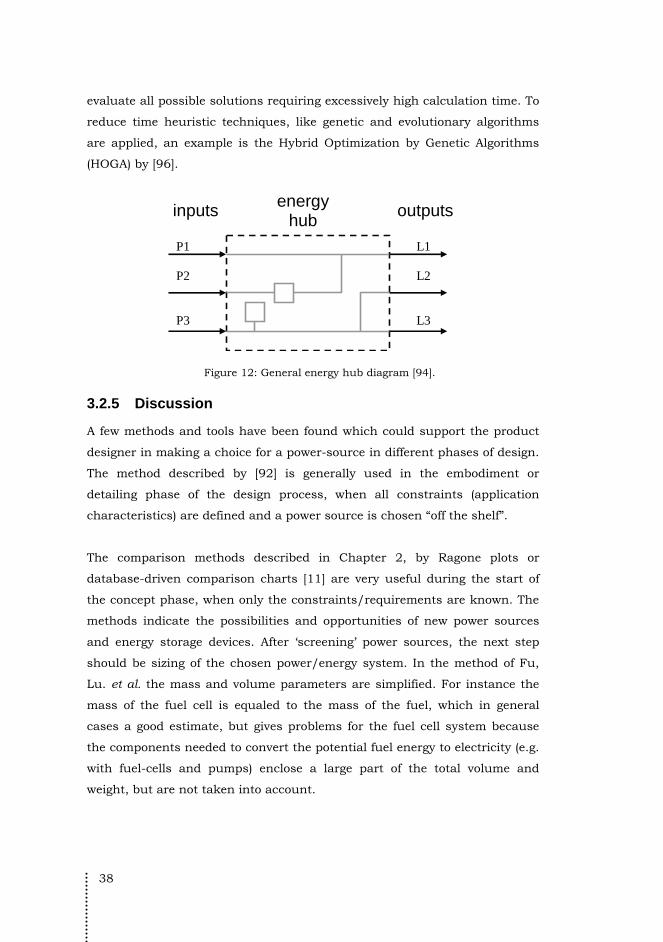
38
evaluate all possible solutions requiring excessively high calculation time. To
reduce time heuristic techniques, like genetic and evolutionary algorithms
are applied, an example is the Hybrid Optimization by Genetic Algorithms
(HOGA) by [96].
inputs outputs
P1 P2 P3
L1 L2 L3
energy hub
Figure 12: General energy hub diagram [94].
3.2.5 Discussion
A few methods and tools have been found which could support the product
designer in making a choice for a power-source in different phases of design.
The method described by [92] is generally used in the embodiment or
detailing phase of the design process, when all constraints (application
characteristics) are defined and a power source is chosen “off the shelf”.
The comparison methods described in Chapter 2, by Ragone plots or
database-driven comparison charts [11] are very useful during the start of
the concept phase, when only the constraints/requirements are known. The
methods indicate the possibilities and opportunities of new power sources
and energy storage devices. After ‘screening’ power sources, the next step
should be sizing of the chosen power/energy system. In the method of Fu,
Lu. et al. the mass and volume parameters are simplified. For instance the
mass of the fuel cell is equaled to the mass of the fuel, which in general
cases a good estimate, but gives problems for the fuel cell system because
the components needed to convert the potential fuel energy to electricity (e.g.
with fuel-cells and pumps) enclose a large part of the total volume and
weight, but are not taken into account.
39
The tools described in [97] are used in larger scale power/energy systems
like wind-power in combination with alternative storage systems. The model
consists of larger blocks of devices. All combinations of power sources and
energy storage systems are evaluated and the optimal combination is chosen.
The method is a system block approach with only a single objective,
minimizing costs.
3.3 Case study review Two experts from Jet Propulsion Lab (JPL) in the field of power source design
have been interviewed [98, 99] to discuss the process of developing a power
system for interterrestrial missions. The interviewed have been selected on
basis of their expertise in the field of power source development.
Besides the interviews three cases-studies have been evaluated reported in
two journal papers and one graduate reports. The following papers/reports
have been reviewed:
1. Icardi et al. “Compact direct methanol fuel cells for portable
application” [100].
2. Bruce Lin, “Conceptual design and modeling of a fuel cell scooter for
urban Asia” [101].
3. Rohrschneider et al., “Flight system options for a long-duration mars
airplane”, [102, 103].
The reports and papers are reviewed on the practical design approach, tools
and methods used, and the main problems which had to be overcome.
3.3.1 JPL interviews
The Jet Propulsion Lab (JPL) is visited by the author on June 11, 2009, and
is situated in Pasadena, California, United States of America. The author has
interviewed two members of the engineering staff at this laboratory, Thomas5
a senior member of the engineering staff [98] and Paul, a senior power
system engineer [99]. Both work in the field of power source engineering for
5 Only the first name is used to indicate the interviewed.
40
extraterrestrial applications like the Mars rover and satellites going out of
the Earths orbit.
JPL is the research laboratory of NASA, since 1958 when the first satellite,
Explorer 1, was send in to space. Since than JPL has send spacecraft to
every planet in the solar system form Mercury to Neptune. JPL engineers
design new space exploration satellites and system parts. Power source and
energy storage devices are a main research field, because these exploration
devices have to work under extreme conditions and have to work for a long
period of time. Costs, durability, mechanical stability and mass are the key
drivers for designing these energy generators.
Thomas is senior manager of a crew who is addressed when a power source
for a mission has to be identified. As an expert he has the right system in his
mind when asked based on simple input variables like cycle life. The focus
when designing a new power source is on optimization for mass, “costs, I
don’t really worry about, it’s not my job”. He uses in-house developed tools
made with Microsoft Excel, Mathcad and does his design work in CAD.
During the identification stage (conceptualization) there is fairly no top-level
programming, FEM or thermodynamic programming involved.
The interview continued with Paul who builds a great variety of satellites
going around the solar system, space, orbit and land. This means the power
source has to work in a variety of environments and thermal design is of
great importance. The most simple, cheapest and lightest option is the solar
array with batteries. The first choice Paul makes is the choice between the
power source, a primary battery, solar array, radioisotope thermoelectric
generator (RTG) or fuel cell. As means of energy storage there are two options,
secondary battery or fuels. Note that the designers specify the primary
battery as a power source and the secondary battery as a energy storage
device. Paul defines a energy storage as an object which can be recharged,
and “you cannot recharge a power source!”, When selecting a power source
or energy storage device it is useful to think in the time domain, from
milliseconds (capacitors), months (primary battery), years (fuel cells) and
more years (RTG or solar array). Solar arrays are capable of working over a
fairly wide time domain as long as the eclipses are not to long. Hybrid
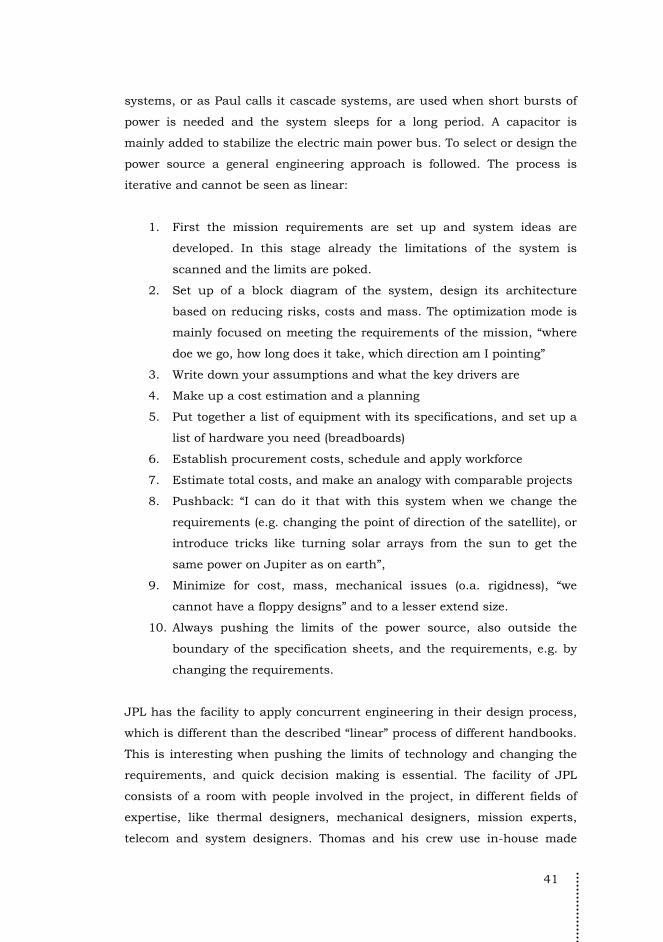
41
systems, or as Paul calls it cascade systems, are used when short bursts of
power is needed and the system sleeps for a long period. A capacitor is
mainly added to stabilize the electric main power bus. To select or design the
power source a general engineering approach is followed. The process is
iterative and cannot be seen as linear:
1. First the mission requirements are set up and system ideas are
developed. In this stage already the limitations of the system is
scanned and the limits are poked.
2. Set up of a block diagram of the system, design its architecture
based on reducing risks, costs and mass. The optimization mode is
mainly focused on meeting the requirements of the mission, “where
doe we go, how long does it take, which direction am I pointing”
3. Write down your assumptions and what the key drivers are
4. Make up a cost estimation and a planning
5. Put together a list of equipment with its specifications, and set up a
list of hardware you need (breadboards)
6. Establish procurement costs, schedule and apply workforce
7. Estimate total costs, and make an analogy with comparable projects
8. Pushback: “I can do it that with this system when we change the
requirements (e.g. changing the point of direction of the satellite), or
introduce tricks like turning solar arrays from the sun to get the
same power on Jupiter as on earth”,
9. Minimize for cost, mass, mechanical issues (o.a. rigidness), “we
cannot have a floppy designs” and to a lesser extend size.
10. Always pushing the limits of the power source, also outside the
boundary of the specification sheets, and the requirements, e.g. by
changing the requirements.
JPL has the facility to apply concurrent engineering in their design process,
which is different than the described “linear” process of different handbooks.
This is interesting when pushing the limits of technology and changing the
requirements, and quick decision making is essential. The facility of JPL
consists of a room with people involved in the project, in different fields of
expertise, like thermal designers, mechanical designers, mission experts,
telecom and system designers. Thomas and his crew use in-house made
42
tools, T-max implemented in Microsoft Excel, to make the right choice
quickly. T-max is a knowledge based reference tool, which uses technology
tables, and is used to implement parametric design. Paul calls it “Technology
table driven parametric design”. The input is load profiles and
sensor/actuators chosen, and its feasibility is tested. The database metrics
have to be updated every year by experts. To keep up to date with new
technologies Thomas is visiting conferences, reviews new technology in
house by testing the product or component, and uses specification sheets.
The technology experts are questioned to the bone for quantifiable
performance characteristics.
3.3.2 Compact DMFC for portable application
Icardi et al. [100] describe a standard systematical engineering approach
towards designing a 250Watt DMFC system for weather stations, medical
devices, signal units, gas sensors and security cameras. First they model the
system in Matlab/Simulink to evaluate the heat and mass fluxes and
pressure drops. The main system components are described in a block-
diagram, with all of there components and input and output flows of gasses
(air and exhaust fumes) and fluids (fuel and water).
The goal of the model was to choose the optimal combination of components
by evaluating setups varying the membranes (A or B), the number of cells
(30 and 40 cell stacks), with or without insulation, and for different
methanol streams. Optimal performance was not specified in the paper. After
modeling the DMFC system and choosing the optimal combination of
components and layout, the design was not initiated. Next step would be
embodiment and engineering of the outputted system.
3.3.3 Conceptual design and modeling of a fuel cell scooter for
urban Asia
Bruce Lin made a conceptual design of a fuel cell scooter for urban Asia in
his thesis report in 2004 [101]. Chapter 4 of this thesis describes how,
utilizing the technology described in the previous chapters, a fuel cell scooter
is designed. First the requirements are defined and performance is modeled
in Matlab. The model consists of system model of the fuel cell stack and
43
auxiliary systems. Basic assumptions are made to obtain overall measure of
performance, for instance parasitic power is a linear function of gross power,
and conservative assumptions are made where data is poorly known.
When improving the systems performance and costs, Lin considers a high-
pressure fuel cell operation and hybridizes the fuel-cell with a battery for
peak powers. The method of attack of this design is a standard engineering
approach, where first the performance requirements are described. Next a
vehicle model is made, where the load at the wheels is defined, and
inefficiencies of the system parts is described. Based on drive-cycles or load
profiles from literature a normalized drive cycle is described. A fuel-cell
system model was setup, where the number of cells in the stack (small or
large cell) and thus the working power-density of the stack, and the
polarization curve were defining the system performance. Maximum
efficiency and a cheap fuel cell were leading in the optimization.
3.3.4 Flight system options for a long-duration mars airplane
Rohrschneider et al. [102] describe the comparison of five different
propulsion systems to be used in a long-duration Mars airplane: a
bipropellant rocket, a battery powered propeller, a DMFC powered propeller,
and beamed solar and microwave powered propeller system.
The approach of Rohrschneider starts with the definition of the goal
obtaining as many new measurements as possible during the mission flight.
The goal of the systems optimization is to get as much data as possible
during one flight. The problem is attacked in two different ways, by
extending the range or endurance of the airplane, or by keeping the range
and endurance fixed while increasing payload. The first solution of extending
the endurance is chosen which can be done by either changing the
technologies used or by finding a combination of the design variables that
produce a better solution.
After the goal and approach is defined a model of the mission is made,
defined in the form of a Design Structure Matrix (DSM) [104]. The different
analyses are broken down according to their traditional disciplines, of which
44
one is the propulsion trade off. Five different systems are modeled according
to density equations more specified by curve-fitting of performance
specifications and physical variables like size, weight and form. The following
power systems were traded of: a bipropellant rocket, a battery powered prop,
a DMFC power prop, a beamed solar powered prop and a beamed microwave
powered prop.
The focus of the optimization is airplane mass within a constrained volume.
Three values are taken into account for choosing the right airplane for the
job: mass of the airplane but also the rocket (mission gross mass), life cycle
costs (LCC) of the power system and total project, and range (velocity,
endurance). Different airplane sizes are calculated by means of a scale-factor
(running from 0.5 to 1.75). Every size of airplane is calculated and the
endurance is limited by velocity (for larger airplanes) or by volume (for the
rocket powered airplane). In the end a graph is produced in which the
launch vehicle can be chosen for the Mars airplane based on scaled size, the
mission gross mass and for the mission LCC.
To make the choice between the different power sources of the airplane,
ModelCenterTM [105] was used to calculate the gross mass, cruise velocity
(endurance) and the LCC. Varying the scale and the configuration of the
airplane resulted in different optimal architectures/power systems for
different missions.
3.3.5 Discussion
In general a system-engineering approach is used by the interviewed persons.
First the requirements are stated, next a system model is made, and all
components are stated and pushed to its limits by means of simulation and
testing of components. Weight and costs seems to be the key drivers for the
decision making. Volume was often less of an issue, and thus left out of the
decision equation. Especially in a concurrent development environment
there is no time to think about a problem. Engineers in the project-room
expect a quick answer for there instant change of the requirements or added
requirement. This means instant evaluation of the power system is a must,
which puts a lot of pressure on the common knowledge of the power-source

45
engineers. Simple tools are used driven by “technology tables” and
parametric design. For concurrent engineering environments quick
calculations are a must.
In general the case studies also show a standard systematical-engineering
approach towards designing power sources. First requirements are setup,
followed by a system model, modeling the performance of the system. Only
Icardi used a block-diagram, but it is assumed the others did the same
without reporting this. After modeling the system Icardi stopped discussing
the design process for the rest of the paper. The modeling part is seen as the
design. The main objective of this design was performance of the system.
Bruce Lin also used the standard approach towards designing the scooter.
First the requirements were set, and an analytical model of the load and
fuel-cell system was produced. The load is matched with the systems
performance, resulting in a size, weight and initial costs of the power system.
Simple equations were used to generate physical dimensions of the
components of the power system and energy storage.
Rohrschneider developed a Mars airplane and took the total gross costs of
the mission into account of the design. Different power systems of the
airplane have been evaluated which, as a part, is taken into account of the
gross performance. The overall project was scheduled in a Design Structure
Matrix. The trade-off between the different airplane propulsion systems was
based on three objectives: mass within a constrained volume, cruise velocity
(endurance) and LCC. Scaling the airplane gave different results.
3.4 Conclusions The goal of this chapter is to identify available tools, when those tools are
applied in the design process, and how real-life designers evaluate different
optional concepts. Different tools have been found in the literature search
which can be used by the product designer supporting him/her in the
selection process of the power system, during the concept phase of the
design process, but also during embodiment. The usability of the tools are
discussed in the previous section and conclusions are drawn in this section.

46
In Figure 13 an overview is given of all tools and methods described in the
previous sections of this chapter, on the time line of the systematic design
approach. PowerQuest, the CES method and working with Ragone plots are
used during the specification (identification) and concept design phase.
During concept/embodiment design system-modeling is generally used to
evaluate different concepts and make a choice based on a single or multiple
objectives. The POWER and HOMER tools are specifically build to evaluate
battery concepts during embodiment/engineering phase of the design
process, where the application specification is already laid out. The T-max
tool used by the JPL experts is a tool which evaluates the consequences for
the power-source instantly when changes are made in the design or
requirements of the application. This tool can thus be used to evaluate
concepts quickly giving instant consequences for the embodiment of the
design (and vice versa).
POWER
Specification Concept Embodiment Detailing
Powerquest
T-Max
DSM
Ragoon plot
CES
Matlab/Simulink
HOMER, HOGA
Energy hubs
Figure 13: Tools and methods during the design process.
The interviewed experts showed the need for tools where changes in the
design or requirements, or when adding new requirements, are instantly
evaluated. Table-driven parametric tools, like their in-house made T-max
47
software, are used by the experts. These tools are based on expert knowledge,
specification sheets of new technologies and components, and in-house
evaluation of the components. Especially in a concurrent design
environment instant evaluation tools like T-max are a must for the engineers,
meaning instant feedback of the consequences of changes in the design or
requirements.
In general a systematic approach is used to bring an idea, via specifications,
conceptualization to embodiment and finally an engineered product. For
every phase of this engineering design process different tools are available.
There are tools which (could) help the designer in identifying opportunities
for alternative power sources like the CES method, Ragone plots and
PowerQuest. These identification tools are based on normalized figures like
energy density, and therefore not always correct. The numbers outputted
from these programs cannot be used to evaluate concepts but merely
identifies the opportunity. Improvement in these tools is needed giving more
than just initiatives or making alternative power sources visible. Tools, like
T-max , which evaluate the power system instantly when changes in the
design are made, are a must for the concurrent design engineer.
Generalized and instant evaluation tools should be developed to give the
designer improved basis for their concept choice.
In the case-studies the tools made were primarily used for the goal of their
single project. The tools were therefore made in software made for modeling
and simulation, like Matlab/Simulink. The goals of the case-study models
came down to optimization of system performance and minimizing (initial)
costs. The Matlab/Simulink tools simulate only one specific setup, and
optimization is mainly done by changing parameters by hand.

48
49
4 Research Questions
4.1 Answers to the initial research question The initial research question defined in Chapter 1 has been researched in
Chapter 2 and 3:
“Which power systems can compete with the commonly used
rechargeable lithium-based battery in the application field of
portable electronic devices, and how can a systematic approach help
product designers select appropriate power systems during the
preliminary design phase?”
In Chapter 2 a diversity of competitors for the rechargeable battery has been
explored. A thorough search to power systems and energy carriers has been
presented and is evaluated. From the desk search it can be concluded that
there are two power system-fuel combinations of interest as an alternative
for the lithium based rechargeable battery:
(i) The high power-dense internal combustion engine (ICE) in
combination with the high energy-dense carbon fuels as petrol,
and
(ii) Fuel cells chemically burning high-energy dense carbon and
hydrogen-based fuels direct to electricity.
Based on power density of the engine, the high energy density of carbon-
based fuels and the low-price of power-system the internal combustion
engine seems to be the best alternative power system. Because of high noise
and toxics output the internal combustion engine is especially of interest for
outside applications, where a high power output is required like in
50
construction work environments. The second interesting power system, the
fuel cell system, is a clean, quiet and energy dense option. In low-power
application the low-temperature fuel cells are of most interest, resulting in
two options the hydrogen based fuel cell (PEM cells) and fuel cells using a
liquid fuel like methanol (DMFC). Hydrogen is complicated because of its low
energy density, and thus needing high pressure vessels to make the system
small. Methanol on the other hand is liquid, has a high energy density, and
is convenient in use, making the fuel a competitive energy carrier. Therefore
the research in this thesis will focus further on this promising alternative for
the lithium-based rechargeable batteries.
In the same chapter the field of portable electronic applications has been
explored and defined as devices using electric energy, with an integrated
power system and carriable in once bag. The size of the device has been
limited to the largest found [22] laptop computer size (<6.2L) and weight
(<4.5kg). Minimum values for these two properties have not been defined.
Devices which are implantable and low-power long-endurance applications
which are not intended to be carried around are left out of the scope of this
research. This does not mean all low-power long-endurance applications are
out of the loop. At the moment no products satisfying this definition have
been found, but in the future the rise for these kinds of products are not
dismissed and thus taken into account during this research.
To explore the systematic approach helping product designers selecting a
power system during the preliminary design phase a state-of-the-art
literature review and case-study review is executed in Chapter 3. Different
tools and methods have been found which could help the product designer
in his/her search for a power system during all phases of the design process.
Four different search and selection type of tools can be distinguished:
comparison charts, selection tools, design tools and optimization tools. There
are tools which (could) help the designer in identifying opportunities for
alternative power systems. These identification tools are based on
normalized figures like energy density, and therefore not always correct. The
numbers outputted from these programs cannot be used to evaluate
concepts but merely identifies the opportunity. Improvement in these tools is
needed giving more than just initiatives or making alternative power systems

51
visible. Tools, which evaluate the power system instantly when changes in
the design are made, are a must for the concurrent design engineer.
Generalized and instant evaluation tools should be developed to give the
designer improved basis for their concept choice. Based on the results from
the case-study review a generalized approach of the engineering designer is
to produce its own evaluations tools in mathematical programs as
Matlab/Simulink. Optimization is done by evaluating different setups by
changing different parameters by hand.
4.2 Redefined problem definition In general the systematic design approach is described by [82, 83]: Laying
out a specification, followed by exploration and evaluation of potential useful
concepts, and based on this evaluation the most promising concepts are
elaborated by producing potentially embodiments, which are evaluated. The
most promising embodiment is elaborated further to produce the final
detailed design. Every phase in this design process can be broken down in
four stages, namely analysis, heuresis, evaluation and the stage in which a
choice has to be made [82]. During the analysis the intellectual activity is
very low, while the heuresis stage is intellectually challenging for the
designer [106]. The latter two stages show less strenuous intellectual activity.
The measured high strain during the heuresis phase is probably caused by
the lack of vision on a clear end to the process: ideas keep coming and there
is no guarantee that the discovered ideas are the best, or at least comparable
to the best. This makes this stage in a phase of the design process a good
place to help the designer in making up their mind.
Usually a power system is chosen at the very end of the design process [11]
instead of at the begin phase of conceptualization. Successful, compact
design of a portable application depends on proper selection of components
and also a matching power/energy system. A large part of the product is
defined in the concept phase, and decisions in this phase are merely first
assumptions. During this phase the product design engineer wants to size
the application and has to make important and sometimes irreversible
choices. The engineer makes use of knowledge developed at school and
university, experts, experience from past projects, or mother wit. Because
the power system is one of the main components, taking up 10 to 30% of the
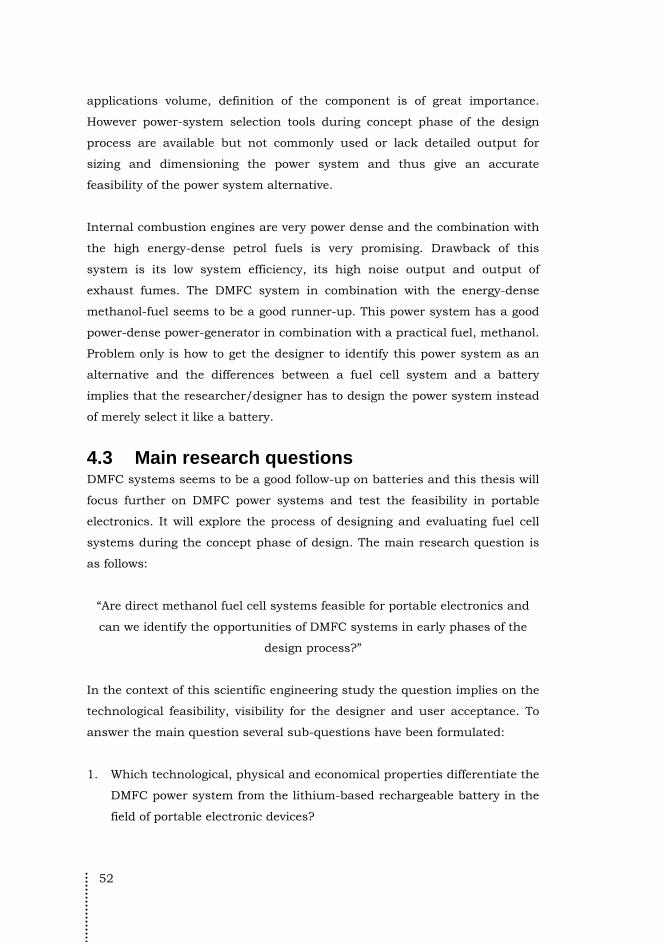
52
applications volume, definition of the component is of great importance.
However power-system selection tools during concept phase of the design
process are available but not commonly used or lack detailed output for
sizing and dimensioning the power system and thus give an accurate
feasibility of the power system alternative.
Internal combustion engines are very power dense and the combination with
the high energy-dense petrol fuels is very promising. Drawback of this
system is its low system efficiency, its high noise output and output of
exhaust fumes. The DMFC system in combination with the energy-dense
methanol-fuel seems to be a good runner-up. This power system has a good
power-dense power-generator in combination with a practical fuel, methanol.
Problem only is how to get the designer to identify this power system as an
alternative and the differences between a fuel cell system and a battery
implies that the researcher/designer has to design the power system instead
of merely select it like a battery.
4.3 Main research questions DMFC systems seems to be a good follow-up on batteries and this thesis will
focus further on DMFC power systems and test the feasibility in portable
electronics. It will explore the process of designing and evaluating fuel cell
systems during the concept phase of design. The main research question is
as follows:
“Are direct methanol fuel cell systems feasible for portable electronics and
can we identify the opportunities of DMFC systems in early phases of the
design process?”
In the context of this scientific engineering study the question implies on the
technological feasibility, visibility for the designer and user acceptance. To
answer the main question several sub-questions have been formulated:
1. Which technological, physical and economical properties differentiate the
DMFC power system from the lithium-based rechargeable battery in the
field of portable electronic devices?

53
2. Which demands with respect to DMFC power systems in portable
electronic devices are most significant from a user point of view, and
how can we use this in a design method?
3. How can we identify the opportunities of DMFC power systems for
portable electronic devices, during early phases of the design process?
4. What are the basic properties that help the designer to model a DMFC
power system from a techno-economical perspective?
5. Which algorithms can be formulated to give the product designer not
only insight in the opportunity of DMFC power systems, but also help
the designer in an appropriate systematic approach
4.4 Methodology As already described in the introduction the focus of Part II is to investigate
the differentiating properties from a technological and user point of view. The
results from these studies, described in Chapter 5 and 6, are used to define
different orders of modeling (Chapter 7), which is an introduction to Part III:
metric-based selection, design and concept evaluation during the conceptual
phase of the design process.
4.4.1 Approach
In the continuation of this thesis the technology of DMFC is compared to the
lithium-ion battery in Chapter 5. The comparison is based on primary
properties, like volume, weight, costs and life cycle specifics. The
technological review is followed by a user acceptance test where the
consumer is assessed in Chapter 6 on the acceptance of DMFC systems as
an alternative for the lithium ion battery. The user is tested by means of a
conjoint het analysis, where the differentiating properties of DMFC and
lithium-ion batteries are used as basis, like volume weight, energy density,
costs and period of charging. Three orders of models are proposed in
Chapter 7, followed by exploring only the first two orders, a heuristic
approach (Chapter 8) and a database driven parametric design approach
(Chapter 9). Both models are metric-based identifying tools and are for use
during the conceptual design phase.

54
4.4.2 Generalization
The research approach chosen delivers first insights in the potential
application of DMFC power systems in portable electronic devices, and of a
potential systematic design approach, which is tested via simulation and the
creation of several engineered product designs. Given the fact that the
research activities took place within an office environment, the findings have
to be considered as indicative in the first place. Also only one electronic
product has served as a case study, which in theory limits the generalization
of the results. Although validation has been sought in peer reviews and
presenting interim results of the study in journal papers and at conferences,
the study and its results should be considered as mainly of an explorative
nature.
4.4.3 Validity and reliability
Validity of the study refers to the measures taken to check the accuracy of
the results by following certain transparent procedures. Within this thesis
different methods are used to acquire data around the scope of the research:
data acquisitions by means of data mining (Chapter 2), interviews and case-
study reviews (Chapter 3), user testing with the conjoint analysis (Chapter 6),
and design research with the help of predictive models (Chapters 5, 8 and 9).
All measures described by Creswell [107] and Baarde and De Goede [108]
have been taken into account to assure validity which will be discussed in
Chapter 10. For instance the data acquired, mined and presented in Chapter
2 is based on different sources and triangulation is used to make a concise
and valid dataset.
The reliability of the data is guaranteed by using a systematic approach to
data collection and evaluation of the data by using statistics (Chapter 2), and
for the user studies (Chapter 6) the protocol was followed belonging to the
method used. The reliability of the first-order predictive model presented in
Chapter 8 is validated by means of two cases from the field. To ensure better
reliability of the models more designs over a range of applications, have to be
evaluated which is discussed in the recommendations of Chapter 10.

55
5 From batteries to DMFC power systems
Within the field of alternative power systems, Chapter 2 defines DMFC
systems as the potential successor for the lithium ion based battery when
applied in portable electronic devices. To make a fair comparison and define
differentiating properties between a DMFC system and a lithium ion battery,
this chapter will give an introduction to secondary batteries in Section 5.1,
with the main focus on lithium based batteries, and the direct methanol fuel
cell system (Section 5.2). In Section 5.3 the difference between the DMFC
and lithium-ion battery is discussed on basis of volume, weight, costs and
life cycle specifics. The results are discussed in Section 5.4. Section 5.5 will
give conclusions on the comparison. The goal of this chapter is to describe
the differentiating properties between the DMFC system and the lithium ion
battery and lay down the first steps towards a metric-based design method.
In Chapter 7 the differentiating properties described in this chapter will be
evaluated for a set of metrics used to choose or design a DMFC system.
5.1 Introduction to batteries A power-system used in portable electronics consists of a Voltage generator
in combination with an energy storage device. In battery systems this is
combined in one device. The basis of batteries is in the use of electrode
materials and use of electrolyte. The active materials in the anode and
cathode define the voltage difference, where, during the discharge, electrons
are produced or oxidized at the anode (negative electrode) routed via an
alternative route, through an external load, to the cathode (positive
electrode). There the electrons are accepted and the cathode material is
reduced [109]. The electric circuit is completed in the electrolyte by the flow
of anions (negative ions) and cations (positive ions) to the anode and cathode,
respectively (Figure 14).
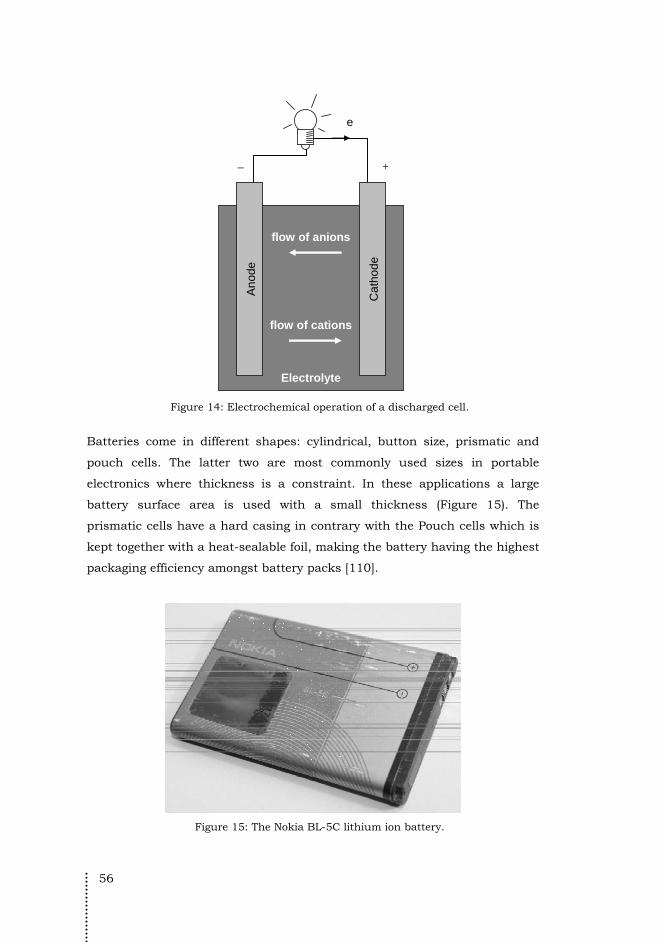
56
An
ode
Ca
thod
e
flow of anions
flow of cations
Electrolyte
− +
e
Figure 14: Electrochemical operation of a discharged cell.
Batteries come in different shapes: cylindrical, button size, prismatic and
pouch cells. The latter two are most commonly used sizes in portable
electronics where thickness is a constraint. In these applications a large
battery surface area is used with a small thickness (Figure 15). The
prismatic cells have a hard casing in contrary with the Pouch cells which is
kept together with a heat-sealable foil, making the battery having the highest
packaging efficiency amongst battery packs [110].
Figure 15: The Nokia BL-5C lithium ion battery.

57
5.1.1 Theory
“A battery is a device that converts the chemical energy contained in its
active materials directly into electric energy by means of an electrochemical
oxidation-reduction (redox) reaction.” [109]. Two types are feasible, the
primary, single use, battery and the secondary, rechargeable, battery. In the
case of the latter battery type the battery is recharged through reversal of the
process.
The term “battery” refers to one or more “cells”, or electrochemical units,
connected in series or parallel. A cell consists of three major components: 1)
the anode or negative electrode, 2) the cathode or positive electrode, and 3)
the electrolyte or ion conductor (Figure 16).
cathode(NiOOH)0.49V
anode(Cd)
-0.81V
+
_
e
e
Figure 16: Basic principle of a Nickel Cadmium cell.
The combination of electrodes defines the cell voltage and capacity of the cell.
Research in battery development is focusing on the most advantageous
combination of anode and cathode materials, which is referred to in the
name of the cell, e.g. Nickel (NiOOH) Cadmium (Cd). Besides performance
other aspects are taken into account like costs of the materials, difficulty in
handling and other deficiencies. The anode is selected with efficiency, high
Coulombic output (Ah g-1), good conductivity, stability, ease of fabrication
and low costs in mind. Metals are mainly used for the anode and because

58
lithium being the lightest metal available, this is predominantly used since
the beginning of the nineties [109].
The working principle of a battery is explained by means of an example of
the NiCad battery (Figure 16). During discharge cadmium metal is oxidized
at the anode to cadmium hydroxide plus two electrons. At the cathode the
electrons are accepted and nickel oxide is reduced to nickel hydroxide. The
electrons are directed externally via an electric circuit resulting in an
electron flow, or current. The electric circuit is completed in the electrolyte
by the flow of negative and positive ions to the anode and cathode
respectively.
Anode: Cd + 2 OH- Cd(OH)2 + 2e-
Cathode: NiOOH + H2O + e- OH- + Ni(OH)2
Overall: Cd + NiOOH + 2 H2O Cd(OH)2 + 2Ni(OH)2
During charge the current flow is reversed and oxidation takes place at the
positive electrode and reduction at the negative electrode. The reactions as
described above are hereby reversed.
5.1.2 Theoretical performance specs and practical values
The theoretical voltage of a cell can be determined by the type of electrode
materials contained in the cell. It can be calculated from the free-energy data
obtained experimentally. As presented in Figure 16 the nickel cadmium
battery has a positive nickel electrode potential, or reduction potential of
0.49V and a negative cadmium electrode potential, oxidation potential of -
0.81V. The standard cell potential can now be calculated by taking the
difference between the cells potentials, in this case E0 = 0.49+0.81 = 1.30V.
For lithium based low-temperature rechargeable cells the theoretical
potential ranges in between 3.50 to 4.10 for Lithium-ion and
Lithium/Manganese dioxide cells, respectively [109].
The capacity of the battery is determined by the amount of active materials
(electrodes) in the cell and expressed as the total quantity of electricity
involved in the electrochemical reaction, defined in terms of coulombs or
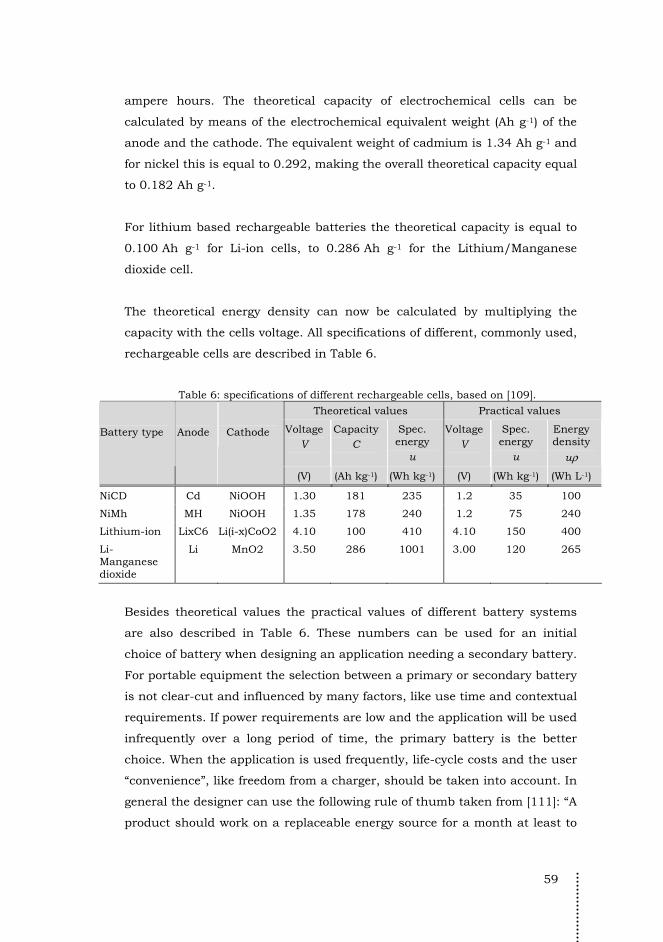
59
ampere hours. The theoretical capacity of electrochemical cells can be
calculated by means of the electrochemical equivalent weight (Ah g-1) of the
anode and the cathode. The equivalent weight of cadmium is 1.34 Ah g-1 and
for nickel this is equal to 0.292, making the overall theoretical capacity equal
to 0.182 Ah g-1.
For lithium based rechargeable batteries the theoretical capacity is equal to
0.100 Ah g-1 for Li-ion cells, to 0.286 Ah g-1 for the Lithium/Manganese
dioxide cell.
The theoretical energy density can now be calculated by multiplying the
capacity with the cells voltage. All specifications of different, commonly used,
rechargeable cells are described in Table 6.
Table 6: specifications of different rechargeable cells, based on [109].
Theoretical values Practical values
Voltage V
Capacity C
Spec. energy
u
Voltage V
Spec. energy
u
Energy density
uρ
Battery type
Anode
Cathode
(V) (Ah kg-1) (Wh kg-1) (V) (Wh kg-1) (Wh L-1)
NiCD Cd NiOOH 1.30 181 235 1.2 35 100
NiMh MH NiOOH 1.35 178 240 1.2 75 240
Lithium-ion LixC6 Li(i-x)CoO2 4.10 100 410 4.10 150 400
Li-Manganese dioxide
Li MnO2 3.50 286 1001 3.00 120 265
Besides theoretical values the practical values of different battery systems
are also described in Table 6. These numbers can be used for an initial
choice of battery when designing an application needing a secondary battery.
For portable equipment the selection between a primary or secondary battery
is not clear-cut and influenced by many factors, like use time and contextual
requirements. If power requirements are low and the application will be used
infrequently over a long period of time, the primary battery is the better
choice. When the application is used frequently, life-cycle costs and the user
“convenience”, like freedom from a charger, should be taken into account. In
general the designer can use the following rule of thumb taken from [111]: “A
product should work on a replaceable energy source for a month at least to
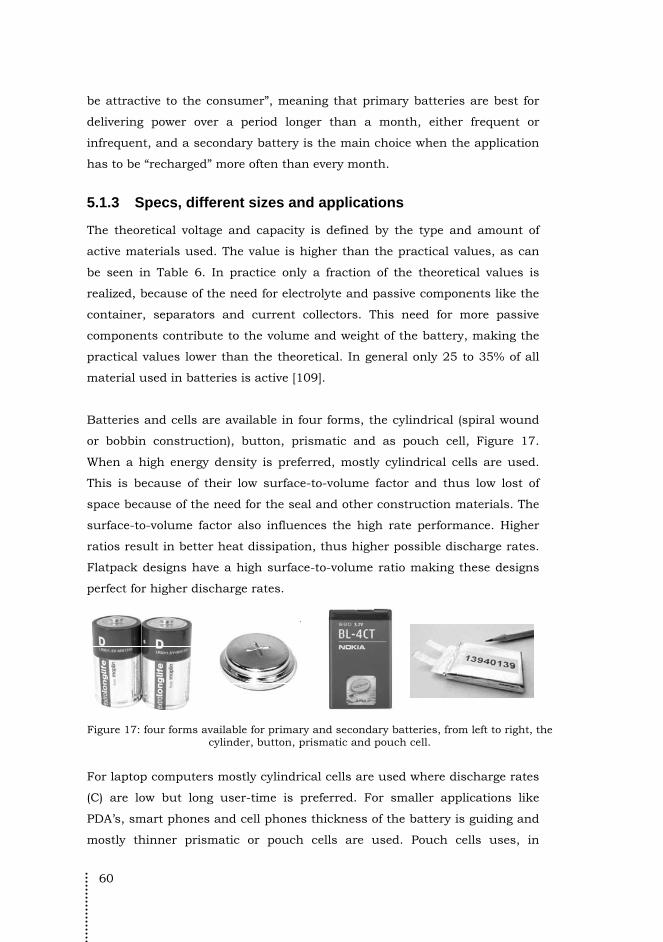
60
be attractive to the consumer”, meaning that primary batteries are best for
delivering power over a period longer than a month, either frequent or
infrequent, and a secondary battery is the main choice when the application
has to be “recharged” more often than every month.
5.1.3 Specs, different sizes and applications
The theoretical voltage and capacity is defined by the type and amount of
active materials used. The value is higher than the practical values, as can
be seen in Table 6. In practice only a fraction of the theoretical values is
realized, because of the need for electrolyte and passive components like the
container, separators and current collectors. This need for more passive
components contribute to the volume and weight of the battery, making the
practical values lower than the theoretical. In general only 25 to 35% of all
material used in batteries is active [109].
Batteries and cells are available in four forms, the cylindrical (spiral wound
or bobbin construction), button, prismatic and as pouch cell, Figure 17.
When a high energy density is preferred, mostly cylindrical cells are used.
This is because of their low surface-to-volume factor and thus low lost of
space because of the need for the seal and other construction materials. The
surface-to-volume factor also influences the high rate performance. Higher
ratios result in better heat dissipation, thus higher possible discharge rates.
Flatpack designs have a high surface-to-volume ratio making these designs
perfect for higher discharge rates.
Figure 17: four forms available for primary and secondary batteries, from left to right, the
cylinder, button, prismatic and pouch cell.
For laptop computers mostly cylindrical cells are used where discharge rates
(C) are low but long user-time is preferred. For smaller applications like
PDA’s, smart phones and cell phones thickness of the battery is guiding and
mostly thinner prismatic or pouch cells are used. Pouch cells uses, in
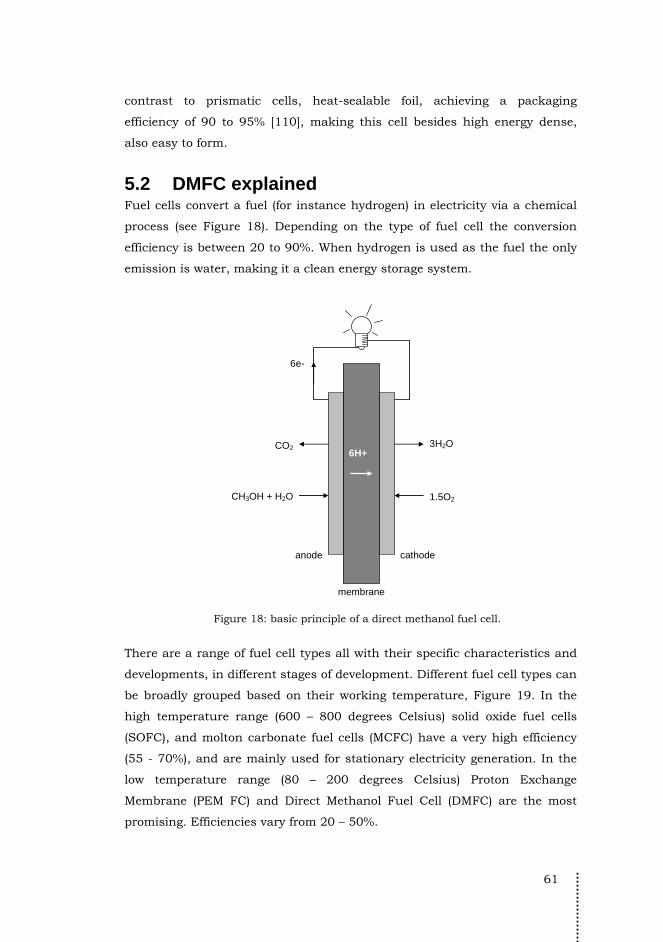
61
contrast to prismatic cells, heat-sealable foil, achieving a packaging
efficiency of 90 to 95% [110], making this cell besides high energy dense,
also easy to form.
5.2 DMFC explained Fuel cells convert a fuel (for instance hydrogen) in electricity via a chemical
process (see Figure 18). Depending on the type of fuel cell the conversion
efficiency is between 20 to 90%. When hydrogen is used as the fuel the only
emission is water, making it a clean energy storage system.
anode cathode
membrane
6H+
CH3OH + H2O
CO2 3H2O
1.5O2
6e-
Figure 18: basic principle of a direct methanol fuel cell.
There are a range of fuel cell types all with their specific characteristics and
developments, in different stages of development. Different fuel cell types can
be broadly grouped based on their working temperature, Figure 19. In the
high temperature range (600 – 800 degrees Celsius) solid oxide fuel cells
(SOFC), and molton carbonate fuel cells (MCFC) have a very high efficiency
(55 - 70%), and are mainly used for stationary electricity generation. In the
low temperature range (80 – 200 degrees Celsius) Proton Exchange
Membrane (PEM FC) and Direct Methanol Fuel Cell (DMFC) are the most
promising. Efficiencies vary from 20 – 50%.
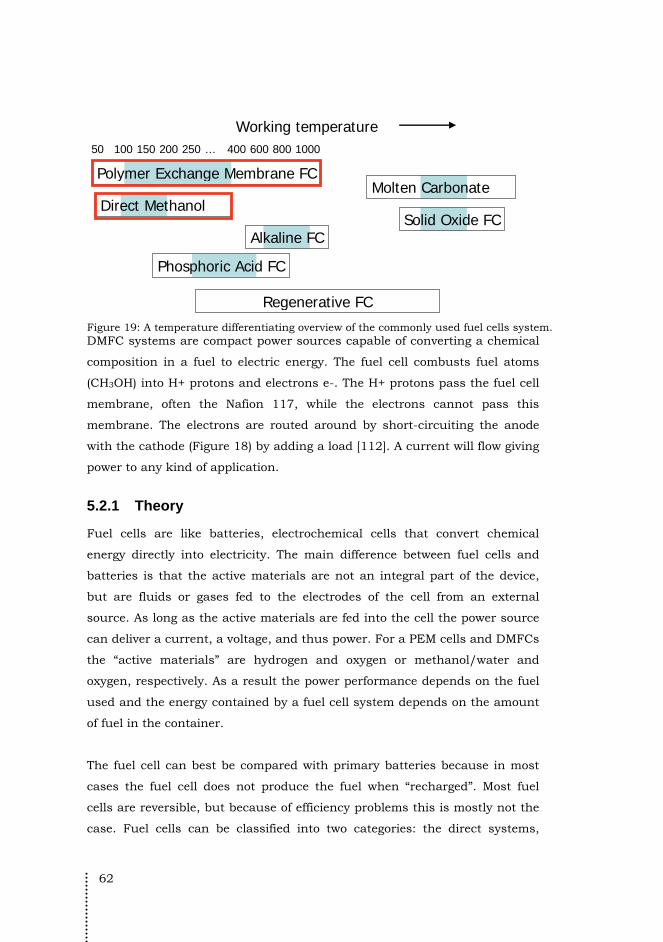
62
Molten Carbonate
Solid Oxide FC
Polymer Exchange Membrane FC
Direct Methanol
Phosphoric Acid FC
Alkaline FC
Regenerative FC
Working temperature 50 100 150 200 250 … 400 600 800 1000
Figure 19: A temperature differentiating overview of the commonly used fuel cells system. DMFC systems are compact power sources capable of converting a chemical
composition in a fuel to electric energy. The fuel cell combusts fuel atoms
(CH3OH) into H+ protons and electrons e-. The H+ protons pass the fuel cell
membrane, often the Nafion 117, while the electrons cannot pass this
membrane. The electrons are routed around by short-circuiting the anode
with the cathode (Figure 18) by adding a load [112]. A current will flow giving
power to any kind of application.
5.2.1 Theory
Fuel cells are like batteries, electrochemical cells that convert chemical
energy directly into electricity. The main difference between fuel cells and
batteries is that the active materials are not an integral part of the device,
but are fluids or gases fed to the electrodes of the cell from an external
source. As long as the active materials are fed into the cell the power source
can deliver a current, a voltage, and thus power. For a PEM cells and DMFCs
the “active materials” are hydrogen and oxygen or methanol/water and
oxygen, respectively. As a result the power performance depends on the fuel
used and the energy contained by a fuel cell system depends on the amount
of fuel in the container.
The fuel cell can best be compared with primary batteries because in most
cases the fuel cell does not produce the fuel when “recharged”. Most fuel
cells are reversible, but because of efficiency problems this is mostly not the
case. Fuel cells can be classified into two categories: the direct systems,

63
where fuel can directly react in the fuel cell, and indirect systems where first
fuel is converted by means of reforming to a hydrogen-rich gas which on its
turn is fed into the fuel cell.
Figure 18 shows the basic principle of a fuel cell. In this case the Direct
Methanol Fuel Cell. In this fuel cell the methanol/water mix (CH3OH + H2O)
is the active material fed into the anode, the fuel electrode, and air/oxygen
(1.5 O2), is fed into the cathode, the oxygen electrode. The cell produces
water (3 H2O) plus carbon dioxide (CO2) as a by product. The overall cell
reaction in the DMFC is represented by the following equation:
H2O + CH3OH + 1.5 O2 CO2 + 3 H2O
During this reaction 6 electrons are produced, which are routed bypassing
the cell. The membrane is the electrolyte of the cell which only conducts H+
ions (cations). In DMFCs the membrane is the same as for hydrogen fueled
PEM cells, often the Nafion 117 membrane.
5.2.2 Theoretical performance specs and practical values
Just like with batteries cells, the Voltage depends on the active materials
used. The theoretical reversible open cell voltage E for DMFCs can be
calculated with the molar Gibbs free energy:
fg
EzF
−Δ= (3)
Where the molar Gibbs free energy fgΔ for methanol is equal to -698,2 kJ
mol-1 [112], F is Faradays number equal to 96485 C mol-1, and z is the
number of electrons passing from the anode to the cathode. In the case of
DMFCs the number of electrons is equal to 6 for each molecule of methanol
(see Figure 18). This will result in a theoretical open cell Voltage equal to
1.21V. In Table 7 all data is described for both the PEM cell and the DMFC,
the most commonly used fuel cell type for portable applications.
Just like for batteries the capacity of a “fuel cell system” depends on the
amount of active material used by the cell. For DMFCs methanol and oxygen
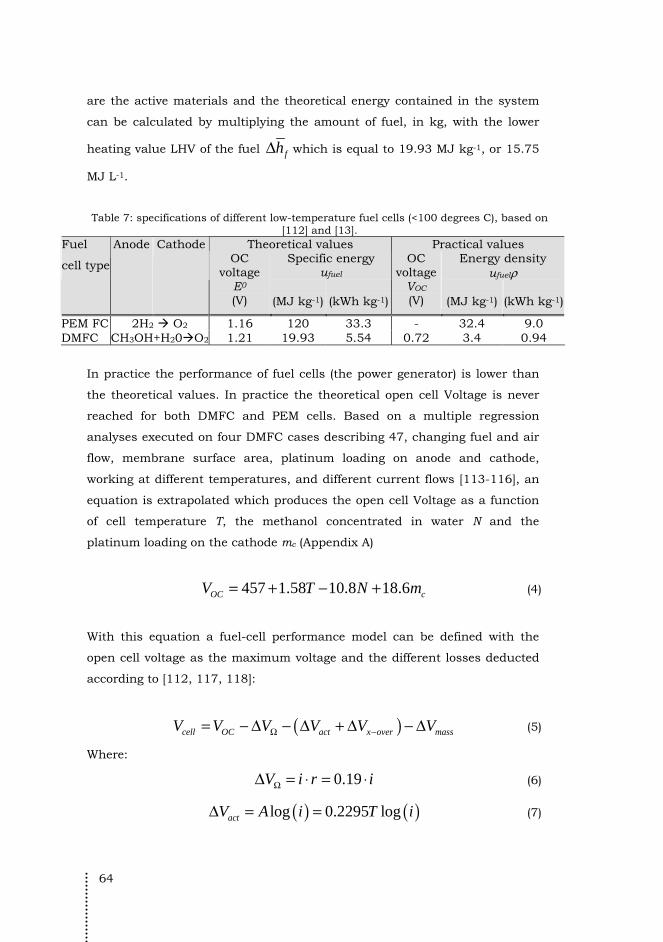
64
are the active materials and the theoretical energy contained in the system
can be calculated by multiplying the amount of fuel, in kg, with the lower
heating value LHV of the fuel fhΔ which is equal to 19.93 MJ kg-1, or 15.75
MJ L-1.
Table 7: specifications of different low-temperature fuel cells (<100 degrees C), based on [112] and [13].
Theoretical values Practical values Specific energy
ufuel Energy density
ufuelρ
Fuel
cell type
Anode CathodeOC
voltage E0
(V)
(MJ kg-1)
(kWh kg-1)
OC voltage
VOC (V)
(MJ kg-1)
(kWh kg-1)
PEM FC 2H2 O2 1.16 120 33.3 - 32.4 9.0 DMFC CH3OH+H20O2 1.21 19.93 5.54 0.72 3.4 0.94
In practice the performance of fuel cells (the power generator) is lower than
the theoretical values. In practice the theoretical open cell Voltage is never
reached for both DMFC and PEM cells. Based on a multiple regression
analyses executed on four DMFC cases describing 47, changing fuel and air
flow, membrane surface area, platinum loading on anode and cathode,
working at different temperatures, and different current flows [113-116], an
equation is extrapolated which produces the open cell Voltage as a function
of cell temperature T, the methanol concentrated in water N and the
platinum loading on the cathode mc (Appendix A)
457 1.58 10.8 18.6OC cV T N m= + − + (4)
With this equation a fuel-cell performance model can be defined with the
open cell voltage as the maximum voltage and the different losses deducted
according to [112, 117, 118]:
( )cell OC act x over massV V V V V VΩ −= − Δ − Δ + Δ − Δ (5)
Where:
0.19V i r iΩΔ = ⋅ = ⋅ (6)
( ) ( )log 0.2295 logactV A i T iΔ = = (7)
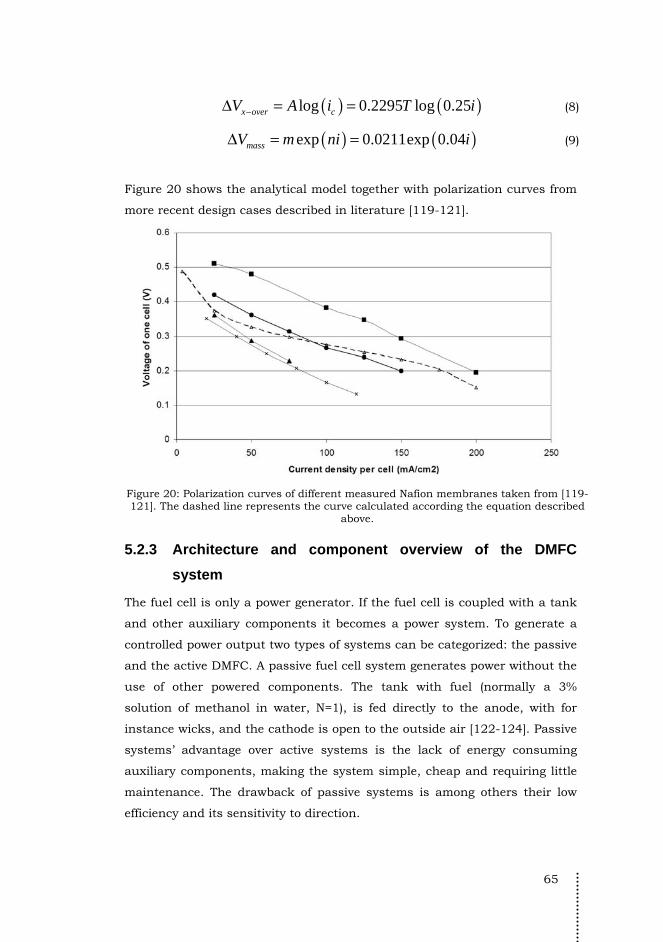
65
( ) ( )log 0.2295 log 0.25x over cV A i T i−Δ = = (8)
( ) ( )exp 0.0211exp 0.04massV m ni iΔ = = (9)
Figure 20 shows the analytical model together with polarization curves from
more recent design cases described in literature [119-121].
Figure 20: Polarization curves of different measured Nafion membranes taken from [119-121]. The dashed line represents the curve calculated according the equation described
above.
5.2.3 Architecture and component overview of the DMFC
system
The fuel cell is only a power generator. If the fuel cell is coupled with a tank
and other auxiliary components it becomes a power system. To generate a
controlled power output two types of systems can be categorized: the passive
and the active DMFC. A passive fuel cell system generates power without the
use of other powered components. The tank with fuel (normally a 3%
solution of methanol in water, N=1), is fed directly to the anode, with for
instance wicks, and the cathode is open to the outside air [122-124]. Passive
systems’ advantage over active systems is the lack of energy consuming
auxiliary components, making the system simple, cheap and requiring little
maintenance. The drawback of passive systems is among others their low
efficiency and its sensitivity to direction.
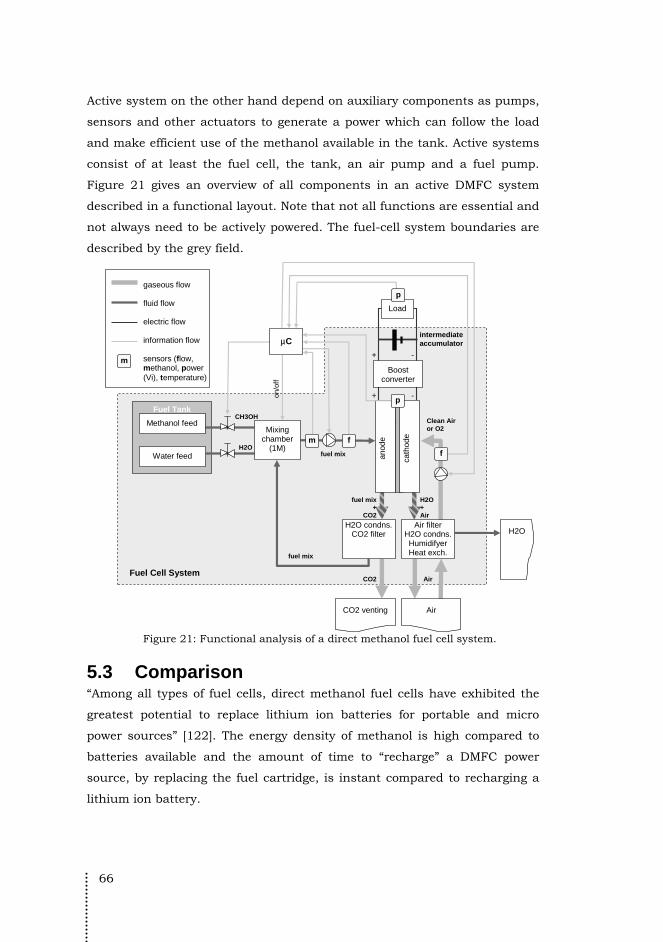
66
Active system on the other hand depend on auxiliary components as pumps,
sensors and other actuators to generate a power which can follow the load
and make efficient use of the methanol available in the tank. Active systems
consist of at least the fuel cell, the tank, an air pump and a fuel pump.
Figure 21 gives an overview of all components in an active DMFC system
described in a functional layout. Note that not all functions are essential and
not always need to be actively powered. The fuel-cell system boundaries are
described by the grey field.
Fuel Tank
anod
e
Methanol feed Mixing
chamber (1M)
Water feed
Air
cath
ode
CO2 venting
Boost converter
Load
gaseous flow fluid flow electric flow information flow sensors (flow, methanol, power (Vi), temperature)
Air filter H2O condns.Humidifyer Heat exch.
+ -
+ -
H2O condns.CO2 filter
fuel mix
fuel mix
CO2 Air
CH3OH
H2O
Clean Air or O2
fuel mix +
CO2
H2O+ Air
H2O
m
p
f m
p
f
on/
off
μC intermediate accumulator
Fuel Cell System
Figure 21: Functional analysis of a direct methanol fuel cell system.
5.3 Comparison “Among all types of fuel cells, direct methanol fuel cells have exhibited the
greatest potential to replace lithium ion batteries for portable and micro
power sources” [122]. The energy density of methanol is high compared to
batteries available and the amount of time to “recharge” a DMFC power
source, by replacing the fuel cartridge, is instant compared to recharging a
lithium ion battery.
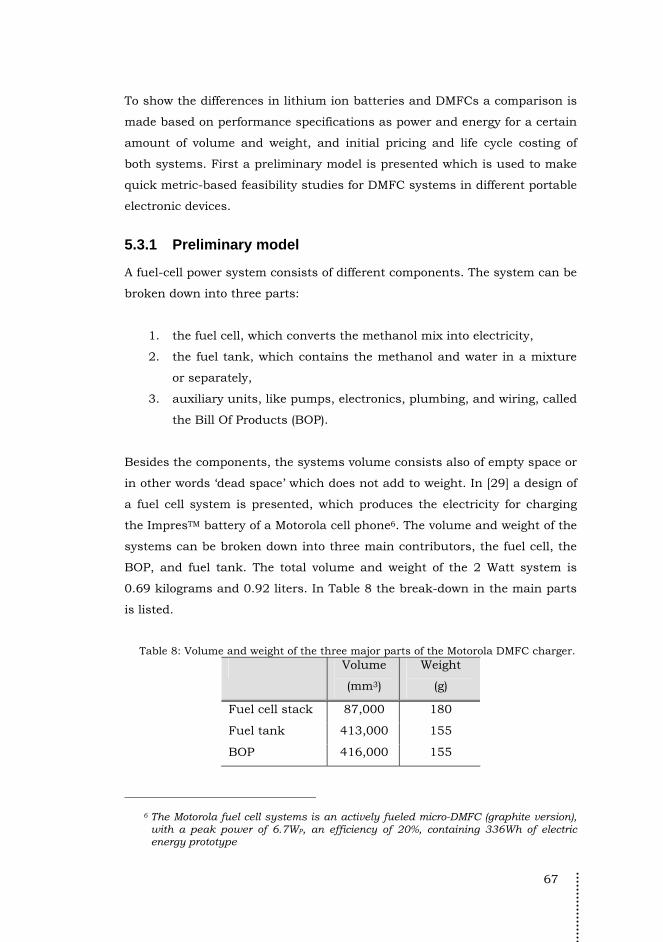
67
To show the differences in lithium ion batteries and DMFCs a comparison is
made based on performance specifications as power and energy for a certain
amount of volume and weight, and initial pricing and life cycle costing of
both systems. First a preliminary model is presented which is used to make
quick metric-based feasibility studies for DMFC systems in different portable
electronic devices.
5.3.1 Preliminary model
A fuel-cell power system consists of different components. The system can be
broken down into three parts:
1. the fuel cell, which converts the methanol mix into electricity,
2. the fuel tank, which contains the methanol and water in a mixture
or separately,
3. auxiliary units, like pumps, electronics, plumbing, and wiring, called
the Bill Of Products (BOP).
Besides the components, the systems volume consists also of empty space or
in other words ‘dead space’ which does not add to weight. In [29] a design of
a fuel cell system is presented, which produces the electricity for charging
the ImpresTM battery of a Motorola cell phone6. The volume and weight of the
systems can be broken down into three main contributors, the fuel cell, the
BOP, and fuel tank. The total volume and weight of the 2 Watt system is
0.69 kilograms and 0.92 liters. In Table 8 the break-down in the main parts
is listed.
Table 8: Volume and weight of the three major parts of the Motorola DMFC charger. Volume
(mm3)
Weight
(g)
Fuel cell stack 87,000 180
Fuel tank 413,000 155
BOP 416,000 155
6 The Motorola fuel cell systems is an actively fueled micro-DMFC (graphite version),
with a peak power of 6.7WP, an efficiency of 20%, containing 336Wh of electric energy prototype
68
Based on these figures a first approach to an analytical model is proposed in
which the volume and weight of a fuel cell system is sized.
The volume of a DMFC system can generally be based on two variables, peak
power (P) and the amount energy of energy (Wh) has to contain. It is
assumed that dimensions of the fuel cell stack and the BOP is based on the
power specifics (P) and the dimensions of the fuel tank are only based on
energy specifics (E). Empty space is included in the BOP volume part. The
following analytical model of the volume in liters is than derived:
( ) ( ) ( )can
fc fuel bop
peak peak
sys vfc fuel bop
V V V V
P PE
p c u pρ η ρ ρ
= + +
= + + (10)
Where: (pρ)fc = 77.3W L-1
(pρ)fuel = 4373Wh L-1
(pρ)bop = 16.1W L-1
ηsys = 20%
cv can = 0.85
The energy density of methanol is based on its Lower Heating Value. The
system efficiency ηsys and volumetric canister coefficient cv can are based on
figures from [29]. BOP is the largest contributor to the total systems volume
(~45%). Less than 20% of the BOPs volume is claimed by the electronics, air
pump, mixing chamber, fuel pumps and others, meaning more than 80% of
the total BOP volume is claimed by empty space, electrical interconnects and
plumbing [29, 125], equaling 35% of the total systems volume.
For weight the same assumptions are made as for volume. Empty space does
not add an increase of the systems weight and is thus not included (note:
theoretically air is not weightless, but assumed to be in this case). The
following analytical model can now be derived:
69
can
fc fuel bop
peak peak
fc sys m fuel bop
m m m m
P PE
p c u pη
= + +
= + + (11)
Where: pfc = 37.2W kg-1
ufuel = 5536Wh kg-1
pbop = 43.2W kg-1
ηsys = 20%
cm can = 0.80
The specific energy of methanol is based on its Lower Heating Value.
These simple models are to compare the DMFC system with other power
sources, like the lithium ion battery, by means of a so-called Ragone plot, as
figured in Figure 22 where the performance specifications of the Sony
3834450A8 [126] prismatic lithium ion battery (4.2V, 7Ah) is compared with
the performance specifications of the DMFC system, described above.
With the help of the simple models derived above an optimization can be
made, for instance when the efficiency of the system is improved from 20%
to 25%, and when empty space is neglected, this will influence volume and
weight.
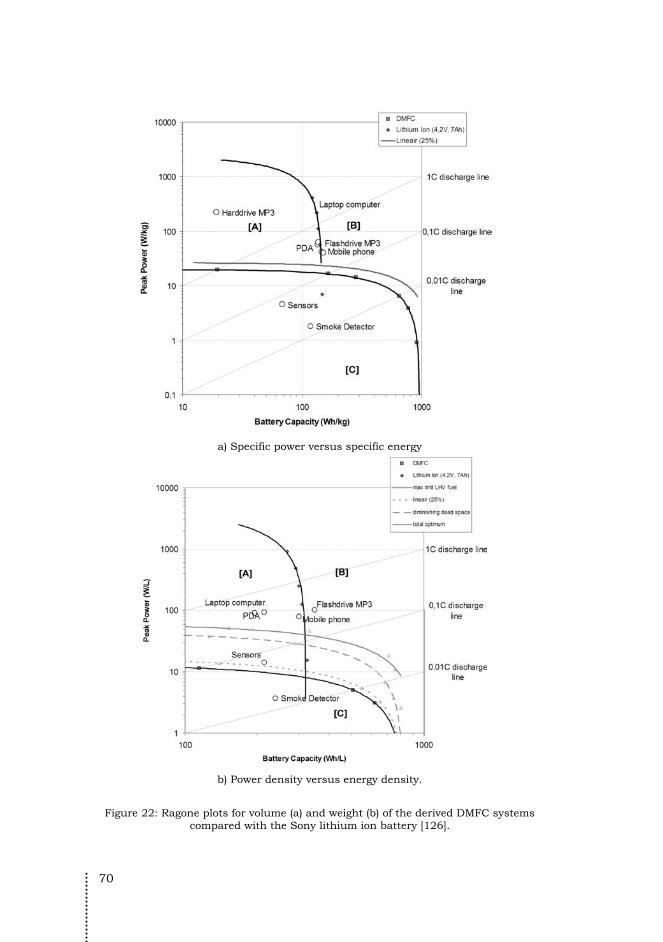
70
a) Specific power versus specific energy
b) Power density versus energy density.
Figure 22: Ragone plots for volume (a) and weight (b) of the derived DMFC systems compared with the Sony lithium ion battery [126].

71
5.3.2 Volume specifications
The volume of cell phones and their batteries have decreased with a factor 2
over the past 10 years. In contrast to battery weight the battery-volume
percentage in mobile phones was constant over the past 10 years at
20%±10%(SD) of its total volume. The volume of PDA’s has decreased over
the period from 1995 to 2004 to ~150 cm3, but their batteries have increased
with a factor 1.5 in volume. This results in an increase of the batteries
volume in PDA’s to 20-27% of the total volume. For laptop computers the
batteries volume ranges in between 6 and 11% of the total volume. The
magnitude has increased slightly over the past 10 years.
The theoretical energy density of Methanol based on the lower heating value
is 4373 Wh L-1. At a system efficiency of 20% the ‘practical’ energy density of
methanol will be around 875 Wh L-1, an improvement of almost a factor 2
compared to the Sony lithium-ion battery described in Table 9.
Table 9: Overview of the characteristics for one primary (alkaline), several rechargeable
batteries and the prototype DMFC from Toshiba. Alkaline
Duracell*
MN1500
NiCad
Sanyo
N3US bulk
NiMH
Sony**
NHAAB4E
Li-ion
Sony
383450A8
Li-poly
Varta
easypack
1000
DMFC
Toshiba***
Dev. phase**** C. C. C. I. C. P.
Shape Cyl. Cyl. Cyl. Prism. Prism. Prism.
Capacity (mWh) 2850 1000 2500 830 1070 2000
Weight (g) 24 23 30 14.3 23 8.5
Dimensions (mm3) 50x∅14.2 50x∅4.2 50x∅14.2 50x35x3.8 62x35x5 22x56x9.1
Energy dens. (Wh L-1) 428 151 379 475 365 178
Spec. Energy (Wh kg-1) 143 52 100 221 172 235
Cycle life 80% (-) 1 300-700 400-500 400-500 >500 -
Normal cell Voltage (V) 1.5 1.2 1.2 3.7 3.7 0.4
* Duracell AA battery, MN1500.
** Sony’s NHAAB4E Rechargeable NI-MH AA Battery Pack, NHAAB4E.
*** Based on a 20h usage at 100mW the energy needed is 2Wh. The tank contains 2cc of
methanol at a 99.5% concentration, containing an amount of energy equal to 0.256MJ =
71.1Wh. The overall efficiency of the system is than equal to ~2.8%.
**** C=commercial, I=introduction, P=prototype phase

72
This table also shows the energy density increase over the past 10 to 15
years in battery technology. The prototype DMFC system of Toshiba [43]
shows that, in contrast to its weight specifics, the volume specifics of the
DMFC system is worse than all other primary or secondary battery presented.
They are even worse when compared to state-of-the-art commercial lithium
ion batteries.
Based on the analytical model an estimate is made for the fuel cell system
volume when applied in different applications. The data is presented in Table
10 and is visualized in Figure 23. From these figures it can be concluded
that BOP is one of the largest contributor to the volume of the total system.
It must be noted that more than 86% of the total BOP volume of the
Motorola design was dead space, electrical interconnects and plumbing, and
only 14% is claimed by the electronics, air pump, mixing chamber, fuel
pumps and others (Figure 24). Thus, diminishing dead space is one of the
key issues to increase energy and power density.
Table 10: Comparison of real power and energy characteristics of the existing battery (left four columns) and the estimated size according to Equation 10 when a DMFC system is
used (right two columns). Power
(W)
Battery
(Wh)
Volume
(cm3)
Energy
density
(Wh L-1)
Estimated
FC volume
(cm3)
Estimated
Energy
density
(Wh L-1)
Sensors 0.010 0.15 0.7 214 0.93 160
Flashdrive MP3 0.025 1.1 5 220 3.23 341
Harddrive MP3 0.25 2.9 6.6 439 22.3 130
Mobile phone 0.80 3 10 300 63.7 47
PDA 1.50 3.5 16.3 215 117 30
Laptop computers 30 65.1 333 195 2331 28
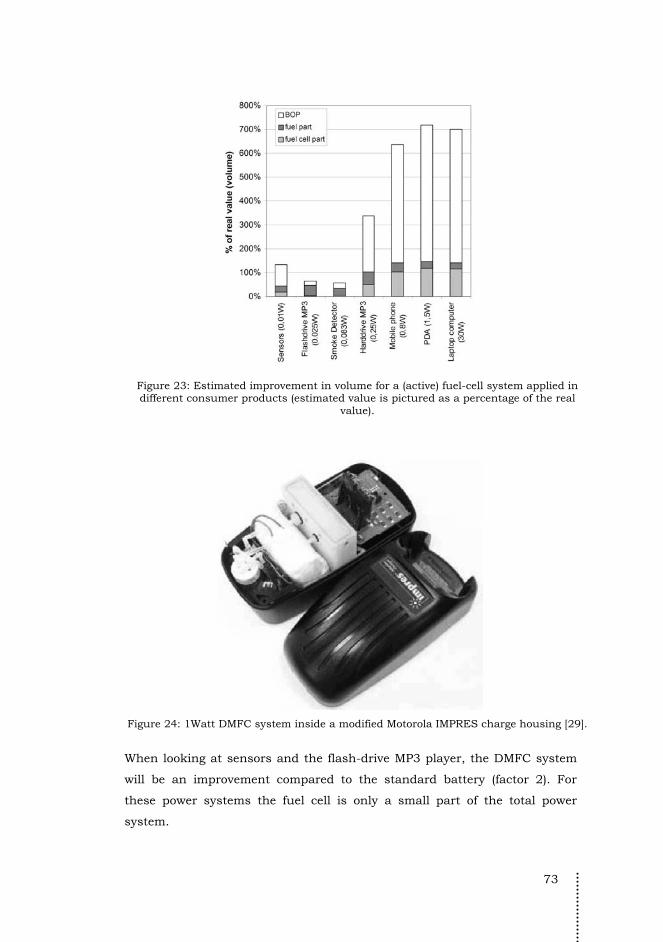
73
Figure 23: Estimated improvement in volume for a (active) fuel-cell system applied in different consumer products (estimated value is pictured as a percentage of the real
value).
Figure 24: 1Watt DMFC system inside a modified Motorola IMPRES charge housing [29].
When looking at sensors and the flash-drive MP3 player, the DMFC system
will be an improvement compared to the standard battery (factor 2). For
these power systems the fuel cell is only a small part of the total power
system.
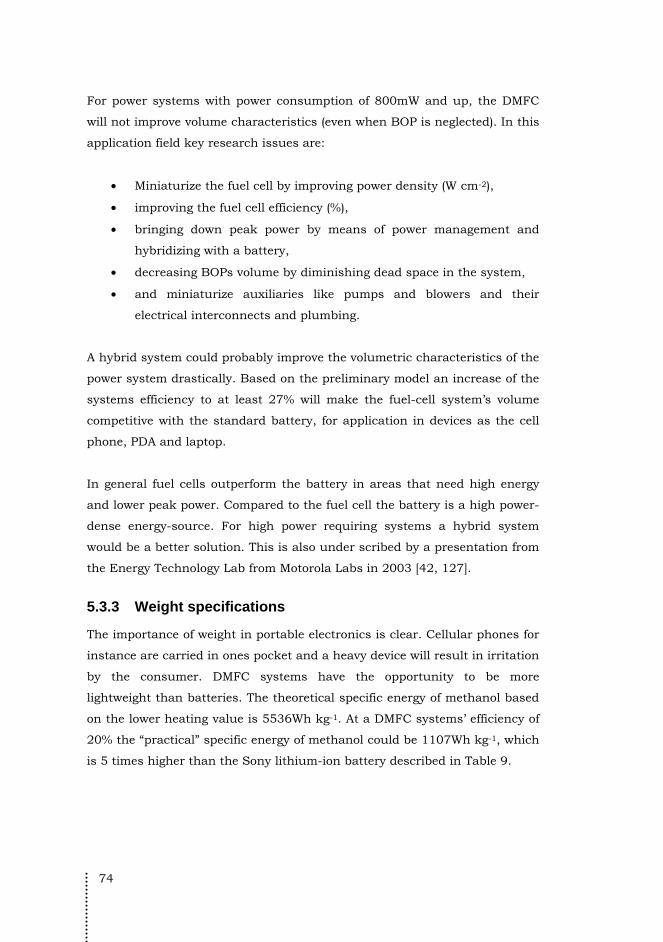
74
For power systems with power consumption of 800mW and up, the DMFC
will not improve volume characteristics (even when BOP is neglected). In this
application field key research issues are:
• Miniaturize the fuel cell by improving power density (W cm-2),
• improving the fuel cell efficiency (%),
• bringing down peak power by means of power management and
hybridizing with a battery,
• decreasing BOPs volume by diminishing dead space in the system,
• and miniaturize auxiliaries like pumps and blowers and their
electrical interconnects and plumbing.
A hybrid system could probably improve the volumetric characteristics of the
power system drastically. Based on the preliminary model an increase of the
systems efficiency to at least 27% will make the fuel-cell system’s volume
competitive with the standard battery, for application in devices as the cell
phone, PDA and laptop.
In general fuel cells outperform the battery in areas that need high energy
and lower peak power. Compared to the fuel cell the battery is a high power-
dense energy-source. For high power requiring systems a hybrid system
would be a better solution. This is also under scribed by a presentation from
the Energy Technology Lab from Motorola Labs in 2003 [42, 127].
5.3.3 Weight specifications
The importance of weight in portable electronics is clear. Cellular phones for
instance are carried in ones pocket and a heavy device will result in irritation
by the consumer. DMFC systems have the opportunity to be more
lightweight than batteries. The theoretical specific energy of methanol based
on the lower heating value is 5536Wh kg-1. At a DMFC systems’ efficiency of
20% the “practical” specific energy of methanol could be 1107Wh kg-1, which
is 5 times higher than the Sony lithium-ion battery described in Table 9.
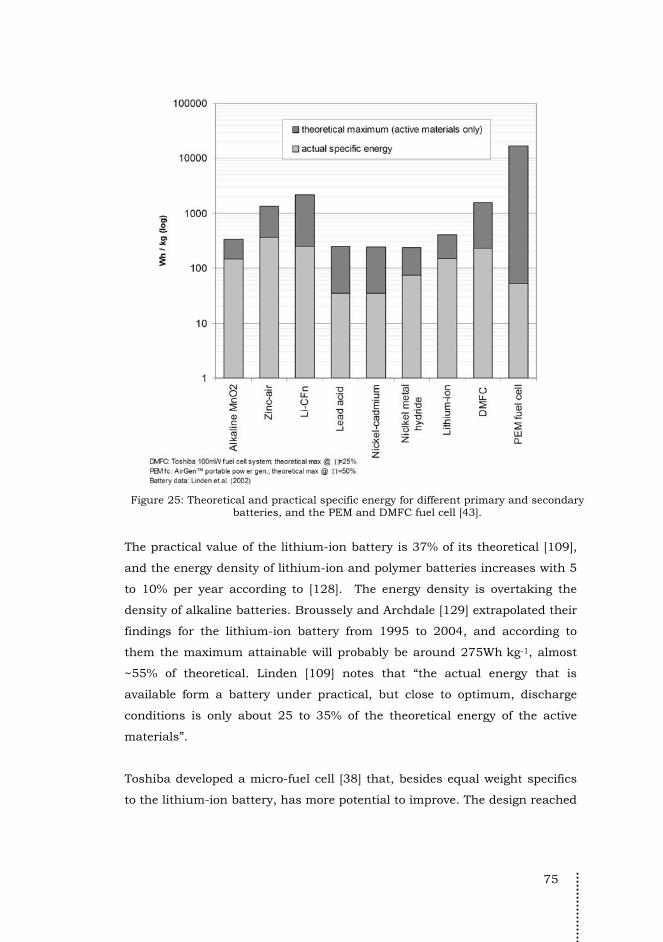
75
Figure 25: Theoretical and practical specific energy for different primary and secondary
batteries, and the PEM and DMFC fuel cell [43].
The practical value of the lithium-ion battery is 37% of its theoretical [109],
and the energy density of lithium-ion and polymer batteries increases with 5
to 10% per year according to [128]. The energy density is overtaking the
density of alkaline batteries. Broussely and Archdale [129] extrapolated their
findings for the lithium-ion battery from 1995 to 2004, and according to
them the maximum attainable will probably be around 275Wh kg-1, almost
~55% of theoretical. Linden [109] notes that “the actual energy that is
available form a battery under practical, but close to optimum, discharge
conditions is only about 25 to 35% of the theoretical energy of the active
materials”.
Toshiba developed a micro-fuel cell [38] that, besides equal weight specifics
to the lithium-ion battery, has more potential to improve. The design reached
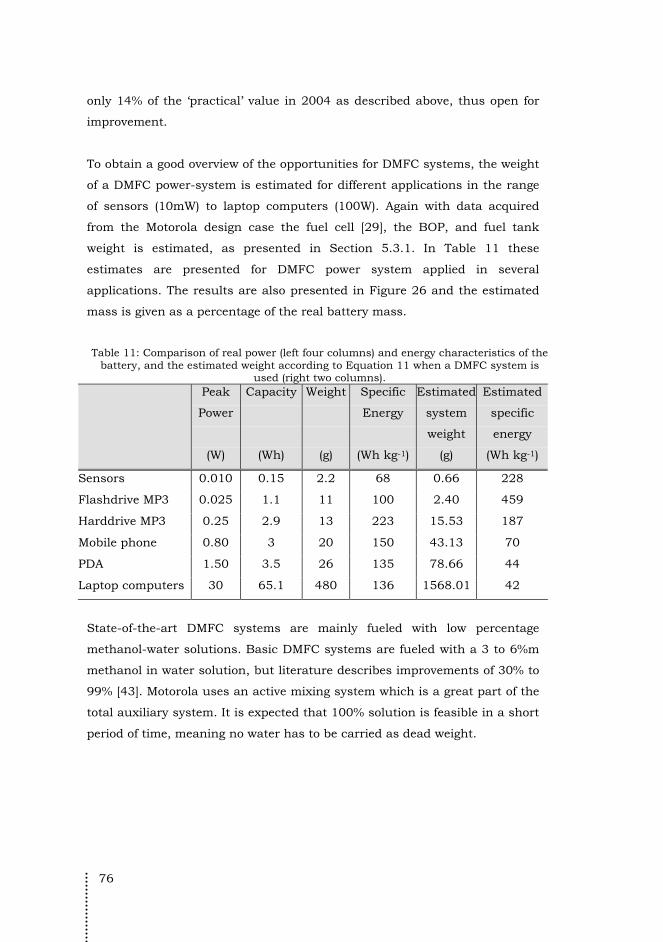
76
only 14% of the ‘practical’ value in 2004 as described above, thus open for
improvement.
To obtain a good overview of the opportunities for DMFC systems, the weight
of a DMFC power-system is estimated for different applications in the range
of sensors (10mW) to laptop computers (100W). Again with data acquired
from the Motorola design case the fuel cell [29], the BOP, and fuel tank
weight is estimated, as presented in Section 5.3.1. In Table 11 these
estimates are presented for DMFC power system applied in several
applications. The results are also presented in Figure 26 and the estimated
mass is given as a percentage of the real battery mass.
Table 11: Comparison of real power (left four columns) and energy characteristics of the battery, and the estimated weight according to Equation 11 when a DMFC system is
used (right two columns). Peak
Power
(W)
Capacity
(Wh)
Weight
(g)
Specific
Energy
(Wh kg-1)
Estimated
system
weight
(g)
Estimated
specific
energy
(Wh kg-1)
Sensors 0.010 0.15 2.2 68 0.66 228
Flashdrive MP3 0.025 1.1 11 100 2.40 459
Harddrive MP3 0.25 2.9 13 223 15.53 187
Mobile phone 0.80 3 20 150 43.13 70
PDA 1.50 3.5 26 135 78.66 44
Laptop computers 30 65.1 480 136 1568.01 42
State-of-the-art DMFC systems are mainly fueled with low percentage
methanol-water solutions. Basic DMFC systems are fueled with a 3 to 6%m
methanol in water solution, but literature describes improvements of 30% to
99% [43]. Motorola uses an active mixing system which is a great part of the
total auxiliary system. It is expected that 100% solution is feasible in a short
period of time, meaning no water has to be carried as dead weight.
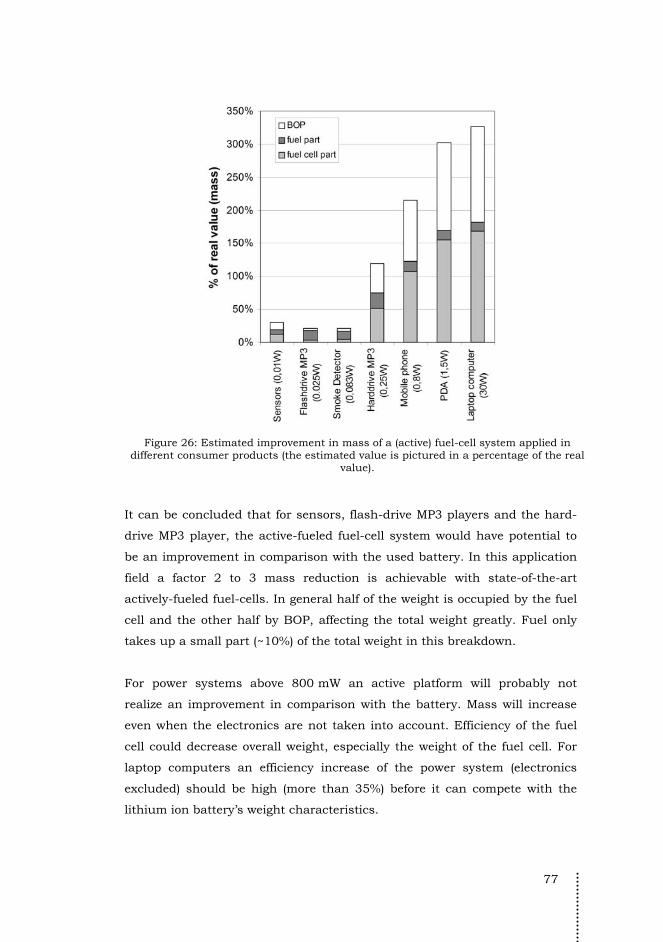
77
Figure 26: Estimated improvement in mass of a (active) fuel-cell system applied in
different consumer products (the estimated value is pictured in a percentage of the real value).
It can be concluded that for sensors, flash-drive MP3 players and the hard-
drive MP3 player, the active-fueled fuel-cell system would have potential to
be an improvement in comparison with the used battery. In this application
field a factor 2 to 3 mass reduction is achievable with state-of-the-art
actively-fueled fuel-cells. In general half of the weight is occupied by the fuel
cell and the other half by BOP, affecting the total weight greatly. Fuel only
takes up a small part (~10%) of the total weight in this breakdown.
For power systems above 800 mW an active platform will probably not
realize an improvement in comparison with the battery. Mass will increase
even when the electronics are not taken into account. Efficiency of the fuel
cell could decrease overall weight, especially the weight of the fuel cell. For
laptop computers an efficiency increase of the power system (electronics
excluded) should be high (more than 35%) before it can compete with the
lithium ion battery’s weight characteristics.
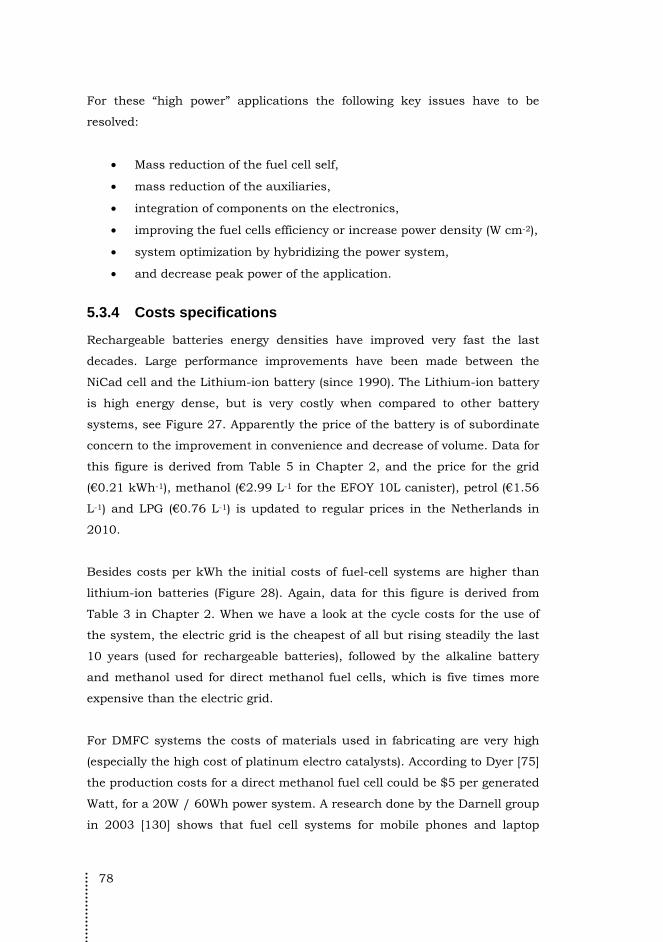
78
For these “high power” applications the following key issues have to be
resolved:
• Mass reduction of the fuel cell self,
• mass reduction of the auxiliaries,
• integration of components on the electronics,
• improving the fuel cells efficiency or increase power density (W cm-2),
• system optimization by hybridizing the power system,
• and decrease peak power of the application.
5.3.4 Costs specifications
Rechargeable batteries energy densities have improved very fast the last
decades. Large performance improvements have been made between the
NiCad cell and the Lithium-ion battery (since 1990). The Lithium-ion battery
is high energy dense, but is very costly when compared to other battery
systems, see Figure 27. Apparently the price of the battery is of subordinate
concern to the improvement in convenience and decrease of volume. Data for
this figure is derived from Table 5 in Chapter 2, and the price for the grid
(€0.21 kWh-1), methanol (€2.99 L-1 for the EFOY 10L canister), petrol (€1.56
L-1) and LPG (€0.76 L-1) is updated to regular prices in the Netherlands in
2010.
Besides costs per kWh the initial costs of fuel-cell systems are higher than
lithium-ion batteries (Figure 28). Again, data for this figure is derived from
Table 3 in Chapter 2. When we have a look at the cycle costs for the use of
the system, the electric grid is the cheapest of all but rising steadily the last
10 years (used for rechargeable batteries), followed by the alkaline battery
and methanol used for direct methanol fuel cells, which is five times more
expensive than the electric grid.
For DMFC systems the costs of materials used in fabricating are very high
(especially the high cost of platinum electro catalysts). According to Dyer [75]
the production costs for a direct methanol fuel cell could be $5 per generated
Watt, for a 20W / 60Wh power system. A research done by the Darnell group
in 2003 [130] shows that fuel cell systems for mobile phones and laptop
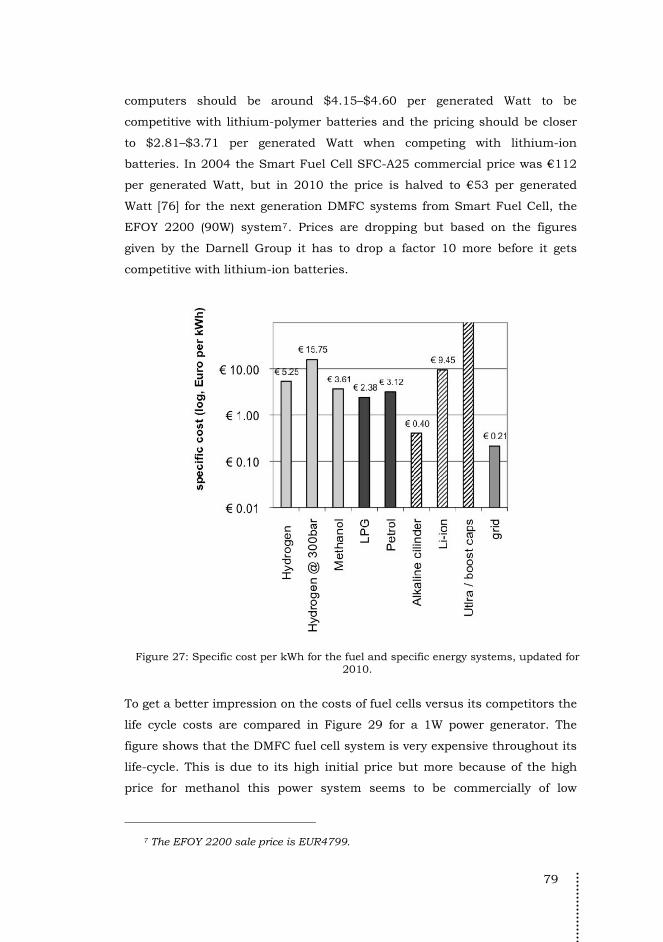
79
computers should be around $4.15–$4.60 per generated Watt to be
competitive with lithium-polymer batteries and the pricing should be closer
to $2.81–$3.71 per generated Watt when competing with lithium-ion
batteries. In 2004 the Smart Fuel Cell SFC-A25 commercial price was €112
per generated Watt, but in 2010 the price is halved to €53 per generated
Watt [76] for the next generation DMFC systems from Smart Fuel Cell, the
EFOY 2200 (90W) system7. Prices are dropping but based on the figures
given by the Darnell Group it has to drop a factor 10 more before it gets
competitive with lithium-ion batteries.
Figure 27: Specific cost per kWh for the fuel and specific energy systems, updated for
2010.
To get a better impression on the costs of fuel cells versus its competitors the
life cycle costs are compared in Figure 29 for a 1W power generator. The
figure shows that the DMFC fuel cell system is very expensive throughout its
life-cycle. This is due to its high initial price but more because of the high
price for methanol this power system seems to be commercially of low
7 The EFOY 2200 sale price is EUR4799.

80
interest. The price for alkaline batteries is very low and for an alkaline AA
battery the prices dropped from €1.74 in 2004 to €1.25 in 2010. According
to this analysis the most cost-effective power system is the alkaline battery.
The life-cycle costs of the rechargeable batteries depend much on the local
electricity price, which increases slowly the last years and strongly depends
on the region you are in. In the Netherlands the electricity price is quite high
compared to other countries in Europe [131].
Figure 28: Specific costs per Watt for different power systems, data from 2004.
The life-cycle costs for the consumer are for both the rechargeable batteries
and a DMFC system higher than a regular alkaline battery. Figure 29 shows
that alkaline batteries are cost effective even at higher energy needs, so why
should the consumer make the transition to a DMFC system. One AA
alkaline battery can hold 2.4Wh of energy. Taking the same size (7.7cm3) for
a methanol canister, it can hold a practical 6.4Wh (at a conversion efficiency
of 17%). This means the number of cartridge replacements for the methanol-
cartridge is 2.7 times less than replacement of the alkaline battery. A
lithium-ion battery can contain up to 1.6Wh in the volume of an AA battery,
which means the “time in-between charges” could be increased with a factor
3.9 when a DMFC system is used. This could be a unique-selling point for
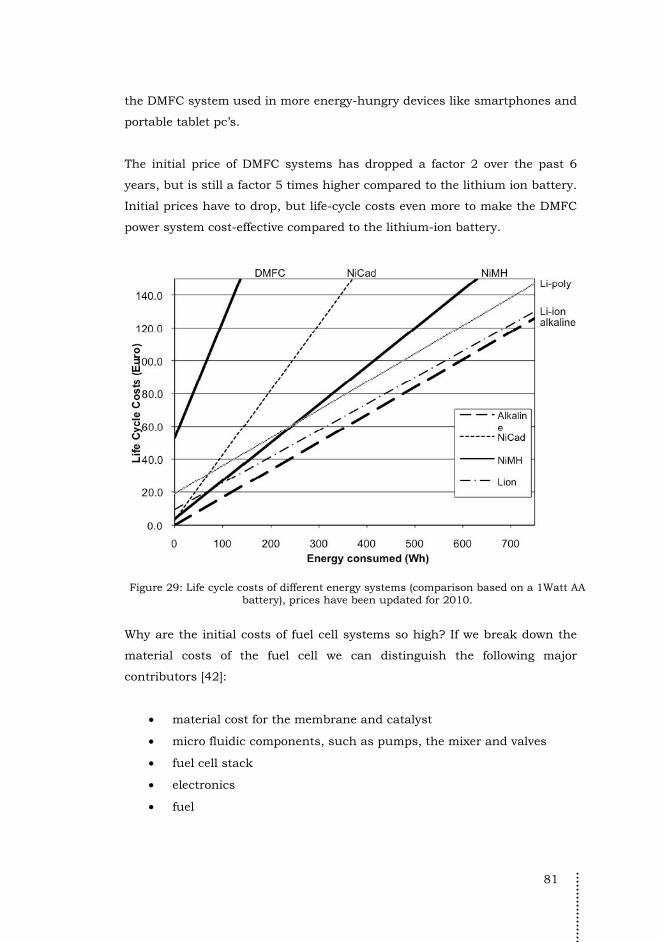
81
the DMFC system used in more energy-hungry devices like smartphones and
portable tablet pc’s.
The initial price of DMFC systems has dropped a factor 2 over the past 6
years, but is still a factor 5 times higher compared to the lithium ion battery.
Initial prices have to drop, but life-cycle costs even more to make the DMFC
power system cost-effective compared to the lithium-ion battery.
Figure 29: Life cycle costs of different energy systems (comparison based on a 1Watt AA
battery), prices have been updated for 2010.
Why are the initial costs of fuel cell systems so high? If we break down the
material costs of the fuel cell we can distinguish the following major
contributors [42]:
• material cost for the membrane and catalyst
• micro fluidic components, such as pumps, the mixer and valves
• fuel cell stack
• electronics
• fuel
82
When we buy a Membrane Electrode Assembly (MEA) at Fuelcellstore [132]
the price is around $105 per generated Watt8. According to the Darnell
group the MEA (GDL, membrane, electrodes, bipolar plate, gaskets and
other) accounts for 40% of the total DMFC costs and 60% can be carried
back to other components and assembly. Total retail price is than equal to
$263 per generated Watt.
The material costs for the membrane and catalysts are significant. The price
for Platinum at the moment is $63.50 per gram [133]. The platinum load on
the Motorola fuel cell is 8 mg Pt cm-2 for the cathode and 10 mg Pt:Ru (1:1)
cm-2 for the anode [29]. The stack has an active area of 110cm2 (5x5cm2, 6
cells) resulting in a price for only platinum used of $125, or $18.65 per
generated Watt. The price for platinum has doubled since the crisis in 2008,
and scarcity is an issue for the future. This means the platinum loading has
to come down, or new catalysts have to be discovered to bring down the
initial price. Acta S.p.A (“Acta”) announced that it had filed a patent
application for a HYPERMEC catalyst for electrolyzers which offers very high
efficiency and yet contains no expensive platinum [71].
Besides material costs the fuel cell development is still in its infant phase.
The Smart Fuel Cell power units are only produced in small series and
focusing on niche-markets like generators for campervans. The development
to improve power and energy densities are still going on. On the other hand
the production of lithium ion batteries is full grown and less costly due to
scale and low assembly effort. The fuel-cell power system consists of a
number of components which increase assembly time and thus cost. This
calls for integration of components, making the system less complex.
According to Motorola the “concept of system-on-chip or power-on-substrate
is the driving force to reduce the complexity of fuel cell assembly and the
manufacturing cost. Highly integrated fuel cell systems with active and
passive micro fluidic components can be achieved by utilizing emerging
MEMS technology” [47].
8 Based on 5 layer DMFC MEA 25cm2 with GDL, $116.90. The Motorola cell has 6
cells and delivers 6.7W, resulting in a price of about $105 per generated Watt.
83
Overall the initial costs of DMFC systems should be cut down, but more
urgent is a needed price-drop of methanol. The costs can be cut down by:
• Lowering or diminishing platinum loading
• Lowering material use and especially dedicated materials like Nafion
• Scaling up production
• Integrating components
• and make use of mass-production manufacturing like injection
molding and etching (PCB)
5.3.5 Life cycle specifics
The times a battery or power system could be recharged or reused depends
on the technical life span of these power sources. For instance the NiCd
battery is troubled with its memory effect bringing back the technical life
span. If charged at regular intervals and always to the max the battery
lifetime will be extended. NiCd batteries can be recharged in between 300 to
700 times and NiMH batteries almost 400 to 500 cycles [134]. Lithium
batteries need a more complex charging procedure because of safety reasons.
The number of recharges is limited to approximately 500 cycles but
improvements are on the way: Toshiba’s claims 1000 cycles [135]. Battery
cycle life is limiting the maximum technical life span a product can be used.
The technical life span for a battery powered laptop computer is in between
1,500 and 2,500 hours (3 to 5 times the number of cycles). The economical
life of portable electronics is two to three years. The technical life span of the
battery will in general outlive the economical life. The degradation rate for
most application batteries is in between 2 to 10V h-1.
DMFC systems have, theoretically, an infinite number of cycles and its
technological life span is limited by material or membrane defect. Knights et
al. [136] describe the “aging mechanisms and lifetime of PEFC and DMFC”
modules. When using load cycling strategy the degradation rate of a DMFC
is 13 V h-1 for almost 2000 hours straight. For DMFC systems the
degradation is clearly higher than those for batteries, typically in the range
of 10 to 25 V h-1. When we only take this cell-performance degradation into
account, the technical life span is more than 60% less than for standard
84
rechargeable batteries. Applied in a laptop computer this will result in a
failure within 600 to 1,000 hours, shorter than the economical life of the
electronic device. The cycle life of fuel cells is thus still an issue to be solved.
5.4 Discussion A tangible trend towards lighter portable electronic devices can be seen.
Battery weight is decreasing at a steady pace, based on the opportunities
introduced by new rechargeable battery types. The specific energy is
increasing from 50Wh kg-1 for NiCd batteries to more than 200Wh kg-1 for
lithium based batteries. For smaller products like the cell phone this
increase in specific energy is mainly used to shrink the battery and make the
device less heavy. Over the years the amount of energy contained in the
battery of a cell phone varied in between 2,000 and 4,000mWh (Figure 30),
en converges to a mean 3,000mWh.
The amount of energy contained by larger power hungry portables, like the
laptop computer, increases with the years (Figure 31). This shows the need
for more energy in the same volume (battery volume percentage over the
total volume is constant over the years) is one of the major goals for laptop
computers.
At the moment a trend is set towards smart phones and tablet-like pc’s
always connected to the internet, like the smartphones and the iPad from
Apple. These devices are more power hungry than the cell phones described
in this chapter. The user uses its smartphones not only for making phone-
calls but more and more for internet applications, which results in a
recharge of the device more often (every other day). For these devices the
need for more energy contained in a smaller volume is, like for laptop
computers, urging.
In Section 5.3.1 an analytical weight model a simple analytical model was
constructed for volume. When applying this model for guessing the volume
of portable electronic devices, the DMFC volume for products in between
10mW and 250W is smaller than the battery used (Figure 23). Again it must
be noted that the model was based on a sole DMFC system without an
auxiliary battery accounting for peak power. The DMFC-hybrid can also
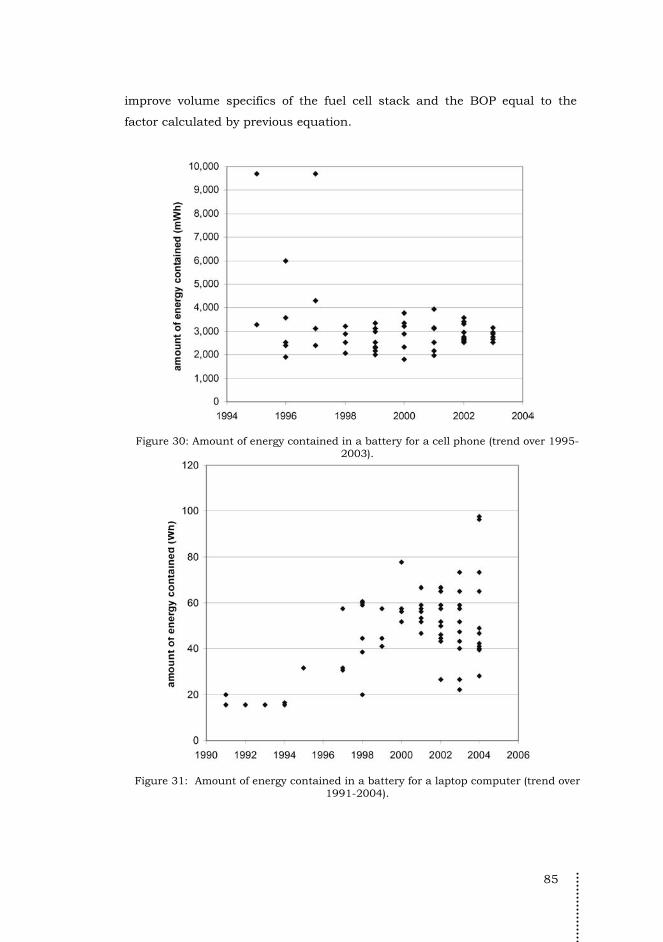
85
improve volume specifics of the fuel cell stack and the BOP equal to the
factor calculated by previous equation.
Figure 30: Amount of energy contained in a battery for a cell phone (trend over 1995-
2003).
Figure 31: Amount of energy contained in a battery for a laptop computer (trend over
1991-2004).

86
Lithium ion batteries are reaching its boundaries of 275Wh kg-1 (Figure 25)
which is almost 55% of the theoretical maximum. The Toshiba micro-DMFC
has only reached 14% of its theoretical maximum, meaning there is a
potential for both DMFC and PEM fuel cells to top the maximum attainable
for lithium based batteries.
Just like volume a quick guesstimate is made for the weight of a DMFC
power system powering different portable devices over a range of 10mW to
100 W. The preliminary results show that the DMFC system will probably
improve the mass specifics of smaller devices like the flash-drive MP3
players and sensors (<250mW) and not the larger devices like the cell phone,
PDA’s and laptop computers. The model described is based on a sole DMFC
system without an auxiliary battery and not on a DMFC hybrid. When
applying a DMFC-hybrid the weight could be reduced even more. The weight
of the fuel cell stack and the BOP can be reduced, at the cost of adding a
small battery, with a factor equal to:
peak
mean
P
P (12)
Analyzing Figure 23 (estimated volume) and Figure 26 (estimated weight), it
shows that weight is less of a problem than volume. Especially when
comparing the density of a DMFC system with that of the lithium ion and
lithium polymer battery. The density of both these batteries is respectively
1.60 kg L-1 and 1.40 kg L-1. Pure methanol on the other hand has a density
equal to 0.79 kg L-1, and combined with water the density of the fuel for a
DMFC system will always be lower than 1 kg L-1. Thus at same volume the
methanol fuel cell will have the advantage over these batteries and be lighter.
Based on this assumption we can postulate that if volume is improved this
will have a even more positive effect on mass.
The price for methanol is high and does not result in a lower life-cycle costs
compared to rechargeable batteries (Figure 27). The initial price is also still
very high compared to the lithium ion battery, but the lower number of
“recharges” could mean a unique selling point for this power system. The
87
initial price has to be cut down by at least a factor 2, and the methanol-price
should be a factor 4 times lower before it gets economically competitive with
the grid-price, and thus with the rechargeable lithium-ion battery.
5.5 Conclusions The goal of this chapter is to answer the first sub-question: Which
technological, physical and economical properties differentiate the DMFC
power system from the lithium-based rechargeable battery in the field of
portable electronic devices? Three main technological properties have been
defined, whereby most power systems are compared with: volume, weight
and (initial) costs.
The volume of cell phone batteries have decreased over the past 10 years,
but in contrast to the battery weight the volume-percentage was kept
constant (cell phones got smaller and the battery followed this trend). On the
other hand for PDAs and laptop computers the battery-volume percentage
has increased by a factor 1.5. The increase in improved energy specifics is
thus mainly used to shrink the battery and make the device less heavy. The
power source in a portable electronic device is an important part defining the
form (for 20% to 30%) and weight (for 15 to 25%) of the device. This means
selecting this component defines largely the form and weight of the device.
Thus decreasing the power source in volume and weight gives the designer
more design freedom.
Theoretically the volume of DMFC systems has an improvement potential of
a factor 2, at a systems efficiency of 20%, over the current lithium-ion
technology. Prototypes are still lagging behind like in the case of the Toshiba
micro DMFC system [43]. Problems with this prototype is the large volume
needed for the fuel cell stack and other auxiliary components, only 7% is
active material, and the low systems efficiency of 2.8%. Weight is of a lesser
issue than volume. DMFC systems have the opportunity to be a factor 3
times more lightweight than lithium ion battery technology. Based on these
figures we can postulate that improving volume specifics of the fuel-cell
system will have an even more positive effect on weight specifics.
88
Initial costs and life-cycle costs of a fuel cell system are high compared to
primary and secondary batteries. The initial price has to be cut down by at
least a factor 5 before it competes with the lithium-ion battery. The
methanol-price should also be cut down with a factor 4, making it
competitive with the grid-price, and thus with the rechargeable lithium-ion
battery. On the other hand the price for lithium ion batteries is high
compared to low-cost rechargeable batteries as the nickel metal hydrate
battery. Apparently the price of the battery is of subordinate concern to the
improvement in convenience (lesser recharges) or decrease in volume. The
DMFC system is an improvement in this field and has to be replaced a factor
2.7 times less than an alkaline battery. Compared to the lithium-ion battery
the DMFC system has to be “recharged” a factor 3.9 times less.
In general fuel cells outperform the battery in areas that need high energy
and lower peak power. Compared to the fuel cell every battery is a high
power-dense energy-source. For low-power and medium power devices, like
the cell phone and laptop computer, a hybrid system will be a better solution.
In this system the fuel cell will only deliver mean power and an extra
intermediate accumulator will take care of peak-power demands. At the cost
of adding a small battery, the volume and weight improvements in the fuel-
cell stack and the BOP is high (Figure 22, group [B]). To test the
improvement a case study is proposed, for a low-power application, with
long-endurance performance-specifications.
Based on the simplified analytical model of volume and weight the
application field can be found mainly in low-power applications with a long
runtime like sensors, MP3 players (without display), and smoke detectors.
Higher power applications are less applicable to be equipped with DMFC
systems because the fuel cell stack gets to large. In between high-power and
the micro-power devices the sole DMFC transits to a DMFC hybrid power
system (DMFC system), which concedes itself in between the MP3 player
(with display) and the cell phone. Volume is hereby the most constraining
parameter. To define this border, and the application field, even better, the
volume and weight of the three parts, fuel cell, BOP and tank, should be
defined better in the model.

89
The main properties found in this chapter will be evaluated and ordered by
importance with a user research. The user will be tested in his/hers
willingness to buy a fuel-cell powered portable, based on the properties
defined in this chapter and other user-properties.

90
91
6 The user and their choice for a power source
For most users of electronic applications the power source in the application
is less important than the functionalities of their application. One important
property comes always forward when buying the application, the time the
application will work on one charge. The consumer is used to dealing with
charging the batteries, often done overnight. Fuel cells on the other hand
have different properties than batteries. As described in Chapter 2 methanol
has a high energy density compared to rechargeable batteries, which results
in a potentially longer run-time for DMFC power systems which could be an
incentive to transfer from batteries to methanol.
Besides increase in runtime also several physical properties will change in
the product. Instead of recharging the battery a cartridge has to be replaced
or the tank is refilled with a syringe. The fuel has to be bought in advance,
which is on one hand costly compared to the ‘free’ energy from the grid. On
the other hand the cartridges have to be carried along. That may be a hassle,
but instant ‘recharging’ is the opportunity.
To find the answer to the second research question about the properties and
its significance from a user point of view a conjoint analysis has been
executed. The conjoint analysis consists of a user acceptance study,
discerning the properties of consumer products likely to affect the transition
from batteries to fuel cell powered systems, Section 6.1. Five differentiating
properties have been selected in Section 6.2 (including the three defined in
Chapter 5) and a conjoint analysis is executed to prioritize these five
properties. In Sections 6.3 and 6.4 the results are presented and discussed.
This chapter will end with conclusions in Section 6.5. In Chapter 7 the

92
differentiating properties from the user point of view will be evaluated further
and metrics for choosing or designing DMFC systems will be defined.
6.1 Approach The approach of this research consists of four parts. First a literature study
is done to find the differentiating properties between the lithium ion battery
and the potential DMFC system. Second the conjoint analysis is setup where
the differentiating properties are examined more in detail.
6.1.1 Differentiating properties
A literature study has been done to find out what properties affect
consumers in buying or using a specific application like a laptop computer, a
PDA or cell phone. More general we want to know “under what conditions
the consumer wants to make the change towards a new energy system” and
“which differentiating properties influence this choice and in which priority”.
Section 6.2 will present this part.
6.1.2 Conjoint analysis
Based on these differentiating properties a conjoint analysis is executed. The
conjoint analysis is a method to find out about several properties of a
product at the same time. By applying the method it is possible to find out
about priorities of properties, as well as the preferred value of each property
itself [137]. The participant is given a pile of in total 16 cards per specified
product. Each card represents a product by describing a couple of properties
of that product (Figure 32).
It is important that the participants fully understand the effect of each
property. Thus prior to the assignment the participant is informed about the
goal, process and what is expected of him/her. If necessary examples are
used. The participant is asked to prioritize the set of cards from best to
worse. This line up of cards is entered in a statistical program, in our case
SPSS [138]. With the help of this program the order of importance of the
properties is calculated for only the participant and for the whole group of
participants. Also the participants preferred values for each property is given.
In this way it is possible to find out about the importance of the properties in
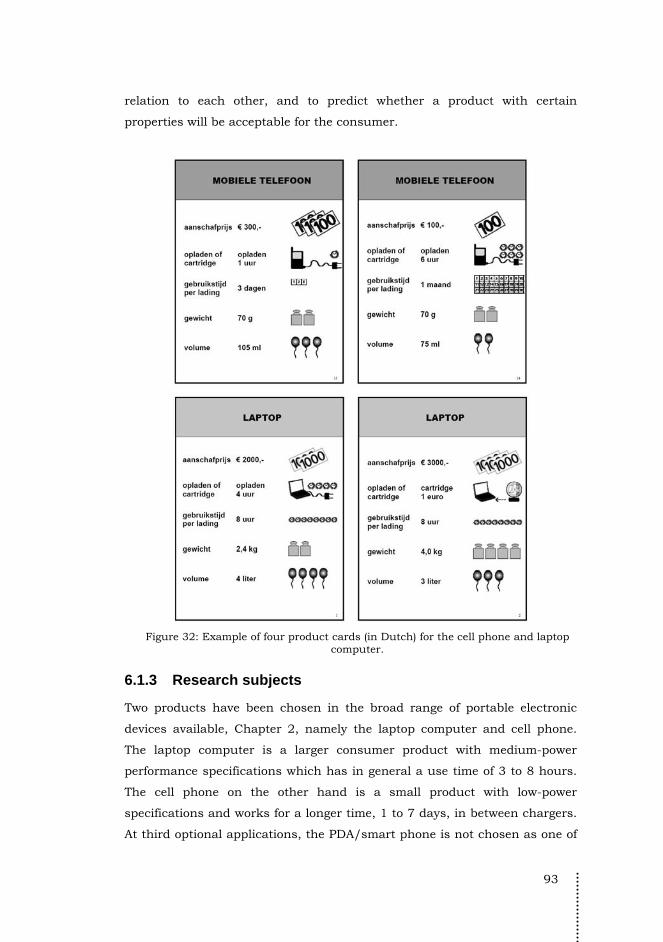
93
relation to each other, and to predict whether a product with certain
properties will be acceptable for the consumer.
Figure 32: Example of four product cards (in Dutch) for the cell phone and laptop
computer.
6.1.3 Research subjects
Two products have been chosen in the broad range of portable electronic
devices available, Chapter 2, namely the laptop computer and cell phone.
The laptop computer is a larger consumer product with medium-power
performance specifications which has in general a use time of 3 to 8 hours.
The cell phone on the other hand is a small product with low-power
specifications and works for a longer time, 1 to 7 days, in between chargers.
At third optional applications, the PDA/smart phone is not chosen as one of
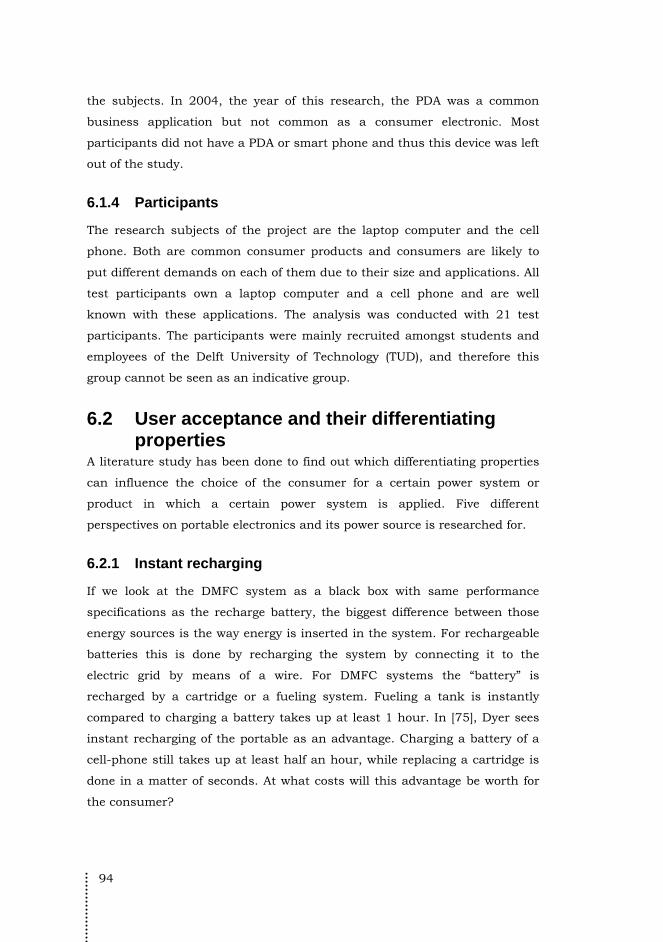
94
the subjects. In 2004, the year of this research, the PDA was a common
business application but not common as a consumer electronic. Most
participants did not have a PDA or smart phone and thus this device was left
out of the study.
6.1.4 Participants
The research subjects of the project are the laptop computer and the cell
phone. Both are common consumer products and consumers are likely to
put different demands on each of them due to their size and applications. All
test participants own a laptop computer and a cell phone and are well
known with these applications. The analysis was conducted with 21 test
participants. The participants were mainly recruited amongst students and
employees of the Delft University of Technology (TUD), and therefore this
group cannot be seen as an indicative group.
6.2 User acceptance and their differentiating properties
A literature study has been done to find out which differentiating properties
can influence the choice of the consumer for a certain power system or
product in which a certain power system is applied. Five different
perspectives on portable electronics and its power source is researched for.
6.2.1 Instant recharging
If we look at the DMFC system as a black box with same performance
specifications as the recharge battery, the biggest difference between those
energy sources is the way energy is inserted in the system. For rechargeable
batteries this is done by recharging the system by connecting it to the
electric grid by means of a wire. For DMFC systems the “battery” is
recharged by a cartridge or a fueling system. Fueling a tank is instantly
compared to charging a battery takes up at least 1 hour. In [75], Dyer sees
instant recharging of the portable as an advantage. Charging a battery of a
cell-phone still takes up at least half an hour, while replacing a cartridge is
done in a matter of seconds. At what costs will this advantage be worth for
the consumer?
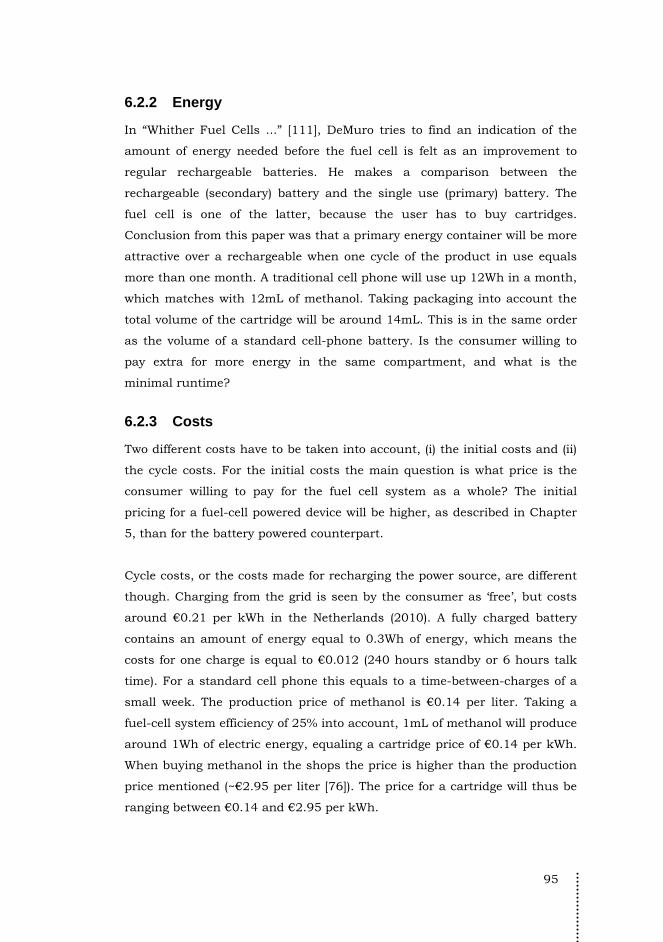
95
6.2.2 Energy
In “Whither Fuel Cells ...” [111], DeMuro tries to find an indication of the
amount of energy needed before the fuel cell is felt as an improvement to
regular rechargeable batteries. He makes a comparison between the
rechargeable (secondary) battery and the single use (primary) battery. The
fuel cell is one of the latter, because the user has to buy cartridges.
Conclusion from this paper was that a primary energy container will be more
attractive over a rechargeable when one cycle of the product in use equals
more than one month. A traditional cell phone will use up 12Wh in a month,
which matches with 12mL of methanol. Taking packaging into account the
total volume of the cartridge will be around 14mL. This is in the same order
as the volume of a standard cell-phone battery. Is the consumer willing to
pay extra for more energy in the same compartment, and what is the
minimal runtime?
6.2.3 Costs
Two different costs have to be taken into account, (i) the initial costs and (ii)
the cycle costs. For the initial costs the main question is what price is the
consumer willing to pay for the fuel cell system as a whole? The initial
pricing for a fuel-cell powered device will be higher, as described in Chapter
5, than for the battery powered counterpart.
Cycle costs, or the costs made for recharging the power source, are different
though. Charging from the grid is seen by the consumer as ‘free’, but costs
around €0.21 per kWh in the Netherlands (2010). A fully charged battery
contains an amount of energy equal to 0.3Wh of energy, which means the
costs for one charge is equal to €0.012 (240 hours standby or 6 hours talk
time). For a standard cell phone this equals to a time-between-charges of a
small week. The production price of methanol is €0.14 per liter. Taking a
fuel-cell system efficiency of 25% into account, 1mL of methanol will produce
around 1Wh of electric energy, equaling a cartridge price of €0.14 per kWh.
When buying methanol in the shops the price is higher than the production
price mentioned (~€2.95 per liter [76]). The price for a cartridge will thus be
ranging between €0.14 and €2.95 per kWh.
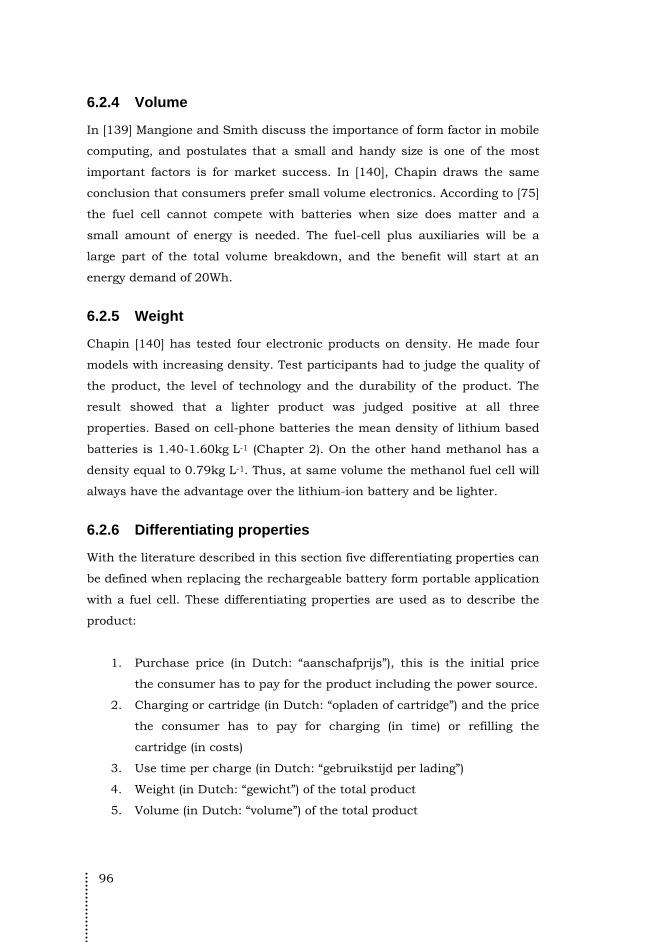
96
6.2.4 Volume
In [139] Mangione and Smith discuss the importance of form factor in mobile
computing, and postulates that a small and handy size is one of the most
important factors is for market success. In [140], Chapin draws the same
conclusion that consumers prefer small volume electronics. According to [75]
the fuel cell cannot compete with batteries when size does matter and a
small amount of energy is needed. The fuel-cell plus auxiliaries will be a
large part of the total volume breakdown, and the benefit will start at an
energy demand of 20Wh.
6.2.5 Weight
Chapin [140] has tested four electronic products on density. He made four
models with increasing density. Test participants had to judge the quality of
the product, the level of technology and the durability of the product. The
result showed that a lighter product was judged positive at all three
properties. Based on cell-phone batteries the mean density of lithium based
batteries is 1.40-1.60kg L-1 (Chapter 2). On the other hand methanol has a
density equal to 0.79kg L-1. Thus, at same volume the methanol fuel cell will
always have the advantage over the lithium-ion battery and be lighter.
6.2.6 Differentiating properties
With the literature described in this section five differentiating properties can
be defined when replacing the rechargeable battery form portable application
with a fuel cell. These differentiating properties are used as to describe the
product:
1. Purchase price (in Dutch: “aanschafprijs”), this is the initial price
the consumer has to pay for the product including the power source.
2. Charging or cartridge (in Dutch: “opladen of cartridge”) and the price
the consumer has to pay for charging (in time) or refilling the
cartridge (in costs)
3. Use time per charge (in Dutch: “gebruikstijd per lading”)
4. Weight (in Dutch: “gewicht”) of the total product
5. Volume (in Dutch: “volume”) of the total product

97
Within the property ‘charge or cartridge’ the test participants could choose
between a charging system equal to what they are used to, or a system with
fuel cartridges that can be replaced instantly. For the first option the time it
needs to charge is noted and for the latter option the extra costs. It is
assumed the cost for the grid is seen as ‘free’ by the participant, so no extra
note is given about price. When the participant asks about the availability of
the cartridges, it is told that they can be bought as easy as penlight batteries.
Each property has three or four different possible values, as can be seen in
Table 12. To get a better feeling about the weight and volume of the different
products described on the cards physical models are used made out of
polystyrene foam and given the proper weight.
Table 12: Overview of all property values used in the test.
Cell phone Laptop
purchase price €100 €1000 €200 €2000 €300 €3000 charge or cartridge charge 1 hour
charge 6 hours cartridge 5 cent cartridge 50 cent
charge 1 hour charge 4 hours cartridge 10 cent cartridge 1 Euro
time of use 3 days 3 hours 1 week 8 hours 1 month 24 hours weight 70 g
100 g 140 g
2.4 kg 3.2 kg 4.0 kg
volume 75 mL 3 L 105 mL 4 L 150 mL 5 L
6.3 Results The output from the SPSS conjoint-analysis consists of a table with three
columns, the averaged importance score, the utility estimate and the
correlations between observed and estimated preferences. The latter column
gives a measure for the quality of reproduction of the empirical data by the
results of the conjoint analysis, and will not be discussed in this chapter.
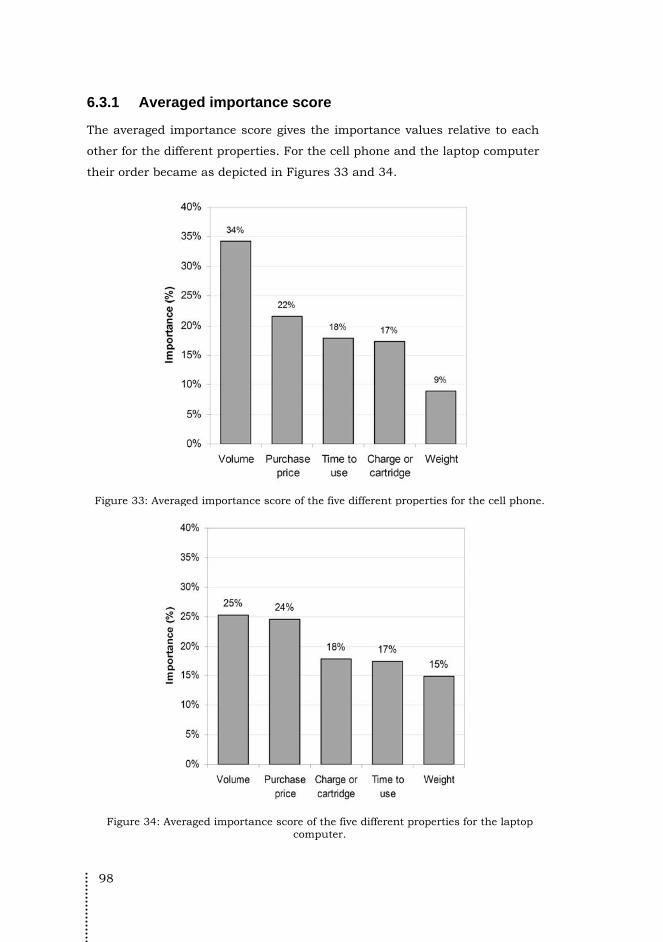
98
6.3.1 Averaged importance score
The averaged importance score gives the importance values relative to each
other for the different properties. For the cell phone and the laptop computer
their order became as depicted in Figures 33 and 34.
Figure 33: Averaged importance score of the five different properties for the cell phone.
Figure 34: Averaged importance score of the five different properties for the laptop
computer.
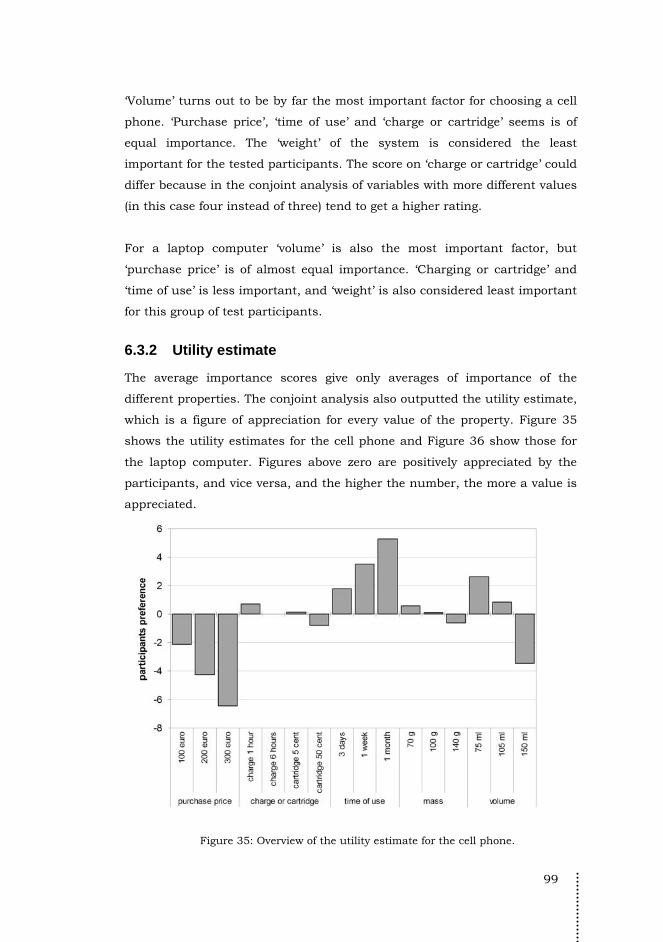
99
‘Volume’ turns out to be by far the most important factor for choosing a cell
phone. ‘Purchase price’, ‘time of use’ and ‘charge or cartridge’ seems is of
equal importance. The ‘weight’ of the system is considered the least
important for the tested participants. The score on ‘charge or cartridge’ could
differ because in the conjoint analysis of variables with more different values
(in this case four instead of three) tend to get a higher rating.
For a laptop computer ‘volume’ is also the most important factor, but
‘purchase price’ is of almost equal importance. ‘Charging or cartridge’ and
‘time of use’ is less important, and ‘weight’ is also considered least important
for this group of test participants.
6.3.2 Utility estimate
The average importance scores give only averages of importance of the
different properties. The conjoint analysis also outputted the utility estimate,
which is a figure of appreciation for every value of the property. Figure 35
shows the utility estimates for the cell phone and Figure 36 show those for
the laptop computer. Figures above zero are positively appreciated by the
participants, and vice versa, and the higher the number, the more a value is
appreciated.
Figure 35: Overview of the utility estimate for the cell phone.
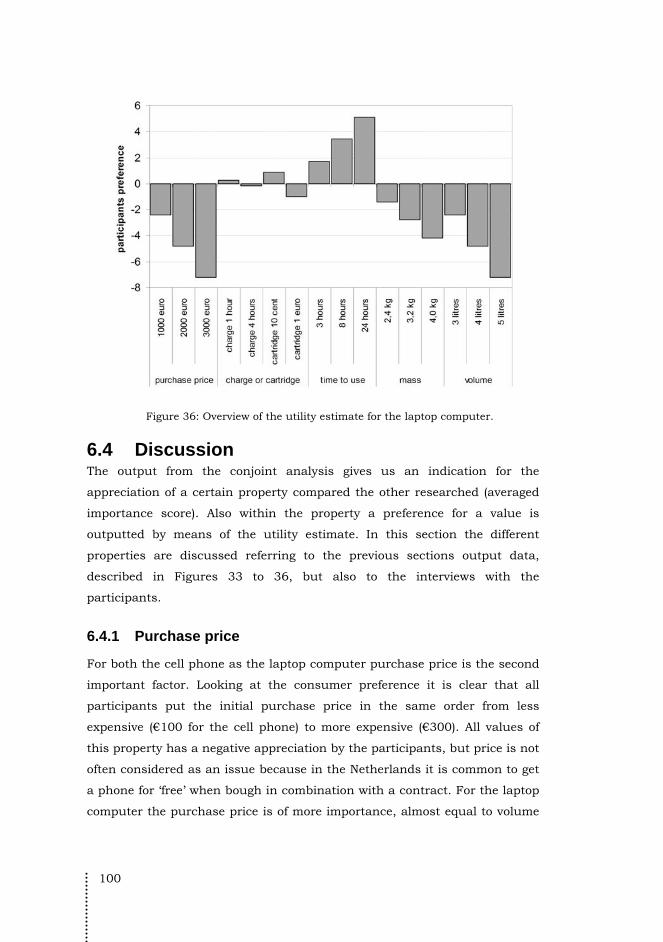
100
Figure 36: Overview of the utility estimate for the laptop computer.
6.4 Discussion The output from the conjoint analysis gives us an indication for the
appreciation of a certain property compared the other researched (averaged
importance score). Also within the property a preference for a value is
outputted by means of the utility estimate. In this section the different
properties are discussed referring to the previous sections output data,
described in Figures 33 to 36, but also to the interviews with the
participants.
6.4.1 Purchase price
For both the cell phone as the laptop computer purchase price is the second
important factor. Looking at the consumer preference it is clear that all
participants put the initial purchase price in the same order from less
expensive (€100 for the cell phone) to more expensive (€300). All values of
this property has a negative appreciation by the participants, but price is not
often considered as an issue because in the Netherlands it is common to get
a phone for ‘free’ when bough in combination with a contract. For the laptop
computer the purchase price is of more importance, almost equal to volume

101
property. As with cell phones all values of this property are appreciated
negatively for the laptop computer.
6.4.2 Charge or cartridge
The preference values for this property are low (in between -1 and 1),
meaning there was not much agreement between the participants on the
choice of a charging system or a cartridge system (at extra costs). Looking at
the utility estimates, the participants all show a preference for charging over
a cheap cartridge for the cell phone and a cheap cartridge over charging for a
short period of time for the laptop computer. A few participants had a clear
liking for one system over the other. Those who preferred the charging
mainly though they would either forget about buying fuel-cartridges or it was
too much of a fuss buying them. Many participants mentioned they did the
charging overnight, so 6 hours was no problem. Those participants
preferring the cartridge system liked the idea of being independent of the
electric grid, or disliked the charging time. The cartridge price of €0.50 for a
full-charge of the cell phone was often seen as rather expensive, especially
when it was in combination with a low time-to-use. When the cartridge could
result in a use-time of a month, this high price was seldom a problem. Many
participants calculated the life-cycle costs to get a better feeling of the total
costs.
6.4.3 Time of use
For both the cell phone as the laptop computer all participants agreed the
longer use-time in between charges the better. However not every participant
thought it equally important. Three days was often to short, even if their cell
phone lasted only for three days. A use-time of a week was seen as an
improvement and most acceptable. A use-time of one month was equally
appreciated as the weeks use time. For the laptop computer 8 hours of use-
time was seen as a big improvement, because you would be able to spend a
whole working day away from the electric grid. The difference between 8 or
24 hours was not seen as an improvement. Three to four hours is seen by
most of the participants as inconvenient. A user time of a full working day (8
hours) is preferred by the participants for the laptop computer. For the cell-
phone a user time of one week is greatly appreciated.

102
6.4.4 Volume
For the cell phone the property of volume is seen as the most important
factor compared to the other properties. Mainly male participants preferred
the smallest volume: “it has to fit easily into my pocket” is a quote of one of
the participants. For the laptop computer this property also is the most
important factor. All participants agreed that a smaller volume is preferred
to the larger volume. Five liters was seen as a bulky laptop computer, four as
an average, and three liters would easily fit into a bag. When we compare
volume preference numbers for the cell phone in Figure 35 to that of the
laptop computer in Figure 36, it shows that for the cell phone a small
volume has a high preference score (>2), while for the laptop computer this
number is negative (< -2.4).
6.4.5 Weight
Compared to the other properties weight was seen as the less important
factor influencing there decision to buy the product. Not all participants
agreed on ‘the lighter cell phone, the better’. Three participants preferred a
heavier cell phone (100 g) over the lightest cell phone (70 g). The 140 grams
cell phone was to heavy for every participant. Especially the two female
participants did not see weight as an issue, because they mainly carried
their cell phone in their bags instead of a pocket. For the laptop computer
the weight of the system also less important compared to the other
properties. In this product all participants preferred a lighter laptop
computer over a heavier laptop computer.
6.4.6 ‘Time of use’ combined with ‘charge or cartridge’
During the card layout by the participants, the participants often took a
longer time to consider the combination of charging, cartridge use and the
time of use (or time in between charges). To test the combination of these
two properties the test results were re-evaluated with twelve cards instead of
16. The twelve evaluated product cards share the same properties of weight,
volume and purchase price while the properties of ‘time of use’ and ‘charge
or cartridge’ varied. The sequence of these, for each the cell phone and
laptop computer, twelve cards is entered in SPSS for a new conjoint analysis.
The results are shown in Figure 37 for the cell phone and Figure 38 for the

103
laptop computer. The order of preference for the user time stays the same
with a short charging time appreciated more than the cheap cartridge for the
cell phone. On the other hand, for the laptop computer the cheap cartridge is
appreciated more than a short charging time.
Figure 37: Overview of the utility estimate for the combination of charge or cartridge and
the use time for the cell phone.
Figure 38: Overview of the utility estimate for the combination of charge or cartridge and
the use time, for the laptop computer.
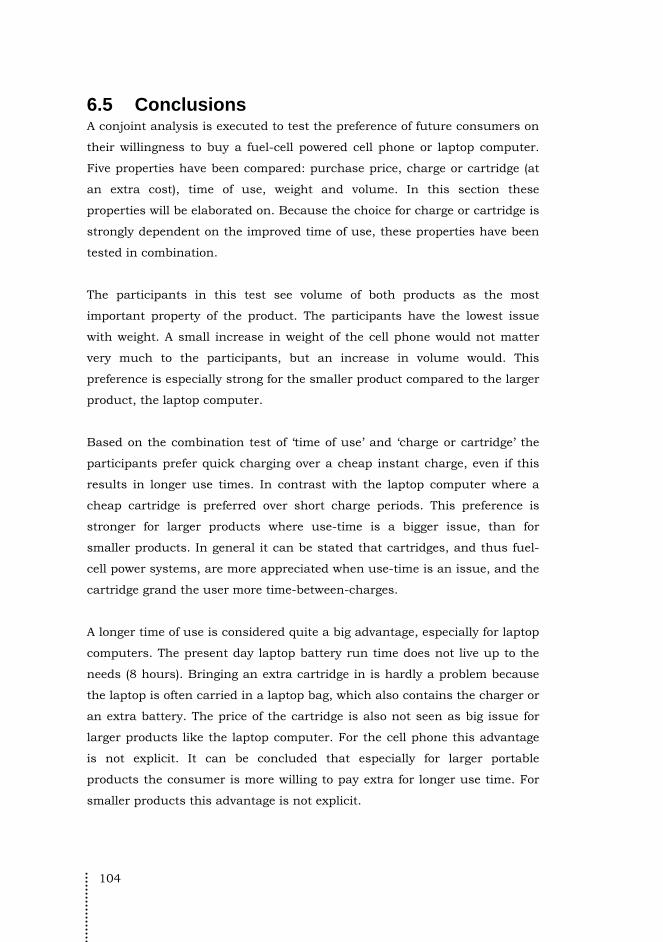
104
6.5 Conclusions A conjoint analysis is executed to test the preference of future consumers on
their willingness to buy a fuel-cell powered cell phone or laptop computer.
Five properties have been compared: purchase price, charge or cartridge (at
an extra cost), time of use, weight and volume. In this section these
properties will be elaborated on. Because the choice for charge or cartridge is
strongly dependent on the improved time of use, these properties have been
tested in combination.
The participants in this test see volume of both products as the most
important property of the product. The participants have the lowest issue
with weight. A small increase in weight of the cell phone would not matter
very much to the participants, but an increase in volume would. This
preference is especially strong for the smaller product compared to the larger
product, the laptop computer.
Based on the combination test of ‘time of use’ and ‘charge or cartridge’ the
participants prefer quick charging over a cheap instant charge, even if this
results in longer use times. In contrast with the laptop computer where a
cheap cartridge is preferred over short charge periods. This preference is
stronger for larger products where use-time is a bigger issue, than for
smaller products. In general it can be stated that cartridges, and thus fuel-
cell power systems, are more appreciated when use-time is an issue, and the
cartridge grand the user more time-between-charges.
A longer time of use is considered quite a big advantage, especially for laptop
computers. The present day laptop battery run time does not live up to the
needs (8 hours). Bringing an extra cartridge in is hardly a problem because
the laptop is often carried in a laptop bag, which also contains the charger or
an extra battery. The price of the cartridge is also not seen as big issue for
larger products like the laptop computer. For the cell phone this advantage
is not explicit. It can be concluded that especially for larger portable
products the consumer is more willing to pay extra for longer use time. For
smaller products this advantage is not explicit.

105
To answer our research question stated in Chapter 4, we have identified five
discerning properties which are not equally important to the user. Volume is
the most important and weight is the lowest importance. The results from
this study can and will be used to evaluate power system designs, where
volume has the most influence in decision making and mass the lowest. In
Chapter 7 this will be explained more in detail.

106
107
7 Introduction to different orders of modeling
The goal of this chapter is to define metrics which can be used in different
orders of modeling, exploring the feasibility of DMFC systems applied in a
portable electronic device commonly equipped with a rechargeable battery.
The models proposed in this thesis are meant to be used during early phases
of the design process, when no or few information is available. Because
‘feasibility’ is such a vague term we have to define this more by introducing
orders of modeling. Section 7.1 describe three orders of modeling which are
proposed to be used by an product designer for evaluating DMFC power
systems as an opportunity for a specific portable electronic device.
In Chapter 4 a comparison is made between a DMFC system and the
lithium-ion battery from a technological point of view. From this perspective
especially volume, weight and price seems to be the most important
properties where the DMFC differs most with the lithium-ion battery. In
Chapter 5 we have made the same comparison but now based on the user
preference. Five properties, initial price, recharge or cartridge, use time,
weight and volume, have been evaluated by means of a conjoint analysis.
The research showed that volume was one of the most important properties
influencing the user choice in buying the device. To answer research
question 3, as defined in Chapter 4, the designer point of view will be
evaluated in Section 7.2. The “set of considerations when choosing a battery
for a portable application” [109] is evaluated and completed with the
selection of a DMFC power system. The main differentiating metrics are
defined in Section 7.3, which are going to be used in the first and second-
order model proposed in Chapters 8 and 9. This chapter proposes the use of
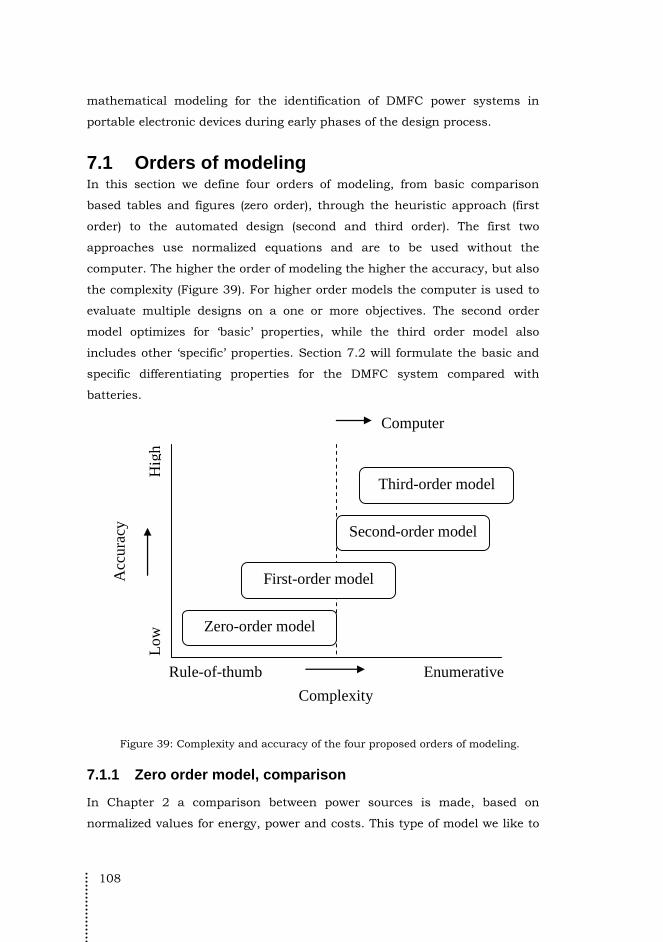
108
mathematical modeling for the identification of DMFC power systems in
portable electronic devices during early phases of the design process.
7.1 Orders of modeling In this section we define four orders of modeling, from basic comparison
based tables and figures (zero order), through the heuristic approach (first
order) to the automated design (second and third order). The first two
approaches use normalized equations and are to be used without the
computer. The higher the order of modeling the higher the accuracy, but also
the complexity (Figure 39). For higher order models the computer is used to
evaluate multiple designs on a one or more objectives. The second order
model optimizes for ‘basic’ properties, while the third order model also
includes other ‘specific’ properties. Section 7.2 will formulate the basic and
specific differentiating properties for the DMFC system compared with
batteries.
Zero-order model
First-order model
Second-order model
Third-order model
Complexity
Rule-of-thumb Enumerative
Computer
Acc
urac
y
Low
H
igh
Figure 39: Complexity and accuracy of the four proposed orders of modeling.
7.1.1 Zero order model, comparison
In Chapter 2 a comparison between power sources is made, based on
normalized values for energy, power and costs. This type of model we like to
109
call the ‘zero order model’. This model compares power sources and energy
systems, and gives good indication what the overall opportunity is for a
specific power system. Although power systems are made visible to the
designer with simple comparing plots, this method does not identify an
opportunity for a specific power source applied in a portable electronic device
which exists or has ‘to be designed’.
7.1.2 First order model, the heuristic approach
The next order model, the ‘first order model’, will help the designer in
evaluating the feasibility of a power source (in our case the DMFC power
system) in comparison with other power sources (in our case the lithium-ion
battery). In Chapter 5 a first approach towards such a first order model, the
preliminary model, is described. Based on a case-study by Motorola [29, 125]
the weight and volume of a DMFC system is calculated by breaking down the
system into three major contributors, the fuel cell stack, BOP (including
empty space) and the fuel tank. This preliminary first-order model gives good
feedback to the designer whether a DMFC system is feasible and how large it
will be. Problems with the first-order model developed in Chapter 4 are (i) its
bad scalability, when applied on a range of applications9, (ii) only basic
properties, like volume and weight, are taken into account, and (iii) there is
no feedback to the designer about the amount of improvement compared to
the standard used battery.
To improve the model a breakdown in components should be made and the
three main parts of the fuel-cell system have to be redefined in normalized
functions. Furthermore an objective function has to be defined to give the
designer direct insight if the DMFC system is an improvement compared to
the standard used battery.
This type of modeling is generally used in conceptual design, and known as
a “rule of thumb”, where equations give the designer preliminary insight in a
9 For instance the contribution of empty space to the total volume is great according
to the model, but in bigger systems the contribution would a lot smaller and will probably not be large percentage of the BOP (as is described in the preliminary model in Chapter 4).

110
specific problem or identify opportunities for specific technologies. This type
of modeling can best be used when no computer is available.
The input data in the model is moderate, but still needs knowledge of the
designed or to be designed device. User profile is needed which is used to
define a load profile. The designer has to know how high the load will be
when the user uses a certain function. Development of the load profile in the
form of a power-to-time function or graph is needed to give a good estimate
of the DMFC hybrid physical performance. The designer has to fall back on
its electronics knowledge and describe the power needed for every function of
the application. This can be done by adding quantitative data (as maximum
and nominal power) to all solutions for every function in the morphological
chart. Summing all power data for every function will give the designer
insight in the potential power needs of the product.
The preliminary model used in Chapter 5 is evaluated resulting in the first-
order model described in Chapter 8. This model is evaluated with two
commercially available DMFC power systems from Smart Fuel Cell [141,
142]. The results show the accuracy of the estimated volume of the three
parts of the fuel-cell system when compared with actual commercially
available DMFC power systems. The mean absolute error is 115% for a very
compact fuel-cell system and 15% for a conventionally designed fuel-cell
system. The large error for the compact fuel-cell system is mainly caused by
wrongly estimating the volume for the BOP. Compact design depends mainly
on the 3D insight of the designer. The BOP can thus be estimated more
proper by evaluating different structural variants, which the designer will
evaluate. The designer is limited by the number of structural variants
he/she can evaluate within a period of time. Furthermore the objective(s) to
evaluate these structural variants are not known or well-defined by the
designer. To solve the problem of evaluating a limited amount of designs, the
computer can be introduced to evaluate more-or-less unlimited amount of
structural variants. The second-order model introduces computer-based
evaluation of multiple designs.
111
7.1.3 Second order model, structural variants
The first order model described in the previous section gives a quick
impression of the feasibility of a DMFC power system applied in a portable
electronic device. The first order model is based on normalized parameters
for basic properties. Problems described are the (i) accuracy of the model, (ii)
the low amount of properties to optimize for, and (iii) the lack of a single
metric, showing the product designer the improvement opportunity in a
single figure.
One part of design and engineering is the act of sizing, dimensioning and
selecting the detailed elements of the design. This part of the design process
can be used to test the feasibility of different design concepts, by using the
computer to evaluate multiple design solutions on one or more parameters.
In general the designer can only evaluate a limited amount of structural
variants (often less than five) on a limited amount of objectives (often only
volume), with a low amount of differentiating components. Within these
structural variants there are variables which specify the main proportions,
like weight, dimensions and costs, but also other details of the application.
To test the feasibility of different concept design, and not only structural
variants, a “quantified optimum design” method can be used. Quantified
parameters are used to evaluate a concept with the help of the computer
which can evaluate a greater deal of concepts in less time than a designer
could.
For the second-order model the accuracy could be improved by evaluating
multiple structural variants with the help of the computer. All structural
variants are generated by the computer and are build up from standard
building blocks, representing all basic components needed in a fuel-cell
system. New metrics are introduced for all basic properties, and an objective
function is defined with whom the design is evaluated with.
In Chapter 9 the second order model is proposed using the computer to
evaluate multiple structural variants and optimizes for the basic properties.
For the second order model the number of metrics is limited to the basic
112
three properties. Components are chosen from a database consisting of
geometrical and non-geometrical data.
7.1.4 Third order model, taking extra variables into account
Besides the basic properties used in the second order model, other, more
specific, properties can be taken into account while evaluating different
structural variants. Specific properties are defined in Section 7.2.
The second order model represents all components in its most basic form,
the parallelepiped. Their actual form is different and to contribute to a more
accurate solution the components should be represented by other
geometrical forms than only parallelepipeds. Also interconnections between
components, like electric wiring and tubing, is not taken into account in the
second-order model and should also be introduced in the third-order model.
7.2 Differentiating properties In Chapter 5 and 6 the difference between DMFC systems and lithium ion
batteries is explored from a technological and a user point of view. The main
differences between the two power systems are volume, weight, charge or
cartridge, use-time and costs. The choice for a power source on the other
hand is not only defined by these properties and will be investigated in this
section. In the Handbook of Batteries [109] a “set of considerations when
choosing a battery for a specific application” is described. In this section
these considerations are discussed for the use in the first, second and third-
order model (Section 7.1). The evaluation will be based on the following
constraints:
• What are the ‘basic’ considerations, and what considerations are
‘specific’?
• Is the consideration quantifiable and formed to a property, or is it
Boolean?
113
According to [109] the following considerations are important and influence
the selection of a battery:
1. Type of battery: primary, secondary or reserve system
2. Electrochemical system: matching of the advantages and
disadvantages and of the battery characteristics with major
equipment requirements
3. Voltage: nominal or operating voltage, maximum and minimum
permissible voltages, voltage regulation, profile of discharge curve,
start-up time, voltage delay
4. Load current and profile: constant current, constant resistance, or
constant power; or others; value of load current or profile, single
valued or variable load, pulsed load
5. Duty cycle: continuous or intermittent, cycling schedule if
intermittent
6. Temperature requirements: temperature range over which operation
is required
7. Service life: length of time operation is required
8. Physical requirements: like mass and volume, size, shape, weight;
terminals
9. Shelf life: active/reserve battery system; state of charge during
storage; storage time a function of temperature, humidity and other
conditions
10. Charge-discharge cycle (if rechargeable): float or cycling service; life
or cycle requirement; availability and characteristics of charging
source; charging efficiency
11. Environmental conditions: vibration, shock spin, acceleration, etc.;
atmospheric conditions (pressure, humidity, etc.)
12. Safety and reliability: permissible variability, failure rates; freedom
from out-gassing or leakage; use of potentially hazardous or toxic
components; type of effluent or signature gases or liquids, high
temperature, etc.; operation under severe or potentially hazardous
conditions; environmentally friendly
13. Unusual or stringent operating conditions: very long-term or extreme-
temperature storage, standby, or operation; high reliability for
special applications; rapid activation for reserve batteries, no voltage
114
delay; special packaging for batteries (pressure vessels, etc.);
unusual mechanical requirements, e.g., high shock or acceleration,
nonmagnetic
14. Maintenance and resupply: ease of battery acquisition, accessible
distribution; ease of battery replacement; available charge facilities;
special transportation, recovery, or disposal procedures required
15. Cost: initial cost; operating or life-cycle cost; use of critical or exotic
(costly) materials.
In the following part all the considerations are discussed and evaluated for
admittance in the first, second or third-order model. An summarization of
this discussion can be found in Table 13.
Consideration 1 is the first choice the designer wants to make. As discussed
in the previous Chapter the DMFC power system is often seen as an
alternative for the secondary system, but is best typed as a replaceable
energy system, thus as an alternative for the primary battery. The result
from all orders of modeling should be an indication which power system is
the better option for the case-study to be evaluated. This consideration
should thus be the result of all-order models.
Within this thesis it is assumed that the DMFC system complies with the
requirements for major equipment, and thus consideration 2 will not be
taken into account.
Unlike some primary and some secondary batteries, fuel cells do not have a
flat discharge curve, but a very steep voltage drop at increasing C-rate.
Within this thesis it is assumed that the DMFC power system complies with
the voltage requirements of the application. Consideration 3 will thus not be
taken into account for the zero to secondary model, but is proposed to be
added to the third-order model.
Consideration 4 and 5 consider the load-profile and the cycling of the
application. As described in Chapter 5 the load-profile is guiding for
choosing the system components and will be used as input in the first,
second and third order model.
115
Temperature (consideration 6) requirements of the system are of great
importance but not differentiating compared the lithium ion battery. The
working temperature range of fuel cell systems is equal or even better to that
of battery systems. Besides that the application field for both power sources
requires a moderate working environment of temperatures between 0 to 40
degrees in which they are functioning well and reliable.
Service life of the power source system is of great importance, because the
system should work flawlessly for at least the economical life expectance of
the application. The economical life expectancy of cell phones is low.
According to Geyer and Blass [143] “the number of end-of-use handsets
increased even faster than this since cell phone lifetimes have been
decreasing, from 3 years in 1991 to 18 months by 2002 and probably even
less today.”. For computers the economical lifetime is longer than for the cell
phone, nearing three years. Especially the technological lifetime of the
battery is bringing the lifetime of laptop computers down to 2 to 5 years
[144]. Consideration 7 is thus an important consideration and should be
included when basic considerations are well satisfied. For this purpose an
approximation should be developed for the technological lifetime of the
power source system and its components. This will not be considered within
this thesis.
As described in Chapter 5 and 6, the physical requirements like weight and
geometrical form are important considerations for the user and for the
designer who wants to choose a power system. The physical properties
(consideration 8) like weight and volume are thus considerations belonging
to the basic considerations, and should be applied in all orders of modeling.
Shelf life is important when the application is on the shelf for a long period
of time, and is only applicable for reserve batteries. DMFC power systems
applied in portable electronic devices do not belong in this group, and
consideration 9 is thus not taken into account in this thesis.
Because the DMFC system is not ‘rechargeable’ but should be refilled or
replaced like primary batteries, consideration 10 is not taken into account.
116
Environmental considerations (consideration 11) are difficult to quantify
reliability in one figure, and thus will not be taken into account in this thesis.
One could imagine that the safety of using high concentrations of methanol
(often of AA quality 99.5%) brings safety issues like poisoning. The safety
issues concerning consideration 12 are difficult to quantify and, within this
thesis, not taken into account. The environmental issues about power
systems is becoming a more urgent problem within the design of products
and systems. Quantifying the life-cycle environmental impact of the DMFC
system is complex and strongly depends on the input and reliability of
underlying data. This issue is not addressed within this thesis.
Basically all portable electronic devices made for consumer use are made for
moderate operating conditions, leading to consideration 13 not taken into
account within this thesis.
Consideration 14 is difficult to quantify and thus not taken into account
within this thesis.
Consideration 15 describes the initial costs and the life cycle costs, which is
differentiating because of the high initial price of fuel cells and the lower life
cycle costs of the fuel used in fuel cell systems. This consideration is
quantifiable and is an important factor, as described in Section 5.3.4 and
5.3.5, to the success or failure of the DMFC power system, and will be
included as one of the main considerations.
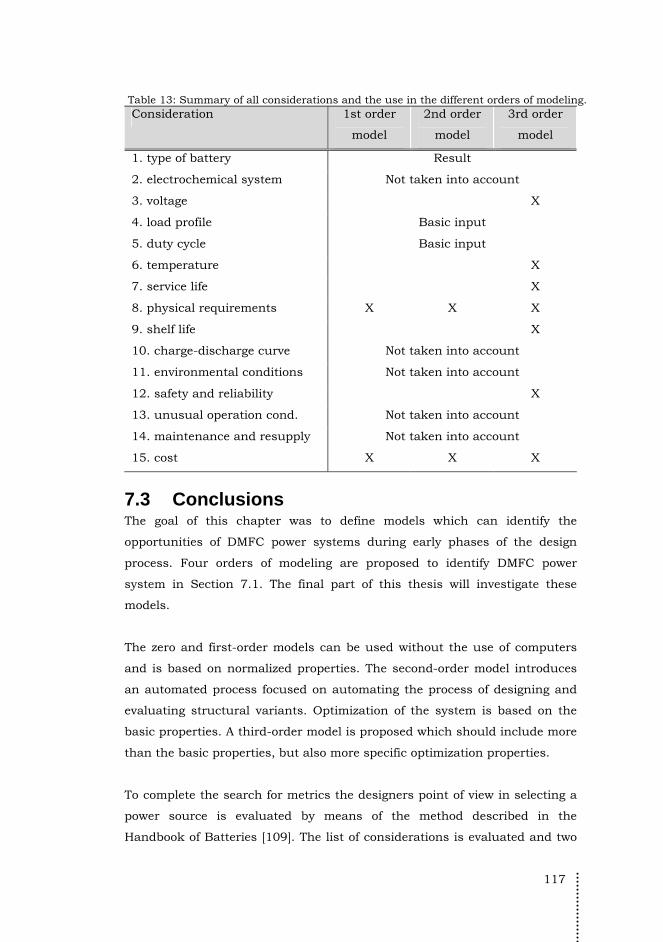
117
Table 13: Summary of all considerations and the use in the different orders of modeling. Consideration 1st order
model
2nd order
model
3rd order
model
1. type of battery Result
2. electrochemical system Not taken into account
3. voltage X
4. load profile Basic input
5. duty cycle Basic input
6. temperature X
7. service life X
8. physical requirements X X X
9. shelf life X
10. charge-discharge curve Not taken into account
11. environmental conditions Not taken into account
12. safety and reliability X
13. unusual operation cond. Not taken into account
14. maintenance and resupply Not taken into account
15. cost X X X
7.3 Conclusions The goal of this chapter was to define models which can identify the
opportunities of DMFC power systems during early phases of the design
process. Four orders of modeling are proposed to identify DMFC power
system in Section 7.1. The final part of this thesis will investigate these
models.
The zero and first-order models can be used without the use of computers
and is based on normalized properties. The second-order model introduces
an automated process focused on automating the process of designing and
evaluating structural variants. Optimization of the system is based on the
basic properties. A third-order model is proposed which should include more
than the basic properties, but also more specific optimization properties.
To complete the search for metrics the designers point of view in selecting a
power source is evaluated by means of the method described in the
Handbook of Batteries [109]. The list of considerations is evaluated and two

118
basic considerations are filtered out: physical properties and costs. The basic
properties to be used in the further development of the first and second-
order model are thus weight, volume and costs. Other, more specific
considerations, and thus properties, are proposed to be evaluated in the
third-order model. Specific, quantifiable, properties which can be evaluated
are: voltage, temperature, service life and safety and reliability.
119
8 First order model: a heuristic approach to modeling a DMFC power source10
As described in Chapter 7 this thesis will evaluate different order of models.
In this chapter the first-order model will be proposed and evaluated. The aim
of this model is to give the designer more insight in the feasibility of DMFC
power systems applied in portable electronic applications using simple
equations (part of research question 5). In Chapter 5 a preliminary model is
used to identify the opportunities in the application field for DMFC power
systems. The preliminary model is based on the design of a case study
presented by Motorola [29, 125]. When applied to different portable
electronic devices the model estimates the volume and weight specifics of a
DMFC power system matching the used battery. Products over de whole
range of portable products were evaluated and the results defined a group of
products in which a DMFC power system could be a technological feasible
alternative. Of all physical constraints volume was the most constraining
property. The preliminary model used was of low accuracy, because it did
not take an intermediate accumulator into account to take care of peak
powers, and the scaling of BOP seems to be off-scale. To make a more
accurate definition of feasible products, the volume and weight of the three
parts, fuel cell, BOP and tank, should be defined more accurate.
This chapter evaluates the preliminary model, described in Chapter 5, by
designing two DMFC power systems powering a Samsung YP5 MP3 player
(Section 8.1). Two approaches are of interest, the ‘standard engineering
approach’, based on commercially available components, and a design
approach based on ‘scaled components’. Both design approaches give a good
10 Parts of this chapter have been presented ASME fuel cell science and technology
conference in Neport Beach, CA (2009) and is published in the Journal of Fuel Cell Science and Technology (2010), “Designing micro fuel cells for portable products”.
120
impression on short-term and long-term feasibility respectively. In Section
8.2 a first design is made using commercially available components.
Unfortunately the components are scarcely available in this power-range en
thus a second design is made where all components are scaled based on
their performance characteristics (Section 8.3). The accuracy of the
preliminary model is tested by means of these designs (Section 8.4) and a
new first-order model is proposed in Section 8.5. Instead of three parts, the
improved DMFC power source model uses more specified parts. This first-
order model is evaluated in Section 8.6 by two commercially available DMFC
systems produced by Smart Fuel Cell AG, the Jenny and Efoy-2200. This
chapter will finish with conclusions on further improvement of the model in
Section 8.7.
8.1 Case study of a MP3 player
8.1.1 Application field
Possible application fields for DMFC power systems are identified with the
help of a Ragone plot (Figure 10) [28, 137, 138]. The power and energy
specifications of different portable electronic devices are laid over the Ragone
plot and three fields of interest can be pinpointed:
[A] High power, short endurance: for applications demanding high power
boosts (>1C). In this case the battery will be the best solution. The
graph shows that the fuel cell system is not going to be an
improvement, even when the fuel-cell system is optimized
[B] High power, normal endurance: for applications demanding normal
discharge characteristics (0.01<C<1) a DMFC in combination with a
battery will be the best solution to improve volume and weight
characteristics. The hybrid power source uses best of both worlds:
high ‘energy density’ of the methanol and high ‘power density’ of the
lithium ion battery.
[C] Low power, long endurance: for applications which have to work a
very long period at very low discharge (C<0.01), e.g. smoke detectors
or Wireless Sensor Network nodes. Stand alone fuel cells seem to be
the best power source for this quadrant.

121
Figure 40: Fields of opportunity for DMFC, based on [29, 125], compared to lithium ion
battery [126].
The plot shows that application field [A] and [B] are of interest for the fuel-
cell only system and a DMFC hybrid power source respectively. Application
field [B] is a field where the endurance of low-power portable consumer
electronics could be increased by adding an extra intermediate accumulator
to the fuel cell. In this chapter the flash drive MP3 player is pinpointed to be
of great interest because it fits this description. The Samsung YP-Z5F flash-
drive MP3 player [146] is choosing as the case study for this thesis, because
this MP3 player had the longest stated runtime of 36 hours at the time
(2007).
8.1.2 Test setup
To get an impression on the runtimes and power profile of the MP3 player
the Samsung Z5F is tested under different conditions (Figure 41). First a
durability test is conducted. Second the different power modes are measured:

122
(i) standby, (ii) play MP3 (56, 128kbs, etc), (iii) light on/off and (iv) pictures.
These measurements give the nominal, mean and peak power output of the
fuel cell system to be designed. From these power settings a choice is made
between a hybrid system (fuel cell + battery) or standalone fuel cell. In the
following section the MP3 player and the test setup is described.
Figure 41: The insides of the Samsung Z5F (millimeter).
The power draw of the battery depends on different aspects of play mode: the
music’s volume, lights-on or off, MP3 or WMA, screen on or off and music
bitrate. All tests are executed at a measure rate of 1 second. In this chapter
the Samsung MP3 player is subjected to these different tests. The battery is
tested to a durability test, a bitrate and compression test, a display test, a
loudness test and a power down and startup test. These tests are described
and conclusions are drawn at the end. Finally this chapter ends with the
conclusions on the tests and some requirements for the synthesis of the fuel
cell system.
The power draw of the battery depends on different aspects of play mode as
described in above. All tests are executed with a Grant SQ800 data logger at
a measure rate of 1 second. Figure 42 shows the test setup. The current is
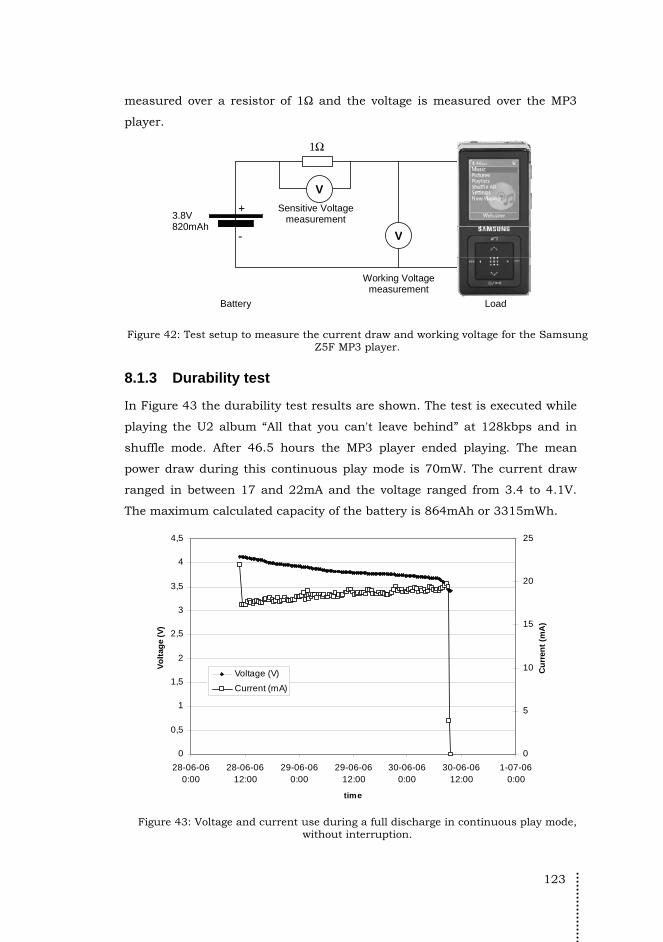
123
measured over a resistor of 1Ω and the voltage is measured over the MP3
player.
V
3.8V 820mAh
V
1Ω
+ -
Sensitive Voltage measurement
Working Voltage measurement
Load Battery
Figure 42: Test setup to measure the current draw and working voltage for the Samsung
Z5F MP3 player.
8.1.3 Durability test
In Figure 43 the durability test results are shown. The test is executed while
playing the U2 album “All that you can't leave behind” at 128kbps and in
shuffle mode. After 46.5 hours the MP3 player ended playing. The mean
power draw during this continuous play mode is 70mW. The current draw
ranged in between 17 and 22mA and the voltage ranged from 3.4 to 4.1V.
The maximum calculated capacity of the battery is 864mAh or 3315mWh.
0
0,5
1
1,5
2
2,5
3
3,5
4
4,5
28-06-060:00
28-06-0612:00
29-06-060:00
29-06-0612:00
30-06-060:00
30-06-0612:00
1-07-060:00
time
Vo
ltag
e (V
)
0
5
10
15
20
25C
urr
ent
(mA
)
Voltage (V)
Current (mA)
Figure 43: Voltage and current use during a full discharge in continuous play mode,
without interruption.

124
0,0
100,0
200,0
300,0
400,0
500,0
600,0
0 50 100 150 200 250
time (sec)
pow
er u
se (m
W)
WMA 128kBs
MP3 128kBs
Figure 44: Power draw of two different compression formats WMA and MP3, both at
128kBs.
8.1.4 Bit-rate and file compression test
From test executed with bitrates ranging from 56kbps to 256kbps no
difference was found in the power draw. At every bit-rate the power draw for
MP3’s was 72mW (with lights out, 50% loudness). However a large difference
is found when different compression formats are used. In Figure 44 the
power draw is depicted for the same song but differently compressed to
either a MP3 or WMA file, played at 128kbps. When both the backlight and
the screen were set to off the power drawn is 72 and 99mW for respectively
the MP3 and WMA file. In general the power draw of the system is largely
prescribed by the backlights and the LCD screen (see Table 14).
Table 14: The difference of in mean, minimum and maximum power draw for the same MP3 and WMA file.
MP3 128kBs WMA 128kBs
Start (everything on) 264 (186-363) mW 321 (245-519) mW
Lights off 236 (156-450) mW 230 (169-428) mW
Screen off 72 (61-92) mW 99 (78-191) mW
8.1.5 Display and loudness test
To get a better insight in the power draw of the LED lights and the LCD
screen, a luminance test has been executed. For this test the screen
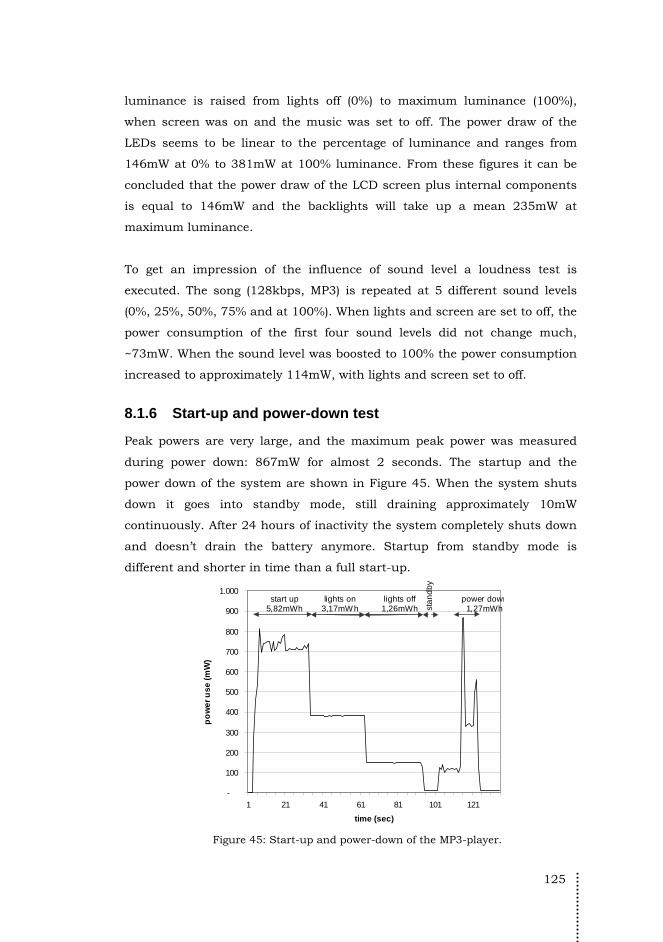
125
luminance is raised from lights off (0%) to maximum luminance (100%),
when screen was on and the music was set to off. The power draw of the
LEDs seems to be linear to the percentage of luminance and ranges from
146mW at 0% to 381mW at 100% luminance. From these figures it can be
concluded that the power draw of the LCD screen plus internal components
is equal to 146mW and the backlights will take up a mean 235mW at
maximum luminance.
To get an impression of the influence of sound level a loudness test is
executed. The song (128kbps, MP3) is repeated at 5 different sound levels
(0%, 25%, 50%, 75% and at 100%). When lights and screen are set to off, the
power consumption of the first four sound levels did not change much,
~73mW. When the sound level was boosted to 100% the power consumption
increased to approximately 114mW, with lights and screen set to off.
8.1.6 Start-up and power-down test
Peak powers are very large, and the maximum peak power was measured
during power down: 867mW for almost 2 seconds. The startup and the
power down of the system are shown in Figure 45. When the system shuts
down it goes into standby mode, still draining approximately 10mW
continuously. After 24 hours of inactivity the system completely shuts down
and doesn’t drain the battery anymore. Startup from standby mode is
different and shorter in time than a full start-up.
-
100
200
300
400
500
600
700
800
900
1.000
1 21 41 61 81 101 121
time (sec)
po
we
r u
se
(m
W)
start up 5,82mWh
lights on 3,17mWh
lights off 1,26mWh
power down1,27mWh st
an
db
y
Figure 45: Start-up and power-down of the MP3-player.
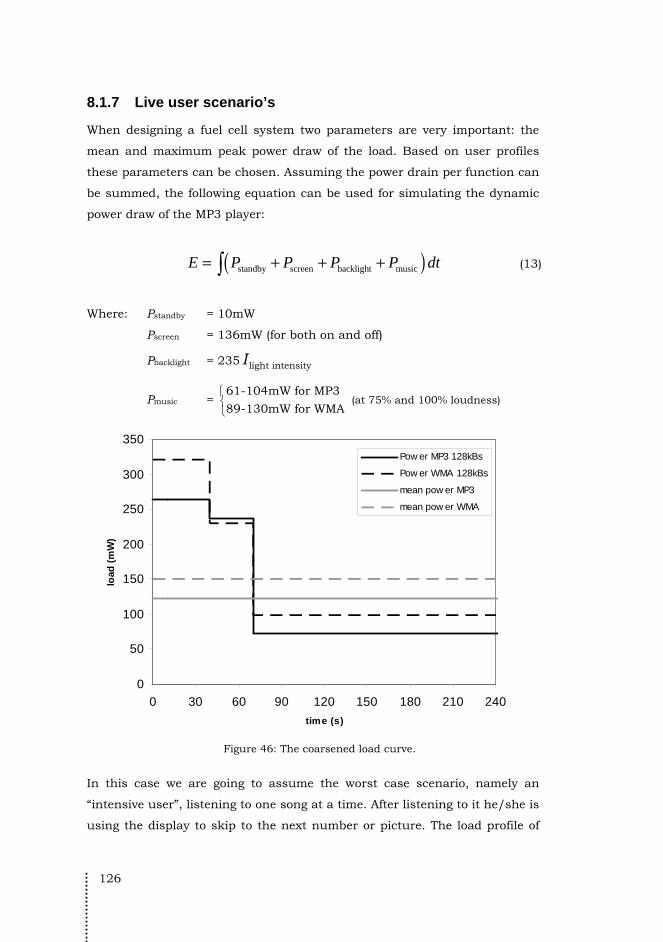
126
8.1.7 Live user scenario’s
When designing a fuel cell system two parameters are very important: the
mean and maximum peak power draw of the load. Based on user profiles
these parameters can be chosen. Assuming the power drain per function can
be summed, the following equation can be used for simulating the dynamic
power draw of the MP3 player:
( )standby screen backlight musicE P P P P dt= + + + (13)
Where: Pstandby = 10mW
Pscreen = 136mW (for both on and off)
Pbacklight = 235 light intensityI
Pmusic =
61-104mW for MP3
89-130mW for WMA (at 75% and 100% loudness)
0
50
100
150
200
250
300
350
0 30 60 90 120 150 180 210 240
time (s)
load
(m
W)
Pow er MP3 128kBs
Pow er WMA 128kBs
mean pow er MP3
mean pow er WMA
Figure 46: The coarsened load curve.
In this case we are going to assume the worst case scenario, namely an
“intensive user”, listening to one song at a time. After listening to it he/she is
using the display to skip to the next number or picture. The load profile of

127
Figure 44 is used and coarsened as visualized in Figure 46. This load curve
has been repeated for at least 2 hours, equaling 30 cycles. Figure 47 shows a
pie-chart diagram of the power breakdown of the MP3 player.
backlight (@100%); 235
LCD; 136
added when using WMA; 30
loudness @100%); 104
Standby; 10
backlight (@100%)
LCD
loudness (@100%)
added when using WMA
Standby
Figure 47: mean power use of different functions in the MP3 player.
As can be seen from the Figure 46 the WMA files are more demanding than
the MP3 files. The nominal power drain for 128kBs WMA files is 150mW and
the maximum power draw is 321mW. Between songs the user is probably
playing with the MP3 player for ~10 seconds at maximum power drain of
321mW. The load characteristic which this standardized user is demanding
is quantized in Table 15.
Table 15: The load curve in numbers as visualized in Figure 46. Period
(sec)
PMP3
(mW)
PWMA
(mW)
EMP3
(mWs)
EWMA
(mWs)
Playing 10 264 321 2640 3210
Start 30 264 321 7920 9600
Lights off 30 236 230 7080 6900
Screen off 180 72 99 12960 17820
Total 240 - - 30600 37560
Mean - 122 150 - -
128
8.2 Design of the DMFC hybrid system
8.2.1 Program of requirements
Now that the physical boundaries and the power characteristics of the
product are known a design has to be made to verify if a fuel cell system is
feasible. The goal of this design exercise is to test the feasibility of a fuel-cell
power-system which fits into the volume of an existing battery compartment
and fulfills the performance need of an intensive user. The fuel cell system
should be small, have an energy density which equals or exceeds that of a
standard lithium-ion rechargeable battery, and is made out of commercially
available components. The following requirements are the main drivers for
this design:
• The power-system plus the fuel tank must fit in the battery
compartment of the Samsung YP-5Z MP3 player (66x33x4mm) and
weighs less than 21g.
• the system peak power has to be at least 868mW, maximum of
900mW
• The power-system should work for an intensive user, requiring a
user profile equal to that of Figure 46, for at least 2 hours or 30
cycles.
• The runtime of the power system should equal or exceed that of the
existing lithium-polymer battery (17h for intensive user, 46,5h
maximum).
• The energy available for an intensive user should be equal to 3,1Wh.
• The power and energy density of the system should be equal or
exceed 100W L-1 and 348Wh L-1.
• The power system module should be easy to assemble and
disassemble
8.2.2 Fuel cell model
The theoretical reversible open cell voltage (E) can be calculated and is for
methanol fueled fuel cells equal to 1,206V. In practice this value will never
be reached and the practical open cell voltage (VOC) is used more often. The
value of the open cell voltage is not constant but depends on the working

129
temperature, the methanol concentration, cathode loading and other
parameters. A multiple regression analysis is executed taking 47 measured
points from 4 different DMFC cases [113-116], as described in Appendix A.
This analysis resulted in the following function describing the open cell
voltage VOC (in mV) as a function of temperature (in K), methanol
concentration (in mol dm-3), and cathode loading (in mg cm-2):
457 1.58 10.8 18.6OC cathV T N m= + − + (14)
Other parameters, like active surface area, fuel flow, cathode anode loading,
and air flow, have been evaluated and have no significant influence on the
open cell voltage. The practical working voltage V can be described as the
open cell voltage minus the Ohmic losses ΔVΩ, the activation losses ΔVact, the
crossover and internal currents ΔVcross, and the mass transportation and
concentration losses ΔVmass, which can be modeled as [112]:
( )OC act x over massV V V V V VΩ −= − Δ − Δ + − Δ (15)
Or:
( ) ( )ln expOC cV V ir A i i m ni= − − + + (16)
Where:
i = current density variable in mA cm-2
r = Area Specific Resistance [117] 0.19kΩ cm2 at 120°
C
ic = crossover current density ~ 0.25i
A = combined slope of the Tafel line for the anode and
cathode A = ( ) ( )2 2
RT RTF Fa cα α+
m 2.11E-2 mV
n
= Mass-transfer overvoltage constants (based on the
Ballard PEMFC [112]) 4.00E-2 cm2 mA-1
αa = charge transfer coefficient at the anode [118] 0.239
αc = charge transfer coefficient at the cathode [118] 0.875
F = Faraday’s constant 96.485 C mol-1
R = Molar gas constant 8.314 J K-1 mol-1

130
The practical V-i curve is shown in Figure 48. With the fuel-cell model
described above the size for the different components can now be set up.
This will be described in detail in the following section.
0
50
100
150
200
250
300
350
400
450
500
0 50 100 150 200 250
current density (mA/cm2)
Vo
ltag
e (m
V)
0
5
10
15
20
25
30
35
40
45
50
Po
wer
(m
W/c
m2)
Figure 48: V-i characteristics used in the fuel cell model at T=298K, mc=2mg cm-2 and
N=1 mol dm-3 (~4%v/v).
8.2.3 System design
In Figure 49 an overview is given of all components, mass flows and the
interconnections. An intermediate accumulator is needed to take care of
peak-power load which probably results in a decrease of the fuel cell volume,
weight and cost. In the following paragraphs the main components will be
discussed and sized. Within this thesis only the components which fall in
the fuel-cell system boundaries, as pictured in Figure 48, are taken into
account. The conversion from a low-voltage to higher/lower working voltage
is not investigated but assumptions have been made, which are discussed in
Section 8.4.2. The physical properties of fuel cells are based on the model as
described in the previous section. The physical properties of all other
components like the pumps and the tank are based on a mass-flow and fuel
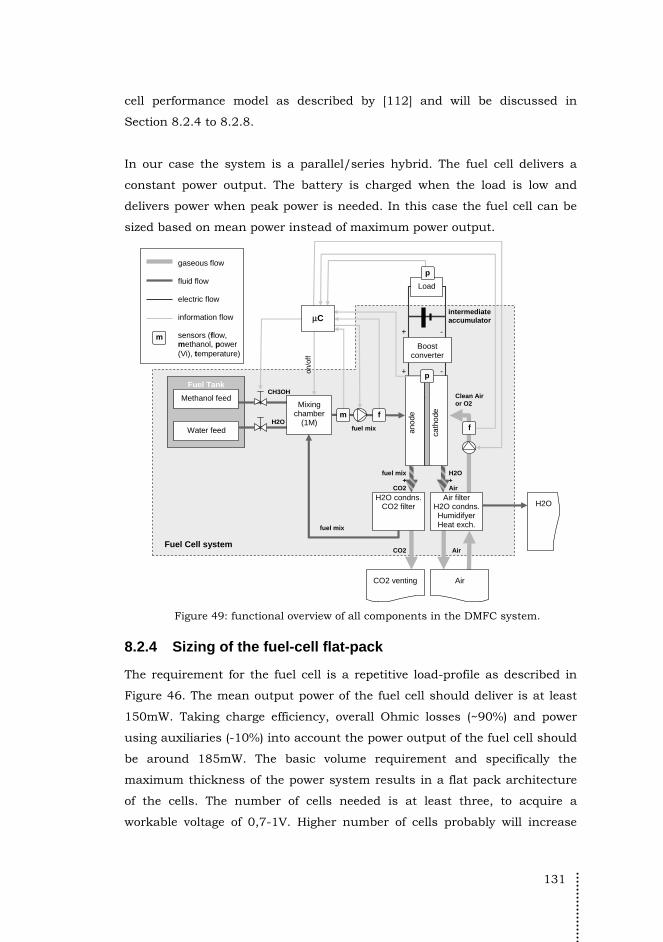
131
cell performance model as described by [112] and will be discussed in
Section 8.2.4 to 8.2.8.
In our case the system is a parallel/series hybrid. The fuel cell delivers a
constant power output. The battery is charged when the load is low and
delivers power when peak power is needed. In this case the fuel cell can be
sized based on mean power instead of maximum power output.
Fuel Tank
anod
e
Methanol feed Mixing
chamber (1M)
Water feed
Air
cath
ode
CO2 venting
Boost converter
Load
gaseous flow fluid flow electric flow information flow sensors (flow, methanol, power (Vi), temperature)
Air filter H2O condns.Humidifyer Heat exch.
+ -
+ -
H2O condns.CO2 filter
fuel mix
fuel mix
CO2 Air
CH3OH
H2O
Clean Air or O2
fuel mix +
CO2
H2O+ Air
H2O
m
p
f m
p
f
on/
off
μC intermediateaccumulator
Fuel Cell system
Figure 49: functional overview of all components in the DMFC system.
8.2.4 Sizing of the fuel-cell flat-pack
The requirement for the fuel cell is a repetitive load-profile as described in
Figure 46. The mean output power of the fuel cell should deliver is at least
150mW. Taking charge efficiency, overall Ohmic losses (~90%) and power
using auxiliaries (-10%) into account the power output of the fuel cell should
be around 185mW. The basic volume requirement and specifically the
maximum thickness of the power system results in a flat pack architecture
of the cells. The number of cells needed is at least three, to acquire a
workable voltage of 0,7-1V. Higher number of cells probably will increase
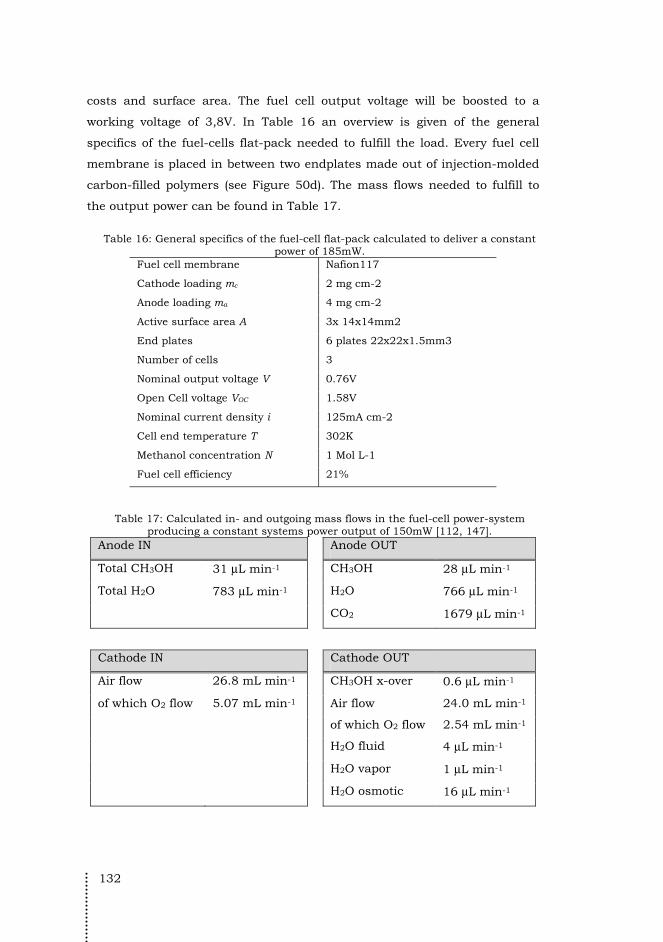
132
costs and surface area. The fuel cell output voltage will be boosted to a
working voltage of 3,8V. In Table 16 an overview is given of the general
specifics of the fuel-cells flat-pack needed to fulfill the load. Every fuel cell
membrane is placed in between two endplates made out of injection-molded
carbon-filled polymers (see Figure 50d). The mass flows needed to fulfill to
the output power can be found in Table 17.
Table 16: General specifics of the fuel-cell flat-pack calculated to deliver a constant
power of 185mW. Fuel cell membrane Nafion117
Cathode loading mc 2 mg cm-2
Anode loading ma 4 mg cm-2
Active surface area A 3x 14x14mm2
End plates 6 plates 22x22x1.5mm3
Number of cells 3
Nominal output voltage V 0.76V
Open Cell voltage VOC 1.58V
Nominal current density i 125mA cm-2
Cell end temperature T 302K
Methanol concentration N 1 Mol L-1
Fuel cell efficiency 21%
Table 17: Calculated in- and outgoing mass flows in the fuel-cell power-system producing a constant systems power output of 150mW [112, 147].
Anode IN Anode OUT
Total CH3OH 31 μL min-1 CH3OH 28 μL min-1
Total H2O 783 μL min-1 H2O 766 μL min-1
CO2 1679 μL min-1
Cathode IN Cathode OUT
Air flow 26.8 mL min-1 CH3OH x-over 0.6 μL min-1
of which O2 flow 5.07 mL min-1 Air flow 24.0 mL min-1
of which O2 flow 2.54 mL min-1
H2O fluid 4 μL min-1
H2O vapor 1 μL min-1
H2O osmotic 16 μL min-1

133
Figure 50: Overview of the size for the main components. From left to right: a) available pumps, b) available intermediate accumulators, c) the water and methanol tanks, d) the
final fuel cell design, and e) the PCB.
8.2.5 Sizing the intermediate accumulator
The list of requirements demanded that the power-system should be able to
follow the load profile as described in Figure 46. In the first 10 and the
following 60 seconds of this load curve the power needed will be realized by
the fuel cell (150mW) plus power from the added accumulator (171mW). The
following 30 seconds will be powered by the fuel cell (150mW) and the
battery (80mW). In the final 3 minutes the fuel cell will power the MP3 player
on its own (99mW), and the remainder power (51mW) will charge the battery
to its nominal capacity (80-100% SOC). The minimum capacity of the battery
needed to fulfill the load of this 4 minute song is approximately 2.6mWh.
During the 30 seconds startup the system uses 700mW. To deal with this
load a minimum of 6mWh is needed.
Options to accumulate this amount of energy are a Nickel Metal Hydrate
(NiMH) button-cell, a lithium rechargeable button cell, or a capacitor (see
Figure 50b). Five important factors will influence the choice: the technical
lifespan, the ability to charge and discharge at high currents (C), the working
voltage, the available capacity and its volume. Both the Lion as the NiMH
battery have a short life-span when discharged to 0-10%SOC. To increase
life-span the batteries should be discharged to 90%SOC, resulting in a
minimum capacity of 26mWh for both the batteries. Lithium based button-
cells are mostly Lithium Vanadium or Aluminum-Manganese batteries
working at a voltage of 3V. The rated (dis)charge rates (<0,1C) of all lithium
ion batteries is the limiting value. A high capacity battery or battery-pack is
needed to comply with the large (dis)charge currents. State-of-the-art lithium
button cells don’t seem to be applicable for intermediate accumulation.
134
NiMH batteries on the other hand are more able to handle high (dis)charge
currents. When complying with the requirements described above two Varta
V40HR NiMH [56] batteries are capable. The specifications can be found in
Table 18 Two batteries of this type are used in the design of the power-
system. The third option, using a capacitor, is good because of its high
power density and long cycle-life, but can not compete with NiMH batteries
on its volume. Furthermore the start-up specifics demand a long on-the-
shelf-life and capacitors tend to have a short self discharge period.
8.2.6 Sizing the fuel tank
In Table 17 the in- and outgoing mass flows are calculated needed to fulfill a
constant power delivery of 185mW. The fuel cell consumes about 3.1μL min-1
(including cross-over) of methanol and 1.4μL min-1 of water. According to the
list of requirements the power-system should be able to produce 3.1Wh of
energy. The amount of methanol needed to fulfill this requirement is 3.75mL.
In our design we use a methanol tank of 4mL. Water is also consumed, in
total 1.5mL, and a tank of the same size as the methanol tank should be
able to comply with the requirements. Because of osmotic drag, almost
16.7mL of water is dragged through too the cathode during one take. If this
water is not recycled a water tank of at least 18mL is needed. If the water is
fully or partially recycled the water tank will take up less space. To decrease
volume we assume water will be recycled as much as possible. The tanks are
made of flexible plastics which is blow-molded in its final shape (Figure 50c).
8.2.7 Fuel and air pumps
Fuel is introduced into the fuel cell by a pump. The flow rate of the fuel
mixture is approximately 0.82mL min-1 (Table 17). Three micro pumps
found comply with this requirement, the HNP mzr®-2521 micro annular gear
pump [148], the ThinXXS MDP1304 piezo actuated micro diaphragm pump
[149] and the Bartels Mikrotechnik MP5 piezo actuated micro diaphragm
pump [150]. Both the HNP and ThinXXS pumps are quite bulky compared to
the Bartels MP5 (see a). The MP5 complies with the required low thickness of
4mm. Further specifics of this pump can be found in Table 18.
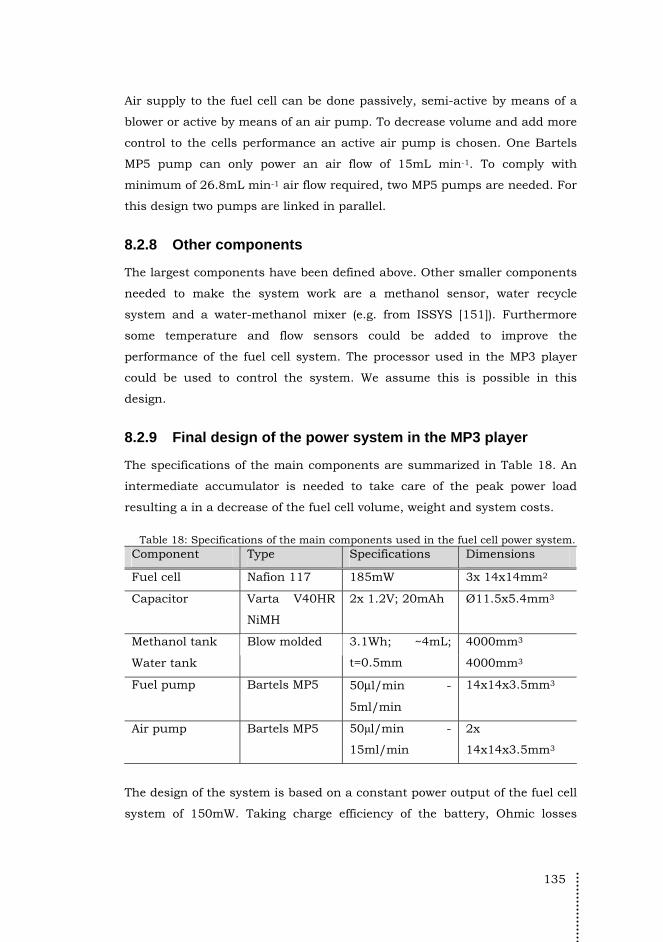
135
Air supply to the fuel cell can be done passively, semi-active by means of a
blower or active by means of an air pump. To decrease volume and add more
control to the cells performance an active air pump is chosen. One Bartels
MP5 pump can only power an air flow of 15mL min-1. To comply with
minimum of 26.8mL min-1 air flow required, two MP5 pumps are needed. For
this design two pumps are linked in parallel.
8.2.8 Other components
The largest components have been defined above. Other smaller components
needed to make the system work are a methanol sensor, water recycle
system and a water-methanol mixer (e.g. from ISSYS [151]). Furthermore
some temperature and flow sensors could be added to improve the
performance of the fuel cell system. The processor used in the MP3 player
could be used to control the system. We assume this is possible in this
design.
8.2.9 Final design of the power system in the MP3 player
The specifications of the main components are summarized in Table 18. An
intermediate accumulator is needed to take care of the peak power load
resulting a in a decrease of the fuel cell volume, weight and system costs.
Table 18: Specifications of the main components used in the fuel cell power system.
Component Type Specifications Dimensions
Fuel cell Nafion 117 185mW 3x 14x14mm2
Capacitor Varta V40HR
NiMH
2x 1.2V; 20mAh Ø11.5x5.4mm3
Methanol tank 4000mm3
Water tank
Blow molded 3.1Wh; ~4mL;
t=0.5mm 4000mm3
Fuel pump Bartels MP5 50μl/min -
5ml/min
14x14x3.5mm3
Air pump Bartels MP5 50μl/min -
15ml/min
2x
14x14x3.5mm3
The design of the system is based on a constant power output of the fuel cell
system of 150mW. Taking charge efficiency of the battery, Ohmic losses
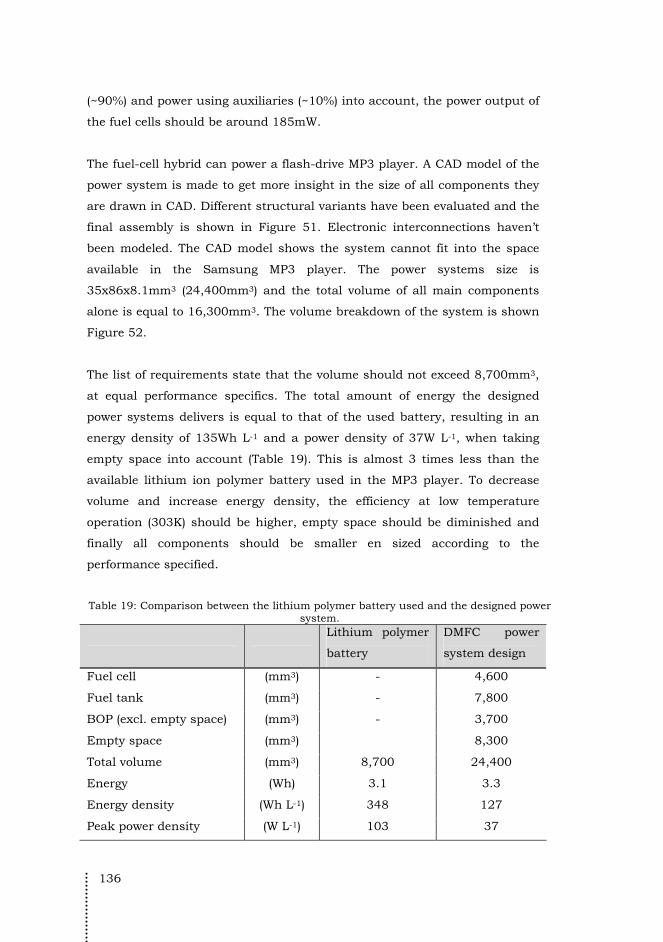
136
(~90%) and power using auxiliaries (~10%) into account, the power output of
the fuel cells should be around 185mW.
The fuel-cell hybrid can power a flash-drive MP3 player. A CAD model of the
power system is made to get more insight in the size of all components they
are drawn in CAD. Different structural variants have been evaluated and the
final assembly is shown in Figure 51. Electronic interconnections haven’t
been modeled. The CAD model shows the system cannot fit into the space
available in the Samsung MP3 player. The power systems size is
35x86x8.1mm3 (24,400mm3) and the total volume of all main components
alone is equal to 16,300mm3. The volume breakdown of the system is shown
Figure 52.
The list of requirements state that the volume should not exceed 8,700mm3,
at equal performance specifics. The total amount of energy the designed
power systems delivers is equal to that of the used battery, resulting in an
energy density of 135Wh L-1 and a power density of 37W L-1, when taking
empty space into account (Table 19). This is almost 3 times less than the
available lithium ion polymer battery used in the MP3 player. To decrease
volume and increase energy density, the efficiency at low temperature
operation (303K) should be higher, empty space should be diminished and
finally all components should be smaller en sized according to the
performance specified.
Table 19: Comparison between the lithium polymer battery used and the designed power system.
Lithium polymer
battery
DMFC power
system design
Fuel cell (mm3) - 4,600
Fuel tank (mm3) - 7,800
BOP (excl. empty space) (mm3) - 3,700
Empty space (mm3) 8,300
Total volume (mm3) 8,700 24,400
Energy (Wh) 3.1 3.3
Energy density (Wh L-1) 348 127
Peak power density (W L-1) 103 37
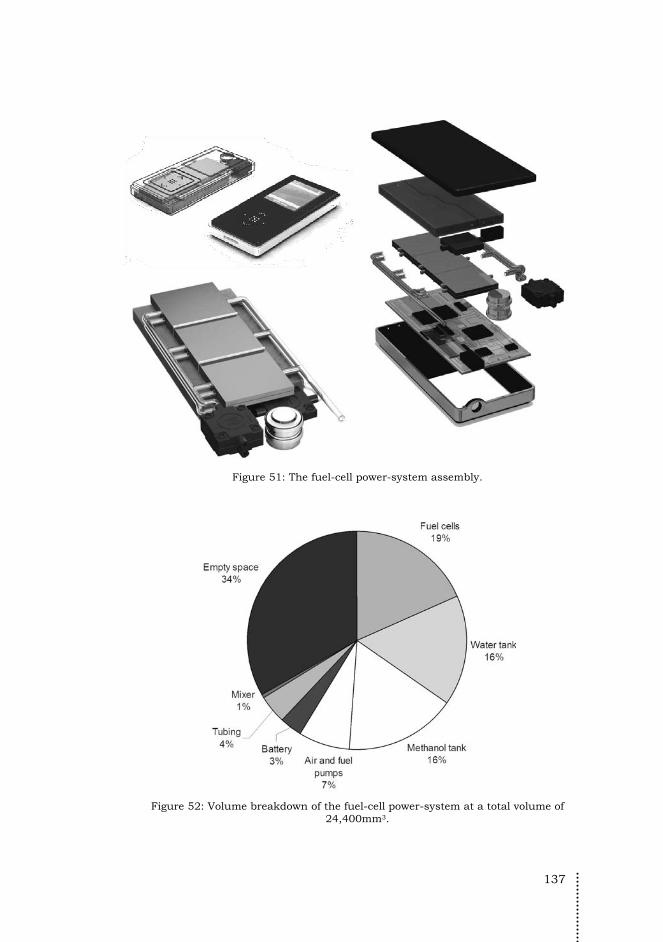
137
Figure 51: The fuel-cell power-system assembly.
Figure 52: Volume breakdown of the fuel-cell power-system at a total volume of
24,400mm3.
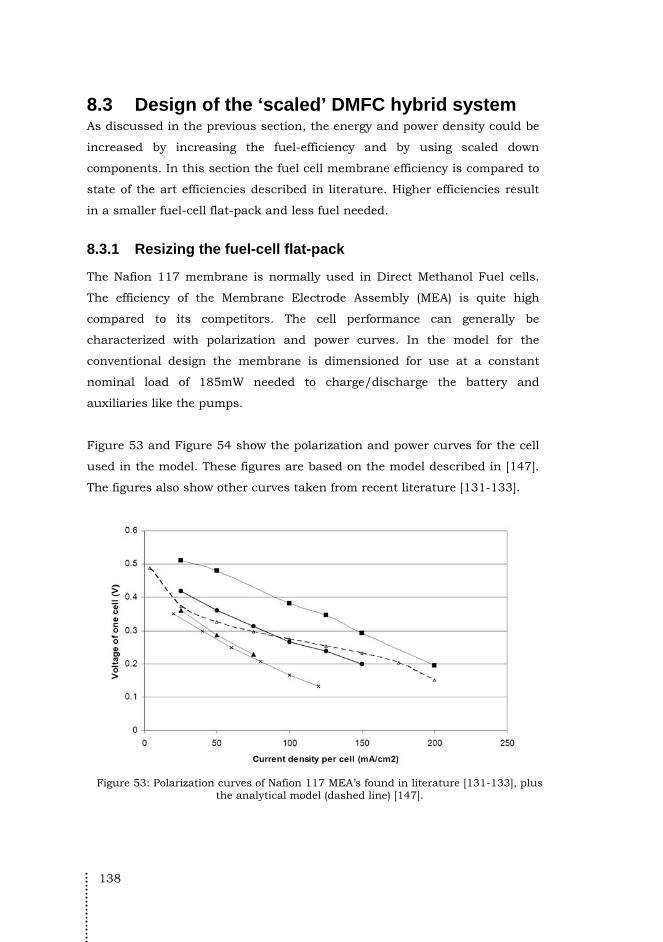
138
8.3 Design of the ‘scaled’ DMFC hybrid system As discussed in the previous section, the energy and power density could be
increased by increasing the fuel-efficiency and by using scaled down
components. In this section the fuel cell membrane efficiency is compared to
state of the art efficiencies described in literature. Higher efficiencies result
in a smaller fuel-cell flat-pack and less fuel needed.
8.3.1 Resizing the fuel-cell flat-pack
The Nafion 117 membrane is normally used in Direct Methanol Fuel cells.
The efficiency of the Membrane Electrode Assembly (MEA) is quite high
compared to its competitors. The cell performance can generally be
characterized with polarization and power curves. In the model for the
conventional design the membrane is dimensioned for use at a constant
nominal load of 185mW needed to charge/discharge the battery and
auxiliaries like the pumps.
Figure 53 and Figure 54 show the polarization and power curves for the cell
used in the model. These figures are based on the model described in [147].
The figures also show other curves taken from recent literature [131-133].
Figure 53: Polarization curves of Nafion 117 MEA’s found in literature [131-133], plus
the analytical model (dashed line) [147].
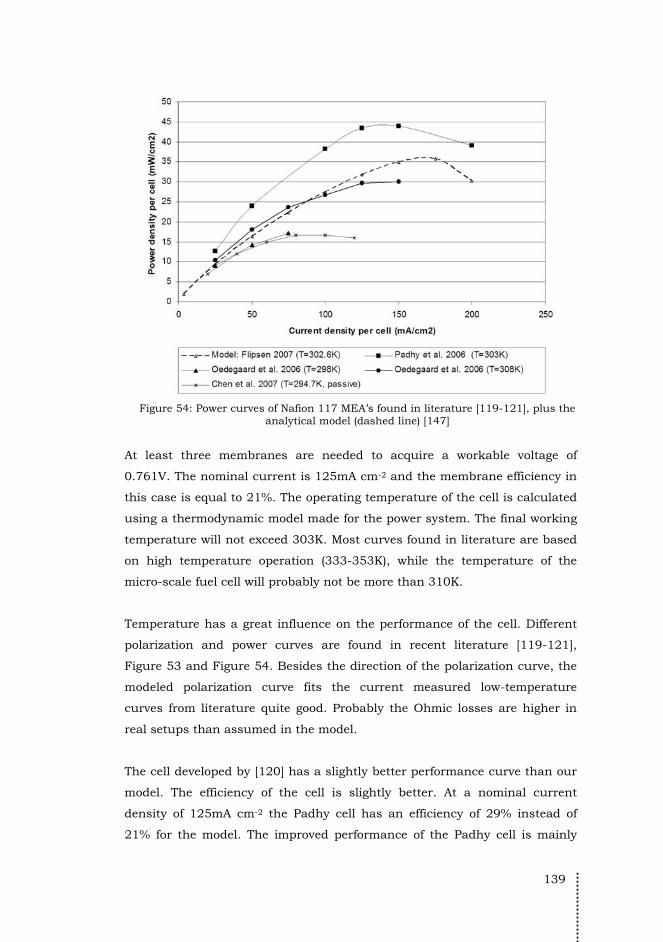
139
Figure 54: Power curves of Nafion 117 MEA’s found in literature [119-121], plus the
analytical model (dashed line) [147]
At least three membranes are needed to acquire a workable voltage of
0.761V. The nominal current is 125mA cm-2 and the membrane efficiency in
this case is equal to 21%. The operating temperature of the cell is calculated
using a thermodynamic model made for the power system. The final working
temperature will not exceed 303K. Most curves found in literature are based
on high temperature operation (333-353K), while the temperature of the
micro-scale fuel cell will probably not be more than 310K.
Temperature has a great influence on the performance of the cell. Different
polarization and power curves are found in recent literature [119-121],
Figure 53 and Figure 54. Besides the direction of the polarization curve, the
modeled polarization curve fits the current measured low-temperature
curves from literature quite good. Probably the Ohmic losses are higher in
real setups than assumed in the model.
The cell developed by [120] has a slightly better performance curve than our
model. The efficiency of the cell is slightly better. At a nominal current
density of 125mA cm-2 the Padhy cell has an efficiency of 29% instead of
21% for the model. The improved performance of the Padhy cell is mainly
140
due to more efficient SS316 endplates with modified serpentine flow field.
Assuming this efficiency can be met in the renewed design the active area of
one cell could be decreased from 14x14 to 12x12mm2.
8.3.2 Resizing the fuel tanks
The previously described efficiency increase also influences the amount of
fuel needed to comply with the demand. The volume of the methanol tanks
will decrease with a factor 1.4 compared to the conventional design. In the
new design only 2.7mL of methanol and 1mL of water is consumed to fulfill
the requirement of 3.1Wh of energy. Again it is assumed that the water
produced by the cell is recycled as much as possible. For the final redesign
the water tank is as large as the methanol tank, both with a storage volume
of 2.79mL (~3.17Wh).
8.3.3 Resizing the intermediate accumulator and trends for the
future
Commercially available rechargeable button cells, as used in the
conventional design, are mainly produced for application in low-power
backup power for personal-computer real-time clocks and BIOS
configuration data. The low discharge characteristics make them not very
useful for application in the fuel-cell battery hybrid design. In general the
battery used in the conventional design is used as a peak-power generator.
Per cycle the battery discharges within 1 minute and is charged in 3 minutes.
This 4 minute charge/discharge-profile of the battery demands the following
for the battery used:
1. high discharge rate, up to 60C
2. high charge rate, up to 20C
3. long cycle life, more than 16,000 cycles
The demands above cannot be met with commercially available rechargeable
button cells. This is mainly because of the low rated (dis)charge rate of
rechargeable button cells and their low cycle life of 1,000 cycles. By taking a
larger cell the charge and discharge rate will decrease, but this also results
in a larger and bulky battery. In the conventional design two Varta V40HR
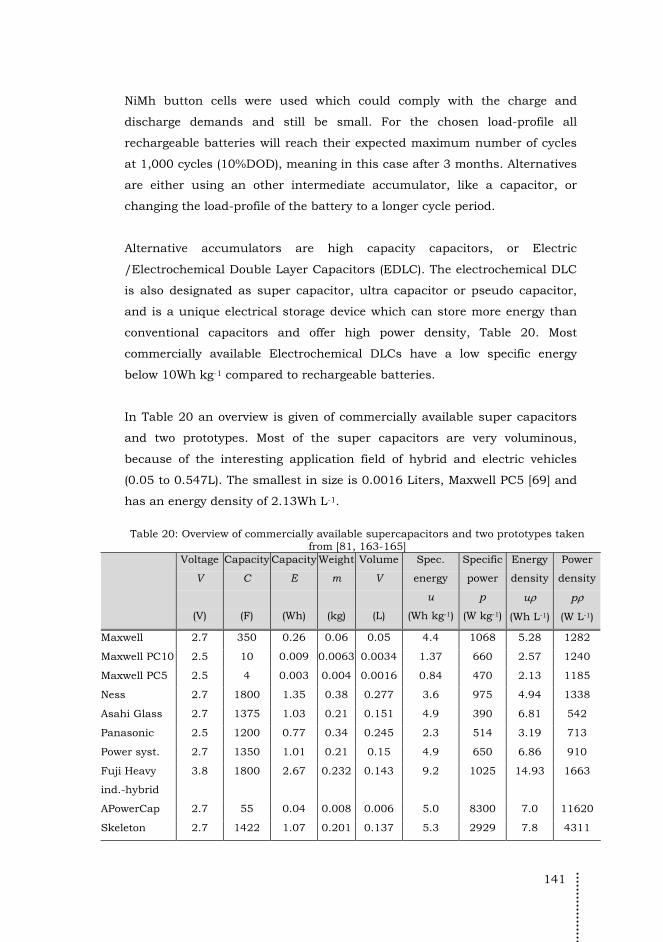
141
NiMh button cells were used which could comply with the charge and
discharge demands and still be small. For the chosen load-profile all
rechargeable batteries will reach their expected maximum number of cycles
at 1,000 cycles (10%DOD), meaning in this case after 3 months. Alternatives
are either using an other intermediate accumulator, like a capacitor, or
changing the load-profile of the battery to a longer cycle period.
Alternative accumulators are high capacity capacitors, or Electric
/Electrochemical Double Layer Capacitors (EDLC). The electrochemical DLC
is also designated as super capacitor, ultra capacitor or pseudo capacitor,
and is a unique electrical storage device which can store more energy than
conventional capacitors and offer high power density, Table 20. Most
commercially available Electrochemical DLCs have a low specific energy
below 10Wh kg-1 compared to rechargeable batteries.
In Table 20 an overview is given of commercially available super capacitors
and two prototypes. Most of the super capacitors are very voluminous,
because of the interesting application field of hybrid and electric vehicles
(0.05 to 0.547L). The smallest in size is 0.0016 Liters, Maxwell PC5 [69] and
has an energy density of 2.13Wh L-1.
Table 20: Overview of commercially available supercapacitors and two prototypes taken
from [81, 163-165] Voltage
V
(V)
Capacity
C
(F)
Capacity
E
(Wh)
Weight
m
(kg)
Volume
V
(L)
Spec.
energy
u
(Wh kg-1)
Specific
power
p
(W kg-1)
Energy
density
uρ
(Wh L-1)
Power
density
pρ
(W L-1)
Maxwell 2.7 350 0.26 0.06 0.05 4.4 1068 5.28 1282
Maxwell PC10 2.5 10 0.009 0.0063 0.0034 1.37 660 2.57 1240
Maxwell PC5 2.5 4 0.003 0.004 0.0016 0.84 470 2.13 1185
Ness 2.7 1800 1.35 0.38 0.277 3.6 975 4.94 1338
Asahi Glass 2.7 1375 1.03 0.21 0.151 4.9 390 6.81 542
Panasonic 2.5 1200 0.77 0.34 0.245 2.3 514 3.19 713
Power syst. 2.7 1350 1.01 0.21 0.15 4.9 650 6.86 910
Fuji Heavy
ind.-hybrid
3.8 1800 2.67 0.232 0.143 9.2 1025 14.93 1663
APowerCap 2.7 55 0.04 0.008 0.006 5.0 8300 7.0 11620
Skeleton 2.7 1422 1.07 0.201 0.137 5.3 2929 7.8 4311
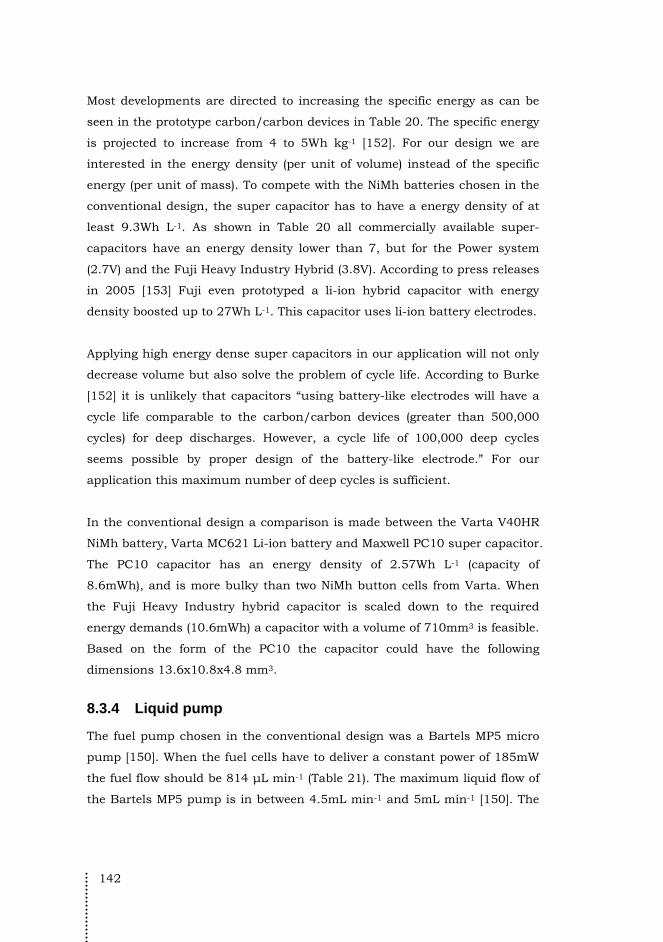
142
Most developments are directed to increasing the specific energy as can be
seen in the prototype carbon/carbon devices in Table 20. The specific energy
is projected to increase from 4 to 5Wh kg-1 [152]. For our design we are
interested in the energy density (per unit of volume) instead of the specific
energy (per unit of mass). To compete with the NiMh batteries chosen in the
conventional design, the super capacitor has to have a energy density of at
least 9.3Wh L-1. As shown in Table 20 all commercially available super-
capacitors have an energy density lower than 7, but for the Power system
(2.7V) and the Fuji Heavy Industry Hybrid (3.8V). According to press releases
in 2005 [153] Fuji even prototyped a li-ion hybrid capacitor with energy
density boosted up to 27Wh L-1. This capacitor uses li-ion battery electrodes.
Applying high energy dense super capacitors in our application will not only
decrease volume but also solve the problem of cycle life. According to Burke
[152] it is unlikely that capacitors “using battery-like electrodes will have a
cycle life comparable to the carbon/carbon devices (greater than 500,000
cycles) for deep discharges. However, a cycle life of 100,000 deep cycles
seems possible by proper design of the battery-like electrode.” For our
application this maximum number of deep cycles is sufficient.
In the conventional design a comparison is made between the Varta V40HR
NiMh battery, Varta MC621 Li-ion battery and Maxwell PC10 super capacitor.
The PC10 capacitor has an energy density of 2.57Wh L-1 (capacity of
8.6mWh), and is more bulky than two NiMh button cells from Varta. When
the Fuji Heavy Industry hybrid capacitor is scaled down to the required
energy demands (10.6mWh) a capacitor with a volume of 710mm3 is feasible.
Based on the form of the PC10 the capacitor could have the following
dimensions 13.6x10.8x4.8 mm3.
8.3.4 Liquid pump
The fuel pump chosen in the conventional design was a Bartels MP5 micro
pump [150]. When the fuel cells have to deliver a constant power of 185mW
the fuel flow should be 814 μL min-1 (Table 21). The maximum liquid flow of
the Bartels MP5 pump is in between 4.5mL min-1 and 5mL min-1 [150]. The
143
liquid flow needed is less than 1mL min-1 meaning the used component is a
factor 5.5 times to powerful.
In Vishal et al. [154] and Laser et al. [155] an overview is given of different
techniques to pump small amounts of liquids. In general the micro pumps
considered in literature are classified in mechanical pumps, like rotary and
vibrating diaphragm pumps, electro kinetic micro pumps, magneto kinetic
micro pumps, phase change micro pumps, and other novel techniques.
In [155] the term Self Pumping Frequency fsp is introduced which is an
interesting metric ratio of maximum flow rate to package size:
maxsp
package
Qf
V= (17)
If we compare piëzo-electromechanical diaphragm pumps to electromagnetic
micro pumps the self pumping frequency of the latter is much lower. For
both commercially and laboratory pumps the volume of the electromagnetic
pump is a factor 3 to 7 larger than the piëzo actuated pump (Table 21).
When volume is of great importance, like in the design of the micro fuel cell
system described, piëzo actuated diaphragm pumps seem to be more
interesting. Reviewing other pumps under development, like the Electro
Hydrodynamic (EHD) and Electro Osmotic pump, a big improvement in
minimizing the pumps volume is achievable.
Table 21: Overview of different commercially and laboratory micro pumps [148-150, 156-159].
Company Type Year Availa-bility
Pump technique actuator
Volume(mm3)
Max liquid flow (μL min-1)
SPR (min-1)
Power rat. (mW min L-1)
Bartels MP5 2006 C diaphragm, piezo 686 5,000 7.3 40
thinXXS MDP1304 2007 C diaphragm, piezo 1383 7,000 5.1 33
Schwarzer SPV125ZL 2009 C diaphragm, piezo 20535 30,000 14.6 1.7
Bohm et al. - 1999 L diaphragm, piezo 288 1,900 6.6 -
Bohm et al. - 1999 L diaphragm, EM 1,000 2,100 2.1 0.24
HNP MZR-2521 2006 C annular gear, EM 9,955 9,000 0.9 333
Richter et al. - 1991 L EHD, injection 6.84 14,000 2,047 -
Chen et al. - 2000 L ElectroOsmotic 0.003 15 4,386 1.4
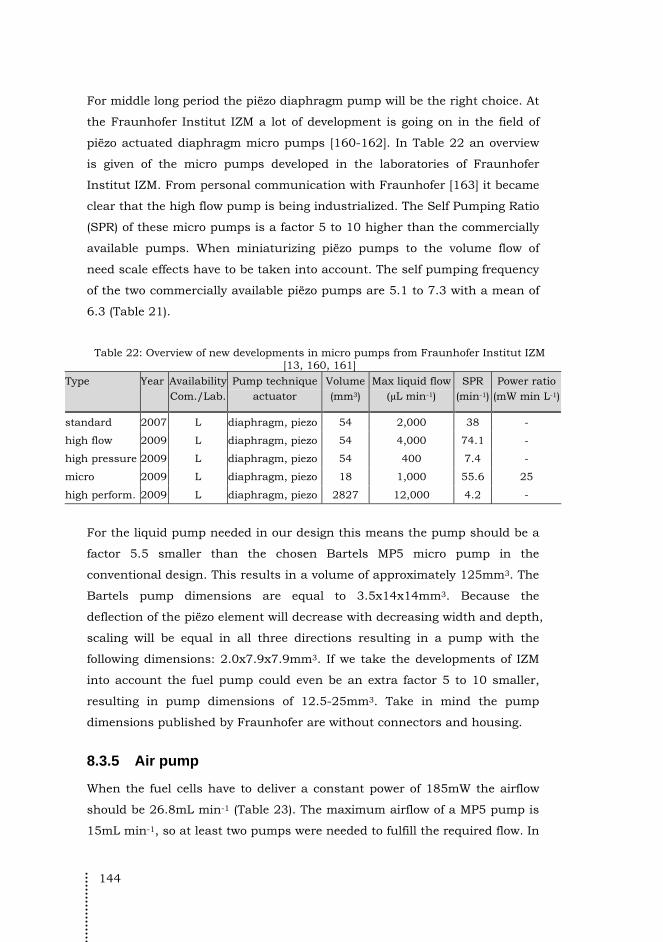
144
For middle long period the piëzo diaphragm pump will be the right choice. At
the Fraunhofer Institut IZM a lot of development is going on in the field of
piëzo actuated diaphragm micro pumps [160-162]. In Table 22 an overview
is given of the micro pumps developed in the laboratories of Fraunhofer
Institut IZM. From personal communication with Fraunhofer [163] it became
clear that the high flow pump is being industrialized. The Self Pumping Ratio
(SPR) of these micro pumps is a factor 5 to 10 higher than the commercially
available pumps. When miniaturizing piëzo pumps to the volume flow of
need scale effects have to be taken into account. The self pumping frequency
of the two commercially available piëzo pumps are 5.1 to 7.3 with a mean of
6.3 (Table 21).
Table 22: Overview of new developments in micro pumps from Fraunhofer Institut IZM [13, 160, 161]
Type Year AvailabilityCom./Lab.
Pump technique actuator
Volume(mm3)
Max liquid flow(μL min-1)
SPR (min-1)
Power ratio (mW min L-1)
standard 2007 L diaphragm, piezo 54 2,000 38 -
high flow 2009 L diaphragm, piezo 54 4,000 74.1 -
high pressure 2009 L diaphragm, piezo 54 400 7.4 -
micro 2009 L diaphragm, piezo 18 1,000 55.6 25
high perform. 2009 L diaphragm, piezo 2827 12,000 4.2 -
For the liquid pump needed in our design this means the pump should be a
factor 5.5 smaller than the chosen Bartels MP5 micro pump in the
conventional design. This results in a volume of approximately 125mm3. The
Bartels pump dimensions are equal to 3.5x14x14mm3. Because the
deflection of the piëzo element will decrease with decreasing width and depth,
scaling will be equal in all three directions resulting in a pump with the
following dimensions: 2.0x7.9x7.9mm3. If we take the developments of IZM
into account the fuel pump could even be an extra factor 5 to 10 smaller,
resulting in pump dimensions of 12.5-25mm3. Take in mind the pump
dimensions published by Fraunhofer are without connectors and housing.
8.3.5 Air pump
When the fuel cells have to deliver a constant power of 185mW the airflow
should be 26.8mL min-1 (Table 23). The maximum airflow of a MP5 pump is
15mL min-1, so at least two pumps were needed to fulfill the required flow. In
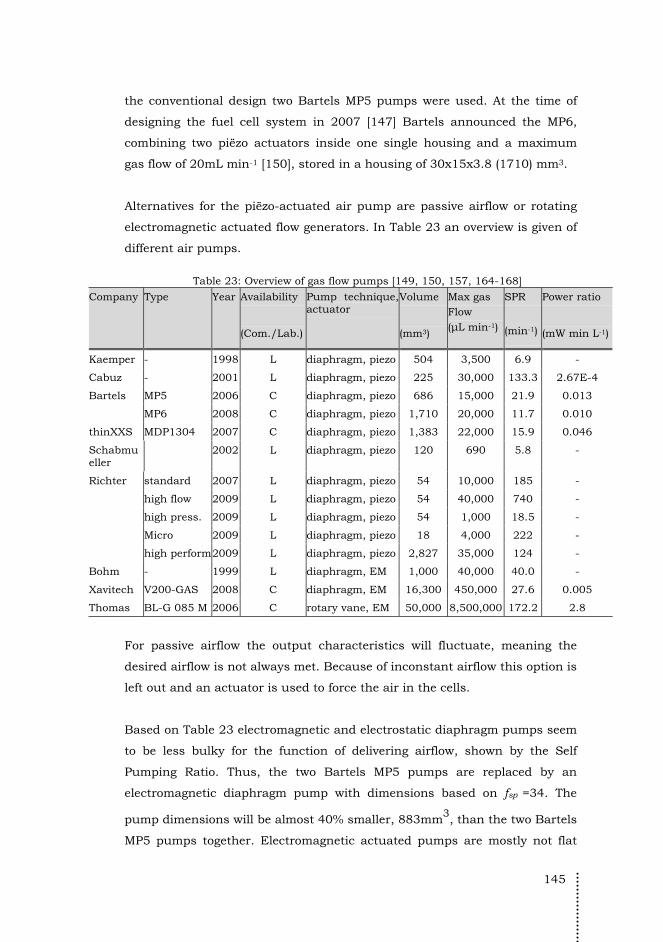
145
the conventional design two Bartels MP5 pumps were used. At the time of
designing the fuel cell system in 2007 [147] Bartels announced the MP6,
combining two piëzo actuators inside one single housing and a maximum
gas flow of 20mL min-1 [150], stored in a housing of 30x15x3.8 (1710) mm3.
Alternatives for the piëzo-actuated air pump are passive airflow or rotating
electromagnetic actuated flow generators. In Table 23 an overview is given of
different air pumps.
Table 23: Overview of gas flow pumps [149, 150, 157, 164-168]
Company Type Year Availability
(Com./Lab.)
Pump technique, actuator
Volume
(mm3)
Max gas Flow (μL min-1)
SPR
(min-1)
Power ratio
(mW min L-1)
Kaemper - 1998 L diaphragm, piezo 504 3,500 6.9 -
Cabuz - 2001 L diaphragm, piezo 225 30,000 133.3 2.67E-4
Bartels MP5 2006 C diaphragm, piezo 686 15,000 21.9 0.013
MP6 2008 C diaphragm, piezo 1,710 20,000 11.7 0.010
thinXXS MDP1304 2007 C diaphragm, piezo 1,383 22,000 15.9 0.046
Schabmueller
2002 L diaphragm, piezo 120 690 5.8 -
Richter standard 2007 L diaphragm, piezo 54 10,000 185 -
high flow 2009 L diaphragm, piezo 54 40,000 740 -
high press. 2009 L diaphragm, piezo 54 1,000 18.5 -
Micro 2009 L diaphragm, piezo 18 4,000 222 -
high perform2009 L diaphragm, piezo 2,827 35,000 124 -
Bohm - 1999 L diaphragm, EM 1,000 40,000 40.0 -
Xavitech V200-GAS 2008 C diaphragm, EM 16,300 450,000 27.6 0.005
Thomas BL-G 085 M 2006 C rotary vane, EM 50,000 8,500,000 172.2 2.8
For passive airflow the output characteristics will fluctuate, meaning the
desired airflow is not always met. Because of inconstant airflow this option is
left out and an actuator is used to force the air in the cells.
Based on Table 23 electromagnetic and electrostatic diaphragm pumps seem
to be less bulky for the function of delivering airflow, shown by the Self
Pumping Ratio. Thus, the two Bartels MP5 pumps are replaced by an
electromagnetic diaphragm pump with dimensions based on fsp =34. The
pump dimensions will be almost 40% smaller, 883mm3, than the two Bartels
MP5 pumps together. Electromagnetic actuated pumps are mostly not flat
146
designs but more long and cylindrical, making a cylindrical pump with a
length of 31mm and a diameter of 6mm feasible. Based on the pumps
developed by Fraunhofer Institut IZM the SPR could even be an extra factor
10 higher. Again it has to be taken into account that all data of the
laboratory pumps is without casing (~60% of total volume).
8.3.6 Other components: tubing and electronics
Besides the previously mentioned components air and fuel has to be
delivered to the fuel cells. Flexible tubing is used with an outer diameter of
∅2mm. The tubes have a limited bending ratio which has to be taken into
account. Two tanks are needed to fuel the DMFC system, one filled with
water and one with methanol. A small passive mixer will mix the water and
methanol to the right concentration (3%w/w). The mixture will be controlled
by two valves. A small methanol micro sensor will measure the concentration
after the mixing tank, controlling the valves. The micro sensor is under
development by ISSYS and KEM, and an estimate of the dimensions is made
based on published data [151].
8.3.7 Assembly of the design
In Figure 55 the final assembly of the fuel-cell power-system is shown. All
components are modeled excluding the electronic interconnections. In this
design it is assumed the controllers are integrated on the PCB of the MP3
player. The specifications of the main components are summarized in Table
24.

147
Figure 55: The fuel cell power system assembly.
Table 24: Specifications of the main components used in the redesigned fuel-cell power system.
Component Type Specs Dimensions [mm3]
Fuel cell membrane 3x Nafion 117 0.53VOC 3x 14x14x2
Capacitor Super capacitor 10.6mWh 13.6x10.8x4.8
Methanol tank blow molded t=0.25mm 3,570
methanol 3.17Wh 2,790
Water tank blow molded - 3,570
Fuel pump Piëzo diaphr. - 7.9x7.9x2.0
Air pump Electromagn. - 31x∅6
148
8.4 Discussion of the design, redesign and the model
8.4.1 Evaluation of the designs
A conventional and scaled design of a 150mW fuel cell power system is made.
Both fuel cell hybrid systems can power a flash-drive MP3 player. The
conventional design is based on commercially available components and the
second design is based on scaled components, where every component
specific is scaled to fulfill the performance needs for that component.
Components are not available but the feasibility of the system, when
components are available, is hereby tested.
For both designs the choice of components and the efficient placing of the
components strongly depend on the qualities of the designer. He or she is
responsible for choosing the right components and an efficient architecture
by for instance structural variants. Both these jobs can be automated,
especially during concept design when the designer is not known with the
availability of different components and its performance specifications.
For both designs the CAD model shows the power system cannot fit in the
space available, 8,700mm3 (66x33x4mm3). The power systems size is for the
conventional design and the scaled design respectively 18mL (83x36x6mm3)
and 24,400mm3 (86x35x8mm3). Table 25 shows the volumetric specifications
of both designs compared to the lithium polymer battery present in the MP3
player.
In the conventional design the fuel tanks were designed as a box. In the
scaled version the tanks are formed fitting in between the tubing and acting
as a platform for fitting the other components. This gives two advantages
over the conventional design: (i) more empty space is effectively used, and (ii)
during assembly the components can be fitted to the tanks, making the
subassembly easier to handle. Table 25 compares the lithium polymer
battery used in the MP3 player with the conventional design and the scaled
design. The scaled design has been a great improvement compared to the
conventional design, but still does not fit into the compartment available.
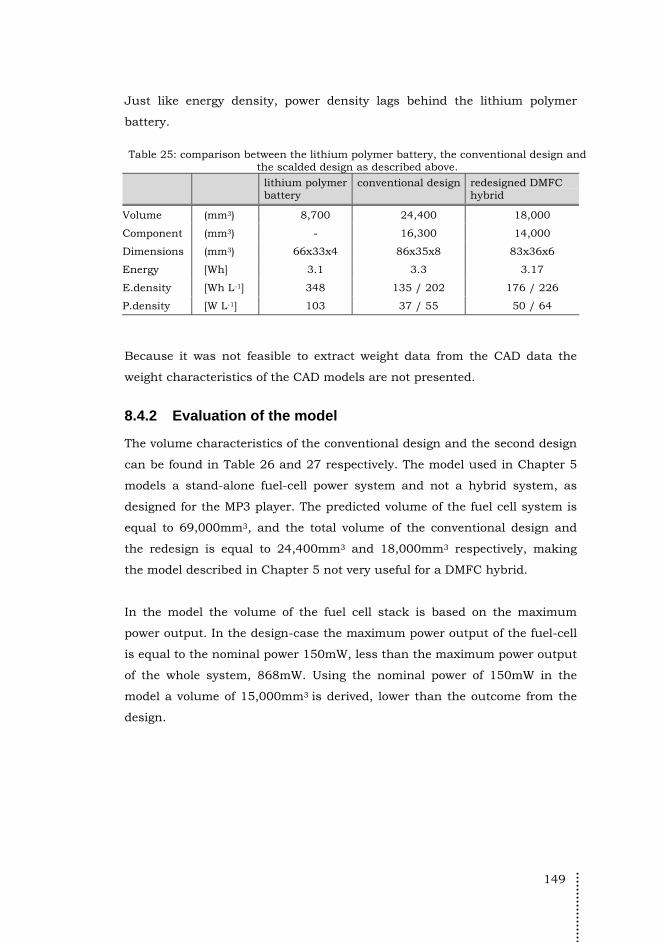
149
Just like energy density, power density lags behind the lithium polymer
battery.
Table 25: comparison between the lithium polymer battery, the conventional design and
the scalded design as described above.
lithium polymer battery
conventional design redesigned DMFC hybrid
Volume (mm3) 8,700 24,400 18,000
Component (mm3) - 16,300 14,000
Dimensions (mm3) 66x33x4 86x35x8 83x36x6
Energy [Wh] 3.1 3.3 3.17
E.density [Wh L-1] 348 135 / 202 176 / 226
P.density [W L-1] 103 37 / 55 50 / 64
Because it was not feasible to extract weight data from the CAD data the
weight characteristics of the CAD models are not presented.
8.4.2 Evaluation of the model
The volume characteristics of the conventional design and the second design
can be found in Table 26 and 27 respectively. The model used in Chapter 5
models a stand-alone fuel-cell power system and not a hybrid system, as
designed for the MP3 player. The predicted volume of the fuel cell system is
equal to 69,000mm3, and the total volume of the conventional design and
the redesign is equal to 24,400mm3 and 18,000mm3 respectively, making
the model described in Chapter 5 not very useful for a DMFC hybrid.
In the model the volume of the fuel cell stack is based on the maximum
power output. In the design-case the maximum power output of the fuel-cell
is equal to the nominal power 150mW, less than the maximum power output
of the whole system, 868mW. Using the nominal power of 150mW in the
model a volume of 15,000mm3 is derived, lower than the outcome from the
design.
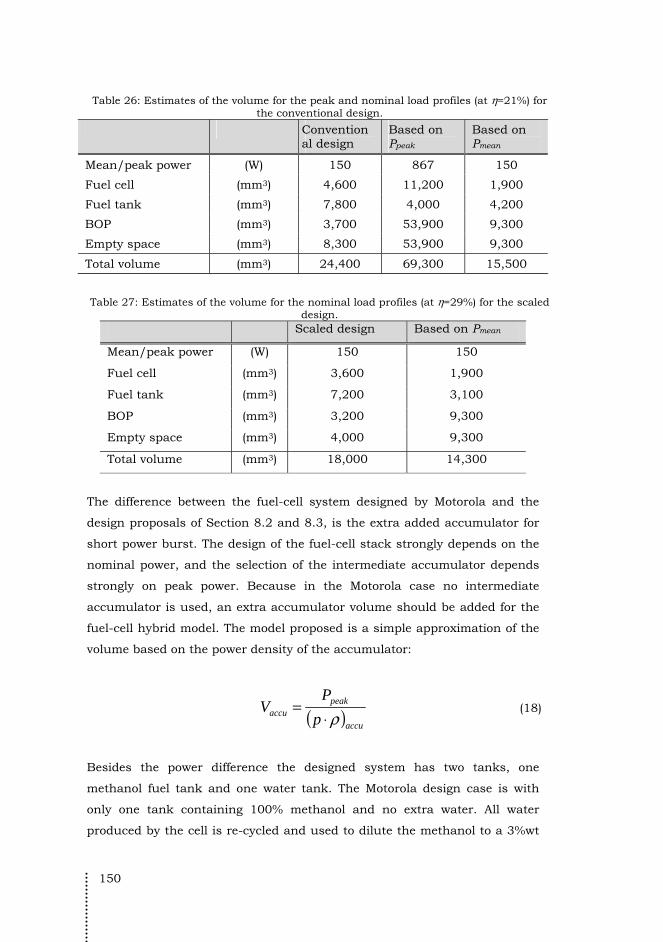
150
Table 26: Estimates of the volume for the peak and nominal load profiles (at η=21%) for the conventional design.
Conventional design
Based on Ppeak
Based on Pmean
Mean/peak power (W) 150 867 150
Fuel cell (mm3) 4,600 11,200 1,900
Fuel tank (mm3) 7,800 4,000 4,200
BOP (mm3) 3,700 53,900 9,300
Empty space (mm3) 8,300 53,900 9,300
Total volume (mm3) 24,400 69,300 15,500
Table 27: Estimates of the volume for the nominal load profiles (at η=29%) for the scaled design.
Scaled design Based on Pmean
Mean/peak power (W) 150 150
Fuel cell (mm3) 3,600 1,900
Fuel tank (mm3) 7,200 3,100
BOP (mm3) 3,200 9,300
Empty space (mm3) 4,000 9,300
Total volume (mm3) 18,000 14,300
The difference between the fuel-cell system designed by Motorola and the
design proposals of Section 8.2 and 8.3, is the extra added accumulator for
short power burst. The design of the fuel-cell stack strongly depends on the
nominal power, and the selection of the intermediate accumulator depends
strongly on peak power. Because in the Motorola case no intermediate
accumulator is used, an extra accumulator volume should be added for the
fuel-cell hybrid model. The model proposed is a simple approximation of the
volume based on the power density of the accumulator:
( )accu
peakaccu p
PV
ρ⋅= (18)
Besides the power difference the designed system has two tanks, one
methanol fuel tank and one water tank. The Motorola design case is with
only one tank containing 100% methanol and no extra water. All water
produced by the cell is re-cycled and used to dilute the methanol to a 3%wt
151
mixture. The effective energy-density of the fuel tank decreases in this
redesign case with a factor two. An extra concentration parameter cmeoh is
introduced in the model. This parameter indicates the amount of methanol
over the total liquid amount. In the Motorola case this parameter is equal to
1.0, in the MP3 design case this parameter is equal to 0.5.
The volume of the fuel-cell flat-pack in the design case has a power density
equal to almost 1/2th, namely 51.5W L-1, of the Motorola case (100W L-1)11.
The Motorola fuel cell is a 4-cell stacked version using bi-polar plates which
are thinner than the end-plates. Making use of a flat-pack design, linking
several independent cells to each other in series, increases the volume of
different cells, but also results in an overall thinner power/energy source. An
extra parameter is added to the final analytical model, the flat-pack constant
cfp, equal to 1 for stacked design and 1.5 for a flat-pack design.
System efficiency ηsys is difficult to predict. On the other hand the fuel cells
efficiency (ηfc) can be derived from the specification sheets of the fuel cell,
based on load. In the Motorola case the fuel cell voltage efficiency is 29% and
the total systems voltage efficiency 22%12. The systems voltage efficiency can
be modeled as:
bopfcsys ηηη ⋅= (19)
Where ηbop is the BOP efficiency [29]:
au
DCDCbop r+=
1
1/ηη (20)
With rau the ratio of auxiliary power to net power (~18.75%) and ηDC/DC the
efficiency of the DC/DC convertor (~90%) makes the BOP efficiency equal to
76%. Both the ratio and the efficiency of the DC/DC convertor are
11 This is the direct power output over the stacks volume. The power density is based
on the systems power-output over the fuel cell stacks volume (77.3W L-1) 12 It is assumed the overall system efficiency equals the systems voltage efficiency.
The overall system efficiency (Eout/Ein) of the Motorola fuel-cell system is 20%
152
approximations based on literature [29] and are outside the design-
boundaries of the fuel-cell system. If power conditioning circuitry is used
inside the electronic device, the device can be powered directly from the fuel
cell without conditioning, meaning without a DC/DC convertor, and achieve
a BOP efficiency of 84%.
The efficiency of the fuel cell also influences the volume of the fuel cell stack.
Higher efficiency means higher power density. For now the power density is
set at (p ρ)fc = 100W L-1. Higher power densities up to 500W L-1 have been
reported by PolyFuel [169]. The volume of the fuel-cell can now be modeled
as follows:
( ) fcfc
nomfpfc p
PcV
ρη ⋅⋅⋅
= (21)
The volume for BOP is based on the volume of wiring, tubing, air and fuel
pumps, other auxiliaries and empty space. A large chunk of this volume is
‘empty space’. In the standard design case almost 32% of the total volume
was taken by empty space. In the redesign this amount was decreased to
almost 20%. For the function proposed in Chapter 5 the BOP volume only
depends on the mean power Pmean and power density of the components
(including empty space) (p ρ)bop. The value for the power density of the BOP
components has to be corrected for, because empty space is diminished. The
empty space will be excluded from the BOP volume and and extra volume is
added, the empty space volume Vempty:
( )*
nombop
bop
PV
p ρ=
⋅ (22)
And
empty es totalV c V= ⋅ (23)
Where: (p ρ)*bop = 70W L-1
ces
= 0.2-0.32

153
8.5 Modified heuristic models for a DMFC hybrid power system
Taking all modification of the previous section into account a new heuristic
model is produced estimating the volumes of the different parts in a scaled
DMFC hybrid power source. The model can be used as a general model for a
first approximation of a DMFC system and a DMFC hybrid system. The
proposed model of Chapter 5 consisted only of three parts, the fuel cell, the
fuel tank and BOP. The modified model is extended with two other parts like
the empty space and the intermediate accumulator.
8.5.1 Model for DMFC system
The following model for an actively fueled DMFC system resulted from the
design case as described in the previous section. This model is a general
model to predict the volume characteristics of a DMFC (in 103mm3) system
less the intermediate accumulator:
( )1
1total fc fuel bopes
V V V Vc
= ⋅ + +−
(24)
Where:
( )
( )( )
( )*
can
fp meanfc
bop fc
runfuel
meoh v bop fc feul
meanbop
bop
empty es total
c PV
p
EV
c c u
PV
p
V c V
η ρ
η η ρ
ρ
⋅=
⋅ ⋅
=⋅ ⋅ ⋅ ⋅
=⋅
= ⋅
As can be seen in the model the following variables are inputted by the user:
• Mean power Pmean
• Runtime on one charge described as the total amount of energy
needed: mean
run
Prun tE Δ=
• Total run time of the system on one charge Δtrun

154
• Single cycle run Δtcycle
• And peak power Ppeak
The normalized variables, like the energy density of the methanol (u ρ)fuel, the
power density of the fuel cells (p ρ)fc [125] and the power density of the
intermediate accumulator (p ρ)accu, in this case a capacitor [69], are generally
available in literature or specification sheets. The power density for the
balance of plant (p ρ)bop is based on scaled down components derived in the
previous section. This data will be stored in the database which should be
updated for new developments in the field:
(uρ)fuel = 4373Wh L-1
(pρ)fc = 100-500W L-1
(pρ)bop = 16-70W L-1
The efficiencies ηx can be found in literature [120, 125] or calculated:
( )
/
1DC DC
bopaur
ηη =+
(20)
Where: ηfc = 21-29%
ηDC/DC = 90-100%
rau = 18.75%
The constants cx are “rule-of-thumbs” developed in the previous section:
cfp = 1.0 or 1.5
ces = 0.2-0.32
cmeoh =
2
meoh
meoh H O
V
V V+
cv can = 0.85
8.5.2 Model for a rechargeable battery
The volume for a rechargeable battery can be modeled with two different
performance parameters, the energy needed for the total run cycle Erun or the
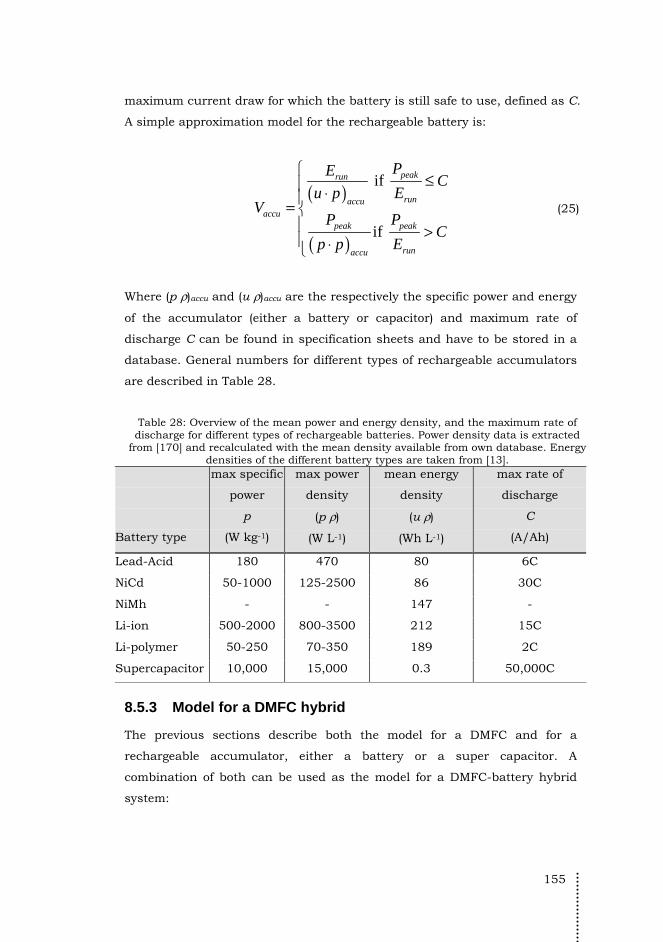
155
maximum current draw for which the battery is still safe to use, defined as C.
A simple approximation model for the rechargeable battery is:
( )
( )
if
if
peakrun
runaccuaccu
peak peak
runaccu
PEC
u p EV
P PC
p p E
≤ ⋅=
> ⋅
(25)
Where (p ρ)accu and (u ρ)accu are the respectively the specific power and energy
of the accumulator (either a battery or capacitor) and maximum rate of
discharge C can be found in specification sheets and have to be stored in a
database. General numbers for different types of rechargeable accumulators
are described in Table 28.
Table 28: Overview of the mean power and energy density, and the maximum rate of discharge for different types of rechargeable batteries. Power density data is extracted
from [170] and recalculated with the mean density available from own database. Energy densities of the different battery types are taken from [13].
Battery type
max specific
power
p
(W kg-1)
max power
density
(p ρ)
(W L-1)
mean energy
density
(u ρ)
(Wh L-1)
max rate of
discharge
C
(A/Ah)
Lead-Acid 180 470 80 6C
NiCd 50-1000 125-2500 86 30C
NiMh - - 147 -
Li-ion 500-2000 800-3500 212 15C
Li-polymer 50-250 70-350 189 2C
Supercapacitor 10,000 15,000 0.3 50,000C
8.5.3 Model for a DMFC hybrid
The previous sections describe both the model for a DMFC and for a
rechargeable accumulator, either a battery or a super capacitor. A
combination of both can be used as the model for a DMFC-battery hybrid
system:

156
( )*1
1total fc fuel bop accues
V V V V Vc
= ⋅ + + +−
(26)
The battery in a DMFC hybrid is used as a peak-power generator containing
enough energy for one single cycle. The volume for this intermediate
accumulator is thus either based on peak power draw (mainly for battery
type of accumulators) or energy needed for a single cycle (mainly for
capacitor type of accumulators). The battery can be modeled as described in
the Equation 25, with the energy per run replaced by the energy needed for
one cycle:
( )
( )
*
if
if
cycle peak
cycleaccuaccu
peak peak
cycleaccu
E PC
u EV
P PC
p E
ρ
ρ
≤ ⋅=
> ⋅
(27)
Where C is the maximum discharge rate (h-1) of the accumulator
8.6 Evaluation of the newly developed model The newly developed model was based on numbers from literature and the
rules of thumb. These rules of thumb were produces by means of the
designs produced in the previous sections, making a validation with this
design not feasible. In Table 29 the newly developed model was tested for the
scaled design, when the following efficiencies, constants and power and
energy densities are used:
ηfc = 29%
ηDC/DC = 90%
cfp = 1.5
ces = 0.2
cmeoh = 1
cvcan = 0.85
(pρ)fc = 100W L-1
(uρ)bop = 70W L-1
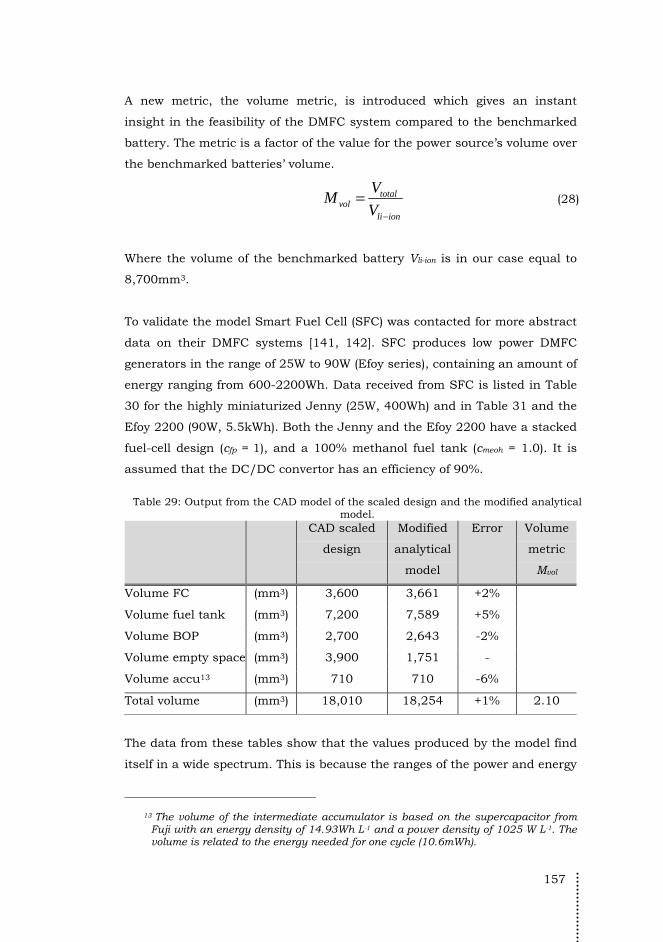
157
A new metric, the volume metric, is introduced which gives an instant
insight in the feasibility of the DMFC system compared to the benchmarked
battery. The metric is a factor of the value for the power source’s volume over
the benchmarked batteries’ volume.
totalvol
li ion
VM
V −
= (28)
Where the volume of the benchmarked battery Vli-ion is in our case equal to
8,700mm3.
To validate the model Smart Fuel Cell (SFC) was contacted for more abstract
data on their DMFC systems [141, 142]. SFC produces low power DMFC
generators in the range of 25W to 90W (Efoy series), containing an amount of
energy ranging from 600-2200Wh. Data received from SFC is listed in Table
30 for the highly miniaturized Jenny (25W, 400Wh) and in Table 31 and the
Efoy 2200 (90W, 5.5kWh). Both the Jenny and the Efoy 2200 have a stacked
fuel-cell design (cfp = 1), and a 100% methanol fuel tank (cmeoh = 1.0). It is
assumed that the DC/DC convertor has an efficiency of 90%.
Table 29: Output from the CAD model of the scaled design and the modified analytical
model. CAD scaled
design
Modified
analytical
model
Error Volume
metric
Mvol
Volume FC (mm3) 3,600 3,661 +2%
Volume fuel tank (mm3) 7,200 7,589 +5%
Volume BOP (mm3) 2,700 2,643 -2%
Volume empty space (mm3) 3,900 1,751 -
Volume accu13 (mm3) 710 710 -6%
Total volume (mm3) 18,010 18,254 +1% 2.10
The data from these tables show that the values produced by the model find
itself in a wide spectrum. This is because the ranges of the power and energy
13 The volume of the intermediate accumulator is based on the supercapacitor from
Fuji with an energy density of 14.93Wh L-1 and a power density of 1025 W L-1. The volume is related to the energy needed for one cycle (10.6mWh).
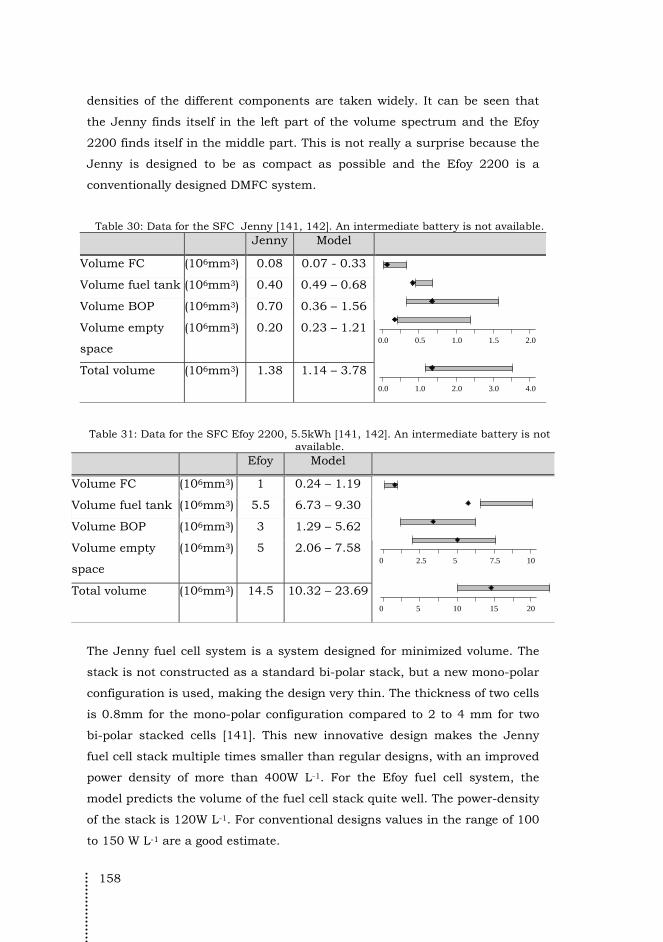
158
densities of the different components are taken widely. It can be seen that
the Jenny finds itself in the left part of the volume spectrum and the Efoy
2200 finds itself in the middle part. This is not really a surprise because the
Jenny is designed to be as compact as possible and the Efoy 2200 is a
conventionally designed DMFC system.
Table 30: Data for the SFC Jenny [141, 142]. An intermediate battery is not available. Jenny Model
Volume FC (106mm3) 0.08 0.07 - 0.33
Volume fuel tank (106mm3) 0.40 0.49 – 0.68
Volume BOP (106mm3) 0.70 0.36 – 1.56
Volume empty
space
(106mm3) 0.20 0.23 – 1.21
0.0 0.5 1.0 1.5 2.0
Total volume (106mm3) 1.38 1.14 – 3.780.0 1.0 2.0 3.0 4.0
Table 31: Data for the SFC Efoy 2200, 5.5kWh [141, 142]. An intermediate battery is not available.
Efoy Model
Volume FC (106mm3) 1 0.24 – 1.19
Volume fuel tank (106mm3) 5.5 6.73 – 9.30
Volume BOP (106mm3) 3 1.29 – 5.62
Volume empty
space
(106mm3) 5 2.06 – 7.58
0 2.5 5 7.5 10
Total volume (106mm3) 14.5 10.32 – 23.69
0 5 10 15 20
The Jenny fuel cell system is a system designed for minimized volume. The
stack is not constructed as a standard bi-polar stack, but a new mono-polar
configuration is used, making the design very thin. The thickness of two cells
is 0.8mm for the mono-polar configuration compared to 2 to 4 mm for two
bi-polar stacked cells [141]. This new innovative design makes the Jenny
fuel cell stack multiple times smaller than regular designs, with an improved
power density of more than 400W L-1. For the Efoy fuel cell system, the
model predicts the volume of the fuel cell stack quite well. The power-density
of the stack is 120W L-1. For conventional designs values in the range of 100
to 150 W L-1 are a good estimate.

159
The lower heating value (LHV) of methanol is fairly constant (4.4kWh L-1),
but the model predictions are for both systems lower than the real values.
This either means the efficiency of the fuel cell system ηfc (21% - 29%) or the
BOP ηbop (76%) or the canisters’ volume coefficient cv can (0.85) is taken to
conservative. An increase in the efficiency to 35% will result in good
predictions of the fuel-tank volume.
The real value of the BOPs’ volume is within the range of both fuel-cell
systems. The power density of the BOP for the Jenny is around 35W L-1, and
for the Efoy this is eqaul to 30W L-1.
The model uses an empty space coefficient ees in between 0.2 and 0.32. The
real empty space coefficient for the Jenny system is 0.15, which is a very
high, resulting in a prediction on the left side of the graph. On the other
hand the real empty space coefficient for the Efoy system is 0.35, which is a
lot higher than the Jenny. Both systems are at the outside limits of the
models’ empty space coefficient.
8.7 Conclusions This chapter describes the development of the first-order model. The model
is based on the zero-order model produced in Chapter 5. The zero-order
model, models the DMFC system broken down in three parts, the fuel cell,
the tank and BOP. The new first-order model extends and improves the
preliminary model by breaking down the system in five parts, the fuel cell,
tank, BOP, empty space and an intermediate battery. The intermediate
battery is introduced to deliver peak powers, while the fuel cell only has to
produce a constant mean power. By introducing a hybrid system the product
designer also has to input the load-profile of the application in the model.
This data is not always at hand during concept-development, making this
model applicable in later phases of the design process.
In general the proposed model approximates the volume of different parts
quite well. The results show that the energy and power-dense Jenny system
moves in the left limit of the model and the more conventional Efoy system
more in the middle. By changing the fuel-cell stack configuration from a bi-
160
polar to a mono-polar system, the power density of the fuel-cell stacks
improves with a factor 4. The influence of this component on total volume of
the system is still low compared to the influence of the BOP and the fuel
tank. When volume is an issue the packing efficiency could be higher than
assumed in the model. The Jenny system shows that an empty space factor
of 0.15 is feasible.
The predictions for the fuel tank are outside the left limits of the model. This
can be explained either by a to conservative efficiency of the fuel cell system
ηfc or the BOP ηbop, or the canisters’ volume coefficient cv can is taken to
conservative.
The first-order model at hand only delivers volumetric evaluation of a DMFC
power system for a specific application. The results from the model deliver a
wide outcome, where innovative design with high packing-efficiency moves
on the left side of the predicted outcome, and conventional designs can be
found in the middle of the predicted outcome. More commercially available
DMFC systems have to tested to evaluate the model more exhaustively, and
define more strict ranges in variables.
Besides volume it does not predict its form, meaning dimensions are not an
outcome. By introducing a more accurate model which places commercially
available components in a 3D space the dimensions of the architecture could
be predicted and give more accurate outcome to volume and dimensions.

161
9 Second order model: database-driven metrics-based design
The results from Chapter 8 shows that the simple analytical approach to
approximate volume and other characteristics are too basic and an approach
with more accuracy is desired. In this Chapter a different approach is
proposed to test the feasibility of a fuel cell system in a specific application.
The approximation does not consist of a simple formula but evaluates
multiple architectures, or structural variants. The evaluation is based on a
multi-parametric optimization algorithm, where volume, weight and costs
are the three basic properties.
In Section 9.1 an introduction is given on preference-based optimization,
followed by an explanation of all metrics which will be optimized for. To
facilitate understanding, comparison and weighing of the effect of different
properties, all properties are made dimensionless. The dimensionless
properties are called metrics M appropriately and are not all equally
important. The importance of the metric is defined by the preference factor λ,
and the values are based on the values found in Chapter 5. Multiplying the
dimensionless factors with the specific preference factors gives the function
F(D) to optimize for, will be described in the last part of Section 9.1. The
optimization function is applied in the design algorithm proposed in Section
9.2. The optimization function is used to find the most optimized
architecture of a DMFC system applied in a specific application. The
algorithm presented is evaluated in Sections 9.3 to 9.6 by applying it to the
design of a DMFC system for the Samsung YP-Z5F MP3 player, as described
in Chapter 8. This Chapter will finish with a discussion, conclusions and
recommendations in Sections 9.7, 9.8 and 9.9.
162
9.1 “Automated design” approach The approach proposed in this chapter is a numerical evaluation of multiple
structural variants optimized for a single objective consisting of different
dimensionless metrics. The computer is used to do more than merely
analyze engineering designs, but also makes design decisions and lead the
design to an improved solution, in short an “automated design” approach. In
this automated design process an optimization algorithm is used to optimize
the system for the basic metrics. In literature the approach for optimized
layout design is used in aeronautical environments, where the 3D packing
problem with performance constraints is generally impossible to solve only
by engineers experience and intuition [183, 184], but also in the design of
circuit boards and IC chip layout [171] and loading of ships, trucks and
trains [172].
First the design variables and the construction of the objective function is
explained in Sections 9.1.1 to 9.1.3. The metrics used and the relative
preference of those metrics are explained in Section 9.1.4 and 9.1.5. Section
9.1.7 will introduce the different types of algorithms which can be used to
find the minimized objective.
9.1.1 Design variables
The numerical quantities for which values are to be chosen in producing the
design will be called “design variables” [173]. For the DMFC system the
position in space and rotation of the different components are design
variables. Amongst other properties we want to minimize volume of the total
design by changing these variables. All design variables can be combined in
a Design vector D, which simply is a list containing all the design variables
for a particular problem. For the case study the only design variables used to
define a solution is the placing of components in space:
( ) ( )( )1
, , , , , ,t r t r iD r r r rθ θ= , for i = 1,2, …, n (29)
Where rt , rr and θ are the translation vector, the rotation vector around
which the object will rotate about, and the angle to rotate respectively for all
n objects in the design. The objects in the design are components, amongst
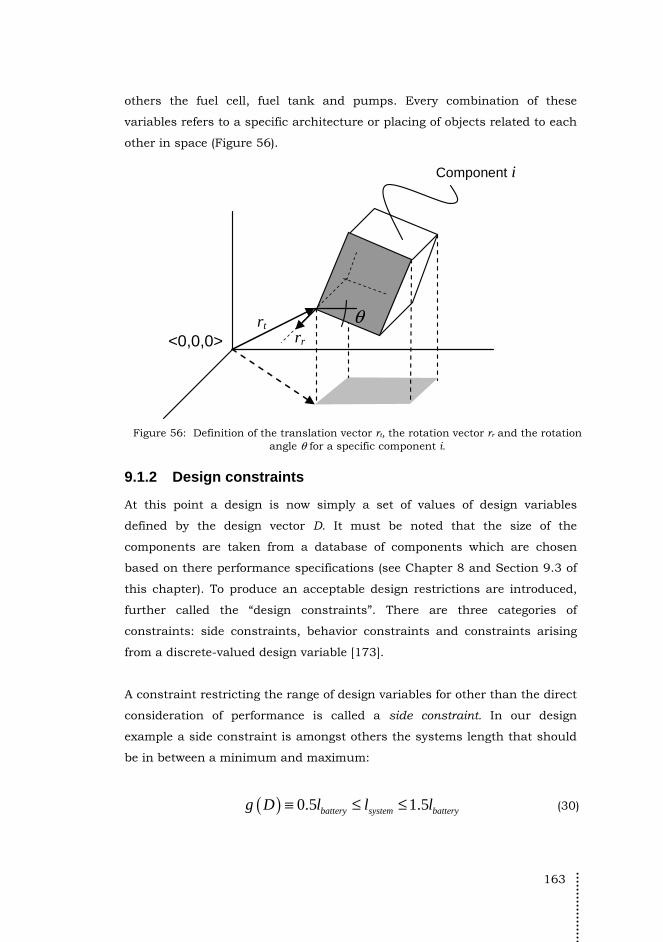
163
others the fuel cell, fuel tank and pumps. Every combination of these
variables refers to a specific architecture or placing of objects related to each
other in space (Figure 56).
rt rr <0,0,0>
Component i
θ
Figure 56: Definition of the translation vector rt, the rotation vector rr and the rotation
angle θ for a specific component i.
9.1.2 Design constraints
At this point a design is now simply a set of values of design variables
defined by the design vector D. It must be noted that the size of the
components are taken from a database of components which are chosen
based on there performance specifications (see Chapter 8 and Section 9.3 of
this chapter). To produce an acceptable design restrictions are introduced,
further called the “design constraints”. There are three categories of
constraints: side constraints, behavior constraints and constraints arising
from a discrete-valued design variable [173].
A constraint restricting the range of design variables for other than the direct
consideration of performance is called a side constraint. In our design
example a side constraint is amongst others the systems length that should
be in between a minimum and maximum:
( ) 0.5 1.5battery system batteryg D l l l≡ ≤ ≤ (30)
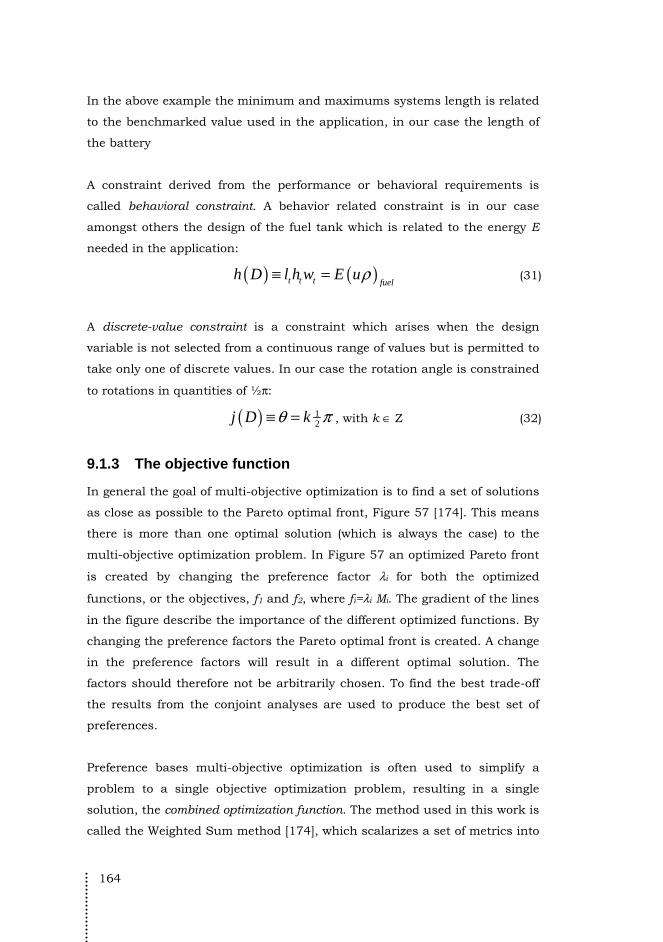
164
In the above example the minimum and maximums systems length is related
to the benchmarked value used in the application, in our case the length of
the battery
A constraint derived from the performance or behavioral requirements is
called behavioral constraint. A behavior related constraint is in our case
amongst others the design of the fuel tank which is related to the energy E
needed in the application:
( ) ( )t t t fuelh D l h w E uρ≡ = (31)
A discrete-value constraint is a constraint which arises when the design
variable is not selected from a continuous range of values but is permitted to
take only one of discrete values. In our case the rotation angle is constrained
to rotations in quantities of ½π:
( ) 1
2j D kθ π≡ = , with k ∈ Z (32)
9.1.3 The objective function
In general the goal of multi-objective optimization is to find a set of solutions
as close as possible to the Pareto optimal front, Figure 57 [174]. This means
there is more than one optimal solution (which is always the case) to the
multi-objective optimization problem. In Figure 57 an optimized Pareto front
is created by changing the preference factor λi for both the optimized
functions, or the objectives, f1 and f2, where fi=λi Mi. The gradient of the lines
in the figure describe the importance of the different optimized functions. By
changing the preference factors the Pareto optimal front is created. A change
in the preference factors will result in a different optimal solution. The
factors should therefore not be arbitrarily chosen. To find the best trade-off
the results from the conjoint analyses are used to produce the best set of
preferences.
Preference bases multi-objective optimization is often used to simplify a
problem to a single objective optimization problem, resulting in a single
solution, the combined optimization function. The method used in this work is
called the Weighted Sum method [174], which scalarizes a set of metrics into
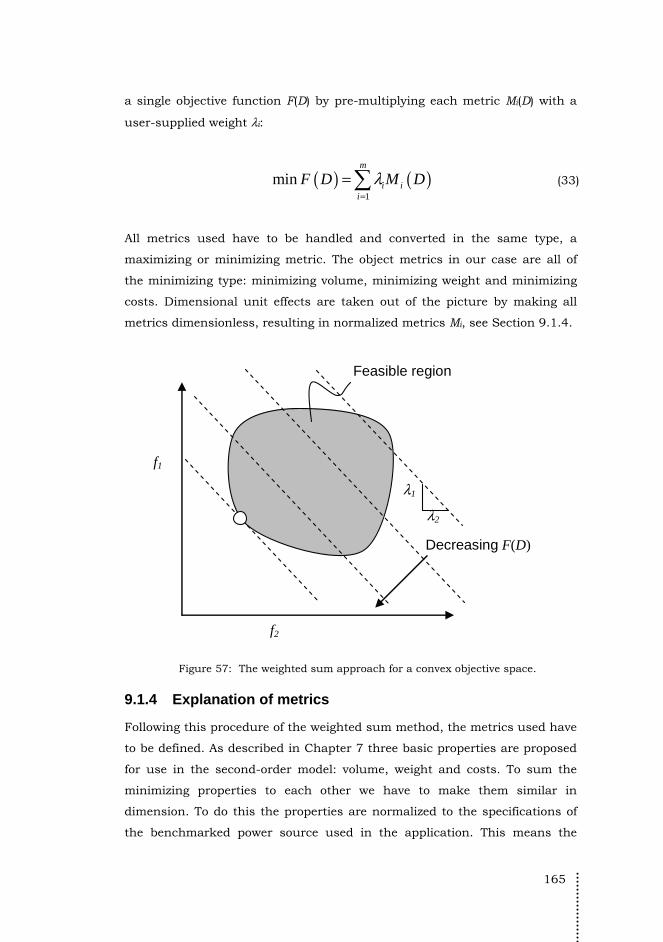
165
a single objective function F(D) by pre-multiplying each metric Mi(D) with a
user-supplied weight λi:
( ) ( )1
minm
i ii
F D M Dλ=
= (33)
All metrics used have to be handled and converted in the same type, a
maximizing or minimizing metric. The object metrics in our case are all of
the minimizing type: minimizing volume, minimizing weight and minimizing
costs. Dimensional unit effects are taken out of the picture by making all
metrics dimensionless, resulting in normalized metrics Mi, see Section 9.1.4.
Feasible region
λ1
λ2
Decreasing F(D)
f1
f2
Figure 57: The weighted sum approach for a convex objective space.
9.1.4 Explanation of metrics
Following this procedure of the weighted sum method, the metrics used have
to be defined. As described in Chapter 7 three basic properties are proposed
for use in the second-order model: volume, weight and costs. To sum the
minimizing properties to each other we have to make them similar in
dimension. To do this the properties are normalized to the specifications of
the benchmarked power source used in the application. This means the
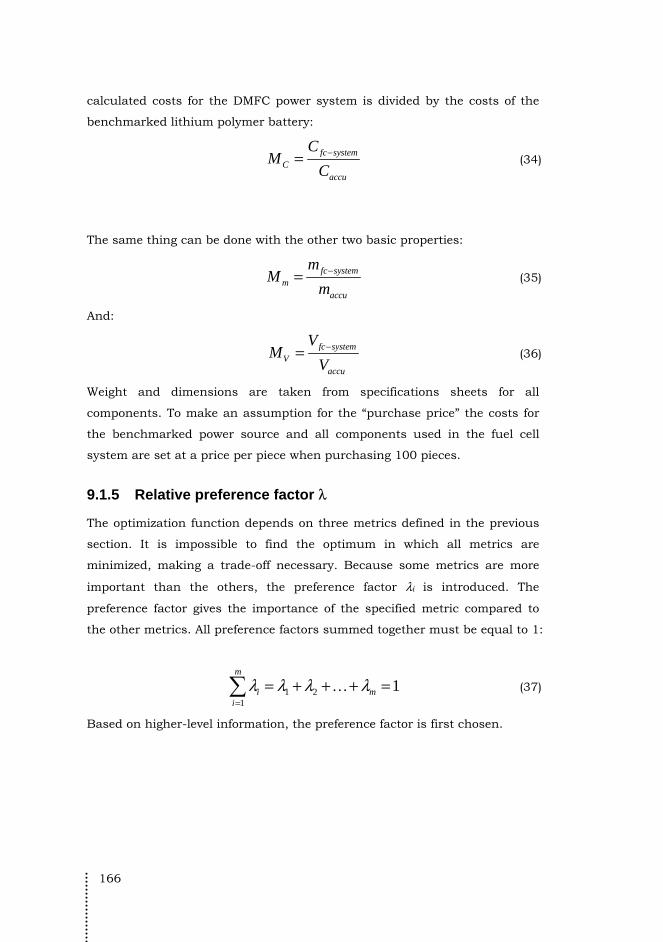
166
calculated costs for the DMFC power system is divided by the costs of the
benchmarked lithium polymer battery:
fc system
Caccu
CM
C−= (34)
The same thing can be done with the other two basic properties:
fc system
maccu
mM
m−= (35)
And:
fc system
Vaccu
VM
V−= (36)
Weight and dimensions are taken from specifications sheets for all
components. To make an assumption for the “purchase price” the costs for
the benchmarked power source and all components used in the fuel cell
system are set at a price per piece when purchasing 100 pieces.
9.1.5 Relative preference factor λ
The optimization function depends on three metrics defined in the previous
section. It is impossible to find the optimum in which all metrics are
minimized, making a trade-off necessary. Because some metrics are more
important than the others, the preference factor λi is introduced. The
preference factor gives the importance of the specified metric compared to
the other metrics. All preference factors summed together must be equal to 1:
1 21
1m
i mi
λ λ λ λ=
= + + + = (37)
Based on higher-level information, the preference factor is first chosen.

167
9.1.6 Presentation of the objective function
The objective function is defined and can be used in an algorithm, in search
for the optimal design with the following minimizing function (Equation 33):
( ) ( ) ( ) ( ) ( )min C C m m V VF D M D M D M D p Dλ λ λ= + + +
(38)
Subject to:
( )( )( )( )( )( )( )( ) ( )
( )
1
2
3
4
5
6
7
1
2
0.5 1.5
0.5 1.5
0.5 1.5
1
0 1
0 1
0 1
battery system battery
battery system battery
battery system battery
C m V
C
m
V
t t t fuel
nomfc fc
fc cel
g D l l l
g D h h h
g D w w w
g D
g D
g D
g D
h D l h w E u
Ph D l w
n V
λ λ λ
λ
λ
λ
ρ
≡ ≤ ≤
≡ ≤ ≤
≡ ≤ ≤
≡ + + =
≡ ≤ ≤
≡ ≤ ≤
≡ ≤ ≤
≡ =
≡ = =⋅
( )( )
12
intersections
1
2
, with
0 if
other
fc
l cell
i j
n
i
j D k k
Obj Objp D
n
θ π
⋅ ⋅
≡ = ∈ Ζ
∉=
Where g1(D) to g3(D) define the search field in which the optimization may
take place, and g4(D) to g7(D) define the field for the preference factors λ. The
behavioral constraints h1(D) and h2(D) define the two flexible components as
will be described in Section 9.3.5 and 9.3.6. To decrease computation time
the values for rotation of the objects is restricted to discrete values by j(D).
The penalty factor p(D) is introduced to the function when objects from the
component set intersect with each other.
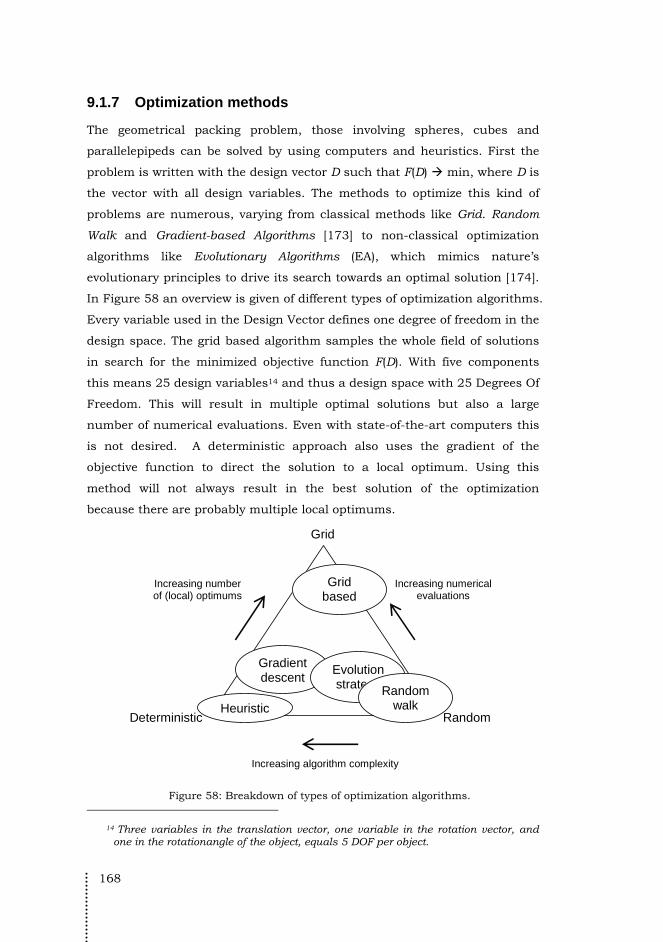
168
9.1.7 Optimization methods
The geometrical packing problem, those involving spheres, cubes and
parallelepipeds can be solved by using computers and heuristics. First the
problem is written with the design vector D such that F(D) min, where D is
the vector with all design variables. The methods to optimize this kind of
problems are numerous, varying from classical methods like Grid. Random
Walk and Gradient-based Algorithms [173] to non-classical optimization
algorithms like Evolutionary Algorithms (EA), which mimics nature’s
evolutionary principles to drive its search towards an optimal solution [174].
In Figure 58 an overview is given of different types of optimization algorithms.
Every variable used in the Design Vector defines one degree of freedom in the
design space. The grid based algorithm samples the whole field of solutions
in search for the minimized objective function F(D). With five components
this means 25 design variables14 and thus a design space with 25 Degrees Of
Freedom. This will result in multiple optimal solutions but also a large
number of numerical evaluations. Even with state-of-the-art computers this
is not desired. A deterministic approach also uses the gradient of the
objective function to direct the solution to a local optimum. Using this
method will not always result in the best solution of the optimization
because there are probably multiple local optimums.
Gradient descent
Evolution strategy
Increasing numerical evaluations
Random Deterministic
Grid based
Random walk
Increasing algorithm complexity
Grid
Increasing number of (local) optimums
Heuristic
Figure 58: Breakdown of types of optimization algorithms.
14 Three variables in the translation vector, one variable in the rotation vector, and
one in the rotationangle of the object, equals 5 DOF per object.

169
A less calculation-intensive method is the random search method generating
a random cloud of design vectors D’s within the design space. Every
improved trial to the previous trial is stored in a table. This method is
analogous to shooting with hail. A more sophisticated random-based method
is the Random Walk. This version is based on a sequence of improved
approximations to the minimum, each derived from the preceding
approximation. The sequence is determined from the prescription [173]:
1n n rD D eρ+ = +
(39)
Where Dn is the “old” approximation to the minimum and Dn+1 is the “new”
approximation, ρ is the scalar step length and er is a unit random vector.
The random walk method guides the solution to a minimum. Depending on
the starting point of the algorithm the solution converges to a local minimum
and not always to the overall minimum.
Within this thesis a variant on the classical method of Random Walk is
chosen to be used in the first approach towards an automated design and
evaluation of multiple structural variants (Section 9.4 and 9.5). To decrease
calculation time and increase accuracy the algorithm is extended with an
evolutionary algorithm in Section 9.6. The solution is directed by a Genetic
Algorithm (GA) [171] where a set of design vectors is generated, which all
represent a unique point in the design space. The objective function
evaluates the designs and decides which solutions are more fit over the
others. A new generation of solutions is generated based on mating the
solutions taking the fitness of each solution into account.
9.2 Presentation of the optimization algorithm Figure 59 shows the flowchart of the algorithm which not only minimizes the
objective function but also chooses the components based on simple
performance specifications, explained in Section 9.3.
The algorithm consists of three parts: the performance input and component
selection (Section 9.2.2), the multi-parametric optimization (Section 9.2.3)
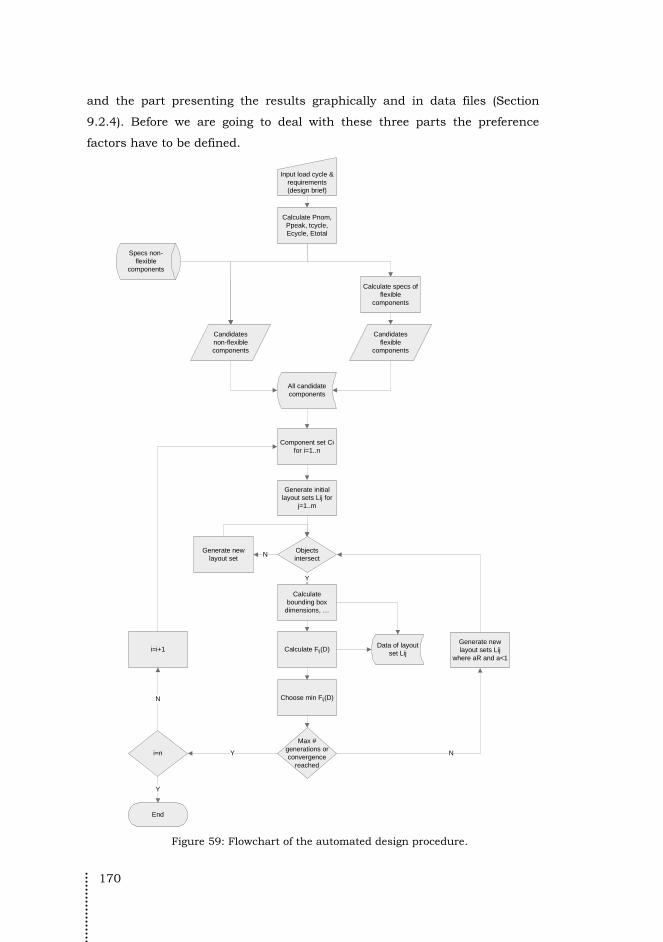
170
and the part presenting the results graphically and in data files (Section
9.2.4). Before we are going to deal with these three parts the preference
factors have to be defined.
Input load cycle & requirements (design brief)
Specs non-flexible
components
Calculate Pnom, Ppeak, tcycle, Ecycle, Etotal
Calculate specs of flexible
components
Candidates flexible
components
Candidates non-flexible components
Generate initial layout sets Lij for
j=1..m
Component set Ci for i=1..n
Objects intersect
Generate new layout set
N
Calculate bounding box
dimensions, …
Y
All candidate components
Calculate Fij(D)
Choose min Fij(D)
Data of layout set Lij
Max # generations or convergence
reached
NY
Generate new layout sets Lij
where aR and a<1
i=n
N
End
Y
i=i+1
Figure 59: Flowchart of the automated design procedure.
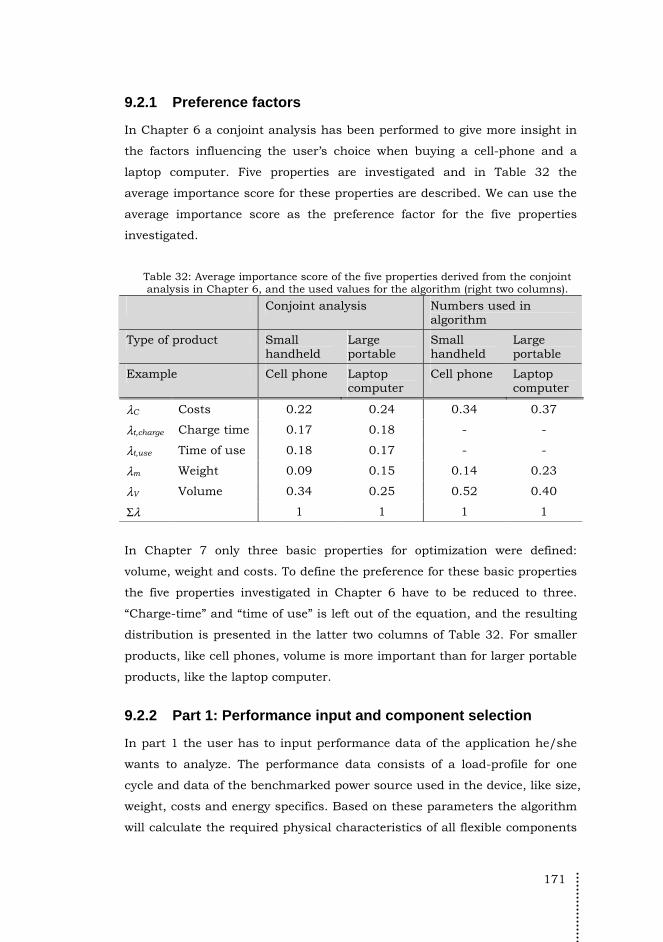
171
9.2.1 Preference factors
In Chapter 6 a conjoint analysis has been performed to give more insight in
the factors influencing the user’s choice when buying a cell-phone and a
laptop computer. Five properties are investigated and in Table 32 the
average importance score for these properties are described. We can use the
average importance score as the preference factor for the five properties
investigated.
Table 32: Average importance score of the five properties derived from the conjoint analysis in Chapter 6, and the used values for the algorithm (right two columns).
Conjoint analysis Numbers used in algorithm
Type of product Small handheld
Large portable
Small handheld
Large portable
Example Cell phone Laptop computer
Cell phone Laptop computer
λC Costs 0.22 0.24 0.34 0.37
λt,charge Charge time 0.17 0.18 - -
λt,use Time of use 0.18 0.17 - -
λm Weight 0.09 0.15 0.14 0.23
λV Volume 0.34 0.25 0.52 0.40
Σλ 1 1 1 1
In Chapter 7 only three basic properties for optimization were defined:
volume, weight and costs. To define the preference for these basic properties
the five properties investigated in Chapter 6 have to be reduced to three.
“Charge-time” and “time of use” is left out of the equation, and the resulting
distribution is presented in the latter two columns of Table 32. For smaller
products, like cell phones, volume is more important than for larger portable
products, like the laptop computer.
9.2.2 Part 1: Performance input and component selection
In part 1 the user has to input performance data of the application he/she
wants to analyze. The performance data consists of a load-profile for one
cycle and data of the benchmarked power source used in the device, like size,
weight, costs and energy specifics. Based on these parameters the algorithm
will calculate the required physical characteristics of all flexible components
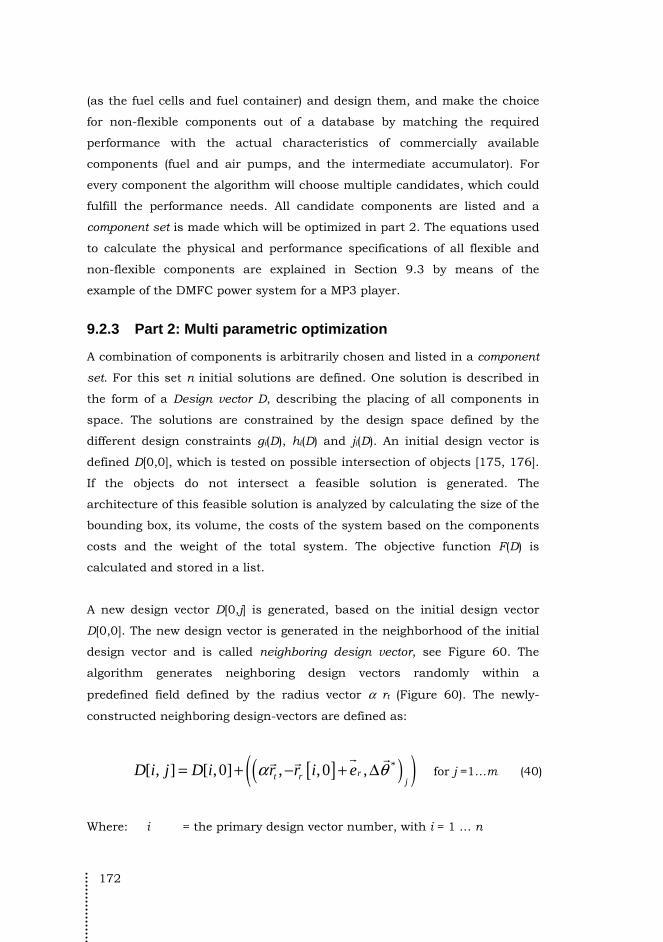
172
(as the fuel cells and fuel container) and design them, and make the choice
for non-flexible components out of a database by matching the required
performance with the actual characteristics of commercially available
components (fuel and air pumps, and the intermediate accumulator). For
every component the algorithm will choose multiple candidates, which could
fulfill the performance needs. All candidate components are listed and a
component set is made which will be optimized in part 2. The equations used
to calculate the physical and performance specifications of all flexible and
non-flexible components are explained in Section 9.3 by means of the
example of the DMFC power system for a MP3 player.
9.2.3 Part 2: Multi parametric optimization
A combination of components is arbitrarily chosen and listed in a component
set. For this set n initial solutions are defined. One solution is described in
the form of a Design vector D, describing the placing of all components in
space. The solutions are constrained by the design space defined by the
different design constraints gi(D), hi(D) and ji(D). An initial design vector is
defined D[0,0], which is tested on possible intersection of objects [175, 176].
If the objects do not intersect a feasible solution is generated. The
architecture of this feasible solution is analyzed by calculating the size of the
bounding box, its volume, the costs of the system based on the components
costs and the weight of the total system. The objective function F(D) is
calculated and stored in a list.
A new design vector D[0,j] is generated, based on the initial design vector
D[0,0]. The new design vector is generated in the neighborhood of the initial
design vector and is called neighboring design vector, see Figure 60. The
algorithm generates neighboring design vectors randomly within a
predefined field defined by the radius vector α rt (Figure 60). The newly-
constructed neighboring design-vectors are defined as:
[ ]( )( )*[ , ] [ ,0] , ,0 ,rt rj
D i j D i r r i eα θ= + − + Δ
for j =1…m (40)
Where: i = the primary design vector number, with i = 1 … n
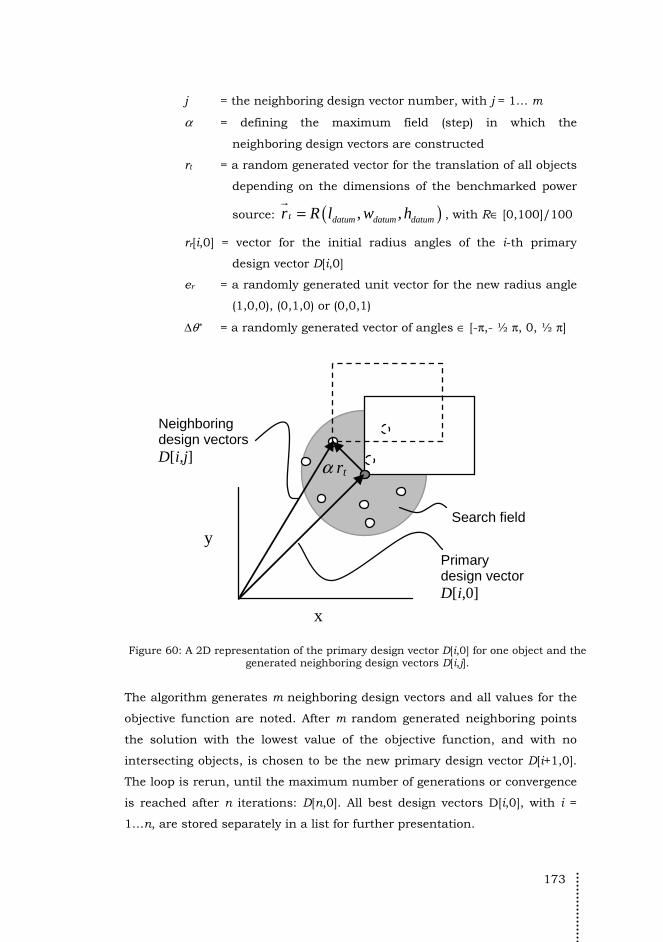
173
j = the neighboring design vector number, with j = 1… m
α = defining the maximum field (step) in which the
neighboring design vectors are constructed
rt = a random generated vector for the translation of all objects
depending on the dimensions of the benchmarked power
source: ( ), ,t datum datum datumr R l w h=
, with R∈ [0,100]/100
rr[i,0] = vector for the initial radius angles of the i-th primary
design vector D[i,0]
er = a randomly generated unit vector for the new radius angle
(1,0,0), (0,1,0) or (0,0,1)
Δθ* = a randomly generated vector of angles ∈ [-π,- ½ π, 0, ½ π]
x
y Primary design vector D[i,0]
Neighboring design vectors D[i,j]
Search field
α rt
Figure 60: A 2D representation of the primary design vector D[i,0] for one object and the
generated neighboring design vectors D[i,j].
The algorithm generates m neighboring design vectors and all values for the
objective function are noted. After m random generated neighboring points
the solution with the lowest value of the objective function, and with no
intersecting objects, is chosen to be the new primary design vector D[i+1,0].
The loop is rerun, until the maximum number of generations or convergence
is reached after n iterations: D[n,0]. All best design vectors D[i,0], with i =
1…n, are stored separately in a list for further presentation.
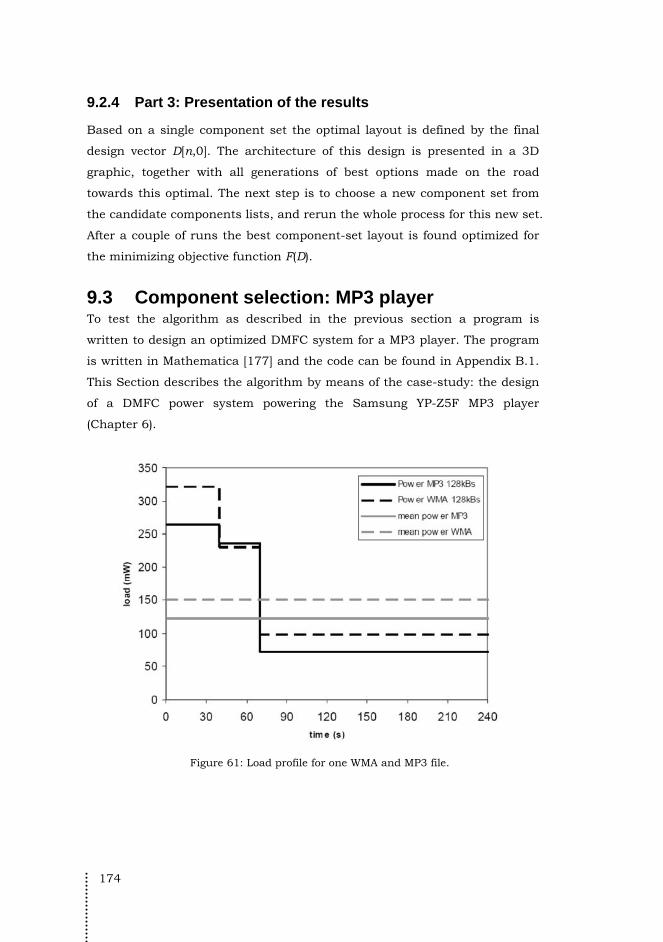
174
9.2.4 Part 3: Presentation of the results
Based on a single component set the optimal layout is defined by the final
design vector D[n,0]. The architecture of this design is presented in a 3D
graphic, together with all generations of best options made on the road
towards this optimal. The next step is to choose a new component set from
the candidate components lists, and rerun the whole process for this new set.
After a couple of runs the best component-set layout is found optimized for
the minimizing objective function F(D).
9.3 Component selection: MP3 player To test the algorithm as described in the previous section a program is
written to design an optimized DMFC system for a MP3 player. The program
is written in Mathematica [177] and the code can be found in Appendix B.1.
This Section describes the algorithm by means of the case-study: the design
of a DMFC power system powering the Samsung YP-Z5F MP3 player
(Chapter 6).
Figure 61: Load profile for one WMA and MP3 file.
175
9.3.1 Performance input data
The data inputted by the user is in the form of load profile of one cycle. In
the case of the MP3 player this is the coarsened load-profile of the WMA file
(- - -) as pictured in Figure 61. The power data is imported as a list of power
in mW versus the time in seconds. The benchmarked battery specifications
are inputted as a list of the capacity (mAh), the working voltage (V), the
weight (g), price (€) and its dimensions (mm).
9.3.2 Introduction into component selection
With the data imported the algorithm will select non-flexible components
from a database of commercially available components and designs flexible
components matching the performance requirements of the device. In basis
the DMFC system consists of five main components:
1. air pump (non-flexible)
2. fuel pump (non-flexible)
3. intermediate accumulator (non-flexible)
4. fuel cell stack or flat pack (flexible)
5. fuel tank (flexible)
Other components like the fuel-water mixer and mixing chamber, water
condenser, air filters and other minor components are left out of this
optimization because of lack of information about these components or the
low impact on volume or weight. It is also assumed that the controller will be
integrated on the PCB of the device.
Data from non-flexible components is extracted from a table (CSV file)
imported in the code. A component is represented by its outer bound
dimensions (length, width and height), its weight, its price, and performance
specific variables. A component is represented as a parallelepiped (or a
Cuboid in Mathematica) by only its height, width and length parameters.
Figure 62 shows the real form dimensions of a fuel pump and its
representation in the program, and in Table 33 an excerpt for the fuel-pump
table is shown. A full overview can be found in Appendix B.3. The choice for

176
a specific component is based on its performance characteristics. For the air
pump and the fuel pump this is the maximum flow (ml min-1) and for the
intermediate accumulator this is the voltage (V) and the capacity (mAh). The
ordering is done on basis of the minimized value of these performance
characteristics.
Representation of the pump
Real form of the component
length[pump]
height[pump]
width[pump]
Figure 62: Real form and the representation of the Schwartzer Precision SP100 EC fuel
pump within the program.
Table 33: An excerpt of the fuel-pump table in the component database. For a full overview see Appendix B.3.
Brand Type V (V)
P (mW)
max flow(ml min-1)
l (mm)
w (mm)
h (mm)
m (g)
Price (€ 100+)
Bartels MP5 Diaphragm, piezo 250 200 5 14 14 3.5 1 0.1
Bartels MP6 Diaphragm, piezo 250 200 6 30 15 3.8 2 0.1
thinXXS MDP1304 Diaphragm, piezo 5 250 10 25.4 26.2 7.5 3 0.1
thinXXS MDP2205 Diaphragm, piezo 5 250 11.8 26.2 25.4 9 3 0.1
HNP MZR2521Annular gear, electromagnetic
18 3000 9 68.8 13 13 56 0.1
… … … … … … … … … … …
9.3.3 Air and fuel pump selection
The air and fuel pump are selected on there fuel flow performance. For every
pump in the table the maximum air or fuel flow is entered. On basis of the
load profile, the air and fuel flow needed is calculated. Methanol crossover
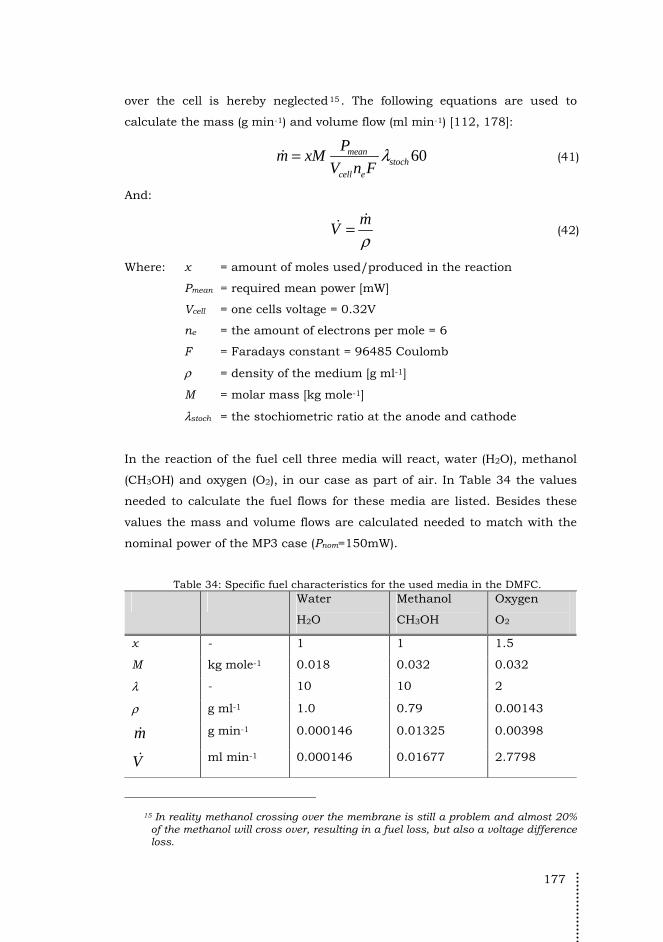
177
over the cell is hereby neglected15 . The following equations are used to
calculate the mass (g min-1) and volume flow (ml min-1) [112, 178]:
60meanstoch
cell e
Pm xM
V n Fλ= (41)
And:
m
Vρ
= (42)
Where: x = amount of moles used/produced in the reaction
Pmean = required mean power [mW]
Vcell = one cells voltage = 0.32V
ne = the amount of electrons per mole = 6
F = Faradays constant = 96485 Coulomb
ρ = density of the medium [g ml-1]
M = molar mass [kg mole-1]
λstoch = the stochiometric ratio at the anode and cathode
In the reaction of the fuel cell three media will react, water (H2O), methanol
(CH3OH) and oxygen (O2), in our case as part of air. In Table 34 the values
needed to calculate the fuel flows for these media are listed. Besides these
values the mass and volume flows are calculated needed to match with the
nominal power of the MP3 case (Pnom=150mW).
Table 34: Specific fuel characteristics for the used media in the DMFC. Water
H2O
Methanol
CH3OH
Oxygen
O2
x - 1 1 1.5
M kg mole-1 0.018 0.032 0.032
λ - 10 10 2
ρ g ml-1 1.0 0.79 0.00143
m g min-1 0.000146 0.01325 0.00398
V ml min-1 0.000146 0.01677 2.7798
15 In reality methanol crossing over the membrane is still a problem and almost 20%
of the methanol will cross over, resulting in a fuel loss, but also a voltage difference loss.

178
Besides for reaction water is also used as a carrier for the fuel to the
membrane. Methanol is normally diluted in water at a percentage equal to
3%m (2.3%v), resulting in an extra water flow needed:
3
2 2.3%CH OH
H O mix
VV =
And thus the total fuel flow at the anode is equal to:
3
3 2 2.3%CH OH
liquid CH OH H O
VV V V= + +
= 0.75 ml min-1
At the cathode the fuel flow consists of oxygen. Because the design does not
include an oxygen tank but the oxygen from air is used, and thus air has to
be pumped around. The oxygen percentage in air is equal to 21%, resulting
in a fuel flow at the cathode equal to:
2
21%O
air
VV =
= 14.6 ml min-1
Based on the calculated fuel flows at the anode and cathode the pumps can
be selected, from a table consisting the dimensions, weight and, when
available, price (for 100 items).
9.3.4 Intermediate accumulator selection
The intermediate accumulator is selected by matching the capacity of the
battery with the required capacity when the battery has to be discharged and
charged within one cycle, when the battery is discharged at a depth of
discharge (DOD) equal to 80%:
0
1
80%
cyclet
nomt
C P P t=
= ⋅ − ⋅ (43)
The dimensions, weight and, when available, price (for 100 items) is taken
from the table.
179
9.3.5 Dimensioning the fuel cell
The fuel cell is the first flexible component in our component set. The fuel
cells are designed as if they were custom build for the application. The
designer has to indicate if the fuel cell is stacked or is designed with flat-
pack architecture. The latter design is more voluminous but has the
advantage of being thin, and thus fitting a thin product design.
The design of the fuel cell stack is based on the design from [120] working at
a cell voltage of Vcell = 0.32 V at a current density of icell = 140 mA cm-2. The
number of cells needed is based on the maximum battery voltage:
battery
fccell
Vn
V
=
(44)
When assuming a flat pack design the required active area of the membrane
can be calculated with:
1
2fcnom
cellfc cell cell
nPA
n V i= ⋅ ⋅
⋅ (45)
And thus the length and the width of all of the cells, when assuming a
squared fuel cell flat pack architecture:
cell cell celll w A= = (46)
The thickness of the fuel cell flat pack is taken to be equal to the thickness
of two endplates making use of the innovative mono-polar architecture with
a thickness of 0.8mm for two cells [141].
Weight is calculated based on density numbers taken from the Motorola case
[29] equal to ρfc = 2.078 kg L-1. Prices are based on the price for one hundred
square centimeters of Membrane Electrode Assembly (MEA) taken from [132]
(may 2010), equaling $356.36, and thus $c3.56 or €c2.97 per mm2. The
MEA used in the design has an active area of 1,420mm2, making the price
for only this component equal to €42.17.
180
9.3.6 Dimensioning the fuel tank
The second flexible component is the fuel tank, which has to match with the
energy need for a single charge. The dimensions of the fuel tank are flexible
and can be used to fill up empty space. In our algorithm we have assumed
the length and width of the tank be equal to the length and the width of the
benchmarked power source. For the MP3 player this is equal to 66 and
33mm. The thickness of the fuel tank is a result from the matching volume
needed to store the required amount of energy (820mAh at 3.7V) and the
amount of water described by cmeoh, as described in Chapter 7, which is in
our case equal to ½ (the amount of water equals the amount of methanol).
The total thickness of the fuel tank is now equal to:
tan
1
meoh
batteryk
meoh E tank tank
Et
c l wρ= ⋅
⋅ ⋅ (47)
The weight of the fuel tank can be calculated with the density of water
(1 kg L-1) and methanol (0.79 kg L-1). Price is assumed to be equal to the
price for a fill-pen refill, where a five-pack of 1.45 mL cartridges costs €1.90
[179], resulting in a price-density of: €1.31x10⁻³ mm-3.
9.3.7 Ordering of components
A list of components is selected based on the performance requirements
imported by the user. A list of compliant components is chosen and sorted
on its performance, where the best performing version is at number one and
the worst is the latter in the list. For the pumps the ordering is based on
volume flow with the lowest value as the most interesting, and for the
intermediate accumulator the lowest value of the energy capacity satisfying
the requirements is the most interesting accumulator. Both flexible
components, the fuel cell and fuel tank designs match the performance
requirements and thus no ordering is needed.
9.4 First test run: initial algorithm To test the algorithm the requirements for a power source applied in the
Samsung YP-Z5F MP3 player are entered into the program. The optimization
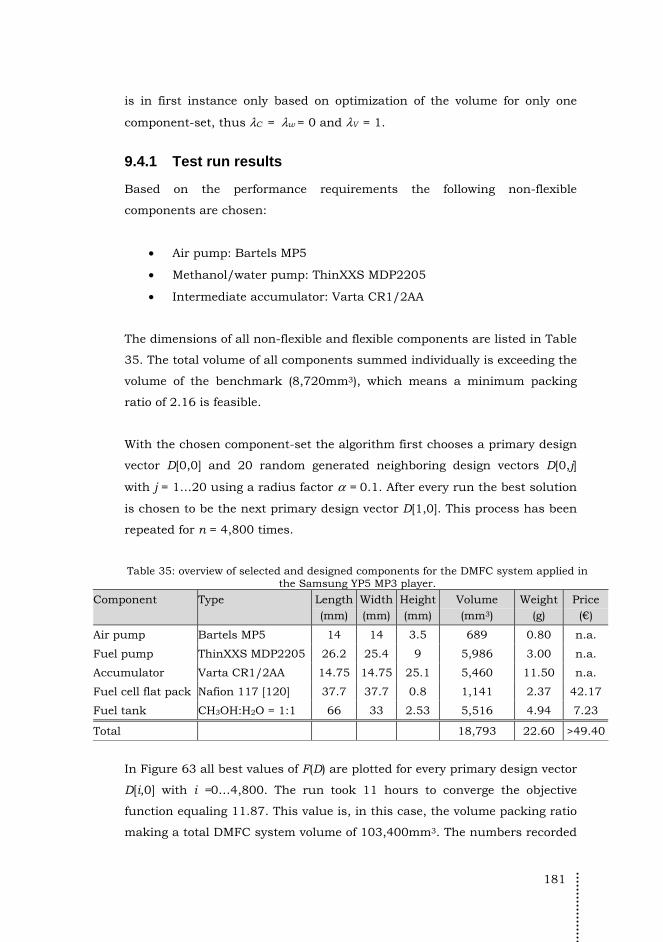
181
is in first instance only based on optimization of the volume for only one
component-set, thus λC = λw = 0 and λV = 1.
9.4.1 Test run results
Based on the performance requirements the following non-flexible
components are chosen:
• Air pump: Bartels MP5
• Methanol/water pump: ThinXXS MDP2205
• Intermediate accumulator: Varta CR1/2AA
The dimensions of all non-flexible and flexible components are listed in Table
35. The total volume of all components summed individually is exceeding the
volume of the benchmark (8,720mm3), which means a minimum packing
ratio of 2.16 is feasible.
With the chosen component-set the algorithm first chooses a primary design
vector D[0,0] and 20 random generated neighboring design vectors D[0,j]
with j = 1…20 using a radius factor α = 0.1. After every run the best solution
is chosen to be the next primary design vector D[1,0]. This process has been
repeated for n = 4,800 times.
Table 35: overview of selected and designed components for the DMFC system applied in
the Samsung YP5 MP3 player.
Component Type Length(mm)
Width(mm)
Height(mm)
Volume (mm3)
Weight (g)
Price (€)
Air pump Bartels MP5 14 14 3.5 689 0.80 n.a.
Fuel pump ThinXXS MDP2205 26.2 25.4 9 5,986 3.00 n.a.
Accumulator Varta CR1/2AA 14.75 14.75 25.1 5,460 11.50 n.a.
Fuel cell flat pack Nafion 117 [120] 37.7 37.7 0.8 1,141 2.37 42.17
Fuel tank CH3OH:H2O = 1:1 66 33 2.53 5,516 4.94 7.23
Total 18,793 22.60 >49.40
In Figure 63 all best values of F(D) are plotted for every primary design vector
D[i,0] with i =0…4,800. The run took 11 hours to converge the objective
function equaling 11.87. This value is, in this case, the volume packing ratio
making a total DMFC system volume of 103,400mm3. The numbers recorded
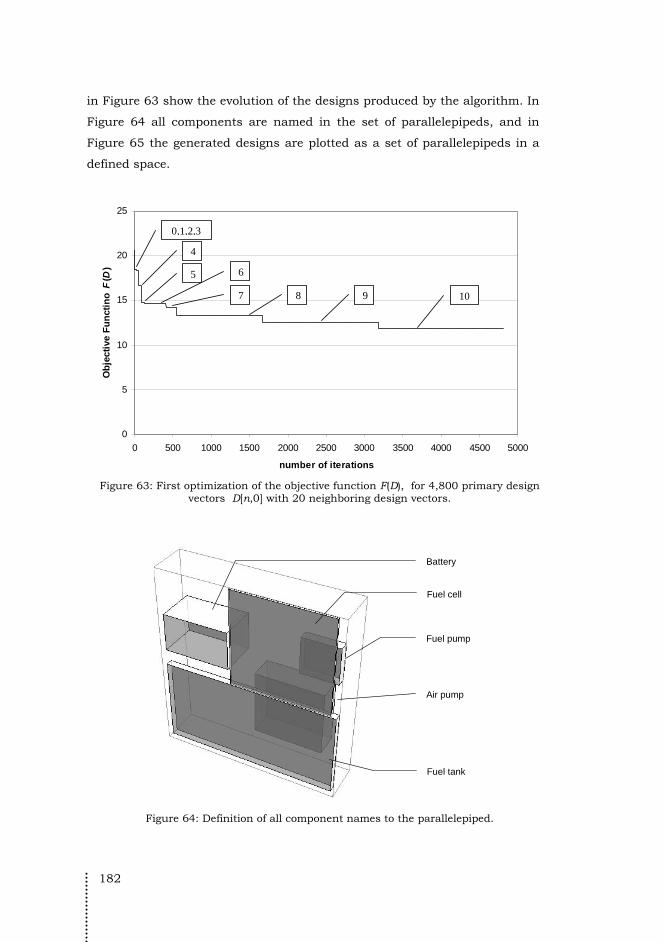
182
in Figure 63 show the evolution of the designs produced by the algorithm. In
Figure 64 all components are named in the set of parallelepipeds, and in
Figure 65 the generated designs are plotted as a set of parallelepipeds in a
defined space.
0
5
10
15
20
25
0 500 1000 1500 2000 2500 3000 3500 4000 4500 5000
number of iterations
Ob
ject
ive
Fu
nct
ino
F(D
)
0,1,2,3
4
5 6
7 8 9 10
Figure 63: First optimization of the objective function F(D), for 4,800 primary design
vectors D[n,0] with 20 neighboring design vectors.
Air pump
Battery
Fuel cell
Fuel pump
Fuel tank
Figure 64: Definition of all component names to the parallelepiped.
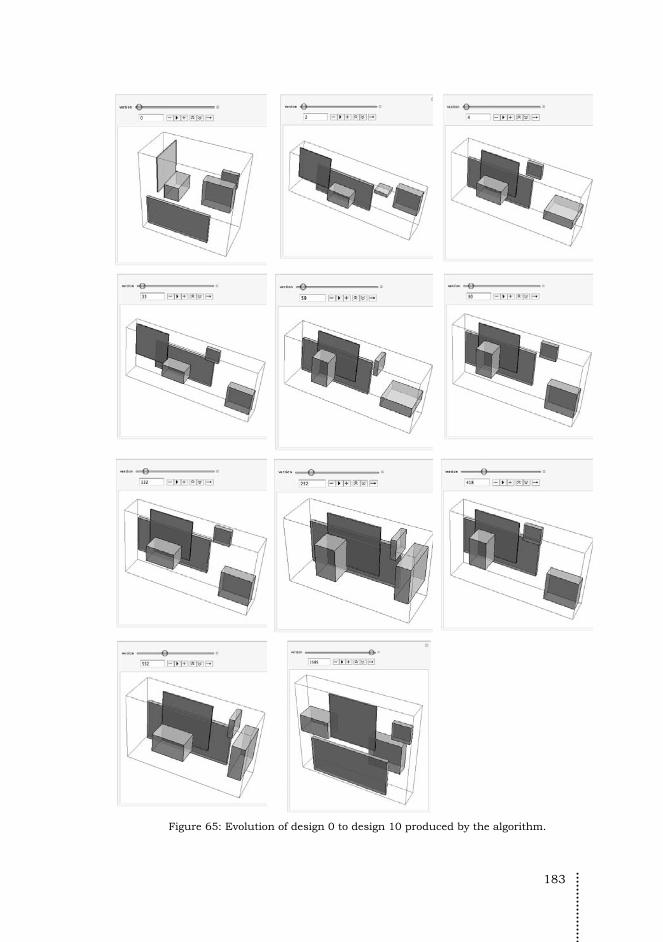
183
Figure 65: Evolution of design 0 to design 10 produced by the algorithm.
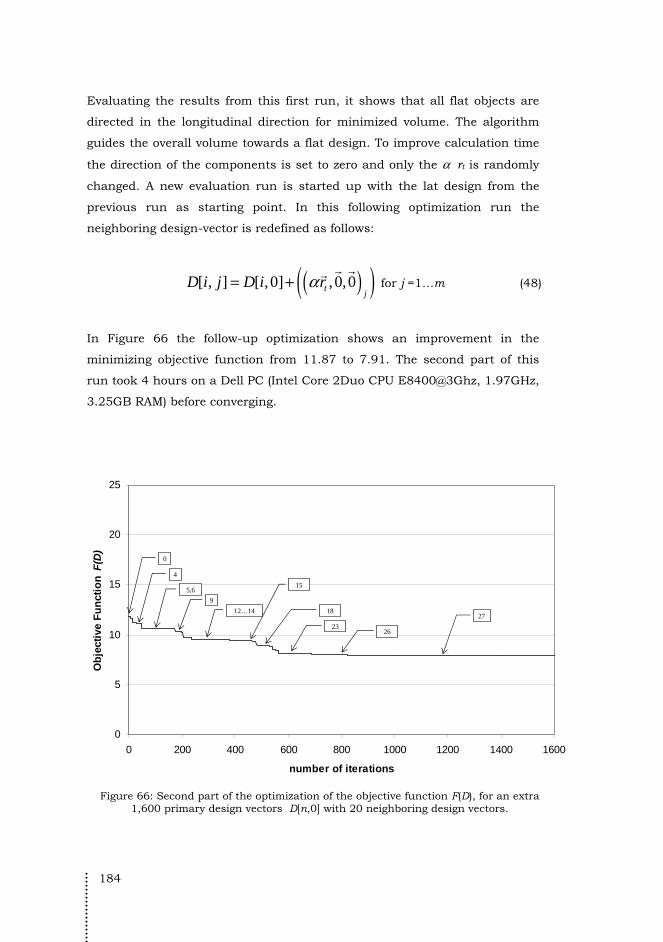
184
Evaluating the results from this first run, it shows that all flat objects are
directed in the longitudinal direction for minimized volume. The algorithm
guides the overall volume towards a flat design. To improve calculation time
the direction of the components is set to zero and only the α rt is randomly
changed. A new evaluation run is started up with the lat design from the
previous run as starting point. In this following optimization run the
neighboring design-vector is redefined as follows:
( )( )[ , ] [ ,0] ,0,0tj
D i j D i rα= +
for j =1…m (48)
In Figure 66 the follow-up optimization shows an improvement in the
minimizing objective function from 11.87 to 7.91. The second part of this
run took 4 hours on a Dell PC (Intel Core 2Duo CPU E8400@3Ghz, 1.97GHz,
3.25GB RAM) before converging.
0
5
10
15
20
25
0 200 400 600 800 1000 1200 1400 1600
number of iterations
Ob
ject
ive
Fu
nct
ion
F(D
)
4
0
5,6
9
12…14
15
18
2326
27
Figure 66: Second part of the optimization of the objective function F(D), for an extra
1,600 primary design vectors D[n,0] with 20 neighboring design vectors.
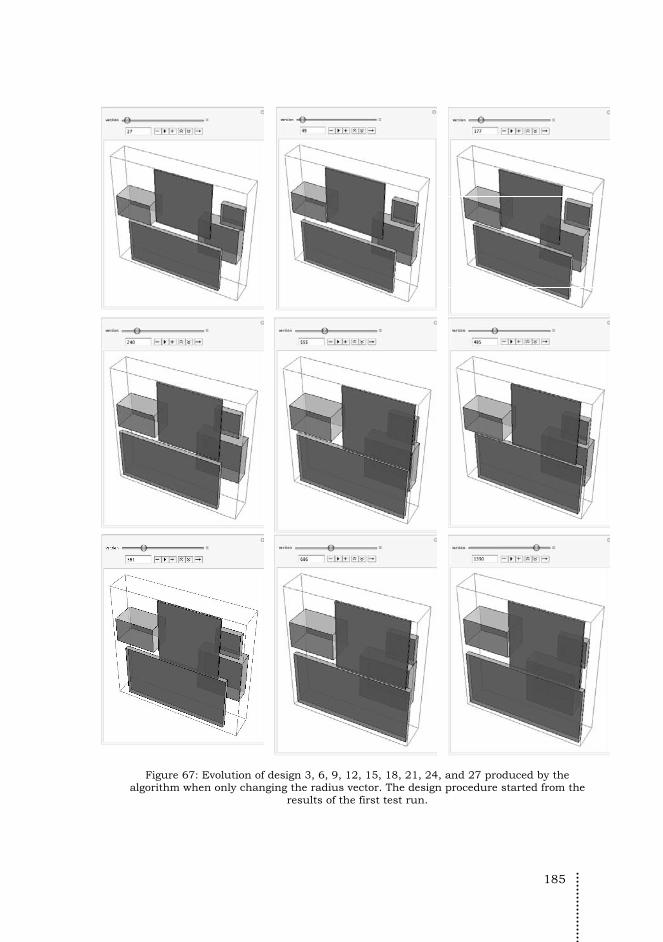
185
Figure 67: Evolution of design 3, 6, 9, 12, 15, 18, 21, 24, and 27 produced by the
algorithm when only changing the radius vector. The design procedure started from the results of the first test run.

186
9.4.2 Evaluation
The results from the first test run show convergence towards a smaller total
volume. The minimizing function is improved to 7.91. The lowest value of the
objective function feasible with this component set is 2.16. The improvement
steps show a slow convergence to a high end-value of the objective function,
not nearly nearing this minimum value feasible. Three problems arise from
the first test run:
1. Observing the evolution of the structural variants in Figure 67, it
can be noted that the fuel-cell (largest squared volume) does not
place itself besides the fuel tank (largest rectangular volume).
2. The lowest achievable end-value of the objective function is very high
for this component set. This value has to be equal or lower than 1
before it will be a feasible solution to the problem.
3. The convergence takes up a long time (15 hours for a test-run of
128,000 iterations). Besides good solutions the algorithm produces a
large amount of solutions which do not contribute to finding the
optimum.
Problem 1 is investigated by conducting a parametric analysis where the
radius vector α rt is varied. Increasing the α stepwise from 0.2 to 1.0 will
increase the search field for neighboring design vectors as defined in Figure
60. This increase of the design field did unfortunately not result in an
improved solution.
Problem 2 is about ordering of components. To improve the test for feasibility
the ordering of the components will be based on the objective function F(D),
instead of the performance parameters as proposed in Section 9.3.7. In our
case the smallest component will be chosen to be the best option. A welcome
circumstance is that this adjustment in the algorithm makes the primary
loop, of evaluating multiple component-sets, redundant (see Figure 59). In
Section 9.5 the algorithm is changed and evaluated with the improvements
as proposed above.
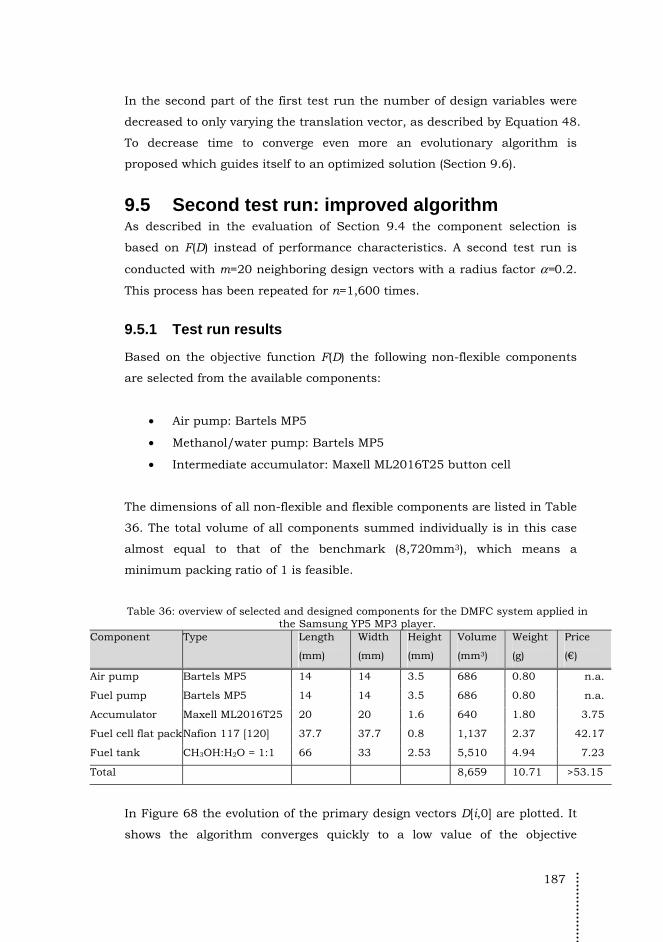
187
In the second part of the first test run the number of design variables were
decreased to only varying the translation vector, as described by Equation 48.
To decrease time to converge even more an evolutionary algorithm is
proposed which guides itself to an optimized solution (Section 9.6).
9.5 Second test run: improved algorithm As described in the evaluation of Section 9.4 the component selection is
based on F(D) instead of performance characteristics. A second test run is
conducted with m=20 neighboring design vectors with a radius factor α=0.2.
This process has been repeated for n=1,600 times.
9.5.1 Test run results
Based on the objective function F(D) the following non-flexible components
are selected from the available components:
• Air pump: Bartels MP5
• Methanol/water pump: Bartels MP5
• Intermediate accumulator: Maxell ML2016T25 button cell
The dimensions of all non-flexible and flexible components are listed in Table
36. The total volume of all components summed individually is in this case
almost equal to that of the benchmark (8,720mm3), which means a
minimum packing ratio of 1 is feasible.
Table 36: overview of selected and designed components for the DMFC system applied in the Samsung YP5 MP3 player.
Component Type Length
(mm)
Width
(mm)
Height
(mm)
Volume
(mm3)
Weight
(g)
Price
(€)
Air pump Bartels MP5 14 14 3.5 686 0.80 n.a.
Fuel pump Bartels MP5 14 14 3.5 686 0.80 n.a.
Accumulator Maxell ML2016T25 20 20 1.6 640 1.80 3.75
Fuel cell flat packNafion 117 [120] 37.7 37.7 0.8 1,137 2.37 42.17
Fuel tank CH3OH:H2O = 1:1 66 33 2.53 5,510 4.94 7.23
Total 8,659 10.71 >53.15
In Figure 68 the evolution of the primary design vectors D[i,0] are plotted. It
shows the algorithm converges quickly to a low value of the objective
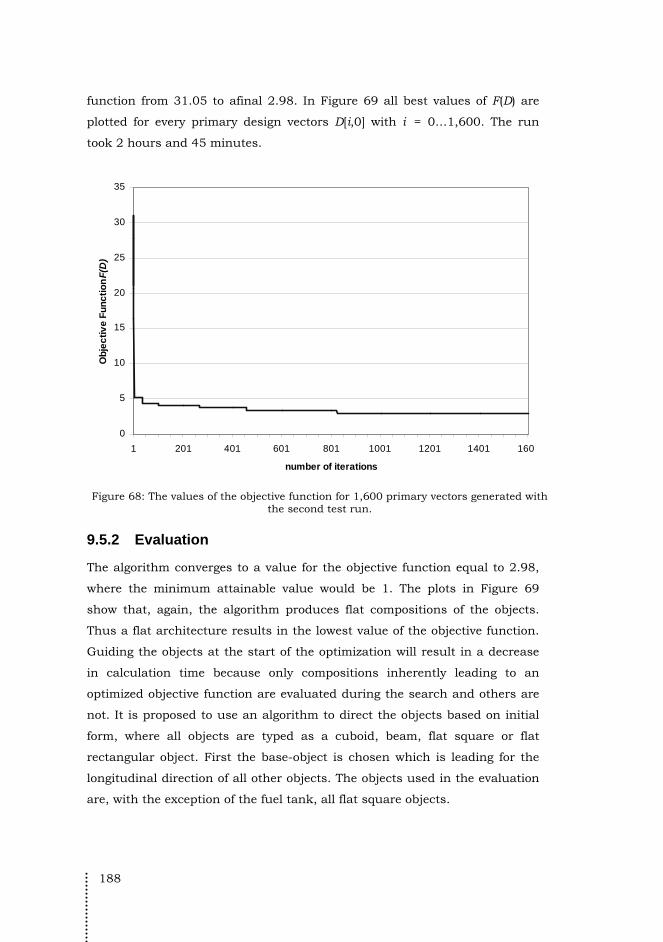
188
function from 31.05 to afinal 2.98. In Figure 69 all best values of F(D) are
plotted for every primary design vectors D[i,0] with i = 0…1,600. The run
took 2 hours and 45 minutes.
0
5
10
15
20
25
30
35
1 201 401 601 801 1001 1201 1401 160
number of iterations
Ob
jec
tiv
e F
un
cti
on
F(D
)
Figure 68: The values of the objective function for 1,600 primary vectors generated with
the second test run.
9.5.2 Evaluation
The algorithm converges to a value for the objective function equal to 2.98,
where the minimum attainable value would be 1. The plots in Figure 69
show that, again, the algorithm produces flat compositions of the objects.
Thus a flat architecture results in the lowest value of the objective function.
Guiding the objects at the start of the optimization will result in a decrease
in calculation time because only compositions inherently leading to an
optimized objective function are evaluated during the search and others are
not. It is proposed to use an algorithm to direct the objects based on initial
form, where all objects are typed as a cuboid, beam, flat square or flat
rectangular object. First the base-object is chosen which is leading for the
longitudinal direction of all other objects. The objects used in the evaluation
are, with the exception of the fuel tank, all flat square objects.

189
Figure 69: Evolution of the second test run. The algorithm produced 11 succeeding designs: 1, 2, 3, 4, 5, 38, 107, 271, 457, 701 and 840.
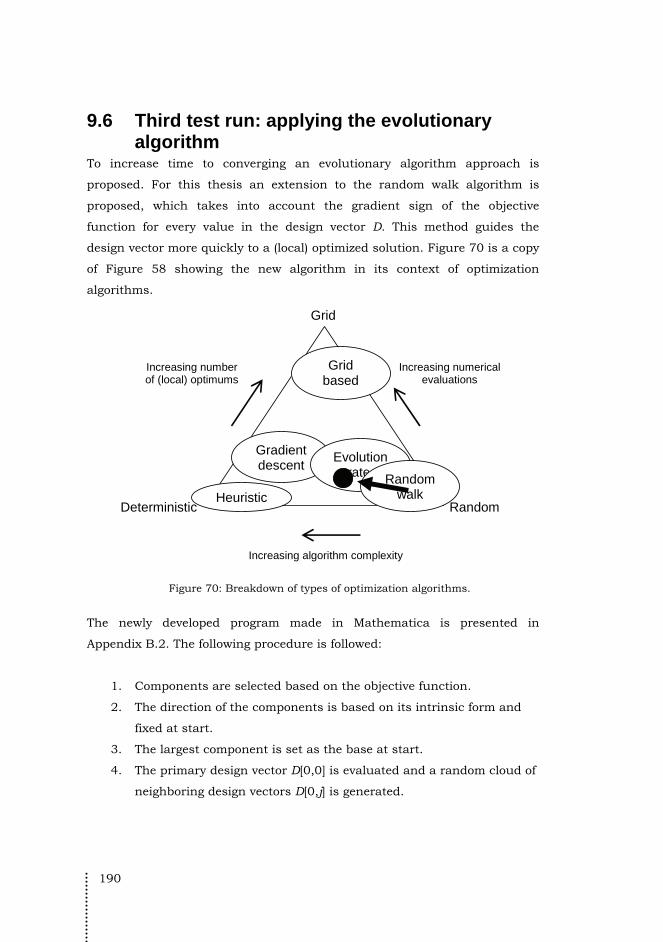
190
9.6 Third test run: applying the evolutionary algorithm
To increase time to converging an evolutionary algorithm approach is
proposed. For this thesis an extension to the random walk algorithm is
proposed, which takes into account the gradient sign of the objective
function for every value in the design vector D. This method guides the
design vector more quickly to a (local) optimized solution. Figure 70 is a copy
of Figure 58 showing the new algorithm in its context of optimization
algorithms.
Gradient descent
Evolution strategy
Increasing numerical evaluations
Random Deterministic
Grid based
Random walk
Increasing algorithm complexity
Grid
Increasing number of (local) optimums
Heuristic
Figure 70: Breakdown of types of optimization algorithms.
The newly developed program made in Mathematica is presented in
Appendix B.2. The following procedure is followed:
1. Components are selected based on the objective function.
2. The direction of the components is based on its intrinsic form and
fixed at start.
3. The largest component is set as the base at start.
4. The primary design vector D[0,0] is evaluated and a random cloud of
neighboring design vectors D[0,j] is generated.
191
5. The fitness of every neighboring design vector is calculated by means
of the objective function Fj(D) plus a penalty function when
intersection occurs p(D).
6. The “gravitational” mean of the cloud is calculated by:
( )
( )
( )
( )
1 1 ( ) ( )
1 ( )
20 20
0 0
20 20
0 0
, ,obj t obj t
obj t
t j t j
j jcloud
j j
j j
r F D r F D
rF D F D
= =
= =
⋅ ⋅ =
for obj(t) =1…5 objects
(49)
Where: j = 0 is the fittest solution from the previous iteration and
j=1…20 are the solutions belonging to the new generated
cloud.
7. The cloud vector is subtracted from the primary translation vector rt ,
consisting of all translation vectors of all objects, and the sign of
every object in the design vector can be determined (Figure 71).
8. A new primary design vector is generated with the new translation
vector rt equal to:
[ ] [ ] ( ) 01,0 ,0t t t cloudr i r i Sign r r r+ = − − (50)
Where: 0r Rα= a randomly generated length within the search field
limited by the maximum radius R.
9. Repeat until the maximum number of generations is reached or
convergence is reached.
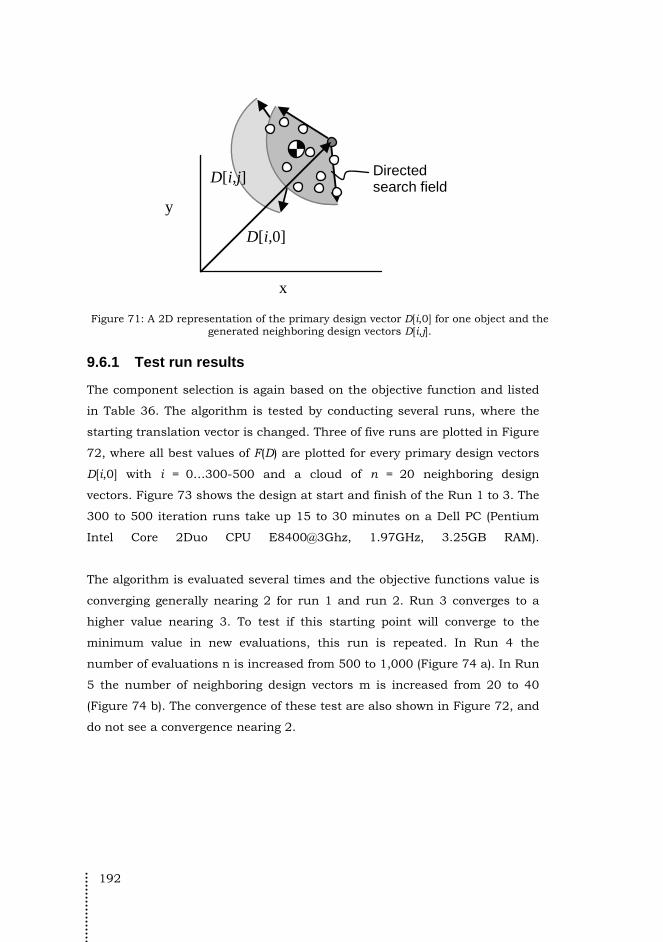
192
x
y
D[i,0]
D[i,j] Directed search field
Figure 71: A 2D representation of the primary design vector D[i,0] for one object and the
generated neighboring design vectors D[i,j].
9.6.1 Test run results
The component selection is again based on the objective function and listed
in Table 36. The algorithm is tested by conducting several runs, where the
starting translation vector is changed. Three of five runs are plotted in Figure
72, where all best values of F(D) are plotted for every primary design vectors
D[i,0] with i = 0…300-500 and a cloud of n = 20 neighboring design
vectors. Figure 73 shows the design at start and finish of the Run 1 to 3. The
300 to 500 iteration runs take up 15 to 30 minutes on a Dell PC (Pentium
Intel Core 2Duo CPU E8400@3Ghz, 1.97GHz, 3.25GB RAM).
The algorithm is evaluated several times and the objective functions value is
converging generally nearing 2 for run 1 and run 2. Run 3 converges to a
higher value nearing 3. To test if this starting point will converge to the
minimum value in new evaluations, this run is repeated. In Run 4 the
number of evaluations n is increased from 500 to 1,000 (Figure 74 a). In Run
5 the number of neighboring design vectors m is increased from 20 to 40
(Figure 74 b). The convergence of these test are also shown in Figure 72, and
do not see a convergence nearing 2.

193
0
1
2
3
4
5
6
7
8
9
10
1 201 401 601
Number of iterations
Ob
jec
tiv
e F
un
cti
on
F(D
)
Run 1 (n=300, m=20)
Run 2 (n=500, m=20)
Run 3 (n=500, m=20)
Run 4 (n=1000, m=20)
Run 5 (n=500, m=40)
Figure 72: Optimization of the objective function F(D), for n primary design vectors
D[n,0] and m=20-40 neighboring design vectors.
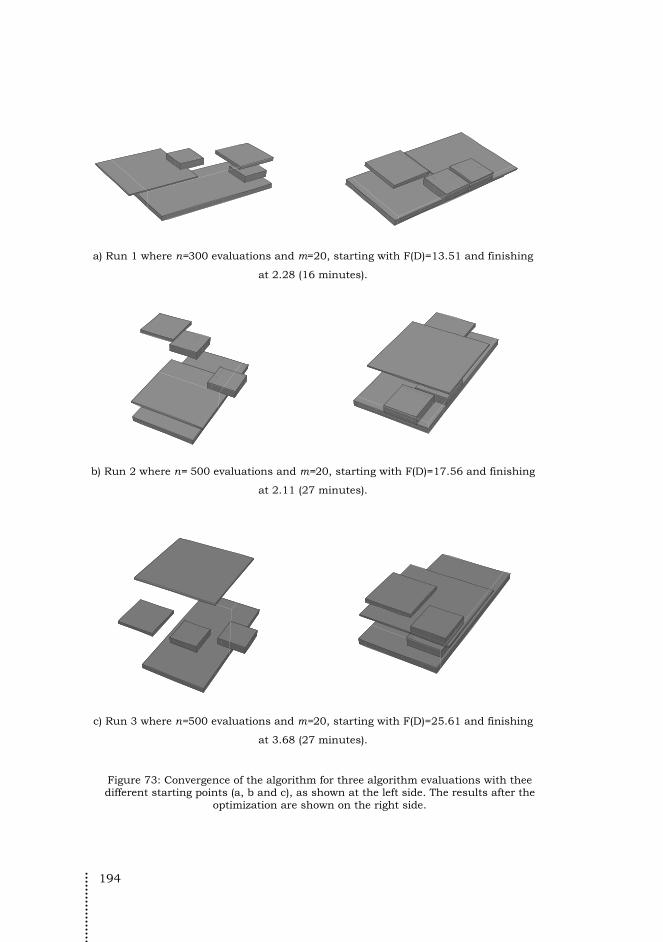
194
a) Run 1 where n=300 evaluations and m=20, starting with F(D)=13.51 and finishing
at 2.28 (16 minutes).
b) Run 2 where n= 500 evaluations and m=20, starting with F(D)=17.56 and finishing
at 2.11 (27 minutes).
c) Run 3 where n=500 evaluations and m=20, starting with F(D)=25.61 and finishing
at 3.68 (27 minutes).
Figure 73: Convergence of the algorithm for three algorithm evaluations with thee different starting points (a, b and c), as shown at the left side. The results after the
optimization are shown on the right side.
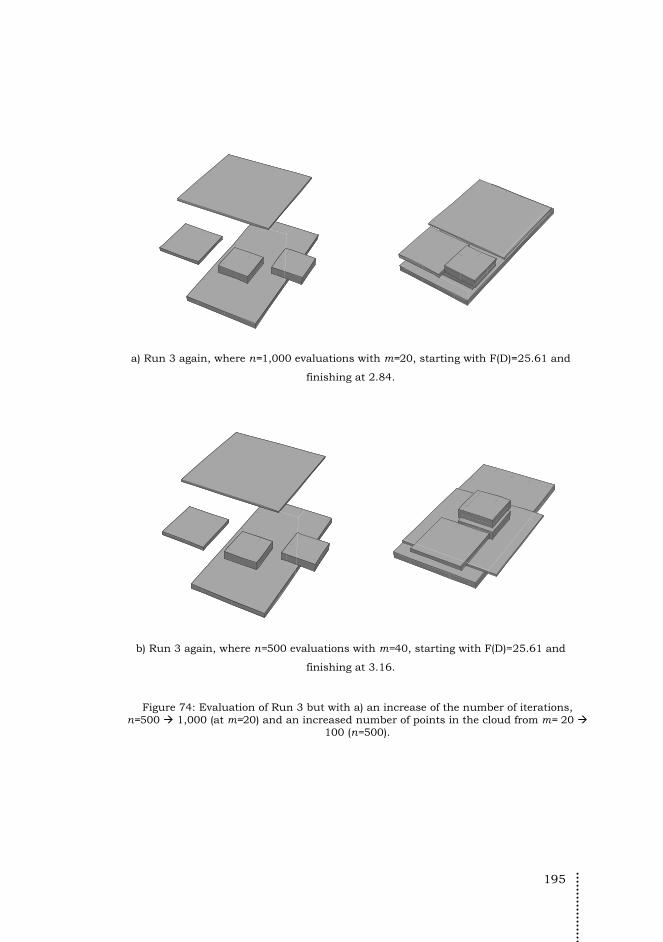
195
a) Run 3 again, where n=1,000 evaluations with m=20, starting with F(D)=25.61 and
finishing at 2.84.
b) Run 3 again, where n=500 evaluations with m=40, starting with F(D)=25.61 and
finishing at 3.16.
Figure 74: Evaluation of Run 3 but with a) an increase of the number of iterations, n=500 1,000 (at m=20) and an increased number of points in the cloud from m= 20
100 (n=500).
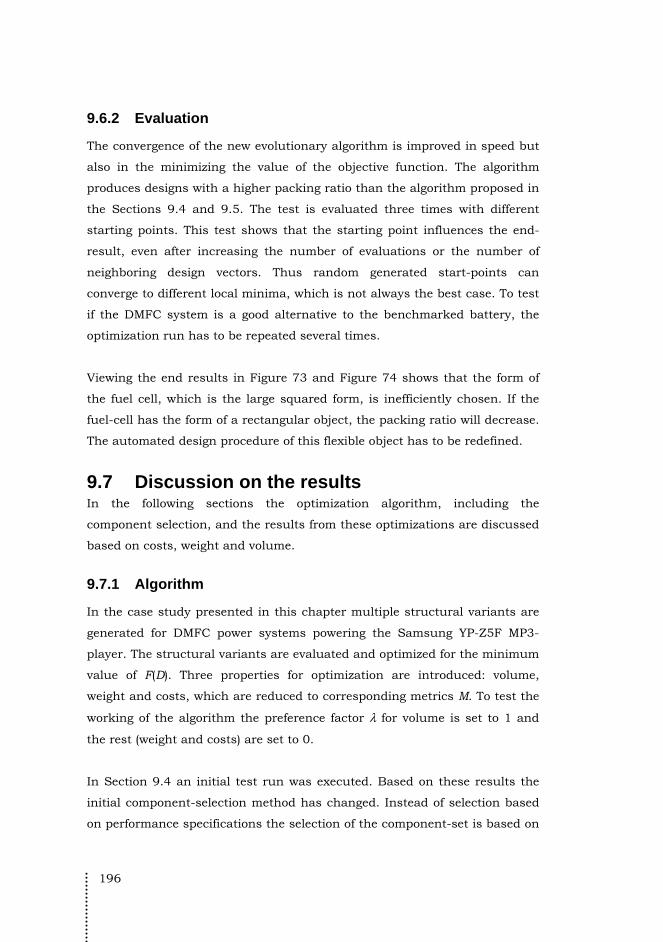
196
9.6.2 Evaluation
The convergence of the new evolutionary algorithm is improved in speed but
also in the minimizing the value of the objective function. The algorithm
produces designs with a higher packing ratio than the algorithm proposed in
the Sections 9.4 and 9.5. The test is evaluated three times with different
starting points. This test shows that the starting point influences the end-
result, even after increasing the number of evaluations or the number of
neighboring design vectors. Thus random generated start-points can
converge to different local minima, which is not always the best case. To test
if the DMFC system is a good alternative to the benchmarked battery, the
optimization run has to be repeated several times.
Viewing the end results in Figure 73 and Figure 74 shows that the form of
the fuel cell, which is the large squared form, is inefficiently chosen. If the
fuel-cell has the form of a rectangular object, the packing ratio will decrease.
The automated design procedure of this flexible object has to be redefined.
9.7 Discussion on the results In the following sections the optimization algorithm, including the
component selection, and the results from these optimizations are discussed
based on costs, weight and volume.
9.7.1 Algorithm
In the case study presented in this chapter multiple structural variants are
generated for DMFC power systems powering the Samsung YP-Z5F MP3-
player. The structural variants are evaluated and optimized for the minimum
value of F(D). Three properties for optimization are introduced: volume,
weight and costs, which are reduced to corresponding metrics M. To test the
working of the algorithm the preference factor λ for volume is set to 1 and
the rest (weight and costs) are set to 0.
In Section 9.4 an initial test run was executed. Based on these results the
initial component-selection method has changed. Instead of selection based
on performance specifications the selection of the component-set is based on
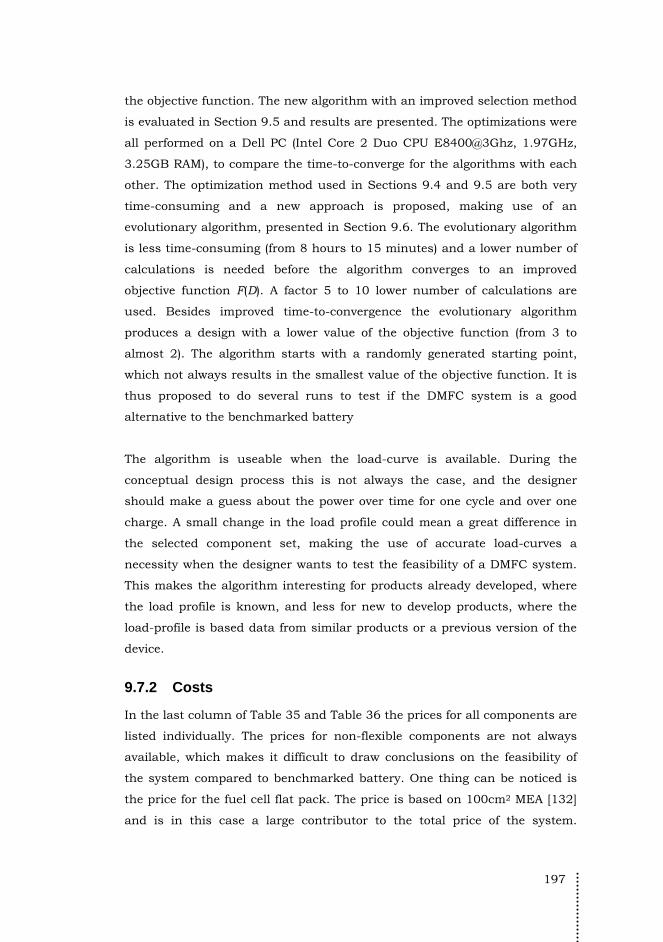
197
the objective function. The new algorithm with an improved selection method
is evaluated in Section 9.5 and results are presented. The optimizations were
all performed on a Dell PC (Intel Core 2 Duo CPU E8400@3Ghz, 1.97GHz,
3.25GB RAM), to compare the time-to-converge for the algorithms with each
other. The optimization method used in Sections 9.4 and 9.5 are both very
time-consuming and a new approach is proposed, making use of an
evolutionary algorithm, presented in Section 9.6. The evolutionary algorithm
is less time-consuming (from 8 hours to 15 minutes) and a lower number of
calculations is needed before the algorithm converges to an improved
objective function F(D). A factor 5 to 10 lower number of calculations are
used. Besides improved time-to-convergence the evolutionary algorithm
produces a design with a lower value of the objective function (from 3 to
almost 2). The algorithm starts with a randomly generated starting point,
which not always results in the smallest value of the objective function. It is
thus proposed to do several runs to test if the DMFC system is a good
alternative to the benchmarked battery
The algorithm is useable when the load-curve is available. During the
conceptual design process this is not always the case, and the designer
should make a guess about the power over time for one cycle and over one
charge. A small change in the load profile could mean a great difference in
the selected component set, making the use of accurate load-curves a
necessity when the designer wants to test the feasibility of a DMFC system.
This makes the algorithm interesting for products already developed, where
the load profile is known, and less for new to develop products, where the
load-profile is based data from similar products or a previous version of the
device.
9.7.2 Costs
In the last column of Table 35 and Table 36 the prices for all components are
listed individually. The prices for non-flexible components are not always
available, which makes it difficult to draw conclusions on the feasibility of
the system compared to benchmarked battery. One thing can be noticed is
the price for the fuel cell flat pack. The price is based on 100cm2 MEA [132]
and is in this case a large contributor to the total price of the system.

198
Compared to the price of the benchmarked battery, the price for only the
MEA is almost 84% of the total price of the battery (€50).
According to Darnell [130] the MEA accounts for 40% of the total DMFC
costs and 60% can be carried back to assembly and other components.
Using this number the total price for the DMFC system would than be
€105.43, making the initial price for the DMFC system a factor two higher
than the lithium-ion battery used, at same specifications. This makes the
DMFC system, at the moment, economically not competing with the
benchmark.
Besides the high price for the MEA and thus the fuel cell, prices for different
components are not always available and liable for change. Because of the
lack of price data for non-flexible components, the optimization with costs as
part of the optimization function is not feasible within the algorithm at the
moment. The component database should be extended with more optional
components, and with more data, specifically on price.
9.7.3 Weight
In Figure 75 the weight break down is plotted for the DMFC system. The fuel
tank is the heaviest component of the system. The total weight of the
component-set selected is 10.7g making this system half the weight of the
benchmark (21g), and thus in this respect very feasible. It must be taken
into account that weight for wiring and plumbing is not yet added to the
weight, which will result in a small increase of the total system weight.
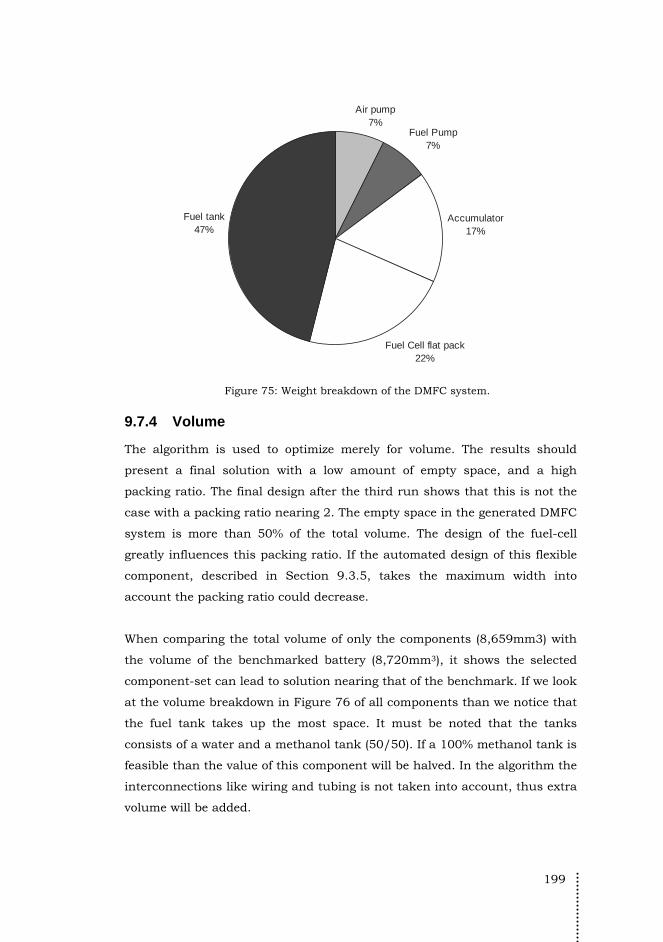
199
Air pump7%
Fuel Pump7%
Accumulator17%
Fuel Cell flat pack22%
Fuel tank47%
Figure 75: Weight breakdown of the DMFC system.
9.7.4 Volume
The algorithm is used to optimize merely for volume. The results should
present a final solution with a low amount of empty space, and a high
packing ratio. The final design after the third run shows that this is not the
case with a packing ratio nearing 2. The empty space in the generated DMFC
system is more than 50% of the total volume. The design of the fuel-cell
greatly influences this packing ratio. If the automated design of this flexible
component, described in Section 9.3.5, takes the maximum width into
account the packing ratio could decrease.
When comparing the total volume of only the components (8,659mm3) with
the volume of the benchmarked battery (8,720mm3), it shows the selected
component-set can lead to solution nearing that of the benchmark. If we look
at the volume breakdown in Figure 76 of all components than we notice that
the fuel tank takes up the most space. It must be noted that the tanks
consists of a water and a methanol tank (50/50). If a 100% methanol tank is
feasible than the value of this component will be halved. In the algorithm the
interconnections like wiring and tubing is not taken into account, thus extra
volume will be added.
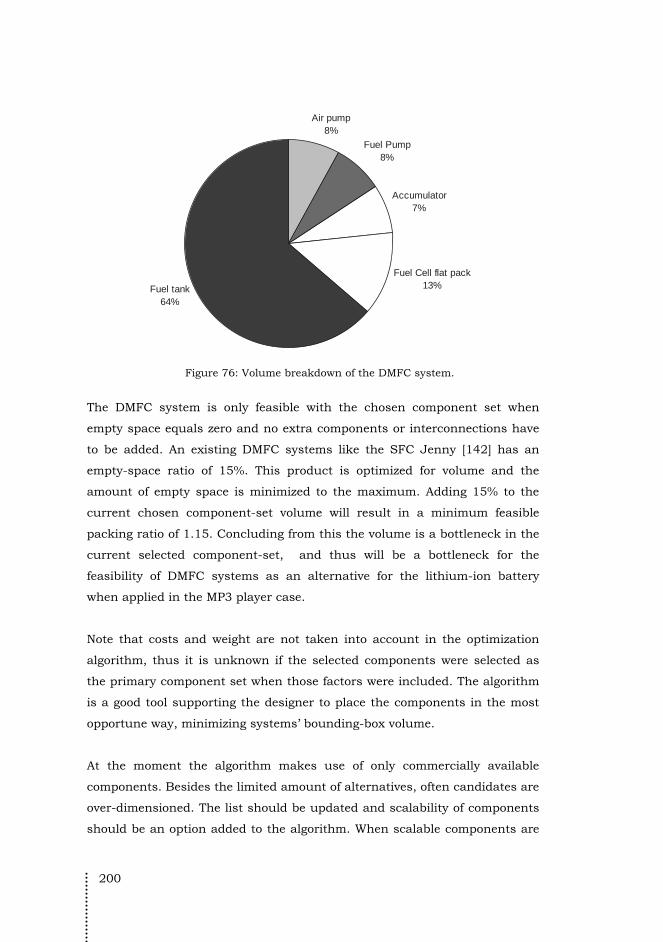
200
Air pump8%
Fuel Pump8%
Accumulator7%
Fuel Cell flat pack13%Fuel tank
64%
Figure 76: Volume breakdown of the DMFC system.
The DMFC system is only feasible with the chosen component set when
empty space equals zero and no extra components or interconnections have
to be added. An existing DMFC systems like the SFC Jenny [142] has an
empty-space ratio of 15%. This product is optimized for volume and the
amount of empty space is minimized to the maximum. Adding 15% to the
current chosen component-set volume will result in a minimum feasible
packing ratio of 1.15. Concluding from this the volume is a bottleneck in the
current selected component-set, and thus will be a bottleneck for the
feasibility of DMFC systems as an alternative for the lithium-ion battery
when applied in the MP3 player case.
Note that costs and weight are not taken into account in the optimization
algorithm, thus it is unknown if the selected components were selected as
the primary component set when those factors were included. The algorithm
is a good tool supporting the designer to place the components in the most
opportune way, minimizing systems’ bounding-box volume.
At the moment the algorithm makes use of only commercially available
components. Besides the limited amount of alternatives, often candidates are
over-dimensioned. The list should be updated and scalability of components
should be an option added to the algorithm. When scalable components are
201
introduced in the algorithm, it will produce designs which are feasible on the
long term.
9.8 Conclusions In this Chapter an algorithm is proposed, and implemented in a
Mathematica program, which consists of three parts:
1. Selecting of non-flexible components from a database and designing
of flexible components. The selection and design are based on
performance input in the form of a single-cycle load-profile and the
performance characteristics of the current power source used in the
portable electronic device. The different feasible components are
combined in feasible component sets.
2. One of the component sets is selected and used to generate multiple
structural variants. The structural variants are evaluated with the
objective function F(D), in our case only for volume and optimized by
minimizing this value.
3. Presentation of the results in the form of 3D layouts, tables
consisting of the id of the design, value for the objective function and
the design vector.
During part 1 the feasible non-flexible components are selected and multiple
component sets are produced. The first component-set evaluated by the first
test run is based on the best performing components which satisfy the
minimum requirements. The ordering of the list of feasible components
should not be based on performance but on the objective function. In the
second test run a new component-set is selected based on the objective
function and tested. The selection based on the objective function makes the
primary loop redundant. This results in the overall run-time of the program,
because only one component-set is evaluated instead of multiple.
In part 2 several structural variants are produced, which are evaluated with
the objective function. To test the program the optimization is only based on
volume, and not on all three defined basic properties. The results from
second test run show that the algorithm converges to a value 2.98 after
1,600 iterations (~8 hours). The time-to-convergence is very high in time and
202
in number of iterations (1,600x20 design vectors have been evaluated). To
increase convergence and time needed to achieve the minimum value of the
objective function, an evolutionary algorithm is proposed and tested in the
third test run. The third test run shows a convergence to a lower value of the
objective function than test run two (nearing 2), in a much lower number of
iterations (factor 5 to 10). The convergence depends strongly on the starting
point of the optimization, and thus several starting points have to be
evaluated to be sure it will converge to the lowest value of several local
minima.
The results from the second and third test run show good convergence of the
algorithm and result in a design proposal for placement of the different
components in space. Viewing those results it can be concluded that the
feasibility of the DMFC system strongly depends on the components volume
and costs. The total weight of the summed components, in de component-set,
is 50% of the weight of the benchmarked battery, and thus no issue for the
feasibility. The third test run, using the evolutionary algorithm, converges to
the lowest value of the objective function, in this case volume, nearing 2.
This means the DMFC system will be twice as voluminous as the
benchmarked battery. This can be decreased by a change in the design of
the fuel-cell from a squared to rectangular form.
When only the component volumes of all components’ individually are
summed together the minimum value of the objective function is 0.99. With
the selected component-set it is thus theoretically feasible to produce a
DMFC system equaling the volume of the benchmarked battery. Because we
did not take other components into account, like wiring, tubing and the
mixing chamber, the total volume will be higher than 0.99, and thus lead to
a more voluminous design.
Besides components, the system will in practice always have a certain
amount of empty space. For the optimized SFC Jenny the empty space is
15% of total volume. If this number is used it can be concluded that DMFC
systems in the MP3 player case, using only commercially available
components, is not feasible at the moment because of volume. The
203
improvement in weight is apparent and will not be an issue for the feasibility
of DMFC systems in the MP3 player case.
The feasibility of the third property, price, is difficult to test. For non-flexible
components prices are not always available, and a small amount of different
options are available. The prices for the components are based on
commercially available sale prices when 100 pieces are bought. The price of
the MEA is also based on sale prices from the Fuelcellstore [132], and the
MEA only will cost €42.17. This price for the MEA alone is 84% of the total
price for the benchmarked battery. The total sale price of the component set
selected by the algorithm is higher than €53.15. An estimate based on the
figures given by Darnell [130] result in a total price for the DMFC system
equaling €105.43. At same specifications this price is twice the price of the
lithium-ion battery used, making the DMFC system not a commercially
attractive alternative.
9.9 Recommendations The amount of commercially available components which can be used in 0 to
100W DMFC systems is low. Smaller components matching low-power
DMFC systems have to be developed. To address this lack of components the
algorithm could be introduced with scalable non-flexible components. These
components are based on existing components but scaled up or down to
match the required performance specifications. Scalable components give
the designer an indication of the long-term feasibility and the constraints of
having to develop new components.
The algorithm can evaluate multiple structural variants with the objective
function as optimization variable. The use of tables and computerized
producing structural variants is a clear way of making quick conceptual
feasibility tests. In our case the feasibility of the DMFC system is tested as
an alternative to the benchmarked rechargeable battery. The tables for non-
flexible components are easy to update to current available components. The
algorithm uses only the three basic properties for optimization, and
extending the number of properties is proposed for the third-order model.
Furthermore the algorithm evaluates only structural variants where
components are represented by simple parallelepipeds. This representation
204
does not follow the form of the actual component very accurate. To improve
the accuracy of the model the objects should be represented by other forms
like cylinders, but also by combination of forms. Interconnections are not
taken into account in the second-order model and the third-order model
should include these in the algorithm. A fourth order model can also include
the influence of heat, fluid flow and other multi-physical parameters.
205
10 Conclusions
This chapter discusses the initial and main Research Questions and gives
recommendations for further research. First the main question will be
answered in Section 10.1. The technological and scientific relevance of the
research, and thus the thesis, will be discussed in Section 10.2, and
recommendations are given in Section 10.4.
10.1 Answer to the main question
10.1.1 Initial Research Question
This thesis started out by asking the following initial Research Question:
“Which power systems can compete with the commonly used rechargeable
lithium based battery in the application field of portable electronic devices,
and how can a systematic approach help product designers select
appropriate power systems during the preliminary design phase?”
The first part of this question is answered by doing a thorough literature
search. First a portable electronic device was defined as a ‘device which uses
electric energy, with an integrated power source and carriable in once bag.
Size is limited to a large laptop computer (6.2kg and 4.5liters), and the
device should be intended to be carried around’. Power ranges from 0.01W to
100W systems with energy specifications in between 0.1 and 200Wh. A large
amount of data was gathered about the physical, economical and
technological properties for a large variety of power systems applied within
the defined application field. Within this search a power system is defined as
a power generator in combination with an energy carrier. The data gathered
was thus broken up in two parts and compared to commonly used
rechargeable batteries on three properties: power, energy and costs. This
206
exploratory research concluded by pinpointing two power systems which
could compete and even outperform the lithium based rechargeable battery,
namely (i) the internal combustion engine (ICE) in combination with a
carbon-based fuel, and (ii) the fuel cell system fueled with hydrogen or
carbon based fuels. The first combination consists of a power-dense
generator with a high energy-dense fuel. Biggest issues with this power
system are its high noise and toxics output, thus makes this system
interesting when applied in outside-the-home environments. The second
power-system of interest is the low-temperature fuel cell systems, the direct
methanol fuel cell (DMFC) or the polymer exchange membrane fuel cell (PEM
FC) system. The PEM FC system makes use of hydrogen as a fuel, stored in
high pressure vessels of up to 600bars, what makes this fuel is less
attractive for application in portable electronic devices. Methanol on the
other hand has a high energy density. The potential of this fuel is storing two
to seven times the amount of energy as contained in current lithium-ion
rechargeable batteries. Within this thesis the research focused will be on
fuel-cell systems fueled with methanol.
The comparison described above is based on existing power systems and
general numbers available at the time. To make a fair comparison between
the different power systems, the systems ought to be designed in different
applications. The second part of the initial Research Question focuses on the
systematic approach of selecting or designing power systems. The literature
review in the field of tools and methods for selecting or sizing a power system
shows that there is a limited amount of tools available. During the
specification phase, and even before, indentifying tools like Powerquest, CES
method and Ragone plots can be used. T-max evaluates the consequences
for the power system when specifications are changed, and is especially
useful when conceptualizing a product. System modeling is generally used
during the concept/embodiment phase, where different concepts are
evaluated and choices are made based on different objectives. Finally
enumerative tools, like POWER, are found which can be used to evaluate
different concepts using single, hybrid or more batteries. These tools are
generally used during the embodiment phase where the devices specification
is already laid out.
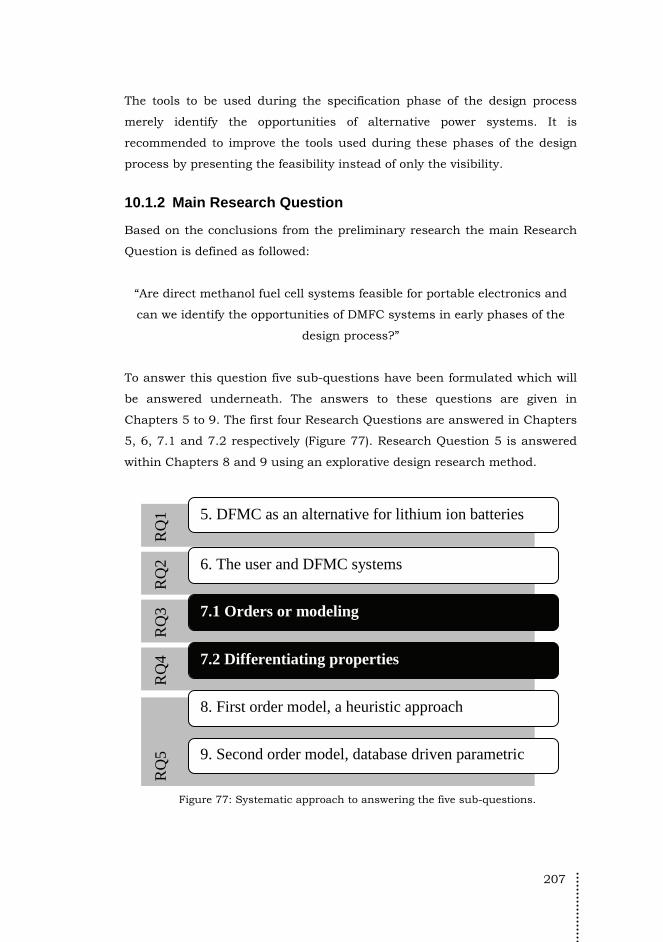
207
The tools to be used during the specification phase of the design process
merely identify the opportunities of alternative power systems. It is
recommended to improve the tools used during these phases of the design
process by presenting the feasibility instead of only the visibility.
10.1.2 Main Research Question
Based on the conclusions from the preliminary research the main Research
Question is defined as followed:
“Are direct methanol fuel cell systems feasible for portable electronics and
can we identify the opportunities of DMFC systems in early phases of the
design process?”
To answer this question five sub-questions have been formulated which will
be answered underneath. The answers to these questions are given in
Chapters 5 to 9. The first four Research Questions are answered in Chapters
5, 6, 7.1 and 7.2 respectively (Figure 77). Research Question 5 is answered
within Chapters 8 and 9 using an explorative design research method.
RQ
4 R
Q3
RQ
2 R
Q5
RQ
1 5. DFMC as an alternative for lithium ion batteries
6. The user and DFMC systems
7.1 Orders or modeling
8. First order model, a heuristic approach
9. Second order model, database driven parametric d i
7.2 Differentiating properties
Figure 77: Systematic approach to answering the five sub-questions.

208
RQ1: Which technological and economical properties differentiate the
DMFC power system from the lithium-based rechargeable battery in the
field of portable electronic devices? To answer the first Research Question
a comparison is made between the two power systems in Chapter 5. Both
power systems are introduced by explaining the technological details, based
on theoretical but also practical values. For portable electronic devices the
power system takes up 20 to 25% of its volume and 10 to 25% of its weight.
This makes the power source an important factor giving form to the device.
The DMFC is compared to the lithium ion battery with a zero-order model,
which estimates volume and weight specifications of the power system based
on power and energy densities of the three main contributors, the fuel cell,
the tank and the bill of products (BOP). The model is based on a case
prototype from literature [29, 125], using a stand-alone fuel cell that follows
the load profile of the application, a cell-phone recharger. No intermediate
battery was used to level peak powers. With this model a Ragone plot is
produced which shows the main physical differences between the DMFC and
one of the best performing lithium-ion batteries at the time [126]. Compared
to the lithium-ion battery the DMFC is a power system with a high energy
and a low power density. In general the DMFC outperforms the battery in
application areas that need high energy and low peak power. Based on the
Ragone plot the DMFC could be a factor 2 to 3 smaller and six times more
lightweight. The potential improvement in volume is not as large as that of
weight and thus it can be postulated that volume is the main bottleneck for
DMFC systems applied in portable electronics, if volume specifics improve,
this will always have a positive effect on weight.
The zero-order model is used to make rough estimates of the physical
properties of the power systems when applied in different electronic devices.
The physical improvements are mainly found in applications with low-power
requirements and high-energy demands, like sensors, smoke detectors and
flash-drive MP3 players with no display. In the application field of laptop
computers, cell phones and displayed devices, only the combination of a
DMFC and battery, a DMFC hybrid or DMFC system, is feasible.

209
Besides physical properties the costs and life-cycle costs are discussed in
Chapter 5. Based on the result presented in this chapter the initial costs of
the DMFC power system should be cut back with at least a factor five before
it becomes as cost-effective as the lithium-ion battery. The life-cycle costs
(LCC) are the main bottleneck in terms of economical feasibility, and the
price of methanol has to be cut down with a factor 4 before its becomes
competitive with grid-price, and thus with rechargeable lithium-ion batteries.
It is common that the consumer is willing to pay more for better performing
power systems, which is the case in the transition from nickel-metal hydride
batteries to lithium-ion based rechargeables. The initial price of lithium ion
batteries is higher compared to the NiMH battery, but the time-in-between-
charges is improved greatly. Besides the LCC the improvement in time-in-
between charges/replacements is calculated. The DMFC power system has
to be replaced 2.7 times less than an alkaline battery, and 3.9 times less
than the lithium-ion battery has to be recharged. The endurance
improvement for the DMFC system is evident and might be an argument for
the consumer to make the switch to DMFC systems, even at a higher price.
RQ2: Which demands with respect to DMFC power systems in portable
electronic devices are most significant from a user point of view, and
how can we make use of this in a design method? To test the preference
of future consumers on their willingness to buy a fuel cell powered cell
phone or laptop computer a conjoint analysis is executed. Five differentiating
properties are used for this studies, weight, volume, purchase price, charge
or cartridge (at extra costs), and time of use. From these five differentiating
properties volume is for both products the most important property of the
product. Weight is of the lowest issue for the participants. The differences
are larger for the cell phone than for the laptop computer. For the cell phone,
the participants had a strong preference for quick charging over an instant
recharge by means of a cartridge. For the laptop computer this was vice
versa. In general it can be stated that cartridges, and thus fuel-cell power
systems, are more appreciated when use-time is an issue, when the
cartridge can provide a longer time-in-between-charges. Use-time is an issue
for devices with runtimes of around 3 hours or less. The preferences of the
user for the different properties are quantified and are to be used in following
preference-based design models.
210
RQ3: How can we identify the opportunities of DMFC power systems for
portable electronic devices, during early phases of the design process?
Different orders of modeling are proposed which range from simple rule-of-
thumbs (zero-order model) to enumerative algorithms (second and third-
order model), ranging from low to high accuracy. The opportunity for a
DMFC power system can be identified, with the zero and first order model.
These models are based on heuristics, and the accuracy of both models is
low. Therefore a second-order model is proposed which is a table-driven
preference-based model using a computer to design and evaluate multiple
structural variants. The model optimizes the process using an objective
function based on the main differentiating properties described in the
previous paragraph.
RQ4: What are the basic properties that help the designer to model a
DMFC power system from a techno-economical perspective? To define
the differentiating properties to compare the DMFC power system with other
power systems the list of considerations influencing the selection of a battery
is evaluated. Three properties, volume, weight and initial costs, are defined
as the three main differentiating properties. These properties are used in the
zero, first and second-order model, for optimizing systems’ specifications.
The three properties give sufficient information on the technological and
economical feasibility of a DMFC power system during the early phase of the
design process. More properties can be introduced in a third-order model,
making the model more advanced and accurate but also more complex,
needing more input data from the tables and from the product designer. The
third-order model is thus proposed to be used in a later phase of the design
process, e.g. the embodiment phase, where engineering of the system is
more important.
RQ5: Which algorithms can be formulated to give the product designer
not only insight in the opportunity of DMFC power systems, but also
help the designer in an appropriate systematic approach? In Chapter 7
four orders of modeling are proposed, the zero to third-order model. The
models all have there own function during the design process. Both the zero
and first-order model can be used to identify opportunities or make a DMFC
system more visible for the designer during the specification and

211
conceptualization phase. The first-order model is an optimized version of the
zero-order model, where the DMFC system is broken down in five parts
instead of three: the fuel cell, its tank, BOP, empty space and the
intermediate battery. The zero-order model is adapted to the first-order
model by means of heuristics obtained by designing a DMFC system for a
MP3 player. The model consists of simple equations which can be used as
rule-of-thumb during preliminary design phases. The input for the model is
minimized to only mean power, peak power and energy requirements for the
specific application. Only volume is worked out within this thesis, because
this is the main driving force in DMFC system design for portable electronic
devices and can be evaluated properly by means of CAD modeling. The
model was validated with two commercially available DMFC systems,
produced by SFC energy, the Jenny and Efoy 2200 fuel cell system [141].
The Jenny fuel cell system is designed and engineered with volume
compactness in mind, and this fuel-cell system is represented by the best-
case estimates from the first-order model (left side of the estimates). The Efoy
2200 fuel cell system is a conventionally designed and engineered product
and finds itself in the middle of the approximations. Based on these two
validations the model estimates the volume of the DMFC system for highly
packed systems (left side estimates), via conventional designs (middle) to bad
designs (right side). The estimate volume of the fuel-tank is for both cases to
high. Either system efficiency, BOP efficiency or the canisters volume is
taken to conservative. More validation tests are needed to fine-tune the
defined coefficients, densities, constants and efficiencies, and make the
model more accurate. The first-order model can be used during the
preliminary phases of the design process and needs a low amount of input
information (Figure 78).
A second-order model is proposed to get a more accurate estimate of the
total volume, but also to get the physical dimensions of the power system.
The second-order model makes use of enumerative methods done on a
computer. Different structural variants are evaluated by means of a
minimizing objective function F(D). The input for the algorithm needs more
information than just the systems’ energy, and mean and peak power, used
in the zero and first-order model. It also needs the load-profile and the
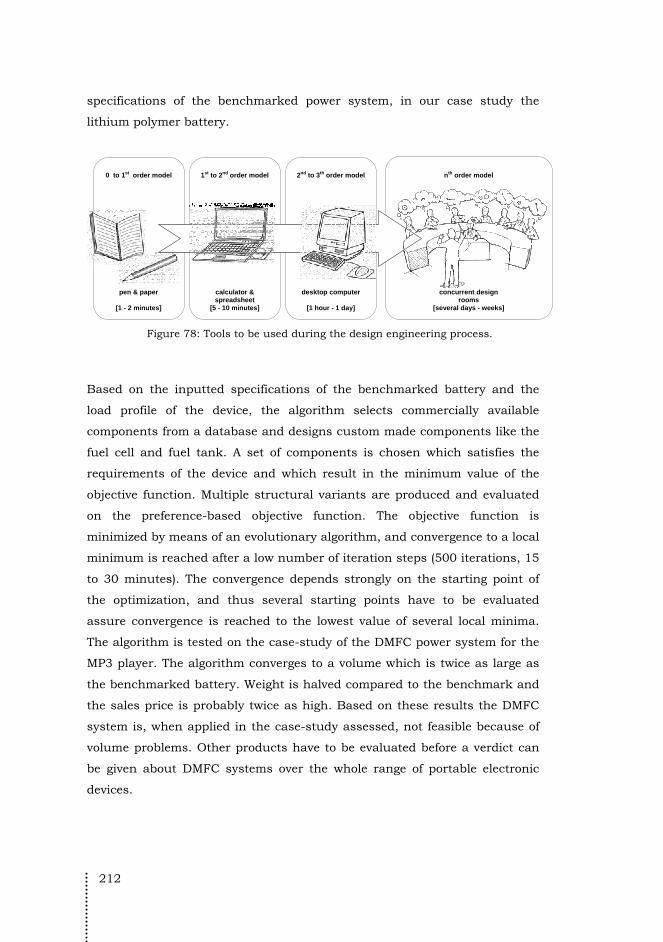
212
specifications of the benchmarked power system, in our case study the
lithium polymer battery.
nth order model
concurrent design rooms
[several days - weeks]
0 to 1st order model
pen & paper
[1 - 2 minutes]
1st to 2nd order model
calculator & spreadsheet
[5 - 10 minutes]
2nd to 3th order model
desktop computer
[1 hour - 1 day]
Figure 78: Tools to be used during the design engineering process.
Based on the inputted specifications of the benchmarked battery and the
load profile of the device, the algorithm selects commercially available
components from a database and designs custom made components like the
fuel cell and fuel tank. A set of components is chosen which satisfies the
requirements of the device and which result in the minimum value of the
objective function. Multiple structural variants are produced and evaluated
on the preference-based objective function. The objective function is
minimized by means of an evolutionary algorithm, and convergence to a local
minimum is reached after a low number of iteration steps (500 iterations, 15
to 30 minutes). The convergence depends strongly on the starting point of
the optimization, and thus several starting points have to be evaluated
assure convergence is reached to the lowest value of several local minima.
The algorithm is tested on the case-study of the DMFC power system for the
MP3 player. The algorithm converges to a volume which is twice as large as
the benchmarked battery. Weight is halved compared to the benchmark and
the sales price is probably twice as high. Based on these results the DMFC
system is, when applied in the case-study assessed, not feasible because of
volume problems. Other products have to be evaluated before a verdict can
be given about DMFC systems over the whole range of portable electronic
devices.
213
The improvement of the second-order model over the first-order model is its
accuracy, and introduction of size besides volume. A third-order model is
proposed where the component set is extended with other components like
the mixer and sensors, but also with interconnections like wiring and
plumbing. Furthermore the components in the second order model are
represented by simple parallelepipeds. To improve accuracy of the
automated design the objects should be represented by other forms like
cylinders, but also by combination of forms. This type of models is
specifically intended to be used in concurrent-design environments, where
the design engineer has to make quick evaluations when specifications or
product requirements change (Figure 78).
10.2 Scientific and technological relevance This thesis covers research in the field of design engineering. One of the
focuses of this thesis is how to transfer the scientific knowledge to design. In
this thesis this is done by exploring the field of alternative power systems for
portable electronic devices, and making these alternatives visible for the
designer. The scientific relevance aims at the methods used and the
technological relevance aims on the practical applicability of the methods
used and results presented. In order to transfer knowledge from theory to
practice a combination of reviewing scientific literature, user testing,
mathematical modeling and research design has been used.
10.2.1 Part I: explorative research
In the first chapters of this thesis an explorative research has been
conducted to power systems. By acquiring large amounts of data on physical,
economical and technological properties of different power generators and
energy carriers, a state-of-the-art and even a historical overview is generated.
This overview proved to be a good starting point to compare power systems
with each other and find differentiating properties. It must be noted that
data acquired is temporarily useable because of fast improvements in the
field. Furthermore for certain technologies, like the DMFC, a low number of
data point are found and presented, which can result in a misrepresented
picture. In order to optimize the reliability of the study all data used in
Chapter 2 were verified by peers by presenting interim results of the study at
214
the International Power Sources Symposium (2004) and by publishing in the
Journal of Power Sources in 2006.
10.2.2 Part II: Differentiating properties
Besides data acquisition this thesis also introduces the consumer as part of
the research and design process in the second part of the thesis. For product
developers the human factors are often difficult to quantify and often limited
to ergonomic data. The method of conjoint analysis (presented in Chapter 6)
showed that this method is a good tool to present the order of preference for
different properties which are not equally dimensioned. This method can
broaden the mind of product and engineering designers not only to focus on
technological optimization but also use preferences of the user. It must be
noted that the number of participants was low (n=21) and thus the results
from this studies can not be generalized for the whole user group. The
results are merely seen as indicative.
10.2.3 Part III: Modeling of DMFC power systems
In the third part of this thesis a research design method has been used to
explore the feasibility of DMFC power systems in portable products. To
validate the models all models are presented at different conferences and
discussed with scientists and developers in the field. The first-order model is
validated by two existing case-studies, which showed a fit with the estimated
values.
To improve this model the second-order model is proposed. This model is
intrinsically validated, because it uses existing components of which
dimensions, weight and other properties are all found in original
specification sheets of the manufacturer. The input data from the tables is
limited because all components are represented by simple forms
(parallelepipeds). This makes this model easy to update, but the results do
not show an accurate result. Extended models, like the third order model,
have to include more physical specifications like connection points and
different sub-sizes but also other constraining properties like temperature
requirements, Voltage, safety and reliability, environmental conditions,
maintenance, etc. This makes the third-order model more accurate, but also
215
labor-intensive in acquiring the data and will increase maintenance for the
developer of the tool.
The method of computerized generation of structural variants and evaluation
of the variants by an objective function is not commonly used in the field of
consumer products design. The proposed approach is relevant for the future
product designers who want to make use of more advanced computer tools
during concept design. In general computers, and automated design during
the concept phase, can contribute to shorten the heuresis phase, and thus
the design cycle. It introduces possible ways to a “first time right” design
process. Other computerized tools could be developed to help the product
designer in making choices during the concept phase of design, and opens a
new direction in product development research.
10.3 Generalization of the models In this thesis the feasibility of DMFC power systems in portable electronic
devices is researched. The research methods used in this study encompass
data acquisition and data mining, desktop literature research, case-study
reviews, user tests, and design research, using heuristic and numerical
modeling. To test the feasibility four models have been proposed, of which
three have been presented. The preliminary model of the zero-th order and
the first-order model are models that can be used during the preliminary
identification phase of the design process. The results give a first glance on
the feasibility of this power system. The model is based on energy and power
densities of main parts of the power system, and thus generally applicable to
other power generators and energy carriers.
For more accuracy and getting more insight in the size of the fuel-cell system,
the second-order model is introduced, making use of the strengths of the
computer to automatically generate a large amount of structural variants,
using the components offered by the tables. Besides generating the
structural variants the second-order model also evaluates every variant. This
type of modeling can be generalized and used by product designers letting
the computer take over the dull part of generating and evaluating structural
variants of a wide range of products. Selection of components and logical
choices can be made by the computer, following a preference based objective
216
function. The designer is in this way forced to think about this the objectives
of its power system in early phases of the design process.
The second and third order models are based on knowledge acquired by
specifications sheets, in-house tests and expert interview. This type of
modeling is generally useable for concurrent design groups where engineers
from different field of expertise work together to generate a single solution
(product) to a problem initiated. Quick decisions have to be made based on
low amount of information. The type of models proposed to make quick but
accurate decisions are fundamental for decision-room design. It must be
noted that the development of these tools should be cost-effective for the
application or technology field the engineer is working in.
The models used in this thesis are specifically produced for estimating the
feasibility of DMFC power systems for portable electronic devices. This
makes the model not applicable to other products smaller or larger scale
than the scope defined in this thesis. The results of the tests described in
Chapter 8 and 9 are only applicable to the device designed, the MP3 player.
Because the power and energy specifications of other applications within this
application field do not differ a great deal from the investigated case study, it
is plausible the results also will apply to these cases. It is recommended to
explore this.
10.4 Recommendations for future research The research executed in this thesis consisted of two parts: to test the
feasibility of DMFC power system as an alternative for the lithium-based
rechargeable battery, and developing a systematic approach for the product
designer, supporting him/her in his decision making during the heuresis
stage of the conceptual design phase.
10.4.1 Direct Methanol Fuel cell systems in portable electronics
Within this thesis only one case is tested on its feasibility. The second-order
model can be used to test a wider range of portable electronic devices, and
give more insight in fields of opportunity for the DMFC system.

217
To increase more potential component-sets for the second-order model, the
component tables should be extended with more commercially available
components. In the performance range of the research conducted the
number of available components is still very low, and thus to test long-term
feasibility of DMFC systems scalability of components could be introduced.
The results will not only show a new design but also pinpoints the research
and development before application is feasible. This could trigger component
developers to produce more miniature components in the required field.
The initial sales price of the MEA is still very high and thus will result in a
high initial price of the fuel cell system (twice as high as the benchmarked
battery). This high initial price of the power source could be of subordinate
concern, when the improvement in convenience is there. Based on results
from Chapter 5 the fuel-cartridge is time-in-between-replacements for fuel
cartridges is 2.7 times longer than for alkaline batteries and even 3.9 times
longer than the lithium-ions’ time-in-between-recharges. If this longer
runtime weighs up to the extra initial price of the power system is certainly a
thing to find out.
Besides initial price the methanol pricing, and thus the life-cycle costs, is
very high compared to recharging or buying alkaline batteries. Again the
improved performance could weigh up to the extra costs, and finding the
tipping point is of interest.
10.4.2 Model development
With regard to the first-order model, the estimates represent a wide range of
possible designs. The left side estimates represent well-engineered DMFC
systems with a high packing ratio. The right side estimates represent bad
engineered DMFC systems, and right in the middle the conventional designs
are situated. To validate the model more commercially available DMFC
systems have to be evaluated by the model, and coefficients, densities,
constants and efficiencies have to be fine tuned. This type of modeling is of
great interest for the conceptual product designers, because a feasibility test
can be made with low amount of input data from the designer. Besides
making use of commercially available systems the second or third order

218
model can be used to produce several DMFC systems powering applications
over the whole range of interest. The automatically produced designs can
than be used to improve the analytical models for the different parts of the
fuel cell system.
Cost estimates are implemented but due to lack of data not tested within the
second order model. This property is one of the main important issues and
the data tables containing commercially components data should therefore
be available, accurate and up to date.
The second-order model is limited in accuracy because the selected
components are represented by only parallelepipeds. Besides the simple
representations no interconnection is taken into account. For the third-order
model it is recommended to improve accuracy by (i) more advanced
representation of the components, (ii) extending the basic set of components
with amongst other the mixer and sensors, and by (iii) introducing
interconnections like wiring and plumbing. Besides more accurate designs
the objective function could be extended by taking more properties in to
account, like the environmental impact but also with thermal requirements
and systems’ endurance.
At the moment the second-order model is prototyped in Mathematica. To
decrease calculation time, especially needed in concurrent engineering
design groups, the model should be written in a lower-level coding
environment.
Besides the DMFC power system other alternative power systems could be
modeled according to the data acquired in Chapter 2. The equations can
than be used to compare the power systems with each other in the early
phases of the design process.
10.4.3 Concept development support by using computers
The models developed within this thesis are the first steps towards
conceptual modeling supporting the product designer in making funded
decision during early phases of the design process. In the systematic

219
approach of design engineering its common to develop an analytical model to
simulate different design-concepts. Mostly these models are prototyped in
numerical programs as Matlab/Simulink and spreadsheet programs as MS
Excel. The access to computer programs is increasing and it is encouraging
to see that new generation designers and scientists make more use of these
tools. As a university and as the school of Industrial Design Engineering we
are obligated to introduce the next generation designers with conceptual
modeling, making use of the support of the computer. The author would like
to recommend research in the field of analytical modeling during the concept
phase of the design process. This thesis is a first step towards generalized
models supporting the designer in conceptual decision making. The
computer can be used to, not only generate an unlimited number of
structural variants, but also for instance in the field of quantitative
morphological charts.

220
221
References
1. Sternblitz-Rubenstein, M.S. Number of Smartphones Worldwide Exceeded 180 Million Units in 2009. 2010 [cited 2010 September 13]; Available from: http://www.marketwire.com/press-release/Number-of-Smartphones-Worldwide-Exceeded-180-Million-Units-in-2009-1167459.htm.
2. John, J. and C. Riddle. Smart phone power. in Proceedings - Design Automation Conference. 2010. Anaheim, CA.
3. Kundu, A., J.H. Jang, J.H. Gil, C.R. Jung, H.R. Lee, S.H. Kim, B. Ku, and Y.S. Oh, Micro-fuel cells--Current development and applications. Journal of Power Sources, 2007. 170(1): p. 67-78.
4. Hallmark, J. End User Perspective - Industrial Consumer Electronics Power (< 20-50W). in DOE Fuel Cell Portable Power Workshop. 2002. Solid State Research Center, Phoenix, Arizona, USA.
5. Flipsen, S.F.J. and J.I.v. Hout, Haalbaarheidsonderzoek naar een opwindbare tandenborstel (for MOY Design). 2000, TNO Industrie, Delft: Delft.
6. Flipsen, B. and M. van der Vlugt, Case study durable energy sources for portables and wearables: walkman case (in Dutch). 1999, TNO Institute of Industrial technologies: Delft, the Netherlands.
7. Flipsen, S.F.J., V. Meeussen, H. Hakkesteegt, and J.W. Raadschelders, PDO eindrapportage: brandstofcellen voor draagbare elektronica. 2002: TNO Industrie, Delft.
8. Flipsen, B., G. Timmers, R. van den Hoed, and I. Leeflang. In search for application fields of fuel cells. in Proceedings of Electronics Goes Green 2000+. 2000: Fraunhofer institut.
9. Flipsen, S.F.J. and V.M.A. Meeussen, Marketscan fuel-powered products (for Swedish Match). 2000, TNO Industrie: Delft.
10. Torenbeek, E., Synthesis of subsonic airplane design. 1982, Delft: Springer.
11. Fu, L., T.J. Lu., and J.E. Huber, Database and selection method for portable power sources. Advanced Engineering Materials, 2005. 7(8): p. 755-765.
12. Cook, K.A. and A.M. Sastry, An algorithm for selection and design of hybrid power supplies for MEMS with a case study of a micro-gas chromatograph system. Journal of Power Sources, 2005. 140(1): p. 181 - 202.
13. Flipsen, B., Power sources compared: The ultimate truth? Journal of Power Sources, 2006. 162(2): p. 927 - 934.
14. van der Voort, E., Design of a methanol fuel cell powered PDA. 2005. 15. Carroll, A. and G. Heiser, An analysis of power consumption in a
smartphone, in 2010 USENIX Annual Technical Conference. 2010: Boston, MA, USA.
16. Mahesri, A. and V. Vardhan, Power consumption breakdown on a modern laptop, in Lecture Notes in Computer Science (including

222
subseries Lecture Notes in Artificial Intelligence and Lecture Notes in Bioinformatics). 2005. p. 165-180.
17. Mourik, F.v., Laagvermogen product op DMFC (in Dutch). 2001, TNO, TU Delft: Delft.
18. Juliussen, E. Worldwide PDA & smartphone forecast 2000-2010. 2003; Available from: http://www.etforecasts.com/products/ES_pdas2003.htm.
19. Onino. Onino website: compare prices and research thousands of products. 2010 [cited 2010 October]; Available from: http://www.onino.co.uk/.
20. Samsung. Specification sheet Samsung Galaxy S. 2010 [cited 2010 October]; Available from: http://www.samsung.com.
21. Apple. Specifications of the Iphone 4. 2010 [cited 2010 October]; Available from: http://www.apple.com/iphone/specs.html.
22. Engelsman, E. and R. Melchior, Trends in batteries for portable computers. 2005, Delft University of Technology: Delft, the Netherlands.
23. Starner, T., Human-powered wearable computing. IBM Systems Journal, 1996. 35(3-4): p. 618-629.
24. Diehl, J.C., P.v. Gennip, and A. Mestre, Design guidelines for renewable energy technologies in mobile products, in Int. design conference. 2006, Design society: Glasgow. p. 1375-1381.
25. Dowling, K., Power Sources for Small Robots. 1997, Robotics Institute: Pittsburgh, PA.
26. Johnson, M.P., Physical limits of portable power storage. 1998, MIT Media Lab: Cambridge, MA, USA.
27. Limmeren, R.v. and M.v.d. Berg, Trends in energy and power supply of mobile phones. 2004, Delft University of Technology: Delft, the Netherlands.
28. Miyake, Y., Y. Akiyama, A. Hamada, Y. Itoh, K. Oda, S. Sumi, K. Nishio, and N. Nishizawa, Status of fuel cells R&D activities at Sanyo. Journal of Power Sources, 1996. 61(1-2): p. 155--160.
29. Xie, C., J. Bostaph, and J. Pavio, Development of a 2 W direct methanol fuel cell power source. Journal of Power Sources, 2004. 136(1): p. 55 - 65.
30. Pavio, J., J. Hallmark, J. Bostaph, A. Fisher, B. Mylan, and C.G. Xie, Developing micro-fuel cells for wireless communications. Fuel Cells Bulletin, 2002. 2002(4): p. 8 - 11.
31. Seiko, C. Seiko Thermic 6C12. 1999 [cited 1999; Available from: www.seiko-corp.co.jp.
32. Elsner, N.B., J.C. Bass, S. Ghamaty, D. Krommenhoek, A. Kushch, J. Mccoy, V. Javonovic, and J. Elsner. Performance specifications of the HZ-2, HZ-9, HZ-14, HZ-20 and the demonstration generator. Power Generating Modules 2004 [cited 2004; Available from: http://www.hi-z.com/.
33. ThermoElectric, G. Performance specifications of: model 5015, 5030, 5060, 5120, 5220, 8550, 1120 and 1500. GlobalTEGs 2004 [cited 2004; Available from: http://www.globalte.com.
34. Piezo Systems, I. Catalogus: performance specifications of T215-A4 and H4 series, T220-A4 and H4 series, and the T226-A4 and H4 series. Piezo Bending Generators 2004 [cited 2004; Available from: www.piezo.com.

223
35. Mabuchi, M., Performance specification sheet: RF-500TB, in Precious metal-brush motors, M. Motor, Editor. 2004: Japan.
36. Juden, C. Dynotest of the Soubitez 42 and AXA-HR dynamo. 2004 [cited 2004; Available from: http://www.myra-simon.com/myra/.
37. Kinetron. Kinetron Micro Generator performance specifications of: MG861, 205, 204, 401, 026 and 901. 2004 [cited 2004; Available from: http://www.kinetron.nl.
38. Toshiba, Toshiba Announces World's Smallest Direct Methanol Fuel Cell with Energy Output of 100 Milliwatts. 2004, Press release.
39. HelioCentris. Performance specifications of: Science education kit. 2004 [cited 2004.
40. SFC. Performance specifications of: A25. 2004 [cited 2004; Available from: http://www.sfc.com.
41. Fuelcellstore. Webshop of fuel cell products and components related, performance specification of: Cute FC series, PEMFC kit, Fuel cell eco, Cozy FC series, Fuel cell Mini, CoolFC series, and others. 2004 [cited 2004; Available from: http://www.fuelcellstore.com.
42. Xie, C., J. Pavio, J. Hallmark, J. Bostaph, and A. Fisher. Key requirements of micro fuel cell system for portable electronics. in Proceedings of the Intersociety Energy Conversion Engineering Conference. 2002.
43. Toshiba, Toshiba Announces World's First Small Form Factor Direct Methanol Fuel Cell for Portable PCs. 2003, Press release.
44. NEC, NEC Develops Smaller Fuel Cell for Notebook PCs. 2003, Press release by NEC.
45. Hepperle, M., Cox Tee-Dee .010. Aeromodeller Oktober, 1979. 46. Webra. Performance specifications of: Speed 50 Aero/Heli 1025 series,
Speed 40 Aero 1034GT, 32GT Aero 1028GT, 61F Aero and 120 Aero. 2004.
47. Fu, K., A.J. Knobloch, F.C. Martinez, D.C. Walther, C. Fernancez-Pello, A.P. Pisano, D. Liepmann, and K. Miyaska. Design and experimental results of small-scale rotary engines. in 2001 ASME International Mechanical Engineering Congress and Exposition. 2001. New York (NY).
48. SuperTigre, Performance specifications of: G34 Aero, GS40 Rin, GS45 Abc, GS45 H ABC, G51 Ring, G61K Ring, G61H Abc-Ring, G75 Ring, G90 Ring, S2000/25, G3250, G4500, Twin 60CC and G20/23, in Supre Tigre, superior quality and performance. 2000: Champaign, IL.
49. A.S.P. Performance specifications of: 108A, 91A, 75A, 46A, 40A, 32A-S, 28, 25A, 15A, 12A AP090, AP15A and four-stroke series. 2004 [cited 2004; Available from: http://www.conrad.nl.
50. X-race. Performance specifications of: 25SZ, M21SZ, 21KS, pro 21SX, pro 21SR, pro 15ST, pro 15SX, M15ES, M15SZ, 17ES, 17SZ, 15ES and 15SZ. 2004.
51. Honda. Performance specifications of: GX-22, GX-31, GX120, GX160, GX200, GX240, GX270 and GX340. 2004 [cited 2004; Available from: http://www.hondashop.com.
52. O.S.Engines, Performance specification of the OS.30 Wankel Rotary 49-PI, O.S. Engines, Editor. 2004: Champaign, Il, USA.
53. Jansen, A.J. and P. Slob. Human power; comfortable one-hand cranking. in Proceedings of International Conference on Engineering Design. 2003. Stockholm, Sweden.
54. Andriesse, C.D., Energieconversies. 1991: University of Utrecht.
224
55. Kawai, K. and M. Harada, Man as Locomotive Engine. 1997, Kyoto University: Kyoto, Japan.
56. Varta, Performance specifications of different primary batteries from Varta: Alkaline, Lithium cilinder, Zinc chloride cilinder; and secondary batteries: NiMH cilinder and button cells, . 2004, Varta.
57. Panasonic, Performance specifications of different secondary batteries: Lead-acid, NiCd cilinder and power packs, NiMh 3000 sub C packs, Li-ion camcorder cells; and goldcaps super capacitors., Panasonic, Editor. 2004.
58. Voltcraft, Performance specifications of Voltcraft Sealed Lead Acid batteries, Voltcraft, Editor. 2004.
59. SAFT, Performance specifications of SAFT Li-ion batteries series, SAFT, Editor. 2004.
60. Rayovac, Performance specifications for Rayovac Alkaline rechargebale batteries, Rayovac, Editor. 2004.
61. Emmerich, Performance specifications of Emerich NiCD button cells, Emmerich, Editor. 2004.
62. Canon, Performance specifications fo different Canon Camcorder batteries, Canon, Editor. 2004.
63. Samsung, Performance specification of Samsung li-ion batteries, Samsung, Editor. 2004.
64. GP, Performance specifications of GP NiMh cilindrical and prismatic cells, GP, Editor. 2004.
65. JVC, Performance specifications of JVC li-ion camcorder batteries. 2004.
66. Sony, Performance specifications of different Sony camcorder batteries, S. Batteries, Editor. 2004.
67. Epcos, Performance specifications of Epcos UltraCaps, Epcos, Editor. 2004.
68. Rutronik, Performance specification of Rutronik Electrolytic condensors, R. EYF, Editor. 2004.
69. Maxwell, Electric Double Layer Capacitor: BOOSTCAP (R) Ultracapacitor. 2004, Maxwell Technologies.
70. Schneuwly, A. and R. Gallay, Properties and applications of supercapacitor, from the state-of-the-art to future trends, in International Conference on Power Electronics, Intelligent Motion and Power Quality. 2000, Mesago PCIM GmbH: Nuernberg, Germany.
71. Zuettel, A., Materials for hydrogen storage. Materials Today, 2003. 6(9): p. 24-33.
72. C.E.S., Cambridge Engineering Selector. 2004. 73. Hockaday, R. Energy Related Devices. 2010 [cited 2010; Available
from: http://www.energyrelatedevices.com. 74. Tsuchiya, H. and O. Kobayashi, Mass production cost of PEM fuel cell
by learning curve. International Journal of Hydrogen Energy, 2004. 29(10): p. 985--990.
75. Dyer, C.K., Fuel cells for Portable Applications. Journal of Power Sources, 2002. 44(2): p. 109--115.
76. Advitek. Brandstofcel. 2010 [cited 2010 November 12]; Available from: http://www.advitekmobilehome.nl.
77. Instant-Power, Performance specification of the Instant power Zinc Air battery, I. Power, Editor. 2004.
78. Mars, P., Power delivery for notebooks and wireless PDA's with supercapacitors. 2001.
225
79. Flipsen, B. Selection of power sources for portable applications. in Portable Energy 2009. 2009: Knowledge Foundation.
80. Roozenburg, N.F.M. and J. Eekels, Productontwerpen, structuur en methoden. 2nd ed. 2003, Utrecht: Lemma.
81. Pahl, G., W. Beitz, and K. Wallace, Engineering Design: a systematic approach. 2nd ed. 1996: Springer.
82. Spitas, C., Analysis of systematic engineering design paradigms in industrial practice: A survey. Journal of Engineering Design, 2010.
83. Eder, W.E., Design Modeling - A design science approach (and why does industry not use it?). Journal of Engineering Design, 1998. 9(4): p. 355-371.
84. Scopus. Scopus scientific search engine. 2009 [cited 2009; Available from: http://www.scopus.com.
85. ScienceDirect. ScienceDirect scientific search engine. 2009 [cited 2009; Available from: http://www.sciencedirect.com.
86. N.A.P., Appendix C: Measures of Performance, in Meeting the energy needs of future warriors. 2004, The National Academies press: Washington D.C., USA. p. 80-87.
87. Christen, T. and M.W. Carlen, Theory of ragone plots. Journal of Power Sources, 2000. 91(2): p. 210-216.
88. Ragone, D.V., Review of battery systems for electrically powered vehicles, in Mid-year meeting of the Society of Automotive Engineers. 1968: Detroit, Mi.
89. Rincón-Mora, G.A. and M. Chen, Squeezing operational life out of a shrinking energy capsule. Power Management Design Line, 2006.
90. Ashby, M.F., Y.J.M. Brechet, D. Cebon, and L. Salvo, Selection strategies for materials and processes. Materials & Design, 2004. 25(1): p. 51 - 67.
91. van Gennip, P., S.Y. Kan, S. Silvester, and B. Flipsen. Power quest, an online software tool to find mobile product-energy-system matches. in Proceedings of the TMCE 2006. 2006. Ljubljana, Slovenia.
92. Cook, K.A., F. Albano, P.E. Nevius, and A.M. Sastry, POWER (power optimization for wireless energy requirements): A MATLAB based algorithm for design of hybrid energy systems. Journal of Power Sources, 2006. 159(1): p. 758 - 780.
93. Wu, Q., Q. Qiu, and M. Pedram. An interleaved Dual-Battery Power supply for Battery-operated Electronics. in Proceedings of Asia and South Pacific Design Automation Conference. 2000: ACM.
94. del Real, A.J., A. Arce, and C. Bordons, Optimization strategy for element sizing in hybrid power systems. Journal of Power Sources, 2009. 193(1): p. 315 - 321.
95. Lilienthal, P. and T. Lambert, HOMER, the optimization model for distributed power. 2009, website.
96. Bernal-Agustin, J.L. and R. Dufo-Lopez, Multi-objective design and control of hybrid systems minimizing costs and unmet load. Electric Power Systems Research, 2009. 79(1): p. 170 - 180.
97. Bernal-Agustin, J.L. and R. Dufo-Lopez, Efficient design of hybrid renewable energy systems using evolutionary algorithms. Energy Conversion and Management, 2009. 50(3): p. 479 - 489.
98. Flipsen, B., Personal interview with Thomas Valdez, senior member engineering staff. 2009: Pasadena, CA, USA.
99. Flipsen, B., Personal interview with Paul Timmerman, senior power system engineer at JPL. 2009: Pasadena, CA, USA.
226
100. Icardi, U.A., S. Specchia, G.J.R. Fontana, G. Saracco, and V. Specchia, Compact direct methanol fuel cells for portable application. Journal of Power Sources, 2008. 176(2): p. 460 - 467.
101. Lin, B., Conceptual design and modeling of a fuel cell scooter for urban Asia, in School of Engineering and Applied Sciences, Department of Mechanical and Aerospace Engineering. 1999, Princeton University: Princeton NJ, USA.
102. Rohrschneider, R.R., Olds J.R. Braun R.D. Hutchinson Jr. V. Kuhl C.A. Steffes S.R., Flight system options for a long-duration Mars airplane. Collection of Technical Papers - AIAA 3rd "Unmanned-Unlimited" Technical Conference, Workshop, and Exhibit, 2004. 2: p. 833-846.
103. Rohrschneider, R.R., Olds J.R. Braun R.D. Hutchinson Jr. V. Kuhl C.A. Steffes S.R., Modeling approach for analysis and optimization of a long-duration Mars airplane. Collection of Technical Papers - 10th AIAA/ISSMO Multidisciplinary Analysis and Optimization Conference, 2004. 1: p. 134-147.
104. Wikipedia. Design Structure Matrix - Wikipedia, The Free Encyclopedia. 2009; Available from: http://en.wikipedia.org/wiki/Design_structure_matrix.
105. Malone, B. and M. Papay, ModelCenter (TM): an integration environment for simulation based design. 1999.
106. Spitas, C., Analysis of systematic engineering design paradigms in industrial practice: Scaled experiments. Journal of Engineering Design, 2010.
107. Creswell, J.W., Research Design: Qualitative and Quantitative Approaches. 2nd. ed. 2003: Sage.
108. Baarde, D.P. and M.P.M. de Goede, Basisboek Kwalitatief Onderzoek. 2001, Houten: Stenfert Kroese.
109. Linden, D. and T.B. Reddy, Handbook of Batteries. 3rd ed. 2001: McGraw-Hill Inc.
110. Buchmann, I. Battery University. 2005 [cited 2010; Available from: www.batteryuniversity.com.
111. DeMuro, D., Whither Fuel Cells. 2003, Motorola Energy Systems Group, Battery Power Products & Technology Magazine.
112. Larminie, J. and A. Dicks, Fuel cell systems explained. 2003: Chichester: Wiley.
113. Shukla, A.K., C.L. Jackson, K. Scott, and R.K. Raman, An improved-performance liquid-feed solid-polymer-electrolyte direct methanol fuel cell operating at near-ambient conditions. Electrochimica Acta, 2002. 47(21): p. 3401--3407.
114. Qi, Z. and A. Kaufman, Open circuit voltage and methanol crossover in DMFCs. Journal of Power Sources, 2002. 110(1): p. 177 - 185.
115. Nakagawa, N. and Y. Xiu, Performance of a direct methanol fuel cell operated at atmospheric pressure. Journal of Power Sources, 2003. 118(1-2): p. 248--255.
116. Okajima, k., M. Suetaka, K. Furukawa, and M. Sudoh, Evaluation of Liquid-feed direct methanol fuel cell at near-ambient temperature for mobile applications. Electrochemistry, 2002. 70(12): p. 928--930.
117. Ramani, V., H.R. Kunz, and J.M. Fenton, Effect of particle size reduction on the conductivity of Nafion®/phosphotungstic acid composite membranes. Journal of Membrane Science, 2005. 266(1-2): p. 110-114.
227
118. Wang, Z.H. and C.Y. Wang, Mathematical Modeling of Liquid-Feed Direct Methanol Fuel Cells. Journal of The Electrochemical Society, 2003. 150(4): p. A508--A519.
119. Oedegaard, A. and C. Hentschel, Characterisation of a portable DMFC stack and a methanol-feeding concept. Journal of Power Sources, 2006. 158(1): p. 177 - 187.
120. Padhy, B.R. and R.G. Reddy, Performance of DMFC with SS 316 bipolar/end plates. Journal of Power Sources, 2006. 153(1): p. 125 - 129.
121. Chen, C.Y., D.H. Liu, C.L. Huang, and C.L. Chang, Portable DMFC system with methanol sensor-less control. Journal of Power Sources, 2007. 167(2): p. 442 - 449.
122. Peiwen Li, N.D., Anthony Dumay, Development and Fabrication of Passive DMFCs, in Seventh International Fuel Cell Science, Engineering and Technology Conference. 2009, ASME: Newport Beach, CA, USA.
123. Qian, W., D.P. Wilkinson, J. Shen, H. Wang, and J. Zhang, Architecture for portable direct liquid fuel cells. Journal of Power Sources, 2006. 154(1): p. 202--213.
124. Kim, D., E.A. Cho, S.A. Hong, I.H. Oh, and H.Y. Ha, Recent progress in passive direct methanol fuel cells at KIST. Journal of Power Sources, 2004. 130(1-2): p. 172--177.
125. Bostaph, J., C. Xie, J. Pavio, A.M. Fisher, B. Mylan, and J. Hallmark, 1W direct methanol fuel cell system as a desktop charger. 2003, internet.
126. Sony, Announcement of New Lithium Ion Batteries, Realizing Industry's Highest Level of Energy Density (A8 series, 383450A8). 2004, Press release.
127. Fisher, A., J. Pavio, J. Bostaph, R. Koripella, B. Mylan, J. Hallmark, S. Rogers, S. Samms, and C. Xie. Technology Development in Methanol-Based fuel cells. in Proceedings of the Third International Micro and Nanotechnology Meeting. 2003. Grenoble, France.
128. Ryynaenen, M. and S. Tasa, Optimized Energy for Future Mobile Multimedia Devices. 2005, Website: www.h2foresight.info/Nokia.ppt.
129. Broussely, M. and G. Archdale, Li-ion batteries and portable power source prospects for the next 5-10 years. Journal of Power Sources, 2004. 136(2): p. 386--394.
130. Wichert, R., Fuel Cells for Portable Power: Markets, Manufacture and Cost. 2003, Darnell Group Inc.: Corona, California, U.S.A.
131. Schuttenhelm, R. Prijs electriciteit fors gestegen (in Dutch), based on: Bron: Nederlands huishouden duur uit met elektriciteit. CBS, mei 2006. 2006 [cited 2010 November]; Available from: http://www.hoesnel.nl/energie_ontwikkeling/elektriciteitsprijs-nederland.html.
132. Fuelcellstore. Webshop for fuel cell and materials. 2010 [cited 2010 november].
133. Kitco. Precious Metal Store: price for Platinum. 2010 [cited 2010 November 2010]; Available from: http://www.kitco.com.
134. Crompton, T.R., Battery Reference Book. 2000: Reed Educational and Professional publishing Ltd.
135. Toshiba's New Rechargeable Lithium-Ion Battery Recharges in Only One Minute. 2005, Press release.
228
136. Knights, S.D., K.M. Colbow, J. St Pierre, and D.P. Wilkinson, Aging mechanisms and lifetime of PEFC and DMFC. Journal of Power Sources, 2004. 127(1-2): p. 127--134.
137. Schoormans, J. and C. de Bont, Consumentenonderzoek in de produktontwikkeling. 1995: Lemma.
138. SPSS, SPSS: data mining, statistische analyse software. 2004, IBM. 139. Mangione-Smith, W.H., "Beauty Depends on Size"-Aristotle. IEEE
Concurrency, 1998. 6(2): p. 8--10. 140. Chapin, T., Density of consumer eelctronics and user perceptionsof
quality, acceptability of weight, level of technology, durability and fragility. 1999, TUFTS University: Medford, USA.
141. Mueller, J., Personal contact with Jens Mueller, Smart Fuel Cell. 2010, Personal contact.
142. SFC. The JENNY 600S fuel cell by SFC. 2010 [cited 2010; Available from: http://www.sfc.com/en/man-portable-jenny.html.
143. Geyer, R. and V. Doctori Blass, The economics of cell phone reuse and recycling. The International Journal of Advanced Manufacturing Technology, 2010. 47(5): p. 515-525.
144. Andrae, A. and O. Andersen, Life cycle assessments of consumer electronics — are they consistent? The International Journal of Life Cycle Assessment, 2010. 15(8): p. 827-836.
145. Flipsen, B., Designing micro fuel cells for portable products. Journal of Fuel Cell Science, Engineering, and Technology, 2010. 7.
146. Samsung. Samsung YP-Z5F MP3 player, specification sheet 2007 [cited 2007; Available from: http://www.samsungmobile.com.
147. Flipsen, B. Design Challenges for a Fuel Cell Powered MP3 Player. 2007. Bath (Great Britain): International Power Sources Symposium.
148. Micro Annular Gear Pump mzr(R)-2521 in Dosing pump for analytical instrumentation. 2006, HNP Mikrosysteme GmbH.: www.hnp-mikrosysteme.de.
149. ThinXXS, Datasheet MDP1304, micro diaphragm pump. 2006, ThinXXS Microtechnology AG.
150. Bartels. Datasheet of the MP5 and MP6 micropump. 2008. 151. Sparks, D., C. Laroche, N. Tran, D. Goetzinger, N. Najafi, K.
Kawaguchi, and M. Yasuda. A new Methanol Concentration Microsensor for Improved DMFC Performance. 2005: Fuel Cell Summit 2005.
152. Burke, A., R&D considerations for the performance and application of electrochemical capacitors. Electrochimica Acta, 2007. 53(3): p. 1083 - 1091.
153. Yogmogita, H., Electrical Storage Technology Combines Li-ion Capacitors. Nikkei Electronics Asia Volume, 2005.
154. Vishal, S., V.G. Suresh, and R. Arvind, Microscale pumping technologies for microchannel cooling systems. 2004: p. 191-221.
155. Laser, D.J. and J.G. Santiago, A review of micropumps. Journal of Micromechanics and Microengineering, 2004. 14(6): p. R35-R64.
156. SP V 125 PZ-L datasheet, The revolutionary Generation of Piezo-Pumps. 2009, Schwartzer GmbH: www.schwartzer.com.
157. Bohm, S., W. Olthuis, and P. Bergveld, A plastic micropump constructed with conventional techniques and materials. Sensors and Actuators A: Physical, 1999. 77: p. 223-228.

229
158. Richter, A., A. Plettner, K.A. Hofmann, and H. Sandmaier, A micromachined electrohydrodynamica (EHD) pump. Sensors and Actuators A, 1991. 29: p. 9.
159. Chen, C.H., S. Zeng, J.C. Mikkelsen, and J.G. Santiago, Development of a planar electrokinetic micropump. 2000.
160. Richter, M., Micropumps - From the Lab to the Fab. Actuator 2006, 2006.
161. Richter, M., ErsterPreis fur die kleinste Siliziumpumpe der Welt. 2007. 162. Zhu, M., P. Kirby, M. Wacklerle, M. Herz, and M. Richter,
Optimization design of multi-material micropump using finite element method. Sensors and Actuators A: Physical, 2009. 149(1): p. 130 - 135.
163. Flipsen, B., Personal communication with M. Richter (Fraunhofer Institut) about Fraunhofers micropump. 2009.
164. Kaemper, K.P., J. Doepper, W. Erhrfeld, and S. Oberbeck. A self-filling low-cost membrane micropump. 1998: IEEE Micro electro Mechanical Systems.
165. Cabuz, C., W.R. Herb, E.I. Cabuz, and S.L. Lu. The dual diaphragm pump. 2001: IEEE.
166. Schabmueller, C.G.J., Self-alignement gas/liquid micropump. Journal of Micromechanical Microengineering, 2002. 12: p. 420-424.
167. Datasheet: V200 and P200 GAS. 2007, Xavitech AB: www.xavitech.com.
168. Rotary Vane Pump BL-G 085 M. 2006, Gardner Denver Thomas: www.rtpumps.com.
169. Polyfuel, Membranes push boundary of power density for DMFC stacks. Membrane Technology, 2007. 2007(11): p. 8 - 9.
170. Hadjipaschalis, I., A. Poullikkas, and V. Efthimiou, Overview of current and future energy storage technologies for electric power applications. Renewable and Sustainable Energy Reviews, 2009. 13(6-7): p. 1513 - 1522.
171. Cagan, J., K. Shimada, and S. Yin, A survey of computational approaches to three-dimensional layout problems. Computer-Aided Design, 2002. 34(8): p. 597-611.
172. Grignon, P.M. and G.M. Fadel, A GA Based Configuration Design Optimization Method. Journal of Mechanical Design, Transactions of the ASME, 2004. 126(1): p. 6-15.
173. Fox, R.L., Optimization methods for engineering design. Mechanics and thermodynamics, ed. H.W.E.a.B. budiansky. 1971: Addison-Wesley Publishing Company. 270.
174. Deb, K., Multi-objective Optimization using Evolutionary Algorithms, ed. S. Ross and R. Weber. 2001: John Wiley & Sons, LTD.
175. Wikipedia. Line-plane intersection - Wikipedia, The Free Encyclopedia. 2010; Available from: http://en.wikipedia.org/w/index.php?title=Line-plane_intersection&oldid=346414975.
176. Wikipedia. Collision detection - Wikipedia, The Free Encyclopedia. 2010; Available from: http://en.wikipedia.org/w/index.php?title=Collision_detection&oldid=349217034.
177. Wolfram, Mathematica (R) 7. 2010, Wolfram Research, Inc.: Champaign, IL, USA.

230
178. Strijk, R., Development and future feasibility of a direct methanol fuel cell system with a power of 50Watts, in Industrial Design Engineering. 2002, Delft University of Technology: Delft.
179. Penworld. Prices for a 5-pack 1.45mL fill-pen refills. 2010 May 2010]; Available from: http://www.penworld.be.

231
A Modeling of the open cell Voltage for a DMFC
The theoretical reversible open cell voltage E0 can be calculated according to
[112]:
0 fg
EzF
−Δ= = 1.206V (51)
In practice this theoretical open cell Voltage is never reached and in our
model the practical open cell Voltage VOC is used equal to [1]:
0
0log( )OCV E A i= + (52)
The working Voltage of a DMFC cell is equal to:
( ) ( )00log( ) log( ) expcV E i r A i i A i m n i= − ⋅ − ⋅ + − + ⋅ ⋅ (53)
Combining Equation 52 with 53 makes:
( )log( ) expOC cV V i r A i i m n i= − ⋅ − ⋅ + + ⋅ ⋅
The practical open cell Voltage is in this equation a great unknown. By
means of multiple regression analysis using 4 case-studies [125-128] and 47
measured points the value of this Voltage is derived in a formula. First a list
of parameters is derived which influence the performance of the cell:
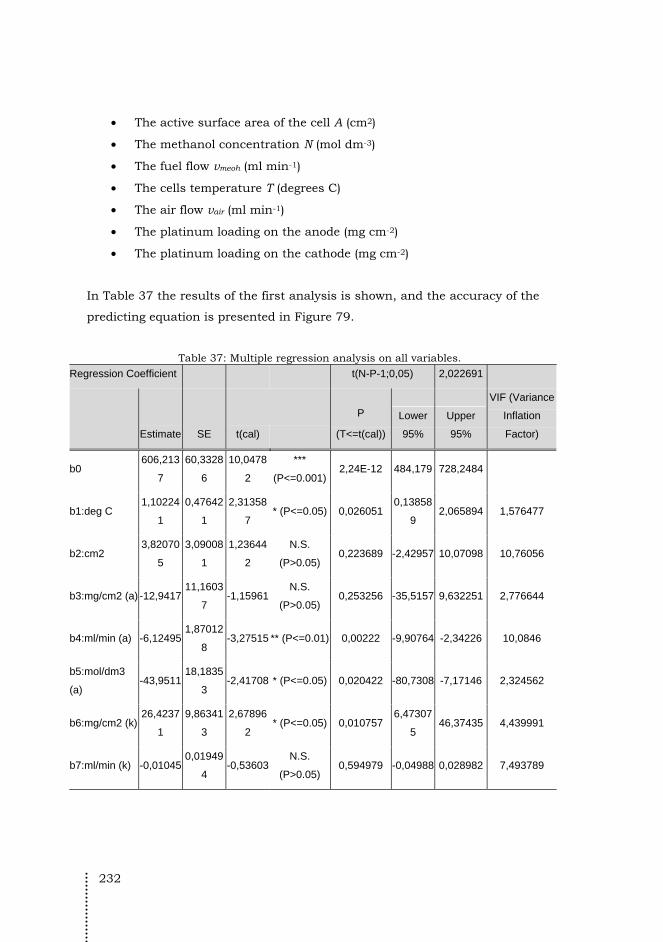
232
• The active surface area of the cell A (cm2)
• The methanol concentration N (mol dm-3)
• The fuel flow vmeoh (ml min-1)
• The cells temperature T (degrees C)
• The air flow vair (ml min-1)
• The platinum loading on the anode (mg cm-2)
• The platinum loading on the cathode (mg cm-2)
In Table 37 the results of the first analysis is shown, and the accuracy of the
predicting equation is presented in Figure 79.
Table 37: Multiple regression analysis on all variables.
Regression Coefficient t(N-P-1;0,05) 2,022691
Estimate SE t(cal)
P
(T<=t(cal))
Lower
95%
Upper
95%
VIF (Variance
Inflation
Factor)
b0 606,213
7
60,3328
6
10,0478
2
***
(P<=0.001) 2,24E-12 484,179 728,2484
b1:deg C 1,10224
1
0,47642
1
2,31358
7 * (P<=0.05) 0,026051
0,13858
9 2,065894 1,576477
b2:cm2 3,82070
5
3,09008
1
1,23644
2
N.S.
(P>0.05) 0,223689 -2,42957 10,07098 10,76056
b3:mg/cm2 (a) -12,941711,1603
7 -1,15961
N.S.
(P>0.05) 0,253256 -35,5157 9,632251 2,776644
b4:ml/min (a) -6,124951,87012
8 -3,27515 ** (P<=0.01) 0,00222 -9,90764 -2,34226 10,0846
b5:mol/dm3
(a) -43,9511
18,1835
3 -2,41708 * (P<=0.05) 0,020422 -80,7308 -7,17146 2,324562
b6:mg/cm2 (k) 26,4237
1
9,86341
3
2,67896
2 * (P<=0.05) 0,010757
6,47307
5 46,37435 4,439991
b7:ml/min (k) -0,010450,01949
4 -0,53603
N.S.
(P>0.05) 0,594979 -0,04988 0,028982 7,493789
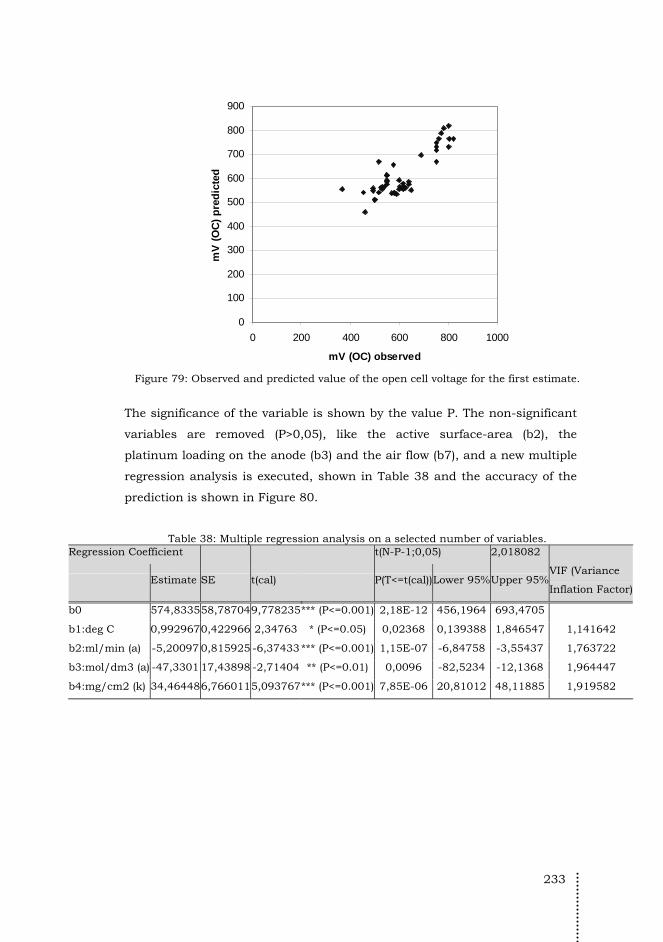
233
0
100
200
300
400
500
600
700
800
900
0 200 400 600 800 1000
mV (OC) observed
mV
(O
C)
pre
dic
ted
Figure 79: Observed and predicted value of the open cell voltage for the first estimate.
The significance of the variable is shown by the value P. The non-significant
variables are removed (P>0,05), like the active surface-area (b2), the
platinum loading on the anode (b3) and the air flow (b7), and a new multiple
regression analysis is executed, shown in Table 38 and the accuracy of the
prediction is shown in Figure 80.
Table 38: Multiple regression analysis on a selected number of variables. Regression Coefficient t(N-P-1;0,05) 2,018082
Estimate SE t(cal) P(T<=t(cal))Lower 95%Upper 95% VIF (Variance
Inflation Factor)
b0 574,833558,787049,778235*** (P<=0.001) 2,18E-12 456,1964 693,4705
b1:deg C 0,9929670,422966 2,34763 * (P<=0.05) 0,02368 0,139388 1,846547 1,141642
b2:ml/min (a) -5,20097 0,815925 -6,37433*** (P<=0.001) 1,15E-07 -6,84758 -3,55437 1,763722
b3:mol/dm3 (a) -47,3301 17,43898 -2,71404 ** (P<=0.01) 0,0096 -82,5234 -12,1368 1,964447
b4:mg/cm2 (k) 34,464486,7660115,093767*** (P<=0.001) 7,85E-06 20,81012 48,11885 1,919582

234
0
100
200
300
400
500
600
700
800
900
0 200 400 600 800 1000
mV (OC) observed
mV
(O
C)
pre
dic
ted
Figure 80: the observed and predicted value of the open cell voltage for the second
estimate.
With a significance of 99% and a R2 = 0.65 (n=47) the following equation
predicting the practical open cell Voltage (in mV) can be defined:
574.8 0.9930 5.2010 47.3301 34.4645OC MeOH cV T v N m= + − − + (54)
In this equation it can be seen that the influence of methanol concentration
is negatively correlated to the open cell Voltage. In [2] the dependency of the
fuel flow is researched experimentally. This research confirms the negative
correlation of the methanol concentration with the open cell Voltage. Besides
this negative correlation the research showed the neglecting influence of fuel
flow on the cell Voltage when it was in between 1 and 4.5 ml min-1. Because
the fuel flows in small portable fuel cells is low, this variable is excluded and
a new multiple regression analysis is executed which will result in a relation
between the open cell Voltage and the temperature T, the platinum loading
on the cathode mc and the methanol concentration N.
Table 39 shows the results from the multiple regression analysis when only
taking the previous variables into account. Again the accuracy of the
prediction is shown in Figure 81.

235
Table 39: Final multiple regression analysis on the most significant variables, temperature, fuel concentration and the platinum loading on the cathode.
Regression Coefficient t(N-P-1;0,05) 2,016692
Estimate SE t(cal) P(T<=t(cal)) Lower 95% Upper 95% VIF
b0 456,757277,34189 5,90569 *** (P<=0.001) 5,01E-07 300,7824 612,732
b1:deg C 1,5809110,5722232,762754 ** (P<=0.01) 0,0084 0,426914 2,734909 1,087351
b2:mol/dm3 (a) -10,7873 22,83112 -0,47248 N.S. (P>0.05) 0,638973 -56,8306 35,25608 1,752156
b3:mg/cm2 (k) 18,59993 8,72175 2,132592 * (P<=0.05) 0,038709 1,010849 36,18902 1,659848
0
100
200
300
400
500
600
700
800
900
0 200 400 600 800 1000
mV (OC) observed
mV
(O
C)
pre
dic
ted
Figure 81: the observed and predicted value of the open cell voltage for the third estimate.
With a significance of 99% and a R2 =0.31 (n=47) the following equation can
be stated:
456.8 1.5809 10.7873 18.5999OC kathV T N m= + − + (55)
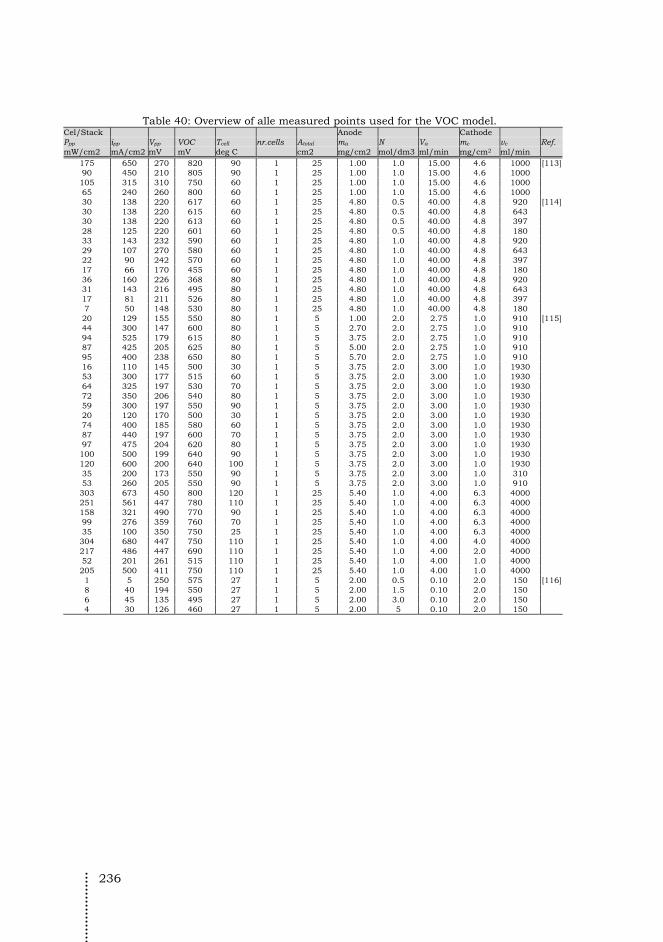
236
Table 40: Overview of alle measured points used for the VOC model. Cel/Stack Anode Cathode Ppp ipp Vpp VOC Tcell nr.cells Atotal ma N Va mc vc Ref. mW/cm2 mA/cm2 mV mV deg C cm2 mg/cm2 mol/dm3 ml/min mg/cm2 ml/min
175 650 270 820 90 1 25 1.00 1.0 15.00 4.6 1000 [113] 90 450 210 805 90 1 25 1.00 1.0 15.00 4.6 1000 105 315 310 750 60 1 25 1.00 1.0 15.00 4.6 1000 65 240 260 800 60 1 25 1.00 1.0 15.00 4.6 1000 30 138 220 617 60 1 25 4.80 0.5 40.00 4.8 920 [114] 30 138 220 615 60 1 25 4.80 0.5 40.00 4.8 643 30 138 220 613 60 1 25 4.80 0.5 40.00 4.8 397 28 125 220 601 60 1 25 4.80 0.5 40.00 4.8 180 33 143 232 590 60 1 25 4.80 1.0 40.00 4.8 920 29 107 270 580 60 1 25 4.80 1.0 40.00 4.8 643 22 90 242 570 60 1 25 4.80 1.0 40.00 4.8 397 17 66 170 455 60 1 25 4.80 1.0 40.00 4.8 180 36 160 226 368 80 1 25 4.80 1.0 40.00 4.8 920 31 143 216 495 80 1 25 4.80 1.0 40.00 4.8 643 17 81 211 526 80 1 25 4.80 1.0 40.00 4.8 397 7 50 148 530 80 1 25 4.80 1.0 40.00 4.8 180 20 129 155 550 80 1 5 1.00 2.0 2.75 1.0 910 [115] 44 300 147 600 80 1 5 2.70 2.0 2.75 1.0 910 94 525 179 615 80 1 5 3.75 2.0 2.75 1.0 910 87 425 205 625 80 1 5 5.00 2.0 2.75 1.0 910 95 400 238 650 80 1 5 5.70 2.0 2.75 1.0 910 16 110 145 500 30 1 5 3.75 2.0 3.00 1.0 1930 53 300 177 515 60 1 5 3.75 2.0 3.00 1.0 1930 64 325 197 530 70 1 5 3.75 2.0 3.00 1.0 1930 72 350 206 540 80 1 5 3.75 2.0 3.00 1.0 1930 59 300 197 550 90 1 5 3.75 2.0 3.00 1.0 1930 20 120 170 500 30 1 5 3.75 2.0 3.00 1.0 1930 74 400 185 580 60 1 5 3.75 2.0 3.00 1.0 1930 87 440 197 600 70 1 5 3.75 2.0 3.00 1.0 1930 97 475 204 620 80 1 5 3.75 2.0 3.00 1.0 1930 100 500 199 640 90 1 5 3.75 2.0 3.00 1.0 1930 120 600 200 640 100 1 5 3.75 2.0 3.00 1.0 1930 35 200 173 550 90 1 5 3.75 2.0 3.00 1.0 310 53 260 205 550 90 1 5 3.75 2.0 3.00 1.0 910 303 673 450 800 120 1 25 5.40 1.0 4.00 6.3 4000 251 561 447 780 110 1 25 5.40 1.0 4.00 6.3 4000 158 321 490 770 90 1 25 5.40 1.0 4.00 6.3 4000 99 276 359 760 70 1 25 5.40 1.0 4.00 6.3 4000 35 100 350 750 25 1 25 5.40 1.0 4.00 6.3 4000 304 680 447 750 110 1 25 5.40 1.0 4.00 4.0 4000 217 486 447 690 110 1 25 5.40 1.0 4.00 2.0 4000 52 201 261 515 110 1 25 5.40 1.0 4.00 1.0 4000 205 500 411 750 110 1 25 5.40 1.0 4.00 1.0 4000 1 5 250 575 27 1 5 2.00 0.5 0.10 2.0 150 [116] 8 40 194 550 27 1 5 2.00 1.5 0.10 2.0 150 6 45 135 495 27 1 5 2.00 3.0 0.10 2.0 150 4 30 126 460 27 1 5 2.00 5 0.10 2.0 150

237
B
Mathematica files
To test the algorithm proposed in chapter 9 this is implemented in two
Mathematica [177] programs, one used for the first and second level run
(Section B.1) and the third-level run, using an evolutionary strategy (Section
B.2). The inputtables including the commercially available pumps and
intermediate accumulator can be found in Section B.3.
B.1 Initial algorithm On the following pages the initial program is presented which is used for the
second test run.
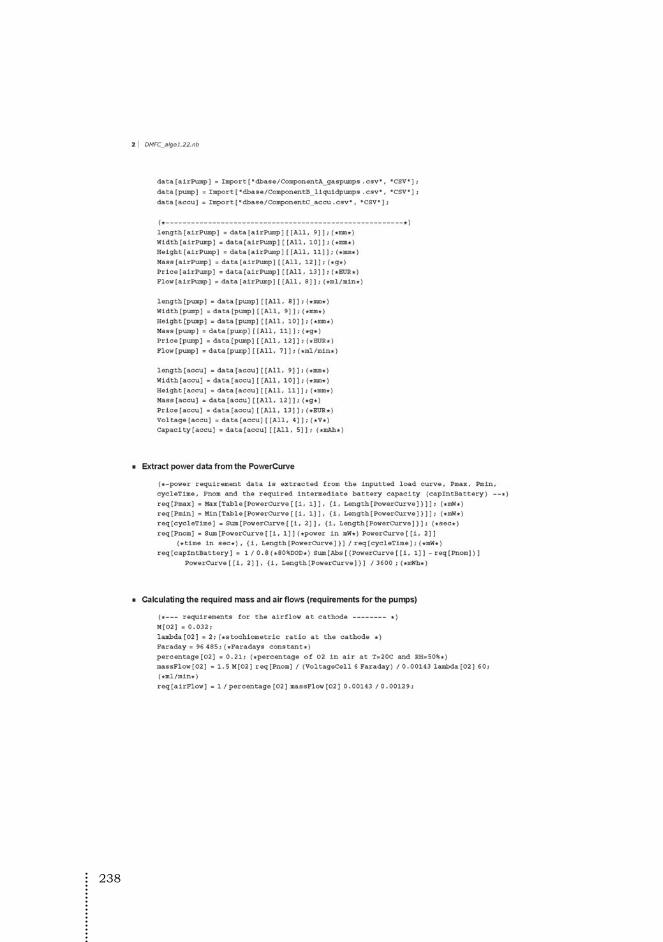
238
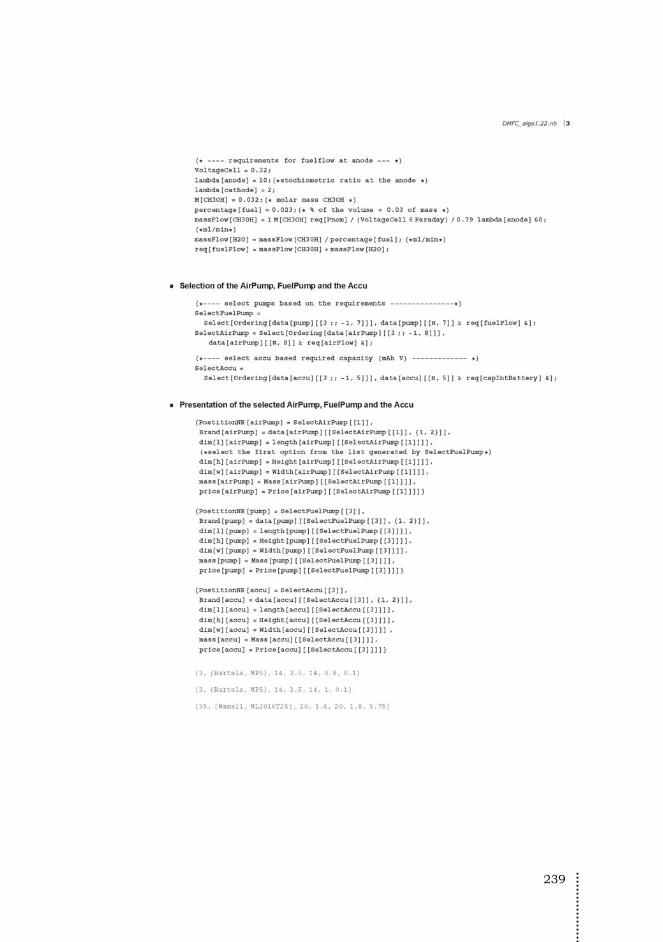
239

240

241
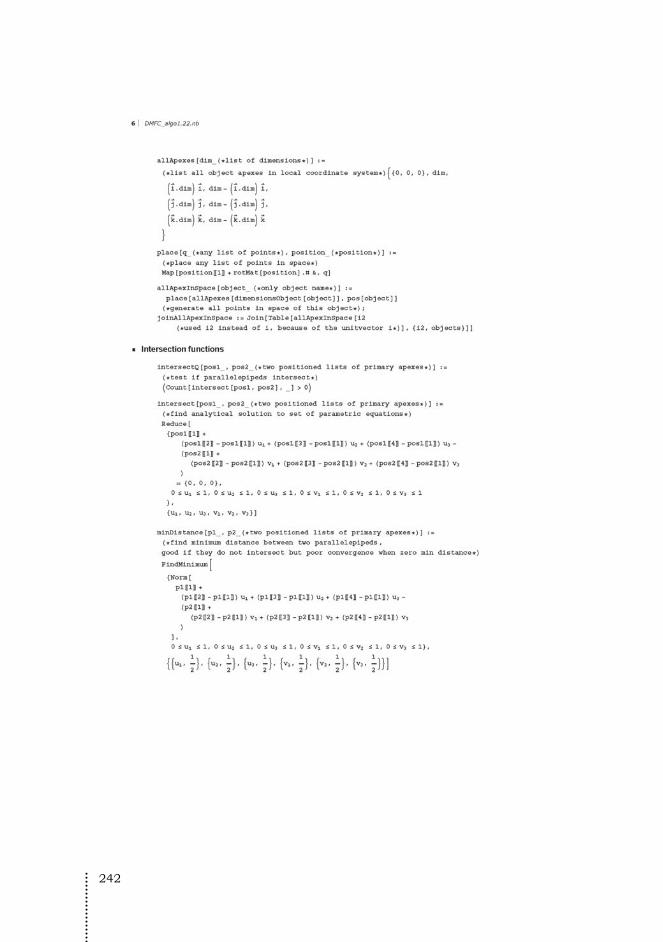
242

243
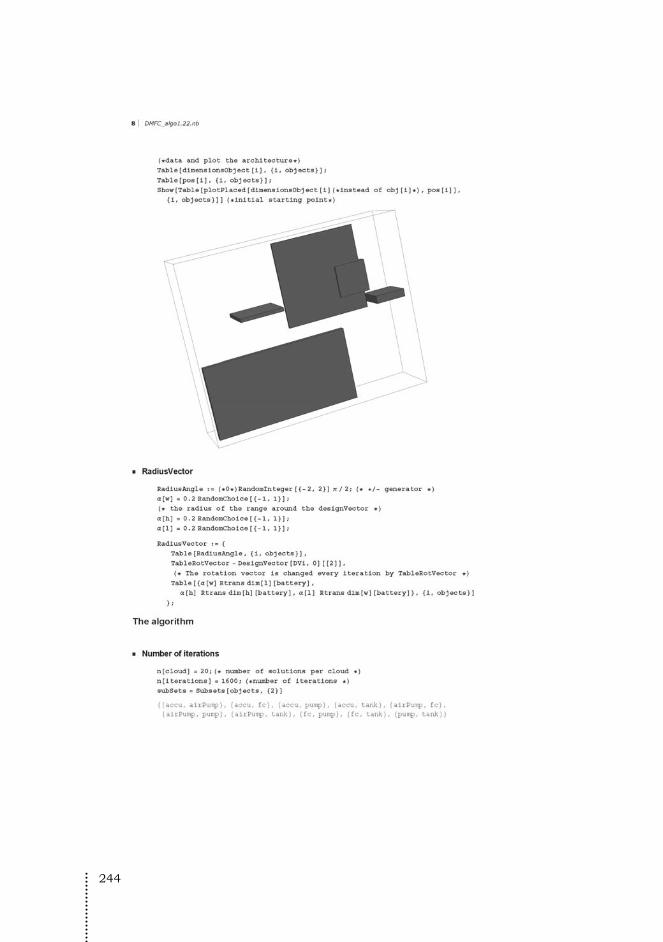
244
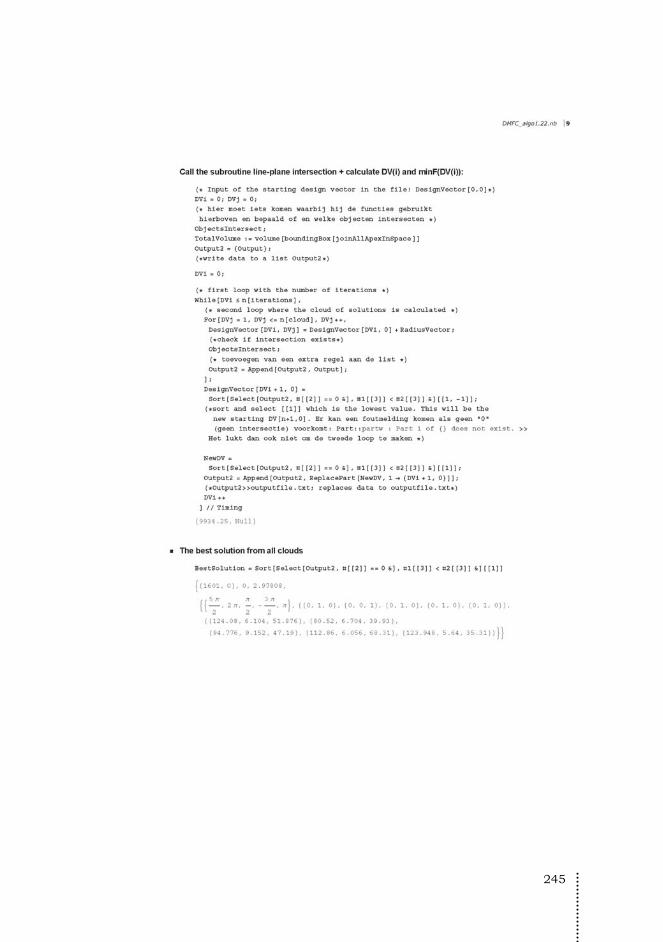
245
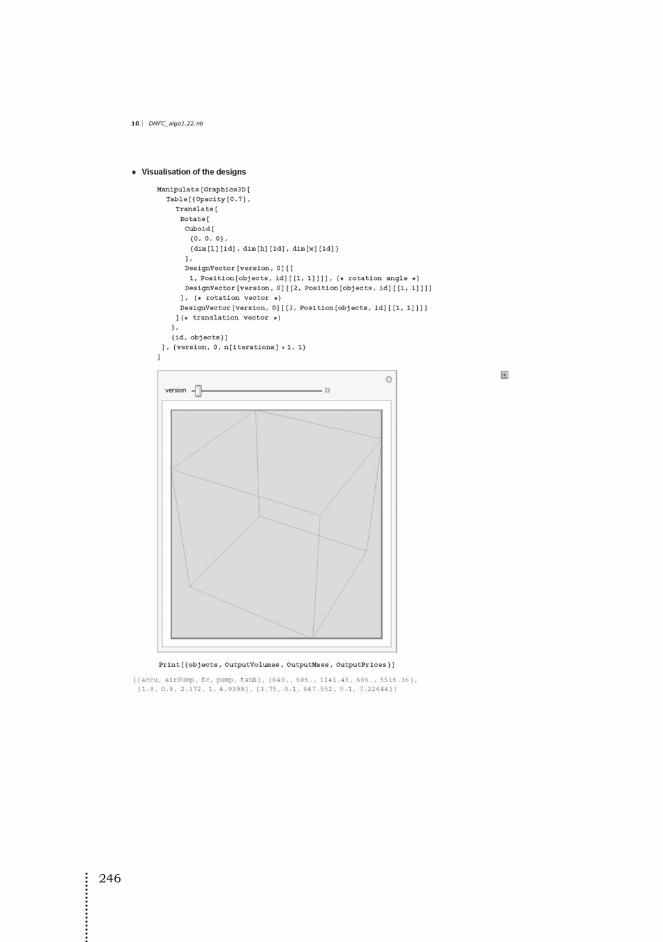
246
247
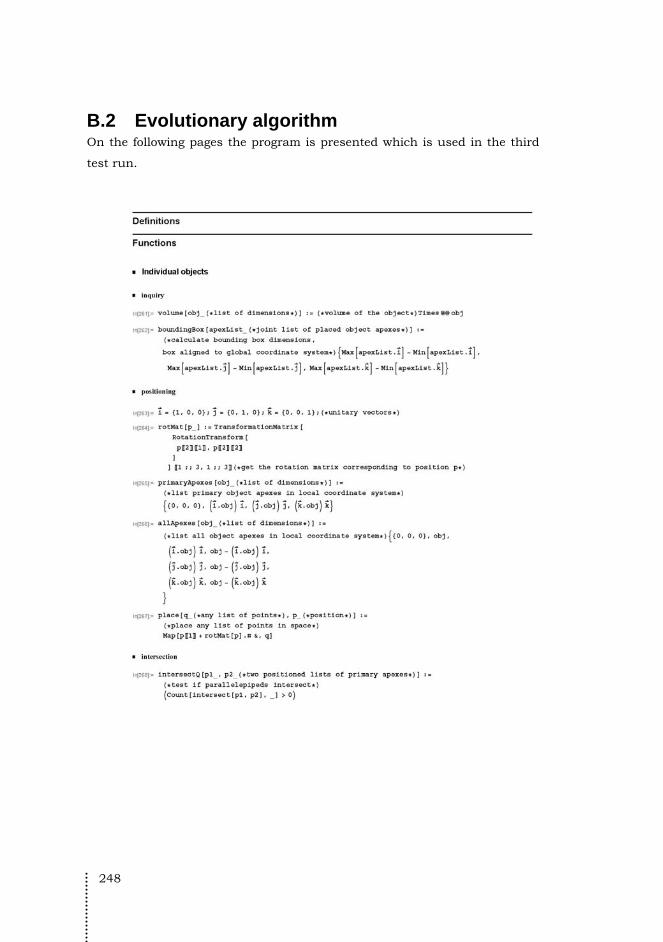
248
B.2 Evolutionary algorithm On the following pages the program is presented which is used in the third
test run.
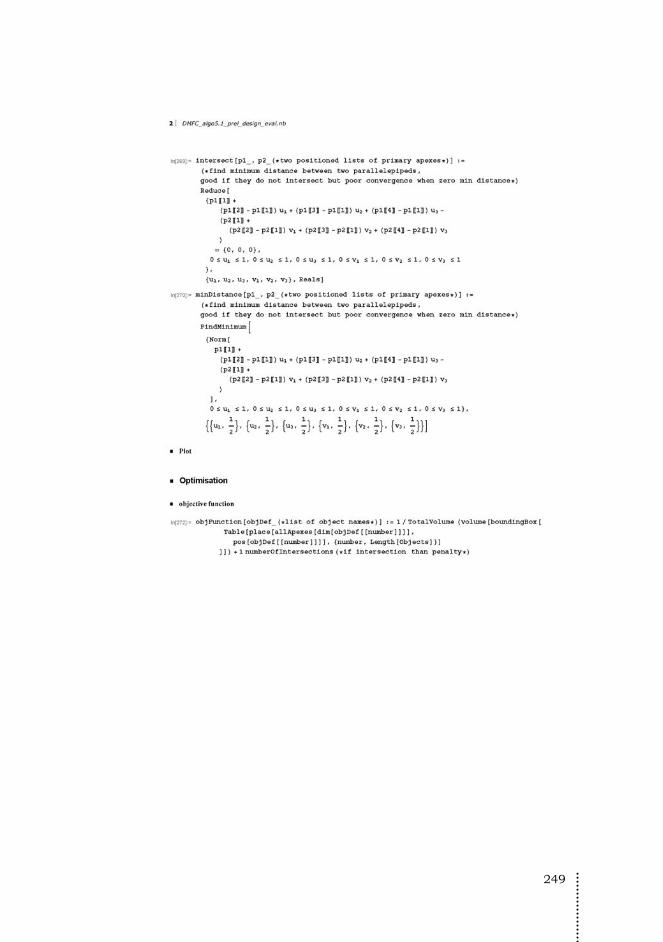
249

250

251

252
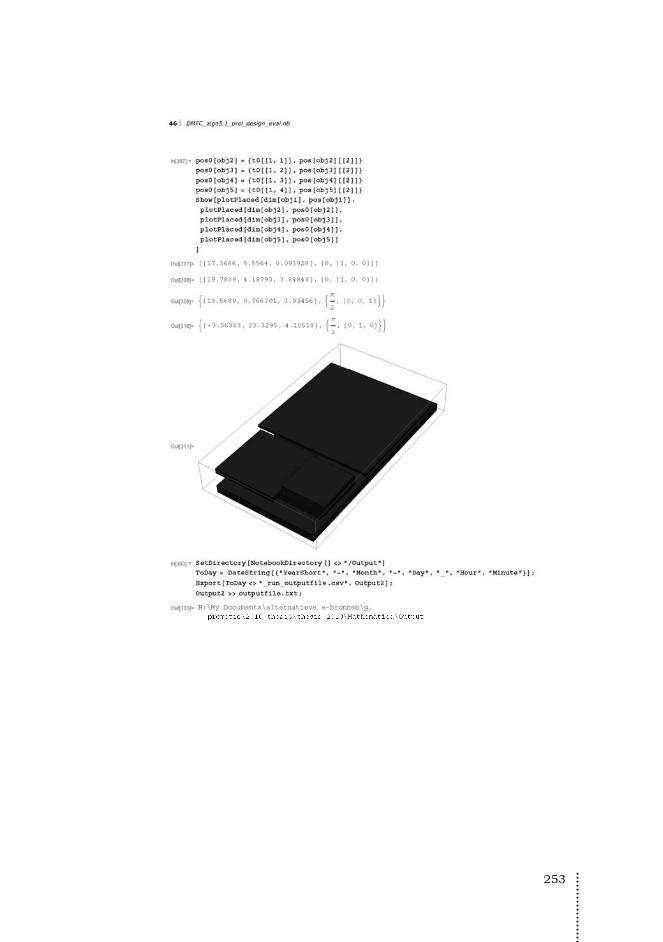
253
254
B.3 Input tables (dbase) All non-flexible components specifications are stored in CSV file format. In
this Section the tables are presented for the gas pump, the liquid pump and
the intermediate accumulator (either a rechargeable battery or
supercapacitor).
The following tables are included in this appendix:
• ComponentA_gaspumps.csv
• ComponentB_liquidpumps.csv
• ComponentC_accu.csv (2 parts)
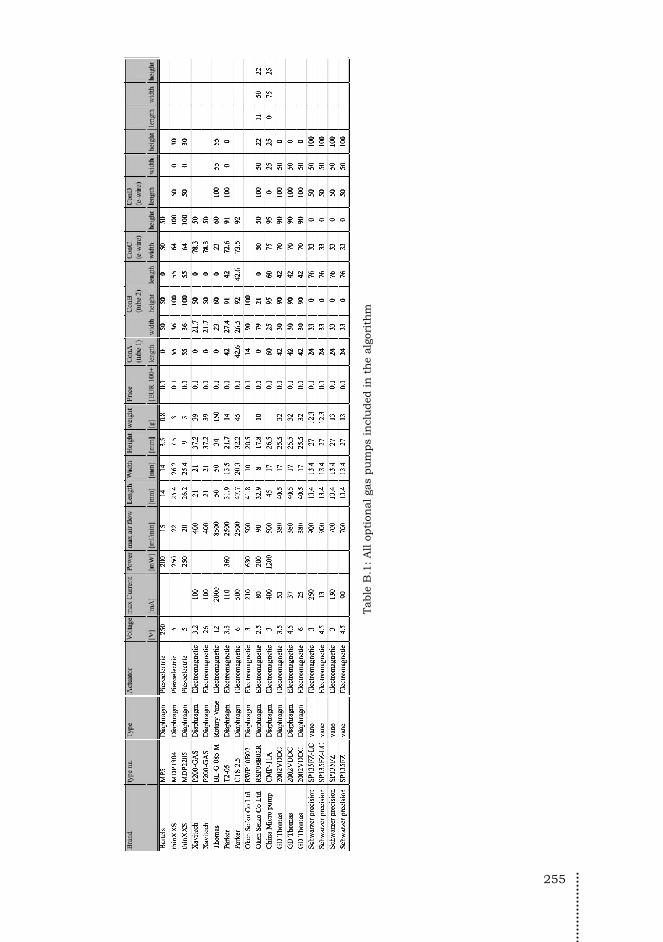
255
Tab
le B
.1: A
ll o
pti
onal
gas
pu
mps
incl
uded
in
th
e al
gori
thm
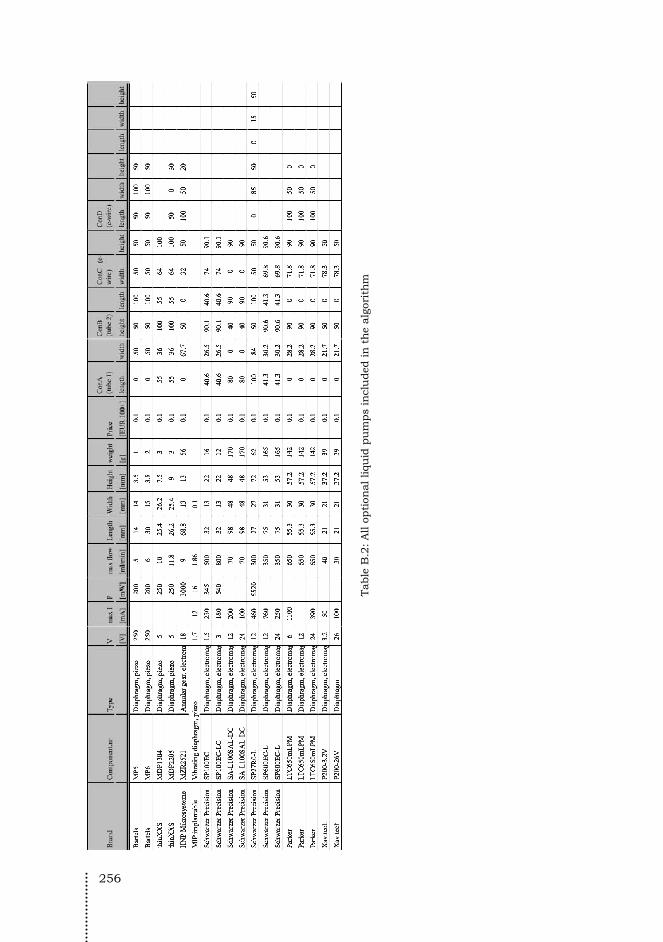
256
Tab
le B
.2: A
ll o
pti
onal
liq
uid
pu
mps
incl
uded
in
th
e al
gori
thm

257
Tab
le B
.3: A
ll o
pti
onal
in
term
edia
te a
ccu
mu
lato
rs in
clu
ded
in
th
e al
gori
thm
(par
t 1).
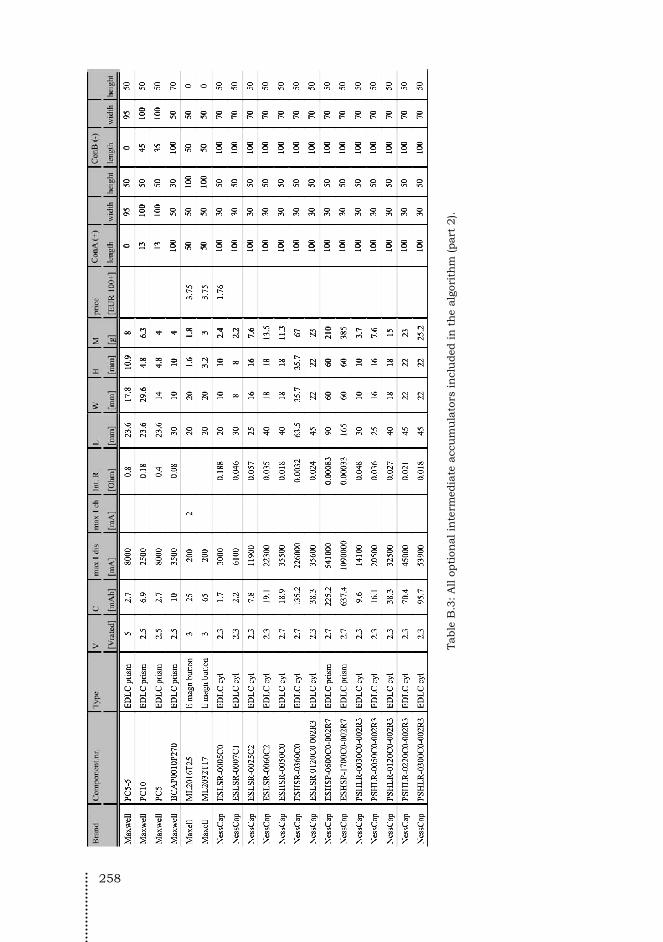
258
Tab
le B
.3: A
ll o
pti
onal
in
term
edia
te a
ccu
mu
lato
rs in
clu
ded
in
th
e al
gori
thm
(par
t 2).

259
Acknowledgements
This bookwork is the result of a long period of research which wouldn’t be
possible without the help of a few people. First of all I want to thank my
promotors and co-promotor, Han Brezet, Christos Spitas and Joris Vergeest.
Han, thank you for your support during the whole period, you were the only
constant factor making research a fun thing. Christos, for making me finish
this PhD and support during the last year of work, we finished it together.
Joris, for being a support during the last period of draft reading and giving
me constructive feedback.
I would like to thank Kas Hemmes for our talks about fuel cells and you
being available when I needed information. Thank you, professor Hans de
Deugd and professor Flip Doorschot for introducing me to the research field
of conceptual modeling and for being supportive in the intermediate phase of
this research.
In 2009 I visited the Jet Propulsion Lab, and my visit was received openly by
Thomas Valdez and Paul Timmerman. I would like to thank you for your
openness and cooperation in my search for information. I have learned a lot
from you guys.
Arjen, for being my roommate, our talks, us cracking jokes and of course
being a good friend. I would like to express my appreciation to all my
colleagues at the Design Engineering/Product Engineering (at random) and
especially: Bert, Maarten, Sander, Gerard, Erik and Erik, JC, Marco, Martin,
Herman and Fred. During the last period of my PhD, you guys were there to
reset my mind and take over a lot of my regular work. Dave for proofreading
and helping me out with my Dunglish (sometimes leaving it like it is). Katrijn
for proofreading the thesis and the mental text-messages during the last
couple of months.

260
This work wouldn’t be feasible without the contribution of several students.
Especially I would like to thank Maarten for your excellent CAD models, Eric
for your down-to-earth approach to fuel cell design, and Anne for your help
in the user assessment.
During the writing process I listened a lot to DJ Sven, DJ Sylverius and Ben
Liebrand (Veronica radio). Hereby my thanks for being in my headphones
during the long periods of programming, writing and thinking. In
anticipation of tonight I would like to thank DJ Fiesto for keeping me up on
the dance floor tonight.
During the PhD I am accompanied by two excellent paranymphs. Ruben
thanks for being an excellent (ex)colleague, roommate and thank you for
introducing me jazz music. Xander, thanks for being a friend and your
support during the defense.
I would like to thank my own family, my parents, brother and sister, and the
family of Petra for being supportive and interested, even during the last
couple of rough months, where it became clear what is really important. I
would like to show my gratitude to Petra, for being supportive and loving
during the whole period. Especially during the last couple of months taking
care of so many things in our lives. Lotte, Karsten and Evie, for making me
smile when I come home and showing me that learning something new every
day is a blessing.
261
Curriculum Vitae
Bas Flipsen was born in Vlierden, the Netherlands on July 13, 1971. He
obtained his HAVO and VWO diplomas in 1988 and 1990, respectively. As a
child he builds aircrafts, objects and repaired his go-cart using dad’s yellow
construction tape and cardboard. In continuation with his early interests he
went to Delft in August 1990, to study Aeronautical Engineering where he
graduated in 1997, on a preliminary design of a ‘Quiet Short Take Off and
Landing Aircraft’. During this period he learned about mathematical
modeling in de conceptualization phase and wanted to explore the creativity
part more. He continued his studies at the school of Industrial Design
Engineering, and graduated in 1999 on the design of a ‘low-power close-in
water heater using a heat pump’. He became an engineering product-
developer at the Delft Product Centre (TNO Industrial Technologies), where
he made first contact with sustainable power systems for portable
electronics. As a mathematical designer he worked on different projects at
the Sustainable Product Innovation group, and in 2002 he made the switch
back to extend his academic career at the Delft University of Technology,
where he started out as an assistant professor. In 2004 the PhD was set to
go and the result is what you have in front of you. Bas loves cycling, eighties
and nineties disco music and likes to draw coloring pages for his kids.
For my full CV:
http://nl.linkedin.com/in/basflipsen

262
Copyright © 2022 FDOKUMEN