Samsung Electronics
87
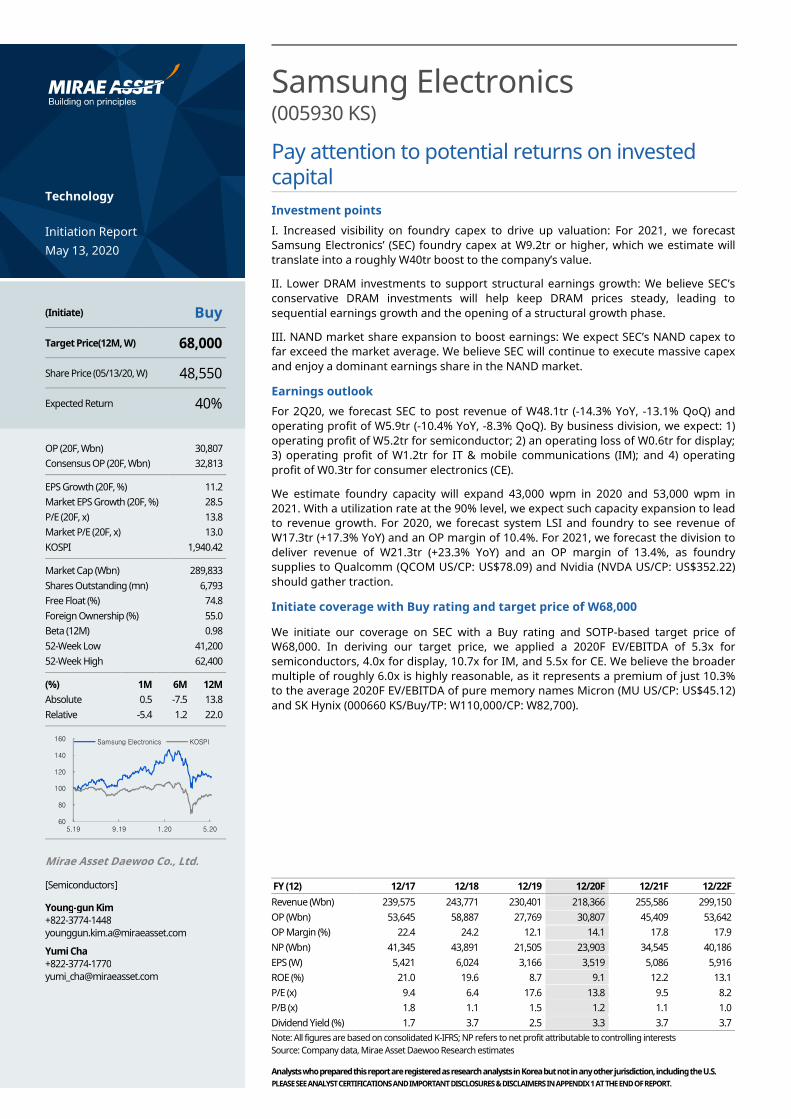
Samsung Electronics ( 005930 KS) Pay attention to potential returns on invested capital Investment points I. Increased visibility on foundry capex to drive up valuation: For 2021, we forecast Samsung Electronics’ (SEC) foundry capex at W9.2tr or higher, which we estimate will translate into a roughly W40tr boost to the company’s value. II. Lower DRAM investments to support structural earnings growth: We believe SEC’s conservative DRAM investments will help keep DRAM prices steady, leading to sequential earnings growth and the opening of a structural growth phase. III. NAND market share expansion to boost earnings: We expect SEC’s NAND capex to far exceed the market average. We believe SEC will continue to execute massive capex and enjoy a dominant earnings share in the NAND market. Earnings outlook For 2Q20, we forecast SEC to post revenue of W48.1tr (-14.3% YoY, -13.1% QoQ) and operating profit of W5.9tr (-10.4% YoY, -8.3% QoQ). By business division, we expect: 1) operating profit of W5.2tr for semiconductor; 2) an operating loss of W0.6tr for display; 3) operating profit of W1.2tr for IT & mobile communications (IM); and 4) operating profit of W0.3tr for consumer electronics (CE). We estimate foundry capacity will expand 43,000 wpm in 2020 and 53,000 wpm in 2021. With a utilization rate at the 90% level, we expect such capacity expansion to lead to revenue growth. For 2020, we forecast system LSI and foundry to see revenue of W17.3tr (+17.3% YoY) and an OP margin of 10.4%. For 2021, we forecast the division to deliver revenue of W21.3tr (+23.3% YoY) and an OP margin of 13.4%, as foundry supplies to Qualcomm (QCOM US/CP: US$78.09) and Nvidia (NVDA US/CP: US$352.22) should gather traction. Initiate coverage with Buy rating and target price of W68,000 We initiate our coverage on SEC with a Buy rating and SOTP-based target price of W68,000. In deriving our target price, we applied a 2020F EV/EBITDA of 5.3x for semiconductors, 4.0x for display, 10.7x for IM, and 5.5x for CE. We believe the broader multiple of roughly 6.0x is highly reasonable, as it represents a premium of just 10.3% to the average 2020F EV/EBITDA of pure memory names Micron (MU US/CP: US$45.12) and SK Hynix (000660 KS/Buy/TP: W110,000/CP: W82,700). FY (12) 12/17 12/18 12/19 12/20F 12/21F 12/22F Revenue (Wbn) 239,575 243,771 230,401 218,366 255,586 299,150 OP (Wbn) 53,645 58,887 27,769 30,807 45,409 53,642 OP Margin (%) 22.4 24.2 12.1 14.1 17.8 17.9 NP (Wbn) 41,345 43,891 21,505 23,903 34,545 40,186 EPS (W) 5,421 6,024 3,166 3,519 5,086 5,916 ROE (%) 21.0 19.6 8.7 9.1 12.2 13.1 P/E (x) 9.4 6.4 17.6 13.8 9.5 8.2 P/B (x) 1.8 1.1 1.5 1.2 1.1 1.0 Dividend Yield (%) 1.7 3.7 2.5 3.3 3.7 3.7 Note: All figures are based on consolidated K-IFRS; NP refers to net profit attributable to controlling interests Source: Company data, Mirae Asset Daewoo Research estimates Technology Initiation Report May 13, 2020 (Initiate) Buy Target Price(12M, W) 68,000 Share Price (05/13/20, W) 48,550 Expected Return 40% OP (20F, Wbn) 30,807 Consensus OP (20F, Wbn) 32,813 EPS Growth (20F, %) 11.2 Market EPS Growth (20F, %) 28.5 P/E (20F, x) 13.8 Market P/E (20F, x) 13.0 KOSPI 1,940.42 Market Cap (Wbn) 289,833 Shares Outstanding (mn) 6,793 Free Float (%) 74.8 Foreign Ownership (%) 55.0 Beta (12M) 0.98 52-Week Low 41,200 52-Week High 62,400 (%) 1M 6M 12M Absolute 0.5 -7.5 13.8 Relative -5.4 1.2 22.0 Mirae Asset Daewoo Co., Ltd. [ Semiconductors] Young-gun Kim +822-3774-1448 [email protected] Yumi Cha +822-3774-1770 [email protected] 60 80 100 120 140 160 5.19 9.19 1.20 5.20 Samsung Electronics KOSPI
-
Upload
khangminh22 -
Category
Documents
-
view
0 -
download
0
Transcript of Samsung Electronics
Samsung Electronics (005930 KS)
Pay attention to potential returns on invested capital
Investment points
I. Increased visibility on foundry capex to drive up valuation: For 2021, we forecast
Samsung Electronics’ (SEC) foundry capex at W9.2tr or higher, which we estimate will
translate into a roughly W40tr boost to the company’s value.
II. Lower DRAM investments to support structural earnings growth: We believe SEC’s
conservative DRAM investments will help keep DRAM prices steady, leading to
sequential earnings growth and the opening of a structural growth phase.
III. NAND market share expansion to boost earnings: We expect SEC’s NAND capex to
far exceed the market average. We believe SEC will continue to execute massive capex
and enjoy a dominant earnings share in the NAND market.
Earnings outlook
For 2Q20, we forecast SEC to post revenue of W48.1tr (-14.3% YoY, -13.1% QoQ) and
operating profit of W5.9tr (-10.4% YoY, -8.3% QoQ). By business division, we expect: 1)
operating profit of W5.2tr for semiconductor; 2) an operating loss of W0.6tr for display;
3) operating profit of W1.2tr for IT & mobile communications (IM); and 4) operating
profit of W0.3tr for consumer electronics (CE).
We estimate foundry capacity will expand 43,000 wpm in 2020 and 53,000 wpm in
2021. With a utilization rate at the 90% level, we expect such capacity expansion to lead
to revenue growth. For 2020, we forecast system LSI and foundry to see revenue of
W17.3tr (+17.3% YoY) and an OP margin of 10.4%. For 2021, we forecast the division to
deliver revenue of W21.3tr (+23.3% YoY) and an OP margin of 13.4%, as foundry
supplies to Qualcomm (QCOM US/CP: US$78.09) and Nvidia (NVDA US/CP: US$352.22)
should gather traction.
Initiate coverage with Buy rating and target price of W68,000
We initiate our coverage on SEC with a Buy rating and SOTP-based target price of
W68,000. In deriving our target price, we applied a 2020F EV/EBITDA of 5.3x for
semiconductors, 4.0x for display, 10.7x for IM, and 5.5x for CE. We believe the broader
multiple of roughly 6.0x is highly reasonable, as it represents a premium of just 10.3%
to the average 2020F EV/EBITDA of pure memory names Micron (MU US/CP: US$45.12)
and SK Hynix (000660 KS/Buy/TP: W110,000/CP: W82,700).
FY (12) 12/17 12/18 12/19 12/20F 12/21F 12/22F
Revenue (Wbn) 239,575 243,771 230,401 218,366 255,586 299,150
OP (Wbn) 53,645 58,887 27,769 30,807 45,409 53,642
OP Margin (%) 22.4 24.2 12.1 14.1 17.8 17.9
NP (Wbn) 41,345 43,891 21,505 23,903 34,545 40,186
EPS (W) 5,421 6,024 3,166 3,519 5,086 5,916
ROE (%) 21.0 19.6 8.7 9.1 12.2 13.1
P/E (x) 9.4 6.4 17.6 13.8 9.5 8.2
P/B (x) 1.8 1.1 1.5 1.2 1.1 1.0
Dividend Yield (%) 1.7 3.7 2.5 3.3 3.7 3.7
Note: All figures are based on consolidated K-IFRS; NP refers to net profit attributable to controlling interests
Source: Company data, Mirae Asset Daewoo Research estimates
Technology
Initiation Report
May 13, 2020
(Initiate) Buy
Target Price(12M, W) 68,000
Share Price (05/13/20, W) 48,550
Expected Return 40%
OP (20F, Wbn) 30,807
Consensus OP (20F, Wbn) 32,813
EPS Growth (20F, %) 11.2
Market EPS Growth (20F, %) 28.5
P/E (20F, x) 13.8
Market P/E (20F, x) 13.0
KOSPI 1,940.42
Market Cap (Wbn) 289,833
Shares Outstanding (mn) 6,793
Free Float (%) 74.8
Foreign Ownership (%) 55.0
Beta (12M) 0.98
52-Week Low 41,200
52-Week High 62,400
(%) 1M 6M 12M
Absolute 0.5 -7.5 13.8
Relative -5.4 1.2 22.0
Mirae Asset Daewoo Co., Ltd.
[Semiconductors]
Young-gun Kim +822-3774-1448 [email protected]
Yumi Cha +822-3774-1770 [email protected]
60
80
100
120
140
160
5.19 9.19 1.20 5.20
Samsung Electronics KOSPI

Samsung Electronics
Mirae Asset Daewoo Research 2
May 13, 2020
C O N T E N T S
I. Investment points 4 Point I: Increased visibility on foundry capex to drive up valuation 4 Point II: Lower DRAM investments � Structural earnings growth 14 Point III: NAND market share expansion to boost earnings 19
II. Outlook and earnings forecasts by division 25 Key assumptions for IT product demand forecasts 25 [Semiconductors] NAND outlook 43 [Semiconductors] DRAM outlook 57 [Semiconductors] System LSI and foundry outlook 72 Display outlook 77 IM outlook 79
III. Valuation 80
IV. Shareholder returns 83
Samsung Electronics
Mirae Asset Daewoo Research 3
May 13, 2020
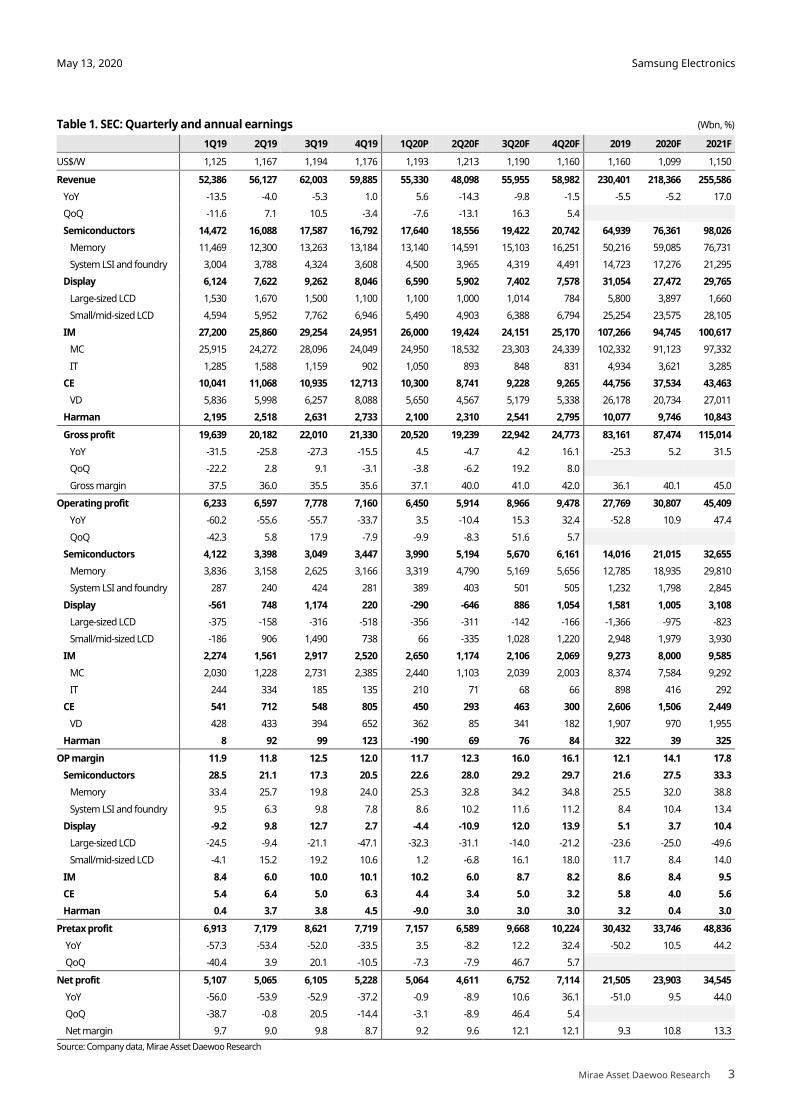
Table 1. SEC: Quarterly and annual earnings (Wbn, %)
1Q19 2Q19 3Q19 4Q19 1Q20P 2Q20F 3Q20F 4Q20F 2019 2020F 2021F
US$/W 1,125 1,167 1,194 1,176 1,193 1,213 1,190 1,160 1,160 1,099 1,150
Revenue 52,386 56,127 62,003 59,885 55,330 48,098 55,955 58,982 230,401 218,366 255,586
YoY -13.5 -4.0 -5.3 1.0 5.6 -14.3 -9.8 -1.5 -5.5 -5.2 17.0
QoQ -11.6 7.1 10.5 -3.4 -7.6 -13.1 16.3 5.4
Semiconductors 14,472 16,088 17,587 16,792 17,640 18,556 19,422 20,742 64,939 76,361 98,026
Memory 11,469 12,300 13,263 13,184 13,140 14,591 15,103 16,251 50,216 59,085 76,731
System LSI and foundry 3,004 3,788 4,324 3,608 4,500 3,965 4,319 4,491 14,723 17,276 21,295
Display 6,124 7,622 9,262 8,046 6,590 5,902 7,402 7,578 31,054 27,472 29,765
Large-sized LCD 1,530 1,670 1,500 1,100 1,100 1,000 1,014 784 5,800 3,897 1,660
Small/mid-sized LCD 4,594 5,952 7,762 6,946 5,490 4,903 6,388 6,794 25,254 23,575 28,105
IM 27,200 25,860 29,254 24,951 26,000 19,424 24,151 25,170 107,266 94,745 100,617
MC 25,915 24,272 28,096 24,049 24,950 18,532 23,303 24,339 102,332 91,123 97,332
IT 1,285 1,588 1,159 902 1,050 893 848 831 4,934 3,621 3,285
CE 10,041 11,068 10,935 12,713 10,300 8,741 9,228 9,265 44,756 37,534 43,463
VD 5,836 5,998 6,257 8,088 5,650 4,567 5,179 5,338 26,178 20,734 27,011
Harman 2,195 2,518 2,631 2,733 2,100 2,310 2,541 2,795 10,077 9,746 10,843
Gross profit 19,639 20,182 22,010 21,330 20,520 19,239 22,942 24,773 83,161 87,474 115,014
YoY -31.5 -25.8 -27.3 -15.5 4.5 -4.7 4.2 16.1 -25.3 5.2 31.5
QoQ -22.2 2.8 9.1 -3.1 -3.8 -6.2 19.2 8.0
Gross margin 37.5 36.0 35.5 35.6 37.1 40.0 41.0 42.0 36.1 40.1 45.0
Operating profit 6,233 6,597 7,778 7,160 6,450 5,914 8,966 9,478 27,769 30,807 45,409
YoY -60.2 -55.6 -55.7 -33.7 3.5 -10.4 15.3 32.4 -52.8 10.9 47.4
QoQ -42.3 5.8 17.9 -7.9 -9.9 -8.3 51.6 5.7
Semiconductors 4,122 3,398 3,049 3,447 3,990 5,194 5,670 6,161 14,016 21,015 32,655
Memory 3,836 3,158 2,625 3,166 3,319 4,790 5,169 5,656 12,785 18,935 29,810
System LSI and foundry 287 240 424 281 389 403 501 505 1,232 1,798 2,845
Display -561 748 1,174 220 -290 -646 886 1,054 1,581 1,005 3,108
Large-sized LCD -375 -158 -316 -518 -356 -311 -142 -166 -1,366 -975 -823
Small/mid-sized LCD -186 906 1,490 738 66 -335 1,028 1,220 2,948 1,979 3,930
IM 2,274 1,561 2,917 2,520 2,650 1,174 2,106 2,069 9,273 8,000 9,585
MC 2,030 1,228 2,731 2,385 2,440 1,103 2,039 2,003 8,374 7,584 9,292
IT 244 334 185 135 210 71 68 66 898 416 292
CE 541 712 548 805 450 293 463 300 2,606 1,506 2,449
VD 428 433 394 652 362 85 341 182 1,907 970 1,955
Harman 8 92 99 123 -190 69 76 84 322 39 325
OP margin 11.9 11.8 12.5 12.0 11.7 12.3 16.0 16.1 12.1 14.1 17.8
Semiconductors 28.5 21.1 17.3 20.5 22.6 28.0 29.2 29.7 21.6 27.5 33.3
Memory 33.4 25.7 19.8 24.0 25.3 32.8 34.2 34.8 25.5 32.0 38.8
System LSI and foundry 9.5 6.3 9.8 7.8 8.6 10.2 11.6 11.2 8.4 10.4 13.4
Display -9.2 9.8 12.7 2.7 -4.4 -10.9 12.0 13.9 5.1 3.7 10.4
Large-sized LCD -24.5 -9.4 -21.1 -47.1 -32.3 -31.1 -14.0 -21.2 -23.6 -25.0 -49.6
Small/mid-sized LCD -4.1 15.2 19.2 10.6 1.2 -6.8 16.1 18.0 11.7 8.4 14.0
IM 8.4 6.0 10.0 10.1 10.2 6.0 8.7 8.2 8.6 8.4 9.5
CE 5.4 6.4 5.0 6.3 4.4 3.4 5.0 3.2 5.8 4.0 5.6
Harman 0.4 3.7 3.8 4.5 -9.0 3.0 3.0 3.0 3.2 0.4 3.0
Pretax profit 6,913 7,179 8,621 7,719 7,157 6,589 9,668 10,224 30,432 33,746 48,836
YoY -57.3 -53.4 -52.0 -33.5 3.5 -8.2 12.2 32.4 -50.2 10.5 44.2
QoQ -40.4 3.9 20.1 -10.5 -7.3 -7.9 46.7 5.7
Net profit 5,107 5,065 6,105 5,228 5,064 4,611 6,752 7,114 21,505 23,903 34,545
YoY -56.0 -53.9 -52.9 -37.2 -0.9 -8.9 10.6 36.1 -51.0 9.5 44.0
QoQ -38.7 -0.8 20.5 -14.4 -3.1 -8.9 46.4 5.4
Net margin 9.7 9.0 9.8 8.7 9.2 9.6 12.1 12.1 9.3 10.8 13.3
Source: Company data, Mirae Asset Daewoo Research
Samsung Electronics
Mirae Asset Daewoo Research 4
May 13, 2020
I. Investment points
Point I: Increased visibility on foundry capex to drive up valuation
SEC’s 2021 foundry capex to reach at least W9.2tr (+77% YoY)
For 2021, we forecast SEC’s foundry capex at W9.2tr or higher, which we estimate will
translate into a roughly W40tr boost to the company’s value (based on TSMC’s [2330 TT/CP:
NT$291.50] average ROIC of 23.5% and P/E of 18x). We believe that capital recovery seems
very likely in the 7nm-or-below segment, in which the company enjoys a duopoly alongside
TSMC.
Technological and capital requirements form high barriers to entry
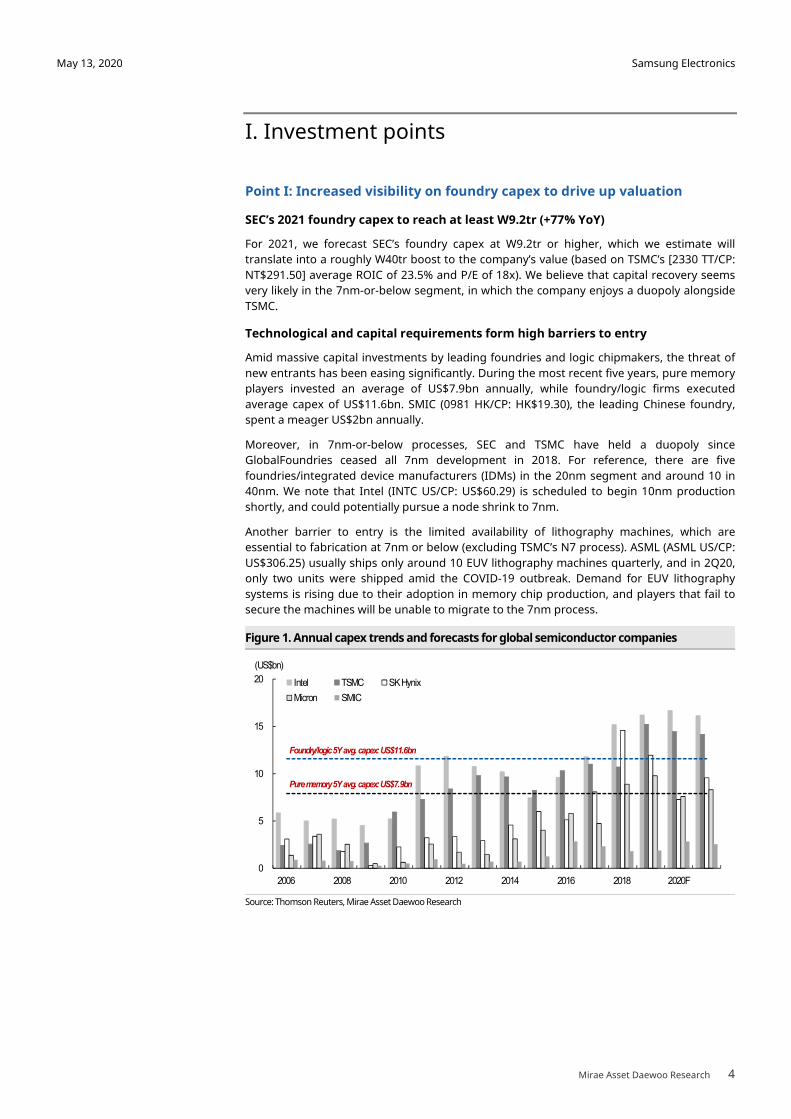
Amid massive capital investments by leading foundries and logic chipmakers, the threat of
new entrants has been easing significantly. During the most recent five years, pure memory
players invested an average of US$7.9bn annually, while foundry/logic firms executed
average capex of US$11.6bn. SMIC (0981 HK/CP: HK$19.30), the leading Chinese foundry,
spent a meager US$2bn annually.
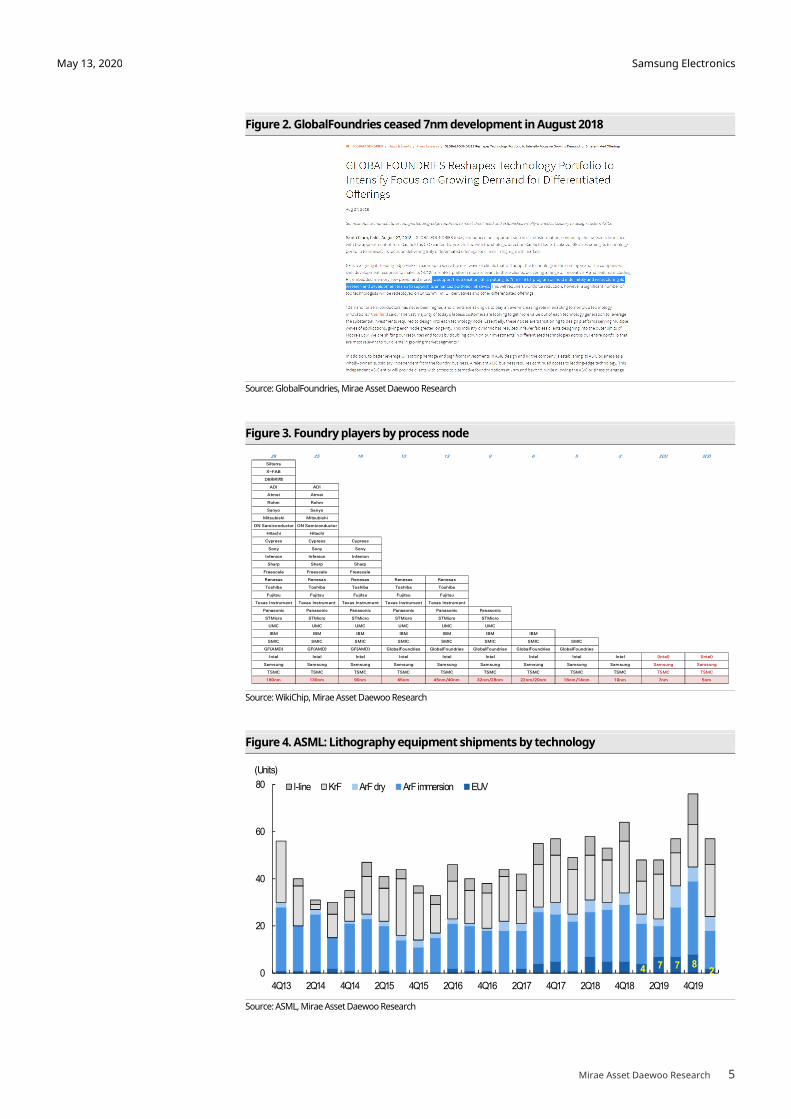
Moreover, in 7nm-or-below processes, SEC and TSMC have held a duopoly since
GlobalFoundries ceased all 7nm development in 2018. For reference, there are five
foundries/integrated device manufacturers (IDMs) in the 20nm segment and around 10 in
40nm. We note that Intel (INTC US/CP: US$60.29) is scheduled to begin 10nm production
shortly, and could potentially pursue a node shrink to 7nm.
Another barrier to entry is the limited availability of lithography machines, which are
essential to fabrication at 7nm or below (excluding TSMC’s N7 process). ASML (ASML US/CP:
US$306.25) usually ships only around 10 EUV lithography machines quarterly, and in 2Q20,
only two units were shipped amid the COVID-19 outbreak. Demand for EUV lithography
systems is rising due to their adoption in memory chip production, and players that fail to
secure the machines will be unable to migrate to the 7nm process.
Figure 1. Annual capex trends and forecasts for global semiconductor companies
Source: Thomson Reuters, Mirae Asset Daewoo Research
0
5
10
15
20
2006 2008 2010 2012 2014 2016 2018 2020F
(US$bn)
Intel TSMC SK Hynix
Micron SMIC
Foundry/logic 5Yavg. capex:US$11.6bn
Pure memory 5Y avg. capex: US$7.9bn
Samsung Electronics
Mirae Asset Daewoo Research 5
May 13, 2020
Figure 2. GlobalFoundries ceased 7nm development in August 2018
Source: GlobalFoundries, Mirae Asset Daewoo Research
Figure 3. Foundry players by process node
Source: WikiChip, Mirae Asset Daewoo Research
Figure 4. ASML: Lithography equipment shipments by technology
Source: ASML, Mirae Asset Daewoo Research
28 25 18 13 13 9 6 5 3 2(3) 2(3)
Silterra
X-FAB
DB하이텍
ADI ADI
Atmei Atmei
Rohm Rohm
Sanyo Sanyo
Mitsubishi Mitsubishi
ON Semiconductor ON Semiconductor
Hitachi Hitachi
Cypress Cypress Cypress
Sony Sony Sony
Infenion Infenion Infenion
Sharp Sharp Sharp
Freescale Freescale Freescale
Renesas Renesas Renesas Renesas Renesas
Toshiba Toshiba Toshiba Toshiba Toshiba
Fujitsu Fujitsu Fujitsu Fujitsu Fujitsu
Texas Instrument Texas Instrument Texas Instrument Texas Instrument Texas Instrument
Panasonic Panasonic Panasonic Panasonic Panasonic Panasonic
STMicro STMicro STMicro STMicro STMicro STMicro
UMC UMC UMC UMC UMC UMC
IBM IBM IBM IBM IBM IBM IBM
SMIC SMIC SMIC SMIC SMIC SMIC SMIC SMIC
GF(AMD) GF(AMD) GF(AMD) GlobalFoundries GlobalFoundries GlobalFoundries GlobalFoundries GlobalFoundries
Intel Intel Intel Intel Intel Intel Intel Intel Intel (Intel) (Intel)
Samsung Samsung Samsung Samsung Samsung Samsung Samsung Samsung Samsung Samsung Samsung
TSMC TSMC TSMC TSMC TSMC TSMC TSMC TSMC TSMC TSMC TSMC
180nm 130nm 90nm 65nm 45nm/40nm 32nm/28nm 22nm/20nm 16nm/14nm 10nm 7nm 5nm
4 7 7 8 2 0
20
40
60
80
4Q13 2Q14 4Q14 2Q15 4Q15 2Q16 4Q16 2Q17 4Q17 2Q18 4Q18 2Q19 4Q19
(Units)
I-line KrF ArF dry ArF immersion EUV

Samsung Electronics
Mirae Asset Daewoo Research 6
May 13, 2020
Demand for SEC’s 7nm-or-below products to expand
� Qualcomm: Mass production of 5nm modem chips to start in 2021
SEC’s foundry unit has won orders for Qualcomm’s Snapdragon X60, the world's first 5nm
5G baseband modem, with mass production scheduled to begin in 2021. We note that,
beginning with the Snapdragon 865 5G platform, Qualcomm has separated its modem and
application processor (AP) orders. While SEC will provide X60 modem chips built on its 5nm
low-power early (LPE) process, TSMC will supply APs built on its N5 process.
Order volumes should be dictated by 5G smartphone demand. Qualcomm is looking for
450mn smartphone sales in 2021 and 750mn units in 2022, and Strategy Analytics forecasts
Qualcomm’s 5G modem shipments at 150mn units. The exact die size of the X60 is not yet
known, but based on the Snapdragon 845’s relatively small die size (91mm2), the production
of 150mn chips annually will require capacity of 30,000 wpm (12”). If mass production
progresses smoothly in 2021, Qualcomm could decide to use SEC’s 4nm LPE process to
manufacture its 5G modems in 2022, in which case additional capex will be needed in 2021.
Figure 5. Snapdragon X60 modem chip to be produced on SEC’s 5nm process (2021)
Source: Qualcomm, Mirae Asset Daewoo Research
Figure 6. 5G smartphone shipment estimates
Source: Gartner, Mirae Asset Daewoo Research
70
190
400
600
950
0
20
40
60
80
0
250
500
750
1,000
2019 2020F 2021F 2022F 2023F
(%)(mn units)
5G smartphone shipments
5G smartphone penetration
Qualcommest.:450mn
Qualcommest.:750mn

Samsung Electronics
Mirae Asset Daewoo Research 7
May 13, 2020
Figure 7. Qualcomm: 5G baseband shipment forecasts
Source: Strategy Analytics, Mirae Asset Daewoo Research
Figure 8. Snapdragon 845 die
Source: TechInsights, Mirae Asset Daewoo Research
Figure 9. Snapdragon 845 production: 540 dies per wafer (12”)
Source: Company materials, Mirae Asset Daewoo Research
9.5mm
632
113
180
248
16
27
63
110
0
100
200
300
400
2019 2020F 2021F 2022F 2023F
(mn units)
SEC
Qualcomm
140
243
Samsung Electronics
Mirae Asset Daewoo Research 8
May 13, 2020
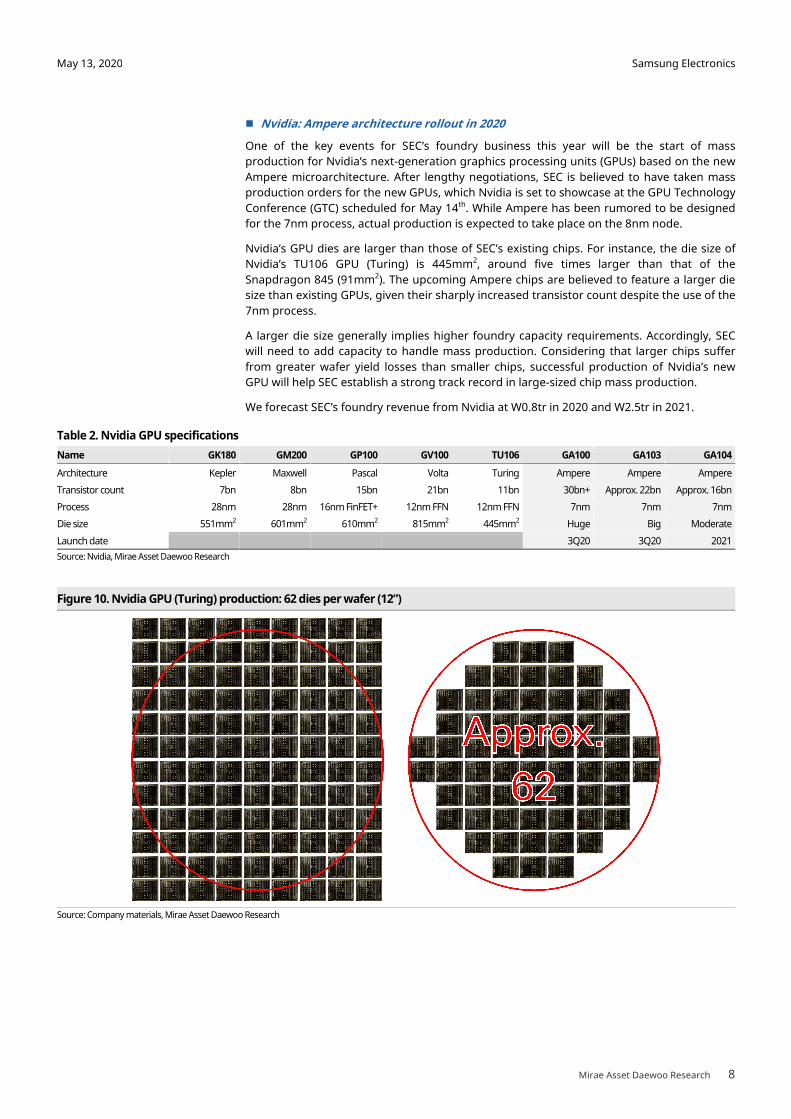
� Nvidia: Ampere architecture rollout in 2020
One of the key events for SEC’s foundry business this year will be the start of mass
production for Nvidia’s next-generation graphics processing units (GPUs) based on the new
Ampere microarchitecture. After lengthy negotiations, SEC is believed to have taken mass
production orders for the new GPUs, which Nvidia is set to showcase at the GPU Technology
Conference (GTC) scheduled for May 14th. While Ampere has been rumored to be designed
for the 7nm process, actual production is expected to take place on the 8nm node.
Nvidia’s GPU dies are larger than those of SEC’s existing chips. For instance, the die size of
Nvidia’s TU106 GPU (Turing) is 445mm2, around five times larger than that of the
Snapdragon 845 (91mm2). The upcoming Ampere chips are believed to feature a larger die
size than existing GPUs, given their sharply increased transistor count despite the use of the
7nm process.
A larger die size generally implies higher foundry capacity requirements. Accordingly, SEC
will need to add capacity to handle mass production. Considering that larger chips suffer
from greater wafer yield losses than smaller chips, successful production of Nvidia’s new
GPU will help SEC establish a strong track record in large-sized chip mass production.
We forecast SEC’s foundry revenue from Nvidia at W0.8tr in 2020 and W2.5tr in 2021.
Table 2. Nvidia GPU specifications
Name GK180 GM200 GP100 GV100 TU106 GA100 GA103 GA104
Architecture Kepler Maxwell Pascal Volta Turing Ampere Ampere Ampere
Transistor count 7bn 8bn 15bn 21bn 11bn 30bn+ Approx. 22bn Approx. 16bn
Process 28nm 28nm 16nm FinFET+ 12nm FFN 12nm FFN 7nm 7nm 7nm
Die size 551mm2 601mm2 610mm2 815mm2 445mm2 Huge Big Moderate
Launch date 3Q20 3Q20 2021
Source: Nvidia, Mirae Asset Daewoo Research
Figure 10. Nvidia GPU (Turing) production: 62 dies per wafer (12”)
Source: Company materials, Mirae Asset Daewoo Research

Samsung Electronics
Mirae Asset Daewoo Research 9
May 13, 2020
� AMD vs. Intel rivalry in 2022 and beyond
The CPU rivalry between Intel and AMD (AMD US/CP: US$55.47) is intensifying. In recent
years, AMD has gained ground with its 7nm technology, while Intel has been held back by
delays to the launch of its 10mn process and poor yields. The primary foundries with which
AMD does business are TSMC (7nm) and GlobalFoundries (14nm+). With Intel already
planning to migrate to 7nm due to poor 10nm yields, AMD will likely have to adopt 5nm to
maintain competitiveness. According to recent press releases, AMD is aiming to kick off 5nm
mass production in 2021, with TSMC handling manufacturing. Meanwhile, the company is
likely to gradually replace its 14nm CPUs with 7nm CPUs, but this migration should prove
complicated given GlobalFoundries’ abandonment of 7nm development. As such, in 2021,
we believe that AMD will decide between: 1) relying solely on TSMC for chip manufacturing;
or 2) choosing to partner with SEC. We believe that both options will be beneficial to SEC.
Indeed, even though the first scenario will not directly benefit the Korean giant, it should be
positive to overall supply/demand dynamics given the likely increase in capacity utilization
on 7nm-or-below processes.
Figure 11. Intel’s manufacturing road map: 7nm CPUs in 2021
Source: Intel, Mirae Asset Daewoo Research
Figure 12. AMD’s CPU and GPU manufacturing road map: 7nm already in place
Source: AMD, Mirae Asset Daewoo Research
Samsung Electronics
Mirae Asset Daewoo Research 10
May 13, 2020
All in all, we think there are three major factors that will affect SEC’s foundry demand in
2021 and beyond:
1) 5nm production for Qualcomm’s 5G modems and potential orders for 4nm fabrication
2) Successful mass production of Nvidia’s new Ampere GPU
3) Whether the company can displace GlobalFoundries to become one of AMD’s two primary
7nm-or-below manufacturing foundry partners
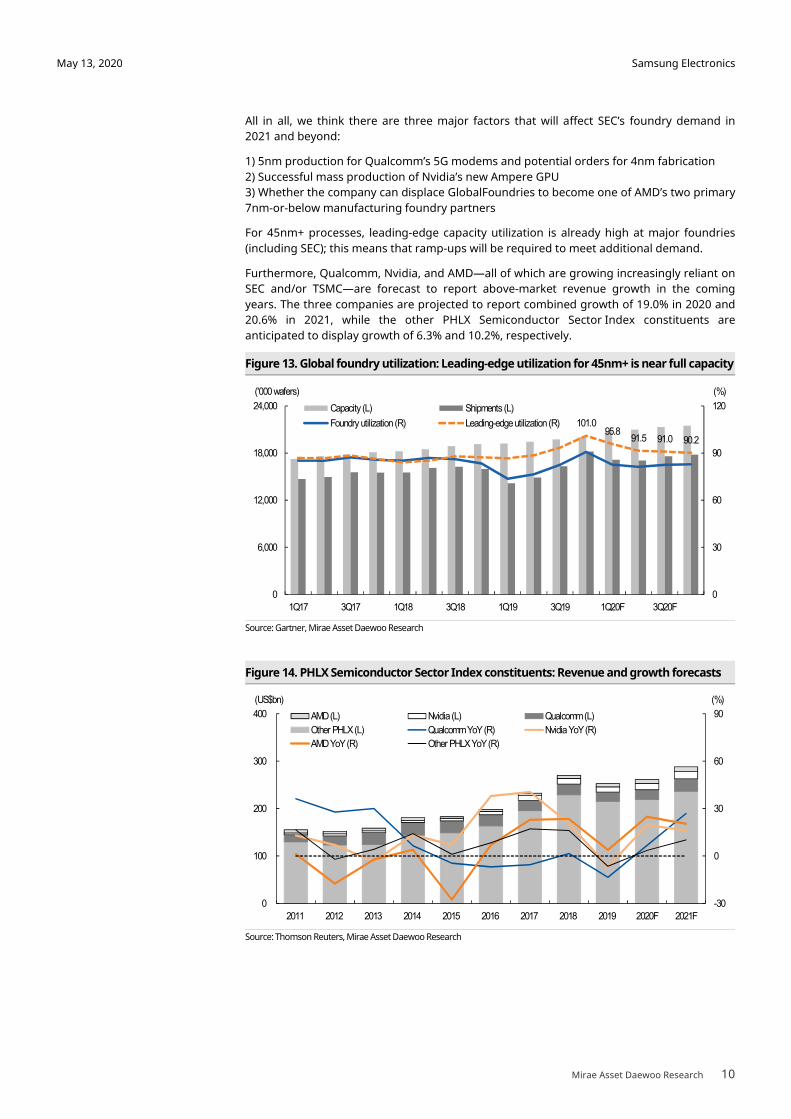
For 45nm+ processes, leading-edge capacity utilization is already high at major foundries
(including SEC); this means that ramp-ups will be required to meet additional demand.
Furthermore, Qualcomm, Nvidia, and AMD—all of which are growing increasingly reliant on
SEC and/or TSMC—are forecast to report above-market revenue growth in the coming
years. The three companies are projected to report combined growth of 19.0% in 2020 and
20.6% in 2021, while the other PHLX Semiconductor Sector Index constituents are
anticipated to display growth of 6.3% and 10.2%, respectively.
Figure 13. Global foundry utilization: Leading-edge utilization for 45nm+ is near full capacity
Source: Gartner, Mirae Asset Daewoo Research
Figure 14. PHLX Semiconductor Sector Index constituents: Revenue and growth forecasts
Source: Thomson Reuters, Mirae Asset Daewoo Research
101.0 95.8
91.5 91.0 90.2
0
30
60
90
120
0
6,000
12,000
18,000
24,000
1Q17 3Q17 1Q18 3Q18 1Q19 3Q19 1Q20F 3Q20F
(%)('000 wafers)
Capacity (L) Shipments (L)
Foundry utilization (R) Leading-edge utilization (R)
-30
0
30
60
90
0
100
200
300
400
2011 2012 2013 2014 2015 2016 2017 2018 2019 2020F 2021F
(%)(US$bn)
AMD (L) Nvidia (L) Qualcomm (L)
Other PHLX (L) Qualcomm YoY (R) Nvidia YoY (R)
AMD YoY (R) Other PHLX YoY (R)
Samsung Electronics
Mirae Asset Daewoo Research 11
May 13, 2020
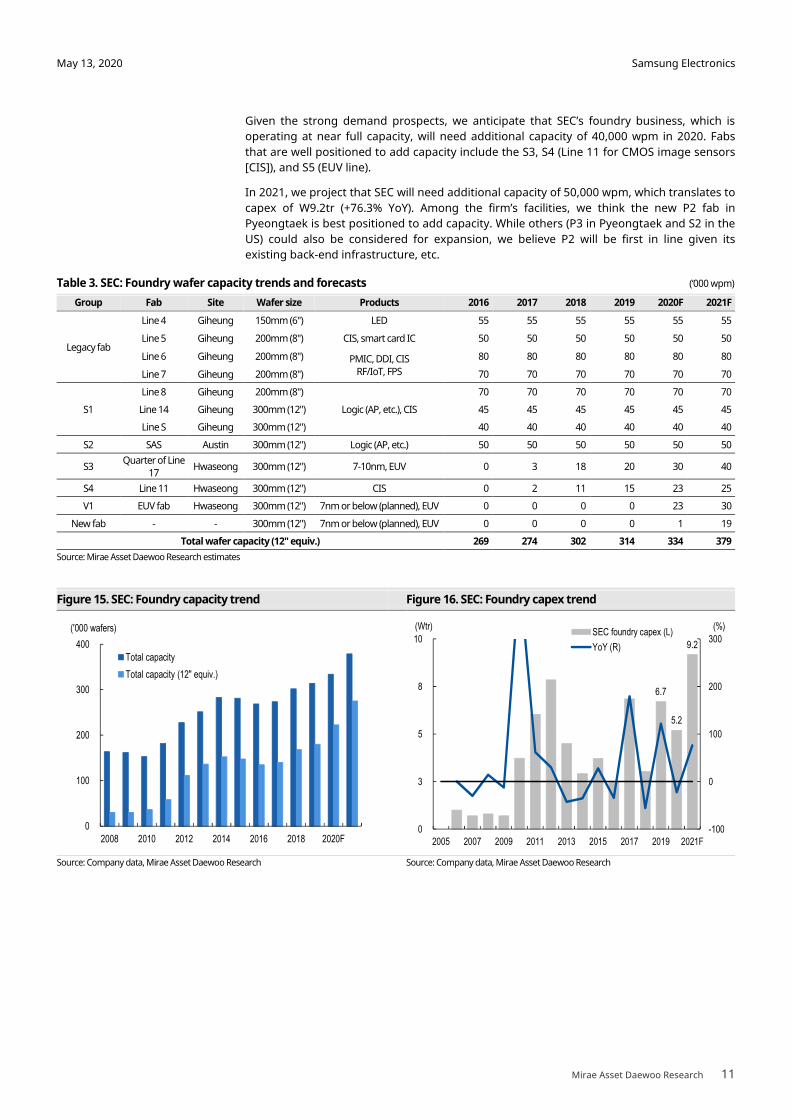
Given the strong demand prospects, we anticipate that SEC’s foundry business, which is
operating at near full capacity, will need additional capacity of 40,000 wpm in 2020. Fabs
that are well positioned to add capacity include the S3, S4 (Line 11 for CMOS image sensors
[CIS]), and S5 (EUV line).
In 2021, we project that SEC will need additional capacity of 50,000 wpm, which translates to
capex of W9.2tr (+76.3% YoY). Among the firm’s facilities, we think the new P2 fab in
Pyeongtaek is best positioned to add capacity. While others (P3 in Pyeongtaek and S2 in the
US) could also be considered for expansion, we believe P2 will be first in line given its
existing back-end infrastructure, etc.
Table 3. SEC: Foundry wafer capacity trends and forecasts (‘000 wpm)
Group Fab Site Wafer size Products 2016 2017 2018 2019 2020F 2021F
Legacy fab
Line 4 Giheung 150mm (6") LED 55 55 55 55 55 55
Line 5 Giheung 200mm (8") CIS, smart card IC 50 50 50 50 50 50
Line 6 Giheung 200mm (8") PMIC, DDI, CIS RF/IoT, FPS
80 80 80 80 80 80
Line 7 Giheung 200mm (8") 70 70 70 70 70 70
S1
Line 8 Giheung 200mm (8")
Logic (AP, etc.), CIS
70 70 70 70 70 70
Line 14 Giheung 300mm (12") 45 45 45 45 45 45
Line S Giheung 300mm (12") 40 40 40 40 40 40
S2 SAS Austin 300mm (12") Logic (AP, etc.) 50 50 50 50 50 50
S3 Quarter of Line
17 Hwaseong 300mm (12") 7-10nm, EUV 0 3 18 20 30 40
S4 Line 11 Hwaseong 300mm (12") CIS 0 2 11 15 23 25
V1 EUV fab Hwaseong 300mm (12") 7nm or below (planned), EUV 0 0 0 0 23 30
New fab - - 300mm (12") 7nm or below (planned), EUV 0 0 0 0 1 19
Total wafer capacity (12" equiv.) 269 274 302 314 334 379
Source: Mirae Asset Daewoo Research estimates
Figure 15. SEC: Foundry capacity trend Figure 16. SEC: Foundry capex trend
Source: Company data, Mirae Asset Daewoo Research Source: Company data, Mirae Asset Daewoo Research
6.7
5.2
9.2
-100
0
100
200
300
0
3
5
8
10
2005 2007 2009 2011 2013 2015 2017 2019 2021F
(%)(Wtr)SEC foundry capex (L)
YoY (R)
0
100
200
300
400
2008 2010 2012 2014 2016 2018 2020F
Total capacity
Total capacity (12" equiv.)
('000 wafers)
Samsung Electronics
Mirae Asset Daewoo Research 12
May 13, 2020
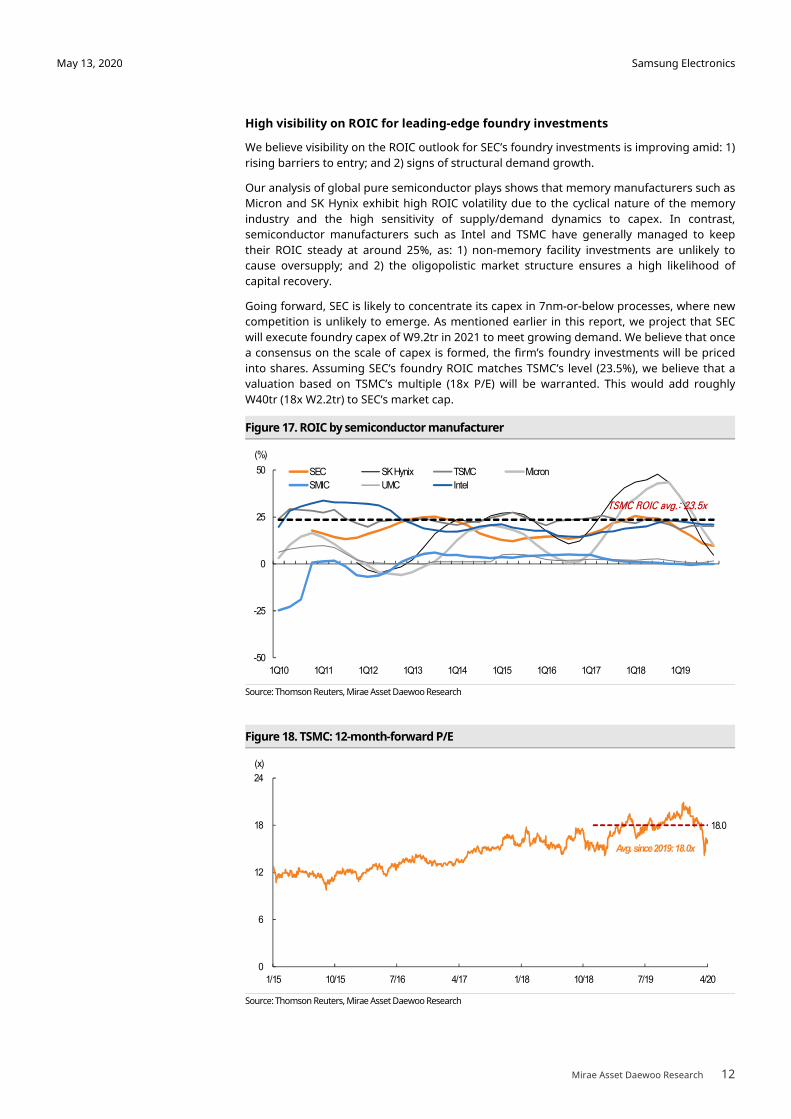
High visibility on ROIC for leading-edge foundry investments
We believe visibility on the ROIC outlook for SEC’s foundry investments is improving amid: 1)
rising barriers to entry; and 2) signs of structural demand growth.
Our analysis of global pure semiconductor plays shows that memory manufacturers such as
Micron and SK Hynix exhibit high ROIC volatility due to the cyclical nature of the memory
industry and the high sensitivity of supply/demand dynamics to capex. In contrast,
semiconductor manufacturers such as Intel and TSMC have generally managed to keep
their ROIC steady at around 25%, as: 1) non-memory facility investments are unlikely to
cause oversupply; and 2) the oligopolistic market structure ensures a high likelihood of
capital recovery.
Going forward, SEC is likely to concentrate its capex in 7nm-or-below processes, where new
competition is unlikely to emerge. As mentioned earlier in this report, we project that SEC
will execute foundry capex of W9.2tr in 2021 to meet growing demand. We believe that once
a consensus on the scale of capex is formed, the firm’s foundry investments will be priced
into shares. Assuming SEC’s foundry ROIC matches TSMC’s level (23.5%), we believe that a
valuation based on TSMC’s multiple (18x P/E) will be warranted. This would add roughly
W40tr (18x W2.2tr) to SEC’s market cap.
Figure 17. ROIC by semiconductor manufacturer
Source: Thomson Reuters, Mirae Asset Daewoo Research
Figure 18. TSMC: 12-month-forward P/E
Source: Thomson Reuters, Mirae Asset Daewoo Research
18.0
0
6
12
18
24
1/15 10/15 7/16 4/17 1/18 10/18 7/19 4/20
(x)
Avg. since 2019:18.0x
-50
-25
0
25
50
1Q10 1Q11 1Q12 1Q13 1Q14 1Q15 1Q16 1Q17 1Q18 1Q19
(%)
SEC SK Hynix TSMC Micron
SMIC UMC Intel
TSMC ROIC avg.: 23.5x

Samsung Electronics
Mirae Asset Daewoo Research 13
May 13, 2020
We believe the case of TSMC illustrates how the market reflects capex into share price. The
foundry player’s 12-month-forward P/E—which gradually rose from an average of 13x in
2016 to 15x in 2017 and 16x in 2018—displayed its sharpest rise ever in 2019. Indeed, while
2020-21 earnings forecasts were left virtually unchanged last year, the stock’s valuation
increased by 20%.
We believe the re-rating was driven by capex outlook upgrades rather than by earnings
forecasts. While earnings projections stayed flat, market expectations for TSMC’s 2020
capex were revised upward by 30% in the second half of 2019. As a consensus formed that
the firm’s investments would translate safely into earnings, upward revisions to capex
projections were accompanied by market value expansion. Like TSMC, we expect SEC to see
a valuation re-rating driven by a promising foundry investment outlook.
Figure 19. TSMC: Quarterly capex Figure 20. TSMC: Quarterly OP
Source: Thomson Reuters, Mirae Asset Daewoo Research Source: Thomson Reuters, Mirae Asset Daewoo Research
Figure 21. TSMC: 12-month-forward P/E Figure 22. TSMC: OP and capex consensus throughout 2019
Source: Thomson Reuters, Mirae Asset Daewoo Research Source: Thomson Reuters, Mirae Asset Daewoo Research
0.0
1.5
3.0
4.5
6.0
1Q15 1Q16 1Q17 1Q18 1Q19 1Q20F 1Q21F
(US$bn)
0.0
1.5
3.0
4.5
6.0
1Q15 1Q16 1Q17 1Q18 1Q19 1Q20F 1Q21F
(US$bn)
9
12
15
18
21
1/19 3/19 5/19 7/19 9/19 11/19
(US$bn)
2020F OP
2021F OP
2020F capex
16.3
20.8
12.9
14.6
15.9
18.0
10
13
16
19
22
1/16 7/16 1/17 7/17 1/18 7/18 1/19 7/19
(x)
Samsung Electronics
Mirae Asset Daewoo Research 14
May 13, 2020
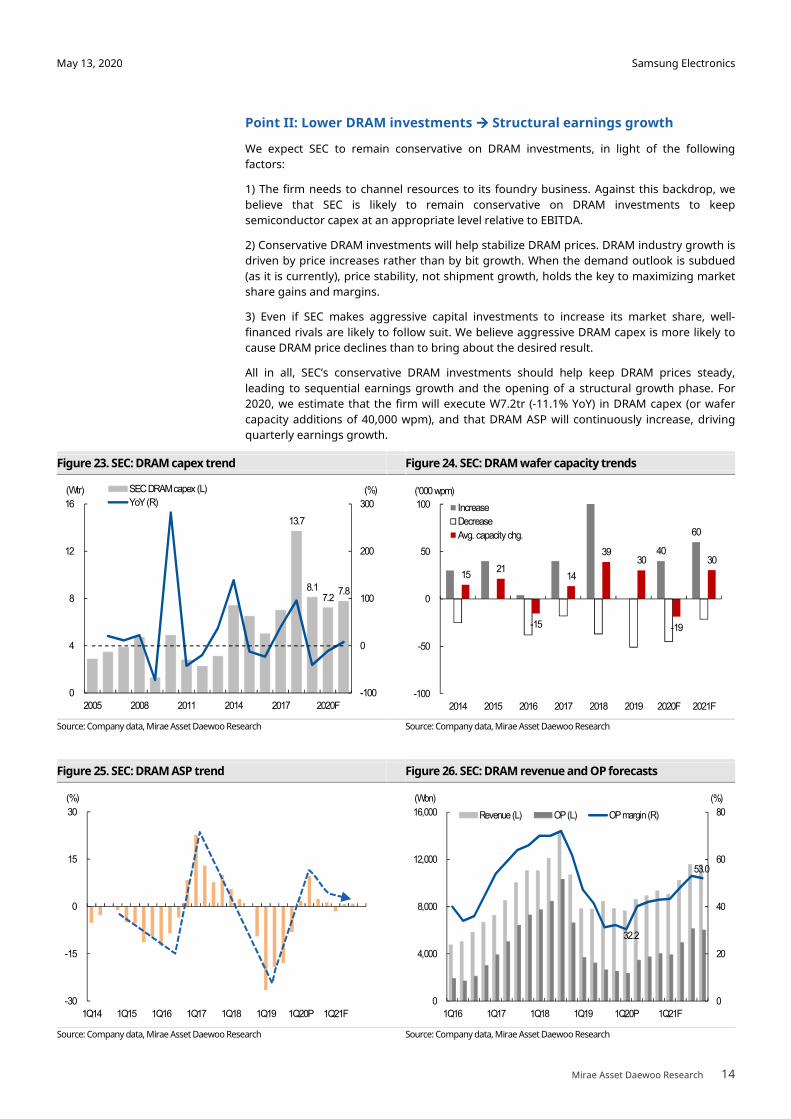
Point II: Lower DRAM investments ���� Structural earnings growth
We expect SEC to remain conservative on DRAM investments, in light of the following
factors:
1) The firm needs to channel resources to its foundry business. Against this backdrop, we
believe that SEC is likely to remain conservative on DRAM investments to keep
semiconductor capex at an appropriate level relative to EBITDA.
2) Conservative DRAM investments will help stabilize DRAM prices. DRAM industry growth is
driven by price increases rather than by bit growth. When the demand outlook is subdued
(as it is currently), price stability, not shipment growth, holds the key to maximizing market
share gains and margins.
3) Even if SEC makes aggressive capital investments to increase its market share, well-
financed rivals are likely to follow suit. We believe aggressive DRAM capex is more likely to
cause DRAM price declines than to bring about the desired result.
All in all, SEC’s conservative DRAM investments should help keep DRAM prices steady,
leading to sequential earnings growth and the opening of a structural growth phase. For
2020, we estimate that the firm will execute W7.2tr (-11.1% YoY) in DRAM capex (or wafer
capacity additions of 40,000 wpm), and that DRAM ASP will continuously increase, driving
quarterly earnings growth.
Figure 23. SEC: DRAM capex trend Figure 24. SEC: DRAM wafer capacity trends
Source: Company data, Mirae Asset Daewoo Research Source: Company data, Mirae Asset Daewoo Research
Figure 25. SEC: DRAM ASP trend Figure 26. SEC: DRAM revenue and OP forecasts
Source: Company data, Mirae Asset Daewoo Research Source: Company data, Mirae Asset Daewoo Research
13.7
8.1 7.2
7.8
-100
0
100
200
300
0
4
8
12
16
2005 2008 2011 2014 2017 2020F
(%)(Wtr) SEC DRAM capex (L)
YoY (R)
-30
-15
0
15
30
1Q14 1Q15 1Q16 1Q17 1Q18 1Q19 1Q20P 1Q21F
(%)
32.2
53.0
0
20
40
60
80
0
4,000
8,000
12,000
16,000
1Q16 1Q17 1Q18 1Q19 1Q20P 1Q21F
(%)(Wbn)
Revenue (L) OP (L) OP margin (R)
40
60
15 21
-15
14
39 30
-19
30
-100
-50
0
50
100
2014 2015 2016 2017 2018 2019 2020F 2021F
Increase
Decrease
Avg. capacity chg.
('000 wpm)
Samsung Electronics
Mirae Asset Daewoo Research 15
May 13, 2020
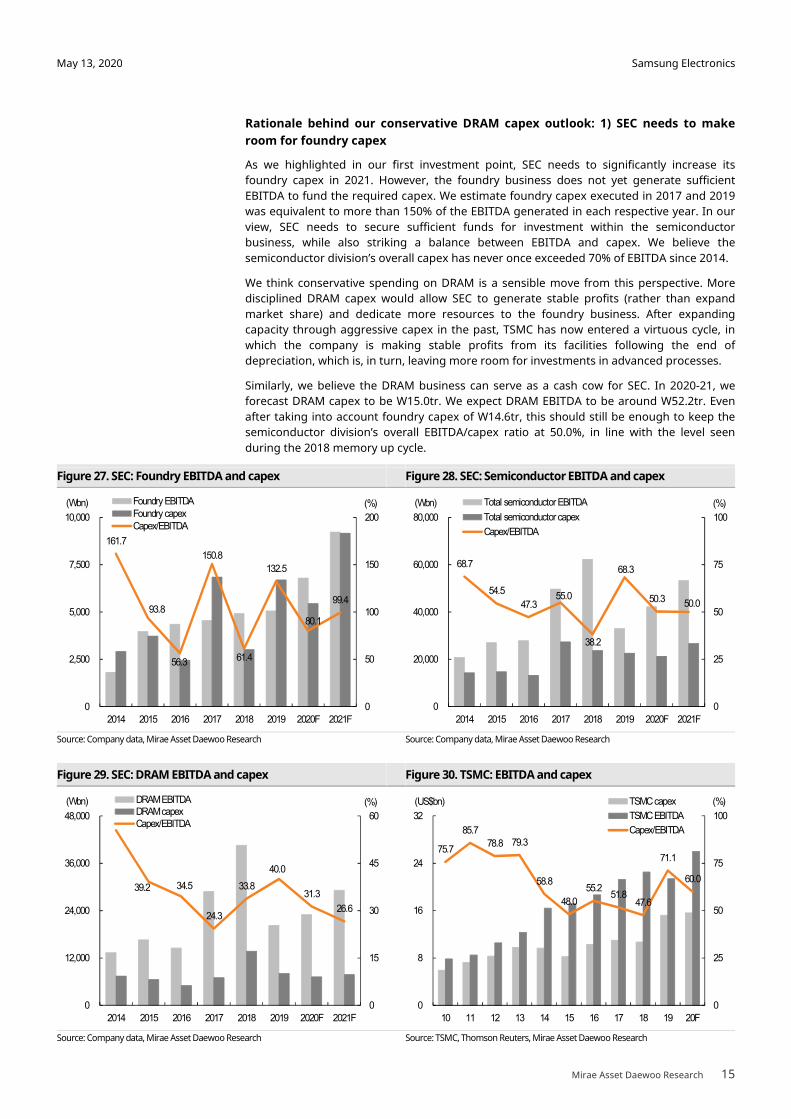
Rationale behind our conservative DRAM capex outlook: 1) SEC needs to make
room for foundry capex
As we highlighted in our first investment point, SEC needs to significantly increase its
foundry capex in 2021. However, the foundry business does not yet generate sufficient
EBITDA to fund the required capex. We estimate foundry capex executed in 2017 and 2019
was equivalent to more than 150% of the EBITDA generated in each respective year. In our
view, SEC needs to secure sufficient funds for investment within the semiconductor
business, while also striking a balance between EBITDA and capex. We believe the
semiconductor division’s overall capex has never once exceeded 70% of EBITDA since 2014.
We think conservative spending on DRAM is a sensible move from this perspective. More
disciplined DRAM capex would allow SEC to generate stable profits (rather than expand
market share) and dedicate more resources to the foundry business. After expanding
capacity through aggressive capex in the past, TSMC has now entered a virtuous cycle, in
which the company is making stable profits from its facilities following the end of
depreciation, which is, in turn, leaving more room for investments in advanced processes.
Similarly, we believe the DRAM business can serve as a cash cow for SEC. In 2020-21, we
forecast DRAM capex to be W15.0tr. We expect DRAM EBITDA to be around W52.2tr. Even
after taking into account foundry capex of W14.6tr, this should still be enough to keep the
semiconductor division’s overall EBITDA/capex ratio at 50.0%, in line with the level seen
during the 2018 memory up cycle.
Figure 27. SEC: Foundry EBITDA and capex Figure 28. SEC: Semiconductor EBITDA and capex
Source: Company data, Mirae Asset Daewoo Research Source: Company data, Mirae Asset Daewoo Research
Figure 29. SEC: DRAM EBITDA and capex Figure 30. TSMC: EBITDA and capex
Source: Company data, Mirae Asset Daewoo Research Source: TSMC, Thomson Reuters, Mirae Asset Daewoo Research
161.7
93.8
56.3
150.8
61.4
132.5
80.1
99.4
0
50
100
150
200
0
2,500
5,000
7,500
10,000
2014 2015 2016 2017 2018 2019 2020F 2021F
(%)(Wbn) Foundry EBITDAFoundry capexCapex/EBITDA
68.7
54.5
47.3 55.0
38.2
68.3
50.3 50.0
0
25
50
75
100
0
20,000
40,000
60,000
80,000
2014 2015 2016 2017 2018 2019 2020F 2021F
(%)(Wbn) Total semiconductor EBITDA
Total semiconductor capex
Capex/EBITDA
39.2 34.5
24.3
33.8
40.0
31.3
26.6
0
15
30
45
60
0
12,000
24,000
36,000
48,000
2014 2015 2016 2017 2018 2019 2020F 2021F
(%)(Wbn) DRAM EBITDADRAM capexCapex/EBITDA
75.7
85.7
78.8 79.3
58.8
48.0
55.2 51.8
47.6
71.1
60.0
0
25
50
75
100
0
8
16
24
32
10 11 12 13 14 15 16 17 18 19 20F
(%)(US$bn) TSMC capex
TSMC EBITDA
Capex/EBITDA

Samsung Electronics
Mirae Asset Daewoo Research 16
May 13, 2020
Rationale behind our conservative DRAM capex outlook: 2) SEC needs to keep
DRAM prices stable
DRAM revenue and profit growth move in line with price changes. It is safe to say that
during the past decade, DRAM revenue and profits have never increased during periods of
price decline. Unlike the NAND market, whether DRAM revenue and profits grow is
determined by whether ASP is rising or falling (not by the price elasticity of shipments), with
bit growth largely fixed.
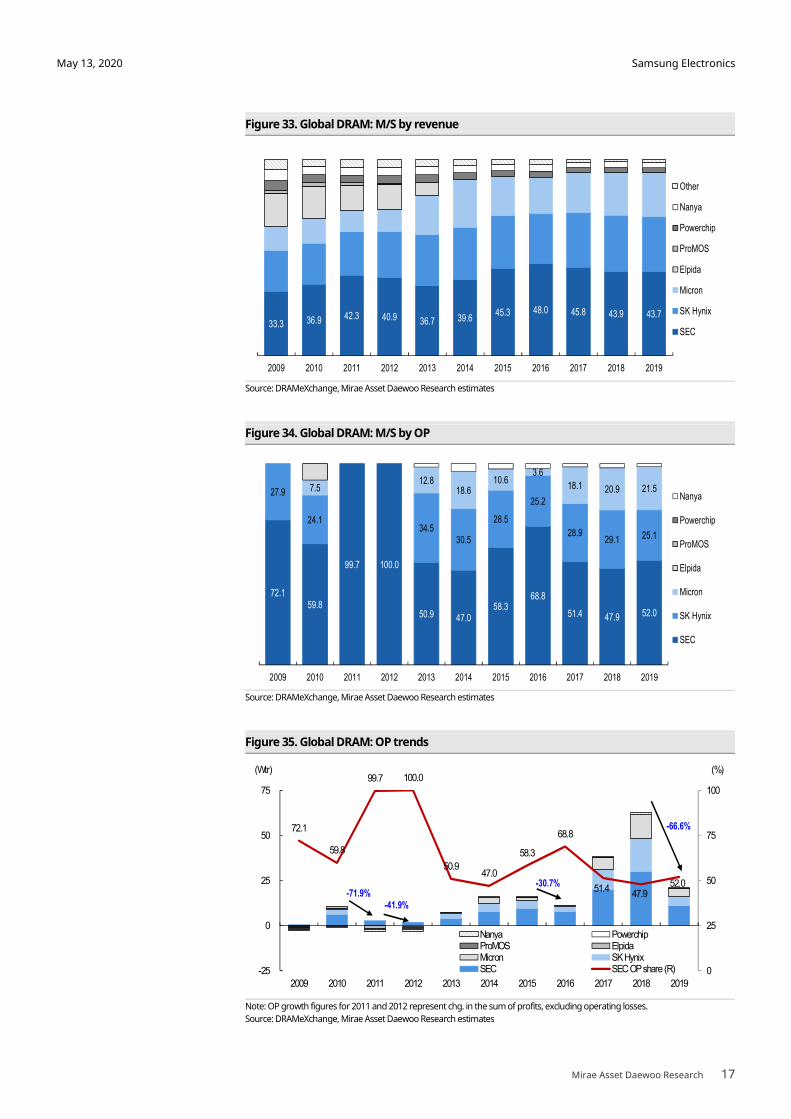
That said, aggressive pricing strategies do work during down cycles. In 2016 and 2019, SEC
was able to either expand or maintain its market share (45.3% � 48.0% in 2016; 43.9% �
43.7% in 2019) by employing an aggressive bit growth strategy. During these years,
operating profit across the DRAM industry declined 30.7% and 66.6%, respectively, but SEC’s
share of overall profits increased from 58.3% to 68.8% and from 47.9% to 52.0%,
respectively. In other words, the company’s strategy of overcoming market downturns
through preemptive inventory depletion has worked well.
However, the DRAM cycle is set to undergo a recovery from 2020. In this case, maintaining
stable prices is likely to take priority over aggressive spending or shipments. Due to SEC’s
conservative capex stance, we expect quarterly ASP to move up in 2020. The uptrend in ASP
should continue through 2021, driving strong profit growth. We forecast SEC’s DRAM
operating profit to grow 12.1% to W13.5tr in 2020 and 55.1% to W21.0tr in 2021.
Figure 31. Global DRAM ASP, bit, revenue, and OP growth
Source: DRAMeXchange, Mirae Asset Daewoo Research estimates
Figure 32. SEC: DRAM ASP, bit, revenue, and OP growth
Source: Company data, Mirae Asset Daewoo Research estimates
-49.9 -29.8
2.3
-0.9 -20.0 -27.0
47.1
14.8
-46.7
50.4
28.6 26.6 34.1 22.8 23.7 19.9 21.0 19.0
-80
0
80
160
240
2011 2012 2013 2014 2015 2016 2017 2018 2019
(%) ASP chg. Bit growth Sales growth OP growth
2011-12Industry-wide losses
-45.8 -29.3
-6.3 -5.0 -17.5
-29.7
48.2
19.5
-49.2
-9.1
3.9
49.8
27.1 25.8
54.1
30.1 35.8
14.7 12.3 23.1 16.7 21.1
-80
0
80
160
240
2011 2012 2013 2014 2015 2016 2017 2018 2019 2020F 2021F
(%)
ASP chg. Bit growth Sales growth OP growth
Samsung Electronics
Mirae Asset Daewoo Research 17
May 13, 2020
Figure 33. Global DRAM: M/S by revenue
Source: DRAMeXchange, Mirae Asset Daewoo Research estimates
Figure 34. Global DRAM: M/S by OP
Source: DRAMeXchange, Mirae Asset Daewoo Research estimates
Figure 35. Global DRAM: OP trends
Note: OP growth figures for 2011 and 2012 represent chg. in the sum of profits, excluding operating losses.
Source: DRAMeXchange, Mirae Asset Daewoo Research estimates
72.1 59.8
99.7 100.0
50.9 47.0 58.3
68.8
51.4 47.9 52.0
27.9
24.1 34.5
30.5
28.5
25.2
28.9 29.1 25.1
7.5 12.8
18.6 10.6
3.6
18.1 20.9 21.5
2009 2010 2011 2012 2013 2014 2015 2016 2017 2018 2019
Nanya
Powerchip
ProMOS
Elpida
Micron
SK Hynix
SEC
72.1
59.8
99.7 100.0
50.9 47.0
58.3
68.8
51.4 47.9
52.0
0
25
50
75
100
-25
0
25
50
75
2009 2010 2011 2012 2013 2014 2015 2016 2017 2018 2019
(%)(Wtr)
Nanya PowerchipProMOS ElpidaMicron SK HynixSEC SEC OP share (R)
-30.7%
-66.6%
-71.9%-41.9%
33.3 36.9 42.3 40.9 36.7 39.6 45.3 48.0 45.8 43.9 43.7
2009 2010 2011 2012 2013 2014 2015 2016 2017 2018 2019
Other
Nanya
Powerchip
ProMOS
Elpida
Micron
SK Hynix
SEC

Samsung Electronics
Mirae Asset Daewoo Research 18
May 13, 2020
Rationale behind our conservative DRAM capex outlook: 3) Competitors to follow
suit
If SEC were to execute capex exceeding demand in order to expand its market share, its
competitors would most likely follow suit. SK Hynix has room for an additional 20,000 wpm
at its C2E fab in Wuxi, China, and is set to complete construction of its M16 fab (designed
capacity of around 100,000 wpm). Micron is also likely to complete expansion of its Taichung
fab in Taiwan and its Hiroshima fab in Japan by the end of the year. As such, DRAM makers
are well-positioned to increase capacity swiftly if necessary. And considering that they differ
very little in terms of cost competitiveness, any competition to expand capacity would likely
only lead to price declines, rather than market share gains. As such, we expect SEC to focus
its investments on bolstering its cost competitiveness.
Until early this year, many expected SEC to pursue aggressive DRAM capex as part of its
efforts to widen its lead over rivals. During past periods of rapid growth, all DRAM makers
vied for market share gains via capacity additions. But with the market now stable and
controlled by a handful of players, aggressive capex would be a recipe for losses rather than
market share gains. As such, we believe mega-fabs represent the best strategy, and one
that is already adopted by all DRAM makers. By maintaining sufficient room in such facilities
for potential lines and clean rooms, companies can expand capacity flexibly depending on
market conditions, thus preventing unnecessary capex spending based on excessive
projections.
Figure 36. SEC: DRAM breakdown by tech node (%) Figure 37. SK Hynix: DRAM breakdown by tech node (%)
Source: DRAMeXchange, Mirae Asset Daewoo Research Source: DRAMeXchange, Mirae Asset Daewoo Research
Figure 38. Micron: DRAM breakdown by tech node (%) Figure 39. Avg. tech node factors of major DRAM makers
Source: DRAMeXchange, Mirae Asset Daewoo Research Source: DRAMeXchange, Mirae Asset Daewoo Research
15
20
25
30
35
0
25
50
75
100
1Q14 1Q15 1Q16 1Q17 1Q18 1Q19 1Q20
Average tech node factor (R)1Znm
1Ynm
1Xnm
20nm
23nm
25nm
35nm
15
20
25
30
35
0
25
50
75
100
1Q14 1Q15 1Q16 1Q17 1Q18 1Q19 1Q20
Average tech node factor (R) 1Znm
1Ynm
1Xnm
21nm
25m
29nm
38nm
15
20
25
30
35
0
25
50
75
100
1Q14 1Q15 1Q16 1Q17 1Q18 1Q19 1Q20
Average tech node factor (R)
1Znm
1Ynm
1Xnm
20nm
25m
30nm
15
20
25
30
35
1Q14 1Q15 1Q16 1Q17 1Q18 1Q19 1Q20
(nm)
SEC
SK Hynix
Micron
Samsung Electronics
Mirae Asset Daewoo Research 19
May 13, 2020
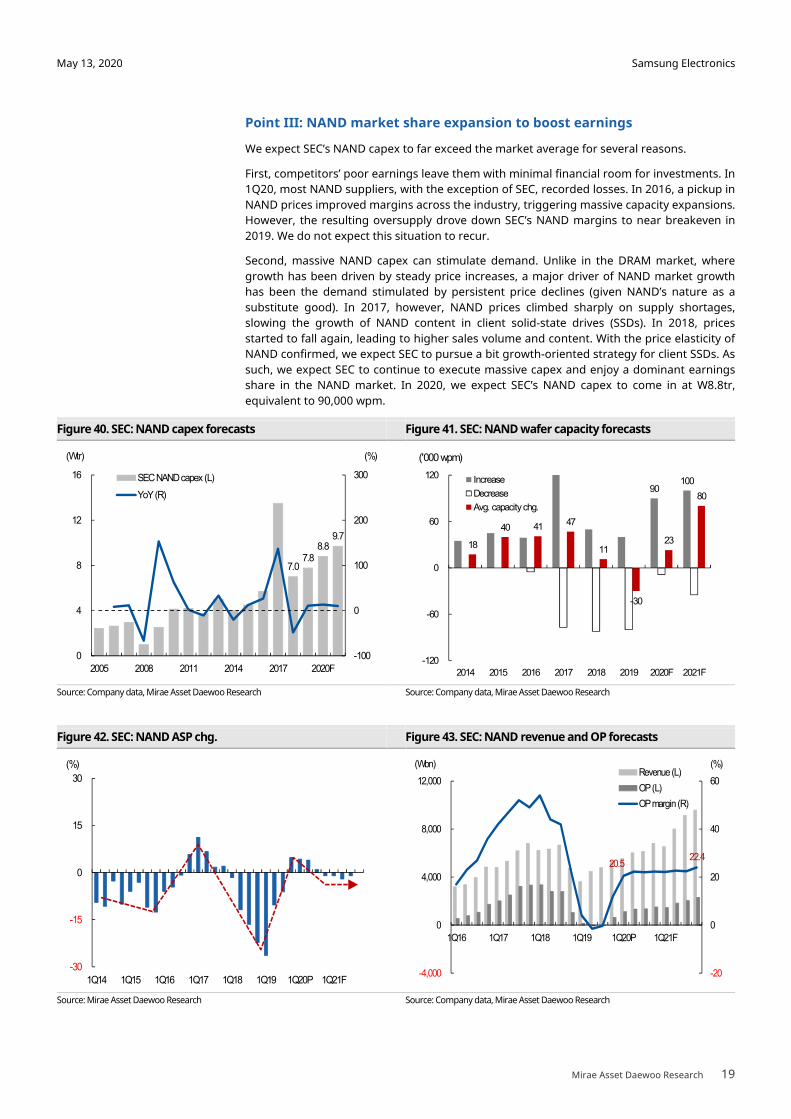
Point III: NAND market share expansion to boost earnings
We expect SEC’s NAND capex to far exceed the market average for several reasons.
First, competitors’ poor earnings leave them with minimal financial room for investments. In
1Q20, most NAND suppliers, with the exception of SEC, recorded losses. In 2016, a pickup in
NAND prices improved margins across the industry, triggering massive capacity expansions.
However, the resulting oversupply drove down SEC’s NAND margins to near breakeven in
2019. We do not expect this situation to recur.
Second, massive NAND capex can stimulate demand. Unlike in the DRAM market, where
growth has been driven by steady price increases, a major driver of NAND market growth
has been the demand stimulated by persistent price declines (given NAND’s nature as a
substitute good). In 2017, however, NAND prices climbed sharply on supply shortages,
slowing the growth of NAND content in client solid-state drives (SSDs). In 2018, prices
started to fall again, leading to higher sales volume and content. With the price elasticity of
NAND confirmed, we expect SEC to pursue a bit growth-oriented strategy for client SSDs. As
such, we expect SEC to continue to execute massive capex and enjoy a dominant earnings
share in the NAND market. In 2020, we expect SEC’s NAND capex to come in at W8.8tr,
equivalent to 90,000 wpm.
Figure 40. SEC: NAND capex forecasts Figure 41. SEC: NAND wafer capacity forecasts
Source: Company data, Mirae Asset Daewoo Research Source: Company data, Mirae Asset Daewoo Research
Figure 42. SEC: NAND ASP chg. Figure 43. SEC: NAND revenue and OP forecasts
Source: Mirae Asset Daewoo Research Source: Company data, Mirae Asset Daewoo Research
7.0 7.8
8.8 9.7
-100
0
100
200
300
0
4
8
12
16
2005 2008 2011 2014 2017 2020F
(%)(Wtr)
SEC NAND capex (L)
YoY (R)
-30
-15
0
15
30
1Q14 1Q15 1Q16 1Q17 1Q18 1Q19 1Q20P 1Q21F
(%)
20.5 22.4
-20
0
20
40
60
-4,000
0
4,000
8,000
12,000
1Q16 1Q17 1Q18 1Q19 1Q20P 1Q21F
(%)(Wbn)Revenue (L)
OP (L)
OP margin (R)
90 100
18
40 41 47
11
-30
23
80
-120
-60
0
60
120
2014 2015 2016 2017 2018 2019 2020F 2021F
Increase
Decrease
Avg. capacity chg.
('000 wpm)

Samsung Electronics
Mirae Asset Daewoo Research 20
May 13, 2020
Rationale behind our aggressive NAND capex outlook: 1) Revisit previous cycle
In 1Q20, margins dipped below breakeven for all NAND makers except SEC, which recorded
an OP margin at the low-20% level. The firm accounted for more than 90% of overall NAND
market profits in the quarter. As SEC will likely strive to maintain its current profit share and
margin levels, we believe it will continue to execute capex in line with demand growth.
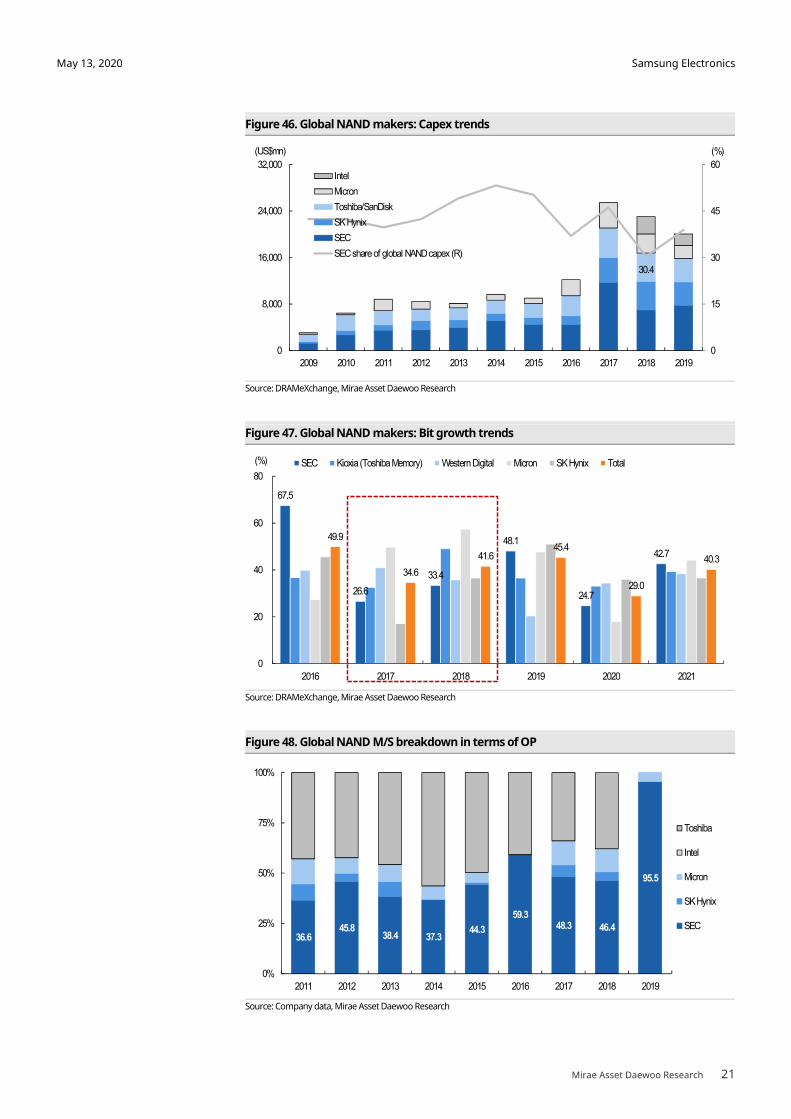
We believe NAND makers’ 2016-18 capex strategy is worth revisiting. NAND ASP/GB, which
had declined continuously from 1Q10, picked up in 2H16 on wafer capacity shortages
arising from the conversion to 3D NAND. At that time, both first-tier (including SEC) and
second-tier NAND suppliers enjoyed high margins. Amid high margins and optimistic
demand forecasts, NAND makers executed aggressive capex.
Although SEC’s NAND capex spending in 2017 was the largest in the industry, its 2018 capex
accounted for only 30% of overall market spending. Thus, the firm displayed below-industry
NAND wafer capacity growth and bit growth in 2017-18. In 2018, prices plunged due to
oversupply stemming from aggressive shipments by chipmakers, driving down NAND
makers’ profits to near or below break-even levels. Of note, the easing of the oversupply
seen in 2019 was mainly driven not by demand growth, but by reduced supply caused by
Toshiba Memory’s power outage.
As the NAND market is still not fully concentrated, we think SEC is highly likely to
aggressively ramp up its NAND capex going forward, setting the stage for another game of
chicken among NAND makers. We see NAND prices stabilizing from 2H20 amid a slowdown
in price growth. With upside to NAND prices likely limited, we believe only players capable of
reducing costs will benefit. All in all, we expect SEC to maintain its leading position in the
NAND space (in terms of capex and operating profit) for some time.
Figure 44. Global NAND makers: OP margin trends Figure 45. SEC: NAND capex trend
Source: Company data, Thomson Reuters, Mirae Asset Daewoo Research Source: Company data, Mirae Asset Daewoo Research
-80
-40
0
40
80
1Q11 1Q12 1Q13 1Q14 1Q15 1Q16 1Q17 1Q18 1Q19
(%) SEC SK Hynix
Micron Intel
Toshiba
7.0 7.8
8.8 9.7
-100
0
100
200
300
0
4
8
12
16
2005 2008 2011 2014 2017 2020F
(%)(Wtr)
SEC NAND capex (L)
YoY (R)
Samsung Electronics
Mirae Asset Daewoo Research 21
May 13, 2020
Figure 46. Global NAND makers: Capex trends
Source: DRAMeXchange, Mirae Asset Daewoo Research
Figure 47. Global NAND makers: Bit growth trends
Source: DRAMeXchange, Mirae Asset Daewoo Research
Figure 48. Global NAND M/S breakdown in terms of OP
Source: Company data, Mirae Asset Daewoo Research
36.6 45.8
38.4 37.3 44.3
59.3 48.3 46.4
95.5
0%
25%
50%
75%
100%
2011 2012 2013 2014 2015 2016 2017 2018 2019
Toshiba
Intel
Micron
SK Hynix
SEC
67.5
26.6
33.4
48.1
24.7
42.7
49.9
34.6
41.6 45.4
29.0
40.3
0
20
40
60
80
2016 2017 2018 2019 2020 2021
(%) SEC Kioxia (Toshiba Memory) Western Digital Micron SK Hynix Total
30.4
0
15
30
45
60
0
8,000
16,000
24,000
32,000
2009 2010 2011 2012 2013 2014 2015 2016 2017 2018 2019
(%)(US$mn)
Intel
Micron
Toshiba/SanDisk
SK Hynix
SEC
SEC share of global NAND capex (R)
Samsung Electronics
Mirae Asset Daewoo Research 22
May 13, 2020
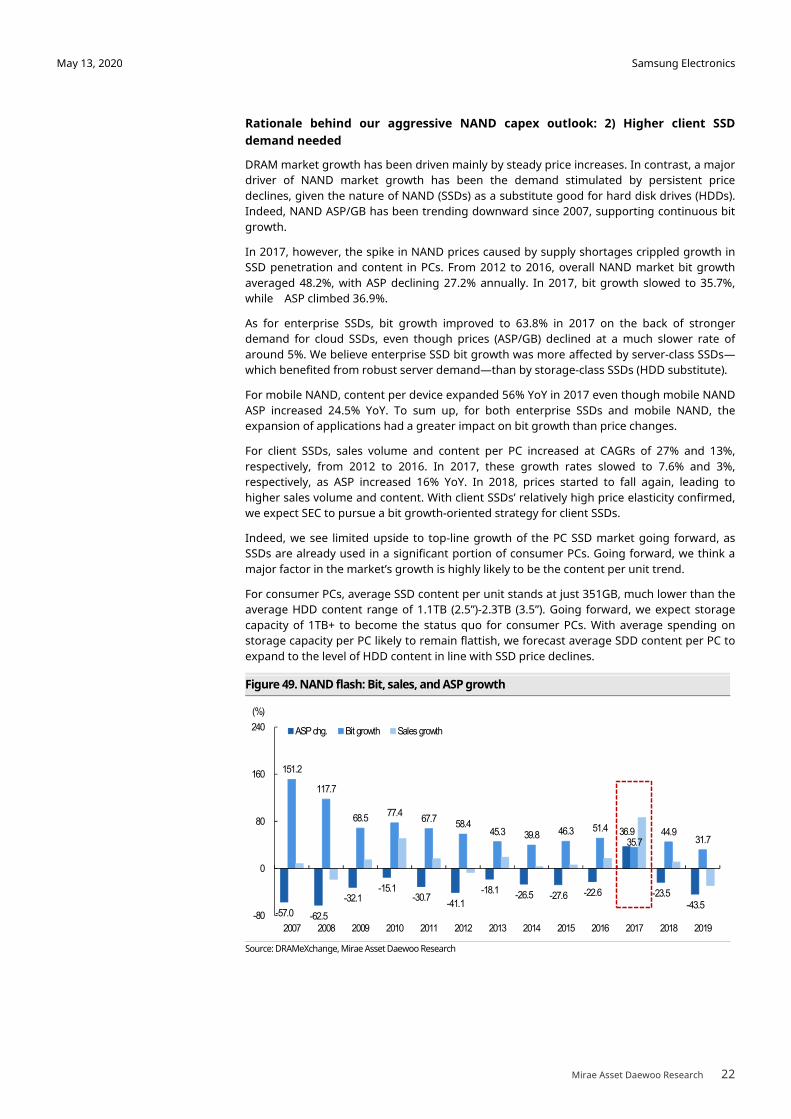
Rationale behind our aggressive NAND capex outlook: 2) Higher client SSD
demand needed
DRAM market growth has been driven mainly by steady price increases. In contrast, a major
driver of NAND market growth has been the demand stimulated by persistent price
declines, given the nature of NAND (SSDs) as a substitute good for hard disk drives (HDDs).
Indeed, NAND ASP/GB has been trending downward since 2007, supporting continuous bit
growth.
In 2017, however, the spike in NAND prices caused by supply shortages crippled growth in
SSD penetration and content in PCs. From 2012 to 2016, overall NAND market bit growth
averaged 48.2%, with ASP declining 27.2% annually. In 2017, bit growth slowed to 35.7%,
while ASP climbed 36.9%.
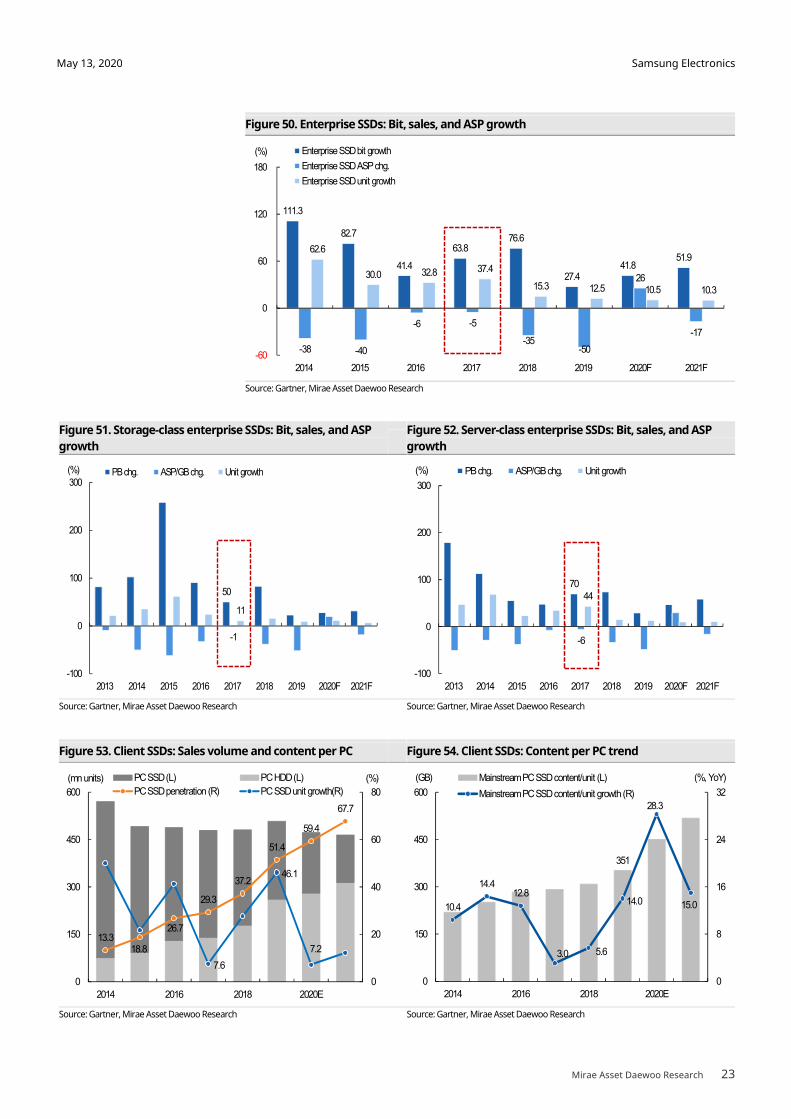
As for enterprise SSDs, bit growth improved to 63.8% in 2017 on the back of stronger
demand for cloud SSDs, even though prices (ASP/GB) declined at a much slower rate of
around 5%. We believe enterprise SSD bit growth was more affected by server-class SSDs—
which benefited from robust server demand—than by storage-class SSDs (HDD substitute).
For mobile NAND, content per device expanded 56% YoY in 2017 even though mobile NAND
ASP increased 24.5% YoY. To sum up, for both enterprise SSDs and mobile NAND, the
expansion of applications had a greater impact on bit growth than price changes.
For client SSDs, sales volume and content per PC increased at CAGRs of 27% and 13%,
respectively, from 2012 to 2016. In 2017, these growth rates slowed to 7.6% and 3%,
respectively, as ASP increased 16% YoY. In 2018, prices started to fall again, leading to
higher sales volume and content. With client SSDs’ relatively high price elasticity confirmed,
we expect SEC to pursue a bit growth-oriented strategy for client SSDs.
Indeed, we see limited upside to top-line growth of the PC SSD market going forward, as
SSDs are already used in a significant portion of consumer PCs. Going forward, we think a
major factor in the market’s growth is highly likely to be the content per unit trend.
For consumer PCs, average SSD content per unit stands at just 351GB, much lower than the
average HDD content range of 1.1TB (2.5”)-2.3TB (3.5”). Going forward, we expect storage
capacity of 1TB+ to become the status quo for consumer PCs. With average spending on
storage capacity per PC likely to remain flattish, we forecast average SDD content per PC to
expand to the level of HDD content in line with SSD price declines.
Figure 49. NAND flash: Bit, sales, and ASP growth
Source: DRAMeXchange, Mirae Asset Daewoo Research
-57.0 -62.5
-32.1 -15.1
-30.7 -41.1
-18.1 -26.5 -27.6 -22.6
36.9
-23.5 -43.5
151.2
117.7
68.5 77.4
67.7 58.4
45.3 39.8 46.3 51.4
35.7 44.9
31.7
-80
0
80
160
240
2007 2008 2009 2010 2011 2012 2013 2014 2015 2016 2017 2018 2019
(%)
ASP chg. Bit growth Sales growth
Samsung Electronics
Mirae Asset Daewoo Research 23
May 13, 2020
Figure 50. Enterprise SSDs: Bit, sales, and ASP growth
Source: Gartner, Mirae Asset Daewoo Research
Figure 51. Storage-class enterprise SSDs: Bit, sales, and ASP
growth
Figure 52. Server-class enterprise SSDs: Bit, sales, and ASP
growth
Source: Gartner, Mirae Asset Daewoo Research Source: Gartner, Mirae Asset Daewoo Research
Figure 53. Client SSDs: Sales volume and content per PC Figure 54. Client SSDs: Content per PC trend
Source: Gartner, Mirae Asset Daewoo Research Source: Gartner, Mirae Asset Daewoo Research
111.3
82.7
41.4
63.8 76.6
27.4 41.8
51.9
-38 -40
-6 -5
-35-50
26
-17
62.6
30.0 32.8 37.4
15.3 12.5 10.5 10.3
-60
0
60
120
180
2014 2015 2016 2017 2018 2019 2020F 2021F
(%) Enterprise SSD bit growth
Enterprise SSD ASP chg.
Enterprise SSD unit growth
50
-1
11
-100
0
100
200
300
2013 2014 2015 2016 2017 2018 2019 2020F 2021F
(%) PB chg. ASP/GB chg. Unit growth
70
-6
44
-100
0
100
200
300
2013 2014 2015 2016 2017 2018 2019 2020F 2021F
(%) PB chg. ASP/GB chg. Unit growth
13.318.8
26.7
29.3
37.2
51.4
59.4
67.7
7.6
46.1
7.2
0
20
40
60
80
0
150
300
450
600
2014 2016 2018 2020E
(%)(mn units) PC SSD (L) PC HDD (L)
PC SSD penetration (R) PC SSD unit growth(R)
351
10.4
14.412.8
3.0 5.6
14.0
28.3
15.0
0
8
16
24
32
0
150
300
450
600
2014 2016 2018 2020E
(%, YoY)(GB) Mainstream PC SSD content/unit (L)
Mainstream PC SSD content/unit growth (R)
Samsung Electronics
Mirae Asset Daewoo Research 24
May 13, 2020
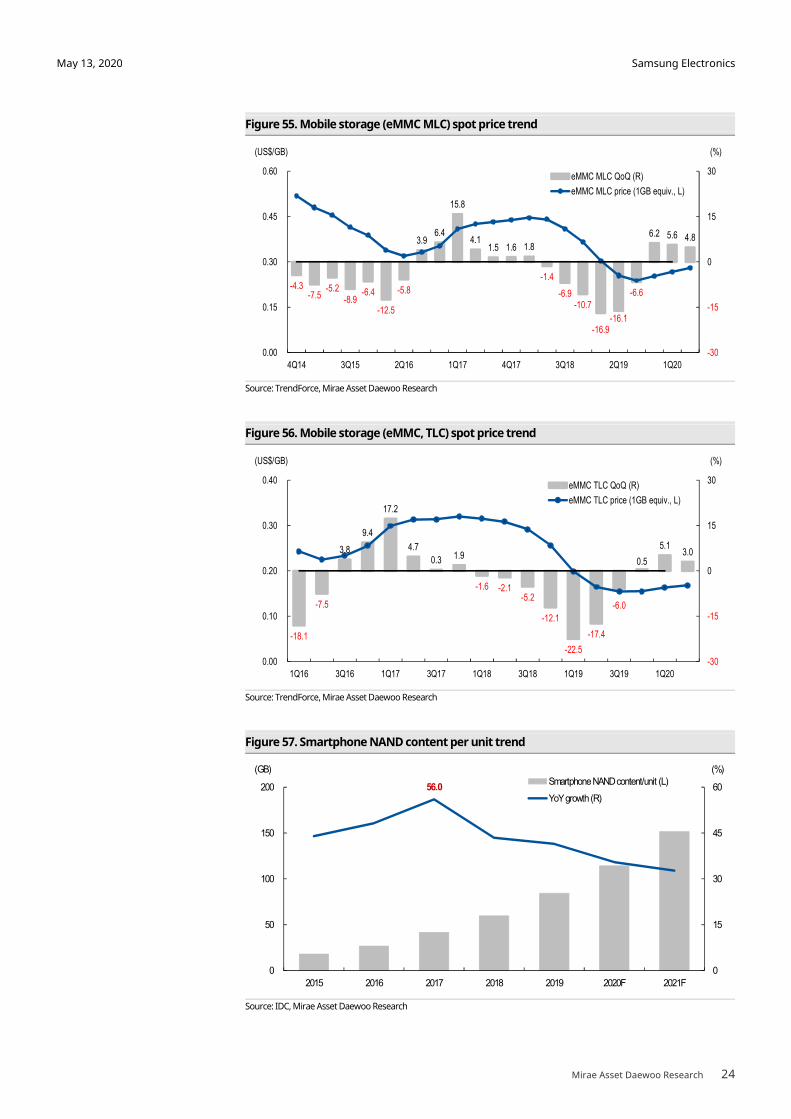
Figure 55. Mobile storage (eMMC MLC) spot price trend
Source: TrendForce, Mirae Asset Daewoo Research
Figure 56. Mobile storage (eMMC, TLC) spot price trend
Source: TrendForce, Mirae Asset Daewoo Research
Figure 57. Smartphone NAND content per unit trend
Source: IDC, Mirae Asset Daewoo Research
56.0
0
15
30
45
60
0
50
100
150
200
2015 2016 2017 2018 2019 2020F 2021F
(%)(GB)Smartphone NAND content/unit (L)
YoY growth (R)
-4.3 -7.5
-5.2 -8.9
-6.4
-12.5
-5.8
3.9 6.4
15.8
4.1 1.5 1.6 1.8
-1.4
-6.9 -10.7
-16.9 -16.1
-6.6
6.2 5.6 4.8
-30
-15
0
15
30
0.00
0.15
0.30
0.45
0.60
4Q14 3Q15 2Q16 1Q17 4Q17 3Q18 2Q19 1Q20
(%)(US$/GB)
eMMC MLC QoQ (R)
eMMC MLC price (1GB equiv., L)
-18.1
-7.5
3.8
9.4
17.2
4.7
0.3 1.9
-1.6 -2.1 -5.2
-12.1
-22.5
-17.4
-6.0
0.5
5.1 3.0
-30
-15
0
15
30
0.00
0.10
0.20
0.30
0.40
1Q16 3Q16 1Q17 3Q17 1Q18 3Q18 1Q19 3Q19 1Q20
(%)(US$/GB)
eMMC TLC QoQ (R)
eMMC TLC price (1GB equiv., L)

Samsung Electronics
Mirae Asset Daewoo Research 25
May 13, 2020
II. Outlook and earnings forecasts by division
Key assumptions for IT product demand forecasts
Given the pace of the COVID-19 spread and the growth of new cases by country, we expect
China to be the first market to see a recovery in IT product demand, followed by the
US/Europe and then India. All in all, our base-case scenario assumes an 8.3% YoY decline in
global smartphone demand and a 15.8% increase in global server demand in 2020.
For smartphone shipment volume, we formulated three scenarios according to the severity
of negative growth in 2Q20 and the extent of demand recovery in 2H20. Our base-case
scenario has smartphone demand: 1) declining at a slower pace QoQ in 2Q20; 2) making a
full-fledged QoQ recovery in 3Q20; 3) and return to the previous year’s levels in 4Q20. Under
our worst-case scenario, which assumes sharper-than-expected contraction in the US and
Europe in 2Q20, demand would continue to decline YoY and fail to recover to the previous
year’s levels in 4Q20.
Table 4. Smartphone shipment scenario analysis (mn units, %)
1Q20F 2Q20F 3Q20F 4Q20F 2019 2020F 2021F
Base case 278 272 336 372 1,372 1,258 1,403
Bear case 278 265 322 370 1,372 1,235 1,287
Worst case 278 255 305 351 1,372 1,189 1,254
YoY
Base case -11.0 -18.1 -6.2 0.7 -2.2 -8.3 11.6
Bear case -11.0 -20.0 -10.0 0.0 -2.2 -10.0 4.2
Worst case -11.0 -23.0 -15.0 -5.0 -2.2 -13.3 5.5
QoQ
Base case -24.9 -2.3 23.7 10.8
Bear case -24.9 -4.6 21.6 14.7
Worst case -24.9 -8.1 19.3 15.3
Source: Mirae Asset Daewoo Research
For server shipment volume, we created two scenarios based on server replacement cycle
length and regional COVID-19 impact. In our analysis, we assumed ODM direct servers to be
more sensitive to changes in the replacement cycle due to their high exposure to cloud
infrastructure. That said, given that ODM direct servers account for just a small slice of the
total pie, we believe structural growth of the server market hinges on hyperscale capex. We
note that our bear-case scenario reflects the possibility of disruptions in server
shipments/installations in the US and Europe.
Table 5. Server shipment scenario analysis (mn units, %)
1Q20F 2Q20F 3Q20F 4Q20F 2019 2020F 2021F
Base case 2,980 3,131 3,165 3,262 10,827 12,538 12,704
Bear case 2,980 2,952 2,985 3,076 10,827 11,993 12,704
YoY
Base case 25.1 27.2 11.6 3.7 -1.5 15.8 1.3
Bear case 25.1 19.9 5.2 -2.2 -1.5 10.8 5.9
QoQ
Base case -5.3 5.1 1.1 3.1
Bear case -5.3 -0.9 1.1 3.1
Source: Mirae Asset Daewoo Research

Samsung Electronics
Mirae Asset Daewoo Research 26
May 13, 2020
1) Smartphone shipment outlook and key assumptions
No consensus has formed among market researchers regarding the real impact of COVID-
19 on IT demand. While it appears clear that smartphone shipments posted a quarterly
decline in the mid-20% range in 1Q20, there are diverging views on: 1) the pace of shipment
declines in 2Q20; and 2) the likelihood of a release of pent-up demand in 2H20.
The spread of COVID-19 began to accelerate around the world (beyond China) in March, and
social distancing has been implemented globally since April, dampening consumer
sentiment. Given the cases of China and Korea, where infections peaked two months after
the first cases emerged, we project that smartphone demand will fall off a cliff during the
first two months of 2Q20 before beginning to stabilize..
Our projections also assume that smartphone shipment volume will decline only 6.2% YoY
and expand more than 20% QoQ, supported by the release of pent-up demand, in 3Q20.
Accordingly, our base-case scenario projects full-year shipment volume to decline 8.3% YoY
(or 110mn units) to 1.26bn units in 2020 and increase 11.6% YoY to 1.4bn units in 2021,
matching 2019 levels.
Figure 58. Global smartphone shipment scenario (quarterly)
Source: IDC, Counterpoint, Mirae Asset Daewoo Research
Figure 59. Global smartphone shipment scenario (annual)
Source: IDC, Counterpoint, Mirae Asset Daewoo Research
-40
-20
0
20
40
0
120
240
360
480
1Q19 2Q19 3Q19 4Q19 1Q20F 2Q20F 3Q20F 4Q20F 1Q21F 2Q21F 3Q21F 4Q21F
(%)(mn units) Base case (U-shaped recovery, L) Bear case (L)Worst case (L) Base case YoY (R)Bear case YoY (R) Worst case YoY (R)
12.6
14.0 13.7
12.4
12.9
11.9
12.5
-20
-10
0
10
20
8
10
12
14
16
2016 2017 2018 2019 2020F 2021F
(%)(mn units) Base case (U-shaped recovery, L) Bear case (L)
Worst case (L) Base case YoY (R)
Bear case YoY (R) Worst case YoY (R)
Samsung Electronics
Mirae Asset Daewoo Research 27
May 13, 2020
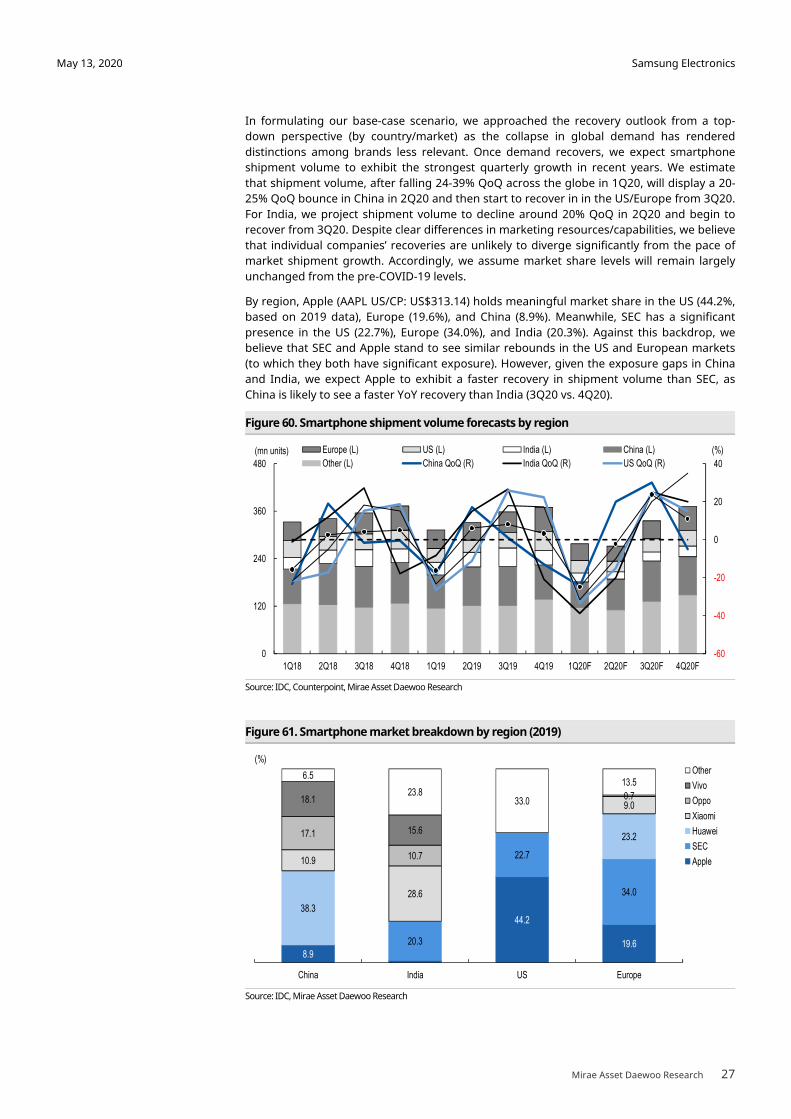
In formulating our base-case scenario, we approached the recovery outlook from a top-
down perspective (by country/market) as the collapse in global demand has rendered
distinctions among brands less relevant. Once demand recovers, we expect smartphone
shipment volume to exhibit the strongest quarterly growth in recent years. We estimate
that shipment volume, after falling 24-39% QoQ across the globe in 1Q20, will display a 20-
25% QoQ bounce in China in 2Q20 and then start to recover in in the US/Europe from 3Q20.
For India, we project shipment volume to decline around 20% QoQ in 2Q20 and begin to
recover from 3Q20. Despite clear differences in marketing resources/capabilities, we believe
that individual companies’ recoveries are unlikely to diverge significantly from the pace of
market shipment growth. Accordingly, we assume market share levels will remain largely
unchanged from the pre-COVID-19 levels.
By region, Apple (AAPL US/CP: US$313.14) holds meaningful market share in the US (44.2%,
based on 2019 data), Europe (19.6%), and China (8.9%). Meanwhile, SEC has a significant
presence in the US (22.7%), Europe (34.0%), and India (20.3%). Against this backdrop, we
believe that SEC and Apple stand to see similar rebounds in the US and European markets
(to which they both have significant exposure). However, given the exposure gaps in China
and India, we expect Apple to exhibit a faster recovery in shipment volume than SEC, as
China is likely to see a faster YoY recovery than India (3Q20 vs. 4Q20).
Figure 60. Smartphone shipment volume forecasts by region
Source: IDC, Counterpoint, Mirae Asset Daewoo Research
Figure 61. Smartphone market breakdown by region (2019)
Source: IDC, Mirae Asset Daewoo Research
-60
-40
-20
0
20
40
0
120
240
360
480
1Q18 2Q18 3Q18 4Q18 1Q19 2Q19 3Q19 4Q19 1Q20F 2Q20F 3Q20F 4Q20F
(%)(mn units) Europe (L) US (L) India (L) China (L)
Other (L) China QoQ (R) India QoQ (R) US QoQ (R)
8.9
44.2
19.6 20.3
22.7
34.0
38.3
23.2
10.9
28.6
9.0
17.1
10.7
0.7 18.1
15.6
6.5
23.8 33.0
13.5
China India US Europe
(%)Other
Vivo
Oppo
Xiaomi
Huawei
SEC
Apple
Samsung Electronics
Mirae Asset Daewoo Research 28
May 13, 2020
According to Counterpoint Research, SEC’s global smartphone sales volume contracted
20.8% QoQ in March 2020 (based on cumulative sell-through), worsening from a 9.9%
decline one year prior. We estimate that the firm’s sales volume did not decline sharply YoY
until March, when the impact of COVID-19 began to be felt in earnest.
In the US, SEC’s sales volume fell 16.4% QoQ, outperforming the overall market (-33.3%
QoQ). We believe the firm fared similarly well in Europe. However, the firm’s sales volume
plunged 42.2% QoQ in India, one of its key markets, faring worse compared to the same
period last year (-27.2% QoQ in 1Q19) and the overall Indian market (-38.8% QoQ).
By region, Europe accounts for 23.6% (as of 2019) of SEC’s sales volume, the US 12.1%, and
India 7.4% We estimate the firm’s smartphone shipment volume in Europe dropped 31.6%
QoQ in 1Q20, with negative growth likely to continue in 2Q20, albeit at a slower pace (aided
by the absence of the weak seasonality seen in 1Q20). We expect the firm’s shipment
volume to recover QoQ in 3Q20 and achieve positive YoY growth in 4Q20. Accordingly, we
estimate SEC’s annual smartphone shipment volume will reach 246mn units (-16.9% YoY) in
2020 and 271 mn units (+10.1% YoY) in 2021.
By region, the US accounts for 44.2% (as of 2019) of Apple’s sales, Europe 19.6%, and China
8.9%. We estimate that Apple’s US smartphone shipment volume declined 33.3% QoQ in
1Q20, with negative growth likely to continue in in 2Q20. However, given the likelihood of a
slowdown in negative shipment growth in the US and high exposure to China, which is
ahead of the pandemic curve, we project that Apple’s global smartphone shipment volume
will expand 6.8% QoQ in 2Q20 and 7.0% YoY in 2020.
The resilient outlook for Apple is due to the fact that 1Q, which marked the peak of the
COVID-19 outbreak, is an off-peak period for Apple in terms of shipments. Indeed, while
Apple’s smartphone shipment volume declined 37.5% QoQ (sell-through basis) in 1Q20, this
figure is largely in line with the average 1Q decline of 34.3% QoQ (sell-in basis) between
2017 and 2019. Even after accounting for the sell-through/sell-in difference, we believe
there remains a possibility that Apple could achieve YoY shipment growth in 2020.
For reference, our base-case scenario is premised on: 1) a significant slowdown in negative
QoQ growth in 2Q20; and 2) a swing to positive QoQ growth in 3Q20 onward, which should
lead to flattish YoY growth in 4Q20.
However, if the decline in shipment growth is sharper than expected in 2Q20, there is a
possibility of demand failing to recover to the previous year’s level in 4Q20. Under this
worst-case scenario, we assume smartphone shipment volume will decline 13.3% YoY (or
180mn units) in 2020 and increase only 5.5% YoY in 2021, failing to reach the 2019 level for
two consecutive years.
Samsung Electronics
Mirae Asset Daewoo Research 29
May 13, 2020
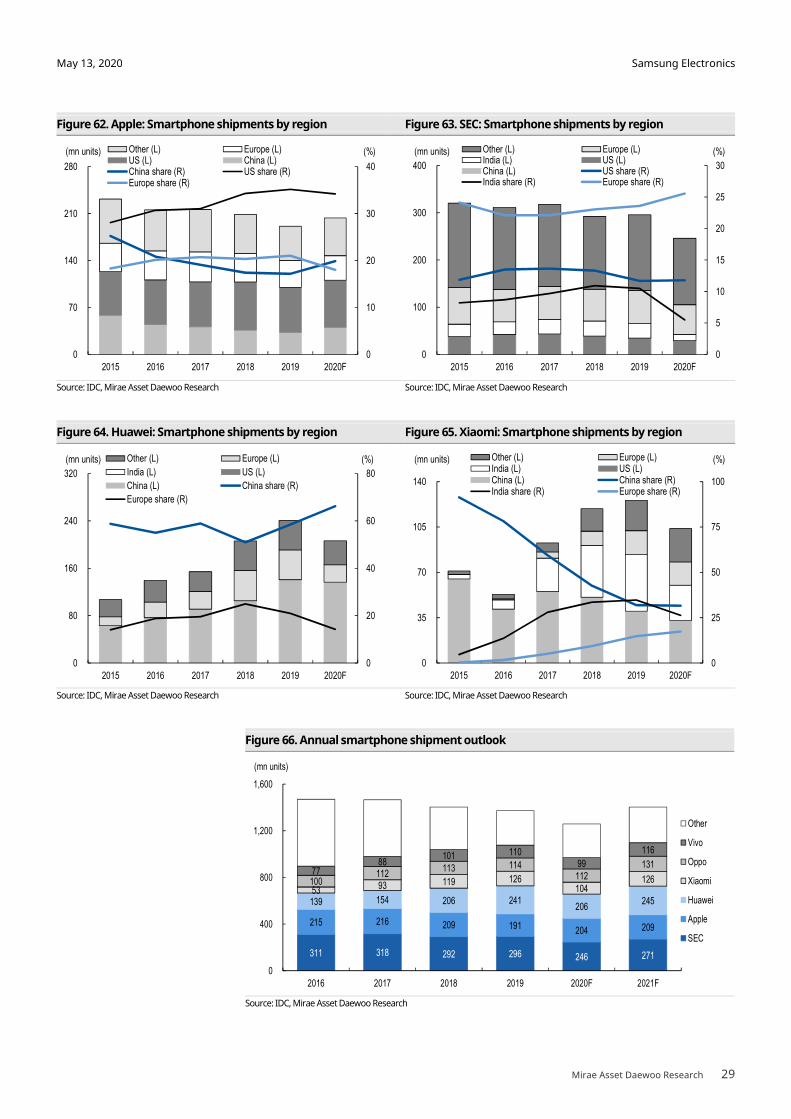
Figure 62. Apple: Smartphone shipments by region Figure 63. SEC: Smartphone shipments by region
Source: IDC, Mirae Asset Daewoo Research Source: IDC, Mirae Asset Daewoo Research
Figure 64. Huawei: Smartphone shipments by region Figure 65. Xiaomi: Smartphone shipments by region
Source: IDC, Mirae Asset Daewoo Research Source: IDC, Mirae Asset Daewoo Research
Figure 66. Annual smartphone shipment outlook
Source: IDC, Mirae Asset Daewoo Research
0
10
20
30
40
0
70
140
210
280
2015 2016 2017 2018 2019 2020F
(%)(mn units) Other (L) Europe (L)US (L) China (L)China share (R) US share (R)Europe share (R)
0
5
10
15
20
25
30
0
100
200
300
400
2015 2016 2017 2018 2019 2020F
(%)(mn units) Other (L) Europe (L)India (L) US (L)China (L) US share (R)India share (R) Europe share (R)
0
20
40
60
80
0
80
160
240
320
2015 2016 2017 2018 2019 2020F
(%)(mn units) Other (L) Europe (L)
India (L) US (L)
China (L) China share (R)
Europe share (R)
0
25
50
75
100
0
35
70
105
140
2015 2016 2017 2018 2019 2020F
(%)(mn units) Other (L) Europe (L)India (L) US (L)China (L) China share (R)India share (R) Europe share (R)
311 318 292 296 246 271
215 216 209 191 204 209
139 154 206 241 206
245 53 93 119 126
104 126 100
112 113 114
112 131
77 88
101 110 99
116
0
400
800
1,200
1,600
2016 2017 2018 2019 2020F 2021F
(mn units)
Other
Vivo
Oppo
Xiaomi
Huawei
Apple
SEC
Samsung Electronics
Mirae Asset Daewoo Research 30
May 13, 2020
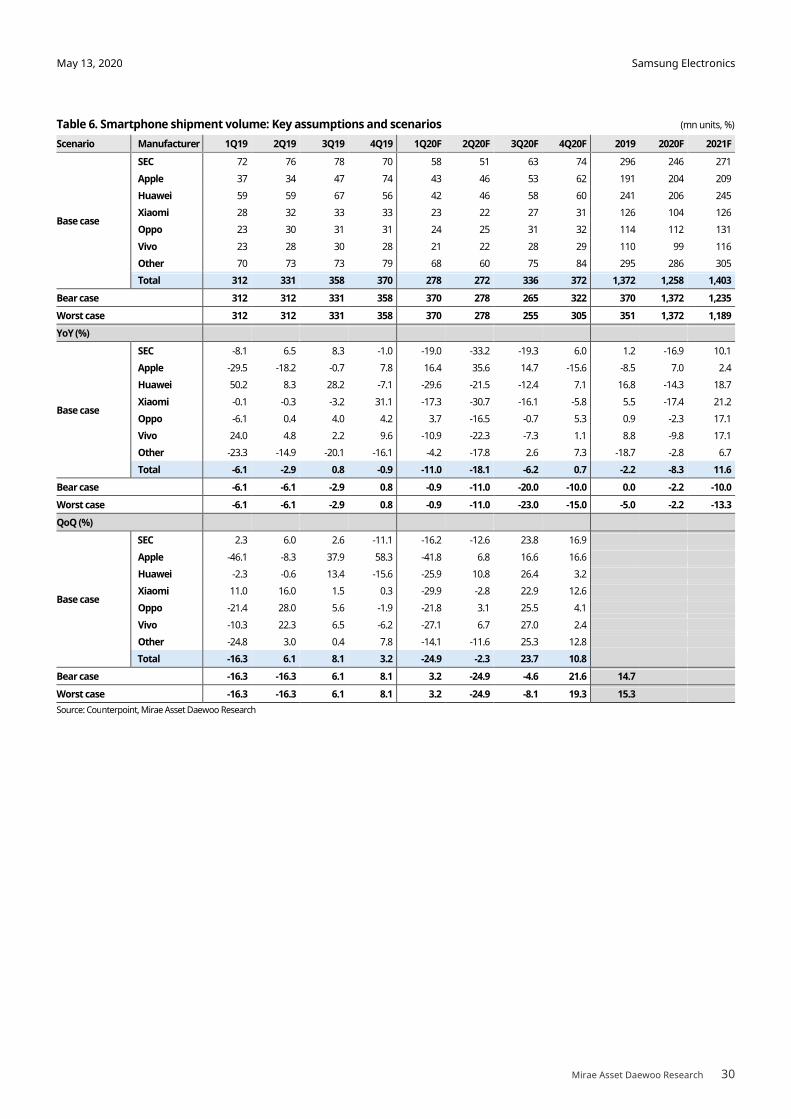
Table 6. Smartphone shipment volume: Key assumptions and scenarios (mn units, %)
Scenario Manufacturer 1Q19 2Q19 3Q19 4Q19 1Q20F 2Q20F 3Q20F 4Q20F 2019 2020F 2021F
Base case
SEC 72 76 78 70 58 51 63 74 296 246 271
Apple 37 34 47 74 43 46 53 62 191 204 209
Huawei 59 59 67 56 42 46 58 60 241 206 245
Xiaomi 28 32 33 33 23 22 27 31 126 104 126
Oppo 23 30 31 31 24 25 31 32 114 112 131
Vivo 23 28 30 28 21 22 28 29 110 99 116
Other 70 73 73 79 68 60 75 84 295 286 305
Total 312 331 358 370 278 272 336 372 1,372 1,258 1,403
Bear case 312 312 331 358 370 278 265 322 370 1,372 1,235
Worst case 312 312 331 358 370 278 255 305 351 1,372 1,189
YoY (%)
Base case
SEC -8.1 6.5 8.3 -1.0 -19.0 -33.2 -19.3 6.0 1.2 -16.9 10.1
Apple -29.5 -18.2 -0.7 7.8 16.4 35.6 14.7 -15.6 -8.5 7.0 2.4
Huawei 50.2 8.3 28.2 -7.1 -29.6 -21.5 -12.4 7.1 16.8 -14.3 18.7
Xiaomi -0.1 -0.3 -3.2 31.1 -17.3 -30.7 -16.1 -5.8 5.5 -17.4 21.2
Oppo -6.1 0.4 4.0 4.2 3.7 -16.5 -0.7 5.3 0.9 -2.3 17.1
Vivo 24.0 4.8 2.2 9.6 -10.9 -22.3 -7.3 1.1 8.8 -9.8 17.1
Other -23.3 -14.9 -20.1 -16.1 -4.2 -17.8 2.6 7.3 -18.7 -2.8 6.7
Total -6.1 -2.9 0.8 -0.9 -11.0 -18.1 -6.2 0.7 -2.2 -8.3 11.6
Bear case -6.1 -6.1 -2.9 0.8 -0.9 -11.0 -20.0 -10.0 0.0 -2.2 -10.0
Worst case -6.1 -6.1 -2.9 0.8 -0.9 -11.0 -23.0 -15.0 -5.0 -2.2 -13.3
QoQ (%)
Base case
SEC 2.3 6.0 2.6 -11.1 -16.2 -12.6 23.8 16.9
Apple -46.1 -8.3 37.9 58.3 -41.8 6.8 16.6 16.6
Huawei -2.3 -0.6 13.4 -15.6 -25.9 10.8 26.4 3.2
Xiaomi 11.0 16.0 1.5 0.3 -29.9 -2.8 22.9 12.6
Oppo -21.4 28.0 5.6 -1.9 -21.8 3.1 25.5 4.1
Vivo -10.3 22.3 6.5 -6.2 -27.1 6.7 27.0 2.4
Other -24.8 3.0 0.4 7.8 -14.1 -11.6 25.3 12.8
Total -16.3 6.1 8.1 3.2 -24.9 -2.3 23.7 10.8
Bear case -16.3 -16.3 6.1 8.1 3.2 -24.9 -4.6 21.6 14.7
Worst case -16.3 -16.3 6.1 8.1 3.2 -24.9 -8.1 19.3 15.3
Source: Counterpoint, Mirae Asset Daewoo Research
Samsung Electronics
Mirae Asset Daewoo Research 31
May 13, 2020
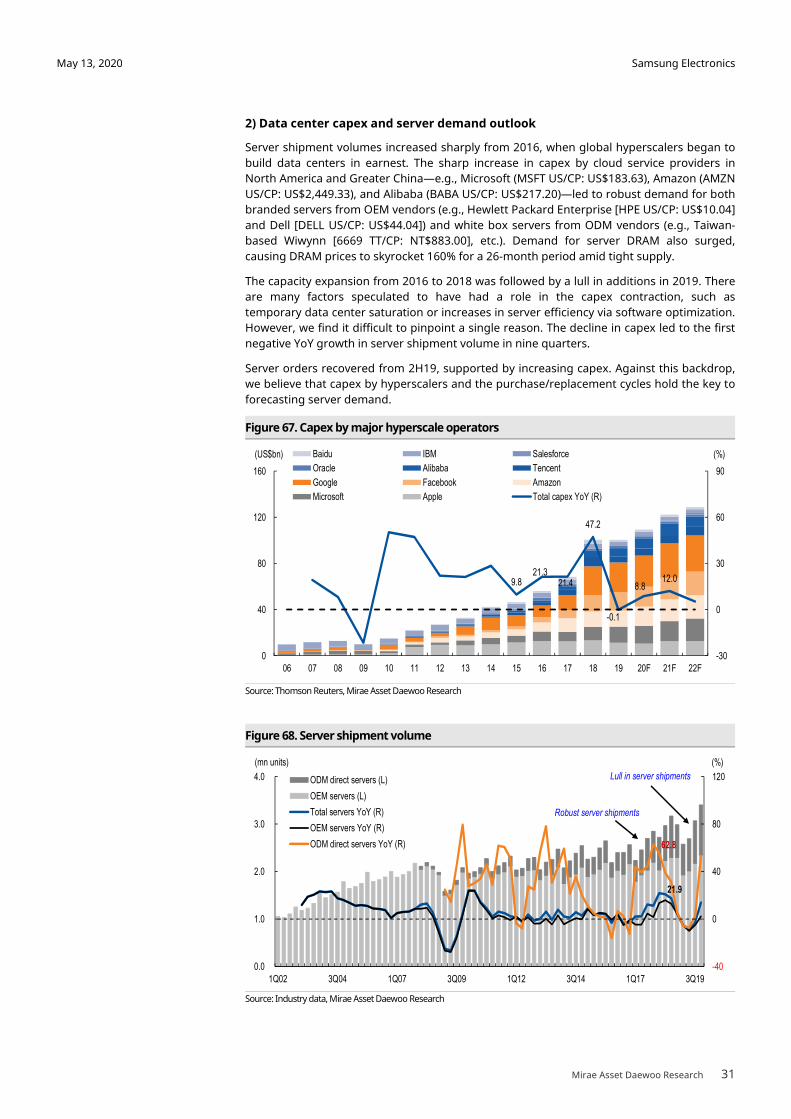
2) Data center capex and server demand outlook
Server shipment volumes increased sharply from 2016, when global hyperscalers began to
build data centers in earnest. The sharp increase in capex by cloud service providers in
North America and Greater China—e.g., Microsoft (MSFT US/CP: US$183.63), Amazon (AMZN
US/CP: US$2,449.33), and Alibaba (BABA US/CP: US$217.20)—led to robust demand for both
branded servers from OEM vendors (e.g., Hewlett Packard Enterprise [HPE US/CP: US$10.04]
and Dell [DELL US/CP: US$44.04]) and white box servers from ODM vendors (e.g., Taiwan-
based Wiwynn [6669 TT/CP: NT$883.00], etc.). Demand for server DRAM also surged,
causing DRAM prices to skyrocket 160% for a 26-month period amid tight supply.
The capacity expansion from 2016 to 2018 was followed by a lull in additions in 2019. There
are many factors speculated to have had a role in the capex contraction, such as
temporary data center saturation or increases in server efficiency via software optimization.
However, we find it difficult to pinpoint a single reason. The decline in capex led to the first
negative YoY growth in server shipment volume in nine quarters.
Server orders recovered from 2H19, supported by increasing capex. Against this backdrop,
we believe that capex by hyperscalers and the purchase/replacement cycles hold the key to
forecasting server demand.
Figure 67. Capex by major hyperscale operators
Source: Thomson Reuters, Mirae Asset Daewoo Research
Figure 68. Server shipment volume
Source: Industry data, Mirae Asset Daewoo Research
9.821.3
21.4
47.2
-0.1
8.812.0
-30
0
30
60
90
0
40
80
120
160
06 07 08 09 10 11 12 13 14 15 16 17 18 19 20F 21F 22F
(%)(US$bn) Baidu IBM Salesforce
Oracle Alibaba Tencent
Google Facebook Amazon
Microsoft Apple Total capex YoY (R)
21.9
62.8
-40
0
40
80
120
0.0
1.0
2.0
3.0
4.0
1Q02 3Q04 1Q07 3Q09 1Q12 3Q14 1Q17 3Q19
(%)(mn units)
ODM direct servers (L)
OEM servers (L)
Total servers YoY (R)
OEM servers YoY (R)
ODM direct servers YoY (R)
Robust server shipments
Lull in server shipments
Samsung Electronics
Mirae Asset Daewoo Research 32
May 13, 2020
Looking ahead, we expect memory chip demand from data centers to remain stable, in light
of the following: 1) capex trends at cloud service providers suggest that the most recent
memory down cycle (end-2018 to early-2019) was triggered by customers’ inventory
reductions, rather than by fundamental demand contraction; 2) the server replacement
cycle is arriving for hyperscalers; and 3) cloud service providers continue to possess strong
growth potential and profitability. (Their interest coverage ratios have reached peak levels.)
With demand from hyperscalers very likely to remain strong, we believe that the timing of
server memory purchases will depend on the direction of mobile market demand. And we
think supply management at DRAM makers will hasten the timing of purchases.
(1) Microsoft and Amazon (cloud service providers): Capex and capital lease trends
Cloud investments at Microsoft and Amazon have shown an oscillating pattern, with
company-wide capex growth and the combined growth of capex and capital leases taking
turns outpacing one another.
At Microsoft, the combined growth of capex and capital leases outstripped capex growth in
4Q16-4Q17. In the subsequent four quarters (1Q18-4Q18), capex displayed faster growth
than capex and capital leases combined. The growth structure reversed in 1Q19-4Q19 (with
capex and capital lease growth prevailing) and again in 1Q20 (with capex growth picking up
more rapidly). Amazon has exhibited a similar, albeit not as pronounced, pattern.
As some servers/network equipment used in data centers are leased assets, we can assume
that new server installations took place during periods in which the combined growth of
capex and capital leases was higher. Accordingly, we estimate that in 1Q20, more
investments were made in infrastructure than in servers. Nevertheless, server DRAM sales
have picked up recently, likely driven by stockpiling demand.
While some market watchers are fretting over the possibility of another server DRAM down
cycle, we note several differences in market conditions compared to in 1Q19. Back before
the onset of the last down cycle, inventory stockpiling continued for over four quarters at
hyperscalers, with capital leases remaining at low levels since 1Q18. With this in mind, we
do not believe that a pickup in stockpiling demand during a single quarter (1Q20) is enough
to give buyers strong bargaining power.
In addition, we believe that DRAM suppliers will no longer just sit on their hands in the face
of a down cycle triggered by stockpiling demand, especially given their oligopolistic market
positioning.
We also note that capital leases continued to expand even during the 2019 memory down
cycle (when capex growth slowed or even turned negative). Microsoft reported zero capex
growth throughout the year, and Amazon posted single-digit capex growth for five
quarters, from 2Q18 to 2Q19. During the same period, however, both companies reported
double-digit growth in capex and capital leases combined. This suggests that investments in
network equipment and servers continued despite the overall fall in investments.
Nevertheless, server DRAM demand stagnated at extremely low levels from end-2018 to
early 2019. We attribute this demand weakness to buyers’ inventory management strategies
aimed at increasing negotiating power, rather than to fundamental demand contraction. In
other words, large channel inventories, rather than a lack of server demand, caused the
down cycle.
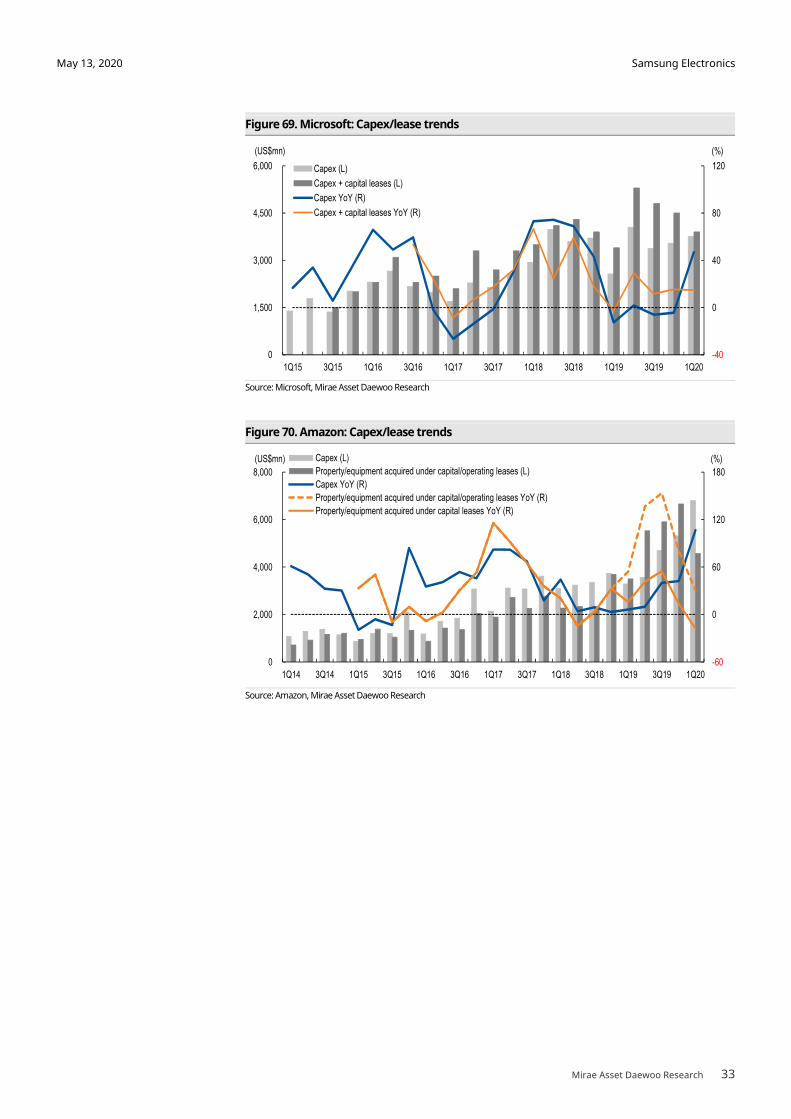
Samsung Electronics
Mirae Asset Daewoo Research 33
May 13, 2020
Figure 69. Microsoft: Capex/lease trends
Source: Microsoft, Mirae Asset Daewoo Research
Figure 70. Amazon: Capex/lease trends
Source: Amazon, Mirae Asset Daewoo Research
-40
0
40
80
120
0
1,500
3,000
4,500
6,000
1Q15 3Q15 1Q16 3Q16 1Q17 3Q17 1Q18 3Q18 1Q19 3Q19 1Q20
(%)(US$mn)
Capex (L)
Capex + capital leases (L)
Capex YoY (R)
Capex + capital leases YoY (R)
-60
0
60
120
180
0
2,000
4,000
6,000
8,000
1Q14 3Q14 1Q15 3Q15 1Q16 3Q16 1Q17 3Q17 1Q18 3Q18 1Q19 3Q19 1Q20
(%)(US$mn) Capex (L)
Property/equipment acquired under capital/operating leases (L)
Capex YoY (R)
Property/equipment acquired under capital/operating leases YoY (R)
Property/equipment acquired under capital leases YoY (R)

Samsung Electronics
Mirae Asset Daewoo Research 34
May 13, 2020
(2) Cloud providers still displaying strong potential, profitability, and financial stability
As data center investments often include leverage (e.g., leases, borrowings, etc.), they can
often put strain on a company’s financial health. However, cloud providers have continued
to report robust earnings growth, with leverage ratios increasingly stabilizing.
For 1Q20, Microsoft’s Intelligent Cloud business reported record revenue of US$12.2bn
(+27.3% YoY) and operating profit of US$4.6bn (+42.1% YoY; highest growth in three years).
Notably, Azure displayed revenue expansion of 59% YoY, growing faster than Amazon Web
Services (AWS), which posted revenue of US$10.2bn (+32.8% YoY) and operating profit of
US$3.1bn (+38.3% YoY). Both Microsoft’s Intelligent Cloud business and AWS continue to
deliver high margins (above 30%).
Microsoft’s quarterly interest expenses have surged since 1Q16, now standing at around
US$600mn. Amazon has also seen its interest expense burden grow since 2Q17, to
US$400mn per quarter. However, we note that both companies generate enough operating
profit to cover such expenses. Indeed, as of 1Q20, Microsoft and Amazon each boast an
interest coverage ratio of around 750% based on cloud income alone.
Figure 71. Microsoft: Revenue and OP trends
Source: Microsoft, Mirae Asset Daewoo Research
Figure 72. AWS: Revenue and OP trends
Source: Amazon, Mirae Asset Daewoo Research
-40
0
40
80
120
0
3,000
6,000
9,000
12,000
1Q16 3Q16 1Q17 3Q17 1Q18 3Q18 1Q19 3Q19 1Q20
(%)(US$mn) AWS revenue (L) AWS OP (L)
AWS OP margin (R) AWS OP YoY (R)
AWS OP QoQ (R)
-40
0
40
80
120
0
4,000
8,000
12,000
16,000
1Q16 3Q16 1Q17 3Q17 1Q18 3Q18 1Q19 3Q19 1Q20
(%)(US$mn) Intelligent Cloud revenue (L) Intelligent Cloud OP (L)
Intelligent Cloud OP YoY (R) Intelligent Cloud OP margin (R)
Azure revenue YoY (R)
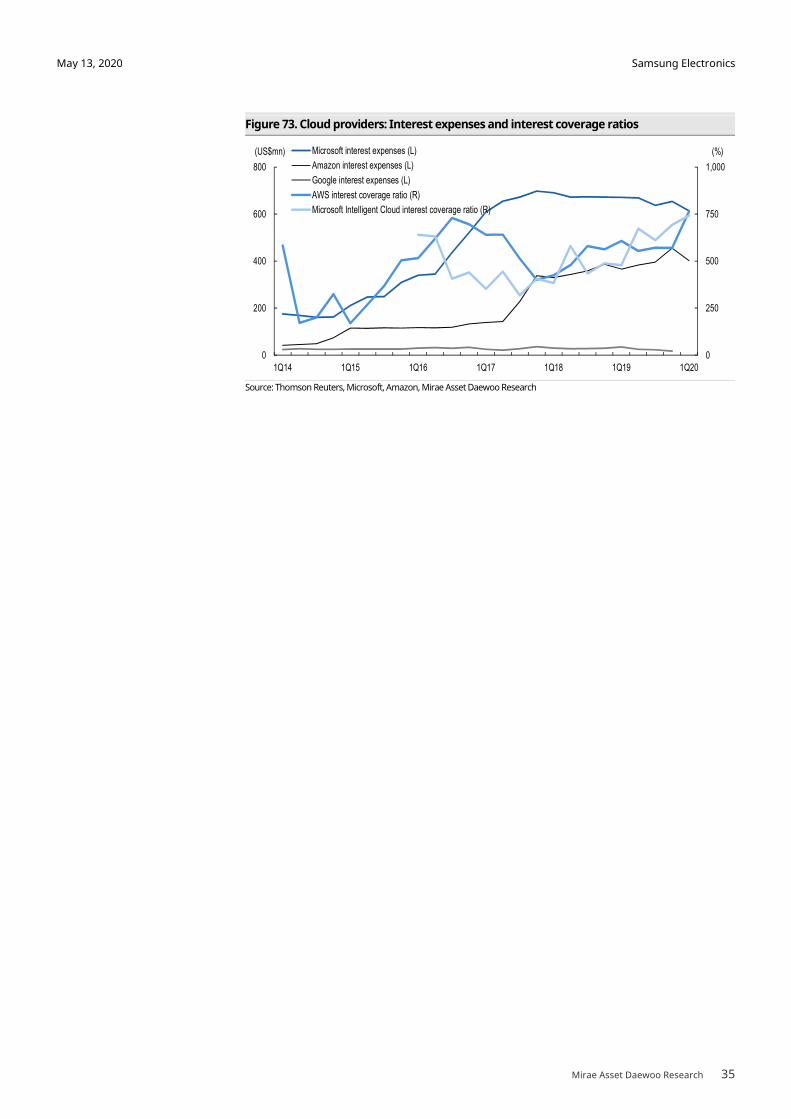
Samsung Electronics
Mirae Asset Daewoo Research 35
May 13, 2020
Figure 73. Cloud providers: Interest expenses and interest coverage ratios
Source: Thomson Reuters, Microsoft, Amazon, Mirae Asset Daewoo Research
0
250
500
750
1,000
0
200
400
600
800
1Q14 1Q15 1Q16 1Q17 1Q18 1Q19 1Q20
(%)(US$mn) Microsoft interest expenses (L)
Amazon interest expenses (L)
Google interest expenses (L)
AWS interest coverage ratio (R)
Microsoft Intelligent Cloud interest coverage ratio (R)
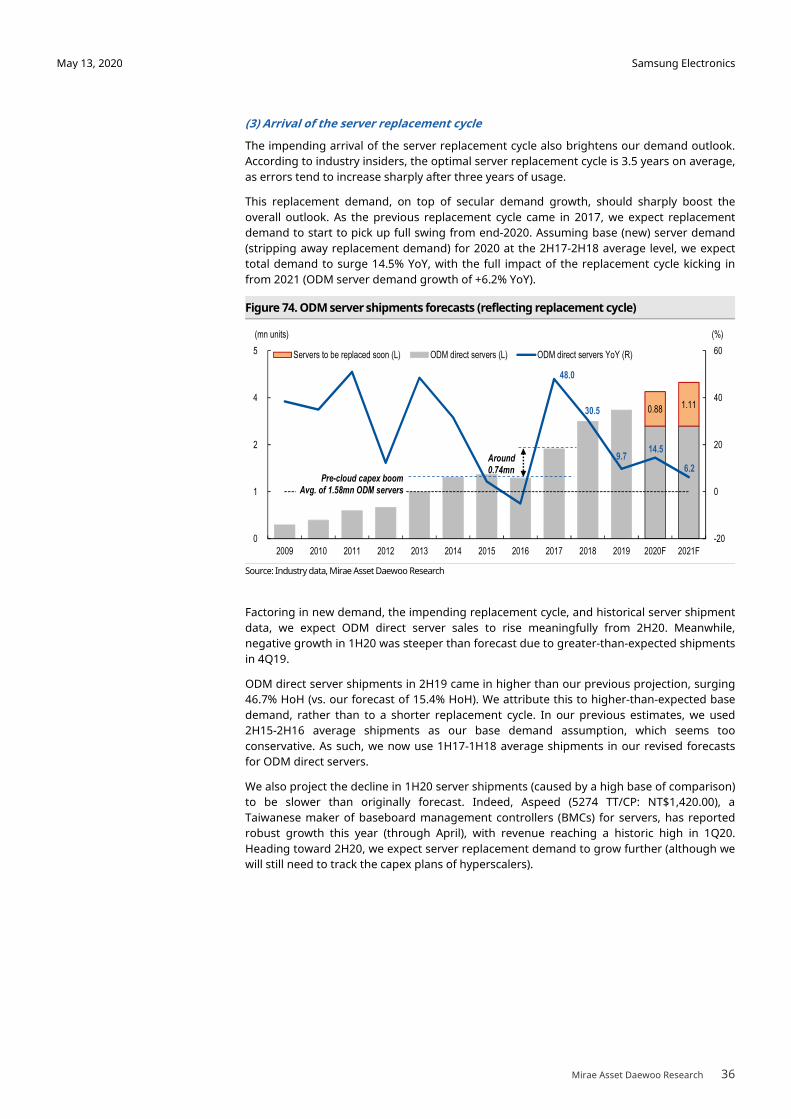
Samsung Electronics
Mirae Asset Daewoo Research 36
May 13, 2020
(3) Arrival of the server replacement cycle
The impending arrival of the server replacement cycle also brightens our demand outlook.
According to industry insiders, the optimal server replacement cycle is 3.5 years on average,
as errors tend to increase sharply after three years of usage.
This replacement demand, on top of secular demand growth, should sharply boost the
overall outlook. As the previous replacement cycle came in 2017, we expect replacement
demand to start to pick up full swing from end-2020. Assuming base (new) server demand
(stripping away replacement demand) for 2020 at the 2H17-2H18 average level, we expect
total demand to surge 14.5% YoY, with the full impact of the replacement cycle kicking in
from 2021 (ODM server demand growth of +6.2% YoY).
Figure 74. ODM server shipments forecasts (reflecting replacement cycle)
Source: Industry data, Mirae Asset Daewoo Research
Factoring in new demand, the impending replacement cycle, and historical server shipment
data, we expect ODM direct server sales to rise meaningfully from 2H20. Meanwhile,
negative growth in 1H20 was steeper than forecast due to greater-than-expected shipments
in 4Q19.
ODM direct server shipments in 2H19 came in higher than our previous projection, surging
46.7% HoH (vs. our forecast of 15.4% HoH). We attribute this to higher-than-expected base
demand, rather than to a shorter replacement cycle. In our previous estimates, we used
2H15-2H16 average shipments as our base demand assumption, which seems too
conservative. As such, we now use 1H17-1H18 average shipments in our revised forecasts
for ODM direct servers.
We also project the decline in 1H20 server shipments (caused by a high base of comparison)
to be slower than originally forecast. Indeed, Aspeed (5274 TT/CP: NT$1,420.00), a
Taiwanese maker of baseboard management controllers (BMCs) for servers, has reported
robust growth this year (through April), with revenue reaching a historic high in 1Q20.
Heading toward 2H20, we expect server replacement demand to grow further (although we
will still need to track the capex plans of hyperscalers).
0.88 1.11
48.0
30.5
9.7 14.5
6.2
-20
0
20
40
60
0
1
2
4
5
2009 2010 2011 2012 2013 2014 2015 2016 2017 2018 2019 2020F 2021F
(%)(mn units)
Servers to be replaced soon (L) ODM direct servers (L) ODM direct servers YoY (R)
Around 0.74mn
Pre-cloud capex boomAvg. of 1.58mn ODM servers
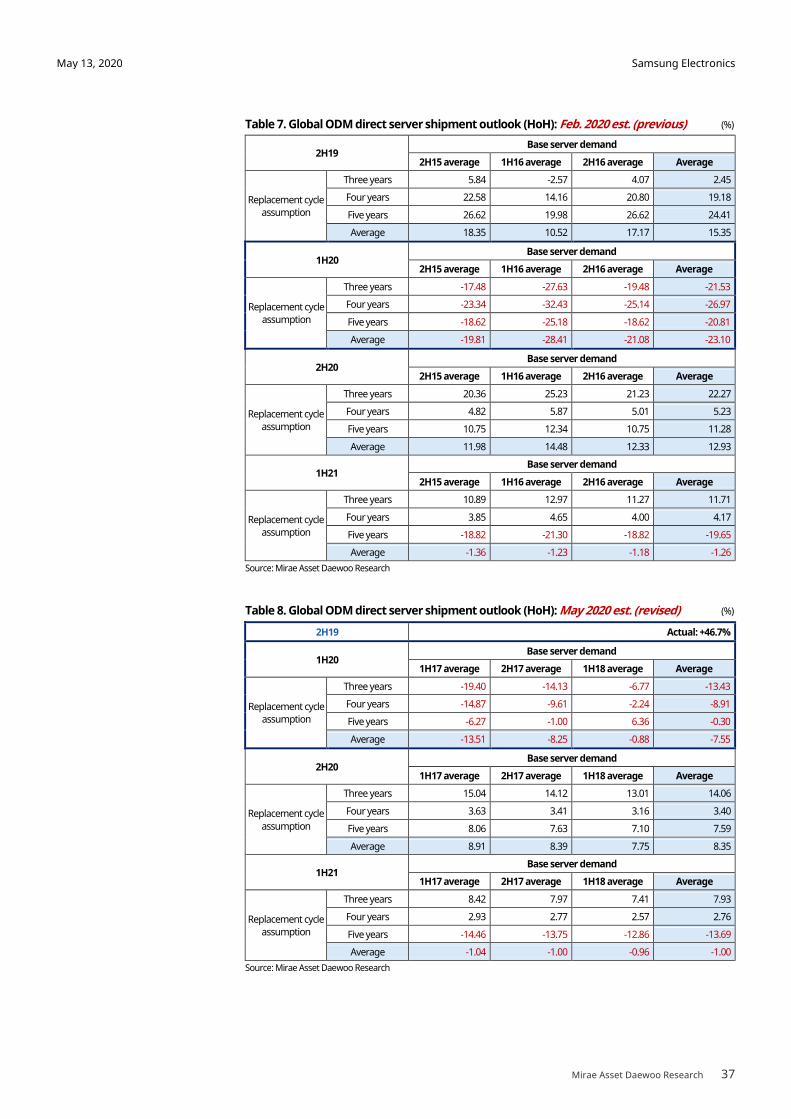
Samsung Electronics
Mirae Asset Daewoo Research 37
May 13, 2020
Table 7. Global ODM direct server shipment outlook (HoH): Feb. 2020 est. (previous) (%)
2H19 Base server demand
2H15 average 1H16 average 2H16 average Average
Replacement cycle assumption
Three years 5.84 -2.57 4.07 2.45
Four years 22.58 14.16 20.80 19.18
Five years 26.62 19.98 26.62 24.41
Average 18.35 10.52 17.17 15.35
1H20 Base server demand
2H15 average 1H16 average 2H16 average Average
Replacement cycle assumption
Three years -17.48 -27.63 -19.48 -21.53
Four years -23.34 -32.43 -25.14 -26.97
Five years -18.62 -25.18 -18.62 -20.81
Average -19.81 -28.41 -21.08 -23.10
2H20 Base server demand
2H15 average 1H16 average 2H16 average Average
Replacement cycle assumption
Three years 20.36 25.23 21.23 22.27
Four years 4.82 5.87 5.01 5.23
Five years 10.75 12.34 10.75 11.28
Average 11.98 14.48 12.33 12.93
1H21 Base server demand
2H15 average 1H16 average 2H16 average Average
Replacement cycle assumption
Three years 10.89 12.97 11.27 11.71
Four years 3.85 4.65 4.00 4.17
Five years -18.82 -21.30 -18.82 -19.65
Average -1.36 -1.23 -1.18 -1.26
Source: Mirae Asset Daewoo Research
Table 8. Global ODM direct server shipment outlook (HoH): May 2020 est. (revised) (%)
2H19 Actual: +46.7%
1H20 Base server demand
1H17 average 2H17 average 1H18 average Average
Replacement cycle assumption
Three years -19.40 -14.13 -6.77 -13.43
Four years -14.87 -9.61 -2.24 -8.91
Five years -6.27 -1.00 6.36 -0.30
Average -13.51 -8.25 -0.88 -7.55
2H20 Base server demand
1H17 average 2H17 average 1H18 average Average
Replacement cycle
assumption
Three years 15.04 14.12 13.01 14.06
Four years 3.63 3.41 3.16 3.40
Five years 8.06 7.63 7.10 7.59
Average 8.91 8.39 7.75 8.35
1H21 Base server demand
1H17 average 2H17 average 1H18 average Average
Replacement cycle assumption
Three years 8.42 7.97 7.41 7.93
Four years 2.93 2.77 2.57 2.76
Five years -14.46 -13.75 -12.86 -13.69
Average -1.04 -1.00 -0.96 -1.00
Source: Mirae Asset Daewoo Research
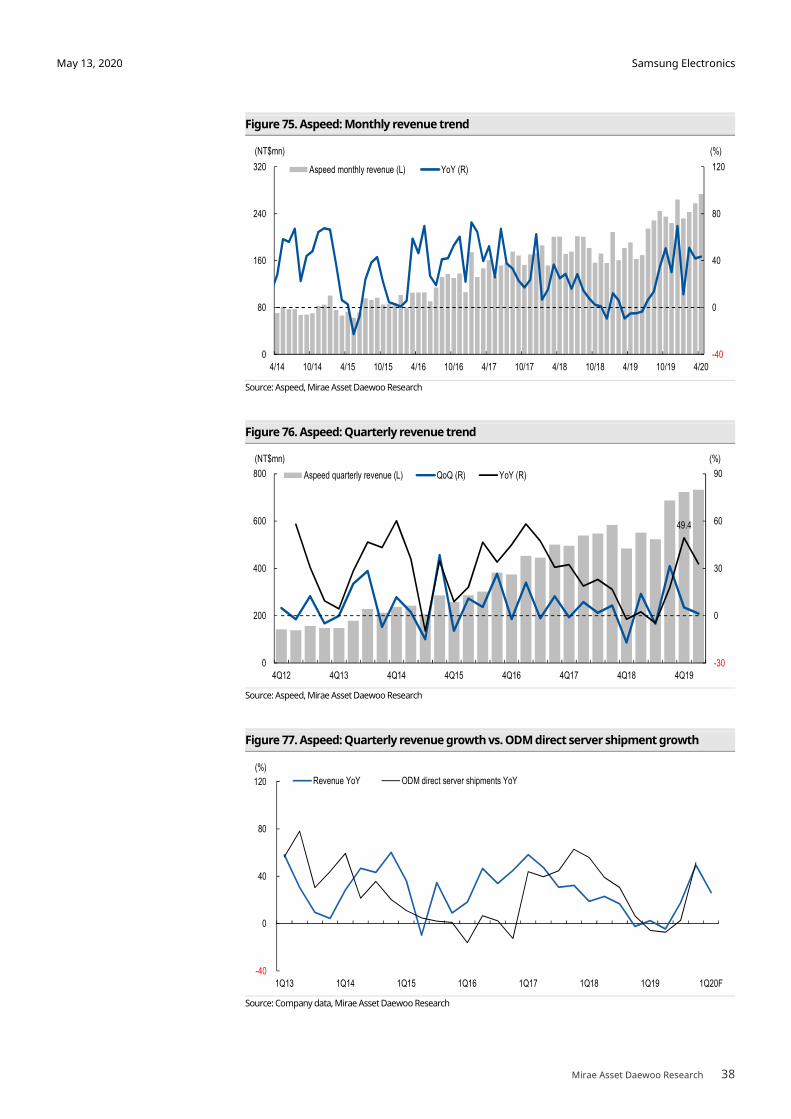
Samsung Electronics
Mirae Asset Daewoo Research 38
May 13, 2020
Figure 75. Aspeed: Monthly revenue trend
Source: Aspeed, Mirae Asset Daewoo Research
Figure 76. Aspeed: Quarterly revenue trend
Source: Aspeed, Mirae Asset Daewoo Research
Figure 77. Aspeed: Quarterly revenue growth vs. ODM direct server shipment growth
Source: Company data, Mirae Asset Daewoo Research
-40
0
40
80
120
0
80
160
240
320
4/14 10/14 4/15 10/15 4/16 10/16 4/17 10/17 4/18 10/18 4/19 10/19 4/20
(%)(NT$mn)
Aspeed monthly revenue (L) YoY (R)
49.4
-30
0
30
60
90
0
200
400
600
800
4Q12 4Q13 4Q14 4Q15 4Q16 4Q17 4Q18 4Q19
(%)(NT$mn)
Aspeed quarterly revenue (L) QoQ (R) YoY (R)
-40
0
40
80
120
1Q13 1Q14 1Q15 1Q16 1Q17 1Q18 1Q19 1Q20F
(%)
Revenue YoY ODM direct server shipments YoY

Samsung Electronics
Mirae Asset Daewoo Research 39
May 13, 2020
Table 9. Global top 10 OEM server shipment outlook (HoH): Feb. 2020 est. (previous) (%)
2H19 Base server demand
2015 average 2016 average 2017 average Average
Replacement cycle assumption
Three years 16.61 18.65 18.27 17.84
Four years 14.98 17.01 16.64 16.21
Five years 18.90 20.94 20.56 20.14
Average 16.83 18.87 18.49 18.06
1H20 Base server demand
2015 average 2016 average 2017 average Average
Replacement cycle assumption
Three years -5.39 -3.58 -3.91 -4.29
Four years 0.58 2.31 1.99 1.63
Five years -2.40 -0.68 -0.99 -1.36
Average -2.40 -0.65 -0.97 -1.34
2H20 Base server demand
2015 average 2016 average 2017 average Average
Replacement cycle assumption
Three years 3.35 3.23 3.25 3.28
Four years 2.79 2.69 2.71 2.73
Five years 4.68 4.52 4.55 4.58
Average 3.60 3.48 3.50 3.53
1H21 Base server demand
2015 average 2016 average 2017 average Average
Replacement cycle assumption
Three years -2.18 -2.10 -2.11 -2.13
Four years -6.81 -6.58 -6.62 -6.67
Five years -3.27 -3.17 -3.19 -3.21
Average -4.09 -3.95 -3.97 -4.00
Source: Mirae Asset Daewoo Research
Table 10. Global top 10 OEM server shipments outlook (HoH): May 2020 est. (revised) (%)
2H19 Actual: +14.7%
1H20 Base server demand
2016 average 2017 average 2018 average Average
Replacement cycle assumption
Three years 0.61 -0.48 10.08 3.40
Four years 5.44 4.36 14.91 8.24
Five years 6.09 5.00 15.56 8.88
Average 4.05 2.96 13.52 6.84
2H20 Base server demand
2016 average 2017 average 2018 average Average
Replacement cycle assumption
Three years 3.42 3.46 3.13 3.34
Four years 3.35 3.39 3.08 3.27
Five years 5.25 5.31 4.82 5.13
Average 4.01 4.05 3.67 3.91
1H21 Base server demand
2016 average 2017 average 2018 average Average
Replacement cycle assumption
Three years -2.84 -2.87 -2.61 -2.78
Four years -7.32 -7.40 -6.74 -7.15
Five years -4.13 -4.17 -3.80 -4.03
Average -4.76 -4.81 -4.38 -4.65
Source: Mirae Asset Daewoo Research
※※※※ For continuity, we included our estimates for the top 10 OEMs; however, our actual
demand model is based on the data of all OEMs <Table 11>.
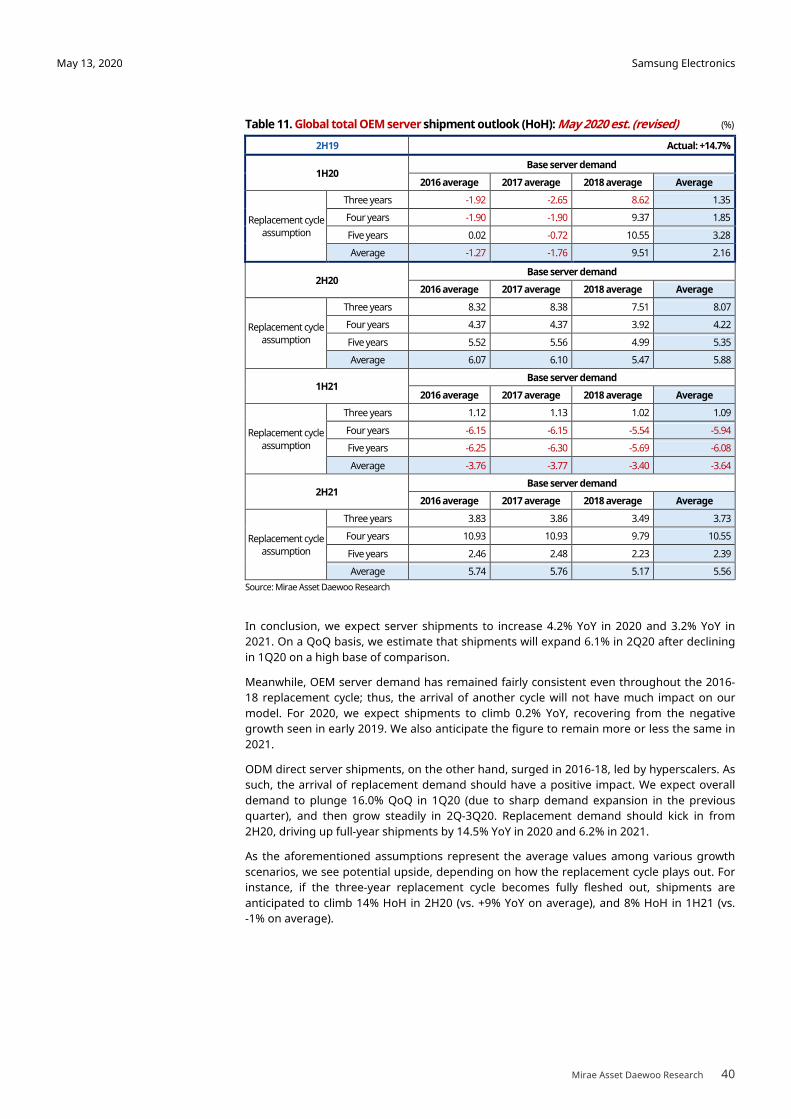
Samsung Electronics
Mirae Asset Daewoo Research 40
May 13, 2020
Table 11. Global total OEM server shipment outlook (HoH): May 2020 est. (revised) (%)
2H19 Actual: +14.7%
1H20 Base server demand
2016 average 2017 average 2018 average Average
Replacement cycle assumption
Three years -1.92 -2.65 8.62 1.35
Four years -1.90 -1.90 9.37 1.85
Five years 0.02 -0.72 10.55 3.28
Average -1.27 -1.76 9.51 2.16
2H20 Base server demand
2016 average 2017 average 2018 average Average
Replacement cycle assumption
Three years 8.32 8.38 7.51 8.07
Four years 4.37 4.37 3.92 4.22
Five years 5.52 5.56 4.99 5.35
Average 6.07 6.10 5.47 5.88
1H21 Base server demand
2016 average 2017 average 2018 average Average
Replacement cycle
assumption
Three years 1.12 1.13 1.02 1.09
Four years -6.15 -6.15 -5.54 -5.94
Five years -6.25 -6.30 -5.69 -6.08
Average -3.76 -3.77 -3.40 -3.64
2H21 Base server demand
2016 average 2017 average 2018 average Average
Replacement cycle assumption
Three years 3.83 3.86 3.49 3.73
Four years 10.93 10.93 9.79 10.55
Five years 2.46 2.48 2.23 2.39
Average 5.74 5.76 5.17 5.56
Source: Mirae Asset Daewoo Research
In conclusion, we expect server shipments to increase 4.2% YoY in 2020 and 3.2% YoY in
2021. On a QoQ basis, we estimate that shipments will expand 6.1% in 2Q20 after declining
in 1Q20 on a high base of comparison.
Meanwhile, OEM server demand has remained fairly consistent even throughout the 2016-
18 replacement cycle; thus, the arrival of another cycle will not have much impact on our
model. For 2020, we expect shipments to climb 0.2% YoY, recovering from the negative
growth seen in early 2019. We also anticipate the figure to remain more or less the same in
2021.
ODM direct server shipments, on the other hand, surged in 2016-18, led by hyperscalers. As
such, the arrival of replacement demand should have a positive impact. We expect overall
demand to plunge 16.0% QoQ in 1Q20 (due to sharp demand expansion in the previous
quarter), and then grow steadily in 2Q-3Q20. Replacement demand should kick in from
2H20, driving up full-year shipments by 14.5% YoY in 2020 and 6.2% in 2021.
As the aforementioned assumptions represent the average values among various growth
scenarios, we see potential upside, depending on how the replacement cycle plays out. For
instance, if the three-year replacement cycle becomes fully fleshed out, shipments are
anticipated to climb 14% HoH in 2H20 (vs. +9% YoY on average), and 8% HoH in 1H21 (vs.
-1% on average).
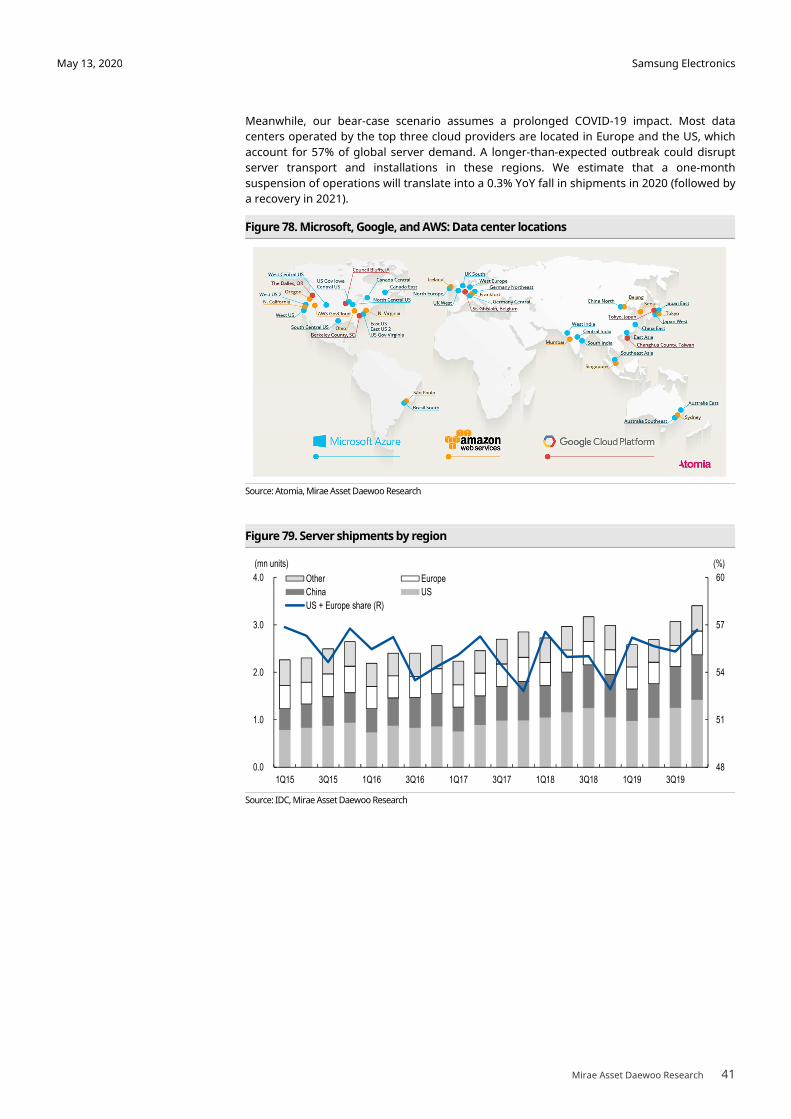
Samsung Electronics
Mirae Asset Daewoo Research 41
May 13, 2020
Meanwhile, our bear-case scenario assumes a prolonged COVID-19 impact. Most data
centers operated by the top three cloud providers are located in Europe and the US, which
account for 57% of global server demand. A longer-than-expected outbreak could disrupt
server transport and installations in these regions. We estimate that a one-month
suspension of operations will translate into a 0.3% YoY fall in shipments in 2020 (followed by
a recovery in 2021).
Figure 78. Microsoft, Google, and AWS: Data center locations
Source: Atomia, Mirae Asset Daewoo Research
Figure 79. Server shipments by region
Source: IDC, Mirae Asset Daewoo Research
48
51
54
57
60
0.0
1.0
2.0
3.0
4.0
1Q15 3Q15 1Q16 3Q16 1Q17 3Q17 1Q18 3Q18 1Q19 3Q19
(%)(mn units)
Other Europe
China US
US + Europe share (R)
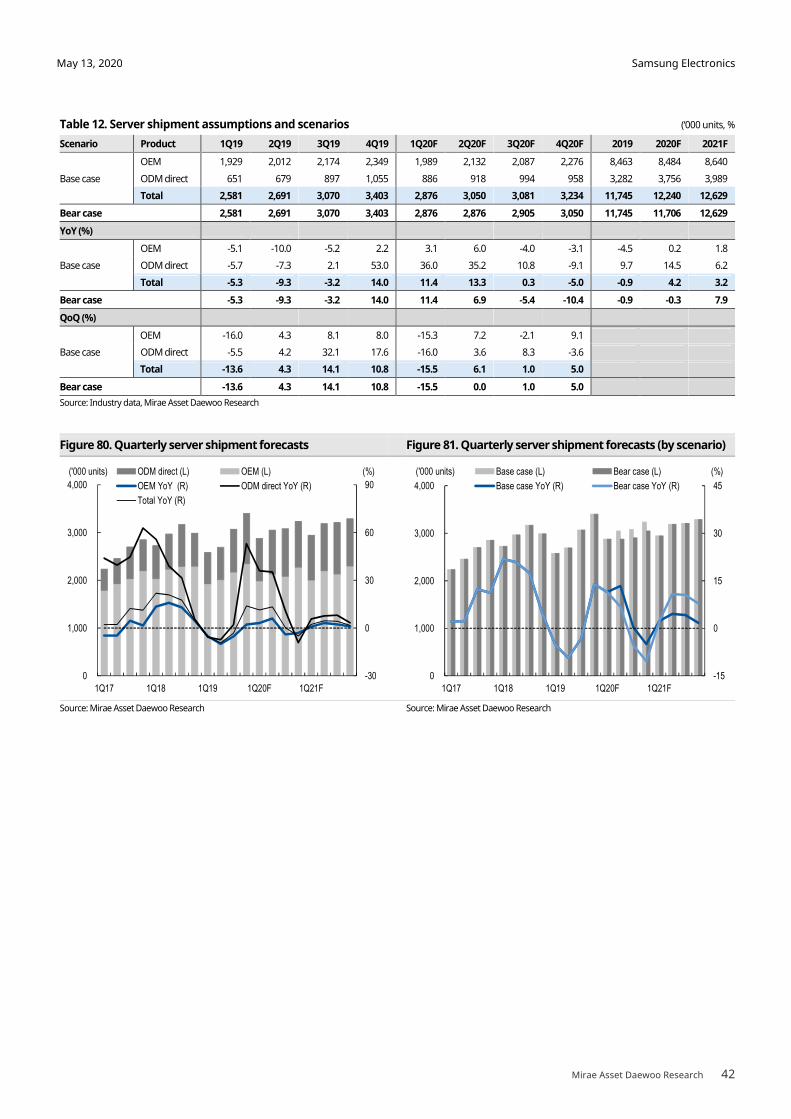
Samsung Electronics
Mirae Asset Daewoo Research 42
May 13, 2020
Table 12. Server shipment assumptions and scenarios (‘000 units, %)
Scenario Product 1Q19 2Q19 3Q19 4Q19 1Q20F 2Q20F 3Q20F 4Q20F 2019 2020F 2021F
Base case
OEM 1,929 2,012 2,174 2,349 1,989 2,132 2,087 2,276 8,463 8,484 8,640
ODM direct 651 679 897 1,055 886 918 994 958 3,282 3,756 3,989
Total 2,581 2,691 3,070 3,403 2,876 3,050 3,081 3,234 11,745 12,240 12,629
Bear case 2,581 2,691 3,070 3,403 2,876 2,876 2,905 3,050 11,745 11,706 12,629
YoY (%)
Base case
OEM -5.1 -10.0 -5.2 2.2 3.1 6.0 -4.0 -3.1 -4.5 0.2 1.8
ODM direct -5.7 -7.3 2.1 53.0 36.0 35.2 10.8 -9.1 9.7 14.5 6.2
Total -5.3 -9.3 -3.2 14.0 11.4 13.3 0.3 -5.0 -0.9 4.2 3.2
Bear case -5.3 -9.3 -3.2 14.0 11.4 6.9 -5.4 -10.4 -0.9 -0.3 7.9
QoQ (%)
Base case
OEM -16.0 4.3 8.1 8.0 -15.3 7.2 -2.1 9.1
ODM direct -5.5 4.2 32.1 17.6 -16.0 3.6 8.3 -3.6
Total -13.6 4.3 14.1 10.8 -15.5 6.1 1.0 5.0
Bear case -13.6 4.3 14.1 10.8 -15.5 0.0 1.0 5.0
Source: Industry data, Mirae Asset Daewoo Research
Figure 80. Quarterly server shipment forecasts Figure 81. Quarterly server shipment forecasts (by scenario)
Source: Mirae Asset Daewoo Research Source: Mirae Asset Daewoo Research
-15
0
15
30
45
0
1,000
2,000
3,000
4,000
1Q17 1Q18 1Q19 1Q20F 1Q21F
(%)('000 units) Base case (L) Bear case (L)
Base case YoY (R) Bear case YoY (R)
-30
0
30
60
90
0
1,000
2,000
3,000
4,000
1Q17 1Q18 1Q19 1Q20F 1Q21F
(%)('000 units) ODM direct (L) OEM (L)
OEM YoY (R) ODM direct YoY (R)
Total YoY (R)

Samsung Electronics
Mirae Asset Daewoo Research 43
May 13, 2020
[Semiconductors] NAND outlook
NAND supply/demand and earnings forecasts
(Demand) For 2020, we expect demand bit growth of 33.0% for core NAND applications. In
the short term, demand from enterprise SSDs is likely to help make up for the decrease in
smartphone NAND bit growth. Overall, we anticipate NAND manufacturers to limit supply
growth to a conservative 29% YoY this year to keep inventory at appropriate levels.
Mobile NAND accounts for around 35% of total NAND demand. Our base-case scenario has
shipments declining 8.3% YoY in 2020; in this case, we estimate bit growth at 24.2% amid
content growth of 35.5%.
We believe that client SSD adoption growth peaked in 2019. Going forward, we believe the
major factor in client SSD bit growth is highly likely to be the content per unit trend. For
2020, we forecast overall client SSD shipments to grow 7.2% YoY to 280mn units and
average content per PC to expand 28.3% YoY to 466GB, resulting in overall client SSD bit
growth of 37.4%.
For enterprise SSDs, bit shipments began to pick up in 4Q19 as prices began to stabilize,
raising expectations for price hikes in 2020. For 2020, we forecast enterprise SSD sales
volume growth at 10.5% and bit growth at 41.8%.
(Supply) For 2020 and 2021, we forecast NAND market bit growth at 29.0% and 40.3%,
respectively, and SEC’s bit growth at 24.7% and 42.7%. Stripping away the resumption of
85,000 wpm that had been lost due to power outages at Kioxia’s Yokkaichi plants in 2019,
we project market net capacity growth at 18,000 wpm in 2020 and 87,000 wpm in 2021. As
for SEC, we forecast net capacity expansions of 23,000 wpm in 2020 and 80,000 wpm in
2021, which would account for most of the industry’s growth. SEC’s competitors are
anticipated to engage in efforts to improve cost efficiency in order to counteract the Korean
giant’s market share expansion strategy.
From 2H20, bit growth is likely to be driven by a recovery in smartphone NAND demand. In
2021, we expect supply/demand conditions to be similar YoY, as SEC will likely ramp up
supply to take advantage of a bump in demand from the client SSD segment. Prices are
projected to remain stable. (Sharp price hikes seem unlikely given the supply and demand
dynamics.)
(Earnings) For 2Q20, we forecast SEC’s NAND unit to post revenue of W6.0tr (+9.0% QoQ)
and an OP margin of 2.3% (slight QoQ improvement). With inventory remaining at normal
levels (two weeks), we believe a 4.0% ASP hike is likely. Moreover, we expect to see bit
growth of 3.0%, driven by solid demand from server and laptop SSDs through 2Q.
Although SEC is anticipated to continue to add wafer capacity until end-2020, the company
is projected to aggressively push out shipments to keep inventory at normal levels. For
4Q20, we expect that the firm’s OP margin will stay largely unchanged from the 2Q level,
with the release of pent-up smartphone demand likely to pick up and ASP holding steady
overall.
For 2021, we forecast NAND demand bit growth to hit 42.4%, driven by smartphone
(+48.0%) and enterprise SSD (+51.9%) applications. On the supply side, SEC is likely to post
above-industry bit growth of 42.7% (vs. industry average of 40.3%). All in all, we expect SEC’s
NAND wafer capacity to expand 16.9%, ASP to decline 2.4%, and OP margin to edge up YoY
to 23.6%.
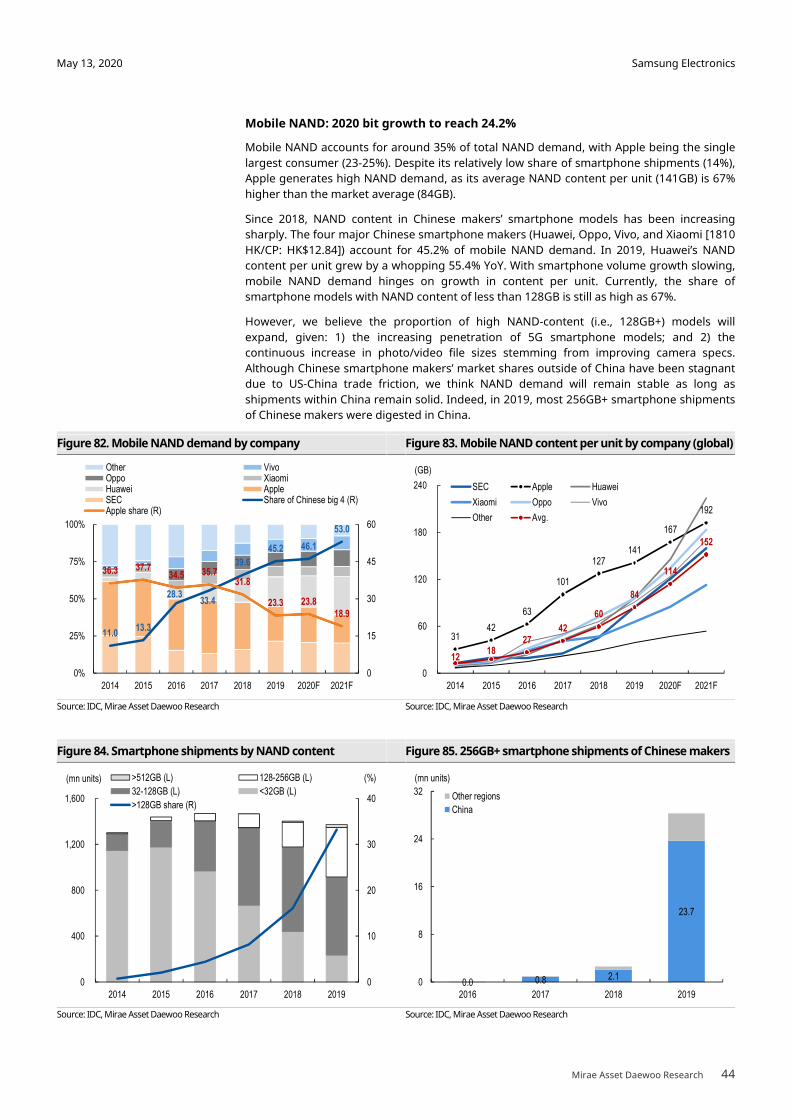
Samsung Electronics
Mirae Asset Daewoo Research 44
May 13, 2020
Mobile NAND: 2020 bit growth to reach 24.2%
Mobile NAND accounts for around 35% of total NAND demand, with Apple being the single
largest consumer (23-25%). Despite its relatively low share of smartphone shipments (14%),
Apple generates high NAND demand, as its average NAND content per unit (141GB) is 67%
higher than the market average (84GB).
Since 2018, NAND content in Chinese makers’ smartphone models has been increasing
sharply. The four major Chinese smartphone makers (Huawei, Oppo, Vivo, and Xiaomi [1810
HK/CP: HK$12.84]) account for 45.2% of mobile NAND demand. In 2019, Huawei’s NAND
content per unit grew by a whopping 55.4% YoY. With smartphone volume growth slowing,
mobile NAND demand hinges on growth in content per unit. Currently, the share of
smartphone models with NAND content of less than 128GB is still as high as 67%.
However, we believe the proportion of high NAND-content (i.e., 128GB+) models will
expand, given: 1) the increasing penetration of 5G smartphone models; and 2) the
continuous increase in photo/video file sizes stemming from improving camera specs.
Although Chinese smartphone makers’ market shares outside of China have been stagnant
due to US-China trade friction, we think NAND demand will remain stable as long as
shipments within China remain solid. Indeed, in 2019, most 256GB+ smartphone shipments
of Chinese makers were digested in China.
Figure 82. Mobile NAND demand by company Figure 83. Mobile NAND content per unit by company (global)
Source: IDC, Mirae Asset Daewoo Research Source: IDC, Mirae Asset Daewoo Research
Figure 84. Smartphone shipments by NAND content Figure 85. 256GB+ smartphone shipments of Chinese makers
Source: IDC, Mirae Asset Daewoo Research Source: IDC, Mirae Asset Daewoo Research
11.0 13.3
28.3 33.4
39.6
45.2 46.1
53.0
36.3 37.7 34.5 35.7
31.8
23.3 23.8
18.9
0
15
30
45
60
0%
25%
50%
75%
100%
2014 2015 2016 2017 2018 2019 2020F 2021F
Other VivoOppo XiaomiHuawei AppleSEC Share of Chinese big 4 (R)Apple share (R)
31 42
63
101
127 141
167
192
12 18
27 42
60
84
114
152
0
60
120
180
240
2014 2015 2016 2017 2018 2019 2020F 2021F
(GB)
SEC Apple Huawei
Xiaomi Oppo Vivo
Other Avg.
0
10
20
30
40
0
400
800
1,200
1,600
2014 2015 2016 2017 2018 2019
(%)(mn units) >512GB (L) 128-256GB (L)
32-128GB (L) <32GB (L)
>128GB share (R)
0.0 0.8 2.1
23.7
0
8
16
24
32
2016 2017 2018 2019
(mn units)
Other regions
China
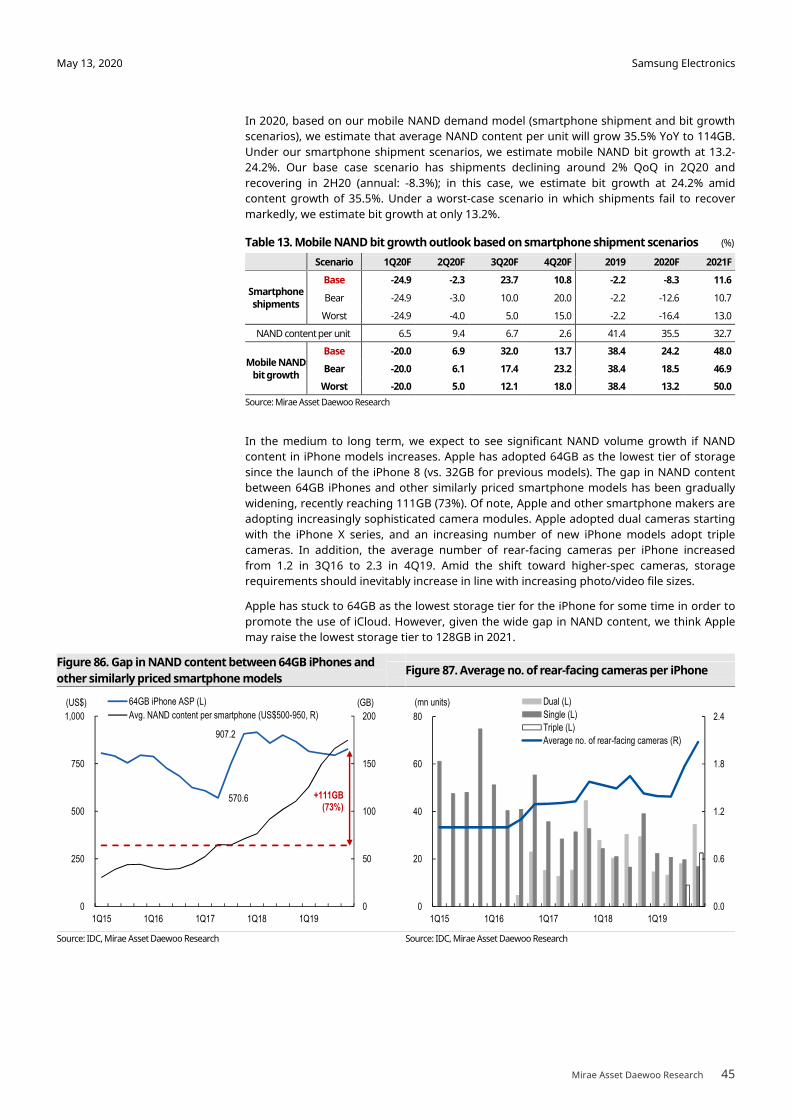
Samsung Electronics
Mirae Asset Daewoo Research 45
May 13, 2020
In 2020, based on our mobile NAND demand model (smartphone shipment and bit growth
scenarios), we estimate that average NAND content per unit will grow 35.5% YoY to 114GB.
Under our smartphone shipment scenarios, we estimate mobile NAND bit growth at 13.2-
24.2%. Our base case scenario has shipments declining around 2% QoQ in 2Q20 and
recovering in 2H20 (annual: -8.3%); in this case, we estimate bit growth at 24.2% amid
content growth of 35.5%. Under a worst-case scenario in which shipments fail to recover
markedly, we estimate bit growth at only 13.2%.
Table 13. Mobile NAND bit growth outlook based on smartphone shipment scenarios (%)
Scenario 1Q20F 2Q20F 3Q20F 4Q20F 2019 2020F 2021F
Smartphone shipments
Base -24.9 -2.3 23.7 10.8 -2.2 -8.3 11.6
Bear -24.9 -3.0 10.0 20.0 -2.2 -12.6 10.7
Worst -24.9 -4.0 5.0 15.0 -2.2 -16.4 13.0
NAND content per unit 6.5 9.4 6.7 2.6 41.4 35.5 32.7
Mobile NAND bit growth
Base -20.0 6.9 32.0 13.7 38.4 24.2 48.0
Bear -20.0 6.1 17.4 23.2 38.4 18.5 46.9
Worst -20.0 5.0 12.1 18.0 38.4 13.2 50.0
Source: Mirae Asset Daewoo Research
In the medium to long term, we expect to see significant NAND volume growth if NAND
content in iPhone models increases. Apple has adopted 64GB as the lowest tier of storage
since the launch of the iPhone 8 (vs. 32GB for previous models). The gap in NAND content
between 64GB iPhones and other similarly priced smartphone models has been gradually
widening, recently reaching 111GB (73%). Of note, Apple and other smartphone makers are
adopting increasingly sophisticated camera modules. Apple adopted dual cameras starting
with the iPhone X series, and an increasing number of new iPhone models adopt triple
cameras. In addition, the average number of rear-facing cameras per iPhone increased
from 1.2 in 3Q16 to 2.3 in 4Q19. Amid the shift toward higher-spec cameras, storage
requirements should inevitably increase in line with increasing photo/video file sizes.
Apple has stuck to 64GB as the lowest storage tier for the iPhone for some time in order to
promote the use of iCloud. However, given the wide gap in NAND content, we think Apple
may raise the lowest storage tier to 128GB in 2021.
Figure 86. Gap in NAND content between 64GB iPhones and
other similarly priced smartphone models Figure 87. Average no. of rear-facing cameras per iPhone
Source: IDC, Mirae Asset Daewoo Research Source: IDC, Mirae Asset Daewoo Research
570.6
907.2
0
50
100
150
200
0
250
500
750
1,000
1Q15 1Q16 1Q17 1Q18 1Q19
(GB)(US$) 64GB iPhone ASP (L)
Avg. NAND content per smartphone (US$500-950, R)
+111GB(73%)
0.0
0.6
1.2
1.8
2.4
0
20
40
60
80
1Q15 1Q16 1Q17 1Q18 1Q19
(mn units) Dual (L)
Single (L)
Triple (L)
Average no. of rear-facing cameras (R)
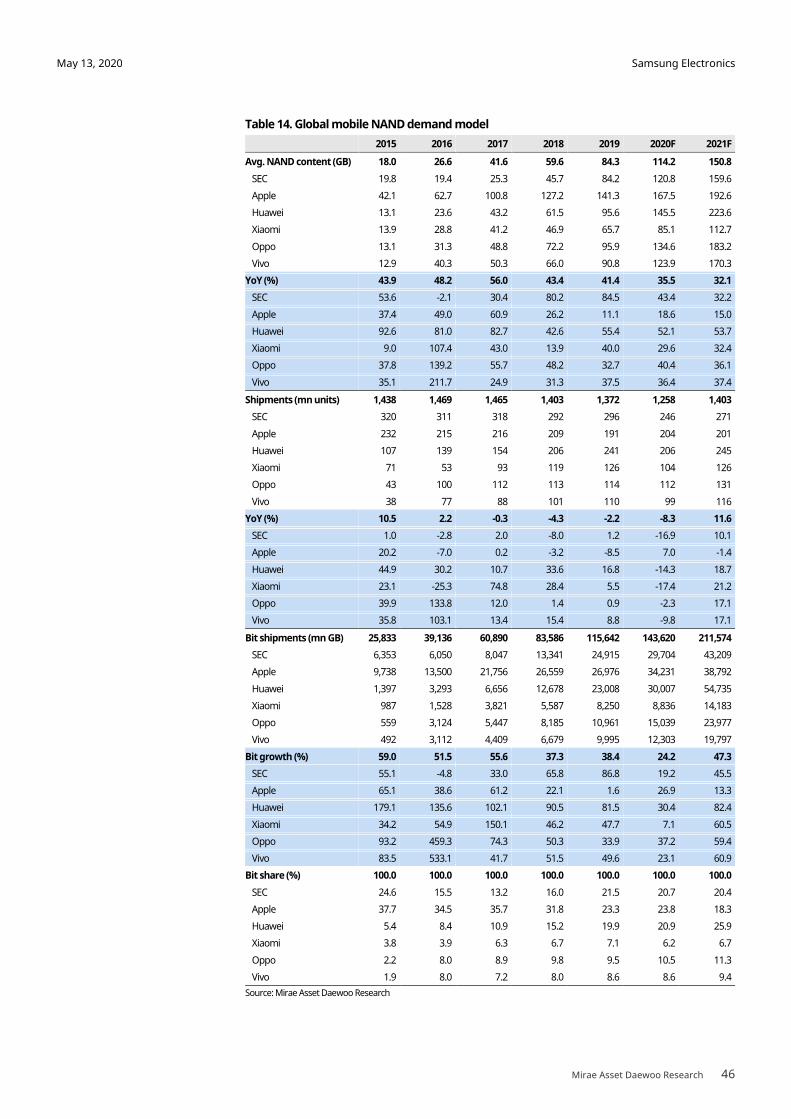
Samsung Electronics
Mirae Asset Daewoo Research 46
May 13, 2020
Table 14. Global mobile NAND demand model
2015 2016 2017 2018 2019 2020F 2021F
Avg. NAND content (GB) 18.0 26.6 41.6 59.6 84.3 114.2 150.8
SEC 19.8 19.4 25.3 45.7 84.2 120.8 159.6
Apple 42.1 62.7 100.8 127.2 141.3 167.5 192.6
Huawei 13.1 23.6 43.2 61.5 95.6 145.5 223.6
Xiaomi 13.9 28.8 41.2 46.9 65.7 85.1 112.7
Oppo 13.1 31.3 48.8 72.2 95.9 134.6 183.2
Vivo 12.9 40.3 50.3 66.0 90.8 123.9 170.3
YoY (%) 43.9 48.2 56.0 43.4 41.4 35.5 32.1
SEC 53.6 -2.1 30.4 80.2 84.5 43.4 32.2
Apple 37.4 49.0 60.9 26.2 11.1 18.6 15.0
Huawei 92.6 81.0 82.7 42.6 55.4 52.1 53.7
Xiaomi 9.0 107.4 43.0 13.9 40.0 29.6 32.4
Oppo 37.8 139.2 55.7 48.2 32.7 40.4 36.1
Vivo 35.1 211.7 24.9 31.3 37.5 36.4 37.4
Shipments (mn units) 1,438 1,469 1,465 1,403 1,372 1,258 1,403
SEC 320 311 318 292 296 246 271
Apple 232 215 216 209 191 204 201
Huawei 107 139 154 206 241 206 245
Xiaomi 71 53 93 119 126 104 126
Oppo 43 100 112 113 114 112 131
Vivo 38 77 88 101 110 99 116
YoY (%) 10.5 2.2 -0.3 -4.3 -2.2 -8.3 11.6
SEC 1.0 -2.8 2.0 -8.0 1.2 -16.9 10.1
Apple 20.2 -7.0 0.2 -3.2 -8.5 7.0 -1.4
Huawei 44.9 30.2 10.7 33.6 16.8 -14.3 18.7
Xiaomi 23.1 -25.3 74.8 28.4 5.5 -17.4 21.2
Oppo 39.9 133.8 12.0 1.4 0.9 -2.3 17.1
Vivo 35.8 103.1 13.4 15.4 8.8 -9.8 17.1
Bit shipments (mn GB) 25,833 39,136 60,890 83,586 115,642 143,620 211,574
SEC 6,353 6,050 8,047 13,341 24,915 29,704 43,209
Apple 9,738 13,500 21,756 26,559 26,976 34,231 38,792
Huawei 1,397 3,293 6,656 12,678 23,008 30,007 54,735
Xiaomi 987 1,528 3,821 5,587 8,250 8,836 14,183
Oppo 559 3,124 5,447 8,185 10,961 15,039 23,977
Vivo 492 3,112 4,409 6,679 9,995 12,303 19,797
Bit growth (%) 59.0 51.5 55.6 37.3 38.4 24.2 47.3
SEC 55.1 -4.8 33.0 65.8 86.8 19.2 45.5
Apple 65.1 38.6 61.2 22.1 1.6 26.9 13.3
Huawei 179.1 135.6 102.1 90.5 81.5 30.4 82.4
Xiaomi 34.2 54.9 150.1 46.2 47.7 7.1 60.5
Oppo 93.2 459.3 74.3 50.3 33.9 37.2 59.4
Vivo 83.5 533.1 41.7 51.5 49.6 23.1 60.9
Bit share (%) 100.0 100.0 100.0 100.0 100.0 100.0 100.0
SEC 24.6 15.5 13.2 16.0 21.5 20.7 20.4
Apple 37.7 34.5 35.7 31.8 23.3 23.8 18.3
Huawei 5.4 8.4 10.9 15.2 19.9 20.9 25.9
Xiaomi 3.8 3.9 6.3 6.7 7.1 6.2 6.7
Oppo 2.2 8.0 8.9 9.8 9.5 10.5 11.3
Vivo 1.9 8.0 7.2 8.0 8.6 8.6 9.4
Source: Mirae Asset Daewoo Research
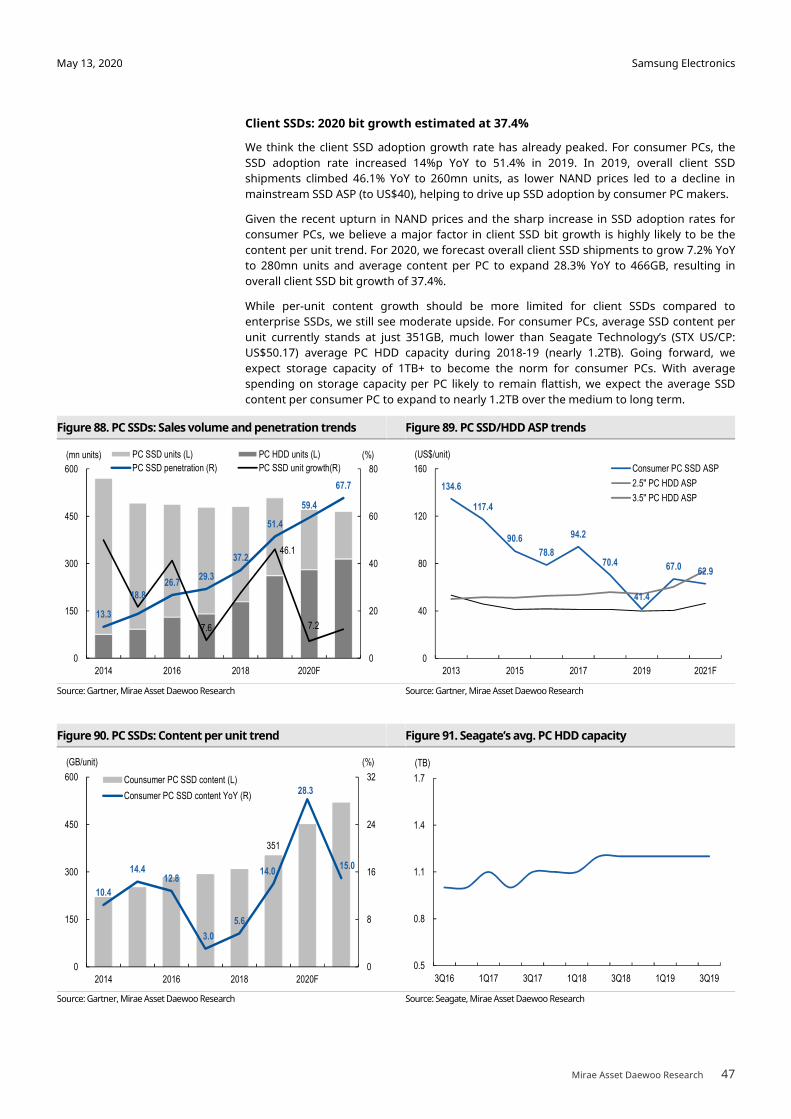
Samsung Electronics
Mirae Asset Daewoo Research 47
May 13, 2020
Client SSDs: 2020 bit growth estimated at 37.4%
We think the client SSD adoption growth rate has already peaked. For consumer PCs, the
SSD adoption rate increased 14%p YoY to 51.4% in 2019. In 2019, overall client SSD
shipments climbed 46.1% YoY to 260mn units, as lower NAND prices led to a decline in
mainstream SSD ASP (to US$40), helping to drive up SSD adoption by consumer PC makers.
Given the recent upturn in NAND prices and the sharp increase in SSD adoption rates for
consumer PCs, we believe a major factor in client SSD bit growth is highly likely to be the
content per unit trend. For 2020, we forecast overall client SSD shipments to grow 7.2% YoY
to 280mn units and average content per PC to expand 28.3% YoY to 466GB, resulting in
overall client SSD bit growth of 37.4%.
While per-unit content growth should be more limited for client SSDs compared to
enterprise SSDs, we still see moderate upside. For consumer PCs, average SSD content per
unit currently stands at just 351GB, much lower than Seagate Technology’s (STX US/CP:
US$50.17) average PC HDD capacity during 2018-19 (nearly 1.2TB). Going forward, we
expect storage capacity of 1TB+ to become the norm for consumer PCs. With average
spending on storage capacity per PC likely to remain flattish, we expect the average SSD
content per consumer PC to expand to nearly 1.2TB over the medium to long term.
Figure 88. PC SSDs: Sales volume and penetration trends Figure 89. PC SSD/HDD ASP trends
Source: Gartner, Mirae Asset Daewoo Research Source: Gartner, Mirae Asset Daewoo Research
Figure 90. PC SSDs: Content per unit trend Figure 91. Seagate’s avg. PC HDD capacity
Source: Gartner, Mirae Asset Daewoo Research Source: Seagate, Mirae Asset Daewoo Research
13.3
18.8
26.729.3
37.2
51.4
59.4
67.7
7.6
46.1
7.2
0
20
40
60
80
0
150
300
450
600
2014 2016 2018 2020F
(%)(mn units) PC SSD units (L) PC HDD units (L)
PC SSD penetration (R) PC SSD unit growth(R)
134.6
117.4
90.6
78.8
94.2
70.4
41.4
67.0 62.9
0
40
80
120
160
2013 2015 2017 2019 2021F
(US$/unit)
Consumer PC SSD ASP
2.5" PC HDD ASP
3.5" PC HDD ASP
0.5
0.8
1.1
1.4
1.7
3Q16 1Q17 3Q17 1Q18 3Q18 1Q19 3Q19
(TB)
351
10.4
14.412.8
3.0
5.6
14.0
28.3
15.0
0
8
16
24
32
0
150
300
450
600
2014 2016 2018 2020F
(%)(GB/unit)
Counsumer PC SSD content (L)
Consumer PC SSD content YoY (R)
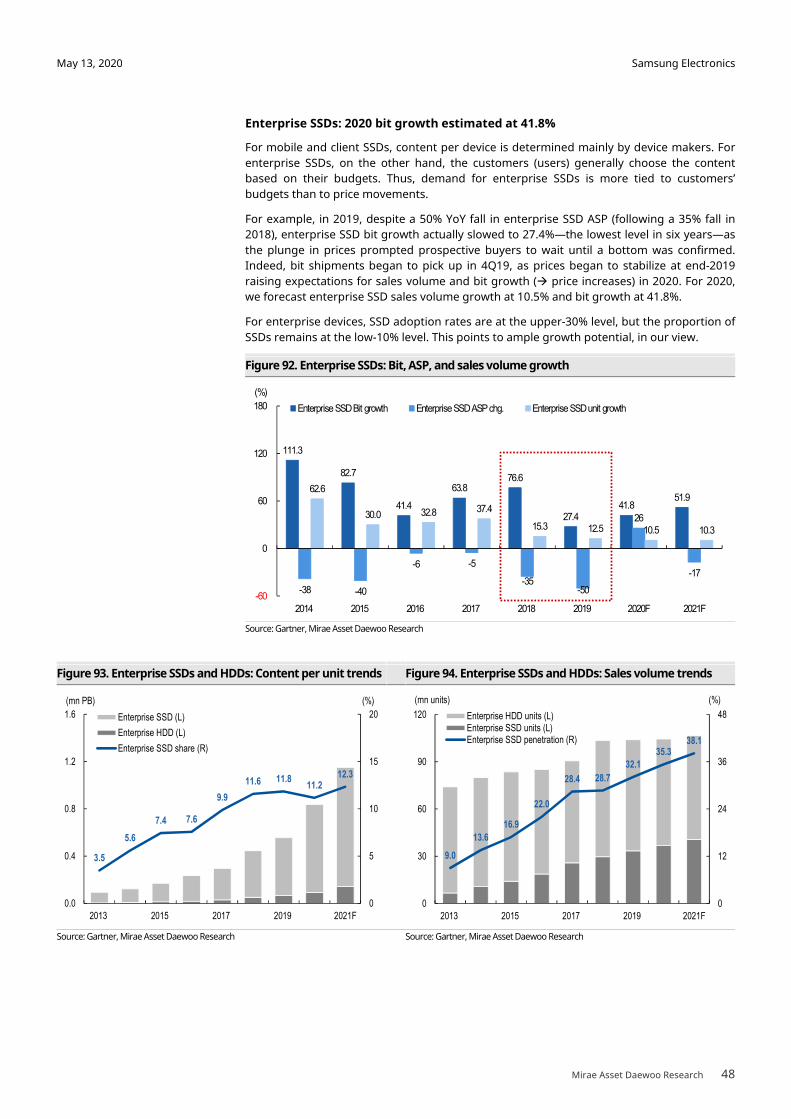
Samsung Electronics
Mirae Asset Daewoo Research 48
May 13, 2020
Enterprise SSDs: 2020 bit growth estimated at 41.8%
For mobile and client SSDs, content per device is determined mainly by device makers. For
enterprise SSDs, on the other hand, the customers (users) generally choose the content
based on their budgets. Thus, demand for enterprise SSDs is more tied to customers’
budgets than to price movements.
For example, in 2019, despite a 50% YoY fall in enterprise SSD ASP (following a 35% fall in
2018), enterprise SSD bit growth actually slowed to 27.4%—the lowest level in six years—as
the plunge in prices prompted prospective buyers to wait until a bottom was confirmed.
Indeed, bit shipments began to pick up in 4Q19, as prices began to stabilize at end-2019
raising expectations for sales volume and bit growth (� price increases) in 2020. For 2020,
we forecast enterprise SSD sales volume growth at 10.5% and bit growth at 41.8%.
For enterprise devices, SSD adoption rates are at the upper-30% level, but the proportion of
SSDs remains at the low-10% level. This points to ample growth potential, in our view.
Figure 92. Enterprise SSDs: Bit, ASP, and sales volume growth
Source: Gartner, Mirae Asset Daewoo Research
Figure 93. Enterprise SSDs and HDDs: Content per unit trends Figure 94. Enterprise SSDs and HDDs: Sales volume trends
Source: Gartner, Mirae Asset Daewoo Research Source: Gartner, Mirae Asset Daewoo Research
111.3
82.7
41.4
63.8 76.6
27.4 41.8
51.9
-38 -40
-6 -5
-35-50
26
-17
62.6
30.0 32.8 37.4
15.3 12.5 10.5 10.3
-60
0
60
120
180
2014 2015 2016 2017 2018 2019 2020F 2021F
(%)
Enterprise SSD Bit growth Enterprise SSD ASP chg. Enterprise SSD unit growth
3.5
5.6
7.4 7.6
9.9
11.6 11.811.2
12.3
0
5
10
15
20
0.0
0.4
0.8
1.2
1.6
2013 2015 2017 2019 2021F
(%)(mn PB)
Enterprise SSD (L)
Enterprise HDD (L)
Enterprise SSD share (R)
9.0
13.6
16.9
22.0
28.4 28.7
32.1
35.338.1
0
12
24
36
48
0
30
60
90
120
2013 2015 2017 2019 2021F
(%)(mn units)
Enterprise HDD units (L)Enterprise SSD units (L)Enterprise SSD penetration (R)
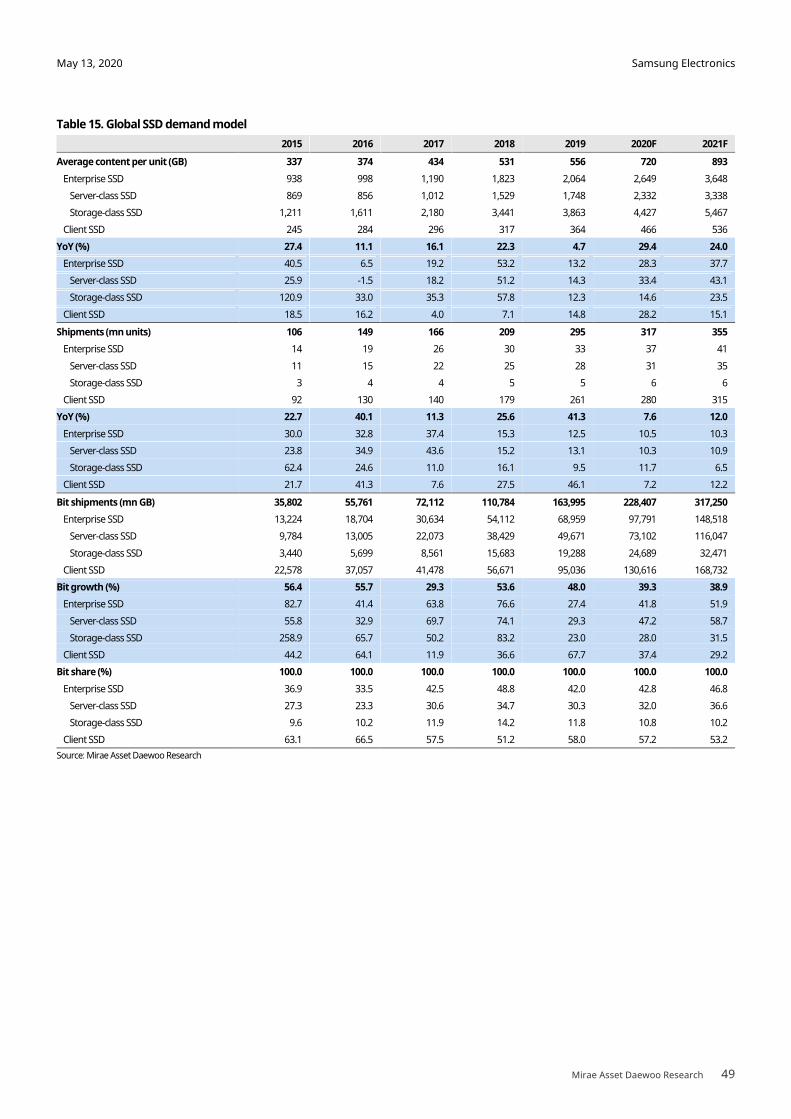
Samsung Electronics
Mirae Asset Daewoo Research 49
May 13, 2020
Table 15. Global SSD demand model
2015 2016 2017 2018 2019 2020F 2021F
Average content per unit (GB) 337 374 434 531 556 720 893
Enterprise SSD 938 998 1,190 1,823 2,064 2,649 3,648
Server-class SSD 869 856 1,012 1,529 1,748 2,332 3,338
Storage-class SSD 1,211 1,611 2,180 3,441 3,863 4,427 5,467
Client SSD 245 284 296 317 364 466 536
YoY (%) 27.4 11.1 16.1 22.3 4.7 29.4 24.0
Enterprise SSD 40.5 6.5 19.2 53.2 13.2 28.3 37.7
Server-class SSD 25.9 -1.5 18.2 51.2 14.3 33.4 43.1
Storage-class SSD 120.9 33.0 35.3 57.8 12.3 14.6 23.5
Client SSD 18.5 16.2 4.0 7.1 14.8 28.2 15.1
Shipments (mn units) 106 149 166 209 295 317 355
Enterprise SSD 14 19 26 30 33 37 41
Server-class SSD 11 15 22 25 28 31 35
Storage-class SSD 3 4 4 5 5 6 6
Client SSD 92 130 140 179 261 280 315
YoY (%) 22.7 40.1 11.3 25.6 41.3 7.6 12.0
Enterprise SSD 30.0 32.8 37.4 15.3 12.5 10.5 10.3
Server-class SSD 23.8 34.9 43.6 15.2 13.1 10.3 10.9
Storage-class SSD 62.4 24.6 11.0 16.1 9.5 11.7 6.5
Client SSD 21.7 41.3 7.6 27.5 46.1 7.2 12.2
Bit shipments (mn GB) 35,802 55,761 72,112 110,784 163,995 228,407 317,250
Enterprise SSD 13,224 18,704 30,634 54,112 68,959 97,791 148,518
Server-class SSD 9,784 13,005 22,073 38,429 49,671 73,102 116,047
Storage-class SSD 3,440 5,699 8,561 15,683 19,288 24,689 32,471
Client SSD 22,578 37,057 41,478 56,671 95,036 130,616 168,732
Bit growth (%) 56.4 55.7 29.3 53.6 48.0 39.3 38.9
Enterprise SSD 82.7 41.4 63.8 76.6 27.4 41.8 51.9
Server-class SSD 55.8 32.9 69.7 74.1 29.3 47.2 58.7
Storage-class SSD 258.9 65.7 50.2 83.2 23.0 28.0 31.5
Client SSD 44.2 64.1 11.9 36.6 67.7 37.4 29.2
Bit share (%) 100.0 100.0 100.0 100.0 100.0 100.0 100.0
Enterprise SSD 36.9 33.5 42.5 48.8 42.0 42.8 46.8
Server-class SSD 27.3 23.3 30.6 34.7 30.3 32.0 36.6
Storage-class SSD 9.6 10.2 11.9 14.2 11.8 10.8 10.2
Client SSD 63.1 66.5 57.5 51.2 58.0 57.2 53.2
Source: Mirae Asset Daewoo Research
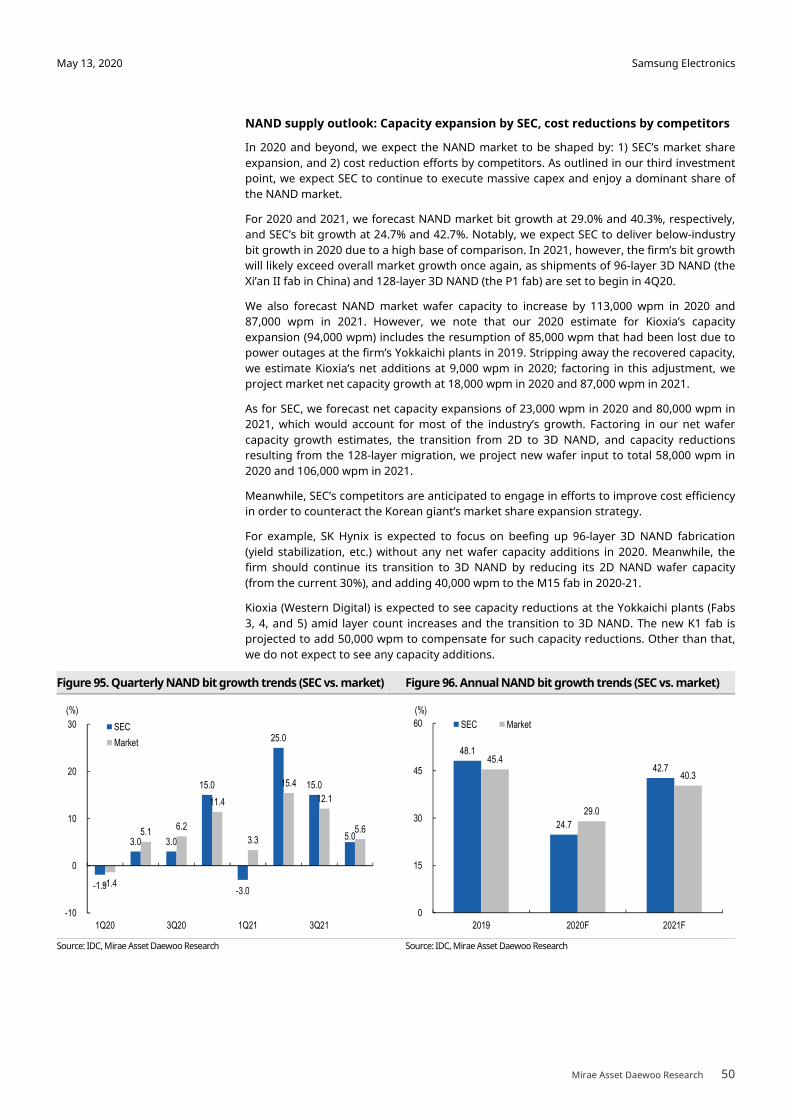
Samsung Electronics
Mirae Asset Daewoo Research 50
May 13, 2020
NAND supply outlook: Capacity expansion by SEC, cost reductions by competitors
In 2020 and beyond, we expect the NAND market to be shaped by: 1) SEC’s market share
expansion, and 2) cost reduction efforts by competitors. As outlined in our third investment
point, we expect SEC to continue to execute massive capex and enjoy a dominant share of
the NAND market.
For 2020 and 2021, we forecast NAND market bit growth at 29.0% and 40.3%, respectively,
and SEC’s bit growth at 24.7% and 42.7%. Notably, we expect SEC to deliver below-industry
bit growth in 2020 due to a high base of comparison. In 2021, however, the firm’s bit growth
will likely exceed overall market growth once again, as shipments of 96-layer 3D NAND (the
Xi’an II fab in China) and 128-layer 3D NAND (the P1 fab) are set to begin in 4Q20.
We also forecast NAND market wafer capacity to increase by 113,000 wpm in 2020 and
87,000 wpm in 2021. However, we note that our 2020 estimate for Kioxia’s capacity
expansion (94,000 wpm) includes the resumption of 85,000 wpm that had been lost due to
power outages at the firm’s Yokkaichi plants in 2019. Stripping away the recovered capacity,
we estimate Kioxia’s net additions at 9,000 wpm in 2020; factoring in this adjustment, we
project market net capacity growth at 18,000 wpm in 2020 and 87,000 wpm in 2021.
As for SEC, we forecast net capacity expansions of 23,000 wpm in 2020 and 80,000 wpm in
2021, which would account for most of the industry’s growth. Factoring in our net wafer
capacity growth estimates, the transition from 2D to 3D NAND, and capacity reductions
resulting from the 128-layer migration, we project new wafer input to total 58,000 wpm in
2020 and 106,000 wpm in 2021.
Meanwhile, SEC’s competitors are anticipated to engage in efforts to improve cost efficiency
in order to counteract the Korean giant’s market share expansion strategy.
For example, SK Hynix is expected to focus on beefing up 96-layer 3D NAND fabrication
(yield stabilization, etc.) without any net wafer capacity additions in 2020. Meanwhile, the
firm should continue its transition to 3D NAND by reducing its 2D NAND wafer capacity
(from the current 30%), and adding 40,000 wpm to the M15 fab in 2020-21.
Kioxia (Western Digital) is expected to see capacity reductions at the Yokkaichi plants (Fabs
3, 4, and 5) amid layer count increases and the transition to 3D NAND. The new K1 fab is
projected to add 50,000 wpm to compensate for such capacity reductions. Other than that,
we do not expect to see any capacity additions.
Figure 95. Quarterly NAND bit growth trends (SEC vs. market) Figure 96. Annual NAND bit growth trends (SEC vs. market)
Source: IDC, Mirae Asset Daewoo Research Source: IDC, Mirae Asset Daewoo Research
-1.9
3.0 3.0
15.0
-3.0
25.0
15.0
5.0
-1.4
5.1 6.2
11.4
3.3
15.4
12.1
5.6
-10
0
10
20
30
1Q20 3Q20 1Q21 3Q21
(%)
SEC
Market48.1
24.7
42.7 45.4
29.0
40.3
0
15
30
45
60
2019 2020F 2021F
(%)
SEC Market
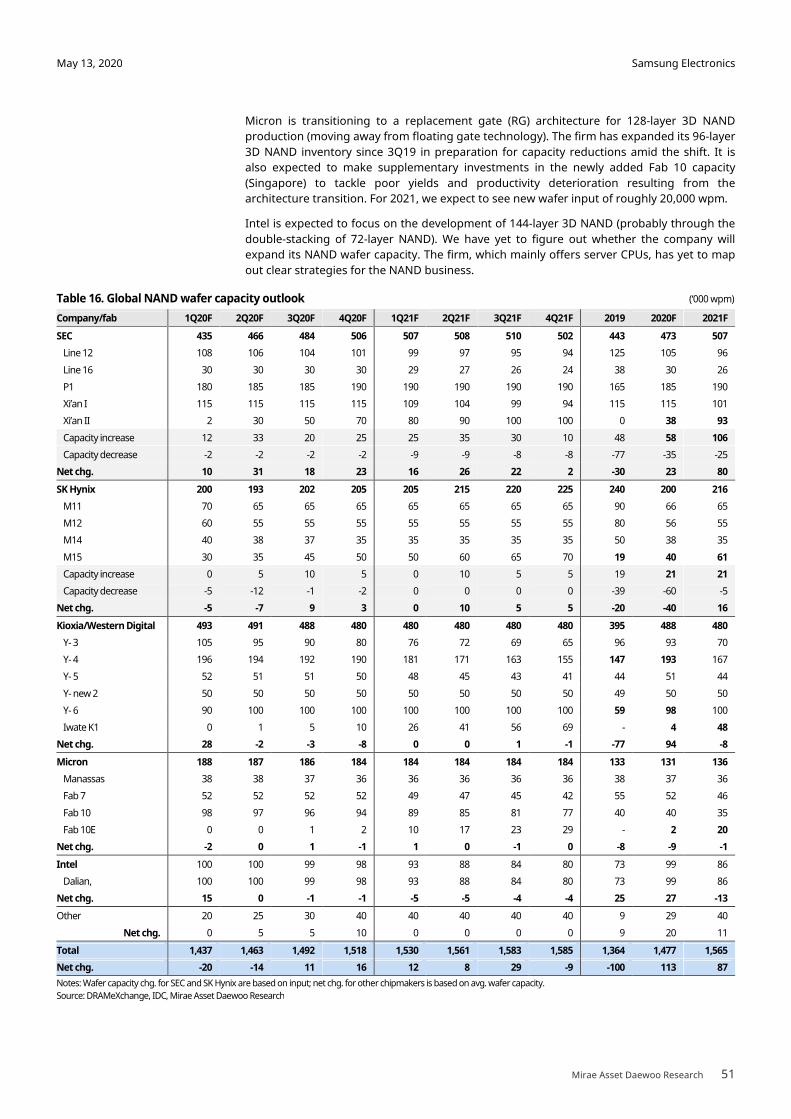
Samsung Electronics
Mirae Asset Daewoo Research 51
May 13, 2020
Micron is transitioning to a replacement gate (RG) architecture for 128-layer 3D NAND
production (moving away from floating gate technology). The firm has expanded its 96-layer
3D NAND inventory since 3Q19 in preparation for capacity reductions amid the shift. It is
also expected to make supplementary investments in the newly added Fab 10 capacity
(Singapore) to tackle poor yields and productivity deterioration resulting from the
architecture transition. For 2021, we expect to see new wafer input of roughly 20,000 wpm.
Intel is expected to focus on the development of 144-layer 3D NAND (probably through the
double-stacking of 72-layer NAND). We have yet to figure out whether the company will
expand its NAND wafer capacity. The firm, which mainly offers server CPUs, has yet to map
out clear strategies for the NAND business.
Table 16. Global NAND wafer capacity outlook (‘000 wpm)
Company/fab 1Q20F 2Q20F 3Q20F 4Q20F 1Q21F 2Q21F 3Q21F 4Q21F 2019 2020F 2021F
SEC 435 466 484 506 507 508 510 502 443 473 507
Line 12 108 106 104 101 99 97 95 94 125 105 96
Line 16 30 30 30 30 29 27 26 24 38 30 26
P1 180 185 185 190 190 190 190 190 165 185 190
Xi’an I 115 115 115 115 109 104 99 94 115 115 101
Xi’an II 2 30 50 70 80 90 100 100 0 38 93
Capacity increase 12 33 20 25 25 35 30 10 48 58 106
Capacity decrease -2 -2 -2 -2 -9 -9 -8 -8 -77 -35 -25
Net chg. 10 31 18 23 16 26 22 2 -30 23 80
SK Hynix 200 193 202 205 205 215 220 225 240 200 216
M11 70 65 65 65 65 65 65 65 90 66 65
M12 60 55 55 55 55 55 55 55 80 56 55
M14 40 38 37 35 35 35 35 35 50 38 35
M15 30 35 45 50 50 60 65 70 19 40 61
Capacity increase 0 5 10 5 0 10 5 5 19 21 21
Capacity decrease -5 -12 -1 -2 0 0 0 0 -39 -60 -5
Net chg. -5 -7 9 3 0 10 5 5 -20 -40 16
Kioxia/Western Digital 493 491 488 480 480 480 480 480 395 488 480
Y- 3 105 95 90 80 76 72 69 65 96 93 70
Y- 4 196 194 192 190 181 171 163 155 147 193 167
Y- 5 52 51 51 50 48 45 43 41 44 51 44
Y- new 2 50 50 50 50 50 50 50 50 49 50 50
Y- 6 90 100 100 100 100 100 100 100 59 98 100
Iwate K1 0 1 5 10 26 41 56 69 - 4 48
Net chg. 28 -2 -3 -8 0 0 1 -1 -77 94 -8
Micron 188 187 186 184 184 184 184 184 133 131 136
Manassas 38 38 37 36 36 36 36 36 38 37 36
Fab 7 52 52 52 52 49 47 45 42 55 52 46
Fab 10 98 97 96 94 89 85 81 77 40 40 35
Fab 10E 0 0 1 2 10 17 23 29 - 2 20
Net chg. -2 0 1 -1 1 0 -1 0 -8 -9 -1
Intel 100 100 99 98 93 88 84 80 73 99 86
Dalian, 100 100 99 98 93 88 84 80 73 99 86
Net chg. 15 0 -1 -1 -5 -5 -4 -4 25 27 -13
Other 20 25 30 40 40 40 40 40 9 29 40
Net chg. 0 5 5 10 0 0 0 0 9 20 11
Total 1,437 1,463 1,492 1,518 1,530 1,561 1,583 1,585 1,364 1,477 1,565
Net chg. -20 -14 11 16 12 8 29 -9 -100 113 87
Notes: Wafer capacity chg. for SEC and SK Hynix are based on input; net chg. for other chipmakers is based on avg. wafer capacity.
Source: DRAMeXchange, IDC, Mirae Asset Daewoo Research
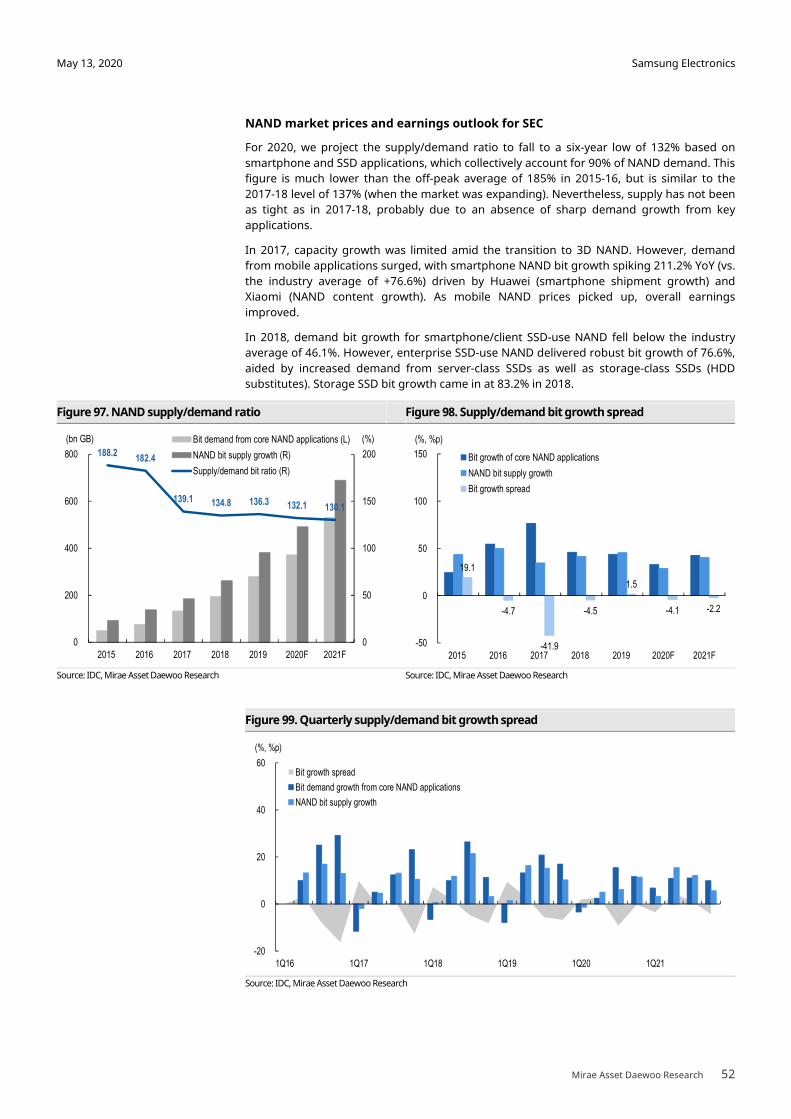
Samsung Electronics
Mirae Asset Daewoo Research 52
May 13, 2020
NAND market prices and earnings outlook for SEC
For 2020, we project the supply/demand ratio to fall to a six-year low of 132% based on
smartphone and SSD applications, which collectively account for 90% of NAND demand. This
figure is much lower than the off-peak average of 185% in 2015-16, but is similar to the
2017-18 level of 137% (when the market was expanding). Nevertheless, supply has not been
as tight as in 2017-18, probably due to an absence of sharp demand growth from key
applications.
In 2017, capacity growth was limited amid the transition to 3D NAND. However, demand
from mobile applications surged, with smartphone NAND bit growth spiking 211.2% YoY (vs.
the industry average of +76.6%) driven by Huawei (smartphone shipment growth) and
Xiaomi (NAND content growth). As mobile NAND prices picked up, overall earnings
improved.
In 2018, demand bit growth for smartphone/client SSD-use NAND fell below the industry
average of 46.1%. However, enterprise SSD-use NAND delivered robust bit growth of 76.6%,
aided by increased demand from server-class SSDs as well as storage-class SSDs (HDD
substitutes). Storage SSD bit growth came in at 83.2% in 2018.
Figure 97. NAND supply/demand ratio Figure 98. Supply/demand bit growth spread
Source: IDC, Mirae Asset Daewoo Research Source: IDC, Mirae Asset Daewoo Research
Figure 99. Quarterly supply/demand bit growth spread
Source: IDC, Mirae Asset Daewoo Research
-20
0
20
40
60
1Q16 1Q17 1Q18 1Q19 1Q20 1Q21
(%, %p)
Bit growth spread
Bit demand growth from core NAND applications
NAND bit supply growth
19.1
-4.7
-41.9
-4.5
1.5
-4.1 -2.2
-50
0
50
100
150
2015 2016 2017 2018 2019 2020F 2021F
(%, %p)
Bit growth of core NAND applications
NAND bit supply growth
Bit growth spread
188.2 182.4
139.1 134.8 136.3 132.1 130.1
0
50
100
150
200
0
200
400
600
800
2015 2016 2017 2018 2019 2020F 2021F
(%)(bn GB) Bit demand from core NAND applications (L)
NAND bit supply growth (R)
Supply/demand bit ratio (R)
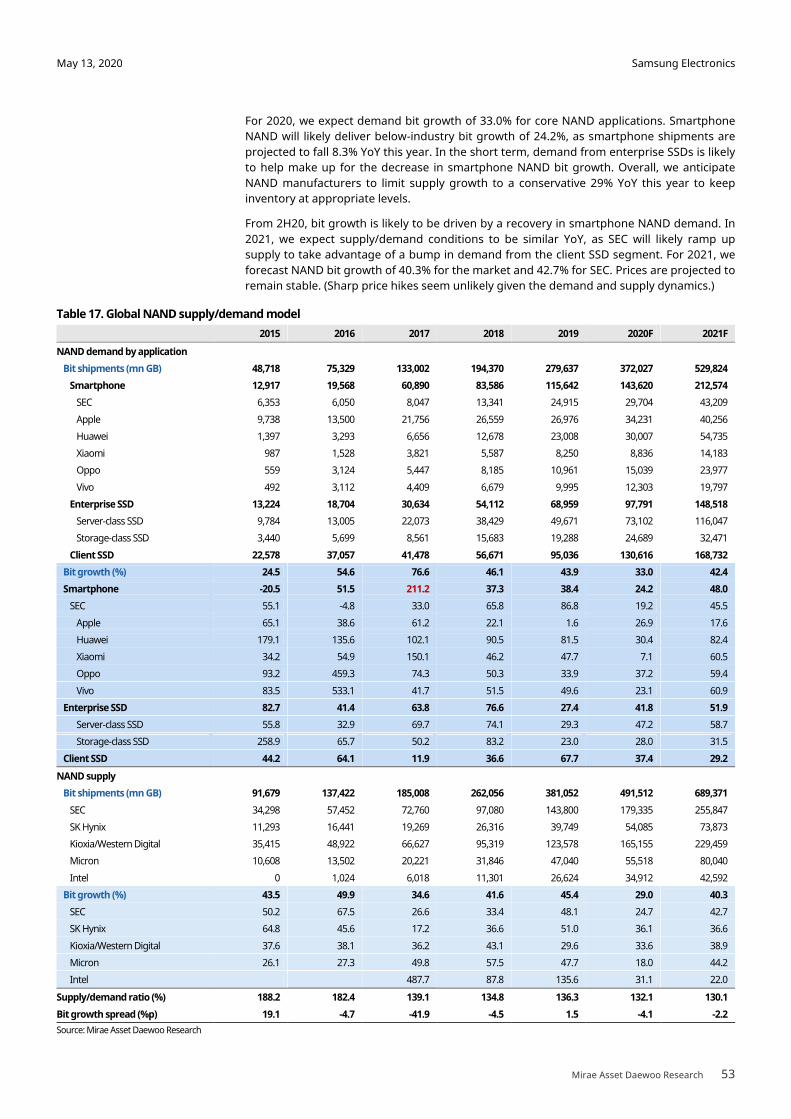
Samsung Electronics
Mirae Asset Daewoo Research 53
May 13, 2020
For 2020, we expect demand bit growth of 33.0% for core NAND applications. Smartphone
NAND will likely deliver below-industry bit growth of 24.2%, as smartphone shipments are
projected to fall 8.3% YoY this year. In the short term, demand from enterprise SSDs is likely
to help make up for the decrease in smartphone NAND bit growth. Overall, we anticipate
NAND manufacturers to limit supply growth to a conservative 29% YoY this year to keep
inventory at appropriate levels.
From 2H20, bit growth is likely to be driven by a recovery in smartphone NAND demand. In
2021, we expect supply/demand conditions to be similar YoY, as SEC will likely ramp up
supply to take advantage of a bump in demand from the client SSD segment. For 2021, we
forecast NAND bit growth of 40.3% for the market and 42.7% for SEC. Prices are projected to
remain stable. (Sharp price hikes seem unlikely given the demand and supply dynamics.)
Table 17. Global NAND supply/demand model
2015 2016 2017 2018 2019 2020F 2021F
NAND demand by application
Bit shipments (mn GB) 48,718 75,329 133,002 194,370 279,637 372,027 529,824
Smartphone 12,917 19,568 60,890 83,586 115,642 143,620 212,574
SEC 6,353 6,050 8,047 13,341 24,915 29,704 43,209
Apple 9,738 13,500 21,756 26,559 26,976 34,231 40,256
Huawei 1,397 3,293 6,656 12,678 23,008 30,007 54,735
Xiaomi 987 1,528 3,821 5,587 8,250 8,836 14,183
Oppo 559 3,124 5,447 8,185 10,961 15,039 23,977
Vivo 492 3,112 4,409 6,679 9,995 12,303 19,797
Enterprise SSD 13,224 18,704 30,634 54,112 68,959 97,791 148,518
Server-class SSD 9,784 13,005 22,073 38,429 49,671 73,102 116,047
Storage-class SSD 3,440 5,699 8,561 15,683 19,288 24,689 32,471
Client SSD 22,578 37,057 41,478 56,671 95,036 130,616 168,732
Bit growth (%) 24.5 54.6 76.6 46.1 43.9 33.0 42.4
Smartphone -20.5 51.5 211.2 37.3 38.4 24.2 48.0
SEC 55.1 -4.8 33.0 65.8 86.8 19.2 45.5
Apple 65.1 38.6 61.2 22.1 1.6 26.9 17.6
Huawei 179.1 135.6 102.1 90.5 81.5 30.4 82.4
Xiaomi 34.2 54.9 150.1 46.2 47.7 7.1 60.5
Oppo 93.2 459.3 74.3 50.3 33.9 37.2 59.4
Vivo 83.5 533.1 41.7 51.5 49.6 23.1 60.9
Enterprise SSD 82.7 41.4 63.8 76.6 27.4 41.8 51.9
Server-class SSD 55.8 32.9 69.7 74.1 29.3 47.2 58.7
Storage-class SSD 258.9 65.7 50.2 83.2 23.0 28.0 31.5
Client SSD 44.2 64.1 11.9 36.6 67.7 37.4 29.2
NAND supply
Bit shipments (mn GB) 91,679 137,422 185,008 262,056 381,052 491,512 689,371
SEC 34,298 57,452 72,760 97,080 143,800 179,335 255,847
SK Hynix 11,293 16,441 19,269 26,316 39,749 54,085 73,873
Kioxia/Western Digital 35,415 48,922 66,627 95,319 123,578 165,155 229,459
Micron 10,608 13,502 20,221 31,846 47,040 55,518 80,040
Intel 0 1,024 6,018 11,301 26,624 34,912 42,592
Bit growth (%) 43.5 49.9 34.6 41.6 45.4 29.0 40.3
SEC 50.2 67.5 26.6 33.4 48.1 24.7 42.7
SK Hynix 64.8 45.6 17.2 36.6 51.0 36.1 36.6
Kioxia/Western Digital 37.6 38.1 36.2 43.1 29.6 33.6 38.9
Micron 26.1 27.3 49.8 57.5 47.7 18.0 44.2
Intel 487.7 87.8 135.6 31.1 22.0
Supply/demand ratio (%) 188.2 182.4 139.1 134.8 136.3 132.1 130.1
Bit growth spread (%p) 19.1 -4.7 -41.9 -4.5 1.5 -4.1 -2.2
Source: Mirae Asset Daewoo Research
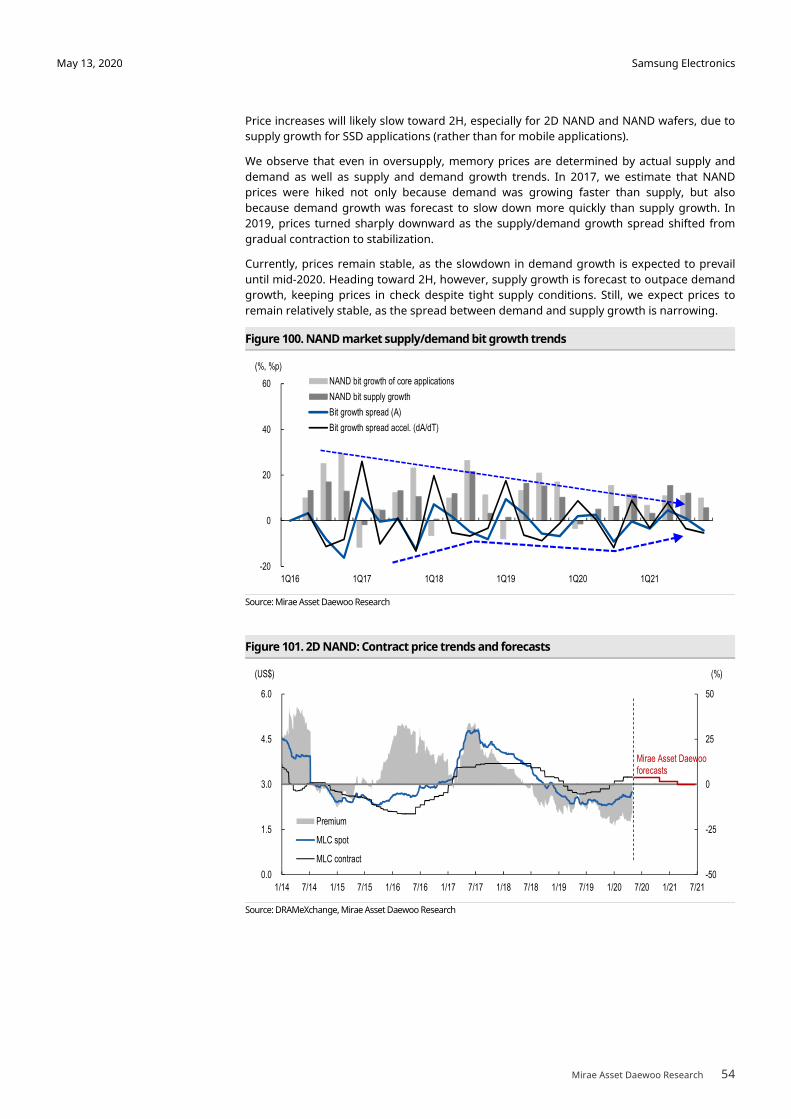
Samsung Electronics
Mirae Asset Daewoo Research 54
May 13, 2020
Price increases will likely slow toward 2H, especially for 2D NAND and NAND wafers, due to
supply growth for SSD applications (rather than for mobile applications).
We observe that even in oversupply, memory prices are determined by actual supply and
demand as well as supply and demand growth trends. In 2017, we estimate that NAND
prices were hiked not only because demand was growing faster than supply, but also
because demand growth was forecast to slow down more quickly than supply growth. In
2019, prices turned sharply downward as the supply/demand growth spread shifted from
gradual contraction to stabilization.
Currently, prices remain stable, as the slowdown in demand growth is expected to prevail
until mid-2020. Heading toward 2H, however, supply growth is forecast to outpace demand
growth, keeping prices in check despite tight supply conditions. Still, we expect prices to
remain relatively stable, as the spread between demand and supply growth is narrowing.
Figure 100. NAND market supply/demand bit growth trends
Source: Mirae Asset Daewoo Research
Figure 101. 2D NAND: Contract price trends and forecasts
Source: DRAMeXchange, Mirae Asset Daewoo Research
-20
0
20
40
60
1Q16 1Q17 1Q18 1Q19 1Q20 1Q21
(%, %p)
NAND bit growth of core applications
NAND bit supply growth
Bit growth spread (A)
Bit growth spread accel. (dA/dT)
-50
-25
0
25
50
0.0
1.5
3.0
4.5
6.0
1/14 7/14 1/15 7/15 1/16 7/16 1/17 7/17 1/18 7/18 1/19 7/19 1/20 7/20 1/21 7/21
(%)(US$)
Premium
MLC spot
MLC contract
Mirae Asset Daewooforecasts

Samsung Electronics
Mirae Asset Daewoo Research 55
May 13, 2020
Figure 102. Mobile storage memory: Contract price trends and forecasts
Source: DRAMeXchange, Mirae Asset Daewoo Research
Figure 103. NAND TLC wafers: Monthly contract price trends and forecasts
Source: DRAMeXchange, Mirae Asset Daewoo Research
-30
-15
0
15
30
0.0
3.0
6.0
9.0
12.0
1/17 7/17 1/18 7/18 1/19 7/19 1/20 7/20 1/21
(%)(US$)
128Gb MoM (R) 256Gb MoM (R) 512Gb MoM (R)
128Gb (L) 256Gb (L) 512Gb (L)
-30
-15
0
15
30
0.00
0.15
0.30
0.45
0.60
1Q16 3Q16 1Q17 3Q17 1Q18 3Q18 1Q19 3Q19 1Q20 3Q20 1Q21
(%)(US$) Blended QoQ (R) eMMC MLC QoQ (R)
eMMC TLC QoQ (R) UFS QoQ (R)
Blended 1GB equiv. price (L) eMMC MLC 1GB equiv. price (L)
eMMC TLC 1GB equiv. price (L) UFS 1GB equiv. price (L)
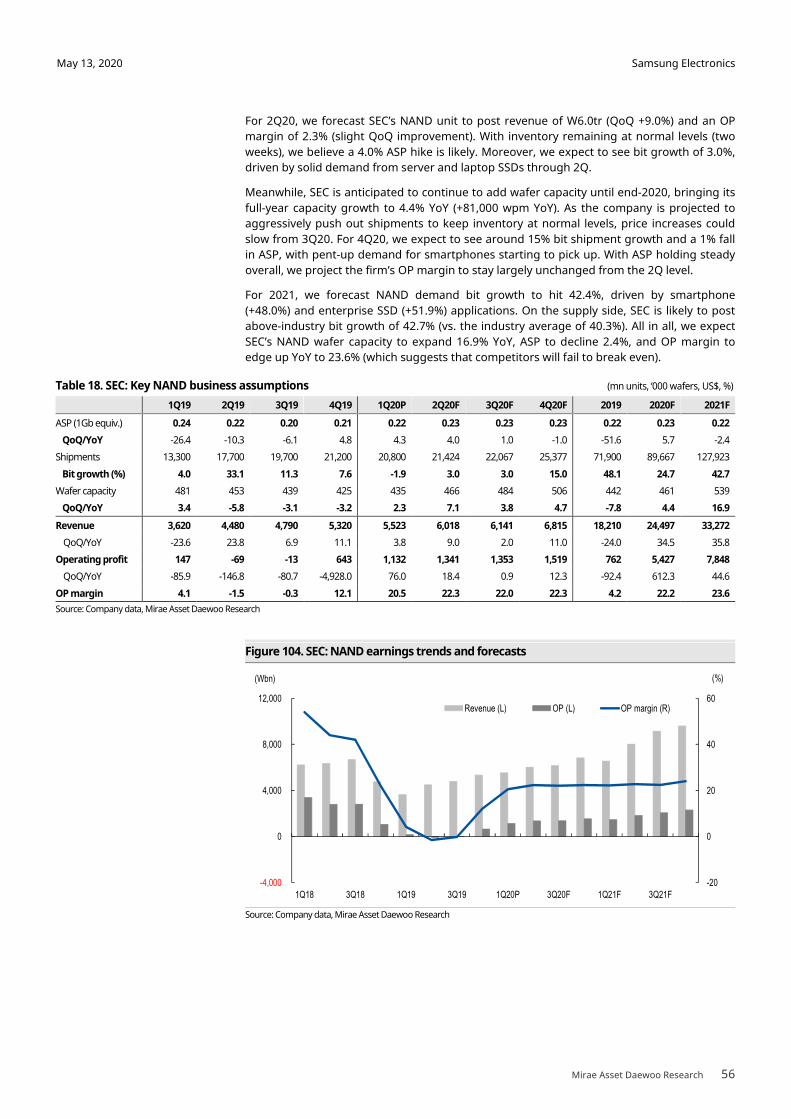
Samsung Electronics
Mirae Asset Daewoo Research 56
May 13, 2020
For 2Q20, we forecast SEC’s NAND unit to post revenue of W6.0tr (QoQ +9.0%) and an OP
margin of 2.3% (slight QoQ improvement). With inventory remaining at normal levels (two
weeks), we believe a 4.0% ASP hike is likely. Moreover, we expect to see bit growth of 3.0%,
driven by solid demand from server and laptop SSDs through 2Q.
Meanwhile, SEC is anticipated to continue to add wafer capacity until end-2020, bringing its
full-year capacity growth to 4.4% YoY (+81,000 wpm YoY). As the company is projected to
aggressively push out shipments to keep inventory at normal levels, price increases could
slow from 3Q20. For 4Q20, we expect to see around 15% bit shipment growth and a 1% fall
in ASP, with pent-up demand for smartphones starting to pick up. With ASP holding steady
overall, we project the firm’s OP margin to stay largely unchanged from the 2Q level.
For 2021, we forecast NAND demand bit growth to hit 42.4%, driven by smartphone
(+48.0%) and enterprise SSD (+51.9%) applications. On the supply side, SEC is likely to post
above-industry bit growth of 42.7% (vs. the industry average of 40.3%). All in all, we expect
SEC’s NAND wafer capacity to expand 16.9% YoY, ASP to decline 2.4%, and OP margin to
edge up YoY to 23.6% (which suggests that competitors will fail to break even).
Table 18. SEC: Key NAND business assumptions (mn units, ‘000 wafers, US$, %)
1Q19 2Q19 3Q19 4Q19 1Q20P 2Q20F 3Q20F 4Q20F 2019 2020F 2021F
ASP (1Gb equiv.) 0.24 0.22 0.20 0.21 0.22 0.23 0.23 0.23 0.22 0.23 0.22
QoQ/YoY -26.4 -10.3 -6.1 4.8 4.3 4.0 1.0 -1.0 -51.6 5.7 -2.4
Shipments 13,300 17,700 19,700 21,200 20,800 21,424 22,067 25,377 71,900 89,667 127,923
Bit growth (%) 4.0 33.1 11.3 7.6 -1.9 3.0 3.0 15.0 48.1 24.7 42.7
Wafer capacity 481 453 439 425 435 466 484 506 442 461 539
QoQ/YoY 3.4 -5.8 -3.1 -3.2 2.3 7.1 3.8 4.7 -7.8 4.4 16.9
Revenue 3,620 4,480 4,790 5,320 5,523 6,018 6,141 6,815 18,210 24,497 33,272
QoQ/YoY -23.6 23.8 6.9 11.1 3.8 9.0 2.0 11.0 -24.0 34.5 35.8
Operating profit 147 -69 -13 643 1,132 1,341 1,353 1,519 762 5,427 7,848
QoQ/YoY -85.9 -146.8 -80.7 -4,928.0 76.0 18.4 0.9 12.3 -92.4 612.3 44.6
OP margin 4.1 -1.5 -0.3 12.1 20.5 22.3 22.0 22.3 4.2 22.2 23.6
Source: Company data, Mirae Asset Daewoo Research
Figure 104. SEC: NAND earnings trends and forecasts
Source: Company data, Mirae Asset Daewoo Research
-20
0
20
40
60
-4,000
0
4,000
8,000
12,000
1Q18 3Q18 1Q19 3Q19 1Q20P 3Q20F 1Q21F 3Q21F
(%)(Wbn)
Revenue (L) OP (L) OP margin (R)
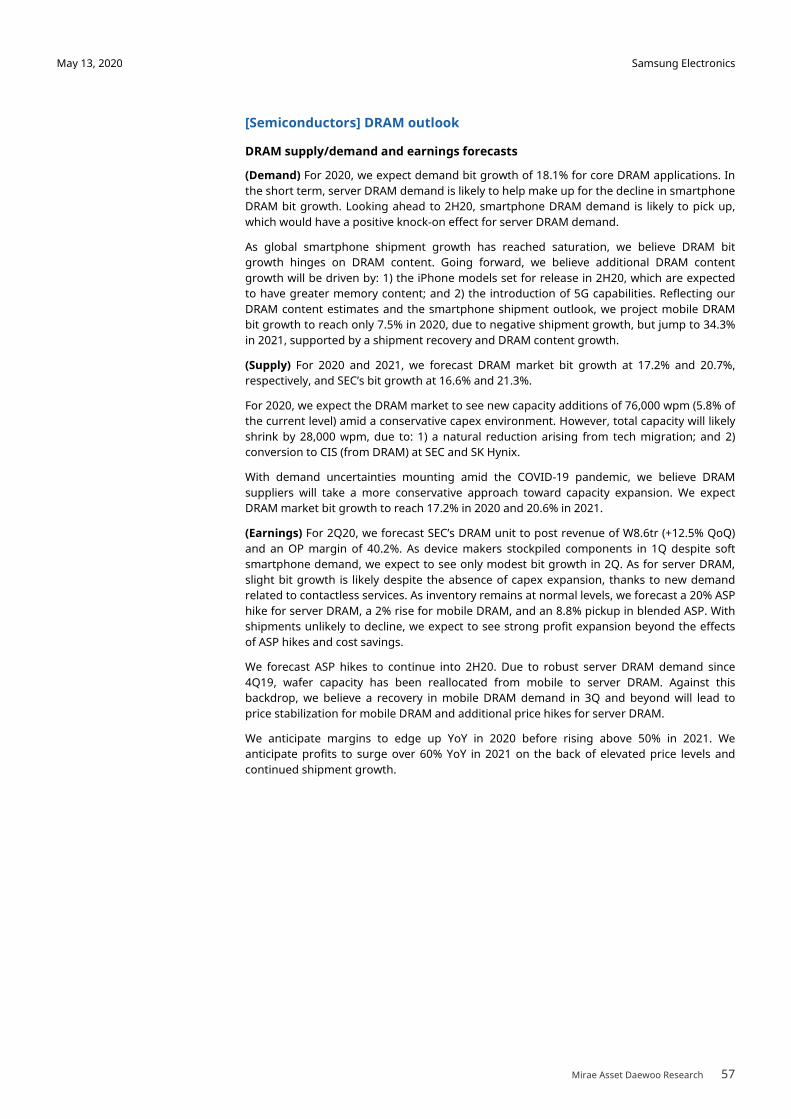
Samsung Electronics
Mirae Asset Daewoo Research 57
May 13, 2020
[Semiconductors] DRAM outlook
DRAM supply/demand and earnings forecasts
(Demand) For 2020, we expect demand bit growth of 18.1% for core DRAM applications. In
the short term, server DRAM demand is likely to help make up for the decline in smartphone
DRAM bit growth. Looking ahead to 2H20, smartphone DRAM demand is likely to pick up,
which would have a positive knock-on effect for server DRAM demand.
As global smartphone shipment growth has reached saturation, we believe DRAM bit
growth hinges on DRAM content. Going forward, we believe additional DRAM content
growth will be driven by: 1) the iPhone models set for release in 2H20, which are expected
to have greater memory content; and 2) the introduction of 5G capabilities. Reflecting our
DRAM content estimates and the smartphone shipment outlook, we project mobile DRAM
bit growth to reach only 7.5% in 2020, due to negative shipment growth, but jump to 34.3%
in 2021, supported by a shipment recovery and DRAM content growth.
(Supply) For 2020 and 2021, we forecast DRAM market bit growth at 17.2% and 20.7%,
respectively, and SEC’s bit growth at 16.6% and 21.3%.
For 2020, we expect the DRAM market to see new capacity additions of 76,000 wpm (5.8% of
the current level) amid a conservative capex environment. However, total capacity will likely
shrink by 28,000 wpm, due to: 1) a natural reduction arising from tech migration; and 2)
conversion to CIS (from DRAM) at SEC and SK Hynix.
With demand uncertainties mounting amid the COVID-19 pandemic, we believe DRAM
suppliers will take a more conservative approach toward capacity expansion. We expect
DRAM market bit growth to reach 17.2% in 2020 and 20.6% in 2021.
(Earnings) For 2Q20, we forecast SEC’s DRAM unit to post revenue of W8.6tr (+12.5% QoQ)
and an OP margin of 40.2%. As device makers stockpiled components in 1Q despite soft
smartphone demand, we expect to see only modest bit growth in 2Q. As for server DRAM,
slight bit growth is likely despite the absence of capex expansion, thanks to new demand
related to contactless services. As inventory remains at normal levels, we forecast a 20% ASP
hike for server DRAM, a 2% rise for mobile DRAM, and an 8.8% pickup in blended ASP. With
shipments unlikely to decline, we expect to see strong profit expansion beyond the effects
of ASP hikes and cost savings.
We forecast ASP hikes to continue into 2H20. Due to robust server DRAM demand since
4Q19, wafer capacity has been reallocated from mobile to server DRAM. Against this
backdrop, we believe a recovery in mobile DRAM demand in 3Q and beyond will lead to
price stabilization for mobile DRAM and additional price hikes for server DRAM.
We anticipate margins to edge up YoY in 2020 before rising above 50% in 2021. We
anticipate profits to surge over 60% YoY in 2021 on the back of elevated price levels and
continued shipment growth.
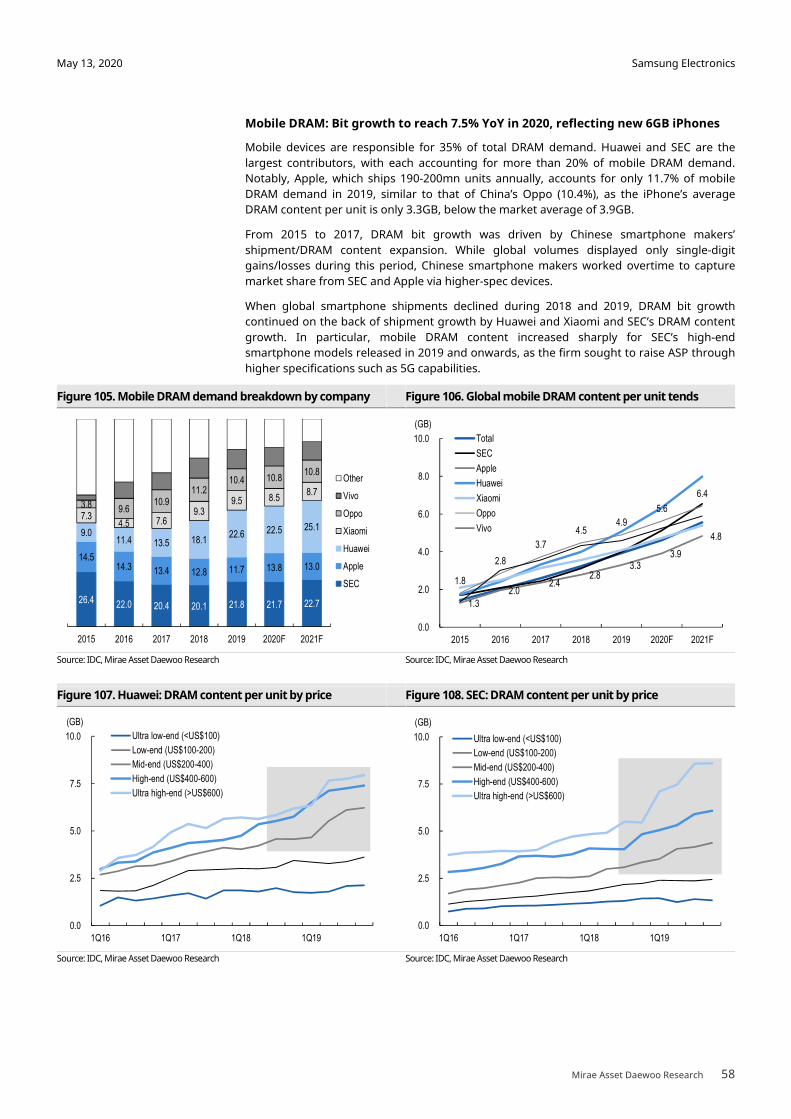
Samsung Electronics
Mirae Asset Daewoo Research 58
May 13, 2020
Mobile DRAM: Bit growth to reach 7.5% YoY in 2020, reflecting new 6GB iPhones
Mobile devices are responsible for 35% of total DRAM demand. Huawei and SEC are the
largest contributors, with each accounting for more than 20% of mobile DRAM demand.
Notably, Apple, which ships 190-200mn units annually, accounts for only 11.7% of mobile
DRAM demand in 2019, similar to that of China’s Oppo (10.4%), as the iPhone’s average
DRAM content per unit is only 3.3GB, below the market average of 3.9GB.
From 2015 to 2017, DRAM bit growth was driven by Chinese smartphone makers’
shipment/DRAM content expansion. While global volumes displayed only single-digit
gains/losses during this period, Chinese smartphone makers worked overtime to capture
market share from SEC and Apple via higher-spec devices.
When global smartphone shipments declined during 2018 and 2019, DRAM bit growth
continued on the back of shipment growth by Huawei and Xiaomi and SEC’s DRAM content
growth. In particular, mobile DRAM content increased sharply for SEC’s high-end
smartphone models released in 2019 and onwards, as the firm sought to raise ASP through
higher specifications such as 5G capabilities.
Figure 105. Mobile DRAM demand breakdown by company Figure 106. Global mobile DRAM content per unit tends
Source: IDC, Mirae Asset Daewoo Research Source: IDC, Mirae Asset Daewoo Research
Figure 107. Huawei: DRAM content per unit by price Figure 108. SEC: DRAM content per unit by price
Source: IDC, Mirae Asset Daewoo Research Source: IDC, Mirae Asset Daewoo Research
26.4 22.0 20.4 20.1 21.8 21.7 22.7
14.5 14.3 13.4 12.8 11.7 13.8 13.0
9.0 11.4 13.5 18.1
22.6 22.5 25.1 7.3
4.5 7.6 9.3
9.5 8.5 8.7
3.8 9.6 10.9
11.2 10.4 10.8
10.8
2015 2016 2017 2018 2019 2020F 2021F
Other
Vivo
Oppo
Xiaomi
Huawei
Apple
SEC
1.3
2.0 2.4
2.8 3.3
3.9
4.8
1.8
2.8
3.7
4.5 4.9
5.6
6.4
0.0
2.0
4.0
6.0
8.0
10.0
2015 2016 2017 2018 2019 2020F 2021F
(GB)
Total
SEC
Apple
Huawei
Xiaomi
Oppo
Vivo
0.0
2.5
5.0
7.5
10.0
1Q16 1Q17 1Q18 1Q19
(GB)
Ultra low-end (<US$100)
Low-end (US$100-200)
Mid-end (US$200-400)
High-end (US$400-600)
Ultra high-end (>US$600)
0.0
2.5
5.0
7.5
10.0
1Q16 1Q17 1Q18 1Q19
(GB)
Ultra low-end (<US$100)
Low-end (US$100-200)
Mid-end (US$200-400)
High-end (US$400-600)
Ultra high-end (>US$600)
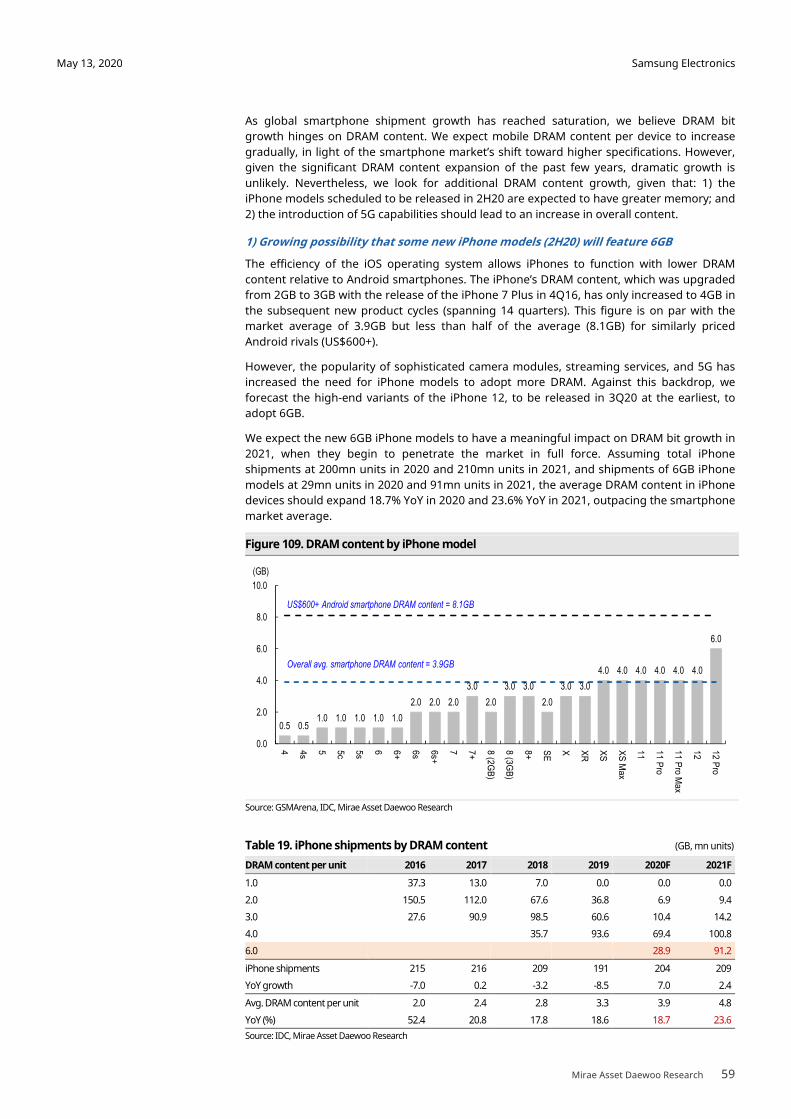
Samsung Electronics
Mirae Asset Daewoo Research 59
May 13, 2020
As global smartphone shipment growth has reached saturation, we believe DRAM bit
growth hinges on DRAM content. We expect mobile DRAM content per device to increase
gradually, in light of the smartphone market’s shift toward higher specifications. However,
given the significant DRAM content expansion of the past few years, dramatic growth is
unlikely. Nevertheless, we look for additional DRAM content growth, given that: 1) the
iPhone models scheduled to be released in 2H20 are expected to have greater memory; and
2) the introduction of 5G capabilities should lead to an increase in overall content.
1) Growing possibility that some new iPhone models (2H20) will feature 6GB
The efficiency of the iOS operating system allows iPhones to function with lower DRAM
content relative to Android smartphones. The iPhone’s DRAM content, which was upgraded
from 2GB to 3GB with the release of the iPhone 7 Plus in 4Q16, has only increased to 4GB in
the subsequent new product cycles (spanning 14 quarters). This figure is on par with the
market average of 3.9GB but less than half of the average (8.1GB) for similarly priced
Android rivals (US$600+).
However, the popularity of sophisticated camera modules, streaming services, and 5G has
increased the need for iPhone models to adopt more DRAM. Against this backdrop, we
forecast the high-end variants of the iPhone 12, to be released in 3Q20 at the earliest, to
adopt 6GB.
We expect the new 6GB iPhone models to have a meaningful impact on DRAM bit growth in
2021, when they begin to penetrate the market in full force. Assuming total iPhone
shipments at 200mn units in 2020 and 210mn units in 2021, and shipments of 6GB iPhone
models at 29mn units in 2020 and 91mn units in 2021, the average DRAM content in iPhone
devices should expand 18.7% YoY in 2020 and 23.6% YoY in 2021, outpacing the smartphone
market average.
Figure 109. DRAM content by iPhone model
Source: GSMArena, IDC, Mirae Asset Daewoo Research
Table 19. iPhone shipments by DRAM content (GB, mn units)
DRAM content per unit 2016 2017 2018 2019 2020F 2021F
1.0 37.3 13.0 7.0 0.0 0.0 0.0
2.0 150.5 112.0 67.6 36.8 6.9 9.4
3.0 27.6 90.9 98.5 60.6 10.4 14.2
4.0 35.7 93.6 69.4 100.8
6.0 28.9 91.2
iPhone shipments 215 216 209 191 204 209
YoY growth -7.0 0.2 -3.2 -8.5 7.0 2.4
Avg. DRAM content per unit 2.0 2.4 2.8 3.3 3.9 4.8
YoY (%) 52.4 20.8 17.8 18.6 18.7 23.6
Source: IDC, Mirae Asset Daewoo Research
0.5 0.51.0 1.0 1.0 1.0 1.0
2.0 2.0 2.0
3.0
2.0
3.0 3.0
2.0
3.0 3.0
4.0 4.0 4.0 4.0 4.0 4.0
6.0
0.0
2.0
4.0
6.0
8.0
10.0
4 4s 5 5c 5s 6 6+ 6s 6s+
7 7+ 8 (2GB
)
8 (3GB
)
8+ SE
X XR
XS
XS
Max
11 11 Pro
11 Pro M
ax
12 12 Pro
(GB)
Overall avg. smartphone DRAM content = 3.9GB
US$600+ Android smartphone DRAM content = 8.1GB
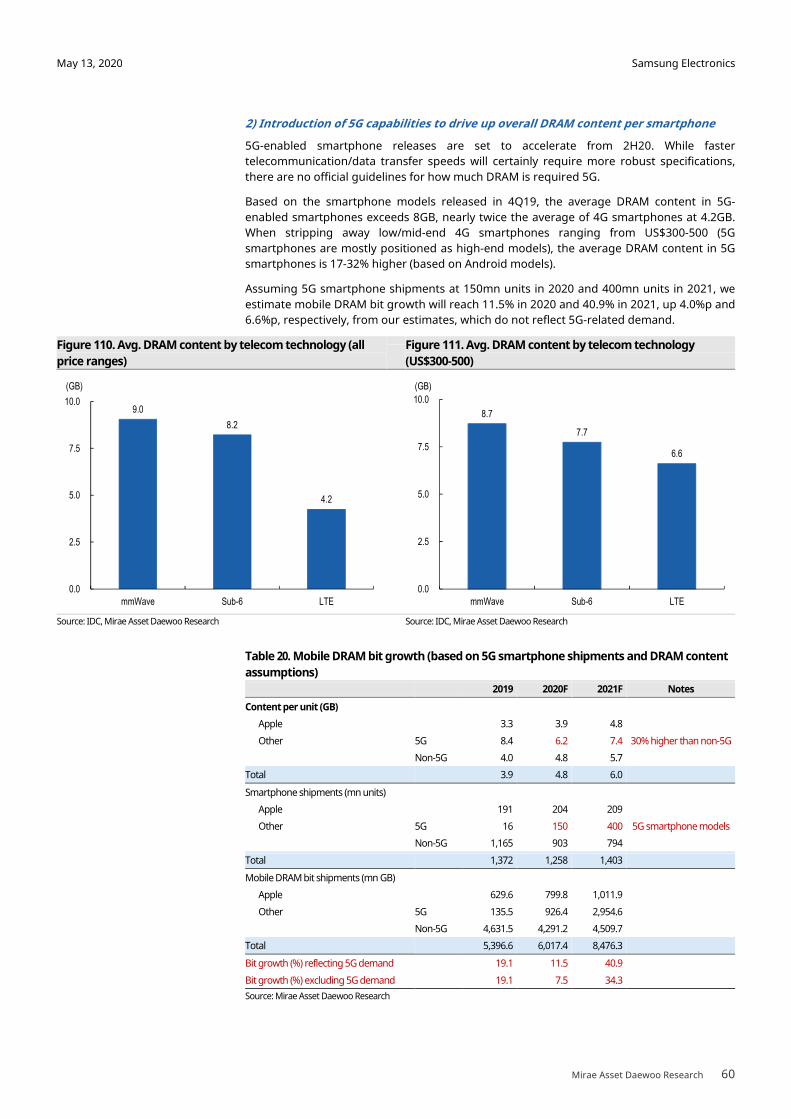
Samsung Electronics
Mirae Asset Daewoo Research 60
May 13, 2020
2) Introduction of 5G capabilities to drive up overall DRAM content per smartphone
5G-enabled smartphone releases are set to accelerate from 2H20. While faster
telecommunication/data transfer speeds will certainly require more robust specifications,
there are no official guidelines for how much DRAM is required 5G.
Based on the smartphone models released in 4Q19, the average DRAM content in 5G-
enabled smartphones exceeds 8GB, nearly twice the average of 4G smartphones at 4.2GB.
When stripping away low/mid-end 4G smartphones ranging from US$300-500 (5G
smartphones are mostly positioned as high-end models), the average DRAM content in 5G
smartphones is 17-32% higher (based on Android models).
Assuming 5G smartphone shipments at 150mn units in 2020 and 400mn units in 2021, we
estimate mobile DRAM bit growth will reach 11.5% in 2020 and 40.9% in 2021, up 4.0%p and
6.6%p, respectively, from our estimates, which do not reflect 5G-related demand.
Figure 110. Avg. DRAM content by telecom technology (all
price ranges)
Figure 111. Avg. DRAM content by telecom technology
(US$300-500)
Source: IDC, Mirae Asset Daewoo Research Source: IDC, Mirae Asset Daewoo Research
Table 20. Mobile DRAM bit growth (based on 5G smartphone shipments and DRAM content
assumptions)
2019 2020F 2021F Notes
Content per unit (GB)
Apple 3.3 3.9 4.8
Other 5G 8.4 6.2 7.4 30% higher than non-5G
Non-5G 4.0 4.8 5.7
Total 3.9 4.8 6.0
Smartphone shipments (mn units)
Apple 191 204 209
Other 5G 16 150 400 5G smartphone models
Non-5G 1,165 903 794
Total 1,372 1,258 1,403
Mobile DRAM bit shipments (mn GB)
Apple 629.6 799.8 1,011.9
Other 5G 135.5 926.4 2,954.6
Non-5G 4,631.5 4,291.2 4,509.7
Total 5,396.6 6,017.4 8,476.3
Bit growth (%) reflecting 5G demand 19.1 11.5 40.9
Bit growth (%) excluding 5G demand 19.1 7.5 34.3
Source: Mirae Asset Daewoo Research
8.7
7.7
6.6
0.0
2.5
5.0
7.5
10.0
mmWave Sub-6 LTE
(GB)
9.0
8.2
4.2
0.0
2.5
5.0
7.5
10.0
mmWave Sub-6 LTE
(GB)

Samsung Electronics
Mirae Asset Daewoo Research 61
May 13, 2020
In our bear-case scenario, we assume 5G smartphone shipments at 100mn units in 2020
and 300mn units in 2021—below consensus levels—reflecting low visibility on smartphone
shipments and high uncertainties over the 5G road map in 2020. Even so, we project mobile
DRAM demand to sharply increase YoY in 2021.
Table 21. Mobile DRAM bit growth (bear-case scenario)
2019 2020F 2021F Note
Content per unit (GB)
Apple 3.3 3.9 4.8
Other 5G 8.4 6.2 7.4 30% higher than non-5G
Non 5G 4.0 4.8 5.7
Total 3.9 4.7 5.9
Smartphone shipments (mn units)
Apple 191 204 209
Other 5G 16 100 300 5G smartphone models
Non 5G 1,165 953 894
Total 1,372 1,258 1,403
Mobile DRAM bits (mn GB)
Apple 629.6 799.8 1,011.9
Other 5G 135.5 617.6 2,216.0
Non 5G 4,631.5 4,528.7 5,077.9
Total 5,396.6 5,946.1 8,305.8
Bit growth (%) reflecting 5G demand 19.1 10.2 39.7
Bit growth (%) excluding 5G demand 19.1 7.5 34.3
Source: Mirae Asset Daewoo Research
Based on our mobile DRAM demand model, we estimate DRAM content per smartphone to
increase 17.3% YoY in 2020 and 20.4% YoY in 2021, reflecting the likely releases of new 6GB
iPhone models and disregarding 5G-related upside. Reflecting our DRAM content estimates
and the smartphone shipment outlook, we project mobile DRAM bit growth to reach only
7.5% in 2020 (due to negative shipment growth), but jump to 34.3% in 2021 (supported by a
shipment recovery and DRAM content growth). Mobile DRAM bit growth is unlikely to turn
negative, as DRAM content growth should more than offset the decline in smartphone
shipments.
Table 22. Demand assumptions and mobile DRAM bit growth scenarios (%)
Scenario 1Q20F 2Q20F 3Q20F 4Q20F 2019 2020F 2021F
Smartphone shipments
Base -24.9 -2.3 23.7 10.8 -2.2 -8.3 11.6
Bear -24.9 -3.0 10.0 20.0 -2.2 -12.6 10.7
Worst -24.9 -4.0 5.0 15.0 -2.2 -16.4 13.0
DRAM content per unit 3.9 2.3 7.5 3.3 21.8 17.3 20.4
Mobile DRAM bit growth
Base -21.9 0.0 33.0 14.4 19.1 7.5 34.3
Bear -21.9 -0.8 18.3 23.9 19.1 2.6 33.3
Worst -21.9 -1.8 12.9 18.8 19.1 -1.9 36.1
Source: Mirae Asset Daewoo Research
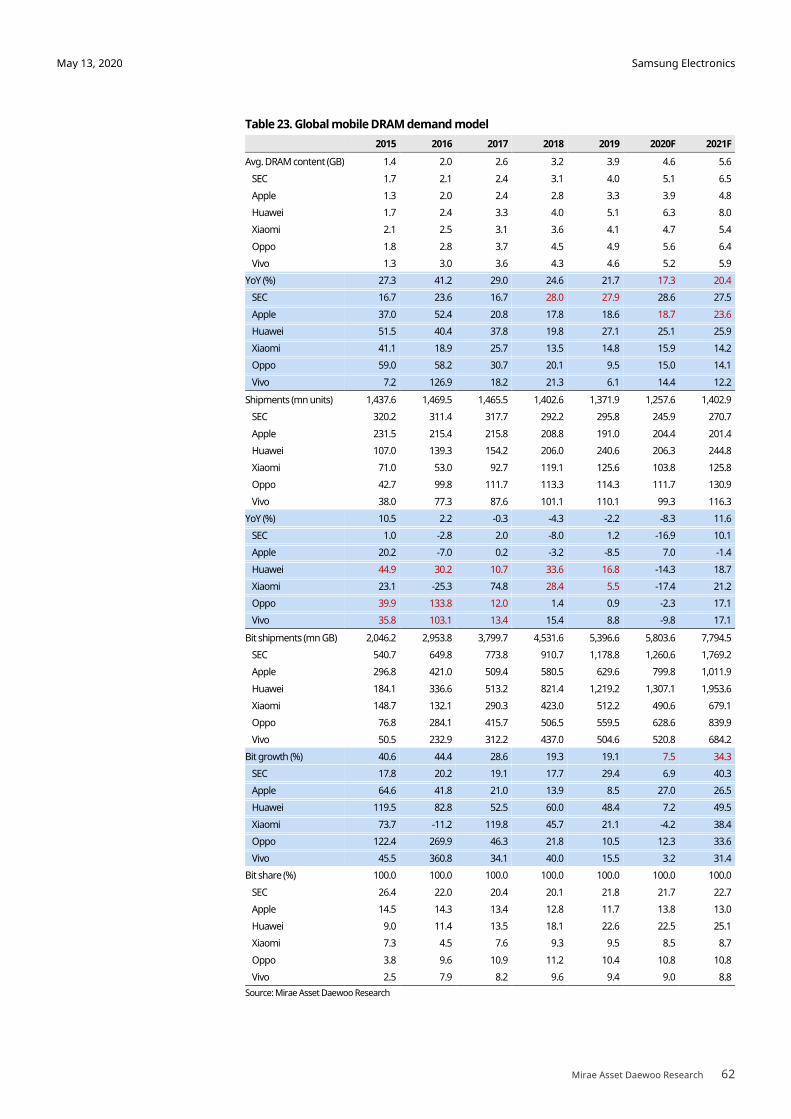
Samsung Electronics
Mirae Asset Daewoo Research 62
May 13, 2020
Table 23. Global mobile DRAM demand model
2015 2016 2017 2018 2019 2020F 2021F
Avg. DRAM content (GB) 1.4 2.0 2.6 3.2 3.9 4.6 5.6
SEC 1.7 2.1 2.4 3.1 4.0 5.1 6.5
Apple 1.3 2.0 2.4 2.8 3.3 3.9 4.8
Huawei 1.7 2.4 3.3 4.0 5.1 6.3 8.0
Xiaomi 2.1 2.5 3.1 3.6 4.1 4.7 5.4
Oppo 1.8 2.8 3.7 4.5 4.9 5.6 6.4
Vivo 1.3 3.0 3.6 4.3 4.6 5.2 5.9
YoY (%) 27.3 41.2 29.0 24.6 21.7 17.3 20.4
SEC 16.7 23.6 16.7 28.0 27.9 28.6 27.5
Apple 37.0 52.4 20.8 17.8 18.6 18.7 23.6
Huawei 51.5 40.4 37.8 19.8 27.1 25.1 25.9
Xiaomi 41.1 18.9 25.7 13.5 14.8 15.9 14.2
Oppo 59.0 58.2 30.7 20.1 9.5 15.0 14.1
Vivo 7.2 126.9 18.2 21.3 6.1 14.4 12.2
Shipments (mn units) 1,437.6 1,469.5 1,465.5 1,402.6 1,371.9 1,257.6 1,402.9
SEC 320.2 311.4 317.7 292.2 295.8 245.9 270.7
Apple 231.5 215.4 215.8 208.8 191.0 204.4 201.4
Huawei 107.0 139.3 154.2 206.0 240.6 206.3 244.8
Xiaomi 71.0 53.0 92.7 119.1 125.6 103.8 125.8
Oppo 42.7 99.8 111.7 113.3 114.3 111.7 130.9
Vivo 38.0 77.3 87.6 101.1 110.1 99.3 116.3
YoY (%) 10.5 2.2 -0.3 -4.3 -2.2 -8.3 11.6
SEC 1.0 -2.8 2.0 -8.0 1.2 -16.9 10.1
Apple 20.2 -7.0 0.2 -3.2 -8.5 7.0 -1.4
Huawei 44.9 30.2 10.7 33.6 16.8 -14.3 18.7
Xiaomi 23.1 -25.3 74.8 28.4 5.5 -17.4 21.2
Oppo 39.9 133.8 12.0 1.4 0.9 -2.3 17.1
Vivo 35.8 103.1 13.4 15.4 8.8 -9.8 17.1
Bit shipments (mn GB) 2,046.2 2,953.8 3,799.7 4,531.6 5,396.6 5,803.6 7,794.5
SEC 540.7 649.8 773.8 910.7 1,178.8 1,260.6 1,769.2
Apple 296.8 421.0 509.4 580.5 629.6 799.8 1,011.9
Huawei 184.1 336.6 513.2 821.4 1,219.2 1,307.1 1,953.6
Xiaomi 148.7 132.1 290.3 423.0 512.2 490.6 679.1
Oppo 76.8 284.1 415.7 506.5 559.5 628.6 839.9
Vivo 50.5 232.9 312.2 437.0 504.6 520.8 684.2
Bit growth (%) 40.6 44.4 28.6 19.3 19.1 7.5 34.3
SEC 17.8 20.2 19.1 17.7 29.4 6.9 40.3
Apple 64.6 41.8 21.0 13.9 8.5 27.0 26.5
Huawei 119.5 82.8 52.5 60.0 48.4 7.2 49.5
Xiaomi 73.7 -11.2 119.8 45.7 21.1 -4.2 38.4
Oppo 122.4 269.9 46.3 21.8 10.5 12.3 33.6
Vivo 45.5 360.8 34.1 40.0 15.5 3.2 31.4
Bit share (%) 100.0 100.0 100.0 100.0 100.0 100.0 100.0
SEC 26.4 22.0 20.4 20.1 21.8 21.7 22.7
Apple 14.5 14.3 13.4 12.8 11.7 13.8 13.0
Huawei 9.0 11.4 13.5 18.1 22.6 22.5 25.1
Xiaomi 7.3 4.5 7.6 9.3 9.5 8.5 8.7
Oppo 3.8 9.6 10.9 11.2 10.4 10.8 10.8
Vivo 2.5 7.9 8.2 9.6 9.4 9.0 8.8
Source: Mirae Asset Daewoo Research
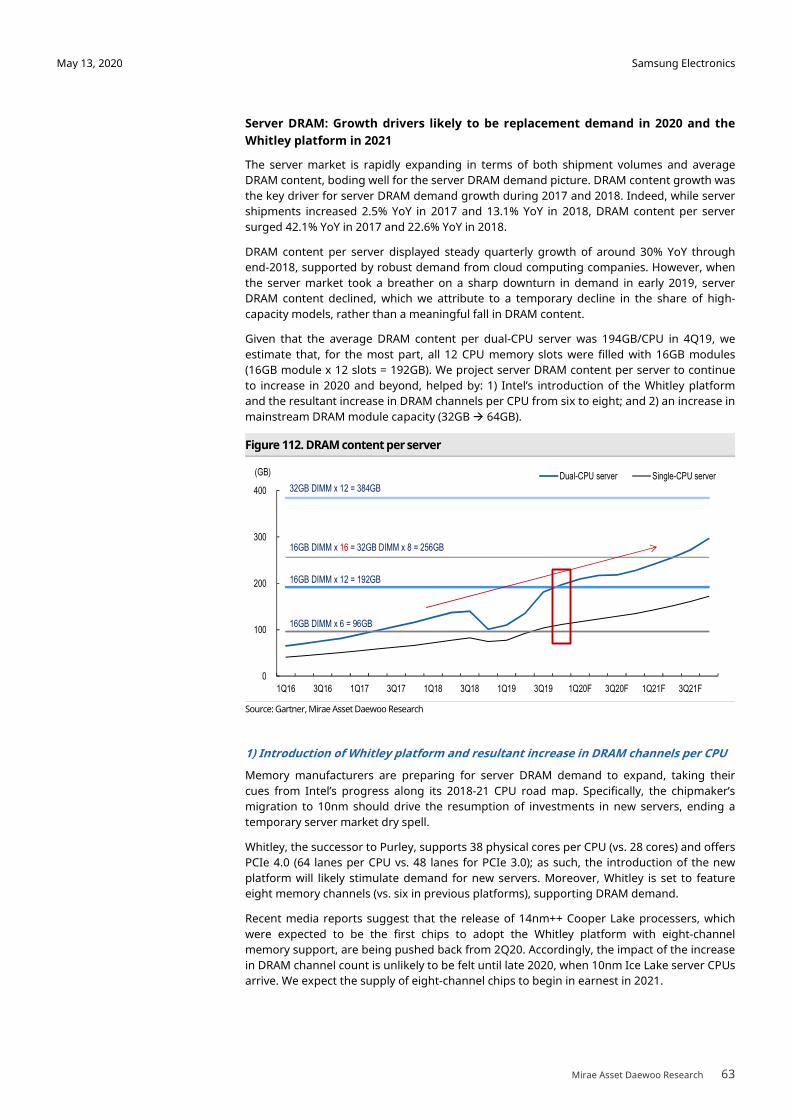
Samsung Electronics
Mirae Asset Daewoo Research 63
May 13, 2020
Server DRAM: Growth drivers likely to be replacement demand in 2020 and the
Whitley platform in 2021
The server market is rapidly expanding in terms of both shipment volumes and average
DRAM content, boding well for the server DRAM demand picture. DRAM content growth was
the key driver for server DRAM demand growth during 2017 and 2018. Indeed, while server
shipments increased 2.5% YoY in 2017 and 13.1% YoY in 2018, DRAM content per server
surged 42.1% YoY in 2017 and 22.6% YoY in 2018.
DRAM content per server displayed steady quarterly growth of around 30% YoY through
end-2018, supported by robust demand from cloud computing companies. However, when
the server market took a breather on a sharp downturn in demand in early 2019, server
DRAM content declined, which we attribute to a temporary decline in the share of high-
capacity models, rather than a meaningful fall in DRAM content.
Given that the average DRAM content per dual-CPU server was 194GB/CPU in 4Q19, we
estimate that, for the most part, all 12 CPU memory slots were filled with 16GB modules
(16GB module x 12 slots = 192GB). We project server DRAM content per server to continue
to increase in 2020 and beyond, helped by: 1) Intel’s introduction of the Whitley platform
and the resultant increase in DRAM channels per CPU from six to eight; and 2) an increase in
mainstream DRAM module capacity (32GB � 64GB).
Figure 112. DRAM content per server
Source: Gartner, Mirae Asset Daewoo Research
1) Introduction of Whitley platform and resultant increase in DRAM channels per CPU
Memory manufacturers are preparing for server DRAM demand to expand, taking their
cues from Intel’s progress along its 2018-21 CPU road map. Specifically, the chipmaker’s
migration to 10nm should drive the resumption of investments in new servers, ending a
temporary server market dry spell.
Whitley, the successor to Purley, supports 38 physical cores per CPU (vs. 28 cores) and offers
PCIe 4.0 (64 lanes per CPU vs. 48 lanes for PCIe 3.0); as such, the introduction of the new
platform will likely stimulate demand for new servers. Moreover, Whitley is set to feature
eight memory channels (vs. six in previous platforms), supporting DRAM demand.
Recent media reports suggest that the release of 14nm++ Cooper Lake processers, which
were expected to be the first chips to adopt the Whitley platform with eight-channel
memory support, are being pushed back from 2Q20. Accordingly, the impact of the increase
in DRAM channel count is unlikely to be felt until late 2020, when 10nm Ice Lake server CPUs
arrive. We expect the supply of eight-channel chips to begin in earnest in 2021.
0
100
200
300
400
1Q16 3Q16 1Q17 3Q17 1Q18 3Q18 1Q19 3Q19 1Q20F 3Q20F 1Q21F 3Q21F
(GB) Dual-CPU server Single-CPU server
16GB DIMM x 6 = 96GB
16GB DIMM x 12 = 192GB
16GB DIMM x 16 = 32GB DIMM x 8 = 256GB
32GB DIMM x 12 = 384GB

Samsung Electronics
Mirae Asset Daewoo Research 64
May 13, 2020
Table 24. Intel’s road map for server CPUs
Platform Purley Whitley Eagle Stream
Processor name Sky Lake X/SP Cascade Lake X/SP (Cooper Lake) Ice Lake Sapphire Rapids Granite Rapids
Processor launch Nov. 2017 Apr. 2019 2Q20 3Q20 2021 2022
Processor node 14nm+ 14nm++ 14nm++ 10nm+ 10nm++ 7nm
DRAM support DDR4 2666Mhz DDR4 2933Mhz DDR4 3200Mhz DDR4 3200Mhz DDR5 DDR5
No. of cores per socket 18/28 max. 18/28 max. 48 max. 38 max. - -
No. of DRAM channels 6 6 8 8 8 8
No. of DIMM per socket 12 12 16 16 16 16
Max. DRAM per CPU 1TB-4.5TB
PCIe lanes 48xPCIe3.0 48xPCIe3.0 64xPCIe3.0 64xPCIe4.0
Source: Mirae Asset Daewoo Research
2) Increase in mainstream DRAM module capacity (32GB ���� 64GB)
With the mass production of 16Gb single-die packages currently underway, the market
share of 64GB dual in-line memory module (RDIMM) equipped with 16 chipsets (16Gb) has
been increasing. Currently, 8Gb-based 32GB modules are the market standard. When 64GB
modules go mainstream, we expect DRAM content per server to expand to the extent that
CPU core capacity allows.
Figure 113. DRAM market breakdown by die capacity Figure 114. SEC’s 64GB DDR4 RDIMM
Source: DRAMeXchange, Mirae Asset Daewoo Research Source: SEC, Mirae Asset Daewoo Research
Table 25. Demand assumptions and server DRAM bit growth scenarios (%)
Scenario 1Q20F 2Q20F 3Q20F 4Q20F 2019 2020F 2021F
Server shipments
Base -15.5 6.1 1.0 5.0 -0.9 4.2 3.2
Bear -15.5 0.0 1.0 5.0 -0.9 -0.3 7.9
DRAM content per unit 5.6 3.6 0.6 4.3 24.0 35.9 22.6
Server DRAM bit growth
Base 2.4 39.3 9.8 10.8 19.7 41.6 26.5
Bear 2.4 31.3 9.8 10.8 19.7 35.4 32.2
Source: Mirae Asset Daewoo Research
0%
25%
50%
75%
100%
1Q18 3Q18 1Q19 3Q19
16Gb
12Gb
8Gb
6Gb
4Gb
2Gb
1Gb
512Mb
256Mb
128Mb
64Mb
16Mb
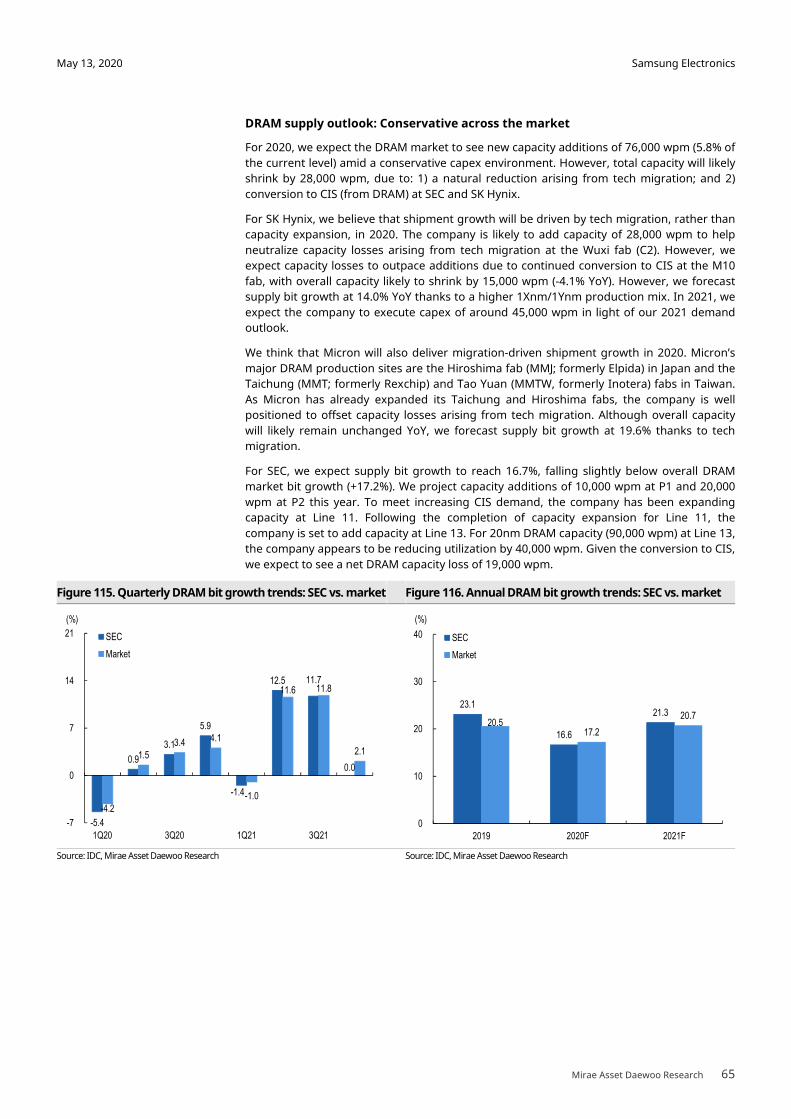
Samsung Electronics
Mirae Asset Daewoo Research 65
May 13, 2020
DRAM supply outlook: Conservative across the market
For 2020, we expect the DRAM market to see new capacity additions of 76,000 wpm (5.8% of
the current level) amid a conservative capex environment. However, total capacity will likely
shrink by 28,000 wpm, due to: 1) a natural reduction arising from tech migration; and 2)
conversion to CIS (from DRAM) at SEC and SK Hynix.
For SK Hynix, we believe that shipment growth will be driven by tech migration, rather than
capacity expansion, in 2020. The company is likely to add capacity of 28,000 wpm to help
neutralize capacity losses arising from tech migration at the Wuxi fab (C2). However, we
expect capacity losses to outpace additions due to continued conversion to CIS at the M10
fab, with overall capacity likely to shrink by 15,000 wpm (-4.1% YoY). However, we forecast
supply bit growth at 14.0% YoY thanks to a higher 1Xnm/1Ynm production mix. In 2021, we
expect the company to execute capex of around 45,000 wpm in light of our 2021 demand
outlook.
We think that Micron will also deliver migration-driven shipment growth in 2020. Micron’s
major DRAM production sites are the Hiroshima fab (MMJ; formerly Elpida) in Japan and the
Taichung (MMT; formerly Rexchip) and Tao Yuan (MMTW, formerly Inotera) fabs in Taiwan.
As Micron has already expanded its Taichung and Hiroshima fabs, the company is well
positioned to offset capacity losses arising from tech migration. Although overall capacity
will likely remain unchanged YoY, we forecast supply bit growth at 19.6% thanks to tech
migration.
For SEC, we expect supply bit growth to reach 16.7%, falling slightly below overall DRAM
market bit growth (+17.2%). We project capacity additions of 10,000 wpm at P1 and 20,000
wpm at P2 this year. To meet increasing CIS demand, the company has been expanding
capacity at Line 11. Following the completion of capacity expansion for Line 11, the
company is set to add capacity at Line 13. For 20nm DRAM capacity (90,000 wpm) at Line 13,
the company appears to be reducing utilization by 40,000 wpm. Given the conversion to CIS,
we expect to see a net DRAM capacity loss of 19,000 wpm.
Figure 115. Quarterly DRAM bit growth trends: SEC vs. market Figure 116. Annual DRAM bit growth trends: SEC vs. market
Source: IDC, Mirae Asset Daewoo Research Source: IDC, Mirae Asset Daewoo Research
-5.4
0.9
3.1
5.9
-1.4
12.5 11.7
0.0
-4.2
1.5 3.4 4.1
-1.0
11.6 11.8
2.1
-7
0
7
14
21
1Q20 3Q20 1Q21 3Q21
(%)
SEC
Market
23.1
16.6
21.3 20.5
17.2
20.7
0
10
20
30
40
2019 2020F 2021F
(%)
SEC
Market
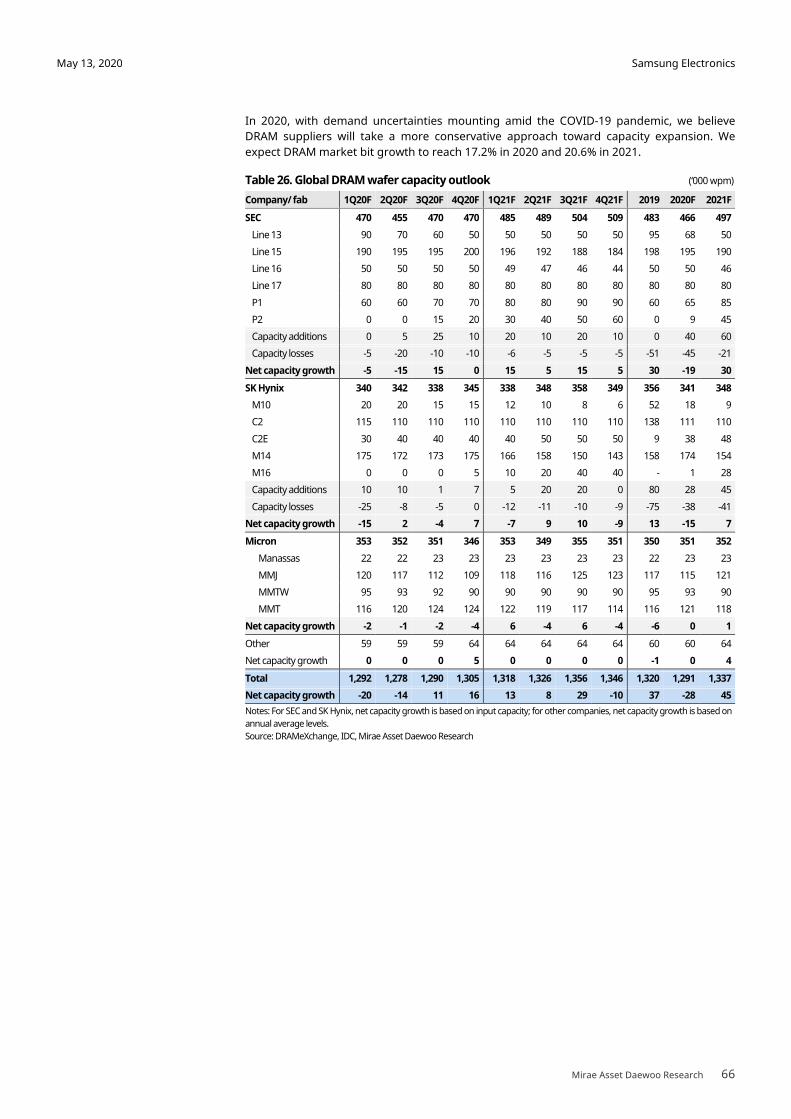
Samsung Electronics
Mirae Asset Daewoo Research 66
May 13, 2020
In 2020, with demand uncertainties mounting amid the COVID-19 pandemic, we believe
DRAM suppliers will take a more conservative approach toward capacity expansion. We
expect DRAM market bit growth to reach 17.2% in 2020 and 20.6% in 2021.
Table 26. Global DRAM wafer capacity outlook (‘000 wpm)
Company/ fab 1Q20F 2Q20F 3Q20F 4Q20F 1Q21F 2Q21F 3Q21F 4Q21F 2019 2020F 2021F
SEC 470 455 470 470 485 489 504 509 483 466 497
Line 13 90 70 60 50 50 50 50 50 95 68 50
Line 15 190 195 195 200 196 192 188 184 198 195 190
Line 16 50 50 50 50 49 47 46 44 50 50 46
Line 17 80 80 80 80 80 80 80 80 80 80 80
P1 60 60 70 70 80 80 90 90 60 65 85
P2 0 0 15 20 30 40 50 60 0 9 45
Capacity additions 0 5 25 10 20 10 20 10 0 40 60
Capacity losses -5 -20 -10 -10 -6 -5 -5 -5 -51 -45 -21
Net capacity growth -5 -15 15 0 15 5 15 5 30 -19 30
SK Hynix 340 342 338 345 338 348 358 349 356 341 348
M10 20 20 15 15 12 10 8 6 52 18 9
C2 115 110 110 110 110 110 110 110 138 111 110
C2E 30 40 40 40 40 50 50 50 9 38 48
M14 175 172 173 175 166 158 150 143 158 174 154
M16 0 0 0 5 10 20 40 40 - 1 28
Capacity additions 10 10 1 7 5 20 20 0 80 28 45
Capacity losses -25 -8 -5 0 -12 -11 -10 -9 -75 -38 -41
Net capacity growth -15 2 -4 7 -7 9 10 -9 13 -15 7
Micron 353 352 351 346 353 349 355 351 350 351 352
Manassas 22 22 23 23 23 23 23 23 22 23 23
MMJ 120 117 112 109 118 116 125 123 117 115 121
MMTW 95 93 92 90 90 90 90 90 95 93 90
MMT 116 120 124 124 122 119 117 114 116 121 118
Net capacity growth -2 -1 -2 -4 6 -4 6 -4 -6 0 1
Other 59 59 59 64 64 64 64 64 60 60 64
Net capacity growth 0 0 0 5 0 0 0 0 -1 0 4
Total 1,292 1,278 1,290 1,305 1,318 1,326 1,356 1,346 1,320 1,291 1,337
Net capacity growth -20 -14 11 16 13 8 29 -10 37 -28 45
Notes: For SEC and SK Hynix, net capacity growth is based on input capacity; for other companies, net capacity growth is based on
annual average levels.
Source: DRAMeXchange, IDC, Mirae Asset Daewoo Research

Samsung Electronics
Mirae Asset Daewoo Research 67
May 13, 2020
DRAM market prices and SEC earnings outlook
For 2020, we project the supply/demand ratio to reach 155% (similar to the 2018-19
average) based on mobile, server, and PC applications, which collectively account for 70% of
DRAM demand. Despite weakening demand prospects amid the COVID-19 pandemic, we
expect DRAM suppliers to defend (or even raise) prices YoY through conservative supply
expansion.
In early 2017, the DRAM market was in oversupply (similar to 2016 conditions). However,
oversupply started to ease meaningfully, and demand bit growth (+24.0%) outpaced supply
bit growth (+21.7%) over the full year, despite a 0.3% YoY fall in smartphone shipments.
Growth in DRAM content per device—led by Apple and Chinese smartphone makers—
played a significant role in demand growth. And perhaps more importantly, surging
demand from servers led to tighter supply and an overall pickup in DRAM prices.
In 2018, supply failed to keep pace with growing demand. While smartphone shipments
contracted at an accelerated pace YoY (-4.3% YoY), continued growth in DRAM content per
device (led by SEC) drove mobile DRAM demand up 19.3% YoY. Moreover, server DRAM
demand bit growth surged 40.8% YoY thanks to hyperscalers. Overall, demand bit growth
from key applications reached 22.0%. On the supply side, however, bit growth declined to
14.7% amid tech migration, with SEC and SK Hynix posting per-wafer bit growth of just 2.7%
and 5.5%, respectively. As a result, supply fell short of demand despite ongoing wafer
capacity expansion efforts.
In 2019, demand weakened across most applications. Smartphone shipments remained on
the downtrend, DRAM content growth slowed, and excessive stock at hyperscalers weighed
heavily on server DRAM bit growth (+24.7%; -16.1%p YoY). At the same time, the DRAM
market entered oversupply as tech migration progressed smoothly. However, DRAM
suppliers—which enjoy an oligopoly—managed to keep the full-year oversupply ratio at the
2018 level by minimizing wafer capacity expansion. Prices also stabilized toward 2H.
For 2020, we expect demand to continue to dwindle amid the coronavirus pandemic, with
demand bit growth falling to a six-year low of 18.1% despite a projected rise in pent-up
demand in 2H. Server DRAM inventory is anticipated to normalize, with demand bit growth
rising above 40% due to a low base of comparison. However, smartphone shipments are
projected to plunge a record 8.3% YoY. On the supply side, we expect to see annual bit
growth of 17.2% (below projected demand bit growth) amid shrinking average wafer
capacity.
Meanwhile, inventory is forecast to remain at normal levels despite lackluster demand, due
to conservative supply management. Against this backdrop, we think that a supply shortage
could occur if demand returns to growth in 2021. As such, DRAM prices are likely to remain
stable going forward.
We expect smartphone demand to start to recover in 3Q, with shipments returning to 2019
levels in 4Q. Accordingly, we assume that mobile DRAM shipments will turn around in 3Q,
and shipment growth will accelerate in 4Q. As for server DRAM, shipments are projected to
stay flat QoQ in 3Q. Hyperscalers are likely to continue to stockpile DRAM until 3Q, adjusting
the pace of their purchases depending on the direction of the mobile DRAM market.
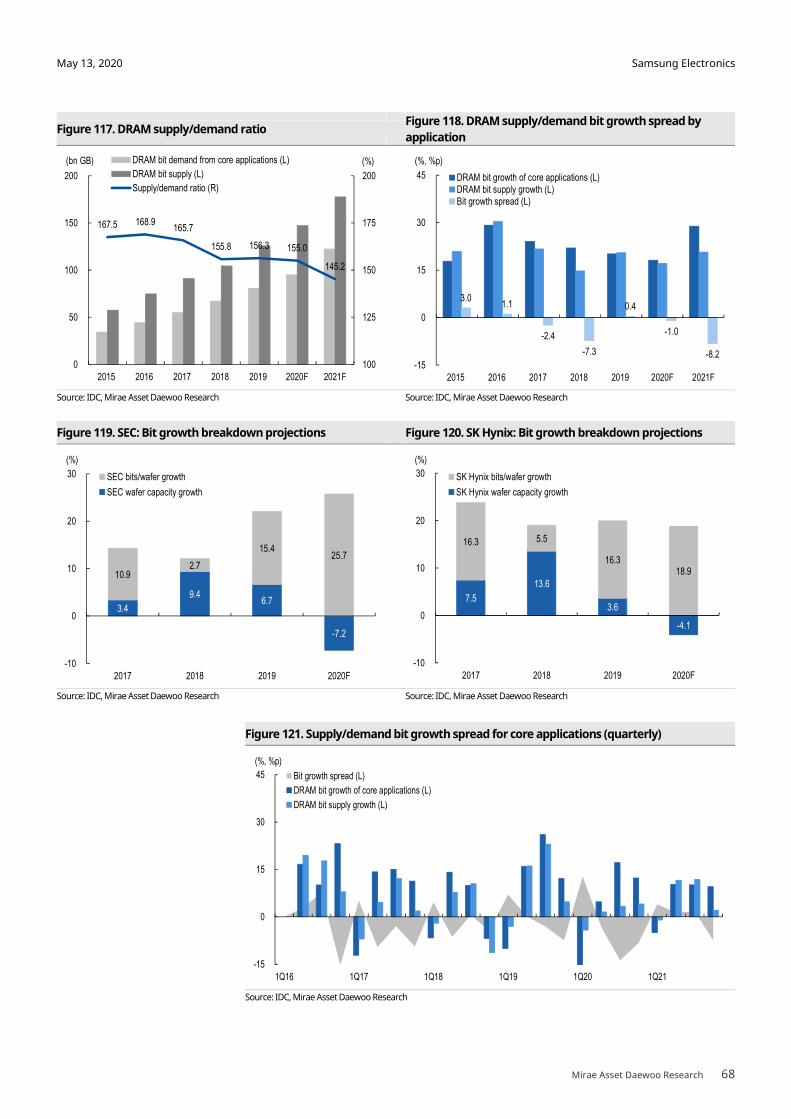
Samsung Electronics
Mirae Asset Daewoo Research 68
May 13, 2020
Figure 117. DRAM supply/demand ratio Figure 118. DRAM supply/demand bit growth spread by
application
Source: IDC, Mirae Asset Daewoo Research Source: IDC, Mirae Asset Daewoo Research
Figure 119. SEC: Bit growth breakdown projections Figure 120. SK Hynix: Bit growth breakdown projections
Source: IDC, Mirae Asset Daewoo Research Source: IDC, Mirae Asset Daewoo Research
Figure 121. Supply/demand bit growth spread for core applications (quarterly)
Source: IDC, Mirae Asset Daewoo Research
7.5
13.6
3.6
-4.1
16.3 5.5
16.3 18.9
-10
0
10
20
30
2017 2018 2019 2020F
(%)
SK Hynix bits/wafer growth
SK Hynix wafer capacity growth
3.4
9.4 6.7
-7.2
10.9 2.7
15.4 25.7
-10
0
10
20
30
2017 2018 2019 2020F
(%)
SEC bits/wafer growth
SEC wafer capacity growth
167.5 168.9 165.7
155.8 156.3 155.0
145.2
100
125
150
175
200
0
50
100
150
200
2015 2016 2017 2018 2019 2020F 2021F
(%)(bn GB) DRAM bit demand from core applications (L)
DRAM bit supply (L)
Supply/demand ratio (R)
3.0 1.1
-2.4
-7.3
0.4
-1.0
-8.2 -15
0
15
30
45
2015 2016 2017 2018 2019 2020F 2021F
(%, %p)
DRAM bit growth of core applications (L)DRAM bit supply growth (L)Bit growth spread (L)
-15
0
15
30
45
1Q16 1Q17 1Q18 1Q19 1Q20 1Q21
(%, %p)
Bit growth spread (L)
DRAM bit growth of core applications (L)
DRAM bit supply growth (L)

Samsung Electronics
Mirae Asset Daewoo Research 69
May 13, 2020
Table 27. Global DRAM supply/demand model
2015 2016 2017 2018 2019 2020F 2021F
Demand from key DRAM applications
Bit shipments (mn Gb) 34,218 44,219 54,853 66,927 80,384 94,965 122,344
Mobile DRAM 16,370 23,631 30,398 36,250 43,173 46,429 62,356
SEC 4,325 5,198 6,190 7,286 9,431 10,085 14,154
Apple 2,375 3,368 4,076 4,644 5,037 6,398 8,095
Huawei 1,473 2,693 4,106 6,571 9,753 10,457 15,629
Xiaomi 1,190 1,057 2,323 3,384 4,098 3,924 5,433
Oppo 614 2,272 3,325 4,052 4,476 5,029 6,719
Vivo 404 1,863 2,498 3,496 4,037 4,167 5,474
Server DRAM 7,819 10,503 15,960 22,478 28,021 39,327 49,804
PC DRAM 10,028 10,085 8,496 8,199 9,191 9,209 10,184
Bit growth (%) 17.8 29.2 24.0 22.0 20.1 18.1 28.8
Smartphone 40.6 44.4 28.6 19.3 19.1 7.5 34.3
SEC 17.8 20.2 19.1 17.7 29.4 6.9 40.3
Apple 64.6 41.8 21.0 13.9 8.5 27.0 26.5
Huawei 119.5 82.8 52.5 60.0 48.4 7.2 49.5
Xiaomi 73.7 -11.2 119.8 45.7 21.1 -4.2 38.4
Oppo 122.4 269.9 46.3 21.8 10.5 12.3 33.6
Vivo 45.5 360.8 34.1 40.0 15.5 3.2 31.4
Server DRAM 27.0 34.3 51.9 40.8 24.7 40.4 26.6
PC DRAM -10.8 0.6 -15.8 -3.5 12.1 0.2 10.6
Supply from key DRAM foundries
Bit shipments (mn Gb) 57,317 74,708 90,902 104,262 125,642 147,262 177,530
SEC 26,283 35,685 40,920 45,970 56,580 66,039 79,955
SK Hynix 16,265 20,190 25,237 30,225 36,435 41,539 48,340
Micron 11,622 15,160 20,908 23,391 27,616 33,037 38,553
Bit growth (%) 20.8 30.3 21.7 14.7 20.5 17.2 20.6
SEC 30.1 35.8 14.7 12.3 23.1 16.7 21.1
SK Hynix 22.9 24.1 25.0 19.8 20.5 14.0 16.4
Micron 4.0 30.4 37.9 11.9 18.1 19.6 16.7
Supply/demand ratio (%) 167.5 168.9 165.7 155.8 156.3 155.1 145.1
Bit growth spread (%p) 3.0 1.1 -2.4 -7.3 0.4 -0.9 -8.3
Source: Mirae Asset Daewoo Research
Figure 122. Supply/demand bit growth (market)
Source: Mirae Asset Daewoo Research
-20
0
20
40
60
1Q16 1Q17 1Q18 1Q19 1Q20 1Q21
(%, %p)
DRAM bit growth of core applications (L)
DRAM bit supply growth (L)
Bit growth spread (A)
Bit growth spread accel. (dA/dT)
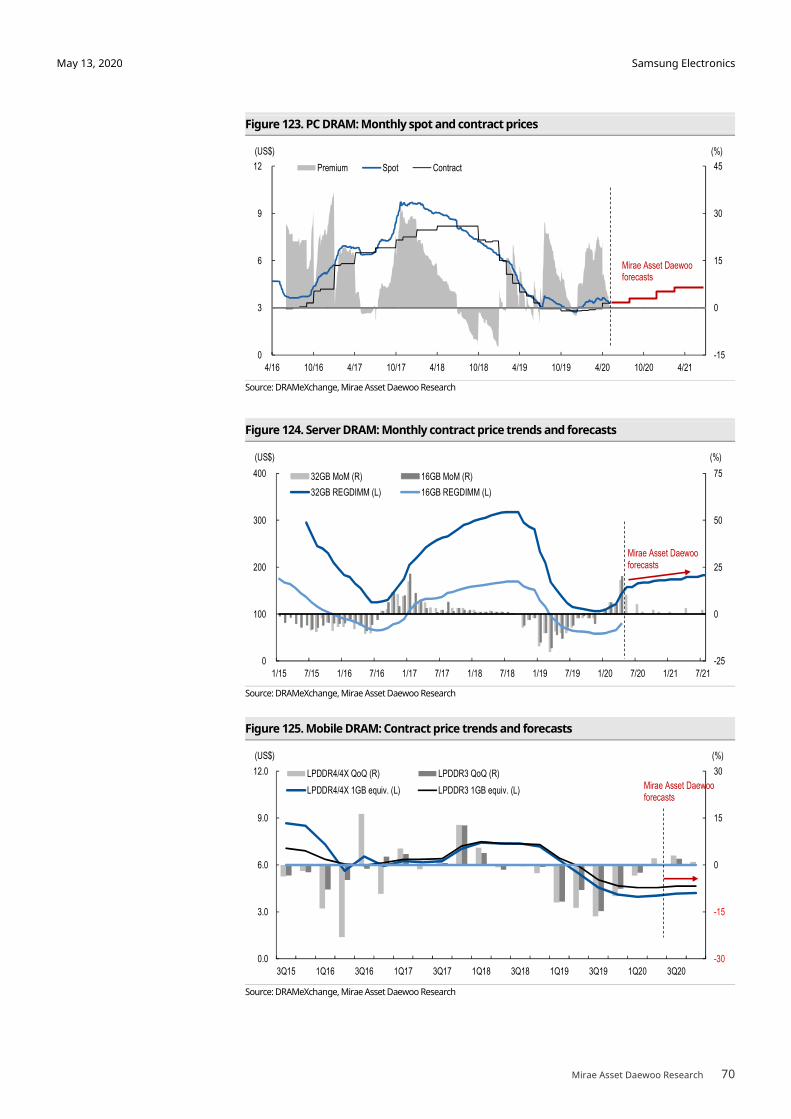
Samsung Electronics
Mirae Asset Daewoo Research 70
May 13, 2020
Figure 123. PC DRAM: Monthly spot and contract prices
Source: DRAMeXchange, Mirae Asset Daewoo Research
Figure 124. Server DRAM: Monthly contract price trends and forecasts
Source: DRAMeXchange, Mirae Asset Daewoo Research
Figure 125. Mobile DRAM: Contract price trends and forecasts
Source: DRAMeXchange, Mirae Asset Daewoo Research
-15
0
15
30
45
0
3
6
9
12
4/16 10/16 4/17 10/17 4/18 10/18 4/19 10/19 4/20 10/20 4/21
(%)(US$)
Premium Spot Contract
Mirae Asset Daewooforecasts
-25
0
25
50
75
0
100
200
300
400
1/15 7/15 1/16 7/16 1/17 7/17 1/18 7/18 1/19 7/19 1/20 7/20 1/21 7/21
(%)(US$)
32GB MoM (R) 16GB MoM (R)
32GB REGDIMM (L) 16GB REGDIMM (L)
Mirae Asset Daewooforecasts
-30
-15
0
15
30
0.0
3.0
6.0
9.0
12.0
3Q15 1Q16 3Q16 1Q17 3Q17 1Q18 3Q18 1Q19 3Q19 1Q20 3Q20
(%)(US$)
LPDDR4/4X QoQ (R) LPDDR3 QoQ (R)
LPDDR4/4X 1GB equiv. (L) LPDDR3 1GB equiv. (L) Mirae Asset Daewooforecasts
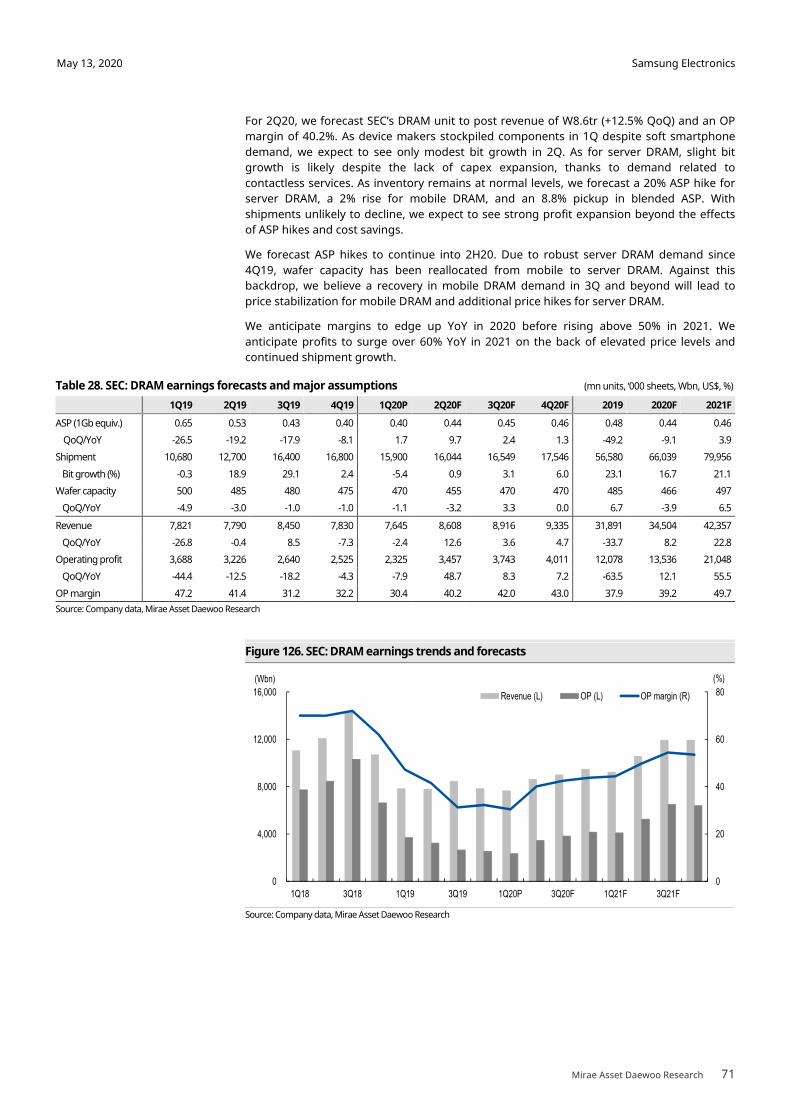
Samsung Electronics
Mirae Asset Daewoo Research 71
May 13, 2020
For 2Q20, we forecast SEC’s DRAM unit to post revenue of W8.6tr (+12.5% QoQ) and an OP
margin of 40.2%. As device makers stockpiled components in 1Q despite soft smartphone
demand, we expect to see only modest bit growth in 2Q. As for server DRAM, slight bit
growth is likely despite the lack of capex expansion, thanks to demand related to
contactless services. As inventory remains at normal levels, we forecast a 20% ASP hike for
server DRAM, a 2% rise for mobile DRAM, and an 8.8% pickup in blended ASP. With
shipments unlikely to decline, we expect to see strong profit expansion beyond the effects
of ASP hikes and cost savings.
We forecast ASP hikes to continue into 2H20. Due to robust server DRAM demand since
4Q19, wafer capacity has been reallocated from mobile to server DRAM. Against this
backdrop, we believe a recovery in mobile DRAM demand in 3Q and beyond will lead to
price stabilization for mobile DRAM and additional price hikes for server DRAM.
We anticipate margins to edge up YoY in 2020 before rising above 50% in 2021. We
anticipate profits to surge over 60% YoY in 2021 on the back of elevated price levels and
continued shipment growth.
Table 28. SEC: DRAM earnings forecasts and major assumptions (mn units, ‘000 sheets, Wbn, US$, %)
1Q19 2Q19 3Q19 4Q19 1Q20P 2Q20F 3Q20F 4Q20F 2019 2020F 2021F
ASP (1Gb equiv.) 0.65 0.53 0.43 0.40 0.40 0.44 0.45 0.46 0.48 0.44 0.46
QoQ/YoY -26.5 -19.2 -17.9 -8.1 1.7 9.7 2.4 1.3 -49.2 -9.1 3.9
Shipment 10,680 12,700 16,400 16,800 15,900 16,044 16,549 17,546 56,580 66,039 79,956
Bit growth (%) -0.3 18.9 29.1 2.4 -5.4 0.9 3.1 6.0 23.1 16.7 21.1
Wafer capacity 500 485 480 475 470 455 470 470 485 466 497
QoQ/YoY -4.9 -3.0 -1.0 -1.0 -1.1 -3.2 3.3 0.0 6.7 -3.9 6.5
Revenue 7,821 7,790 8,450 7,830 7,645 8,608 8,916 9,335 31,891 34,504 42,357
QoQ/YoY -26.8 -0.4 8.5 -7.3 -2.4 12.6 3.6 4.7 -33.7 8.2 22.8
Operating profit 3,688 3,226 2,640 2,525 2,325 3,457 3,743 4,011 12,078 13,536 21,048
QoQ/YoY -44.4 -12.5 -18.2 -4.3 -7.9 48.7 8.3 7.2 -63.5 12.1 55.5
OP margin 47.2 41.4 31.2 32.2 30.4 40.2 42.0 43.0 37.9 39.2 49.7
Source: Company data, Mirae Asset Daewoo Research
Figure 126. SEC: DRAM earnings trends and forecasts
Source: Company data, Mirae Asset Daewoo Research
0
20
40
60
80
0
4,000
8,000
12,000
16,000
1Q18 3Q18 1Q19 3Q19 1Q20P 3Q20F 1Q21F 3Q21F
(%)(Wbn)
Revenue (L) OP (L) OP margin (R)
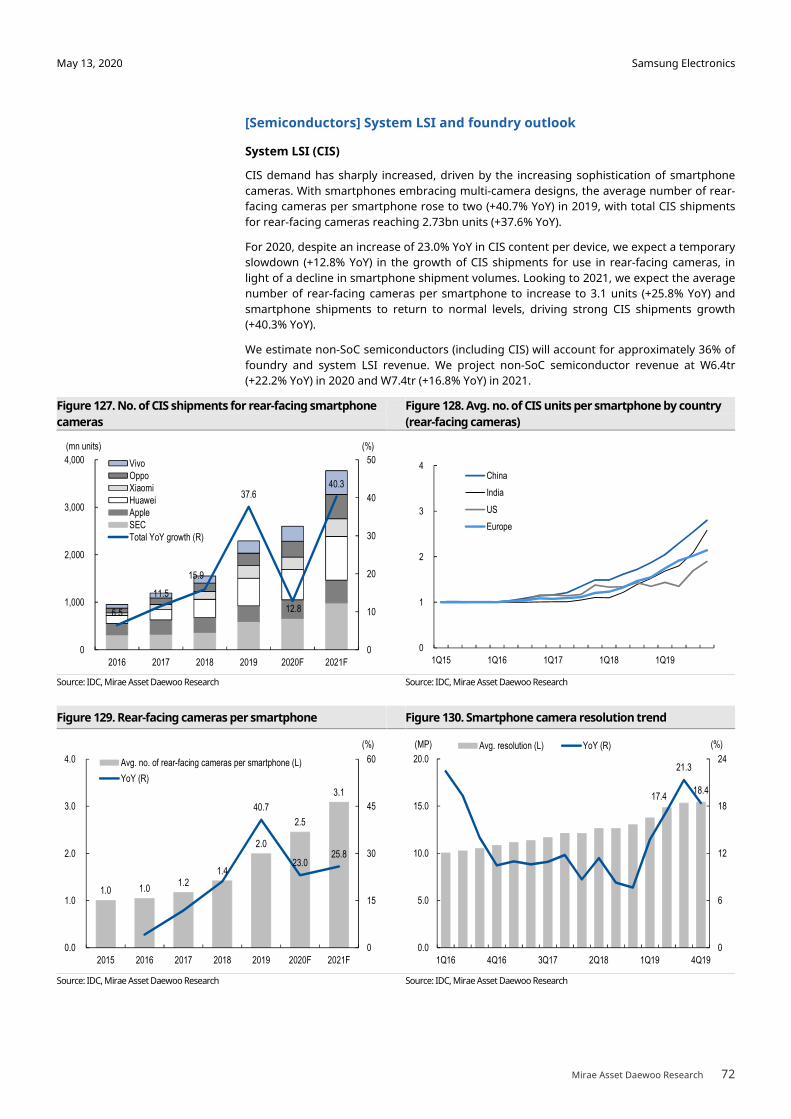
Samsung Electronics
Mirae Asset Daewoo Research 72
May 13, 2020
[Semiconductors] System LSI and foundry outlook
System LSI (CIS)
CIS demand has sharply increased, driven by the increasing sophistication of smartphone
cameras. With smartphones embracing multi-camera designs, the average number of rear-
facing cameras per smartphone rose to two (+40.7% YoY) in 2019, with total CIS shipments
for rear-facing cameras reaching 2.73bn units (+37.6% YoY).
For 2020, despite an increase of 23.0% YoY in CIS content per device, we expect a temporary
slowdown (+12.8% YoY) in the growth of CIS shipments for use in rear-facing cameras, in
light of a decline in smartphone shipment volumes. Looking to 2021, we expect the average
number of rear-facing cameras per smartphone to increase to 3.1 units (+25.8% YoY) and
smartphone shipments to return to normal levels, driving strong CIS shipments growth
(+40.3% YoY).
We estimate non-SoC semiconductors (including CIS) will account for approximately 36% of
foundry and system LSI revenue. We project non-SoC semiconductor revenue at W6.4tr
(+22.2% YoY) in 2020 and W7.4tr (+16.8% YoY) in 2021.
Figure 127. No. of CIS shipments for rear-facing smartphone
cameras
Figure 128. Avg. no. of CIS units per smartphone by country
(rear-facing cameras)
Source: IDC, Mirae Asset Daewoo Research Source: IDC, Mirae Asset Daewoo Research
Figure 129. Rear-facing cameras per smartphone Figure 130. Smartphone camera resolution trend
Source: IDC, Mirae Asset Daewoo Research Source: IDC, Mirae Asset Daewoo Research
6.5
11.5
15.9
37.6
12.8
40.3
0
10
20
30
40
50
0
1,000
2,000
3,000
4,000
2016 2017 2018 2019 2020F 2021F
(%)(mn units)
VivoOppoXiaomiHuaweiAppleSECTotal YoY growth (R)
1.0 1.0 1.2
1.4
2.0
2.5
3.1
40.7
23.0 25.8
0
15
30
45
60
0.0
1.0
2.0
3.0
4.0
2015 2016 2017 2018 2019 2020F 2021F
(%)
Avg. no. of rear-facing cameras per smartphone (L)
YoY (R)
17.4
21.3
18.4
0
6
12
18
24
0.0
5.0
10.0
15.0
20.0
1Q16 4Q16 3Q17 2Q18 1Q19 4Q19
(%)(MP) Avg. resolution (L) YoY (R)
0
1
2
3
4
1Q15 1Q16 1Q17 1Q18 1Q19
China
India
US
Europe

Samsung Electronics
Mirae Asset Daewoo Research 73
May 13, 2020
Table 29. Global smartphone CIS demand model (rear-facing cameras)
2016 2017 2018 2019 2020F 2021F
Avg. number of rear-facing cameras per smartphone (units)
1.0 1.2 1.4 2.0 2.3 2.7
SEC 1.0 1.0 1.2 2.0 2.4 2.9
Apple 1.1 1.4 1.5 1.7 1.9 2.3
Huawei 1.2 1.4 1.9 2.4 2.8 3.2
Xiaomi 1.0 1.1 1.4 2.1 2.6 3.0
Oppo 1.0 1.2 1.5 2.3 2.7 3.2
Vivo 1.0 1.2 1.5 2.3 2.9 3.4
%, YoY 4.2 11.8 21.1 40.7 16.3 16.0
SEC 0.0 2.8 20.9 60.6 22.2 18.6
Apple 12.8 24.6 7.9 15.4 9.3 18.8
Huawei 16.8 17.7 30.6 30.9 17.3 11.4
Xiaomi 3.7 9.0 25.7 48.6 21.0 15.6
Oppo 0.0 23.0 23.7 50.3 19.8 16.1
Vivo 0.6 17.1 27.2 56.3 22.0 19.2
Smartphone shipments (mn units) 1,469 1,465 1,403 1,372 1,258 1,403
SEC 311 318 292 296 246 271
Apple 215 216 209 191 204 201
Huawei 139 154 206 241 206 245
Xiaomi 53 93 119 126 104 126
Oppo 100 112 113 114 112 131
Vivo 77 88 101 110 99 116
%, YoY 2.2 -0.3 -4.3 -2.2 -8.3 11.6
SEC -2.8 2.0 -8.0 1.2 -16.9 10.1
Apple -7.0 0.2 -3.2 -8.5 7.0 -1.4
Huawei 30.2 10.7 33.6 16.8 -14.3 18.7
Xiaomi -25.3 74.8 28.4 5.5 -17.4 21.2
Oppo 133.8 12.0 1.4 0.9 -2.3 17.1
Vivo 103.1 13.4 15.4 8.8 -9.8 17.1
Rear-facing camera shipments (mn units) 1,537 1,714 1,986 2,733 2,914 3,772
SEC 311 327 363 591 600 783
Apple 243 303 317 334 391 458
Huawei 168 219 381 583 586 775
Xiaomi 55 105 169 265 265 371
Oppo 100 137 172 261 306 416
Vivo 78 103 151 258 284 396
%, YoY 6.5 11.5 15.9 37.6 6.6 29.4
SEC -2.8 4.9 11.2 62.6 1.6 30.5
Apple 4.9 24.8 4.4 5.5 17.0 17.1
Huawei 52.1 30.2 74.4 52.8 0.5 32.3
Xiaomi -22.5 90.5 61.4 56.8 -0.1 40.1
Oppo 133.8 37.7 25.5 51.7 17.0 36.0
Vivo 104.3 32.8 46.8 70.1 10.1 39.5
Source: Mirae Asset Daewoo Research
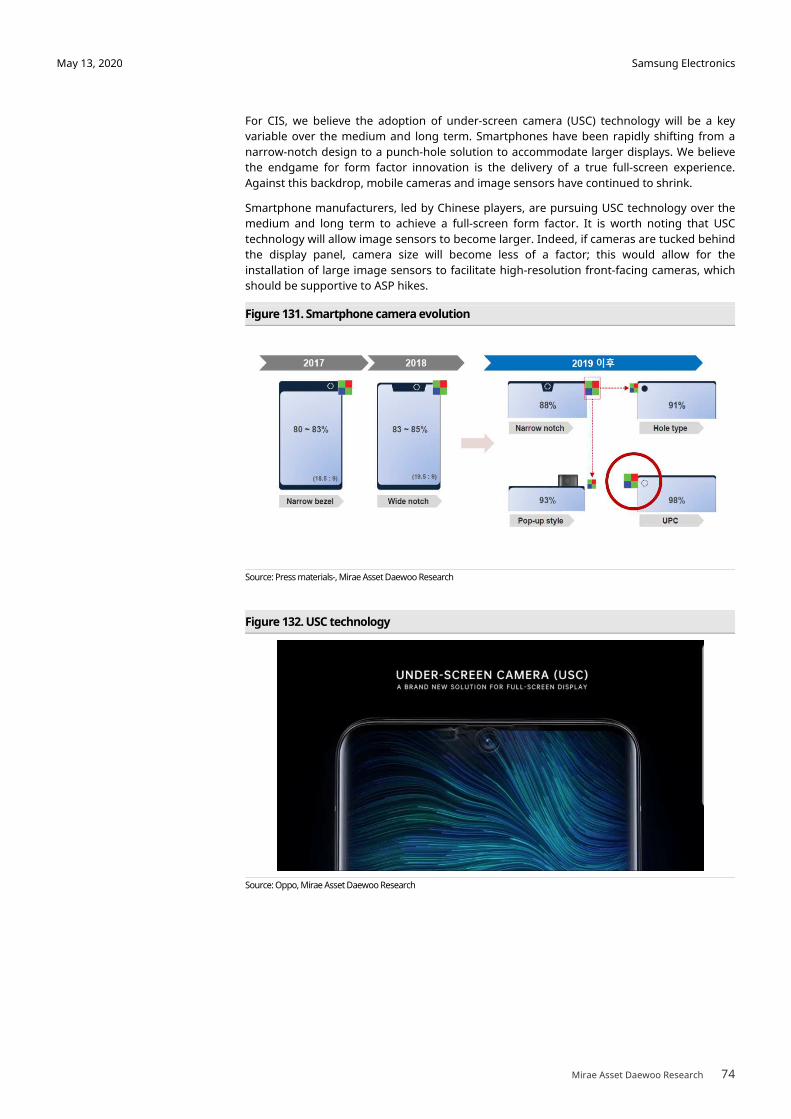
Samsung Electronics
Mirae Asset Daewoo Research 74
May 13, 2020
For CIS, we believe the adoption of under-screen camera (USC) technology will be a key
variable over the medium and long term. Smartphones have been rapidly shifting from a
narrow-notch design to a punch-hole solution to accommodate larger displays. We believe
the endgame for form factor innovation is the delivery of a true full-screen experience.
Against this backdrop, mobile cameras and image sensors have continued to shrink.
Smartphone manufacturers, led by Chinese players, are pursuing USC technology over the
medium and long term to achieve a full-screen form factor. It is worth noting that USC
technology will allow image sensors to become larger. Indeed, if cameras are tucked behind
the display panel, camera size will become less of a factor; this would allow for the
installation of large image sensors to facilitate high-resolution front-facing cameras, which
should be supportive to ASP hikes.
Figure 131. Smartphone camera evolution
Source: Press materials-, Mirae Asset Daewoo Research
Figure 132. USC technology
Source: Oppo, Mirae Asset Daewoo Research

Samsung Electronics
Mirae Asset Daewoo Research 75
May 13, 2020
Foundry
We estimate that foundry revenue from non-captive customers will account for 34% of non-
memory semiconductor revenue in 2020. Despite steady growth in the CIS segment, we
forecast this figure to increase to 41% in 2021, driven by growing exposure to Qualcomm
and Nvidia.
We expect foundry capacity to expand 43,000 wpm in 2020 and 53,000 wpm in 2021. With a
utilization rate at around the 90% level, we expect these capacity expansions to lead to
revenue growth. For 2020, we forecast the system LSI and foundry businesses to report
revenue of W17.2tr (+17.3% YoY) and an OP margin of 10.4%. For 2021, we forecast the
division to deliver revenue of W21.2tr (+23.3% YoY) and an OP margin of 13.4%, as foundry
supplies to Qualcomm and Nvidia should gather traction.
Table 30. SEC: System LSI and foundry earnings forecasts and key assumptions: (‘000 wafers, US$, %, Wbn)
1Q19 2Q19 3Q19 4Q19 1Q20P 2Q20F 3Q20F 4Q20F 2019 2020F 2021F
Wafer capacity 848 848 848 848 938 953 983 1,028 848 975 1,133
QoQ/YoY 0.0 0.0 0.0 0.0 10.6 1.6 3.1 4.6 4.4 15.0 16.1
ASP 3,887 4,031 4,314 3,809 4,234 3,811 3,887 3,965 4,027 3,971 4,264
QoQ/YoY -7.2 3.7 7.0 -11.7 11.2 -10.0 2.0 2.0 -10.1 -1.4 7.4
Revenue 3,004 3,788 4,324 3,608 4,500 3,965 4,319 4,491 14,723 17,276 21,295
QoQ/YoY -13.0 8.4 16.2 11.2 49.8 4.7 -0.1 24.5 5.8 17.3 23.3
SoC (AP/modem) 961 947 1,124 902 1,575 1,190 1,080 1,123 3,934 4,967 4,996
LSI (CIS/DDI) 1,021 1,288 1,470 1,443 1,710 1,586 1,512 1,572 5,222 6,380 7,453
Non-captive foundry 1,021 1,553 1,730 1,263 1,215 1,190 1,728 1,797 5,566 5,929 8,846
Qualcomm 1,186 3,096
NVIDIA 788 2,457
Other 3,955 3,292
Operating profit 287 240 424 281 389 403 501 505 1,232 1,798 2,845
QoQ/YoY 196.8 -16.1 76.2 -33.6 38.2 3.8 24.3 0.7 -16.5 45.9 58.3
OP margin 9.5 6.3 9.8 7.8 8.6 10.2 11.6 11.2 8.4 10.4 13.4
Source: Company data, Mirae Asset Daewoo Research
Figure 133. SEC: Foundry capacity and utilization Figure 134. SEC: System LSI and foundry revenue
Source: Company data, Mirae Asset Daewoo Research Source: Company data, Mirae Asset Daewoo Research
0
25
50
75
100
0
250
500
750
1,000
1,250
1Q18 3Q18 1Q19 3Q19 1Q20P 3Q20F
(%)LSI wafer capacity (L)LSI wafer shipments (L)Utilization (R)
('000 wafers/quarter)
0
4
8
12
16
0
2,000
4,000
6,000
8,000
1Q18 1Q19 1Q20P 1Q21F
(%)(Wbn) Revenue (L) OP (L)
OP margin (R)
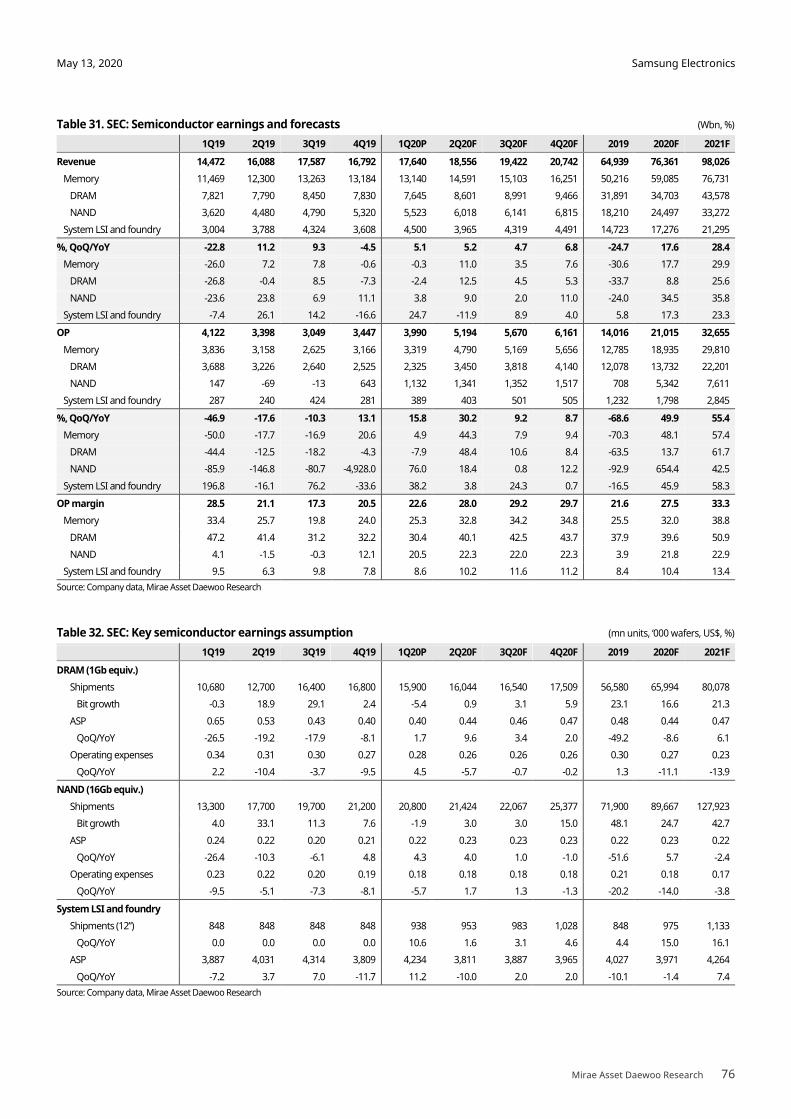
Samsung Electronics
Mirae Asset Daewoo Research 76
May 13, 2020
Table 31. SEC: Semiconductor earnings and forecasts (Wbn, %)
1Q19 2Q19 3Q19 4Q19 1Q20P 2Q20F 3Q20F 4Q20F 2019 2020F 2021F
Revenue 14,472 16,088 17,587 16,792 17,640 18,556 19,422 20,742 64,939 76,361 98,026
Memory 11,469 12,300 13,263 13,184 13,140 14,591 15,103 16,251 50,216 59,085 76,731
DRAM 7,821 7,790 8,450 7,830 7,645 8,601 8,991 9,466 31,891 34,703 43,578
NAND 3,620 4,480 4,790 5,320 5,523 6,018 6,141 6,815 18,210 24,497 33,272
System LSI and foundry 3,004 3,788 4,324 3,608 4,500 3,965 4,319 4,491 14,723 17,276 21,295
%, QoQ/YoY -22.8 11.2 9.3 -4.5 5.1 5.2 4.7 6.8 -24.7 17.6 28.4
Memory -26.0 7.2 7.8 -0.6 -0.3 11.0 3.5 7.6 -30.6 17.7 29.9
DRAM -26.8 -0.4 8.5 -7.3 -2.4 12.5 4.5 5.3 -33.7 8.8 25.6
NAND -23.6 23.8 6.9 11.1 3.8 9.0 2.0 11.0 -24.0 34.5 35.8
System LSI and foundry -7.4 26.1 14.2 -16.6 24.7 -11.9 8.9 4.0 5.8 17.3 23.3
OP 4,122 3,398 3,049 3,447 3,990 5,194 5,670 6,161 14,016 21,015 32,655
Memory 3,836 3,158 2,625 3,166 3,319 4,790 5,169 5,656 12,785 18,935 29,810
DRAM 3,688 3,226 2,640 2,525 2,325 3,450 3,818 4,140 12,078 13,732 22,201
NAND 147 -69 -13 643 1,132 1,341 1,352 1,517 708 5,342 7,611
System LSI and foundry 287 240 424 281 389 403 501 505 1,232 1,798 2,845
%, QoQ/YoY -46.9 -17.6 -10.3 13.1 15.8 30.2 9.2 8.7 -68.6 49.9 55.4
Memory -50.0 -17.7 -16.9 20.6 4.9 44.3 7.9 9.4 -70.3 48.1 57.4
DRAM -44.4 -12.5 -18.2 -4.3 -7.9 48.4 10.6 8.4 -63.5 13.7 61.7
NAND -85.9 -146.8 -80.7 -4,928.0 76.0 18.4 0.8 12.2 -92.9 654.4 42.5
System LSI and foundry 196.8 -16.1 76.2 -33.6 38.2 3.8 24.3 0.7 -16.5 45.9 58.3
OP margin 28.5 21.1 17.3 20.5 22.6 28.0 29.2 29.7 21.6 27.5 33.3
Memory 33.4 25.7 19.8 24.0 25.3 32.8 34.2 34.8 25.5 32.0 38.8
DRAM 47.2 41.4 31.2 32.2 30.4 40.1 42.5 43.7 37.9 39.6 50.9
NAND 4.1 -1.5 -0.3 12.1 20.5 22.3 22.0 22.3 3.9 21.8 22.9
System LSI and foundry 9.5 6.3 9.8 7.8 8.6 10.2 11.6 11.2 8.4 10.4 13.4
Source: Company data, Mirae Asset Daewoo Research
Table 32. SEC: Key semiconductor earnings assumption (mn units, ‘000 wafers, US$, %)
1Q19 2Q19 3Q19 4Q19 1Q20P 2Q20F 3Q20F 4Q20F 2019 2020F 2021F
DRAM (1Gb equiv.)
Shipments 10,680 12,700 16,400 16,800 15,900 16,044 16,540 17,509 56,580 65,994 80,078
Bit growth -0.3 18.9 29.1 2.4 -5.4 0.9 3.1 5.9 23.1 16.6 21.3
ASP 0.65 0.53 0.43 0.40 0.40 0.44 0.46 0.47 0.48 0.44 0.47
QoQ/YoY -26.5 -19.2 -17.9 -8.1 1.7 9.6 3.4 2.0 -49.2 -8.6 6.1
Operating expenses 0.34 0.31 0.30 0.27 0.28 0.26 0.26 0.26 0.30 0.27 0.23
QoQ/YoY 2.2 -10.4 -3.7 -9.5 4.5 -5.7 -0.7 -0.2 1.3 -11.1 -13.9
NAND (16Gb equiv.)
Shipments 13,300 17,700 19,700 21,200 20,800 21,424 22,067 25,377 71,900 89,667 127,923
Bit growth 4.0 33.1 11.3 7.6 -1.9 3.0 3.0 15.0 48.1 24.7 42.7
ASP 0.24 0.22 0.20 0.21 0.22 0.23 0.23 0.23 0.22 0.23 0.22
QoQ/YoY -26.4 -10.3 -6.1 4.8 4.3 4.0 1.0 -1.0 -51.6 5.7 -2.4
Operating expenses 0.23 0.22 0.20 0.19 0.18 0.18 0.18 0.18 0.21 0.18 0.17
QoQ/YoY -9.5 -5.1 -7.3 -8.1 -5.7 1.7 1.3 -1.3 -20.2 -14.0 -3.8
System LSI and foundry
Shipments (12”) 848 848 848 848 938 953 983 1,028 848 975 1,133
QoQ/YoY 0.0 0.0 0.0 0.0 10.6 1.6 3.1 4.6 4.4 15.0 16.1
ASP 3,887 4,031 4,314 3,809 4,234 3,811 3,887 3,965 4,027 3,971 4,264
QoQ/YoY -7.2 3.7 7.0 -11.7 11.2 -10.0 2.0 2.0 -10.1 -1.4 7.4
Source: Company data, Mirae Asset Daewoo Research
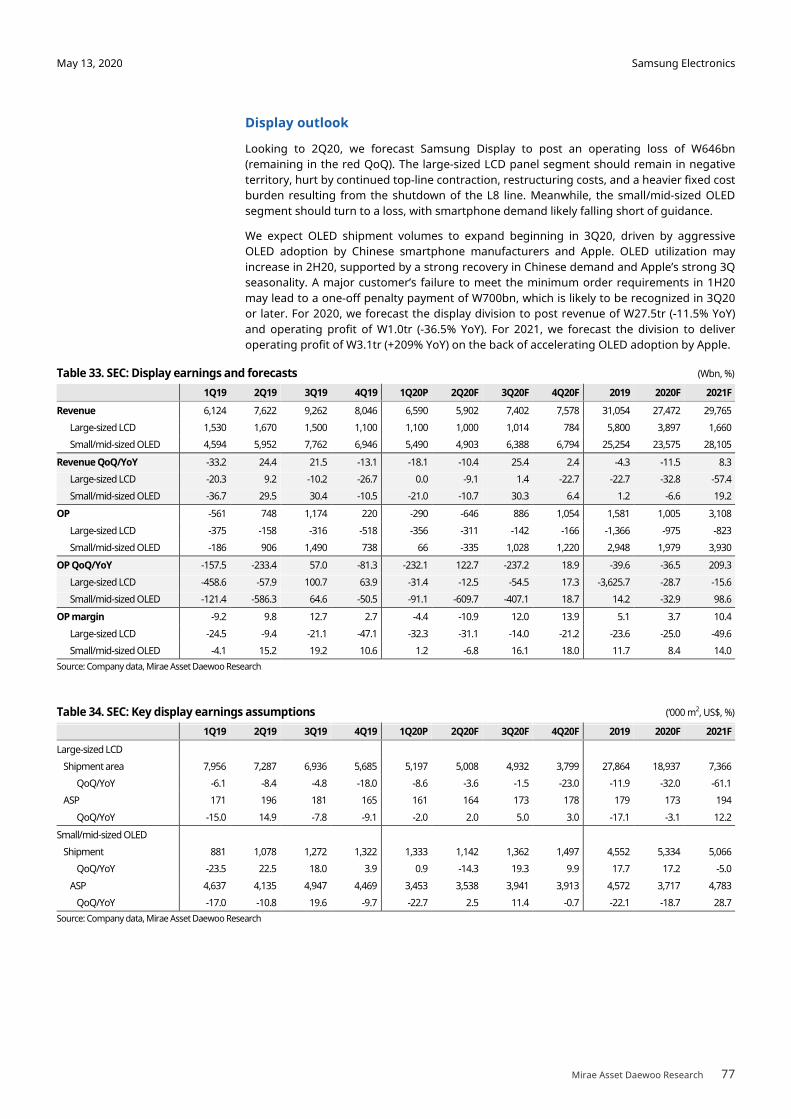
Samsung Electronics
Mirae Asset Daewoo Research 77
May 13, 2020
Display outlook
Looking to 2Q20, we forecast Samsung Display to post an operating loss of W646bn
(remaining in the red QoQ). The large-sized LCD panel segment should remain in negative
territory, hurt by continued top-line contraction, restructuring costs, and a heavier fixed cost
burden resulting from the shutdown of the L8 line. Meanwhile, the small/mid-sized OLED
segment should turn to a loss, with smartphone demand likely falling short of guidance.
We expect OLED shipment volumes to expand beginning in 3Q20, driven by aggressive
OLED adoption by Chinese smartphone manufacturers and Apple. OLED utilization may
increase in 2H20, supported by a strong recovery in Chinese demand and Apple’s strong 3Q
seasonality. A major customer’s failure to meet the minimum order requirements in 1H20
may lead to a one-off penalty payment of W700bn, which is likely to be recognized in 3Q20
or later. For 2020, we forecast the display division to post revenue of W27.5tr (-11.5% YoY)
and operating profit of W1.0tr (-36.5% YoY). For 2021, we forecast the division to deliver
operating profit of W3.1tr (+209% YoY) on the back of accelerating OLED adoption by Apple.
Table 33. SEC: Display earnings and forecasts (Wbn, %)
1Q19 2Q19 3Q19 4Q19 1Q20P 2Q20F 3Q20F 4Q20F 2019 2020F 2021F
Revenue 6,124 7,622 9,262 8,046 6,590 5,902 7,402 7,578 31,054 27,472 29,765
Large-sized LCD 1,530 1,670 1,500 1,100 1,100 1,000 1,014 784 5,800 3,897 1,660
Small/mid-sized OLED 4,594 5,952 7,762 6,946 5,490 4,903 6,388 6,794 25,254 23,575 28,105
Revenue QoQ/YoY -33.2 24.4 21.5 -13.1 -18.1 -10.4 25.4 2.4 -4.3 -11.5 8.3
Large-sized LCD -20.3 9.2 -10.2 -26.7 0.0 -9.1 1.4 -22.7 -22.7 -32.8 -57.4
Small/mid-sized OLED -36.7 29.5 30.4 -10.5 -21.0 -10.7 30.3 6.4 1.2 -6.6 19.2
OP -561 748 1,174 220 -290 -646 886 1,054 1,581 1,005 3,108
Large-sized LCD -375 -158 -316 -518 -356 -311 -142 -166 -1,366 -975 -823
Small/mid-sized OLED -186 906 1,490 738 66 -335 1,028 1,220 2,948 1,979 3,930
OP QoQ/YoY -157.5 -233.4 57.0 -81.3 -232.1 122.7 -237.2 18.9 -39.6 -36.5 209.3
Large-sized LCD -458.6 -57.9 100.7 63.9 -31.4 -12.5 -54.5 17.3 -3,625.7 -28.7 -15.6
Small/mid-sized OLED -121.4 -586.3 64.6 -50.5 -91.1 -609.7 -407.1 18.7 14.2 -32.9 98.6
OP margin -9.2 9.8 12.7 2.7 -4.4 -10.9 12.0 13.9 5.1 3.7 10.4
Large-sized LCD -24.5 -9.4 -21.1 -47.1 -32.3 -31.1 -14.0 -21.2 -23.6 -25.0 -49.6
Small/mid-sized OLED -4.1 15.2 19.2 10.6 1.2 -6.8 16.1 18.0 11.7 8.4 14.0
Source: Company data, Mirae Asset Daewoo Research
Table 34. SEC: Key display earnings assumptions (‘000 m2, US$, %)
1Q19 2Q19 3Q19 4Q19 1Q20P 2Q20F 3Q20F 4Q20F 2019 2020F 2021F
Large-sized LCD
Shipment area 7,956 7,287 6,936 5,685 5,197 5,008 4,932 3,799 27,864 18,937 7,366
QoQ/YoY -6.1 -8.4 -4.8 -18.0 -8.6 -3.6 -1.5 -23.0 -11.9 -32.0 -61.1
ASP 171 196 181 165 161 164 173 178 179 173 194
QoQ/YoY -15.0 14.9 -7.8 -9.1 -2.0 2.0 5.0 3.0 -17.1 -3.1 12.2
Small/mid-sized OLED
Shipment 881 1,078 1,272 1,322 1,333 1,142 1,362 1,497 4,552 5,334 5,066
QoQ/YoY -23.5 22.5 18.0 3.9 0.9 -14.3 19.3 9.9 17.7 17.2 -5.0
ASP 4,637 4,135 4,947 4,469 3,453 3,538 3,941 3,913 4,572 3,717 4,783
QoQ/YoY -17.0 -10.8 19.6 -9.7 -22.7 2.5 11.4 -0.7 -22.1 -18.7 28.7
Source: Company data, Mirae Asset Daewoo Research
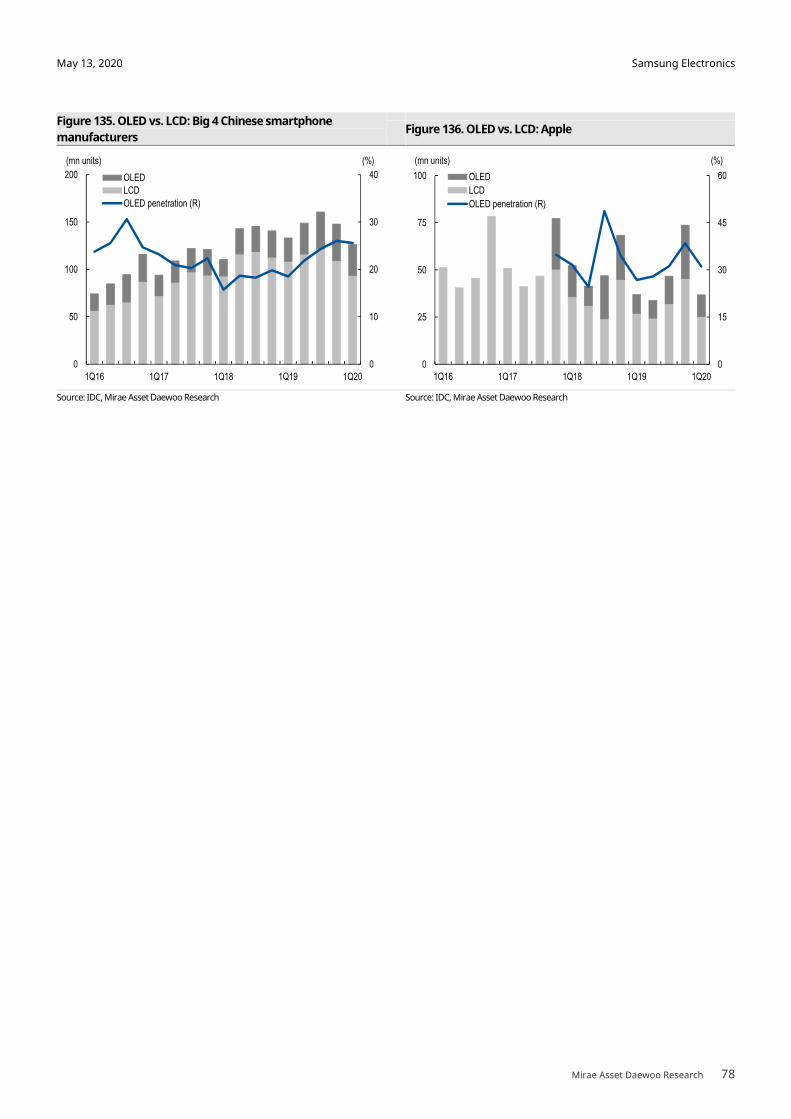
Samsung Electronics
Mirae Asset Daewoo Research 78
May 13, 2020
Figure 135. OLED vs. LCD: Big 4 Chinese smartphone
manufacturers Figure 136. OLED vs. LCD: Apple
Source: IDC, Mirae Asset Daewoo Research Source: IDC, Mirae Asset Daewoo Research
0
10
20
30
40
0
50
100
150
200
1Q16 1Q17 1Q18 1Q19 1Q20
(%)(mn units)
OLED
LCD
OLED penetration (R)
0
15
30
45
60
0
25
50
75
100
1Q16 1Q17 1Q18 1Q19 1Q20
(%)(mn units)
OLED
LCD
OLED penetration (R)

Samsung Electronics
Mirae Asset Daewoo Research 79
May 13, 2020
IM outlook
For 2Q20, we forecast the IM division to post revenue of W19.4tr (-24.9% YoY, -25.3% QoQ)
and operating profit of W1.2tr (-24.8% YoY, -55.7% QoQ), assuming SEC’s global smartphone
shipment volumes at 500mn units (-14% QoQ; -24% QoQ in the US and -18% QoQ in India).
Although SEC is likely to post worse-than-market shipment declines in the US and India, we
expect the firm to maintain its market share levels. Assuming average marketing spend at
US$28.6 per smartphone (+37.4% QoQ), we estimate the IM division to increase total
marketing spend to W2.1tr (+22.4% QoQ) in 2Q20 to defend market share. While OP margin
should slump to 6.0% (-3.9%p QoQ) against this backdrop, we believe increased marketing
spend is inevitable amid weak demand.
Looking to the full year, we estimate SEC’s annual smartphone shipment volumes to reach
270mn units (-16.7% YoY) in 2020. We look for shipment growth throughout 2H20, as
volumes in the US, India and Europe are likely to expand QoQ from 3Q20. With the release
of high-end smartphone models (i.e., the Galaxy Fold 2 in July and the Galaxy Note 11 in
August), we expect SEC’s smartphone ASP to increase to US$265 (+8.1% QoQ) in 3Q20.
Although SEC’s marketing expenses are likely to remain flattish QoQ in 3Q20 to stimulate
demand, we estimate OP margin to improve QoQ to exceed 8%, supported by ASP hikes. For
2020, we forecast the IM division to post revenue of W94.7tr (-11.7% YoY) and operating
profit of W8.0tr (-13.7% YoY).
Table 35. SEC: IM earnings and forecasts (Wbn, %)
1Q19 2Q19 3Q19 4Q19 1Q20P 2Q20F 3Q20F 4Q20F 2019 2020F 2021F
Revenue 27,200 25,860 29,254 24,951 26,000 19,424 24,151 25,170 107,266 94,745 100,617
MC 25,915 24,272 28,096 24,049 24,950 18,532 23,303 24,339 102,332 91,123 97,332
IT 1,285 1,588 1,159 902 1,050 893 848 831 4,934 3,621 3,285
Revenue QoQ/YoY 16.6 -4.9 13.1 -14.7 4.2 -25.3 24.3 4.2 6.5 -11.7 6.2
MC 16.8 -6.3 15.8 -14.4 3.7 -25.7 25.7 4.4 6.0 -11.0 6.8
IT 13.5 23.6 -27.1 -22.1 16.3 -15.0 -5.0 -2.0 18.7 -26.6 -9.3
OP 2,274 1,561 2,917 2,520 2,650 1,174 2,106 2,069 9,273 8,000 9,585
MC 2,030 1,228 2,731 2,385 2,440 1,103 2,039 2,003 8,374 7,584 9,292
IT 244 334 185 135 210 71 68 66 898 416 292
OP QoQ/YoY 50.4 -31.4 86.9 -13.6 5.1 -55.7 79.4 -1.8 -8.8 -13.7 19.8
MC 51.3 -39.5 122.5 -12.7 2.3 -54.8 84.9 -1.8 -12.0 -9.4 22.5
IT 43.8 36.6 -44.4 -27.0 55.1 -66.0 -5.0 -2.0 37.7 -53.7 -29.7
OP margin 8.4 6.0 10.0 10.1 10.2 6.0 8.7 8.2 8.6 8.4 9.5
MC 7.8 5.1 9.7 9.9 9.8 6.0 8.7 8.2 8.2 8.3 9.5
IT 19.0 21.0 16.0 15.0 20.0 8.0 8.0 8.0 18.2 11.5 8.9
Source: Company data, Mirae Asset Daewoo Research
Table 36.SEC: Key IM earnings assumptions (mn units, US$, %)
1Q19 2Q19 3Q19 4Q19 1Q20P 2Q20F 3Q20F 4Q20F 2019 2020F 2021F
Handset shipments 78.5 83.2 85.3 75.5 64.1 55.9 68.7 79.8 322.5 268.5 294.5
QoQ/YoY 0.6 5.9 2.6 -11.5 -15.0 -12.8 22.8 16.2 -0.5 -16.7 9.7
Smartphone shipments 71.9 76.2 78.2 69.5 58.3 50.1 62.7 74.0 295.8 245.1 271.6
QoQ/YoY 2.3 6.0 2.6 -11.1 -16.1 -14.0 25.0 18.0 1.2 -17.2 10.8
Smartphone % 91.6 91.6 91.6 92.1 90.9 89.7 91.3 92.7 91.7 91.3 92.2
Handset ASP 250.8 212.5 235.3 217.5 314.0 263.7 283.2 262.1 228.9 239.8 247.8
QoQ/YoY 14.3 -15.3 10.7 -7.5 44.4 -16.0 7.4 -7.5 -2.5 4.8 3.3
Smartphone ASP 272.1 230.7 255.5 234.5 295.0 244.9 264.6 243.6 248.1 261.0 267.2
QoQ/YoY 12.8 -15.2 10.7 -8.2 25.8 -17.0 8.1 -7.9 -4.1 5.2 2.4
Source: Company data, Mirae Asset Daewoo Research
Samsung Electronics
Mirae Asset Daewoo Research 80
May 13, 2020
III. Valuation
Initiate coverage with Buy rating and target price of W68,000
We initiate our coverage on SEC with a Buy rating and SOTP-based target price of W68,000.
In deriving our target price, we applied a 2020F EV/EBITDA of 5.3x for semiconductors, 4.0x
for display, 10.7x for IM, and 5.5x for CE. We believe the broader multiple of roughly 6.0x is
highly reasonable, as it represents a premium of just 10.3% to the average 2020F EV/EBITDA
of pure memory names Micron and SK Hynix. We think a valuation premium is justified for
the following reasons:
1) Semiconductors: Stronger margins and market dominance vs. peers
Despite having only 69% EBITDA exposure to semiconductors, SEC boasts stronger memory
market share and margins compared to pure plays.
Memory margins tend to hinge more on cost competitiveness (backed by technological
advances and scale) than on marketing capabilities/strategic positioning. In the DRAM
segment, SEC’s margins are over 10%p higher than those of rivals thanks to the firm’s tech
migration lead. Meanwhile, in NAND, the firm accounts for 98% of the market’s overall
profits, boasting solid pricing power and ample room for capex.
SEC holds a dominant position in the global memory market (50% DRAM market share, 45%
NAND market share). Given the firm’s current output levels and room for additional capex,
we see limited downside to market share going forward. And given that market leaders
tend to benefit the most from overall semiconductor industry growth, we think the
semiconductor division’s robust profit growth alone justifies a valuation premium.
2) IM: Robust sourcing capabilities and product innovation
Thanks to successful vertical integration, SEC enjoys key advantages in sourcing necessary
components (e.g., chips). In addition, we believe that the IM division’s ability to
manufacture/launch innovative products (e.g., foldable phones) is a factor that could help
narrow the valuation gap with Apple going forward.
3) Foundry: Strong growth potential and barriers to entry:
If we separately value SEC’s foundry business using an EV/EBITDA multiple of 8.8x, in line
with the levels of TSMC and Intel, our fair value estimate for the company would see a 4.4%
boost <Table 38>.
SEC shares are now trading at a 2020F P/E of 13.8x and P/B of 1.2x. These levels do not
appear high relative to historical bottom levels and the Bloomberg consensus. Our target
price implies nearly 40% upside to the current price (W48,550).
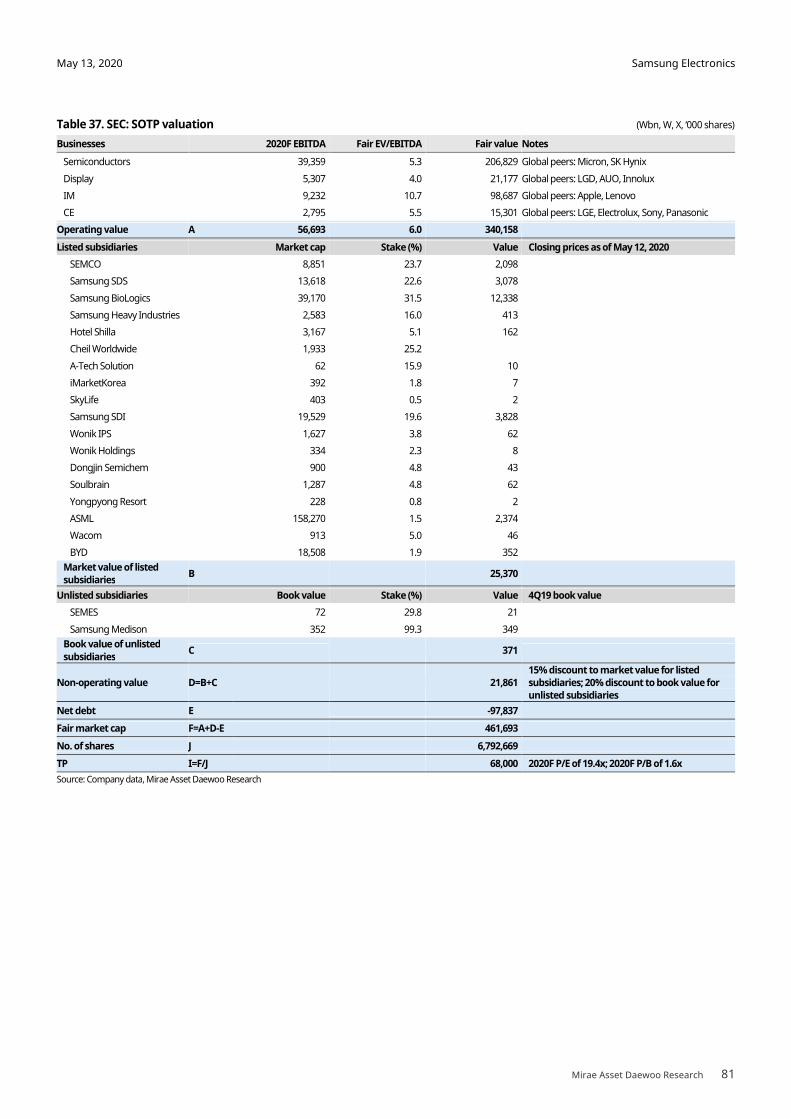
Samsung Electronics
Mirae Asset Daewoo Research 81
May 13, 2020
Table 37. SEC: SOTP valuation (Wbn, W, X, ‘000 shares)
Businesses 2020F EBITDA Fair EV/EBITDA Fair value Notes
Semiconductors 39,359 5.3 206,829 Global peers: Micron, SK Hynix
Display 5,307 4.0 21,177 Global peers: LGD, AUO, Innolux
IM 9,232 10.7 98,687 Global peers: Apple, Lenovo
CE 2,795 5.5 15,301 Global peers: LGE, Electrolux, Sony, Panasonic
Operating value A 56,693 6.0 340,158
Listed subsidiaries Market cap Stake (%) Value Closing prices as of May 12, 2020
SEMCO 8,851 23.7 2,098
Samsung SDS 13,618 22.6 3,078
Samsung BioLogics 39,170 31.5 12,338
Samsung Heavy Industries 2,583 16.0 413
Hotel Shilla 3,167 5.1 162
Cheil Worldwide 1,933 25.2
A-Tech Solution 62 15.9 10
iMarketKorea 392 1.8 7
SkyLife 403 0.5 2
Samsung SDI 19,529 19.6 3,828
Wonik IPS 1,627 3.8 62
Wonik Holdings 334 2.3 8
Dongjin Semichem 900 4.8 43
Soulbrain 1,287 4.8 62
Yongpyong Resort 228 0.8 2
ASML 158,270 1.5 2,374
Wacom 913 5.0 46
BYD 18,508 1.9 352
Market value of listed subsidiaries
B 25,370
Unlisted subsidiaries Book value Stake (%) Value 4Q19 book value
SEMES 72 29.8 21
Samsung Medison 352 99.3 349
Book value of unlisted
subsidiaries C 371
Non-operating value D=B+C 21,861 15% discount to market value for listed subsidiaries; 20% discount to book value for unlisted subsidiaries
Net debt E -97,837
Fair market cap F=A+D-E 461,693
No. of shares J 6,792,669
TP I=F/J 68,000 2020F P/E of 19.4x; 2020F P/B of 1.6x
Source: Company data, Mirae Asset Daewoo Research
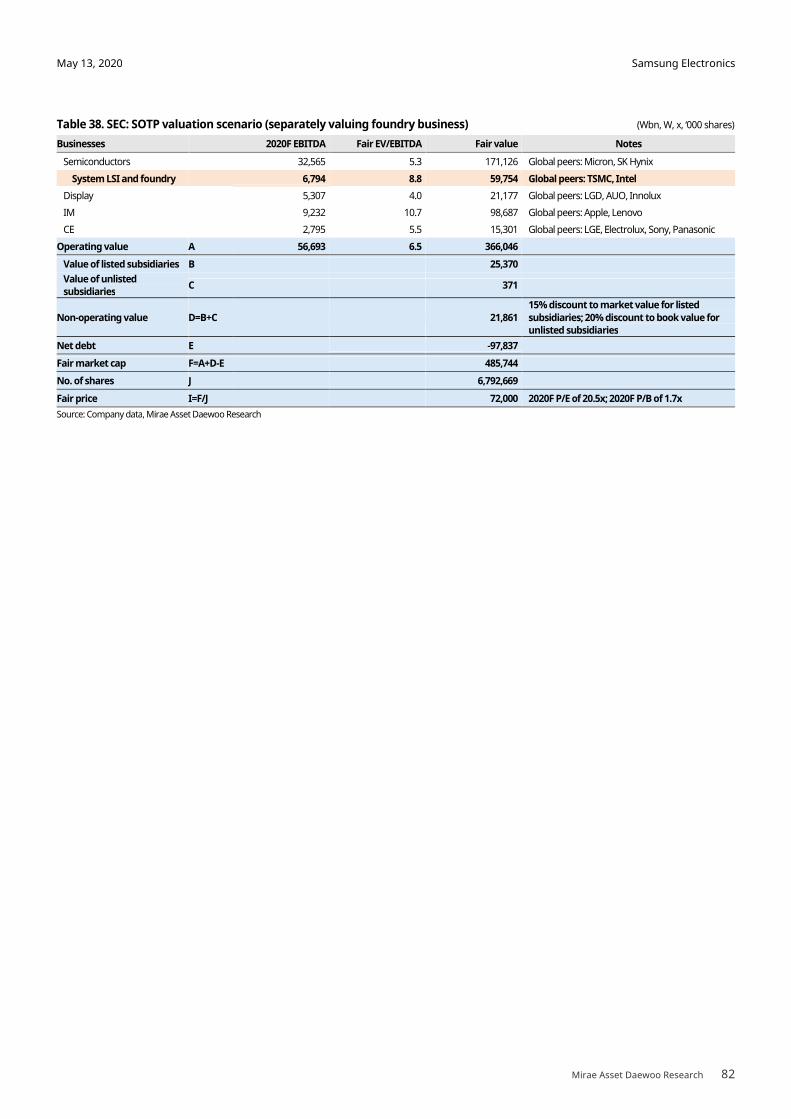
Samsung Electronics
Mirae Asset Daewoo Research 82
May 13, 2020
Table 38. SEC: SOTP valuation scenario (separately valuing foundry business) (Wbn, W, x, ‘000 shares)
Businesses 2020F EBITDA Fair EV/EBITDA Fair value Notes
Semiconductors 32,565 5.3 171,126 Global peers: Micron, SK Hynix
System LSI and foundry 6,794 8.8 59,754 Global peers: TSMC, Intel
Display 5,307 4.0 21,177 Global peers: LGD, AUO, Innolux
IM 9,232 10.7 98,687 Global peers: Apple, Lenovo
CE 2,795 5.5 15,301 Global peers: LGE, Electrolux, Sony, Panasonic
Operating value A 56,693 6.5 366,046
Value of listed subsidiaries B 25,370
Value of unlisted subsidiaries
C 371
Non-operating value D=B+C 21,861
15% discount to market value for listed
subsidiaries; 20% discount to book value for unlisted subsidiaries
Net debt E -97,837
Fair market cap F=A+D-E 485,744
No. of shares J 6,792,669
Fair price I=F/J 72,000 2020F P/E of 20.5x; 2020F P/B of 1.7x
Source: Company data, Mirae Asset Daewoo Research

Samsung Electronics
Mirae Asset Daewoo Research 83
May 13, 2020
IV. Shareholder returns
In October 2017, SEC announced that it would return 50% of free cash flow (FCF) to
shareholders for the 2018-20 period. Moreover, the company announced that future M&A
investments would not be deducted from FCF. Since the announcement, SEC has delivered
returns of W9.6tr in both 2018 and 2019 (including a W9.3tr share buyback/retirement
program). Notably, actual FCF has far outpaced the company’s three-year assumption of
W59.9tr, with 2018-19 FCF standing at around W57tr. Based on our 2020 outlook and
assumptions, we estimate that the actual shareholder return base for 2018-20 will be
around W9tr greater than the company’s assumption ([2018-20F FCF – W59.9tr] x 50%).
We believe that SEC will pay out solid dividends going forward. Share buybacks and
cancellations would drive up financial affiliates’ stakes in SEC, raising the need for disposals
to meet regulatory requirements. Assuming that the company pays out dividends on FCF of
W60tr, we estimate dividend yield at 3.4% based on the current share price. If SEC returns
additional cash to shareholders, ROE would see a boost, which could set the stage for P/B
expansion.
At end-2020, SEC will announce a new dividend policy for 2021 and beyond. Despite high
uncertainties arising from the COVID-19 pandemic, we expect to see a more shareholder-
friendly approach, which should help the stock defend against downside risk.
Table 39. SEC: Shareholder return forecasts (Wbn)
2015 2016 2017 2018 2019 2020F 2021F Note
Net cash 212,547 268,430 64,428 81,640 84,744 104,955 126,906
Operating cash flow A 40,062 47,386 62,162 67,032 45,383 49,520 57,370
Capex B 25,880 24,143 42,792 29,556 25,368 28,523 33,021
Cash outflow from M&As C 411 622 8,754 2018-20 shareholder return program: M&A
investments not to be deducted from FCF
FCF D=A-B-C 13,770 22,621 10,616 37,475 20,015 20,997 24,349
Shareholder return target (% of FCF) E 50% 50% 50% 50% 50% 50% 50%
Shareholder return target (Wbn) F=DxE 6,885 11,310 5,308 18,738 10,008 10,499 12,174 2018-20 shareholder return program: FCF
assumption of W59.9tr
DPS (W) G 420 570 850 1,416 1,416 1,416 1,600 Quarterly dividend payouts started in 2017
No. of shares outstanding (mn) H 7,290 6,999 6,810 6,793 6,793 6,793 6,793
Dividends I=GxH 3,062 3,989 5,789 9,618 9,618 9,618 10,868
FCF after dividend payout J=F-I 10,708 18,631 4,827 27,857 10,397 11,379 13,481
FCF after previous year’s dividend payout K (-1 year) 10,708 18,631 4,827
Excess cash after previous year’s share buyback L -3,000 -10,281 -3,952
Total share buybacks M=K+L 5,015 7,708 8,350 875 0 0 0
Total shareholder returns N=I+M (+1 year) 10,770 12,340 6,664 9,618 9,618 9,618 10,868
Total shareholder returns as % of FCF O=N/D 78% 55% 63% 26% 48% 46% 45%
EPS (W) P 2,241 2,773 5,530 6,086 3,200 3,507 5,050
Payout ratio Q=G/P 19% 21% 15% 23% 44% 40% 32%
Annual avg. market cap R 214,860 230,416 344,999 334,336 309,359 286,848 286,848 Based on current market cap (May 12, 2020)
for 2020 and 2021
Dividend yield S=I/R 1.4% 1.7% 1.7% 2.9% 3.1% 3.4% 3.8%
Shareholder return ratio T=N/R 5.0% 5.4% 1.9% 2.9% 3.1% 3.4% 3.8%
Source: Company data, Mirae Asset Daewoo Research
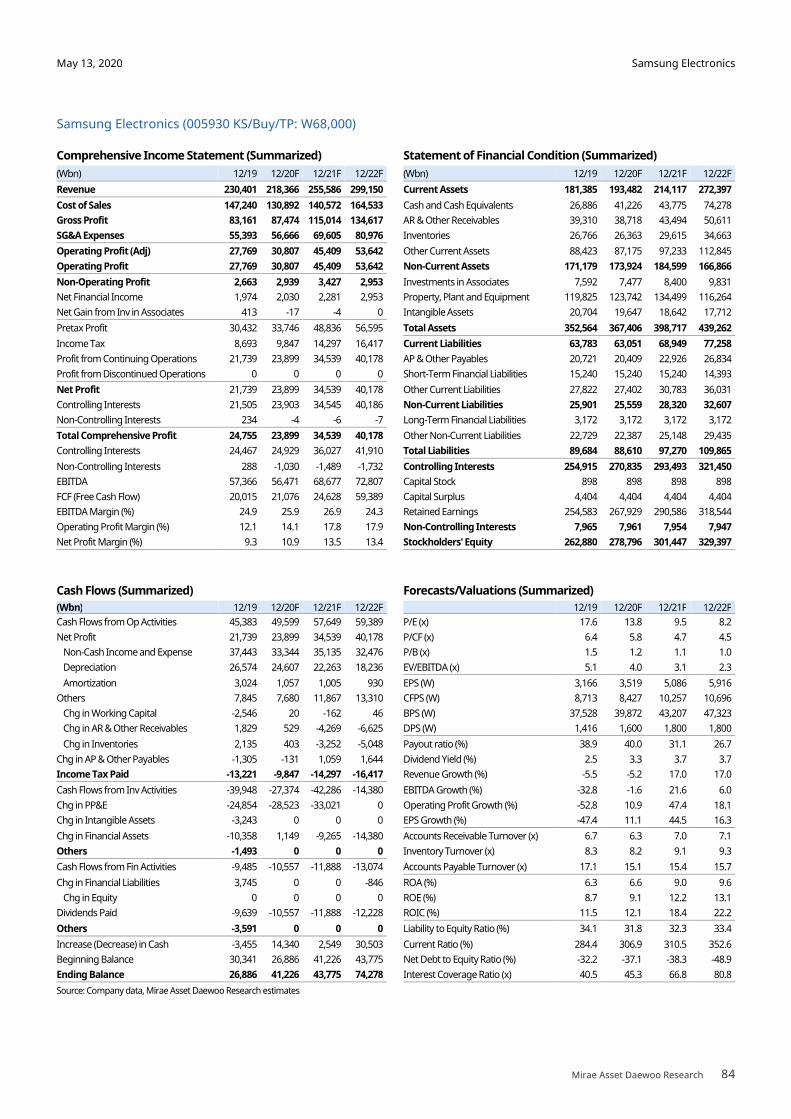
Samsung Electronics
Mirae Asset Daewoo Research 84
May 13, 2020
Samsung Electronics (005930 KS/Buy/TP: W68,000)
Comprehensive Income Statement (Summarized) Statement of Financial Condition (Summarized)
(Wbn) 12/19 12/20F 12/21F 12/22F (Wbn) 12/19 12/20F 12/21F 12/22F
Revenue 230,401 218,366 255,586 299,150 Current Assets 181,385 193,482 214,117 272,397
Cost of Sales 147,240 130,892 140,572 164,533 Cash and Cash Equivalents 26,886 41,226 43,775 74,278
Gross Profit 83,161 87,474 115,014 134,617 AR & Other Receivables 39,310 38,718 43,494 50,611
SG&A Expenses 55,393 56,666 69,605 80,976 Inventories 26,766 26,363 29,615 34,663
Operating Profit (Adj) 27,769 30,807 45,409 53,642 Other Current Assets 88,423 87,175 97,233 112,845
Operating Profit 27,769 30,807 45,409 53,642 Non-Current Assets 171,179 173,924 184,599 166,866
Non-Operating Profit 2,663 2,939 3,427 2,953 Investments in Associates 7,592 7,477 8,400 9,831
Net Financial Income 1,974 2,030 2,281 2,953 Property, Plant and Equipment 119,825 123,742 134,499 116,264
Net Gain from Inv in Associates 413 -17 -4 0 Intangible Assets 20,704 19,647 18,642 17,712
Pretax Profit 30,432 33,746 48,836 56,595 Total Assets 352,564 367,406 398,717 439,262
Income Tax 8,693 9,847 14,297 16,417 Current Liabilities 63,783 63,051 68,949 77,258
Profit from Continuing Operations 21,739 23,899 34,539 40,178 AP & Other Payables 20,721 20,409 22,926 26,834
Profit from Discontinued Operations 0 0 0 0 Short-Term Financial Liabilities 15,240 15,240 15,240 14,393
Net Profit 21,739 23,899 34,539 40,178 Other Current Liabilities 27,822 27,402 30,783 36,031
Controlling Interests 21,505 23,903 34,545 40,186 Non-Current Liabilities 25,901 25,559 28,320 32,607
Non-Controlling Interests 234 -4 -6 -7 Long-Term Financial Liabilities 3,172 3,172 3,172 3,172
Total Comprehensive Profit 24,755 23,899 34,539 40,178 Other Non-Current Liabilities 22,729 22,387 25,148 29,435
Controlling Interests 24,467 24,929 36,027 41,910 Total Liabilities 89,684 88,610 97,270 109,865
Non-Controlling Interests 288 -1,030 -1,489 -1,732 Controlling Interests 254,915 270,835 293,493 321,450
EBITDA 57,366 56,471 68,677 72,807 Capital Stock 898 898 898 898
FCF (Free Cash Flow) 20,015 21,076 24,628 59,389 Capital Surplus 4,404 4,404 4,404 4,404
EBITDA Margin (%) 24.9 25.9 26.9 24.3 Retained Earnings 254,583 267,929 290,586 318,544
Operating Profit Margin (%) 12.1 14.1 17.8 17.9 Non-Controlling Interests 7,965 7,961 7,954 7,947
Net Profit Margin (%) 9.3 10.9 13.5 13.4 Stockholders' Equity 262,880 278,796 301,447 329,397
Cash Flows (Summarized) Forecasts/Valuations (Summarized)
(Wbn) 12/19 12/20F 12/21F 12/22F 12/19 12/20F 12/21F 12/22F
Cash Flows from Op Activities 45,383 49,599 57,649 59,389 P/E (x) 17.6 13.8 9.5 8.2
Net Profit 21,739 23,899 34,539 40,178 P/CF (x) 6.4 5.8 4.7 4.5
Non-Cash Income and Expense 37,443 33,344 35,135 32,476 P/B (x) 1.5 1.2 1.1 1.0
Depreciation 26,574 24,607 22,263 18,236 EV/EBITDA (x) 5.1 4.0 3.1 2.3
Amortization 3,024 1,057 1,005 930 EPS (W) 3,166 3,519 5,086 5,916
Others 7,845 7,680 11,867 13,310 CFPS (W) 8,713 8,427 10,257 10,696
Chg in Working Capital -2,546 20 -162 46 BPS (W) 37,528 39,872 43,207 47,323
Chg in AR & Other Receivables 1,829 529 -4,269 -6,625 DPS (W) 1,416 1,600 1,800 1,800
Chg in Inventories 2,135 403 -3,252 -5,048 Payout ratio (%) 38.9 40.0 31.1 26.7
Chg in AP & Other Payables -1,305 -131 1,059 1,644 Dividend Yield (%) 2.5 3.3 3.7 3.7
Income Tax Paid -13,221 -9,847 -14,297 -16,417 Revenue Growth (%) -5.5 -5.2 17.0 17.0
Cash Flows from Inv Activities -39,948 -27,374 -42,286 -14,380 EBITDA Growth (%) -32.8 -1.6 21.6 6.0
Chg in PP&E -24,854 -28,523 -33,021 0 Operating Profit Growth (%) -52.8 10.9 47.4 18.1
Chg in Intangible Assets -3,243 0 0 0 EPS Growth (%) -47.4 11.1 44.5 16.3
Chg in Financial Assets -10,358 1,149 -9,265 -14,380 Accounts Receivable Turnover (x) 6.7 6.3 7.0 7.1
Others -1,493 0 0 0 Inventory Turnover (x) 8.3 8.2 9.1 9.3
Cash Flows from Fin Activities -9,485 -10,557 -11,888 -13,074 Accounts Payable Turnover (x) 17.1 15.1 15.4 15.7
Chg in Financial Liabilities 3,745 0 0 -846 ROA (%) 6.3 6.6 9.0 9.6
Chg in Equity 0 0 0 0 ROE (%) 8.7 9.1 12.2 13.1
Dividends Paid -9,639 -10,557 -11,888 -12,228 ROIC (%) 11.5 12.1 18.4 22.2
Others -3,591 0 0 0 Liability to Equity Ratio (%) 34.1 31.8 32.3 33.4
Increase (Decrease) in Cash -3,455 14,340 2,549 30,503 Current Ratio (%) 284.4 306.9 310.5 352.6
Beginning Balance 30,341 26,886 41,226 43,775 Net Debt to Equity Ratio (%) -32.2 -37.1 -38.3 -48.9
Ending Balance 26,886 41,226 43,775 74,278 Interest Coverage Ratio (x) 40.5 45.3 66.8 80.8
Source: Company data, Mirae Asset Daewoo Research estimates
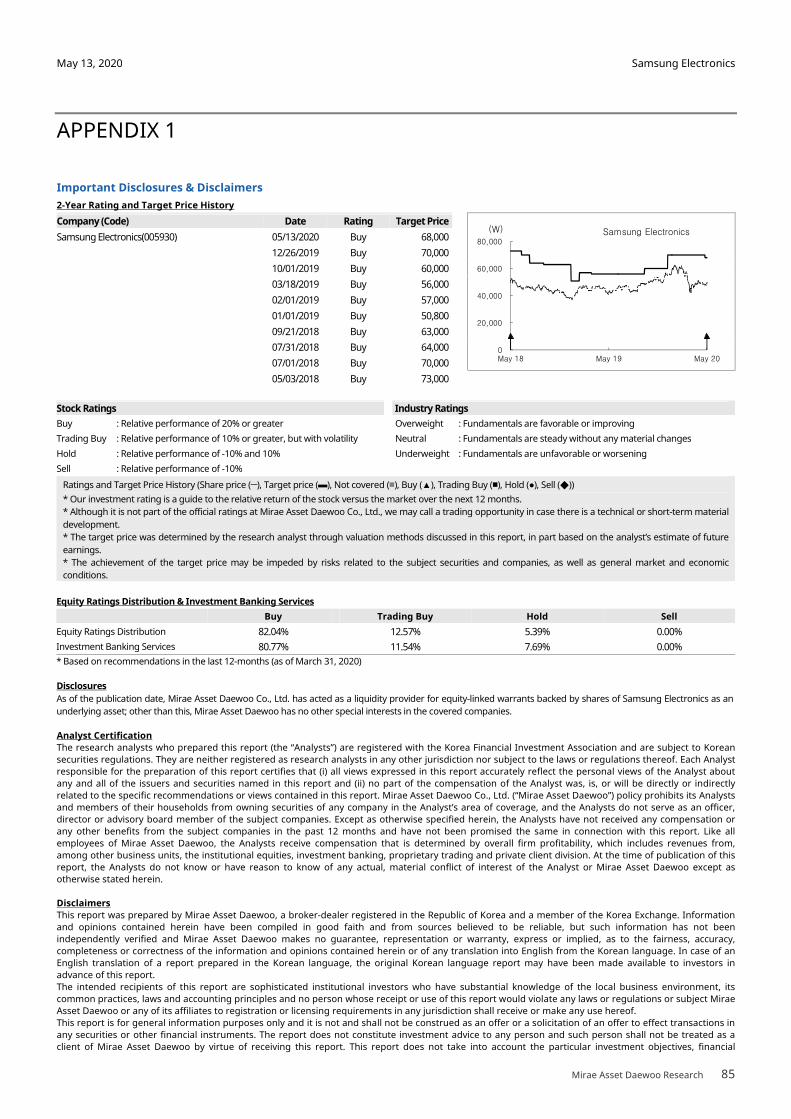
Samsung Electronics
Mirae Asset Daewoo Research 85
May 13, 2020
APPENDIX 1
Important Disclosures & Disclaimers
2-Year Rating and Target Price History
Company (Code) Date Rating Target Price
Samsung Electronics(005930) 05/13/2020 Buy 68,000
12/26/2019 Buy 70,000
10/01/2019 Buy 60,000
03/18/2019 Buy 56,000
02/01/2019 Buy 57,000
01/01/2019 Buy 50,800
09/21/2018 Buy 63,000
07/31/2018 Buy 64,000
07/01/2018 Buy 70,000
05/03/2018 Buy 73,000
Equity Ratings Distribution & Investment Banking Services
Buy Trading Buy Hold Sell
Equity Ratings Distribution 82.04% 12.57% 5.39% 0.00%
Investment Banking Services 80.77% 11.54% 7.69% 0.00%
* Based on recommendations in the last 12-months (as of March 31, 2020)
Disclosures
As of the publication date, Mirae Asset Daewoo Co., Ltd. has acted as a liquidity provider for equity-linked warrants backed by shares of Samsung Electronics as an
underlying asset; other than this, Mirae Asset Daewoo has no other special interests in the covered companies.
Analyst Certification
The research analysts who prepared this report (the “Analysts”) are registered with the Korea Financial Investment Association and are subject to Korean
securities regulations. They are neither registered as research analysts in any other jurisdiction nor subject to the laws or regulations thereof. Each Analyst
responsible for the preparation of this report certifies that (i) all views expressed in this report accurately reflect the personal views of the Analyst about
any and all of the issuers and securities named in this report and (ii) no part of the compensation of the Analyst was, is, or will be directly or indirectly
related to the specific recommendations or views contained in this report. Mirae Asset Daewoo Co., Ltd. (“Mirae Asset Daewoo”) policy prohibits its Analysts
and members of their households from owning securities of any company in the Analyst’s area of coverage, and the Analysts do not serve as an officer,
director or advisory board member of the subject companies. Except as otherwise specified herein, the Analysts have not received any compensation or
any other benefits from the subject companies in the past 12 months and have not been promised the same in connection with this report. Like all
employees of Mirae Asset Daewoo, the Analysts receive compensation that is determined by overall firm profitability, which includes revenues from,
among other business units, the institutional equities, investment banking, proprietary trading and private client division. At the time of publication of this
report, the Analysts do not know or have reason to know of any actual, material conflict of interest of the Analyst or Mirae Asset Daewoo except as
otherwise stated herein.
Disclaimers
This report was prepared by Mirae Asset Daewoo, a broker-dealer registered in the Republic of Korea and a member of the Korea Exchange. Information
and opinions contained herein have been compiled in good faith and from sources believed to be reliable, but such information has not been
independently verified and Mirae Asset Daewoo makes no guarantee, representation or warranty, express or implied, as to the fairness, accuracy,
completeness or correctness of the information and opinions contained herein or of any translation into English from the Korean language. In case of an
English translation of a report prepared in the Korean language, the original Korean language report may have been made available to investors in
advance of this report.
The intended recipients of this report are sophisticated institutional investors who have substantial knowledge of the local business environment, its
common practices, laws and accounting principles and no person whose receipt or use of this report would violate any laws or regulations or subject Mirae
Asset Daewoo or any of its affiliates to registration or licensing requirements in any jurisdiction shall receive or make any use hereof.
This report is for general information purposes only and it is not and shall not be construed as an offer or a solicitation of an offer to effect transactions in
any securities or other financial instruments. The report does not constitute investment advice to any person and such person shall not be treated as a
client of Mirae Asset Daewoo by virtue of receiving this report. This report does not take into account the particular investment objectives, financial
Stock Ratings Industry Ratings
Buy : Relative performance of 20% or greater Overweight : Fundamentals are favorable or improving
Trading Buy : Relative performance of 10% or greater, but with volatility Neutral : Fundamentals are steady without any material changes
Hold : Relative performance of -10% and 10% Underweight : Fundamentals are unfavorable or worsening
Sell : Relative performance of -10%
Ratings and Target Price History (Share price (─), Target price (▬), Not covered (■), Buy (▲), Trading Buy (■), Hold (●), Sell (◆))
* Our investment rating is a guide to the relative return of the stock versus the market over the next 12 months.
* Although it is not part of the official ratings at Mirae Asset Daewoo Co., Ltd., we may call a trading opportunity in case there is a technical or short-term material
development.
* The target price was determined by the research analyst through valuation methods discussed in this report, in part based on the analyst’s estimate of future
earnings.
* The achievement of the target price may be impeded by risks related to the subject securities and companies, as well as general market and economic
conditions.
0
20,000
40,000
60,000
80,000
May 18 May 19 May 20
(W) Samsung Electronics
Samsung Electronics
Mirae Asset Daewoo Research 86
May 13, 2020
situations, or needs of individual clients. The report is not to be relied upon in substitution for the exercise of independent judgment. Information and
opinions contained herein are as of the date hereof and are subject to change without notice. The price and value of the investments referred to in this
report and the income from them may depreciate or appreciate, and investors may incur losses on investments. Past performance is not a guide to future
performance. Future returns are not guaranteed, and a loss of original capital may occur. Mirae Asset Daewoo, its affiliates and their directors, officers,
employees and agents do not accept any liability for any loss arising out of the use hereof.
Mirae Asset Daewoo may have issued other reports that are inconsistent with, and reach different conclusions from, the opinions presented in this report.
The reports may reflect different assumptions, views and analytical methods of the analysts who prepared them. Mirae Asset Daewoo may make
investment decisions that are inconsistent with the opinions and views expressed in this research report. Mirae Asset Daewoo, its affiliates and their
directors, officers, employees and agents may have long or short positions in any of the subject securities at any time and may make a purchase or sale, or
offer to make a purchase or sale, of any such securities or other financial instruments from time to time in the open market or otherwise, in each case
either as principals or agents. Mirae Asset Daewoo and its affiliates may have had, or may be expecting to enter into, business relationships with the
subject companies to provide investment banking, market-making or other financial services as are permitted under applicable laws and regulations.
No part of this document may be copied or reproduced in any manner or form or redistributed or published, in whole or in part, without the prior written
consent of Mirae Asset Daewoo.
Distribution
United Kingdom: This report is being distributed by Mirae Asset Securities (UK) Ltd. in the United Kingdom only to (i) investment professionals falling within
Article 19(5) of the Financial Services and Markets Act 2000 (Financial Promotion) Order 2005 (the “Order”), and (ii) high net worth companies and other
persons to whom it may lawfully be communicated, falling within Article 49(2)(A) to (E) of the Order (all such persons together being referred to as
“Relevant Persons”). This report is directed only at Relevant Persons. Any person who is not a Relevant Person should not act or rely on this report or any of
its contents.
United States: Mirae Asset Daewoo is not a registered broker-dealer in the United States and, therefore, is not subject to U.S. rules regarding the
preparation of research reports and the independence of research analysts. This report is distributed in the U.S. by Mirae Asset Securities (USA) Inc., a
member of FINRA/SIPC, to “major U.S. institutional investors” in reliance on the exemption from registration provided by Rule 15a-6(b)(4) under the U.S.
Securities Exchange Act of 1934, as amended. All U.S. persons that receive this document by their acceptance hereof represent and warrant that they are a
major U.S. institutional investor and have not received this report under any express or implied understanding that they will direct commission income to
Mirae Asset Daewoo or its affiliates. Any U.S. recipient of this document wishing to effect a transaction in any securities discussed herein should contact
and place orders with Mirae Asset Securities (USA) Inc. Mirae Asset Securities (USA) Inc. accepts responsibility for the contents of this report in the U.S.,
subject to the terms hereof, to the extent that it is delivered to a U.S. person other than a major U.S. institutional investor. Under no circumstances should
any recipient of this research report effect any transaction to buy or sell securities or related financial instruments through Mirae Asset Daewoo. The
securities described in this report may not have been registered under the U.S. Securities Act of 1933, as amended, and, in such case, may not be offered
or sold in the U.S. or to U.S. persons absent registration or an applicable exemption from the registration requirements.
Hong Kong: This report is distributed in Hong Kong by Mirae Asset Securities (HK) Limited, which is regulated by the Hong Kong Securities and Futures
Commission. The contents of this report have not been reviewed by any regulatory authority in Hong Kong. This report is for distribution only to
professional investors within the meaning of Part I of Schedule 1 to the Securities and Futures Ordinance of Hong Kong (Cap. 571, Laws of Hong Kong) and
any rules made thereunder and may not be redistributed in whole or in part in Hong Kong to any person.
All Other Jurisdictions: Customers in all other countries who wish to effect a transaction in any securities referenced in this report should contact Mirae
Asset Daewoo or its affiliates only if distribution to or use by such customer of this report would not violate applicable laws and regulations and not subject
Mirae Asset Daewoo and its affiliates to any registration or licensing requirement within such jurisdiction.
Samsung Electronics
Mirae Asset Daewoo Research 87
May 13, 2020
Mirae Asset Daewoo International Network
Mirae Asset Daewoo Co., Ltd. (Seoul) Mirae Asset Securities (HK) Ltd. Mirae Asset Securities (UK) Ltd.
Global Equity Sales Team
Mirae Asset Center 1 Building
26 Eulji-ro 5-gil, Jung-gu, Seoul 04539
Korea
Units 8501, 8507-8508, 85/F
International Commerce Centre
1 Austin Road West
Kowloon
Hong Kong
41st Floor, Tower 42
25 Old Broad Street,
London EC2N 1HQ
United Kingdom
Tel: 82-2-3774-2124 Tel: 852-2845-6332 Tel: 44-20-7982-8000
Mirae Asset Securities (USA) Inc. Mirae Asset Wealth Management (USA) Inc. Mirae Asset Wealth Management (Brazil) CCTVM
810 Seventh Avenue, 37th Floor
New York, NY 10019
USA
555 S. Flower Street, Suite 4410,
Los Angeles, California 90071
USA
Rua Funchal, 418, 18th Floor, E-Tower Building Vila
Olimpia
Sao Paulo - SP
04551-060
Brasil
Tel: 1-212-407-1000 Tel: 1-213-262-3807 Tel: 55-11-2789-2100
PT. Mirae Asset Sekuritas Indonesia Mirae Asset Securities (Singapore) Pte. Ltd. Mirae Asset Securities (Vietnam) LLC
Equity Tower Building Lt. 50
Sudirman Central Business District
Jl. Jend. Sudirman, Kav. 52-53 Jakarta Selatan
12190
Indonesia
6 Battery Road, #11-01
Singapore 049909
Republic of Singapore
7F, Saigon Royal Building
91 Pasteur St.
District 1, Ben Nghe Ward, Ho Chi Minh City
Vietnam
Tel: 62-21-515-3281 Tel: 65-6671-9845 Tel: 84-8-3911-0633 (ext.110)
Mirae Asset Securities Mongolia UTsK LLC Mirae Asset Investment Advisory (Beijing) Co., Ltd Beijing Representative Office
#406, Blue Sky Tower, Peace Avenue 17
1 Khoroo, Sukhbaatar District
Ulaanbaatar 14240
Mongolia
2401B, 24th Floor, East Tower, Twin Towers
B12 Jianguomenwai Avenue, Chaoyang District
Beijing 100022
China
2401A, 24th Floor, East Tower, Twin Towers
B12 Jianguomenwai Avenue, Chaoyang District
Beijing 100022
China
Tel: 976-7011-0806 Tel: 86-10-6567-9699 Tel: 86-10-6567-9699 (ext. 3300)
Shanghai Representative Office Ho Chi Minh Representative Office
38T31, 38F, Shanghai World Financial Center
100 Century Avenue, Pudong New Area Shanghai
200120
China
7F, Saigon Royal Building
91 Pasteur St.
District 1, Ben Nghe Ward, Ho Chi Minh City
Vietnam
Tel: 86-21-5013-6392 Tel: 84-8-3910-7715