Direct detection of trace haloacetates in drinking water using microbore ion chromatographyImproved...
8
Journal of Chromatography A, 1047 (2004) 205–212 Direct detection of trace haloacetates in drinking water using microbore ion chromatography Improved detector sensitivity using a hydroxide gradient and a monolithic ion-exchange type suppressor Leon Barron, Brett Paull ∗ National Centre for Sensor Research, School of Chemical Sciences, Dublin City University, Glasnevin, Dublin 9, Ireland Received 5 April 2004; received in revised form 28 June 2004; accepted 29 June 2004 Abstract A highly sensitive gradient microbore ion chromatographic method was developed with electrolytically generated hydroxide eluents for the determination of low g/L levels of chloroacetate, bromoacetate, trifluoroacetate, dichloroacetate, chlorodifluoroacetate, dibromoacetate, trichloroacetate, bromodichloroacetate and dibromochloroacetate disinfectant by-products formed as a result of chlorination of drinking waters. The possibility of using a packed bed Dionex Atlas suppressor with a hydroxide gradient at microbore flow rates was investigated in order to reduce baseline noise levels. The Atlas suppressor displayed a very significant reduction in noise levels compared to the standard alternative ASRS Ultra suppressor, reducing noise by a factor of 15–20 in some cases, allowing trace haloacetic acids (HAs) to be seen with the direct injection of 100 L of treated water, with prior chloride and sulfate removal. To lower detection limits even further, a solid phase extraction was employed to preconcentrate HAs, resulting in detection limits of between 0.09 and 21.5 g/L. The method was applied to the determination of HAs in environmental samples and standard addition curves for three drinking water samples were carried out for both direct injection and preconcentration methods. R 2 values in both cases were ≥0.98. Combined content for US Environmental Protection Agency regulated HAs in the three drinking water samples from Dublin City University; New Ross, Co. Wexford and Drogheda, Co. Louth were 46.5, 58.3 and 12.6 g/L, respectively. © 2004 Elsevier B.V. All rights reserved. Keywords: Atlas suppressor; Water analysis; Environmental analysis; Haloacetates; Halogenated compounds; Disinfectant by-products; Organochlorine compounds; Organobromine compounds; Organofluorine compounds 1. Introduction Disinfectant by-products (DBPs) in treated drinking wa- ters are of significant concern, as the presence of certain DBPs represents a potential health hazard to humans. Ini- tial concerns arose upon the discovery of such hazards as- sociated with the formation of trihalomethanes (THMs) in the early 1970s. Since then, the second most abundant class of DBP, the haloacetic acids (HAs), have received increased ∗ Corresponding author. Tel.: +353 1 7005060; fax: +353 1 7005503. E-mail address: [email protected] (B. Paull). attention, with improvements in analytical technology high- lighting their presence, albeit at ultra-trace levels, in most chlorinated waters. Research over the past few years has clearly linked the formation of HAs, for the most part, to the chlorination of natural organic matter (NOM) containing water as part of its treatment process, as well as inorganic bromide found in ground and surface waters [1–5]. In the European context only trihalomethanes are currently covered by legislation and are limited within the European Union to a maximum of 150 g/L for total THMs until further review in 2008 when this value is to be reduced to 100 g/L. However, in the USA the US Enviromen- tal Protection Agency (EPA) has stated that the presence 0021-9673/$ – see front matter © 2004 Elsevier B.V. All rights reserved. doi:10.1016/j.chroma.2004.06.100
-
Upload
independent -
Category
Documents
-
view
2 -
download
0
Transcript of Direct detection of trace haloacetates in drinking water using microbore ion chromatographyImproved...
Journal of Chromatography A, 1047 (2004) 205–212
Direct detection of trace haloacetates in drinking waterusing microbore ion chromatography
Improved detector sensitivity using a hydroxide gradientand a monolithic ion-exchange type suppressor
Leon Barron, Brett Paull∗
National Centre for Sensor Research, School of Chemical Sciences, Dublin City University, Glasnevin, Dublin 9, Ireland
Received 5 April 2004; received in revised form 28 June 2004; accepted 29 June 2004
Abstract
luents fort oacetate,t f drinkingw stigated ino he standarda e seen witht phasee hed both directi encyr ere 46.5,5©
K anochlorinec
1
tDtsto
igh-ost
s hastoinganic
entlyean
cedn-ence
0d
A highly sensitive gradient microbore ion chromatographic method was developed with electrolytically generated hydroxide ehe determination of low�g/L levels of chloroacetate, bromoacetate, trifluoroacetate, dichloroacetate, chlorodifluoroacetate, dibromrichloroacetate, bromodichloroacetate and dibromochloroacetate disinfectant by-products formed as a result of chlorination oaters. The possibility of using a packed bed Dionex Atlas suppressor with a hydroxide gradient at microbore flow rates was inverder to reduce baseline noise levels. The Atlas suppressor displayed a very significant reduction in noise levels compared to tlternative ASRS Ultra suppressor, reducing noise by a factor of 15–20 in some cases, allowing trace haloacetic acids (HAs) to b
he direct injection of 100�L of treated water, with prior chloride and sulfate removal. To lower detection limits even further, a solidxtraction was employed to preconcentrate HAs, resulting in detection limits of between 0.09 and 21.5�g/L. The method was applied to tetermination of HAs in environmental samples and standard addition curves for three drinking water samples were carried out for
njection and preconcentration methods.R2 values in both cases were≥0.98. Combined content for US Environmental Protection Agegulated HAs in the three drinking water samples from Dublin City University; New Ross, Co. Wexford and Drogheda, Co. Louth w8.3 and 12.6�g/L, respectively.2004 Elsevier B.V. All rights reserved.
eywords: Atlas suppressor; Water analysis; Environmental analysis; Haloacetates; Halogenated compounds; Disinfectant by-products; Orgompounds; Organobromine compounds; Organofluorine compounds
. Introduction
Disinfectant by-products (DBPs) in treated drinking wa-ers are of significant concern, as the presence of certainBPs represents a potential health hazard to humans. Ini-
ial concerns arose upon the discovery of such hazards as-ociated with the formation of trihalomethanes (THMs) inhe early 1970s. Since then, the second most abundant classf DBP, the haloacetic acids (HAs), have received increased
∗ Corresponding author. Tel.: +353 1 7005060; fax: +353 1 7005503.E-mail address:[email protected] (B. Paull).
attention, with improvements in analytical technology hlighting their presence, albeit at ultra-trace levels, in mchlorinated waters. Research over the past few yearclearly linked the formation of HAs, for the most part,the chlorination of natural organic matter (NOM) containwater as part of its treatment process, as well as inorgbromide found in ground and surface waters[1–5].
In the European context only trihalomethanes are currcovered by legislation and are limited within the EuropUnion to a maximum of 150�g/L for total THMs untilfurther review in 2008 when this value is to be reduto 100�g/L. However, in the USA the US Envirometal Protection Agency (EPA) has stated that the pres
021-9673/$ – see front matter © 2004 Elsevier B.V. All rights reserved.oi:10.1016/j.chroma.2004.06.100
206 L. Barron, B. Paull / J. Chromatogr. A 1047 (2004) 205–212
of HAs also requires legislation, and a combined maxi-mum contaminant level (MCL) of 60�g/L for the five mostcommonly occurring HAs, namely, chloroacetate, bromoac-etate, dichloroacetate, dibromoacetate and trichloroacetate,has been proposed. Within this regulation, dichloroacetateshould never be present and trichloroacetate concentrationsshould not amount to more than 30�g/L.
Currently the bulk of routine analyses for both THMs andHAs are carried out by gas chromatography with electroncapture or mass spectrometric detection (EPA Methods 552and 552.2)[6,7]. These methods have become the standardEPA Methods for HA analyses and although extremely time-consuming derivatisation/extraction procedures are required,the methods are both reliable and exhibit excellent detectionlimits. Two reviews have been compiled recently detailing thevarious analytical approaches taken for the determination ofDBPs, one focusing on all DBPs[8] and the second lookingat HAs in isolation[9]. Both of the above articles review liq-uid chromatographic techniques for HA determinations andhighlight the fact that until recently, despite obvious advan-tages, the technique of ion chromatography (IC) has receivedonly limited attention. Given that the pKa of all the HAs ofinterest are lower than 2.8, they exist as anions in treateddrinking waters and therefore direct analysis of haloacetatesis possible by IC, thereby eliminating complex derivatisationp
car-r aredi ogra-p ionsw ob-t reso-l HAs air eta singa imilard ion-e -pairo itedl sedM th-o tionh iu eta reDc po-r cov-e ub� ationf nupw iu eta hlo-r wa-tr of upt s)
of 0.089–0.118�g/L in an ion-pair chromatography method[12].
Improvements in HA detection limits have recently beenreported through the use of the new Dionex AEES Atlas sup-pressor with carbonate/bicarbonate eluents[13]. The sup-pressor itself, which has a suppression bed composed ofan ion-exchange monolith and flow distribution disks, hasbeen specifically designed for use with carbonate/bicarbonateeluents, and is of too low a capacity to be used with hy-droxide eluents run with standard bore IC (suppression ca-pacity up to 25 mN at 1.0 mL/min compared to 200 mN at1.0 mL/min for the ASRS Ultra suppressor (Dionex)). How-ever, the work detailed in this paper outlines the possibilityof using the Atlas suppressor with electrolytically generatedhydroxide eluents for a microbore IC method. The large re-duction seen in baseline noise resulting from this combina-tion results in a large reduction in detection limits comparedto those obtained using the ASRS Ultra suppressor. Sam-ples of treated water were collected and the possibility ofdirect microbore IC analysis without preconcentration wasinvestigated. Additionally, to reduce detection limits to sub-�g/L concentrations, samples were also preconcentrated 25-fold using a hyper-crosslinked polystyrene–divinylbenzene(PS–DVB) sorbent[10,16,17]and analysed using the abovemethod.
2
2
ionc pedw steme lumn(a res-s ltras up-p wass sup-ps Ion-P rep gra-p edl r-t tionr andd uterw pre-c alticp fit-t ri-s wasc tion
rocedures.Some recent studies into the use of IC include that
ied out by Sarzanini et al., who developed and compon-pair chromatography and anion-exchange chromathy methods[10]. Although some reasonable separatere obtained, detection limits were higher than those
ainable with the standard GC method and completeution and quantitation of all five of the EPA regulatedpecies in drinking water samples was not possible. Nl. [11] developed a similar anion-exchange method ucarbonate–hydrogencarbonate eluent and reported s
etection limits to Sarzanini. Although both of these anxchange methods were more sensitive than other ionr ion-exclusion methods investigated, they still exhib
imited selectivity and detection limits close to the propoCL of 60�g/L, highlighting the need for improved meds with more sensitive detection. Large volume injecas been used a means to reduce detection limits by Ll., who used 500�L sample volumes with standard boionex AS9HC and AS16 columns[13,14]. Lui et al. alsoombined high volume injection with a microwave evaative preconcentration technique with almost 100% rery for all HAs. Detection limits were reported in the sg/L range and the technique offered excellent separ
rom matrix anions in drinking water supplies after cleaith chloride removal cartridges. In a recent paper by Ll., levels of HAs and other oxyhalide DBPs, such as cate and bromate were determined in bottled drinkinger [15]. Again, the detection limits were in the sub-�g/Lange. It has also been reported that sample volumeso 900�L have been used with limit of detections (LOD
. Experimental
.1. Instrumentation
For chromatographic separations, a Dionex DX500hromatograph (Dionex, Sunnyvale, CA, USA) equipith a GP50 gradient pump, EG40 eluent generation syquipped with a continuously regenerating anion trap coCRATC), LC25 chromatography oven operated at 40◦C andCD20 electrical conductivity detector was used. Supp
ion was carried out with either a 2 mm Dionex ASRS Uuppressor (at 50 mA) or a 4 mm AEES Atlas electrolytic sressor (at 19 mA), in the auto-recycle mode. Currentupplied to the Atlas suppressor with a Dionex SC20ressor controller. Injection was carried out using a 100�Lample loop. The analytical column used was a Dionexac AS16 (250 mm× 2 mm) and all tubing was microboolyether ether ketone (PEEK). Optimum ion chromatohy conditions were 2.5 mM KOH for 10 min, then ramp
inearly to 20 mM for 5 min and kept at 20 mM KOH for a fuher 20 min (eluent flow rate = 0.3 mL/min). Post-acquisie-equilibration time was 10 min. For instrument controlata acquisition, a Dell Optiplex GX1 personal compas used with Peak Net 6.0 software installed. Whereoncentration was required, a Gilson Minipuls 3 peristump (Gilson, Middleton, WI, USA) was employed and
ed with Anachem 0.63 mm poly(vinyl chloride) (PVC) petaltic tubing (Anachem, Luton, UK). Preconcentrationarried out using Merck LiChrolut EN solid-phase extrac
L. Barron, B. Paull / J. Chromatogr. A 1047 (2004) 205–212 207
(SPE) cartridges (Merck, Darmstadt, Germany) at a flow rateof 2 mL/min. For chloride and sulfate removal, Alltech Maxi-Clean IC-Ba, IC-Ag and IC-H cleanup cartridges were used(Alltech Associates, Deerfield, IL, USA).
2.2. Chemicals
All reagents used were of analytical reagent grade pu-rity. Sodium chloroacetate (98%), bromoacetic acid (99%+),sodium trifluoroacetate (98%), sodium dichloroacetate(98%), chlorodifluoroacetic acid (98%), dibromoacetic acid(97%), trichloroacetic acid (99%+), bromodichloroaceticacid (neat) and dibromochloroacetic acid (neat) were all or-dered from Aldrich (Milwaukee, WI, USA) along with allinorganic anions and carboxylates prepared from their re-spective sodium salts. Stock HA solutions were prepared toa concentration of 10 mM and stored in the refrigerator fora maximum of 2 weeks at 4◦C in the dark. Stock inorganicanion and carboxylate standards were prepared to a concen-tration of 1000 mg/L. All working standards were freshly pre-pared daily using diluent water from a Milli-Q purificationsystem (Millipore, Bedford, MA, USA) with a specific re-sistance of 18.3 M� cm. Sulfuric acid used for acidificationof preconcentration samples and standards was 99% purityand also ordered from Aldrich along with analytical-gradep e asa d toa thes Ad er-s ewR
2
es-t in.T imesw me-d kt re-f ory.D n in-s n thes worko romt werea 2.2,a e thece ridea adingo SPEc werep2 e to
the mark with Milli-Q water. All solutions pertaining to aparticular sample HA determination were prepared from thatsample of drinking water. When fortifications were made avolume of the stock standard was transferred to a 50-mL vol-umetric flask and made to the mark with sample. The dilutionfactor was then taken into account. This dilution factor wassmall with the largest standard addition spike concentration of10�M corresponding to a dilution factor of 1/1000. The ph-thalate internal standard was used as a retention time markerand to assess the separation of phthalate from trichloroac-etate and added to the samples at a concentration of 1�M,which corresponded to a 1/10,000 dilution of sample andas a result was negligible (5�L phthalate in 50 mL of sam-ple).
Volumes of 50 mL of sample were acidified to <pH 0.3by addition of a 4.5 mL aliquot of concentrated sulfuric acid.LiChrolut EN SPE cartridges were preconditioned with 3 mLMeOH, followed by 3 mL 200 mM sulfuric acid. Sampleswere loaded onto the solid phase extraction cartridge at aflow rate of 2 mL/min. After preconcentration, the cartridgewas washed with 1 mL of Milli-Q water and eluted finallywith 2 mL of 10 mM NaOH. This solution was then passedthrough a series of Alltech Maxi Clean cartridges at a flowrate of 1 mL/min, which were preconditioned with 10 mLMilli-Q water prior to the cleaning step. This series consistedo rst1 utionwt
3
3
ione fromc sul-f usinga c-c e andd ution,s rovet se-l idee nientr ast te arev min.T andd anda thegt tem-p c an-i wed
otassium hydrogenphthalate (with ortho isomer) for usn internal standard. This standard was initially prepareconcentration of 10 mM and was prepared along with
tock HA solutions. Drinking water samples (50 mL) for Heterminations were collected from the Dublin City Univity laboratory water supply, as well as two others from Noss, Co. Wexford, and Drogheda, Co. Louth.
.3. Sample collection and treatment
Samples of drinking water were collected from domic taps by allowing the tap to run for approximately 3 mhe sample bottle (1000 mL) was then rinsed three tith drinking water before sampling. Samples were imiately chilled in a refrigerator at 4◦C and kept in the dar
o minimise degradation of HAs. Samples were kept in arigerator until analysis or transportation to the laboraturing transportation, sample bottles were stored in aulated container containing an ice pack for analysis oame day. All the samples collected and analysed in thisriginated from chlorinated sources. In all, one sample f
hree locations was taken in this way and all samplesnalysed the following day. In the USEPA Method 55mmonium chloride is added to water samples to ensuronversion of free chlorine to combined chlorine[2]. How-ver, it was feared that the addition of such levels of chlond subsequent IC separation might have caused overlof the anion-exchange column, even after cleanup withhloride removal cartridges. Fresh working standardsrepared daily from the stock solutions outlined inSection.2 for analytical performance determinations and mad
f two IC-Ba, one IC-Ag and one IC-H cartridge. The fimL of the eluate was discarded and the remaining solas passed through a 0.45�m filter prior to injection onto
he IC.
. Results and discussion
.1. Separation of HAs
For the purpose of HA determinations, a high capacityxchange column was necessary to separate trace HAsommonly occurring inorganic anions such as chloride,ate and nitrate, present in large excess. Early attempts
Dionex AS11HC (250 mm× 2 mm) column were unsuessful in separating bromoacetate, chlorodifluoroacetatibromoacetate from these anions with adequate resolo the IonPac AS16 was employed in an effort to imphis. The microbore AS16 is a high capacity hydroxideective column (42.5�eq./column) and requires a hydroxluent gradient to separate and elute HAs in a conveun time. Resolution was optimum using 2.5 mM KOHhe starter concentration. Chloroacetate and bromoacetaery hydrophilic and are eluted first at 9.30 and 10.70he later eluting trichloroacetate, bromodichloroacetateibromochloroacetate required 20 mM KOH for elutionll nine HAs could be eluted in a 35-min runtime usingradient program detailed inSection 2.1. It was noticed from
he optimisation of the anion-exchange method that ovenerature played a major role in separating the inorgani
ons from HAs. The effect of elevated temperature allo
208 L. Barron, B. Paull / J. Chromatogr. A 1047 (2004) 205–212
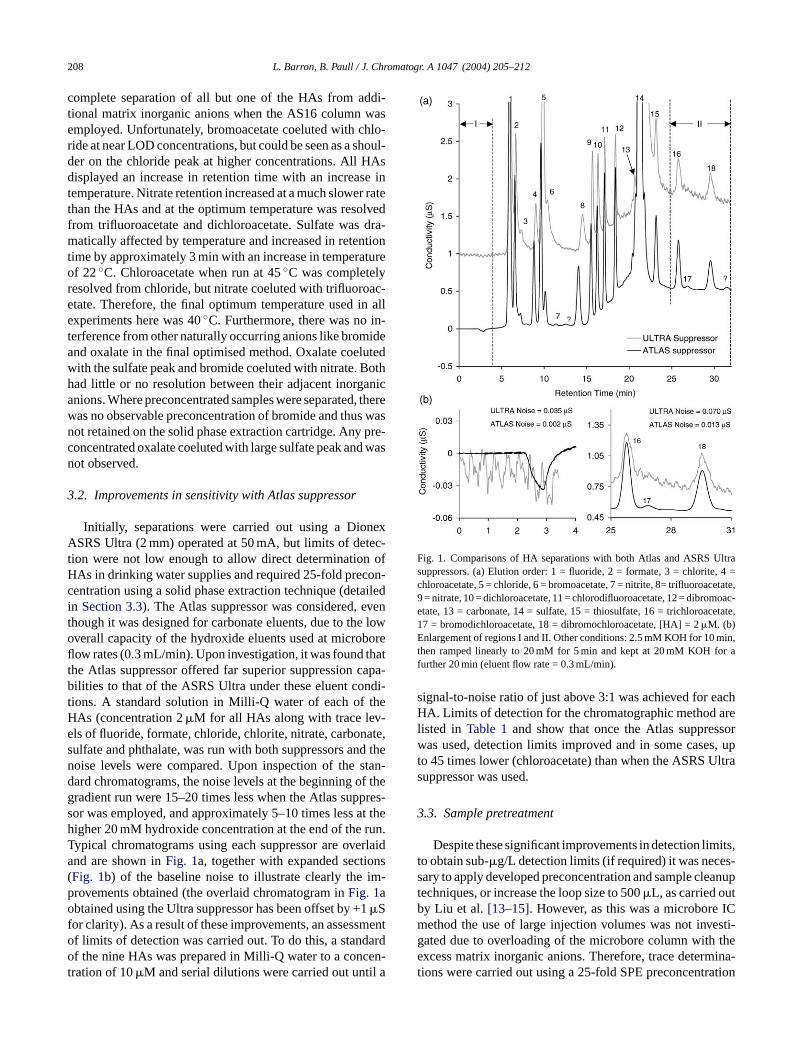
complete separation of all but one of the HAs from addi-tional matrix inorganic anions when the AS16 column wasemployed. Unfortunately, bromoacetate coeluted with chlo-ride at near LOD concentrations, but could be seen as a shoul-der on the chloride peak at higher concentrations. All HAsdisplayed an increase in retention time with an increase intemperature. Nitrate retention increased at a much slower ratethan the HAs and at the optimum temperature was resolvedfrom trifluoroacetate and dichloroacetate. Sulfate was dra-matically affected by temperature and increased in retentiontime by approximately 3 min with an increase in temperatureof 22◦C. Chloroacetate when run at 45◦C was completelyresolved from chloride, but nitrate coeluted with trifluoroac-etate. Therefore, the final optimum temperature used in allexperiments here was 40◦C. Furthermore, there was no in-terference from other naturally occurring anions like bromideand oxalate in the final optimised method. Oxalate coelutedwith the sulfate peak and bromide coeluted with nitrate. Bothhad little or no resolution between their adjacent inorganicanions. Where preconcentrated samples were separated, therewas no observable preconcentration of bromide and thus wasnot retained on the solid phase extraction cartridge. Any pre-concentrated oxalate coeluted with large sulfate peak and wasnot observed.
3
nexA ec-t ofH on-c tailedi vent e lowo borefl hatt capa-b ndi-t heH -e ate,s d then stan-d f theg pres-s at theh run.T erlaida ns( im-po 1f mento ardo en-t il a
Fig. 1. Comparisons of HA separations with both Atlas and ASRS Ultrasuppressors. (a) Elution order: 1 = fluoride, 2 = formate, 3 = chlorite, 4 =chloroacetate, 5 = chloride, 6 = bromoacetate, 7 = nitrite, 8= trifluoroacetate,9 = nitrate, 10 = dichloroacetate, 11 = chlorodifluoroacetate, 12 = dibromoac-etate, 13 = carbonate, 14 = sulfate, 15 = thiosulfate, 16 = trichloroacetate,17 = bromodichloroacetate, 18 = dibromochloroacetate, [HA] = 2�M. (b)Enlargement of regions I and II. Other conditions: 2.5 mM KOH for 10 min,then ramped linearly to 20 mM for 5 min and kept at 20 mM KOH for afurther 20 min (eluent flow rate = 0.3 mL/min).
signal-to-noise ratio of just above 3:1 was achieved for eachHA. Limits of detection for the chromatographic method arelisted in Table 1and show that once the Atlas suppressorwas used, detection limits improved and in some cases, upto 45 times lower (chloroacetate) than when the ASRS Ultrasuppressor was used.
3.3. Sample pretreatment
Despite these significant improvements in detection limits,to obtain sub-�g/L detection limits (if required) it was neces-sary to apply developed preconcentration and sample cleanuptechniques, or increase the loop size to 500�L, as carried outby Liu et al. [13–15]. However, as this was a microbore ICmethod the use of large injection volumes was not investi-gated due to overloading of the microbore column with theexcess matrix inorganic anions. Therefore, trace determina-tions were carried out using a 25-fold SPE preconcentration
.2. Improvements in sensitivity with Atlas suppressor
Initially, separations were carried out using a DioSRS Ultra (2 mm) operated at 50 mA, but limits of det
ion were not low enough to allow direct determinationAs in drinking water supplies and required 25-fold precentration using a solid phase extraction technique (den Section 3.3). The Atlas suppressor was considered, ehough it was designed for carbonate eluents, due to thverall capacity of the hydroxide eluents used at microow rates (0.3 mL/min). Upon investigation, it was found the Atlas suppressor offered far superior suppressionilities to that of the ASRS Ultra under these eluent co
ions. A standard solution in Milli-Q water of each of tAs (concentration 2�M for all HAs along with trace levls of fluoride, formate, chloride, chlorite, nitrate, carbonulfate and phthalate, was run with both suppressors anoise levels were compared. Upon inspection of theard chromatograms, the noise levels at the beginning oradient run were 15–20 times less when the Atlas supor was employed, and approximately 5–10 times lessigher 20 mM hydroxide concentration at the end of theypical chromatograms using each suppressor are ovnd are shown inFig. 1a, together with expanded sectioFig. 1b) of the baseline noise to illustrate clearly therovements obtained (the overlaid chromatogram inFig. 1abtained using the Ultra suppressor has been offset by +�S
or clarity). As a result of these improvements, an assessf limits of detection was carried out. To do this, a standf the nine HAs was prepared in Milli-Q water to a conc
ration of 10�M and serial dilutions were carried out unt
L. Barron, B. Paull / J. Chromatogr. A 1047 (2004) 205–212 209
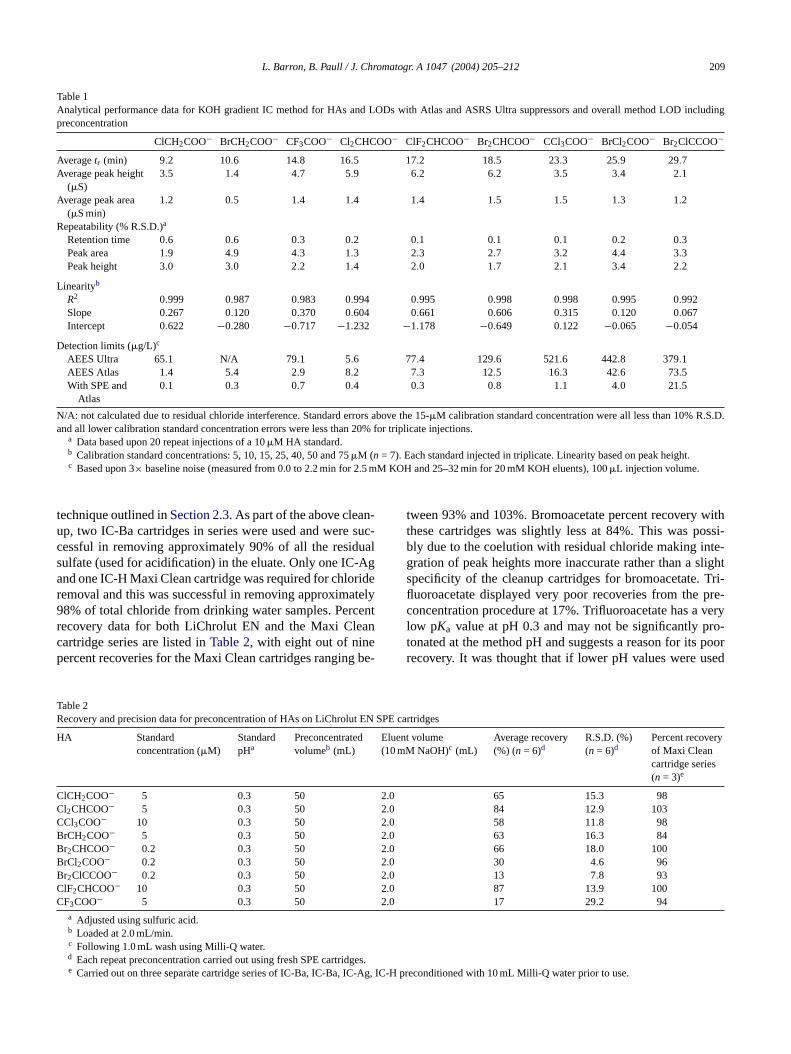
Table 1Analytical performance data for KOH gradient IC method for HAs and LODs with Atlas and ASRS Ultra suppressors and overall method LOD includingpreconcentration
ClCH2COO− BrCH2COO− CF3COO− Cl2CHCOO− ClF2CHCOO− Br2CHCOO− CCl3COO− BrCl2COO− Br2ClCCOO−
Averagetr (min) 9.2 10.6 14.8 16.5 17.2 18.5 23.3 25.9 29.7Average peak height
(�S)3.5 1.4 4.7 5.9 6.2 6.2 3.5 3.4 2.1
Average peak area(�S min)
1.2 0.5 1.4 1.4 1.4 1.5 1.5 1.3 1.2
Repeatability (% R.S.D.)a
Retention time 0.6 0.6 0.3 0.2 0.1 0.1 0.1 0.2 0.3Peak area 1.9 4.9 4.3 1.3 2.3 2.7 3.2 4.4 3.3Peak height 3.0 3.0 2.2 1.4 2.0 1.7 2.1 3.4 2.2
Linearityb
R2 0.999 0.987 0.983 0.994 0.995 0.998 0.998 0.995 0.992Slope 0.267 0.120 0.370 0.604 0.661 0.606 0.315 0.120 0.067Intercept 0.622 −0.280 −0.717 −1.232 −1.178 −0.649 0.122 −0.065 −0.054
Detection limits (�g/L)c
AEES Ultra 65.1 N/A 79.1 5.6 77.4 129.6 521.6 442.8 379.1AEES Atlas 1.4 5.4 2.9 8.2 7.3 12.5 16.3 42.6 73.5With SPE and
Atlas0.1 0.3 0.7 0.4 0.3 0.8 1.1 4.0 21.5
N/A: not calculated due to residual chloride interference. Standard errors above the 15-�M calibration standard concentration were all less than 10% R.S.D.and all lower calibration standard concentration errors were less than 20% for triplicate injections.
a Data based upon 20 repeat injections of a 10�M HA standard.b Calibration standard concentrations: 5, 10, 15, 25, 40, 50 and 75�M (n = 7). Each standard injected in triplicate. Linearity based on peak height.c Based upon 3× baseline noise (measured from 0.0 to 2.2 min for 2.5 mM KOH and 25–32 min for 20 mM KOH eluents), 100�L injection volume.
technique outlined inSection 2.3. As part of the above clean-up, two IC-Ba cartridges in series were used and were suc-cessful in removing approximately 90% of all the residualsulfate (used for acidification) in the eluate. Only one IC-Agand one IC-H Maxi Clean cartridge was required for chlorideremoval and this was successful in removing approximately98% of total chloride from drinking water samples. Percentrecovery data for both LiChrolut EN and the Maxi Cleancartridge series are listed inTable 2, with eight out of ninepercent recoveries for the Maxi Clean cartridges ranging be-
Table 2Recovery and precision data for preconcentration of HAs on LiChrolut EN SPE cartridges
HA Standardconcentration (�M)
StandardpHa
Preconcentratedvolumeb (mL)
Eluent volume(10 mM NaOH)c (mL)
Average recovery(%) (n = 6)d
R.S.D. (%)(n = 6)d
Percent recoveryof Maxi Cleancartridge series(n = 3)e
ClCH2COO− 5 0.3 50 2.0 65 15.3 98Cl2CHCOO− 5 0.3 50 2.0 84 12.9 103CCl3COO− 10 0.3 50 2.0 58 11.8 98BrCH2COO− 5 0.3 50 2.0 63 16.3 84Br2CHCOO− 0.2 0.3 50 2.0 66 18.0 100BrCl2COO− 0.2 0.3 50 2.0 30 4.6 96Br2ClCCOO− 0.2 0.3 50 2.0 13 7.8 93ClF2CHCOO− 10 0.3 50 2.0 87 13.9 100CF3COO− 5 0.3 50 2.0 17 29.2 94
ges.-Ag, IC
tween 93% and 103%. Bromoacetate percent recovery withthese cartridges was slightly less at 84%. This was possi-bly due to the coelution with residual chloride making inte-gration of peak heights more inaccurate rather than a slightspecificity of the cleanup cartridges for bromoacetate. Tri-fluoroacetate displayed very poor recoveries from the pre-concentration procedure at 17%. Trifluoroacetate has a verylow pKa value at pH 0.3 and may not be significantly pro-tonated at the method pH and suggests a reason for its poorrecovery. It was thought that if lower pH values were used
a Adjusted using sulfuric acid.b Loaded at 2.0 mL/min.c Following 1.0 mL wash using Milli-Q water.d Each repeat preconcentration carried out using fresh SPE cartride Carried out on three separate cartridge series of IC-Ba, IC-Ba, IC
-H preconditioned with 10 mL Milli-Q water prior to use.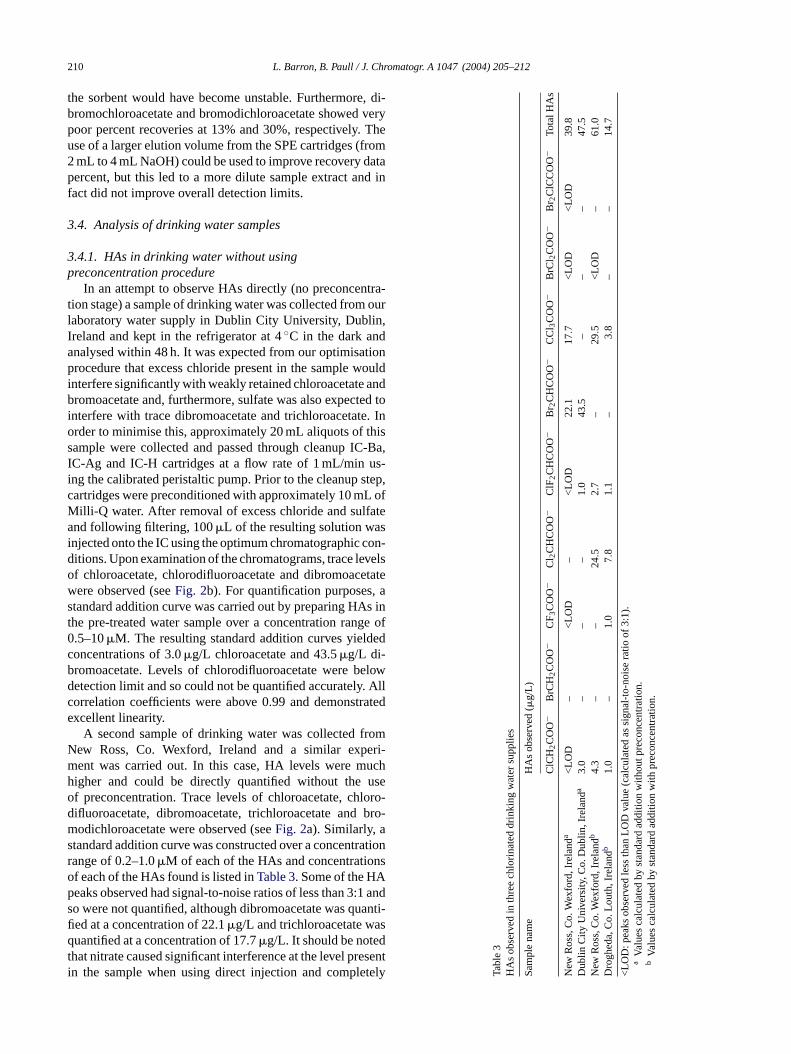
210 L. Barron, B. Paull / J. Chromatogr. A 1047 (2004) 205–212
the sorbent would have become unstable. Furthermore, di-bromochloroacetate and bromodichloroacetate showed verypoor percent recoveries at 13% and 30%, respectively. Theuse of a larger elution volume from the SPE cartridges (from2 mL to 4 mL NaOH) could be used to improve recovery datapercent, but this led to a more dilute sample extract and infact did not improve overall detection limits.
3.4. Analysis of drinking water samples
3.4.1. HAs in drinking water without usingpreconcentration procedure
In an attempt to observe HAs directly (no preconcentra-tion stage) a sample of drinking water was collected from ourlaboratory water supply in Dublin City University, Dublin,Ireland and kept in the refrigerator at 4◦C in the dark andanalysed within 48 h. It was expected from our optimisationprocedure that excess chloride present in the sample wouldinterfere significantly with weakly retained chloroacetate andbromoacetate and, furthermore, sulfate was also expected tointerfere with trace dibromoacetate and trichloroacetate. Inorder to minimise this, approximately 20 mL aliquots of thissample were collected and passed through cleanup IC-Ba,IC-Ag and IC-H cartridges at a flow rate of 1 mL/min us-ing the calibrated peristaltic pump. Prior to the cleanup step,c L ofM atea si con-d velso etatew , as s int ge of0 dedcb elowd . Allc ratede
romN eri-m uchh useo loro-d bro-ms rationr nsop :1 ands anti-fi sq dt esenti tely Ta
ble
3H
As
obse
rved
inth
ree
chlo
rinat
eddr
inki
ngw
ater
supp
lies
Sam
ple
nam
eH
As
obse
rved
(�
g/L)
ClC
H2C
OO
−B
rCH
2C
OO
−C
F 3C
OO
−C
l 2C
HC
OO−
ClF
2C
HC
OO−
Br 2
CH
CO
O−C
Cl 3
CO
O−
BrC
l 2C
OO
−B
r 2C
lCC
OO−
Tota
lHA
s
New
Ros
s,C
o.W
exfo
rd,I
rela
nda<
LOD
–<
LOD
–<
LOD
22.1
17.7
<LO
D<
LOD
39.8
Dub
linC
ityU
nive
rsity
,Co.
Dub
lin,I
rela
nda3.
0–
––
1.0
43.5
––
–47
.5N
ewR
oss,
Co.
Wex
ford
,Ire
landb
4.3
––
24.5
2.7
–29
.5<
LOD
–61
.0D
rogh
eda,
Co.
Lout
h,Ir
elan
db
1.0
–1.
07.8
1.1
–3.8
––
14.7
<LO
D:p
eaks
obse
rved
less
than
LOD
valu
e(c
alcu
late
das
sign
al-t
o-no
ise
ratio
of3:
1).
aVa
lues
calc
ulat
edby
stan
dard
addi
tion
with
outp
reco
ncen
trat
ion.
bVa
lues
calc
ulat
edby
stan
dard
addi
tion
with
prec
once
ntra
tion.
artridges were preconditioned with approximately 10 milli-Q water. After removal of excess chloride and sulfnd following filtering, 100�L of the resulting solution wa
njected onto the IC using the optimum chromatographicitions. Upon examination of the chromatograms, trace lef chloroacetate, chlorodifluoroacetate and dibromoacere observed (seeFig. 2b). For quantification purposestandard addition curve was carried out by preparing HAhe pre-treated water sample over a concentration ran.5–10�M. The resulting standard addition curves yieloncentrations of 3.0�g/L chloroacetate and 43.5�g/L di-romoacetate. Levels of chlorodifluoroacetate were betection limit and so could not be quantified accuratelyorrelation coefficients were above 0.99 and demonstxcellent linearity.
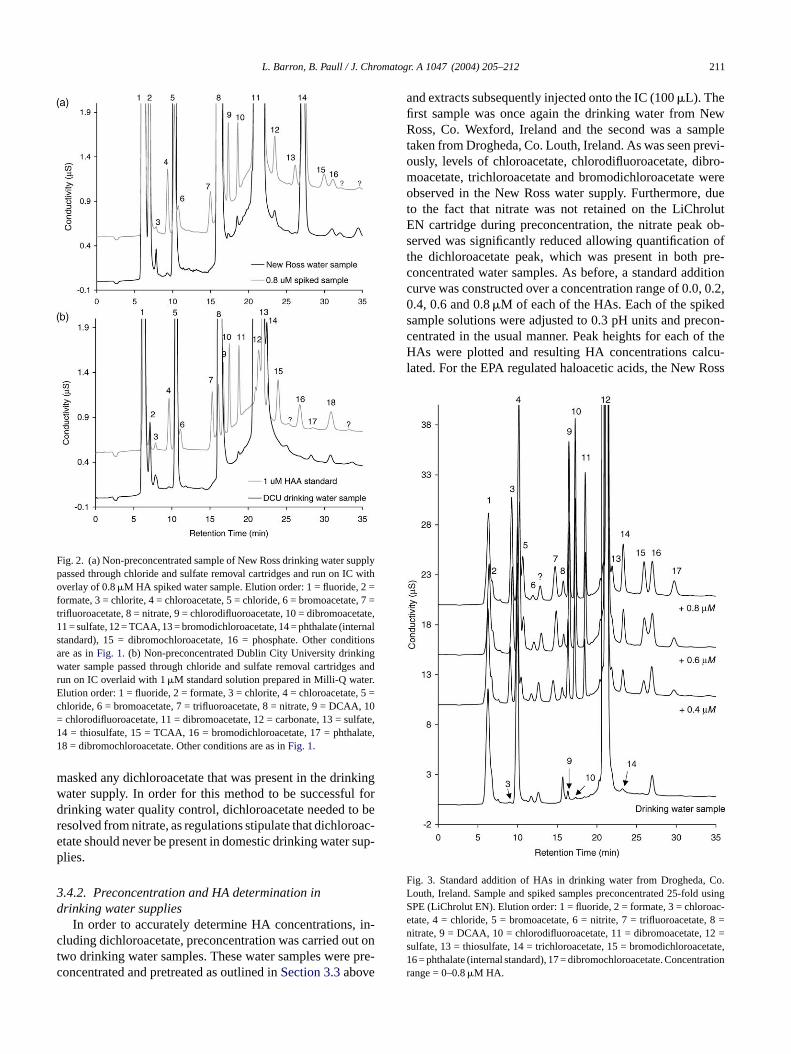
A second sample of drinking water was collected few Ross, Co. Wexford, Ireland and a similar expent was carried out. In this case, HA levels were migher and could be directly quantified without thef preconcentration. Trace levels of chloroacetate, chifluoroacetate, dibromoacetate, trichloroacetate andodichloroacetate were observed (seeFig. 2a). Similarly, a
tandard addition curve was constructed over a concentange of 0.2–1.0�M of each of the HAs and concentratiof each of the HAs found is listed inTable 3. Some of the HAeaks observed had signal-to-noise ratios of less than 3o were not quantified, although dibromoacetate was qued at a concentration of 22.1�g/L and trichloroacetate wauantified at a concentration of 17.7�g/L. It should be note
hat nitrate caused significant interference at the level prn the sample when using direct injection and comple
L. Barron, B. Paull / J. Chromatogr. A 1047 (2004) 205–212 211
Fig. 2. (a) Non-preconcentrated sample of New Ross drinking water supplypassed through chloride and sulfate removal cartridges and run on IC withoverlay of 0.8�M HA spiked water sample. Elution order: 1 = fluoride, 2 =formate, 3 = chlorite, 4 = chloroacetate, 5 = chloride, 6 = bromoacetate, 7 =trifluoroacetate, 8 = nitrate, 9 = chlorodifluoroacetate, 10 = dibromoacetate,11 = sulfate, 12 = TCAA, 13 = bromodichloroacetate, 14 = phthalate (internalstandard), 15 = dibromochloroacetate, 16 = phosphate. Other conditionsare as inFig. 1. (b) Non-preconcentrated Dublin City University drinkingwater sample passed through chloride and sulfate removal cartridges andrun on IC overlaid with 1�M standard solution prepared in Milli-Q water.Elution order: 1 = fluoride, 2 = formate, 3 = chlorite, 4 = chloroacetate, 5 =chloride, 6 = bromoacetate, 7 = trifluoroacetate, 8 = nitrate, 9 = DCAA, 10= chlorodifluoroacetate, 11 = dibromoacetate, 12 = carbonate, 13 = sulfate,14 = thiosulfate, 15 = TCAA, 16 = bromodichloroacetate, 17 = phthalate,18 = dibromochloroacetate. Other conditions are as inFig. 1.
masked any dichloroacetate that was present in the drinkingwater supply. In order for this method to be successful fordrinking water quality control, dichloroacetate needed to beresolved from nitrate, as regulations stipulate that dichloroac-etate should never be present in domestic drinking water sup-plies.
3.4.2. Preconcentration and HA determination indrinking water supplies
In order to accurately determine HA concentrations, in-cluding dichloroacetate, preconcentration was carried out ontwo drinking water samples. These water samples were pre-concentrated and pretreated as outlined inSection 3.3above
and extracts subsequently injected onto the IC (100�L). Thefirst sample was once again the drinking water from NewRoss, Co. Wexford, Ireland and the second was a sampletaken from Drogheda, Co. Louth, Ireland. As was seen previ-ously, levels of chloroacetate, chlorodifluoroacetate, dibro-moacetate, trichloroacetate and bromodichloroacetate wereobserved in the New Ross water supply. Furthermore, dueto the fact that nitrate was not retained on the LiChrolutEN cartridge during preconcentration, the nitrate peak ob-served was significantly reduced allowing quantification ofthe dichloroacetate peak, which was present in both pre-concentrated water samples. As before, a standard additioncurve was constructed over a concentration range of 0.0, 0.2,0.4, 0.6 and 0.8�M of each of the HAs. Each of the spikedsample solutions were adjusted to 0.3 pH units and precon-centrated in the usual manner. Peak heights for each of theHAs were plotted and resulting HA concentrations calcu-lated. For the EPA regulated haloacetic acids, the New Ross
Fig. 3. Standard addition of HAs in drinking water from Drogheda, Co.Louth, Ireland. Sample and spiked samples preconcentrated 25-fold usingSPE (LiChrolut EN). Elution order: 1 = fluoride, 2 = formate, 3 = chloroac-etate, 4 = chloride, 5 = bromoacetate, 6 = nitrite, 7 = trifluoroacetate, 8 =nitrate, 9 = DCAA, 10 = chlorodifluoroacetate, 11 = dibromoacetate, 12 =sulfate, 13 = thiosulfate, 14 = trichloroacetate, 15 = bromodichloroacetate,16 = phthalate (internal standard), 17 = dibromochloroacetate. Concentrationrange = 0–0.8�M HA.
212 L. Barron, B. Paull / J. Chromatogr. A 1047 (2004) 205–212
water sample contained 58.3�g/L of the five regulated HAsin total, which lies just under the EPA maximum contamina-tion limit. Excluding dichloroacetate, the total concentrationof these five HAs was 33.8�g/L. Upon examination of thestandard addition data obtained for the New Ross sampleanalysed without preconcentration, the total HA5 concen-tration (without dichloroacetate), shows excellent agreementwith this value at 39.8�g/L. The second water sample fromDrogheda Co. Louth, Ireland was analysed in the same way bymeans of 25-fold preconcentration. Again, levels of chloroac-etate, trifluoroacetate, dichloroacetate, chlorodifluoroacetateand trichloroacetate were observed. The only regulated HAswith peak heights greater than LOD level were chloroac-etate, dichloroacetate and trichloroacetate and summed to atotal of 12.6�g/L chlorodifluoroacetate and trifluoroacetatewere also observed and the total of all HA was quantified at14.7�g/L. All standard addition curves displayed linearity(Fig. 3) with correlation coefficients above 0.98. Once more,all these figures can be found inTable 3.
4. Conclusions
By using the Atlas suppressor with hydroxide eluents atlow flow rates, significantly lower detection limits for nineH res-s be-t ly1 asff duc-t tifi-c deeds l gasc
Acknowledgements
The authors would like to thank Enterprise Ireland forfunding this project.
References
[1] R.F. Christman, D.L. Norwood, D.S. Millington, J.D. Johnson, En-viron. Sci. Technol. 17 (1983) 625.
[2] A.D. Nikolau, S.K. Golfinopaulos, T.D. Lekkas, J. Environ. Mongr.4 (2002) 910.
[3] C.M. Villanueva, M. Kogevinas, J.O. Grimalt, Water Res. 37 (2003)953.
[4] L.A. Rossman, R.A. Brown, P.C. Singer, J.R. Nuckols, Water Res.35 (2001) 3483.
[5] A.G.I. Dalvi, R. Al-Rashid, M.A. Javeed, Desalination 129 (2000)261.
[6] J. Hodgeson, J. Collins, R.E. Barth, EPA Method 552.0, Revision 1.0,National Exposure Research Laboratory, Office of Research and De-velopment, U.S. Environmental Protection Agency, Cincinnati, OH,1990.
[7] D.J. Munch, J.W. Munch, A.M. Pawlecki, EPA Method 552.2, Revi-sion 1.0, National Exposure Research Laboratory, Office of Researchand Development, U.S. Environmental Protection Agency, Cincin-nati, OH, 1995.
[8] H. Weinberg, Anal. Chem. 71 (1999) 801A.[9] E.T. Urbansky, J. Environ. Monit. 2 (2000) 285.
[10] C. Sarzanini, M.C. Bruzzoniti, E. Mentasti, J. Chromatogr. A 850
[ r. A
[ 97.[[[[ 5
[ 8)
A species were obtained than with the ASRS Ultra suppor. Limits of detection without preconcentration wereween 1.4 and 73.5�g/L for a microbore IC method with on00�L injection volume. With solid phase extraction this w
urther reduced to a concentration range of 0.09–21.5�g/Lor the HA9. When preconcentration was employed, a reion in residual nitrate allowed identification and quanation of dichloroacetate. The developed method is inimple, practical and a viable alternative to conventionahromatographic techniques.
(1999) 197.11] L.M. Nair, R. Saari-Nordhaus, J.M. Anderson Jr., J. Chromatog
671 (1994) 309.12] M. Takino, S. Daishima, K. Yamaguchi, Analyst 125 (2001) 1013] Y. Liu, S. Mou, J. Chromatogr. A 997 (2003) 225.14] Y. Liu, S. Mou, Microchem. J. 75 (2003) 79.15] Y. Liu, S. Mou, Chemosphere 55 (2004) 1253.16] D. Martınez, J. Farre, F. Borrull, M. Calull, J. Chromatogr. A 83
(1999) 187.17] D. Martınez, F. Borrull, M. Calull, J. Chromatogr. A 827 (199
105.